midbrain dopaminergic neurons in the mouse: computer-assisted mapping
TRANSCRIPT

THE JOURNAL OF COMPARATIVE NEUROLOGY 369~361-371 ( 1996)
Midbrain Dopaminergic Neurons in the Mouse: Computer-Assisted Mapping
E.L. NELSON, C.-L. LIANG, C.M. SINTON, AND D.C. GERMAN Division of Comparative Medicine (E.L.N.), and Department of Psychiatry (C.-L.L., C.M.S.,
D.C.G.), University of Texas Southwestern Medical Center, Dallas, Texas 75235-9070
ABSTRACT The dopaminergic (DA) neurons in the midbrain play a role in cognition, affect and
movement. The purpose of the present study was to map and quantify the number of DA neurons in the midbrain, within the nuclei that constitute cell groups A8, A9 and A10, in the mouse. Two strains of mice were used; the C57BL/6 strain was chosen because it is commonly used in neurobiological studies, and the FVB/N strain was chosen because it is used frequently in transgenic studies. DA neurons were identified, in every fifth 20-pm-thick coronal section, using an antibody against tyrosine hydroxylase. Cell locations were entered into a computer imaging system. The FVB/N strain has 42% more midbrain DA neurons than the C57BL/6 strain; on one side of the brain there were 15,135 t 356 neurons (mean % S.E.M.) in the FVBIN strain, and 10,645 2 315 neurons in the C57BLi6 strain. In both strains, approxi- mately 11% of the neurons were located in nucleus A8 (the DA neurons in the retrorubral field), 38% in nucleus A9 (the DA neurons in the substantia nigra pars compacta, pars reticulata, and pars lateralis), and 51% in nucleus A10 (the DA neurons in midline regions such as the ventral tegmental area, central linear nucleus, and interfascicular nucleus). The number of midbrain DA cells, and their distribution within the three nuclear groups, is discussed with respect to findings in other species. , 1 ~ 6 Wiley-Liss. Inc.
Indexing terms: immunohistochemical staining, tyrosine hydroxylase, retrorubral field, substantia nigra, ventral tegmental area
The midbrain dopaminergic (DA) neurons play a role in cognition, affect and movement, and their dysfunction is important for both psychiatric and neurodegenerative dis- eases (e.g., Carlsson, 1978; Hornykiewicz, 1979). For ex- ample, the dopamine hypothesis of schizophrenia is based upon two pharmacological observations: ( 1) dopamine ago- nists, like amphetamine, L-DOPA, and the direct dopamine receptor agonists bromocriptine and lisuride, can induce various psychotic reactions in normal individuals (Snyder, 1972; Davis and Janowsky, 1973; Angrist et al., 1974; Angrist, 1987); and (2) the clinical potency of antipsychotic drugs is positively correlated with their affinity for the D2 DA receptor (Creese et al., 1976; Seeman et al., 1976). In Parkinson’s disease there is bradykinesia, akinesia, muscu- lar rigidity, a resting tremor, and impairment of postural reflexes. In this disease there is significant degeneration of the midbrain DA neurons, primarily in the substantia nigra (Hassler, 1939; German et al., 1989), and a corresponding reduction in dopamine concentrations in the striatum, limbic regions, and cerebral cortex (Hornykiewicz, 1979; Scatton et al., 1983).
The midbrain DA neurons were first identified in the rodent, and called nuclei A8, A9 and A10 (Dahlstrom and Fuxe, 1964). The nucleus A8 cells are located in the
retrorubral field (RRF). The nucleus A9 cells are located in the substantia nigra pars compacta (SNC), substantia nigra pars reticulata (SNR), and substantia nigra pars lateralis (SNL). The nucleus A10 cells are located in several nuclei on or near the midline: in the ventral tegmental area (VTA), nucleus parabrachialis pigmentosus (PBP), nucleus para- nigralis (PN), interfascicular nucleus (IF), and central linear nucleus (CLi). These neurons project to the striatum, limbic system, and cerebral cortex in a topographic manner (Fallon and Moore, 1978; Swanson, 1982).
The midbrain DA neurons have been studied most exten- sively in the rat, including an analysis of neuroanatomical localization, morphology, number, and axonal projections (e.g., Ungerstedt, 1971; Lindvall and Bjorklund, 1974; Fallon and Moore, 1978; Bentivoglio et al., 1979; Phillipson, 1979; Swanson, 1982; Gerfen et al., 1982; German and Manaye, 1993). These neurons have been also studied in the mouse (Bak, 1967; Ross et al., 1976; Baker et al., 1980; Seniuk et al., 19901, cat (Halliday and Tork, 1986; Jimenez-
Accepted December 21, 1995. Address reprint requests to Dr. Dwight C. German, Department of
Psychiatry, U.T. Southwestern Medical Center, 5323 Harry Hines Blvd., Dallas. TX 75235-9070.
L 1996 WILEY-LISS, INC.
362 E.L. NELSON ET AL.
Mannheim) in PBS-TGS for 30 minutes. Sections were rinsed thoroughly in PBS-TGS 3 times for 10 minutes, followed by a wash in 0.1 M sodium acetate buffer (pH 6.0); and (4) the sections were treated with nickelidiaminobenzi- dine (DAB)/H2O2 solution (0.035% DABI2.5Q nickel ammo- nium sulfate/0.007% H20z) in acetate buffer for 5-8 min- utes, rinsed in distilled H20, mounted, air-dried, dehydrated in alcohol and coverslipped. For all incubation and rinse steps, the sections were agitated on a shaker table.
Castellanos and Graybiel, 19871, monkey (Halliday and Tork, 1986; Arsenault et al., 1988; German et al., 1988; Lynd-Balta and Haber, 1994), and man (Hassler, 1939; McGeer et al., 1977; Bogerts et al., 1983; Pearson et al., 1983; German et al., 1983, 1989).
The purpose of the present study was to quantify the number of DA neurons in the several nuclei that constitute the midbrain DA cell groups, and map the two-dimensional distributions in the mouse. Two mouse strains were se- lected for study: FVB1N and C57BLi6. The FVBiN strain was chosen because it is used frequently for transgenic work due to its high fecundity and large prominent pronu- clei in its eggs which facilitate microinjection of DNA (Taketo et al., 1991). The C57BL16 strain was chosen because it is commonly used in neurobiological studies (e.g., Moisset, 1977; Helmeste and Seeman, 1982; Tomac et al., 1995), and it has been used as an animal model of Parkin- son’s disease (Heikkila et al., 1984; Hallman et al., 1985; Seniuk et al., 1990). The quantification of midbrain DA neurons is important for comparison purposes with other species, and for future studies of these neurons in both normal and transgenic mice.
MATERIALS AND METHODS Six male, 6 to 10-week-old FVB/N mice (Harlan Sprague-
Dawley, Indianapolis, IN) and six male, 6 to 10-week-old C57BLi6 mice (Taconic Farms, Germantown, NY) were used for experimentation. The animals were decapitated, the skull overlying the dorsal surface of the brain was removed, and the heads were immersion-fixed in 10% neutral buffered formalin for 10 days. The mice were decapitated without anesthesia, in accordance with proce- dures established by our Institutional Animal Care and Research Advisory Committee. The heads were mounted in a stereotaxic apparatus and, with the skull surface in the horizontal plane, the brains were blocked with a coronal cut through the rostral portion of the hypothalamus. Brains were then immersed in a 20% sucroseiformalin solution 24 hours prior to sectioning. Coronal sections were cut on a freezing microtome positioning the cut surface of the brain parallel to the microtome blade. Since we found marked differences in midbrain DA cell numbers in the two mouse strains, we sought to determine whether the difference was correlated with the volume of the major DA nerve terminal site in the striatum. Three animals of both strains were used for analysis of the midbrain, and three animals were used for analysis of the striatum. The sections through the midbrain (20-pm-thick) and striatum (50-pm-thick) were saved in plastic, formalin-filled boxes.
TH immunohistochemistry Every fifth section, from the level of the caudal mammil-
lary bodies to the rostral pons, was stained with a polyclonal antibody against tyrosine hydroxylase (TH, Eugene Tech International, Inc., Allendale, NJ). The staining procedure included minor variations to that published earlier (Ger- man et al., 1988). Briefly, free-floating sections were incu- bated in: (1) a 1% solution of H2O2 in 0.1 M phosphate- buffered saline (PBS; pH 7.4) for 30 minutes to reduce endogenous peroxidase activity, and rinsed in PBS-TGS solution (PBS with 0.3% Triton X-100, and 1% normal goat serum); (2) rabbit polyclonal TH antiserum, diluted 1:2,000, for 18-24 hours at room temperature and rinsed in PBS; (3) 1: 100 goat anti-rabbit IgG peroxidase (POD; Boehringer
Nissl staining In three animals of both strains, six coronal sections
through the rostrocaudal extent of the striatum were stained with cresyl violet. Every tenth section was mounted, spanning a 2.5-mm rostrocaudal distance. Sections from all animals were carefully matched according to rostrocaudal level.
Computer imaging A computer imaging system was used to map the loca-
tions of TH-containing cells, and to measure striatal vol- umes and cell sizes. The imaging system consisted of a SUN 31260 Workstation with CARP software (Biographics, Inc., Winston-Salem, NC). Details of the computer imaging procedure have been published previously (German et al., 1988, 1989). For mapping midbrain DA neurons, the tissue sections were placed on the microscope stage (Leitz, Or- tholux II), and an outline was drawn, using 40 x magnifica- tion, around the section with the aid of a digitizing tablet, microscope drawing tube, and computer-generated grid scan system. A line was drawn around the midbrain region containing the TH-immunoreactive somata, to define the “area of interest.” The locations of all TH-containing neurons within the area of interest were mapped at a magnification of 2 5 0 ~ . After a cell was marked, a small bright green asterisk appeared over the cell. Once all the cells in a field of view were marked, the computer moved the microscope stage to an adjacent field, and the cell marking procedure was repeated. After all the cells in an area of interest were marked, the procedure was repeated using the next tissue section.
A labeled cell was defined as a TH-immunoreactive soma with or without a visible nucleus. Pieces of cells were counted if they were larger than half the size of nearby cells with clearly visible nuclei. Faintly stained cells, encoun- tered at the rostral-medial portion of the DA cell complex, were also counted. In order to ensure that all cells within the section were immunostained, the 20-pm-thick sections were labeled with antibody as free-floating sections, and with exposure to the primary antibody for 18-24 hours to ensure adequate exposure to all cells within the tissue sections.
The striatal volume was measured by using Nissl-stained sections. A line was drawn around the tissue section perimeter, and a second line was drawn around the perim- eter of the striatum ( l o x magnification). The borders were determined with the aid of TH-immunostained sections through the striatum of an FVBiN and C57BLi6 mouse. The ventral border of the striatum, at rostral levels that are adjacent to the nucleus accumbens, was defined according to the atlas of Paxinos and Watson ( 1986), and the dorsal, lateral and medial borders were defined by the location of the corpus callosum and lateral ventricle.

MIDBRAIN DOPAMINERGIC NEURONS IN THE MOUSE 363
Nuclear delineations Lines were drawn around the perimeters of cell groups
A8, A9, and A10. Nucleus A8 comprised the DA cells in the RRF. Nucleus A9 was defined as the DA cells of the SNC, SNR, and SNL. Nucleus A10 was subdivided into three groups; DA cells in the (1) CLi, (2) IF, and (3) VTA. The VTA, as defined here, also contains the DA cells in the PN, PBP, and the rostral linear raphe nucleus, because the neuroanatomical borders of these latter three nuclei were not clearly discernible. The boundaries for the seven regions were chosen by examining the size and shape of the TH- stained neuronal groups, cellular relationships to axonal projections and nearby fiber bundles, and with the aid of the rat brain atlas of Paxinos and Watson (1986), since it pro- vides boundaries for many of the midbrain nuclear regions.
Split cell counting error was corrected by using the formulaofAbercrombie (1946): N = n (t/(t + d)). Here N = total number of cells, n = number of cells counted, t = section thickness, and d = cell diameter. The average of the long and short axes was used to determine the correction factor for each nucleus in each brain. The total number of cells in the nucleus was calculated from the formula of Konigsmark (1970) where Nt = NS x (St/Ss); Nt = total of cells, Ns = number of cells counted, St = total number of sections through the nucleus, Ss = the number of sections in which cells were counted.
Cell size The sizes of the TH-immunoreactive midbrain cells, in
each of the seven nuclei, were measured. In two sections through each nucleus of each animal, cells with clearly visible nuclei were examined, and the long and short axes were measured using 400 x magnification. In each mouse, measurements were taken from 50 cells in the SNC, 15 cells in the SNR, 10 cells in the SNL, 50 cells in the VTA, 25 cells in IF, 30 cells in CLi, and 30 cells in RRF. The number of cells measured in each region was based upon the number of cells within each nucleus; there were many cells in the SNC and VTA, but few cells in the SNR and SNL.
RESULTS Midbrain TH-containing neurons
The TH-immunoreactive neurons in the midbrain span a distance of approximately 2.0 mm in both mouse strains. The cells begin at the level of the caudal hypothalamus, and end a t the level of the rostral pons. The TH cell locations were mapped in 19 sections in each mouse brain.
Six representative sections, from ros- tral to caudal, stained with the TH antibody, are illustrated in Figure 1, and cell plots with neuroanatomical boundaries for the same sections are illustrated in Figure 2. Level 1 is at the most rostral portion of the midbrain DA cell complex, near the midrostrocaudal portion of the mammillary nucleus (Figs. 1A and 2A) where the SNC contains 80 TH- immunoreactive cells. The cell numbers are the cell counts within a given section prior to correction for split cell counting error. The VTA is situated dorsal and medial to the SNC, and has approximately 50 neurons. The SNL, situated lateral to the SNC, has only 1 TH-immunoreactive neuron. Notice the collection of TH-immunoreactive fibers in the medial forebrain bundle situated dorsal and medial to the VTA (Fig. IA). A border between the SNC and VTA can be observed where the densely packed SNC cells, with
C57BLlfi mouse.
dendrites descending into the SNR, are adjacent to the VTA cells that are less compact and located dorsal and medial to the SNC.
Level 2 is 300 pm caudal to Level 1, at the caudal portion of the mammillary nucleus (Figs. 1B and 2B), where the I F nucleus contains roughly 9 neurons; the VTA has about 110 neurons, the SNC has 140 neurons, the SNR has 6 neurons, and the SNL has 7 neurons. There are a few midline cells that ascend to the level of the cerebral aqueduct. At this level, many TH-immunoreactive fibers course medial and lateral to the fasciculus retroflexus. The same rule was used to determine the border between the SNC and VTA, as used above in Level 1.
Level 3 is 300 pm caudal to Level 2, and near the rostral interpeduncular nucleus (Figs. 1C and 2C). Here nucleus IF has 7 cells, the VTA contains over 200 TH-containing neurons, and the SNC has about 140 cells. There are a few cells in SNR and SNL. At this level, the medial lemniscus divides the SNC (below) from the VTA (above), and the SNC cells continue medially to the interpeduncular nucleus.
Level 4 is 300 pm caudal to Level 3, at the pontomesence- phalic border (Figs. 1D and 2D), where nucleus CLi con- tains 18 neurons, the SNC contains less than 100 neurons, and there are a few cells located in SNR and SNL. The rostral portion of nucleus A8 is located at this level, and contains roughly 54 TH-immunoreactive neurons in the RRF. The medial lemniscus still separates the medial SNC cells from the dorsally positioned VTA cells.
Level 5 is 300 pm caudal to Level 4, a t the caudal interpeduncular nucleus (Figs. 1E and 2E), where the CLi is prominent with 44 TH-containing neurons, and 18 neurons are located in a region that is contiguous with the caudal extent of the VTA (referred to as nucleus AlOc). There are also about 7 cells here that are contiguous with cells in the caudal aspect of the SNC (referred to as nucleus A9c). This region still contains the DA dendrites projecting in the dorsoventral plane, as observed rostrally in the SNR. Nucleus A8 contains roughly 70 TH-containing neurons in the RRF, and represents the majority of the cells at this level. A few cells, in the central midline, represent cells in the rostral aspect of the dorsal raphe nucleus.
Level 6 is 300 pm caudal to Level 5, and is at the caudalmost extent of the DA cell complex (Figs. 1F and 2F). At this level there are less than 80 TH-containing neurons. The majority of TH-immunoreactive cells are in the CLi, RRF, and the dorsal raphe nucleus. There are a few remaining cells in nuclei A9c and AlOc.
The midbrain cell sizes were variable, but could be divided into t.wo general groups (Table 1). The larger cells were located in the SNC, SNR, and RRF. The average size in this group is 21 x 13 pm (long x short soma axis). The smaller cells were located in the SNL, VTA, IF, and CLi. The average cell size here was 16 x 10 pm.
The estimated total number of neurons in the C57BLi6 midbrain, calculated for each of the seven nuclei (SNC, SNR, SNL, VTA, RRF, IF, and CLi), taking into consider- ation cell size and split cell counting error, is 10,645 * 315 TH-immunostained neurons (mean 2 S.E.M.), on one side of the brain. The range in cell number was 10,310 to 11,275 cells in the three animals studied. There are 1,260 * 135 nucleus A8 cells, 4,105 t 40 nucleus A9 cells, and 5,280 2 220 nucleus A10 cells; 12%:, 39%, and 49% of the total, respectively.
The number of DA cells in the SN, VTA, RRF, IF and CLi is illustrated throughout the rostrocaudal extent of each
364 E.L. NELSON ET AL.
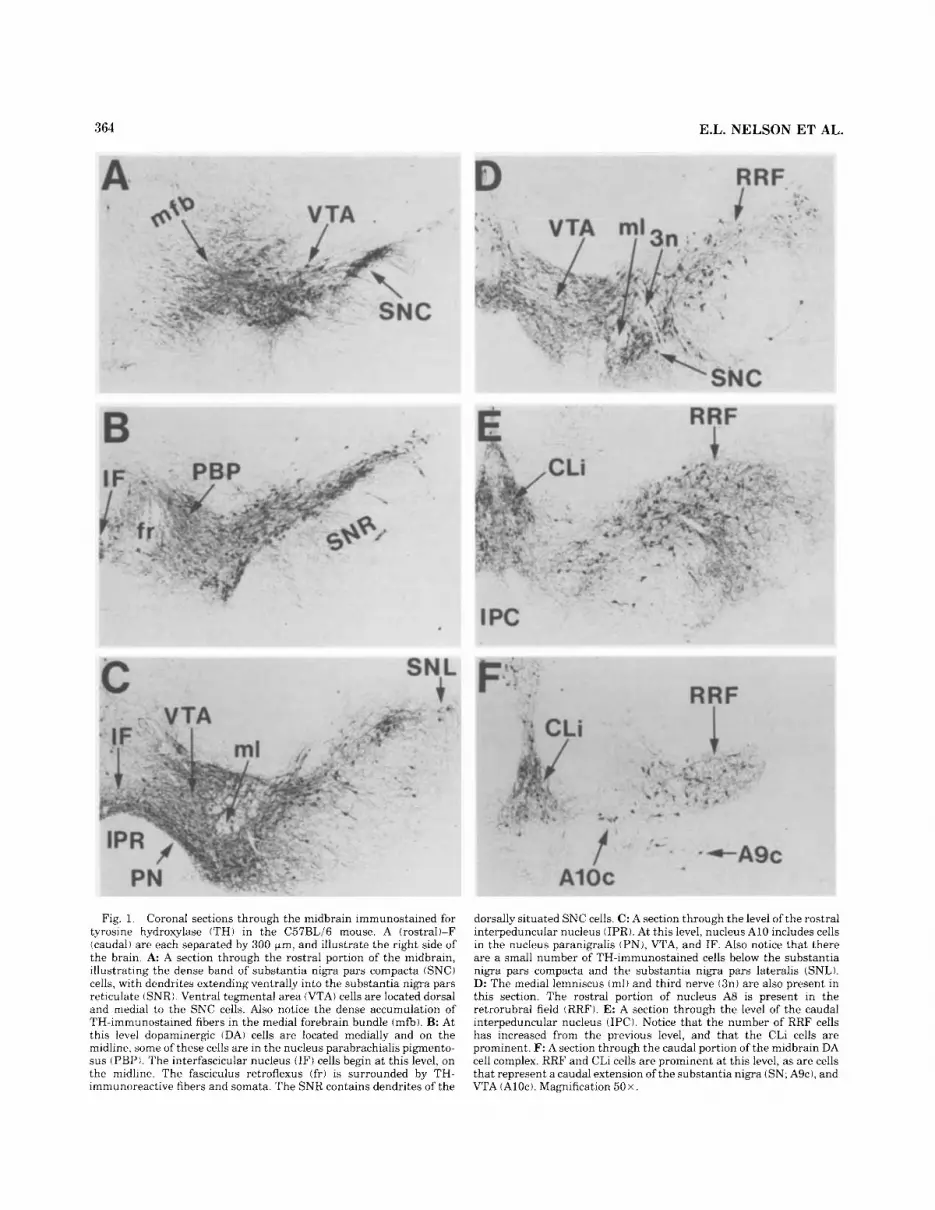
Fig. 1. Coronal sections through the midbrain immunostained for tyrosine hydroxylase iTH1 in the C57BLi6 mouse. A (rostral)-F (caudal) arc each separated by 300 Fm, and illustrate the right side of the brain. A A section through the rostral portion of the midbrain, illustrating the dense hand of substantia nigra pars compacta iSNC) cells, with dendrites extending ventrally into the substantia nigra pars reticulate ISNRI. Ventral tegmental area (VTAI cells are located dorsal and medial to the SNC cells. Also notice the dense accumulation of TH-immunostained fibers in the medial forebrain bundle (mfb). B: At this level dopaminergic (DA) cells are located medially and on the midline, some of these cells are in the nucleus parabrachialis pigmento- sus IPBP). The interfascicular nucleus (IF) cells begin a t this levcl, on thc midline. The fasciculus retroflexus (frl is surrounded by TH- immunoreactive fibers and somata. The SNR contains dendrites of the
dorsally situated SNC cells. C : A section through the level of the rostral interpeduncular nucleus (IPR). At this level, nucleus A10 includes cells in the nucleus paranigralis (PN), VTA, and IF. Also notice that there are a small number of TH-immunostained cells below the substantia nigra pars compacta and the substantia nigra pars lateralis (SNL). D: Thc medial lemniscus (ml) and third nerve (3111 are also present in this section. The rostral portion of nucleus A8 is present in the retrorubral field (RRF). E: A section through the level of the caudal interpeduncular nucleus (IPCI. Notice that the number of RRF cells has increased from the previous level, and that the CLi cells are prominent. F: A section through the caudal portion of the midbrain DA cell complex. RRF and CLi cells are prominent a t this level, as are cells that represent a caudal extension of the substantia nigra (SN; A9c), and VTA (Aloe). Magnification 50x.

MIDBRAIN DOPAMINERGIC NEURONS IN THE MOUSE 365
I I
-3411171 B l
\ \
'. Lt
i t-- ! I
I
+ K 6 I 72 I 22
C i I
Fig. 2 . Computer-generated maps of midbrain DA cell locations in six representative sections through the rostrocaudal extent of the midbrain of the C57BL/6 mouse. A i ros t rd-F (caudal) represent the maps of the cell locations illustrated in Figure 1. The neuroanatomical boundaries of the several nuclear groups are illustrated. Grid lines are separated by 0.5 mm, each cell is illustrated as a black triangle, and a t the bottom of each map is the number of cells within each vertical column.
nucleus (Fig. 3 ) . The numbers have been corrected for split cell counting error. The SN cells, which include the com- bined SNC, SNR and SNL, extend from rostral to caudal within the midbrain, a distance of about 1.7 mm. The greatest number of cells, 80-90 cells in a 20-pm-thick section, is found approximately 500 pm from the rostral portion of the midbrain. The VTA cells begin approximately 100 pm caudal to the rostral portion of the midbrain (at the point marked 200 pm), and the caudal component of this cell group (nucleus AlOc) extends to the caudalmost mid- brain region, a distance of about 1.6 mm. The number of VTA neurons is greatest at the level of the interpeduncular
TABLE 1. Neuronal cell sizes in the C57BLi6 strain
Average Nucleus Long axis' Short axis
S N C 20.2 i 0.5 12.6 2 0.4 16.4 2 0.1 S N K 22.9 z 0.1 14.3 2 0.3 1X.6 2 0.1 SNL 15.6 I 0 3 10.3 2 0.3 13 0 2 0.3 VTA 17.7 2 0 9 10.4 2 0.4 14.1 i 0.6 IF 14.9 L 0.3 10.1 5 0.1 12.5 i 0.2 CLi 15.8 2 0.4 10.3 2 0.3 13.1 z 0.1 RRF 2 0 4 2 1 0 12.X 2 0.4 16.6 I 0.7
'Cell rneasurenwnts in pn. mean 2 S.E.M., n = 3
150
L
a, a 5 100 Z
a, - - 0
50
0
Fig. 3.
' VTA 4- RRF -8- IF I+- CLi -
2 4 6 8 10 12 14 16 18 2 4 6 8 10 12 14 16 18
Distance (X 100pm)
Plots of the number of TH-immunostained cells in five nuclear groups throughout the rostrocaudal extent of the midbrain DA cell complex in the C57BLi6 mouse. Numbers represent mean 2 S.E.M. cells at different rostrocaudal locations within the midbrain DA cell complex in three mice. The cell numbers have been corrected for split-cell counting error. Rostra1 is to the left, and caudal is to the right. For a definition of the abbreviations, see the text.
nucleus, and there are from 90 to 100 cellsisection about 1,000 pm from the rostral portion of the midbrain DA cell complex. The RRF cells are located at the caudal portion of the midbrain DA cell complex; these cells begin about 1.2 mm from the rostral portion of the midbrain; they extend for 700 pm, and there are as many as 50 cellsisection at the most dense location. The CLi cells are also located at the caudal portion of the midbrain DA cell complex, and at the same rostrocaudal level as the RRF cells. The greatest number of CLi cells is 40 cellsisection. The IF cells are located in the middle rostrocaudal portion of the midbrain DA cell complex; they extend from 600 to 1,200 pm from the rostral level of the midbrain, and at the most dense location there are 10-15 cellsisection.
The midbrain DA neurons in the FVBiN mouse are distributed in a similar fashion to those in the C57BIJ6 mouse. The same rules were used to define the neuroanatomical boundaries as in the C57BLi6 strain. Level 1 is at the middle portion of the mammillary nucleus (Fig. 2A), and the SNC contains about 100 TH-immuno- stained neurons. The VTA is located dorsal-medial to the SNC, and has about 30 neurons. There are also a few TH-immunoreactive neurons which extend along the mid- line; the dorsal cells, near the cerebral aqueduct, are in the caudal portion of nucleus A1 1, and the mid- to ventral cells are associated with the rostral linear nucleus.
The FVBIN mouse.

366
TABLE 2. Neuronal cell sizes in the FVBiN strain
E.L. NELSON ET AL.
Nucleus Long axis' Short axis Average
S N C 21.0 2 0.2 12.5 i 0.2 16.8 i 0.1 SNR 23.9 ? 0.7 12.7 2 0.3 18.3 2 0.4 SNI. 16.5 i 0.7 10.6 2 0.1 13.5 ? 0.3 VTA 17.3 L 0.1 10 1 i 0.1 13 7 2 0.1 IF 13.0 2 0.5 8.1 2 0 . 1 10.6 i 0.2 CLI 15.0 ? 0.3 8.6 2 0.2 11.8 ? 0.2 RRF 18.5 i 0.3 11.9 2 0.5 15.2 i 0.4
~~
'Cell measurements in pm, mean t S.E.M., n = 3
Level 2 is near the interpeduncular fossa (Fig. 2B) and the VTA contains about 120 neurons, and the IF nucleus, on the ventral midline, has about 10 neurons. The SNC contains roughly 200 neurons, and the SNL contains 4 neurons. There are additional midline cells which extend dorsally to the level of the cerebral aqueduct.
Level 3 is at the midrostrocaudal portion of the interpe- duncular nucleus (Fig. ZC), and the DA somata in the combined VTA and IF nuclei have increased to over 300 cells. The SNC contains about 225 cells, 7 neurons in the SNR, and 3 neurons in the SNL. There are still a few cells associated with the midline above the IF.
Level 4 is near the caudal interpeduncular nucleus and rostral pons (Fig. 2D), and nucleus IF is replaced with the rostral CLi which contains about 100 TH-positive neurons. Nucleus AS begins at this level, with about 95 cells in the RRF. The VTA contains about 105 DA neurons. The SNC is now less than 100 cells, with 5 in the SNR, and 9 in the SNL.
Level 5 is at the caudal interpeduncular nucleus (Fig. ZE), and the SNC and VTA have become replaced by nuclei A9c and AlOc, respectively. The CLi contains 64 TH- positive neurons, over half of all nucleus A10 neurons at this level. Nucleus AS has about 100 TH-positive neurons in the RRF. There are 3 cells in the caudal extent of SNL. On the midline, dorsal to the CLi, there are neurons forming the rostral portion of the dorsal raphe nucleus.
Level 6 is at the caudalmost portion of the midbrain DA cell complex (Fig. ZF), and there are a total of 100 TH- immunoreactive cells; the majority of neurons can be divided equally between the CLi, RRF, and the dorsal raphe nucleus. There are also a few cells in nuclei A9c and AlOc.
The size of the TH-immunoreactive neurons in the CLi and IF nuclei is significantly smaller in the FVB/N strain than in the C57BLi6 strain (Table 2). In the FVB/N strain, the largest cells are located in the SNC, SNR and RRF (average 21 x 12 pm), and the smaller cells are located in SNL, VTA, IF and CLi (average 15 x 9 pm). The average cell size for CLi cells was 10% smaller in the FVBIN strain, and the IF cells were 15% smaller in the FVB/N strain (Welch's t test, P = 0.001).
The estimated total number of TH-immunostained neu- rons, calculated for each of the seven nuclei, taking into consideration cell size and correction for split-cell counting error, are 15,135 & 356 (mean 2 S.E.M.) neurons unilater- ally in the combined nuclei A8, A9, and A10. The range for total cell number is 14,255-15,730 for the three animals studied. There are 1,689 ? 72 cells in nucleus AS; 5,579 f 160 cells in nucleus A9; and 7,867 ? 150 cells in nucleus A10; 11%, 37%, and 52% ofthe total, respectively.
The rostrocaudal distribution of midbrain DA neurons in the FVB/N mouse is illustrated in Figure 4. The SN cells (i.e., the combined SNC, SNR and SNL cells) extend
a,
50
2 4 6 8 10 12 14 16 18
Distance (X 100prn)
Plots of the number of TH-immunostained cells within five nuclear groups throughout the rostrocaudal extent of the midbrain DA cell complex in the FVBiN mouse. Numbers represent mean ? S.E.M. cells in four mice. Rostra1 is to the left, and caudal is to the right. The cell numbers have been corrected for split-cell counting error. Abbrevia- tions defined in the text.
Fig. 4.
throughout the rostrocaudal extent of the midbrain. The number of SN cells is greatest from approximately 500 to 900 pm from the rostral portion of the midbrain where there are 95-1 15 neurons per section. The greatest number ofVTA cells are located 800-1,000 pm from the rostral part of the midbrain where there are 150-160 cells per section. The VTA cells also extend the entire length of the midbrain DA cell complex. The RRF cells are located 1,200-1,900 pm from the rostral part of the midbrain, and there are approximately 25-50 cells per section. The IF is located 600-1,100 pm from the rostral portion of the midbrain, and at the most dense location there are approximately 20 cells per section. The CLi is located just caudal to the IF, and it extends from 1,200 to 1,900 pm from the rostral portion of the midbrain; at its most dense location, there are about 50 cells per section.
Rostrocaudal cell numbers: C57BLJ6 and FVBIN mice. The average number of TH-immunostained cells, within each of the five nuclei, changes across the rostrocaudal extent of the midbrain DA cell complex (Fig. 5). In the FVB/N strain there are uniformly more TH-immunoreac- tive cells in all five nuclei which contain DA neurons (SN, VTA, RRF, IF, and CLi). In the SN, in general there are more cells throughout the rostrocaudal extent of the mid- brain in the FVB/N strain, with the greatest disparity at the level of the interpeduncular nucleus (800-1,100 pm from the rostral portion of the midbrain). In the VTA, the FVB/N strain has over 50% more cells only at the level of the interpeduncular nucleus. In the RRF, IF and CLi, the FVB/N strain has more cells throughout most of the rostrocaudal extent of each nucleus.
Striatal volume There was no difference in striatal volume between the
two mouse strains. The striatal volume was 9.21 t 0.33 mm3 in the C57BL/6 mice, and 9.14 2 0.25 mm3 in the FVB/N mice. This conclusion is based upon analysis of six Nissl-stained sections, spanning 2.5 mm of the striatum

MIDBRAIN DOPAMINERGIC NEURONS IN THE MOUSE 367
150
c a
I5O t
-7
L a n $100 z a 0
- - 50
0 2 4 6 8 10 12 14 16 18
Dis tance (X 100prn)
! RRF Cells
2 4 6 8 10 12 14 16 18 Dis tance (X 100prn)
a n
z 5 100
CLI Cells
2 4 6 8 10 12 14 16 18 Dis tance (X 100prn)
150 /- a
50
IF Cells
2 4 6 8 10 12 14 16 18 Dis tance (X 100prn)
+- FVB -m C5 7 B L/6
2 4 6 8 10 12 14 16 18 Dis tance (X 100prn)
Fig. 5. A-E: Comparisons of the number of midbrain DA neurons, in five nuclear groups, across the rostrocaudal extent of the nucleus in the FVB/N and C57BLi6 mouse strains. Notice that the FVB/N strain consistently has more DA cells, in each nucleus, than the C57BLi6 strain. Rostra1 is to the left, caudal is to the right in each panel.
(which begins rostrally at the level of the nucleus accum- bens, and ends caudally at the level of the thalamus). The animals were the same age (47 days), the fixed brain
weights were similar (C57BLi6 474 -C 6 mg; W B i N 483 t 5 mg) and body weight was somewhat higher in the FVBiN strain (C57BLi6 22.6 * 0.3 g; FVBiN 26.6 * 0.6 g).

368 E.L. NELSON ET AL.
DISCUSSION Midbrain DA neurons in the mouse
There are marked differences in midbrain DA cell num- bers in different mouse strains. There are over 40% more midbrain DA neurons in the FVB/N strain compared to the C57BLl6 strain. On the two sides of the brain there is a combined total of approximately 30,000 neurons in the FVBiN strain, and 21,000 neurons in the C57BLI6 strain. Counting TH-immunostained neurons in nuclei A9 and A10 of BALBicJ and CBAIJ mice, Baker et al. (1980) found 21% more cells in BALBIcJ than in CBAIJ. There was an average of 7,849 2 487 (mean & S.E.M.) cells in BALBIcJ, and 6,223 -t 151 cells in CBAIJ. This same group reported over 100% more DA cells in the SN of BALBIcJ mice compared to CBAiJ mice (Ross et al., 1976). In the BGCBA mouse, Triarhou et al. (1988) counted a total of 8,951 midbrain DA cells in nuclei A8, A9 and A10. The lower number of cells counted in the latter studies is due to the use of a different cell counting procedure from the one used in the present study. Only cells with clearly visible nuclei were counted in the latter three studies, and in the first two studies the cell counts were taken over a 1,000 pm rostro- caudal extent of the midbrain which is about half the size of the region sampled in the present study. Using similar procedures to those used in the present study, the BALBIc mouse strain has been reported to have a total of approxi- mately 25,000 midbrain DA neurons (German et al., 1983).
The difference in midbrain DA cell numbers in FVBIN and C57BL/6 mice does not appear to be related to the TH antibody, or to the immunohistochemical staining proce- dure. The antibody used in the present study was very effective in staining midbrain neurons in the two mouse strains, as well as immunostaining catecholaminergic neu- rons and fibers in the brains of other species. Tissue sections from both mouse strains were processed together, and the immunostaining intensity was very dark in both species. The antibody was able to penetrate the 20-pm section thickness because focusing through the section with a microscope allowed visualization of immunostained cells and neuronal processes a t all levels.
The reason that the BALB/cJ strain had 21% more neurons than the CBA/J strains was thought to be related to the fact that the BALB/cJ strain has a significantly larger ( 18%) striatal DA nerve terminal volume compared to that of the CBAIJ strain; 7.86 t 0.26 vs. 6.61 t 0.28 mmZ3 (Baker et al., 1980). Because the FVBiN strain has over 40% more midbrain DA neurons than the C57BLi6 strain, we compared the striatal volume in the two strains, but found no difference in size: approximately 9.2 mm3 in both strains. The striatal volumes are larger in the FVBiN and C57BL/6 strains, compared to the BALBicJ and CBAiJ strains, possibly because the latter two strains were examined in paraffin-embedded sections, which shrinks tissue significantly more than in frozen sections (used in the present study). Both the Baker et al. (1980) study and the present study measured striatal area in several Nissl- stained tissue sections from rostra1 to caudal through the striatum, and both studies used 6-week-old animals. Since there was no difference in striatal volume between the FVBiN and C57BLi6 mouse strains, the size of the striatal target is not a major factor that can account for differences in midbrain DA cell number between mouse strains.
The midbrain DA neurons are heterogeneous in shape with fusiform, triangular, and polygonal (multipolar) cells
being found mainly in nuclei A8 and A9, and smaller oval-shaped cells in the midline, A10 regions. The largest cells, in the midbrain DA cell complex of both strains, are located in the SNC, SNR, and RRF (on average 21 x 13 pm). This cell size is similar to that reported for the SNC previously (Bak, 1967; Ramon y Cajal, 1995). The smaller oval-shaped cells are found in the IF and CLi nuclei (on average 15 x 9 pm). The DA cells in the SNC, SNR, SNL and VTA are of comparable size in the two strains; however, the CLi and IF cells are 10-15% smaller, respectively, in the N B / N strain.
Midbrain DA neurons in different species The number of midbrain DA neurons vary markedly
among different species. The combined number of nucleus A8, A9 and A10 TH-immunoreactive neurons in the mouse vary from 20,000 to 30,000 in the FVBIN, C57BLI6 and BALBIc strains (present study; German et al., 1983). In rat, there is an estimated 45,000 TH-immunoreactive neurons in the combined nuclei A8, A9 and A10 (German and Manaye, 1993). In monkey (Macuca fuscicularis), there are approximately 160,000 TH-immunoreactive neurons lo- cated in the entire midbrain DA cell complex (German et al., 1988). In humans, the estimates have ranged from 400,000 (McGeer et al., 1977; German et al., 1983, 1989) to approxi- mately 600,000 cells (Bogerts et al., 1983; Pakkenberg et al., 1991). The studies in humans examined the number of neuromelanin pigmented cells, as opposed to cells stained for TH, because neuromelanin is a byproduct of catechol- amine synthesis in the primate brain, and easy to identify without immunohistochemical treatment of the tissue sec- tions (Graham, 1979; Bogerts, 1981; Saper and Petito, 1982).
The size of midbrain DA neurons also varies considerably among species. Most previous studies have dealt with the SN, and in the present study the mouse TH-immuno- stained cells were approximately 20 x 12 pm in size. The majority of studies in rat, cat, primate and man have examined the SN neurons using Golgi- and Nissl-stained sections, and some studies have used electron microscopy (e.g., Gulley and Wood, 1971; Hajdu et al., 1973; Schwyn and Fox, 1974; Juraska et al., 1977; Poirier et al., 1983; Halliday and Tork, 1986). However, it is not possible to compare the cell types according to neurotransmitter con- tent. Comparisons can be made among studies that used immunohistochemical staining procedures to identify the DA neurons. Using TH immunohistochemical staining procedures, there are increases in SN DA cell size from rodent to primate: in rat the cells are of similar size to those in the mouse (22 x 11 pm, German and Manaye, 1993); in monkey the cells are approximately 35 x 15 pm (Sainiri sciureus, Arsenault et al., 1988); in man the cell sizes can be 2-3 times larger than in the rodent (the larger cells measure 60 x 30 pm, Pearson et al., 1983; German, unpub- lished observation). Thus, in primates the midbrain DA neurons are larger as well as more numerous than in the rodent.
Nuclei A8, A9 and A10 The present study used standard neuroanatomical bound-
aries to define the nuclei that comprise the midbrain DA cell complex in the mouse. Differences in cell size, morphology, packing density and proximity to fiber bundles (e.g., medial lemniscus) were used to demarcate the boundaries of the SNC, SNL, SNR, RRF, VTA, CLi, and IF. Based upon

MIDBRAIN DOPAMINERGIC NEURONS IN THE MOUSE 369
previous definitions of nuclei A8, A9 and A10 (Dahlstrom and Fuxe, 1964; Ungerstedt, 1971; Lindvall and Bjorklund, 1974; Hokfelt et al., 1984) we defined nucleus A8 as the RRF DA neurons, nucleus A9 as the SN DA neurons, and nucleus A10 as the VTA (which includes PN and PBP), CLi and IF DA neurons. The boundaries between nuclei were similar to those defined previously in the rat (Hokfelt et al., 1984; Paxinos and Watson, 1986). Some investigators have avoided making nuclear boundaries between the three midbrain DA cell groups because the boundaries between the nuclei are not distinctly separate (in mouse, rat, monkey or man). These investigators chose to combine the cells into a single grouping (DiCarlo et al., 1973; Fallon and Moore, 1978; Lynd-Balta and Haber, 1994).
Nucleus A8 cells are located in the RRF, in the ventrolat- era1 reticular formation at the level of the pontine-midbrain junction. In the two mouse strains, ll-12% of the midbrain DA cells are localized in nucleus A8. This is about twice the percentage observed in the rat (6%, German and Manaye, 1993), or in the monkey (7%', German et al., 1988). In the present study, some of the caudal midbrain DA neurons that traditionally have been included as part of nucleus A8 were included as a caudal extension of nuclei A9 and A10 (referred to as nuclei A9c and AlOc, respectively), similar to the nomenclature of Hokfelt et al. (1984). This was based on cellular location and morphology, and the observation that these cells were spatially contiguous with the cells in SNC and VTA.
In the monkey, rat, and mouse, the RRF DA neurons merge with the SNC cells rostrally. This has led to the suggestion that both A8 and A9 may represent a single entity in the monkey (DiCarlo et al., 1973) and rat (Fallon and Moore, 1978). However, in the monkey (Arsenault et al., 1988), mouse (present study) and man (Pearson et al., 1983), there are morphological differences between A8 and A9 neurons that justify their inclusion in separate popula- tions. Also, the TH fibrous neuropil of nucleus A8 (see Fig. 1F) is markedly different from that of nucleus A9 not only in the mouse, but also in the rat (German and Manaye, 1993) and monkey (Arsenault et al., 1988).
Nucleus A9 is composed of DA neurons in the substantia nigra (Dahlstrom and Fuxe, 1964). The majority ofA9 cells are located in the SNC, and only a small number of DA neurons are located in the SNR and SNL. The dorsal border of the SNC is separated from the overlying VTA by the medial lemniscus, at the level of the interpeduncular nucleus. At this same level, the medial SNC cells are those that are densely packed, extending to the lateral edge of the interpeduncular nucleus, and they have dendrites that extend ventrally into the SNR. From 37% to 39% of the midbrain DA neurons in the mouse are located in nucleus A9. This value is slightly lower than the 45% reported for the rat (German and Manaye, 1993), and markedly lower than the 76% for the monkey (German et al., 1988). In man, as in the monkey, the majority of midbrain DA neurons are found in nucleus A9 (Hassler, 1939; Bogerts et al., 1983; German et al., 1989).
In rodents, the organization of the SNC DA neurons consists of a relatively uniform sheet of cells (Dahlstrom and Fuxe, 1964; Jacobowitz and Palkovits, 1974; Lindvall and Bjorklund, 1974; Pickel et al., 1975; German et al., 1983; Hokfelt et al., 1984; Triarhou et al., 1988), but in primates the nucleus is more complexly organized (Hassler, 1939; Olszewski and Baxter, 1954; Francois et al., 1984; Arsenault et al., 1988; Lynd-Balta and Haber, 1994). In the
primate, the SN contains tiers of cells from dorsal to ventral. The dorsal tier (7) is most prominent rostrally, and many of these neurons contain the calcium-binding protein calbindin-Dzxk (Gerfen et al., 1987; Lavoie and Parent, 1991; German et al., 1992), whereas the ventral tiers (p and a ) DA neurons do not contain calbindin-DZxk. The ventral tiers contain DA neurons with dendrites that extend ven- trally into the SNR, as in the rodent. Unlike the rodent, however, the primate contains distinct clusters of DA neurons (nigrosomes) that project either to the caudate nucleus or to the putamen (Parent et al., 1983).
In the mouse, nucleus A10 occupies a similar region to that in the rat, cat, monkey, and man. Halliday and Tork (1986) described six nuclei within the VTA of the rhesus monkey: PN, PBP, rostral and caudal CLi, IF, and rostral linear nucleus. Dopamine immunohistochemical staining identified these same nuclei in the squirrel monkey (Arse- nault et al., 1988). In the mouse, nucleus A10 accounts for 50-52% of the total number of midbrain DA neurons. Nucleus A10 cells constitute a lower percentage of the total midbrain DA neurons in other species: 46% in rat (German and Manaye, 1993); 17% in monkey (German et al., 1988); and 21-32% in man (Bogerts et al., 1983; German et al., 1989). The majority of nucleus A10 cells are located in the VTA (which includes cells in PBP, and PN). Nucleus IF, on the other hand, is densely packed but contains only a small percent of the total number of nucleus A10 cells. In the C57BLi6 strain, the I F has only 4% of the A10 cells, compared to 7% in the FVBIN. In the rat, roughly 15% of the A10 cells are located in IF (German and Manaye, 1993). Although some of the differences among species in the proportions of nucleus A10 cells are likely due to difficulties in defining the boundaries of this nucleus, there are never- theless marked differences in these proportions between species.
The differences in the proportions of midbrain DA neu- rons that reside in nuclei A8, A9 and A10 between species may be important for species differences in the relative size of the axonal projection fields of the three nuclear groups. In the rat, nuclei A8 and A9 cells project mainly to the dorsal striatum, whereas nucleus A10 cells project primar- ily to the ventral striatum (which includes the nucleus accumbens and olfactory tubercle) and nonstriatal regions such as the septum, amygdala, habenula, and limbic brain- stem regions (Fallon and Moore, 1978; Swanson, 1982; Berger et al., 1985; Gerfen et al., 1987). In primates, many neurons in the ventral tier of the SN project to the dorsal striatum, but there are also some striatal-projecting cells that originate in nuclei A8 and A10 (in PN; Szabo, 1980; Francois et al., 1984). The ventral striatum of the primate receives innervation from midbrain neurons in the nucleus A10 area, and from cells in both the dorsal and ventral tiers of the SN (Lynd-Balta and Haber, 1994). Because there is a greater percentage of nucleus A9 cells in the primate compared to the rodent, this may indicate that the primate has a greater percentage of striatal projecting midbrain DA neurons than the rodent. Whether the species difference in the percentage of midbrain DA neurons that are located in nuclei A8, A9 and A10 reflects a corresponding difference in axonal projections, must await further study.
Conclusion The FVBiN mouse strain has a total of approximately
30,000 midbrain TH-containing neurons, whereas the C57BLi6 mouse strain has 21,000. The difference in cell

370 E.L. NELSON ET AL.
numbers is not due to a difference in the size of the major DA target site in the striatum; striatal volumes are the same in both mouse strains. Nuclei A8, A9 and A10 contain 1154, 382, and 51% of the total midbrain DA neurons, respectively. Nuclei A9 and A10 continue more caudally than originally described in the rat, and the caudal regions are referred to as nuclei A9c and AlOc, respectively. The difference in midbrain DA cell numbers between the two mouse strains is distributed comparably among the several nuclei that comprise the midbrain DA cell complex. There is both an increase in the number and size of midbrain DA neurons from rodent to primate. The proportion of mid- brain DA neurons that are located in nuclei A8, A9, and A10 also differ from rodent to primate; in primates the majority ( > 70% ) of midbrain DA neurons are located in nucleus A9, whereas in the mouse the greatest percentage of cells is located in nucleus A10 (51%). The midbrain DA cell maps will be useful for future neurobiological and transgenic studies that use these mouse strains.
ACKNOWLEDGMENTS This research was supported by grants from the NIH (NS
30406, RR 070311, the James Webb Fund of the Dallas Foundation, the Zigenbein Fund, and the American Parkin- son Disease Association, Inc. The authors thank Dr. Ke- bretan Manaye for valuable help with computer imaging, and Ms. Judy Burdette for secretarial assistance.
LITERATURE CITED Abercrombie. M. ( 1946) Estimation of nuclear population from microtome
sections. Anat. Rec. 94239-247. Angrist, B. ( 19871 Pharmacological models of schizophrenia. In F.A. Henn
and L.E. DeLisi (eds): Handbook of Schizophrenia, Vol. 2. Amsterdam: Elsevier, pp. 391-424.
Angrist. B.. G. Sathananthan, S. Wilk, and S. Gershon (19741 Amphetamine psychosis: Behavioral and biochemical aspects. J . Psychiat. Res. I I:13-23.
Arsenault. M.-Y., A. Parent, P. Seguela, and L. Descarries (1988) Distribu- tion and morphological characteristics of dopamine-immunoreactive neurons in the midbrain of the squirrel monkey (Sairnirz sciureus). J . Comp. Neurol. 267.489-506.
Bak. I.J. I 1967) The ultrastructure of the substantia nigra and caudate nucleus of the mouse-and the cellular localization of catecholamines. Exp. t h i n Res. 3:40-57.
Baker, H., T.H. Joh, and D.J. Reis 11980) Genetic control of number of midhrain dopaminergic neurons in inbred strains of mice: Relationship to size and neuronal density of the striatum. Proc. Natl. Acad. Sci. USA 77.43694373,
Bentivoglio. M., D. van der Kooy, and H.G.J.M. Kuypers (19791 The organization of the efferent projections of the substantia nigra in the rat. A retrograde fluorescent double labeling study. Brain Res. 174.1-17.
Berger. B.. C. Verney, C. Alvarez, A. Vigny, and K.B. Helle (1985) New dopaminergic terminal fields in the motor, visual (area 18b) and retrosple- nial cortex in the young and adult rat. Immunocytochemical and catecholamine histochemical analyses. Neuroscience 15r983-998.
Bogerts, B. I 1981) A brainstem atlas of catecholaminergic neurons in man, using melanin as a natural marker. J . Comp. Neurol. 197:63-80.
Bogerts. B.. J. Hantsch. and M. Herzer (1983) A morphometric study of the dopamine-containing cell groups in the mesencephalon of normals, Parkinson patients, and schizophrenics. Biol. Psychiat. 18:951-969.
Carlsson, .A. ( 1978) Antipsychotic drugs, neurotransmitters and schizophre- nia. Am. J . Psychiatry 135:164-173.
Creese, I . , D.K. Burt, and S.H. Snyder (19761 Dopamine receptor binding predicts clinical and pharmacological potencies nf antischizophrenic drugs. Science 192:481-483.
Dahlstrom, A, . and K. Fuxe (1964) Evidence for the existence of monoamine- containing neurons in the central nervous system. I . Demonstration of monoamines in the cell bodies of brain stem neurons. Acta Physiol. S c a d Suppl. 232:l-55.
Davis, J.M., and D.S. Janowsky (1973) Amphetamine and methylphenidate psychosis. In E. Usdin and S.H. Snyder (eds.): Frontiers of Catechol- amine Research. New York: Pergamon Press, pp. 977-981.
DiCarlo, V., J .E . Hubbard, and P. Pate (1973) Fluorescence histochemistry of monoamine-containing cell bodies in the brain stem of the squirrel monkey (Sairniri .sc~ureusl. J. Comp. Neurol. 125:347-372.
Fallon, J . , and R.Y. Moore (1978) Catecholamine innervation of the basal forebrain. IV. Topography of the dopamine projection to the basal forebrain and neostriatum. J . Comp. Neurol. 180545-580.
Francois, C., G. Percheron, and J . Yelnik ( 1984) Localization ofnigrostriatal, nigrot.halamic and nigrotectal neurons in ventricular coordinates in macaques. Neuroscience 13:6 1-76.
Gerfen, C.R., W.A. Staines, G.W. Arbuthnott, and H.C. Fibiger (1982) Crossed connections of the substantia n i p a in the rat. J . Comp. Neurol. 207:283-303.
Gerfen, C.R., M. Herkenham, and J . Thibault (1987) The neostriatal mosaic: 11. Patch- and matrix-directed mesostriatal dopaminergic and non- dopaminergic systems. Neuroscience 7.39 15-3934.
German, D.C., and K.F. Manaye (19931 Midbrain dopaminergic neurons (nuclei A8, A9 and A10): Three-dimensional reconstruction in the rat. J . Comp. Neurol. 331:297-309.
German, D.C., D.S. Schlusselberg, and D.J. Woodward (1983) Three- dimensional computer reconstruction of midbrain dopaminergic neuro- nal pcpulations: From mouse to man. J . Neural Trans. 57243-254.
German, D.C.. M. Dubach, S. Askari, S.G. Speciale, and D.M. Bowden (19881 l-Methyl-4-phenyl-l,2,3.6-tetrahydropyridine-induced parkinsonian syn- drome in Macaca fascicularis: Which midbrain dopaminergic neurons are lost? Neuroscience 24.161-174.
German, D.C.. K.F. Manaye, W.K. Smith, D.J. Woodward, and C.B. Saper (1989) Midbrain dopaminergic cell loss in Parkinson’s disease: Computer visualization. Ann Neurol. 26.507-514.
German, D.C., K.F. Manaye, P.K. Sonsalla, and B.A. Brooks (1992) Midbrain dopaminergc cell loss in Parkinson’s Disease and MPTP-induced parkin- sonism: Sparing ofcalbindin-D,,,-containing cells. Ann. New York Acad. Sci. 648:42-62.
Graham, D.C. (1979) On the origin and significance of neuromelanin. Arch. Pathol. Lab. 10,9:359-962.
Gulley, R.L., and R.1,. Wood (1971) The fine structure of the neurons in the rat substantia nigra. Tissue Cell 3:675-690.
Hajdu, F., R. Hassler, and I.J. Bak (1973) Electron microscopic study of the substantia nigra and the strio-nigral projection in the rat. 2. Zellforsch 146.207-221.
Halliday, G.M.. and I. Tork (1986) Comparative anatomy of the ventrome- dial mesencephalic tegmentum in the rat, cat, monkey and human. J . Comp. Neurol. 252:423-445.
Hallman, H., J . Lange, I,. Olson, I. Stromberg, and G. Jonsson (1985) Neurochemical and histochemical characterization of neurotoxic effects of l-methyI-4-phenyl-l,2,3,6-tetrahydropyridine on brain catecholamine neurnnes in the mouse. J. Neurochem. 44:117-127.
Hassler, K. (1939) Zur pathologischen anatomie des senilen und des parkinsonistichen tremor. J. Psychol. Neurol. 49: 13-55.
Heikkila, R.E., A. Hess, and R.C. Duvoisin (1984) Dopaminergic neurotoxic- ity of l-methyl-4-phenyl-l,2,3,6-tetrahydropyridine in mice. Science 224:1451-1453.
Helmeste, D.M., and P. Seeman ( 1982) Amphetamine-induced hypolocomn- tion in mice with more brain D2 dopamine receptors. Psychiat. Res. 7.351-359.
Hokfelt, T., R. Martensson, A. Bjorklund, S. Kleinau, and M. Goldstein (1984) Distributional maps of tyrosine-hydroxylase-immunoreactive neu- rons in the rat brain. In A. Bjorklund and T. Hokfelt (edsJ: Handbook of Chemical Neuroanatomy, Vol. 2. New York: Elsevier Press. pp. 277-379.
Hornykiewicz, 0. (1979) Brain dopamine in Parkinson’s disease and other neurolok~cal disturbances. In A.S. Horn, J . Korf, and B.H.C. Westerink (eds): The Neurnbiology of Dopamine. New York: Academic Press, pp. 633-654.
Jacobowitz, D.M., and M. Palkovits (1974) Topographic atlas of catechol- amine and acetylcholinesterase-containing neurons in the rat brain. 1. Forebrain i telenccphalon, diencephalon). J. Comp. Neurol. 157:13-28.
Jimenez-Castellanos, J., and A.M. Graybiel (1987) Subdivisions of the dopamine-containing AX-AS-AlO complex identified by their differential mesostriatal innervation of striosomes and extrastriosomal matrix. Neuroscience 23223-242
Juraska, J.M., C.J. Wilson, and P.M. Groves (1977) The substantia nigra of the rat: A Golgi study. J. Comp. Neurol. 172,585-600.
MIDBRAIN DOPAMINERGIC NEURONS IN THE MOUSE 371
Konigsmark, B.W. (19701 Methods for the counting of neurons. In W.J.H. Nauta and S.O.E. Ebbeson (edsl: Contemporary Research Method in Neuroanatomy. New York: Springer, pp. 315-380.
Lavoie, B., and A. Parent (19911 Dopaminergic neurons expressing calbindin in normal and parkinsonian monkeys. NeuroReport 2601-604.
Lindvall, O., and A. Bjorklund (1974) The organization of the ascending catecholamine neuron systems in the rat brain as revealed by the glyoxylic acid fluorescence method. ActaPhysiol. Scand. lSuppll412;148.
Lynd-Balta, E., and S.N. Haber (19941 The organization of midbrain projections to the ventral striatum in the primate. Neuroscience 59.609- 623.
McGeer, YL., E.G. McGeer, and J.S. Suzuki (1977) Aging and extrapyrami- dal functions. Arch. Neurol. 34:33-35.
Moisset, B. 11977) Genetic analysis of the behavioral response to d- amphetamine in mice. Psychopharmacology 53.263-267.
Olszewski, J . . and 0. Baxter (1954) Cytoarchitecture of the Human Brain Stem. Basel: Karger.
Pakkenberg, B., A. Moller, H.J.G. Gundersen, A. Mouritzen Dam, and H. Pakkenberg ( 19911 The absolute number of nerve cells in substantia nigra in normal subjects and in patients with Parkinson's disease estimated with an unbiased stereological method.
Parent, A,, A. Mackey, and L. De Bellefeuille (19831 The subcortical afferents to caudate nucleus and putamen in primate: A fluorescence retrograde double labeling study. Neuroscience 10.1137-1150.
Paxinos. G., and C. Watson (19861 The Rat Brain in Stereotaxic Coordinates. New York: Academic Press.
Pearson. J., M. Goldstein, K. Markey, and L. Brandeis (19831 Human brainstem catecholamine neuronal anatomy as indicated by immunocyto- chemistry with antibodies to tyrosine hydroxylase. Neuroscience 8:3-32.
Phillipson, O.T. ( 1979) The cytoarchitecture of the interfascicular nucleus and ventral tegmental area of Tsai in the rat. J. Comp. Neurol. I87:8,!-98.
Pickel,V.M.,'LH. Joh, P.M. Field,C.G. Becker,andD.J. Reis(l975)Cellular localization of tyrosine hydroxylase in brain by light and electron microscopy. Brain Res. 85:295-300.
Poirier, L.J., M. Giguere, and R. Marchand (1983) Comparative morphology of the substantia nigra and ventral tegmental area in the monkey, cat and rat. Brain Res. Bull. 11.371-397.
Ramon y Cajal, S. (19951 Histology of the Nervous System. Vol. 11. N. Swanson and L.W. Swanson (translators), New York: Oxford, p. 226.
Ross, R.A., A.B. Judd, V.M. Pickel, T.H. Joh, and D.J. Reis (1976) Strain- dependent variations in number of midbrain dopaminergic neurons. Nature 264:654-656.
Saper, C.B., and C.K. Petito ( 1982) Correspondence of melanin-pigmented neurons in the human brain with A1-A14 catecholamine cell groups. Brain 105:s 7- 102.
Scatton, B., F. Javoy-Agid, and L. Rouquier (19831 Reduction of cortical dopamine, noradrenaline, serotonin and their metabolites in Parkin- son's disease. Brain Res. 275.321-328.
Schwyn, R.C., and C.A. Fox (1974) The primate substantia nigra: A golgi and electron microscopic study. J. Hirnforsch 15:95-126.
Seeman, P. , T. Lee, M. Chau-Wong, and K. Wong (19761 Antipsychotic drug doses and neurolepticidopamine receptors. Nature, Lond. 261:717-719.
Seniuk, N.A., W.G. Tatton, and C.E. Greenwood (1990) Dose-dependent destruction of the coeruleus-cortical and nigral-striatal projections by MPTP. Brain Res. 527.7-20.
Snyder, S.H. (1972) Catecholamines in the brain as mediators of amphet- amine psychosis. Arch. Gen. Psychiat. 27:169-179.
Swanson, L.W. (19821 The projections of the ventral tegmental area and adjacent regions: A comhined fluorescent retrograde tracer and immuno- fluorescence study in the rat. Brain Res. Bull. 9321-353.
Szabo, J . (1980! Organization of the ascending striatal afferents in monkeys. J . Comp. Neurol. 189:307-321.
Taketo, M., A.C. Schroeder, L.E. Mobraaten, K.B. Gunning, G. Hanten, R.R. Fox, T.H. Roderick, C.L. Stewart, F. Lilly, C.T. Hansen, and P.A. Overbeek (19911 FVBIN: An inbred mouse strain preferable for trans- genic analyses. Proc. Natl. Acad. Sci. 88.2065-2069.
Tomac, A,, E. Lindqvist, L.-F.H. Lin, S.O. Ogren, D. Young, B.J. Hoffer, and L. Olson (1995) Protection and repair of the nigrostriatal dopaminergic system by GDNF in vivo. Nature 373:335-339.
Triarhou, L.C., J . Norton, and B. Ghetti (19881 Mesencephalic dopamine cell deficit involves areas A8, A9 and A10 in weaver mutant mice. Exp. Brain Res. 70.256-265.
Ungerstedt. U. (1971) Stereotaxic mapping of the monoamine pathways in the rat brain. Acta Physiol. Scand. [SuppII367:148.