microeconomics principles online
TRANSCRIPT

Research in Economic Education
In this section, the Journal of Economic Education publishes original theo-retical and empirical studies of economic education dealing with the analysisand evaluation of teaching methods, learning, attitudes and interests, materials,or processes.
PETER KENNEDY, Section Editor
Teaching and Learning Principles ofMicroeconomics Online: An EmpiricalAssessment
Chiara Gratton-Lavoie and Denise Stanley
Abstract: How do students enrolled in online courses perform relative to thosewho choose a more traditional classroom environment? What student characteris-tics help explain differences in student academic achievement in the two modes ofinstruction? What factors affect the students’ choice of instruction mode? The au-thors address these questions in relation to the teaching of introductory economicscourses. They find that the two groups of students are significantly different inage, gender composition, marital status and number of children, GPA, previouseconomics exposure, planned major, and other important characteristics. The rawdata suggested a higher mean score for the online class sections. But after con-sidering course selection bias, the findings indicated that age and GPA positivelyaffect students’ performance in the course, whereas the online teaching mode hasa narrowly insignificant, or even negative, effect. Semester effects are most impor-tant for the online subsample, and male students enjoy a premium in the traditionalclassroom setting.
Keywords: academic achievement, online teaching, principles of microeconomics,self-selectionJEL codes: A20, A22
Chiara Gratton-Lavoie is a lecturer of economics and the director of the Center for Economic Ed-ucation at California State University, Fullerton (e-mail: [email protected]). Denise Stanleyis an associate professor of economics at California State University, Fullerton. The authors thankAndrew Gill, Peter Kennedy, and three anonymous referees for their comments and valuable sugges-tions. Copyright © 2009 Heldref Publications
Winter 2009 3

Online learning has been described as a solution to some of the educational chal-lenges emerging in the twenty-first century. As the children of the baby boomersenter college, both public and private universities face greater student enrollmentsand reduced budgets. This surge in enrollment figures has created financial strainson many colleges across the nation. At the same time, students reside at greaterdistances from their universities and face increasing work and family demands ontheir time (Bonca 1998). Colleges and universities have therefore implementedalternatives to the traditional classroom-based experience, ranging from Web-based delivery of certain classroom materials to complete online instruction.
Does online education represent a cost-effective solution to these challengeswhile maintaining or improving teaching quality? Might the new technology some-how reduce the long-standing gender gap in economics? We address the literatureon these two questions. Next we present our study, which uses a data set that allowsfor a decomposition of test scores by teaching mode and gender. We specificallyinvestigate the variables affecting course selection and performance for students en-rolled in economics principles courses and present results of the empirical analysis.
LITERATURE ON ONLINE EDUCATION
A widespread debate has begun to emerge among academics regarding Internettechnology. Sosin (1998) provided an overview of the arguments. On the positiveside, an online class provides faster information access, it can be structured to ac-commodate different learning styles and student types, and it encourages studentsto take a more responsible, constructive role in the learning process (Zhang 1998;Brewer and Erickson 1997; McCollum 1997). More time is available for studyingwhen long travel times to a distant campus are eliminated, and students enrolled inonline classes can gain computer skills useful for future career paths (Agarwal andDay 1998). Student-professor interaction may be enhanced by online instruction.The distance-learning format allows the instructor to rely on asynchronous com-munication for content delivery, dedicating the time spent (synchronously) onlinewith the students to class discussion and student-instructor interaction (Navarroand Shoemaker 2000a). Finally, if the online classroom is at least as effective alearning environment as the traditional classroom, education delivery costs perstudent and per concept taught could be lowered, therefore lowering the total costsof education.
Others point to traditional classroom benefits such as immediate response tostudent questions and frequent student-to-student interaction (Zhang et al. 2004).Furthermore, potential advantages of online learning, such as provision of individ-ualized instruction to accommodate different learning styles and use of interactive,hands-on learning materials, would not be realized if the online instructor struc-tures the Web-based course as a replica of the traditional course. Students maythen worry about memorization more than they would in the traditional setting(Twigg 2001). Technical problems related to the Web infrastructure and to sys-tem incompatibilities are common, and higher withdrawal rates occur in onlineteaching (Navarro 2000). Bredon and Shanahan (2000) offered a critical analysisof both costs and product characteristics of online instruction.
4 JOURNAL OF ECONOMIC EDUCATION
A parallel debate exists around gender performance differentials in economics.Siegfried (1979) reviewed the literature on the gender gap in students’ performancein standardized, multiple-choice examinations. In most cases, the evidence indi-cates a statistically significant, although often small, male advantage over femalesin the understanding of economics concepts. Later works on high school economicliteracy by Watts (1987), Walstad and Soper (1989), Evans (1992), and Walstadand Robson (1997) reported statistically significant gender differences favoringmales. Qualitatively similar results on the effect of gender on test scores measur-ing economic knowledge are obtained in studies of economic literacy at the collegelevel. Lopus (1997), for example, determined an average male advantage on theTUCE macro and micro pretest for a national sample of students divided acrossprinciples of microeconomics and macroeconomics entry-level college courses,after controlling for students’ exposure to economic education in high school andfor student abilities as measured by SAT scores.
Changing the teaching format may help to reduce the gender gap in economics.Online teaching could favor female students intimidated in a traditional coed lec-ture setting. If female students are those more likely to hold many responsibilities(including family, work, and study), online courses could represent a time-savinginnovation that would enhance the performance of this subgroup. But there are fewrigorous studies to document the process through which students decide betweenonline and traditional teaching formats, particularly with an eye toward genderoutcomes, and only a handful of studies have compared the factors linking sortingand student performance in traditional versus online delivery systems.
Some Lessons from Social Science
Online teaching and learning methods have been implemented across nearlyall academic disciplines. Some studies have focused on student satisfaction andpersistence as indicators of class quality, with these indicators ultimately affectingstudents’ test scores and grade outcomes. For instance, McLaren (2004) foundthat online classes have higher dropout rates than traditional lecture-based classes;however, those students who did persist in attending the online section receivedgrades similar to their lecture counterparts. McFarland and Hamilton (2005) foundno difference in student satisfaction or performance between those enrolled inonline and lecture sections. Turning mainly to student exam performance results,Russell (2006) reviewed 355 research studies and found that, in most cases, learningoutcomes are comparable across teaching modes.
Regarding economics, in 2000 more than 50 institutions offered at least 100online economics courses (Navarro 2000), and although many U.S. economistsstill rely on “chalk-and-talk” lecture delivery with some technology enhancements(Becker and Watts 2001), the number of universities offering online economicscourses has grown. The online component varies from the simple use of e-mail afterlectures and postings of some course materials and online quizzes to full online con-tent delivery and testing or teleconferencing. Most offerings, and related studies,focus on introductory economics. As Navarro and Shoemaker (2000a) empha-sized, this body of literature consists typically of case studies rather than rigorous,
Winter 2009 5
controlled comparison of learning outcomes between live, lecture-based eco-nomics and economics online. A common trend is to integrate Web-based newsor active games (e.g., Iowa Electronic Markets) into class work (Simkins 1999)or to use course Web pages and online quizzes (Judge 1999; Leuthold 1998), butthe effectiveness of these techniques has not been fully assessed. For example,Gregor and Cuskelly (1994, qtd. in Agarwal and Day 1998) noted greater studentparticipation through bulletin boards, but they do not focus on analysis of studentperformance.
One of the first studies of online economics instruction (Vachris 1997) againfound no significant difference between student performance in an online Princi-ples of Macroeconomics class and in a traditional lecture setting. More recently,Harter and Harter (2004) examined student performance in an introductory eco-nomics course over four semesters, introducing a class Web page and online quizzesin the second semester of data collection. The technology enhancements did notimprove performance on multiple-choice questions, after controlling for a varietyof students’ background characteristics.
However, other studies did report on improved performance in online environ-ments. Agarwal and Day (1998) measured the value added of a “partial” onlinelearning experience in undergraduate principles and graduate courses that usedsupplemental e-mail, online exercises, and class discussion lists. They found thatthe “partially online” students performed significantly better on concept questionsadded to the final exam and suggested that the Internet enhancements worked betterfor students with higher initial GPAs. Navarro and Shoemaker (2000a) found thatonline learners perform better than traditional students in a macroeconomics prin-ciples class. In their case, multimedia CD-ROMs containing video, audio, and textlectures were used as the principal online delivery instruments. They compared theresults of both online and traditional students on 15 short essay questions includedin the final exam.
Sosin et al. (2004) constructed a large database of introductory economics stu-dents across several institutions. Although a wide range of technology enhance-ments were considered (e.g., class Web pages, PowerPoint, e-mail), online-onlycourses were not included. Overall, the use of technology significantly improvedstudents’ performance; however, women continued to perform worse than men ineconomics, and the students’ self-reported GPA had a significant impact in raisingtest scores. The authors suggest that factors affecting students’ choice of classeswith technology enhancements may be linked to their observed performance.
A contradictory result was reported by Brown and Liedholm (2002), who com-pared performance in microeconomics principles courses across three teachingmodes: traditional lecture, online video lecture, and a hybrid course consistingof traditional lectures supplemented with online assignments. Although onlinestudents had higher GPAs and ACT scores, they scored significantly lower on acommon set of multiple-choice questions. However, female students did performa bit better in the online setting, suggesting that the gender gap in economics mightbe reduced by the use of online instruction.
Anstine and Skidmore (2005) addressed the student self-selection issue in ananalysis of MBA students taking statistics and managerial economics classes.
6 JOURNAL OF ECONOMIC EDUCATION
Students in their sample chose between entirely online classes and traditional in-class formats. Although the online students started the semester scoring higher onboth the GMAT and a class pretest, they performed significantly worse on take-home exams: a simple regression analysis indicates a 5 percent penalty associatedwith the online environment, after controlling for students’ background character-istics. They found that the average student performed worse in the online class,even after controlling for endogeneity between choice of learning environmentand learning outcomes. They also found little effect of gender on either courseselection or performance, an issue to which we pay attention in this study. Anstineand Skidmore’s analysis concerns graduate-level courses; we focus here on thelink between course selection and performance in introductory economics.
A NEW EXPERIMENT AT CSUF
In this study we analyze academic performance of students who enrolled inmultiple sections of Principles of Microeconomics at California State University,Fullerton. Some of the sections were offered as online classes using basic, easy-to-use Internet tools rather than multimedia technologies. As we discuss in detailin the next section, most students were able to choose enrollment across differentofferings of the principles class, so comparison of student performance betweenonline and traditional courses assumes each student has sorted according to hisor her comparative advantage. However, our students, like those in most U.S.baccalaureate institutions, are not “specialized” online learners. They take fewcourses online and a larger number of classes in a traditional lecture format. Giventhe high cost of living in the area, many students work one or more jobs in additionto attending classes.
Specifically, we attempt to address some of the questions raised by Navarroand Shoemaker (2000a, 2000b), and by Brown and Liedholm (2002), on whetherstudents in introductory economics courses perform better online, and whetherstudent background characteristics (and gender) have an impact on their academicperformance as well as on their choice of learning mode. Furthermore, in ouranalysis, we follow Anstine and Skidmore (2005) to address the issue of courseselection bias and the possibility that hidden factors affecting a student’s choiceof instruction mode may ultimately affect performance in the class.
Research and Course Design
We taught eight sections of Introductory Microeconomics across four consecu-tive semesters (Fall 2001, Spring 2002, Fall 2002, and Fall 2003), each semesterusing two alternative modes of instruction, hereafter referred to as the onlinemode and the hybrid mode. The first semester represented a learning experiencefor the instructors and was removed from the sample. As detailed in the follow-ing paragraphs, although the instructional methods used for the control and thetest groups had many features in common, they differed by design in the de-gree to which they used online technology. Thus, we did not take a pure testof traditional lecture teaching against online teaching; rather, we compared the
Winter 2009 7

in-person classroom experience with minimal computer supplements (common inmany universities relying on low-tech teaching tools) with an almost completelyonline experience.1 In addition, the online classes (relying on chat rooms) tendedto be smaller in size than the hybrid classes (typically with 38 students) as onlineteaching was, at the time, a new phenomenon on our campus, which led to sectionsizes not being equalized. However, dropout rates remained similar in the differentmodes.2
Overall, we taught economics principles to 156 students across the threesemesters, with 58 students enrolled in the online sections and 98 students enrolledin the hybrid sections. Across semesters, and within each mode of instruction, thegroups were similar in size; for all groups, we adopted the same textbook, thesame course content, problem sets, and exam format (but different questions eachyear). The same online support and instructional technology (Blackboard CourseInfo 5.0) were used to create course Web sites for communication through postingof class information and material, class announcements, and e-mail. Each onlinesection of the class met in person only three times, for examinations, whereas thehybrid class met face-to-face for 2.5 hours per week.
Some evidence suggests that instructors with a comparative advantage in teach-ing online tend to select that mode of instruction (Navarro 2000). To avoid in-structors’ self-selection issues, and because only one online section of the coursewas offered by the department each semester, we alternated in teaching the Inter-net course. To minimize instructor bias, we selected the same textbook, assignedthe same readings and problem sets, used the same lecture notes and the sameexams, and shared any other material relevant to the course. Additionally, duringeach semester of instruction we coordinated the sequence in which topics werecovered, as well as the timing of exams, assignments, and so forth.
We administered a confidential entry survey to all students in the first weekof instruction. We also obtained permission to access students’ records on theonline SIS+ university database, from which we collected information on GPA,transfer status, and course load when entering the class. These data allowed us tocontrol for selection bias, and to isolate the effect of the instructional technology onstudents’ performance.
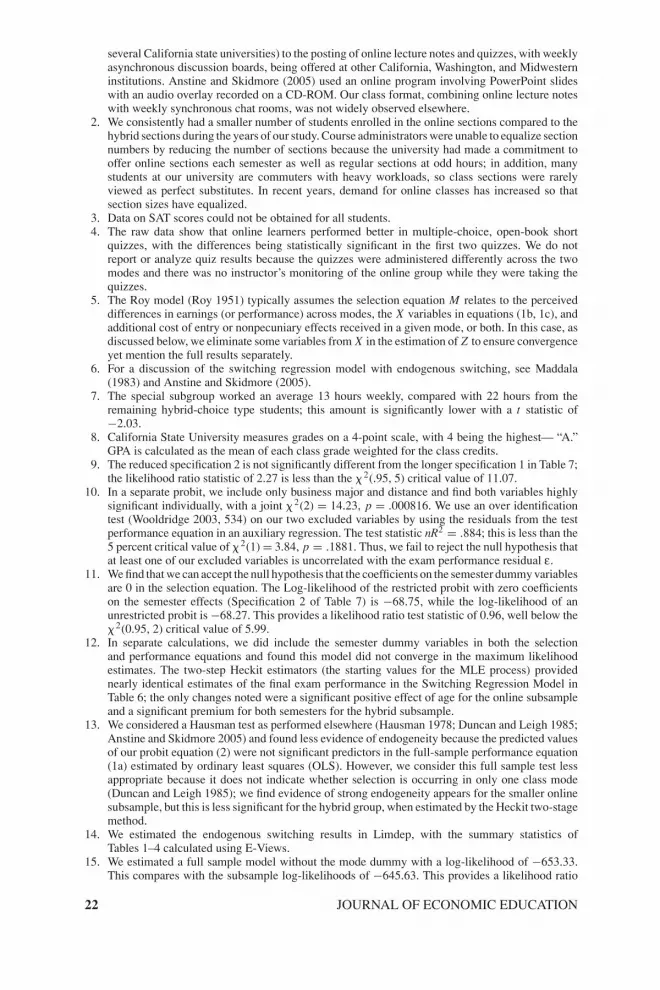
The key aspects of the course designs are presented in Appendix A. The hybridcourse involved weekly, face-to-face lectures for about 90 minutes, a minimalclass Web site, and hands-on computer lab assignments for roughly another 45–50 minutes per week. The online course involved an expanded Web site. Studentsused the Internet to access online study guide problems and used various otherInternet resources to complete the lab assignments. Course content was deliveredentirely in the virtual environment, with students using the weekly chat sessions forcontent clarification. Sample problems were completed together in the synchronouschat sessions. We graded chat room attendance and participation alike, ensuringsome feedback for the students between the posting of lecture notes and the groupdiscussion times.
Appendix B lists the evaluation instruments used. Exams constituted about75 percent of each student’s final grade, and we allowed students to drop thelowest of the three open-book quiz scores. Each in-class, proctored examination
8 JOURNAL OF ECONOMIC EDUCATION

contained the same questions for both the online and the hybrid course. All an-swers were graded from common keys and using the same point allocation acrossquestions.
Analysis of Class Composition and Students’ Entry Characteristics
We present the statistics regarding students’ personal characteristics (seeTable 1) and their academic background (Table 2). The raw data show that theonline students were on average older than the students in the hybrid group.Whereas both groups had a much-older student who was more than 50 yearsof age, the age distribution demonstrates youth tending toward the hybrid group.Eighty-five percent of the hybrid students were 23 years old and younger, com-pared with 47 percent online. The online group had a higher proportion of marriedstudents with children, and these variables were highly correlated with student age.There were more female students in the online group than in the hybrid group,and they traveled longer distances to campus. More students in the online courseshad taken an economics class before, but they had taken less calculus. The onlinegroup also reported working more hours per week and studying longer hours thanthe hybrid group. With regard to declared majors, the hybrid group had a higherproportion of business majors than the online group. Our tests indicate that sta-tistically significant differences existed between class groups for most measures,with only a few notable exceptions (distance traveled, parents’ education, mathbackground, and semester of enrollment).3
Gender differences also emerge regarding some of the relevant backgroundcharacteristics. Females in the online class were more likely to be married withchildren, and their parents were better educated. Women were also earning awider variety of majors, worked more hours off campus, and studied longer. Therewas no significant difference in student GPA across genders, yet the female stu-dents had less calculus background than the men and tended to have enrolled ineconomics previously.
Does Online Learning Improve Performance? Analysisof Summary Statistics
Table 3 presents the summary statistics for the performance measures. We listthe individual exam means because, although all students in our sample com-pleted the final, not all attempted all of the earlier tests.4 No statistical significanceemerged for the earlier in-class exams, but the online group and hybrid group diddiverge on the final examination. Specifically, the raw data suggested that the onlinelearners performed significantly better on the final. There were some differencesacross semesters, which are accounted for in the econometric analysis. Namely,the final exam scores from the first semester (Spring 2002) mirrored the pattern inTable 3, whereas in the second semester there were few differences between the twogroups, and in the third semester of our data both groups of students performedworse than previously, although the gap between the online and hybrid groupsremained present.
Winter 2009 9

TA
BL
E1
.D
efin
itio
ns
an
dS
um
ma
ryS
tati
stic
so
fP
erso
na
lC
ha
ract
eris
tics
Onl
ine
grou
pH
ybri
dgr
oup
(n=
58)
(n=
98)
Test
stat
istic
Mal
e(n
=79
)Fe
mal
e(n
=77
)Te
stst
atis
tic
Var
iabl
eM
SDM
SD�
2t
pM
SDM
SD�
2t
p
Age
(yea
rs)
25.3
16.
9220
.73
4.12
5.18
.000
021
.97
5.28
22.9
16.
211.
01.3
1M
ale
(%)
3659
7.70
.005
5—
—D
ista
nce
toca
mpu
s(m
iles)
19.0
410
.84
16.4
29.
521.
56.1
216
.39
10.4
918
.42
9.67
1.24
.22
Mar
ried
(%)
296
14.6
8.0
001
1317
0.56
.45
Chi
ldre
n(%
)21
410
.92
.001
09
120.
34.5
6W
ork
per
wee
k(h
ours
)29
.20
14.6
722
.27
10.6
43.
38.0
009
24.1
012
.63
25.6
112
.80
0.73
.46
Stud
ype
rw
eek
(hou
rs)
12.7
58.
7210
.14
7.95
1.83
.07
10.4
97.
8811
.81
8.78
0.95
.35
Pare
ntw
itha
colle
gede
gree
7467
0.80
.37
6575
2.15
.14
10 JOURNAL OF ECONOMIC EDUCATION

TA
BL
E2
.D
efin
itio
ns
an
dS
um
ma
ryS
tati
stic
so
fA
cad
emic
Ch
ara
cter
isti
cs
Onl
ine
Hyb
rid
grou
pgr
oup
Mal
eFe
mal
e(n
=58
)(n
=98
)Te
stst
atis
tic(n
=79
)(n
=77
)Te
stst
atis
tic
Var
iabl
eM
SDM
SD�
2t
pM
SDM
SD�
2t
p
Prev
ious
econ
omic
s(%
)59
405.
19.0
228
3955
3.67
.055
4C
umul
ativ
eG
PA(4
.0sc
ale)
2.85
0.57
2.57
0.60
2.89
.004
52.
650.
592.
690.
620.
42.6
7
Bus
ines
sm
ajor
(%)
4873
10.0
5.0
015
6860
1.26
.26
Com
plet
edco
llege
calc
ulus
(%)
3339
0.57
.45
4231
1.89
.17
Com
plet
edco
llege
alge
bra
(%)
7681
0.49
.48
7583
1.66
.20
Sem
este
r1
(%)
3134
0.12
.73
3729
1.17
.28
Sem
este
r2
(%)
3337
0.25
.62
3535
.002
.96
Sem
este
r3
(%)
3629
0.73
.39
2836
1.30
.25
Winter 2009 11

TABLE 3. Summary Statistics of Assessment Outcomes
Online (n = 58) Hybrid (n = 98)
Variable M SD M SD t p
Midterm 1 73.51 11.59 72.34 14.44 0.52 .600Midterm 2 59.02 16.93 59.43 17.30 −0.14 .880Final exam
Total 68.11 13.83 61.65 16.77 2.48 .014Semester 1 (n = 51) 71.58 12.34 60.42 16.55 2.73 .005Semester 2 (n = 55) 72.16 14.64 69.47 13.83 0.66 .260Semester 3 (n = 50) 61.48 12.24 53.34 16.43 2.00 .030
TABLE 4. Scores by Gender and Instruction Mode for All Semesters
Male (n = 79) Female (n = 77)
Variable M SD M SD t p
Midterm 1Online 77.71 12.06 71.06 10.73 2.16 .0352Hybrid 75.39 13.49 67.88 14.79 2.57Total (n = 153) 76.01 13.09 69.41 13.01 3.13 .0021
Midterm 2Online 62.05 18.11 57.38 16.28 0.99 .3245Hybrid 64.20 15.75 52.66 17.34 3.22 .0013Total (n = 149) 63.62 16.32 54.99 16.88 3.17 .0018
Final examOnline 68.88 13.81 67.68 14.01 0.32 .7528Hybrid 66.39 14.96 54.79 17.05 3.56 .0006Total (n = 156) 67.05 14.62 60.98 16.86 2.40 .0174
Interesting performance trends emerge in Table 4 when we compare scoresacross gender and modes of instruction. Straight comparisons of the exam scoresacross gender lines show significantly lower scores for women. In theory, onlineeducation can lessen the gender gap in economics by either lowering male per-formance or by improving female performance in those sections compared to thehybrid class. Our results suggest the latter. Although women received fewer totalpoints than men in both online and hybrid courses, over the semester the gendergap (in exam points) was significantly reduced in the online group, but it persistedin the hybrid group. The online class shows no significant difference in the femaleand male scores on the final examination, and, in fact, the online females outscorethe males enrolled in the lecture/hybrid classes. Our results follow Brown andLiedholm (2002), yet suggest a weaker possibility of the distance-learning envi-ronment being especially favorable to female students.
12 JOURNAL OF ECONOMIC EDUCATION
ANALYSIS OF PERFORMANCE ACROSS MODES
In this section, we consider how the teaching mode affects performance, con-trolling for many other students’ characteristics. We use an endogenous switchingregression model to address the effects of students’ self-selection across modes.We consider whether the trends in students’ mode choice and performance arejointly determined, and we use the results to predict how exogenously assignedstudents would perform in different types of classes. Overall, we demonstratethe importance of student GPA and class semester in determining student out-comes. We also find that women and men had different experiences across teachingmodes.
Possible Links between Teaching Mode Selection and Student Performance
Economics departments usually offer multiple sections of the principles classes,and we assume that students can choose the section that best meets their needs.The ideal section may vary by time, instructor, or type of teaching method. Inthis study, students had the opportunity to choose between a regular economicsprinciples class and the online version when they registered in advance of eachsemester. As the literature suggests, many factors could lead a student to preferan online class: working, living farther from campus, childcare responsibilities, orpast problems learning economics in a traditional class, to name a few.
Tangible links between teaching mode choice and class performance are likely.As a worker’s self-selection into an appropriate job choice can improve his or herwelfare (Roy 1951), students who can self-select into the teaching mode appropri-ate to their human capital or location characteristics should also perform better inan economic principles course and achieve other family and work-based goals. Werecognize that students often include other concerns (e.g., family, work) in classsection choice, so that utility maximization is their ultimate goal.
Examining the Interlinked Selection and Performance Results
A basic econometric choice framework is needed to measure the impact ofteaching mode on student performance while taking into account the problems ofstudent heterogeneity and class selection processes. We rely on the framework pro-posed by Maddala (1983) for program evaluation and self-selection. The generalfitted estimates for analyzing exam score performance caused by the treatment ofonline education (without selection bias) would be:
Y =
⎧⎪⎨⎪⎩
Y f = � f + �′M + B ′f X + ε f (a) (full sample)
Y1 = �1 + B ′1 X + ε1, if M = 1 (b) (for participants)
Y0 = �0 + B ′0 X + ε0, if M = 0, (c) (for nonparticipants)
(1)
where � is a parameter to capture the constant scores in each teaching mode (1, 0,or f ), B1 is a parameter vector of regressors for students in the online mode, B0
is a parameter vector of regressors for students in the hybrid teaching mode, B f
is a parameter vector of regressors for all students, M is a dummy variable that
Winter 2009 13
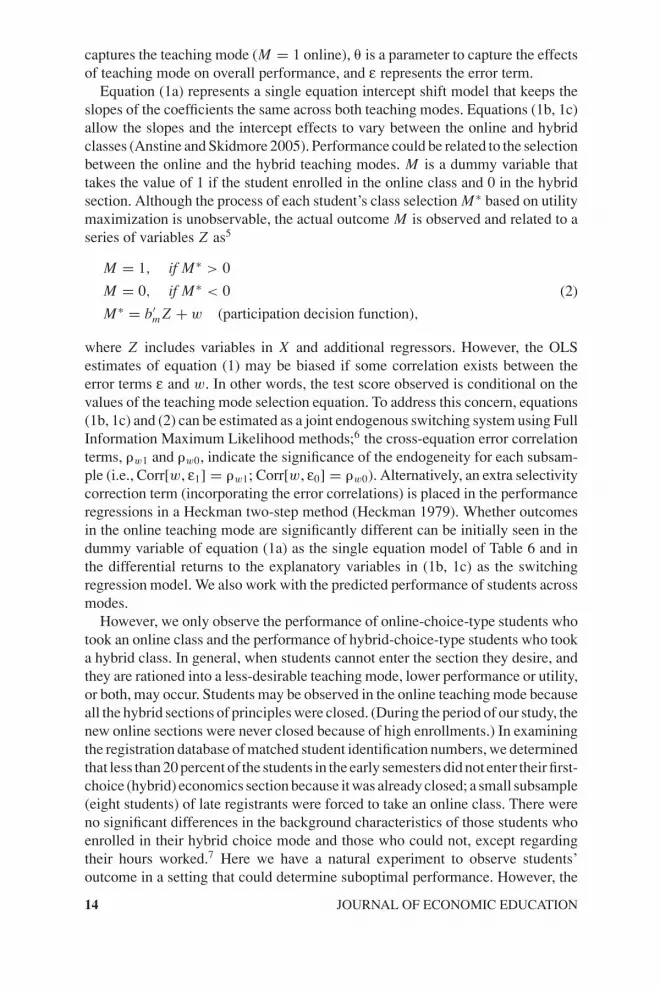
captures the teaching mode (M = 1 online), � is a parameter to capture the effectsof teaching mode on overall performance, and ε represents the error term.
Equation (1a) represents a single equation intercept shift model that keeps theslopes of the coefficients the same across both teaching modes. Equations (1b, 1c)allow the slopes and the intercept effects to vary between the online and hybridclasses (Anstine and Skidmore 2005). Performance could be related to the selectionbetween the online and the hybrid teaching modes. M is a dummy variable thattakes the value of 1 if the student enrolled in the online class and 0 in the hybridsection. Although the process of each student’s class selection M∗ based on utilitymaximization is unobservable, the actual outcome M is observed and related to aseries of variables Z as5
M = 1, if M∗ > 0
M = 0, if M∗ < 0
M∗ = b′m Z + w (participation decision function),
(2)
where Z includes variables in X and additional regressors. However, the OLSestimates of equation (1) may be biased if some correlation exists between theerror terms ε and w. In other words, the test score observed is conditional on thevalues of the teaching mode selection equation. To address this concern, equations(1b, 1c) and (2) can be estimated as a joint endogenous switching system using FullInformation Maximum Likelihood methods;6 the cross-equation error correlationterms, �w1 and �w0, indicate the significance of the endogeneity for each subsam-ple (i.e., Corr[w, ε1] = �w1; Corr[w, ε0] = �w0). Alternatively, an extra selectivitycorrection term (incorporating the error correlations) is placed in the performanceregressions in a Heckman two-step method (Heckman 1979). Whether outcomesin the online teaching mode are significantly different can be initially seen in thedummy variable of equation (1a) as the single equation model of Table 6 and inthe differential returns to the explanatory variables in (1b, 1c) as the switchingregression model. We also work with the predicted performance of students acrossmodes.
However, we only observe the performance of online-choice-type students whotook an online class and the performance of hybrid-choice-type students who tooka hybrid class. In general, when students cannot enter the section they desire, andthey are rationed into a less-desirable teaching mode, lower performance or utility,or both, may occur. Students may be observed in the online teaching mode becauseall the hybrid sections of principles were closed. (During the period of our study, thenew online sections were never closed because of high enrollments.) In examiningthe registration database of matched student identification numbers, we determinedthat less than 20 percent of the students in the early semesters did not enter their first-choice (hybrid) economics section because it was already closed; a small subsample(eight students) of late registrants were forced to take an online class. There wereno significant differences in the background characteristics of those students whoenrolled in their hybrid choice mode and those who could not, except regardingtheir hours worked.7 Here we have a natural experiment to observe students’outcome in a setting that could determine suboptimal performance. However, the
14 JOURNAL OF ECONOMIC EDUCATION

differentials in the process of sorting could also be related to unobserved problemsthat students faced because they registered late.
Econometric Terms and Results
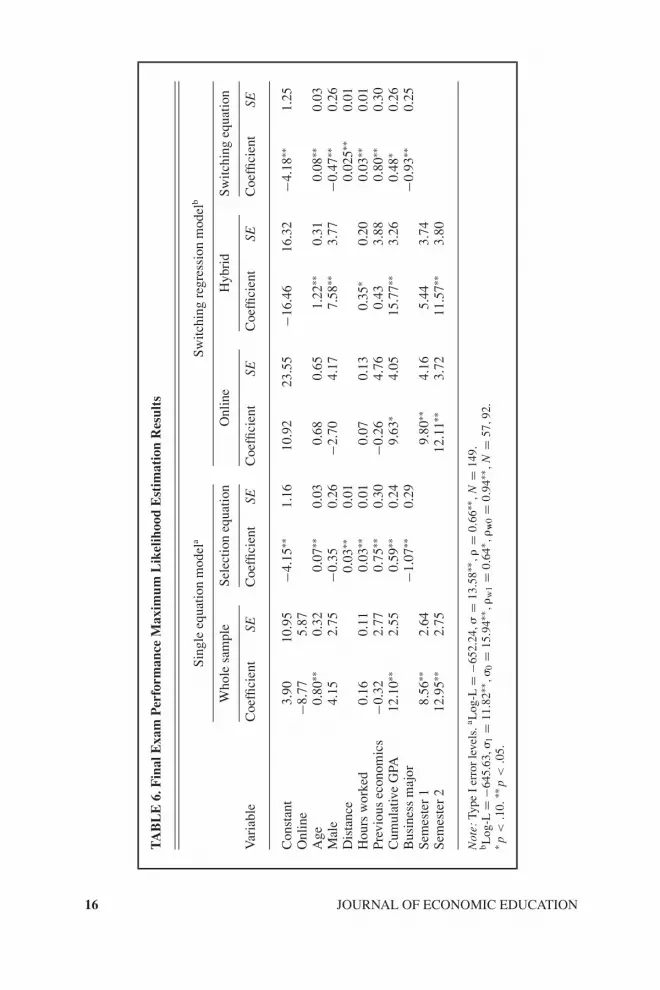
Although we collected data on all quizzes and exams, we focus on the mandatoryfinal exam score as measure of student cumulative knowledge of the class. Inaddition, focus on the final avoids problems associated with the quizzes and earlierexams with the inclusion of students who later dropped. The results in Tables 5and 6 use variables described in Tables 1 and 2 to explain why students ended up inthe online section (M = 1) and the factors behind student performance (measuredas points on the final exam).
We examine selection in a univariate probit framework in Table 5. We hy-pothesize that older students possess more maturity and discipline and that theygravitate to online learning. Also, women with children could need more timeflexibility so that the variables “kids” would be positive with “male” negative.A greater distance from campus should increase online enrollment probability asshould a greater number of hours worked. Because many students in our universityare first-generation college enrollees, we also include parent college completion
TABLE 5. Univariate Probit Online Mode Selection for the MaximumLikelihood Estimation
Specification 1a Specification 2b
Marginal MarginalVariable Coefficient SE effects Coefficient SE Effects
Constant −4.28∗∗ 1.00 −4.54∗∗ 0.97Age 0.05∗ 0.03 0.02 0.07∗∗ 0.03 0.026Male −0.32 0.26 −0.12 −0.24 0.25 −0.13Distance 0.02∗ 0.01 0.009 0.02∗ 0.01 0.01Kids 0.55 0.53 0.21Hours worked
per week0.04∗∗ 0.01 0.01 0.035∗∗ 0.01 0.01
Parent with collegedegree
−0.07 0.30 −0.03
Previous economics 0.85∗∗ 0.28 0.31 0.79∗∗ 0.27 0.29Cumulative GPA 0.74∗∗ 0.23 0.28 0.68∗∗ 0.22 0.25Business major −1.05∗∗ 0.30 −0.39 −1.035∗∗ 0.29 −0.39Completed college
calculus−0.12 0.28 −0.05
Semester 1 −0.09 0.32 −0.03Semester 2 −0.29 0.31 −0.11
Note: Type I error levels. aLog-L = −67.62; � 2(6, N = 149) = 63.03, 75% observed correct.bLog-L = −68.75; � 2(6, N = 149) = 60.75, 77% observed correct.∗ p < .10. ∗∗ p < .05.
Winter 2009 15
TA
BL
E6
.F
ina
lE
xa
mP
erfo
rma
nce
Ma
xim
um
Lik
elih
oo
dE
stim
ati
on
Res
ult
s
Sing
leeq
uatio
nm
odel
aSw
itchi
ngre
gres
sion
mod
elb
Who
lesa
mpl
eSe
lect
ion
equa
tion
Onl
ine
Hyb
rid
Switc
hing
equa
tion
Var
iabl
eC
oeffi
cien
tSE
Coe
ffici
ent
SEC
oeffi
cien
tSE
Coe
ffici
ent
SEC
oeffi
cien
tSE
Con
stan
t3.
9010
.95
−4.1
5∗∗1.
1610
.92
23.5
5−1
6.46
16.3
2−4
.18∗∗
1.25
Onl
ine
−8.7
75.
87A
ge0.
80∗∗
0.32
0.07
∗∗0.
030.
680.
651.
22∗∗
0.31
0.08
∗∗0.
03M
ale
4.15
2.75
−0.3
50.
26−2
.70
4.17
7.58
∗∗3.
77−0
.47∗∗
0.26
Dis
tanc
e0.
03∗∗
0.01
0.02
5∗∗0.
01H
ours
wor
ked
0.16
0.11
0.03
∗∗0.
010.
070.
130.
35∗
0.20
0.03
∗∗0.
01Pr
evio
usec
onom
ics
−0.3
22.
770.
75∗∗
0.30
−0.2
64.
760.
433.
880.
80∗∗
0.30
Cum
ulat
ive
GPA
12.1
0∗∗2.
550.
59∗∗
0.24
9.63
∗4.
0515
.77∗∗
3.26
0.48
∗0.
26B
usin
ess
maj
or−1
.07∗∗
0.29
−0.9
3∗∗0.
25Se
mes
ter
18.
56∗∗
2.64
9.80
∗∗4.
165.
443.
74Se
mes
ter
212
.95∗∗
2.75
12.1
1∗∗3.
7211
.57∗∗
3.80
Not
e:Ty
peI
erro
rle
vels
.a Log
-L=
−652
.24,
�=
13.5
8∗∗ ,
�=
0.66
∗∗,
N=
149.
bL
og-L
=−6
45.6
3,�
1=
11.8
2∗∗ ,
�0
=15
.94∗
∗ ,�
w1
=0.
64∗ ,
�w
0=
0.94
∗∗,
N=
57,92
.∗ p
<.1
0.∗∗
p<
.05.
16 JOURNAL OF ECONOMIC EDUCATION
as a signal of likely student motivation to enroll online. We also add academiccharacteristics that might affect the propensity to choose an online class. Herewe explore whether students with a higher GPA, strong math background (calcu-lus), and a planned business major are more likely to enter the online sections.We expect those having taken economics previously may opt for the online sec-tion to repeat a failed class or to build on their experience. We explore enrollmentsacross the semesters as online education received more publicity (the third semesterdummy is omitted because online enrollments were noticeably higher and scoreslower).
Table 5 shows that students’ personal characteristics and human capital togetherinfluenced their choice of class type. In the longer model (specification 1), maleswere 12 percentage points less likely to choose the online option, and each year ofage increased the online probability by about 2 percentage points. Even apart fromhaving children and a heavier workload, older students may possess the maturitynecessary for online education. Distance from campus affects choice even thoughmany students still needed to commute to campus for other classes. Those withheavier job demands and more hours worked almost always selected an onlinecourse. Business majors (perhaps those with more insight on the best and worsthybrid course instructors) were highly unlikely to choose the online option. We findno semester effects in the students’ choice pattern. Those who had previously hadsome economics principles class were nearly 31 percentage points more likely toexperiment with the online class. And a student’s GPA has some effect on sorting,with the academically successful students 28 percent more likely to choose anonline class.8 Specification 2 presents a moderate-sized specification including themost significant variables that we focus on below.9 Gender is considered becausewe expect women to prefer the convenience of online education, and we do find thisterm significant in the joint maximum likelihood estimates (MLE). Few differencesare observed across the specifications, although the role of age in the online optionincreases.
Two variables in the selection process (distance and business major) were omit-ted from the final exam score equation for identification of a possible endogenousswitching model. We feel these are valid variables to remove for identification be-cause they should affect a student’s choice of class mode yet not their performancein it; student residency location should not matter, and the mixed business andsocial science content of Economic Principles makes it appropriate for studentsof many different majors. Standard chi-square tests demonstrate that the variablesare significant predictors and that they are uncorrelated with the error term in thetest performance equations although correlated with the class mode selection.10
Thus, in the second equations we explore whether age (+), gender (−), workhours (−), previous economics (+), GPA (+), and semesters (+) are likely tochange test scores apart from the teaching mode (with our expectations in paren-theses). We include the semester dummies in Table 6 to control for the reality ofdifferent tests offered each term;11 however, because the standard practice underly-ing the Roy model is one in which the regressors Z in the selection equation includeall variables in X , we estimated that separately.12 We focus on whether students’choices across teaching regimes could be inside the structure of the model with
Winter 2009 17

links between the unobservable factors affecting both selection and performance(the correlation between w and ε), suggesting an endogenous switching process.13
Table 6 presents the estimates of the final exam scores for the full sample sin-gle equation model, and each subsample of students with selectivity correctionsin a switching regression model.14 The MLE switching equation (specification2) did not vary substantially from the univariate probit results of Table 5, apartfrom the evidence that males are less likely to choose the online class. Neithera semi-log nor Tobit specification of the dependent variable (final exam points)provided an improvement in fit, nor did interaction terms in the performance re-gressions (e.g., age, gender). The initial view of the full sample, single equationmodel shows student performance is affected by age, academic background, andclass semester. Similar to Agarwal and Day (1998), we find good students con-tinue to do better than mediocre ones. A student’s acquired knowledge—measuredthrough their previous GPA—significantly raises the final exam score by morethan a full letter grade. Older students also enjoyed a performance premium. Af-ter controlling for these factors and assuming equal slopes across class modes,the online dummy barely misses being significantly negative (p = .14). How-ever, this result constrains the returns to background characteristics to be equalacross modes.
Some differences in the online and hybrid class subsamples appear on the rightside, which allows for mode slope effects. Although the two subsample perfor-mance equations miss being significantly different and the data better fit a singleequation, a few important differences are worth noting.15 We find students receivedifferent returns to their personal characteristics depending on which class modethey take. There appears to be a higher return to GPA and age in the hybrid class,and males in the hybrid sections see a significant increase of nearly a grade (7.5points) compared to females. The semester effects are more relevant in the onlinesubsample: student performance increased significantly as the online class sectionsbecame more standardized (or instruction improved) across time.
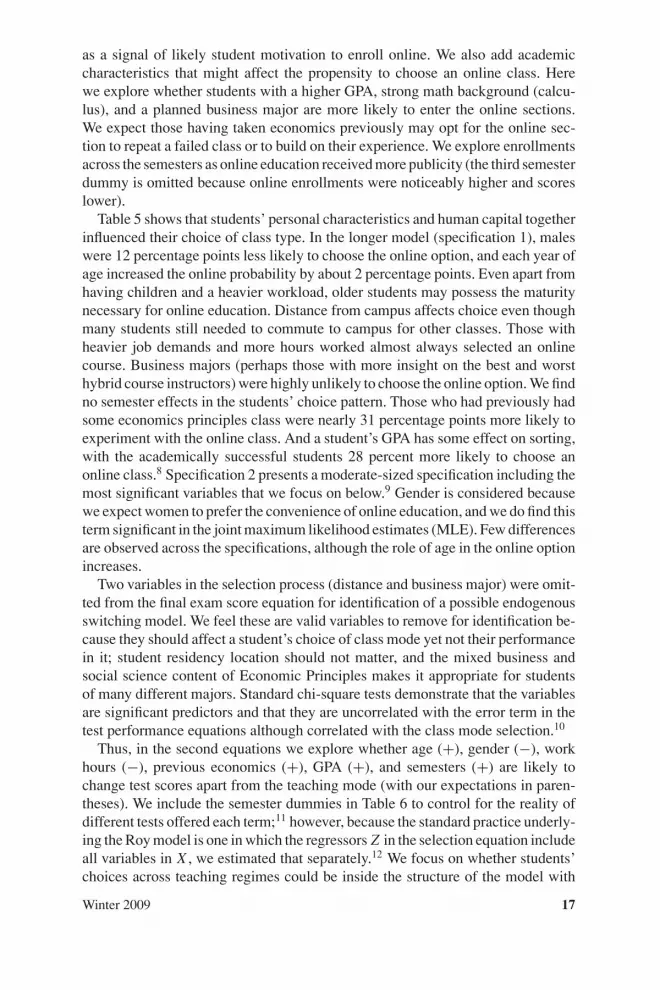
To further explore how observable student personal characteristics affect per-formances across modes, we ran a full interaction single equation model allowingboth the intercept and slopes to vary across the online and hybrid modes. This spec-ification, presented in Table 7, demonstrates that the online class in itself (throughthe intercept) is not significantly negative; the gender slope effects for the onlinegroup are more important. We ran a separate regression to focus only on the mostsignificant differences in the subsamples (the gender interaction effects), settingthe slopes of the other terms equal across subsamples; under this scenario, we findimportant gender differentials by class mode. Namely, males receive a full gradeworse on the final exam in the online class.
Selectivity bias is present. The positive correlation coefficient �w1 suggests pos-itive sorting for those students who chose the online class; a significant positiverelationship exists between the latent factors affecting the probability of enter-ing an online class and how those factors affected the final exam scores. But thepositive �w0 for the hybrid group implies negative sorting; some hybrid-type stu-dents could have received a higher return to their latent factors, and performedbetter than an average person, in an online class had they enrolled there. These
18 JOURNAL OF ECONOMIC EDUCATION
TABLE 7. Interaction Model of Final Exam Maximum Likelihood EstimationResults
Sample 1a Sample 2b
Variable Coefficient SE Coefficient SE
Constant −10.26 14.87 −0.22 10.85Online 10.61 20.14 −6.27 5.20Age 1.04∗∗ 0.31 0.82∗∗ 0.30Age × online 0.24 0.71Male 8.02 3.25 8.18 3.14Male × online −11.67∗∗ 4.97 −11.78∗∗ 4.60Hours worked 0.28 0.18 0.17 0.11Hours worked × online 0.28 0.18Previous economics −0.16 0.19 0.17 2.90Previous economics × online 0.04 3.43Cumulative GPA 14.40∗∗ 2.92 12.98∗∗ 2.47Cumulative GPA × online −3.54 4.82Semester 1 6.51∗∗ 3.41 7.90∗∗ 2.55Semester 1 × online 3.27 5.81Semester 2 12.36∗∗ 3.45 12.27∗∗ 2.69Semester 2 × online −0.73 5.27
Note: Type I error levels. aIntercept and all slope effects of online mode; Log-L = −646.86,� = 13.95∗∗, � = 0.79∗∗.bIntercept and only significant slope effects of online mode; Log-L = −648.43, � =13.93∗∗, � = 0.77∗∗.∗∗ p < .05.
hidden characteristics of the students in our sample could have improved studentperformance in the online mode.16
The restrictive single equation specification in Table 6 suggests nearly similarfinal test scores across the two teaching modes. To verify this, we next considerpredicted learning outcomes using the MLE coefficients for each subsample in Ta-ble 6. The average predicted final exam score for each subgroup in their actual classis not that different (63.51 points online and 67.70 hybrid, for an approximately4 point gross gap). But predicted scores, controlling for endogeneity, are differ-ent than observed scores; a student with the average characteristics of the wholesample would receive 59.66 points online and a significantly higher amount, 71.5points, in the hybrid class (t = −18.43).17 And students would perform differ-ently if placed in a different class setting than what they had chosen. We findthe online-choice type student would receive a higher final score of 77.78 in thehybrid class (t = 11.97). A student with the average hybrid-type characteristicswould receive 10 points less in the online class (t = −14.19). We note that theeffect of the demographic differentials within each mode is quite strong, but, ingeneral, the students with online-type characteristics always do significantly betterin any type of class. Their initially higher GPA and older age benefit them in all
Winter 2009 19

class settings, yet their returns to these characteristics are higher in a hybrid class.18
This trend is consistent as we exogenously vary two important student backgroundcharacteristics across a range of possible scenarios.19
In sum, we find a negative penalty associated with online teaching for most stu-dents. The endogeneity of the selection process could explain the opposite examscore trends of Table 3. Stronger students chose the online mode and hence in-creased the mean in those sections. Returns to students’ latent factors (not includedin the regression) suggest a premium to the online class and may explain why somedid select that option. However, returns to important human capital endowments ofeach student—age and GPA—are higher in a traditional setting so that the strongerstudents could have done better there. The only exception remains along some gen-der variations; younger female students with low GPAs would not do any better inthe hybrid setting.
Finally, Table 6 also provides an opportunity to view the effects of sortingagainst student preferences. We consider the predicted performance of the specialstudents in both modes using the MLE regressions results in Table 6. Here we findthe students who did not self-select into their preferred hybrid mode were penalizedsignificantly. The given demographics of this group suggest low performance inany class (their actual average final exam score in the online sections was only57.13 points); however, we predict their final exam scores would be 61 pointsin the hybrid class yet only 52 points online (t = −2.81). Thus these studentslikely could have performed better in a traditional class setting had there beensections open to accommodate them. This highlights the importance of studentself-selection and the need to balance the availability of class sections of differentmodes in introductory economics.
CONCLUDING REMARKS
We find that the virtual classroom environment, when compared with a hybridsetting (a lecture section with some Internet supplements), has a complex impacton the performance of students taking introductory economics classes. Althoughthe raw data suggest improved performance of online students, our controls for theendogenous selection process point toward an insignificant or even negative effect.Our findings echo both those reported on the popular “No Significant Difference”Web site, and by Vachris (1997) and Anstine and Skidmore (2005), yet wouldnot support other studies of economics showing strong improved online outcomes(Agarwal and Day 1998; Navarro and Shoemaker 2000a, 2000b).
Under a variety of specifications we find that older, working women are morelikely to choose an online class. Good students with a high GPA, those who hadpreviously taken economics, and nonbusiness majors consistently opted to try theonline economic principles class. Major and GPA variables exerted the strongestmarginal effect on class selection. Most students entered their first choice of classsection and teaching mode.
In this study, the students’ choices (based in part on latent variables) did resultin higher raw exam scores on average for those who actually selected that mode; inparticular, female students improve significantly in the online setting. We control
20 JOURNAL OF ECONOMIC EDUCATION

for semester effects because the same exam was not offered each term; this trendappears in two of the three semesters included. However, controlling for otherfactors, we then find no significant difference on the final exam scores of studentsenrolled in the online sections under a restrictive specification not allowing fordifferential returns on the explanatory variables. We barely reject the hypothesisthat two different regression processes occur in the online and hybrid teachingmodes. For the online subsample of students, semester effects were crucial along-side GPA. In the more traditional hybrid mode, male students continue to enjoyan advantage over female students. Separately, we consider only the significantfactors affecting mode performance; in this scenario the male students could doworse online (see Table 7). Thus we find the gender gap may be reduced by onlineeducation, both by the fact that men receive a higher differential in the hybrid andlecture-based setting, and that women do better in an online setting.
We highlight the important, and significant, endogeneity of class modeselection—students choose a class section based on factors that the researchercan and cannot see. We find evidence of positive sorting for the online subsam-ple and negative sorting for the hybrid subsample; latent student characteristicsshould have assisted them in performing better online. But we also exogenouslyassign students across modes and use the coefficients of the subsample regressionto consider if they could have done better in a different class mode than what theyactually chose. This process shows that most students would have performed bestin the hybrid class, given various levels of observed performance variables. Thefinding that factors not included in our regression favor the online setting standsin contrast to lower returns to important explanatory regressors (age and GPA) inthat mode. Of the observed factors that influenced selection, only GPA, age, andmale gender significantly increased performance (particularly in the hybrid mode),suggesting that students more likely followed both a utility maximization and acomparative advantage rationale in their decision making.
Overall the teaching effectiveness of the online class mode improved in themiddle semesters of our experiment. This suggests that it could be of value toperform repeated studies in institutions that have managed online classes for adecade or more. Online class delivery may offer a solution to distance educationin economics; however, we would note that its cost-effectiveness is not provenhere as the online classes had lower enrollment than the hybrid sections, giventhe imperfect administrative adjustment process that affected enrollments in theearly years. In designing our study, we chose to limit ourselves to easy-to-use,accessible, and relatively simple Internet tools, whereas other studies includedmultimedia presentations that used video, digital sound, animated photo images,and interactive graphs, for highly sophisticated content delivery. Wider competitionin the principles market could lower the cost of these supplements over time.
NOTES
1. We examined the online economics offerings at several large, state, Tier II and Tier III institutions,and community colleges. We found that the majority of these institutions use simple online tools in acourse format similar to ours. The options range from online students being offered computerizedor cable television links to simultaneous campus lectures, followed by online quizzes (done at
Winter 2009 21
several California state universities) to the posting of online lecture notes and quizzes, with weeklyasynchronous discussion boards, being offered at other California, Washington, and Midwesterninstitutions. Anstine and Skidmore (2005) used an online program involving PowerPoint slideswith an audio overlay recorded on a CD-ROM. Our class format, combining online lecture noteswith weekly synchronous chat rooms, was not widely observed elsewhere.
2. We consistently had a smaller number of students enrolled in the online sections compared to thehybrid sections during the years of our study. Course administrators were unable to equalize sectionnumbers by reducing the number of sections because the university had made a commitment tooffer online sections each semester as well as regular sections at odd hours; in addition, manystudents at our university are commuters with heavy workloads, so class sections were rarelyviewed as perfect substitutes. In recent years, demand for online classes has increased so thatsection sizes have equalized.
3. Data on SAT scores could not be obtained for all students.4. The raw data show that online learners performed better in multiple-choice, open-book short
quizzes, with the differences being statistically significant in the first two quizzes. We do notreport or analyze quiz results because the quizzes were administered differently across the twomodes and there was no instructor’s monitoring of the online group while they were taking thequizzes.
5. The Roy model (Roy 1951) typically assumes the selection equation M relates to the perceiveddifferences in earnings (or performance) across modes, the X variables in equations (1b, 1c), andadditional cost of entry or nonpecuniary effects received in a given mode, or both. In this case, asdiscussed below, we eliminate some variables from X in the estimation of Z to ensure convergenceyet mention the full results separately.
6. For a discussion of the switching regression model with endogenous switching, see Maddala(1983) and Anstine and Skidmore (2005).
7. The special subgroup worked an average 13 hours weekly, compared with 22 hours from theremaining hybrid-choice type students; this amount is significantly lower with a t statistic of−2.03.
8. California State University measures grades on a 4-point scale, with 4 being the highest— “A.”GPA is calculated as the mean of each class grade weighted for the class credits.
9. The reduced specification 2 is not significantly different from the longer specification 1 in Table 7;the likelihood ratio statistic of 2.27 is less than the � 2(.95, 5) critical value of 11.07.
10. In a separate probit, we include only business major and distance and find both variables highlysignificant individually, with a joint � 2(2) = 14.23, p = .000816. We use an over identificationtest (Wooldridge 2003, 534) on our two excluded variables by using the residuals from the testperformance equation in an auxiliary regression. The test statistic nR2 = .884; this is less than the5 percent critical value of � 2(1) = 3.84, p = .1881. Thus, we fail to reject the null hypothesis thatat least one of our excluded variables is uncorrelated with the exam performance residual ε.
11. We find that we can accept the null hypothesis that the coefficients on the semester dummy variablesare 0 in the selection equation. The Log-likelihood of the restricted probit with zero coefficientson the semester effects (Specification 2 of Table 7) is −68.75, while the log-likelihood of anunrestricted probit is −68.27. This provides a likelihood ratio test statistic of 0.96, well below the� 2(0.95, 2) critical value of 5.99.
12. In separate calculations, we did include the semester dummy variables in both the selectionand performance equations and found this model did not converge in the maximum likelihoodestimates. The two-step Heckit estimators (the starting values for the MLE process) providednearly identical estimates of the final exam performance in the Switching Regression Model inTable 6; the only changes noted were a significant positive effect of age for the online subsampleand a significant premium for both semesters for the hybrid subsample.
13. We considered a Hausman test as performed elsewhere (Hausman 1978; Duncan and Leigh 1985;Anstine and Skidmore 2005) and found less evidence of endogeneity because the predicted valuesof our probit equation (2) were not significant predictors in the full-sample performance equation(1a) estimated by ordinary least squares (OLS). However, we consider this full sample test lessappropriate because it does not indicate whether selection is occurring in only one class mode(Duncan and Leigh 1985); we find evidence of strong endogeneity appears for the smaller onlinesubsample, but this is less significant for the hybrid group, when estimated by the Heckit two-stagemethod.
14. We estimated the endogenous switching results in Limdep, with the summary statistics ofTables 1–4 calculated using E-Views.
15. We estimated a full sample model without the mode dummy with a log-likelihood of −653.33.This compares with the subsample log-likelihoods of −645.63. This provides a likelihood ratio
22 JOURNAL OF ECONOMIC EDUCATION

test statistic of 15.4, which just misses being significant compared with the chi-squared statistic of15.51 for 8 degrees of freedom at the .05 Type I error level. Using a Chow test on the pooled andseparate sum of squares in the Heckit two-step (and OLS) regressions, we calculated F statisticsof 2.21 and 1.45, which cannot reject the hypothesis of equality at the .05 Type I error level with136 and 9 degrees of freedom.
16. In our two-stage Heckit results preceding the MLE estimations of Table 6, we find a positive meanand a positive coefficient on the � term for the online group whose average product is 6.6 points;for the hybrid group, the negative mean and the positive coefficient on the � term gives an averageproduct of −4.6 points.
17. Because the students measured across two modes represent nonindependent, matched pairs sam-ples, we consider a test of the significance of the means of the difference as outlined in McCall(1986, 232).
18. We decomposed the predicted gross gap of −4 points associated with the online class into aneffect caused by the returns at the mean in a class mode (B1 − B0) × X0 and the effect caused bydifferent background mean factors (X1 − X0) × B0. The first component summed to −10.35 andthe second 5.67, suggesting the penalty of the online regime outweighed the stronger backgroundcharacteristics of the online students.
19. We held all other background characteristics of the students constant yet varied their gender,age, and GPA across two extreme levels (age at 20 and 40 years; GPA at 2 and 4). For men, theyoungest, lowest GPA students would earn 50 points in an online class compared with 62 in thehybrid class; raising their GPA to 4.0 raises their scores to 69 and 93 points, respectively. Theoldest male students with a very low GPA would still perform better in the hybrid class (63.5points there, compared with 86 online), with extreme scores of 83 points in an online class and118 points in hybrid class for older students with a 4.0 GPA. The trends are the same for womenwith a 4.0 GPA, yet the youngest women with a 2.0 GPA would earn 53 points online and 54 in ahybrid class.
REFERENCES
Agarwal, R., and A. E. Day. 1998. The impact of the Internet on economic education. Journal ofEconomic Education 29 (2): 99–110.
Anstine, J., and M. Skidmore. 2005. A small sample study of traditional and online courses with sampleselection adjustment. Journal of Economic Education 36 (2): 107–28.
Becker, W. E., and M. Watts. 2001. Teaching economics at the start of the 21st century: Still chalk andtalk. American Economic Review Papers and Proceedings 91 (May): 446–51.
Bonca, C. 1998. Welcome to Virtual U. OC Weekly Sept. 3: 4–10.Bredon, G., and M. Shanahan. 2000. Economics cybercourses. Journal of Economic Perspectives 14
(Fall): 227–28.Brewer, S., and D. Erickson. 1997. A tale of two classrooms. Journal of Computing in Teacher Education
13 (April): 20–22.Brown, B. W., and C. E. Liedholm. 2002. Can Web courses replace the classroom in principles of
microeconomics? American Economic Review Papers and Proceedings 92 (May): 444–48.Duncan, G., and D. Leigh. 1985. The endogeneity of union status: An empirical test. Journal of Labor
Economics 3 (3): 385–401.Evans, M. O. 1992. An estimate of race and gender role-model effects in teaching high school. Journal
of Economic Education 23 (3): 209–17.Harter, C. L., and J. F. Harter. 2004. Teaching with technology: Does access to computer technology
increase student achievement? Eastern Economic Journal 30 (Fall): 507–14.Hausman, J. 1978. Specification tests in econometrics. Econometrica 46 (6): 1251–71.Heckman, J. 1979. Sample selection bias as a specification error. Econometrica 47 (1): 153–61.Judge, G. 1999. The production and use of online Web quizzes for economics. Computers in Higher
Education Economics Review 13 (1): 21–25.Leuthold, J. H. 1998. Building a homepage for your economics class. Journal of Economic Education
29 (3): 247–61.Lopus, J. S. 1997. Effects of the high school economics curriculum on learning in the college principles
class. Journal of Economic Education 28 (2): 143–53.Maddala, G. S. 1983. Limited-dependent and qualitative variables in econometrics. Cambridge: Cam-
bridge Univ. Press.McCall, R. B. 1986. Fundamental statistics for behavioral sciences. 4th ed. San Diego: Harcourt Brace
Jovanovich.
Winter 2009 23

McCollum, K. 1997. A professor divides his class in two to test online instruction. Chronicle of HigherEducation Feb. 21: A23.
McFarland, D., and D. Hamilton. 2005. Factors affecting student performance and satisfaction: Onlinevs. traditional course delivery. Journal of Computer Information Systems 46 (2): 25–33.
McLaren, C. H. 2004. A comparison of student persistence and performance in online and classroombusiness statistics experiences. Decision Sciences Journal of Innovative Education 2 (1): 1–10.
Navarro, P. 2000. Economics in the cyberclassroom. Journal of Economic Perspectives 14 (Spring):119–32.
Navarro, P., and J. Shoemaker. 2000a. Performance and perceptions of distance learners in cyberspace.American Journal of Distance Education 14 (October): 15–35.
———. 2000b. Policy issues in the teaching of economics in cyberspace: Research design, coursedesign, and research results. Contemporary Economic Policy 18 (July): 359–66.
Roy, D. 1951. Some thoughts on the distribution of earnings. Oxford Economic Papers 3: 135–46.Russell, T. 2006. No significant difference phenomenon. http://www.nosignificantdifference.org (ac-
cessed June 19, 2006).Siegfried, J. J. 1979. Male–female differences in economic education: A survey. Journal of Economic
Education 10 (2): 1–11.Simkins, S. P. 1999. Promoting active-student learning using the World Wide Web in economics courses.
Journal of Economic Education 30 (3): 278–91.Sosin, K. 1998. Using the Internet and computer technology to teach economics. In Teaching eco-
nomics to undergraduates: Alternatives to chalk and talk, ed. W. E. Becker and M. Watts, 119–39.Cheltenham, UK: Edward Elgar.
Sosin, K., B. Blecha, R. Agarwal, R. Bartlett, and J. Daniel. 2004. Efficiency in the use of technology ineconomic education: Some preliminary results. American Economic Review Papers and Proceedings94 (May): 253–58.
Twigg, C. A. 2001. Innovation in online learning: Moving beyond no significant difference. Troy, NY:Rensselaer Polytechnic Institute.
Vachris, M. A. 1997. Teaching economics in a virtual elassroom. Virginia Economic Journal 2 (Septem-ber): 17–26.
Walstad, W. B., and D. Robson. 1997. Differential item functioning and male–female differences onmultiple-choice tests in economics. Journal of Economic Education 28 (2): 155–71.
Walstad, W. B., and J. C. Soper. 1989. What is high school economics? Factors contributing to studentachievement and attitudes. Journal of Economic Education 20 (1): 23–38.
Watts, M. 1987. Student gender and school district differences affecting the stock and flow of economicknowledge. Review of Economics and Statistics 69 (August): 561–66.
Wooldridge, J. 2003. Introductory econometrics: A modern approach. 3rd ed. Mason, OH: Thomson-South-Western.
Zhang, D., J. Zhao, L. Zhou, and J. Nunamaker. 2004. Can e-learning replace classroom learning?Communications of the ACM 47 (5): 75–79.
Zhang, P. 1998. A case study on technology use in distance learning. Journal of Research of Computingin Education 30 (Summer): 398–416.
24 JOURNAL OF ECONOMIC EDUCATION
APPENDIX A
COURSE DESIGNS
Differences in course design are presented in bold type.
Online course (N = 58) Hybrid course (N = 98)
Textbook and companion Website with online study guide
Textbook and companion Website with online study guide
Instructor Web site forannouncement, posting ofrelevant material, and grades
Instructor Web site forannouncement, posting ofrelevant material, and grades
Online lecture supplements Face-to-face lecturesWeekly online chats and
mandatory onlineparticipation
Weekly computer labassignments
Weekly computer labassignments
E-mail E-mailElectronic testing: online
quizzesIn-class quizzes (open book)
In-class midterms (2) and finalexam
In-class midterms (2) and finalexam
APPENDIX B
PERFORMANCE EVALUATION INSTRUMENTS
Common InstrumentsThree quizzes (online for online students only)
Common multiple-choice questionsOpen books and notes
Two in-person examsCommon format and contentMultiple-choice, true or false, and essay questions
In-person final examinationCommon format and contentCumulative, with more emphasis on last third of courseMultiple-choice, true or false, and essay questionsWeekly computer lab assignments
Online Course OnlyWeekly online chat and online participationExtra credit discussion board postings
Hybrid Course OnlyExtra credit attendance points
Winter 2009 25

Reproduced with permission of the copyright owner. Further reproduction prohibited without permission.