ap microeconomics course study guide - webflow
TRANSCRIPT
1
From Simple Studies, https://simplestudies.edublogs.org
@simplestudiesinc on Instagram
AP Microeconomics Course Study Guide
From Simple Studies, https://simplestudies.edublogs.org & @simplestudiesinc on
Table of Contents:
Tips for Test …………………………………………………………………………...…... 2
What is Economics? ………………………………………………………………...…….. 4
Econ Systems …………………………………………………………………....………... 6
Supply & Demand ………………………………………………………………...………. 7
Elasticity and Taxation …………………………………………………………….....…… 11
Theory of Consumer Choice or Behavior ………………………………………...………. 15
Supply, Costs, and Production ……………………………………….………...…...…...... 16
Product Markets ………………………………………………………………...…..…….. 18
Perfect Competition ………………………………………………………………….….... 18
Monopoly ………………………………………………………………...…...……….…. 19
Imperfect Competition ………………………...……………………………...….…...….. 20
Resource Markets ………………………………………………………………...……..... 22
Market Failure and Externalities ……………………………………………….………… 23
2
From Simple Studies, https://simplestudies.edublogs.org
@simplestudiesinc on Instagram
Tips For Test:
● Two-thirds of your grade comes from the multiple choice, while the other third comes
from the FRQ
● There are roughly 60 multiple choice questions, and you are given about 70 minutes
to complete them
● The FRQ has one long question and two short questions, and you are given roughly
60 minutes to complete them
● Topics covered
○ 8%-14% - Basic economic concepts cover
○ 55%-70% - Nature and functions of product markets cover roughly
○ 10%-18% - Factor Markets cover roughly
○ 12%-18% - Market Failure and the role of the government covers roughly
● Score information
○ In order to earn a 5, you must get 80% or higher on the exam
○ In order to earn a 4, you must get 60% or higher on the exam
○ In order to earn a 3, you must get 50% or higher on the exam
○ In order to earn a 2, you must get 33% or higher on the exam
○ In order to earn a 1, you must get 0% or higher on the exam
● On multiple choice, pace yourself accordingly, and never stick on one question for too
long.
● Whenever you have doubts, graph it out!
● There is no penalty for wrong answers, so answer every question to the best of your
ability, taking guesses if needed
● Anytime a potential answer uses extreme words (ex. “always”, “never”, “rarely”,
“none”) that choice is usually not the best choice to go with
● Stay positive for most answer choices, but recognize if there is “not” or “except”, in
which case you pick the negative answer
● Read the question carefully, analyze it, and simplify it if needed in order to avoid
confusion.
● The difficulty usually increases towards the second half of the test, so be able to
answer all the easy questions in the beginning with confidence
● For FRQs, remember that you get consistency points for your answers, so if you feel
you messed up, as long as you do the right steps, even with the wrong numbers, you
will still earn credit for that problem
3
From Simple Studies, https://simplestudies.edublogs.org
@simplestudiesinc on Instagram
● Always make sure to remember your P’s and Q’s when labeling a graph
● Concision is key, as this is an AP Micro Exam, not AP Lang, so essays are not needed
● Always draw a graph; it can only help you, not harm you
● If a question asks for you to show your work, you better show it
● If a question asks to explain, you need to give a written explanation of your
work/thought process
● If a question asks for you to identify or determine, then they ask for a straightforward
answer, so not much writing is required
● If a question asks for you to draw or show, then a graph is required
● Know about the 4 market structures as the long frq usually asks about perfect
competition, monopoly, or monopolistic competition; oligopoly is also asked in one
of the short questions
● Any topic from this course can be used in the two short questions, so study up!
4
From Simple Studies, https://simplestudies.edublogs.org
@simplestudiesinc on Instagram
What is Economics?
● Economics is social science that studies how resources are used and how they can be
used to their full potential
● Macro vs. Micro:
○ Macroeconomics: the study of economic problems encountered by the nation
as a whole
○ Microeconomics: the study of economic problems encountered by the
individuals within the economy
● Positive vs. Normative:
○ Positive Economics: based on the scientific method, so hypotheses are formed
and tested
○ Normative Economics: based on the way things “should” be; valuing
judgments
● Resources: anything that can be used to produce other goods or services
○ Most resources are either land, labor, or capital
■ Land: considered to be all natural resources
■ Labor: considered to be all human attributes that are productive
■ Capital: productive equipment/machinery
● Opportunity Cost: what is sacrificed in order to obtain something else
○ Ex. The opportunity cost of studying for 2 hours is how you could have
watched Netflix for 2 hours
○ 𝑂𝑝𝑝𝑜𝑟𝑡𝑢𝑛𝑖𝑡𝑦 𝐶𝑜𝑠𝑡 𝑜𝑓 𝐺𝑜𝑜𝑑 𝑋 =𝛥𝐺𝑜𝑜𝑑 𝑌𝑃𝑟𝑜𝑑𝑢𝑐𝑡𝑖𝑜𝑛
𝛥𝐺𝑜𝑜𝑑 𝑋 𝑃𝑟𝑜𝑑𝑢𝑐𝑡𝑖𝑜𝑛
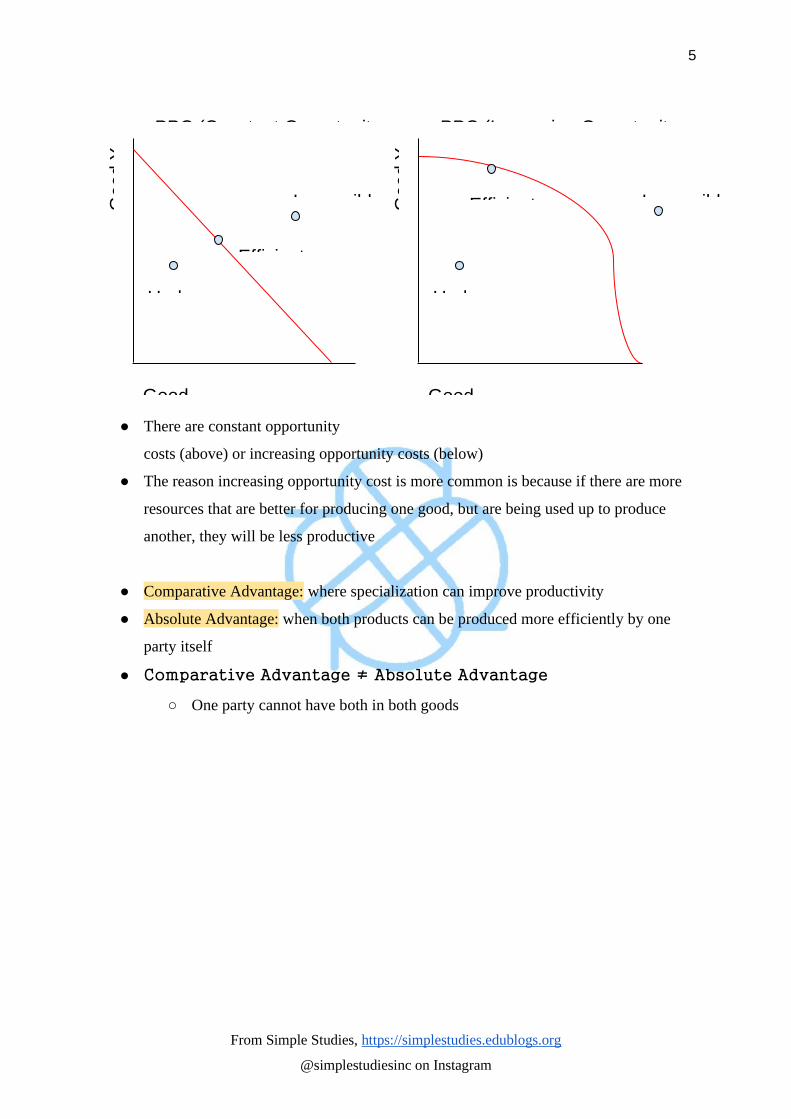
● Production Possibility Curve:
○ Shows the combination of two goods being produced using the economy’s
resources
○ Points below the curve are possible but inefficient
○ Points on the curve are possible and efficient
○ Points above the curve are impossible (unless the economy has an increase in
resources)
○ Changes in technology/productivity and changes in the amount of resources
can cause the curve to shift (increases = right shift, decreases = left shift)
○ Unemployment does not shift the curve, but rather moves the point as it is
below the curve
5
From Simple Studies, https://simplestudies.edublogs.org
@simplestudiesinc on Instagram
● There are constant opportunity
costs (above) or increasing opportunity costs (below)
● The reason increasing opportunity cost is more common is because if there are more
resources that are better for producing one good, but are being used up to produce
another, they will be less productive
● Comparative Advantage: where specialization can improve productivity
● Absolute Advantage: when both products can be produced more efficiently by one
party itself
● Comparative Advantage ≠ Absolute Advantage
○ One party cannot have both in both goods
Go
od
Y
Good
PPC (Constant Opportunity
Underem
Efficient
Impossibl Go
od
Y
Good
PPC (Increasing Opportunity
Underem
Efficient Impossibl
6
From Simple Studies, https://simplestudies.edublogs.org
@simplestudiesinc on Instagram
Econ Systems:
● Market: mechanism that allows buyers and sellers to exchange goods and services
● Law of Supply: when the price of a product increases, the quantity supplied increases
● Law of Demand: when the price of a product increases, the quantity demanded
decreases
● Command Economy: where a central government dictates what will/will not be
produced, how much of it will be produced, and who gets the final products
○ Can be described as communist/socialist governments
● Capitalism: where supply and demand determine the prices in a free market
● Allocative Efficiency: where resources are deployed in the optimal way to ensure the
right products are sold in the right amounts to satisfy consumers
● Mixed Economy: blend of government commands and capitalism
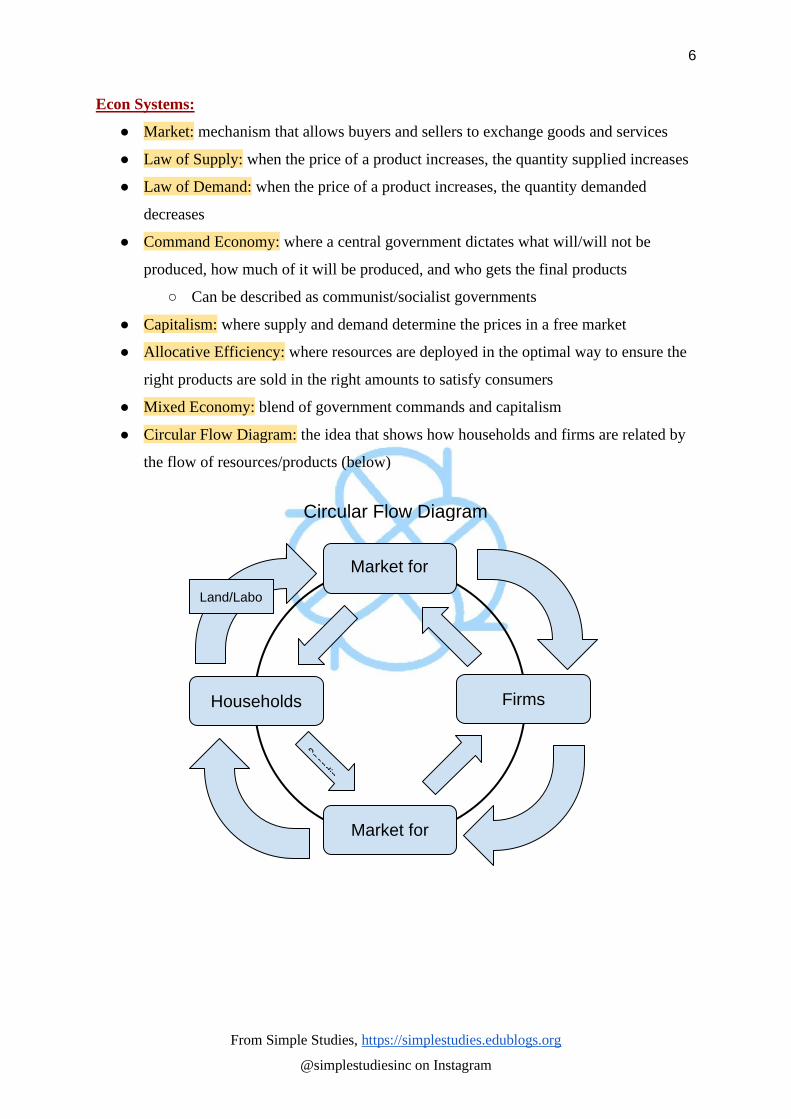
● Circular Flow Diagram: the idea that shows how households and firms are related by
the flow of resources/products (below)
Circular Flow Diagram
Market for Resources
Firms
Market for Goods/Service
Households
Land/Labor/Capital
7
From Simple Studies, https://simplestudies.edublogs.org
@simplestudiesinc on Instagram
Supply and Demand:
● Changes in demand mean a shift in the demand curve due to a non-price determinant
● Changes in supply mean a shift in the supply curve due to a non-price determinant
● Changes in quantity demanded mean a price change, so there is only movement along
the demand curve
● Changes in quantity supplied mean a price change, so there is only movement along
the demand curve
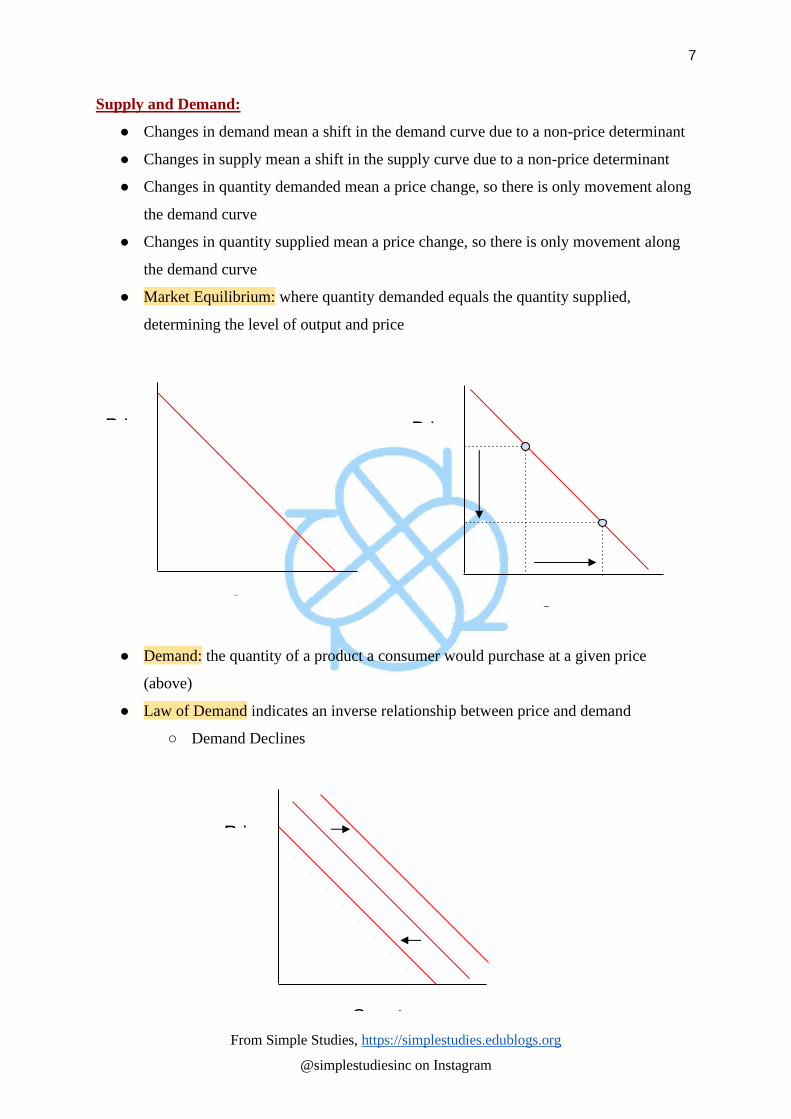
● Market Equilibrium: where quantity demanded equals the quantity supplied,
determining the level of output and price
● Demand: the quantity of a product a consumer would purchase at a given price
(above)
● Law of Demand indicates an inverse relationship between price and demand
○ Demand Declines
Quan
Demand
Quan
D
Changes in Quantity
Quant
Shifts in Demand
8
From Simple Studies, https://simplestudies.edublogs.org
@simplestudiesinc on Instagram
● The Income Effect: when prices fall, consumers can afford to buy more of a certain
good/service
● The Substitute Effect: when the price of a good increases, its price also increases
relative to the prices of other equivalent goods
● Determinants of Demand:
○ SPICE Mnemonic
■ S - Substitute Goods
■ P - Preferences/Population
■ I - Income
■ C - Complementary Goods
■ E - Expectations
● Substitute Goods: when an increase in the price of one good results in an increased
demand for the other good
○ Direct relationship
● Preferences: consumers’ taste for a good/service (taste increases = demand increases)
○ Direct relationship
● Population: number of consumers in the market, so a bigger market is more demand
○ Direct relationship
● Income: when people have more currency to spend, their demand increases
○ Normal Good: as income increases, demand increases (direct relationship)
○ Inferior Good: as income increases, demand decreases (indirect relationship)
● Complementary Goods: goods that are purchased separately but used together, and as
the price for one good increases, the demand for the other decreases
○ Inverse relationship
● Expectations: if consumers expect future prices to increase, the demand for the
product today increases
○ Direct relationship
9
From Simple Studies, https://simplestudies.edublogs.org
@simplestudiesinc on Instagram
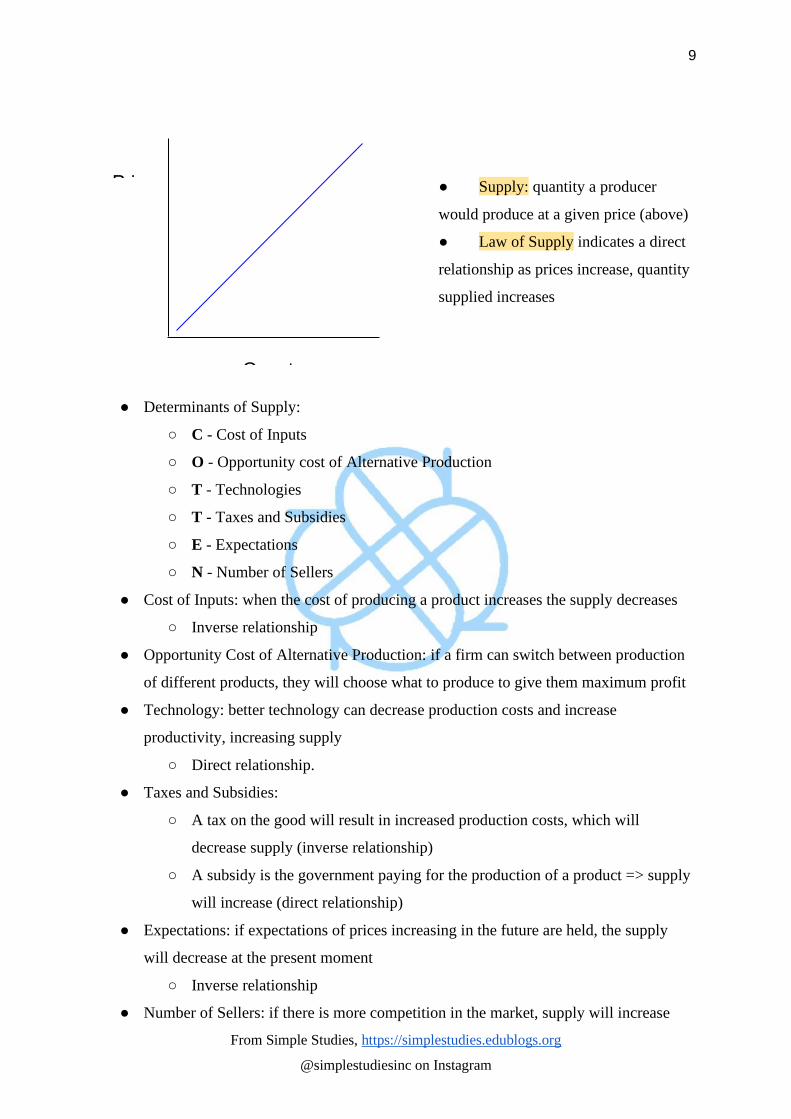
● Supply: quantity a producer
would produce at a given price (above)
● Law of Supply indicates a direct
relationship as prices increase, quantity
supplied increases
● Determinants of Supply:
○ C - Cost of Inputs
○ O - Opportunity cost of Alternative Production
○ T - Technologies
○ T - Taxes and Subsidies
○ E - Expectations
○ N - Number of Sellers
● Cost of Inputs: when the cost of producing a product increases the supply decreases
○ Inverse relationship
● Opportunity Cost of Alternative Production: if a firm can switch between production
of different products, they will choose what to produce to give them maximum profit
● Technology: better technology can decrease production costs and increase
productivity, increasing supply
○ Direct relationship.
● Taxes and Subsidies:
○ A tax on the good will result in increased production costs, which will
decrease supply (inverse relationship)
○ A subsidy is the government paying for the production of a product => supply
will increase (direct relationship)
● Expectations: if expectations of prices increasing in the future are held, the supply
will decrease at the present moment
○ Inverse relationship
● Number of Sellers: if there is more competition in the market, supply will increase
Quant
Supply
10
From Simple Studies, https://simplestudies.edublogs.org
@simplestudiesinc on Instagram
○ Direct relationship
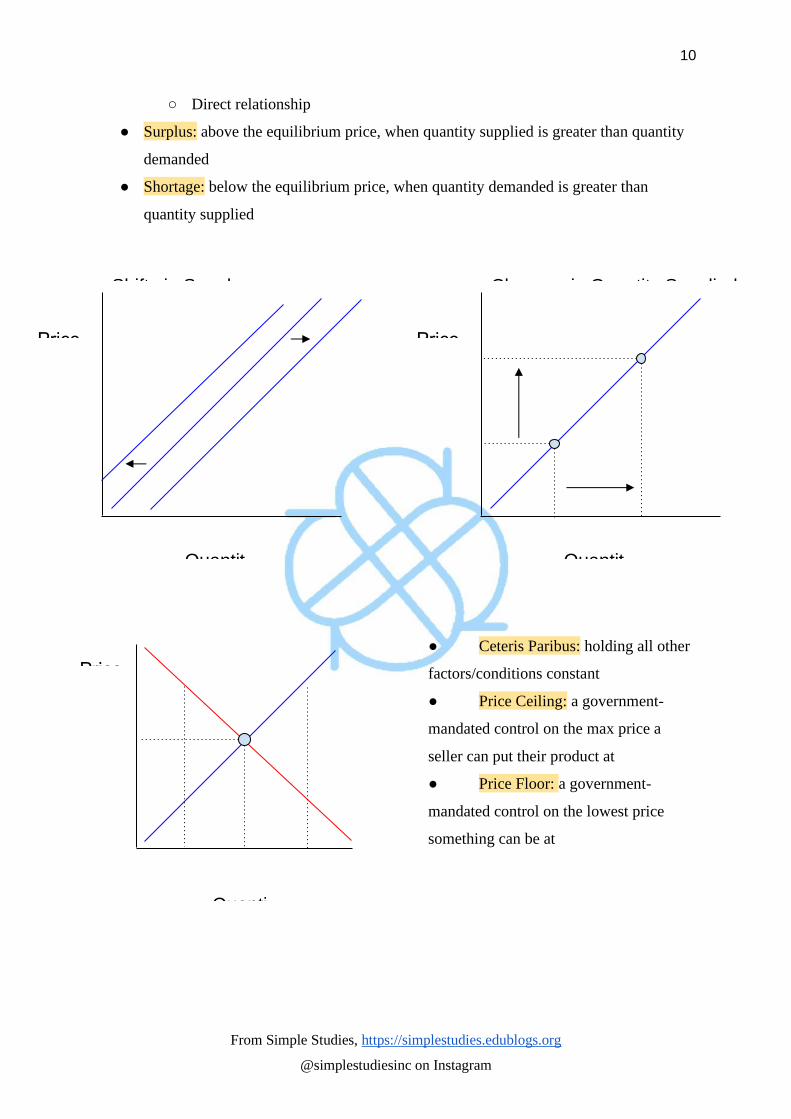
● Surplus: above the equilibrium price, when quantity supplied is greater than quantity
demanded
● Shortage: below the equilibrium price, when quantity demanded is greater than
quantity supplied
● Ceteris Paribus: holding all other
factors/conditions constant
● Price Ceiling: a government-
mandated control on the max price a
seller can put their product at
● Price Floor: a government-
mandated control on the lowest price
something can be at
Quantit
Changes in Quantity Supplied
Quantit
Shifts in Supply S
increa
Quanti
Price Floor
D Q Q
11
From Simple Studies, https://simplestudies.edublogs.org
@simplestudiesinc on Instagram
Elasticity and Taxation:
● Total Revenue Test (TR): 𝑃 × 𝑄 = 𝑇𝑅
● Unit Elastic: if price increases by a factor and quantity demanded decreases by the
same factor, total revenue stays the same
● Elastic Demand: if the price increases by a factor and quantity demanded decreases by
a greater factor, total revenue decreases
○ Inverse Relationship
● Inelastic Demand: If the price increases by a factor and quantity demanded decreases
by a smaller factor, total revenue increases
○ Direct Relationship
● Price Elasticity of Demand Formula: %𝛥𝑄𝑢𝑎𝑛𝑡𝑖𝑡𝑦 𝐷𝑒𝑚𝑎𝑛𝑑𝑒𝑑
%𝛥𝑃𝑟𝑖𝑐𝑒
● Price Elasticity of Supply Formula: %𝛥𝑄𝑢𝑎𝑛𝑡𝑖𝑡𝑦 𝑆𝑢𝑝𝑝𝑙𝑖𝑒𝑑
%𝛥𝑃𝑟𝑖𝑐𝑒
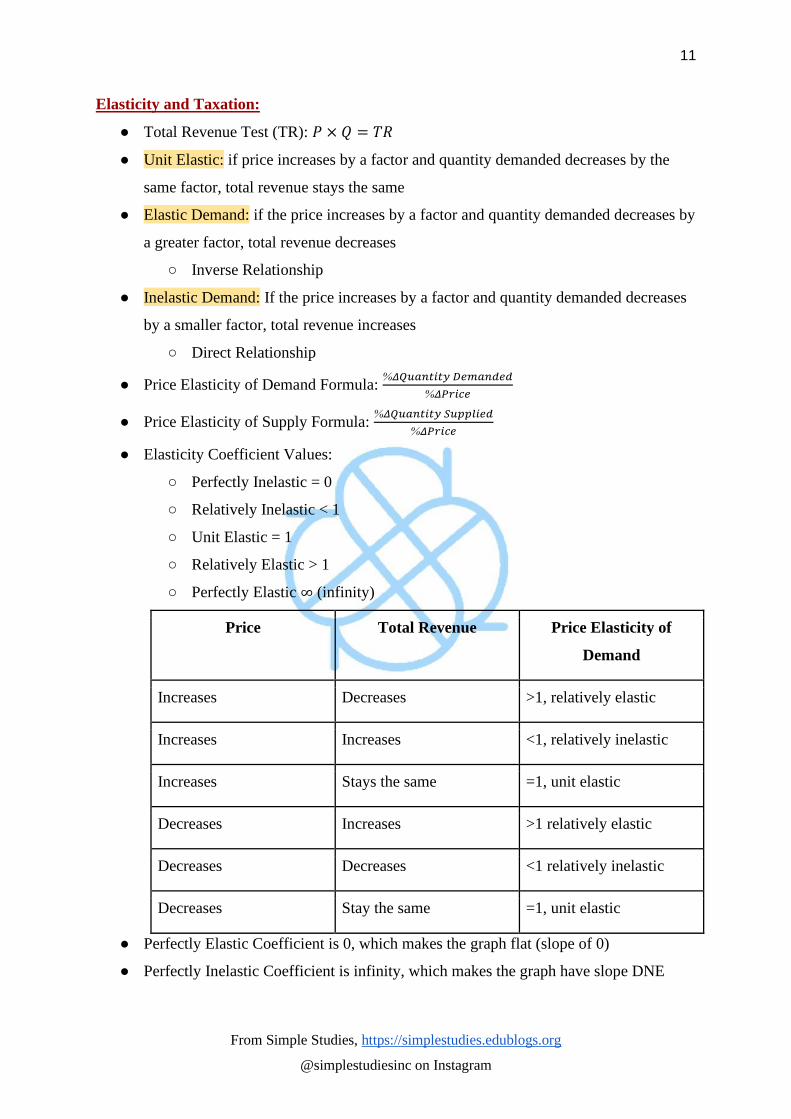
● Elasticity Coefficient Values:
○ Perfectly Inelastic = 0
○ Relatively Inelastic < 1
○ Unit Elastic = 1
○ Relatively Elastic > 1
○ Perfectly Elastic ∞ (infinity)
Price Total Revenue Price Elasticity of
Demand
Increases Decreases >1, relatively elastic
Increases Increases <1, relatively inelastic
Increases Stays the same =1, unit elastic
Decreases Increases >1 relatively elastic
Decreases Decreases <1 relatively inelastic
Decreases Stay the same =1, unit elastic
● Perfectly Elastic Coefficient is 0, which makes the graph flat (slope of 0)
● Perfectly Inelastic Coefficient is infinity, which makes the graph have slope DNE
12
From Simple Studies, https://simplestudies.edublogs.org
@simplestudiesinc on Instagram
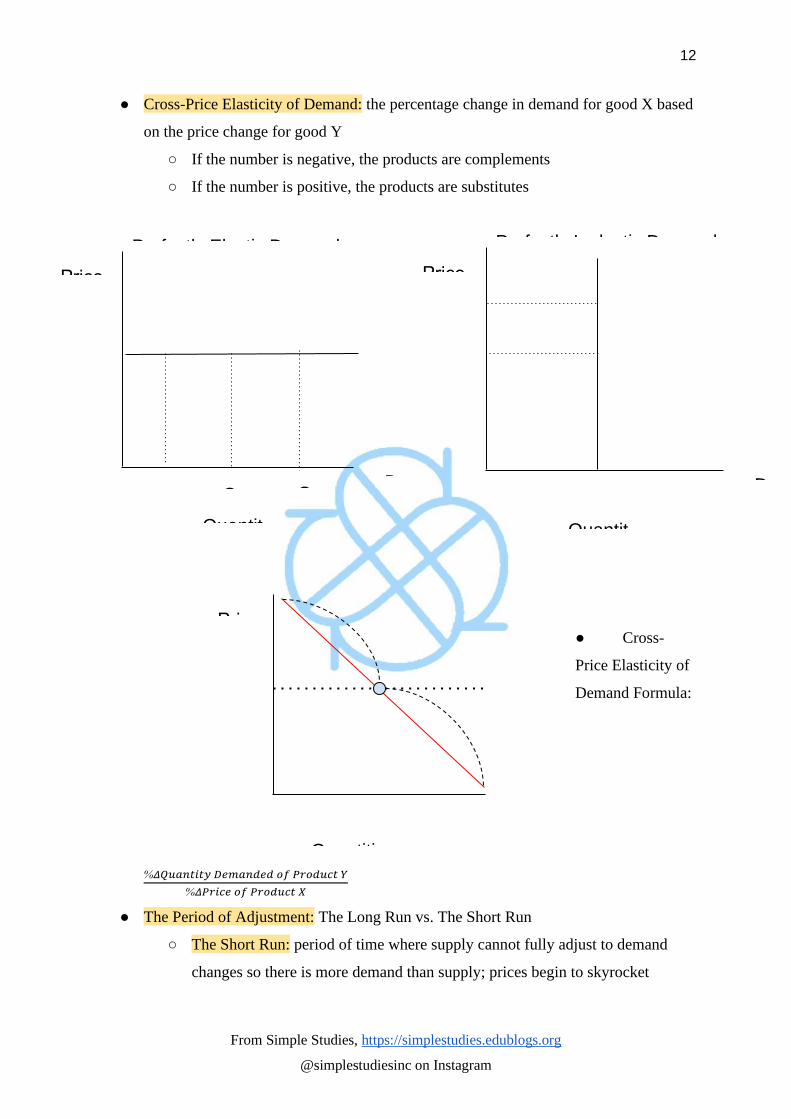
● Cross-Price Elasticity of Demand: the percentage change in demand for good X based
on the price change for good Y
○ If the number is negative, the products are complements
○ If the number is positive, the products are substitutes
● Cross-
Price Elasticity of
Demand Formula:
%𝛥𝑄𝑢𝑎𝑛𝑡𝑖𝑡𝑦 𝐷𝑒𝑚𝑎𝑛𝑑𝑒𝑑 𝑜𝑓 𝑃𝑟𝑜𝑑𝑢𝑐𝑡 𝑌
%𝛥𝑃𝑟𝑖𝑐𝑒 𝑜𝑓 𝑃𝑟𝑜𝑑𝑢𝑐𝑡 𝑋
● The Period of Adjustment: The Long Run vs. The Short Run
○ The Short Run: period of time where supply cannot fully adjust to demand
changes so there is more demand than supply; prices begin to skyrocket
Quantities
Price Elasticity of Demand
D
Quantit
Perfectly Inelastic Demand
D
Quantit
Perfectly Elastic Demand
D Q Q
13
From Simple Studies, https://simplestudies.edublogs.org
@simplestudiesinc on Instagram
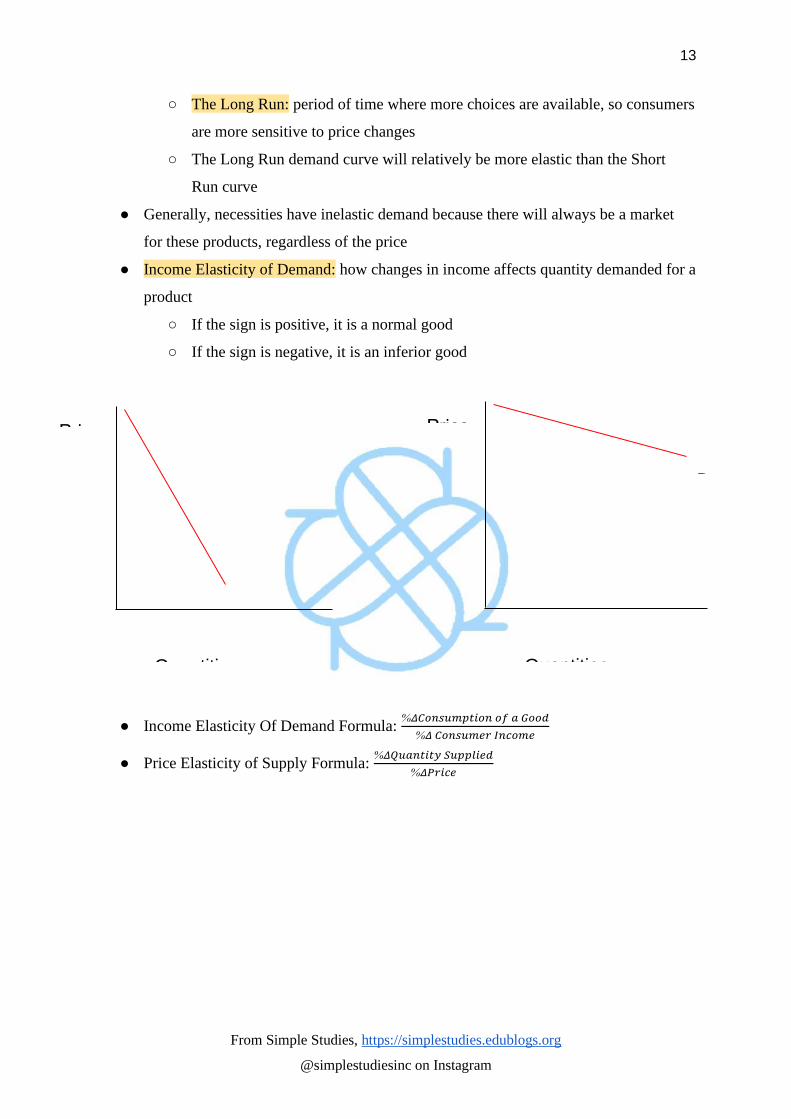
○ The Long Run: period of time where more choices are available, so consumers
are more sensitive to price changes
○ The Long Run demand curve will relatively be more elastic than the Short
Run curve
● Generally, necessities have inelastic demand because there will always be a market
for these products, regardless of the price
● Income Elasticity of Demand: how changes in income affects quantity demanded for a
product
○ If the sign is positive, it is a normal good
○ If the sign is negative, it is an inferior good
● Income Elasticity Of Demand Formula: %𝛥𝐶𝑜𝑛𝑠𝑢𝑚𝑝𝑡𝑖𝑜𝑛 𝑜𝑓 𝑎 𝐺𝑜𝑜𝑑
%𝛥 𝐶𝑜𝑛𝑠𝑢𝑚𝑒𝑟 𝐼𝑛𝑐𝑜𝑚𝑒
● Price Elasticity of Supply Formula: %𝛥𝑄𝑢𝑎𝑛𝑡𝑖𝑡𝑦 𝑆𝑢𝑝𝑝𝑙𝑖𝑒𝑑
%𝛥𝑃𝑟𝑖𝑐𝑒
Quantities
Long run
D
Quantities
Short run
D
14
From Simple Studies, https://simplestudies.edublogs.org
@simplestudiesinc on Instagram
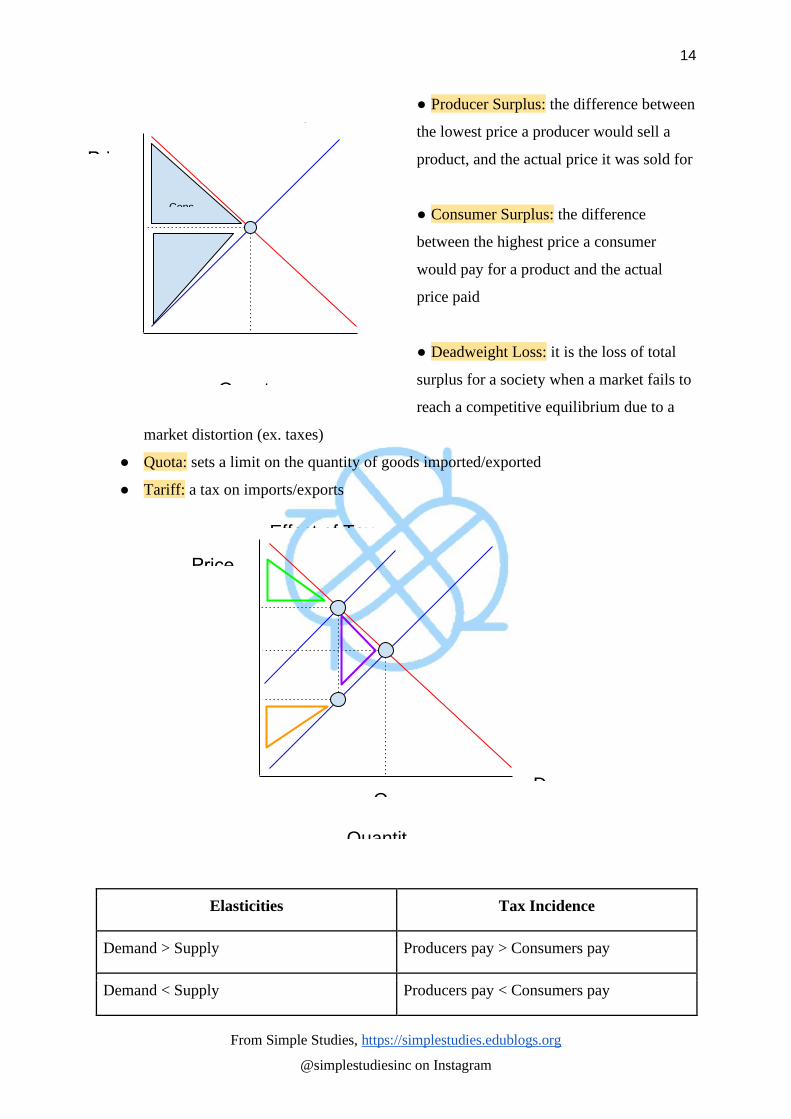
● Producer Surplus: the difference between
the lowest price a producer would sell a
product, and the actual price it was sold for
● Consumer Surplus: the difference
between the highest price a consumer
would pay for a product and the actual
price paid
● Deadweight Loss: it is the loss of total
surplus for a society when a market fails to
reach a competitive equilibrium due to a
market distortion (ex. taxes)
● Quota: sets a limit on the quantity of goods imported/exported
● Tariff: a tax on imports/exports
Elasticities Tax Incidence
Demand > Supply Producers pay > Consumers pay
Demand < Supply Producers pay < Consumers pay
Quant
Consumer vs Producer
D Q
Cons
Quantit
Effect of Tax
D
PE
QE
Deadweight loss
Consum
Producer
15
From Simple Studies, https://simplestudies.edublogs.org
@simplestudiesinc on Instagram
Perfectly Inelastic Demand Consumers pay all
Perfectly Inelastic Supply Producers Pay all
Perfectly Elastic Demand Consumers pay Nothing
Perfectly Elastic Supply Producers Pay Nothing
16
From Simple Studies, https://simplestudies.edublogs.org
@simplestudiesinc on Instagram
Theory of Consumer Choice or Behavior:
● Consumers rank goods in terms of preference
● Utils: a measurement of utility/satisfaction
● Utility: how much satisfaction a consumer has
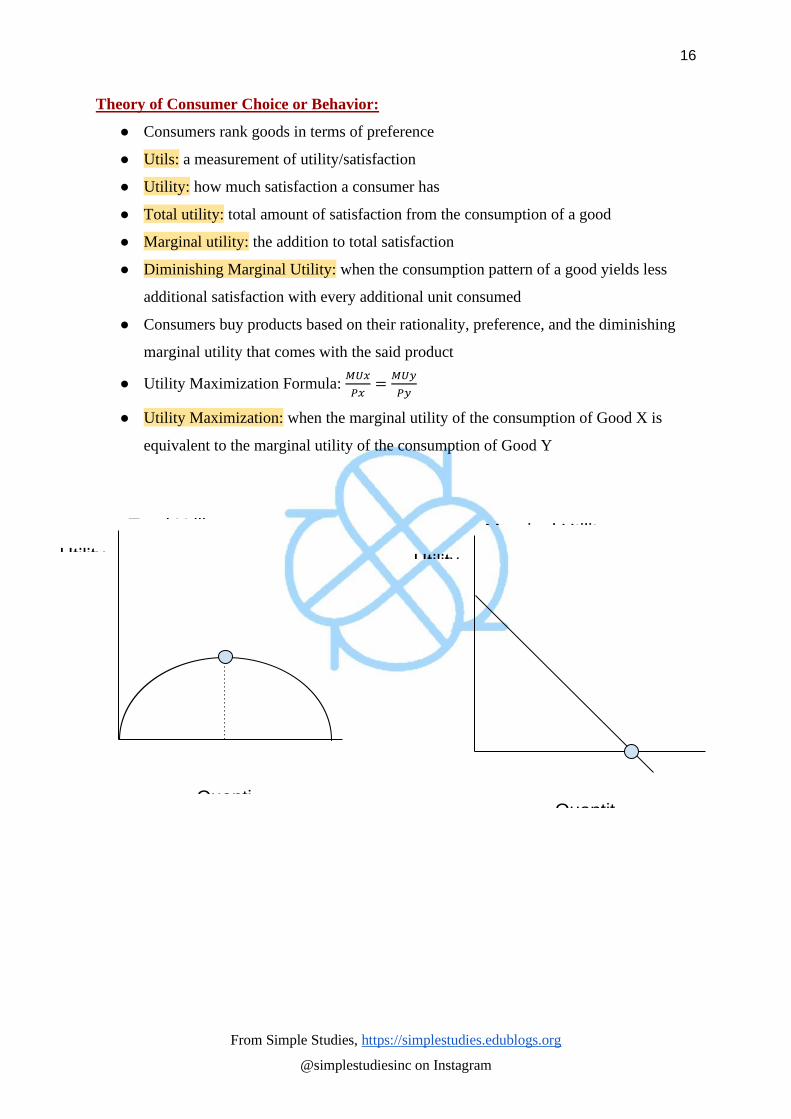
● Total utility: total amount of satisfaction from the consumption of a good
● Marginal utility: the addition to total satisfaction
● Diminishing Marginal Utility: when the consumption pattern of a good yields less
additional satisfaction with every additional unit consumed
● Consumers buy products based on their rationality, preference, and the diminishing
marginal utility that comes with the said product
● Utility Maximization Formula: 𝑀𝑈𝑥
𝑃𝑥=
𝑀𝑈𝑦
𝑃𝑦
● Utility Maximization: when the marginal utility of the consumption of Good X is
equivalent to the marginal utility of the consumption of Good Y
Quantit
Marginal Utility
Quanti
Total Utility
17
From Simple Studies, https://simplestudies.edublogs.org
@simplestudiesinc on Instagram
Supply, Costs, and Production:
● Accounting Profit: the difference between total revenues and explicit costs
● Average Fixed Cost: a firm’s total fixed cost divided by total output
○ 𝐴𝐹𝐶 = 𝑇𝑜𝑡𝑎𝑙 𝐹𝑖𝑥𝑒𝑑 𝐶𝑜𝑠𝑡
𝑂𝑢𝑡𝑝𝑢𝑡
● Average Product: total product divided by the variable input used in production
○ 𝐴𝑃 = 𝑇𝑜𝑡𝑎𝑙 𝑜𝑢𝑡𝑝𝑢𝑡
𝑉𝑎𝑟𝑖𝑎𝑏𝑙𝑒 𝑖𝑛𝑝𝑢𝑡
● Average Total Cost: Average Variable Costs + Average Fixed Costs
● Average Variable Cost: 𝑇𝑜𝑡𝑎𝑙 𝑉𝑎𝑟𝑖𝑎𝑏𝑙𝑒 𝐶𝑜𝑠𝑡
𝑂𝑢𝑡𝑝𝑢𝑡
● Diseconomies of Scale: as a firm’s output increases, it’s long-run average total cost
curve increases as well
● Economic Profit: total revenues that are subtracted by both explicit/implicit costs
● Excise Tax: a per-unit tax that is placed on the sales of a specific product
● Fixed Costs: these costs cannot change when quantity changes in the short run, but
can change in the long run
● Law of Diminishing Marginal Returns: the range of output where production
increases at a decreasing rate
● Long Run: the long-term view of a situation where supply fully adjusts to changes in
demand and wages aren’t sticky
● Lump-Sum Tax: a fixed tax that is put on producers regardless of how much they
produce; affects both the average fixed and total costs
● Marginal Cost: 𝛥𝑇𝑜𝑡𝑎𝑙 𝐶𝑜𝑠𝑡
𝛥𝑂𝑢𝑡𝑝𝑢𝑡
● Marginal Product: how much more product can be produced when another input is
added by a firm
○ 𝑀𝑃 = 𝐶ℎ𝑎𝑛𝑔𝑒 𝑖𝑛 𝑜𝑢𝑡𝑝𝑢𝑡
𝐶ℎ𝑎𝑛𝑔𝑒 𝑖𝑛 𝑖𝑛𝑝𝑢𝑡
● Normal Profit: where an entrepreneur will not be better off in any other venture
● Per-Unit Tax: a tax on each additional unit produced; affects variable costs (ex.
marginal cost, average total/variable costs)
● Short Run: a period of time where supply does not adjust to changes in demand
● Total Costs: all fixed and variable costs in total
○ TC = Total Variable Costs + Total Fixed Costs
● Variable Costs: costs that change as production increases
18
From Simple Studies, https://simplestudies.edublogs.org
@simplestudiesinc on Instagram
Product Markets:
● Monopolistic Competition: a market structure characterized by many medium sized
firms who are innovative and differentiate their products in both price and non price
ways
● Monopoly: one firm that constitutes the entire industry selling a product, for there are
no close substitutes
● Oligopoly: a market structure characterized by few sellers that are interdependent of
each other to create control over price markets
● Perfect Competition: a market structure characterized by a large number of sellers
with a homogeneous product, infinitely elastic demand for firms, and no price takers
● Price Takers: cannot control the price of their goods because they don't have enough
market power and must accept the market price
● Price Makers: can control and manipulate markets by charging prices that is in excess
of marginal costs to maximize profits
Perfect Competition:
● Economic Efficiency: the distribution of resources to their most productive and
desired uses
● Profit-Maximizing Criterion: also called Loss-Minimizing Criterion, where the level
of output at which the marginal revenue is equivalent to the marginal cost
○ Marginal Revenue = Marginal Cost
● Shut-Down Point: when the price is less than the average variable cost, the firm
should shut down in the short-run
○ Price < AVC ==> the firm should shut down
● Price = Marginal Revenue is the perfectly competitive firm’s demand function
● Price = Marginal Cost is the socially optimal price (efficiency) that can be achieved
under perfect competition in the long run
● Price = Minimum Average Cost is the formula for a perfectly competitive firm in the
long run
● (Price - Average Total Cost) * Output will calculate either profits or losses
19
From Simple Studies, https://simplestudies.edublogs.org
@simplestudiesinc on Instagram
Monopoly:
● Herfindahl Index: the sum of the squares of market shares of a firm in a particular
market or industry; used to measure the level of concentrated power of said firm in an
industry
● Natural Monopolies: monopolies that have many cost advantages and can offer a
lower cost for a product than most other firms
● Price-Discrimination: when different customers are charged with different prices for
the same product
● Socially-Optimal Pricing: where government regulators force monopolies to have
allocatively efficient pricing, which can force firms to go out of business, or require
large subsidies to compensate
● Fair-Return Pricing: regulators created to set prices deliberately to let monopolies
break-even and earn normal profits like the other firms in the same industry
● Unregulated Monopoly: these monopolies produce at the profit-maximizing quantity,
underproduce, and overcharge
● Regulated Monopolies Pricing At A Fair-Return Price:
○ Price = Average Total Cost
● Regulated Monopolies Pricing At A Socially Optimal Price:
○ Price = Marginal Cost
20
From Simple Studies, https://simplestudies.edublogs.org
@simplestudiesinc on Instagram
Imperfect Competition:
● Cartel: a group of firms that act together and have a formal agreement not to compete
with one another
● Collusion: an agreement that is usually illegal to agree on the price and quantity
produced in a given market
● Dominant Strategy: the best choice for one player regardless of what the other player
may end up choosing
● Game Theory: the study of how firms and people act tactically during a game
● Prisoner’s Dilemma: if neither of them confess, they both get a prison sentence. If one
of them confesses and the other doesn’t, one gets a longer sentence than the other, or
can potentially walk free. If both confess, then they get a longer prison sentence than
they would have gotten if both of them didn’t confess.
● Monopolistic Competition:
○ Has relatively easy entries
○ Has differentiated products
○ Has advertising and non-price competition
○ Has inefficient, excess capacity
○ Has a large number of buyers and sellers
○ Has long-run equilibrium
○ Is allocatively inefficient with the price being greater than the marginal costs
○ Has the price greater than the marginal revenue
○ Is the most common type of market structure in America
● Nash Equilibrium: game theory outcome, which involves when both players choose
the action that is best for them, given the actions of other players, yet they reach the
same payoff matrix cell
● Oligopoly:
○ Have formidable barriers to entry
○ Have differentiated or similar products
○ Has interdependence
○ Has few firms that control major shares of the market
○ Is allocatively inefficient, where the price is greater than the marginal cost,
resulting in excess profits
○ Has the price greater than the marginal revenue
○ Has price-makers
21
From Simple Studies, https://simplestudies.edublogs.org
@simplestudiesinc on Instagram
○ Has collusive activities and cooperative arrangements
○ Has actions that are influenced by the actions of rivals
22
From Simple Studies, https://simplestudies.edublogs.org
@simplestudiesinc on Instagram
Resource Markets:
● Derived Demand: the demand for a resource such as labor comes from the product the
resource helps to produce
● The firm in a perfectly competitive labor market is a price taker, because of the wage
rate paid by the firm for its workers, while supply is perfectly elastic
● Marginal Revenue Product: represents the demand for labor
● Marginal Factor Cost: represents the cost of labor
● Monopsony: a market where there is only a singer buyer for labor
● Three things shift the demand curve for labor:
○ Demand for the product.
○ Changes in productivity.
○ Changes in prices of other resources.
● Least Cost Rule: to minimize costs, a firm must adjust the ratio of inputs labor to be
equivalent to its capital
○ 𝑀𝑃𝑙
𝑃𝑙=
𝑀𝑃𝑘
𝑃𝑘
23
From Simple Studies, https://simplestudies.edublogs.org
@simplestudiesinc on Instagram
Market Failure and Externalities:
● Coase Theorem: theory that states private parties have the ability to solve issues
created by externalities by themselves without needing government assistance
● Free-Rider Problem: government ends up providing public goods because people
benefit from public goods that they didn’t pay for
● Gini Coefficient: a measure of income inequality with a range of 0 to 1
○ 1 means all the income goes to one family
○ 0 means all the families receive the same amount of income
● Lorenz Curve: shows how much a country’s total income is earned by a household
● Marginal Social Benefit: the benefits that come with society’s consumption of
products
● Marginal Social Cost: the costs that came to society when additional units of goods
are produced
● Negative Externality: when a third party outside of the given market has to take some
of the cost of producing a product, causing the market to produce too much of the
good
● Positive Externality: the production/consumption of a good/service that creates
benefits for third parties that were not involved in the transaction; causes the maker to
produce little of that said good/service
● Private Goods: goods that are exclusive in consumption
● Progressive Tax: tax that increases to higher rates as incomes increase
● Proportional Tax: tax that imposes the same tax rates on everyone regardless of their
incomes
● Public Goods: goods that are non exclusive, so one singular person’s consumption of
it does not exclude others’ benefits from it
● Regressive Tax: tax where the tax burden falls as incomes rise
24
From Simple Studies, https://simplestudies.edublogs.org
@simplestudiesinc on Instagram
Works Cited
Musgrave, Frank, et al. Barron's AP Microeconomics/Macroeconomics. Barron's
Educational Series, 2015.
Ray, Margaret A., et al. Krugman's Economics for AP. BFW/Worth Publishers, 2015.