mathematical concepts as emerging tools in computing applications
TRANSCRIPT

1
MATHEMATICAL CONCEPTS AS EMERGING TOOLS IN COMPUTING
APPLICATIONS
Sergei Abramovich
State University of New York at Potsdam
This paper deals with computational applications of number theory concepts developed from arithmetic properties of spreadsheet-based lattices. It reflects on activities explored with in-service and pre-service teachers in an egalitarian, student-centered university classroom. The proposed pedagogy emphasizes the emergence of the concepts as a response to a particular problematic situation that arises via design of a computational environment. A discussion of the current mathematics education reform incorporates comments by the teachers.
Journal of Computers in Mathematics and Science Teaching, 19(1), 2000, 21-46

2
The old, the near, the accustomed, is not that to which but that with which we attend; it does not furnish the material of a problem, but of its solution.
John Dewey
INTRODUCTION This paper is a reflection on activities associated with the course Computers for Elementary
Mathematics Teachers (CEMT) conducted by the author at the University of Illinois at Chicago in Summer 1997. The content of the activities dealt with computational applications of mathematical concepts developed from arithmetic properties of spreadsheet-based lattices. The students enrolled in this course ranged from experienced mathematics teachers who were at the end of their masters program to undergraduate mathematics education majors whose formal mathematics background was limited to the requisite courses for elementary teachers. It was through these problem-solving- oriented courses that the undergraduates became familiar with such mathematical concepts and structures as quotient, remainder, primality, divisibility, factoring, greatest common divisor, the greatest integer function, the Fibonacci recursion, and the Euclidean algorithm. Some undergraduate and graduate students were enrolled simultaneously in courses for elementary teachers that presented advanced perspectives of these concepts and structures. One of the major assumptions of the CEMT course was that any prerequisite mathematics knowledge would help students revisit and re-learn the concepts by using them as problem solving tools in application to the construction of computational environments.
The CEMT course had multiple educational objectives and principles of design, which were concerned with mathematics, computing, and pedagogy. From a mathematics education perspective the design principles of the course focused on the use of content-bounded problems in which the development of mathematical concepts goes along with an instant link to situational referents. From a computer education perspective, the course emphasized the emergence of a mathematical concept as a response to a particular syntactic inquiry that arises via design of a computational environment. From the point of view of pedagogy, the course was designed to demonstrate how the teacher-student relationship in a computational setting originates on the expert/novice plane and gradually moves to the master/apprentice plane. The master/apprentice metaphor is used here in a sense that a student was given an opportunity to learn and/or revisit mathematical ideas and concepts as they are situated in a problem-solving context of computational environments. In this setting the goal of generating ideas and acquiring concepts was in their immediate application to situations problematized by students themselves. Because such situations may be new for both parties, students were expected to solve problems in an apprentice type mode of learning.
The CEMT course was designed to provide an alternative to simply transmitting disconnected concepts and instead to expose elementary teachers (hereafter referenced as teachers) to the same concepts through a situation in which the concepts emerge naturally and the teachers discuss and apply the concepts through dialogic discourse (i.e., a discourse based on a direct interaction of two or more individuals). A classroom where the course was conducted had only one computer connected to an overhead projection panel. The teachers, due to the dialogic orientation of the class, directed the use of the computer toward immediate demonstration of emerging ideas.
Several authors have expressed a perspective on acquiring knowledge with the focus on application as a basis for reform in mathematics curriculum and instruction. Building on Dewey’s (1933) notion of reflective inquiry, Hiebert et al. (1996) argued that a student should be allowed to problematize

3
mathematics content and in doing so to blur the distinction between acquiring knowledge and applying it. As far as instruction with technology is concerned, there is a sense of agreement in the mathematics education community that computing technology has the potential to promote such change in pedagogy by stimulating gains in student knowledge and understanding as a by-product of computer-mediated activities. Therefore, didactical focus on applications is particularly applicable to the computer-enhanced mathematics classroom.
One such approach to mathematics pedagogy, based on human ability to represent a variety of relationships in a real world graphically, is described by Schwartz and Yerushalmy (1995). These authors have designed software which mediates students’ informal linguistic representations of abstract mathematical concepts through computer graphics. Mathematical modeling is viewed as a process of formalizing verbal representation of a concrete situation; and such mediated activities in the context of secondary mathematics are used to facilitate the transition from a concrete situation expressed in the form of natural language to its abstract mathematical model. This transition is supported with numeric and graphic evidence rather than with pure algebraic symbolism of functions and equations.
Another computational approach to application-oriented and sense making mathematics pedagogy was documented by Noss and Hoyles (1996) who have designed a computational environment for graphical modeling of mathematical ideas related to banking practices. Noss and Hoyles made an assumption that bank employees might learn abstract mathematical concepts from their everyday work, view different models from banking routines under the angle of a common mathematical structure, and appreciate rigor and formal discourse through its meaningful application to familiar situations.
While the above two approaches to modeling mathematics emphasize the power of the use of functions in terms of graphs and tables, the approach taken in the CEMT course focused on the use of electronic manipulatives (spreadsheet-based rectangular grids) as mediational means in the transition from a content-bounded problem to its numeric representation in the form of arrays of numbers — something that like graphs “can be just as inspiring in a lesson” (MacKinnon, 1993, p. 7). The use of a spreadsheet makes these arrays interactive so that an electronic link can be established between two types of semiotic devices — grids and arrays. In addition, spreadsheet-based activities were explored with the teachers for a dual purpose: to encourage inductive reasoning through data-driven conjecturing and foster skills in making deductive arguments. Finally, the use of concepts as tools promoted a purposeful interaction among the teachers through resolving problematic situations of computational environments and mediated social dimension of mathematics instruction. In this paper the discussion covers several topics spanning from arithmetic to number theory with a focus on the use of mathematical concepts in application to computing.
BRIDGING THE ENACTIVE AND THE SYMBOLIC WITH CONTENT
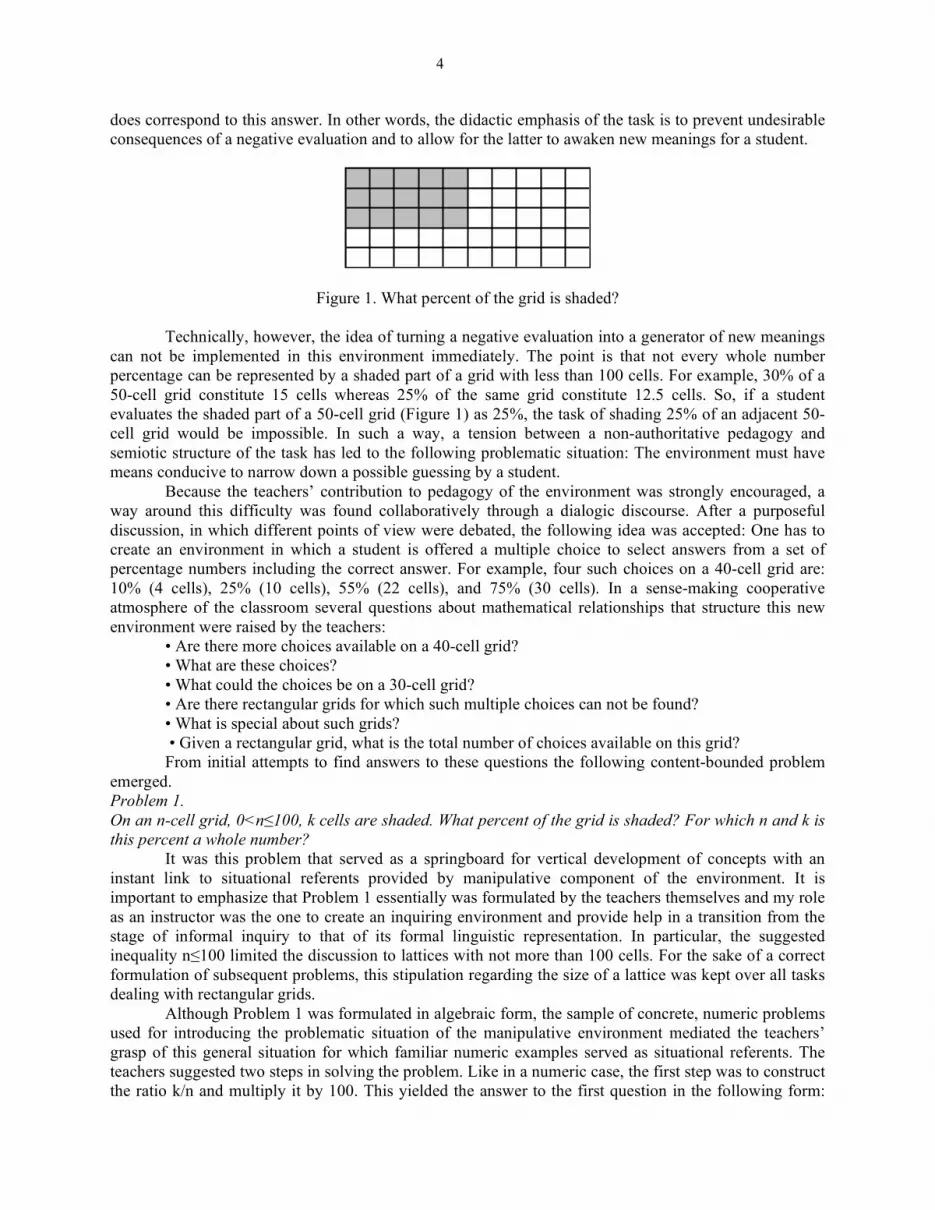
Arithmetic Properties of Rectangular Grids The problem formulated in this section occurred in a course of constructing a manipulative environment for solving percentage problems in elementary mathematics classroom. This environment utilizes a spreadsheet’s capacity to be used as a manipulative with a hot link to numeric notation. As reported elsewhere (Abramovich & Stephens, 1997), in such environment a student is presented with a rectangular grid which contains less than 100 cells. On this grid a number of cells is shaded (Figure 1) such that the shaded part constitutes a whole number percentage of the entire grid. A task for a student is to evaluate what percent of the grid is shaded and enter this percentage number into an answer box (a cell of the spreadsheet). The hot link established between iconic and numeric notations of the environment enables a computer to display a message evaluating a content of the answer box. If the student’s answer is incorrect, a computer-generated message suggests to continue the task on an, otherwise hidden, identical adjacent non-shaded grid. The objective of this new task is to give a student an opportunity to appropriate an incorrect answer as a thinking device and, in doing so, to shade a region on the adjacent grid which
4
does correspond to this answer. In other words, the didactic emphasis of the task is to prevent undesirable consequences of a negative evaluation and to allow for the latter to awaken new meanings for a student.
Figure 1. What percent of the grid is shaded?
Technically, however, the idea of turning a negative evaluation into a generator of new meanings can not be implemented in this environment immediately. The point is that not every whole number percentage can be represented by a shaded part of a grid with less than 100 cells. For example, 30% of a 50-cell grid constitute 15 cells whereas 25% of the same grid constitute 12.5 cells. So, if a student evaluates the shaded part of a 50-cell grid (Figure 1) as 25%, the task of shading 25% of an adjacent 50-cell grid would be impossible. In such a way, a tension between a non-authoritative pedagogy and semiotic structure of the task has led to the following problematic situation: The environment must have means conducive to narrow down a possible guessing by a student. Because the teachers’ contribution to pedagogy of the environment was strongly encouraged, a way around this difficulty was found collaboratively through a dialogic discourse. After a purposeful discussion, in which different points of view were debated, the following idea was accepted: One has to create an environment in which a student is offered a multiple choice to select answers from a set of percentage numbers including the correct answer. For example, four such choices on a 40-cell grid are: 10% (4 cells), 25% (10 cells), 55% (22 cells), and 75% (30 cells). In a sense-making cooperative atmosphere of the classroom several questions about mathematical relationships that structure this new environment were raised by the teachers: • Are there more choices available on a 40-cell grid? • What are these choices? • What could the choices be on a 30-cell grid? • Are there rectangular grids for which such multiple choices can not be found? • What is special about such grids? • Given a rectangular grid, what is the total number of choices available on this grid? From initial attempts to find answers to these questions the following content-bounded problem emerged. Problem 1. On an n-cell grid, 0<n≤100, k cells are shaded. What percent of the grid is shaded? For which n and k is this percent a whole number? It was this problem that served as a springboard for vertical development of concepts with an instant link to situational referents provided by manipulative component of the environment. It is important to emphasize that Problem 1 essentially was formulated by the teachers themselves and my role as an instructor was the one to create an inquiring environment and provide help in a transition from the stage of informal inquiry to that of its formal linguistic representation. In particular, the suggested inequality n≤100 limited the discussion to lattices with not more than 100 cells. For the sake of a correct formulation of subsequent problems, this stipulation regarding the size of a lattice was kept over all tasks dealing with rectangular grids. Although Problem 1 was formulated in algebraic form, the sample of concrete, numeric problems used for introducing the problematic situation of the manipulative environment mediated the teachers’ grasp of this general situation for which familiar numeric examples served as situational referents. The teachers suggested two steps in solving the problem. Like in a numeric case, the first step was to construct the ratio k/n and multiply it by 100. This yielded the answer to the first question in the following form:

5
(k/n)100 percent of the grid is shaded. The second step was to set up the following constraint: the shaded region (a subgrid of the first order) must constitute a whole number percentage of the whole grid. At this point the teachers realized that some integral pairs (k, n), 0<k≤n, make the ratio (k/n)100 a whole number whereas some such pairs do not. For example, k=2 and n=3 yield (2/3)100=66.(6) — a repeating decimal. Yet k=3, n=5 yield (3/5)100= 60 — a whole number. Likewise, the teachers explored other pairs of integers through trial and error. The empirical approach to the second part of Problem 1 prompted use of the spreadsheet as a computational environment to help generate pairs (k,n) which, in turn, were incorporated into design of the manipulative environment. It is worth noting that the teachers were not familiar with the use of a spreadsheet as a two-dimensional modeling tool and a pencil-and-paper chart was helpful in bridging the gap between the general idea and its technical implementation. In particular, the use of the $ sign as a syntactic constraint for the degree of freedom of variables involved in two-variable formulas was introduced to the teachers by means of debugging initial attempts in replicating formulas without careful consideration of how a computer operates these formulas. That is, the $ sign was introduced as a special notation enabling the teachers to refine those spreadsheet formulas which do not control the degree of freedom of the variables involved. Exploiting syntactic versatility of a spreadsheet A spreadsheet computational capacity to deal with processes depending on two variables makes it possible to explore the algebraic expression 100 (k/n) numerically by computing its values for every pair of whole numbers k and n within a specified range. In search of whole number percentages such computing involves the division of two whole numbers, and a whole number quotient resulted from this division can be interpreted twofold: (i) division with a zero remainder, and (ii) division with a zero fractional part. As far as a spreadsheet-based kit of computing devices is concerned, these two ways of generating whole number percentages can be implemented by using, respectively, either the function MOD or INT. Whereas the former computes a remainder from the division of two numbers which is supposed to be a zero, the latter truncates a fractional part of a quotient which, in turn, has to be a fixed point of the greatest integer function. When a student deals with the notation MOD(5,2) in a pencil-and-paper environment, the resulting number is up to his or her decision; when a student enters the formula =MOD(5,2) into a cell of a spreadsheet the resulting number is due to the spreadsheet computing. Once the result is available on the spreadsheet, computer-generated statement MOD(5,2)=1 enables a student to reflect on it and make sense of the abstract notation through numerical evidence — a persuasive argument which is both heuristic and demonstrative. The same interplay exists between the notation INT(5/2) and the spreadsheet formula =INT(5/2). Therefore, the use of either of the spreadsheet functions MOD or INT from a kit of available computing devices makes it possible to display whole number percentages only. A pedagogy which utilizes syntactic versatility of the software facilitates the process of socializing a student into what Wertsch and Minick described as a “culturally accepted situation definition” (1990, p.79); that is, the process of mastering a formal mathematical symbolism. Furthermore, the recognition of the availability of different syntactic means contributes to a classroom culture in which students are granted flexibility and freedom in developing various problem-solving strategies. This sense-making classroom atmosphere enabled an in-service teacher to make the following remark: “ I enjoyed our class discussions on the formulas as we were able to try out and see the results immediately.” An equal access to the computer, as the remark indicates, turned out to be also an important element of this culture. It is worth noting that the emphasis on syntactic versatility of spreadsheets made acquisition of divisibility concepts meaningful for the teachers. That is, these concepts were introduced as problem solving tools available for generating numerical evidence rather than just abstract mathematical notations. Another focus of the instruction was helping the teachers experience mathematics as an integral whole uniting different courses that they have been taking through the program of studies. In the words of one in-service teacher: “I feel that my understanding of developing sequences was greatly enhanced. Excel led

6
me to think about divisibility and remainders. These concepts were very prevalent in our methods for generating various sequences.” In the same vein, a pre-service teacher acknowledged: “Concepts explored in our class were also explored in my number theory course. These classes actually covered some of the same concepts and each helped me with the other. I feel that explorations made possible by a spreadsheet did enhance my understanding of some of the mathematical ideas which seem a little bit clearer now. This [computer] class especially helped with understanding of MOD function.” Indeed, in a spreadsheet environment the MOD function became a tool for a pre-service teacher rather than only notation as in the number theory course. This fact indicates that learning number theory concepts in such an environment can be organized through the concept-related triad emergence-discussion-application regarding concrete computational problems. It is through this approach a classroom environment can be described in terms of the master/apprentice metaphor. In such intellectual milieu a mathematical concept is not explicitly taught or introduced by an instructor through a transmission like model of communication but rather it is discovered in a class collective attempt to make sense in a problematic situation of a computational environment.
Numerical evidence incites reflective inquiry Figure 2 shows a fragment of a template with percentage numbers generated in the k-range from 1 to 100 and n-range from 1 to 100. On this template, row 2 beginning from cell C2 and column B beginning from cell B3 were filled with positive integer values of n and k respectively; cell C3 was filled with the spreadsheet formula =IF(AND(C$2>=$B3,INT($A$2*$B3/C$2)= $A$2*$B3/C$2), $A$2*$B3/C$2,” “) (or its alternative =IF(AND(C$2>=$B3,MOD($A$2*$B3,C$2)=0), $A$2*$B3/C$2,” “)) which was replicated across the template. Both formulas contain an absolute reference to cell A2 the content of which can be instantly changed yielding an interactive change across the template. Numerical evidence of whole number percentages provided by spreadsheet modeling when attended with an attitude of reflective inquiry called for interpretation of the visual information. According to my plan, this interpretation included: (i) creating a problematic situation by asking a meaningful question; (ii) conjecturing and debating an answer to this question, and (iii) providing a formal demonstration (proving) of the conjecture. With this in mind, the class generated the following questions aimed at in-depth investigation of arithmetic properties of rectangular grids. • What is special about a 20-cell grid on which 20 different choices to shade in a whole number percentage are possible? • What is special about a 9-cell grids on which only one (trivial) choice is possible? • How can one distinguish between 20 and 9 in that sense? • Has it something to do with numbers of the different parity? • And if so, why does a 5-cell grid allows for 5 choices? • What does the number of non-empty cells in each column depend on? Attempts to answer these questions gave rise to a new problem formulated here in both content-bounded and algebraic formats. Problem 2 How many subgrids of an n-cell grid constitute its whole number percentage part, provided that shape and location of a subgrid is not important? In other words, given a positive integer n, in how many ways can one choose a positive integer k≤n such that (k/n)100 is a positive integer also? Computer-generated data shown in Figure 2 enabled the teachers to approach the problem from a visual perspective. Indeed, if n=5 all natural numbers k from 1 through 5 work for Problem 2, whereas the case n=7 allows for one solution only, namely k=7. What is special about number 7 that allows for only one (trivial) solution? What if n=32, 88 or 96? That is, how many subgrids of, respectively, a 32, 88, and 96-cell grids can be located to give a whole number percentage part of a whole grid? A simple distinction

7
between these three numbers and the number 7 that one may come up with is the even vs. odd property. In fact, the teachers questioned: Is this an appropriate distinction indeed? Good question! Further utilization of a spreadsheet computing was helpful in exploring Problem 2 from both numeric and graphic perspectives. To this end, the number of choices for each grid in the range 1:100 was found electronically: the use of the spreadsheet function =COUNT in row 1 made it possible to display the total number of choices for a specified grid. In addition, when data in rows 2 and 1 were considered, respectively, as x and y values, a graphic representation of their relationship was constructed. A chart embedded into the spreadsheet template (Figure 2) showed the dependence between n and the number of ways to make the ratio 100k/n a whole number.
Figure 2. Numeric and graphic solutions to Problem 2
From data-driven conjecturing to proving The use of a spreadsheet made it possible to introduce Problem 2 to the teachers in four different notations: iconic, algebraic, numeric, and graphic. This variety of representational formats highlighted the semiotic heterogeneity of the spreadsheet which was used as a tool kit. The metaphor of a tool kit (Abramovich & Brantlinger, 1998) refers to an array of semiotically heterogeneous representational formats which mediate students’ mathematical thinking in a technology-rich environment. The basic tenet of the tool kit approach is that qualitatively different representational formats promote students’ conceptual development through mathematical visualization and mediated action. In particular, the use of a spreadsheet-based tool kit stimulated a classroom discourse aimed at finding the solution to Problem 2. The following questions concerning the behavior of the oscillating graph shown on the chart of Figure 2 supported the discourse. • How can this graph be interpreted? • What are the points at which the graph and the bisector coincide? • What are the points at which the graph assumes the minimum value? • How many different y-values does the graph have? • What is special about these values? The following note by an in-service teacher reflected the summary of this discussion and pointed to a solution to Problem 2. As the teacher put it: “The most unexpected discovery [we made in the class] was that the number of cells that result in whole number percentages is equal to the greatest common factor between the original number and 100.” It is the computational environment that mediated the inductive discovery of the solution by the teachers. In turn, the availability of a plausible conjecture enabled the teachers to grasp the starting point of a deductive argument and accomplish the demonstrative phase of the solution with relative ease. Following is a sketch of a proof produced by the teachers in the master/apprentice kind of learning environment in which the role of the instructor was the one to initiate and supervise the
1234567891011
A B C D E F G H I J K L M N O P Q R S T U V1 2 1 4 5 2 1 4 1 10 1 4 1 2 5 4 1 2 1 20
100 k\n 1 2 3 4 5 6 7 8 9 10 11 12 13 14 15 16 17 18 19 20
1 100 50 25 20 10 5
2 100 50 40 25 20 10
3 100 75 60 50 30 25 20 15
4 100 80 50 40 25 20
5 100 50 25
6 100 75 60 50 40 30
7 100 70 50 35
8 100 80 50 40
9 100 90 75 60 50 45
0
10
20
30
1 5 9 13 17

8
performance of proof; that is, to rectify a notational structure of deductive arguments by mathematically motivated elementary teachers. Because the above conjecture highlighted the gcd(n,100) as a key to understanding the underlying relationships among the variables involved, n and 100 were represented as n=rs and 100=ms, where gcd(r,m)=1 and s=gcd(n, 100). Therefore (k/n)100=kms/(rs)=km/r. All values k=r, k=2r, ..., k=sr make the ratio km/r a whole number. Indeed, the list of such k-values ends with k=sr because n=rs and k≤r and this brings about exactly s=gcd(n,100) different choices to shade an n-cell grid in the whole number percentage. This completed the demonstrative phase of the solution to Problem 2. Once again, the method of two-dimensional spreadsheet modeling and semiotic heterogeneity of the software enabled the teachers to experience and participate in several qualitatively different phases of mathematical activity — modeling, interpreting modeling data, data-driven conjecturing, informal testing of conjectures through numerical evidence, and formal demonstration (proving) of a mathematical proposition.
EMERGENCE OF A NEW CONCEPT THROUGH DECONTEXTUALIZATION
Subgrids of the second order As mentioned in introductory pages, one of the major assumptions underlying the CEMT course was that the emphasis on content-bounded problems brings about an effective approach to the development of mathematical concepts in computational environments. One may ask: What does the word effective mean in this context? It means that at any layer of an individual’s concept awareness the approach makes it possible to link the concept to a situational referent so that the concept can then be reconstructed in an enactive mode by using a semiotic heterogeneity of a learning environment. Then by reflecting on his or her action one can make a cognitive leap from the plane of action to the plane of thought where decontextualization of mediational means, that is generalization, becomes possible. Still the process of generalization is rooted in a particular observation. Indeed, consider all subgrids of a 56-cell grid each of which constitutes its whole number percentage part. According to the solution of Problem 2 there exist gcd(56,100)=4 such parts — subgrids of the first order. Yet, a 56-cell grid can itself be considered as a whole number percentage part of a larger grid and the subgrids of the former may, in turn, be considered as parts of the latter — subgrids of the second order. Such twist imparted to the content-bounded problem became a starting point for new inquiries raised by the instructor.
• How does the number of such subgrids of a given grid change if they are considered as the subgrids of the second order? • For example, a 56-cell grid is 70% of an 80-cell grid (Figure 3). How many subgrids of a 56-cell grid constitute a whole number percentage part of a larger grid for which the former is 70%? • In other words, how many subgrids of the second order of an 80-cell grid each of which contains not more than 56 cells constitute its whole number percentage part, provided that shape and location of such subgrid is not important? (One such subgrid of the second order is shaded dark in Figure 3 and it contains 28 cells).
Figure 3 . Dark part as a subgrid of the second order of an 80-cell grid.
The last question gave rise to a new problematic situation (referred below to as Problem 3). Before discussion of Problem 3, the class considered one more example. Let a 10-cell grid be referred to as 15% of another grid. Does such larger grid exist? Simple calculations showed that there is no such grid

9
because the ratio 10/0.15 is a repeating decimal. Therefore, a 10-cell grid is 15% of an “unreal” grid with a non-whole number of cells. This numeric example pointed to the fact that a whole number may constitute a whole number percentage of a non whole number. In what follows the discussion will be extended in such a way as to include two cases: one that deals with a grid that constitutes a whole number percentage of a “real” grid; and another that deals with a grid which constitutes a whole number percentage of an “unreal” (hypothetical) grid. In such a way, the class formulated Problem 3. How many subgrids of an n-cell grid constitute a whole number percentage part of a larger, perhaps a hypothetical, grid for which the former is a p% part, provided that shape and location of a subgrid is not important? In other words, given whole numbers p and n, in how many ways can one choose a whole number k in order to make the expression (k/n)p a whole number? Once again, a slight modification of the environment of Figure 2 made it possible to utilize the spreadsheet-based tool kit for modeling a solution to Problem 3 which turns into Problem 2 when p=100. The template of Figure 4 represents such modified environment in which cell A2 contains a value of p=15. At this point one of the teachers wondered: What are the numbers displayed in row 1 (Figure 4)? By analogy with Problem 2 the class guessed that numbers in row 1 are GCDs between 15 and the numbers in row 2. In other words, these numbers count the number of subgrids of a given grid (n is fixed) each of which constitutes a whole number percentage (displayed in cell A2) of a larger, perhaps hypothetical, grid.
Figure 4. Numeric and graphic solutions to Problem 3.
The teachers were already prepared for a formal demonstration of this conjecture and one of them volunteered to do proof on an overhead. The teacher wrote the proportion n:p=k:x, the follow-up equality x=kp/n, and then explained: If an n-cell grid constitutes p% of another grid, then for the latter a k-cell grid constitutes x%. The conjecture about the relationship between n and p prompted to represent p and n as follows: p=ms and n=rs, where s=gcd(p,n). Canceling s out in the expression x=kms/rs yielded x=km/r, where m and r are relatively prime. Likewise the case of an 100-cell grid, exactly s multiples of r are allowed for k, namely, k=r, k=2r, ..., k=sr. Therefore, on an n -cell grid which constitutes p% of another grid there exist gcd(n,p) subgrids of the second order each of which constitutes a whole number percentage of the latter. In other words, given whole numbers n and p , there exist gcd(n,p) ways to choose a whole number k≤n in order to make the expression (k/n)p a whole number. This gave a solution to Problem 3. This solution was completed by the teachers through a computer-mediated dialogic discourse in a master/apprentice type of a learning environment.
1234567891011
A B C D E F G H I J K L M N O P Q R S T U V1 1 3 1 5 3 1 1 3 5 1 3 1 1 15 1 1 3 1 5
15 k\n 1 2 3 4 5 6 7 8 9 10 11 12 13 14 15 16 17 18 19 20
1 15 5 3 1
2 15 10 6 5 3 2
3 15 9 5 3
4 15 12 10 6 5 4 3
5 15 5
6 15 10 9 6 5
7 15 7
8 15 12 10 8 6
9 15 9
0
10
20
30
1 5 9 13 17

10
The sum of greatest common divisors as a problem solving tool The discussion can be extended beyond the use of content-bounded problems. That is, the decontextualization of mediational means may take place at this point in order to develop concepts further. Indeed, one can allow the alteration of both k and n in the expression (k/n)p while keeping p constant. Such extension of Problem 3 led to another problem situation decontextualized from electronic lattices. Problem 4 Given a whole number p, in how many ways can one choose a positive integer pair (k,n), k≤n≤p, so that (k/n)p is a positive integer? When the problem was formulated, one of the teachers asked: What is the reason for the constraint n≤p? The teacher clearly demonstrated a tendency towards reflective inquiry. I explained that the inequality n≤p is introduced into this problem because the discussion is limited to grids with not more than 100 cells. If we allow, however, the case n>p, that would mean that a hypothetical grid has more than 100 cells. Indeed, setting up the proportion n:h=p:100 where h is the number of cells on a hypothetical grid results in h=(n/p)100 and thus h>100 when n>p. In such a way, a link to an electronic manipulative as a situational referent helped the teachers to make sense of a formal mathematical constraint.
In search of a solution to Problem 4 one can denote as T(p) the numerical function of the positive integer variable p which counts the number of all pairs (k,n), k≤n≤p, such that (k/n)p is a whole number. In order to compute the function T(p) for particular values of p, one can modify the environment used for modeling Problem 3 to allow for the summing of numbers in row 1 (Figure 4). For example, when the entry of cell A2 is 15, T(15) — the sum of the first 15 numbers in row 1 — equals 45. This fact can be interpreted twofold: (i) in iconic form — all 15% parts of all hypothetical grids have the total of 45 (second order) subgrids each of which constitutes a whole number percentage of a corresponding hypothetical grid; (ii) in algebraic form — there exists 45 whole number pairs (k, n), k≤n≤15, such that 15k/n is a whole number. In general, the numerical function T(p) can be expressed by the following sum
T(p)=gcd(p,1)+gcd(p,2)+...+gcd(p,p). Indeed, given a positive integer p, for any positive integer n there exist gcd(n,p) values of k such that (k/n)p is a positive integer. Therefore, the function T(p) gives the total number of such pairs (k, n). In other words, the above sum gives a solution to Problem 4. In particular, the total number of subgrids of all rectangular grids with not more than 100 cells each of which constitutes its whole number percentage part is 520. In other words, this number gives the total number of choices to shade in whole number percentage all such rectangular grids. In such a way, the emergence of a sense-making concept — the sum of greatest common divisors — from a non content-bounded task, like Problem 4, is an example of how meaning of a mathematical concept may stem from a problem to which it provides a mean of solution (Vergnaud, 1982).
REVISITING FAMILIAR CONCEPTS IN NEW ENVIRONMENTS
Improving computing complexity The above expression for T(p) is not a constructive formula; that is, it is not applicable for a straightforward analytical or graphical investigation of the behavior of T(p). A special case of prime number p was explored with relative ease yielding an estimate of T(p). Indeed, if p is a prime number then the last term in the sum gcd(p,1)+gcd(p,2)+...+gcd(p,p) equals p whereas each of the remaining p-1 terms equals 1. Therefore, when p is a prime number T(p)=2p-1 and T(p)>2p-1 for all composite p. In such a way, the inequality T(p)≥2p-1 is an estimate of the function T(p) from below. The teachers wondered: Can a spreadsheet be used to investigate the behavior of the function T(p) in the case of a composite p ? The answer is yes, but such numerical investigation becomes a cumbersome task

11
within the existing computational environment (Figure 4). There are two reasons for that. First, the task requires a manual repetitive alteration of the content of cell A2 (an input p) in order to evaluate the output T(p). Second, the evaluation of a single value of T(p) requires p2 calculations. In such a way, the teachers have come up with new problematic situations dealing with the issue of improving computing complexity. The questions to be answered were: • How can values of T(p) be generated without the need to manually alter the content of cell A2 and store individual values one by one? • How can one reduce the number of calculations in evaluating the value of T(p)? Note that the issue of computing complexity becomes meaningful for the teachers if, indeed, the environment enables an improvement in terms of reducing the number of calculations and the way the calculations can be performed. Furthermore, through an active participation in the improvement of an algorithm the teachers gained a better understanding of mathematical relationships and concepts that underpin a computational procedure. As the next two sections show, a dynamic representation of non-constructively defined mathematical structures and the utilization of the Euclidean algorithm are the answers to problematic situations dealing with the improvement of computing complexity. Furthermore, as a by-product of the improvement of a computational procedure for exploring the function T(p), are the unexpected connection of the Euclidean algorithm to Fibonacci numbers and the appearance of prime numbers as a numeric solution to an equation involving the function T(p). Once again, in resolving these situations through spreadsheet modeling the teachers revisited familiar mathematical concepts through their use as problem solving tools of computational environments. This filled the concepts with new meanings and tied them to a social dimension of knowledge which is acquired through activity mediated by tools which are the products of social evolution and cultural development.
Linking the Euclidean algorithm and Fibonacci recursion The Euclidean algorithm of finding the greatest common divisor of two whole numbers is a recursive procedure of successive divisions based on the relation of fundamental importance in number theory—the remainder equals the dividend minus the divisor times the quotient. Setting two whole numbers as a dividend and divisor, the last non-zero remainder obtained through this procedure is the greatest common divisor between the two numbers. A spreadsheet is particularly amenable for such recurrent counting. As far as the evaluation of the function T(p) is concerned, by replicating the above fundamental relation across and down a spreadsheet template (Figure 5) each term of the sum gcd(p,1)+gcd(p,2)+...+gcd(p,p) can be found through the Euclidean algorithm. In comparison with the environment described above, this new computational setting has a real potential to reduce the number of calculations in evaluating the function T(p).
In constructing such spreadsheet template the first meaningful inquiry is into how many rows on a template one should allocate in order to implement the Euclidean algorithm for a particular pair of whole numbers (k, n). As Figure 5 shows, computing the gcd(k,15), 0<k<15, requires at most 4 divisions for each k. Simple calculations show, however, that the finding of gcd(15,26) requires 5 divisions. This raises the question about the maximum number of divisions, which may be necessary for finding the greatest common divisor of two numbers within a specified range. The answer to this question is given by a theorem due to French mathematician of the 19th century Lamé (Uspensky & Heaslet, 1939). Namely, the number of divisions required to find the greatest common divisor of a and b (a>b) is not greater than five times the number of digits of the smaller number. According to this statement, in order for the Euclidean algorithm to be completed on a spreadsheet for any two numbers, one of which has not more than 2 digits, 10 rows on the template should be arranged. In general, from Lamé’s Theorem it follows that the number of computations needed to evaluate T(p) through the Euclidean algorithm equals 5p([log(p)]+1). In comparison with the computational environment shown in Figure 4 in which the evaluation of T(200) requires 40,000 calculations, this new environment requires only 3000 calculations. Rather than being formally taught a piece of isolated mathematics, Lamé’s Theorem was presented to the

12
teachers as a tool needed to resolve the problematic situation. Acquiring such skills in mathematics pedagogy and gaining that kind of experience of mathematics with technology would help the teachers to be creative in their own computer-based instruction. Once again, the teachers were engaged into problematizing the issue of data representation within a computational medium. The following questions were explored: • How can one make a computer to display all GCDs in one line (row 17)?
• How can one make a computer to terminate the execution of the Euclidean algorithm when number n reaches its upper limit displayed in cell B3?
• How does one count the number of different GCDs in the sum of GCDs? A lack of space limits elaboration of these questions. However, one especially engaging and relevant problem that was investigated with the teachers is worthy of brief mentioning. The problem deals with finding a pair of whole numbers in the range 1:200 for which the Euclidean algorithm requires exactly 10 steps. As it turned out, such pair is 144 and 89 and the sequence of corresponding remainders is 55, 34, 21, 13, 8, 5, 3, 2, 1. What is special about these numbers? After some contemplation several teachers recognized the Fibonacci numbers. Later, an in-service teacher remarked: “In our classroom investigation of the Euclidean algorithm it was very surprising to find the appearance of the Fibonacci sequence! Why? What does it mean? Wow! The wonder of the Fibonacci numbers ... they pop up everywhere ... and what does it mean?” The focus on meaning in this teacher’s comment makes a strong case for technology-enabled pedagogy. Indeed, it is the computer environment enabled the teachers to revisit Fibonacci numbers: the relation among a dividend, quotient, divisor and remainder — that underlies the Euclidean algorithm, turns out to be the Fibonacci recursion in the case of the unit quotient. This interpretation, in turn, can link the discussion to another familiar concept — the Golden Ratio. Clearly, such intriguing investigation without the use of tools of technology may be beyond the grasp of elementary teachers. The next section provides yet another example of using the spreadsheet-based Euclidean algorithm as a tool of what is sometimes described as computer-enabled mathematics pedagogy.
Figure 5. Computing T(p) through the Euclidean algorithm
123
456789101112131415161718192021
A B C D E F G H I J K L M N O P Q1 2 3 4 5 6 7 8 9 10 11 12 13 14 15
15
Euclidean 1 2 3 4 5 6 7 8 9 10 11 12 13 14 15
Algorithm 15 15 15 15 15 15 15 15 15 15 15 15 15 15 15
1 2 3 4 5 6 7 8 9 10 11 12 13 14 15
1 3 3 1 7 6 5 4 3 2 1 15
1 1 3 3 1 15
1 15
15
15
15
15
15
15
9 8 9 7 9 8 8 7 7 8 6 8 7 8
GCD(C4,C5) 1 1 3 1 5 3 1 1 3 5 1 3 1 1 15
8 4 2 1
The sum of GCDs 45 8 12 10 15

13
Generating prime numbers through the Euclidean algorithm One of the powerful yet less generally known features of a spreadsheet is its computational and operational capacity of dynamic construction of non-constructively defined functions; that is, the capacity of a computerized table representation of functions defined neither through the closed-form formula nor through recursion. The function T(p) gives an example of such a numerical function — its values can not be computed by just replicating a spreadsheet formula along the set of p-values like in a case of explicitly or recursively defined functions. Yet, such table can be constructed in an iterative mode of computing enabling the use of circular references in spreadsheet formulas. The teachers were exposed to this advanced use of spreadsheets using the function T(p) as an appropriate example. Figure 6 displays
a corresponding numeric situation upon the completion of the iterative mode of computing; its bottom part (rows 23 and 24) is the table representation of the function T(p). Following is the description of operations that must be carried out in order to construct such table for 200 values of T(p).
Figure 6. A fragment of the table representation of T(p) displayed in rows 23-24.
First, as Figure 6 shows, row 23 has to be filled with values of p — consecutive natural numbers from 1 through 200, cell C24 with 1, cell D24 with the spreadsheet formula =IF($B$3=1,0,IF(D23=$B$3,$B$21,D24)) — a circular reference — replicated then to cell GT24 (i.e., 199 times to the right). Second, one has to create a slider that controls the range 1 through 200, link it to cell B3, set it at the starting value (p=1), and play the slider. In doing so, upon the appearance of every new value of T(p) in cell B21, a corresponding cell in row 24 duplicates that value and leaves it unchanged in a subsequent computing due to a circular reference defined in each cell of row 24. Note that the powerful computational feature of a spreadsheet to dynamically construct table representations of numerical functions can be utilized in other situations: generating numbers with special properties like Pythagorean triples, abundant, deficient, perfect and prime numbers; generating table representations of numerical functions like the sum of divisors function, Euler’s phi-function, to name a few. In particular, prior to playing the slider, the spreadsheet formula =IF(D24=2*D23-1,D23,” “) can be defined in cell D22 and replicated to the right so that the spreadsheet then becomes a generator of prime numbers. The table representation of the function T(p) can be complemented by its graphic representation (Figure 7). One can recognize that the straight line y=2p-1 is concurrent to the graph of T(p) at points with only prime first coordinates and thus the graph of the equation T(p)=2p-1 gives an alternative representation of the distribution of prime numbers among the natural number sequence. A thoughtful investigation of both the table and graph reveals an intriguing behavior of this function and can generate a variety of follow-up activities for students. Following are the examples of such activities (assignments)
123451718192021222324
A B C D E F G H I J K L M N O P Q R S1 2 3 4 5 6 7 8 9 10 11 12 13 14 15 16 17
200
Euclidean 1 2 3 4 5 6 7 8 9 10 11 12 13 14 15 16 17
Algorithm 200 200 200 200 200 200 200 200 200 200 200 200 200 200 200 200 200
GCD(C4,C5) 1 2 1 4 5 2 1 8 1 10 1 4 1 2 5 8 1
80 40 20 16 20 8
The sum of GCDs 1300 80 80 80 80 160 80
2 3 5 7 11 13 17
1 2 3 4 5 6 7 8 9 10 11 12 13 14 15 16 17
1 3 5 8 9 15 13 20 21 27 21 40 25 39 45 48 33

14
which can promote students’ learning of structured programming and data representation in a spreadsheet environment by utilizing such syntactic versatility and semiotic heterogeneity.
• Display all values of T(p) in increasing/decreasing order. • Locate electronically the values of T(p) which occur twice running consecutively
(doubles). • Locate electronically the values of T(p) which occur three times running consecutively
(triples). • Locate electronically at least one pair of numbers p1 and p2 for which T(p1)=T(p2). • Locate at least one triple of numbers p1, p2 and p3 for which T(p1)=T(p2)= T(p3). • Find the smallest value of T(p) which can be attained at three different points.
Figure 7. Prime numbers as graphic solutions to the equation T(p)=2p-1.
A spreadsheet as a learning environment offers many interesting and possibly challenging
problem-solving situations. When being exposed to such use of general purpose software in-service and pre-service teachers are very likely to be able to implement similar approaches in their own teaching. In this intellectual milieu informal and formal thinking, computational and mathematical reasoning, intuitive and systematic problem solving strategies are the means for learning mathematics in context. Finally, the richness of the environment enables to utilize many problematic situations for assessment practices that incorporate the idea of reciprocal teaching with technology described elsewhere (Abramovich, 1995).
SPREADSHEETS: A NEW FORM OF EDUCATIONAL SOFTWARE?
A critical point in using mathematical concepts as tools in application to computing was to facilitate in-service and pre-service teachers’ experience of how these concepts evolve from a familiar quantitative situation if one is allowed to problematize the familiar in a purposeful way. Like the complexity of symphony stems gradually from an unpretentious tune, the structure of mathematics develops through numerous generalizations and abstractions of a simple idea. This reflects an intrinsic nature of any mathematical concept which arises from an intuitive observation in order to be utilized further in “attending” more and more abstract structures. Technology mediates the development of mathematical concepts and their subsequent use in application to computing. When the teachers are comfortable with using computers as conceptual tools, the very choice of a problematic situation is not of major importance — the faculty of reflective inquiry and problematizing has much stronger connection with the classroom culture than that with the task (Hiebert et al., 1996). As one of the teachers put it: “The task does not dictate the nature of a class, the teacher does! ” By fostering reflective inquiry in computational environments, mathematics education courses can help students explore structural relationships, both vertical and horizontal, among different concepts. In doing so one can construct an “empirical situation in which [familiar] objects are differently related to one another” (Dewey, 1929, p. 86). An example of such empirical situation is the above improvement of computing complexity by which Fibonacci numbers and prime numbers have become connected to the Euclidean algorithm. In other words, familiar objects and concepts were connected to each other as a
0
200
400
600
800
1000
1200
1400
1600
1 7
13
19
25
31
37
43
49
55
61
67
73
79
85
91
97
103
109
115
121
127
133
139
145
151
157
163
169
175
181
187
193
199

15
result of treating the problem of computing complexity as “a challenge to thought” (ibid., p. 103). However, the freedom to seek for alternative methods of educational computing depends mostly on a classroom culture and the teachers are up front responsible for establishing this culture. By creating and maintaining such intellectual milieu in mathematics classroom the teachers can demonstrate that conceptual knowledge does develop through reflective inquiry if one can extract a concept from a state of semiotic equilibrium and activate its self-development. Through design of alternative computational environments the teachers can meaningfully use mathematical concepts as problem solving tools. It appears that mathematics preparation of teachers is in a direct dependence on the increasing use of technology in schools. Frolic effects of interactive computing, multicolored icons, and the ease of “button pressing” (Blum and Niss, 1991) by students does not diminish the importance of the teacher’s knowledge of the subject matter as some challengers of technology-based instruction might allude. Quite the contrary, as my experience indicates, the use of spreadsheets by the teachers is likely to positively affect their general perspective on the study of mathematics. Reflecting on the CEMT course, one experienced elementary teacher affirmed: “Briefly working in the spreadsheet environment it becomes obvious that it is more important today that universities provide our upcoming teachers with a strong background in mathematics so they would feel comfortable to sort through the open-ended character of the computer environment.” In her opinion, “the limited comfort level with mathematics of many elementary school teachers has limited our American children’s achievement in this area.” The teacher believes that the advent of spreadsheet-based environments into schools calls for a better conceptual understanding of mathematics on the part of the teachers: “What was a deep concern in the past really becomes a critical issue with using a spreadsheet as mathematical/pedagogical tool.” Mathematics education courses for teachers should foster practical skills and genuine experience with computational environments which incorporate open-minded pedagogy. As this paper has demonstrated, a computer-mediated discourse on arithmetical properties of rectangular grids stem from attempts to create a computational environment in which students were allowed and even encouraged to appropriate an incorrect answer as a thinking device, a generator of new meanings. A pedagogy that goes beyond the individual orientation of mental functioning conceptualizes an advancement and measures an educative growth of a student not in terms of the production of correct answers but in terms of the quality and diversity of thinking (Dewey, 1926). The opportunity to reflect on an erroneous thought which led to an incorrect answer emphasizes respect for students’ ideas and provides support of purposeful communication in contemporary mathematics classrooms. A significant part of national efforts to excel in educational reform concerns research on educational technology. The President's Committee of Advisors on Science and Technology, Panel on Educational Technology (Shaw et al., 1997) suggested that much of the research must be aimed at developing new forms of software in support of the non authoritative, student-centered classroom based on constructivist applications of educational computing. In a computerized constructivist mathematics classroom students are likely to enrich their mathematical experience by problematizing familiar situations and expanding their interest in a particular topic through reflective inquiry. Research on such classroom indicates that the effectiveness of the use of technology is “tightly linked” with the instructional philosophy which views computers as conceptual tools rather than as a delivery system (Connell, 1998). Design of computational environments, like those described in the paper, supports and contributes to the research goal outlined by the Panel. Because the use of spreadsheets is generally treated as one of the components of computer literacy, the more the software becomes available in schools, the more it will be integrated into mathematics curriculum provided that teachers can be assisted by schools of education in retrofitting this general purpose application in an educational environment (Kaput, 1992). In this respect, spreadsheets may be construed as new generation of school-based educational software appropriation of which by teachers is not limited by financial constraints and commercial availability. In particular, a proficiency of elementary teachers in the use of a spreadsheet as a tool for conceptual development and educative growth becomes a crucial factor in advancing such use with children. I share an in-service teacher’s comments as a closing for my reflections: “What has impressed me most [in the

16
use of spreadsheets] is the visual impact and instant extension of a problem. It really carries a punch! As a teacher I can attest that the “wow” factor is a joy in mathematics classroom. I felt this often as a student from computational environments created on a spreadsheet in our class. I can now use a computer to develop and practice mathematical concepts in my 6th grade classroom.”
References Abramovich, S. (1995). Bridging Manipulative-Exploratory Play and the Development of Mathematical Concepts in a Technology-Rich Environment. In D.T. Owens, M.K. Reed and G.M. Millsaps (Eds.), Proceedings of the 17th Annual Meeting of the North American Chapter of the International Group for the Psychology of Mathematics Education (v. 1, 111-116). Columbus, OH: The ERIC Clearinghouse for Science, Mathematics, and Environmental Education. Abramovich, S., & Stephens, G. (1997). Generating Meaning Beyond “Right-Wrong” Evaluations in an Interactive Manipulative Environment. In J.A. Dossey, J.O. Swafford, M. Parmantie, & A.E. Dossey (Eds.), Proceedings of the 19th Annual Meeting of the North American Chapter of the International Group for the Psychology of Mathematics Education (v. 2, 606). Columbus, OH: The ERIC Clearinghouse for Science, Mathematics, and Environmental Education. Abramovich, S., & Brantlinger, A. (1998). Tool Kit Approach to Using Spreadsheets in Secondary Mathematics Teacher Education. In S. McNeil, J.D. Price, S. Boger-Mehall, B. Robin, J. Willis (Eds.) Technology and Teacher Education Annual, 1998 (v.1, 573-577). Charlottesville, VA: AACE.
Blum, W., & Niss, M. (1991). Applied mathematical problem solving, modeling, applications, and links to other subjects — state, trends and issues in mathematics instruction. Educational Studies in Mathematics, 22, 37-68. Connell, M. L. (1998). Technology in constructivist mathematics classrooms. Journal of Computers in Mathematics and Science Teaching, 17 (4), 311-338. Dewey, J. (1926). Democracy and education. New York: MacMillan. Dewey, J. (1929). The quest for certainty. New York: Minton, Balch & Co. Dewey, J. (1933). How we think: A restatement of the relation of reflective thinking to the educative process. Boston: Heath. Hiebert, J., Carpenter, T.P., Fennema, E., Fuson, K., Human, P., Murray, H., Olivier, A., Wearne, D. (1996). Problem solving as a basis for reform in curriculum and instruction: The case of mathematics. Educational Researcher, 25 (4), 12-21. Kaput, J. J. (1992). Technology and Mathematics Education. In D. A. Grouws (Ed.), Handbook of research on mathematics teaching and learning (515-556). New York: Macmillan. MacKinnon, N. (1993). Friends in youth. The Mathematical Gazette, 77, 2-25. Noss, R., & Hoyles, C. (1996). The visibility of meaning: Modeling the mathematics of banking. International Journal of Computers for Mathematical Learning, 1(1), 3-31. Shaw, D., et al. (1997). Report to the President on the use of technology to strengthen K-12 education in the United States. Washington, DC: President's Committee of Advisors on Science and Technology, Panel on Educational Technology. Schwartz, J.L., & Yerushalmy, M. (1995). On the need for a bridging language for mathematical learning. For the Learning of Mathematics, 15 (2), 29-35. Uspensky, J.V., & Heaslet, M.A. (1939). Elementary number theory. New York: MacGraw Hill. Vergnaud, G. (1982). Cognitive and development psychology research on mathematics education: some theoretical and methodological issues. For the Learning of Mathematics, 3 (2), 31-41. Wertsch, J.V. and Minick, N.J. (1990). Negotiating Sense in the Zone of Proximal Development. In M. Schwebel, C.A. Maher, & N.S. Fagley (Eds.), Promoting cognitive growth over the life span (71-88). Hillsdale, N.J.: Lawrence Erlbaum.

17
Acknowledgments I am grateful to Bridget Arvold of the University of Illinois at Urbana-Champaign for many helpful suggestions on an earlier draft of this paper. I would also like to thank Dolores Burdick of Eugene Field Elementary School, Chicago, Illinois for thoughtful comments on the CEMT course.