market assessment & retail strategy west dempster street
TRANSCRIPT

Market Assessment & Retail StrategyWest Dempster Street Corridor
Skokie, IL January 19, 2010
4Insights, Inc.
6450 College Road #304
Lisle, IL 60532
www.4Insights.com
Table of ContentsEXECUTIVE SUMMARY
1.0 Study Objectives
2.0 Study Process
3.0 Methodology
4.0 Macro Economic Overview
5.0 Trade Area Definition
6.0 Customer Bases
6.1 Demographic Profile
6.2 Lifestyle Profile
6.3 Workplace Population
6.4 Daytime Population
6.5 Motorists
7.0 Consumer Survey
8.0 Consumer Demand
9.0 Study Area Assessment
9.1 Business Inventory
9.2 Site Characteristics
10.0 Competition
11.0 Retail Strategy
12.0 Tenant Mix Plan
2
EXECUTIVE SUMMARY
STUDY OBJECTIVES: (Section 1.0)4Insights was commissioned by the Village of Skokie to analyze the retail potential of the West Dempster Corridor Study Area anddevelop a supportable retail strategy and tenant recruitment plan—one that meets the general retail vision of the Village of Skokie as closely as the market allows.
The Study Area was defined by the Village of Skokie as: the West Dempster Street Corridor, north and south sides, bounded by Skokie Boulevard on the east and Interstate-94 on the west.
MACRO ECONOMIC OVERVIEW: (Section 4.0)As of the date of this report, experts are divided as to both the pace and strength of the post-recession retail recovery. According to a just-completed study by 4Insights for the International Council of Shopping Centers (ICSC), the retail recovery depends on three interrelated factors: Consumer spending patterns; Retailer performance; and the Commercial Real Estate Market.
(1) Consumer Spending Patterns
During this recession, even affluent consumers have contracted spending. The question is how long all consumers will stay on their spending diet. Most experts agree that this recession has caused a lifestyle downshift among most American consumers that will persist throughout this slow recovery, at least through 2010 or until jobs recover. This is due not only to financial circumstances, but also to a fundamental shift in values from “wants” to “needs;” from impulse to planned spending; away from upscale brands; and to buying on sale—or getting some other reward (thanks to internet comparison shopping). The 20% of the nation’s consumers, who can afford some luxury goods, are already inching their way back to some brands, but are very subtle about it. Being ostentatious is “out.”
Consumers remains conflicted. While their ‘Present Situation’ index is the lowest since l983, somehow the ‘Consumer Confidence’ index has grown from 38.6 in 2008 to 52.9 in December of 2009. Even better, the ‘Expectation Index’ has increased to 75.6—the highest since December 2007.
Besides job growth, the other factor impacting consumer spending revival is home sales. Record low mortgage rates, home buyer tax credits, and the rock bottom prices of distressed homes on the market have encouraged sales of existing homes to surge over the past year—but last month, the National Association of Realtors reported its first drop in its pending home sales index in the last 10 months. In addition, 25% of homes nationally now have mortgages worth more than the current market price of their homes—and therefore we expect more foreclosures in 2010. The Chicago area is one of the top 4 markets nationally for job losses and foreclosures, which are expected to impact suburban markets more this year.
3
EXECUTIVE SUMMARY
MACRO ECONOMIC OVERVIEW: (Section 4.0), cont’d
(2) Retailer Performance
2009 Holiday sales exceed retailers’ expectations of a -1% decline, instead posting a +1% adjusted sales gain over 2008—but that was the worse Holiday season in 40 years. In the Chicago Metro Area, the first three quarters of 2009 saw all categories of retail sales decline by $8.2 billion, or 11% (includes Auto Dealers and Gas Stations).
The largest declines were in Apparel & Accessories (-10%); Furniture & Electronics (-20%); and Lumber, Building & Hardware (-14%). Drugs & Misc. Retail declined (-8%), but most of that was in the specialty stores contained in this category. Drug Stores held up better than most other categories.
Faring best in the first 3 quarters of 2009 were General Merchandise Stores and Food stores, which declined only 3-4%; and Drinking and Eating Places, declining -5%. Nevertheless, major retail chains are optimistic that sales will begin to rise mid-2010 and finish the year overall at +3%.
We see weak expansion in most retail categories in 2010, and depending on a strong 2010 Holiday season, some category-specific expansion resuming in 2011. This assumes that unemployment bottoms out at 11% mid-year and begins a slow, but steady upcurve as the Federal government unwinds us from the massive stimulus, while keeping taxes, inflation, and interest rates low.
Currently expanding national retail chains are concentrated in the daily-living and price-sensitive categories: discounters (Walmart); mass merchandisers (Kohl’s); warehouse clubs (Costco); off-price (TJMaxx); dollar stores (Dollar General); Grocery & Drug; Convenience stores; and Wine & Liquor stores. Expanding foodservice is concentrated in quick, casual, and low to moderately- priced formats: Five Guys, Qdoba, Chipotle, Panera Bread, Potbelly, and some casual table service restaurants and sports bars.
This is a very positive trend for Retail areas such as the Dempster Study Area, because these types of retailers can be attracted to corridor-type, strip mall and free standing sites of sufficient size and density.
Several of the strongest retail companies will be acquiring or merging with their weaker competitors…and that means consolidation of units. The bottom line will be more vacancies competing with fewer expanding retail units, continuing to depress rental rates and occupancy rates—and therefore property values, throughout 2010-11.
4
EXECUTIVE SUMMARY
MACRO ECONOMIC OVERVIEW: (Section 4.0), cont’d
(3) The Commercial Retail Estate Market
Billions of dollars in commercial property loans, including all types of shopping centers will come due in 2011. Banks will either extend these loans or take the hit on their books and foreclose. The re-disposition of these distressed properties and the restructuring of all of this debt, we estimate, will take at least two years.
In addition, shopping center vacancy rates are now at record 10% vacancies. ICSC optimistically predicts full recovery for shopping centers in 18-24 months. 4Insights, the Urban Land Institute, and the National Retail Federation are more conservative. We estimate that it will take at least two years for most properties, especially the “B” malls (second tier centers), to begin recovering some of their former value. New shopping center construction is not expected to show gains until 2013—and that depends on interest rates. There is private investment capital waiting in the wings for the right deal—but market prices have to stabilize before either private investors or banks will take the risk.
Mixed use construction (with or without retail) is also expected to remain stagnant until 2012-13. The residential condo sales and office leasing that drive its economics are at record low levels, exacerbated by tight construction and home mortgage loans. The seasonally-adjusted annual rate of new home sales in November was back down to its lowest levels since April. In Chicago, 32,000 units in 406 developments have been shuttered in the past 18-20 months.
The Office Market, the other driver of mixed-use development is not expected to recover to a ‘structural vacancy rate’ (the normal market rate) of 10.9% before 3 years. However, some developers of niche office space, such as medical offices, may be enticed with the financial incentives of a public/private partnership, and for those buildings, some niche retail categories may be appropriate for street level.
The Bottom Line: Macro Trends Impact on West Dempster Study Area Retail Strategy
• The foregoing macro-economic trends indicate a challenging 2-3 years for new development of both free-standing retail and Neighborhood Centers. However, the West Dempster Study area, with its adjacent commuter station, high-traffic volume on Dempster and exit to I-94, suggest that it has clear advantages for specific retail categories and formats defined in this Study, when the market finally does recover.
• Much will depend on the size, the quality and accessibility of the future retail clusters than can be assembled there.
5
EXECUTIVE SUMMARY
TRADE AREA DELINEATION: (Section 5.0)
The geographic size and shape of the Study Area’s retail trade area is largely determined by size, location, and retail offering of the competition. The second factor in determining the trade area is travel time and accessibility. The adjacency of the Study Area to Interstate-94 greatly expands the geographic reach to the north and south in just a few additional minutes of drive time.
The Primary trade area is the estimated geographic area from which 50% of Study Area retail customers will originate. It is estimated to be 5-minutes drive time* (approximately 2-miles) for Residents, the Workplace Population, and Daytime Population.
The Secondary trade area, which will provide an additional 20% of retail customers (with much lower trip frequency) is estimated at 10-minutes drive time (approximately 13 miles at its farthest north and south terminal points).*
CUSTOMER BASES: (Section 6.0)
The Study Area has 4 potential Customer Bases for retail expansion in the Study Area:
Residents —who make a trip to the Study Area from home.
Workplace Population—both residents and non-residents of the trade area who make trips to the Study Area from their workplaces.
Daytime Population—who make trips to the trade area for purposes other than shopping or dining, e.g. business meetings, school, medical appointments, etc. This category includes CTA and bus commuteres at the Skokie Swift station in the heart of the Study Area.
Motorists—who are passing through the Study Area on their way to another destination.
• Drive Times: 4Insights believes that Claritas’ nationally-modeled drive times are optimistic, estimating 13 miles in 10-minutes drive time, in light of Chicago traffic congestion. We estimate that the distance is shorter during most of the average workday--about 8-10 miles.
• SOURCE: All Demographic, Lifestyle Segmentation and Maps in this report are from Nielsen Claritas 2009.
6
EXECUTIVE SUMMARY
CUSTOMER BASES (Section 6.0), cont’d
Customer Base #1: Residents
A. Demographic Profile*:
There are 19,892 Resident households in the 5-minute drive time trade area (TA) and 93,391 households in the 10-minute TA.
They are predominately Baby Boomer and above in age, but the largest single age group is 25-44 (22%). There are also 20% over age 65. About 1/3 of households have children under 18 at home.
Incomes are solidly Midscale to Upper Midscale ($64,600 median HH) in the 5-minute TA and $72,600 in the 10-minute TA. About 17% of households are Upscale ($100K+ median). However, 75% of total households in each trade area are “Family Households”(two or more related people living together), and these households have higher incomes: $72,200 and $89,000 median, respectively. This fact should be highlighted for tenant recruitment purposes.
Trade area residents are both highly educated and highly diverse, with a high percentage of foreign-born immigrants. More than half of trade area residents speak another language in addition to English at home—important for foodservice retail planning.
The income profile of the Residents in the 10-minute trade area has only slightly more Upscale income households than the 5-minute trade area: 27% vs. 25% >$100K median HH. These affluent 10-minute trade area residents are less likely to make frequent trips to the Study Area from home to shop or dine, but there is a great opportunity to capture them at their workplacesnear the Study Area.
B. Lifestyle Profile (“Psychographics”)
Lifestyle Segmentation groups residents by their lifestyles, life stages and buying patterns, providing much more detailed information for retail planning than Demographics.
The TOP 10 Lifestyle Segments (those in highest density), which make up 82% of the resident households in the 5-minute, and 65% of the households in the 10-minute TA are the same—which is a great advantage for retail planning.
5 of the TOP 10 Segments are Baby Boomers and up, age 45-64+. They are highly educated with professional jobs, and UpperMidscale to Upscale Incomes ($75-$114K+ median). The other half of the TOP 10 Segments are more Midscale ($50’s-$60s).
Four of the Top 10 (highest density) Resident Segments are also in the TOP 10 (highest density) Workplace Population Segments, making them first priority Target Customers for Retail Planning: They are in the 45-65+ age ranges.
(1) New Empty Nests (2) Pools and Patios Both are Upper Midscale Segments ($71K median HH income);
(3) Upper Crust (4) Money and Brains Both are Upscale Segments ($89 / $114 median HH income.)
7
EXECUTIVE SUMMARY
CUSTOMER BASES (Section 6.0) cont’d
Customer Base #2--Workplace Population:
The majority of the Study Area’s retail customers will come from the Workplace Population. There are 42,762 workers in the 5-minute trade area; and 197,467 in the 10-minute TA—a 4.6 time increase.
Importantly, only 23% of residents both live and work in the 10-minute trade area. This means that 77% of total workers, or 152,049 are non-residents who come into the 10-minute trade area 5 days every week, and can be captured for retail purchasing when they otherwise would not make such frequent trips from home to the Study Area to shop or dine. Realistically, retail in the Study Area would capture only a portion of these 152,000 workers—most will be those closer to it. Even a very small 10% capture rate, however, would add more than 15,000 non-resident consumers during the workday
Also very positive for retail expansion, the Lifestyle Profile (which indicates retail tastes) of the Workplace Population in the 5-minute trade area is 80% identical to workers in the 10-minute trade area. That means that the same retail mix planned for the workers of 5-minute Primary trade area, should also appeal to the tastes and price points of the workers in the 10-minute trade area. Again, the challenge will be attracting them away from heavy competition.
Another advantage to the Study Area’s Workplace Population is that it has the type of job classifications that allow workers to leave the premises for lunch or running errands more frequently--and they have the income to do so. 39% are Executive Professional in the 5-minute TA and 35% in the 10-minute TA, a strong percentage.
To capture this large, crucial base of potential customers, the retail mix for the Study Area must address the shopping/dining wants of these time-pressed workers. That means moderately-priced, efficient foodservice and daily-living convenience-type retail. It means easy access from Dempster St., or the commuter parking lot (with traffic lights, if necessary)—and enough pull-up parking to the storefronts. It means compelling signage and brightly lit storefronts that are immediately visible from fast-moving Dempster Street. It means creating a large enough cluster--with enough well-known, popular local and national foodservice and retail businesses--to imprint an identity and create a destination habit among workers who have a huge number of other options just 5 minutes away.
The shopping/dining frequency and spending levels of these workers also suggests that they will support retail. The 2008 SkokieResident Consumer Survey conducted by 4Insights for Downtown Skokie offers useful estimates of these levels for retail planning,because the Lifestyle Profile of the more than 700 survey respondents is 80% the same as the Resident AND the Workplace Population in the 5-minute trade area of the West Dempster Study Area.
The 2008 Skokie Consumer Survey also provides the category types and specific names of restaurants and retailers wanted, which is reflected in the Tenant Mix Plan in this Study (Section 12.0). The most requested foodservice formats were a moderately-priced, casual restaurants with table service, and a quick-serve restaurants such as Panera.
8
EXECUTIVE SUMMARY
CUSTOMER BASES (Section 6.0), cont’d
Customer Base #3--Daytime Population
Local non-residents in the 10-minute trade area can add thousands more potential customers weekly for Study Area retail. These people come for a variety of non-retail purposes—boarding mass transit, business or social meetings; medical appointments; libraries and schools; or doing business at non-retail institutions such as government offices. Much of their spending will be on impulse eating, and running errands for daily living goods and services, just as for the Workplace Population.
Chief among the Daytime Population magnets is the Dempster CTA Skokie Swift Station, the center point of the Study Area, with an estimated 800,000 boardings in 2008. The Station is also a a hub for Pace and other bus lines, which adds thousands more consumers to the immediate Study Area daily.
The site requirements and the retail mix needed to attract these Daytime visitors are identical to the Workplace Population, which allows for consistency in the retail mix plan.
Customer Base #4—Transient Motorists
The final Customer Base for Study Area retail is the 30,100 motorists who traverse Dempster daily on their way to other destinations. The same requirements and type of retail mix that attract the Workplace and Daytime Populations will attract them.
Once the new retail area has established its identity as a unique, appealing retail cluster these motorists, they will eventually begin planning their trips to stop for food or convenience needs en route to their other destinations.
CONSUMER SURVEY (Section 7.0)
Consumer shopping and dining preferences from The 2008 Consumer Survey was able to be utilized for the Dempster Study, because the Resident Lifestyle Segmentation Profile, and the Workplace Lifestyle Profile, were 80% the same as the profile of the Respondents to the 2008 Survey. (Details are in Section 7.0)
9
EXECUTIVE SUMMARY
THE CONSUMER DEMAND REPORT (Section 8.0)Some retailers and brokers refer to two government reports--one published by the U.S. Bureau of Labor Statistics, and the other, State sales tax records, that have been combined and widely marketed by many national syndicated data providers, such as NeilsenClaritas, as a way to estimate the amount of sales potential in any given geographic trade area.
4Insights provides this data to our clients, but does not regard the Consumer Demand Report as an accurate estimate of retail potential without the manual addition of the demand of Workplace Population, which we have computed and added to the Study Area’s retail demand in Section 8.0.
In the West Dempster Study Area, the extra spending potential added by 197,000 workers, 77% of whom are non-residents of the 10-minute trade area, changes the potential to ‘positive’ in several categories.
According to the Consumer Demand report, at the 2-mile radius, the greatest opportunity for retail expansion suitable for the Study Area is in the Grocery, General Merchandise, Limited Service (quick serve) Restaurants, Florists and Computer Software. When the impact of the Workplace Population demand is added by 4Insights’ computation formula--several areas of negative potential become positive opportunity for retail expansion.
STUDY AREA ASSESSMENT (Section 9.0)
4Insights’ inventory of current ground floor retail businesses resulted in 110 locations in the Study Area, representing approximately 340,000 building square feet (SF), of which 51% were vacant. On the positive side, the large number of vacancies also offers the opportunity to assemble new or re-development sites that if strategically planned, could make the Study Area a destination for the crucial Workplace and Daytime Populations, when the retail market recovers.
Traditional retail makes up only 10% of the Study Area current mix, which does not currently provide a base on which to build a retail cluster identity. The current commercial mix is primarily independent (non-chain), service firms. Restaurants are particularly lacking—only 8% of the total mix--and are a big opportunity for the Study Area.
As a retail site, the Study Area has several advantages besides the ability to assemble new development sites: the highly trafficked Dempster St. arterial, with 31,000 average daily trips (ADTs); a direct exit/entrance to/from I-94, which has 175,000 ADTs, less than ½ mile away; the major CTA rapid transit stop and bus hub at the Skokie Swift station, the center point of the Study Area. A recently redeveloped retail cluster, Gross Point Crossing, could be a an example of success that encourages new development.
10
EXECUTIVE SUMMARY
RETAIL COMPETITION (Section 10.0)The size and shape of the Study Area’s trade area is defined primarily by its dense competition and its current lack of retail offering. Proximity to I-94 enables consumers to access these competitors from home or work in a few minutes. 4Insights identified and analyzed this full range of sizes and formats, from major regional shopping centers to corridor independents that are within the 5-mile radius of the Study Area.
The predominant price ranges were moderate. Merchandise tastes were more casual, conservative and mainstream with the exception of Westfield Old Orchard and some upscale, more trendy Evanston boutiques.
The major competition for the type of retail suitable for the West Dempster corridor Study Area, is found in Village Crossing and the retail/foodservice lining Touhy Ave., just 2 miles south of the Study Area. Hundreds more independent, chain, and free-standing retailers or small strip centers line Dempster, Golf Rd. and Devon Ave.
All of these retail corridors share the same current problems, increased by the recession: high vacancies, outdated building stock, inadequate parking (much of it on the street making access difficult in peak traffic periods), unattractive streetscapes and storefronts, and substandard co-tenants in a choppy flow of retail interrupted by other business types—all of which discourage cross shopping.
Based on the 4Insights’ interiews with the planning officials of Skokie’s neighboring communities in June, 2009, no new major retail or retail/mixed-use developments are in the pipeline. Further, the current state of the commercial real estate market generally does not suggest any new development starts for up to three years.
The glut of prime vacant spaces and available financing in both shopping centers and free-standing corridor retail—in addition to a 30-50% decline in suburban commercial rentals in the Chicago market, will make recruitment for the Study Area extremely challenging before that time period. Current property owners may also be less willing to sign long-term leases or invest in rehabbing properties, waiting for rents and market values to rebound.
11

EXECUTIVE SUMMARY
RETAIL STRATEGY (Section 11.0)Based on the foregoing analysis, 4Insights recommends the following Retail Strategy for the Study Area:
Develop the largest cluster of strategically-planned retail possible, in order to create a clear identity and “reason for the trip” among the Workplace and Daytime Populations. The strategy for the Study Area is not to compete on the size of the retail cluster--that would be impossible. The strategy is to have enough total space on adjacent or proximate sites to be perceived by the Target Customers as a retail destination trip during their workday.
The mix of tenants, since it will be limited in number, must be strategically matched to the Workplace and Daytime Population’s (which includes commuters) needs—which are primarily moderately priced food service, convenience and errand running for daily living-type services.
This tenant mix will be anchored by carefully-selected favorite, proven foodservice operators mentioned by respondents to the 2008 Skokie Consumer Survey. It includes the independent restaurateurs and merchants who have built their own following--and who draw from their own wider trade area. These initial anchor tenants are crucial to the further leasing of the Study Area, as they will be evidence of its potential and they will set the quality tone for subsequent tenants. A few of most popular regional or national chains may be added to round out this mix.
The co-tenants to these anchors must also be proven, successful local businesses, mostly food-related, with moderate price points and timely, efficient service to cater to time-pressed workers. Their size is not as important as their quality, reputation, and built-in customer following. The mix should be balanced to reflect the ethnic diversity of Study Area Residents, but have wide appeal tothe Workplace and Daytime Populations. The more unique and outstanding each individual new recruit is, the stronger the Study Area retail district will become. (Tenant Mix, Section 12.0)
By strategically developing the Study Area, the Village of Skokie can offer leading popular restaurants and services (such as bakeries and florists), the advantages of a high traffic site, with more parking, better environment, and a strong mix of hand-picked co-tenants to help them attract more customer traffic. These are all advantages for recruitment of tenants and developers.
Because the retail in the Study Area will have to cope with the congestion of peak periods of the departures and arrivals of thousands of Commuters daily, it is crucial that the vehicle and pedestrian flow between the CTA and bus stations be planned foreasiest possible access to the adjacent retail, both for pedestrians and by cars leaving the parking lot. This is particularly important for new retail developed on the north side of Dempster.
The retail mix will be driven by several types of foodservice, but will be complemented by personal service categories that attract the Workplace Population as well as Residents with the opportunity to run several errands without moving the car, which is unusual for corridor retail such as on Dempster, where most retail is based on a single, auto-driven stop.
12
EXECUTIVE SUMMARY
RETAIL STRATEGY (Section 11.0), cont’dThe Retail Strategy focuses on redeveloping block areas that are adjacent to--and across from--the CTA Station. The following block
areas will be the priority areas for redevelopment.
Cluster #1 – Former Dempster Swift Shopping Center (To Niles Center Rd.)
This cluster combines two sites that are in the heart of the West Dempster Street Study Area:
• The former Dempster Swift shopping center adjacent to the train tracks including the vacated building that is located to the rear at 8734 Bronx Ave. With the exception of Subway, which will be moving to the old Hot Dog Island building, and Norman’s Jewelry, the entire property lies vacant, ready for redevelopment.
• All property adjacent to the Dempster Swift center from Bronx Ave. and Niles Center Rd. This block is comprised of several buildings owned by various property owners separated by a number of vacated parcels dispersed throughout the block.
• The vision for this cluster is to make it the corridor’s primary destination for foodservice businesses, primarily assorted restaurants and quick serve eateries. The key is to pursue a mix of unique local restaurateurs that have an established following, offer a variety of American and ethnic food and are moderately-priced, augmented by a selection of high-quality national concepts that will appeal to a lunchtime clientele.
Cluster #2 – North Dempster From Train Tracks To Niles Center Rd. (McDonald’s)
This cluster also combines two sites that are in the heart of the West Dempster Study Area--on the north side of the corridor:
• The buildings east of the train tracks to Bronx Ave. include the buildings along Bronx Ave. north of Dempster. This block includes many vacated spaces and buildings recently acquired by the Village.
• The retail buildings from Bronx Ave. going east to but not including the McDonald’s site at Niles Center Rd.
These two sites combined, are prime for redevelopment, due to the large number of vacancies and the dated condition and configurations of the buildings. In addition, a portion of the block is under Village ownership. Nevertheless, multiple building owners are involved and any redevelopment plans would require either land assemblage or multiple owner cooperation.
The vision for this cluster is create a destination that focuses on convenience retail and complements the foodservice oriented offering slated for the properties to the south. The strategy is to pursue an anchor business such as a small grocery store of amaximum 15-20,000 SF that will be an important focal point for the street and will set the tone for a complementary set of convenience-type businesses. Parking availability and easy access from the boulevard median are required.
13
EXECUTIVE SUMMARY
RETAIL STRATEGY--(Section 11.0) cont’d
Cluster #3– South Dempster, Gross Point Rd. To LeClaire Ave.
This cluster is southeast, diagonally across from Gross Point Crossing shopping center and includes: All buildings and empty land parcels filling the block from Gross Point Rd. to LeClaire Ave.
This block is comprised of several separate buildings. If combined, they are a suitable site for redevelopment, due to their large number of vacancies and the dated condition and configurations of the buildings. A portion of the block is under Village ownership, however, multiple building owners are involved and any redevelopment would require their cooperation.
The strategy for this block is to pursue strong retail, personal service and non-retail uses that would complement Gross Point Crossing and the businesses just north of the block (e.g.,new gas station, Walton Chrysler). It would serve as an extension of the retail mix in the proposed new developments east of the train station. Destination businesses that are typical of corridor retail, and would attract patrons from a wider area, would be appropriate here. The key is to pursue uses that are not well-represented in the vicinity.
TENANT MIX PLAN (Section 12.0)
The Tenant Mix Plan provides a detailed recruitment guide for the three key Clusters recommended for redevelopment. The strongest tenant mix for each Cluster is detailed by category, with specific tenant name recommendations and descriptions. Specific tenants recommended for each cluster area are intended to illustrate the type and caliber of businesses that would be suitable for the Study Area. This list is specific enough to guide commercial retail brokers to help achieve the overall vision for the West Dempster Study Area.
The criteria for selection of these example tenants is stated in Section 12.0. Because the Retail Recruitment initiative will not be in full force for approximately 3 years, the status of the retailers in the Tenant Mix Plan may change, or new retailers will appear in the market that are great prospects. Therefore, prior to starting the recruitment effort, this Tenant List should be updated to ensure the best fit for the Retail Strategy.
Foodservice businesses, (e.g. food-related retailers, sit down and quick serve restaurants ) and convenience oriented retail are the top priority categories throughout the Tenant Mix Plan. They address the needs of the Target Customer Bases (Residents, and the Workplace Population and Daytime Population, which includes Commuters), allowing thousands of non-resident consumers to be captured. Recruiting a synergistic collection of concepts that begin with carefully selected anchor businesses, followed by a complimentary set of concepts that are mid-scale in price points and span a wide variety of ages, tastes, and ethnicities are required.
14
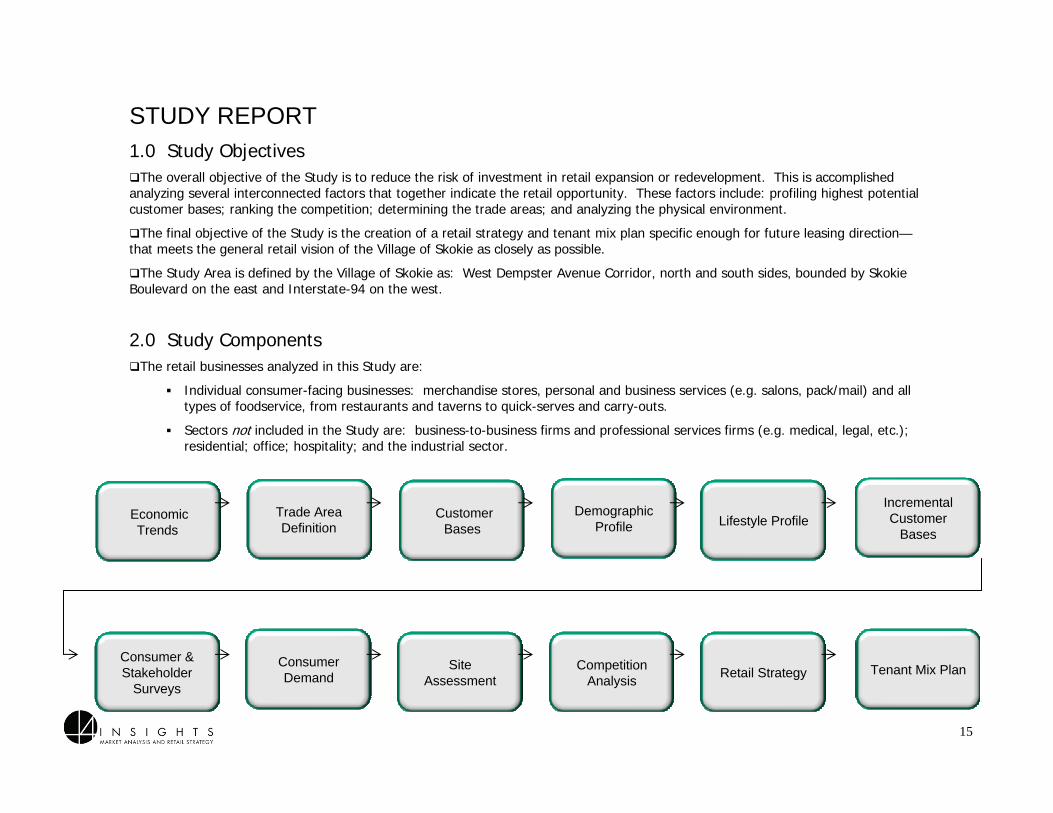
1.0 Study ObjectivesThe overall objective of the Study is to reduce the risk of investment in retail expansion or redevelopment. This is accomplished
analyzing several interconnected factors that together indicate the retail opportunity. These factors include: profiling highest potential customer bases; ranking the competition; determining the trade areas; and analyzing the physical environment.
The final objective of the Study is the creation of a retail strategy and tenant mix plan specific enough for future leasing direction—that meets the general retail vision of the Village of Skokie as closely as possible.
The Study Area is defined by the Village of Skokie as: West Dempster Avenue Corridor, north and south sides, bounded by Skokie Boulevard on the east and Interstate-94 on the west.
2.0 Study ComponentsThe retail businesses analyzed in this Study are:
Individual consumer-facing businesses: merchandise stores, personal and business services (e.g. salons, pack/mail) and all types of foodservice, from restaurants and taverns to quick-serves and carry-outs.
Sectors not included in the Study are: business-to-business firms and professional services firms (e.g. medical, legal, etc.); residential; office; hospitality; and the industrial sector.
Economic Trends
Trade Area Definition
Retail StrategyConsumer & Stakeholder
Surveys
Consumer Demand
Site Assessment
Customer Bases
Demographic Profile Lifestyle Profile
Incremental Customer
Bases
Competition Analysis
Tenant Mix Plan
STUDY REPORT
15
3.0 Study Methodology
3.1 Background Data Review: Review all master plans, studies, and policies related to the Study objectives, including the inventory of all current and planned retail spaces (re-development or new development within the next 3 years) in and around the West Dempster Corridor, supplied by the Village.
3.2 The Workplan: Write the project specific tasks, responsibilities and timeline for Village approval.
3.3 Demographics: Analyze and map key variables affecting retail strategy, using Census projections through 2014.
3.4 Lifestyle Segmentation: Identify and map the location of the Target Customer Segments. Create the Target Customer profile using the Neilsen-Claritas Prizm NE segmentation system.
3.5 Incremental Customer Bases: Identify potential retail customer bases in addition to residents that are high potential to the Dempster corridor sector.
3.6 Stakeholder Interviews: Conduct up to 10 stakeholder interviews (additional to the Sector A. Study), selected in concert with Village staff, to determine assets that create consumer preference and barriers that discourage shopping. The level of community leadership support for retail expansion is also ascertained.
3.7 Conduct Site Inventory & Audit Physical Site: Update inventory and mapping supplied by the Village on the Dempster corridor sector, along with an audit of general site characteristics affecting retail.
3.8 Conduct On-site Competitive Market Review: Visit all key competitive retail clusters. Map and classify competitors as to their impact on the West Dempster Corridor.
3.9 Develop The Market Positioning Statement: Articulate the “points of difference” for West Dempster Corridor retail from the competition that will attract the Targeted Lifestyle Segment Customers—and form the foundation for future marketing programs.
3.10 Review Sector A. Consumer Survey: 4Insights will refer to the 2009 Resident Consumer Survey conducted previously for Sector A. (Downtown Skokie) for information points applicable to the West Dempster Corridor. A separate consumer survey for West Dempster was not conducted for this Study.
3.11 Develop The General Retail Strategy: Develop a 3-year strategic approach to pre-recruitment and the future leasing effort for the Study Area.
3.12 Develop The Representative Tenant Mix Plan: The recommended sample tenant mix plan will be determined by combining the results of the Study analysis with the available current spaces and the anticipated development/re-development of additional spaces planned to be open by 2013, supplied by the Village.
3.13 Present The Preliminary Study Report: The Study Report will be presented for discussion and approval to the Village Workteam and any edits/additions will be made at that time to complete the final report document.
3.14 Present The Final Study Report: Upon request of the Village, key highlights from the Study will be presented to the Village Board.
16
4.0 Macro Economic Overview
The Retail recovery depends on three interrelated factors
As of the date of this report, experts are divided as to both the pace and strength of the post-recession retail recovery. According to a just-completed study by 4Insights for the International Council of Shopping Centers (ICSC), the retail recovery depends on three interrelated factors: Consumer spending patterns; Retailer performance; and the Commercial Real Estate Market.
(1) Consumer Spending Patterns
During this recession, even affluent consumers have contracted spending. The question is how long all consumers will stay on their spending diet. Most experts agree that this recession has caused a lifestyle downshift among most American consumers that will persist throughout this slow recovery, at least through 2010 or until jobs recover. This is due not only to financial circumstances, but also to a fundamental shift in values from “wants” to “needs;” from impulse to planned spending; away from upscale brands; and to buying on sale—or getting some other reward (thanks to internet comparison shopping). The 20% of the nation’s consumers, who can afford some luxury goods, are already inching their way back to some brands, but are very subtle about it. Being ostentatious is “out.”
Consumers remains conflicted. While their ‘Present Situation’ index is the lowest since l983, somehow the ‘Consumer Confidence’ index has grown from 38.6 in 2008 to 52.9 in December of 2009. Even better, the ‘Expectation Index’ has increased to 75.6—the highest since December 2007.
Besides job growth, the other factor impacting consumer spending revival is home sales. Record low mortgage rates, home buyer tax credits, and the rock bottom prices of distressed homes on the market have encouraged sales of existing homes to surge over the past year—but last month, the National Association of Realtors reported its first drop in its pending home sales index in the last 10 months. In addition, 25% of homes nationally now have mortgages worth more than the current market price of their homes—and therefore we expect more foreclosures in 2010. The Chicago area is one of the top 4 markets nationally for job losses and foreclosures, which are expected to impact suburban markets more this year.
17
4.0 Macro Economic Overview, cont’d
(2) Retailer Performance
2009 Holiday sales exceed retailers’ expectations of a -1% decline, instead posting a +1% adjusted sales gain over 2008—but that was the worse Holiday season in 40 years. In the Chicago Metro Area, the first three quarters of 2009 saw all categories of retail sales decline by $8.2 billion, or 11% (includes Auto Dealers and Gas Stations).
The largest declines were in Apparel & Accessories (-10%); Furniture & Electronics (-20%); and Lumber, Building & Hardware (-14%). Drugs & Misc. Retail declined (-8%), but most of that was in the specialty stores contained in this category. Drug Stores held up better than most other categories.
Faring best in the first 3 quarters of 2009 were General Merchandise Stores and Food stores, which declined only 3-4%; and Drinking and Eating Places, declining -5%. Nevertheless, major retail chains are optimistic that sales will begin to rise mid-2010 and finish the year overall at +3%.
We see weak expansion in most retail categories in 2010, and depending on a strong 2010 Holiday season, some category-specific expansion resuming in 2011. This assumes that unemployment bottoms out at 11% mid-year and begins a slow, but steady upcurve as the Federal government unwinds us from the massive stimulus, while keeping taxes, inflation, and interest rates low.
Currently expanding national retail chains are concentrated in the daily-living and price-sensitive categories: discounters (Walmart); mass merchandisers (Kohl’s); warehouse clubs (Costco); off-price (TJMaxx); dollar stores (Dollar General); Grocery & Drug; Convenience stores; and Wine & Liquor stores. Expanding foodservice is concentrated in quick, casual, and low to moderately- priced formats: Five Guys, Qdoba, Chipotle, Panera Bread, Potbelly, and some casual table service restaurants and sports bars.
This is a very positive trend for Retail areas such as the Dempster Study Area, because these types of retailers can be attracted to corridor-type, strip mall and free standing sites of sufficient size and density.
Several of the strongest retail companies will be acquiring or merging with their weaker competitors…and that means consolidation of units. The bottom line will be more vacancies competing with fewer expanding retail units, continuing to depress rental rates and occupancy rates—and therefore property values, throughout 2010-11.
18
4.0 Macro Economic Overview, cont’d
19
(3) The Commercial Retail Estate Market
Billions of dollars in commercial property loans, including all types of shopping centers will come due in 2011. Banks will either extend these loans or take the hit on their books and foreclose. The re-disposition of these distressed properties and the restructuring of all of this debt, we estimate, will take at least two years.
In addition, shopping center vacancy rates are now at record 10% vacancies. ICSC optimistically predicts full recovery for shopping centers in 18-24 months. 4Insights, the Urban Land Institute, and the National Retail Federation are more conservative. We estimate that it will take at least two years for most properties, especially the “B” malls (second tier centers), to begin recovering some of their former value. New shopping center construction is not expected to show gains until 2013—and that depends on interest rates. There is private investment capital waiting in the wings for the right deal—but market prices have to stabilize before either private investors or banks will take the risk.
Mixed use construction (with or without retail) is also expected to remain stagnant until 2012-13. The residential condo sales and office leasing that drive its economics are at record low levels, exacerbated by tight construction and home mortgage loans. The seasonally-adjusted annual rate of new home sales in November was back down to its lowest levels since April. In Chicago, 32,000 units in 406 developments have been shuttered in the past 18-20 months.
The Office Market, the other driver of mixed-use development is not expected to recover to a ‘structural vacancy rate’ (the normal market rate) of 10.9% before 3 years. However, some developers of niche office space, such as medical offices, may be enticed with the financial incentives of a public/private partnership, and for those buildings, some niche retail categories may be appropriate for street level.
The Bottom Line: Macro Economic Trends’ Impact on West Dempster Study Area Retail Strategy
• The foregoing macro-economic trends indicate a challenging 2-3 years for new development of both free-standing retail and Neighborhood Centers. However, the West Dempster Study area, with its adjacent commuter station, high-traffic volume on Dempster and exit to I-94, suggest that it has clear advantages for specific retail categories and formats defined in this Study, when the market finally does recover.
• Much will depend on the size, the quality and accessibility of the future retail clusters than can be assembled there.
5.0 Trade Area Delineation
The geography of trade areas is determined by the type of measurement used—and the competition The first step in estimating consumer retail potential is to define the trade area for each customer base, that is, the geographic area from which most customers will come. The trade area size and configuration may vary with each customer base, for example, Workplace Population has a tighter trade area than Residents coming from home. For some customer bases, such as Daytime Population, it is not possible to determine a specific geographic area, but other measures can be used to estimate potential consumer traffic in the area, as will be explained in Section 6.0.
No matter what measurement is used, the size of the trade area depends on Competition, described in (Section 10.0) and SiteCharacteristics (Section 9.2).
The generally accepted retail industry term “primary trade area” is the geographic area from which an estimated 50% of customers will be generated. The “secondary trade area” denotes a larger geographic area from which an additional 20% of customers are estimated to originate.
For this Study, drive time minutes were used to delineate the trade area for both Residents and the Workplace Population, because the West Dempster Study Area is a highly-trafficked arterial retail corridor with near access to I-94. When a different geographic measurement is used to delineate these trade areas, e.g. Radius mile rings, the consumer density, whether they are Residents or Workplace Population, within this trade area will be different.
Whenever a retail cluster is very near an Interstate freeway access, just a few minutes of extra drive time exponentially increases the number of people and households captured in the trade area polygon. However, there is a trade-off: while freeways greatly increase drive time trade area population numbers, they can be perceived by consumers as a barrier to get to a retail site, thereby discouraging frequent convenience-oriented trips. This is especially true of trips from the Workplace, since time is limited. Freeways also make it faster for consumers to reach the competition.
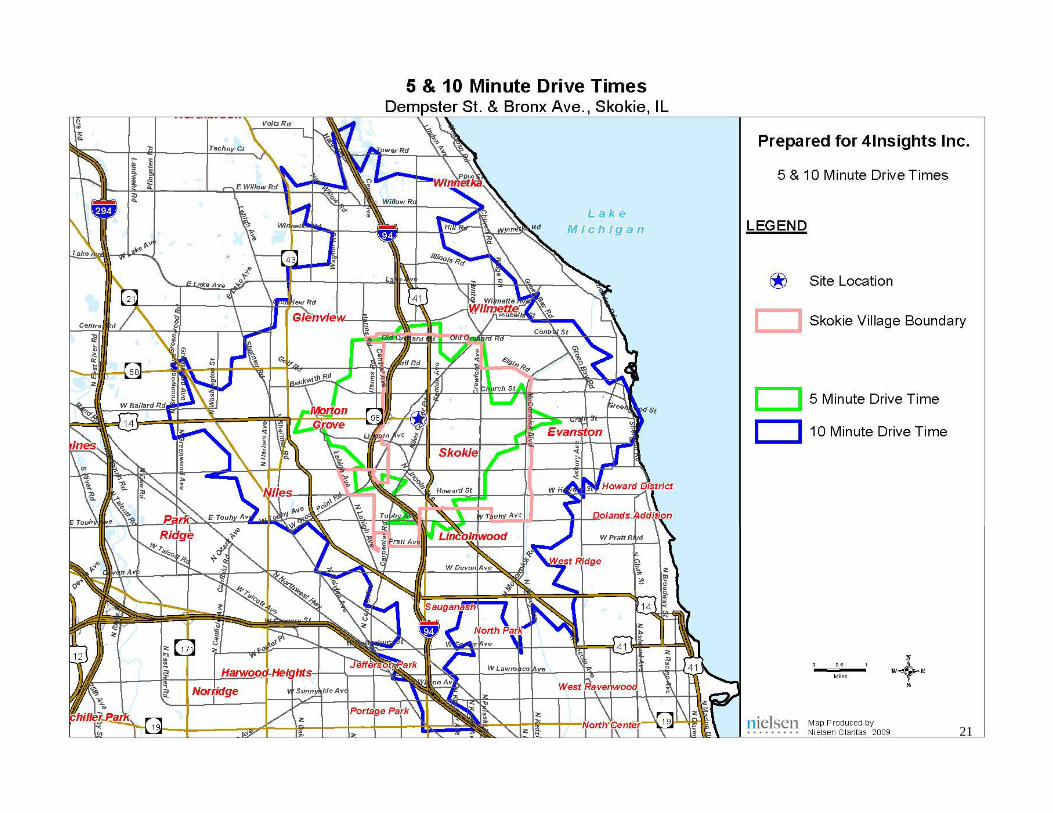
Therefore, the 5-minute drive time is estimated to be the Primary Trade Area measurement for resident trips to the Study Area from home. The population increases 4.6 times from the 5-minute to the 10-minute drive time, which is the Secondary Trade Area. The 15-minute drive time trade area extends too far geographically and contains more than 500,000 residents—making it too large for accurate analysis and a feasible draw, and its not considered a trade area for the Study Area.
The 5-minute drive time is estimated to be the primary trade area for trips from the Workplace, because of the volume and proximity of so much retail competition.
However, because of Dempster Street’s I-94 north and south exits, it is very likely that the Study Area retail, if strategically planned with retail magnets, will also attract some of the 197,000 workers in the wider 10-minute drive time trade area. Because 77% or 152,000 of them are NON-residents who come into the 10-minute area to work every day, attracting even a small percent of them could add thousands of additional retail customers daily.
20
21
6.0 Customer Bases
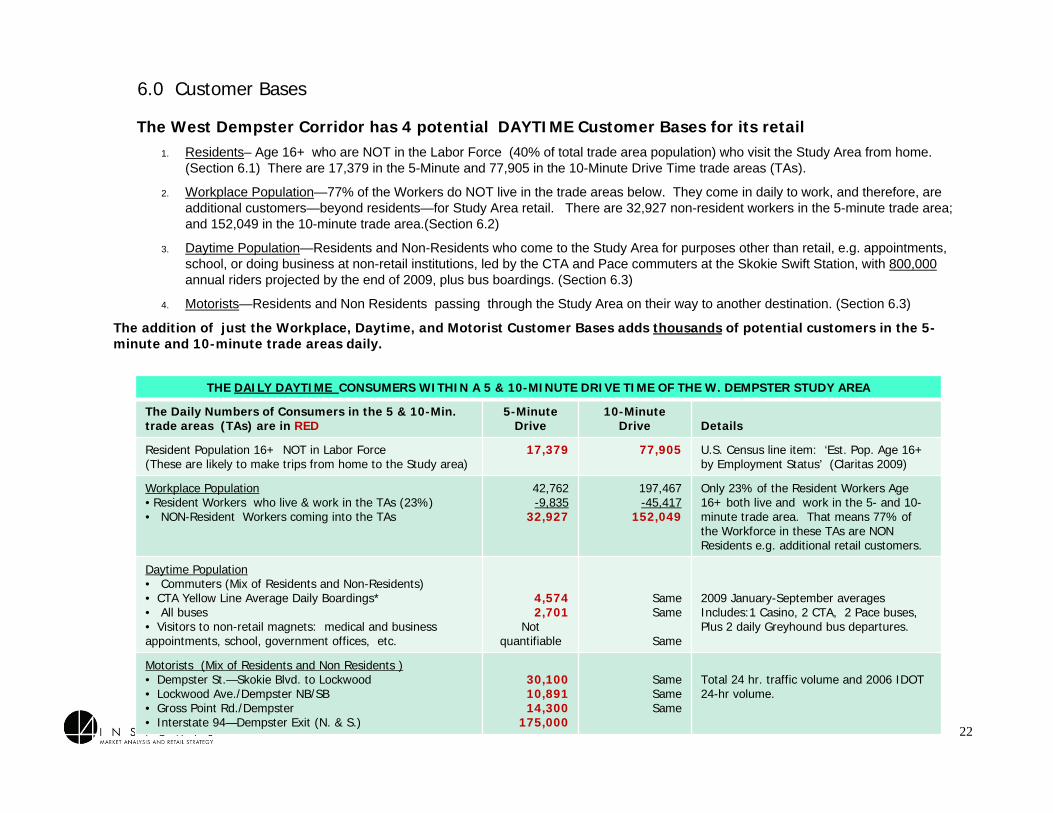
The West Dempster Corridor has 4 potential DAYTIME Customer Bases for its retail1. Residents– Age 16+ who are NOT in the Labor Force (40% of total trade area population) who visit the Study Area from home.
(Section 6.1) There are 17,379 in the 5-Minute and 77,905 in the 10-Minute Drive Time trade areas (TAs).
2. Workplace Population—77% of the Workers do NOT live in the trade areas below. They come in daily to work, and therefore, are additional customers—beyond residents—for Study Area retail. There are 32,927 non-resident workers in the 5-minute trade area; and 152,049 in the 10-minute trade area.(Section 6.2)
3. Daytime Population—Residents and Non-Residents who come to the Study Area for purposes other than retail, e.g. appointments, school, or doing business at non-retail institutions, led by the CTA and Pace commuters at the Skokie Swift Station, with 800,000annual riders projected by the end of 2009, plus bus boardings. (Section 6.3)
4. Motorists—Residents and Non Residents passing through the Study Area on their way to another destination. (Section 6.3)
The addition of just the Workplace, Daytime, and Motorist Customer Bases adds thousands of potential customers in the 5-minute and 10-minute trade areas daily.
THE DAILY DAYTIME CONSUMERS WITHIN A 5 & 10-MINUTE DRIVE TIME OF THE W. DEMPSTER STUDY AREA
The Daily Numbers of Consumers in the 5 & 10-Min. trade areas (TAs) are in RED
5-Minute Drive
10-MinuteDrive Details
Resident Population 16+ NOT in Labor Force (These are likely to make trips from home to the Study area)
17,379 77,905 U.S. Census line item: ‘Est. Pop. Age 16+ by Employment Status’ (Claritas 2009)
Workplace Population• Resident Workers who live & work in the TAs (23%)• NON-Resident Workers coming into the TAs
42,762-9,835
32,927
197,467 -45,417
152,049
Only 23% of the Resident Workers Age 16+ both live and work in the 5- and 10-minute trade area. That means 77% of the Workforce in these TAs are NON Residents e.g. additional retail customers.
Daytime Population• Commuters (Mix of Residents and Non-Residents) • CTA Yellow Line Average Daily Boardings*• All buses• Visitors to non-retail magnets: medical and business appointments, school, government offices, etc.
4,5742,701
Not quantifiable
SameSame
Same
2009 January-September averagesIncludes:1 Casino, 2 CTA, 2 Pace buses,Plus 2 daily Greyhound bus departures.
Motorists (Mix of Residents and Non Residents )• Dempster St.—Skokie Blvd. to Lockwood• Lockwood Ave./Dempster NB/SB• Gross Point Rd./Dempster• Interstate 94—Dempster Exit (N. & S.)
30,100 10,891 14,300
175,000
SameSameSame
Total 24 hr. traffic volume and 2006 IDOT 24-hr volume.
22
23
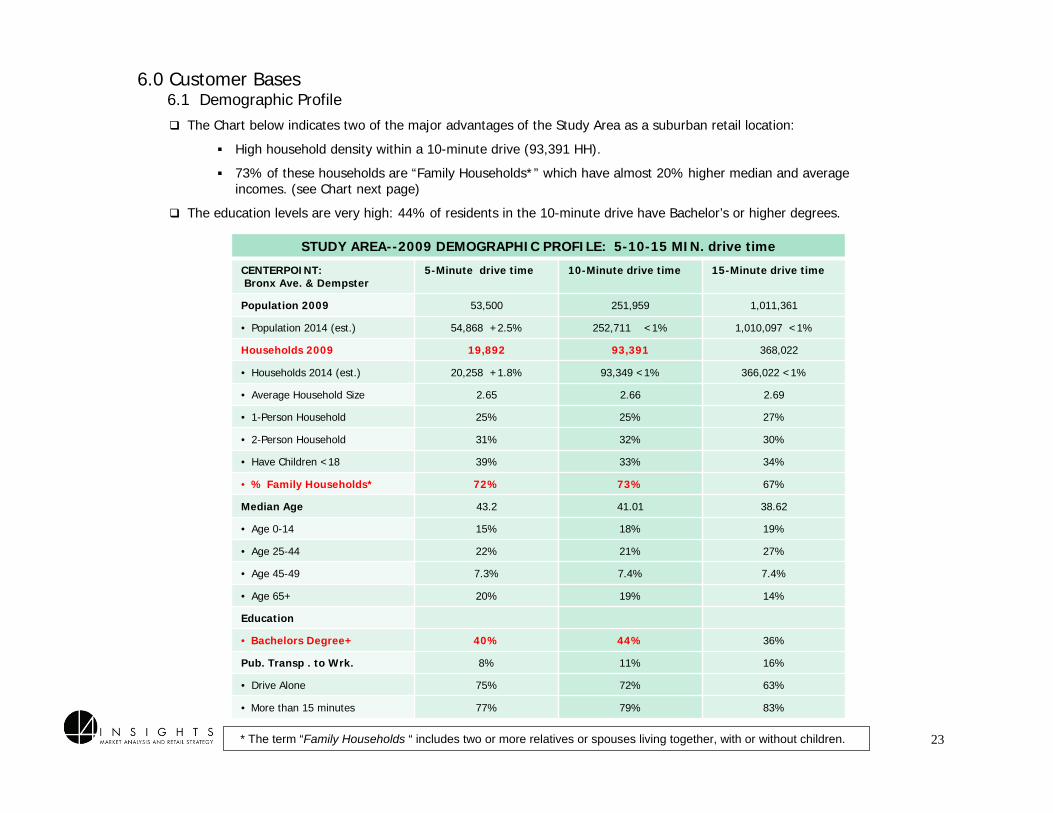
STUDY AREA--2009 DEMOGRAPHIC PROFILE: 5-10-15 MIN. drive time
CENTERPOINT: Bronx Ave. & Dempster
5-Minute drive time 10-Minute drive time 15-Minute drive time
Population 2009 53,500 251,959 1,011,361
• Population 2014 (est.) 54,868 +2.5% 252,711 <1% 1,010,097 <1%
Households 2009 19,892 93,391 368,022
• Households 2014 (est.) 20,258 +1.8% 93,349 <1% 366,022 <1%
• Average Household Size 2.65 2.66 2.69
• 1-Person Household 25% 25% 27%
• 2-Person Household 31% 32% 30%
• Have Children <18 39% 33% 34%
• % Family Households* 72% 73% 67%
Median Age 43.2 41.01 38.62
• Age 0-14 15% 18% 19%
• Age 25-44 22% 21% 27%
• Age 45-49 7.3% 7.4% 7.4%
• Age 65+ 20% 19% 14%
Education
• Bachelors Degree+ 40% 44% 36%
Pub. Transp . to Wrk. 8% 11% 16%
• Drive Alone 75% 72% 63%
• More than 15 minutes 77% 79% 83%
6.0 Customer Bases6.1 Demographic Profile
* The term “Family Households “ includes two or more relatives or spouses living together, with or without children.
The Chart below indicates two of the major advantages of the Study Area as a suburban retail location:
High household density within a 10-minute drive (93,391 HH).
73% of these households are “Family Households*” which have almost 20% higher median and average incomes. (see Chart next page)
The education levels are very high: 44% of residents in the 10-minute drive have Bachelor’s or higher degrees.

STUDY AREA--2009 DEMOGRAPHIC PROFILE: 5-10-15 MIN. drive time
trade area GEOGRAPHY 5-Minute drive time 10-Minute drive time 15-Minute drive time
Household Income
Median HH Inc.* $64,631 $72,600 $61,060
Average HH Inc. $80,986 $101,943 $86,836
• Under $50K 37% 33% 42%
• $50-$99.9K 37% 32% 32%
• $100-$149.9K 17% 18% 14%
• $150k+ 10% 17% 12%
• Med. Family Inc.* $76,200 $88,980 $74,051
• Avg. Family Inc. $93,517 $119,616 $102,987
Med. Housing Value $329,584 $374,449 $353,589
• Value $200-$399,000 63% 49% 49%
• Owner Occupied 73% 79% 60%
• 1 or 2 Units 60% 70% 44%
• 3 to 50 Units 40% 30% 56%
• Median Year Built 1959 1957 1953
Occupations
• Management & Professional 44% 48% 39%
• Sales & Office 30% 28% 27%
24
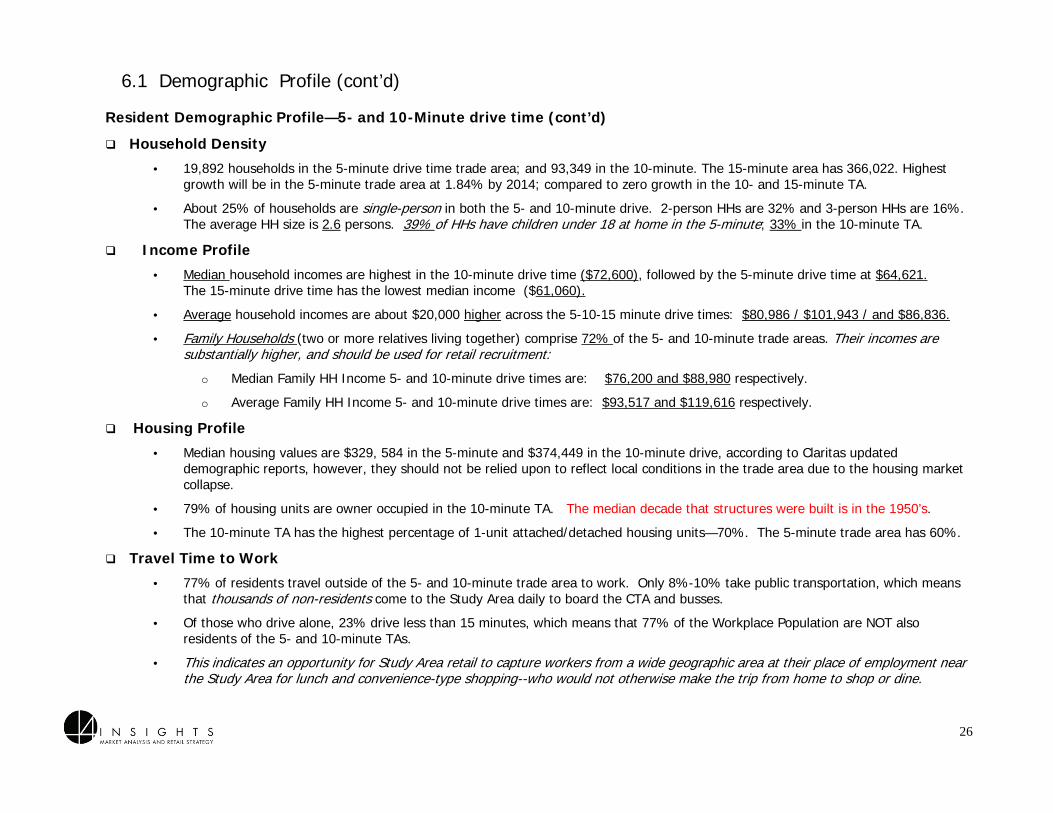
6.1 Demographic Profile, cont’d“Family Households” (previous page) have almost 20% higher household income levels. In the Study area at 10-minutes drive time, 73% of the Study Area households are “Family Households, therefore, almost three quarters of the households have solid upper midscale median incomes of $88,980, and upscale average incomes of $119,616. (in red, below). This is an important fact for tenant recruitment.
Another advantage for retail is that almost half of the residents in the 10-minute Study Area have management or professional occupations, which proves that they have enough disposable income to support retail.
Population Density & Growth:
• The 2009 population in the 5-minute trade area is 53,500; in the 10-minute is 251,959 and the 15-minute is 1.0 million. 5-year growth is forecasted at 2.6% for the 5-minute drive time and .3% for the 10-minute drive time, which favorably compares to the wider 15-minute drive time’s zero growth estimates.
Resident Population Profile—5- and 10-Minute drive time
• Race/Ancestry: The ‘White Alone’ population is highest at 10-minute drive time (73%) and lowest at 5-minutes (54%). Within this category, the highest ancestries are German (9%) followed almost equally by Polish (8%) and Russian (6%).
• The leading non-White race is ‘Asian Alone,” comprising 25% of the 5-minute and 16% of the 10-minute drive times. The leading subcategory of ‘Asian Alone’ in both of these drive times is Asian Indian (28%). Second is Filipino (24%) and third is Korean (22/10%). African Americans are just over 4%. Hispanic households are 5%, in contrast to the wider metro area drive time of 15 minutes—where they are 19% of households.
• Less than half of households speak only English at home: 46% at 5 minutes; 35% at 10 minutes drive time.
Occupation/Education Profile
• The management and professional occupational levels are high in both the 5- and 10-minute trade areas: 44% / 48%. (See Workplace Population, Section 6.3).
• The 10-minute drive time has the highest education levels, with 44% having achieved a Bachelors or higher education, followed by 40% in the 5-minute drive—compared to just 36% in the 15-minute drive.
Age Profile
• The 5- and 10-minute TAs are similar across most age segments, but older than the wider 15-minute TA. The median ages of the 5- and 10-minute TAs are 43.7/44.7, vs. the younger median age of 38.3 in the 15-minute drive time.
• The breakdown of ages indicates less young children (ages 0-14) in the 5-and 10-minute drive than in the wider 15-minute drive time, and more older people 50+. The intermediate age group of teens/young adults age 15-24, and the age 45-49 group are similar across all drive times.
• The 50-85+ age groups are very similar in the 5-and 10-minute TAs, except for the segment age 75-84, where the 5-minute drive time percentage is 1% higher, e.g. older (7.70 / 6.75%).The 5 and 10-minute TAs have 20% age 65+. The largest age group across all drive times is age 24-44. It is 22% of the 5- and 10-minute TAs and 27% of the 15-minute TA.
6.1 Demographic Profile, cont’d
25
Resident Demographic Profile—5- and 10-Minute drive time (cont’d)
Household Density
• 19,892 households in the 5-minute drive time trade area; and 93,349 in the 10-minute. The 15-minute area has 366,022. Highest growth will be in the 5-minute trade area at 1.84% by 2014; compared to zero growth in the 10- and 15-minute TA.
• About 25% of households are single-person in both the 5- and 10-minute drive. 2-person HHs are 32% and 3-person HHs are 16%. The average HH size is 2.6 persons. 39% of HHs have children under 18 at home in the 5-minute; 33% in the 10-minute TA.
Income Profile
• Median household incomes are highest in the 10-minute drive time ($72,600), followed by the 5-minute drive time at $64,621.The 15-minute drive time has the lowest median income ($61,060).
• Average household incomes are about $20,000 higher across the 5-10-15 minute drive times: $80,986 / $101,943 / and $86,836.
• Family Households (two or more relatives living together) comprise 72% of the 5- and 10-minute trade areas. Their incomes are substantially higher, and should be used for retail recruitment:
o Median Family HH Income 5- and 10-minute drive times are: $76,200 and $88,980 respectively.
o Average Family HH Income 5- and 10-minute drive times are: $93,517 and $119,616 respectively.
Housing Profile
• Median housing values are $329, 584 in the 5-minute and $374,449 in the 10-minute drive, according to Claritas updated demographic reports, however, they should not be relied upon to reflect local conditions in the trade area due to the housing market collapse.
• 79% of housing units are owner occupied in the 10-minute TA. The median decade that structures were built is in the 1950’s.
• The 10-minute TA has the highest percentage of 1-unit attached/detached housing units—70%. The 5-minute trade area has 60%.
Travel Time to Work
• 77% of residents travel outside of the 5- and 10-minute trade area to work. Only 8%-10% take public transportation, which means that thousands of non-residents come to the Study Area daily to board the CTA and busses.
• Of those who drive alone, 23% drive less than 15 minutes, which means that 77% of the Workplace Population are NOT also residents of the 5- and 10-minute TAs.
• This indicates an opportunity for Study Area retail to capture workers from a wide geographic area at their place of employment near the Study Area for lunch and convenience-type shopping--who would not otherwise make the trip from home to shop or dine.
6.1 Demographic Profile (cont’d)
26
27
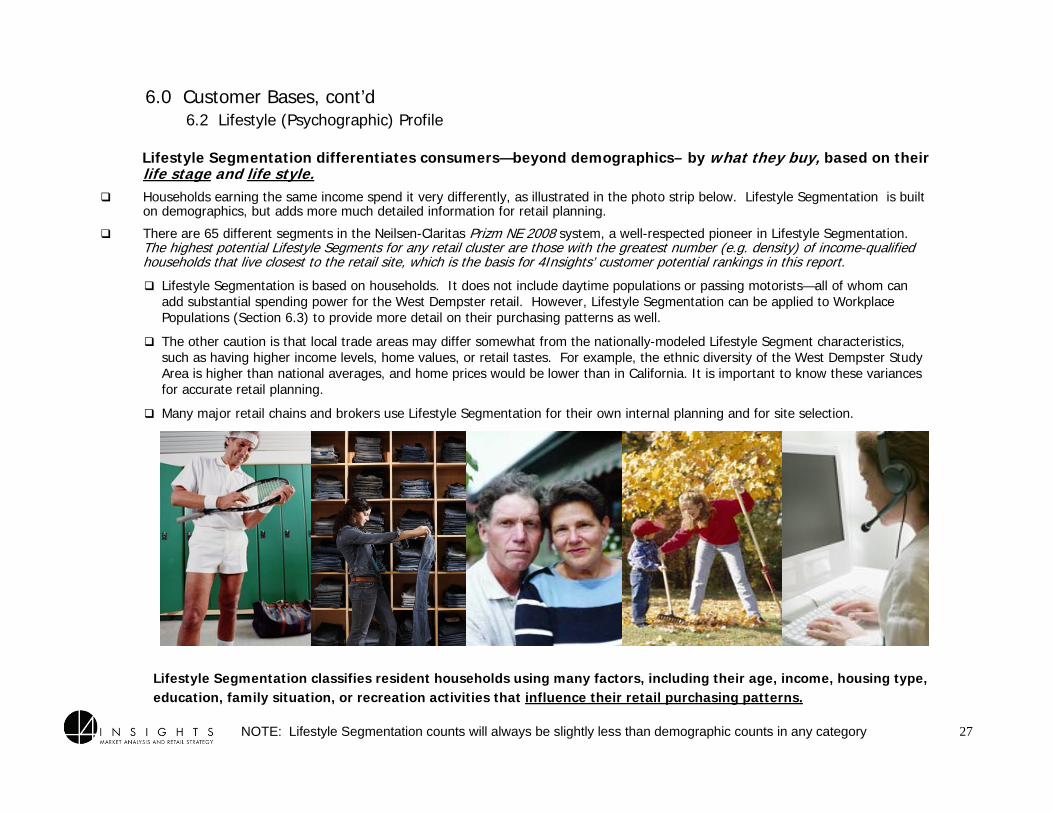
6.0 Customer Bases, cont’d6.2 Lifestyle (Psychographic) Profile
Lifestyle Segmentation classifies resident households using many factors, including their age, income, housing type, education, family situation, or recreation activities that influence their retail purchasing patterns.
Lifestyle Segmentation differentiates consumers—beyond demographics– by what they buy, based on their life stage and life style.Households earning the same income spend it very differently, as illustrated in the photo strip below. Lifestyle Segmentation is built on demographics, but adds more much detailed information for retail planning.
There are 65 different segments in the Neilsen-Claritas Prizm NE 2008 system, a well-respected pioneer in Lifestyle Segmentation. The highest potential Lifestyle Segments for any retail cluster are those with the greatest number (e.g. density) of income-qualified households that live closest to the retail site, which is the basis for 4Insights’ customer potential rankings in this report.
Lifestyle Segmentation is based on households. It does not include daytime populations or passing motorists—all of whom can add substantial spending power for the West Dempster retail. However, Lifestyle Segmentation can be applied to Workplace Populations (Section 6.3) to provide more detail on their purchasing patterns as well.
The other caution is that local trade areas may differ somewhat from the nationally-modeled Lifestyle Segment characteristics, such as having higher income levels, home values, or retail tastes. For example, the ethnic diversity of the West Dempster Study Area is higher than national averages, and home prices would be lower than in California. It is important to know these variances for accurate retail planning.
Many major retail chains and brokers use Lifestyle Segmentation for their own internal planning and for site selection.
NOTE: Lifestyle Segmentation counts will always be slightly less than demographic counts in any category
WEST DEMPSTER STUDY AREA-TARGET RESIDENT LIFESTYLE SEGMENTS (2008 PRIZM-NE)
drive times FROM BRONX AVE. & DEMPSTER: 5-minutes 10-minutes
TOTAL 2008 HOUSEHOLDS (2008 Prizm NE) 19,893 93,388
Segment Number & Name
Med. HH Income
Age Cluster
Kids < 18
College Own /Rent
% of HHs % of HHs
14 New Empty Nests** $71 65+ Low Grad/Post Own 15% 11%
22 Young Influentials $48 <35 Low Grad Rent 13% *
15 Pools & Patios** $71 45-64 Low Grad Own 13% 09%
21 Gray Power $52 65+ Low Grad Own 12% 05%
17 Beltway Boomers $74 45-54 High Grad Own 08% 05%
19 Home Sweet Home $67 25-54 Low Grad Own 07% *
01 Upper Crust** $114 55-64 Low Grad/Post Own 06% 12%
39 Domestic Duos $48 55+ Low Hs Grad Rent 04% *
07 Money & Brains** $89 45-64 Med Grad+ Own 03% 04%
30 Suburban Sprawl $50 45-64 Low Grad Own 03% *
02 Blue Blood Estates $119 45-64 Low Grad Own * 05%
03 Movers & Shakers $102 35-54 Low Grad+ Own * 06%
29 American Dreams $55 35-54 Med Grad Own * 04%
10 Second City Elite $77 45-64 Low Grad+ Own * 04%
% of TOTAL HHs 82%16,312
65%60,702 28
6.2 Lifestyle Profile, cont’d
Source: Neilsen-Claritas 2009. *Blank Columns indicate Segments that are not Top 10 highest density for each geography, but may appear in the trade area
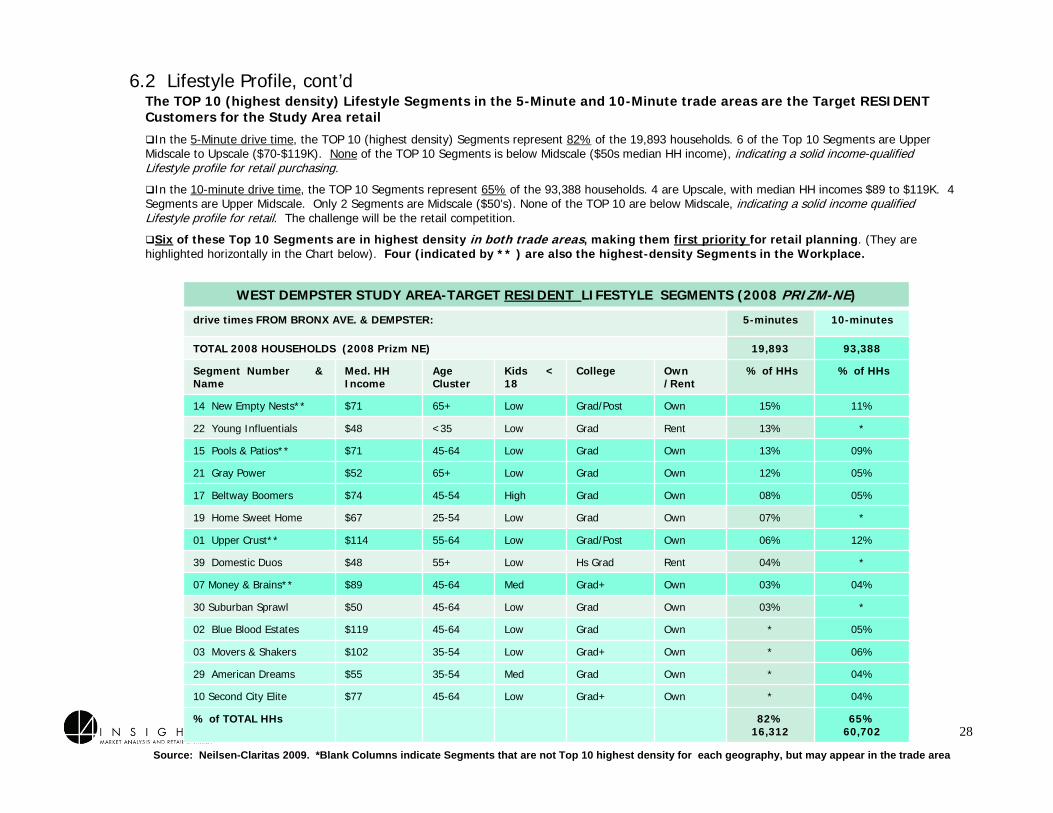
The TOP 10 (highest density) Lifestyle Segments in the 5-Minute and 10-Minute trade areas are the Target RESIDENT Customers for the Study Area retail
In the 5-Minute drive time, the TOP 10 (highest density) Segments represent 82% of the 19,893 households. 6 of the Top 10 Segments are Upper Midscale to Upscale ($70-$119K). None of the TOP 10 Segments is below Midscale ($50s median HH income), indicating a solid income-qualified Lifestyle profile for retail purchasing.
In the 10-minute drive time, the TOP 10 Segments represent 65% of the 93,388 households. 4 are Upscale, with median HH incomes $89 to $119K. 4 Segments are Upper Midscale. Only 2 Segments are Midscale ($50’s). None of the TOP 10 are below Midscale, indicating a solid income qualified Lifestyle profile for retail. The challenge will be the retail competition.
Six of these Top 10 Segments are in highest density in both trade areas, making them first priority for retail planning. (They are highlighted horizontally in the Chart below). Four (indicated by ** ) are also the highest-density Segments in the Workplace.
1) New Empty Nests--Age 65+. Median HH Income $71,000. They are 15% of the 5-Min. & 11% of the 10-Min. TA.
75% of this segment is over 65. These are upper-midscale couples, with post graduate degrees, whose children are gone. Most are retired. They are primarily white, suburban homeowners—many have downsized into condominiums. They lead an active and activist lifestyle, committed to their issues and interests. They attend the opera, play tennis, watch 60 Minutes, shop at Talbot’s, Lands End, and Eddie Bauer. They eat at Outback Steak House, go to live theater performances, shop at Costco, and are active travelers, taking packaged tours.
2) Pools & Patios--Age 55-64. Median HH Income $71,000. They are 13% and 9%.
Formed during the postwar Baby Boom, these parents have evolved into today’s empty nesting couples in older, stable suburban neighborhoods that exploded in the 1950’s & 60’s. A mix of primarily white and Asian college graduates, they work in professional, management and other white collar jobs. Some are already retired. They buy books on tape and have the top index for taking cruises. They buy at Nordstrom, Sears Hardware, Barnes & Noble and the Home Shopping Network. They eat at the Macaroni Grill, Houlihan’s and Boston Market.
3) Gray Power—Age 65+. Median HH Income $51,800. They are 12% and 5%.
These seniors are midscale, college graduated, home-owning suburbanites who are aging in place rather than moving to retirement communities. Most are white. The children are gone and they are mostly retired. They shop at Macy’s and Talbot’s, eat at Macaroni Grill, quick serve restaurants and hamburger places; take cruises and bus trips, belong to fraternal organizations, and are very high coupon users.
4) Beltway Boomers—Age 45-54. Median HH Income $74. They are 8% and 5%.
These are the college grad Baby Boomers who married later and settled into white collar jobs, who are now in suburban householdswith children still at home. Their kid-centered lifestyles revolve around school, soccer and baseball, amusement parks, family recreation and vacations. They are Nordstrom, J. Crew and Lane Bryant shoppers. They like California Pizza Kitchen, White Hen, shopping at food warehouse clubs and drive mini-vans. Kid-friendly retail will attract them.
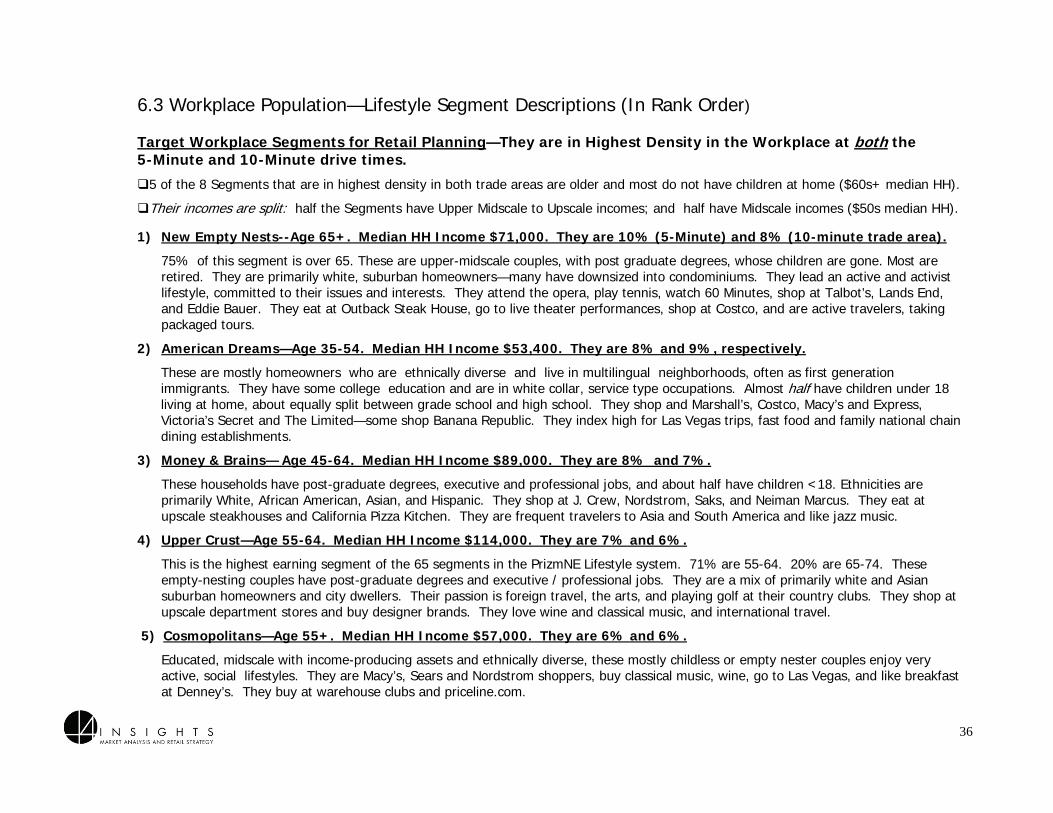
Target Workplace Segments for Retail Planning—They are in Highest Density in the Workplace at both the 5-Minute and 10-Minute drive times
5 of the 8 Segments that are in highest density in both trade areas are older and most do not have children at home ($60s+ median HH).
Half of the Segments have Upper Midscale to Upscale incomes; and half have Midscale incomes ($50s median HH).
6.2 Lifestyle Profile cont’d
29
Lifestyle Segment Descriptions (in Rank Order)
Target Resident Segments , cont’d.
6.2 Lifestyle Profile, cont’d
30
5) Upper Crust—Age 55-64. Median HH Income $114,000. They are 6% and 12%.
This is the highest earning segment of the 65 segments in the PrizmNE Lifestyle system. 71% are 55-64. 20% are 65-74 These empty-nesting couples have post-graduate degrees and executive / professional jobs. They are a mix of primarily white and Asian suburban homeowners and city dwellers. Their passion is foreign travel, the arts, and playing golf at their country clubs. They shop at upscale department stores and buy designer brands. They love wine and classical music, and international travel.
6) Money & Brains— Age 45-64. Median HH Income $89,000. They are 3% and 4%.
These households have post-graduate degrees, executive and professional jobs, and about half have children <18. Ethnicities are primarily White, African American, Asian, and Hispanic. They shop at J. Crew, Nordstrom, Saks, and Neiman Marcus. They eat at upscale steakhouses and California Pizza Kitchen. They are frequent travelers to Asia and South America and like jazz music.
The Segments below are the TOP 10 (highest density) Segments in the 5-minute TA only. They are included here as Target Customers, because of their high density in the 5-minute TA, which makes them likely to make more frequent visits to Study Area retail.
7) Young Influentials—Age <35. Median HH Income $48,000. They are 13% of the 5-minute trade area.
Having recently left their college dorms, this diverse singles segment is not like the acquisitive yuppie Baby Boomers of their parents’ generation. They are more preoccupied with balancing work and leisure pursuits. With Midscale incomes, (and student loans) they now live in apartment complexes surrounded by recreation, health clubs and social sports. Most do not have children.They like sports bars, taverns, casual restaurants like Bennigan’s and Hooters, hamburger places, convenience stores and laundromats.
8) Home Sweet Home—Age 25-54. Median HH Income $67,000. They are 7% of the 5-minute trade area.
These professional college graduates are married suburbanites living in mid-sized homes, but with few children. With their Upper Midscale incomes and small families, these residents have comfortable lifestyles with pets, electronics, and hobby and sports equipment. They are an ethnically diverse segment. They dine at Ruth Chris and Lone Star Steakhouses and Chipotle, Baja Fresh, and fast food burger places and go to bars and nightclubs. They shop at Express, order music on the internet, bowl and play billiards and exercise at a club regularly.
Four of these 8 Highest Density Resident Segments are also in the TOP 10 (highest density) Workplace Population Segments, making them first priority Target Customers for Retail Planning: They are in the 45-65+ age ranges.
(1) New Empty Nests; (2) Pools and Patios—both are Upper Midscale Segments ($71K median HH income); (3) Upper Crust; (4) Money and Brains—both are Upscale Segments ($89 / $114 median HH income.)
6.0 Customer Bases, cont’d6.3 Workplace Population
Workplace Populations are a crucial Customer Base for corridor retail districts such as West Dempster.
Office and other Workplace Populations are especially valuable to retail, because they come into the trade area every weekday, unlike residents who make only periodic trips from home.
New research done in 2009 by Retail Forward, Inc. indicates that increasingly, consumers are integrating shopping and eating into their workday, making several short ‘mission’ stops. Therefore, to capture them, retail must be visible, and signage very clear. Since corridor retail is motorist—not pedestrian driven–access to parking must be convenient and immediately apparent.
The retail tenant mix must also be designed to cater to workers’ narrow range of retail buying patterns, dominated by: foodservice, errand running, browsing and impulse items, (e.g. books, music, drug store items, cards and gifts, convenience stores)—and personal services (e.g., watch repair to haircuts).
The key questions to answer about Workplace Population for retail planning are:
How many workers are there in a reasonable distance from the Study Area?
What are their occupations? Do they enable workers to easily make shopping and dining trips from their workplace?
Do their income levels permit them to shop or dine frequently during the workday?
What are their lifestyle characteristics, education, hobbies, interests that suggests the type of retail that would attract them?
Who are the Lifestyle Segments that are first priority for retail planning?
How often do they eat out and how much do they spend for lunch or dinner? What type of restaurant formats and brands do they prefer?
How similar is the Workplace Population to the profile of the trade area residents? Can the same retail mix attract both?
What percent of the Workplace Population lives outside of the trade area, and therefore are additional or “incremental” potential retail customers to the residents? (These incremental customers can be captured from their workplaces. They might otherwise not make a special trip from home to West Dempster retail.)
31
To accurately estimate the size of the Workplace Population Customer Base for the Study Area, there are several important considerations:
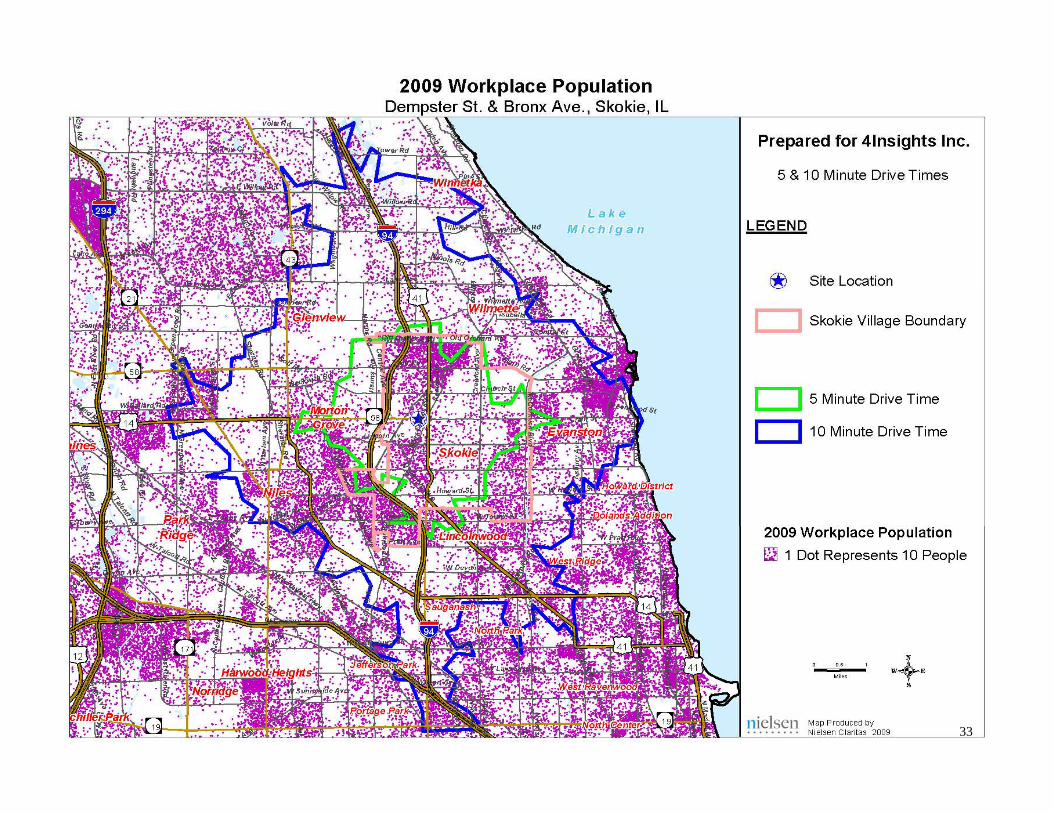
Its location less than ½ mile from the I-94 Interstate, with direct north/south exits to Dempster St., means that 183,700 workers can reach it within 10 minutes—and more than half a million workers can reach it within 15-minutes—an extremely large and attractive potential customer base. (Chart, following page).
However, this easy northwest-southeast freeway access means that the myriad of retail, food, and services competition to the West Dempster Study Area can also be reached in just minutes as well, thereby limiting the size of the trade area. Time-pressed workers are unlikely to drive very far past many other closer retail/food options, unless the retail was unique and superior in product, service, or convenient parking. In addition, freeways can sometimes be “perceptual barriers” by consumers--perceived as too congested to cross.
The Dempster Corridor itself is a heavily trafficked arterial exposing its retail to 30,100 daily by motorists. It is, however, also lined with a nearly continuous flow of all types of retail, again discouraging time-pressed workers to drive past closer options—unless the Study Area retail was deemed to be a superior retail destination, as previously defined.
As previously stated, retail on the Dempster corridor is motorist, not pedestrian-driven. The width and traffic volume on Dempster is likely to discourage pedestrian crossing to shop both north and south sides of the street. However, properly assorted retail in a contiguous flow may entice time-pressed workers to visit multiple retail outlets on the same side of the street.
Therefore, strategically selected retail businesses in a contiguous flow, with easy parking, that begin adjacent to the Skokie swift station should be successful in capturing the Workplace Population commuting by auto, bus or CTA on the south side of Dempster.
6.3 Workplace Population, cont’d
32
33
5-10-15 Minute drive time
5-minutes 10-minutes 15-minutes
42,762 197,467 539,198
39% 35% 35%
31% 32% 30%
17% 20% 21%
13% 13% 14%
6.3 Workplace Population, cont’d
34
(From Bronx Ave. & Dempster): 1-2-3- Mile Radii
1-Mile 2-Miles 3-Miles
Total Workplace Population 9,389 57,839 110,238
Executive & Professional• Management• Sales & Marketing• Educators
35% 37% 36%
Administration & Support• Management Support• Admin-Clerical • Technical
28% 30% 26%
Trade & Labor 22% 21% 25%
Service Personnel• Food & Beverage• Personal Services• Health Care
15% 12% 13%
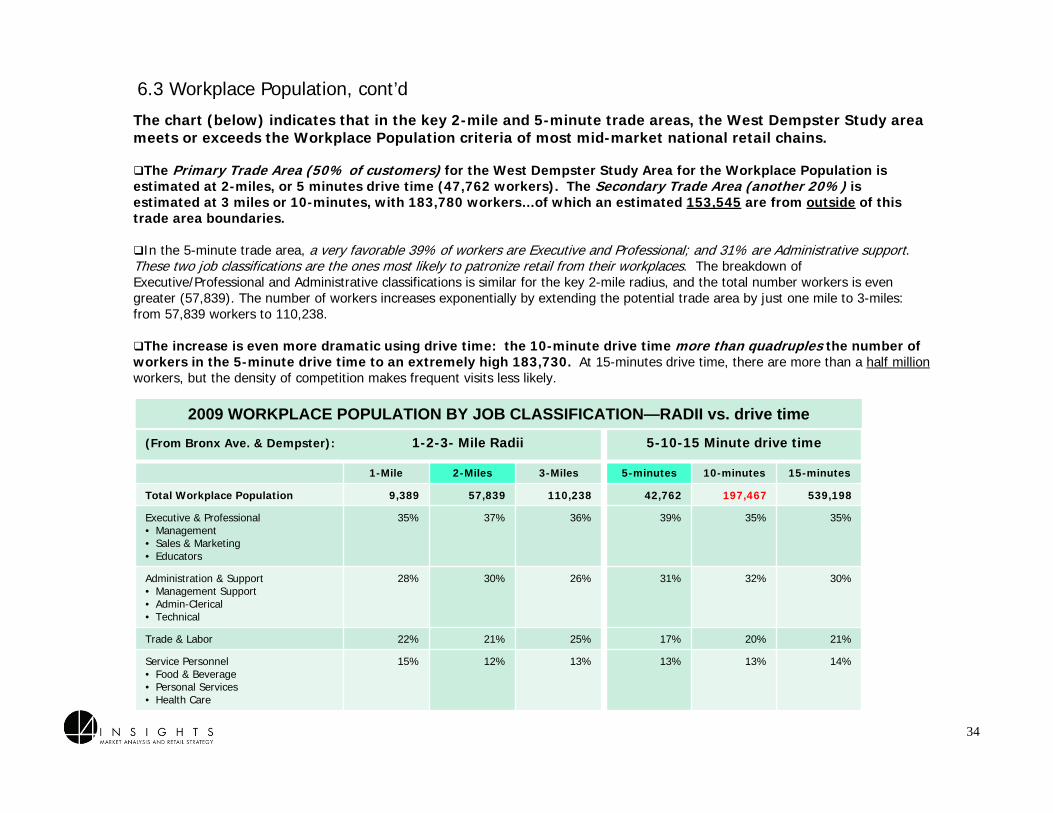
2009 WORKPLACE POPULATION BY JOB CLASSIFICATION—RADII vs. drive time
The chart (below) indicates that in the key 2-mile and 5-minute trade areas, the West Dempster Study area meets or exceeds the Workplace Population criteria of most mid-market national retail chains.
The Primary Trade Area (50% of customers) for the West Dempster Study Area for the Workplace Population isestimated at 2-miles, or 5 minutes drive time (47,762 workers). The Secondary Trade Area (another 20%) is estimated at 3 miles or 10-minutes, with 183,780 workers…of which an estimated 153,545 are from outside of this trade area boundaries.
In the 5-minute trade area, a very favorable 39% of workers are Executive and Professional; and 31% are Administrative support. These two job classifications are the ones most likely to patronize retail from their workplaces. The breakdown of Executive/Professional and Administrative classifications is similar for the key 2-mile radius, and the total number workers is even greater (57,839). The number of workers increases exponentially by extending the potential trade area by just one mile to 3-miles: from 57,839 workers to 110,238.
The increase is even more dramatic using drive time: the 10-minute drive time more than quadruples the number of workers in the 5-minute drive time to an extremely high 183,730. At 15-minutes drive time, there are more than a half million workers, but the density of competition makes frequent visits less likely.
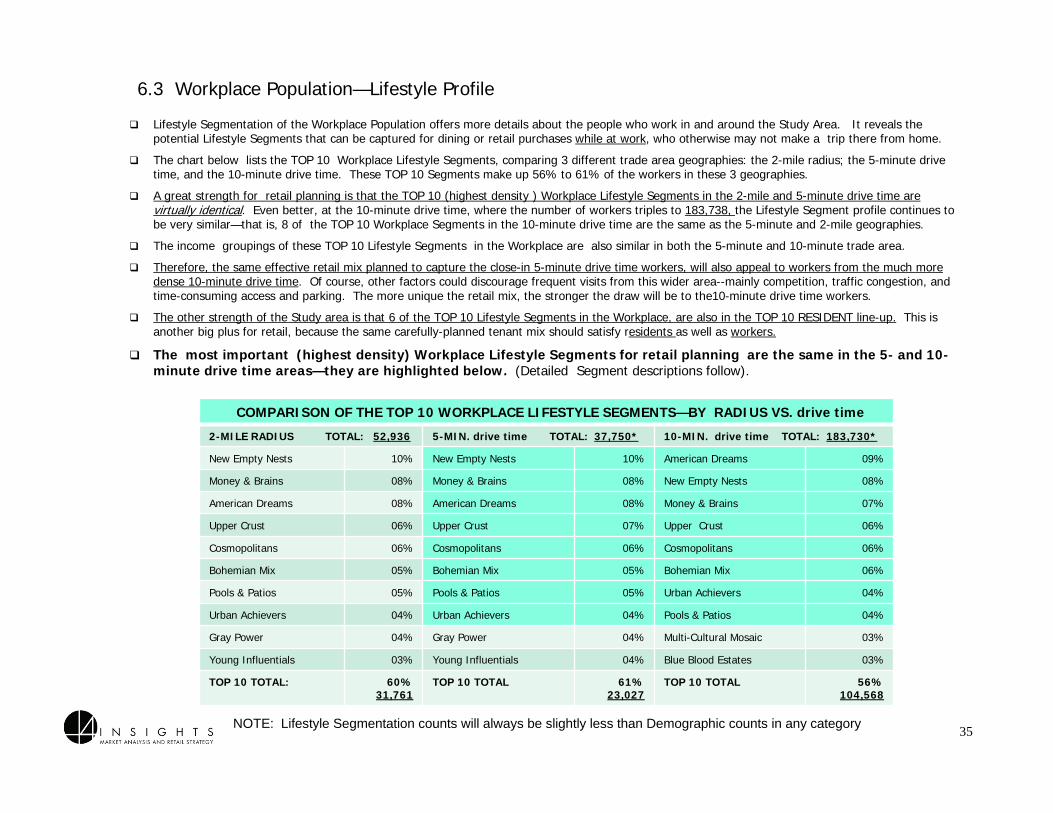
COMPARISON OF THE TOP 10 WORKPLACE LIFESTYLE SEGMENTS—BY RADIUS VS. drive time
2-MILE RADIUS TOTAL: 52,936 5-MIN. drive time TOTAL: 37,750* 10-MIN. drive time TOTAL: 183,730*
New Empty Nests 10% New Empty Nests 10% American Dreams 09%
Money & Brains 08% Money & Brains 08% New Empty Nests 08%
American Dreams 08% American Dreams 08% Money & Brains 07%
Upper Crust 06% Upper Crust 07% Upper Crust 06%
Cosmopolitans 06% Cosmopolitans 06% Cosmopolitans 06%
Bohemian Mix 05% Bohemian Mix 05% Bohemian Mix 06%
Pools & Patios 05% Pools & Patios 05% Urban Achievers 04%
Urban Achievers 04% Urban Achievers 04% Pools & Patios 04%
Gray Power 04% Gray Power 04% Multi-Cultural Mosaic 03%
Young Influentials 03% Young Influentials 04% Blue Blood Estates 03%
TOP 10 TOTAL: 60%31,761
TOP 10 TOTAL 61%23,027
TOP 10 TOTAL 56%104,568
Lifestyle Segmentation of the Workplace Population offers more details about the people who work in and around the Study Area. It reveals the potential Lifestyle Segments that can be captured for dining or retail purchases while at work, who otherwise may not make a trip there from home.
The chart below lists the TOP 10 Workplace Lifestyle Segments, comparing 3 different trade area geographies: the 2-mile radius; the 5-minute drive time, and the 10-minute drive time. These TOP 10 Segments make up 56% to 61% of the workers in these 3 geographies.
A great strength for retail planning is that the TOP 10 (highest density ) Workplace Lifestyle Segments in the 2-mile and 5-minute drive time are virtually identical. Even better, at the 10-minute drive time, where the number of workers triples to 183,738, the Lifestyle Segment profile continues to be very similar—that is, 8 of the TOP 10 Workplace Segments in the 10-minute drive time are the same as the 5-minute and 2-mile geographies.
The income groupings of these TOP 10 Lifestyle Segments in the Workplace are also similar in both the 5-minute and 10-minute trade area.
Therefore, the same effective retail mix planned to capture the close-in 5-minute drive time workers, will also appeal to workers from the much more dense 10-minute drive time. Of course, other factors could discourage frequent visits from this wider area--mainly competition, traffic congestion, and time-consuming access and parking. The more unique the retail mix, the stronger the draw will be to the10-minute drive time workers.
The other strength of the Study area is that 6 of the TOP 10 Lifestyle Segments in the Workplace, are also in the TOP 10 RESIDENT line-up. This is another big plus for retail, because the same carefully-planned tenant mix should satisfy residents as well as workers.
The most important (highest density) Workplace Lifestyle Segments for retail planning are the same in the 5- and 10-minute drive time areas—they are highlighted below. (Detailed Segment descriptions follow).
6.3 Workplace Population—Lifestyle Profile
35NOTE: Lifestyle Segmentation counts will always be slightly less than Demographic counts in any category
1) New Empty Nests--Age 65+. Median HH Income $71,000. They are 10% (5-Minute) and 8% (10-minute trade area).
75% of this segment is over 65. These are upper-midscale couples, with post graduate degrees, whose children are gone. Most are retired. They are primarily white, suburban homeowners—many have downsized into condominiums. They lead an active and activist lifestyle, committed to their issues and interests. They attend the opera, play tennis, watch 60 Minutes, shop at Talbot’s, Lands End, and Eddie Bauer. They eat at Outback Steak House, go to live theater performances, shop at Costco, and are active travelers, taking packaged tours.
2) American Dreams—Age 35-54. Median HH Income $53,400. They are 8% and 9%, respectively.
These are mostly homeowners who are ethnically diverse and live in multilingual neighborhoods, often as first generation immigrants. They have some college education and are in white collar, service type occupations. Almost half have children under 18 living at home, about equally split between grade school and high school. They shop and Marshall’s, Costco, Macy’s and Express, Victoria’s Secret and The Limited—some shop Banana Republic. They index high for Las Vegas trips, fast food and family national chain dining establishments.
3) Money & Brains— Age 45-64. Median HH Income $89,000. They are 8% and 7%.
These households have post-graduate degrees, executive and professional jobs, and about half have children <18. Ethnicities are primarily White, African American, Asian, and Hispanic. They shop at J. Crew, Nordstrom, Saks, and Neiman Marcus. They eat at upscale steakhouses and California Pizza Kitchen. They are frequent travelers to Asia and South America and like jazz music.
4) Upper Crust—Age 55-64. Median HH Income $114,000. They are 7% and 6%.
This is the highest earning segment of the 65 segments in the PrizmNE Lifestyle system. 71% are 55-64. 20% are 65-74. These empty-nesting couples have post-graduate degrees and executive / professional jobs. They are a mix of primarily white and Asian suburban homeowners and city dwellers. Their passion is foreign travel, the arts, and playing golf at their country clubs. They shop at upscale department stores and buy designer brands. They love wine and classical music, and international travel.
5) Cosmopolitans—Age 55+. Median HH Income $57,000. They are 6% and 6%.
Educated, midscale with income-producing assets and ethnically diverse, these mostly childless or empty nester couples enjoy very active, social lifestyles. They are Macy’s, Sears and Nordstrom shoppers, buy classical music, wine, go to Las Vegas, and like breakfast at Denney’s. They buy at warehouse clubs and priceline.com.
Target Workplace Segments for Retail Planning—They are in Highest Density in the Workplace at both the 5-Minute and 10-Minute drive times.
5 of the 8 Segments that are in highest density in both trade areas are older and most do not have children at home ($60s+ median HH).
Their incomes are split: half the Segments have Upper Midscale to Upscale incomes; and half have Midscale incomes ($50s median HH).
6.3 Workplace Population—Lifestyle Segment Descriptions (In Rank Order)
36
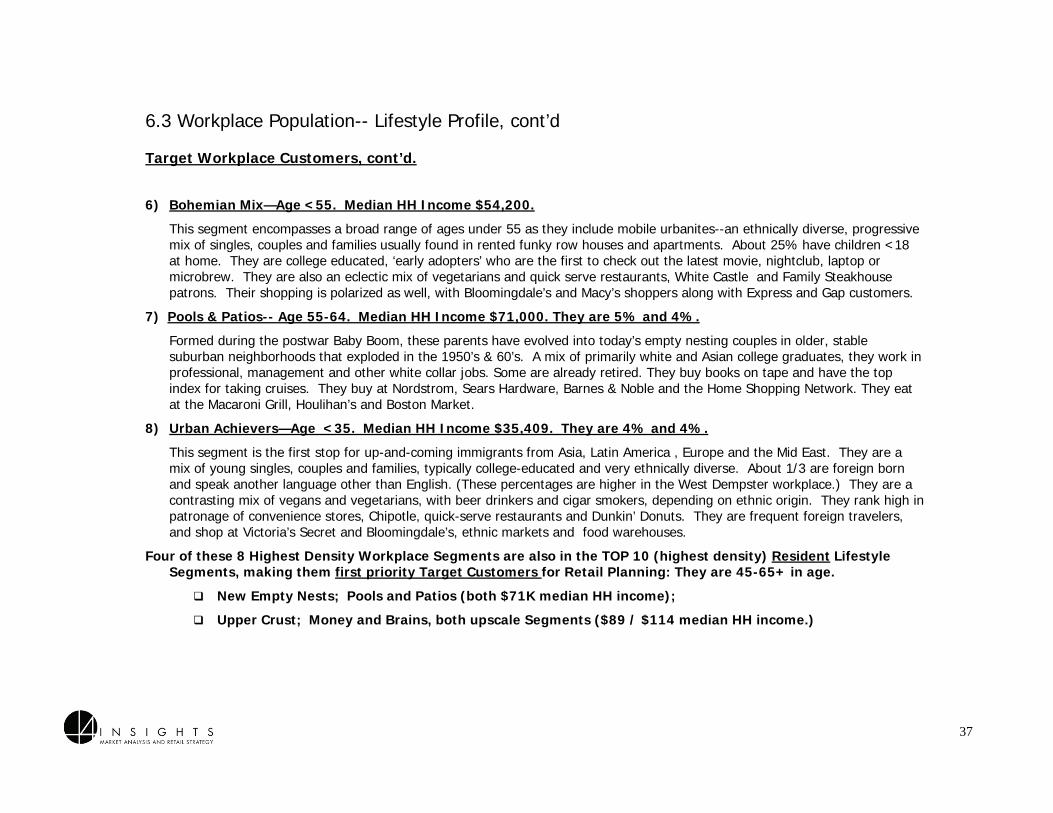
Target Workplace Customers, cont’d.
6.3 Workplace Population-- Lifestyle Profile, cont’d
37
6) Bohemian Mix—Age <55. Median HH Income $54,200.
This segment encompasses a broad range of ages under 55 as they include mobile urbanites--an ethnically diverse, progressive mix of singles, couples and families usually found in rented funky row houses and apartments. About 25% have children <18 at home. They are college educated, ‘early adopters’ who are the first to check out the latest movie, nightclub, laptop or microbrew. They are also an eclectic mix of vegetarians and quick serve restaurants, White Castle and Family Steakhouse patrons. Their shopping is polarized as well, with Bloomingdale’s and Macy’s shoppers along with Express and Gap customers.
7) Pools & Patios-- Age 55-64. Median HH Income $71,000. They are 5% and 4%.
Formed during the postwar Baby Boom, these parents have evolved into today’s empty nesting couples in older, stable suburban neighborhoods that exploded in the 1950’s & 60’s. A mix of primarily white and Asian college graduates, they work in professional, management and other white collar jobs. Some are already retired. They buy books on tape and have the top index for taking cruises. They buy at Nordstrom, Sears Hardware, Barnes & Noble and the Home Shopping Network. They eat at the Macaroni Grill, Houlihan’s and Boston Market.
8) Urban Achievers—Age <35. Median HH Income $35,409. They are 4% and 4%.
This segment is the first stop for up-and-coming immigrants from Asia, Latin America , Europe and the Mid East. They are a mix of young singles, couples and families, typically college-educated and very ethnically diverse. About 1/3 are foreign born and speak another language other than English. (These percentages are higher in the West Dempster workplace.) They are a contrasting mix of vegans and vegetarians, with beer drinkers and cigar smokers, depending on ethnic origin. They rank high in patronage of convenience stores, Chipotle, quick-serve restaurants and Dunkin’ Donuts. They are frequent foreign travelers, and shop at Victoria’s Secret and Bloomingdale’s, ethnic markets and food warehouses.
Four of these 8 Highest Density Workplace Segments are also in the TOP 10 (highest density) Resident Lifestyle Segments, making them first priority Target Customers for Retail Planning: They are 45-65+ in age.
New Empty Nests; Pools and Patios (both $71K median HH income);
Upper Crust; Money and Brains, both upscale Segments ($89 / $114 median HH income.)
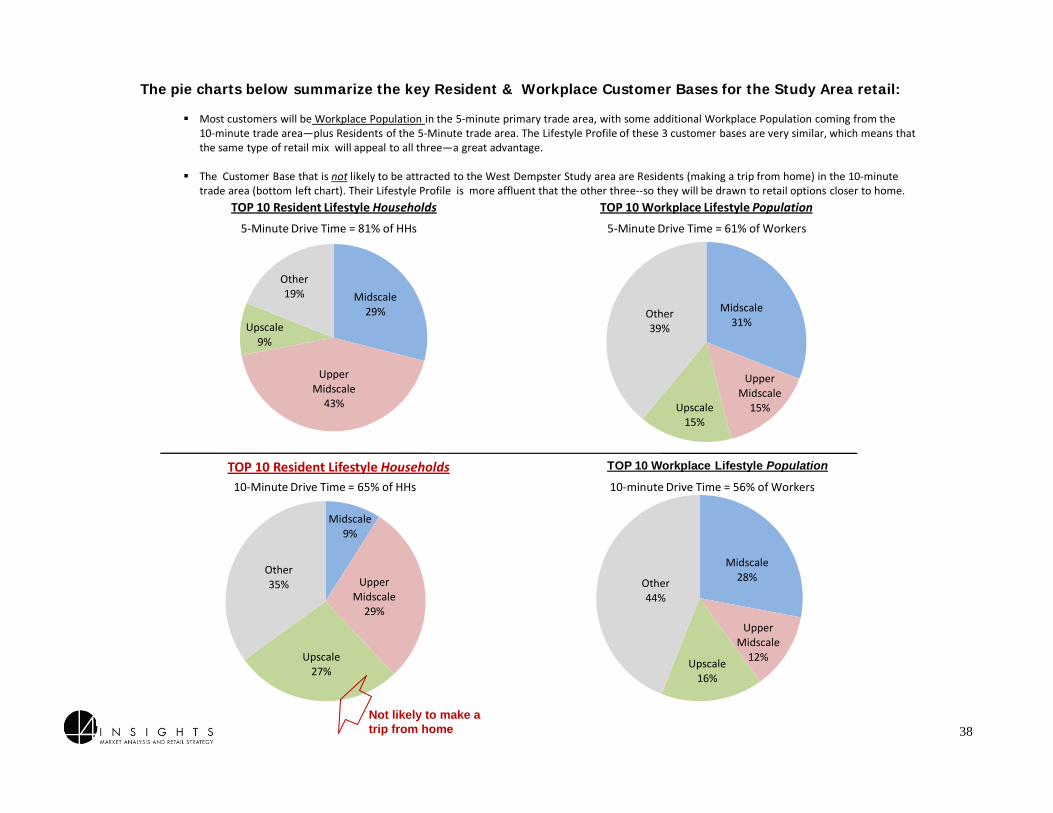
Income definitions here:
Midscale 29%
Upper Midscale 43%
Upscale 9%
Other 19%
Midscale 31%
Upper Midscale 15%Upscale
15%
Other 39%
Midscale 9%
Upper Midscale 29%
Upscale 27%
Other 35%
Midscale 28%
Upper Midscale 12%Upscale
16%
Other 44%
TOP 10 Resident Lifestyle Households TOP 10 Workplace Lifestyle Population
The pie charts below summarize the key Resident & Workplace Customer Bases for the Study Area retail:
Most customers will be Workplace Population in the 5‐minute primary trade area, with some additional Workplace Population coming from the 10‐minute trade area—plus Residents of the 5‐Minute trade area. The Lifestyle Profile of these 3 customer bases are very similar, which means that the same type of retail mix will appeal to all three—a great advantage.
The Customer Base that is not likely to be attracted to the West Dempster Study area are Residents (making a trip from home) in the 10‐minute trade area (bottom left chart). Their Lifestyle Profile is more affluent that the other three‐‐so they will be drawn to retail options closer to home.
5‐Minute Drive Time = 81% of HHs
10‐Minute Drive Time = 65% of HHs
TOP 10 Resident Lifestyle Households
5‐Minute Drive Time = 61% of Workers
10‐minute Drive Time = 56% of Workers
TOP 10 Workplace Lifestyle Population
Not likely to make a trip from home 38

Types of Foodservice That Would Increase Dinner Visits to Downtown Skokie
(Up to 3 selections were permitted)
Sample Size: 666 % of Mentions
Casual restaurant 45%
Ethnic restaurant 28%
Coffee/Bakery 26%
Delicatessen 26%
Fine Dining 24%
Quick Serve (Panera-type) 20%
Pizza 17%
Healthy/salad/vegetarian 17%
Ice Cream / Yogurt 16%
Fast Food 15%
Sandwich Shop 14%
Brew Pub / Tavern 9%
Wine Bar 4%
Juices / Smoothies 3%
Other 3%
NOTE: A complete list of write-in names is available in the Addendum to the 2008 Top 10 Village Lifestyle Segment Survey.
Village TOP 10 Lifestyle Segment Survey--Restaurants That Would Increase Dining Visits to Downtown Skokie Top Write In Mentions
Type of Restaurant (Total Names Mentioned)
# of Mentions
Type of Restaurant(Total Names Mentioned)
# of Mentions
Casual/Family (82 Names)• Sanders • Chili’s • Corner Bakery • Olive Garden • Annie’s • Applebees’
110706060404
Coffee /Bakery (24 Names)• Starbuck’s• Panera• Caribou• Corner Bakery• Sweety Pies• Dunkin Donuts
291510090604
Sandwich Shop (17 Names)• Potbelly • Panera • Subway
121007
Delicatessen (12 Names)• The Bagel• Max & Benny’s• Kaufmanns
272417
Fine Dining (39 Names)• Wildfire• Bonefish• McCormick & Schmidt• Mykonos• Pete Miller’s
0603030302
Pizza (23 Names)• Lou Malnati’s• Giordano’s• Village Inn• Barnaby’s
25080605
Fast Food (19 Names)• McDonald’s• Wendy’s• Burger King• Subway
21130706
Ethnic (63 Names)• Indian• Chinese• Pita Inn• Mexican
09060504
Quick Serve (16 Names)• Panera• Corner Bakery• Chipotle• Pita Inn
54090202
Brew Pub/Tavern (17 Names)• Curragh’s• Hackney’s• Village Inn
050202
Wine Bar—No leader (4 Names) Ice Cream/Yogurt (16 Names)• Dairy Queen•Baskin Robbins•Oberweiss
161108
In 2008, 4Insights conducted a shopping/dining direct mail survey of the TOP 10 Resident Lifestyle Segments within Village boundaries. 734 surveys were tabulated and 2,000 write in responses analyzed. Since 9 of the TOP 10 (highest density) Lifestyle Segments in the West Dempster 5-Minute drive time are the same as in the Village—their dining preferences expressed in that Survey should be very similar and useful for retail planning in the West Dempster Study Area.
The average frequency of dining out for lunch was 1.5 times per week. Average spending was $7.92 for lunch, $13-14 for a casual dinner with table service. Average spending for a social occasion dinner was $24 for one adult without drink or tip. Most requested restaurant format was casual table service dining.
7.0 Consumer Survey
39
8.0 Consumer Demand
The Consumer Demand report* estimates that a retail opportunity exists among select categories suitable for the Dempster Street corridor up to the 1.5-mile radius, however, it is not a reliable indicator for the reasons explained below.
Consumer Demand reports are used by some retailers and brokers to determine the opportunity for new retail in a given geographic trade area. The “Retail Opportunity,” or “Gap” as stated in these reports is simply the calculated difference between “demand” and “supply” captured within the defined geographic area. This report can be misleading, especially in retail areas that depend on customer bases beyond residents, such as Workplace, Daytime and Transit-oriented Populations—which is the case with the West Dempster Study Area.
• The “Demand” portion of the equation is the dollar amount that residents only indicate that they spend for specific categories in the Bureau of Labor Statistics Consumer Expenditure Survey. These are self-reported, estimated expenditures based on recall, not on any tax reports. Not included in the Consumer Expenditures Survey is spending by other non-resident customer bases: Workplace, Daytime or Commuter/Motorist populations. Therefore, the Consumer Demand report underestimates the total demand potential for the West Dempster Study Area.
• The “Supply” column in the Consumer Demand report, in contrast, is based on actual sales, because it is based on actual sales tax filings by retail businesses. Therefore, these actual sales numbers include BOTH resident and non-resident customer sales within a defined geographic area, including the Workplace and Daytime Populations. The “supply” side, of the Consumer Demand report, then, appears larger in proportion to the “demand” side. The result is that the retail opportunity appears to be less than it actually is.
The other reason that the Consumer Demand report is an unreliable predictor of retail potential is that it does not factor in other key elements that are crucial to retail success—including the location and strength of competitors; access and parking issues; configuration and appearance of the site; and the strength of current tenants.
40
*Consumer Demand reports are sold by many syndicated data companies, including the 2008 figures quoted in this report from Neilsen-Claritas, Inc. They are derived from a compilation of two different government reports: (1) the U.S. Bureau of Labor Statistics’ national Consumer Expenditure Survey ,in which consumers are asked to estimate their spending in specific categories of goods and services, and (2) State business sales tax records. These sales taxes are reported according to the NAICS business classification system. These categories are too general for accurate retail planning in small trade areas such as the West Dempster Corridor.
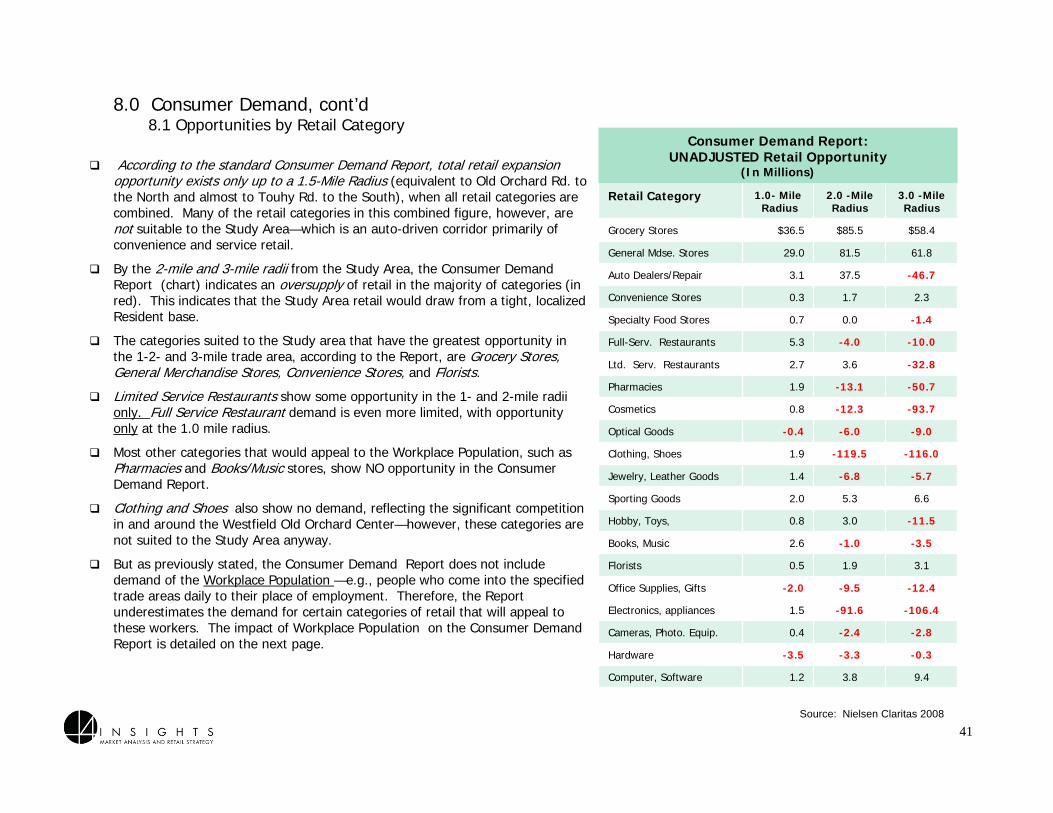
Consumer Demand Report:UNADJUSTED Retail Opportunity
(In Millions)
Retail Category 1.0- MileRadius
2.0 -Mile Radius
3.0 -Mile Radius
Grocery Stores $36.5 $85.5 $58.4
General Mdse. Stores 29.0 81.5 61.8
Auto Dealers/Repair 3.1 37.5 -46.7
Convenience Stores 0.3 1.7 2.3
Specialty Food Stores 0.7 0.0 -1.4
Full-Serv. Restaurants 5.3 -4.0 -10.0
Ltd. Serv. Restaurants 2.7 3.6 -32.8
Pharmacies 1.9 -13.1 -50.7
Cosmetics 0.8 -12.3 -93.7
Optical Goods -0.4 -6.0 -9.0
Clothing, Shoes 1.9 -119.5 -116.0
Jewelry, Leather Goods 1.4 -6.8 -5.7
Sporting Goods 2.0 5.3 6.6
Hobby, Toys, 0.8 3.0 -11.5
Books, Music 2.6 -1.0 -3.5
Florists 0.5 1.9 3.1
Office Supplies, Gifts -2.0 -9.5 -12.4
Electronics, appliances 1.5 -91.6 -106.4
Cameras, Photo. Equip. 0.4 -2.4 -2.8
Hardware -3.5 -3.3 -0.3
Computer, Software 1.2 3.8 9.4
8.0 Consumer Demand, cont’d8.1 Opportunities by Retail Category
According to the standard Consumer Demand Report, total retail expansion opportunity exists only up to a 1.5-Mile Radius (equivalent to Old Orchard Rd. to the North and almost to Touhy Rd. to the South), when all retail categories are combined. Many of the retail categories in this combined figure, however, are not suitable to the Study Area—which is an auto-driven corridor primarily of convenience and service retail.
By the 2-mile and 3-mile radii from the Study Area, the Consumer Demand Report (chart) indicates an oversupply of retail in the majority of categories (in red). This indicates that the Study Area retail would draw from a tight, localized Resident base.
The categories suited to the Study area that have the greatest opportunity in the 1-2- and 3-mile trade area, according to the Report, are Grocery Stores, General Merchandise Stores, Convenience Stores, and Florists.
Limited Service Restaurants show some opportunity in the 1- and 2-mile radii only. Full Service Restaurant demand is even more limited, with opportunity only at the 1.0 mile radius.
Most other categories that would appeal to the Workplace Population, such as Pharmacies and Books/Music stores, show NO opportunity in the Consumer Demand Report.
Clothing and Shoes also show no demand, reflecting the significant competition in and around the Westfield Old Orchard Center—however, these categories are not suited to the Study Area anyway.
But as previously stated, the Consumer Demand Report does not include demand of the Workplace Population —e.g., people who come into the specified trade areas daily to their place of employment. Therefore, the Report underestimates the demand for certain categories of retail that will appeal to these workers. The impact of Workplace Population on the Consumer Demand Report is detailed on the next page.
Source: Nielsen Claritas 2008
41
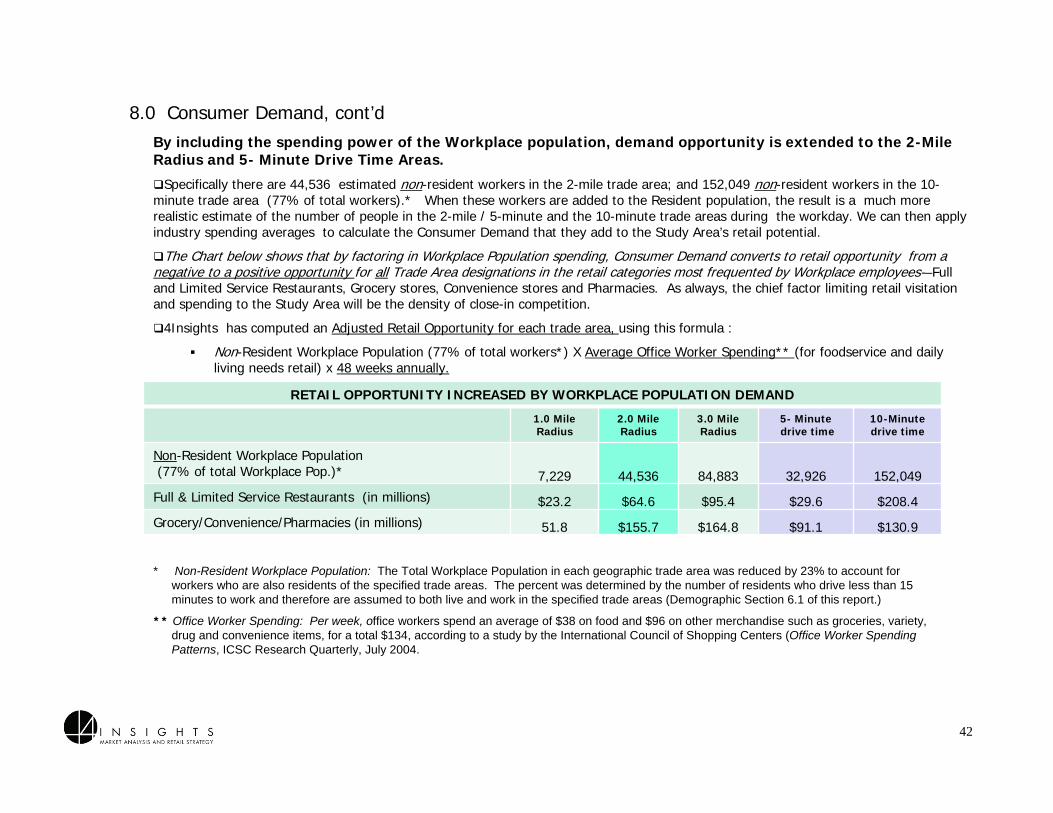
8.0 Consumer Demand, cont’dBy including the spending power of the Workplace population, demand opportunity is extended to the 2-Mile Radius and 5- Minute Drive Time Areas.
Specifically there are 44,536 estimated non-resident workers in the 2-mile trade area; and 152,049 non-resident workers in the 10-minute trade area (77% of total workers).* When these workers are added to the Resident population, the result is a much more realistic estimate of the number of people in the 2-mile / 5-minute and the 10-minute trade areas during the workday. We can then apply industry spending averages to calculate the Consumer Demand that they add to the Study Area’s retail potential.
The Chart below shows that by factoring in Workplace Population spending, Consumer Demand converts to retail opportunity from anegative to a positive opportunity for all Trade Area designations in the retail categories most frequented by Workplace employees-–Full and Limited Service Restaurants, Grocery stores, Convenience stores and Pharmacies. As always, the chief factor limiting retail visitation and spending to the Study Area will be the density of close-in competition.
4Insights has computed an Adjusted Retail Opportunity for each trade area, using this formula :
Non-Resident Workplace Population (77% of total workers*) X Average Office Worker Spending** (for foodservice and daily living needs retail) x 48 weeks annually.
42
RETAIL OPPORTUNITY INCREASED BY WORKPLACE POPULATION DEMAND
1.0 Mile Radius
2.0 Mile Radius
3.0 Mile Radius
5- Minutedrive time
10-Minute drive time
Non-Resident Workplace Population(77% of total Workplace Pop.)* 7,229 44,536 84,883 32,926 152,049
Full & Limited Service Restaurants (in millions) $23.2 $64.6 $95.4 $29.6 $208.4
Grocery/Convenience/Pharmacies (in millions) 51.8 $155.7 $164.8 $91.1 $130.9
* Non-Resident Workplace Population: The Total Workplace Population in each geographic trade area was reduced by 23% to account for workers who are also residents of the specified trade areas. The percent was determined by the number of residents who drive less than 15 minutes to work and therefore are assumed to both live and work in the specified trade areas (Demographic Section 6.1 of this report.)
* * Office Worker Spending: Per week, office workers spend an average of $38 on food and $96 on other merchandise such as groceries, variety, drug and convenience items, for a total $134, according to a study by the International Council of Shopping Centers (Office Worker Spending Patterns, ICSC Research Quarterly, July 2004.
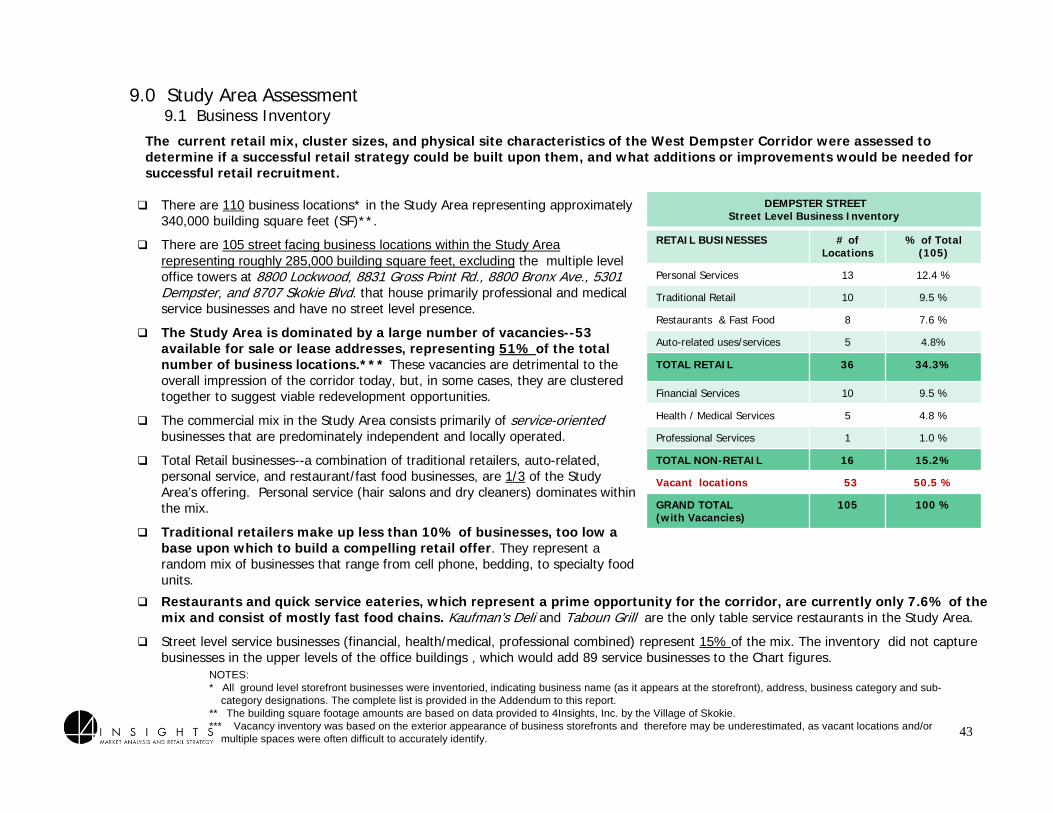
43
9.0 Study Area Assessment 9.1 Business Inventory
There are 110 business locations* in the Study Area representing approximately 340,000 building square feet (SF)**.
There are 105 street facing business locations within the Study Area representing roughly 285,000 building square feet, excluding the multiple level office towers at 8800 Lockwood, 8831 Gross Point Rd., 8800 Bronx Ave., 5301 Dempster, and 8707 Skokie Blvd. that house primarily professional and medical service businesses and have no street level presence.
The Study Area is dominated by a large number of vacancies--53 available for sale or lease addresses, representing 51% of the total number of business locations.*** These vacancies are detrimental to the overall impression of the corridor today, but, in some cases, they are clustered together to suggest viable redevelopment opportunities.
The commercial mix in the Study Area consists primarily of service-oriented businesses that are predominately independent and locally operated.
Total Retail businesses--a combination of traditional retailers, auto-related, personal service, and restaurant/fast food businesses, are 1/3 of the Study Area’s offering. Personal service (hair salons and dry cleaners) dominates within the mix.
Traditional retailers make up less than 10% of businesses, too low a base upon which to build a compelling retail offer. They represent a random mix of businesses that range from cell phone, bedding, to specialty food units.
DEMPSTER STREETStreet Level Business Inventory
RETAIL BUSINESSES # of Locations
% of Total(105)
Personal Services 13 12.4 %
Traditional Retail 10 9.5 %
Restaurants & Fast Food 8 7.6 %
Auto-related uses/services 5 4.8%
TOTAL RETAIL 36 34.3%
Financial Services 10 9.5 %
Health / Medical Services 5 4.8 %
Professional Services 1 1.0 %
TOTAL NON-RETAIL 16 15.2%
Vacant locations 53 50.5 %
GRAND TOTAL (with Vacancies)
105 100 %
The current retail mix, cluster sizes, and physical site characteristics of the West Dempster Corridor were assessed to determine if a successful retail strategy could be built upon them, and what additions or improvements would be needed for successful retail recruitment.
NOTES: * All ground level storefront businesses were inventoried, indicating business name (as it appears at the storefront), address, business category and sub-
category designations. The complete list is provided in the Addendum to this report. ** The building square footage amounts are based on data provided to 4Insights, Inc. by the Village of Skokie.*** Vacancy inventory was based on the exterior appearance of business storefronts and therefore may be underestimated, as vacant locations and/or
multiple spaces were often difficult to accurately identify.
Restaurants and quick service eateries, which represent a prime opportunity for the corridor, are currently only 7.6% of the mix and consist of mostly fast food chains. Kaufman’s Deli and Taboun Grill are the only table service restaurants in the Study Area.
Street level service businesses (financial, health/medical, professional combined) represent 15% of the mix. The inventory did not capture businesses in the upper levels of the office buildings , which would add 89 service businesses to the Chart figures.
44
9.0 Study Area Assessment9.2 Physical Characteristics
The location and physical characteristics of Dempster Street have a major impact on its retail strategy.
Site Situation and Access:
The Village of Skokie is a first ring suburb of approximately 10.5 square miles located northwest of the City of Chicago. Major roadways accessing the Village are Skokie Blvd. (US-41) and Dempster Street (IL-58). Dempster and Touhy have exits to I-94 (Edens Expressway) and to I-294 (North-South Tollway).
The Village of Skokie is bordered by the upscale Villages of Glenview and Wilmette to the north; the Village of Lincolnwood and the City of Chicago to the south; the Villages of Niles and Morton Grove to the west; and the city of Evanston to the east. With the exception of Evanston and the City of Chicago, all are smaller in population size.
The West Dempster Street Study Area is located within the northern portion of the Village. The Study Area is comprised primarily of properties that face the north and south sides Dempster Street, bookended by Interstate-94 to the East and Skokie Boulevard to the West.
Dempster Street serves as a major east-west arterial with East and Westbound enter and exit from Interstate-94 and connects to Skokie Boulevard which functions a major north/south arterial through the Village of Skokie.
The Skokie Swift CTA Station is located in the heart of the Study Area and its ridership serves as a major customer base for the corridor. Expansion plans have been in development but no conclusions or final timetable has been established, therefore, the market assessment and proposed retail strategy will be based on the corridors existing configuration and available space.
Dempster Street’s Site Assets:
1.Large cluster of vacancies located near the CTA station present significant opportunity for redevelopment that could dramatically enhance the retail offer in the corridor and change the overall character and significance of the street.
2.Dempster Street functions as a major east/west arterial with one of the Village’s three exits (Dempster St., Touhy Ave. & Golf Rd. ) on/off Interstate 94.
3.The corridor maintains strong Average Daily Traffic counts (roughly 30,100 ADTs at the Study Area’s midpoint) that are lower than those of Touhy Ave. (43,100 ADTs), but slightly better than Golf Rd. (29,400 ADTs). A compelling retail cluster has the potential to capitalize on the significant traffic (175,000 ADTs) that I-94 could deliver to the Study Area.
4.The successful redeveloped Gross Point Crossing project serves as a good example for other potential redevelopment efforts and can act as a catalyst project tor developing a compelling retail cluster surrounding the train station, extending to Bronx Ave., the center point of the Study Area.

1. High traffic roadway limits pedestrian movement and cross shopping.
• Traffic levels are high and fast-moving, discouraging pedestrian crossing to retail.
• Boulevard partitions are not conducive to easy, safe cross shopping and deter walkability.
• Because of its situation on the Dempster corridor, the Study Area will remain a single-stop, vehicle-oriented retail district.
2. No contiguous flow of retail due to large number of vacancies and limited number of retailers.
• Traditional retailers, excluding automotive related businesses, represent less than 10% of the total businesses in the Study area, and are throughout the corridor, not in clusters. The lack of synergy provided by adjacent strong co-tenants make the Study Area a desirable location for new recruitment.
• The large number of current vacancies interrupts retail flow, creating large gaps in the retail flow and projecting an impression that the Study Area, or Dempster corridor at large, is not a place where retail can succeed.
3. Much of the retail is dated-looking and building stock is old, with much of the street requiring redevelopment.
• Building stock throughout the corridor is relatively old, in poor condition, and in out-dated configurations that do not meet the aesthetic or physical requirements of today’s retailers. Property depths appear to be too shallow, limiting building size potential and adequate visible parking options.
• The dimensions of many properties appear to be too narrow to accommodate sufficient parking and adequate spaces for potential new tenants.
• Storefronts in many cases are poorly maintained and uninviting. They do not convey professional presentation standards and this detracts from the overall appearance of the corridor. Storefront signs are of mixed quality.
4. Too few traffic generators at present to attract large numbers of consumers to the Study Area.
• There are no major retail anchors currently in the Study Area to draw consumers to the Study Area.
• Current traffic generators to the Study Area include: the CTA station, Kaufmans’ Deli, which has wide appeal and regional draw, Walton Chrysler when it reopens, 5 full-service banks, and 5 professional, multi-level office buildings that house office workers and attract daytime non-residents for non-retail purposes.
9.0 Study Area Assessment9.2 Physical Characteristics, cont’d
Dempster Street Site Challenges for Retail Expansion:
45
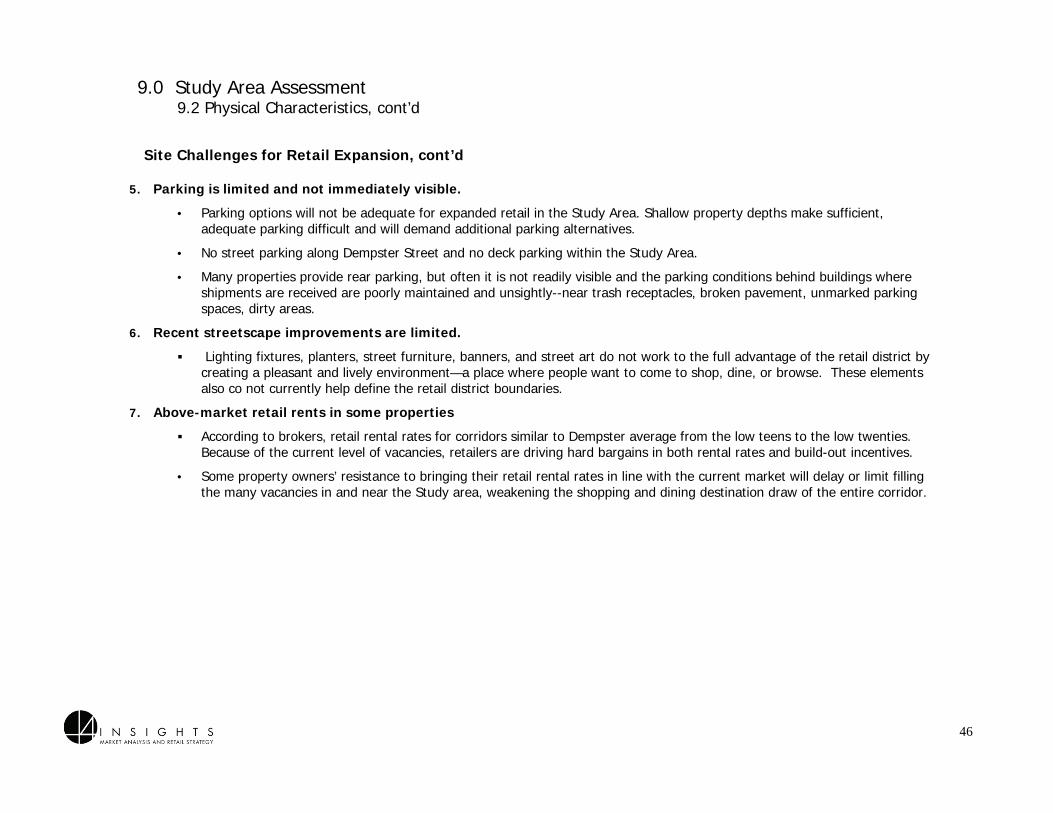
5. Parking is limited and not immediately visible.
• Parking options will not be adequate for expanded retail in the Study Area. Shallow property depths make sufficient, adequate parking difficult and will demand additional parking alternatives.
• No street parking along Dempster Street and no deck parking within the Study Area.
• Many properties provide rear parking, but often it is not readily visible and the parking conditions behind buildings where shipments are received are poorly maintained and unsightly--near trash receptacles, broken pavement, unmarked parking spaces, dirty areas.
6. Recent streetscape improvements are limited.
Lighting fixtures, planters, street furniture, banners, and street art do not work to the full advantage of the retail district by creating a pleasant and lively environment—a place where people want to come to shop, dine, or browse. These elements also co not currently help define the retail district boundaries.
7. Above-market retail rents in some properties
According to brokers, retail rental rates for corridors similar to Dempster average from the low teens to the low twenties. Because of the current level of vacancies, retailers are driving hard bargains in both rental rates and build-out incentives.
• Some property owners’ resistance to bringing their retail rental rates in line with the current market will delay or limit filling the many vacancies in and near the Study area, weakening the shopping and dining destination draw of the entire corridor.
9.0 Study Area Assessment9.2 Physical Characteristics, cont’d
Site Challenges for Retail Expansion, cont’d
46
47
10.0 Retail Competition 10.1 Overview
4Insights’ On-Site Competitive Assessment Process
The Competitive Assessment identifies the major retail competitors who will be vying for the same Customer Bases targeted for for the West Dempster Study Area.
The location, retail offering, and access relative to these Target Customers, will determine the opportunities and the final Retail Strategy for the Study Area.
The 4Insights Competitive Assessment covered the primary and secondary trade areas delineated in Section 5.0 of this report, from the center point of Bronx Avenue and Dempster Street.
• Primary Trade Area: 2-mile radius and 5-minute drive time--drawing 50% of customers.
• Secondary Trade Area: 5 miles or 10-minutes drive time--drawing an additional 20% of customers.
The On-Site Competitive Analysis Covered:
Significant retail centers that target the Study Area’s Target Customer Bases, and could potentially impact the Study Area.
Major retail clusters or “hubs” that represent key shopping destinations for primary shopping needs.
Individual retailers, especially high profile big box, mass merchandisers, supermarket chains and department stores, as well as significant convenience and specialty stores that are consumer magnets.
Large clusters of notable fast food and sit down restaurants that are dining destinations for both targeted Workplace and Resident populations.
Store mix within each retail venue to determine price points, merchandise styling trends, brand preferences and overall taste levels.
Other nearby Corridor retail areas, Touhy Ave., Golf Rd., and Devon Ave. in particular, that offer the same type of retail and foodservice, and share similar physical characteristics that would directly compete with the Study Area.
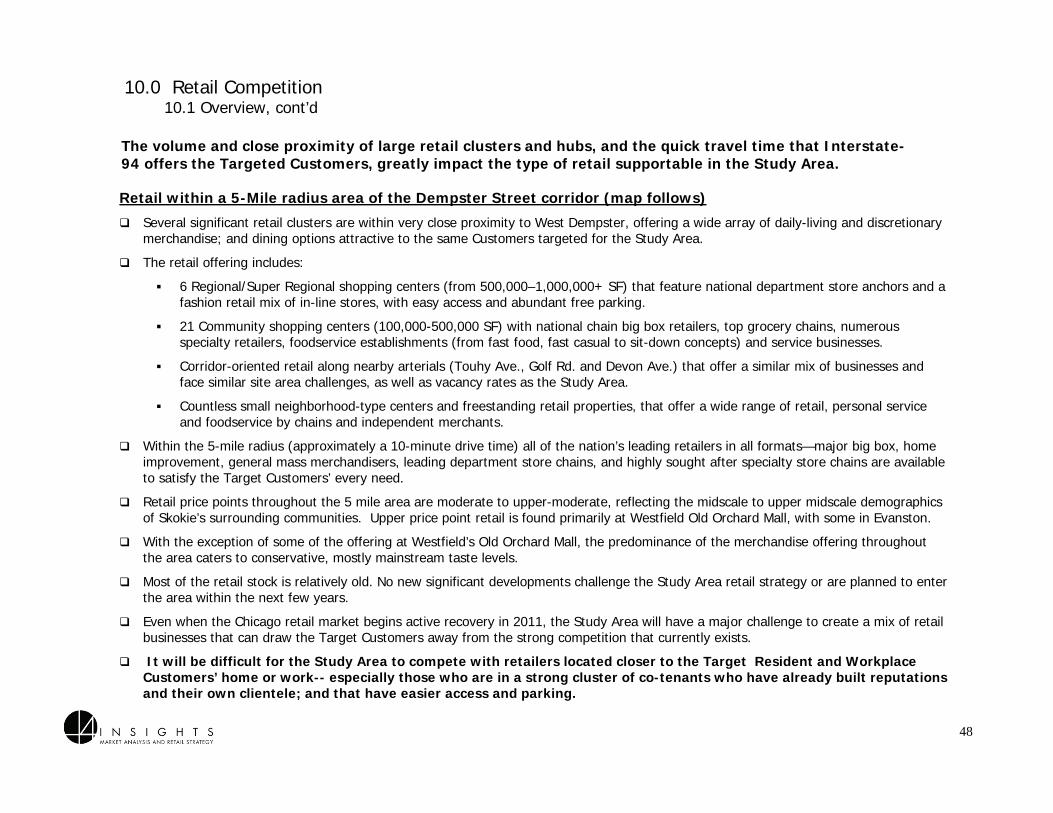
48
Retail within a 5-Mile radius area of the Dempster Street corridor (map follows)
Several significant retail clusters are within very close proximity to West Dempster, offering a wide array of daily-living and discretionary merchandise; and dining options attractive to the same Customers targeted for the Study Area.
The retail offering includes:
6 Regional/Super Regional shopping centers (from 500,000–1,000,000+ SF) that feature national department store anchors and a fashion retail mix of in-line stores, with easy access and abundant free parking.
21 Community shopping centers (100,000-500,000 SF) with national chain big box retailers, top grocery chains, numerous specialty retailers, foodservice establishments (from fast food, fast casual to sit-down concepts) and service businesses.
Corridor-oriented retail along nearby arterials (Touhy Ave., Golf Rd. and Devon Ave.) that offer a similar mix of businesses and face similar site area challenges, as well as vacancy rates as the Study Area.
Countless small neighborhood-type centers and freestanding retail properties, that offer a wide range of retail, personal service and foodservice by chains and independent merchants.
Within the 5-mile radius (approximately a 10-minute drive time) all of the nation’s leading retailers in all formats—major big box, home improvement, general mass merchandisers, leading department store chains, and highly sought after specialty store chains are available to satisfy the Target Customers’ every need.
Retail price points throughout the 5 mile area are moderate to upper-moderate, reflecting the midscale to upper midscale demographicsof Skokie’s surrounding communities. Upper price point retail is found primarily at Westfield Old Orchard Mall, with some in Evanston.
With the exception of some of the offering at Westfield’s Old Orchard Mall, the predominance of the merchandise offering throughout the area caters to conservative, mostly mainstream taste levels.
Most of the retail stock is relatively old. No new significant developments challenge the Study Area retail strategy or are planned to enter the area within the next few years.
Even when the Chicago retail market begins active recovery in 2011, the Study Area will have a major challenge to create a mix of retail businesses that can draw the Target Customers away from the strong competition that currently exists.
It will be difficult for the Study Area to compete with retailers located closer to the Target Resident and Workplace Customers’ home or work-- especially those who are in a strong cluster of co-tenants who have already built reputations and their own clientele; and that have easier access and parking.
The volume and close proximity of large retail clusters and hubs, and the quick travel time that Interstate-94 offers the Targeted Customers, greatly impact the type of retail supportable in the Study Area.
10.0 Retail Competition10.1 Overview, cont’d
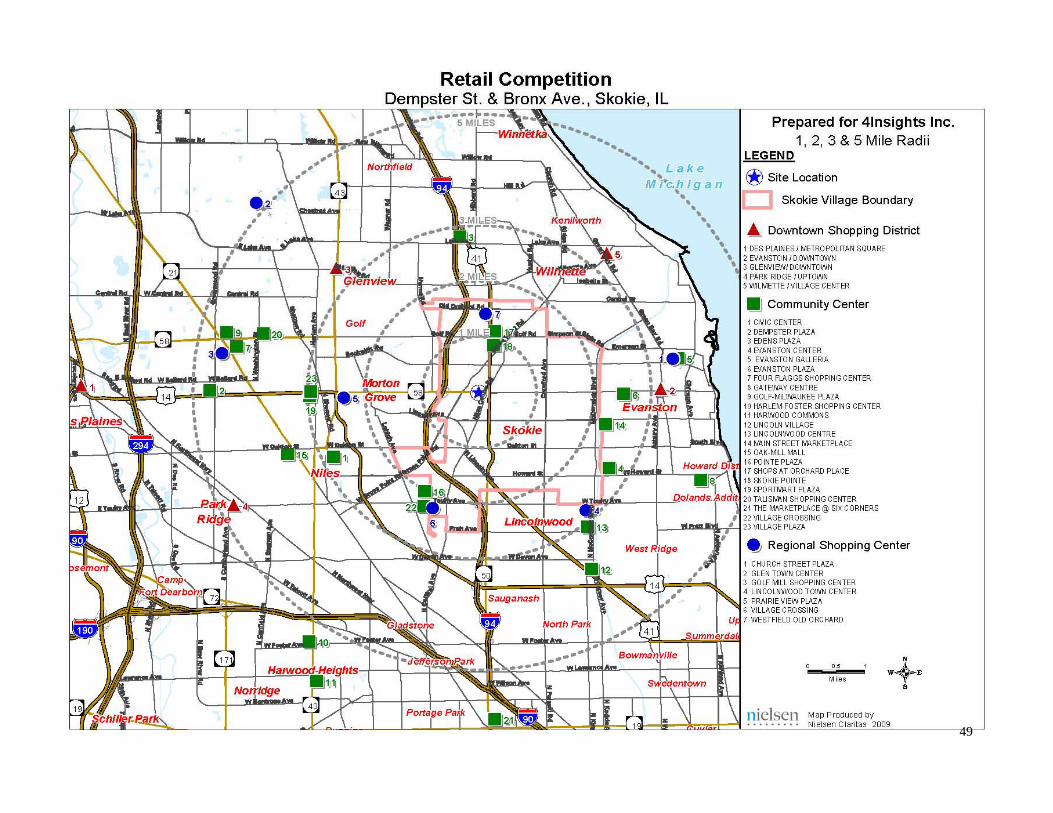
49
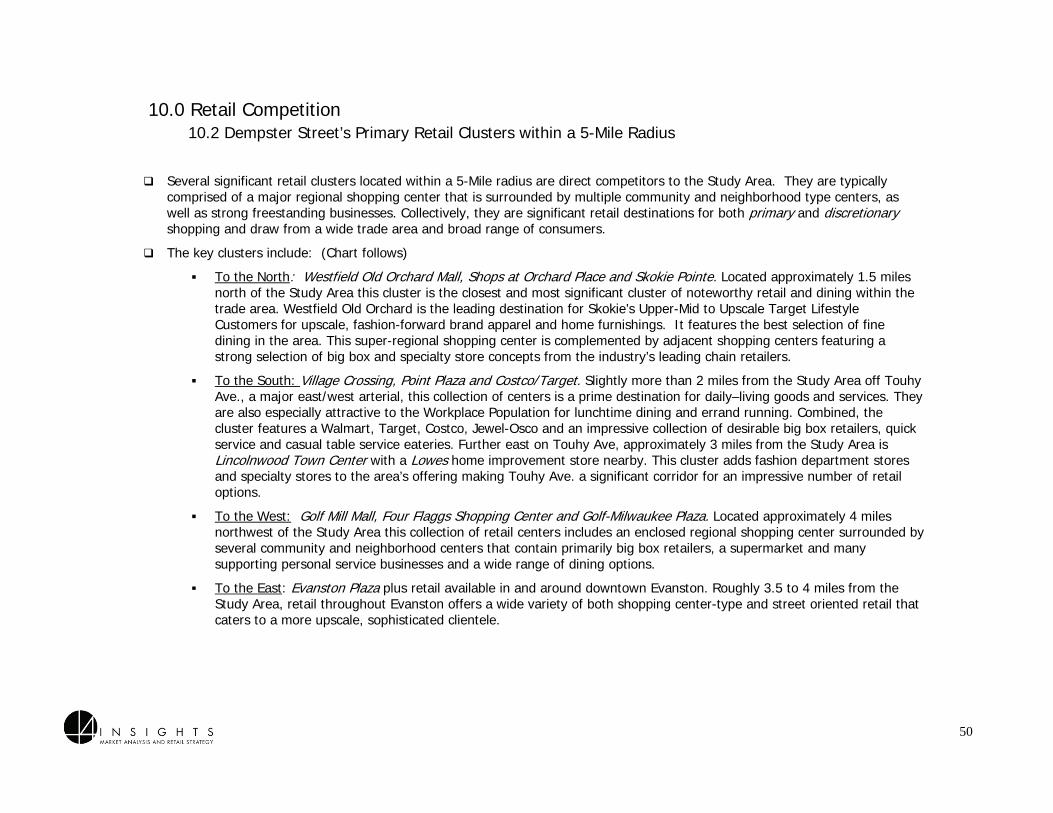
50
10.0 Retail Competition10.2 Dempster Street’s Primary Retail Clusters within a 5-Mile Radius
Several significant retail clusters located within a 5-Mile radius are direct competitors to the Study Area. They are typically comprised of a major regional shopping center that is surrounded by multiple community and neighborhood type centers, as well as strong freestanding businesses. Collectively, they are significant retail destinations for both primary and discretionary shopping and draw from a wide trade area and broad range of consumers.
The key clusters include: (Chart follows)
To the North: Westfield Old Orchard Mall, Shops at Orchard Place and Skokie Pointe. Located approximately 1.5 miles north of the Study Area this cluster is the closest and most significant cluster of noteworthy retail and dining within the trade area. Westfield Old Orchard is the leading destination for Skokie’s Upper-Mid to Upscale Target Lifestyle Customers for upscale, fashion-forward brand apparel and home furnishings. It features the best selection of fine dining in the area. This super-regional shopping center is complemented by adjacent shopping centers featuring a strong selection of big box and specialty store concepts from the industry’s leading chain retailers.
To the South: Village Crossing, Point Plaza and Costco/Target. Slightly more than 2 miles from the Study Area off Touhy Ave., a major east/west arterial, this collection of centers is a prime destination for daily–living goods and services. They are also especially attractive to the Workplace Population for lunchtime dining and errand running. Combined, the cluster features a Walmart, Target, Costco, Jewel-Osco and an impressive collection of desirable big box retailers, quick service and casual table service eateries. Further east on Touhy Ave, approximately 3 miles from the Study Area is Lincolnwood Town Center with a Lowes home improvement store nearby. This cluster adds fashion department stores and specialty stores to the area’s offering making Touhy Ave. a significant corridor for an impressive number of retail options.
To the West: Golf Mill Mall, Four Flaggs Shopping Center and Golf-Milwaukee Plaza. Located approximately 4 miles northwest of the Study Area this collection of retail centers includes an enclosed regional shopping center surrounded by several community and neighborhood centers that contain primarily big box retailers, a supermarket and many supporting personal service businesses and a wide range of dining options.
To the East: Evanston Plaza plus retail available in and around downtown Evanston. Roughly 3.5 to 4 miles from the Study Area, retail throughout Evanston offers a wide variety of both shopping center-type and street oriented retail that caters to a more upscale, sophisticated clientele.

51
10.0 Retail Competition10.2 Dempster Street’s Primary Retail Clusters within a 5-Mile Radius
Cluster Anchor Stores Description
Northern ClusterOld Orchard
Macy’s, Nordstrom, Lord & Taylor, Bloomingdales. 1,727,,000 SF, 120 stores
Open-air center offering most comprehensive mix of mid-price to luxury brand home and apparel retailers addressing strong family, Baby Boomer to Generation X and Y age groups
Shops at Orchard Place Best Buy, Petco, DSW, Pier 1, 165,000 SF, 16 stores
Across from Old Orchard Mall. Big box mix with strong mid-scale to upscale specialty chains and eateries – mostly national chain concepts.
Skokie Pointe/ Fashion Sq. Old Navy, Jewel-Osco, Marshalls, 219,000 SF, 20 stores
Large older style strip convenience oriented, grocery store anchored shopping center.
Southern ClusterVillage Crossing
Jewel-Osco, Dick’s S. G. Petland, Best Buy, Office Max. 460,262 SF, 51 stores
Expansive community center with strong mix of convenience-oriented and specialty big box stores and eateries.
Pointe Plaza Walmart, Fresh Farms Int’l Market. 325,700 SF, 30 stores
Large center with some distressed spaces filled with big box and convenience based stores. Contains the only Walmart within 3 miles.
Costco/Target Costco, Target only Only Costco location within 5 mile radius. Closest Target to Study Area.
Lincolnwood Town Ctr. Carson Pirie Scott, Kohl’s, Old Navy with Lowes nearby. 421,863 SF, 94 stores
Moderate, mainstream enclosed mall featuring national chain stores targeting midscale consumers. Store mix targets teens and families.
Western ClusterGolf Mill Mall
JCPenney, Target, Sears, Kohl’s. 931,000 SF, 120 stores
Enclosed regional mall catering to mid-scale consumers.
Four Flaggs S.C. Jewel Osco, Joann Fabrics, Office Depot. 364,000 SF, 29 stores
Grocery store anchored convenience community center.
Golf Milwaukee Plaza Walmart, Farmers Best Market. 250,000 SF, 28 stores
Community strip type center catering largely to an Asian customer base.
Eastern Cluster
Evanston Plaza Dominick’s, AJ Wright, Citi Trends. 204,000 SF, 33 stores
Large convenience oriented center with a number of vacancies.
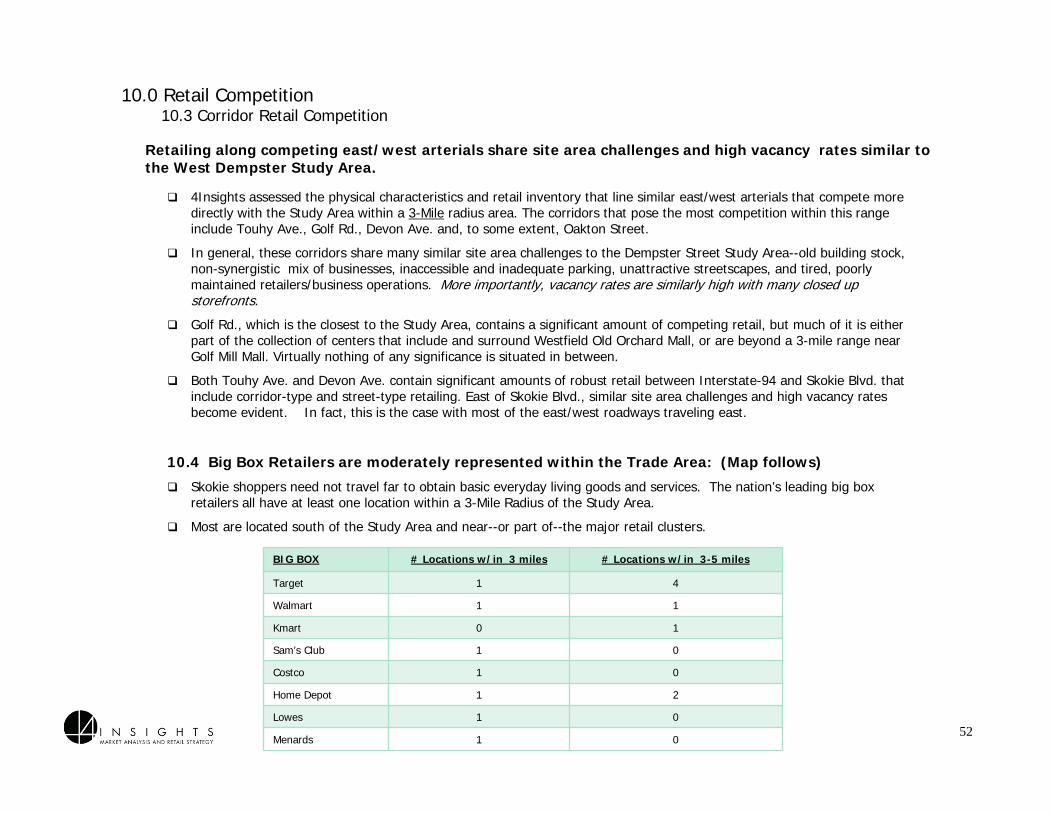
52
10.0 Retail Competition10.3 Corridor Retail Competition
Retailing along competing east/west arterials share site area challenges and high vacancy rates similar to the West Dempster Study Area.
4Insights assessed the physical characteristics and retail inventory that line similar east/west arterials that compete more directly with the Study Area within a 3-Mile radius area. The corridors that pose the most competition within this range include Touhy Ave., Golf Rd., Devon Ave. and, to some extent, Oakton Street.
In general, these corridors share many similar site area challenges to the Dempster Street Study Area--old building stock, non-synergistic mix of businesses, inaccessible and inadequate parking, unattractive streetscapes, and tired, poorly maintained retailers/business operations. More importantly, vacancy rates are similarly high with many closed up storefronts.
Golf Rd., which is the closest to the Study Area, contains a significant amount of competing retail, but much of it is either part of the collection of centers that include and surround Westfield Old Orchard Mall, or are beyond a 3-mile range near Golf Mill Mall. Virtually nothing of any significance is situated in between.
Both Touhy Ave. and Devon Ave. contain significant amounts of robust retail between Interstate-94 and Skokie Blvd. that include corridor-type and street-type retailing. East of Skokie Blvd., similar site area challenges and high vacancy rates become evident. In fact, this is the case with most of the east/west roadways traveling east.
10.4 Big Box Retailers are moderately represented within the Trade Area: (Map follows)
Skokie shoppers need not travel far to obtain basic everyday living goods and services. The nation’s leading big box retailers all have at least one location within a 3-Mile Radius of the Study Area.
Most are located south of the Study Area and near--or part of--the major retail clusters.
BIG BOX # Locations w/in 3 miles # Locations w/in 3-5 miles
Target 1 4
Walmart 1 1
Kmart 0 1
Sam’s Club 1 0
Costco 1 0
Home Depot 1 2
Lowes 1 0
Menards 1 0
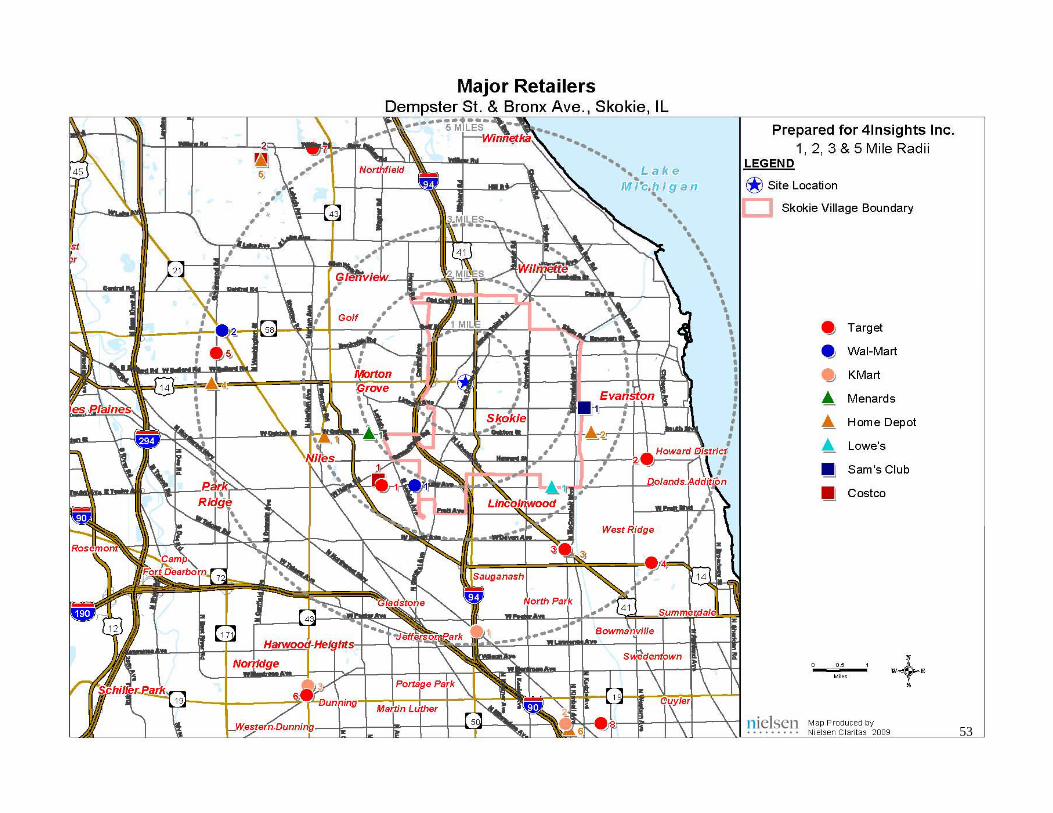
53
54
10.0 Retail Competition10.5 Convenience Retailers
Convenience Retail--Grocery and Drug stores (Maps Follow)
Grocery stores, whether they are the chief anchors or just part of the tenant mix of convenience-oriented centers, are not abundant throughout the 3-Mile radius area. Only a couple of large supermarket chains are located within a 1-2 mile radius the Study Area for residents to choose from. The Consumer Demand Report (even without the adjustment for added Workplace Population) sites additional opportunity for more of these units.
A wide variety of independent grocers dominate the Grocery category in the 3-mile trade area. They are mostly small establishments that cater to the ethnic clientele of the trade area. The most notable independents include Fresh Farms International Market and Market Place on Oakton.
Leading supermarket chains in the area include Dominick’s with 3 locations, Jewel/Osco with 3 units, and 2 Aldi units with a third soon to open.
Pharmacies are well represented within close proximity to the West Dempster Study Area. Six Walgreens and CVS units are located within one mile of the Study Area, limiting the opportunity for any additional units.
Opportunity exists in the Grocery category within the trade area.
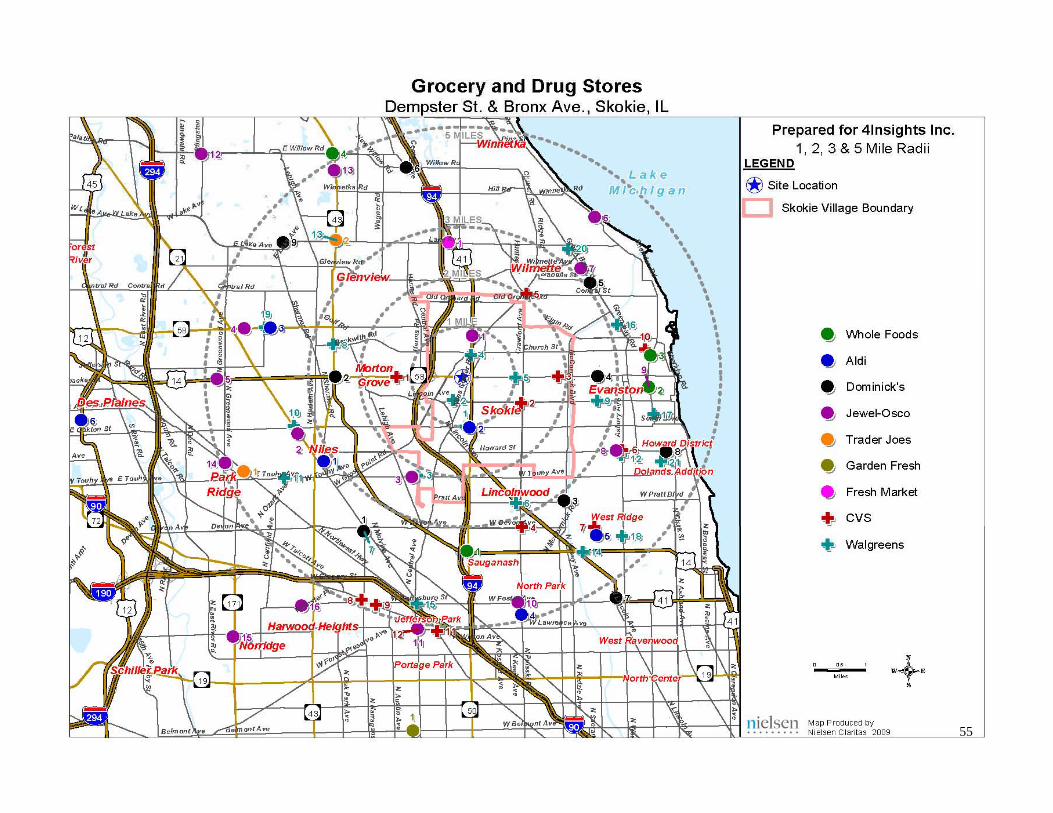
55
56
11.0 Retail Strategy
Redevelopment of the vacated sites adjacent to and north of the CTA Station are key to revitalizing the Study Area.
The Skokie Swift CTA Station/Bus Terminal is the focal point and magnet that draws both residents and non-residents to the Study Area. Though expansion plans are under development that would significantly increase the draw to the area, no concrete plans with short term completion dates are in place at this time.
The retail strategy recommendations in this report assume that no expansion plans will take place within the 3-5 year timeframe of this study, and therefore are based on the Study Area’s current configuration.
The property sites that are both adjacent to and across Dempster St. from the station are the best potential retail development opportunities, because of (1) the current significant vacancies; and (2) the Village’s acquisition of specific properties. Combined with the already successfully redeveloped Gross Point Crossing shopping center, these sites form a retail cluster of sufficient size that could attract the Customer Bases outlined in this Study, e.g. Dempster transient Motorists, Residents , Workplace and Daytime Populations, and commuters from the CTA station.
The strength of this future Study Area retail cluster will depend on the quality and synergy of tenants recruited, and the ease of accessibility for pedestrians to visit the foodservice and retailers without moving their cars.
Three properties are key to initiating a successful revitalization of the Study Area are indicated in order of development priority, by color code on the study area map that follows.
• The Dempster Swift Shopping Center adjacent to the CTA station, along with the vacated building to the rear at 8734 Bronx. Plus, the adjacent block of buildings that run from Bronx Ave. to Niles Center Rd.
• Properties on the north side of Dempster Street traveling east from the train tracks to McDonald’s at Niles Center Road, including the buildings along Bronx Ave. (Addresses: 8800, 8812, 8816 and 8820 Bronx Ave.)
• Properties on the south side of Dempster Street between Gross Point Rd. and LeClaire Ave. that are a mix of vacated and occupied spaces, plus a few small, undeveloped land parcels.
These combined properties in the heart of the Study Area are the contiguous core needed to dramatically improve its retail potential. Connectivity, visibility, easy access and parking are crucial to success. Strategic redevelopment here, with strong initial ‘anchors’ and a unique mix of established retailers will create a destination in the minds of the Targeted Customer Bases as well as establish the quality level and identity for further tenant recruitment.
The Retail Strategy focuses on the needs of the Workplace, Daytime and Transient Motorist Populations—led by a variety of foodservice, from casual table service, to quick serve, to fast food and carry out, all at moderate price levels. Convenience or “daily living needs” retail and services round out this mix—all geared to time-pressed consumers captured while they are at their workplace, commuting, or doing non-retail business in the Study Area.
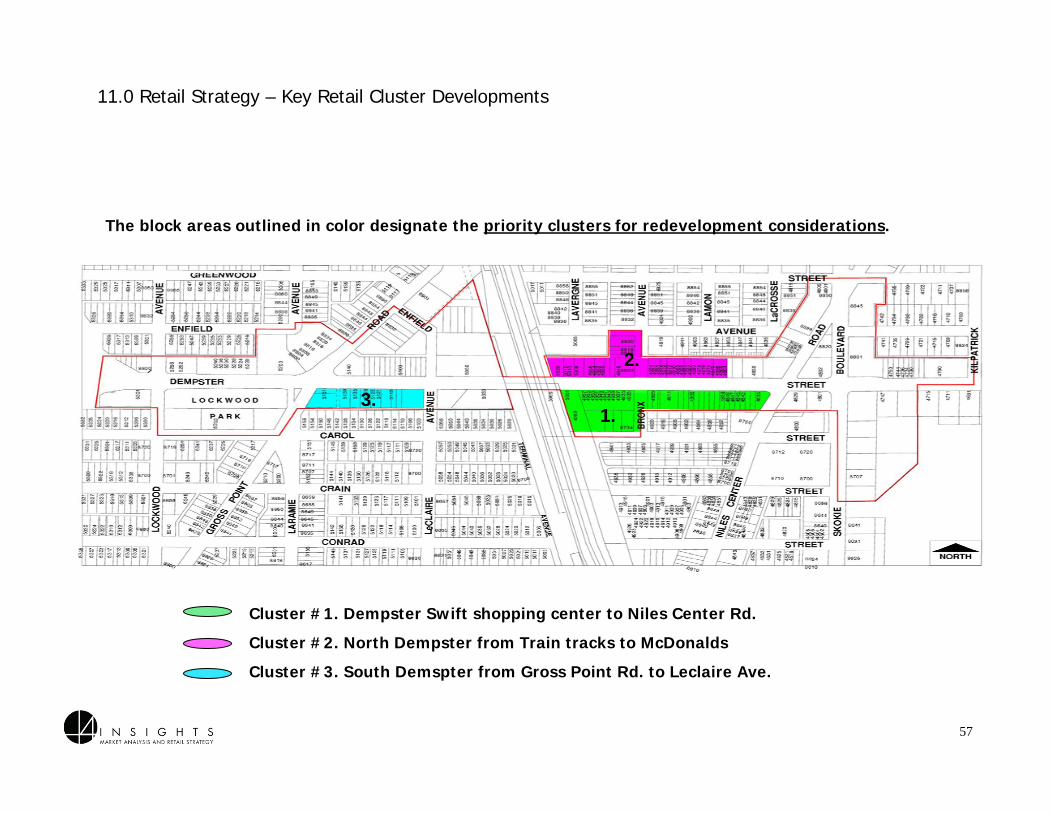
11.0 Retail Strategy – Key Retail Cluster Developments
Cluster #1. Dempster Swift shopping center to Niles Center Rd.
Cluster #2. North Dempster from Train tracks to McDonalds
Cluster #3. South Demspter from Gross Point Rd. to Leclaire Ave.
The block areas outlined in color designate the priority clusters for redevelopment considerations.
1.
2.
3.
57
58
12.0 Tenant Mix Plan & Cluster Detail
The tenant mix plan for each Cluster block provides retail category recommendations and specific tenant names that would accomplish the Retail Strategy and set the quality level and identity for the entire Study Area.
The first recruitment priority should be to secure targeted, select ‘anchor’ businesses that will convey the overall food and convenience identity and will be the primary consumer magnets for the Study Area.
Because the Village currently has no significant development plans that will influence the recommendations, it is not possible to anticipate which buildings will be redeveloped or upgraded and when--or how new development will be configured; the amount of available retail square footage; or the number of available lease spaces in each Cluster. Therefore, 4Insights estimated the overall space based on land area measurements provided by the Village. As a result, the businesses specified in the Tenant Mix Plan do not conform to specific spaces, but rather provide general merchandising direction, by retail category for the entire Cluster.
Though many parcels would be suitable to mixed-use development, the proposed strategy addresses the retail opportunity only and therefore provides a tenant mix plan for areas where retail and service uses would be the most suitable.
The Tenant Mix Plan list is intended to provide examples of the type of business categories and caliber of tenants, based on the Study findings and criteria, and the current market and retail line-up. We assume that this list will be shared with real estate brokers who can provide more information on tenant interest, expansion plans, financials and lease requirements at the time of active recruitment which we recommend begin when the market recovers in 2012-2013. By that date, the recommended tenants may have undergone changes, and new, successful retailers may emerge. It is important that the Tenant Mix Plan be updated before the final recruitment process commences.
The Tenant Mix Plan provides a recruitment guide for the 3 key Clusters identified for redevelopment.
59
12.0 Tenant Mix Plan—Tenant Selection Criteria
4Insights used the following criteria to select the type of retail stores, foodservice and services businesses that have the highest success potential for the West Dempster Study Area.
Retail and restaurants that appeal to the Demographic and Lifestyle profiles of the Customer Bases defined in this Study: Residents and Non Residents, with focus on the Workplace Population and Daytime Populations, including CTA/bus commuters within the 5 minute to 10 minute drive time area, and transient motorists.
Retail that fits into the Study’s competitive marketplace and would give the corridor a unique identity and niche as a retail destination for the time-pressed consumer.
Retailers that do not depend solely on ‘walk-in’ customer traffic, but do off-premise business, such as: catering and/or delivery; both consumer and business-to-business services; who sell on e-commerce sites, or effectively use their web sites and social networking to market their businesses.
Retail with sound financial performance, run by proven successful operators who have their own customer following and would enhance the corridor’s image and identity. This is especially crucial for the Study Area’s first ‘anchors.’
Restaurants that appeal to a broad range of consumers and ethnicities that make up a large percentage of Skokie’s resident base.
Top-requested names or categories of retail/foodservice from the previous Village Resident Survey, or who have built-in clientele and receive positive reviews in local and trade media. These could be strong national concepts that are seeking locations in smaller suburban areas or strong independents from other Chicago suburbs.
Retail that, at least initially, can fit into the dimensions of good spaces currently available, so that the Village does not have to wait entirely for new development.
Restaurants that serve the most dayparts (serving periods), especially those suitable for both breakfast, lunch, and 4:00 snacks and coffee, after work bar, dinner, and carry outs--and appeal to both adults and families.
Retail and restaurants that fit the overall proposed identity, personality, in the Retail Strategy/Tenant Mix plan—and are synergistic with their current surrounding co-tenants--or will be synergistic with planned future tenants.
Concepts unique to the area that will distinguish the corridor and command a wider draw.
60
12.0 Tenant Mix Plan by Cluster Block
CLUSTER #1 – FORMER DEMPSTER SWIFT SHOPPING CENTER (TO NILES CENTER RD.)
This cluster combines two sites that are in the heart of the West Dempster Street Study Area:
• The former Dempster Swift shopping center adjacent to the train tracks including the vacated building that is located to the rear at 8734 Bronx Ave. With the exception of Subway, which will be moving to the old Hot Dog Island building, and Norman’s Jewelry, the entire property lies vacant, ready for redevelopment.
• All property adjacent to the Dempster Swift center from Bronx Ave. and Niles Center Rd. This block is comprised of several buildings owned by various property owners separated by a number of vacated parcels dispersed throughout the block.
These two combined sites are the first priority for redevelopment due to their location adjacent to the train station (important nucleus of traffic to/from the Study Area); the large number of vacant spaces and recent acquisition of the Dempster Swift Center property by the Village. Combined, the sites can provide a sufficient amount of square footage to create a convincing retail statement--one that would serve as the catalyst to future development.
The first parcel (Dempster Swift center) is the most immediately available for redevelopment. The challenge for redeveloping the second block is that multiple building owners would be involved and would require either some land assemblage or multiple owner cooperation.
Based on data provided by the Village, the Property Area of the two blocks combined is approximately 150,752 SF which currently accommodates 46,750 SF of Building Space. In order to ensure sufficient parking is provided, the tenant mix plan recommendations use a 3.0-3.5:1 land-to-building ratio to calculate potential retail square footage. Assuming that no additional land south of the sites is obtained as part of any redevelopment, the plan estimates a potential new retail center could accommodate approximately 43,100 to 50,300 SF of building space.
The vision for this cluster is to make it the corridor’s primary destination for foodservice businesses, primarily assorted restaurants and quick serve eateries. The key is to pursue a mix of unique local restaurateurs that have an established following, offer a variety of American and ethnic food and are moderately-priced, augmented by a selection of high-quality national concepts that will appeal to a lunchtime clientele.
Kaufman’s Deli, which offers a unique mix and draws from a wide area, is an an example of the caliber of concepts that would do well here and would be a solid anchor for a variety of other complementary concepts.
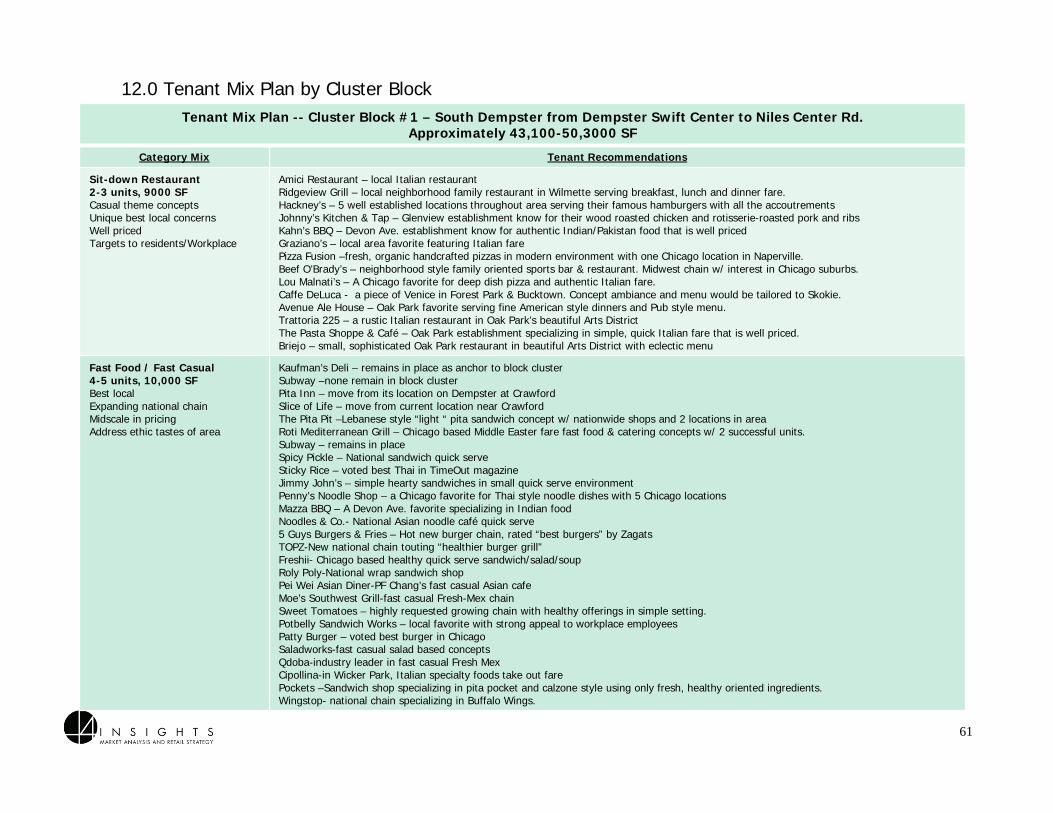
61
12.0 Tenant Mix Plan by Cluster BlockTenant Mix Plan -- Cluster Block #1 – South Dempster from Dempster Swift Center to Niles Center Rd.
Approximately 43,100-50,3000 SF
Category Mix Tenant Recommendations
Sit-down Restaurant 2-3 units, 9000 SFCasual theme conceptsUnique best local concerns Well priced Targets to residents/Workplace
Amici Restaurant – local Italian restaurant Ridgeview Grill – local neighborhood family restaurant in Wilmette serving breakfast, lunch and dinner fare. Hackney’s – 5 well established locations throughout area serving their famous hamburgers with all the accoutrements Johnny’s Kitchen & Tap – Glenview establishment know for their wood roasted chicken and rotisserie-roasted pork and ribsKahn’s BBQ – Devon Ave. establishment know for authentic Indian/Pakistan food that is well pricedGraziano’s – local area favorite featuring Italian farePizza Fusion –fresh, organic handcrafted pizzas in modern environment with one Chicago location in Naperville. Beef O’Brady’s – neighborhood style family oriented sports bar & restaurant. Midwest chain w/ interest in Chicago suburbs.Lou Malnati’s – A Chicago favorite for deep dish pizza and authentic Italian fare. Caffe DeLuca - a piece of Venice in Forest Park & Bucktown. Concept ambiance and menu would be tailored to Skokie. Avenue Ale House – Oak Park favorite serving fine American style dinners and Pub style menu.Trattoria 225 – a rustic Italian restaurant in Oak Park’s beautiful Arts DistrictThe Pasta Shoppe & Café – Oak Park establishment specializing in simple, quick Italian fare that is well priced. Briejo – small, sophisticated Oak Park restaurant in beautiful Arts District with eclectic menu
Fast Food / Fast Casual4-5 units, 10,000 SFBest local Expanding national chainMidscale in pricingAddress ethic tastes of area
Kaufman’s Deli – remains in place as anchor to block clusterSubway –none remain in block clusterPita Inn – move from its location on Dempster at Crawford Slice of Life – move from current location near CrawfordThe Pita Pit –Lebanese style “light “ pita sandwich concept w/ nationwide shops and 2 locations in areaRoti Mediterranean Grill – Chicago based Middle Easter fare fast food & catering concepts w/ 2 successful units. Subway – remains in placeSpicy Pickle – National sandwich quick serveSticky Rice – voted best Thai in TimeOut magazineJimmy John’s – simple hearty sandwiches in small quick serve environmentPenny’s Noodle Shop – a Chicago favorite for Thai style noodle dishes with 5 Chicago locationsMazza BBQ – A Devon Ave. favorite specializing in Indian food Noodles & Co.- National Asian noodle café quick serve5 Guys Burgers & Fries – Hot new burger chain, rated “best burgers” by ZagatsTOPZ-New national chain touting “healthier burger grill”Freshii- Chicago based healthy quick serve sandwich/salad/soupRoly Poly-National wrap sandwich shopPei Wei Asian Diner-PF Chang’s fast casual Asian cafeMoe’s Southwest Grill-fast casual Fresh-Mex chainSweet Tomatoes – highly requested growing chain with healthy offerings in simple setting.Potbelly Sandwich Works – local favorite with strong appeal to workplace employeesPatty Burger – voted best burger in ChicagoSaladworks-fast casual salad based conceptsQdoba-industry leader in fast casual Fresh MexCipollina-in Wicker Park, Italian specialty foods take out farePockets –Sandwich shop specializing in pita pocket and calzone style using only fresh, healthy oriented ingredients.Wingstop- national chain specializing in Buffalo Wings.
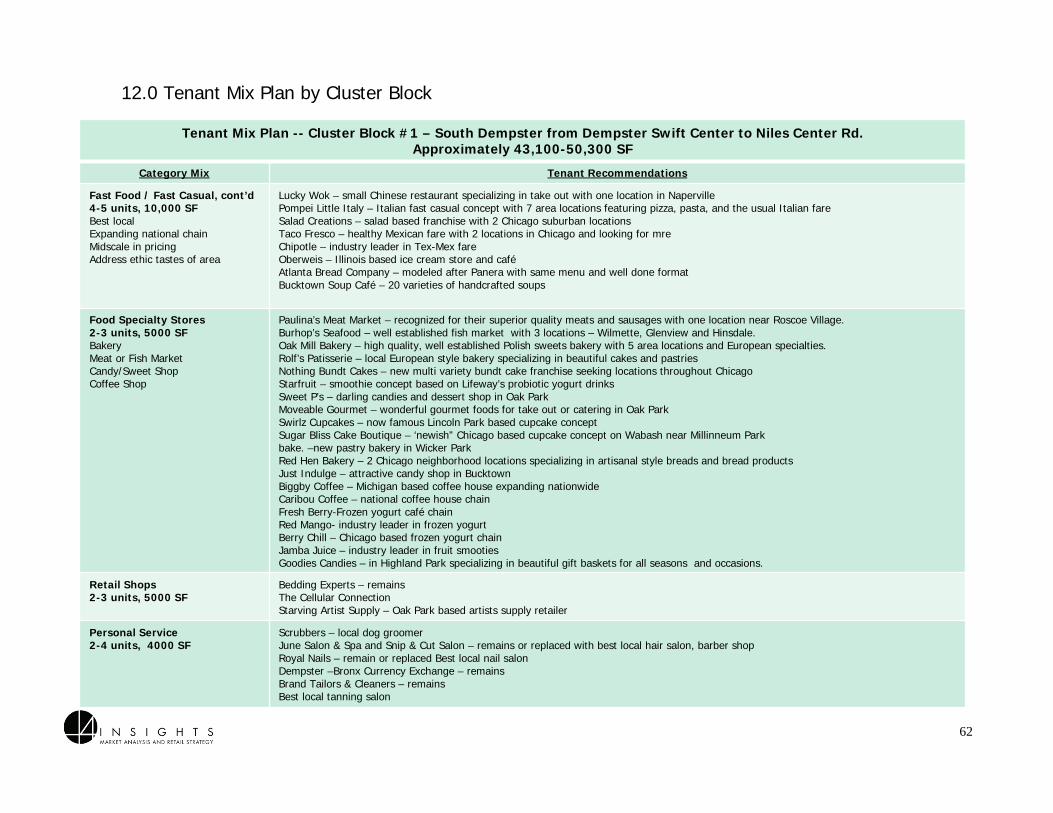
62
12.0 Tenant Mix Plan by Cluster Block
Tenant Mix Plan -- Cluster Block #1 – South Dempster from Dempster Swift Center to Niles Center Rd. Approximately 43,100-50,300 SF
Category Mix Tenant Recommendations
Fast Food / Fast Casual, cont’d4-5 units, 10,000 SFBest local Expanding national chainMidscale in pricingAddress ethic tastes of area
Lucky Wok – small Chinese restaurant specializing in take out with one location in Naperville Pompei Little Italy – Italian fast casual concept with 7 area locations featuring pizza, pasta, and the usual Italian fareSalad Creations – salad based franchise with 2 Chicago suburban locationsTaco Fresco – healthy Mexican fare with 2 locations in Chicago and looking for mreChipotle – industry leader in Tex-Mex fareOberweis – Illinois based ice cream store and caféAtlanta Bread Company – modeled after Panera with same menu and well done format Bucktown Soup Café – 20 varieties of handcrafted soups
Food Specialty Stores2-3 units, 5000 SFBakeryMeat or Fish MarketCandy/Sweet ShopCoffee Shop
Paulina’s Meat Market – recognized for their superior quality meats and sausages with one location near Roscoe Village.Burhop’s Seafood – well established fish market with 3 locations – Wilmette, Glenview and Hinsdale. Oak Mill Bakery – high quality, well established Polish sweets bakery with 5 area locations and European specialties.Rolf’s Patisserie – local European style bakery specializing in beautiful cakes and pastriesNothing Bundt Cakes – new multi variety bundt cake franchise seeking locations throughout ChicagoStarfruit – smoothie concept based on Lifeway’s probiotic yogurt drinksSweet P’s – darling candies and dessert shop in Oak ParkMoveable Gourmet – wonderful gourmet foods for take out or catering in Oak ParkSwirlz Cupcakes – now famous Lincoln Park based cupcake concept Sugar Bliss Cake Boutique – ‘newish” Chicago based cupcake concept on Wabash near Millinneum Parkbake. –new pastry bakery in Wicker ParkRed Hen Bakery – 2 Chicago neighborhood locations specializing in artisanal style breads and bread productsJust Indulge – attractive candy shop in BucktownBiggby Coffee – Michigan based coffee house expanding nationwide Caribou Coffee – national coffee house chainFresh Berry-Frozen yogurt café chainRed Mango- industry leader in frozen yogurtBerry Chill – Chicago based frozen yogurt chainJamba Juice – industry leader in fruit smootiesGoodies Candies – in Highland Park specializing in beautiful gift baskets for all seasons and occasions.
Retail Shops2-3 units, 5000 SF
Bedding Experts – remainsThe Cellular ConnectionStarving Artist Supply – Oak Park based artists supply retailer
Personal Service2-4 units, 4000 SF
Scrubbers – local dog groomerJune Salon & Spa and Snip & Cut Salon – remains or replaced with best local hair salon, barber shopRoyal Nails – remain or replaced Best local nail salonDempster –Bronx Currency Exchange – remainsBrand Tailors & Cleaners – remainsBest local tanning salon
63
12.0 Tenant Mix Plan by Cluster Block
CLUSTER #2 – NORTH DEMPSTER BETWEEN TRAIN TRACKS AND NILES CENTER RD. (McDonald’s)
This cluster also combines two sites that are in the heart of the West Dempster Study Area--on the north side of the corridor:
• The buildings east of the train tracks to Bronx Ave. include the buildings along Bronx Ave. north of Dempster. This block includes many vacated spaces and buildings recently acquired by the Village.
• The retail buildings from Bronx Ave. going east to but not including the McDonald’s site at Niles Center Rd.
These two sites combined, are prime for redevelopment, due to the large number of vacancies and the dated condition and configurations of the buildings. In addition, a portion of the block is under Village ownership. Nevertheless, multiple building owners are involved and any redevelopment plans would require either land assemblage or multiple owner cooperation.
Based on data provided by the Village, the Property Area is equivalent to approximately 109,787 SF which currently accommodates 53,417 SF of ground floor Building Space. Using a 3.0-3.5:1 land to building ratio a new retail center could accommodate approximately 31,400 –36,600 SF feet of retail space.
The vision for this cluster is create a destination that focuses on convenience retail and complements the foodservice oriented offering slated for the properties to the south. The strategy is to pursue an anchor-like business such as a small grocery store of no more than 15-20,000 SF that will be an important focal point for the street and will set the tone for a complementary set of convenience-type businesses. The challenge is to pursue a local or regional concept that in addition to offering basic food staples, features prepared meals or food selections that will appeal to commuters and motorists for a convenient quick-stop on their home from work. The Consumer Demand Report--even without the addition of Workplace Population by 4Insights--supports the need for an additional grocery store, as there are few nearby options.
A configuration that provides abundant, easy to access parking and easy entry/exit into the center from the boulevard will be critical to its success. Traffic lights at Bronx Ave. and easy left turns into the center particularly from the train station all need to be strategically-planned.
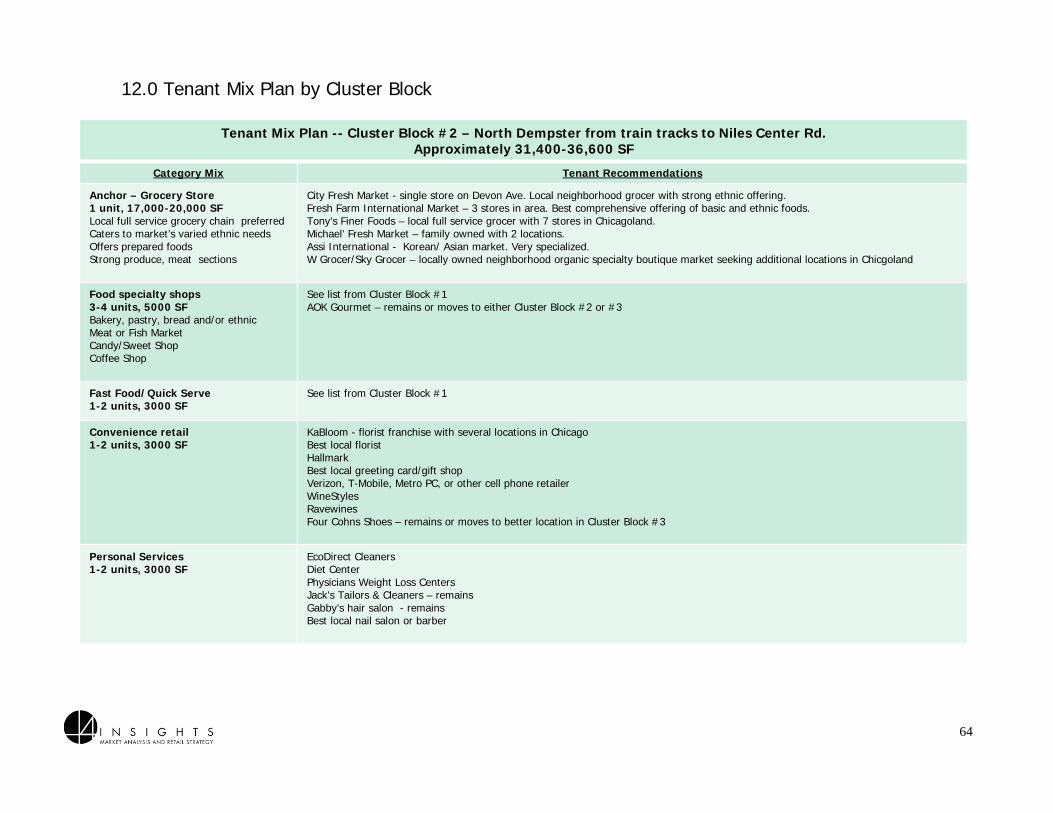
64
12.0 Tenant Mix Plan by Cluster Block
Tenant Mix Plan -- Cluster Block #2 – North Dempster from train tracks to Niles Center Rd. Approximately 31,400-36,600 SF
Category Mix Tenant Recommendations
Anchor – Grocery Store1 unit, 17,000-20,000 SFLocal full service grocery chain preferredCaters to market’s varied ethnic needsOffers prepared foods Strong produce, meat sections
City Fresh Market - single store on Devon Ave. Local neighborhood grocer with strong ethnic offering. Fresh Farm International Market – 3 stores in area. Best comprehensive offering of basic and ethnic foods. Tony’s Finer Foods – local full service grocer with 7 stores in Chicagoland. Michael’ Fresh Market – family owned with 2 locations. Assi International - Korean/ Asian market. Very specialized. W Grocer/Sky Grocer – locally owned neighborhood organic specialty boutique market seeking additional locations in Chicgoland
Food specialty shops3-4 units, 5000 SFBakery, pastry, bread and/or ethnicMeat or Fish MarketCandy/Sweet ShopCoffee Shop
See list from Cluster Block #1AOK Gourmet – remains or moves to either Cluster Block #2 or #3
Fast Food/Quick Serve1-2 units, 3000 SF
See list from Cluster Block #1
Convenience retail1-2 units, 3000 SF
KaBloom - florist franchise with several locations in ChicagoBest local floristHallmark Best local greeting card/gift shopVerizon, T-Mobile, Metro PC, or other cell phone retailerWineStylesRavewinesFour Cohns Shoes – remains or moves to better location in Cluster Block #3
Personal Services1-2 units, 3000 SF
EcoDirect Cleaners Diet CenterPhysicians Weight Loss CentersJack’s Tailors & Cleaners – remainsGabby’s hair salon - remainsBest local nail salon or barber
65
12.0 Tenant Mix Plan by Cluster Block
CLUSTER #3– SOUTH DEMPSTER, GROSS POINT RD. TO LECLAIRE AVEThis cluster is southeast, diagonally across from Gross Point Crossing shopping center and includes:
• All buildings and empty land parcels filling the block from Gross Point Rd. to LeClaire Ave.
This block is comprised of several separate buildings. If combined, they are a suitable site for redevelopment, due to their large number of vacancies and the dated condition and configurations of the buildings. In addition, a portion of the block is under Village ownership. Nevertheless, multiple building owners are involved and any redevelopment would require multiple owner cooperation.
The block’s significance is that it is diagonally across from Gross Point Crossing, a pivotal retail center for the Study Area. A redeveloped Cluster #3 into a new and improved retail center would complement Gross Point Crossing’s success and would further strengthen the Study Area’s draw.
Based on data provided by the Village, the Property Area is approximately 62,162 SF which currently accommodates 16,155 SF of Building Square footage. Using a 3.0-3.5:1 land to building ratio a new retail center could accommodate approximately 17,800–20,700 SF of building space in this block.
The strategy for this block is to pursue strong retail, personal service and non-retail uses that would complement Gross Point Crossing and the businesses just north of the block (new gas station, Walton Chrysler). It would serve as an extension of the retail mix in the proposed new developments east of the train station. Destination businesses that are typical of corridor retail, and would attract patrons from a wider area, would be appropriate here. The key is to pursue uses that are not well-represented in the vicinity.
Many of the existing businesses such as Budget-Rent-A-Car and Car-X remain suitable for this block and would fit comfortably within a newly designed center configuration.
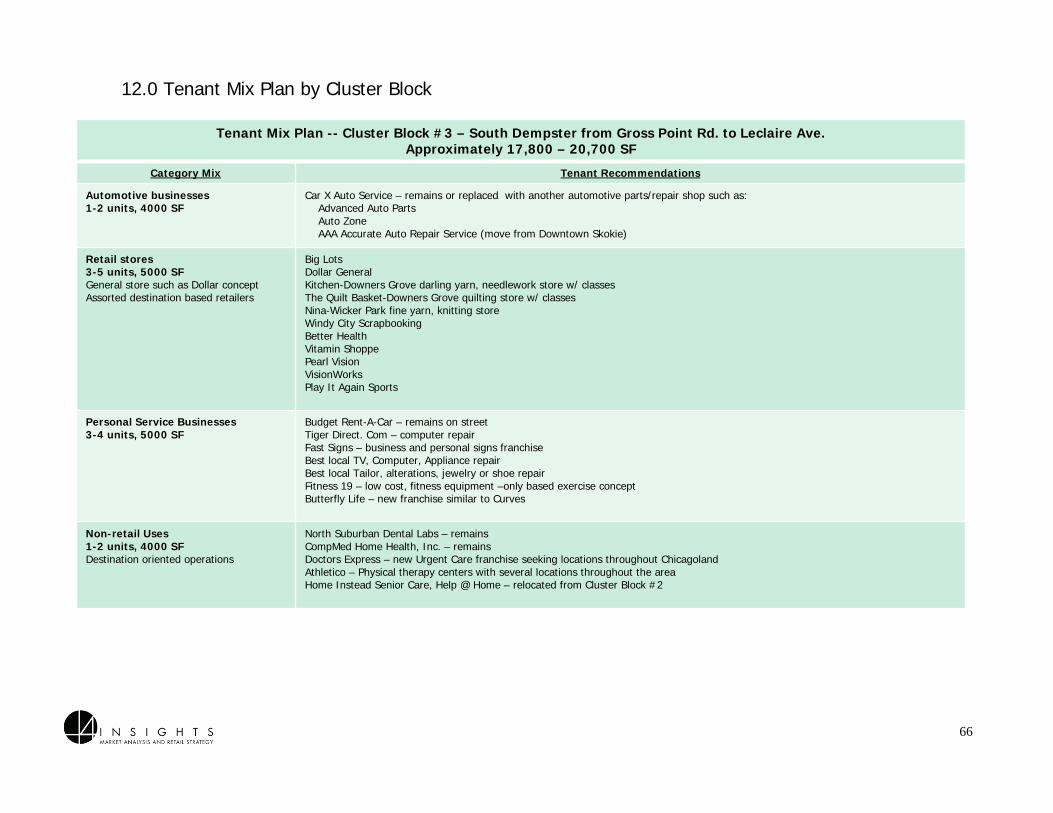
66
12.0 Tenant Mix Plan by Cluster Block
Tenant Mix Plan -- Cluster Block #3 – South Dempster from Gross Point Rd. to Leclaire Ave. Approximately 17,800 – 20,700 SF
Category Mix Tenant Recommendations
Automotive businesses1-2 units, 4000 SF
Car X Auto Service – remains or replaced with another automotive parts/repair shop such as:Advanced Auto PartsAuto ZoneAAA Accurate Auto Repair Service (move from Downtown Skokie)
Retail stores3-5 units, 5000 SFGeneral store such as Dollar conceptAssorted destination based retailers
Big LotsDollar GeneralKitchen-Downers Grove darling yarn, needlework store w/ classesThe Quilt Basket-Downers Grove quilting store w/ classesNina-Wicker Park fine yarn, knitting storeWindy City ScrapbookingBetter HealthVitamin ShoppePearl VisionVisionWorksPlay It Again Sports
Personal Service Businesses3-4 units, 5000 SF
Budget Rent-A-Car – remains on streetTiger Direct. Com – computer repairFast Signs – business and personal signs franchiseBest local TV, Computer, Appliance repairBest local Tailor, alterations, jewelry or shoe repairFitness 19 – low cost, fitness equipment –only based exercise concept Butterfly Life – new franchise similar to Curves
Non-retail Uses1-2 units, 4000 SFDestination oriented operations
North Suburban Dental Labs – remainsCompMed Home Health, Inc. – remainsDoctors Express – new Urgent Care franchise seeking locations throughout ChicagolandAthletico – Physical therapy centers with several locations throughout the areaHome Instead Senior Care, Help @ Home – relocated from Cluster Block #2
ADDENDUM
1.Study Area Business Inventory: Delivered to the Village of Skokie under separate cover
67