consumer retail
TRANSCRIPT
Anand Rathi Share and Stock Brokers Limited (hereinafter “ARSSBL”) is a full-service brokerage and equities-research firm and the views expressed therein are solely of ARSSBL and not of the companies which have been covered in the Research Report. This report is intended for the sole use of the Recipient. Disclosures and analyst certifications are present in the Appendix. Anand Rathi Research India Equities
Consumer
UpdateIndia I Equities
Vaishnavi Mandhaniya Research Analyst
Sensex: 52880
Nifty: 15834
6 July 2021
Consumer Retail Q4 FY21 results review
As consumer demand moved toward normal, innerwear/apparel/ footwear/department-store Q4 revenue growth averaged 72%/0.4%/ 35%/12% y/y. Innerwear continued to be the strongest category in Q4 and in FY21 was driven by market-share gains and continued traction in athleisure. Covid’19-triggered restrictions and regional lockdowns halted the recovery toward end-Q4. Most companies expect gradual recovery from Q2 FY22 with pent-up demand, the festival season and easing of restrictions.
Apparel at almost 100% recovery, innerwear continues strong growth. Q4 began with retailers seeing near normal consumer behaviour, with fresh merchandise being launched and pent-up demand. Recovery in apparel retailers averaged ~100%; Arvind Fashions, Trent and TCNS’ revenues grew y/y. In footwear, growth averaged ~35% y/y led by strong growth in Relaxo (~38%) and Khadim (~71%). Bata’s recovery at ~95% was lower than peers. Innerwear averaged ~72% growth, largely from double-digit volume growth.
Cash-positive quarter aided by revenue recovery, cost rationalising. The greater operating leverage led to companies’ better operating performances. For most companies, costs inched up to previous levels. Some continue to talk of structural savings ahead. Innerwear EBITDA growth averaged ~250%, driven by operating leverage and better gross margins as companies raised prices to mitigate cotton/yarn price rises. Footwear companies experienced gross margin pressure with the rise in raw material prices, and adverse product & channel mixes. Khadim and Relaxo, however, reported EBITDA margin expansion, driven by cost savings and operating efficiencies. Barring Kewal Kiran, all apparel retailers’ EBITDA margins expanded, driven by more sales and cost savings.
Cost structure optimisation. Despite significant cost controls, the lower operating leverage led to declines/losses (EBITDA level) for most companies in FY21. Fixed rents, the major cost for most retailers, shrank during the year, averaging ~33% y/y. Employee and other costs (advertising, travel, etc.) were considerably curtailed, declines averaging respectively 12% and 17% y/y. As operations pick up, most of these will return.
Expansion plans on track for FY22. Network expansion slowed down in FY21 significantly, with capex declining ~40% y/y on average. Most companies talked of accelerated store expansion ahead. ABFRL plans to open ~300-400 Lifestyle stores in FY22. Pantaloons added 19 in FY21 and plans to add ~60 in FY22. TCNS spoke of 60 additions and VMart plans to continue its addition of ~40 stores in FY22.
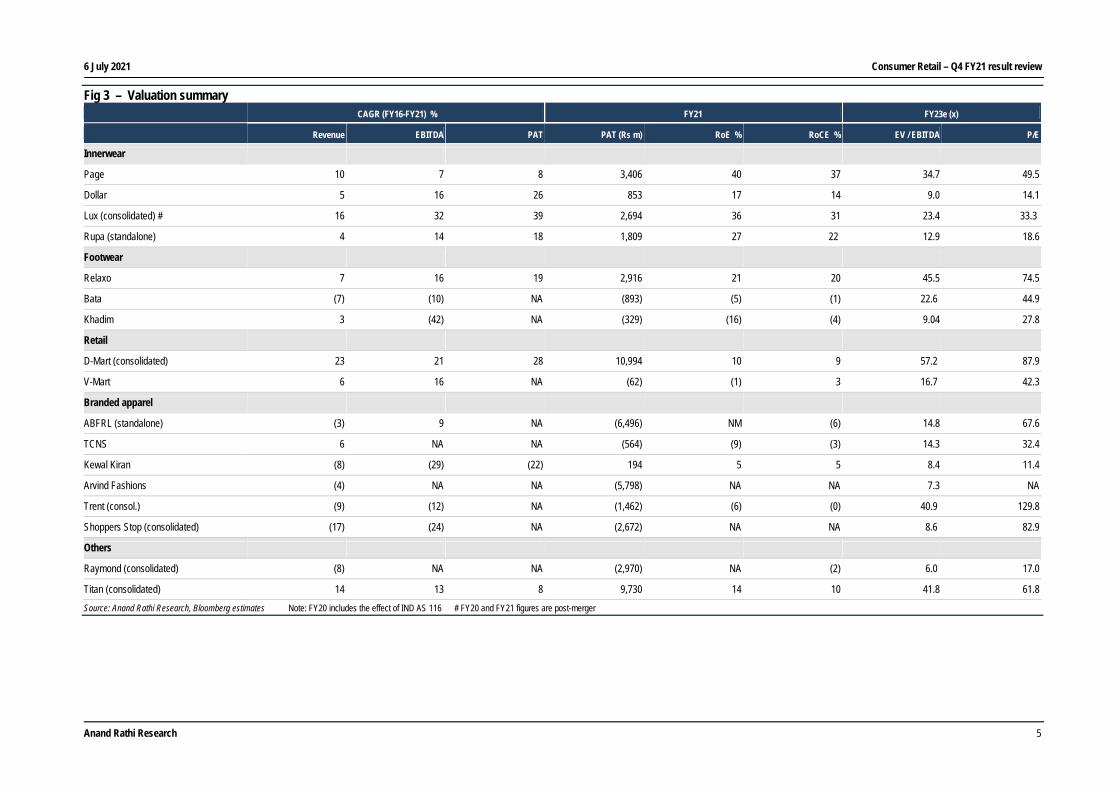
Valuations. The consumer retail sector now quotes at an EV/EBITDA of 22x and a P/E of ~50x on FY23e.
6 July 2021 Consumer Retail – Q4 FY21 result review
Anand Rathi Research 3
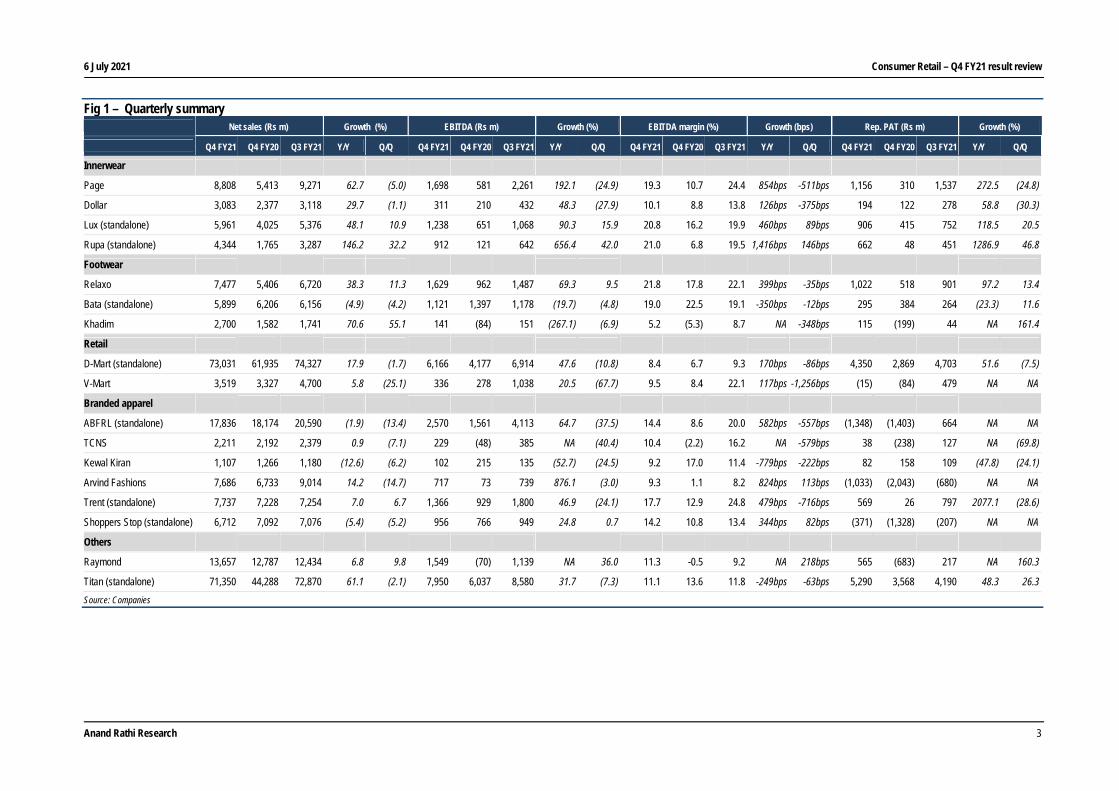
Fig 1 – Quarterly summary Net sales (Rs m) Growth (%) EBITDA (Rs m) Growth (%) EBITDA margin (%) Growth (bps) Rep. PAT (Rs m) Growth (%)
Q4 FY21 Q4 FY20 Q3 FY21 Y/Y Q/Q Q4 FY21 Q4 FY20 Q3 FY21 Y/Y Q/Q Q4 FY21 Q4 FY20 Q3 FY21 Y/Y Q/Q Q4 FY21 Q4 FY20 Q3 FY21 Y/Y Q/Q
Innerwear
Page 8,808 5,413 9,271 62.7 (5.0) 1,698 581 2,261 192.1 (24.9) 19.3 10.7 24.4 854bps -511bps 1,156 310 1,537 272.5 (24.8)
Dollar 3,083 2,377 3,118 29.7 (1.1) 311 210 432 48.3 (27.9) 10.1 8.8 13.8 126bps -375bps 194 122 278 58.8 (30.3)
Lux (standalone) 5,961 4,025 5,376 48.1 10.9 1,238 651 1,068 90.3 15.9 20.8 16.2 19.9 460bps 89bps 906 415 752 118.5 20.5
Rupa (standalone) 4,344 1,765 3,287 146.2 32.2 912 121 642 656.4 42.0 21.0 6.8 19.5 1,416bps 146bps 662 48 451 1286.9 46.8
Footwear
Relaxo 7,477 5,406 6,720 38.3 11.3 1,629 962 1,487 69.3 9.5 21.8 17.8 22.1 399bps -35bps 1,022 518 901 97.2 13.4
Bata (standalone) 5,899 6,206 6,156 (4.9) (4.2) 1,121 1,397 1,178 (19.7) (4.8) 19.0 22.5 19.1 -350bps -12bps 295 384 264 (23.3) 11.6
Khadim 2,700 1,582 1,741 70.6 55.1 141 (84) 151 (267.1) (6.9) 5.2 (5.3) 8.7 NA -348bps 115 (199) 44 NA 161.4
Retail
D-Mart (standalone) 73,031 61,935 74,327 17.9 (1.7) 6,166 4,177 6,914 47.6 (10.8) 8.4 6.7 9.3 170bps -86bps 4,350 2,869 4,703 51.6 (7.5)
V-Mart 3,519 3,327 4,700 5.8 (25.1) 336 278 1,038 20.5 (67.7) 9.5 8.4 22.1 117bps -1,256bps (15) (84) 479 NA NA
Branded apparel
ABFRL (standalone) 17,836 18,174 20,590 (1.9) (13.4) 2,570 1,561 4,113 64.7 (37.5) 14.4 8.6 20.0 582bps -557bps (1,348) (1,403) 664 NA NA
TCNS 2,211 2,192 2,379 0.9 (7.1) 229 (48) 385 NA (40.4) 10.4 (2.2) 16.2 NA -579bps 38 (238) 127 NA (69.8)
Kewal Kiran 1,107 1,266 1,180 (12.6) (6.2) 102 215 135 (52.7) (24.5) 9.2 17.0 11.4 -779bps -222bps 82 158 109 (47.8) (24.1)
Arvind Fashions 7,686 6,733 9,014 14.2 (14.7) 717 73 739 876.1 (3.0) 9.3 1.1 8.2 824bps 113bps (1,033) (2,043) (680) NA NA
Trent (standalone) 7,737 7,228 7,254 7.0 6.7 1,366 929 1,800 46.9 (24.1) 17.7 12.9 24.8 479bps -716bps 569 26 797 2077.1 (28.6)
Shoppers Stop (standalone) 6,712 7,092 7,076 (5.4) (5.2) 956 766 949 24.8 0.7 14.2 10.8 13.4 344bps 82bps (371) (1,328) (207) NA NA
Others
Raymond 13,657 12,787 12,434 6.8 9.8 1,549 (70) 1,139 NA 36.0 11.3 -0.5 9.2 NA 218bps 565 (683) 217 NA 160.3
Titan (standalone) 71,350 44,288 72,870 61.1 (2.1) 7,950 6,037 8,580 31.7 (7.3) 11.1 13.6 11.8 -249bps -63bps 5,290 3,568 4,190 48.3 26.3
Source: Companies
6 July 2021 Consumer Retail – Q4 FY21 result review
Anand Rathi Research 4
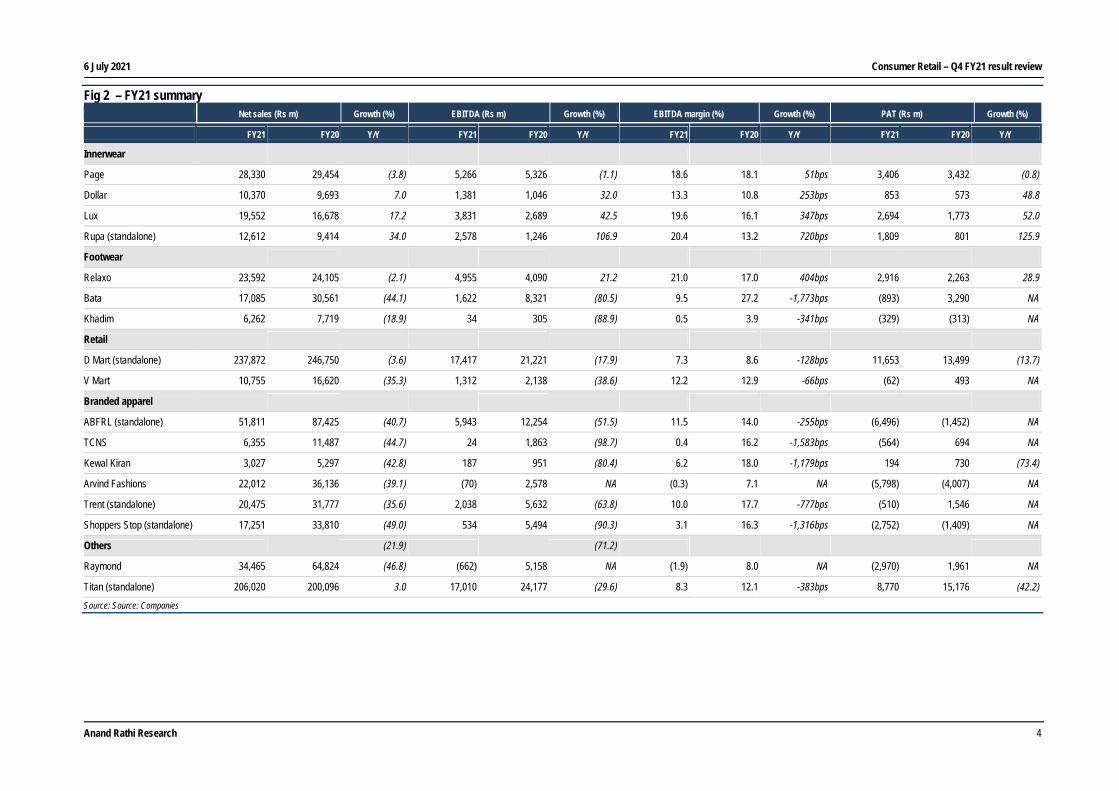
Fig 2 – FY21 summary Net sales (Rs m) Growth (%) EBITDA (Rs m) Growth (%) EBITDA margin (%) Growth (%) PAT (Rs m) Growth (%)
FY21 FY20 Y/Y FY21 FY20 Y/Y FY21 FY20 Y/Y FY21 FY20 Y/Y
Innerwear
Page 28,330 29,454 (3.8) 5,266 5,326 (1.1) 18.6 18.1 51bps 3,406 3,432 (0.8)
Dollar 10,370 9,693 7.0 1,381 1,046 32.0 13.3 10.8 253bps 853 573 48.8
Lux 19,552 16,678 17.2 3,831 2,689 42.5 19.6 16.1 347bps 2,694 1,773 52.0
Rupa (standalone) 12,612 9,414 34.0 2,578 1,246 106.9 20.4 13.2 720bps 1,809 801 125.9
Footwear
Relaxo 23,592 24,105 (2.1) 4,955 4,090 21.2 21.0 17.0 404bps 2,916 2,263 28.9
Bata 17,085 30,561 (44.1) 1,622 8,321 (80.5) 9.5 27.2 -1,773bps (893) 3,290 NA
Khadim 6,262 7,719 (18.9) 34 305 (88.9) 0.5 3.9 -341bps (329) (313) NA
Retail
D Mart (standalone) 237,872 246,750 (3.6) 17,417 21,221 (17.9) 7.3 8.6 -128bps 11,653 13,499 (13.7)
V Mart 10,755 16,620 (35.3) 1,312 2,138 (38.6) 12.2 12.9 -66bps (62) 493 NA
Branded apparel
ABFRL (standalone) 51,811 87,425 (40.7) 5,943 12,254 (51.5) 11.5 14.0 -255bps (6,496) (1,452) NA
TCNS 6,355 11,487 (44.7) 24 1,863 (98.7) 0.4 16.2 -1,583bps (564) 694 NA
Kewal Kiran 3,027 5,297 (42.8) 187 951 (80.4) 6.2 18.0 -1,179bps 194 730 (73.4)
Arvind Fashions 22,012 36,136 (39.1) (70) 2,578 NA (0.3) 7.1 NA (5,798) (4,007) NA
Trent (standalone) 20,475 31,777 (35.6) 2,038 5,632 (63.8) 10.0 17.7 -777bps (510) 1,546 NA
Shoppers Stop (standalone) 17,251 33,810 (49.0) 534 5,494 (90.3) 3.1 16.3 -1,316bps (2,752) (1,409) NA
Others (21.9) (71.2)
Raymond 34,465 64,824 (46.8) (662) 5,158 NA (1.9) 8.0 NA (2,970) 1,961 NA
Titan (standalone) 206,020 200,096 3.0 17,010 24,177 (29.6) 8.3 12.1 -383bps 8,770 15,176 (42.2)
Source: Source: Companies
6 July 2021 Consumer Retail – Q4 FY21 result review
Anand Rathi Research 5
Fig 3 – Valuation summary CAGR (FY16-FY21) % FY21 FY23e (x)
Revenue EBITDA PAT PAT (Rs m) RoE % RoCE % EV / EBITDA P/E
Innerwear
Page 10 7 8 3,406 40 37 34.7 49.5
Dollar 5 16 26 853 17 14 9.0 14.1
Lux (consolidated) # 16 32 39 2,694 36 31 23.4 33.3
Rupa (standalone) 4 14 18 1,809 27 22 12.9 18.6
Footwear
Relaxo 7 16 19 2,916 21 20 45.5 74.5
Bata (7) (10) NA (893) (5) (1) 22.6 44.9
Khadim 3 (42) NA (329) (16) (4) 9.04 27.8
Retail
D-Mart (consolidated) 23 21 28 10,994 10 9 57.2 87.9
V-Mart 6 16 NA (62) (1) 3 16.7 42.3
Branded apparel
ABFRL (standalone) (3) 9 NA (6,496) NM (6) 14.8 67.6
TCNS 6 NA NA (564) (9) (3) 14.3 32.4
Kewal Kiran (8) (29) (22) 194 5 5 8.4 11.4
Arvind Fashions (4) NA NA (5,798) NA NA 7.3 NA
Trent (consol.) (9) (12) NA (1,462) (6) (0) 40.9 129.8
Shoppers Stop (consolidated) (17) (24) NA (2,672) NA NA 8.6 82.9
Others
Raymond (consolidated) (8) NA NA (2,970) NA (2) 6.0 17.0
Titan (consolidated) 14 13 8 9,730 14 10 41.8 61.8
Source: Anand Rathi Research, Bloomberg estimates Note: FY20 includes the effect of IND AS 116 # FY20 and FY21 figures are post-merger
6 July 2021 Consumer Retail – Q4 FY21 result review
Anand Rathi Research 3
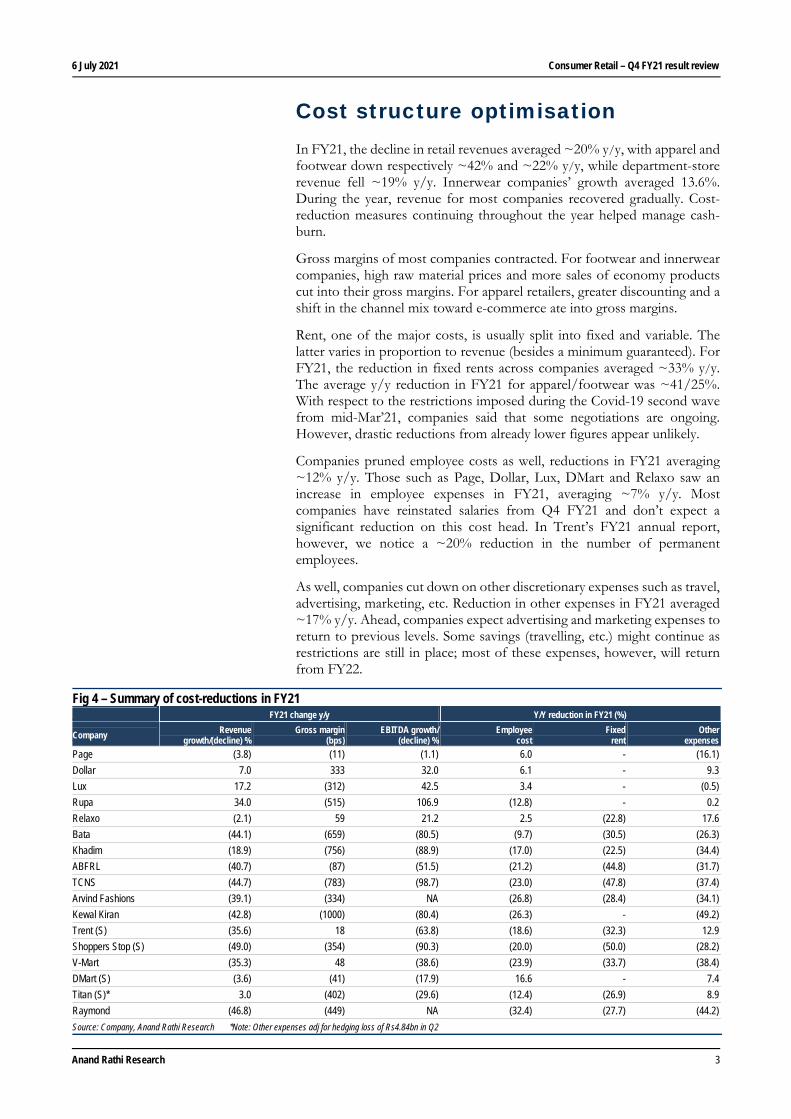
Cost structure optimisation In FY21, the decline in retail revenues averaged ~20% y/y, with apparel and footwear down respectively ~42% and ~22% y/y, while department-store revenue fell ~19% y/y. Innerwear companies’ growth averaged 13.6%. During the year, revenue for most companies recovered gradually. Cost-reduction measures continuing throughout the year helped manage cash-burn.
Gross margins of most companies contracted. For footwear and innerwear companies, high raw material prices and more sales of economy products cut into their gross margins. For apparel retailers, greater discounting and a shift in the channel mix toward e-commerce ate into gross margins.
Rent, one of the major costs, is usually split into fixed and variable. The latter varies in proportion to revenue (besides a minimum guaranteed). For FY21, the reduction in fixed rents across companies averaged ~33% y/y. The average y/y reduction in FY21 for apparel/footwear was ~41/25%. With respect to the restrictions imposed during the Covid-19 second wave from mid-Mar’21, companies said that some negotiations are ongoing. However, drastic reductions from already lower figures appear unlikely.
Companies pruned employee costs as well, reductions in FY21 averaging ~12% y/y. Those such as Page, Dollar, Lux, DMart and Relaxo saw an increase in employee expenses in FY21, averaging ~7% y/y. Most companies have reinstated salaries from Q4 FY21 and don’t expect a significant reduction on this cost head. In Trent’s FY21 annual report, however, we notice a ~20% reduction in the number of permanent employees.
As well, companies cut down on other discretionary expenses such as travel, advertising, marketing, etc. Reduction in other expenses in FY21 averaged ~17% y/y. Ahead, companies expect advertising and marketing expenses to return to previous levels. Some savings (travelling, etc.) might continue as restrictions are still in place; most of these expenses, however, will return from FY22.
Fig 4 – Summary of cost-reductions in FY21 FY21 change y/y Y/Y reduction in FY21 (%)
Company Revenue growth/(decline) %
Gross margin (bps)
EBITDA growth/(decline) %
Employee cost
Fixed rent
Other expenses
Page (3.8) (11) (1.1) 6.0 - (16.1)
Dollar 7.0 333 32.0 6.1 - 9.3
Lux 17.2 (312) 42.5 3.4 - (0.5)
Rupa 34.0 (515) 106.9 (12.8) - 0.2
Relaxo (2.1) 59 21.2 2.5 (22.8) 17.6
Bata (44.1) (659) (80.5) (9.7) (30.5) (26.3)
Khadim (18.9) (756) (88.9) (17.0) (22.5) (34.4)
ABFRL (40.7) (87) (51.5) (21.2) (44.8) (31.7)
TCNS (44.7) (783) (98.7) (23.0) (47.8) (37.4)
Arvind Fashions (39.1) (334) NA (26.8) (28.4) (34.1)
Kewal Kiran (42.8) (1000) (80.4) (26.3) - (49.2)
Trent (S) (35.6) 18 (63.8) (18.6) (32.3) 12.9
Shoppers Stop (S) (49.0) (354) (90.3) (20.0) (50.0) (28.2)
V-Mart (35.3) 48 (38.6) (23.9) (33.7) (38.4)
DMart (S) (3.6) (41) (17.9) 16.6 - 7.4
Titan (S)* 3.0 (402) (29.6) (12.4) (26.9) 8.9
Raymond (46.8) (449) NA (32.4) (27.7) (44.2)
Source: Company, Anand Rathi Research *Note: Other expenses adj for hedging loss of Rs4.84bn in Q2
6 July 2021 Consumer Retail – Q4 FY21 result review
Anand Rathi Research 4
Innerwear
Strong volume-driven growth for innerwear Driven by continuing demand for innerwear and athleisure, and boosted by a weaker base in Q4 FY20, innerwear companies continued to report strong growth in Q4, averaging ~72% y/y, vs. ~20% the quarter prior (Q4 FY20 revenue had fallen ~28% y/y). Despite Q1 FY21 being a washout, innerwear companies’ FY21 growth averaged ~14% y/y, led by Rupa (34%), Lux (17.2%) and Dollar (7%), while Page’s revenue declined 3.8% y/y.
Volumes for Page, Lux and Dollar grew respectively 54%, 29% and 17% y/y in Q4 FY21. For FY21 volume growth was 11%, 32%, 13.2% respectively for Dollar, Rupa and Lux. Page’s volumes declined ~11-12% according to our estimates.
Yarn and cotton prices have climbed considerably. Companies, however, hiked prices to mitigate the impact on gross margins. Hence, gross margins of all innerwear companies (incl. sub-contracting expenses) expanded during the quarter (ranging from 82bps to 613bps y/y). For FY21 Lux reported a 23bp gross margin contraction y/y to 34.5%, while Dollar, Rupa and Page’s gross margins expanded respectively 214bps, 36bps and 35bps y/y to 36.7%, 35.6% and 51.7%.
Driven by the higher gross margins, better operating leverage and costs saved, the EBITDA margin expansion across companies averaged ~700bps y/y: Page up 854bps to 19.3%, Dollar up 126bps to 10.1%, Lux up 460bps to 20.8%, and Rupa up 1,416bps to 21%.
The working-capital cycle (on sales) improved for all the companies vs FY20 by 20-51 days. Lux’s working-capital days reduced by 38 y/y aided by inventory days and debtor days reducing by 20 and 11 respectively, and payable days increasing by seven. Dollar’s working-capital days reduced by 20 y/y led by 19 fewer debtor days and increase in creditor days by four. Dollar’s inventory days were three more y/y. Rupa’s working-capital days improved the most (51 days fewer y/y) led by 63 fewer inventory days.
The companies continued to expand their touch points and distributor networks during the year. The growth trajectory was higher. Per managements, demand is likely to continue, driven by the growing shift toward formal manufacturers and the rising preference for athleisure.
Page Industries
Page reported 63% y/y revenue growth in Q4 FY21 to Rs8,808m, led by 54% y/y volume growth. Its gross margin contracted 122bps y/y to 57.6%. Employee and other expenses were respectively ~23% and 37% higher y/y. As percent of sales, however, they were 611bps and 365bps lower y/y. Hence, the EBITDA margin expanded to 19.3% (from 10.7% a year ago). The Rs1,698m EBITDA was ~3x higher y/y. Depreciation was 5% lower, interest expense was down 16% and other income was 44% lower y/y. PBT was Rs1,526m (Rs432m a year back). The tax rate was 24.3% (28.2% a year ago). PAT was Rs1,156m (Rs310m in Q4 FY20).
FY21 revenue was down ~4% y/y to Rs28,330m. EBITDA was slightly lower (1%) y/y to Rs5,266m and the EBITDA margin expanded 51bps y/y to 18.6%. PAT at Rs3,406m was ~1% lower y/y.
6 July 2021 Consumer Retail – Q4 FY21 result review
Anand Rathi Research 5
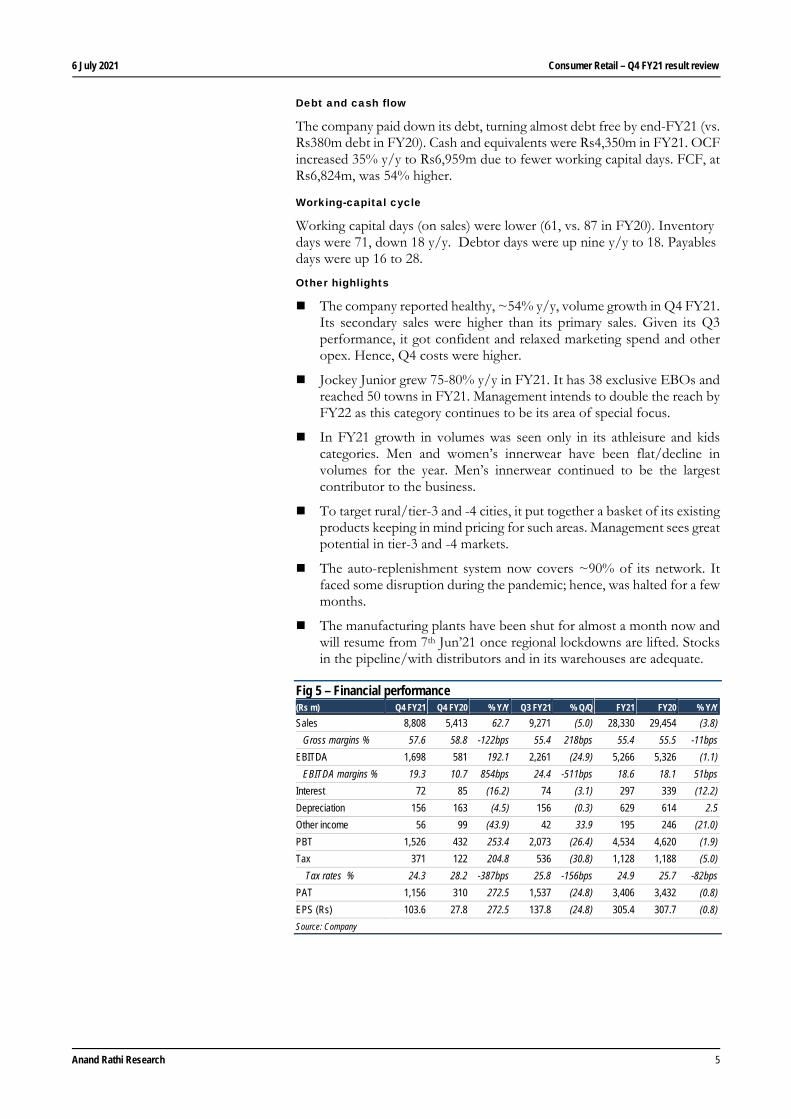
Debt and cash flow
The company paid down its debt, turning almost debt free by end-FY21 (vs. Rs380m debt in FY20). Cash and equivalents were Rs4,350m in FY21. OCF increased 35% y/y to Rs6,959m due to fewer working capital days. FCF, at Rs6,824m, was 54% higher.
Working-capital cycle
Working capital days (on sales) were lower (61, vs. 87 in FY20). Inventory days were 71, down 18 y/y. Debtor days were up nine y/y to 18. Payables days were up 16 to 28.
Other highlights
The company reported healthy, ~54% y/y, volume growth in Q4 FY21. Its secondary sales were higher than its primary sales. Given its Q3 performance, it got confident and relaxed marketing spend and other opex. Hence, Q4 costs were higher.
Jockey Junior grew 75-80% y/y in FY21. It has 38 exclusive EBOs and reached 50 towns in FY21. Management intends to double the reach by FY22 as this category continues to be its area of special focus.
In FY21 growth in volumes was seen only in its athleisure and kids categories. Men and women’s innerwear have been flat/decline in volumes for the year. Men’s innerwear continued to be the largest contributor to the business.
To target rural/tier-3 and -4 cities, it put together a basket of its existing products keeping in mind pricing for such areas. Management sees great potential in tier-3 and -4 markets.
The auto-replenishment system now covers ~90% of its network. It faced some disruption during the pandemic; hence, was halted for a few months.
The manufacturing plants have been shut for almost a month now and will resume from 7th Jun’21 once regional lockdowns are lifted. Stocks in the pipeline/with distributors and in its warehouses are adequate.
Fig 5 – Financial performance (Rs m) Q4 FY21 Q4 FY20 % Y/Y Q3 FY21 % Q/Q FY21 FY20 % Y/Y Sales 8,808 5,413 62.7 9,271 (5.0) 28,330 29,454 (3.8)
Gross margins % 57.6 58.8 -122bps 55.4 218bps 55.4 55.5 -11bps
EBITDA 1,698 581 192.1 2,261 (24.9) 5,266 5,326 (1.1)
EBITDA margins % 19.3 10.7 854bps 24.4 -511bps 18.6 18.1 51bps
Interest 72 85 (16.2) 74 (3.1) 297 339 (12.2)
Depreciation 156 163 (4.5) 156 (0.3) 629 614 2.5
Other income 56 99 (43.9) 42 33.9 195 246 (21.0)
PBT 1,526 432 253.4 2,073 (26.4) 4,534 4,620 (1.9)
Tax 371 122 204.8 536 (30.8) 1,128 1,188 (5.0)
Tax rates % 24.3 28.2 -387bps 25.8 -156bps 24.9 25.7 -82bps
PAT 1,156 310 272.5 1,537 (24.8) 3,406 3,432 (0.8)
EPS (Rs) 103.6 27.8 272.5 137.8 (24.8) 305.4 307.7 (0.8)
Source: Company
6 July 2021 Consumer Retail – Q4 FY21 result review
Anand Rathi Research 6
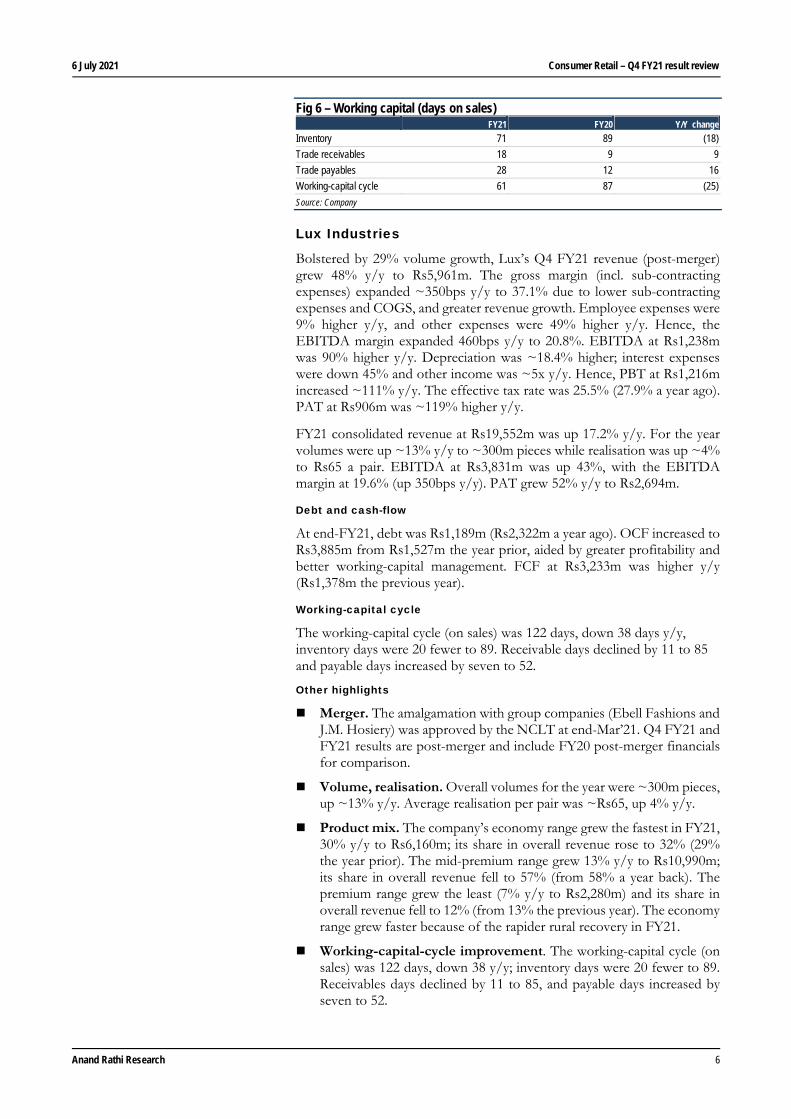
Fig 6 – Working capital (days on sales) FY21 FY20 Y/Y change
Inventory 71 89 (18)
Trade receivables 18 9 9
Trade payables 28 12 16
Working-capital cycle 61 87 (25)
Source: Company
Lux Industries
Bolstered by 29% volume growth, Lux’s Q4 FY21 revenue (post-merger) grew 48% y/y to Rs5,961m. The gross margin (incl. sub-contracting expenses) expanded ~350bps y/y to 37.1% due to lower sub-contracting expenses and COGS, and greater revenue growth. Employee expenses were 9% higher y/y, and other expenses were 49% higher y/y. Hence, the EBITDA margin expanded 460bps y/y to 20.8%. EBITDA at Rs1,238m was 90% higher y/y. Depreciation was ~18.4% higher; interest expenses were down 45% and other income was ~5x y/y. Hence, PBT at Rs1,216m increased ~111% y/y. The effective tax rate was 25.5% (27.9% a year ago). PAT at Rs906m was ~119% higher y/y.
FY21 consolidated revenue at Rs19,552m was up 17.2% y/y. For the year volumes were up ~13% y/y to ~300m pieces while realisation was up ~4% to Rs65 a pair. EBITDA at Rs3,831m was up 43%, with the EBITDA margin at 19.6% (up 350bps y/y). PAT grew 52% y/y to Rs2,694m.
Debt and cash-flow
At end-FY21, debt was Rs1,189m (Rs2,322m a year ago). OCF increased to Rs3,885m from Rs1,527m the year prior, aided by greater profitability and better working-capital management. FCF at Rs3,233m was higher y/y (Rs1,378m the previous year).
Working-capital cycle
The working-capital cycle (on sales) was 122 days, down 38 days y/y, inventory days were 20 fewer to 89. Receivable days declined by 11 to 85 and payable days increased by seven to 52.
Other highlights
Merger. The amalgamation with group companies (Ebell Fashions and J.M. Hosiery) was approved by the NCLT at end-Mar’21. Q4 FY21 and FY21 results are post-merger and include FY20 post-merger financials for comparison.
Volume, realisation. Overall volumes for the year were ~300m pieces, up ~13% y/y. Average realisation per pair was ~Rs65, up 4% y/y.
Product mix. The company’s economy range grew the fastest in FY21, 30% y/y to Rs6,160m; its share in overall revenue rose to 32% (29% the year prior). The mid-premium range grew 13% y/y to Rs10,990m; its share in overall revenue fell to 57% (from 58% a year back). The premium range grew the least (7% y/y to Rs2,280m) and its share in overall revenue fell to 12% (from 13% the previous year). The economy range grew faster because of the rapider rural recovery in FY21.
Working-capital-cycle improvement. The working-capital cycle (on sales) was 122 days, down 38 y/y; inventory days were 20 fewer to 89. Receivables days declined by 11 to 85, and payable days increased by seven to 52.
6 July 2021 Consumer Retail – Q4 FY21 result review
Anand Rathi Research 7
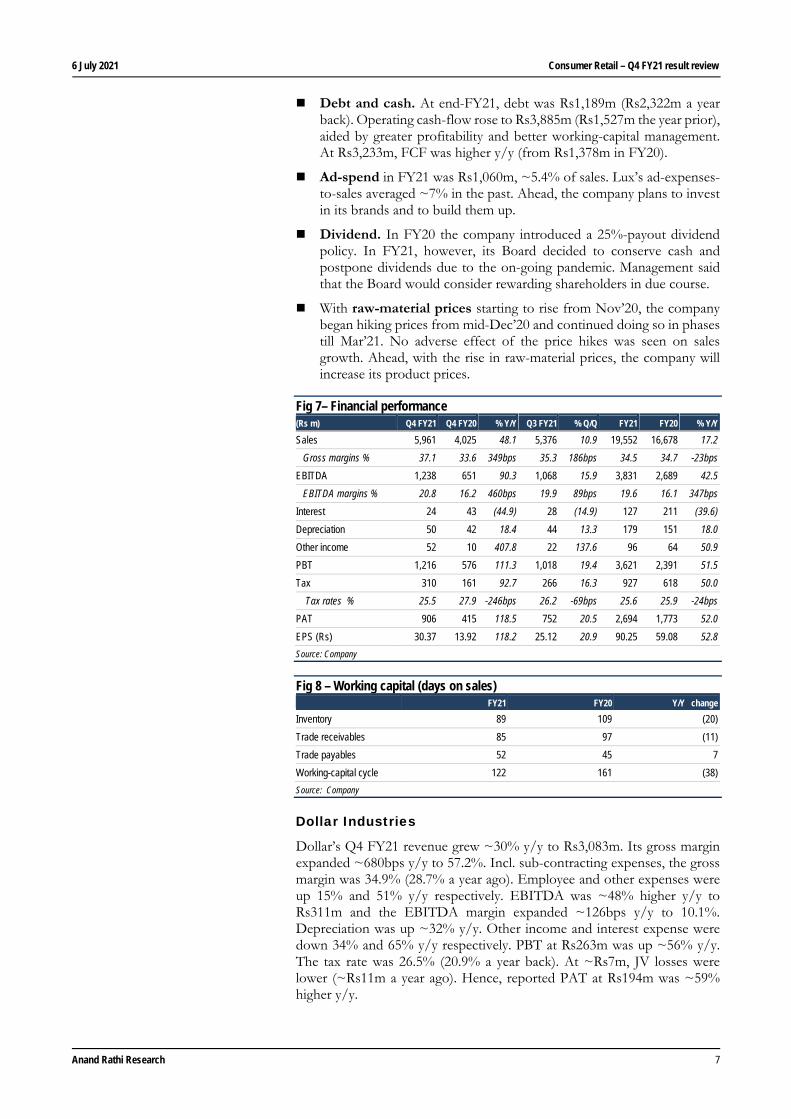
Debt and cash. At end-FY21, debt was Rs1,189m (Rs2,322m a year back). Operating cash-flow rose to Rs3,885m (Rs1,527m the year prior), aided by greater profitability and better working-capital management. At Rs3,233m, FCF was higher y/y (from Rs1,378m in FY20).
Ad-spend in FY21 was Rs1,060m, ~5.4% of sales. Lux’s ad-expenses-to-sales averaged ~7% in the past. Ahead, the company plans to invest in its brands and to build them up.
Dividend. In FY20 the company introduced a 25%-payout dividend policy. In FY21, however, its Board decided to conserve cash and postpone dividends due to the on-going pandemic. Management said that the Board would consider rewarding shareholders in due course.
With raw-material prices starting to rise from Nov’20, the company began hiking prices from mid-Dec’20 and continued doing so in phases till Mar’21. No adverse effect of the price hikes was seen on sales growth. Ahead, with the rise in raw-material prices, the company will increase its product prices.
Fig 7– Financial performance (Rs m) Q4 FY21 Q4 FY20 % Y/Y Q3 FY21 % Q/Q FY21 FY20 % Y/Y
Sales 5,961 4,025 48.1 5,376 10.9 19,552 16,678 17.2
Gross margins % 37.1 33.6 349bps 35.3 186bps 34.5 34.7 -23bps
EBITDA 1,238 651 90.3 1,068 15.9 3,831 2,689 42.5
EBITDA margins % 20.8 16.2 460bps 19.9 89bps 19.6 16.1 347bps
Interest 24 43 (44.9) 28 (14.9) 127 211 (39.6)
Depreciation 50 42 18.4 44 13.3 179 151 18.0
Other income 52 10 407.8 22 137.6 96 64 50.9
PBT 1,216 576 111.3 1,018 19.4 3,621 2,391 51.5
Tax 310 161 92.7 266 16.3 927 618 50.0
Tax rates % 25.5 27.9 -246bps 26.2 -69bps 25.6 25.9 -24bps
PAT 906 415 118.5 752 20.5 2,694 1,773 52.0
EPS (Rs) 30.37 13.92 118.2 25.12 20.9 90.25 59.08 52.8
Source: Company
Fig 8 – Working capital (days on sales) FY21 FY20 Y/Y change
Inventory 89 109 (20)
Trade receivables 85 97 (11)
Trade payables 52 45 7
Working-capital cycle 122 161 (38)
Source: Company
Dollar Industries
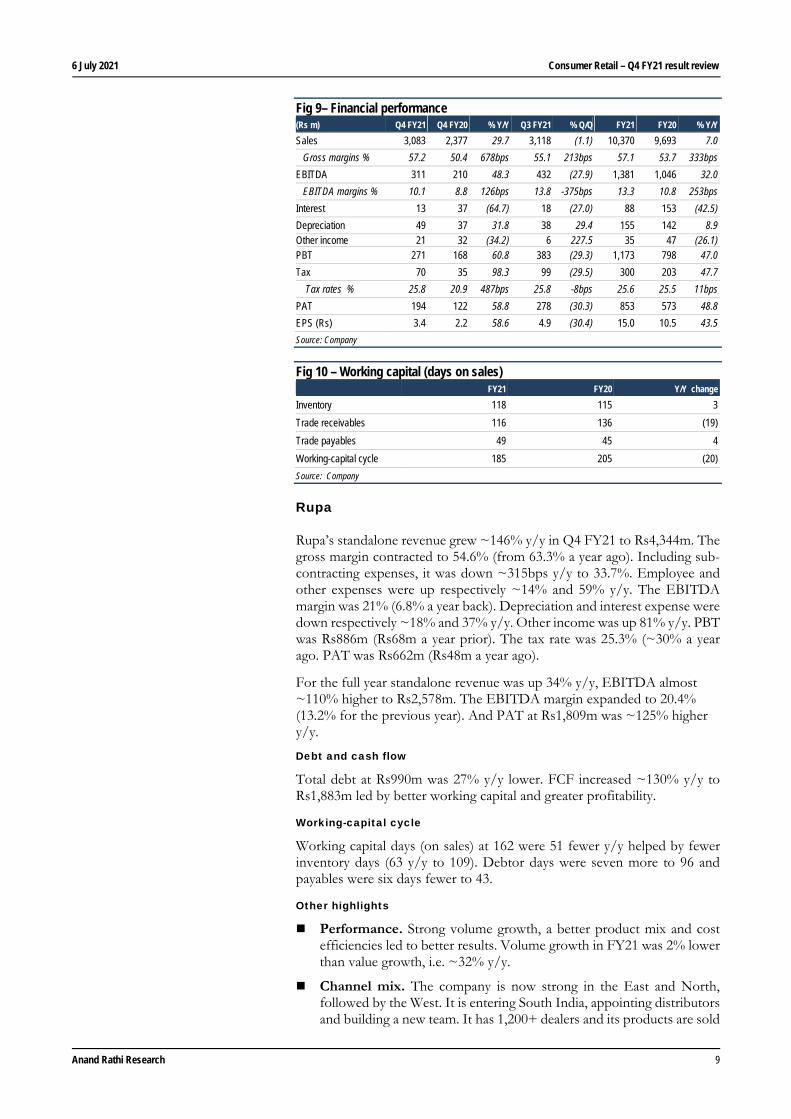
Dollar’s Q4 FY21 revenue grew ~30% y/y to Rs3,083m. Its gross margin expanded ~680bps y/y to 57.2%. Incl. sub-contracting expenses, the gross margin was 34.9% (28.7% a year ago). Employee and other expenses were up 15% and 51% y/y respectively. EBITDA was ~48% higher y/y to Rs311m and the EBITDA margin expanded ~126bps y/y to 10.1%. Depreciation was up ~32% y/y. Other income and interest expense were down 34% and 65% y/y respectively. PBT at Rs263m was up ~56% y/y. The tax rate was 26.5% (20.9% a year back). At ~Rs7m, JV losses were lower (~Rs11m a year ago). Hence, reported PAT at Rs194m was ~59% higher y/y.
6 July 2021 Consumer Retail – Q4 FY21 result review
Anand Rathi Research 8
FY21 revenue grew 7% y/y. The EBITDA margin expanded ~250bps to 13.3%. Reported PAT at Rs853m was 49% higher y/y.
Debt and cash flow
Borrowings were down ~42% y/y to Rs1,219m. OCF increased 150% y/y to Rs1,324m boosted by greater profitability and better working capital. FCF at Rs1,097 was ~260% higher y/y.
Working-capital cycle
Working capital days (on sales) were 20 fewer y/y to 185, aided by 19 fewer receivable days y/y to 116, and four more payable days y/y to 49. Inventory days were three more to 118.
Other highlights
Brand-wise FY21 contribution: Big Boss 43%, Dollar socks 1%, Force-go Wear 2%, Force NXT 3%, Missy 8%, Regular 34%, Thermal 9%. Athleisure did very well during the year and its contribution to overall sales grew to 14%.
Online sales jumped and the traction continues. The e-commerce contribution to sales was ~2.25% (1.5% earlier).
Volume, ASP growth. FY21 volume growth was 11% and overall revenue growth, 7%. Average implied realisation per piece was ~Rs59, down 4% y/y. Management said the realisation decline was due to greater discounts/schemes to channel partners and a change in the product mix toward lower-priced products during the year.
Project Lakshya. The Covid’19-triggered national lockdown in 2020 and regional lockdowns in 2021 slowed a roll-out of this project. At present, it is being implemented in five states, showing growth in distributors, retail reach and sales. Ahead, the company plans to roll it out in south and north-east India.
Working capital. Management says net working-capital days in FY21 were down 15 y/y to 186. Debtor days improved by 13 during the year. It plans to shorten working capital further, by 15-20 days, in FY22.
Advertising and promotional expenditure. FY21 A&P expense was Rs790m,~7.5% of sales. Of that, ~Rs500m was on rebranding and brand re-engineering. This exercise was started in 2019-20. Also, the logo was changed; hence, a 360-degree rebranding exercise. Ahead, it plans to spend ~Rs500m-600m in FY22, of which ~Rs200m will be toward branding and ~Rs300m-400m for A&P.
Raw material. Since Nov’20 the company has passed on all raw material price rises. Besides, it hiked prices in Apr’21. In FY21 the gross margin rose ~2% on the passing on of the raw-material price rise, with the advantage of older raw-material stocks.
Outlook. The company guided to ~13-15% revenue growth in FY22, and a ~150-200bp margin expansion, to ~15%.
6 July 2021 Consumer Retail – Q4 FY21 result review
Anand Rathi Research 9
Fig 9– Financial performance (Rs m) Q4 FY21 Q4 FY20 % Y/Y Q3 FY21 % Q/Q FY21 FY20 % Y/Y Sales 3,083 2,377 29.7 3,118 (1.1) 10,370 9,693 7.0
Gross margins % 57.2 50.4 678bps 55.1 213bps 57.1 53.7 333bps
EBITDA 311 210 48.3 432 (27.9) 1,381 1,046 32.0
EBITDA margins % 10.1 8.8 126bps 13.8 -375bps 13.3 10.8 253bps
Interest 13 37 (64.7) 18 (27.0) 88 153 (42.5)
Depreciation 49 37 31.8 38 29.4 155 142 8.9Other income 21 32 (34.2) 6 227.5 35 47 (26.1)PBT 271 168 60.8 383 (29.3) 1,173 798 47.0
Tax 70 35 98.3 99 (29.5) 300 203 47.7
Tax rates % 25.8 20.9 487bps 25.8 -8bps 25.6 25.5 11bps
PAT 194 122 58.8 278 (30.3) 853 573 48.8
EPS (Rs) 3.4 2.2 58.6 4.9 (30.4) 15.0 10.5 43.5
Source: Company
Fig 10 – Working capital (days on sales) FY21 FY20 Y/Y change
Inventory 118 115 3
Trade receivables 116 136 (19)
Trade payables 49 45 4
Working-capital cycle 185 205 (20)
Source: Company
Rupa
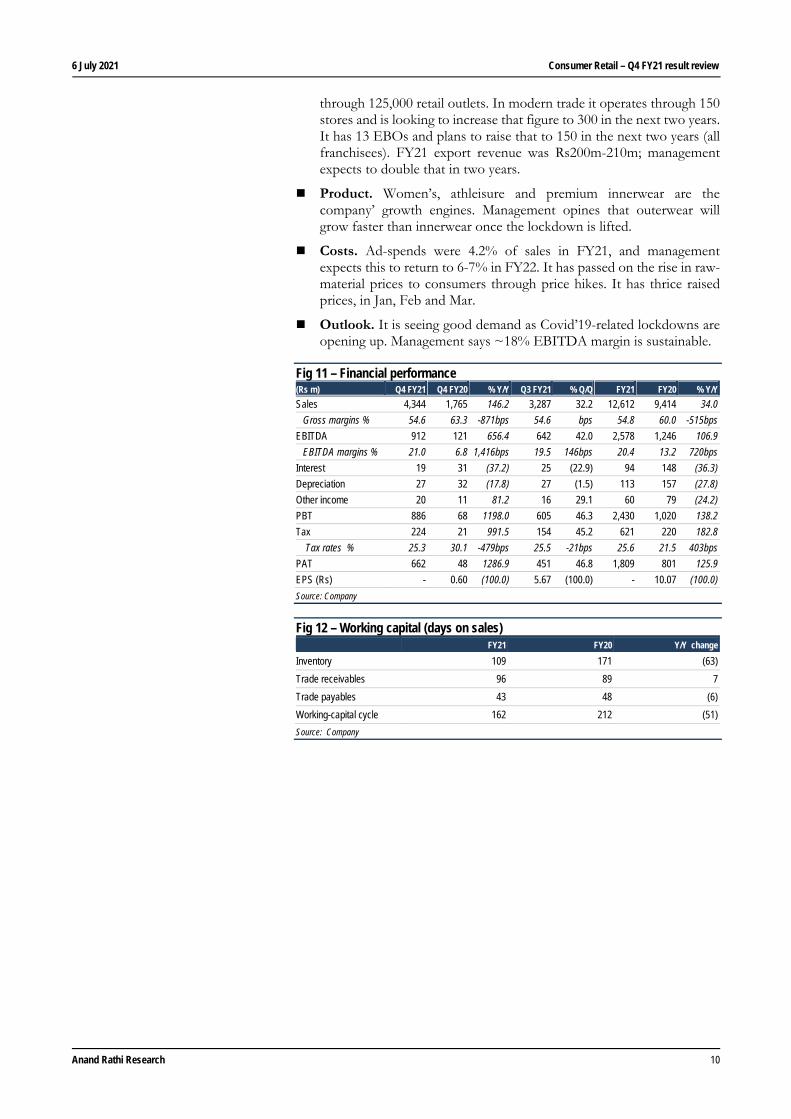
Rupa’s standalone revenue grew ~146% y/y in Q4 FY21 to Rs4,344m. The gross margin contracted to 54.6% (from 63.3% a year ago). Including sub-contracting expenses, it was down ~315bps y/y to 33.7%. Employee and other expenses were up respectively ~14% and 59% y/y. The EBITDA margin was 21% (6.8% a year back). Depreciation and interest expense were down respectively ~18% and 37% y/y. Other income was up 81% y/y. PBT was Rs886m (Rs68m a year prior). The tax rate was 25.3% (~30% a year ago. PAT was Rs662m (Rs48m a year ago).
For the full year standalone revenue was up 34% y/y, EBITDA almost ~110% higher to Rs2,578m. The EBITDA margin expanded to 20.4% (13.2% for the previous year). And PAT at Rs1,809m was ~125% higher y/y.
Debt and cash flow
Total debt at Rs990m was 27% y/y lower. FCF increased ~130% y/y to Rs1,883m led by better working capital and greater profitability.
Working-capital cycle
Working capital days (on sales) at 162 were 51 fewer y/y helped by fewer inventory days (63 y/y to 109). Debtor days were seven more to 96 and payables were six days fewer to 43.
Other highlights
Performance. Strong volume growth, a better product mix and cost efficiencies led to better results. Volume growth in FY21 was 2% lower than value growth, i.e. ~32% y/y.
Channel mix. The company is now strong in the East and North, followed by the West. It is entering South India, appointing distributors and building a new team. It has 1,200+ dealers and its products are sold
6 July 2021 Consumer Retail – Q4 FY21 result review
Anand Rathi Research 10
through 125,000 retail outlets. In modern trade it operates through 150 stores and is looking to increase that figure to 300 in the next two years. It has 13 EBOs and plans to raise that to 150 in the next two years (all franchisees). FY21 export revenue was Rs200m-210m; management expects to double that in two years.
Product. Women’s, athleisure and premium innerwear are the company’ growth engines. Management opines that outerwear will grow faster than innerwear once the lockdown is lifted.
Costs. Ad-spends were 4.2% of sales in FY21, and management expects this to return to 6-7% in FY22. It has passed on the rise in raw-material prices to consumers through price hikes. It has thrice raised prices, in Jan, Feb and Mar.
Outlook. It is seeing good demand as Covid’19-related lockdowns are opening up. Management says ~18% EBITDA margin is sustainable.
Fig 11 – Financial performance (Rs m) Q4 FY21 Q4 FY20 % Y/Y Q3 FY21 % Q/Q FY21 FY20 % Y/Y Sales 4,344 1,765 146.2 3,287 32.2 12,612 9,414 34.0
Gross margins % 54.6 63.3 -871bps 54.6 bps 54.8 60.0 -515bps
EBITDA 912 121 656.4 642 42.0 2,578 1,246 106.9
EBITDA margins % 21.0 6.8 1,416bps 19.5 146bps 20.4 13.2 720bps
Interest 19 31 (37.2) 25 (22.9) 94 148 (36.3)
Depreciation 27 32 (17.8) 27 (1.5) 113 157 (27.8)
Other income 20 11 81.2 16 29.1 60 79 (24.2)
PBT 886 68 1198.0 605 46.3 2,430 1,020 138.2
Tax 224 21 991.5 154 45.2 621 220 182.8
Tax rates % 25.3 30.1 -479bps 25.5 -21bps 25.6 21.5 403bps
PAT 662 48 1286.9 451 46.8 1,809 801 125.9
EPS (Rs) - 0.60 (100.0) 5.67 (100.0) - 10.07 (100.0)
Source: Company
Fig 12 – Working capital (days on sales) FY21 FY20 Y/Y change
Inventory 109 171 (63)
Trade receivables 96 89 7
Trade payables 43 48 (6)
Working-capital cycle 162 212 (51)
Source: Company
6 July 2021 Consumer Retail – Q4 FY21 result review
Anand Rathi Research 11
Branded Apparel
Almost back to normal With average sales growth almost flat y/y (up 0.4%), branded apparel retailers had an almost normal quarter. Declines in ABFRL, Kewal Kiran and Shoppers Stop were respectively ~2%, 13% and 5% y/y. Arvind Fashions reported the strongest growth (~14% y/y), followed by Trent (7%) and TCNS (~1%). Footfalls and sales in Q4 returned to normal for most retailers. However, Covid-19 second-wave restrictions from the second week of March dampened the recovery.
All the companies barring Kewal Kiran reported y/y EBITDA margin expansion in Q4. Cost rationalising continued to some extent. However with sales picking up, costs such as rentals were back to the pre-Covid run rate toward the end of the quarter. For many companies manpower costs returned in Jan. Rental reductions in Q4 have been lower and were expected to return to normal. However, with the restrictions toward the second half of Mar, companies have again engaged in negotiations with landlords for Q1 FY22. Fixed-rental concessions received by apparel retailers in Q4 averaged ~16% (~18% in the quarter prior).
Aditya Birla Fashion & Retail
ABFRL standalone sales were down ~2% y/y to Rs17.8bn. The gross margin was up 205bps y/y to 53.3%, q/q up from 52.3%. Employee, rent and other expenses were down respectively 19%, 18% and 3% y/y. EBITDA was Rs2,570m (Rs1,561m a year ago). The EBITDA margin was 14.4% (8.6% a year back). Other income was Rs202m, up from Rs169m a year prior (Q4 FY21 includes rental concession), depreciation was up 6.2% and interest expense was almost flat y/y. Deferred tax was Rs455m (a year prior -Rs379m). There was a one-time tax impact of Rs1,085m. Rep. standalone PAT loss was Rs1,348m (Rs1,403m a year prior).
For FY21, standalone revenue was down ~41%, EBITDA was Rs5,943m, down 52% y/y. PAT loss was Rs6,496m (a Rs1,452m loss in FY20).
Madura Lifestyle brands reported revenue decline of 6.4% to Rs10bn in Q4 FY21. The EBITDA margin was 17.5% (15.3% a year ago) driven by strong cost-control steps. Its retail stores delivered ~8% industry-leading growth despite Covid-19. Its FY21 revenue fell ~41% y/y to Rs27.5bn, with the EBITDA margin at 12.4% (17.2% the year prior). At end-FY21 it had 2,379 stores. It continued to add stores relentlessly, 383 during the year, of which ~88% were franchisees. It shut down ~247 unviable stores during the year and plans to add 300-400 in FY22. Pantaloons Q4 FY21 revenue fell ~5% y/y to Rs6bn (LTL at negative 10.6%). The EBITDA margin was 14.4% (8.9% a year ago). The margin expansion was driven by better inventory management and lower discounting and better overall cost management. The performance across markets was different: smaller towns grew y/y and metros/tier-1 cities lagged last year’s growth. High Street stores recovered faster than stores in malls. The e-commerce channel grew ~3x. The share of revenue from private brands was ~59% (~61% a year back). Pantaloons’ FY21 revenue/EBITDA declined 47%/51%. Its EBITDA margin was 14.8% (16% in FY20). The company added 19 stores in FY21 and plans to add 60 in FY22. Also, it shut 15 unviable ones, ending the year with 346 stores.
6 July 2021 Consumer Retail – Q4 FY21 result review
Anand Rathi Research 12
Fast Fashion and Others. Q4 FY21 revenue of the other businesses (Fast Fashion, innerwear and other brands) rose 36% to Rs2.1bn while the EBITDA margin came at 5.6% (vs. a negative 27.4% a year back). The other businesses’ FY21 revenue declined ~19% y/y. The EBITDA was Rs260m (vs a Rs510m EBITDA loss the year prior). Innerwear and athleisure grew 56% y/y in Q4 FY21 and ~3% y/y in FY21. Expansion in the trade channel continued, adding ~5,500 outlets during the year. The category is now present in 28,000 MBOs. Also, 10 EBOs were added in the year and its EBO count was 47 at end-FY21. Ahead, it will continue to open more EBOs and MBO touch points. Ethnic-wear brands. Ethnic-wear brands reported Q4 revenue of Rs380m and an EBITDA loss of Rs240m. The loss was higher during the quarter due to the Sabyasachi-acquisition-related expense, which management said was a one-time affair. The EBITDA loss should be Rs170m-180m. Jaypore and Shantanu & Nikhil reported ~70% and 12% revenue growth in Q4 respectively. The company added in-home, sleepwear and loungewear categories in Jaypore and opened its first store post acquisition. It plans to add 10 more Jaypore stores in FY22.
Debt and cash flow
Debt was Rs11.2bn (Rs27.7bn in FY20). During the year the company raised Rs22.5bn through equity, and used it to repay debt. Losses suffered during the year were funded from the net working-capital reduction (down Rs7.6bn y/y). OCF increased 74% to Rs11.bn in FY21 led by lower working capital. FCF was Rs10bn (Rs3.5bn in FY20).
Working-capital cycle
Working capital days (on sales) were lower at 9 vs. 38 in FY20. Inventory days were 25 more to 123 days. Debtor days were higher at 51 vs 35 in FY20. Payable days were 164 vs 95 in FY20.
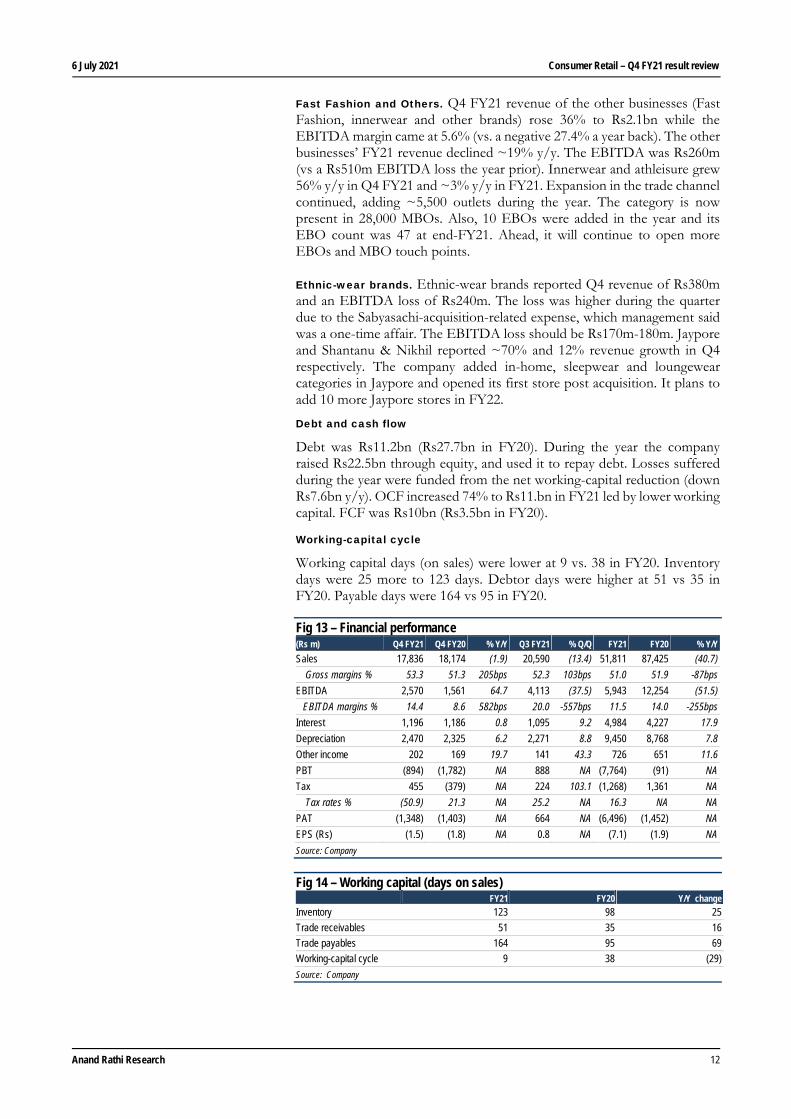
Fig 13 – Financial performance (Rs m) Q4 FY21 Q4 FY20 % Y/Y Q3 FY21 % Q/Q FY21 FY20 % Y/Y Sales 17,836 18,174 (1.9) 20,590 (13.4) 51,811 87,425 (40.7)
Gross margins % 53.3 51.3 205bps 52.3 103bps 51.0 51.9 -87bps
EBITDA 2,570 1,561 64.7 4,113 (37.5) 5,943 12,254 (51.5)
EBITDA margins % 14.4 8.6 582bps 20.0 -557bps 11.5 14.0 -255bps
Interest 1,196 1,186 0.8 1,095 9.2 4,984 4,227 17.9
Depreciation 2,470 2,325 6.2 2,271 8.8 9,450 8,768 7.8
Other income 202 169 19.7 141 43.3 726 651 11.6
PBT (894) (1,782) NA 888 NA (7,764) (91) NA
Tax 455 (379) NA 224 103.1 (1,268) 1,361 NA
Tax rates % (50.9) 21.3 NA 25.2 NA 16.3 NA NA
PAT (1,348) (1,403) NA 664 NA (6,496) (1,452) NA
EPS (Rs) (1.5) (1.8) NA 0.8 NA (7.1) (1.9) NA
Source: Company
Fig 14 – Working capital (days on sales) FY21 FY20 Y/Y change
Inventory 123 98 25
Trade receivables 51 35 16
Trade payables 164 95 69
Working-capital cycle 9 38 (29)
Source: Company
6 July 2021 Consumer Retail – Q4 FY21 result review
Anand Rathi Research 13
TCNS Clothing
TCNS Clothing reported ~1% y/y revenue growth in Q4 FY21 to Rs2,211m. The gross margin contracted 45bps y/y to 57.5%. Employee, S&D and other expenses were respectively 17%, 9% and 34% lower y/y. EBITDA was Rs229m (vs. a Rs48m loss a year ago). The 10.4% EBITDA margin contrasted with -2.2% a year back. Interest expense was ~21% higher y/y, and depreciation was down ~20% y/y. Other income came at Rs181m (vs. Rs91m a year back) including rent concessions. The Q4 FY21 PBT was Rs46m (vs. a Rs365m loss a year ago). Net profit came at Rs38m (vs. a Rs238m net loss in Q4 FY20). FY21 revenue was down ~45% y/y to Rs6,355m. The gross margin contracted 783bps to 57.1%. EBITDA was down ~99% y/y to Rs24m. The Rs564m net loss contrasted with a Rs694m profit the year prior.
Debt and cash-flow
The company maintained its net cash position and ended the year with cash balance of Rs1,873m, vs a starting balance of Rs1,713m (in addition to unutilized bank limits). OCF decreased ~13% y/y due to lower profitability. However due to lower capex (down ~66% y/y), FCF was marginally higher (3% y/y) to Rs1,027m.
Working-capital cycle
Working capital days (on sales) were 80 days more to 202 at end-FY21. Debtor days were ~39 days more y/y to 95. Inventory days were up ~55 days to 160. Creditor days were 14 days more to 52 days.
Other highlights
Performance. W/Wishful revenue declined 2%/23% and Aurelia grew 11% in Q4 FY21. Tier-2 and -3 markets recovered to near pre-Covid levels. The online channel sales’ strong momentum continued, sales doubling y/y. On its rationalisation completed, the MBO channel primary billing began in Feb’21.
Cost reduction. FY21 fixed costs were down ~30% y/y with rentals/ employee and other overheads down 45%, 23% and 29% respectively. The company doesn’t expect much employee-cost savings, while other overheads could reduce 10-20% from. FY20. Rental savings are still being negotiated.
Store network. After shutting 44 EBOs and conserving cash, the company plans to add 60 EBOs and 200-250 LFS in FY22 and FY23 each. It has signed up 30 EBOs in Q4 which are slated to open in H1 FY22. It ended FY21 with 551 EBOs, 1,011 MBOs and 2,123 LFS.
6 July 2021 Consumer Retail – Q4 FY21 result review
Anand Rathi Research 14
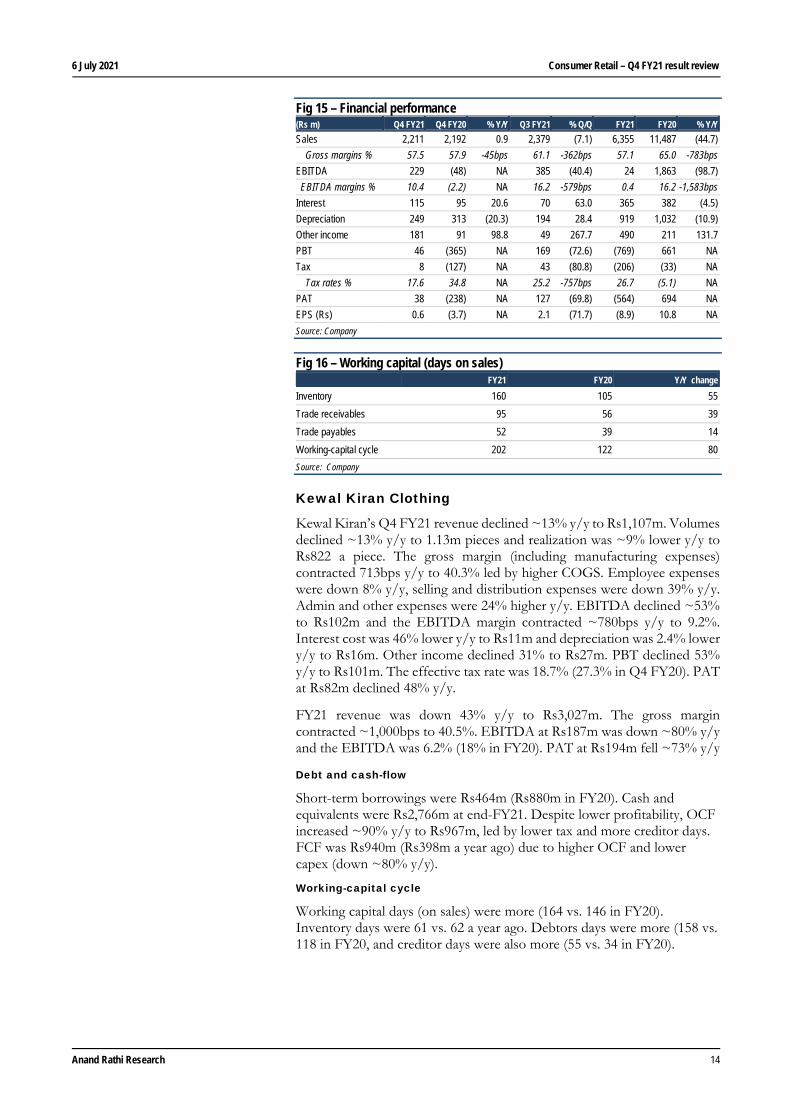
Fig 15 – Financial performance (Rs m) Q4 FY21 Q4 FY20 % Y/Y Q3 FY21 % Q/Q FY21 FY20 % Y/Y Sales 2,211 2,192 0.9 2,379 (7.1) 6,355 11,487 (44.7)
Gross margins % 57.5 57.9 -45bps 61.1 -362bps 57.1 65.0 -783bps
EBITDA 229 (48) NA 385 (40.4) 24 1,863 (98.7)
EBITDA margins % 10.4 (2.2) NA 16.2 -579bps 0.4 16.2 -1,583bps
Interest 115 95 20.6 70 63.0 365 382 (4.5)
Depreciation 249 313 (20.3) 194 28.4 919 1,032 (10.9)
Other income 181 91 98.8 49 267.7 490 211 131.7
PBT 46 (365) NA 169 (72.6) (769) 661 NA
Tax 8 (127) NA 43 (80.8) (206) (33) NA
Tax rates % 17.6 34.8 NA 25.2 -757bps 26.7 (5.1) NA
PAT 38 (238) NA 127 (69.8) (564) 694 NA
EPS (Rs) 0.6 (3.7) NA 2.1 (71.7) (8.9) 10.8 NA
Source: Company
Fig 16 – Working capital (days on sales) FY21 FY20 Y/Y change
Inventory 160 105 55
Trade receivables 95 56 39
Trade payables 52 39 14
Working-capital cycle 202 122 80
Source: Company
Kewal Kiran Clothing
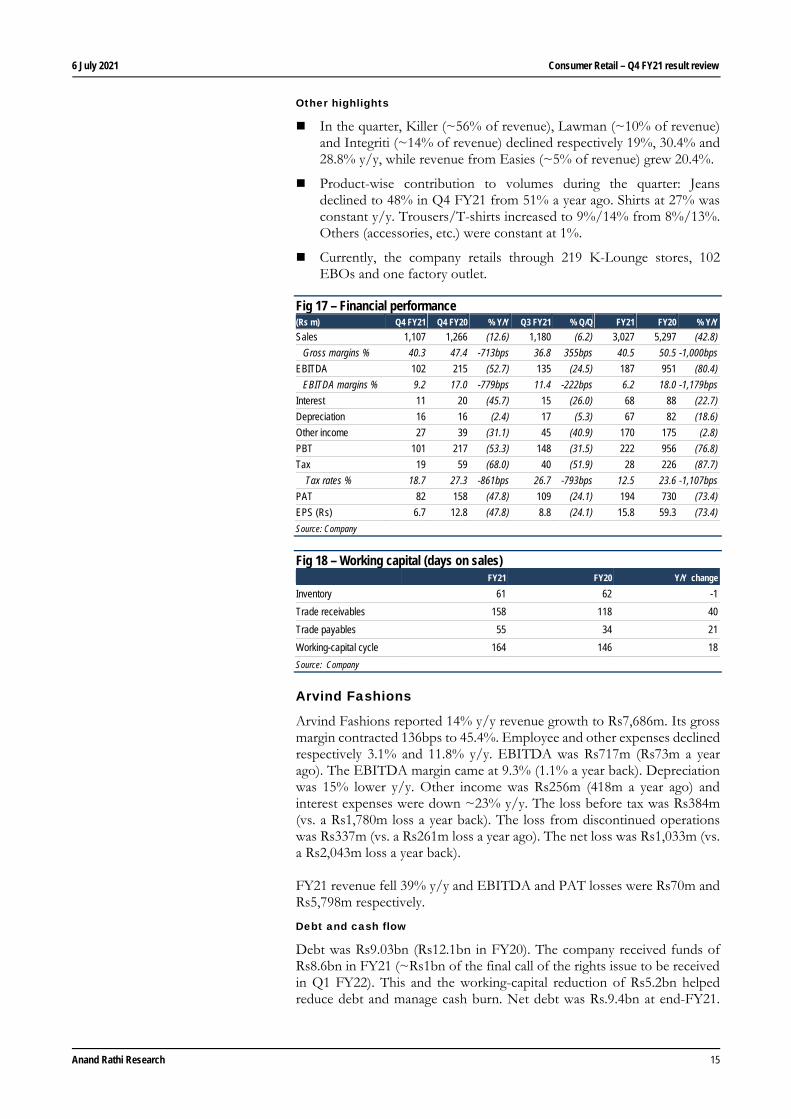
Kewal Kiran’s Q4 FY21 revenue declined ~13% y/y to Rs1,107m. Volumes declined ~13% y/y to 1.13m pieces and realization was ~9% lower y/y to Rs822 a piece. The gross margin (including manufacturing expenses) contracted 713bps y/y to 40.3% led by higher COGS. Employee expenses were down 8% y/y, selling and distribution expenses were down 39% y/y. Admin and other expenses were 24% higher y/y. EBITDA declined ~53% to Rs102m and the EBITDA margin contracted ~780bps y/y to 9.2%. Interest cost was 46% lower y/y to Rs11m and depreciation was 2.4% lower y/y to Rs16m. Other income declined 31% to Rs27m. PBT declined 53% y/y to Rs101m. The effective tax rate was 18.7% (27.3% in Q4 FY20). PAT at Rs82m declined 48% y/y.
FY21 revenue was down 43% y/y to Rs3,027m. The gross margin contracted ~1,000bps to 40.5%. EBITDA at Rs187m was down ~80% y/y and the EBITDA was 6.2% (18% in FY20). PAT at Rs194m fell ~73% y/y
Debt and cash-flow
Short-term borrowings were Rs464m (Rs880m in FY20). Cash and equivalents were Rs2,766m at end-FY21. Despite lower profitability, OCF increased ~90% y/y to Rs967m, led by lower tax and more creditor days. FCF was Rs940m (Rs398m a year ago) due to higher OCF and lower capex (down ~80% y/y).
Working-capital cycle
Working capital days (on sales) were more (164 vs. 146 in FY20). Inventory days were 61 vs. 62 a year ago. Debtors days were more (158 vs. 118 in FY20, and creditor days were also more (55 vs. 34 in FY20).
6 July 2021 Consumer Retail – Q4 FY21 result review
Anand Rathi Research 15
Other highlights
In the quarter, Killer (~56% of revenue), Lawman (~10% of revenue) and Integriti (~14% of revenue) declined respectively 19%, 30.4% and 28.8% y/y, while revenue from Easies (~5% of revenue) grew 20.4%.
Product-wise contribution to volumes during the quarter: Jeans declined to 48% in Q4 FY21 from 51% a year ago. Shirts at 27% was constant y/y. Trousers/T-shirts increased to 9%/14% from 8%/13%. Others (accessories, etc.) were constant at 1%.
Currently, the company retails through 219 K-Lounge stores, 102 EBOs and one factory outlet.
Fig 17 – Financial performance (Rs m) Q4 FY21 Q4 FY20 % Y/Y Q3 FY21 % Q/Q FY21 FY20 % Y/Y Sales 1,107 1,266 (12.6) 1,180 (6.2) 3,027 5,297 (42.8)
Gross margins % 40.3 47.4 -713bps 36.8 355bps 40.5 50.5 -1,000bps
EBITDA 102 215 (52.7) 135 (24.5) 187 951 (80.4)
EBITDA margins % 9.2 17.0 -779bps 11.4 -222bps 6.2 18.0 -1,179bps
Interest 11 20 (45.7) 15 (26.0) 68 88 (22.7)
Depreciation 16 16 (2.4) 17 (5.3) 67 82 (18.6)
Other income 27 39 (31.1) 45 (40.9) 170 175 (2.8)
PBT 101 217 (53.3) 148 (31.5) 222 956 (76.8)
Tax 19 59 (68.0) 40 (51.9) 28 226 (87.7)
Tax rates % 18.7 27.3 -861bps 26.7 -793bps 12.5 23.6 -1,107bps
PAT 82 158 (47.8) 109 (24.1) 194 730 (73.4)
EPS (Rs) 6.7 12.8 (47.8) 8.8 (24.1) 15.8 59.3 (73.4)
Source: Company
Fig 18 – Working capital (days on sales) FY21 FY20 Y/Y change
Inventory 61 62 -1
Trade receivables 158 118 40
Trade payables 55 34 21
Working-capital cycle 164 146 18
Source: Company
Arvind Fashions
Arvind Fashions reported 14% y/y revenue growth to Rs7,686m. Its gross margin contracted 136bps to 45.4%. Employee and other expenses declined respectively 3.1% and 11.8% y/y. EBITDA was Rs717m (Rs73m a year ago). The EBITDA margin came at 9.3% (1.1% a year back). Depreciation was 15% lower y/y. Other income was Rs256m (418m a year ago) and interest expenses were down ~23% y/y. The loss before tax was Rs384m (vs. a Rs1,780m loss a year back). The loss from discontinued operations was Rs337m (vs. a Rs261m loss a year ago). The net loss was Rs1,033m (vs. a Rs2,043m loss a year back). FY21 revenue fell 39% y/y and EBITDA and PAT losses were Rs70m and Rs5,798m respectively.
Debt and cash flow
Debt was Rs9.03bn (Rs12.1bn in FY20). The company received funds of Rs8.6bn in FY21 (~Rs1bn of the final call of the rights issue to be received in Q1 FY22). This and the working-capital reduction of Rs5.2bn helped reduce debt and manage cash burn. Net debt was Rs.9.4bn at end-FY21.
6 July 2021 Consumer Retail – Q4 FY21 result review
Anand Rathi Research 16
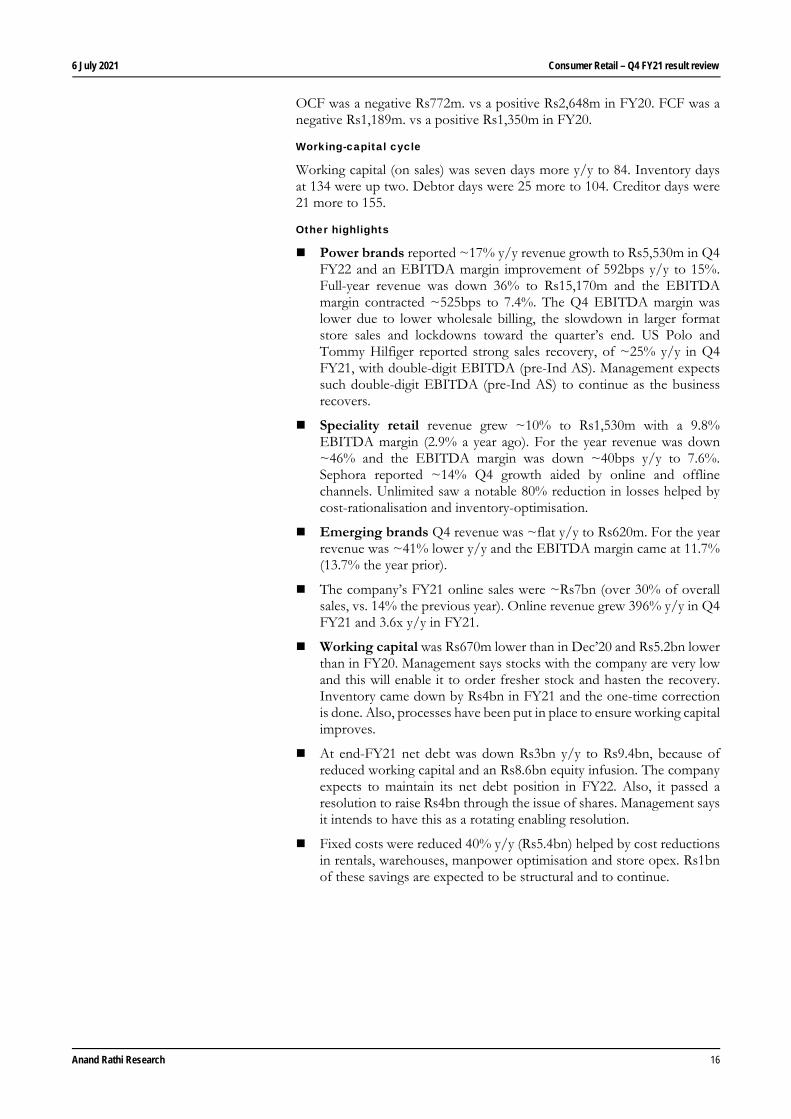
OCF was a negative Rs772m. vs a positive Rs2,648m in FY20. FCF was a negative Rs1,189m. vs a positive Rs1,350m in FY20.
Working-capital cycle
Working capital (on sales) was seven days more y/y to 84. Inventory days at 134 were up two. Debtor days were 25 more to 104. Creditor days were 21 more to 155.
Other highlights
Power brands reported ~17% y/y revenue growth to Rs5,530m in Q4 FY22 and an EBITDA margin improvement of 592bps y/y to 15%. Full-year revenue was down 36% to Rs15,170m and the EBITDA margin contracted ~525bps to 7.4%. The Q4 EBITDA margin was lower due to lower wholesale billing, the slowdown in larger format store sales and lockdowns toward the quarter’s end. US Polo and Tommy Hilfiger reported strong sales recovery, of ~25% y/y in Q4 FY21, with double-digit EBITDA (pre-Ind AS). Management expects such double-digit EBITDA (pre-Ind AS) to continue as the business recovers.
Speciality retail revenue grew ~10% to Rs1,530m with a 9.8% EBITDA margin (2.9% a year ago). For the year revenue was down ~46% and the EBITDA margin was down ~40bps y/y to 7.6%. Sephora reported ~14% Q4 growth aided by online and offline channels. Unlimited saw a notable 80% reduction in losses helped by cost-rationalisation and inventory-optimisation.
Emerging brands Q4 revenue was ~flat y/y to Rs620m. For the year revenue was ~41% lower y/y and the EBITDA margin came at 11.7% (13.7% the year prior).
The company’s FY21 online sales were ~Rs7bn (over 30% of overall sales, vs. 14% the previous year). Online revenue grew 396% y/y in Q4 FY21 and 3.6x y/y in FY21.
Working capital was Rs670m lower than in Dec’20 and Rs5.2bn lower than in FY20. Management says stocks with the company are very low and this will enable it to order fresher stock and hasten the recovery. Inventory came down by Rs4bn in FY21 and the one-time correction is done. Also, processes have been put in place to ensure working capital improves.
At end-FY21 net debt was down Rs3bn y/y to Rs9.4bn, because of reduced working capital and an Rs8.6bn equity infusion. The company expects to maintain its net debt position in FY22. Also, it passed a resolution to raise Rs4bn through the issue of shares. Management says it intends to have this as a rotating enabling resolution.
Fixed costs were reduced 40% y/y (Rs5.4bn) helped by cost reductions in rentals, warehouses, manpower optimisation and store opex. Rs1bn of these savings are expected to be structural and to continue.
6 July 2021 Consumer Retail – Q4 FY21 result review
Anand Rathi Research 17
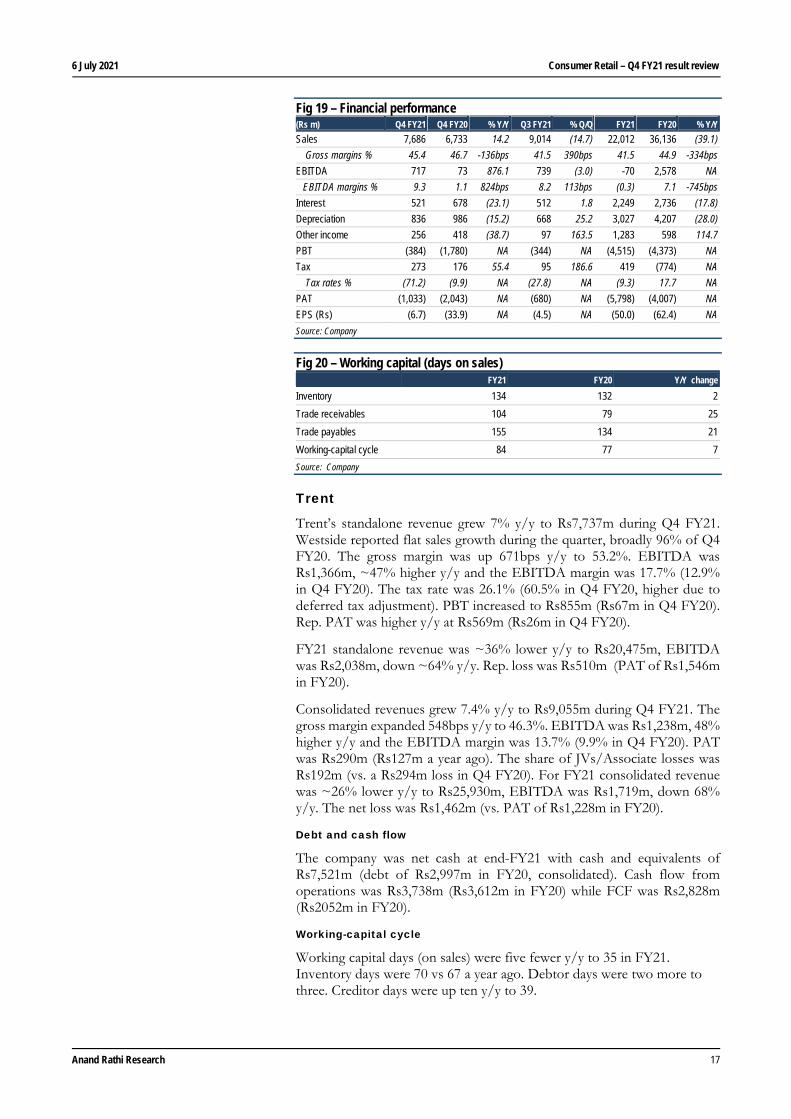
Fig 19 – Financial performance (Rs m) Q4 FY21 Q4 FY20 % Y/Y Q3 FY21 % Q/Q FY21 FY20 % Y/Y Sales 7,686 6,733 14.2 9,014 (14.7) 22,012 36,136 (39.1)
Gross margins % 45.4 46.7 -136bps 41.5 390bps 41.5 44.9 -334bps
EBITDA 717 73 876.1 739 (3.0) -70 2,578 NA
EBITDA margins % 9.3 1.1 824bps 8.2 113bps (0.3) 7.1 -745bps
Interest 521 678 (23.1) 512 1.8 2,249 2,736 (17.8)
Depreciation 836 986 (15.2) 668 25.2 3,027 4,207 (28.0)
Other income 256 418 (38.7) 97 163.5 1,283 598 114.7
PBT (384) (1,780) NA (344) NA (4,515) (4,373) NA
Tax 273 176 55.4 95 186.6 419 (774) NA
Tax rates % (71.2) (9.9) NA (27.8) NA (9.3) 17.7 NA
PAT (1,033) (2,043) NA (680) NA (5,798) (4,007) NA
EPS (Rs) (6.7) (33.9) NA (4.5) NA (50.0) (62.4) NA
Source: Company
Fig 20 – Working capital (days on sales) FY21 FY20 Y/Y change
Inventory 134 132 2
Trade receivables 104 79 25
Trade payables 155 134 21
Working-capital cycle 84 77 7
Source: Company
Trent
Trent’s standalone revenue grew 7% y/y to Rs7,737m during Q4 FY21. Westside reported flat sales growth during the quarter, broadly 96% of Q4 FY20. The gross margin was up 671bps y/y to 53.2%. EBITDA was Rs1,366m, ~47% higher y/y and the EBITDA margin was 17.7% (12.9% in Q4 FY20). The tax rate was 26.1% (60.5% in Q4 FY20, higher due to deferred tax adjustment). PBT increased to Rs855m (Rs67m in Q4 FY20). Rep. PAT was higher y/y at Rs569m (Rs26m in Q4 FY20).
FY21 standalone revenue was ~36% lower y/y to Rs20,475m, EBITDA was Rs2,038m, down ~64% y/y. Rep. loss was Rs510m (PAT of Rs1,546m in FY20).
Consolidated revenues grew 7.4% y/y to Rs9,055m during Q4 FY21. The gross margin expanded 548bps y/y to 46.3%. EBITDA was Rs1,238m, 48% higher y/y and the EBITDA margin was 13.7% (9.9% in Q4 FY20). PAT was Rs290m (Rs127m a year ago). The share of JVs/Associate losses was Rs192m (vs. a Rs294m loss in Q4 FY20). For FY21 consolidated revenue was ~26% lower y/y to Rs25,930m, EBITDA was Rs1,719m, down 68% y/y. The net loss was Rs1,462m (vs. PAT of Rs1,228m in FY20).
Debt and cash flow
The company was net cash at end-FY21 with cash and equivalents of Rs7,521m (debt of Rs2,997m in FY20, consolidated). Cash flow from operations was Rs3,738m (Rs3,612m in FY20) while FCF was Rs2,828m (Rs2052m in FY20).
Working-capital cycle
Working capital days (on sales) were five fewer y/y to 35 in FY21. Inventory days were 70 vs 67 a year ago. Debtor days were two more to three. Creditor days were up ten y/y to 39.
6 July 2021 Consumer Retail – Q4 FY21 result review
Anand Rathi Research 18
Other highlights
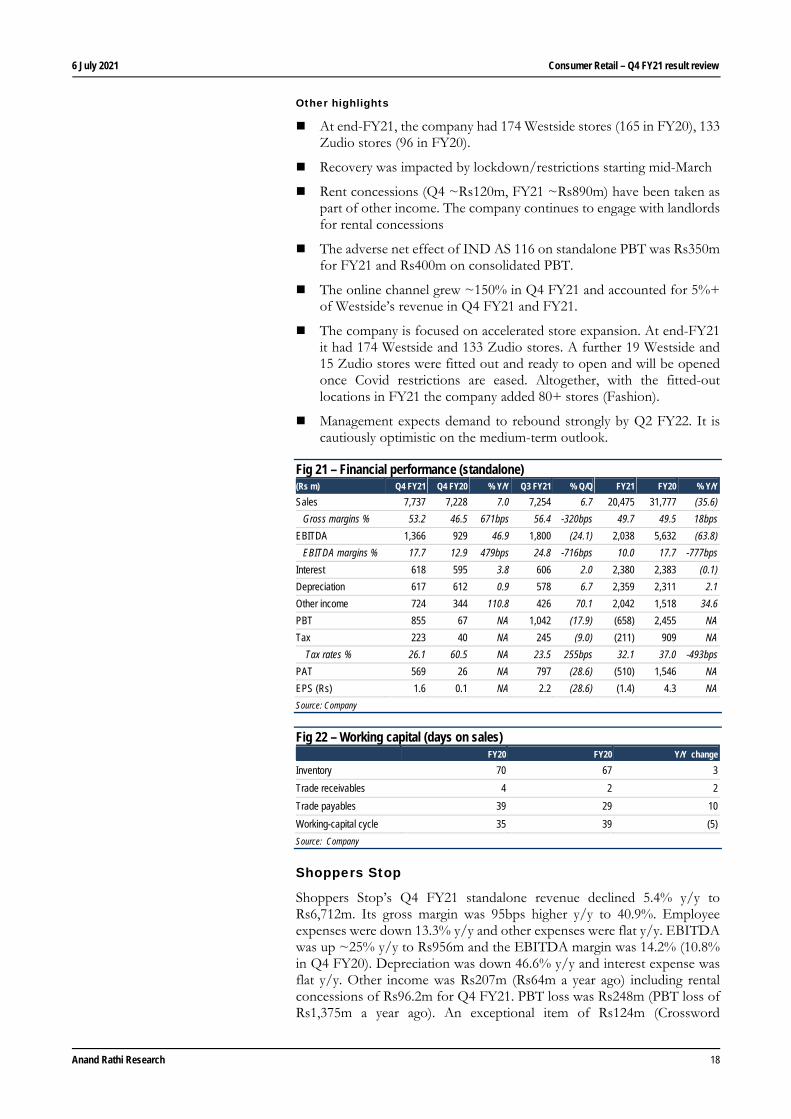
At end-FY21, the company had 174 Westside stores (165 in FY20), 133 Zudio stores (96 in FY20).
Recovery was impacted by lockdown/restrictions starting mid-March
Rent concessions (Q4 ~Rs120m, FY21 ~Rs890m) have been taken as part of other income. The company continues to engage with landlords for rental concessions
The adverse net effect of IND AS 116 on standalone PBT was Rs350m for FY21 and Rs400m on consolidated PBT.
The online channel grew ~150% in Q4 FY21 and accounted for 5%+ of Westside’s revenue in Q4 FY21 and FY21.
The company is focused on accelerated store expansion. At end-FY21 it had 174 Westside and 133 Zudio stores. A further 19 Westside and 15 Zudio stores were fitted out and ready to open and will be opened once Covid restrictions are eased. Altogether, with the fitted-out locations in FY21 the company added 80+ stores (Fashion).
Management expects demand to rebound strongly by Q2 FY22. It is cautiously optimistic on the medium-term outlook.
Fig 21 – Financial performance (standalone) (Rs m) Q4 FY21 Q4 FY20 % Y/Y Q3 FY21 % Q/Q FY21 FY20 % Y/Y Sales 7,737 7,228 7.0 7,254 6.7 20,475 31,777 (35.6)
Gross margins % 53.2 46.5 671bps 56.4 -320bps 49.7 49.5 18bps
EBITDA 1,366 929 46.9 1,800 (24.1) 2,038 5,632 (63.8)
EBITDA margins % 17.7 12.9 479bps 24.8 -716bps 10.0 17.7 -777bps
Interest 618 595 3.8 606 2.0 2,380 2,383 (0.1)
Depreciation 617 612 0.9 578 6.7 2,359 2,311 2.1
Other income 724 344 110.8 426 70.1 2,042 1,518 34.6
PBT 855 67 NA 1,042 (17.9) (658) 2,455 NA
Tax 223 40 NA 245 (9.0) (211) 909 NA
Tax rates % 26.1 60.5 NA 23.5 255bps 32.1 37.0 -493bps
PAT 569 26 NA 797 (28.6) (510) 1,546 NA
EPS (Rs) 1.6 0.1 NA 2.2 (28.6) (1.4) 4.3 NA
Source: Company
Fig 22 – Working capital (days on sales) FY20 FY20 Y/Y change
Inventory 70 67 3
Trade receivables 4 2 2
Trade payables 39 29 10
Working-capital cycle 35 39 (5)
Source: Company
Shoppers Stop
Shoppers Stop’s Q4 FY21 standalone revenue declined 5.4% y/y to Rs6,712m. Its gross margin was 95bps higher y/y to 40.9%. Employee expenses were down 13.3% y/y and other expenses were flat y/y. EBITDA was up ~25% y/y to Rs956m and the EBITDA margin was 14.2% (10.8% in Q4 FY20). Depreciation was down 46.6% y/y and interest expense was flat y/y. Other income was Rs207m (Rs64m a year ago) including rental concessions of Rs96.2m for Q4 FY21. PBT loss was Rs248m (PBT loss of Rs1,375m a year ago). An exceptional item of Rs124m (Crossword
6 July 2021 Consumer Retail – Q4 FY21 result review
Anand Rathi Research 19
impairment loss). Tax was Rs1m (deferred tax credit) vs deferred tax credit of Rs342m in Q4 FY20. The company reported a net loss of Rs371m vs a net loss of Rs1,328m a year ago.
FY21 revenue declined 49% y/y to Rs17,251m. EBITDA was Rs534m vs Rs5,494m a year ago. PAT loss was Rs2,752m (loss of Rs1,409m in FY20).
Debt and cash flow
Borrowings were Rs938m (Rs1,237m in FY20). FY21 OCF was Rs99m (Rs5,644m in FY20); FCF was a negative Rs724m (positive Rs3,858m).
Working-capital cycle
The working-capital cycle (on sales) was a negative 55 days (vs. a negative 26 days in FY20). Inventory days were 179 vs. 132 in FY20. Debtors days were seven vs. four in FY20. Creditor days were 241 vs. 162 in FY20.
Other highlights
Performance. The company attained the highest sales recovery in Q4 (~90%). Comparable growth fell 10.7% in Q4 FY21. Footfalls were 5%/19%/50%/83% in Q1/Q2/Q3/Q4. In the second half of Mar’21 the second wave of Covid-19 started impacting. Non-metro stores did well, growing 4%; and metro stores declined 18% in Q4. Category-wise, kid’s, denim, women’s western wear, home and intimate apparel have done well, and formal wear saw modest growth.
Costs. The company has a savings target of Rs4.5bn; it saved Rs4.3bn. One-third of cost savings came from lease rentals, the balance from employee and other expenses. There will be some cost savings in FY22 vs. FY20 on lease rentals, employee and other expenses.
Private labels sales growth was ~12% in Q4 FY21 and 38% volume growth. The contribution to overall sales during the quarter was ~13%, 250bps higher y/y. The company has improved its fashion quotient relevant to the latest trends, upgraded the quality of merchandise and simplified its price matrix. It launched ALTLife, athleisure for men and women, and INSENSE, sleepwear and many products for kids.
First Citizen contributed ~72% to overall sales (76% last year). New enrolments were 106,000 and the average ticket size increased 1%. Black-card membership enrolment increased 3x y/y. The omni channel contribution rose to 40% (from 20%). Personal shopper contribution to overall revenue was 15%, with a 2.6x increase in ticket size.
Beauty. ~17% contribution to revenue. Management says the beauty category has recovered better than overall company growth. The company plans to open ~10 Arcelia stores in FY22.
Omni. E-commerce sales were up 188%, 3x y/y, and its share increased to 6%+ (from 1.5% last year). It introduced new brands exclusively for the omni channel during the quarter. 50 of its stores currently are tied up with Amazon and 20% of its online sales are through Amazon.
Outlook. The company expects the Covid-19 impact to continue in Q1 FY22 and expects it to reduce by Q2. It will then start opening stores. If Covid-19 continues, capex will be deferred. It plans to open ~20 stores across all formats in FY22, 10 Shoppers Stop stores and the balance beauty/Arcelia stores. 2-3 (loss-suffering) stores may shut down next quarter. It has sufficient cash reserves to manage cash burn.
6 July 2021 Consumer Retail – Q4 FY21 result review
Anand Rathi Research 20
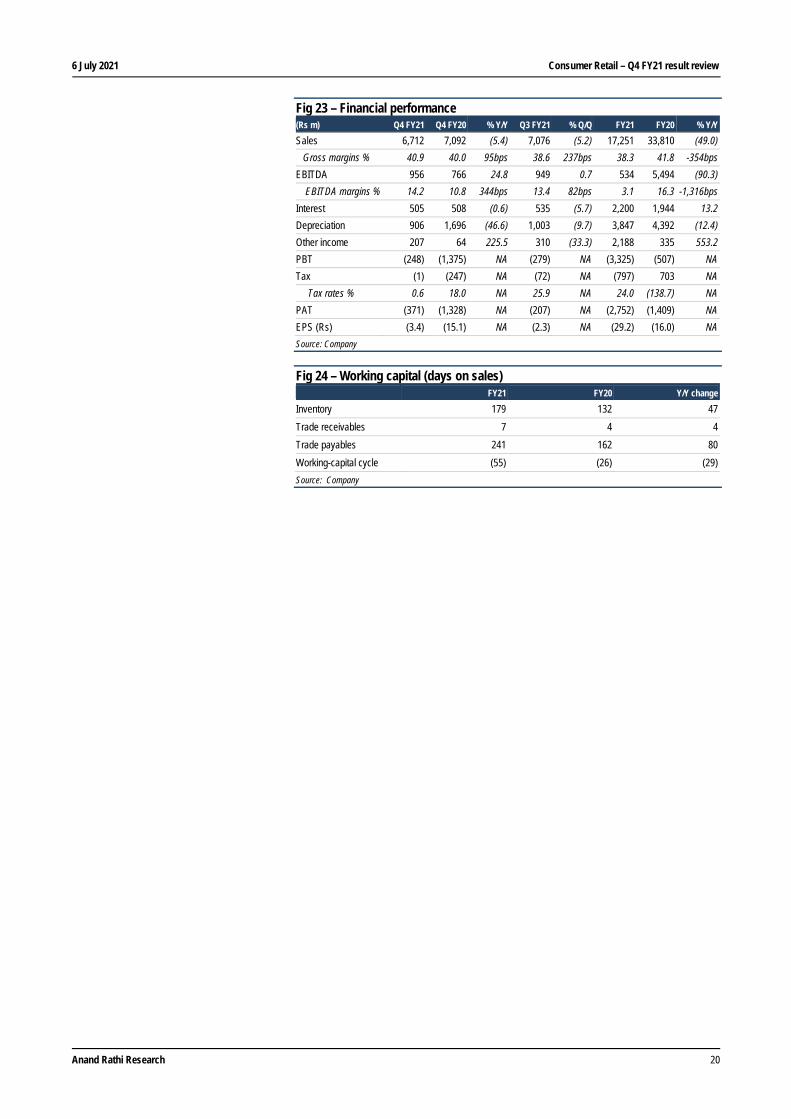
Fig 23 – Financial performance (Rs m) Q4 FY21 Q4 FY20 % Y/Y Q3 FY21 % Q/Q FY21 FY20 % Y/Y Sales 6,712 7,092 (5.4) 7,076 (5.2) 17,251 33,810 (49.0)
Gross margins % 40.9 40.0 95bps 38.6 237bps 38.3 41.8 -354bps
EBITDA 956 766 24.8 949 0.7 534 5,494 (90.3)
EBITDA margins % 14.2 10.8 344bps 13.4 82bps 3.1 16.3 -1,316bps
Interest 505 508 (0.6) 535 (5.7) 2,200 1,944 13.2
Depreciation 906 1,696 (46.6) 1,003 (9.7) 3,847 4,392 (12.4)
Other income 207 64 225.5 310 (33.3) 2,188 335 553.2
PBT (248) (1,375) NA (279) NA (3,325) (507) NA
Tax (1) (247) NA (72) NA (797) 703 NA
Tax rates % 0.6 18.0 NA 25.9 NA 24.0 (138.7) NA
PAT (371) (1,328) NA (207) NA (2,752) (1,409) NA
EPS (Rs) (3.4) (15.1) NA (2.3) NA (29.2) (16.0) NA
Source: Company
Fig 24 – Working capital (days on sales) FY21 FY20 Y/Y change
Inventory 179 132 47
Trade receivables 7 4 4
Trade payables 241 162 80
Working-capital cycle (55) (26) (29)
Source: Company
6 July 2021 Consumer Retail – Q4 FY21 result review
Anand Rathi Research 21
Retail
Almost normal D-Mart’s (standalone) revenue grew ~18% y/y in Q4 FY21. Management says Q4 FY21 began with cautious optimism as Covid-19 infections had reduced, restrictions were lifted and vaccinations started. However, at the start of Mar’21 Covid-19 cases started increasing across the country and since then local restrictions increased in April and May.
As consumer demand moved toward normal, V-Mart’s Q4 revenue grew 6% y/y. Sales recovery, aided by store openings, Holi and fresh merchandise, was encouraging. Footfalls were 12% lower y/y offset by a higher conversion rate of 61.1% (up 600bps y/y). The average bill size was 8% higher y/y while the ASP was down 9% y/y.
D-Mart’s EBITDA grew ~48% y/y to Rs6,166m. Its EBITDA margin expanded 170bps y/y to 8.4%, aided by growth in the top line, and revival of discretionary spends, per management.
Led by higher full-price sales and pent-up demand, V-Mart’s gross margin expanded ~130bps y/y to 29.8%. Its EBITDA margin expanded ~117bps y/y to 9.5%.
D-Mart and V-Mart continued retail expansion during the year adding 22 and 13 stores respectively (net basis).
Avenue Supermarts
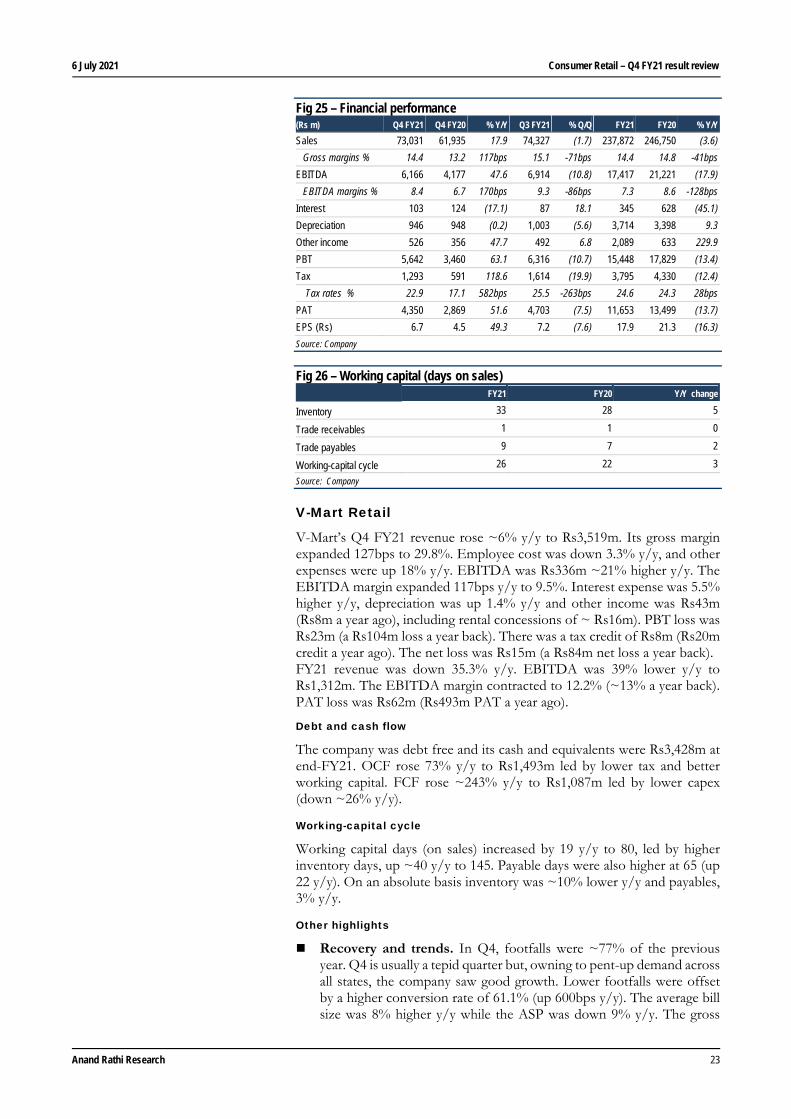
D-Mart (standalone) reported 18% y/y revenue growth to Rs73.0bn in Q4 FY21. The 14.4% gross margin was up 117bps y/y. Employee expenses were up 8% y/y and other expenses were up 8.4% y/y. EBITDA at Rs6,166m rose 47.6% y/y. The EBITDA margin at 8.44% expanded 170bps y/y. Interest expense was down 17% y/y to Rs103m, depreciation was flat y/y at Rs946m. Other income was up 47.7% y/y to Rs526m. PBT was up 63.1% y/y to Rs5,642m. The tax rate was 22.9% (17.1% in Q4 FY20). PAT at Rs4,350m was 51.6% higher y/y.
FY21 standalone revenue was down 3.6% y/y to Rs238bn. The gross margin was down 41bps to 14.42%. EBITDA at Rs17.4bn was down 17.9% y/y and the EBITDA margin contracted 128bps to 7.32%. PAT at Rs11.7bn was down 13.7% y/y.
In Q4 FY21, 13 stores were added. In FY21, 22 were added and two were converted into fulfilment centres for Avenue E-commerce. Total store count was 234.
Working-capital cycle
The cash-conversion cycle was 26 days (22 in FY20) led by five more inventory days y/y to 33
Debt and cash flow
OCF was up 8% y/y to Rs13.9bn while FCF was up 6% y/y to Rs11.9bn. Capex (net) for the year was ~Rs2.0bn, up 17% y/y. The company was net cash, with cash and equivalents balance of Rs14.3bn at end-FY21.
6 July 2021 Consumer Retail – Q4 FY21 result review
Anand Rathi Research 22
Other highlights
D-Mart stores. During FY21 the sales mix shifted toward grocery and FMCG. General merchandise and apparel sales accounted for 22.9% of total sales in FY21 (27.31% in FY20).
The change in sales mix resulted from consumer preference for need-based/essential goods for a significant part of the year, reduced discretionary spending and restrictions on selling non-essentials in the early part of the year. This impacted margins during the year.
In Q4 FY21 however, margins indicate revival of discretionary spend vs. the previous three quarters (Q1 FY21 – Q3 FY21).
Construction was impacted in H1 FY21 and the company gradually commenced it from H2 and added 22 stores during the year
D-Mart ready. Continued expansion across the MMR; added four cities during the year: Ahmedabad, Pune, Bengaluru and Hyderabad.
Impact of the second wave of Covid-19. Q4 FY21 began with cautious optimism as Covid-19 infections had reduced, restrictions were lifted and vaccination had started. However at the start of Mar’21 Covid-19 cases started increasing across the country and since then local restrictions increased in April and May.
The company continues to ensure stringent health and hygiene protocols at all its premises to ensure employee and customer safety. All employees are supported during health issues/medical emergencies.
Significant disruptions were seen from Mar’21 at its store operations. Restrictions and local level enforcements have become much stricter and vary from store closures on certain days or for extended periods to restricted store operating hours and selling only essential goods in most cities and towns. In general, more than 80% of its stores are operating for significantly fewer hours (not exceeding four per day) or even shut for operations for one to two weeks or on weekends. These shutdowns have an adverse and severe impact on revenues.
It currently continues to receive a regular supply of goods from suppliers. However, this time there may be a problem of excess inventory, an issue larger than during the first wave. The receding threat of the pandemic and consequent sales surge in Q3 and most of Q4, followed by the coming summer and back-to-school season made it plan more optimistically. This could have a longer-term impact on its inventory-to-sales ratio as it would take longer to liquidate excess inventory.
Since Mar’21 the company is once again seeing significant restrictions on construction. At present, , it would be unable to forecast the impact of the current lockdowns on its store-opening pipeline for this year. However, it is optimistic here as migration of construction workers is not visible as during the first time.
6 July 2021 Consumer Retail – Q4 FY21 result review
Anand Rathi Research 23
Fig 25 – Financial performance (Rs m) Q4 FY21 Q4 FY20 % Y/Y Q3 FY21 % Q/Q FY21 FY20 % Y/Y Sales 73,031 61,935 17.9 74,327 (1.7) 237,872 246,750 (3.6)
Gross margins % 14.4 13.2 117bps 15.1 -71bps 14.4 14.8 -41bps
EBITDA 6,166 4,177 47.6 6,914 (10.8) 17,417 21,221 (17.9)
EBITDA margins % 8.4 6.7 170bps 9.3 -86bps 7.3 8.6 -128bps
Interest 103 124 (17.1) 87 18.1 345 628 (45.1)
Depreciation 946 948 (0.2) 1,003 (5.6) 3,714 3,398 9.3
Other income 526 356 47.7 492 6.8 2,089 633 229.9
PBT 5,642 3,460 63.1 6,316 (10.7) 15,448 17,829 (13.4)
Tax 1,293 591 118.6 1,614 (19.9) 3,795 4,330 (12.4)
Tax rates % 22.9 17.1 582bps 25.5 -263bps 24.6 24.3 28bps
PAT 4,350 2,869 51.6 4,703 (7.5) 11,653 13,499 (13.7)
EPS (Rs) 6.7 4.5 49.3 7.2 (7.6) 17.9 21.3 (16.3)
Source: Company
Fig 26 – Working capital (days on sales) FY21 FY20 Y/Y change
Inventory 33 28 5
Trade receivables 1 1 0
Trade payables 9 7 2
Working-capital cycle 26 22 3
Source: Company
V-Mart Retail
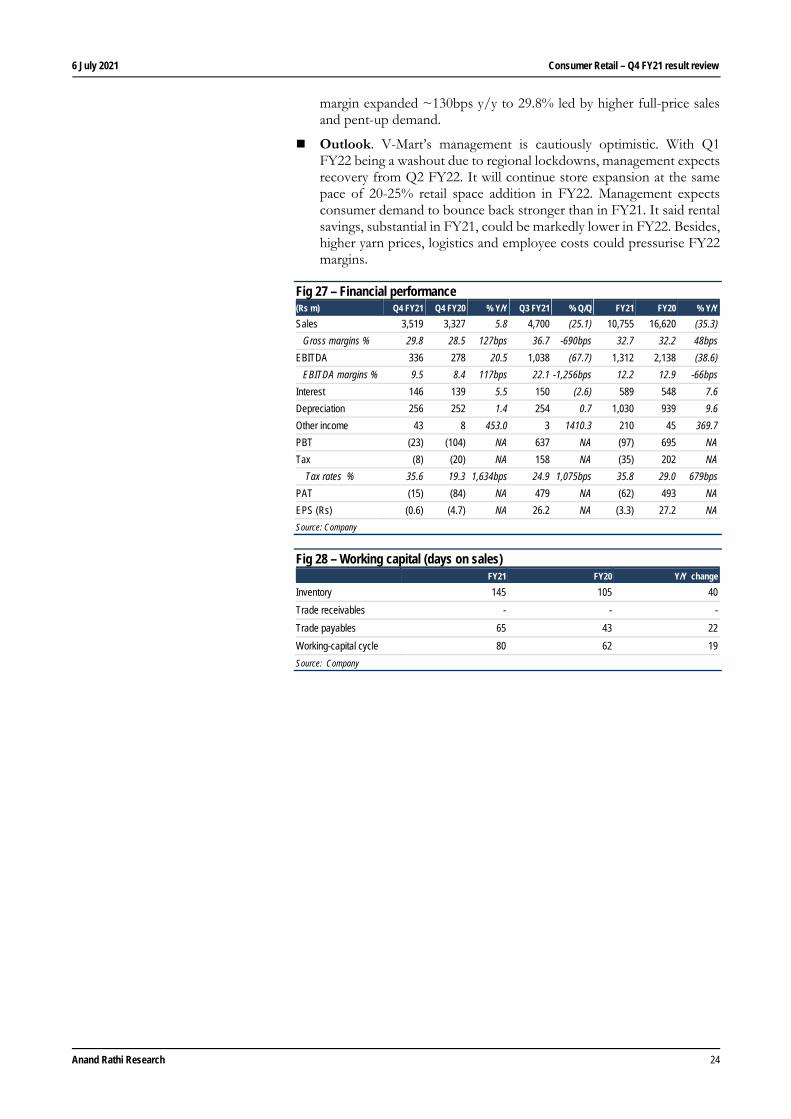
V-Mart’s Q4 FY21 revenue rose ~6% y/y to Rs3,519m. Its gross margin expanded 127bps to 29.8%. Employee cost was down 3.3% y/y, and other expenses were up 18% y/y. EBITDA was Rs336m ~21% higher y/y. The EBITDA margin expanded 117bps y/y to 9.5%. Interest expense was 5.5% higher y/y, depreciation was up 1.4% y/y and other income was Rs43m (Rs8m a year ago), including rental concessions of ~ Rs16m). PBT loss was Rs23m (a Rs104m loss a year back). There was a tax credit of Rs8m (Rs20m credit a year ago). The net loss was Rs15m (a Rs84m net loss a year back). FY21 revenue was down 35.3% y/y. EBITDA was 39% lower y/y to Rs1,312m. The EBITDA margin contracted to 12.2% (~13% a year back). PAT loss was Rs62m (Rs493m PAT a year ago).
Debt and cash flow
The company was debt free and its cash and equivalents were Rs3,428m at end-FY21. OCF rose 73% y/y to Rs1,493m led by lower tax and better working capital. FCF rose ~243% y/y to Rs1,087m led by lower capex (down ~26% y/y).
Working-capital cycle
Working capital days (on sales) increased by 19 y/y to 80, led by higher inventory days, up ~40 y/y to 145. Payable days were also higher at 65 (up 22 y/y). On an absolute basis inventory was ~10% lower y/y and payables, 3% y/y.
Other highlights
Recovery and trends. In Q4, footfalls were ~77% of the previous year. Q4 is usually a tepid quarter but, owning to pent-up demand across all states, the company saw good growth. Lower footfalls were offset by a higher conversion rate of 61.1% (up 600bps y/y). The average bill size was 8% higher y/y while the ASP was down 9% y/y. The gross
6 July 2021 Consumer Retail – Q4 FY21 result review
Anand Rathi Research 24
margin expanded ~130bps y/y to 29.8% led by higher full-price sales and pent-up demand.
Outlook. V-Mart’s management is cautiously optimistic. With Q1 FY22 being a washout due to regional lockdowns, management expects recovery from Q2 FY22. It will continue store expansion at the same pace of 20-25% retail space addition in FY22. Management expects consumer demand to bounce back stronger than in FY21. It said rental savings, substantial in FY21, could be markedly lower in FY22. Besides, higher yarn prices, logistics and employee costs could pressurise FY22 margins.
Fig 27 – Financial performance (Rs m) Q4 FY21 Q4 FY20 % Y/Y Q3 FY21 % Q/Q FY21 FY20 % Y/Y Sales 3,519 3,327 5.8 4,700 (25.1) 10,755 16,620 (35.3)
Gross margins % 29.8 28.5 127bps 36.7 -690bps 32.7 32.2 48bps
EBITDA 336 278 20.5 1,038 (67.7) 1,312 2,138 (38.6)
EBITDA margins % 9.5 8.4 117bps 22.1 -1,256bps 12.2 12.9 -66bps
Interest 146 139 5.5 150 (2.6) 589 548 7.6
Depreciation 256 252 1.4 254 0.7 1,030 939 9.6
Other income 43 8 453.0 3 1410.3 210 45 369.7
PBT (23) (104) NA 637 NA (97) 695 NA
Tax (8) (20) NA 158 NA (35) 202 NA
Tax rates % 35.6 19.3 1,634bps 24.9 1,075bps 35.8 29.0 679bps
PAT (15) (84) NA 479 NA (62) 493 NA
EPS (Rs) (0.6) (4.7) NA 26.2 NA (3.3) 27.2 NA
Source: Company
Fig 28 – Working capital (days on sales) FY21 FY20 Y/Y change
Inventory 145 105 40
Trade receivables - - -
Trade payables 65 43 22
Working-capital cycle 80 62 19
Source: Company
6 July 2021 Consumer Retail – Q4 FY21 result review
Anand Rathi Research 25
Footwear
Performance, a mixed bag Footwear companies’ performance was a mixed bag with Relaxo’s/ Khadim’s revenue ~38%/71% higher y/y and Bata’s ~5% lower y/y.
The gross margins of all the three contracted ~300-770bps y/y. The decline was due to higher raw material prices, adverse sales and channel mix, discounting, etc.
Driven by costs savings and operating leverage, Khadim and Relaxo reported EBITDA margin expansions. Relaxo’s Q4 EBITDA margin expanded ~400bps y/y to 21.8% while Khadim’s was 5.2% (vs. a negative 5.3% a year ago). Bata’s EBITDA margin contracted ~350bps y/y to 19%.
Relaxo and Khadim both saw a shift of consumers to open and value-for-money footwear, which impacted their overall realisations.
According to the companies’ managements, demand had returned to normal in Q4, then was disrupted by the Covid-19 second wave lockdowns. They expect demand to bounce back when restrictions are lifted. However uncertainties pertaining to further lockdowns and rising cases remain.
Relaxo
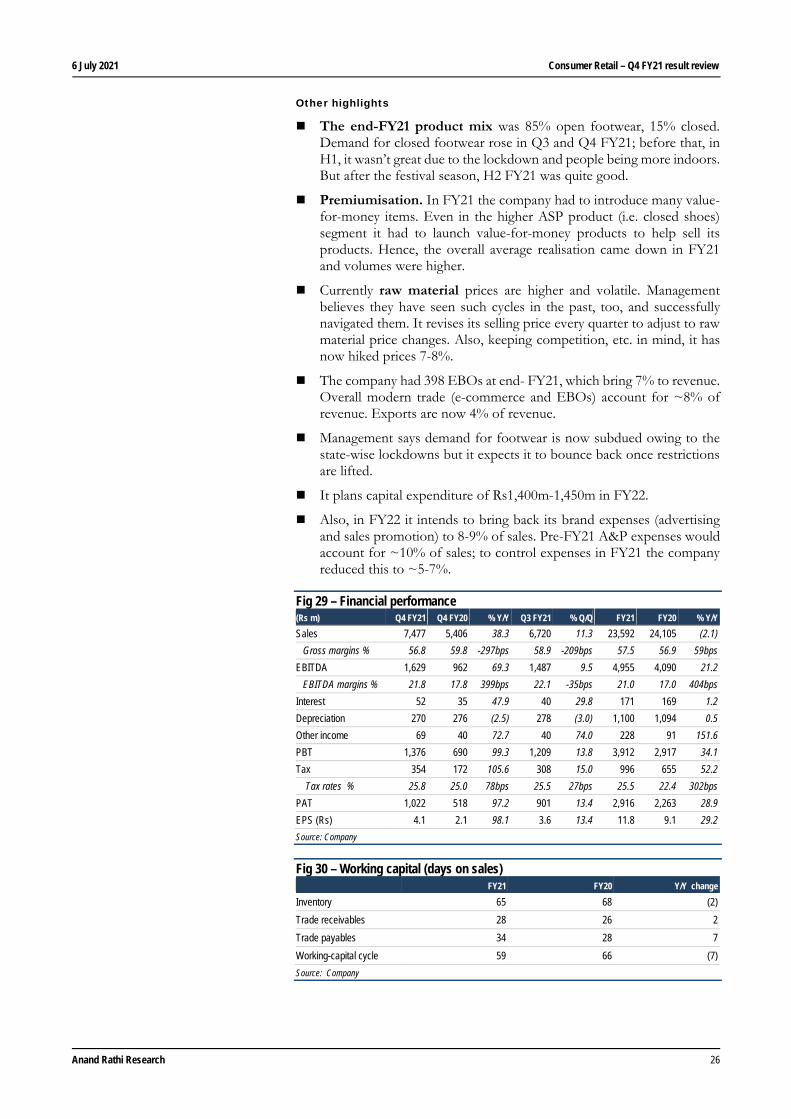
Relaxo reported 38.3% y/y revenue growth to Rs7,477m in Q4 FY21. Its gross margin contracted 297bps y/y to 56.8%. Employee and other expenses were up respectively 21% and 13% y/y. As percent of sales, both were down 171bps and 525bps respectively y/y to 12% and 23.1%. The EBITDA margin expanded 399bps y/y to 21.8% led by strong revenue growth, a favourable product mix and cost savings. EBITDA at Rs1,629m grew 69.3% y/y. Interest costs rose 48% y/y to Rs52m, depreciation was 2.5% lower y/y to Rs270m and Other income was Rs69m (Rs40m in Q4 FY20) including lease rent waiver/reduction of Rs15.3m. PBT grew 99% y/y to Rs1,376m. The effective tax rate was 25.8% (25% in Q4 FY20). PAT at Rs1,022m was 97% higher y/y.
FY21 revenue was 2.1% lower y/y to Rs23,592m. Volume growth was 6.4% y/y to 191m pairs. Average realisation per pair (implied) was down 8% y/y to Rs124. The gross margin expanded 59bps y/y to 57.5%. EBITDA at Rs4,955m was 21.2% higher y/y. The EBITDA margin at 21% expanded 404bps y/y led by a favourable product mix and cost savings. PAT grew 29% y/y to Rs2,916m.
Debt and cash flow
The company paid off its debt (long- and short-term) and is comfortable with its liquidity as operations start. OCF was 61% higher y/y to Rs5,131m driven by greater profitability and lower working capital. FCF improved 93% y/y to Rs3,912m
Working-capital cycle
The working-capital cycle was seven days fewer y/y to 59. Inventory days were two fewer y/y to 65. Receivable days were two more y/y to 28, and payable days at 34, were seven more y/y.
6 July 2021 Consumer Retail – Q4 FY21 result review
Anand Rathi Research 26
Other highlights
The end-FY21 product mix was 85% open footwear, 15% closed. Demand for closed footwear rose in Q3 and Q4 FY21; before that, in H1, it wasn’t great due to the lockdown and people being more indoors. But after the festival season, H2 FY21 was quite good.
Premiumisation. In FY21 the company had to introduce many value-for-money items. Even in the higher ASP product (i.e. closed shoes) segment it had to launch value-for-money products to help sell its products. Hence, the overall average realisation came down in FY21 and volumes were higher.
Currently raw material prices are higher and volatile. Management believes they have seen such cycles in the past, too, and successfully navigated them. It revises its selling price every quarter to adjust to raw material price changes. Also, keeping competition, etc. in mind, it has now hiked prices 7-8%.
The company had 398 EBOs at end- FY21, which bring 7% to revenue. Overall modern trade (e-commerce and EBOs) account for ~8% of revenue. Exports are now 4% of revenue.
Management says demand for footwear is now subdued owing to the state-wise lockdowns but it expects it to bounce back once restrictions are lifted.
It plans capital expenditure of Rs1,400m-1,450m in FY22.
Also, in FY22 it intends to bring back its brand expenses (advertising and sales promotion) to 8-9% of sales. Pre-FY21 A&P expenses would account for ~10% of sales; to control expenses in FY21 the company reduced this to ~5-7%.
Fig 29 – Financial performance (Rs m) Q4 FY21 Q4 FY20 % Y/Y Q3 FY21 % Q/Q FY21 FY20 % Y/Y Sales 7,477 5,406 38.3 6,720 11.3 23,592 24,105 (2.1)
Gross margins % 56.8 59.8 -297bps 58.9 -209bps 57.5 56.9 59bps
EBITDA 1,629 962 69.3 1,487 9.5 4,955 4,090 21.2
EBITDA margins % 21.8 17.8 399bps 22.1 -35bps 21.0 17.0 404bps
Interest 52 35 47.9 40 29.8 171 169 1.2
Depreciation 270 276 (2.5) 278 (3.0) 1,100 1,094 0.5
Other income 69 40 72.7 40 74.0 228 91 151.6
PBT 1,376 690 99.3 1,209 13.8 3,912 2,917 34.1
Tax 354 172 105.6 308 15.0 996 655 52.2
Tax rates % 25.8 25.0 78bps 25.5 27bps 25.5 22.4 302bps
PAT 1,022 518 97.2 901 13.4 2,916 2,263 28.9
EPS (Rs) 4.1 2.1 98.1 3.6 13.4 11.8 9.1 29.2
Source: Company
Fig 30 – Working capital (days on sales) FY21 FY20 Y/Y change
Inventory 65 68 (2)
Trade receivables 28 26 2
Trade payables 34 28 7
Working-capital cycle 59 66 (7)
Source: Company
6 July 2021 Consumer Retail – Q4 FY21 result review
Anand Rathi Research 27
Bata
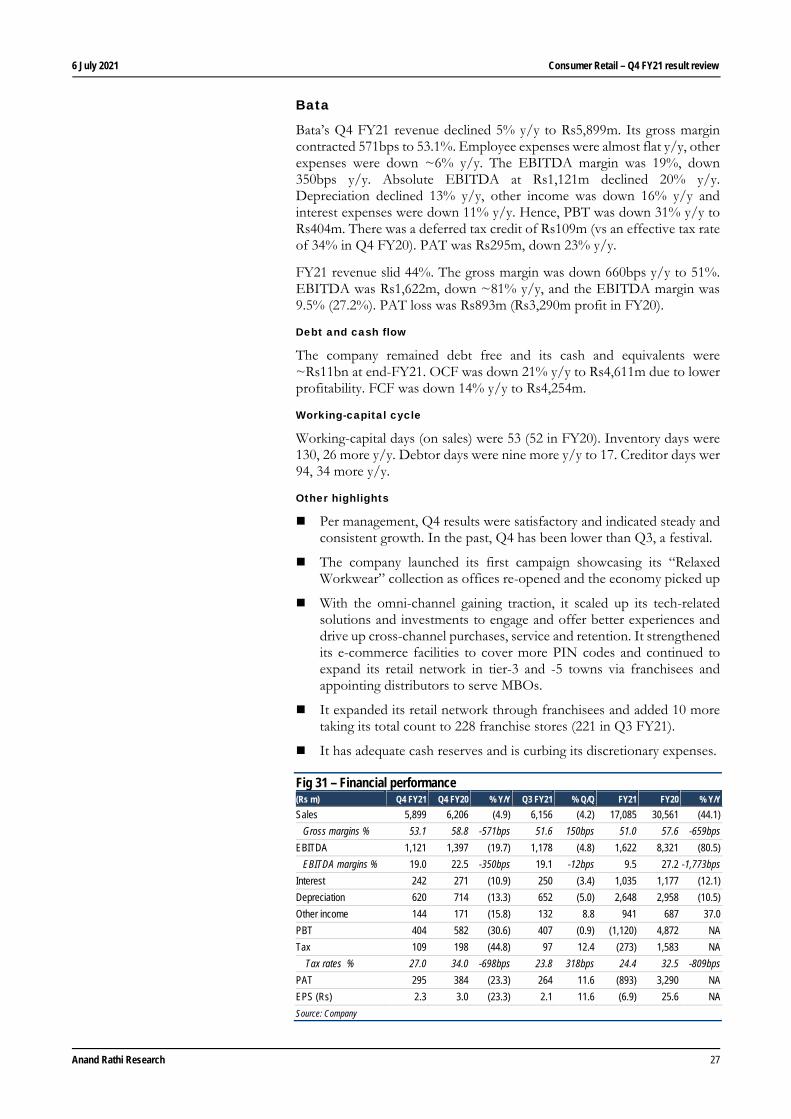
Bata’s Q4 FY21 revenue declined 5% y/y to Rs5,899m. Its gross margin contracted 571bps to 53.1%. Employee expenses were almost flat y/y, other expenses were down ~6% y/y. The EBITDA margin was 19%, down 350bps y/y. Absolute EBITDA at Rs1,121m declined 20% y/y. Depreciation declined 13% y/y, other income was down 16% y/y and interest expenses were down 11% y/y. Hence, PBT was down 31% y/y to Rs404m. There was a deferred tax credit of Rs109m (vs an effective tax rate of 34% in Q4 FY20). PAT was Rs295m, down 23% y/y.
FY21 revenue slid 44%. The gross margin was down 660bps y/y to 51%. EBITDA was Rs1,622m, down ~81% y/y, and the EBITDA margin was 9.5% (27.2%). PAT loss was Rs893m (Rs3,290m profit in FY20).
Debt and cash flow
The company remained debt free and its cash and equivalents were ~Rs11bn at end-FY21. OCF was down 21% y/y to Rs4,611m due to lower profitability. FCF was down 14% y/y to Rs4,254m.
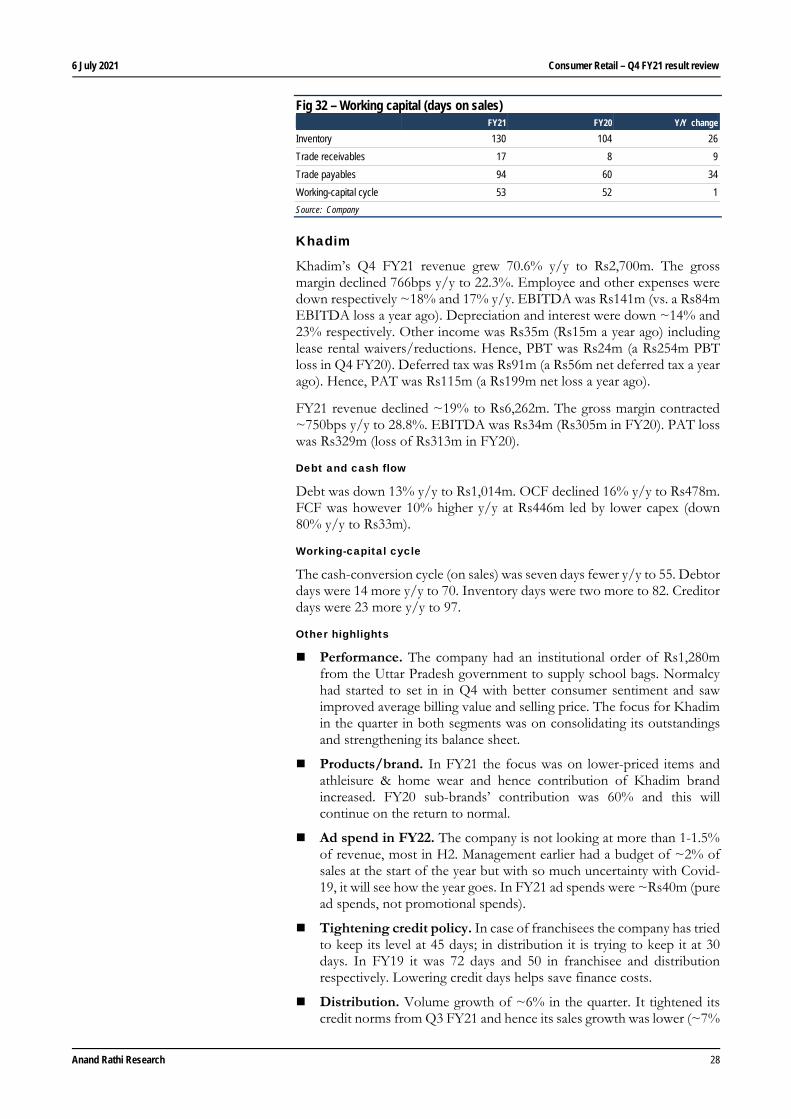
Working-capital cycle
Working-capital days (on sales) were 53 (52 in FY20). Inventory days were 130, 26 more y/y. Debtor days were nine more y/y to 17. Creditor days wer 94, 34 more y/y.
Other highlights
Per management, Q4 results were satisfactory and indicated steady and consistent growth. In the past, Q4 has been lower than Q3, a festival.
The company launched its first campaign showcasing its “Relaxed Workwear” collection as offices re-opened and the economy picked up
With the omni-channel gaining traction, it scaled up its tech-related solutions and investments to engage and offer better experiences and drive up cross-channel purchases, service and retention. It strengthened its e-commerce facilities to cover more PIN codes and continued to expand its retail network in tier-3 and -5 towns via franchisees and appointing distributors to serve MBOs.
It expanded its retail network through franchisees and added 10 more taking its total count to 228 franchise stores (221 in Q3 FY21).
It has adequate cash reserves and is curbing its discretionary expenses.
Fig 31 – Financial performance (Rs m) Q4 FY21 Q4 FY20 % Y/Y Q3 FY21 % Q/Q FY21 FY20 % Y/Y Sales 5,899 6,206 (4.9) 6,156 (4.2) 17,085 30,561 (44.1)
Gross margins % 53.1 58.8 -571bps 51.6 150bps 51.0 57.6 -659bps
EBITDA 1,121 1,397 (19.7) 1,178 (4.8) 1,622 8,321 (80.5)
EBITDA margins % 19.0 22.5 -350bps 19.1 -12bps 9.5 27.2 -1,773bps
Interest 242 271 (10.9) 250 (3.4) 1,035 1,177 (12.1)
Depreciation 620 714 (13.3) 652 (5.0) 2,648 2,958 (10.5)
Other income 144 171 (15.8) 132 8.8 941 687 37.0
PBT 404 582 (30.6) 407 (0.9) (1,120) 4,872 NA
Tax 109 198 (44.8) 97 12.4 (273) 1,583 NA
Tax rates % 27.0 34.0 -698bps 23.8 318bps 24.4 32.5 -809bps
PAT 295 384 (23.3) 264 11.6 (893) 3,290 NA
EPS (Rs) 2.3 3.0 (23.3) 2.1 11.6 (6.9) 25.6 NA
Source: Company
6 July 2021 Consumer Retail – Q4 FY21 result review
Anand Rathi Research 28
Fig 32 – Working capital (days on sales) FY21 FY20 Y/Y change
Inventory 130 104 26
Trade receivables 17 8 9
Trade payables 94 60 34
Working-capital cycle 53 52 1
Source: Company
Khadim
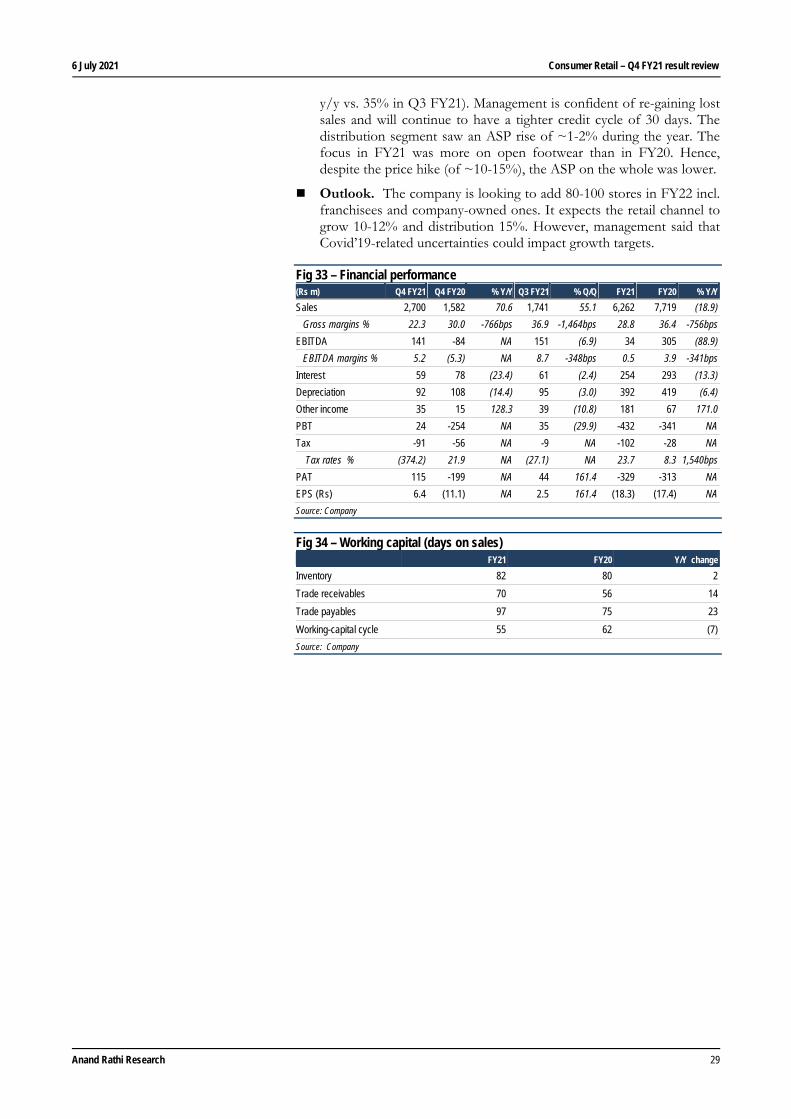
Khadim’s Q4 FY21 revenue grew 70.6% y/y to Rs2,700m. The gross margin declined 766bps y/y to 22.3%. Employee and other expenses were down respectively ~18% and 17% y/y. EBITDA was Rs141m (vs. a Rs84m EBITDA loss a year ago). Depreciation and interest were down ~14% and 23% respectively. Other income was Rs35m (Rs15m a year ago) including lease rental waivers/reductions. Hence, PBT was Rs24m (a Rs254m PBT loss in Q4 FY20). Deferred tax was Rs91m (a Rs56m net deferred tax a year ago). Hence, PAT was Rs115m (a Rs199m net loss a year ago).
FY21 revenue declined ~19% to Rs6,262m. The gross margin contracted ~750bps y/y to 28.8%. EBITDA was Rs34m (Rs305m in FY20). PAT loss was Rs329m (loss of Rs313m in FY20).
Debt and cash flow
Debt was down 13% y/y to Rs1,014m. OCF declined 16% y/y to Rs478m. FCF was however 10% higher y/y at Rs446m led by lower capex (down 80% y/y to Rs33m).
Working-capital cycle
The cash-conversion cycle (on sales) was seven days fewer y/y to 55. Debtor days were 14 more y/y to 70. Inventory days were two more to 82. Creditor days were 23 more y/y to 97.
Other highlights
Performance. The company had an institutional order of Rs1,280m from the Uttar Pradesh government to supply school bags. Normalcy had started to set in in Q4 with better consumer sentiment and saw improved average billing value and selling price. The focus for Khadim in the quarter in both segments was on consolidating its outstandings and strengthening its balance sheet.
Products/brand. In FY21 the focus was on lower-priced items and athleisure & home wear and hence contribution of Khadim brand increased. FY20 sub-brands’ contribution was 60% and this will continue on the return to normal.
Ad spend in FY22. The company is not looking at more than 1-1.5% of revenue, most in H2. Management earlier had a budget of ~2% of sales at the start of the year but with so much uncertainty with Covid-19, it will see how the year goes. In FY21 ad spends were ~Rs40m (pure ad spends, not promotional spends).
Tightening credit policy. In case of franchisees the company has tried to keep its level at 45 days; in distribution it is trying to keep it at 30 days. In FY19 it was 72 days and 50 in franchisee and distribution respectively. Lowering credit days helps save finance costs.
Distribution. Volume growth of ~6% in the quarter. It tightened its credit norms from Q3 FY21 and hence its sales growth was lower (~7%
6 July 2021 Consumer Retail – Q4 FY21 result review
Anand Rathi Research 29
y/y vs. 35% in Q3 FY21). Management is confident of re-gaining lost sales and will continue to have a tighter credit cycle of 30 days. The distribution segment saw an ASP rise of ~1-2% during the year. The focus in FY21 was more on open footwear than in FY20. Hence, despite the price hike (of ~10-15%), the ASP on the whole was lower.
Outlook. The company is looking to add 80-100 stores in FY22 incl. franchisees and company-owned ones. It expects the retail channel to grow 10-12% and distribution 15%. However, management said that Covid’19-related uncertainties could impact growth targets.
Fig 33 – Financial performance (Rs m) Q4 FY21 Q4 FY20 % Y/Y Q3 FY21 % Q/Q FY21 FY20 % Y/Y Sales 2,700 1,582 70.6 1,741 55.1 6,262 7,719 (18.9)
Gross margins % 22.3 30.0 -766bps 36.9 -1,464bps 28.8 36.4 -756bps
EBITDA 141 -84 NA 151 (6.9) 34 305 (88.9)
EBITDA margins % 5.2 (5.3) NA 8.7 -348bps 0.5 3.9 -341bps
Interest 59 78 (23.4) 61 (2.4) 254 293 (13.3)
Depreciation 92 108 (14.4) 95 (3.0) 392 419 (6.4)
Other income 35 15 128.3 39 (10.8) 181 67 171.0
PBT 24 -254 NA 35 (29.9) -432 -341 NA
Tax -91 -56 NA -9 NA -102 -28 NA
Tax rates % (374.2) 21.9 NA (27.1) NA 23.7 8.3 1,540bps
PAT 115 -199 NA 44 161.4 -329 -313 NA
EPS (Rs) 6.4 (11.1) NA 2.5 161.4 (18.3) (17.4) NA
Source: Company
Fig 34 – Working capital (days on sales) FY21 FY20 Y/Y change
Inventory 82 80 2
Trade receivables 70 56 14
Trade payables 97 75 23
Working-capital cycle 55 62 (7)
Source: Company
6 July 2021 Consumer Retail – Q4 FY21 result review
Anand Rathi Research 30
Others
Titan
Titan’s standalone Q4 FY21 revenue was 61% higher y/y to Rs71.4bn. The gross margin contracted y/y to 21.4% (from. 30.1% a year back). Employee and ad expenses were down respectively 12.4% and 51.3% y/y. Other expenses were 27% higher y/y. The EBITDA margin contracted ~249bps y/y to 11.1% and absolute EBITDA rose 31.7% to Rs7.95bn. PBT rose 36% y/y to Rs7bn. The effective tax rate was 24.6% (30.8% a year ago). PAT was up 48% y/y to Rs5.3bn.
Segment-wise, jewellery sales were up 71% y/y to Rs64.2bn (excl. gold bullion sales of Rs250m, jewellery grew 70% y/y). The jewellery EBIT margin contracted 327bps y/y to 10.9%. The watches category reported flat revenue growth to Rs5.6bn. Its EBIT margin was 8.3% (13% a year ago). Eyewear sales were up 18% y/y to Rs1,270m. The EBIT margin was 18% (1.7% a year back). Revenue of the “others” category declined 16% y/y.
FY21 standalone revenue was 3% higher y/y to Rs206bn. The EBITDA margin contracted 383bps to 8.3%; EBITDA was Rs17bn, 30% lower y/y. PAT at Rs8.7bn was 42% lower y/y.
Store network: During the year the company added 26 Tanishq stores, two Mia and 25 Caratlane (net). In its watches category, it added 13 World of Titan and 11 Helios, and closed 13 Fastrack stores (net). In its eyewear business it added 15 stores (net). At end-FY21, the overall store count was 1,819 (1,895 in FY20).
Working capital: The cash-conversion cycle (on sales) for the year ended FY21 was 134 days, two fewer y/y. Inventory days were unchanged y/y at 141. Trade receivable days were one day more y/y to five. Trade payable days were three more to 12.
Other highlights
Q4 FY21 performance. Growth exceeded management expectations and crossed internal targets. Q4 sales growth was exceptionally high even on lower base. Managements says FY22 began well, with good sales momentum. Then Covid-9 struck again. The company ended the quarter on a good note with sales and profit growth despite both not being in line. Tier-2 and -3 towns recovered and reported greater revenue throughout the year and even in Q4 (compared to metros).
Gross margin impact. Sales growth was good (60% in Q4), though gross margin growth was not, due to 1) more sales of jewellery (the lowest gross-margin business due to its nature), 2) two other one-time items and 3) customs duty which was reduced; hence, losses. Individual businesses also dented the gross margin. The company sold many gold coins, and studded-jewellery growth was lower. The mix of watches and wearables was also impacted.
The company was aware of margin pressures but focused on growth and increasing market share plus ensuring vendors/franchisees/sales people get good growth/incentives etc.
Gold on lease. The company used higher share of gold on lease to release cash, and will utilise this when needed. Hence, it ended the year with ~Rs30bn cash.
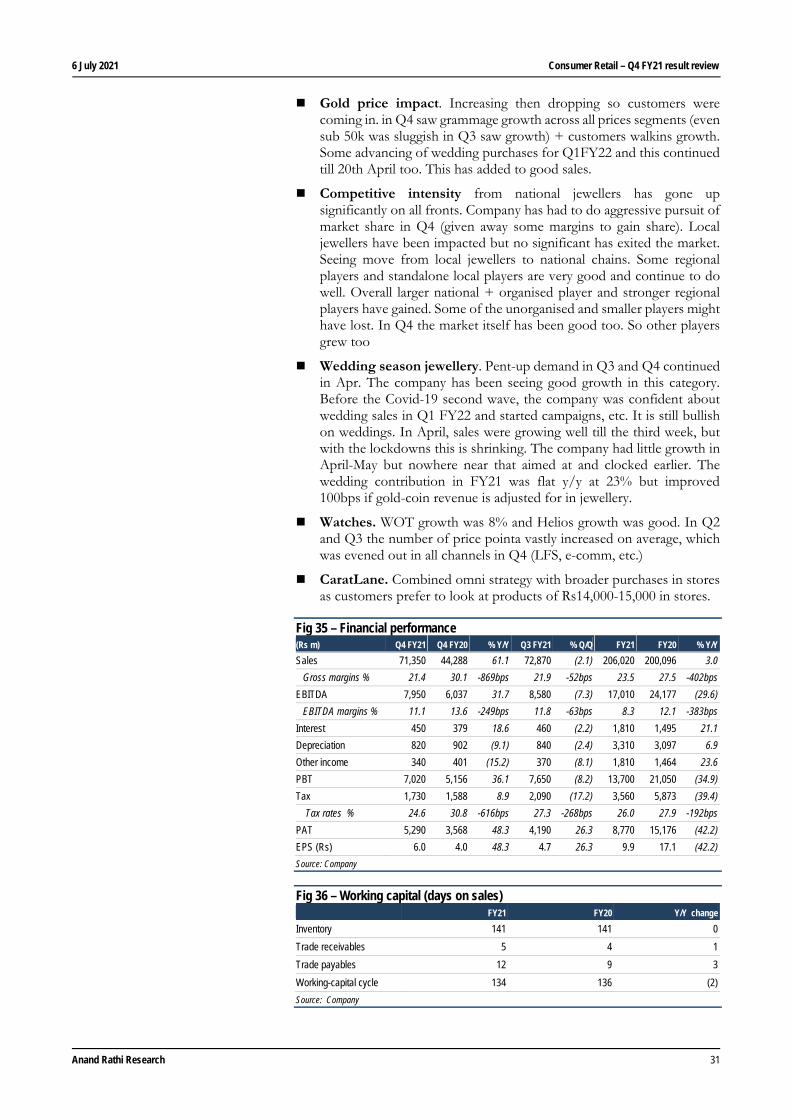
6 July 2021 Consumer Retail – Q4 FY21 result review
Anand Rathi Research 31
Gold price impact. Increasing then dropping so customers were coming in. in Q4 saw grammage growth across all prices segments (even sub 50k was sluggish in Q3 saw growth) + customers walkins growth. Some advancing of wedding purchases for Q1FY22 and this continued till 20th April too. This has added to good sales.
Competitive intensity from national jewellers has gone up significantly on all fronts. Company has had to do aggressive pursuit of market share in Q4 (given away some margins to gain share). Local jewellers have been impacted but no significant has exited the market. Seeing move from local jewellers to national chains. Some regional players and standalone local players are very good and continue to do well. Overall larger national + organised player and stronger regional players have gained. Some of the unorganised and smaller players might have lost. In Q4 the market itself has been good too. So other players grew too
Wedding season jewellery. Pent-up demand in Q3 and Q4 continued in Apr. The company has been seeing good growth in this category. Before the Covid-19 second wave, the company was confident about wedding sales in Q1 FY22 and started campaigns, etc. It is still bullish on weddings. In April, sales were growing well till the third week, but with the lockdowns this is shrinking. The company had little growth in April-May but nowhere near that aimed at and clocked earlier. The wedding contribution in FY21 was flat y/y at 23% but improved 100bps if gold-coin revenue is adjusted for in jewellery.
Watches. WOT growth was 8% and Helios growth was good. In Q2 and Q3 the number of price pointa vastly increased on average, which was evened out in all channels in Q4 (LFS, e-comm, etc.)
CaratLane. Combined omni strategy with broader purchases in stores as customers prefer to look at products of Rs14,000-15,000 in stores.
Fig 35 – Financial performance (Rs m) Q4 FY21 Q4 FY20 % Y/Y Q3 FY21 % Q/Q FY21 FY20 % Y/Y Sales 71,350 44,288 61.1 72,870 (2.1) 206,020 200,096 3.0
Gross margins % 21.4 30.1 -869bps 21.9 -52bps 23.5 27.5 -402bps
EBITDA 7,950 6,037 31.7 8,580 (7.3) 17,010 24,177 (29.6)
EBITDA margins % 11.1 13.6 -249bps 11.8 -63bps 8.3 12.1 -383bps
Interest 450 379 18.6 460 (2.2) 1,810 1,495 21.1
Depreciation 820 902 (9.1) 840 (2.4) 3,310 3,097 6.9
Other income 340 401 (15.2) 370 (8.1) 1,810 1,464 23.6
PBT 7,020 5,156 36.1 7,650 (8.2) 13,700 21,050 (34.9)
Tax 1,730 1,588 8.9 2,090 (17.2) 3,560 5,873 (39.4)
Tax rates % 24.6 30.8 -616bps 27.3 -268bps 26.0 27.9 -192bps
PAT 5,290 3,568 48.3 4,190 26.3 8,770 15,176 (42.2)
EPS (Rs) 6.0 4.0 48.3 4.7 26.3 9.9 17.1 (42.2)
Source: Company
Fig 36 – Working capital (days on sales) FY21 FY20 Y/Y change
Inventory 141 141 0
Trade receivables 5 4 1
Trade payables 12 9 3
Working-capital cycle 134 136 (2)
Source: Company
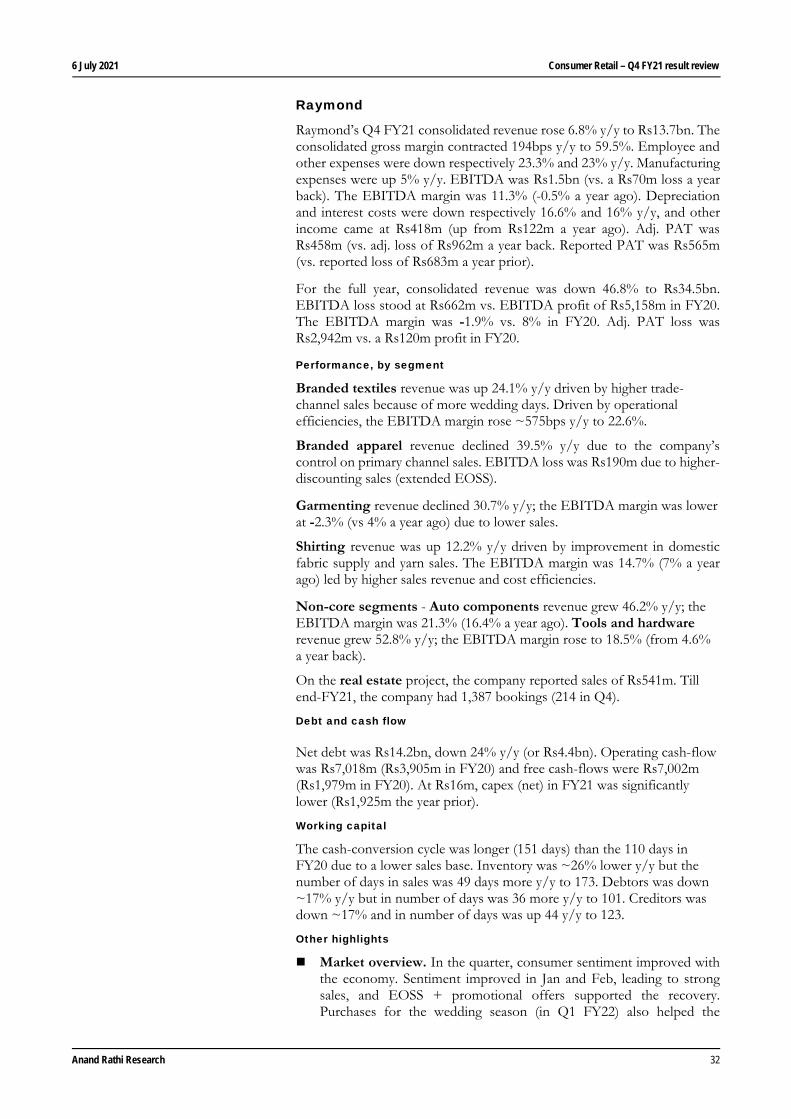
6 July 2021 Consumer Retail – Q4 FY21 result review
Anand Rathi Research 32
Raymond
Raymond’s Q4 FY21 consolidated revenue rose 6.8% y/y to Rs13.7bn. The consolidated gross margin contracted 194bps y/y to 59.5%. Employee and other expenses were down respectively 23.3% and 23% y/y. Manufacturing expenses were up 5% y/y. EBITDA was Rs1.5bn (vs. a Rs70m loss a year back). The EBITDA margin was 11.3% (-0.5% a year ago). Depreciation and interest costs were down respectively 16.6% and 16% y/y, and other income came at Rs418m (up from Rs122m a year ago). Adj. PAT was Rs458m (vs. adj. loss of Rs962m a year back. Reported PAT was Rs565m (vs. reported loss of Rs683m a year prior).
For the full year, consolidated revenue was down 46.8% to Rs34.5bn. EBITDA loss stood at Rs662m vs. EBITDA profit of Rs5,158m in FY20. The EBITDA margin was -1.9% vs. 8% in FY20. Adj. PAT loss was Rs2,942m vs. a Rs120m profit in FY20.
Performance, by segment
Branded textiles revenue was up 24.1% y/y driven by higher trade-channel sales because of more wedding days. Driven by operational efficiencies, the EBITDA margin rose ~575bps y/y to 22.6%.
Branded apparel revenue declined 39.5% y/y due to the company’s control on primary channel sales. EBITDA loss was Rs190m due to higher-discounting sales (extended EOSS).
Garmenting revenue declined 30.7% y/y; the EBITDA margin was lower at -2.3% (vs 4% a year ago) due to lower sales.
Shirting revenue was up 12.2% y/y driven by improvement in domestic fabric supply and yarn sales. The EBITDA margin was 14.7% (7% a year ago) led by higher sales revenue and cost efficiencies.
Non-core segments - Auto components revenue grew 46.2% y/y; the EBITDA margin was 21.3% (16.4% a year ago). Tools and hardware revenue grew 52.8% y/y; the EBITDA margin rose to 18.5% (from 4.6% a year back).
On the real estate project, the company reported sales of Rs541m. Till end-FY21, the company had 1,387 bookings (214 in Q4).
Debt and cash flow
Net debt was Rs14.2bn, down 24% y/y (or Rs4.4bn). Operating cash-flow was Rs7,018m (Rs3,905m in FY20) and free cash-flows were Rs7,002m (Rs1,979m in FY20). At Rs16m, capex (net) in FY21 was significantly lower (Rs1,925m the year prior).
Working capital
The cash-conversion cycle was longer (151 days) than the 110 days in FY20 due to a lower sales base. Inventory was ~26% lower y/y but the number of days in sales was 49 days more y/y to 173. Debtors was down ~17% y/y but in number of days was 36 more y/y to 101. Creditors was down ~17% and in number of days was up 44 y/y to 123.
Other highlights
Market overview. In the quarter, consumer sentiment improved with the economy. Sentiment improved in Jan and Feb, leading to strong sales, and EOSS + promotional offers supported the recovery. Purchases for the wedding season (in Q1 FY22) also helped the
6 July 2021 Consumer Retail – Q4 FY21 result review
Anand Rathi Research 33
recovery. A faster recovery was seen in tier-3 towns and below than in tier -1 and -2, and metros.
The company focused on cost rationalisation and effective working capital to maintain liquidity. Operating cost down 40% y/y during the year, more than the 30-33% guidance. On the continued focus, working capital management contracted Rs730m vs. end-Dec.’20. As a result, debt was down Rs1,670m in Q4 FY21.
Rental savings of Rs800m/43% of previous year (FY20) level – combination of rental waivers and realigning rentals.
Net store closure is at 73 for the quarter and 152 for FY21 – total stores at 1,486 as of FY21 end.
Demerger. Filed NCLT approval. However, due to lockdown, etc., approvals have been impacted. Management expects the process to be completed in FY22.
Fig 37 – Financial performance (Rs m) Q4 FY21 Q4 FY20 % Y/Y Q3 FY21 % Q/Q FY21 FY20 % Y/Y Sales 13,657 12,787 6.8 12,434 9.8 34,465 64,824 (46.8) Gross margins % 59.5 61.4 -194bps 49.7 977bps 52.3 56.8 -449bps
EBITDA 1,549 (70) NA 1,139 36.0 (662) 5,158 NA EBITDA margins % 11.3 (0.5) 1,189bps 9.2 218bps (1.9) 8.0 -988bps
Interest 608 724 (16.0) 684 (11.1) 2,760 3,027 (8.8)Depreciation 707 848 (16.6) 764 (7.4) 3,142 3,398 (7.5)Other income 418 122 242.0 430 (2.9) 2,014 959 109.9PBT 651 (1,519) NA 121 439.2 (4,551) (308) NATax 194 (557) NA 13 1438.9 (1,609) (428) NA Tax rates % 29.8 36.7 -690bps 10.4 NA 35.4 139.1 NA
PAT 565 (683) NA 217 160.3 (2,970) 1,961 NAEPS (Rs) 8.5 (10.3) NA 3.3 160.3 (44.6) 29.5 NASource: Company
Fig 38 – Working capital (days on sales) FY21 FY20 Y/Y change
Inventory 173 124 49
Trade receivables 101 65 36
Trade payables 123 79 44
Working-capital cycle 151 110 41
Source: Company
Appendix Analyst Certification The views expressed in this Research Report accurately reflect the personal views of the analyst(s) about the subject securities or issuers and no part of the compensation of the research analyst(s) was, is, or will be directly or indirectly related to the specific recommendations or views expressed by the research analyst(s) in this report. The research analysts are bound by stringent internal regulations and also legal and statutory requirements of the Securities and Exchange Board of India (hereinafter “SEBI”) and the analysts’ compensation are completely delinked from all the other companies and/or entities of Anand Rathi, and have no bearing whatsoever on any recommendation that they have given in the Research Report.
Anand Rathi Ratings Definitions
Analysts’ ratings and the corresponding expected returns take into account our definitions of Large Caps (>US$1bn) and Mid/Small Caps (<US$1bn) as described in the Ratings Table below:
Ratings Guide (12 months) Buy Hold Sell Large Caps (>US$1bn) >15% 5-15% <5% Mid/Small Caps (<US$1bn) >25% 5-25% <5% Research Disclaimer and Disclosure inter-alia as required under Securities and Exchange Board of India (Research Analysts) Regulations, 2014
Anand Rathi Share and Stock Brokers Ltd. (hereinafter refer as ARSSBL) (Research Entity) is a subsidiary of Anand Rathi Financial Services Ltd. ARSSBL is a corporate trading and clearing member of Bombay Stock Exchange Ltd, National Stock Exchange of India Ltd. (NSEIL), Multi Stock Exchange of India Ltd (MCX-SX) and also depository participant with National Securities Depository Ltd (NSDL) and Central Depository Services Ltd. ARSSBL is engaged in the business of Stock Broking, Depository Participant and Mutual Fund distributor.
The research analysts, strategists, or research associates principally responsible for the preparation of Anand Rathi research have received compensation based upon various factors, including quality of research, investor client feedback, stock picking, competitive factors and firm revenues.
General Disclaimer: This Research Report (hereinafter called “Report”) is meant solely for use by the recipient and is not for circulation. This Report does not constitute a personal recommendation or take into account the particular investment objectives, financial situations, or needs of individual clients. The recommendations, if any, made herein are expression of views and/or opinions and should not be deemed or construed to be neither advice for the purpose of purchase or sale of any security, derivatives or any other security through ARSSBL nor any solicitation or offering of any investment /trading opportunity on behalf of the issuer(s) of the respective security (ies) referred to herein. These information / opinions / views are not meant to serve as a professional investment guide for the readers. No action is solicited based upon the information provided herein. Recipients of this Report should rely on information/data arising out of their own investigations. Readers are advised to seek independent professional advice and arrive at an informed trading/investment decision before executing any trades or making any investments. This Report has been prepared on the basis of publicly available information, internally developed data and other sources believed by ARSSBL to be reliable. ARSSBL or its directors, employees, affiliates or representatives do not assume any responsibility for, or warrant the accuracy, completeness, adequacy and reliability of such information / opinions / views. While due care has been taken to ensure that the disclosures and opinions given are fair and reasonable, none of the directors, employees, affiliates or representatives of ARSSBL shall be liable for any direct, indirect, special, incidental, consequential, punitive or exemplary damages, including lost profits arising in any way whatsoever from the information / opinions / views contained in this Report. The price and value of the investments referred to in this Report and the income from them may go down as well as up, and investors may realize losses on any investments. Past performance is not a guide for future performance. ARSSBL does not provide tax advice to its clients, and all investors are strongly advised to consult with their tax advisers regarding taxation aspects of any potential investment.
Opinions expressed are our current opinions as of the date appearing on this Research only. We do not undertake to advise you as to any change of our views expressed in this Report. Research Report may differ between ARSSBL’s RAs and/ or ARSSBL’s associate companies on account of differences in research methodology, personal judgment and difference in time horizons for which recommendations are made. User should keep this risk in mind and not hold ARSSBL, its employees and associates responsible for any losses, damages of any type whatsoever.
ARSSBL and its associates or employees may; (a) from time to time, have long or short positions in, and buy or sell the investments in/ security of company (ies) mentioned herein or (b) be engaged in any other transaction involving such investments/ securities of company (ies) discussed herein or act as advisor or lender / borrower to such company (ies) these and other activities of ARSSBL and its associates or employees may not be construed as potential conflict of interest with respect to any recommendation and related information and opinions. Without limiting any of the foregoing, in no event shall ARSSBL and its associates or employees or any third party involved in, or related to computing or compiling the information have any liability for any damages of any kind.
Details of Associates of ARSSBL and Brief History of Disciplinary action by regulatory authorities & its associates are available on our website i.e. www.rathionline.com
Disclaimers in respect of jurisdiction: This report is not directed to, or intended for distribution to or use by, any person or entity who is a citizen or resident of or located in any locality, state, country or other jurisdiction where such distribution, publication, availability or use would be contrary to law or regulation or which would subject ARSSBL to any registration or licensing requirement within such jurisdiction(s). No action has been or will be taken by ARSSBL in any jurisdiction (other than India), where any action for such purpose(s) is required. Accordingly, this Report shall not be possessed, circulated and/or distributed in any such country or jurisdiction unless such action is in compliance with all applicable laws and regulations of such country or jurisdiction. ARSSBL requires such recipient to inform himself about and to observe any restrictions at his own expense, without any liability to ARSSBL. Any dispute arising out of this Report shall be subject to the exclusive jurisdiction of the Courts in India.
Statements on ownership and material conflicts of interest, compensation - ARSSBL and Associates
Answers to the Best of the knowledge and belief of ARSSBL/ its Associates/ Research Analyst who is preparing this report
Research analyst or research entity or his associate or his relative has any financial interest in the subject company and the nature of such financial interest. No
ARSSBL/its Associates/ Research Analyst/ his Relative have actual/beneficial ownership of one per cent or more securities of the subject company, at the end of the month immediately preceding the date of publication of the research report?
No
ARSSBL/its Associates/ Research Analyst/ his Relative have actual/beneficial ownership of one per cent or more securities of the subject company No
ARSSBL/its Associates/ Research Analyst/ his Relative have any other material conflict of interest at the time of publication of the research report? No
ARSSBL/its Associates/ Research Analyst/ his Relative have received any compensation from the subject company in the past twelve months No
ARSSBL/its Associates/ Research Analyst/ his Relative have managed or co-managed public offering of securities for the subject company in the past twelve months
No
ARSSBL/its Associates/ Research Analyst/ his Relative have received any compensation for investment banking or merchant banking or brokerage services from the subject company in the past twelve months
No
ARSSBL/its Associates/ Research Analyst/ his Relative have received any compensation for products or services other than investment banking or merchant banking or brokerage services from the subject company in the past twelve months
No
ARSSBL/its Associates/ Research Analyst/ his Relative have received any compensation or other benefits from the subject company or third party in connection with the research report
No
ARSSBL/its Associates/ Research Analyst/ his Relative have served as an officer, director or employee of the subject company. No
Other Disclosures pertaining to distribution of research in the United States of America
This research report is a product of ARSSBL, which is the employer of the research analyst(s) who has prepared the research report. The research analyst(s) preparing the research report is/are resident outside the United States (U.S.) and are not associated persons of any U.S. regulated broker-dealer and therefore the analyst(s) is/are not subject to supervision by a U.S. broker-dealer, and is/are not required to satisfy the regulatory licensing requirements of FINRA or required to otherwise comply with U.S. rules or regulations regarding, among other things, communications with a subject company, public appearances and trading securities held by a research analyst account.
This report is intended for distribution by ARSSBL only to "Major Institutional Investors" as defined by Rule 15a-6(b)(4) of the U.S. Securities and Exchange Act, 1934 (the Exchange Act) and interpretations thereof by U.S. Securities and Exchange Commission (SEC) in reliance on Rule 15a 6(a)(2). If the recipient of this report is not a Major Institutional Investor as specified above, then it should not act upon this report and return the same to the sender. Further, this report may not be copied, duplicated and/or transmitted onward to any U.S. person, which is not the Major Institutional Investor.
In reliance on the exemption from registration provided by Rule 15a-6 of the Exchange Act and interpretations thereof by the SEC in order to conduct certain business withMajor Institutional Investors, ARSSBL has entered into an agreement with a U.S. registered broker-dealer, Cabrera Capital Markets. ("Cabrera"). Transactions in securities discussed in this research report should be effected through Cabrera or another U.S. registered broker dealer.
1. ARSSBL or its Affiliates may or may not have been beneficial owners of the securities mentioned in this report.
2. ARSSBL or its affiliates may have or not managed or co-managed a public offering of the securities mentioned in the report in the past 12 months.
3. ARSSBL or its affiliates may have or not received compensation for investment banking services from the issuer of these securities in the past 12 months and do not expect to receive compensation for investment banking services from the issuer of these securities within the next three months.
4. However, one or more of ARSSBL or its Affiliates may, from time to time, have a long or short position in any of the securities mentioned herein and may buy or sell those securities or options thereon, either on their own account or on behalf of their clients.
5. As of the publication of this report, ARSSBL does not make a market in the subject securities.
6. ARSSBL or its Affiliates may or may not, to the extent permitted by law, act upon or use the above material or the conclusions stated above, or the research or analysis on which they are based before the material is published to recipients and from time to time, provide investment banking, investment management or other services for orsolicit to seek to obtain investment banking, or other securities business from, any entity referred to in this report.
© 2021. This report is strictly confidential and is being furnished to you solely for your information. All material presented in this report, unless specifically indicated otherwise, is under copyright to ARSSBL. None of the material, its content, or any copy of such material or content, may be altered in any way, transmitted, copied or reproduced (in whole or in part) or redistributed in any form to any other party, without the prior express written permission of ARSSBL. All trademarks, service marks and logos used in this report are trademarks or service marks or registered trademarks or service marks of ARSSBL or its affiliates, unless specifically mentioned otherwise.
Additional information on recommended securities/instruments is available on request.
ARSSBL registered address: Express Zone, A Wing, 9th Floor, Western Express Highway, Diagonally Opposite Oberoi Mall, Malad (E), Mumbai – 400097. Tel No: +91 22 6281 7000 | Fax No: +91 22 4001 3770 | CIN: U67120MH1991PLC064106.