sales insights for retail 3.0 with retail promotion analyzer 1.0
TRANSCRIPT

User Guide Document Version: 2.1 – Final Date: July 14, 2020
PUBLIC
Sales Insights for Retail 3.0 with retail promotion analyzer 1.0 User Guide
User Guide PUBLIC
Sales Insights for Retail 3.0 with retail promotion analyzer 1.0
User Guide – Version:1.0 – Final
July 14, 2020
© 2020 SAP SE or an SAP affiliate company. All rights reserved. 2
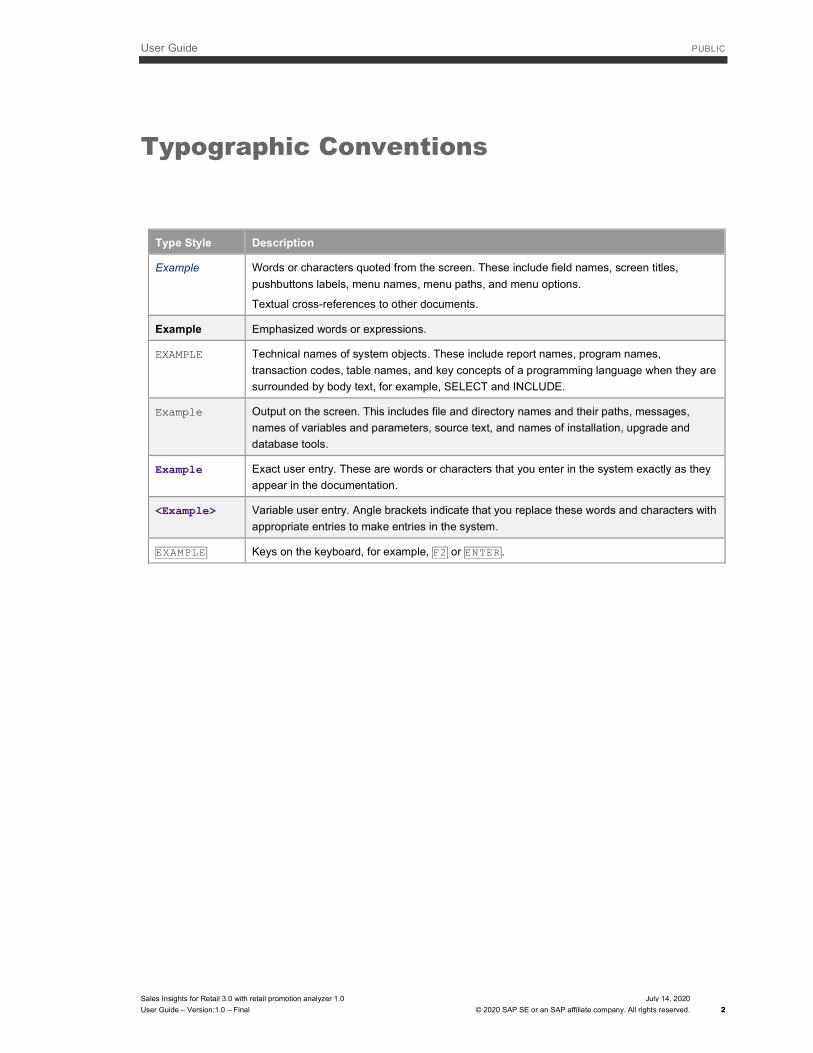
Typographic Conventions
Type Style Description
Example Words or characters quoted from the screen. These include field names, screen titles,
pushbuttons labels, menu names, menu paths, and menu options.
Textual cross-references to other documents.
Example Emphasized words or expressions.
EXAMPLE Technical names of system objects. These include report names, program names,
transaction codes, table names, and key concepts of a programming language when they are
surrounded by body text, for example, SELECT and INCLUDE.
Example Output on the screen. This includes file and directory names and their paths, messages,
names of variables and parameters, source text, and names of installation, upgrade and
database tools.
Example Exact user entry. These are words or characters that you enter in the system exactly as they
appear in the documentation.
<Example> Variable user entry. Angle brackets indicate that you replace these words and characters with
appropriate entries to make entries in the system.
EXAMPLE Keys on the keyboard, for example, F2 or ENTER .

User Guide PUBLIC
Sales Insights for Retail 3.0 with retail promotion analyzer 1.0
User Guide – Version: 2.1 – Final
July 14, 2020
© 2020 SAP SE or an SAP affiliate company. All rights reserved. 3
Document History
Version Status Date
2.1 Final July 14, 2020 Released to Customer
2.0 Ready for
Internal
Review
June 26, 2020 Document updated to reflect the latest changes
1.0 Draft June 24, 2020

User Guide PUBLIC
Sales Insights for Retail 3.0 with retail promotion analyzer 1.0
User Guide – Version: 2.1 – Final
July 14, 2020
© 2020 SAP SE or an SAP affiliate company. All rights reserved. 4
Table of Contents
1 Getting Started ....................................................................................................... 7 1.1 Before You Start ............................................................................................................................... 7 1.2 What Is SAP Sales Insights for Retail with Retail Promotion Analyzer? ........................................... 7 1.3 Key Concepts ................................................................................................................................... 7
2 SAP Sales Insights for Retail with Retail Promotion Analyzer Basics .................. 9 2.1 Logging on to the Application ........................................................................................................... 9 2.2 Getting to Know the Application........................................................................................................ 9 2.3 Key Metrics (KPIs) .......................................................................................................................... 10
3 Setting the Scope of Analysis .............................................................................. 14 3.1 Setting the Time Frame .................................................................................................................. 14 3.2 Selecting Product Sets ................................................................................................................... 15 3.3 Selecting a Store Set ...................................................................................................................... 17 3.4 Searching for Products and Stores ................................................................................................. 18 3.5 Setting Options for the Key Item List, Affinity Calculation and Promotion Analyzer ........................ 19
3.5.1 Options for Key Item List................................................................................................. 19 3.5.2 Options for Affinity Insight ............................................................................................... 20 3.5.3 Options for Promotion Analyzer ...................................................................................... 23
3.6 Setting Additional Transaction Filters ............................................................................................. 23
4 Performing the Analysis ........................................................................................ 25 4.1 Genie Insights ................................................................................................................................. 25 4.2 Value Driver Tree ........................................................................................................................... 25 4.3 Key Item List ................................................................................................................................... 28
4.3.1 Development Over Time for Key Item List ...................................................................... 32 4.4 Affinity Insight ................................................................................................................................. 34 4.5 Promotion Analyzer ........................................................................................................................ 38
4.5.1 Virtual Promotion Manager ............................................................................................. 43 4.5.2 Manage Promotion Templates ........................................................................................ 44
5 Saving Results for Further Analysis ..................................................................... 46

User Guide PUBLIC
Sales Insights for Retail 3.0 with retail promotion analyzer 1.0
User Guide – Version:1.0 – Final
July 14, 2020
© 2020 SAP SE or an SAP affiliate company. All rights reserved. 5
Table of Figures
Figure 1: New Computation Menu ............................................................................................................................... 14 Figure 2: Setting the Time Frame ................................................................................................................................ 15 Figure 3: Selecting first of the two Product Sets for Affinity Insight Computation ......................................................... 16 Figure 4: Selecting Tags for Products .......................................................................................................................... 17 Figure 5: Selecting a Set of Stores .............................................................................................................................. 18 Figure 6: Selecting Tags for Stores .............................................................................................................................. 18 Figure 7: Additional Search Settings for Products ........................................................................................................ 19 Figure 8: Options for Key Item List ............................................................................................................................... 20 Figure 9: Options for Affinity Insight ............................................................................................................................. 21 Figure 10: Equation to Calculate Support .................................................................................................................... 22 Figure 11: Equation to Calculate Expected Support .................................................................................................... 22 Figure 12: Equation to Calculate Delta Support ........................................................................................................... 22 Figure 13: Options for Promotion Analyzer .................................................................................................................. 23 Figure 14: Header Area in Value Driver Tree Workspace ............................................................................................ 25 Figure 15: Value Driver Tree ........................................................................................................................................ 26 Figure 16: Value Driver Details .................................................................................................................................... 27 Figure 17: Bar Chart for Value Driver Tree .................................................................................................................. 28 Figure 18: Header Information for Key Item List .......................................................................................................... 29 Figure 19: Key Item List: Table-Based View ................................................................................................................ 30 Figure 20: Sorting, Filtering, Grouping, and Column Selection in Key Item List ........................................................... 30 Figure 21: Scatter Plot Chart for Key Items ................................................................................................................. 31 Figure 22: Bar Chart Showing Long Tail Effect ............................................................................................................ 32 Figure 23: Development over Time .............................................................................................................................. 33 Figure 24: Price Details for Key Items .......................................................................................................................... 33 Figure 25: Total Basket Contents by Revenue for Key Items ...................................................................................... 34 Figure 26: Header Information for Affinity Insights ....................................................................................................... 35 Figure 27: Heat Map for Affinity Insight ........................................................................................................................ 36 Figure 28: Affinity Insight Tree Map ............................................................................................................................. 37 Figure 29: Affinity Insight Table View ........................................................................................................................... 37 Figure 30: Header Information for Promotion Analyzer Workspace ............................................................................. 38 Figure 31: Overview of KPIs in Promotion Analyzer Workspace.................................................................................. 38 Figure 32: Waterfall Graph of Promotion Effects in Overview Section ......................................................................... 39 Figure 33: Bubble Graph of Promotion Ratings in Overview Section ........................................................................... 39 Figure 34: Interactive table in Promotions Section ....................................................................................................... 40 Figure 35: Bar Chart of various Metrics in Promotions section .................................................................................... 40 Figure 36: Weekly aggregates of various metrics in Promotions section ..................................................................... 40

User Guide PUBLIC
Sales Insights for Retail 3.0 with retail promotion analyzer 1.0
User Guide – Version: 2.1 – Final
July 14, 2020
© 2020 SAP SE or an SAP affiliate company. All rights reserved. 6
Figure 37: Distribution of Promotion Products over time and participating Stores in Promotions section .................... 41 Figure 38: Promo Investment (EUR) and ROI (%) in Promotions Section ................................................................... 41 Figure 39: Promotion Selection on Promotion Details page ......................................................................................... 42 Figure 40: Promotion Selection on Promotion Details page ......................................................................................... 42 Figure 41: Line Chart of Margin on the Promotion Details page .................................................................................. 43 Figure 42: Additional details on Promotion Metrics ...................................................................................................... 43 Figure 43: Setting up the Simulation Parameters in Virtual Promotion Manager ......................................................... 44 Figure 44: Promotion Simulation in Virtual Promotion Manager .................................................................................. 44 Figure 45: Promotion Templates Manager ................................................................................................................... 45 Figure 46: Managing Snapshots .................................................................................................................................. 46

User Guide PUBLIC
Sales Insights for Retail 3.0 with retail promotion analyzer 1.0
User Guide – Version: 2.1 – Final
July 14, 2020
© 2020 SAP SE or an SAP affiliate company. All rights reserved. 7
1 Getting Started
1.1 Before You Start
Before you start working with SAP Sales Insights for Retail with retail promotion analyzer, make sure that the
following prerequisites are met:
One of the following web browsers is installed on your machine:
o Microsoft Internet Explorer 10/Microsoft Edge
o Mozilla Firefox 70 or above
o Google Chrome 70 or above
You have received the URL to call up the application.
You are authorized to access the application.
1.2 What Is SAP Sales Insights for Retail with Retail Promotion Analyzer?
SAP Sales Insights for Retail with retail promotion analyzer is tailored to meet your needs as retail category
managers and merchandising managers. This highly flexible reporting tool allows you to analyze your point-of-sales
data on market basket level and determine product affinities.
For example, you can analyze the following:
Absolute numbers of market baskets that contain products from two selected sets of the product hierarchy
Average multiplicities of products in market baskets
Change of multiplicities during promotion
Causal relationships between products
Total market basket sales or profits associated with specific products
Most successful and least successful products or product groups for the selected stores and time frame
Root causes for changes in revenue and profit for the selected stores and products
SAP Sales Insights for Retail with retail promotion analyzer is based on SAP HANA®, SAP's in-memory database.
This technology allows you to perform real-time computations on extremely large data sets.
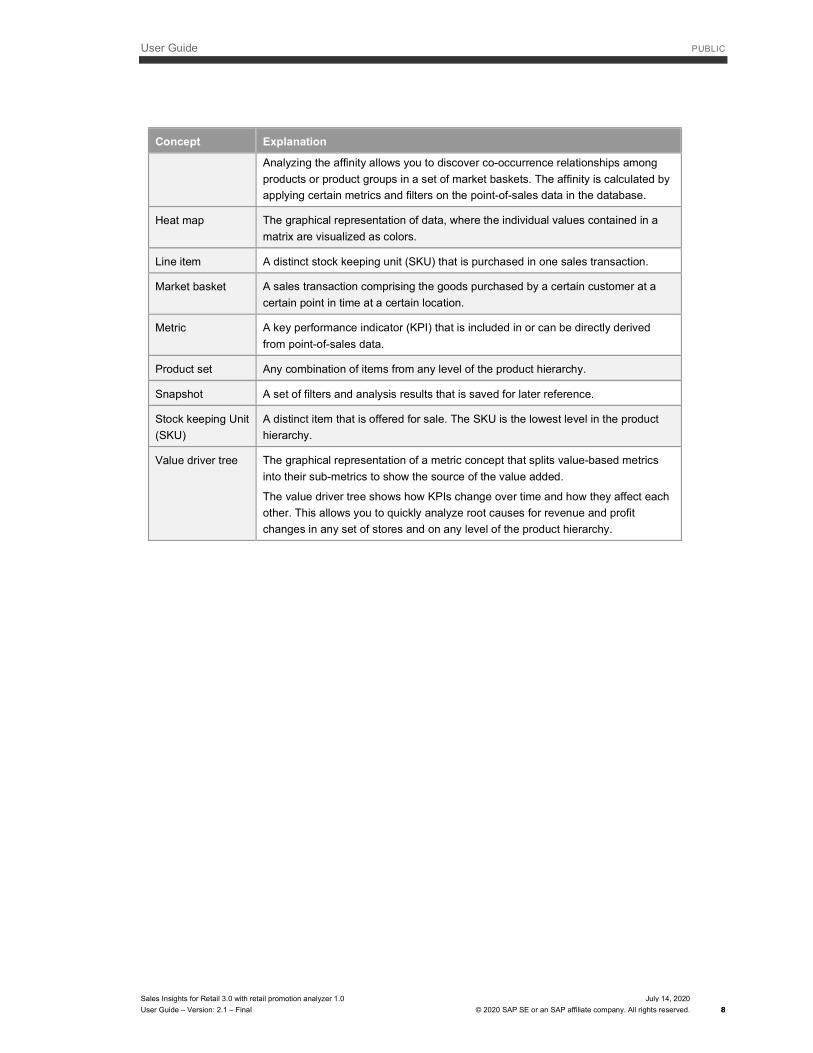
1.3 Key Concepts
Concept Explanation
Affinity A quantitative relationship that is determined based on two products or product
sets purchased together in one market basket.
User Guide PUBLIC
Sales Insights for Retail 3.0 with retail promotion analyzer 1.0
User Guide – Version: 2.1 – Final
July 14, 2020
© 2020 SAP SE or an SAP affiliate company. All rights reserved. 8
Concept Explanation
Analyzing the affinity allows you to discover co-occurrence relationships among
products or product groups in a set of market baskets. The affinity is calculated by
applying certain metrics and filters on the point-of-sales data in the database.
Heat map The graphical representation of data, where the individual values contained in a
matrix are visualized as colors.
Line item A distinct stock keeping unit (SKU) that is purchased in one sales transaction.
Market basket A sales transaction comprising the goods purchased by a certain customer at a
certain point in time at a certain location.
Metric A key performance indicator (KPI) that is included in or can be directly derived
from point-of-sales data.
Product set Any combination of items from any level of the product hierarchy.
Snapshot A set of filters and analysis results that is saved for later reference.
Stock keeping Unit
(SKU)
A distinct item that is offered for sale. The SKU is the lowest level in the product
hierarchy.
Value driver tree The graphical representation of a metric concept that splits value-based metrics
into their sub-metrics to show the source of the value added.
The value driver tree shows how KPIs change over time and how they affect each
other. This allows you to quickly analyze root causes for revenue and profit
changes in any set of stores and on any level of the product hierarchy.

User Guide PUBLIC
Sales Insights for Retail 3.0 with retail promotion analyzer 1.0
User Guide – Version: 2.1 – Final
July 14, 2020
© 2020 SAP SE or an SAP affiliate company. All rights reserved. 9
2 SAP Sales Insights for Retail with Retail Promotion Analyzer Basics
The following sections help you to familiarize yourself with SAP Sales Insights for Retail with retail promotion
analyzer. They provide information about the available workspaces as well as options for selecting and configuring
the calculation and display of the data you want to analyze.
2.1 Logging on to the Application
To open the SAP Sales Insights for Retail with retail promotion analyzer workspace, proceed as follows:
1. Open your web browser and enter the URL provided to you by your local IT department.
The SAP HANA log-on screen appears.
2. Enter the username and the initial password provided to you by your local IT department.
3. Change the initial password (if required).
4. Choose Log On.
2.2 Getting to Know the Application
SAP Sales Insights for Retail with retail promotion analyzer allows you to analyze your point-of-sales data on market
basket level. The application focuses on identifying quantitative relationships between different products or product
groups.
You select the data you want to analyze by setting the scope for a computation, for example, time frame, products,
and stores to be included in the analysis.
Note
The screenshots in this document are intended to provide an example of the user interface. The actual
options available to you may differ. This depends on the data in your database as well as on the system set-
up.
Available Workspaces
You can use the following workspaces to analyze your point-of-sales data:
Genie Insights
This screen is the first one shown after you have logged on to SAP Sales Insights for Retail with retail promotion
analyzer. Genie Insights screen gives you an overview of notifications related to computation results, for
example, significant increases or decreases.
Value Driver Tree

User Guide PUBLIC
Sales Insights for Retail 3.0 with retail promotion analyzer 1.0
User Guide – Version: 2.1 – Final
July 14, 2020
© 2020 SAP SE or an SAP affiliate company. All rights reserved. 10
This workspace allows you to identify what drives an increase or decrease in business performance for the
selected stores and products or product groups by comparing profit-related KPIs in two different time frames.
Key Item List
This workspace helps you to find the most successful or least successful products or product groups in the
selected stores or in a certain area of your assortment. You can also use the key item list to identify the stores or
regions that are most or least successful at selling a selected set of products.
Affinity Insight
This workspace enables you to analyze the composition of market baskets, for example, by determining how
many customers purchased a certain combination of products.
Promotion Analyzer
This workspace allows you to quantify and evaluate the effectiveness of past promotions according to predefined
KPIs.
Virtual Promotions Manager
This workspace allows you to perform 'what-if' analysis and to simulate future promotions.
For more information about the individual workspaces, see Performing the Analysis.
Parameters for Computation
When you start a new computation for any of the workspaces listed above, you must first set the scope of your
analysis. After setting the scope, you trigger the computation.
When you set the scope, you use the following parameters:
Time Frame
Products
Stores
Transaction Filters
For details about how to set the scope for your analysis, see Setting the Scope of Analysis.
2.3 Key Metrics (KPIs)
Metrics are key performance indicators (KPIs) that are included or can be derived from point-of-sales data. SAP
Sales Insights for Retail with retail promotion analyzer is based on the idea of calculating and visualizing different
metrics based on a defined set of market baskets.
The following table lists the metrics that the system calculates when you trigger the analysis.
Note
The calculation depends on the workspace that is currently being displayed. If you are in the Affinity Insight
workspace, for example, the system only calculates the metrics that are relevant for this workspace.
Metric Definition Used in Workspace
Average basket line items The average number of items included in the baskets
that contain at least one item from the selected
product or product group.
Key Item List

User Guide PUBLIC
Sales Insights for Retail 3.0 with retail promotion analyzer 1.0
User Guide – Version: 2.1 – Final
July 14, 2020
© 2020 SAP SE or an SAP affiliate company. All rights reserved. 11
Metric Definition Used in Workspace
Average basket profit The average profit resulting from a transaction that
contains at least one item from the selected product
sets.
Key Item List
Average basket revenue The average revenue resulting from a transaction that
contains at least one item from the selected product
sets.
Key Item List
Average buying frequency The average number of times a customer purchases
the selected products in the selected stores in the
specified time frame.
Value Driver Tree
Baseline Sales Total Sales in 'Normal' Times Promo Analyzer
Baskets (also: number of
transactions)
The number of distinct sales transactions that contain
at least one item from the selected product set.
Affinity Insight
Key Item List
Value Driver Tree
Cannibalization Lost/gained Sales for items in similar item groups Promo Analyzer
Cost of promotion The lost margin from selling the item at a discount. Promo Analyzer
Distinct buyers (also:
number of customers)
The number of individual customers that purchased
any item in the selected product set. Customers are
identified by their loyalty card ID. If this is not present,
the system considers each transaction as unique.
Key Item List
Value Driver Tree
Drag Along Sales uplift for items which people have bought
together with promoted item which they would not
have bought without the promotion
Promo Analyzer
Gross margin The gross income expressed as a percentage of the
net sales.
Gross margin = (Sales revenue - cost of sales) x 100
÷ sales revenue
Value Driver Tree
Hoarding (-) Loss of sales from customers buying less of the
promoted items after the promotion compared to
normal time sales or increase in sales after the
promotion has ended compared to baseline due to
promotion highly positive impact
Promo Analyzer
Hoarding (+) Sales uplift from customers buying more promoted
items during promotion
Promo Analyzer
Increased consumption Sum of Sales for customers who would have anyway
bought the item, but now are consuming more of the
item because it is on promotion
Promo Analyzer
Incremental Margin Promo Margin After Direct Effects minus Baseline
Sales
Promo Analyzer

User Guide PUBLIC
Sales Insights for Retail 3.0 with retail promotion analyzer 1.0
User Guide – Version: 2.1 – Final
July 14, 2020
© 2020 SAP SE or an SAP affiliate company. All rights reserved. 12
Metric Definition Used in Workspace
Incremental Sales EUR Promo Sales After Direct Effects minus Baseline
Sales
Promo Analyzer
Net New Customers Total
Margin
Sum of margin from new customers attributed to store Promo Analyzer
New customers for the item Loyal customers buying the promoted item for the first
time
Promo Analyzer
Profit The surplus remaining after all costs are deducted
from the total revenue generated.
Profit = Gross margin x Revenue
Affinity Insight
Key Item List
Value Driver Tree
Promo Sales Baseline Sales after all direct effects (Hoarding,
Cannibalization, Increased consumption, Net New
Customers for Promoted Item, Net New Customers
for Shop, Promo Discounts, Other Discounts, Vendor
Promo Investments, Other Direct Effects)
Promo Analyzer
Promo Sales Share in % Promo Sales divided by Total Sales Promo Analyzer
Promo Uplift Sum of positive hoarding, cannibalization, increased
consumption, Net New Customers for Promoted Item
and Net New Customers for Shop.
Promo Analyzer
Promotion share The total revenue generated by products on
promotion divided by the revenue generated by all
products.
Value Driver Tree
Regular Sales Total Sales minus Promo Sales Promo Analyzer
Revenue The income generated from the sale of goods before
any costs or expenses are deducted.
Affinity Insight
Key Item List
Value Driver Tree
Score A numeric expression that is calculated based on the
rating of a metric on a scale from 0 to 100. The final
score is the weighted average value resulting from the
values calculated for the individual metrics.
Key Item List
Share The number of times (in percent) items of both
product sets A and B appear together in distinct
transactions relative to the total number of distinct
transactions.
Affinity Insight
Share of A in baskets
containing B
The share of transactions that include product set A
relative to the number of transactions that include
product set B.
Affinity Insight
Share of B in baskets
containing A
The share of transactions that include B relative to the
number of transactions that include A
Affinity Insight
Total margin The sum of all the effects in the waterfall Promo Analyzer

User Guide PUBLIC
Sales Insights for Retail 3.0 with retail promotion analyzer 1.0
User Guide – Version: 2.1 – Final
July 14, 2020
© 2020 SAP SE or an SAP affiliate company. All rights reserved. 13
Metric Definition Used in Workspace
Total Promo Discount/Depth
in %
(Promo Sales per Unit minus Baseline Sales per Unit)
divided by Baseline Sales per Unit
Promo Analyzer
Total Sales EUR Sales in Euro without VAT Promo Analyzer
Unit sales The total number of units (SKUs) of a product that are
sold in distinct transactions.
Affinity Insight
Key Item List
User Guide PUBLIC
Sales Insights for Retail 3.0 with retail promotion analyzer 1.0
User Guide – Version: 2.1 – Final
July 14, 2020
© 2020 SAP SE or an SAP affiliate company. All rights reserved. 14
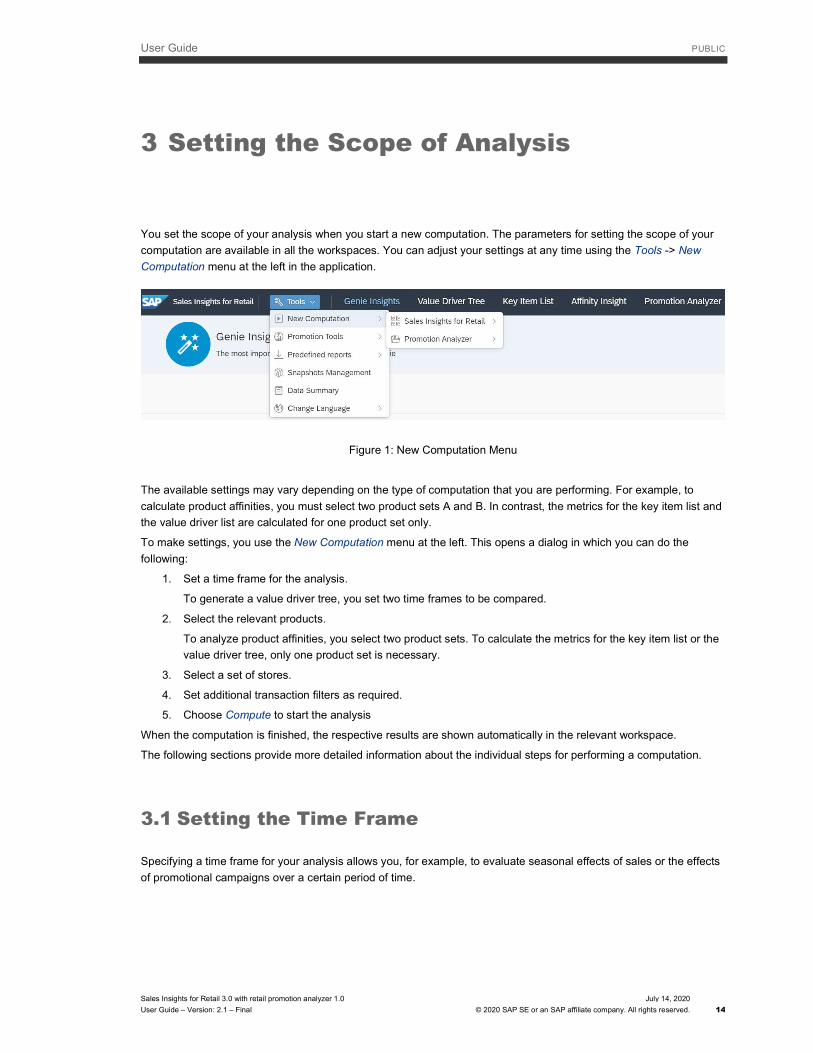
3 Setting the Scope of Analysis
You set the scope of your analysis when you start a new computation. The parameters for setting the scope of your
computation are available in all the workspaces. You can adjust your settings at any time using the Tools -> New
Computation menu at the left in the application.
Figure 1: New Computation Menu
The available settings may vary depending on the type of computation that you are performing. For example, to
calculate product affinities, you must select two product sets A and B. In contrast, the metrics for the key item list and
the value driver list are calculated for one product set only.
To make settings, you use the New Computation menu at the left. This opens a dialog in which you can do the
following:
1. Set a time frame for the analysis.
To generate a value driver tree, you set two time frames to be compared.
2. Select the relevant products.
To analyze product affinities, you select two product sets. To calculate the metrics for the key item list or the
value driver tree, only one product set is necessary.
3. Select a set of stores.
4. Set additional transaction filters as required.
5. Choose Compute to start the analysis
When the computation is finished, the respective results are shown automatically in the relevant workspace.
The following sections provide more detailed information about the individual steps for performing a computation.
3.1 Setting the Time Frame
Specifying a time frame for your analysis allows you, for example, to evaluate seasonal effects of sales or the effects
of promotional campaigns over a certain period of time.
User Guide PUBLIC
Sales Insights for Retail 3.0 with retail promotion analyzer 1.0
User Guide – Version: 2.1 – Final
July 14, 2020
© 2020 SAP SE or an SAP affiliate company. All rights reserved. 15
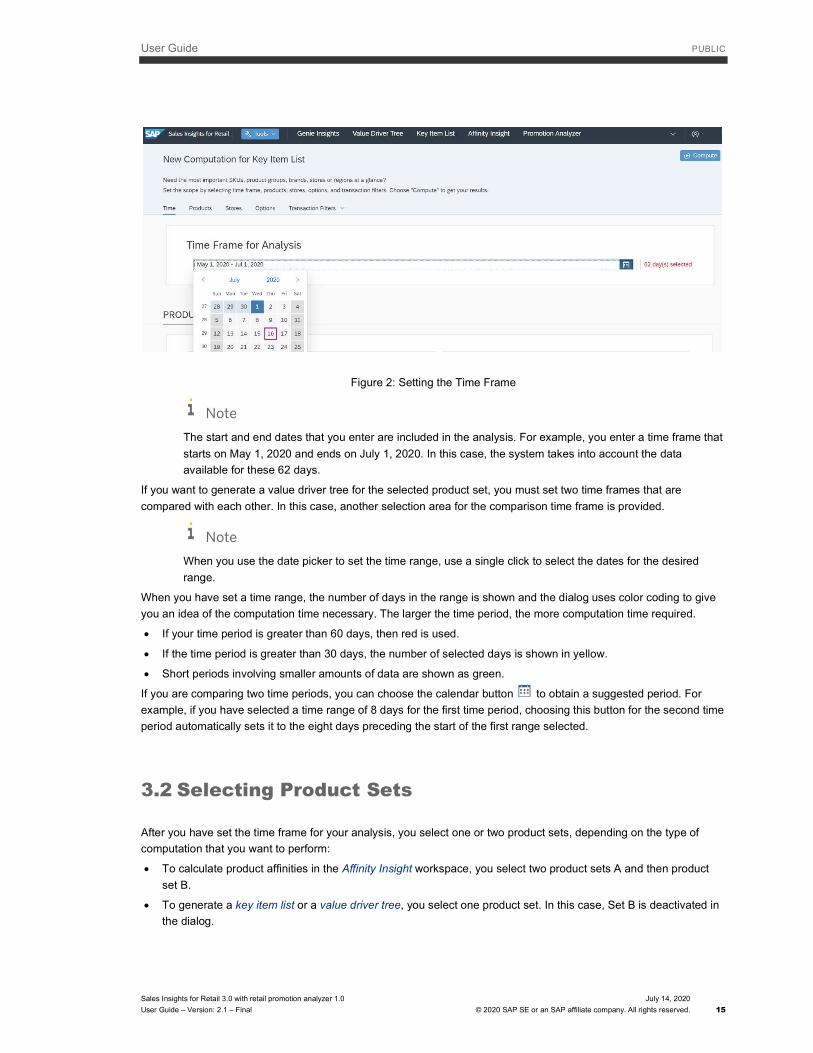
Figure 2: Setting the Time Frame
Note
The start and end dates that you enter are included in the analysis. For example, you enter a time frame that
starts on May 1, 2020 and ends on July 1, 2020. In this case, the system takes into account the data
available for these 62 days.
If you want to generate a value driver tree for the selected product set, you must set two time frames that are
compared with each other. In this case, another selection area for the comparison time frame is provided.
Note
When you use the date picker to set the time range, use a single click to select the dates for the desired
range.
When you have set a time range, the number of days in the range is shown and the dialog uses color coding to give
you an idea of the computation time necessary. The larger the time period, the more computation time required.
If your time period is greater than 60 days, then red is used.
If the time period is greater than 30 days, the number of selected days is shown in yellow.
Short periods involving smaller amounts of data are shown as green.
If you are comparing two time periods, you can choose the calendar button to obtain a suggested period. For
example, if you have selected a time range of 8 days for the first time period, choosing this button for the second time
period automatically sets it to the eight days preceding the start of the first range selected.
3.2 Selecting Product Sets
After you have set the time frame for your analysis, you select one or two product sets, depending on the type of
computation that you want to perform:
To calculate product affinities in the Affinity Insight workspace, you select two product sets A and then product
set B.
To generate a key item list or a value driver tree, you select one product set. In this case, Set B is deactivated in
the dialog.
User Guide PUBLIC
Sales Insights for Retail 3.0 with retail promotion analyzer 1.0
User Guide – Version: 2.1 – Final
July 14, 2020
© 2020 SAP SE or an SAP affiliate company. All rights reserved. 16
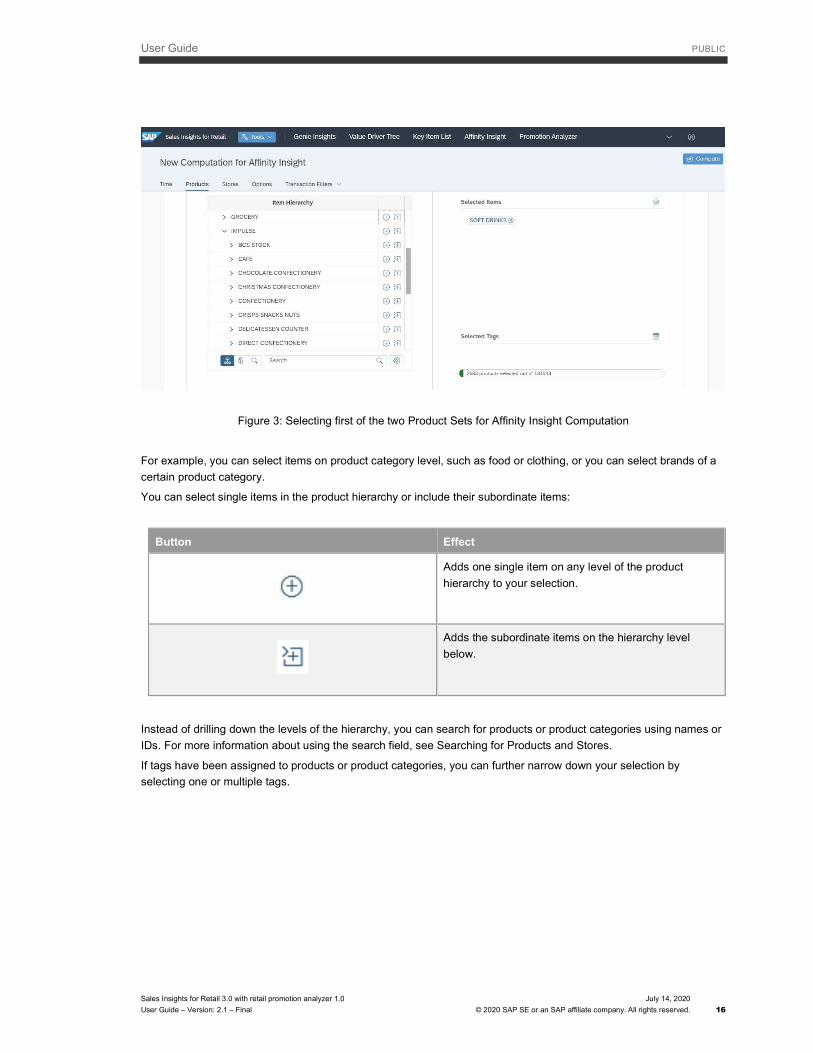
Figure 3: Selecting first of the two Product Sets for Affinity Insight Computation
For example, you can select items on product category level, such as food or clothing, or you can select brands of a
certain product category.
You can select single items in the product hierarchy or include their subordinate items:
Button Effect
Adds one single item on any level of the product
hierarchy to your selection.
Adds the subordinate items on the hierarchy level
below.
Instead of drilling down the levels of the hierarchy, you can search for products or product categories using names or
IDs. For more information about using the search field, see Searching for Products and Stores.
If tags have been assigned to products or product categories, you can further narrow down your selection by
selecting one or multiple tags.

User Guide PUBLIC
Sales Insights for Retail 3.0 with retail promotion analyzer 1.0
User Guide – Version: 2.1 – Final
July 14, 2020
© 2020 SAP SE or an SAP affiliate company. All rights reserved. 17
Figure 4: Selecting Tags for Products
When you select items or tags in a product set, the area at the lower right in the selection dialog immediately shows
you how many products you have selected out of the entire hierarchy. Color coding here also gives you an indication
of whether your selection might be too small or large.
3.3 Selecting a Store Set
When setting the parameters for a computation, you can select stores on various levels of the store hierarchy. For
example, you can select all stores located in a certain region or country. You can also select individual stores.

User Guide PUBLIC
Sales Insights for Retail 3.0 with retail promotion analyzer 1.0
User Guide – Version: 2.1 – Final
July 14, 2020
© 2020 SAP SE or an SAP affiliate company. All rights reserved. 18
Figure 5: Selecting a Set of Stores
For more information about using the search field, see Searching for Products and Stores.
You can further narrow down your selection by filtering the available stores using one or multiple tags that are
currently assigned to them (if available).
Figure 6: Selecting Tags for Stores
As with the product selection, the area at the lower right in the selection dialog immediately shows you how many
stores you have selected out of the entire store hierarchy. Color coding here also gives you an indication of whether
your selection might be too small or large.
3.4 Searching for Products and Stores
When you're selecting products and stores, you can also use the search field to find relevant items. Note the
following about the search function:
You can use the percentage sign wildcard or enclose your search term in double quotations to find similar terms.
You can right-click the column header in the product or tag hierarchy for products or stores to apply an additional
filter.
Instead of drilling down the different levels of a product or store hierarchy, you can search using the name or the ID of
the product or store. You can even search for a list of products or stores. For example, to search for multiple IDs or
names, separate your entries using semicolons:
Example
You type 0002;0003 in the search field for stores and press Enter . The system shows all stores with the
ID number 0002 and all stores with the ID number 0003.

User Guide PUBLIC
Sales Insights for Retail 3.0 with retail promotion analyzer 1.0
User Guide – Version: 2.1 – Final
July 14, 2020
© 2020 SAP SE or an SAP affiliate company. All rights reserved. 19
You can also copy a list of IDs for products or stores directly from a spreadsheet and paste them into the search field.
The application automatically handles them as separate search terms, and it is not necessary to enter separating
semicolons.
Additional search settings are available for selecting products. You can choose between the general product
hierarchy and the marketing product hierarchy. For each selection, you can decide whether you want to exclude
inactive product or include the promotion ID.
Figure 7: Additional Search Settings for Products
3.5 Setting Options for the Key Item List, Affinity Calculation and Promotion Analyzer
When you are in the Key Item List , Affinity Insight or Promotion Analyzer workspace, you can use additional options
to configure the calculation and display of the analysis results.
3.5.1 Options for Key Item List
When you make settings for a key item list computation, you can make settings that affect the data displayed:

User Guide PUBLIC
Sales Insights for Retail 3.0 with retail promotion analyzer 1.0
User Guide – Version: 2.1 – Final
July 14, 2020
© 2020 SAP SE or an SAP affiliate company. All rights reserved. 20
Figure 8: Options for Key Item List
You can make the following settings here:
1. You specify the level of aggregation. For example, this might be by product, by brand, or by store.
Note
Which levels are available to you and how these are named depends on your system configuration.
2. You determine which metrics in the list are most important by rating them on a scale from 1 to 100 in the Score
Adjustable Weights section.
Based on your rating, the system calculates the score for all metrics. The overall score that is displayed in the
key item list is the weighted average value created from the score for the individual metrics.
3. You specify whether to display the items with the highest score or those with the lowest score in the key item list.
o To display the items with the highest score, you select the Show Results with the Highest Scores option.
o To display the items with the lowest score, you select the Show Results with the Lowest Scores option.
3.5.2 Options for Affinity Insight
When you make settings for an affinity insight computation, you can also make settings that affect the data displayed:

User Guide PUBLIC
Sales Insights for Retail 3.0 with retail promotion analyzer 1.0
User Guide – Version: 2.1 – Final
July 14, 2020
© 2020 SAP SE or an SAP affiliate company. All rights reserved. 21
Figure 9: Options for Affinity Insight
Calculate Metrics at SKU Level
You can specify that product affinities are calculated at SKU level in addition to the hierarchy levels that you selected
when specifying the product sets.
Example
You select set A = Beverages and set B = Bread. If you do not activate the calculation at SKU level, the
system analyzes how many transactions contain at least one item from the beverages category and one item
from the bread category. If you activate the calculation at SKU level, the analysis is performed for any
possible combination of SKUs in these categories.
When the results are displayed in the Affinity Insight workspace, you can use the dropdown to switch
between displaying the results for the selected product category level (Levels) or on SKU level (Products).
Delta Support for Affinity Heatmap
You can activate delta support for the computed heatmap. If this is activated, the heatmap results are based on the
difference between the metrics for support and expected support. You can use this setting to make sure that the
detected correlations between two sets of products are significant.
The following elements are used to calculate this, using two product sets, A and B:
Count(S): This is the total count of distinct transactions (also referred to as 'market baskets') in the selected
transaction set.
Count(A): This is the total number of distinct transactions in which one of the SKUs from A appears.
Count(B): This is the total number of distinct transactions in which one of the SKUs from B appears.
Count(AB): This is the total number of distinct transactions in which both one SKU from A and one SKU from B
appear.

User Guide PUBLIC
Sales Insights for Retail 3.0 with retail promotion analyzer 1.0
User Guide – Version: 2.1 – Final
July 14, 2020
© 2020 SAP SE or an SAP affiliate company. All rights reserved. 22
Example
Assume that there are 100 market baskets and two product sets. Product set A contains beverages and
cheese, while product set B contains milk. The value for count(S) is 100. The value for count(A) is the
number of market baskets that contain at least one beverage or cheese product. The value for count(B) is
the number of market baskets that contain at least one milk product. The value for count(AB) is the
number of baskets that contain at least one beverage or cheese product and at least one milk product.
The number of times that a pair consisting of product A and product B appears together in distinct transactions,
relative to the total number of distinct transactions, is called support. This is calculated as follows:
Figure 10: Equation to Calculate Support
In the dashboard, this metric is called Support (%).
The expected support for a pair of products A and B is calculated as follows:
Figure 11: Equation to Calculate Expected Support
In the dashboard, this metric is called ExpSupport (%).
The difference between the actual support and the expected support is called delta support. This is calculated as
follows:
Figure 12: Equation to Calculate Delta Support
In the dashboard, this metric is called DSupport (%).
User Guide PUBLIC
Sales Insights for Retail 3.0 with retail promotion analyzer 1.0
User Guide – Version: 2.1 – Final
July 14, 2020
© 2020 SAP SE or an SAP affiliate company. All rights reserved. 23
Use Subcategory as Levels
You can automatically use subcategories as levels in the heatmap. Then you don't need to set them explicitly when
you're creating your computation.
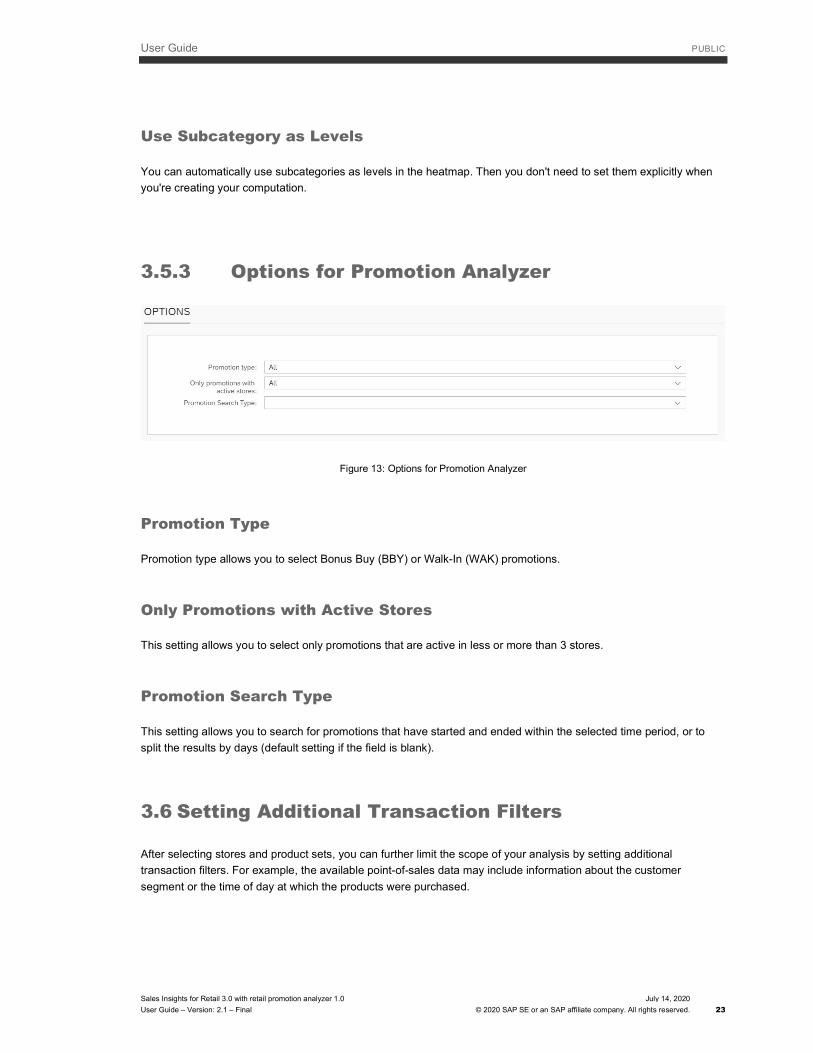
3.5.3 Options for Promotion Analyzer
Figure 13: Options for Promotion Analyzer
Promotion Type
Promotion type allows you to select Bonus Buy (BBY) or Walk-In (WAK) promotions.
Only Promotions with Active Stores
This setting allows you to select only promotions that are active in less or more than 3 stores.
Promotion Search Type
This setting allows you to search for promotions that have started and ended within the selected time period, or to
split the results by days (default setting if the field is blank).
3.6 Setting Additional Transaction Filters
After selecting stores and product sets, you can further limit the scope of your analysis by setting additional
transaction filters. For example, the available point-of-sales data may include information about the customer
segment or the time of day at which the products were purchased.

User Guide PUBLIC
Sales Insights for Retail 3.0 with retail promotion analyzer 1.0
User Guide – Version: 2.1 – Final
July 14, 2020
© 2020 SAP SE or an SAP affiliate company. All rights reserved. 24
Note
Which transaction filters are available depends on the information included in your point-of-sales data as well
as your system configuration. If no filtering options are available, additional configuration may be necessary.
If in doubt, contact your system administrator.

User Guide PUBLIC
Sales Insights for Retail 3.0 with retail promotion analyzer 1.0
User Guide – Version: 2.1 – Final
July 14, 2020
© 2020 SAP SE or an SAP affiliate company. All rights reserved. 25
4 Performing the Analysis
This section of the user guide describes the available workspaces that you can use to analyze your point-of-sales
data.
4.1 Genie Insights
This area gives you an overview of notifications to alert you of important computation results. The alerts are grouped
according to various categories, such as significant product variation. The relevant thresholds for alerts are set during
implementation.
To see the computation details, choose Expand Group.
You can provide feedback about whether a notification was useful.
This workspace also allows you to set up and start a new computation for value driver tree, key item list, or affinity
insight.
4.2 Value Driver Tree
The Value Driver Tree workspace allows you to quickly analyze the root causes for changes in revenue and profit for
the selected store and product set. The value driver tree shows how the profit-related metrics develop over time and
how they affect each other. In addition, you can display a bar chart that breaks down the amount of profit according to
the vendor company.
The header area in the workspace shows the settings selected for the computation.
Figure 14: Header Area in Value Driver Tree Workspace

User Guide PUBLIC
Sales Insights for Retail 3.0 with retail promotion analyzer 1.0
User Guide – Version: 2.1 – Final
July 14, 2020
© 2020 SAP SE or an SAP affiliate company. All rights reserved. 26
To change the settings, choose Edit. You can then create a new computation using the adjusted settings. When the
computation is complete, the workspace opens to show your results.
You can use the History dropdown at the right to access the last ten computations that you have performed in the
workspace.
Value Driver Tree
In the graphical representation of the value driver tree, the profit is split into various sub-metrics.
Figure 15: Value Driver Tree
The display is based on the following hierarchy:
Profit
Gross margin
o Gross margin of products that are not on promotion
o Gross margin of products that are on promotion
o Promotion share
Revenue
o Average basket size
o Items per basket
o Price per item
o Number of transactions
o Number of customers
o Average buying frequency
The color coding shows you immediately whether and to what extent a metric is trending upwards or downwards:
Green means that the trend shows an increase of more than 3%.
Red means that the trend shows a decrease of more than 3%.
User Guide PUBLIC
Sales Insights for Retail 3.0 with retail promotion analyzer 1.0
User Guide – Version: 2.1 – Final
July 14, 2020
© 2020 SAP SE or an SAP affiliate company. All rights reserved. 27
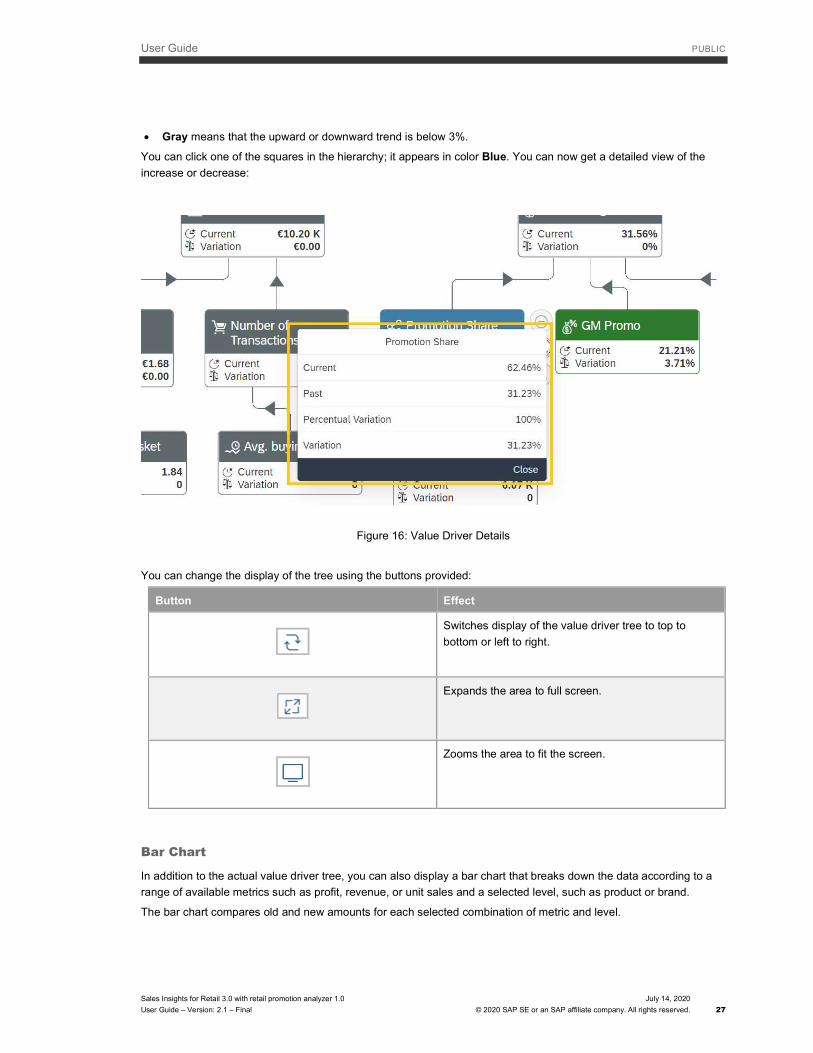
Gray means that the upward or downward trend is below 3%.
You can click one of the squares in the hierarchy; it appears in color Blue. You can now get a detailed view of the
increase or decrease:
Figure 16: Value Driver Details
You can change the display of the tree using the buttons provided:
Button Effect
Switches display of the value driver tree to top to
bottom or left to right.
Expands the area to full screen.
Zooms the area to fit the screen.
Bar Chart
In addition to the actual value driver tree, you can also display a bar chart that breaks down the data according to a
range of available metrics such as profit, revenue, or unit sales and a selected level, such as product or brand.
The bar chart compares old and new amounts for each selected combination of metric and level.

User Guide PUBLIC
Sales Insights for Retail 3.0 with retail promotion analyzer 1.0
User Guide – Version: 2.1 – Final
July 14, 2020
© 2020 SAP SE or an SAP affiliate company. All rights reserved. 28
Figure 17: Bar Chart for Value Driver Tree
Additional functions are available at the upper right that allow you to do the following:
Show or hide the legend
Zoom in or out
Expand to full screen
Export the results to a spreadsheet
Note
Note that when you export data to a spreadsheet, any filters that you have set in the view are not taken into
account. You can apply filters after exporting the entire data set.
The buttons at the right also allow you to choose between the following bar graph modes:
Comparison
Variation
Table view
In the table view, you can right-click on column headers to apply additional filters and sorting criteria.
4.3 Key Item List
The Key Item List workspace allows you to quickly identify the most successful and the least successful products or
product groups. The system creates the key item list based on the time frame, products, and stores you selected.
The header area in the workspace shows you the settings selected for the computation.
User Guide PUBLIC
Sales Insights for Retail 3.0 with retail promotion analyzer 1.0
User Guide – Version: 2.1 – Final
July 14, 2020
© 2020 SAP SE or an SAP affiliate company. All rights reserved. 29
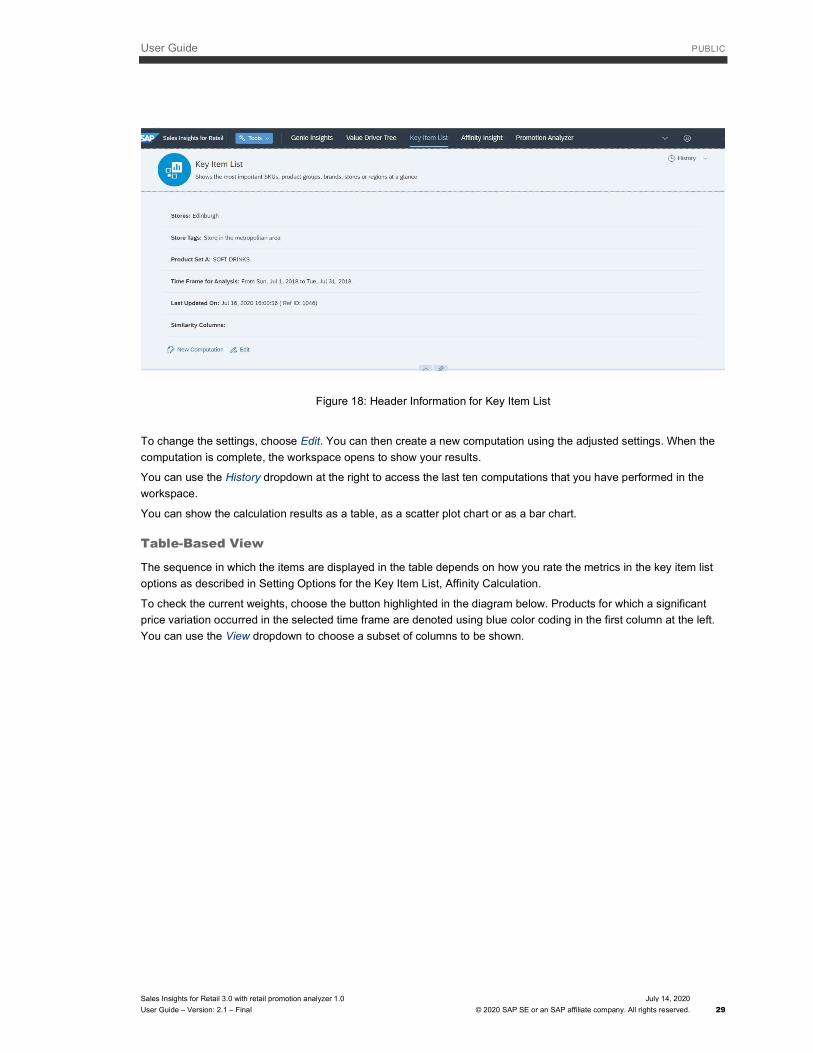
Figure 18: Header Information for Key Item List
To change the settings, choose Edit. You can then create a new computation using the adjusted settings. When the
computation is complete, the workspace opens to show your results.
You can use the History dropdown at the right to access the last ten computations that you have performed in the
workspace.
You can show the calculation results as a table, as a scatter plot chart or as a bar chart.
Table-Based View
The sequence in which the items are displayed in the table depends on how you rate the metrics in the key item list
options as described in Setting Options for the Key Item List, Affinity Calculation.
To check the current weights, choose the button highlighted in the diagram below. Products for which a significant
price variation occurred in the selected time frame are denoted using blue color coding in the first column at the left.
You can use the View dropdown to choose a subset of columns to be shown.
User Guide PUBLIC
Sales Insights for Retail 3.0 with retail promotion analyzer 1.0
User Guide – Version: 2.1 – Final
July 14, 2020
© 2020 SAP SE or an SAP affiliate company. All rights reserved. 30
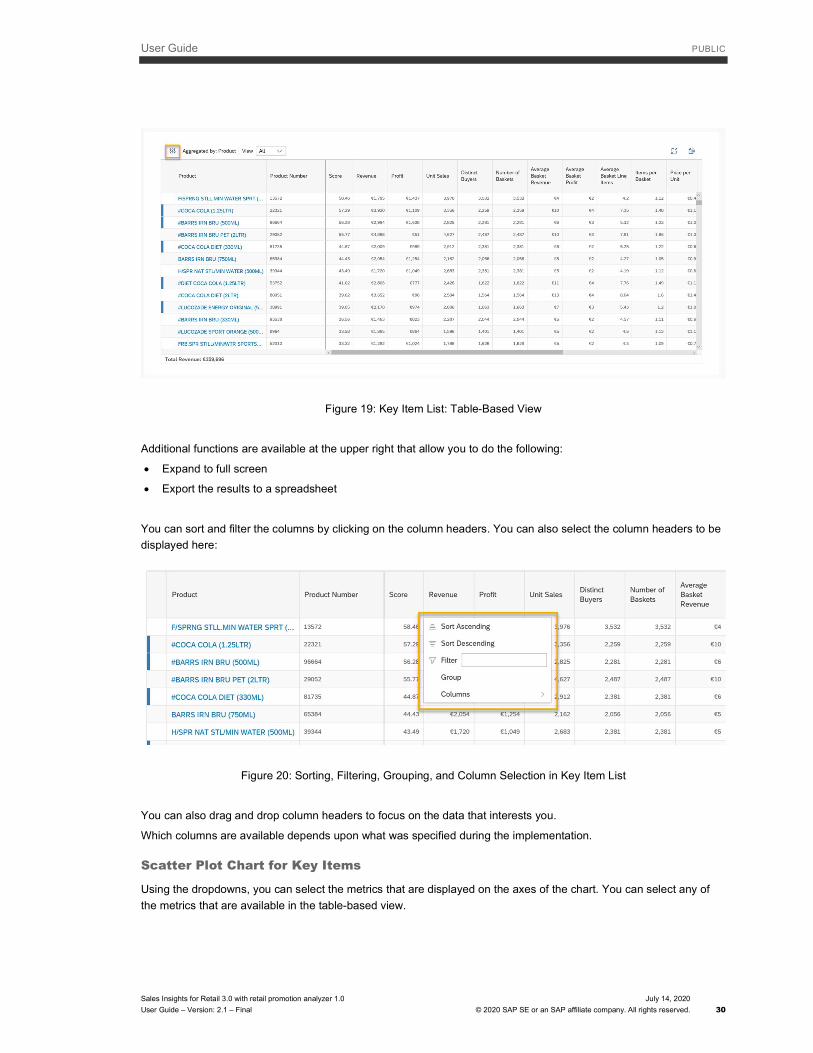
Figure 19: Key Item List: Table-Based View
Additional functions are available at the upper right that allow you to do the following:
Expand to full screen
Export the results to a spreadsheet
You can sort and filter the columns by clicking on the column headers. You can also select the column headers to be
displayed here:
Figure 20: Sorting, Filtering, Grouping, and Column Selection in Key Item List
You can also drag and drop column headers to focus on the data that interests you.
Which columns are available depends upon what was specified during the implementation.
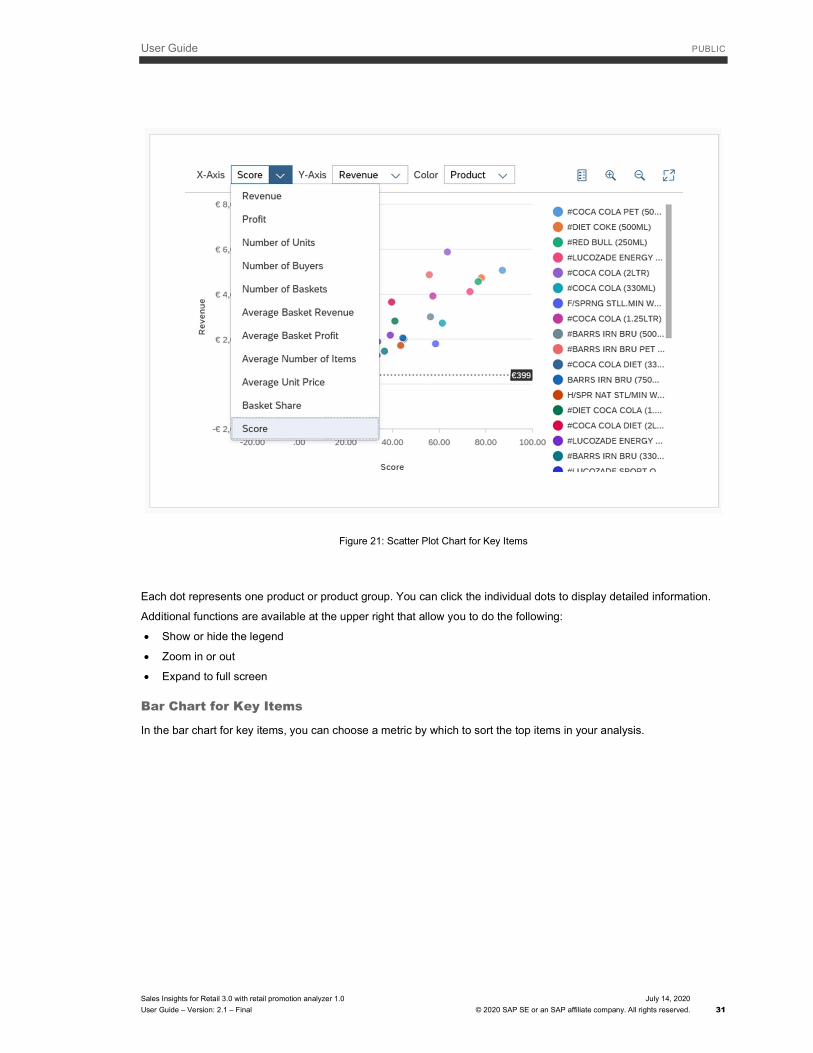
Scatter Plot Chart for Key Items
Using the dropdowns, you can select the metrics that are displayed on the axes of the chart. You can select any of
the metrics that are available in the table-based view.
User Guide PUBLIC
Sales Insights for Retail 3.0 with retail promotion analyzer 1.0
User Guide – Version: 2.1 – Final
July 14, 2020
© 2020 SAP SE or an SAP affiliate company. All rights reserved. 31
Figure 21: Scatter Plot Chart for Key Items
Each dot represents one product or product group. You can click the individual dots to display detailed information.
Additional functions are available at the upper right that allow you to do the following:
Show or hide the legend
Zoom in or out
Expand to full screen
Bar Chart for Key Items
In the bar chart for key items, you can choose a metric by which to sort the top items in your analysis.
User Guide PUBLIC
Sales Insights for Retail 3.0 with retail promotion analyzer 1.0
User Guide – Version: 2.1 – Final
July 14, 2020
© 2020 SAP SE or an SAP affiliate company. All rights reserved. 32
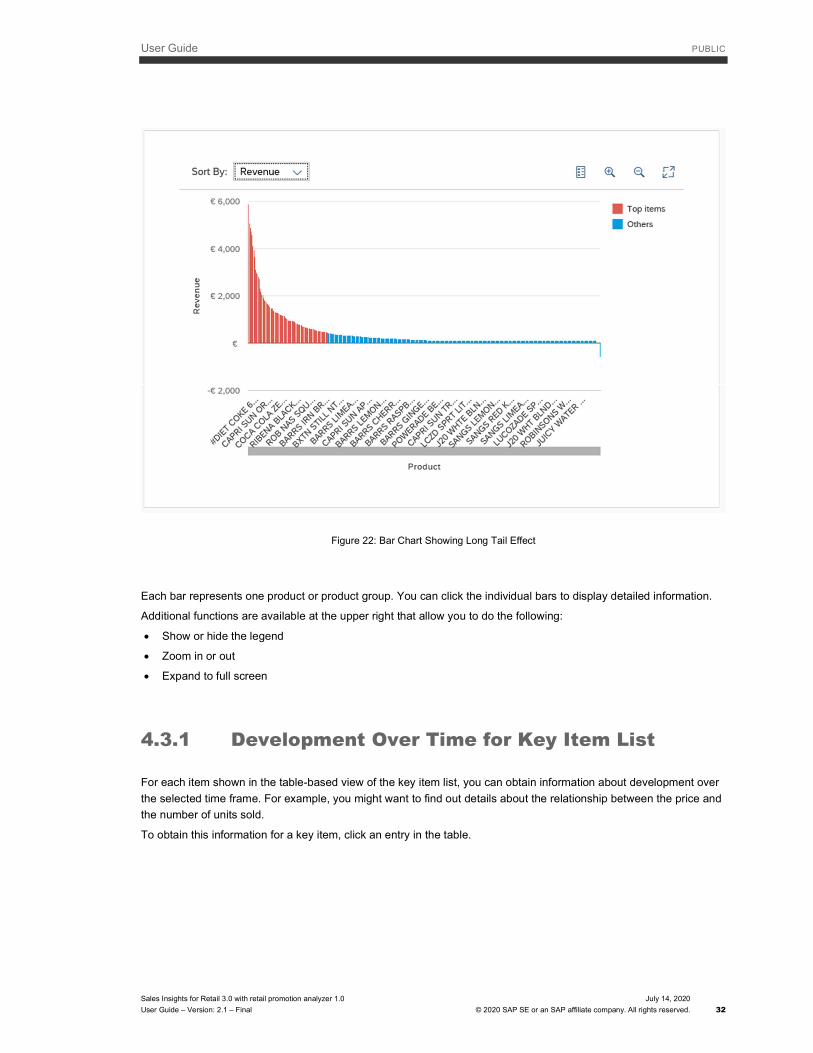
Figure 22: Bar Chart Showing Long Tail Effect
Each bar represents one product or product group. You can click the individual bars to display detailed information.
Additional functions are available at the upper right that allow you to do the following:
Show or hide the legend
Zoom in or out
Expand to full screen
4.3.1 Development Over Time for Key Item List
For each item shown in the table-based view of the key item list, you can obtain information about development over
the selected time frame. For example, you might want to find out details about the relationship between the price and
the number of units sold.
To obtain this information for a key item, click an entry in the table.

User Guide PUBLIC
Sales Insights for Retail 3.0 with retail promotion analyzer 1.0
User Guide – Version: 2.1 – Final
July 14, 2020
© 2020 SAP SE or an SAP affiliate company. All rights reserved. 33
Figure 23: Development over Time
You can use the dropdown lists to set the axes and aggregation levels for the selected item. Various metrics whose
development over time you want to analyze, such as price details, total basket contents by revenue, and statistics.
Price Details
When you're looking at the development of key items over time, you can also take a closer look at the price details.
This graph shows you the average actual and optimal price positions for the items and automatically computes the
price elasticity:
Figure 24: Price Details for Key Items

User Guide PUBLIC
Sales Insights for Retail 3.0 with retail promotion analyzer 1.0
User Guide – Version: 2.1 – Final
July 14, 2020
© 2020 SAP SE or an SAP affiliate company. All rights reserved. 34
You can click on the dots shown in the graph to obtain detailed explanations. You can also view this data in table
form.
Total Basket Contents by Revenue
This view gives you detailed insight into how particular items in the basket contribute to revenue.
Figure 25: Total Basket Contents by Revenue for Key Items
You can click on each segment shown to obtain details. This gives you an idea of items that are bought together.
Statistics
You can also display a range of statistics about the computed data:
Units per basket
Total basket revenue
Similar products
Correlations with other product
General correlations - here you can hover over the correlation value to obtain more details about the analysis
results.
4.4 Affinity Insight
The Affinity Insight workspace allows you to find product affinities, for example, by calculating how often products of
the two selected product sets are sold together.
The header area in the workspace shows you the settings selected for the computation.

User Guide PUBLIC
Sales Insights for Retail 3.0 with retail promotion analyzer 1.0
User Guide – Version: 2.1 – Final
July 14, 2020
© 2020 SAP SE or an SAP affiliate company. All rights reserved. 35
Figure 26: Header Information for Affinity Insights
To change the settings, choose Edit. You can then create a new computation using the adjusted settings. When the
computation is complete, the workspace opens to show your results.
You can use the History dropdown at the right to access the last ten computations that you have performed in the
workspace.
You can visualize the calculation results as a heat map, a tree map, or a table. The diagrams show you the number
of baskets.
In each visualization, additional functions are available at the upper right that allow you to do the following:
Show or hide the legend
Zoom in or out
Expand to full screen
Export the results to a spreadsheet
Heat Map
Using the dropdowns, you can specify whether to display the results for the top product levels or for the top product
pairs (SKUs).
The items in product set A are displayed on the x-axis and the items of product set B are displayed on the y-axis of
the heat map.
User Guide PUBLIC
Sales Insights for Retail 3.0 with retail promotion analyzer 1.0
User Guide – Version: 2.1 – Final
July 14, 2020
© 2020 SAP SE or an SAP affiliate company. All rights reserved. 36
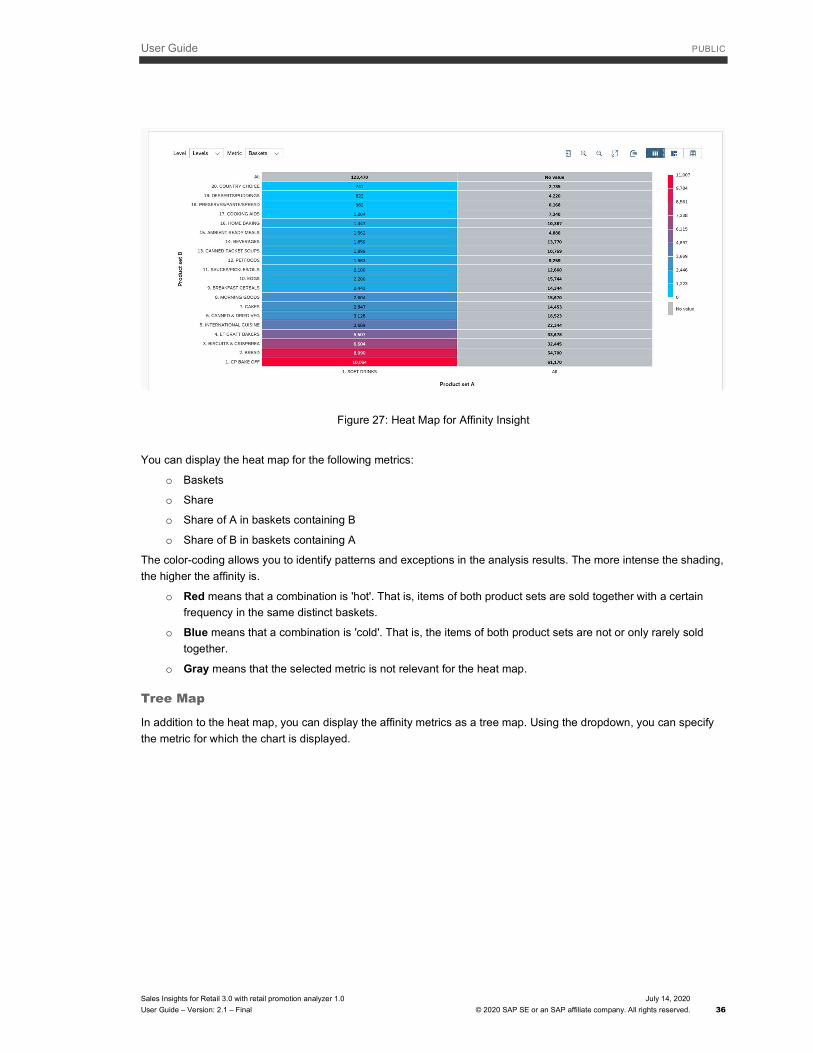
Figure 27: Heat Map for Affinity Insight
You can display the heat map for the following metrics:
o Baskets
o Share
o Share of A in baskets containing B
o Share of B in baskets containing A
The color-coding allows you to identify patterns and exceptions in the analysis results. The more intense the shading,
the higher the affinity is.
o Red means that a combination is 'hot'. That is, items of both product sets are sold together with a certain
frequency in the same distinct baskets.
o Blue means that a combination is 'cold'. That is, the items of both product sets are not or only rarely sold
together.
o Gray means that the selected metric is not relevant for the heat map.
Tree Map
In addition to the heat map, you can display the affinity metrics as a tree map. Using the dropdown, you can specify
the metric for which the chart is displayed.

User Guide PUBLIC
Sales Insights for Retail 3.0 with retail promotion analyzer 1.0
User Guide – Version: 2.1 – Final
July 14, 2020
© 2020 SAP SE or an SAP affiliate company. All rights reserved. 37
Figure 28: Affinity Insight Tree Map
You can display the tree map for the following metrics:
o Baskets
o Units
o Revenue
o Profit
Table View
You can also display the affinity metrics in a table view.
Figure 29: Affinity Insight Table View

User Guide PUBLIC
Sales Insights for Retail 3.0 with retail promotion analyzer 1.0
User Guide – Version: 2.1 – Final
July 14, 2020
© 2020 SAP SE or an SAP affiliate company. All rights reserved. 38
4.5 Promotion Analyzer
The Promotion Analyzer workspace allows you to quantify and evaluate the effectiveness of past promotions
according to predefined KPIs.
The header area in the workspace shows you the settings selected for the computation.
Figure 30: Header Information for Promotion Analyzer Workspace
To change the settings, choose Edit. You can then create a new computation using the adjusted settings. When the
computation is complete, the workspace opens to show your results.
You can use the History dropdown at the right to access the last ten computations that you have performed in the
workspace.
The results are shown under three main sections: Overview, Promotions and Graphs.
Overview
The overview provides a snapshot of 9 KPIs relevant to the promotions ran in the selected time frame.
Figure 31: Overview of KPIs in Promotion Analyzer Workspace

User Guide PUBLIC
Sales Insights for Retail 3.0 with retail promotion analyzer 1.0
User Guide – Version: 2.1 – Final
July 14, 2020
© 2020 SAP SE or an SAP affiliate company. All rights reserved. 39
Two types of graphs are also available under the KPI table.
The first graph is the waterfall graph, which shows the contribution of various effects (stock-up, cannibalization, etc.)
to promotion outcome. The user can use the Waterfall Type dropdown menu to choose whether to aggregate sale or
margin results. Additionally, the Tactics Breakdown dropdown menu allows the user to visualize the effects of various
promotion tactics.
Figure 32: Waterfall Graph of Promotion Effects in Overview Section
The second graph is a bubble graph that shows the ratings of promotions based on total investment and total margin.
Figure 33: Bubble Graph of Promotion Ratings in Overview Section
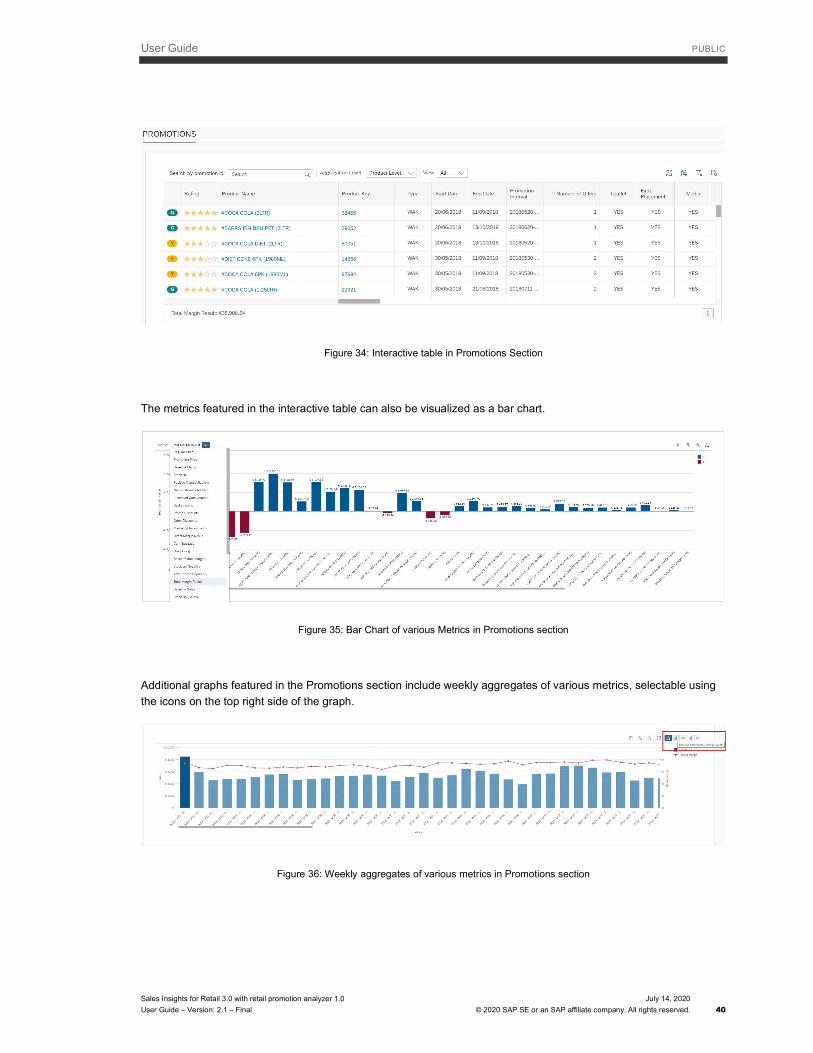
Promotions
This section lists all promotions within the selected timeframe in an interactive table. The table allows the user to
perform several actions: search by product or promotion, change the data aggregation level, apply filters to columns,
and export data to Excel files. Additionally, clicking on a product name will open a new window with detailed results
for that specific product.
User Guide PUBLIC
Sales Insights for Retail 3.0 with retail promotion analyzer 1.0
User Guide – Version: 2.1 – Final
July 14, 2020
© 2020 SAP SE or an SAP affiliate company. All rights reserved. 40
Figure 34: Interactive table in Promotions Section
The metrics featured in the interactive table can also be visualized as a bar chart.
Figure 35: Bar Chart of various Metrics in Promotions section
Additional graphs featured in the Promotions section include weekly aggregates of various metrics, selectable using
the icons on the top right side of the graph.
Figure 36: Weekly aggregates of various metrics in Promotions section
User Guide PUBLIC
Sales Insights for Retail 3.0 with retail promotion analyzer 1.0
User Guide – Version: 2.1 – Final
July 14, 2020
© 2020 SAP SE or an SAP affiliate company. All rights reserved. 41
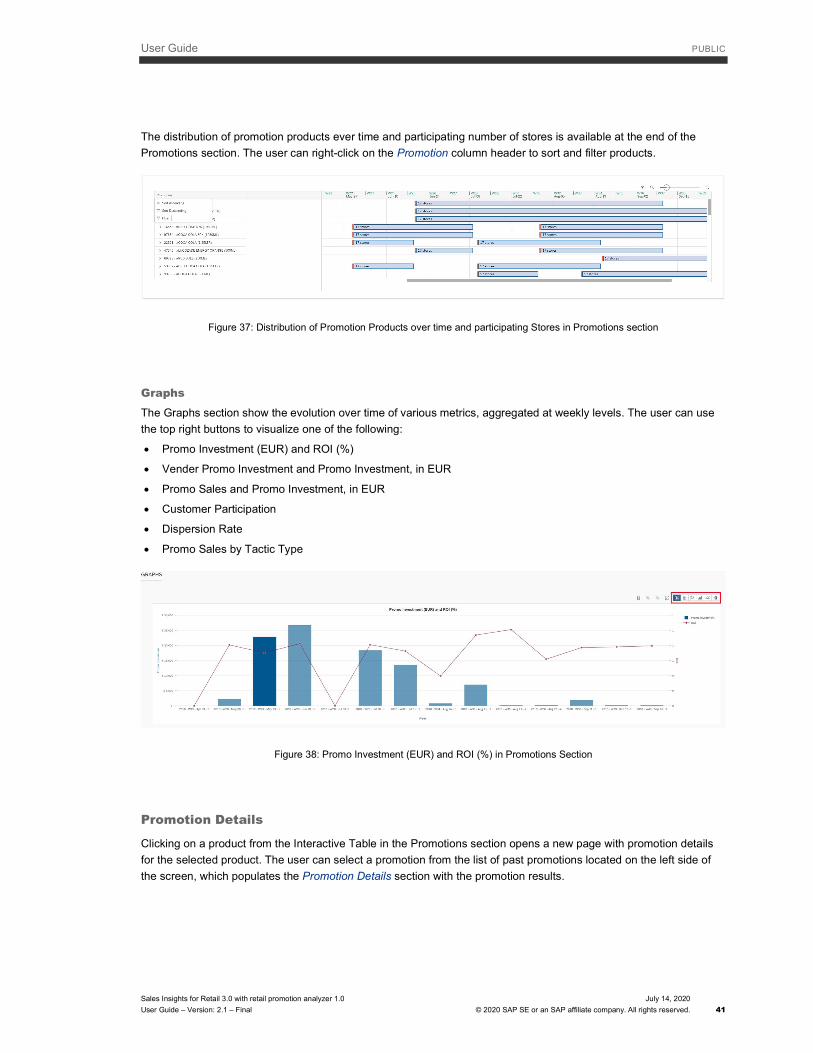
The distribution of promotion products ever time and participating number of stores is available at the end of the
Promotions section. The user can right-click on the Promotion column header to sort and filter products.
Figure 37: Distribution of Promotion Products over time and participating Stores in Promotions section
Graphs The Graphs section show the evolution over time of various metrics, aggregated at weekly levels. The user can use
the top right buttons to visualize one of the following:
Promo Investment (EUR) and ROI (%)
Vender Promo Investment and Promo Investment, in EUR
Promo Sales and Promo Investment, in EUR
Customer Participation
Dispersion Rate
Promo Sales by Tactic Type
Figure 38: Promo Investment (EUR) and ROI (%) in Promotions Section
Promotion Details
Clicking on a product from the Interactive Table in the Promotions section opens a new page with promotion details
for the selected product. The user can select a promotion from the list of past promotions located on the left side of
the screen, which populates the Promotion Details section with the promotion results.

User Guide PUBLIC
Sales Insights for Retail 3.0 with retail promotion analyzer 1.0
User Guide – Version: 2.1 – Final
July 14, 2020
© 2020 SAP SE or an SAP affiliate company. All rights reserved. 42
Figure 39: Promotion Selection on Promotion Details page
The layout of Promotion Details page is similar to the layout of Promotion Analyzer workspace. At the top of the page
it features a header with information about the promotion dates and store locations, and the rest of the page is split in
three sections: Summary, Waterfall and Details.
The Summary section of the promotion results shows the stores in which the promotion was active, the promotion's
dates, rating and total direct sales results.
Figure 40: Promotion Selection on Promotion Details page
The Waterfall section is similar to the one we described for the Promo Analyzer workspace, except it contains
detailed results for the selected promotion from the left screen.
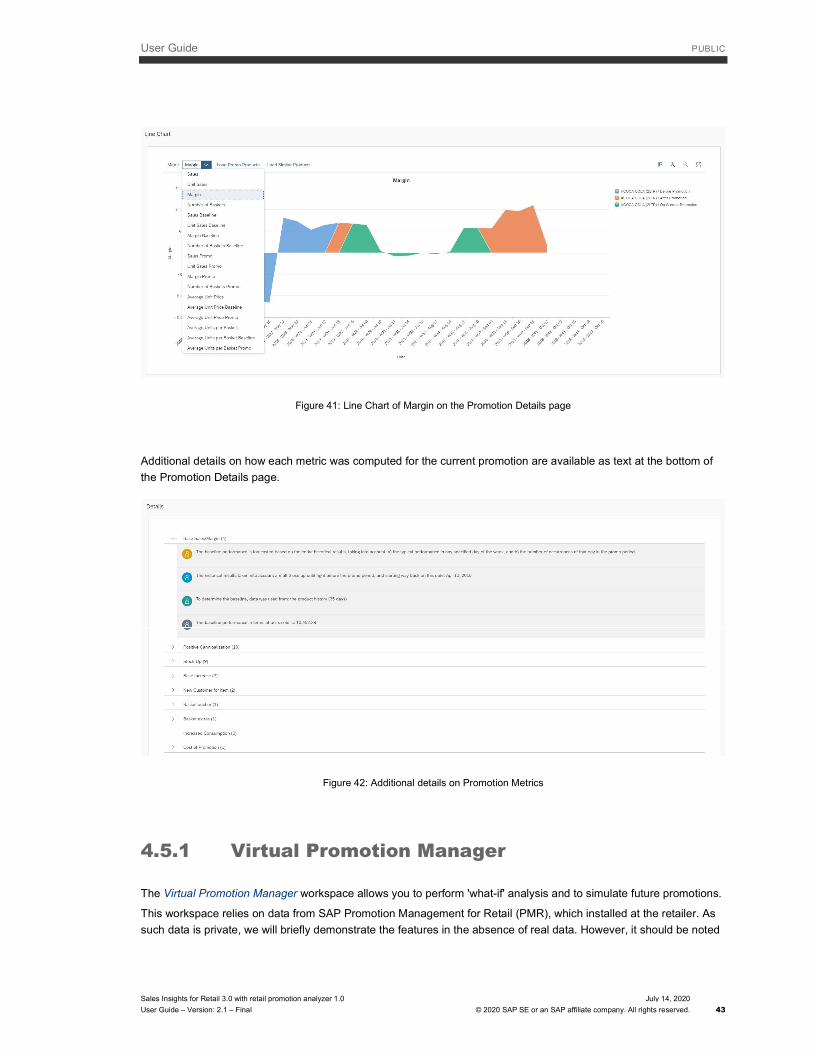
The Details section, the user can further investigate various metrics using either dedicated graphs and tables (for
cannibalization, cannibalization distance, and drag-along) or generic line charts for other metrics that can be selected
from the Metric dropdown menu.
User Guide PUBLIC
Sales Insights for Retail 3.0 with retail promotion analyzer 1.0
User Guide – Version: 2.1 – Final
July 14, 2020
© 2020 SAP SE or an SAP affiliate company. All rights reserved. 43
Figure 41: Line Chart of Margin on the Promotion Details page
Additional details on how each metric was computed for the current promotion are available as text at the bottom of
the Promotion Details page.
Figure 42: Additional details on Promotion Metrics
4.5.1 Virtual Promotion Manager
The Virtual Promotion Manager workspace allows you to perform 'what-if' analysis and to simulate future promotions.
This workspace relies on data from SAP Promotion Management for Retail (PMR), which installed at the retailer. As
such data is private, we will briefly demonstrate the features in the absence of real data. However, it should be noted

User Guide PUBLIC
Sales Insights for Retail 3.0 with retail promotion analyzer 1.0
User Guide – Version: 2.1 – Final
July 14, 2020
© 2020 SAP SE or an SAP affiliate company. All rights reserved. 44
that this solution is integrated with the client's landscape and is able to receive data and to push back into PMR the
recommended promotions obtained during the 'what-if' analysis.
The setup for Virtual Promotion Manager is similar to the setup for Promotion Analyzer, please refer to Section 3:
Setting the Scope of Analysis for detailed instructions. In brief, using Edit, you can adjust promotion settings and then
press Compute. This step collects data from future planed promotions from SAP Promotion Management for Retail
(PMR), which is used for the 'what-if' analysis. When the computation is complete, you return to the Virtual Promotion
Manager workspace, where you can define the simulation parameters in the Strategy Outcome section.
Figure 43: Setting up the Simulation Parameters in Virtual Promotion Manager
After setting up the parameters, the user clicks on Simulate All in the Offer Parameters section. The table below is
populated with promotion offers and includes the simulated metrics. The user can choose an offer and click on Send
to PMR to push the offer into the PMR.
Figure 44: Promotion Simulation in Virtual Promotion Manager
4.5.2 Manage Promotion Templates
Promotion templates are a set of parameters which are used for computing promotion metrics and simulations. To
view and edit promotion templates, click on Tools/Promotion Tool/Manage Promotion Templates. In the workspace
that opens, the user can add new templates using Add Template button or select and edit an existing template. The
templates can apply to specific products; therefore, the user can switch from Edit to Product using the icons located
on the top right of the Promotion Template table.

User Guide PUBLIC
Sales Insights for Retail 3.0 with retail promotion analyzer 1.0
User Guide – Version: 2.1 – Final
July 14, 2020
© 2020 SAP SE or an SAP affiliate company. All rights reserved. 45
Figure 45: Promotion Templates Manager
User Guide PUBLIC
Sales Insights for Retail 3.0 with retail promotion analyzer 1.0
User Guide – Version: 2.1 – Final
July 14, 2020
© 2020 SAP SE or an SAP affiliate company. All rights reserved. 46
5 Saving Results for Further Analysis
You can use snapshots to save results that you would like to use again later. A snapshot is a set of settings and
analysis results. The snapshot feature is helpful if you want to compare the results of the current session with the
results of a previous session. You can also use it for storing settings that you use regularly.
Creating Snapshots
To save the current results of the current session as a snapshot, proceed as follows:
1. Choose Tools -> Snapshots Management button at the upper right corner.
This opens the workspace for managing snapshots.
2. Choose New Snapshot.
A dialog box appears.
3. Enter a name for the snapshot you want to save.
4. Specify whether you want the snapshot to be visible to others.
5. Choose Save.
Your snapshot is then shown in the overall list of available snapshots.
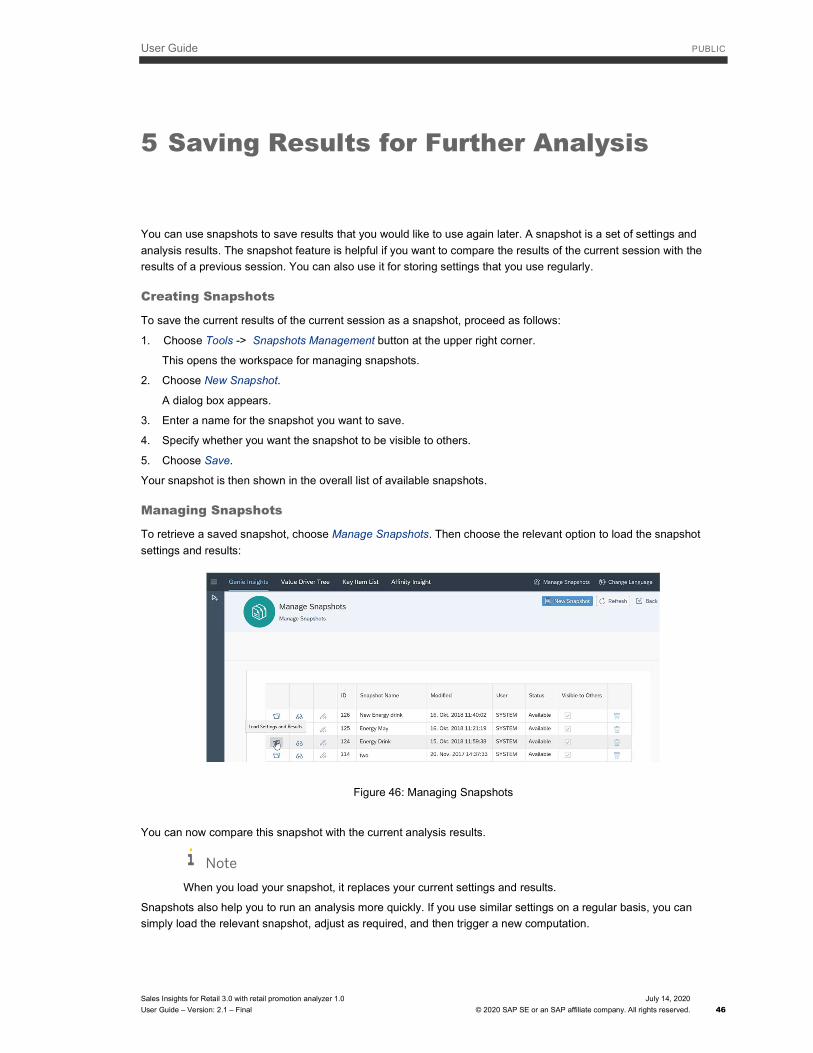
Managing Snapshots
To retrieve a saved snapshot, choose Manage Snapshots. Then choose the relevant option to load the snapshot
settings and results:
Figure 46: Managing Snapshots
You can now compare this snapshot with the current analysis results.
Note
When you load your snapshot, it replaces your current settings and results.
Snapshots also help you to run an analysis more quickly. If you use similar settings on a regular basis, you can
simply load the relevant snapshot, adjust as required, and then trigger a new computation.

User Guide PUBLIC
Sales Insights for Retail 3.0 with retail promotion analyzer 1.0
User Guide – Version: 2.1 – Final
July 14, 2020
© 2020 SAP SE or an SAP affiliate company. All rights reserved. 47
You can also use this table to do the following:
Check the settings used in a snapshot
Rename a snapshot and change its visibility setting
Delete a snapshot
Note
You can only modify and delete your own snapshots.

www.sap.com/contactsap
© 2020 SAP SE or an SAP affiliate company. All rights reserved.