the grating order analyzer - lighttrans
TRANSCRIPT
www.wyrowski-photonics.com
Introduction to the analysis and display of the diffraction efficiencies and Rayleigh coefficients of gratings
UseCase.0086 (2.0)
The Grating Order Analyzer
www.wyrowski-photonics.com
Requirements & Recommendations
• This use case requires VirtualLab Fusion Build 6.1.0.20 or higher.
• Required Toolboxes: – Grating Toolbox
• The trial version of VirtualLab Fusion allows the application of this use case with the following restrictions: – The trial version does not support saving of the system
description or calculated results.
www.wyrowski-photonics.com
Use Case Description
• The analysis of the diffraction efficiencies of gratings is the typical modeling task with gratings.
• The efficiencies follow from the Rayleigh coefficients. • Both quantities are given for each of the diffraction orders
of a grating. • VirtualLab Fusion enables the calculation of efficiencies
and Rayleigh coefficients by the fully vectorial Fourier Modal Method (FMM).
• This is done by the Grating Order Analyzer, which can display the efficiencies and Rayleigh coefficients of the distinct orders in various ways.
• This use case introduces the Grating Order Analyzer.
www.wyrowski-photonics.com
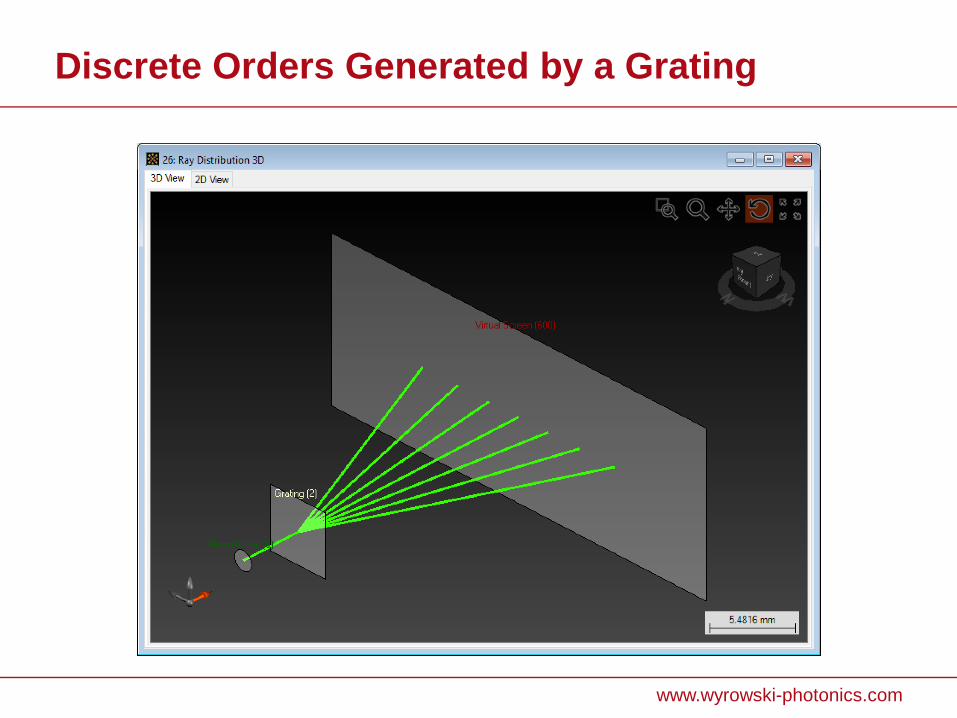
Discrete Orders Generated by a Grating
www.wyrowski-photonics.com
Grating Orders
• If a grating is illuminated with a laser beam it generates a set of discrete orders dependent on the period.
• The deflection of the grating orders is defined by the two-dimensional grating equation.
• The grating structure as well as the incident light define the efficiencies of the orders.
• The efficiencies can be calculated by the Fourier Modal method available in VirtualLab.
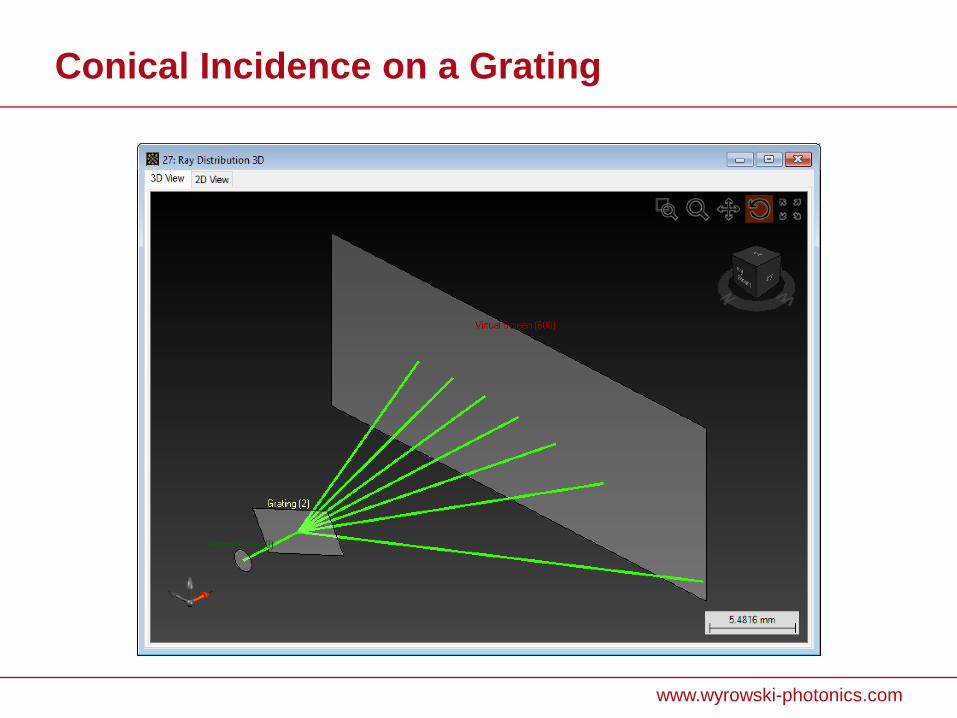
• If a linear grating is illuminated under an angle (conical incidence) the scattered orders of the grating are in general no longer on a line.
• This is also included in the simulation of grating systems in VirtualLab.
www.wyrowski-photonics.com
Conical Incidence on a Grating
www.wyrowski-photonics.com
This Use Case Shows You...
• ...how to calculate: – Direction of diffraction orders (m,n) according to the 2D grating
equation – Diffraction efficiencies of the different orders – Rayleigh coefficients in TE/TM or x,y,z coordinate system
• ...how to display the quantities in different ways: – Tables – Polar diagrams – Position and efficiency/coefficient of orders in different
coordinates including the lateral position
• All calculations can be done dependent on the polarization of the incident wave.
• Linear (1D) and crossed (2D) gratings can be analyzed.

Applied VirtualLab Techniques and Tools
www.wyrowski-photonics.com
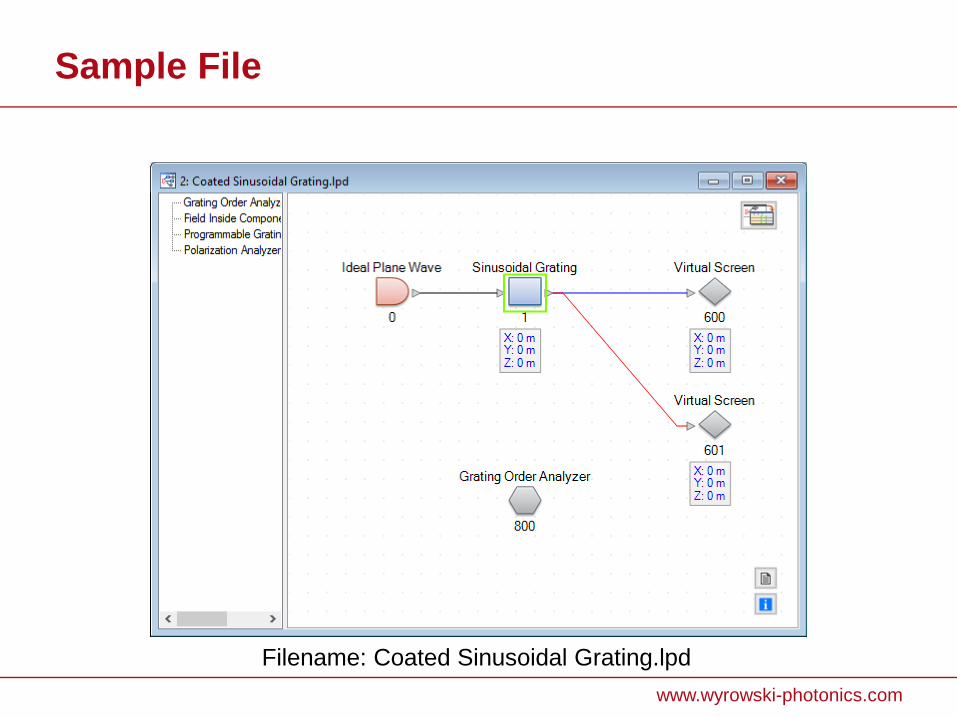
Sample File
Filename: Coated Sinusoidal Grating.lpd
www.wyrowski-photonics.com
Grating Specification
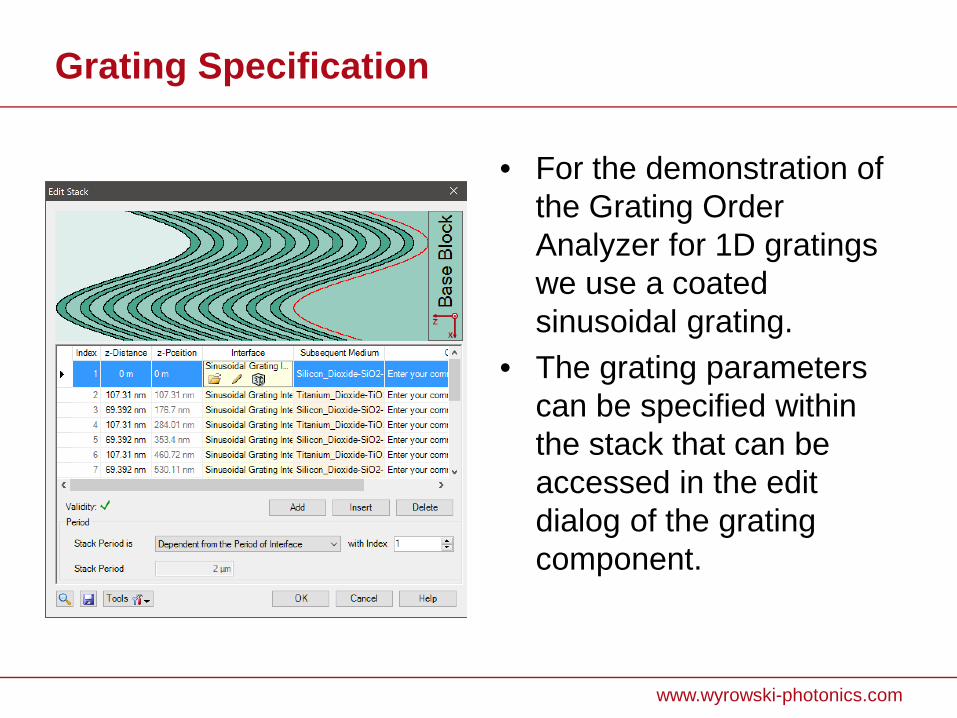
• For the demonstration of the Grating Order Analyzer for 1D gratings we use a coated sinusoidal grating.
• The grating parameters can be specified within the stack that can be accessed in the edit dialog of the grating component.
www.wyrowski-photonics.com
Grating Order Analyzer
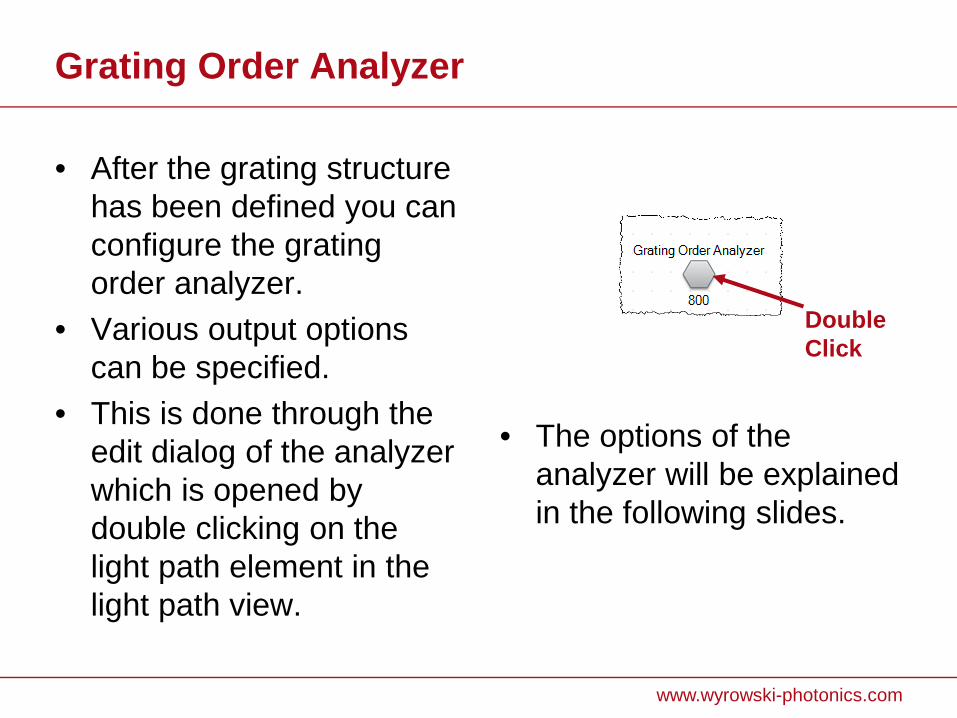
• The options of the analyzer will be explained in the following slides.
• After the grating structure has been defined you can configure the grating order analyzer.
• Various output options can be specified.
• This is done through the edit dialog of the analyzer which is opened by double clicking on the light path element in the light path view.
Double Click
www.wyrowski-photonics.com
Grating Order Analyzer
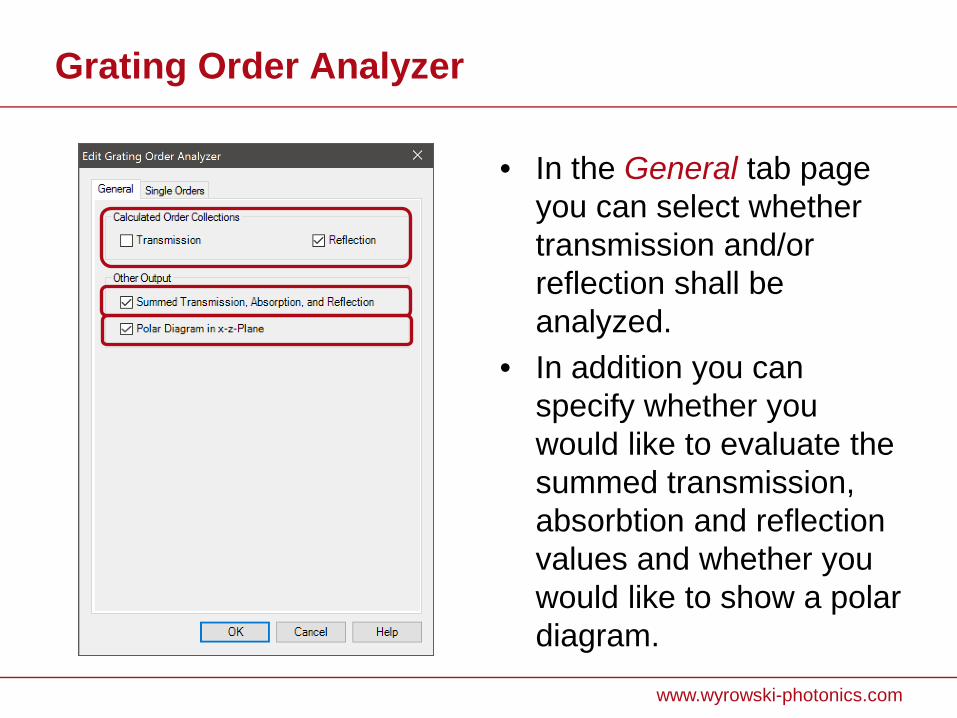
• In the General tab page you can select whether transmission and/or reflection shall be analyzed.
• In addition you can specify whether you would like to evaluate the summed transmission, absorbtion and reflection values and whether you would like to show a polar diagram.
www.wyrowski-photonics.com
Grating Order Analyzer
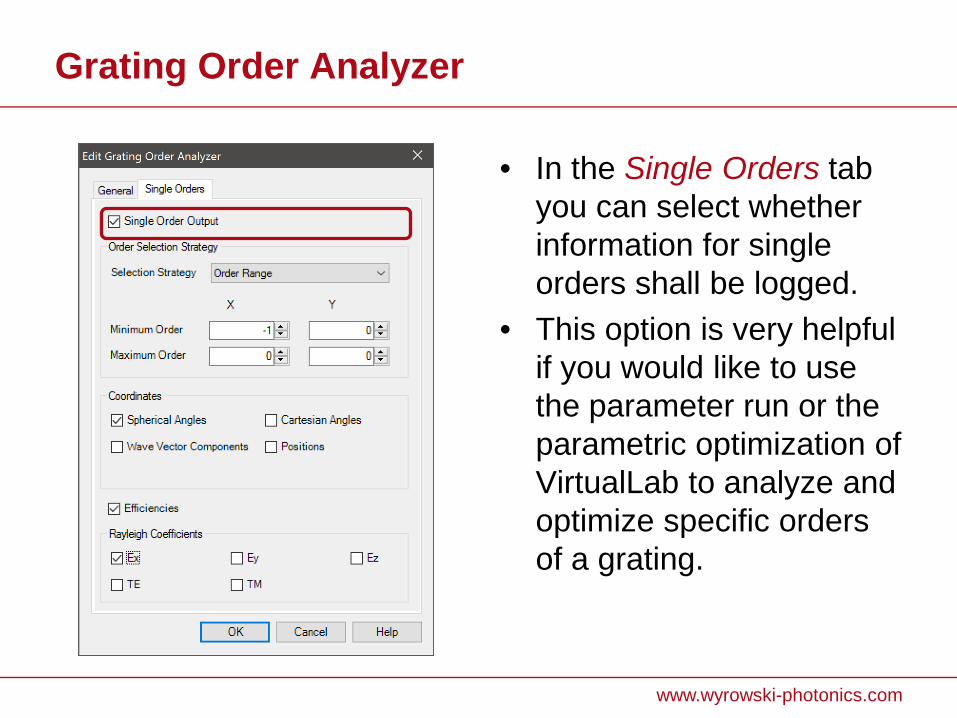
• In the Single Orders tab you can select whether information for single orders shall be logged.
• This option is very helpful if you would like to use the parameter run or the parametric optimization of VirtualLab to analyze and optimize specific orders of a grating.
www.wyrowski-photonics.com
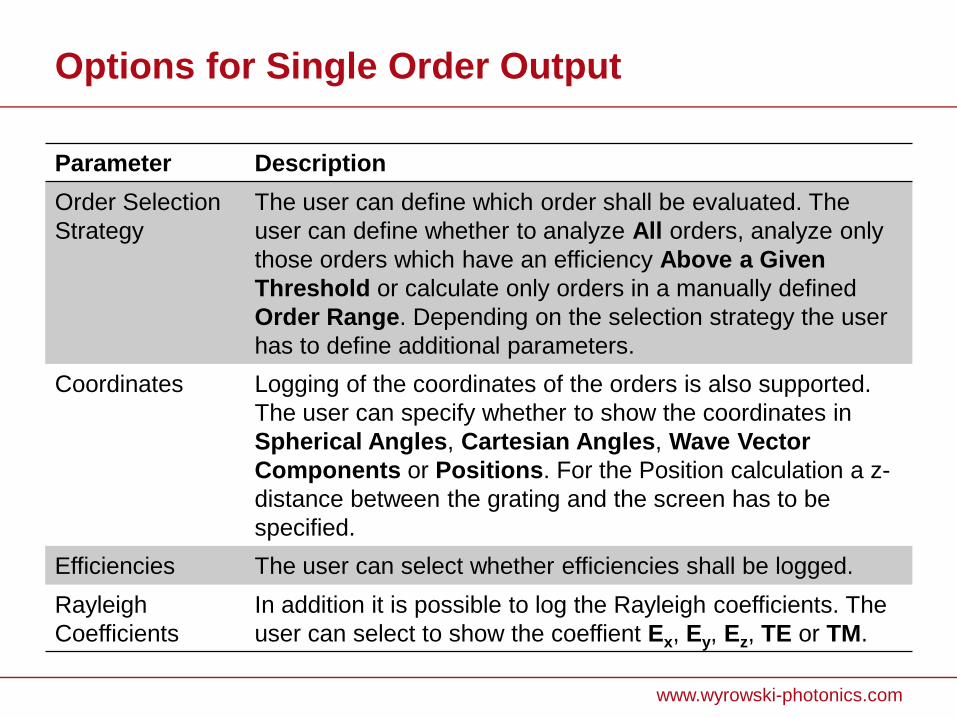
Options for Single Order Output
Parameter Description Order Selection Strategy
The user can define which order shall be evaluated. The user can define whether to analyze All orders, analyze only those orders which have an efficiency Above a Given Threshold or calculate only orders in a manually defined Order Range. Depending on the selection strategy the user has to define additional parameters.
Coordinates Logging of the coordinates of the orders is also supported. The user can specify whether to show the coordinates in Spherical Angles, Cartesian Angles, Wave Vector Components or Positions. For the Position calculation a z-distance between the grating and the screen has to be specified.
Efficiencies The user can select whether efficiencies shall be logged. Rayleigh Coefficients
In addition it is possible to log the Rayleigh coefficients. The user can select to show the coeffient Ex, Ey, Ez, TE or TM.
www.wyrowski-photonics.com
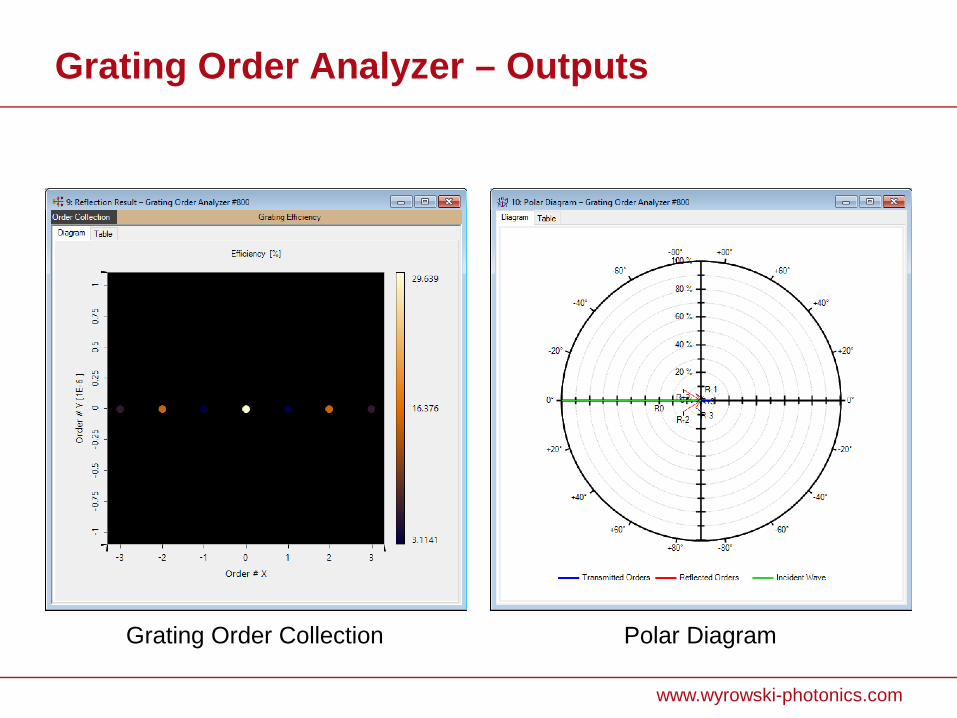
Grating Order Analyzer – Outputs
Grating Order Collection Polar Diagram
www.wyrowski-photonics.com
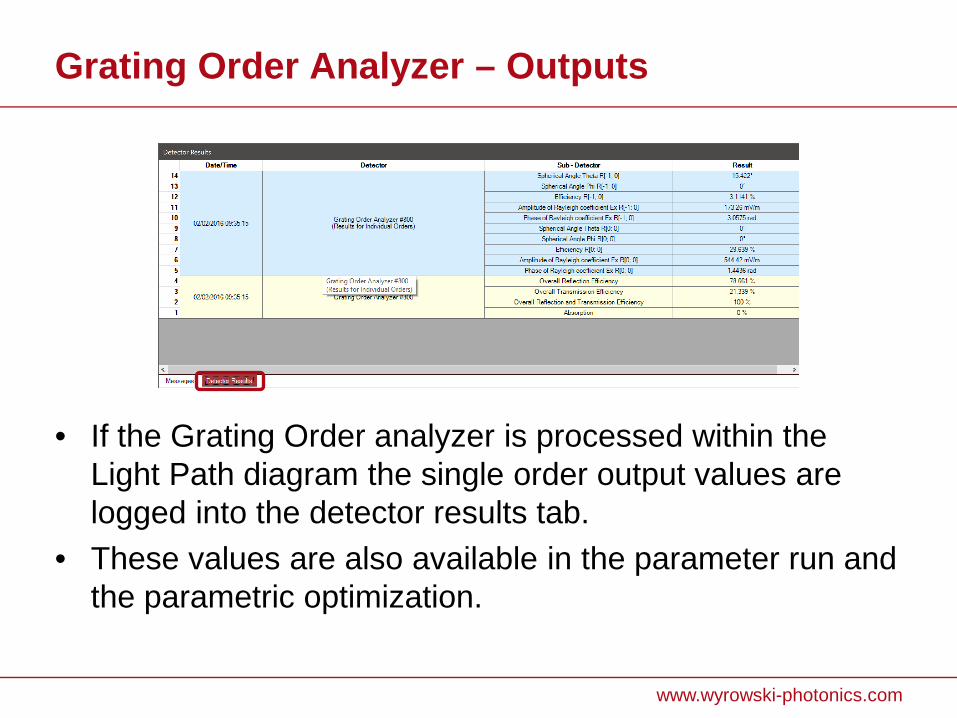
Grating Order Analyzer – Outputs
• If the Grating Order analyzer is processed within the Light Path diagram the single order output values are logged into the detector results tab.
• These values are also available in the parameter run and the parametric optimization.
Grating Order Output: Polar Diagram
www.wyrowski-photonics.com
Polar Diagram
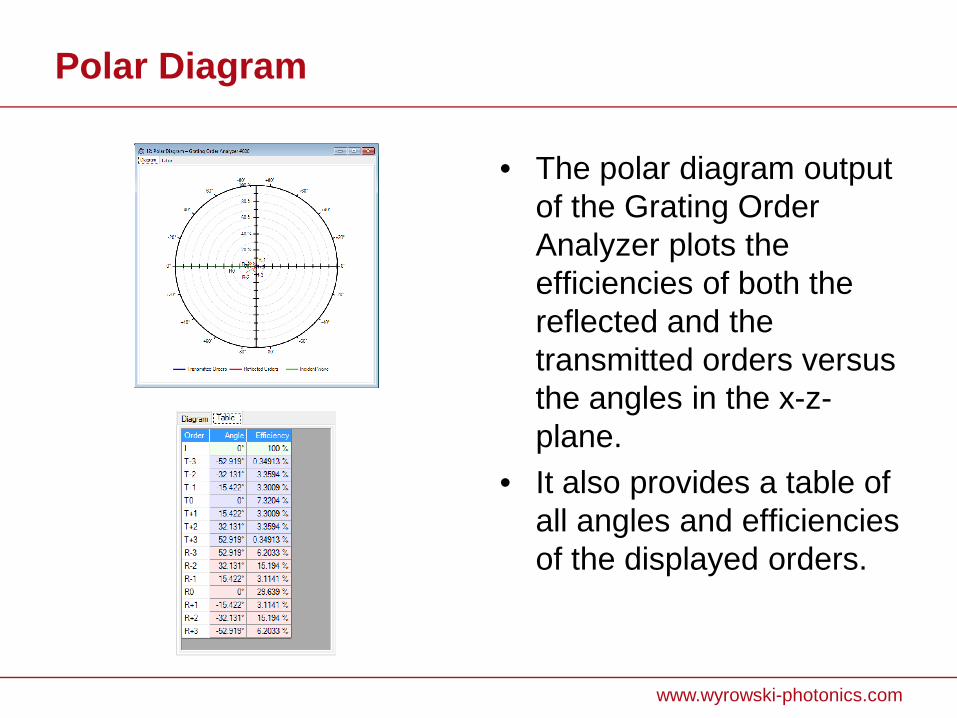
• The polar diagram output of the Grating Order Analyzer plots the efficiencies of both the reflected and the transmitted orders versus the angles in the x-z-plane.
• It also provides a table of all angles and efficiencies of the displayed orders.
www.wyrowski-photonics.com
Configuring the Polar Diagram
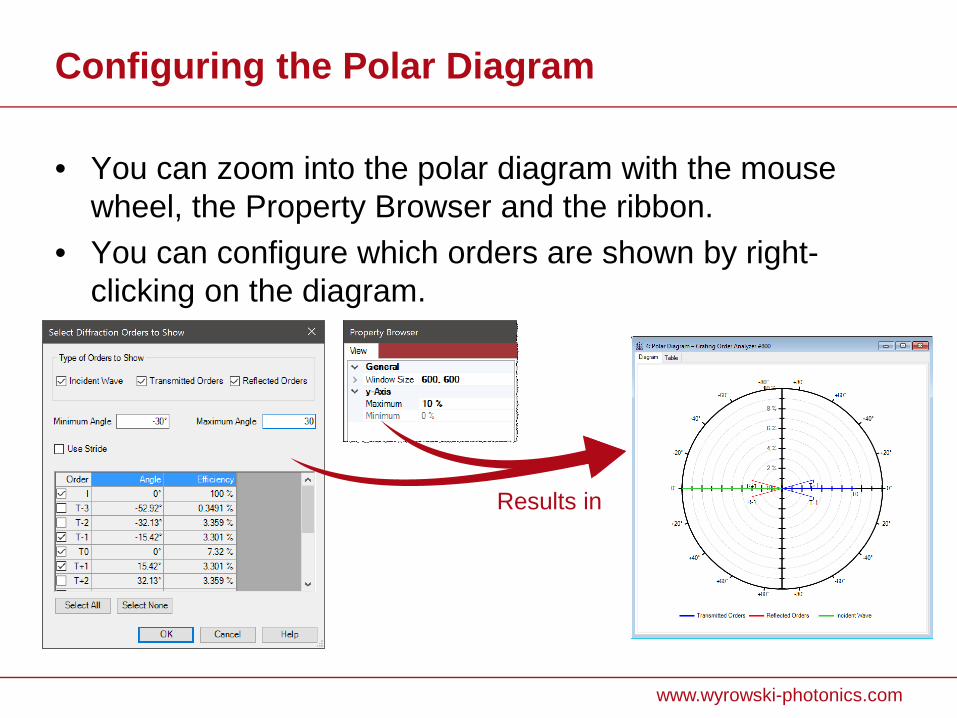
• You can zoom into the polar diagram with the mouse wheel, the Property Browser and the ribbon.
• You can configure which orders are shown by right-clicking on the diagram.
Results in
Grating Order Output: Order Collection
www.wyrowski-photonics.com
Grating Order Collection
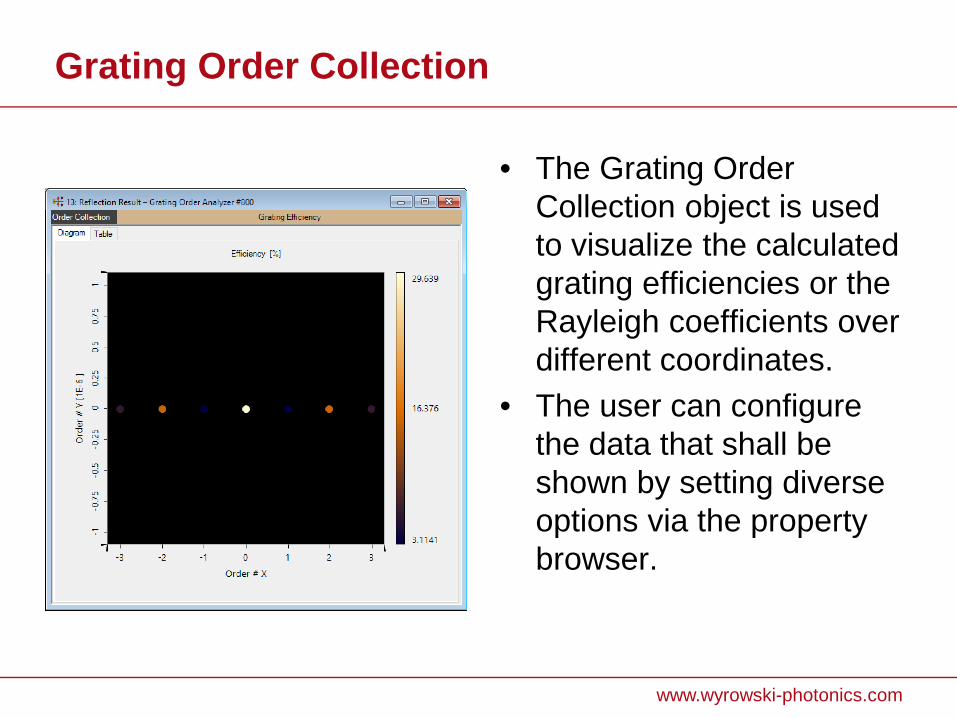
• The Grating Order Collection object is used to visualize the calculated grating efficiencies or the Rayleigh coefficients over different coordinates.
• The user can configure the data that shall be shown by setting diverse options via the property browser.
www.wyrowski-photonics.com
Setup of Data to Show
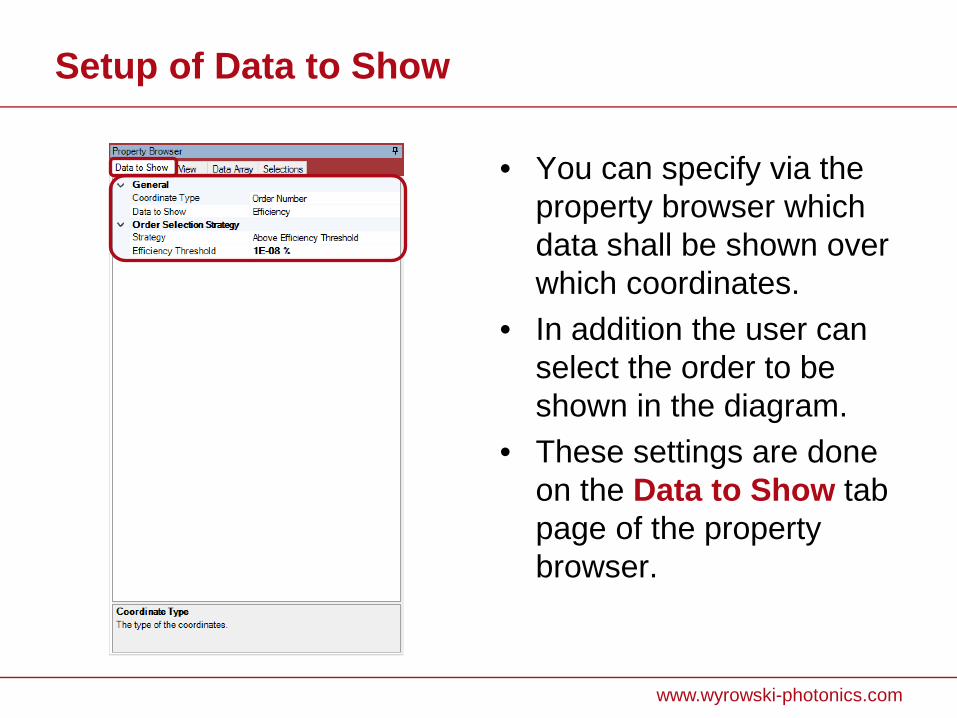
• You can specify via the property browser which data shall be shown over which coordinates.
• In addition the user can select the order to be shown in the diagram.
• These settings are done on the Data to Show tab page of the property browser.
www.wyrowski-photonics.com
Setup of Data to Show
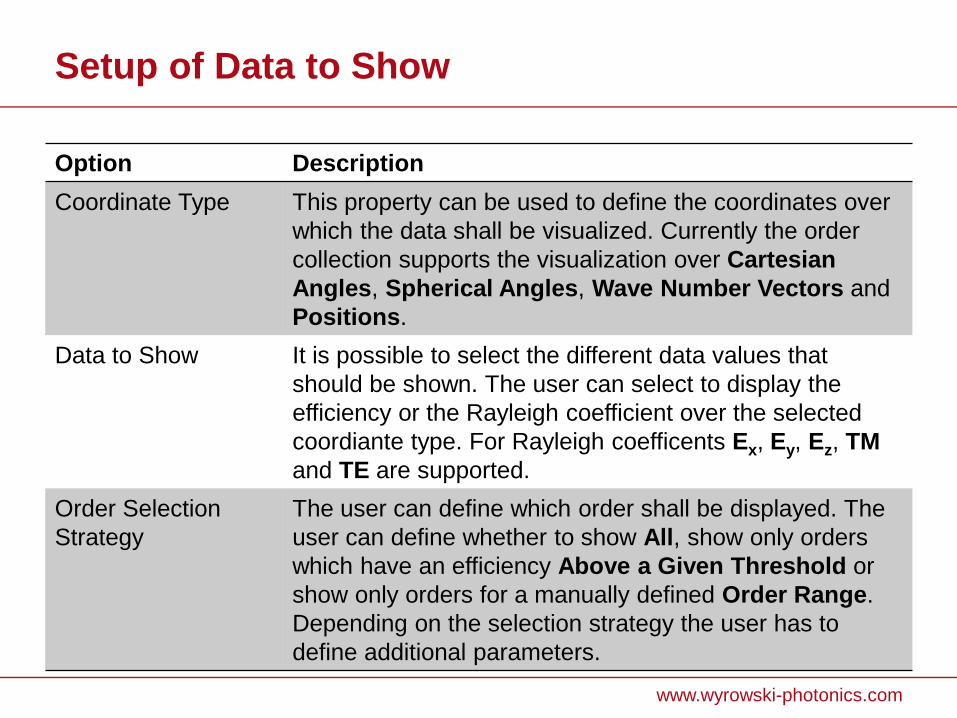
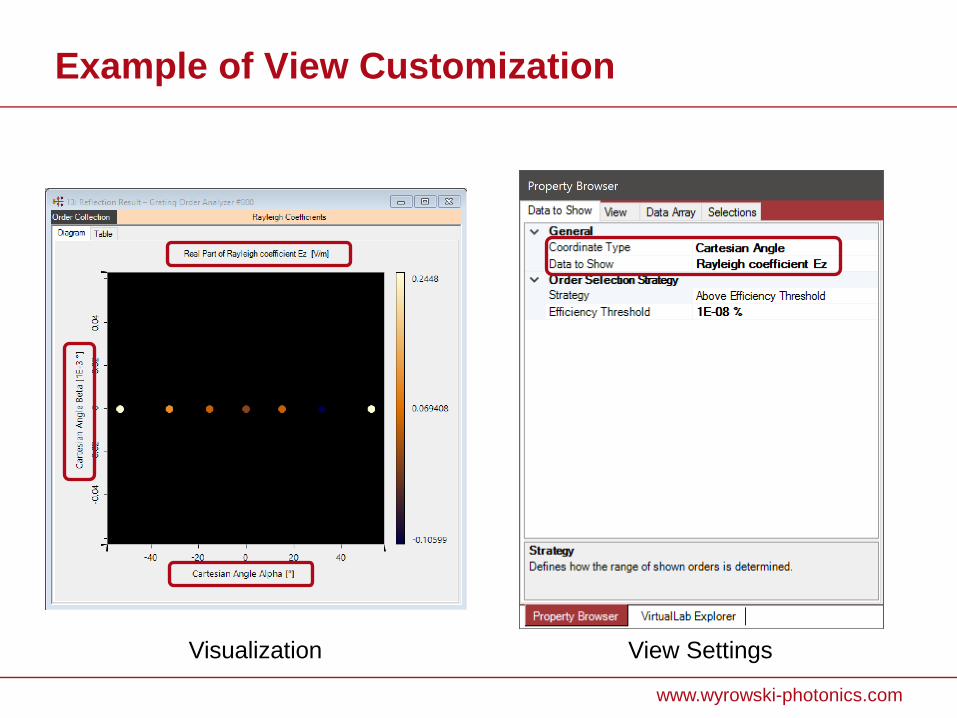
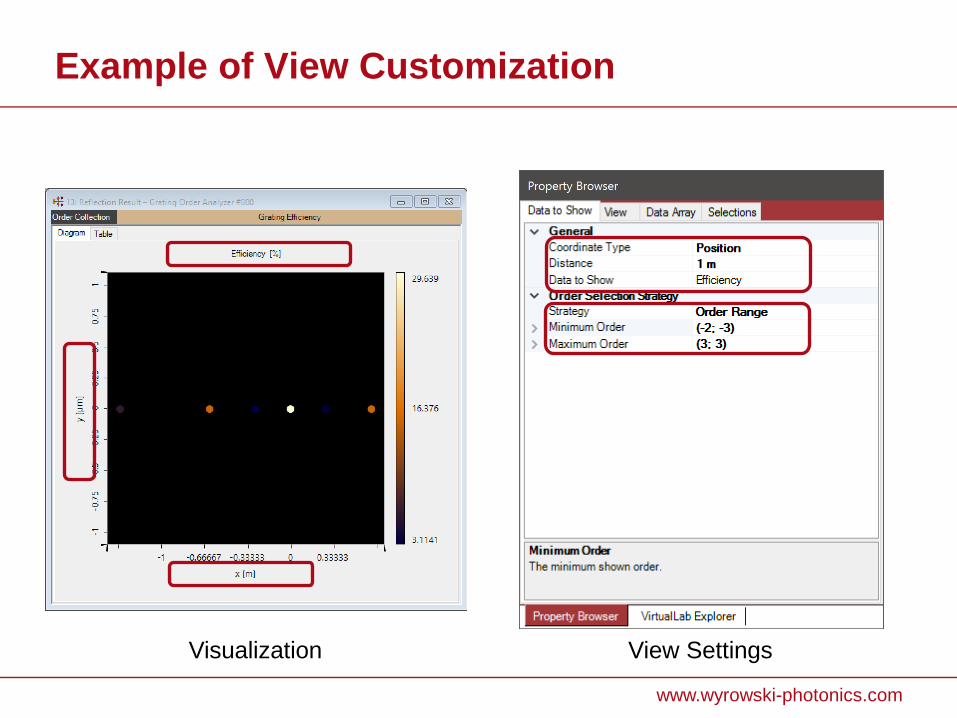
Option Description Coordinate Type This property can be used to define the coordinates over
which the data shall be visualized. Currently the order collection supports the visualization over Cartesian Angles, Spherical Angles, Wave Number Vectors and Positions.
Data to Show It is possible to select the different data values that should be shown. The user can select to display the efficiency or the Rayleigh coefficient over the selected coordiante type. For Rayleigh coefficents Ex, Ey, Ez, TM and TE are supported.
Order Selection Strategy
The user can define which order shall be displayed. The user can define whether to show All, show only orders which have an efficiency Above a Given Threshold or show only orders for a manually defined Order Range. Depending on the selection strategy the user has to define additional parameters.
www.wyrowski-photonics.com
Setup of Additional View Settings
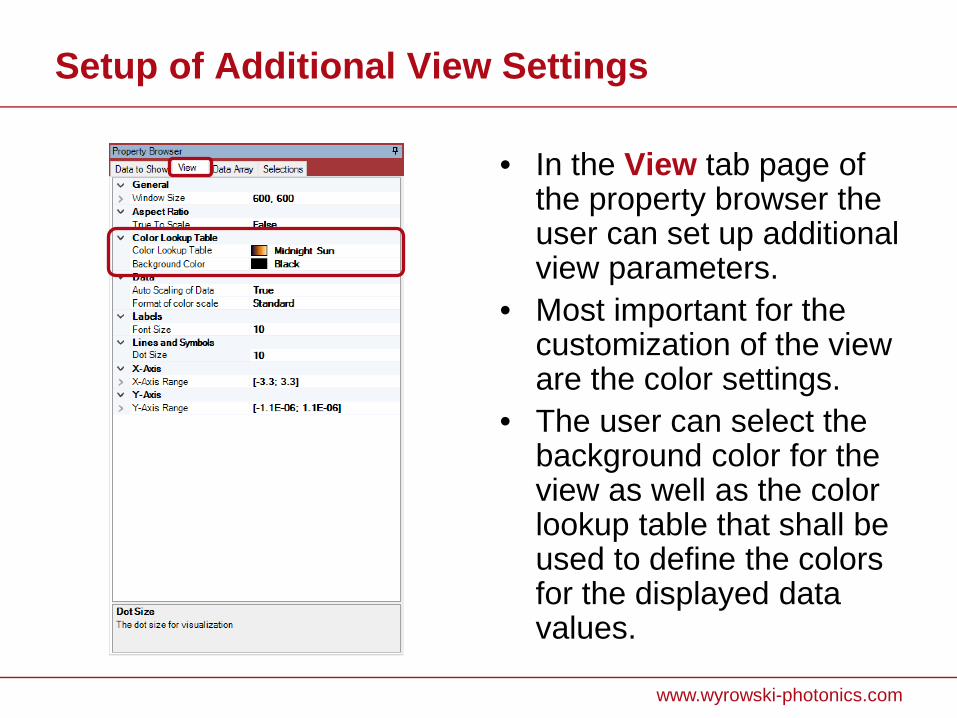
• In the View tab page of the property browser the user can set up additional view parameters.
• Most important for the customization of the view are the color settings.
• The user can select the background color for the view as well as the color lookup table that shall be used to define the colors for the displayed data values.
www.wyrowski-photonics.com
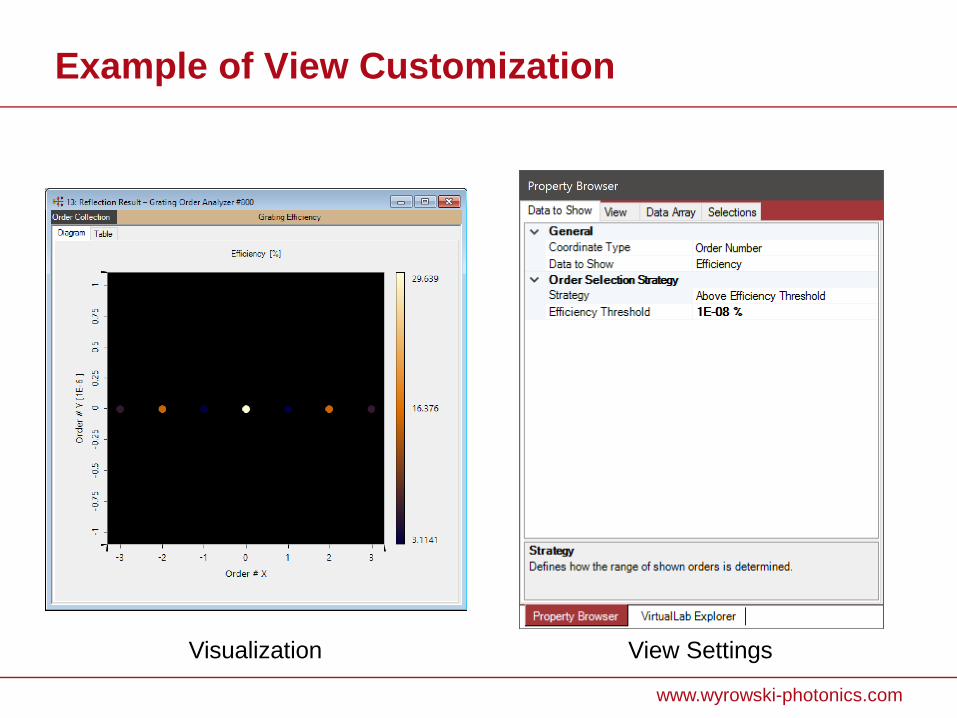
Example of View Customization
View Settings Visualization
www.wyrowski-photonics.com
Example of View Customization
View Settings Visualization
www.wyrowski-photonics.com
Example of View Customization
View Settings Visualization

Visualization of Conical Incidence
www.wyrowski-photonics.com
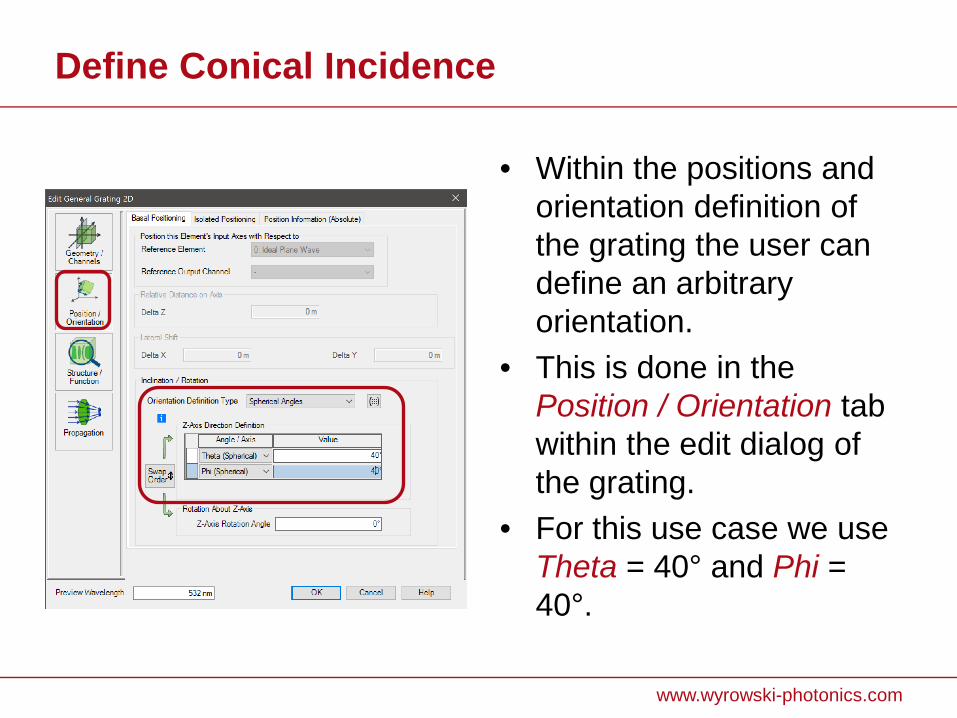
Define Conical Incidence
• Within the positions and orientation definition of the grating the user can define an arbitrary orientation.
• This is done in the Position / Orientation tab within the edit dialog of the grating.
• For this use case we use Theta = 40° and Phi = 40°.
www.wyrowski-photonics.com
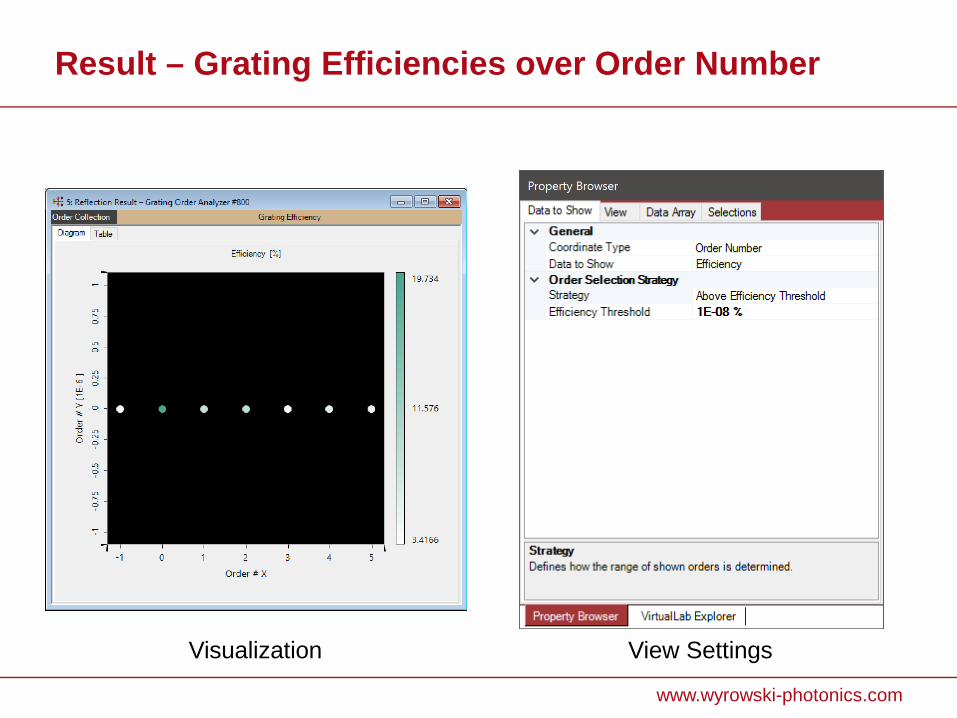
Result – Grating Efficiencies over Order Number
View Settings Visualization
www.wyrowski-photonics.com
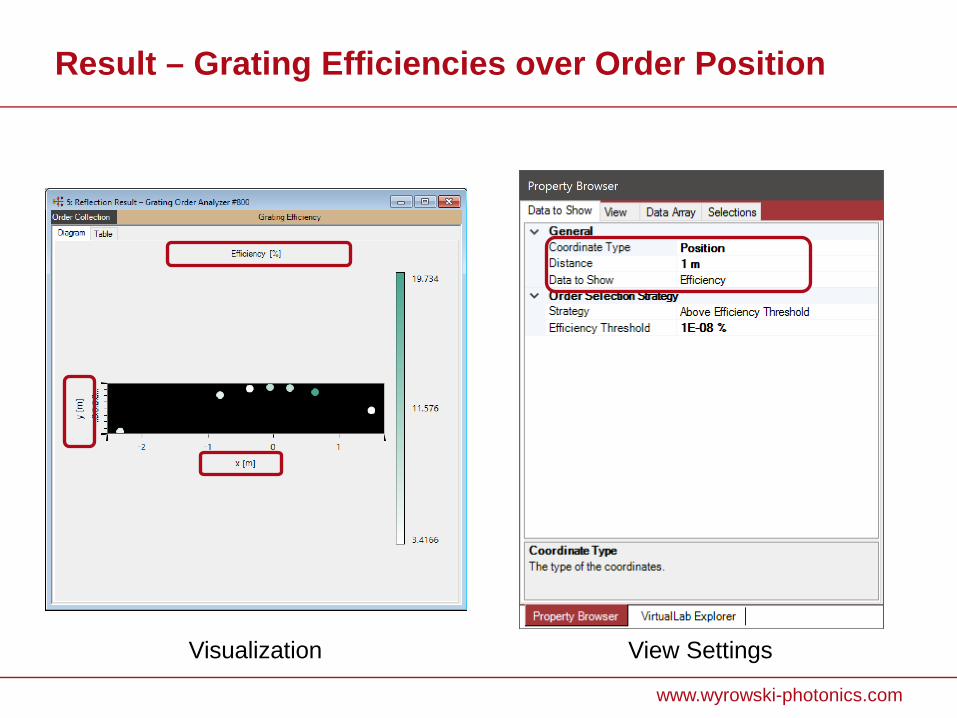
Result – Grating Efficiencies over Order Position
Visualization View Settings
www.wyrowski-photonics.com
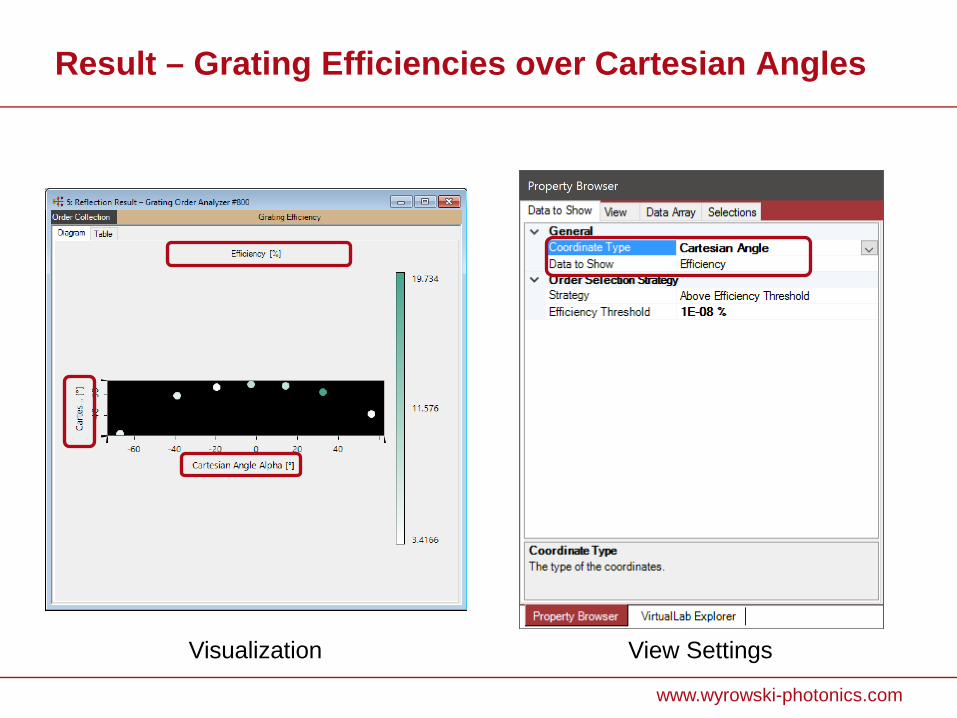
Result – Grating Efficiencies over Cartesian Angles
Visualization View Settings
www.wyrowski-photonics.com
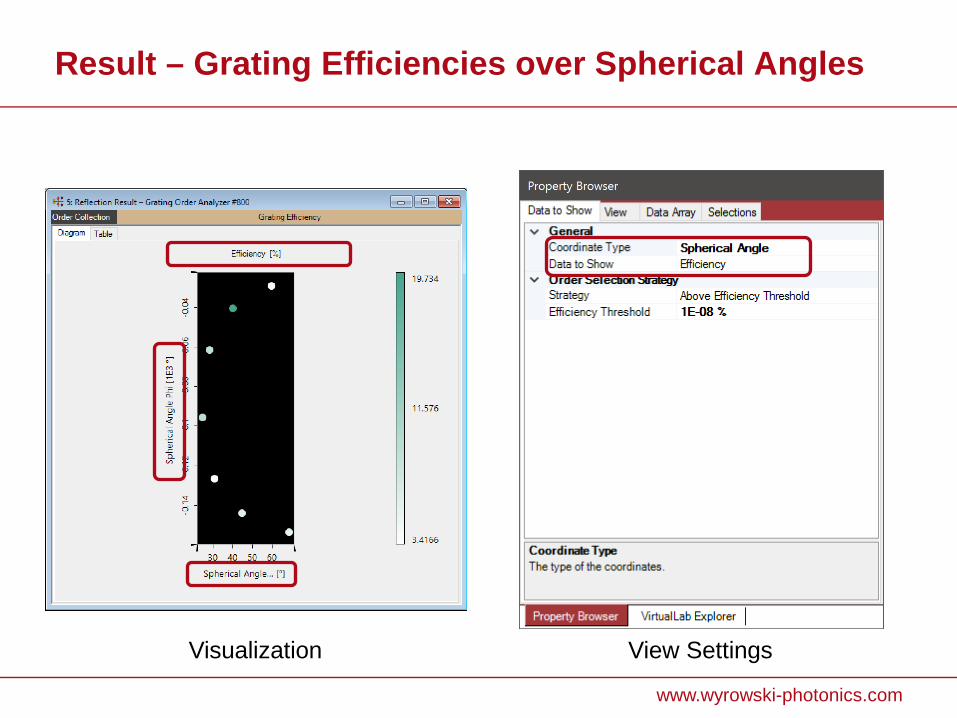
Result – Grating Efficiencies over Spherical Angles
Visualization View Settings
www.wyrowski-photonics.com
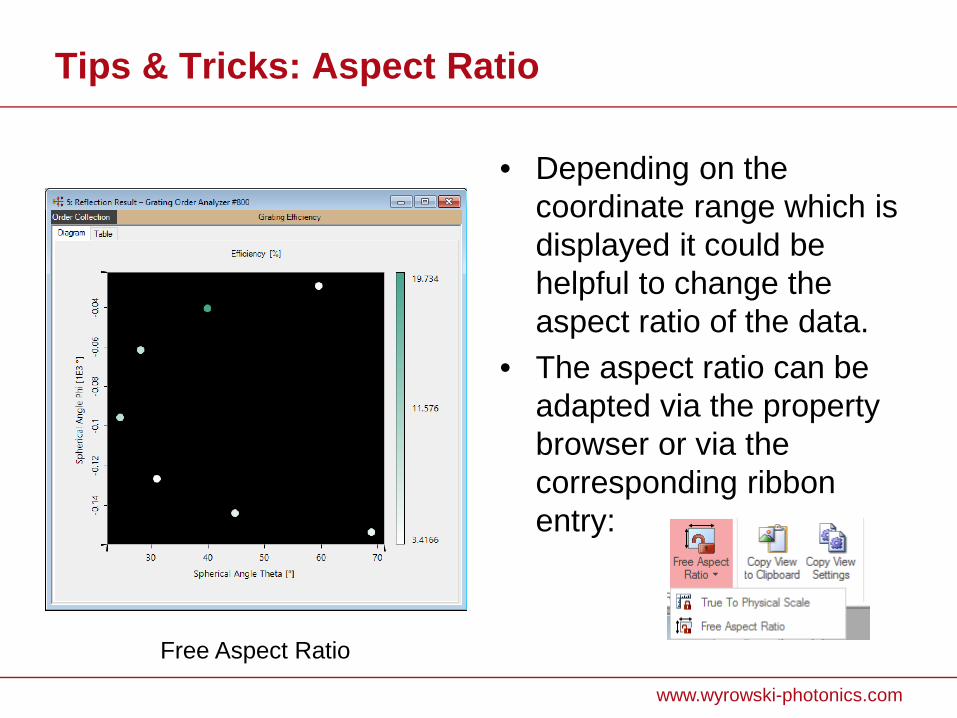
Tips & Tricks: Aspect Ratio
• Depending on the coordinate range which is displayed it could be helpful to change the aspect ratio of the data.
• The aspect ratio can be adapted via the property browser or via the corresponding ribbon entry:
Free Aspect Ratio
In case of questions please do not hesitate to contact us via [email protected].