roma street
TRANSCRIPT
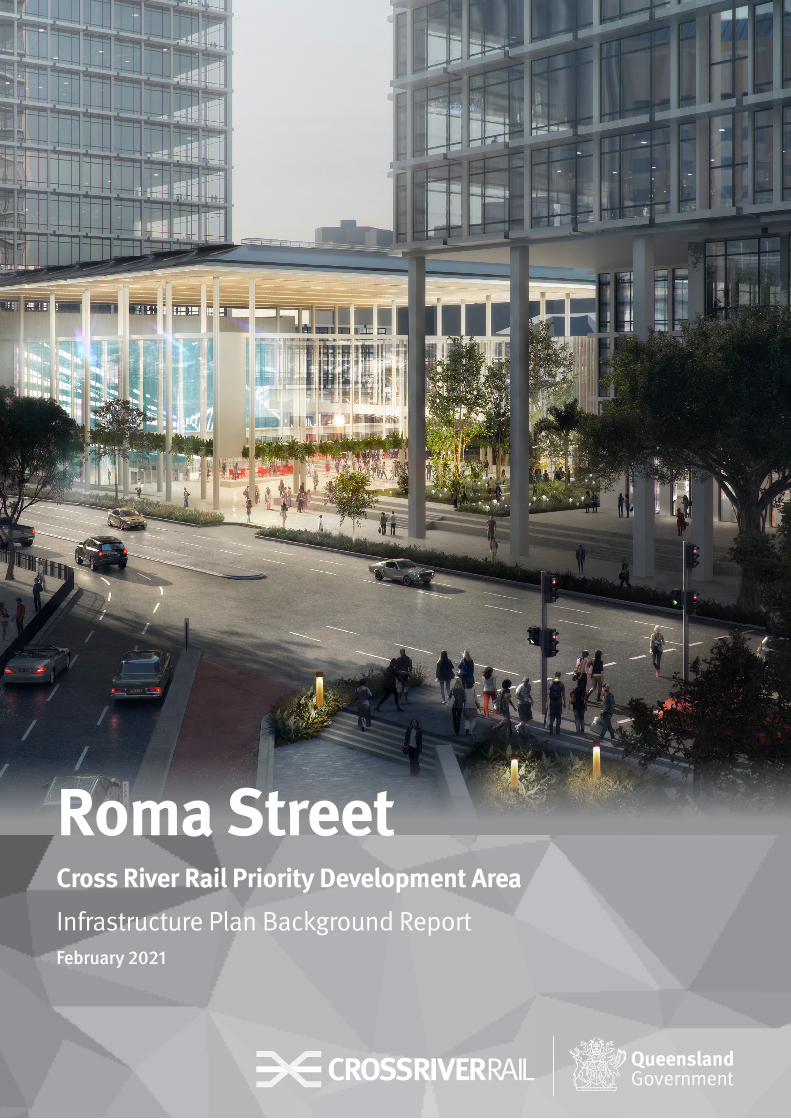
Cross River Rail Priority Development Area Infrastructure Plan Background ReportFebruary 2021
Roma Street
The Department of State Development, Infrastructure, Local Government and Planning improves productivity and quality of life in Queensland by leading economic strategy, industry development, infrastructure and planning, for the benefit of all.
Copyright
This publication is protected by the Copyright Act 1968.
Licence
This work, except as identified below, is licensed by the Department of State Development, Infrastructure, Local Government and Planning under a Creative Commons Attribution (CC BY) 4.0 Australia licence. To view a copy of this licence, visit: http://creativecommons.org.au/.
You are free to copy, communicate and adapt this publication, as long as you attribute it as follows:
© State of Queensland, Department of State Development, Infrastructure, Local Government and Planning, February 2021.
Third party material that is not licensed under a Creative Commons licence is referenced within this document. All content not licensed under a Creative Commons licence is all rights reserved. Please contact the Department of State Development, Infrastructure, Local Government and Planning / the copyright owner if you wish to use this material.
The Queensland Government is committed to providing accessible services to Queenslanders of all cultural and linguistic backgrounds. If you have difficulty understanding this publication and need a translator, please call the Translating and Interpreting Service (TIS National) on 13 14 50 and ask them to contact the Department of State Development, Infrastructure, Local Government and Planning on 07 3452 7100.
Disclaimer
While every care has been taken in preparing this publication, to the extent permitted by law, the State of Queensland accepts no responsibility and disclaims all liability (including without limitation, liability in negligence) for all expenses, losses (including direct and indirect loss), damages and costs incurred as a result of decisions or actions taken as a result of any data, information, statement or advice, expressed or implied, contained within. To the best of our knowledge, the content was correct at the time of publishing.
Any references to legislation are not an interpretation of the law. They are to be used as a guide only. The information in this publication is general and does not take into account individual circumstances or situations. Where appropriate, independent legal advice should be sought.
Copies of this publication are available on our website at www.dsdmip.qld.gov.au and further copies are available upon request to:
Cross River Rail Delivery Authority
PO Box 15476, Brisbane City East, QLD 4002 Phone: 1800 010 875 Email: [email protected] Web: www.crossriverrail.qld.gov.au
Economic Development Queensland
Department of Department of State Development, Infrastructure, Local Government and Planning GPO Box 2202, Brisbane Queensland 4002.
1 William Street Brisbane Qld 4000 (Australia) Phone: 13 QGOV (13 74 68) Email: [email protected] Web: www.edq.qld.gov.au
ii Roma Street | Cross River Rail Priority Development Area | Draft Infrastructure Plan Background Report
iiiRoma Street | Cross River Rail Priority Development Area | Draft Infrastructure Plan Background Report
Table of Contents1 Background 1
1.1 Purpose of Infrastructure Plan Background Report 22 Growth projections 3
2.1 Introduction 32.2 Growth projection years 32.3 Existing development demand 32.4 Potential development capacity 32.5 Development constraints 32.6 Growth rates 32.7 Growth projections summary 4
3 Demand projections 54 Desired standard of service 6
4.1 Water supply 64.2 Wastewater 64.3 Stormwater 64.4 Transport 64.5 Parks and community facilities 6
5 Infrastructure planning 75.1 Purpose 75.2 Planning horizon 75.3 Water supply 75.4 Wastewater 75.5 Stormwater 85.6 Transport 85.7 Parks and community facilities 85.8 Infrastructure summary & categories 9
6 Infrastructure costs 126.1 Cost of land 126.2 Cost of the works 12
6.2.1 Water 126.2.2 Wastewater 126.2.3 Stormwater 126.2.4 Transport 126.2.5 Parks and community facilities 12
6.3 On-cost allowances 136.4 Contingency allowance 13
7 Development charges 148 Trunk infrastructure cost schedules 15
iv Roma Street | Cross River Rail Priority Development Area | Draft Infrastructure Plan Background Report
Appendices
Appendix A PDA boundary map
Appendix B Development yields and reference scheme
Appendix C Demand generation rates
Appendix D Demand projections
Appendix E Technical memorandums / network summary reports / future infrastructure network plans
Appendix F Future Trunk Infrastructure network plans
Appendix G Future Trunk Infrastructure cost schedules
List of Tables
Table 2-1: Future residential dwellings and non-residential floor space projections 4
Table 2-2: Future population and employment projections 4
Table 5-1: Infrastructure summary table and categories 9
Table 6-1: On-cost allowance 13
Table 6-2: Contingency allowance 13
List of Figures
Figure 1-1: Roma Street PDA Boundary 2
Document Control
vROMA STREET PRIORITY DEVELOPMENT AREA Cross River Rail Delivery Authority Infrastructure Plan Background Report Prepared for Cross River Rail Delivery Authority
SMEC Internal Ref. 30032260 23 November 2020
Document Control
Document: Roma Street Priority Development Area
File Location: \\aubnfsv006.sjgroup.local\Urban$\Projects\30032260\100 Concept-Feasibility\105 Deliverables\01 Roma St\Infrastructure Plan Background Report\Rev 06
Project Name: Cross River Rail Delivery Authority Infrastructure Plan Background Report
Project Number: 30032260
Revision Number: 06
Issue Register
DISTRIBUTION LIST DATE ISSUED NUMBER OF COPIES
Cross River Rail Delivery Authority 23 Nov 2020 Electronic issue
SMEC Company Details
Approved by: Kate Drews
Address: Level 6, 480 St Pauls Tce, Fortitude Valley, QLD, 4006
Signature:
Tel: 07 3324 7813 Fax:
Email: [email protected] Website: www.smec.com
The information within this document is and shall remain the property of: Cross River Rail Delivery Authority (CRRDA).
1 ROMA STREET PRIORITY DEVELOPMENT AREA Cross River Rail Delivery Authority Infrastructure Plan Background Report Prepared for Cross River Rail Delivery Authority
SMEC Internal Ref. 30032260 23 November 2020
1 Background The Queensland Government’s Cross River Rail Precincts Delivery Strategy (the strategy) sets a vision for each Cross River Rail (CRR) Station precinct that is aligned to the Government’s policy priorities. The strategy sets out a vision for Roma Street Precinct to be an extension of the Central Business District (CBD) and Brisbane’s gateway to jobs, tourism and recreation.
To facilitate the realisation of this potential, the Roma Street precinct focus will be on:
• The key arrival destination for the central CBD, and the western gateway to the City’s premier cultural, leisureand entertainment offerings including a Potential Major Entertainment Arena (PMEA).
• Improved public realm and active transport connections to improve pedestrian movement and connections.• Significant upgrades to State-owned station interchange for CRR, Metro and bus services, including realignment
of the Inner Northern Busway.
The strategy sets out a Roma Street Precinct Intent, located at one of Brisbane’s most significant city centre arrival points, that has the opportunity to become a key economic and community hub through major redevelopment, reinvigorating heritage places, new public spaces and developing strong connections to nearby major parklands and facilities.
To support the Government’s vision for the precinct, the Roma Street CRR Priority Development Area (PDA) was declared on 13 December 2019 and an Interim Land Use Plan (ILUP) given effect. Roma Street is one of the new underground stations with associated PDAs. The PDA was declared to assist with the delivery of the CRR Project’s broader objectives.
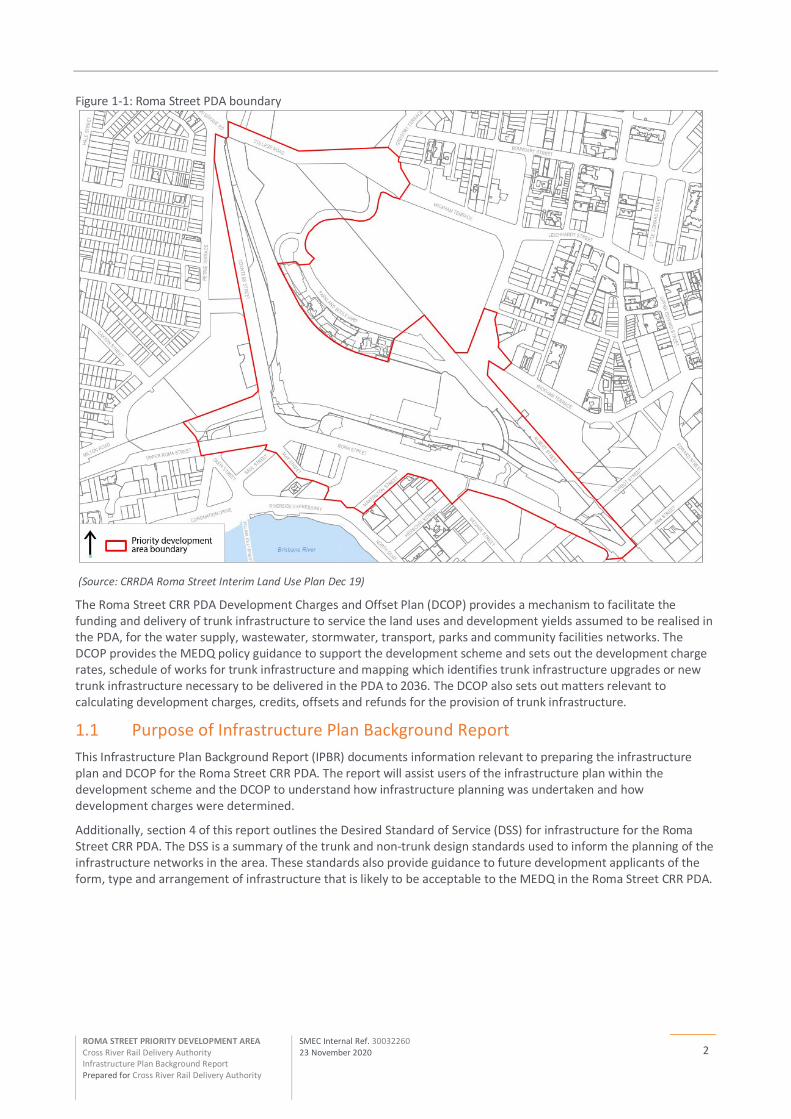
The Roma Street CRR PDA is approximately 32 hectares and is located on the outer edge of Brisbane’s city centre. The PDA includes state-owned land holdings, state transport corridors and roads, and other land in and around the rail station. It is approximately bound by College Road, Parkland Boulevard and Parkland Crescent to the north, Wickham Terrace, Albert Street and Emma Miller Place to the east, Roma Street, North Quay and Upper Roma Street to the south and Countess Street to the west (Refer Figure 1-1 and Appendix A).
The PDA declaration provides the opportunity to reconnect the area with the city centre, Spring Hill and Petrie Terrace, and with the Brisbane River and Kurilpa Bridge. The Roma Street CRR PDA regulates development on land within the Roma Street CRR PDA. The Minister for Economic Development Queensland (MEDQ) has delegated certain functions and powers under the Economic Development Act 2012 (the ED Act) to the Cross River Rail Delivery Authority (CRRDA) including plan, carry out, promote or coordinate activities to facilitate economic development and development for community purposes.
The Roma Street CRR PDA Development Scheme (the development scheme) is applicable to development on land within the boundaries Roma Street CRR PDA. From the date of approval, the development scheme replaces the Roma Street Cross River Rail PDA ILUP which commenced upon declaration.
The development scheme consists of the following:
1. a land use plan that regulates development in the PDA (section 2)
2. an infrastructure plan that describes infrastructure required to support achievement of the land use plan (section 3)
3. an implementation strategy that describes objectives and actions that complement the land use plan andinfrastructure plan to achieve the main purpose of the ED Act (section 4).
The development scheme was prepared under delegation by the CRRDA in collaboration with Economic Development Queensland, State agencies, and other key stakeholders.
2 ROMA STREET PRIORITY DEVELOPMENT AREA Cross River Rail Delivery Authority Infrastructure Plan Background Report Prepared for Cross River Rail Delivery Authority
SMEC Internal Ref. 30032260 23 November 2020
Figure 1-1: Roma Street PDA boundary
(Source: CRRDA Roma Street Interim Land Use Plan Dec 19)
The Roma Street CRR PDA Development Charges and Offset Plan (DCOP) provides a mechanism to facilitate the funding and delivery of trunk infrastructure to service the land uses and development yields assumed to be realised in the PDA, for the water supply, wastewater, stormwater, transport, parks and community facilities networks. The DCOP provides the MEDQ policy guidance to support the development scheme and sets out the development charge rates, schedule of works for trunk infrastructure and mapping which identifies trunk infrastructure upgrades or new trunk infrastructure necessary to be delivered in the PDA to 2036. The DCOP also sets out matters relevant to calculating development charges, credits, offsets and refunds for the provision of trunk infrastructure.
1.1 Purpose of Infrastructure Plan Background Report This Infrastructure Plan Background Report (IPBR) documents information relevant to preparing the infrastructure plan and DCOP for the Roma Street CRR PDA. The report will assist users of the infrastructure plan within the development scheme and the DCOP to understand how infrastructure planning was undertaken and how development charges were determined.
Additionally, section 4 of this report outlines the Desired Standard of Service (DSS) for infrastructure for the Roma Street CRR PDA. The DSS is a summary of the trunk and non-trunk design standards used to inform the planning of the infrastructure networks in the area. These standards also provide guidance to future development applicants of the form, type and arrangement of infrastructure that is likely to be acceptable to the MEDQ in the Roma Street CRR PDA.
3 ROMA STREET PRIORITY DEVELOPMENT AREA Cross River Rail Delivery Authority Infrastructure Plan Background Report Prepared for Cross River Rail Delivery Authority
SMEC Internal Ref. 30032260 23 November 2020
2 Growth projections 2.1 Introduction The rate of growth projected for the Roma Street CRR PDA is based on the potential residential and non-residential development in the area and forms the basis for the planning of the infrastructure services. The following sections detail the development and associated growth envisaged for the area.
2.2 Growth projection years The Roma Street PDA growth projections were prepared for the following years:
• The base date 2020 (prior to the demolition of the Brisbane Transit Centre (BTC) and Hotel Jen) and the following projection years: − year of opening of the new Roma Street CRR station 2025 − 2026− 2031− ultimate development at 2036.
2.3 Existing development demand The Gross Floor Area (GFA) of existing buildings within the Roma Street CRR PDA were estimated to form a demand on infrastructure at 2020, prior to the demolition of the BTC and Hotel Jen.
2.4 Potential development capacity The vision for the Roma Street CRR PDA is to facilitate a mix of short term accommodation, residential, commercial, entertainment, community and education land uses in the Precinct. While a development scheme is yet to be finalised for the PDA, a Baseline Potential Development Scenario – reference scheme (the reference scheme) was adopted to forecast future servicing demand. The ultimate potential development capacity that may be achieved on premises within the PDA was calculated based on the type and density of development allowable under the Reference Scheme (the planned density), considering impacting factors such as existing development, land tenure and plot size to determine a likely development outcome.
Following calculation of the potential development yield (in GFA per m²), these areas were then distributed between various land uses (commercial, retail, industrial and residential), in accordance with the development yields and reference scheme table (Appendix B).
The plot ratios and dwelling size assumptions are averages and they recognise that development may occur in individual circumstances at higher or lower densities. Appendix B states the plot ratios and GFA distribution assumptions assumed for land within each future development site within the PDA.
2.5 Development constraints The projected growth for the PDA has been calculated taking into consideration known development constraints which may limit the potential yield of land. Absolute constraints (such as flooding, transport infrastructure, parkland, etc.) were addressed as part of the reference scheme.
2.6 Growth rates The rate of growth for residential and non-residential development in the PDA was determined by the CRRDA having regard to the anticipated timing of government land becoming available for development, the anticipated staging of future development, market analysis and industry engagement.
4
ROMA STREET PRIORITY DEVELOPMENT AREA Cross River Rail Delivery Authority Infrastructure Plan Background Report Prepared for Cross River Rail Delivery Authority
SMEC Internal Ref. 30032260 23 November 2020
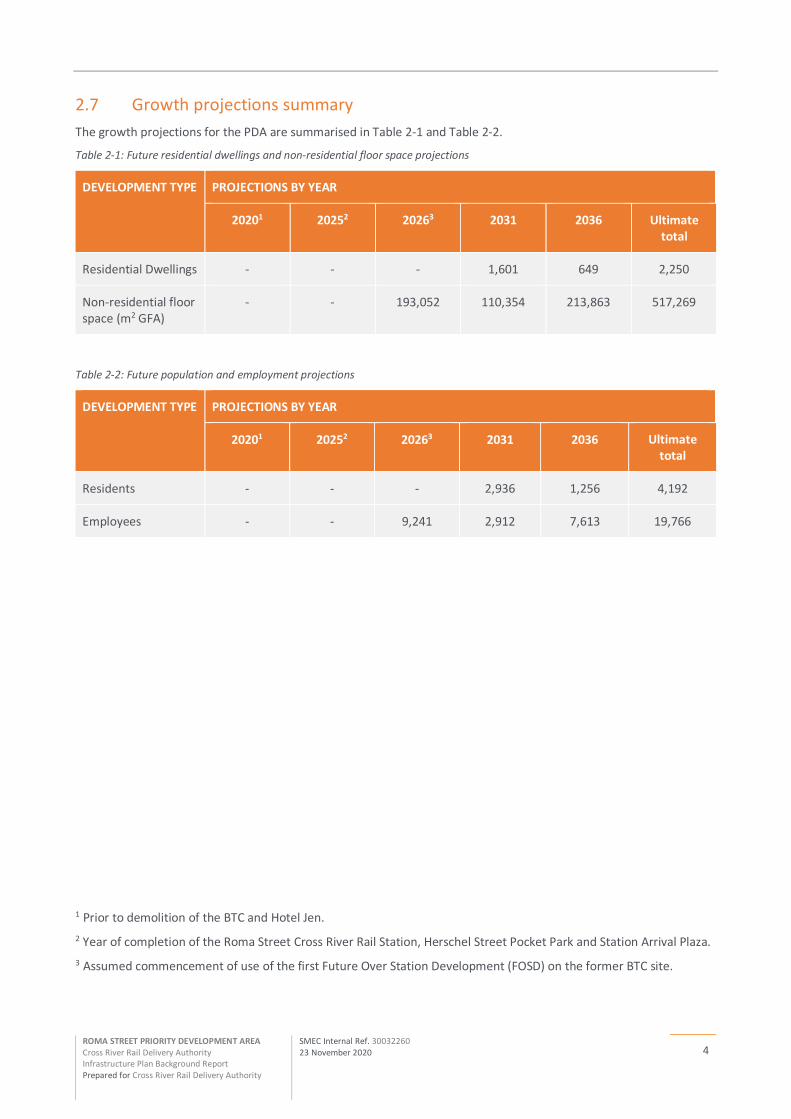
2.7 Growth projections summary The growth projections for the PDA are summarised in Table 2-1 and Table 2-2.
Table 2-1: Future residential dwellings and non-residential floor space projections
DEVELOPMENT TYPE PROJECTIONS BY YEAR
20201 20252 20263 2031 2036 Ultimate total
Residential Dwellings - - - 1,601 649 2,250
Non-residential floor space (m2 GFA)
- - 193,052 110,354 213,863 517,269
Table 2-2: Future population and employment projections
DEVELOPMENT TYPE PROJECTIONS BY YEAR
20201 20252 20263 2031 2036 Ultimate total
Residents - - - 2,936 1,256 4,192
Employees - - 9,241 2,912 7,613 19,766
1 Prior to demolition of the BTC and Hotel Jen. 2 Year of completion of the Roma Street Cross River Rail Station, Herschel Street Pocket Park and Station Arrival Plaza. 3 Assumed commencement of use of the first Future Over Station Development (FOSD) on the former BTC site.

5 ROMA STREET PRIORITY DEVELOPMENT AREA Cross River Rail Delivery Authority Infrastructure Plan Background Report Prepared for Cross River Rail Delivery Authority
SMEC Internal Ref. 30032260 23 November 2020
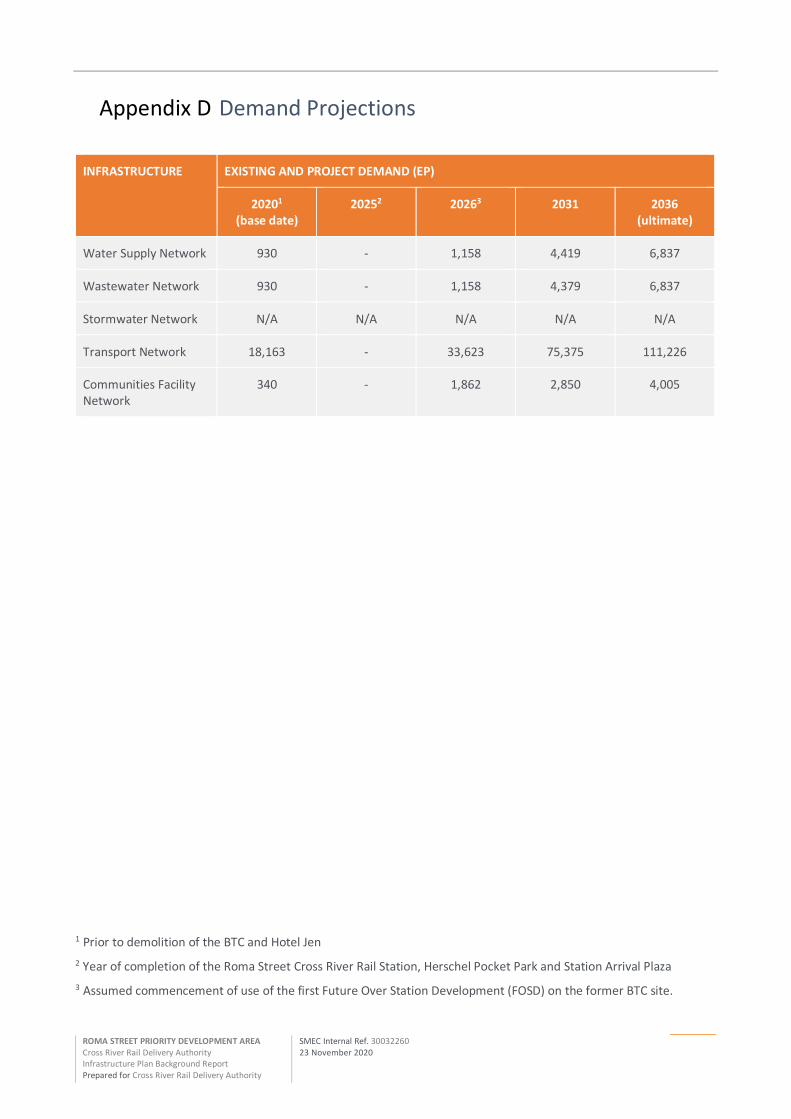
3 Demand projections Growth projections are converted into demand projections to enable infrastructure planning to be undertaken.
Different infrastructure networks express infrastructure demand using different demand units. The demand units used by each local network in the PDA are as follows:
• for the water supply network, equivalent persons (EP)• for the wastewater network, equivalent persons (EP)• for the stormwater quantity network, impervious area expressed in hectares (Imp Ha)• for the transport network, trips per day (trips)• for the parks and community facilities network, persons.
The demand generation rates used by each network to convert growth projections into demand are stated in Appendix C.
The demand projections for each network are stated in Appendix D.
6 ROMA STREET PRIORITY DEVELOPMENT AREA Cross River Rail Delivery Authority Infrastructure Plan Background Report Prepared for Cross River Rail Delivery Authority
SMEC Internal Ref. 30032260 23 November 2020
4 Desired standard of service 4.1 Water supply The Desired Standards of Service (DSS) for the water supply network is consistent with:
• the design standards for the water supply network stated in the South East Queensland Design and ConstructionCode, as may be amended from time to time.
The latest DSS can be accessed on the SEQ Water Supply and Sewerage Design and Construction Code website.
4.2 Wastewater The DSS for the wastewater network is consistent with:
• the design standards for the wastewater network stated in the South East Queensland Design and ConstructionCode, as may be amended from time to time.
The latest DSS can be accessed on the SEQ Water Supply and Sewerage Design and Construction Code website.
4.3 Stormwater The DSS for the stormwater network is consistent with the Brisbane City Plan 2014, Schedule 6, Chapter 7 for the trunk infrastructure network and supporting policy, as may be amended from time to time.
The latest DSS can be accessed on the Brisbane City Council (BCC) website.
4.4 Transport The desired standard of service for the road network is as follows:
• design the road network to comply with the following:− the standard road cross-sections in BCC’s Infrastructure Design Planning Scheme Policy (IDPSP)− transport corridors are planned to cater for 2036 planning horizon.− active transport routes must always be publicly accessible, or a suitable alternative route must be provided
during the operation of events.
CRRDA have adopted BCC’s DSS, as per the Brisbane City Plan 2014 Local Government Infrastructure Plan (LGIP), for all transport networks as outlined in Roma Street Priority Development Area – Transport Report prepared by SMEC, dated 4 November 2020. However, where BCC’s DSS conflicts with the following standards, the standards listed below prevail:
• The Department of Transport and Main Roads Technical Note 128 Selection and Design of Cycle Tracks.
The latest DSS can be accessed on the BCC website.
4.5 Parks and community facilities The DSS for the parks and land for community facilities network is consistent with the BCC LGIP and supporting policy, as may be amended from time to time. Refer to the following sections of the Brisbane City Plan 2014 for the relevant DSS:
• Part 4 (LGIP)• Public Parks and Land for Community Facilities Network – extrinsic material• Planning Assumptions – extrinsic material.
The latest DSS can be accessed on the BCC website.
7
ROMA STREET PRIORITY DEVELOPMENT AREA Cross River Rail Delivery Authority Infrastructure Plan Background Report Prepared for Cross River Rail Delivery Authority
SMEC Internal Ref. 30032260 23 November 2020
5 Infrastructure planning 5.1 Purpose As described in section 3.1 of the development scheme, the purpose of the infrastructure plan is to ensure that the PDA vision is achieved through:
1. integrating infrastructure planning with land use planning identified in the development scheme 2. identifying the infrastructure requirements which may be delivered by the relevant infrastructure provider such
as state government, BCC, Urban Utilities or applicants 3. providing a basis for imposing conditions on development approvals 4. responding to the increased demand on the relevant infrastructure networks.
This IBPR should be read in conjunction with the development scheme infrastructure plan (Section 3) and the DCOP. Section 3.2 of the development scheme identifies the various infrastructure networks and Section 3.3 describes three PDA infrastructure categories: trunk, non-trunk and other which inform future funding arrangements.
5.2 Planning horizon The infrastructure plans for the Roma Street CRR PDA have a planning horizon of 2036. This horizon was chosen to align with the anticipated staging of future development and the realisation of ultimate development in the Roma Street CRR PDA. The PDA is assumed to be fully developed by 2036.
5.3 Water supply The Roma Street PDA Precinct is currently generally well serviced in terms of water supply pressure and flow. Assessment of the existing external water supply infrastructure indicated that no upgrades of the existing water infrastructure will be required to service the future development demands within the PDA.
There is an existing large diameter trunk watermain running through the Parkland. This trunk main will be required to be protected during the works.
Further details relating to the planning of water supply infrastructure for the PDA is documented in Appendix E:
• Water Supply & Wastewater Technical Note – Technical Memo prepared by SMEC, dated 4 November 2020.
Refer to Appendix F and G for planned trunk infrastructure project mapping and cost schedules (where applicable).
A summary of whether the identified infrastructure may be trunk, non-trunk or other infrastructure is provided in Table 5-1.
5.4 Wastewater The Roma Street PDA is generally divided into two main catchments. The south-west catchment of the PDA discharges into the existing wastewater infrastructure located at Roma Street, that continues through Makerston Street and North Quay, before connecting into a large trunk main at Turbot Street. The capacity of this infrastructure is constrained and will require upgrades inside and outside of the Roma Street PDA to adequately service the demand generated by the potential future development. This may involve upgrade works of the wastewater infrastructure in Makerston Street.
Planning of wastewater infrastructure for the PDA is documented in Appendix E:
• Water Supply & Wastewater Technical Note – Technical Memo prepared by SMEC, dated 4 November 2020.
This includes an overall existing and future Wastewater Infrastructure Network Plan identifying non-trunk, trunk and other infrastructure as may be applicable.
Refer to Appendix F – Map 02 Wastewater - Future Trunk Infrastructure Plan and Appendix G for the planned trunk infrastructure project mapping and cost schedules.
A summary of whether the identified infrastructure may be trunk, non-trunk or other infrastructure is provided in Table 5-1.
8 ROMA STREET PRIORITY DEVELOPMENT AREA Cross River Rail Delivery Authority Infrastructure Plan Background Report Prepared for Cross River Rail Delivery Authority
SMEC Internal Ref. 30032260 23 November 2020
5.5 Stormwater The stormwater network around the Roma Street area is known to be significantly under capacity and does not currently manage a 10 per cent Annual Exceedance Probability (AEP) storm event flow. The ultimate developed conditions of the Roma Street CRR PDA development do not contribute significant additional flows that would worsen the stormwater performance in the area however, the development does provide the opportunity to address some of the existing drainage issues for the overall catchment and is anticipated to introduce additional land use activities and densities into the precinct.
Modelling indicates that the PDA catchment area is responsible for 57 per cent of the flow for recommended stormwater network upgrade ST01 and 38 per cent of the flow for recommended stormwater network upgrade ST02 (refer Appendices E, F and G for recommended infrastructure network upgrades). In the interests of apportioning the costs of mitigating an existing stormwater issue between existing and future users, government entities and PDA and non-PDA drainage origins, indicative costs have been apportioned accordingly between future PDA development and BCC.
Further details relating to the planning of stormwater infrastructure for the PDA is documented in Appendix E:
Roma Street Precinct Stormwater Management – Technical Memo prepared by SMEC, dated 20 August 2020.
This includes an overall existing and future Stormwater Infrastructure Network Plan identifying non-trunk, trunk and other infrastructure as may be applicable.
Refer to Appendix F – Map 03 Stormwater - Future Trunk Infrastructure Plan and Appendix G for the planned trunk infrastructure project mapping and cost schedules.
A summary of whether the identified infrastructure may be trunk, non-trunk or other infrastructure is provided in Table 5-1.
5.6 Transport Planning of transport infrastructure to service the development within the PDA is documented in Appendix E: • Roma Street Priority Development Area – Transport Report prepared by SMEC, dated 4 November 2020.
This includes overall existing and future Transport Infrastructure Network Plans identifying non-trunk, trunk and other infrastructure as may be applicable.
Refer to Appendix F - Map 04a Transport (Road) - Future Trunk Infrastructure Plan and Map 04b Transport (Active) – Future Trunk Infrastructure Plan and Appendix G for the planned trunk infrastructure project mapping and cost schedules.
Trunk infrastructure is represented by roads and intersections of higher-order road hierarchies, including Motorway, Arterial, Suburban, District roads. These road hierarchies are demonstrated in the Road Hierarchy Overlay contained within the Brisbane City Plan 2014. Within the road corridor, trunk infrastructure includes the formation, carriageway, footpaths, street trees and furniture, cycleways, bridges, in-road drainage and intersections with at least three arms of trunk roads or where the MEDQ considers that the future project is considered on balance to have wider transport network benefits (e.g. car, pedestrian, cycle) and will service multiple future development sites.
Where transport upgrades required for the PDA intersect with other planned trunk infrastructure or development infrastructure (as per BCC’s or Urban Utilities’ infrastructure planning policies), the transport upgrade is to provide for or accommodate the efficient delivery of all planned infrastructure. This may include the provision of other planned trunk infrastructure or development infrastructure where the delivery of that additional infrastructure is determined to be the most efficient and cost-effective solution.
A summary of whether the identified infrastructure may be trunk, non-trunk or other infrastructure is provided in Table 5-1.
5.7 Parks and community facilities Considering the high levels of quality park and open space areas provided by Roma St Parkland along with BCC’s proposed enhancements to Victoria Park and Green Spine, the PMEA project, Emma Miller Place public realm enhancements, and TSD Roma Street Station Plaza and potential expansion, Herschel Street Pocket Park, it is concluded that no further parks investments beyond these are recommended to incorporated into the Roma Street PDA.
9 ROMA STREET PRIORITY DEVELOPMENT AREA Cross River Rail Delivery Authority Infrastructure Plan Background Report Prepared for Cross River Rail Delivery Authority
SMEC Internal Ref. 30032260 23 November 2020
Regarding community facilities, it is recommended that the opportunity be provided in the PDA for the inclusion of dedicated space for further community facilities infrastructure. It is recommended that the specific form of community facility be informed by the network planning for the community facilities network being undertaken by BCC. It is further recommended that the facility be centrally located in the PDA, in a visible and highly accessible location with potential site options including the potential redevelopment of the existing Roma Street Parkland Administrative Building (near the Coach Terminal) or re-purposing of the Roma Street Heritage Station Building. The trigger for provision of the facility is residential growth within the PDA of (capacity for) an additional 2,500 residents, which is planned to occur by 2031.
Planning of parks and community facilities infrastructure to service development within the PDA was informed by the following reports in Appendix E:
Roma Street CRR Precinct Community Infrastructure Assessment – Technical Memo prepared by SMEC, dated 4 November 2020.
This includes an overall existing and future Community Infrastructure Network Plan identifying non-trunk, trunk and other infrastructure as may be applicable.
A summary of whether the identified infrastructure may be trunk, non-trunk or other infrastructure is provided in Table 5-1.
Refer to Appendix F – Map 05 Parks and Community Facilities - Future Trunk Infrastructure Plan, and Appendix G for the planned trunk infrastructure project mapping and cost schedules.
5.8 Infrastructure summary and categories A summary of whether the identified infrastructure may be trunk, non-trunk or other infrastructure is provided in Table 5-1. Refer to sections 3.3 and 3.4 of the development scheme infrastructure plan for additional information regarding the relevant infrastructure categories and funding arrangements.
Table 5-1: Infrastructure summary table and categories
INFRASTRUCTURE IDS
INFRASTRUCTURE NETWORKS
INFRASTRUCTURE DETAILS (REFER APPENDIX E, F & G)
INFRASTRUCTURE CATEGORY
POTENTIAL FUNDING
N/A Water supply Internal servicing mains - various Non-trunk Developer
SEW-01A
Wastewater
Makerston St Sewer - Gravity Main Trunk Development charges
N/A Gravity Main (inside PDA) - various Non-trunk Developer
SEW-01B North Quay Sewer - Gravity Main (outside PDA) Trunk Development
charges N/A Private pump station - tbd Non-trunk Developer N/A Alternative treatment - tbd Non-trunk Developer
SW 1-12 Stormwater
Stormwater pipes / culverts – various under Garrick Street, May Street and Roma Street
Trunk
Partially development charges & Other entity tbd1
N/A Stormwater pipe/culvert - tbd Non-trunk Developer N/A On-site retention/detention - tbd Non-trunk Developer
I01
Transport
Garrick Street / Roma Street Intersection Trunk Development
charges
I06 College Road / Parkland Boulevard Intersection Trunk
Partially development charges & Other entity tbd1
I07 Intersection Non-trunk Developer
10 ROMA STREET PRIORITY DEVELOPMENT AREA Cross River Rail Delivery Authority Infrastructure Plan Background Report Prepared for Cross River Rail Delivery Authority
SMEC Internal Ref. 30032260 23 November 2020
INFRASTRUCTURE IDS
INFRASTRUCTURE NETWORKS
INFRASTRUCTURE DETAILS (REFER APPENDIX E, F & G)
INFRASTRUCTURE CATEGORY
POTENTIAL FUNDING
I02, I03, I04, I05, I08
Intersections – various (Potential Arena) Other Other entity tbd1
RD01 Garrick Street intersection works - road corridor Non-trunk Developer
RD02 Parkland Blvd road corridor Non-trunk Developer
AT01 Pathway - widening Inner Northern Bikeway from College Way to Parkland Crescent
Trunk
Partially development charges & Other entities tbd1
AT02
Pathway - widening and public realm enhancements to Parkland entrance from Parkland Kiosk to Albert Street (Potential Arena)
Other Other entity tbd1
AT03 Pathway - New pedestrian / cycle overpass spanning over Roma Street (Potential Arena)
Other Other entity tbd1
AT04 Pathway - New pedestrian / cycle skywalk parallel to Roma Street (Potential Arena)
Other Other entity tbd1
AT05 Pathway - New pedestrian / cycle bridge spanning over Roma Street rail lines
Trunk Developer charges
AT08
Pathway - New pedestrian / cycle bridge from Roma Street Parkland spanning over Countess Street to Victoria Barracks
Other Other entity tbd1
AT09 Pathway - Upgrade to Courts Precinct path from Roma Street to George Street (Potential Arena)
Other Other entity tbd1
AT10
Pathway - New pedestrian / cycle access connecting Roma Street overpass (AT03) to Albert Street (Potential Arena)
Other Other entity tbd1
AT11
Pathway - New pedestrian skywalk connecting Western Future Over Station Development (FOSD) to existing Barracks pedestrian bridge to Lang Park
Trunk
Partially development charges & Other entities tbd1
AT12
Pathway - Parkland Boulevard ‘Cycle Street’ enhancements - Inner Northern Bikeway Parkland Crescent to Ramp
Trunk
Partially development charges & Other entities tbd1
N/A Pathway/Pathway bridge - tbd Non-trunk Developer N/A On road facilities - tbd Tbd Tbd1
PC01 Herschel Street Pocket Park (CRR TSD) Other CRR TSD
PC02 Roma Street Station Arrival Plaza (CRR TSD) Other CRR TSD
PC03 Emma Miller Place enhancements (Potential Arena) Trunk Partially
development
11 ROMA STREET PRIORITY DEVELOPMENT AREA Cross River Rail Delivery Authority Infrastructure Plan Background Report Prepared for Cross River Rail Delivery Authority
SMEC Internal Ref. 30032260 23 November 2020
INFRASTRUCTURE IDS
INFRASTRUCTURE NETWORKS
INFRASTRUCTURE DETAILS (REFER APPENDIX E, F & G)
INFRASTRUCTURE CATEGORY
POTENTIAL FUNDING
charges & Other entities tbd1
PC04
Parks and community facilities
Multi‐purpose community facility (leased floor space) including community meeting rooms
Trunk
Partially development charges & Other entities tbd1
PC05 Expanded Roma Street Station Arrival Plaza – Urban Common
Trunk
Partially development charges & Other entities tbd1
PC06 (N) Roma Street Streetscape improvements (west)
Non‐trunk & Other
Developer & CRR TSD
PC06 (S) Roma Street Streetscape improvements (west)
Non‐trunk Developer
PC07 Albert Street Green Spine (Potential Arena)
Other Other entity tbd1
PC08 Potential Entertainment Arena Other Other entity tbd1
PC09 Roma Street Streetscape improvements (east) (Potential Arena)
Other Other entity tbd1
N/A Public open space (streetscape / public realm) tbd
Non‐trunk Developer
1 To be determined (Funding arrangements and potential contributions to be discussed with relevant government entities)
12
ROMA STREET PRIORITY DEVELOPMENT AREA Cross River Rail Delivery Authority Infrastructure Plan Background Report Prepared for Cross River Rail Delivery Authority
SMEC Internal Ref. 30032260 23 November 2020
6 Infrastructure costs The cost of infrastructure has been determined as follows.
6.1 Cost of land The assumptions regarding the cost of future infrastructure (land) was determined for each network as follows:
• No additional private land is proposed to be acquired for the infrastructure necessary to support the Roma Street CRR PDA
• If it is identified that a land value is required to provide an offset value for trunk infrastructure land, the value is to be based on the Valuer-General’s annual valuation rate (rate per m² basis, in accordance with the land Valuation Act 2010) that is current at the time the offset is granted.
6.2 Cost of the works The cost of future infrastructure (works) was determined for each network as detailed in the following sections.
6.2.1 Water
No future trunk infrastructure works was identified.
6.2.2 Wastewater
Wastewater cost estimates were prepared by SMEC. These costs are provided as lump sum costs per infrastructure item and are based on a detailed cost calculation adopting industry rates at FY2020/2021. The schedule of works (Appendix G) identifies the specific base cost for each infrastructure item.
6.2.3 Stormwater
Stormwater cost estimates were prepared by SMEC. These costs are provided as lump sum costs per infrastructure item and are based on a detailed cost calculation adopting industry rates at FY2020/2021. The schedule of works (Appendix G) identifies the specific base cost for each infrastructure item.
6.2.4 Transport
Future trunk infrastructure works for the transport network are based on several sources. These include:
• For trunk intersection works – Intersection upgrade costs (including indirect costs, locational factors, and relocation allowance costs) within the BCC LGIP Extrinsic Material documents at FY2016/17
• For trunk pathway and pathway bridge costs: − Unit rates for similar projects provided by Rider Levett Bucknall (RLB) at FY2018/219 − Unit rates for similar projects provided by SMEC at FY2019/20 − Average unit rates for similar projects (between RLB and SMEC) − Nominal unit rates provided by Integran, where necessary.
The schedule of works (Appendix G) identifies the specific base cost for each infrastructure item.
6.2.5 Parks and community facilities
Future trunk infrastructure works for the parks and community facilities networks are based on the following sources:
• Urban common park embellishment: − Urban common unit rates within the BCC LGIP Extrinsic Material documents at FY2016/17, calculated as a
rate per square metre based on BCC’s preferred park size. • Community facility land:
− Based on a 20-year lease within Roma Street Heritage building (or other appropriate location) using industry estimates for inner city space, averaged between high and low exposure locations at FY2020/21.
The schedule of works (Appendix G) identifies the specific base cost for each infrastructure item.
13 ROMA STREET PRIORITY DEVELOPMENT AREA Cross River Rail Delivery Authority Infrastructure Plan Background Report Prepared for Cross River Rail Delivery Authority
SMEC Internal Ref. 30032260 23 November 2020
6.3 On-cost allowances On-costs represent the owner’s project costs and may include:
• survey for the work• geotechnical investigations for the work• strategic planning• detailed design for the work• project management, procurement and contract administration• environmental investigations for the work, and• portable long service leave payment for a construction contract for the work.
The on-costs allowances that have been applied to infrastructure costs in the PDA are stated in Table 6-1.
Table 6-1: On-cost allowance
NETWORK ON-COSTS ALLOWANCE
Transport (Road) 13% applied to the Base Cost (inclusive of cost factors)
Transport (Active) 17% applied to the Base Cost (inclusive of cost factors)
All other networks 17% applied to the Base Cost (inclusive of cost factors)
6.4 Contingency allowance A contingency allowance is included in the cost of future infrastructure works to deal with known risks. The contingency allowance typically reduces in accordance with the level of planning undertaken for the infrastructure item. The level of contingency allowance applied for infrastructure works in each network are stated in Table 6-2.
Table 6-2: Contingency allowance
NETWORK CONTINGENCY ALLOWANCE
Water 40% applied to the Base Cost (inclusive of on-costs and cost factors)
Sewerage 40% applied to the Base Cost (inclusive of on-costs and cost factors)
Stormwater 40% applied to the Base Cost (inclusive of on-costs and cost factors)
Transport (Road) 40% applied to the Base Cost (inclusive of on-costs and cost factors)
Transport (Active) 20% applied to the Base Cost (inclusive of on-costs and cost factors)
Parks and community facilities 30% applied to the Base Cost (inclusive of on-costs and cost factors)
14
ROMA STREET PRIORITY DEVELOPMENT AREA Cross River Rail Delivery Authority Infrastructure Plan Background Report Prepared for Cross River Rail Delivery Authority
SMEC Internal Ref. 30032260 23 November 2020
7 Development charges Development Charges have been adopted consistent with current Adopted Infrastructure Charges currently levied by BCC and Urban Utilities
15
ROMA STREET PRIORITY DEVELOPMENT AREA Cross River Rail Delivery Authority Infrastructure Plan Background Report Prepared for Cross River Rail Delivery Authority
SMEC Internal Ref. 30032260 23 November 2020
8 Trunk infrastructure cost schedules Detailed cost schedules were prepared for each trunk infrastructure item identified in the DCOP.
Refer to Appendix G for further details.


ROMA STREET PRIORITY DEVELOPMENT AREA Cross River Rail Delivery Authority Infrastructure Plan Background Report Prepared for Cross River Rail Delivery Authority
SMEC Internal Ref. 30032260 4 November 2020
Appendix A PDA Boundary Map
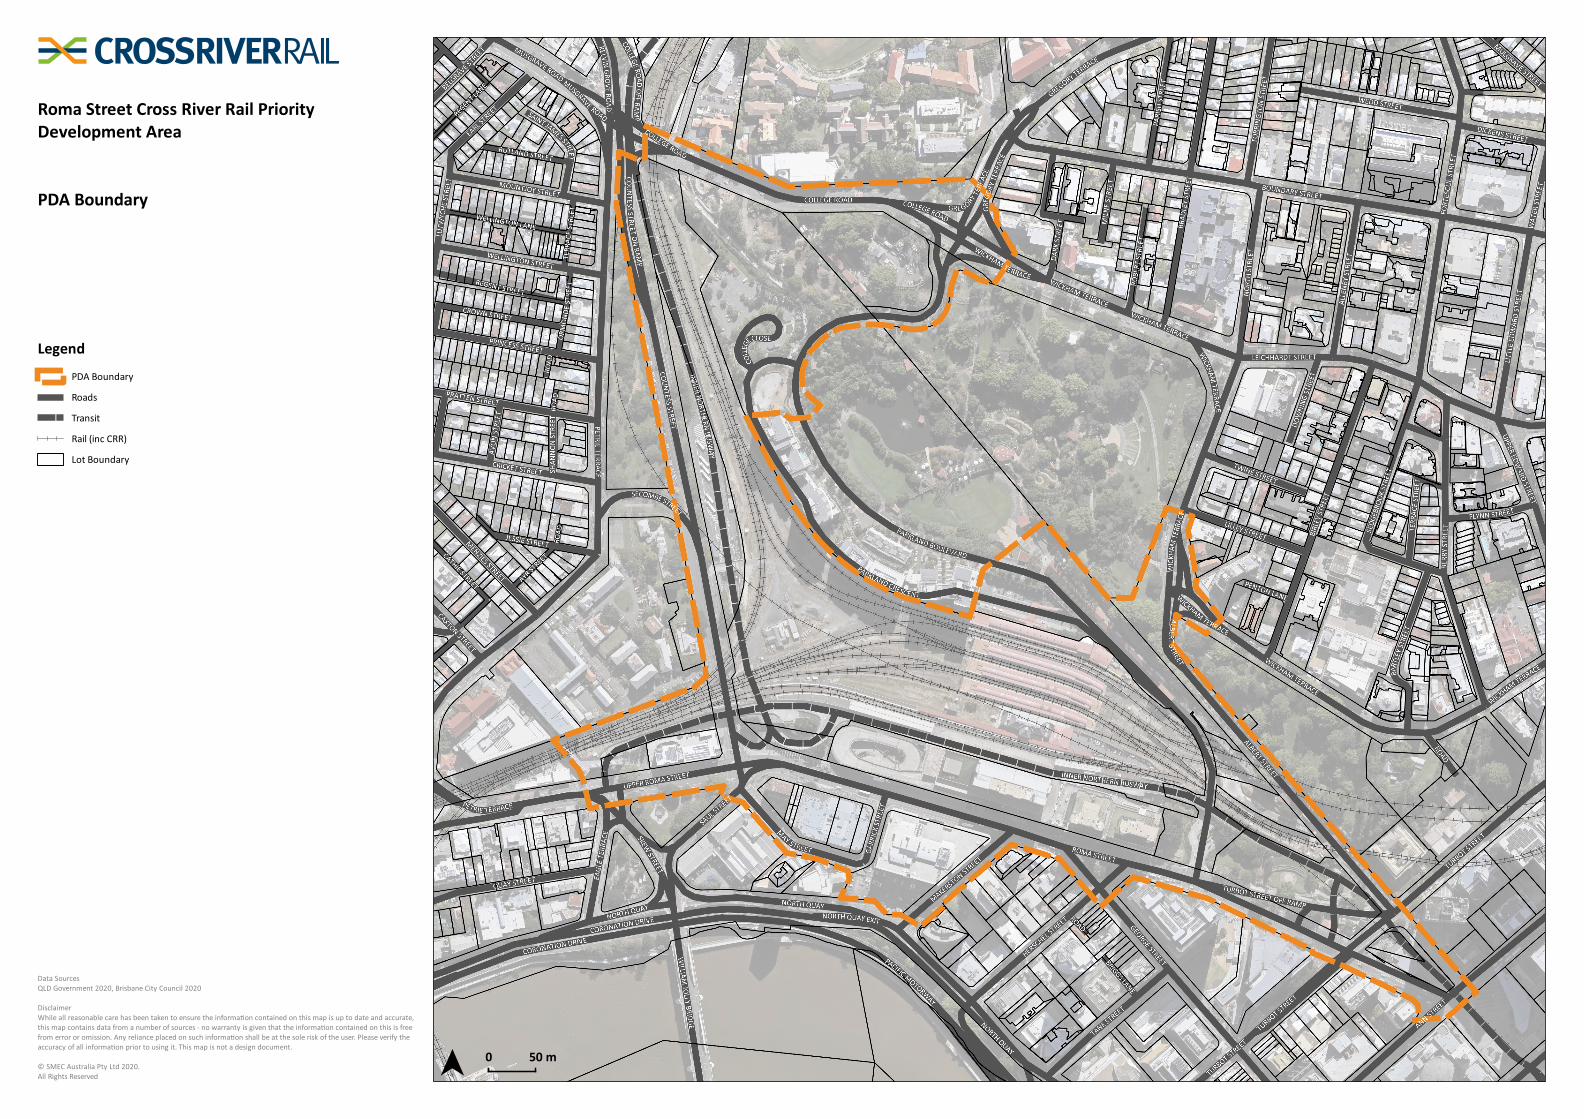
Roma Street Cross River Rail PriorityDevelopment Area
PDA Boundary
Roads
Transit
Rail (inc CRR)
Lot Boundary
Legend
Data SourcesQLD Government 2020, Brisbane City Council 2020
DisclaimerWhile all reasonable care has been taken to ensure the informa on contained on this map is up to date and accurate,this map contains data from a number of sources - no warranty is given that the informa on contained on this is freefrom error or omission. Any reliance placed on such informa on shall be at the sole risk of the user. Please verify theaccuracy of all informa on prior to using it. This map is not a design document.
© SMEC Australia Pty Ltd 2020.All Rights Reserved
PDA Boundary
ROMA STREET PRIORITY DEVELOPMENT AREA Cross River Rail Delivery Authority Infrastructure Plan Background Report Prepared for Cross River Rail Delivery Authority
SMEC Internal Ref. 30032260 23 November 2020
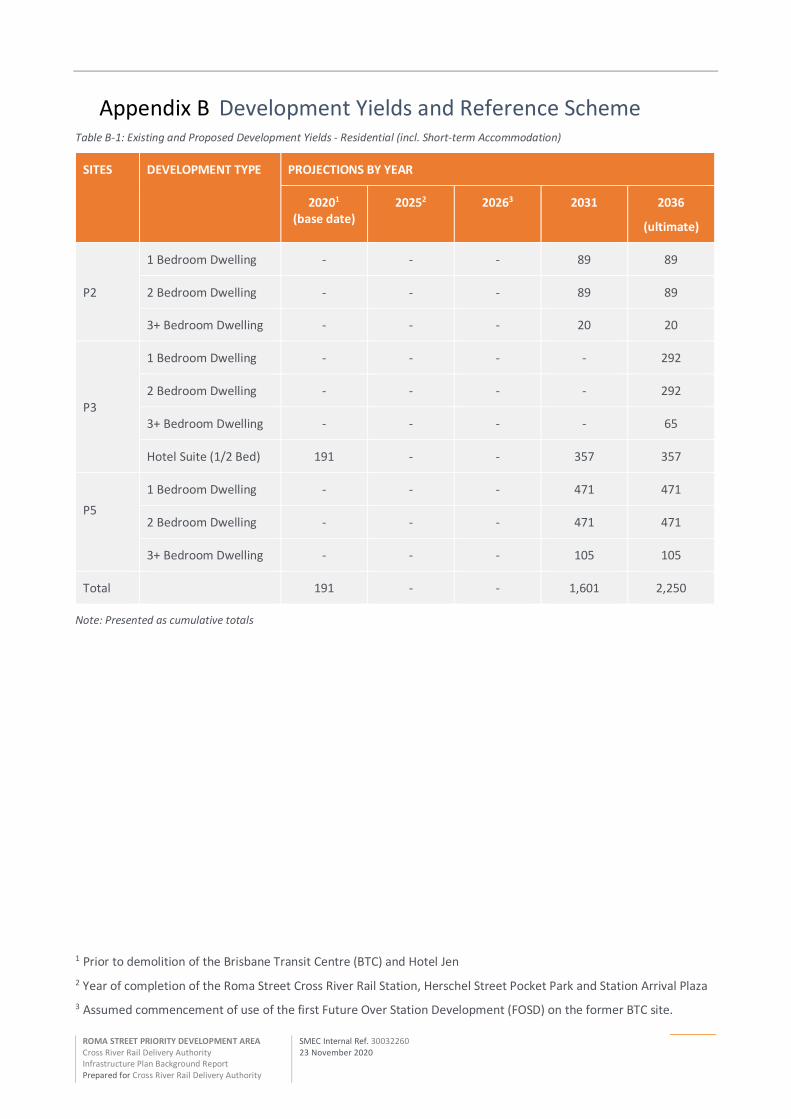
Appendix B Development Yields and Reference Scheme Table B-1: Existing and Proposed Development Yields - Residential (incl. Short-term Accommodation)
SITES DEVELOPMENT TYPE PROJECTIONS BY YEAR
20201 (base date)
20252 20263 2031 2036
(ultimate)
P2
1 Bedroom Dwelling - - - 89 89
2 Bedroom Dwelling - - - 89 89
3+ Bedroom Dwelling - - - 20 20
P3
1 Bedroom Dwelling - - - - 292
2 Bedroom Dwelling - - - - 292
3+ Bedroom Dwelling - - - - 65
Hotel Suite (1/2 Bed) 191 - - 357 357
P5 1 Bedroom Dwelling - - - 471 471
2 Bedroom Dwelling - - - 471 471
3+ Bedroom Dwelling - - - 105 105
Total 191 - - 1,601 2,250
Note: Presented as cumulative totals
1 Prior to demolition of the Brisbane Transit Centre (BTC) and Hotel Jen 2 Year of completion of the Roma Street Cross River Rail Station, Herschel Street Pocket Park and Station Arrival Plaza 3 Assumed commencement of use of the first Future Over Station Development (FOSD) on the former BTC site.
ROMA STREET PRIORITY DEVELOPMENT AREA Cross River Rail Delivery Authority Infrastructure Plan Background Report Prepared for Cross River Rail Delivery Authority
SMEC Internal Ref. 30032260 23 November 2020
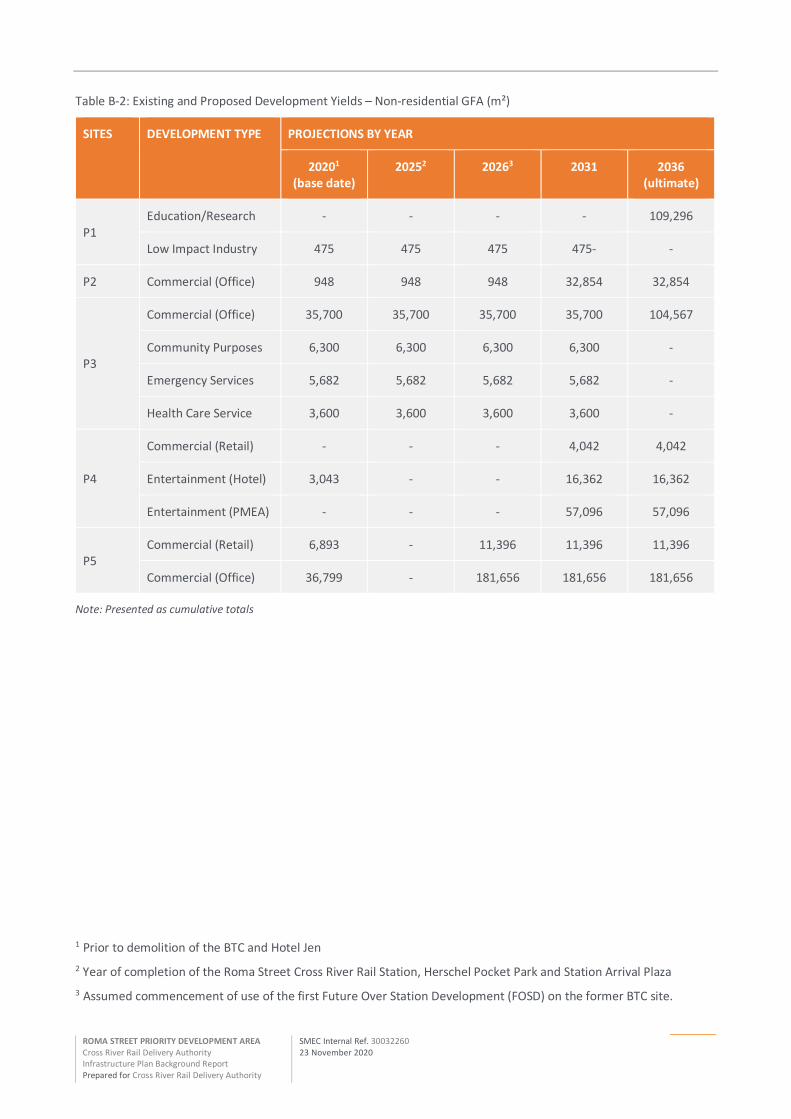
Table B-2: Existing and Proposed Development Yields – Non-residential GFA (m²)
SITES DEVELOPMENT TYPE PROJECTIONS BY YEAR
20201 (base date)
20252 20263 2031 2036 (ultimate)
P1 Education/Research - - - - 109,296
Low Impact Industry 475 475 475 475- -
P2 Commercial (Office) 948 948 948 32,854 32,854
P3
Commercial (Office) 35,700 35,700 35,700 35,700 104,567
Community Purposes 6,300 6,300 6,300 6,300 -
Emergency Services 5,682 5,682 5,682 5,682 -
Health Care Service 3,600 3,600 3,600 3,600 -
P4
Commercial (Retail) - - - 4,042 4,042
Entertainment (Hotel) 3,043 - - 16,362 16,362
Entertainment (PMEA) - - - 57,096 57,096
P5 Commercial (Retail) 6,893 - 11,396 11,396 11,396
Commercial (Office) 36,799 - 181,656 181,656 181,656
Note: Presented as cumulative totals
1 Prior to demolition of the BTC and Hotel Jen 2 Year of completion of the Roma Street Cross River Rail Station, Herschel Pocket Park and Station Arrival Plaza 3 Assumed commencement of use of the first Future Over Station Development (FOSD) on the former BTC site.
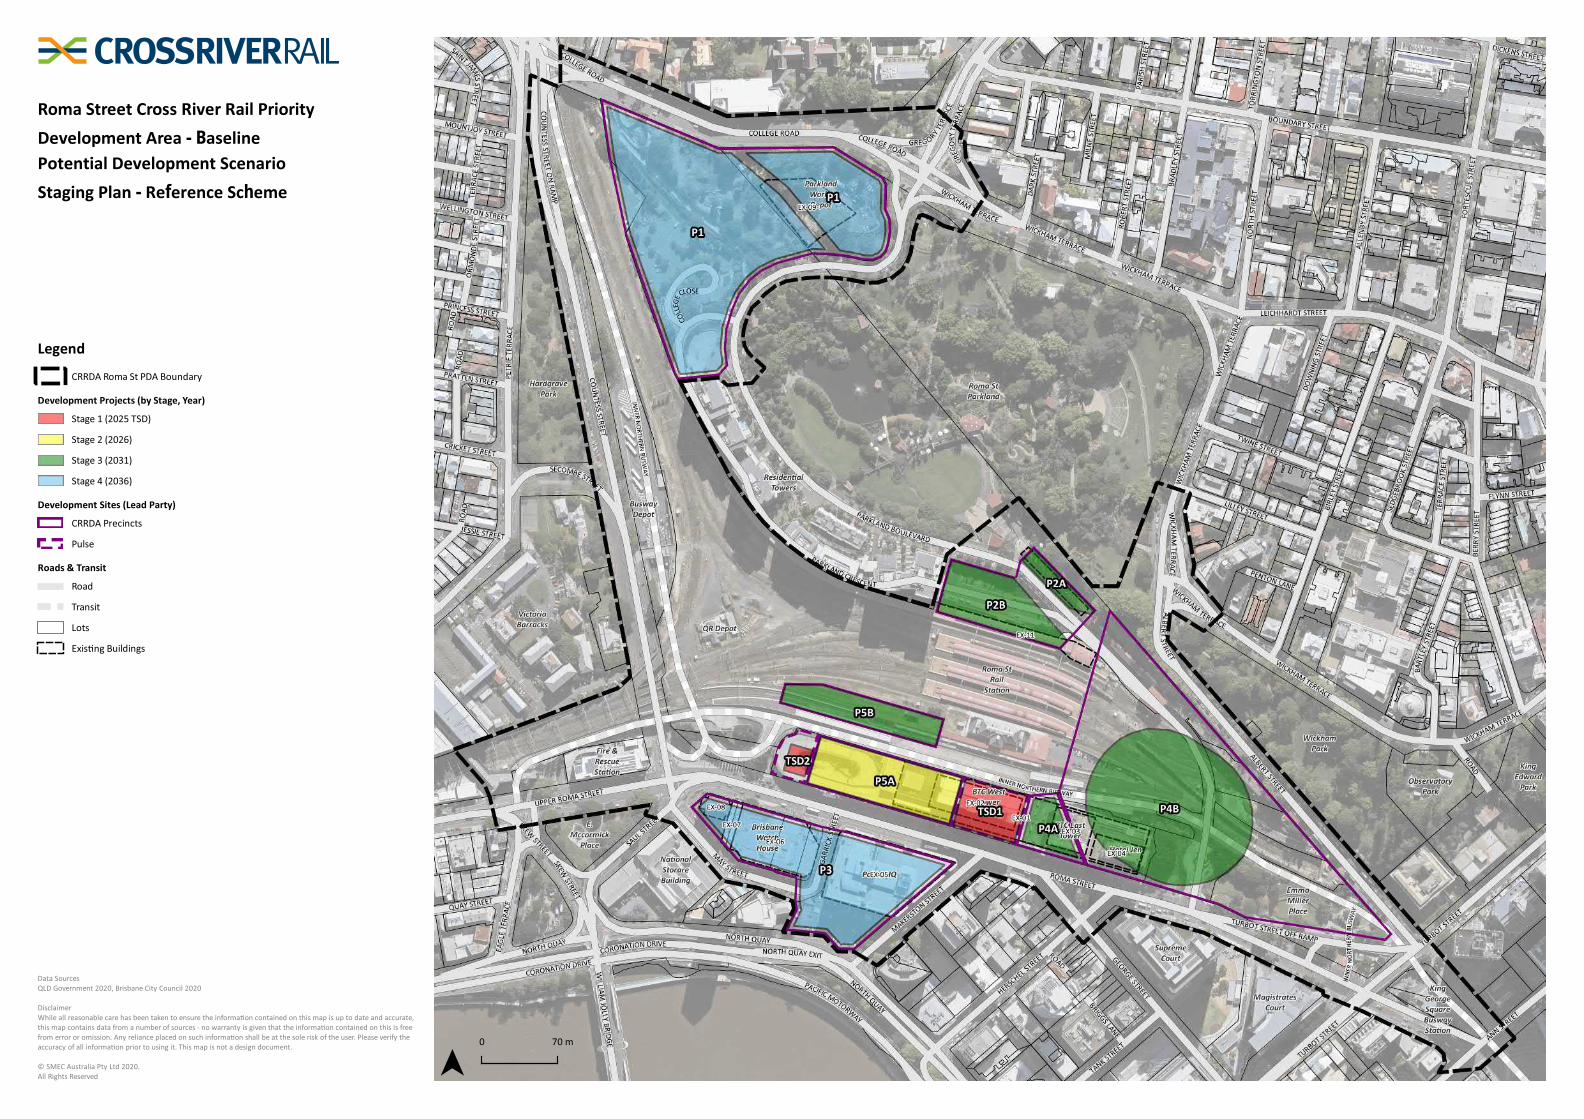
Roma Street Cross River Rail Priority
Development Area - Baseline Potential Development Scenario
Staging Plan - Reference Scheme
CRRDA Roma St PDA Boundary
Development Projects (by Stage, Year)
Stage 1 (2025 TSD)
Stage 2 (2026)
Stage 3 (2031)
Stage 4 (2036)
Development Sites (Lead Party)
CRRDA Precincts
Pulse
Roads & Transit
Road
Transit
Lots
Exis ng Buildings
Legend
Data SourcesQLD Government 2020, Brisbane City Council 2020
DisclaimerWhile all reasonable care has been taken to ensure the informa on contained on this map is up to date and accurate,this map contains data from a number of sources - no warranty is given that the informa on contained on this is freefrom error or omission. Any reliance placed on such informa on shall be at the sole risk of the user. Please verify theaccuracy of all informa on prior to using it. This map is not a design document.
© SMEC Australia Pty Ltd 2020.All Rights Reserved
ROMA STREET PRIORITY DEVELOPMENT AREA Cross River Rail Delivery Authority Infrastructure Plan Background Report Prepared for Cross River Rail Delivery Authority
SMEC Internal Ref. 30032260 23 November 2020
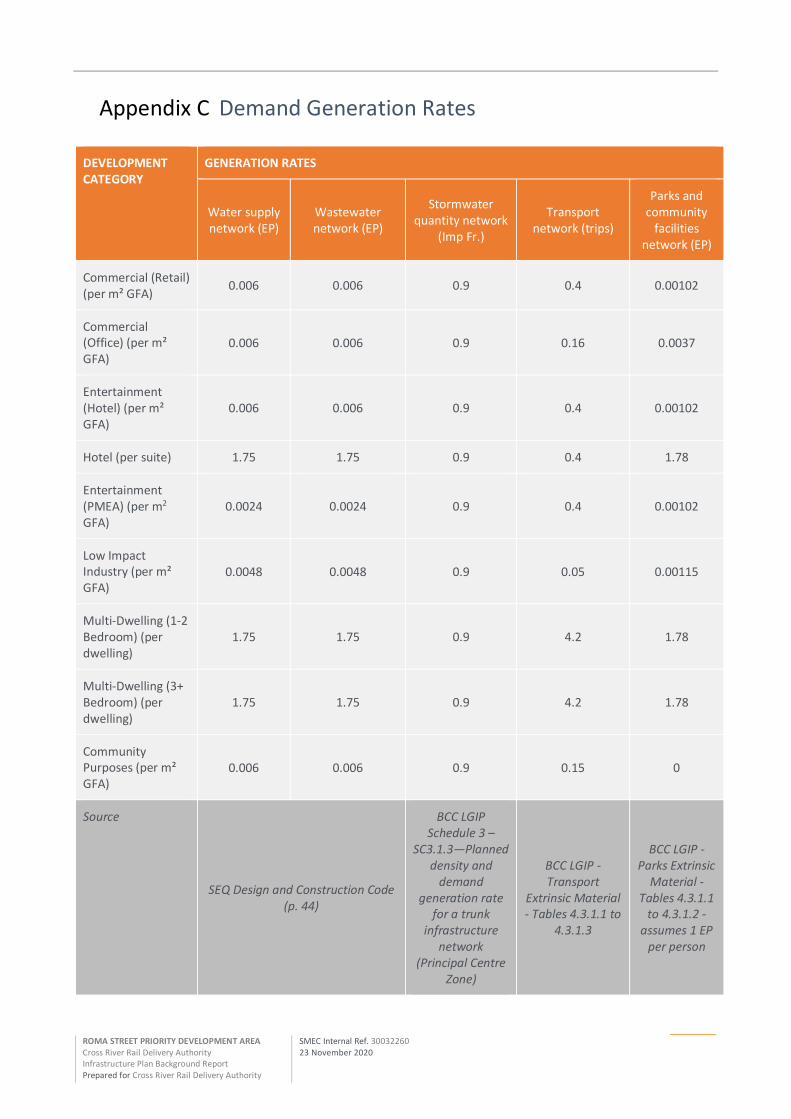
Appendix C Demand Generation Rates
DEVELOPMENT CATEGORY
GENERATION RATES
Water supply network (EP)
Wastewater network (EP)
Stormwater quantity network
(Imp Fr.)
Transport network (trips)
Parks and community
facilities network (EP)
Commercial (Retail) (per m² GFA) 0.006 0.006 0.9 0.4 0.00102
Commercial (Office) (per m² GFA)
0.006 0.006 0.9 0.16 0.0037
Entertainment (Hotel) (per m² GFA)
0.006 0.006 0.9 0.4 0.00102
Hotel (per suite) 1.75 1.75 0.9 0.4 1.78
Entertainment (PMEA) (per m2 GFA)
0.0024 0.0024 0.9 0.4 0.00102
Low Impact Industry (per m² GFA)
0.0048 0.0048 0.9 0.05 0.00115
Multi-Dwelling (1-2 Bedroom) (per dwelling)
1.75 1.75 0.9 4.2 1.78
Multi-Dwelling (3+ Bedroom) (per dwelling)
1.75 1.75 0.9 4.2 1.78
Community Purposes (per m² GFA)
0.006 0.006 0.9 0.15 0
Source
SEQ Design and Construction Code (p. 44)
BCC LGIP Schedule 3 –
SC3.1.3—Planned density and
demand generation rate
for a trunk infrastructure
network (Principal Centre
Zone)
BCC LGIP - Transport
Extrinsic Material - Tables 4.3.1.1 to
4.3.1.3
BCC LGIP - Parks Extrinsic
Material - Tables 4.3.1.1
to 4.3.1.2 - assumes 1 EP
per person
ROMA STREET PRIORITY DEVELOPMENT AREA Cross River Rail Delivery Authority Infrastructure Plan Background Report Prepared for Cross River Rail Delivery Authority
SMEC Internal Ref. 30032260 23 November 2020
Appendix D Demand Projections
INFRASTRUCTURE EXISTING AND PROJECT DEMAND (EP)
20201 (base date)
20252 20263 2031 2036 (ultimate)
Water Supply Network 930 - 1,158 4,419 6,837
Wastewater Network 930 - 1,158 4,379 6,837
Stormwater Network N/A N/A N/A N/A N/A
Transport Network 18,163 - 33,623 75,375 111,226
Communities Facility Network
340 - 1,862 2,850 4,005
1 Prior to demolition of the BTC and Hotel Jen 2 Year of completion of the Roma Street Cross River Rail Station, Herschel Pocket Park and Station Arrival Plaza 3 Assumed commencement of use of the first Future Over Station Development (FOSD) on the former BTC site.
ROMA STREET PRIORITY DEVELOPMENT AREA Cross River Rail Delivery Authority Infrastructure Plan Background Report Prepared for Cross River Rail Delivery Authority
SMEC Internal Ref. 30032260 23 November 2020
Appendix E Technical Memorandums / Network Summary Reports / Future Infrastructure Network Plans
Page 1
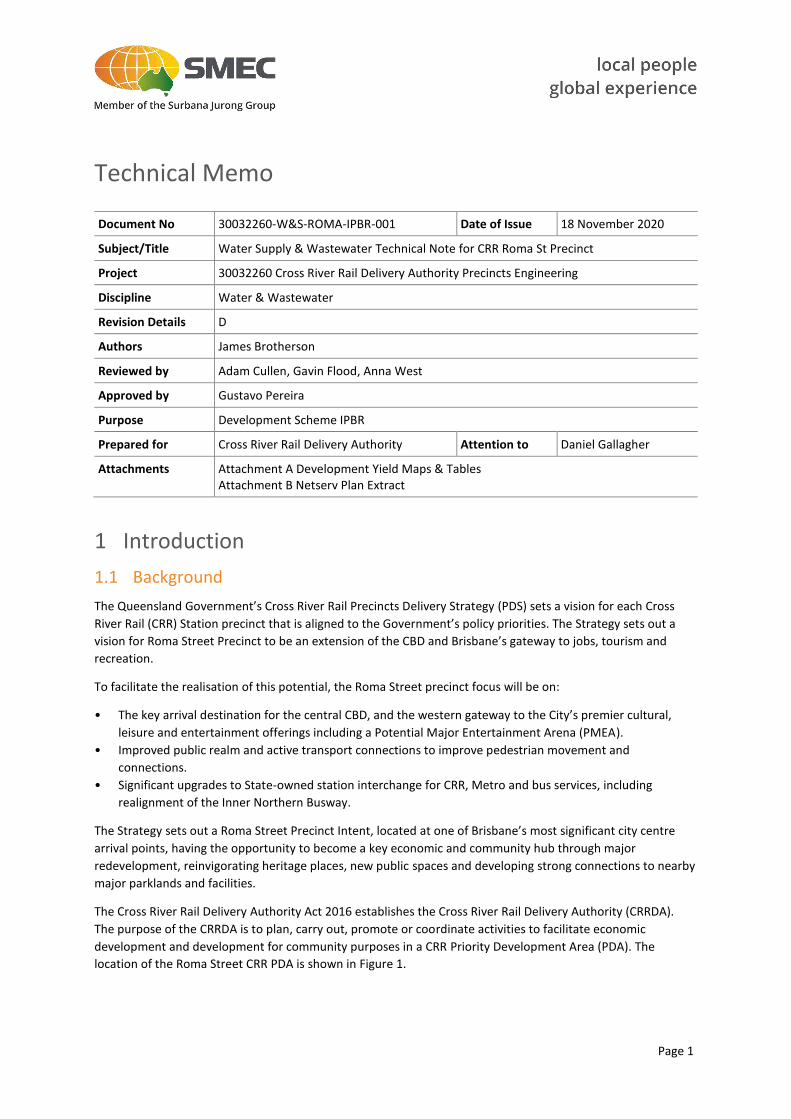
Technical Memo
Document No 30032260-W&S-ROMA-IPBR-001 Date of Issue 18 November 2020
Subject/Title Water Supply & Wastewater Technical Note for CRR Roma St Precinct
Project 30032260 Cross River Rail Delivery Authority Precincts Engineering
Discipline Water & Wastewater
Revision Details D
Authors James Brotherson
Reviewed by Adam Cullen, Gavin Flood, Anna West
Approved by Gustavo Pereira
Purpose Development Scheme IPBR
Prepared for Cross River Rail Delivery Authority Attention to Daniel Gallagher
Attachments Attachment A Development Yield Maps & Tables Attachment B Netserv Plan Extract
1 Introduction
1.1 Background
The Queensland Government’s Cross River Rail Precincts Delivery Strategy (PDS) sets a vision for each Cross
River Rail (CRR) Station precinct that is aligned to the Government’s policy priorities. The Strategy sets out a
vision for Roma Street Precinct to be an extension of the CBD and Brisbane’s gateway to jobs, tourism and
recreation.
To facilitate the realisation of this potential, the Roma Street precinct focus will be on:
• The key arrival destination for the central CBD, and the western gateway to the City’s premier cultural,
leisure and entertainment offerings including a Potential Major Entertainment Arena (PMEA).
• Improved public realm and active transport connections to improve pedestrian movement and
connections.
• Significant upgrades to State-owned station interchange for CRR, Metro and bus services, including
realignment of the Inner Northern Busway.
The Strategy sets out a Roma Street Precinct Intent, located at one of Brisbane’s most significant city centre
arrival points, having the opportunity to become a key economic and community hub through major
redevelopment, reinvigorating heritage places, new public spaces and developing strong connections to nearby
major parklands and facilities.
The Cross River Rail Delivery Authority Act 2016 establishes the Cross River Rail Delivery Authority (CRRDA).
The purpose of the CRRDA is to plan, carry out, promote or coordinate activities to facilitate economic
development and development for community purposes in a CRR Priority Development Area (PDA). The
location of the Roma Street CRR PDA is shown in Figure 1.
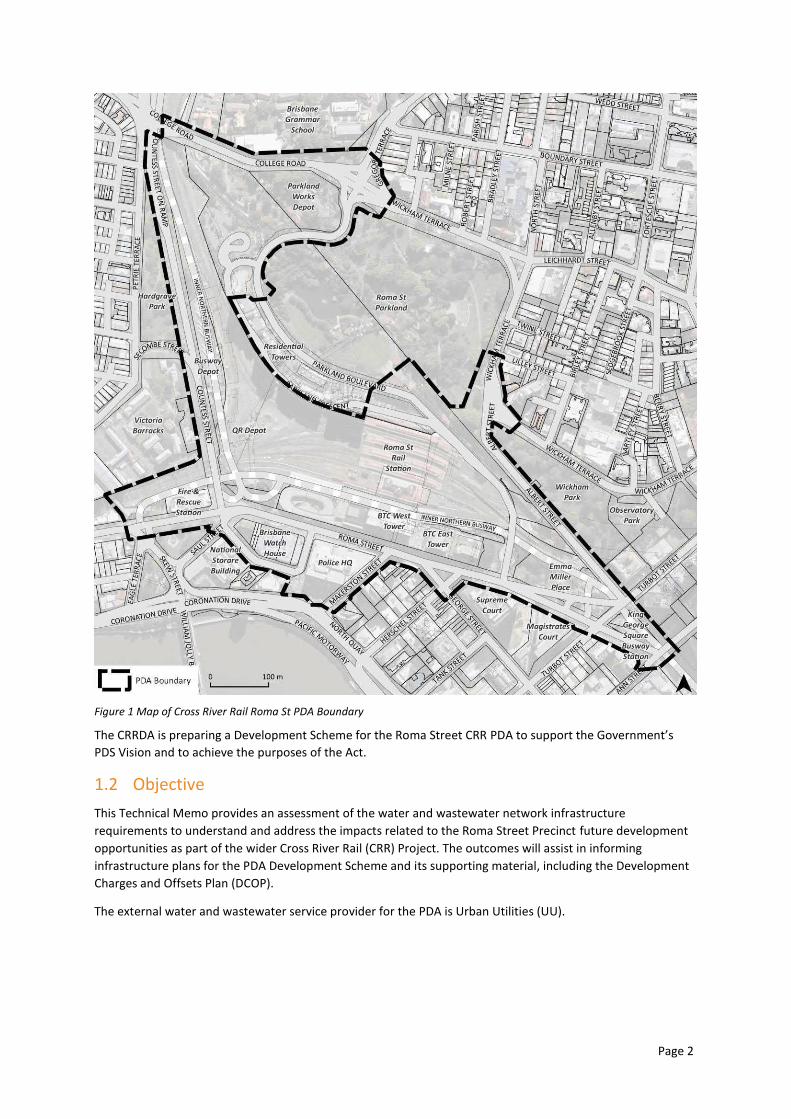
Page 2
Figure 1 Map of Cross River Rail Roma St PDA Boundary
The CRRDA is preparing a Development Scheme for the Roma Street CRR PDA to support the Government’s
PDS Vision and to achieve the purposes of the Act.
1.2 Objective
This Technical Memo provides an assessment of the water and wastewater network infrastructure
requirements to understand and address the impacts related to the Roma Street Precinct future development
opportunities as part of the wider Cross River Rail (CRR) Project. The outcomes will assist in informing
infrastructure plans for the PDA Development Scheme and its supporting material, including the Development
Charges and Offsets Plan (DCOP).
The external water and wastewater service provider for the PDA is Urban Utilities (UU).
Page 3
2 Land Use
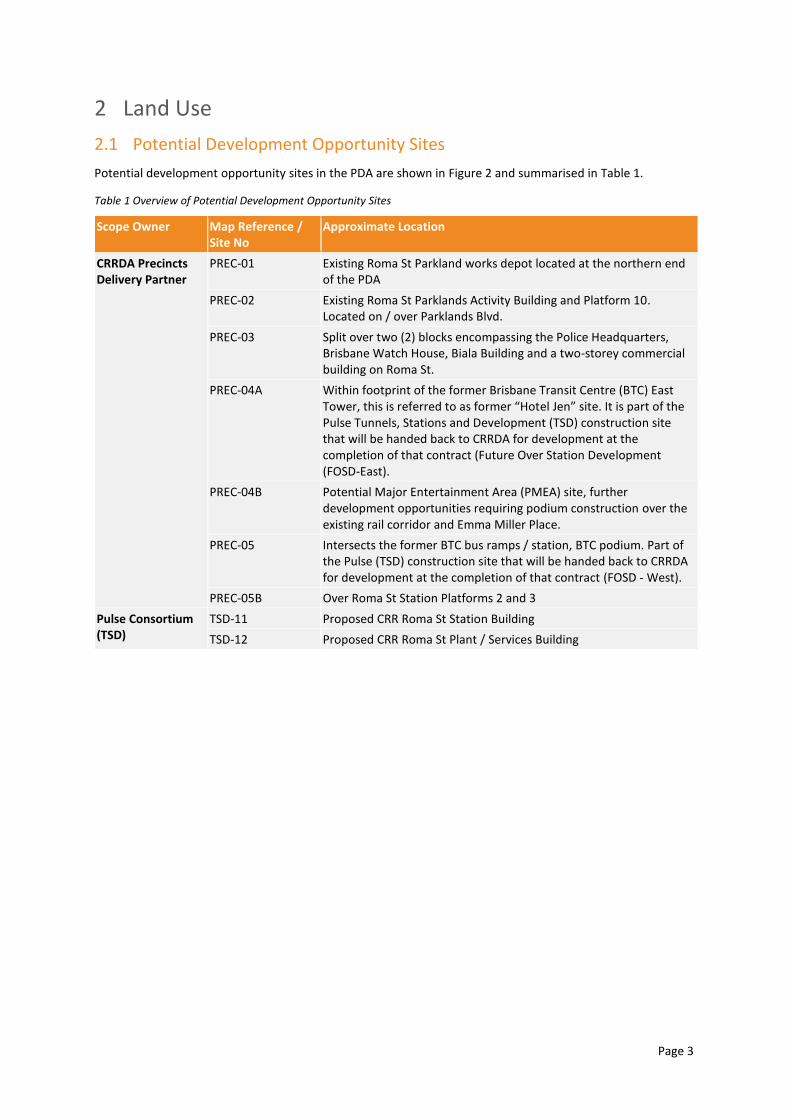
2.1 Potential Development Opportunity Sites
Potential development opportunity sites in the PDA are shown in Figure 2 and summarised in Table 1.
Table 1 Overview of Potential Development Opportunity Sites
Scope Owner Map Reference / Site No
Approximate Location
CRRDA Precincts Delivery Partner
PREC-01 Existing Roma St Parkland works depot located at the northern end of the PDA
PREC-02 Existing Roma St Parklands Activity Building and Platform 10. Located on / over Parklands Blvd.
PREC-03 Split over two (2) blocks encompassing the Police Headquarters, Brisbane Watch House, Biala Building and a two-storey commercial building on Roma St.
PREC-04A Within footprint of the former Brisbane Transit Centre (BTC) East Tower, this is referred to as former “Hotel Jen” site. It is part of the Pulse Tunnels, Stations and Development (TSD) construction site that will be handed back to CRRDA for development at the completion of that contract (Future Over Station Development (FOSD-East).
PREC-04B Potential Major Entertainment Area (PMEA) site, further development opportunities requiring podium construction over the existing rail corridor and Emma Miller Place.
PREC-05 Intersects the former BTC bus ramps / station, BTC podium. Part of the Pulse (TSD) construction site that will be handed back to CRRDA for development at the completion of that contract (FOSD - West).
PREC-05B Over Roma St Station Platforms 2 and 3
Pulse Consortium (TSD)
TSD-11 Proposed CRR Roma St Station Building
TSD-12 Proposed CRR Roma St Plant / Services Building
Roma Street Cross River Rail PriorityDevelopment AreaWater & Wastewater Technical Note
CRRDA Roma St PDA Boundary
Development Sites (by Owner)
CRRDA Precincts
Pulse
Roads & Transit
Road
Transit
Lots
Legend
Data SourcesQLD Government 2020, Brisbane City Council 2020
DisclaimerWhile all reasonable care has been taken to ensure the informa on contained on this map is up to date and accurate,this map contains data from a number of sources - no warranty is given that the informa on contained on this is freefrom error or omission. Any reliance placed on such informa on shall be at the sole risk of the user. Please verify theaccuracy of all informa on prior to using it. This map is not a design document.
© SMEC Australia Pty Ltd 2020.All Rights Reserved
Figure 02Poten al Development Opportunity Sites
Page 5
2.2 Development Scenarios
Potential Development Land Use Scenarios assessed are summarised in Table 2. Maps and yield tables
associated with these scenarios are contained in Attachment A Development Yield Maps & Tables.
Table 2 Land Use Scenarios
Scenario Description
Scenario 1 (Baseline) “Baseline” scenario that has been the focus of reference design planning, as well as some sensitivity analysis.
2.3 Equivalent Persons Estimate
2.3.1 Methodology
Estimates of Equivalent Persons (EP) unit of demand were developed for the Baseline Potential Development
Scenario. The estimates were developed in accordance with the South East Queensland (SEQ) Water and Sewer
Design and Construction Code (“the SEQ Code”).
The EP estimate is specific to water and wastewater network planning, and it should not be interpreted as
representing true future population of development in the PDA.
Totals shown in tables and charts (including EP, water and wastewater demand estimates) are not calculated
“as formatted” and often include decimal parts that are not visible due to number formatting.
2.3.2 Existing Scenario / Demand Credits
An Existing Land Use EP estimate was prepared to quantify demand credits associated with the removal of
existing buildings / demand sources as potential sites are redeveloped. The analysis found that the existing EP
credits equates to approximately 895 EPs.
Roma Street Cross River Rail PriorityDevelopment AreaWater & Wastewater Technical Note
CRRDA Roma St PDA Boundary
Exis ng Buildings
Development Sites (by Owner)
CRRDA Precincts
Pulse
Roads & Transit
Road
Transit
Lots
Legend
Data SourcesQLD Government 2020, Brisbane City Council 2020
DisclaimerWhile all reasonable care has been taken to ensure the informa on contained on this map is up to date and accurate,this map contains data from a number of sources - no warranty is given that the informa on contained on this is freefrom error or omission. Any reliance placed on such informa on shall be at the sole risk of the user. Please verify theaccuracy of all informa on prior to using it. This map is not a design document.
© SMEC Australia Pty Ltd 2020.All Rights Reserved
MapRef Name
EX-01 Existing BTC Podium
EX-02 Existing BTC West Tower
EX-03 Existing BTC East Tower
EX-04 Existing Hotel Jen
EX-05 Existing Police Headquarters / Police Museum Building
EX-06 Existing Brisbane Watch House
EX-07 Existing Private Commercial Building
EX-08 Existing Biala Building
EX-09 Existing Works Depot
EX-10 Existing Activity Building
EX-11 Existing Platform 10
Figure 03Exis ng Buildings
Page 7
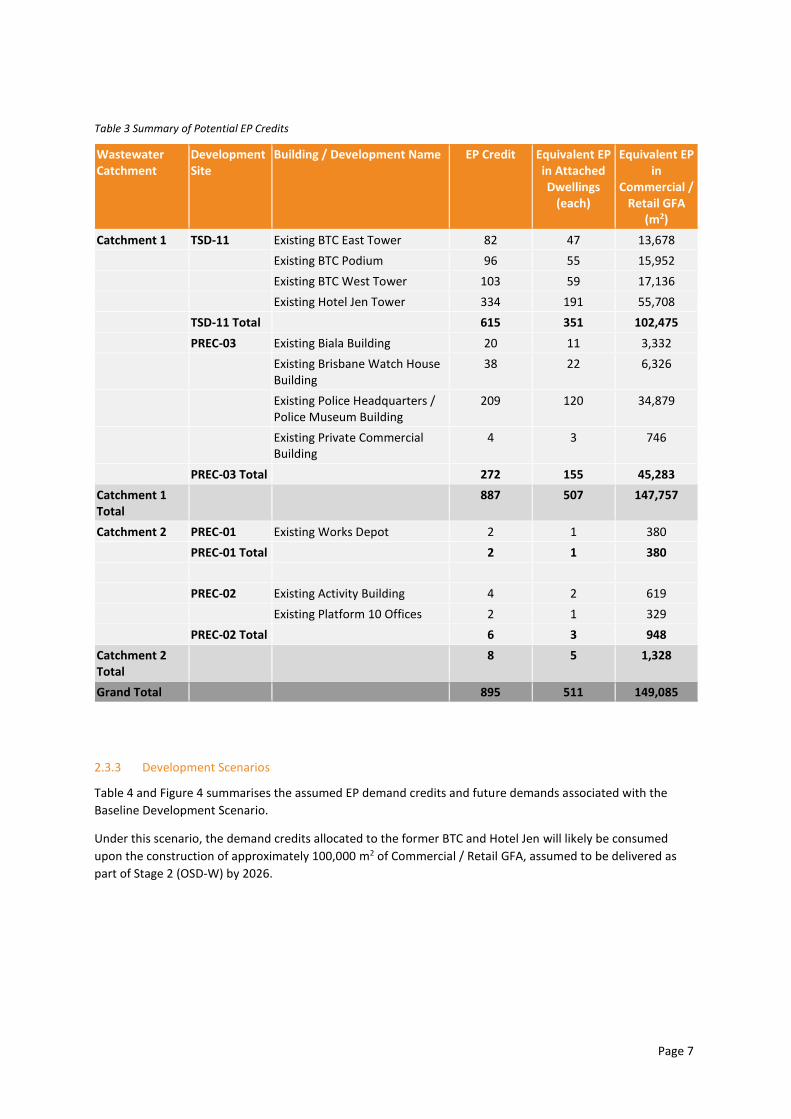
Table 3 Summary of Potential EP Credits
Wastewater Catchment
Development Site
Building / Development Name EP Credit Equivalent EP in Attached Dwellings
(each)
Equivalent EP in
Commercial / Retail GFA
(m2)
Catchment 1 TSD-11 Existing BTC East Tower 82 47 13,678
Existing BTC Podium 96 55 15,952
Existing BTC West Tower 103 59 17,136
Existing Hotel Jen Tower 334 191 55,708
TSD-11 Total
615 351 102,475
PREC-03 Existing Biala Building 20 11 3,332
Existing Brisbane Watch House Building
38 22 6,326
Existing Police Headquarters / Police Museum Building
209 120 34,879
Existing Private Commercial Building
4 3 746
PREC-03 Total
272 155 45,283
Catchment 1 Total
887 507 147,757
Catchment 2 PREC-01 Existing Works Depot 2 1 380
PREC-01 Total
2 1 380
PREC-02 Existing Activity Building 4 2 619
Existing Platform 10 Offices 2 1 329
PREC-02 Total
6 3 948
Catchment 2 Total
8 5 1,328
Grand Total
895 511 149,085
2.3.3 Development Scenarios
Table 4 and Figure 4 summarises the assumed EP demand credits and future demands associated with the
Baseline Development Scenario.
Under this scenario, the demand credits allocated to the former BTC and Hotel Jen will likely be consumed
upon the construction of approximately 100,000 m2 of Commercial / Retail GFA, assumed to be delivered as
part of Stage 2 (OSD-W) by 2026.
Page 8
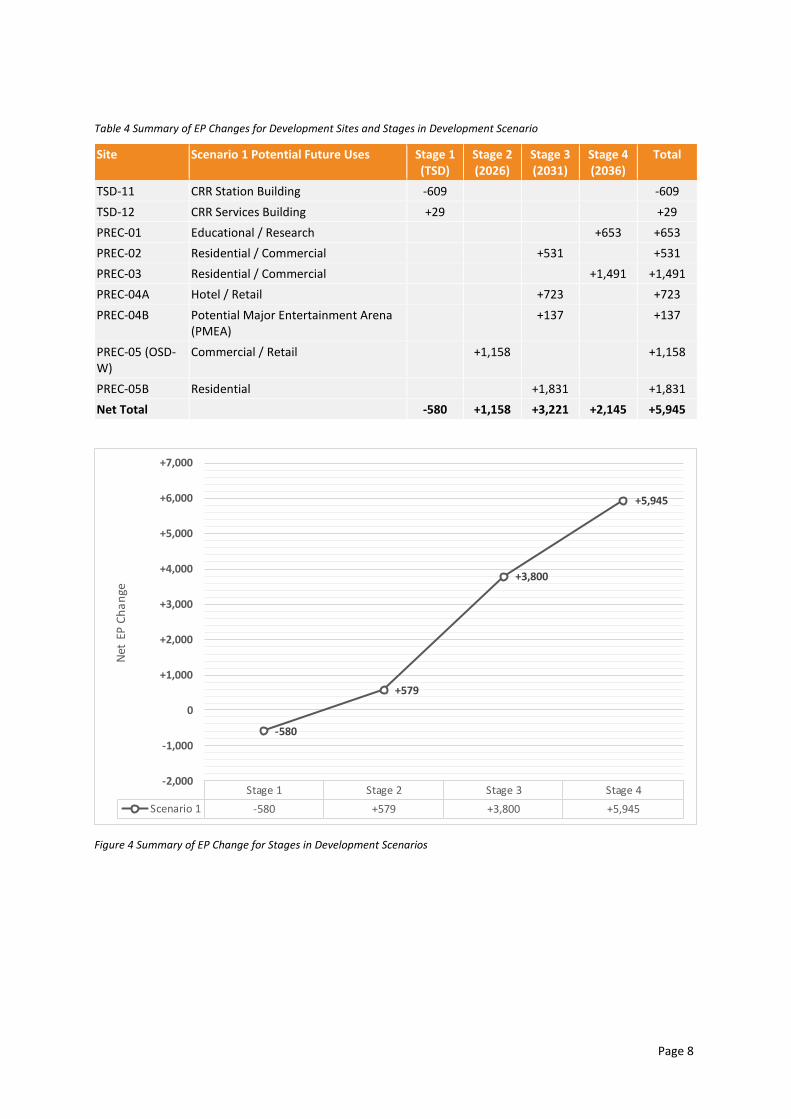
Table 4 Summary of EP Changes for Development Sites and Stages in Development Scenario
Site Scenario 1 Potential Future Uses Stage 1 (TSD)
Stage 2 (2026)
Stage 3 (2031)
Stage 4 (2036)
Total
TSD-11 CRR Station Building -609
-609
TSD-12 CRR Services Building +29
+29
PREC-01 Educational / Research
+653 +653
PREC-02 Residential / Commercial
+531
+531
PREC-03 Residential / Commercial
+1,491 +1,491
PREC-04A Hotel / Retail
+723
+723
PREC-04B Potential Major Entertainment Arena (PMEA)
+137
+137
PREC-05 (OSD-W)
Commercial / Retail
+1,158
+1,158
PREC-05B Residential
+1,831
+1,831
Net Total
-580 +1,158 +3,221 +2,145 +5,945
Figure 4 Summary of EP Change for Stages in Development Scenarios
Stage 1 Stage 2 Stage 3 Stage 4
Scenario 1 -580 +579 +3,800 +5,945
-580
+579
+3,800
+5,945
-2,000
-1,000
0
+1,000
+2,000
+3,000
+4,000
+5,000
+6,000
+7,000
Net
EP
Ch
an
ge
Page 9
3 Water Supply
3.1 Existing Infrastructure
Service Providers
The primary external water service provider is UU.
There is a network of private water mains within Roma St Parkland which is shown in the UU network dataset
as being State Government owned.
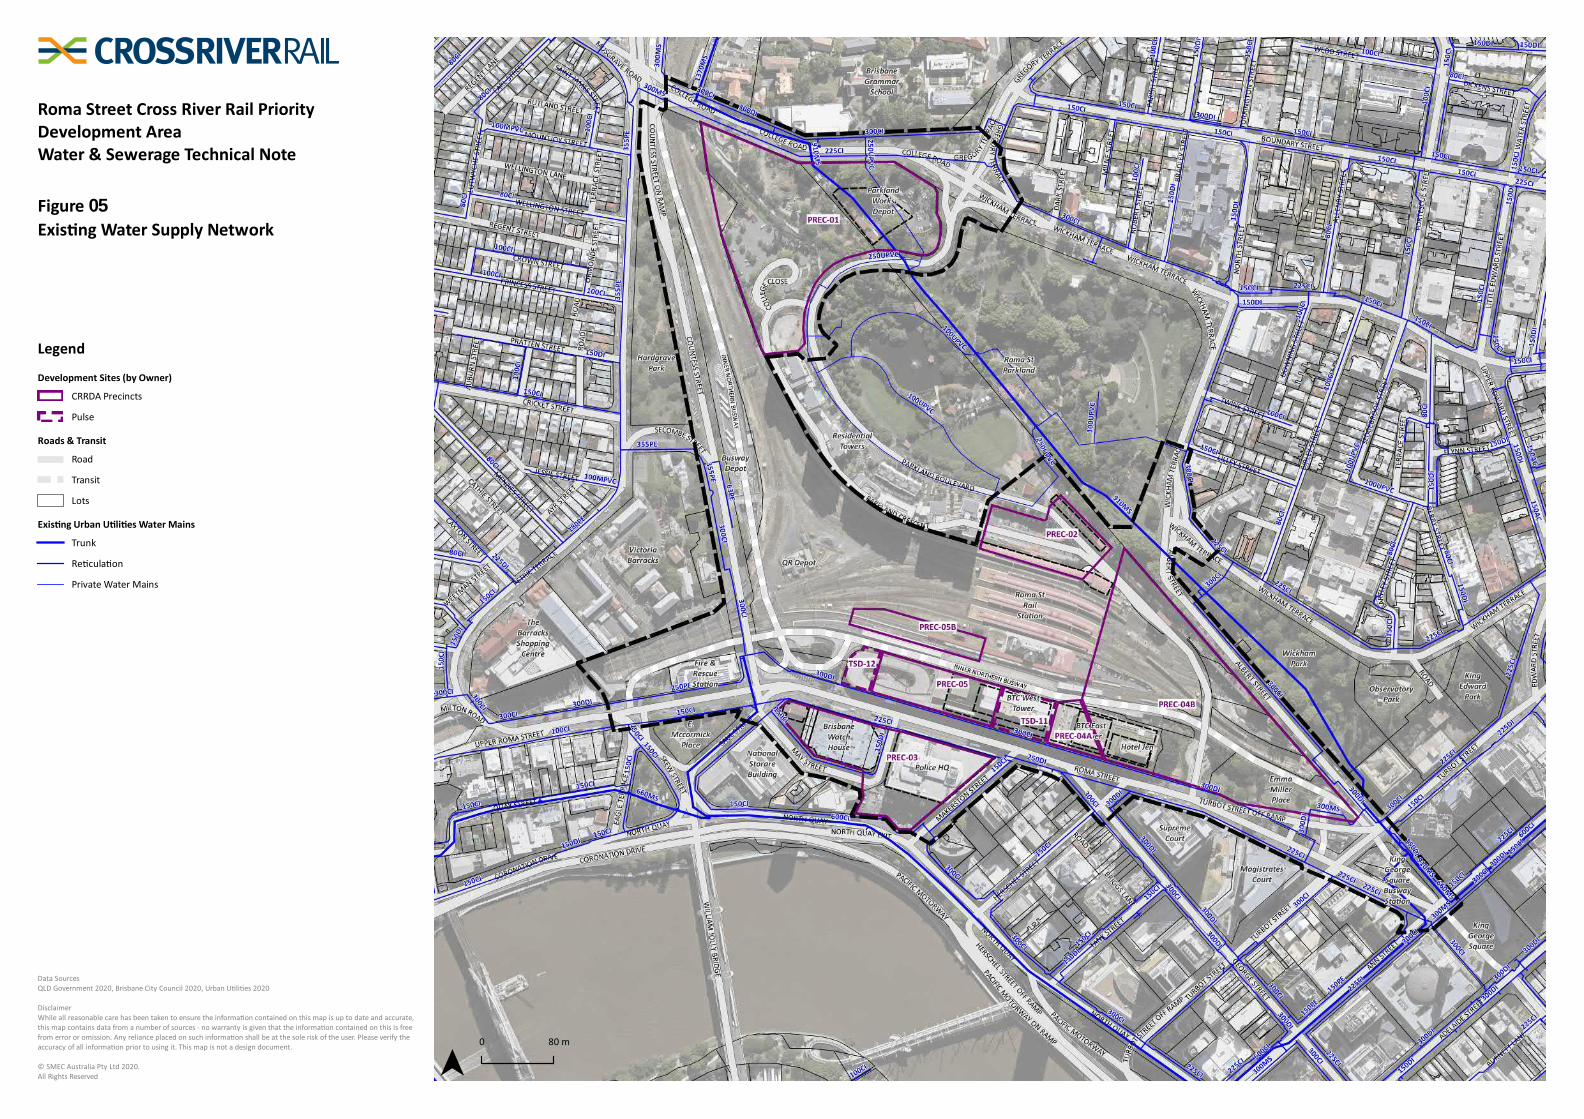
Infrastructure
The external water network around the PDA is shown in Figure 5. Notable water infrastructure in the PDA is as
follows:
• 910mm diameter Mild Steel (MS) trunk water main that intersects the PDA in a northwest / southeast
direction through Roma St Parklands and along the Albert St corridor. This is part of the S002 Bardon to
City Trunk Water Main which is an important supply main to the CBD. It was constructed in 1975.
• 300mm diameter reticulation main on north side of Roma St
The PDA falls within the Green Hill Water Supply Zone.
Existing Network Performance
The PDA is well-serviced in terms of existing potable water flow and pressure to accommodate the potential
development opportunities identified in the PDA.
Existing Planned Infrastructure
No relevant future UU water infrastructure projects are identified in or around the PDA in UU’s Netserv Plan
2020.
Roma Street Cross River Rail PriorityDevelopment AreaWater & Sewerage Technical Note
Development Sites (by Owner)
CRRDA Precincts
Pulse
Roads & Transit
Road
Transit
Lots
Exis ng Urban U li es Water Mains
Trunk
Re cula on
Private Water Mains
Legend
Data SourcesQLD Government 2020, Brisbane City Council 2020, Urban U li es 2020
DisclaimerWhile all reasonable care has been taken to ensure the informa on contained on this map is up to date and accurate,this map contains data from a number of sources - no warranty is given that the informa on contained on this is freefrom error or omission. Any reliance placed on such informa on shall be at the sole risk of the user. Please verify theaccuracy of all informa on prior to using it. This map is not a design document.
© SMEC Australia Pty Ltd 2020.All Rights Reserved
Figure 05Exis ng Water Supply Network
Page 11
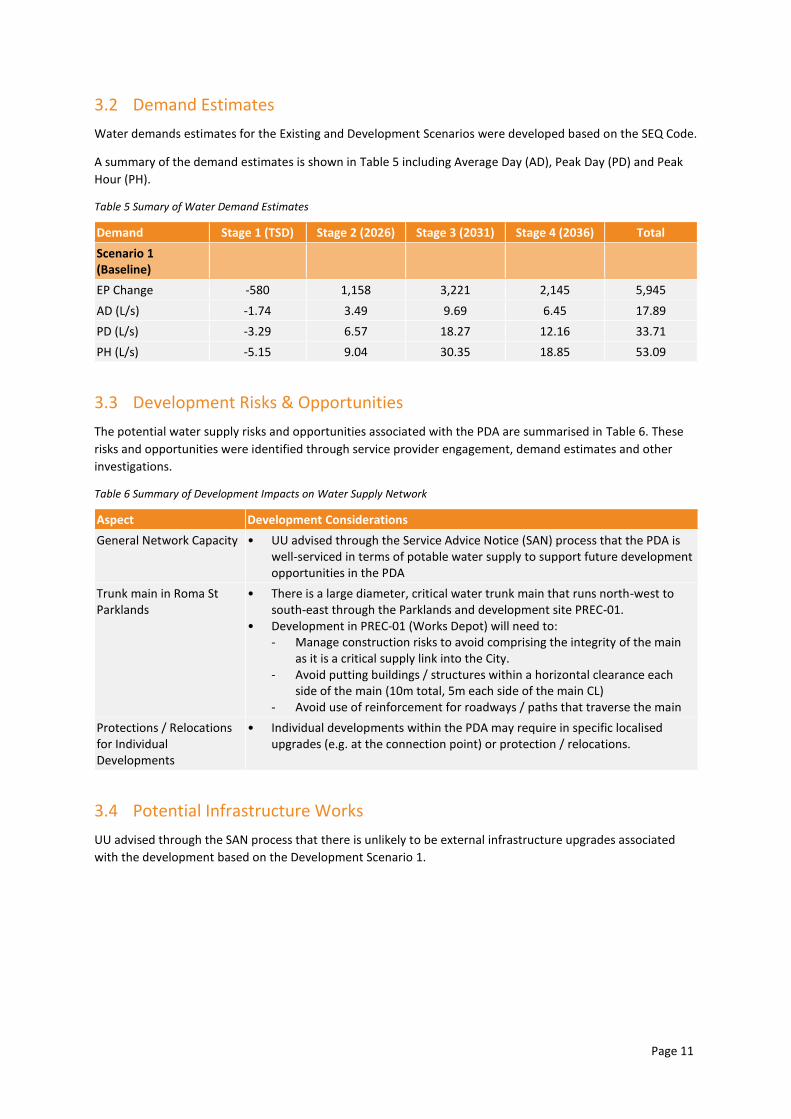
3.2 Demand Estimates
Water demands estimates for the Existing and Development Scenarios were developed based on the SEQ Code.
A summary of the demand estimates is shown in Table 5 including Average Day (AD), Peak Day (PD) and Peak
Hour (PH).
Table 5 Sumary of Water Demand Estimates
Demand Stage 1 (TSD) Stage 2 (2026) Stage 3 (2031) Stage 4 (2036) Total
Scenario 1 (Baseline)
EP Change -580 1,158 3,221 2,145 5,945
AD (L/s) -1.74 3.49 9.69 6.45 17.89
PD (L/s) -3.29 6.57 18.27 12.16 33.71
PH (L/s) -5.15 9.04 30.35 18.85 53.09
3.3 Development Risks & Opportunities
The potential water supply risks and opportunities associated with the PDA are summarised in Table 6. These
risks and opportunities were identified through service provider engagement, demand estimates and other
investigations.
Table 6 Summary of Development Impacts on Water Supply Network
Aspect Development Considerations
General Network Capacity • UU advised through the Service Advice Notice (SAN) process that the PDA is well-serviced in terms of potable water supply to support future development opportunities in the PDA
Trunk main in Roma St Parklands
• There is a large diameter, critical water trunk main that runs north-west to south-east through the Parklands and development site PREC-01.
• Development in PREC-01 (Works Depot) will need to: - Manage construction risks to avoid comprising the integrity of the main
as it is a critical supply link into the City. - Avoid putting buildings / structures within a horizontal clearance each
side of the main (10m total, 5m each side of the main CL) - Avoid use of reinforcement for roadways / paths that traverse the main
Protections / Relocations for Individual Developments
• Individual developments within the PDA may require in specific localised upgrades (e.g. at the connection point) or protection / relocations.
3.4 Potential Infrastructure Works
UU advised through the SAN process that there is unlikely to be external infrastructure upgrades associated
with the development based on the Development Scenario 1.
Page 12
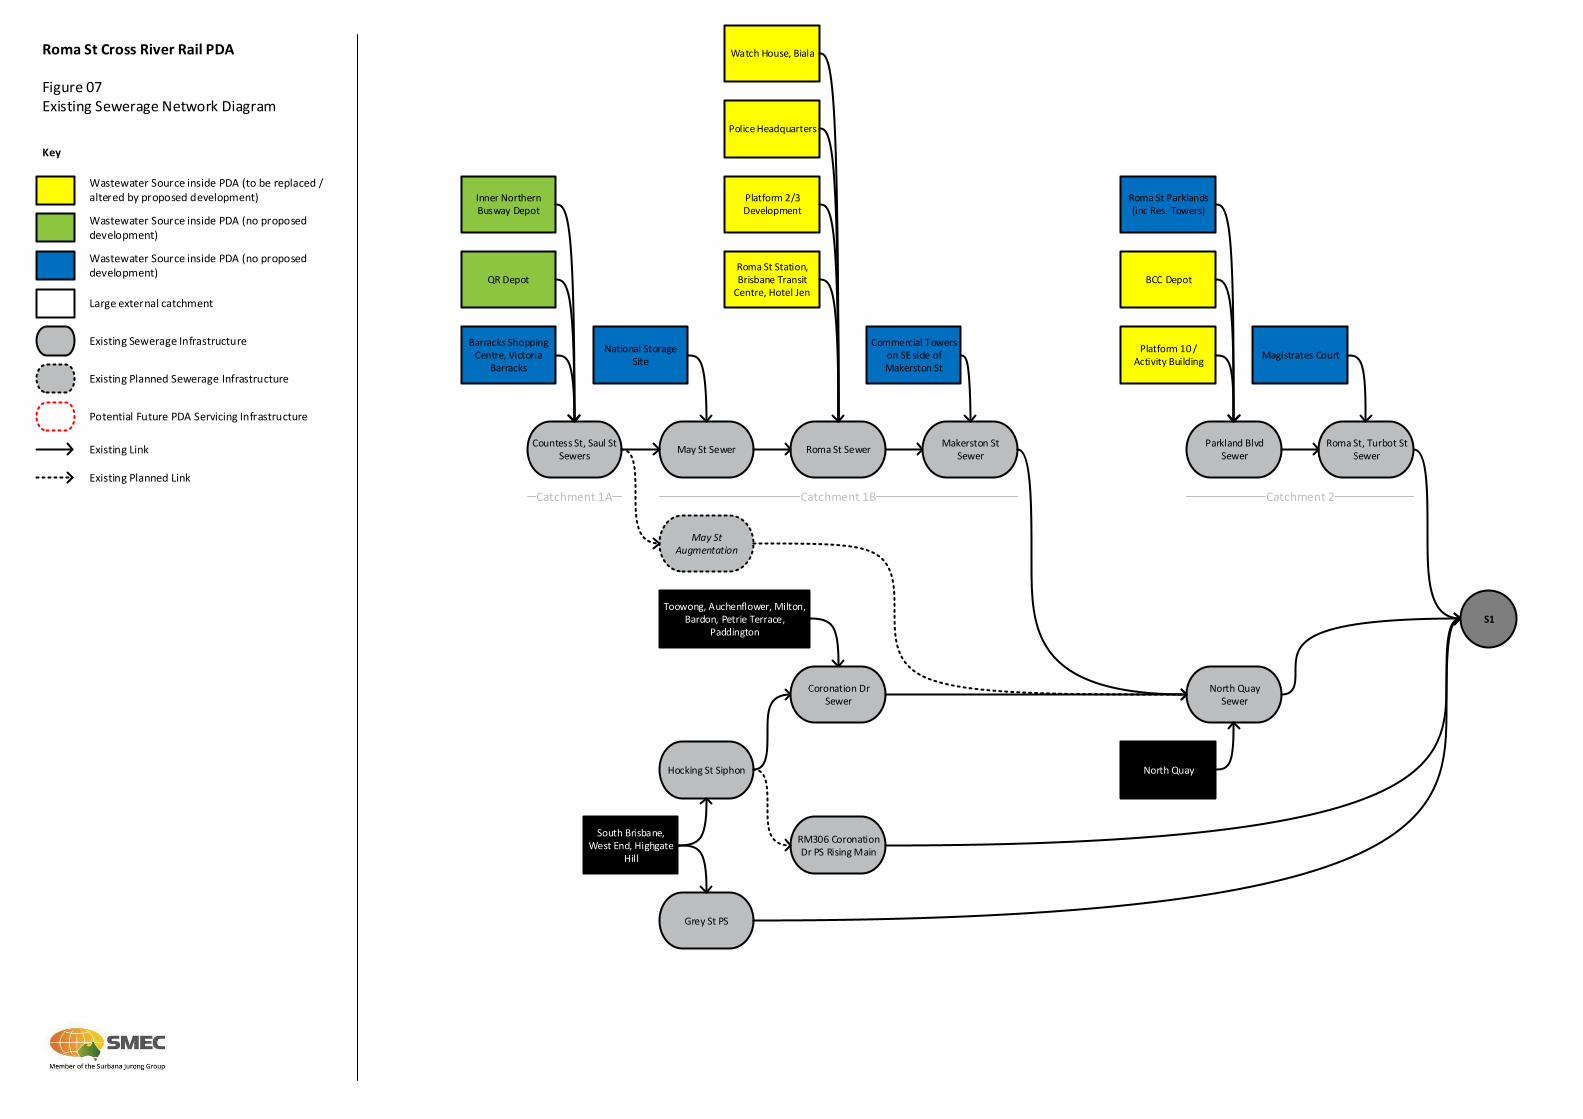
4 Wastewater
4.1 Existing Infrastructure
Service Providers
The primary external wastewater service provider is UU.
Internal Catchments & Infrastructure
A map of the existing wastewater network around the PDA is contained in Figure 6. A network diagram of the
existing and possible future wastewater network is contained in Figure 7.
The wastewater network intersecting the PDA is effectively split into two (2) separate catchments. Notable
features of the wastewater catchments intersecting the PDA include:
• Catchment 1: Wastewater network upstream of sewer main on Makerston St, divided into two (2) sub-
catchments:
- Catchment 1A:
- Services existing Roma St Fire / Ambulance Station, Victoria Barracks, The Barracks Shopping
Centre, Busway depot, QR Depot
- Contains the following mains / subnetworks:
- 150mm diameter Earthenware (EW) sewer servicing The Barracks Shopping Centre
- 150mm diameter EW / Cast Iron (CI) sewer along Countess St
- Discharges into Catchment 1B at manhole MH167453 on the intersection of Saul St and May St
- This sub-network may eventually be diverted away from the PDA as part of the UU project CBD-
2016-GM-0016 (identified in 2020 Netserv Plan) Augmentation of May St.
- Catchment 1B:
- Services existing BTC, Hotel Gen, Brisbane Watch House / Police Museum, various properties on
Saul St, May St, Garrick St and Makerston St
- Contains following mains / subnetworks:
- 150mm diameter EW sewer along May St, Garrick St
- 225mm diameter sewer on Roma St with connections from the Brisbane Transit Centre,
Roma St Station and Hotel Jen.
- 225mm diameter earthenware sewer on Makerston St that discharges into the North Quay
sewer.
- Discharges into the North Quay sewer on the at the intersection of Makerston St and North Quay
• Catchment 2:
- Services Works Depot (in PDA) and residential towers along Parkland Blvd (outside of PDA)
- Contains following mains / subnetworks:
- Small network of 150/255mm diameter VC sewer servicing the Roma St Parklands
- 225mm diameter Vitrified Clay (VC) sewer servicing
- 375/400mm diameter Ductile Iron (DI) / VC sewer along Parkland Blvd, under the rail lines and
Inner-Northern Busway
- Discharges into the S1 sewer on Turbot St.

Roma Street Cross River Rail PriorityDevelopment AreaWater & Sewerage Technical Note
Development Sites (by Owner)
CRRDA Precincts
Pulse
Sewerage Manhole
Sewerage Main
Trunk Sewer
Re cula on / Other
Sewerage Rising Main
Exis ng Planned UU Sewerage Projects
Internal Sewerage Catchments
Catchment 1A
Catchment 1B
Catchment 2
Roads & Transit
Road
Transit
Lots
Legend
Data SourcesQLD Government 2020, Brisbane City Council 2020, Urban U li es 2020
DisclaimerWhile all reasonable care has been taken to ensure the informa on contained on this map is up to date and accurate,this map contains data from a number of sources - no warranty is given that the informa on contained on this is freefrom error or omission. Any reliance placed on such informa on shall be at the sole risk of the user. Please verify theaccuracy of all informa on prior to using it. This map is not a design document.
© SMEC Australia Pty Ltd 2020.All Rights Reserved
Figure 06Exis ng Sewerage Network
Makerston StSewer
North QuaySewer
Parkland BlvdSewer
Barracks Shopping Centre, Victoria
Barracks
Roma St SewerMay St SewerCountess St, Saul St
Sewers
May St Augmentation
Commercial Towers on SE side of Makerston St
Roma St Parklands (inc Res. Towers)
Roma St, Turbot St Sewer
Magistrates Court
BCC DepotRoma St Station, Brisbane Transit
Centre, Hotel Jen
Platform 10 / Activity Building
Police Headquarters
Watch House, Biala
QR Depot
National Storage Site
Inner Northern Busway Depot
Platform 2/3 Development
Hocking St Siphon
Coronation Dr Sewer
RM306 Coronation Dr PS Rising Main
Toowong, Auchenflower, Milton, Bardon, Petrie Terrace,
Paddington
South Brisbane, West End, Highgate
Hill
North Quay
Grey St PS
S1
Wastewater Source inside PDA (no proposed development)
Wastewater Source inside PDA (to be replaced / altered by proposed development)
Wastewater Source inside PDA (no proposed development)
Large external catchment
Potential Future PDA Servicing Infrastructure
Existing Sewerage Infrastructure
Existing Link
Existing Planned Link
Existing Planned Sewerage Infrastructure
Catchment 1B Catchment 2
Roma St Cross River Rail PDA
Key
Figure 07Existing Sewerage Network Diagram
Catchment 1A
Page 15
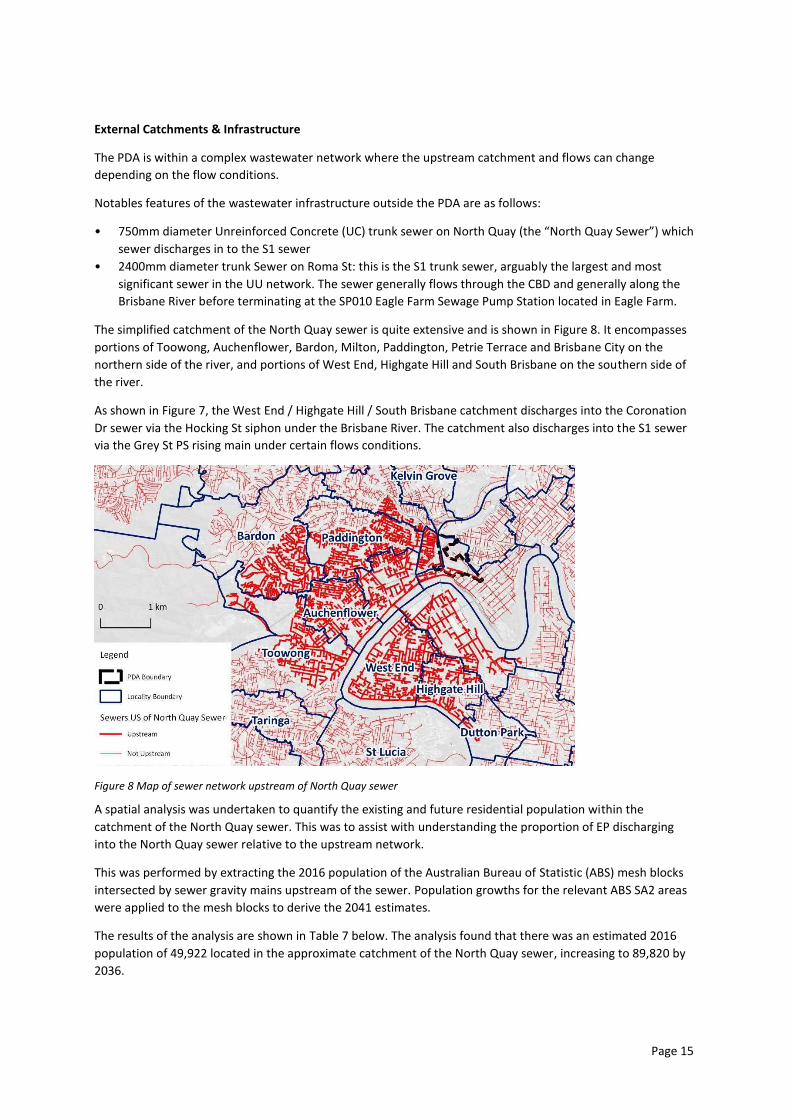
External Catchments & Infrastructure
The PDA is within a complex wastewater network where the upstream catchment and flows can change
depending on the flow conditions.
Notables features of the wastewater infrastructure outside the PDA are as follows:
• 750mm diameter Unreinforced Concrete (UC) trunk sewer on North Quay (the “North Quay Sewer”) which
sewer discharges in to the S1 sewer
• 2400mm diameter trunk Sewer on Roma St: this is the S1 trunk sewer, arguably the largest and most
significant sewer in the UU network. The sewer generally flows through the CBD and generally along the
Brisbane River before terminating at the SP010 Eagle Farm Sewage Pump Station located in Eagle Farm.
The simplified catchment of the North Quay sewer is quite extensive and is shown in Figure 8. It encompasses
portions of Toowong, Auchenflower, Bardon, Milton, Paddington, Petrie Terrace and Brisbane City on the
northern side of the river, and portions of West End, Highgate Hill and South Brisbane on the southern side of
the river.
As shown in Figure 7, the West End / Highgate Hill / South Brisbane catchment discharges into the Coronation
Dr sewer via the Hocking St siphon under the Brisbane River. The catchment also discharges into the S1 sewer
via the Grey St PS rising main under certain flows conditions.
Figure 8 Map of sewer network upstream of North Quay sewer
A spatial analysis was undertaken to quantify the existing and future residential population within the
catchment of the North Quay sewer. This was to assist with understanding the proportion of EP discharging
into the North Quay sewer relative to the upstream network.
This was performed by extracting the 2016 population of the Australian Bureau of Statistic (ABS) mesh blocks
intersected by sewer gravity mains upstream of the sewer. Population growths for the relevant ABS SA2 areas
were applied to the mesh blocks to derive the 2041 estimates.
The results of the analysis are shown in Table 7 below. The analysis found that there was an estimated 2016
population of 49,922 located in the approximate catchment of the North Quay sewer, increasing to 89,820 by
2036.
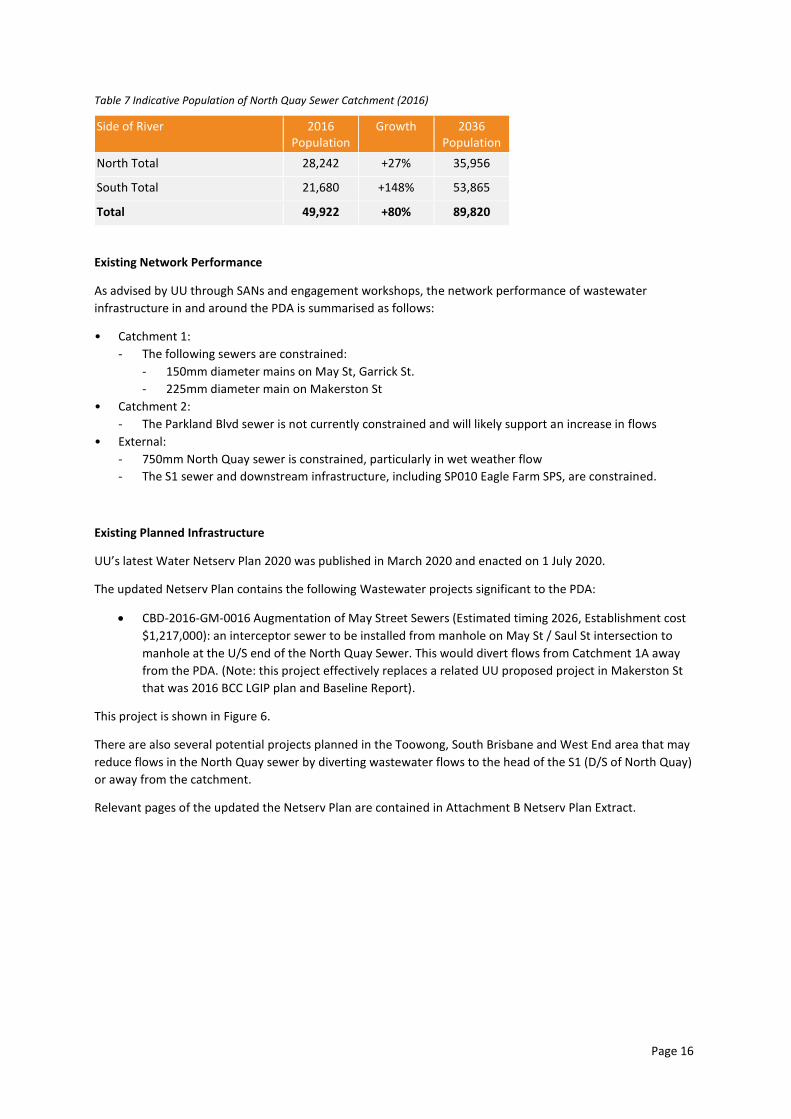
Page 16
Table 7 Indicative Population of North Quay Sewer Catchment (2016)
Side of River 2016 Population
Growth 2036 Population
North Total 28,242 +27% 35,956
South Total 21,680 +148% 53,865
Total 49,922 +80% 89,820
Existing Network Performance
As advised by UU through SANs and engagement workshops, the network performance of wastewater
infrastructure in and around the PDA is summarised as follows:
• Catchment 1:
- The following sewers are constrained:
- 150mm diameter mains on May St, Garrick St.
- 225mm diameter main on Makerston St
• Catchment 2:
- The Parkland Blvd sewer is not currently constrained and will likely support an increase in flows
• External:
- 750mm North Quay sewer is constrained, particularly in wet weather flow
- The S1 sewer and downstream infrastructure, including SP010 Eagle Farm SPS, are constrained.
Existing Planned Infrastructure
UU’s latest Water Netserv Plan 2020 was published in March 2020 and enacted on 1 July 2020.
The updated Netserv Plan contains the following Wastewater projects significant to the PDA:
• CBD-2016-GM-0016 Augmentation of May Street Sewers (Estimated timing 2026, Establishment cost
$1,217,000): an interceptor sewer to be installed from manhole on May St / Saul St intersection to
manhole at the U/S end of the North Quay Sewer. This would divert flows from Catchment 1A away
from the PDA. (Note: this project effectively replaces a related UU proposed project in Makerston St
that was 2016 BCC LGIP plan and Baseline Report).
This project is shown in Figure 6.
There are also several potential projects planned in the Toowong, South Brisbane and West End area that may
reduce flows in the North Quay sewer by diverting wastewater flows to the head of the S1 (D/S of North Quay)
or away from the catchment.
Relevant pages of the updated the Netserv Plan are contained in Attachment B Netserv Plan Extract.
Page 17
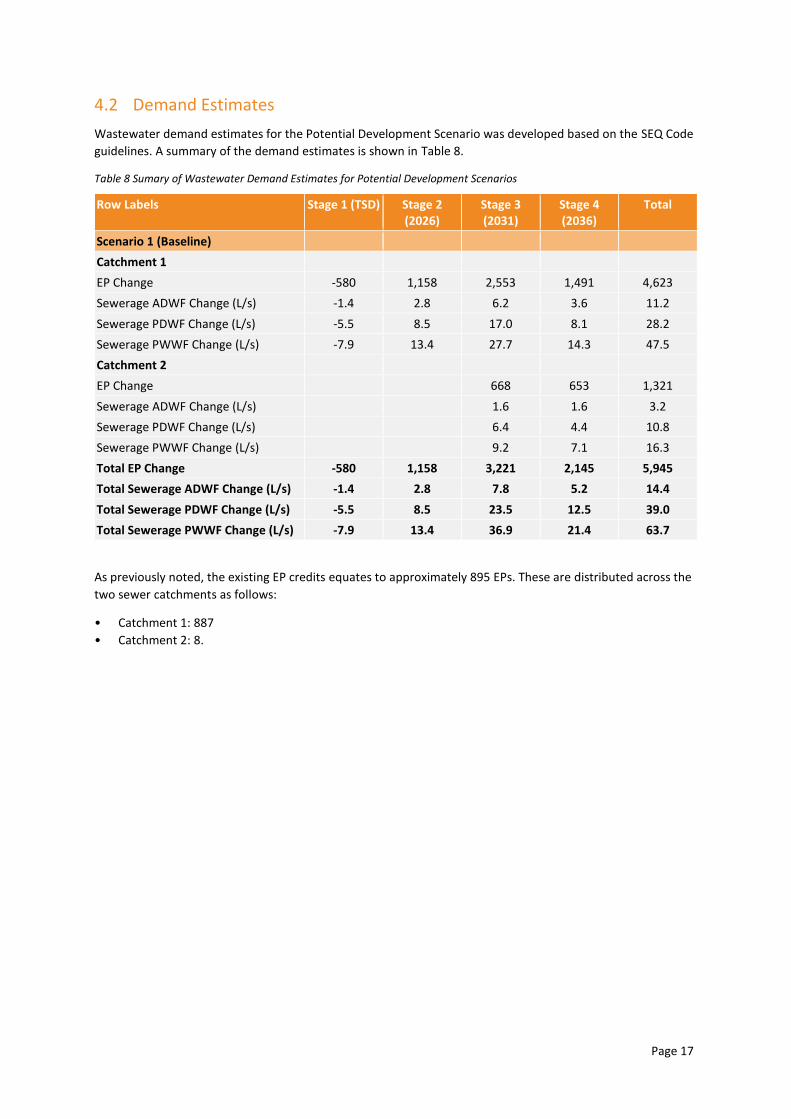
4.2 Demand Estimates
Wastewater demand estimates for the Potential Development Scenario was developed based on the SEQ Code
guidelines. A summary of the demand estimates is shown in Table 8.
Table 8 Sumary of Wastewater Demand Estimates for Potential Development Scenarios
Row Labels Stage 1 (TSD) Stage 2 (2026)
Stage 3 (2031)
Stage 4 (2036)
Total
Scenario 1 (Baseline)
Catchment 1
EP Change -580 1,158 2,553 1,491 4,623
Sewerage ADWF Change (L/s) -1.4 2.8 6.2 3.6 11.2
Sewerage PDWF Change (L/s) -5.5 8.5 17.0 8.1 28.2
Sewerage PWWF Change (L/s) -7.9 13.4 27.7 14.3 47.5
Catchment 2
EP Change
668 653 1,321
Sewerage ADWF Change (L/s)
1.6 1.6 3.2
Sewerage PDWF Change (L/s)
6.4 4.4 10.8
Sewerage PWWF Change (L/s)
9.2 7.1 16.3
Total EP Change -580 1,158 3,221 2,145 5,945
Total Sewerage ADWF Change (L/s) -1.4 2.8 7.8 5.2 14.4
Total Sewerage PDWF Change (L/s) -5.5 8.5 23.5 12.5 39.0
Total Sewerage PWWF Change (L/s) -7.9 13.4 36.9 21.4 63.7
As previously noted, the existing EP credits equates to approximately 895 EPs. These are distributed across the
two sewer catchments as follows:
• Catchment 1: 887
• Catchment 2: 8.
Page 18
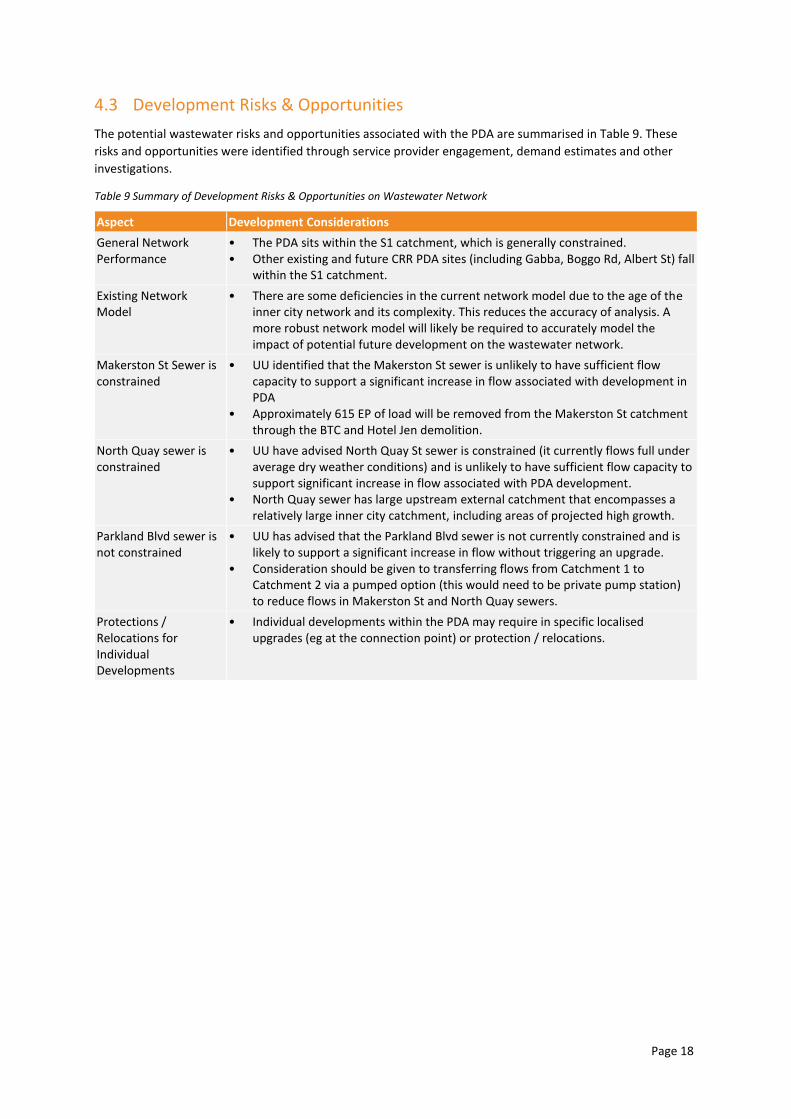
4.3 Development Risks & Opportunities
The potential wastewater risks and opportunities associated with the PDA are summarised in Table 9. These
risks and opportunities were identified through service provider engagement, demand estimates and other
investigations.
Table 9 Summary of Development Risks & Opportunities on Wastewater Network
Aspect Development Considerations
General Network Performance
• The PDA sits within the S1 catchment, which is generally constrained. • Other existing and future CRR PDA sites (including Gabba, Boggo Rd, Albert St) fall
within the S1 catchment.
Existing Network Model
• There are some deficiencies in the current network model due to the age of the inner city network and its complexity. This reduces the accuracy of analysis. A more robust network model will likely be required to accurately model the impact of potential future development on the wastewater network.
Makerston St Sewer is constrained
• UU identified that the Makerston St sewer is unlikely to have sufficient flow capacity to support a significant increase in flow associated with development in PDA
• Approximately 615 EP of load will be removed from the Makerston St catchment through the BTC and Hotel Jen demolition.
North Quay sewer is constrained
• UU have advised North Quay St sewer is constrained (it currently flows full under average dry weather conditions) and is unlikely to have sufficient flow capacity to support significant increase in flow associated with PDA development.
• North Quay sewer has large upstream external catchment that encompasses a relatively large inner city catchment, including areas of projected high growth.
Parkland Blvd sewer is not constrained
• UU has advised that the Parkland Blvd sewer is not currently constrained and is likely to support a significant increase in flow without triggering an upgrade.
• Consideration should be given to transferring flows from Catchment 1 to Catchment 2 via a pumped option (this would need to be private pump station) to reduce flows in Makerston St and North Quay sewers.
Protections / Relocations for Individual Developments
• Individual developments within the PDA may require in specific localised upgrades (eg at the connection point) or protection / relocations.
Page 19
4.4 Potential Infrastructure Works
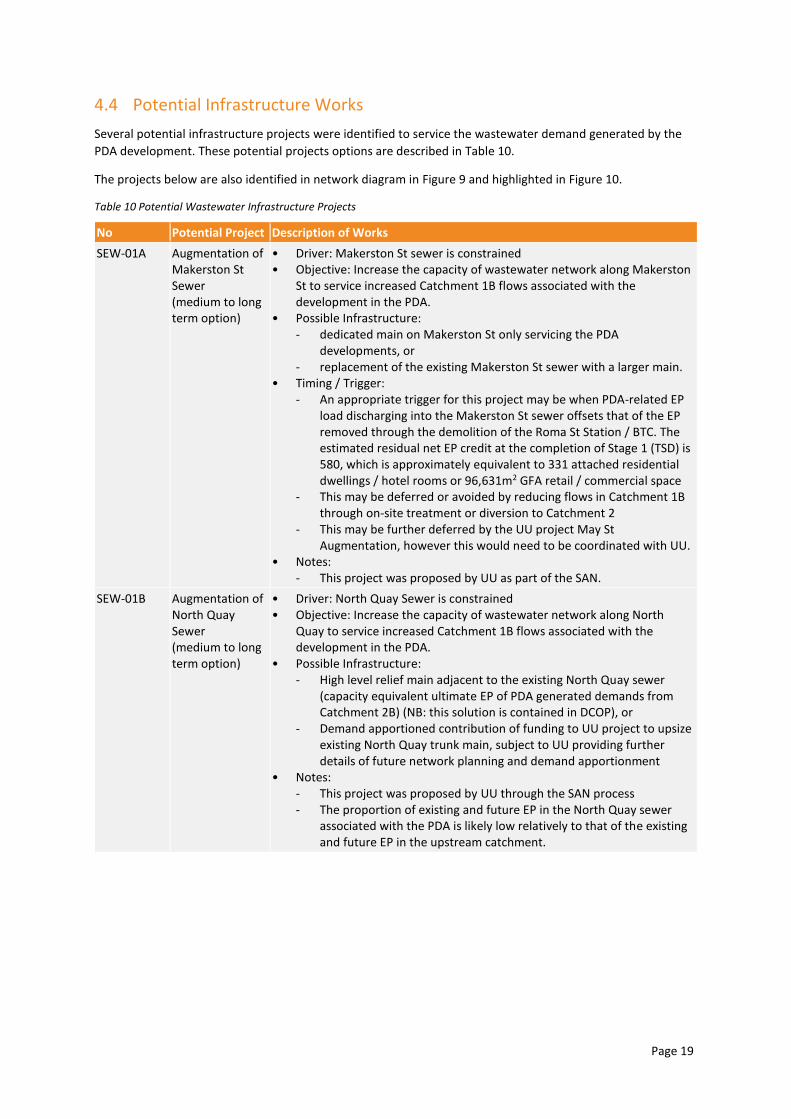
Several potential infrastructure projects were identified to service the wastewater demand generated by the
PDA development. These potential projects options are described in Table 10.
The projects below are also identified in network diagram in Figure 9 and highlighted in Figure 10.
Table 10 Potential Wastewater Infrastructure Projects
No Potential Project Description of Works
SEW-01A Augmentation of Makerston St Sewer (medium to long term option)
• Driver: Makerston St sewer is constrained • Objective: Increase the capacity of wastewater network along Makerston
St to service increased Catchment 1B flows associated with the development in the PDA.
• Possible Infrastructure: - dedicated main on Makerston St only servicing the PDA
developments, or - replacement of the existing Makerston St sewer with a larger main.
• Timing / Trigger: - An appropriate trigger for this project may be when PDA-related EP
load discharging into the Makerston St sewer offsets that of the EP removed through the demolition of the Roma St Station / BTC. The estimated residual net EP credit at the completion of Stage 1 (TSD) is 580, which is approximately equivalent to 331 attached residential dwellings / hotel rooms or 96,631m2 GFA retail / commercial space
- This may be deferred or avoided by reducing flows in Catchment 1B through on-site treatment or diversion to Catchment 2
- This may be further deferred by the UU project May St Augmentation, however this would need to be coordinated with UU.
• Notes: - This project was proposed by UU as part of the SAN.
SEW-01B Augmentation of North Quay Sewer (medium to long term option)
• Driver: North Quay Sewer is constrained • Objective: Increase the capacity of wastewater network along North
Quay to service increased Catchment 1B flows associated with the development in the PDA.
• Possible Infrastructure: - High level relief main adjacent to the existing North Quay sewer
(capacity equivalent ultimate EP of PDA generated demands from Catchment 2B) (NB: this solution is contained in DCOP), or
- Demand apportioned contribution of funding to UU project to upsize existing North Quay trunk main, subject to UU providing further details of future network planning and demand apportionment
• Notes: - This project was proposed by UU through the SAN process - The proportion of existing and future EP in the North Quay sewer
associated with the PDA is likely low relatively to that of the existing and future EP in the upstream catchment.
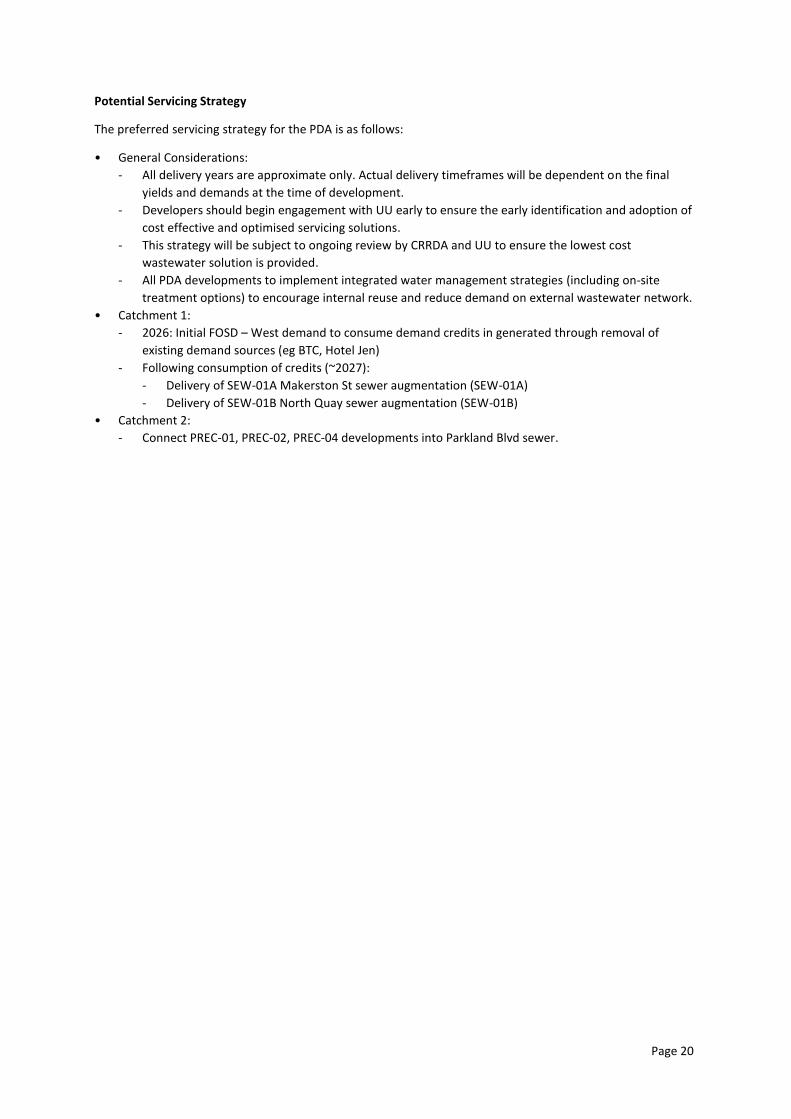
Page 20
Potential Servicing Strategy
The preferred servicing strategy for the PDA is as follows:
• General Considerations:
- All delivery years are approximate only. Actual delivery timeframes will be dependent on the final
yields and demands at the time of development.
- Developers should begin engagement with UU early to ensure the early identification and adoption of
cost effective and optimised servicing solutions.
- This strategy will be subject to ongoing review by CRRDA and UU to ensure the lowest cost
wastewater solution is provided.
- All PDA developments to implement integrated water management strategies (including on-site
treatment options) to encourage internal reuse and reduce demand on external wastewater network.
• Catchment 1:
- 2026: Initial FOSD – West demand to consume demand credits in generated through removal of
existing demand sources (eg BTC, Hotel Jen)
- Following consumption of credits (~2027):
- Delivery of SEW-01A Makerston St sewer augmentation (SEW-01A)
- Delivery of SEW-01B North Quay sewer augmentation (SEW-01B)
• Catchment 2:
- Connect PREC-01, PREC-02, PREC-04 developments into Parkland Blvd sewer.
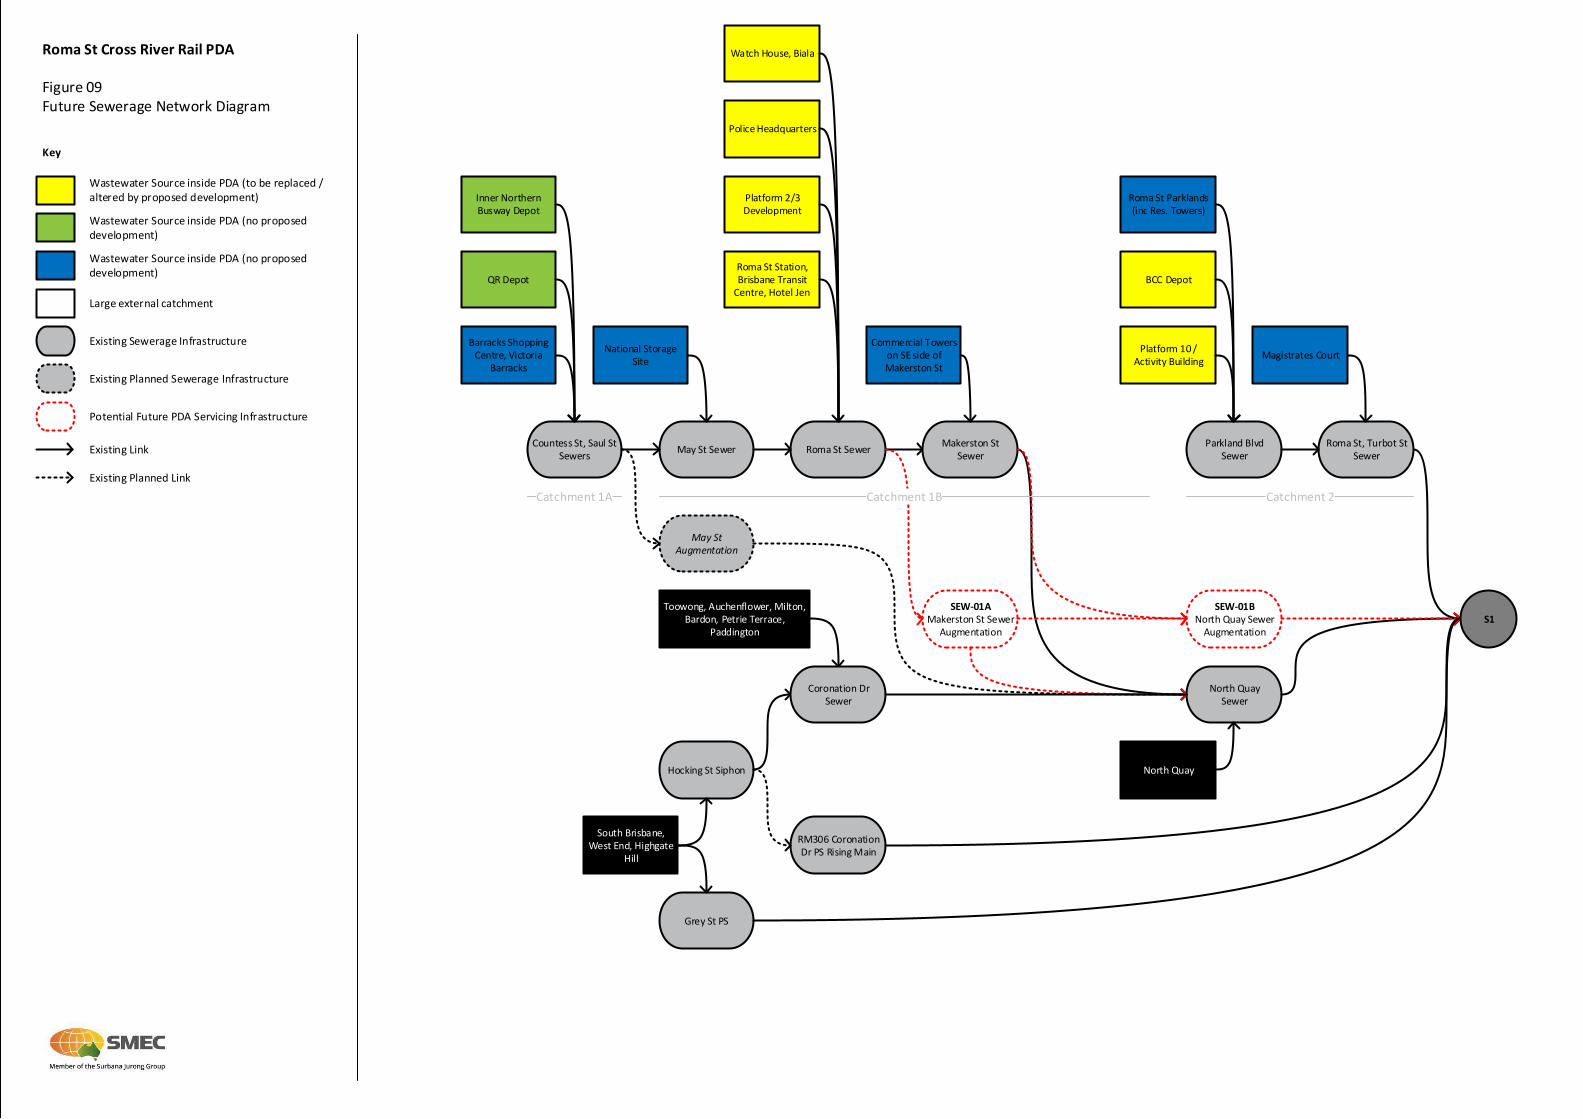
Makerston StSewer
North QuaySewer
Parkland BlvdSewer
Barracks Shopping Centre, Victoria
Barracks
Roma St SewerMay St SewerCountess St, Saul St
Sewers
May St Augmentation
Commercial Towers on SE side of Makerston St
Roma St Parklands (inc Res. Towers)
Roma St, Turbot St Sewer
Magistrates Court
BCC DepotRoma St Station, Brisbane Transit
Centre, Hotel Jen
Platform 10 / Activity Building
Police Headquarters
Watch House, Biala
QR Depot
SEW-01AMakerston St Sewer
Augmentation
SEW-01BNorth Quay Sewer
Augmentation
National Storage Site
Inner Northern Busway Depot
Platform 2/3 Development
Hocking St Siphon
Coronation Dr Sewer
RM306 Coronation Dr PS Rising Main
Toowong, Auchenflower, Milton, Bardon, Petrie Terrace,
Paddington
South Brisbane, West End, Highgate
Hill
North Quay
Grey St PS
S1
Wastewater Source inside PDA (no proposed development)
Wastewater Source inside PDA (to be replaced / altered by proposed development)
Wastewater Source inside PDA (no proposed development)
Large external catchment
Potential Future PDA Servicing Infrastructure
Existing Sewerage Infrastructure
Existing Link
Existing Planned Link
Existing Planned Sewerage Infrastructure
Catchment 1B Catchment 2
Roma St Cross River Rail PDA
Key
Figure 09Future Sewerage Network Diagram
Catchment 1A
Roma Street Cross River Rail PriorityDevelopment AreaWater & Sewerage Technical Note
Development Sites (by Owner)
CRRDA Precincts
Pulse
Poten al Sewerage Projects
Sewerage Main
Trunk Sewer
Re cula on / Other
Sewerage Manhole
Sewerage Rising Main
Exis ng Planned UU Sewerage Projects
Internal Sewerage Catchments
Catchment 1A
Catchment 1B
Catchment 2
Roads & Transit
Road
Transit
Lots
Legend
Data SourcesQLD Government 2020, Brisbane City Council 2020, Urban U li es 2020
DisclaimerWhile all reasonable care has been taken to ensure the informa on contained on this map is up to date and accurate,this map contains data from a number of sources - no warranty is given that the informa on contained on this is freefrom error or omission. Any reliance placed on such informa on shall be at the sole risk of the user. Please verify theaccuracy of all informa on prior to using it. This map is not a design document.
© SMEC Australia Pty Ltd 2020.All Rights Reserved
Figure 10Poten al Sewerage Projects
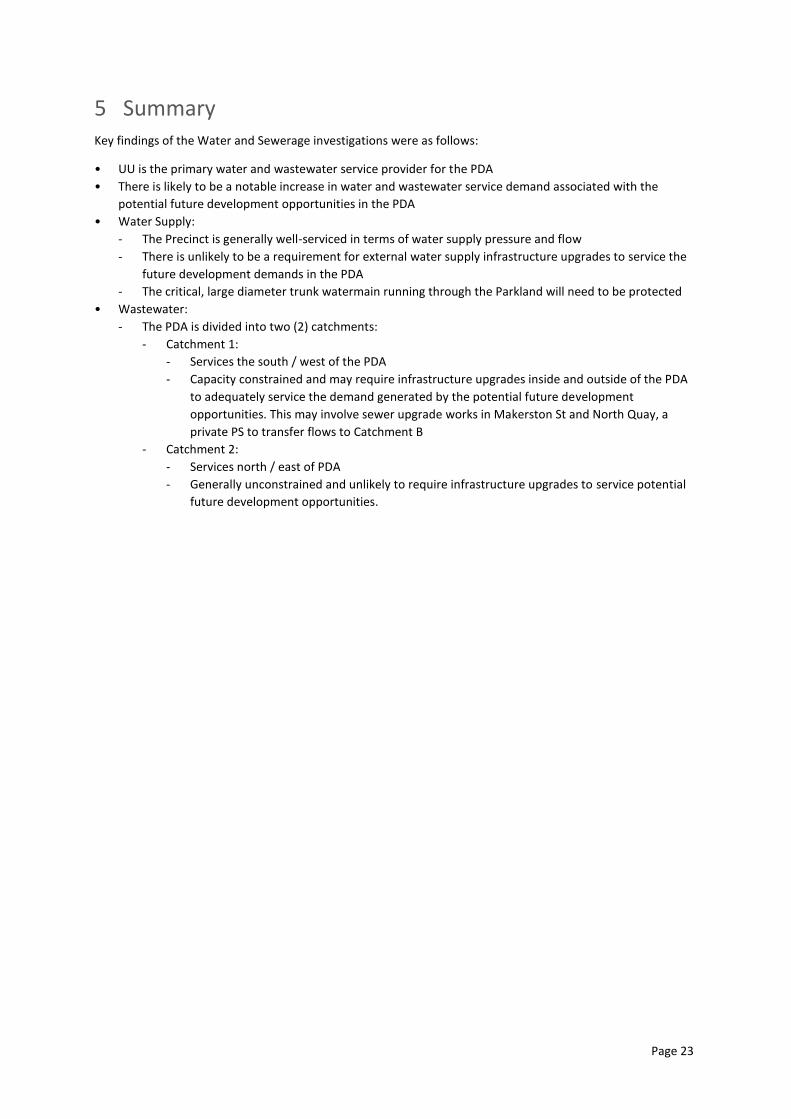
Page 23
5 Summary Key findings of the Water and Sewerage investigations were as follows:
• UU is the primary water and wastewater service provider for the PDA
• There is likely to be a notable increase in water and wastewater service demand associated with the
potential future development opportunities in the PDA
• Water Supply:
- The Precinct is generally well-serviced in terms of water supply pressure and flow
- There is unlikely to be a requirement for external water supply infrastructure upgrades to service the
future development demands in the PDA
- The critical, large diameter trunk watermain running through the Parkland will need to be protected
• Wastewater:
- The PDA is divided into two (2) catchments:
- Catchment 1:
- Services the south / west of the PDA
- Capacity constrained and may require infrastructure upgrades inside and outside of the PDA
to adequately service the demand generated by the potential future development
opportunities. This may involve sewer upgrade works in Makerston St and North Quay, a
private PS to transfer flows to Catchment B
- Catchment 2:
- Services north / east of PDA
- Generally unconstrained and unlikely to require infrastructure upgrades to service potential
future development opportunities.

Attachment A Development Yield Maps & Tables
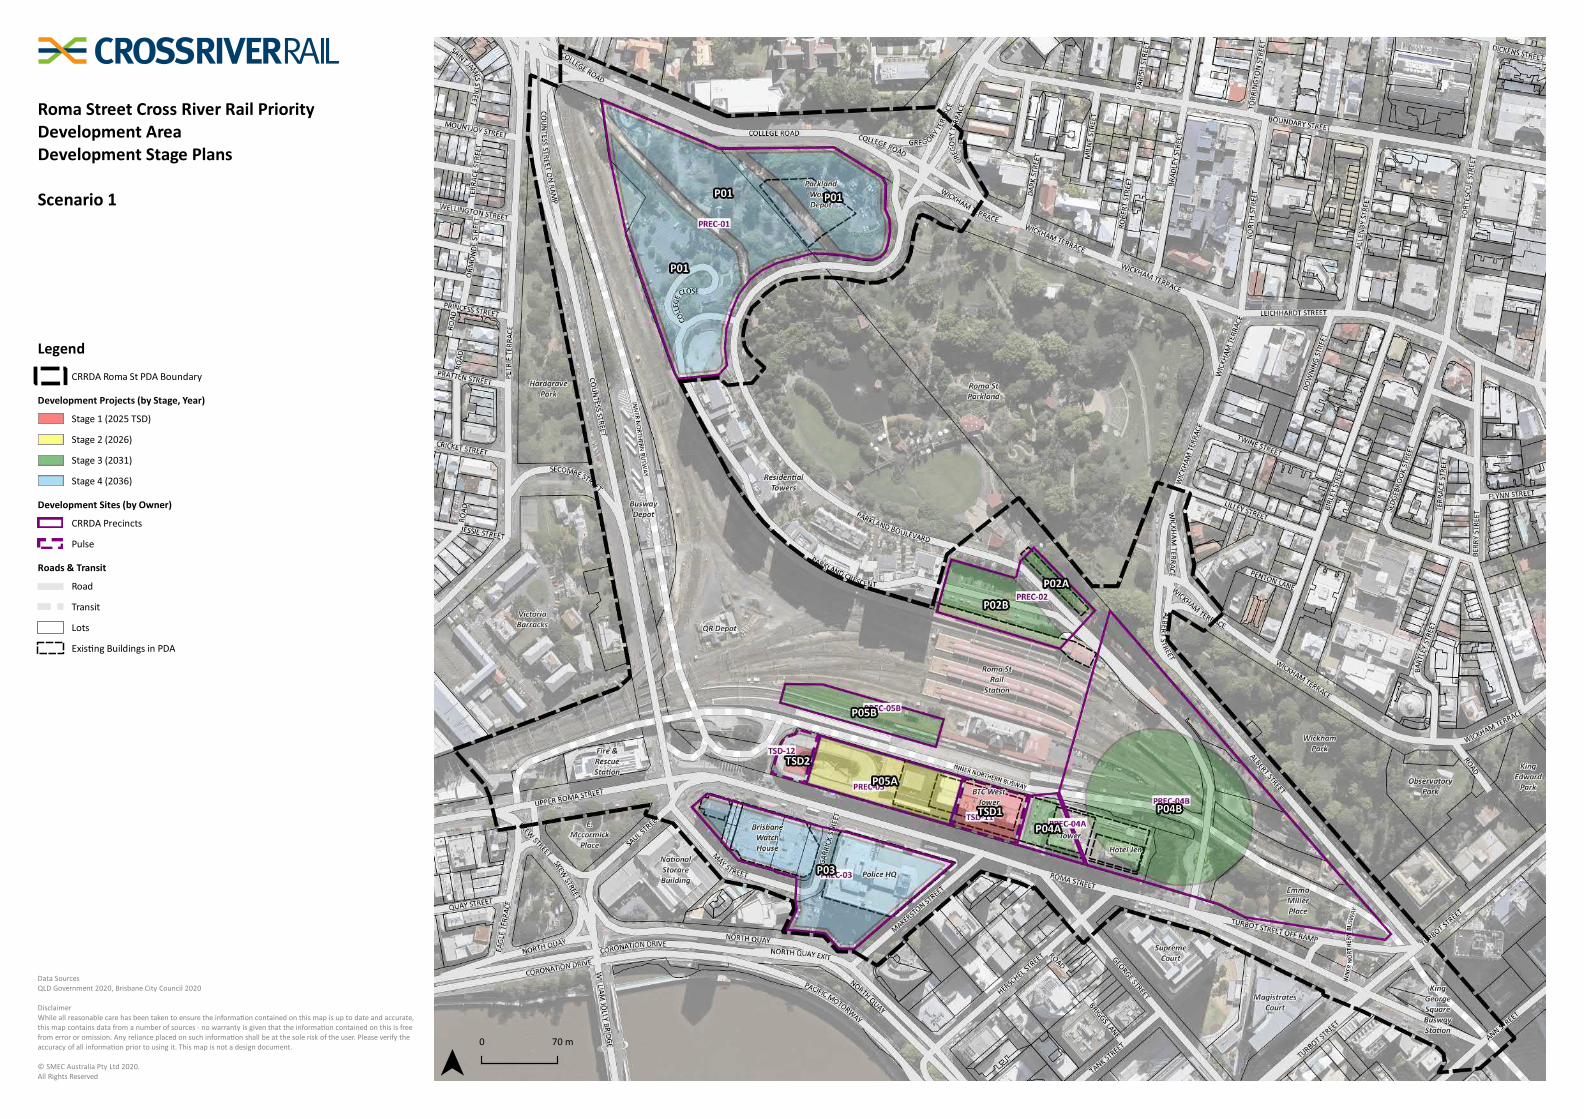
Roma Street Cross River Rail PriorityDevelopment AreaDevelopment Stage Plans
CRRDA Roma St PDA Boundary
Development Projects (by Stage, Year)
Stage 1 (2025 TSD)
Stage 2 (2026)
Stage 3 (2031)
Stage 4 (2036)
Development Sites (by Owner)
CRRDA Precincts
Pulse
Roads & Transit
Road
Transit
Lots
Exis ng Buildings in PDA
Legend
Data SourcesQLD Government 2020, Brisbane City Council 2020
DisclaimerWhile all reasonable care has been taken to ensure the informa on contained on this map is up to date and accurate,this map contains data from a number of sources - no warranty is given that the informa on contained on this is freefrom error or omission. Any reliance placed on such informa on shall be at the sole risk of the user. Please verify theaccuracy of all informa on prior to using it. This map is not a design document.
© SMEC Australia Pty Ltd 2020.All Rights Reserved
Scenario 1
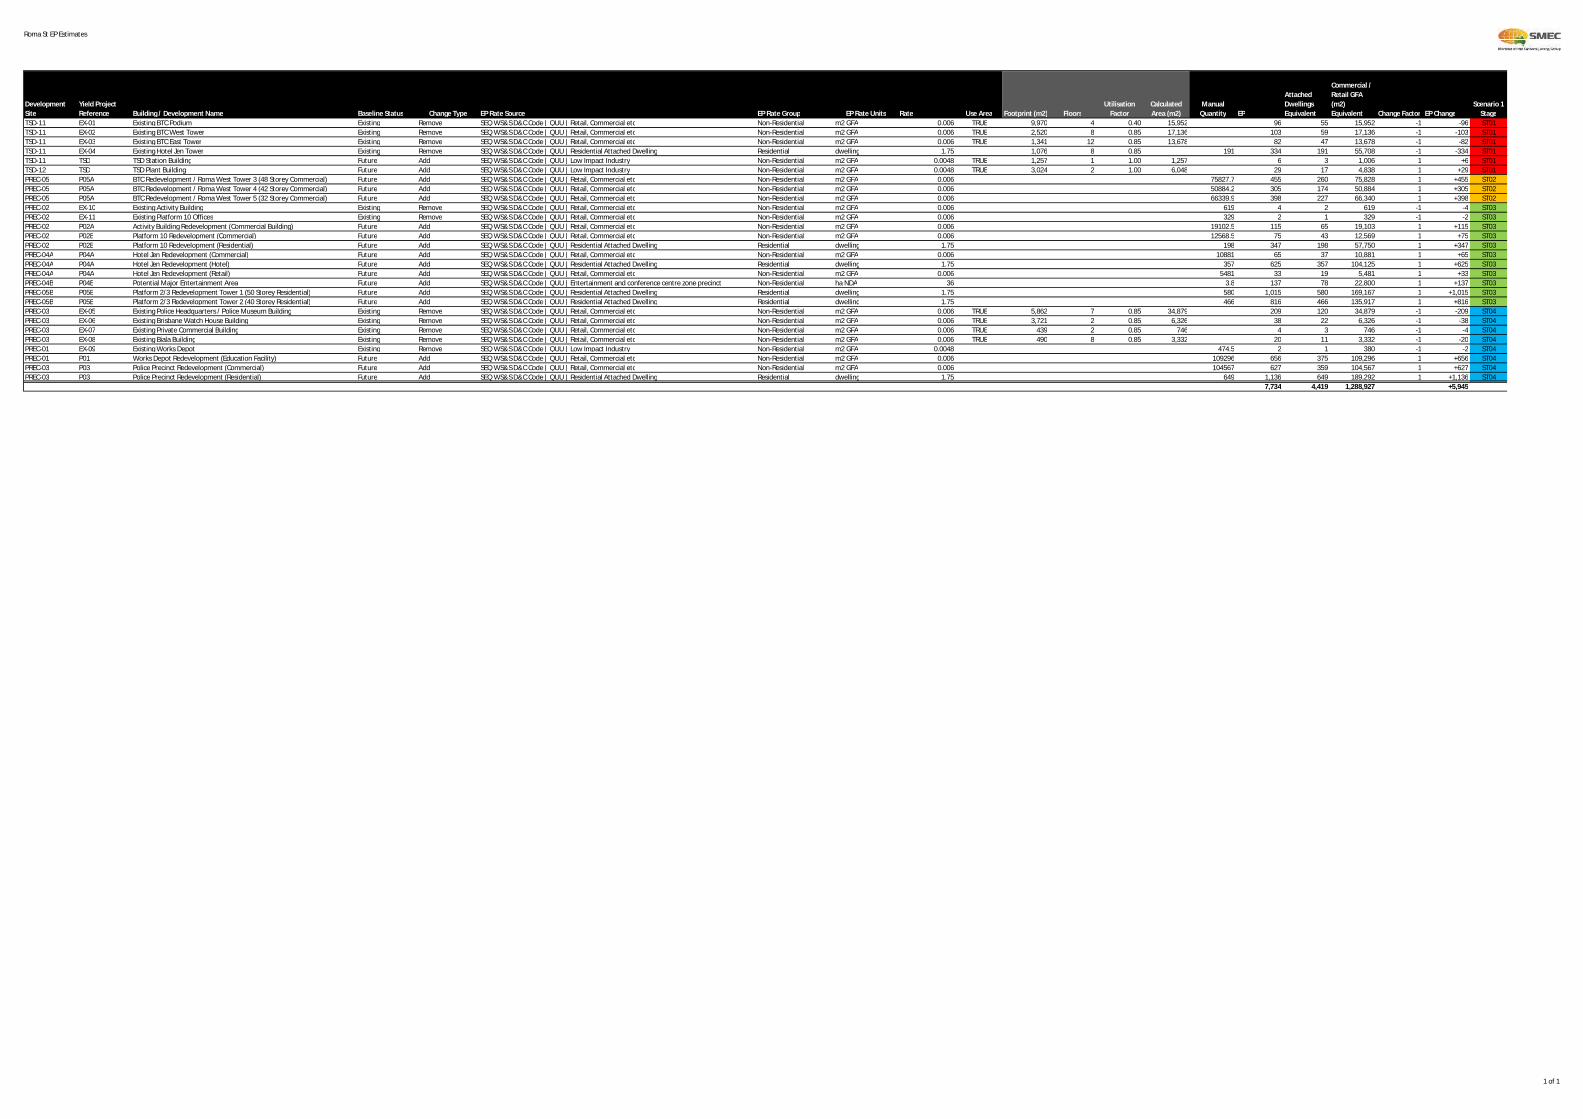
Roma St EP Estimates
DevelopmentSite
Yield ProjectReference Building / Development Name Baseline Status Change Type EP Rate Source EP Rate Group EP Rate Units Rate Use Area Footprint (m2) Floors
UtilisationFactor
CalculatedArea (m2)
ManualQuantity EP
AttachedDwellingsEquivalent
Commercial /Retail GFA(m2)Equivalent Change Factor EP Change
Scenario 1Stage
TSD-11 EX-01 Existing BTC Podium Existing Remove SEQ WS&S D&C Code | QUU | Retail, Commercial etc Non-Residential m2 GFA 0.006 TRUE 9,970 4 0.40 15,952 96 55 15,952 -1 -96 ST01TSD-11 EX-02 Existing BTC West Tower Existing Remove SEQ WS&S D&C Code | QUU | Retail, Commercial etc Non-Residential m2 GFA 0.006 TRUE 2,520 8 0.85 17,136 103 59 17,136 -1 -103 ST01TSD-11 EX-03 Existing BTC East Tower Existing Remove SEQ WS&S D&C Code | QUU | Retail, Commercial etc Non-Residential m2 GFA 0.006 TRUE 1,341 12 0.85 13,678 82 47 13,678 -1 -82 ST01TSD-11 EX-04 Existing Hotel Jen Tower Existing Remove SEQ WS&S D&C Code | QUU | Residential Attached Dwelling Residential dwelling 1.75 1,076 8 0.85 191 334 191 55,708 -1 -334 ST01TSD-11 TSD TSD Station Building Future Add SEQ WS&S D&C Code | QUU | Low Impact Industry Non-Residential m2 GFA 0.0048 TRUE 1,257 1 1.00 1,257 6 3 1,006 1 +6 ST01TSD-12 TSD TSD Plant Building Future Add SEQ WS&S D&C Code | QUU | Low Impact Industry Non-Residential m2 GFA 0.0048 TRUE 3,024 2 1.00 6,048 29 17 4,838 1 +29 ST01PREC-05 P05A BTC Redevelopment / Roma West Tower 3 (48 Storey Commercial) Future Add SEQ WS&S D&C Code | QUU | Retail, Commercial etc Non-Residential m2 GFA 0.006 75827.7 455 260 75,828 1 +455 ST02PREC-05 P05A BTC Redevelopment / Roma West Tower 4 (42 Storey Commercial) Future Add SEQ WS&S D&C Code | QUU | Retail, Commercial etc Non-Residential m2 GFA 0.006 50884.2 305 174 50,884 1 +305 ST02PREC-05 P05A BTC Redevelopment / Roma West Tower 5 (32 Storey Commercial) Future Add SEQ WS&S D&C Code | QUU | Retail, Commercial etc Non-Residential m2 GFA 0.006 66339.9 398 227 66,340 1 +398 ST02PREC-02 EX-10 Existing Activity Building Existing Remove SEQ WS&S D&C Code | QUU | Retail, Commercial etc Non-Residential m2 GFA 0.006 619 4 2 619 -1 -4 ST03PREC-02 EX-11 Existing Platform 10 Offices Existing Remove SEQ WS&S D&C Code | QUU | Retail, Commercial etc Non-Residential m2 GFA 0.006 329 2 1 329 -1 -2 ST03PREC-02 P02A Activity Building Redevelopment (Commercial Building) Future Add SEQ WS&S D&C Code | QUU | Retail, Commercial etc Non-Residential m2 GFA 0.006 19102.5 115 65 19,103 1 +115 ST03PREC-02 P02B Platform 10 Redevelopment (Commercial) Future Add SEQ WS&S D&C Code | QUU | Retail, Commercial etc Non-Residential m2 GFA 0.006 12568.5 75 43 12,569 1 +75 ST03PREC-02 P02B Platform 10 Redevelopment (Residential) Future Add SEQ WS&S D&C Code | QUU | Residential Attached Dwelling Residential dwelling 1.75 198 347 198 57,750 1 +347 ST03PREC-04A P04A Hotel Jen Redevelopment (Commercial) Future Add SEQ WS&S D&C Code | QUU | Retail, Commercial etc Non-Residential m2 GFA 0.006 10881 65 37 10,881 1 +65 ST03PREC-04A P04A Hotel Jen Redevelopment (Hotel) Future Add SEQ WS&S D&C Code | QUU | Residential Attached Dwelling Residential dwelling 1.75 357 625 357 104,125 1 +625 ST03PREC-04A P04A Hotel Jen Redevelopment (Retail) Future Add SEQ WS&S D&C Code | QUU | Retail, Commercial etc Non-Residential m2 GFA 0.006 5481 33 19 5,481 1 +33 ST03PREC-04B P04B Potential Major Entertainment Area Future Add SEQ WS&S D&C Code | QUU | Entertainment and conference centre zone precinct Non-Residential ha NDA 36 3.8 137 78 22,800 1 +137 ST03PREC-05B P05B Platform 2/3 Redevelopment Tower 1 (50 Storey Residential) Future Add SEQ WS&S D&C Code | QUU | Residential Attached Dwelling Residential dwelling 1.75 580 1,015 580 169,167 1 +1,015 ST03PREC-05B P05B Platform 2/3 Redevelopment Tower 2 (40 Storey Residential) Future Add SEQ WS&S D&C Code | QUU | Residential Attached Dwelling Residential dwelling 1.75 466 816 466 135,917 1 +816 ST03PREC-03 EX-05 Existing Police Headquarters / Police Museum Building Existing Remove SEQ WS&S D&C Code | QUU | Retail, Commercial etc Non-Residential m2 GFA 0.006 TRUE 5,862 7 0.85 34,879 209 120 34,879 -1 -209 ST04PREC-03 EX-06 Existing Brisbane Watch House Building Existing Remove SEQ WS&S D&C Code | QUU | Retail, Commercial etc Non-Residential m2 GFA 0.006 TRUE 3,721 2 0.85 6,326 38 22 6,326 -1 -38 ST04PREC-03 EX-07 Existing Private Commercial Building Existing Remove SEQ WS&S D&C Code | QUU | Retail, Commercial etc Non-Residential m2 GFA 0.006 TRUE 439 2 0.85 746 4 3 746 -1 -4 ST04PREC-03 EX-08 Existing Biala Building Existing Remove SEQ WS&S D&C Code | QUU | Retail, Commercial etc Non-Residential m2 GFA 0.006 TRUE 490 8 0.85 3,332 20 11 3,332 -1 -20 ST04PREC-01 EX-09 Existing Works Depot Existing Remove SEQ WS&S D&C Code | QUU | Low Impact Industry Non-Residential m2 GFA 0.0048 474.5 2 1 380 -1 -2 ST04PREC-01 P01 Works Depot Redevelopment (Education Facility) Future Add SEQ WS&S D&C Code | QUU | Retail, Commercial etc Non-Residential m2 GFA 0.006 109296 656 375 109,296 1 +656 ST04PREC-03 P03 Police Precinct Redevelopment (Commercial) Future Add SEQ WS&S D&C Code | QUU | Retail, Commercial etc Non-Residential m2 GFA 0.006 104567 627 359 104,567 1 +627 ST04PREC-03 P03 Police Precinct Redevelopment (Residential) Future Add SEQ WS&S D&C Code | QUU | Residential Attached Dwelling Residential dwelling 1.75 649 1,136 649 189,292 1 +1,136 ST04
7,734 4,419 1,288,927 +5,945
1 of 1

Attachment B Netserv Plan Extract
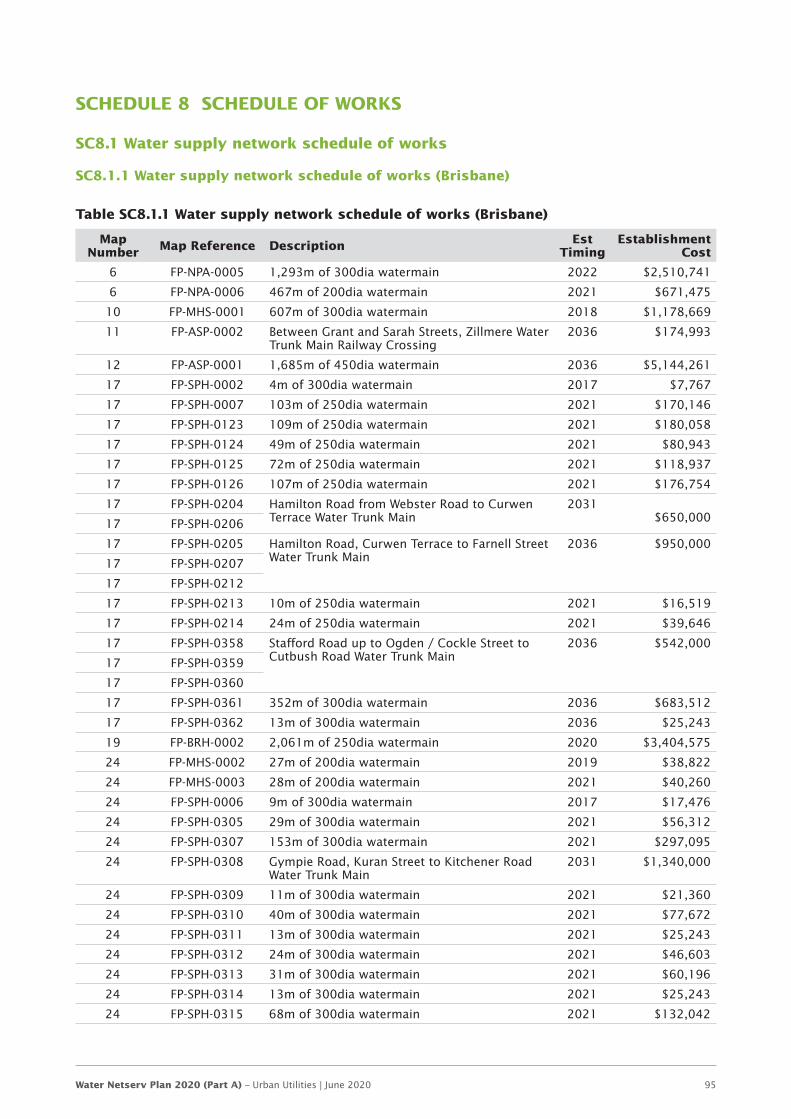
Water Netserv Plan 2020 (Part A) – Urban Utilities | June 2020 95
SCHEDULE 8 SCHEDULE OF WORKS
SC8.1 Water supply network schedule of works
SC8.1.1 Water supply network schedule of works (Brisbane)
Table SC8.1.1 Water supply network schedule of works (Brisbane)
Map Number Map Reference Description Est
TimingEstablishment
Cost
6 FP-NPA-0005 1,293m of 300dia watermain 2022 $2,510,741
6 FP-NPA-0006 467m of 200dia watermain 2021 $671,475
10 FP-MHS-0001 607m of 300dia watermain 2018 $1,178,669
11 FP-ASP-0002 Between Grant and Sarah Streets, Zillmere Water Trunk Main Railway Crossing
2036 $174,993
12 FP-ASP-0001 1,685m of 450dia watermain 2036 $5,144,261
17 FP-SPH-0002 4m of 300dia watermain 2017 $7,767
17 FP-SPH-0007 103m of 250dia watermain 2021 $170,146
17 FP-SPH-0123 109m of 250dia watermain 2021 $180,058
17 FP-SPH-0124 49m of 250dia watermain 2021 $80,943
17 FP-SPH-0125 72m of 250dia watermain 2021 $118,937
17 FP-SPH-0126 107m of 250dia watermain 2021 $176,754
17 FP-SPH-0204 Hamilton Road from Webster Road to Curwen Terrace Water Trunk Main
2031 $650,000 17 FP-SPH-0206
17 FP-SPH-0205 Hamilton Road, Curwen Terrace to Farnell Street Water Trunk Main
2036 $950,000
17 FP-SPH-0207
17 FP-SPH-0212
17 FP-SPH-0213 10m of 250dia watermain 2021 $16,519
17 FP-SPH-0214 24m of 250dia watermain 2021 $39,646
17 FP-SPH-0358 Stafford Road up to Ogden / Cockle Street to Cutbush Road Water Trunk Main
2036 $542,000
17 FP-SPH-0359
17 FP-SPH-0360
17 FP-SPH-0361 352m of 300dia watermain 2036 $683,512
17 FP-SPH-0362 13m of 300dia watermain 2036 $25,243
19 FP-BRH-0002 2,061m of 250dia watermain 2020 $3,404,575
24 FP-MHS-0002 27m of 200dia watermain 2019 $38,822
24 FP-MHS-0003 28m of 200dia watermain 2021 $40,260
24 FP-SPH-0006 9m of 300dia watermain 2017 $17,476
24 FP-SPH-0305 29m of 300dia watermain 2021 $56,312
24 FP-SPH-0307 153m of 300dia watermain 2021 $297,095
24 FP-SPH-0308 Gympie Road, Kuran Street to Kitchener Road Water Trunk Main
2031 $1,340,000
24 FP-SPH-0309 11m of 300dia watermain 2021 $21,360
24 FP-SPH-0310 40m of 300dia watermain 2021 $77,672
24 FP-SPH-0311 13m of 300dia watermain 2021 $25,243
24 FP-SPH-0312 24m of 300dia watermain 2021 $46,603
24 FP-SPH-0313 31m of 300dia watermain 2021 $60,196
24 FP-SPH-0314 13m of 300dia watermain 2021 $25,243
24 FP-SPH-0315 68m of 300dia watermain 2021 $132,042
Water Netserv Plan 2020 (Part A) – Urban Utilities | June 2020 96
Map Number Map Reference Description Est
TimingEstablishment
Cost
24 FP-SPH-0316 5m of 300dia watermain 2021 $9,709
24 FP-SPH-0317 7m of 300dia watermain 2021 $13,593
24 FP-SPH-0319 26m of 300dia watermain 2021 $50,487
24 FP-SPH-0320 78m of 300dia watermain 2021 $151,460
24 FP-SPH-0324 Stafford Road up to Ogden/ Cockle Street Water Trunk Main
2036 $131,000
24 FP-SPH-0325 110m of 300dia watermain 2036 $213,597
24 FP-SPH-0326 Gympie Road, Kuran Street to Kitchener Road Water Trunk Main
2031 $1,340,000
24 FP-SPH-0327 66m of 300dia watermain 2036 $128,158
24 FP-SPH-0328 58m of 300dia watermain 2036 $112,624
24 FP-SPH-0329 193m of 300dia watermain 2036 $374,766
24 FP-SPH-0330 43m of 300dia watermain 2021 $83,497
24 FP-SPH-0331 6m of 300dia watermain 2036 $11,651
24 FP-SPH-0332 9m of 250dia watermain 2021 $14,867
24 FP-SPH-0333 26m of 250dia watermain 2021 $42,950
24 FP-SPH-0334 58m of 250dia watermain 2021 $95,810
24 FP-SPH-0373 Gympie Road, Kuran Street to Kitchener Road Water Trunk Main
2031 $1,340,000
24 FP-SPH-0374
25 FP-ELH-0023 22m of 300dia watermain 2041 $42,719
25 FP-ELH-0023 172m of 300dia watermain 2041 $333,989
25 FP-ELH-0023 28m of 300dia watermain 2041 $54,370
25 FP-ELH-0023 58m of 300dia watermain 2041 $112,624
25 FP-ELH-0023 100m of 300dia watermain 2041 $194,179
25 FP-ELH-0023 91m of 300dia watermain 2041 $176,703
25 FP-ELH-0023 89m of 300dia watermain 2041 $172,820
25 FP-ELH-0023 48m of 300dia watermain 2041 $93,206
25 FP-ELH-0023 119m of 300dia watermain 2041 $231,074
25 FP-ELH-0023 130m of 300dia watermain 2041 $252,433
25 FP-ELH-0023 36m of 300dia watermain 2041 $69,905
25 FP-ELH-0023 96m of 300dia watermain 2041 $186,412
25 FP-ELH-0023 79m of 300dia watermain 2041 $153,402
25 FP-ELH-0023 90m of 300dia watermain 2041 $174,762
25 FP-SPH-0011 8m of 300dia watermain 2017 $15,534
25 FP-SPH-0020 131m of 200dia watermain 2008 $188,358
25 FP-SPH-0024 21m of 200dia watermain 2008 $30,195
25 FP-SPH-0030 16m of 300dia watermain 2017 $31,069
30 FP-TGP-0003 296m of 300dia watermain 2020 $574,771
32 FP-BOH-0003 673m of 250dia watermain TBD $1,111,732
32 FP-BRH-0054 559m of 200dia watermain 2016 $803,758
32 FP-ELH-0001 152m of 300dia watermain 2014 $295,153
32 FP-ELH-0014 14m of 300dia watermain 2014 $27,185
32 FP-ELH-0022 31m of 300dia watermain 2041 $60,196
32 FP-ELH-0022 12m of 300dia watermain 2041 $23,302
32 FP-ELH-0022 73m of 300dia watermain 2041 $141,751
32 FP-ELH-0022 194m of 300dia watermain 2041 $376,708
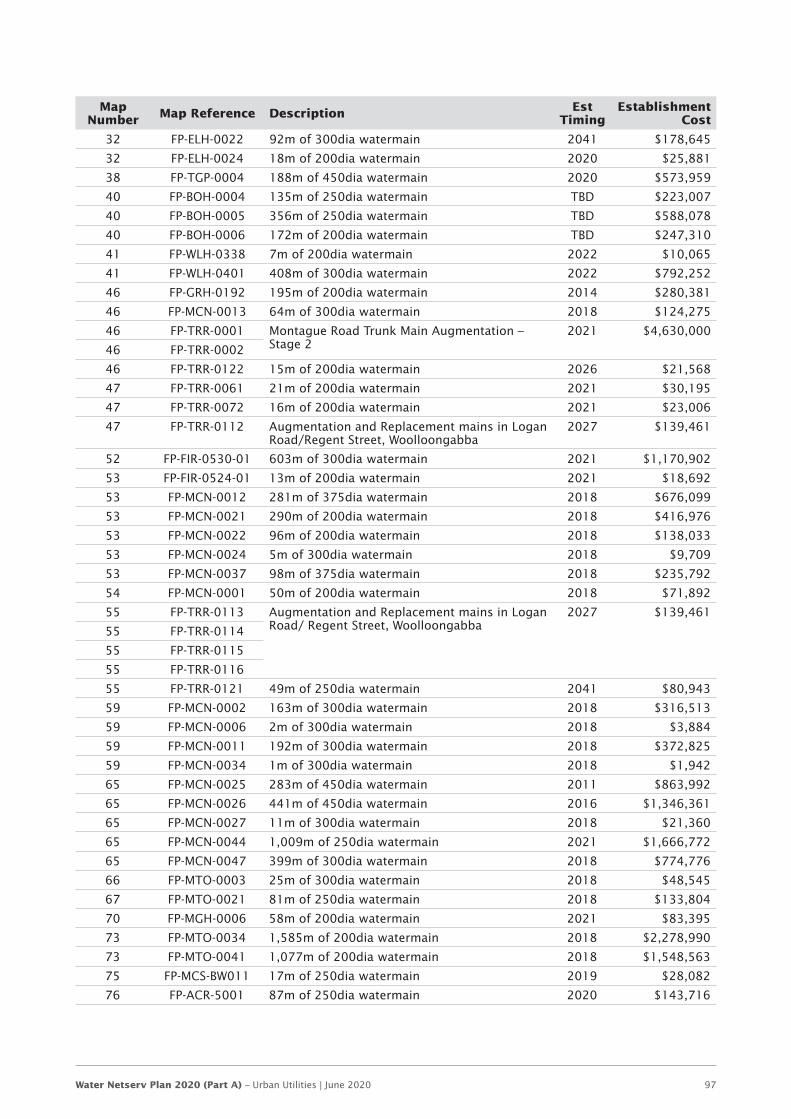
Water Netserv Plan 2020 (Part A) – Urban Utilities | June 2020 97
Map Number Map Reference Description Est
TimingEstablishment
Cost
32 FP-ELH-0022 92m of 300dia watermain 2041 $178,645
32 FP-ELH-0024 18m of 200dia watermain 2020 $25,881
38 FP-TGP-0004 188m of 450dia watermain 2020 $573,959
40 FP-BOH-0004 135m of 250dia watermain TBD $223,007
40 FP-BOH-0005 356m of 250dia watermain TBD $588,078
40 FP-BOH-0006 172m of 200dia watermain TBD $247,310
41 FP-WLH-0338 7m of 200dia watermain 2022 $10,065
41 FP-WLH-0401 408m of 300dia watermain 2022 $792,252
46 FP-GRH-0192 195m of 200dia watermain 2014 $280,381
46 FP-MCN-0013 64m of 300dia watermain 2018 $124,275
46 FP-TRR-0001 Montague Road Trunk Main Augmentation – Stage 2
2021 $4,630,000
46 FP-TRR-0002
46 FP-TRR-0122 15m of 200dia watermain 2026 $21,568
47 FP-TRR-0061 21m of 200dia watermain 2021 $30,195
47 FP-TRR-0072 16m of 200dia watermain 2021 $23,006
47 FP-TRR-0112 Augmentation and Replacement mains in Logan Road/Regent Street, Woolloongabba
2027 $139,461
52 FP-FIR-0530-01 603m of 300dia watermain 2021 $1,170,902
53 FP-FIR-0524-01 13m of 200dia watermain 2021 $18,692
53 FP-MCN-0012 281m of 375dia watermain 2018 $676,099
53 FP-MCN-0021 290m of 200dia watermain 2018 $416,976
53 FP-MCN-0022 96m of 200dia watermain 2018 $138,033
53 FP-MCN-0024 5m of 300dia watermain 2018 $9,709
53 FP-MCN-0037 98m of 375dia watermain 2018 $235,792
54 FP-MCN-0001 50m of 200dia watermain 2018 $71,892
55 FP-TRR-0113 Augmentation and Replacement mains in Logan Road/ Regent Street, Woolloongabba
2027 $139,461
55 FP-TRR-0114
55 FP-TRR-0115
55 FP-TRR-0116
55 FP-TRR-0121 49m of 250dia watermain 2041 $80,943
59 FP-MCN-0002 163m of 300dia watermain 2018 $316,513
59 FP-MCN-0006 2m of 300dia watermain 2018 $3,884
59 FP-MCN-0011 192m of 300dia watermain 2018 $372,825
59 FP-MCN-0034 1m of 300dia watermain 2018 $1,942
65 FP-MCN-0025 283m of 450dia watermain 2011 $863,992
65 FP-MCN-0026 441m of 450dia watermain 2016 $1,346,361
65 FP-MCN-0027 11m of 300dia watermain 2018 $21,360
65 FP-MCN-0044 1,009m of 250dia watermain 2021 $1,666,772
65 FP-MCN-0047 399m of 300dia watermain 2018 $774,776
66 FP-MTO-0003 25m of 300dia watermain 2018 $48,545
67 FP-MTO-0021 81m of 250dia watermain 2018 $133,804
70 FP-MGH-0006 58m of 200dia watermain 2021 $83,395
73 FP-MTO-0034 1,585m of 200dia watermain 2018 $2,278,990
73 FP-MTO-0041 1,077m of 200dia watermain 2018 $1,548,563
75 FP-MCS-BW011 17m of 250dia watermain 2019 $28,082
76 FP-ACR-5001 87m of 250dia watermain 2020 $143,716
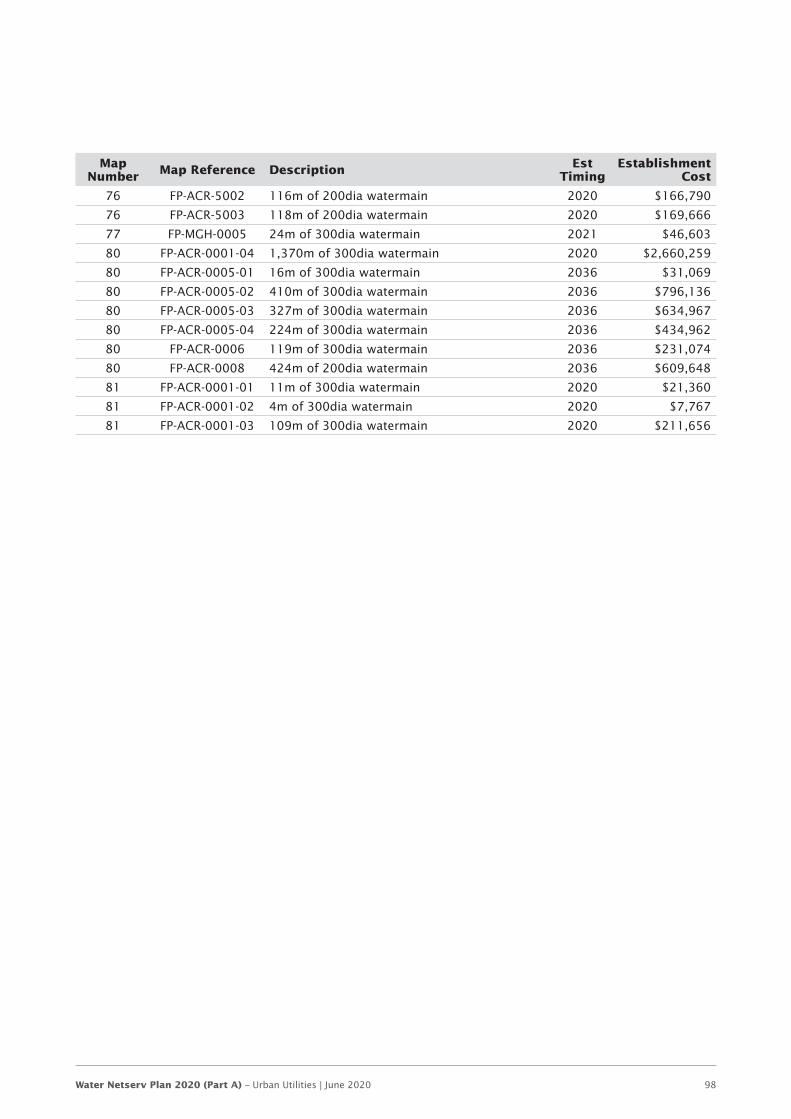
Water Netserv Plan 2020 (Part A) – Urban Utilities | June 2020 98
Map Number Map Reference Description Est
TimingEstablishment
Cost
76 FP-ACR-5002 116m of 200dia watermain 2020 $166,790
76 FP-ACR-5003 118m of 200dia watermain 2020 $169,666
77 FP-MGH-0005 24m of 300dia watermain 2021 $46,603
80 FP-ACR-0001-04 1,370m of 300dia watermain 2020 $2,660,259
80 FP-ACR-0005-01 16m of 300dia watermain 2036 $31,069
80 FP-ACR-0005-02 410m of 300dia watermain 2036 $796,136
80 FP-ACR-0005-03 327m of 300dia watermain 2036 $634,967
80 FP-ACR-0005-04 224m of 300dia watermain 2036 $434,962
80 FP-ACR-0006 119m of 300dia watermain 2036 $231,074
80 FP-ACR-0008 424m of 200dia watermain 2036 $609,648
81 FP-ACR-0001-01 11m of 300dia watermain 2020 $21,360
81 FP-ACR-0001-02 4m of 300dia watermain 2020 $7,767
81 FP-ACR-0001-03 109m of 300dia watermain 2020 $211,656
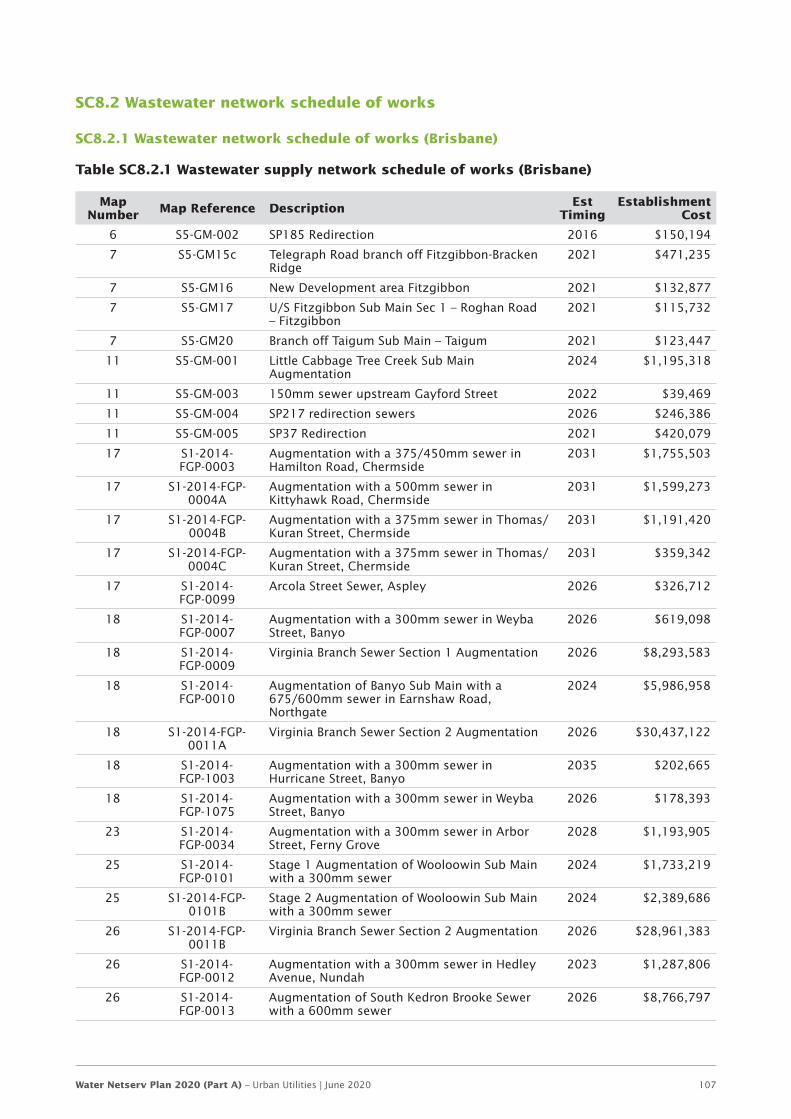
Water Netserv Plan 2020 (Part A) – Urban Utilities | June 2020 107
SC8.2 Wastewater network schedule of works
SC8.2.1 Wastewater network schedule of works (Brisbane)
Table SC8.2.1 Wastewater supply network schedule of works (Brisbane)
Map Number Map Reference Description Est
TimingEstablishment
Cost
6 S5-GM-002 SP185 Redirection 2016 $150,194
7 S5-GM15c Telegraph Road branch off Fitzgibbon-Bracken Ridge
2021 $471,235
7 S5-GM16 New Development area Fitzgibbon 2021 $132,877
7 S5-GM17 U/S Fitzgibbon Sub Main Sec 1 – Roghan Road – Fitzgibbon
2021 $115,732
7 S5-GM20 Branch off Taigum Sub Main – Taigum 2021 $123,447
11 S5-GM-001 Little Cabbage Tree Creek Sub Main Augmentation
2024 $1,195,318
11 S5-GM-003 150mm sewer upstream Gayford Street 2022 $39,469
11 S5-GM-004 SP217 redirection sewers 2026 $246,386
11 S5-GM-005 SP37 Redirection 2021 $420,079
17 S1-2014-FGP-0003
Augmentation with a 375/450mm sewer in Hamilton Road, Chermside
2031 $1,755,503
17 S1-2014-FGP-0004A
Augmentation with a 500mm sewer in Kittyhawk Road, Chermside
2031 $1,599,273
17 S1-2014-FGP-0004B
Augmentation with a 375mm sewer in Thomas/ Kuran Street, Chermside
2031 $1,191,420
17 S1-2014-FGP-0004C
Augmentation with a 375mm sewer in Thomas/ Kuran Street, Chermside
2031 $359,342
17 S1-2014-FGP-0099
Arcola Street Sewer, Aspley 2026 $326,712
18 S1-2014-FGP-0007
Augmentation with a 300mm sewer in Weyba Street, Banyo
2026 $619,098
18 S1-2014-FGP-0009
Virginia Branch Sewer Section 1 Augmentation 2026 $8,293,583
18 S1-2014-FGP-0010
Augmentation of Banyo Sub Main with a 675/600mm sewer in Earnshaw Road, Northgate
2024 $5,986,958
18 S1-2014-FGP-0011A
Virginia Branch Sewer Section 2 Augmentation 2026 $30,437,122
18 S1-2014-FGP-1003
Augmentation with a 300mm sewer in Hurricane Street, Banyo
2035 $202,665
18 S1-2014-FGP-1075
Augmentation with a 300mm sewer in Weyba Street, Banyo
2026 $178,393
23 S1-2014-FGP-0034
Augmentation with a 300mm sewer in Arbor Street, Ferny Grove
2028 $1,193,905
25 S1-2014-FGP-0101
Stage 1 Augmentation of Wooloowin Sub Main with a 300mm sewer
2024 $1,733,219
25 S1-2014-FGP-0101B
Stage 2 Augmentation of Wooloowin Sub Main with a 300mm sewer
2024 $2,389,686
26 S1-2014-FGP-0011B
Virginia Branch Sewer Section 2 Augmentation 2026 $28,961,383
26 S1-2014-FGP-0012
Augmentation with a 300mm sewer in Hedley Avenue, Nundah
2023 $1,287,806
26 S1-2014-FGP-0013
Augmentation of South Kedron Brooke Sewer with a 600mm sewer
2026 $8,766,797
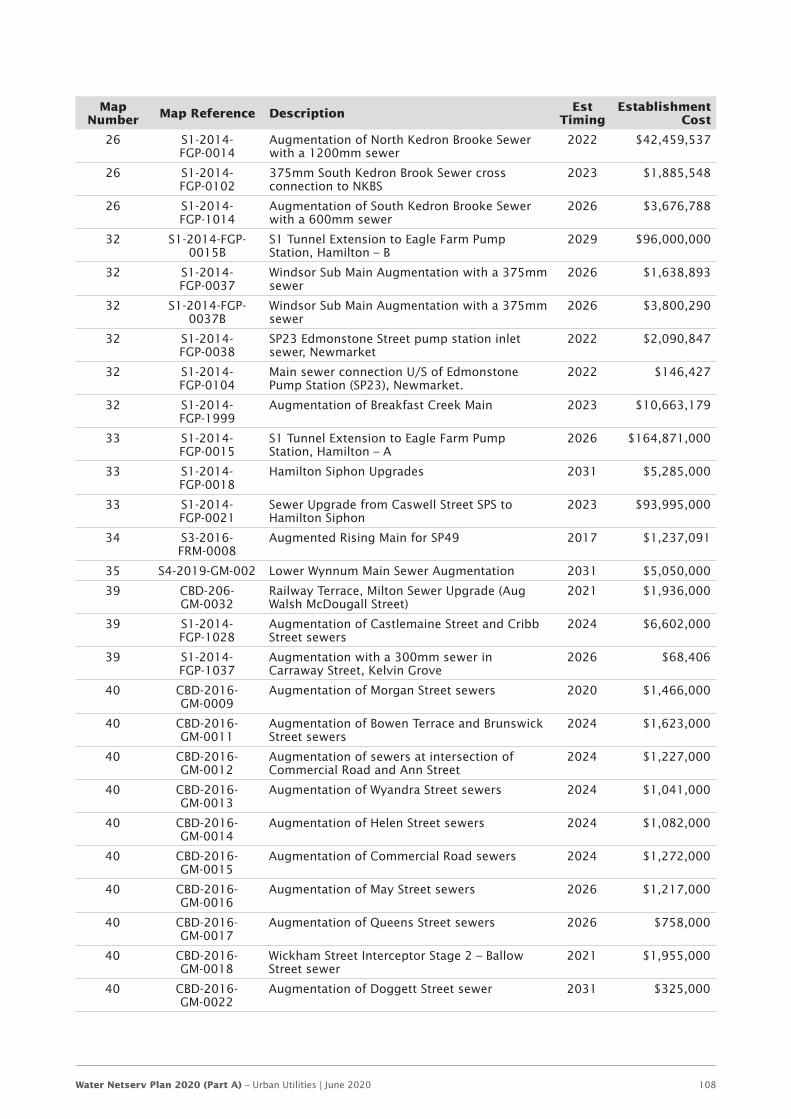
Water Netserv Plan 2020 (Part A) – Urban Utilities | June 2020 108
Map Number Map Reference Description Est
TimingEstablishment
Cost
26 S1-2014-FGP-0014
Augmentation of North Kedron Brooke Sewer with a 1200mm sewer
2022 $42,459,537
26 S1-2014-FGP-0102
375mm South Kedron Brook Sewer cross connection to NKBS
2023 $1,885,548
26 S1-2014-FGP-1014
Augmentation of South Kedron Brooke Sewer with a 600mm sewer
2026 $3,676,788
32 S1-2014-FGP-0015B
S1 Tunnel Extension to Eagle Farm Pump Station, Hamilton – B
2029 $96,000,000
32 S1-2014-FGP-0037
Windsor Sub Main Augmentation with a 375mm sewer
2026 $1,638,893
32 S1-2014-FGP-0037B
Windsor Sub Main Augmentation with a 375mm sewer
2026 $3,800,290
32 S1-2014-FGP-0038
SP23 Edmonstone Street pump station inlet sewer, Newmarket
2022 $2,090,847
32 S1-2014-FGP-0104
Main sewer connection U/S of Edmonstone Pump Station (SP23), Newmarket.
2022 $146,427
32 S1-2014-FGP-1999
Augmentation of Breakfast Creek Main 2023 $10,663,179
33 S1-2014-FGP-0015
S1 Tunnel Extension to Eagle Farm Pump Station, Hamilton – A
2026 $164,871,000
33 S1-2014-FGP-0018
Hamilton Siphon Upgrades 2031 $5,285,000
33 S1-2014-FGP-0021
Sewer Upgrade from Caswell Street SPS to Hamilton Siphon
2023 $93,995,000
34 S3-2016-FRM-0008
Augmented Rising Main for SP49 2017 $1,237,091
35 S4-2019-GM-002 Lower Wynnum Main Sewer Augmentation 2031 $5,050,000
39 CBD-206-GM-0032
Railway Terrace, Milton Sewer Upgrade (Aug Walsh McDougall Street)
2021 $1,936,000
39 S1-2014-FGP-1028
Augmentation of Castlemaine Street and Cribb Street sewers
2024 $6,602,000
39 S1-2014-FGP-1037
Augmentation with a 300mm sewer in Carraway Street, Kelvin Grove
2026 $68,406
40 CBD-2016-GM-0009
Augmentation of Morgan Street sewers 2020 $1,466,000
40 CBD-2016-GM-0011
Augmentation of Bowen Terrace and Brunswick Street sewers
2024 $1,623,000
40 CBD-2016-GM-0012
Augmentation of sewers at intersection of Commercial Road and Ann Street
2024 $1,227,000
40 CBD-2016-GM-0013
Augmentation of Wyandra Street sewers 2024 $1,041,000
40 CBD-2016-GM-0014
Augmentation of Helen Street sewers 2024 $1,082,000
40 CBD-2016-GM-0015
Augmentation of Commercial Road sewers 2024 $1,272,000
40 CBD-2016-GM-0016
Augmentation of May Street sewers 2026 $1,217,000
40 CBD-2016-GM-0017
Augmentation of Queens Street sewers 2026 $758,000
40 CBD-2016-GM-0018
Wickham Street Interceptor Stage 2 – Ballow Street sewer
2021 $1,955,000
40 CBD-2016-GM-0022
Augmentation of Doggett Street sewer 2031 $325,000
Water Netserv Plan 2020 (Part A) – Urban Utilities | June 2020 109
Map Number Map Reference Description Est
TimingEstablishment
Cost
40 CBD-2016-GM-0024
Augmentation of Perry Lane sewers 2036 $1,306,000
40 CBD-2016-GM-0025
40 CBD-2016-GM-0033
Augmentation of Astor Terrace and Wickham Street sewers
2023 $3,019,000
40 CBD-2016-GM-0035
Wickham Street Interceptor Sewer Stage 1 2021 $9,403,000
40 CBD-2016-GM-0036
Augmentation of Alfred-Constance Street sewers
2021 $2,444,000
40 CBD-2016-GM-0037
Augmentation of Longland Street sewer to S1 main
2021 $2,284,000
40 CBD-2016-GM-0052
Augmentation of Water Street sewers Stage 2 2021 $11,085,000
40 CBD-2016-GM-0053
40 S1-2014-FGP-0040A
Augmentation of Herston Branch Sewer 2025 $211,956
40 S1-2014-FGP-1000
Augmentation of Breakfast Creek Main 2023 $15,889,723
40 S1-2014-FGP-1009
Augmentation with a 225mm sewer in Bowen Bridge Road Bowen Hills
2031 $633,705
40 S1-2014-FGP-1010
Augmentation with a 225mm sewer in Herston Road
2026 $118,779
40 S1-2014-FGP-1038
Augmentation with a 300mm sewer near Inner City Bypass
2031 $945,619
40 S1-2014-FGP-1039
Augmentation with a 325mm sewer in Gilchrist Avenue, Herston
2026 $672,553
40 S1-2014-FGP-1067
Augmentation with a 450mm sewer in Campbell Street Bowen Hills
2026 $819,352
41 S1-2014-FGP-0020
Perrin Creek Sub Main augmentation with 600mm sewer-Stage 1
2022 $5,310,000
41 S1-2014-FGP-0023
Augmentation of Stewart to Bilyana Street sewer d/s of Barramul Street PS. Morningside.
2024 $1,713,083
41 S1-2014-FGP-0026
Augmentation of Jenolan Avenue Sewer, Hawthorne
2026 $2,502,258
41 S1-2014-FGP-0103
Perrin Creek Sub Main augmentation with 600mm sewer- Stage 2
2024 $6,910,000
41 S1-2014-FGP-1005
Augmentation with a 225mm sewer near Algoori Street, Morningside
2026 $757,830
41 S1-2014-FGP-1042
Augmentation with a 375mm sewer in Beverley Street, Morningside
2035 $1,021,698
41 S1-2014-FGP-1068
Augmentation with a 300mm sewer near Stuart Street, Bulimba
2026 $995,918
42 S3-2016-FGP-0003
Bulimba Creek Trunk Sewer Augmentation (Stage 3)
2036 $78,583,035
42 S3-2016-FGP-0047
Model indicates SP258 is under capacity, replaces with gravity sewer.
2025 $8,121,991
43 S4-2019-GM-001 Upper Wynnum Main Sewer Augmentation 2021 $3,200,000
Water Netserv Plan 2020 (Part A) – Urban Utilities | June 2020 110
Map Number Map Reference Description Est
TimingEstablishment
Cost
46 CBD_2016_GM_0001
Augmentation of Montague Road and Bank Street sewers
2022 $1,948,000
46 CBD_2016_GM_0002
46 CBD_2016_GM_0003
46 CBD_2016_GM_0006
Augmentation of Sylvan Road sewers 2021 $6,038,000
46 CBD-2016-GM-0019
Augmentation of Montague Road sewers 2031 $1,666,000
46 CBD-2016-GM-0021
Augmentation of Ferry Road sewers 2031 $1,353,000
46 CBD-2016-GM-0023
Augmentation of Kurilpa Street sewers 2036 $1,145,000
46 CBD-2016-GM-0031
Extension of DN800 sewers along Lissner and Bennet Streets
2021 $7,390,000
46 CBD-2016-GM-0041
West End Sub-Main Augmentation Stage 1 (Riverside Drive Phase 1)
2022 $7,236,000
46 CBD-2016-GM-0043
Augmentation of Jane Street sewers 2022 $1,028,000
46 S1-2014-FGP-0087
Brisbane Street Sewer upgrade, d/s of SP99, Toowong
2031 $268,392
46 S1-2014-FGP-0091
Augmentation of Inlet sewer u/s of Heroes Avenue SP103, Taringa
2023 $174,521
46 S1-2014-FGP-0117
Augmentation of Patrick Lane sewer 2025 $1,604,000
46 S1-2014-FGP-0119
Brisbane Street Sewer upgrade, d/s of SP99, Toowong
2031 $152,567
46 S1-2014-FGP-1012
Augmentation with a 375mm sewer in Macquarie Street, St Lucia
2025 $1,277,123
46 S1-2014-FGP-1027
Augmentation with a 500mm sewer in Macquarie Street, St Lucia
2025 $30,046
46 S1-2014-FRP-0003
Rising main upgrade from Brisbane Street PS SP99, Toowong.
2031 $218,754
47 CBD_2016_GM_0004
Augmentation of Boundary Street sewers 2024 $703,000
47 CBD_2016_GM_0005
Augmentation of Ernest Street sewers 2028 $325,000
47 CBD_2016_GM_0007
47 CBD_2016_GM_0008
Augmentation of Margaret Street sewers 2023 $1,847,000
47 CBD-2016-GM-0020
Augmentation of Hope Street sewers 2031 $866,000
47 CBD-2016-GM-0026
Augmentation of Jurgens Street sewers 2036 $1,874,000
47 CBD-2016-GM-0034
Augmentation of Albert Street sewers via Eliz St diversion sewer
2021 $6,800,000
47 CBD-2016-GM-0039
Augmentation of Rawlins Street sewer 2021 $2,678,000
47 CBD-2016-GM-0040
Water Netserv Plan 2020 (Part A) – Urban Utilities | June 2020 111
Map Number Map Reference Description Est
TimingEstablishment
Cost
47 CBD-2016-RM-0038
Augmentation of Kangaroo Point Sub-Main 2024 $6,513,000
47 S1-2014-FGP-1026
Augmentation with a 375mm sewer near Gladstone Street, Cooparoo
2023 $2,913,588
47 S1-2014-FGP-1052
Augmentation with a 150mm sewer in Brook Street, South Brisbane
2024 $2,082,000
48 S1-2014-FGP-0028
Augmentation of Ferguson Road Sewer, Seven Hills
2026 $1,124,276
50 S3-2016-FGP-0005
Augmentation U/S of SP258. Planned bypass of SPS.
2025 $1,399,739
54 S1-2014-FGP-0093
Augmentation of Carmody Street Branch, St Lucia
2023 $1,780,000
54 S1-2014-FGP-1001
Augmentation with a 400mm sewer in College Road, St Lucia
2022 $1,458,084
55 S1-2014-FGP-0033
Augmentation with 300mm sewer in Cedar Street, Greenslopes
2024 $1,195,169
55 S1-2014-FGP-0094
Augmentation of Gravity Main leading to SP175, St Lucia
2022 $2,592,594
55 S1-2014-FGP-1020
Augmentation with a 525mm sewer near South East Busway, Greenslopes
2022 $1,010,707
55 S1-2014-FGP-1021
Augmentation with a 600mm sewer near Baron Street, Greenslopes
2031 $2,972,031
55 S1-2014-FGP-1021B
Augmentation with a 600mm sewer near Baron Street, Greenslopes
2031 $1,272,179
55 S1-2014-FGP-1025
Augmentation with a 375mm sewer near Ridge Street, Greenslopes
2028 $2,532,487
57 AL00001-AL00018
Cost based on Bulimba Creek Trunk Sewer Feasibility Study
2016 $82,070,000
65 S6-GM44 Collection main 05 of Church Road PS, Moggill 2018 $159,162
65 S6-GM45 Collection main 06 of Church Road PS, Moggill 2018 $102,417
70 S3-2021-FGP-0012
Sewer Augmentation along Mount Gravatt-Capalaba Road to end of Mascar Street.
2021 $704,352
70 S3-2026-FGP-0014
Montreal St. augmentation. Additional flow from Mt. Gravatt development area.
2026 $80,044
70 S3-2031-FGP-0016
Open space (Malinya Place) Augmentation required due to Mt Gravatt development.
2031 $493,354
70 S3-2031-FGP-0016
Open space (Malinya Place) Augmentation required due to Mt Gravatt development.
2031 $TBA
70 S3-2041-FGP-0017
Montreal St. augmentation between Newnham Road and Geneva Street.
2041 $239,940
78 RDS-NS21 Future Growth driven by Rochedale Development
2021 $635,938
78 RDS-NS22 Future Growth driven by Rochedale Development
2021 $54,420
82 S3-2016-FGP-0002
Sewer Augmentation D/S of SP171 two sections off Beenleigh Road and Alpita Road
2017 $135,356
IPSWICH CITY
LOCKYER VALLEY REGIONAL
BRISBANE CITY
SCENIC RIM REGIONAL
SOMERSET REGIONAL
160
161
162
1 23 4 56 7 8 910 11 12 13 14 1516 17 18 19 20 21
22 23 24 25 26 27 28
16429 30 31 32 33 34 35 36
163 16537 38 39 40 41 42 43 44
45 46 47 48 49 50 5152 53 54 55 56 57
91 58 59 60 61 62 63134 135 136 137 138 139 92 93 94 95 96 65 66 67 68 69 70 71 72
140 141 142 97 98 99 100 101 73 74 75 76 77 78143 102 103 104 105 106 107 108 79 80 81 82 83144 110 111 112 113 114 115 116 117 84 85 86 87145 120 121 122 123 124 125 88 89 90
126 127 128 129 130131 132 133
146 152153
147 154 155148 156 157 158
149 159
150151
64
118109
119
LegendMap indexPriority infrastructure areaLocal Government Area
PRIORITY INFRASTRUCTURE AREA
PROJECT
TITLE
Map sheet series index1 - 165
Basemap Credits: Sources: Esri, HERE, Garmin, Intermap, increment PCorp., GEBCO, USGS, FAO, NPS, NRCAN, GeoBase, IGN, Kadaster NL,
PUBLISHER: PLANNING GROUPREVISION DATE : Thursday, 18 June 2020FILENAME : NETSERV PLAN mapping series Version 5 IndexPROJECTION: MAP GRID OF AUSTRALIA, ZONE 56HORIZONTAL DATUM: GEOCENTRIC DATUM OF AUST 1994
F0 5 10 15 20 25
Kilometers
NETSERV PLANmapping series
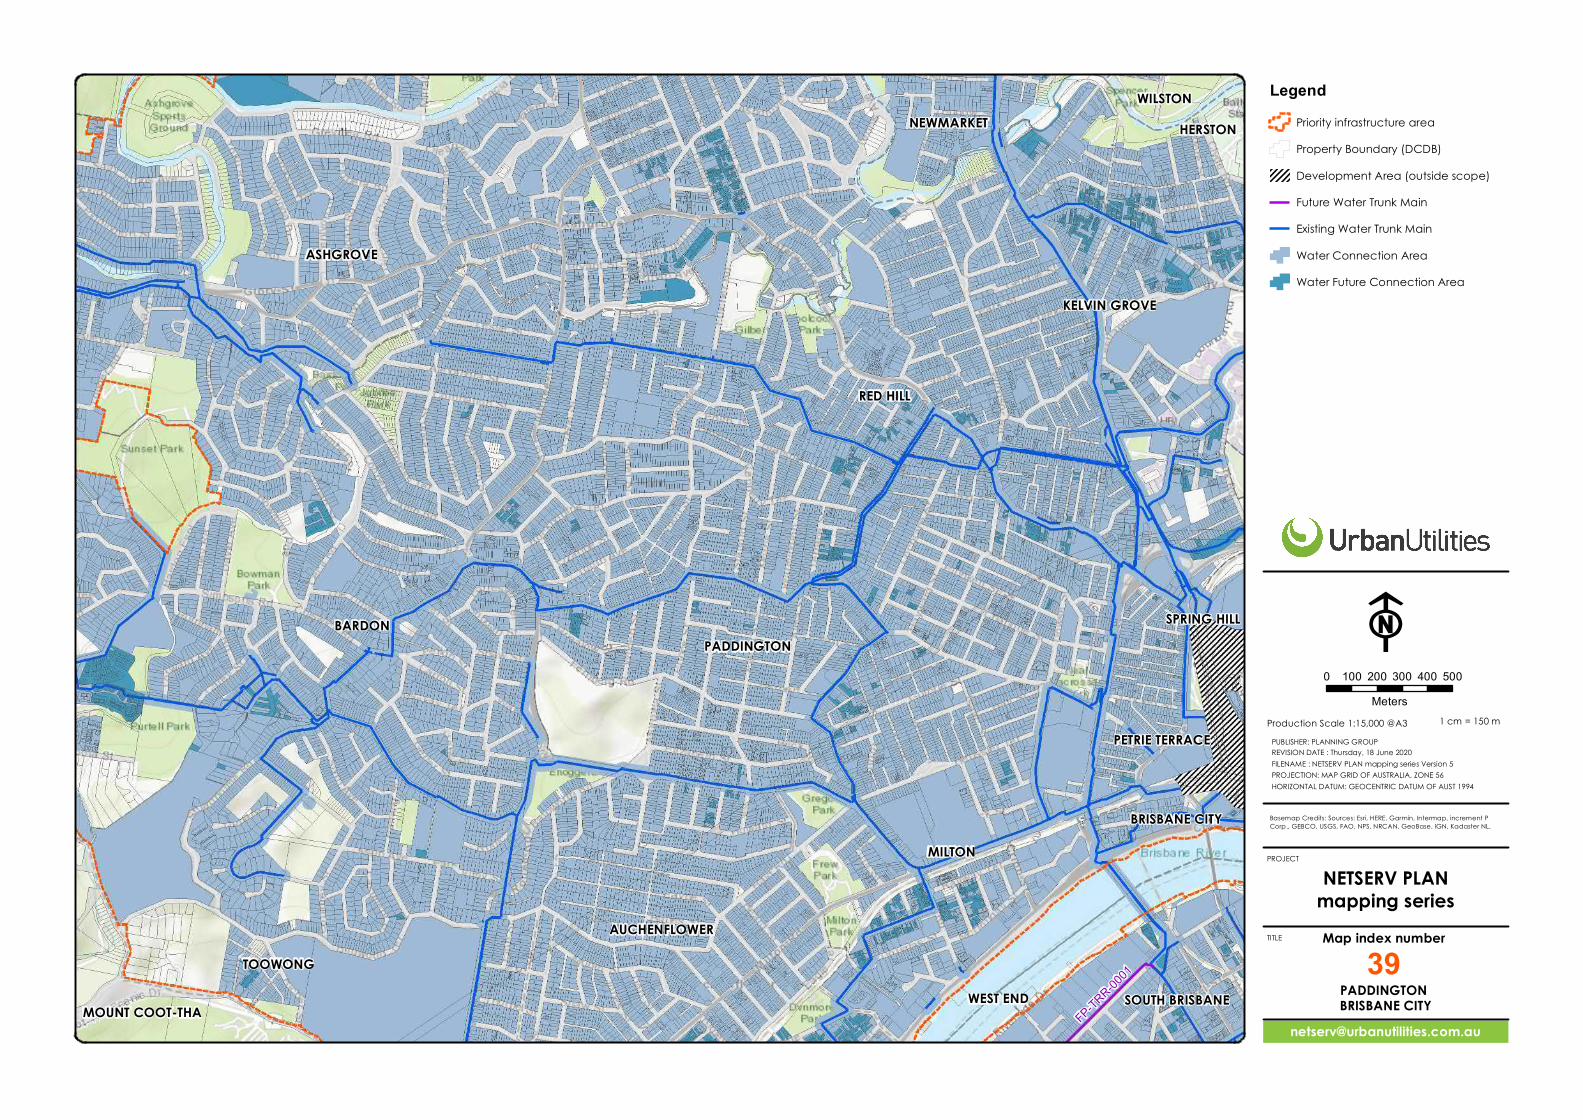
AUCHENFLOWER
ASHGROVE
BARDON
BRISBANE CITY
MILTON
HERSTON
KELVIN GROVE
TOOWONG
MOUNT COOT-THA
NEWMARKETWILSTON
RED HILL
SOUTH BRISBANE
PETRIE TERRACE
WEST END
PADDINGTONSPRING HILL
FP-TRR-0001
PROJECT
TITLE
Map index number39
Basemap Credits: Sources: Esri, HERE, Garmin, Intermap, increment PCorp., GEBCO, USGS, FAO, NPS, NRCAN, GeoBase, IGN, Kadaster NL,
LegendPriority infrastructure areaProperty Boundary (DCDB)Development Area (outside scope)Future Water Trunk MainExisting Water Trunk MainWater Connection AreaWater Future Connection Area
Production Scale 1:15,000 @A3PUBLISHER: PLANNING GROUPREVISION DATE : Thursday, 18 June 2020FILENAME : NETSERV PLAN mapping series Version 5PROJECTION: MAP GRID OF AUSTRALIA, ZONE 56HORIZONTAL DATUM: GEOCENTRIC DATUM OF AUST 1994
F0 100 200 300 400 500
Meters1 cm = 150 m
NETSERV PLANmapping series
PADDINGTONBRISBANE CITY
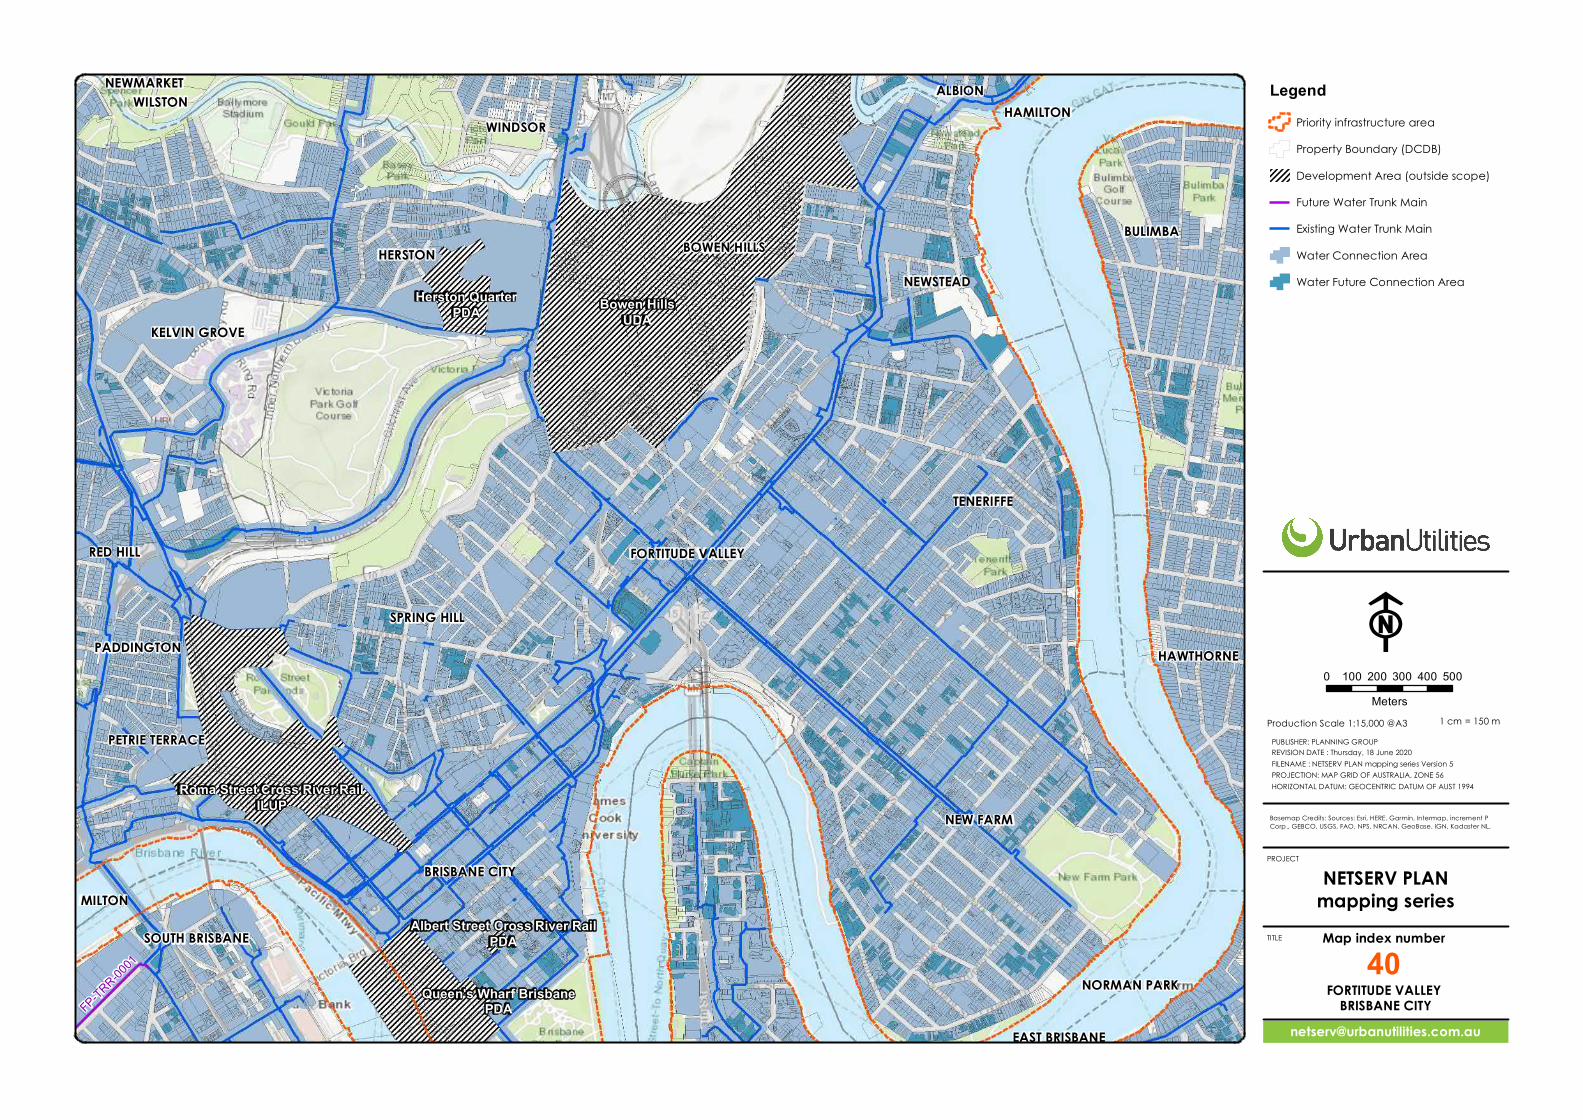
ALBION
BOWEN HILLSBULIMBA
BRISBANE CITY
NEWSTEAD
MILTON
EAST BRISBANE
HAMILTON
HAWTHORNE
HERSTON
FORTITUDE VALLEY
KELVIN GROVE
TENERIFFE
NEW FARM
NEWMARKET
WINDSOR
NORMAN PARK
WILSTON
RED HILL
SOUTH BRISBANE
PETRIE TERRACE
PADDINGTONSPRING HILL
Queen's Wharf BrisbanePDA
Herston QuarterPDA Bowen Hills
UDA
Albert Street Cross River RailPDA
Roma Street Cross River RailILUP
FP-TRR-0001
PROJECT
TITLE
Map index number40
Basemap Credits: Sources: Esri, HERE, Garmin, Intermap, increment PCorp., GEBCO, USGS, FAO, NPS, NRCAN, GeoBase, IGN, Kadaster NL,
LegendPriority infrastructure areaProperty Boundary (DCDB)Development Area (outside scope)Future Water Trunk MainExisting Water Trunk MainWater Connection AreaWater Future Connection Area
Production Scale 1:15,000 @A3PUBLISHER: PLANNING GROUPREVISION DATE : Thursday, 18 June 2020FILENAME : NETSERV PLAN mapping series Version 5PROJECTION: MAP GRID OF AUSTRALIA, ZONE 56HORIZONTAL DATUM: GEOCENTRIC DATUM OF AUST 1994
F0 100 200 300 400 500
Meters1 cm = 150 m
NETSERV PLANmapping series
FORTITUDE VALLEYBRISBANE CITY
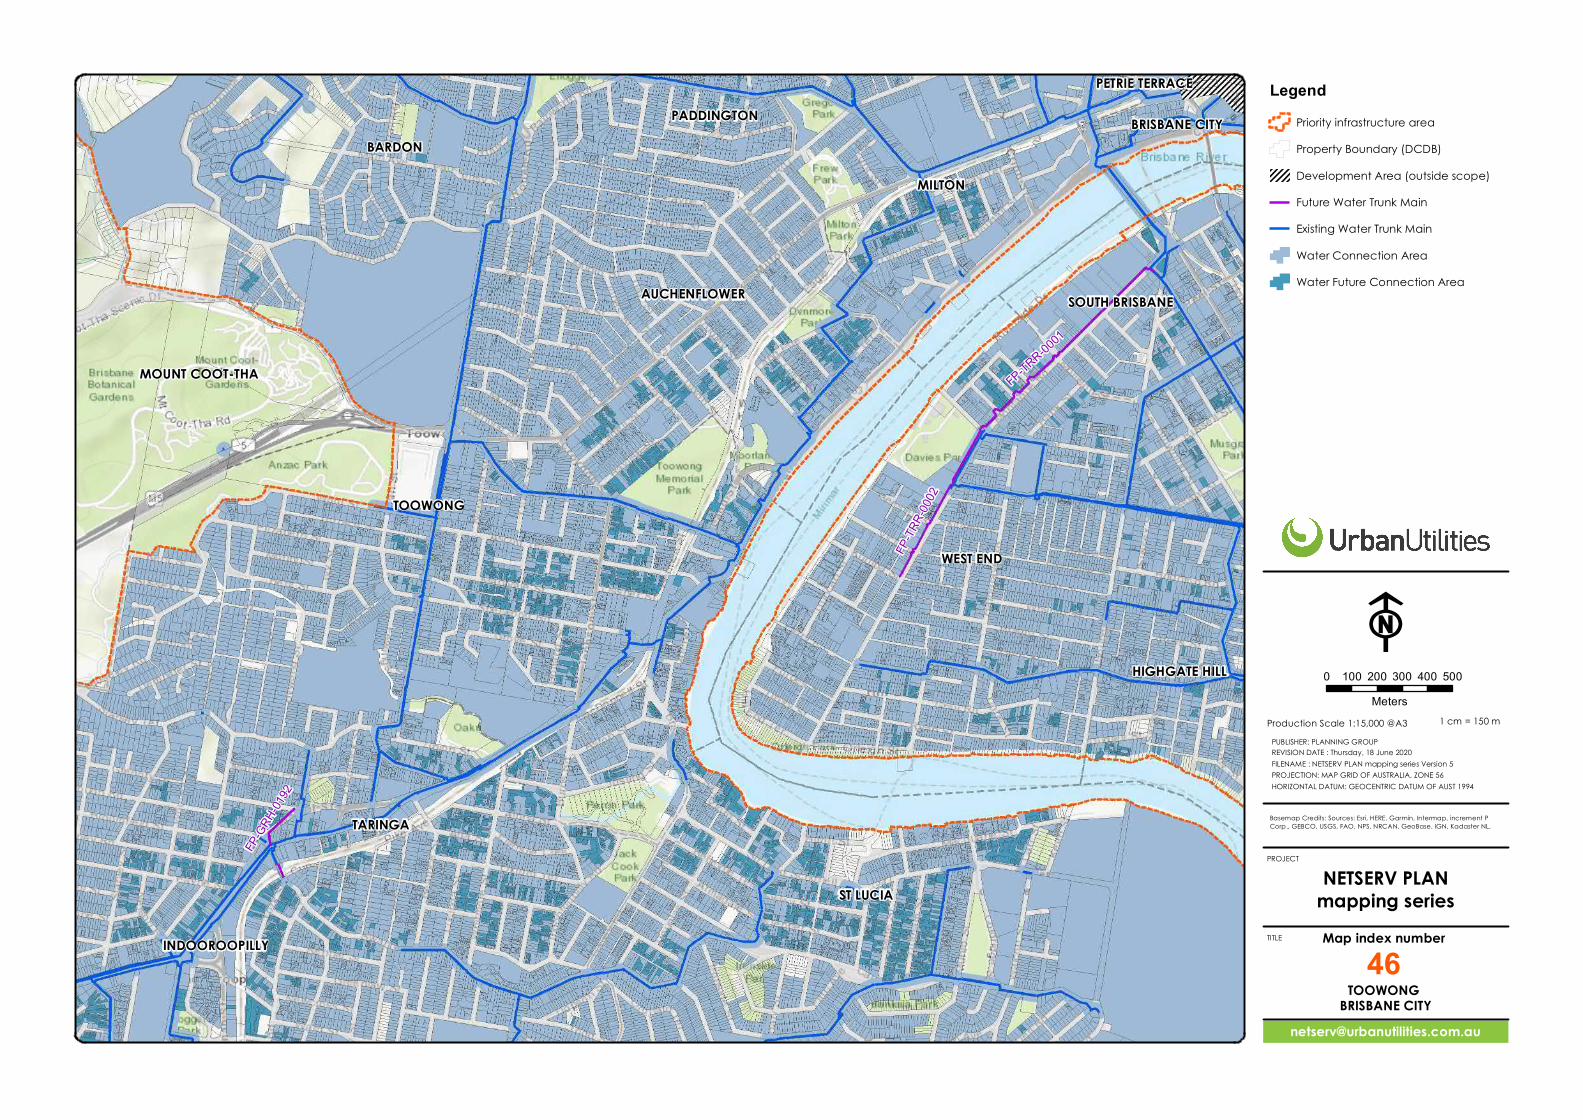
AUCHENFLOWER
BARDONBRISBANE CITY
MILTON
INDOOROOPILLY
HIGHGATE HILL
TARINGA
TOOWONG
MOUNT COOT-THA
SOUTH BRISBANE
PETRIE TERRACE
ST LUCIA
WEST END
PADDINGTON
FP-GRH
-0192
FP-TR
R-000
2
FP-TRR-0001
PROJECT
TITLE
Map index number46
Basemap Credits: Sources: Esri, HERE, Garmin, Intermap, increment PCorp., GEBCO, USGS, FAO, NPS, NRCAN, GeoBase, IGN, Kadaster NL,
LegendPriority infrastructure areaProperty Boundary (DCDB)Development Area (outside scope)Future Water Trunk MainExisting Water Trunk MainWater Connection AreaWater Future Connection Area
Production Scale 1:15,000 @A3PUBLISHER: PLANNING GROUPREVISION DATE : Thursday, 18 June 2020FILENAME : NETSERV PLAN mapping series Version 5PROJECTION: MAP GRID OF AUSTRALIA, ZONE 56HORIZONTAL DATUM: GEOCENTRIC DATUM OF AUST 1994
F0 100 200 300 400 500
Meters1 cm = 150 m
NETSERV PLANmapping series
TOOWONGBRISBANE CITY
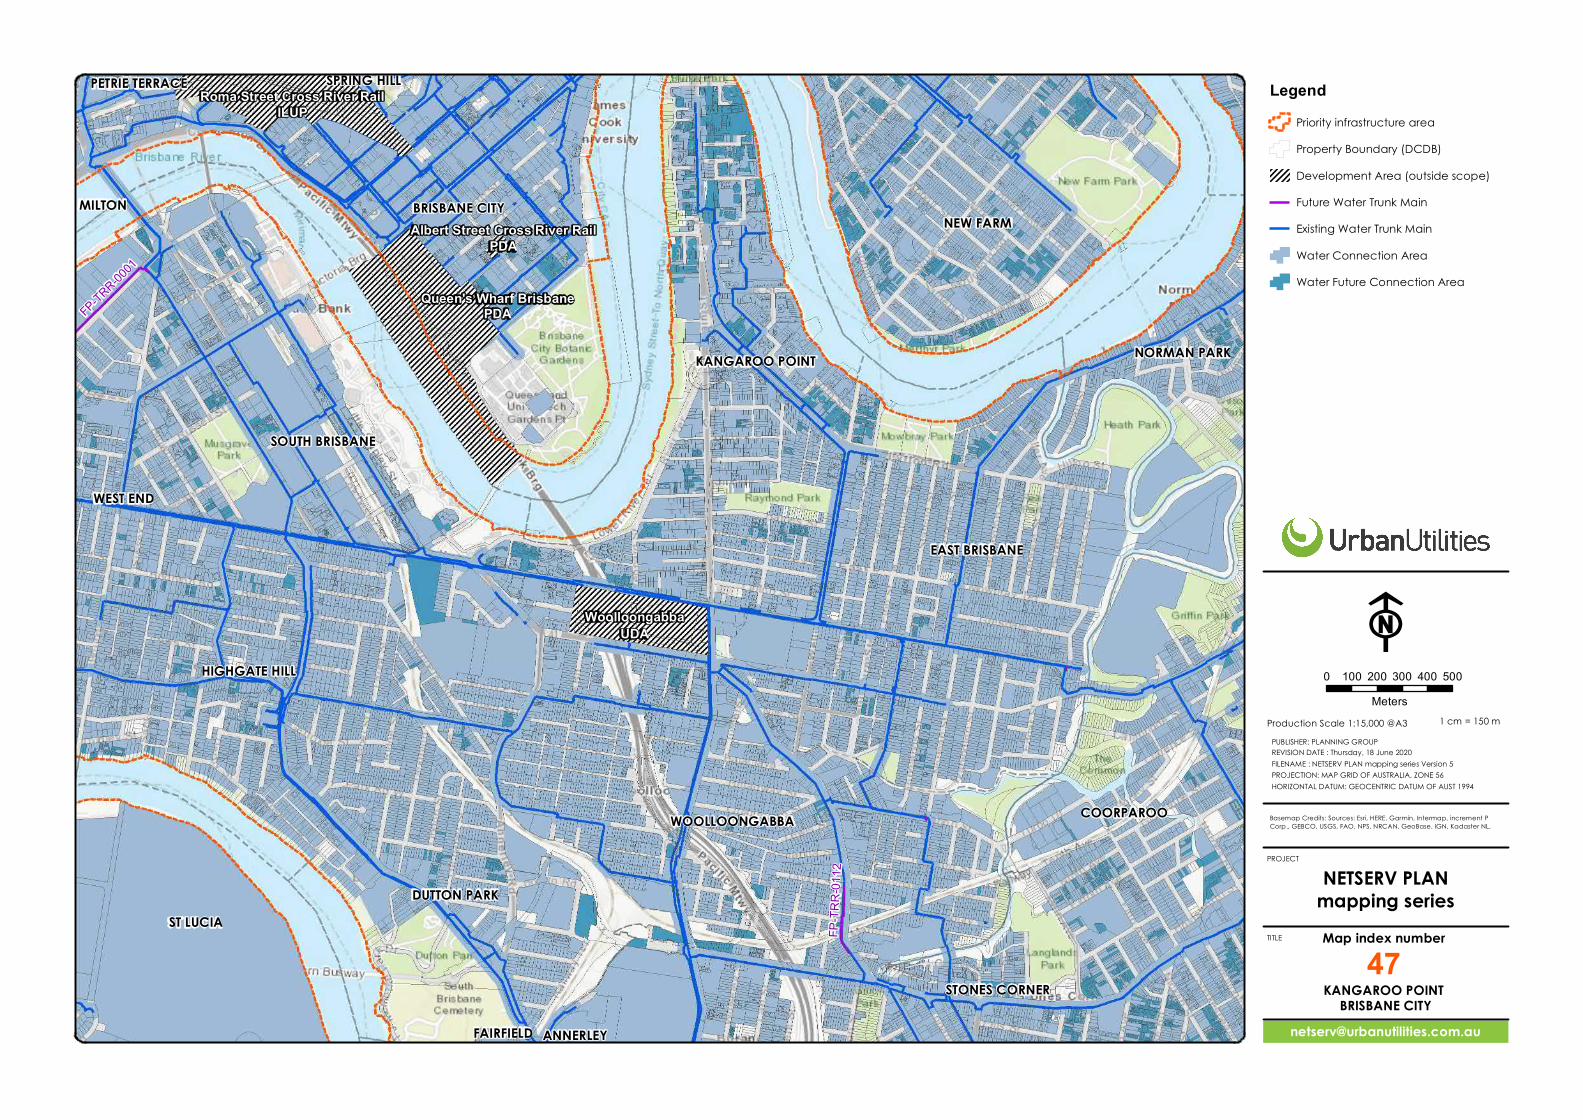
ANNERLEY
BRISBANE CITY
COORPAROO
DUTTON PARK
MILTON
EAST BRISBANE
HIGHGATE HILL
FAIRFIELD
NEW FARM
KANGAROO POINT NORMAN PARK
WOOLLOONGABBA
SOUTH BRISBANE
PETRIE TERRACE
ST LUCIA
STONES CORNER
WEST END
SPRING HILL
Queen's Wharf BrisbanePDA
WoolloongabbaUDA
Albert Street Cross River RailPDA
Roma Street Cross River RailILUP
FP-T
RR-01
12
FP-TRR-0001
PROJECT
TITLE
Map index number47
Basemap Credits: Sources: Esri, HERE, Garmin, Intermap, increment PCorp., GEBCO, USGS, FAO, NPS, NRCAN, GeoBase, IGN, Kadaster NL,
LegendPriority infrastructure areaProperty Boundary (DCDB)Development Area (outside scope)Future Water Trunk MainExisting Water Trunk MainWater Connection AreaWater Future Connection Area
Production Scale 1:15,000 @A3PUBLISHER: PLANNING GROUPREVISION DATE : Thursday, 18 June 2020FILENAME : NETSERV PLAN mapping series Version 5PROJECTION: MAP GRID OF AUSTRALIA, ZONE 56HORIZONTAL DATUM: GEOCENTRIC DATUM OF AUST 1994
F0 100 200 300 400 500
Meters1 cm = 150 m
NETSERV PLANmapping series
KANGAROO POINTBRISBANE CITY
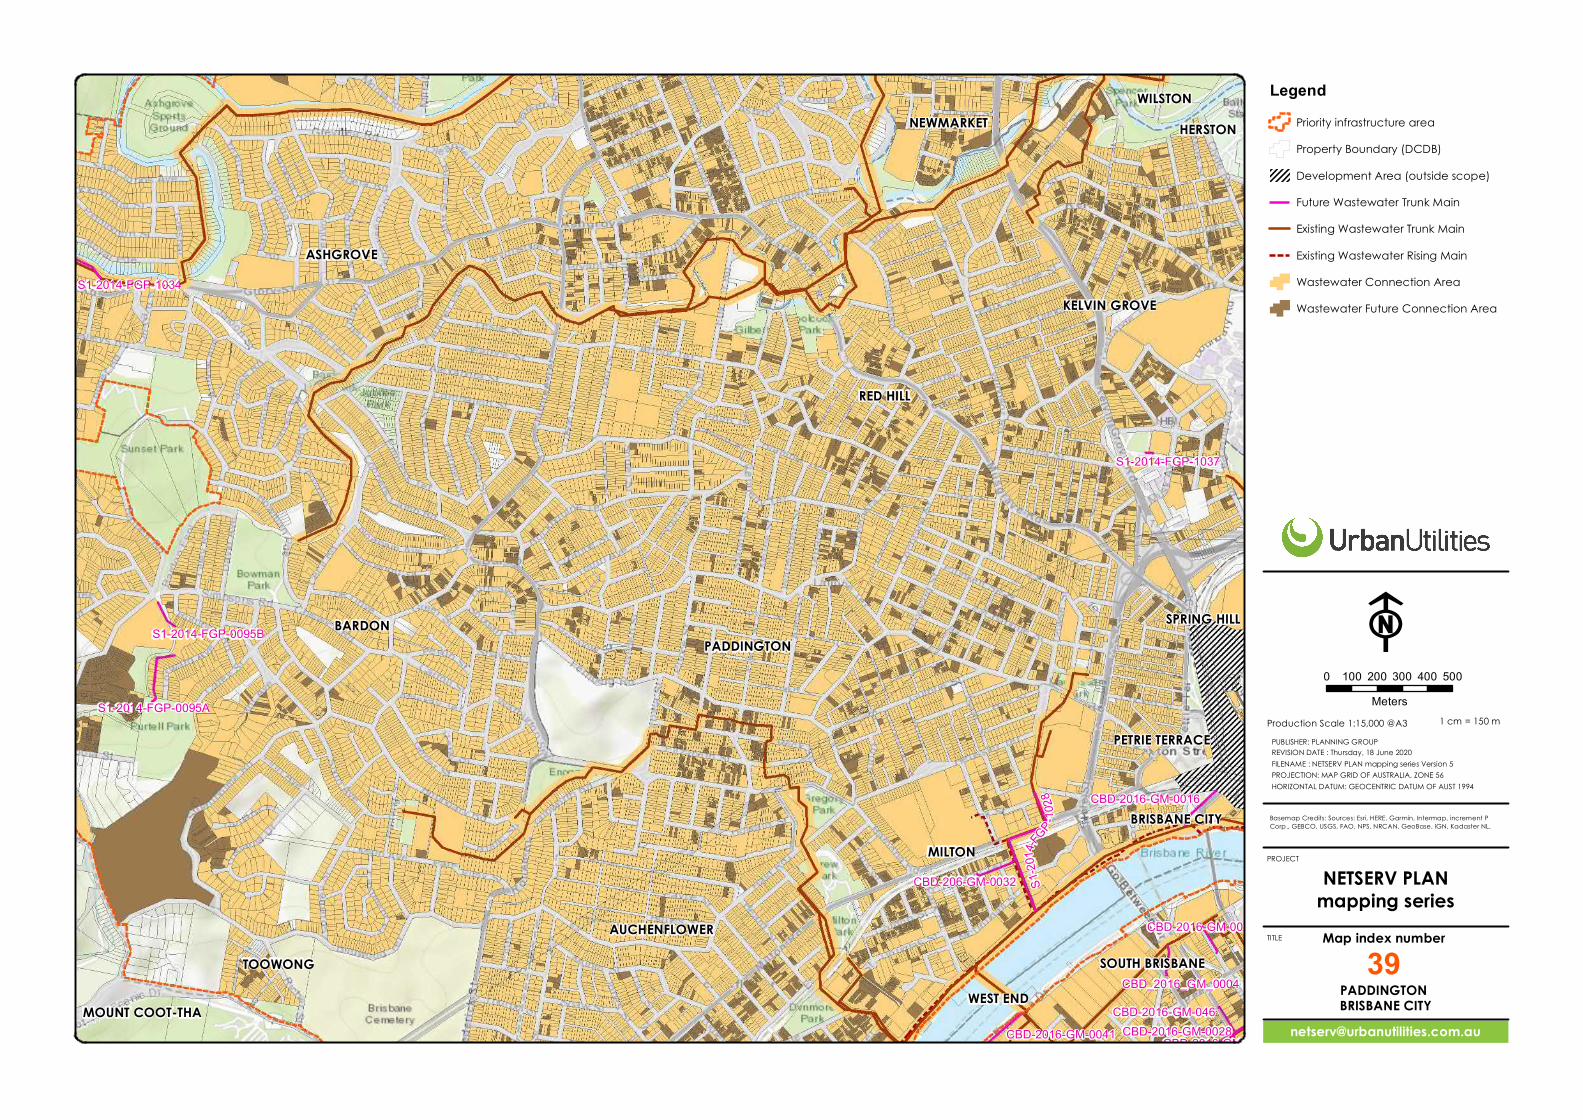
AUCHENFLOWER
ASHGROVE
BARDON
BRISBANE CITY
MILTON
HERSTON
KELVIN GROVE
TOOWONG
MOUNT COOT-THA
NEWMARKETWILSTON
RED HILL
SOUTH BRISBANE
PETRIE TERRACE
WEST END
PADDINGTONSPRING HILL
S1-2014-FGP-1037
CBD-2016-GM-0028
CBD_2016_GM_0004
S1-2014-FGP-0095B
CBD-2016-GM-046
S1-2014-FGP-1034
CBD-206-GM-0032
CBD-2016-GM-0041
CBD-2016-GM-0016
S1-2014-FGP-0095A
S1-20
14-FG
P -1028
CBD-2016-GM-0045
CBD-2016-GM-0020
PROJECT
TITLE
Map index number39
Basemap Credits: Sources: Esri, HERE, Garmin, Intermap, increment PCorp., GEBCO, USGS, FAO, NPS, NRCAN, GeoBase, IGN, Kadaster NL,
LegendPriority infrastructure areaProperty Boundary (DCDB)Development Area (outside scope)Future Wastewater Trunk MainExisting Wastewater Trunk MainExisting Wastewater Rising MainWastewater Connection AreaWastewater Future Connection Area
Production Scale 1:15,000 @A3PUBLISHER: PLANNING GROUPREVISION DATE : Thursday, 18 June 2020FILENAME : NETSERV PLAN mapping series Version 5PROJECTION: MAP GRID OF AUSTRALIA, ZONE 56HORIZONTAL DATUM: GEOCENTRIC DATUM OF AUST 1994
F0 100 200 300 400 500
Meters1 cm = 150 m
NETSERV PLANmapping series
PADDINGTONBRISBANE CITY
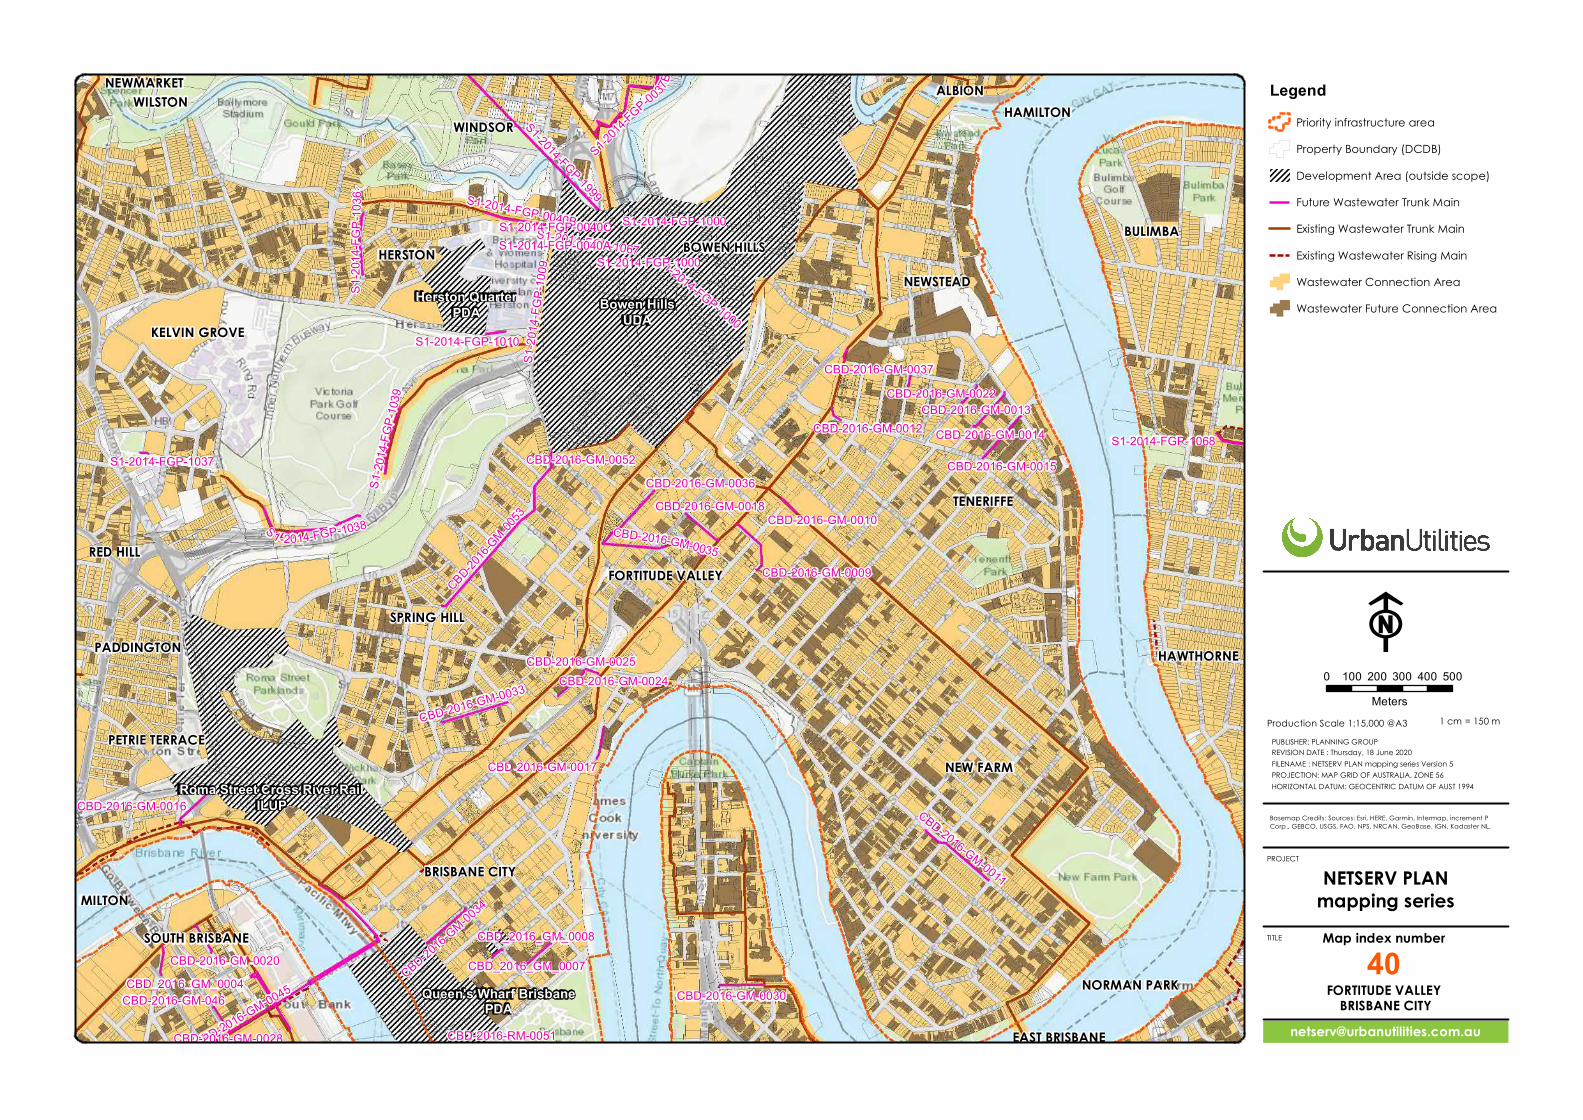
ALBION
BOWEN HILLSBULIMBA
BRISBANE CITY
NEWSTEAD
MILTON
EAST BRISBANE
HAMILTON
HAWTHORNE
HERSTON
FORTITUDE VALLEY
KELVIN GROVE
TENERIFFE
NEW FARM
NEWMARKET
WINDSOR
NORMAN PARK
WILSTON
RED HILL
SOUTH BRISBANE
PETRIE TERRACE
PADDINGTONSPRING HILL
Queen's Wharf BrisbanePDA
Herston QuarterPDA Bowen Hills
UDA
Roma Street Cross River RailILUP
S1-2014-FGP-1037
CBD-2016-GM-0037
CBD_2016_GM_0007
CBD-2016-GM-0022
CBD-2016-GM-0052
CBD-2016-RM-0051
CBD-2016-GM-0024
CBD-2016-GM-0012
CBD-2016-GM-0010
CBD-2016-GM-0013
CBD_2016_GM_0004
S1-2014-FGP-1068
CBD-2016-GM-046
CBD-2016-GM-0020
CBD-2016-GM-0017
S1-2014-FGP-1010
CBD-2016-GM-0025
CBD_2016_GM_0008
CBD-2016-GM-0018
CBD-2016-GM-0030
CBD-2016-GM-0014
CBD-2016-GM-0016
CBD-2016-GM-0036CBD-2016-GM-0015
S1-2014-FGP-1000
CBD-2016-GM-0009
S1-20
14-F G
P-10
36
S1-2014-FGP-1067
S1-20
14-FG
P-10
09
S1-20
14-FG
P-10
39
CBD-2016-GM-0033
S1-2014-FGP-0040B
CBD-2016-GM-0045
CBD-2016-GM-0011
CBD-2016-GM-0034
S1 -2014-FGP-1038
S1-2014-FGP-1000
S1-2014
-FGP-0037B
CBD-2016-GM-0035
CBD-2016-
GM-0053
S1-2014-FGP-1999
S1-2014-FGP-0040C
CBD-2016-GM-0028
S1-2014-FGP-1000S1-2014-FGP-0040A
PROJECT
TITLE
Map index number40
Basemap Credits: Sources: Esri, HERE, Garmin, Intermap, increment PCorp., GEBCO, USGS, FAO, NPS, NRCAN, GeoBase, IGN, Kadaster NL,
LegendPriority infrastructure areaProperty Boundary (DCDB)Development Area (outside scope)Future Wastewater Trunk MainExisting Wastewater Trunk MainExisting Wastewater Rising MainWastewater Connection AreaWastewater Future Connection Area
Production Scale 1:15,000 @A3PUBLISHER: PLANNING GROUPREVISION DATE : Thursday, 18 June 2020FILENAME : NETSERV PLAN mapping series Version 5PROJECTION: MAP GRID OF AUSTRALIA, ZONE 56HORIZONTAL DATUM: GEOCENTRIC DATUM OF AUST 1994
F0 100 200 300 400 500
Meters1 cm = 150 m
NETSERV PLANmapping series
FORTITUDE VALLEYBRISBANE CITY
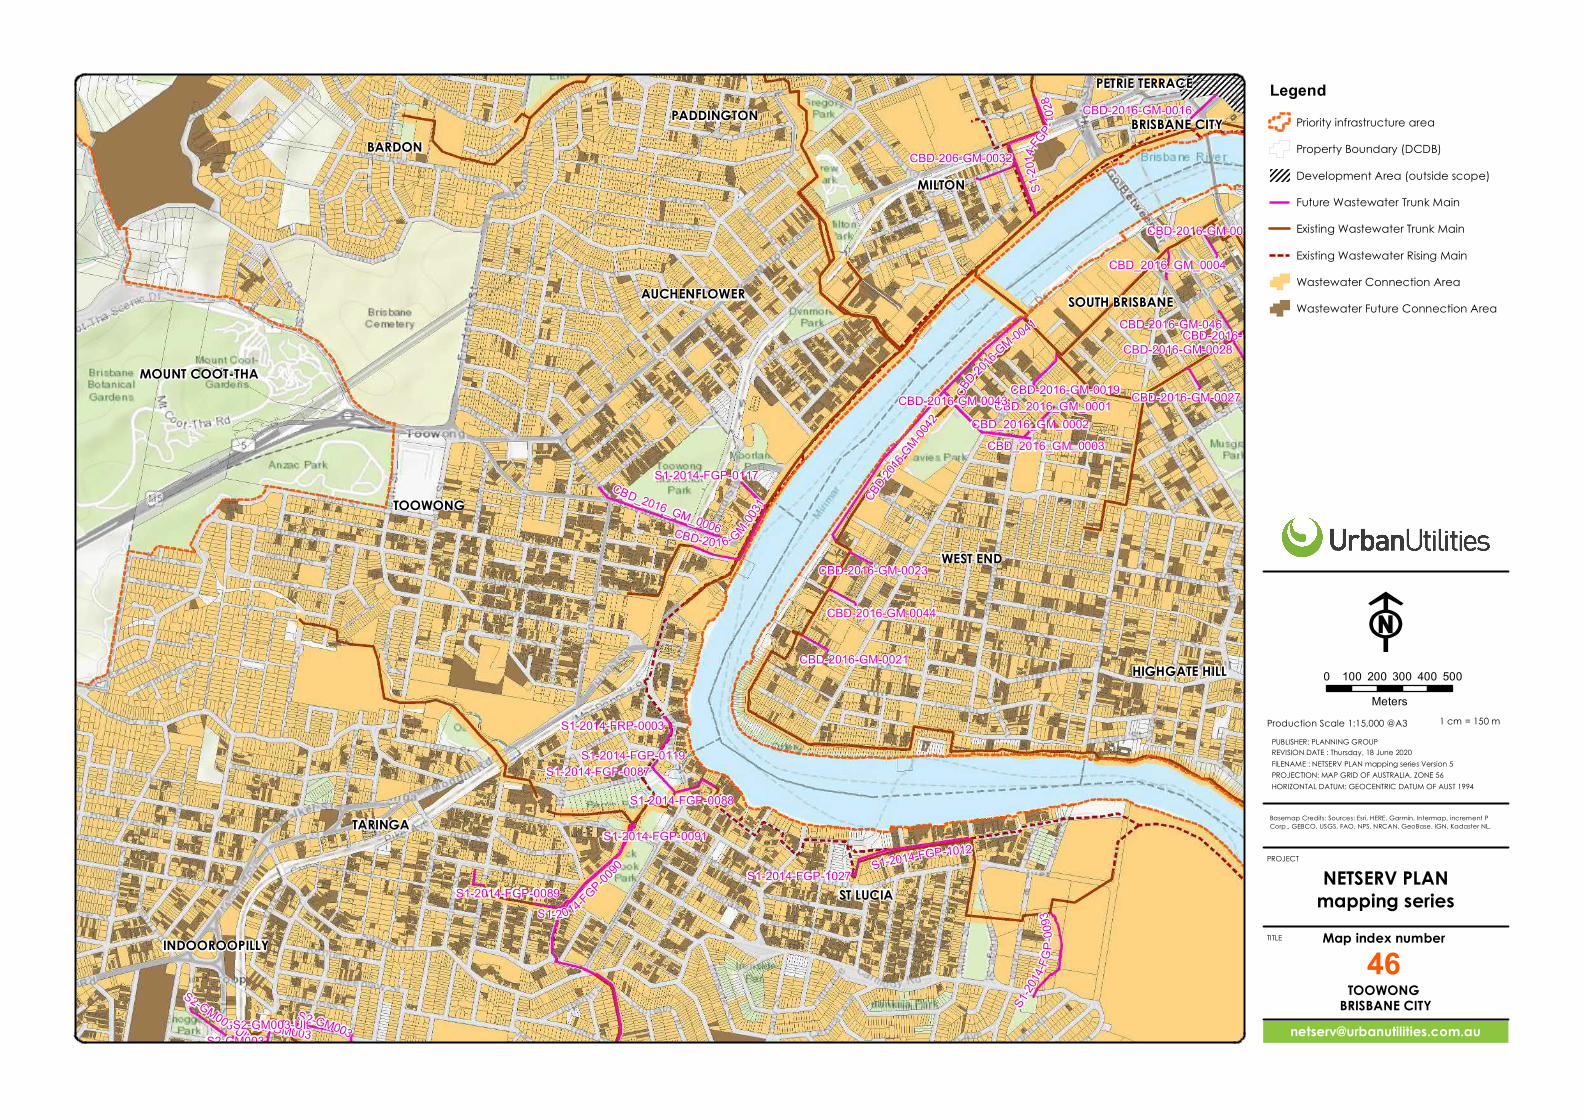
AUCHENFLOWER
BARDONBRISBANE CITY
MILTON
INDOOROOPILLY
HIGHGATE HILL
TARINGA
TOOWONG
MOUNT COOT-THA
SOUTH BRISBANE
PETRIE TERRACE
ST LUCIA
WEST END
PADDINGTON
S1-2014-FGP-1027
S1-2014-FGP-0091
CBD_2016_GM_0003
S1-2014-FGP-0119
S1-2014-FRP-0003
CBD-2016-GM-0028
S1-2014-FGP-0089
CBD-2016-GM-0023
CBD-2016-GM-0027
CBD-2016-GM-0021
CBD-2016-GM-046
CBD-2016-GM-0044
S1-2014-FGP-0117
CBD_2016_GM_0002
CBD-2016-GM-0019
CBD-206-GM-0032
S1-2014-FGP-0088
CBD-2016-GM-0016
S1-2014-FGP-0087
S2-GM003
S2-GM003-UltS2-GM003
S1-20
14-FG
P-00
93
CBD-2016-GM-0031
CBD-20
16-GM-0041
S1-2014-FGP-1012
S1-2014-FGP-0090
CBD_2016_GM_0006
S1-20
14-FG
P -1028
CBD-20
16-GM-00
42
S2-GM003
CBD_2016_GM_0004
CBD-2016-GM-0020
S2-GM003-Ult
CBD-2016-GM-0045
CBD_2016_GM_0001CBD-2016-GM-0043
PROJECT
TITLE
Map index number46
Basemap Credits: Sources: Esri, HERE, Garmin, Intermap, increment PCorp., GEBCO, USGS, FAO, NPS, NRCAN, GeoBase, IGN, Kadaster NL,
LegendPriority infrastructure areaProperty Boundary (DCDB)Development Area (outside scope)Future Wastewater Trunk MainExisting Wastewater Trunk MainExisting Wastewater Rising MainWastewater Connection AreaWastewater Future Connection Area
Production Scale 1:15,000 @A3PUBLISHER: PLANNING GROUPREVISION DATE : Thursday, 18 June 2020FILENAME : NETSERV PLAN mapping series Version 5PROJECTION: MAP GRID OF AUSTRALIA, ZONE 56HORIZONTAL DATUM: GEOCENTRIC DATUM OF AUST 1994
F0 100 200 300 400 500
Meters1 cm = 150 m
NETSERV PLANmapping series
TOOWONGBRISBANE CITY
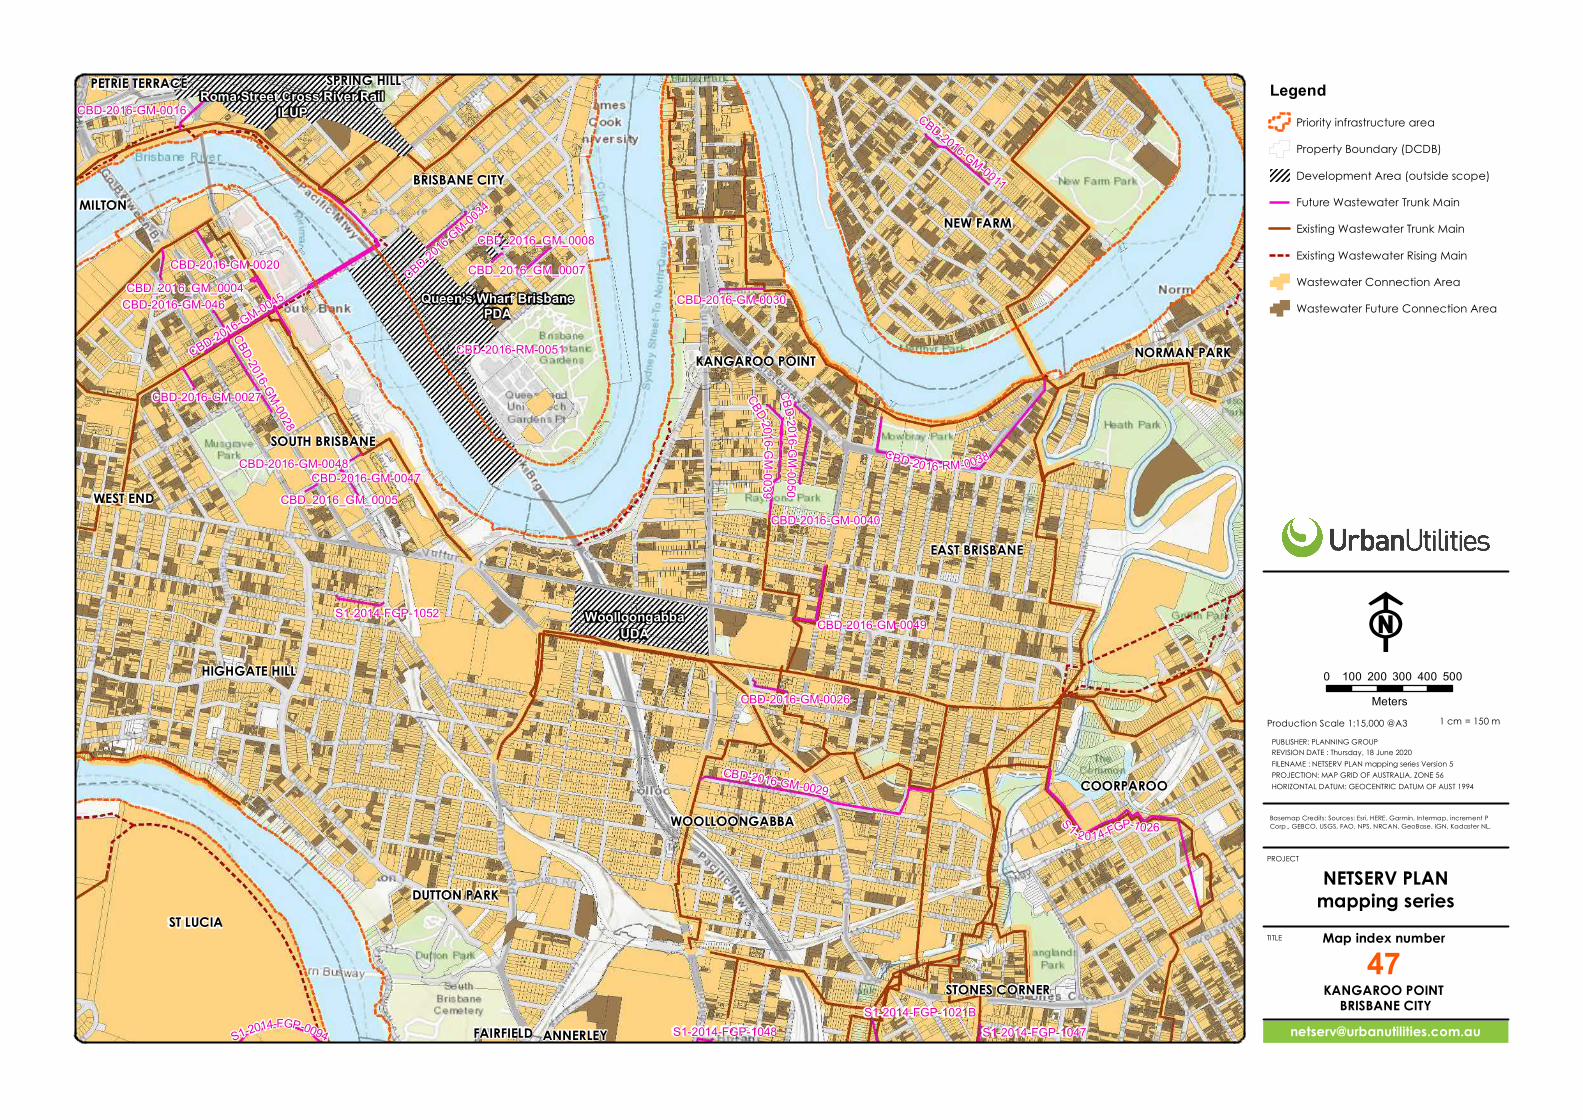
ANNERLEY
BRISBANE CITY
COORPAROO
DUTTON PARK
MILTON
EAST BRISBANE
HIGHGATE HILL
FAIRFIELD
NEW FARM
KANGAROO POINT NORMAN PARK
WOOLLOONGABBA
SOUTH BRISBANE
PETRIE TERRACE
ST LUCIA
STONES CORNER
WEST END
SPRING HILL
Queen's Wharf BrisbanePDA
WoolloongabbaUDA
Roma Street Cross River RailILUP
CBD_2016_GM_0005
CBD_2016_GM_0007
S1-2014-FGP-1047S1-2014-FGP-1048S1-2014-FGP-1021B
CBD-2016-GM-0027
CBD-2016-GM-0047
CBD_2016_GM_0004CBD-2016-GM-046
CBD-2016-GM-0020
CBD-2016-GM-0040
CBD-2016-RM-0051
CBD-2016-GM-0026
CBD_2016_GM_0008
CBD-2016-GM-0048
CBD-2016-GM-0030
S1-2014-FGP-1052
CBD-2016-GM-0016
CBD-2016-GM-0049
CBD-2016-GM-0039
CBD-2016-GM-0011
CBD-2016-GM-0045
CBD-2016-GM-0028
CBD-2016-GM-0034
CBD-2016-GM-0050
S1-2014-FGP-0094
CBD-2016-RM-0038
CBD-2016-GM-0029
S1- 201 4-FGP-1026
PROJECT
TITLE
Map index number47
Basemap Credits: Sources: Esri, HERE, Garmin, Intermap, increment PCorp., GEBCO, USGS, FAO, NPS, NRCAN, GeoBase, IGN, Kadaster NL,
LegendPriority infrastructure areaProperty Boundary (DCDB)Development Area (outside scope)Future Wastewater Trunk MainExisting Wastewater Trunk MainExisting Wastewater Rising MainWastewater Connection AreaWastewater Future Connection Area
Production Scale 1:15,000 @A3PUBLISHER: PLANNING GROUPREVISION DATE : Thursday, 18 June 2020FILENAME : NETSERV PLAN mapping series Version 5PROJECTION: MAP GRID OF AUSTRALIA, ZONE 56HORIZONTAL DATUM: GEOCENTRIC DATUM OF AUST 1994
F0 100 200 300 400 500
Meters1 cm = 150 m
NETSERV PLANmapping series
KANGAROO POINTBRISBANE CITY
1
ROMA STREET PRECINCT STORMWATER MANAGEMENT Cross River Rail Prepared for Cross River Rail Delivery Authority
SMEC Internal Ref. 30032260 20 August 2020
Technical Memo
Technical Memo No 30032260-SW-ROMA-IPBR-001 Date of Issue 20 August 2020
Subject/Title Roma Street Precinct Stormwater Management
Project Name Cross River Rail Project Number 30032260
Discipline Stormwater Management
Document Number 30032260–SW-ROMA-IPBR-001
Revision Details 01
Authors Sheyanne Frisby, Mufrat Noor
Reviewed by Martin Kijlstra / Gustavo Pereira
Approved by Gustavo Pereira
Prepared for Cross River Rail Delivery Authority
Purpose: Development Scheme IPBR Attention to
Daniel Gallagher
Richard Clarke
Attachments
Appendix A – Catchment Maps
Appendix B – Trunk Network Layout and ID
Appendix C – Existing Case Proposed Network Solution
Appendix D – Existing Case Pipe Capacity
Appendix E – DRAINS Model and Results
1 Introduction The Cross River Rail Delivery Authority (CRRDA) are preparing a Development Scheme for the Roma Street Cross River Rail Priority Development Area (PDA) to support the Queensland Government’s Cross River Rail Precincts Delivery Strategy (PDS) Roma Street Precinct Vision.
The PDA sets out a vision of Roma Street Precinct to be an extension of the CBD and Brisbane’s gateway to jobs, tourism and recreation.
To facilitate the realisation of this potential, the Roma Street precinct focus will be on:
The key arrival destination for the central CBD, and the western gateway to the City’s premier cultural, leisure and entertainment offerings including a Potential Major Entertainment Arena (PMEA).
Improved public realm and active transport connections to improve pedestrian movement and connections.
Significant upgrades to State-owned station interchange for CRR, Metro and bus services, including realignment of the Inner Northern Busway.
The Strategy sets out a Roma Street Precinct Intent, located at one of Brisbane’s most significant city centre arrival points, has the opportunity to become a key economic and community hub through major redevelopment, reinvigorating heritage places, new public spaces and developing strong connections to nearby major Parkland and facilities.
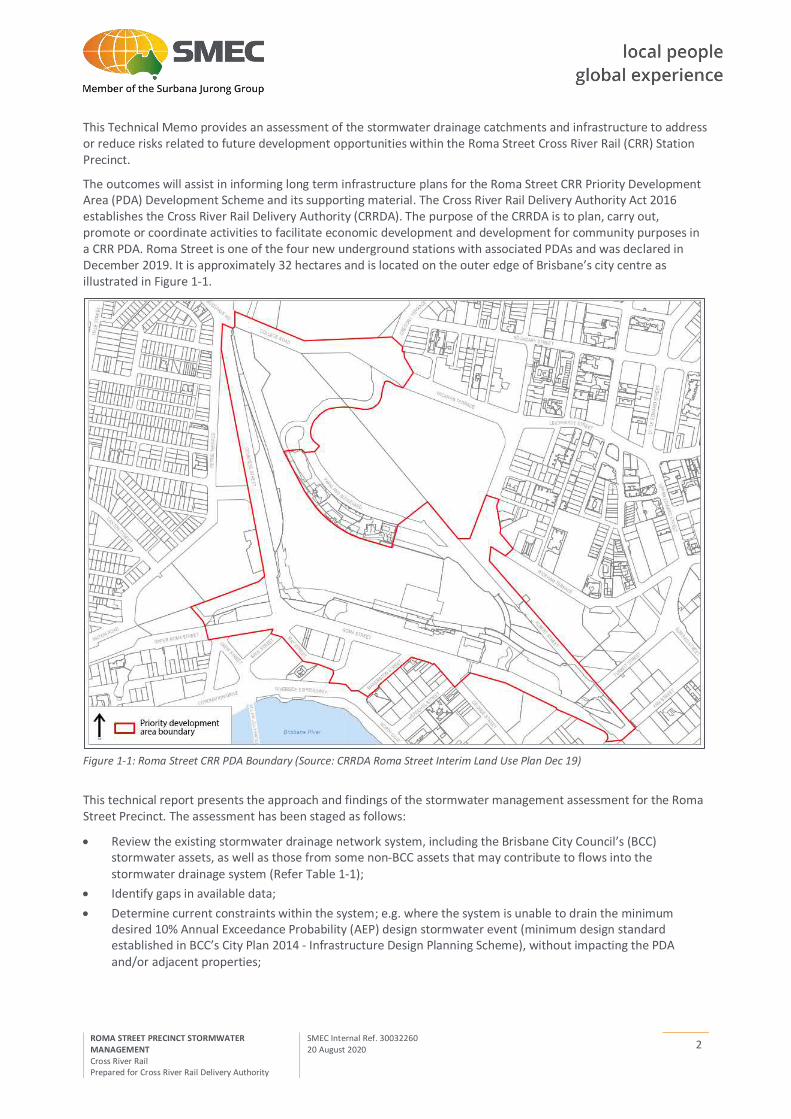
2
ROMA STREET PRECINCT STORMWATER MANAGEMENT Cross River Rail Prepared for Cross River Rail Delivery Authority
SMEC Internal Ref. 30032260 20 August 2020
This Technical Memo provides an assessment of the stormwater drainage catchments and infrastructure to address or reduce risks related to future development opportunities within the Roma Street Cross River Rail (CRR) Station Precinct.
The outcomes will assist in informing long term infrastructure plans for the Roma Street CRR Priority Development Area (PDA) Development Scheme and its supporting material. The Cross River Rail Delivery Authority Act 2016 establishes the Cross River Rail Delivery Authority (CRRDA). The purpose of the CRRDA is to plan, carry out, promote or coordinate activities to facilitate economic development and development for community purposes in a CRR PDA. Roma Street is one of the four new underground stations with associated PDAs and was declared in December 2019. It is approximately 32 hectares and is located on the outer edge of Brisbane’s city centre as illustrated in Figure 1-1.
Figure 1-1: Roma Street CRR PDA Boundary (Source: CRRDA Roma Street Interim Land Use Plan Dec 19)
This technical report presents the approach and findings of the stormwater management assessment for the Roma Street Precinct. The assessment has been staged as follows:
Review the existing stormwater drainage network system, including the Brisbane City Council’s (BCC) stormwater assets, as well as those from some non-BCC assets that may contribute to flows into the stormwater drainage system (Refer Table 1-1);
Identify gaps in available data;
Determine current constraints within the system; e.g. where the system is unable to drain the minimum desired 10% Annual Exceedance Probability (AEP) design stormwater event (minimum design standard established in BCC’s City Plan 2014 - Infrastructure Design Planning Scheme), without impacting the PDA and/or adjacent properties;
3
ROMA STREET PRECINCT STORMWATER MANAGEMENT Cross River Rail Prepared for Cross River Rail Delivery Authority
SMEC Internal Ref. 30032260 20 August 2020
Where pipe size, or level data is not available, undertake a sensitivity analysis to determine if the lack of data is critical;
Identify network sections or pipe runs where the current stormwater drainage does not perform to current design standards and identify potential upgrades in areas where it directly benefits the Roma Street Precinct development opportunities, Precinct access and other associated benefits (e.g. external properties).
Update the model to include the CRR Roma Street Precinct development features;
Determine constrained sections of the stormwater system and associated impacts due to the CRR precinct development;
Determine options to mitigate the impacts and demonstrate effectiveness of the proposed measures;
The objective of this staged approach is to identify constraints, impacts and opportunities directly attributed to the proposed Roma Street Precinct development, as well as pre-development constraints.
1.1 Available Data
A summary of the available reference documents and sources of data for the stormwater analysis are presented in Table 1-1.
Table 1-1: Reference Documents and Available Data
Document Name Date Prepared By
CRR - Roma Street Precinct - Baseline Infrastructure Report - Appendices
November 2018 SMEC
CRR - Roma Street Precinct - Baseline Infrastructure Report - Rev_C November 2018 SMEC
Technical Report Cross River Rail Project – Tunnel, Stations and Development Package (TSD)
October 2019 Hatch
Inner Northern Busway Drawings (Ascon and Asbuilt) 2003 – 2008 SKM, Thiess
Brisbane City Council Spatial Data – Stormwater April 2019 BCC
Brisbane River Catchment Flood Study 2020 BMT
ELVIS LiDAR 2014 ELVIS
2 Existing Stormwater Network Initially the existing stormwater network was modelled using DRAINS software for the existing precinct infrastructure, to identify existing constraints in the network prior to the CRR Roma Street Precinct future development opportunities being realised.
2.1 Stormwater Catchments
2.1.1 General
The catchment area assessed for this study encompasses 52.5 ha of land bounded by Albert St, Wickham Terrace, Upper Roma Street and North Quay. The catchment discharges to the Brisbane River at two outlet locations under Makerston Street and Tank Street. The catchment is mostly impervious, with the exception of the Roma Street Parkland, Hardgrave park and some small vegetated/grassed areas in the road and rail verges. Appendix A shows the catchments for Roma Street Precinct which were delineated for the purpose of the stormwater assessment. The catchment includes the Roma Street Parkland, part of the Roma Street rail precinct, the Inner Northern Busway (INB), and various commercial building areas in the Brisbane Central Business District (CBD).
4
ROMA STREET PRECINCT STORMWATER MANAGEMENT Cross River Rail Prepared for Cross River Rail Delivery Authority
SMEC Internal Ref. 30032260 20 August 2020
2.1.2 External Catchments
For the purpose of this study, external catchments have been defined as any area outside of the PDA which drain to the Roma Street Precinct network. This includes a large portion of the Roma Street Parkland, the Victoria Barracks and Petrie Terrace along with areas in the vicinity of Upper Roma Street, Saul Street, Herschel Street and Tank Street. These external catchments are 26.2ha in size and include the majority of pervious areas within the study extents. Approximately half of the external catchments are classified as pervious land.
2.1.3 PDA Catchments
The PDA catchments are all catchments delineated within the PDA boundary and includes Countess Street, the INB, Roma Street Rail Precinct and the Roma Street road corridor. The PDA catchments make up 26.3ha which is half of the study area. Almost all of the land in this area is considered impervious, with approximately 5% of the area classified as pervious.
2.2 Stormwater Network
The stormwater network information used in this assessment is freely available BCC spatial data (found at https://www.data.brisbane.qld.gov.au/data/group/spatial-data). This information was valuable as it was the most comprehensive data set available for this assessment. The data however, did not include many key attributes which were necessary for understanding how the current network functions. A limited amount of missing network data was able to be extracted from an existing federated Navisworks model of the Roma Street area.
Invert levels (IL) for most of the pipes were unknown and were inferred from the available data. Generally, minimum pipe grades were applied where data was not available, or pipe grades were set so that the known ILs could be achieved.
Surface levels (SL) of pits were generally unknown and where data was not available, SLs were derived from the LiDAR model obtained (2014).
Pipe size information was complete for all pipes. All modelling assumes the information in the BCC spatial data is correct except for two segments of pipe which were changed manually. These pipes were corrected as they showed a significant decrease in pipe size along a large network line and were assumed to be incorrect. A segment of pipe along Roma Street (Line A) was found to be a circular 450mm diameter pipe between an upstream rectangular box culvert of size 1.8x1.8m and downstream rectangular box culvert of size 1.5x2.1m. The 450mm diameter pipe segment was assumed to be incorrect and therefore manually updated on the model to a rectangular 1.8x1.8m box culvert to match the upstream pipe. The second location was along Garrick Street (Line F) where the drainage network discharged into the Roma Street drainage network. At this location the downstream pipe appeared to reduce in size compared to the upstream circular pipe from a 525mm diameter pipe to a 375mm diameter pipe resulting in a contraction. This was once again assumed to be incorrect and therefore the 375mm diameter pipe was upsized in the model to match the upstream pipe segment.
INB drawings were made available, which assisted in confirming network information in that area and assisted to confirm its configuration. Google Street View and high resolution Metromap Imagery also confirmed the location of many pits in the network. To improve the reliability of the modelling information, a detailed survey of the area would be necessary or at minimum, conformation of IL at key locations.
Given the network is currently under capacity (under-sized for the desired level of service and resulting in surcharging), the majority of the trunk network is functioning under pressure and therefore modelling undertaken as part of this assessment wasn’t severely impacted by the lack of IL information and would not have impacted HGL results significantly.
2.2.1 Key Trunk Network Pipes
The main pipe conveying flow to the outlet is a large brick arch pipe (Line A) which varies in size along the length of the pipe (see Figure 2-1, or Appendix B for a larger map). It begins in the Roma Street Parkland as a 1.8 x 1.8m brick arch pipe and changes to a 2.4 x 2.4m brick arch pipe under Parkland Boulevard. The pipe continues southwest underneath the Roma Street rail corridor towards the INB where the pipe changes back to a 1.8 x 1.8m brick arch
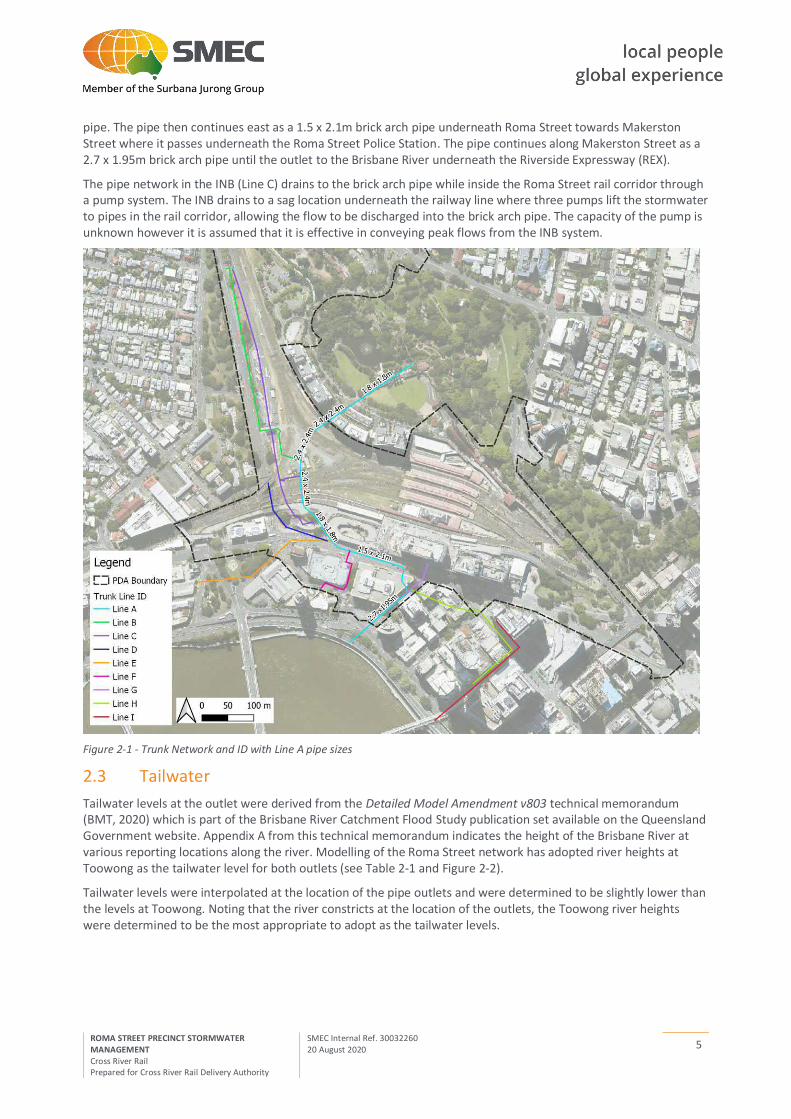
5
ROMA STREET PRECINCT STORMWATER MANAGEMENT Cross River Rail Prepared for Cross River Rail Delivery Authority
SMEC Internal Ref. 30032260 20 August 2020
pipe. The pipe then continues east as a 1.5 x 2.1m brick arch pipe underneath Roma Street towards Makerston Street where it passes underneath the Roma Street Police Station. The pipe continues along Makerston Street as a 2.7 x 1.95m brick arch pipe until the outlet to the Brisbane River underneath the Riverside Expressway (REX).
The pipe network in the INB (Line C) drains to the brick arch pipe while inside the Roma Street rail corridor through a pump system. The INB drains to a sag location underneath the railway line where three pumps lift the stormwater to pipes in the rail corridor, allowing the flow to be discharged into the brick arch pipe. The capacity of the pump is unknown however it is assumed that it is effective in conveying peak flows from the INB system.
Figure 2-1 - Trunk Network and ID with Line A pipe sizes
2.3 Tailwater
Tailwater levels at the outlet were derived from the Detailed Model Amendment v803 technical memorandum (BMT, 2020) which is part of the Brisbane River Catchment Flood Study publication set available on the Queensland Government website. Appendix A from this technical memorandum indicates the height of the Brisbane River at various reporting locations along the river. Modelling of the Roma Street network has adopted river heights at Toowong as the tailwater level for both outlets (see Table 2-1 and Figure 2-2).
Tailwater levels were interpolated at the location of the pipe outlets and were determined to be slightly lower than the levels at Toowong. Noting that the river constricts at the location of the outlets, the Toowong river heights were determined to be the most appropriate to adopt as the tailwater levels.
6
ROMA STREET PRECINCT STORMWATER MANAGEMENT Cross River Rail Prepared for Cross River Rail Delivery Authority
SMEC Internal Ref. 30032260 20 August 2020
Table 2-1 - Tailwater Level
Location Tailwater Level (mAHD) at Toowong
10% AEP 1% AEP
Outlet 1 (Makerston Street) 2.08 6.74
Outlet 2 (Tank Street) 2.08 6.74
Figure 2-2 - Location of Outlets
2.4 Limitations of the Model
Due to the limited availability of reliable data, the model contains some assumptions including:
Model data was adopted from the BCC Spatial Data with any missing information interpolated as previously discussed. Data used in the modelling included the pipe network and all pit or stormwater device layers available from BCC. Attributes from this data included spatial location, IL, SL pipe size and pipe type;
Modelling concrete pipes as class FRC Class 3 with a Manning’s n value of 0.013;
Modelling the brick arch pipe as a Box Culvert with a Manning’s n value of 0.015;
The brick arch and egg-shaped stormwater conduits have been modelled as box culverts in the existing case. An area assessment can be undertaken in detailed design to determine their actual area. The pipe areas are
7
ROMA STREET PRECINCT STORMWATER MANAGEMENT Cross River Rail Prepared for Cross River Rail Delivery Authority
SMEC Internal Ref. 30032260 20 August 2020
likely smaller than those modelled in this exercise, meaning that the impact of the existing case is likely larger than what has been currently assessed.
Assuming the tailwater level to be uniform across all outlets based on BRCFS (2020);
Surface Levels at pits were derived from LiDAR (2014) where data was unavailable;
The model was prepared to assess the capacity of the existing pipe network and does not assess the inlet capacity of the system. Based on imagery and pit spacing it was assumed that pit capacity was not an issue for the network;
The current modelling is not to be used in any detailed design or detailed assessments. It is a high-level assessment looking at the pipe capacity of the network only for the purpose of assisting in informing infrastructure plans for the Roma Street CRR PDA;
Impervious areas were determined based on areal imagery;
Time of concentrations were assumed based on fraction impervious area and land use;
When sizing the upgrade to the brick arch pipe, all additional pipes or box culverts were increased to a size that would allow 100% of the catchment runoff to enter the network to ensure that the upgraded pipes could carry the capacity of the entire network.
2.5 Existing Constraints
The stormwater network around the Roma Street area is known to be significantly under capacity and cannot convey a 10% AEP storm event flow. Further, a previous study undertaken by Hatch found that pipe capacities in Countess Street, Upper Roma Street, Saul Street and Garrick Street are exceeded even during a 63% AEP event, causing the network to surcharge and pond on and along the streets including Roma Street, at unsafe depths. Appendix C shows a map of the existing case pipe network capacity, depicting pipes with spare capacity, pipes with no spare capacity but not surcharging and pipes with no spare capacity and surcharging.
2.6 Proposed Constraint Resolutions
Due to the busy CBD location of Roma Street, any potential constraint resolutions are severely affected by the disruption that upgrades may cause to pedestrian and vehicular traffic in the area. Therefore, proposed solutions consider both the stormwater network and the impact of the constructions works required to complete the upgrades.
A series of proposed solutions were modelled for the existing case to determine where the most effective upgrades can be undertaken. It was found that upgrades along a section of the Line A brick arch pipe (Refer Appendix D) which runs from the Roma Street Parkland, along Roma Street and Makerston Street to an outlet under the REX, was the most efficient solution to improve the capacity of the trunk main. Upgrading this section of pipe would resolve the main capacity issue within the trunk network and would also allow for a portion of the pipe to be redirected away from under the Roma Street Police Station building, if this site is re-developed in the future, facilitating ease of future maintenance for that section of the trunk main.
As discussed above, the model assumes the drainage network discharging into the trunk main would have adequate capacity to convey the 10% AEP for their respective local catchments (lines B, C, D, E, F, G, H and I). This however is not the case, with all lines currently performing well under the necessary network capacity, resulting in excessive surcharge from those lines being directed to Roma Street. All these lines drain stormwater runoff generated from catchments outside the PDA area and resolutions for those lines were not addressed as part of this study.
The exception is Line F (Garrick Street), which drains the PDA area located to the south of Roma Street. Further, it is recommended that the stormwater pipe in Garrick Street be upgraded concurrently with any future redevelopment of the Roma Street Police Headquarters site (nominally assumed to occur in 2036 in the CRR Roma Street Precinct Baseline Staging Assumptions) as this line is significantly under capacity and also contributes to flooding along Roma Street. This line also receives surcharge flows from line E, outside the PDA area. The recommended augmentation of Line F takes into consideration the extra flows received from Line E. Table 2-2 below shows the
8
ROMA STREET PRECINCT STORMWATER MANAGEMENT Cross River Rail Prepared for Cross River Rail Delivery Authority
SMEC Internal Ref. 30032260 20 August 2020
proposed pipe upgrades and Appendix D shows a map of the upgrade area and the proposed PDA pipe upgrade segments. It is noted that the proposed upgrades alone will not be sufficient to resolve the flooding issues within the Roma Street stormwater drainage network catchment. Additional upgrades would be required to be undertaken for the remaining drainage network outside the PDA. The proposed works however would considerably improve the current situation and reduce the flooding within Roma Street road corridor. Refer Appendix E for the flow comparison (pipe flow and overland flow) for the catchment.
Table 2-2 - Proposed Pipe Upgrades
Pipe Pipe reference Infrastructure Type Current Size (m) New Size (m) Length (m)
SW1 1 Stormwater 0.675 1.8 x 1.8 5.5
SW1 2 Stormwater 1.8 x 1.8 2.4 x 2.4 13.5
SW1 3 Stormwater 1.5 x 2.1 2.4 x 2.4 25
SW1 4 Stormwater 1.5 x 1.05 2.4 x 2.4 210
SW2 5 Stormwater 0.100 525 13.59
SW2 6 Stormwater 0.100 525 31.396
SW2 7 Stormwater 0.375 525 2.18
SW2 8 Stormwater 0.375 600 7.812
SW2 9 Stormwater 0.450 600 40.161
SW2 10 Stormwater 0.525 600 11.732
SW2 11 Stormwater 0.525 600 8.895
SW2 12 Stormwater 0.525 600 13.43
It is noted that the modelling assumed no-worsening of drainage impacts from future development sites within the PDA, with on-site detention proposed to be incorporated into future developments. The Roma Street road corridor flood impacts proposed to be mitigated are an existing issue. It is noted that the future development opportunities within the PDA are assumed to introduce more residents and workers into the Precinct, therefore mitigating the existing flooding issue is considered warranted.
The results from the modelling indicates that the existing runoff from land within the PDA is responsible for approximately 60% of the flows into the trunk main (Line A) and approximately 35% of the flows into Line F (Garrick Street). The remaining flows (approximately 40% of the flows into the trunk main and approximately 65% of the flows into Garrick Street) are generated from catchments outside the PDA.
3 Roma Street Precinct Developed Network Once the existing constraints were understood, the stormwater network was modelled with the proposed Roma Street Precinct infrastructure, and compounding constraints analysed.
3.1 Changes to catchments
Three proposed future PDA development scenario was assessed for its impacts to the current layout allowing for the proposed pipe upgrades mentioned in Section 2. Based on the PDA area, the existing case sub catchments were altered to suit. Refer to Appendix A for the design case catchment plans.
9
ROMA STREET PRECINCT STORMWATER MANAGEMENT Cross River Rail Prepared for Cross River Rail Delivery Authority
SMEC Internal Ref. 30032260 20 August 2020
3.1.1 Changes to External Catchments
In the design scenario, no changes were made to external catchments. It is understood that the Victoria Barracks may be subject to re-development in the long term however it was assumed that there will be no changes to the imperviousness of the area, or any increase in flow generation will be mitigated by a detention system to be constructed as part of its long-term re-development.
3.1.2 Changes to PDA Catchments
In the design scenario, changes were made to the PDA catchment area to account for the larger extents of development. In the design scenario, the CRR Project P04B (PMEA) area was included in the model extending outside of the base case catchment areas resulting in a slight increase in catchment area. The fraction imperious in the design scenario changes slightly as a limited section of the Roma Street Parkland existing Depot site is assumed to be utilised for a redevelopment opportunity.
3.2 Developed Stormwater Constraints and Proposed Responses
The assumed ultimate re-development in the PDA area has very little to negligible impact on the stormwater network performance in the Roma Street road corridor, once the proposed upgrades are adopted.
3.2.1 Impacts Due to External Catchments
It has been assumed that there are no additional impacts contributing to the network as a result of external catchments. As discussed, no changes have been considered, however there is the possibility of a redevelopment at the Victoria Barracks. Given the network downstream is significantly under capacity (resulting in surcharge), the future re-development of the Barracks site presents an opportunity to utilise detention of stormwater on-site to avoid increased flows in the downstream network.
3.2.2 Impacts due to PDA Catchments
While there are assumed changes (future development) to the catchment area in the long term that have been analysed within the PDA area, there are no significant impacts to the flows into pipe network. Given the limitations of the existing drainage network, it is recommended that the future development of the PMEA, Activity Building area, Parkland Depot site and Future Over Station Development (FOSD) on Roma Street frontage include on-site detention measures to reduce the pressure on the existing network.
3.3 Summary and Conclusion
The existing stormwater network for the Roma Street PDA is generally undersized, causing surcharging and localised flooding, particularly in Countess Street, the INB and Roma Street road corridor.
By upgrading the existing stormwater system in Roma Street, Garrick Street and a section of Makerston street, surcharging and overland flows in Roma Street road corridor can be reduced and some spare capacity in the trunk main could be provided for potential future upgrades of stormwater systems in the upper catchments of the system, particularly, Countess Street, the INB and catchment area to the west.
The Roma Street PDA future development sites does not contribute significant flows that would worsen the stormwater performance in the area. However, future development within the PDA does provide the opportunity to address some of the existing drainage issues for the overall catchment.

10
ROMA STREET PRECINCT STORMWATER MANAGEMENT Cross River Rail Prepared for Cross River Rail Delivery Authority
SMEC Internal Ref. 30032260 20 August 2020
Appendix A: Roma Street Catchment Maps
Existing Case Catchment Map
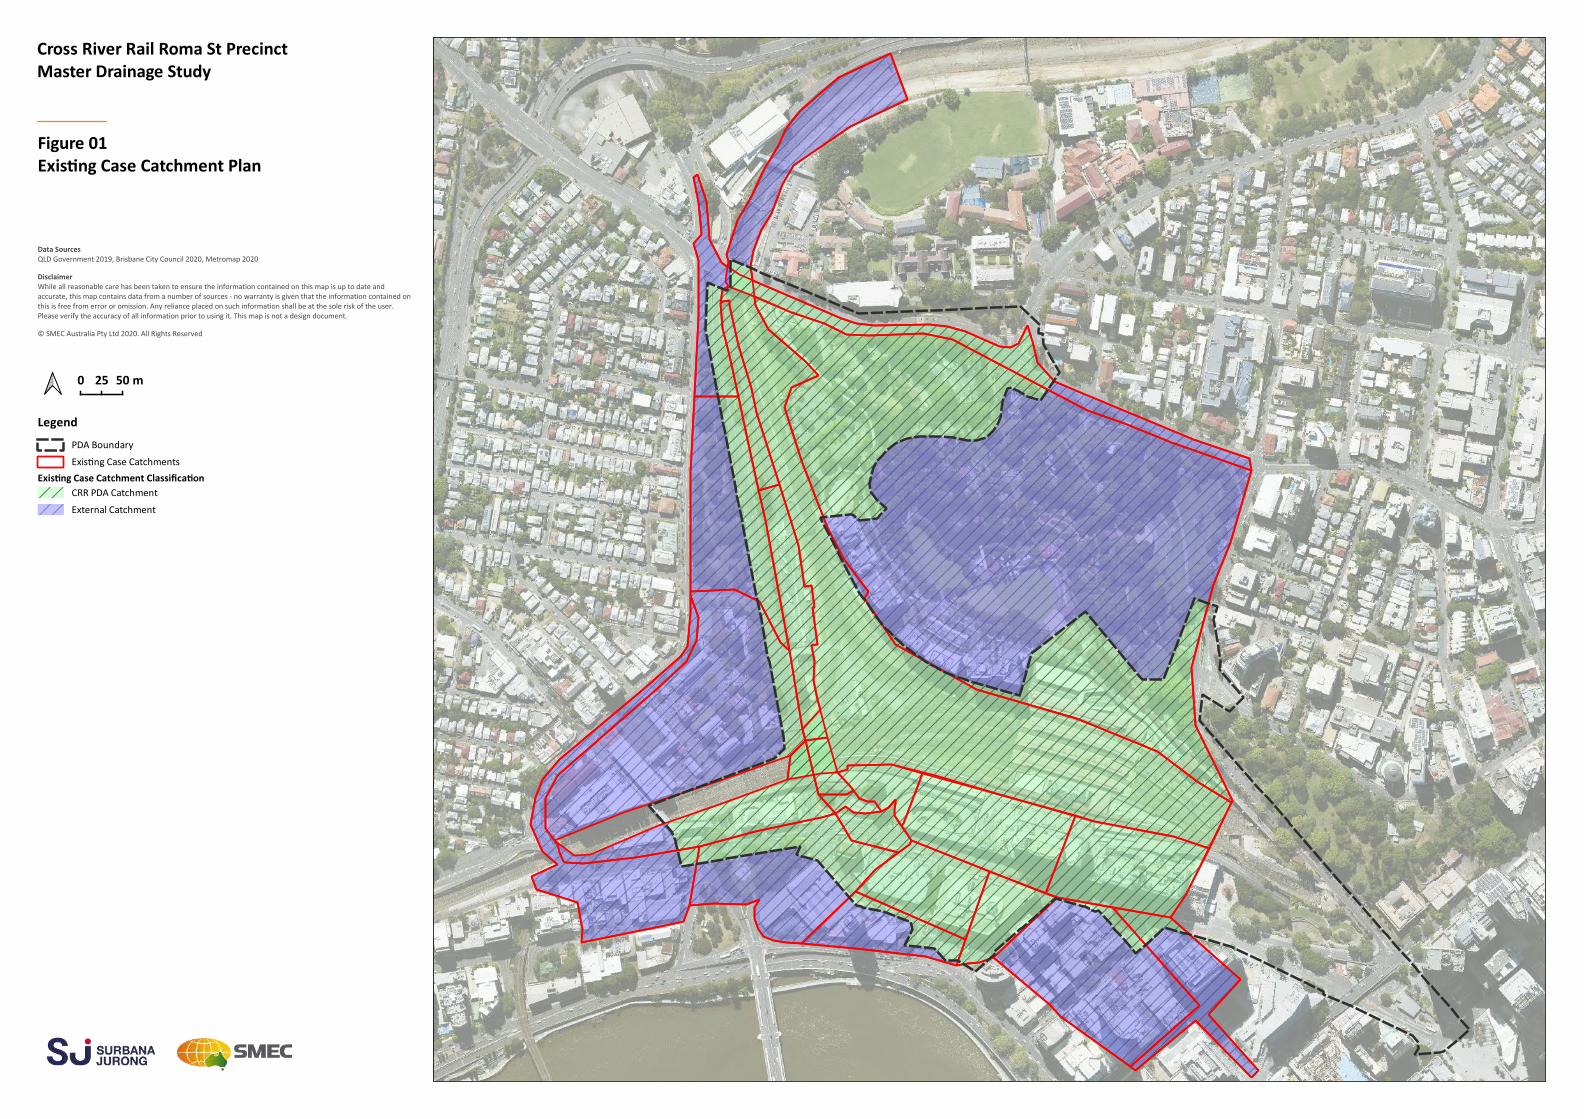
Cross River Rail Roma St PrecinctMaster Drainage Study
PDA Boundary
Exis ng Case Catchments
Exis ng Case Catchment Classifica onCRR PDA Catchment
External Catchment
Legend
Data SourcesQLD Government 2019, Brisbane City Council 2020, Metromap 2020
DisclaimerWhile all reasonable care has been taken to ensure the information contained on this map is up to date andaccurate, this map contains data from a number of sources - no warranty is given that the information contained onthis is free from error or omission. Any reliance placed on such information shall be at the sole risk of the user.Please verify the accuracy of all information prior to using it. This map is not a design document.
© SMEC Australia Pty Ltd 2020. All Rights Reserved
Figure 01Exis ng Case Catchment Plan

11
ROMA STREET PRECINCT STORMWATER MANAGEMENT Cross River Rail Prepared for Cross River Rail Delivery Authority
SMEC Internal Ref. 30032260 20 August 2020
Design Case PDA Catchment Map
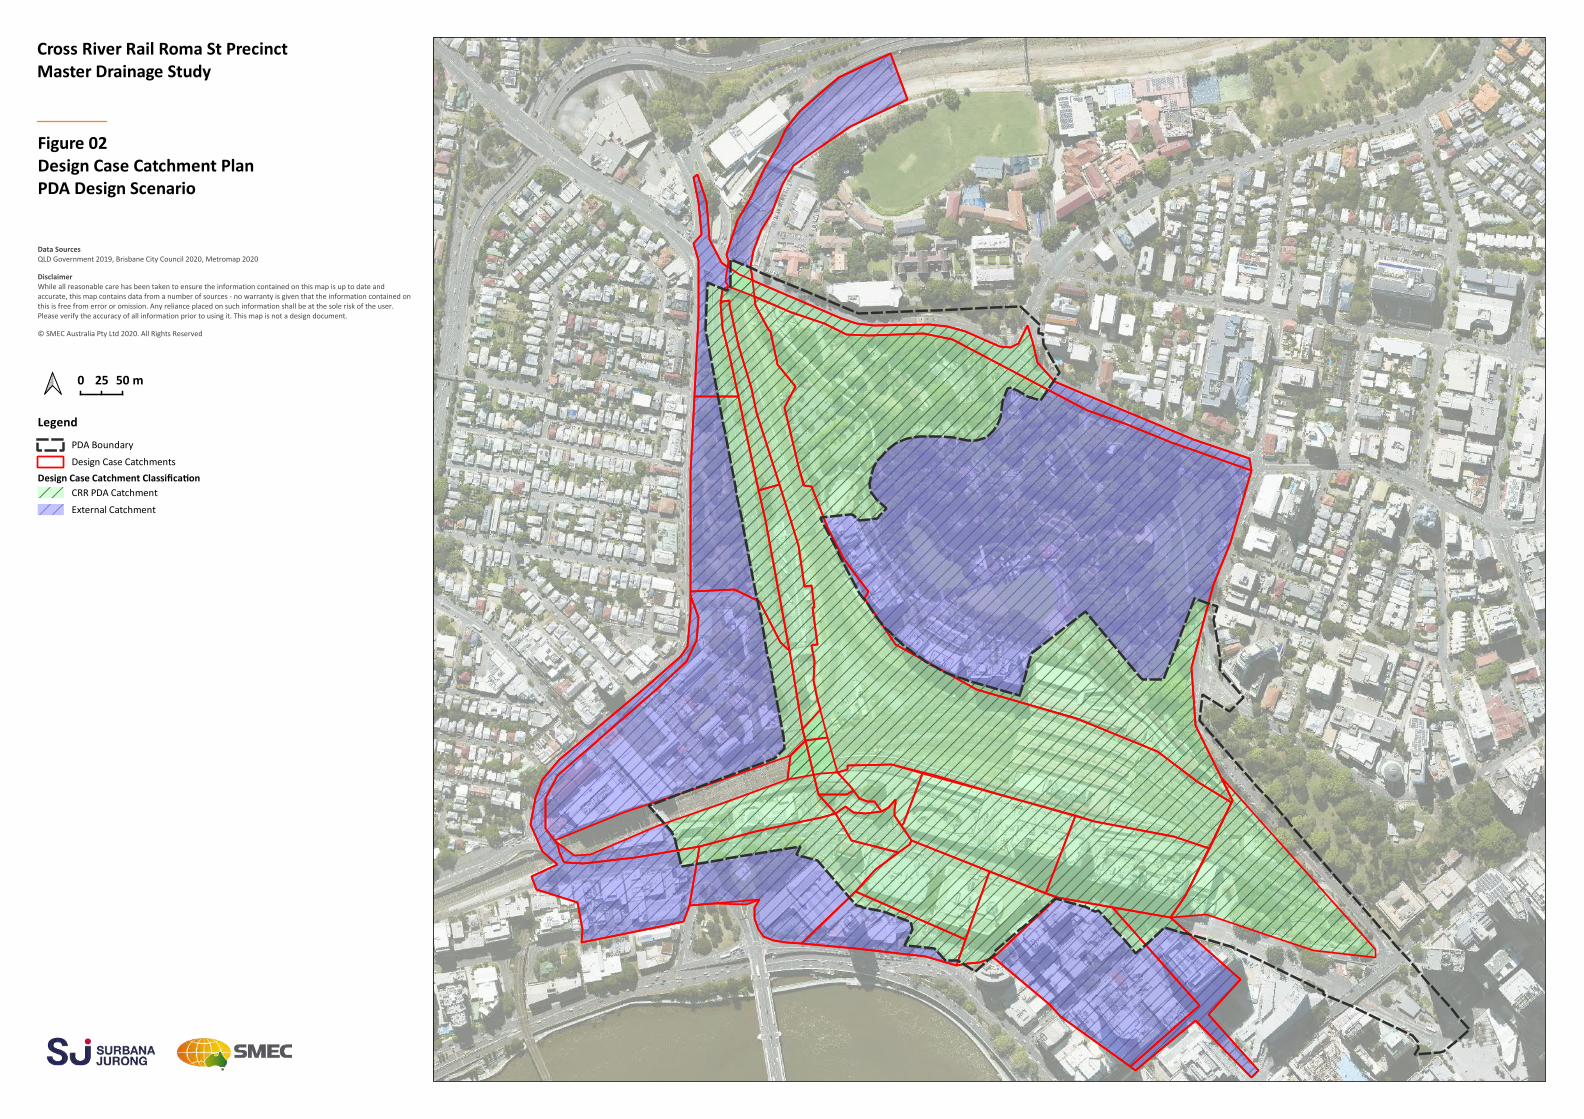
Cross River Rail Roma St PrecinctMaster Drainage Study
PDA Boundary
Design Case Catchments
Design Case Catchment Classifica onCRR PDA Catchment
External Catchment
Legend
Data SourcesQLD Government 2019, Brisbane City Council 2020, Metromap 2020
DisclaimerWhile all reasonable care has been taken to ensure the information contained on this map is up to date andaccurate, this map contains data from a number of sources - no warranty is given that the information contained onthis is free from error or omission. Any reliance placed on such information shall be at the sole risk of the user.Please verify the accuracy of all information prior to using it. This map is not a design document.
© SMEC Australia Pty Ltd 2020. All Rights Reserved
Figure 02Design Case Catchment PlanPDA Design Scenario

12
ROMA STREET PRECINCT STORMWATER MANAGEMENT Cross River Rail Prepared for Cross River Rail Delivery Authority
SMEC Internal Ref. 30032260 20 August 2020
Trunk Network Layout and ID
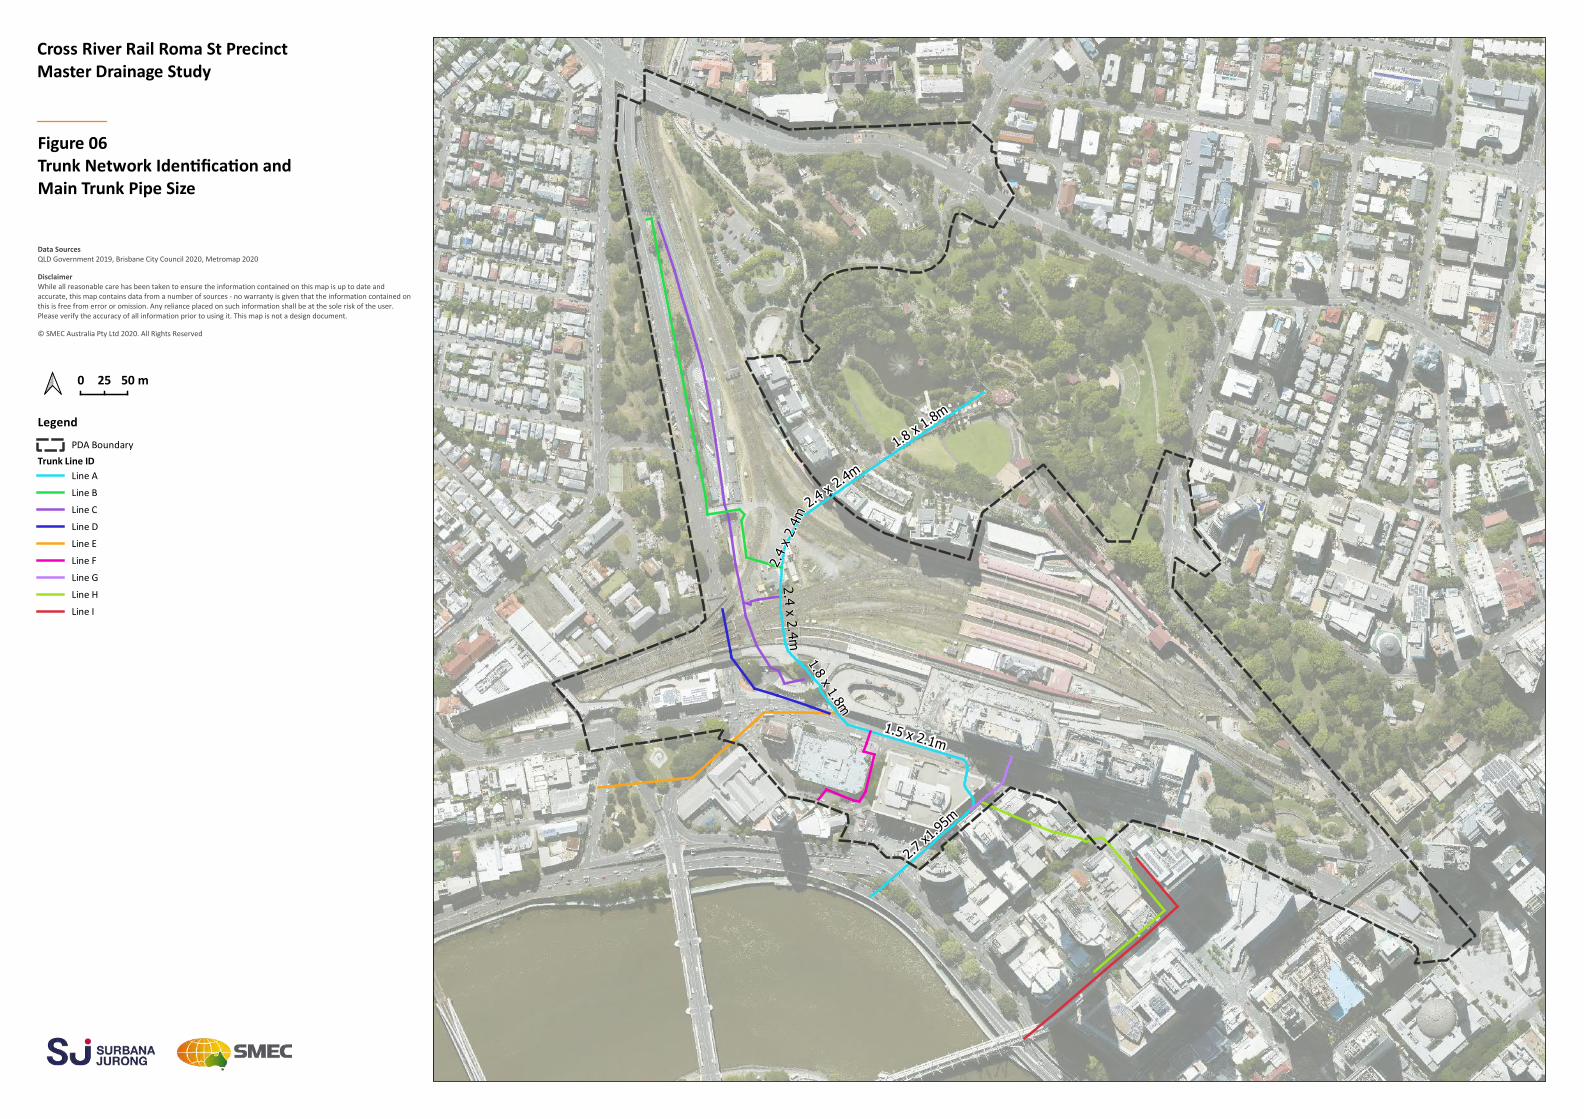
Cross River Rail Roma St PrecinctMaster Drainage Study
PDA Boundary
Trunk Line IDLine A
Line B
Line C
Line D
Line E
Line F
Line G
Line H
Line I
Legend
Figure 06Trunk Network Iden fica on andMain Trunk Pipe Size
Data SourcesQLD Government 2019, Brisbane City Council 2020, Metromap 2020
DisclaimerWhile all reasonable care has been taken to ensure the information contained on this map is up to date andaccurate, this map contains data from a number of sources - no warranty is given that the information contained onthis is free from error or omission. Any reliance placed on such information shall be at the sole risk of the user.Please verify the accuracy of all information prior to using it. This map is not a design document.
© SMEC Australia Pty Ltd 2020. All Rights Reserved

13
ROMA STREET PRECINCT STORMWATER MANAGEMENT Cross River Rail Prepared for Cross River Rail Delivery Authority
SMEC Internal Ref. 30032260 20 August 2020
Existing Case Pipe Capacity
Cross River Rail Roma St PrecinctMaster Drainage Study
PDA Boundary
Pipe Capcity Exis ng CasePipe Has Capacity
No Pipe Capacity, Not Surcharging
No Pipe Capacity, Surcharging
Legend
Data SourcesQLD Government 2019, Brisbane City Council 2020, Metromap 2020
DisclaimerWhile all reasonable care has been taken to ensure the information contained on this map is up to date andaccurate, this map contains data from a number of sources - no warranty is given that the information contained onthis is free from error or omission. Any reliance placed on such information shall be at the sole risk of the user.Please verify the accuracy of all information prior to using it. This map is not a design document.
© SMEC Australia Pty Ltd 2020. All Rights Reserved
Figure 05Exis ng Case Pipe Capacity
Line A
Line B
Line C
Line D
Line ELine F
Line G
Line H
Line I

14
ROMA STREET PRECINCT STORMWATER MANAGEMENT Cross River Rail Prepared for Cross River Rail Delivery Authority
SMEC Internal Ref. 30032260 20 August 2020
Existing Case Proposed Network Solution
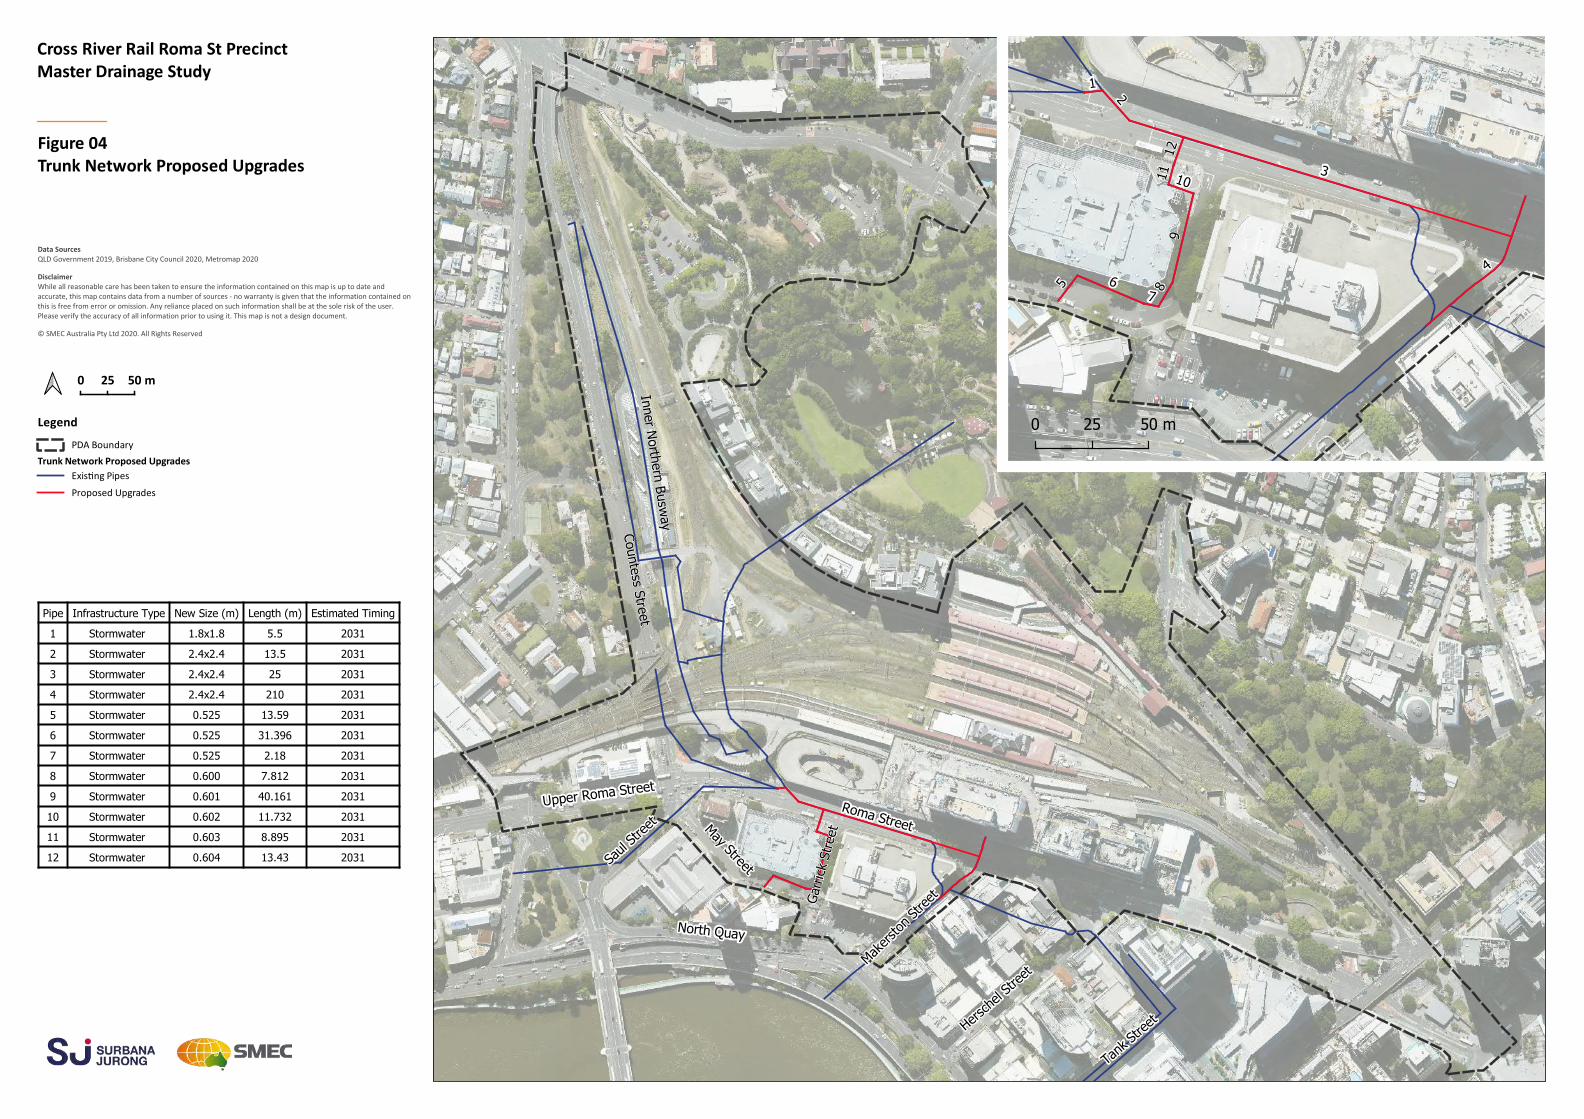
Cross River Rail Roma St PrecinctMaster Drainage Study
PDA Boundary
Trunk Network Proposed UpgradesExis ng Pipes
Proposed Upgrades
Legend
Data SourcesQLD Government 2019, Brisbane City Council 2020, Metromap 2020
DisclaimerWhile all reasonable care has been taken to ensure the information contained on this map is up to date andaccurate, this map contains data from a number of sources - no warranty is given that the information contained onthis is free from error or omission. Any reliance placed on such information shall be at the sole risk of the user.Please verify the accuracy of all information prior to using it. This map is not a design document.
© SMEC Australia Pty Ltd 2020. All Rights Reserved
Figure 04Trunk Network Proposed Upgrades
Pipe Infrastructure Type New Size (m) Length (m) Estimated Timing
1 Stormwater 1.8x1.8 5.5 2031
2 Stormwater 2.4x2.4 13.5 2031
3 Stormwater 2.4x2.4 25 2031
4 Stormwater 2.4x2.4 210 2031
5 Stormwater 0.525 13.59 2031
6 Stormwater 0.525 31.396 2031
7 Stormwater 0.525 2.18 2031
8 Stormwater 0.600 7.812 2031
9 Stormwater 0.601 40.161 2031
10 Stormwater 0.602 11.732 2031
11 Stormwater 0.603 8.895 2031
12 Stormwater 0.604 13.43 2031

15
ROMA STREET PRECINCT STORMWATER MANAGEMENT Cross River Rail Prepared for Cross River Rail Delivery Authority
SMEC Internal Ref. 30032260 20 August 2020
DRAINS Model and Results
DRAINS Model Layout
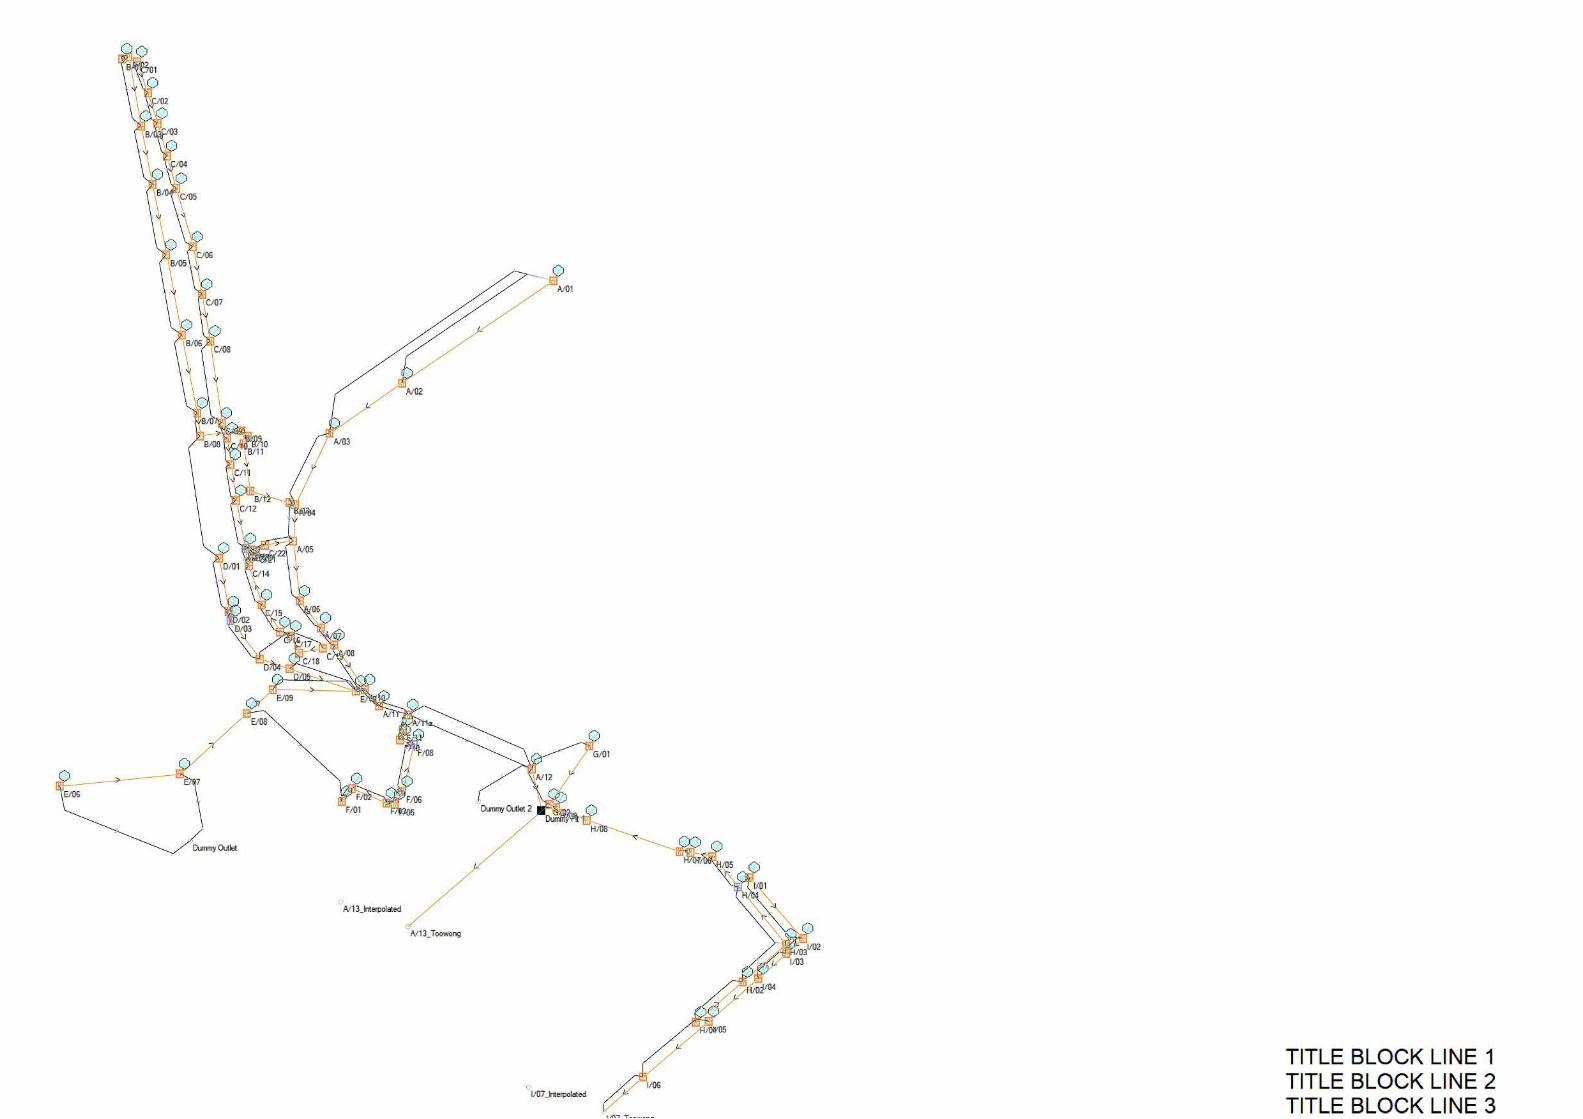
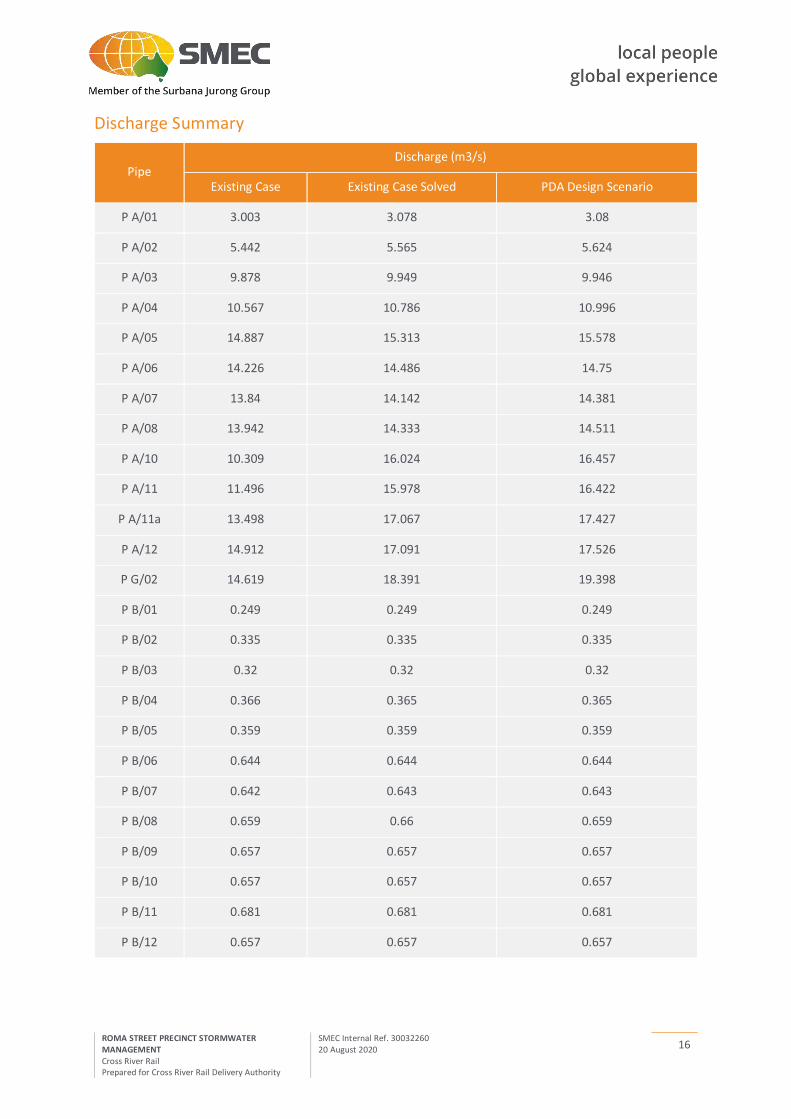
16
ROMA STREET PRECINCT STORMWATER MANAGEMENT Cross River Rail Prepared for Cross River Rail Delivery Authority
SMEC Internal Ref. 30032260 20 August 2020
Discharge Summary
Pipe Discharge (m3/s)
Existing Case Existing Case Solved PDA Design Scenario
P A/01 3.003 3.078 3.08
P A/02 5.442 5.565 5.624
P A/03 9.878 9.949 9.946
P A/04 10.567 10.786 10.996
P A/05 14.887 15.313 15.578
P A/06 14.226 14.486 14.75
P A/07 13.84 14.142 14.381
P A/08 13.942 14.333 14.511
P A/10 10.309 16.024 16.457
P A/11 11.496 15.978 16.422
P A/11a 13.498 17.067 17.427
P A/12 14.912 17.091 17.526
P G/02 14.619 18.391 19.398
P B/01 0.249 0.249 0.249
P B/02 0.335 0.335 0.335
P B/03 0.32 0.32 0.32
P B/04 0.366 0.365 0.365
P B/05 0.359 0.359 0.359
P B/06 0.644 0.644 0.644
P B/07 0.642 0.643 0.643
P B/08 0.659 0.66 0.659
P B/09 0.657 0.657 0.657
P B/10 0.657 0.657 0.657
P B/11 0.681 0.681 0.681
P B/12 0.657 0.657 0.657
17
ROMA STREET PRECINCT STORMWATER MANAGEMENT Cross River Rail Prepared for Cross River Rail Delivery Authority
SMEC Internal Ref. 30032260 20 August 2020
Pipe Discharge (m3/s)
Existing Case Existing Case Solved PDA Design Scenario
P B/13 0.657 0.657 0.657
P C/01 0.037 0.037 0.037
P C/02 0.074 0.074 0.074
P C/03 0.111 0.111 0.111
P C/04 0.148 0.148 0.148
P C/05 0.185 0.185 0.185
P C/06 0.237 0.237 0.237
P C/07 0.295 0.295 0.295
P C/08 0.352 0.352 0.352
P C/09 0.409 0.409 0.409
P C/10 0.468 0.467 0.467
P C/11 0.531 0.533 0.532
P C/12 0.581 0.581 0.581
P Dummy 1.945 1.947 1.946
P C/19 0.076 0.07 0.07
P C/18 0.102 0.105 0.102
P C/17 0.253 0.253 0.254
P C/16 0.298 0.298 0.298
P C/15 0.352 0.352 0.352
P C/14 0.782 0.778 0.778
P C/20 0.798 0.797 0.798
P C/21 0.854 0.855 0.854
P C/22 1.253 1.253 1.253
P D/01 0.565 0.59 0.59
P D/02 0.6 0.677 0.677
P D/03 0.777 0.789 0.789

18
ROMA STREET PRECINCT STORMWATER MANAGEMENT Cross River Rail Prepared for Cross River Rail Delivery Authority
SMEC Internal Ref. 30032260 20 August 2020
Pipe Discharge (m3/s)
Existing Case Existing Case Solved PDA Design Scenario
P D/04 0.81 0.921 0.919
P D/05 0.842 0.936 0.919
P E/10 1.511 1.773 1.585
P E/06 0.441 0.441 0.441
P E/07 0.384 0.406 0.395
P E/08 0.435 0.47 0.447
P E/09 0.603 0.667 0.605
P F/01 0.204 0.416 0.425
P F/02 0.228 0.435 0.457
P F/03 0.257 0.482 0.483
P F/05 0.293 0.543 0.541
P F/06 0.403 0.624 0.625
P F/08 0.521 0.708 0.726
P F/10 0.649 0.867 0.909
P F/11 1.017 1.254 1.297
P G/01 0.769 0.77 1.769
P G/01a 1.856 1.834 2.79
P H/01 0.087 0.088 0.088
P H/02 0.185 0.188 0.188
P H/03 0.126 0.118 0.117
P H/04 0.337 0.307 0.3
P H/05 0.435 0.395 0.386
P H/06 0.584 0.584 0.573
P H/07 0.824 0.823 0.814
P H/08 1.103 1.103 1.092
P H/09 1.206 1.205 1.193
19
ROMA STREET PRECINCT STORMWATER MANAGEMENT Cross River Rail Prepared for Cross River Rail Delivery Authority
SMEC Internal Ref. 30032260 20 August 2020
Pipe Discharge (m3/s)
Existing Case Existing Case Solved PDA Design Scenario
P I/01 0.156 0.154 0.155
P I/02 0.305 0.311 0.309
P I/03 0.378 0.378 0.379
P I/04 0.458 0.461 0.461
P I/05 0.472 0.472 0.472
P I/06 0.471 0.471 0.471