insight into the digestive processes of the wood-boring marine crustacean limnoria quadripunctata
TRANSCRIPT

i
Insight into the digestive processes of the
wood-boring marine crustacean
Limnoria quadripunctata
A thesis submitted in partial fulfilment of the requirements for the award of the
degree of Doctor of Philosophy of the University of Portsmouth
By
Graham Paul Malyon
Institute of Marine Sciences, School of Biological Sciences
University of Portsmouth
PO4 9LY
March 2011

ii
Abstract A better understanding of wood degradation mechanisms used by Limnoria
quadripunctata may lead to the development of more specific treatments to control
biodeterioration that have fewer side effects than the traditional broad spectrum
biocides. Thus, a clear understanding of digestion in wood boring animals is required.
This knowledge of the digestive strategies used by L. quadripunctata could also be
applied to the degradation of lignocellulose, and provide a novel source of enzymes
which could be used to degrade this recalcitrant substrate.
Cellulase activity of extracts of L. lignorum were demonstrated in the 1950s (Ray &
Julian, 1952) and the possibility of a microbial contribution to this activity was later
tested by electron microscope investigations of the digestive gland (hepatopancreas) and
hindgut (Boyle & Mitchell 1978, Sleeter et al. 1978) which showed, unlike other
isopods (Zimmer et al. 2002), no resident gut microbes. New sequencing data also
shows no evidence of symbiont-derived enzyme sequences in messenger RNA harvested
from the hepatopancreas of L. quadripunctata (King et al. 2010). Further evidence for
an independent digestion mechanism in L. quadripunctata came from an endo-β-
1,4glucanase that belongs to the GH7 family of cellulases, also found in termites
(Watanabe and Tokuda 2010) being detected in cells of the hepatopancreas of L.
quadripunctata by Dymond et al. (2003) using in situ hybridisation experiments.
Subsequent detailed examination of the transcriptome of the hepatopancreas of L.
quadripunctata revealed large numbers of RNA sequences encoding for a range of
enzymes that have been implicated in cellulose degradation in other organisms.
Particularly numerous were sequences for glycosyl hydrolase families GH5, 7 and 9
(King et al. 2010). This made L. quadripunctata the first animal reported to possess a
GH7 in an animal genome.
Most recently Western blots have been used in this study to identify GH5a and GH7a
protein in the hepatopancreas and gut of L. quadripunctata as well as successful in situ
localisation of GH5a and GH9a RNA in the hepatopancreas. This work confirms the
hepatopancreas as the site of secretion of these enzymes and that they are translated into

iii
protein which is then found in the gut. Furthermore a carboxymethyl cellulose assay was
used in this study and showed positive degradation by hepatopancreas and gut extract
which confirms the presence of active amorphous cellulose degrading enzymes in these
tissues.
In parallel with the efforts to reveal the presence and activity of endogenous enzymes
produced by L. quadripunctata, investigations into the chemistry of wood breakdown
and utilization by the organism have been undertaken. X-ray diffraction is an effective
tool for showing changes in cellulose crystallinity and its use has demonstrated
increased crystallinity in wood after digestion, while FTIR has reinforced this
observation by showing changes in the hemicelluloses which are the more amorphous
components of wood. Furthermore NMR has been used to identify 13C labelled glucose
originating from feeding L. quadripunctata with a 13C enriched wheat straw substrate.
This glucose was identified in gut extract and labelled 13C trehalose from the
hepatopancreas. This provides evidence of digestion products being assimilated into the
metabolic pool which has been complemented by evidence for digestion of wood
provided by measurements using HPLC to compare, quantify and identify the sugar
components of wood lost during digestion. Together this work provides new insight into
how wood is affected by digestion in L. quadripunctata and what effect the activity of
enzymes involved in this processing is having on the wood.

iv
Acknowledgements During my PhD I had the pleasure of working with many people to whom I wish to
express my sincere gratitude. Firstly I wish to thank Simon Cragg for his endless
enthusiasm, support, guidance and ultimately his belief in me. I would also like to thank
Matt Guille who was my second supervisor and Simon Streeter for reading numerous
drafts of this manuscript and his invaluable technical support and guidance in the
laboratory.
I am very grateful for the financial support from TRADA throughout my first year and
payment of my initial fees as well as the BBSRC for funding two more years and
making the bulk of this work possible. Special thanks must also go to my ‘main
sponsors’ Ro and Chris who paid for the rest of my fees, and to my mum and dad for
keeping me afloat, you all made this possible.
The support staffs at the Institute of Marine Science Portsmouth have been a continual
source of banter and wisdom; firstly Maureen, Ray and Jenny who were with me at the
beginning and Adam and Lucy who were there at the end, also a very special thanks to
Joy Watts who read an early draft of this manuscript and whose comments gave me a
real boost when I needed it.
I would also like to extend my sincerest thanks to my collaborators from other
institutions; their willingness to assist me and give up their time is a tribute to the
generosity of these individuals. In order of appearance, Jan Van den Bulcke for running
the HR-X-ray-CT scans of L. quadripunctata. I would also like to thank the research
team at Unisence for teaching me how to use the pH and Oxygen probes and special
thanks to Adam Bonner who tirelessly worked to maintain the tidal tank experiment.
Furthermore the whole team at the University of York led by Simon McQueen-Mason
have been a pleasure to work with from the very beginning. I would like to thank
Andrew King for preparing the cDNA library for L. quadripunctata and Yi Li for
annotating the EST sequences. This work was crucial for the construction of the
plasmids carried out by Katrin Besser which I used in my in situ hybridisation

v
experiments and later the expression of the recombinant protein by Luisa Elias which
facilitated the raising of antibodies for my western blots. I would also like to thank Will
Eborall who conducted the proteomic analysis of my L. quadripunctata extracts. Also, I
would like to thank Katrin Besser for conducting some last minute RTqPCR for me, and
finally from York I would like to thank Leonardo Gomez for the sugar analysis he did
for me, and later hosting me so I could conduct the process myself.
I would also like to thank Gervais Sawyer who carefully prepared the wood samples for
me that were used throughout this study he also supplied the custom made faecal pellet
press and lots of cheerful advice. The X-ray work would not have got underway if it was
not for the ‘just give it a go’ attitude of John McGeehan who showed me how to use his
machine and then let me, thank you John. The analysis of the X-ray results also
benefited from the comments of Xinfeng Xie who gave me confidence in this data set.
Many thanks are also due to Andre Klüppel who conducted FT-IR data collection for me
and provided insightful ideas on my PCA treatment of this data.
I have also been lucky to work with and visit Stéphane La Barre and Nelly Kervarec in
France. Once to discuss how I should conduct my NMR experiments then again the look
over the results, these meetings were a real mix of business and pleasure thank you for
your hospitality. The NMR work was conducted under the guidance of Peter Cary and
Chris Read thank you for your patience and letting me drive the machine. Finally I
would also like to say a big thank you to Michael Pean for providing me with labelled
straw without which the NMR work could not have been conducted.
As well as my collaborators and colleagues, my family and friends have been with me
all the way I can honestly say your belief in me and full support at every stage has made
the last few years a pleasure. Kyla, you have been there through it all, I cannot thank
you enough you are quite simply my star. Mum Dad and Roz you have been there when
I needed you most and fully supported me all the way I could not ask for more. Finally I
would like to thank my Pompey family, you know who you are.

vi
Contents Chapter 1
General introduction
1.1 Overview 1
1.2 Structure of wood 2
1.3 Cellulose degradation 6
1.4 Lignin degradation 7
1.5 Wood as a substrate for Xylotrophic organisms 9
1.6 Wood as a substrate for L. quadripunctata 11
1.7 Aims 14
Chapter 2
The functional anatomy and physiology of the digestive tract
of Limnoria quadripunctata
2.1 Introduction 16
2.2 Materials and methods 19
2.2.1 Light microscopy of whole organisms and tissues 19
2.2.2 Scanning electron microscopy (SEM) fixative and preparation 19
2.2.3 Sectioning and post-fixation of hepatopancreas tissue 19
2.2.4 High resolution X-ray computer tomography of L. quadripunctata 20
2.2.5 L. quadripunctata tissue, inhibition of bacterial growth assay 20
2.2.6 Measurement of levels of oxygen and pH within the digestive tract using
microelectrodes 21
2.2.7 L. quadripunctata collection and experimental design of the feeding
assessment 22
2.2.8 Faecal pellet counting procedure 23
2.2.9 Measurement of feeding under tidal conditions 24
2.2.10 Vacuum impregnation of wood sticks with butylated hydroxytoluene
25
2.3 Results 26
2.3.1 Light microscopy 26

vii
2.3.2 Scanning electron microscopy (SEM) 29
2.3.3 High resolution X-ray computer tomography 32
2.3.4 Inhibition of bacterial growth by L. quadripunctata tissue 35
2.3.5 Dorsoventral pH profile of the hindgut of L. quadripunctata 37
2.3.6 Dorsoventral oxygen profile of the hindgut of L. quadripunctata 38
2.3.7 Effect of exposure of L. quadripunctata to various tidal regimes on pellet
production rate 39
2.3.8 Effect of Butylated hydroxytoluene (BHT) on faecal pellet production
40
2.4 Discussion 41
Chapter 3
Using molecular biology and biochemistry to understand digestion
in L. quadripunctata
3.1 Introduction 44
3.1.2 A molecular biology approach to digestion in L. quadripunctata 44
3.1.3 The Biochemistry of digestion in L.quadripunctata 46
3.2 Materials and Methods 47
3.2.1 Buffer and Media Recipes 42
3.2.1.1 Native polyacrylamide gel electrophoresis for protein
analysis 42
3.2.1.2 Transformation of competent cells 47
3.2.1.3 Preparation of the hepatopancreas tissue for probing 48
3.2.1.4 Western blotting materials 48
3.2.1.5 Carboxymethyl cellulose (CMC) plate assay materials 50
3.2.1.6 In Vitro enzyme assay materials 51
3.2.1.7 Catechin phenol oxidase assay materials 51
3.2.1.8 Catechol phenol oxidase assay materials 52
3.2.1.9 Native in-gel phenol oxidase enzyme assays materials 53
3.2.2 Extraction of RNA from the hepatopancreas of L. lignorum 54 3.2.3 Native polyacrylamide gel electrophoresis for protein analysis 55

viii
3.2.4 In situ hybridisation of glycosyl hydrolase sequences 57
3.2.4.1 Transformation of competent cells 57
3.2.4.2 Plasmid isolation from competent cells 57
3.2.4.3 Restriction digest of plasmid 58
3.2.4.4 Linearised plasmid purification with a
phenol-chloroform extraction 59
3.2.4.5 RNA probe synthesis using T3 and T7 polymerase 59
3.2.4.6 Preparation of the hepatopancreas tissue for probing 60
3.2.5 Preparation of protein samples for antibody production 61
3.2.6 Western blotting of glycosyl hydrolase family proteins 61
3.2.7 Carboxymethyl cellulose (CMC) assay to determine
enzyme activity 63
3.2.8 In Vitro enzyme assays 63
3.2.9 Catechin phenol oxidase assay 64
3.2.10 Repeat catechin phenol oxidase assay 66
3.2.11 Catechol phenol oxidase assay 66
3.2.12 Native in-gel phenol oxidase enzyme assays for
monophenoloxidase, diphenoloxidase and laccase activity 67
3.3 Results 68
3.3.1 L. lignorum hepatopancreas RNA extraction for cDNA library preparation
68
3.3.2 Native polyacrylamide gel electrophoresis (PAGE) with mass spectroscopy
69
3.3.3 In situ hybridisation of glycosyl hydrolase mRNA sequences in the
hepatopancreas tissue 70
3.3.4 Western blots of glycosyl hydrolase proteins 70
3.3.5 Carboxymethyl cellulose assay 74
3.3.6 In vitro enzyme assays for; cellobiohydrolase, galactosidase,
mannosidase, glucosidase and xylanase activities 75
3.3.7 In vitro phenol oxidase assay 75

ix
3.3.8 Mono-phenol oxidase (MPO), di-phenol oxidase (DPO), and laccase
native in-gel assay 77
3.4 Discussion 80
Chapter 4
The physical and chemical properties of wood that affect
natural durability in the marine environment
4.1 Introduction 83
4.2 Materials and methods 87
4.2.1 Wood durability trials 87
4.2.2 The extractives leached from the wood 87
4.3 Results 90
4.3.1 Wood durability trials 90
4.3.2 Effect of density on pellet production 93
4.3.3 Feeding rate from early and late wood of non-durable Pseudotsuga
menziesii 94
4.4 Discussion 95
Chapter 5
Evidence of lignocellulose digestion by L. quadripunctata
5.1 Introduction 97
5.2 Materials and methods 101
5.2.1 X-ray diffraction study 101
5.2.2 Fourier-Transformed Infrared spectroscopy diffraction study 102
5.2.3 Crystalline cellulose feeding assay 102
5.2.4Wood compositional analysis 103
5.2.5 Analysis of metabolites in hepatopancreas and whole animals by nuclear
magnetic resonance (NMR spectroscopy) 105
5.2.6 NMR spectroscopy data acquisition and processing 106
5.2.7 SEM of straw and faecal pellets 106
5.3 Results 107

x
5.3.1 X-ray diffraction analysis of L. quadripunctata faecal pellets produced
while feeding on P. sylvestris an F. sylvatica. 107
5.3.2 FT-IR spectroscopy analysis of L. quadripunctata faecal pellets produced
while feeding on P. sylvestris an F. sylvatica. 110
5.3.3 Crystalline cellulose feeding assay 113
5.3.4 Wood compositional analysis to determine sugar loss 114
5.3.5 NMR spectroscopy HSQC experiment using whole body extract from
L. quadripunctata with natural abundance of 13C 116
5.3.6 NMR spectroscopy HSQC experiment using whole body extract from
L. quadripunctata with 13C enrichment 116
5.3.7 NMR spectroscopy HSQC experiments using specific tissue extract from
L. quadripunctata with enrichment of 13C 123
5.3.8 SEM photomicrographs of the straw and the faecal pellet 127
5.4 Discussion 128
Chapter 6
General Discussion 133
Reference list 142
Appendix 155

xi
Abbreviations list
°C degrees Celsius µL microliters µm micrometers Ab antibody ANOVA analysis of variance anti-Dig anti-digoxigenin AP alkaline phosphatase ATR attenuated total reflection BCIP 5-Bromo-4-chloro-3-indolyl phosphate BHT butylated hydroxytoluene BSA bovine serum albumin CCA copper chromium arsenic cDNA complementary-deoxyribonucleic acid CI crystallinity index cm centimeter CMC carboxymethyl cellulose CPD critical point dried Da dalton dH2O distilled water Dig-NTP digoxigenin-nucleotide triphosphate DMF dimethyl formamide DNA deoxyribonucleic acid DPO diphenol oxidase EDX energy dispersive X-ray EN European norm EST expressed sequence tag FAB fatty acid binding FAD flavin adeine dinucleotide fm food mass FT-IR fourier transformed infrared (spectroscopy) G gut g gravitational force GH glycosyl hydrolase GL gut lumen GLM general linear model GT gut tissue H hour HCL hydrochloric acid HMDS hexamethyldisilazane

xii
HP hepatopancreas HPL hepatopancreas lumen HPLC high performance liquid chromatography HPT hepatopancreas tissue HR X-ray CT high resolution X-ray computer tomography HRP horse raddish peroxidase hrs hours HSQC heteronuclear single quantum coherence IgG Immunoglobulin G kV kilovolts LB lysogeny broth LRR leucine rich repeat LV low viscosity M molar m mandible MAB maleic acid buffer MALDI matrix assisted laser desorption ionisation
MEMFA 3-(N-morpholino)propanesulfonic acid, ethylene glycol tetra-acetic acid, magnesium sulphate, formaldehyde
MHz megahertz mins minuets mL milliliter mM millimolar mm millimeters MPa Megapascals MPO monophenol oxidase mRNA messenger Ribonucleic acid nm nano meters NMR nuclear magnetic resonance OD optical density P probability Pa Pascal PAGE polyacrylamide gel electrophoresis PBS phosphate buffered saline PCA principle component analysis PCR polymerase chain reaction pH percentage hydrogen PMSF phenyl methyl sulfonyl fluoride pNP para-nitro phenol RNA ribonucleic acid rpm resolutions per minuet

xiii
RTqPCR real time quantitative polymerase chain reaction s seconds SDS sodium dodecy sulphate SE standard error SEM scanning electron microscope SOC super optimal broth with catabolite repression SSC saline sodium citrate TBE tris borate ethylenediaminetetraacetic acid TBST tris buffered saline tween TEM transmission electron microscope TFA trifluororoacetic acid TMSP sodium 3-(trimethylsilyl)-2,2,3,3-d4-propionate TOF time of flight TRIS tris(hydroxymethyl)aminomethane U unit UV ultra violet V volts v/v volume per volume w/v weight per volume WISH whole mount in situ hybridisation

xiv
Section Contributions of collaborators to work reported in this thesis Institution
2.2.4 High resolution X-ray computer tomography of L. quadripunctata
Jan Van den Bulcke scanned the specimens I prepared
Ghent University
2.2.9 Measurement of feeding under tidal conditions
Adam Bonner maintained the tank and collected the data
Portsmouth University
3.2.1 Extraction of RNA from the hepatopancreas of L. lignorum
I extracted the RNA Andrew King prepared the cDNA and Yi Li annotated the EST sequences York University
3.2.2 Native polyacrylamide gel electrophoresis for protein analysis
Will Eborall ran the MALDI TOF TOF and digested the protein I extracted York University
3.2.3 In situ hybridisation of glycosyl hydrolase sequences
Katrin Besser designed the plasmid I used for my in situ hybridisations York University
3.2.4 Preparation of protein samples for antibody production
Luisa Elias expressed the recombinant protein used to raise antibodies for the Western blots York University
4.2.1 Wood durability trials Gervais Sawyer prepared the wood specimens and calculated the density n/a
5.2.1 X-ray diffraction study I collected the data and Xinfeng Xie helped with the interpretation
Maine University
5.2.2 Fourier-Transformed Infrared spectroscopy diffraction study
Andre Klüppel performed the FT-IR and commented on my PCA analysis
Georg-August-University Göettingen
5.2.3 Crystalline cellulose feeding assay Katrin Besser carried out the RTqPCR York University
5.2.4 Wood compositional analysis
Leonardo Gomez chemically digested and analysed the sugars using the Dionex HPLC system York University
5.2.6 NMR spectroscopy data acquisition and processing
Peter Cary set up the NMR and acquired the data I processed and assigned the spectrum
Portsmouth University
The contribution of collaborators, to work reported in this thesis. All the
experimental work was carried out on Limnoria. quadripunctata, except the
extraction of RNA from L. lignorum.

xv
Declaration
Whilst registered as a candidate for the above degree, I have not been registered for any
other research award. The results and conclusions embodied in this thesis are the work
of the named candidate and have not been submitted for any other academic award.
Graham Paul Malyon

Introduction
1
Chapter 1
General introduction
1.1 Overview
A multidisciplinary approach to lignocellulose degradation is appropriate, because
knowledge of both the lignocellulose substrate and the animal are required to interpret
the results of studies which include both digestive capability and evidence of changes to
the lignocellulose substrate itself.
A large amount of terrestrial organic input ends up being carried down rivers and into
the sea therefore creating a natural niche for wood degrading bacteria, fungi and marine
wood borers. These organisms carry out an important role in degrading this terrestrial
detritus. This niche has been extended by our use of timbers as a construction material in
the marine environment where a wide range of borers attack them (Cragg et al., 1999).
This creates habitats for these naturally occurring organisms which are a threat to
manmade wooden structures in the sea (Menzies, 1957). Some wood borers tunnel and
filter feed, whereas Limnoria. quadripunctata (Holthuis) tunnel and feed on the wood
itself (Ray & Julian, 1952).
Work has been carried out on a population of L. quadripunctata which was maintained
in constantly flowing seawater, in tanks at the University of Portsmouth, Institute of
Marine Sciences. The L. quadripunctata were left on the wood which had been
colonised and subsequently removed from a local site in Portsmouth. Wood fragments
were left in the tank until the L. quadripunctata were required (Figure 1.1).

Introduction
2
Figure 1.1: The indoor aquarium facilities at the institute of marine science.
The three tanks pictured are used to maintain cultures of L. quadripunctata with
no tidal cycle, in constantly flowing sea water, which is filtered, then pumped,
into the tanks from Langstone harbour.
1.2 Structure of wood
Cellulose can occur in six polymorphs, and recently native cellulose (I) which is the
only form that occurs in nature has been divided into two distinct polymorphs (α, β)
(Sugiyama et al., 1991, VanderHart & Atalla, 1984). Cellulose I is not the most
thermodynamically favourable structure formed by cellulose chains and consequently
cellulose chains synthesized in vitro give rise to the more favourable polymorph
structure of cellulose II. Ideas about the ultimate crystalline structure of cellulose are
still being revised (figure 1.2). The cellulose that occurs in wood has crystalline regions
and amorphous components. However it is important to state that amorphous cellulose
probably still possesses a degree of order and is not in fact amorphous in the strictest
sense (O'Sullivan, 1997).

Introduction
3
Figure 1.2: Structural representation of cellulose in (A) cellulose microfibril
(B) the elementary fibril and (C) the H-bond network. This diagram displays the
hydrogen bonding network and structural arrangement of a cellulose fibril in the
allomorph cellulose (Iβ). Also present are the hemicelluloses which contribute to
the amorphous content. The cross section of the fibril (B) also demonstrates
radial variation in the crystallinity with highly crystalline regions represented in
red to the less ordered surface in blue. The role of pectin, which is a complex
polysaccharide containing 1, 4 linked α-D-galacturonic acid residues is to cross
link the other components of the cell wall and stabilise them. Diagram taken
from Himmel et al. (2007).

Introduction
4
Figure 1.3: Two glucose molecules linked by a β-(1,4)-glucosidic bond.
Reproduced from (O'Sullivan, 1997). This structure represents cellobiose which
is the repeated unit of the cellulose chains.
The crystalline region of cellulose is composed of repeated linked β-(1,4)-glucose units
(Figure 1.3) with a degree of polymerisation ranging from 300 to 15,000 (Ragauskas et
al., 2006). This repeated structure forms long, tightly packed hydrogen bonded strands
which are closely associated with each other. This allows chains to orientate so they
form multiple hydrogen bonds between them, packing tightly together in a recalcitrant
crystalline matrix (Figure 1.4).
Figure 1.4: A structural model of the elementary fibril of cellulose with
chain dislocations. Reproduced from Hermans & Weidinger (1949). Fibre width
3.5 nm.

Introduction
5
Surrounding this are the less densely packed hemicelluloses, which are branching hetero
polymers with a degree of polymerisation ranging from 70 to 200 units consisting of
substituted sugars made of shorter chains. This matrix is then enclosed by lignin (figure
1.5), a complex polymer derived from repeated units of coniferyl, coumaryl and sinapyl
alcohol (Ragauskas et al., 2006).
(A)
(B)
Lignin 1.5: Structural representation of lignin. The structures of the three
major components of lignin are represented in (A) and a diagrammatic view of
the possible repeating structure of this heterogeneous structural polymer (B).
Recovered from http://www.sigmaaldrich.com.

Introduction
6
As new structural information changes the way we view wood (lignocellulose) and the
interaction between its three main components; lignin, hemicelluloses and cellulose the
action needed by the enzymes that degrade this substrate can be characterised further.
This leads to a hypothesis to explain the observed degradative capability being proposed
and new components of the system being described. An example of this development
was found in a problem with the traditional view of cellulose degradation. It is difficult
to explain how the enzymes bind and degrade the highly crystalline region of the
microfibril. Evidence has been found for proteins which bind to and disrupt the
analogous crystalline substrate chitin (Vaaje-Kolstad et al., 2010). Their action breaks
the chains and disrupts the crystalline packing; this process depends on molecular
oxygen and reductants being present. Discussion of the potential of these glycosyl
hydrolase (GH) proteins, their mechanism and potential savings through increasing the
efficiency of lignocellulose conversion has been presented by Harris et al.(2010).
1.3 Cellulose degradation
The classical model of cellulosic degradation requires three cellulases to achieve the
complete depolymerisation of cellulose (Watanabe & Tokuda, 2010). Firstly an
endoglucanase cuts the chains, then an exocellulase hydrolyses cellodextrins from the
free chain ends and a glucosidase hydrolyses glucose (Figure 1.6). This synergistic
mechanism speeds up cellulose degradation and requires all three enzymes working
together, which causes a cascade effect which speeds up the digestion to a far greater
speed than the one attainable with just an exocellulase working alone (Watanabe &
Tokuda, 2010).

Introduction
7
Figure 1.6: Diagrammatic representation of the digestion of cellulose.
Cellobiohydrolases act on the non-reducing or reducing termini of cellulose
fibres to progressively release cellobiose. Endo-β-1,4-glucanases randomly
cleave cellulose chains, while β-glucosidases hydrolyze cellobiose or cello-
oligomers to form glucose from the non-reducing ends. Diagram from Watanabe
& Tokuda (2010).
In comparison to this, bacteria have the cellulosome which is viewed as a
muticomponent machine for cellulose degradation (Bayer et al., 2004). The cellulosome
is an assembly of carbohydrate binding domain with a scaffoldin subunit and cohesin
subunits incorporating the different enzyme components. This facilitates the action of
the enzymes by attaching them to the substrate, this localises the required components
and speeds up the absorption of digested products (Bayer et al., 2004).
1.4 Lignin degradation
Lignin-degrading enzymes commonly are oxidases or peroxidases. Oxidases utilise
molecular oxygen as the oxidant and possess mono- and di-phenolase activities (Figure

Introduction
8
1.7) while peroxidases utilise hydrogen peroxide to generate oxygen radicals that can
attack lignin (Solomon et al., 1996).
Figure 1.7: Biochemistry of lignin degradation. A catalytic cycle which shows
the monoxygenation of monophenols (MPO activity) and the oxidation of ortho-
diphenols (DPO activity) to ortho-quinones by a tyrosinase (T = tyrosine and D
= DOPA bound forms). Figure taken from Solomon et al., (1996).
Lignin is the second most abundant biopolymer on earth, second only to cellulose (Kirk,
1971). It is resistant to degradation and although microbes and fungi possess some
sophisticated biochemical systems (particularly the white rot fungi) which
synergistically degrade both lignin and cellulose (Westermark & Eriksson, 1974)
nothing can survive on lignin as its sole carbon source (Cullen & Kersten, 2004.).
Lignification of plants provides mechanical strength and helps protect against
degradation and water loss (Fengel, 1984). Lignin degradation is important if efficient

Introduction
9
digestion of cellulose is to occur, and the mechanism occurring in L. quadripunctata is
therefore of interest. In addition to a number of reaction mechanisms involving redox
cycling of intermediates to attack lignocellulose (Mason et al., 2003), degradation is
also enhanced by mediators which help the action of enzymes penetrate deeper into the
lignocellulose matrix than the size of the enzyme would allow (Gomez-Toribio et al.,
2009).
Commonly, oxidase enzymes implicated in lignin degradation in fungi are laccases
(Mayer & Staples, 2002). Laccases can have mono- and di-phenoloxidase activity, but
must interact synergistically with others enzymes to prevent the simultaneous
recondensation of intermediate chemical species reduced by this oxidative attack
(unstable radical intermediates) from re-polymerising by the further reduction of the
quinones and other radical compounds present (Westermark & Eriksson, 1974). The
FAD-dependent aryl-alcohol oxidase system is an example of this synergistic redox
system with laccase and has been shown to degrade lignin (Marzullo et al., 1995). Some
white rot fungi also possess an enzyme called cellobiose quinone oxidoreductase. It
displays a synergistic lignocellulose breakdown mechanism which uses the oxidised
products of lignin degradation to simultaneously reduce cellobiose (Westermark &
Eriksson, 1974). The similar mechanisms of the oxidase and peroxidase lignin
degrading strategies make it hard to isolate exactly what system is involved. Substrate
selection and product determination are critical in evaluating activities.
1.5 Wood as a substrate for Xylotrophic organisms
Until recently the accepted view was that there was no endogenous cellulase production
in higher animals and the ability of insects like termites to live on wood was due to the
cellulolytic activity of the symbionts in their hindgut. This idea dates as far back as
Cleveland (1924) found that defaunated termites died, and possessed protozoa which
had the ability to utilise wood. Classically, terrestrial ruminants maintain a large array of
microbes in their stomachs which produce cellulases and other enzymes, to break down
cellulose.

Introduction
10
That endogenous cellulase production occurs in several metazoan groups has been
settled by molecular biology evidence (Watanabe & Tokuda, 2001). The termite hindgut
is a useful contrast to that of L. quadripunctata because it is reported as having an array
of microbes (Hongoh et al., 2003) in contrast to the hindgut of L. lignorum which is
reported as being microbe free (Boyle & Mitchell, 1978) except under exceptional
circumstances. Zachary et al., (1983) reported that bacteria were present in the hindgut
of L. tripunctata feeding on wood treated with creosote. It was proposed that this
association may benefit Limnoria by providing some resistance to the toxic effects of
the preservative. This is not to say that the endogenous production of cellulases has not
been reported in termites (Khademi et al., 2002, Nakashima et al., 2002) along with
enzymes of microbial origin.
The first definitive evidence of an endogenous cellulose degradation capability
originating from endoglucanase activity not secreted from symbiotic microbes was in
plant parasitic nematodes (Smant et al., 1998). The authors claim that plant parasitic
nematodes could have the ability to degrade crystalline cellulose, and that, because of
the close relatedness of the endoglucanases to those of bacteria; it is possible that they
acquired these genes by horizontal gene transfer from a prokaryote. The degradation of
wood by microorganisms includes bacteria, fungi and protozoa (Varm et al., 1994,
Warren, 2003). Just a year later the expression of cellulase genes and the site of enzyme
secretion (hepatopancreas) were confirmed in the non marine crustacean, the red claw
crayfish Cherax quadricarinatus (Byrne et al., 1999). The authors of that study also
suggested that the ancestral GH9 gene was present before the diversification of
crustacea and insects. Kostanjšek (2010) reported the endogenous origin of endo-β(1,4)-
glucanase from Porcellio scaber, contrary to previous work described in a paper by
(Zimmer et al., 2002), which claimed there was no endogenous cellulase production.
Kostanjšek and colleagues approach used in situ hybridisation. This demonstrates how
detailed molecular biology is challenging the view established by authors such as
Zimmer that animals do not possess endogenous cellulases. Just why cellulase is not a
common enzyme activity in all animals like amylase or proteinase remains unclear
(Watanabe & Tokuda, 2001).

Introduction
11
1.6 Wood as a substrate for L. quadripunctata
At the start of my studies there was already both old and new evidence that L.
quadripunctata possessed the potential to digest wood. Extracts of L. lignorum were
shown to demonstrate cellulase activity in the 1950s (Ray & Julian, 1952) and Benson et
al., (1999) reported the absence of symbiotic bacteria and protozoans in the hindgut of
L. tripunctata and demonstrated activity of whole animal tissue homogenate against
carboxymethyl cellulose (CMC). An endo-β1,4 glucanase also found in termites
(Watanabe & Tokuda, 2010) was crucially detected in cells of the hepatopancreas of L.
quadripunctata by Dymond et al. (2003). However just one cellulitic enzyme does not
equal complete cellulose degradation and the action of the enzyme discovered by
Dymond et al., (2003) alone cannot explain nutrition in L. quadripunctata. The
endoglucanase was the only cellulase isolated from invertebrates, until the first report of
an endogenous exoglucanase in the expressed sequence tag (EST) database from L.
quadripunctata hepatopancreas tissue (King et al., 2010). This established L.
quadripunctata as a model system for research into lignocellulose degradation with the
first report of a GH7 (Figure 1.8) in an animal genome and the discussion of a possible
role of haemocyanins in lignin degradation.
A detailed examination of the transcriptome of the hepatopancreas of L.quadripunctata
revealed large numbers of EST sequences encoding for a range of enzymes that have
been implicated in cellulose degradation in other organisms. Amongst these were
numerous sequences for glycosyl hydrolase families GH5, 7 and 9 (King et al., 2010) as
well as critically no evidence of symbiont-derived sequences in messenger RNA
harvested from the hepatopancreas (King et al., 2010).

Introduction
12
Figure 1.8: The relative abundance in ESTs isolated from hepatopancreas
tissue of L. quadripunctata. (A) Shows the whole set, while (B) details the
abundance of various glycosyl hydrolase (GH) family protein sequences.
Reproduced from (King et al., 2010).
Glycoside Hydrolase Family 5
Known Activities chitosanase (EC 3.2.1.132); β-mannosidase (EC 3.2.1.25); Cellulase (EC 3.2.1.4); glucan 1,3-β-glucosidase (EC 3.2.1.58); licheninase (EC 3.2.1.73); glucan endo-1,6-β-glucosidase (EC 3.2.1.75); mannan endo-β-1,4-mannosidase (EC 3.2.1.78); endo-β-1,4-xylanase (EC 3.2.1.8); cellulose β-1,4-cellobiosidase (EC 3.2.1.91); β-1,3-mannanase (EC 3.2.1.-); xyloglucan-specific endo-β-1,4-glucanase (EC 3.2.1.151); mannan transglycosylase (EC 2.4.1.-); endo-β-1,6-galactanase (EC 3.2.1.164)
Mechanism Retaining Clan GH-A 3D Structure Status ( β / α ) 8
Catalytic Nucleophile/Base Glu (experimental)
Catalytic Proton Donor Glu (experimental)
Note formerly known as cellulase family A; Following a recent paper by St John et al. (FEBS Letters, 2010, in press) several GH5 subfamilies have been reassigned to GH30.
A B

Introduction
13
Glycoside Hydrolase Family 7
Known Activities endo-β-1,4-glucanase (EC 3.2.1.4); [reducing end-acting] cellobiohydrolase (EC 3.2.1.-); chitosanase (EC 3.2.1.132); endo-β-1,3-1,4-glucanase (EC 3.2.1.73)
Mechanism Retaining Clan GH-B 3D Structure Status β-jelly roll
Catalytic Nucleophile/Base Glu (experimental)
Catalytic Proton Donor Glu (experimental)
Note formerly known as cellulase family C. The cellobiohydrolases of this family act processively from the reducing ends of cellulose chains to generate cellobiose. This is markedly different from the IUBMB definition of cellobiohydrolases (EC 3.2.1.91), which act from the non-reducing ends of cellulose.
Glycoside Hydrolase Family 9
Known Activities endoglucanase (EC 3.2.1.4); cellobiohydrolase (EC 3.2.1.91); β-glucosidase (EC 3.2.1.21); exo-β-glucosaminidase (EC 3.2.1.165)
Mechanism Inverting 3D Structure Status ( α / α ) 6 Catalytic Nucleophile/Base Asp (experimental)
Catalytic Proton Donor Glu (experimental)
Note formerly known as cellulase family E.
Figure 1.9: Details of the three main GH families that contribute to the EST
sequences isolated from the L. quadripunctata hepatopancreas. The
information was recovered from the carbohydrate active enzyme database.
www.cazy.org
The haemocyanin possessed by L. quadripunctata is their oxygen carrying protein and
with a slight modification could become capable of phenol oxidase activity, which is a
major pathway involved in lignin degradation. Haemocyanin from the spiny lobster

Introduction
14
Panulirus argus has been shown to have phenol oxidase activity after proteolytic
cleavage (Perdomo-Morales et al., 2008). Although L. quadripunctata do feed on fungal
and bacterially degraded wood in the marine environment, these organisms do not
become established in the digestive tract. Sleeter et al., (1978) found no hindgut
microflora in L. tripunctata and suggested that there may be antimicrobial substances
produced in the digestive tract. Although they may ingest enzymes from these
organisms, it is the synergistic action of their own enzymes, the site of secretion of
which is the hepatopancreas, where Dymond et al. (2003) localised the expression of a
β1,4 endoglucanase, which is the focus of this work. 454 pyrosequencing has also been
used to analyse the hindgut transcriptomes of five beetles. This work claims that the lack
of enzymes that display lignocellulose activity is down to a lack of sequencing studies.
They also make the interesting point that what limits current enzymatic activity is
stability and susceptibility to by-products of industrial processes and advocate the idea
that there may be many novel enzymes as yet undiscovered (Pauchet et al., 2010).
1.7 Aims
The main aim of this project is to understand the mechanisms that L. quadripunctata
uses to digest lignocelluloses, a complex recalcitrant substrate. The starting point of the
study will focus on the anatomy and physiology of the animal by using HR-X-ray-CT to
produce images of the internal arrangement of the digestive system. No work has been
carried out as yet to investigate a possible antimicrobial effect that could be helping to
maintain the sterile digestive tract and this study aims to develop some testing
methodology to address this question. Furthermore, the pH and oxygen concentrations
in the hindgut will be measured and these parameters are of interest as they have
implications for digestive processes. This study also aims to investigate the effect of a
tidal regime on feeding rates in L. quadripunctata as well as the effect on feeding after
the addition of an antioxidant to the wood.
The identification of protein from the hepatopancreas and gut using MALDI-TOF-TOF
linked to the L. quadripunctata data-base is a modern proteomic approach which will be
used to identify the proteins in the gut and hepatopancreas. This work also aims to

Introduction
15
develop in situ hybridisation to localise the expression of two new glycosyl hydrolase
sequences GH5a and GH9a to provide evidence to complement the published GH7
localisation in the hepatopancreas tissue. This work will be complemented by western
blots which have as yet not been carried out to confirm that these expressed transcribed
RNA sequences are indeed translated into protein which is in turn secreted to the gut.
Furthermore testing of L. quadripunctata tissue extracts for activity against CMC, MPO
and DPO substrates has not been attempted and the characterisation of enzymatic
activity present in the tissues will be undertaken by this study. In addition to work on the
animal, changes to the wood itself after digestion by L. quadripunctata have not been
studied, X-ray and FT-IR of faecal material will be used to detect changes post digestion
combined with sugar analysis and NMR to track and identify the degradation products.
The hypotheses of this work are that L. quadripunctata digests the wood it lives on, that
it possesses a range of enzymes of endogenous origin that allow it to do this, and that,
once the wood is digested, the products of digestion are incorporated into the metabolic
pool.

Anatomy and physiology
16
Chapter 2
The functional anatomy and physiology of the digestive
tract of Limnoria quadripunctata
2.1 Introduction
A better understanding of the anatomy of L. quadripunctata provides insight into how L.
quadripunctata is adapted to a life living on, and in, wood. Observations about the
physiology of these animals e.g. the pH and oxygen level in the hindgut, develops the
fundamental understanding of the physiology of. L. quadripunctata and helps refine our
ideas about its digestive strategy.
The morphological features which define the animals as L.quadripunctata are described
according to (Ray, 1959). The electron microscope work was carried out to ensure that
the laboratory maintained culture was indeed L. quadripunctata. Light microscopy of
L.quadripunctata was also used to investigate a report of iron crystals in L. lignorum
hepatopancreas tissue by Strunk, (1959). If these crystals were found and could be
confirmed as containing iron this would provide evidence of the presence of a
component of Fenton chemistry present in the hepatopancreas. The Fenton reaction
which utilises hydrogen peroxide and ferrous Iron to produce hydroxyl radicals is used
by white-rot fungi to degrade lignin (Gomez-Toribio et al., 2009). If L. quadripunctata
can store iron then it is possible that it can be secreted into the gut along with enzymes
such as laccase and peroxidase to help degrade lignin.
Specimens require fixation of tissues, using glutaraldehyde, which cross-links protein,
followed by dehydration as it will be placed under vacuum within the SEM chamber.
One disadvantage with the SEM is that once a specimen is arranged and attached to a
stub and coated, it cannot be easily moved. This means that a range of views must be
taken on separate specimens. Therefore initial systematic light microscopy is required to

Anatomy and physiology
17
identify suitable specimens. SEM images have a higher resolution than that attainable
with visible light due to the smaller wavelength of the electrons in the beam when
compared to that of the visible spectrum. They also have a characteristic three
dimensional effect and a large depth of field. SEM will be used to confirm the findings
of the light microscopy because the taxonomic detail is so much more clearly resolved
in SEM observations.
X-ray tomography was used with the aim of elucidating how the digestive tissue of the
hepatopancreas joins with the hindgut. Collaboration with the University of Gent has
allowed access to a high resolution X-ray computer tomography (CT) scanner and
facilitated the visualisation of the internal architecture of the digestive system using this
non-invasive technique for the first time. The scanner takes hundreds of slices through
the specimen and software can then be used to collate these image stacks into a three
dimensional model that can be dissected and viewed in any direction. This technique
allows the penetration of the outer surface of the specimen and is a non destructive way
of visualising the internal structure. Although it does not achieve the resolution that can
be attained with a scanning electron microscope, it does provide a more complete
overview of the structures present, which complements work on the scanning electron
microscope.
The possibility of a microbial contribution to cellulase activity was investigated by
scanning electron microscope investigations of the hepatopancreas and hindgut which
showed, unlike other isopods (Zimmer et al., 2002), no resident hindgut microbes
(Boyle & Mitchell, 1978, Sleeter et al., 1978). This prompted the investigation into
bacterial inhibition which aimed to discover if there was any evidence to suggest that L.
quadripunctata was actively secreting a substance that was inhibiting the proliferation
and establishment of bacteria within the hindgut.
Physiological conditions as yet untested in this animal were the pH and oxygen levels
within the digestive system. These values may have implications regarding the
breakdown process of the wood. Microsensors have previously been used to characterise

Anatomy and physiology
18
conditions within the hindgut of Chironomus plumosus (Stief & Eller, 2006). Hindguts
were dissected out and mounted on agar and it was found that the hindgut was
completely anoxic and the pH was approximately half a unit higher than the surrounding
medium, throughout the hindgut. Microsensors have also been used on termites with the
emphasis on the microbial ecology of these systems and the results challenged the idea
that hindguts of termites were simply anoxic as they revealed axial gradients in pH and
oxygen present in the hindguts of both lower and higher termites (Brune et al., 1995,
Ebert & Brune, 1997). These studies discuss the importance of oxygen availability and
consumption rates with respect to digestion.
Butylated hydroxy-toluene was chosen as a treatment after reviewing the literature for a
suitable candidate treatment to apply to L. quadripunctata, a series of studies (Schultz &
Nicholas, 2000, Schultz & Nicholas, 2002, Schultz et al., 2005) highlighted the
properties, and wood protection potential of BHT. This benign antioxidant is well suited
to the marine environment as it is not soluble in water. Therefore once the wood is
impregnated and in service there will be reduced leaching and associated loss of activity.
BHT is reported as having little or no preventative effect when used alone against decay
fungi unless used in combination with a biocide, but when used in combination with a
biocide there is a greater effect (Schultz & Nicholas, 2000). This work aims to
investigate if the addition of an antioxidant to wood can reduce the rate at which L.
quadripunctata feeds.

Anatomy and physiology
19
2.2 Materials and methods 2.2.1 Light microscopy of whole organisms and tissues
Specimens of L. quadripunctata were identified throughout this study with oblique
lighting to highlight surface features particularly the pleotelson. Image stacks were made
with Helicon Focus software (HeliconSoft) and light micrographs were taken on a Zeiss
Lumar V12 stereo microscope. The light microscope was also used with bright field
illumination to allow the visualisation of semi-transparent sections of hepatopancreas
tissue. Cross polar filters were used for the examination of whole hepatopancreas to
determine if there is any material which is optically active present in the tissue e.g.
crystalline material.
2.2.2 Scanning electron microscopy (SEM) fixative and preparation
A 0.2M sodium cacodylate, 2mM calcium chloride, 3% v/v glutaraldehyde, fixative
with a pH 7-8 was made using 100 mL stock sodium cacodylate and calcium chloride
buffer at 0.4M and 4mM respectively with 24 mL of glutaraldehyde, pH balanced to 7-8
with concentrated HCl, and the appropriate volume of dH2O to make a total of 200 mL.
The buffer rinse solution was aqueous 0.2M sodium cacodylate with 2mM calcium
chloride at pH 7.5. All the solutions were stored at 4°C. Specimens of L. quadripunctata
were prepared for electron microscopy first by fixing at pH 7.5 in an aqueous 3% v/v
glutaraldehyde buffered with 0.2M sodium cacodylate and containing 2mM calcium
chloride (for 2 hrs). The specimens were buffer washed before dehydration in a graded
ethanol series (50-100% v/v) before being transferred to absolute acetone and
evaporating from hexamethyldisilazine (HMDS) overnight. Specimens were mounted
on adhesive carbon tabs placed on aluminium stubs and sputter-coated using a
gold/palladium target, before viewing with a JEOL JSM-6060LV scanning electron
microscope in secondary electron mode at 15 kV accelerating voltage.
2.2.3 Sectioning and post-fixation of hepatopancreas tissue
Specimens were prepared as for SEM, but, post-fixed with a 1% w/v aqueous osmium
tetroxide solution for 90 mins before being dehydrated in a graded ethanol series. The
samples were transferred through two changes of each absolute ethanol for 10 mins and

Anatomy and physiology
20
propylene oxide for 15 mins before adding an equal quantity of low viscosity
embedding medium (LV Resin, Agar Scientific) sufficient to cover the sample was
added, mixed and infiltrated for 30 mins at room temperature before transferring to
100% embedding medium for 90 mins. Finally, specimens were transferred, embedded
and cured for 24 hrs at 60°C, before sectioning on an ultra-microtome and staining with
toluidine blue.
2.2.4 High resolution X-ray computer tomography of L. quadripunctata
The tomography scanner used was a multi-resolution X-ray tomography scanner: High
Resolution X-ray CT (HR-X-ray-CT) operated by Jan Van den Bulcke of the University
of Ghent, Belgium. Specimens were dried from HMDS (see SEM methods) or critical
point dried (CPD) from absolute acetone using liquid CO2, or lyophilised (see NMR
spectroscopy methods) to determine the best way of preparing the specimens. They were
also sent ‘wet’ in 70% v/v ethanol/water to determine the most effective means of
preparation.
2.2.5 L. quadripunctata tissue, inhibition of bacterial growth assay
Ten animals were dissected into hindgut, hepatopancreas and rest of body samples.
Tissue samples were then incubated overnight in a shaking incubator at 220 rpm and
37°C in 50 mL centrifuge tubes containing 20 mL seawater medium (0.5% w/v peptone
in filtered, sterilised seawater). Controls were 1) samples of wood upon which the L.
quadripunctata were feeding 2) an aliquot of 0.2 µm filtered, autoclaved seawater 3) 20
ml of medium into which the tip of the dissection tweezers had been briefly immersed.
One tube of the resulting bacterial culture was then used to provide bacterial growth for
the test of inhibition. This culture was spread onto the seawater media agar plates to
produce bacterial lawns. Fifty animals were dissected into samples of hindgut,
hepatopancreas and rest-of-body tissues. The tissue samples were collected onto ice in
separate microcentrifuge tubes and centrifuged at 12,000 g for 30 sec before the
resultant tissue pellet (hepatopancreas, hindgut, rest of body) was applied to the pre-
spread plate using a spatula, then incubated at 37°C overnight. The plates were then

Anatomy and physiology
21
photographed with a Zeiss Lumar V12 stereo microscope using oblique illumination.
This experiment was a preliminary investigation only carried out once.
2.2.6 Measurement of levels of oxygen and pH within the digestive tract using
microelectrodes
Oxygen and pH levels were measured in the hindgut of whole specimens mounted on
agar plates; the agar was acting as a specimen support and as a barrier to prevent
damage to the tip of the microelectrode. Specimens were placed on the surface of the
agar and suspended in a cool (25-30°C) second layer of 12.5% w/v aqueous gelatine.
Once the gelatine had set with the specimen lying flat and the ventral surface exposed
figure 2.1, seawater was used to flood the plate to maintain a damp environment and, in
the case of pH measurement, to complete the microelectrode circuit. The oxygen
microelectrode was then calibrated against a 0.1M ascorbic acid and 0.1M sodium
hydroxide mixture to provide an anoxic standard, as well as air-saturated dH2O which
had been vigorously bubbled for 5 mins. The pH electrode was calibrated using buffers
made up at pH 4, 7 and 10 in dH2O. The specimen was then examined with a dissecting
microscope using illumination from both above and below. This illumination provides
both contrast and depth perception, which allowed the accurate placement of the
microelectrode within the hindgut figure 2.1.
Figure 2.1: A Schematic showing the microelectrode insertion procedure.
The cross indicates the location of measurement within the hindgut of L.
quadripunctata. Diagram courtesy of Chloe Delgary.

Anatomy and physiology
22
Using a micromanipulator, the 10 µm tip of the microelectrode was passed through the
cuticle of the ventral surface in the hindgut. The microelectrode was then withdrawn
using a motor driven Z axis (figure 2.2) in 20 µm steps with 3 second acquisition and 3
seconds of rest between measurements this allowed measurements to be made in the
hindgut lumen. Once the electrode was removed, the specimen was cut from the plate
and the gelatine was gently heated to allow removal of the live specimens which were
observed to swim and feed normally on Pinus. sylvestris.
Figure 2.2: Schematic of the microelectrode set up. The Image shows how the
automated Z axis allows the profiling of the sample. Image from
http://www.unisense.com/Default.aspx?ID=725
2.2.7 L. quadripunctata collection and experimental design of the feeding
assessment
Specimens of Limnoria quadripunctata were collected from a heavily infested piece of
balau wood (Shorea sp.) removed from a site in the intertidal zone at Portsmouth, UK
(grid reference SZ 638 984 GB). The L. quadripunctata were extracted from their
burrows by splitting the wood along the grain into progressively smaller splinters using

Anatomy and physiology
23
a hammer and chisel. Exposed L. quadripunctata were collected using a fine paintbrush.
After extraction, checks of individual L. quadripunctata were carried out under a stereo
dissecting microscope at ×7 magnification to ensure that only healthy L. quadripunctata
with rapidly beating pleopods and no sign of damage and were used. Once acclimatised
overnight at 20 ± 1°C, individual L. quadripunctata were then placed in 5 mL of
seawater in cylindrical wells 20 mm in diameter, in 12-well cell culture trays. Wood
samples for the feeding tests were machined into sticks of dimensions 20 × 4.5 × 2.5
mm. Heartwood was used in all cases, except for the non-durable comparison species P.
sylvestris, from which sapwood was used. Prior to experimentation, the sticks were
leached in seawater for one week, with a change of water after three days. The L.
quadripunctata were kept at a temperature of 20 ± 1°C with a fluorescent light source at
the intensity of 32-38 Lux (as measured with a Lutron LX – 101 light meter) in a 14
hours on, 10 hours off, day-night cycle. The feeding rate of individual L. quadripunctata
was assessed by twice-weekly faecal pellet counts over a 28-day period. Every day on
which the faecal pellet count was made, the L. quadripunctata and their corresponding
sticks were transferred to identical temperature-equilibrated wells prefilled with
seawater, and any dead animals were replaced.
2.2.8 Faecal pellet counting procedure
The wells were photographed and faecal pellet counts made using ImageJ (freeware
available at http:/rsbweb.nih.gov/ij/index.html). The images were imported as a
sequence and converted to greyscale to reduce the file size (Figure 2.3A). The area
corresponding to the bottom of the well was selected with the circle tool and the
surroundings deleted to remove interference. The light background was subtracted and a
macro to convert the stacked images to binary format was run (Figure 2.3B). The images
were calibrated by the number of pixels per millimetre and the particle analysis macro
commenced after specifying a lower threshold of 0.01 mm to eliminate noise from
particles too small to be faecal pellets, and selecting the ‘Show outlines’ and
‘Summarise data’ options to provide anomaly checking (Figure 2.3C). This procedure
generated an automatic spreadsheet containing the faecal pellet counts. Counts taken

Anatomy and physiology
24
from specimens that moulted between water changes and/or died were not included in
the calculation of means of feeding rate, or statistical analysis.
Scale bar 20 mm.
Figure 2.3: Automated faecal pellet counting. A)
Identification of area for analysis. B) Binary image
of faecal pellets. C) Outlined and numbered faecal
pellets. D) Enlarged image of numbered pellets.
2.2.9 Measurement of feeding under tidal conditions
A tidal tank was set up using two peristaltic pumps, one to constantly fill the tank and
one to empty it once it was filled. The pumps mimicked the ebb and flow of the tide
cycle seen in natural situations with an hour advance every day. This apparatus allowed
the selection of one of four tidal heights representing high to medium to low exposure to
water on each tide, as well as a continuously submerged group in the sump of the tank.
Pellets per day were measured as described previously in section 2.2.8 from 20 animals
per level, over a month of feeding on P. sylvestris. To allow the collection of faecal
pellets under tidal conditions L. quadripunctata were first kept under the conditions
described in section 2.2.7 for a week to allow them to burrow into 20 × 4.5 × 2.5 mm P.
sylvestris sapwood sticks. The sticks were then pinned into microcentrufuge tubes with
the lids cut off and the tubes pierced around the base to allow water to drain and leave a
sump behind to collect the faecal material in the tubes. These were then put into racks
and plankton mesh used, held down with rubber bands to hold the tubes in place and
A B C
D

Anatomy and physiology
25
allow the water to flush the apparatus with the simulated tide. The faecal material could
then be collected by pipette and the animals kept under simulated tidal conditions to
investigate the effect of tide on feeding rate.
Experimental
Tidal Height
Total Time Immersed Total Time Air Exposed
Hours Hours
High Shore 3.3 9.7
Mid Shore 5.7 7.3
Low Shore 7.7 5.3
Sub-tidal Constant 0
Table 2.1: Time immersed and exposed during the trial per 24H cycle.
2.2.10 Vacuum impregnation of wood sticks with butylated hydroxytoluene (BHT)
The 20 × 4.5 × 2.5 mm P. sylvestris sapwood sticks were dried for two hours in an oven
at 60°C, and then placed in a beaker containing 5, 10 or 15% w/v butylated
hydroxytoluene solution dissolved in methanol. A 0.02 MPa vacuum was applied over
24 hours at 4°C to prevent the solvent boiling off, before being slowly released. This
expelled air from the wood and returned the pressure to normal: if the sample was not
saturated, air expansion will cause the wood to float when put under vacuum. The
procedure was repeated until the sticks remained submerged, and the sticks were dried
overnight on filter paper in a fume hood. To ensure no solvent remained, the sticks were
then placed in a vacuum desiccator (when below 163 millibar at 21°C, the trace
methanol readily evaporates). Then the wood was then re-saturated in seawater by
applying a 0.02 MPa vacuum at room temperature.

Anatomy and physiology
26
2.3 Results 2.3.1 Light microscopy
Viewing the L. quadripunctata specimens under a stereo microscope was routine to
check the exact species of limnoriid. Observation with a microscope is also a quick way
of identifying any damaged L. quadripunctata. Healthy L. quadripunctata have beating
pleopods located towards the posterior of the animal; these are the gaseous exchange
surfaces and are also used for swimming. Both feeding behaviour and the grooming
actions of the body surfaces were easy to observe using light microscopy.
The light microscope was also used for more critical examination of anatomy (Figure
2.4B). By manipulating the specimen into an artificial glass burrow a lateral view was
obtained which shows the arrangement of the legs in the burrow and gives a clear view
of the segments that make up the body.
Light microscopy was also used to view thin sections of material, Figure 2.5A shows a
cross section of a hepatopancreas that has been fixed and stained for viewing on a
transmission electron microscope (TEM). The osmium shows up black inside the tissue
and is lipophilic, so it highlights lipid droplets inside the cells. The convoluted inner
surface of the lumen of the hepatopancreas is also visible with the cellular surface
extending in dome-like protuberances into the luminal space. There are also numerous
clearer areas of tissue, which could possibly be vacuoles forming secretions which can
also be seen in figure 2.5B.

Anatomy and physiology
27
Figure 2.4: Photomicrograph (A) shows two specimens of L. quadripunctata
(B) is a lateral view of a single animal in an artificial burrow.
Photomicrographs of L. quadripunctata (A) Shows a ventral and lateral view;
(B) shows a lateral view of a single specimen in an artificial burrow.
A
B 1 mm
1 mm

Anatomy and physiology
28
150 µm
500 µm
Figure 2.5: Hepatopancreas A) Transverse section showing cells and luminal
space with cells extending in dome like protuberances. B) A longitudinal view
clearly showing granular appearance of tissue, proximal to distal region left to
right.
A
B

Anatomy and physiology
29
2.3.2 Scanning electron microscopy (SEM)
All the SEM images are taken in back scattered electron mode which gives a
characteristic shadowing effect combined with the depth of field achieved with SEM
that creates images with well-defined surface features.
The main structure used to identify the species of L. quadripunctata is the shape of, and
sculpturing present, on the pleotelson. The best technique for identifying the taxonomic
detail of a specimen is scanning electron microscopy (SEM). This provides images of
much greater resolution and magnification than is possible with light microscopy,
enabling resolution of the fine structure present on the exoskeleton. Figure 2.6 A shows
the last two body segments made of the 5th pleonal somite and pleotelson the most
obvious features on these segments that identify L. quadripunctata are the X shaped
carinae on the pleonal somite and the four puncti arranged in a square which are more
visible in figure 2.6 B.
A lateral view of a L. quadripunctata specimen is presented in figure 2.7 A, the
enhanced detail of the exoskeleton allows more taxonomic detail to be uncovered for
example the number of segments which make up the antennae and the number of
flagella articles extending from the tip. Other features include the compound eye, claws
on the end of the foot for holding the animal inside the burrow. The ventral view
presented in figure 2.7 B is a useful orientation for examining the mouth parts and
determining the sex of the specimen in this case the brood plates (oostegites) of the
female arranged inside the legs are not visible so it is most likely a male. Although
between brooding the oostegites shrink they are still visible.

Anatomy and physiology
30
Figure 2.6: Electron micrographs of the posterior dorsal surface of L.
quadripunctata. Image A) contains the last two segments, the 5th pleonal somite
and pleotelson. Image B) has a red oval around the X shaped carinae and a red
circle around the four puncti.
A
B
A
B

Anatomy and physiology
31
Figure 2.7: Electron micrographs showing a lateral view and ventral view of
L. quadripunctata. The lateral view presented in Image A) has a red circle
around the compound eye. The ventral view in image B) has a red circle around
the pleopods, which are used for gaseous exchange and swimming.
A
B
A
B

Anatomy and physiology
32
2.3.3 High resolution X-ray computer tomography
There is a close association of the hindgut and hepatopancreas as they enter the head
(Figure 2.8 A): the cross-section of the four lobes of the hepatopancreas can be seen
with the hindgut above them. Figure 2.8 B shows how the hepatopancreas extends along
the length of the body and remains associated with the hindgut. The hepatopancreas
joins the hindgut almost in the head from underneath at the very start of the hindgut and
it is this region which is of particular interest to digestion. Circled in red on figure 2.9 is
an area that has been shown to contain filter structures in the crustacea (Brunet et al.,
1994). All the photos presented here are sections prepared from one critical point dried
specimen.

Anatomy and physiology
33
Figure 2.8: Three dimensional reconstructions of L. quadripunctata. Image A)
shows a dorsally sectioned specimen with the hindgut (red) and hepatopancreas (green)
circled. Image B) is a lateral section showing hepatopancreas (green) circled alongside
the hindgut (red).
A
B

Anatomy and physiology
34
Figure 2.9: An image of the head of L. quadripunctata. Circled in red is the
region that joins the hepatopancreas to the hindgut. The food mass (fm) can be
seen above and the hepatopancreas to the right of the circle. Also visible is the
mandible labelled (m) as well as the hepatopancreas circled in green.
fm
m

Anatomy and physiology
35
2.3.4 Inhibition of bacterial growth by L. quadripunctata tissue
The results of the bacterial inhibition study suggest that there was inhibition of bacterial
growth around the area of the plate which had been treated with hepatopancreas tissue
and some disruption of growth on the plate treated with the supernatant of the
hepatopancreas tissue. There was no inhibition of growth on the area of the plate treated
with the hindgut tissue or the body tissue or either supernatant (Figure 2.10 D, E)
Bacteria were cultured from hindgut tissue in a seawater medium enriched with peptone
and under oxygenated conditions at 37°C. This would not be selective for the marine
bacteria usually associated with the hindgut. These bacteria were used simply as a quick
test to see if there was any antimicrobial activity. The culturable bacteria were not a
representation of the diverse fauna that is present on wood in the marine environment.
This work represents a preliminary investigation into an explanation for the observed
un-colonised gut in L. quadripunctata and the potential antimicrobial activity this may
represent.

Anatomy and physiology
36
Figure 2.10: A composite of plated bacterial cultures inoculated with L.
quadripunctata tissue. A) Is a bacterial lawn while B) is the same lawn when
inoculated with L. quadripunctata hindgut extract. C) Shows the lawn on the
same plate inoculated with hepatopancreas extract. D) Demonstrates the growth
of L. quadripunctata body tissue and E) shows growth on the same plate
inoculated with hindgut tissue extract. F) Is the same plate inoculated with
hepatopancreas tissue extract; note the zone of clearance which indicates the
inhibition of bacterial growth in this preliminary assay.
A.
B.
C.
D.
E.
F.
(Scale bar 1 cm)

Anatomy and physiology
37
2.3.5 Dorsoventral pH profile of the hindgut of L. quadripunctata
A pH microsensor was used to produce dorsoventral pH profiles of the hindgut from ten
live L. quadripunctata. The probe started fully inserted into the animal at the zero point
and was withdrawn whilst recording the changes in pH. The probe starts off at pH 9.1
inside the gut of L. quadripunctata which slowly drops off as it leaves the gut at around
180 µm. The pH continues to lower to the pH of seawater at pH 8.3 once the
microsensor has left the surrounding medium and is back in seawater.
Figure 2.11: showing the pH inside the hindgut of L. quadripunctata part A
shows all 10 profiles together while part B is a plot of the mean and standard
error. The profiles run from inside the hindgut to outside left to right.
7.8
8
8.2
8.4
8.6
8.8
9
9.2
0 100 200 300 400 500
pH
Depth in micrometers
7.8
8
8.2
8.4
8.6
8.8
9
9.2
0 100 200 300 400 500
pH
Depth in micrometers
A
BA

Anatomy and physiology
38
2.3.6 Dorsoventral oxygen profile of the hindgut of L. quadripunctata
An oxygen microsensor was used to produce dorsoventral oxygen profiles of the hindgut
from ten live L. quadripunctata. The probe started fully-inserted into the animal at the
zero point and was withdrawn whilst recording the changes in oxygen concentration.
The probe starts off at a 5% concentration inside the gut of L. quadripunctata which
quickly increases as it leaves the gut at around 180 µm. The oxygen concentration
continues to increase to 90% once the microsensor is back in seawater.
Figure 2.12: showing the oxygen concentration inside the hindgut of L.
quadripunctata part A shows all 10 profiles together while part B is a plot of the
mean and standard error. The profiles run from inside the hindgut to outside left
to right.
0102030405060708090
100
0 200 400 600 800 1000 1200 1400 1600 1800 2000
% O
xyge
n co
ncen
trat
ion
Depth in micrometers
0102030405060708090
100
0 200 400 600 800 1000 1200 1400 1600 1800 2000
% O
xyge
n co
ncen
trat
ion
Depth in micrometers
A
B

Anatomy and physiology
39
2.3.7 Effect of exposure of L. quadripunctata to various tidal regimes on pellet
production rate
The results clearly demonstrate that being constantly immersed in seawater in the
subtidal zone does not have a negative effect on the feeding rate of L. quadripunctata
figure 2.13. Furthermore constant immersion does not hinder the L. quadripunctata
because specimens under this condition show the highest feeding rate. The large
standard error for the counts can be accounted for by lack of data on the moulting and or
death of individuals.
Figure 2.13: Pellet production per day of animals feeding in the tidal tank.
The subtidal level had no exposure to tide and the highest level of feeding. The
low feeding level overall when compared to figure 2.14 is accounted for by fact
that the L. quadripunctata were being kept under more natural conditions with
the seawater at an ambient temperature for the time of year of the test 11 °C ± 1
°C which is suboptimal for feeding rate.
0
5
10
15
20
25
30
High Medium Low Subtidal
Pelle
t pro
duct
ion
per
day
Tidal level

Anatomy and physiology
40
2.3.8 Effect of Butylated hydroxytoluene (BHT) on faecal pellet production
There was no significant difference in feeding rate between specimens fed untreated
wood and wood treated with methanol alone. There was a reduction in feeding at a 5%
concentration of BHT but this was not significantly different from the control or the
higher concentrations. At a 10% and 15% concentration of BHT there is a significant
decrease in feeding when compared to the control. Statistical analysis was performed
using a one-way ANOVA with a single fixed factor, concentration with Tukeys post hoc
test. Shared letters indicate treatments that were not significantly different.
Figure 2.14: Feeding rate of L. quadripunctata on wood impregnated with a
range of concentrations of BHT. The graph represents the effect of BHT
loading of Pinus sylvestris sapwood (achieved by methanol solvent vacuum
impregnation) on the feeding rate of L. quadripunctata as measured by faecal
pellet production over a period of four weeks. The zero concentration data
includes counts from animals feeding on untreated wood and on wood
impregnated with the solvent alone. Statistical analysis was performed using a
one-way ANOVA with a single fixed factor, concentration. Shared letters
indicate treatments that were not significantly different.
0
10
20
30
40
50
60
70
80
90
0 5 10 15
Pelle
t pro
duct
ion
per
day
BHT solution concentration (% w/v)
a
ab
bb

Anatomy and physiology
41
2.4 Discussion
The osmium stain observed in the light microscopy work suggests the presence of lipid
in the hepatopancreas cells with a lumen that is highly convoluted and increased in
surface area this suggests the tissue is involved in absorption and or secretion. Previous
work studying the hepatopancreas of L. lignorum has identified the presence of
intracellular crystals within the cells of the hepatopancreas (Strunk, 1959). Although No
evidence of these structures was found in the specimens of L. quadripunctata examined
in this study. The author did concede that the occurrence of these crystals is sporadic
with no satisfactory correlation of external factors which may indicate their presence
within L. lignorum (Strunk, 1959). Specimens of hepatopancreas from L.
quadripunctata contained copper accumulations in their cells (Tupper et al., 2000) when
the animals that had been feeding on copper chromium and arsenic (CCA) treated and
untreated wood. This accumulation and storage of copper was attributed to its use in
blood pigments and enzymes and accounts for the tolerance of L. quadripunctata to this
wood treatment.
The high resolution X-ray tomography used in this study has helped refine the ideas
about the internal structure of the digestive system. The exact arrangement of the filters
surrounding the entrance to the hepatopancreas can now be more accurately targeted
because the orientation within the body cavity is more clearly defined by the 3D
reconstructions of this region. Thin sections could be prepared and visualised on a
transmission electron microscope to improve the resolution further. Future work could
adapt a technique used by Wirkner & Richter (2004), who used a method consisting of
injecting a resin to improve the contrast in the circulatory organs of the woodlouse when
visualised using X-ray tomography. This could be adapted to the digestive system of the
L. quadripunctata and used to improve the contrast in these soft tissues.
The apparent absence of bacteria in the hindgut was reported by Sleeter et al. (1978).
This finding raises a fundamental question about how the sterile digestive tract is
maintained. As the animal feeds on wood it also must ingest the associated bacteria and
fungi (Cragg et al., 1999), but the role these play remains to be fully understood. The

Anatomy and physiology
42
findings of this study suggest that the hepatopancreas contains a compound that exhibits
antimicrobial activity. The antimicrobial activity data represents preliminary work in
this area and with increased interest in the mechanisms of innate immunity, presented in
a recent review by Vazquez et al., (2009) the possible mechanisms for the activity of
the compounds identified in active immune response is discussed.
The use of Clark-type oxygen microelectrodes and glass pH microelectrodes for
profiling termite hindguts by Brune et al., (1995) revealed that oxygen penetrated all but
the central portions (which were completely anoxic) as well as hindgut regions still
possessing 50% of the oxygen saturation of air. This contrasts with the concentration in
L. quadripunctata body tissues of around 0-5% inside the hindgut. Brune et al. (1995)
also reported a region of pH 10 within the termite hindgut, although mostly it was
neutral, as was observed in the L. quadripunctata hindgut. The conclusion was that the
termite hindgut was an axially and radially heterogeneous system, which is due to the
activities of the microbiota that inhabit its various regions. This is in contrast to the L.
quadripunctata hindgut, which is relatively simple and mostly classified as hindgut with
none of the specialised regions seen in termites. Future work would include the rate of
oxygen consumption within the hindgut and body tissue of L. quadripunctata, as well as
further pH investigations in organisms under the influence of a tidal cycle to determine
if there are any changes in this variable that correlate with tidal height.
The tidal tank experiment was conducted to investigate the effect of tide on feeding
rates. The results of the tidal tank experiment demonstrate that there is some increase in
feeding rate in specimens with no tidal exposure. This suggests that L. quadripunctata
may not be feeding while under aerial emersion. This could be due to a limited oxygen
supply within the burrow during this time, and could result in a digestive cycle within
these intertidal specimens. The available oxygen in the burrow could be investigated by
future work and the cells of the hepatopancreas investigated by study with a
transmission electron microscope to see if there are any morphological changes within
the cells of this tissue associated with the tidal cycle.

Anatomy and physiology
43
In an early unsuccessful run of this experiment, the L. quadripunctata were able to
escape and, interestingly, out of the 80 used in total, 13 were alive, one was dead and
there were two couples, the rest were missing. This suggests that they were able to swim
and locate another burrow. This requires further testing to elucidate the mechanism but
was outside the scope of the present work.
The antioxidant BHT was chosen because of its low toxicity (Schultz & Nicholas, 2000)
and low solubility in water (so there is reduced loss from leaching). Of the 124 animals
used in the experiment with BHT-treated wood, only six animals died over the 4-week
feeding period. No significant difference in feeding rate between the solvent control and
untreated wood was detected, but feeding on 10% and 15% BHT impregnated wood was
significantly reduced. Work conducted by Schultz et al., (2004) on the effect of
combining BHT with a biocide found that the addition of BHT increased the efficacy of
wood treatment against fungal and termite degradation when compared to biocide alone.
This work used BHT alone and in a separate study, Schultz & Nicholas (2000) found
that BHT had little or no preservative effect with respect to decay fungi. BHT is
behaving as a free radical scavenger and antioxidant by acting as a reducing agent itself.
The introduction of BHT in the food could help stop the degradation of the
lignocellulose via a reactive oxygen species such as the hydroxyl radical which is
produced by some brown rot fungi which utilize Fenton chemistry and hydrogen
peroxide to produce this radical species to help degrade lignin (Tejiran & Xu, 2010) if L.
quadripunctata utilises a similar mechanism in its ability to degrade lignocellulose then
a reduction in feeding which correlates to an increasing load of antioxidant could
suggest that oxidative chemistry is involved in its ability to degrade lignocellulose.

Molecular biology and biochemistry
44
Chapter 3
Using molecular biology and biochemistry to understand
digestion in L. quadripunctata
3.1 Introduction
This chapter explores the understanding of the digestive capabilities of L.
quadripunctata by using the molecular techniques, in situ hybridisation and western
blotting to localise the site of expression and confirm the presence of translated protein
in the tissues of L. quadripunctata. These techniques in themselves do not confirm that
the identified protein has the expected enzymatic activity, so a series of assays were
used to characterise the enzyme activity in hepatopancreas and hindgut tissues. The aim
of the studies reported in this chapter was to localise the expression of, and identify the
secretion of GH protein in L. quadripunctata as well as to characterise the enzymatic
activity of the hindgut.
3.1.2 A molecular biology approach to digestion in L. quadripunctata
The starting point for the development of the molecular work was greatly assisted by the
availability of a sequence database for the transcribed sequences of RNA originating
from the hepatopancreas. A complete analysis has been published by King et al. (2010)
and a summary is presented in Figure 1.8. The first step in this study was to isolate RNA
for L. lignorum. This was undertaken to facilitate future work on this species of
Limnoria in the same manner that the sequencing the of the RNA from the
hepatopancreas and EST library creation facilitated the protein identification, in situ
hybridisation and western blotting presented in this study of L. quadripunctata
The sequence database has allowed the identification of proteins by linking mass
spectroscopy to sequence information. The first step of protein identification requires
the dissection of specific tissue from L. quadripunctata and the separation of the protein

Molecular biology and biochemistry
45
components by native polyacrylamide gel electrophoresis (PAGE). The bands are then
cut out and sent for analysis by collaborators. To assign protein identities, the protein
analysis were carried out using matrix-assisted laser desorption/ionisation (MALDI)
time of flight (TOF)-TOF mass spectroscopy. This technique first requires the digestion
of the protein by trypsin, then the samples are spotted and dried onto a plate which is
inserted into the mass spectroscopy machine which then fires a laser at the peptides to
ionise them. Then it records the masses of the ionised fragments based on their time of
flight to the detector. This is linked to a computer that records the spectrum and chooses
the 10 most abundant ions. These ions are then further fragmented and the masses
recorded, this second step increases the sensitivity of the technique. Next, each of the
spectra sets are then compared with spectra theoretically created by a computer of all the
peptide sequences in the database for L. quadripunctata which are searched using the
MASCOT search engine (Perkins et al., 1999). This approach yields a list of possible
matches for the identification of the protein in the sample based on theoretical masses of
the proteins predicted in the database.
The sequence database also allowed the synthesis of RNA sequences specific to
glycosyl hydrolase (GH) proteins from L. quadripunctata that could be used for in situ
hybridisation to localise their expression within specific tissues of L. quadripunctata. In
situ hybridisation uses a complementary strand of digoxygenin labelled mRNA which
will hybridise to a specific mRNA. The digoxygenin is targeted by an antibody
conjugated to an enzyme that catalyses a colour reaction when its substrate is
introduced, highlighting where the mRNA is located within the tissue or cell. The results
of the in situ experiments presented by King et al. (2010) demonstrated positive staining
for GH 7a and 7b in the hepatopancreas tissue. In this study antisense and sense
sequences from the database were hybridised to hindgut and hepatopancreas tissue, to
localise the expression of the GH 5, 7, 9a sequences.
The sequence database also facilitated the expression of recombinant protein by our
collaborators in York which was then used to raise antibodies in sheep for western blots.
Western blotting is used to confirm the presence of a specific target protein therefore

Molecular biology and biochemistry
46
confirming the translation of the mRNA transcripts. Antibodies to the desired protein
were raised in sheep by injecting them with the GH protein synthesized from the L.
quadripunctata sequences. L. quadripunctata hindgut and hepatopancreas tissue
samples were separated first by dissection and subsequent gel electrophoresis before the
proteins were transferred to a membrane to allow them to be exposed to antibodies
raised in sheep against the GH proteins. This membrane was then exposed to a
secondary antibody raised against sheep antibodies conjugated to an enzyme which
catalyses a reaction that stains the membrane where the target protein is bound.
3.1.3 The Biochemistry of digestion in L.quadripunctata
Yonge (1927) reported an absence of cellulase in L. lignorum this was followed up by
Ray & Julian (1952) who tested for the presence of reducing sugars after the incubation
of hepatopancreas tissue homogenate with a suspension of filter paper. The result was
positive for cellulose degradation a conclusion deduced from the presence of reducing
sugars in the mixture.
The determination of the activity of raw tissue extract of the hindgut and hepatopancreas
displayed against the soluble amorphous cellulose derivative carboxymethyl cellulose,
method was adapted from Teather & Wood (1982). The deactivation of enzymatic
activity by denaturing the protein structure with heat is a critical step to determine
whether or not the observed reaction is occurring through an enzymatic process. Tests
were also carried out to determine if the hindgut and hepatopancreas tissue could
demonstrate activity against a range of substrates which would indicate whether or not
these tissues posses any of the following activities; cellobiohydralase, galactosidase,
mannosidase, glucosidase and xylanase. To further characterise the activity of L.
quadripunctata, enzyme assays to determine the potential for the degradation of lignin
were also performed. In gel assays are a refinement of the in vitro phenol oxidase assay
and were an attempt to identify if any of the proteins that can be separated by PAGE
possessed specific phenol oxidase activities. The method used was adapted from those
of Sidjanski et al., (1997) who tested for phenol oxidase activity in Anopheles stephensi.

Molecular biology and biochemistry
47
3.2 Materials and Methods 3.2.1 Buffer and Media Recipes
3.2.1.1 Native polyacrylamide gel electrophoresis for protein analysis
8% Native Gel:
- 5.6 mL 30% (w/v) Acrylamide: Bisacrylamide
- 2.1 mL 10× TBE
- 13.069 mL dH2O
- 210 µL 10% w/v APS
- 21 µL TEMED
Running Buffer:
1× TBE (50mL 10× + 450 mL dH2O) 10× TBE stock 108 g tris base 55 g boric acid
9.3g EDTA adjusted to 1 L with dH2O.
3.2.1.2 Transformation of competent cells
SOB media and agar:
Media 100 mL Agar 500 mL
2% Tryptone 2 g 10 g
0.5% Yeast Extract 0.5 g 2.5 g
10mM NaCl 5M stock 200 µL 1 mL
2.5mM KCl 250mM stock 1 mL 5 mL
10mM MgCl2 1M stock 1 mL 5 mL
10mM MgSO4 1M stock 1 mL 10 mL
(SOB agar 20 mM)
Agar None 15 g
Autoclave and add glucose afterwards to make it SOC the glucose was filter sterilized <
2 µm and made up with dH2O.
20mM Glucose 2M stock 1mL 5mL
LB-Lysogeny broth
Made by adding 20 g of LB mix to a litre of dH2O (constituents per litre: 10 g tryptone,
5 g yeast extract, and 5 g sodium chloride).

Molecular biology and biochemistry
48
3.2.1.3 Preparation of the hepatopancreas tissue for probing
WISH hybridisation buffer mix
50% v/v deionised formamide, 20× saline sodium citrate (SSC, 15 mM sodium citrate
150 mM sodium chloride) , 1 µg mL-1 yeast tRNA, 100 µg mL-1 heparin, 1× Denhart’s,
0.1% v/v Tween 20, 5mM Na2EDTA and stored at 4°C.
10× PBST (1 L) 10× 1×
- 80 g NaCl 1.37M 137mM
- 2 g KCl 27mM 2.7mM
- 14.4 g Na2HPO4 101.5mM 10.2mM
- 2.4 g KH2PO4 17.6mM 1.8mM
-5 mL Tween 20 0.5% v/v 0.05% v/v
- made up to 1 L with dH2O
3.2.1.4 Western blotting materials
All buffers and solutions were made with deionised water and sterile filtered to 0.2 µm.
Protein in mg ml-1
5a 7a
- PI = 13.82 - PI = 9.77
- 1st = 12.00 - 1st = 10.00
- 2nd = 13.63 - 2nd = 11.84
- 3rd = 12.03 - 3rd = 12.94
All standardised to 5a 3rd bleed (12.03 mg ml-1) in blocking buffer.
10× TBST (1 L) 10× 1×
- 100 mL 1M Tris-HCl pH 8 100mM 10mM
- 87.66 g NaCl 1.5M 150mM
- 5 mL Tween 20 0.5% v/v 0.05% v/v
- made up to 1 L with dH2O

Molecular biology and biochemistry
49
Blocking Buffer
- 50 mL 10× TBST 1× TBST
- 25 g Marvel milk powder 5% w v-1
- made up to 500 mL with dH2O
Western Chemiluminescent Solutions
100 µL 250mM luminol 1.1mM
44 µL 90 mM p-coumaric acid 0.9mM
1 mL 1 M tris-HCL pH 8 100mM
8.856 mL dH2O
6 µL hydrogen peroxide 0.06% v/v
1 mL Tris-HCl pH 8 100mM
8.994 mL dH2O
3× SDS-PAGE Loading Dye
7.2 mL 1M Tris-HCL pH 6.8 0.36M
1.8 g SDS 9% w v-1
3 mL glycerol 15% v/v
3 mL β-mercaptoethanol 15% v/v
0.04 g Bromophenol Blue 0.2% w v-1
up to 20 mL with dH2O
4 % SDS-PAGE Stacking Gel
- 1.3 mL Protogel 30 % w/v (37.5:1) Acrylamide: Bisacrylamide
- 2.5 mL Protogel Stacking Buffer
- 6.1 mL dH2O
- 50 µL 10 % w/v APS (0.1 g APS + 950 µl dH2O)
- 10 µL TEMED

Molecular biology and biochemistry
50
12.5 % SDS-PAGE Resolving Gel
- 8.3 mL Protogel 30 % w/v (37.5:1) Acrylamide: Bisacrylamide
- 5 mL 4 × Resolving buffer
- 6.4 mL dH2O
- 200 µL 10 % w/v APS (0.1 g APS + 950 µL dH2O)
-20 µL TEMED
6.6ml resolving gel: 1.4ml stacking gel
Running Buffer 1× SDS PAGE
Tris-Glycine-SDS PAGE Buffer (10× stock) used as a (1×) contains, 0.25M Tris base,
1.92M glycine, and 1% (w/v) SDS from (National Diagnostics).
Transfer Buffer
12.114 g tris 20mM
56.303 g glycine 150mM
1 L methanol 20% v/v
Up to 5 L with dH2O
3.2.1.5 Carboxymethyl cellulose (CMC) plate assay materials
Buffer mix
- 500 µL 1M Tris-HCl pH 7.5
- 0.002 g Benzamidine
- 125 µL 0.2M PMSF
- 300 µL 5M NaCl
- 9.075 mL dH2O
CMC Plates
- 1.7% w/v Agar
- 0.5% w/v CMC

Molecular biology and biochemistry
51
Congo red Solution
- 2% w/v Congo red
- 500 mL dH2O
3.2.1.6 In Vitro enzyme assay materials
10× Enzyme reaction buffer
- 200µL dH2O
- 1 mL Tris-HCl pH 7.5
- 600 µL 5M NaCl
- 200 µL PMSF
- 0.003 g Benzamidine hydrochloride
The Novozyme enzyme cocktail (supplied by collaborators) consisted of Celluclast 1.5L
(CCN03108) and Novozyme 188 (DCN00211) in a 4:1 ratio. The cocktail was purified
with a GE Healthcare HiTrap desalting column and eluted in 25mM sodium acetate
buffer pH 4.5 (stock solution 2M = 82.03g Na acetate in 300 mL H2O, adjust pH to 4.5
using acetic acid, and adjust volume to 500 mL with H2O). The CAZyme™ β-
Glucosidase was supplied by Lucigen® and the other enzymes from Sigma®.
Prepare the positive controls using the 5× buffer
Enzyme Buffer dH2O
a. Cellobiohydrolase (CAZyme) 8.03 µL 20 µL 66.97 µL
b. Galactosidase(Enzyme) 0.3 µL 20 µL 74.7 µL
c. Mannosidase(Enzyme) 10 µL 20 µL 65 µL
d. Xylanase (Novozyme) 2.5 µL 20 µL 72.5 µL
e. Glucosidase (Novozyme) 2.5 µL 20 µL 72.5 µL
3.2.1.7 Catechin phenol oxidase assay materials
All solutions throughout filtered to 0.2 µm and degassed, also catechol and catechin
solutions are light sensitive so they were wrapped in foil.

Molecular biology and biochemistry
52
Stock 0.5 L 1M Tris-HCl pH 7.5:
- 60.57 g Tris
- Make up to 450 mL with dH2O
- pH to 7.5 using HCl
50mM Tris-HCl pH 7.5:
- 0.5 mL 1M tris-HCl pH 7.5
- 9.5 mL dH2O
50mM Tris-HCl pH 7.5 + 8M urea:
- 0.303 g tris
- 24.024 g urea
- dissolve in 30 mL dH2O (heat)
- pH to 7.5 using HCl
- made up to 50 mL with dH2O
Catechin solution 50µM:
- 5 µg catechin
- 345 µL 20% v/v ethanol
3.2.1.8 Catechol phenol oxidase assay materials
50mM Tris-HCl pH 7.5 + 50mM catechol:
- 5 mL 50mM Tris-HCl pH 7.5
- 0.028 g catechol
- dissolve

Molecular biology and biochemistry
53
HP SUBSTRATE
VOLUME OF REACTANTS pH MACERATE TREATMENT
maceration boiling urea 60 Catechin 25 uL sample + 250 uL catechin 7.5 Thicker pestle No No 60 Catechin 25 uL sample + 250 uL catechin 7.5 Thicker pestle 2 mins No 60 Catechin homogenate + 250 uL catechin 7.5 Thicker pestle No No na Catechin 25 uL sample + 250 uL catechin 7.5 N/A No No
10 x 3 Catechin 10 uL sample + 100 uL catechin 7.5 Teflon pestle No No 10 x 3 Catechin 10 uL sample + 100 uL catechin 7.5 Teflon pestle 10 mins 8M na Catechin 10 uL sample + 100 uL catechin 7.5 N/A No No
40 Catechol 100 uL sample + 1 mL catechol 7.5 Thicker pestle No No 40 Catechol 100 uL sample + 1 mL catechol 7.5 Thicker pestle 1 hour 8M na Catechol 100 uL sample + 1 mL catechol 7.5 N/A No No na Catechol 100 uL sample + 1 mL catechol 7.5 N/A 1 hour 8M
Table 3.1 Summary table of the phenol oxidase assay methods used.
3.2.1.9 Native in-gel phenol oxidase enzyme assays materials
Mushroom tyrosinase was used as the monophenol and diphenol oxidase activity
positive control and the laccase positive control was from Rhus vernicifera (Sigma).
50mM Tris HCl pH 7.5 + protease inhibitors:
- 0.5 mL 1M Tris HCl pH 7.5
- 125 µL 0.1 M Phenylmethyl sulphonyl fluorides (PMSF)
- 0.002 g Benzamidine
- 9.375 mL dH2O
- filter (0.2 µm)
0.1M PMSF made by dissolving 1.742 g solid in 100 mL isopropanol. Aliquots of 1 mL
were dispensed and stored at -20°C. Also, the buffers were made to 1.25× final
concentration to take into account addition of loading buffer dilution.
Loading buffer 50mM Tris-HCl pH 7.5 + 20% w/v Ficoll:
- 2 g Ficoll
- 0.5 mL 1M Tris-HCl pH 7.5

Molecular biology and biochemistry
54
- make up to 10 mL with dH2O
- heat to dissolve Ficoll
- filter 0.2 µm
Monophenol oxidase (MPO) stain:
- 0.039 g tyrosine methyl ester (10mM)
- 10 mg phenazine methosulphate
- 20 mg nitroblue tetrazolium
- 1 mL 1M Tris-HCl pH 7.5 (50mM)
- 19 mL dH2O
Diphenoloxidase (DPO) stain:
- 0.018 g catechol (10mM)
- 800 µL 1M Tris-HCl pH 7.5 (50mM)
- 15.2 mL dH2O
- 4 mL 0.3% w/v3-methyl-2-benzothiazolinone hydrazone hydrochloride - MBTH (0.03
g in 10 mL EtOH)
Laccase stain:
- 0.014 g syringaldazine (2mM)
- 1 mL 1M Tris-HCl pH 7.5
- 10 mL 100% v/v EtoH
- 9 ml dH2O
Laccase positive control:- 83.3 mg solid material 120 U mg-1 so 9996 units in total,
resuspended in 999.6 µL 50mM Tris-HCl pH 7.5 and centrifuged at 12,000 g for 1 min
to sediment the particulate matter.
3.2.2 Extraction of RNA from the hepatopancreas of L. lignorum Whole hepatopancreases were dissected from 40 L. lignorum and frozen sequentially in
liquid nitrogen, before storage at -70°C in a microcentrifuge tube.

Molecular biology and biochemistry
55
A 1 mL aliquot of Trizol® (Invitrogen) was added to each tube and the sample
homogenized with a Teflon pestle. The tubes were vortexed for 10 s then incubated at
room temperature for 5 mins. The lysate was flash frozen in liquid nitrogen or put in the
-70°C freezer. For further processing the lysate was defrosted at room temperature and
vortexed briefly, prior to the addition of 200 µL of chloroform, vortexing for 15 s and
centrifuging at 12,000 g at room temperature for 5 mins.
The top phase containing the RNA was transferred to a fresh tube and 500 µL
isopropanol was added and gently mixed by inverting the tube several times. This
mixture was then incubated for 15 mins at room temperature then centrifuged at 12,000
g at 4°C for 10 mins. Afterwards the supernatant was removed and 1 mL of cold 70%
v/v ethanol was added to the pellet and centrifuged at 12,000 g at 4°C for 5 mins. The
supernatant was removed and the tube left to air dry for 10 min, before vortexing gently
to re-dissolve the RNA pellet in 123 µL distilled RNase-free water.
A 1% w/v agarose gel was made by dissolving 0.5 g agarose in 50 mL of 1× TBE buffer
using a microwave-oven. Upon cooling, 3µL of ethidium bromide was added and the gel
poured with a dog tooth comb placed into position. When the gel set the submarine gel-
tank was then filled with 1× TBE buffer to the line. Finally 3 µL of sample with 2 µL of
5× Orange G loading dye (15% (v/v) Ficoll 0.2% (w/v) Orange G) was loaded. The
powerpack was set to 120 V and the gel was allowed to run for 15 mins, before
visualisation of product under UV excitation of the ethidium bromide.
3.2.3 Native polyacrylamide gel electrophoresis for protein analysis
The first step of the protein analysis requires the separation of the proteins in the tissue
sample by gel electrophoresis. Fifty hindguts and fifty hepatopancreases from the same
fifty specimens were dissected and macerated before 15 µL of sample was loaded with 5
µl loading dye (15% (v/v) Glycerol 0.2% (w/v) Bromophenol Blue) onto the pre-run 8%
native polyacrylamide gel and electrophoresed for 75 mins (100 V, room temperature,
1× TBE). Gels were loaded in duplicate and stained with Coomassie (Safestain –

Molecular biology and biochemistry
56
Invitrogen). These proteins form discrete bands which may contain one or many
proteins cut from the gel and sent for further analysis to identify them; this was carried
out by my collaborator (Will Eborall, University of York) using a trypsin digest
followed by MALDI-TOF-TOF.
Positive-ion MALDI mass spectra were obtained using a Bruker Ultraflex III in
reflection mode, equipped with an Nd:YAG smart beam laser. MS spectra were acquired
over a mass range of m/z 800-4000. Final mass spectra were externally calibrated
against an adjacent spot containing 6 peptides (des-Arg1-Bradykinin, 904.681;
Angiotensin I, 1296.685; Glu1-Fibrinopeptide B, 1750.677; ACTH (1-17 clip),
2093.086; ACTH (18-39 clip), 2465.198; ACTH (7-38 clip), 3657.929.). Monoisotopic
masses were obtained using a SNAP averaging algorithm (C 4.9384, N 1.3577, O
1.4773, S 0.0417, H 7.7583) and an S/N threshold of 2.
For each spot, the ten strongest peaks of interest (with a signal/noise ratio greater than
30) were selected for MS/MS fragmentation. Fragmentation was performed in LIFT
mode without the introduction of a collision gas. The default calibration was used for
MS/MS spectra, which were baseline-subtracted and smoothed (Savitsky-Golay, width
0.15 m/z, cycles 4); monoisotopic peak detection used a SNAP averaging algorithm (C
4.9384, N 1.3577, O 1.4773, S 0.0417, H 7.7583) with a minimum S/N of 6. Bruker
flexAnalysis software (version 3.3) was used to perform the spectral processing and
peak list generation for both the MS and MS/MS spectra.
Tandem mass spectral data were submitted to database searching using a locally-running
copy of the Mascot program (Matrix Science Ltd., version 2.2.0), through the Bruker
ProteinScape interface (version 2.1). Search criteria included: Enzyme, Trypsin; Fixed
modifications, Carbamidomethyl (C); Variable modifications, Oxidation (M); Peptide
tolerance, 250 ppm; MS/MS tolerance, 0.5 Da; Instrument, MALDI-TOF-TOF;
Database, L. quadripunctata ESTs. Methods courtesy of Will Eborall.

Molecular biology and biochemistry
57
3.2.4 In situ hybridisation of glycosyl hydrolase sequences
3.2.4.1 Transformation of competent cells
Plasmid pSC-B cloning vector (StrataClone) containing sequences specific to glycosyl
hydrolase family proteins 5a, 7a, and 9a (supplied by our collaborators) were thawed on
ice along with XL-10 Gold® (Stratagene) ultracompetent cells. Four 15 mL centrifuge
tubes were set on ice, and 50 µL aliquots of ultracompetent cells with a 2.5 µL aliquot
of plasmid DNA were added (2.5 µL dH2O to control), before incubation for 30 mins.
The samples were then heat shocked at 42°C for 90 s in a water bath, and returned to ice
for 2 mins before 800 µL of room temperature SOC medium was added to each tube.
Centrifuge tubes were placed in a shaking incubator operating at 220 rpm and 37°C for
45 mins. Next, 500 µL of 50 mg mL-1 kanamycin (final concentration 50 µg mL-1) was
added to 500 mL of SOC agar and the plates poured before drying in an oven at 65°C
for 15 mins. Finally 250 µL and 150 µL aliquots of transformed cells, of each plasmid
were plated, allowed to dry for 10 mins, then incubated overnight at 37°C.
Six culture flasks were used and 250 mL of Lysogeny broth (LB) was added to each,
before autoclaving. Then 500 µL of stock kanamycin was added to each flask to produce
a final concentration of 100 µL mL-1. A single colony was picked from each plate using
a pipette tip and inoculated into a separate flask. Each type of GH plasmid-transformed
bacterium was replicated and all cultures and controls placed into a shaking incubator at
220 rpm and 37°C overnight.
3.2.4.2 Plasmid isolation from competent cells
For plasmid isolation, a midi-prep kit (Macherey-Nagel) was used with the standard
protocol adjusted as follows. First the optical density (OD) of the cultures was
calculated by adding 1 mL LB to a cuvette containing 1 mL of culture (blanking on the
LB) then multiplying the reading by two, thus affording greater accuracy in the reading
by ensuring that the OD values were within the limits of the spectrophotometer, the
readings were taken at 600 nm.

Molecular biology and biochemistry
58
The cultures were poured into centrifuge bottles and spun at 5000 g for 20 mins at 4°C.
The appropriate volume of resuspension buffer calculated from the OD by multiplying
the OD by the volume of culture in mL, divided by 50 which gives the mL of buffer to
pipette into the centrifuge bottle to resuspend the pellet, next the solution was added to a
50 mL centrifuge tube with an equal volume of lysis buffer and mixed by inverting the
tube five times prior to incubation at room temperature for 5 mins.
Neutralisation buffer was added to the tubes as per manufacturer’s instructions. The
resulting lysate was clarified by centrifuging at 4000 g for 15 mins at room temperature
and the clear supernatant was aspirated into a fresh pre-equilibrated column. The
column was washed and the plasmid eluted into a fresh 15 mL centrifuge tube, and the
final concentration of plasmid was determined by UV spectrophotometry at 280 nm.
The DNA was precipitated by the addition of 5 mL of isopropanol, incubated at room
temperature for 2 mins, and centrifuged at 4000 g, for 30 mins, at 4°C. The supernatant
was decanted to waste and 2 mL 70% v/v ethanol was added. The mixture was again
centrifuged at 4000 g, for 15 mins, at room temperate. The ethanol was discarded, and
the DNA was resuspended in 10mM tris buffer at pH 8.5 to produce a final
concentration of 100 µg mL-1.
3.2.4.3 Restriction digest of plasmid
The restriction digest conditions were followed as described by New England Biolabs
(NEB) recommendation for the restriction enzymes Sma1 (T3) Hind III and EcoR 5 (T7)
which were used to cut the (plasmid) pSC-B cloning vector (StrataClone) at unique
restriction sites downstream of either the T3 or T7 RNA polymerase binding sites. A 1%
(w/v) agarose gel was prepared and 5 µL of each digest product and uncut control
loaded, each comprising 3 µL DNA, 1 µL dH2O and 1 µL 5× Orange G loading dye.
The gel was electrophoresed at 100 V for 60 mins in 1× TBE running buffer and
visualised using a UV excitation of ethidium bromide to determine the restriction
efficiency.

Molecular biology and biochemistry
59
3.2.4.4 Linearised plasmid purification with a phenol-chloroform extraction
The volume of the plasmid preparation was made up to 400 µL with ultrapure water
(Sigma) and 400 µL of phenol was added, followed by vortexing for 30 s and
centrifuging at 12000 g for 4 mins at room temperature. The top layer was pipetted into
a new microcentrifuge tube and 400 µL of chloroform was added, the tube was vortexed
for a further 30 s and centrifuged at 12000 g for 4 mins at room temperature. The top
layer was again pipetted into a new microcentrifuge tube and 1 mL ethanol and 40 µL
3M sodium acetate were added. The sample was then stored at -80°C for at least 2 hrs,
before centrifuging the samples at 12000 g for 30 mins at 4°C, then the supernatant was
decanted without dislodging the pellet, before adding 500 µL 70% v/v ethanol. Then the
samples were centrifuged at 14000 g for 10 mins (4°C) before decanting the ethanol and
air drying the pellet. The pellets were resuspended in 10 µL ultrapure water (Sigma) and
the DNA concentration quantified by UV spectrophotometry 260 nm.
3.2.4.5 RNA probe synthesis using T3 and T7 polymerase
5 µL 10× RNA polymerase transcription buffer was added to the appropriate volume of
ultrapure water (Sigma) to make the template with water volume equal to 34.5 µL. Next,
5 µL Dig-NTP mix, 0.5 µL RNA protector, and template DNA (approximately 1-6 µL)
was combined with 5 µL of either T3 or T7 RNA polymerase (supplier NEB), and
incubated at 37°C for 2 h. When only 15 mins of the two hours remained, 5 µL DNase I
(supplier NEB), plus 6 µL DNase I buffer were added. Next, 2 µL of the RNA sample
was run on a gel and the rest of the sample stored in the -80°C freezer. The 2µL of RNA
was put on ice and a 1% w/v agarose gel prepared as before, 6 µL of ultrapure water
(Sigma) and 2 µL 5× Orange G was added and electrophoresed at 120 V for 10 mins in
1× TBE running buffer and visualised under UV excitation of ethidium bromide. The
probe was defrosted on ice and IllustraTM MicrospinTM G-25 columns (GE Healthcare)
used to purify it as per the manufacturer’s instructions. The purified probe was stored at
-20°C.

Molecular biology and biochemistry
60
3.2.4.6 Preparation of the hepatopancreas tissue for probing
The protocol for the whole mount in situ hybridization (WISH) was modified from the
Xenopus wholemount in situ hybridization method (Broadbent & Read, 1999).
Tissue was fixed using MEMFA fixative (0.1M MOPS, 2mM EGTA, 1mM MgSO4).
The MEM salts are made up as 10× concentrated stock and autoclaved. Formaldehyde
(FA) is added to give a final concentration of 3.7% and stock salts (MEM) were diluted
from fresh and used immediately. The tissue was fixed in MEMFA for 45 mins,
replaced with methanol, left for 30 mins, transferred to fresh methanol and stored in
methanol at -20°C. The tissue was re-hydrated by washing in 75%, 50% and 25% (v/v)
methanol in Phosphate buffered saline tween (PBST) solutions (5 mins in each) before a
final wash in PBST for a further 5 mins. The tissue (hindgut and hepatopancreas) was
then acetylated by washing twice in 0.1M triethanolamine for 5 mins each. A 2.5 µL
volume of acetic anhydride was added to a second wash, with a further 2.5 µL acetic
anhydride added after 5 mins. The triethanolamine and acetic anhydride were removed
by two 5 min washes with PBST.
The PBST was replaced with 1 mL WISH hybridisation buffer mix and changed after 5
mins for a fresh 1 mL hybridisation buffer mix; the tissue was then pre-hybridised for 6
hrs at 60°C. Following pre-hybridisation, hybridisation buffer was removed and
replaced with fresh buffer containing RNA probe at 1 µg µL-1. Hybridisation was then
left to proceed at 60°C overnight. Following overnight incubation, hybridisation buffer
was replaced with 50% (v/v) deionised formamide with 5× saline sodium citrate (SSC)
and incubated for 10 mins at 60°C. All subsequent post-hybridisation washes were
performed at 60°C. These were: 25% (v/v) deionised formamide, 2× SSC (10 mins);
12.5% v/v deionised formamide, 2× SSC (10 mins); 2× SSC 0.1% v/v Tween 20 (10
mins); 0.1× SSC, 0.1% v/v Tween 20 (30 mins). The tissue was washed for a further
three times in PBST for 5 mins with each wash at room temperature.
A 2% solution of blocking reagent (Boehringer Mannhein) dissolved in maleic acid
buffer (MAB) (100mM maleic acid, 150mM NaCl pH 7.5 at 80°C) was freshly made.

Molecular biology and biochemistry
61
The PBST was removed from the samples and replaced with MAB. After 10 mins, this
was replaced with MAB plus blocking reagent and incubated at room temperature for 5
hrs. The tissue was then incubated overnight at 4°C, with gentle rocking, with a 1:2000
dilution of anti-Dig Ab fragments conjugated to alkaline phosphatase in MAB blocking
solution. Excess unbound antibody was then removed by washing 9× for 20 mins with
MAB at room temperature with gentle rocking.
The alkaline phosphatase-catalysed colour reaction was then developed by two washes
in AP buffer (100mM NaCl, 100mM Tris, 50mM MgCl2, 1% v/v Tween) for 5 mins
each before transfer to AP buffer containing 9 µL nitroblue tetrazolium (one tablet
dissolved in 196 µL dimethyl formamide (DMF) and 104 µL dH2O) and 3.5 µL BCIP
(one tablet dissolved in 500 µL DMF). Tissue was then stored in the dark at room
temperature for 2 hrs and was periodically examined to determine the extent of the
colour reaction. Once there was visible stain the tissue had three washes (~ 5 mins each)
in PBST, one in methanol for 5 mins, one in AP buffer for 5 minutes and, finally, into
MEMFA for 20 mins. The samples were then stored in methanol for 30 mins before
changing the methanol and storing at -20°C.
3.2.5 Preparation of protein samples for antibody production
Hexahistidine-tagged samples of glycosyl hydrolase (GH) family proteins (GH5a and
GH7a) were obtained from our collaborators in a buffer containing 25mM tris-HCl pH
7.5, 50mM NaCl, 10% w/v glycerol. Both proteins were at approximate concentrations
of 1 mg mL-1. Proteins were dialysed overnight in 10mM NH4HCO3 at 4°C. The
samples were then frozen at -80°C and lyophilised overnight.
3.2.6 Western blotting of glycosyl hydrolase family proteins
Plasma samples from sheep previously injected with GH5a and GH7a were purified
using a capryllic acid precipitation. Two volumes (30 mL) 60mM sodium acetate pH 4
were added to one volume (15 mL) plasma, and 1.154 mL capryllic acid was then added
drop-wise, with gentle stirring, over a period of approximately half an hour to produce a
final concentration of 2.5% v/v. The solution was then centrifuged using an AvantiTM J-

Molecular biology and biochemistry
62
20XP equipped with a JA-25.50 rotor (Beckman Coulter) at 4°C, 30,000 g for 30 mins.
The supernatant containing the IgG was filtered through grade 4 filter paper and
dialysed (dialysis tubing MWCO 6000-8000 Da) overnight in PBS at 4°C before
quantification using UV spectroscopy at 280 nm.
Protein was prepared from 50 hepatopancreases and 50 hindguts of L. quadripunctata
dissected onto ice. A total volume of 65 µL of tissue fluid, 5× SDS loading dye and
dH2O was produced. The sample was then subsequently vortexed, centrifuged and
denatured at 95°C for 5 mins.
The proteins were resolved by a 4% stacking, 12.5% resolving SDS-polyacrylamide gel
electrophoresis in 1× SDS running buffer. The samples were electrophoresed at 60 V for
35 mins to allow protein stacking, followed by 150 V for one hour. All samples were
run in quadruplicate as 15 µL aliquots across two gels with 5 µL Invitrogen SeeBlue
plus 2 Prestained Standard (Invitrogen) also being loaded for comparison and size
determination. Once electrophoresis was completed the gels were placed on pre-soaked
blotting paper next to Amersham Hybond-ECL membrane (GE Healthcare) sandwiched
between foam pads, placed in a plastic cassette and loaded into the Criterion Blotter
(Bio-Rad) filled with transfer buffer, as per the manufacturer’s instructions. Blotting
was performed using pre-chilled buffer (4°C), with stirring, at 100 V for 1 hour.
The membrane was then removed and blocked overnight in blocking buffer (appendix
one) on an orbital shaker at 10°C. The membrane was then incubated in 20 mL blocking
buffer containing primary antibody at a final concentration of 12.03 mg mL-1 for 3 hrs at
room temperature. The blocking buffer with primary antibody solution was then
replaced with 20 mL blocking buffer and washed for 15 mins at room temperature. This
was repeated a further three times. The blocking buffer was then replaced with 20 mL
blocking buffer containing 5 µL HRP-conjugated donkey anti-sheep antibodies and
incubated for one hour at room temperature. The membranes were then rinsed four times
for 15 mins in blocking buffer followed by three; 5 min washes in 1× TBST. Finally, the
membranes underwent three 5 min washes in PBS, and one final wash overnight.

Molecular biology and biochemistry
63
The membranes were subsequently washed twice more in PBS for 5 mins prior to the
addition of the development solution sequentially to each membrane to ensure equal
development times, then visualised in a Fujifilm LAS-3000 Intelligent dark box.
3.2.7 Carboxymethyl cellulose (CMC) assay to determine enzyme activity
Fifty L. quadripunctata, hepatopancreas and hindguts were dissected out into 20 µL
buffer in total on ice, centrifuged (3000 g, 5 mins) and the supernatant consisting of
luminal fluids was aspirated into a separate microcentrifuge tube. Next, 20 µL of buffer
was added to the remaining tissue sample and crushed with a mini pestle and centrifuge
at 12,000 g for 5 mins. The supernatant was aspirated and the samples made up to 100
µL using the buffer.
A positive control consisting of 2.5 µL Novozyme enzyme cocktail with 97.5 µL dH2O
was made. Heat-denatured samples were prepared by heating 50 µL of each sample at
80°C for 90 mins. The CMC plates were dried (60°C, 10 mins) and two holes were
made in them using a cork borer. The 50 µL samples were then pipetted into each hole
and the plates incubated overnight at 25°C. Approximately 10 mL Congo red was then
poured on to each plates and left to stain the CMC for about 15 mins. The excess stain
was then removed and the plates were covered with 1M NaCl solution for
approximately 15 mins. This was then removed; the plates were rinsed and then
photographed. The whole procedure was then replicated.
3.2.8 In Vitro enzyme assays
Hindguts and hepatopancreases of 250 L. quadripunctata were dissected into five equal
batches (50 per assay) in 1× buffer, placing the hindgut and hepatopancreas into
separate microcentrifuge tubes containing 100 µL of 1× buffer. Next the tubes were
made up to 475 µL with 1× buffer and centrifuged at 12,000 g for 5 mins. The
supernatant was removed from both and put in tubes marked ‘lumen’ and keep on ice.
Then 400 µL 1× buffer was added to both microcentrifuge tubes containing the pelleted
tissue, and crushed using a plastic pestle, before centrifuging at 12,000 g for 5 mins. The

Molecular biology and biochemistry
64
supernatant was removed from both and put in tubes marked ‘tissue’ and keep on ice.
The lumen and tissue samples were split into ten aliquots of 47.5 µL each and retained
on ice.
The negative control was prepared by first weighing the L. quadripunctata tissue pellets
(approximately 2 mg), dissecting out Echinogammarus marinus muscle tissue and
ensuring that an equivalent weight was obtained. Next, 400 µL 1× buffer was added to
the microcentrifuge tube containing the muscle tissue, a plastic pestle was used to
macerate the tissue, and the sample was centrifuged at 12,000 g for 5 mins. The
supernatant was separated into five aliquots of 47.5 µL and retained on ice.
The positive controls were split into two sets of 47.5 µL and kept on ice. Then the
blanks containing 20 µL of 5× buffer and 75 µL dH2O were made and five aliquots of
47.5 µL kept on ice. Each set of enzyme tests lanes consisted of: Blank, Positive control
(×2), Negative control, HPL (×2), HPT (×2), GL (×2), GT (× 2). One sample of each set
of duplicates for each test was incubated at 80°C for 1.5 hrs. However, the thermophilic
cellobiohydrolase positive control was heated at 95°C for the same length of time to
ensure denaturation. Finally 2.5 µL of the corresponding pNP substrate to each enzyme
set and was added and incubated at 25°C for 1 hr. However, the cellobiohydrolase
positive controls were incubated at 70°C for 1 hr. Then 50 µL of 1M Na2CO3 (0.53 g in
5 mL) was added to each set of samples to stop the reaction, vortexed, and centrifuge
gently before measuring the absorbance at 405 nm using the Nanodrop 1000 UV
spectrophotometer (manufacturer Thermo scientific).
3.2.9 Catechin phenol oxidase assay
All solutions throughout filtered to 0.2 µm and degassed, also catechol and catechin
solutions are light sensitive so they were wrapped in foil.

Molecular biology and biochemistry
65
Figure 3.1: Reactions of tyrosinases and catecholoxidases. (a) Monophenolic
compounds are hydroxylated ortho diphenols are oxidized to ortho quinones by
catecholoxidase and tyrosinase (catecholoxidase activity). This activity is
mediated by the oxy form (Cu II state with bound dioxygen) (b), and by the met
form (Cu II state without bound dioxygen) of these enzymes (c), respectively.
Figure taken from (Decker & Tuczek, 2000).
Sixty L. quadripunctata hepatopancreases were dissected into ice cold 50mM Tris-HCl
pH 7.5 buffer and homogenised. The homogenate was centrifuged and the supernatant
aspirated. A 250 µL aliquot of catechin solution was added to test solutions, these being:
buffer only, boiled buffer plus homogenate, and buffer plus homogenate. The
homogenate was centrifuged at 12 000 g for 1 min and the heat-treated sample heated to
greater than 95°C for 1 min and then incubated overnight at room temperature. As there
appeared to be no rapid colour change and the catechin did not appear to be readily

Molecular biology and biochemistry
66
soluble in 20% (v/v) ethanol, a further aliquot of 250 µL catechin solution was added to
the homogenised tissue in buffer and incubated overnight along with the other samples.
3.2.10 Repeat catechin phenol oxidase assay
Aliquots of 10 mL buffer were dispensed into the; blank (Tris), denatured (Tris + urea),
test (Tris). Each condition was replicated. Following addition of ten L. quadripunctata
hepatopancreas to each of the denatured and test samples the denatured samples were
incubated at 95°C for 10 mins and centrifuged 12,000 g for 1 min. The absorbance of
each sample at was measured at 456 nm and recorded at regular intervals; the samples
were centrifuged before analysis on the Nanodrop 1000 (Thermo) and incubated at
20°C. Oxidisation of the ortho diphenols to ortho quinones of the catechin and catechol
compounds produces a yellow coloration and UV absorbance at 456 and 436
respectively so the reaction can be followed spectrophotometrically.
Figure 3.2: The chemical structure of catechin (A) and catechol (B). Blue
represents carbon atoms red represents oxygen atoms and white represents
hydrogen atoms, structures drawn in ACD LABS ChemDraw version 12.0.
3.2.11 Catechol phenol oxidase assay
Four test conditions were used: test and test blank, denatured and denatured blank.
Aliquots of 100 µL buffer were added to a microcentrifuge tube. A total of 40
A
B

Molecular biology and biochemistry
67
hepatopancreases were added to both tests then macerated. The ‘denatured’ sample was
then heated to 95°C for an hour and the other kept on ice. After cooling to room
temperature, 1 mL aliquots of the 50mM catechol solution were added and absorbance
measurements at 436 nm were recorded in triplicate.
3.2.12 Native in-gel phenol oxidase enzyme assays for monophenoloxidase,
diphenoloxidase and laccase activity
Fifty hindguts and fifty hepatopancreases from fifty specimens of L. quadripunctata
were dissected in buffer (50mM tris-HCl pH 7.5, 1.25mM PMSF, 1.25mM
benzamidine-HCl), dabbed dry on tissue paper and placed into 20 µL of the above
buffer on ice. The mixture was centrifuged at 600 g for 5 mins at room temperature and
the supernatant was aspirated and kept on ice. The tissue was then resuspended in a
further 20 µL reaction buffer and macerated using a Teflon pestle. The mixture was then
centrifuged at 12,000 g for 5 mins at room temperature and the supernatant was again
aspirated. Concurrently, 80 µL of 1 U µL-1 mushroom tyrosinase (Sigma-Aldrich) in
50mM tris-HCl pH 7.5 was split into two equal volumes: one volume was incubated at
80°C for 15 mins, whilst the other volume was incubated on ice. Following this, each
sample was mixed with 0.25 volumes 20% w/v Ficoll in 50mM tris-HCl pH 7.5 and
centrifuged at 14,100 g for 1 min at room temperature. Aliquots of each sample (12.5
µL each of: positive control; heat-denatured positive control; (10 U per lane) bovine
serum albumin (BSA) negative control; HP lumen extract; HP tissue; hindgut lumen
extract; hindgut tissue) were loaded onto pre-run 8% native polyacrylamide gels and
electrophoresed for 75 mins [100 V, room temperature, 1× TBE (National Diagnostics)].
Gels were loaded in duplicate: one was stained with Coomassie (Safestain - Invitrogen);
the other was stained for monophenoloxidase (MPO) activity. The MPO assay involved
incubating the gel at room temperature in the MPO solution for approximately 30-45
mins in a foil-covered container. This procedure was repeated for the diphenoloxidase
(DPO) and laccase tests with the appropriate controls.

Molecular biology and biochemistry
68
3.3 Results 3.3.1 L. lignorum hepatopancreas RNA extraction for cDNA library preparation.
Once the RNA was extracted from the hepatopancreas, it was electrophoresed and
photographed to confirm that the extraction was successful with little sign of RNA
degradation. This RNA was then used by our collaborators to create a cDNA library and
sent for sequencing using a Roche 454 GS-FLX pyrosequencer. This sequencing
technique then produced a library of expressed sequence tags (ESTs) for the L. lignorum
hepatopancreas (Figure 3.3). However the reference made throughout this work will be
to the L. quadripunctata hepatopancreas EST library shown in Figure 1.8 which
illustrates the abundance and diversity of GH family protein sequences isolated from the
hepatopancreas. Although sequences that have a significant implication for digestion
were isolated from the hepatopancreas of L. quadripunctata such as the GH family
proteins, it remained to be seen if these were translated into protein and present in the
hindgut.
Figure 3.3: The relative abundance in ESTs isolated from hepatopancreas
tissue of L. lignorum. (A) Shows the whole set, while (B) details the abundance
of various glycosyl hydrolase (GH) family protein sequences. The total RNA
extracted was sent for cDNA library construction and subsequent 454
pyrosequencing which produced an EST library (annotated by Yi Li).
B. A.

Molecular biology and biochemistry
69
3.3.2 Native polyacrylamide gel electrophoresis (PAGE) with mass spectroscopy
The results of the mass spectroscopy (MALDI-TOF-TOF) (Figure 3.5) linked to the
sequence database of L. quadripunctata identified proteins in the hepatopancreas and
hindgut fluid and tissue. In the hepatopancreas fluid, ferritin which is an iron storage
protein and haemocyanin which is the oxygen carrying protein in L. quadripunctata
were identified along with GH 9a and b and GH 7a and b. This is significant because
while in situ localisation of GH 7a and b was carried out by King et al. (2010) and
confirmed the hepatopancreas as the site of secretion of the GH 7a and b what this study
did not check was hindgut tissue. The hindgut interestingly contained haemocyanin as
well as GH 9a and b and GH 7a and b. That these proteins were present in this analysis
is a strong indication that the in situ localisation and western blots should be carried out.
Figure 3.4: An example of the Mascot search result window the spectrum shows the peaks which represent the mass and abundance of fragmented ions.

Molecular biology and biochemistry
70
3.3.3 In situ hybridisation of glycosyl hydrolase mRNA sequences in
hepatopancreas tissue.
This technique localises the expression of the mRNA encoding specific target proteins
to the hepatopancreas tissue. L. quadripunctata were tested for GH5a, 7a and 9a. Ten
hepatopancreas along with the corresponding hindgut were tested for each GH, and no
positive stain for any of the sequences was found in the hindgut, of the specimens tested.
There was also no stain in any of the (control) sense tissue tested. There was positive
staining of the hepatopancreas tissue corresponding to the GH5a and GH9a, which
indicates that these proteins are transcribed in this tissue. However there was no GH 7a
sequence expression identified in any of the tissue tested (Figure 3.6). Intriguingly in the
hepatopancreases that positively stained there appeared to be a variation in the intensity
between the four lobes of the hepatopancreas (Figure 3.6 antisense GH5a and 9a) this
suggests differential secretory roles and warrants further investigation.
3.3.4 Western blots of glycosyl hydrolase proteins
The results of the western blots (Figure 3.7) confirm the presence of GH5a and GH7a
proteins in the hindgut and hepatopancreas of L. quadripunctata. The reactive band
shows increasing intensity as the number of antibodies increase with the repeated
exposure to the protein. The GH7a blots suggest that there is some cross reactivity of the
antibody most likely with other GH7 proteins. There appears to be a molecular weight
discrepancy between the first bleed and the second and third bleeds for GH7a this is
most likely caused by an unspecific GH7cross reactivity which is swamped by the
specific signal once the antibody concentration rises in the later bleeds. The second and
third bleeds also show evidence of degradation which is suggested by the lower
molecular weight bands.

Molecular biology and biochemistry
71
A
B
Figure 3.5: Coomassie stained native polyacrylamide gels. The candidate
protein was identified by MALDI-TOF-TOF. The most striking identified bands
are the haemocyanin in the hindgut fluid along with the GH 7a and 7b and the
GH 9a this strongly suggests the presence and endogenous nature as they are
also present in the hepatopancreas which the EST analysis and microscope
observations have shown to be sterile.

Molecular biology and biochemistry
72
Figure 3.6: Localisation of RNA transcripts of GH 5a, 7a and 9a. The four
lobes of the hepatopancreas are visible still attached to the head. The
hepatopancreas shows up clear unless the target RNA transcripts are present.
Stain can be seen in the lumen and cells of the hepatopancreas targeted with the
GH5a and GH9a complementary RNA sequences. In each case 10 specimens’
hepatopancreas and gut were tested. The differential staining in the lobes of the
hepatopancreas is visible in the minor lobes of GH7a and Gh9a.

Molecular biology and biochemistry
73
Figure 3.7: Western blots of GH5a and 7a. The duplicate gel that contained
the bands which corresponded to the area highlighted as containing the target
protein identified by the western blot were sent for MALDI-TOF-TOF analysis
by my collaborator Will Eborall. The results of the analysis were that GH5 was
present in the band identified by the GH5a western and GH7 and 9 were present
in the GH7a western. The pre-immune is a control and the successive bleeds
represent an increased exposure response to the protein.

Molecular biology and biochemistry
74
3.3.5 Carboxymethyl cellulose assay
The heat inactivation of the positive control was only partially successful because the
Novozyme enzyme cocktail (supplied by collaborators) consisted of Celluclast 1.5L
(CCN03108) and Novozyme 188 (DCN00211) in a 4:1 ratio. The enzyme cocktail is
particularly thermostable but there was a clear decrease in the level of activity. There
was no activity observed in the negative control, but both the hindgut and
hepatopancreas tissue homogenate had a positive degradation reaction for the CMC that
was also successfully heat denatured. The heat denaturation indicates that the conversion
process is enzymatic. The assay was repeated three times to reinforce the result.
Figure 3.8: CMC agar plate assay Test and heat denatured samples indicated
by (+) and (-) respectively. (A) The positive control shows activity in the test and
heat denatured sample although there is a significant decrease in the level of
activity in the heat denatured. This enzyme is thermostable and not all activity is
lost. (B) The negative control shows no activity in the test or heat denatured
sample. (C) The hindgut tissue sample has activity in the test but not the heat
denatured which strongly suggests that the hindgut has CMC degrading enzyme
activity. (D) The hepatopancreas also shows activity in the test sample and none
in the denatured there also appears to be slightly more CMC degrading activity
in this tissue.

Molecular biology and biochemistry
75
3.3.6 In vitro enzyme assays for cellobiohydrolase, galactosidase, mannosidase,
glucosidase and xylanase activities
The positive controls for the tests worked, but the hindgut and hepatopancreas (tissue or
lumen) extracts demonstrated no activity when compared to the controls. Except for the
glucosidase assay which demonstrated some activity compared to the denatured test
extracts (Table 3.2), this activity is characteristic of exo-acting glycosyl hydrolase.
A B C D E Positive control 0.041 1.009 0.647 0.130 0.421 Positive denatured 0.014 0.123 0.046 0.001 0.007 Negative control 0.023 0.007 0.018 0.007 0.007 HPL 0.003 0.006 0.021 0.041 0.010 HPL d 0.005 0.008 0.021 0.006 0.009 HPT 0.003 0.022 0.020 0.022 0.010 HPT d 0.004 0.022 0.015 0.004 0.009 GL 0.003 0.008 0.022 0.023 0.013 GL d 0.003 0.005 0.018 0.002 0.006 GT 0.002 0.007 0.020 0.008 0.009 GT d 0.015 0.006 0.021 0.002 0.007
Table 3.2: In vitro enzyme assay results A) Cellobiohydrolase B) galactosidase
C) mannosidase D) glucosidase E) xylanase. The measurements were taken on a
spectrophotometer at 405 nm, and the samples divided into (HP) hepatopancreas
and (G) Hindgut (L) lumen and (T) tissue extracts (d) denotes denatured sample.
The results of the glucosidase assay are highlighted in red.
3.3.7 In vitro phenol oxidase assay
Tests were carried out using hepatopancreas tissue extract and two phenolic substrates
catechol and catechin to assess if this tissue contained any enzymes capable of oxidising
these substrates. These substrates were chosen as indicators of putative lignin degrading
capability, which is a polyphenolic substrate. There was no sign of oxidised products
forming in either assay. However the denatured samples appear to show some activity
(Figure 3.9) while and a small change is recorded in the test samples.

Molecular biology and biochemistry
76
A.
B.
Figure 3.9: Results of the phenol oxidase assay tests. (A) is the repeat catechin
phenol oxidase assay results (B) is the catechol phenol oxidase assay results. The
graphs demonstrate the apparent activation of the denatured control.

Molecular biology and biochemistry
77
3.3.8 Mono-phenol oxidase (MPO), di-phenol oxidase (DPO), and laccase native in-
gel assay
The mono-phenol oxidase gel (Figure 3.10) shows some interesting activities, with all
the lanes standing out against the blue background of the stain, the positive control lane
shows clearance of the stain with a red centre. The MPO activity assay relies on the
transfer of electrons from the tyrosine methyl ester to the acceptor phenazine
methosulphate which is visualised by the subsequent reduction of nitroblue tetrazolium
to a violet colour (Sidjanski et al., 1997), with this in mind there are faint zones of
clearance in the lanes of the gel that appear throughout the hepatopancreas, lumen and
tissue extracts as well as the hindgut lumen and tissue extracts along with a violet/red
precipitation. These results suggest that there is mono-phenol oxidase activity in both
the hindgut and hepatopancreas of L. quadripunctata.
The di-phenol oxidase gel (Figure 3.11) is much simpler to interpret; the positive control
in this case creates a dark red stain and there is a more diffuse area of staining that
corresponds to the hindgut tissue extract which suggests this tissue possess some di-
phenol oxidase activity. The DPO activity is visualised on the gel by the enzymatic
oxidation of catechol to its quinnone product which then condenses with the MBTH to
form a red stain (Sidjanski et al., 1997).
As well as this stain there are two very distinct bands in the hepatopancreas lumen and
tissue samples that also occur in (Figure 3.12) the gel that was stained for laccase
activity. The laccase activity is visualised on the gel by the enzymatic oxidation of
syringaldazine which forms a bright pink stain on the gel (Sidjanski et al., 1997).

Molecular biology and biochemistry
78
Figure 3.10: Native PAGE stained for mono-phenol oxidase activity. The
lanes run from; positive control, denatured positive control, negative control
(bovine serum alubumin), hepatopancreaus lumen, hepatopancreas tissue,
hindgut lumen, hindgut tissue, from left to right. There are zones of clearance
with red stain in the middle in all four lanes which indicates mono-phenol
oxidase activity in all the hepatopancreus and hindgut extracts.
Positive Denat BSA HP fluid HP tissue gut fluid gut tissue control

Molecular biology and biochemistry
79
Figure 3.11: Native PAGE stained for di-phenol oxidase activity. The lanes
run from left to right; positive control, denatured positive control, negative
control (bovine serum alubumin), hepatopancreas lumen, hepatopancreas tissue,
hindgut lumen, hindgut tissue. Highlighted in the green circle is diffuse activity
in the hindgut tissue and highlighted in red are the bands which corrospond to
the bands identified in figure 3.9 which possess both di-phenol oxidase and
lacccase activities.
Figure 3.12: Native PAGE stained for laccase oxidase activity.The lanes run
from left to right; positive control, denatured positive control, negative control
(bovine serum alubumin), hepatopancreas lumen, hepatopancreas tissue, hindgut
lumen, hindgut tissue. Highlighted in red are two bands that correspond to the
bands in figure 3.8 which contain di-phenol oxidase activity and appear to show
laccase activity in this case.
Positive Denat BSA HP fluid HP tissue gut fluid gut tissue control
Positive Denat BSA HP fluid HP tissue gut fluid gut tissue control

Molecular biology and biochemistry
80
3.4 Discussion The results of the EST annotation provided in the King et al. (2010) paper demonstrate
that 27% of the sequences isolated from the hepatopancreas code for GH family
proteins. Within this group 53.3% of the sequences belong to GH family 7, 37% GH
family 9 and 3.9% GH family 5 (Figure 1.8). The abundance of the GH family proteins
isolated from this tissue strongly suggests that it is the site of synthesis and secretion of
these carbohydrate active enzymes. A significant portion of the sequences (17.3%) also
coded for haemocyanin proteins which have been shown to possess a phenol oxidase
capability after proteolytic cleavage (Perdomo-Morales et al., 2008) which could be
important in lignin degradation.
The first phase was to try and isolate protein which could now be identified from the
sequence database on the basis of the molecular mass. Extracts of hindgut and
hepatopancreas tissue were separated by native PAGE and the excised bands sent for
trypsin digestion MALDI-TOF-TOF analysis linked by a MASCOT search of the L.
quadripunctata EST data base. In the annotation the abundance of haemocyanin
sequences the appearance of leucine rich repeat proteins (LRR), fatty-acid binding
proteins (FAB), along with ferritin and proteases from the hepatopancreas should also
be highlighted. Crucially, no protist-like sequences appeared in the EST annotation
(King et al., 2010).
This provided evidence that the sequences isolated from the hepatopancreas could be
used to identify haemocyanins and GH family 7 and 9 proteins in the hindgut fluid. The
results showed that these proteins were also present in the hepatopancreas and that this
tissue also contained ferritin which is a protein used to store iron. The protease cathepsin
A was also isolated in the hepatopancreas. This is interesting because the phenol oxidase
capability of haemocyanin is activated by cleavage that relieves the steric hindrance of
the active site (Decker & Tuczek, 2000) and allows this protein normally used for
oxygen transport to carry out this alternative function.

Molecular biology and biochemistry
81
The in situ localisation of mRNA transcripts within the tissues of L. quadripunctata was
used to demonstrate that the site of transcription of the GH 5a and 9a was indeed
localised to the hepatopancreas tissue and not associated with the tissue of the hindgut
lining. Previous work (King et al., 2010) localised the expression of the GH 7a and b
family proteins to the hepatopancreas. In this case the GH 7a did not demonstrate any
positive staining in the specimens examined. These results demonstrate that the
hepatopancreas tissue previously identified by Dymond et al. (2003) as the site of
mRNA encoding a putative endo-β-1,4-glucanase (cellulase) GH 7a also possesses
cellulases belonging to the GH family’s 5a and 9a. The lack of positive result for the
expression of GH 7a in this study requires further investigation.
Although the presence of GH family proteins has been inferred up until now by the EST
data base MALDI-TOF-TOF analysis of tissue and in situ localisation of mRNA
transcripts, no work has conclusively identified the presence of the protein (translated)
from the transcribed sequences in the hepatopancreas and, crucially, in the hindgut
tissue where the protein would need to be secreted to digest the ingested wood. Western
blotting is a technique which can identify specific proteins from a complex mixture
obtained from a tissue homogenate. Unfortunately, antibodies could not be raised to GH
9a but were successfully raised to GH5 and 7a. Both the hepatopancreas and hindgut
tissue tested positive for GH5 and 7a with just one single band identified for the GH5a.
There was a large band identified for GH 7a and an array of smaller molecular weight
bands which could indicate that there was some degradation of the protein. This result
was repeated and when considered with the in situ evidence confirms that the
hepatopancreas is the site of transcription and translation of GH 5a which is then present
in the hindgut. Although GH7a is identified as a protein in the hindgut and
hepatopancreas, this study found no evidence of transcription of this gene. However the
presence of the protein indicates that the in situ work requires repetition and the western
blotting also used to identify the transcribed GH 9a protein.
The carboxymethyl cellulose assay is evidence of enzymatic activity originating from
the hindgut and hepatopancreas tissue homogenate of L. quadripunctata that specifically

Molecular biology and biochemistry
82
degrades amorphous cellulose. The zone of hydrolysis around the well can be visualised
by staining the substrate with Congo red. The results show that there is activity in both
the hindgut and hepatopancreas which can be stopped by heating which suggests that
this process is of enzymatic origin.
The positive control showed the highest level of activity, this is not unsurprising as it is
a purified enzyme. The hindgut and hepatopancreas reactions were performed with raw
tissue homogenate and the radius of degraded material was approximately half the area
with slightly more reaction occurring in the hepatopancreas test. This demonstrates that
there is an enzyme present that can degrade CMC in the hindgut and hepatopancreas of
L. quadripunctata.
The phenol oxidase activity assays appear to show mostly MPO and a little DPO and
laccase activity mainly associated with the hepatopancreas tissue. Whether or not this
activity has any significance for digestive capability could be investigated by further
testing to see if L. quadripunctata tissue extracts can effectively depolymerise a model
lignin substrate.

Natural durability of wood
83
Chapter 4
The physical and chemical properties of wood that affect
natural durability in the marine environment
4.1 Introduction
The short term laboratory assessment of resistance of species of wood to the boring
activities of L. quadripunctata was developed by Borges et al (2008). The study
screened for the effects of leachable and non leachable factors of over 40 tropical
hardwoods and their resistance to the boring activity of L. quadripunctata by using
faecal pellet production as an indicator of feeding rate. The need for a short term test is a
consequence of the standard longer term (5 years EN 275) marine trial of timbers, which
must be conducted before timber can be accredited for construction in the marine
environment. This long term testing has a significant cost involved so a short term test to
narrow down a long list of potential species at this early stage significantly reduces these
costs.
Figure 4.1: Showing the attack of L. quadripunctata at Yarmouth Pier, Isle of Wight photo was taken of a supporting pile of Chlorocardium rodiei which had been in service for 20 years.

Natural durability of wood
84
The difficulty of protecting wood in the sea is clearly visible in Figure 4.1. It is
necessary to create a physical or chemical barrier to the boring organisms which would
otherwise settle on it. The nature of a chemical barrier requires it to leach a toxic
compound out into the surrounding water to deter settlement of larvae and dispersing
individuals. Preservatives become less potent over time as the additive leaches out of the
wood and may have chronic and acute effects on marine flora and fauna (Brown &
Eaton, 2001). These additives may also be expensive and have possible unexpected side
effects. Chromated copper arsenate (CCA) for example was a widely used preservative
which has been reported in some cases to increase settlement of fouling organisms such
as barnacles (Brown & Eaton, 2001); also limnoriids can feed on CCA treated wood
(Cragg et al., 1999). The type of timber used in marine construction has become more
important since the use of many preservatives have now been banned under
environmental legislation. Furthermore with the continuing use of the remaining and
most widely used marine preservative, creosote under review alternatives need to be
developed. It has already been banned in fresh water environments by European Union
legislation. This has lead to demand for sustainably grown naturally durable timber for
use in marine construction.
This study aims to build on the work of Borges et al (2008) and develop the test
methodology by introducing the automated pellet counting procedure described in
chapter 2. The focus of this investigation is digestion, and therefore factors which affect
the durability of timber in the marine environment such as extractives and density are
important because they could provide insight into the digestive strategies used by L.
quadripunctata.
A macroscopic effect of the chemical composition of wood which can affect the feeding
rate of L. quadripunctata is its hardness. However, the microscopic effect of a wood’s
chemical composition can also affect feeding rate at the level of the digestion itself. It is
hard to separate these macroscopic and microscopic effects due to their close
relationship. These physical effects combined with extractives form a highly complex
recalcitrant substrate.

Natural durability of wood
85
Extractives represent the chemical components of wood that are leached from the wood
under neutral pH conditions and can be soluble in either polar or non polar solvents.
There are a variety of chemical species of extractives known from wood which include
phenolic compounds, terpenes, aliphatic acids, alcohols and many more (Fengel &
Wegener, 1984). Wood has distinct regions which occur within the tree, the inner
section of heart wood no longer contains living cells and has an accumulation of
extractives while the outer layers of sap wood contain few extractives and the living
tissue (Taylor et al., 2002).
To make matters more complicated, the structural and extractive components of wood
vary temporally and spatially: for example, in Norway spruce, the heartwood contained
more lignin and less cellulose than sapwood and between early wood and late wood
there were differences in the distribution of sugars in the hemicelluloses as well as
lipophilic extractives being less concentrated in the late wood (Bertaud & Holmbom,
2004). This provides an interesting problem, due to the small size of L. quadripunctata
which means that it can encounter many distinct chemical environments over a small
range within wood. The tree also contains early wood and late wood growth rings which
indicate in what season the growth occurred, slow winter growth forms denser late
wood, and fast summer growth forms less dense summer wood. However tropical wood
lacks this structure due to the loss of seasonality, and all year round growth associated
with the climate in this growing region. Throughout this study heart wood was used in
all cases except Pinus sylvestris where sap wood was used. It was included as the non-
durable comparison species throughout all the experiments to allow effective
comparison and confirm that the L. quadripunctata were feeding normally.
Some examples of the range of extractives isolated from wood used in this trial include
alkaloids from Chlorocardium rodiei (McKennis et al., 1956) inositol and sitosterol
from Nauclea diderrichii (King & Jurd, 1953) and tropalone derivatives in Goupia
glabra (Mesa-Siverio et al., 2003). It is expected that the wood species that significantly
reduce feeding rate independent of density may contain extractives which could be
investigated as a source of either a toxic or antifeedant for use in wood protection, or
Natural durability of wood
86
digestive disruption agent. Work on termites has already developed the use of
extractives and identified sesquiterpenes isolated from the chemical components of four
Dipterocarpus species that have insecticidal activity against Southeast Asian termites
Neotermes sp (Messer et al., 1990). The approach used by Messer et al could further be
developed by determining whether the mode of action inhibits digestion or has more
general toxicity, as well as applying this approach to the study of L. quadripunctata
There is also a report of an antifeedant effect observed with the subterranean termite
Coptotermes formosanus due to extracted flavonoids (Ohmura et al., 2000). The
flavonoids have been evaluated in terms of their chemical structure and this detailed
approach to the specific chemical structure could also be developed with respect to L.
quadripunctata to develop a more specific biocide.
Previous work has quantified wood hardness and positively correlated it with density
and demonstrated that pellet production rate shows a negative correlation with
increasing hardness (Cragg et al., 2007). Other studies have reported the same trend
with increasing density (Borges et al., 2008, Sivrikaya et al., 2009). This study also
aims to determine the relationship between feeding rate and density. The experimental
aim of this chapter is to assess the feeding rate of L. quadripunctata using faecal pellet
counts as the indicator of feeding rate over a wide range of wood species, and determine
if there is evidence in this case for the reported link between feeding rate, density and
extractives. This work is also aimed at the unanswered question of how relatively dense
and less dense wood from heartwood of the same non-durable timber will perform when
attacked by L. quadripunctata. This may gives clues as to the effect of how density
affects feeding rate independent of variation in extractives.
The hypothesis of this work is that the denser the wood the slower the L. quadripunctata
will feed which will be reflected in lower faecal pellet counts, but density will not be the
only factor and the extractives in the wood will also affect its durability.

Natural durability of wood
87
4.2 Materials and methods 4.2.1 Wood durability trials
The collection of L. quadripunctata for the wood durability trials and the experimental
design of the feeding assessment along with the automated faecal pellet counting
procedure were described in chapter two. In this study 12 animals were fed on each
wood species and 40 wood species used in total. The trials consisted two separate runs,
one of 24 species (trial 1) and another run of 22 species (trial 2) both included the non-
durable comparator, Pinus sylvestris as well as two species widely used in marine
construction Lophira alata and Chlorocardium rodiei. The feeding rate on early and late
wood of Pseudotsuga menziesii was performed using 24 individuals for both early and
late wood over a period of 28 days under the same conditions as all the feeding studies.
The density was calculated by Gervais Sawyer (who also supplied the wood) by first
weighing air dry wood and measuring the volume by water displacement of water
saturated wood and using these measurements to calculate the density.
4.2.2 The extractives leached from the wood
Wood was pre-leached in seawater for one week with a water change after 4 days prior
to the test. This saturation allows the L. quadripunctata to feed and the most readily
leached extractives to be lost (Figure 4.2).
Figure 4.2: Extractives leached from the wood over a one-week period prior
to the outset of the trial. Examples of the intensity of the coloration of some
extractives.
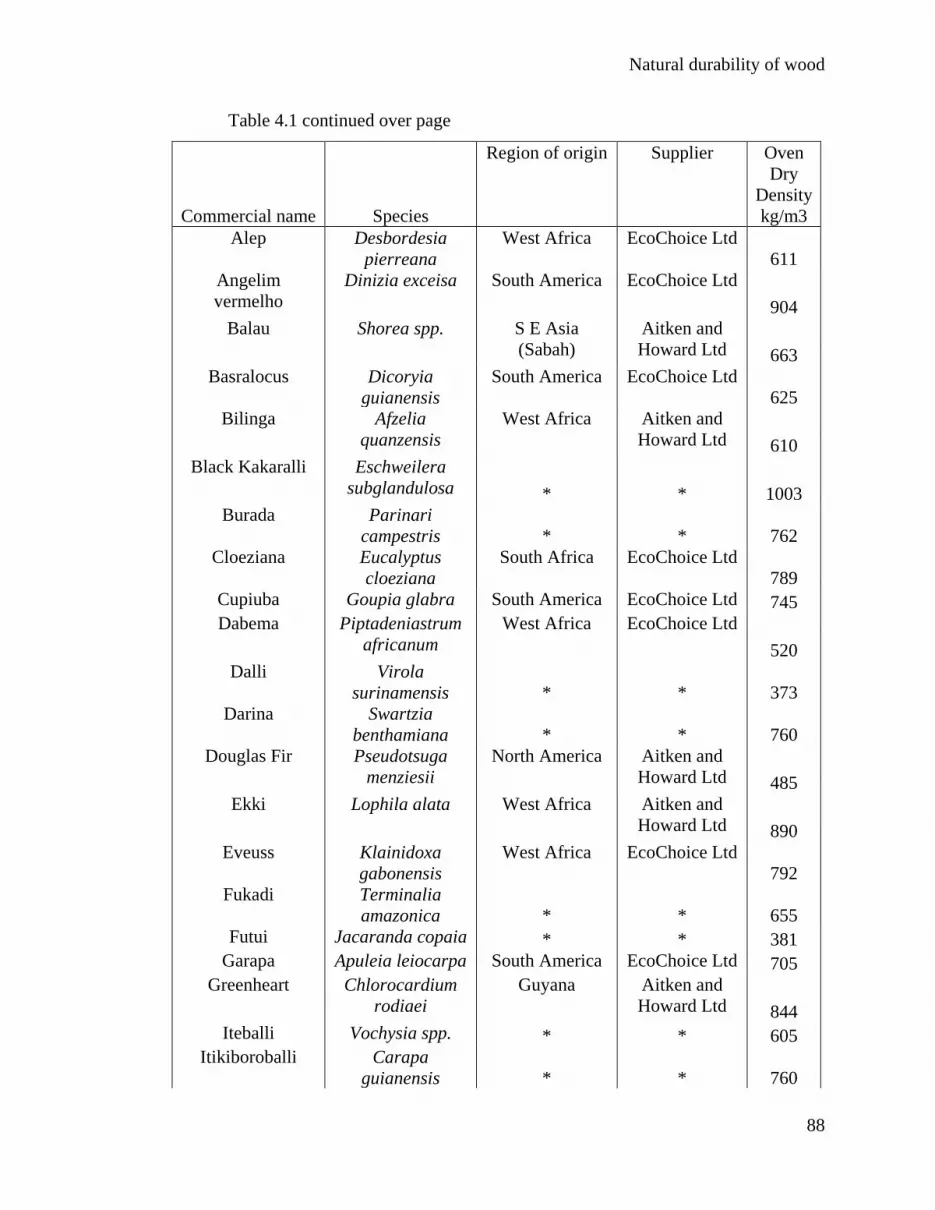
Natural durability of wood
88
Table 4.1 continued over page
Commercial name Species
Region of origin Supplier Oven Dry
Density kg/m3
Alep Desbordesia pierreana
West Africa EcoChoice Ltd 611
Angelim vermelho
Dinizia exceisa South America EcoChoice Ltd 904
Balau Shorea spp. S E Asia (Sabah)
Aitken and Howard Ltd 663
Basralocus Dicoryia guianensis
South America EcoChoice Ltd 625
Bilinga Afzelia quanzensis
West Africa Aitken and Howard Ltd 610
Black Kakaralli Eschweilera subglandulosa * * 1003
Burada Parinari campestris * * 762
Cloeziana Eucalyptus cloeziana
South Africa EcoChoice Ltd 789
Cupiuba Goupia glabra South America EcoChoice Ltd 745 Dabema Piptadeniastrum
africanum West Africa EcoChoice Ltd
520 Dalli Virola
surinamensis * * 373 Darina Swartzia
benthamiana * * 760 Douglas Fir Pseudotsuga
menziesii North America Aitken and
Howard Ltd 485 Ekki Lophila alata West Africa Aitken and
Howard Ltd 890 Eveuss Klainidoxa
gabonensis West Africa EcoChoice Ltd
792 Fukadi Terminalia
amazonica * * 655 Futui Jacaranda copaia * * 381 Garapa Apuleia leiocarpa South America EcoChoice Ltd 705 Greenheart Chlorocardium
rodiaei Guyana Aitken and
Howard Ltd 844 Iteballi Vochysia spp. * * 605 Itikiboroballi Carapa
guianensis * * 760

Natural durability of wood
89
Karri Eucalyptus diversicolor
Australia Aitken and Howard Ltd 656
Kurokai Protium decandrum * * 524
Limonabelli Chrysophyllum pomiferum * * 761
Massaranduba Manbarklak spp. South America EcoChoice Ltd 869 Mora Mora exceisa South America Aitken and
Howard Ltd 776 Mora Bukea Mora bukea * * 876 Mukulungu Autronella
congoensis West Africa EcoChoice Ltd
744 Muneridan Ruizteriana
albiflora * * 615 Niove Staudtia
kamerunensis West Africa EcoChoice Ltd
707 Okan Cylicodiscus
gabunensis West Africa EcoChoice Ltd
854 Opepe Nauclea
diderrichii West Africa EcoChoice Ltd
669 Piquia Caryocar spp. South America EcoChoice Ltd 645 Purpleheart Peltogyne spp. South America Aitken and
Howard Ltd 693 Sapucaia Lecythis
paraensis South Amercia EcoChoice Ltd
943 Scots Pine
Sapwood Pinus sylvestris Western Europe TRADA
Technology 419 Sougue Parinari excelsa West Africa EcoChoice Ltd 766 Suya Pouteria speciosa * * 521 Tali Erythrophleum
micranthum West Africa EcoChoice Ltd
760 Tatajuba Bagassa spp. South America EcoChoice Ltd 732 Timborana Enterolobium
schomburgkii South America EcoChoice Ltd
718 Tonka bean Dipteryx odorata * * 988 Wadara Swartiza
leiocalycina * * 522
Table 4.1 Timber species tested within this study for their resistance to
L. quadripunctata.

Natural durability of wood
90
4.3 Results 4.3.1 Wood durability trials
The results of trial 1 presented in figure 4.3 show that there is also a clear outlying group
formed by Vochysia sp, Virola surinamensis and Jacaranda copaia which is less
durable than the non-durable comparison species P. sylvestris. There are 12 other
species which form a group with levels of feeding similar to the widely used species
Lophira alata and Chlorocardium rodiei with 7 species identified as being more durable
than Chlorocardium rodiei but just as durable as Lophira alata in this test. These
timbers are therefore identified as being of potential interest for the long term testing of
their durability in the marine environment. The results of trial 2 presented in figure 4.4
also have a clear outlying group of non-durable timbers consisting of Eucalyptus
diversicolor, Pseudotsuga menziesii and Pinus sylvestris at the other end of the spectrum
there is a group of 14 comparably durable timbers which are not significantly different
from each other that includes the widely used species Lophira alata and Chlorocardium
rodiei. This graph therefore identifies 12 timbers which are not significantly more or
less durable than the timbers currently used in marine construction with respect to
resistance to L. quadripunctata attack.
Wood species that demonstrated a toxic effect were removed from the analysis. They
were identified by a negative regression in feeding over time and are listed below. These
species would be suitable candidates for further work, which could characterise the
extractives and investigate their effect and mode of action with respect to L.
quadripunctata. Wood was considered to have a toxic effect when a negative regression
of feeding was seen over time.
1. Shorea guiso
2. Goupia glabra
3. Staudtia kamerunensis
4. Cylicodiscus gabunensis
5. Nauclea diderrichii
6. Caryocar glabrum
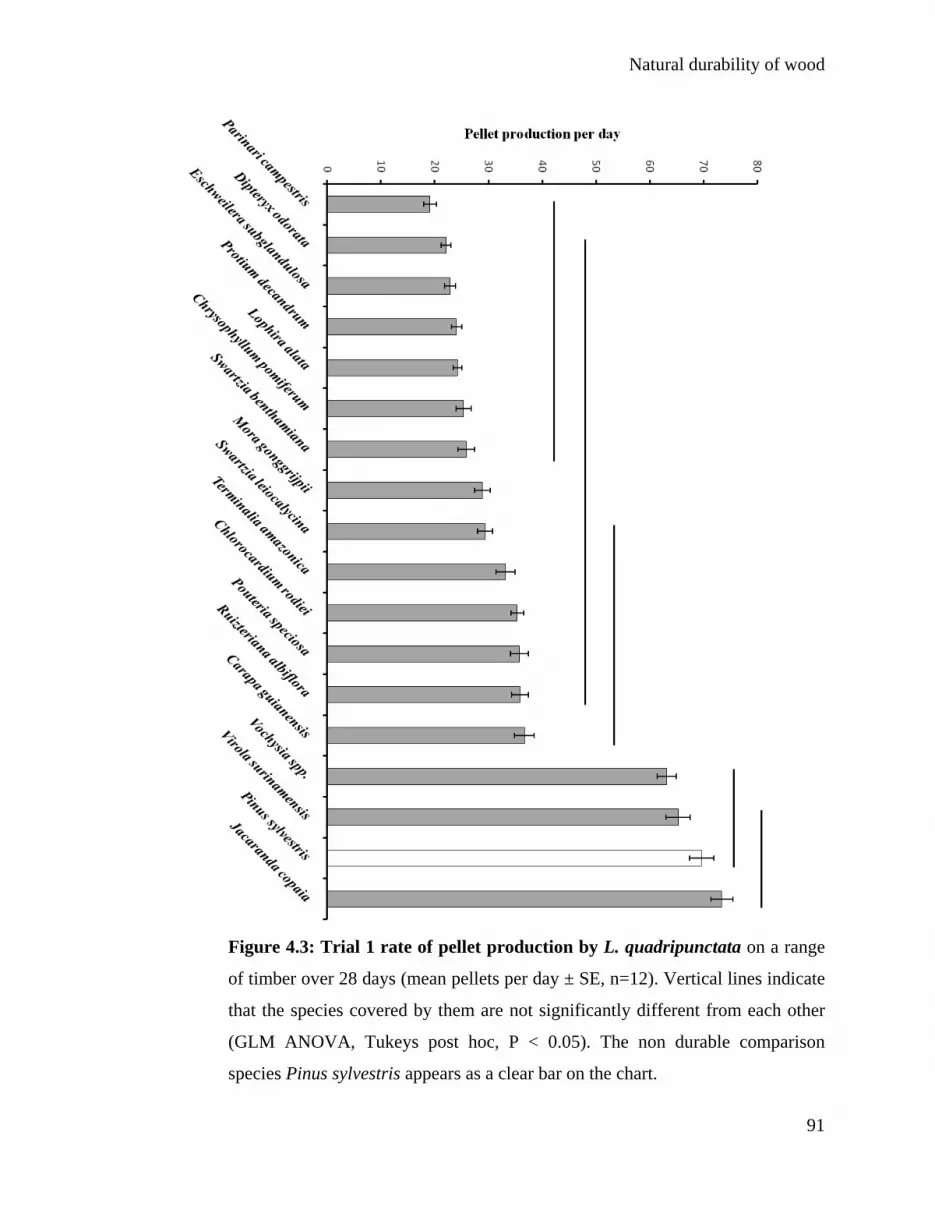
Natural durability of wood
91
Figure 4.3: Trial 1 rate of pellet production by L. quadripunctata on a range
of timber over 28 days (mean pellets per day ± SE, n=12). Vertical lines indicate
that the species covered by them are not significantly different from each other
(GLM ANOVA, Tukeys post hoc, P < 0.05). The non durable comparison
species Pinus sylvestris appears as a clear bar on the chart.

Natural durability of wood
92
Figure 4.4: Trial 2 rate of pellet production by L. quadripunctata on a range
of timber over 28 days (mean pellets per day ± SE, n=12). Vertical lines indicate
that the species covered by them are not significantly different from each other
(GLM ANOVA, Tukeys post hoc, P < 0.05). The non durable comparison
species Pinus sylvestris appears as a clear bar on the chart.

Natural durability of wood
93
4.3.2 Effect of density on pellet production
The faecal pellet production data from both wood durability trials was sorted with
respect to the density, and then scatter plotted to illustrate the relationship. This clearly
showed a significant positive correlation between reduced feeding rate and increasing
density. There were also two outlying groups circled in red on figure 4.5 one above and
one below the line. These groups represent species where another factor, perhaps the
extractives, are having a significant effect on feeding rate independent of the effect you
might expect from density alone.
Figure 4.5: Relationship between wood density and feeding rate. The linear
regression line demonstrates the close relationship between feeding rate and
density. The R2 value gives an estimate for the closeness of fit of the regression
line and the data. Outlying groups which do not follow the same pattern as the
rest of the data are highlighted in red circles, these groups show feeding rates
which suggests that other factors such as extractives are affecting feeding as well
as density.
y = -0.0548x + 68.455R² = 0.33
0
10
20
30
40
50
60
70
80
360 460 560 660 760 860 960
Pelle
t pro
duct
ion
per
day
Oven dry density Kg m3

Natural durability of wood
94
4.3.3 Feeding rate from early and late wood of non-durable Pseudotsuga menziesii
The results show that feeding rate on the more dense late wood remains relatively
consistent throughout the duration of the study with a significant increase, whereas
feeding rate on the early wood has a significant decrease over time. Feeding on early
wood is higher at the start of the trial, as may be expected for the less dense wood of a
non-durable species. However this trend decreases over time. The difference in feeding
rate goes from being highly significant P < 0.0005 to non-significant P > 0.05 when
compared to the denser late wood over the period of the test (standard t test).
Figure 4.6: The change in mean pellet per day over time from L.
quadripunctata fed on early wood and late wood from Pseudotsuga menziesii.
The difference starts significant and ends up not significantly different (P > 0.05
t test) over the 28 day duration of the test.
0
10
20
30
40
50
60
70
80
90
100
0 5 10 15 20 25 30
Pelle
t pro
duct
ion
per
day
Days
Early Wood
Late Wood

Natural durability of wood
95
4.4 Discussion The results from the feeding trials show that there are a range of timbers which
demonstrate a natural resistance to L. quadripunctata. These timbers could be used in
further testing to marine borer threats to determine if they have a broad range of anti
borer activity. Previous work on the leachable and non-leachable factors (Borges et al.,
2008) identified the leachate from two species used in this study, Shorea guiso and
Goupia glabra to be toxic to L. quadripunctata, which agrees with the findings
presented here. Other new toxic species were identified these species showed a negative
regression of feeding rate over time and had high mortality throughout the trial.
However, the exact mechanism of the interaction with the wood to produce an
antifeedant and or toxic effect requires more investigation. The water changing regime
was not only critical to provide accurate counts over time but also to maintain the health
of the L. quadripunctata by reducing the accumulation of potentially harmful extractives
in the water under the static conditions of the test that would not be experienced in the
sea due to the dilution factor.
When all the wood durability trial data was plotted along with the corresponding density
data the regression line illustrated that there was a clear pattern of decreasing feeding
rate with increasing density. In this study, the R2 value for the line was 0.33 which
represents the proportion of the data that the regression line represents which was higher
than the value in the published data Borges et al. (2008) had a R2 value of 0.148 pellet
production plotted with density. What this graph also demonstrated was that density is
not the only factor affecting the feeding rate. There are clear outliers in the data set in
the middle of the range of density and at the bottom of faecal pellet production, these
species were identified after the durability trials as being worthy of future investigation
of their extractives.
The results of the investigation into the effect of density on feeding rate are most
difficult to explain. What was expected were two parallel lines showing higher feeding
on the less dense early wood and lower feeding on the more dense late wood. This is the
pattern which emerged at the beginning of the trial but over time the feeding rate on the

Natural durability of wood
96
early wood dropped off. Both samples originate from the heartwood of the same species
so the observed affects should be attributed to density alone. However further chemical
analysis of the wood is required to confirm if the extractives do not vary in composition
between the early and late wood and what changes there are in the structural
components. This trial also needs to be repeated and extended to see what happens to the
trend over time after 28 days. Also the extractable and non extractable chemical
components need to be analysed. The data suggests that there is more than just the effect
of density due to the observed significant reduction in feeding.

Lignocellulose digestion
97
Chapter 5
Evidence of lignocellulose digestion by L. quadripunctata
5.1 Introduction
This chapter reports on investigation of the changes in lignocellulose as a result of
hindgut passage, therefore gaining indirect information about the effects of digestion.
This approach required a set of complementary techniques such as X-ray diffraction and
Fourier transformed infrared (FT-IR) spectroscopy to investigate the changes in
lignocellulose, as well as nuclear magnetic resonance (NMR) spectroscopy to determine
the presence of break down products in the L. quadripunctata.
The crystalline structure of wood was first verified by X-ray diffraction by Meyer &
Misch (1937). Although a considerable amount is now known about the crystalline
structure of cellulose (Langan et al., 2005, Paakkari, 1988, Wada et al., 1997) there is
still controversy over the most reliable method for measuring the crystallinity index
(CI). X-ray diffraction to determine the crystallinity of native cellulose using a simple
equation linked to the properties of the characteristic diffraction pattern from wood was
developed by Segal et al. (1959). This allowed the expression of the percent of
crystalline material in the total cellulose content as the crystallinity index (CI), which
enabled the evaluation of the difference in crystallinity between samples and therefore
the comparison of the effectiveness of different hydrolysis treatments. This method is
best suited for a semi-quantitative comparison between samples, as it is a simple model
which does not take into account the contribution of other peaks related to crystallinity
(Park et al., 2010). There are also other methods for measuring the CI, e.g. solid state
NMR spectroscopy (Park et al., 2009), which produces very different measures of CI to
the X-ray diffraction method. They are consistently higher when measured with X-ray
diffraction. This research is mostly carried out by parties interested in how the CI affects
the digestibility of lignocellulose and who want a consistent reliable measure associated
with the digestion of a particular lignocellulose substrate.

Lignocellulose digestion
98
The determination of the CI has been used by researchers to investigate the changes
associated with wood degradation by brown rot fungi. For example, Howell et al. (2009)
reported an increase in percent crystallinity as measured by X-ray diffraction, early in
the decay process. X-ray diffraction will be used in this study to investigate changes
associated in cellulose crystallinity after digestion by L. quadripunctata.
Complementary evidence to the study of wood by X-ray diffraction was collected from
attenuated total reflection (ATR) FT-IR spectroscopy. This measures the changes to an
infrared beam when it comes into contact with a sample (Idris et al., 2003). As no
radiation is transmitted through the sample and simply extends a short distance into the
specimen as it passes in contact with it, the ATR refinement of conventional FT-IR
spectroscopy minimises the variation between samples due to changes in path length
caused by errors in preparation. Infra-red radiation is used to observe the changes across
many wavelengths in response to chemical environment. This technique has been used
to measure changes in wood following digestion, in the dry wood borer Trichoferus
holosericeus (Palanti et al., 2010). These authors discovered that there were changes at
the wavenumbers that are characteristic of hemicelluloses. ATR FT-IR spectroscopy
was applied in this study to wood, before and after digestion by L. quadripunctata, to
assess what changes had occurred. Principle component analysis (PCA) was used to
highlight the regions of the FT-IR spectra which were different from each other, after
digestion.
As well as investigating the changes caused by digestion to the lignocellulose itself,
changes in gene expression of GH sequences in response to feeding within the animal
were investigated. A purely crystalline feeding substrate was selected and a feeding trial
was performed to ascertain to what extent gene regulation is influenced by the feeding
substrate. By collecting hepatopancreas tissue from L. quadripunctata that had been
feeding on pure crystalline cellulose, then sending samples for analysis to collaborators
who used the polymerase chain reaction (PCR) to amplify specific GH genes obtained
from the 454 database from L. quadripunctata hepatopancreas, so the effect that feeding
on pure crystalline cellulose had on levels of GH gene expression was assessed. A study

Lignocellulose digestion
99
which used wood-feeding termites and crystalline cellulose as a substrate for in vitro
enzyme assays found that termites have flexible and adaptive mechanisms within their
microflora that allow them to degrade this substrate (Tokuda et al., 2005). By feeding
the L. quadripunctata with pure crystalline cellulose in a preliminary experiment and
analysing the regulation of the GH genes, we can help define whether or not they can
adapt to this particularly recalcitrant substrate alone, to gain nutrition.
The final method used to identify changes in the wood after digestion was a
saccharification assay which was used to determine the proportions of carbohydrates
present in the wood before and after the digestion. This procedure used chemical
treatments to hydrolyse the wood and faecal pellet samples into their component sugars,
followed by HPLC to quantify and identify the released sugars. From this analysis, the
sugar components that are removed by the L. quadripunctata digestion process can be
deduced.
That the products of digestion are used by the animal has been inferred up to now by
work carried out by Seifert (1964) which demonstrated by measuring mass loss that L.
quadripunctata break down ingested wood. Direct evidence of the uptake of wood
digestion products is vital to determining whether or not L. quadripunctata can utilise
wood as a food source. Such evidence can be obtained by NMR spectroscopy
confirming the presence of, and investigating the fate of digestion products within the
animal. This is a powerful technique that can analyse the complex mixture of
compounds present in an extract of biofluid and provide detailed structural information
and identification. The NMR spectrometer is a device capable of influencing the
magnetisation of nuclei with half integer spin (Levitt & Forsterling, 2010). Not all
isotopes of atoms can be influenced in this way. Hydrogen atoms are the most common
nuclei to be investigated because of their sensitivity to the technique; this is referred to
as proton NMR spectroscopy, another common nucleus of interest is carbon. However
when carbon is the chemical species of interest the sample must be enriched with the 13C
isotope to increase the signal, because of its low natural abundance which is 1.1%. The
most abundant (>99%) isotope of carbon, 12C, is NMR inactive. The heteronuclear

Lignocellulose digestion
100
single quantum coherence (HSQC) experiment was used in this study. It is an
observation of a 2D heteronuclear chemical shift correlation map between directly
bonded 1H and 13C nuclei (López-Rituerto et al., 2010). This experimental technique
allows more confidence in the identification of the molecules present in the extract.
NMR spectroscopy was used as a tool in this study to track the flow of carbon from the
feeding substrate, which in this case 100% 13C-labelled wheat straw, into the animal. By
using similar techniques as those developed in the area of environmental metabolomics
(Hines et al., 2007) as a starting point, the experiment was able to track the labelled
straw degradation products into the specific tissues involved in digestion in L.
quadripunctata such as the hindgut and hepatopancreas. This could provide direct
evidence of degradation products in the hindgut and potentially identify the energy
storage compound used by L. quadripunctata in the rest of the body.
The hypothesis to be tested is this: that L. quadripunctata can break down wood and use
the products. The focus of this chapter is in two parts, firstly detecting any changes in
the wood and then secondly looking for the products of lignocellulose digestion that are
associated with that change.

Lignocellulose digestion
101
5.2 Materials and methods 5.2.1 X-ray diffraction study
For the X-ray diffraction study, 12 L. quadripunctata were fed on P. sylvestris and 12 on
Fagus sylvatica (beech) as described in chapter 2, for 30 days. Faecal pellets were
collected twice weekly, and pooled collections of faecal material for individual animals
were then centrifuged (14,000 g, 1 min), resuspended three times in dH2O to remove
salts and air-dried for one week at room temperature. The faecal material was then
pressed into 2 mm wide discs using a custom made press (Figure 5.1) along with a
milled wood control. The discs weighed between 900 and 1100 µg, and measured 100-
140 µm thick. The disc was then mounted on a steel pin using Loctite® adhesive. A
corresponding sliver of wood from the same feeding stick that was digested to produce
the faecal pellets was cut to the same thickness as the compressed faecal pellet disc.
Each sample was then mounted on a Huber goniometer in an Xcalibur Nova X-ray
diffractometer. Samples were aligned in the beam and the detector distance was set to 60
mm. They were then exposed for a total of 600 s to X-rays (Cu source, 1.54 Å) with
oscillations between 0 and 1 degree. Measurements were taken at three points across the
disc.
Figure 5.1: Pellet press in the A) unassembled and B) assembled
configuration. Manufactured by Gervais Sawyer.
A B

Lignocellulose digestion
102
5.2.2 Fourier-Transformed Infrared spectroscopy diffraction study
For the FT-IR spectroscopy study, the collection and preparation of faecal material was
performed at the same time as the X-ray preparation. The collected and dried material
was pressed into discs and spectra for each faecal pellet sample and corresponding
feeding stick were collected, plus spectra from a ground wood control, made from
milled wood of the feeding stick. Principle component analysis (PCA) analysis was
carried out using The Unscrambler X version 10.0.1 (CAMO software developers).
Fourier-transform infrared (FT-IR spectroscopy) spectra of each sample were recorded
on a Vektor 22 IR spectrophotometer (Bruker, Germany) (32 scans at 4 cm-1 resolution)
using the attenuated total reflection (ATR) technique (Dura-SamplIRTM, SensIR
Technologies, Warrington, UK). The rubber band method (64 points) of the OPUS NT
software (Bruker, Germany) was used for baseline correction (Andre Klüppel pers
comm.)
5.2.3 Crystalline cellulose feeding assay
A feeding assay was conducted in the same manner as described in chapter two, but with
crystalline cellulose as the feeding substrate. The microcrystalline cellulose (Sigma) was
put into a weighing boat and wetted with (2 µm filtered) seawater before sandwiching
with a second weighing boat and fixed with tape. This was then compressed in a vice
and the resulting biscuit broken into 10mm × 10mm × 3mm (approx) pieces. Pre-
wetting of the micro-crystalline substrate is critical to ensure cohesion due to its
hygroscopic nature; otherwise swelling occurs and it falls apart. The microcrystalline
cellulose was then fed to 12 L. quadripunctata over a period of three weeks. After ten
days, the wells were photographed and the faecal pellets were collected. The L.
quadripunctata were dissected and the hepatopancreas and hindgut frozen immediately
in liquid nitrogen before transport to my collaborator Katrin Besser for quantitative real-
time polymerase chain reaction (RTqPCR), of the key digestive enzymes identified in
(King et al., 2010).

Lignocellulose digestion
103
5.2.4 Wood compositional analysis
P. sylvestris was fed to 50 L. quadripunctata for one week, as described in chapter 2.
The faecal pellets from every animal were collected together with a pipette and the
seawater was aspirated. After feeding, the remainder of the feeding sticks and all the
faecal material was washed with dH2O and centrifuged at 14 000 g. The dH2O was then
aspirated and replaced. This was repeated three times to remove the salts before samples
were then allowed to dry for one week at room temperature. The wood and faecal pellets
were subsequently sent for the analysis of their various sugar contents. Faecal pellet and
wood samples were divided into three aliquots of 5 mg, and each of them was used as a
replicate.
The sequential hydrolysis of non-cellulosic monosaccharide and cellulosic
monosaccharides for compositional analysis was conducted at York University. Once
the faecal pellet samples and controls were weighed to 4 mg they were put into 5 ml
screw top tubes. The dried faecal pellet was broken up with a needle and all samples
were washed with absolute ethanol 3 times and centrifuged at 13000 g at room
temperature for 5 min between each wash. After the third wash the samples were
centrifuged for 10 min to compact the pellet to allow the removal of most of the ethanol
before drying at in a heat block at 35 °C with the lids off.
The standards include a mixture of nine monosaccharides (arabinose, fucose, galactose,
galacturonic acid, glucose, glucuronic acid, mannose, rhamnose, and xylose) each at 100
µM. The preparation of the standards is done by pipetting 250, 500, and 750 µl into
screw cap tubes (two sets prepared). The samples were then dried using a speed vac
concentrator (SPD131DDA thermo scientific).
Once all the samples were ready for hydrolysis TFA (2M Trifluororoacetic acid) was
prepared by adding 3 ml 99.5% TFA to 17 ml dH2O. Next 1 ml was then added to all the
samples and standards. While the TFA was added, the tubes were flushed with dry
Argon. This removes oxygen from the mix as performing the hydrolysis with oxygen
present would destroy the sugar.

Lignocellulose digestion
104
The vials were then heated at 100 °C for 4 h and mixed twice during the hydrolysis step.
They were then concentrated as before using a centrifugal evaporator. Once this step
was complete 500 µL of propanol was added and evaporated then 200 µl of propanol
was added and evaporated. Then the samples were resuspended in 500 µl of dH2O,
vortexed and put in a heating block at 35 °C for 10 min then centrifuged at 13000 g at
room temperature for 10 min and the supernatant aspirated into a new tube. This whole
step was then repeated to ensure efficient extraction and the second 500 µl extract added
to the previous aliquot. The resulting extract was dried in the centrifugal evaporator
along with the pellets, which could then be used in a second hydrolysis step. When the
samples were needed for HPLC using the Dionex system they were rehydrated in the
appropriate solvent and filtered then run through the machine to determine the
identification and quantification of the sugars present in the extract.
For the second and final extract the pellet is totally dissolved. The treatment is carried
out on the wood and faecal pellet sample as well as the second set of standards
(controls). 50 µl of w/w H2SO4 was added to all the tubes. These were then vortexed
every 15 min for 2:30 H and incubated at room temperature to fully hydrolyse the
sample. Once the hydrolysis was complete 1050 µl of dH2O was added to each tube (to
reduce the H2SO4 to a concentration of 3.42%). The samples were then vortexed and
placed in a heating block for 4 H at 120 °C. After this step the samples were mixed and
allowed to cool before the addition of 1 µl of 1% Bromophenol Blue. The samples were
the centrifuged and a 550 µl aliquot removed and placed in a new tube. This aliquot is
partially neutralised by the addition of 500 µl of 150 mM Ba(OH)2. The neutralisation is
then completed by adding BaCO3 powder until the solution turns blue. The samples are
then centrifuged to eliminate the precipitated BaSO4 and the samples frozen to finish the
precipitation. The supernatant is then treated in the same manner as the first extract and
analysed to allow the quantification of sugars.

Lignocellulose digestion
105
5.2.5 Analysis of metabolites in hepatopancreas and whole animals by nuclear
magnetic resonance (NMR spectroscopy)
Two hundred L. quadripunctata were extracted from a piece of sea defence timber (see
methods in chapter 2) within 2 hours after its removal from the sea. A further fifty were
extracted after the wood had been stored in the laboratory in running seawater with no
tidal cycle for one month. Fifty of the first batch of animals were immediately frozen in
liquid nitrogen and stored at -80°C. The remaining 150 were divided into three equal
groups with each group being subjected to a different feeding regime. These were: 1)
starved for seven days; 2) starved for seven days then fed for ten days with 13C-labelled
straw; and 3), fed 13C-labelled straw over a ten-day period as soon as they had been
removed from the wood.
A total of 48 L. quadripunctata were used for experimental purposes for each feeding
condition: 40 healthy L. quadripunctata were used for extraction and subsequent NMR
spectroscopy analysis. Prior to extraction, the batches of 40 animals were placed
together in a 15 mL centrifuge tube on ice. The seawater was then aspirated and the
specimens were frozen in liquid nitrogen and stored at -80°C. Once the batches from all
feeding conditions had been collected they were taken from storage and processed at the
same time. They were transferred in liquid nitrogen and lyophilised overnight in a
vacuum of 3.33 Pa with a condenser temperature of -105°C. The samples were then
sealed in a microcentrifuge tube and wrapped in Parafilm.
Each batch was ground to a fine powder in a microcentrifuge tube using a Teflon pestle.
A consistent quantity of powdered tissue (0.01 g ± 0.001g) was used for the series of
whole animal extractions. A 720 µL aliquot of D2O was then added to allow efficient
maceration of the tissue prior to vortexing for one minute and centrifuging at 14 000 g
for 10 min. The clear 700 µL of supernatant was aspirated into an NMR tube and a 2 µL
aliquot of 10mM sodium 3-(trimethylsilyl)-2,2,3,3-d4-propionate (TMSP) was added to
provide a standard to allow the calibration of the chemical shift axis to 0.00 ppm. The
specific tissue NMR spectroscopy was carried out on tissue dissected from 50 L.
quadripunctata that had been feeding on 13C labelled straw for one week. Once

Lignocellulose digestion
106
dissected into; body, hindgut and hepatopancreas in separate tubes and immediately
frozen in liquid nitrogen the tissue samples were prepared as before.
5.2.6 NMR spectroscopy data acquisition and processing
The spectrometer used was Oxford Instruments 600 MHz machine equipped with a
Varian cryoprobe. The 1H,13C-HSQC spectra were acquired at 25 °C with 180 t1
increments each with 128 transients, and with 1H and 13C spectral widths of 8000 Hz
and 25000 Hz, respectively. The spectral data were imported into MestReNova software
(Version: 6.2.1 © Mestrelab Research S.L.) where it was automatically Fourier
transformed, phased, and base line corrected. Both axes were calibrated using the TMSP
reference peak before running an automatic peak picking macro. This generated a list of
peaks identified from the spectra. This peak list was used to run a search of the HSQC
spectra on the Human Metabolome database (www.hmdb.ca version 2.5). This search of
the data-base was carried out using a high shift tolerance (0.08 ppm for 1H, 0.4 ppm for 13C) which generated a list of identified chemical species and their associated chemical
shifts. Chemical species were then assigned by hand on the original spectrum and only
those with complete sets of chemical shifts were then deemed to be present in the
sample. The peaks were assigned to an accuracy of one decimal place, and a number of
peaks remain unassigned in the spectra.
5.2.7 SEM of straw and faecal pellets
The SEM materials and methods were identical to the technique previously described in
chapter 2.

Lignocellulose digestion
107
5.3 Results 5.3.1 X-ray diffraction analysis of L. quadripunctata faecal pellets produced while
feeding on P. sylvestris an F. sylvatica.
Two distinct sets of X-ray diffraction spectra were generated, firstly the fibre diffraction
patterns from solid wood samples seen in Figure 5.2 B and secondly powder diffraction
seen in 5.2 A, C. The crystalline cellulose fibres caused diffraction of the X-ray beam
and gave rise to the intense broad peaks at around 15 and 22 degrees as well as the less
intense diffraction at around 37 degrees (Figure 5.3). When the cellulose was ground
into a powder by milling the wood or the grinding action of the L. quadripunctata
mandibles this produced powder diffraction patterns. The now randomly assorted
cellulose crystals result in the diffraction of all the possible orientations of the crystal at
once. This is visible in the radial peaks of figure 5.2 A and C when they are compared to
the broad diffraction peaks of figure 5.2 B. The relative intensity of these peaks can be
more easily compared by plotting them on a radially averaged graph (Figure 5.3). A
feature of the data in figure 5.3 is the increase in intensity in the faecal pellet sample;
this suggests that the crystalline component of the cellulose is more dominant in the
faecal pellet sample. The additional peaks in the faecal pellet plot marked with an (*) are
accounted for by salt contamination which can be seen in figure 5.2 (A) as single intense
points of diffraction. The graph also shows the shift in the peaks at 15, 22, and 35
degrees to the left which is most pronounced in the peak at 35 degrees. Triplicate
measurements for each sample of wood, faecal pellet and control were made then
averaged to generate the traces illustrated; fourteen faecal pellet discs with
corresponding feeding stick and ground wood control were scanned in total, seven for P.
sylvestris and seven for F. sylvatica.
F. sylvatica was tested to see if there were any major differences detectable between the
way softwood (P. sylvestris) and hardwood (F. sylvatica) was digested. The analysis
showed little difference but a peak labelled as salt contamination at around 26 degrees
occurred within these samples as well, the peak at 26 degrees has not been reported in
the literature. However, it could be from one of the planes in the cellulose crystal lattice,
and further calculation and analysis of this peak is underway (Xinfeng Xie, pers comm.).

Lignocellulose digestion
108
Figure 5.2: Diffraction plates of specimens derived from P. sylvestris. Plate A
shows diffraction of the faecal pellets, B diffraction of the wood sample and C
diffraction of the ground wood control.
Figure 5.3: Radially-averaged graph demonstrating the relative intensity of
diffraction for P. sylvestris. Salt contamination marked with a (*).
0
2
4
6
8
10
12
10 15 20 25 30 35 40
Rel
ativ
e in
tens
ity
2θ (degrees)
Faecal pelletWood sampleGround wood
A B C
*
*

Lignocellulose digestion
109
Figure 5.4: Diffraction plates of specimens derived from F. sylvatica. Plate A
shows diffraction of the faecal pellets, B diffraction of the wood sample and C
diffraction of the ground wood control.
Figure 5.5: Radially-averaged graph demonstrating the relative intensity of
diffraction for F. sylvatica. Salt contamination marked with a (*).
0
2
4
6
8
10
12
10 15 20 25 30 35 40
Rel
ativ
e in
tens
ity
2θ (degrees)
Faecal pellet
Wood sample
Ground wood
A C B
*

Lignocellulose digestion
110
5.3.2 FT-IR spectroscopy analysis of L. quadripunctata faecal pellets produced
while feeding on P. sylvestris an F. sylvatica.
FT-IR spectroscopy was used to analyse milled wood and faecal pellets generated by
animals feeding on P. sylvestris and F. sylvatica. The aim was to determine the effect of
digestion by L. quadripunctata on these substrates was whilst taking into account the
effect of the mechanical grinding. The results revealed very little obvious variation
between the samples (Figure 5.6 A). The P. sylvestris and F. sylvatica samples were
treated separately during the PCA analysis so that the variation between hard and soft
woods would not obscure any detectable difference. The analysis revealed that 73% of
the difference between faecal pellets and feeding sticks from P. sylvestris was attributed
to just one component of the spectrum (Figure 5.6 B, C). The wavenumber which the
PCA analysis identified as contributing the highest proportion of variation between the
spectra was then highlighted on the FT-IR spectra (Figure 5.6 A). This region is
associated with changes to the hemicelluloses, more accurately the xyloglucan ring
(Kacuráková et al., 2002). The same analysis was carried out on the F. sylvatica samples
(Figure 5.7). This highlighted exactly the same region of the spectrum (Figure 5.7 a, c)
which is associated with the hemicelluloses.
In conclusion, the main component of the samples which varied between wood and
faecal pellet was the hemicellulose. The grinding of the wood in both cases separated
from the faecal pellet sample during the PCA analysis (Figure 5.6 B and 5.7 b). This
demonstrates that the changes to the hemicelluloses were independent of L.
quadripunctata grinding the wood as part of the digestion process. Therefore the data
strongly suggest that the changes occurred to the hemicellulosic content of the wood as a
result of gut passage in L. quadripunctata.

Lignocellulose digestion
111
Figure 5.6: Graph A) represents the fingerprint region of the FT-IR
spectrum at 760-1800 nm-1 throughout which changes in the molecular
components and structures are measured. Diagram B) is a principle
component score plot and graphically represents the separation between the
measurements. Principle component (PC) 1 is represented by the x axis and
accounts for 73% of the variation within the sample. It separates on the score
plot B) into (a) faecal pellet and (b) wood measurements. PC 2 is represented by
the Y axis this separates out (c) milled wood from the faecal pellets and the
wood. The difference associated with the change from wood to faecal pellets
represented by PC 1 is shown on graph C), the loadings plot. This peak
highlights the area that correlates with the wavenumber on spectrum A) that
accounts for the difference in PC 1.
A)
B) C)

Lignocellulose digestion
112
Figure 5.7: Graph a) represents the fingerprint region of the FT-IR
spectrum at 760-1800 nm-1 throughout which changes in the molecular
components and structures are measured. Diagram b) is a principle
component score plot and graphically represents the separation between the
measurements. Principle component (PC) 1 is represented by the x axis and
accounts for 67% of the variation within the sample. It separates on the score
plot b) into (A) faecal pellet and (B) wood measurements. PC 2 is represented by
the Y axis this separates out (C) milled wood from the faecal pellets and the
wood. The difference associated with the change from wood to faecal pellets
represented by PC 1 is shown on graph c), the loadings plot. This peak highlights
the area that correlates with the wavenumber on spectrum a) that accounts for the
difference in PC 1. One faecal pellet outlier is also highlighted in red on the
score plot, b).
b)
a)
c) (67%)
(20%)

Lignocellulose digestion
113
5.3.3 Crystalline cellulose feeding assay
The 12 L. quadripunctata burrowed into the crystalline cellulose (Figure 5.8) at a rate
comparable to that of animals feeding on the non durable timber P. sylvestris. The
feeding test lasted 21 days and throughout the duration of the study the L.
quadripunctata remained burrowed and produced faecal pellets. Once the animals were
removed from their burrows, they were confirmed as alive by monitoring the beating of
the pleopods, and observing the crawling and swimming behaviour over the substrate
and around their wells.
20mm
Figure 5.8: Photomicrograph of a L. quadripunctata specimen feeding on
crystalline cellulose. The picture was taken after 10 days feeding; the telson of
the L. quadripunctata can be seen below point A which marks the entrance to the
burrow. Photo B shows the faecal pellets made from crystalline cellulose.
A
B
Lignocellulose digestion
114
5.3.4 Wood compositional analysis to determine sugar loss
To determine if there was loss of sugars from the wood after digestive transit in L.
quadripunctata, samples of wood and faecal material were sent for the analysis of their
sugar contents by a collaborator (Leonardo Gomez, University of York). The results of
the analysis are in two halves which are additive. The first graph, figure 5.9 A shows the
results of a mild extraction procedure which determines the quantities of reducing sugars
released. This demonstrated that there was a reduction in the quantity of glucose and
mannose in the faecal pellets when compared to the wood (P. sylvestris). There was also
a small increase in rhamnose and galacturonic acid from the levels extracted in the wood
when compared to the faecal pellets. The second graph, figure 5.9 B shows the result of
the second stage of the treatment, the total extraction step, which removes all the sugars
from the sample. The graph demonstrates the abundance of glucose and mannose in the
wood. With this extraction the only sugar to show a marked reduction in the faecal
material is glucose. The galacturonic acid proportion also appears to increase a little.
The glucose loss could come from glucose-rich polysaccharides such as xyloglucans,
glucomannans or, indeed, amorphous cellulose along with loss in mannose which is also
abundant in the hemicelluloses (Leonardo Gomez pers comm.). The data complements
the findings of the X-ray and FT-IR spectroscopy experiments and suggests that the
digestion in L. quadripunctata is limited to glucose and mannose residues under the
feeding conditions tested.

Lignocellulose digestion
115
Figure 5.9: Graphs of sugars released from P. sylvestris and L.
quadripunctata faecal pellets under treatment with trifluoroacetic acid
(TFA) and sulphuric acid. The graphs are additive and together represent the
total sugar content in equivalent samples of wood and faecal pellet. The data
suggests the loss of glucose and mannose sugar residues from the wood after L.
quadripunctata digestion.
A. TFA mild extraction
B. H2SO4 total extraction

Lignocellulose digestion
116
5.3.5 NMR spectroscopy HSQC experiment using whole body extract from L.
quadripunctata with natural abundance of 13C.
The starting point for the investigation into tracking 13C labelled digestion products in L.
quadripunctata was to first establish what the natural abundance of 13C was under the
conditions of the test. Data was collected from a batch of L. quadripunctata freshly
removed from the environment (Figure 5.10 A). This established the presence of
betaine, glycine, trimethylamine N-oxide and trehalose. This represents a snap shot of
the metabolic pool of a group of animals. The compounds identified will not be the
definitive list of metabolites present in the sample, just those abundant enough to be
identified. To determine that keeping the animals under constant immersion for the
duration of other feeding studies using 13C labelled straw, would not be a factor which
altered the levels of metabolites within L. quadripunctata, a group was kept under
constant immersion in the flow-through tanks. The identified metabolites from this test
(Figure 5.10 B) were identical to those from animals removed directly from the sea. This
is not to say that there was no change, but that the major components were still present
and nothing new could be identified. To determine the affect of starvation on the
metabolic pool, a group were starved for one week. Metabolites still present in this
sample (Figure 5.11) were betaine, glycine and trimethylamine N-oxide. No trehalose
was detected.
5.3.6 NMR spectroscopy HSQC experiment using whole body extract from L.
quadripunctata with 13C enrichment.
Now the protocol had been established, L. quadripunctata were fed 13C labelled wheat
straw. The breakdown products of the straw could now be identified in the whole body
extract of L. quadripunctata. Two feeding regimes were used, one group was fed
labelled straw (Figure 5.12 A) the other group was starved first then fed labelled straw
(Figure 5.12 B). The enrichment of 13C in the metabolic pool greatly increased the
number of metabolites that could be identified (Table 5.1). More metabolites were
identified from the group which were starved then fed labelled straw than the group just
fed labelled straw. The metabolites identified from the group starved first then fed
labelled straw provided evidence for the breakdown of labelled cellulose to labelled
glucose and its storage in the form of trehalose.

Lignocellulose digestion
117
Figure 5.10: Natural abundance HSQC NMR spectroscopy. Spectrum A)
shows the peaks identified for the whole body extract of L. quadripunctata
removed directly from wood from the sea. While B) is a spectrum of whole body
extract from L. quadripunctata removed from the same piece wood one month
after being taken from the sea and stored in the constant immersion flow-through
facilities at the marine laboratories. The compounds identified from both spectra
were betaine, glycine, trimethylamine N-oxide and trehalose.
A
B
13C (ppm)
13C (ppm)
1H (ppm)
1H (ppm) 1
1
2
3
1
5 2
1 7
6 4 3
1
7 6 4
1
2
1 5 2
1

Lignocellulose digestion
118
Figure 5.11: Natural abundance HSQC NMR spectroscopy of animals after
one week of starvation. The metabolites still identifiable after one week of
starvation were (A) betaine, (B) glycine and (C) trimethylamine N-oxide. When
compared to the previous spectra in figure 5.10 the absence of (D) trehalose is
clear.
(A) Betaine spectrum
13C (ppm)
1H (ppm)
1
2
1
1

Lignocellulose digestion
119
(B) Glycine spectrum
(C) Trimethylamine N-oxide spectrum

Lignocellulose digestion
120
(D) Trehalose spectrum

Lignocellulose digestion
121
Figure 5.12: 13C labelled HSQC NMR spectroscopy. Spectrum A) shows the
peaks identified for the whole body extract of L. quadripunctata removed
directly from wood from the sea and fed 13C labelled straw for 10 days. While B)
is a spectrum of whole body extract from L. quadripunctata from the same
wood, starved for 7 days then fed labelled straw for 10days. The compounds
identified from each spectrum are listed in table 5.1.
A
B
13C (ppm)
13C (ppm)
1H (ppm)
1H (ppm)

Lignocellulose digestion
122
Metabolites Fed label 5.12 A
Starved/fed label 5.12 B
Alanine x x Betaine x x Glucose
x
Trehalose x x Succinic acid
x
Trimethylamine n-oxide x x Glucuronic acid x x Glycolic acid
x
Lactic acid
x Erythritol x x Iditol
x
Glycine x Glutamic acid x Glycerol x
Table 5.1 Indicating presence (x) of various metabolites identified from figure
5.12 A and B. Labelled glucose was not found in animals fed labelled straw with
no period of starvation. The glucose storage compound trehalose was identified
in both cohorts of animals.

Lignocellulose digestion
123
5.3.7 NMR spectroscopy HSQC experiments using specific tissue extract from L.
quadripunctata with enrichment of 13C.
The next step was to feed 13C labelled straw a second group of L. quadripunctata. These
specimens were subsequently dissected into samples containing the specific tissues:
hindgut, hepatopancreas and the rest of the body. This technique allowed the
identification of the metabolite composition within specific tissues. The removal of the
signals from the gut and hepatopancreases tissue also allowed the identification of the
largest number of metabolites, 16 in total, from the rest of body extraction (Figure 5.13
A). The hindgut tissue contained glucose, betaine and acetic acid. The labelled glucose
present in the hindgut (Figure 5.13 B) is direct evidence of a labelled break down of
glucose from the digestion of wheat straw. That the glucose present in the gut is then
assimilated and stored in the body was confirmed by the analysis of the hepatopancreas
tissue extract. The glucose storage product trehalose was identified (Figure 5.13 C) in
the hepatopancreas tissue extract. The spectrum has been labelled with the assignments
made using the human metabolome database as an example. The peak list that identifies
trehalose is outlined in figure 5.13 D and a full list of the peaks for all the metabolites
assigned in this study is available in the appendix.

Lignocellulose digestion
124
A. Remaining body tissue
B. Hindgut tissue
13C (ppm)
13C (ppm)
1H (ppm)
1H (ppm)

Lignocellulose digestion
125
C. Hepatopancreas tissue
D. Trehalose example
13C (ppm)
1H (ppm)
1
2
3
4
5
6
7
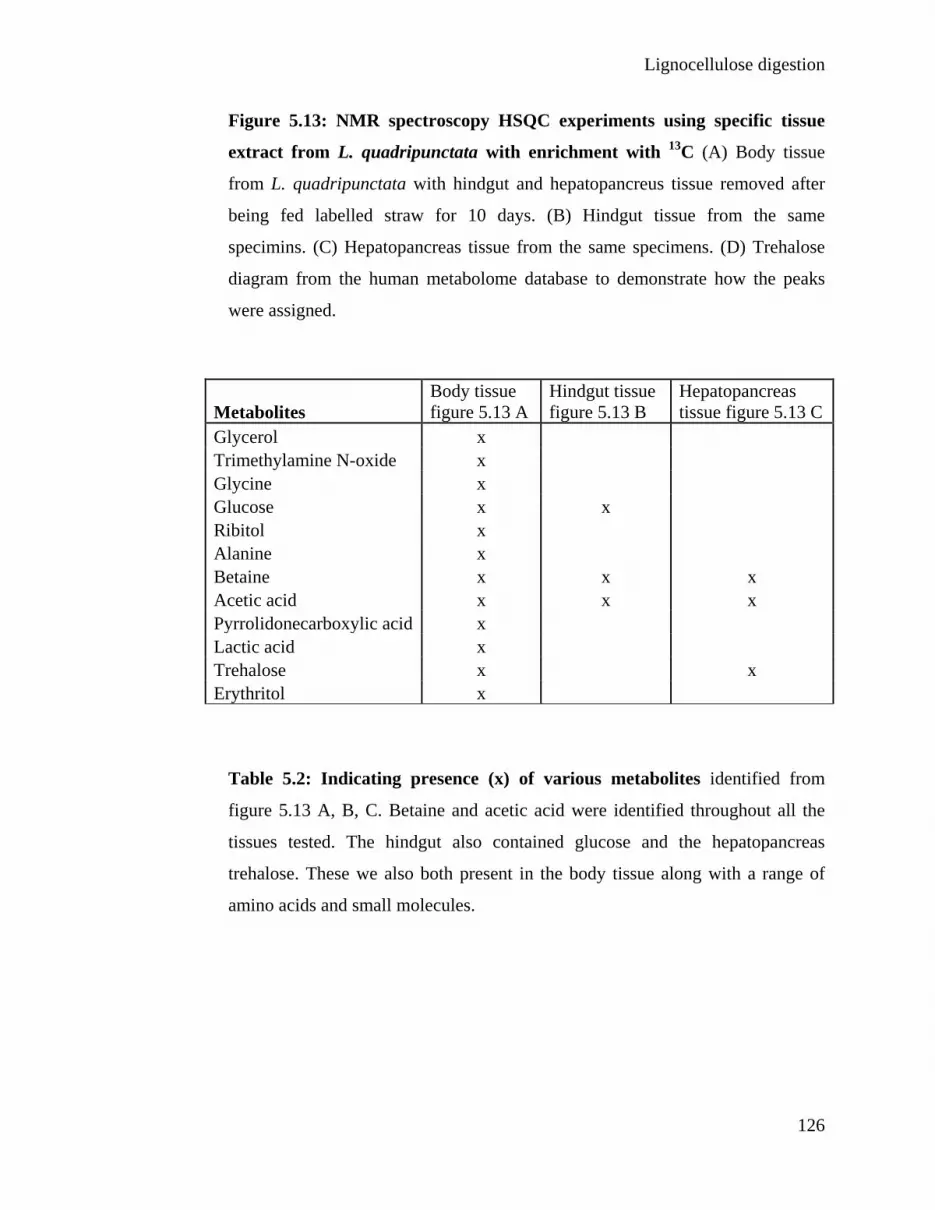
Lignocellulose digestion
126
Figure 5.13: NMR spectroscopy HSQC experiments using specific tissue
extract from L. quadripunctata with enrichment with 13C (A) Body tissue
from L. quadripunctata with hindgut and hepatopancreus tissue removed after
being fed labelled straw for 10 days. (B) Hindgut tissue from the same
specimins. (C) Hepatopancreas tissue from the same specimens. (D) Trehalose
diagram from the human metabolome database to demonstrate how the peaks
were assigned.
Table 5.2: Indicating presence (x) of various metabolites identified from
figure 5.13 A, B, C. Betaine and acetic acid were identified throughout all the
tissues tested. The hindgut also contained glucose and the hepatopancreas
trehalose. These we also both present in the body tissue along with a range of
amino acids and small molecules.
Metabolites Body tissue figure 5.13 A
Hindgut tissue figure 5.13 B
Hepatopancreas tissue figure 5.13 C
Glycerol x Trimethylamine N-oxide x Glycine x Glucose x x
Ribitol x Alanine x Betaine x x x
Acetic acid x x x Pyrrolidonecarboxylic acid x
Lactic acid x Trehalose x
x Erythritol x

Lignocellulose digestion
127
5.3.8 SEM photomicrographs of the straw and the faecal pellet
The 13C labelled wheat straw was easily consumed by the L. quadripunctata and the
exposed cell walls can be seen in figure 5.14 A which shows part of a burrow. The
faecal pellets contained the ground up components of the wheat straw cell wall, and did
not appear colonised by any bacteria (Figure 5.14 B).
Figure 5.14 SEM picture of wheat straw and faecal pellet. (A) Shows a piece
of 13C labelled straw that has been attacked by a L. quadripunctata (B) is a close
up of a faecal pellet form the digested straw.
A
B

Lignocellulose digestion
128
5.4 Discussion The collection of FT-IR spectra was used to complement to findings of the X-ray
diffraction. Because of the complexity of the spectra produced, PCA was used to help
interpret the data. PCA is a very useful statistical technique which is good at dealing
with large datasets and comparing all the individual measurements. Although hundreds
of measurements are made when collecting an FT-IR spectroscopy data set the variation
between data sets is usually down to a subset of frequencies. Using PCA the frequencies
that contribute to the overall variation can be identified. The region of the spectrum that
accounted for the observed variation in this study is associated with changes in the
hemicellulose, specifically in the xyloglucan ring (Kacuráková et al., 2002). This
indicates that the changes are in the amorphous region of the sample, the hemicelluloses.
This observation suggests that the digestion process is mainly affecting the less ordered
amorphous region in the lignocellulose. X-ray diffraction was then used to determine if
the expected increase in crystallinity, associated with its increase as a proportion of the
sample after the removal of some of the amorphous component, could be detected.
X-ray diffraction of lignocellulosic substrates is widely used for the determination of
crystallinity in a sample (Andersson et al., 2004, Paakkari & Serimaa, 1984, Thygesen
et al., 2005). The use of X-ray diffraction specifically to study the changes induced
through the effect of wood degradation is more limited. It has been used to determine
the effect on crystallinity after wood degradation by brown rot fungi (Howell et al.,
2009) as well as the effect of the bacterial cellulosome on crystallinity (Boisset et al.,
1999). To this author’s knowledge, the use of X-ray diffraction to investigate the effect
of wood digestion by an invertebrate is a new use of this technique. Howell et al (2009)
found there was a consistent relative increase in the crystallinity measurement in the
early stages of degradation by brown rot fungi. The use of X-ray diffraction in this study
determined that there was a consistent increase in crystallinity in the faecal pellet with
respect to the wood it was produced from this is consistent with a loss of the
hemicelluloses and less crystalline cellulose which would increase the crystalline
material as a percentage of the remaining material in the faecal pellets. This result was

Lignocellulose digestion
129
predicted by the FT-IR spectroscopy and confirmed by X-ray diffraction. The next step
was to determine what specific sugars were being removed by this process.
Indirect evidence for digestion of cellulose by L. quadripunctata was provided by
measurements that showed that the proportions of cellulose, hemicelluloses and lignin in
faecal pellets were lower than they were in the wood on which the animals were feeding
(Seifert, 1964). HPLC analysis of the abundance and composition of sugars in the wood
and faecal pellet was used to test the observation of this study that in light of evidence
that the wood is altered by digestion there should be a change in the percentage
composition of the sugar residues. The results suggest that the digestion process in L.
quadripunctata removes glucose and mannose residues when L. quadripunctata feeds
on P. sylvestris. This preference for two residues which make up a large percentage of
the hemicelluloses is further evidence that the enzymes target these components
particularly.
NMR spectroscopy was used to look for evidence of the products of digestion entering
the metabolic pool. The question the wood compositional analysis does not answer is
what the loss of sugars was after digestion in percentage terms because the quantity of
material processed by the L. quadripunctata to produce the faecal pellets was not
determined. Accurate mass loss will enable the determination of the percentage loss of
the sugars caused by the digestion process of L. quadripunctata.
Once it was clear that the wood was being degraded, it became very important to find
direct evidence of the sugars from the digested material entering the animals. Once a
suitable 13C labelled substrate was identified (wheat straw) the aim was to feed this
labelled carbon source to the L. quadripunctata and track the source of this enrichment
into the tissues. Firstly, an extraction protocol needed to be developed. This was
strongly influenced by the work of Lin et al (2006). NMR spectroscopy, which has
proved a valuable tool for investigating lignocellulose breakdown (Boonstra et al., 2006,
Hopkins et al., 1998, Matulova et al., 2008), has been used to demonstrate the
generation of glucose from the substrate and to probe the metabolic pool of fed and

Lignocellulose digestion
130
starved animals. 13C-enriched glucose found in the metabolic pool is a signal of
complete breakdown of the labelled food. However, the composition of the metabolic
pool is dynamic and the measurements gained are snapshots which may not provide the
whole picture (Lin et al., 2006). The use of NMR for the determination of metabolites in
complex mixtures has the advantage of relatively simple sample preparation which
allows subsequent analysis that is not limited to a few compounds (Fan, 1996). The
development of the method benefitted from advances in the field of metabolomics e.g.
an extensive study conducted by Lin et al. (2007) which concluded that grinding
lyophilised tissue produced less sample-to-sample variation. This is why this approach
was adopted in this study. The inspiration for the use of specific tissues which would
allow the determination of more specific localised metabolite content came from a study
of Hines et al. (2007). This work emphasised the importance of considering variables
like, age, gender and tissue when conducting metabolomics studies. The NMR study
was not intended as an attempt to identify the metabolites present in L. quadripunctata
and determine how they changed in response to environmental stimuli, but as a tool for
tracking labelled glucose into the metabolic pool. A large sample was chosen to provide
an evaluation of the population as a whole but with the refinement of specific tissue
sampling to make the data more informative. The 13C labelled feeding substrate, wheat
straw contains a cellulose I allomorph with low crystallinity (Liu et al., 2005) and the
crystallinity from different parts of the stem also showed little difference. This suggests
that in light of the X-ray diffraction and FT-IR data L. quadripunctata is able to digest
the less crystalline regions of the cellulose and possibly glucose residues from
hemicelluloses and other straw components such as pectin.
An extract of L. quadripunctata whole tissue was prepared from a group that had been
kept under laboratory conditions with no tide. To account for the fact that the feeding
enrichment would be taking place under artificial conditions, an assessment to see that
there were no gross changes was essential; it also provided a repeat of the determination
of the natural abundance experiment. Once animals that had been fed labelled straw
were analysed and an increase in the relative abundance of labelled metabolites in the
whole body extract of the animals was discovered, this provided evidence of labelled

Lignocellulose digestion
131
glucose. Next the use of specific tissue extract on animals fed labelled straw dissecting
and separating the L. quadripunctata into their body, hindgut and hepatopancreas tissue
and analysing them to identify what was present was carried out. This analysis
completed the story; labelled glucose was located in the hindgut, labelled trehalose in
the hepatopancreas and labelled glycogen in the body, this provided direct evidence of
assimilation of wood digestion products into the metabolic pool. Interestingly betaine
was consistently present throughout all the samples with a larger signal relative to
anything else. It is reported to function as an osmolyte in marine crustacea (Burg &
Ferraris, 2008) so its presence in an intertidal marine crustacean is not surprising. All the
evidence presented by this work does not detect the use of crystalline cellulose by L.
quadripunctata. Therefore, the crystalline cellulose assay was developed to test if L.
quadripunctata in their natural state simply digest the hemicelluloses and amorphous
cellulose rather than the more recalcitrant crystalline cellulose. They may regulate gene
expression in response to the composition of the substrate on which they feed. The L.
quadripunctata fed for three weeks on this substrate with very low mortality which
could suggest that they were indeed gaining nutrition from the substrate. The regulation
of gene expression is dependent upon the possession of digestive enzymes capable of
degrading crystalline cellulose. Preliminary evidence compiled from feeding trials on a
range of wood species suggests that the feeding substrate does affect the expression
levels of glycosyl hydrolayses in L. quadripunctata (Katrin Besser, personal
communication). However the result for the expression levels of GH proteins whilst
feeding on pure crystalline cellulose demonstrated that GH gene expression levels are
very low. More work is needed to definitively determine if L. quadripunctata can utilise
the pure crystalline portion of lignocellulose by analysing the substrate with X-ray
diffraction after gut passage.
This chapter raises a number of findings, firstly there is the observation made by the FT-
IR spectroscopy data that the changes to lignocellulose are in the amorphous content or
hemicelluloses. This means that there should be an associated increase in crystallinity of
the faecal pellets detectable with X-ray diffraction. This is what was observed, this is
due to the crystalline material representing a higher proportion of the material in the

Lignocellulose digestion
132
faecal pellet thus increasing the intensity of diffraction of X-ray. This loss of sugars
should be accountable for in the faecal pellet and the wood compositional analysis
detected losses of glucose and mannose from wood to faecal pellet. Finally the products
of digestion should be identifiable in the specific tissues of the L. quadripunctata and
the NMR spectroscopy data identified labelled glucose in the gut and trehalose in the
hepatopancreas.

Discussion
133
Chapter 6
General Discussion
The in situ hybridization experiment positively identified the expression of GH5a and
GH9a genes in the hepatopancreas of L. quadripunctata. This is new information which
complements the already published identification of GH7a (King et al., 2010). The gut
tissue of L. quadripunctata was also tested and showed no evidence of GH transcription.
However this study failed to identify GH7a in the hepatopancreas contrary to published
results, and the replication of the in situ experiment is a focus of future work which
would include exploration of possible site specific differential expression of GH5a and
GH7a in the lobes of the hepatopancreas.
The application of the Western blot technique to identify a specific protein in a tissue
extract has given new evidence which confirms the presence of GH5a and GH7a protein
in the gut and hepatopancreas. Together this work confirms that the suggested site of
transcription and translation of GH protein in L. quadripunctata (Dymond et al., 2003)
is the hepatopancreas.
The CMC plate assay gave a positive result for the depolymerisation of this amorphous
cellulose substrate. This shows that gut and hepatopancreas tissue extract contains an
enzyme active against amorphous cellulose, which is expected from the X-ray and FT-
IR observations. However the identification of specific enzymatic activity within tissue
extract of L. quadripunctata proved problematic, although the test for glucosidase
showed some activity. This suggests that the other results could be explained by an
insufficient concentration of enzyme in the extract.
Future work could repeat the assay and possibly use twice the number of guts and
hepatopancreases to prepare the tissue extracts. Future work could also repeat the phenol
oxidase in-gel assays and the bands which show activity could be removed, and sent for

Discussion
134
protein analysis using MALDI-TOF-TOF. This could identify the protein present in the
bands and help confirm the result. In parallel with the efforts to reveal the presence and
activity of endogenous enzymes produced by L. quadripunctata, investigations into the
chemistry of wood breakdown and utilization by the organism have been undertaken.
X-ray diffraction is an effective tool for showing changes in cellulose crystallinity and
its use has demonstrated increased crystallinity in wood after digestion, while FTIR has
reinforced this observation by showing changes in the hemicelluloses which are the
more amorphous components of wood. Furthermore NMR has been used to identify 13C
labelled glucose originating from feeding L. quadripunctata with a 13C enriched wheat
straw substrate. This glucose was identified in gut extract and labelled 13C trehalose
from the hepatopancreas. This provides evidence of digestion products being assimilated
into the metabolic pool which has been complemented by evidence for digestion of
wood provided by measurements using HPLC to compare, quantify and identify the
sugar components of wood lost during digestion. Together this work provides new
insight into how wood is affected by digestion in L. quadripunctata and what effect the
activity of enzymes involved in this processing is having on the wood.
The SEM observations appeared to show some variation between the markings on the
telson region of L. quadripunctata. The puncti were appeared reduced and clear zones
not covered in spines were more obvious. Evidence has recently come to light that
suggests that there are morphological differences between the males and females of L.
quadripunctata (Simon Cragg pers comm). This could mean that there is a need to
review the taxonomic descriptions to check that there has not been duplication of
species when it is in fact morphological differences between males and females of the
same species.
The continuing development of imaging techniques such as HR X-ray CT scanning
means that future work will benefit from three dimensional reconstruction of the
digestive system. This could be brought about by enhancements of the differentiation
between the soft tissue using resins to impregnate organs of interest such as the gut and

Discussion
135
hepatopancreas (Wirkner & Richter, 2004). This HR X-ray CT complements the use of
the TEM studies of the digestive tract which can be combined with stains to highlight
material like chitinous cuticle. Features of the hepatopancreas could be investigated
using energy dispersive X-ray (EDX) analysis which can be combined with the SEM
and can be used to identify the elemental composition of the sample. This could be used
to look for evidence of iron contained in ferritin crystals in the hepatopancreas using
light microscopy and TEM to produce a collection of images (Strunk, 1959) in L.
quadripunctata. If stores of iron are identified in the hepatopancreas it would be useful
to define the feeding conditions under which the deposits accumulate.
The observed antimicrobial properties identified by a preliminary experiment which
used the hepatopancreas tissue could be linked to the production of peptides from the
respiratory protein, haemocyanin (Destoumieux-Garzón et al., 2001). Previous work has
identified peptides which have been cleaved from the C-terminal of a haemocyanin in
Panaeus vannamei. These peptides have displayed fungicidal activity and it is possible
that L. quadripunctata uses antimicrobial peptides cleaved from its haemocyanin to help
maintain its virtually sterile digestive tract (Boyle & Mitchell, 1978, Ray & Julian,
1952, Ray, 1959, Sleeter et al., 1978). Zasloff (2002) published a review in which the
potential of these widespread antimicrobial peptides is discussed. Their possible mode
of action is also described as targeting the cellular membrane which distinguishes
microbial cells from plant and animals and disrupting its structure causing cell lysis and
death (Figure 6.1). With the potential of antimicrobial peptides for providing novel ways
to treat bacterial infection the mechanism that functions in L. quadripunctata could
prove to be an important aspect of future research in this species.

Discussion
136
Figure 6.1: Graphical representation of how antimicrobial peptides may
interact with a bacterial cytoplasmic membrane. The figure was taken from
Zasloff (2002).
The L. quadripunctata haemocyanin could also prove to possess even more
functionality. Haemocyanin possesses a conserved active site in common with other
type 3 copper proteins which have phenoloxidase activity, tyrosinases and
catecholoxidases. The removal of an N-terminal sequence peptide removes some of the
steric hindrance associated with the active site in haemocyanins and allows them to act
as phenoloxidase (Decker & Tuczek, 2000). This speculatively means that the
haemocyanin could play a role in the digestion of lignin in L. quadripunctata The
apparent phenol oxidase activity observed in the denatured controls in the in vitro
phenol oxidase assay could be explained by the partial heat-denaturation of the

Discussion
137
haemocyanin, which could have removed the steric hindrance of the active site and
produce the observed activity.
Evidence which suggests that haemocyanin may indeed carry out other roles in L.
quadripunctata is provided by the protein analysis of the gut and hepatopancreas tissue.
Crucially haemocyanin was detected in the gut fluid which for a protein normally
associated with oxygen transport is not where it is expected. Also cathepsin A was
identified in the hepatopancreas along with haemocyanin. Cathepsin A is a protease and
could be responsible for the activation of haemocyanin through the cleavage of an N-
terminal sequence or the production of an antimicrobial peptide with the cleavage of a
C-terminal sequence.
This of course requires further investigation. Crucial future work would include the
recombinant expression of L. quadripunctata haemocyanin and determination of its
structure and range of enzymatic functions before and after the removal of steric
hindrance of the active site, combined with the testing of the potential antimicrobial
properties of the short C-terminal peptide sequence. This would help propose a
mechanism for some fundamental aspects of L. quadripunctata biology, the sterile
digestive tract and mechanism of lignin degradation.
Measurement of oxygen levels within the hindgut revealed an anoxic environment.
What this does not tell us is whether or not oxygen is excluded from the gut because it is
bound by haemocyanin upon diffusion into the body, or if oxygen is being used up in an
active manner, either by tissue surrounding the gut or by microbes living on the wood
within it. It is worth mentioning that aerobic communities of cellulolytic bacteria can
produce large amounts of cellulases (Bayer et al., 2004) whereas anaerobes are much
more limited in their output. The oxygen probe work could be developed further by
using a flow cell (Stief & Eller, 2006) to determine oxygen consumption rates within
dissected gut tissue.

Discussion
138
The BHT feeding test demonstrated a significant reduction in feeding from L.
quadripunctata exposed to a 10% w/v concentration of BHT in their food.. Future work
in developing BHT as a preservative in the marine environment could try combining it
with metal chelators as used in a study with fungus already (Schultz & Nicholas, 2002).
Testing to see if this improved its effectiveness against L. quadripunctata this could
further inhibit digestion by removing essential metal ions critical to enzymatic activity.
The pH of the hindgut was found to be around 9.1 this suggests a starting point for work
concerning the optimal conditions for activity of the digestive enzymes in L.
quadripunctata. This work could be developed further by testing all regions along the
length of the gut e.g. the insertion of the probe through the base of the cephalon and into
the proventriculous where the hepatopancreas joins the gut. This could identify if there
are any distinct physiological conditions in a region of the gut closely associated with
the hepatopancreas.
The development of the tidal tank was initially aimed at calculating feeding rates under
different tidal regimes. The purpose of this was based around the hypothesis that as
intertidal organisms, L. quadripunctata may have a digestive cycle; this has been
reported for other intertidal organisms (Langton & Gabbott, 1974). The concern was that
keeping the L. quadripunctata in tanks with no tidal regime and conducting feeding tests
under this condition would be negatively affecting the feeding rate. The tidal tank results
demonstrated that the highest levels of feeding were in fact from the specimens under
constant immersion. What this suggests is that the L. quadripunctata exposed to the air
stopped or slowed their wood consumption during this period. This in turn suggests that
there may be some periodicity to L. quadripunctata digestion. Future work could look
for morphological changes in the hepatopancreas tissue associated with tidal height
using TEM. This could be linked to a study using RT-PCR to model gene expression in
the hepatopancreas over the tidal cycle and correlate this with morphological changes in
the tissue.

Discussion
139
The feeding study carried out on the non durable P. menziesii requires repetition. Next
time the calculation of the density of early and late wood, and the characterisation of the
extractives using an analytical technique to isolate, identify and quantify them should be
carried out. The feeding study should also be extended to see what happens to the
feeding rate over a longer time scale. This will allow a more complete analysis of the
complex relationship between the effect of physical and chemical characteristics of
wood on natural durability with respect to L. quadripunctata.
The main role of the peritrophic membrane in herbivorus insects is to protect them from
ingested chemicals. The membrane surrounds the ingested food matter in the gut and
controls the transfer of potentially harmful compounds secreted by plant like tannins
from entering the body (Barbehenn, 2001). Peritrophic membranes are formed of chitin
microfibrils in a proteoglycan matrix (Lehane, 1997). A peritrophic membrane is
reported throughout the hindgut of L. quadripunctata (Zachary & Colwell, 1979,
Zachary et al., 1983). However Tupper et al. (2000) found the membrane was only
present in the anterior portion of the hindgut. To what extent it is found throughout the
gut of L. quadripunctata remains to be elucidated. There is some evidence of substances
associated with the peritrophic membrane being observed in this study. They normally
include an uronic acid residue of either glucuronic acid or iduronic acid (Lehane, 1997)
which are also in wood. Sugar analyses of the faecal pellets appear to show very small
increases in the galacturonic acid and glucuronic acid residues in the faecal pellets
(Figure 5.9). This could be evidence of peritrophic membrane being excreted attached to
faecal pellets from L. quadripunctata. This is of course a hypothesis that requires further
investigation. The peritrophic membrane could help explain the ability of L.
quadripunctata to consume durable timbers such as C. rodiei and not suffer chronic
toxic effects (Barbehenn, 2001).
The microecology of the burrows and wood infested with L. quadripunctata and the
external micro flora of these animals has received attention by Boyle (1981) and
Delgery et al. (2006). It is suggested that the grooming and ingestion of these microbes
may be a way of recycling nitrogen for L. quadripunctata whose nitrogen source

Discussion
140
remains unclear, as wood is low in this element and the main component of their
exoskeleton is chitin, a polymer containing nitrogen which is then moulted and not re
ingested by the animal (personal observation).
L. tripunctata have been exposed to 14C labelled glycine in a dilute solution in sea water
and were reported to become very radioactive. When incubated with antibiotics the
uptake of 14C labelled glycine was reduced (Anderson & Stephens, 1969) the
microorganisms were reported as being associated with the exoskeleton. It is possible
therefore that a supplementary nitrogen source could be obtained by L. quadripunctata
from microorganisms ingested along with wood or groomed from the body surfaces.
However Anderson & Stephens (1969) concluded that there is no evidence to support
this hypothesis from their study.
It is possible that the source of nitrogen in the diet of L. quadripunctata could be
developed using NMR spectroscopy techniques to track the flow of nitrogen in this
animal. Future work could include growing the bacteria on 15N labelled media, and then
introduce these to host L. quadripunctata and test using NMR spectroscopy for the label
in cellular components.
What has not been addressed as yet is exactly what role microbes have played in the
ability of L. quadripunctata to digest lignocellulose. This is because the evidence
presented so far has been concerned with the enzymes available from L. quadripunctata
alone. Further work could include the production of axenic cultures of microbes and the
L. quadripunctata themselves. The effects on the survival of L. quadripunctata would
be very interesting. Trichomitopsis termopsidis were isolated and axenically cultured by
(Yamin, 1978) from a termite and shown to be cellulolytic. This work would provide an
interesting comparison for future work in this area.
In conclusion, there were three hypotheses that this work set out to explore and were
stated at the end of chapter one. Firstly, the hypothesis was that L. quadripunctata
would digest the wood it lives on and now, from the X-ray and FTIR data presented

Discussion
141
here, we have a better understanding of the extent of the digestion. Secondly, it was
hypothesised that L. quadripunctata would possess a range of enzymes of endogenous
origin that allow it to digest wood. The data from in situ localisation and western blots
have revealed some new endogenous enzymes, but whether the complete lignocellulosic
substrate can be dealt with remains unclear. The final hypothesis was that, once the
wood is digested, the products of digestion would be incorporated into the metabolic
pool and this was revealed by NMR. However what is still unclear is exactly what role
microbes might play in the digestion of L. quadripunctata.
Reference list
142
Reference list
Anderson J.W. and Stephens G.C. (1969) Uptake of organic material by aquatic
invertebrates. VI. Role of epiflora in apparent uptake of glycine by marine
crustaceans. Marine Biology, 4(3), 243-249.
Andersson S., Wikberg H., Pesonen E., Maunu S. and Serimaa R. (2004) Studies
of crystallinity of Scots pine and Norway spruce cellulose. Trees - Structure and
Function, 18(3), 346-353.
Barbehenn R.V. (2001) Roles of peritrophic membranes in protecting herbivorous
insects from ingested plant allelochemicals. Archives of Insect Biochemistry and
Physiology, 47(2), 86-99.
Bayer E.A., Belaich J.-P., Shoham Y. and Lamed R. (2004) The cellulosomes:
multienzyme machines for degradation of plant cell wall polysaccharides. Annual
Review of Microbiology, 58(1), 521-554.
Benson L.K., Stanley A.R. and Johnson B. R. (1999) Evidence of cellulose
digestion in the wood boring isopod Sphaeroma terebrans. Florida Scientist, 62(2),
128-144.
Bertaud F. and Holmbom B. (2004) Chemical composition of earlywood and
latewood in Norway spruce heartwood, sapwood and transition zone wood. Wood
Science and Technology, 38(4), 245-256.
Boisset C., Chanzy H., Henrissat B., Lamed R., Shoham Y. and Bayer E.A.
(1999) Digestion of crystalline cellulose substrates by the Clostridium thermocellum
cellulosome: structural and morphological aspects. Biochemical Journal, 340, 829-
835.
Boonstra M.J., Pizzi A. and Rigolet S. (2006) Correlation of C-13-NMR analysis
with fungal decay tests of polymeric structural wood constituents. I. Basidiomycetes.
Journal of Applied Polymer Science, 101(4), 2639-2649.

Reference list
143
Borges L.M.S., Cragg S.M., Bergot J., Williams J.R., Shayler B. and Sawyer
G.S. (2008) Laboratory screening of tropical hardwoods for natural resistance to the
marine borer Limnoria quadripunctata: The role of leachable and non-leachable
factors. Holzforschung, 62(1), 99-111.
Boyle P.J. and Mitchell R. (1978) Absence of microorganisms in crustacean
digestive tracts. Science, 200(4346), 1157-1159.
Broadbent J. and Read E.M. (1999) Wholemount in situ hybridisation of Xenopus
and Zebrafish Embryos.
Brown C.J. and Eaton R.A. (2001) Toxicity of chromated copper arsenate (CCA)-
treated wood to non-target marine fouling communities in Langstone harbour,
Portsmouth, UK. Marine Pollution Bulletin, 42(4), 310-318.
Brune A., Emerson D. and Breznak J. (1995) The termite gut microflora as an
oxygen sink: microelectrode determination of oxygen and pH gradients in guts of
lower and higher termites. Appl. Environ. Microbiol., 61(7), 2681-2687.
Brunet M., Arnaud J. and Mazza J. (1994) Gut structure and digestive cellular
processes in marine crustacea. Oceanography and Marine Biology, 32, 335-367.
Burg M.B. and Ferraris J.D. (2008) Intracellular organic osmolytes: function and
regulation. Journal of Biological Chemistry, 283(12), 7309-7313.
Byrne K.A., Lehnert S.A., Johnson S.E. and Moore S.S. (1999) Isolation of a
cDNA encoding a putative cellulase in the red claw crayfish Cherax
quadricarinatus. Gene, 239(2), 317-324.
Cleveland L.R. (1924) The physiological and symbiotic relationships between the
intestinal protozoa of termites and their host: with special reference to Reticulitermes
flavipes (Kollar). Biological Bulletin, 46(5), 203-227.

Reference list
144
Cragg S.M., Danjon C. and Mansfield-Williams H. (2007) Contribution of
hardness to the natural resistance of a range of wood species to attack by the marine
borer Limnoria. Holzforschung, 61(2), 201-206.
Cragg S.M., Pitman A.J. and Henderson S.M. (1999) Developments in the
understanding of the biology of marine wood boring crustaceans and in methods of
controlling them. International Biodeterioration & Biodegredation, 43(4), 197-205.
Cullen D. and Kersten P.J. (2004) Enzymology and molecular biology of lignin
degradation. The Mycota III : biochemistry and molecular biology. Berlin ;
Heidelberg : Springer-Verlag, 249-273.
Decker H. and Tuczek F. (2000) Tyrosinase/catecholoxidase activity of
hemocyanins: structural basis and molecular mechanism. Trends in Biochemical
Sciences, 25(8), 392-397.
Delgery C.C., Cragg S.M., Busch S. and Morgan E.A. (2006) Effects of the
epibiotic heterotrich ciliate Mirofolliculina limnoriae and of moulting on faecal
pellet production by the wood-boring isopods, Limnoria tripunctata and Limnoria
quadripunctata. Journal of Experimental Marine Biology and Ecology, 334(2), 165-
173.
Destoumieux-Garzón D., Saulnier D., Garnier J., Jouffrey C., Bulet P. and
Bachère E. (2001) Crustacean Immunity. Journal of Biological Chemistry, 276(50),
47070-47077.
Dymond J., Guille M.J. and Cragg S.M. (2003) Isolation of a putative endogenous
endo-b-1,4-glucanase (cellulase) from the midgut diverticulae of the wood-boring
crustacean, Limnoria quadripunctata. International Research Group on Wood
Preservation.
Ebert A. and Brune A. (1997) Hydrogen concentration profiles at the oxic-anoxic
interface: a microsensor study of the hindgut of the wood-feeding lower termite
Reticulitermes flavipes (Kollar). Appl. Environ. Microbiol., 63(10), 4039-4046.

Reference list
145
Fan T.W-M. (1996) Metabolite profiling by one- and two-dimensional NMR
analysis of complex mixtures. Progress in Nuclear Magnetic Resonance
Spectroscopy, 28(2), 161-219.
Fengel D. and Wegener G. (1984) Wood chemistry, ultrastructure, reactions, New
York: Walter de Gruyter.
Gomez-Toribio V., Garcia-Martin A.B., Martinez M.J., Martinez A.T. and
Guillen F. (2009) Induction of extracellular hydroxyl radical production by white-
rot fungi through quinone redox cycling. Appl. Environ. Microbiol., 75(12), 3944-
3953.
Harris P.V., Welner D., McFarland K.C., Re E., Poulsen J-C.N., Brown K.,
Salbo R., Ding H., Vlasenko E., Merino S., Xu F., Cherry J., Larsen S. and
Leggio L.L. (2010) Stimulation of lignocellulosic biomass hydrolysis by proteins of
glycoside hydrolase family 61: structure and function of a large, enigmatic family.
Biochemistry, 49(15), 3305-3316.
Hermans P.H. and Weidinger A. (1949) X-ray studies on the crystallinity of
cellulose. Journal of Polymer Science, 4(2), 135-144.
Himmel M.E., Ding S-Y., Johnson D.K., Adney W.S., Nimlos M.R., Brady J.W.
and Foust T.D. (2007) Biomass recalcitrance: engineering plants and enzymes for
biofuels production. Science, 315(5813), 804-807.
Hines A., Oladiran G.S., Bignell J.P., Stentiford G.D. and Viant M.R. (2007)
Direct sampling of organisms from the field and knowledge of their phenotype: key
recommendations for environmental metabolomics. Environmental Science &
Technology, 41(9), 3375-3381.
Hongoh Y., Ohkuma M. and Kudo T. (2003) Molecular analysis of bacterial
microbiota in the gut of the termite Reticulitermes speratus (Isoptera;
Rhinotermitidae). FEMS Microbiology Ecology, 44(2), 231-242.

Reference list
146
Hopkins D.W., Chudek J.A., Bignell D.E., Frouz J., Webster E.A. and Lawson
T. (1998) Application of C-13 NMR to investigate the transformations and
biodegradation of organic materials by wood- and soil-feeding termites, and a
coprophagous litter-dwelling dipteran larva. Biodegradation, 9(6), 423-431.
Howell C., Steenkjær Hastrup A.C., Goodell B. and Jellison J. (2009) Temporal
changes in wood crystalline cellulose during degradation by brown rot fungi.
International Biodeterioration & Biodegradation, 63(4), 414-419.
Idris A., Ismail A.F., Noorhayati M. and Shilton S.J. (2003) Measurement of
rheologically induced molecular orientation using attenuated total reflection infrared
dichroism in reverse osmosis hollow fiber cellulose acetate membranes and
influence on separation performance. Journal of Membrane Science, 213(1-2), 45-
54.
Kacuráková M., Smith A.C., Gidley M.J. and Wilson R.H. (2002) Molecular
interactions in bacterial cellulose composites studied by 1D FT-IR and dynamic 2D
FT-IR spectroscopy. Carbohydrate Research, 337(12), 1145-1153.
Khademi S., Guarino L.A., Watanabe H., Tokuda G. and Meyer E.F. (2002)
Structure of an endoglucanase from termite, Nasutitermes takasagoensis. Acta
Crystallographica Section D, 58(4), 653-659.
King A.J., Cragg S.M., Li Y., Dymond J., Guille M.J., Bowles D.J., Bruce N.C.,
Graham I.A. and McQueen-Mason S.J. (2010) Molecular insight into
lignocellulose digestion by a marine isopod in the absence of gut microbes.
Proceedings of the National Academy of Sciences of the United States of America,
107(12), 5345-5350.
King F.E. and Jurd L. (1953) The chemistry of extractives from hardwoods. Part
XII. The cyclitols and steroids of opepe (Sarcocephalus diderrichii). Journal of the
Chemical Society (Resumed), 239, 1192-1195.

Reference list
147
Kirk T.K. (1971) Effects of microorganisms on lignin. Annual Review of
Phytopathology, 9, 185-211.
Kostanjšek R., Milatovič M. and Štrus J. (2010) Endogenous origin of endo-β-
1,4-glucanase in common woodlouse; Porcellio scaber; (Crustacea, Isopoda).
Journal of Comparative Physiology B: Biochemical, Systemic, and Environmental
Physiology, 180(8), 1143-1153.
Langan P., Sukumar N., Nishiyama Y. and Chanzy H. (2005) Synchrotron X-ray
structures of cellulose Iβ and regenerated cellulose II at ambient temperature and
100 K. Cellulose, 12(6), 551-562.
Langton R.W. and Gabbott P.A. (1974) The tidal rhythm of extracellular digestion
and the response to feeding in Ostrea edulis. Marine Biology, 24(2), 181-187.
Lehane M.J. (1997) Peritoophic matrix structure and function. Annual Review of
Entomology, 42(1), 525-550.
Levitt M.H. and Forsterling F.H. (2010) Spin dynamics: Basics of Nuclear
Magnetic Resonance, Second Edition.
Lin C., Wu H., Tjeerdema R. and Viant M. (2007) Evaluation of metabolite
extraction strategies from tissue samples using NMR metabolomics. Metabolomics,
3(1), 55-67.
Lin C.Y., Viant M.R. and Tjeerdema R.S. (2006) Metabolomics: Methodologies
and applications in the environmental sciences. Journal of Pesticide Science, 31(3),
245-251.
Liu R., Yu H. and Huang Y. (2005) Structure and morphology of cellulose in
wheat straw. Cellulose, 12(1), 25-34.

Reference list
148
López-Rituerto E., Avenoza A., Busto J.H. and Peregrina J.M. (2010) Evidence
of metabolic transformations of amino acids into higher alcohols through 13C NMR
studies of wine alcoholic fermentation. Journal of Agricultural and Food Chemistry,
58(8), 4923-4927.
Marzullo L., Cannio R., Giardina P., Santini M.T. and Sannia G. (1995)
Veratryl alcohol oxidase from Pleurotus ostreatus participates in lignin
biodegradation and prevents polymerization of laccase-oxidized substrates. Journal
of Biological Chemistry, 270(8), 3823-3827.
Mason M.G., Nicholls P. and Wilson M.T. (2003) Rotting by radicals-the role of
cellobiose oxidoreductase? Biochem. Soc. Trans., 31(6), 1335-1336.
Matulova M., Nouaille R., Capek P., Pean M., Delort A.M. and Forano E.
(2008) NMR study of cellulose and wheat straw degradation by Ruminococcus albus
20. Febs Journal, 275(13), 3503-3511.
Mayer A.M. and Staples R.C. (2002) Laccase: new functions for an old enzyme.
Phytochemistry, 60(6), 551-565.
McKennis H., Hearst P.J., Drisko R.W., Roe T. and Alumbaugh R.L. (1956)
Isolation of a tetramethoxylated alkaloid from demerara greenheart. Journal of the
American Chemical Society, 78(1), 245-248.
Menzies R.J. (1957) The marine borer family limnoriidae (Crustacea, Isopoda). Part
I: Northern and central america: systematics, distribution, and ecology. Bulletin of
Marine Science, 7, 101-200.
Mesa-Siverio D., Estévez-Braun A., Ravelo Á.G., Murguia J.R. and Rodríguez-
Afonso A. (2003) Novel DNA-damaging tropolone derivatives from Goupia glabra.
European Journal of Organic Chemistry, 2003(21), 4243-4247.
Messer A., McCormick K., Sunjaya, Hagedorn H.H., Tumbel F. and Meinwald
J. (1990) Defensive role of tropical tree resins: antitermitic sesquiterpenes from
southeast asian dipterocarpaceae. Journal of Chemical Ecology, 16(12), 3333-3352.

Reference list
149
Meyer K.H. and Misch L. (1937) Positions des atomes dans le nouveau modèle
spatial de la cellulose. Helvetica Chimica Acta, 20(1), 232-244.
Nakashima K., Watanabe H., Saitoh H., Tokuda G. and Azuma J.I. (2002) Dual
cellulose-digesting system of the wood-feeding termite, Coptotermes formosanus
(Shiraki). Insect Biochemistry and Molecular Biology, 32(7), 777-784.
O'Sullivan A. (1997) Cellulose: the structure slowly unravels. Cellulose, 4(3), 173-
207.
Ohmura W., Doi S., Aoyama M. and Ohara S. (2000) Antifeedant activity of
flavonoids and related compounds against the subterranean termite Coptotermes
formosanus (Shiraki). Journal of Wood Science, 46(2), 149-153.
Paakkari T., Blomberg M. and Serimaa R. (1988) A texture correction for
quantitative X-ray powder diffraction analysis of cellulose. Journal of Applied
Crystallography, 21(5), 393-397.
Paakkari T. and Serimaa R. (1984) A study of the structure of wood cells by X-
ray diffraction. Wood Science and Technology, 18(2), 79-85.
Palanti S., Pizzo B., Feci E., Fiorentino L. and Torniai A.M. (2010) Nutritional
requirements for larval development of the dry wood borer Trichoferus holosericeus
(Rossi) in laboratory cultures. Journal of Pest Science, 83(2), 157-164.
Park S., Baker J., Himmel M., Parilla P. and Johnson D. (2010) Cellulose
crystallinity index: measurement techniques and their impact on interpreting
cellulase performance. Biotechnology for Biofuels, 3(1), 10.
Park S., Johnson D., Ishizawa C., Parilla P. and Davis M. (2009) Measuring the
crystallinity index of cellulose by solid state 13C nuclear magnetic resonance.
Cellulose, 16(4), 641-647.

Reference list
150
Pauchet Y., Wilkinson P., Chauhan R. and ffrench-Constant R.H. (2010)
Diversity of beetle genes encoding novel plant cell wall degrading enzymes. PLoS
ONE, 5(12), e15635.
Perdomo-Morales R., Montero-Alejo V., Perera E., Pardo-Ruiz Z. and Alonso-
Jiménez E. (2008) Hemocyanin-derived phenoloxidase activity in the spiny lobster
Panulirus argus (Latreille, 1804). Biochimica et Biophysica Acta, 1780(4), 652-658.
Perkins D.N., Pappin D.J.C., Creasy D.M. and Cottrell J.S. (1999) Probability-
based protein identification by searching sequence databases using mass
spectrometry data. Electrophoresis, 20(18), 3551-3567.
Ragauskas A.J., Williams C.K., Davison B.H., Britovsek G., Cairney J., Eckert
C.A., Frederick Jr W.J., Hallett J.P., Leak D.J., Liotta C.L., Mielenz J.R.,
Murphy R., Templer R. and Tschaplinski T. (2006) The path forward for biofuels
and biomaterials. Science, 311(5760), 484-489.
Ray D.L. and Julian J.R. (1952) Occurrence of cellulase in Limnoria. Nature,
169(4288), 32-33.
Ray D.L. (1959) Marine boring and fouling organisms, Seattle: Univ. Washington
Press.
Schultz T.P. and Nicholas D.D. (2000) Naturally durable heartwood: evidance for a
proposed dual defensive function of the extractives. Phytochemistry, 54, 47-52.
Schultz T.P. and Nicholas D.D. (2002) Development of environmentally-benign
wood preservatives based on the combination of organic biocides with antioxidants
and metal chelators. Phytochemistry, 61(5), 555-560.
Schultz T.P., Nicholas D.D. and Prewitt M.L. (2004) Environmentally-benign
wood preservatives based on an organic biocide:antioxidant combination: Ground-
contact efficacy ratings and BHT depletion after four years of exposure.
Holzforschung, 58(3), 300-304.

Reference list
151
Segal L., Creely J.J., Martin A.E. and Conrad C.M. (1959) An empirical method
for estimating the degree of crystallinity of native cellulose using the X-ray
diffractometer. Textile Research Journal, 29(10), 786-794.
Seifert K. (1964) Über den abbau der holzsubstanz durch die bohrassel Limnoria.
European Journal of Wood and Wood Products, 22(6), 209-215.
Sidjanski S., Mathews G.V. and Vanderberg J.P. (1997) Electrophoretic
separation and identification of phenoloxidases in hemolymph and midgut of adult
Anopheles stephensi mosquitoes. The Journal of Parasitology, 83(4), 686-691.
Sivrikaya H., Cragg, S. and Borges L. (2009) Variation in resistance to marine
borers in commercial timbers from Turkey, as assessed by marine trial and
laboratory screening. Turkish Journal of Agriculture and Forestry, 33, 569-576.
Sleeter T.D., Boyle P.J., Cundell A.M. and Mitchell R. (1978) Relationships
between marine microorganisms and the wood-boring isopod Limnoria tripunctata.
Marine Biology, 45(4), 329-336.
Smant G., Stokkermans J.P.W.G., Yan Y., DeBoer J.M., Baum T.J., Wang X.,
Hussey R.S., Gommers F.J., Henrissat B., Davis E.L., Helder J., Schots A. and
Bakker J. (1998) Endogenous cellulases in animals: Isolation of β-1,4-
endoglucanase genes from two species of plant-parasitic cyst nematodes.
Proceedings of the National Academy of Sciences of the United States of America,
95(9), 4906-4911.
Solomon E.I., Sundaram U.M. and Machonkin T.E. (1996) Multicopper oxidases
and oxygenases. Chemical Reviews, 96(7), 2563-2606.
Stief P. and Eller G. (2006) The gut microenvironment of sediment-dwelling
Chironomus plumosus larvae as characterised with O2, pH, and redox microsensors.
Journal of Comparative Physiology B: Biochemical, Systemic, and Environmental
Physiology, 176(7), 673-683.

Reference list
152
Strunk S.W. (1959) The formation of intracellular crystals in midgut glands of
Limnoria lignorum. Journal of Biophysical and Biochemical Cytology, 5(3), 385-
392.
Sugiyama J., Vuong R. and Chanzy H. (1991) Electron diffraction study on the
two crystalline phases occurring in native cellulose from an algal cell wall.
Macromolecules, 24(14), 4168-4175.
Taylor A., Gartner B. and Morrell J. (2002) Heartwood formation and natural
durability, a review. Wood and Fiber Science, 34(4), 587-611.
Teather R.M. and Wood P.J. (1982) Use of Congo red-polysaccharide interactions
in enumeration and characterization of cellulolytic bacteria from the bovine rumen.
Appl. Environ. Microbiol., 43(4), 777-780.
Tejiran A. and Xu F. (2010) Inhibition of cellulase-catalyzed lignocellulosic
hydrolysis by iron and oxidative metal ions and complexes. Appl. Environ.
Microbiol., 76(23), 7673-7682.
Thygesen A., Oddershede J., Lilholt H., Thomsen A.B. and Stahl K. (2005) On
the determination of crystallinity and cellulose content in plant fibres. Cellulose, 12,
563-576.
Tokuda G., Lo N. and Watanabe H. (2005) Marked variations in patterns of
cellulase activity against crystalline- vs. carboxymethyl-cellulose in the digestive
systems of diverse, wood-feeding termites. Physiological Entomology, 30(4), 372-
380.
Tupper C., Pitman A.J. and Cragg S.M. (2000) Copper accumulation in the
digestive caecae of Limnoria quadripunctata (Holthius) (Isopoda: Crustacea)
tunnelling CCA-treated wood in laboratory cultures. Holzforschung, 54(6), 570-576.
Vaaje-Kolstad G., Westereng B., Horn S.J., Liu Z., Zhai H., Sølie M. and
Eijsink V.G.H. (2010) An oxidative enzyme boosting the enzymatic conversion of
recalcitrant polysaccharides. Science, 330(6001), 219-222.

Reference list
153
VanderHart D.L. and Atalla R.H. (1984) Studies of microstructure in native
celluloses using solid-state carbon-13 NMR. Macromolecules, 17(8), 1465-1472.
Varm A., Kolli B.K., Paul J., Saxena S. and König H. (1994) Lignocellulose
degradation by microorganisms from termite hills and termite guts: A survey on the
present state of art. FEMS Microbiology Reviews, 15(1), 9-28.
Vazquez L., Alpuche J., Maldonado G., Agundis C., Pereyra-Morales A. and
Zenteno E. (2009) Review: Immunity mechanisms in crustaceans. Innate Immunity,
15(3), 179-188.
Wada M., Okano T. and Sugiyama J. (1997) Synchrotron-radiated X-ray and
neutron diffraction study of native cellulose. Cellulose, 4, 221-232.
Warren R.A.J. (2003) Microbioal hydrolysis of polysaccharides. Annual Review of
Microbiology, 50(1), 183-212.
Watanabe H. and Tokuda G. (2001) Animal cellulases. Cellular and Molecular
Life Sciences, 58(9), 1167-1178.
Watanabe H. and Tokuda G. (2010) Cellulolytic systems in insects. Annual
Review of Entomology, 55, 609-632.
Westermark U. and Eriksson K-E. (1974) Carbohydrate dependant enzymatic
quinone reduction during lignin degradation. Acta Chemica Scandinavica, 28, 204-
208.
Wirkner C.S. and Richter S. (2004) Improvement of microanatomical research by
combining corrosion casts with MicroCT and 3D reconstruction, exemplified in the
circulatory organs of the woodlouse. Microscopy Research and Technique, 64(3),
250-254.
Yamin M.A. (1978) Axenic cultivation of the cellulictic flagellate Trichomitopsis
termopsidis (Cleveland) from the termite Zootermopsis. Journal of Eukaryotic
Microbiology, 25(4), 535-538.
Reference list
154
Yonge C.M. (1927) The absence of cellulase in Limnoria. Nature, 119, 855.
Zachary A. and Colwell R.R. (1979) Gut-associated microflora of Limnoria
tripunctata in marine creosote-treated wood pilings. Nature, 282(5740), 716-717.
Zachary A., Parrish K.K. and Bultman J.D. (1983) Possible role of marine
bacteria in providing the creosote resistance of Limnoria tripunctata. Marine
Biology, 75(1), 1-8.
Zasloff M. (2002) Antimicrobial peptides of multicellular organisms. Nature,
415(6870), 389-395.
Zimmer M., Danko J.P., Pennings S.C., Danford A.R., Carefoot T.H., Ziegler
A. and Uglow R.F. (2002) Cellulose digestion and phenol oxidation in coastal
isopods (Crustacea: Isopoda). Marine Biology, 140(6), 1207-1213.

Appendix
155
Appendix
The shift list used to identify the metabolites in the NMR spectroscopy study obtained
from the human metabolome database:
http://www.hmdb.ca/search/spectra?type=nmr_search
F1 Referrers to the 13C chemical shift and F2, the 1H chemical shift.
Alanine

Appendix
156
Acetate
Betaine

Appendix
157
Erythritol
Glucose

Appendix
158
Glucuronic acid
Glutamic acid

Appendix
159
Glycerol
Glycine

Appendix
160
Glycolic acid
Iditol

Appendix
161
Lactic acid
Pyrrolidonecarboxylic acid

Appendix
162
Ribitol
Succinic acid

Appendix
163
Trehalose
Trimethylamine N-oxide