info edge (india) limited
TRANSCRIPT

Info Edge (India) LimitedIndia’s internet classifieds company
August, 2017
1

DisclaimerThis presentation has been prepared by Info Edge (India) Limited (the “Company”) solely for information purposes without any regard to any specific objectives,financial situations or information needs of any particular person. This presentation and its contents are confidential and should not be copied, distributed,disseminated, published or reproduced, in whole or part, or disclosed by recipients directly or indirectly to any other person. By reviewing this presentation, youagree to be bound by the trailing restrictions regarding the information disclosed in these materials.
This presentation contains statements that constitute forward-looking statements. These statements include descriptions regarding the intent, belief or currentexpectations of the Company or its directors and officers with respect to the results of operations and financial condition of the Company. These statementscan be recognized by the use of words such as “expects,” “plans,” “will,” “estimates,” “projects,” or other words of similar meaning. Such forward-lookingstatements are not guarantees of future performance and involve risks and uncertainties, and actual results may differ from those in such forward-lookingstatements as a result of various factors and assumptions which the Company believes to be reasonable in light of its operating experience in recent years.The risks and uncertainties relating to these statements include, but not limited to, risks and uncertainties, regarding fluctuations in earnings, our ability tomanage growth and competition, among others. The Company does not undertake any obligation to revise or update any forward-looking statement that maybe made from time to time by or on behalf of the Company. Given these risks, uncertainties and other factors, viewers of this presentation are cautioned not toplace undue reliance on these forward-looking statements.
No representation, warranty, guarantee or undertaking, express or implied, is or will be made as to, and no reliance should be placed on, the accuracy,completeness, correctness or fairness of the information, estimates, projections and opinions contained in this presentation. Potential investors must make theirown assessment of the relevance, accuracy and adequacy of the information contained in this presentation and must make such independent investigation asthey may consider necessary or appropriate for such purpose. Such information and opinions are in all events not current after the date of this presentation.Further, past performance of the Company is not necessarily indicative of its future results. Any opinions expressed in this presentation or the contents of thispresentation are subject to change without notice. This presentation should not be construed as legal, tax, investment or other advice.
Neither the Company nor any placement agent, promoters or any other persons that may participate in any offering of any securities of the Company shall haveany responsibility or liability whatsoever for any loss howsoever arising from this presentation or its contents or otherwise arising in connection therewith.
This presentation does not constitute or form part of and should not be construed as, directly or indirectly, any offer or invitation or inducement to sell or issue,or any solicitation of any offer to purchase or subscribe for, any securities of the Company by any person in any jurisdiction, including in India, the UnitedStates, Australia, Canada or Japan, nor shall it or any part of it or the fact of its distribution form the basis of, or be relied on in connection with, any investmentdecision or any contract or commitment therefore.
Securities of the Company may not be offered or sold in the United States absent registration or an applicable exemption from registration under the UnitedStates Securities Act of 1933, as amended.
This presentation is not a prospectus, a statement in lieu of a prospectus, an offering circular, an advertisement or an offer document under the CompaniesAct, 2013, the Securities and Exchange Board of India (Issue of Capital and Disclosure Requirements) Regulations, 2009, as amended, or any other applicablelaw in India.
Data, numbers and statements made are what the company or investee company believes are a reasonable representation of the respective business(es).
All figures mentioned are for Info Edge (India) Ltd. as a standalone entity and are as of June 30, 2017 or for the quarter ended June 30,2017, unless indicated otherwise
Q1 FY18 or Q1 FY17 - 18 means the period Mar 31, 2017 to Jun 30, 2017
FY17 or FY 16-17 or FY 2017 means the Financial Year starting April 1, 2016 and ending March 31, 2017
1 Crore = 10 Million = 100 Lakh 2

Our internal businesses
Dominant market leader India’s leading real estate site
Number 3 but fastest growing India’s leading education listings site
Job site focused on the Gulf market
3
Executive search

Strategic investments#
India’s leading restaurant ratings and review siteShareholding ~46%*
Supplementary online learning platform for K12 and Entrance ExamsShareholding ~59%*
Men’s grooming range (Ustraa) and creative/fun productsShareholding ~48 %*
India’s leading insurance comparison siteShareholding ~10%*^
India’s leading site for prints and photobooks Shareholding ~57%*
# Other strategic investments include Vacation Labs (SAAS solution for tour operators, 26%); Unnati Helpers (Tech enabled employment software, 28%); Rare Media Company (Field sales force management, 35%); Diro Labs (Phonebook app, 15%); Wishbook (Catalog sharing app, 22%), Mydala (deals & discounts, 42%)* Approximate shareholding on fully disbursed and converted basis, held directly or indirectly (through subsidiaries, associates or affiliates). The % shareholding may or may not translate into an equivalent economic interest on account of conditions in the investment/ shareholders agreements. ^ being Info Edge's proportionate share of economic interest. Info Edge's 50.01% subsidiary, Makesense holds nearly 20% of PolicyBazaar in association with Temasek. Temasek had infused a total of Rs 134 Crore for its 49.99% stake in Oct, 2015
4
On demand, at home, beauty related servicesShareholding ~49%*

824 13
26
2152 23
97
2241
Revenue and Operating EBITDA margin for the standalone entity, 2007 – 2017
Financial performance track record
Margins declined during FY 14 -16 mainly on account of increased investments in 99acres
• IND-AS numbers for FY16 and FY17; Margins for FY16and FY17 calculated on EBITDA adjusted for non-cash charges. Rest all years in I GAAP.
• Please note that as per IGAAP, the FY16 and FY17 Op. EBITDA margins were at 22% and 33% respectively, while the recruitment EBITDA margins were at 54% and 56% respectively
5
140
219
245
232
294
377 43
7 506 61
2 718 80
2
26%29%
27%29%
33%38%
34% 33%30%
21%
32%35.7%
41.5%43.6%
41.1%45.3%
51.0%49.0% 50.5%
53.7% 53.5% 56.1%
0%
10%
20%
30%
40%
50%
60%
0
100
200
300
400
500
600
700
800
900
FY07 FY08 FY09 FY10 FY11 FY12 FY13 FY14 FY15 FY16* FY17*
Revenue (Rs Crore) Operating EBITDA margin (%) Recruitment EBITDA margin (%)

Strong CashAccretion
Negative WC Cycle
High margins and operating
leverage
Capital efficiency
Strong balance sheet, negative working capital and negligible leverage
Liabilities – Negligible leverage
Assets – 58% Cash
As of June 30, 2017 (as per IND-AS)6
58%
30%
2%4%
6%Cash & LiquidInvestments
Strategic Investments
Net Fixed Assets
Non Current Assets
Current Assets
Cash and equivalents Rs 1455 Crore
82%
14%
4%
Shareholders Equity
Deferred Sales Revenue
Liabilities & Provisions

Corporate governance
Independent Directors are a majority on the Board
Separation of Chairman and CEO role
Non Executive Chairman
Statutory Audit performed by EY
Internal Audit performed by an external firm
Audit committee comprises of only Independent Directors
Disclosure of quarterly balance sheet and cash flow statements though not mandatory in India
Formal dividend policy (15 to 40% of standalone PAT adjusted for non-cash charges / income)
Whistle blower mechanism
7
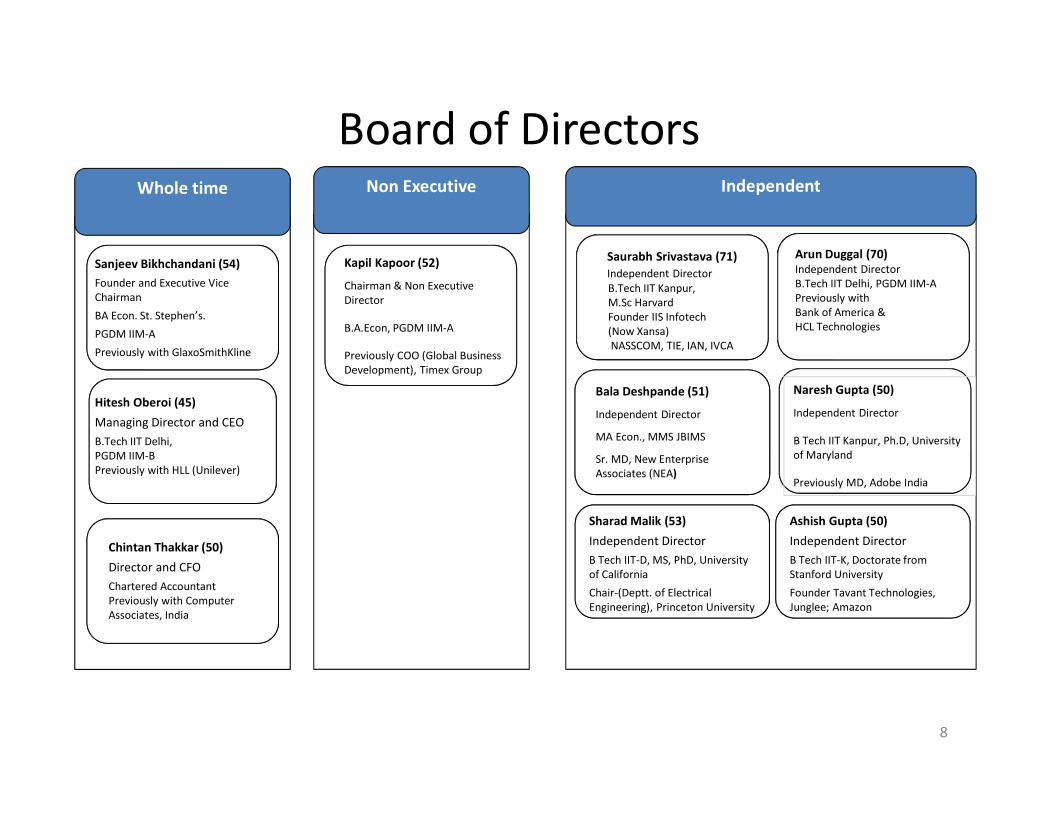
Board of Directors
Saurabh Srivastava (71)Independent DirectorB.Tech IIT Kanpur,M.Sc HarvardFounder IIS Infotech(Now Xansa)NASSCOM, TIE, IAN, IVCA
Arun Duggal (70)Independent DirectorB.Tech IIT Delhi, PGDM IIM-APreviously with Bank of America &HCL Technologies
Naresh Gupta (50)
Independent Director
B Tech IIT Kanpur, Ph.D, University of Maryland
Previously MD, Adobe India
Bala Deshpande (51)
Independent Director
MA Econ., MMS JBIMS
Sr. MD, New Enterprise Associates (NEA)
Kapil Kapoor (52)
Chairman & Non Executive Director
B.A.Econ, PGDM IIM-A
Previously COO (Global Business Development), Timex Group
Independent Non Executive
Sanjeev Bikhchandani (54)Founder and Executive Vice Chairman
BA Econ. St. Stephen’s.
PGDM IIM-A
Previously with GlaxoSmithKline
Hitesh Oberoi (45)Managing Director and CEOB.Tech IIT Delhi, PGDM IIM-BPreviously with HLL (Unilever)
Whole time
Chintan Thakkar (50)Director and CFOChartered AccountantPreviously with Computer Associates, India
Sharad Malik (53)Independent DirectorB Tech IIT-D, MS, PhD, University of California
Chair-(Deptt. of Electrical Engineering), Princeton University
8
Ashish Gupta (50)Independent DirectorB Tech IIT-K, Doctorate from Stanford University
Founder Tavant Technologies, Junglee; Amazon
Mumbai
Bangalore
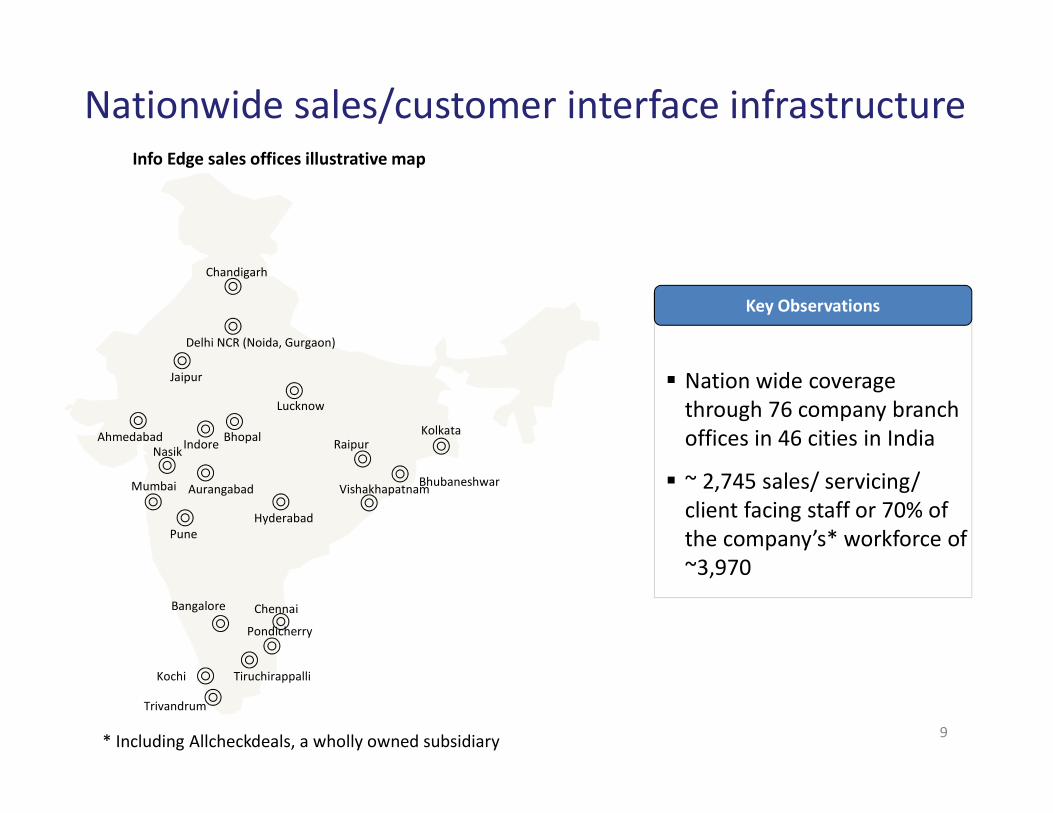
Nationwide sales/customer interface infrastructure
Nation wide coverage through 76 company branch offices in 46 cities in India
~ 2,745 sales/ servicing/ client facing staff or 70% of the company’s* workforce of ~3,970
Delhi NCR (Noida, Gurgaon)
Chennai
Hyderabad Pune
Kolkata
Chandigarh
Key Observations
Info Edge sales offices illustrative map
Lucknow
Ahmedabad Bhopal
Jaipur
IndoreNasik
Aurangabad
Tiruchirappalli
Trivandrum
Vishakhapatnam
Pondicherry
* Including Allcheckdeals, a wholly owned subsidiary
Kochi
Bhubaneshwar
Raipur
9
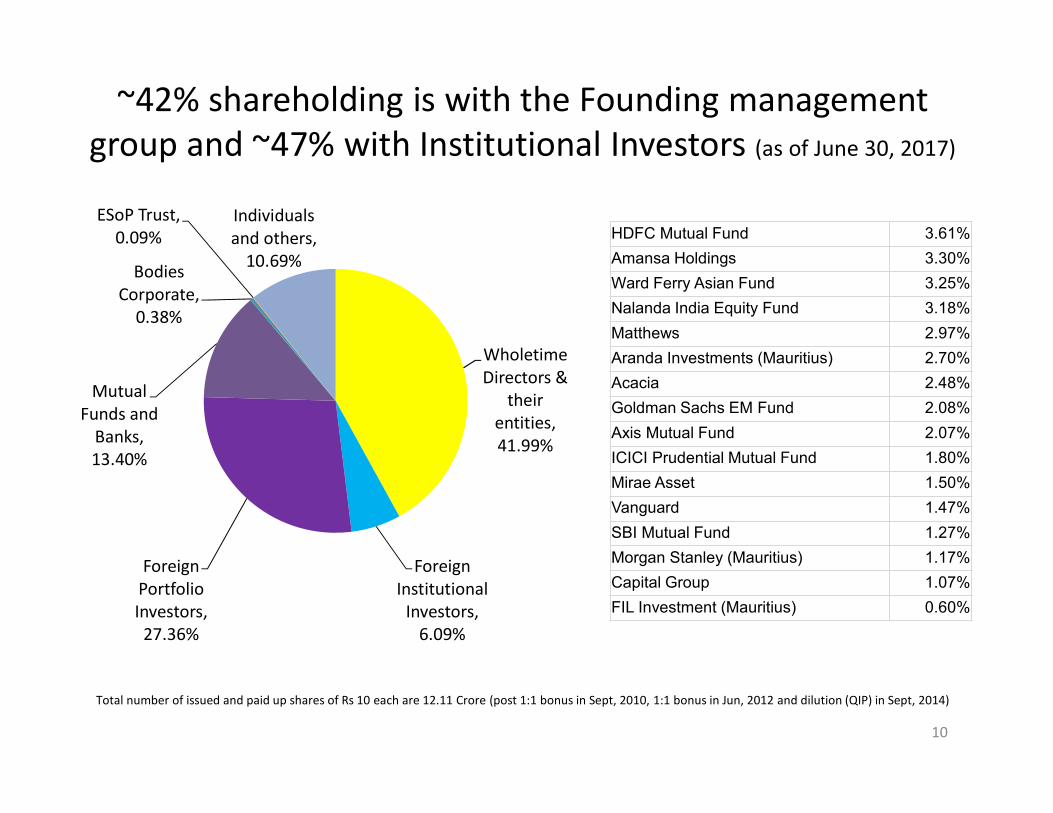
~42% shareholding is with the Founding management group and ~47% with Institutional Investors (as of June 30, 2017)
Total number of issued and paid up shares of Rs 10 each are 12.11 Crore (post 1:1 bonus in Sept, 2010, 1:1 bonus in Jun, 2012 and dilution (QIP) in Sept, 2014)
10
Wholetime Directors &
their entities, 41.99%
Foreign Institutional
Investors, 6.09%
Foreign Portfolio Investors,
27.36%
Mutual Funds and
Banks, 13.40%
Bodies Corporate,
0.38%
ESoP Trust, 0.09%
Individuals and others,
10.69%HDFC Mutual Fund 3.61%
Amansa Holdings 3.30%
Ward Ferry Asian Fund 3.25%
Nalanda India Equity Fund 3.18%
Matthews 2.97%
Aranda Investments (Mauritius) 2.70%
Acacia 2.48%
Goldman Sachs EM Fund 2.08%
Axis Mutual Fund 2.07%
ICICI Prudential Mutual Fund 1.80%
Mirae Asset 1.50%
Vanguard 1.47%
SBI Mutual Fund 1.27%
Morgan Stanley (Mauritius) 1.17%
Capital Group 1.07%
FIL Investment (Mauritius) 0.60%

Naukri
11

12

Naukri is the dominant leader in the online job market
• During or end of, Q1 FY 17-18– ~74% traffic share in June, 2017 (Source : SimilarWeb)
– 375,000 avg. job listings on a given day– ~5.3 Crore resumes– 17,700+ avg. resumes added daily – 264,000+ resumes modified daily– 800,000 to 1,000,000 resume searches daily– 70 to 100 lakh resume contacts by recruiters daily – 40,000+ job seekers availed premium services
• 47,200+ unique clients in Q1FY18 vs 43,800+ in Q1FY17 (based on IND-AS revenue)
13

14
Source: SimilarWeb Above chart excludes Linkedin since much of the traffic may not pertain to jobs~66% of the total sessions for Naukri, in Q1 FY 17-18, through mobile, Source : Google Analytics
Traffic from desktops and laptops based on time spent
0.0%
10.0%
20.0%
30.0%
40.0%
50.0%
60.0%
70.0%
80.0%
90.0%
Naukri Monster India Timesjob Shine
Naukri has dominant traffic share

Naukri has dominant traffic share
15
Source: SimilarWeb Above chart excludes Linkedin since much of the traffic may not pertain to jobs~66% of the total sessions for Naukri, in Q1 FY 17-18, through mobile, Source : Google Analytics
Traffic from mobile web based on time spent
0.0%
10.0%
20.0%
30.0%
40.0%
50.0%
60.0%
70.0%
80.0%
Naukri Monster India Timesjob Shine

Naukri has dominant traffic share Android App traffic share based on time spent
16
Source: SimilarWeb Above chart excludes Linkedin since much of the traffic may not pertain to jobs~66% of the total sessions for Naukri, in Q1 FY 17-18, through mobile, Source : Google Analytics
0%
10%
20%
30%
40%
50%
60%
70%
80%
90%
100%
Naukri TimesJobs Shine Monster

Naukri is a business of the virtuous circle
We get the most
clients We’ve got the most jobs
We get the most traffic
We get the most response
• Naukri has over 100% of industry profits enabling greater investment in – Product
innovation– Engineering– Brand support– Sales network – Servicing back
office– Superior talent
Benefits
17

Revenue sourcesB2B revenues about 90% (from Recruiters)– Resume database access– Job listing (response management)– Employer branding (visibility)– Career site manager – Others - Resume short listing and screening,
campus recruitment– Non recruitment advertising (other than for
jobs) B2C about 10%– Job seeker services
18

Breakup of revenue by product type and industry in FY 16-17*
Assuming 50% of the revenue from Recruitment firms is from IT industry, then IT and ITeS is about 42%
BFSI is banking, financial services and insurance* All percentages calculated as per IND-AS
19
IT and ITES, 30.1%
Recruitement firms, 25.3%
Infrastructure, 14.2%
BFSI, 5.1%
Manufacturing, 5.7%
Services/ others, 19.6%
Resume database
access, 60.4%Job listings, 13.2%
Job seeker services,
10.8%
Branding, 8.1%
Assisted search, 4.6%
CSM, 1.5%
Referral hiring tool, 0.4%
Others, 0.9%

Average Revenue per unique client growing with increasing number of clients*
20
200280 331 334 384
480553
633
0
100
200
300
400
500
600
700
FY10 FY11 FY12 FY13 FY14 FY15 FY16 # FY17 #
Recruitment segment Billing (Rs Cr)
* FY16 and FY17 numbers in IND-AS, rest all periods in IGAAP. # FY16 and FY17 numbers in IND-AS, rest in I GAAP
41 45 53 56 57 61 66 68
35 4246 48 51 57 65 71
0
20
40
60
80
0
20
40
60
80
FY10 FY11 FY12 FY13 FY14 FY15 FY16* FY17*
Naukri India - Revenue per client and # of clients
Avg. realization in Rs '000 (LHS) # of unique clients in '000 (RHS)

Product Innovation is the cornerstone of our strategy
• Android/iOS native jobseeker apps
• Recruiter app (in Beta)• Progressive Web App
• Recruitment Management System1
• RMS Pro• RMS Referral• RMS Consultant
• Friction free connectors to other ATS
• Reviews• Job aggregation
Job & Content
Aggregation
Recruitment Automation
Tools
Data
ScienceMobile
1 All solutions earlier pertaining to CSM, Response management, application tracking, and referral hiring tool are being rebranded into an automated end-to-end hiring process tool called Naukri Recruitment Management System (Naukri RMS)2 NLP = Natural Language Processing
INNOVATIONS
21
• NLP2 based content extraction• Semantic search• Personalized user experience• Machine Learning based
relevance algorithms• Algorithms on Crowd sourced
data• Job recommendations
Pay
Ta
xQ
BO
QB
OA
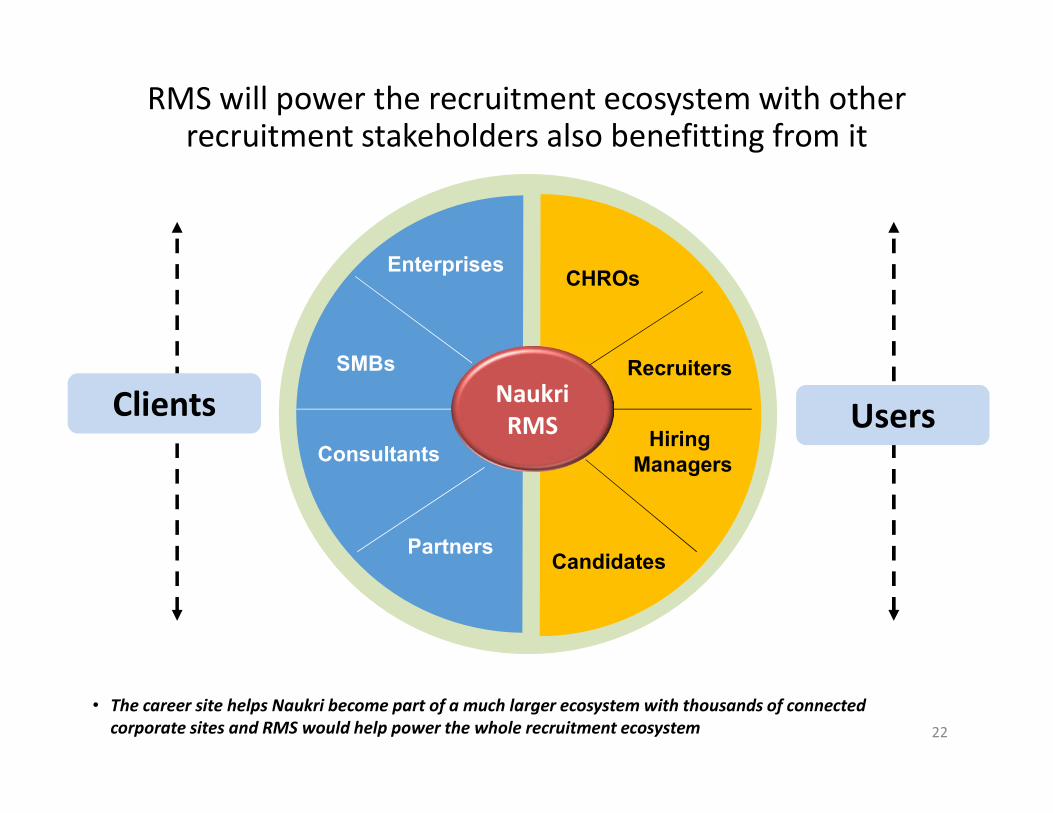
Enterprises
SMBs
Consultants
CHROs
Recruiters
Hiring Managers
PartnersCandidates
Naukri RMS
22
UsersClients
RMS will power the recruitment ecosystem with other recruitment stakeholders also benefitting from it
• The career site helps Naukri become part of a much larger ecosystem with thousands of connected corporate sites and RMS would help power the whole recruitment ecosystem

Naukri RMS
23

Recruiter profilePlatform for public profiles of HR professionals and recruitment
consultants
Jobseekers can ‘FOLLOW’
Recruiter Updates
Keep jobseekers informed of recruiter’s
Active Jobs
Help Build recruiter’s personal database
24
Over 150,000 jobs have Recruiter Profile details, 50% of these jobs have Recruiter Photographs40% more applies for jobs with a recruiter profile and a photograph attached
Jobseekers can search from over 250,000 recruiter profiles and follow them for updates
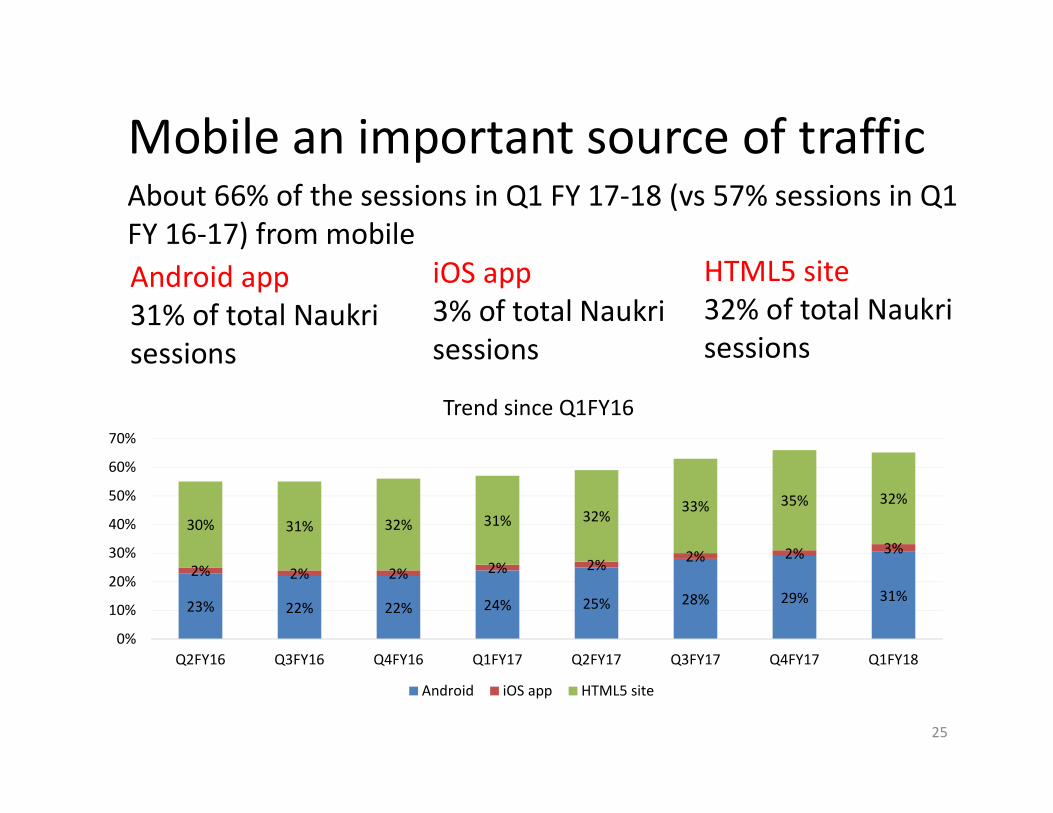
Mobile an important source of trafficAbout 66% of the sessions in Q1 FY 17-18 (vs 57% sessions in Q1 FY 16-17) from mobileAndroid app31% of total Naukri sessions
iOS app3% of total Naukri sessions
HTML5 site32% of total Naukri sessions
Trend since Q1FY16
25
23% 22% 22% 24% 25% 28% 29% 31%
2% 2% 2% 2% 2% 2% 2% 3%30% 31% 32% 31% 32%
33% 35% 32%
0%
10%
20%
30%
40%
50%
60%
70%
Q2FY16 Q3FY16 Q4FY16 Q1FY17 Q2FY17 Q3FY17 Q4FY17 Q1FY18
Android iOS app HTML5 site

The App and HTML5 site
26

Competition• Local job boards
– Indeed.co.in – Monsterindia.com– Timesjobs.com– Shine.com
• Linkedin– Solves a different problem
• Continuous innovation and improvements in product and service is the key to counter competition
27

Some international comparisonsName of the website
Approx. revenue from recruitment (in USD mn) @
No. of profiles/ resumes in mn
No. of unique clients
Approx. Market Cap of the company (in USD bn )**
51job.com*(China)
341 103 460,000 2.88
Seek.com^(Australia)
250 5 - 4.82
Recruit#(Japan)
3,616 - - 30.51
Info Edge 93 51 65,500 1.94
* Annual report/ presentation for year ended December 31, 2016^ Domestic revenue from Australia New Zealand as per annual report / presentation for year ended June 30, 2016# financial nos./ corporate presentation for year ended March 31, 2017, total revenue of Recruit is USD 16.5 bn of which 3.6 bn (mentioned above) is HR media** as of July 20, 2017 @ Revenue converted basis 1 USD = 1.26 AUD = 112.1 JPY = INR 64.4 being exchange rates as of July 20, 2017
28

99acres
29

30

Online real estate business - India
• Real estate estimated to be one of the large advertising category in print (~Rs 2000 Crore in FY 16-17)
• Our estimate of spend on online real estate portals was about Rs 350 Crore in FY 16-17 (excluding Google and Facebook)
• 99acres, a leader amongst 6 players– Google and local classifieds sites (like Olx and Quikr)
also compete for this market• Access through mobile increasing (nearly 65% of the
sessions in Q1 through mobile vs 53% in Q1 last year)
31

99acres traffic share pulling ahead
32
Traffic from desktops and laptops based on time spent
Source: SimilarWeb~65% of the total sessions for 99acres, in Q1 FY17-18, through mobile. Source: Google Analytics
0.0%
5.0%
10.0%
15.0%
20.0%
25.0%
30.0%
35.0%
40.0%
45.0%
50.0%
99acres Magicbricks Commonfloor Housing

99acres traffic share pulling ahead
33
Traffic from mobile web based on time spent
Source: SimilarWeb~65% of the total sessions for 99acres, in Q1 FY17-18, through mobile. Source: Google Analytics
0.0%
10.0%
20.0%
30.0%
40.0%
50.0%
60.0%
99acres Magicbricks Commonfloor Housing
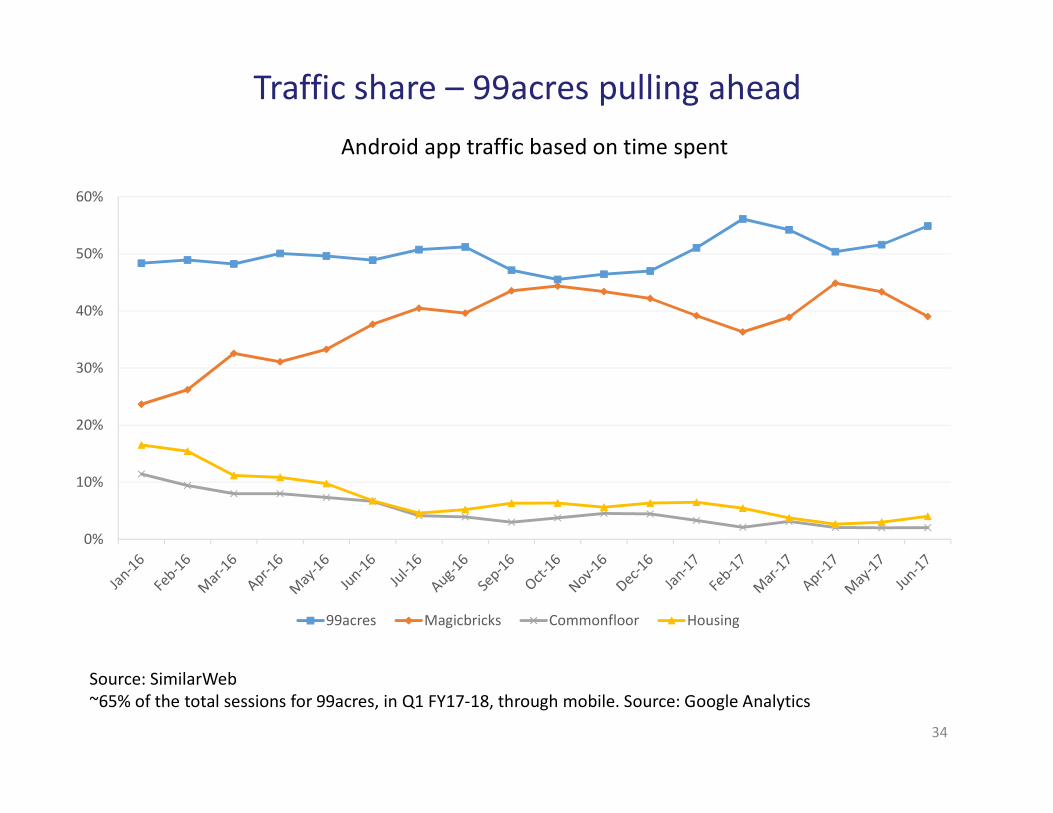
Traffic share – 99acres pulling aheadAndroid app traffic based on time spent
34
Source: SimilarWeb~65% of the total sessions for 99acres, in Q1 FY17-18, through mobile. Source: Google Analytics
0%
10%
20%
30%
40%
50%
60%
99acres Magicbricks Commonfloor Housing

Status of competition• 99acres and Magicbricks are the two serious players
in classifieds sites category• Housing was taken over by Proptiger (an agency) and
REA Group reportedly invested in the company• Indiahomes saw a management and investor exit,
not much activity• Commonfloor was taken over by Quikr
35
Post 2015, competitive activity has declined significantly. No substantial impact / activity yet post above mentioned consolidations.

99acres business model
Projects Listings Featured listings Microsites Email campaigns Banner Ads
Re-sale Listings Featured listings
Rental Listings Featured listings
So we get the most
clients We’ve got the most real estate
listings
So we get the most
traffic
So we get the most response
Revenue Model
36

Some approx. numbers for 99acres
• As of June 30, 2017– Total projects 1.39 lakh* (under construction or ready
to move in)– Total listings** 7.28 lakh of which owner listings were
2.73 lakh• Residential 6.12 lakh• Commercial 1.16 lakh
*1 lakh = 100,000**Typically, listings stay live for 2 months
37

In FY 16-17*
No. of customers in ‘000 Revenue breakup by customer type
38
* Based on Billings data
14.7
5.0
BROKER BUILDER
44%
53%
BROKER BUILDER
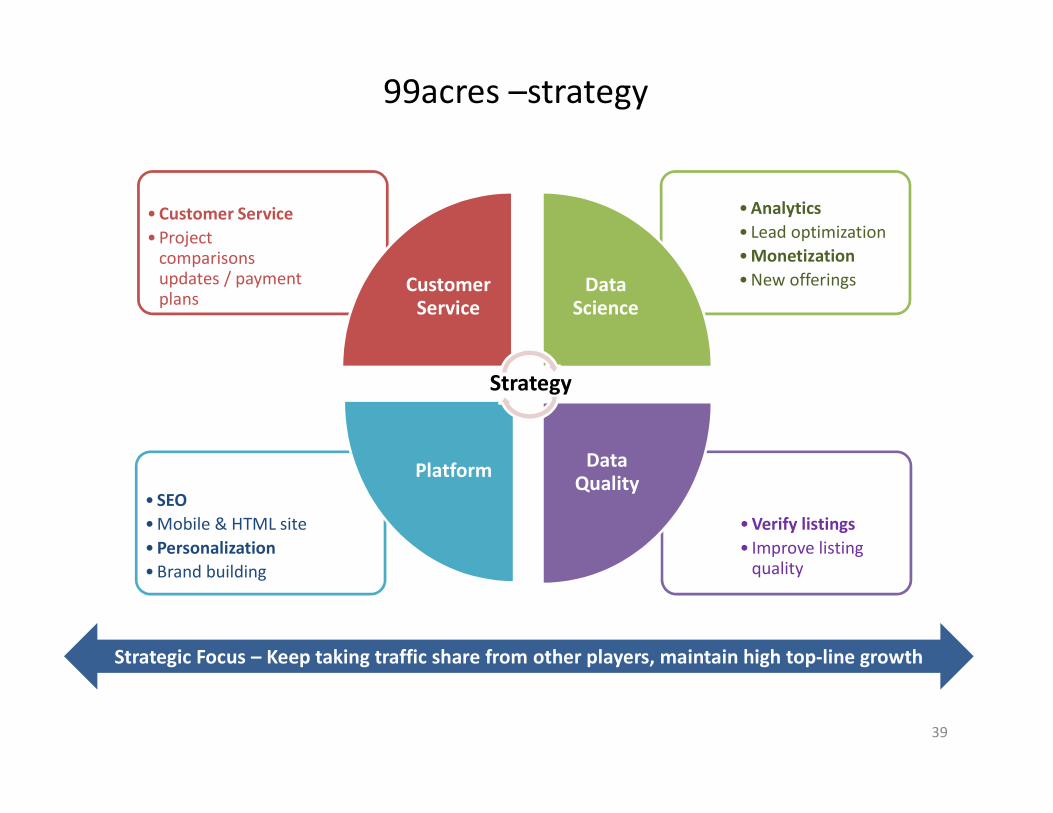
99acres –strategy
• Verify listings• Improve listing
quality
• SEO• Mobile & HTML site• Personalization• Brand building
• Analytics• Lead optimization• Monetization• New offerings
• Customer Service• Project
comparisons updates / payment plans
Customer Service
Data Science
Data Quality
Platform
Strategic Focus – Keep taking traffic share from other players, maintain high top-line growth
Strategy
39
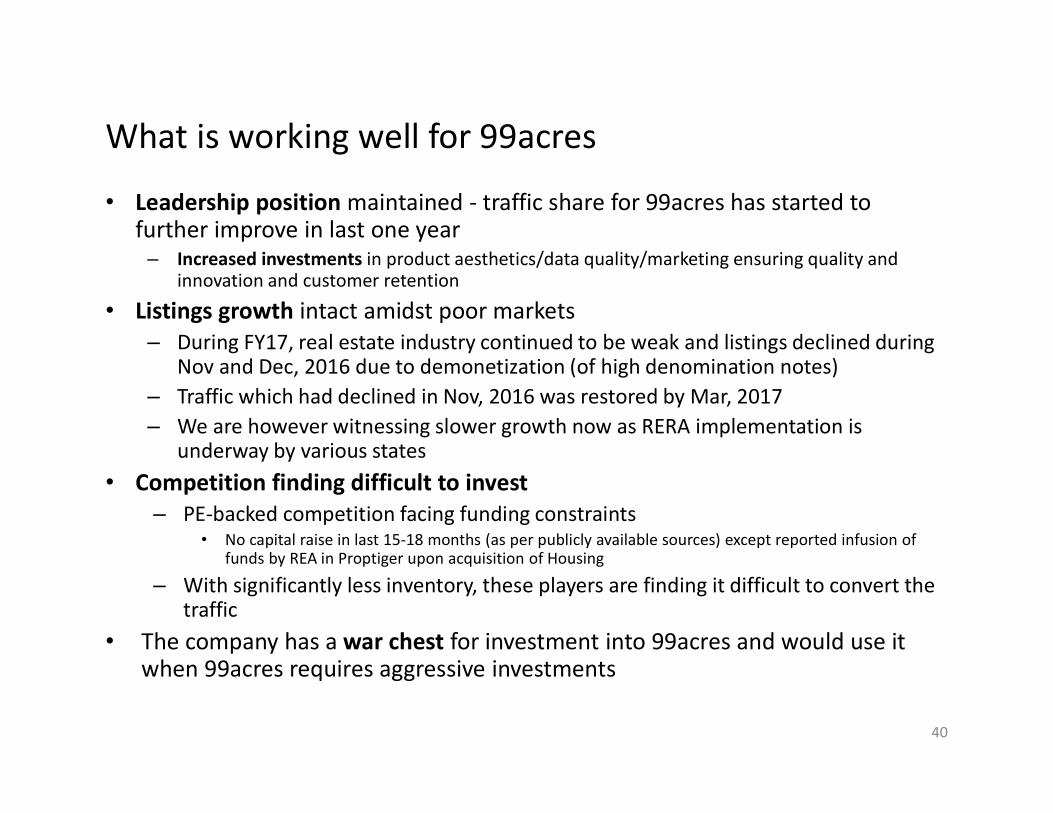
What is working well for 99acres
• Leadership position maintained - traffic share for 99acres has started to further improve in last one year
– Increased investments in product aesthetics/data quality/marketing ensuring quality and innovation and customer retention
• Listings growth intact amidst poor markets– During FY17, real estate industry continued to be weak and listings declined during
Nov and Dec, 2016 due to demonetization (of high denomination notes)– Traffic which had declined in Nov, 2016 was restored by Mar, 2017– We are however witnessing slower growth now as RERA implementation is
underway by various states• Competition finding difficult to invest
– PE-backed competition facing funding constraints • No capital raise in last 15-18 months (as per publicly available sources) except reported infusion of
funds by REA in Proptiger upon acquisition of Housing
– With significantly less inventory, these players are finding it difficult to convert the traffic
• The company has a war chest for investment into 99acres and would use it when 99acres requires aggressive investments
40
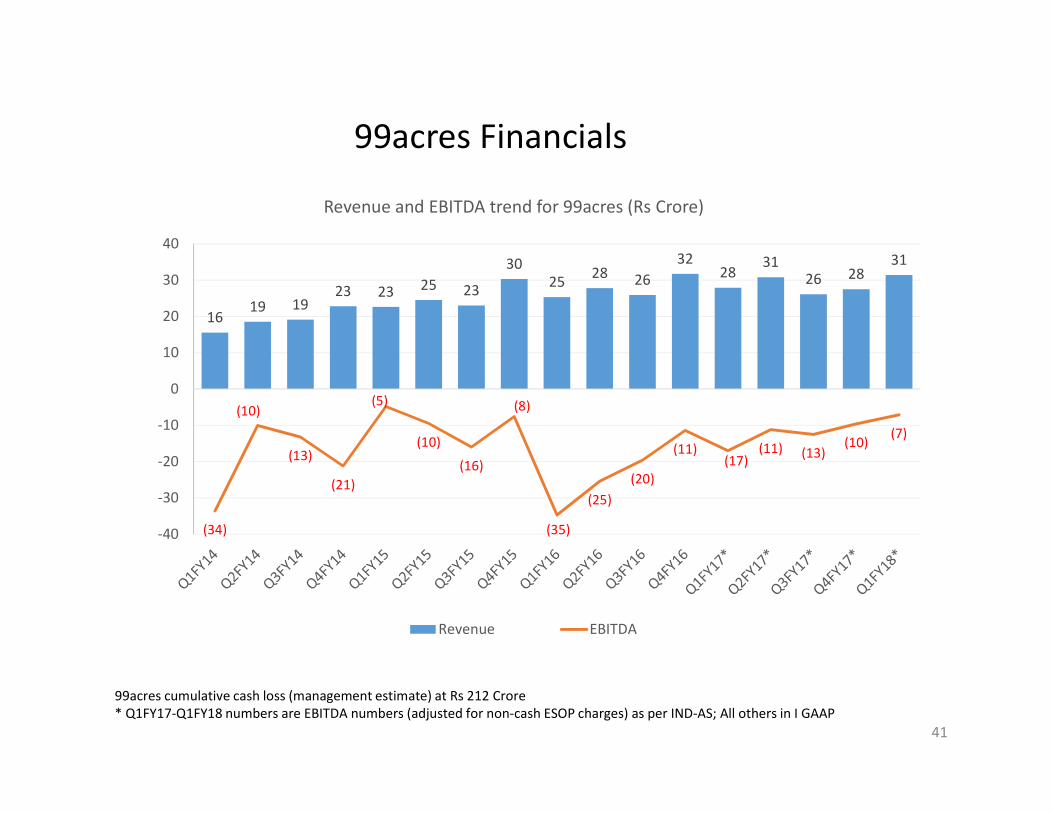
99acres Financials
99acres cumulative cash loss (management estimate) at Rs 212 Crore* Q1FY17-Q1FY18 numbers are EBITDA numbers (adjusted for non-cash ESOP charges) as per IND-AS; All others in I GAAP
1619 19
23 23 25 23
3025 28 26
3228
3126 28
31
(34)
(10)
(13)
(21)
(5)
(10)
(16)
(8)
(35)
(25)(20)
(11)(17)
(11) (13)(10)
(7)
-40
-30
-20
-10
0
10
20
30
40
Revenue and EBITDA trend for 99acres (Rs Crore)
Revenue EBITDA
41

Mobile app – home screen, navigation and search page
42
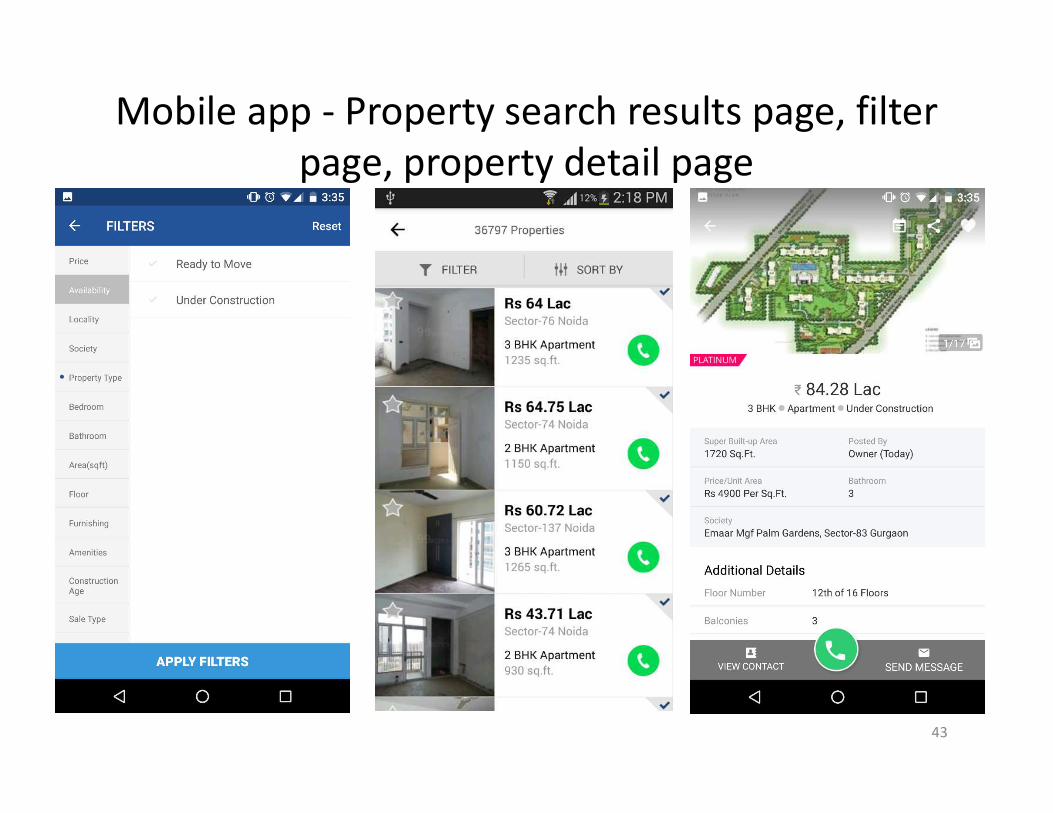
Mobile app - Property search results page, filter page, property detail page
43

Mobile app – project search results page, project detail page and property posting form
44

Mobile an important source of traffic
Android app22% of total 99acres sessions
iOS app3% of total 99acres sessions
HTML5 site40% of total 99acres sessions
About 65% of the sessions in Q1 FY 17-18 (vs 53% of the sessions in Q1 FY 16-17) from mobile
Trend since Q1FY16
45
16% 15% 20% 21% 20% 20% 23% 20% 22%1% 1%
1% 2% 2% 2% 2% 2% 3%28%
37% 30% 29% 31% 34% 34% 38%40%
0%
10%
20%
30%
40%
50%
60%
70%
Q1FY16 Q2FY16 Q3FY16 Q4FY16 Q1FY17 Q2FY17 Q3FY17 Q4FY17 Q1FY18
Android iOS app HTML5 site

Jeevansathi
46
47

Online matrimonial business - India
• Online market estimated to be Rs 600 to 650 crore in FY 16-17• Three main players – Bharat matrimony, Shaadi and
Jeevansathi• Used by
– Those disconnected from mother communities– Youngsters wanting choice
• In many instances process is driven by family• Fragmented market
– Basis geography – Communities (religion, caste, sub castes)
48

Jeevansathi business model
So we get the most
clients
So we get the most
traffic
Website– Free to list– Free to search– Free to express interest– Free to accept others expression of interest– Pay to get contact details
Offline centres (10 centres operational)– Walk in sales for matching services
Franchise - walk in centers
49

Competition• Three main players
– Bharat Matrimony is the leader– Shaadi is no. 2– Jeevansathi no. 3
• Bharat Matrimony dominates states in south India and non resident Indians from these states
• Shaadi leads in Gujarat and Punjab and non resident Indians from these states
• Jeevansathi leads in certain north India communities and states
• However, there are overlaps amongst sites
50

Time share – Jeevansathi gaining market shareDesktop traffic (including laptops) based on time spent
51
0%
10%
20%
30%
40%
50%
60%
70%
Jeevansathi Shaadi Bharat Matrimony
Source: SimilarWebWebsites considered for Shaadi – Shaadi, Marathi, Bengali, Telugu, Punjabi, Tamil, Kannada, OdiaWebsites considered for BM – BM, Hindi, Marathi, Bengali, Telugu, Punjabi, Tamil, Kannada, Oriya, Elite, Community, Christian, Muslim, SC, Brahmin, Divorce

Time share – Jeevansathi gaining market share
Mobile traffic (excluding app) based on time spent
52
0%
10%
20%
30%
40%
50%
60%
Jeevansathi Shaadi Bharat Matrimony
Source: SimilarWebWebsites considered for Shaadi – Shaadi, Marathi, Bengali, Telugu, Punjabi, Tamil, Kannada, OdiaWebsites considered for BM – BM, Hindi, Marathi, Bengali, Telugu, Punjabi, Tamil, Kannada, Oriya, Elite, Community, Christian, Muslim, SC, Brahmin, Divorce

Mobile app
53

Jeevansathi growing faster and has demonstrated break-even1
1 Jeevansathi has grown at an average 24% YoY in the past eight quartersJeevansathi cumulative cash loss (management estimate) at Rs 62 Crore* Q1FY17-Q1FY18 numbers are EBITDA numbers (adjusted for non-cash ESOP charges) as per IND-AS; All others in I GAAP
9 9 9 9 10 9 10 10 11 11 1213 14 14 14
1518
(3)(1) (2) (1)
(5)
(10)
(16)
(8)
(4)(6)
(2) (1)0 (1) (2)
(4) (4)
-20
-15
-10
-5
0
5
10
15
20
Revenue and EBITDA trend for Jeevansathi (Rs Crore)
Revenue EBITDA
54

Mobile an important source of traffic
Android app57% of total Jeevansathi sessions
HTML5 site26% of total Jeevansathi sessions
About 90% sessions in Q1 FY 17-18 (vs 82% sessions in Q1 FY 16-17) from mobile
Trend since Q1FY16
iOS app (launched on Nov 13, 2015)
7% of total Jeevansathi sessions
55
35% 41% 41% 45% 48% 50% 51% 53% 57%0%
0% 1%4% 6% 6% 6% 7% 7%
31%30% 32%
30% 28% 28% 29% 28% 26%
0%
20%
40%
60%
80%
100%
Q1FY16 Q2FY16 Q3FY16 Q4FY16 Q1FY17 Q2FY17 Q3FY17 Q4FY17 Q1FY18
Android iOS app HTML5 site

Shiksha
56

57

Shiksha – some approx. nos.
So we get the most
clients
So we get the most traffic
58As of end June, 2017

Educational classifieds business - India• Education as a category spends amongst the highest in print
–Spend in print estimated to be similar to real estate
• Online , School/College contact programs, Consultant commissions & fairs form bulk of remaining marketing spends by colleges and Universities
• Growing number of online players
59

60
ShikshaA website which helps students decide undergraduate and post graduate options, by
providing useful information on careers, exams, colleges & courses

Shiksha business model
So we get the most
clients
So we get the most traffic
61
• Branding & advertising solution for colleges & universities (UG, PG, post PG)– Both Indian and foreign entities advertise– Large number of Indian students go overseas for higher
education • Estimated at ~125,000 + every year
• Lead generation– Potential student/applicants details bought by colleges and
their agents – Full counselling service for international university partners
• Prospective students have free access to all information on the site (some post registration)

62
Authentic College Reviews

63
Q&A mobile app for expert advice
63

64
Campus representatives from colleges for credible advice

65
Home page for Overseas Education

Mobile sites
Study Abroad
India
66

Competition – different for India and abroad
• Online– HotCourses India/ IDP– Studyportals – Masterstudies– Top mba / Top universities
(QS)– Collegeboard– Yocket– Multiple Emerging start-
ups
• Study Abroad consultants
67
• Print Media• Online
• Google • Pagalguy • HTcampus• Minglebox• Careers360• MBA Universe• CollegeDekho• CollegeDunia• Sarvgyan• Aglasem• Others
Domestic Study abroad

Shiksha quarterly financials
Shiksha cumulative cash loss (management estimate) at Rs 42 Crore* Q1FY17-Q1FY18 numbers are EBITDA numbers (adjusted for non-cash ESOP charges) as per IND-AS; All others in I GAAP
6 64
6
9
65
7
11
7 6
11 129
6
10
14
(2)0
(1) (2)0 (0)
(3) (2)
1 (1) (2)
1 (1)
1
(4)
1 3
(6.00) (4.00) (2.00)
- 2.00 4.00 6.00 8.00
10.00 12.00 14.00 16.00
Revenue and EBITDA trend for Shiksha (Rs Crore)
Revenue EBITDA
68

Investee companies
69
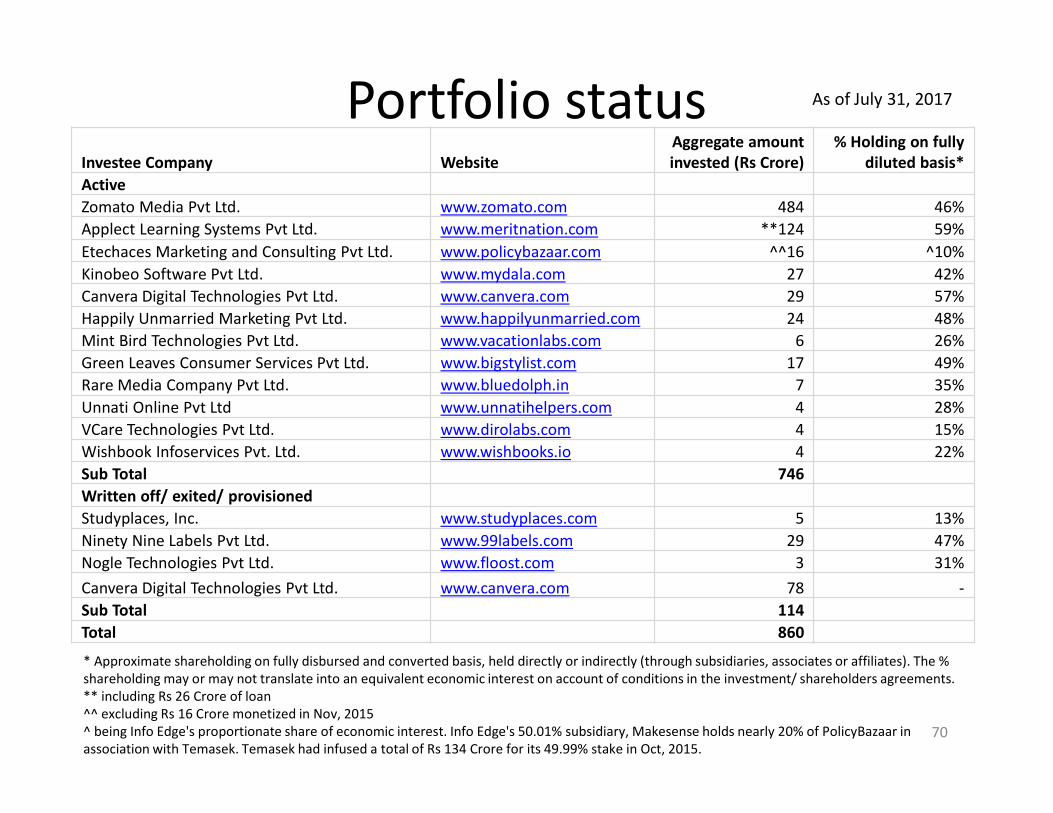
Portfolio status As of July 31, 2017
* Approximate shareholding on fully disbursed and converted basis, held directly or indirectly (through subsidiaries, associates or affiliates). The % shareholding may or may not translate into an equivalent economic interest on account of conditions in the investment/ shareholders agreements. ** including Rs 26 Crore of loan^^ excluding Rs 16 Crore monetized in Nov, 2015^ being Info Edge's proportionate share of economic interest. Info Edge's 50.01% subsidiary, Makesense holds nearly 20% of PolicyBazaar in association with Temasek. Temasek had infused a total of Rs 134 Crore for its 49.99% stake in Oct, 2015.
Investee Company WebsiteAggregate amount invested (Rs Crore)
% Holding on fully diluted basis*
Active Zomato Media Pvt Ltd. www.zomato.com 484 46%Applect Learning Systems Pvt Ltd. www.meritnation.com **124 59%Etechaces Marketing and Consulting Pvt Ltd. www.policybazaar.com ^^16 ^10%Kinobeo Software Pvt Ltd. www.mydala.com 27 42%Canvera Digital Technologies Pvt Ltd. www.canvera.com 29 57%Happily Unmarried Marketing Pvt Ltd. www.happilyunmarried.com 24 48%Mint Bird Technologies Pvt Ltd. www.vacationlabs.com 6 26%Green Leaves Consumer Services Pvt Ltd. www.bigstylist.com 17 49%Rare Media Company Pvt Ltd. www.bluedolph.in 7 35%Unnati Online Pvt Ltd www.unnatihelpers.com 4 28%VCare Technologies Pvt Ltd. www.dirolabs.com 4 15%Wishbook Infoservices Pvt. Ltd. www.wishbooks.io 4 22%Sub Total 746Written off/ exited/ provisionedStudyplaces, Inc. www.studyplaces.com 5 13%Ninety Nine Labels Pvt Ltd. www.99labels.com 29 47%Nogle Technologies Pvt Ltd. www.floost.com 3 31%Canvera Digital Technologies Pvt Ltd. www.canvera.com 78 -Sub Total 114Total 860
70
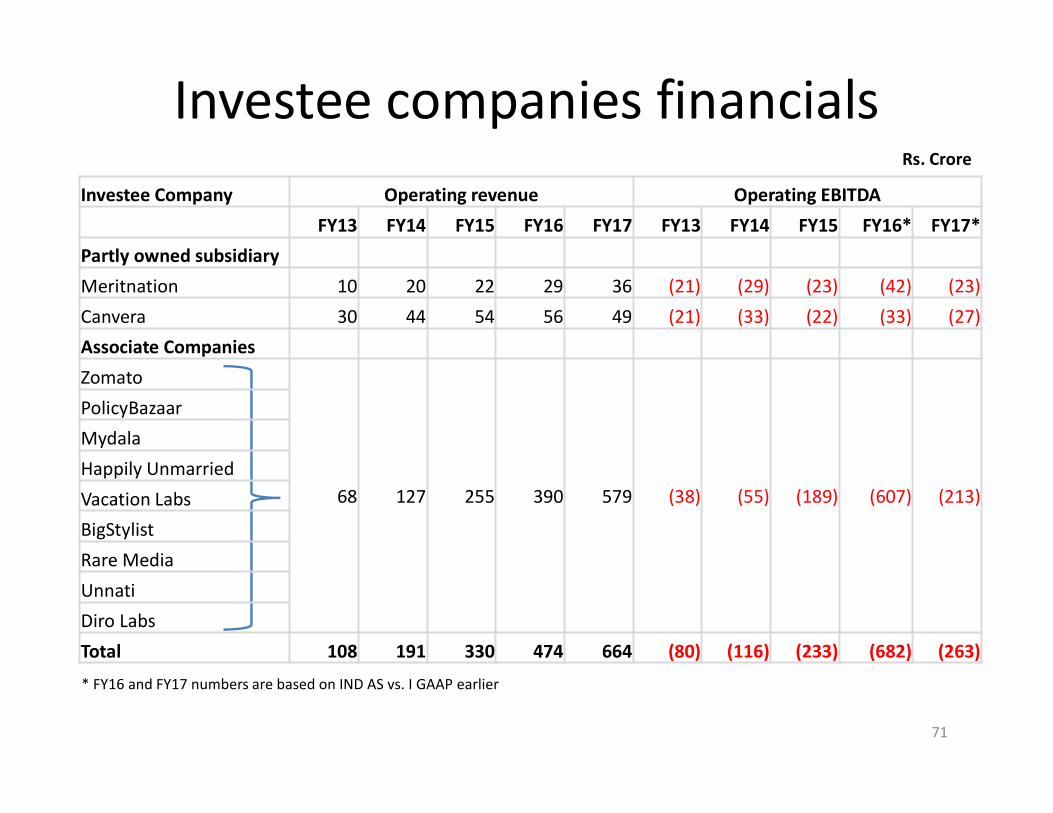
Investee companies financialsRs. Crore
71
Investee Company Operating revenue Operating EBITDA
FY13 FY14 FY15 FY16 FY17 FY13 FY14 FY15 FY16* FY17*Partly owned subsidiary
Meritnation 10 20 22 29 36 (21) (29) (23) (42) (23)
Canvera 30 44 54 56 49 (21) (33) (22) (33) (27)Associate Companies
Zomato
68 127 255 390 579 (38) (55) (189) (607) (213)
PolicyBazaarMydala
Happily Unmarried
Vacation LabsBigStylist
Rare Media
UnnatiDiro Labs
Total 108 191 330 474 664 (80) (116) (233) (682) (263)
* FY16 and FY17 numbers are based on IND AS vs. I GAAP earlier

Zomato
72

Zomato – brief overview
• Zomato is the largest restaurant search & discovery platform globally with presence in 24 countries
– Food ordering service is available in India and UAE and is growing strongly
• Unique tech enabled, low cost feet-on-street model ensures exhaustive listings in a particular city and rich content
• High volume of user generated content results in strong network effects
• Key facts:
– ~120 million sessions globally in June ‘17
• >80% sessions through mobile (m-web and app)
– 1.29 mn restaurant listings across the world
– ~2.4 mn orders processed in June ’17
73
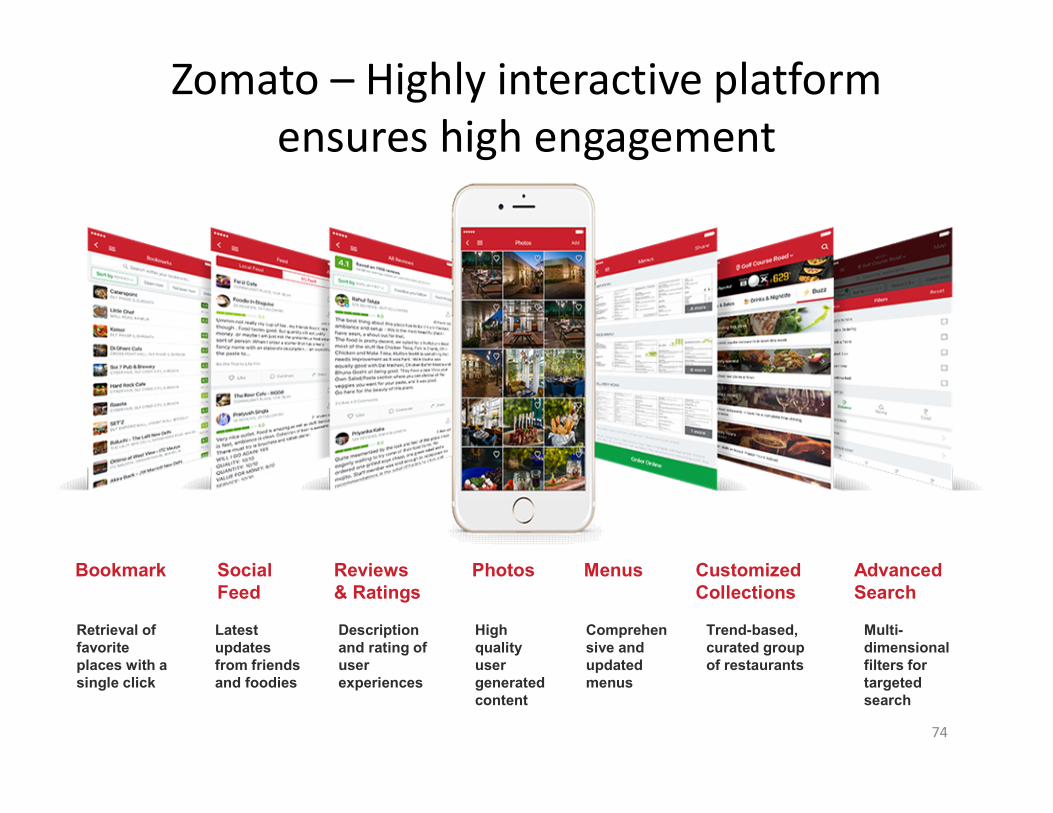
Zomato – Highly interactive platform ensures high engagement
74
Bookmark Advanced Search
PhotosReviews& Ratings
SocialFeed
Customized Collections
Menus
Retrieval of favorite places with a single click
Multi-dimensional filters for targeted search
High quality user generated content
Description and rating of user experiences
Latest updates from friends and foodies
Trend-based, curated group of restaurants
Comprehensive and updated menus

Zomato – mobile app
75

Zomato – table reservation platform
76
Pick your favorite place to dine outSelect date, time and no. of guests
Enter your details
Get a confirmation message and your booking is done
PolicyBazaar
77

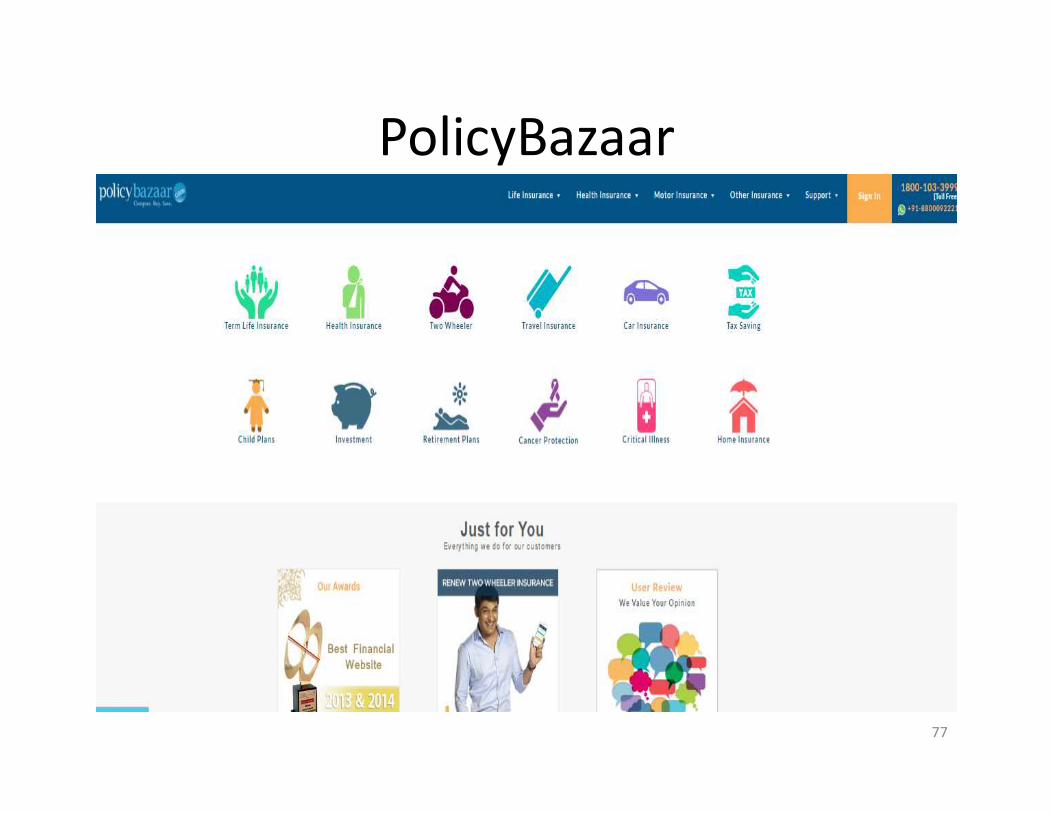
PolicyBazaar
• PolicyBazaar is India’s online price comparison site for insurance– A clear value add to individuals and Financial
Institutions• A leader in its category
– estimated 95% share of insurance comparison & 50% of online Insurance transactions
• A large untapped and growing market– A fraction (less than 4%) of the Indian population is
insured
78

Meritnation
79

Meritnation• Supplementary online learning platform for K12 and Entrance Exams
– Proprietary content– Freemium model– Direct to consumer
• Provides free solutions mainly for – mathematics and science for K12 of popular national Indian curriculum’s
viz. CBSE and ICSE and some State Boards– free solutions restricted to popular text books and user generated
content• Paid product for online assessment and teaching solutions
– provides resources to kids for self study after school– Option for live online tuition classes
• Test prep product for engineering and medical entrance examinations• Over 10 million registered users• ~55-60% sessions through mobile
80

Canvera
81

• Print and design services for professional photographers for their album needs, primarily weddings
• Build brand with the consumers (Yougraphy)• Products & services include:
– Printed products (albums) sold to the photographer (main source of revenue)
– Design of printed products and websites (service business that supports the product business)
– Web solutions to help professional photographer build their website (SaaS)
– Albums, books, prints for consumers (recently launched)
• Expertise in digital imaging and printing
82
Canvera

• Business model– Photographers pay to order printed albums or photographs– Additional sources of monetization possible
• Micro site and ad revenues from photographer classifieds– Recently introduced products for consumers
• Sales presence in 200+ cities• New launches
– Every printed book can now be downloaded to a mobile devices using Canvera's app and from the app shared on Facebook, WhatsApp
– App for photographers• Photographers directory basis city and location
83
Canvera contd.

84
Happily Unmarried

• Grooming range for men “Ustraa”• Designs and sells fun products
– With an Indian touch
• Proportion of online sales growing rapidly.
85
Happily Unmarried

Financials(Standalone)
86
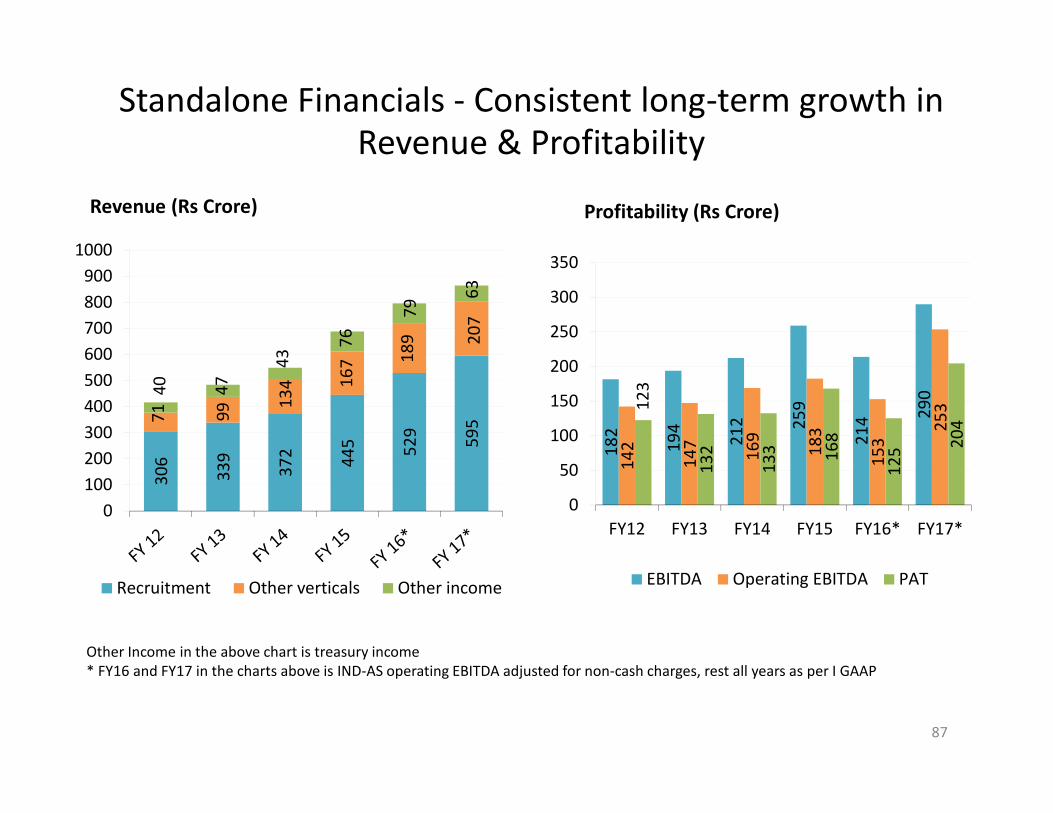
Standalone Financials - Consistent long-term growth in Revenue & Profitability
Revenue (Rs Crore) Profitability (Rs Crore)
Other Income in the above chart is treasury income* FY16 and FY17 in the charts above is IND-AS operating EBITDA adjusted for non-cash charges, rest all years as per I GAAP
306
339
372 44
5 529 59
571 99
134 16
7 189 20
7
40 47
43
76
79
63
0100200300400500600700800900
1000
Recruitment Other verticals Other income18
2
194
212 25
9
214 29
0
142
147 169
183
153
25312
3
132
133 16
8
125 20
4
0
50
100
150
200
250
300
350
FY12 FY13 FY14 FY15 FY16* FY17*
EBITDA Operating EBITDA PAT
87

Segmental operating EBITDA
Segmental Operating EBITDA (Rs Crore)
* FY16 and FY17 in the charts above are IND-AS EBITDA numbers adjusted for non-cash charges, rest all years as per I GAAP
88
155 166188
239283
334
-5 -8 -7 -34-93
-50-8 -11 -12 -7 -16 -8
-150
-100
-50
0
50
100
150
200
250
300
350
400
FY12 FY13 FY14 FY15 FY16* FY17*
Recruitment Real estate Other verticals

Team
89

Management TeamName Age Qualifications Designation/ Role Previously worked with Year of joiningSanjeev Bikhchandani 54 BA Economics St. Stephens, PGDM IIM-A Founder and Executive Vice Chairman Lintas, Glaxo Smith Kline 1995Hitesh Oberoi 45 B Tech, IIT Delhi, PGDM, IIM-B Managing Director and CEO HLL (Unilever) 2000
Deepali Singh 43 B Sc, LLB, Delhi University, PGDBA, IPM Executive Vice President Firstnaukri Aptech 2000Arif Ismail Parker 42 BA Executive Vice President- Sales ITNation.com 2000Vibhore Sharma 43 B Sc, IGNOU Chief Technology Officer Naukri Pioneer 2001
Suresh V. 45BE, Masters in Management, Sathya Sai Institute of Management Chief Sales Officer - Naukri.com Xerox 2001
Neeraj Sharma 44 B.Com , PGPM Executive Vice President- Sales 2001Niraj Kumar Rana 41 BSC, MBA Executive Vice President- Sales - 2001Swati Vashistha 40 MBA Senior Vice President Sales Systems - 2001
Manoj P 43
BE- University of Mysore MBA - Xavier Institute of Management and Entrepreneurship Executive Vice President- Sales Indian Seamless Group 2002
Harveen Singh Bedi 45PGDBA-Birla Institute of Management Technology Executive Vice President Quadrangle & Ehire Nestle 2002
Dinesh P Kumar 41 MBA Executive Vice President- Sales Notre Advertising 2002Satyajit Yogeshchandra Tripathi 44 BSc ,PGDBM
Executive Vice President- Emerging Markets, 99acres - 2002
Ambrish Kumar Singh 43 Btech, MBAExecutive Vice President and Head Sales & Customer Delivery Shiksha LSI Software, Pentasoft Tech 2003
Ankur Kheterpal 43 B.Com Christ College Bengaluru Senior Vice President IT Infrastructure
Solutions Infosystems Pvt. Ltd. , Wintech Education, Sunrise Consultancy 2005
Meetu Arora 39
PG Diploma, Computer Applications -Acharya Narendra Dev College - New Delhi Senior Vice President Quality Assurance
Induslogic India Pvt. Ltd. , IBM Global Services, Magic Software Pvt. Ltd. 2006
Sharmeen Khalid 46 MBA, IRMA Chief Human Resources Officer Polaris 2006Shalabh Nigam 45 B Tech, IIT Kanpur Chief Technology Officer - JS, 99acres Baypackets 2007Rajesh Khetarpal 44 CA Executive Vice President- Finance Bharti 2007Sumeet Singh 43 BBA, MBA Chief Marketing Officer CII 2007
Nishant Pandey 41 B Tech, IIT Delhi, MBA ISBExecutive Vice President and Product Head Shiksha Schlumberger 2008
Rinchan Gupta 39 BE - Comp ScienceSenior Vice President User experience and Design HP India 2008
Vivek Jain 43 B Tech, IIT Delhi, PGDM, IIM – BChief Product Officer-Naukri & Head-Naukri Fast Forward
Isoft, Adobe, IBM, ICICI Securities 2010
Ages as of 20 July, 2017; About 10% of the total employees are covered under ESOP90

Name Age Qualifications Designation/ Role Previously worked with Year of joining
Maneesh Upadhyaya 39 B Sc, MBA, FMS, Delhi UniversityExecutive Vice President & Business Head -Shiksha Bain & Co. 2010
Tarun Aggarwal 42 Btech, MBA IIM AhemedabadExecutive Vice President and Business Head-Naukri Gulf
HT Media, Tech Mahindra, HCL Technologies 2010
Amit Kumar Singh 40 Btech - IIT Kanpur, PGDBM - IIM CalcuttaExecutive Vice President - Product Development Adobe Systems, Citibank 2011
Jai Prakash Sharma 42 MBA Sikkim Manipal University Senior Vice President Technical OperationsAOL Online, First Advantage, Adobe Software 2011
Rohan Mathur 33PGDM Business Management, IIM Ahmedabad
Senior Vice President & Business Head Jeevansathi
Cadence Design Systems, Mindtree 2011
Murlee Manohar Jain 39 Bcom, CS Associate Vice President-Secretarial & CS Apollo Tyres 2013Chintan Arvind Thakkar 50 CA CFO Computer Associates 2014
Pankaj Jain 42 B.Tech - IIT Delhi, MS- Stanford University Executive Vice President- Key Projects
Spice Online Retail, Spice Televentures, Taxila, Siebel Systems 2014
Shailesh Chandra 43 BE - Delhi College of Engg, PGDBM- IIM A Executive Vice President
Amazon, Genpact, Indian Railways, Maruti Udyog, Indian Petrochemicals 2014
Narasimha Jayakumar 44MBA- London Business School, PGDM-IIM-B, B Tech- NIT Karnataka Chief Business Officer- 99acres.com
TV18 Home Shopping Network Ltd, Google, Expedia, Galileo Int., TAS 2015
Jatin Bery 43
MSc Corp & Int'l Finance (Durham University), MBA (IMI), BA (Hons) Economics (St.Stephen’s College)
Executive Vice President Corporate Development
Kotak Investment Banking, Ernst & Young, JPMorgan 2015
Sujith Nair 40 MCM, Pune University Senior Vice President EngineeringSmriti Netcoms, C-Net Asset/ International 2015
Niraj Seth 46 B.Tech - IIT KharagpurExecutive Vice President – Career Site Manager, Naukri
Intuit Inc., Cleartrip.com, Monster.com 2017
Nitin Bansal 41 Btech, Computer Science, IIT Delhi Executive Vice President
Meritnation.com, Applect Learning Systems, Intel & Hughes Software Systems 2017
Pradeep Kumar Singh 39Btech, IET Lucknow; Lucknow University; Mtech IIT Roorkee Executive Vice President
Amazon, Adobe Systems, Novell Inc. 2017
Nitendra Rajput 42BE, Govt. Engg College, Jabalpur; Rani Durgavati University Senior Vice President Analytics IBM Research 2017
91
Management Team Contd.
Ages as of 20 July, 2017; About 10% of the total employees are covered under ESOP

Source: IAMAI, IMRB
Internet in India – growing at a rapid pace
92
28
3842 43 45
0
5
10
15
20
25
30
35
40
45
50
Oct '14 Oct '15 Oct '16 (E) Dec '16 (E) Jun '17 (E)*
Internet users in India (Crore)

Banks/ brokerages that cover us
Indicative list, subject to change
Firm Analyst Phone Number E-mail
Axis Capital Sahil Desai +91.22.4325 1121 [email protected]&K Securities Sushil Sharma +91.22.4031 7117 [email protected] Sachin Salgaonkar +91 22 6632 8667 [email protected] Broking Ankit Kedia +91.22.4215 9634 [email protected] Gaurav Malhotra +91.22.6631 9885 [email protected] Ankur Rudra +91.22.6650 5059 [email protected] Suisse Anantha Narayan +91 22 6777 3730 [email protected] Bank Aniruddha Bhosale +91 22 7180 4037 [email protected] Sandip Agarwal +91.22.6623 3474 [email protected] Securities Kuldeep Koul +91.22.6637 7573 [email protected] Rishi Jhunjhunwala +91.22.4646 4645 [email protected] Morgan Viju K George +91.22.6157 3597 [email protected] Jeffries Arya Sen +91.22.4224 6122 [email protected] Securities Kanwaljeet Saluja +91.22.4336 0860 [email protected] Alankar Garude +91.22.6720 4328 [email protected] Stanley Parag Gupta +91.22.6118 2230 [email protected] Motilal Oswal Ashish Chopra +91.22.3982 5424 [email protected] Ashwin Mehta +91.22.40374465 [email protected] Capital Soumitra Chatterjee +91.44.4228 8151 [email protected] Gautam Chhaochharia +91.22.6155 6080 [email protected]
93

Investor relations contacts
Name Chintan Thakkar Prince Poddar
Designation CFO Investor Relations
e mail [email protected] [email protected]
Telephone +91 120 3082137 +91 120 3082091
Fax +91 120 3082095
Address Info Edge (India) Limited, B 8, Sector 132, Noida – 201 301, Uttar Pradesh, India
Website www.infoedge.in
94

Annexures
95

Naukri’s Android App traffic based on time spent – including Indeed
96
Source: SimilarWeb Above chart excludes Linkedin since much of the traffic may not pertain to jobs~66% of the total sessions for Naukri, in Q1 FY 17-18, through mobile, Source : Google Analytics
0%
10%
20%
30%
40%
50%
60%
70%
80%
90%
Naukri TimesJobs Shine Monster Indeed
Naukri’s traffic share

97
Source: SimilarWeb Above chart excludes Linkedin since much of the traffic may not pertain to jobs~66% of the total sessions for Naukri, in Q1 FY 17-18, through mobile, Source : Google Analytics
0.0%
10.0%
20.0%
30.0%
40.0%
50.0%
60.0%
70.0%
Naukri Monster India Timesjob Shine Indeed
Naukri’s traffic share
Naukri’s Desktop and Laptops traffic based on time spent – including Indeed
98
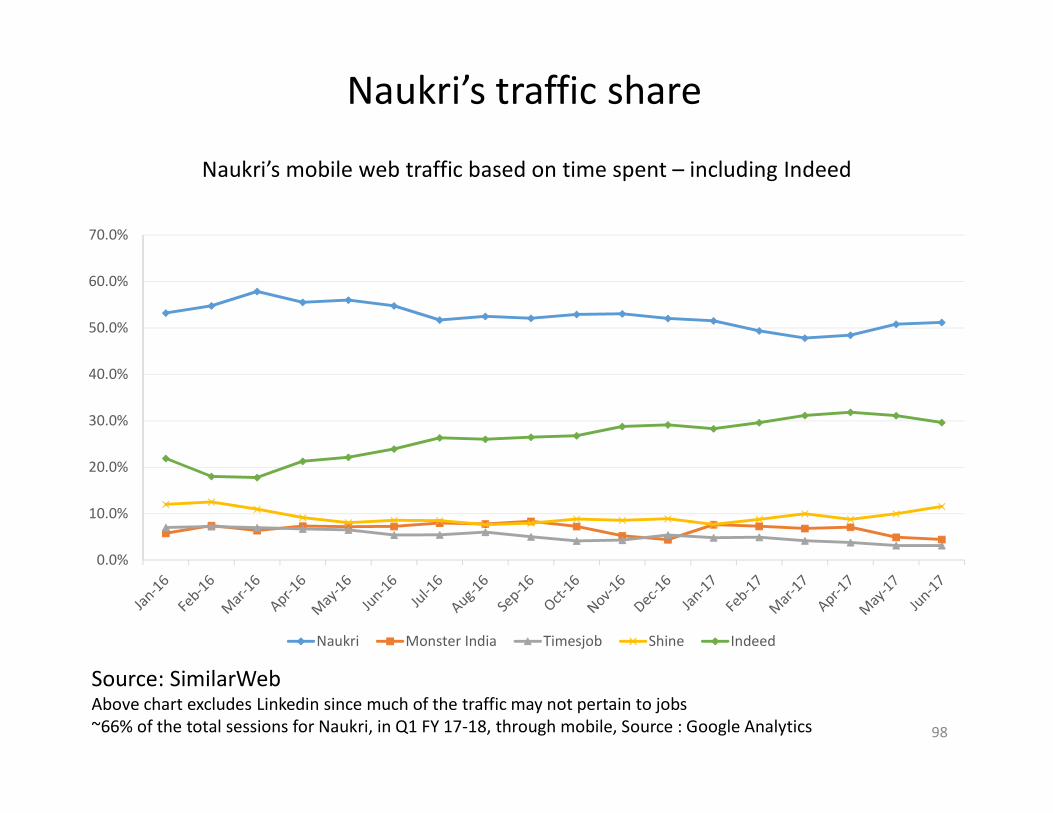
Source: SimilarWeb Above chart excludes Linkedin since much of the traffic may not pertain to jobs~66% of the total sessions for Naukri, in Q1 FY 17-18, through mobile, Source : Google Analytics
Naukri’s traffic share
0.0%
10.0%
20.0%
30.0%
40.0%
50.0%
60.0%
70.0%
Naukri Monster India Timesjob Shine Indeed
Naukri’s mobile web traffic based on time spent – including Indeed