indoor radon and its decay products - escholarship
TRANSCRIPT

Lawrence Berkeley National LaboratoryLawrence Berkeley National Laboratory
TitleIndoor Radon and Its Decay Products: Concentrations, Causes, and Control Strategies
Permalinkhttps://escholarship.org/uc/item/76d903g1
AuthorNero, A.V.
Publication Date2008-12-03
eScholarship.org Powered by the California Digital LibraryUniversity of California

~"1\
LBL-27798
ffi1 Lawrence Berkeley Laboratory11;:1 UNIVERSITY OF CALIFORNIA
,APPLI ED SCI ENCEDIVISION
Indoor Radon and Decay Products:Concentrations, Causes, and Control Strategies
A.V. Nero, A.J. Gadgil, W.W. Nazaroff, and K.L. Revzan
January 1990
TWO-WEEK LOAN COpy
This is a Library Circulating Copy
which may be borrowed for two weeks.
APPLIED SCIENCEDIVISION
Prepared for the U.S. Department of Energy under Contract Number DE-AC03-76SF00098.

LBL-27798
INDOOR RADON AND DECAY PRODUCTS:CONCENTRATIONS, CAUSES, AND CONTROL STRATEGIES
A. V. Nero, A.J. Gadgil, W.W. Nazaroff*, and K.L. RevzanIndoor Environment Program
Applied Science DivisionLawrence Berkeley Laboratory
Berkeley, CA 94720 USA
and
*Department of Civil EngineeringUniversity of California Berkeley
Berkeley, CA 94720 USA
January 1990
This work was supported by the Director, Office of Energy Research, Office of Health andEnvironmental Research, Human Health Assessments Division and Pollutant Characterizationand Safety Research Division of the U.S. Department of Energy under Contract No. DEAC03-76SF00098.

ABSTRACT
This report is an introduction to the behavior of radon 222 and its decay products in indoorair. This includes review of basic characteristics of radon and its decay products and offeatures of the indoor environment itself, all of which factors affect behavior in indoor air.The experimental and theoretical evidence on behavior of radon and its decay products isexamined, providing a basis for understanding the influence of geological, structural, andmeteorological factors on indoor concentrations, as well as the effectiveness of controltechniques. We go on to examine three important issues concerning indoor radon. We thusinclude I) an appraisal of the concentration distribution in homes, 2) an examination of theutility and limitations of popular monitoring techniques and protocols, and 3) an assessmentof the key elements of strategies for controlling radon levels in homes.
11

Contents
Summary and Perspective on the Issues of Indoor Radon .......•.............
Page
I. Introduction ......•.•..••....•••••...••••.•..•...•....••..•.....•. 9A. Historical perspective. • • • • • . • . • • • • • • • . • . • . . • • • • • • • • . • • . • • . • • • • . . 9B. Characteristics of radon and its decay products ....••.....••.......•. 13C. Behavior of radon indoors: general principles ..•••••..•.•.•••..•..•. 16
II. Appraisal of concentrations in U.S. homes and other buildings •.•••...•..•.. 19
A. Studies indicating the concentration distribution in U.S. housing .•..•.•. 21B. More recent data on U.S. residences .••••••••.••.•••••••..•..••••. 25C. The occurrence of high concentrations or exposures ••••••••••••••...• 31D. Residential concentrations in other countries .•••••••.•••••••••...••. 38E. Other buildings •••••••••••••.••.•••••••••••••.••••••••••.••••• 41
III. Factors affecting indoor concentrations .•.••••••.•..•••••••••••••....•• 42
A. Temporal and spatial dependence .••....••..•••.••••.••..••••..••. 42B. Sources and transport processes . • • . • • • . • • . • • • • • • . • . . • . • . • • • . • • • . 45
I. Soil and building materials ..•.•••••••..•••••••••••.•••••••... 472. Watet ....••••••••••••••••••••••••••••..•••••••••.•••..••. 503. Summary of source contributions .•••••••••••.••.•••..•..•..... 51
C. Capabilities for predicting indoor concentrations .•..••••••.••.•....•. 51I. House or site models •••••••••••••.•••••.••••••••.•.••.•••..•. 542. Predictive models for the housing stock •••••••••••••••.••.•.•..•• 583. Data for geographic radon modeling •••••••••••.•••••.•..•••.••• 60
D. Control techniques ••••••••••••••••••••••..••••••••••••••••...•• 67I. Techniques that reduce entry of radon from soil ••••.•..••••.•.••. 672. Detailed studies of radon entry and the influence of control techniques 683. Other types of control techniques •.••••••••..•••••••.••.•....•. 69
IV. Techniques and protocols for monitoring indoor concentrations .•........••. 71A. Measurement techniques .•••.••.•..••••.•.•••••••••.••.••.....•• 71
I . Methods .•.•••.••••••••.•••••..•.••.•.•••.••.••.•......... 7 I2. Calibration and testing •.•...•..•.....•...•...•...•••......•. 733. Field performance ••••••••••••.••...•..•••.•.••.••..•.....•. 74
B. Interpreting and utilizing results .•••••••••....•••.••••••••........ 74I. Techniques and strategies for identifying high-radon homes· . . . . . . . . 752. Framework for interpretation and control .••...••..••••....••... 763. Home transfers .•••••••.••••..••••.•••••••.•••••••••....... 77
V. Behavior of the decay products ••..••..•.••••.••••.•.•••••••..•••.•.•• 81A. General considerations. • • • • . . • • • • . • • • . • • • • . • . . • • • . . • • • • . . . . . . . • . 81B. The Jacobi model ••••••••••••••.••••.•.••••..•.••••••.•...••••. 82C. Radioactive decay, recoil, and ventilation ...........•..•.••........ 84D. Attachment................................................... 85E. Deposition .•.•.••.•••••••••.•...•.••••.....•...•••••.•••..... 86F. Implication for health effects. . . • . • . . . . . . . . • . • . • • • . . • . • • • . . . • . . • . . 87G. Effect of air-cleaning devices ..•..•••..•.•....•..•..••••...•..•.. 89H. Recent research on the nature and behavior of unattached 218 pO •••••••• 89
v

Contents Page
VI. Strategies for controlling indoor concentrations . • • • • • . . . • • • • . • • • . • • • • • • 91A. Elements of control strategies •••••.•.••••••••••••.•••••.•••.•••• 91
1. Risk as a basis for specifying objectives ...•.•...••.•.••••..••.. 942. Guidelines and standards .••••..•..••••••••.•.••••••••.•••••• 963. Identifying houses with excessive concentrations .•..•••.••••.•••• 974. Selecting control techniques .•..••..••••••••....••.•••..•..••• 99
B. Exploring policies for reducing exposures ••••••••.••.••••.••••••••• 102I. Form and implications of current policies .••••••••••••••.....••. 1022. Pitfalls and problems ••••••.•••••.••••.•••••••••••.•••.••••• 1093. Moving towards a coherent policy • • . . • • • • • • • • • • • • • • • • • • • • • • • • III
References ......................................................... 114
Appendices .••••••••••••••••••••••••••••••••••••••••.•••••••.••.•••. 129A. Radioactive quantities and units of measure ••••• ". ••••••••••.••• . .•• 129B. Ven tilation rates: distribution and dependence • • • • • • • • • • • • • • • . . • • • • . . 131C. Outdoor concentrations of radon and its decay products ••••. • • . • . • • • • • 133D. Radon 220 and its decay products ••.•.•••••••••••••.•••.••••••••• 135
VI

Summary and Perspective on the Issues of Indoor Radon
Since the mid-1980s, the importance of indoor radon as a potential health risk for the generalpublic has finally come to be recognized. As a result, research efforts have become more extensivethan they were before, and substantial efforts to reduce concentrations in U.S. homes have begun.This increased activity makes necessary a concerted effort to understand the growing amount ofinformation available from research, monitoring, and control efforts and to assure that futureresearch efforts and control strategies take proper account of this understanding. It is evident,however, from recent history that more effort must be devoted to utilizing, and more care tointerpreting, the growing amount of information that is available.
The purpose of this report is to provide an introduction to the behavior of radon 222 andits decay products, based primarily on research of the last fifteen years, and to review certainimportant aspects of the radon question about which there has been significant misunderstanding.We therefore include I) an appraisal of the concentration distribution in U.S. homes, 2) anexamination of the utility and limitations of popular monitoring techniques and protocols, and 3)a discussion of the key elements of strategies for controlling radon levels in homes. It is usefulhere to summarize the main results from this review of radon and decay-product behavior, as wellas to provide some perspective on the three key issues just mentioned.
Since 1980, there have been approximately 15 international meetings devoted substantiallyor solely to the question of indoor radon, as well as many meetings focussing on narrow aspectsof the question and numerous professional society meetings within the context of which indoorradon has been considered. In addition, hundreds of scientific articles on various aspects of indoorradon have appeared in a wide range of journals during the last dozen or so years. Such a wealthof meetings and articles reflects the substantial amount of research conducted since the mid-1970son the occurrence, behavior, health effects, and control of radon and its decay products in theindoor environment. This research has already provided a reasonably comprehensive overaIl pictureof indoor radon and has laid the groundwork for more effective identification of high-radon areasand houses and for more efficient reduction of indoor exposures where necessary.
Research on radon has included study of both the physical behavior and the biological effectsof radon and its decay products. This report reviews only the former, but it is worth noting thatresearch on the health effects of radon - including epidemiological studies of miner exposures andlung cancer, laboratory studies of animals, and theoretical studies of how radon's decay productsflow into and are deposited in the lung - present a more or less convergent picture of the healthrisks associated with decay-product exposures. We are therefore in a reasonable position to makeestimates of the risk from indoor exposures.
Thus, living for a lifetime at radon concentrations of, say, 740 Bq/m3 (20 pCi/l) causes dosesin the range that apparently increased the risk of lung cancer among miners, causing an addedchance of contracting this disease of 5 or 10%. Living a lifetime in a 150 Bq/m3 (4 pCi/I) houseconstitutes a proportionately smaller estimated risk, say I or 2%. This is in the range of risks thatwe accept routinely from accidents in our homes or cars, but substantially greater than those frompollutants that are regulated in outdoor environmental media (air and water). Furthermore, theserisks are the average of the estimates for smokers and nonsmokers, while in fact the preponderanceof evidence suggests that the risks for smokers are significantly larger, and those for nonsmokerssignificantly smaller, than the percentages cited.
A difficulty, in any case, with estimating risks at radon concentrations of 150 Bq/m3 andlower is that the epidemiological data do not provide direct evidence of health effects at themoderate exposures involved, in particular among the general public. On the other hand, thecurrent understanding of dose-response relationships, especially for the alpha radiation from radondecay products, suggests the prudent course of presuming that the proportionately smaIler lung

cancer risks estimated for these exposures actually occur. A complication is that, based onepidemiological evidence, it is thought that the risk from radon is, to a greater or lesser degree,synergistic with that of smoking, so that most of the risk estimated for radon exposures of thegeneral public occurs among smokers, who even without radon incur much greater risks (a 25% orgreater chance of dying from smoking a pack and a half of cigarettes per day) knowingly andvoluntarily. (It is thus ironic that exposures at ISO Bq/m3 are often said to be equivalent in riskto smoking half a pack of cigarettes per day, a factor-of-ten overestimate for those who don'tsmoke.) Still, health risk estimates provide one of the main bases for determining what radonconcentrations might be deemed excessive and hence for focussing research and control efforts.
Radon behavior
Although it has long been known that radon occurs in all atmospheres, indoors and outdoors,a key initial finding of researchers was that indoor levels are considerably higher than thoseoutdoors, simply because the radon enters into a much smaller atmosphere - i.e., the volumecontained by the building interior. A primary result of early studies was that a very wide rangeof concentrations occurs indoors, ranging from a few Bq/m3 (comparable to the typical outdoorlevel of 9 Bq/m3 , or 0.25 pCi/I) to many thousands of Bq/m3 (more than 100 pCi/I). At aboutthe same time it became clear that the major source of indoor radon was not usually the buildingmaterials or water supplies, such as had been studied intensively in Sweden and Maine, respectively,but the ground under the house, where radon IS generated from radium that is naturally presentin the soil. Such studies, completed by 1980, led to experimental and theoretical research, as wellas practical control programs (e.g., in Canada), that indicated that radon entered houses primarilyby being carried in from the ground along with air that is drawn from the soil by small pressuredifferences between the house interior and the ground. These pressure differences are gefleratedby the temperature differences that occur when indoor air is warmer than that outdoors, bywind-driven air flow around the structure, and - in some cases - by the building's heating orcooling system. It is these pressure differences that also cause general infiltration of air throughthe above-ground building shell, thus exchanging air between the indoor and outdoor atmospheresand providing the major means of ventilating small structures. This infiltration serves, then, toremove radon and other indoor-generated pollutants from the indoor atmosphere.
Although even now not understood in detail, this overall picture of radon production andentry provides a broad basis (I) for understanding the entry of radon into indoor environments,as well as the manner in which the wide range of indoor concentrations depends on soil, structural,and meteorological factors, and (2) for developing effective and efficient means for reducing entrywhere necessary. A principal result from the overall research on radon entry and removal is thatwhether or not a building has high or low indoor concentrations is determined primarily by therate at which radon enters the structure, rather than by the ventilation rate. Programs to reduceenergy use in buildings, for example by using weatherstripping and caulking, therefore appear tohave had only a small effect on indoor levels - to the point of being immeasurable in practice.Still, the same type of meteorological and structural factors affect both radon entry and energylosses through infiltration, and extreme forms of ventilation reduction certainly can affect indoorlevels substantially. Research on radon entry, removal, and control thus needs to be conducted inthe context of a full understanding of building design and operation.
Experimental and theoretical studies of radon entry and removal thus provide an understandingof how indoor radon concentrations depend on the various classes of factors - whether geological,structural, or meteorological - that determine them. This understanding, together with calculationalmodels and practical experience, can lead to more efficient identification of areas that tend tohave high radon concentrations, as well as individual houses with excessive levels, and to betterunderstanding and design of the control techniques that can be applied in various circumstances.
2

w
INFORMATION FROM US. BUILDINGS I, , •DECAY·PRODUCT
RADON BEHAVIOR BEHAVIOR INDOOR ATMOSPHERICBEHAVIOR
• generation! ion Slopplnglavailability neutralization • chemical reachons
"and transformations
• transport . particle ,into bUildings interactions • transport mechanisms
• transport out of • removal mechanismsI . removal HEALTH EFFECTSbUildings mechanisms"'\.-1 • epidemiology
+ I
~• animal studies
PREDICTIVE MODEL b ,for Indoor POPULATION • doSimetry
radon concentrahons CONTROL TECHNIQUES----.. EXPOSURE MODEL • mechanisms
t....
t · Source reduction • •• venlllatlOn RISK ESTIMATIONIDENTIFICATION · air cleaning
~ • POLICYI01 target components EVALUATION
of building stock GUIDELINES
tor standards
tCONTROL STRATEGY
RELATIONSHIP OF INDOOR ENVIRONMENTALRESEARCH TO A RADON CONTROL STRATEGY
XBL 901·6217
Figure O. Major components of research on indoor radon
The bold boxes constitute a program of basic research. The figure shows the relationship of basicand applied studies among themselves and to an overall control strategy.

It is these two capabilities, identification and control, together with assessment of the health risksand a perspective on acceptable risks, that constitute the major elements needed for formulatingan effective overall strategy for control of indoor radon.
Thus far, a concerted effort has not been constituted to develop these essential elementssystematically or to examine the underlying premises and objectives in controlling the risk fromradon (or other indoor pollutants). Indeed, even for the more elementary tasks of properlyinterpreting monitoring data or adopting appropriate monitoring protocols, much of what we knowfrom basic studies of radon behavior has not been utilized. Before examining these issues, we turnto research on the behavior of the decay products.
Decay-product behavior
Decades ago it was realized that it is the short-lived decay products of radon, rather thanthe radon itself, that can deposit in the lung, thereby exposing the lining of the tracheobronchialtract to alpha particles from decay of the polonium members of the radon decay chain. It is thisexposure that is thought to lead to the development of the excess numbers of lung cancers experiencedby underground miners. Key work of the last two decades has been to understand what happensto the decay products after they are formed in the indoor atmosphere, both in terms of theirattachment to preexisting particles in the air and their deposition on walls or removal by ventilationor air cleaners, and in terms of the degree to which the decay products in different forms, eitherattached or not, deposit on and irradiate the lung lining when breathed. Aspects of this workinclude 1) basic studies of how the decay products behave in the air, from the time of theirformation from radioactive decay to their attachment, deposition, or removal, 2) associated studiesof the effect of various removal techniques, including ventilation and air cleaning, on the airborneconcentrations of decay products in various forms, and 3) experimental and theoretical studies ofdeposition of decay products in the lung and the associated exposure of cells in the lung liningthat can be transformed to a cancerous state.
These efforts have led to a functionally useful theoretical description of the behavior of thedecay products indoors, based on an understanding of the characteristics of the radon decay seriesand on experimental determination of concentration ratios in various environmental conditions.Although further development is still needed to take account of the detailed physical and chemicalbehavior of the decay products and of the influence of air movement and other indoor environmentalconditions, this theoretical picture is sufficient to lead to several important conclusions. First,both the unattached decay products (thought now actually to be molecular agglomerates formedrapidly around the decay products after they appear in the air from radioactive decay) and theattached form (resulting from attachment of these agglomerates to particles in the air) are importantin determining the dose to the lung. That is, both deposit to a significant degree onto the liningof the tracheobronchial tract.
Secondly, although it is the airborne concentration of decay products that causes the dose ofconcern, the radon concentration appears to provide an equally good measure of this dose. Forexample, decay-product concentrations are relatively low compared with radon when theconcentration of airborne particles is low, since this leads to more rapid deposition of decay productson the room walls (because the unattached molecular agglomerates are more highly mobile). However,a higher dose to the lung (in particular, the bronchial epithelium) per unit activity can resultbecause the unattached decay products that remain in the air deposit in the lung with higherefficiency than decay products attached to particles. As a result, air-cleaning methods that removeparticles and decay products from the air, while able to reduce the total decay product concentrationsubstantially, appear to have relatively little effect on the dose to the lung. This approach istherefore not ordinarily recommended as a means of reducing indoor levels. Rather, the preferredmethod for control is to reduce the entry of the radon itself into the indoor environment.
4

Finally, an understanding of decay-product characteristics is a principal basis for thetheoretical models for deposition and dose in the lung, such as have been used to understand thepotential effects of air cleaning just mentioned. These models also provide a primary basis forour present understanding that exposure to decay products in homes can lead to similar doses, andhence presumably the same size risks, as exposures that occurred in mines.
Radon concentrations in homes
A key issue, then, is what concentrations occur in homes. By 1980, it was clear that mosthouses have concentrations of tens of Bq/m3 (say, 0.2 to 2 pCi/I), but that significant numbershave substantially higher levels, with some having even thousands of Bq/m3 (say, 100 pCi/I). Infact, increasing amounts of data in the early 1980s suggested that hundreds of thousands of U.S.homes might have levels of hundreds of Bq/m3 (i.e., 10 pCi/l, give or take a factor of two orthree). The occurrence of average and high indoor concentrations was clarified considerably as aresult of a 1984 analysis of earlier data and a year-long survey in physics faculty's housing thatbegan that same year. Both of these studies yielded an average concentration, predominantly insingle-family housing, of about 55 Bq/m3 (1.5 pCi/I) and about 6% of houses exceeding 150 Bq/m3
(4 pCi/I). The studies indicated that 1 or 2% of houses have levels greater than 300 Bq/m3 (8pCi/l) and, if the results are extrapolated, suggested that perhaps 0.1 % of houses have levelsexceeding 740 Bq/m3 (20 pCi/I), the level at which occupants receive annual exposures comparableto the limit for miners.
Since the discovery of levels up to tens of thousands of Bq/m3 (i.e., more than 1000 pCijl)in eastern Pennsylvania in late 1984, a much larger number of homes have been monitored thanpreviously. Unfortunately, the resulting data have often been published or publicized in a waythat leads to an exaggerated picture of indoor radon concentrations, in particular of averageconcentrations and the fraction of houses having elevated levels. This has occurred, as discussedbelow, not because the monitoring techniques employed are unreliable in themselves, but becausethey have been employed in ways that do not indicate the concentrations that people are actuallyexposed to or their frequency distribution. Thus published accounts of recent large amounts ofdata suggest that the average concentration in houses is about 150 Bq/m3 (4 pCi/I), which is aboutthree times the actual average, that 20 or 30% of houses have levels greater than 150 Bq/m3, aboutfour times the actual percentage, and that I% have levels greater than 740 Bq/m3 (20 pCi/I), whilethe real percentage appears to be a factor of ten lower.
These accounts have led to a substantial distortion of the general perception of indoor radonlevels. This, in turn, has led to action programs aimed at the bulk of U.S. homes, which - ironically- can delay the formulation of programs focussed on finding and fixing houses with genuinelyhigh levels. One contributor to this exaggerated perception of the problem, and to the formulationof overreaching rather than focussed efforts, is a corresponding exaggeration of the risks entailedfrom radon exposures and of their significance. a fundamental issue in formulating control strategies.However. the simple misinterpretation and misrepresentation of monitoring data can contributesubstantially to distorting the objectives and design of strategies for controlling excessive levels.
Monitoring techniques, protocols, and interpretation
Techniques suitable for large-scale monitoring efforts have been available for several years.It is important to employ these techniques in protocols that are suitable for the intended purposeand to interpret the results properly. A major difficulty in portrayal of the radon problem inrecent years has been the use of monitoring protocols that are suitable, at best, for screeningpurposes. Often, though, the results are used as though they were an actual indicator of humanexposures, for example. by comparing them with the remedial action guideline of 150 Bq/m3 (4pei/I) recommended by the Environmental Protection Agency (EPA). However the presently
5
recommended screening protocol is a short-term measurement, placed in the basement if there isone, while the guideline applies to the average concentration to which occupants are actuallyexposed throughout the year. Even the average concentration in basements approaches or exceedsthe action guideline, numerically. But a house with 150 BQ/m3 (4 pCi/l) in the basement is likelyto have about 50 BQ/m3 (about 1.5 pCi/I) as an average concentration in the primary living space,where the guideline normally applies. Such differences account for much of the great discrepancynoted above in estimates of the percentage of homes with concentrations greater than such levelsof concern as ISO BQ/m3 (4 pCi/l) and 740 BQ/m3 (20 pCi/I). Avoiding such misinterpretationrequires that such screening data not be used for assessing average exposures or for indicating theprobability of high concentrations.
However, a more fundamental problem persists, i.e., that any short-term screening protocolought to be altered either in where the detector is deployed or in interpretation of the results, orboth. Since the concern about radon has to do with human exposures, the better place to deploya detector is in the primary living space. As presently designed, the raw result from the screeningprotocol typically gives a substantial overestimate of the concentration for one particular class ofhouses, i.e., those having basements. Since this large overestimation does not occur for other classesof houses, a substantial distortion is introduced into the general screening methodology, one thatartificially introduces a much higher proportion of houses with basements into the follow-up poolthan of houses built with a crawl space or a slab-on-grade foundation. Even for the lattersubstructure types, because the screening protocol is usually specified as a short-term winter test,concentrations also tend to be overestimated, but to a degree that varies from one part of thecountry to another (depending on variations in winter to annual-average concentrations that dependon environmental and other factors).
The major part of these discrepancies can be reconciled by monitoring in primary livingspace. However, it is also necessary to develop simple calculational methods that take account ofthe house design and location, and of data from the geographic area where the monitoring is beingperformed, to convert the raw monitoring result to an estimate of the annual-average concentrationto which the occupants are actually exposed. This estimate can then sensibly be compared withthe remedial action guideline. In this way, occupants will not be frightened when in fact levelsare low, and remedial efforts can be focussed (and money expended) on the houses that actuallyhave elevated levels.
A particular difficulty is that of real estate transactions, where a decision about remedialaction is often wanted in a very short time, much shorter than the year-long monitoring that oughtordinarily to be the basis for a final decision on such action. For the house transfer situation, aninterpretive protocol such as that just mentioned is almost essential to avoid inappropriate effortsand fears in large numbers of homes. This interpretive model would be a simplified representation,expressed in a simple computer model, of the current understanding of how soil, structural, andmeteorological factors (for the house and area being considered) would be expected, in view oflocal monitoring experience, to affect indoor concentrations. It would yield the proportion betweenthe long-term living-space concentration and the result from the monitoring protocol being used.Converting from the raw result to at least an estimate of the real concentration could substantiallyimprove how decisions are made in real estate transactions. The situation would also be improvedsubstantially by a better understanding of what radon levels actually indicate a need for action,an understanding that underlies development of an overall control strategy.
6

Elements of strategies for controlling indoor radon
A national strategy for controlling indoor radon levels entails three majOi elements, each acomplex system in itself. These are I) a system of guidelines for limiting indoor concentrationsor for controlling the factors that affect indoor levels, 2) a methodology for finding buildings withhigh concentrations, presumably including means for identifying the geographic areas where highconcentrations have a higher-than-average probability of occurring, and 3) a decision frameworkfor choosing the measures that wili be applied to individual structures or, for the case of buildingsyet to be constructed, classes of structures. These three elements are closely linked and their detailsdepend substantially both on the growing scientific understanding of radon behavior and, just asimportantly, on how we decide to deal with the risks of indoor pollutants in general.
Our general perspective on indoor risks critically affects the risk-limiting objectives that arechosen for indoor radon and, hence, the concentration-limiting recommendations or other measuresthat might be undertaken to limit public exposures. However, the risks from radon and otherindoor pollutants are different in size and nature than those we experience in other contexts, as aresult of which simple comparisons can lead to anomalous and often counterproductive results.Thus risks of cancer estimated for indoor pollutants tend to be much greater than those estimatedfor po"llutants in outdoor air and water supplies. This fact might suggest the need for urgent,large-scale efforts. On the other hand, indoor risks are comparable in size to risks encounteredin occupational settings, are in the same range or lower than accident risks in our homes and cars,and are far lower than the risks associated with cigarette smoking - which complicates considerationof radon considerably, since most of the risk from radon is thought to occur in association withcigarette smoking.
An essential element in formulating risk-limiting objectives for radon and other indoorpollutants is therefore an examination of the premises for risk avoidance or acceptability in thisand other settings. The issues of individual control, knowledge, cost, and benefit differ in eachof these settings, which accounts for the fact that risk limits are substantially different in differentcircumstances. Appreciation of such differences also accounts, in part, for the fact that radonlimits for new and existing housing can differ substantially from each other and from one countryto another. Finally, from a practical point of view, considering for the moment only concentrationlimits (rather than other means - such as building codes - that can be used to limit exposures),only modest changes in numerical guidelines can have substantial effects on the number of housesaffected. A guideline of 150 Bq/m3 affects about 6% of single family houses, but would havesubstantial local differences - for example, it appears likely that no more than lout of a hundredCalifornia homes exceed this guideline. On the other hand, a limit of 740 Bq/m3 (20 pCi/I) appearsto affect only about 0.1 % of single-family houses nationwide, and probably a negligible percentagein California.
As a result, the precise guideline and the geographic area in question can affect drasticallythe method for identifying homes exceeding the guideline. If an area has been found, using aproper monitoring protocol, to have 20% of homes exceeding the guideline, then a recommendationthat every home be monitored may be appropriate. On the other hand, if the percentage exceedingthe guideline appears to be only one or a few percent, then a combination of surveys and modelingto identify areas that have a proportionately higher percentage of high concentrations appearsappropriate. Utilization of the understanding of factors affecting indoor concentrations and ofimproved monitoring techniques and protocols can contribute substantially to such efforts. Oncesuch areas, and individual houses having high concentrations, are identified, one can utilize anappropriate decision matrix for determining what technical measures to employ, how to performfollow-up measurements, etc.
7

The critical dependence of the design and cost effectiveness of a radon control strategy onan overall risk perspective and on the resulting risk-limiting objectives and associated concentrationlimits suggests urgent attention to this question, as well as continued substantial efforts to improveour basic understanding of radon and decay product behavior. Given the information from minerstudies, as well as some consideration of estimated risks and of how society and individuals considerrisk, it appears that homes having concentrations exceeding 740 Bq/m3 (20 pCi/I) or so should bea primary focus of initial control efforts. Individuals in these homes suffer significant risks, theestimates of which are supported fairly directly by epidemiological and other health evidence. Thiseffort would entail finding and fixing approximately 100,000 homes across the United States. Whilethis would be a substantial undertaking, and indeed would constitute one of the nation's majorenvironmental efforts, it would not significantly affect the average exposure to indoor radon. Itssole objective would be to prevent individuals from suffering excessive risks, i.e., risks that arelarger than most of us would accept in many circumstances. In addition, it would provide informationrelevant to identifying houses with only moderately high concentrations, and to lowering themefficiently, and it would identify areas where radon-specific building codes might be formulatedto avoid high concentrations in new houses.
Extending the remedial effort to all homes with levels greater than 150 Bq/m3 (4 pCi/I)expands the efforts approximately fifty-fold, i.e., to perhaps 4 million homes. If successful, such::I large-scale effort would reduce the (estimated) radon-related risks of virtually all individuals even smokers - to below those we routinely accept, such as the 2% individual risk of dying in caraccidents. In addition, it would reduce the total number of lung cancers estimated to be associatedwith indoor radon by about 10 or 20%, affecting primarily smokers. The last qualification isimportant, since the total number of cancers avoided by this multi-billion dollar commitment wouldbe about I% of the mortality caused by smoking itself. In terms of cost effectiveness, the commitmentper premature death avoided would be much less than that for many environmental efforts, butmuch greater than measures related to accidents (such as smoke detectors or seat belts), and ofcourse very much greater than the cost to avoid a smoking-related death.
Finally, to achieve the reduction of indoor levels to outdoor levels of 10 Bq/m3 or so (0.2or 0.3 pCi/l) would require, over the long term, very substantial financial commitments in everyhome in the country, totalling hundreds of billions of dollars. This would, in effect, be aimed atconstructing an impermeable shield against radon from the earth (as well as from water and buildingmaterials). These large differences among several possible goals make clear the importance of aconcerted and systematic approach to the design of a strategy for controlling radon, includingconsideration of the basic premises and objectives for limiting risk in the indoor environment.
8

I. INTRODUCTION
A. Historical Perspective
The radiation dose from inhaled decay products of radon 222 is the dominant component ofnatural radiation exposures of the general population. Monitoring in various countriesyields average residential 222Rn concentrations ranging from 10 to 100 Bq/m3 (0.3-3 pCi/I).lFor a country such as the United States, with an average residential concentration of about40 Bq/m 3 (I pCi/l), the average lifetime risk of lung cancer caused by exposure to radondecay products is estimated to be about 0.4%, causing, then, on the order of 10,000 cases oflung cancer annually among the U.S. population of 245 million. (See, for example, Lubinand Boice 1989.) As illustrated in Figure I - showing data from the United States that isdiscussed in section ILA - this risk is more significant than that received on the averagefrom all other natural radiation sources or from medical exposures. Further, the dose fromradon's decay products exceeds by a factor of 10 to 100 the average doses from nuclearpower or weapons testing.
Probably more important is the fact that in any country or region indoor levels a factor of10 or more higher than the average sometimes occur. In fact, it has been the commonexperience of the radon research community since the late 1970s that 222 Rn concentrationsin the range of 200 to 2000 Bq/m3 (5 - 54 pCi/I) are found with startling frequency. And,although it might be thought that the estimated lung cancer risk associated even with anordinary concentration such as 40 Bq/m3 is very large compared with many environmentalinsults of concern (Nero 1988), living for prolonged periods at concentrations above 200Bq/m3 leads to estimated individual lifetime risks exceeding I or 2%. The highest valuesfound - far greater 2000 Bq/m3
- have risks even larger than those from cigarette smoking.However, unlike smokers, those living in unusually high radon concentrations are rarelyaware of the large risks they may thereby be suffering. (An important qualification forthese estimates of radon risk, though, is that they average the risk for smokers andnonsmokers, while the evidence suggests that the risk for smokers is higher than that given,and that for nonsmokers is lower. See NAS 1988.)
The principal basis for present concern about exposures to radon's decay products is theexperience with lung cancer incidence among underground miners. High fatality ratesobserved among miners as early as the sixteenth century were only later ascribed to lungcancer. And it was only after recognition in the 1950s that excessive lung cancer rates wereoccurring among uranium miners in the United States and elsewhere that examination ofexposure history versus incidence indicated a relationship between added risk of lung cancerand exposures to 222 Rn decay products. Broadly speaking, results from a number of studiesconducted among various miner groups, uranium and otherwise, have shown roughlyconsistent results. In the meantime, substantial efforts have been devoted to loweringexposure rates. Nonetheless, even current occupational limits - while keeping exposuresmuch lower than before controls were implemented - are high enough that exposure at thelimit still entails a significant risk and, indeed, one that is larger than the risk associatedwith exposure at the occupational limit for most other hazardous substances in theworkplace.
1 This paper uses SI units throughout, except in examination of certain of the U.S.concentration data (where the original data are given in traditional units and conversion IS
difficult or awkward). See Appendix A for a discussion of quantities and units.
9

Comparison To Other Radiation Exposures
222Rn Concentration (Bq/m3)
200 100 200 300
GM
en 15j
GM = 35 Bq/m3
Q) GSD = 2.8enAM = 61 Bq/m3::J
0::r:-0 10
--cQ)u~
Q)Q.
5
>8
82 4 6
222Rn Concentration (pCijf)
oW-llllWlll=Ccn:b£:llb3~~~~JJo
XBL 8411-4824A
Figure I. Probability distribution of 222Rn concentrations in U.S. homes
These data result from direct aggregation of 19 sets of data, totalling 552 homes, from the UnitedStates. The smooth curve is a lognormal function with the indicated parameters (Nero et al. 1986).The upper scale indicates approximately the relative effective doses from radon and other sourcesof radiation exposure.
10

The experience gained in the uranium mines provided, not only information on health risks,but also the initial tools for understanding the occurrence, behavior, and control of radonand its decay products in the more general environment. The various isotopes of radon 222 Rn being the most important - are present to a greater or lesser degree in allenvironmental media - air, water, and soil - arising naturally from the radioactive decay ofradium, whose isotopes are members of the decay series originating with uranium andthorium, primordial constituents of the earth's crust.
The initial focus of environmental studies, however, was still exposures resulting fromindustrial processes, primarily the mining and milling of uranium, that increased theaccessibility of radon to the outdoor atmosphere or to indoor environments. A principalexample has been high 222 Rn concentrations inside homes and other buildings in the vicinityof Grand Junction, Colorado, that were built on or with radium-rich tailings from uraniummilling. Another case, in Canada, is that of the mining communities of Port Hope,Uranium City, Elliot Lake, and Bancroft, where remedial action programs were undertakenbecause of the possibility that indoor concentrations were unusually high because of localmining or milling activities. A comparable example is observation of higher-than-averageindoor concentrations in homes built on lands in Florida that have been disturbed as theresult of mining phosphate ores. These ores typically have elevated concentrations of theuranium series, and resulting waste products have high concentrations of radium. Althoughexposure limits were set by the United States and Canada for each of these cases, it is nowclear that the concentrations found in these communities - while higher than average - areno higher than those occurring in many other areas due merely to radon from the groundor, in some cases, from building components using materials with natural concentrations ofradionuclides.
Indication of the potential significance of radon in the general building stock came with therealization in the 1970s of the health implications of very high concentrations in Swedishhomes built using light-weight concretes incorporating alum shale as aggregate. This shalehad extremely high radium content, causing high radon emanation rates from the finishedconcrete. This, together with low ventilation rates prompted by the interest in reducingenergy use, resulted in high airborne concentrations in this segment of the housing stock.Ironically, it has subsequently been found in Sweden that the bulk of radon in the totalhousing stock comes from the ground. Furthermore, monitoring in various countries hasindicated that even average indoor concentrations are significant from the point of view ofenvironmental risks. And, indeed, while changes in the ventilation rate can affect theindoor concentration significantly, the primary determinant of whether or not a particularindoor environment has high levels is, for many classes of buildings, the rate of radonentry.
Because of the apparent health implications, the earlr: work on indoor concentrations hasgiven rise to a broad range of research characterizing 22 Rn and its decay products indoors.This work has included significant monitoring programs in homes, investigation of thesources of indoor radon, study of the behavior of the decay products, and development oftechniques for controlling indoor concentrations. In addition, radiobiologists andepidemiologists have begun to apply dosimetric and dose-response data explicitly to theproblem of environmental exposures. These international efforts have resulted in anex tensive literature, including the major collections indicated in Table I and hundreds ofother papers that appear in a wide variety of journals and conference proceedings.
11

Table 1
Major collections containing indoor radon articles
Natural Radiation Environment III, proceedings of Symposium, Houston, Texas, April 1978 (Edited by T. F.Gesell and W.M. Lowder) - Technical Information Center (CONF-780422), Springfield, Virginia, 1980.
Radon and Radon Daughters in Urban Communities Associated with Uranium Mining and Processing, proceedingsof three AECB Workshops in Ontario, Canada, 1978-1980 - Atomic Energy Control Board, Ottawa,Canada, 1978-1980.
Assessment of Radon and Daughter Exposure and Related Biological Effects, proceedings of Specialist Meeting,Rome, Italy, March 1980. (Edited by G.F. Clements, A.V. Nero, F. Steinhausler, M.E. Wrenn) - RD Press,Salt Lake City, Utah, 1982.
Natural Radiation Environment, proceedings of Second Special Symposium on Natural Radiation Environment,Bombay, India, January 1981. (Edited by K.G. Vohra, U.C. Mishra, K.C. Pillai, and S. Sadasivan) - WileyEastern Limited, New Delhi, 1982.
Indoor Air Pollution, proceedings of the International Symposium on Indoor Air Pollution, Health and EnergyConservation, Amherst, Massachusetts, October 1981. (Edited by J. Spen~ler, C. Hollowell, D.Moschandreas, O. Fanger) - Special Issue of Environment International 8 (Nos 1-6), 1982.
Indoor Radon (Edited by A.V. Nero and W.M. Lowder) - Special Issue of Health Physics 45 (No 2), August 1983.
Radon - Radon Progeny Measurements, proceedings of International Meeting, Montgomery, Alabama, August1981 - U.S. Environmental Protection Agency (EPA 520/5-83/021), Washington, 1983.
Indoor Exposure to Natural Radiation and Associated Risk Assessment, proceedings of International Seminar,Anacapri, Italy, October 1983. (Edited by G.F. Clemente, H. Eriskat, M.C. O'Riordan, J. Sinnaeve) Special Issue of Radiation Protection Dosimetry 7 (Nos 1-4), 1984.
Exposure to Enhanced Natural Radiation and Its Regulatory Implications, proceedings of Seminar, Maastricht,Netherlands, March 1985. (Edited by B. Bosnjakovic, P.H. van Dijkum, M.C. O'Riordan, and J. Sinnaeve)- Special Issue of Science of the Total Environment 45, October 1985.
Indoor Radon, proceedings of APCA International Specialty Conference, Philadelphia, Pennsylvania, February1986 - Air Pollution Control Association (SP-54), Pittsburgh, 1986.
Indoor Air Quality, based on the Third International Conference on Indoor Air Quality and Climate, Stockholm,August 1984. (Edited by B. Berglund, U. Bergland, T. Lindvall, J. Spengler, and J. Sundell) - SpecialIssue of Environment International 12 (Nos. 1-4), 1986; more of the radon papers are in Radon, PassiveSmoking, Particulates and Housing Epidemiology, Vol. 2 of Indoor Air (Edited by B. Berglund, T. Lindvall,and J. Sundell), Swedish Council for Building Research, Stockholm, 1984.
Radon and its Decay Products: Occurrence, Properties and Health Effects, proceedings of ACS SYmposium, NewYork City, New York, April 1986. (Edited by P. Hopke) - American Chemical Society Symposium Series331, Washington, 1987.
Indoor Radon II, proceedings of APCA International Specialty Conference, Cherry Hill, New Jersey, April 1987 Air Pollution Control Association (SP-60 and Supplement), Pittsburgh, 1987.
Indoor Air '87 proceedings of the Fourth International Conference on Indoor Air Quality and Climate, Vol. 2,Berlin, August 1987. (Edited by B. Seifert, H. Esdorn, M. Fischer, H. Ruden, and J. Wegner) - Institutefor Water, Soil and Air Hygiene, Berlin, 1987; full papers to appear in special issue of EnvironmentInternational.
Natural Radioactivity, proceedings of the Fourth International Symposium on the Natural RadiationEnvironment, Lisbon, December 1987. (Edited by A.a. de Bettencourt, J.P. Galvao, W. Lowder, M. Olast,and J. Sinnaeve) - Special issue of Radiation Protection Dosimetry 24 (nos 1-4), 1988.
Proceedings: the 1988 Symposium on Radon and Radon Reduction Technology, Denver, October 1988.Environmental Protection Agency Report EPA-600/9-89-006, Research Triangle Park, 1989.
Major Reviews
Health Risk of Radon and Other Internally Deposited Alpha Emitters (Committee on the Biological Effects ofIonizing Radiation) - National Academy Press, Washington, 1988.
Indoor Pollutants (Committee on Indoor Pollutants) - National Academy Press, Washington, 1981.
Ionizing Radiation: Sources and Biological Effects (United Nations Scientific Committee on the Effects of AtomicRadiation) - United Nations, New York, 1982.
Evaluation of Occupational and Environmental Exposures to Radon and Radon Daughters in the United States Report No. 78, National Council on Radiation Protection and Measurements, Bethesda, MD., 1984.
Radon and Its Decay Products in Indoor Air (edited by W.W. Nazaroff and A.V. Nero)-Wiley, New York, 1988
12

The present repon serves as a broad introduction to our growing understanding of radonand its decay products in indoor air. It also reviews several critical issues related toexposure assessment and formulation of control strategies. Specifically, we examine whatwe know about the concentrations and behavior of radon and its decay products, as well asthe utility of various monitoring techniques and the key elements of strategies forcontrolling indoor concentrations. A much more detailed review of the behavior (andhealth effects) of radon and its decay products is contained in Nazaroff and Nero (1988).
While the present paper serves as an introduction to the behavior of radon and its decayproducts, its utility lies more in the examples it gives of important questions where therecent explosion of activity on radon has not been accompanied by corresponding care inthe critical examination, interpretation, and valuation of results. In our view, this difficultyhas arisen partly from a lack of familiarity with the understanding that has arisen from theresearch of the last decade, and partly from a tendency to interpret and act on the basis ofpreconceptions developed in other fields and contexts. The first causes repetition of pastwork or misinterpretation of current results, and the second leads to inappropriate and oftencounterproductive action. We hope the key issues we examine will illustrate the importanceof unusual care in dealing with an exposure that causes, after all, risks that are estimated tobe far larger than those often considered in "environmental" settings. This fact, takenalone, may lead to control programs that are more extensive and expensive than anyprevious program of environmental control. But, in fact, control Objectives and strategiesshould be devised also in the knOWledge that these "large" risks estimated from indoor radonare, ironically, no larger than other risks that the public accepts daily as a matter of course.In general, the formulation of sensible strategies for dealing with indoor air quality requiresdevelopment of a more complete perspective on environmental risk than has heretofore beenavailable (Nero 1988).
B. Characteristics of Radon and Its Decay Products
A principal characteristic of radon thilt gives it mOre radiological significance than earliermembers of the uranium (and thorium) decay chains is the fact that it is a noble gas. Assuch, once it is formed in radium-bearing material, a radon atom is relatively free to move,provided it first reaches the material's pore space (typically by recoil due to the parentradium atom's emission of an alpha particle). Once in the pore space, macroscopic transportof radon is possible, either by molecular diffusion or by flow of the fluid in the pore space.Radon can therefore reach air or water to which humans have access, provided thattransport is sufficiently rapid to be completed before the radon decays.
Radon 222 - formed in the 238U decay chain (Figure 2) from decay of 226Ra - is the mostimportant radon isotope because it has the longest half life, 3.8 days. This is long enoughthat much of the 222 Rn formed either in building materials or in the ground withinapproximately a meter of building understructures can reach the indoor environment.Similarly, much of the 222 Rn formed within about a meter of the earth's surface reaches theoutdoor atmosphere, although this has less radiological significance than that reachingindoor environments, which have relatively small volumes compared with the contributingsource material. In some cases, whether for the indoor or outdoor environment, radon frommuch larger distances than a meter can be important if high-permeability transport routes(such as gravelly soil or fissures in the ground) are available.
In contrast, although about as much 220Rn (sometimes called thoron) actIVity is formed (inthis case from decay of 224 Ra, a member of the thorium 232 decay chain - see Appendix Don 220 Rn ), substantially less reaches air because its short half life (56 s) limits the distance it
13

a i4 1
2J8u ~U
4 47X 109y 245X 105y
234Pam il (23)
5 420) a (4 72. 478)
1 17 min
23ATh j 10 10 020)ZX>-rh
241 d 7 54X 1try
a (462. 469)
226Ra
1600 y
a (4 60.478)
mRn
382 d
a (549)
211PO21'pO 21OpO
3.04 min d (327 154. 150) 164 us d (1 16) 138 d
a (600)21'SI a (769) 2'OSI
a (530)
199 min 501 d
214Pbd (0 67. 072. 1 02) 210Pb d (002 006) 2C6Pb
268 min 22.3 y Stable
XBL 8719206A
Figure 2. Uranium 238 decay chain. including 222Rn and its decay products
Radon 222, its parent 226Ra. and its decay products are members of the 238U decay series. Airborneconcentrations of 218pO. 214Pb. and 214Bi are of prime radiological interest due to their potentialfor retention in the lung, leading to subsequent irradiation by the alpha decays of 218pO and 214pO.Half-lives (in boxes) and alpha energies (in Me V) are from Browne and Firestone (1986), exceptfor the 218pO half-life (from Martz et aL 1989). Beta end-point energies (in MeV) are from NCRP(1985), except for 234Th and 234Pam , from Lederer and Shirley (1978). See Appendix 0 forcomparable 232Th decay chain (given in Figure 24).
14

can travel before decay.:! Finally, very little of another radon isotope, 219Rn. is present inair because the 235 U decay chain, of which it is a member, has a natural abundance that isa factor of 100 lower and because of 219Rn,s short half life (4 s).
The second important characteristic of radon is that it decays to radionuclides that are bothchemically active and relatively short-lived. As indicated in Figure 2, the fourradionuclides following decay of 222 Rn haye half lives of less than 30 minutes, so that - ifcollected in the lung on being inhaled - they are likely to decay to :!lOPb before removal bylung clearance mechanisms. (Similarly, 220 Rn begins a series of relatively short-livedisotopes; the most significant dose arises from the inhalation of 212 pb , which has a half lifeof 10.6 h.)
The radiation released on decay of the short-lived decay products imparts the lung dose towhich increased risk of lung cancer is attributed. The alpha radiation from the poloniumisotopes contributes the radiologically significant dose, primarily because alpha particlesdeposit their energy within such a small thickness of tissue. As a result, the alpha energy isdeposited in the relatively sensitive lung lining and also has a dense deposition pattern,which has much greater biological impact.
The concentration of (short-lived) decay products in air is not ordinarily given in terms ofindividual decay-product concentrations, but rather by a collective concentration that isnormalized to the amount of alpha decay energy that will ultimately result from the mixtureof decay products that is present. This quantity is the "equilibrium-equivalent" decayproduct concentration (EEOC),3 the amount of each decay product necessary to COllectivelyhave the same potential alpha energy concentration (PAEC) that is actually present. (Thedecay-product concentration can also be given in terms of the PAEC itself. See AppendixA on quantities and units.) The ratio of EEOC to radon concentration is the equilibriumfactor, equal to I if radon and all its decay products are in equilibrium (and therefore havethe same radioactivity concentration), but in the range of 0.2-0.6 for most indooratmospheres and somewhat higher outdoors.
For a given indoor radon concentration, the concentrations of the decay products can varyover a substantial range, since they are removed from the air, not only by radioactivedecay, but also by ventilation and by reactions with the structure and its furnishings. Anadditional and important manifestation of their chemical activity is the fact that the decay
2 Although indoor concentrations of the 220 Rn gas itself are ordinarily much less than thoseof 222 Rn , scattered data (cf. Appendix on 220 Rn ) suggest that, at least in buildings withaverage or below-average 222Rn concentrations, the potential alpha energy concentration(PA EC) of 220 Rn decay products -- while ordinarily less than that from 222 Rn decayproducts -- can be a significant fraction of the total PAEC. Unfortunately, too littleinformation is available to assess reliably the overall prevalence or importance of 220Rn andits decay products, except to say that its PAEC has rarely, if ever, been found to approachthe higher levels found for 222 Rn indoors. (And, in any case, the effective dose per unitPAEC is thought to be far smaller for the 220 Rn decay series than for the 222 Rn series; cf.James (1988).) As discussed later, however, results from measurements of indoorconcentrations are consistent with a picture where 222 Rn transport is dominated by pressuredriven flow, and 220Rn transport by diffusion.
3 This quantity is often called the equilibrium-equivalent radon concentration, a practicethat is avoided here because it is actually a measure of the decay-product concentration.
15

products can form small airborne agglomerates and can attach to previously existingparticles. Such characteristics of the airborne decay products affect the rate at which theydeposit on the walls and furnishings, the pattern and degree of deposition in the lung, and ultimately - the magnitude and distribution of the associated radiation dose.
C. Behavior of Radon Indoors: General Principles
The indoor concentration of radon and its decay products, or of any other airbornepollutant, depends on three factors: the entry or production rate from various sources, theventilation rate, and the rates of chemical or physical transformation or removal. Becauseof its relatively long half life and lack of chemical activity, 222Rn itself acts much like astable pollutant whose indoor concentration is determined by only two factors, the entryrate and the ventilation rate. In contrast, the behavior of the decay products is much morecomplex, depending on the radon that is present, the ventilation rate, and the interplayamong radioactive decay, chemical reactivity, particle concentrations, and the nature of theboundary layer between the indoor atmosphere and the surfaces that enclose it.Nonetheless, as a practical matter, the decay-product concentration is indicatedapproximately by the radon concentration, which is determined by source and ventilationcharacteristics. The influence of these factors on indoor concentrations is discussed herebriefly. In addition, Appendix B treats the question of ventilation rates per se.
In the observation of high concentrations in Swedish homes in the 1970s, both excessiveentry rates and decreased ventilation rates appeared to be important contributors. Theseobservations constituted a signal that scientists in other countries should investigate radonconcentrations in their own building stocks. It was also in this same period that extensiveresearch on other aspects of indoor air quality was beginning (see citations in Table 1),because of the discovery that other classes of pollution could occur indoors at higher levelsthan outdoors. For example, the byproducts of combustion - such as carbon monoxide,nitrogen oxides, and particulates - are the primary pollutants from the point of view ofoutdoor air quality. But concentrations are often much higher indoors, due to the presenceof gas stoves, kerosene space heaters, and other appliances that are not vented effectively tothe outdoors (Girman et al. 1982, Spengler and Sexton 1983). Similarly, although organicchemicals of various kinds are regulated in outdoor air and around toxic waste dumps,concentrations can be much higher indoors, again because of the presence of indoor sources(Miksch et al. 1982, McCann et al. 1987). In the United States - as well as in othercountries - much of the research on indoor air quality began because of the fear thatenergy conservation measures might raise levels of such pollutants. This led, for example,to a substantial program of research supported by the U.S. Department of Energy (DOE),beginning in 1976.
The basis of this concern may be seen by considering the steady-state concentration of anonreactive gas entering an interior space from effectively internal sources (including theground) at a fixed rate per unit volume, Sv' The concentration in this case is easily shownto be
( I )
where), is the ventilation rate, 1 is the concentration in outdoor air, and d is the decayVOl
rate of the gas (if applicable). For typical ventilation rates, greater than 0.1 h- , the decayrate of 222 Rn (0.0076 h -1) can be ignored in this equation, so that I - I = Sv/),' This
o vsimplifies even further, to I = Sv/ ),v' when - as is often the case - the outdoorconcentration is much smaller than the indoor. (Note that), and d are rate constants. i.e.,
vthe fraction removed per unit time.)
16

This expression does not encompass recently understood and important aspects of radonbehavior, including time dependent and interactive phenomena, as discussed in latersections. Moreover, as is obvious, it cannot be used to describe the behavior of radondecay products, whose concentrations are determined by a number of interdependentreaction rates. Nonetheless, it is useful for specific purposes. An obvious example is that,for a fixed source strength, Sy, a decrease in the ventilation rate - e.g., to save energy will result in a corresponding increase in the indoor concentration.
However, the greater importance of source strengths in determining indoor radonconcentrations became clear in initial studies of indoor concentrations and ventilation rates.Earlier work had already indicated significant concentrations of 222 Rn and its decayproducts in U.S. homes (George and Breslin 1980); and subsequent work had confirmedthat, with supply of differing amounts of mechanical ventilation in a given house, the radonconcentration varied as the inverse of the ventilation rate (Nazaroff et aL 1981). But resultsfrom simultaneous 222Rn and ventilation-rate measurements in several groups of U.S. homesshowed no apparent correlation between these two parameters (Nero et al. 1983). Asshown in Figure 3, the radon concentrations and ventilations rates for each sample groupshowed an approximately order-of- magnitude range; for the combined sample of about 100homes, the concentration showed a significantly larger variability than the ventilation rate.If the ventilation rate .\ and source strength Sy were independent in this sample of houses,and if the range of concentrations observed were caused primarily by differences inventilation rate, then - because I = Sv/ >'v takes a linear form, In I = In S - In >'v' on alogarithmic plot - the data points of Figure 3 would cluster around a straight line withslope -I. No such correlation is apparent. The relative range and independence of thesetwo quantities suggested that the source strength was the dominant determinant of the widerange of concentrations observed in U.S. housing.
Such indications prompted substantial work in understanding the size and variability ofradon entry rates, as discussed below. However, it is important to emphasize that otherfactors still play an important role: ventilation rates vary substantially within the housingstock, which is of course one of the major incentives for past and current efforts toincrease the efficiency of energy use in buildings. (In the United States, an added incentiveis that even the average ventilation rate - see Appendix B - is relatively high comparedwith rates in many countries.) And, even for a given radon concentration, theconcentrations and physical state of the decay products - which account for the healtheffects of principal concern - can vary significantly. We turn now to an appraisal ofconcentrations in U.S. homes, and a brief review of concentrations elsewhere, after whichwe will examine more closely the factors affecting indoor levels. Concentrations of 220Rnand its decay products are reviewed briefly in Appendix D.
17

" "• EnergY-EfficientA San Francisco• Maryland
- /0~ • ... 1•-- •u • •a. •• ••• •'- • ••c: • ••0 • ~...+= •• ••E • • •.... I· ••c: .. A<U •U A 1I
A, ••c:
0 A. A A •• A
U • A •C\J A
fA..... •
C\J A
C\JA
AAll
A
c: A
0 A"'0 A0 0./ A. •a::
0.0/ 0.1 /
Air change rate (hr -I)
/0
XBL 8/8-"'5
Figure 3. Radon 222 concentrations and air change rates measured in 98 U.S. residences
The results shown are from three survey groups: "energy-efficient" houses in the United States :md(one) in Canada; conventional houses in the San Francisco area; and conventional houses in acommunity in rural Maryland (data from Nero et al. )983).
18

II. APPRAISAL OF CONCENTRATIONS IN U.S. HOMES AND OTHER BUILDINGS
Since identification of 222 Rn and its decay products as potentially important indoorpollutants, a large number of efforts have been undertaken actually measuringconcentrations in homes. In a few countries, mostly European, these efforts have includedsurveys in statistically-designed samples of the housing stock. This has not yet occurred inthe United States. However, there have been many studies and much monitoring conductedin the United States, and - taken together - monitoring efforts to date provide a usefulappreciation of residential radon concentrations even in the United States.
Interestingly, the most useful indication of the distribution of concentrations in the UnitedStates arises from studies undertaken prior to the explosion of activity since the discoveryof extremely high indoor levels in eastern Pennsylvania and New Jersey. This is truebecause the earlier results offer the possibility of estimating the annual-averageconcentration in living space without the problem of oversampling in areas known to havehigh concentrations. This contrasts with the more than a million measurements performedsince 1985, either taken in houses where the owners request monitoring (which tends to
concentrate monitoring in locales known to have high radon levels indoors) or performedusing short-term detectors, often placed in basements (which therefore does not indicatelevels to which the occupants are typically exposed). Unfortunately, the public - and evenmany scientists - have been misled by the careless use of such data (which can, however, beuseful for their own purposes).
Data are less complete for commercial and public buildings, although a variety ofinformation can be brought to bear to suggest the approximate scale of radon concentrationsin such environments.
This section briefly reviews the results of indoor radon surveys, primarily those performedin residences. No attempt is made to mention the many specific studies that have beenperformed. In particular, for residences - the focus of large numbers of studies - only thefew surveys or analyses that are representative of a large segment of the housing stock arediscussed explicitly. Results from a significant number of individual surveys may be foundin the major references given in Table I and in numerous individual journal articles andreports. The studies indicative of concentrations in particular countries are summarized inTable 2.
It is also worth noting the tendency of the research community to measure radonconcentrations in survey efforts, rather than decay-product concentrations. This tendencyarises largely from the availability of reasonably reliable and very simple integrating etchedtrack radon monitors (see, for example, Alter and Fleischer 1981), a significant contrast tothe state of decay-product monitoring. (An alternative technique being used in manyshorter- term studies, and in screening measurements recommended by the U.S.Environmental Protection Agency, is based on collection of radon for a few days incharcoal canisters, as discussed in Section IV; see, for example, Cohen and Cohen 1983.)Fortunately, given a reasonable understanding of the relationship between radon and itsdecay products and an awareness of the fact that the decay-product-to-radon ratio(typically in the range of 0.2 to 0.8) does not vary as widely as radon concentrations,measurement of the radon is a reasonable indicator of decay-product concentrations and is avery effective tool in survey efforts. This is analogous to the situation for many otherpollutants: for example, although health effects associated with NOz exposures may have asubstantial dependence on peak (rather than average) concentrations, an integrating samplercan be a very effective survey instrument, provided that associated studies examine
19

Table 2. Distribution of 222Rn Concentration in VarIous Countries
Count ry
U.S.A.
NO. of Homes
Moni tored
617
Type
single-fam; ly
Concentration
(Bq/m3)
GM AM
:n 55
GSO or
Xof tail
2.6
Notes
aggregated 22 data sets,
adjusting to annual-average
Reference
Nero et al. 1966
453 38 54 2.36 physics professors Cohen 1966
Canada 9999 13 2.7 median values from 14 city surveys; McGregor et al. 1960
mostly basement values; PAEC
converted assuming equil. factor;
0.5
:}No
Sweden
Dermark
Finland
Federal Republ ic
of Germany
500
346
146
4500
6000
{
detached
apartments
single-family
flats
sma II houses
69
53
40
122
85
90
49
2X > 800 Bq/m3 }built before 1975
0.5X > 800 Bqlm3
<2X > 200 8q1m3
4X > 400 Bq/m3
1.6
Swedjemark & Mjones
1964a
Ulbak et al. 1968
Castren et al. 1967
Schmeir &Yicke 1965
Netherlands
8elgium
France
Un i ted K i ngdOOI
Ireland
JiJpan
1000
79
1552
2000
1036
251
24
41
50
15
56
19
100
25
1.6
1.7
2.6
2.6
2X > 400 8q/m3
2X > 100 8q/m3
high levels show excess above
lognormal
preliminary national survey
living areas; bedrooms had GM of
11 Bq/m3
Coopos ,I e at 4 city surveys
Put &de Meijer 1984
Poffijn et al. 1985
Rannou 1987
Green et al. 1985
McLaughl in &
lIaslolek 1968
Aoyama et al. 1987

relationships between average and peak concentrations under well-characterized conditions.As seen below, another incentive for emphasizing the radon concentrations per se is thatthis parameter appears to be a relatively direct indicator for use in strategies for identifyingand controlling excessive concentrations and, as discussed elsewhere (James 1988), it mayactually be a more consistent indicator of dose than the decay-product concentration - atleast based on current dosimetric models.
A. Studies Indicating the Concentration Distribution in U.S. Housing
Despite a broad range of U.S. efforts to characterize indoor radon, including a substantialnumber of studies that have included measurements in existing U.S. homes, there has beenno direct broad-scale determination of the concentrations to which the U.S. population isexposed. The numerous U.S. studies have varied significantly in incentives, scientificObjectives, selection of homes, and measurement procedures. The nature of the results fromthese studies therefore vary significantly, as do the conclusions that may be drawn fromthem. An obvious solution to this difficulty would be to carry out measurements in a validstatistical sampling of U.S. homes, such as is now being planned by the EnvironmentalProtection Agency (EPA). From even an approximate evaluation of the data already inhand, it is clear that measurements in on the order of 1000 homes would determine themean concentration very accurately and ascertain the fraction of homes at highconcentrations (say, 5 times the mean) to a reasonable accuracy.
However, regardless of the potential importance of such an effort, the data already availableare quite substantial, including tens of data sets from a wide variety of studies undertakenyears ago and one data set obtained from a national sampling with a year-longmeasurement. The results from these earlier efforts constitute a reasonable basis forconsidering the scope of the radon problem in the United States and, hence, for formulatingan effective strategy for controlling excessive exposures to radon decay products.
It had been clear for some time before the discovery of very high indoor concentrations onthe "Reading Prong" in Pennsylvania that a systematic analysis of available data would haveconsiderable value, and such an analysis was performed on data available as of 1984-1985(Nero et al. 1986). This analysis explicitly considered important differences betweenvarious surveys and aggregated the resulting data sets, using both nonparametric andlognormal representations to yield a nominal radon distribution for single-family houses (thedominant type of residence) in the United States. The analysis handled the diverse naturesof the total of 38 data sets included by (I) discriminating between those that wereundertaken because high concentrations were expected, and those that were not, (2)normalizing data taken in the winter to an approximate annual-average concentration, sincethis is the result of principal interest for exposure (and risk) assessment, and (3) weightingthe different data sets by number of houses, region, and population, in order to examinethe sensitivity of the resulting distribution to aggregation method.
Figure I showed the probability distribution obtained from direct aggregation of 19 of thedata sets for which there was no prior expectation of high radon concentrations and forwhich individual data were available. This particular aggregation, while not suitable fordrawing conclusions about annual-average concentrations, indicates the substantialconformance of indoor radon concentrations to a lognormal representation, a result that hasbeen observed in many individual studies.
The analytical effort examined a total of 38 data sets, corresponding to different areas(usually a state or urban area) of the United States. A significant number of these sets
21

arose from monitoring efforts that were prompted by some prior knowledge of a potentialfor elevated concentrations. However, the main conclusions of the analysis were based on22 data sets apparently lacking such prior indication. In either case (i.e., the 38 sets or the22-set grouping), the geometric mean (GM) concentrations from the individual sets rangedfrom 11 to 210 Bq/m3 (actually, 0.3 - 5.7 pCi/l, since all of these studies used thetraditional units). Geometric standard deviations (GSDs) ranged from 1.3 to 4 among all38 sets. The results of aggregating these sets in different manners are fairly insensitive tothe manners of aggregation, with the main distinction being simply that aggregationsutilizing the full 38 sets yielded a somewhat higher aggregate mean than those includingonly the 22 "unbiased" sets.
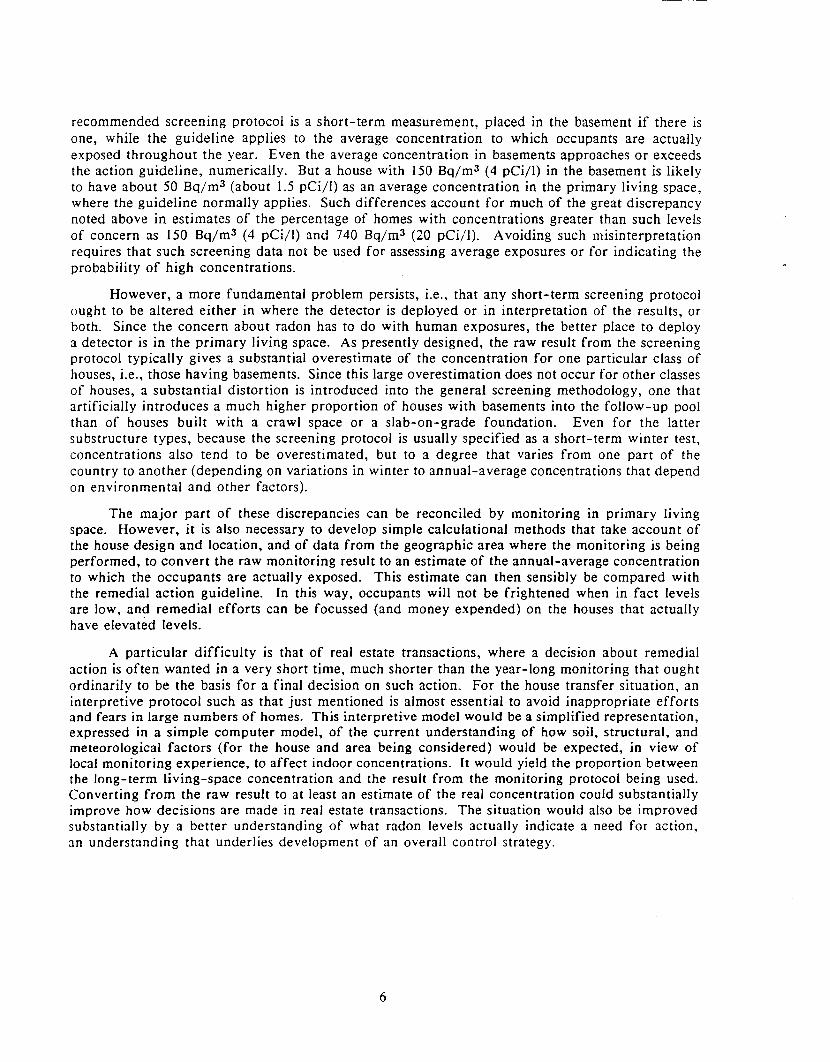
The overall result, relying on the 22-set aggregations (and including a normalization of datataken .only during heating seasons to obtain an estimate of year-long averages; see discussionbelow) is a distribution of annual-average 222 Rn concentrations that averages 55 Bq/m3 (1.5pCi/1) and that has a long tail with 1-3% of homes exceeding 300 Bq/m3 (8 pCi/I). Theanalysis indicates that 7% (or about 4 million) of the U.S. single-family housing stock haveconcentrations greater than 150 Bq/m3 (4 pCi/I). Alternatively, the distribution can beexpressed as a lognormal function with a GM of 33 Bq/m3 (0.9 pCi/1) and a GSD of 2.8, asshown in Figure 4. (The distribution is represented by a straight line, the form which alognormal distribution takes when one plots the logarithm of the concentration versus thepercentage of homes having less than that concentration on the probability scale indicated.)
This result can only be associated with the portion of the housing stock consisting of singlefamily houses, since 99% of the data are drawn from such houses. These are, however, thedominant element of the U.S. housing stock, and the results indicate that on the order of amillion homes in the United States have annual-average 222Rn concentrations of 300 Bq/m3
or more.
Another interesting observation from this analysis is that the geometric means of the"unbiased" 22 sets are themselves log normally distributed, with a GSD of 2.0. This indexdemonstrates the substantial variability of mean indoor radon concentrations from one areato another. This variability has substantial importance in interpreting data on indoor radonconcentrations - or in representation of the frequency distribution of concentrations - andin formulating control strategies. It is discussed below (Section C) in the context ofestimating the fraction of the housing stock having high concentrations.
The distributional parameters indicated above have, of course, significant uncertainties,partly due to statistical limjtations and partly because no systematic method was employedin selecting the homes to be monitored. The mere fact that the data are from groups ofhomes selected in 22 (or 38) different areas suggests that the results have some utility,though no estimate of the uncertainty due to potential bias in selecting houses can be made.The statistical uncertainty can be estimated merely by noting that 22 independent results,with a GSD of about 2, can be shown to imply an uncertainty in the aggregate mean ofapproximately 15%. The uncertainty due to sampling bias would raise the total uncertaintyabove this level. It is also worth noting that the 22 sets included a total of 8 I 7 homes (ofwhich 552 are shown in Figure I), but this number cannot be used as the basis forestimating the statistical uncertainty, since they were grouped by region and weighted asgroups in the aggregation method employed (Nero et al. 1986).
At about the same time that this analysis was being performed, an important survey wasbeing undertaken on a nationwide basis, performing an integrated year-long measurement inthe homes of 453 physics faculty at 101 colleges and universities across the United States
22
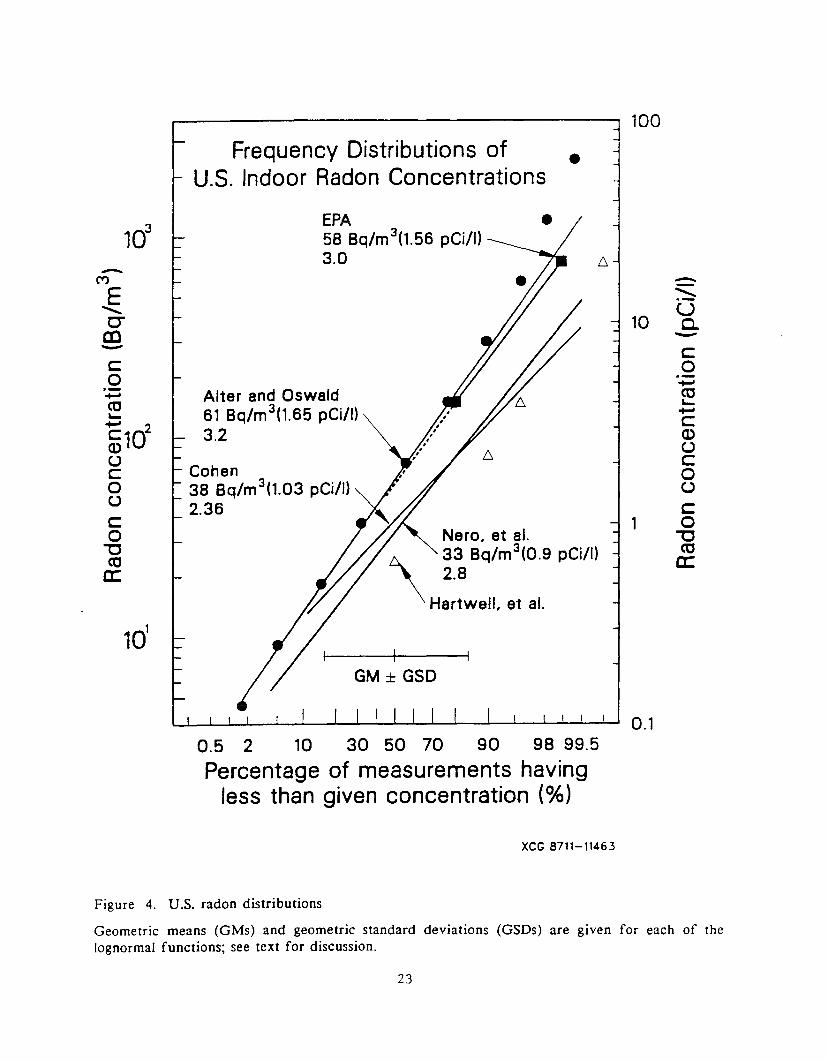
[t-requency uistributions of
U.S. Indoor Radon Concentrations •3 100
GM ± GSD
EPA58 Bq/m 3 (1.56 pCi/1)3.0
co...co~...cQ)ucouco
'"Cco
a::
-:'"UC.-
0.1
10
1Nero, et al.
\
33 Bq/m 3 (0.9 pCi/1)2.8
Hartwell, et al.
Alter and Oswald61 Bq/m 3 (1.65 pCi/l)3.2
Cohen38 Bq/m 3 (1.03 pCi/1)2.36
-('I")E..........c:ral-
0.5 2 10 30 50 70 90 98 99.5
Percentage of measurements havingless than given concentration (%)
XCG 8711-11463
Figure 4. U.S. radon distributions
Geometric means (GMs) and geometric standard deviations (GSDs) are given for each of thelognormal functions; see text for discussion.
23

(Cohen 1986). The 222Rn concentrations obtained average 54 Bq/m3 (1.47 pCi/l) and canbe represented by a lognormal distribution admirably well, with a GM and GSD of 38Bq/m 3 and 2.36, respectively (cf. Figure 4). This implies that 0.8% of homes haveconcentrations greater than 300 Bq/m , at the low end of the range estimated from theanalysis of Nero et aI. (1986). On the other hand, the fraction above 150 Bq/m3
, 6%, isvery close to the earlier result. Although a study of homes of physics faculty cannot beconstrued to be a representative sampling of U.S. homes (a problem suffered also by theaggregate analysis just discussed), this study has the advantage that the homes are widelydistributed across the United States and that the measurement protocol determined directly ayear-long average concentration. The averages from the 101 institutions are themselveslognormally-distributed, with a GM of 46 Bq/m3 and a GSD of 1.75. Interestingly, thehighest values of geographical averages from both this study and Nero et al. (1986) occurredin the state of North Dakota, in particular in cities in the Red River Valley.
A significant number of the earlier studies analyzed in Nero et al. (I986) measured theconcentration of decay products instead of radon (though the primary grouping of 22 setsrelied almost entirely on etched-track detectors). One of these in particular measured bothconcentrations averaged over week-long periods, thereby determining directly an effectiveequilibrium ratio, which was found to range from 0.31 to 0.82 among the houses examined(George and Breslin 1980). As will be evident from the measurements from othercountries, discussed below, there is significant evidence that equilibrium ratios tend toaverage about 0.4 among samples of housing, with significant variability from one time toanother, from one house to another, and perhaps some differences from one region orcountry to another.
We note another important study that was undertaken prior to 1985, but the results ofwhich have only begun to be available recently, namely a statistically-designed survey ofradon concentrations in more than 2000 homes in New York State (Hartwell et al. 1987).The annual-average living space concentrations resulting from that work are illustrated inFigure 4, along with the distributional forms from the work discussed above. The NewYork results are, for the most part, slightly lower than the tentative nationwide distributionsfrom Nero et al. (1986) and Cohen (1986), as indicated by either the distribution in thefigure or the average for the New York results, about 42 Bq/m3 (1.1 pCi/I). On the otherhand, aggregation of the several New York data sets that appear among the 22-set groupingof Nero et aI. (1986) yields an average of about 40 Bq/m3 (I pCi/l), similar to the averagefrom the New York State survey (which, however, yielded annual-average concentrations).And the direct average of concentrations in the 16 New York homes of physics professorsmonitored by Cohen (1986) is 30 Bq/m3 (0.8 pCi/I). These comparisons indicate that, atleast for the one state-wide survey that is designed to yield annual-average concentrationsin the living space, the results are in the same range as those that served as a partial basisfor the U.S. distribution discussed earlier.
At present, it is the analysis of Nero et al. (1986) and the data of Cohen (I986) that provideour present appreciation of the U.S. concentration distribution in residences, and principallyin single-family houses. As noted above, these efforts both yield average concentrations of55 Bq/m 3 and substantial conformance to a lognormal distribution. As seen in Figure 4, thepercentage of homes having more than 150 Bq/m 3 (4 pCi/I), the EPA's primary guidelinefor remedial action (USEPA 1986), is about 6% for either distribution. The twodistri bu tions diverge significan tl y as the concen tration increases to higher levels, so that thepercentages having concentrations greater than, say, 300 Bq/m3 (8 pCi/l) are approximately1.8% and 0.8%, respectively, from Nero et al. (1986) and Cohen (1986). Extrapolating to740 Bq/m3 (20 pCi/l) yields, respectively, 0.13% and 0.02%, a substantial difference, but in
24

either case a small percentage. These results contrast strongly with those from the largedata bases of indoor radon concentrations that have been accumulated subsequent (and due)to the discovery of very large concentrations in homes on the Reading Prong geologicformation in eastern Pennsylvania. As we will see below, the large fractions of homes oftencited to exceed either the EPA guideline or 740 Bq/m3 (at which level residents wouldreceive annual exposures comparable to the occupational limit) are almost always wrong,resulting from surveys or data compilations that do not yield annual-average concentrationsin the living spaces of representative sets of homes.
B. More recent data on U.S. residences
By the early 1980s it had been clear that indoor radon levels were high enough to warrantreal· concern. Hence the monitoring efforts cited in the previous section. Not only did italready appear that the bulk of U.S. houses had concentrations in the range of 20 to 100Bq/m3 (i.e., about 0.5 to 3 pCi/I), thus indicating an average toward the central part of thisrange, but a significant number of homes had already been found to have much higherconcentrations, though not in a representative survey. For example, of perhaps three orfour thousand measurements in U.S. homes that the research community had performed by1984, between 10 and 20 had yielded results in the range of 2000 to 6000 Bq/m3 (about 50to ISO pCi/I), an extraordinarily high proportion having about 100 times the average. Thiscaused speculation about when the first home having 1000 times the average level would befound. It happened within a year, in eastern Pennsylvania!
Since very high concentrations had already been found in eastern Pennsylvania (Sachs et al.1982), this was something of a rediscovery. But it galvanized the political and regulatorycommunity into finally paying substantial attention to the problem of indoor radon. It hasalso resulted in very large numbers of measurements being performed in U.S. homes, morethan a million by the date of this publication.
Unfortunately, this very large amount of monitoring has not greatly improved ourappreciation of the frequency distribution. In fact, due to the way that information hasbeen presented to the public, and even to the scientific community, a substantial distortionhas occurred. As a result, many have a greatly inflated notion of what averageconcentrations are and of how frequently homes have levels exceeding the EPA guideline orhigher levels, such as the 740 Bq/m3 that corresponds roughly to the limit of 4 WLM/y thatapplies to exposure rates in occupational settings. It is therefore important to examinecertain of the large data sets that have become available, in order to understand how theyhave been misinterpreted or misused. Furthermore, it is useful to see what newinformation can be obtained from these data, in spite of their deficiencies for generalassessment purposes.
As noted above, the monitoring technique that is most suitable for determining the averageradon concentration in a structure over a substantial period is to deploy an etched-trackdetector, which can remain in place even for a full year, though they are most frequentlyused for a period of a month to several months. By 1986, the use of such detectors hadresulted in a substantial data base, and the results from approximately 60,000 measurementsin U.S. homes were examined to indicate a nationwide distribution (Alter and Oswald1987). The average of these results was found to be 266 Bq/m3 (7.2 pei/I), but 50,000 ofthese results arose from only 6 states, including some where monitoring programs have beenundertaken because of the existence of high concentrations. Removing these states yieldsan average, for the 10,251 remaining results, of 158 Bq/m3 (4.26 pCi/I). Two alternativemethods of obtaining a more representative selection or weighting yield averages of 152 and
25

153 Bq/m3. The authors find this convergence striking, assert that the results provide a
rough "exposure" estimate, and conclude that the national "exposure" exceeds that citedpreviously, e.g., the 55 Bq/m3 average indoor concentration from Nero et a1. (1986). It isstriking, in fact, that the average from Alter and Oswald (1987) approximates the remedialaction limit of 150 Bq/m3 recommended by the EPA.
In point of fact, even the three restricted data sets are likely to have irremovableoverrepresentation of homes with high concentrations, simply because of repetitive samplingin homes or areas where high levels are found and the fact that such oversampling has notbeen removed from the data set. Furthermore, the parameter of interest for indoorexposures is the annual-average concentration in the living space, and the data set of Alterand Oswald (1987) has not been corrected to yield annual-average values and has not beenedited on the basis of location. As an illustration of the outcome of using such data, weindicate here (and in Table 3) the probable scale of error in using the results as in Alter andOswald (1987).
A major difficulty is that a large portion of recent measurements have been performed inbasements that are not primary living space. Many U.S. homes have basements, especiallyin the areas where a great deal of monitoring has bee_n performed (such as easternPennsylvania and New Jersey), and the protocol recommended by the EPA for "screening"specifies monitoring in basements where they exist (USEPA 1986). However,concentrations in basements average approximately twice those on the first floor during thewinter, with an even larger ratio during the summer (Cohen 1987 and Hartwell et a1. 1987).In fact, even Alter and Oswald (1987) describe results from a subset of their measurementsin which location was recorded, finding that 44% were taken in basements and have anaverage concentration 2.0 times the average from the non-basement readings.
If we attempt to correct an apparent average of 155 Bq/m3 (4.2 pCi/l) to a living-spaceaverage assuming that 44% have results that are a factor of 2 higher than the living-spacevalue, we find a corrected average of 108 Bq/m3 (2.9 pCi/l), a large change. It is evenmore difficult, and probably impossible, to estimate the effect of oversampling in areas orhouses where high concentrations are known or suspected. We note that a mere 25%reduction of the average yields 81 Bq/m3 (2.2 pCi/l); as will be discussed elsewhere, thereare indications from the etched-track data themselves and from comparison with the EPAdata discussed below that the effect of oversampling is at least this large. Finally, due tothe nature of monitoring programs and recommendations, a preponderance of measurementsare performed during winter only. As indicated above, annual-average concentrations havebeen found to average approximately 72% of winter values (Nero et a1. 1986). Givenprobable mixes of seasons in which the etched-track measurements were taken, the annualaverage concentrations may therefore be 80 or 90% of the value above, Le., approximately69 Bq/m3 (1.9 pCi/l).
The above estimate is not intended to represent an actual corrected value, because there isnot enough information to adjust the results quantitatively. However, these considerationsare enough to indicate that, based on the results from Alter and Oswald (I987), an averageof less than 75 Bq/m3 (2 pCi/1) - and therefore consistent with the earlier results - isprobable, and that the values cited in the paper itself give a wholly misleading indication ofpublic exposures.
Another major result of Alter and Oswald (1987) is the implication that large numbers ofhomes have high concentrations; e.g., 23% of the 10,251 data in the "U.S. minus 6 states"data set exceed 150 8q/m3
, the EPA remedial action recommendation. These results arealso plotted on Figure 4, where we see that a lognormal function with a GM of 61 Bq/m3
26

Table 3. Comparative characteristics of U.S. radon distributions
GM AM "Corrected"
Sample Size (Bq/m3) GSD (Bq/m3 ) AM (Bq/m3)
Nero et al. 817 33 2.8 55
1986
Cohen 1986 453 38 2.36 54
Alter and 10,251 64 3.48 158 70 ± 35?a
Oswald 1987
USEPA 1987 10,000 (58)b (3.0)b 110 55e
a Raw average corrected by factors of 0.75 for overrepresentation of high-concentration
homes and 0.85 for approximate correction from winter to annual-average
concentrations in majority of homes. Result is then divided by 1.44 to correct for 44%
of data taken in basements (based on Alter and Oswald 1987), where concentrations are
approximately two times higher than in living space.
b Lognormal parameters for lognormal function drawn between EPA data points, as on
Figure 4.
c Raw average corrected by factor of 0.72 (from Nero et al. 1986), since all results were
in winter, and divided by 1.44, assuming same fraction of basements as in Alter and
Oswald (1987).
27

(1.65 pCi/l) and a GSD of 3.2 fits the points up to ISO Bq/m3 very well, but that there is avery large excess of results with higher concentrations, especially at very high values. Theconsiderations discussed above would appear to account for the fact that this curve issubstantially above those of earlier studies, as well as for a substantially inflated percentageof houses exceeding ISO Bq/m3
.
Results of considerable interest have also arisen from recent efforts of the EPA inconjunction with a number of states. For example, during the winter of 1986-87, charcoaldetectors were deployed in statistically chosen samples of homes in nine states, plus anotherstate in which vol un teers were relied on. The results of surveys in these ten states werereported in a press conference in August, 1987 and in associated materials (USEPA 1987).From the press materials, one finds the following information: the number of homesmonitored in the main sample varied from 190 to 1787 for the ten states, totalingapproximately 10,000. (Additional samples were taken on a volunteer basis, in at least onecase to investigate areas thought to have a potential for higher concentrations than average.)The average concentration for the main sample was 110 Bq/m3 (3.0 pCi/I); 20% ofmeasurements exceeded 148 Bq/m3 (4.0 pCi/l) and approximately 1.1% exceeded 740 Bq/m3
(20 pCi/I). Measurements were taken following the EPA screening protocol and using 2day sampling during the heating season. A large proportion of the sampling was performedin basements. Thus these results do not represent annual-average concentrations to whichpeople are exposed. Nonetheless, the press reports, in accordance with the EPA pressrelease, compared these results directly with the EPA action guideline and indicated that21 % of (the total of) 11,600 homes exceeded the guideline. This conclusion is obviouslywrong, based on an inappropriate use of the data, but unfortunately has had a large role informing public and policy perceptions of the problem of indoor radon.
The data, however, could be useful in other respects. On Figure 4 are plotted (solidsquares) the probabilities corresponding to 148 and 740 BQ/m3
• The lognormal functionpassing through these points has a GM of 58 Bq/m3 (1.56 pCi/l) and a GSD of 3.0, forwhich the corresponding arithmetic mean is 106 Bq/m3 (2.9 pCi/l). This is close enough tothe actual average reported to suggest, based on the limited information available (EPA1987), that this lognormal function may be a useful representation of the data. If so, it isinteresting to note that lognormality is maintained at least up to the region of 740 Bq/m3
.
This contrasts strongly with the data of Alter and Oswald, and others, who report raw oruncontrolled data, but is consistent in this respect with the data of Nero et al. (1986) andCohen (1986). It is important, in this context, to realize that - for the most part - the EPAdata arise from a statistical sampling, thus avoiding the over-representation of high areasthat is characteristic of most of the recent large data sets.
That the EPA distribution as a whole is higher that the earlier results is not surprISIng,considering the monitoring protocol. As an illustration (Table 3), if the same correctionfrom basement concentrations as above is made to the arithmetic mean of 110 Bq/m3
, andthe resulting 76 Bq/m 3 is corrected to an annual-average value using the factor of 0.72from Nero et al. (1986), an average of 55 Bq/m 3 is found. The precise agreement withearlier results is fortuitous, but indicates that - if proper adjustments could be made agreement would be quite satisfactory. Furthermore, these adjustments would dramaticallyreduce the fractions above 148 and 740 Bq/m 3
, probably to the vicinity of previous results,which were that perhaps 6% of homes exceed 148 Bq/m3 and perhaps 0.1% exceed 740BQ/m 3
.
The EPA data also give the first useful indication of the shape of the distribution at evenhigher concentrations, at least for these ten states. Extrapolating the lognormalrepresentation (of Figure 4) to high levels indicates that approximately 0.01 %, i.e., a single
28

home out of the 10,000, ought to have exceeded 3700 Bq/m3 (100 pCi/l). The numberactually found in the EPA/state surveys was three, which is reasonably close. Ifadjustments were made to annual-average concentrations in living spaces, one would expectfrom this data set that a lower number, i.e., fewer than 3 in 10,000 homes, would exceed3700 Bq/m3
. This contrasts strongly with the results of Alter and Oswald (1987) and otherswho find much higher fractions exceeding this level, basically because their data are notrepresentative. The fact that most data are also taken with the EPA screening protocolsuggests that the fraction of houses having annual-average living-space concentrationsgreater than this level will be even lower than the upper limit indicated here.
This is not to suggest that the extreme high-concentration tail of the distribution of U.S.concentrations does not exceed a lognormal representation. The ten states in the initial EPAsurvey may turn out to have less variance among them than the U.S. as a whole. Thequestion of the high concentration tail is examined in more detail below, but it is worthmentioning at this point that some of the 1987 EPA data have been reported in more detail,including the actual frequency distributions and comparisons of certain subsets (RoncaBattista et a1. 1988) for five of the ten states. One of the interesting observations fromthese results is that, although the data differ substantially from one state to another,examination of results from basements versus first floors (in houses without basements)indicates that the differences between these states may arise primarily from differences inthe fractions of houses having basements. Furthermore, if parallel sets of data fromAlabama are any indication, results from volunteers are on the average about 50% greaterthan results from randomly selected houses, for reasons that are not understood.
In 1988, the EPA - in another press conference - announced the results from surveys inseven more states, again in a manner that was open to wide and substantialmisinterpretation (USEPA 1988). Thus it was said that in these states nearly one in threehomes had screening levels exceeding the EPA guideline, and that "over 200,000 homes inthese states will have levels greater than 20 pCi/l, a level that exceeds current healthprotection standards for uranium miners." The press release and resultinl stories neglectedto say I) that most of the homes with screening levels above 150 Bq/m (4 pCi/1) will befound not to exceed the EPA guideline, which pertains to annual-average concentrations inliving areas, and 2) that a very small fraction of the 200,000 hornes cited will actually befound to cause annual exposures exceeding those for uranium miners. Because of suchomissions, the public release of carelessly interpreted information on the surveys the EPAhas conducted in cooperation with the states has given a highly misleading impression of thenature and scope of the indoor radon problem. Unfortunately this impression is reinforcedby the manner in which some scientists also represent the current understanding, anexample being the paper on the etched-track data base discussed above (Alter and Oswald1987). Regrettably, these misleading representations sometimes persist (Alter and Oswald1989).
We mention one other major data base, that developed by Cohen and coworkers atPittSburgh. There the "Radon Project" has performed very large numbers of measurementsusing charcoal sampling techniques, and the results reported using various geographic scales,e.g., as presented in Cohen (1987). In a more recent table of "Radon Levels by States andCounties," the results of some 38,872 measurements in living areas are reported, averaging122 Bq/m3 (3.3 pCi/I), with a GM of 61 Bq/m3 (1.7 pCi/I) and with no report of the GSD(Cohen 1989). Approximately 17% of the results exceed 148 Bq/m3 (4 pCi/I), while 2%exceed 740 Bq/m3 (20 pCi/I). While the detailed data, given by county (or even by ZIPcode in an alternative form of the table), may be useful in determining relativeconcentrations, the results as a whole appear to be substantially higher in concentration thanthose reviewed in the previous section, although not as great as the etched-track data just
29
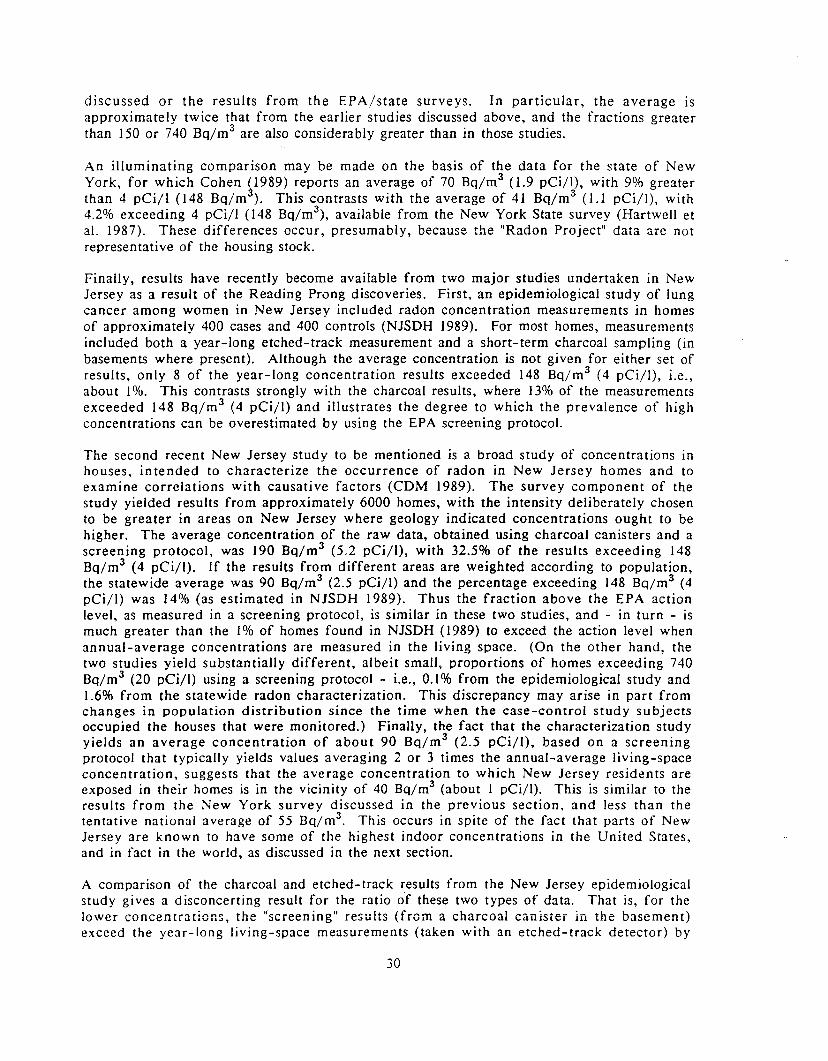
discussed or the results from the EPA/state surveys. In particular, the average isapproximately twice that from the earlier studies discussed above, and the fractions greaterthan 150 or 740 Bq/m3 are also considerably greater than in those studies.
An illuminating comparison may be made on the basis of the data for the state of NewYork, for which Cohen ~1989) reports an average of 70 Bq/m3 (1.9 pCi/I), with 9% greaterthan 4 pCi/1 (148 Bq/m). This contrasts with the average of 41 Bq/m3 (1.1 pCi/I), with4.2% exceeding 4 pCi/1 (148 Bq/m3
), available from the New York State survey (Hartwell eta1. 1987). These differences occur, presumably, because the "Radon Project" data are notrepresentative of the housing stock.
Finally, results have recently become available from two major studies undertaken in NewJersey as a result of the Reading Prong discoveries. First, an epidemiological study of lungcancer among women in New Jersey included radon concentration measurements in homesof approximately 400 cases and 400 controls (NJSOH 1989). For most homes, measurementsincluded both a year-long etched-track measurement and a short-term charcoal sampling (inbasements where present). Although the average concentration is not given for either set ofresults, only 8 of the year-long concentration results exceeded 148 Bq/m3 (4 pCi/I), i.e.,about I%. This contrasts strongly with the charcoal results, where 13% of the measurementsexceeded 148 Bq/m3 (4 pCi/l) and illustrates the degree to which the prevalence of highconcentrations can be overestimated by using the EPA screening protocol.
The second recent New Jersey study to be mentioned is a broad study of concentrations inhouses, intended to characterize the occurrence of radon in New Jersey homes and toexamine correlations with causative factors (COM 1989). The survey component of thestudy yielded results from approximately 6000 homes, with the intensity deliberately chosento be greater in areas on New Jersey where geology indicated concentrations ought to behigher. The average concentration of the raw data, obtained using charcoal canisters and ascreening protocol, was 190 Bq/m3 (5.2 pCi/I), with 32.5% of the results exceeding 148Bq/m3 (4 pCi/I). If the results from different areas are weighted according to population,the statewide average was 90 Bq/m3 (2.5 pCi/l) and the percentage exceeding 148 Bq/m3 (4pCi/I) was 14% (as estimated in NJSDH 1989). Thus the fraction above the EPA actionlevel, as measured in a screening protocol, is similar in these two studies, and - in turn - ismuch greater than the I% of homes found in NJSOH (1989) to exceed the action level whenannual-average concentrations are measured in the living space. (On the other hand, thetwo studies yield substantially different, albeit small, proportions of homes exceeding 740Bq/m3 (20 pei/l) using a screening protocol - i.e., 0.1 % from the epidemiological study and1.6% from the statewide radon characterization. This discrepancy may arise in part fromchanges in population distribution since the time when the case-control study subjectsoccupied the houses that were monitored.) Finally, the fact that the characterization studyyields an average concentration of about 90 Bq/m3 (2.5 pCi/I), based on a screeningprotocol that typically yields values averaging 2 or 3 times the annual-average living-spaceconcentration, suggests that the average concentration to which New Jersey residents areexposed in their homes is in the vicinity of 40 Bq/m3 (about I pCi/I). This is similar to theresults from the New York survey discussed in the previous section, and less than thetentative national average of 55 Bq/m3
. This occurs in spite of the fact that parts of NewJersey are known to have some of the highest indoor concentrations in the United States,and in fact in the world, as discussed in the next section.
A comparison of the charcoal and etched-track results from the New Jersey epidemiologicalstudy gives a disconcerting result for the ratio of these two types of data. That is, for thelower concentrations, the ,jscreening" results (from a charcoal canister in the basement)exceed the year-long living-space measurements (taken with an etched-track detector) by
30

approximately a factor of 2. However, for the "screening" results exceeding 150 and 300Bq/m3 (i.e., 4 and 8 pCi/I), the difference grows to a factor of 5, indicating that, at leastfor the homes examined in this study, high results from the screening protocol tend to begrossly exaggerated.
C. The occurrence of high concentrations or exposures
The previous sections provide a basic picture of the distribution of indoor radonconcentrations, i.e., that the average concentration in single-family residences isapproximately 55 Bq/m3
, that about 6% of houses have concentrations exceeding 150Bq/m3
, and roughly 1% have levels above twice this value. Limited data suggest that as thelevel of concern increases, the fraction of houses above it falls very rapidly, so that thefraction of houses with levels exceeding 740 Bq/m3 appears to be only about 0.1 %.Monitoring data also show a marked dependence of the distribution on geographic area, sothat the broad distribution just indicated does not indicate the much greater occurrence ofhigh values that may occur in specific areas. In this section, we examine the extent towhich we can understand, on present evidence, the high-concentration tail of the nationaldistribution and the variability of local distributions from one place to another. We alsoindicate the potentially great difference between the distribution of concentrations in homesand the frequency distribution of human exposures. All of these questions have substantialimplications for formulating risk-limiting objectives and for designing control strategies, thesubject of Section VI.
The various efforts discussed above, although adequate for indicating the frequencydistribution of low to moderately high concentrations, do not permit an unequivocalestimate of the frequency of occurrence of homes having very high concentrations. Evenfor the percentage of houses with concentrations exceeding only 740 Bq/m3 (20 pCi/I),estimates are difficult because, first, the data of Nero et a1. (1986) and Cohen (1986) do notinclude enough houses to provide sound estimates of occurrence at such levels and,secondly, the other data bases that are available, as discussed in the previous section, arenot based on annual-average concentrations in living space. Thus, as noted above, the Neroet al. (1986) and Cohen (1986) results suggest the fraction above this level to be 0.13 and0.02%, respectively, while the EPA 1987 result of 1.1% must be disregarded, consideringthe monitoring protocol employed. The other survey cited, that in New York (Hartwell etal. 1987) is relevant, since it had a distributional form that was only slightly different fromthose of Nero et al. (1986) and Cohen (1986) - as seen in Figure 4 - and that has only0.2% of homes with concentrations exceeding 740 Bq/m3
, in contrast with the 1987 EPAresults or the even larger fractions of 3 or 4% from the Alter and Oswald (1987) data baseand 2% from Cohen (1989).
The uncertainty in estimates becomes even larger for fractions of houses at higher levels,e.g., above 3700 Bq/m3 (100 pCi/I). Although a number of houses with heating seasonvalues of this magnitude had been found prior to 1984-85, it was the intense monitoring ineastern Pennsylvania, following discovery of the house having of the order of 100,000Bq/m3
, that led to identification of numerous houses with levels greater than 3700 Bq/m3.
These efforts have, in turn, led to the impression that a substantial number of U.S. houseshave such high levels, in contrast to the approximately 2 in a million that would beestimated by extrapolating the distribution of Nero et al. (1986) to such high concentrations.Such extrapolation would only be valid if the lognormal distribution were an adequaterepresentation of the actual distribution even for such high levels, a possibility for whichthere is no direct evidence, considering the relatively small number of homes treated inNero et al. (1986) and Cohen (1986).
31

The only evidence that gives a direct quantitative indication of the probability of such highlevels is the data from the EPA surveys where, as noted above, 3 of 10,000 data reported in1987 (USEPA 1987) exceeded 3700 Bq/m3
, whereas a direct extrapolation of the data atlower levels suggested about 0.0 I % should exceed this level. Of the 11,000 measurementsreported in 1988 (USEPA 1988), five exceeded this level, i.e., 0.05%. In contrast,approximately 0.5% of the full data base of Alter and Oswald (1987) exceed 3700 Bq/m3, afull order of magnitude greater than the EPA results, presumably reflecting the substantialoversampling of high concentration houses in that data base. And, based on the charcoaldata of Cohen and coworkers, 0.1 % of house have been estimated to exceed this level(Cohen 1987b). However, the EPA results provide, in effect, an upper bound on thefraction having such levels, because these data are from monitoring using the EPA'sscreening protocol, so that they are short-term measurements, about half taken inbasements. It would therefore nOl be surprising if, typically, the EPA results must bedivided by approximately 2 to yield the annual-average value in the living space, in whichcase the number in their 1987 sample remaining above 3700 Bq/m3 would be zero, sincenone of the 8 houses cited above had concentrations exceeding twice this value. Given thestatistics, and a bit of speculation, it would be fair to say that the EPA results suggest thaton the order of I house out of 20,000 may have annual-average living-space concentrationsexceeding 3700 Bq/m3
.
This still permits the possibility that the national distribution diverges from a lognormaldistribution at very high concentrations. In fact, even the 2000-house survey in New York(Hartwell et aI. 1987) indicates such a divergence, in that the fraction of houses exceeding740 Bq/m3 (20 pCi/I) is greater than would be expected from an extrapolation from thelower points shown in Figure 4. To put it another way, the cumulative probability plotcurves upward as the concentration increases, indicating an excess of houses with highconcentrations as compared with a lognormal distribution, for which the data would fallalong a straight line. A similar form has been observed in many circumstances, raising thepossibility that a simple lognormal form - with parameters such as those found by Nero etal. (I986) or Cohen (I986) - that adequately represents the data for the vast bulk of housesmay not suffice for the very small portion of residences that have very high concentrationsand may, in fact, substantially underestimate the number of such residences.
This possibility must be considered, especially in view of the seemingly large number ofhouses with high concentrations that have been found in the area of the Reading Prong,primarily in eastern Pennsylvania and New Jersey. Furthermore, even the Pennsylvaniadata from the Reading Prong area alone suggest a distributional form that has a rising slopefor higher concentrations on a cumulative probability plot. An example of such data isgiven in Figure 5, which shows results from a Pennsylvania mailing of etched-track devicesto homes in the Reading Prong area; detectors were placed for three months, primarily inthe winter (of 1985-86), in basements where there was one (Granlund 1988). Although thisfigure does not provide detailed information on the distributional form, particularly atlower concentrations, it is clear that the slope of the curve increases in the region of thehighest concentrations. Thus, although the line, with a GSD of 2.9, adequately representsthe central probability region, its use would substantially underestimate the fraction ofhomes at very high levels (and overestimate the fraction at very low levels). Note that themedian value from this survey is approximately 200 Bq/m3 (5.4 pCi/l), considerably greaterthan the geometric mean of 33 Bq/m3 (0.9 pCi/1) from Nero et al. (1986), reflecting boththe higher-than-average concentrations in the Reading Prong and the fact that most ofthese detectors were placed in basements. (Note also that the GSD is similar to that fromNero et ai. 1986, in contrast to other, more well-known Pennsylvania results withsubstantially higher GSDs, but that were not acquired in as careful a manner.)
32
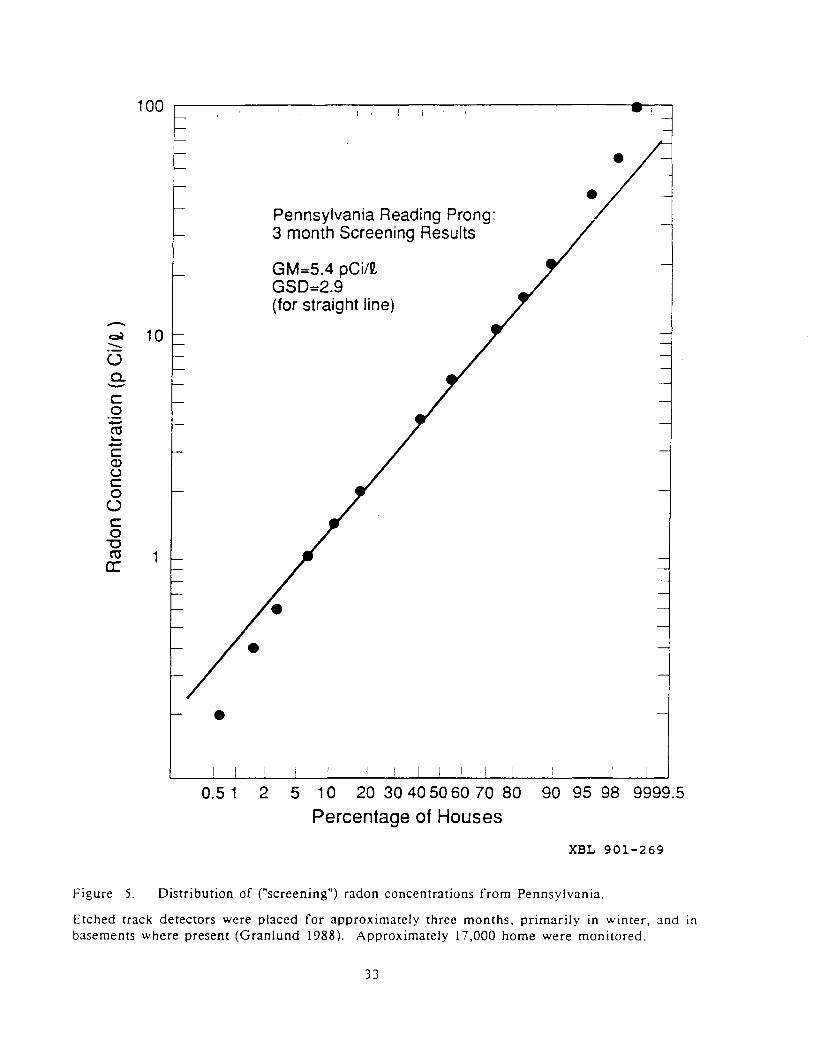
100 E
-~ 10-oa.-con5~-C<l>UCooco
"'Cca 1a:
I I
•Pennsylvania Reading Prong:3 month Screening Results
GM=5.4 pCi/2,GSD=2.9(for straight line)
•
0.5 1 2 5 10 20 30 405060 70 80 90 95 98 9999.5
Percentage of Houses
XBL 901-269
Figure 5. Distribution of ("screening") radon concentrations from Pennsylvania.
Etched track detectors were placed for approximately three months. primarily in winter. and inbasements where present (Granlund 1988). Approximately 17.000 home were monitored.
33

Such observed excesses of high concentrations have given rise to speculation of varyingkinds, one being that a supralognormal form is characteristic of areas having highconcentrations. However, a counterexample is provided by the case of Clinton, New Jersey,where very high concentrations were found during 1986 (Osborne 1987). The data fromClinton are shown on Figure 6, where it is seen that they are fit well by a straight line withthe lognormal parameters indicated. (Note, in this case, the very large GM and GSD.)
An alternative hypothesis is that such local or regional surveys effectively add two or moresubpopulations that together yield a supralognormal form, the questions then being why andof what form. For example, it has been proposed (Goble and Socolow 1988) that the tail ofregional or national distributions may decrease in proportion to some power of theconcentration, which - if true - would imply a substantial greater fraction of the totalpopulation exposure occurring among occupants of high-concentration houses than isimplied by the essentially exponential form of the tail of a lognormal distribution. As aresult, the form of the tail can have significant implications for understanding risks, fordesigning epidemiological studies, or for formulating strategies to limit risks.
On the other hand, some type of supralognormal form is consistent with the hypothesis thatindoor concentrations are well represented, in general, by lognormal functions, and that thesupralognormal form results from what is in effect the addition of two - or in any case asmall number of - subpopulations that individually are adequately represented by singlelognormal functions. This is consistent with the general hypothesis - based on the "centrallimit theorem" from statistics (Aitchison and Brown 1957) - that a lognormal form resultswhen, for example, the parameter of interest is effectively the product of a large number ofunderlying parameters, which themselves may be distributed normally (i.e., according to aGaussian distribution). Considering that we know, based on our physical understanding (asdiscussed in Section III) that the indoor concentration is in fact determined by a wide rangeof factors, some multiplicative and some additive, it is not surprising to find thatdistributional forms often fit lognormal functions well. In fact, it is also known that someof the causative factors are lognormally distributed, as illustrated by the lognormaldistribution of uranium and thorium concentrations in most rock types (Wollenberg andSmith 1987).
This picture also accounts for the fact that the lognormal function may serve well at anygeographic scale, whether town, city, state, or nation. At any of these scales, theobservable - the indoor radon concentration - is determined by a large number ofunderlying factors (especially in view of the fact that each primary factor, such as the soilradium concentration, is itself determined by an underlying complex of factors), but therange or particular distribution of the underlying factors differ from one geographic scaleor location to another. In this picture, then, the distribution for a large region can beconsidered to be the sum of the distributions representing the smaller areas that make upthat region. And, in the limit of large numbers of subareas, the regional (or national)distribution can be expected to be represented, in first order, by a single lognormaldistribution - just as is true of distributions for smaller areas. On the other hand, as oneacquires more and more data, so that the regional/national distribution is more preciselydetermined, one may find evidence of divergence from a single lognormal, particularly inthe extreme tail, simply because that tail can be influenced greatly by the occurrence of oneor a few areas having extraordinary concentrations.
Thus, one might expect that, when a distributional form is found, with increasing amountsof data, to diverge in the tail from a lognormal form, it can be reasonably represented insecond order by a sum of two lognormal functions. One test of this hypothesis is toexamine the largest data sets available that have been developed in well-defined areas
34

1000
-cal~
()
Cl.
c:0-~
100....-c:Q)uc:0()c:0
"'C~
a:
10
Radon inClinton N.J. Homes
GM=3.7x1 0 3 Bq/m3
(100 pCi/P.)GSD=5.0
/•
Figure 6.
2 5 10 30 50 70 90 95 98
Percentage of Houses
XBL 901-212
Distribution of radon concentrations in a neighborhood of Clinton, New Jersey.
Data are from short-term monitoring, using charcoal collectors, in approximately March of 1986(Osborne 1987). 103 houses were monitored.
35

and with well-defined protocols. Perhaps the largest such set is data from the BonnevillePower Administration's Residential Weatherization Program (BPA 1986). This program hasperformed tens of thousands of measurements, using etched-track detectors, in homes in thePacific Northwest, so that for some states there are many thousands of data, permitting anunusually precise examination of the distributional form.
As an illustration, roughly 18,000 data from Washington, in the form acquired from BPAby Lawrence Berkeley Laboratory, are shown in Figure 7. Consistent with many otherobservations, the cumulative probability curve rises with respect to a straight line as theconcentration increases above the high-probability region (around 50%). On the other hand,at extremely high concentrations, this rise moderates, indicating a more complete andcomplex distributional form than can be recognized from smaller numbers of measurements.The solid curve in fact is the sum of two lognormal distributions, a dominant one (95%)with a GM of 19 Bq/m3 (0.5 pCi/I), somewhat smaller than average, plus a small amount(5%) of a lognormal function having a GM of 116 Bq/m3 (3.1 pCi/I), six times as large asthat of the dominant component, and with a GSD that is slightly larger. This sumresembles the form of the observed distribution very closely, suggesting that the distributionis, in effect, the sum of two subsets, each represented well by a lognormal function.
As noted, the question of the detailed form of the frequency distribution is related to thefact that the distribution at a large scale can be considered to be the sum of distributionsfor smaller areas. These local distributions vary substantially from one area to another, asindicated by the broad studies of Nero et aI. (I986) and Cohen (1986) and by many localstudies, such as the screening study of the Reading Prong in Pennsylvania and the surveyfocused on Clinton, New Jersey, for which the resulting data sets were given in Figures 5and 6. It should be emphasized that these data sets were all taken in the winter, inbasements where they existed. Nonetheless, they are striking, considering that in both areasmonitoring identified at least one house with concentrations on the order of 100,000 Bq/m3,
and in the Clinton neighborhood studies, half the houses had concentrations exceeding 7500Bq/m3
.
The EPA/state surveys discussed in the previous section also demonstrate the strongvariability with location. Ironically, the EPA data released in 1988 (USEPA 1988) includedidentification of an area "similar in severity to the Reading Prong," i.e., Minnesota andNorth Dakota. It was, in fact, in the Red River Valley, at the border between these states,that both Nero et aI. (1986) and Cohen (1986) found the highest U.S. concentrations tooccur.
Another survey of interest because it also indicates an area with concentrations comparableto those in the Reading Prong and the Red River Valley, or other parts of Minnesota andNorth Dakota, was performed as part of studies in the Pacific Northwest (Turk et aI.1989a). There homes in the Spokane River Valley were found to have a distribution with aGM of 240 Bq/m3 (6.5 pCi/1) and a GSD of 3.1; the average concentration was 490 Bq/m3
(13.2 pCi/i). In contrast with the data from the Reading Prong, these data are takenpredominantly in living areas (as opposed to basements), so that they exceed the values fromthe Reading Prong significantly, though this area represents a smaller population. In bothcases, the data are taken in the heating season.
The main result of survey efforts is thus to provide a reasonably good appreciation of theconcentration distribution, including the probability of houses exceeding various levels ofconcern. Furthermore, the substantial variability of concentrations with geographic area isevident, so that the fraction of homes above any given level of concern will vary greatlyfrom one area to another. This is especially true of very high concentrations, but even
36
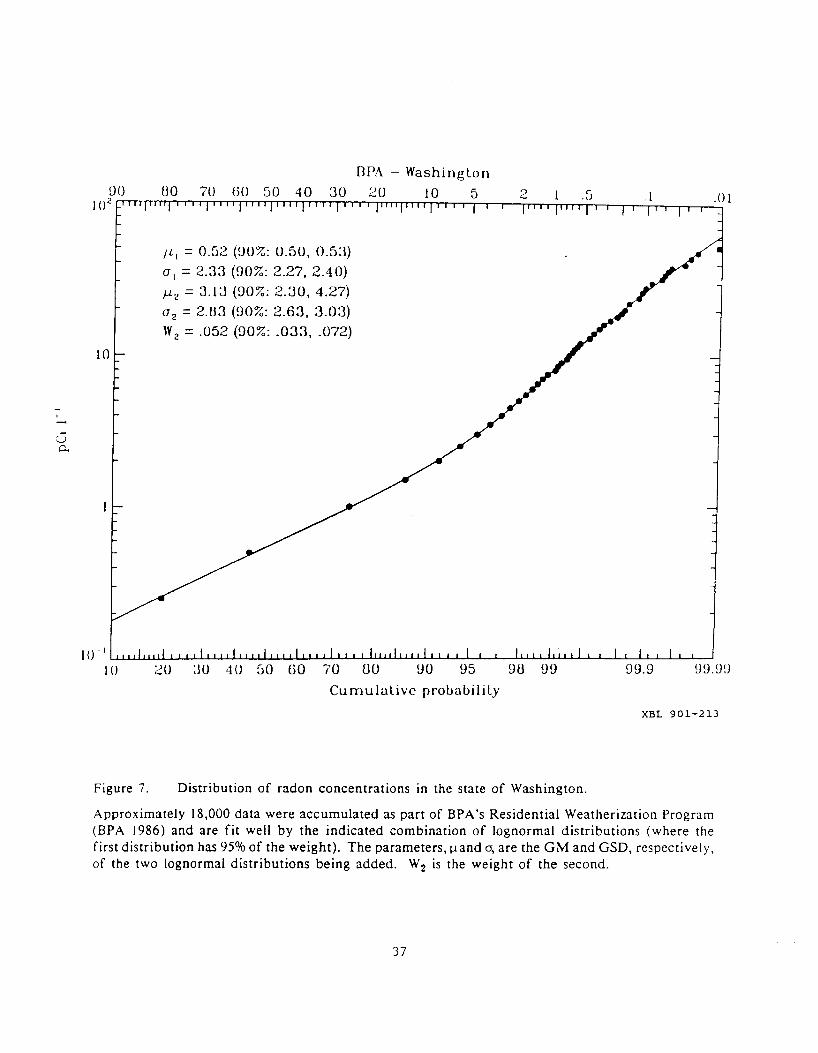
orA - WashingtongO UO 70 GO 50 40 30 20 10 5
I () 2 [TTTTTrrnrrrnrr.-TT1TTlrTTTTTTr1"TTrnlTTTlTTrrnTT1lTTT.-T-.-,--nrTT';'TT"1':";::"--r--r-"-:':"'-'c-r~~·0 I
-I
10
ILl = 0.52 (nO%: 0.50, 0.53)
0 1 =2.33 (nO%: 2.27, 2.40)
11-2 = 3.13 (nO%: 2.30, 4.27)
O 2 =2.113 (00%: 2.63, 3.03)
W2 = .052 (00%: .033, .072)
20 JO 40 50 60 70 00 UO 95 9U 99
Cumulative probability
99.9
XBL 901-213
Figure 7. Distribution of radon concentrations in the state of Washington.
Approximately 18,000 data were accumulated as part of BPA's Residential Weatherization Program(BPA 1986) and are fit well by the indicated combination of lognormal distributions (where thefirst distribution has 95% of the weight). The parameters,l-land cr, are the GM and GSD, respectively,of the two lognormal distributions being added. W2 is the weight of the second.
37

applies to levels barely above the EPA guideline of 150 Bq/m3. Thus, while very largefractions, of the order of a third, of homes in areas such as the Reading Prong or the Redand Spokane River Vallels are found to exceed an annual-average living spaceconcentration of 150 Bq/m , in other areas the fraction is very small, no more than 1%.For example, results from a survey among its employees by the Los Angeles Times indicatethat only 0.7% of Los Angeles-area houses have concentrations exceeding 150 Bq/m3 (LosAngeles Times 1988). These differences greatly affect the nature of strategies to limitexposures.
This is especially true in view of the fact that the distribution of human exposures iscertainly very different from the distribution of concentrations, simply because people tendto live in several (or even many) houses during their lives. Their lifetime exposures thusarise from an average of the concentrations in these various dwellings. As an illustration,Figure 8 contrasts the concentration distribution resulting from the analysis of Nero et a1.(I986) with the distribution of average concentrations to which people would be exposedduring their lives if every person moved every seven years to a house chosen randomlyfrom all houses in the U.S. This is an extreme assumption, but provides an effective lowerbound on the breadth of the exposure distribution, whereas the concentration distributionprovides an effective upper bound, i.e., the distribution of average concentrations to whichpeople would be exposed if they all lived in the same house during their entire lifetimes.The two results are substantially different, simply because averaging across houses tends toreduce the probability of very low or very high exposures. Thus the average exposureassuming no movement results in 6% or 7% of the population experiencing lifetime averageconcentrations exceeding the EPA guideline, while the assumption of uniform randommovement results in only 0.6% of the population experiencing such average concentrations.These limits bound the distribution of actual exposures, which we can speculate is morelikely to have on the order of 2% of people exceeding the EPA guideline during theirlifetimes. This is, of course, far smaller than the impression one would obtain from pressreports, which suggest that 20 or 30% of the population are receiving exposures of thismagnitude. The difference between the concentration and exposure distributions is likely tobe even more drastic when one considers higher levels of concern, e.g., 740 Bq/m3 (20pCi/I).
D. Residential concentrations in other countries
Substantial radon monitoring efforts have also occurred in the countries other than theUnited States, as summarized in Table 2. One of the earliest large surveys of indoor radonconcen trations was conducted in Canada, where approximate information on indoor levelshas been obtained by performing grab-sample measurements in a large number (9,999) ofhomes (McGregor et a1. 1980). Rather than being a representative sampling, homes wereselected from 14 of Canada's largest cities, therefore directly representing a large portion ofthe housing stock, but not the housing of Canada as a whole. The geometric mean EEOCvaried from 3 to 13 Bqjm3 among these cities, the median being 7 Bqjm3
. The medianGSO was about 2.7. These results cannot, however, be thought of as representing the livingspace of these homes, since the preferred sampling site was chosen to be the basement andmonitoring was done in summer. (The 222 Rn concentrations were also measured, but aresuspect in view of the very large GSO obtained, having a median of 4.0 among the 14cities, and the fact that measurements were performed in basements.)
Significant efforts to determine indoor radon concentrations have been conducted innumerous European countries. In severa! of these, efforts have been designed to providerepresentative information on concentrations in the housing stock as a whole. The results
38

0.0.30 -r------------------------------------------...,
0.025
0.020c0
:::l.0'--IIIa 0.015>--
..00
..00'-a-
0.010
0.005 ':
"
,,
,,,",,
,I
", ":;;:, I
; ;:~: ,;111 11' )1
,.Il r ' I j
,," ,,' II~
II"'" 1'1.,ltl \ III
.11 tillIII jill'
. 1,1, ,/, I
'I'I~,
"" J"'"'"'" ,,"~I
",-"" '.~, Legend
Concentrations in housing stock
.350300250150 200
Indoor Radon [Bq/m"3]10050
0.000 i-------:-----..,...,;"..-....:."'-"...,.~..I.li:o.~-":'O~.L:o~I.::..~:..u;~~~::l.ili:o~lJ-----~
o
XBL 901-215
Figure 8. Comparison of the distributions of indoor concentrations and lifetime exposures.
The solid curve is a concentration distribution (based on Nero et al. 1986) with GM = 33 Bq/m 3
and GSD = 2.8. The dashed is calculated using Monte Carlo sampling from the concentrationdistribution, assuming everyone moves to a randomly selected house every 7 years. (The simulationis for 5000 lives, each of 82 years.)
39
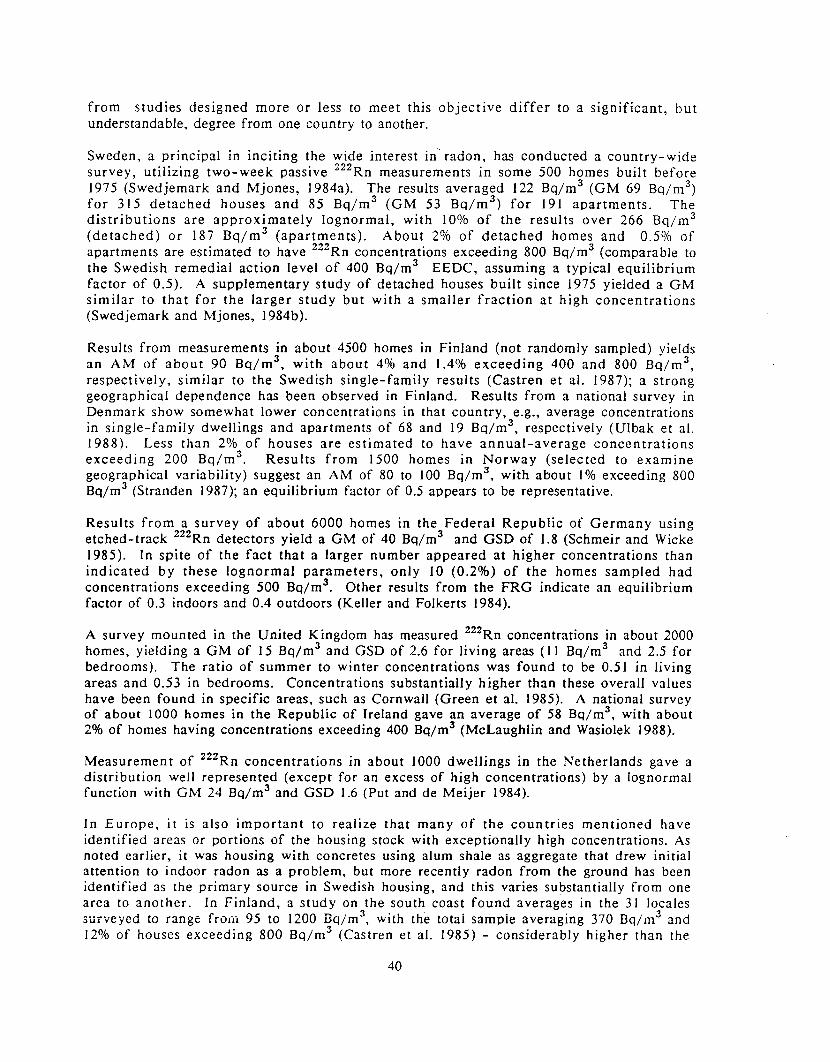
from studies designed more or less to meet this objective differ to a significant, butunderstandable, degree from one country to another.
Sweden, a principal in inciting the wide interest in radon, has conducted a country-widesurvey, utilizing two-week passive 222 Rn measurements in some 500 homes built before1975 (Swedjemark and Mjones, 1984a). The results averaged 122 Bqjm3 (GM 69 Bqjm3 )
for 315 detached houses and 85 Bqjm 3 (GM 53 Bqjm 3) for 191 apartments. The
distributions are approximately lognormal, with 10% of the results over 266 Bqjm 3
(detached) or 187 Bqjm 3 (apartments). About 2% of detached homes and 0.5% ofapartments are estimated to have 222Rn concentrations exceeding 800 Bqjm3 (comparable tothe Swedish remedial action level of 400 Bqjm3 EEDC, assuming a typical equilibriumfactor of 0.5). A supplementary study of detached houses built since 1975 yielded a GMsimilar to that for the larger study but with a smaller fraction at high concentrations(Swedjemark and Mjones, 1984b).
Results from measurements in about 4500 homes in Finland (not randomly sampled) yieldsan AM of about 90 Bqjm 3
, with about 4% and 1.4% exceeding 400 and 800 Bqjm 3 ,
respectively, similar to the Swedish single-family results (Castren et al. 1987); a stronggeographical dependence has been observed in Finland. Results from a national survey inDenmark show somewhat lower concentrations in that country, e.g., average concentrationsin single-family dwellings and apartments of 68 and 19 Bqjm3
, respectively (Ulbak et al.1988). Less than 2% of houses are estimated to have annual-average concentrationsexceeding 200 Bqjm 3
• Results from 1500 homes in Norway (selected to examinegeographical variability) suggest an AM of 80 to 100 Bqjm 3
, with about 1% exceeding 800Bqjm3 (Stranden 1987); an equilibrium factor of 0.5 appears to be representative.
Results from a survey of about 6000 homes in the Federal Republic of Germany usingetched-track 222Rn detectors yield a GM of 40 Bqjm3 and GSD of 1.8 (Schmeir and Wicke1985). In spite of the fact that a larger number appeared at higher concentrations thanindicated by these lognormal parameters, only 10 (0.2%) of the homes sampled hadconcentrations exceeding 500 Bqjm3
• Other results from the FRG indicate an equilibriumfactor of 0.3 indoors and 0.4 outdoors (Keller and Folkerts 1984).
A survey mounted in the United Kingdom has measured 222Rn concentrations in about 2000homes, yielding a GM of 15 Bqjm3 and GSD of 2.6 for living areas (II Bqjm3 and 2.5 forbedrooms). The ratio of summer to winter concentrations was found to be 0.51 in livingareas and 0.53 in bedrooms. Concentrations substantially higher than these overall valueshave been found in specific areas, such as Cornwall (Green et aI. 1985). A national surveyof about 1000 homes in the Republic of Ireland gave an average of 58 Bq/m3
, with about2% of homes having concentrations exceeding 400 Bqjm3 (McLaughlin and Wasiolek 1988).
Measurement of 222 Rn concentrations in about 1000 dwellings in the Netherlands gave adistribution well represented (except for an excess of high concentrations) by a lognormalfunction with GM 24 Bqjm3 and GSD 1.6 (Put and de Meijer 1984).
In Europe, it is also important to realize that many of the countries mentioned haveidentified areas or portions of the housing stock with exceptionally high concentrations. Asnoted earlier, it was housing with concretes using alum shale as aggregate that drew initialattention to indoor radon as a problem, but more recently radon from the ground has beenidentified as the primary source in Swedish housing, and this varies substantially from onearea to another. In Finland, a study on the south coast found averages in the 31 localessurveyed to range from 95 to 1200 Bq/m 3
, with the total sample averaging 370 Bq/m3 and12% of houses exceeding 800 Bq/m3 (Castren et al. 1985) - considerably higher than the
40

national parameters mentioned above. As a final example, the average from Cornwall was390 Bq/m3
, fifteen times the national average for the United Kingdom (Green et al. 1985).
More limited information is available from a number of other countries. Except for speciallocal areas, none of the results exceed the distribution found for the Scandinavian countries.And some approach the considerably lower levels characteristic of the outdoors, withaverage concentrations in the vicinity of 10 Bq/m3
.
E. Other Buildings
Relatively few data are available - particularly in published form - on radon concentrationsin buildings other than residences. However, the same range of radon sources contributingto residential radon also contribute - to a greater or lesser degree - to levels in otherbuildings. Hence, it is to be expected that the minimum concentration observed in suchbuildings is the outdoor level - averaging about 10 Bq/m3 of 222Rn, as indicated inAppendix C - but that higher levels, sometimes even into the range of those in residences,should be the norm. To the extent that structures such as hospitals or office buildings havea larger number of stories and higher ventilation rates than residences, we would expectlower concentrations.
Only a small number of measurements in other buildings - whether offices, stores,hospitals, or schools - have actually been performed, and virtually no statisticallymeaningful data have been developed. It is, nonetheless, worth mentioning a few substantialstudies from the United States as examples. One of these was conducted in the Pittsburgh,Pennsylvania area, using grab-sample measurements taken during occupancy (an importantissue if ventilation systems are turned off during unoccupied hours) in schools, stores, andother public and commercial buildings (Cohen et a1. 1984). Average concentrations forvarious groups of buildings, many including on the order of a hundred measurements, werein the vicinity of 15-20 Bq/m3
, slightly higher than the outdoor concentrations measured(about 10 Bq/m3
), and much less than the annual-average concentrations found in a localsurvey of residential levels, averaging about 96 Bq/m3
. A survey of 38 office buildings inthe Pacific Northwestern United States found concentrations to average 11, 26, and 44Bq/m3 for the three cities included (Turk et aI. 1986). These results, obtained withintegrating samplers, are somewhat lower than comparable residential concentrations in therespective areas.
Only scant information has been developed for other buildings in recent years. The notableexception is that of schools, for which the EPA recently released preliminary informationon school-room concentrations during a news conference during April 1989 (USEPA 1989a),during which they recommended that schools monitor every room that is used frequently onthe basement or ground-floor levels. Of approximately 3000 classrooms monitored (in 16states) in gathering this preliminary information, 10% of the rooms tested hadconcentrations exceeding 150 Bq/m3
, and 3% gave results exceeding 740 Bq/m3. These
results were based on two-day charcoal collection, but other details of the monitoringprotocol were not given, a critical question for schools, since these generally havemechanical ventilation systems that are often turned off outside of school operating hours.It is evident from other data that the EPA results cannot be used to draw generalconclusions. For example, a survey of hundreds of school rooms in California found noneto exceed 150 Bq/m3 (California Department of Health Services 1989).
41

III. FACTORS AFFECTING INDOOR CONCENTRAnONS
The concentration of radon in homes and other buildings varies substantially from one area toanother, from one structure to another, and even within the same structure. Likewise, in thesame building there is often a substantial variation with time on various temporal scales, i.e.,season to season, week to week, and on a daily or hourly basis. Understanding the nature andorigin of such variability is important as a basis for evaluating the scope of the radon problem(and indeed simply for interpreting monitoring data) and for formulating effective strategiesfor control. We first examine the dependence of concentration on time, and to a lesser extenton location, within the same structure. We then examine the sources and transport of radon,as a basis for understanding where high concentrations are likely to occur and for designingeffective techniques for reducing the rate of entry of radon into the indoor atmosphere.
A. Temporal and Spatial Dependence
The previous section reviewed U.S. monitoring data, indicating not only the variability ofindoor concentrations from one area to another, but also the critical dependence ofconcentration measurements on the time period and location of monitoring. The question ofmonitoring techniques and protocols is the subject of a later section, but we here reviewbriefly some of the primary information on temporal and spatial dependencies, both tounderstand better the interpretation of monitoring data and as a further indication of theimportance of differences in sources and transport processes in determining the indoorconcentration.
Numerous measurements of radon in dwellings have indicated the substantial variation withtime of 222Rn and its decay products. This variability occurs with time of day, weatherconditions, or season. Without ascribing any cause to this variability - which is certainlyrelated to environmental or operational parameters affecting radon entry or removal (orbehavior of the decay products) - we here indicate the nature of time variability by example.
One of the earlier examples of short-term variability was obtained using continuous 222Rnmonitors in a New Jersey house, measuring basement and upper floor concentrations over aperiod of weeks (Spitz et al. 1980). A significant diurnal dependence was observed, consistentwith later measurements, which however sometimes showed a stronger difference betweenmaxima and minima.
Subsequent work has examined the dependence of concentrations on various factors, directlymeasuring not only the concentration, but also source parameters and environmental factorsaffecting radon entry and ventilation rates (Nazaroff et al. 1985). An example of such realtime measurements is shown in Figure 9. Detailed examination of such correlations isimportant for understanding radon entry and removal, as discussed later in Section B.
More recent studies of radon entry have provided further information on the variability ofindoor concentrations over different time scales. For example, Figures 10 and 11 show datafrom one of 14 New Jersey houses in which measurements examining the effectiveness ofcontrol techniques were performed over a period of approximately one year. Figure 10 showsdata in which short-term variations can be seen, while Figure 11 shows results from the samehouse after averaging over 3-day periods. In either case, substantial variability is evident.
It is also known that substantial seasonal variability occurs, as is often seen between winter andyear-long measurements. For example, Table 4 shows a comparison of winter and annualaverage results from four different studies from Nero et a1. (1986), giving the average andlognormal parameters. In these studies, the average of measured annual-average concentrations
42

Ii
----1,
20 0 [I ,.,. :-::-: -:-t:"':~:-:-•..•.. .-:-.. , ••......,....,.,.--::-: .
Temperature (0C)
20.0J--1---------------Jo~ 1
o400.0 I-....I..._~ ...L ~_ _:_=________::~ ~_ ___j
-200 LI --1
9: ~~150 =1
o~~~; ..'~I.~ J1.
0
0r ~llf Air-Exchange Rate (hr· ')
Soil Activity (min-')
lJ
13/15/82
IID'--__~
Barometric Pressure (X105 Pa)0965 ;--------------------_.:...--_---------,---5.oLoPrecipitation (cm)
° =3/3/82 3/9/82
of----------------------1016
DateXBL 839-3141
Figure 9. Variability of 222Rn concentration, ventilation rate, and environmental parameters in ahouse in a basement.
These data were accumulated over a two-week period during a several-month experiment examiningthe dependence of radon entry on environmental factors (Nazaroff et al. 1985).
43

c:;rr--r-T""""""f-r-"""".,...--r-....--r""""--;r-""1r--T""--,-.,..........---r--r-"""""'-'-..-.---r--r--l .;:
""'
c,
:--~
c-..--
""':'J
, ,, ," ~, -
; ,. '.. '.. '.. '" '
~.. t~: ::, <:: ::
• ,!l :}
", "" '~: :
" ,.. ,,. "" "• I, ": I,: .~
: ..
, ,, ,..., .~'
:.>, !, "',: ::, ", "'".....
" ." .""....I'", . ~
'"'"...""..c
~
E0"
e:.c0
"'"." 0:l:: .,.
I/,I
"""
.3 0 !\ i/a ::':V', '
, .'::"""""..I
O'--'--'--'--L-.1-.1-..L.-..l...-..o-..o-....L-....l.--'--'--'--L-'---'----L---L-l.-l.--l--J--l--l--l--lUl10 JAN 14 JAN 18 JAN 22 JAN 26 JAN 07 FEO
XBL 901-216
Figure 10. Radon concentration in the living space as a function of time.
Data are from a house studied in New Jersey (cf. Revzan 1989). Also shown (dashed line) is thetemperature difference between indoors and outdoors.
oo
'"
E0"0c:lUl-.,.Co
"'".":l:."
'"... 0"" a... :-:c,.
XBL ;01-217
Figure 11. Radon concentration in the living space as a function of time, averaged over three-dayperiods.
Data are from the same house as in Figure 10.
44

is less than the average winter values (although the difference is modest in the case of Maine).If we calculate the ratio of annual-average concentrations to winter concentrations, this isfound to average 0.72. This difference has important implications for the potentialinterpretation of the large-scale data sets acquired primarily since 1985, discussed previously.Equally significant, in this case for assessing the prevalence of higher-than-averageconcentrations, is that the width of the annual-average distribution is also smaller, as given bythe GSD. Assuming the GSD was the same, and that the entire distribution was merely scaled
. in proportion to the average in going from winter to annual-average, could thus overestimatethe fraction of homes having concentrations above levels of concern such as 150 Bq/m3 and740 Bq/m3
. In a more recent study in Colorado, Borak et a1. (1989) found - using etchedtrack detectors - the ratio of measured annual concentration to the average of summer andwinter measurement results to have a mean of 1.0 ± 0.3. On the other hand, the GSDs forwinter and summer were similar to that for year-long measurements.
The New York State survey (Hartwell et a1. 1987) gives an indication of the effects of seasonaldifferences, based on a statistical sample. This effort gave an average of 41 Bq/m3 (1.1 pCi/l)for year-long measurements in the living space, in contrast to 52 Bq/m3 (1.4 pCi/l) for 2month winter measurements. This yields a ratio of 0.79, in the range from Nero et a1. (1986).Percentages greater than 148 Bq/m3 (4 pCi/1) were 4.2% and 5.0% for year-long and wintermeasurements, respectively, showing only a slight difference. The results of Borak et a1.(1989) show a greater difference, i.e., a winter to annual ratio of approximately 0.65 andpercentages greater than 150 Bq/m3 of 50% for winter and 20% for annual measurements.
Turning to spatial differences, the New York State study found a substantial differencebetween basement and living-space concentrations, with basement values averaging 100 Bq/m3
(2.7 pCi/I), based on year-long mea~urements, approximately 2.5 times the living-spaceaverage. This factor is generally consistent with other information. For example, Alter andOswald (1987) found a ratio of 2.0, as noted above, although this is generally for shorter-termmeasurements. And Cohen (1989) finds an average in basements of 249 Bq/m3 (6.7 pCi/l), afactor of 2.0 times the average from living-space measurements. The New York ratio may belarger than these because it is a comparison of year-long' measurements and because, whereasthe living-space value tends to change substantially between winter and summer, basementvalues are thought to be more stable. Thus, for example, the ratio basement (year-long) toliving-space (winter) measurements is 1.9, quite close to the other results cited. Finally, thereis significant evidence that, for houses with higher than average concentrations, basementconcentrations may exceed those in living areas by more than a factor of 2, an example beingthe factor of 5 differential for higher-concentration houses, found in NJSDH 1989.
B. Sources and Transport Processes
Radon arises from trace concentrations of radium in the earth's crust, and indoorconcentrations depend on access of this radon to building interiors. Radon can enter directlyfrom soil or rock, via utilities such as water (and, in principle, natural gas) that carry radon, orfrom crustal materials that are incorporated into the building structure in the form of concrete,rock, and brick. The relative importance of these pathways depends on the circumstances, butit has become clear that the first - direct ingress from the soil - ordinarily dominates thehigher indoor concentrations that have been observed in homes.
Indications of this arose in early investigations of radon in U.S. houses, when it was found thatmeasurements of radon emanating from structural materials could not account for observedindoor concentrations, based on estimates of the air exchange rate (George and Breslin 1980).Moreover, practical experience in reducing concentrations in the Canadian mining communitiesmade it clear that the major entry route was through the house understructure, at least in thehouses in which remedial measures were attempted (Scott 1988).
45

Tabl e 4. Comparison of annual-average to winter parameters of radon distributions
Annual-average 222Rn ~inter-only 222Rna Ratio of annual-average towinter paramters
Number of houseswi th winter and
Location SU1lTler AM GM GSD AM GM GSD AM GM GSD Referencemeasurements
Pacific Nil 32 3.27 2.18 2.25 4.58 2.97 2.41 0.714 0.734 0.934 Thor 1984
Central Maine 58 2.86 1.61 2.52 3.42 1.66 2.81 0.836 0.970 0.897 Hess et al. 1985
Eastern 36 7.57 3.29 3.41 11.25 4.40 3.81 0.673 0.748 0.895 Sachs et al. 1982~ Pennsylvania0\
Philadelphia, PA 23 2.73 2.01 2.15 4.20 2.61 2.63 0.650 0.770 0.817 George et al. 1984area
Average ratio 0.718 0.806 0.886
a The "annual-average" concentration is calculated as 0.5 x·(winter + summer). The distributional parameters, i.e., the arithmetic mean (AM) andgeometric mean (GM) - both in pCi/l . and the geometric standard deviation (GSD), are then calculated from the results, as well as from thewinter-only results.

A clearer picture emerged with availability of information on the distribution of entry ratesinferred from direct measurements of radon concentration and ventilation rate (such as thedata shown in Figure 3). Figure 12 shows such entry-rate distributions from various countries,as well as indicating the potential contribution of various sources. Although building materialswere first suspected as the major source in the U.S., based on the experience in Europe (e.g.,Hildingson 1982), the initial U.S. results strongly suggested that the soil must be the majorsource (Nero et a1. 1983). Understanding how the rate of radon entry could be approximatelyequal to the unimpeded flux from the ground (i.e., in the absence of the house) has been amajor focus of research on radon entry, in both North America and Europe.
This section discusses briefly the current state of knowledge of radon sources and transport.Far more comprehensive treatments are given in Nazaroff et a1. (1988), Stranden (1988), andNazaroff et al. 1987b.
I. Soil and Building Materials
Understanding the radon mass balance for a building requires specific consideration of thevarious sources. As indicated in Figure 12, a median (or GM) entry rate for U.S. singlefamily houses appears to be in the vicinity of 20 Bq m- 3h- I (0.5 pei l-Ih-I). Based onemanation rate measurements from U.S. concretes (Ingersoll 1983), one might expect emissionsfrom this source to account for a median of about 2 to 3 Bq m- 3 h- I , far below the rateobserved. On the other hand, the potential contribution from unattenuated soil flux, a medianof about 25 Bq m-3 h-1 (based on Wilkening et al. 1972), corresponds much more closely withthe indoor observations. However, houses have understructures that might be expected toimpede substantially the ingress of radon, at least by diffusion, the main mechanism forcausing the observed fluxes from uncovered soil. As discussed in detail in Nero and Nazaroff(1984) and in Nazaroff et al. (1988), although transport via diffusion accounts well forobserved fluxes from building materials and exposed soil (and could account for small fluxesfrom the soil through some understructure materials, such as concrete), diffusion cannotaccount for the total entry rates observed in single-family houses. Another mechanism mustaccount for the efficiency with which radon from soil enters such homes. It appears that thismechanism is bulk flow of soil gas driven by small pressure differences between the lower partof the house interior and the outdoors.
As discussed in Appendix B on ventilation rates, pressure differences of only a few pascal i.e., on the order of only a ten thousandth of an atmosphere - arise from winds and indooroutdoor temperature differences and are the cause of ventilation in homes during seasons whenthe windows are closed. These same pressure differences can, in principle, drive the smallflows of soil gas needed to account for the observed rate of radon entry into homes: soil gascontains enough radon that, on the average, only 0.10f0 of infiltrating air would have to bedrawn from the soil to account for observed indoor concentrations (Nero and Nazaroff 1984).
Work during the 1980s has been aimed at characterizing directly and systematically thepotential for pressure differences to cause entry of radon via soil gas, probably throughimperfections and penetrations in the house understructure that permit passage of the relativelysmall amount of soil gas required. The prototype of such a work was a study of radon entryin a single family house with a basement (see Figure 9) that analyzed the entry rate versus theventilation rate, measured over a period of months, and concluded that entry could usefully berepresented by a sum of two components: one - the smaller - independent of ventilation rate,much as diffusion would be, and a larger term proportional to ventilation rate, as pressuredriven flow might be (Nazaroff et al. 1985). Moreover, the observed pressure and soilparameters appeared consistent with the soil-gas flow rate that was implied by the measuredconcentrations and ventilation rates.
47
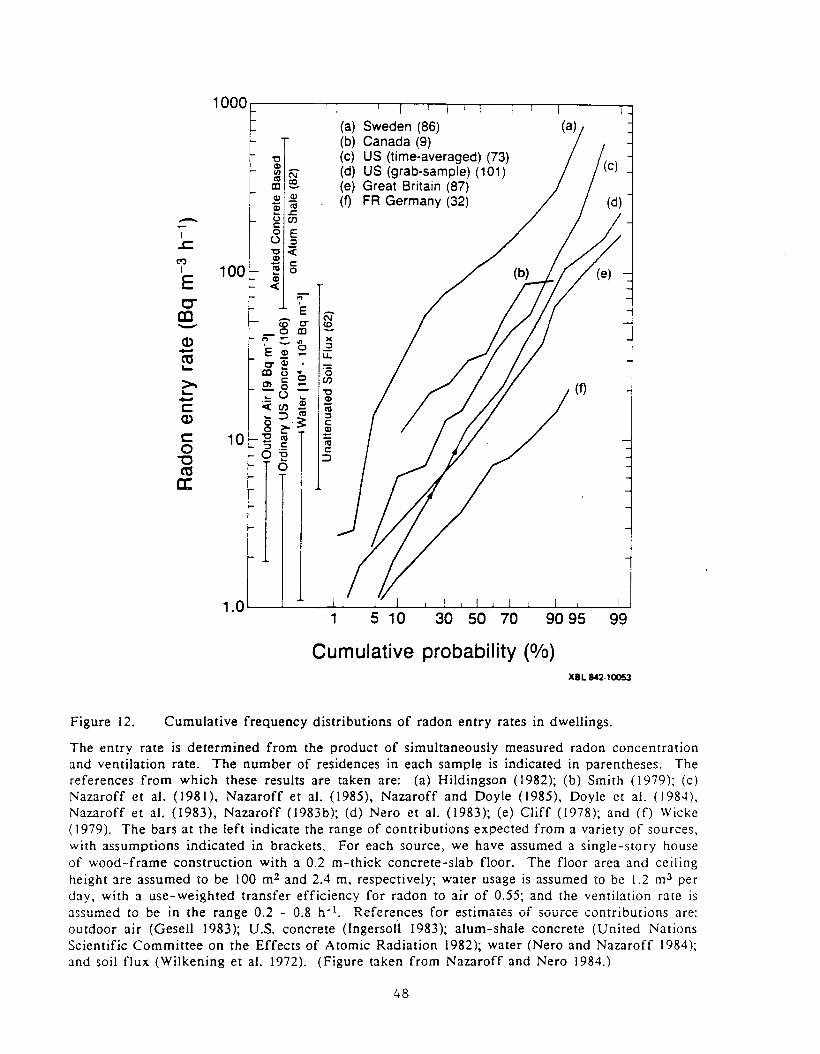
99909530 50 701
1000(a) Sweden (86)(b) Canada (9)
~r-(c) US (time-averaged) (73)
en C\l (d) US (grab-sample) (101)<ll co (e) Great Britain (87)
~CD-Ql Ql (f) FR Germany (32)-(1j~ .c- gel)
I 0 E~
U ::l"'0 <
to) Ql
"§ c:I 100 0
E Ql«C"
;:;-,
CD E N- CEO" !£._OCDQ) '"' - )(
'E ~ ~ ::l- u:ca O"~~ CD U • '0>0- m c: ° eI)
_0 -~ ... U "'0- ... Ql
C <eI) ~ iiiQ) ... ::::l <ll ::l8 .~ c:
c 10 "'0 ~ ~_ <ll
iii0 ::l c:
015 c:"'C .... ::::lca 0
a:
Cumulative probability (%)XBL842·1005J
Figure 12. Cumulative frequency distributions of radon entry rates in dwellings.
The entry rate is determined from the product of simultaneously measured radon concentrationand ventilation rate. The number of residences in each sample is indicated in parentheses. Thereferences from which these results are taken are: (a) Hildingson (1982); (b) Smith (1979); (c)Nazaroff et al. (1981), Nazaroff et al. (1985), Nazaroff and Doyle (1985), Doyle et a!. (1984),Nazaroff et a!. (1983), Nazaroff (1983b); (d) Nero et a!. (1983); (e) Cliff (1978); and (f) Wicke(1979). The bars at the left indicate the range of contributions expected from a variety of sources,with assumptions indicated in brackets. For each source, we have assumed a single-story houseof wood-frame construction with a 0.2 m-thick concrete-slab floor. The floor area and ceilingheight are assumed to be 100 m2 and 2.4 m, respectively; water usage is assumed to be 1.2 m3 perday, with a use-weighted transfer efficiency for radon to air of 0.55; and the ventilation rate isassumed to be in the range 0.2 - 0.8 h- 1. References for estimates of source contributions are:outdoor air (Gesell 1983); U.S. concrete (Ingersoll 1983); alum-shale concrete (United NationsScientific Committee on the Effects of Atomic Radiation 1982); water (Nero and Nazaroff 1984);Jnd soil flux (Wilkening et a!. 1972). (Figure taken from Nazaroff and Nero 1984.)
48

Although other research has sometimes suggested that diffusion provides the dominantcontribution to entry rate (e.g., Holub et a1. 1985), such results usually appear questionable (asindicated, for example, by the foHow-on correspondence given with Holub et al. 1985), andthe preponderance of other work (e.g., Bruno 1983 and Akerblom et a1. 1984) indicates theimportance of soil-gas flow.
This is also indicated by work following the initial studies just mentioned. Perhaps mostsignificant, experiments have directly observed, in houses with basements, the undergrounddepressurization implied by this picture, and have monitored underground soil-gas movementby injecting and monitoring tracers (Nazaroff et a1. 1987). These observations have beenconfirmed in subsequent work, including a different kind of experiment, i.e., practicalexperience with remedial measures in eastern Pennsylvania (Henschel and Scott 1986), theSpokane River Valley (Turk et a1. 1989a,b), and other areas with high radon concentrations,using techniques of the kind discussed in Scott (1988). See the more detailed discussion ofcontrol techniques in Section III.D. Such work is confirming and providing new informationon the flow of radon-bearing air through house understructures. It is interesting to note thatthese results may also have significant implications for entry of other pollutants from the soil(Nazaroff et a1. 1987, Kliest et a1. 1989, Garbesi and Sextro 1989).
Finally, the fundamental picture of radon entry suggested by this work has been complementedby increasingly sophisticated modeling of radon entry, beginning with simulations described inDSMA (1983). Later, analytical representations of entry and removal were found useful byMowris and Fisk (I988) for examining the influence of exhaust ventilation (which artificiallydepresses the pressure inside the structure) on indoor levels. Arvela et a1. (1988) have, usingsimilarly simple approaches, attempted to predict indoor concentrations by modeling themanner that entry and removal are influenced by meteorological factors. Loureiro (1987) useda 3-dimensional finite-difference model to simulate radon entry assuming a constant pressuredifference, permitting the soil type in the immediate vicinity of the basement to differ fromthat further away. In parallel, Schery et a1. (1988) have continued to develop the basicformalism for transport through porous fractured media (cf. Nazaroff et a1. 1988).
The next step is to extend modeling to consider I) more heterogeneous configurations inrespect to substructure and soil, 2) time-dependent effects (both short- and long-term), and 3)two-phase effects involving the interaction of water and soil gas. For example, Narasimhan eta1. (1989) have beg un to examine the effects of transient air flow theoretically. A morecomplete discussion of the objectives and and state of modeling, including its use forunderstanding the effectiveness of control techniques and for simulating the distribution as afunction of geographic or numerical variables, is given in Section III.C.
The studies of houses with basements have given results that may also apply in large part toslab-on-grade structures, where the pressure difference generated can still draw soil gasthrough any penetrations in or around the slab. However, few direct measurements in suchstructures have been reported. A notable exception is the case of Clinton, NJ, where veryhigh concentrations were discovered (Osborne 1987), as seen in Figure 6, and where some ofthe houses were wholly or partially slab-on-grade. (However, it should be noted that thesehomes had sub-slab heating ducts whose presence contributed substantially to radon entry.)
The other understructure type of substantial importance is the crawl space, which to someextent isolates the interior from the soil - at least in respect to pressure-driven flow betweenthe two. Limited measurements of the transport efficiency of radon through crawl spacesyield the result that a substantial portion of the radon leaving uncovered soil manages to enterthe interior, even if vents are open to permit natural ventilation of the space (Nazaroff andDoyle 1985).
In retrospect, this is not entirely surprising, since the stack effect will tend to draw infiltrating
49

air into the home from the crawl space, which can retain radon from the soil in conditionswhere winds are not sufficient to flush it to the outdoors via the vents. Furthermore, forstructures where the vents are sealed shut, e.g., to save energy, it is conceivable that the crawlspace still provides sufficient connection between the house interior and the soil that pressuredriven flow can enhance the flux from the soil above levels associated merely with diffusion;the work reported in Nazaroff and Doyle (1985) may have observed this effect. Anotherobservation from this study in that energy conservation efforts that focus on tightening thefloor above a crawl space can significantly reduce infiltration" rates, while reducing radon entrya corresponding amount, as a result of which indoor concentrations are little affected. Themodeling approach of Mowris and Fisk (1988), together with the basic understanding ofinfiltration (see Appendix B), affords direct means for assessing the effect of tighteningmeasures to reduce either entry or air infiltration.
Thus sufficient mechanisms exist to account for the substantial amount of radon that appearsto enter single-family homes from the soil, apparently without great regard to substructuretype. However, this does not imply that other sources of radon are unimportant. As discussedelsewhere (Stranden 1988), it is clear that materials utilized in a building structure cancontribute substantial indoor concentrations, although this is not usually the case (even fornatural stone that has higher-than-average radium content). Moreover, in buildings that arerelatively isolated from the ground, such as multi-story apartment buildings, indoorconcentrations are expected to be lower than average - as if often the case in central Europeandwellings - and to arise primarily from the building materials and from radon in outdoor air.
2. Water
Probably more important than buildings materials, as a source of radon in certain parts of thehousing stock, is domestic water drawn from underground sources. Surface waters have radonconcentrations too small to affect indoor levels when used domestically, but ground water is ina good position to accumulate radon generated within the earth's crust. As a result, very highradon concentrations can sometimes be found in associated water supplies. For example, ~
survey of 222Rn concentrations in well-water in Maine found a range of 7 x 10² to 7 x 10Bq/m 3 (20 to 180,000 pCi/l), while wells in granitic areas were found to average 8 x 10 5
Bq/m3 (Hess et al. 1983); and the average concentration in water from drilled wells in Finlandhas been found to be 6.3 x 10⁵ Bq/m3 (Asikainen and Kahlos 1980). With normal water use,the radon entering indoor air from water with such high concentrations can be expected to besignifican t.
Examinations of the overall potential contribution of water-borne radon to indoorconcentrations have tended to be no more sophisticated than to consider typical water userates, house volumes, and ventilation rates, yielding a ratio of radon in air to radon in thewater supply of about 10-4
. However, it is possible to make a more realistic estimate of thedistribution of the air-to-water ratio, using more detailed distributional information (ratherthan just averages) on water use rates, efficiency of radon release from domestic water used invarious ways, house volumes, and ventilation rates. Such an analysis of U.S. data for singlefamily houses yields a ratio with a lognormal distribution having a GM of 0.65 x 10- 4 and aGSD of 2.88, as discussed by Nazaroff et a1. (1987b). Taken together with recently developeddata on 222 Rn in public water supplies (Horton 1985), such a distribution permits quantitativeassessment of the contribution of public water supplies to indoor radon concentrations. Theresult of such an assessment is that such supplies contribute an average of approximately IBq/m3 (0.03 pCi/l) in the 30% of U.S. homes served by ground water, i.e., only about 2% ofthe average indoor concentration in U.S. single-family homes.
However, the very high water-borne concentrations that are sometimes found - particularlyfrom private wells - must be expected to contribute much larger airborne concentrations in
50

the homes affected. Using the few data that are available for the approximately 18% of theU.S. population using private wells, the airborne contribution from water for this segment ofthe housing stock can be estimated to average about 20 Bq/m3 (Nazaroff et a1. 1987b). About10% of the houses served by these wells (totaling about 2% of the U.S. housing stock) areestimated to have indoor concentrations from water of 40 Bqjm3 or more. Although theseestimates for radon from private wells cannot be regarded to be reliable, they suggest that theportion of the population using private wells may be experiencing significantly higher radonexposures than average, particularly in areas with high radon activity in water.
A recent report of results of radon monitoring in water from private wells, although not fromstatistically designed surveys, seems to confirm these indications, although a somewhat smallercontribution from water is suggested. The results gave state-wide average concentrations inprivate-well water ranging from about 10,000 Bqjm3~ indicating a contribution to indoor airaveraging about 1 Bqjm3 in such states, to about 500,000 Bqjm3 in several states, implying anaverage contribution of about 50 Bqjm3 (comparable to the national average) in houses withprivate wells in such states (Vitz 1989). The average of statewide averages was approximately125,000 Bqjm3, implying an average waterborne contribution, in houses with private wells, of10-15 Bqjm3, slightly lower than suggested above. In addition, there may be a bias towardhigh-concentration houses, considering the manner of distribution of the kits. Nonetheless,these results confirm the potentially significant contribution of radon from private-well water,particularly in the fraction of houses with water-borne radon concentrations that aresignificantly higher that the statewide averages. Such results also suggest that, overall,waterborne radon may contribute about 5% of the about 50 Bqjm3 average radon concentrationin U.S. homes.
3. Summary of Source Contributions
We can thus point to the major sources of radon present in indoor environments. For singlefamily houses and other structures of one or two stories, the ground constitutes the principalsource, but with a noticeable portion entering with outdoor air, Le., on the order of 10 Bqjm3
(cf. Appendix C). However, there are circumstances in which the building materials ordomestic water supplies are important. In contrast, in high-rise buildings, includingapartments, the ground is of lesser importance, and the amount of radium-bearing buildingmaterials per unit volume is larger, so that outdoor air and the building materials are typicallythe dominant contributors, although the ground and water supplies can be important in somecases. Other potential sources, such as natural gas ordinarily contribute negligible amounts bycomparison (Gesell 1973, Johnson et al. 1973).
For a specific set of assumptions, characteristic of U.S. buildings, Table 5 indicates theapproximate average contribution of various sources to the indoor concentration for singlefamily buildings and (to the extent data are available) for apartments. For comparison, theobserved concentrations are also given. Note that, considering the uncertainties involved, thepresumed contributions are consistent with the observed levels, i.e., an average of 55 Bq/m3
in single-family houses and a substantially smaller concentration in high-rise apartments.
C. Capabilities for predicting indoor concentrations
Development of predictive models of the indoor radon concentration is useful, and in fact,essential for several purposes. The overall (national) distribution of the average indoor radonconcentration in the existing housing stock can be determined by appropriate survey efforts,but in fact much more information is required. This requires 1) the development of modelsthat represent research results in such a way as to simulate the radon concentration in a givenhouse as a function of time in a given house (diurnal and seasonal variations), and that can be
51

Table 5. Approximate Contributions of Various Sources to Observed
Average Radon Concentrations. a
Single- Family High-Rise
Houses Apartments
Bq/m3 (pCi/I) Bq/m3 (pCi/I)
Soil potential (based on flux 50 (1.5) >0 (>0)
measurements)
Water (public supplies)b 0.4 (0.01) 0.4 (0.01)
Building materialsc 2 (0.05) 4 (0.1 )
Outdoor air 10 (0.25) 10 (0.25)
Observed indoor concentrations 55 ( 1.5) 12? (0.3?)
a In each case, the arithmetic mean is shown, based on entry rates (or, in the case of outdoor
air, concentrations) discussed in the text and on an air exchange rate of 0.5 h- 1.
b Indicated water contribution applies to 80% of u.S. population served by public supplies.
Contribution may average 15 Bq/m3 in homes using private wells, with even higher
contribution in high-activity areas.
c The contribution of building materials in single-family houses corresponds to a slightly
smaller geometric mean entry rate than the 2 to 3 Bq m3 h- 1 estimated in the text because not
all houses are slab-on-grade or one-story. A higher contribution to apartment air is
suggested on the presumption that, on the average, high-rise apartments have a larger amount
of radium-bearing material per unit volume than do single-family homes.
52

be used to evaluate the effectiveness of control techniques, as well as to interpret monitoringresults, and (2) the formulation of operational models to estimate the expected distribution In
housing stock subsets, depending on the type of construction, geographic area, etc.
Predictive models are desirable for
• estimating population risk from indoor radon exposures,
• assessment of relative costs of mitigation per avoided statistical death, for variouscontrol measures, and relative to measures to reduce risks from other (non-radon)causes,
• identification of population segments at high risk, and setting 10 motion policies toreduce these risks,
• estimation of impacts of changes in demographic patterns, the building stock andbuilding operation (often owing to energy conservation measures), changes in occupantbehavior, in terms of changes in risk to the population, and the costs of controlmeasures,
• providing guidance for conducting house-to-house surveys of indoor radonconcentrations (when to measure, where to measure),
• interpreting monitoring results, and
• identifying data gaps and imperfect understanding of the physical mechanismsinvolved in radon generation, transport, entry and removal.
Predictive models of exposure must be based on predictive models of concentrations, folding indata on time-activity and mobility patterns of the population whose exposure is to beevaluated.
Predictive models of indoor radon concentration span a wide range of model types, both interms of complexity and in terms of specificity. At one end of the specificity spectrum wouldbe a model of a particular house (with or without a basement) sitting on the soil, andincorporating submodels that attempt to simulate the physical phenomena occurring in terms ofsoil-gas transport and entry into the house, including the subsequent behavior of radon (andperhaps its decay products) in the various zones of the house, until their removal from theindoor air by decay and ventilation (and perhaps plateout and deposition in the lung). Thespecific model may be simple or complex, in terms of how much of the detail is modeled, assuggested in the models referred to above (Section III.H). At the other end of the spectrum ofspecificity would be a predictive model that attempts to estimate the overall distribution ofindoor radon concentrations in U.S. homes, on an annual-average basis. Again the level ofcomplexity could vary, ranging from a single general distribution to a model that incorporatesand indicates the dependence on climate, soil properties, regional construction styles, etc.
The two types of models described above are based on different approaches to the problem.The first model is based on modeling the physical processes involved in the house in detail andon verification of the sub-models with detailed measurements and adequate samples ofintermediate data. Such models result from, and are directly associated with, the basicexperimental work on radon (and decay product) behavior. The second approach is based onsurveys of underlying factors - and to some extent of indoor radon concentrations - inadequately large samples of the housing stock, developing distributions to represent the entirehousing stock of interest. In fact, the above two examples describe the two extreme cases; inpractice, a combination of both the approaches in some judicious measure is usually adapted.
53

To enable the modeling effort to fulfill the expectations described above, the sampling surveyapproach is inadequate for prediction of impacts of various changes in building stock and itsuse and operation, because the underlying understanding of the causative mechanisms ismissing; on the other hand the mechanistic model, though rich in its analytical detail of thecausative mechanisms, is inadequate of itself to answer questions regarding exposures and risksto the overall population because data on distribution of housing constructions, soil types, andother explanatory variables can be obtained only from surveys.
I. House or site models
Progress on models for individual houses (or sites) is illustrated by the work discussed in theprevious section, i.e., DSMA (1983), Mowris and Fisk (1988). Loureiro (I987). and so on. Adetailed predictive model of indoor radon .concentrations in a house would require developmentand integration of the several sub-models. Figure 13 illustrates the structure of such a modelfor a general indoor pollutant where the indoor concentration is determined by mass balancerelationships involving sources, ventilation and reactions, which - in turn - are influenced bybuilding design, meteorology, occupant behavior and. of course. innate characteristics of thesources of each pollutant. Radon-specific aspects of such a structure are shown in Figure 14.Major components of a radon model. and an indication of our current understanding of thephysical processes. include:
• By far the dominant mode of entry of radon into houses is pressure-driven flow ofradon-bearing soil gas into the house, as discussed in the previous section. Formodeling this phenomenon, which is the most important entry route from theviewpoint of understanding high indoor radon concentrations. at least a threecomponen t model is needed: I) a model of how the soil moisture content. permeabili tyand emanating fraction of radium are distributed beneath and in the vicinity of thehouse. 2) a model of the house-soil interface in terms of occurrence and extent of anyhorizontal gaps between the slab and the underlying soil or (more commonly) existenceand characterization of any layer of highly permeable gravel under the slab, the extentand character of cracks and openings in the slab and basement walls to the soil, anylayer of uncompacted soil near the basement walls. existence and extent of a small gap(owing to soil subsistence and shrinkage) between the basement walls and the adjacentsoil, construction details of the basement slab and walls and any drainage system. and3) a model of the physical phenomena that cause the pressure differences for drivingthe soil gas into the house. such as the indoor-outdoor temperature difference,operation of appliances that exhaust house air to the outside (thus contributing to theinduced pressure difference), wind-induced pressures owing to its interaction with thesoil and house surfaces, and the influence of barometric pressure fluctuations on thesoil and house pressure fields. This structure is indicated in Figure 15.
• The radon concentration in the water used in the house will be primarily determinedby whether the water supply is from a private well and the radium concentration inthe soil with which the ground-water in the well has had contact. The radon thatenters the house from the use of such water depends on the amount of water use andon the kind of use to which the water is put. (For example, use of this water forflushing a toilet releases about 3 times less radon per unit of water use than fromtaking a shower (Nazaroff et al. 1987b).
• Diffusion of radon into indoor air owing to building materials is determined by thediffusivity of radon and the radium content in the materials (Stranden 1988). Similardiffusive entry from bare soil (in the absence of a basement slab) is controlled by theradium concentration, the emanating fraction of radium, and the diffusivity of radonin the soil.
54

.,IIIIIIIIIIIIIII
_- .... _1OccupantBehavior
Meteorology ~,Indoor
I
ISource ... ---J,--'\..
Behavior1---
*I tOutdoor Building
Concentrations Design
t + ~ IF
--.tions Mass-Balance Ventilation
Model Model
tI
, -. I
Reac
I--------------~-,
I I
IIIIIIII
XBL 901-6216
Figure 13. General design of a physical model for the indoor air quality in a house.
Concentrations of a specific substance are determined by competing source and removal terms asindicated and, in principle, may exhibit variability with both location and time. (Reactions mayalso include those with other indoor pollutants, not indicated.)
55

WalerProper
liesI .__--:-/?' II /'~ /
--r ' .i /' //
/
./
Canst rlwtionPradices
:I '~ ------..1--- _
SoilI'roper
li('~
.. Removal RadonConcenlralion
Enlry
IExposuref----
XBL 901-214
Figure 14. Design for a physical model of the radon concentration in a house.
The indoor radon concentration may be calculated from a variety of sub-models which, in turn,utilize a variety of physical (and human) data.
Radon Availability Radon Migration
Radioactive decay
Moisture;temperature:soil gram-sizedistribution;intragranularof Ra atoms
Radioactivedecay;migration tooutdoor air
Length
Porosity;Moisture
~Diffusion
Permeability
t t__-r-I---'
Soil grain-size Flow mechanisms:distribution; temperature differences;mOisture; wind;porosity barometric pressure changes;
precipitation; changesin water table;snow or ice cover
location
tFraction
Geochemicalprocesses
Radongeneration
(radium decay)
XBL851Q.11933
Figure 15. Overall design for understanding or modeling the entry of radon from the soil.
Radon entry alone, if represented completely in a model, involves a complex of processes andinformation affecting radon generation and transport.
56

• The subsequent behavior of radon that enters the house via various routes isdetermined by the interzonal convection and by ventilation rates in the various zones;both of these are influenced by infiltration and temperature-induced pressuredifferences, which also influence the pressure-driven entry rate of radon via the soilgas, so the behaviors of these sub-models are not really separable. See Appendix Bfor a brief discussion of ventilation and associated models.
• The behavior of decay products of radon in the indoor air further depends on theconcentration and size distribution of indoor aerosol which they encounter. (Thistopic is treated separately in Section Y.).
• Finally, the exposure of house occupants to radon decay products is influenced notonly by their occupancy patterns, but also by their own operation of the house, suchas thermostat settings, operation of whole-house or kitchen exhaust fans, use of aircleaners to remove indoor aerosols, activities that generate indoor aerosol, etc.
It seems likely that only large numerical models would be able to handle the simulation andintegration of the detailed sub-models that is expected from the above description of acomplete house model. A further difficulty is that there are considerable gaps in our presentability to describe the above phenomena mathematically. For example, the interaction of theexternal wind field with the soil surface and the house, which influences the soil-gas entryinto the house (and may influence radon concentrations in the soil gas itself), is poorlyunderstood and hence difficult to model.
Furthermore, there are often practical problems in obtaining input data for some phenomenathat we believe we understand and can model adequately. For example, even thoughsophisticated and detailed models of three dimensional, soil-gas transport driven by anexternally imposed pressure field exist (Loureiro 1987, Narasimhan et al. 1989), it is not clearhow, in a practical situation, one would go about obtaining a "sufficiently" detailed andaccurate map of distribution of relative permeability and emanating fraction of radium in thesoil near and beneath the house to enable one to predict with confidence the behavior of theentry sub-model. Often the test of "sufficiently" adequate data is met only by comparingprediction with experiment, and obtaining more and more data till the predictions areconsistent with observations. This problem also applies to the input data limitation oninterzone convection, and the soil-house interface.
On the other hand, the more complete development of such models does offer a framework forrepresenting our increasing understanding of the entry and removal of radon, and hence is anecessary feature of research in this area. Furthermore, as this understanding becomes morefirm, it is hoped that simplified forms of such models can serve effectively in keyapplications. The most obvious is to improve the design of control techniques appropriate tovarious situations. The more subtle is to use the models as a basis for interpreting monitoringdata and, indeed, as a basis for the housing stock models discussed below, which developstatistical representations of the distribution of indoor concentrations as a function ofgeographical, structural, and other variables desired.
Furthermore, an intermediate approach to modeling, as one alternative to a fully deterministicmodeling approach just described, is to develop a stochastic model of indoor air quality, wherethe driving forces are only statistically known. Another alternative - with obvious practicalapplications - is to leave out the house model altogether, and concentrate on the potential ofthe site to provide a high rate of radon entry. An example of the first approach (though notapplied to radon as yet) is provided by Haghighat et al. (1988). An example of the secondapproach is provided by the attempts to provide measures or simple indices for characterizingsites with respect to their radon source potential. The purpose of such characterization is not topredict indoor radon concentrations and exposures as such, but to predict locations where
57

control measures or modified construction practices would be desirable. Since it now seemsclear that high radon entry rates into houses can occur also from soils having ordinary radiumconcentrations but with high relative permeability (Nazaroff and Sextro 1989), these indiceshave attempted to combine these two governing parameters (emanating fraction of radium andrelative permeability) to obtain a single and simple index for radon source potential ofhomogeneous soils (DSMA 1983, Nazaroff and Sextro 1989, Kunz 1988, Kunz et a1. 1989, andYokel 1989). While the index is a useful measure to characterize sites where the soil isrelatively homogeneous, sites with considerable inhomogeneities abound in the Northeast. Atthese sites, channeling of soil gas along strata or shear zones of high relative permeabilitypassing near the house sub-structure appear to provide pathways for high rates of soil-gasentry into some houses, while their neighboring houses have much lower entry rates.
A third alternative is to build a model based on physical understanding of the majorphenomena, but attempt to determine the values of the unknown parameters by short term"diagnostic" tests and procedures. This approach attempts to model indoor radon concentrationsby focusing on building up a manageable simulation structure by making judicious simplifyingassumptions. A recent attempt (Revzan 1989) focused on two New Jersey houses would serveas a good example of the state of the art in this direction. The model incorporates distinctmodels of soil-gas transport, its entry and removal from the basement, and its entry andremoval from the upstairs living space. The occupant behavior, geological and structuralfactors are not modeled, but derived from fitting the observed data to observed concentrationsover a 'limited period under constraints of the sub-models. The derived parameters and thesub-models are then used to predict radon concentrations for other periods. Similar short-termdiagnostic methods to predict long-term performance have been recently developedsuccessfully for residential energy use by Subbarao and Balcomb (1988). There is hope that asimilar approach can be developed and validated. for indoor radon concentrations. Anotherdiagnostic effort, aimed at characterizing the sub-slab structure (in terms of communicationand permeability) for predicting effectiveness of sub-slab ventilation technique in reducingindoor radon concentrations, is described by Matthews et a1. (1989).
2. Predictive Models for the Housing Stock
As discussed in the previous section, predictive models for housing stocks are based primarilyon a physical model, combined with data on relevant parameters from statistical samples of thehousing population. Figure 16 illustrates the major components of such a model, which wouldyield the indoor concentration for the entire housing stock, but - more importantly - as afunction of house type, geographic area, etc. It could also be used to assess the effectivenessof proposed control strategies. The "kernel" of such a model is some form of the physicalmodels discussed above.
Assuming the existence of a physical model, the key problem in predictive modeling for thehousing stock is the development of a data structure representing the key characteristics of thehousing stock. Although some of the relevant information is available in the form desired, thisis the exception, rather than the rule. And there has certainly not been any survey to acquireall the required information in a single statistical sampling of the housing stock. Thisinformation would include key structural and operational characteristics, relevant geologicalparameters, and associated meteorological data, to mention the major classes of data required.At present, it is necessary - for such modeling applications - to piece together partialinformation from different sources, in the absence of a consistent or complete set of theinformation required.
To some ex tent, these deficiencies can be alleviated by intercomparison of derived andsecondary data sources obtained from a number of related surveys that contribute
58
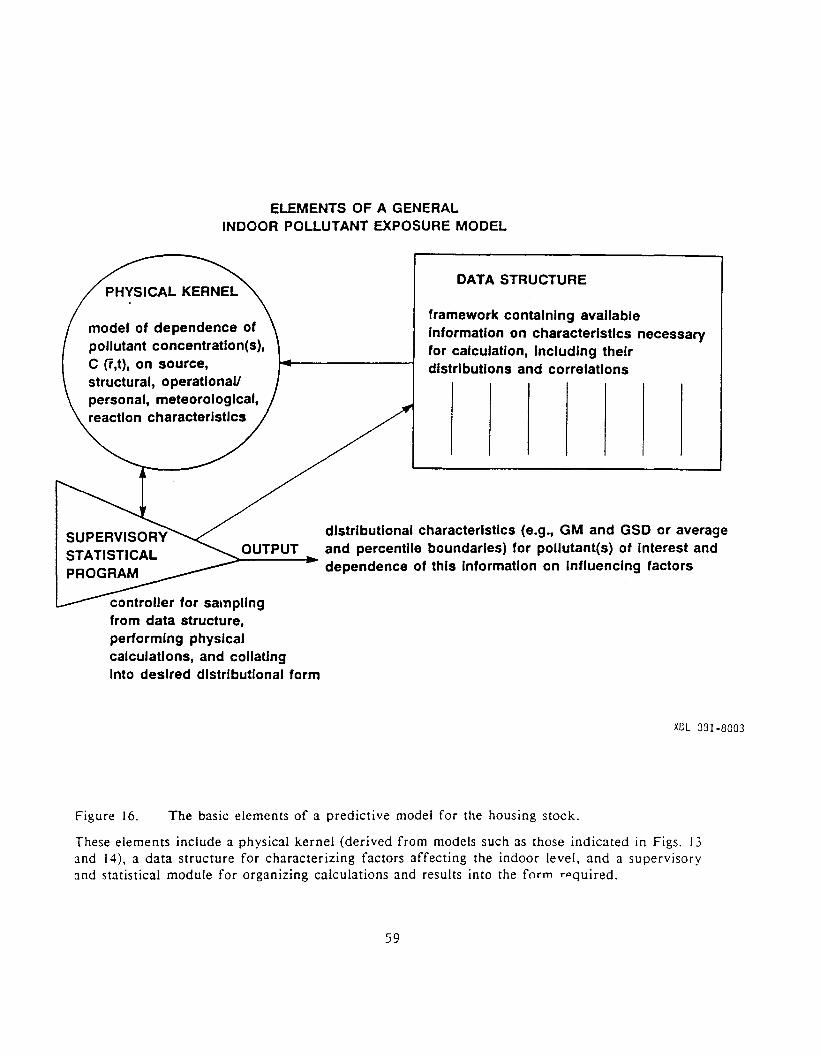
ELEMENTS OF A GENERALINDOOR POLLUTANT EXPOSURE MODEL
DATA STRUCTURE
framework containing availableInformation on characteristics necessaryfor calculation, Including theirdistributions and correlations
distributional characteristics (e.g., GM and GSD or averageand percentile boundaries) for pollutant{s) of Interest and
~-----I~ dependence of this Information on Influencing factors
controller for samplingfrom data structure,performing physicalcalculations, and collatingInto desired distributional form
model of dependence ofpollutant concentratlon{s),C (r,t), on source,structural, operatlonallpersonal, meteorological,reaction characteristics
XCL 331-8003
Figure 16. The basic elements of a predictive model for the housing stock.
These elements include a physical kernel (derived from models such as those indicated in Figs. 13and 14), a data structure for characterizing factors affecting the indoor level, and a supervisoryand statistical module for organizing calculations and results into the form r"quired.
59

to the information that the model attempts to represent. In fact, such intercomparisons canlead to identification of data-gaps, survey errors, and inadequacies in the presentunderstanding of the physical phenomena involved. Examples of such surveys would be thoseproviding data on distribution of air-exchange rates, housing construction types, soilpermeabilities and radium concentrations, personal exposure measurements, concentrationsurveys, experimental and demographic data on lung cancer rates, and so on.
For example, from an examination of the survey data on distribution of indoor radonconcentrations, soil relative permeabilities, and radium concentrations discussed below (Section3), it appears that our present understanding of the radon entry and removal mechanisms isinadequate to explain in detail the narrowness of the radon concentration distribution relativeto the breadth of distributions of soil radium concentrations and soil relative permeabilities, asdiscussed in the next section. A preliminary analysis of BPA data from 84 houses (includingsoil properties, indoor radon concentrations, and air-exchange rates) leads to similarconclusions.
A major example of this general approach to modeling is the work of Traynor et al. (1989),who have constructed a model for assessing residential concentrations of combustion-generatedpollutants, in particular CO, N02, and respirable suspended particulates. There is some hopethat development of predictive models for the case of radon and other pollutants will be easedby the acquisition of data from the (roughly) SOOO-home national radon survey to beconducted by the EPA. This would provide a basic data set on house characteristics, includingeven appliances, that will be the first self-consistent set of information serving as a basis forpredictive modeling. Furthermore, the indoor radon concentrations will automatically beavailable for testing and validating the model. It is important to realize that the results onhouse characteristics will also serve as a primary resource for predictive modeling for otherindoor pollutants. (Unfortunately, however, the associated Questionnaire was not designed toinclude a few key Questions that would be very helpful for these other pollutants.)
Finally, predictive models of exposures in the housing stock can be built up not only based onthe physical survey results, but incorporating the ongoing process of increased publicawareness, homeowner testing, development of public policy, implementation and effectivenessof remedial measures, and resulting changes in population risks and statistical deaths (Smalland Peters 1988). Though such attempts are relatively new, they represent a potentially fruitfulline of investigation in attempting to analyze the impact of various public policy options on thepopulation exposure and risk.
3. Data for geographic radon modeling
Radon arises primarily from radium present in the ground, as a result of which numerousattempts have been made to correlate indoor concentrations with the radium content of soil andother relevant parameters. One of the major lines of work has been the use of a "radon indexnumber," such as discussed above, as an indicator of the indoor radon potential. Such indicestypically involve both the radium concentration and the permeability, since the latter is oneindex of the transport of soil gas indoors.
In addition, there have been a number of studies attempting simply to examine the correlationbetween radium concentration and indoor radon levels, an example being that of Kothari andHan (1984). With the upsurge of interest in means to identify high-radon areas or sites, theseefforts have increased, often with application in known high-radon areas (cf., for example,Reimer and Gunderson 1989 and Duval et al. 1989).
One natural resource for such efforts, and one that could serve admirably in the context of ageographic predictive model, is the data from the National Uranium Resource Evaluation
60

(NURE), as part of which the National Aerial Radiometric Reconnaissance (NARR) measuredthe gamma radiation from the top 0.5 m of soil or rock of the United States as an indicator ofuranium concentration.
In an early examination of the utility of that data for purposes of assessing indoor radon on ageographic basis, Moed et a1. (1985) examined the data for California and the PacificNorthwest. Their report provides a basic description of the NARR data, as well asinformation on concentrations in the areas mentioned and results from ground-truth testing ofthe data in selected areas of the Pacific Northwest. More recently, the data have beenreformulated into a more generally useful data base (Revzan et a1. 1988), some results of whichare worthy of description.
The NARR Database of Surficial Radium Content
The NARR survey was carried out by seven subcontractors, each of which was responsible fora number of National Topographic Map Series quadrangles of 2° longitude by 10 latitude or140-200 by 112 km. Data were collected along primary flightlines, separated by intervals of 5km or less in regions of interest and 10 km in others, and along tie lines, runningperpendicular to the primary lines and separated by intervals of 20-30 km. Counting rates forgamma rays of interest, among them that of 214Bi, a decay product of radon, were recorded atintervals of I second, so that each datum represents the radiation from an area whose diameteris on the order of 50-100 m. The flightline itself is covered completely, with considerableoverlap between adjacent points, but there is obviously considerable missing information forthe territory between flightlines. The spectrometers were calibrated using concrete padscontaining known concentrations of the nuclides of interest. The data given as ppm equivalenturanium, which we express as Bq kg-lor pCi g-l radium, are actually better indicators of porespace radon than they are of uranium or radium in soil granules.
Although the complete NARR data are available on magnetic tapes, the variety of formatsused and the large storage requirements make use of the data inconvenient at best. To create adatabase which could be retained on a single storage device, the east-west flightlines weredivided into 125 intervals, each covering 0.016 0 of longitude, and the north-south flightlinesinto 80 intervals, each covering 0.02SO of latitude; each interval represents roughly 1.6 km (1mi). Although the complete data can only support a resolution of 10 km, since that is theusual flightline spacing, the higher resolution of the database may prove useful if a techniquefor using the tie lines as a basis for interpolation is developed.
The reduced data are stored by quadrangle in ASCII files. For each interval, the stored datainclude: the central longitude and latitude, the f1jghtline number and direction, the FederalInformation Processing System code for the state and county in which the point lies, and thearithmetic mean and standard deviation of Ra (pCi g-l), Th (ppm), K (percent), atmospheric214Bi (equivalent pCi g-l Ra) and gross gamma (counts). The subcontractor's code for the rockor soil type is also stored; codes used by different subcontractors are not identical, so that theusefulness of the geological information is limited. For each quadrangle, a separate filecontains information on the subcontractor, calibration of detectors, and aircraft type, averagesof the nuclide concentrations, temperature, and atmospheric pressure for each flightline, and alist of the states and counties covered by the main data file, with the number of data pointslying in each. The entire database requires approximately 350 megabytes of storage.
A U.S. Radium Map
Figure 17 is a map of the contiguous 48 states on which each dot represents the average of thestored (1.6 km) radium concentrations for the surrounding 20 x 20 km area. Data fromprimary and tie lines are treated identically. The radius of the dot indicates the magnitude of
61

0\N
XBL 8711-4927A
Figure 17. Mean radium in soil for 20 X 20 km areas of the contiguous 48 states.
From the smallest to the largest, the 6 circle radii represent concentrations of 0-20, 20-40, 40-60,60-80, 80-100, and> 100 Bq kg- 1 soil.

the concentration (see caption). Blank areas occur where data were not available. Areas ofthe map with higher radium concentration appear darker than those of low concentration.
The map reveals that certain areas appear sufficiently different in character from theirsurroundings to lead to suspicion that there might be problems involved in attempting tocompare data from subcontractors using different detection systems, despite their use of thesame calibration pads. The problem is perhaps most clearly exhibited in two quadrangles ofcentral south Wyoming and central north Colorado which appear lighter in shading thanadjacent quads. In both, all of the 20 x 20 km averages are in the lowest range; thesurroundings are at least one range higher. The means of Ra for the two anomalousquadrangles are 6.3 and 8.1 Bq kg-I, while the mean Ra of the six surrounding quadrangles in33.3 Bq kg-I; so that the problem appears to be with the uranium calibration alone. However,the subcontractor used a detection system with identical calibration factors, presumably thesame system, in a number of other quadrangles, none of which stands out from itssurroundings. The cause of the Wyoming-Colorado anomaly remains unclear.
Other possible calibration anomalies appear in southwestern South Dakota (a single quadsurveyed by a different subcontractor from the surrounding quads), eastern Washington andwestern Idaho (two quads, each flown by a different subcontractor), and San Jose, California,which will be discussed below. The average radium concentration of the territories surveyedby individual subcontractors ranges from 20 to 32 Bq kg-I, but the variation may be explained,at least in part, by the different areas of the country flown by each; the question of theimportance of subcontractor performance remains open. The problem of smoothing outartificial discontinuities in a Ra map is currently under investigation (e.g., Duval 1989).
The following areas, which the map reveals as having noticeably high radium concentrationscompared to their surroundings, have also been found to have high radon concentrations inhomes (Nero et al. 1986): eastern Pennsylvania-northern New Jersey (Reading Prong), easternTennessee-western North Carolina, eastern Washington-western Idaho (Spokane-Cour d'Alene),and western Florida (phosphate-bearing land). Apart from Florida, where the situation is wellunderstood, and Tennessee, the mean levels of radium in these areas are not extremely high,and, in any case, the nature of the relationship between the means of radium in soil and radonin houses remains to be established.
For the sake of completeness, it is worth mentioning the regions which are known to have highradon concentrations but do not appear, according to this data reduction, to have high radiumlevels and those which, conversely, have high radium concentrations but in which high radonlevels have not, at least as yet, been found. In the former category there is just one region:the Red River valley of North Dakota. While the map shows the valley to be somewhat higherin radium than the territory to the east and west, the level is the same as that of the territoryto the south, so that it is difficult to infer from radium concentrations alone that this might bea region of interest. In the latter category, there are a number of obvious examples: centralCalifornia, southern Arizona-New Mexico, a number of regions in the Rocky Mountain states,central New Hampshire-southern Maine, and most conspicuously, southwestern South Dakota.Some of these are known to be areas in which uranium deposits occur; some, as suggested, maystand out because of calibration problems; some may be worthy of specific monitoring efforts.
Mapping of Quadrangles
The quadrangle is the most natural mapping scale between the U.S. as a whole and the verydetailed studies which will be necessary for regions of particular interest. Maps of soil radiumfor individual quadrangles can be useful in analyzing discontinuities which appear to the U.S.map, in pointing out discontinuities not apparent on the larger scale map, and in identifyingsmaller regions of high concentration. Since there are fewer than 500 quadrangles, the number
63

of maps is large but not unmanageable.
A quadrangle of particular interest is San Jose, located entirely in California betweenlongitudes 1200 and 1220 Wand between latitudes 370 and 38 0 N, which appears on the U.S.map as a region having radium concentrations generally in the third or fourth range, i.e.,between 40 and 80 Bq kg-I. The elevated radon concentrations which are suggested by thesefigures have not been reported, although it is not clear that sufficient measurements have beenmade to have discovered them. A radium map of the primary flightline data for thisquadrangle at the scale of lOx 10 km, using the same technique used in the creation of theU.S. map, is provided as Figure 18. whose caption provides details. The map reveals threeregions of elevated concentrations with the possibility of a fourth beginning at the rightbottom. The regions of high concentrations are surrounded by areas of much lower levels. Asimilar map of the tie line data differs markedly in character.
The OCCurrence of temperature inversions in the area suggests that examining the relationshipbetween the corrected radium level and the temperature during data collection might beproductive. As it turn out, the San Jose quadrangle exhibits a fairly high positive statisticalcorrelation between the average temperature for the period of data collection for a primary(east-west) flightline and the average radium concentration reported for that flightline (Pearsoncorrelation 0.78; probability of the absence of correlation 0.000). The positive correlation doesnot appear for the tie lines, nor does it appear for the other nuclides for either the primary ortie lines; neither does it appear for any of the surrounding quadrangles. Subsequent groundtruth studies (Wollen berg and Revzan 1989) indicate that the high radium concentrationssuggested by the NARR data for the San Jose area are misleading.
The appearance of quadrangles whose radium concentrations are discontinuous with thesurrounding quadrangles (cf. Fig. 17), or are in some other way anomalous, suggests thatcorrective measures be taken when the data are actually used. The simplest of these measures,which might be used where a calibration problem is suspected. is to apply a correction factorso that the transition to the surrounding quadrangles is smooth (Duval 1989). A somewhatmore sophisticated approach is to use the data from the tie lines, weighted to adjust for thesmaller number of points if desired. together with the primary flightline data, to create a' newset of values for the quadrangle; mathematical techniques to carry out this procedure, whichinvolve interpolation and smoothing, are readily available. Finally, it is possible to createcontour maps from the individual data points. Such maps can be compared with similar mapsfor adjoining quadrangles, and the data for one or more of the quadrangles can be adjusted toproduce a smooth transition.
The Statistics of Radium in the Soil, Indoor Radon, and Other Factors
On the basis of the 22,172 averages used for the 20 x 20 km map, the geometric mean (GM)radium concentration for the U.S. mapping is 25 Bq kg-I, the geometric standard deviation(GSD) is 1.6, the arithmetic mean (AM) is 27 Bq kg-I, and the arithmetic standard deviation(ASD) is 12 Bq kg-I. These parameters are useful for making comparisons among regions, butthey are misleading in that each datum is treated as if it were itself an observation rather thanas an average of data which are themselves averages of original observations. Since the database retains the number of observations and the AM and ASD for each 1.6 km flightlinedatum, one can calculate an ASD for each 20 x 20 km region and then an ASD for thecontiguous U.S. On the basis of the original 24,591,855 measurements, this number is 21 Bqkg-I. Calculation of the GM and the GSD on the same basis involves approximations, sincethe GM and GSD of the observations have not been retained in the reduced database. If dataare lognormally distributed, the AM and ASD may be used to calculate a GM and GSD,yielding 2 I Bq kg- I and 2.0, respectively. As a check on this result, a GM and GSD may becalculated for each 1.6 km datum, after which overall parameters may be calculated from these
64
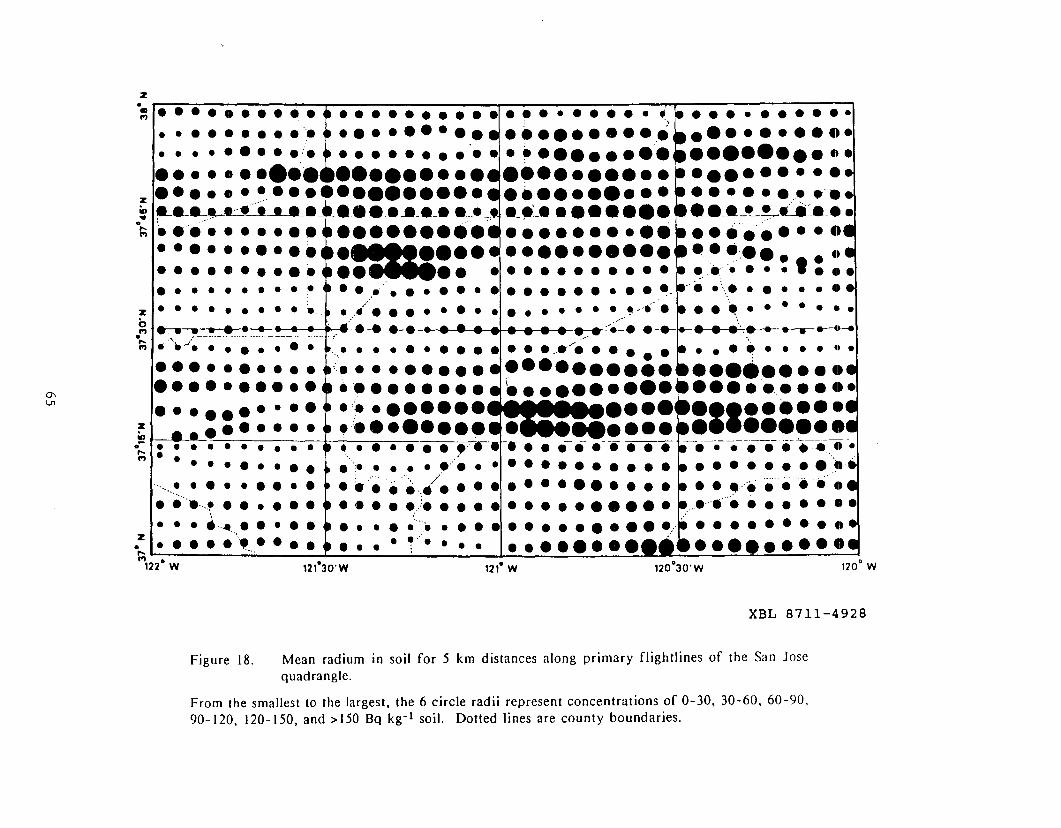
z
.:!: ,. • • • • • • • ····1· ··········~ ··... ·... t.,>~ • • • • • • • • It ••••••••••••••••••••••••••••••••••••••••.... ../. . ' ~ ........•.• ••.•..... •.........:.••............ ~ ......••...... ~••.••.........~ ...~ I~-._~.··.··••• __e_••••----.-.-.~.~••~.'-.-....••• • ._~~LJf.-••~~ .•....... •••••••••........••..•................. .-. .••••••••• ~ ••~•• ••••••••••• ~.~ •.. t •••• • • • • • • ••• • • ,e'•••••••••••••••••, .. ~ .\.••••• •••
Z I· ·······.• ·,,,/. ••··•··•······ ~, .•". ..."..... II •~ /.... .-/.............. .....--... -..~ .'.. j~--~.-~.._; ..~-~-•.. ~---.', ...--.. • • • •• • ••.~ •••• II •
•••••••••• •••••• ••••• •••••••••• ••••••••••......... ~ .......•.....~ .~ •..::::::: ::;::::::. ..:::: :11::::::.;:~. • • • • •• •.•••••• •. -.- 41 .' .-.- .--.- • •• -.-.-.--••- .-.-.-. •M I: : ~ '. . '......... . ,.,. ............ . .
"' ~ ........ ......,/'.............. .. ~,..... .· ~ ...... . ..: .·.. ~... ..... . : ,' .Z' . ,..... · • • • •'.... • •• • ... r· · .. •••••••• ' •••••••••C'1•• 0 0
122 W 121 30'W 121" W 120 30'W 120 W
(J\
Ln
XBL 8711-4928
Figure 18. Mean radium in soil for 5 km distances along primary f1ightlines of the San Josequadrangle.
From the smallest to the largest, the 6 circle radii represent concentrations of 0-30, 30-60, 60-90,90-120, 120-150, and> 150 Bq kg- l soil. Dotted lines are county boundaries.

numbers: the GM on this basis is 22 Bq kg- 1 and the GSD is again 2.0.
If we now consider that each original observation itself represents an integration of severalhundred square feet and that large areas of the country remain unobserved due to therelatively large distances between flightlines, it is apparent that the actual GSD of observationsof radium in soil made at ground level, each representing an area the size of a house, is likelyto be somewhat greater than 2.0. The GSD of measurements of radon concentration in housesin the U.S. is approximately 2.8 (Nero et al. 1986). Suppose that the indoor radonconcentration is the product of the soil gas radon concentration. represented by the radiumconcentration, and some other lognormally distributed factor or combination of factors. Giventhe fact that the logarithms of GSDs add in quadrature, two factors contributing equally to thevariation in radon would each have a GSD of 2.1. which is very close to the calculated GSDfor radium. The observed variation in radium in soil may thus account for roughly half theobserved variation in indoor radon.
A more comprehensive view of the factors leading to the observed distribution of radonconcentrations must take account not only of the radium concentration, but also of variabilityin permeability and substructure characteristics. as well as differences in ventilation rateassociated with varying characteristics of the building shell. In fact, it has been observed(Grimsrud 1988) that the "leakage area" of structures (see Appendix B for discussion) also has adistribution with a GSD not far from 2.0. Given the uncertainties involved, it is useful toobserve that, if the grand distribution of radon concentrations has a GSD of about 3.0, thiswould be accounted for by three underlying factors, each varying independently of the otherwith individual GSDs of 1.9. This is similar to the GSDs just mentioned for the radiumconcentration and the leakage area, but has the difficulty that it is much smaller than the GSDassociated with soil permeabilities.
As discussed in Nazaroff et a!. (1988) and elsewhere, soil permeabilities vary over a very widerange, in fact by a factor of about a million from coarse sand or gravel to fine clays. Giventhat a noticeable fraction of underlying natural soils is associated with these extreme values, itappears that the overall distribution of soil permeabilities must have a GSD of about 10 or 15,very much larger than the other variances involved in the issue of indoor radon. Thus if thefull variability of soil permeability were expressed in a linear way in the observedconcentrations, then the concentration distribution would also have a GSD of 10 or more,which is clearly not the case.
This leads to the conclusion that the indoor concentration is not linearly dependent on soilpermeabilities, a conclusion that is of course suggested by other evidence. That is, at very lowpermeabilities, diffusion of radon (rather than soil-gas movement) must be the dominanttransport mechanism. and at very high permeabilities, other factors (including the integrity ofthe understructure itself) must limit the extent to which extreme values of permeability areexpressed as high indoor concentrations. The precise manner in which the full range ofpermeabilities is "compressed," in term of its expression in radon concentrations, is notunderstood, but that this occurs is clear. One of the main objectives of the physical modelingof radon entry discussed above is to understand the interaction of these factors in yielding theindoor concentration, as a basis for understanding the occurrence of high concentrations andhow remedial measures can reduce them. It is in the context of predictive models thatphysical models can be utilized for understanding the association of high concentrations withdifferent geographic areas or housing characteristics.
Unfa-rtunately, although the radium data are available in a form suitable for such modelingand assessment purpose, the same is not true for other information. In particular, informationon other key parameters, such as soil permeability and house characteristics - while availableto some degree - is not formulated into consistent data bases that can be used easily forevaluation purposes. Thus, for example, Soil Conservation Service maps provide some
66

indicators of water permeability, which in turn may be related to permeability to gas flow, butthis information has not become available in a form that is easily used, other than potentiallyfor assessing the radon potential of localities. Similariy, some degree of information isavailable on housing characteristics, but not from a consistent survey that provides, of itself, adependable basis for assessing indoor concentrations. As noted above, the EPA's plannednational radon survey may alleviate this situation in two or three years.
For the present, improvements in our capabilities for representing transport processes are thekey to understanding the occurrence of high indoor radon concentrations, the effectiveness ofcontrol techniques, and the potential for formulating models that can be used, not only toidentify areas and structure types with a high radon potential, but to assess the effectiveness ofcontrol strategies aimed at reducing exposures.
D. Control Techniques
In principle, indoor concentrations of radon and its decay products are influenced by entryrates, ventilation rates, and other removal or transformation mechanisms, the last categoryaffecting primarily the decay products. It has become clear that the main influence on indoorconcentrations - and hence the main contributor to the overall variance - is the entry rate,with a somewhat smaller dependence on ventilation rates. As for the influence of decayproduct interactions, although there is clearly some variability in the equilibrium factor, it istypically in the vicinity of 0.4, with almost all indoor environments within a factor of two ofthis.
Just as variability in the entry rate is the major contributor to the observed variance in indoorconcentrations, so techniques that limit the entry rate are found to have the greatest potentialfor effecting large reductions in indoor concentrations, although techniques that providegreater ventilation (or even that remove radon or its decay products from the indoor air bycleaning methods) can be useful in some circumstances. We here review briefly some of theevidence and current research on methods to reduce entry of radon into the indoor atmosphere.More thorough discussions appear in such works as Nazaroff and Nero 1988 and NCRP 1989.
I. Techniques that reduce entry of radon from the soil.
Consistent with the observation that most radon enters single-family houses via the flow of soilgas from the ground through the substructure, radon entry can be reduced by sealing entryroutes or by altering the pressure differential between indoors and the soil that drives thetransport of soil gas. Such methods are reviewed in Scott (1988), but we here mention some ofthe more important work reported on such techniques.
An initial and important body of work was presented in a series of three conferencessponsored by the Atomic Energy Control Board in 1978-80 (AECB 1978-80), where a numberof efforts employing methods for sealing or altering the pressure field were described.Similarly, efforts at Grand Junction and elsewhere, where elevated indoor levels associatedwith the indiscriminate use of uranium mill tailings had been discovered, prompted work oncontrol techniques, one example being the work of Culot and collaborators on sealants (Culot etal. 1978).
With the discovery of high radon concentration in the general building stock beginning in thelate 1970s, efforts to reduce concentrations in such structures began in earnest by the early1980s, although - even to this day - such efforts are not reported very effectively in theliterature. Notable exceptions are studies of control techniques in selected small groups ofhouses. Turk et al. (1989a,b) report on control techniques in a group of homes in the
67

Spokane River Valley, where - beginning in 1985 - they examined the effectiveness oftechniques that either pressurize or depressurize the layer of soil immediately beneath thebasement slab, as well as the use of basement overpressurization, air-to-air heat exchangers,crawlspace ventilation, and sealant techniques (particularly in conjunction with subslabventilation). In general, it was subslab ventilation (especially used in a pressurization mode)that effected the most substantial reductions in indoor concentrations. This work has includedfollow-up studies of previously installed remedial systems (Prill et al. 1989).
A series of meetings sponsored by the EPA since 1986 have included a number of reports oncontrol techniques, although these are sometimes almost anecdotal. An exception is a report ofHenschel and Scott (1986) on remedial measures in a group of homes in Pennsylvania, where avariety of soil-ventilation techniques were employed in homes with concrete block-wallbasements .. Other papers at the same meeting (APCA 1986) and others (APCA 1987 andUSEPA 1989b), as well as the international meetings listed in Table 1, have includedsubstantial work on control techniques. Papers, for example, by Erickson (1987) and Cliff etal. (1987) are indicative of the efforts in European countries. Finally, the effectiveness of themethods indicated above for even extreme indoor levels is demonstrated by the reduction ofhigh levels in Clinton, New Jersey (Osborne 1987).
A basic question is the longevity of control systems. Experience with the systems installed inSpokane indicates the need for some degree of care in avoiding degradation of performance ordefeat of the systems (Prill et al. 1989), observations that also come out of the work ofNitschke et al. (1988).
Finally, an area recently recelvmg more attention, on the part of both governmental agenciesand those who develop building codes, is new housing. Ultimately, it is expected that, in areaswhere radon concentrations tend to be significantly higher than average, new buildings oughtto be constructed so that controls are easily implemented where necessary. The DOE,· theEPA, several States, and professional organizations have activities in this area. Several reportsof new- home construction techniques appeared recently in USEPA 1989b.
2. Detailed studies of radon entry and the influence of control techniques
In some cases, groups of homes appearing to require remedial measures have been used toinvestigate in detail the process for radon entry and the influence on these processes ofdifferent types of control techniques. A principal example of this approach is a group of 14homes selected in New Jersey, of which 7 served as an initial group on which instrumentationfor continuous real-time monitoring of radon concentrations and related environmentalvariables was installed (Sextro et al. 1987). Shortly thereafter, an additional group of 7 homeswas instrumented, in which a somewhat different regime of experimentation was instituted(see, for example, Hubbard et al. 1988). These efforts had several related objectives: (I) toinvestigate the dynamics of the entry process (cf. Revzan 1989 for such an analysis), (2) tostudy the effectiveness of remedial techniques and to observe, in the process, their influenceon entry mechanisms, and (3) to examine the effectiveness of diagnostic measurements andprocedures in characterizing entry and in choosing associated remedial techniques (cf Turk etal. 1987). Analysis of the results from the studies in this group of homes continues, with thehomes also serving as a test bed for continuing projects (e.g., Sextro et al. 1989 and Hubbardet al. 1989).
Some studies have also been undertaken to examine transport processes, and related controltechniques, in controlled situations. A principal example is an experimental study currentlyunder way, where small basement-like structures will be emplaced in well-characterized andrelatively uniform sites, with an array of instrumentation in the soil and structure to examinethe influence of environmental conditions on radon generation, transport, and entry over year-
68
long periods of time (Fisk et al. 1989). In parallel a substantial program developing improvedsimulation models in underway, in part to represent adequately the dependence of the observedvariations with time, moisture conditions, and soil parameters.
3. Other types of control techniques
In some cases, the major contributor to high indoor levels is not a high rate of entry from thesoil or, even when it is, it is deemed necessary to reduce indoor levels by means other thanreducing entry from the soil. One class of such cases is that where radon in water is a majorcontributor to the indoor concentration. The basic approaches to reducing entry via watersupplies in such cases are to hold the water long enough to permit substantial decay of radon(which has a four-day half life), to aerate the water to effect transfer to air outside the indooratmosphere, or to filter the water, e.g., by using a char.coal trap. Papers on these topics appearin USEPA 1989b. A significant difficulty with the use of charcoal is the accumulation of longlived radon decay products, which then pose a radiation hazard because of their gammaactivity. Although, as discussed above, it appears that domestic water supplies account foronly about 5% of observed indoor concentrations on the average, a sufficient number of homeshave elevated levels (at least by the EPA standard) due to entry via water supplies, thatsignificant attention must be given to means for controlling such entry.
A more generally significant question is the potential for using increased ventilation as a meansfor controlling indoor levels. Given that in only a small portion of cases are excessively lowventilation rates the major cause of elevated indoor concentrations, this approach is ordinarilynot the most effective one. On the other hand, increased ventilation can provide for modestdecreases in indoor concentrations on a long-term basis, can be used (in extreme cases) as aninterim measure for reducing levels substantially (i.e., until a permanent solution isimplemented) and, in structures where unusual building methods are employed to reduceinfiltration far below the average, mechanical ventilation is typically advisable, not only foravoiding high radon concentrations but for preventing excessive levels of a variety of otherindoor pollutants.
The role of general ventilation techniques in the control of indoor pollutants is reviewed inFisk et al. (1984). The effectiveness of mechanical ventilation using air-to-air heat exchangeto recover energy that would otherwise be lost for control of radon concentrations was studiedby Nazaroff et al. (1981), and the overall performance of such systems with respect to energywas evaluated by Fisk and Turiel (1983). More recently, the general effect of mechanicalventilation on indoor radon levels, including potential increases in concentrations associatedwith exhaust ventilation, were evaluated theoretically (Mowris and Fisk 1988).
Finally, the remaining approach for reducing indoor concentrations is to employ methods thatremove radon or its decay products from indoor air itself. Generally, the removal of radongas, by for example charcoal Cleaning, has not been deemed to be as effective as reduction ofradon entry, although some effort has been devoted to evaluating this method (Bocanegra andHopke 1987).
Much more attention has been given to the use of filtration or electrostatic precipitation on theremoval of decay products, since it has been established that marked reduction in the EEOCcan be effected using such techniques. Such work is reviewed briefly in Section V and morethoroughly elsewhere (e.g., in Jonassen and McLaughlin 1988). As discussed there, because ofthe particulars of decay-product behavior, including attachment to airborne aerosols and thediffering deposition rates of attached versus unattached decay products, the large reductionsthat are seen in EEOC are not thought to be reflected in correspondingly large reductions inthe dose to the lung. In fact, according to the dosimetric calculation of James (1988), theradon concentration itself may be a better indicator of dose than the EEOC. In any case,
69

because of the ambiguities in effect of air-cleaning methods, this is not the approach of choicein reducing doses in homes having high radon concentrations.
70

IV. TECHNIQUES AND PROTOCOLS FOR MONITORINGiNDOOR CONCENTRATIONS
The availability of techniques for measuring concentrations of radon and its decay productsis a clear prerequisite for understanding the occurrence and behavior of these radionuclidesin the indoor environment. Measurement capabilities are also necessary for purposes morespecifically associated with risk assessment and control strategies. This section brieflyindicates the techniques available for monitoring in houses, not for research on radon ordecay-product behavior, but primarily for purposes of public policy or action.
A. Measurement Techniques
Measurement of the airborne concentration of radon or its decay products is based ondetection of the radiation associated with radioactive decay. This radiation includes, notonly the alpha and beta radiation indicated in Figure 2, but X or gamma radiation that isthe immediate product of decay from the "excited" state in which it is left to its "ground" orunexcited state. Any of these forms of radiation is capable of creating ions in materialsthrough which it passes, and measurement methods are based on detection of this ionizationor its aftermath.
In spite of this uniformity in the basic principle of detection, practical measurementtechniques take widely different forms, substantially affecting their range of application.Specific techniques are designed for measuring the concentration of radon, the EEDC, or indeed - the concentration of individual decay products. Some techniques are suitable forshort-term measurements, where a "grab" sample of air is taken, or for continuous real-timemeasurements, where repeated samples are taken. Other techniques are designed forintermediate to long-term sampling, where only the average concentration is sought. Sometechniques may be self-contained, requiring the presence of a moderate to large piece ofequipment at the site of measurement, while other techniques deploy a small sampler ordetector, which must be returned to a central analytical laboratory for readout. Finally,some techniques are inexpensive or easy to use, while others are suitable for use only in thecontext of experiments carried out by experienced scientists.
Measurement techniques are treated in a number of specific instrumentation reviews(Budnitz 1974, George J980, Nazaroff 1988a, NCRP 1988). We here mention only thetechniques suitable for wide-scale use and the efforts to calibrate and test them.
I. Methods
Widely-used techniques that are suitable for use in monitoring large numbers of housesinclude the following:
Grab-sample monitoring for either 222 Rn or its decay products can be performed usinghighly portable self-contained instruments that use a scintillation material to measure alphaparticles emitted in a small collection cell (for 222 Rn ) or from a filter (for the decayproducts). The entire measurement is completed within some tens of minutes, thereforeonly giving the concentration at a specific time. Considering the potential variability ofconcentration with time (cf. Section lILA), this does not give a direct measure of theaverage exposure rate in a home.
A charcoal sampler with dimensions on the order of 10 cm can be used to collect 222 Rn
71

over a period of a day to a week, then sealed and returned to a laboratory, where thegamma radiation from decay products contained in the sampler can be measured (Cohen andCohen 1983, Cohen and Nason 1986). This technique is not suitable for more than oneweek because late in this period much of the 222Rn collected at the beginning will be gonebecause of its 4-day half life.
An etched-track detector with dimensions of only about 3-4 cm (or, in some versions,more) can be placed in a home for periods from weeks to a year, then returned to alaboratory where the plastic detector material is etched to show tracks left by the passage ofalpha particles from the decay of 222 Rn and it decay products (Alter and Fleisher 1981).As ordinarily deployed, such detectors have a filter permitting entry of 222Rn, but not itsdecay products (for which it is difficult to calibrate the device). This technique has theadvantage of giving a long-term average concentration, which - however - might beconsidered a disadvantage if a quiCk result is desired. Beginning in 1988, etched-trackdetectors with larger areas (depending on rapid scanning techniques, rather than opticalcounting) began to be made available for short-term measurements, at least in Europe.
Continuous monitoring, based on either of the principles mentioned for grab sampling, isuseful primarily for investigations of the time-dependent behavior of radon or its decayproducts, either in laboratory or field situations. It may also be used, however, as aconvenient alternative to grab-sampling to ascertain the effectiveness of control techniquesas they are being installed in a house. Moreover, simple and relatively inexpensive devicesare now becoming available for the situation - probably infrequent - where occupants wishto have an active warning when radon concentrations rise above a specified level.
Several developments have occurred in large part since the reviews cited above. Theseinclude two integrating monitoring methods and a new approach for estimating pastconcentrations.
One of the monitoring methods recently commercialized in the United States is an "electret"based passive integrating detector (Kotrappa et a1. 1988). The electret is a piece of Teflonthat has induced on it a semi-permanent electrical charge, which - because of the associatedfield - can collect ions produced by decay of radon and its decay products. This causes areduction in the electret's surface voltage that can be measured as an indicator ofcumulative radon exposure.
The other monitoring method - mentioned above - is use of etched-track material where,instead of counting tracks optically, "spark" counting is used. This technique, employed inEurope (cf. Tommasino 1980 and Rannou 1987), can employ larger areas of material, andhence permit higher sensitivity at lower cost. However, as noted in Tymen et al. (1988),the use of larger, open detectors (i.e., without a filter or membrane that permits only radongas to enter) can introduce significant uncertainties due to their sensitivity to the decayproducts.
Finally, integrating monitoring methods are utilized in epidemiological studies (such asNJSDH 1989) where past exposures of subjects are examined on the basis of current averageconcentrations in their homes. Recent studies, however, suggest an alternative method ofsuch estimation, i.e., by measuring the deposited activity on glass surfaces of 210pO, the longlived radio nuclide that results from decay of 222Rn and its short-lived decay products.Because 210 pO has a half-life of 22 years, it may serve as a retrospective or prospectiveexposure measure (Samuelsson 1988).
72

2. Calibration and testing
Significant efforts have been devoted to calibrating detectors and to testing their practicalreliability, as well as the dependence of results on monitoring protocol. The testing of thedetectors themselves - and, by implication, their analysis - is ordinarily carried out inexposure chambers under stable, reasonably wel1-characterized conditions. This approach,while a necessary component of calibration efforts, has substantial limitations: It cannotreflect the full range of conditions in which detectors are actually used. Nor can it revealvariations in detector fabrication or analysis - both factors that can affect sensitivity without extraordinarily intensive efforts. We here indicate, in general, the types ofcalibration and testing efforts that have taken place in recent years.
A mainstay of efforts to calibrate a variety of radon detectors in the United States has beenthe program at the DOE Environmental Measurements Laboratory (EML), which hasexposure chambers and monitoring capabilities that permit the exposure of detectors toknown atmospheres under control1ed conditions. These facilities have therefore been usedas a kind of primary reference laboratory for a variety of organizations in the UnitedStates, including both research groups and detector manufacturers. An effort of researchgroups began in 1980, whereby samplers were sent to EML and analyzed by the respectivegroups, who also generally maintained their own calibration facilities using - as does theEML facility - radon sources based on 226Ra solutions supplied by the National Institute ofStandards and Technology. Initial results of this effort are reported by Fisenne et al.(1983). In addition, developers of commercial detectors have used this facility directly orindirectly, either by placing their detectors in the EML chamber (e.g., Alter and Fleischer1981) or by calibrating their detectors in a chamber that is connected via anintercomparison system with this chamber (e.g., Kotrappa et al. 1988).
Since the much more widescale monitoring that began in 1985 and later, the EPA hasundertaken a Radon Measurement Proficiency Program in which companies may submitdetectors to the EPA for testing, general1y by exposing them to known concentrations ofradon in a Federal exposure chamber, after which the detectors are analyzed by the vendorand the results compared by the EPA with the known levels. The EPA periodicallypublishes a list of companies that have passed the test requirements. The early rounds oftesting were performed using the EML chamber, but the site soon changed to the EPA'sEastern Environmental Facility. And whereas only 39 companies participated in the firstround of tests (in 1986), the number exceeded 1000 in 1988. The primary criterion of thistest is that the companies report concentrations within 25% of the "true" value. Untilrecently, the tests were not "blind," in that the companies voluntarily sent known detectorsfor exposure. They could therefore take pains that these particular samplers were treated ascarefully as possible. (More recently, a system of blind testing has been undertaken, inwhich the companies do not know what detectors are being tested.) Any company mayenlist in this program simply by contacting the EPA (Radon Technical Information Service1988). Results from the program are reviewed in a recent report on uncertainties in radonmeasurements (USGAO 1989).
Stil1, both of the approaches above apply quite limited testing to the detectors provided byany particular vendor or manufacturer. A significant supplement to these efforts has beenthe program carried out at the DOE Technical Measurements Center, which has exposeddetectors purchased (blind) from various manufacturers to various radon concentrations,issuing periodic reports (Martz et al. 1989b). This program has found anomalies in theperformance of detector types that indicate the need for caution in their use. For aprogram employing large numbers of detectors, e.g., a systematic surveyor anepidemiological study, determining the quality of the resulting data can be accomplished bya program of quality assurance and quality control, as discussed for example in NCRP(1988).
73

3. Field performance
The three types of calibration and testing just described provide some basis for utilizing thevarious types of detectors that are now commercially available. However, this does notdemonstrate their reliability in actual conditions of use. To some extent this is assured bytesting their performance, in laboratory studies, in the range of physical conditions that willbe encountered in actual homes (and other buildings). In addition, one has to test to makesure that the detectors are actually used properly, which often means in accord with theinstructions provided. Again, in the context of major studies or epidemiologial surveys, thiscan be accomplished by a program of quality assurance and testing.
The most difficult problem in employing the array of detectors now available has to dowith protocols and with interpretation, in large part the subject of the next section. Wehave already seen, in Sections II.B and lILA, the substantial dependence of concentration onlocation and time and, hence, the sensitivity of monitoring results to the protocol employed.There have, in addition, been increasing numbers of studies aimed specifically at comparingdifferent techniques or protocols in parallel exposures.
A few such comparisons have been made incidentally. For example, in the New Jerseyepidemiologial study discussed earlier (NJSDH 1989), annual-average results in living spacediffered markedly from "screening" results from basements. This is consistent with otherdata (e.g., Alter and Oswald 1987, Borak et a1. 1989), which showed roughly factor-of-twodifferences between basement and living-space results. Furthermore, other results (cf.Table 4, in Section lILA) indicate the potential importance of seasonal variations inconcentration. On the other hand, Steck (1989) has reported relatively good correspondencebetween overall results, given for example as the median concentration, between annualaverage living-space concentrations and EPA "screening" results for the states of Minnesotaand Wisconsin. This good correspondence, a strong contrast with other (albeit limited)results, may occur because of structural, climatic, or occupancy patterns in these areas thatdiffer from those in other parts of the United States; it may also arise, in part, because ofthe particular circumstances in which the comparisons were made.
The sensitivity of particular measurement protocols to the time dependence of indoorconcentrations has also been suggested in several recent studies. Scott (1989) has illustratedhow different patterns of variability arise from different source behavior, reaching theconclusion that several IS-day measurements over a year are required to approximate theannual-average concentration. Sextro and Lee (1989) illustrate the sensitivity of short-termsampling with charcoal canisters to variability in indoor concentrations, based on theoreticalanalysis and measurements in an environmental chamber. It is evident that more substantialwork of this kind is necessary if measurement results are to be used properly as a basis forestimating the concentrations to which occupants are actually exposed.
B. Interpreting and Utilizing Results
The earlier discussion of concentrations in U.S. homes (Section ILA) illustrates thedifficulties with proper use of monitoring results. A particular concern - as noted in theprevious section - is interpretation of short-term monitoring in a non-representativelocation as an indication of the concen tration to which people are exposed or of the fractionof houses where concentrations exceed relevant guidelines or recommendations. Thus, insurveys to determine the distribution of concentrations, or as an element in controlstrategies (cf. Section VI), care must be taken to interpret data consistently with themonitoring procedure used, paying attention to the period over which sampling is
74

performed, the time of year during which the measurement is performed, and the locationof sampling. Where the particular sampling technique and protocol does not yield directlythe parameter desired, auxiliary measurements in a subset of houses and additionalinformation (such as meteorological) may be required as a basis for interpretation. In somecases, the possibility for such interpretation can be substantially enhanced by a theoreticalframework relating indoor concentrations to the factors affecting them.
I. Techniques and strategies for identifying high-radon homes
National or regional surveys together with some form of predictive modeling (cf. SectionIII.C.2) can be designed to identify geographic areas or types of buildings where highconcentrations tend to occur. Once houses in an area or class are known to have a highprobability of excessive concentrations, it is still necessary to monitor each house of concernto determine actual levels in individual houses. The objective of such monitoring isultimately to obtain a useful estimate of the annual-average concentration in the livingspace. Achieving this simply stated objective is complicated by two factors: first,measurement techniques differ substantially in their suitability for determining thisquantity; and secondly, the annual-average has an intrinsic variability because of itsdependence on a variety of factors, including such obvious ones as the local meteorologyand the pattern of use of the home being examined. As a result, any measurement outcomemust be utilized within an interpretive framework associated with the concentrationguidelines being applied.
In the U ni ted States, at present, it is recommended by the EPA that the initial measurementbe performed using a charcoal detector in the lowest level of the structure (USEPA 1986),yielding a result that is indicative, but that cannot be used as a basis for a decision (or, asseen in Section II, for indicating the exposure distribution).
Because it can be left in place for a year, the etched-track technique is most directly suitedto measuring the desired quantity. However, even for this technique, the resulting value isnot unam biguous. A single detector measures the concentration in one location, so it maynot accurately reflect the average living-space concentration, even if placed in the mostheavily occupied room. Thus, even aside from the intrinsic variability in the concentrationdue to meteorology and use patterns, every technique has limitations associated withprotocol, as well as analytical uncertainties intrinsic to the technique itself. The resultingconcentration therefore has an uncertainty that must be considered in any use to which it isput. However, uncertainties of approximately 20 or 30 percent are not a great concern: therisk associated with radon exposures is assumed to be a smooth function with no threshold,so that the guidelines should not have sudden thresholds, nor should occupants' decisionsordinarily be affected by modest uncertainties in measurement results. (At present,however, because of the manner in which protocols and guidelines are formulated and used,a concentration of 160 Bq/m3
- i.e., 4.3 pei/I - may cause a reaction much different than avalue 20% lower.)
Utilization of the charcoal technique requires attention to the issues of variability overmedium to long times, e.g., from week to week and from one season to another. Suchvariability can introduce substantial uncertainties, which, however, can be reducedsignificantly with knowledge of meteorological conditions at the time of measurement,coupled with a theoretical or experiential framework within which to make necessaryadjustments. Nonetheless, there are significant limitations. For example, in an area withmoderate summertime meteorological conditions, it is unlikely that a low reading fromsummer monitoring is a useful indicator of the annual-average concentration. As discussedbelow, results from charcoal sampling can be more useful in the proper interpretiveframework. However, this framework is only now being developed.
75

Finally, grab sampling - because it does not average even the very large daily variationsknown to occur - gives little basis for any kind of decision, not even about whether or notto monitor further, unless performed a number of times, as indicated below. Ironically,single grab samples can be used - with proper interpretation - to indicate area means (andeven distributions) in a regional survey (Scott 1983b). But there is presently no adequatemeasurement methodology or interpretive framework for determining that, in a singlehouse, one low reading indicates a low annual average or that a high reading indicates theneed for remediation. In any area where high concentrations occur, almost every grabsample measurement would have to be followed by an integrated measurement, which is tosay that the grab-sample measurement has very limited utility. An alternative is to performa number of grab samples in a house, effectively simulating an integrated sample.(Furthermore, it is important to recognize the importance of grab sampling or real-timemeasurements for monitoring the concentration during attempts to implement controlmeasures in a specific house.)
As indicated, even if a useful measurement technique is employed, some interpretation hasto be applied and uncertainties considered in utilizing the result within a system ofguidelines. This extends even to the consideration of temporal variability from year toyear. But the most difficult variability to consider is that arising from different patterns ofoccupancy and operation of homes, as well as different personal habits (such as cigarettesmoking). Creating a monitoring and control strategy that copes explicitly with all suchmatters is probably not practical. In fact, considering that houses typically have a sequenceof occupants, it may be best that the concentration estimate sought from any monitoringapproach and interpretive framework be that characteristic of some "normal" use pattern andnot be linked to personal habits but only to key operational questions.
Perhaps the dominant operational question is the amount of ventilation, either through openwindows or because of mechanical (heating, ventilating, or air-conditioning) systems. As anexample of the kind of criterion that might be used, in many areas windows are normallykept closed during the heating season, and this is the period during which the higher indoorconcentrations occur. If current occupants leave windows open during the heating season,the concentration estimate should probably adjust monitoring results to the "normal"condition in some way, at least for subsequent occupants. Formulating a consistentapproach for handling such complexities, while sometimes perplexing, is a necessary part ofa long-term radon control strategy.
2. Framework for interpretation and control
Just as the results of a regional survey must be interpreted in light of design and objectivesof the survey, the results of monitoring in an individual house must be used intelligently.First, using the result to estimate an annual-average concentration in the living spaceordinarily requires some degree of interpretation. Secondly, the manner in which thisestimate is used in making a decision about controls depends on how it fits into theapplicable guidance structure and on what means might be appropriate for achieving areduction in concentration, as discussed in Section VI.
Obtaining an estimate of the annual-average concentration and its uncertainty requiresconsideration of the various factors just discussed in connection with monitoring techniques.Some of these arise directly from the measurement technique itself, so that their effect maybe evaluated by contractors or individuals performing measurements. Others require moresophistication, e.g., an analytical approach and sufficient local information to convert areading from, say, charcoal collection over several days to an estimated annual-averageconcentration. It is likely that this capability could only be maintained by a central
76

(although, perhaps local) authority or contractor. To some extent, such complications canbe minimized by careful design of the framework for utilizing the resulting estimate. (Seediscussion of home transfers, below.)
This interpretive framework is an essential functional element in any local control program.Specifically, it must match a specific measurement result to the structure of guidelines andyield a course of action, if any. The guidelines presumably have a series of concentrationranges with differing recommendations. These might be ranked as follows: a below-averagerange in which no consideration of action is suggested, an above-average (but not high)range for which it is suggested only that individuals may wish to consider remedial action, ahigh range in which action is recommended at some time, a very high range in which actionis recommended soon (e.g., within one year), and an extreme range in which action isrecommended essentially immediately (e.g., within weeks). Depending on where ameasuremen t result fits into this scheme, either a decision for or against remedial actionmight be appropriate or subsequent monitoring might be indicated. For example, a charcoalsample result that falls into the lowest range or into the very high range would probably bereliable enough to make a decision, specifically to decline action in the first case and tochoose some remedial measure(s) in the second. On the other hand, a charcoal-sampleresult in the above-average or high ranges would probably warrant further monitoring (i.e.,a year-long measurement or a sequence of charcoal measurements) to determine the annualaverage concentration with more assurance, after which a decision could be made on asounder basis. The details of such a structure for decision require careful consideration.But it is clear such a structure must be adopted, either explicitly or implicitly. The defaultstructure, where no such consideration is given, is simply the one where all measurementresults are utilized as though they yield the annual-average concentration with the samedegree of assurance. This would be absurd and, where it occurs, leads to unnecessaryconcern and cost.
A central element in the future for utilizing a diversity of types of measurement resultswould be simple models or algorithms for obtaining an estimate of the annual-averageconcentration to which occupants are exposed, utilizing the available results, together withother information, in some consistent theoretical framework. Thus the raw result would beconverted to an annual-average concentration utilizing a simplified version of a radonbehavior model, together with specific information on the house type, monitoring protocol,and meteorological conditions, as well as the local experience on temporal and spatialvariability of radon concentrations. Such a conversion algorithm - based on the morecomplex predictive models described in Section III.e - could have a consistent general formfor use throughout the nation, but with key parameters and ratios determined by localmonitoring results. It would permit the making of an estimate of annual-averageconcentrations, which - while having significant uncertainties - is still superior to the rawmonitoring result. The information in Sections II.B and lILA make clear the inadequacy ofusing short-term monitoring data alone for making remedial decisions.
3. Home transfers
A key problem in radon monitoring and interpretation is the case where the sale of a houseis pending and a radon measurement is performed to see if remedial action is "needed,"usually by comparison with EPA guidance. This situation affects, not just the individualsinvolved in the sale, but the real estate industry, and even those involved in employeerelocation (see, for example, Mansfield 1986).
In the circumstances of house sales, the real problem is how to arrange the measurement,decision, and action so as to make a decision on remedial action on the basis of either ameasurement, or a reasonable estimate, of the annual-average concentration in a living
77

space. Two elements suggest themselves as helping accomplish this, one having to do withmeasurement protocols and interpretations and the other involving disclosure and, wherenecessary, follow-up and remedial action.
The essential problem in a real estate transaction is that it occurs over a brief period oftime. This has often resulted in the attempt to determine any need for radon-relatedremedial action in the same period. As a result the monitoring protocol that is, de facto.available to those involved in the transaction is presently only the EPA's "screening"protocol, a short-term measurement in the lowest portion of the house (i.e., the basementfor most of the houses in the eastern U.S. that have been monitored). As discussed above,a result from this type of measurement ought not to be compared with the EPA guidancebecause the screening protocol does not provide a measure of the average concentration towhich occupants are exposed. However, as a practical matter, short-term results often arecompared with the EPA guidance, for lack of anything else, much as the EPA itself oftendoes. We have already observed that this can be grossly misleading: a house with 150Bq/m3 (4 pCi/I) of radon in the basement during a short-term winter measurement does nothave an elevated concentration, but rather has an average concentration (implying, typically,an annual-average living-space concentration in the vicinity of the average concentrationfor U.S. houses, i.e., about 50 Bq/m3
).
A great improvement would be had by reporting, not just the numerical result, but acorresponding estimate of the annual-average concentration, with an uncertainty band(which ought to be included for short-term measurements in any case, since values caneasily vary up or down by a factor of two from one week to the next for such ameasurement). Thus, as part of better reporting, instead of a sheet of paper that says "theconcentration in your house measured under.... conditions was 200 Bq/m3
" (or 5.4 pCi/l,since SI units are not used by the EPA or contractors), the report would say something like,"based on a short-term measurement result of 6 pCi/l, the estimated annual-averageconcentration to which occupants of your house are exposed in normal use is 2.5 pCi/l,with a ninety percent chance that the value actually lies between I and 5 pCi/i." In thiscase, in all likelihood the annual-average value for the house is below 150 Bq/m3, thoughthe actual numerical result from the EPA screening protocol is higher.
Being able to make a reasonable estimate of the actual annual-average (living-space)concentration requires - as discussed above - utilizing the understanding of radon behaviorthat has been developed over the last decade, and the experience with actual measurementresults that is now building up, especially in areas where radon has been found to be aproblem. This understanding and experience could be brought to bear to enable people tomake sensible decisions about their houses and to minimize the anguish that results from ameasurement protocol that, for houses with basements at least, tends to yield a numericalresult substantially higher than the concentration that people are exposed to. Furthermore,it would prevent the fear and hysteria caused in an area when it is reported that, say, "29%of houses exceed the EPA remedial action guideline," when in fact a much smallerpercentage do. As part of any revision of guidelines and protocols, it would be a great helpif even the EPA screening measurement were revised to place a detector in the actual livingspace and to report both the numerical result and - based on an estimating proceduremaintained by local authorities - an estimate of the annual-average concentration. Moreemphasis also has to be given to the fact that, in ordinary circumstances, a long-termmeasurement has to follow virtually any short-term measurement.
This brings us directly to the problem faced in real estate transactions. An improvedmeasurement and reporting protocol, and the associated procedure for estimating the annualaverage concentration, would have to be established by authorities outside the real estatecommunity. However, the procedure for using this information sensibly is directly affectedby the manner in which transactions occur. As noted above, ordinarily a short-term
78

measurement, yielding an estimate of the annual-average concentration, would be followedby a long-term measurement if there were a possibility that the real annual-averageconcentration was above 4 pei/I. Thus, if the (estimated) concentration, based on a shortterm measurement, is anywhere between, say, 2 and 20 pCi/l, there is a significantpossibility that the real annual-average exceeds 4 pCi/1. For estimates greater thansomething like IOta 20 pCi/l, one might say that the probability is sufficiently high that, ina real estate transaction, one might simply presume the level exceeds the guideline andproceed with remedial action. The problem is that this occurs only in a small number ofcases. Usually an estimated level, if higher than average, will be in the range from 2 to 10pCi/l, where there is considerable uncertainty whether the levels actually exceed theguideline. For most houses with such monitoring results from short-term measurements, theannual-average will not exceed 4 pCi/I, so that the sensible thing is to follow up with along-term measurement to determine the real average concentration.
This would require that the decision on remedial action be postponed, which becomespossible if the problem is treated as, for example, termite damage is treated in California.Thus the seller could place an amount of money for remedial action in an escrow account,the money to be used if the long-term result indicates that remedial action ought eventuallyto be performed. If the long-term measurement result turns out to be less than 4 pCi/l, themoney would be returned to the seller. This procedure would require development of atransfer "protocol," we might call it, i.e., some kind of agreement attached to the sale, andpreferably to the deed, that details what has happened and states what will happen undervarious circumstances. Based on the need for disclosure, it is probably useful if reportsfrom radon monitoring be recorded permanently, in any case, independently of whether theresult is high or low or whether the house is up for sale. The question at the time of a realestate transaction would then be, not what the radon concentration is or whether remedialaction is suggested, but rather how measurements and remediation occur in view of the factthat a sale is being concluded. An amount of money placed in escrow might serve well inthis context.
Regardless of the details, one major objective is to make a decision in the light of realinformation, not a short-term measurement that mayor may not indicate the level to whichoccupants of the house are really exposed. Another major objective is to properly associateany such information with the house in a relatively permanent way, so that any subsequentoccupant of the house will know whether measurements were performed and whether theresults were high or low. This would then be part of the normal disclosure of informationfor a house in a high radon area and would remove the onus from any particular house.Furthermore, information on the presence, use, and maintenance requirements of any radoncontrol systems installed also ought to be available for subsequent occupants.
Such possibilities require examination of modification or additions to the legal instrumentsused in real estate transactions. Of course, the scope of actions required to lowerconcentrations is almost always modest enough that simpler approaches are possible. If, forexample, the cost is approximately I% of the home's selling price, and the probability ofaction being needed is modest (say no more than 10 or 20% for the area), then the probablecost is so low that remediation is not an issue that even needs to be considered in a realestate transaction. Even if the probability is higher for the area, say, exceeding 20%, theamount of money involved is so small that it should not complicate a sale: a 20% probabilityof having to spend $1000 or $2000 is often irrelevant financially, and it appears appropriateto find simple legal approaches for handling the problem.
In any case, with respect to measurement protocols and reporting, we can do much betterthan the present situation. Even an approximate estimator of the annual-averageconcentration will be better than using the present screening result, which we know is oftencompletely wrong for making decisions. Developing this procedure and establishing it as a
79

component in public guidance is not the sole responsibility of the real estate industry, butrequires the active involvement of regulators and scientists.
The proper interpretation and utilization of monitoring results is a difficult problem, butexactly the type that is the most important in developing an effective strategy forcontrolling excessive levels of indoor radon, the subject of Section VI.
80

V. BEHAVIOR OF THE DECAY PRODUCTS
The health impact associated with radon arises from inhalation of its short-lived decayproducts. Radon itself, being chemically inert, is not hazardous at environmental levels.However, its decay products are chemically reactive and, upon inhalation, may becomedeposited on the lining of the lung. Subsequent radioactive decays, notably the alphaparticle emissions from 218pO and 214 pO - in the case of 222Rn - or 212 Bi and 212 pO - inthe case of 220 Rn - damage tissue near the deposition site. It is through thismechanism that the increased risk of lung cancer associated with exposure to radon andits decay products arises.
Although it does not constitute a direct health hazard, radon is a suitable surrogate forcharacterizing the hazard due to inhalation of the decay products. The presence of thesedecay products in indoor air is due to the radioactive decay of radon in indoor air, the rateof which is, of course, proportional to the radon concentration. Thus, given that thetechnology for routinely measuring radon is more developed than that for measuring thedecay products, estimating the magnitude of the health risk and making decisions about theneed for mitigation are appropriately based on radon concentration data.
Nevertheless, a detailed understanding of the risks of exposure to radon requires knowledgeof the factors that govern the concentrations and the physical and chemical states of radondecay products in indoor air. Such knowledge is essential for applying the epidemiologicalevidence obtained from occupational exposures of underground miners to the problem ofestimating risks from indoor exposures of general populations. This knowledge is alsoneeded to evaluate the prospect of reducing the risk of indoor radon exposure withoutchanging the radon concentration by altering the concentrations and/or states of the decayproducts. Knowledge of radon decay product behavior has application to more fundamentalscientific questions as well, including issues of radio lytic particle generation and ultrafineparticle dynamics.
In this section, the behavior of radon's decay products is summarized, and references tocentral works in the literature are provided. Although the discussion of this section focusesprimaril6' on behavior of 222Rn decay products, the same considerations apply in the mainto the 22 Rn series. At a few points in the discussion, critical differences are indicated.
A. General Considerations
For assessing health risks of radon's decay products, only a subset of the radioactive decaychains are of interest. A species in the decay series following a radon isotope may pose asignificant inhalation health hazard if (a) its half life is long enough for its numberconcentration to build to a significant level; (b) its half life and those of its predecessors arenot long relative to biological clearance times; and (c) it emits an alpha particle or it issucceeded by an alpha' emitting isotope that satisfies condition (b). Thus, the health hazardfrom 222 Rn arises from the alpha decay of 218pO following its inhalation, and from thealpha decay of 214pO followin~ inhalation of 218pO , 214pb, and 214Bi. The concentrationsand states of 218 pO, 214Pb and 14S i determine the magnitude of this hazard. Likewise, thema~nitude of the health hazard from 220Rn is determined by the concentrations and statesof 12Pb and 212 S i; the inhalation of either isotope leads to an alpha decay from either 212Bior 212 pO (see Appendix D).
One overall measure of the health hazard of the decay products is given by the potentialalpha energy concentration (PAEC) or, analogously, the equilibrium-equivalent decayproduct concentration (EEDC). The relationship between the activity concentrations of the
81
constituent isotopes and these lumped measures are defined in Appendix A.
Because they convey no information about the physical or chemical state of the decayproducts, the EEDC and PAEC are imperfect measures of the radon-related health hazard.The most important parameter associated with the state of a decay product is its diffusioncoefficient, which is a measure of its ability to migrate across fluid streamlines and depositon to surfaces, including those within the lung. A major distinction is drawn between thedecay products that are attached to preexisting airborne particles, and those that are not soattached, referred to as "attached" and "unattached," respectively. The partitioning betweenthese states is commonly reported by means of the "unattached fraction," which is the ratioof the concentration of unattached decay products to the total concentration of decayproducts. The unattached fraction may be applied to an individual isotope, such as 218pO ,
or to an aggregate measure, such as the EEDC. For the attached fraction, the diffusivity isdetermined by the size of the airborne particles to which the decay products are attached.For the unattached fraction, the diffusivity is largely determined by the degree of clusteringof water vapor and other low-vapor-pressure gases around the decay product.
Because of its smaller size and correspondingly greater diffusivity, a much larger radioactivedose to the bronchial epithelium is ascribed to the unattached decay products (l00-150mGy/WLM) than to those that are attached (5-20 mGy/WLM) (James 1988).4
Apart from its size, the electric charge associated with a decay product influences theprobability or rate of its deposition. Migration of charged species in response to electricfields may alter the rate of deposition of radon decay products onto indoor surfaces. Forthe unattached fraction, the diffusion coefficient of the charged species is smaller than thatof the corresponding neutral species (Phillips et at. 1988). In any case, neutralization israpid, so that only a small portion (order of 10%) of the unattached 218pO present in the airis in a charged state (Jonassen and McLaughlin 1988).
In an atmosphere in which the concentration of radon is stable and each decay product,once formed, is removed only by radioactive decay, radon and its decay products wouldachieve a state of radioactive equilibrium, with each having the same (radioactivity)concentration. For buildings, in which indoor air is exchanged with outdoor air at somerate, not only is the radon concentration less than it would otherwise be, but theconcentrations of the decay products are reduced relative to that of radon because ofremoval by ventilation.
However, the behavior of the decay products, as suggested above, is further complicated bytheir chemical activity: the fact that the decay products can attach to particles or surfaces,and that these attachment rates can vary with conditions, makes general characterization ofthe state of the decay products, and its dependence on governing factors, complex.Nevertheless, since we are dealing with only a few species, whose rate of production fromearly members of the decay chain is determined solely by known half lives, it is possible tospecify a relatively straightforward framework for considering the behavior of the decayproducts. The specification of this framework is the subject of the next section.
B. The Jacobi Model
Figure 19 illustrates, for an unspecified decay product, or "progeny," various mechanismsfor changing the state or presence of the decay product, other than radioactive decay itself.Given the parameters that are indicated in Figure 19, a system of conservation-of-activity
4 One Gy represent the deposition of 1 J of energy from ionizing radiation per kg oftissue. The WLM is a measure of decay-product exposure, as discussed in Appendix A.
82

Attachment Recoil (218pO only)(A) (r A
1)
Ventilation (Ay) Att h d Deposition (Ada)... ac e • --------i~~
Control Device (\c') Progeny DParticle
II
Decay (Ao) iIIII
Unattached' Plate-out (AdU)Progeny • ------••
Other RemovalProcesses:
Ventilation (Ay)
Ventilation (Ay)~
Control Device (AFu)
Radon Q
Wall orOtherMacroSurface
XBL 901-6218
Figure 19. Decay-product removal mechanisms (other than radioactive decay) and associatedrate constan ts.
Once created by decay of its parent, a decay product (or "progeny") may attach to an airborneparticle, a process that is usually considered to be reversible for 218pO because of the substantialrecoil energy associated with alpha decay. Whether attached or not, a decay product can be removedfrom the indoor air by plateoutjdeposition on indoor surfaces, by ventilation, by an air-cleaningdevice, or by radioactive decay.
83
equations can be specified that determine the concentrations based on given rate constants(Jacobi 1972; Porstendorfer et al. 1978; Knutson 1988). Practical application of such atheoretical framework usually requires assumptions that simplify the picture. For example,mixing within the indoor space is often considered to be occur sufficiently rapidly that theconcentration of each species is independent of position, except in a thin boundary layeradjacent to each surface. Also, it is commonly assumed that rate constants for attachmentand deposition are independent of the specific species. The model is then stated as a set ofalgebraic equations reflecting the balances of steady-state concentrations among attachedand unattached species, as follows (Knutson 1988):
Al Ao = (AI + Ay + -\ + AdU) A1
u
Aa A1u = (\ + Ay + A/) Ala
A2A
1U+ r A2 Ala = (A
2+ >'y + Aa + >./) A2U
AaA2U + (1 - r)A2 Ala = (A2
+ >'y + A/) A2a
A3A
2U= (A
3+ Ay + >'a + AdU)A 3U
(1)
(2)
(3)
(4)
(5)
(6)
In these equations, Ao represents the activity concentration of 222Rn, A.a and A.u, represent,
I 1respectively, the attached and unattached activity concentrations of the ith decay product, A.
I
is the radioactive decay constant of the ith decay product, A is the removal rate byy
ventilation, Aa is the rate of attachment to preexisting particles, and Ada and AdU representthe deposition rate of attached and unattached decay products, respectively. The isotopes218 po , 214 pb , and 214 Bi, correspond to i = 1, 2, and 3, respectively. The parameter rdenotes the probability that, on alpha decay, the newly formed 214Pb atom will becomedetached by recoil from the particle to which its predecessor was attached. (Detachment isnot considered to occur with the less energetic recoil resulting from the beta decay of214 Pb .) In this formulation, the removal rate of decay products by filtration is assumed tobe zero.
This set of equations contains eight parameters (seven rates A and the recoil probability r).If values for these parameters are known, then the attached and unattached concentrationsof each of the short-lived 222 Rn decar products (six unknowns) can be computed from thismodel (six equations) for any given 2 2Rn concentration. Conversely, as is often done, themodel can be used with measurements of the decay product concentrations to determinevalues of the parameters.
In the next three sections, evidence pertaInIng to the value of these parameters in rooms isdiscussed briefly. Knutson (1988) provides a more detailed examination and evaluation ofthe data.
C. Radioactive Decay, Recoil, and Ventilation
The probability of an isotope radioactively decaying varies greatly from one species toanother, but, for a given species, is invariant with respect to changes in environmentalconditions. The probability of decay is commonly given in terms of a decay constant,which represents, for a system in which no new production occurs, the slope of the natural10farithm of the amount of an isotope vs. time. For the short-lived decay products of22 Rn, the decay constants are 13.7 h-1 for 218pO (Martz et at. 1989), 1.55 h-1 for 214Pb and
84

2.09 h-1 for 214Bi (Browne and Firestone 1986).
Polonium-218 decays by emitting an alpha particle, I.e., t\\'o protons and t\VQ neutrons,from its nucleus with a kinetic energy of 6.0 MeV. The newly formed 214Pb atom recoils much as a gun recoils from the firing of a bullet. Its recoil energy is 110 keV, given by(m(:/mpb)Ea where rna and Ea are the mass and kinetic energy, respectively, of the alphaparticle, and mpb is the mass of the lead atom. This energy is sufficient to break chemicalbonds so that, !f the 218pO was attached to a particle, there is a significant probability thatthe 214Pb atom will become detached on formation. In the model described in the previoussection, the parameter r accounts for this process. Mercer (1976) recommends a value of0.83 for this parameter, and this value will be used here.
Note that even though a beta decay may be accompanied by the release of energy of similarmagnitude to that of an alpha decay, the recoil of the atom 'formed by beta decar isnegligible, owing to the small mass of the electron. The maximum recoil energy for 2 4Bifrom beta decay of 214 Pb is 2.6 eV, almost 5 orders of magnitude smaller than the recoilenergy of 214Pb. Thus, recoil detachment of 214Bi is not considered in the model.
Ventilation rates in buildings span a considerable range. For residential buildings, theventilation rate is most often reported as the air flow rate divided by the building volume,with units of inverse hours. A typical value is 0.5 h-1, and available data suggest that thecentral 90% of the distribution is in the range 0.2-2 h- 1 (Nazaroff et al. 1987b). Furtherdiscussion of ventilation can be found in Appendix B.
D. Attachment
Ambient air, whether outdoors or inside buildings, contains a surprisingly highconcentration of suspended particles. The size of these particles varies from molecularclusters having a diameter in the vicinity of 0.00 I jjm to dust particles and pollens that areseveral tens of jjm in diameter. Most of the aerosol mass is found in two narrower sizeranges: a fine mode covering the approximate range 0.05 to 2 jjm diameter, and a coarsemode from 2 to about 50 jjm in diameter.
Unattached radon decay products, and particles, migrate in air because of random collisionswith surrounding gas molecules. Through this process (among other, generally lessimportant processes) the unattached decay product may collide with a preexisting particleand adhere, becoming an attached decay product. For a given atmosphere, the rate atwhich attachment occurs depends on the number concentration of particles, and on theirsize distribution. The total rate of attachment is given by the relationship
00
). = Ij1(d ) n(d ) d(d )a p p p
a(7)
where d is the particle diameter, j1(d ) is the attachment rate coefficient, and n(dp
) IS thesize distfibution density function, which satisfies
00
N=fn(d)d(d) (8)o p p
where N is the total number concentration of particles. For particles that are small relativeto the mean-free-path of air molecules (r = 0.065 jjm), the attachment rate coefficient isproportional to the square of the particle diameter; for large particles, the attachment ratecoefficient is directly proportional to the particle diameter. An expression that spans both
85

conditions is cited by Phillips et a1. (1988):
211" V d 2 (d + 2n 0/3(d
p) = ----p--p-------
80 (d + 20 + V d 2p p
(9)
where V is the mean thermal velocity of the unattached decay products (-140 m S-l) and 0is the diffusion coefficient of the unattached decay products (-0.05 - 0.06 cm 2 S-l).
Measurements of the activity-weighted particle size distribution show that most of theattached decay products are associated with particles in the diameter range 0.05 to 0.3 pm(George and Breslin 1980).
Attachment rates in the range 3 to 600 h- 1 have been calculated for indoor environments bycombining expressions like these with measurements of the particle size distribution (e.g.,Raes et al. 1984). A simpler approach is to combine a characteristic mean value for /3 witha measurement of the total number concentration of particles (as condensation nuclei) in theair (Knutson 1988). Values for fi in the range (2-8) x 10-3 cm3 h- 1 have been reported byPorstendorfer (I 984). The accuracy of the latter approach depends on the consistency ofthe particle size distribution, a condition that may hold approximately, but certainly notrigorously.
On the basis of available data, Knutson (1988) suggested that attachment rates for indoorenvironments typically are within the range 5 to 500 h- 1
, which corresponds to a particlenumber (condensation nucleus) concentration in the range 103 to 105 cm-3
, given an averageattachment rate coefficient of 5 x 10⁻³ cm3 h- 1
. A "baseline" value for attachment of 50 h- 1
is suggested, corresponding to the geometric mean of the end points of this range. Notethat through the use of high efficiency filters, particle number concentrations may bereduced to levels substantially lower than 103 em -3 (Offermann et a1. 1985).
Given the broad range of values it may span, the attachment rate is potentially important asa parameter affecting the dose associated with a given radon level. More information onthe number concentration and size distribution of particles in indoor air would improve theunderstanding of radon health risks.
E. Deposition
As depicted in Figure 19, radon decay products, either attached or unattached, may becomedeposited onto surfaces in a room. This process reduces the airborne concentration andtherefore the dose associated with a given radon level.
In general, the deposition rate of reactive pollutants onto indoor surfaces varies with thenature and strength of near-surface flows (Nazaroff and Cass 1989a). Turbulent flowconditions and higher near-surface velocities yield smaller boundary-layer thicknesses andconsequently higher deposition rates. The deposition rate also varies with the diffusioncoefficient of the species, and so radon decay products that are unattached deposit at amuch higher rate than do those that are attached.
The "deposition velocity" is a useful concept for reporting theoretical and experimentaldeposition rates. Denoted by v<j' it is defined in this context as the decay-product fluxdensity to a surface (units: activIty per area per time) divided by the concentration (units:activity per volume) at a large distance from the surface. Thus, vd has units of velocity.The total loss rate due to deposition, Ad a or AdU for attached or unattached decay products,respectively, is given by vd A/V, where A is the surface area of the room, V is its volume,and the deposition velocity is averaged over all surfaces.
86
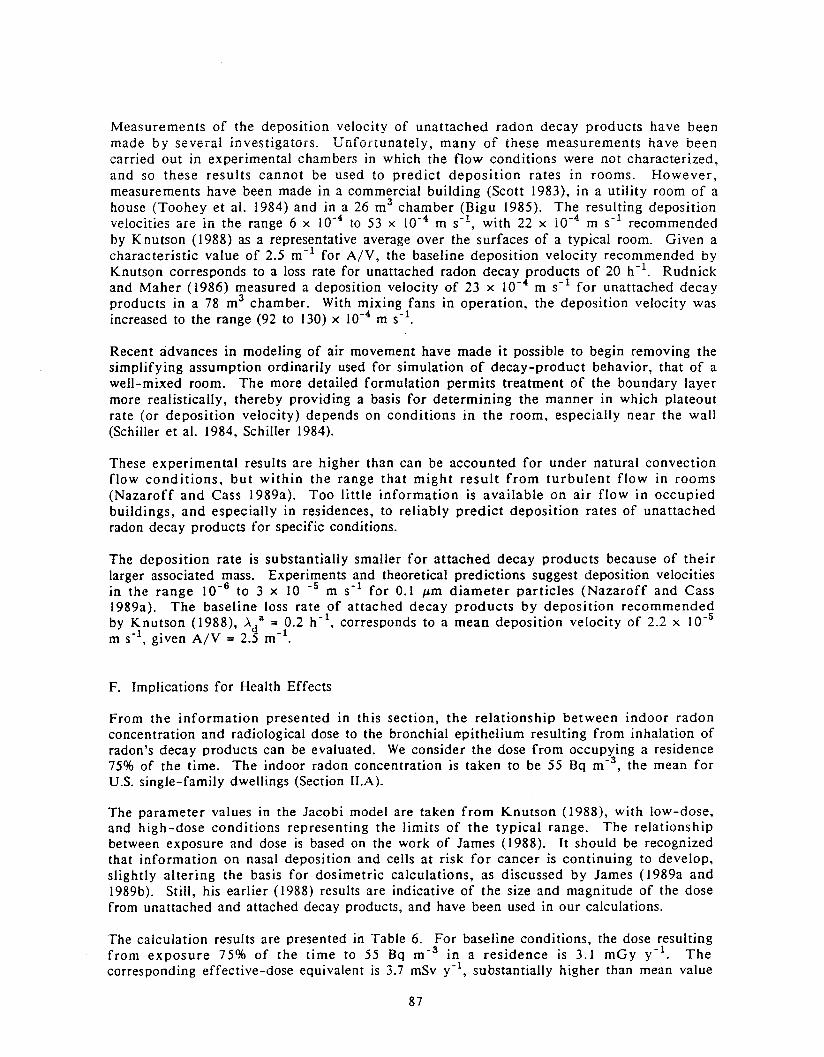
Measurements of the deposition velocity of unattached radon decay products have beenmade by several investigators. Unfortunately, many of these measurements have beencarried out in experimental chambers in which the flow conditions were not characterized,and so these results cannot be used to predict deposition rates in rooms. However,measurements have been made in a commercial building (Scott 1983), in a utility room of ahouse (Toohey et al. 1984) and in a 26 m 3 chamber (Bigu 1985). The resulting depositionvelocities are in the range 6 x 10⁻⁴ to 53 X 10-4 m s-\ with 22 x 10-4 m S-l recommendedby Knutson (1988) as a representative average over the surfaces of a typical room. Given acharacteristic value of 2.5 m -1 for A/V, the baseline deposition velocity recommended byKnutson corresponds to a loss rate for unattached radon decay products of 20 h- 1. Rudnickand Maher (1986) measured a deposition velocity of 23 x 10-4 m S-l for unattached decayproducts in a 78 m3 chamber. With mixing fans in operation, the deposition velocity wasincreased to the range (92 to 130) x 10-4 m s-l.
Recent advances in modeling of air movement have made it possible to begin removing thesimplifying assumption ordinarily used for simulation of decay-product behavior, that of awell-mixed room. The more detailed formulation permits treatment of the boundary layermore realistically, thereby providing a basis for determining the manner in which plateoutrate (or deposition velocity) depends on conditions in the room, especially near the wall(Schiller et al. 1984, Schiller 1984).
These experimental results are higher than can be accounted for under natural convectionflow conditions, but within the range that might result from turbulent flow in rooms(Nazaroff and Cass 1989a). Too little information is available on air flow in occupiedbuildings, and especially in residences, to reliably predict deposition rates of unattachedradon decay products for specific conditions.
The deposition rate is substantially smaller for attached decay products because of theirlarger associated mass. Experiments and theoretical predictions suggest deposition velocitiesin the range 10-6 to 3 x 10 -s m S-l for 0.1 #lm diameter particles (Nazaroff and Cass1989a). The baseline loss rate of attached decay products by deposition recommendedby Knutson (1988), .Ada = 0.2 h- 1, corresponds to a mean deposition velocity of 2.2 x IO-s
m s-\ given A/V = 2.5 m- 1.
F. Implications for Health Effects
From the information presented in this section, the relationship between indoor radonconcentration and radiological dose to the bronchial epithelium resulting from inhalation ofradon's decay products can be evaluated. We consider the dose from occupying a residence75% of the time. The indoor radon concentration is taken to be 55 Bq m -3, the mean foru.s. single-family dwellings (Section II.A).
The parameter values in the Jacobi model are taken from Knutson (1988), with low-dose,and high-dose conditions representing the limits of the typical range. The relationshipbetween exposure and dose is based on the work of James (1988). It should be recognizedthat information on nasal deposition and cells at risk for cancer is continuing to develop,slightly altering the basis for dosimetric calculations, as discussed by James (1989a and1989b). Still, his earlier (1988) results are indicative of the size and magnitude of the dosefrom unattached and attached decay products, and have been used in our calculations.
The calculation results are presented in Table 6. For baseline conditions, the dose resultingfrom exposure 75% of the time to 55 Bq m- 3 in a residence is 3.1 mGy y-1. Thecorresponding effective-dose equivalent is 3.7 mSv y-l, substantially higher than mean value
87

Table 6. Mean bronchial epithelial dose due to indoor 222Rn decay-product exposure. a
EEDC Dose
Condition A" (h- 1) Aa (h- 1) Ad"'{h- 1) Adu (h- 1) (Bq m-3) f (b) (mGy y-l)p
Low-dose 1.5 500 0.4 40 18.2 0.011 1.6
Baseline 0.5 50 0.2 20 20.9 0.062 3.1
High-dose 0.2 5 0.1 10 14.1 0.32 6.5
a Based on 75% occupancy at the mean concentration of 55 Bqjm3 for U.S. single-family
dwellings. The decay product concentrations are calculated using the Jacobi model (Jacobi
1972; Knutson 1988). The dose conversion factors are 125 mGyjWLM for unattached decay
products and 7.5 mGyjWLM for attached decay products (James 1988). These factors are
sensitive to the presumed behavior of the decay products in the nasal passages and to what
epithelial cells are considered to be potential sites for alterations leading to cancer. Some
changes in these presumptions have occurred since the calculations of James (1988), as
indicated in James (1989a). New information is still being developed, causing some changes
in the doses given in this table, but these changes are only on the order of 10 or 20% (James
1989b).
b Unattached fraction of the potential alpha energy concentration or, equivalently, of the
EEDC.
88

of 1.4 mSv y-l associated with other radiation exposures (Sinnaeve et aI. 1984). (Note: thedose equivalent computed here for residential radon exposure is much higher than the ImS" ,,-1 rn~~r+n~ b" Sl'--~e"- -+ ~I \11 • Y 1I;;IJVIll;;U Y IUli:1 VI;; 1;;1 i:11.)
The radiation dose associated with a given indoor radon level varies by a factor of 4 from"low-dose" to "high-dose" conditions. Note that the dose correlates with the unattachedfraction, but not with the EEOC. This observation is consistent with the findings by James(I988) that the 222 Rn concentration may be as good as (and in many cases a better)indicator of effective-dose equivalent than the EEOC.
G. Effect of Air-Cleaning Oevices
The effect of operating an air-cleaning device on the radiological dose from radon's decayproducts is not easily evaluated. Passing an air stream through a high-efficiency particlefilter, for example, would effectively remove both attached and unattached decay products,reducing dose. However, operation of such a device in an indoor environment would alsoreduce the concentration of airborne particles, thereby lowering the attachment rate A , and
aincreasing the unattached fraction, possibly increasing dose. To complicate matters further,the operation of a control device often increases the degree of air movement in a roomwhich would lead to higher rates of deposition, again reducing dose. Certain air cleaners,some ionizers for example, alter the electric field strength in a room which in turn mayaffect the deposition rate of attached and unattached decay products, and non-radioactiveparticles. Thus, quantifying the benefit that might be achieved through the use of an aircleaner in an indoor atmosphere is complicated.
The Jacobi model, coupled with a dosimetric model, as described in previous subsections,can serve, with modification, as a framework for evaluating the effectiveness of aircleaning devices (Jonassen and McLaughlin 1988). One need only (1) interpret A to be thetotal rate of removal by ventilation and filtration, and (2) properly account for
vthe effect
of the control device on the parameters Aa , A a, and Adu. Of course, it is far from trivial toproperly account for changes in the values o~ these parameters. Changes in the attachmentrate, in particular, depend on other considerations such as the rates of supply and removalof indoor particles, a complicated problem in its own regard (Nazaroff and Cass 1989b).
Overall, the radical reduction in decay-product concentration (given as EEOC or PAEC)that is possible by air cleaning with filters may not cause a corresponding decrease ineffective dose and in health effects; it is even possible that there is no decrease at all(Jonassen 1984) or an increase (Maher et aI. 1987). Recent experimental work by Maher etal. (1987) suggests that combining the use of an ion generator with a mixing fan is aneffective method of air cleaning for reducing radiological dose from radon decay products.
H. Recent Research on the Nature and Behavior of Unattached 2l8po
The diffusion coefficient of unattached 218 pO is a key parameter that governs its behavior,affecting its deposition rate, attachment rate, and dose effectiveness. Recent studies on thedynamics of unattached 218 pO illuminate the factors that influence its diffusivity.
One key factor is the charge state of 218 po . Upon decay of 222 Rn by alpha-particleemission, a recoiling atom of 218 pO, possessing a kinetic energy of 101 keY, is formed. Inair, this recoiling atom has a range of 50 j.lffi, losing its excess kinetic energy over a periodof nanoseconds through interactions with gas molecules. At the end of this initial period,most of the 2l8 pO atoms possess a sin~le positive charge, with a fraction being electricallyneutral. The charged, unattached l8 pO may be neutralized through one of several
89

mechanisms: (a) small ion recombination, the rate of which is proportional to the squareroot of the radon concentration; (b) electron transfer, which depends on the availability ofmolecules having a low ionization potential, such as N0
2and NH
3; and (c) electron
scavenging (Chu and Hopke 1988). The rate of neutralization of 218pO thus depends on theconstituents of the surrounding atmosphere. Since charged species have a lower diffusioncoefficient than corresponding neutral species (Phillips et al. 1988), atmospheric componentsother than particles affect radon decay-product dynamics.
In addition to the issue of neutralization rate, unattached 218 pO may serve as a center forthe formation of a molecular cluster or an ultrafine particle. The ran~e of experimentallydetermined diffusion coefficients for unattached 218pO (0.03 - 0.10 cm S-l) is smaller thanthe value predicted by kinetic theory for a single, neutral 218po atom (Phillips et al. 1988).In air, 218po is rapidly oxidized of Po0
2. Hopke (I988) reviewed experimental evidence
that argues for the production of radiolytic ultrafine particles incorporating 218pO by thefollowing mechanism. The recoiling 218 po atom causes the dissociation of water vapormolecules into a hydrogen radical and a hydroxyl radical, both highly reactive compoundsin air (Seinfeld 1986). Certain trace gases, if present, form low-vapor pressure speciesupon reaction with hydroxyl radical. One important example is sulfur dioxide, whichbecomes HS03 and is rapidly hydrolyzed to sulfuric acid. Since the recoil path of 218pO isshort (order 100 Jjm in air), the low-volatility sulfuric acid molecules would tend to collidewith the PoO~ molecule and condense there, rather than on airborne particles. Sulfuric acidis hygroscopIc, so water vapor molecules tend to be drawn to the cluster as well. Raes(1985) has developed a framework for theoretical consideration of the cluster formationprocess, based on thermodynamic arguments.
Such studies (reviewed in Hopke 1988) are improving our fundamental understanding ofdecay-product behavior. This, in turn, increases our confidence in using the Jacobiframework for assessing the importance and influence of building-related factors andcontrol techniques on the concentrations and physical characteristics of airborne decayproducts. This framework is a primary basis for estimating the dose to the lung, usingdosimetric models such as those presented by NCRP (l984b) and James (1988).
90

VI. STRATEGIES FOR CONTROLLING INDOOR CONCENTRAnONS
During the last decade or so, efforts to characterize the levels of 222 Rn decay products inhomes have demonstrated that even average indoor concentrations are high enough to entail anunusually large estimated risk compared with other identifiable environmental insults.Furthermore, the higher concentrations found are unacceptable by virtually any standard. Aresult of these findings has been the sharply growing concern among policy makers and thegeneral public over the radon issue, leading to substantial, sometimes frantic, efforts toidentify and control excessive concentrations in areas where these are known to occur.
These recent efforts, along with previous research, have demonstrated a number of difficultiesin formulating a program to control indoor radon. One difficulty is the identification of areasor types of buildings where high concentrations tend to occur: possible approaches, includingmonitoring in samples of houses or examining fundamental parameters affecting radon entryrates, do not as yet yield consistently reliable results. And even when a high-concentrationarea is identified, finding individual houses with excessive concentrations involves difficultchoices in monitoring protocol and interpretation. Even more fundamental is the difficulty ofdetermining what constitutes an acceptable level: existing regulatory structures and buildingcodes give little guidance on the control of pollutants in private environments, so that controlefforts have had to rely on makeshift, often arbitrary, guidelines. And even when a house isjudged to need remedial action, difficulty in deciding what measure(s) might be appropriate iscompounded by the sparse and inconsistent experience with various control techniques.Finally, all these difficulties are amplified by a single important point: homes are essentiallyprivate environments. The entire process of setting guidelines, finding houses with high levels,and deciding what control techniques are to be employed requires a framework that delineatesresponsibilities among the concerned parties.
The major elements of a control strategy, and the underlying scientific understanding ortechnical capabilities are indicated in Figure 20. The purposes of this section are first to examine these essential elements and second to use this framework to explore current U. S.federal policy on indoor radon. This examination is intentionally a rather detached view ofwhat might be seen as an urgent problem. But, however important and urgent, indoor radonhas been with us since we began to live in enclosed spaces. In the United States, only a fewpercent of the houses that ought to be considered for remedial action have so far beenidentified. Careful consideration of basic issues can substantially increase the effectivenessand efficiency of a control strategy that may involve a million homes, millions of individuals,and many billions of dollars.
A. Elements of Control Strategies
As illustrated in Figure 20, an overall control strategy consists of three main elements: a systemof guidelines, methodologies for identification, and a framework for control. Thesecomponents are based on an underlying scientific and technical understanding, and - onceframed - interact with one another directly.
Before proceeding to a brief discussion of each element, it is useful to indicate theseinterrelationships somewhat more explicitly, as is done in Figure 21. Several importantobservations can be made at this point:
(l) Each of the "elements" discussed here is, in fact, a system or framework. The system ofguidelines would specify several kinds of standards applying to various classes of buildings(e.g., existing or future) and indicating objectives for concentrations or ventilation rates, as
91

Guidelines Identification Control
XBL 871·9205
Figure 20. The main elements of a control strategy.
These include a system of guidelines, means for identifying the portion of the building stockrequiring action, and a framework for choosing appropriate control actions. Formulation of theguidelines and implementation of the control strategy in general depend on scientific understandingof the health risks of indoor exposures, of the behavior of radon and its decay products, and ofthe principles by which excessive concentrations can be controlled.
92
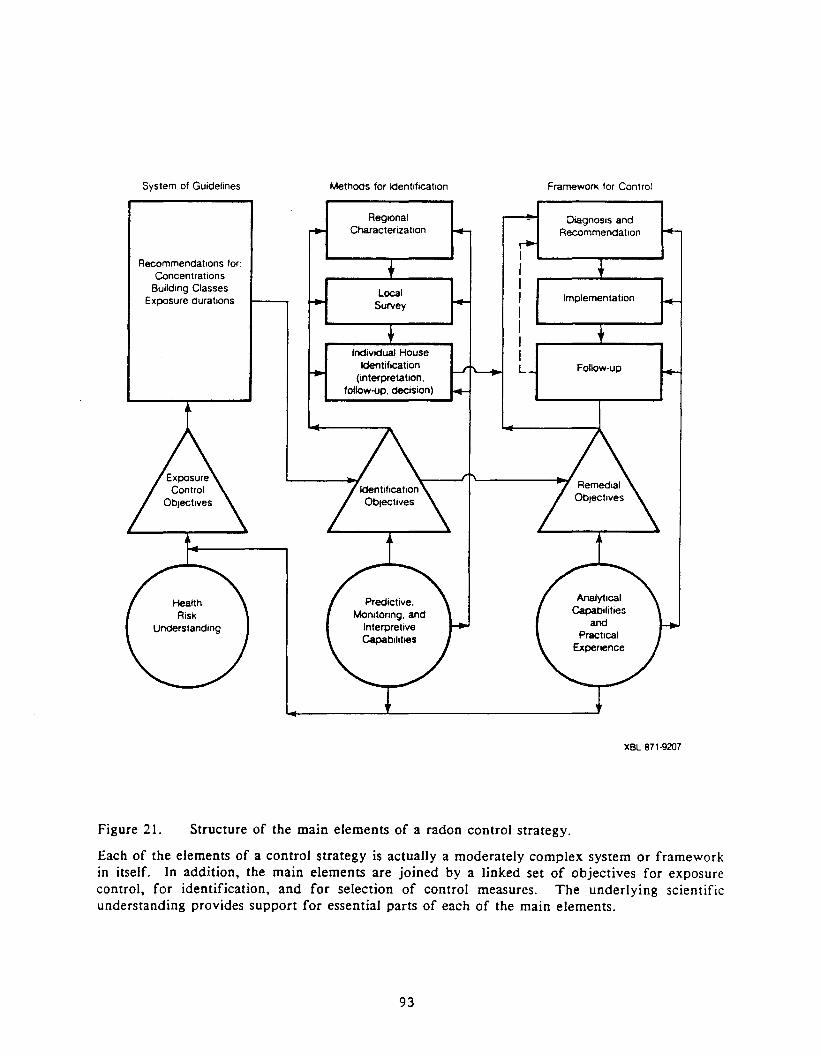
System of Guidelines
Recommendations for:Concentrations
Building ClassesExposure durations
Methods for Identification
Regiona!Charactenzatlon
Individual HouseIdentification
(interpretation,follow-up, decision)
Framework for Control
DiagnosIs andRecommendation
Follow-up
XBL 871-9207
Figure 21. Structure of the main elements of a radon control strategy.
Each of the elements of a control strategy is actually a moderately complex system or frameworkin itself. In addition, the main elements are joined by a linked set of objectives for exposurecontrol, for identification, and for selection of control measures. The underlying scientificunderstanding provides support for essential parts of each of the main elements.
93

well as time frames for implementation. Similarly, the methodology for identification includesstrategies for identifying high-radon areas, for surveying these areas, and for measuring andinterpreting concentrations in individual houses. Finally, the framework for control includes amethodology for choosing and implementing appropriate technical measures and forsubsequently determining their effectiveness.
(2) Each major element in the strategy is driven by a set of objectives. For the system ofguidelines, the goals are set by considerations like those set forth in the next section. In turn,the guidance system, once established, helps to specify the objectives for identification andcontrol. This interrelationship will become evident in the discussion to follow.
(3) The underlying scientific understanding affects the overall control strategy in twoimportant ways. First, it is a basis for determining the objectives for each element. Theobjectives for the system of guidelines are affected directiy by consideration ·not only of healthrisks and exposures, but also by the scientific understanding of radon and decay productbehavior and by the corresponding design and effectiveness of methods for identification andcontrol. Secondly, the manner in which the identification methods and control techniques areimplemented is guided directly by the general scientific understanding of radon behavior.
The overall framework shown in Figure 2 I can be interpreted at two levels. First, it indicatesthe basic elements needed to implement an overall national strategy for control of indoorradon. Secondly, some key operative elements apply directly to individual structures, i.e., theinterpretation of monitoring results and the choice and implementation of appropriate controltechniques. It will be noted, as the discussion proceeds, that the problem of finding andalleviating high concentrations in the existing housing stock is emphasized, with particularattention to the case of single-family houses. However, the framework presented here can beapplied to other aspects of the indoor radon question, including future housing, multifamilystructures, or buildings devoted to other purposes.
I. Risk as a basis for specifying objectives
One of the principal bases for environmental standards is the potential for the pollutants inquestion to cause human disease or death. Even for a given setting, it is usually difficult toformulate a consistent set of standards for different pollutants, not only for practical reasonshaving to do with their origin and cost of control, but also because it is difficult to assess therisk on a uniform basis: pollutants have different types of risks, often not comparable, and thequality of the information base used for assessing risk differs from one pollutant to another.This inescapable difficulty is usually compounded by the fact that, from one situation toanother, the level of risk that is considered acceptable can change. The indoor environmentcannot sensibly be treated on the same basis as either the outdoor or occupationalenvironments, which also have rationales that differ from one another.
To illustrate this point, consider one risk measure - an individual's lifetime risk of early death associated with the following circumstances. Mortality is not, of course, the only risk criterionthat could be used, but it is suitable for illustrative purposes.
a. Personal criteria for risk aversion tend to cause avoidance of lifetime risks exceeding levelsof 10-1 to 10-2 if the risks in question are under individual control. The larger number (10%)is associated with cigarette smoking (which actually has a total mortality risk of 25% or more)and the smaller (I -2%) with automobile accidents. One to a few percent lifetime risk may bethe level at which people begin to worry about chronic risks over which they have somecontrol, and - as is clear - even at this level many people will deem the risk acceptablebecause of some perceived benefit.
94

b. Occupational criteria for exposures that are specifically related to the type of work, such asa substance arising from an industrial process, and over which the worker has limited control,tend to lie in the range of 10-2 to 10-3
. These exposures must be distinguished from incidentalones, such as those that occur merely because a worker is in an indoor space (e.g., an office).It is interesting to note that, except possibly for the recently lowered benzene standard, thelifetime risk associated with 222Rn decay-product exposures in mines may be the highestoccupational risk from pollutant exposure, several percent according to current risk estimates.
c. Finally, environmental criteria for risks that arise externally to the people exposed, overwhich they have no control, and that are not directly related to a benefit to them, are typicallymuch less than 10- 3 and often in the vicinity of 10- 5
, or even 10- 6 , a range that theEnvironmental Protection Agency commonly uses as a criterion for examining and regulatingenvironmental risks.
Environmental risks must be distinguished from risks that individuals suffer in circumstancesof direct benefit to themselves, specifically in their own homes and places of work. We liveindoors because of a wide range of benefits, including comfort, convenience, and health. Onemight therefore anticipate that appropriate risk criteria for naturally occurring or occupantgenerated pollutants in this environment should be in the range between environmental criteriaand either occupational or personal criteria. In cases of industrial contamination of livingspaces a more stringent standard might be appropriate because of the externality of the insult.
Pollutant exposures cause risks in addition to that of early death. In the indoor environment,emissions from unvented (or improperly operating) combustion appliances, organic chemicalsfrom a variety of materials and products, and cigarette smoke are often found to cause largerexposures to many hazardous compounds than occur in the outdoor environment. These maylead to a significant risk of acute irritant or allergic response or to chronic respiratory illness.It is difficult to compare such risks with that of lung cancer, in terms of either frequency ordetriment. Given better knowledge of the full range of risks, one approach is to express allrisks in terms of estimated days of life lost or ill, then to assign weighting factors that dependon the severity of the illness.
Simply considering the risk of early death estimated to arise from 222Rn-decay-productexposures, the average level of individual risk associated with lifetime exposure (75%occupancy) at the average concentration of 55 Bq m- 3 in U. S. single-family homes isestimated to be 7 x 10⁻³ (0.7%) (NAS 1988). As indicated in Section II, some homes havelower concentrations, implying risks in the range of 10-4 to 10-3
; however, a significantnumber cause risks exceeding 10-2 (i.e., 1%) and even 10-1 (l0%) for lifetime occupancy. It isapparent that a risk criterion in the vicinity of 10- 5 or even 10- 4 is impractical for indoorenvironments. And it is difficult to conceive of a radon risk criterion as low as 10-3
, not onlybecause it is lower than the present average for indoor environments, but because it iscomparable to the estimated risk for continuous exposure to the average outdoor concentrationof 222Rn decay products. Even a criterion in the vicinity of 10-2 would affect a very largenumber of homes, and have large associated costs, as discussed in Section VI.B.
We must, therefore, content ourselves with the fact that the risks estimated for indoorexposures to 222Rn decay products will remain much higher than risks associated with most"environmental" insults causing a risk of premature death. We can console ourselves that, byaccepting this indoor risk (and others), we gain substantial benefits. On the other hand, it isstill important to examine means of avoiding unusually high indoor concentrations, and perhapseven of lowering the average significantly.
95

2. Guidelines and Standards
Several classes of standards offer some guidance for the case of indoor radon. Among theseare existing radiation standards, general occupational and environmental standards, andbuilding-related standards (Nero 1988b).
Standards or guidelines for controlling indoor radon may be formulated in three ways: (I) byspecifying a minimum ventilation rate, thereby controlling the rate at which radon is removed;(2) by requiring the use of radon-resistant construction practices, thereby controlling the rateof radon entry; and (3) by specifying an upper limit for radon concentration. An importantexample of the first category is ASHRAE Standard 62-1989 on "Ventilation for AcceptableIndoor Air Quality," formulated by the American Society of Heating, Refrigerating, and AirConditioning Engineers. The main orientation of this standard is the provision of asufficiently high ventilation rate to assure adequately low levels of human-related pollutants,e.g., CO
2and odors. Nonetheless, the basic ventilation rates recommended - approximately 0.5
air changes per hour for homes - also provide adequate assurance of general indoor air quality,assuming that no unusually large pollutant sources are present. Specification of radon-relatedconstruction measures for new housing in radon-prone areas might have the broadest effect onpublic exposures, particularly for houses that would otherwise have decay-productconcentrations below 200 Bqjm3 (0.05 WL). Such measures can be implemented moreefficiently in new homes, in the same way that improved specifications on electrical wiring canhave a wide effect at low cost in new homes.
Significant steps have been taken in recent years toward development of concentration-basedstandards for radon in homes. This guidance has been developed primarily for two situationsthat must be distinguished: (I) remedial action in buildings whose indoor concentrations arethought to be elevated due to industrial activities or contamination and (2) remedial measuresin ordinary homes, where the radon comes from sources in their natural state or, at least,without elevation due to special types of industrial processing. This report focuses on thelatter category; see Nero (l988b) for a discussion of the former.
Considering the recent evidence of a significant incidence of high concentrations in manycountries, the radiation protection community has made substantial progress in formulatingguidance for ordinary homes (see Table 7). This class of homes is much larger than those withcontamination, and the number of people exposed to high concentrations from undisturbednatural sources of radon is very much larger than those seriously affected by industrialresidues.
The International Commission on Radiological Protection (ICRP 1984) and the NationalCouncil on Radiation Protection and Measurements (NCRP 1984) have made explicit, albeitslightly different, recommendations for radon in buildings. In 1983, the ICRP maderecommendations both for remedial action and for new housing, suggesting that, for the first,"if the remedial action considered is fairly simple, an action level in the region of 200 Bqjm3
(0.055 WL, a decay-product concentration equivalent to about 400 Bqjm3 of 222 Rn ) might beconsidered," but that "for severe and disrupting remedial action, a value several times largermight be more appropriate." The NCRP, on the other hand, recommended that remedialaction be taken, where necessary, to limit individuals' total exposure to 2 WLMjy. This isequivalent to an avera~e concentration of about 0.04 WL or, assuming as much as 80%occupancy, an indoor 22 Rn concentration of 370 Bq/m3 (for an equilibrium factor of 0.50).Although the NCRP said nothing about new construction, the ICRP did, stating the belief that"a reasonable upper bound [for decay-product concentration] is of the order of 100 Bqjm3
(0.027 WL) and that, in many countries, a value of this magnitude would prevent radon frombecoming a dominating source of risk in dwellings." Although neither of these reportsthoroughly considered the causes of and influences on high radon concentrations, both showedsubstantial sophistication in the formulation of guidance for existing and (in the case of the
96

ICRP) future housing.
More recently, the World Health Organization (1987), in recommendations for indoor andoutdoor pollutants, dealt with radon and formaldehyde in the indoor environment. The basicrecommendation for radon was that remedial actions in buildings with radon concentrationshigher than 800 Bq/m3 be considered in all cases and that the total dose before remedial actionshould not exceed 4000 Bq m-3 y (e.g., that a home with 800 Bq/m3 should be modified within5 years). It also recommended that, where simple measures are possible, action be consideredfor concentrations higher than 200 Bq/m3
. Finally, it recommended that building codes beformulated to avoid levels higher than 200 Bq/m3 in new structures. This framework ofrecommendations is similar to the guidance now employed in Sweden, where the relatively highremedial action limit of 800 Bq/m3 was chosen largely for practical reasons.
During 1986, the EPA issued guidance for U.S. householders (USEPA 1986), recommendingthat houses with radon concentrations greater than ISO Bq/m3 be altered to reduce levels. Thesuggested urgency of the action depends on how high the concentration is, with the speediestaction recommended for houses having a radon concentration above 7400 Bq/m3 . Theguidelines are stated in terms of radon concentration, a sensible provision considering that thepreferred monitoring techniques measure the radon concentration, as discussed in Section IV,and that this appears to be a reliable indicator of risk (cf. James 1988). However, as indicatedin Table 7, the recommended remedial action level is lower than that suggested by others,thereby affecting a much larger number of homes.
In 1988 the U. S. Congress passed an amendment to the Toxic Substances Control Act thatestablished, as a long-term national goal, that air in buildings in the United States should be asfree of radon as outdoor air (U.S. Congress 1988). The implications of the current EPArecommendations and of the long-term national goal are discussed in Section VI.B.
3. Identifying houses with excessive concentrations
Although a comprehensive strategy for controlling exposures to radon decay products indoorswill include attention to the total population exposure, an appropriate near-term focus is onexisting homes that have higher-than-average concentrations. Efficient means to identify thisportion of the housing stock is therefore an essential element of a cohesive control strategy. Astrategy for identifying the housing having high concentrations can be divided practically intotwo stages: (I) characterization of concentration by area or housing class and (2) intensiveefforts in the areas or classes thought to have the highest probability of high concentrations.The first stage can be carried out by a combination of pt"edictive modeling (as discussed inSection III.C) and monitoring (as discussed in Section IV). In this context, predictive modelingis built on an understanding of the factors that govern indoor concentrations and on theavailability of data relating to those factors. To use monitoring for this purpose requires aninterpretive framework to assess the probability of elevated concentrations in an area or abuilding class based on the results of a set of measurements.
Two key questions must be addressed in formulating an identification strategy: (I) How manyhouses are involved? and (2) How are the houses distributed, by location or othercharacteristics, within the full housing stock?
In view of the apparent frequency distribution of concentrations, the number of housesrequiring identification depends critically on the concentration above which remedial action isdesired. A change of a factor of two in the remedial action level may cause a change of afactor of five to ten in the total number of houses involved (Nero et al. 1986).
Practical experience combined with systematic examination of the U.S. monitoring data (as
97

Table 7. Recommended Limits of 222Rn Concentrations in Buildings a
Existing buildings
Ordinary Contaminated Futurebuildings
Reference
Professional Organizations
ICRP 400 Bq/m3 (higher level 200 Bq/m3 ICRP 1984for more difficultremedial actions)
NCRP 370 Bq/m3 b NCRP 1984
WHO 800 Bq/m3 c 200 Bq/m3 WHO 1986(200 Bq/m3 if simplemeasures)
ASHRAE 200 Bq/m3 e ASHRAE 1989
Countries
UnitedStates
Canada
Nordiccountriesd
148 Bq/m 3
800 Bq/m3
(consider action above200 Bq/m3 )
74-370 Bq/m3
148 Bq/m3
-10 Bq/m3 f
200 Bq/m3
Costle 1979; USEPA1986; U.S.Congress1988
Letourneau 1986
RPI 1986
Recommendations given in terms of EEDC are converted to 222Rn concentrationsassuming an equilibrium factor of 0.5.
b Recommended limit is 340 WL-h per year, equivalent to 0.050 WL for 80% occupancy.
C Remedial action to be performed before added exposure exceeds 4000 Bq m-3 y (27WLM).
d These countries are Denmark, Finland, Iceland, Norway, and Sweden. In earlierrecommendations (Swedjemark 1986), Sweden had specified a 140 Bq/m3 limit for newbuildings and had not specifically recommended consideration of action, in existingbuildings, for levels in the range 200-800 Bq/m3 .
e The 1981 ASHRAE recommendation of 74 Bq/m3 has been changed in a 1989 revision tothe equivalent of 200 Bqjm3 (giving NCRP 1984, apparently incorrectly, as a source forthe guideline). However, an addendum to ASHRAE 1989 now being considered wouldchange the ASHRAE recommendation to 148 Bq/m3, based on USEPA recommendations.
The U.S. Congress has established a long-term national goal of making air inside buildingsas free of radon as outdoor air.
98

described in Section II) makes it clear that there is substantial clustering by area of houses withelevated concentrations. This point is illustrated in Figure 22, which shows the cumulativedistribution of mean concentrations from 22 geographical areas of the United States (Nero eta1. 1986). These means range over more than a factor of ten, even within this small number ofareas. (A comparable result based on different data was reported by Cohen (1986).) Theindividual data sets show that the houses with excessive concentrations tend to be clustered inthe areas with mean concentrations that are above the average. Conversely, a large portion ofthe country appears to have a very small fraction of houses with indoor radon concentrationssubstantially greater than the nationwide mean. Attention to the area-mean concentration maythus be regarded as a way of prioritizing the effort, causing the earliest and most substantialattention to be focused on areas that have the bulk of the houses needing remedial action.
Because of the variability of concentrations in any area or class, the final identification ofhouses for which remedial action should be considered requires direct measurements. A keyelement in monitoring individual houses will be a framework for interpreting measurementresults as a basis for deciding whether action is needed, what kind, and how fast.
4. Selecting control techniques
The presumed situation for choosing remedial measures is one where the results of monitoring,interpreted in light of some set of guidelines, has prompted a decision to seek a reduction inthe concentration in a particular house. Along with this specific decision will have come somesense of the importance of the action (reflected indirectly in the degree of concentrationreduction sought) and of its urgency (manifested in terms of a recommended time duringwhich action should be implemented). These two objectives are determined in view ofmonitoring results and the remedial action guidelines, possibly after some diagnosis of potentialcauses of the high levels, and constitute the broad premises for choosing the course of actionand specific measures suited to the house in question. Thus the overall framework forremedial action utilizes objectives designated (at least tentatively) for the house beingconsidered and includes (1) choice of appropriate control measures, (2) a capability forimplementing this plan of action, and (3) any necessary follow-up.
Choosing specific remedial measures in individual homes is the most difficult aspect ofoperating a remedial action program. The indoor concentration depends in a very complexway on many factors. In particular, the pathways and forces accounting for radon entry into agiven house are often extremely complicated and heterogeneous. Due in part to thiscomplexity, as well as to limited experience, procedures for characterizing the specific entryprocess in a given house are tentative at best. Presently, one can - on the basis. of limitedexamination and measurements - formulate an hypothesis (i.e., a diagnosis). This diagnosiscan be tested most efficiently in a very practical way, i.e., by implementing an associatedcontrol measure or set of measures. The process of collecting information, formulating ahypothesis, and implementing control measures may be repeated until the desired reduction isachieved.
The apparent success of remedial measures should be confirmed by a follow-up measurementthat provides a basis for estimating the new annual-average concentration associated with thehouse. An apparent change in concentration during the course of remediation cannot beconsidered sufficient of itself: the apparent success may depend on meteorological oroperational conditions that change with time. Moreover, even if the efficacy of the controlapproach that has been implemented is confirmed by follow-up monitoring, future changes incharacteristics of the house structure (e.g., continued settling in the understructure) mightcause a later problem. The probability of such difficulties will depend on features of thehouse being considered and on the type of remedial measures that have been implemented. Acontrol program should incorporate confirmation and follow-up procedures to accommodate
99

99.9 99 98 95 90 80 70 60 50 40 30 20 10 5 2 1 0.5 0.1
185
99.990 95 98 9920 30 40 50 60 70 801050.5 1 20.3 L-.l-L..J....L.I....l..LJ..LL.LL.J..I.L-.L...J.....LL..L.I....l...l..1..L.l'-Lll.l.LU...J...LL..Ll..l..llllllll..U.llllll.UlLLL..LL..LWlill.ll.J..L.L.J.....LL.L...L-.ll.U..LIJ..I..L.L.LLL.L.L....J
0.1
100
~ 2 cry~
-- 0 EG --aS ~c Cell 50Q) X 2.0
ell
EQ)
E
~33 Bq/m3
uW 0.88 pCi11 ;::
WE
30 E0 0Q) Q)<.9 0 <.9
X 2.0 0
020
050
Cumulative probability
Distribution at annual average GMs for 22 sets of indoor radon data
from various areas in the U.S.
XBL 864·10770
Figure 22. Distribution of annual-average geometric means for U.S. data.
The geometric means (GMs) from 22 sets of data from around the United States (analyzed by Neroet al. 1986) are plotted versus the probability that the mean is less than the given value. On thisscale, if the GMs are distributed lognormally, they should lie along a straight line. The geometricstandard deviation of the indicated line is 2.0, providing a measure of the variability of GMs forthese various areas.
100

this possibility.
It is useful to illustrate crudely the process of selecting appropriate remedial measures byindicating two of the primary possibilities to be examined and choices to be made.Specifically, one class of choices has to do with the seriousness and urgency of the problemand another has to do with the characteristics of the house.
Considering the first class of choices, if the concentration falls into the extreme range,something should be done in a short time. The only measures immediately available to mostoccupants are temporary evacuation, increased ventilation (or perhaps air cleaning usingcharcoal adsorption), or obtaining the immediate attention of a contractor. None of theoptions is attractive. Evacuation is inconvenient and expensive. Sufficient ventilation toeffect a large reduction in concentration is often uncomfortable and costly (as would be aircleaning at high rates). Securing the rapid attention of a contractor is likely to causesubstantially increased costs and, perhaps, decrease the quality of the alterations made.Fortunately, very few houses fall into the range where action is recommended so rapidly. Insuch cases the optimal choice often will be to provide temporary ventilation to reduce theconcentration to one of the lower ranges until an attempt at more permanent remedial measurescan be arranged.
The more usual situation, i.e., where action is recommended "sometime" or "soon," or where theowner decides to do something even though action is not specifically recommended, will occurwith much higher frequency and should be the main focus of a structure for choosingmeasures. In that case, decisions can be made in light of the relative priority of the factorsthat affect indoor concentrations. Ordinarily, the ventilation rate in a high-radon house is inthe normal range, so that the main focus of control efforts will be on radon entry. (Shouldthis not be true, i.e., if the house is one in which the infiltration rate is unusually low becauseof special construction practices, then some consideration should be given to increasing theventilation rate, as discussed below.) Because the main mechanism for radon entry ismovement of air from the ground into the house, associated control techniques (Section I1I.D)seek either to reduce this flow or to reduce the radon concentration in the nearby soil air, orboth (cf. Scott 1988). The technique appropriate to a specific house depends on the type ofstructure, details of the substructure and underlying ground, and the reduction factor sought.The most effective means often have been found to involve systems for altering the pressurebalance between the lower part of the house and the ground or for venting radon from the soilto the outdoors. The effectiveness of these systems can be increased by sealing theunderstructure, even though such sealing of itself is usually relatively ineffective.
Thus, in considering the seriousness of the problem and focusing primarily on the case ofmoderately high levels, we have turned already to the usual case in terms of housecharacteristics, i.e., where the overall difficulty is an excessive entry rate and the most likelysolution is to be found in reducing flow from the ground. However, there is a smallerprobability of situations where other means are appropriate, either where ventilation is used ona temporary basis to alleviate truly extreme concentrations, or - somewhat more frequently where the house has much lower than average ventilation rates due to unusual constructionpractices.
Houses with features that save energy by maintammg unusually low infiltration rates can beexpected to have higher-than-average concentrations of radon and other indoor pollutants.Such levels can be reduced by using mechanical systems to increase the overall ventilation rateof the house to a normal level, say 0.5 h- 1
. The simplest such system is some form of exhaustventilation. However, because exhaust fans increase the inward pressure across the buildingshell, they may also increase the rate of radon entry, thus changing the concentration little oreven increasing it (Mowris and Fisk 1988). For this reason, systems to increase the houseventilation rate ordinarii y should be balanced, incorporating both an air intake and air exhaust.
101
(Such a system can utilize heat exchange between the incoming and outgoing air streams, thusavoiding most of the energy loss associated with increased ventilation rates (Fisk and Turiel1983). Similarly, exhaust ventilation, utilized for reasons other than radon, can include heatrecovery.)
An overall scheme for diagnosis and selection of control techniques must be more detailed thansuggested by this overall consideration of urgency, house type, and control approach. It mustalso be tailored to the type of houses and radon entry modes characteristic of a locale orregion. Indeed, even the system of guidelines and the methodologies for survey, monitoring,and interpretation can be expected to depend on the characteristics of the region and thefrequency and severity of radon problems in the local building stock. Unfortunately, noconcerted effort has yet been mounted, either to examine the risk-limiting objectives or theirpremises in detail or to develop properly the elements of a radon control strategy.
B. Exploring Policies for Reducing Exposures
Despite the lack just noted, specific components of a national policy to control exposures toradon decay products in U.S. homes have been put forth in recent years. As indicated in thissection, analysis of these components suggests that, at a minimum, billions of dollars would berequired to rapidly and fully implement a national radon-control policy. Because of the largeassociated costs, it is prudent to examine carefully the implications of policy options. Twoaspects of this issue amplify the importance of such an examination: (1) there are no closelyrelated precedents to the problem of indoor radon from which a rational policy might beadapted; and (2) it is likely that federal policies will be needed to address other indoor airquality issues in the future.
The purpose of this section is to explore federal policy options for controlling indoor radon.We focus on current policy, examining the number of lung cancer cases that may be avoided,the costs of implementing control measures, and the prospects for attaining the policy goals.Potential problems in identifying and reducing indoor concentrations are considered. Finally, adiscussion of characteristics that might be expected in a comprehensive policy are presented,emphasizing specific shortcomings of current policy with respect to the general considerationspresented in Section VI.A.
1. Form and implications of current policies.
Two elements constitute the core of present United States federal policy for controllingexposures to indoor radon. First, the Environmental Protection Agency and the Centers forDisease Control have made recommendations and provided guidance to citizens that include ameasurement protocol and guidelines for taking remedial action to limit radon levels in theirhomes (USEPA 1986; Ronca-Battista et aI. 1988; USEPA 1988). Second, an amendment to theToxic Substances Control Act has recently been adopted that, among other provisions,establishes a long-term national goal of greatly reducing indoor radon concentrations (U.S.Congress 1988). In this section, these policy elements are described, and the cost andreductions in risk associated with successful implementation of the policies are discussed. 4
4The Office of Drinking Water of the U.S. EPA is planning to propose a standard to limitradon in public water supplies because of the health risk posed by inhalation of decay productsfollowing radon release from the indoor use of water (Federal Register 1986). The costs andpotential risk reductions are much smaller than those associated with the EPA/CDCrecommendations and TSCA amendment considered in this paper. (On the other hand, the costbenefit ratio may be higher.)
102
The EPA and CDC have recommended that a screening measurement for indoor radonconcentration be made in every household located below a building's third story above ground(USEPA 1988). The measurement protocol calls for a two-day average sample to be taken,under closed-house conditions, on the lowest livable level of the home (USEPA 1986; RoncaBattista et a1. 1988). If the measurement result is above 150 Bq/m3 (4 pCi/I), follow-upmeasurements are recommended to better determine the average concentration to whichoccupants are exposed. If the follow-up measurements yield an average result in excess of 150Bq/m3
, it is recommended that corrective action be taken to permanently reduce indoorconcentrations. Recommendations on the duration of follow-up measurements and the urgencyfor corrective action depend on the results of the indoor concentration measurement. Therationale for setting the principal criterion at 150 Bq/m3 combines historical precedent in theU.S. and the objective of reducing exposures to the extent judged reasonable, given that noexposure can be considered risk-free.
It is important to note that these recommendations do not constitute regulatory standards.According to the present philosophy, it is to be left to individual residents to weigh the risksof radon exposure against the costs of control. In this regard, the strategy for controllingindoor radon departs radically from that for controlling outdoor air pollutants. In the lattercase, federal standards have been established, control measures have been implemented, andthe imposition of sanctions has been threatened for regions that do not achieve compliance.The differences in approach arise naturally because outdoor air is a community resource,whereas indoor environments are largely private (Sexton and Repetto 1982). However, thisposition does not accommodate the public resource aspects of the building stock, as discussedin a later section.
We may estimate the cost of a particular strategy by considering the costs of identification(primarily that of monitoring, with present recommendations) and remediation for the numberof houses presumed to need it. The estimated cost of implementing the EPA/CDCrecommendations in the current housing stock is approximately $2.2 billion for measurementsand $6.6 billion for remediation plus $0.8 billion per year for operation and maintenance.5
Using an annual discount rate of 5% with a 30-year time horizon, the net present value of thecosts for measurement and remediation is $20 billion.
5Screening measurements would be required in approximately 80 million residences at a unitcost of $15 for a charcoal monitor. Based on the EPA reports that 20-30% of homes exceedthe 150 Bq/m3 (4 pCi/1) criterion in screening measurements, subsequent monitoring would berequired in approximately 20 million residences at a unit cost of $50 for two alpha-trackmonitors capable of measuring long-term average concentrations. Mitigation would berequired in 7.3% of 60 million single-family dwellings at an estimated average cost of $1500for installation, corresponding to the median cost of installing a subslab ventilation system(Turk et a1. 1989b). Annual operation and maintenance costs are estimated as $185 perremediated household, broken down as follows: $100 for electricity to operate the fan (1300kWh at $0.075/kWh), $35 for gas-fired space heating to compensate for additional air exchange(0.2 air changes per hour in a 300 m3 home located in a 2800 degree-day (centigrade, base 18C) climate, at $0.57/therm), and $50 for annual monitoring, occasional fan replacement, andadditional minor maintenance. The cost data apply for homes with basements; less informationis available on the cost of reducing radon levels in houses with slab-an-grade or crawl-spacesubstructures.
103

The benefit in reducing risks depends on the average effectiveness of remediation. If allsingle-family dwellings having a radon concentration above 150 Bq/m3 (4 pCi/I) were reducedto the present average of 55 Bq/m3
, the reduction in total population exposure would be 22%.6If the mitigation measures were less effective, so that the average concentration in remediatedhOusing were 150 Bq/m3
, the reduction in total population exposure would be 12%. The meanof these two results, i.e. reduction to an average of 100 Bq/m3
, is used here for illustration.According to the risk estimates presented in Table 8 for a stable population, completeimplementation of the current EPA/CDC policy would reduce the population exposure by 17%,ultimately leading to an annual avoidance of 2500 lung cancer deaths per year - 2300 amongsmokers and 200 among nonsmokers. An annual lung cancer mortality of more than 12,000cases would stiU be attributed to radon exposures.
Assuming a 30-year average effective lifetime for remediated households, the average cost (netpresent value) per lung cancer death averted under the current guidelines is estimated to be$0.27 million.7 This compares favorably with the range of $0.4-7 miUion per death avertedthat the EPA considers reasonable to justify the cost of controlling an environmental pollutant(Puskin and Nelson 1989). However, as discussed in Section VI.A.l, the case of indoor radonis not analogous to the situations in which an activity by some external organization isresponsible for the hazardous exposure, and public funds are to be spent for remediation. Byalternative comparisons, radon remediation is not as attractive. For example, the costs perdeath averted for installing smoke detectors in homes and for installing passive restraints inautomobiles have been estimated at $30,000 and $100,000, respectively, and yet these riskreducing measures are not uniformly required.
As the guideline for remedial action increases, the average cost-effectiveness of radon controlimproves. Table 9 shows the results for five action levels applied to single-family dwellings,assuming in each case that remedial measures reduce the average indoor concentration to 100Bq/m3
, and that the average cost of remediation is independent of the action level. Theseaction levels correspond approximately to the range of values recommended in differentcountries (Table 7). At the higher guideline levels, most of the cost is associated with thescreening measurement program, which is assumed to include every home. Mitigation at thesehigher levels could be made much more cost effective by developing more efficient means foridentifying households with elevated concentrations, e.g., by first identifying areas with highaverage concentrations, then monitoring intensively in those areas.
For this range of action guidelines, the reduction in population exposure resulting from asuccessful mitigation program is a small fraction, 0.01-0.17, of the current exposure. Toreduce the current population exposure by a large fraction, remediation would be required in amajority of households, with an action guideline much lower than the current EPA/CDCrecommendation. For an action level below 150 Bq/m3 (4 pei/I), the cost-effectiveness ofmitigation is uncertain, but would probably be reduced. A larger fraction of households wouldrequire remediation, reducing the average cost per home of identifying those above the
6Radon concentrations would be reduced from an average of 260 Bq/m3 to 55 Bq/m3 in 4.4million dwellings (7.3% of the 60 million single-family residences), housing 12 millionindividuals. Assuming average occupancy of 75%, and 50% equilibrium between radon's decayproducts and radon, the exposure rate would be reduced by an average of 1.07 WLM y-l forthese 12 million individuals, corresponding to 0.054 WLM y-1 or 22% when averaged over theentire population.
7Cos t (net present value) per death averted computed as $20 billion/(30 years x 2500 cases" -1\ _ 'l:f\ 27 .... ;II;"~ par ~nsaJ I - ~v. , au.l .lVIl ,",,1 \".41 'l;'.
104

Table 8. Estimated annual lung cancer deaths in the United States attributable to radonexposure.*
Population1000s
Lung Cancer Death Rate (y-l)All Causes Radon-Attributable
Current Population ( 1986)Male
never smokedformer smokercurrent, light smoker+current, heavy smoker+
Femalenever smokedformer smokercurrent, light smoker+current, heavy smoker+
Male, totalFemale, totalCurrent population, total
Stable Population ++Male
nonsmokersmoker
Femalenonsmokersmoker
Male, totalFemale, totalStable population, total
63,900 1,900 ,20026,100 42,900 4,80018,200 21,400 2,6008,900 22,600 3,100
81,300 3,100 ,30017,100 14,700 1,70020,000 15,800 1,900
5,300 8,000 1,100
117,400 88,800 10,700123,700 41,600 5,000241, 100 130,400 15,700
82,300 5,900 ,68035,000 67,000 7,700
84,300 4,100 ,47039,400 55,000 6,100
117,400 73,000 8,400123,700 59,000 6,600241,100 132,000 15,000
* Individual entries rounded. For the current population, data were obtained from thefollowing sources: (a) total population by age and sex from 1986 deaths and death rates, U.S.Department of Health and Human Services (1988); (b) population smoking habits by age and sexfrom U.S. Bureau of the Census (1987); (c) relative risks of death due to lung cancer by age,sex, and smoking habit from Mattson et al. (1987); (d) total lung cancer mortality rates 'by ageand sex from National Center for Health Statistics (1988) Table 8.5. For the stable populationcalculations, individuals were assumed to either begin a lifelong smoking habit at age 20 or tonever smoke. The proportion of males and females at 20 who smoke was taken to be 0.44 and0.45, respectively, corresponding to the respective proportions in the age group 20-24 who haveever smoked (reference cited in b above). Separate life tables were constructed by sex andsmoking status using 1986 mortality statistics (reference cited in a above) and relative mortalityrates by all causes for light smokers (less than 25 cigarettes per day) and persons who havenever smoked (reference cited in c above). Lung cancer death rates were assumed to be thesame as for the current population. For both conditions, lung cancer mortality rates werecorrected for radon-attributable lung cancer incidence to obtain non-exposed incidence rates.Additional references for preparing this table: Nero et al. 1986; NAS 1988.+ Light smoker defined as one smoking less than 25 cigarettes per day.++ "Stable" means zero-growth with current age-dependent mortality rates.
105

Table 9. Societal costs and health benefits associated with different action limits for indoor radon control*
Aggregate Cost
Guideline (NPV, Sbillion)
Affected Pop. Exp.
Homes Reduction Deaths Averted Cost per Death Averted
(Bq/m3 ) (pCi/l) (mi II ion) (~) (No./30 years) Heas. Hitigat. Total (NPV, Sthousand)
150 4 4.2 17 75,000 2.0 18 20 270
250 7 1.4 10 44,000 1.5 6.1 7.6 170
400 11 0.4 5 22,000 1.3 1.7 3.0 140
600 16 0.1 2 8,800 1.2 0.4 1.6 180
800 22 0.04 1 4,400 1.2 0.2 1.4 320
~
o~ * Assumptions: (a) only single family dwelling exceed guideline; (b) reduction to 100 Bq/m3 achieved in each remediation; (c) distribution of radon
concentration in single-family dwellings as given in Nero et al. (1986); (d) dose reduction averaged over entire population, assuming average exposure
equals 0.25 ~LH/y; (e) 69% of population lives in 60 million single family residences with an average occupancy of 75~; (f) premature lung cancer
deaths averted computed assuming the mitigation measures are effective over a thirty-year period; (g) cost data: screening measurements @ S15 each in
80 million residential dwellings, follow-up measurement @ S50 in four times the number of homes requiring mitigation, and net present value of
installation ($1500), operation ($135 per year) and maintenance (S50 per year) of mitigation system is S4340, computed with a 5% discount rate.

criterion. However, most of the cost would be associated with mItlgation, and the cost ofremediation per household may be higher. Furthermore, the average reduction in exposure perhome remediated would be smaller. At present there is little practical experience withreducing indoor radon to a concentration below ISO Bq/m3
.
Because of the apparent synergistic interaction between smoking and radon (NAS 1988), andbecause of the mobility of the U.S. population, the cost of controlling indoor radon is lessattractive to certain individuals than to society as a whole. Consider, for example, an owneroccupied residence inhabited by four lifelong nonsmokers: two adults, aged 40 (male andfemale), and two children, aged 10 (male and female). Assume that the home is to beoccupied for ten years before the family moves, that the average indoor radon concentration is260 Bq/m3 (the average concentration in households with a concentration above 150 Bq/m3
according to the lognormal representation of the distribution from Nero et al. 1986), and thatremediation at the average cost cited earlier would reduce the average indoor concentration to100 Bq/m3
. The average net present value of the homeowner's cost for remediation would beapproximately $3000.8 The remediation would lead to a cumulative reduction in exposure perhousehold of 33 WLM for the four occupants over ten years.9 From the risk projections of theHEIR IV committee, the lifetime risk of one lung cancer death in the family would be 0.0227in the absence of remediation and 0.0216 with remediation. The informed homeowner wouldbe faced with this question: Is it worthwhile to spend $3000 today to reduce the risk by about5% in relative terms (or about 1 in 1000 in absolute terms) that someone in my family will dieof lung cancer? For a cohort of such households, an average of one lung cancer death wouldbe avoided for every 900 homes remediated. Thus, the average cost (net present value) perlung cancer death averted is $2.7 million, not including the expense of initially identifying thehouseholds. Since the costs of remediation are not strongly dependent on the initial radonconcentration, applying control becomes progressively more attractive at higher indoorconcentrations, but progressively less so at lower concentrations. Also, the initial expense ofinstalling a radon-mitigation system may be recovered when the home is sold, thereby reducingthe overall mitigation cost to the present homeowner.
From the perspective of a household in which there are smokers, the cost of radon remediationappears more attractive. If, in the previous example, all four family members were - or, inthe case of the children, would become - smokers, the lifetime risk of at least one lung cancerdeath in the family would be 0.35 without remediation and would be reduced by 0.016 (to0.33) with radon mitigation. The reduction in absolute risk is more than an order ofmagnitude larger than for the nonsmoking family at the same cost. On average, one lungcancer death would be averted in a cohort of 60 such households in which mitigation wasapplied, implying an average cost per lung cancer death averted of only $180,000 (againexcluding the cost of initially identifying the houses). However, in the absence of incentivessuch as low-interest loans for remediation, it seems unlikely that most smokers would make thenecessary investment to reduce the radon-related risk of lung cancer when the dominant causeof their risk is smoking.
From a public health perspective, the goal of reducing lung cancer incidence also may be moreeasily met by changing the population's smoking habits rather than by aggressive measures toreduce indoor radon concentrations. It is estimated that 85% of the annual lung cancer deathrate of 130,000 cases in the United States is due to cigarette smoking (National Center forHealth Statistics 1988; U.S. Department of Health and Human Services 1982). A permanent
8Installation cost of $1500, plus $185 per year in operation and maintenance expenses,discounted at an annual rate of 5%.
9Reduction by 160 Bq/m3 corresponds to 0.84 WLM y-l person- 1 in avoided exposure assuming75% occupancy and 50% equilibrium between radon's decay products and radon.
107

reduction by about 3% in the number of cigarette smokers would reduce the annual mortalitydue to lung cancer by the same amount as a radon-mitigation program that succeeded inachieving the EPA/CDC recommendations. The overall health benefit from reducing smokingto this extent would be much larger, since lung cancer is only one of several diseases to whichsmoking contributes. That is, a completely successful program, judged by the EPA/CDCguidance, would achieve a health benefit (occurring mostly among smokers) equivalent to a 1%reduction in smoking.
By legislation, a long-term national goal was recently established to make air within buildingsin the United States "as free of radon as the ambient air outside of buildings" (U. S. Congress1988). The legislation contains several provisions to promote movement towards this goal, suchas a requirement that EPA develop model construction standards for new buildings.
The implications of measures needed to achieve this goal are staggering. The indoor radonconcentration can only be reduced to the outdoor level by greatly reducing radon entry fromsoil, potable water, and building materials. As it is unlikely that radon entry from thesesources could be completely prevented, it would also be necessary to remove radon fromindoor air by filtration, for example with activated carbon (Bocanegra and Hopke 1989).
Whether this goal could be achieved in the existing housing stock is unclear. Certainly,substantial improvements in radon measurement and mitigation technology would be required.Even if it is technically feasible, the costs would be prohibitively large, on the order of $1trillion. 10
If this long-term national goal were achieved, the average cumulative exposure of the U.S.population to radon decay products would be lowered by about 75%,11 reducing the annualmortality from radon-related lung cancers by about 11,000 cases per year (l0,000 cases avertedper year among smokers, 900 among nonsmokers). An annual incidence of about 4,000 lungcancer deaths still would be attributed to radon exposure. Again assuming a 30-yeareffectiveness of mitigation, the cost per lung cancer averted is estimated to be about $3million.
Because mItIgation measures cost less to apply in new construction than in remediation, thisobjective would be less impractical, but still difficult and costly to achieve, if it wereimplemented gradually in new housing. Even in this case, though, an annual investment of atleast several billion dollars might be required to compensate for an expense of several thousanddollars in each of a million new housing units.
WOnly a rough estimate is possible, since there is no experience with reducing radon to thisextent. The average net present value of the initial and operating cost per householdremediated is estimated to be in the range $10,000-$16,000. Mitigation steps (and approximateaverage costs) are these: (a) reduce soil gas entry to meet current EPA guideline, $3-5 K; (b)further reduce soil gas entry to near zero ($3-5 K); (c) use activated charcoal or alternativefiltration technique to remove radon from indoor air ($4-6 K); (d) limit radon concentration inpotable water supplies (small); and (e) limit radon from building materials (small). Thesemeasures would have to be applied in most of the 90 million U.S. residences to achieve thelong-term national goal. If applied in 70 million households, the total net present value of thecost would be on the order of $1 trillion.
llContinuous exposure to the average outdoor level of 9 Bq/m3 results in an estimatedcumulative exposure to radon decay products of 0.063 WLM y-l, or 25% of the estimatedcurrent exposure, 0.25 WLM y-l.
108
2. Pitfalls and problems.
For the analyses of the previous section it was assumed that current technology for radonmeasurement and mitigation would be applied effectively. In fact, a number of problems mayprevent policy objectives from being achieved efficiently, as discussed in this section.
Most of the mitigation experience in the United States has been developed over the past fewyears in New York, New Jersey, Pennsylvania, and Washington. This experience is too recentto yield reliable information on the long-term efficacy of remedial measures, a necessaryfeature of an effective control program. Studies conducted a few years after installationindicate that a monitoring and maintenance program is necessary to ensure that mitigationmeasures continue to function effectively (Prill et al. 1989; Nitschke et al. 1988). Moreover,building practices vary widely across the country, so that the experience gained in one regionmay not be directly transferrable to another.
Quality assurance in radon detection is promoted by a measurement proficiency programestablished by the Environmental Protection Agency (Radon Technical Information Service1988). This program is necessary; however, it is not clear that it is sufficient to ensureaccurate measurements at concentrations near the guideline. In the test protocol, severaldetectors are exposed to an elevated, constant concentration of radon in a controlledatmosphere. By contrast, in measuring indoor concentrations, one or two detectors are exposedto a varying concentration of radon, which is often much lower than that used in the testprotocol, in an atmosphere in which temperature and humidity may be uncontrolled.Moreover, "blind" tests - Le., those in which the vendors do not know that their detectors arebeing tested - are only now being incorporated into the program. As a result, the truemeasurement uncertainty for a single measurement in a residence may be larger than suggestedby the 25% criterion for passing the test.
To achieve the long-term national goal, substantial improvements in measurement andmitigation technology would be required. Inexpensive monitoring devices routinely used forscreening and longer-term integrated measurements are not sufficiently sensitive to measureoutdoor radon concentrations accurately (a necessity for determining that the goal is beingmet). Equally important, there has been no direct experimental demonstration that indoorconcentrations of radon can be practically reduced to outdoor levels.
Furthermore, under current practice, one can expect many houses to be misclassified withrespect to the 150 Bq/m3 (4 pei/l) guideline. The EPA protocol entails a two-day screeningmeasurement, under closed-house conditions, on the lowest livable level of the home. Theintention is to produce the highest indoor concentration that may be sustained in the home.The screening measurement permits rapid action for those homes in which the indoor radonconcentration is exceedingly high. However, indoor radon concentrations fluctuate markedly,even under closed-house conditions, and the fluctuation periods can exceed the two-dayscreening measurement period (Scott 1989). One cannot conclude from a single screeningmeasurement result below 150 BQ/m3 that the annual average result for the household is belowthe guideline.
The results of screening measurements have also been misinterpreted in projecting themagnitude of the radon problem in U.S. housing (cf. Section ILA). Surveys have beenconducted using the screening protocol in twenty-five states over the past few years. Asignificant fraction of the households in each state yielded measurements exceeding ISO Bq/m3
,
a fact that was used to substantiate the recommendation for screening measurements in mosthomes. These results overstate the size of the problem because the measurements were madein closed houses and often in basements. Furthermore, due to temporal fluctuations, an
109
overestimate of the fraction of homes exceeding 150 Bq/m3 would also result from the twoday measurement protocol even if the measurements were conducted under ordinary livingconditions. 12
The objectives of current EPA/CDC policy cannot be met without widespread publiccompliance. The extent to which the U.S. public will follow these recommendations is notknown. However, experience in New Jersey suggests that even with a highly publicized andlarge local radon problem, and despite substantial support and encouragement fromgovernmental agencies, only a small fraction of residents have had a measurement made of theradon concentration in their home (Bynum et a1. 1988). Furthermore, much of themeasurement and mitigation effort has occurred with real estate transfers, suggesting thateconomic concerns about radon exceed personal health concerns.
To an extent, the decisions about whether to measure and to mitigate are appropriately left toindividual residents. However, there is a public interest in reducing indoor radon exposures.Because the U.S. population is highly mobile, a homeowner will be less likely to adopt controlmeasures than would the society operating as a unit unless mitigation is required or unless itscost is recovered through increased property values. Furthermore, the costs of medical careare largely borne by society through insurance, rather than directly by individuals. Inaddition, under the current policy, remediation is unlikely in homes that are rented.
Although the projected health consequences associated with indoor radon exposure are large, ithas not yet been possible, and will be difficult in the future, to demonstrate a compellingassociation between environmental radon exposure and lung cancer rates. Also, because of theseparation in time between exposure and effect, and because of the large incidence of lungcancer from smoking, a specific lung cancer death cannot reliably be attributed to radonexposure. Amidst this uncertainty, arguments are put forth that indoor exposures to radon aremuch less hazardous than the risk projections presented in this paper would suggest (Cohen1989b). Such controversy diminishes the will of the public to take corrective action.
.In addition, it is important to recognize that even with an aggressive program to reduce radonexposures, benefits will not be observed quickly. There is a latency period following exposurebefore the onset of illness. Thus, following a change in the population exposure, no change inlung cancer rate would be expected until the latency period (five years, according to the BEIRIV committee (NAS 1988» has elapsed. Evidence also suggests that increased risk due toexposure persists (with some reduction in magnitude) throughout life. Therefore, decadeswould elapse following full implementation of remediation measures before a substantialfraction of the benefit of reduced risks would be expressed, and even then the reduced risksmay not be detectable, particularly if cigarette smoking habits continue to change.
According to the parameters of the lognormal distribution of indoor radon concentrationspresented in Nero et al. (1986), there are approximately 70,000 homes in the United States inwhich the average radon concentration exceeds 800 Bq/m3
. At this level, a 75%-time occupantreceives a cumulative exposure of 4 WLM y-l, equal to the limit for underground uraniumminers (Federal Register 1968). For an individual exposed at this level throughout life, the
12Because of the large temporal fluctuations in concentrations, some homes with annualaverages below 150 Bq/m3 will be measured at greater than 150 Bq/m3
, and, conversely, somehomes with annual averages above 150 Bq/m3 will be measured at concentrations below thisguideline. But, because of the shape of the distribution of indoor concentrations, among allhomes with mean concentrations within an increment, €, of the 150 Bq/m3 guideline, manymore are below rather than above this leveL Therefore, the incidence of faise positives isexpected to exceed the incidence of false negatives, and so the number of homes above theguideline is overestimated.
110

risk of lung cancer is extraordinarily high, ranging from 2% for female nonsmokers to 33% formale smokers (NAS 1988).13 By almost any criterion, this level of health risk due tounsuspected exposure to radon's decay products in one's home is unacceptable. It should be ahigh priority to rapidly identify these homes and take corrective measures to reduce exposuresin them. The establishment of the stringent long-term national goal may divert attention andresources from those homes in which the problem is acute. Indeed, strict emphasis onachieving the EPA guideline in the millions of homes that have concentrations only moderatelyabove 150 Bq/m3 may dilute the overall effectiveness of the effort to identify and takeremedial action in the small fraction of these homes in which the indoor radon concentration isextraordinarily large.
3. Moving towards a coherent policy.
In this section, some important characteristics of a reasoned response to indoor radon arediscussed. These issues are, at best, underemphasized in the current approach. In our view,these aspects must be explicitly incorporated to make effective progress toward the goal ofreducing indoor radon exposures.
As discussed in Section VLA, a comprehensive control strategy for limiting exposure to indoorradon may be viewed as having three key elements: a system of exposure guidelines, methodsfor classifying buildings with respect to the guidelines, and a framework for prescribing andimplementing control techniques. Each of these elements can be found at a minimal level inpresent federal policy. However, formulating these elements independently does not, by itself,constitute the development of a comprehensive strategy. Effort must also be devoted toresolving some fundamental, underlying issues in controlling radon and other indoor airpollutants as well. For example, the respective responsibilities of the concerned parties owners, occupants, builders, and local, state, and federal governments - remain ambiguous. Acohesive strategy for controlling indoor radon cannot be developed without integratingtechnical assessments with an understanding of political, economic, and legal aspects of theissue. Beyond establishing objectives, methods for achieving these goals must be carefullyplanned. To do so requires a concerted effort that is more explicit and detailed than has so farbeen undertaken.
Turning to more specific issues, the EPA/CDC recommendation that a screening measurementbe made in virtually every home is an inefficient means to achieve the goal of identifyinghomes with annual average concentrations exceeding 150 Bq/m3 (4 pCi/I). The major value ofa screening measurement is to identify homes in which the radon concentrations are so highthat remedial action should be taken before an annual or seasonal average measurement can becompleted. (Even in homes with concentrations above 200 pCi/1 (7400 Bq/m3), it isrecommended that a follow-up short-term (one-week) measurement be made beforeundertaking remedial measures.) As discussed in Sections II.C and VI.A.3, these homesconstitute a very small fraction of the housing stock, and, because they occur in clusters, canbe identified more efficiently by methods other than measuring every household. Increasedattention should be given to the possibility of using geological information, in combinationwith radon concentration measurements in a sample of homes in a region, to identify areas inwhich a significant probability of very high concentrations exists (Duval 1983; Kothari andHan 1984; Revzan et al. 1988). Greater effort should also be devoted to developingmechanisms for providing information to residents on the distribution of indoor radonconcentrations in their communities so they can make informed decisions on whether tomeasure radon in their homes (Bynum et a1. 1988).
13 By comparison, in the absence of radon exposure, the lifetime risk of lung-cancer IS
estimated to be 0.6% for female nonsmokers and 12% for male smokers.
III

Because of the large, naturally occurring, temporal variations in indoor radon concentrations,screening measurements cannot be considered a reliable indicator of long-term averageexposure conditions, the parameter of concern for assessing the risk of lung cancer.Misinterpretation of the results of screening measurements has generated much confusion aboutthe extent of the indoor radon problem. Instead of encouraging screening measurements,measurements of long-term average concentrations under actual living conditions should bepromoted. The results of these measurements provide a superior basis for making decisionsabout remediation.
To a greater extent than for the control of many other environmental pollutants, public supportand cooperation are vital for achieving reductions in radon exposure. Public information andtraining provided by the EPA contribute to this goal, but more could be done. For example,EPA's establishment of a remedial action guideline may yield a de facto standard that affectsmuch of the population without any formal mechanism for criteria development, scientificreview, or public comment. The federal government's response to indoor radon should bereassessed through a means that encourages discussion and debate.
Turning to consideration of the TSCA amendment, much of the cost to achieve the long-termnational goal as presently stated would be spent to achieve small marginal reductions inexposure. Most of the benefit of this goal could be realized at a small fraction of the cost byestablishing a target concentration in the vicinity of 25-50 Bq/m3 and by attempting to achievethis goal only in new construction. The long-term goal should be supported by a plan forattainment, including a time frame.
In general, wherever possible, federal policy should promote a steady development of radonmeasurement and mitigation expertise, rather than a boom-bust cycle. Indoor radon is awidespread problem and there is a long history of human exposures. A crash program toidentify and mitigate homes above the present guideline is inefficient. If a backlash of publicopinion were to result from, for example, an overstatement of the magnitude of the problem,then the ultimate benefit may be smaller than that which could be achieved by a moreefficient, gradual response. Steady development would permit the growth of an infrastructureof trained individuals and businesses. Mitigation measures could be steadily improved. Bettermeasurement techniques might be developed. More information would become available onthe health risks of environmental exposures, yielding a stronger basis for mitigation decisions.These benefits cannot be realized if the radon problem is treated as an epidemic that requiresrapid countermeasures with little regard for scientific uncertainties and accompanying costs.
A steady response will be encouraged if our primary short-term goal is to identify and applyremedial measures in houses having indoor concentrations that are extremely high. Byreducing radon concentrations in these homes, we can ensure that individual risks due toindoor radon exposure are not extraordinarily high relative to those that are routinely acceptedin association with other activities, such as riding in a car. With vigorous and focused effort,it might be possible to identify and correct excessive concentrations in these homes within afew years. Ultimately, any substantial reduction in the cumulative population exposure wouldrequire concentration reductions in a large fraction of the building stock. If this goal is to besought, it could best be accomplished gradually, with relatively stringent controls applied tonew construction and, possibly, a second level of control in existing buildings. As decadeswould be required to achieve such a goal, the opportunity is available to deliberately considerits merits and costs, and to improve the basis for making decisions by developing additionalinformation. We are most likely to reduce radon-related health risks at reasonable cost only ifwe apply a sustained and steady effort to the problem of reducing indoor exposures.
112

Acknowledgments
This work was supported by the Director, Office of Energy Research, Office of Health andEnvironmental Research, Human Health Assessments Division and Pollutant Characterizationand Safety Research Division of the U.S. Department of Energy under Contract No. DE-AC0376SF00098.
We would like to thank R.C. Diamond, E.O. Knutson, W.M. Lowder, R.G. Sextro, and H.A.Wollenberg, Jr., as well as others in and for the U.S. Department of Energy, for theircomments on this report. We are also grateful to T.D. Gartner and R.M. Rodriguez for theirefforts in preparing the manuscript.
113

REFERENCES
AECB 1978-80: Atomic Energy Control Board. Canada. 1st, 2nd, and 3rd Workshops on radon
and radon daughters in urban communities associated with uranium mining and processing,
Elliot Lake, Ontario, March 7-9, 1978, Bancroft. Ontario, March 13-14, 1979, and Port Hope,
Ontario, March 13-14, 1980.
Aitchison, J. and Brown. J.A.C. (1957). The Lognormal Distribution, Cambridge Univ. Press,
Cambridge, England.
Akerblom, G .• Andersson, P. and Clavensjo, B. (1984). Soil gas radon -- a source for indoor
radon daughters, Rad. Prot. Dos. 7, 49.
Alter, H.W. and Fleischer. R.L. (1981). Passive integrating radon monitor for environmental
monitoring. Health Phys., 40, 693.
Alter, H.W. and Oswald, R.A. (1987). Nationwide distribution of indoor radon concentrations: a
preliminary data base, J. Air Pollution Control Ass. 37, 227.
Alter, H.W. and Oswald, R.A. (1989). Nationwide distribution of indoor radon measurements, in
USEPA 1989b, p. 3-1.
Aoyama, T. et al. (1987). Long-term measurements of radon concentrations in the living
environments in Japan: a preliminary report, in Hopke 1987, p. 124.
APCA (1986). Indoor Radon, Air Pollution Cont. Assoc. Specialty Conf. Proceedings SP-54,
Pittsburgh. Pa.
APCA (1987). Indoor Radon II, Air Pollution Cont. Assoc. Specialty Conf. Proceedings SP-60
and Supplement. Pittsburgh, Pa.
ASHRAE (1989). Ventilation for acceptable indoor air quality, Standard 62-1989, American
Society of Heating, Refrigeration. and Air-Conditioning Engineers, Atlanta. GA.
Arvela, H., Voutilainen, A., Makelainen, I., Castren. O. and Winqvist. K. (1988), Comparison ofpredicted and measured variations of indoor radon concentration. Rad. Prot. Dos. 24, 231.
Asikainen. M. and Kahlos, H. (1980). Natural radioactivity of drinking water in Finland, Health
Phys.. 39, 77.
Bigu, J. (1985). Radon daughter and thoron daughter deposition velocity and unattached fraction
under laboratory-controlled conditions and in underground uranium mines. J. Aerosol Sci .. 16,
157.
Bocanegra, R. and Hopke, P.K. (1989). Theoretical evaluation of indoor radon control using a
charcoal adsorption system, J. Air Pollution Control. Assoc. 39. 305.
Borak, T.B., Woodruff, B.• and Toohey, R.E. (1989). A survey of winter, summer, and annual
average 222Rn concentrations in family dweiiings, Health Phys. 57, 465.
114
BPA (1986). Radon monitoring results from BPA's residential weatherization Program,
Bonneville Power Administration Report DOE/BP- 71.
Browne, E. and Firestone, R.B. (1986). Table of radioactive isotopes (V.S. Shirley, ed.), Wiley:
New York.
Bruno, R.C. (1983). Sources of indoor radon in houses: a review, J. Air Pollution Control Assoc.
33, lOS.
Bruno, R.C. (1983b). Verifying a model of radon decay product behavior indoors, Health Phys ..
45, 471.
Budnitz, R.J. (1974). Radon-222 and its daughters - a review of instrumentation for
occupational and environmental monitoring, Health Phys .. 26, 145.
Bynum, J., Klotz, J., Cahill, M., and Nicholls, G. (1988). The rationale and experiences in
implementing New Jersey's Radon Program, paper 88-106.5, Air Pollution Control Association,
Pittsburgh, PA.
California Department of Health Services (1989). Radon in California schools, news release,
Sacramento, CA, April 20.
Castren, 0., Voutilainen, A., Winqvist, K., and Makelainen, I. (1985). Studies of high indoor
radon areas in Finland, Sci. Total Environ.. 45, 311.
Castren, 0., Makelainen, I., Winqvist, K., and Voutilainen, A. (1987). Indoor radon
measurements in Finland: A status report, in Hopke 1987, p. 97.
. CDM, Camp Dresser & MeKee (1989). Statewide Scientific Study of Radon, Summary Report,
New Jersey Department of Environmental Protection, Trenton, NJ.
Chu, K.-D. and Hopke, P.K. (1988). Neutralization kinetics for polonium-218, Environ. Sci.
Techno!.. 22, 711.
Cliff, K.D. (1978). Assessment of airborne radon daughter concentrations in dwellings in Great
Britain, Phys. Med. Bioi .. 23, 696.
Cliff, K.D., Wrixon, A.D., Miles, J.C.H., and Lomas, P.R. (1987). Remedial measures to reduceradon concentrations in a house with high radon levels, in Hopke 1987, p. 536.
Cohen, B.L. (1986). A national survey of 222Rn in U.S. homes and correlating factors, Health
Phys. 51, 175.
Cohen, B.L. (1987). Radon - A homeowner's guide to detection and control. Consumers Union,
Mount Vernon, NY.
Cohen, B.L. (1987b). Personal communication and draft paper.
Cohen, B.L. (1989). Table of "Radon levels by states and counties."
Cohen, B.L. (1989b). Correlation between mean radon levels and lung cancer rates in U.S.
counties: A test of the linear-no threshold theory, in USEPA 1989b, p. 2-15.
115

Cohen, B.L. and Cohen, E.S. (1983). Theory and practice of radon monitoring with charcoal
adsorption, Health Phys., 45, 501.
Cohen, B.L. and Nason, R. (1986). A diffusion barrier charcoal adsorption collection for
measuring Rn concentrations in indoor air, Health Phys. 50, 457.
Cohen. B.L., Kulwicki, D.R., Warner, K.R., Jr., and Grassi, c.L. (1984). Radon concentrations
inside public and commercial buildings in the Pittsburg area, Health Phys., 47, 399.
Castle, D.M. (1979). Recommendations for radiation protection of persons residing on
phosphate lands, contained in a letter from U.S. EPA Administrator Castle to the Governor of
Florida, 30 May.
Culot, M.V.J., Schiager, K.J., and Olson, H.G. (1978). Development of a radon barrier, Health
Phys. 35, 375.
Dietz, R.N., and Cote, E.A. (1982). Air infiltration measurements in a home using a convenient
perfluorocarbon tracer technique, Environ. Int., 8, 419.
Doyle, S.M., Nazaroff, W.W., and Nero, A.V. (1984). Time-averaged indoor radon
concentrations and infiltration rates sampled in four U.S. cities, Health Phys., 47, 579.
DSMA Atcon Ltd. (1983). Review of existing instrumentation and evaluation of possibilities for
research and development of instrumentation to determine future levels of radon at a proposed
buildings site, Atomic Energy Control Board Report INFO-0096, Ottawa, Canada.
Duval, J.S. (1983). Composite color images of aerial gamma-ray spectrometric data, Geophys. 48,
722.
Duval, J.S. (1989). Radon prediction using gamma-ray spectrometric data (abstract), EOS 70,
496.
Duval, J.S., Onon, J.K., and Jones, W,J. (1989). Estimation of radon potential in the Pacific
Northwest using geological data, Bonneville Power Administration Report DOE/BP-1234.
Ericson, S.-O. (1987). Modified design in new construction prevents infiltration of soil gas that
carries radon, in Hopke 1987, p. 526.
Federal Register (1968). Vol. 33, 19947, 28 December
Federal Register (1986). Vol. 51,34836, 30 September
Fisenne, I.M., George, A., and McGahan, M. (1983). Radon measurement intercomparisons,
Health Phys. 45, 553.
Fisk, W.J. and Turiel, I. (1983). Residential air- to-air heat exchangers: Performance,
energy-savings, and economics, Energy and Buildings, 5, 197.
Fisk, W.J., Spencer, R.K., Grimsrud, D.T., Offerman, F.J., Pedersen, B., and Sextro, R.G.
(1984), Indoor air quality control techniques: a critical review, Lawrence Berkeley Laboratory
Report, LBL-16493.
116

Fisk, W.J., Flexser, S., Gadgil, A.J., Holman, H.-Y., Modera, M.P., et a1. (1989). Monitoring
and modeling for radon entry into basements: a status report for the small structures project,
Lawrence Berkeley Laboratory Report, LBL-27692, Berkeley, CA.
Garbesi, K. and Sextro, R.G. (1989). Modeling and field evidence of pressure-driven entry of
soil gas into a house through permeable below-grade walls, Environ. Sci. Technol. 23, 1481.
George, A.C. (1972). Indoor and outdoor measurements of natural radon and radon decay
products in New York City air, in Natural Radiation Environment, Adams, J.A.S., Lowder,
W.M., and Gesell, T.F., Eds., CONF-720805, National Technical Information Services,Springfield, VA, p. 741.
George, A.C. (1980). Radon and radon daughter field measurements, in Pmc. Seminar on
Traceability for Ionizing Radiation Measurements. National Bureau of Standards, Washington,
DC.
George, A.C., and Breslin, A.J. (1980). The distribution of ambient radon and radon daughters
in residential buildings in the New York-New Jersey area, in Natural Radiation Environment
Ill, Gesell, T.F., and Lowder, W.M., Eds., Tech. Info. Ctr/DOE CONF-780422, Springfield,
VA, p. 1272.
George, A.C., Knutson, E.O., and Tu, K.W. (1983). Radon daughter plateout - I. Measurements,
Health Phys., 45, 439.
George, A.C., Duncan, M., and Franklin, H. (1984). Measurements of radon in residential
buildings in Maryland and Pennslyvania, U.S.A., Radiat. Prot. Dosim. 7, 291.
Gesell, T.F. (1973). Some radiological aspects of radon-222 in liquified petroleum gas, in Nobel
Gases. Stanley, R.E. and Moghissi, A.A., Eds., U.S. Energy Research & Dev. Admin.
CONF-730915, Las Vegas, NV, p. 612.
Gesell, T.F. (1983). Background atmospheric 222Rn concentrations outdoors and indoors: A
review, Health Phys., 45, 289.
Girman, J.R., Apte, M.R., Traynor, G.W., Allen l.R., and Hollowell, C.D. (1982). Pollutantemission rates from indoor combustion appliances and sidestream cigarette smoke, EnvironmentInternational 8, 213.
Gobel, R., and Socolow, R. (1988). High radon houses: implications for epidemiology and risk
assessment, draft manuscript (Sept. 30).
Granlund, c.L. (1988). Personal communication
Green, B.M.R., Brown, L., Cliff, K.D., Driscoll, eM.H., Miles, J.c., and Wrixon, A.D. (1985).
Surveys of natural radiation exposure in UK dwellings with passive and active measurement
techniques, Sci. Total Environ., 45, 459.
Grimsrud, D.T. (1988). Personal communication.
Grimsrud, D.T., Modera, M.P., and Sherman, M.H. (1982). A predictive air infiltration model
-- long-term field test validation, ASHRAE Trans. 88, 1351.
117

Grot, R.A. and Clark, R.E. (1981). Air leakage characteristics and weatherization techniques for
low-income housing, in Thermal Performance of the Exterior Envelopes of Buildings, Report
ASHRAE SP28, American Society of Heating, Refrigerating and Air Conditioning Engineers,
New York, p. 178.
Gunning, C. and Scott, A.G. (1982). Radon and thoron daughters in housing. Health Phys., 42,
527.
Haghighat, F., Chandrashekar, M. and Unny T.E. (1987). Thermal behaviour of buildings under
random conditions, Applied Mathematical Modeling, Vol. 11, p. 349
Haghighat, F., Fazio, P, and Unny, T.E. (1988). A predictive stochastic model for indoor air
quality, Building and Environment, 23, 195.
Harley, N.H. (1984). Comparing radon daughter dose: environmental versus underground
exposure, Rad. Prot. Dos., 7, 371.
Hartwell, T.D., Perritt, R.L., Sheldon, L.S., Cox, B.G., Smith, M.L., and Rizutto, J.E. (1987).
Distribution of radon levels in New York State homes, in Seifert et al. 1987, Yol. 2, p. 398; for
more recent results, cf. R.L. Perritt et aI., Distribution of radon levels in New York State
homes, in USEPA 1989b, p. 3-37, and R.L. Perritt et aI., manuscript submitted to Health Phys.
1989.
Henschel, D.B. and Scott, A.G. (1986). The EPA program to demonstrate mitigation measures
for indoor radon: initial results, in APCA 1986, p. 110.
Hess, C.T., Weiffenbach, C.Y., and Norton, S.A. (1983). Environmental radon and cancer
correlations in Maine, Health Phys., 45, 339.
Hess, C.T., R.L. Fleischer, L.G. Turner (1985). Field and laboratory tests of etched track
detectors for 222Rn: summer-vs-winter variations and tightness effects in marine houses, Health
Phys. 49, 65.
Hildingson, O. (1982). Radon measurements in 12,000 Swedish homes, Environ. Int., 8, 67.
Holub, R.F., Droullard, R.F., Borak, T.B., Inkret, W.C., Morse, J.G., and Baxter, J.F. (1985),Radon-222 and 222Rn progeny concentrations measured in an energy-efficient house equipped
with heat exchanger, Health Phys.. 49, 267; see also related correspondence (1988) in Health
Phys. 55, 1005 ff.
Hopke, P.K. (Ed.) (1987). Radon and its decay products - occurrence, properties and health
effects, American Chemical Soc. Symposium Series 331, Washington, D.C.
Hopke, P.K. (1988). The initial atmospheric behavior of radon decay products, Report
DOE/ER-0375, U.S. Department of Energy, Washington, D.C.
Horton, T.R. (1985). Nationwide occurrence of radon and other natural radioactivity in public
water supplies, Report EPA 520/5-85-008, U.S. Environmental Protection Agency, Eastern
Environmental Radiation Facility, Montgomery, AL.
118

Hubbard, L. Gadsby, K., Bohac, D., Lovell, A., Harrje, D., Socolow, R., Matthews, T.,
Dudney, c., and Sanchez, D. (1988), Radon entry into detached dwellings: house dynamics andmitigation techniques, Rad. Prot. Dos. 24, 491.
Hubbard, L.M, Bolker, B., Socolow, R.H., Dickerhoff, D., and Mosley, R.B. (1989), Radon
dynamics in a house heated alternatively by forced air and by electric resistance, in USEPA
1989b, p. 6-1.
ICRP (1984). Principles for Limiting Exposure of the Public to Natural Sources of Radiation.
International Commission on Radiological Protection, publication 39, Annals of the ICRP, 14,
No.1.
Ingersoll, J.G. (1983). A survey of radionuclide contents and radon emanation rates in building
materials used in the U.S., Health Phys.. 45, 363.
Jacobi, W. (1972). Activity and potential alpha energy of radon 222 and radon 220 daughters indifferent air atmospheres, Health Phys., 22, 441.
James, A.C. (1988). Lung dosimetry, in Nazaroff and Nero 1988, p. 259.
James, A.C. (1989a). Reassessment of factors influencing lung dose from radon daughters, paper
presented at a technical exchange meeting on "Assessing Indoor Radon Health Risks," Grand
Junction, Sept. 18-19.
James, A.C. (1989b). Personal communication.
Johnson, R.H., Bernhardt, D.E., Nelson, N.S., and Galley, H.W. (1973). Radiological health
significance of radon, in Noble Gases, Stanley, R.E. and Moghissi, A.A., Eds., U.S. Energy
Research & Dev. Admin. report CONF-730915, Las Vegas, NV, p. 532.
Jonassen, N. (1984). Removal of radon daughters by filtration and electric fields, Rad. Prot.
Dos.. 7, 407.
Jonassen, N. and McLaughlin, J.P. (1988). Removal of radon and radon progeny from indoor
air, in Nazaroff and Nero 1988, p. 435.
Keller, G., and Folkerts, K.H. (1984). A study on indoor radon, in Indoor Air: Radon. Passive
Smoking. Particulates and Housing Epidemiology. Vol. 2. Berglund, B., Lindvall, T., andSundell, J., Eds., Swedish Council for Building Research, Stockholm, p. 149.
Keller, G., Folkerts, K.H., and Muth, H. (1982). Activity concentrations of 222Rn, 22oRn, and
their decay products in German dwellings, dose calculations and estimate of risk, Radiat.
Environ. Biophys.. 7, 263, cited in Schery 1986.
Kliest, J., Fast, T., Boley, J.S.M., van de Wiel, H., and Bloemen, H. (1989). The relationship
between soil contaminated with volatile organic compounds and indoor air pollution,
Environment International 15,419.
Knutson, E.O. (1988). Modeling indoor concentrations of radon's decay products, in Nazaroff
and Nero 1988, p. 161.
119

Kothari, B.K. and Han, Y. (1984). Association of indoor radon concentrations with airborne
surveys of uranium in surficial material, Northeastern Environ. Sci. 3, 30.
Kunz, e., Laymon, C.A., and Parker, e. (1988). Gravelly soils and indoor radon, in USEPA
1989b, p. 5- 75.
Kunz, e.O. (1988). Indoor radon: source characterization, Environmental Progress, 7, 236.
Letourneau, E.G. (1986). Radon standard for Canada, in Indoor Air Quality in Cold Climates:
Hazards and Abatement Measures. D.S. Walkinshaw, ed., Air Pollution Control Association,
Pittsburgh, PA. p. 488-495.
Lederer, e.M. and Shirley, V.S. (1978). Table of Isotopes. 7th Ed., Wiley-Interscience, New
York.
Liddament, M. and Allen, C. (1983). The validation and comparison of mathematical models of
air infiltration, AIC 1I, Technical Note, Air Infiltration Centre, Bracknell, Great Britain.
Los Angeles Times (1988). Results of radon survey
Loureiro, e. de Oliveira (1987). Simulation of the steady-state transport of radon from soil into
houses with basements under constant negative pressure, LBL-24378.
Lubin, J.H. and Boice, Jr., J.D. (1989). Estimating Rn-induced lung cancer in the United States,
Health Phys .. 57, 417.
Maher, E.F., Rudnick, S.N. and Moeller, D.W. (1987). Effective removal of airborne 222Rn
decay products in buildings, Health Phys. 53, 351.
Mansfield, R.H., III (1986). How radon gas will affect the relocation industry, Mobility.
July-August, p. 6.
Martz, D.E., Harris, R.T., and Langner, G.H., Jr. (1989). The half-life of 218pO, Health Phys ..
57, 121.
Martz, D.E., George, J.L., Mamich, S.T., and Langner, G.H., Jr. (l989b). Validation of the
diffusion barrier charcoal cannister method, U.S. DOE Grand Junction Projects Office, report
UNCjGJ-47 (TMC), Grand Junction, CO.
Mattson, M.E., Pollack, E.S., Cullen, J.W. (1987). What are the odds that smoking will kill you?,
Amer. J. Public Health 77, 425.
Matthews, T.G., Wilson, D.L. TerKonda, P.K. Saultz, R.J., Goolsby, G., Burns, S.E., and Haas,J. W. (I989). Radon diagnostics: subslab communication and permeabiliity measurements, in
USEPA 1989b, p. 6-45.
McCann, J., Horn, L., Girman, l.R., and Nero, A. V. (1987). Potential risks from exposure to
organic carcinogens in indoor air, in S.S. Sanbhu et al. (Eds.) Short-Term Bioassays in the
Analysis of Complex Environmental Mixtures V. Plenum, New York.
McGregor, R.G., Vasudev, P., Letourneau, E.G., McCullough, R.S., Prantl, F.A., and
Taniguchi, H. (I980). Background concentrations of radon and radon daughters in Canadian
homes, Health Phys.. 39, 285.
120

McLaughlin, J.P. and Wasiolek, P. (1988). Radon levels in Irish dwelling, Rad. Prot. Dos. 24,
383.
Mercer, T.T. (1976). The effect of particle size on the escape of recoiling RaB atoms from
particulate surfaces, Health Phys., 31, 173.
Miksch, R.R., Hollowell, C.D., and Schmidt, H.E. (1982). Trace organic chemical contaminants
in office spaces, Environment International 8, 129.
Moed, B.A., Nazaroff,W.W., Nero, A.V., Schwehr, M.B., and Van Heuvelen, A. (1985).
Identifying areas with potential for high indoor radon levels: analysis of the national airborne
radiometric reconnaissance data for California and the Pacific Northwest, LBL-16955.
Mowris, R.J. and Fisk, W.J. (1988). Modeling the effects of exhaust ventilation on 222Rn entry
rates and indoor 222Rn concentrations, Health Phys. 54, 491.
Narasimhan, T.N., Tsang, Y.W., and Holman, H.-Y. (1989). On the potential of transient flow
in advective radon entry into buildings, to be published in Geophys. Res. Letts.
NAS (198 I). Indoor Pollutants, National Research Council, National Academy Press, Washington,
D.C.
NAS (1988). Health Risks 0/ Radon and Other Internally Deposited Alpha Emitters: Beir IV,
Committee on the Biological Effects of Ionizing Radiations, National Research Council, National
Academy Press, Washington, D.C.
National Center for Health Statistics (1988). Vital Statistics 0/ the United States, 1986. DHHS
Pub. No. (PHS) 88-1114, U.S. Government Printing Office, Washington, D.C., Table 8.5.
Nazaroff, W.W. (1988), Measurement techniques, in Nazaroff and Nero 1988, p. 491.
Nazaroff, W. W. and Cass, G.R. (l989a). Mass-transport aspects of pollutant removal at indoor
surfaces, Environ. Int., in press.
Nazaroff, W.W. and Cass, G.R. (l989b). Mathematical modeling of indoor aerosol dynamics,
Environ. Sci. Technol., 23, 157.
Nazaroff W.W. and Doyle, S.M. (1985). Radon entry into houses having a crawl space, Health
Phys .. 48, 265.
Nazaroff, W.W. and Nero, A.V. (1984). Transport of radon from soil into residences, in Indoor
Air: Radon, Passive Smoking, Particulates and Housing Epidemiology, Vol. 2, Berglund, B.,Lindvall, T., and Sundell, J., Eds., Swedish Council for Building Research, Stockholm, p. 15.
Nazaroff, W.W. and Nero, A.V. (Eds.) (1988). Radon and Its Decay Products in Indoor Air,
Wiley, New York.
Nazaroff, W.W. and Sextro, R.G. (1989). Technique for measuring the indoor 222Rn source
potential of soil, Environmental Science & Technology, 23, 451.
Nazaroff, W.W., Boegel, M.L., Hollowell, C.D., and Roseme, G.D. (1981). The use of
mechanical ventilation with heat recovery for controlling radon and radon-daughter
concentrations in houses. Atmos. Environ. IS, 263.
121
Nazaroff, W.W., Boegel, M.L., and Nero, A.V. (1983). Measuring radon source magnitude in
residential buildings, in Proc. International Meeting on Radon-Radon Progeny Measurements,
Report 520/5-83/021, U.S. Environmental Protection Agency, Washington, DC, p. 101.
Nazaroff, W.W., Offerman, F.J., and Robb. A.W. (1983). Automated system for measuring
air-exchange rate and radon concentration in houses, Health Phys., 45, 525.
Nazaroff, W.W., Feustel, H., Nero, A.V., Revzan, K.L., Grimsrud, D.T., Essling, M.A., and
Toohey, R.E. (1985). Radon transport into a detached one-story house with a basement, Atmas.Env., 19, 31.
Nazaroff, W.W., Lewis, S.R., Doyle, S.M., Moed, B.A., and Nero, A.V. (1987). Experiments on
pollutant transport from soil into residential basements by pressure-driven air flow, Environ.
Sci. and Tech., 21 459.
Nazaroff, W.W., Doyle, S.M., Nero, A.V., and Sextro, R.G. (l987b). Potable water as a source of
airborne 222Rn in U.S. dwellings: a review and assessment, Health Physics. 52, 281.
Nazaroff, W.W., Moed, B.A., and Sextro, R.G. (1988), Soil as a source of indoor radon:generation, migration, and entry, in Nazaroff and Nero 1988, p. 57.
NCRP (1984). Exposures /ram the Uranium Series with Emphasis on Radon and Its Daughters.
National Council on Radiation Protection and Measurements, Report No. 77, Bethesda, MD.
NCRP (1984b). Evaluation 0/ Occupational and Environmental Exposures to Radon and Radon
Daughters in the United States, National Council on Radiation Protection and Measurements,Report No. 78, Bethesda, MD.
NCRP (1985). A Handbook 0/ Radioactivity Measurement Procedures. 2nd Ed., National Coucilon Radiation Protection and Measurements, Report No. 58, Bethesda, MD.
NCRP (1988). Measurement 0/ Radon and Radon Daughters in Air. National Council on
Radiation Protection Measurements, Report No. 97, Bethesda, MD.
NCRP (1989). Control 0/ Radon in Houses, National Council on Radiation Protection and
Measurements, Report No. 103, Bethesda, MD.
Nero, A. V. (1983). Airborne radionuclides and radiation in buildings: A review. Health Phys.,
45, 303.
Nero, A.V. (1988). Controlling indoor air pollution, Scientific American, 258, 42.
Nero, A.V. (1988b). Elements of a strategy for control of indoor radon, in Nazaroff and Nero
1988, p. 459.
Nero, A.V. and Nazaroff, W.W. (1984). Characterising the source of radon indoors, Rad. Prot.
Dos.. 7, 23.
Nero, A.V., Berk, J.V., Boegel, M.L., Hollowell, C.D., Ingersoll, J.R., and Nazaroff, W.W.
(1983). Radon concentrations and infiltration rates measured in conventional andenergy-efficient houses, Health Phys., 45, 401.
122

Nero, A.Y., Schwehr, M.B., Nazaroff, W.W., and Revzan, K.L. (1986). Distribution of airborne
radon-222 concentrations in U.S. homes, Science, 234, 992.
Nero, A.Y., Revzan, K.L., and Sextro R.G. (1987). Appraisal of the U.S. data on indoor radonconcentrations, Presented at the Fourth International Symposium on the Natural Radiation
Environment, Lisbon, Portugal, December. Lawrence Berkeley Laboratory Report No.
LBL-24345.
Nitschke, LA., Clarkin, M.E., Brennan, T., Rizzuto, J.E. and Osborne, M. (1988). Long-termassessment of residential radon-mitigation systems, Paper 88-107.5, in Annual Meeting of the
Air Pollution Control Association, Dallas, Texas, June 19-24.
NJSDH (1989). A Case-Control Study of Radon and Lung Cancer among New Jersey Women
(Technical Report - Phase I), New Jersey State Department of Health, Trenton, NJ.
Offerman, F.J., Sextro, R.G., Fisk, W.J., Grimsrud, D.T., Nazaroff, W.W., Nero, A.Y., Revzan,
K.L., and Yater, J. (1985). Control of respirable particles in indoor air with portable air
cleaners, Atmos. Environ., 19, 1761.
Osborne, M.C. (I987). Resolving the radon problem in Clinton, New Jersey, houses, in Seifert et
al. 1987, p. 305.
Phillips, C.R., Khan, A. and Leung, H.M. Y. (1988). The nature and determination of the
unattached fraction of radon and thoron progeny, in Nazaroff and Nero 1988, p. 203.
Poffijn, A., Marijns, R., Yanmarke, H., and Uyttenhuve, J. (1985). Results of a preliminary
survey on radon in Belgium, Sci. Total Environ., 45, 335.
Porstendorfer, J. (1984). Behavior of radon daughter products in indoor air, Radiat. Prot.
Dosim.. 7, 107.
Porstendorfer, J., Wicke, A., and Schraub, A. (1978). The influence of exhalation, ventilationand deposition processes upon radon (222Rn) and thoron (220Rn) and their decay products in
indoor air, Health Phys., 34, 465.
Prill, R.J., Fisk. W.J. and Turk, B.H. (1989). Evaluation of radon mitigation systems in 14houses over a two-year period, Lawrence Berkeley Laboratory Report, LBL-27083, submitted to
J. Air Pollution Cont. Assoc.
Puskin, J.S. and Nelson, C.B. (1989). EPA's perspective on risks from residential exposure, J.
Air Pollution Cont. Assoc. 39, 915.
Put, L.W., and de Meijer, R.J. (1984). Survey of radon concentrations in Dutch dwellings, in
Indoor Air: Radon, Passive Smoking, Particulates and Housing Epidemiology, Vol. 2. Berglund,B., Lindvall, T., and Sundell, J., Eds., Swedish Council for Building Research, Stockholm, p. 49.
Radon Technical Information Service (1988). National Radon Measurement Proficiency (RMP)
Program: Application and Participation Manual, Report EPA-520/1-88-056, U.S. EnvironmentalProtection Agency, Washington, D.C.
123

Raes, F. (1985). Description of the properties of unattached 218pO and 212Pb particles by means
of the classical theory of cluster formation, Health Phys .. 49, 1177.
Raes, F., Janssens, A., Declerq, A., and Vanmarcke, H. (1984). Investigation of the indoor
aerosol and its effect on the attachment of radon daughters, Radiat. Prot. Dosim.. 7, 127.
Rannou, A. (1987). Indoor radon exposure assessment: an overview of the French survey, in
APCA 1987, p. 78.
Reimer, G.M. and Gundersen, L.C.S. (1989). A direct correlation among indoor Rn, soil gas Rn
and geology in the Reading Prong near Boyertown, Pennslyvania, Health Phys. 57, 155.
Revzan, K.L. (1989). Radon entry, distribution, and removal in two New Jersey houses with
basements, submitted to Atmospheric Environment, Lawrence Berkeley Laboratory Report
LBL-26830, Berkeley, CA.
Revzan, K.L., Nero, A.V., and Sextro, R.G. (1988). Mapping surficial radium content as a
partial indicator of radon concentrations in U.S. houses, Radiat. Prot. Dosim., 24, 179.
Ronca-Battista, M., Moon, M., Bergsten, J., White, S.B., Alexander, B., and Holt, N. (1988).
Radon 222 concentrations in the United States - results of sample surveys in five states, Radial.
Prot. Dosim. 24, 307.
Ronca-Battista, M., Magno, P. and Nyberg, P.C. (1988b). Standard measurement techniques and
strategies for indoor 222Rn measurements, Health Phys. 55, 67.
RPI (1986). Naturally Occurring Radiation in the Nordic Countries -- Recommendations. The
Radiation Protection Institutes in Denmark, Finland, Iceland, Norway and Sweden.
Rudnick, S.N. and Maher, E.F. (1986). Surface deposition of 222Rn decay products with and
without enhanced air motion, Health Phys., 51, 283.
Sachs, H.M., Hernandez, T.L., and Ring, J.W. (1982). Regional geology and radon in buildings,
Environ. Int .. 8, 97.
Samuelsson, C. (1988). Retrospective determination of radon in houses, Nature 334, 338.
Schery, S.D. (1985). Measurements of airborne 212Pb and 220Rn concentrations at varied indoor
locations within the United States, Health Phys.. 49, 1061.
Schery, S.D. (1986). Studies of thoron and thoron progeny: indications for transport of
radioactivity from soil to indoor air, in APCA 1986, p. 25.
Schery, S.D. (l986b). Private communication
Schery, S.D., Holford, D.l., Wilson, J.L., and Phillips, F.M., (1988). The flow and diffusion of
radon isotopes in fractured porous media: part I, finite slabs; part 2, semi-infinite media, Rad.
Prot. Dos. 24, 185 and 191.
Schiller, G .E. (1984). A theoretical convective transport model of indoor radon decay products.
Ph.D. thesis, University of California, Berkeley.
124

Schiller, G.A., Nero, A.V., Revzan, K.L., and Tien, c.L. (1984). Radon decay-product behavior
indoors: numerical modeling of convection effects. Lawrence Berkeley Laboratory Report
LBL-17609, Berkeley, CA; see also Schiller et al. (1989), manuscripts submitted to Atmospheric
Environ.
Schmeir, H., and Wicke, A. (1985). Results from a survey of indoor radon exposures in the
Federal Republic of German, Sci. Total Environ., 45, 307.
Scott, A.G. (1983). Radon daughter deposition velocities estimated from field measurements,
Health Phys.. 45, 481.
Scott, A.G. (1983b). The distribution of average radon daughter concentrations in housesestimated from single-sample surveys, Health Phys. 45, 435.
Scott, A.G. (1988). Preventing radon entry, in Nazaroff and Nero 1988, p. 407.
Scott, A.G. (1989). Effect of indoor radon variability on the duration and interpretation of
radon measurements, in USEPA 1989b, p. 4-15.
Seifert, B., Esdorn, H., Fischer, M., Riiden, H., and Wegner, J. (1987). Indoor Air '87.
Proceedings of 4th International Conference on Indoor Air Quality and Climate (Berlin, 17-21
Aug. 1987), Institute for Water, Soil and Air Hygiene, Berlin, Volume 2, Environmental Tobacco
Smoke, Multicomponent Studies. Radon, Sick Buildings, Odours and Irritants. Hyperractivities
and Allergies.
Seinfeld, J.H. (1986). Atmospheric Physics and Chemistry of Air Pollution, Wiley: New York.
Sexton, K. and Repetto, R. (1982). Indoor air pollution and public policy, Environ. Int. 8, 5.
Sextro, R.G. and Lee, D.O. (1989). The performance of charcoal-based radon detection under
time-varying radon conditions: experimental and theoretical results, in USEPA 1989b, p. 2-81.
Sextro, R.G., Harrison, J., Moed, B.A., Revzan, K.L., Turk, B.H., Grimsrud, D.T., Nero, A.V.,
Sanchez, D.C., and Teichman, K.Y. (1987). An intensive study of radon and remedial measures
in New Jersey homes: preliminary results, in Seifert et aI. 1987, p. 295.
Sextro, R.G., Nazaroff, W.W., and Turk, B.H. (1989). Spatial and temporal variation in factorsgoverning the radon source potential of soil, in EPA 1989b, p. 5-61.
Sinnaeve, J., Clemente, G. and O'Riordan, M. (1984). The emergence of natural radiation,
Radiat. Prot. Dosim.. 7, 15.
Small, M.J. and Peters, C.A. (1988). Public policy model for the indoor radon problem, Mathl &
Comput. Modeling, 10, 5, p. 349-358.
Smith, D. (1979). Ventilation rates and their influence on equilibrium factor, in AECB 1979.
Spengler, J.D. and Sexton, K. (1983). Indoor air pollution: a public health perspective, Science,
221, 9.
125

Spitz, H. B., Wrenn, M.E., and Cohen, N. (1980) Diurnal variation of radon measured indoors
and outdoors in Grand Junction, Colorado, and Teaneck, New Jersey, and the influence that
ventilation has upon the buildup of radon daughters, in Natural Radiation Environment III,
Gesell, T.F. and Lowder, W.M., Eds., US Dept. of Energy, CONF-780422, Springfield, VA, p.
1308.
Steck, OJ. (1989). Statewide radon surveys: screening vs. long-term measurements, in USEPA
1989b, p. 1-67.
Stranden, E. (1987). Radon 222 in Norweigen dwellings, in Hopke 1987, p. 70.
Stranden, E. (1988). Building materials as a source of indoor radon, in Nazaroff and Nero 1988,p. I 13.
Subbarao, K. and Balcomb, J.D. (1988). Short-term energy monitoring (STEM)-summary of
1988 activities, Solar Energy Research Institute, Golden, CO.
Swedjemark, G.A. (1986). Swedish limitation schemes to decrease Rn daughters in indoor air,
Health Phys .. 5I, 569.
Swedjemark, G .A. and Mjones, L., (1984a). Radon and radon daughter concentrations in
Swedish homes, Rad. Prot. Dos., 7, 341.
Swedjemark, G.A. and Mjones, L. (I984b). Exposure of the Swedish population to radondaughters, in Indoor Air: Radon, Passive Smoking, Particulates and Housing Epidemiology, Vol.
2. Berglund, B., Lindvall, T., and Sundell, J., Eds., Swedish Council for Building Research,
Stockholm, p. 37.
Thor, P.W. (1984). Personal communications.
Tommasino, L. (1980). Solid dielectric detectors with breakdown phenomena and their
applications in radioprotection, Nucl. Illst. Meth .. 173, 73.
Toohey, R.E., Essling, M.A., Rundo, J., and Hengde, W. (1984). Measurements of the deposition
rates of radon daughters on indoor surfaces, Radiat. Prot. Dosim., 7, 143.
Toth, A. (I984). A simple field method for determination of 220Rn and 222Rn daughter energyconcentrations in room air. Rad. Prot. Dos., 7, 247.
Traynor, G.W., Aceti, J.D., Apte, M.G., Smith, B.V., Green, L.L. Smith-Reiser, A., Novak,
K.M., and Moses, D.O. (1989). Macromodel for assessing residential concentrations of
combustion-generated pollutants: model development and preliminary predictions for CO, NO:!,
and respirable suspended particles, Lawrence Berkeley Laboratory Report, LBL-23089.
Turk, B.H., Brown, J.T., Geisling-Sobotka, K., Grimsrud, D.T., Harrison, J., Koonce, J.F., and
Revzan, K.L. (I986). Indoor air quality and ventilation measurements in 38 Pacific Northwest
commercial buildings, Lawrence Berkeley Laboratory Report LBL-21453, Berkeley, CA.
Turk, B.H., Prill, F.J., Fisk, W.J., Grimsrud, D.T., Moed, B.A., and Sextro, R.G. (1986). Radonand remedial action in Spokane River Valley residences: an interim report, Lawrence Berkeley
Laboratory Report LBL-21399, Lawrence Berkeley Laboratory, Berkeley, CA.
126

Turk, B.H., Harrison, J., Prill, R.J., and Sextro, R.G. (1987). Interim report on diagnostic
procedures for radon control, Lawrence Berkeley Laboratory Report, LBL-23089.
Turk, B.H., Prill, R.J., Grimsrud, D.T., Moed, B.A., and Sextro, R.G. (1989a). Characterizing
the occurrence, sources, and variability of radon in Pacific Northwest homes, Lawrence
Berkeley Laboratory Report, LBL-26960, submitted to J. Air Poll. Cont. Assoc.
Turk, B.H., Prill, R.J., Fisk, W.J., Grimsrud, D.T. and Sextro, R.G. (1989b). Effectiveness of
radon control techniques in 15 homes, Lawrence Berkeley Laboratory Report, LBL-26961,
submitted to J. Air Poll. Cont. Assoc.
Tymen, G., Mouden, A., McLaughlin, J.P., Wasiolek, P., and Rannou, A. (1988). A comparison
of the exposure response of French and Irish radon detectors during field measurements in
houses in Brittany, Radiat. Prot. Dosim. 24, 371.
Ulbak, K., Stenum, B., Sorensen, A., Majborn, B. Botter-Jensen, L., and Nielsen, S.P. (1988).
Results from the Danish indoor radiation survey, Rad. Prot. Dos. 24, 401.
United Nations Scientific Committee on the Effects of Atomic Radiation (1982). Ionizing
Radiation: Sources and Biological Effects. United Nations, New York.
U.S. Bureau of the Census (1987). Statistical Abstract of the United States: 1988, 108th Edition,
Washington, D.C., Table 182.
U.S. Congress (1988). Indoor Radon Abatement Act of 1988, Title III of the Toxic Substances
Control Act, PL 100-551.
U.S. Department of Health and Human Services (1982). The Health Consequences of Smoking:
Cancer, U.S. Government Printing Office, Washington, D.C.
U.S. Department of Health and Human Services (1988). Monthly Vital Statistics Report 37(6),
supplement.
USEPA (1986). A Citizen's Guide to Radon: What It Is and What To Do About It. Report
OPA-86-004, United States Environmental Protection Agency and U.S. Department of Health
and Human Services, U.S. Government Printing Office, Washington, D.C.
USEPA (1987). EPA Finds Radon Problems in 10-State Survey, EPA news release and fact
sheets, Washington, D.C. Aug. 4.
USEPA (1988). EPA and Assistant Surgeon General call for radon home testing, EPA news
release and fact sheets, Washington, D.C., September 12.
USEPA (1989a). EPA urges schools to check for radon, EPA news release and fact sheets,
Washington, D.C., April 20.
USEPA (l989b). Proceedings: The 1988 Symposium on Radon and Radon Reduction Technology,
Vol. I - the Symposium Oral Papers, Report EPA-600/9-89-006a.
USGAO, U.S. General Accounting Office (1989). Air Pollution: Uncertainty Exists in Radon
Measurements. report GAO/RCED-90-25, Washington, DC.
127

Vitz, E. (1989). Preliminary results of a nationwide waterborne radon survey, in EPA 1989b, p.
8-1.
WHO (1987). Air Quality Guidelines for Europe. WHO Regional Publications, European SeriesNo. 23, World Health Organization Regional Office for Europe, Copenhagen.
Wicke, A. (1979). Untersuchengen zur Frage der Naturlichen Radioktivitat der Luft in Wohn
and Aufenthaltstraumen, Phd., thesis, Justus Liebig Universitat, Giessen.
Wilkening, M.H., Clements, W.E., and Stanley, D. (1972). Radon-222 flux measurements in
widely separated regions, in Natural Radiation Environment JI. Adams, I.A.S., Lowder, W.M.,
and Gesell, T.F., Eds., CONF-720805, National Technical Information Service, Springfield,
VA, p. 717.
Wollenberg, H.A. and Smith, A.R. (1987). Radiogenic heat production of crustal rocks,
Geophys. Res. Lett .. 14, 295.
Wollenberg, H.A. and Revzan, K.L. (I 989). Radium regionalization in California, submitted to
Geophys. Res. Lett.
Yokel, F.Y. (I989). Site characterization for radon source potential, U.S. Department of
Commerce report NISTIR 89-4106, Gaithersburg, MD.
128

APPENDICES
A. RADIOACTIVE QUANTITIES AND UNITS OF MEASURE
Amounts of radioactive material can be specified in principle by either mass or activity, thelatter being more conventional. The activity is the actual rate at which atoms decayradioactively, and the standard international (SI) unit for activity is the Becquerel (Bq),equal to a decay rate of one per second (S-l). This unit (or its traditional equivalent, theCurie) is adequate for expressing activity and (activity) concentration, not only for radon,but also for its decay products and any combination of them. The present work utilizes 51units primarily, but traditional units are defined below in terms of the modern units. Inthe text, the older units are sometimes given parenthetically or when citing work that isdifficult to translate without modifying sense or quantitative results.
For decay products, the collective quantity of most use is the equilibrium-equivalent decay~roduct concentration (EEDC). Based on the alpha decay energies and half lives of the22 Rn decay series (see Figure 2), the EEDC is given in terms of the individual decay
product concentrations as:
EEDC = 0.104 x Ie18po) + 0.514 x Ie14Pb) + 0.382 x Ie14Bi),
with concentrations of each decay product (and of the EEDC) given in Bq/m3 or pCi/I, asindicated in Table 10. (The 214pO concentration does not contribute significantly to thisexpression because of its very short half life, causing very few 214pO atoms to be present inair as compared with the other short-lived decay products. However, the 214pO alphaenergy is the largest contributor to the coefficients in this expression, since the presence ofeach of the previous three decay products implies a 214pO decay.) The analogous expressionfor the 220Rn series (cf. data in Appendix D, below) is
EEDC = 0.913 x Ie12pb) + 0.087 x Ie12Bi).
e 16pO and 212 pO do not contribute directly to this expression - again, because of their veryshort half lives - even though 212pO contributes the dominant alpha energy.)
Historically, the potential alpha energy concentration (PAEC) itself was used as the measureof decay-product concentration, with the standard unit being working level (WL). Thecorresponding 51 unit is that of energy per unit volume, J/m3
, and: PAEC = EEDC x 5.56x 10- 9 J/Bq (or 1283 MeV/pCi) for the 222Rn series. (The corresponding factor for the220Rn series is 7.56 x 10⁻⁸ J/Bq or 1.75 x 10⁴ MeV/pCi.) In any case, the PAEC iseffectively supplanted by the EEDC (i.e., the decay-product concentration itself), exceptpossibly in specifying exposures. (Note that in one respect the PAEC is a more effectivemeasure of concentration than the EEDC, i.e., in comparing 222Rn and 220Rn: per unitradioactivity, the 220Rn decay products carry 13.6 times as much PAEC as the 222Rn decayproducts.)
The basic measure of exposure is essentially the product of concentration (or its equivalent)and time. EEDC x time has units of Bq m-3S, although hour, month, or year might also beused as the unit of time. PAEC x time has 51 units of J m -3S , but the traditional units areworking-level hour (WLH) or -- more frequently -- working-level month (WLM), equal to173 WLH. Exposure rate, in the 51 units, simply reduces to average EEDC (oralternatively PAEC), but in the old units is usually WLM/y.
129

Table 10. SI Units and Equivalents for Traditional Unitsa
Parameter. SI Unit
Activity, Bq
Concentration, Bq m- 3
PAEC, J m-3
EEDC222 , Bq m-3
EEDC220 Bq m-3
Exposure, J m- 3s
Exposure, Bq m-3y
Exposure rate, J m-3
Exposure rate, Bq m- 3
Conversion for Traditional Unit
I Ci = 3.7 x 10¹⁰ Bq (1 pCi = 0.037 Bq)
1 pCi/1 = 37 Bq m-3
1 WL = 1.3 x 10⁵ MeV/1 = 2.08 x 10⁻⁵ J m-3
1 WL (PAEC) = 3750 Bq m-3
1 WL (PAEC) = 276 Bq m- 3
1 WLM = 12.97 J m- 3s
WLM = 74.0 Bq m-3y (for the 222Rn series)
1 WLM/y = 4.11 x 10⁻⁷ J m-3
1 WLM/y = 74.0 Bq m-3 (for the 222Rn series)
a The data on which these conversions and the expressions for EEDC are based are taken
from Browne and Firestone (1986), except for the half-life of 218pO, taken to be the 3.04
min found by Martz et al. (1989).
130
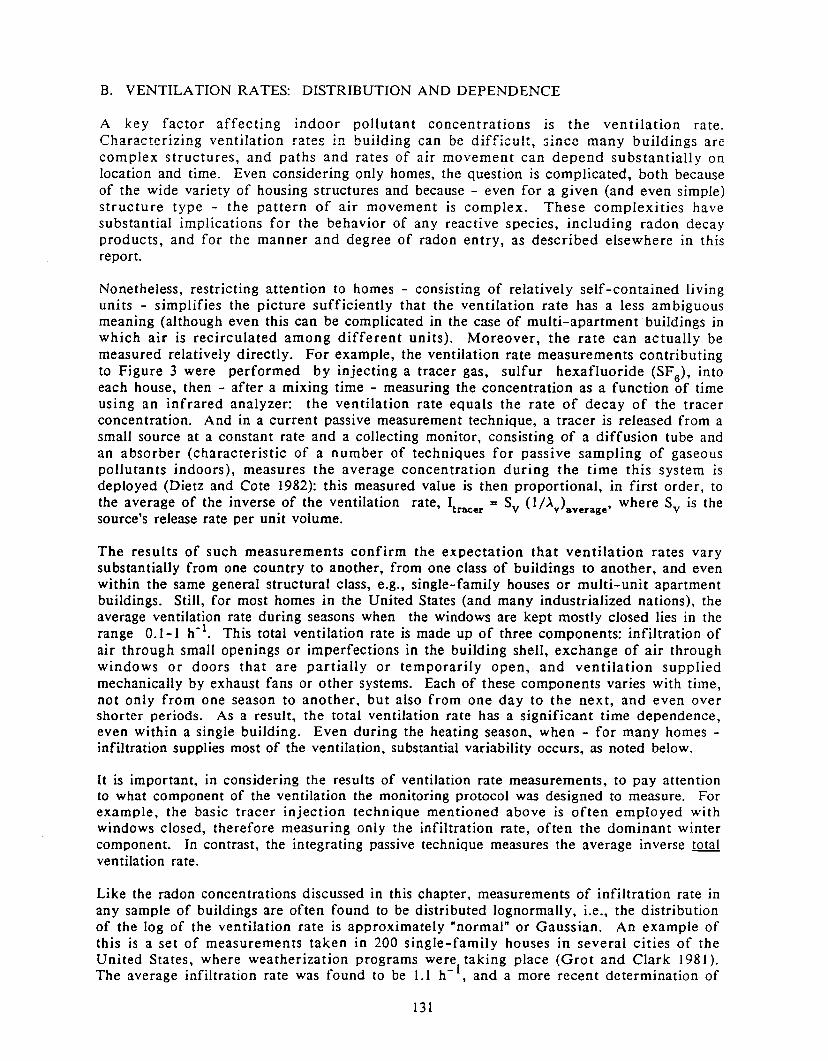
B. VENTILATION RATES: DISTRIBUTION AND DEPENDENCE
A key factor affecting indoor pollutant concentrations is the ventilation rate.Characterizing ventilation rates in building can be difficult, since many buildings arecomplex structures, and paths and rates of air movement can depend substantially onlocation and time. Even considering only homes, the question is complicated, both becauseof the wide variety of housing structures and because - even for a given (and even simple)structure type - the pattern of air movement is complex. These complexities havesubstantial implications for the behavior of any reactive species, including radon decayproducts, and for the manner and degree of radon entry, as described elsewhere in thisreport.
Nonetheless, restnctmg attention to homes - consisting of relatively self-contained livingunits - simplifies the picture sufficiently that the ventilation rate has a less ambiguousmeaning (although even this can be complicated in the case of multi-apartment buildings inwhich air is recirculated among different units). Moreover, the rate can actually bemeasured relatively directly. For example, the ventilation rate measurements contributingto Figure 3 were performed by injecting a tracer gas, sulfur hexafluoride (SF6)' intoeach house, then - after a mixing time - measuring the concentration as a function of timeusing an infrared analyzer: the ventilation rate equals the rate of decay of the tracerconcentration. And in a current passive measurement technique, a tracer is released from asmall source at a constant rate and a collecting monitor, consisting of a diffusion tube andan absorber (characteristic of a number of techniques for passive sampling of gaseouspollutants indoors), measures the average concentration during the time this system isdeployed (Dietz and Cote 1982): this measured value is then proportional, in first order, tothe average of the inverse of the ventilation rate, It = Sv (I/A ) , where Sv is the• racer v averagesource's release rate per umt volume.
The results of such measurements confirm the expectation that ventilation rates varysubstantially from one country to another, from one class of buildings to another, and evenwithin the same general structural class, e.g., single-family houses or multi-unit apartmentbuildings. Still, for most homes in the United States (and many industrialized nations), theaverage ventilation rate during seasons when the windows are kept mostly closed lies in therange O. I - I h-1. This total ventilation rate is made up of three components: infiltration ofair through small openings or imperfections in the building shell, exchange of air throughwindows or doors that are partially or temporarily open, and ventilation suppliedmechanically by exhaust fans or other systems. Each of these components varies with time,not only from one season to another, but also from one day to the next, and even overshorter periods. As a result, the total ventilation rate has a significant time dependence,even within a single building. Even during the heating season, when - for many homes infiltration supplies most of the ventilation, substantial variability occurs, as noted below.
It is important, in considering the results of ventilation rate measurements, to pay attentionto what component of the ventilation the monitoring protocol was designed to measure. Forexample, the basic tracer injection technique mentioned above is often employed withwindows closed, therefore measuring only the infiltration rate, often the dominant wintercomponent. In contrast, the integrating passive technique measures the average inverse totalventilation rate.
Like the radon concentrations discussed in this chapter, measurements of infiltration rate inany sample of buildings are often found to be distributed 10gnormaUy, i.e., the distributionof the log of the ventilation rate is approximately "normal" or Gaussian. An example ofthis is a set of measurements taken in 200 single-family houses in several cities of theUnited States, where weatherization programs were taking place (Grot and Clark 198 I).The average infiltration rate was found to be l. I h-I, and a more recent determination of
131

the geometric mean and standard deviation yields 0.90 and 2.13, respectively, as discussedelsewhere (Nazaroff et al. 1987b). Considering the age and condition of these houses, theirinfiltration rates are higher than the average U.S. value, which in turn is significantlyhigher than in northern European countries where substantial energy-saving efforts appearto have effected significant reduction in infiltration rates.
In recent years, the processes driving infiltration rates in homes have come to be betterunderstood, and even embodied in relatively simple quantitative models. Basically, we nowknow that infiltration occurs because of air convection into and out of the house, driven bysmall pressures across the building shell arising from two factors: winds, which obviouslyexert small - albeit complex - forces on the building and its surroundings (specifically, theground), and temperature differences between indoors and outdoors. During the heatingseason, this temperature difference causes a "stack" effect (much as in a fireplace andchimney), such that air is drawn in near the bottom of the structure and forced out towardthe top. The pressure differences caused by winds and temperature differences are roughlycomparable in size, averaging on the order of a few pascal (with higher values in relativelysevere climates). Because the size and pattern of the associated pressures vary markedlyfrom one time to another, it is not surprising that infiltration rates also vary substantially.
A number of groups have formulated models giving the infiltration rates in terms of thepertinent environmental parameters, and their success is reviewed in a publication of theAir Infiltration Centre (Liddament and Allen 1983). As successful as any model - evencomplex ones - is a simple parameterization of the infiltration rate in terms of the windspeed V, the temperature difference ~T, and an effective "leakage area" A. In theseoterms, the infiltration component of the ventilation rate may be expressed as
here f w is a parameter accounting for local and terrain shielding effects, the distribution ofleakage area around the building envelope, and the height of the building relative to theheight at which the wind speed is measured; f. is a stack parameter accounting for thebuilding height and the distribution of leakage area (Grimsrud et aI. 1982). Using thismodel together with applicable meteorological information, heating-season infiltration rateshave been estimated from measurements performed in 200 houses distributed throughout theUnited States and Canada. The average was found to be 0.67 h- 1 (with a significantlylower value, 0.48 h -1, found for houses less than two years old at the time of measurement).
132

C. OUTDOOR CONCENTRAnONS OF RADON AND ITS DECAY PRODUCTS
During the last two or three decades, a significant effort has been devoted to monitoring ofoutdoor radon concentrations, either as part of the overall characterization of environmentalradiation exposures or to determine environmental radon levels as a contrast to those inoccupational or indoor settings. A paper by Gesell reviews and analyzes the results fromsuch efforts, examining the variability of outdoor 222Rn concentrations with time of day,season, altitude, and location (Gesell 1983).
The magnitude and behavior of outdoor concentrations is indicated by Figure 23, wherecontinuous measurements taken at three locations are seen to yield concentrations (averagedover approximately one month) in the range of 4 to 15 Bq/m3 (0.1 - 0.4 pCi/I), with asignificant seasonal variation whose behavior differed among the locations. Examining thesame data versus time of day yields average concentrations having a substantial diurnalvariability (roughly a factor-of-two range in each case), with the lowest values occurring atnoon or soon thereafter and the highest in the middle of the night or early morning. Theobserved variation with time can be attributed to differences in environmental conditions,affecting not only the movement of radon out of the ground. but also - and probably moreimportantly - the rapidity of mixing in the atmosphere. This mixing determines the heightdependence of concentration, which varies only modestly over distances comparable to theheight of buildings (e.g., about a factor of two from 1 to 100 m or from 0.01 to 1 m heightabove the ground).
Significantly higher and lower values than found in Figure 23 have been found at otherlocations, e.g .• averages of 28 Bq/m3 in Grand Junction and 0.5-1 Bq/m3 in Alaska; lowvalues also occur in areas substantially influenced by marine air. Moreover, instantaneousvalues can also vary markedly from the averages. Gesell suggests that ~e mean value forthe contiguous United States lies between 0.1 and 0.4 pCi/1 (4-15 Bq/m ), probably in thevicinity of 0.25 pCi/1 (10 Bq/m3
). Data from other countries are not dissimilar.
Some information is also available on the decay products in outdoor air, where - because ofthe relative absence of surfaces (compared with indoors) - one might expect higherequilibrium ratios. For example
2measurements in New York yielded ratios around 0.45
(with uncombined fraction of 18pO of 9%) at a rural location and 0.40 (uncombinedfraction of 5%) on a city sidewalk (George 1972). Subsequent measurements outsideeight houses in New York and New Jersey gave mean equilibrium ratios averaging 0.79,considerably higher than the indoor ratios measured (George and Breslin 1980). Morerecent data (cf. Table 11) yields an equilibrium factor of 0.56.
A 222Rn concentration of 10 Bq/m3, while completely negligible compared with the higherindoor values observed, is still significant compared with typical indoor concentrations.Therefore the outdoor contribution has to be considered in making precise estimates ofhuman exposures to 222Rn decay products. It also has to be considered in examining thesources of radon found indoors: the approximately 10 Bq/m3 coming in with outdoor air isabout 20% of the average 222 Rn concentration observed in U.S. single-family homes and aneven larger percentage of concentrations in other types of buildings.
133

SEASONAL VARIATION
0.4 15
0.3CHESTER.- NEW JERSEY
lo.. 10Q.) -0.2 C")...
E--..5 --..
() 0.1 C-o. al- -Z 0 0
Z0 0.4 0- 15~ t-« 0.3 BUDAPEST. «c: HUNGARY a:t- 10 t-Z 0.2 ZLU
5LU
() 0.1 ()Z Z0 0 0 0() ()
Z 0.4 SOCORRO. 15 ZNEW MEXICO0 00 0.3 10 0« «c: 0.2 a:
0.1 5
0JAN FEB MAR APR MAY JUN JUL AUG SEP OCT NOV DEC
MONTH
XBL 871-9911
Figure 23. Year-long variability of atmospheric 222Rn concentration.
Measurements were performed 1 m above the ground in three different iocations (figure adaptedfrom Gesell (I983), by permission).
134

D. RADON 220 AND ITS DECAY PRODUCTS
Our present understanding of the occurrence and behavior of 220Rn and its decay productsis very limited compared with our knowledge of the 222Rn series. Not nearly as mucheffort has been devoted to 220Rn characterization, because preliminary and modest evidence- both theoretical and experimental - suggests that airborne concentrations of 220Rn and itsdecay products are not as important from a radiological point of view as their morecommon relatives. This occurs in spite of the fact that the 232Th decay series, shown inFi1.ure 24, has approximately the same (activity) concentration in the earth's crust as the23 U series, about 25 Bq/kg (Nero 1983, United Nations 1982).
The differences have to do partly with the short half life of 220Rn, 1 min as compared with4 d for 222 Rn , and partly with the details of radon and decay product behavior in theindoor or outdoor environment and inside the lung. The first factor sharply limits the timeavailable for transport from the source material, so that only a small thickness of buildingmaterial or soil serves as an effective source for 220Rn entering the atmosphericenvironment, indoors or outdoors. The second affects the concentrations present in the airand the dose delivered by the decay products that deposit in the lung. The net result of allthese factors is that - at least for indoor 222Rn concentrations in the normal range - the220Rn decay products (in particular 212Pb ) appear - on the basis of limited evidence - tohave a potential alpha energy concentration (PAEC) that is less than, but still significantcompared with, that from the 222Rn series. However, the PAEC itself does not reflect thepresent understanding that a given amount of alpha energy from the 222 Rn series hassubstantially more biological impact than alpha energy from the 220Rn series (cf. James1988).
We consider first the concentrations expected if transport from the source to the air weredominated by diffusion for both of these radon isotopes, as is likely to be the case outdoors.The depth of soil serving as a source is then indicated by the diffusion length, which isproportional to the square root of the half life. The ratio of the 220Rn to 222Rn half lives is1/5940 (i.e., 55.6 s/3.82 d), yielding 1/77 as the diffusion length ratio. This indicates therelative depth cleared per characteristic time, which is given by the half lives. Since theactivity concentration in the soil is similar for the 232Th and 238U series, the relative rate atwhich 220 Rn and 222 Rn activity escape from the surface of the source material is therelative thickness cleared (1/77) divided by the relative time scale (I/5940), yielding afactor of 77. Thus much more 220Rn activity is expected to escape than 22 Rn activity!(However, because of the difference in half lives, this greater activity is supported by only1/77th as many atoms.) In contrast, it is easy to show that - if the transport mechanism ispressure-driven flow of air through the source material and into the open air - the rate atwhich activity leaves the surface is the same for the two isotopes. (In this case, only1/5940th as many 220Rn atoms escape.)
For a typical ventilation rate of I h-1, the assumption of pure diffusion (with no barriersbetween the source and the air) can therefore be shown, using Eq. I of Section I, to implyabout twice as much 220Rn activity in indoor air as 222Rn (since the ratio of activitiesentering is similar to the ratio of the ventilation rate to the 220Rn decay constant). As wewill see, the observed ratio is not usually this large. However, for outdoor air, thecorrespondence is reasonably good. For example, a review by Schery (1986) of 220Rn and itsdecay products indoors cites typical fluxes from open soil of 2 Bq m-2s-1 for 220Rn and0.0 16 Bq m -2S-1 for 222Rn, a ratio that is only slightly larger than the factor of 77 suggestedabove. Based on a simple eddy diffusion model to represent the transport of radon upwardinto the atmosphere, he concludes that the concentrations of 220Rn and 222Rn I m above theground ought to be 9 and 6 Bq/m3, respectively, compared with his (limited) measurementresults of i 6 and 6 Bq/m3, respectively. He notes that his tentative result of 4.6 nJ/m3 forPAEC212 (the PAEC from 212 pb , the primary 220Rn decay product: see Appendix A on
135
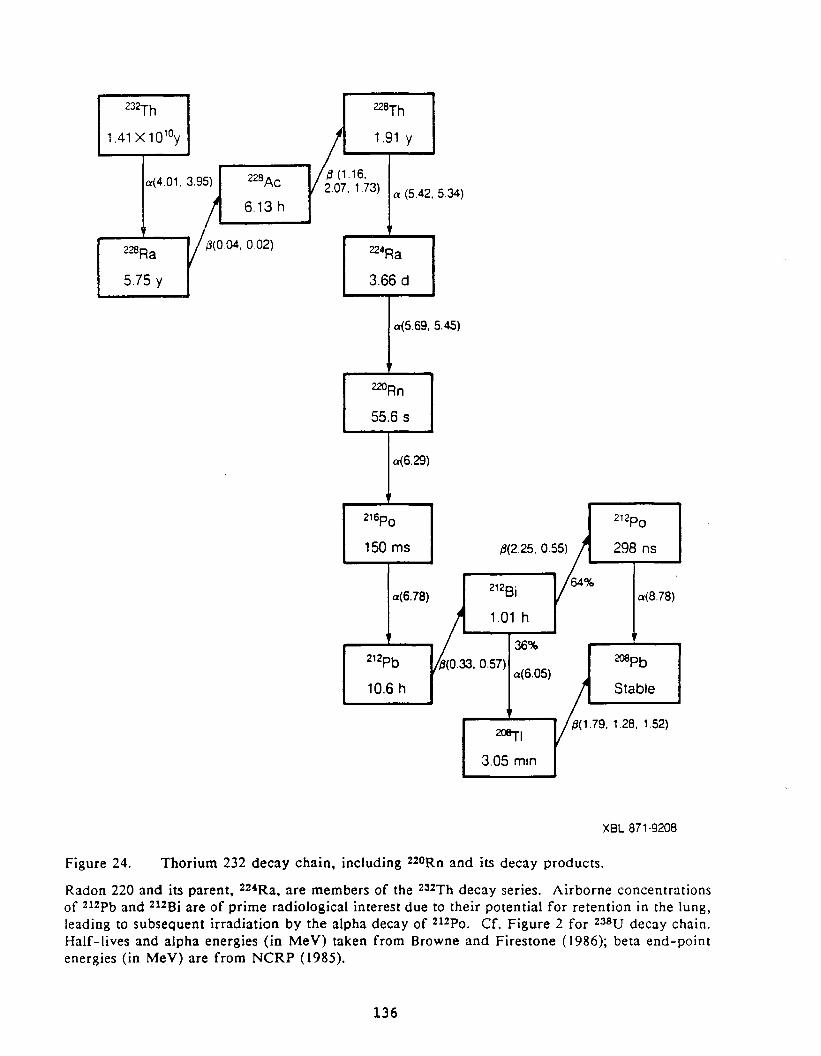
232Th 228Th
1.41 x 10 lDy 1.91 Y
a(4.01, 3.95) 228Ac {3 (116,2.07, 173) a (5.42, 5.34)
6.13 h
228Ra{3(004, 002) 224Ra
5.75 y 3.66 d
a(5.69, 5.45)
220Rn
55.6 s
a(6.29)
216pO 212pO
150 ms (3(2.25, 0.55) 298 ns
2128i 64%a(6.78) a(8.78)
1.01 h
36%212Pb ji(O.33. 0.57) 208Pb
a(6.05)10.6 h Stable
~I(3(1.79, 128, 1.52)
3.05 min
XBL 871-9208
Figure 24. Thorium 232 decay chain, including 220Rn and its decay products.
Radon 220 and its parent, 224Ra. are members of the 232Th decay series. Airborne concentrationsof 212Pb and 212Bi are of prime radiological interest due to their potential for retention in the lung,leading to subsequent irradiation by the alpha decay of 212PO. Cf. Figure 2 for 238U decay chain.Half-lives and alpha energies (in MeV) taken from Browne and Firestone (1986); beta end-pointenergies (in MeV) are from NCRP (1985).
136

quantities and units), versus 20 nJ/m 3 for PAEC 222 (the PAEC from the 222 Rn decayproducts), compares reasonably with more extensive measurements made in the FederalRepublic of Germany (Keller et al. 1982). (These results imply an equilibrium factor for220Rn decay piaducts that is extremely small -- not surprising considering the relative haiflives of 220Rn and 212Pb -- and an equilibrium factor of 222Rn decay products greater than0.5.)
The data on indoor concentrations are limited and more difficult to interpret. A number ofworkers cite results for the ratio of PAEC220 to PAEC222 centering around 0.5. See, forexample, European data ranging from 0.3 to 0.8, summarized in Toth (1984) and NorthAmerican results from Elliott Lake, Canada, of 0.3 (Gunning and Scott 1982) and for theUnited States of 0.6 (Schery 1985). These results indicate the potential significance of the220Rn series indoors. However, our understanding of the factors affecting the 220Rnconcentrations, both absolutely and relative to 222Rn, is tentative at best.
For example, if entry of both radon isotopes is diffusion dominated, as has been supposedin some classes of European housing (particularly apartment structures), and concentrationsin the source materials are similar, then indoor radon concentrations ought to be similar forthe two isotopes (as noted earlier), the activity concentration of the decay products oU~ht tobe a factor of 5 or so less for 220Rn than for 222Rn (because the long half life of 12Pbcauses most of it to be removed by ventilation or deposition rather than by decay), and thePAEC220 ought to be greater than the PAEC222 by a modest factor, e.g., 2 or 3. Even inEuropean housing the ratio is closer to 0.5, suggesting significant differences in the sourceconcentrations or generation parameters for the two isotopes, barriers to the presumeddiffusion process, other mechanisms for radon entry, or unaccounted-for differences in thedecay-product behavior.
One difficulty is obvious, i.e., at the concentrations typical of European apartmentstructures, the 222Rn entering the indoor air from structural materials can almost be equaledby that entering from the outdoor air. In contrast, the 220Rn half life is so short comparedwith ventilation time constants that no comparable contribution arises for this isotope.
Another factor to be considered is the more interestin~ one that pressure-driven flow hasbeen shown to be the dominant contributor to indoor 22Rn for many types of structuresand may also be significant for 220Rn. For homes such as those that dominate the U.S.housing stock, little diffusion from the floor and wall material is expected in any case(because of the use of wood and the painting of other types of materialsJ, so that someother entry route is likely to dominate observed concentrations of the 22 Rn series. Asindicated above, comparable concentrations in the source materials would imply similaractivity entry rates for a pure flow process. Because of the relative size of decay rates andtypical ventilation rates, this would imply 220Rn concentrations only about 2% of 222Rnconcentrations and (using the same argument as above) a similar ratio of PAECs, if weignore the concentration gradients possible for such a short-lived isotope as 220Rn. Thusthe concentration ratios expected differ by about two orders of magnitude, depending onwhether diffusion or flow is the presumed mechanism, and the actual observations - in bothEuropean and American housing - lies approximately at the geometric mean. This suggeststhe dominance of different entry mechanisms for the two isotopes or a combination ofdiffusion and flow applying to both, a possibility that was indicated in the early work onpressure-driven flow (Nazaroff et al. 1985).
However, the measurements of Schery in U.S. buildings (Schery 1985) also afford thepossibility for an interesting comparison, indicated in Table II. There are indicated theresults of outdoor measurements cited above, as well as the average indoor PAEC212 andPAEC~ ;! from Schery's 68 measurements in buildings in 21 states. The detailed data showa signIfIcant correlation between these two parameters (in contrast to the work of Gunning
137
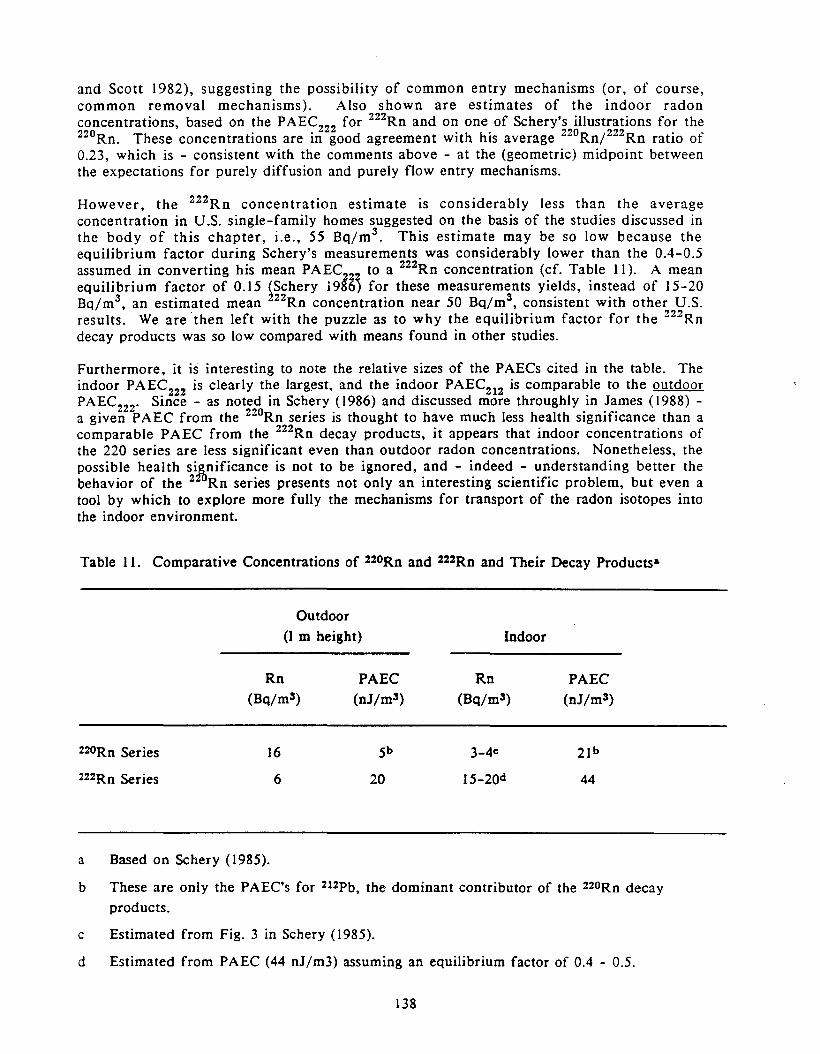
and Scott 1982), suggesting the possibility of common entry mechanisms (or, of course,common removal mechanisms). Also shown are estimates of the indoor radonconcentrations, based on the PAEC222 for 222Rn and on one of Schery's illustrations for the220Rn. These concentrations are in good agreement with his average 220Rn/222Rn ratio of0.23, which is - consistent with the comments above - at the (geometric) midpoint betweenthe expectations for purely diffusion and purely flow entry mechanisms.
However, the 222Rn concentration estimate is considerably less than the averageconcentration in U.S. single-family homes suggested on the basis of the studies discussed inthe body of this chapter, i.e., 55 Bq/m3
. This estimate may be so low because theequilibrium factor during Schery's measurements was considerably lower than the 0.4-0.5assumed in converting his mean PAEC to a 222Rn concentration (cf. Table 11). A meanequilibrium factor of 0.15 ~Schery 199~1 for these measurements yields, instead of 15-20Bq/m3 , an estimated mean 22Rn concentration near 50 Bq/m3
, consistent with other U.S.results. We are then left with the puzzle as to why the equilibrium factor for the 222Rndecay products was so low compared with means found in other studies.
Furthermore, it is interesting to note the relative sizes of the PAECs cited in the table. Theindoor PAEC222 is clearly the largest, and the indoor PAEC212 is comparable to the outdoorPAEC222. Since - as noted in Schery (1986) and discussed more throughly in James (I988) a given PAEC from the 220Rn series is thought to have much less health significance than acomparable PAEC from the 222Rn decay products, it appears that indoor concentrations ofthe 220 series are less significant even than outdoor radon concentrations. Nonetheless, thepossible health siJbnificance is not to be ignored, and - indeed - understanding better thebehavior of the 2 Rn series presents not only an interesting scientific problem, but even atool by which to explore more fully the mechanisms for transport of the radon isotopes intothe indoor environment.
Table 11. Comparative Concentrations of %%ORn and %%%Rn and Their Decay Products&
Outdoor(l m height) Indoor
Rn PAEC Rn PAEC(Bq/m3) (nJ/m3 ) (Bq/m3) (nJ/m3)
220Rn Series 16 5b 3-4c 21 b
2%2Rn Series 6 20 15-20d 44
a Based on Schery (1985).
b These are only the PAEC's for 21%Pb, the dominant contributor of the 220Rn decayproducts.
c Estimated from Fig. 3 in Schery (1985).
d Estimated from PAEC (44 nJ/m3) assuming an equilibrium factor of 0.4 - 0.5.
138