india infrastructure report 2001 - idfc
TRANSCRIPT

INDIA INFRASTRUCTURE REPORT 2001

Editor
Sebastian MorrisProject co-ordinators
Anupam B. Rastogi, IDFCSebastian Morris, IIM (A)
Prem K. Kalra, IIT (K)
INDIA INFRASTRUCTURE REPORT 2001
3iNetworkInfrastructure Development Finance CompanyIndian Institute of Management, Ahmedabad
Indian Institute of Technology, Kanpur
1
1YMCA Library Building, Jai Singh Road, New Delhi 110001
Oxford University Press is a department of the University of Oxford. It furthers theUniversity�s objective of excellence in research, scholarship, and education
by publishing worldwide in
Oxford New YorkAthens Auckland Bangkok Bogota Buenos Aires Calcutta
Cape Town Chennai Dar es Salaam Delhi Florence Hong Kong IstanbulKarachi Kuala Lumpur Madrid Melbourne Mexico City Mumbai
Nairobi Paris Sao Paolo Singapore Taipei Tokyo Toronto Warsaw
with associated companies in
Berlin Ibadan
© Oxford University Press 2000
ISBN 0 19 565.........................
Typeset by Excellent Laser Typesetters, Pitampura, Delhi 110034Printed in India ........................................
and published by Manzar Khan, Oxford University PressYMCA Library Building, Jai Singh Road, New Delhi 110001
When the Infrastructure Development Finance Company (IDFC) was in its formative stages, I felt that much ofits value would depend upon our ability to assimilate relevant knowledge already existing in the area of our interest.Apart from setting up our own policy advisory group to think through problems related to private investmentin infrastructure development, we also felt that we ought to be able to scan the broader environment to help uswith the task at hand.
Harnessing creative talent by developing research programmes in collaboration with the academic community,was one method of achieving this objective. We visited both IIM, Ahmedabad and IIT, Kanpur to see if there wasany interest in the enterprise. To our delight we found considerable enthusiasm for the idea. The result was thefounding of the 3iNetwork�as an open network where new like-minded partners from industry, academia, non-governmental organizations, and even the government can come together to realize its mission in a spirit ofcooperative endeavour.
The 3iNetwork essentially has a dual role: to identify projects within the two academic institutions to furtherthe process of investment in relevant and appropriate infrastructure projects and; to annually document issues ininfrastructure development arising from the evolving political and economic environment in the country. Withregard to the first, we are currently funding nine projects, ranging from virtual reality simulation labs to publicutility pricing for infrastructure services.1
This first attempt by us to document infrastructure issues has resulted in the India Infrastructure Report 2001.This report focuses on the policies required to create an appropriate market structure for infrastructure provisionand the regulatory framework this implies. We envisage that this enterprise will evolve into a periodic documentthat records progress in the country as a whole, and in the various states on matters of both policy evolution andproject development in infrastructure. We intend this to be a standard work of reference with respect to infrastructuredevelopment in India.
IDFC considers itself fortunate to have played the role of a catalyst in this process of bringing together academiaand industry to deliberate upon and solve many of today�s problems. It is our belief that a free, frank, and openexchange of views is necessary to arrive at the most innovative and workable solutions that will find acceptanceamong various stakeholders. We are ultimately concerned with processes that yield optimal solutions for thegovernment, encourage private participation in investment and provision of infrastructure services, provide anenvironment of healthy competition, and, above all offer quality services to citizens. With the right frameworkand willingness to put people first, systems can work to achieve this objective. We need to ask ourselves one simplequestion in this context�is it sustainable, and is this in the interest of the consumer? If the answer is �no� we needto seek alternatives, even if that means eliminating existing structures of governance. Governance is about citizens,for citizens, and has no other purpose. We hope to develop the 3iNetwork into an ever-growing fraternity and,together, make a difference for the people of India.
December 2000 NASSER MUNJEE
1 The range of activity could be viewed on the network�s portal at www.3inetwork.org or at www.idfc.com.
PREFACE
Samir K. Barua Indian Institute of Management, AhmedabadRakesh Basant Indian Institute of Management, AhmedabadAtanu Chakraborty Directorate of Employment and Training, Government of Gujarat, GandhinagarPuneet Chitkara Indian Institute of Technology, KanpurKeshab Das Gujarat Institute of Development Research, AhmedabadSaumyen Guha Indian Institute of Technology, KanpurAmita Gupta Infrastructure Leasing and Financial Services, New DelhiRekha Jain Indian Institute of Management, AhmedabadAshok Jhunjhunwala Indian Institute of Technology, MadrasAbha Singhal Joshi Centre for Human Rights Initiative, New DelhiPrem K. Kalra Indian Institute of Technology, KanpurT. Madhavan Indian Institute of Management, AhmedabadS. Manikutty Indian Institute of Management, AhmedabadB. R. Marwah Indian Institute of Technology, KanpurM. P. Mathur National Institute of Urban Affairs, New DelhiAlice Albin Morris Unnati, Organisation for Development Education, AhmedabadSebastian Morris Indian Institute of Management, AhmedabadAnish Nanavaty Infrastructure Development Finance Company, MumbaiAjay Narayanan Infrastructure Development Finance Company, ChennaiB. P. Pundir Indian Institute of Technology, KanpurG. Raghuram Indian Institute of Management, AhmedabadBhaskar Ramamurthi Indian Institute of Technology, MadrasK.V. Ramani Indian Institute of Management, AhmedabadM. Y. Rao PricewaterhouseCoopers and Development Associates Ltd., BhubaneshwarVivek Raval Unnati, Organisation for Development Education, AhmedabadDheeraj Sanghi Indian Institute of Technology, KanpurSujata Sawant Rail India Technical and Economic Services, Urban Transport Division, New DelhiRajiv Shekhar Indian Institute of Technology, KanpurY. M. Shivamurthy Infrastructure Development Finance Company, MumbaiV. K. Sibal Rail India Technical and Economic Services, Urban Transport Division, New DelhiSidharth Sinha Indian Institute of Management, AhmedabadVinita Sinha Infrastructure Development Finance Company, MumbaiGeetam Tiwari Indian Institute of Technology, DelhiJayanth Varma Securities and Exchange Board of India, Mumbai
CONTRIBUTORS
The 3iNetwork had met several times to discuss the proposition of an infrastructure report and its possible contents,before adopting the theme of industry structure and regulation. Freewheeling discussions among engineers, socialscientists, and practising managers, gave us much insight and many leads to work and write upon. It is now clearto all of us that the topic chosen for the first report could not have been more timely. Nasser Munjee first articulatedthe idea that policy and regulatory contradictions stand in the way of the development of several physicalinfrastructural sectors, especially with respect to private investment. The theme was both broad and unifying. Manymore articles than those carried in the report were written. Not all could be included due to the limitations of spaceand time. Similarly, not all who took active part in the report have written papers. However, their contributionsare as important to the success of the report as that of the writers.
There continue to be uncertainties with regard to the likely and intended industry structure and restructuringin many of the infrastructural areas. This in conjunction with today�s recession, and institutional and organizationalinadequacies, have worked to create a situation wherein a fresh approach to the development of infrastructure isimportant. If this report is able to outline the necessary national effort to create the basic contours of the �secondround of reform� then it would have served its purpose. We are grateful to IDFC, specifically to Nasser Munjeeand Anupam Rastogi who provided us this opportunity.
The need to go beyond stylistic, piecemeal and doctrinaire approaches, to a more thoughtful and pragmatic oneis by now obvious to any one involved in the development of infrastructure in India. For example, neither theextreme positions of �abolish all subsidies�, nor its contrary of the continuance of the status quo, are justified.Therefore, reform today poses a greater challenge than what is generally believed. The challenge is not merelypolitical, but also intellectual�we need to deeply worry about the �incentive compatibility� and the institutionalbasis of any policy. At IIM(A) many of us have long held this view. We were pleasantly surprised to discover similarthinking amongst our colleagues both at IDFC and IIT(K). We worked together closely as part of the 3iNetwork,and in putting together IIR 2001. It became clear to us that the basic problems cut across many of the infrastructuralareas. While vested interests do stand in the way of reform, such interests have usually been a creation of perverseincentives and insensitive policy. The need to direct intellectual capital into infrastructure is an important task aheadfor our country.
The technological dimensions of this task are perhaps as important as the challenge of institutional reform andincentive compatibility. This is especially so in today�s world wherein information technology in its broadest sensehas the potential to redraw the very economic fabric of society through change in the many ways of communication.Similarly, cheap, real time measurement possibilities, advances in data storage and mining create scope for constructedmarkets, light regulation, monitoring and control, direct participation and regulation by people, that are only dimlysensed at this juncture. The telecom sector is being directly turned around by developments in technology, andother sectors will not be able to escape its indirect effects. The aspect of convergence already tends to make obsoletesome of the institutional initiatives at a sectoral level. In this world of uncertainty, and where phenomena mutatefaster than theory, there is a strong need to get back to the basic principles, to �respect� the specificities of the particularsituation and society.
Such a task is seemingly contradictory, but not as useless as a doctrinaire approach would be. Little can be achievedin a democracy like ours without the participation of people in socially important infrastructure such as roads, dams,
ACKNOWLEDGEMENTS
and municipal water. Thus, issues such as land acquisition and people�s right to know, are part of the debate, requiringresolution. Therefore, we also invited persons outside the network but with experience to join the IIR 2001 team.
We see this report as a modest effort to understand infrastructure and its problems, with the recognition thatthere are broader dimensions to the problem. We also hope that at this juncture when the direction to move isnot clear, such an approach is rewarding.
The preliminary papers were presented at the writers� workshop held at IIM(A) in mid-August. We thank allthe special invitees for their comments and lively participation�Sadashiv Rao, Cherian Thomas, Partha Mukhopadhyay,Jayalakshmi Jayaraman, Janak Talsania, Nirmal Mohanty, and Anupam Srivatsava from IDFC, and Subir Gokarnof the National Council of Applied Economic Research (NCAER). I also thank the IIM(A) faculty who participatedin the workshop. To Anupam Rastogi, a special thanks is due for holding together the entire workshop. I am gratefulto the team of rappoteurs consisting of Bharat Verma, Vinisha Thaker, Deepa Keskhani, Trupti Patel, and ChristinaSullivan Sarabhai for painstakingly recording the highlights of the discussions.
A collective effort such as this one is hardly possible without the involvement of several persons. Devika Fernandesof the IDFC was ready to provide much crucial information and data however ill-defined the requests. DeepaKeshkani, Trupti Patel, and Vinisha Thaker took up the �back office� operations at IIM(A). They put together thebibliography, the abbreviations and helped me with the manuscript, besides assisting G. Raghuram and Rekha Jainwith their papers. Ram Mishra looked after the coordination at IIT(K). Urmil Anjaria, my secretary, workedfeverishly to get the various papers in shape. Kavita Iyengar and Shreemoyee Patra at Oxford University Press, Delhinot only did a remarkable job of supervising the entire editorial task within an exceedingly tight schedule but alsoensured that I did not slacken on the deliverables. Christina Sullivan Sarabhai saved me much time by copyeditingmany of the papers.
I would also like to thank Jahar Saha, for encouraging the IIM(A) component of the team in so many ways.My personal indebtedness is also due to Jayanth Varma, G. Raghuram, Sidharth Sinha, Bithin Datta, Rekha Jain,Keshab Das, Anupam Rastogi, Jaya Singhania, Puneet Chitkara, Rakesh Basant, Dheeraj Sanghi, Arun P. Sinha, T. V.Prabhakar, Atanu Chakraborty, Bernard D�Mello, R. Nagaraj, Nasser Munjee, Alice Albin, M. Y. Rao, S. K. Barua,Y. M. Shivamurthy, Anish Nanavaty, Sanjay Dhande, B. R. Marwah, Prem Kalra, K. K. Saxena and Subir Gokarnfor the discussions I had with them on various issues in infrastructure. I gained much from these discussions.
Mahesh Vyas gave the team and me the confidence that came from knowing that the database of the Centre forMonitoring the Indian Economy (CMIE) was always available to us. The report owes much to the informationprovided by the CMIE, and I am indebted to Mahesh Vyas for this.
On behalf of the contributors, I thank all those who have helped us put together this report. However, we aloneare responsible for any errors that remain.
SEBASTIAN MORRIS
viii Acknowledgements
CONTENTS
List of Tables xivList of Boxes xviiList of Figures xviiiList of Abbreviations and Acronyms xix
1 . Overview 1Sebastian Morris
2. Issues in Infrastructure Development Today: The Interlinkages 9Sebastian Morris
Introduction 9The Situation Today 10Macroeconomic Linkages 13The Approach to Reform and Restructuring 15Ill-conceived Reforms 16Leverage Points for Change 17Public Enterprise in Infrastructure 18Pricing and Subsidies 21Regulatory Stances 23The Constraint of Land and Environment 28The Right to Information and Pressures from Below 31
3. Regulation of Tariffs and Interconnection: Case Studies 33Sidharth Sinha
Case 1. Rebalancing of Telecom Tariffs 35Case 2. Interconnection between Fixed and Mobile Networks 42Case 3. Availability-based Tariff (ABT) Order of the CERC 48
4. Regulatory Dilemmas in Infrastructure Financing 53Jayanth Varma
Introduction 53Relaxing Financial Sector Regulations 53Government Support for Infrastructure Financing 58Conclusion 62
5. Structural Issues and Constraints 63
5.1 INTERFACE BETWEEN SECTOR-SPECIFIC REGULATORY BODIES AND
COMPETITION AGENCIES: A CASE OF THE INDIAN TELECOM SECTOR 63Rakesh Basant
The Experience of Other Countries 63
x Con t en t s
Telecom Standards, Intellectual Property Rights (IPRs), and Competition Policy 66The TRAI Ordinance and the Distribution of Responsibilities 66The Allocation of Responsibilities: Some Considerations 67Modifications in the Indian Institutional Structure 70
5.2 POLITICAL AND BUREAUCRATIC HURDLES IN REFORM AND RESTRUCTURING:THE ELECTRICITY SECTOR 71M. Y. Rao
5.3 NEED FOR A BOT LAW: GUJARAT INFRASTRUCTURE DEVELOPMENT ACT 73Atanu Chakraborty
5.4 PROJECT PREPARATION: THE CINDERELLA OF PRIVATE SECTOR PARTICIPATION (PSP) 76Atanu Chakraborty
5.5 HOW MUCH MORE OF THIS INFLICTION?THE CASE OF THE AHMEDABAD�VADOARA EXPRESSWAY 77Amita Gupta and Sebastian Morris
5.6 LAND ACQUISITION: LAW AND PRACTICE 80Y. M. Shivamurthy and Vinita Sinha
Introduction 80Public Purpose 81Acquisition Procedure 82Compensation 83Resettlement and Rehabilitation 84Suggested Amendments to the Legislative Framework 85Conclusion 85
5.7 ENVIRONMENT AND SOCIAL RISKS IN INFRASTRUCTURE DEVELOPMENT 87Ajay Narayanan
Public Pressure and Judicial Intervention 87International Pressures 88Regulatory Framework for the Environment 89The Way Forward 90PAPs as Stakeholders in Project Development 90
5.8 THE RIGHT TO INFORMATION AS A TOOL OF EMPOWERMENT 91Abha Singhal Joshi
6. The Electricity Sector 94
6.1 MISSING INTERCONNECTIONS IN THE POWER SYSTEMS 94Puneet Chitkara, Rajiv Shekhar, and Prem K. Kalra
Introduction 94Bulk Tariffs 95Being Fair to Consumers 96Subsidies 97Resource Mobilization 97Transmission 98Pricing of Transmission Services 100
6.2 POWER SECTOR REFORMS AND REGULATION: THE ROAD AHEAD 104Sebastian Morris
Introduction 104The Current Paradigm 105Overcoming the �Agency Problem� 109Creating the Market 112Values of �X� 118
Cont en t s xi
Market Conduct 119Labour and Modalities 124Conclusion 125
7. Integrated Transport 129
7.1 THE TRANSPORT SECTOR 129G. Raghuram
Estimating Demand 129Transport Myopia 130Segmenting the Market 134Structure of the Transport Sector 136
7.2 SECTORAL ISSUES IN TRANSPORTATION 146G. Raghuram
Air 146Rail 149Road Transport 155Maritime Transport 159Pipelines 165Multimodal Transport 166
7.3 PORT AND SHIPMENT MANAGEMENT AT SINGAPORE PORT:THE REVOLUTION IN THE USE OF ELECTRONIC DATA INTERCHANGE 167K. V. Ramani
Management of Container Terminals 168
7.4 AT THE CROSSROADS: PIPELINE INFRASTRUCTURE FOR OIL PRODUCTS 171Samir K. Barua and T. Madhavan
Introduction 171Operation 171Advantage of Pipeline Transportation 171Oil Pipelines in India 171Existing Policy 173On-going Projects of PIL 174Tariff 175Pipeline Projects Remain Unbankable 175Tariff Determination in the US and UK 176The Road Ahead 176Regulatory Framework is Necessary 176
7.5 INTEGRATING COASTAL SHIPPING WITH THE NATIONAL TRANSPORT NETWORK 177G. Raghuram
A Review of Trends and Patterns 177Coastal Traffic Profile 180Economics of Coastal Movement 183Traffic Potential 185Utilization of Ships 185Regulatory Issues 186Infrastructure Focus Areas 187
8. The Telecom Sector 189
8.1 A REVIEW OF THE INDIAN TELECOM SECTOR 189Rekha Jain
Introduction 189Basic Services 194
xii Content s
Rural Telecom Services 195International Telecom Services and the VSNL 195National Telecom Policy 1994 and 1999 197Private Participation 199Emergent Issues 201Strengthening the TRAI 202Issues in Licensing 203Bundling 203Unit of Bidding 204Bid Design 204Interconnection Issues 204Universal Service Obligations (USOs) 205Demand Estimates 205Spectrum Management 206Role of Competition 207
8.2 LOOKING BEYOND NTP 99 210Ashok Jhunjhunwala
Introduction 210Where did the Operators go Wrong? 211Some Implications of Revenue Sharing 211NTP 99: Some Specific Issues 214Conclusion 215
8.3 NUMBER PORTABILITY: WHY DO WE NEED IT? 217Dheeraj Sanghi
APPENDICES
8.1.1 Note on IP Telephony and Voice over Internet Protocol (VoIP) 2208.1.2 Data Services before NTP 99 2228.1.3 Scope and Functions of the TRAI 2238.2.1 Efforts of the Telecommunication and Computer Network (TeNet) Group 223
9. The Spatial Context 236
9.1 FINANCES AND FUNCTIONING OF URBAN LOCAL BODIES: A SITUATION REPORT 236M. P. Mathur
Introduction 236ULBs 238Functional Domain of ULBs 239Fiscal Domain of ULBs 240Composition of Own Revenues 241Municipal Expenditure 243Trends in Municipal Finance 244Grants to States for Financing Local Bodies: CFC Recommendations 245Water Supply, Sanitation, and Solid Waste Disposal 246Major Drawbacks in the Existing Tariff Structure 251Privatization in Municipalities 251Innovations in Municipal Accounting Systems 253Conclusion 254
9.2 URBAN AND INTER-URBAN ROAD DESIGNS IN INDIA:ISSUES CONCERNING MIXED TRAFFIC 256Geetam Tiwari
Traffic Patterns and Planning Issues in Indian Cities 256The �Critical Element� in the City Transport Fabric: Vulnerable Road Users 257
Contents xiii
Avoided Costs through Investments in Bicycle/NMV Friendly Infrastructure 257Inter-Urban Transport Issues 259
9.3 VEHICULAR AIR POLLUTION IN INDIA:RECENT CONTROL MEASURES AND RELATED ISSUES 260B. P. Pundir
Vehicular Air Pollution and Emission Regulations 260Emission Control of In-service Vehicles 261Remedial Measures 262Benzene 262Oxygenates 262CNG 262
9.4 IMPLICATIONS OF THE 74TH AMENDMENT ON THE WATER AND
WASTEWATER SECTOR 263Anish Nanavaty
Key Features 264Water Sector Implications 264Extent of Devolution 264
9.5 RURAL DRINKING WATER SUPPLY: ISSUES AND STRATEGIES 269Keshab Das
Introduction 269Statal Role: Chasing Changing Targets 269The Problem of Mobilizing Finance 273Management by Local Community 276Design and Technology 276Concluding Observations 277
9.6 BUS TRANSPORT IN DELHI 277B. R. Marwah, V.K. Sibal, and Sujata Sawant
Introduction 277Inadequacy of the Bus Transport System in Delhi 278Growth of the DTC 278Comparison of Operational Performance of DTC and Private Bus Operation 279Accident Scenario 280Operational Characteristics of Chartered Buses 280Summary, Conclusions, and Recommendations 280
9.7 DEALING WITH DROUGHT 281Saumyen Guha
Issues for Implementation 282
Bibl iography 283
TABLES
3.1 Bimonthly Rentals in Rural and Non-rural Areas 37
3.2 Call Charges for Rural Areas 37
3.3 Call Charges for Urban Areas 37
3.4 STD Call Charges Per Minute 37
3.5 International Call Charges 37
3.6 Number of Mobile Subscribers 42
3.7 Minutes of Usage 1998�9 42
3.8 Tariffs in Various Consultation Papers and TRAI Orders 46
6.1.1 Operational Performance of Coal-based NTPC Stations 104
6.2.1 The Internal Rate of Return of the Difference in the Foreign Exchange FlowsBetween a Nationalist Alternative and an Enron-like Project 107
6.2.2 The Position of the GEB Had Leakages been Plugged 1995�6 111
6.2.3 Average Sizes of Various Classes of Consumers of GEB c.1995�6 116
6.2.4 H-index in the Generation Subsector in Gujarat in the Immediate Future c.2002 117
7.1.1 Estimates and Projections of Freight and Passenger Traffic by Rail and Road 129
7.1.2 Distribution of Internal Effort for Freight and Passengers over Various Modes 130
7.1.3 Road Deaths and Vehicles in India and in Certain Other Countries 1996 131
7.1.4 Road Deaths in India in 1961 and 1996 131
7.1.5 Premature Deaths Due to Ambient Air Pollution Exceeding WHO Standard c.1995in Some Indian Cities 133
7.1.6 Transport Sector Components and Involvement of the State and Private Sector 137
7.2.1 Traffic at Airports 146
7.2.2 Passenger Traffic at Airports 1998�9 147
7.2.3 Cargo Traffic at Airports 1998�9 147
7.2.4 Airport Movement at Airports 1998�9 147
7.2.5 Indices of Growth of Traffic Output and Inputs 149
7.2.6 Freight and Passenger Traffic (Chinese Railways) 1997 150
7.2.7 Freight Business of Indian Railways: 1998�9 and 1988�9 151
7.2.8 Passenger Business of IR 152
7.2.9 Utilization of Assets by Railways 153
7.2.10 Road Safety Statistics 1994�5 156
7.2.11 Total Registered Motor Vehicles in India 157
7.2.12 Performance Indicators of All State Road Transport Undertakings 158
7.2.13 Traffic and Performance Indicators at Major Ports 1998�9 159
7.2.14 Commodity-wise Cargo Traffic Handled at Major Ports 161
7.2.15 Container Traffic Handled at Major Ports 161
7.2.16 Container Traffic 1998�9 162
7.2.17 The World�s Top 20 Container Ports 162
7.2.18 Distribution of International Container Traffic betweenDirect and Trans-shipment Traffic, 1998�9 162
7.2.19 Port Statistics 1998�9 163
7.4.1 Primary Sources of Energy: India and the World 173
7.4.2 Growth Rates in Consumption of Oil 173
7.4.3 Shares of Alternative Modes of Transportation of Oil in India 173
7.4.4 Mode-wise Distribution of Petroleum Products 174
7.4.5 Major Crude and Product Pipelines in India 174
7.4.6 Projected Growth of Pipelines in India 174
7.5.1 Cargo Traffic at Major and Minor Ports and the Share of Coastal Shipping 177
7.5.2 Cargo Traffic at Major Ports and the Share of Coastal Shipping 178
7.5.3 Cargo Traffic at Minor and Intermediate Ports and the Share of Coastal Shipping 178
7.5.4 Portwise Cargo Traffic 1998�9 and the Share of Coastal Shipping 179
7.5.5 Share of Coastal Cargo at Various Ports 1998�9 180
7.5.6 Cargoes Loaded at Major, GMB, and Minor Ports 1997�8 181
7.5.7 Cargoes Unloaded at Major, GMB, and Minor Ports 1997�8 182
7.5.8 Some Aspects of Cargo Handling at Major Ports thatHave Significant Coastal Traffic 1997�8 183
7.5.9 Coastal Traffic in Certain Commodities at GMB Ports 1997�8 183
8.1.1 Milestones in Telecom Reforms 191
8.1.2 Share of Telecom Sector in National Plan Outlays 192
8.1.3 Direct Exchange Lines (DELs), Waiting List for Telephones (1985�97),and Demand Estimates until 2006 194
8.1.4 International Comparison of Telecom Indicators 194
8.1.5 Fixed Line and Cellular Mobile Teledensity in India 195
8.1.6 Telecom Services and Population in Rural and Urban Areas 195
8.1.7 Planned Gateways of Private Operators 196
8.1.8 Distribution of Incoming Telephone Traffic over Originating Countries 196
8.1.9 Distribution of Outgoing Telephone Traffic over Originating Countries 197
8.1.10 List of Basic Service Providers in India and Their Areas of Operation 200
8.1.11 Licence Fee Payable under � Migration Package� 201
8.1.12 Number of Cellular Subscribers c.1999 201
8.1.13 Subscriber Base of Private Basic Service Operators 201
8.1.14 Spectrum Allocation in Some Asian Countries 206
8.1.15 Actual Inflow of FDI in the Telecom Sector fromAugust 1991 to October 1999 210
Tables xv
A.8.1.1 Indicators of Telecom Network in India 230
A.8.1.2 Circle-wise Status of DELs and Waiting List 1998�9 232
A.8.1.3 Key Network and Performance Indicators for VSNL 233
A.8.1.4 Telecom Companies in Top Emerging Market 234
A.8.1.5 Top Ten Net Settlement Countries, as Indicated byEstimated Net Settlements to Rest of the World 1998 234
A.8.1.6 Top Ten Net Settlement Surplus Countries, as Measured byEstimated Net Settlements to Rest of the World 1998 235
A.8.1.7 Call Revenue Contribution by Different Subscriber Categories 235
9.1.1 Urbanization Trends in India 1951�2021 236
9.1.2 Revenues of the Centre, States, and Municipalities 1991�2 237
9.1.3 ULBs in India 1991 238
9.1.4 Major Sources of Income for Municipal Bodies in India 240
9.1.5 Source of Municipal Revenues 1997�8 241
9.1.6 Composition of Municipal Taxes 1992�3 242
9.1.7 Composition of Revenue Expenditure 1997�8 243
9.1.8 Per Capita Revenue Expenditure on Core Services 1997�8 244
9.1.9 Trends in Revenue Structure of Municipalities in India 244
9.1.10 Trends in Municipal Finances in Selected States 245
9.1.11 Key Indicators for Selected Urban Services 247
9.1.12 Levels of Water Supply and Sanitation in Urban India 248
9.1.13 Water Supply in Metro Cities 248
9.1.14 Distribution of Urban Centres by Per Capita Water Supply Levels 1997�8 248
9.1.15 Distribution of Urban Centres by Per Capita Expenditure Levels 249
9.1.16 Percentage of Urban Households Classified by Nature of Sanitation Facility 1988�9 249
9.1.17 Solid Waste Collection and Generation in Selected Metro Centres of India c.1998 250
9.1.18 Revenue Receipts and Expenditures with regard to Water Supply andSanitation in Selected Cities 1993�4 250
9.1.19 Private Sector Participation in Water Supply and Sanitation Projects 251
9.3.1 Vehicle Population in India, Delhi and Mumbai 261
9.5.1 Monthly Tariff to Paying Customers for Cross-subsidizing the Poor 1994�5 274
9.5.2 Sources of Drinking Water in Inhabited Villages in India 275
9.6.1 Comparable Performance of DTC and Private Buses 279
9.6.2 Details of Accidents by Blue Line/Red Line Buses 280
9.6.3 Operational Characteristics of Chartered Buses 280
9.7.1 Record of Government Rural Drinking Water Supply Schemes 282
xvi Tables
3.1 Background to Tariff and Interconnection Regulation 34
3.2 Rebalancing Tariffs with Price Caps in the UK 39
5.3.1 Key Departments Up In Arms Against the GIDB 75
5.6.1 Land Acquisition Process: The Case of Poshitra Port 86
5.7.1 Hotshot Consultants Copy a Report to Get Project Cleared 88
6.2.1 California Electricity Markets 127
7.1.1 How Potholes Affect Vehicle Operating Costs 132
7.1.2 Deluge, BMC Punch Holes in BEST�s Coffers 133
7.1.3 Constraints which Deplete Rail Transport Capacity butwhich are Removable by Low Investments 141
7.1.4 Low Investment Strategies to De-bottleneck Road Systems 142
7.1.5 Role of Citizens in Monitoring Roads 144
7.1.6 Transport Research and Training 145
7.2.1 A Relook at Passenger Car Equipments in the Indian Context 160
7.4.1 Ambient Air Quality and Noise 173
7.5.1 Advantages of Coastal Shipping 184
7.5.2 A Relative Success Story 186
8.1.1 The DOT and the Precursor to Reform 190
8.1.2 A Brief Review of Restructuring in Some Other Countries 192
8.1.3 The Telecom Network and the DoT 193
8.1.4 STD calls are Not a Preserve of the Rich 209
8.2.1 Enabling Telecom and Internet Connectivity inSmall Towns and Rural India 216
9.1.1 Local Governance in Small Towns in Gujarat since the CAA74:First Impressions 255
9.4.1 How Low Usage Charges for Drinking Water Actagainst the Interests of the Poor 268
9.5.1 Overexploitation of Groundwater can be Overcome byCorrectly Pricing Electricity and Diesel 270
BOXES
6.2.1 The proposed competitive structure of the electric power industry 111
6.2.2 Extingushing BPSA contracts of SEBs with the NTPC 122
7.1.1 Transport myopia 131
7.1.2 Framework to segment users 135
7.2.1 Roles of ports: Regulator, landowner and utility 163
7.3.1 Energy conservation in pipelines fuel consumption(pipeline vis-à-vis rail) 172
7.3.2 Energy conservation in pipelines fuel consumption(pipeline vis-à-vis road short distance) 172
A.8.2.1 Remote terminal at the curb serving subscribers on copper or wireless 224
A.8.2.2 Several RTs connected on a rink network to a COMUX andthen to an exchange 224
A.8.2.3 corDECT WLL 225
A.8.2.4 Relay base station 226
A.8.2.5 Direct internet access system 226
A.8.2.6 Internet usage today 227
A.8.2.7 An AC serving subscribers through a SU 227
A.8.2.8 PDH/SDH Fibre backhaul with drop and insert (D & I) 228
A.8.2.9 AC providing POTS, wireless internet plus simultaneous voice connectivityand DSL connections presiding internet plus voice 228
A.8.2.10 Deployment of access centres in Chennai 229
A.8.2.11 Deployment in a rural area 229
9.5.1 Factors causing regression of rural water supply status 272
9.5.2 Improving availability and ensuring sustainability: options 276
FIGURES
AAI Airport Authority of IndiaABT Availability-based TariffACP anti competitive practicesADB Asian Development BankADC Analogue Digital ConverterADSL Asynchronous Digital Subscriber LoopADV animal drawn vehicleAIMTC All India Motor Transport CongressAITD Asian Institute of Transport DevelopmentAPM Administered Pricing MechanismAPSEB Andhra Pradesh State Electricity BoardAPTRANSCO Andhra Pradesh Transmission Company, an inheritor company of the APSEBARV Annual Ratable ValueARWSP Accelerated Rural Water Supply ProgrammeBDSL Basic Rate DSLBDSU Basic Digital Subscriber UnitBFOT build, finance, operate and transferBKPL Barvani�Kanpur PipelineBOLT build, operate, lease, and transferBOO build, operate, and ownBOOT build, own, operate and transferBoP balance of paymentsBoT build, operate and transferBPSA Bulk Purchase and Sales Agreement
(between central power corporations like the NTPC, NHPC, NPC and SEBs)BSD Base Station DistributorBSES Bombay Suburban Electric Supply (Undertaking) LimitedBSO basic service operatorBWSSB Bangalore Water Supply & Sewerage BoardCBD central business districtCBSs Compact Base StationsCCL Continental Construction LimitedC-DOT Centre for Development of TelematicsCEA Central Electricity AuthorityCERC Central Electricity Regulatory CommissionCFC Central Finance CommissionCFSs Container Freight StationsCIDCO City and Industrial Development Corporation
ABBREVIATIONS AND ACRONYMS
CLASS Customs Local Area Signalling ServicesCLEC competitive local exchange carrierC M C Computer Maintenance Corporation Ltd.CMSP Cellular Mobile Service ProviderCNG Compressed Natural GasCOAI Cellular Operators Association of IndiaCOMUS Central Office MuxCONCOR Container Corporation of IndiacorDECT Registered DECT of TeNetCPC Central Power Corporations (NTPC, NHPC, NPC, REC)CPCB Central Pollution Control BoardCPE Customer Premise EquipmentCPHEEO Central Public Health and Environmental Engineering OrganisationCPP Calling Party PaysCRS Commissionerate of Railway SafetyCSP Cable Service ProviderC T U Central Transmission UtilityDEL Direct Exchange LineDFIs Development Financial InstitutionsDGCs Distribution-cum-Generating CompaniesDG-IV General Directorate of Competition of the European UnionDGT Director General, Telecommunications, OFTEL, UKDIAS Direct Internet Access SystemDIU DECT Interface UnitDLD Domestic Long DistanceDMH Dandeli Mini-Hydel ProjectDMRT Delhi Mass Rapid TransitDNPR&R Draft National Policy on Rehabilitation and ResettlementDoT Department of TelecommunicationDPC Dabhol Power Company Ltd.DPA Dubai Ports AuthorityDPCs District Planning CommitteesDPI Department of Programme Implementation (of the Ministry of Planning),
Government of IndiaDSP Digital Signal ProcessorDSU Digital Subscriber UnitDTC Delhi Transport CorporationDTHB direct to home broadcastingDTO Department of Telecom OperationsDTS Department of Telecom ServicesDVC Damodar Valley CorporationECB External Commercial BorrowingECIL Electronics Corporation of India Ltd.EDI Electronic Data InterchangeEHV extra high voltageEIA environment impact analysesEPA Environmental Protection AgencyERC Electricity Regulations Act, 1998ERR economic rate of returnETSI European Telecommunications Standards InstituteEW England & Wales (Pool or electricity System)EZEV Equivalent Zero Emission VehiclesFAC fully allocated costs
xx Abbreviations and Acronyms
FACTS flexible AC transmission systemsFCC Federal Communication CommissionFCVs Fuel Cell VehiclesFDI foreign direct investmentFERC Federal Energy Regulatory CommissionFIRE Financing Institution Reform and ExpansionFLAG fibre optic link around the globeFOI Freedom of Information ActFPI Foundation for Public InterestFSI floor space indexFSP fixed service providersGAIL Gas Authority of India LimitedGAPL Gujarat Adani Port LimitedGATS General Agreement on Trade and ServicesGDCF gross domestic capital formationGDP gross domestic priceGDR Global Depository ReceiptGEB Gujarat Electricity BoardGIDB Gujarat Infrastructure Development BoardGIDC Gujarat Industrial Development CorporationGMB Gujarat Maritime BoardGMSC Global Mobile Service CarrierGNCTD Government of National Capital Territory of DelhiGPPL Gujarat Pipavav Port LimitedGRT gross registered tonnageGSM Group Special MobileGWSSB Gujarat Water Supply and Sewerage BoardHBCP Haldia�Barauni Crude Oil PipelineHDSU high bit rate digital subscriber unitHDT host digital terminalHERC Haryana Electricity Regulatory CommissionHEVs hybrid electric vehiclesHMRPL Haldia�Mourigram�Rajbandh PipelineHUAC high voltage alternating current (transmission)HUDC high voltage direct current (transmission)IAN Integrated Access NodeIBPL Indo-Burma Petroleum LimitedIBRD International Bank for Reconstruction and DevelopmentIC internal combustionICAO International Civil Aviation OrganizationICE Information, Communication and EntertainmentICF Integral Coach FactoryICSEM Institute for Catchment Studies and Environmental ManagementIDC International Data CorporationIDWSSF International Drinking Water Supply and Sanitation DecadeIETP Internet Engineering Task ForceIEGC Indian Electricity Grid CodeIETF Internet Engineering Task ForceIFC International Finance CorporationILEC Incumbent Local Exchange CourierIMO International Monetary OrganizationINF Intelligent Network ForumINSA Indian National Shipowners� Association
Abbreviations and Acronyms xxi
IOCL Indian Oil Corporation LimitedIP Internet ProtocolIPP Independent Power ProjectIPRs Intellectual Property RightsIRR internal rate of returnISDN International Subscriber Dialling NumberISP Internet Service ProviderITI Indian Telephone Industries Ltd.ITS Indian Telecom ServiceITU International Telecommunications UnionITXC Internet Telephony Exchange CarrierJNPT Jawaharlal Nehru Port TrustJRY Jawahar Rozgar YojanaJTM Jabatan Telekom MalaysiaJVC Joint Venture CompanyKBPL Kandla�Bhatinda PipelineKPRC KP Rao Committee (set up to study bulk tariff)KRC Konkan Railway CorporationLAA Land Acquisition Act 1894LEC Local exchange carrierLEV Low Emission VehicleLIBOR London Inter Bank Offer RateLNP Local Number PortabilityLoC Letter of CreditLoI Letter of IntentLPCD Litres per capita per dayLRAC Long run average costsLRDSS Long Range Decision Support SystemLRIC Long Run Incremental CostLRMC Long Run Marginal CostsLSP Local Service ProviderLT Laxmi TransformersMAINS Maritime Information SystemMERC Maharashtra Electricity Regulatory CommissionMGC merchant (independent) generating companyMHV medium and heavy vehicleMIDC Maharashtra Industrial Development CorporationMIGA Multilateral Investment Guarantee agencyMIS Management Information SystemMJPL Mathura�Jalandhar PipelineMMC Monopolies and Mergers Commission of the UKMNP Minimum Needs ProgrammeMOEF Ministry of Environment and ForestsMoP Ministry of PowerMoST Ministry of Surface TransportMOT Maintain, Operate and TransferMoU Memorandum of UnderstandingMPCs Metropolitan Planning CommitteesMRTPC Monopoly and Restrictive Trade Practices CommissionMRTS mass rail transit systemMSEB Maharashtra State Electricity BoardMSO Multiple Service OperatorMSRDC Maharashtra State Roads Development Corporation Limited
xxii Abbreviations and Acronyms
MTBE methyl tertiary butyl etherMTC Mobile Termination ChargeMTNL Maharashtra Transport Nigam LimitedMTW motorized two-wheelersMWS Multi WallsetNABARD National Bank for Rural DevelopmentNBCC National Building Construction Company LimitedNHAI National Highway Authority of IndiaNHPC National Hydro Power Corporation LimitedNIC National Informatics CentreNICs newly industrialized countriesNLC Neyveli Lignite Corporation Ltd.NLDC national long distance carrierNLDO National Long Distance OperatorNLDS National Long Distance ServicesNMHC/NMOG Non-Methane HydrocarbonNORD pool The electricity pool of the Nordic countriesNPC Nuclear Power CorporationNTF National Task ForceNTPC National Thermal Power Corporation Ltd.NZ New Zealand (Pool or electricity system)O C C Oil Co-ordination CommitteeOERC Orissa Electricity Regulatory CommissionOHPC Orissa Hydro Power CorporationoptiMA Registered brand of TeNetOSEB Orissa State Electricity BoardOYW own your wagon (scheme of the Railways)PAFC Phosphoric AcidPAP Project Affected PeoplePCC Public Common CarrierPCS Personal Service CommunicationPCUs Passenger Car Equivalent UnitsPDH Plesiochronous Digital HeirarchyPEMFC Polymeric Electrolyte Membrane Fuel CellsPGCIL Power Grid Corporation of India LimitedPIL Petronet India LimitedPJM Pennsylvania, New Jersey and MarylandPLF plant load factorPOL Petroleum Oil and LubricantPPA Power Purchase AgreementPPP Public�Private PartnershipPRCL Pipavav Rail Corporation LimitedPRIs Panchayati Raj InstitutionsPSEG Public Service Electric and Gas CompanyPSP Private Sector ParticipationPSTN Public Switched Telephone NetworkPTC Power Trading Corporation LimitedPUC Pollution Under ControlQP Quality ProblemRAS Remote Access SwitchRBI Reserve Bank of IndiaRBS Relay Base StationR C Restructuring Commission
Abbreviations and Acronyms xxiii
REC Rural Electrification CorporationRGNDWM Rajiv Gandhi National Drinking Water MissionRLDC Regional Load Despatch CentreR MC Rajkot Municipal CorporationROE return on equityROI return on investmentRo-Ro Roll-on-Roll-OffROW right of wayRPI Retail price indexR T Remote TerminalRTF Regional Task ForceRTO Road Transport OfficeRV Rateable ValueSACFA Standing Advisory Committee on Frequency AllocationSBM Single Buoy MooringSCADA Supervisory Control and Data AcquisitionSCICI Shipping Credit and Industry Corporation of India Ltd.SEBI Securities & Exchange Board of IndiaSEGW Secondary Sector (electricity, gas and water)SEZ Special Economic ZoneSGCP Switching Gateway Control ProtocolSMPL Salaya�Mathura PipelineSOHO Small Office Home OfficeSPM suspended particulate matterSPV Special Purpose VehicleSRMC short run marginal costSRTUs State Road Transport UndertakingsSSA Secondary Switching AreaSTD�PCOs Subscriber Trunk Dialling/Public Call OfficesSTM Syarikat Telekim MalaysiaSTU State Trading Utilitysu subscriber unitSVC Static VAR compensation systemsTAMP Tariff Authority for Major PortsTAS Tattihalla Augmentation SchemeTCI Transport Corporation of India LimitedTCIL Telecommunications Corporation of India Ltd.TeNet Telecommunication and Computer NetworkTEUs twenty feet equivalent unitsTIPHON The Internet Protocol Harmonization over NetworkTNSEB Tamil Nadu State Electricity BoardToU time of useTRAI Telecom Regulatory Authority of IndiaTRANSCO transmission companyTTSC Transport, Trading, Storage and CommunicationUI Unscheduled interchangeULB Urban Local BodyULEV ultra low emission vehicleUnicom United TelecomUPSBC Uttar Pradesh State Bridges Construction Company LimitedUPSEB Uttar Pradesh State Electiricyt BoardUSO Universal Service ObligationVAR Volt Ampere Reactive
xxiv Abbreviations and Acronyms
VoIP Voice over Internet ProtocolVPT Village Panchayat TelephonesVRS Voluntary Retirement SchemeVSAT Very Small Aperture TerminalVSNL Videsh Sanchar Nigam LimitedVTS Vessel Traffic Management or Surveillance ServicesWILL Wireless in Local LoopWNP Wireless Number PortabilityWPC Wireless Planning and Co-ordination WingWS Wall SetZEV Zero Emission Vehicle
Abbreviations and Acronyms xxv
1The overall theme is �regulation and industry struc-
ture�, far more broadly interpreted than is conventional.Indeed, the approach has been to discuss the principalconstraints in the development and commercializationof infrastructure. We also show how the two areinterlinked in a market economy. The principal con-straints, including those of a structural and institutionalnature, which we believe need to be overcome for thefast development of infrastructure are also covered.
Thus the conservative approach to macroeconomicpolicy which may have slowed down growth over thelast three years or so and the land acquisition processeswhich arrest infrastructure development and create dis-sent against development are discussed. Similarly, thelimitations of the principal local bodies (the municipali-ties) that would have to organize much of the urbaninfrastructure are also discussed.
Public enterprise, whether structured as a companyor operating within government departments, findcoverage especially in its potential for commercializa-tion. Government departments and regulatory bodiesprivatizing public enterprise are also discussed.
In this report�in keeping with the overall objectiveof the 3iNetwork, viz. to �lead intellectual capital intoinfrastructure��we attempt to go beyond a discussion ofcurrent constraints to suggest changes in terms of ap-proaches, institutional reorganization, and appropriatepolicy. Thus we do not hesitate to point out the possibleneed for an alternative paradigm with regard to project-affected people. Similarly, we would question the con-sensus around the need to eliminate subsidies. The biggerproblem is the mode of administration of subsidies. Oursuggestions are best seen as attempts to bring to theattention of policy makers, developers, and others, freshavenues for extended consideration.
India Infrastructure Report (IIR) 2001 has several contribu-tors including members of the 3iNetwork, a networkof three institutions: the Infrastructure DevelopmentFinance Company, the Indian Institute of Technology,Kanpur, and the Indian Institute of Management,Ahmedabad.
In little less than six months since the idea of a reportoutlining the developments and constraints in infrastruc-ture was mooted, the members and others outside theseinstitutions wrote on sectors and themes that constitutephysical infrastructure. The coverage no doubt varieswith regard to the sectors. Similarly, not all the impor-tant issues that bear on regulation and industry structurehave been covered. Thus there should have been moredetailed treatment of urban transportation especially theintermodal dimensions. Similarly the constraints im-posed by current practices with regard to land use inurban areas are not covered. The housing sector has beenentirely omitted. Industrial parks had to be omitted forlack of time and because we were anyway not able tocover the important aspects of land use in urban areas.These are important omissions which we hope would betaken up in later issues of the IIR.
Nevertheless, in the chapters here we put forward apicture of infrastructure development in India, review-ing the major developments especially with regard topolicy and regulation. We draw out certain themes thatare interesting and which help in understanding perver-sities such as distortionary prices, systematic exclusionof the poor, very inefficient operations, and largeallocative failures that run through nearly all the sectors.We also outline the nature of both state and marketfailure with regard to infrastructure and of the relation-ship between the two. We also identify, in some sectorsmore than in others, the restructuring tasks ahead.
OVERVIEW
Sebastian Morris
2 India Infrastructure Report 2001
When the idea of such a report was first mooted, itwas felt that problems of infrastructure have an emer-gent character, as reformers and governments learn todo what is right for the economy and the consumer.Thus the mistakes that had been made and need correc-tion (in the view of the contributors) are discussed.The challenge of private sector involvement runs rightthrough the report. This is not because we feel that thestate has no role or only a declining one, but becausewe are convinced that commercialization, which ismore important than ownership, is vital to the realiza-tion of both allocative and operational efficiency ofinfrastructure. And that cannot be realized withouteither a certain degree of privatization or a reorientationof public enterprise away from rules and guidelines totasks. We see as more important the feedback effect ofsome degree of privatization, through the tension forreform that such privatization creates, than the fact ofprivatization per se. Thereby the �state failure� thatlimited public enterprise from delivering can begin to beovercome.
Chapter 2, �Issues in Infrastructure DevelopmentToday: The Interlinkages� (Sebastian Morris), discussescross-sectoral problems, bringing out interrelationshipsand interlinkages. The need for reform is real. It is nolonger a question of merely signalling to the world atlarge that the country is ready to open its doors toprivate and foreign capital. Privatization or commercial-ization of public enterprise and restructuring of manyof the infrastructural areas is an urgent necessity. Thefiscal situation is explosive in power and urban servicesand the opportunities in telecom are too large to bemissed, especially for an economy that has shown somuch potential in software and remote delivery ofservices. Transport services are misdirected by highlydistortionary prices, and pipelines are held back byimproper policy.
The economy would most certainly have enteredinto a phase of infrastructural shortage, given the slowergrowth of infrastructure in the 1990s. This arises becauseof the �limited capacity of the state to invest� and theprivate sector�s unwillingness to do so, since the ex-pected regulatory and policy clarity has not been ob-tained. While the resulting costs of denial are undoubted-ly large, this relative �shortage�, or �infrastructure laterrather than first�, has its own advantages in that theproblem of directing infrastructural investments is hardlythere. The first priority would be to relax the shortages.Appropriability too could improve. But in many areasthe state continues to derive its priorities politically orthrough planning �exercises�. More efficient use of infra-structure is also possible today.
The slowing down of infrastructural investments in
the 1990s has had negative effects on investment demandin general and is most certainly one of the factorsunderlying the slow growth of the economy since1997�8. The economy may have reached a stage wherefrom the demand side a major push in infrastructuralinvestment is necessary. Indeed, the matter may beurgent enough to bring back public investment eventhough it is known to be inefficient.
The problem is not subsidies per se but their modeof administration. Not a single meeting on infrastruc-ture, especially power and water, takes place withoutlamenting the subsidies. Their administration in such amanner as to create moral hazard in the organizationsproviding the service has been an important reason forthe failure of public organizations. Although the vestedinterests against reform are strong, they may not be thegroups that are usually identified as such�workers andsubsidized groups. The vested interests are more likelyto be bureaucrats and politicians who have to give upprivileges they have enjoyed as managers and owners.The emphasis on vested interests as a barrier againstreform may have been overstated. Reforms have notbeen too well conceived, and that more than vestedinterests has limited their scope thus far. The need todayis to create the right market structures to take advantageof competition wherever possible, and institute lightregulation elsewhere. These are tasks that require highlevels of skills and effort.
It is important that public enterprises be allowed tofunction commercially and towards their primary tasks.The pressures against denial of that freedom have in-creased. The possibility of privatization indeed improvesthe prospects for such autonomy, and hence for com-mercialization of public enterprise in infrastructure.�Empty solutions� that merely postpone the day ofreckoning continue to be generated, as when privatizationof State Electricity Boards� (SEBs�) assets by selling thesame to state-level Public Sector Undertakings (PSUs) isproposed, or a sham privatization is proposed to �satisfy�a multilateral agency. The days for such behaviourwould soon be over.
The myth that low prices are in the interest of thepoor needs to be recognized as such and exposed. Lowprices have created the problem of slow expansion orstagnation of the service, and hence have kept a largenumber of the poor as �outsiders�, that is those who aredenied the service since they do not even have access.There is a need to distinguish between subsidization ofaccess and subsidization of use, the former being welfareenhancing. Direct subsidization via stamps or couponsis the need of the hour especially in irrigation, drinkingwater, and electricity. That would allow these servicesto be viably provided by private capital.
O v e r v i e w 3
So deep have been the price distortions that invest-ments have been taking place on the basis of suchdistorted prices. Naturally demand has also been af-fected. As the reform extricates the system out of thesedistortions there would be a phase when the true pricesand demand would be discovered.
The notion that whenever there is a market failurein the neoclassical static sense, an orthodox price regu-lation is called for is quite questionable. When inan area like telecom, growth is expected to be rapidbecause of technological changes and network econo-mies, contestability is high and the orthodox regulatorystance is scarcely appropriate. In telecom, especially,freer entry and more liberal interconnect rules wouldtherefore be justified. Convergence too creates it ownopportunity for one industry to ride on another asInternet today can be expected to ride on cable televisionand high bandwidth cables on existing powerline infra-structure.
The most important structural constraint remainsthe process of land acquisition. The current process andvaluations may not be correct if the specificities ofthe Indian situation and the fact that the land marketitself has been distorted by land use restrictions are takeninto account. On land acquisition and resettlement ofproject-affected people, the law needs to change to createthe space for their inclusion in the project as stakehold-ers. Only this can lower the risk from �displacement�.
Relevant information about public bodies when avail-able with the concerned public can work wonders inmaking such bodies and their officials responsible. Assuch, a genuine right to information Act is necessary forthe reorientation of the state to its people and theirinfrastructural needs.
Chapter 3, �Regulation of Tariffs and Interconnec-tion: Case Studies� (Sidharth Sinha), brings out threecases of tariff rulings by regulators in India, two in thecase of the telecom sector and one in bulk power. Thechapter uncovers the underlying assumptions and con-cerns of the regulator and the regulated, and the limi-tation of these rulings, to make a critical assessment ofthe same. Some of the limitations in the defined powersof the regulator and in the existing structure of theindustry are brought forth.
Independence of the regulator has gained currencybut still remains contested and contingent. The tempta-tion to dilute financial regulation or oversight to allowmore lax standards in lending to infrastructure is naturalbut dangerous. This is discussed in Chapter 4, �Regula-tory Dilemmas in Infrastructure Financing� (JayanthVarma). The author comes to the conclusion that whilecredit enhancements and tax support for funds flowinto infrastructure would be appropriate, dilution of
standards would not be so. The recent experience of theEast Asian countries as well as historical experiencewould show that there is little need for such relaxations,despite the force with which governments and develop-ers may put forward their arguments. Financial markets,especially debt markets are quick to emerge, when theopportunities arise. The problem with infrastructure isusually, and more certainly in India, with the sector assuch�regulatory and policy uncertainties, allocativeinefficiencies arising out of government�s influence ininvestment decisions�than in the need for special finan-cial dispensation for infrastructure. This is not to denythe role of credit enhancement and land grants in the caseof infrastructure with high social returns.
Chapter 5 discusses the principal structural con-straints in infrastructure development in India. As �in-dependent� regulation emerges in many sectors, there isneed to look at the relationship between sector-specificregulators and the competition agencies. There are manyreasons why we should have a competition policy,despite the known limitations of the same in a trans-forming economy. Convergence is an important driverthat in the years to come would question the standardprescription of an �independent� sector-specific regula-tor. Convergence in India could be driven by bothtechnology, as in telecom as voice over Internet Protocol(IP) becomes a distinct possibility, and by the economiesof the �right of way� which tend to be amplified, giventhe many clearances and dealings with governmentbodies that have to be gone through before any networkinvestments can be in place. The first part of Chapter 5,�Interface between Sector-specific Regulatory Bodies andCompetition Agencies� (Rakesh Basant), brings out theconflicts that are likely and flags the loose ends, callingfor a more detailed study of possible options.
In �Political and Bureaucratic Hurdles in Reform andRestructuring� (M. Y. Rao), the history of the birth ofthe Orissa regulator is brought out by one who not onlyhad a ringside view but was actively involved in the earlystages of the reform. The biases and assumptions and thevested interests that had to be overcome in institutionalreform for regulation remain just as relevant today. Weget a feel of the nature of the state and bureaucracy inIndia at the provincial level. Most certainly hardeningbudgets and the crisis-like situation were the drivers forchange. Thus threats more than opportunities are goingto work in the Indian situation.
An important development in the involvement ofthe private sector has been the passage of several build,operate and transfer (BOT) laws by state governments.In �Need for a BOT Law� (Atanu Chakraborty), whohad been involved in the design of the Gujarat Infrastruc-ture Act, brings out the salient features and the processes
4 India Infrastructure Report 2001
involved in bringing forth the legislation. Limitationsapart, such BOT laws bring in the operational efficiencyof the private sector into areas of infrastructure thatare appropriable in part or full. As many state govern-ments gear themselves for reform, the experience ofGujarat would be of interest. Change is not without itshiccups and opponents. In infrastructure, the �power ofthe status quo� is most acute: markets do not naturallyexist. They have to be �created� by design, law, and useof technology. Such unbundling makes the task ofgovernment more challenging. As such the capacity andcapability of the government is vital to the success ofreform and privatization.
�Project Preparation: The Cinderella of Private SectorParticipation (PSP)� (Atanu Chakraborty), as its namesuggests, laments the relative neglect of this ratherpainstaking but important task when the state putsforward projects for the private sector. The task isespecially important if foreign developers are to beinterested in Indian projects. Indian government has todevelop the skills to put forth projects that speakthe same language that developers and foreign institu-tional investors expect. Unfortunately, many govern-ment departments are still to learn what constitutes therelevant details. The creation of specialized bureauscan only be the first step in the diffusion of the relevantskills for project preparation through the state govern-ment system. �How much more of this Infliction? TheCase of the Ahmedabad�Vadodara Expressway� (AmitaGupta and Sebastian Morris) brings out coordinationfailure of government construction in a large project.Few projects have failed on the same scale as thisexpressway. The case is archetypical of what happenswhen a bureaucracy has moved far from the Weberianideal upon which the case for public provisioning rests.Given the current, entirely dysfunctional systems andprocedures within government, the case tells us that themore pertinent question to ask may well have been:�How did such bureaucracies deliver at all?� The answerwe guess may well lie in the work of key persons withinthe system who are willing to creatively interpret theirroles to make things happen. That such persons exist isbeyond doubt. The challenge therefore is to energizethem as change agents within the state system.
In �Land Acquisition: Law and Practice�, Y. M.Shivamurthy and Vinita Sinha bring out the salientfeatures of the Act. The court rulings which have tendedto display much concern for the status of the affectedpersons are also discussed. Land acquisition has beenproblematic but its solution does not lie in the new bill,which seeks to curb certain freedoms of the affectedpersons. Indeed a case is made for a paradigm changein land for infrastructure. No infrastructure, however
socially beneficial, can be built on inadequate compen-sation for those whose land had to be taken away. Thatargument is valid not only from the point of view ofjustice but also because significant reductions in the timefor acquisition and the risks involved cannot come ifevery act of acquisition has to become a tussle, as itcurrently is. On what needs to be done though, thereis some divergence in this report itself. �Land Acquisi-tion: The Case of Poshitra Port� (Alice Albin Morris)documents an ongoing process of land acquisition. Theinadequacies in the practice are brought out, as thepeople experience the process of their lands beingacquired by the government. In this case the governmenthas gone through most of the motions as specified, inthe letter but not in the spirit of the law.
In �Environment and Social Risks in InfrastructureDevelopment� Ajay Narayanan makes a case for the landacquisition law to change in keeping with �case law�. Heargues for larger compensation and also some involve-ment of those affected. The need for the Act to be morein line with the Draft Policy on Project-Affected Peoplesof the Ministry of Rural Development is also discussed.Moreover environmental risks of infrastructural projectsdo not go away with mere adherence to all clearances.Project developers have to do much more, truly reduc-ing if not eliminating the ill effects on the environmentand adequately compensating those affected.
The environmental consciousness of the 1970s andthe 1980s resulted in a formalistic and clearance-basedapproach. As the terms of the clearances were system-atically violated judicial activitism resulted and muchopposition from those affected created risks. The re-sponse of the state which was doing much of theinfrastructural development was more towards bearthese risks and costs and suffer as a consequence, ratherthan to go beyond the law to reduce the risks. Today,with private financial institutions being involved, thatapproach could possibly give way to true risk mitigationas they realize that mere adherence to clearances is noguarantee of freedom from risk. But has this realizationtaken root? Not as yet, if the story �Hotshot ConsultantsCopy a Report to get Project Cleared� (B. S. Nagaraj,Indian Express) is any indication.
What can a harried citizenry, in the face of statefailure and widespread corruption, do? Today lack ofa right to information constrains the average citizenand when he is really desperate, as when his land is beingtaken over for �public� purposes or when a local industrypumps back pollutants into the ground, he has no choicebut to agitate. A thoroughgoing right to information lawcould do much in a democracy, especially in as plurala society as ours. �The Right to Information as a Toolof Empowerment� (Abha Singhal Joshi) argues that the
O v e r v i e w 5
expectations of citizens have been dashed, as the newbill is more an exercise to deny information while havingthe form of a �freedom of information�. It would changenothing and the hoped for instrument for the democratictransformation of society would be one more exampleof �tokenism�. Information with regard to local bodiesand public processes�expenditure statements, plans,allocations etc.�of local bodies and corporations havinga public aspect, when available with the immediatepopulation who are affected by their working, can havedramatic effects on elected and non-elected officials. Thepressures for accountable and responsible working canbe significant, and that, privatization or not, is vital tothe improvement in infrastructure and its orientationtowards the customer.
In Chapter 6, �The Electricity Sector�, the leadpaper �Missing Interconnections in the Power Systems�(Puneet Chitkara, Rajiv Shekhar, and Prem K. Kalra)takes a close look at the present proposals and rulingsof the Central Electricity Regulatory Commission(CERC), bringing out their limitations and suggestingthe direction for change. The contradictions createdby institutions like the Power Trading Corporation,given the need for competitive behaviour among sellersand buyers of wholesale power, are drawn out. Theelectricity grid is in very poor shape with grid frequen-cies for hours on end being either far above or belowthe stipulated 50 cycles. The current attempt is toconvert a problem of indiscipline (that requires for itssolution stiff punitive measures and disconnection) toa commercial schedule of varying rates that give largeincentives for adhering to grid rules, as the proposedavailability-based tariff seeks to do. Would it work?Not at all, argues Chapter 6. The difficulties in thecurrent framework for interstate trade in power and theproblem of �identifying the culprits for grid failures� arealso covered.
In �Power Sector Reforms and Regulation: The RoadAhead� (Sebastian Morris) the roots of the currentproblems including the increasing regulatory and policyrisks are brought out. The need to directly administersubsidies through a stamps-based system is put forth. Noother system would work since anything else wouldcreate a situation of moral hazard for the utility inquestion. More than subsidization it is the vested inter-ests within the SEBs and outside that have stood in theway of reform and restructuring. Leakages are very largeand if they could be plugged most SEBs would becommercially viable entities at tariffs close to currentlevels! That is the principal challenge, and only directsubsidization can succeed in delinking reform from thesubsidy question. A model of reform and regulationthat brings in competition in generation is proposed in
some detail. The aspects of the market creation pro-cesses, the tasks that need to be carried out, the degreeof unbundling, the prospects for competition and themanagement and ownership of transmission, distribu-tion, and generation assets are considered. In any marketmodel the independent power producers� (IPPs�) powerpurchase agreements (PPAs) would become strandedcontracts, imposing great cost on consumers. Variousoptions to extinguish such contracts and boldly gotowards a market model are put forth. Both parts to thechapter on the power sector argue that in not havingbrought out a paper outlining the strategy for regulationand restructuring, the government has imposed muchuncertainty on prospective investors who have thereforekept away. Even if the details of legislation and thepassage of bills would take time, the need for a credibleannouncement of the kind of system and change thegovernment wants is important. If the right to choosethe supplier can be given to bulk buyers, and similarlycaptive units can be allowed to go on the grid, theresistance from the SEBs and their �hedging strategy��to corporatize without any change in the incentivepatterns or in ownership, for example�could be broken.
In section 7.1 �The Transport Sector�, G. Raghuramprovides a birds-eye view of the problems with thevarious sectors that constitute transportation. The ne-glect of the intermodal and multimodal aspects and theunderinvestments in the sector resulting in �transportmyopia� are brought out. The effect of absurd prices oninvestment choice and traffic patterns and the hugereturns to relaxation of congestion both in rail and roadthat are possible, especially on the �golden quadrilateral�,are discussed. A schema classifying the various activitiesis presented. The notions of the �network�, �rollingstock�, �terminal�, service, and regulation are appliedacross the sectors to result in a meaningful approach foran integrated treatment of shipping, roads, pipelines,airlines, and railways. Marwah�s paper Box 7.1.4 high-lights the vast returns to debottlenecking roads. Seemingcapacity constraints in roads in many situations are dueto the lack of the attention to bottlenecks on roads thatare prone to arise in the Indian situation�sections ofroads that are damaged, frequent use of certain portionsby animals and slow moving vehicles, and too manyjunctions on highways.
�Sectoral Issues in Transportation� discusses in detaileach of the sectors to the extent possible given thelimitations of publicly available data. Productivity hasbeen improving steadily in the Railways, and the needis really to price their products appropriately and bringabout a customer orientation. The Railways could raisetheir declining share of freight tonne kms by providinglogistic solutions especially to large customers. Railway
6 India Infrastructure Report 2001
privatization, except at the margins for certain kinds ofnon-network related services, is seen by the author asnot immediately feasible. The logistic aspect which issensed only when the provider is willing to see theproblem of transportation from the point of view of thecustomer needs to inform change and improvements inthe sector. In �A Relook at Passenger Car Equivalents(PCEs) in the Indian Context�, Box 7.2.1, Marwahargues that the standard tool of road designers, the PCEwould not work because of the wide variation in vehicletypes, so the need to develop easy to use simulationmodels is very important. If the notion of the PCE hasto be retained, for the Indian highways the standard 1210type truck should be the reference.
�Port and Shipment Management at Singapore Port:The Revolution in the Use of Electronic Data Inter-change (EDI)� (K. V. Ramani) in presenting the develop-ments at Singapore port helps to remind us of thedistance between our best ports and Singapore. TodaySingapore port uses IT and the Web to cut turnaroundtimes from two days to hours!
�At the Crossroads: Creating Pipeline Infrastructurefor Oil Products� (Samir K. Barua and T. Madhavan)reviews the development of oil pipelines in India.Pipelines have been held back due to adverse policy andthe pressure exercised by the Railways to keep forthemselves a large part of the liquid freight movementin India. The present policy of joint ventures and stand-alone companies will not allow pipeline constructionto take off. Financial institutions naturally insist on takeor pay contracts. The policy has not been sufficientlyappreciative of the network nature of pipelines, whereindevelopments in one segment affect on all other seg-ments. The need to quickly move on to a commoncarrier mode for regulation and access to pipeline infra-structure is argued for.
�Integrating Coastal Shipping with the NationalTransport Network� (G. Raghuram) argues that coastalshipping has been constrained by archaic customs andcabotage laws. The potential for coastal shipping,especially in low value bulk items, is at least twiceits current levels. When combined with other modes,that is with appropriate strategies to provide connectiv-ity of urban and industrial places to coastal ports, coastalshipping can emerge as the main mode for carriage ofbulk between the west and east coasts.
The telecom sector in India has perhaps seen themost rapid changes whatever the yardsticks. �Review ofthe Indian Telecom Sector� (Rekha Jain) looks at themajor developments in the institutions, policy, regula-tion, and network and industry since the process ofreform began in the early 1990s. NTP 1999 and theearlier NTP 1994 are discussed. The gradual evolution
of policy from monopoly to licensed oligopoly and nowcompetition is indeed a most positive development. Thepressure on the incumbent as private parties wereallowed in has made the incumbent expand its capacityremarkably. At current tariffs and connection chargesmuch of the demand has been met. The challengetherefore is to bring in new demand. How far has thepolicy succeeded? Not very far, since the high licencefees, the lack of competition in the beginning, thepossible denial of network economies to the players, andindependent regulation itself may have stood in the wayof a rapid fall in prices. While cellular services� have hadsome success, basic services� privatization remains awoeful failure.
�Looking Beyond NTP 99� (Ashok Jhunjhunwala)argues for a paradigm shift into local and small-scalesolutions which alone, in a poor country, can quicklygive us the 100 million subscribers aimed at. For sucha development to take place, use of Indian technologyand breaking out of the bind of interlocking interna-tional credit and technology (and equipment) marketsare necessary. Appropriate policy that allows the appli-cation of such technologies, the unit of licensing to bemore flexibly defined, and smaller players to operate isnecessary. �Enabling Telecom and Internet Connectivityin Small Towns and Rural India� (Ashok Jhunjhunwalaand Bhaskar Ramamurthi) describes ways to achieve asudden jump in Internet and telecom usage. Essentiallythe need is to pursue cost-reducing approaches ratherthan feature-adding research which has a functionality inthe rich countries given high incomes and high telecomdensities. Few transnationals would be interested in cost-reducing research since they would have geared up forthe biggest and most lucrative markets. �Number Port-ability: Why do we need it?� (Dheeraj Sanghi) examinesthe importance of number portability in the working ofthe competitive market for telecom services. The steepfall in 1�800 number prices as the US regulators an-nounced a phased plan for number portability is inter-esting. Despite appearances to the contrary, an earlypursuit of number portability can do much for compe-tition in telecom services. The poor also use STDfacilities at PCOs and the assumption that STD is usedlargely by business and the rich is not quite correct.�STD Calls are Not a Preserve of the Rich� (S. Manikutty)brings this out.
The spatial context of infrastructure could not beas effectively covered in this report as we would haveliked. Industrial parks and rural infrastructure, exceptdrinking water, have not been covered here. Moreimportantly, there are, we know, major distortions inthe market for urban land. Very severe restrictions inland use, cumbersome processes for changes in land
O v e r v i e w 7
use permits, rent control, and punitive taxes on sale ofland create a highly distorted market, wherein the pricesthat rule are no indication of true social costs orscarcities. Investment decisions based on these pricescould carry the distortions further into the economy ashas most certainly happened in the larger cities. Thisproblem still remains to be addressed and it is hopedthat a future issue of the IDR would be able to take upthe topic of urban land and its use. The 74th Amend-ment to the Constitution (CAA74) that sought togive power, autonomy, and fiscal devolution to urbanlocal bodies is an important focus of the chapter on thespatial context of infrastructure. Financing and Func-tioning of Urban Local Bodies: A Situation Report�(M. P. Mathur) examines the present situation statisti-cally. It draws attention to the poor fiscal situation,and lack of autonomy despite the changes since theCAA74. Again, quite like the situation with regard tothe right to information bill, there has been majordivergence between the form and content of the devo-lution. State governments have �hedged� the indepen-dence of urban local bodies, keeping many importantpowers at the state level and making other devolutionscontingent upon the state governments� own assessment.The urban bodies of the largest cities in any case havehad the relevant autonomy and the reasons for theirpoor performance lie elsehere in competitive politics, intheir relationship with state governments, in irrationaltariff policies, in poor organizational processes, espe-cially in the confusion of responsibility between theelected and nonelected officials. The promise held outfor the smaller municipalities by the CAA74 has beenbelied. The urban bodies are under much fiscal stress andthose without access to revenues from octroi and entrytaxes have not even been able to maintain existing levelsof service. The only answer is rationalizing user chargesand better collection of local taxes. The potential thoughis very good, but not generally recognized as such, sincethe paradigm of free water and sewerage is deeplyentrenched. �Local Governance in small towns in Gujaratsince the 74th Amendment: First Impressions� (AliceAlbin Morris and Vivek Raval) brings out the fact thatdespite the CAA74 nothing has really changed in foursmall towns in Gujarat.
�Implications of the 74th Amendment on the Waterand Waste water Sector� (Anish Nanavaty) brings outthe dismal situation with regard to water in mostmunicipalities. The fact that muncipalities do not havethe freedom to chose the organization with whom theycan deal to provide water and sewerage services, is amajor limitation. They have to necessarily deal with theparastatal bodies of the state government. Responsibilityis therefore displaced and poor and indequate coverage
results with the municipalities having little incentiveto charge fully to expand the service since that is �notpart of their brief�. In some cases since supplies toindustry are under the purview of parastatals rather thanthe urban bodies, they are also denied good revenues.Coverage of water remains poor and, even worse, theactual consumption by the poor remains woefully inad-equate. �How Low User Charges for Drinking WaterAct against the Interests of the Poor� (Sebastian Morris)conceptualizes how low charges actually deny the pooraccess to water. Low charges with restricted supplycreate a shortage and the elastic demand of the richtypically �competes� with the inelastic demand of thepoor. In that unequal struggle the poor most certainlylose and suffer �denial�. Access to and use of sewerageservices have been even more skewed. We could not,unfortunately, take a look at the performance of watersupply systems, with their large losses and leakages. Anaverage of 40 per cent of water is either lost or illegallydiverted. While the rural people should have had easyaccess to drinking water, at least in such areas as are notseverely water scarce, the reality is very different.Pollution, competition from urban areas, and, mostimportantly, diversion to agricultural use, since drinkingwater tends to have the least priority, have caused muchdenial in rural areas. �Rural Drinking Water Supply:Issues and Strategies� (Keshab Das) outlines the currentsituation and argues for a pluralistic approach to ruraldrinking water with private and cooperative effortssupplementing the state. Overdrawal of groundwater foragriculture, especially in water-scarce regions like northGujarat and Rajasthan, which creates drinking waterscarcities is interlinked with the electricity subsidies.Removal of the horse power (HP) based tariffs and thesubsidization of pumping can bring down the dead-weight losses in the economy. This is brought out in�Over exploitation of Ground Water can be Overcomeby Correctly Pricing Electricity and Diesel� (SebastianMorris).
In �Dealing with Drought� (Saumyen Guha) arguesthe case for storage of water in small reservoirs andponds with local initiative and involvement of thepeople. Assignment of water rights will be crucial to thesuccess of such efforts.
Urban transport has characteristics of its own. Urbanspace, especially central space being limited, congestioncannot be entirely avoided. The density of traffic andpopulation implies that the social cost of private motor-ized transport is more than the private costs. Besidespollution, congestion creates this anomaly. In the Indiancontext the different types of road users, rangingfrom pedestrians (not just moving between two stagesor modes of motorized transport) and cycles, besides
8 India Infrastructure Report 2001
motorized two wheelers, buses, and cars, impose theirown special problems, which planners do not typicallyunderstand or incorporate in their designs. Thus inDelhi the fact that buses and cycles share the same roadspace imposes very large negative externalities on thecyclist. Accident rates for pedestrians and cyclists arevery large. When the problem is approached from thepoint of view of safety, altogether different possibilitiessuggest themselves to increase the carrying capacity ofthe transport system of a city like Delhi. These insightsare outlined and developed in �Urban and Inter-urbanRoad Designs in India: Issues Concerning Mixed Traffic�(Geetam Tiwari). Special lanes for cyclists and trafficseparation can greatly increase carrying capacity. Incontrast conventional planning which emphasizesflyovers and speedways may actually reduce carryingcapacity. The chapter puts forward the basics of a designof city roads and traffic management that is at oncehumane and efficient, and has wide relevance in bus-based cities like Delhi. The fact that for a long time to
come the majority of the Indian population wouldnot be able to afford cars, taken together with theconstraint that expensive metro systems are out in thisera of state contraction, means that most cities shouldfind the safety-based simulation approach of Tiwariuseful.
Delhi�s infamous blue/red line bus service standsexposed as the worst possible kind of privatization andhas imposed upon the population of Delhi very highaccident rates. The irrational routes, the small size of theoperators, and the lack of any kind of control over theoperators are brought out in �Bus Transport in Delhi�(B. R. Marwah, V. K. Sibal, and Sujata Sawant). Aslong as the scam of the Delhi bus system continuesthere is no hope for privatization of urban bus services.�Vehicular Air Pollution in India: Recent Control Mea-sures and Related Issues� (B. P. Pundir) critically looksat the strategy of the government to control pollutionby specifying the engine type and limits on exhaustgases.
INTRODUCTION
Infrastructure development is at a crucial juncture inIndia today. Tentative steps have been taken towards amore pluralistic provisioning, especially by the privatesector, and as a result infrastructure as a whole hasreached a point of irreversibility. It is no longer possibleto go back to the old mode wherein the state, bothcentral and provincial, actively provided the bulk ofphysical infrastructure. The reason is not that �the statehas no funds�, as many believe, but the enormous waste,including the dead-weight losses of the old mode, thatstands exposed.
In a broader sense, what has failed is not stateownership per se, but the assumption that in a largemarket economy many infrastructural sectors couldindefinitely be run non-commercially. Yet the stepstaken in the 1990s do not necessarily add up to a changein the right direction. Indeed, as I will argue, some ofthe important changes brought about ostensibly tofurther commercialization may actually have damagedits long-term prospects. These dysfunctional changeswill soon have to be corrected.
No Longer a Question of Signalling
Even if change necessarily involves signalling, to boththe concerned �public� and the world at large, that Indiais credibly moving away from its closed door controlledeconomy, enough time has already passed. Many morepressing priorities beyond mere communication of theintent of change have emerged. The need for action andfor demonstration of an ability to address the problemsof change as they come along, through the frameworkof an overall stated strategy, is acute. Thus the viabilityof the infrastructure business of domestic financial
institutions, encouraged to lend to commercially ori-ented infrastructure, is itself at stake. The growth ratesof infrastructural development in sectors like power,water, and roads have fallen well below the ratesachieved in the 1980s.
The question no longer is whether or not to privatize,or, more generally, bring about incentive compatibility,but how to do so. That puts us at a crossroads whereone path is a more thought through, sustainable, andsocially beneficial privatization and commercial provi-sioning. The other, which can be tempting to decisionmakers and lenders alike, is essentially one of �privatizing�without a proper fiscal and institutional basis which canonly lead to a deeper mess and greater catastrophe. Thatpolicy makers will make mistakes is inevitable. But thatthe mistakes should have such major consequences, ashas happened in India, is not acceptable. The effect ofmistakes on the economy can be minimized, if a direc-tion or a desired state (in the near future) is crediblyindicated at the very beginning. Unfortunately, in acountry where many policies typically originate fromthe desk of a harried bureaucrat in the form of a �note�or paper, inevitably the immediate situation looms verylarge and ominous. The need for consistency and inter-nal coherence with the change taking place in the restof the economy is often sacrificed and the long-termvalue of a contemplated measure could then become acasualty. Added to that, there is the tendency towards�tokenism� (to show that change is taking place) ratherthan change which is more difficult to bring about: itsdesign requires the services of experts and many mindsand involves many more departments and institutions.This results, often enough, in policies and actions thatcould be quite dysfunctional to the overall progress ofreform. Such ad hocism would not reveal credibly the
2 ISSUES IN INFRASTRUCTUREDEVELOPMENT TODAY:THE INTERLINKAGES
Sebastian Morris
10 India Infrastructure Report 2001
end state or the direction that is intended. As a result,mistakes in policy even when they are reversed havea much greater negative impact on the economy thanthey should have.
In many areas of infrastructure, such as telecommu-nications, power, road transport, and airlines, it ispossible and necessary to make long-term commitment,at least to the extent that the government spells out insome manner the state in which it wants the industryto be. In other words, there is then scope for a trans-parent and risk-reducing change.
There is increased acceptance by workers that changeis inevitable and that their collective role should notgenerally go beyond issues of income and workingconditions into questioning or insisting upon particularforms of organizations and particular prices for theservices of their organizations. Hence the absence of anannounced strategy is disturbing. Surely the argumentthat the announcements would only have given workersthe scope to protest is less convincing today. Evenwhen there are outright statements of commitmentto privatization of central public sector undertakings(PSUs), the avoidance of a legislated process ofprivatization does not augur well. The need to distancethe privatization process from the government and itsday-to-day exigencies is obvious. In a democracy wherethe government itself is involved in the details ofprivatization of particular enterprises, it is inevitablethat questions will arise about particular actions andpricing decisions in the privatization process and thesewill be hotly contested and opposed. The process maythen be delayed indefinitely or altogether scrapped.With a credible commitment to fair and corruptionfree privatization, and by pursuing it through a consti-tutional or other distanced body, the chances of asuccessful privatization would, on the other hand, bebright in India today. Indeed, without that distancingand independence of the privatization process, real andquick privatization would not be possible even if thegovernment were fair and worked in the best interestsof society.
THE SITUATION TODAY
Infrastructure First and Later
The consensus of development economics of the 1950sand 1960s was around balanced growth of various types,including through plans. But very early, Hirschmanpointed to the historical experience of unbalancedgrowth in industrial transformation and to the pressuresfor growth in other sectors to which the disequilibriumcreated by the process of unbalanced growth leads.Autonomous growth is hardly ever balanced or broad
based till the industrialization process is virtuallycomplete. Outside the command economies, India haspursued a strategy of growth across the widest possiblesectors and with much depth. It is now well known thathuge costs were borne in pursuing the same in a closedeconomy framework. The costs were not only directlyeconomic, but also administrative, resulting in thestrengthening of bureaucratic controls and restrictions.The distortions that these unleashed created hugescope for rents. The year 1965, as is widely known, isa watershed in the development of the economy. Thestructural retrogression (Shetty 1978) that India enteredinto in 1965 was deep, and some of the major sectors ofinfrastructure, like the railways and irrigation, were itsworst victims. The Indian Railways have never reallyrecovered from the absolute decline in gross capitalformation in the mid-1960s. Until 1965, the MahalanobisPlan, with its emphasis on balance, also thereforeattempted to provide infrastructure, prior to itsneed. The emphasis was on both physical and socialinfrastructure and the strategy inter alia was one ofprioritizing infrastructure. That being so, the issue of itsdirection or allocation was crucial. Given the modelwhich was based on the notion that production andphysical allocation to particular sectors could be carriedout in great detail, like in the Soviet Union, there couldnot have been a conceptual problem. This worked verywell up to 1965.
The Redistribution Agenda Emerges
The period from 1965 right up to 1979 was one of veryslow growth when much of East Asia overtook India.This long period of stagnation essentially changed thefocus of policy and the state, from growth and distribu-tion to redistribution. Many of the sop programmes,the major subsidies, and the very idea that poverty hadto be alleviated separately from the development processarose in this period as a �self-evident truth�. In manyways, even after the two decades of good growth inthe 1980s and 1990s, the assumptions and world-viewsformed in this period still haunt policy makers andpolitical parties. Notably the notion that the primarypurpose of the state is to carry out redistributionthrough an ever-expanding bureaucratic apparatus andin a detailed and micro manner persists. It has nodoubt come under attack, but it remains unshaken forseveral reasons.
The Problematic Growth of the 1980s and 1990s
The growth in the 1980s and 1990s, especially the latter,may not on the whole have been labour absorbing. Thelong period of nearly eleven years of growth, up to
Issues in Infrastructure Development Today 11
1990�1 from 1979�80, without much labour absorptionby the private corporate sector, was perhaps necessaryto recover from the long stagnation period during whichexcess employment had been hoisted on the privatesector through controls, dysfunctional labour move-ments, and hardly any competition in the market. Inthe 1990s the public sector showed, for the first time,a decline in employment growth. Employment till thenhad grown at a virtually autonomous and constantrate since 1965. The shedding of excess labour, thoughdelayed by over ten years, was marked in sectors liketextiles and other low value added activities, especiallydetailed manufacturing, where the public sector hadto face competition, especially from smaller firms andthe unorganized sector. The vast cost advantage whichsmaller firms have, due to the �schism� in the labourmarket, is compounded by the higher growth rate inwages and lower work and productivity �norms� in thepublic sector, even in comparison to the organizedprivate sector.
Growth itself, in the 1990s, while rapid in relation tothe stagnation period, was nowhere near the blazing9�10 per cent per annum of the Chinese economy, nowfor well over two decades since 1978. The precedingMaoist period had itself witnessed growth at 6�7 per cent!At these growth rates, there is no need for specialattention to poverty or subsidization. The poor�s inter-est is integral to the growth process itself and in lessthan a couple of decades per capita income doubles.The initial near equality of incomes, brought aboutthrough the Communist Revolution, which removed atone stroke any possible demand inadequacy, was theengine of growth. To this engine was added a secondone in the form of manufactured exports, since theopen door policy of 1979. Chinese growth has beenthoroughly labour absorbing and, contrary to popularbelief, less unequal between regions than that in India!In India the need to specifically provide for the poor(or more correctly to provide sops to neutralize anypossible dissent from systematically gathering strength),is therefore a result of the very slowness of growth andits specific character, in that it has hardly been labourabsorbing. The schism in the labour market is, of course,one determinant, and a result as well of this specificcharacter of growth.
Advantages of Infrastructure Following Upon Growth
Clearly the resurgence of the 1980s led to infrastructuralshortage which may have deepened in the 1990s. Thistransition from an infrastructure-led economy toone where infrastructure lags has its advantages! It isimportant to recognize that as infrastructure, especiallythat which has a direct bearing on production elsewhere
in the economy, is constrained, the benefits to be gainedin relaxing these constraints can be large enough toimprove appropriability and profitability in its provi-sioning. When infrastructure follows industrial develop-ment, the scope for its private provisioning increases.Indeed, if commercial orientation is not resisted by thestate bureaucracy and vested interests of the earlierregime, then perhaps the most important gain in infra-structure following growth is that allocative efficiencyneed not suffer. This is particularly relevant for a societywhere systems of patronage continue, without signsof abatement, despite over forty years of the formationof the Plan and a state process of making investmentdecisions. Investment allocation need not be based onassumptions, models, and exigencies of the planner andthe politician. The economy and the market could thendetermine investments and location choice in a transpar-ent manner. Investments in urban infrastructure, intowns like Tiruppur or Moradabad, bursting with eco-nomic activity, and therefore in dire need of infrastruc-ture, would result in stupendous social returns.
The State�s Continued Say in Investment Decisions
Similarly, it is no longer necessary to predict whereroads, ports, and railways will be needed. The shortages,scarcities, overloading, etc. are evident. This is so notbecause economic developments were allowed to leadinfrastructural investments per se, but because evenafter the evidence of shortages, planners and politicianscontinued to derive their priorities in the old way.Among the worst excesses of mislocation are a steel plantin Karnataka, when in Tacher in Orissa we have (andit was known as such) the world�s best site for ore, andpaper mills atop hills in the North East. It must beremembered that as early as 1965, Plan-based allocationsand decisions with regard to infrastructure were alreadybeing corrupted by political exigencies.1 Indeed duringthe stagnation period, almost no central public enter-prise, however powerful vis-à-vis the government, couldhave avoided suboptimal decisions, especially with re-gard to location but also technology and product mar-kets, emerging out of the political process. The economics,in the form of the Plan, served to justify the decisionsalready taken on political and other considerations.
The tendency of the government to have a major sayin infrastructure projects, even when there are shortagesand congestion to lead infrastructural activity, is thusvery strongly embedded. Even a very progressive BOTlaw of the Gujarat government has been translated bythe state and politics into a set of �projects� based onthe planners� and politicians� sense of priority, rather
1 For instance, see Das (1997); also Das (1999).
12 India Infrastructure Report 2001
than on demand per se. To the extent that the basketof projects is large enough and there is a clear commit-ment to involve the private sector, and in the structuraldetails of the project the private sector is not shieldedfrom demand risks, there is scope for the allocation ofresources to be driven by the economics. Neverthelessthe allocative efficiency gains would be nowhere nearwhat they could have been had visible shortages andconstraints driven prioritization of projects.
The Large Costs of Denial
Infrastructure that comes later has another advantage.Shortages are capable of revealing willingness to pay.The true value of denial and therefore of the true costof exclusion of the �outsider� become known. Today thecost borne by the �outsider� is not equal to the value ofthe resource consumed by an equivalently placed �in-sider�, but is closer to his willingness to pay. Watermarket prices in and around most cities not covered bypublic supply in India and sales of privately generatedelectricity by using locally made contraptions hitched toslow speed diesel engines (and increasingly by morestandard diesel generator (DG) sets), in places like Patnacity even to poor households, tell us a lot about thewillingness to pay. At a fraction of these prices, theexpansion of many services would hardly require anyspecial measures like subsidies, only an orderly liberal-ization and removal of other legal hurdles to commercialprovisioning and entry. Even suboptimal entry, at leasttill such time as most of the glaring shortages areovercome, would be better than continued denial.
Urban Road and Space �Congestion� andSimulation Approaches
The only exception would obviously be urban roadcongestion and congestion on metro buses and trains asin Mumbai and Calcutta. This is because urban centralspace is constrained. There is only so much of it. Herethere will have to be planning approaches that usesimulation to examine the effects of alternative proposalssuch as denser packing of office and residential space byallowing a higher floor space index (FSI), or coordinatedand asymmetric signals during peak hours. Contem-plated bans on personal motorized transport in certainareas, shifting of transport-intensive activities to more�appropriate� locations and freer land use rules andrestrictions could also be examined by the simulationmode. The simulation mode has become increasinglyrelevant and appropriate not only because sophisticatedcomputers and software are easily available, but alsobecause the notion that the physical design, as also thedesign of rules, can and often does have consequences
not envisaged by designers is given its due weight. Byassigning an �autonomy� to users and agents (in a stylisticmanner no doubt) in simulation models, serious users ofsuch models have an orientation and philosophy quitedifferent from central planners or from planners andarchitects with their unquestioned a priories.
Infrastructure Developed Later But With theWillingness to Direct and Shepherd
Commercially oriented infrastructure would ensure thatlittle or no infrastructure remains idle. Thus we wouldnot have empty trains running from Ahmedabad toRajkot or from Trivandrum to Kanyakumari, just tosatisfy some perceived value in trains that �span thelength and breadth of the country�, while elsewherepeople have to travel packed like sardines.
Infrastructure Later Conserves Capital
Infrastructure that is created later conserves capital andresults in fuller utilization. This can reduce the economy-wide capital�output ratio. It is most pertinent to notethat much of East Asia, until recently, was in a situationof infrastructure created later (perhaps more because ofthe extremely rapid growth of manufacturing). In the1990s, huge capital inflows allowed it to go in forinfrastructure, anticipating (not necessarily correctly)future infrastructural needs. The high risk of lengtheningpayback periods, even as the tenure of finances wasdeclining, because an increasing part of the funding wasfrom foreign sources, was at the root of the East Asiancrisis.
While there are severe shortages, a significant part ofexisting infrastructure in India is underused or evenun-used, such as in cities with overprovisioning ofroads but having absurd design, like Delhi, Chandigarh,and Gandhinagar, and roads which only politicians andbureaucrats need, such as those between Gandhinagarand Ahmedabad. Other examples of misdirected resourceallocation are plush airports where there are only twoflights a day, even as others are woefully short of passen-ger amenities, and Rajdhani and Shatabdi first classes thatrun with the occasional government passenger. Suchmisdirections are so pervasive that the enormity of thecosts that they impose are hardly even realized. Due todelays and cost overruns which erode the productivevalue of savings, public enterprise may have imposed apenalty of as much as 1.5 to 2.0 per cent on the growthrate of the economy! If to that the costs of the underutilizedand unutilized infrastructure are added, the growth pen-alty may have been even higher! Who has borne thesecosts? Obviously the poor, especially those who are stillunemployed, since they, more than others, would have
Issues in Infrastructure Development Today 13
gained through faster growth; and of course the �out-sider�, as also perhaps the capitalists. Only the middleclasses may not have suffered much, because of theirfixed and rising incomes, which do not depend much onthe growth in the economy. In fact they have the benefitof cheaper services, including those of domestic servants,in an economy that has little dynamism in creatingfactory jobs. Moreover they can always rely upon somekind of preferential access to infrastructural services inshort supply.
Despite all the benefits of later infrastructure, theyarise quite clearly from having fallen behind the theo-retically optimum proportion of infrastructure. Whilethis is true, what is being argued is that the informa-tional, governance, and institutional costs of remainingclose to or above optimum level can be too large for atransforming economy, with pressures on the state tospread thin the resources for infrastructural investmentOther than that it places a greater reliance on theplanner and the politician rather than on the market. Inthe given situation of large-scale state failure in India,the late arrival of infrastructure has its obvious advan-tages.
MACROECONOMIC LINKAGES
Demand Owes Much to Infrastructural Investments
Not only in journalistic discussions, but surprisingly,even in academia, the demand aspect of infrastructurehardly ever finds mention. The sectors electricity, gas,and water (EGW) of the Central Statistical Organisation(CSO) and transport, storage and communication (TSC)while constituting barely 10 per cent of the GDPconstitute 25 per cent of the gross domestic capitalformation (GDCF). This is an aspect of the stage ofdevelopment of the economy. With better incomes, thecontribution of non-input infrastructure like housingand urban services will increase. Composition apart,until the industrialization process is completed andfor some time after that, when other infrastructurelike housing, shopping malls, and city formation func-tions improve, the gross domestic capital formation(GDCF) in infrastructure would be larger than itsrelative contribution to gross domestic product (GDP).Certainly at the stage of development the country is in,productive or input-type infrastructure�power, irriga-tion, basic water, and sewerage in urban areas, telecom,basic and technical education, roads for trucks andbuses, ports and railways�will have to expand at a rateat least corresponding to the growth rate of the economy.In these areas, except possibly telecom, the longer lifeof assets than those in manufacturing, other services, andthe primary sector obviously means that the investment
pressure from infrastructure is a major source of theinvestment demand in the economy.
Therefore, ceteris paribus, the investments actuallymade in infrastructure have a major impact on incomelevel via the demand multiplier. Indeed, in barely openeconomies, like the Indian economy before 1984 andthe Chinese economy before 1978, investments in in-frastructure (largely in the public sector), along withagricultural output, were the principal drivers of theeconomy. Today, along with these, exports too havebecome principal exogenous categories of expendituresfor both the economies.
The developments in the 1990s, following the stabi-lization of 1991�2 and the structural adjustment there-after, are worth recalling. The tightening budgets ofpublic enterprises, arising out of sharp expenditurereductions, hurt investments in infrastructure, bringingabout a significant drop in the rate of capacity additions.Overall, the reduction in public expenditure has fallenin a large measure on investments in general and moreparticularly on infrastructural investments. As arisingout of the liberal strategy of rolling back the state, evenafter the economy had been stabilized, this was to beexpected, since the public sector had a predominant rolein infrastructure and tightening its budgets would alsoaffect infrastructure.
Rising Private Investments in Manufacturing MaskedDecline in (Public) Investments in Infrastructure
Yet, once the economy stabilized by 1992�3, invest-ments grew very rapidly, despite the relative slowdownin public (and infrastructural) investments. This wasbecause investments as a whole were kept up at earlierrates of growth, or higher, by the very large rise inprivate investments, largely in manufacturing. Whileprivate investments seemed to rise in areas like power,they slowed down after a while and in any case their risewas too small to replace the large shortfall in publicinvestments. At that time in 1996�7, I (Morris 1997)argued that the economy would slow down becauseexports had been affected by adverse exchange ratepolicy and the scope for private investment in theaggregate to continue at the earlier high rate was notreally there. (Recovery from the recession took twoyears and even today the pointless defence of thecurrency and attendant inability to lower interest rateswill continue to hold back the growth of the economy!)
The reason private investment could not have risen tofill the void created by the falling off of public investmentafter 1996�7 is because then (and even as yet) the policy,legal, and institutional clarity, besides the price reformnecessary for private sector entry into infrastructure ona large scale had not come. It could not have come
14 India Infrastructure Report 2001
quickly, certainly not in India, where change typicallyhas been of the two-steps-forward-one-step-backwardvariety. The reforms needed for private capital to enteron a large scale will have to be deep and fundamental andinvolve major shifts away from the current paradigm.Privatization on �escrow� or �lease� basis could only havegone thus far. It will, in other words, require the secondor constructive stage of reforms.
Even State Investments in Infrastructure areBetter than No Investments
Here it is important to remember that uncertainty withregard to infrastructure (and ideological and financialrestrictions on the public sector investing) creates adepressionary pressure. Thus the economy bears a costand a risk in growing more slowly. In the 1980s, withthe state investing (however inefficiently), this demandside factor was not adverse and did not slow down theeconomy.
Higher �Target� Growth for Monetary Policy
Despite this, realized growth rates in the 1990s havenot been low. Indeed, they have on the average beenonly marginally less for the industrial sector than thosein the 1980s, and probably higher for the economy asa whole, owing to the faster growth of the servicessector.2 Rather than using this fact to justify conser-vative macro-economic policies, as the Reserve Bank ofIndia (RBI) has all along been doing, it is necessary torecognize that the achievable growth rates are consider-ably higher than what is generally believed�possiblyeven as high as 9 per cent (Morris 1997). Monetarypolicy, including monetization of fiscal deficit, couldhave been much more ambitious and exchange ratepricing more aggressive than the general consensuswould have it.
A revival of infrastructural investment could indeedforce the government and the RBI to accept this highergrowth potential of the economy and hence an alterna-tive higher equilibrium, where a 5 per cent overall fiscaldeficit is actually sustainable (and possibly necessary) forsome years to come.3 Infrastructural investment willthen be higher than that in the 1990s. With money
supply growth faster4 than in the 1990s and much lowerexchange rates, the openness of the economy increasessteadily through higher growth of the traded sector atbetween 50 and 100 per cent faster than the rest ofthe economy. Inflation may be marginally higher at 7�8per cent5 rather than the present 6�7 per cent, but thereal interest rate would be lower by at least threepercentage points. In that situation, growth would becloser to 9 per cent.
Economic Revival Requires Infrastructural Investment
The leverage point for change would be both invest-ments in infrastructure, and exports (through the ex-change rate), to affect demand positively. Thus, not onlyfrom supply side considerations, but even more urgentlyon account of the demand side, infrastructural invest-ments will have to revive. The matter may be so urgentthat if private investments are going to be delayed forthe reasons mentioned above and the corrections to relaxthe constraints are not forthcoming in the near future,a reversion to public investments will be necessary.
Large Potential for Private Investments
The potential for genuine private investment, with theright kind of reform, is large because of certain interre-lated factors. The areas of infrastructure that havefunctionality at this point (from the supply side, orrequirements) are power, telecom, roads, and urbanwater. All except roads are highly appropriable andmuch of telecom is possible even via competition modes!There is no problem of excludability in all of theseexcept roads. Even here the build, operate, and transfer(BOT) route will be valid and provide substantial privateinvestment, till such time as bottleneck situations areaddressed and relaxed. Thus a crash restructuring of the
2 Higher export growth at least till 1996�7 and an averageagricultural growth of 3.2 per cent (from the 1980s� 3.0 per cent)and structural changes towards higher productivity industries mayhave been responsible.
3 Applying a suitable growth rate of exports of 15 per cent perannum instead of 10 per cent, a growth rate of the economy of8 per cent instead of 6 per cent, and an inflation rate of 8 per centinstead of 5 per cent on a standard sustainable primary overallfiscal deficit formula, a figure much higher than the generallyassumed 2.30 per cent is arrived at, viz. 4.56 per cent.
4 Targeting money supply growth may not be the right strategyin India. (For the first couple of years of stabilization, one couldgrant the validity of monetary targeting.) Even elsewhere, econo-mies like the US�where the money multiplier has been far morestable than in India�have grown much faster by shedding theirearlier monetarist conservatism and targeting interest rates.
5 The assumption that inflation is essentially a monetaryphenomenon is not quite correct. At inflation above 9 per cent,money supply growth is no doubt the driving factor. At ratesmuch below, up to about 8 per cent, it is the price of primaryproducts whose supply and demand are both inelastic in the shortrun that has driven the inflation rate in India. Primary products,especially agricultural, have a volatility which is more than doublethat of manufactured goods, when we look at monthly data. Thusbuffer stocking of food and an incomes policy that links spendingto the investment demand will be the solution for the economy.Indeed, a well-thought-out incomes policy has inter alia been afacet of high speed growth in East Asia, including that of Japanin the 1950s and early 1960s.
Issues in Infrastructure Development Today 15
power sector on the lines suggested in this report6 andopening up of the telecom sector on the lines of thePrime Minister�s Office�s Draft Bill will be necessary.Similarly, the opening up of the urban water sector,especially distribution, to BOT at least in areas notpresently covered, or poorly covered by existing publicenterprises or parastatals, will help the urban poor agreat deal. The last would no doubt entail that urbanbodies have the freedom to act and to initiate openingup the water and sewerage sectors with minimal regu-lation, limited to standards of safety and possibly aliberal price cap. In roads the decision to set up anautonomous road fund with substantial stakeholding byroad users and citizens would make it feasible for theprivate sector to go beyond toll roads, to own andoperate even urban roads. In all these, detailed analyticalwork to produce requisite legal and contractual docu-ments, as also bills to be tabled in legislative bodieswill take time. But the point really is to draft and declarea clear overall strategy that outlines the future courseof action and the objective of reform. In a sense whatwe are saying is that there should be �equifinality� ingovernment actions to necessarily lead to the announcedstate of the industry.
THE APPROACH TO REFORM AND
RESTRUCTURING
State Ownership Did Not OvercomeCoordination Failure
It is relevant at this point to recall that one dimensionof the state failure that brought about the crisis of theearly 1990s was precisely its inability to coordinateacross sectors. It may be emphasized that this needfor coordination was perhaps the most important reasonfor state ownership in these sectors in the first place.Indeed, the whole idea of the intersectoral consistencyplan that India pursued for over four decades essentiallyarose out of the recognition of such interrelationships.That the effort has failed is not because the need orthe opportunity for coordination and interdependenceis any less, but because it has not been adequately andappropriately pursued. Planners did not attempt totranslate the desired goals and targets into prices, incen-tives, and consistent rules, but sought to direct agentsthrough administrative fiat in what was even thenessentially a market economy.
The Mode of State Direction is Important
The option of directives, controls, and administrationthrough parastatals and public enterprises was an easy
one for the bureaucracy. It would have been intellectu-ally demanding to translate the desired goals and targetsinto prices, taxes, and rules, in a manner that createdappropriate incentives for agents and managers to actand move towards the very same goals. The intellectualenvironment of that period which did not question thestate�s ability or capacity (or even motivation) to carryout the task of directing and controlling the economy,has certainly been part of the problem. In a short time,certainly by the mid-1960s, the inconsistencies whichcreated rents had backlash effects, resulting in a politicaland economic structure in which rents and profits wereso closely intertwined, as to be impossible to disentangle.For the future, piecemeal approaches are no longerfeasible. Thus, even while the decisions and legislationsmay be slow, the strategy for the change cannot beincomplete if it is to become a credible (and inevitable)guide to the future.
Commercialization of Investment Decisionsis the Real Challenge
The objective of early planners to arrive at someunderstanding of the contours of a desirable futureremains valid in a market economy. But now theattempt ought to be to steer the economy with fewerand less dysfunctional instruments, or even to allow theeconomy to find its own way. This is the challenge ofreform in the Indian context.
It goes without saying that there will be situationswhere the future is only dimly discerned, where predict-ability is poor, or even where there are no obviousinstruments to lead the economy. In such situations,simple rules that enhance the role of markets, not justin producing and selling but also in investments, i.e.to allow and create conditions for markets to play abigger role in the allocative process, would be functionalto the growth and development of the economy.
The challenge of reform and privatization is reallyto bring the market process into allocative decisions.Governments everywhere shy away from this role formarkets with regard to infrastructure. The Indian state,which has the task of balancing various pressure groupsand competing regions, would be most reluctant toconcede any reduction in its own role in investmentdecisions. To bring the investment decisions in infra-structure into the market process remains a challenge inmany sectors, especially in sectors where failure arisesfrom lack of excludability. The problem is more impor-tant to transforming economies like India, where thetask of building basic infrastructure lies ahead.
The shift to privatization of infrastructure from astate-dominated system cannot be easy or sudden. It maynot even be necessary to start with. Allowing managers
6 See section 7.3 in this report.
16 India Infrastructure Report 2001
the freedom to manage and organizations the basis to becommercially oriented is good enough. Yet in practicalterms the Indian government, at both state and centrallevels, has not shown the capacity to allow managers ofpublic enterprises to work without political interfer-ence. It has also not been able to refrain from settingprices that are unsustainable. Infrastructure with state-dominated provisioning poses the dual challengeof privatization (which it shares with all public enter-prises in general) and of overcoming in some mannerthe �market failure� that is a characteristic of it. Regu-lation, detailed or otherwise, and market creation througha clear definition of property rights are important meansto overcome market failure. Similarly, creating incentivecompatibility through appropriate choices and restric-tions on ownership is also a significant means to curbmarket failure. The market-creating power of high speedand networked computers, when brought to the aid ofthese approaches, can considerably enhance the processof commercialization of infrastructure.
Mode of Redistribution is the Problem
The above tasks would be common to reforms any-where. The Indian situation offers specific challengeswhich can hardly be understood completely with refer-ence to experiences elsewhere. The context is veryimportant. Often policy makers and analysts complainthat change is politically difficult and eminently goodmeasures such as tariff reform and removal of poorlydirected subsidies are viewed as impossible withoutpolitical will. Hence reform is slowed down or alto-gether stalled . The problem, while requiring a politicalsolution today, may itself have been a creation of thepast. For example the decision to subsidize or redistrib-ute may not have been wrong per se, but its modemight be questionable. Thus the creation of the well-entrenched nexus in adulterating and short measuringpetrol, diesel, cooking gas and other oil products. Thesevested interests are a creation of the original ham-handedness of the policy, and are today strong enoughto slow down or even stall change.
Vested Interests Can Be Countered
From comparative studies of the Indian state and thestrong East Asian states, we do know that the latterintervened as much, and perhaps even more strongly,than did India. But they showed an ability to beconscious of the �unintended� and compositional conse-quences of government direction, unlike the Indianstate. They have also tended to periodically correct suchconsequences. In India, slower state and bureaucraticprocesses, inadequate coordination across and within
vast bureaus, and perhaps even quicker response ofagents to exploit the rent opportunities so created wereres-ponsible for the pervasiveness of distortions andrent-seeking behaviour. Eventually, vested interests haveevolved. Yet one must not exaggerate the power ofvested interests, since there are always others outside thecurrent system of benefits and rent generation, thatcould be mobilized for change. Potentially, such �outsid-ers� are larger in number and await the �political entre-preneurship� that would mobilize and activate them tobe the vanguards of change.
ILL-CONCEIVED REFORMS
Vested interests may not have been the principalreason for the slowness of reforms in the 1990s. Poorconception and design may be the chief culprits. Addi-tionally, resistance from the bureaucracy and poorcredibility of the reformers to carry out reforms in afair and non-partisan manner have created doubts abouttheir benefits among sections that could potentiallyhave been the most important gainers. The tendency tomake do with �known� persons�retired bureaucratsand judges�rather than bringing in experts and specialcompetencies has also contributed to the slownessand ineptness of certain reform initiatives. Analyticallyit is not certain that the same forces which pushedfor the early reforms (the so-called first stage of thereforms), and gained sub-stantially from them, will notoppose the next stage of the more challenging reforms.There is, therefore, no doubt about the need to findnew allies, including those without voices. There mayeven be need to keep at a distance the elements thatsupported and pushed for reforms in the first stage.Thus, independent power producers (IPPs), early devel-opers, foreign institutional investors (FIIs), and govern-ments with changeable commitment to the economycould resist change if competition in the broadest sensewere to emerge to challenge the profitability of theirearly investments.
The Challenge of Constructive Reforms
The early phase of the reform, where the constructiveaspect was small, needs to be distinguished from reformsneeded now that have to, inter alia, construct marketswhere none existed before. It has also to create newinstitutions with more appropriate incentive structuresand codify simple rules that are conditional rather thanabsolute. Similarly there is need to clarify and refineproperty rights and bring about common propertymanagement approaches to overcome certain kinds ofmarket failure. While the dismantling of licences, re-moval of import controls and restrictions, relaxation of
Issues in Infrastructure Development Today 17
entry restrictions for foreign capital and the lifting of theban on the private sector in certain product marketswere all relatively uncomplicated, the changes requiredtoday are not so. The problem is not only morecomplex, but solutions will also depend on the speci-ficities of society, economy, and state capacity. Thuslearning from experience elsewhere in the world whileimportant would be far more contingent. There are nosimple substitutes for creative approaches. The possibil-ity of being overwhelmed by the received wisdom islarge.
Consumers� Interest as the A PrioriConcern of Reforms
In bringing about infrastructural reform today, theemergent and the unanticipated aspects are large. I havealready stated, therefore, that the scope and need for astrategy of reform are substantial. What can be thecommon contents of such a reform? Much of it would,understandably, depend upon the particular sectorand the specific possibilities of liberalization, the natureof market and state failure that may exist, and otherdimensions of the industrial structure. But certainly,the strategy can always reiterate that the purpose ofreform lies in the interest of consumers and society asa whole. Thus reforms should have as their priorityconsumer and societal interests and not the means orintermediate goals such as privatization, or bringingabout independent regulation. Many contradictionswhich regulators today face would not be existing hadthe consumer been given primacy.
External Pressures Alone are Inadequate
Infrastructure sectors such as roads, housing, watersupply, and sanitation, which, in contrast to othersectors like telecom or power, use traded goods to alesser extent in their construction and operation, are,therefore, less likely to be subject to external pressurefor change. The pressures would have to come fromwithin, or possibly from development financial institu-tions (DFIs) and multilateral agencies (MLAs). Externalprivate interests would tend to be limited to consultingfirms and lenders and it is not always the case that theoptimal and sustainable reform is necessary for theirprojects� success. Project success may well be betterassured by certain suboptimal (from a societal point ofview) contracts that protect the interest of the lenderrather than true reform. The danger of a spate of suchsuboptimal contracts �defining�, through their practice,the nature of change is large. This is especially so whenthe change has been driven by the presumption that �thestate has no money�.
LEVERAGE POINTS FOR CHANGE
Deregulation and Commercialization toCorrect State Failure
A valid issue that arises is: it was state failure thatbrought about the crisis of the economy and the shortprovisioning of infrastructure in the first place. Andnow if the state has an important role in creatingappropriate strategies and institutions for regulation,is there any real hope for infrastructure unless statefailure is overcome? Even privatization and orderlyand correct deregulation would require state capacity.To get a handle on this important question, it isnecessary to understand the nature of state failure inIndia. It is certainly not a failure arising out of incom-petence, since even today many individuals withinthe bureaucracy and those outside, but on call, haveall the skills to analyse and find solutions to mostproblems. Similarly, the average Indian politician ismore educated than those in many other countriesincluding the US. State failure is primarily one ofincentive incompatibility and the distortions thathave followed therefrom. As a result, there is a majormismatch between responsibility and authority. Exist-ing structures, reporting relationships, and processesmore generally have resulted in the displacement ordilution of responsibility. Even when organizationsof the state have started with concern for the primarytask, deterioration along these lines has been common.Corruption in high places is also an important dimen-sion of state failure, but as earlier stated, corruptionfeeds on the inappropriate design of organizations andon �policies that create rents�. Despite all that hashappened thus far, the Indian state machinery cannotbe called �kleptocratic�.7
Reform Does Not Need �Ideal� Bureaucracies
Perhaps the most important reason for commerciali-zation and privatization is that commercialized orprivatized enterprises demand good and competent pro-cesses and structures only within a small part of theoverall governmental machinery, possibly not even allthe time. Thus, even if the bulk of the public worksdepartment (PWD) is corrupt or caught in a quagmireof impotence, a small group, well shielded for a whilefrom dysfunctional bureaucratic and political processesand possibly having the support of the top politician,can push through, for example, a worthy BOT law.Once a few projects go through in a fair fashion anda process is established, the potential of substantialsections of the state machinery to delay and hold back
7 Many in Africa are indeed so [Leys (1975) & Shivji (1976)].
18 India Infrastructure Report 2001
change is reduced. Indeed, as a result, the pressures onthese organizations to change may well increase. Evenif they do not change, instead of stalling projects andinfrastructure businesses, their activities may then merelyadd some costs (rent) to them.
It is because of this ability to do with less thanuniformly good state systems that commercializationand the private sector�s role become vital. If indeedpluralistic delivery takes place, the backlash effects of thesame could generally clean up the rest of the machinery,since the returns to corruption fall dramatically ascompetition emerges and the returns of technology andbetter management improve. This has already takenplace in manufacturing industries in India in the 1990sand it is now beginning to show where independentregulators are fighting to do their jobs.
All or None Kind of Change is Very Difficult
Even in the most dismal of state systems, there arepeople who are not corrupt and make honest efforts topursue the primary task. A wholesale replacement ofstate administration, even a thoroughly corrupt one, hasbeen rare. A quick change for the better via reform ofgovernance that includes the state machinery has alsobeen rare and is almost impossible without revolution-ary political change. The Indian state system is, all saidand done, �fair� in politics, at least to those who havevoices (and most do). To �insiders�, that is those withsome endowments, it is fair even in an economic sense.Thus the state has a legitimacy which goes beyond thecredibility of particular governments and their policies.Moreover, those actively involved in corruption arebasically few. Many within the administrative systemare in a state of impotence because of the cumulativeimpact of past mistakes that have brought about incen-tive incompatibilities and reduced the scope for action.There are many honest civil servants, who even withinthe current system, are able to take risks pursuingchange. Would such groups reach the critical minimumsize for large-scale change?
�Leverage� Points for Change
Change that starts small but attacks key leverage pointsof the system has great potential and may even havebegun to occur. Ushering in markets and commercial-ization in infrastructure can build upon such changes tounleash the potential of the economy and its positivefeedback effects on the state system. True reform wouldhave such effects. With the economy growing at muchhigher rates than at present, �outsiders� could soonbecome �insiders� and the returns to corruption coulddwindle considerably and the stakes (and capacities) of
those who are victims could become high enough toensure high costs to corruption. For example, the USwas a very corrupt economy in the 1920s, but theeconomic dynamism of the 1920s gave rise to large-scaleimprovements in governance. Similar pressures are nowat work in China, where �campaigns�, the patent re-sponse of the Chinese society to problems, have madeexamples out of corruption in high places. Corruptioncan then decline suddenly. That day may not be too faroff in India, if it can shake off its current constraints tohigh speed �inclusive� growth.
PUBLIC ENTERPRISE IN INFRASTRUCTURE
�Hardening� Versus Performance Budgets
One essential aspect of the reform thus far has been thevery significant hardening of the budgets of publicenterprises. The central PSUs almost immediately after1991�2 felt the pinch of cutbacks in budgetary contri-butions. With a lag, state-level PSUs and local bodieswhich have a big role in the provision of physicalinfrastructure also felt the heat. �Hardening� of budgetscan create conditions for task orientation and for tariffreform in the organizations which then have to copewith falling contributions from the state. But thus farto rely on that aspect alone has been quite short-sighted.It has meant that the potential to use related andcomplementary instruments like variability in the hard-ening of budgets, performance linking of budgets andresources, discretionary and incentive pay for employeesof public enterprises has been missed. Simple hardeningof budgets for a parastatal, while salaries of workers andmanagers alike as employees of the state are protected,is hardly a situation likely to improve efficiency. If asmall portion (even additional) of employees� wages andsalaries could be linked to performance improvementand to the surpluses or losses reduced, then hardeningbudgets could work to improve systemic efficiency.There is much variation in the degree of public enter-prise performance even when adjusted for differingopportunities. Linking of earnings of employees withperformance is then possible. No doubt, these cannotlead to optimal investment decisions per se, till such timeas the entity in question itself generates a substantialpart of its investment requirements. Similarly, when theenterprises in question do not have their own specificand separate budgets, or when change in one set ofenterprises is desired, across the board hardening couldresult in perverse behaviour. Thus, in many states,state-level PSUs continue to exist and new ones areset up, even as those employing semi-skilled and un-skilled workers are closed. This is being done so that
Issues in Infrastructure Development Today 19
bureaucrats and politicians do not lose those �expenseaccounts�. The key to the successful working of hard-ened budgets is stakeholding�of employees and manag-ers�in the future of the enterprise in question. This mayhelp in changing the behaviour of managers; those whoare part of a cadre and whose career paths and salariesare almost entirely independent of the performance ofthe enterprise they manage would be little affected byhardening budgets.
The Bogey of Social Considerations
Unfortunately, so-called social considerations haveloomed large, thwarting and resisting commercial pro-visioning. One must recognize that, despite over fortyyears of state-directed and -controlled provisioning withlow prices, in the name of the poor, neither regionalnor income inequality is in any way less than in manyother countries. The spread of modern infrastructurelike electricity, piped drinking water, and telephonesis well below that in countries like China. More thanthis fact, the reasons for failure to cover, via publiclyprovided infrastructure, as much of the population aswas desired and expected to be covered remain to besystematically addressed. Low, even very low, prices canonly go so far in improving consumption among thepoor. The very poor can hardly be expected to consumeurban sanitary services or electricity beyond the singlebulb and fan, only because these services are cheap. Inthe long run, income is the determinant of demand andprices only an indication of costs. Thus the problem ofaccess goes beyond infrastructure to development. Verybriefly, countries in East Asia which carried out �one-shot� land reforms, rather than using the state continu-ally to redistribute (as India has been attempting todo), and whose industrializations were labour absorbinghave had high rates of income growth and, necessarilytherefore, of infrastructure development. Export orien-tation was an important aspect of their labour absorp-tion. When prices are systematically kept separate fromcosts for long, then that effect can be recognized asequivalent to a small rise in income, usually smaller thanthe subsidy value of the subsidized good consumed. Itis obvious that there are severe fiscal limits to raisingincomes through subsidizes in an economy that has yetto make its industrial transformation.
Problems of Indian Public Enterprise
The ritualization of processes and institutions meantto bring about functional modes of working, has beenmost potent in ensuring that no real or substantivechange takes place even as the �form� and symbols ofchange become ends in themselves. Thus the MoUs
between public enterprises (CEOs) and administrativeministries, meant to free top managers from interferenceby government, have, in India, been almost completelyritualized. Similar arrangements have worked well inother countries, notably France. In India MoUs arepaper exercises and ministries are hardly constrained bythem. Enterprises show �good to excellent� performanceby soft targeting, and the ritual continues every yearwith more paper work and an added bureau. Similarly,holding companies which have worked well in Italy todistance management from dysfunctional interferenceby government have not been successful in India.
Project Implementation
Typically benefits are overestimated and costs under-estimed to show high internal rates of return (IRRs) andbenefit�cost ratios. After sanction the true costs slowlyemerge and delays in approval of the revised (higher)estimates recoil/turn on the project already under con-struction, increasing costs beyond what they couldotherwise have been. Spreading the funds with thegovernment over a larger number of projects than arefeasible without delays results in additional delaysand cost overruns. Other organizational inadequacies,especially when the projects are implemented by depart-ments or departmental enterprises, with their poor orinappropriate organizational processes and lack of skillsin project implementation, compound the problem.The result is very poor project implementation, withcost overruns in excess of 60 per cent. So project costestimates are usually underestimates of the true costs,but the realized costs are equivalent to overestimates. Ifproblems of inaccurate estimation of costs have becomeentrenched and inefficient practices the norm, then thepublic enterprise cost figures are worse than useless. Thisagain underlines the need for benchmark studies andindependent, engineering-based estimates to, if nothingelse, circumscribe true costs. Otherwise private partieswill be tempted to use the situation to their advantage.
The Danger of Empty �Solutions�
The problem of the Indian public enterprises goes farbeyond the usual �agency problem� that state-ownedenterprises worldwide suffer from to some degree.There is over-manning, governmental interference atall levels, tolerance of enormous leakage and waste,highly constraining rules, and corruption.8 In such asituation and when the pressure for reform and im-proved economic performance (real or token) is strong,
8 Nevertheless there are remarkable cases that are free of theseevils: the National Thermal Power Corporation (NTPC) andBharat Heavy Electricals Limited (BHEL) would be cases in point.
20 India Infrastructure Report 2001
there is a premium upon the �clever� civil servant orconsultant who can offer seeming �solutions� that aresuch in appearance but not in content, allowing the rentsin the status quo to continue.
The Potential for Well-managed Public Enterprises
In a vast ocean of state failure, there are some examplesof success of public enterprise and state provisioning:The NTPC as a player in wholesale electricity, theMaharashtra State Road Development Corporation(MSRDC) in highway planning and construction,the Tamil Nadu State Electricity Board (TNSEB) andMetro-water Chennai are reasonably efficient. The onecommon feature is that their managers have had agreater degree of operational autonomy. Dysfunctionalgovernment interference has been kept out in suchorganizations. This has happened either because thegovernment itself made this �one exception� as in thecase of the MSRDC, or because the organizations� topmanagers �fought hard� to negotiate the boundary. Andthe strength emanating from good performance (itselfinfluenced by the functionality of the interface) wouldhave given more power to top managers than in mostother public enterprises. That would have allowed themto thwart repeated attempts by politicians and civilservants to interfere in operational decisions and some-times even to resist pressures against the commercialinterests of the enterprise. Thus, while the model of�well-performing� public enterprise has largely failed inIndia, the few exceptions and the reasons for theirsuccess allow a more optimistic assessment of publicenterprise, suitably restricted. The reasons for the sameare many, but perhaps the most important is urgency.State and central governments when confronted withchallenging and important tasks have, at least occasion-ally, been able to bring out the good aspects of stateprovisioning and ownership, by leaving them to themanagers to do the job. Therefore the potential to avoidinterference is certainly there.9
Ownership and Commercial Provisioningare Not the Same
A related point is that commercial provisioning ofinfrastructure is neither synonymous with private pro-visioning, nor does public ownership necessarily have tobe non-commercial in approach. Vast allocative andoperational efficiency gains await reformers who can
push systems and sectors into this commercial orienta-tion, without being orthodox about ownership. Inspecific situations, ownership, including a certain degreeof private participation, is important because certainkinds of commercialization are easy with private partici-pation. Even if the tendency towards dysfunctionalinterference can be overcome (this is not a problem inFrance, Italy, China, or South Korea, with much stateownership), the aspect of commercial orientation re-mains. Hence the crucial task of reformers concernedwith restructuring is, in creating the right industrystructure, and rules of behaviour both operational andinvestment that are in keeping with efficiency in situa-tions of imperfect markets or even near market failure.Yet with entrenched vested interests, as in the case ofstate electricity boards (SEBs), reform may have to startwith a change in ownership, or at least with internalincentive mechanisms within �the existing�, or theirinheritor, organizations.
Improvement in Public Enterprise Performance isCrucial to Infrastructure
Prospects for commercialization increase dramaticallyif improvements in the interface and attenuation of�agency failure� can take place, because a very large partof infrastructure is in the public sector. More impor-tantly, in crucial areas like public health, education,and perhaps even roads, the private sector would be adifficult option. This is because despite the develop-ments in unbundling arising out of fundamental de-velopments in contracting, technology, and marketcreation processes that have led to the relative declineof the classical public enterprise and of traditionaldetailed regulation, these areas have severe appropriabi-lity problems.
With pressures for privatization increasing by theday, the case for �giving managers and workers a fairchance to perform by untying their hands� can also bestrongly put. If indeed that happens, then part owner-ship by employees can be effective in bringing aboutincentive compatibility within existing organizations.As part of the process of liberalization, controls, fiatsand case by case direction gave way to price-basedinstruments like tariffs and prices were brought closerto international and domestic values. In the second stageof reforms, ownership changes, the removal of distor-tions created by (past) policies and practices, and theremoval of the many �objectives� and constraints placedupon public enterprises can bring huge rewards. Thereare immediate opportunities for reformers in settingright dysfunctional interface between public organiza-tions, and in relaxing the commercially restrictive poli-cies on public enterprise. The ownership aspect, or
9 Indeed, the case for privatization in India rests on theexperience that governments have continued to dysfunctionallyinterfere. Thus the more general solution to public enterpriseperformance in today�s context remains disinvestments below 50per cent.
Issues in Infrastructure Development Today 21
disinvestment, could be considered subsequently andcorrecting the above distortions lays the grounds forsuccessful privatization. Such a strategy would imply aninstitutional and managerial approach backed by politi-cal commitment. If that seems difficult, despite theobvious opportunity, then the only option is to wait forprivatization from above.
The Need to Eliminate Conflicting Tasksand Constraints
Public enterprises have been saddled with conflictingtasks that go beyond their primary purpose�to provideabove market benefits to employees, especially at thelower levels; yet they have no freedom to pay differen-tially for performance and skills, subsidize and cross-subsidize�sometimes with no limits�encourage smallvendors, industrialists, and local enterprise, buy fromother public enterprises. They have also to maintainthree parallel accounting systems, be subject to govern-ment clearance and involvement in the details of invest-ment decisions, be amenable to advice from Parliament,and subject to operational �guidance� from the govern-ment. If these conflicting tasks and constraints areremoved, even without major ownership changes someenterprises would be able to commercially orient them-selves.
A Commercialized Public Sector is Not aContradi c t i on
When it is proposed that public enterprises need notbe non-commercial in their approach, it seems like anuntenable position to both the old proponents of thesocialist model and the neoclassically inclined whobelieve that public enterprise should be limited tocertain sectors with a public goods character. In truth,the reasons for state enterprise could go far beyond thepublic goods market failure or the natural monopolysituation. Public enterprises in late industrializationhave been used to lead developments in particularsectors, especially the �strategic� sectors of the economy,and to create a domestic capitalist class with the abilityto hold its own against foreign capital. In this under-standing there is an emergent character to markets,and public enterprise may be seen as force-feeding thedevelopment of markets. Thus the market orientationof public enterprise is a crucial aspect of not just reformof infrastructure development but of carrying througha successful industrial transformation.
Levelling the Playing Field
What would help to bring in commercial orientationof public enterprise in infrastructure? Foremost would
be the separation of subsidization from the enterpriseproviding the service. With regard to electricity, it isargued here that this is the first and foremost issue thatneeds be addressed. This separation, through the mecha-nism of direct subsidy, can remove in one stroke theexcuse for deviations from commercial orientation andperformance. This aspect has already been discussed.Next in importance would be levelling the playing fieldbetween public and private enterprises. In reformingcountries, across the board budget cuts and openingup of the sector to private capital can often be underspecial law or directive that does not include existingpublic enterprises. These may then continue to beburdened under the old constraints and impositions.Thus, until recently, even as the IPPs were allowedequity rates starting with 16 per cent and going up to30 per cent, and that too with very little business riskbeing borne by the equity shareholders, the NTPC wasforced to take only a 12 per cent return with huge risksand on allowable depreciation rates which were muchlower! This kept the NTPC�s large debt and equitycapacity from being brought to bear on adding togeneration capacity, relatively much cheaper thanwhat any of the new private players could offer! Hadit been allowed even a 16 per cent return things wouldhave been different. Even today the bias against theNTPC continues. There are similar examples of biasesagainst reasonably well-performing state enterpriseswhose capacities and capabilities are vital to the devel-opment of infrastructure. A certain bias against anincumbent in a network industry like telecom maybe desirable, but the bias often goes beyond that neededto change market structures to bring about greatercommercial orientation, competition, and incentiveregulation.
PRICING AND SUBSIDIES
The Tendency to Load an Intermediate Rather Thana Final Good: Inversion in Tariff Systems
In electricity, industry cross subsidises households inmany states and agriculturalists in all states. In railways,freight cross subsidizes passengers and suburban traffic,in water, industry again cross-subsidizes households.In power and railways, we have reached a situationwhere the high tariffs for industrial consumers and forfreight, respectively, in turn affect investment decisions!The organizations in question also continue to losedemand. The effects and the nature of these losses arediscussed elsewhere. Here the focus is on the politicalbasis for such distortionary tariffs. Price controls are animportant aspect in a �mixed economy� that sets itself a�socialist goals�. The long years of �redistribution as
22 India Infrastructure Report 2001
the central effort and task of the state and policy�,entrenched the tendency to use prices and controlsto reward and punish consumers. Thus �luxury� prod-ucts like automobiles had a total tax that may haveexceeded 120 per cent on manufacturing cost. Eventoday, total taxes on an automobile may be as high as90 per cent while the prices for such things as waterare abysmally low.
While this may seem consistent with the plannedobjective of curbing unnecessary consumption to mobi-lize all resources for investment, in reality during the1970s and 1980s, high and rising administered prices forinputs of industry have acted as a regressive �taxation�.Water, electricity, coal, freight charges, and heavy taxeson energy are examples. The inputs used by industry ingeneral cannot on any account be final luxury consump-tion goods. Thus the tendency to avoid bringing subsi-dies to bear on the budget, but to allocate them repressivelyon the economy as a whole, via higher input prices, issimilar to the regression in using indirect taxes for rev-enues. Unfortunately, despite the considerable scalingdown and rationalization of indirect taxes, the implicittaxes (in the cross-subsidization) have not only contin-ued, but have even grown. They are all intimately linkedto infrastructural services. They have proved difficult toreduce despite the best intentions, because the policythus far has not explored necessary stepping stone solu-tions. Such solutions have to delink subsidy from thereform process, and allow the reform of infrastructuralsectors to continue. In almost all situations direct sub-sidization would allow the link to be broken. Subsidycould then be capped and with the gains of reform, itwould become a smaller part of the overall economy.10
Subsidization of Access Rather than Use
Subsidization has some value when the external effectsare large, as in vaccinations, primary health care, edu-cation, encouraging the shift from kerosene lamps toelectric bulbs, use of safe drinking water, and such othermerit goods. Interesting and relatively robust methodsdo exist for ensuring that merit goods subsidies cancontinue to be provided even under privatized orcommercialized systems. Besides, subsidization of accessrather than subsidization of goods or use of servicewould provide for greater social value and positiveexternalities.
Reform and Subsidies are Not Incompatible
The bogey of merit goods and subsidization has beenunfairly used to stall reform by its detractors and
surprisingly even by those who genuinely represent thepoor. Herein the problem, besides poor communica-tion, could be one of the reformers and state lacking thecredibility to ensure that the benefits of reform areequitably distributed. By insisting upon a roll back ofsubsidies (which is usually not necessary), reformershave unwittingly played into the hands of those whopoliticize subsidies to stall reforms. Many sectors ofinfrastructure, of which electricity is one glorious ex-ample, also including urban water, irrigation, hospitalservices, municipal waste collection, are very badlymanaged with enormous leakages and waste. The needof the hour is to emerge from the catch-22 situation ofsubsidies being used to justify existing inefficienciesand waste and these in turn contributing greatly to the�need� for subsidies, by raising costs unnecessarily! It israther disturbing that no clear strategy has thus faremerged from official circles on how reform can usefullybe dissociated from subsidies and each addressed appro-priately.
Subversion of the Independence of the Regulator
The idea that the regulatory function needs to beseparated from the government as a player and providerin a situation of pluralistic supply is almost axiomatic.While the idea has most certainly taken root for the goodof the reform process, it is still being hotly contested andsubverted, or subtly displaced, as when a clever clauseis inserted into the bills creating regulators, to retainunwarranted government control or influence.
Contracts and Their Appropriateness
The role of contracts in their most general sense in-creases dramatically with pluralistic provisioning ofinfrastructure. Earlier, the government, typically throughinternalization, could work around the imperfectionsin contracts with its parastatals and/or public enterprise,or even between them. They now become inevitablenot only because of ownership changes, but also becausewherever possible even state-owned entities need tohave their independent (and separate) budgets. They arealso essential if performance has to be meaningfullyreflected in the accounting statements of enterprises.Tightening budgets also require budgetary coherencewith the organization�s power to spend and to be heldaccountable. With enhanced role of contracts, lawyerscan be expected to gain, but their gain can be usefullyminimized through appropriate, easier, and standardcontracts. Very honest and dedicated government offi-cials often take great pride in bargaining hard withvendors and construction contractors. Indeed, one-sidedcontracts have often been drawn up, whetted by the legal10 See section 7.2 for the design of such a scheme for farmers.
Issues in Infrastructure Development Today 23
departments of the state or its parastatals, and pushedon to �helpless� private parties. No contract can everbe complete. So it is probable that such unfair contractsare accepted by private parties only because they haveoptions to cheat or underperform, possibly even inways that still meet the contract. The simple idea thatin all contracts both parties should have some gainand hence a stake in the contract tends to get over-looked. A serious businessman would be concerned ifthe people with whom he dealt did not have the scopeto make money. As the reform process creates theneed for contracts and agreements among governments,public enterprises, and private parties of many hues,the issue of their appropriateness, in terms of fairness,match between control and responsibility, incentivecompatibility, and specifically the adequacy of �insideoptions�, becomes urgent. More than legal skill, eco-nomic and managerial perspectives need to be incorpo-rated in drawing up contracts.
Pricing Distortions are Likely to Run Deep
There is a tendency to keep prices artificially low whenthe service in question is perceived to be a necessity.However, the willingness to pay for necessities is higher,ceteris paribus, than for say �luxuries�. This is true, forexample, of drinking water. However, drinking wateris priced lower in relation to water for electricitygeneration or for industrial use. This can result inperverse allocation and further distortions with invest-ment decisions being based on such prices. Allocationof the resource then has to be made administratively,since market clearing prices are not possible and long-run marginal costs are not reflected in the prices. Thisset-up would typically result in underprovisioning ofdrinking water. The poor would have to compete withthe rich and the well connected for water allocations,and it is almost a forgone conclusion that they will bethe losers. This is the second order effect of pricedistortions, the first being the effect on consumptionpatterns and substitutes. It is quite likely that a signifi-cant part of public investment has taken place underdistorted prices. Extricating the economy from the messis an important task for the regulatory and restructuringstrategy.
Reform is Also About Cost Discovery
Unfortunately, in infrastructure, there is no easy methodlike trade liberalization or duty simplification to revealthe true costs. In the case of tradables, cascading multipleand complex duty structures that have hidden the truecomparative advantages of many activities are revealedwhen tariff simplification takes place. In infrastructure,
there will have to be a process of cost discovery asreform and deregulation progress and multiple suppliersemerge. The regulator will have to be sensitive to thepossible backlash effects that would have taken theprices far from the correct costs. Thus the true costswhen they are revealed could surprise developers, insti-tutions, and the regulator.
Demand Itself May Have Been Distorted
It has already been discussed why the existing demand,and simple projections based on the same, will not do.As costs are discovered and prices are brought in linewith true costs, there will be adjustments of consump-tion and use to these new prices. Equally important,certain structural developments taking place in theeconomy may bring about changes in what were earlierconsidered �robust income elasticities�. For example,it is widely believed that the income elasticity of thedemand for electricity is around 1.3�1.5, given thestage of development the country is in. The Chinese,South Korean, and Mexican experiences in this regardwould lead one to believe that at current levels of real(purchasing-power-parity-based) income, India shouldhave the same elasticity that China had in the 1980s(around 1.7). In fact, however, India has a much lowerelasticity that is possibly even declining in the 1990s.This is because of the changing composition of thegross domestic product (GDP), which seems to bemoving away from energy-using industries, and possiblyalso widening income inequalities, which reduce thedemand for wage and basic good industries. Efficient useof energy by the private sector may also have contrib-uted somewhat to this decline. Only if expansive labour-intensive growth were to take place would elasticityincrease.
REGULATORY STANCES
The Natural Monopoly Revisited
It is important to understand the changing dimensionsof market failure in the light of developments in con-tracting, technology, and property right clarifications,which give rise to more opportunities for deregulation.By now it is widely accepted that regulators and reform-ers should take the best possible advantage of theopportunities for market-based solutions.
It would be useful to briefly review the principal typesof failure that require intervention by players other thanmarket participants. In so doing, we will go beyond thetextbook natural monopoly, since that is only one aspectof market failure. But first, a review of the textbooknatural monopoly. The natural monopoly arises out ofunit production costs falling rapidly with output and
24 India Infrastructure Report 2001
continuing to fall even at the point of equilibrium withsupply, so that costs of one player are much lower thanthose for any other conceivable set of players.11 Cellulartelecom, fixed line telecom, electricity distribution, gasand oil pipelines are typical cases. Profit-maximizingbehaviour on the part of the private monopolist wouldresult in dead-weight losses and transfers from consumersto the monopolist, so that the monopolist has tobe regulated to result in allocatively efficient marginalcost pricing. At marginal cost prices the monopolistdoes not recover his cost, so the best solution is a subsidyto the monopolist at marginal cost prices, and thesecond best is full cost pricing. Ideally, if all costs areknown and one can see far into the future, the practicalregulator should simply fix prices at long-run marginalcosts (LRMC) which would be lower than long-runaverage costs (LRAC). The charge would then have tobe of a two-part type, with the charge for the use asabove. And the charge for access or connection, wouldhave to be equal to the difference between LRAC andLRMC. The access charge for consumers would haveto be based on a rule such as the Ramsey rule of inverseproportionality to the demand elasticities for particulargroups of consumers. But the information condition isalways violated. More importantly, the motivation ofthe regulator to do good cannot be assumed, but needsto be crafted.
Capital Market Failures
Another condition of market failure arises from thenature of capital and bond markets in developing coun-tries. When income streams, beyond say ten years, areignored in discounting a project, then capital marketsbeyond that period do not exist. In such a situation,private parties would not be willing to price a serviceor a product that arises out of the use of capital assetswith an economic life of say twenty-five years at the truesocial prices, even if there are no appropriability prob-lems. Services of ships, aircraft, office, and rental spacesare typically subject to this �failure�. But such sectorsneed not be regulated because when there is competition,it may be assumed that economic profits would bewhittled down, even if the industry starts with suchprofits. In infrastructure, the privatization process, whennot accompanied by major efforts to develop localcapital markets, would necessarily result in regulators
having to award prices that are higher than the long-runincremental costs had such capital markets existed. Thedifference could be substantial in such activities aselectricity generation, gas pipelines, and arterial high-ways. The BOT approach helps keep the overall trans-fers from the economy to the private player to aminimum, but this brings about intergenerational �trans-fers� from the present generation of consumers to thenext.
�Outsiders� and Higher than LRMC Prices
This inadequacy of capital may be seen in a positive lightin a less developed economy, because the larger thannormal surpluses of the service-providing entity, wheninvested in the same activity would expand the serviceat a faster rate than otherwise (with LRMC that assumesthat long-term capital markets exist). Many potentialusers of the service are �outsiders�, not because they donot have the incomes to consume the service, butbecause there is not enough supply. The �outsiders�would then be brought in more quickly than otherwise.Recognizing this higher growth aspect (provided thesurpluses are invested to expand the service), thisintergenerational distortion may actually be worthwhiletill such time as there are no �outsiders�. The �better�solution would still be for the state, or taxes on therich, to finance the fastest possible expansion of theservice to encompass all current �outsiders�. But suchapproaches have proved difficult in all but the mostcomprehensive state systems�the Soviet Union withregard to housing, China with regard to basic amenities.
High Growth, Technological Change, and�Effective� Contestability
The natural monopoly situation warrants active regula-tion only when there is little or no contestability. Thus,despite passenger airlines with fixed schedules having anatural monopoly character, regulation is known to bean undesirable intervention, since contestability shouldensure low enough prices. But many sectors are notcontestable enough�water distribution, pipelines, elec-tricity distribution, bulk water�either because the sunkcosts are high or because of resource specificity.
�Effective contestability� can improve considerablywith high growth. This insight is not usual in standardtreatment of the natural monopoly and hence somediscussion on the same is carried out in this report. Asystem of backbone cables or optical fibres providingbandwidth is a natural monopoly at any time, but highgrowth implies entry, since an entrant needs to usehis capacity suboptimally only for a short period.Hence, as long as rapid growth takes place, the need for
11 Strictly, sub-additivity of the cost function over the entirerange of the output is necessary for a traditional natural monopolyto exist. Most such industries in the advanced capitalist countries(except those at the frontiers of technical change like computers,biotechnology, and telecom), are slow-growing industries, and assuch the orthodox regulatory stance would be appropriate.
Issues in Infrastructure Development Today 25
regulation is minimal�to lay down interconnection andother standards and possibly not even the access charges.Similarly, rapid technological progress gives rise tofalling costs and hence an advantage to entrants, soeffective contestability is high. For these reasons, anorthodox regulatory posture with regard to such indus-tries may be misplaced.
Unfortunately regulatory theories are cast in a staticframework, and hence are unable to formally commentupon the dynamic situation. In areas like water supply,electricity generation and distribution, and sewerageservices, growth of more than 10 per cent per annumor so is not expected. And the expected technical changeis modest and inferred a few years in advance. Here theorthodox regulatory stance of attempting to regulate isnot inappropriate. Though even here the first attemptshould be to overcome market failure through market-creating rules and institutions, or by internalizing ex-ternalities, if the source of the failure is externalities,through such measures as attribution, clarity, and mar-kets in such newly created property. This aspect ofmarket creation is dealt with later.
In a situation of costs falling with time, competition,duopoly, or even monopoly with small players activelynibbling at the market share of the incumbent, maywell be tolerable, since consumers can look forwardto falling real prices, even though these may remainabove costs at any particular point in time. Thus ifgi is the growth rate in total factor productivity andpi is the rate of growth in prices, so long as gi � pi >S1 wi · (gi � pi), where S
1 wi = 1, the growth of the sector
(under no regulation) is increasingly beneficial to con-sumers. Such a situation would probably also be the beststrategy for the policy maker, as long as unregulatedgrowth does not result in adverse effects on safety andon future consumer choice. Maybe the right time for theregulator to step in would be when growth has plateauedoff and a few new consumers are being added and theindustry has become �normal�.
�Catching Up� Could Result in �Contestability�For A While
But then what about industries like pipeline networksor distribution systems, which could grow very rapidlyin late industrializing economies, as the economiescatch up with the advanced capitalist countries? It is notalways true that these industries during such a highgrowth phase need regulation. The gas and oil pipelinesbusiness in the US came about over a period of intenseand unregulated growth. Similarly, the rail networks inan earlier period. As long as they were growing, therewas a �contestability� of a certain kind. The questionis really an empirical one with regard to gas and oil
pipelines in India today. If indeed much of the networkhas yet to come up (as it would seem in China whichis unambiguously on the path of industrial transforma-tion), then regulation should come only after much ofthe network is in place. The problem in the case of Indiais that it is not so certain that the economy is on thepath of successful industrial transformation, neithercan it be said that it is in the pre-take off stage.12
Orthodox Regulation is Not Appropriate forTelecom and Related Industries
In the case of telecom on the other hand, without doubt,there is no space for detailed regulation in India. Telecomis as much at the frontier of technological change inIndia as it is in the advanced capitalist countries. More-over, with falling costs and rising incomes, even thoughmuch more slowly than in China, the number of familiesthat can afford telephones will rise very rapidly, thoughnot at the stupendous pace of China. Even today, at leasta third of all TV-owning households can use telephones.Several factors have prevented the realization of thispotential. Under state provisioning the coverage waslimited by high costs; the idea of a telephone as a luxuryof the idle (when used at homes) stifled the market.Widespread use of telecom had little priority underplanning. This itself may have been an effect of thesmall size of the network.13 The high cost was inter aliathe result of inappropriate technology choice, virtuallyno R&D, and most importantly, massive overmanningin the erstwhile Department of Telegraphs and nocompetition at all in virtually all segments of theindustry, from manufacturing of instruments upwards.With the liberalization of the 1990s and the subsequentrapid growth, the network has now reached a size andcoverage where there is little or no pent-up demand atthe current high prices. Supply-side relaxations havehelped achieve the high rate of expansion (but it is stillminiscule in comparison to what China has been ableto achieve). Clearly, its further growth depends uponnew subscribers whose basis for demand would haveto be income growth. On account of income growth,the numbers above the income level where a telephonecreates net consumer surplus to the user could grow atmore than three times of 4 per cent (per capita incomegrowth), that is at more than 12 per cent per annum
12 China in contrast is the archetypical late industrializer,others being Japan, South Korea, and Taiwan possibly Thailand,Malaysia, and Vietnam.
13 Planners realized the value of telephones in business. Thepreferential allotment of telephones to offices, businesses, shops,nurses, and doctors is a case in point. What they did not realizewas that the value of telephones, even to businesses, is a functionof the numbers connected, including of general citizens.
26 India Infrastructure Report 2001
(Morris 1999). The major growth would have to comefrom both a significant price fall and consumer-sidenetwork economies. The consumer-side network eco-nomies could in turn interact with falling costs.
Consumer Side Network Economies are theKey to Network Expansion
Thus far, discussions on scale economies in telecomhave focused on production-side network economies,that is the aspect of the natural monopoly showingfalling costs with the increased size of the network. Moreimportantly, the user side benefits (true consumer-sidenetwork effects), begin to operate as more peopleconnect to the network. Thus at today�s low penetrationlevels, those with telephones cannot assume that allshopkeepers or services they deal with have telephones.The lower middle classes, today, do not have a strongneed for telephones, especially for local use, becausefew others in their social groups have telephones. Thepoint is once telephone density among today�s lowermiddle classes reaches about 30 per cent, it will increaseby leaps and bounds to quickly reach near full coverageamong them. Affordability is not the question here. Themiddle middle classes were already covered to the extentof 25�40 per cent when the reform began. As such, ina few years of very high growth, possibly as high as 50per cent in this segment, telephone density may havecome closer to being complete among the middle middleclasses.
Bidding would have Prevented Costs andPrices from Falling
Such large network effects arising out of consumer-sideeconomies can result in strategic behaviour, on the partof telecom companies. Unfortunately, in India the bid-based licence fee meant that the monopolist/duopolistsin the industry were pushed to the low-level equilibriumof the (short-run) profit maximizing natural monopoly.No regulation at all would most surely have led tovery different behaviour early enough. Today, with thelicence-fee-based system having gone and the PrimeMinister�s recent announcements of significant openingup of the sector to entry and competition, and assumingthat the announcements are a precursor to full compe-tition14 in the future, strategic behaviour will almostinevitably be in the direction of low access prices. Thiswill allow the network to expand rapidly, so that thecompany doing so is in a better position than itsrivals. Differential discriminating price behaviour, but
with a positive end results, will then be almost certain.In other words, there will be strong incentives forserious telecom companies to expand the networkeven to �uneconomic� areas, for the purpose of reach andcompleteness, since these have much value for the highuse consumer.
USO becomes a Bogey Against Competition
The concern of the regulator to ensure Universal ServiceObligation (USO) may be unnecessary. Confusion willbe created by incumbent state players who are boundto lose market share at least in the next few years tocome and by players who came in with the assumptionthat there would be little or no competition. Thecompetition that is likely even from the incumbentwill seem to be predatory once it really begins! But aslong as the competing networks adhere to uniformstandards, takeovers of weaker firms will ultimatelyensure correct duopoly or regional monopoly industrystructure, at least for the first leg, that is local loop inwireless or with wires. Those who can drop pricesat the right time to suddenly expand the network willwin the telecom war in India. In a few years from now,say five, the bulk of the lower middle class will havereached that level of income whereby a phone at homeis affordable. Then those who had dropped their priceswill become dominant.
Further Cost Reductions are Possible
There are of course technological developments thatcould result in an even higher than expected drop inprices: non-proprietary exchanges which can be puttogether, like personal computers (PCs) with inter-operable cards, would be an important development. Ifthe world agrees to have voice over IP, with priority tovoice packets, then long-distance costs could drop dra-matically. Similarly, convergence could drive telecom,along with other broadband uses, in ways that areseemingly difficult to predict at this point. But as longas the local loop costs remain significant, the picture ofbeggars with telephones will remain mythical. It isalmost certain that all costs other than local loop costswill fall; the question is when will the fall start? Evenin the local loop, the potential of intermediate solutionslike the one proposed by Ashok Jhunjhunwala in thisreport, can actually take the telecom revolution furtherand possibly even very close to that myth; but only ifadopted at least at circle level!
Through a convergence of voice, broadcasting, andInternet use over cable and wireless, through the IPmode, which would also make possible direct-to-home(DTH) broadcasting, the joint effects of one class of
14 The fine print would hopefully bring the much neededcompetition in all segments.
Issues in Infrastructure Development Today 27
users, viz. cable TV users, on Internet computer penetra-tion can be high. Among middle to upper middle classhouseholds in India, penetration of the Internet viacable modems would most certainly be very high.Internet would then ride on the costs being borne by thebase of cable TV users. As cable modems reach the 20to 30 per cent of cable subscribers, internet users can inturn drive cable networks to higher quality and startopology. This in turn could drive higher quality cableTV and most importantly downloadable films andentertainment material including conventional broad-casts, but with a flexibility over viewing times and ofcourse material. All this means that the bandwidth isfor quite some time to come going to be short, despitesome expectations to the contrary, and therefore hugeinvestments in bandwidth are likely.
Do ceiling prices as the regulator currently rules,have a role? Indeed they do, as long as the dominanceof the Department of Telecommunications (DoT) is notwhittled away and strategies of firms do not inevitablyshift to network expansion. When that happens, mostof the effective prices will be significantly lower thanpast cost based-prices!
Appropriate Regulatory Stances
The discussions in the preceding pages leads to somegeneral propositions: (1) When growth and techno-logical change is rapid, as it is in the case of telecom(defined broadly), there is little role for the traditionalregulatory stance. More than price regulation, what isimportant is to keep entry costs low and not frown uponconsolidations that are cost reducing. Such consolida-tions typically occur after bouts of competition andfast growth of the network. (2) In other sectors withslower growth but with the potential for much fastergrowth than the rest of the economy, it may still bepossible to hold back regulation, to allow players togrow and dominate portions of the industry. The bulkgas pipeline networks and retail distribution networksin cities, could be cases in point. More detailed empiricalinvestigations are called for to be able to take a positionon such industries confidently. (3) In less developedcountries (LDCs) with as yet little coverage of people,the focus should shift from prices to growth of theservice. There is an automatic �hedge� here for thepolicy-maker concerned with welfare. If coverage isgrowing rapidly, then surely the prices cannot be wrong.They may still have deviated from the optimal (in thesense of a static optimum), but no regulator can possiblyhave all the information to do the tight-rope walkingthat the traditional regulatory stance demands. (4) Insectors with massive undercoverage and a large numberof �outsiders� who would typically pay very high prices
in alternative high cost provision�private water mar-kets for instance�or who do without the same�forexample electricity in villages and towns of Bihar�rapidexpansion could take place with deregulation. Allowingmany kinds of players with little or no territorial orownership restrictions, including public enterprisesrelatively free of governmental control in operationaldecisions, municipal corporations and others, has afunctionality that arises out of increased coverage. Ifhigher rates than costs are allowed to be charged andmost importantly, the surpluses above allowed rates areconstrained to be invested in the service,15 then rapidexpansions can take place. Of course once near completecoverage or coverage of all who can afford16 has beenreached, prices would have to be regulated more tradi-tionally.
Cross-sectoral Dimensions Need Recognition
Therefore the resolution of problems of infrastructuralsectors, while seemingly amenable to a sector by sectortreatment, because the peculiarities of each sector arequite significant, may not in reality be so. Thus, trans-port modes need to be seen together when the emphasisshifts from the developer, the provider, the regulatoror the administrator with his need for administrativeconvenience, to the customer, as it should in anymeaningful commercial orientation. Similarly, theservices and goods of the oil, gas, electricity, pipelines,and tankers sectors need to be seen together. Telecom,value-added services, wireless and internet services, andeven broadcast sectors, �converge� from a technologicaland consumer use standpoint. It is not only because oftechnological convergence but also due to the moremundane and usual dependence of sectors on each otherin terms of inputs, outputs, substitutes, and comple-ments that the need for coordinated treatment can beignored only at a great cost to the economy.
Opportunities for �Leapfrogging�
Reform of infrastructure creates opportunities for �leap-frogging� and for innovations in technology and designwhen the space for multiple providers, including privateplayers, is created. But realization of such opportunitiesis not automatic. There may well be pressures to thecontrary. A reform, overly influenced by transnationalequipment and technology suppliers in interlockingarrangements with private funds (and home country
15 Such investments need not necessarily be in the same region.16 Those who cannot afford, if their number is too small, as
is the case in the advanced countries, can be subsidized. In slowlygrowing LDCs, their number is too large for subsidization to bea solution. Income growth, and therefore high speed growth ofthe economy, is the only solution.
28 India Infrastructure Report 2001
banks), does not augur well for innovative, intermedi-ate, and possibly more appropriate solutions. This isespecially so in situations where technology changesrapidly�telecom, for instance�or where the use of theservice has a great deal of local specificity�road andwater systems, for example. Unfortunately, the poten-tial of Indian technology and creativity to find solutionsto the typical problems of infrastructure, like measure-ment systems for vehicular traffic, lane separation inmultiple lane highways, design of the local loop, stan-dardized and non-proprietary architecture to drive downtelephone exchange costs, and innovative designs forduplicable and self-sustaining private schools, is onlybeginning to be considered with the seriousness that itdeserves.
Innovation in Institutional Design
Innovations which take advantage of certain behaviouralpatterns, unique to the society are also possible in thedesign of institutions and contracts. Thus the existenceof successful cooperatives in many areas of economicactivity and a vast number of industry associations,including those specific to the location and estates,gives rise to the potential for cooperative financing andmanagement of certain services like power and water. Ata time when regulatory clarity and policy are evolving,such arrangements could have much value. Such ap-proaches and innovation could have played a wider role,had reformers started with the objective of solvingproblems and in a consultative manner.
THE CONSTRAINT OF LAND
AND ENVIRONMENT
Land and Infrastructure in India
Land and environment, especially the displacement ofpeople affected by projects, have been at the forefrontof the media, popular consciousness, and in publicinterest litigation, including in the apex court.
Despite all that has been said, it is important to discussthe environmental context for infrastructure develop-ment. It was in the early 1980s that the Ministry ofEnvironment and Forests came into the limelight, asit became the one single ministry �responsible� for thebulk of the delays in public sector projects, which hadto necessarily obtain environmental clearance. Delaysin obtaining clearances from this ministry were as largeas five to seven years. Coal, rail, transmission, and hydelpower projects were most severely affected. The notionthat �no forests be lost�, resulted in the ministry insistingupon the transfer of equivalent amount of land to theForest Department, whenever use of forest land under
the Department was involved in a project. Thus landunder the Forest Department was by definition �forestland� whatever its actual state may have been. Manyinfrastructural projects were held up for proposing touse even highly degraded �forest land�! This formallegalistic approach when strictly adopted, resulted invast delays and cost overruns, without in any wayprotecting forests, since the reasons for the loss ofgood forests lay elsewhere. The principal reason wasillegal felling by organized groups, more often than notwith the connivance of the department officials! Otherfactors were poor and archaic forest management prac-tices of the Department and the interruption of the�natural� process of ecological succession and regrowthdue to pressure from people for grazing and marginalcultivation.
The Forest Bill and Reactions
The late 1980s saw the New Forest Bill, which attemptedto protect forests by circumscribing the rights of forestdwellers and other poor people dependent upon forests,rather than by attempting to address illegal felling andpoor management practices squarely. However, thegovernment could not have its way, since opposition tothe Draft Forest Bill was strong. Alternatives revolvingaround the involvement of local people, joint manage-ment of forests, complete ban on felling in certainregions, and the need for biosphere reserves were forcedupon the government by agitations and protests. Also,with earlier movements like the Chipko and Apikoentering the public idiom, the pressures on the govern-ment to change were large. Consciousness of the needto protect forests is now widespread among the intelli-gentsia and the media. This positive development tookplace over a remarkably short period of time and itseffects began to be seen in the (possible) slowdown inthe rate of loss of forest cover in the 1990s.
Movements Against Dams
Simultaneously, with this ideological development, cham-pioning the rights of project affected peoples (PAPs)began in many parts of the country, the NarmadaBachao �Andolan� and the movement against the TehriDam in the Himalayas being examples of the moreforceful of these. Such movements succeeded in goodmeasure in focusing attention on the (external) costsborne by those affected and displaced from theirdwellings and habitat and served to considerably im-prove the rehabilitation package for those displaced.However, the movement has most certainly gone be-yond the interests of people affected by the dams andthe environment (in the sense of non-wasteful and
Issues in Infrastructure Development Today 29
conscientious use of natural resources) to a virtualdissent on development. Indeed, the agenda to help thedisplaced people may not have been the principal one,even to start with, in the private perspective of some ofits leaders. Logic and fact no longer have a place in the�debate� on the Narmada, as governments and �pro-Narmada� groups have begun to realize. The issue hasmost certainly gone on to the emotional and ideologicalplane. Undoubtedly, the hold of the anti-dam protago-nists and their nebulous �alternative development� ideais strongly emotive. Significant numbers of the intelli-gentsia share their understanding and approach, howeveralien it is to the people who are actually affected.
Post-modernist Roots
It is this ideology that is at the root of the environmentalrisk linked to all land using infrastructure. And even ifparticular projects and firms are able to avoid or bypassits worst excesses, the country as a whole has borne hugecosts. The power of this ideology stems from its post-modernist character and origins. It has important sup-port among many. Today, possibly the majority of theintelligentsia are post-modernist in Western societies.They can indulge in the luxury of aggressive environ-mentalism now that the good life is assured in the West.That prior generations in the West had carried out theirown industrialization at stupendous and often unneces-sary environmental cost, in the light of which theenvironmental damage in countries like China withhigh speed industrial growth pales into insignificance, isconveniently forgotten. The slowness (yet not stagna-tion) of the Indian economy has meant that ideas (fromthe West), including post-modernist areas, have a ten-dency to take root among sections of the intelligentsiaahead of their time, in terms of the stage of developmentof the economy! Thus labour movements with demandsfor labour standards not inferior to those in the West,took root with barely 15 per cent of the labour forcehaving been absorbed in modern industry.
Middle Classes May Be Ambivalent to Expansive Growth
Similarly, for sections of the elite, especially for themiddle and upper middle classes with fixed incomesunrelated to the level of economic activity, growth is notcritical to lifestyles or even incomes. Most opinionmakers fall into this group. High speed growth isimportant for competitive and capable capitalists andfor the poor who are still �outsiders�. The appeal to thevalue of indigenous lifestyles and �protection of local ortribal culture� is functionally (to the transformationprocess) no different from sugar-coating the continuedexclusion of the �outsider�. When post-modernists from
the West, with their vast resources, work together withthe local intelligentsia and in alliance with people likethe tribals and the very poor who thus far have not hada chance to be part of the developmental process, apowerful force is forged. Against this force, the resourcesof governments, businesses, and developers are meagre.
Governments are Handicapped
Indeed, governments, especially state governments, havea particularly severe handicap emanating from corrup-tion�the standard 5�15 per cent cut in all capitalforming public expenditure�which makes them shirkfrom making available information for �modernists� andothers to defend the case of development more force-fully. The tainted image of the state and its obviousfailure in not being able to internalize the negativeexternalities of development projects that displace peoplefrom their land, or degrade the environment, makes itan interested party. Therefore, it has hardly any cred-ibility when it attempts to influence public opinion,even when its facts are right!
MLAs and NGOs are Already �Green�
So infectious has been this post-modernist ideology thatmuch of the Left, since the fall of the Soviet Union, hasturned �green�. The majority of the non-governmentalorganizations (NGOs) are anti-development in orienta-tion and even the World Bank has turned green at oneend and become orthodox at the other end. It is not atall accidental that countries with higher growth ratesand egalitarian initial conditions (East Asian and China)do not have any significant post-modernist opinionsand not many NGOs with an anti-development dispo-sition. Not only that, they also have had better recordof protecting the environment.
Need for an �Economic Approach� to Land and People
The solution, therefore, is in higher employment-generating growth and in policies, rules, and institutionsthat internalize the environmental costs of growth,more particularly those of people displaced and affectedby projects. The land acquisition process and the processof rehabilitation of project affected people, as they existtoday, even when carried out by the state in accordancewith the rules, are generally problematic exercises.Neither the stance of the NGOs as elaborated in theDraft Policy on Rehabilitation and Resettlement(DNPR&R), nor its antithesis, viz. the Draft Bill onLand Acquisition (brought about with the intention ofspeeding up land acquisition for infrastructural develop-ment) is in the right direction. The problem with thelatter is not, as one critic stated that the Draft Bill is
30 India Infrastructure Report 2001
economic in approach, but that it is not sufficiently so.It retains all the elements of the colonial 1884 Act, whichis almost entirely a political statement of the overridingpowers of the state with respect to land. The DraftPolicy on the other hand though with many goodfeatures is far too ambitious. To do justice to it in itsentirety would be tantamount to arresting development.
Current Problems in Land Acquisition
Major critiques of land acquisition, now that �marketrates� or better are being paid, are as follows: (1) Publicpurpose has been so broadly interpreted in actual prac-tice as to include nearly all commercial activity, notjust activities such as building of roads which may nothave other significant land use options, defence andsecurity projects, or projects of great social benefit likedams and irrigation projects. Even industrial projectswhich have wide flexibility in the land they could useare interpreted as �public purpose�. Indeed, in the com-petition for attracting investments, states like Gujarathave acquired land for all kinds of commercial activities,to be handed over to the investor. (2) Excess land isacquired. (3) The processes are such that cornering ofthe land takes place especially in land-abundant areas,where therefore the benefits of appreciation are deniedto the original (often poor) owners of the land. (4) Thefocus on land means precluding from compensationthose who do not own land as such but are dependentfor their livelihood upon the local economy, workingas daily labourers, petty service providers, and traders,who are rendered jobless with the destruction of thelocal economy. (5) Making rather too much rest on thewisdom of the collector has the potential to backfire inthe face of organized opposition from those whose landsare acquired, especially in areas where land is dear andintensively used. (6) All these claims are generally trueand the current refinements speed up acquisition byshort-circuiting the process of announcement, declara-tion, and hearing for compensation and award. (7) Evenwhen market prices are paid, the authorities go byrecord books. These are typically understated and re-duce the burden of a very onerous stamp duty!
Market Prices are Distorted
While the awarding of market rates has been acceptedby even the detractors of the Bill as a positive develop-ment, there are problems here which may help explainwhy acquisitions have still been problematic. Landacquisition remains a protracted process in most areasexcept in places like coastal Gujarat and Kutch with verylittle agricultural productivity and low population den-sity. The problem may well lie in two related factors.
A market price for land, as much as for assets, assumestradability of land. Agricultural land is typically nottradable for non-agricultural use except through costlyprocesses of application for grant of government permis-sion. As such, the market price is one that takes intoaccount the restrictions in use. The benefits of highervalues to industrial use (given higher productivity ofland in industrial use) does not spill over to all landcurrently in agricultural use. As such, land prices (ofagricultural land) do not include the probability ofindustrial or non-agricultural use at much higher prices.All the benefit of the higher price accrues to the landdesignated (or �released�) by the government for non-agricultural use from time to time. In land acquisition,therefore, the true prices would have been substantiallyhigher than the prior prices. But given the acquisitionprocess that goes by past prices, owners are not able tobenefit from the same. Hence there is a �loss� to thelandowner, resulting in his opposition to the acquisitionprocess. In case the government chooses to go by theprices prevailing, say, two years after the announcement,then for such prices to exist trade in land after theannouncement of acquisition has to take place. Thatwould mean opening the door wide to speculativecornering of land by those in the know, even before thedecision is formally announced.
Clearly, to minimize understatement of land valuesin transaction records, low duties are a must. This wouldactually help develop the market for land, which wouldwork to the interest of all landowners including smalllandholders.
Similarly many states restrict agricultural landowner-ship to �farmers�. Thereby, the only beneficiaries ofprior (to official announcement) information in landacquisition are politicians, who in their status as �farm-ers� do not have to compete with other �speculators�.More importantly, not only is the market for landconstrained by land use as outlined earlier, but byrestrictions on the �identity� of the buyer.
Typically, in areas with poor productivity in alter-native use, especially agriculture, but with much indus-trial dynamism, the problem is usually one of excessacquisition and cornering of lands by those connectedto the government and in the know. In areas with highproductivity and high density of population, as in Goaor Kerala, the problem tends to be of opposition toland acquisition.
Need for Direct Negotiations
A more open negotiation process of land acquisition,with �all or none� deals offered by developers and othersrequiring land, would be appropriate. Most commercialprojects which have flexibility in the land they can use
Issues in Infrastructure Development Today 31
ought not to go through the state for land acquisition.Instead, private purchase based on a bargaining approachwould be right. The acquirer does not face monopolyand the owners of the land always have the option ofalternative use. Private acquisition would have to bebrought under a policy whose principal dimensionscould be as follows:
(a) The acquirer necessarily makes a uniform baseprice offer for the land. Otherwise he could get landcheap by offering differential rates, or even createnegative externalities for most owners, by first acquiringa small amount of land at high prices.
(b) Similarly, farmers and the village as a wholeshould have to collectively deal and negotiate with thepotential acquirer within the framework of a policy thatis fair to the landowner and ensures him some gain outof the enhanced value of the land. Typically, when landis so acquired, the details of the subsequent pollutionmitigation and safeguards, buffer zone, charges payablein case of occasional pollution, other arrangements suchas jobs, and coverage of non-owners who are dependentupon the local economy should go into a contractbetween the acquirer and the �village� or collective body.The government should bear the onus and cost ofensuring implementation, as it does in the case of anybusiness contract. This will no doubt increase the costof land, but will thereby result in its optimal use. Therisks will then truly come down. Fighting existinghigh risks by creating an �anti-people� law is certainly notthe solution. Public acquisition with the social purposeclause should be used only in such cases where the landrequired is specific.
India, with one of the highest population densities,has to be particularly careful about the externalities inindustrial use of land. The high cost of land that sucha process would reveal, would mean that pollutingindustries would go to such places where costs are low.
Displacement and Environmental Impact Needto be Conceptually Separated
Interestingly most activitists and commentators on landacquisition have tended to see environmental damageand the hardships and displacement of PAPs together,to weave a thesis of �development being anti-poor�. Inreality, the environmental costs of development by wayof pollution, degradation of forests, and loss of specieshave to be conceptually seperated from the costs to thepeople displaced. It is the colonial, almost anti-peopleland acquisition practice that hurts people most andinvite major protest. With better land acquisition�onewherein the displaced gain most�the �dissent on devel-opment� of post-modernists would find less takers.
THE RIGHT TO INFORMATION AND
PRESSURES FROM BELOW
Right to Information and ResponsibleLocal Governance
Beyond the rights of the displaced, the constructivecontribution of environmental and people�s movementshas been to draw attention to the need for informationto be publicly available. Information is currently mo-nopolized by the state and is occasionally and selectivelyavailable to groups and journalists, but not generally tothe common man. Particularly difficult to come by aredata on government spending at local level, especiallypertaining to infrastructure and subsidies.
The MKSS�s (Mazdoor Kisan Sanghatan Sangh�s) longyears of struggle for the poor showed to the people, thepolitician, and the bureaucrat the power of informationin the right hands (people) as regards governmentactivities. This was long before it had become popularin academic and journalistic circles to ask for the�freedom of information bill�. Organizations now realizethat in the Internet world driven by information,information access can be a potent way to empowerpeople and embed responsibility. Similarly, there hasbeen a slower realization that the value of data is anon-linear function of its size and coverage, increasingrapidly with the number of attributes and the popula-tion, in commercial settings. In Rajasthan, under theinitiative of the Tilonia group, the MKSS, with the activeinvolvement of the people in general, forced the govern-ment to concede to making available information onsuch records as local expenditure on schools, wages,wells, buildings, etc. incurred by local and state govern-ments.
In the �jan sunwai�, in which publicly under videoofficial records were read, some officials even publiclyadmitted to widespread corruption and fraudulentpractices. The specific details, the prima facie evidence,and the public aspect of this �jan sunwai�, had the effectof creating a people�s movement for information. Themovement, by its very nature and objective and entirelydemocratic and legal tools, was powerful enough toinclude wide sections of society, even officials in theirindividual capacity. The Tilonia Group led by ArunaRoy and others had discovered a most potent leveragepoint for change in governance and in society as awhole in the form of the �jan sunwai� and the focuson relevant information per se. With the Internet andan Appropriate Right to Information act on thelines suggested recently (see Godbole, 1999 and section5.8), the same strategy has the potential to reducecorruption considerably. Why so? Very briefly, givendemocracy and the need to balance the interests of
32 India Infrastructure Report 2001
many competing groups, the Indian state has a strongneed to appear to be fair, even when it is not. Whilethe democratic and people�s constitution charges thestate machinery with the responsibility for certainsocial and publicly beneficial tasks, it also makes itaccountable to the people. In actual practice, the factthat the economy has excluded many and archaic anddespotic rules and laws have continued�the OfficialSecrets Act and the Land Acquisition Act, for example�means that �form of fairness� in administration canbe exposed rather simply by opening up governmentpapers.
Thereby the hiatus between the form and the contentbecomes tense and either one has to give way. So a �rightto information bill� is most likely. Yet the initialprocesses are likely to be tortuous, and the governmentin power, however sincere it may be, will find itself
under severe pressure from the bureaucracy and theaverage politician to give the bill the form of a freedomor right to information bill, while in reality loadingit with so many constraints and special situationsconsiderations for denial as to render it impotent. Thereis therefore, the real danger that a bill which nobodybut officialdom and the corrupt want gets pushed.From the viewpoint of infrastructural development,information regarding state and local bodies whenregularly and routinely available to the people, shoulddo much to reform governments, especially in theirenterprise and regulatory dimension. Nothing couldbe better for commercial provisioning and for goodgovernance which engenders local (and general) develop-ment. Given the democratic fabric of our society, thisright to information becomes a necessity for real changethat brings in the �outsider�.
or potential fixed line traffic migrating to the cellularnetworks. Therefore the incumbent fixed line operatordoes not have a clear-cut incentive to negotiate a fairinterconnect agreement with the relatively smaller cel-lular networks. Apart from this, there is also thepossibility of the fixed and mobile operators colluding,given the monopoly characteristics of both fixed andmobile call termination. Hence there is need for someregulatory oversight, if not full regulatory intervention,in the case of fixed mobile interconnection. The secondcase study discusses the TRAI�s attempts to arrive ata fixed�mobile interconnection arrangement, especiallyin the context of a transition to the calling party pays(CPP) regime. As it turns out, the TRAI order wasstruck down by the court, precipitating amendmentsto the TRAI Act and the replacement of the Chairmanand all TRAI members, except one.
The third case study examines the Availability BasedTariff (ABT) Order of the Central Electricity Regula-tory Commission (CERC) for central generating sta-tions. The order is directed at resolving problems ofgrid indiscipline. The instrument is a two-part tariffstructure, with penalties for deviating from scheduledgeneration and drawals. While there is little controversyabout the CERC�s objective and the basic design ofthe tariff structure, NTPC, the party most affected bythe order, has objected to the target availability normsand the nature of incentive payments embedded inthe two-part tariff. These aspects of the two-part tariffwere motivated by CERC�s attempts to raise certainbenchmarks in order to improve the efficiency ofNTPC�s operations. The resulting stand off betweenthe CERC and National Thermal Power Corporation(NTPC) illustrates the difficulties in providing incen-tives for efficiency in an essentially non-competitive
This chapter provides three detailed case studies oftariff and interconnection regulation in the telecomand power sectors: rebalancing of telecommunicationtariffs, interconnection between fixed and mobile net-works, and availability-based tariffs for central generat-ing stations.
In the telecommunication sector the existing tariffsenable the operators�Department of Telecommunica-tions (DoT), Mahanagar Telephone Nigam Ltd. (MTNL),and Videsh Sanchar Nigam Ltd. (VSNL)�to earn reason-able rates of return. In fact, according to some observersthe current returns may be excessive, especially if onetakes into account the potential for improvements inefficiency. However, as in most other countries, whichare in the initial stages of moving from a monopolisticto a competitive market structure, the tariffs are not costbased. National and international long-distance calls sub-sidize monthly rentals or access charges. Subscribers payhigher call charges on a slab basis as the number of callsincreases; and rentals and call charges for rural subscrib-ers are lower than those for urban subscribers eventhough the cost of rural coverage is significantly higher.Such cross subsidies are unsustainable in a competitiveenvironment. Therefore the first major task of theTelecom Regulatory Authority of India (TRAI) was torebalance tariffs and simultaneously provide for alternatefunding of Universal Service. The first case study de-scribes and evaluates the tariff rebalancing exercise. Abrief description of the tariff rebalancing exercise under-taken in the United Kingdom (UK) is also presented.
Fixed and mobile networks are both complementaryand competitive. For the incumbent fixed line mo-nopoly operator there is an increase in revenue fromthe new traffic generated by the cellular network. Atthe same time, there is a loss of revenue due to existing
3 REGULATION OF TARIFFSAND INTERCONNECTION:CASE STUDIES
Sidharth Sinha
34 India Infrastructure Report 2001
BOX 3.1
Background to Tariff and Interconnection Regulation
The aim of price regulation is to achieve in a situation of monopoly the economic efficiency outcomes of competitive markets.Economic efficiency ensures the supply of welfare maximizing amounts of goods/services (allocative efficiency) in the mostcost-efficient manner (productive efficiency). In a dynamic context it also calls for a process of continuous innovation andproductivity improvements. In addition to providing the economic efficiency outcome of competitive markets, price regulationis often required to serve social objectives (e.g. distributional concerns) and operate within political constraints (e.g. uniformnationwide pricing requirements).
Economic theory provides two basic frameworks for price regulation�Ramsey prices and contestable market prices. Boththese frameworks point to the need for taking into account demand side factors, in addition to costs, in setting prices, especiallyin a situation of significant joint and common costs. Neither of these approaches requires allocation of joint and commoncosts. However, regulators have traditionally been reluctant to set prices based on demand characteristics, especially demandelasticities, and have preferred to set prices equal to fully allocated costs (FACs). In recent years there has been a move awayfrom historical and short-term costs to a cost concept described as Long Run Incremental Cost (LRIC) which uses forwardlooking costs taking into account expected changes in technology and productivity. A further development has been the useof �price caps� where the regulator specifies the average price increase for a basket of services. The flexibility for fixing individualprices is left to the operator, with prices often subject to caps and floors. The use of both LRIC and price caps representsattempts by the regulator to provide incentives for improvements in efficiency and productivity.
The main problem in price regulation is the informational disadvantage of the regulator vis-à-vis the regulated firm. Theprincipal�agent relationship between the two gives rise to familiar problems of �moral hazard� (hidden action) and �adverseselection� (hidden information). The regulator (as principal) would like to set prices that induce the regulated firm (the agent)to act in a particular way. For example, if the regulator knew what the firm�s cost would be, were it productively efficient,she could set prices to cover these costs and force the firm to be efficient in order to sustain itself. In practice, the regulatorwill never have enough information to use this approach. The regulator may be able to audit the firm�s costs ex post, buthe cannot tell what they will be ex ante, and he will never know what they might have been if the firm had taken actionsto reduce them. In part this is because an outside regulator will never know as much as the firm, but the firm itself maybe genuinely uncertain about its cost ex ante.
Given these problems with �conduct regulation� it is desirable to move to a competitive structure so that less reliance needsto be placed on the imperfect mechanism of regulation. Price regulation is then seen only as a temporary measure and infact may be designed with the explicit objective of moving to a competitive structure. In fact regulation may be unnecessaryeven in the case of natural monopoly if there is competition from other modes of providing the same service. This has beenreferred to as �intermodal competition� in the transportation sector where the term is used to describe the rivalry betweenrailroads, road transport, pipelines, and water transport, all of which compete for freight traffic. If intermodal competitionis strong enough, regulation may be unnecessary even if one or more mode of transport appears to have the structure ofa natural monopoly. In the case of telecommunications a good example of emerging �intermodal competition� is that betweenvoice telephony and internet telephony or between wireline and wireless telecommunication. It is also possible to separateor �unbundle� the natural monopoly and competitive segments of a business so that competition may be introduced in thecompetitive segments while the natural monopoly segment is subject to regulation.
Apart from the regulation of prices of final services there is the question of access pricing when a market dominated bya single operator is being opened up to competition. For example, in the telecommunications sector, in countries with highteledensity the incumbent operator is likely to have all potential customers connected to its network. Even in countries withlow teledensity a substantial portion of the potentially more lucrative customers are likely to be connected to the incumbent�snetwork. Given the substantial cost of being connected to a network most users will be connected to only one fixed and/or only one mobile network. As long as a user is connected to a given network, that network has a monopoly over the�local loop� for providing access to that user. New entrants would require this access for providing services either in competitionwith the incumbent or completely new services. Users connected to other fixed line or mobile networks would also requirethis access.
The resulting situation can be conceived of as a �network of networks� encompassing both complementary vertical andcompetitive horizontal relationships. In the case of complementary vertical relationships, interconnection is mutuallyprofitable and the exclusion of rivals is not consistent with profit-maximizing behaviour. This would be the case if the twooperators provide complementary components which need to be bundled together to provide end-to-end service to thecustomer. It would also be applicable in the case of two similar networks each with its own �captive customers�. However,in these cases while there is little incentive for excluding the other it is possible for the access charge to be used as a collusivedevice. When networks offer substitute services then there is incentive for each network to try to prevent the other frombringing its service to the consumer. The dominant operator may then use its monopoly position over some bottleneckfacilities, e.g. the local loop, to prevent others from providing the substitute service, by not offering interconnection atall or only on highly unfavourable terms. In both cases there is need for regulating the terms of interconnection pro-vision.
Regulation of Tariffs and Interconnection 35
system. There is a limit to the extent to which tariffstructure design can achieve the efficiency outcomes ofa competitive market strcuture.
CASE 1. REBALANCING OF TELECOM TARIFFS
The TRAI initiated the consultation process for fixingtelecom tariffs in Novermber 1997, with the release ofits consultation paper on Concepts, Principles, andMethodologies. Until then tariffs had been set by theDoT with periodic revisions. The last tariff increaseof around 20 per cent had been implemented in May1994. Since 1982, tariffs had been growing at a com-pound annual growth rate (CAGR) of approximately8 per cent, almost at par with the long-term inflationrate. As in most other countries, tariffs are characterizedby significant cross-subsidies. In its second consultationpaper of September 1998 the TRAI argued that cross-subsidies were unsustainable in a competitive environ-ment and would result in inefficient allocation of re-sources. Therefore the primary objective of the firsttariff review process was to rebalance tariffs and movethem closer to costs. However, it was pointed outthat some deviation from cost-based prices would con-tinue in order to encourage access to and use of basicservices.
Cost Estimation
Regulators across the world are increasingly using long-run incremental cost (LRIC) instead of the traditionalfully allocated cost (FAC) for costing of services. Theterm long run in the context of LRIC refers to a periodlong enough for all of a firm�s costs to become variableor avoidable. Incremental costs are the additionalcosts, usually expressed as a cost per unit, that a firm willincur as a result of producing an additional quantityof the good or service. The relevant increment is theentire quantity of the service that a firm produces, ratherthan just a marginal increment over and above a givenlevel of production. Incremental costs are, therefore,forward looking and not historical or embedded costs.The TRAI would have preferred to use LRIC, but giventhe lack of relevant information it decided to use FACas a starting point. The TRAI has attempted to costthe various basic services by allocating all capital andoperating costs across four categories�rental (or access),local calls, long-distance calls, and international calls.The costs that are allocated are:
CAPITAL COSTS
The capital costs of the local network determine the costof rentals. The costing uses a capital cost per line ofRs 31,000. This includes the cost of the local network
as well as the long-distance network. The cost of thelocal network is estimated at Rs 23,250 or Rs 25,000. Thebalance is the cost of the long-distance network. Theestimate of capital cost per line is based on a study byIndustrial Credit and Investment Corporation of India(ICICI) Consulting, �Revenue shortfall on account ofuneconomic subscribers in DoTs fixed line network�.Since the DoT does not maintain any cost data centrally,they were collected from a sample of ten secondaryswitching areas (SSAs). The data revealed that eventhough there is no significant variation across exchangesystems there is wide variation in cumulative capitalexpenditure (CAPEX) across SSAs. The cost per directexchange line (DEL) ranged from a low of Rs 12,400in Coonoor, Tamil Nadu to Rs 45,207 in Gwalior,Madhya Pradesh. The variation in cost was attributed toimproper allocation of �other costs� and due to differ-ences in the geographical terrain. It was then decided toobtain �updated� cost data from five SSAs, separatelyfrom rural and urban DELs. Ultimately, cost data fromthree SSAs, backed up by DoT officials� judgements,were used to arrive at national-level cost data.
The capital cost for long-distance transmission isallocated between long-distance and international calls(both incoming and outgoing) on the basis of minutesof traffic. This estimate is based on the ICICI estimateof transmission cost to the next highest exchange. Analternative estimate is obtained on the basis of the break-up of the DoT�s Annual Plan Allocations, 1992�3 to1997�8 (Table A II.2 of Consultative Document). Ac-cording to this about one-fifth to one-fourth of thecapital cost of the local network was accounted for bylong-distance-related capital costs.
OPERATING COSTS
The DoT has provided figures for operating costs andthe total number of metred calls for the year 1996�7. Thebasis of the break-up of operational costs betweenlocal and long distance is not provided. The exact break-up of metred calls across the three categories is notavailable. Information on the minutes of internationaltraffic is available from the VSNL since this informationis necessary for settlement payments. The TRAI hasestimated the number of minutes of local and STD callsusing informal estimates of pulse duration and distribu-tion of total number of metred calls across the threecategories.
The operating costs for the local network are allo-cated across local, long-distance, and international min-utes of traffic since the local network is used by all calls.The operating expenses related to the long-distancenetwork are allocated between long-distance and inter-national minutes of traffic.
36 India Infrastructure Report 2001
CAPITAL AND OPERATING COST OF VSNL OPERATIONS
This represents the cost of international transmissionand switching and is assigned exclusively to internationalcall minutes. These costs are based on an InternationalTelecommunications Union (ITU) study on �The Chang-ing International Telecommunications Environment:Country Case Study India�, prepared by Tarifica (UK)and Indian Institute of Management, Ahmedabad (IIMA)(India).
Determination of Rental and Usage Charges
Rental and usage tariffs have been determined in thefollowing manner:
RENTALS
The rentals proposed by the TRAI are based on theactual current rentals, adjusted for inflation and increasein real gross domestic product (GDP) per capita, sincerentals were last revised in 1993. There is a 50 per centadjustment for the cumulative price increase for theperiod March 1993 to March 1999. An additional adjust-ment of 15 per cent is made for increase in real GDPper capita during this period. Therefore the proposedrentals are not directly related to the estimated costs.This was motivated largely out of a concern that lowuser subscribers would drop out of the network at cost-based rentals.
LOCAL CALLS
The tariff for local calls is based on the operational costof the local network allocated to local calls. The callcharge for the first 500 metred calls per month in abilling cycle for rural subscribers is less than the lowestestimated cost-based charge without any margin. Thecorresponding call charge for urban subscribers (againwithout margin or with a small margin) is equivalent tothat estimated with average call-holding time of 2.8minutes. With a call holding time of 2.5 minutes, thistariff would be below cost. For calls in addition to thefirst 500 metred calls per month in a billing cycle, amargin of 20 per cent has been provided above the upperlimit of the cost-based charge with holding time of 2.8minutes. This also provides a margin on the upper limitof cost-based charges estimated for an average holdingtime of 2.5 minutes.
LONG DISTANCE CALLS
The long distance tariff is based on the allocated costsof the local and long distance networks as well as the costof rentals which is not recovered through rental charges.
INTERNATIONAL CALLS
The tariff for international calls is based on the allocated
costs of the local and long distance networks, the excessof cost of rental over rental charges, the costs of inter-national transmission and switching, and the �settlementrate� payment to the foreign carrier.
The major features of the TRAI�s 1999 tariff orderare:
� There is an increase in rentals, mainly to account forinflation and growth in real GDP per capita, sincerentals were last revised in 1993. However, rentalscontinue to be below the FAC.� There is an increase in local call charges.� The tariff for domestic and international long-dis-tance calls has been reduced. However, these continueto be above cost in order to cover the deficit on rentals.� The TRAI devised a category of �low user sub-scribers�, those making up to 1000 calls bimonthly,which constitutes about 70 per cent of the total subscrib-ers. The rental for this category will remain unchangedfor the period April 1999 to March 2002, even thoughit is scheduled to increase for other categories of con-sumers.� With regard to usage charges, for the first 500 calls(except for free calls) the charge is Re 0.80 per call forrural areas and Re 1.00 per call for urban. For calls above500 per month the charge is Rs 1.20 per call.� The order provides tariffs for the year 1999�2000 aswell as for 2000�1 and 2001�2.
A standard tariff package provides basic services atthe tariffs specified in the schedule, and includes thespecified number of free calls. Subscribers must have theoption of getting basic services at the standard tariffpackage, that is at tariffs and free call allowance specifiedin the schedule. In addition, the service provider mayoffer �alternative tariff packages� to subscribers. In thealternative packages, items for which tariffs are specifiedin terms of a ceiling will continue to be subject tothe specified ceiling. Items for which a specific amountof tariff is shown in the schedule (for example rentalsand call charges) may have any alternative tariff in the�alternative tariff package�. Similarly, an alternativefree call allowance may be provided in an �alternativetariff package�.
Tables 3.1�3.5 give the charges for basic telecomservices before the TRAI order, those proposed by theorder, and those implemented by the DoT. The TRAItariffs are for 1999�2000. As already pointed the TRAIalso determined tariffs for 2000�1 and 2001�2.
Implementation of Tariff Order
The DoT strongly opposed the reduction in long-distance and international charges and argued that this
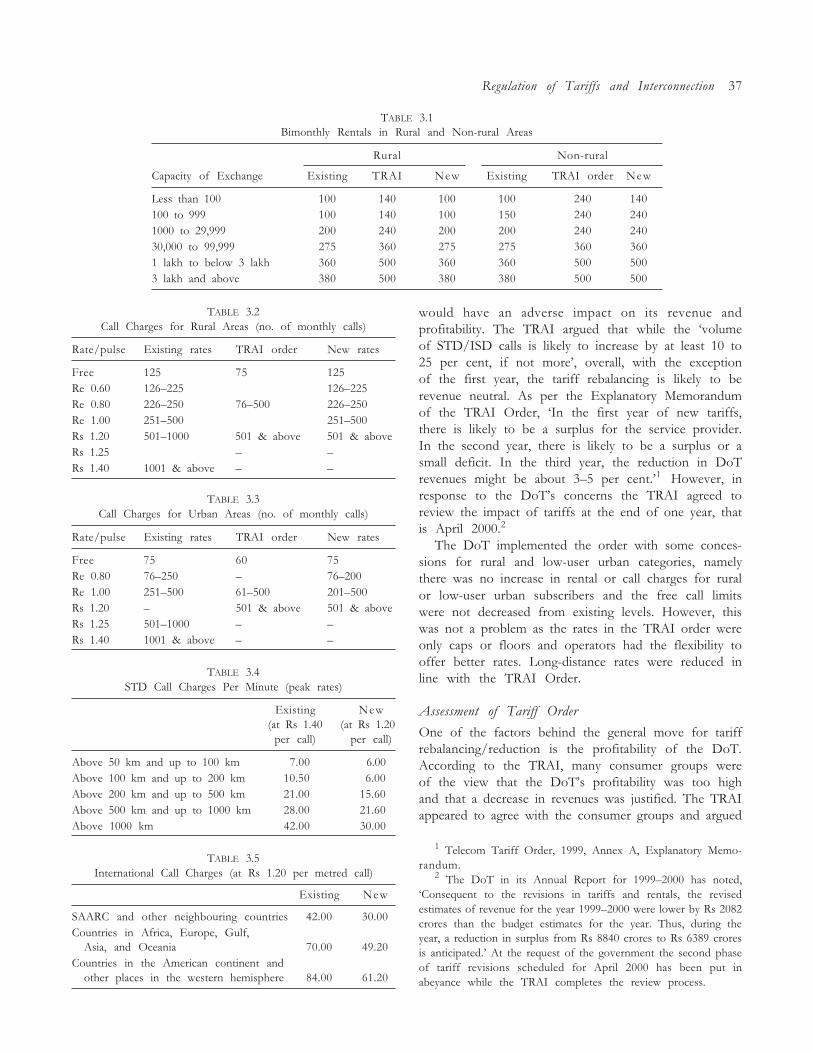
Regulation of Tariffs and Interconnection 37
TABLE 3.1Bimonthly Rentals in Rural and Non-rural Areas
Rural Non-rural
Capacity of Exchange Existing TRAI New Existing TRAI order New
Less than 100 100 140 100 100 240 140100 to 999 100 140 100 150 240 2401000 to 29,999 200 240 200 200 240 24030,000 to 99,999 275 360 275 275 360 3601 lakh to below 3 lakh 360 500 360 360 500 5003 lakh and above 380 500 380 380 500 500
TABLE 3.2Call Charges for Rural Areas (no. of monthly calls)
Rate/pulse Existing rates TRAI order New rates
Free 125 75 125Re 0.60 126�225 126�225Re 0.80 226�250 76�500 226�250Re 1.00 251�500 251�500Rs 1.20 501�1000 501 & above 501 & aboveRs 1.25 � �Rs 1.40 1001 & above � �
TABLE 3.3Call Charges for Urban Areas (no. of monthly calls)
Rate/pulse Existing rates TRAI order New rates
Free 75 60 75Re 0.80 76�250 � 76�200Re 1.00 251�500 61�500 201�500Rs 1.20 � 501 & above 501 & aboveRs 1.25 501�1000 � �Rs 1.40 1001 & above � �
TABLE 3.4STD Call Charges Per Minute (peak rates)
Existing New(at Rs 1.40 (at Rs 1.20
per call) per call)
Above 50 km and up to 100 km 7.00 6.00Above 100 km and up to 200 km 10.50 6.00Above 200 km and up to 500 km 21.00 15.60Above 500 km and up to 1000 km 28.00 21.60Above 1000 km 42.00 30.00
TABLE 3.5International Call Charges (at Rs 1.20 per metred call)
Existing New
SAARC and other neighbouring countries 42.00 30.00Countries in Africa, Europe, Gulf,
Asia, and Oceania 70.00 49.20Countries in the American continent and
other places in the western hemisphere 84.00 61.20
would have an adverse impact on its revenue andprofitability. The TRAI argued that while the �volumeof STD/ISD calls is likely to increase by at least 10 to25 per cent, if not more�, overall, with the exceptionof the first year, the tariff rebalancing is likely to berevenue neutral. As per the Explanatory Memorandumof the TRAI Order, �In the first year of new tariffs,there is likely to be a surplus for the service provider.In the second year, there is likely to be a surplus or asmall deficit. In the third year, the reduction in DoTrevenues might be about 3�5 per cent.�1 However, inresponse to the DoT�s concerns the TRAI agreed toreview the impact of tariffs at the end of one year, thatis April 2000.2
The DoT implemented the order with some conces-sions for rural and low-user urban categories, namelythere was no increase in rental or call charges for ruralor low-user urban subscribers and the free call limitswere not decreased from existing levels. However, thiswas not a problem as the rates in the TRAI order wereonly caps or floors and operators had the flexibility tooffer better rates. Long-distance rates were reduced inline with the TRAI Order.
Assessment of Tariff Order
One of the factors behind the general move for tariffrebalancing/reduction is the profitability of the DoT.According to the TRAI, many consumer groups wereof the view that the DoT�s profitability was too highand that a decrease in revenues was justified. The TRAIappeared to agree with the consumer groups and argued
1 Telecom Tariff Order, 1999, Annex A, Explanatory Memo-randum.
2 The DoT in its Annual Report for 1999�2000 has noted,�Consequent to the revisions in tariffs and rentals, the revisedestimates of revenue for the year 1999�2000 were lower by Rs 2082crores than the budget estimates for the year. Thus, during theyear, a reduction in surplus from Rs 8840 crores to Rs 6389 croresis anticipated.� At the request of the government the second phaseof tariff revisions scheduled for April 2000 has been put inabeyance while the TRAI completes the review process.
38 India Infrastructure Report 2001
that, �it is true that the DoT surpluses are significantbut the authority�s opinion is that at the present stageof India�s telecom development, it is necessary for theDoT to have substantial surpluses for expanding thenetwork and to meet other social obligations�. There aretwo problems with this argument. First, surpluses arenot necessarily the only means of financing growth.High growth firms rely on internal surpluses as well asexternal debt and equity to finance growth. Second,surpluses essentially represent a return on investmentand, hence, must be evaluated in a corresponding man-ner. In the case of the DoT, it must be noted that evenif its surplus appears large in absolute terms at aboutRs 7000 crores in 1995�6, in terms of return on capitalemployed it is only about 20 per cent. Moreover, thisis on a pre-tax basis since the DoT does not pay any taxescurrently. In terms of return on equity the profitabilityof the MTNL and the VSNL, both with significantprivate shareholdings, is much higher. Therefore, thequestion of the level of surpluses that is justified mustbe separated from the level of funds required forinvestment. In essence, the responsibility of the regula-tor is not to provide for a particular level of revenue orsurpluses, but only a return on capital which is commen-surate with the level of risk of the business given areasonable level of efficiency of operations. Once thebusiness is able to achieve this level of return, capital fornew investment may be expected to flow in fromexternal sources.
In spite of the concern about the DoT�s surplusesthe order considers the impact of the rebalancing onlyon the DoT�s revenues. Its impact on costs and, there-fore, profitability is not considered. For example, giventhe likely increase in traffic, because of the higherelasticity of demand of STD/ISD, costs are likely toincrease, which could have a negative impact on profits,even if there is no adverse impact on revenues. Thispoints to the need for developing a model of profitsrather than just revenues. Such a model will also haveto take into account the possibility of improvementsin efficiency of operations and corresponding reductionin costs.
Overall, the TRAI is faced with a severe informationproblem, which is unlikely to be resolved so long as theDoT continues to function as a government departmentwith no commercially relevant management informa-tion system. The tariff order is based on extremelytentative cost and usage information. The analysis uses�representative� cost estimates for the current capitalcosts of the local and long-distance transmission net-works. Operating cost estimates are based on historicalcosts. Finally, allocation of costs is based on extremelyspeculative estimates of the number of minutes of local,
STD, and international calls.3 Improvements in effi-ciency have also not been considered.
This problem of cost and usage data is likely to persistas long as the DoT is not corporatized and does notadopt a commercial accounting and management infor-mation system. The Indian telecom sector, perhaps, hasthe unique distinction of being a government depart-ment regulated by a regulatory authority. In most casesthe government department is at least corporatized, withsome time frame for privatization, prior to regulation.This has several implications for price regulation. Priceregulation in general, and incentive-based regulation inparticular, assumes a commercial orientation on thepart of the regulated firm. This is not possible withoutat least coporatization of the DoT. Of course, corporati-zation by itself is unlikely to be adequate if there is noautonomy of operations and introduction of privateshareholding. Without corporatization and commercial-ization the DoT will be unable to produce the kind ofinformation that is required by the regulator for mean-ingful regulation or in fact that would be needed forefficient management of any commercial organization.
Along with the corporatization of the DoT there isneed to introduce competition in the telecommunica-tion sector as rapidly as possible. Even with competitionthe need for regulatory oversight and intervention willnot disappear. The regulator will still have to deal withissues related to interconnection, predatory pricing,collusion, and universal service. However, competitionwill alleviate some of the information problems andeliminate the need for detailed service by service calcu-lations of costs and tariffs. It may then be possible tomove to selective price cap regulation. Competition willalso force the pace of tariff rebalancing by creating theright incentives for the incumbent.
So far the attempt to introduce competition in fixedline services has been a non-starter. Three rounds oftenders since June 1995 for a licence in each circle haveresulted in licences being issued for six circles only.Against these licences, services have been commissionedin three circles�Madhya Pradesh, Maharashtra, andAndhra Pradesh�with a total subscriber base of about100,000 as of January 2000. The New Telecom Policy
3 The estimate of domestic long-distance minutes provides agood example of the problems with the TRAI�s estimates. In itsconsultation paper on tariffs the TRAI estimated the total numberof long-distance minutes ranging from 8 to 11 billion minutes(p. 66, para. 53, Annex 2) as of 1996�7. In contrast, its consultationpaper on �Introduction of Competition in Domestic Long Dis-tance Communications� provides an estimate of 26 billion minutesfor 1998�9 (p. 24, para. 100, Tables 3�8). This estimate is subjectto certain caveats but these are unlikely to make a significantdifference.
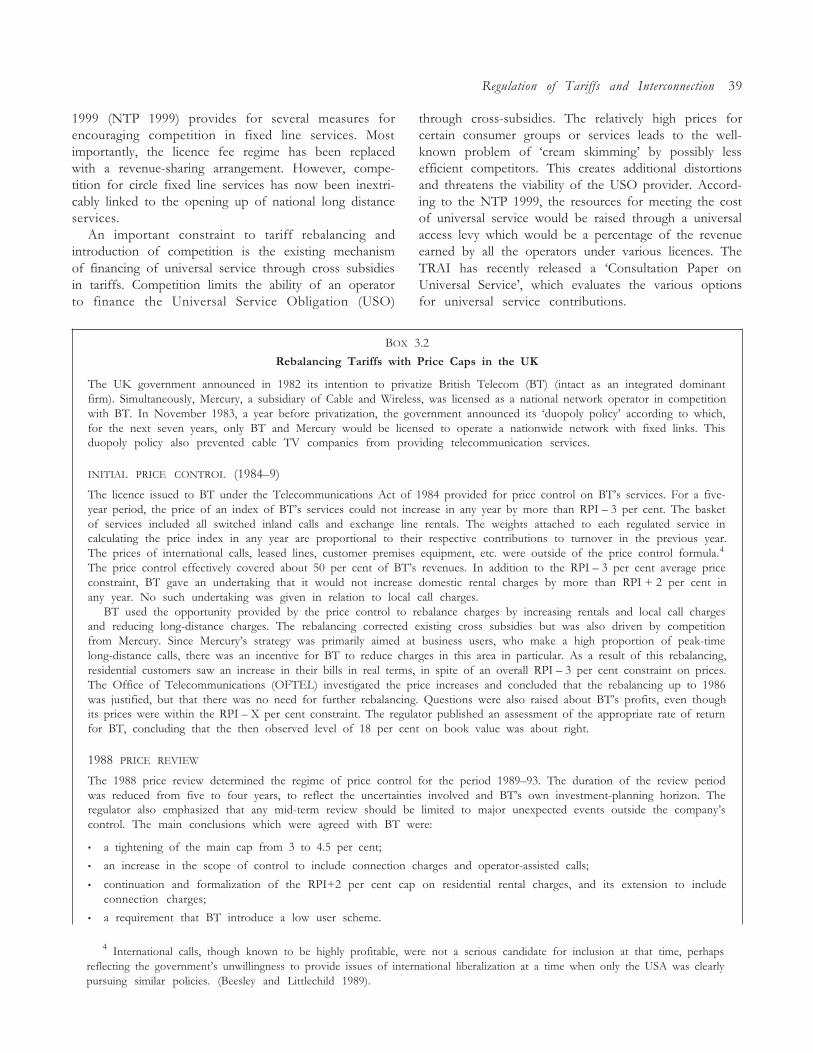
Regulation of Tariffs and Interconnection 39
1999 (NTP 1999) provides for several measures forencouraging competition in fixed line services. Mostimportantly, the licence fee regime has been replacedwith a revenue-sharing arrangement. However, compe-tition for circle fixed line services has now been inextri-cably linked to the opening up of national long distanceservices.
An important constraint to tariff rebalancing andintroduction of competition is the existing mechanismof financing of universal service through cross subsidiesin tariffs. Competition limits the ability of an operatorto finance the Universal Service Obligation (USO)
through cross-subsidies. The relatively high prices forcertain consumer groups or services leads to the well-known problem of �cream skimming� by possibly lessefficient competitors. This creates additional distortionsand threatens the viability of the USO provider. Accord-ing to the NTP 1999, the resources for meeting the costof universal service would be raised through a universalaccess levy which would be a percentage of the revenueearned by all the operators under various licences. TheTRAI has recently released a �Consultation Paper onUniversal Service�, which evaluates the various optionsfor universal service contributions.
BOX 3.2
Rebalancing Tariffs with Price Caps in the UK
The UK government announced in 1982 its intention to privatize British Telecom (BT) (intact as an integrated dominantfirm). Simultaneously, Mercury, a subsidiary of Cable and Wireless, was licensed as a national network operator in competitionwith BT. In November 1983, a year before privatization, the government announced its �duopoly policy� according to which,for the next seven years, only BT and Mercury would be licensed to operate a nationwide network with fixed links. Thisduopoly policy also prevented cable TV companies from providing telecommunication services.
INITIAL PRICE CONTROL (1984�9)
The licence issued to BT under the Telecommunications Act of 1984 provided for price control on BT�s services. For a five-year period, the price of an index of BT�s services could not increase in any year by more than RPI � 3 per cent. The basketof services included all switched inland calls and exchange line rentals. The weights attached to each regulated service incalculating the price index in any year are proportional to their respective contributions to turnover in the previous year.The prices of international calls, leased lines, customer premises equipment, etc. were outside of the price control formula.4
The price control effectively covered about 50 per cent of BT�s revenues. In addition to the RPI � 3 per cent average priceconstraint, BT gave an undertaking that it would not increase domestic rental charges by more than RPI + 2 per cent inany year. No such undertaking was given in relation to local call charges.
BT used the opportunity provided by the price control to rebalance charges by increasing rentals and local call chargesand reducing long-distance charges. The rebalancing corrected existing cross subsidies but was also driven by competitionfrom Mercury. Since Mercury�s strategy was primarily aimed at business users, who make a high proportion of peak-timelong-distance calls, there was an incentive for BT to reduce charges in this area in particular. As a result of this rebalancing,residential customers saw an increase in their bills in real terms, in spite of an overall RPI � 3 per cent constraint on prices.The Office of Telecommunications (OFTEL) investigated the price increases and concluded that the rebalancing up to 1986was justified, but that there was no need for further rebalancing. Questions were also raised about BT�s profits, even thoughits prices were within the RPI � X per cent constraint. The regulator published an assessment of the appropriate rate of returnfor BT, concluding that the then observed level of 18 per cent on book value was about right.
1988 PRICE REVIEW
The 1988 price review determined the regime of price control for the period 1989�93. The duration of the review periodwas reduced from five to four years, to reflect the uncertainties involved and BT�s own investment-planning horizon. Theregulator also emphasized that any mid-term review should be limited to major unexpected events outside the company�scontrol. The main conclusions which were agreed with BT were:
� a tightening of the main cap from 3 to 4.5 per cent;
� an increase in the scope of control to include connection charges and operator-assisted calls;
� continuation and formalization of the RPI+2 per cent cap on residential rental charges, and its extension to includeconnection charges;
� a requirement that BT introduce a low user scheme.
4 International calls, though known to be highly profitable, were not a serious candidate for inclusion at that time, perhapsreflecting the government�s unwillingness to provide issues of international liberalization at a time when only the USA was clearlypursuing similar policies. (Beesley and Littlechild 1989).
40 India Infrastructure Report 2001
The low-user scheme gives customers the option of cheaper rental charges together with thirty units of free calls, withcalls in excess being charged at a higher rate.
DUOPOLY REVIEW
The government initiated a duopoly review in 1991, with the expiry of the government�s commitment not to licence fixed-link network operators to compete with BT and Mercury. The resulting white paper concluded that the duopoly policy shouldbe ended, except in respect of international operations in the short term. In addition, cable TV companies were now allowedto offer telecommunications in their own right. In addition mobile operators were permitted to provide fixed link service.
As a part of the white paper the X in the main cap was increased from 4.5 to 6.25 per cent and international servicesalso came under control, with an immediate 10 per cent reduction in international charges. This was in response to publicconcerns about the high returns BT was earning on international calls, estimated by OFTEL as over 80 per cent on capitalemployed. As a result of these changes, regulated services accounted for about 70 per cent of BT�s turnover. Apart from theRPI + 2 per cent cap on exchange rentals, a new cap on the median customer�s telephone bill of RPI � 7 per cent wasintroduced. Because of this constraint on rebalancing between call and rental charges, BT argued that without a requirementon competitors to make adequate payments towards its access deficit there would be unfair and inefficient cream skimming.
1992 PRICE REVIEW
The 1992 price review determined the price control regime for the period 1993�7. Its main conclusions were:
� a tightening of X in the main cap from 6.25 to 7.5
� a continuation of the RPI + 2 per cent cap on domestic and single-line business exchange-line rentals
� a stipulation that no individual prices (other than the above exchange-line rentals) increase by more than RPI in any year
� any quantity discounts offered by BT would not count when assessing BT�s compliance with the RPI � 7.5 per cent price cap
� BT�s low user scheme should be strengthened
� Investment targets, including digital services reaching 99 per cent of the population, should be attained by the end of theprice control period.
1995 POLICY STATEMENT ON COMPETITION
As a result of the consultation following the July 1995 policy statement, �Effective Competition: Framework for Action�,the RPI + 2 per cent constraint on BT�s exchange line rental charges was removed. This was a significant deregulatorystep, encouraging BT to develop innovative packages of call and rental charges which could offer greater freedom of choiceto the consumer. This also required BT to nominate one package as a reference tariff against which compliance with theRPI � X per cent cap could be measured.
1997 PRICE REVIEW
In the 1997 price control review OFTEL concluded that, in the past, price control benefits had gone disproportionately toprofitable customer groups where BT faced competition. This included not only business customers but also high spendingresidential users.
Average effective value of X for 1990�1 to 1995�6per cent
Official price control 6.6All residential customers 4.2First 80 per cent of residential customers 2.7Top 20 per cent high spending residential customers 5.7All business customers 9.3
This is the joint result of the higher levels of competition faced by BT for business and high-spending residential customersand the higher levels of profitability of these services. Price control in future was to be focused on groups with the leastaccess to competition and, therefore, most need of protection. This is defined as the first 80 per cent by spending of residentialcustomers and small business customers. The tariff review made the following proposals:
� A formal price cap of RPI � 4.5 per cent covering those services currently controlled, applied using only the revenues andcalling patterns of the first 80 per cent of residential customers by bill size.
� BT would be required to offer a package for business customers which would provide call charges no higher than those
Regulation of Tariffs and Interconnection 41
used for calculating adherence to price control in the residential market, and line rental increases of no more than RPIper year.
This structure was considered the best way of ensuring that price-cap regulation was provided to those who needed itmost while giving BT greater freedom in areas where competition was already effective.
OFTEL�S APPROACH TO SETTING X
In the case of OFTEL the price cap is set by using a financial model which is used to project forward costs, revenues, andcapital employed for the services within each tariff basket. If a large proportion of costs and fixed assets are shared betweenactivities inside and outside the proposed price control baskets, the coverage of the model may need to be expanded to includeall those activities where there is potential for costs or assets to be shared. Based on the forecasts derived from the model,a range of values of X is chosen for each price control so as to allow the firm to earn an acceptable expected rate of returnby the end of the control period. In order to model the financial performance a number of parameters will need to be estimated:
� potential growth in demand for each service and the firm�s share of each service market;
� the relationship between the costs and volumes of output produced;� the scope for improvement in productivity;� future movements in input prices;� the allocation of overheads and fixed assets to the price-controlled business, after taking into account expansion of non-
controlled business.
However, as pointed out by OFTEL,
The selection of a precise X for the purpose of RPI � X formula is in the end a judgement. It is necessary to assess where, within the rangeof values suggested by the modelling set out above, the right balance is struck between price protection for vulnerable customers and theefficiency levels that are reasonable for the UK industry. It is also a duty of the Director General to take account of the need for BT tobe able to finance the services which it is obliged to provide. A key consideration in arriving at the value of X is the fact that the bestprotection for customers and the best spur to higher efficiency will be competition.
Conclusions from the UK Price Cap Experience
In the initial phase of price regulation the emphasis was on tariff rebalancing, while maintaining overall financial viability.However, the speed and extent of rebalancing was left to BT, subject to the RPI � 3 per cent constraint and additional RPI + 2per cent constraint on rentals. The overall RPI � 3 per cent constraint included both the monopolistic access provision andlocal calls as well as the relatively competitive long-distance calls giving rise to the possibility of predatory cross-subsidization.Given the existing cross subsidization in the opposite direction this was not viewed as a problem in the initial stages. However,the regulator was aware of this possibility and placed informal constraints on the rebalancing, in addition to the formal pricecontrol.
Once substantial rebalancing had been achieved, and constraints on entry removed with the duopoly review, the regulatorincreasingly turned the focus of price control to low-spending residential and small business users�markets with lowcompetition. As early as 1988, BT was required to introduce a low cost low-user scheme. Following the duopoly review,a new cap of RPI � 7 per cent on the median customer�s telephone bill was added. Apart from this the 1992 price reviewstipulated that no individual prices (other than exchange line rentals) increase by more than RPI in any year. These additionalcaps on all charges while continuing with the RPI + 2 per cent cap on exchange line rentals constrained BT�s ability to rebalancetariffs. The cap on exchange rentals was finally removed in 1995. The 1997 price review recognized that there was adequatecompetition for business and high-spending residential customers. Further price protection was, therefore, to be limited tothe lowest spending 80 per cent of residential customers and small business customers.
The UK experience of telecommunications illustrates the use of the RPI � X method of regulation in an industry withrapid technological change and an industry structure which is constantly evolving towards increasing competition. The RPI � Xmethod of fixing a maximum price path for an exogenously fixed interval of time provides the incentive for continuousexploitation of new technology to reduce costs. Simultaneously, the RPI � X method can be easily targeted towards thoseaspects of the business where regulation is most needed. In principle, rate-of-return regulation can similarly be targeted, butthe practical difficulties of disaggregated rate of return measurement would impose a considerable burden.
The UK experience also demonstrates that RPI � X is not a passive form of regulation where the regulator need get activeonly once in five years or so. OFTEL has been fairly active and the explicit rules of price control have been supplementedwith implicit regulation. Price regulation has broadened and tightened over time to take account of changing industryconditions. This has happened not only at the times of formal price review but also between price review. Contrary to therate-of-return regulation, which provides only a single number�the rate of return�for regulation, the RPI � X approachprovides a number of elements�the X factor, the control period, the coverage of the basket, and sub-caps. It is possible forthe regulator and the regulated firm to reach an agreement on a package of these elements even if there are disagreementson individual elements.
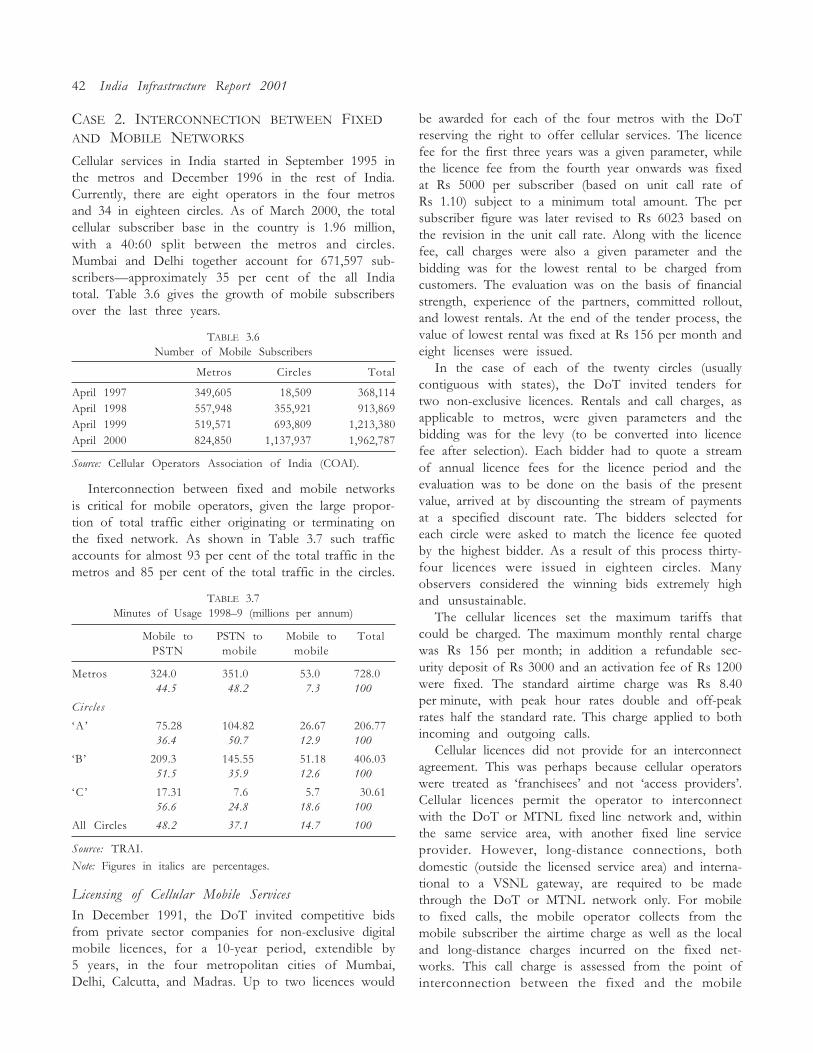
42 India Infrastructure Report 2001
CASE 2. INTERCONNECTION BETWEEN FIXED
AND MOBILE NETWORKS
Cellular services in India started in September 1995 inthe metros and December 1996 in the rest of India.Currently, there are eight operators in the four metrosand 34 in eighteen circles. As of March 2000, the totalcellular subscriber base in the country is 1.96 million,with a 40:60 split between the metros and circles.Mumbai and Delhi together account for 671,597 sub-scribers�approximately 35 per cent of the all Indiatotal. Table 3.6 gives the growth of mobile subscribersover the last three years.
TABLE 3.6Number of Mobile Subscribers
Metros Circles Total
April 1997 349,605 18,509 368,114April 1998 557,948 355,921 913,869April 1999 519,571 693,809 1,213,380April 2000 824,850 1,137,937 1,962,787
Source: Cellular Operators Association of India (COAI).
Interconnection between fixed and mobile networksis critical for mobile operators, given the large propor-tion of total traffic either originating or terminating onthe fixed network. As shown in Table 3.7 such trafficaccounts for almost 93 per cent of the total traffic in themetros and 85 per cent of the total traffic in the circles.
TABLE 3.7Minutes of Usage 1998�9 (millions per annum)
Mobile to PSTN to Mobile to TotalPSTN mobile mobile
Metros 324.0 351.0 53.0 728.044.5 48.2 7.3 100
Circles
�A� 75.28 104.82 26.67 206.7736.4 50.7 12.9 100
�B� 209.3 145.55 51.18 406.0351.5 35.9 12.6 100
�C � 17.31 7.6 5.7 30.6156.6 24.8 18.6 100
All Circles 48.2 37.1 14.7 100
Source: TRAI.
Note: Figures in italics are percentages.
Licensing of Cellular Mobile Services
In December 1991, the DoT invited competitive bidsfrom private sector companies for non-exclusive digitalmobile licences, for a 10-year period, extendible by5 years, in the four metropolitan cities of Mumbai,Delhi, Calcutta, and Madras. Up to two licences would
be awarded for each of the four metros with the DoTreserving the right to offer cellular services. The licencefee for the first three years was a given parameter, whilethe licence fee from the fourth year onwards was fixedat Rs 5000 per subscriber (based on unit call rate ofRs 1.10) subject to a minimum total amount. The persubscriber figure was later revised to Rs 6023 based onthe revision in the unit call rate. Along with the licencefee, call charges were also a given parameter and thebidding was for the lowest rental to be charged fromcustomers. The evaluation was on the basis of financialstrength, experience of the partners, committed rollout,and lowest rentals. At the end of the tender process, thevalue of lowest rental was fixed at Rs 156 per month andeight licenses were issued.
In the case of each of the twenty circles (usuallycontiguous with states), the DoT invited tenders fortwo non-exclusive licences. Rentals and call charges, asapplicable to metros, were given parameters and thebidding was for the levy (to be converted into licencefee after selection). Each bidder had to quote a streamof annual licence fees for the licence period and theevaluation was to be done on the basis of the presentvalue, arrived at by discounting the stream of paymentsat a specified discount rate. The bidders selected foreach circle were asked to match the licence fee quotedby the highest bidder. As a result of this process thirty-four licences were issued in eighteen circles. Manyobservers considered the winning bids extremely highand unsustainable.
The cellular licences set the maximum tariffs thatcould be charged. The maximum monthly rental chargewas Rs 156 per month; in addition a refundable sec-urity deposit of Rs 3000 and an activation fee of Rs 1200were fixed. The standard airtime charge was Rs 8.40per minute, with peak hour rates double and off-peakrates half the standard rate. This charge applied to bothincoming and outgoing calls.
Cellular licences did not provide for an interconnectagreement. This was perhaps because cellular operatorswere treated as �franchisees� and not �access providers�.Cellular licences permit the operator to interconnectwith the DoT or MTNL fixed line network and, withinthe same service area, with another fixed line serviceprovider. However, long-distance connections, bothdomestic (outside the licensed service area) and interna-tional to a VSNL gateway, are required to be madethrough the DoT or MTNL network only. For mobileto fixed calls, the mobile operator collects from themobile subscriber the airtime charge as well as the localand long-distance charges incurred on the fixed net-works. This call charge is assessed from the point ofinterconnection between the fixed and the mobile
Regulation of Tariffs and Interconnection 43
networks. The fixed line charges are paid to the fixedline operator on a monthly basis. For fixed to mobilecalls the fixed line operator collects the appropriatefixed line charges and the mobile operator collects theairtime charges from the mobile subscriber receivingthe call.
The NTP 1999 of the Government of India providesfor a new policy framework for cellular mobile serviceproviders (CMSPs) which implies certain changes intheir licence conditions. Most importantly the NTP1999 replaces the payment of licence fees to the govern-ment by a revenue-sharing scheme. The other importantfeatures of the new policy are:
� direct interconnectivity between licenced CMSPs andany other type of service provider (including anotherCMSP) in their area of operation including sharing ofinfrastructure with any other type of service providershall be permitted;� interconnectivity between service providers in differ-ent service areas shall be reviewed in consultation withthe TRAI;� the CMSP to be allowed to directly interconnect withthe VSNL after opening of national long distance from1 January 2000;� the CMSPs to be permitted to provide mobile tele-phony services including permission to carry their ownlong distance traffic within their service area withoutseeking an additional licence.
Cellular Tariff Restructuring
Cellular tariffs were restructured along with the restruc-turing of fixed line tariffs. The main reason for restruc-turing cellular tariffs was that the monthly rental ofRs 156, as specified in the cellular licence, was not onlylower than the monthly rental for the alphanumericpaging service, but was also lower than the two highestcategories of fixed line service. Simultaneously, theairtime charge was too high. This had resulted in alarge number of low-usage subscribers who were a �netcost� to the operators. Therefore, the major objective ofthe tariff restructuring was to bring the monthly rentalcloser to the fixed costs of the network and airtimecharges closer to operating costs. In addition the TRAIwanted to introduce a CPP regime �with the intent toboost usage of the network�.
The TRAI estimated the cost of access and airtimefor fixing cost-based rentals and airtime usage charges.The cost of access was based on capex per subscriber.The cost of airtime was based on operating expenses.The TRAI used cost information provided by cellularoperators. Actual data had been provided for thetwo years 1996�7 and 1997�8 and projections for the
following four years. Rentals and airtime charges werecalculated using capex and operating expense forecastsfor 1999�2000 and 2000�1.
Using the median estimate the TRAI fixed a rentalof Rs 600 (earlier Rs 156) and airtime charge of Rs 6(earlier Rs 16.80) per minute as price caps. The proposedprice cap tariffs constituted a �standard package� alwaysavailable to subscribers. Operators were free to offeralternative packages with higher rentals and airtimecharges than those in the standard package. The TRAIpostponed implementation of the CPP system toAugust 1999 since �the DoT had indicated that it willtake some time to make the technical adjustmentsrequired to implement the CPP system�.
Fixed-Mobile Interconnection
As already pointed out there is no interconnect agree-ment between the DoT/MTNL and cellular operators.Cellular operators and the DoT/MTNL have beenengaged in discussions on an interconnect agreementsince 1996 but no agreement has so far been reached. Thetwo major issues that need resolution are: (a) multiplepoints of interconnection and (b) interconnectionaccess charges.
MULTIPLE POINTS OF INTERCONNECTION
Cellular operators, especially in circles, would likemultiple points of interconnection since it enables themto carry calls on their network to the maximum extentpossible and thereby minimize fixed line charges forboth originating and terminating calls. On the otherhand, the DoT would prefer a single point of intercon-nection and to charge STD rates for originating andterminating calls to and from the mobile network. TheDoT issued an order in January 1997 directing that intra-circle calls would be charged at the pulse rate of 8/16/24/32 seconds. This implied that the peak rate for a fixedto mobile call would be equivalent to about 24 localcalls. The DoT argued that with a single point ofinterconnect, fixed to mobile traffic in a circle wouldhave to travel an average of 100�200 km on the DoTlong-distance network before being handed over to thecellular network at the single point of interconnect. Thecharges specified by the DoT were the STD rates for the100�200 km slab. The DoT also argued that the higherstrata of society like businessmen, corporate organiza-tions etc., which form the core of revenue earning sourceof DoT through high STD calling, are also the potentialtarget customers for cellular mobile service. A local calltariff for fixed to mobile will be very lucrative. All theirSTD calls within a circle will get converted into localcalls. This will completely wipe out the revenue base ofnot only DoT but also the basic service operators to
44 India Infrastructure Report 2001
whom the government is shortly going to issue licensesfor operating fixed telephone service.
Finally, the DoT pointed out that fixed to mobilecalls provide additional value to the fixed line caller bybeing able to contact the mobile subscriber �possessingno knowledge of the mobile holders� whereabouts withinthe circle�. Moreover, the fixed caller has the option ofusing the fixed network to (try to) contact the mobilesubscriber. �It is up to the fixed caller to make a needbased, economic choice of the various options.� (Lateron, in the CPP dispute, the DoT would take a stancecontrary to this view.)
In response to the DoT tariff notification, cellularoperators approached the High Court of Delhi, whichstayed the DoT order. However, with the issue of agovernment notification constituting the TRAI, theCourt directed the DoT and cellular operators toapproach the TRAI for a resolution of their dispute.The TRAI issued an order in April 1997 directing DoT�that subject to technical integrity of the network andtechnical feasibility, to grant both-way connectivity atpoints of interconnect and multiple Global MobileSwitching Centres (GMSCs) to the cellular operators,as they may require�. With multiple points of intercon-nection the basis for charging fixed to mobile calls atSTD rates would be eliminated. However, cellularoperators continue to complain that the TRAI order isnot being followed by the DoT. For example, accordingto them, �the Department of TelecommunicationServices (DTS) is insisting that only one interconnectper secondary switching area (SSA) will be permitted.�
Interconnection Access Charges
In the second consultation paper on Telecom Pricing(9 September 1998) the TRAI stated that interconnectioncharges include payment for a link established betweentwo networks (set up cost) and for the use of theinterconnection provider�s network facilities (usagecharges). The TRAI further clarified that interconnec-tion prices are, in general, based on costs, and/or arecharged in the form of revenue sharing between theinterconnecting operators. �While the proportion ofrevenue shared is normally a result of negotiations, incertain instances it is based on the interconnectioncosts incurred by the interconnecting operators.� It isin this context that the first interconnection regulationis titled, �The Telecommunication Interconnection(Charges and Revenue Sharing) Regulation 1999�. In thisorder, charges related to �set-up costs� have been speci-fied as interconnection charges. These include chargesfor leased circuits and port charges. Leased circuitcharges had been determined in the first tariff order and
port charges have been specified in this order. Usagecharges in the interconnection order are specified asrevenue-sharing arrangements.
In the interconnection order, the TRAI was carefulto specify that
the revenue sharing arrangements are interim, and are notbased on detailed cost analysis. Application of an access/carriage charge regime will provide more logically tenableusage charges. . . . Till any access/carriage charge is imple-mented, a system of revenue sharing must be in place togive effect to the commercial relationships arising throughinterconnection.
For basic services the following revenue-sharingarrangement was specified largely based on the inter-connection terms specified in the licence for basicservices:
� Bill and keep for local calls.
� For domestic long-distance calls the originating ser-vice provider pays Re 0.48 per unit of measured call.This is equivalent to 40 per cent of the highest per callcharge of Rs 1.20.
� For international calls the originating service pro-vider pays Re 0.66 per unit of measured call. This isequivalent to 55 per cent of the highest per call chargeof Rs 1.20.
For calls between the cellular mobile and fixed linenetworks the revenue-sharing arrangement is the sameas specified in the original licence. The revenue-sharingarrangement was expected to change with the implemen-tation of the CPP regime. In the second consultationpaper the TRAI had suggested that the cellular mobileoperator should retain a percentage of the revenueearned from long-distance and international calls. How-ever, in the final order the TRAI refrained from takingany action on this for the following reasons:
� Basic service providers have an access deficit to makeup from long distance and international call charges.Cellular operators have no such requirement sinceprofitability has been built into the specified tariffs thatare based on median cost estimates (and not on lowerestimates based on costs of an efficient provider).
� Tariff forbearance has been specified for supplemen-tary services, which is an additional source of revenues.
� Tariff flexibility has been offered for cellular mobiletariffs for long-distance calls made within the circle.
Cellular operators continue to press for sharing ofSTD and international call charges on the grounds ofparity with basic services operators. As an interimarrangement they would like the interconnection access
Regulation of Tariffs and Interconnection 45
charges for fixed service providers to be made applicableto cellular operators as well.
CPPTRAI�S CONSULTATION AND ORDER
In the second consultation paper on Telecom Pricing (9September 1998) the TRAI had suggested a changeoverto a CPP regime. In the mobile to mobile case thetransition would be accompanied by a �sender keeps all�policy. However, such a policy would not be appropri-ate for fixed to mobile calls because of the asymmetriccosts of the two networks. Hence a migration to CPPwould have to be accompanied by a suitable intercon-nection policy. In the consultation paper the TRAIspecified a charge of Rs 3.90 per minute for a fixed tomobile call with the revenue shared between the fixedand mobile operator in the ratio of 15:85. This arrange-ment was based on two considerations:
� At Rs 3.90 per minute the fixed to mobile chargewould be about nine times the fixed to fixed charge. InEurope the corresponding average ratio was aboutthirteen times.� A 15:85 sharing would ensure that the fixed lineoperator overall received the same revenue as that fora fixed to fixed call.
However, in the first tariff order the TRAI postponedthe implementation of the CPP regime to August 1999,mainly because the DoT had indicated that it would takesome time to make the technical adjustments requiredto implement the CPP system.
One major and immediate outcome of the NTP 1999was the replacement of the licence fee regime by aninterim revenue share of 15 per cent. The governmentwould take a final decision on the percentage share onthe basis of the TRAI�s recommendations. Since thelicence fee forms a part of the costs incurred by serviceproviders, a migration to the revenue-share regimerequired a review of the cost-based tariffs specified inthe first tariff order. The TRAI combined this review,along with an assessment of the introduction of a CPPregime, in consultation paper No. 99/4 of 31 August1999. In this paper the TRAI proposed reduction inrentals and airtime charges. It also modified its earlierproposal of Rs 3.90 per minute for local calls from thefixed to the mobile network with a 15:85 sharingbetween fixed and mobile operators. It now proposed acharge of Rs 2.40 for the first two minutes and Rs 1.20for each successive two minutes, with equal shares forthe fixed and mobile operators. This reduction was donein response to several comments on its earlier proposalstating that the fixed to mobile tariff was too high andwould discourage fixed to mobile calls.
In the consultation process, following the release ofthe consultation paper, a number of operators claimedthat their position would be adversely affected by theproposed tariffs. Cellular operators also expressedconcern that the relatively low fixed to mobile tariffwould encourage a call-back phenomenon where mobilesubscribers would call fixed line numbers and then be�called back� by the fixed line subscribers in order tosave on airtime charges. However, the TRAI felt thatthe data provided by the parties to support their claimswere not appropriate. The TRAI decided that it wouldcontinue its examination of the corrected information.Simultaneously, on a purely interim basis, it wouldnotify certain tariff reductions together with the intro-duction of the CPP regime.
The TRAI announced the new tariffs in the Telecom-munication Tariffs (Fifth Amendment) Order dated 17September 1999. For cellular mobile services the rentalswere reduced from Rs 600 to Rs 475 per month formetros and Rs 500 per month for circles. Airtimecharges were reduced from Rs 6 to Rs 4 per minute formetros and Rs 4.50 for circles. With the implementationof the CPP airtime charges were applicable only foroutgoing minutes. For calls from the mobile to fixednetwork, as before, the mobile subscriber would pay,in addition to the airtime charge, the relevant chargesfor the fixed network. The fixed network charges wouldbe collected by the mobile operator and passed on tothe fixed network operator.
For local calls from the fixed to mobile networkthe order specified a charge of Rs 2.40 for the firstminute and Rs 1.20 for each successive minute. This wasexactly double the charge specified in the consultationpaper. The main reason cited for this increase was toreduce the possibility of call-back from fixed to mobileand at the same time, provide a higher total revenuefor sharing. However, the TRAI clearly stated that itwould not like the fixed to mobile call charges to beas high as suggested in the second consultation paperon tariffs. As stated by the TRAI, the tariff balancestwo objectives: �Keeping low the charge for this pre-mium call by basic service subscribers, while providinga reasonable amount of revenue to cellular mobilenetwork to partially substitute for the revenue loss onaccount of removing the incoming call charge forcellular mobile, and to pay for utilizing the network.�
Revenue sharing arrangements between fixed andmobile operators were specified in the accompanyingTelecommunication Interconnection (Charges and Rev-enue Sharing�First Amendment) Regulation 1999. Thisspecified the payment of a mobile termination charge(MTC) to the mobile operator of Rs 1.60 for the firstminute and Re 0.80 for each successive minute. This
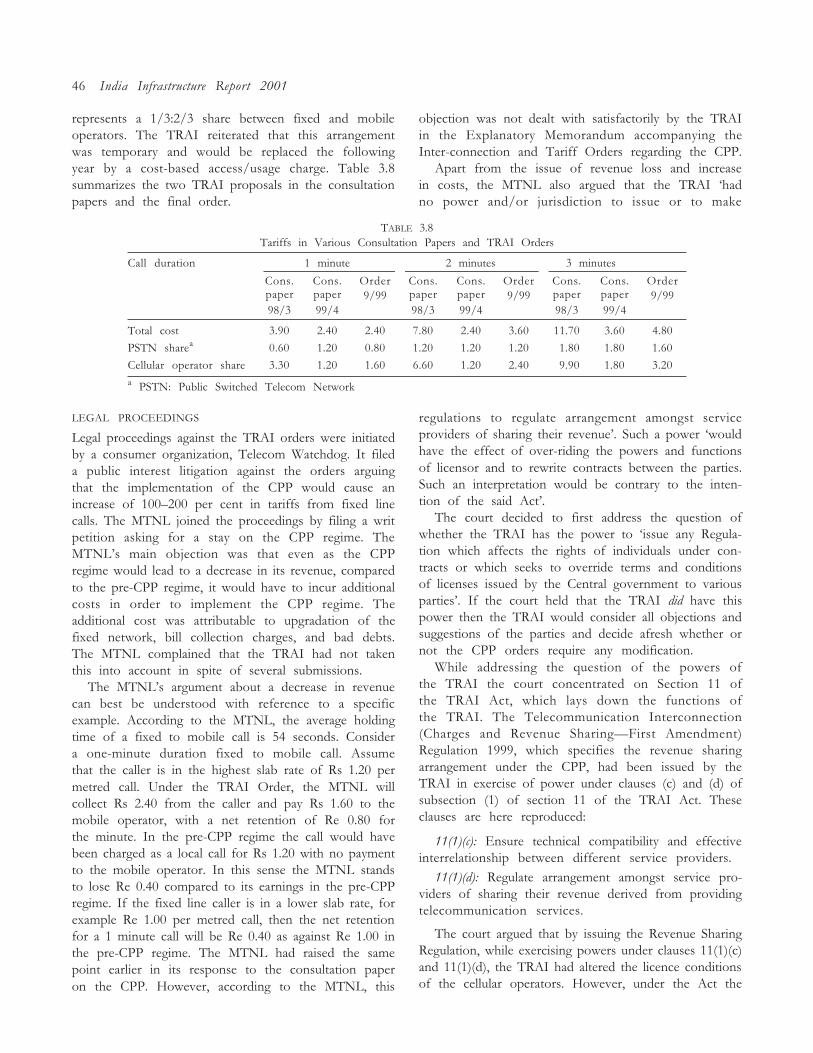
46 India Infrastructure Report 2001
represents a 1/3:2/3 share between fixed and mobileoperators. The TRAI reiterated that this arrangementwas temporary and would be replaced the followingyear by a cost-based access/usage charge. Table 3.8summarizes the two TRAI proposals in the consultationpapers and the final order.
TABLE 3.8Tariffs in Various Consultation Papers and TRAI Orders
Call duration 1 minute 2 minutes 3 minutes
Cons. Cons. Order Cons. Cons. Order Cons. Cons. Orderpaper paper 9/99 paper paper 9/99 paper paper 9/9998/3 99/4 98/3 99/4 98/3 99/4
Total cost 3.90 2.40 2.40 7.80 2.40 3.60 11.70 3.60 4.80
PSTN sharea 0.60 1.20 0.80 1.20 1.20 1.20 01.80 1.80 1.60
Cellular operator share 3.30 1.20 1.60 6.60 1.20 2.40 09.90 1.80 3.20a PSTN: Public Switched Telecom Network
LEGAL PROCEEDINGS
Legal proceedings against the TRAI orders were initiatedby a consumer organization, Telecom Watchdog. It fileda public interest litigation against the orders arguingthat the implementation of the CPP would cause anincrease of 100�200 per cent in tariffs from fixed linecalls. The MTNL joined the proceedings by filing a writpetition asking for a stay on the CPP regime. TheMTNL�s main objection was that even as the CPPregime would lead to a decrease in its revenue, comparedto the pre-CPP regime, it would have to incur additionalcosts in order to implement the CPP regime. Theadditional cost was attributable to upgradation of thefixed network, bill collection charges, and bad debts.The MTNL complained that the TRAI had not takenthis into account in spite of several submissions.
The MTNL�s argument about a decrease in revenuecan best be understood with reference to a specificexample. According to the MTNL, the average holdingtime of a fixed to mobile call is 54 seconds. Considera one-minute duration fixed to mobile call. Assumethat the caller is in the highest slab rate of Rs 1.20 permetred call. Under the TRAI Order, the MTNL willcollect Rs 2.40 from the caller and pay Rs 1.60 to themobile operator, with a net retention of Re 0.80 forthe minute. In the pre-CPP regime the call would havebeen charged as a local call for Rs 1.20 with no paymentto the mobile operator. In this sense the MTNL standsto lose Re 0.40 compared to its earnings in the pre-CPPregime. If the fixed line caller is in a lower slab rate, forexample Re 1.00 per metred call, then the net retentionfor a 1 minute call will be Re 0.40 as against Re 1.00 inthe pre-CPP regime. The MTNL had raised the samepoint earlier in its response to the consultation paperon the CPP. However, according to the MTNL, this
objection was not dealt with satisfactorily by the TRAIin the Explanatory Memorandum accompanying theInter-connection and Tariff Orders regarding the CPP.
Apart from the issue of revenue loss and increasein costs, the MTNL also argued that the TRAI �hadno power and/or jurisdiction to issue or to make
regulations to regulate arrangement amongst serviceproviders of sharing their revenue�. Such a power �wouldhave the effect of over-riding the powers and functionsof licensor and to rewrite contracts between the parties.Such an interpretation would be contrary to the inten-tion of the said Act�.
The court decided to first address the question ofwhether the TRAI has the power to �issue any Regula-tion which affects the rights of individuals under con-tracts or which seeks to override terms and conditionsof licenses issued by the Central government to variousparties�. If the court held that the TRAI did have thispower then the TRAI would consider all objections andsuggestions of the parties and decide afresh whether ornot the CPP orders require any modification.
While addressing the question of the powers ofthe TRAI the court concentrated on Section 11 ofthe TRAI Act, which lays down the functions ofthe TRAI. The Telecommunication Interconnection(Charges and Revenue Sharing�First Amendment)Regulation 1999, which specifies the revenue sharingarrangement under the CPP, had been issued by theTRAI in exercise of power under clauses (c) and (d) ofsubsection (1) of section 11 of the TRAI Act. Theseclauses are here reproduced:
11(1)(c): Ensure technical compatibility and effectiveinterrelationship between different service providers.
11(1)(d): Regulate arrangement amongst service pro-viders of sharing their revenue derived from providingtelecommunication services.
The court argued that by issuing the Revenue SharingRegulation, while exercising powers under clauses 11(1)(c)and 11(1)(d), the TRAI had altered the licence conditionsof the cellular operators. However, under the Act the
Regulation of Tariffs and Interconnection 47
TRAI does not have powers to alter the terms andconditions of licences. Under clause 11(1)(b) of theAct it merely has the power to recommend terms andconditions of licence to a service provider. The courtalso pointed out that clause 11(1)(d) only empowersthe TRAI to regulate revenue-sharing arrangementsamong service providers. The TRAI can intervene onlyin the event of service providers being unable to reachan agreement.
Section 14 of the Act also provides the TRAI theauthority to settle disputes on matters, among others,relating to revenue-sharing arrangements between differ-ent service providers. The court argued that if the TRAIhad powers to issue regulations (regarding revenuesharing) which were binding on service providers and/or upon the central government then everybody wouldbe bound to follow those regulations and the questionof adjudicating a dispute would not arise.
The court struck down both the Tariff Amendmentand the Interconnection Amendment Orders as theyrelated to the CPP regime. However, it suggested thatthe TRAI should take suitable steps to ensure thatthe benefits of the change in the licence fee structureare passed on to consumers even if the accompanyingCPP regime is not implemented. Cellular operatorsagreed to implement the reduced tariffs without theCPP features.
TRAI ACT AMENDMENT
In January 2000, the government issued The TelecomRegulatory Authority of India (Amendment) Ordinancewhich amended the original TRAI Act of 1997. Changeswere introduced both in the composition and powers ofthe Authority. In response to the court�s ruling in theCPP case, section 11(1) of the Act, outlining the func-tions of the Authority, was amended. Section 11(1) nowconsists of two parts, (a) and (b). Part (a) defines thepurely recommendatory functions and part (b) otherfunctions. In part (b) the following new clause has beeninserted:
11(1)(b)(ii): notwithstanding anything contained inthe terms and conditions of the licence granted beforethe commencement of the Telecom Regulatory Author-ity (Amendment) Ordinance, 2000, fix the terms andconditions of interconnectivity between the serviceproviders.
The amendment also altered the procedure forsettlement of disputes. In the original Act all disputesbetween service providers, or between service providersand a group of consumers were to be adjudicated by abench constituted by the TRAI Chairperson. The amend-ment provides for the establishment of an Appellate
Tribunal, known as the Telecom Disputes Settlementand Appellate Tribunal. In addition to the disputesmentioned in the earlier Act, the Tribunal would alsoadjudicate disputes �between a licensor and a licensee�.It would also �hear and dispose of appeal against anydirection, decision or order of the authority (i.e. TRAI)under this act�. Decisions of the Appellate Tribunal canbe appealed against only in the Supreme Court.
Concluding Comments
The TRAI has repeatedly emphasized that inter-connection/usage/access charges should be based onincremental costs directly attributable to provision ofinterconnection/access/usage. So far the only access/usage charge determination made by the TRAI is theMTC for calls from the fixed to mobile network in aCPP regime. In all other cases it has essentially contin-ued with the revenue-sharing arrangements specifiedin the various licences. In the case of the MTC the TRAIalso had to determine the fixed to mobile retail tariffand, therefore, the amount retained by the fixed lineoperator.
The tariff and revenue-sharing proposals of the TRAIappear to be driven not so much by costs as by theconcern to ensure that the tariff is not �too high� andboth cellular and fixed line operators receive a �reason-able share�. The only possible way to achieve theseobjectives in a convincing manner is to base them oncosts rather than some general notions of affordabilityand reasonableness. The TRAI realized that its recom-mendations suffered from this problem and repeatedlyemphasized the �interim� nature of its proposals, withthe promise of eventually moving to cost-based rates.The fate of the CPP proposals clearly shows that non-cost-based interim proposals are not sustainable in atransparent regulatory environment. The TRAI couldpossibly have used its earlier costing of the basic andcellular networks and made suitable adjustments toarrive at cost-based tariffs and MTC. Given the lack ofinformation such charges would still have problemsbut they would be more acceptable to operators andconsumers.
Interconnection arrangements can be worked outeither through direct negotiations among operators orspecified by the regulator at the end of a consultationprocess. Even in the case of direct negotiations, theregulator may have to intervene if operators are unableto reach an agreement or if the agreement is not inthe interest of consumers. In the CPP case the TRAIadopted the alternative of specifying charges, eventhough it had been all along encouraging the DoT andcellular operators to negotiate an interconnect agree-ment. The TRAI�s actions were perhaps precipitated
48 India Infrastructure Report 2001
by the failure of the DoT and the operators to reach anagreement, and by its own view of the urgency ofintroducing the CPP regime. However, according tothe verdict of the court, the TRAI Act did not give theTRAI the power to fix interconnection charges. Theamended Act seeks to remedy this lacuna and providethe TRAI the power to set interconnection charges.
The TRAI has repeatedly emphasized that intercon-nection or access charges should be based on incrementalcosts directly attributable to the provision of intercon-nection or access. Thus far, the only determination onaccess charges by the TRAI was on the MTC for callsfrom the fixed to mobile network, in a CPP regime. Inall other cases, the TRAI has used the revenue-sharingarrangements specified in the various licences. Whiledetermining the MTC, the TRAI also had to determinethe fixed to mobile retail tariff and, therefore, theamount retained by the fixed line operator.
CASE 3. AVAILABILITY-BASED TARIFF (ABT)ORDER OF THE CERC
The CERC was established under the Electricity Regu-latory Commissions Act and has been vested with thepower to regulate the tariff of generating companiesowned or controlled by the central government. TheCERC inherited from the central government the taskof introducing ABTs. The government had been exam-ining for over five years the reform of the tariff structureof bulk power so as to improve grid discipline andoperation. Most of the grid problems are the result ofgenerators and beneficiaries deviating from their respec-tive schedules for generating or drawing power. Duringpeak hours, with excess drawal, there is a drop infrequency, with the reverse happening during off peakhours. In addition there are rapid and wide changes infrequency for many hours every day and frequent griddisturbances causing tripping of generating stations andinterruption of supply to large blocks of consumers anddistributors of the regional grids. The main reason forlack of grid discipline is the absence of penalties fordeviating from schedules. This in turn is related to theoverall structure of tariffs.
Background on Tariffs for Central Generating Plants
The current tariffs for central generating stations arebased on recommendations of the K. P. Rao Committee.The committee made a distinction between fixed andvariable charges. Fixed charges include all costs otherthan fuel costs and return on equity. The governmenthas notified the return on equity from time to time. Itwas increased from 10 per cent to 12 per cent on 21December 1991 and then to 16 per cent on 1 November
1998. Fuel cost is included under variable charges. Thecommittee laid down norms for all costs, though thesehave not been reviewed over time as recommended bythe committee. Full fixed charges are recoverable if thegeneration level, including �deemed generation�, is be-tween 5500 and 6000 hours. Assuming a total of 8760hours during the year, this is equivalent to a plant loadfactor (PLF) of 62.78 per cent to 68.49 per cent. Deemedgeneration is the number of hours a generating stationis available but forced to back down because of systemconstraints. Sharing of the fixed cost among beneficiariesis based on actual energy drawals as a proportion of totaldrawals by all beneficiaries. Variable cost is also basedon energy drawals. The system provided for an incentivepayment of 1 paise per kwh for each 1 per cent increasein PLF above 68.49 per cent. Penalty for operatingbelow a PLF of 62.8 per cent was a pro-rata reductionin fixed charges recovery, assuming 100 per cent recov-ery at 68.5 per cent and 50 per cent recovery at 0 PLF.
Fixed charge allocation based on actual energy drawalswas perhaps appropriate for perpetual scarcity situationswhere it was not possible to make available the allottedMW capacity to the beneficiary. There is also no meritorder problem during scarcity as all plants are dis-patched. However, this fixed cost allocation formuladid not help grid operation during surplus situations.Since state electricity boards (SEBs) considered theirown fixed costs as sunk costs they always found itmore economical to run their plants, even if the variablecost of these plants was higher, so long as the variablecost was less than the total cost payable to the NTPC.As a result a few states having less generating facilities,and dependent on the NTPC, almost always ended uppaying a larger share of fixed charges.
In the absence of a compulsory merit order schedul-ing and dispatch for all plants in the entire region,self-despatch of the plants was resorted to. The K. P. RaoCommittee recommendation regarding vesting regionalelectricity boards (REBs) with statutory powers forbacking down of plants on merit order basis, withpenalties for non-fulfilment of such directives, wasnot implemented. This lead to grid indiscipline andinefficiencies, especially in regions with surplus capaci-ties. Other recommendations of the committee such astime-of-day pricing, which could have improved griddiscipline and economic efficiency, have also not beenimplemented.
The central government issued a set of norms inMarch 1992 to determine tariffs for power plants tobe set up by the independent power producers (IPPs)in the private sector. These have subsequently beenmodified from time to time. The norms provide for fullrecovery of fixed charges, including 16 per cent return
Regulation of Tariffs and Interconnection 49
on equity, at 68.5 per cent PLF. In addition, for every1 percentage point increase in the deemed PLF there isan incentive in the form of an increase in return onequity of up to 0.7 per cent. There is also a penalty,calculated as a pro rata reduction in the recovery of fixedcost for deemed PLF below target level.
Draft Notification on ABT
Prior to the transfer of tariff regulation powers to theCERC, the central government had been examiningfor over five years the reform of the tariff structureof bulk power. The government had engaged interna-tional consultants to comprehensively study the Indianpower sector and recommend a suitable tariff struc-ture. Their report recommended the introduction of anAvailability-based Tariff (ABT) structure. The govern-ment then constituted a National Task Force (NTF) aswell as regional task forces (RTFs) to debate on variousissues in the introduction of an ABT. A draft notifica-tion, dated 7 April 1999, was ready but before it couldbe notified the tariff setting powers were transferred tothe CERC.
The ABT system seeks to achieve a situation whereleast cost power is despatched in preference to morecostly power (merit order despatch). This becomesdifficult without a two-part tariff for all stations. Statestend to compare the total cost of central generatorswith the variable cost of their own stations, since forthem the fixed costs of state-level stations are sunkcosts. This results in making central generation appearmore expensive than state-level stations, even thoughon variable cost basis the former may be cheaper. Thetwo-part tariff of the ABT, by making the payment offixed cost a fixed liability of the states, converts it intoa sunk cost thereby levelling the playing field betweencentral generators and state-level plants.
Currently beneficiaries are not liable for payment ofthe fixed cost associated with the share of capacityallocated to them. If a beneficiary decides not to drawany energy he can escape payment of the fixed charge,which then gets paid by the person drawing energy. Thisis unfair since it increases the cost of energy even forthose beneficiaries who may be drawing energy withintheir entitlements. The two-part tariff of the ABTassures that each beneficiary will be liable for paymentof the fixed cost associated with its share of allocatedgeneration capacity.
On the other hand generators have a perverse finan-cial incentive to go on generating even when theremay be no demand. This results in high frequency inthe grid as is endemic in the eastern region. The ABTwill discourage such behaviour by pricing generationoutside the schedule in relation to prevailing frequency.
The following are salient features of the two-parttariff proposed by the NTF:
� The return on equity (ROE) is treated separatelyfrom all other fixed charges.� Reimbursement of fixed charges is based on theavailability or declared capacity of the generating sta-tion. There are measures to check and penalize excess/under declaration of availability. Available capacity isallocated to beneficiaries on the basis of entitlement.Provision is also made for the unallocated central shareof power.� Full fixed cost, excluding ROE, is recovered at 30per cent availability on pro rata basis between 0 and 30per cent. ROE is recovered on pro rata availabilitybetween 30 and 70 per cent. There is an incentive ofadditional ROE of 0.4 per cent for each 1 per cent in-crease in availability beyond 70 per cent and up to 85per cent. Beyond 85 per cent the incentive is reducedto 0.3 per cent.� Variable cost payment is based on the scheduledenergy demand of beneficiaries.� There is provision for additional payment of capacitycharge in respect of prolonged outage of any unit of astation beyond ninety days of outage.� The system provides for scheduling of despatch on adaily basis, at least one day in advance, so as to matchsupply and demand.� A charge for unscheduled interchange (UI) chargefor the supply and consumption of energy in variationfrom the pre-committed daily schedule. This chargevaries inversely with the system frequency prevailingat the time of supply/consumption. Hence it reflectsthe marginal value of energy at the time of supply.
CERC Order on ABT 5
The CERC issued its order on ABT after almost sixmonths of hearings and consultations. The CERC orderon ABT differs from the draft notification in certainsignificant ways.
� It increases the target availability level at whichgenerators will be able to recover their fixed costs andROE from 62.79 per cent deemed PLF at present to 80per cent (85 per cent after one year) for all thermalstations, 85 per cent for hydro in the first year and77 per cent (82 per cent after one year) for National LongDistance Carrier (NLC). The draft notification providedfor recovery of annual fixed costs (minus ROE) at 30per cent availability and recovery of ROE on pro ratabasis between 30 per cent and 70 per cent availability.This order provides for payment of capacity charges
5 Availability Based Tariffs Order dated 4 January 2000.
50 India Infrastructure Report 2001
between 0 per cent and target availability on pro ratabasis.
� The draft notification had provided for payment ofcapacity charges for prolonged outages. The order dis-allows such payments.� It delinks the earning of incentive from availabilityand links it instead to the actual achievement of genera-tion. Hence incentives will be earned by generatorsonly where there is genuine demand for additionalenergy generation unlike the prevailing situation, oras per the proposed draft notification, whereby it isearned purely because the generator is available.� The draft notification linked incentives to return onequity. However, this order preserves the status quoof 1 paise per kwh for each 1 per cent increase in PLFabove target availability. The PLF is based on actual andnot �deemed generation�.� It introduces severe financial penalties for grid indis-cipline along with significant rewards for behaviourwhich enforces grid discipline for both generators aswell as beneficiaries (see also section 7.1).� The order permits market pricing for the trading ofsurplus energy by beneficiaries and generators. It urgesthe Government of India to allocate the unallocatedcapacity a month in advance so that beneficiaries knowtheir exact share in capacity in advance and can take stepsto trade surplus power.
NTPC�s Objections to the ABT Order
Soon after the release of the ABT order the NTPCrequested a review of the following aspects of the order.
Fixation of target availability at 80 per cent for theperiod 2000�1 and 85 per cent thereafter.
� The government of India policy for IPPs provides forrecovery of full fixed charges including 16 per centreturn on equity at 68.49 per cent PLF. Most of theprivate power agreements (PPAs) have also been signedon this basis. The target availability of 80 per cent inthe ABT order is inconsistent with this policy. TheCERC does not have jurisdiction to set tariffs which arenot consistent with declared government policy.� Some of the IPPs will be selling power in more thanone state and will, therefore, fall under the purview ofthe CERC. The ABT order, which applies only to theNTPC, is, therefore, discriminatory.� The CERC has given no reason for deviating from thetarget availability of 70 per cent specified in the draftnotification of the Government of India.� The CERC has not taken into account several factorssuch as planned maintenance, forced outages, non-availability of fuel for gas-based plants, and �regulation
on account of non-payment of outstanding dues� inarriving at the 80�5 per cent target availability.
� Target availability norms cannot be set in isolationfrom other norms such as financial structure, returnon equity, depreciation, operations and maintenance(O&M) expenditure, and station heat rate. These othernorms have yet to be fixed pending the result of studiescommissioned by the CERC.
� Industrywide norms have not been considered insetting the target availability.
Incentive on actual PLF beyond 80�5 per cent.
� In the case of IPPs incentives in the form of additionalreturn on equity are available beyond 68.5 per cent(PLF plus deemed generation). This is equivalent toproviding incentives on the basis of availability ratherthan actual PLF. The ABT order, therefore, discrimi-nates against the NTPC.
� In the ABT order the incentive for performancebeyond 80�5 per cent PLF is less than the penalty in caseavailability is less than 80�5 per cent.
� In the absence of a merit order despatch system it isnot correct to base incentives on actual generationinstead of availability.
� Marketing of surplus capacity to deficit regions inorder to improve capacity utilization is not possiblebecause of transmission constraints.
Pro rata reduction of fixed charges and returns at alllevels.
� This is inconsistent with the draft ABT notification,which provides for some recovery of fixed charges in theevent of prolonged outages.
Penalty for misdeclaration of capacity.
� There is a need to define misdeclaration and alsodevelop a proper mechanism for implementation. Thereis also a need to streamline procedures for revision ofdeclared availability on account of factors beyond thecontrol of the NTPC.
Resolving the Differences
While the CERC order makes a number of changes tothe draft notification, the main point of contentionis the change in target availability from 70 per cent to80 per cent (from 1 April 2000) and 85 per cent (from1 April 2001). This becomes all the more significantas all fixed charges, including ROE, are recoverable ona pro rata basis between 0 and 80 per cent availability.This is in contrast to the provision in the draft notifi-cation where fixed charges, excluding ROE, are recov-erable 100 per cent at an availability of 30 per cent,
Regulation of Tariffs and Interconnection 51
and only the ROE is recoverable on a pro rata basisbetween 30 per cent and 70 per cent. Additionally, theorder does not make any provision for fixed chargespayment for prolonged outages. Finally, the generatorearns incentive payments not just by exceeding targetavailability but by achieving PLF of greater than 80per cent, based on actual, and not deemed, generation.
The draft notification availability norm takes intoaccount:
� the NTPC average performance over a period of tenyears of approximately 72 per cent;
� that IPPs are allowed full recovery of fixed cost andROE at an availability of 68.5 per cent;
� all-India average for thermal stations, including theNTPC, of 58 per cent.6
Similarly, the CERC has identified target availabilityas �the average level a unit is expected to attain� (5.5.2).7
It has also refrained from setting stationwise targetavailability �since it may involve accepting inefficienciesof each unit and the target cannot, therefore, be ideal inall cases� (5.5.7). It also agreed with the NTF observationthat �Performance of NTPC stations should not becompared with that of SEBs old stations while determin-ing target availability for NTPC units� (5.5.5). TheCERC used the following information for arriving at thefigure for target availability.
� CEA Annual Report figures for 1998�9 of 76.5per cent PLF for NTPC stations and all India averageof 64.6 per cent. �The average of 75.6 per cent whencombined with the experience of deemed generation,would lead to an average availability of around 80per cent to 85 per cent� (5.5.4).
� Availability of NTPC plants over the last five years.(There are only ranges of availability across various unitsand no average is mentioned in the order.)
Fixing target availability on the basis of historicalaverage performance is justified to the extent it impliesthat on an average, across plants and across years,the NTPC will be able to recover their fixed charges,including the 16 per cent ROE. However, this will betrue only if the �penalties� for below average perfor-mance and the �incentives� for above average perfor-mance are symmetric. Interestingly, the draft notificationsatisfied this condition with respect to the ROE. Foreach percentage point availability below 70 per centthe firm loses 0.4 per cent ROE (16 per cent divided by
40, the difference between 30 and 70 per cent) and foreach percentage point availability above 70 per cent (andup to 85 per cent) it gains 0.4 per cent ROE. Therefore,if, on an average, the NTPC achieves an availability of70 per cent its ROE will also be 16 per cent, on anaverage. In this framework not all payments receivedfor availability above 70 per cent are in the nature ofincentives. They are merely payments to ensure that, onan average, the NTPC earns its ROE. The 0.3 per centadditional ROE for availability above 85 per cent inthe draft notification is more in the nature of anincentive.
In the case of the CERC order, for each percentagepoint performance below 80 per cent (availability)NTPC loses 1/80th of the total fixed costs, includingROE. However, for each percentage point performanceabove 80 per cent (actual generation) it receives anincentive of 1 paise per Kwh. The gains and losses areunlikely to be symmetric. In fact, since the incentivesare based on actual generation, they will be realizedonly at availabilities of higher than 80 per cent, forexample 85 per cent, assuming 5 per cent deemedgeneration. The rationale given for this deviation�PLFinstead of availability�is that �mere availability of theplant without demand cannot justify incentive pay-ment�. (5.4.3) However, as discussed in the precedingparagraph, payments for performance above targetavailability are not really in the nature of incentivepayments. They are to ensure that the firm on an averagerealizes its full costs and return. In this case, since thegains and losses are not symmetric, it is unlikely thatthe NTPC will on an average earn its fixed costs evenif it achieves, on an average, the target availability of80 per cent. This point is in fact made in passing in theNTPC review petition. (A.6.s).
Second, differences in the performance of units canarise not only because of differences in efficiency butalso because of differences in technology, age, and fuelsupply. While differences in efficiency should not beconsidered in setting norms, differences in factors be-yond the control of the firm should be taken intoaccount in setting norms or assessing performanceagainst norms. Of these, perhaps, the fuel supply prob-lem is most significant because of problems in gasallocation for gas-based plants. As per Annexure F of theNTPC review petition, the weighted average PLF forthe last five years of gas-based plants has been only 57.5per cent as compared to 76.6 per cent for coal-basedplants. There is thus obvious need to separate thegas-based plants and not average them along with thecoal-based plants. Perhaps, their target availability couldbe linked to the availability of gas, including fromimported sources.
6 NTPC Petition No. 2/1999 (3.ii).7 This and subsequent figures in parentheses refer to chapter
and paragraph nos of the Availability-based Tariffs Order dated4 January 2000 of the Central Electricity Regulation Commission.
52 India Infrastructure Report 2001
Third, there is the question of how to deal withlow probability events, such as prolonged outages,even caused by a �cyclone�! (5.6.3). It is not appropriateto ignore them just because they are low probabilityevents because, when they do occur, they can imposesignificant costs on the NTPC. However, it may bedifficult to include them in the averages used for work-ing out target availability since they may not haveoccurred in the sample period used for calculating theaverage. The approach taken in the draft notification ofmaking special provision for prolonged outages is prob-ably most appropriate. This should be incorporated inthe CERC order as well. An alternative, if possible, isfor NTPC to take insurance cover for such prolongedoutages and include the annual insurance premium in itsfixed cost for the year.
Finally, while NTPC performance should not becompared with that of old SEB plants, there is certainlyno problem in comparing it with other plants, equiva-lent in terms of availability of fuel and finance. It shouldnot be impossible to find such plant in several parts ofthe country which can serve as comparison for NTPCplants.
ConclusionsIn summary the CERC needs to consider the followingmodifications to its ABT order:
� Separate gas plants and coal-based plants fortariff purposes. The target availability and PLF of 80 percent is appropriate for coal-based plants, going by thedata provided by the NTPC in its revenue petitionAnnexure-F. Coal-based plants have, on an average(across plants in a year), achieved an equivalent availabil-ity factor of 78�85 per cent in each year since 1993�4.
Target availability/PLF of gas-based plants should belinked to gas availability. Of course, the NTPC shouldbe encouraged to explore all possibilities for obtainingadequate gas supplies.
� Target availability may have to be set below thehistorical average availability to account for asymmetricgains and losses. The incentive aspect should be builtin only after the scope for achieving higher availabilitylevels has clearly been established on the basis of detailedtechnical studies of NTPC plant performance. Thiscould be a part of the CERC norms setting exercise. Thestructure of the incentive mechanism should also bethought through more clearly. As pointed out, so calledincentive payments may not really be incentive pay-ments.
� Prolonged outages should be excluded from thecalculation of historical averages. Instead, special provi-sion should be made for prolonged outages as in the draftnotification. The possibility of obtaining insurance forsuch outages should also be explored.
� Overall, in response to the NTPC�s demandfor �revenue neutrality� the CERC should emphasizethat the ABT system is designed to ensure that theNTPC covers all its costs and earns the 16 per cent rateof return. The obligation of the regulator is to ensureviability and not revenue neutrality. The ability of theABT system to generate the appropriate ROE for theNTPC can only be demonstrated by simulations orscenario analysis conducted on a financial model ofthe NTPC. To begin with, such a model could besimple. Over time complexities can be added to makeit increasingly realistic. This must be an essential partof the ABT exercise.
4 REGULATORY DILEMMAS ININFRASTRUCTURE FINANCING
Jayanth Varma
INTRODUCTION
For most of the twentieth century, publicly financedinfrastructure was the widely accepted norm. It wasonly in the closing years of the century that privatefinancing made a huge comeback. Students of econo-mic history know that infrastructure was largely pri-vately financed in the nineteenth century. Now it isbecoming increasingly clear that in this, as in manyother respects, the twenty-first century will be more likethe nineteenth than the twentieth century.
It is now well understood that private capital willhave to build a large part of the infrastructure thatwe need in India over the coming years. However, theprivate sector can play this role only if it has access todomestic or international sources of financing forboth equity and debt. In emerging markets, financ-ing large infrastructure projects can become difficultsince financial institutions and markets are not suffi-ciently well developed. Promoters of infrastructureprojects then turn to the government to help them byeither
� relaxing the financial regulatory regime for suchprojects, or
� providing fiscal incentives, direct subsidies orother forms of government support to attract privatecapital.
This chapter discusses the conditions under whichgovernments should consider either of these two ap-proaches to promoting privately financed infrastructure.It concludes that while both these approaches havepotential uses, they are quite often simply �soft� alterna-tives to the painful but essential reforms in the regula-tion of the infrastructure sectors.
RELAXING FINANCIAL SECTOR REGULATIONS
Is There a Conflict between Regulationand Development?
A fairly common argument in favour of regulatoryrelaxation is that financial sector regulators (for examplethe securities market regulator, the central bank, thefinance ministry, and the insurance regulator) shouldplace �larger national interests� above their own regula-tory objectives. After all, the nation needs roads andbridges urgently, and it is argued that a slight laxity infinancial regulations is a small price to pay for ensuringthat this infrastructure is built quickly. In this view,economic development is the paramount objective foremerging markets, and regulators in these countries haveto balance their regulatory and developmental roles.
It is doubtless true that financial sector regulators inemerging markets have a developmental role to play.Often they have to first create and develop the marketsand institutions that they are supposed to regulate, andit is not uncommon for a developmental mandate to beenjoined by statute. For example, the Securities andExchange Board of India (SEBI) Act states: �It shall bethe duty of SEBI to protect the interests of investors insecurities and to promote the development of, and toregulate, the securities markets.�
Yet this is far from saying that regulators shouldcompromise fundamental objectives like investor protec-tion in the pursuit of �larger national interests�. In fact,the developmental role of regulators is, in the ultimateanalysis, only a proactive way of ensuring investorprotection by actively encouraging the development ofinstitutions and markets that meet investors� needs.
It is here argued that the alleged dilemma of choosingbetween good roads and sound banks is a non-existent
54 India Infrastructure Report 2001
one. It is possible and necessary to have both. It is alsoargued that if ever one had to choose between the two,one should choose the latter. The reason is simply thata weak financial system would ultimately drag the restof the economy down with it, and the best infrastructurein the world would then be of little use.
Is Infrastructure Financing Risk Free?
Another common argument is that infrastructure isso urgently needed and so clearly beneficial to societyat large that there are no real risks in infrastructureprojects. It is felt that as quasi-monopoly providers ofessential services, infrastructure projects are low-riskprojects. It is also thought that infrastructure developersare chosen after careful evaluation of competing bids,and that they are unlikely to be fly-by-night operators.
On closer examination, however, one finds thatthe alleged absence of risks in infrastructure projectsis a myth. Part of the reason is that a socially beneficialproject may still be quite risky from the investors�point of view. When regulators are asked to diluteprudential safeguards for infrastructure financing, it isuseful to keep in mind the various sources of uniquerisks in infrastructure projects and their financing ins-truments.
� Demand-side risks arise because infrastructure is theultimate non-tradable and is characterized by high assetspecificity. Demand can be highly price and incomesensitive, as was amply demonstrated during the EastAsian crisis. Some examples are cited below.
Kuala Lumpur�s second international airport becameoperational at a time when the Asian crisis had depressedair traffic. As a result, the existing airport was adequateto handle the prevailing traffic, and it became apparentthat the second airport could profitably have beendelayed a few years. Unlike an aircraft, which can beredeployed on a more profitable route, an airport hasa high degree of asset specificity�it can serve only itslocal market.
Bangkok�s traffic jams were so legendary that whenthree alternative mass transit systems were initiated inthe mid-1990s, they must have seemed risk-free propo-sitions. But after the Asian crisis, with slower trafficgrowth and reduced willingness of consumers to pay forconvenience during times of economic hardship, it isdoubtful whether these projects would be commerciallyviable. Thailand�s cement manufacturers can exporttheir way out of trouble, but the light railway is con-demned to live with its local market.
Pakistan�s private power projects are all in jeopardybecause of insufficient demand and high tariffs resulting
from currency depreciation. Power is less of a non-tradable than many other infrastructure products, but itstradability is still limited�India is the only potentialbuyer of Pakistani power.
� Appropriability risks arise because of free rider prob-lems and political considerations. Even if a project issocially beneficial, the benefits may not accrue to theproject because of lack of appropriability. For thisreason, projects often have to be sufficiently large inscope to allow multiple benefit streams to be appropri-ated. This of course leads to management risks.
A good example of this is the Canary Wharf projectin London that bankrupted the giant construction firmOlympia and York. When the project failed, critics saidthat Olympia and York had bitten off more than theycould chew. Olympia and York replied that, if anything,the project was too small rather than too large. They saidthat they should also have included a light railroad toincrease the marketability of the commercial propertythat they were building at Canary Wharf.
Another example is the Eurotunnel rail link under thesea between the United Kingdom (UK) and France.Critics argue that one reason for the project�s poorperformance is the fact that it did not include a roadlink. However, at the time of awarding the contract toEurotunnel against competing bidders, one importantconsideration for the governments was that it had a well-researched and detailed plan with a short constructionschedule and committed funding. The road�rail linkwould have been more expensive, complex, riskier, andmore difficult to finance.
� Management risks are significant because projectcomplexity is very high and management often has norelevant experience or track record.
The telecom bidding in India is a good example.Many companies with no track record in this businesswon telecom licences on the basis of bids, which withhindsight appear too high. The government had tomigrate these contracts from licence fees to revenuesharing. There has also been a wave of mergers, consoli-dation, and restructuring in the industry.
� Some infrastructure projects carry high technical risksbecause of their technical complexity, possibility oftechnological obsolescence, and safety/environmentalconcerns.
Technological risks are well illustrated by the Iridiumproject which promised satellite telephony anywhere onthe planet through a network of dedicated satellites.Rapid advances in cell phone technology, however,reduced Iridium to a niche market too tiny to be eco-nomically viable.
Regulatory Dilemmas in Infrastructure Financing 55
� Financial and legal risks arise from non-recoursefinancing, complex payment mechanisms (for exampleescrow accounts), and imperfect credit enhancement.
Non-recourse financing means that the debt is securedonly by the assets and cash flows of the project itself.The parent company does not guarantee the debt at all.
Escrow accounts are an imperfect form of security,as borrowers can under conditions of financial distresssometimes divert cash flows to non-escrowed accounts,leaving the lender with no effective remedy.
� Instrument-specific risks arise from maturity mis-matches, exposure to interest rate fluctuations, restric-tions on assignability, and charge creation. Examples ofthese are given later in this chapter.
With this in mind, I turn to the regulatory issues indifferent sources of financing.
Regulatory Issues in Tapping Retail Investors
In most countries, companies can tap retail investors forequity only after they have established a track record.This is not usually possible in infrastructure projects.Many countries exempt infrastructure projects fromthe track record requirements for listing. One possiblejustification for this could be that infrastructure projectsare typically awarded by government agencies after acareful evaluation of the capability of the bidder. Assuch, the possibility of fly-by-night operators emergingin this area are somewhat reduced. Nevertheless, this isa conscious sacrifice of investor protection.
Most security market regulators worldwide rely onstrong disclosure requirements in ensuring that thepublic is not misled by issuers of capital. Ensuringeffective disclosure in infrastructure projects can be quitechallenging:
Not only are the projects themselves quite comp-lex, but they involve complex contracts (for examplePower Purchase Agreements [PPAs]), complex legalstructures (for example escrow accounts and specialpurpose vehicles), and complex priority rules and chargeson assets.
Complex instruments are quite common in infra-structure financing globally. Sometimes different finan-cial instruments are �stapled� together so that investorscan buy and sell them only as a unit. Different kindsof debt may be stapled together, or debt may be stapledtogether with a non-detachable equity warrant. Euro-tunnel provides an example where the shares of theBritish and French companies operating the tunnel arestapled together and can be traded only as a unit.
In India, we have seen several public sector infrastruc-ture projects where there have been serious disclosure
problems in the prospectus. Consider the followingexamples:
Irrigation projects promoted by various state govern-ments have issued bonds on the strength of a tripartiteagreement with the state governments. Retail investorshave had great difficulty in understanding the differencebetween a government guarantee and the tripartiteagreement. Disclosure of the tripartite agreement hasleft much to be desired.
There have been bond issues that were rated princi-pally on the strength of a letter of comfort from thegovernment. The letter of comfort was neither repro-duced in the prospectus nor even made available forinspection.
There have also been municipal �secured� bonds.These were not really secure in any meaningful sense.All that promised was that security would be createdon certain assets. On these assets the corporation ob-tained, after all due diligence and efforts, the requisiteconsents and permissions to create the mortgage orcharge.
Regulators also insist on effective, continuing dis-closure by entities that have raised capital from thepublic. In an infrastructure project, it is not uncommonfor the issuer of security to be a special purpose vehicle(SPV) while the operating company and the ultimateguarantor are totally different entities. Continuing dis-closure may mean disclosure by one or more of theseentities or it may mean disclosure on a consolidatedbasis. Some countries (for example Australia) requirethat all three statements (SPV, operator, and consoli-dated) be sent to investors so that they can choose whichones to use. While not wholly satisfactory, this may bethe best possible solution. In the Eurotunnel examplegiven earlier, UK law requires that investors be given thestand-alone financial statements of the UK company.French law requires a �horizontal� consolidation of theUK and French companies. Investors thus receive twosets of accounts prepared under different accountingstandards.
There has been some talk of infrastructure developersin India wanting to float special purpose mutual fundsthat would invest only in the debt securities of thepromoter. If this were acceded to, it would destroy thediversification that is the hallmark of a mutual fund.
Regulatory Issues in Tapping Contractual Savings
Much of the literature on infrastructure financing inIndia refers to the large pool of contractual savingslike provident funds, pension funds, and insurance.Unfortunately, tapping contractual savings is not free ofregulatory problems.
56 India Infrastructure Report 2001
In case of defined benefit schemes, the sponsor ofthe scheme guarantees a specified set of benefits (forexample lifetime pensions) regardless of actual perfor-mance of the investment portfolio underlying the fund.Ensuring the solvency of such funds is notoriouslydifficult. Globally, there have been several instances ofgovernment- and corporate-sponsored defined benefitschemes that have become bankrupt in all but name.
� It is forecasted that the US Social Security system willturn into deficit by around 2010 or 2015.� Most Japanese companies have large unfundedpension liabilities that they have not so far been requiredto report on their balance sheets. This must be keptin mind while considering the apparent success ofmany East Asian countries in using their government-sponsored contractual savings as a vast pool of develop-mental finance.� East Asian countries like Malaysia and Singaporemobilized large savings through contractual savingsschemes. The governments were able to use these fundsquite effectively in financing industrialization and infra-structure development. In trying to replicate this suc-cess, we must remember that apart from prudentinvestment policies, the viability of this model wasfacilitated by rapid economic growth and by favourabledemographics.
In case of defined contribution schemes, the sponsordoes not guarantee any benefits. The benefits that thecontributor receives depend entirely on the returnearned by the investment portfolio underlying thescheme. In some cases, the contributor is allowed tochoose between a limited number of investment port-folios managed by the sponsor. The regulatory dilemmahere arises because contractual savings involve a signifi-cant element of forced savings as well as a pre-emptionof these savings into specific investment channels. It isall the more important for the regulator to ensure areasonable return on these savings. Otherwise, contrac-tual saving schemes could become an instrument offinancial repression.
The Indian regulatory regime for contractual savingsis based on the archaic and arcane notion of a �trustsecurity�. As the name suggests, these are the onlysecurities in which charitable trusts are allowed to invest.However, the same investment restrictions apply toprovident funds and some other contractual savingsvehicles. In India, the definition of trust security is a statesubject and does not come under the purview of any ofthe financial sector regulators. For all practical purposes,the approval of a security as a trust security has been apolitical decision with little emphasis on investor pro-tection. Maharashtra, which is home to some of the
largest trusts and provident funds, is known to use thetrust security approval to ensure subscription for bondsfloated by government bodies in Maharashtra. Trustsecurity approval for bonds of comparable risk fromgovernment bodies of other states have often beendenied or delayed.
Regulatory Issues in Borrowing fromBanks and Financial Institutions
Financing of infrastructure by banks and financial insti-tutions gives rise to three different kinds of regulatoryissues.
First, many infrastructure projects require long-termfinancing. When banks provide such funding, they areexposed to a maturity mismatch, as most of theirfunding is through short-term deposits. The maturitymismatch is partly a liquidity risk and partly an interestrate risk. Lending on a floating rate basis can mitigatethe interest rate risk for the bank but at the cost ofcreating the same risk for the project. Capital-intensiveinfrastructure projects are not well positioned to handlethis risk.
Because of their long maturity and unique risks,credit appraisal of infrastructure projects is very differ-ent from the credit appraisal that banks do for providingshort-term credit facilities to industrial borrowers. As aresult, only a relatively small number of banks have theappraisal skills required for this purpose.
Large infrastructure projects may breach banks� ex-posure limits for individual borrowers or industries.This problem arises when banks attempt to fill the gapcreated by the projects� inability to tap other sources offinance. The problem is also aggravated when only alimited number of banks have the willingness and abilityto engage in infrastructure financing.
This is not to deny that banks have a significant roleto play in infrastructure financing. The point is ratherthat they cannot be the sole or even the dominantproviders of funds for these projects. However, a projectthat is able to tap a diverse range of funding optionscould benefit greatly from timely bank finance. For thisto happen, it is necessary to strengthen and reform thebanking system (Ferreira and Khatami 1996).
Regulatory Issues in Tapping Foreign Debt
There is a vast literature on the regulatory issuesinvolved in opening up the economy to external capitalflows. An important conclusion in this literature is thatopening up the capital account to foreign debt is moredangerous than opening it up to foreign direct invest-ment (FDI) or even to foreign portfolio investment. TheEast Asian crisis has brought this home in dramatic
Regulatory Dilemmas in Infrastructure Financing 57
fashion. East Asian countries opened up their economiesto capital inflows (especially debt-creating inflows) whileretaining substantial restrictions on capital outflows.This coupled with weaknesses in the financial sector ledto the economy as a whole taking very large foreignexchange risks and credit spread risks (Varma 1998).
India has operated a fairly restrictive policy onallowing foreign borrowing. The key element in thishas been an annual ceiling on aggregate external com-mercial borrowing (ECB). This has been coupled witha floor on debt maturity and a ceiling on interest ratespread, which together act as a credit-rating filter. Anoften heard demand is that infrastructure should beexempt from the annual ECB ceiling. One argument infavour of this has been that the requirement for infra-structure finance is so large that the domestic capitalmarket is simply incapable of meeting this need in theforeseeable future.
The major problem with this argument is that if theinfrastructure financing need is indeed so large, not justfor the next year or two but for the foreseeable future,then we as a nation cannot possibly afford that infra-structure at all. It is evident that if the financing remainslarge for several years, then in time its debt service wouldbecome equally large (if not larger). If the financingrequirement were too large for our economy to absorb,then we would not be able to absorb the servicingrequirement either.
The only way out of this would be if the largeinvestments led to a large increase in our debt servicecapability. Unfortunately, this is not likely to happenbecause infrastructure tends to produce non-tradableoutputs. Unlike an export-oriented factory, which earnsthe foreign exchange for its own debt servicing, an infra-structure project produces goods and services that mustof necessity be locally consumed. This means thatfinancing infrastructure with foreign debt is particularlyrisky from a macroeconomic point of view. In fact, onecould argue that the ECB for an infrastructure projectmust be subject to even more stringent caps than normalECB.
Historical experience suggests that dependence onforeign funds for infrastructure is likely to be a short-term phenomenon. There might be a few years duringwhich the need for infrastructure financing is verygreat and has to be met from foreign sources, but overa period of time this dependence is likely to decrease.In fact, after a few years the infrastructure companiesthemselves would probably generate significant cashflows and the dependence on outside finance (debt orequity from domestic or foreign markets) would comedown. For example, in the United States, railroadcompanies relied on outside finance for 98 per cent of
their capital needs in the 1880s. By World War I, internalsources accounted for 40 per cent of capital needs, andduring 1920�40, internal sources provided 95 per centof the capital needs. In a less extreme form, the samestory was repeated in other infrastructure industrieslike electricity and telephones (Ulmer 1960).
Recent experience of the International Finance Cor-poration (IFC) suggests that foreign funds account formore than half the project costs in developing countries(IFC 1996). However, the IFC itself recognizes that thisis not sustainable and argues that domestic savingsintermediated through domestic capital markets wouldprovide a larger chunk of infrastructure financing in thefuture.
Regulatory Issues in Tapping Foreign Equity
There are no major regulatory concerns in tappingforeign equity for infrastructure projects. In fact forsome sectors, like telecom, foreign equity is very attrac-tive. Dedicated sector funds exist, especially in theUnited States, for some of these sectors. These fundshave distinctive expertise and competence in the sector,and their global experience and diversification enablesthem to take a view on technology.
Data for IFC-funded infrastructure projects suggestthat foreign funding in the form of debt is nearly fourtimes as large as foreign funding in the form of equity(IFC 1996, table 6.2). This is only partly explained bythe fact that the projects had an average debt -to-equityratio of about 1:5:1. Interestingly, the experience in thenineteenth century was not very different. It has beenestimated that around 1914, the value of British holdingof foreign bonds was about two and a half times thevalue of British holding of foreign equities (Lewis 1938).Eichengreen (1994) suggests that this bias against equityarises because investors in stocks require a more reliableand comprehensive flow of information as compared toinvestors in bonds, and because foreigners have greaterdifficulty in getting this information.
Regulatory Issues in Tapping the Consumer
There are some distinctive advantages in creating inno-vative financial instruments that offer preferential accessto infrastructure services in return for financing. Pref-erential access may be in the form of lower cost,guaranteed availability, or superior quality. An extremeexample would be a power company that floats bondswhose coupons and redemption are specified not inmoney terms but in units of electricity. These kinds ofinstruments
� provide a natural hedge both for the operating com-pany and for the consumer
58 India Infrastructure Report 2001
� are especially beneficial when fixed costs are highand� provide reliable indicators of demand
However, there could be a possible conflict withsectoral regulatory structures. Many sectoral regulatorsmay take a dim view of the implicit �bundling� ofinfrastructure services with financial claims. Abhorrentas these ideas may seem to orthodox sectoral regulators,they do deserve serious consideration in sectors likepower, irrigation, and water where a combination ofregulatory and state failures makes alternative routesto infrastructure development very difficult. At least inthe transitional phase, pending thoroughgoing reformsin these sectors, sectoral regulators should probablypermit some degree of bundling of financial claims withinfrastructure services.
GOVERNMENT SUPPORT FOR
INFRASTRUCTURE FINANCING
Alternative Forms of Support
Government support for infrastructure financing cantake several forms:
� In India, income tax incentives have been providedeither to the infrastructure project itself or to theinvestors in such a project.
� Some infrastructure projects enjoy a tax holidayfor a few years, but for long-gestation projects thismay not mean much in present value terms, as theseprojects do not expect to make significant profits inthe initial years.
� Interest earned on certain infrastructure bonds hasbeen exempted from income tax.
� Limited tax breaks have been given for equityinvestment in certain infrastructure companies.
� Central and state governments in India have under-written the major sources of risk in some infrastructureprojects through guarantees of various kinds.
� In many power projects, PPAs transfer all demandrisks and input cost risks to the government.
� In some other projects, developers have (withvarying degrees of success) been demanding guaran-tees from the government in respect of projectedtraffic and other demand parameters.
� In many emerging markets including India, govern-ments have used their directed credit systems to channelfunds into infrastructure. India has done this with itsbanks and insurance companies, while some East Asiancountries have used their large state-managed contractualsavings pools in this manner.
� Britain has had considerable success with auctions inwhich competing developers bid for the lowest amountof subsidy that they would accept in return for under-taking a socially desirable infrastructure project that isnot privately profitable. This is like an auction oflicences except that the licence fee is negative. Just as acompany pays the government for the right to under-take lucrative projects (telecom licences, for example),the government pays the company to undertake unprof-itable but socially useful projects (a low-traffic railwayline, for example).
� The nineteenth century provides plentiful examplesof governments providing credit enhancement for ordirectly subscribing to bonds floated by infrastructurecompanies.
I shall argue later in the chapter that though negativelicence fees represent the most transparent and efficientway of supporting infrastructure financing in a maturecapital market, credit enhancement could also have arole to play in a country with underdeveloped debtmarkets. But before coming to these conclusions, let ustake a closer look at each of the tools listed above.
Income Tax Incentives
In general, income tax incentives represent a blunt andinefficient instrument for promoting any specific eco-nomic activity. This is true for infrastructure financingas well. Tax incentives are available equally to the mostprofitable projects which would have been undertakeneven without the tax break. In fact, a tax holiday ismost valuable to highly profitable projects! Anotherdifficulty is that the persons who are in the best positionto utilize the tax incentive may not be the ones whoare best equipped to undertake the desired economicactivity. Many tax incentives are most attractive toretail investors, and the project may not be suitable forretail financing.
Above all, tax incentives go against the general thrustof fiscal reform, which aims at a low tax rate with fewdeductions and exemptions. Tax incentives for financialinstruments also distort the capital market and workagainst the objective of financial sector reforms to createan efficient market free of segmentation.
Risk Transfer to the Government
In many ways, this route is the worst possible topromote private infrastructure. In fact, when the riskshave been transferred to the government, the �derisked�project is �private� infrastructure in name only. Ineconomic substance, such derisked projects are simplyan expensive form of government borrowing to financeinfrastructure. With the major risks assumed by the
Regulatory Dilemmas in Infrastructure Financing 59
government, the private sector is provides hardly anyrisk capital. The capital the private sector provides tosuch derisked projects is analogous to lending to thegovernment with a risk premium added for residualrisks assumed by the project. True, such �borrowing�does not show up in the government�s fiscal deficit,but that is only because the government�s accountingdoes not recognize contingent liabilities at all. In fact,replacing publicly funded infrastructure with deriskedprivately funded projects is substantially the same asreplacing government borrowing with a contingentliability.
The whole idea of private financing of infrastructureis to let capital markets assume a greater role in theallocation of resources. This would happen only if theequity investors in so-called private infrastructure pro-jects bear most of the significant risks and receive theassociated rewards. Any attempt to derisk the projectsby transferring significant demand-side risks to thegovernment defeats the very objective of private sectorinfrastructure financing.
After reviewing the IFC�s experience in this regard,Bond and Carter (1994) state: �IFC�s experience indicatesthat it is the combination of risk finance and perfor-mance-linked contracts that determines the success ofprivate infrastructure projects. Capital supplied withoutrisk (i.e. government guaranteed) and/or without bind-ing incentives has not had a similar record of success.�It is paradoxical that despite this evidence from itsown experience, the World Bank�s policy prescriptionsfor sectors like power in India amount to deriskingthe project and transferring major risks to the govern-ment.
Directed Credit
Directed credit is largely a pre-liberalization phenom-enon. Financial sector reforms seek to reduce the scopeof directed credit and to eliminate it eventually. More-over, directed credit is only a non-transparent way of(quasi) sovereign credit enhancement. Providing creditenhancement directly and transparently has the advan-tage of not weakening the financial system.
Negative Licence Fee
If an infrastructure project has a high social but an un-acceptable private rate of return, the socially desirablelevel of investment can be achieved by a transferpayment from the state to the private sector. This is astandard proposition in the economic theory relatingto externalities. The theory would also say that thetransfer payment should not exceed the amount of theexternality itself (the difference between the social and
private returns to the project). If this is violated, thenprojects that earn an unacceptable social rate of returnmay be undertaken.
The negative licence fee arrived at through a biddingprocess can potentially achieve this transfer payment.The auction process must include a reservation price(or upset price) to set a ceiling on the transfer paymentand ensure that it does not exceed the externality. Ofcourse, cynics would argue that regardless of whateconomic theory might say, this upset price will inpractice be more the outcome of political processesthan anything else. The determination of this upsetprice is therefore the principal difficulty involved inoperationalizing the concept.
Another problem that has occasionally arisen inBritain relates to the bankruptcy of the original bidder.Often the project is characterized by high asset specific-ity, and most of the money that has already beeninvested in the project may be regarded as a sunk cost.Then it would appear that a small incremental invest-ment made by the state to rescue the project has a hugesocial return. The government may thus be temptedto provide an additional subsidy to the project to saveit from bankruptcy. On the other hand, it could beargued that such an additional subsidy would amountto renegotiating the bids of the original auction and isnot fair to other bidders. In a sense, this problem arisesfrom bankruptcy rather than the subsidy itself. More orless the same problem has arisen in India with companiesthat bid very large (positive) licence fees for telecomlicences and then got into financial distress.
Credit Enhancement
There is a fairly large amount of literature showing thatthe privately financed infrastructure of the nineteenthcentury in fact made substantial use of public funds. Forexample, the UK was the only large country that didnot support railway construction with public funds inthat century. In a country like the United States, thefederal, state, and local governments provided financialsupport in various forms. They subscribed to some ofthe Railways� bonds, they guaranteed the interest onsome bonds, and they provided the collateral for manybonds through their land grants.1
All these forms of credit enhancement made infra-structure bonds more easily marketable to domesticand foreign investors. Yet in almost none of these caseswas the government support anywhere near complete.Paradoxically, the only important instance of almostcomplete government guarantee that reduced the risk
1 See, for example, Eichengreen (1994) and Dobin (1994).
60 India Infrastructure Report 2001
of default to virtually zero was that of the guaranteesprovided to finance railroad construction in colonialIndia. These guarantees, which provided clean arbitrageprofits to the investor, lacked economic justificationand were motivated by political and military consider-ations. The result, of course, was a railway networkthat revealed scant concern for commercial optimality.Unfortunately, the colonial Indian railroad guaranteeshave helped to wrongly convince many Indian policymakers and analysts that infrastructure financing re-quires large public financial support.
In drawing lessons from the nineteenth century, wemust disregard the colonial Indian experience and inter-pret the experiences of other countries in the light ofthe following crucial factors:
� In the nineteenth century, financial markets in mostof the North American and European countries werestill in the process of development. It is significantthat the country with the best financial markets andinstitutions (the UK) did not find it necessary to provideany financial support at all.2 Thus public support reflectsthe state of the financial sector even more than theunique characteristics of infrastructure projects.
� A great deal of the difficulty of attracting privatecapital to the railroads in the nineteenth century stemmedfrom the fact that this was then a new industry whoseeconomics was totally unknown. Projecting the returnson railroads in unfamiliar terrain must have been asdifficult then as projecting the returns on an internetcompany is today. (The key difference was that unliketoday�s internet companies, the railroads needed hugeamounts of physical investment and therefore lots offunds.) Today countries like India are trying to drawprivate funds into mature infrastructure projects whoseeconomics is extremely well understood both domesti-cally and globally. This makes the task far easier thanthe task of the great infrastructure projects of thenineteenth century.
� In many cases, the state provided funds for specificprojects more like an economic agent (or rather a collec-tive of economic agents) than like a state exercisingits sovereign function. For example, a city that wasthreatened with being bypassed in railroad route plansoften offered money to the railroad to change theseplans so as to pass through the city. It was behaving justas any private economic agent would.3
� Some forms of public support, like land grants,represented a mechanism by which the project couldappropriate the social returns more completely andinternalize some of the externalities. For example, whenthe construction of a railroad leads to a rise in propertyprices in the vicinity, what we are seeing is a largeexternality (the landowners garner some of the socialbenefits of the railroad). The land grant merely servedto internalize this externality and bring private returnscloser to social returns. Evidently, land grants mighthave a similar role to play in encouraging privateinvestment in road building in India.
This analysis suggests that the principal argument infavour of credit enhancement as a tool for promotinginfrastructure development in India is our relativelyunderdeveloped bond markets. It is to this that thischapter now turns.
Development of the Bond Market
Much of the literature on the Indian debt market has alugubrious air to it. Indeed a very common phrase thatone hears is that the Indian debt market is a dead market.Much of the discussion therefore concludes either thatthe debt market will not develop in the foreseeablefuture or that the state must somehow bring this marketinto existence through tax breaks and other regulatorychanges.
I believe that while governments can create market-places, the participants create markets. A market comesinto existence when a critical mass of economic agentsfinds it advantageous to transact in that market. In thecase of the debt market, three kinds of participants canhave the incentive to create the market�the borrowers,the lenders, and the intermediaries. Experience suggeststhat most often the borrowers have taken the initiativein this regard, just as in most product markets themanufacturers go about creating the market for theirproducts. The reason is simple�the borrowers havethe greatest ability to internalize the market creationcosts in the form of lower borrowing costs. Havingsaid that, it must be added that the nineteenth centuryprovides some interesting examples of debt marketsbeing created by financial intermediaries.4 Even in thiscase, though, the government in its capacity as a majorborrower played a vital role in supporting and encour-aging these intermediaries.
2 �The United Kingdom is the only important country whoserailways have been developed practically without public aid,�Dunn (1913).
3 It is sometimes thought that this practice was undesirable andrepresented a form of corruption. This is not the case at all. Infact, it was a fairly rational way of choosing a railway route, if
we assume that the cities competed with each other in a more orless �efficient� market. Interestingly, in Britain, where the centraland local governments refrained from supporting the railroads,private local groups took up the task of influencing the routeplanning (Dobbin 1994).
4 See, for example, Landes (1956) for more information.
Regulatory Dilemmas in Infrastructure Financing 61
Recent global experience provides ample reason to beoptimistic about these markets emerging fairly quicklywhen the conditions are ripe:
� When the Euro came into existence at the beginningof 1999, many observers were optimistic about thecurrency but fretted about the lack of a well-developedbond market in the Euro zone. In just over a year�s time,while the currency has fared disastrously, the corporatebond market in the Euro, including the high yieldmarket, has exceeded the expectations of most analysts.On most measures, the market now rivals the dollarmarket. European integration forced large Europeancompanies to raise huge amounts of debt to finance theircross-border expansion. With that kind of incentive, apan-European debt market came to life very quickly.
� When the East Asian crisis struck, corporate debtmarkets in the region were as close to being non-existentas in India. In the wake of the crisis, companies that hadborrowed significantly in dollars were looking desper-ately to replace them with local currency debt. Thebanks were weighed down with bad debts and unableto lend. Slowly East Asian companies appear to becreating a local currency bond market. To take just oneexample, Thailand�s largest industrial conglomerate,Siam Cement, was able to raise over US $ 1 billion oflocal currency bonds in the space of a few months. Ofcourse, it had to design innovative bonds, use severalmaturity tranches, create arrangements for marketmaking, and so on. But the point is that borrowers withstrong incentives will incur these costs.
� During most of the 1990s, South Africa presented thestrange spectacle of an economy where the corporatebond market was more liquid and active than the stockmarket. The Bond Exchange boasted of annual tradingvolumes equal to several times the total bonds outstand-ing. Even more strangely, some of the large corporatebonds (particularly public sector corporate bonds) weremore liquid than the sovereign bonds of the Republicof South Africa itself. The reason was that these largeissuers provided very active market-making facilities intheir own bonds. By standing ready to buy and sell theirown bonds, they created a liquid market for them. Thecosts that they incurred in such market making wereperhaps more than made up by the lower interest ratesthat they paid (in some cases lower than that onsovereign bonds). This example once again highlightsthe fact that borrowers who face the right incentives doend up creating a liquid bond market.5
What I am trying to drive at is that if a critical massof infrastructure developers had access to fundamentallyprofitable projects, then the lack of a debt market wouldnot prove to be much of an obstacle. Chances are that,armed with strong incentives, they would simply goabout creating the required market.
Of course, governments can make a big difference inthis process of market development.
� On the negative side, the government can destroy thepotential for a debt market by pursuing wrongmacroeconomic policies and creating regulatory ob-stacles. In India, governments have done much toimpede the growth of the debt market:
� Some state governments have imposed cripplingstamp duties on secondary market transactions inbonds and on securitization transactions.
� Market-distorting instruments of monetary policyhave also dampened the development of the bondmarket. A complete shift to open market operationsand to interest rate targeting would be beneficial.
� Even more than the large fiscal deficit, the market-distorting manner in which it is financed is a negativefactor for the bond market. Despite major reforms,pre-emption of resources by the government hasnot been entirely eliminated. This reduces the num-ber and diversity of players in the bond market anddecreases the liquidity of the secondary market.Moreover, the continued willingness of the centralbank to support the government�s borrowing prog-ramme through direct subscription in the primarymarket (development) is highly market distorting.Since corporate bonds are priced off the sovereignyield curve, distortions in the government bondmarket create difficulties for the corporate bondmarket as well.
� Some of the tax incentives for small savings havethe effect of segmenting the fixed-income market.For example, the post-tax yield on the public pro-vident fund is so high that no other instrumentcan effectively compete with it. This makes bondmarkets unattractive to a large segment of retailinvestors.
� On the positive side, the government can facilitatethe process of developing the debt market. It can helpcreate that critical mass of borrowers. Credit enhance-ment and related techniques have a role to play here.For example, if the state were to offer to subscribe toone bond for every two bonds that are placed with thepublic, developers would have a huge incentive toraise bonds on a large scale. If the government were toprovide a partial guarantee, then the fillip to the market
5 It would take us too far afield to discuss the historical factorsin the apartheid era and thereafter which led to the particularinstitutional structure of the South African financial sector.
62 India Infrastructure Report 2001
CONCLUSION
Thus, to conclude, the possibility of private financing ofinfrastructure in India is fairly bright. The difficultiesinvolved are far from insuperable. There is definitely noneed for the state to step in with direct or indirectsupport on such a scale that the private project effec-tively becomes a privately managed but publicly fundedproject. Possible government intervention has in thischapter been narrowed down to some limited forms ofsubsidy and credit enhancement. It has also been arguedhere that there is little cause for relaxation of financialsector regulations to deal with the alleged peculiaritiesof infrastructure.
At a fundamental level, it is here argued, mostproblems in infrastructure financing arise due to weak-nesses in the sectoral regulatory structure. For example,the near bankruptcy of the state electricity boards isthe key problem in the power sector. Similarly, inappro-priate pricing adversely affects canal irrigation andwater and sewerage projects. These problems haveto be resolved one way or the other, and mechanismslike escrow accounts can only postpone the day ofreckoning. It would be a tragedy if it were to beattempted to deal with these deep-seated regulatoryproblems by creating harmful distortions in the financialsector.
would be even greater. A partial guarantee may mean,for example
� a Brady bond-6 style guarantee of the principalwith or without a rolling interest guarantee� an interest guarantee covering only the gestationperiod or� a guarantee covering only a percentage of theholdings of an investor with or without a monetarycap.
It is possible that these techniques need be usedonly for a few large, high-profile projects in the initialperiod. Thereafter, if the debt market gathers steam,subsequent projects may well be able to stand on theirown feet without much state support.
It is important from a moral hazard perspective tokeep the guarantee limited in scope. If the guaranteecovers the bulk of the present value of the debt serviceobligations, the bond holders have little incentive tomonitor the project and to make careful assessment ofits creditworthiness. For the capital markets to performtheir resource allocation function fairly well, it is nec-essary that bond holders face sufficient residual risk totake their monitoring role seriously. And as I haveearlier emphasized, it is even more important that equityholders bear practically all the demand-side risks, tech-nological risks, and operational risks of the project.
6 Brady bonds, named after the then US Treasury Secretary,were created in the 1980s as part of the restructuring of LatinAmerican sovereign debt. The principal value of these bonds wasbacked by zero coupon US Treasury bonds, so that the principalwas effectively guaranteed by the US government. In some cases,a part of the interest was also guaranteed by a rolling guarantee.
5 STRUCTURAL ISSUESAND CONSTRAINTS
Rakesh Basant
5.1 INTERFACE BETWEEN SECTOR- SPECIFIC
REGULATORY BODIES AND COMPETITION AGENCIES:A CASE OF THE INDIAN TELECOM SECTOR
Rakesh Basant
Regulation and competition policy can be mutuallyreinforcing but their instruments are different. In de-regulating environments the less the regulatory regimesinterfere with the working of the market, the moreroom there is for competition policy. The mutuallyreinforcing nature of these two sets of policies requiresthat there be some coordination between the agenciesthat implement these policies. Issues relating to suchcoordination are particularly relevant for India today,as it is setting up sector-specific regulatory bodies,along with the liberalization and privatization of thesesectors. The country is also in the process of reviewingits competition policy. This part chapter explores therelationship between competition agencies and telecomauthorities in order to highlight the key issues relevantfor such linkages in India.
The part chapter is divided into five sections. It beginswith a discussion of the linkages between competitionand sectoral (telecom) authorities in different countriesto highlight the variety across geographic locations. Thesecond section explores very briefly how intellectualproperty rights (IPRs) may require coordination betweencompetition and the industry regulator in the telecomcontext. The third section summarizes the key aspectsof the amended Telecom Regulatory Authority of India(TRAI) Ordinance (Amended), 2000 to bring out theanomalies in the jurisdictions of the sectoral regulators�the TRAI and the Appellate Dispute Settlement Tribu-nal�and the competition authority�the Monopolyand Restrictive Trade Practices Commission (MRTPC).
Various issues that need to be considered for the alloca-tion of responsibilities between the competition author-ity and the industry regulator are discussed in the nextsection. In the light of the discussion in the first foursections, the concluding section suggests some changes inthe institutional design of the linkages between sectoralregulation and implementation of competition policy.
THE EXPERIENCE OF OTHER COUNTRIES
Given contextual realities, each country would probablyhave to find its own model of the interface betweencompetition policy and sector-specific regulation. How-ever, for any such framework to emerge, links betweencompetition agencies and sectoral regulatory authoritieswill have to be developed. The Telecom Treaty as apart of the General Agreement on Trade and Services(GATS) at the World Trade Organization (WTO) hasgone a long way in achieving such global frameworkby incorporating a number of competition principles,including bringing to the fore the issue of leveragingmonopoly power in one part of the telecom market inanother segment.
In the regulation of utilities, different countries havedealt with competition-related issues in a variety ofways. By and large, anti-competitive conduct has beenrelated to abuse of market power by dominant incum-bents. Such abuse of dominance has taken various formslike unfair network access charges and interconnectionarrangements, cross-subsidy across services (including
64 India Infrastructure Report 2001
equipment sale and service provision), and undue priceand other discrimination and preference. Prohibitionof such arrangements price control or price caps incertain (especially natural monopoly) segments of theutility, accounting separation, publication of prices,and general rules of competition policy have beenutilized to reduce or correct such practices. In this broadcontext, the relationship between regulatory agenciesin different countries is now looked at to identifysome critical issues in this area.
The French Scenario: Clear Separation of Functions1
The telecom sector in France has been liberalized andthe industry opened to competition. France Telecom,the government operator of the telecom system, haspartly been privatized; the government still owns themajority share. A regulatory agency for this sector wascreated before the privatization exercise began. Theregulatory agency is responsible for identifying firms to issuelicences and for determining the interconnection rates. Thecompetition authority monitors the actual conduct of firms.Given the relationship between interconnection ratesand the price of services (which will depend on compe-tition), the authority will have to make sure there isno dumping at the level of services.
While this separation of functions, based on a prioridetermination of who gets into the field and ex postverification of firms� behaviour, appears neat, in practiceit is unlikely to be so. For example, some constraintsthat operators have to face are more stringent when theyhave a dominant position in another sector from whichthey have diversified into telecom, or if they have adominant position in the telecom sector itself.
To implement these conditions, the relevant marketsand dominant position need to be defined and it isquite likely that the regulatory agency and competitionauthority may have different views on this issue. Andthis possibility exists for all those decisions that areat the intersection of regulation and competition. Toavoid some of these problems, the two agencies haveto cooperate on these decisions. While the regulatoryauthority in France has the final word with respect toall a priori decisions, it has to seek the opinion of thecompetition agency and publish it along with its ownopinion. This is useful for the operators because thecompetition agency can intervene ex post, and at thatstage the opinion of the competition agency will beconsidered final. The appeal mechanism is the samefor both the regulatory and competition decisions; alldecisions can be contested at the Paris Appeal Court in
a chamber specialized in regulation and competitionissues. In this manner, the French government hassought to incorporate into the law itself a balancedrelationship between the two agencies and a cooperatingmechanism.
The Canadian System: Dominance of theSectoral Authority2
The Canadian Radio, Television and Telecommunica-tions Commission (CRTC) is the overseer of the telecomand broadcasting networks. The commission is reason-ably independent, but, according to one view, its roleis becoming less crucial. One of the most unfortunateaspects of the CRTC is the non-transparency of itsappeal mechanism. Any of the decisions of the CRTCcan be appealed against to the Cabinet (not in thecourts), but the meetings of the Cabinet are held incamera. This secret appeal process implies that one doesnot know what the other side has presented.
The interface between the regulation and competitionauthorities has been ensured through a recent revisionof competition law. A provision has been put in wherebythe Director of Investigation and Research, who is thehead of the competition office, has a statutory right toappear before federal regulatory tribunals and commis-sions as well as parliamentary committees that are todecide on regulatory and competition-related matters.He is also invited by the provincial regulatory bodies.There have been situations where this right has beenexercised. For example, the intervention of the directorin the early telecom hearings led to what was calledthe interconnect decision resulting in the dilution ofBell Canada�s monopoly. Besides, the director can alsointervene in anti-dumping hearings. The Canadian sys-tem, therefore, provides for interface among competi-tion, regulatory, and trade agencies. However, despitethese institutional provisions, in practice the CRTCdeals on its own with most issues of anti-competitivebehaviour in the telecom sector and is fairly independentof other institutions.
The United Kingdom: Privatization Experience isRedefining Boundaries of Control 3
The industry regulator, the Office of Telecommunica-tions (OFTEL), is responsible for enforcing the regula-tory rules contained in the licences of network operatorsas well as proposing new licence conditions. The modi-fied licence conditions can come into effect in twoways: either the licensee agrees to a modification or the
1 This subsection is based on Basant and Morris (2000), chapter9.
2 This subsection is based on Basant and Morris (2000), chapter9.
3 This subsection draws on Barnes (1998) and Nuttal andVickers (1996).
Structural Issues and Constraints 65
Monopolies and Mergers Commission (MMC) is calledin to arbitrate by the Director General Telecommuni-cations (DGT), OFTEL. The MMC investigates andreports whether the licensee�s activity operates, or islikely to operate, against public interest and if so,whether modifications of licence can remedy theseadverse effects. In cases where the MMC finds that thereare adverse effects, it also specifies modifications thatcould remedy these effects. The DGT OFTEL, caneither follow the suggestions of the MMC or make otherlicence modifications that he thinks are necessary toprevent the adverse effects. Thus the DGT has somediscretion as to how any adverse effects specified by theMMC should be remedied, though he can modify thelicence only so as to remedy these. Moreover, while theDGT can make a reference to the MMC for licencemodification, the Secretary of State has unlimited powerto direct the MMC not to proceed with the referenceif it appears necessary in the interest of national securityor sensitive relations with foreign governments.
Policy on entry into the industry (that is awardingnew licences) is made by the Department of Trade andIndustry, although OFTEL has an advisory role here.The licence conditions relate to many aspects of serviceprovision, including the prices the licensee may charge.Several of these conditions relate to competition, forexample accounting separation, prohibition of unduediscrimination and preference, prohibition of cross-subsidy, access charges and interconnection agreements,and publication of charges.
Given the long experience of privatization and asso-ciated regulatory processes, OFTEL has argued that eventhe provisions mentioned above do not provide itwith sufficient control over the transition to competi-tion. It has been suggested that a new licence conditionfor telecom operators prohibiting behaviour that hasthe object or the effect of preventing, restricting, ordistorting competition in telecommunications needsto be added. Besides, the DGT has also proposedthat he should be granted anti-competitive practices(ACP) powers which will enable him to determineanti-competitive conduct of operators, and in suchinstances, intervene and adjudicate without them beingable to appeal to the MMC.4 In effect, the DGT becomesthe market referee whose decision is final and subjectonly to judicial appeal.
Overall, the regulatory system in the UK seems tobe moving away from a situation where competitionconditions were embodied in the licence�and in disputesvis-à-vis these conditions, decisions of the competitionauthority superseded those of the telecom authority�toa situation where more stringent competition-relatedlicensing conditions are imposed. And the telecom au-thority is seeking wider jurisdiction over such matters.
The European Union (EU): The Rules of theGame are Still to Emerge5
The national competition laws and the Union compe-tition law coexist. The EU law becomes effective assoon as an anti-trust case acquires transborder elements.The European Commission has twenty commissioners,one of them being responsible for competition matters.However, decisions in this field are taken by the com-mission as a body and the interaction with other policiesis in-built through the existence of other commissioners,who are responsible for other policy matters. Similarly,decisions regarding telecom matters are not to be takenby the Directorate General of Competition (DG-IV)alone but in consultation with commissioners of otherservices. The European Commission also cooperatesvery closely with member states on these kinds of issues.Consultation with member states is done within theframework of the advisory committees. When a legisla-tion has to be passed, member states play a key role inthat decision.
In recent years of significant trade liberalizationwithin the EU, there have been some cases of jointventures in the telecom and media industries whereinthe companies in question applied to the EuropeanCommission for permission to go ahead with theseventures. Permission was finally granted after somenegotiations with member states to open up markets insome sectors earlier than foreseen. When the EuropeanCommission takes a decision in anti-trust cases, it issubject to the jurisprudence of the two European courts,namely the Court of First Instance, which looks veryclosely at factual matters, and the European Court ofJustice, which answers appeals on legal issues.
The Extreme Case of New Zealand6
New Zealand�s approach to the regulation of telecom-munications differs from that of most other countries.It has attracted considerable attention in recent years.The most widely known aspect of this approach isthe absence of a sectoral authority. Interconnection
4 In performing this task, the DGT will take into account theprinciples and practices of European competition law, statementsand reports by the UK competition authorities, and non-bindingpublished guidelines. Third-party rights to take action for damageswould exist if a licensee violated an enforcement order followinga determination that its conduct was anti-competitive, but nopowers to fine would exist.
5 This subsection draws on Basant and Morris (2000), chapter9.
6 This subsection is based on Klein (1998) and Webb and Taylor(1998).
66 India Infrastructure Report 2001
agreements, access pricing to the telecom network,etc. are supervised by the Commerce Commission,New Zealand�s competition policy authority, under itsgeneral rules. The New Zealand government expectsparties to act in good faith and expedite any courtactions. However, as in other countries, there are certainsocial obligations (for example limits on price increasesfor residential customers) which find expression throughthe �golden share� in the dominant telecom company,Telecom, being retained by the government. Besides,there are information disclosure obligations on thecompany to reduce information asymmetry and facili-tate arbitration of disputes by the Commerce Commis-sion. Finally, the Ministry of Commerce can imposeregulatory measures like price controls if it is satisfiedthat conditions for effective competition do not existand control is necessary to protect network users orconsumers.
In recent years, this �light-handed regulation� oftelecommunications has been criticized. When a newentrant, Clear Communications, negotiated for aninterconnection agreement with the incumbent, (NewZealand) Telecom, lack of sector-specific rules andguidelines resulted in high uncertainty about intercon-nection rules. This led to protracted litigation, withthe Commonwealth Privy Council in the UK acting asfinal arbiter. Consequently, many in New Zealand arenow arguing for sector-specific regulatory rules thatwill clarify things like price-setting principles to reduceuncertainty.
TELECOM STANDARDS, INTELLECTUAL
PROPERTY RIGHTS (IPRS), AND
COMPETITION POLICY
Policies on IPRs, standards, and competition interactin a variety of ways. In 1992, the European Commissionset out a number of principles to govern the relationshipbetween IPRs and standardization. Although the com-mission is not directly involved in setting the standards,its views are influential in so far as they affect tenderspecifications for public procurement. Besides, since thecommission is the guardian of European competitionpolicy, its views are of great importance for firmsconsidering the possible effects of a refusal to allow theirintellectual property to be incorporated in a standard.The European Telecommunications Standards Institute(ETSI) plays an important role in the standard-settingprocess in the EU. The two key principles are as follows:
� The standard makers should do everything possibleto identify IPRs that could be involved in a proposedstandard and consult with the holders of those rights. In
general, only if it appears that the relevant rights areavailable for licensing should they be incorporated intothe standard. The IPR owners should also identify anyright that might be used in a standard under discussionand indicate if that right can be licensed.
� Intellectual property owners should be treated fairly.They should be given reasonable opportunity to deter-mine whether any of their rights would be required fora proposed standard and to decide whether to agree tothat use. If they do agree to licence their rights, thereshould be a clear mechanism to arrive at fair royaltyrates for use by those operating under the standard.
In principle, the intellectual property owner can refuseto licence his right to be used in a standard but in caseof such a refusal, the case may be referred to the Euro-pean Commission�s Competition Policy Directorate.Thus a valuable intellectual property that has become ade facto standard due to its commercial success mayeither be �compulsorily� licensed or the property ownermay face anti-trust action.
THE TRAI ORDINANCE AND THE
DISTRIBUTION OF RESPONSIBILITIES
Given the above background, one can see that the TRAIOrdinance (Amended), 2000 has not explicitly addressedthese issues. The role of ensuring competition is beingperformed by the TRAI, the Telecom Disputes Settle-ment and Appellate Tribunal (henceforth the Tribunal),as well as the competition authority (MRTPC). Thefollowing features of the Ordinance bring out theconfusion. For example, the Ordinance provides thatthe TRAI will make recommendations, either suo motoor on request from the licensor, on the followingmatters:
� Need and timing for introduction of new serviceprovider.
� Terms and conditions of licence to a service provider.� Revocation of licence for non-compliance with termsand conditions of licence.� Measures to facilitate competition and promote effi-ciency in the operation of telecom services so as tofacilitate growth in such services.
� Technological improvements in the services providedby the service providers.
� Type of equipment to be used by service providersafter inspection of equipment used in the network.
� Measures for the development of telecom technologyand any other matter relatable to telecom industry ingeneral.� Efficient management of available spectrum.
Structural Issues and Constraints 67
It is obvious that all these activities directly orindirectly impinge on competition. Additional respon-sibilities of the TRAI suggest that it is also required toimplement competition-related conditions. For example,the ordinance provides that the TRAI is also to dischargethe following functions:
� Ensure compliance with terms and conditions oflicence.
� Notwithstanding anything contained in the termsand conditions of the licence granted before the com-mencement of the TRAI (Amendment) Ordinance,2000, fix terms and conditions of interconnectivitybetween service providers.
� Ensure technical compatibility and effective intercon-nection between different service providers.
Given the problems of IPRs and standards discussedearlier, these activities also impinge on competition inthe telecom market.
Apart from the TRAI, the ordinance creates a sepa-rate dispute settlement mechanism for the telecomsector. The Tribunal has been created which will adju-dicate any dispute between:
� a licensor and licensee,
� two or more service providers, and
� a service provider and group of consumers.
This is provided that nothing in this clause shall applyin respect of matters relating to:
� monopolistic trade practice, restrictive trade practice,and unfair trade practice, which are subject to the juris-diction of the MRTPC established under subsection(1) of section 5 of the Monopolies and Restrictive TradePractices Act, 1969;
� the complaint of an individual consumer maintain-able before a Consumer Redressal Forum or a ConsumerDisputes Redressal Commission or the National Con-sumer Redressal Commission established under section9 of the Consumer Protection Act, 1986; and
� disputes between the telegraph authority and anyother person referred to in subsection (I) of section 7Bof the Indian Telegraph Act, 1885.
In addition, the Tribunal will hear and dispose ofappeals against any direction, decision, or order of theauthority (TRAI) under this act.
It is obvious that in the ordinance the roles ofTRAI, the Tribunal, and the MRTPC are not clearlydefined. Virtually all disputes between licensors andlicensees and between service providers will havesome competition-related ramifications. Most casesrelating to access charges, interconnection arrangements,
simultaneous provision of equipment and services,cross- subsidization of services by the dominant players,etc. impinge on competition in the market. Whowill deal with disputes relating to these? For example,if we have a case similar to the one in the UK aboutnumber portability, whose jurisdiction will it fallunder? Similarly, will assessment of mergers and acqui-sitions in the telecom sector involve participation ofthe TRAI or the Tribunal? Such participation may benecessary as many studies have pointed out that whilehostile takeover bids can be useful sources of informa-tion, consummated mergers, and even conglomeratemergers, are likely to worsen regulatory problems aris-ing from asymmetric information (Nuttall and Vickers1996).
Given these problems, it is not clear how the Tribunalwill deal with various disputes. Prima facie such ill-defined jurisdictions will lead to considerable delays inlitigation. Surely their roles can be usefully delineated?
THE ALLOCATION OF RESPONSIBILITIES:SOME CONSIDERATIONS
In a situation where a monopolistic regulated industry(like utilities) is being privatized and where competitivepressures are being brought to bear, what should bethe guiding principles to deal with anti-competitivebehaviour? Should problems related to competition beunder the jurisdiction of the competition authority orthe industry regulator? There are no clear answers tothese questions. It is clear, however, that the rules intransition are qualitatively different from those thatare adequate to deal with straightforward monopolyproblems. They are likely to become less deterministicand more complex (Barnes 1998). Besides, competitionrelated problems are likely to persist in this phase oftransition. This will be so because, unless broken up bystructural remedies, the privatized utilities (or existingpublic sector players) will inherit dominant positionsin relation to consumers. Such a dominant positionwill not easily be eroded, as it not only facilitates cross-subsidies but is also sustained by consumer-switchingcosts. Despite technological change, parts of such regu-lated industries will remain naturally monopolistic.Moreover, often such naturally monopolistic segmentsimpinge on the competitive environment of relatedindustries which are not naturally monopolistic them-selves, but have economies of scope with the former.7
Apart from the possibilities of anti-competitivebehaviour outlined, the complexity of the interactionsbetween competition and regulation means that theallocation of responsibilities between competition and
7 See Nuttal and Vickers (1996) for details of these issues.
68 India Infrastructure Report 2001
sectoral regulatory authorities is not without difficulty(Nuttall and Vickers 1996):
� the two are substitutes in so far as sufficient compe-tition might reduce the role of regulation and theassociated imperfections;
� they are complements in so far as competition canenhance the effectiveness of regulation, for example byreducing information asymmetries;
� regulation can distort competition due to its effectson the incentives and opportunities of regulated en-tities.
The received wisdom is that effective sectoral regula-tion (as against generic competition policy) is neededwhen rivalry is inadequate within an industry and whengeneral anti-competitive provisions are too weak tosafeguard the interests of consumers. As mentioned,the presence of dominant incumbent telecom operators,the multi output nature of these firms, and the existenceof large common costs provide opportunities for anti-competitive behaviour. While these conditions exist inthe telecom industry and can be used as a justificationfor the existence of the sectoral regulatory authority,it does not shed any light on the division of responsi-bilities.
Several characteristics of effective regulation havebeen identified in the literature. These include indepen-dence, accountability, transparency, fairness, simplicityand clarity, speed, and consistency. It has also beenargued that the institutional arrangements should haveprovisions for appeal, penalties, and periodic review.While one can judge an arrangement specifying thelinks between the competition and industry regulatoryauthorities on these grounds, in the context of thetelecom industry the implications of three featuresneed special attention: (a) technological convergencein telecommunications; (b) trade-off between potentialof regulatory capture and sector-specific skills; and (c)regulatory uncertainty.
Issues Relating to Technological Convergence
Given the natural monopoly characteristics of telecom-munications, especially the local loop of networks,ensuring effective competition in this segment has beenan important regulatory problem. Since inter-networkcompetition is difficult to obtain, the focus has been onfair access and reasonable interconnection arrangements.The emerging convergence in telecom technologymay change this condition. Networks that were highlydifferentiated in what services they could deliver (forexample broadcasting versus voice technology) are nowsomewhat equivalent in terms of services they can
deliver to customers. Different ways of providing thesame type of services and the provision of totally newtypes of services are developing rapidly. These arechanging the rules of competition; competition is on therise not only across networks, with various networksbecoming close substitutes, but also in service provision.Broadly, technological changes are leading to growingdemand (especially of Internet services) and innovationsare significantly modifying the structural features of thetelecom industry with emerging convergence acrossfixed and mobile and across Information Technology(IT) and media sectors.
What implications do these developments have forthe relationship between the sector-specific regulatoryauthority and competition authority? The final impactof the technology convergence is still largely unknown.Meanwhile, these developments cut across the existingregulations and challenge conventional definitions ofthe telecom industry. In such a scenario, heavy-handedand inconsistent regulation across different deliverymechanisms, arbitrary service classifications, and nar-row choices of standards can distort markets. If theregulation is unnecessarily restrictive, it may also resultin economic inefficiency with customers failing toget the full benefit of technological convergence.
One can argue that with appropriate provisions, thegeneral competition law can provide the frameworkwithin which these new technological developmentscan be tackled. However, while convergence is bringingdifferent types of networks closer to equivalence, itis not making them the same; at least, not as yet. Theparticular bottleneck points (for example scarce re-sources like radio spectrum, incumbency dominance,natural monopoly in some elements in the localloop, or the particular way customers are locked intoa specific network by their purchase of equipment)will continue to vary due to economic and technicalreasons. Broadly, issues relating to network intercon-nection will remain very significant in terms of policydue to persistence of (a) fixed costs of a subscriber beingconnected to a network (both for fixed and mobilenetworks); and (b) network externalities between sub-scribers. In other words, anti-competitive behaviour interms of setting excessive access and interconnectioncharges will remain a reality and will have to be dealtwith.
The ultimate manifestation of convergence will bea single optical fibre cable providing telecom, comput-ing, and media services. The customer premise equip-ment will sort the incoming signals according to theinformation carried by them. The convergence of tele-communications, computing and media interests, andthe provision of services may lead to future market
Structural Issues and Constraints 69
structures dominated by multimedia conglomerates.8
Given the technological uncertainty, while one needs torecognize this possibility, there is no need to worryunduly about it and argue for excessive regulation so thatsuch structures do not emerge. As mentioned, such anapproach can distort markets and may even retardtechnological growth. Besides, it is difficult to predict ifand when such structures will emerge. In the interim,a more liberal, less regulated policy may be optimal. Ithas been argued that when technical change is rapid itwill be more difficult to circumscribe the domain ofnatural monopoly and the dynamic benefits of compe-tition are likely to be large.
Competition is often very valuable for the very reason that itis impossible to quantify ex ante that it will be valuable. Areview of the deregulation experiments in the United Stateshighlights the role of unexpected new ways of doing businesswhich have followed deregulation and led to welfare gains.[Klein 1998: 70]
Technological convergence brings into sharperfocus the issue of jurisdiction of sectoral authorities. Inthe case of the UK, both the MMC and OFTEL makespecific efforts to keep �competitive markets competi-tive� (Barnes 1998). The telecom equipment market isfully competitive with a large number of suppliers andno firm has a dominant position. However, BritishTelecom�s (BT�s) dominance in network services canresult in anti-competitive behaviour in the form of tiedor subsidized sales of equipment to its customers.OFTEL sets and maintains rules cutting across bound-aries so that the equipment market remains competitive.It is not clear how such anti-competitive conduct cuttingacross industry boundaries will be dealt with in theIndian context. Firms like BPL which make telephoneequipment are already in the telecom services market.
It may be useful to incorporate such exigencies in thelicensing conditions to prevent anti-competitive behaviourof the kind described here.
Overall, technological convergence brings out twosalient issues that are relevant for the allocation ofresponsibilities. One, industry boundaries are very fluidand it is very difficult to define a �telecom market�. Two,more and more segments of the �telecom market� willincreasingly become contestable making it difficultto come up with per se prohibitions for any potentialanti-competitive practice. The first calls for the exten-sion of boundaries for the �telecom regulatory authority�and the latter highlights the emerging complexity ofcompetition-related issues in the sector.
Regulatory Capture and Sector-specific Skills:Is There a Trade-off?
Competition agencies may be less prone to capture asthey are more distant from the players in a sector. Onthe other hand they may lack the detailed technicalcompetence required to deal with some sector-specificissues. For example, it has been suggested that entryrestrictions are particularly hard to undo when theboundary of a protected firm coincides with the politicaljurisdiction that grants the protection. There are obvi-ous benefits from collusion between the political powersand the firm, which would be reduced if the firmoperated across jurisdictions and several political entitieshad to collude to extract monopoly rents. In the samevein a regulatory authority which covers utilities beingprovided for by a variety of sectors (for example telecomand cable) is less likely to be captured. The key challengeis to strike a balance between these considerations whilepreserving coherent decision making to reduce uncer-tainty for investors. An implementation of this generalprinciple may imply empowering the competition au-thority to deal with fairly generic issues, such as collu-sion, while asking the regulatory agency to look aftermore sector-specific issues, such as interconnection rules,pricing, or quality of service. It may also imply that amechanism to appeal to the competition authorityagainst decisions of the sectoral authority impingingon competition (for example interconnection) is desir-able. In many systems, mergers in regulated industriesare subject to scrutiny by both industry-specific andeconomy-wide regulation.
The Regulatory Uncertainty
The uncertainty embodied in the generic competitionlaw in New Zealand to deal with telecom-related issueshas already been mentioned. This created incentives forthe dominant incumbent to exploit this uncertainty.
8 Convergence, if fully realized, can cause a variety of regu-latory problems. The primary problem is that the access provider,the organization providing the optical fibre to each and everyhouse and business, becomes a vertically integrated monopoly.Since the difference between long-distance and local disappears,the choice of long-distance operator also vanishes. Since the access-providing fibre is connected to the Internet, the choice of InternetService Provider (ISP) disappears. Similar to the current optionof subscribing to the Internet through cable where it is connectedto the ISP continuously, such a situation will exist for video trafficalso. This monopoly position is likely to be abused throughblocking of sites, channels, and e-commerce sites. Competition isunlikely to be a major regulating device; because of the hugeinvestments involved it is doubtful whether a duopoly can besustained. The role of regulation becomes more crucial in thisenvironment. Regulation will also be essential due to the hugeinvestments. Cross-subsidization cannot be done away with, infact the cross-subsidization value may increase in the case of aconverged network (Ramadesikan 1999).
70 India Infrastructure Report 2001
The other key problem relating to the use of competi-tion law to deal with sectoral issues has been delays (andexpense) associated with litigation. It has been arguedthat the New Zealand competition law is incapable of�effectively handling the complexity of telecommunica-tions access and interconnection disputes and thereremains a real prospect of interative disputes aboutdifferent aspects of the same subject matter and evenabout the same subject matter�. Consequently, regula-tory uncertainty and associated litigation delays andcosts may themselves act as a barrier to entry that maybe exploited by the dominant incumbent (Webb andTaylor 1998, p. 5).
Whatever framework for sectoral regulation is adoptedto tackle anti-competitive behaviour, it should not leadto even more detailed rules. Any regulatory structure,therefore, should not provide a route towards evendeeper and more intrusive regulation. The creation of aseparate appellate body for telecom and the lack ofclarity about disputes that are not related to competitionissues makes the structure proposed in the TRAI billquite cumbersome. This is later discussed in greaterdetail.
Early and timely action is extremely important in ageneral sense too; any action necessary to stop anti-competition behaviour must take place fast enough toavoid, if possible, competitors going out of businessbefore any corrective action can be taken. The proposalof OFTEL to add a new licence condition for telecomoperators that would prohibit actions that prevent,restrict, or distort competition in telecommunications,with the DGT having powers to determine if theconduct has interesting implications, increases theregulatory discretion of OFTEL. It has several advan-tages in terms of reducing regulatory uncertainty anddelays:
First, it diminishes the incentive for anti-competitive behaviourby reducing delays in stopping behaviour that is found to beanti-competitive. By contrast, general UK competition law hasrather weak deterrent effect since, with the exception ofradical divestiture remedies, the sanction faced by a firm is justthat it will eventually be told to desist from conduct found tobe anticompetitive, with no interim measures or third partyrelief. Second, the proposal is based on the effect rather thanthe form or description of behaviour. No matter how lengthy,a list of proscribed practices is likely to contain gaps, especiallyin a rapidly evolving industry. Courses of conduct withdifferent descriptions may be close substitutes in terms of theireconomic effects (and course of conduct that fall under thesame description may have very different effects). An effects-based prohibition moreover does away with the need tointroduce new licence conditions to fill gaps as they appear,and the associated delays. Third, the new condition wouldallow a number of detailed monopoly controls, and their
attendant costs and inefficiencies, to be removed. [Nuttal andVickers 1996]
These arguments would suggest inclusion of severaleffects-based general competition-related conditions inthe licence so that the onus of not indulging in anti-competitive conduct is on the licensee. This, along withthe inclusion of competition-related issues within thejurisdiction of the sectoral regulator, may reduce uncer-tainty and delays of litigation. The outcome may beachieved by having more effects-based licensing condi-tions and a special group within the competition agency(as in the case of the European Competition Commis-sion) to expeditiously deal with telecom-related compe-tition issues.
MODIFICATIONS IN THE INDIAN
INSTITUTIONAL STRUCTURE
Which of these models should India adopt? At onelevel, the French system seems promising, with thedivision of roles between the regulation and competitionauthorities clearly defined. The possible areas of overlaphave also been identified. The distinction betweenauthorities dealing with ex ante issues (like entry) andex post concerns (behaviour) is sensible. The TRAIordinance provides such a division of roles between theTRAI and the Tribunal. Unfortunately, the proposedamendment to the TRAI Act does not appreciate thepossible conflict of roles between the Tribunal and thecompetition authority. These conflicts will need to beidentified and resolved. Based on the above discussion,the following modifications in the Indian telecom-related institutional structure seem desirable:
� The distinction between disputes relating to anti-competitive behaviour (which are to be dealt with by theMRTPC) and others is very arbitrary. The currentstructure will add to regulatory uncertainty and willeventually lead to delays with multiple suits filed bothwith the Tribunal and the MRTPC. Consequently, theadvantage of having a sector-specific dispute settlementmechanism to reduce delays will be lost. Therefore,either all disputes should be heard by the MRTPC andthe higher courts or the Tribunal should deal with alldisputes relating to telecom with a provision of appealin the Supreme Court.
� If the MRTPC or any other competition authorityis to tackle the disputes with the abolition of theTribunal, a separate cell within the commission to dealwith the sector�s issues will need to be created toexpedite cases and also develop the requisite expertise.The model of the DG-IV of the European Commissionis promising in this regard.
Structural Issues and Constraints 71
� If the sectoral authority is given the powers to dealwith competition issues, its coverage needs to be en-larged to encompass all aspects of information, commu-nication, and entertainment services.9 Such a change willnot only take care of some issues relating to technologi-cal convergence, it will also mitigate to some extent theproblems associated with regulatory capture.
� While inclusion in the licence of clauses prohibitingbehaviour that prevents, restricts, or distorts competi-tion in telecommunications is a good idea to reduceregulatory uncertainty, the implementation of competi-tion regulations will have to remain flexible and liberalin order not to distort the market and the dynamics oftechnological development.
5.2 POLITICAL AND BUREAUCRATIC HURDLES
IN REFORM AND RESTRUCTURING:THE ELECTRICITY SECTOR
M. Y. Rao
financial latitude not available to government depart-ments. Such parastatals including innumerable state-levelpublic enterprises had been and continue to be conve-nient arrangements to throw parties or go on foreignjaunts. In Orissa there was the added complication thatalmost all electrical engineers of the OSEB were techni-cally employees of the state government on deputation.Frequent transfers and postings of the board employees,especially engineers, generated graft and rents. The dualcontrol exercised by the government as the appointingauthority, and by the board as the immediate employer,had only exacerbated the confusion. Many exploitedthis situation for easy postings, postings with scopefor rent, etc. The impending loss of control over theelectrical engineering cadre and of a cherished fiefdomwere perhaps the most important considerationsamong the decision makers. Even today, several yearsdown the road of reform, these questions still hauntcertain sections of the bureaucracy and government.There is much talk about amending the reform act tomake the OERC and the privatized companies �moreaccountable to the people�.
Orissa, however, was lucky to have the full supportof both the two Chief Ministers for the reforms. Thebill went through the assembly with only minor hitches.One such hitch was resolved by accepting a whollyunnecessary amendment to the effect that any transferof assets from the Grid Corporation of Orissa (Gridco)and Orissa Hydro Power Corporation (OHPC) to anyother entity could be �only on lease�. (A subsequentamendment corrected this.) Another hitch related to theservice conditions of the members of the OERC. Fromthe very beginning, the OERC was envisaged as a high-powered authority with quasi-judicial powers, whichwould be able to stand above lobbying and partisanpoliticians. Indeed, the draft of the bill contained pro-visions to the effect that the salary and allowances of
9 Newspaper reports suggest that such an authority is beingenvisaged.
10 The Bill marks the first step towards deregulating electricityin India.
It is well known that Orissa took the lead in electricityreforms. The preparations started as early as 1993�4 andby the end of 1994, the broad contours of the reformshad taken shape. The sector was to be unbundled intoseparate corporate entities for generation, transmission,and distribution. The Orissa Electricity RegulatoryCommission (OERC) was to be created as an autono-mous body and phased privatization of the corporatizedentities was to take place.
Towards the end of 1994 and in early 1995, drafts ofthe Orissa Electricity Reform Bill10 were circulated tothe various ministries in Delhi and were the subject ofheated discussions. Senior officials in the ministry as wellas in the Central Electricity Authority (CEA) were notconvinced of the need for any reform Act. What is in thereform Act that is not covered by the existing electricitylaws? Was not the CEA also autonomous? What is it thatthe commission can do which the CEA failed to do?What will happen to the supply of electricity to farmersor rural areas? How can we entrust a vital area likeelectricity to private hands? Would they not simply stripthe assets and decamp? After innumerable rounds ofdiscussions, the central government finally cleared thedraft with the support of the Union Minister for Power,the Finance Minister, and the Union Finance Secretary.
The scene of the battle then shifted to Bhubaneshwar.The bill was tabled in the legislative assembly and wasdebated for several days. Legislators agonized overpossible loss of control of the House over the privatizedsuccessors of the Orissa State Electricity Board (OSEB).Government functionaries were even more exercisedabout loss of government control over the entities whichwere, in effect, adjuncts of the government but with
72 India Infrastructure Report 2001
members of the OERC and their staff would be �charged�to the consolidated fund of the state (and not �voted�);and that the service conditions of members of the OERCcould not be varied to their disadvantage during theirtenure. When the bill was finally passed, the firstprovision was re-tained but the second one was �unac-countably� dropped somewhere between the draft andthe printed bill.
Eventually, the rules framed by the state governmentdid include a provision to the effect that the conditionsof service of the chairman and members of the OERCcould not be varied to their disadvantage during theirtenures. But this rule which can be changed by executivefiat does not provide the OERC with the same degreeof protection as a provision in the Act itself wouldhave. Reforms in other states, however, learned fromthis experience. Andhra Pradesh, Rajasthan, and UttarPradesh have, for example, included a specific provisionprotecting the service conditions of regulators in theirreform Acts.
Persuading the (Board�s) officers� associations to ac-cept reforms turned out to be a tortuous and exhaustingaffair. To begin with, the associations refused to acceptthat the Electricity Board was deeply in the red. Partof the reason for this contention lay in the way accountsare maintained by the state electricity boards (SEBs).Under the Electricity Supply Act, 1948, the SEBs are toset their tariffs in such a way that after taking intoaccount government subsidies and meeting all expenses,they should achieve a return of 3 per cent on their fixedassets. This government subsidy, especially in the 1990s,turned out to be only an accounting entry, as thefinances of the state governments were also in disarray.But the myth that the Boards were making a nominalprofit persisted. More importantly, the cost plus pricingunder the Act could technically mean that the possibilityof being in the red is ruled out by definition.
Associations were also deeply concerned about theservice conditions in the post-reform scenario. Thereform Act clearly spelt out that the service conditionsof employees in the new set-up would not be inferiorto what they had earlier been. This did not satisfy theassociations who took the matter to courts, several infact, from the Bhubaneshwar and Cuttack Benches ofthe State Administrative Tribunal to the High Courtand finally the Supreme Court, where they eventuallylost. In the interim period, a �fitment� exercise gaveseveral hundred officers substantial pay increases by wayof compensation for stagnation at various levels.
In sharp contrast to the officers, the non-executiveemployees belonging to some forty-six unions turnedout to be much more amenable. Several rounds ofdiscussions and continuous dialogue with the unions
ensured that the scope for rumours and other mischiefwas limited. A wage revision agreement signed by theunions with retrospective effect was another importantreassuring measure. Unlike the officers, the unions didnot tie down Gridco in the courts, and despite severalstrike threats, Gridco did not lose a single day owing toindustrial action during the entire period.
The OERC issued its first tariff order on 12 March1997, when the assembly happened to be in session(budget session). The tariff order caused a furore in theassembly with several members raising questions ofprivilege against the commission for what they per-ceived as the imposition of a tax on electricity withoutthe authority of the House and that too when theHouse was in session. The Chief Managing Director ofGridco and the Law Secretary to the government weresummoned to the Chief Minister�s chamber in theassembly for urgent consultations.
It was pointed out that what OERC had done waswell within the provisions of the reform Act whichhad come into force after the same House had passedit. The matter was sorted out after the Chief Minister,the Speaker, and the Leader of the Opposition had adiscussion. The Speaker announced on the floor of theHouse that there was no privilege issue involved. That,however, did not prevent some of the opposition mem-bers from walking out of the House.
An important consideration that propelled the stategovernment towards reforms was the cash crunch, withthe reforms holding out hope of an end to the needfor government support to the power sector. Thisdriving principle had some interesting fallouts. Gridcocame into existence on 1 April 1996 when the reformact also came into force. The transmission and distri-bution assets of the Electricity Board which had abook value of Rs 1201 crore, were taken over by thestate government and then upvalued by an additionalRs 1194 crore. The entire assets worth Rs 2395 crorewere then vested in Gridco. This upward revaluationwas prompted by the need to have a capital base capableof absorbing the loans required for upgrading thesystem and to have a self-financing ratio of 20 per centand an adequate debt�equity ratio. However, the upvaluedamount of Rs 1194 crore was treated as though it wasthe government�s contribution to Gridco. Againstthis �contribution�, government dues to the OSEB onaccount of subsidy and electricity charges, totallingRs 340 crore, were written off. Gridco was required toissue Rs 400 crore worth of bonds and Rs 253 croreworth of shares to the government.
The state government got out of their obligationto pay Rs 340 crore to the OSEB/Gridco, but the neteffect was that Gridco started life with a minus figure
Structural Issues and Constraints 73
of nearly Rs 1000 crore. Even today, Gridco has notrecovered from the effects of this upvaluation exercise.However, other states learnt from the Orissa experienceand have provided for substantial government subsidyto the reforming entities during the initial transitionperiod of four to five years. For example, Rajasthan,Haryana, and Andhra Pradesh have proposed transi-tional period support of Rs 4370 crore, Rs 1992 crore,and Rs 12,547 crore, respectively, to their reformingentities.
Senior levels of decision making within the govern-ment were never fully reconciled to the autonomy ofthe OERC, or to the provision of the reform Actstipulating that while the government might issue direc-tions for concessional tariff to specified categories ofconsumers, it was bound to compensate the distributioncompanies for the losses they might then have to bearas a result of the government directives. This stipulationis still being viewed as an affront to government sover-eignty.
It had been quite usual for the government to agreeto many concessions to �deserving� consumers. At vari-ous times, export-oriented units, cooperative textilemills, and ailing public sector units (PSUs) were grantedconcessions in electricity charges, security deposits, andelectricity duty. During one of the board meetings ofGridco in early 1997, the board debated the �concessions�promised to some industries by the state governmentand felt that they would need clearance from the OERCso that the cost of the concessions could be claimedfrom the government as subsidy. A senior bureaucraton the board exploded at this suggestion but is romouredto currently be an aspirant for chairmanship of theOERC. Whether there has been a change of heart aboutthe Commission is not known.
The Orissa Electricity Reform Act came intoforce from 1 April 1996 when the transmission- anddistribution-related assets, liabilities, and personnel ofthe OSEB were vested in Gridco. This was done througha transfer scheme framed by the state governmentunder the Reform Act. Under the next phase of Gridco�sreform, Gridco�s statewide distribution business wasreorganized into four zonal entities which were thenregistered as Gridco�s wholly owned subsidiaries. Thencame the question of transferring Gridco�s distribution-related assets, liabilities, and personnel to these distribu-tion companies.
There were endless discussions in the secretariat abouthow this was to be accomplished. The oft-repeatedquestions were: Why not a simple commercial agree-ment between the companies? Where is the need fora statutory scheme? The realization that the matterwas not quite so simple came much later. In addition toassets and liabilities, there were also employees to betransferred which could not have been done with acommercial agreement alone. Workers would requiresome statutory protection to guarantee them that theirservice conditions in the new set-up would not beinferior to the old.
There was also a legal hitch. The reform Act contin-ued the stipulation that any transfer from Gridco to anyother company could be �only on lease�. How does onelease out employees? On the other hand, can there bean agreement between the companies which contem-plates an arrangement other than a lease of the employ-ees? Would not such an agreement be ab initio null andvoid? This legal dilemma was finally resolved throughan ordinance which did away with the portion of the actstipulating �only on lease�. The transfer scheme wasframed under the amended act in November 1998.
5.3 NEED FOR A BOT LAW:GUJARAT INFRASTRUCTURE DEVELOPMENT ACT
Atanu Chakraborty
In April 1999 the Governor of Gujarat signed an ordi-nance to facilitate private sector participation (PSP) ininfrastructure in the state. This brought about the firstoverarching privatization law in the country. Fourmonths later the state assembly unanimously passed abill entitled Gujarat Infrastructure Development Act,1999.
The trend towards privatizing infrastructure thatwas witnessed in Latin America and South East Asiain the 1980s could not be ignored in India after the
balance of payments (BoP) crisis of 1990�1.The impetusfor privatization came from the need to bridge thefund gap that the government faced in the provision ofinfra-structure. In Gujarat alone, the government esti-mates that fund requirement in eight infrastructuresectors up to the year 2010 will be Rs 117,000 crore,or US $ 29 billion. (Government of Gujarat 1999b).The India Infrastructure Report (1999) estimates anational requirement of about US $ 300 billion. Inthe earlier stages, achievement of project and delivery
74 India Infrastructure Report 2001
efficiency that is possible in a privatized project was amatter of ideological debate. This is a more acceptedargument today, though there is still little empiricalevidence available.
Private infrastructure projects do not happen auto-matically. They have to be engendered via a process ofequitable risk sharing. Such a mechanism is crucial toPSP.
A frequently asked question was why do we need aBOT law? (The term BOT here is used to represent theentire genre of PSP projects and not in a restrictive senseof build, operate, and transfer.) Would the usual Con-tract Act, Land Acquisition Act, Arbitration Act, andother sector-specific Acts not be adequate?
Privatizing infrastructure typically involves a largenumber of players, that is the sponsoring agency, theproject developer, the lenders, sometimes even equip-ment suppliers, the regulator, and consumers of theservices, each with its own set of concerns. Even beforea contract is entered into, much groundwork needs tobe done, right from conceptualizing the project, topreparing feasibility studies, defining the institutionalframework, working out the risk allocation, and doingthe developer procurement. To lenders and investors, aclear definition of powers and duties of the involvedministries and the public authorities is essential to thesuccess of the project. Experience has shown that uncer-tainty over which set of officials has the authority todeliver a particular ingredient of the BOT scheme canbe a major obstacle (Gulslain 1997). Before the passageof the BOT law, none of the existing laws had clearprovisions on the following important aspects:
� appropriate pricing to allow equity investors a com-petitive rate of return;
� framework for clearly structuring a BOT project,particularly the scope, obligations, and rights of theprivate developer;
� standardized and streamlined procedures for approvalof the project and selection of the developer;
� the norms and kind of support including �concessions�and subsidies that the government could provide.
� What would be a reasonable security package that wasat once acceptable to the lenders?
� Who would be the �BoT prime mover� withinthe government to act as the overall coordinator ofthe privatization programme (Pricewaterhouse Coopers1999).
Many steps in the privatization of infrastructure arecommon across the sectors of physical infrastructure.Hence to cover the common dimensions and issues inseparate laws for every sector was neither necessary nor
desirable. It would only have created confusion. Eachsectoral law would not only introduce divergence in thegovernment�s approach in different sectors but also sowseeds of confusion in the minds of prospective investors.
A contract can only offer remedies and means forthe participating private parties to exercise their rights(Wilde 1997). Thus for example, parties need to beassured against risks emanating from people�s protestsagainst environmental risk. The participating sponsor-ing agencies also need a road map to be able to handleprivatization of the infrastructure project. When thesize of the project is large, government participation insome manner may be necessary to lower the risk for thedeveloper, especially in the early stages of privatization.A road map showing how to go about a BOT projectwould be of use to even the public agencies. These issuesapart, the impact of a BOT law cannot be understated.To investors the law offers the advantage of explicitpolitical endorsement, which is not negligible given theoften politically contentious nature of privatization(Wilde 1997).
The process of the passage of the law through variousstages and departments within the department waseducational. A priori assumptions pertaining to a parti-cular group/class can be totally misplaced as shallsoon be seen. The need for building world-class in-frastructure was articulated when Gujarat revised itsIndustrial Policy in 1995 and set up the Gujarat StateInfrastructure Development Board (GIDB). Initiativeswere taken to launch port privatization on a largescale as well. Following these initiatives, the need for aclear and transparent framework for privatization wasacutely realized.
Senior politicians in the state understood the under-lying logic very quickly. This came as a pleasant surpriseto those who were engaged in the preparation of thedrafts. A BOT scheme tends to be fairly complicatedand the dynamics that are covered are not usually easyto understand. Senior politicians even found the rightpolitical idiom to sell the idea to their fellow politicians.Most of the senior echelons in the bureaucracy werealso receptive to the idea and became active championsfor the law.
As a strategy, consensus building was attemptedfrom the start. The executive departments of the gov-ernment were expected to oppose the proposals, per-ceiving them as a curtailment of their authority. Thereforethe draft of the law was discussed with all executivedepartments in detail at various round table meetings.Such meetings continued to take place until a fewhours before the draft of the bill went to the cabinetfor approval! The other potential participants in theBOT scheme, viz. developers, large corporate houses,
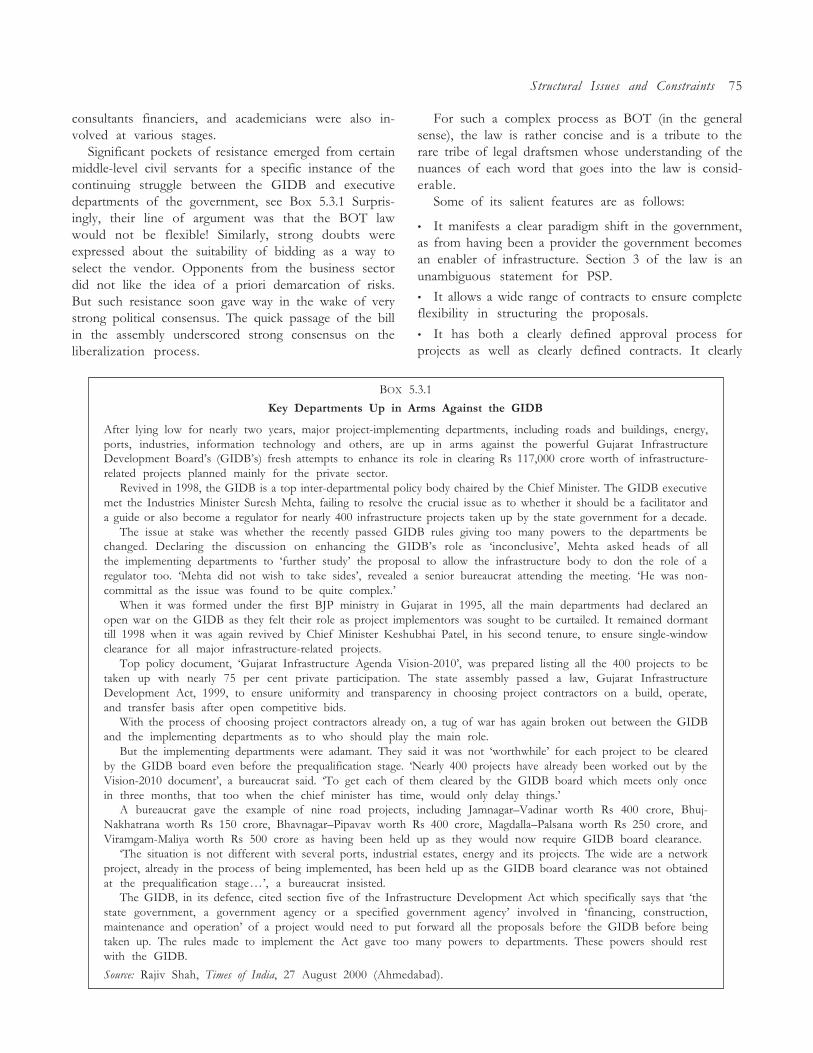
Structural Issues and Constraints 75
consultants financiers, and academicians were also in-volved at various stages.
Significant pockets of resistance emerged from certainmiddle-level civil servants for a specific instance of thecontinuing struggle between the GIDB and executivedepartments of the government, see Box 5.3.1 Surpris-ingly, their line of argument was that the BOT lawwould not be flexible! Similarly, strong doubts wereexpressed about the suitability of bidding as a way toselect the vendor. Opponents from the business sectordid not like the idea of a priori demarcation of risks.But such resistance soon gave way in the wake of verystrong political consensus. The quick passage of the billin the assembly underscored strong consensus on theliberalization process.
For such a complex process as BOT (in the generalsense), the law is rather concise and is a tribute to therare tribe of legal draftsmen whose understanding of thenuances of each word that goes into the law is consid-erable.
Some of its salient features are as follows:
� It manifests a clear paradigm shift in the government,as from having been a provider the government becomesan enabler of infrastructure. Section 3 of the law is anunambiguous statement for PSP.
� It allows a wide range of contracts to ensure completeflexibility in structuring the proposals.
� It has both a clearly defined approval process forprojects as well as clearly defined contracts. It clearly
BOX 5.3.1
Key Departments Up in Arms Against the GIDB
After lying low for nearly two years, major project-implementing departments, including roads and buildings, energy,ports, industries, information technology and others, are up in arms against the powerful Gujarat InfrastructureDevelopment Board�s (GIDB�s) fresh attempts to enhance its role in clearing Rs 117,000 crore worth of infrastructure-related projects planned mainly for the private sector.
Revived in 1998, the GIDB is a top inter-departmental policy body chaired by the Chief Minister. The GIDB executivemet the Industries Minister Suresh Mehta, failing to resolve the crucial issue as to whether it should be a facilitator anda guide or also become a regulator for nearly 400 infrastructure projects taken up by the state government for a decade.
The issue at stake was whether the recently passed GIDB rules giving too many powers to the departments bechanged. Declaring the discussion on enhancing the GIDB�s role as �inconclusive�, Mehta asked heads of allthe implementing departments to �further study� the proposal to allow the infrastructure body to don the role of aregulator too. �Mehta did not wish to take sides�, revealed a senior bureaucrat attending the meeting. �He was non-committal as the issue was found to be quite complex.�
When it was formed under the first BJP ministry in Gujarat in 1995, all the main departments had declared anopen war on the GIDB as they felt their role as project implementors was sought to be curtailed. It remained dormanttill 1998 when it was again revived by Chief Minister Keshubhai Patel, in his second tenure, to ensure single-windowclearance for all major infrastructure-related projects.
Top policy document, �Gujarat Infrastructure Agenda Vision-2010�, was prepared listing all the 400 projects to betaken up with nearly 75 per cent private participation. The state assembly passed a law, Gujarat InfrastructureDevelopment Act, 1999, to ensure uniformity and transparency in choosing project contractors on a build, operate,and transfer basis after open competitive bids.
With the process of choosing project contractors already on, a tug of war has again broken out between the GIDBand the implementing departments as to who should play the main role.
But the implementing departments were adamant. They said it was not �worthwhile� for each project to be clearedby the GIDB board even before the prequalification stage. �Nearly 400 projects have already been worked out by theVision-2010 document�, a bureaucrat said. �To get each of them cleared by the GIDB board which meets only oncein three months, that too when the chief minister has time, would only delay things.�
A bureaucrat gave the example of nine road projects, including Jamnagar�Vadinar worth Rs 400 crore, Bhuj-Nakhatrana worth Rs 150 crore, Bhavnagar�Pipavav worth Rs 400 crore, Magdalla�Palsana worth Rs 250 crore, andViramgam-Maliya worth Rs 500 crore as having been held up as they would now require GIDB board clearance.
�The situation is not different with several ports, industrial estates, energy and its projects. The wide are a networkproject, already in the process of being implemented, has been held up as the GIDB board clearance was not obtainedat the prequalification stage . . . �, a bureaucrat insisted.
The GIDB, in its defence, cited section five of the Infrastructure Development Act which specifically says that �thestate government, a government agency or a specified government agency� involved in �financing, construction,maintenance and operation� of a project would need to put forward all the proposals before the GIDB before beingtaken up. The rules made to implement the Act gave too many powers to departments. These powers should restwith the GIDB.
Source: Rajiv Shah, Times of India, 27 August 2000 (Ahmedabad).
76 India Infrastructure Report 2001
identifies the agencies and commits to appropriate ob-jective criteria to choose projects.
� It outlines two modes of selection of the developer,one through competitive bidding and the other througha process of direct negotiation that has an inbuiltprovision for fairness and transparency. (The negotiatedprocess was to provide the private sector the opportu-nity to innovate appropriate structures in projects ofpublic interest.)
� It provides for a delicate balance between the nodalagency, that is the GIDB, and executive departments ofthe government. (The GIDB assumes the role of facili-tator while line departments are charged with actualimplementation, thus both can use their specific strengthsin a clear and non-obtrusive manner.)
� It contains a clause on charging user fees as well
as an introduction of the concept of market-basedpricing.
� It contains enabling provisions for lenders to takeover projects in cases of default.
� It addresses project maintenance, transfer of technol-ogy, and training of the public agency staff.
The law has undergone the test of actual implemen-tation in a couple of projects. The experience gainedthereby has been invaluable in drafting the rules forimplementing the law. A BOT law is just one of theimportant pieces in the jigsaw of infrastructure projectimplementation. Sector-specific legislation that promotescompetition and provides for regulation, careful projectpreparation, and quick decision taking by the govern-ment remains central to the theme of private-sectorparticipation in infrastructure.
5.4 PROJECT PREPARATION
THE CINDERELLA OF PRIVATE SECTOR PARTICIPATION ( PSP)Atanu Chakraborty
is undoubtedly because the agencies do not prepare theprojects in a thorough manner. As most of the existingagencies are engineer driven, their concept of projectpreparation is usually limited to detailed engineeringdrawings and bills of quantities! To an investor this isunnecessary: he does not expect to be told �how� to goabout the project; that he presumes is his competance.�What the government wants� is, on the other hand,never clearly stated. Even the more enlightened of thesponsoring agencies still tend to look at the privatesector project proponent as a �works contractor�.
PSP in the infrastructure sector involves a paradigmshift. The sponsoring agency whose job is to provide aparticular product/service seeks to make that happenthrough a private sector agent. Obviously, the sponsor-ing agency has to know reasonably well what it is thatit wants. To illustrate the point, in the case of privatizationof a road on build, operate, and transfer (BOT) basis,the material used is of least importance. It is imperativeto ensure that the road handles traffic at a certainpredefined level of efficiency over the life of the agree-ment and that safety and environmental conditions areappropriately met. One such agency in privatizing aroad over a bridge decided to hand over drawings of thetoll plaza instead of specifying the amount of traffic andthe maximum permissible waiting time in a specifiedperiod. The traffic being heavier than expected, snarlsresulted in heavy congestion, leading to increased userside costs for vehicles.
The revival of the private sector in infrastructure projectsbegan in the UK in the early 1980s and soon became aworldwide trend. Deregulation, regulation, independenceof the regulator, pricing, rules of access to bring aboutcompetition, and the privatization process gatheredmomentum and came into the limelight.
Much of the discourse was dedicated to regulation,the tussle between regulation and monopolies, and thestructure of industry. Tasks like working out the correctscale of projects, or detailed and demanding analysis, didnot always get due attention. When the wave ofprivatization reached third world countries like India,�regulation� came to be seen almost as a panacea for allproblems. No wonder the regulators have been the firstto be blighted in the post-privatization phase. In Indiathe so-called �investment jamborees� compounded theproblems. States vied with each other to attract largeindustrial investments. Large teams organized by stategovernments either descended on Mumbai, or bigshows were held in state capitals to attract �investment�,especially for infrastructure projects. Big melas (fairs)were held, where a couple of sheets of paper masquer-aded as a project and memoranda of understanding(MOUs) were signed by the dozen. Obviously, a largenumber of the projects emanating from these congrega-tions never saw the light of day and spoilt the reputa-tions of state agencies as serious seekers of investment.
The poor rate at which projects are being activelypursued in the course of privatization of infrastructure
Structural Issues and Constraints 77
�rapid environment impact� analysis, so that at the post-bidding stage of the project, the likely costs to coverenvironmental damage and displacement are well known.
� Ensuring whether the project is useful to society. Thismeans looking at the economic rate of return (ERR).� Financially analysing the project, that is ensuringwhether the project is bankable.
This process leads to the point where the sponsoringagency takes the primary decision as to whether theproject needs to be taken up at location and whetherit would be possible to take it up as a PSP project. Ifthis decision is taken, then the risk allocation has to bedecided in a manner that ensures financial viability ofthe project. In fact, government underwriting of part ofthe risk usually ensures implementation of the project.But such underwriting should be carefully and con-sciously done.
Carrying out the entire process up front is timeconsuming and costly. But doing it at a later stage, as hashappened in quite a few projects in India, leads to delayswhich are far more costly both to the project as well asthe economy. The project preparation process has to beinteractive, iterative, and open so that as far as possibleall the stakeholders are involved. This helps to shape aproject that is implementable.
Project preparation has to be followed up by quickdecision making, otherwise the studies tend to becomedated and their relevance becomes questionable.
Project preparation is an activity that needs to bestrengthened considerably by the sponsoring governmentagency. Along with a regulatory regime and sectorrestructuring, it forms an important aspect of PSP. Thisis particularly so when market failure in certain infra-structure sectors persists. It is also relevant because theallocation decision is for most governments very difficultto give up. The lead has to be taken by the governmentagency. Very few governments have understood thisneed. Fewer still have committed resources to creatingsuch competencies.
The preparation process in a PSP project involvesproject definition, analysis and projection of demanddetermination of willingness of the user to pay the costat various levels of service, proper sizing, and if needbe, phasing. Understanding these dimensions of theproject is useful and necessary for the allocation ofrisks between the private sector proponent and thesponsoring agency, and possibly others. The idea isto ensure that the project is bankable and at the sametime no party bears a risk that it should not bear oris not capable of bearing.
The process of doing so involves thinking aboutthe project through its life, and not just at the cons-truction stage, as tends to happen in projects wherea works contract is awarded and maintenance is noteven considered. The agency is thereby led to criticallyexamine whether the project is truly socially impor-tant. The most important change that this bringsabout in the approach of the sponsoring agency isthat it leads the agency to sharply focus on outputparameters, which are of utmost importance to theconsumer�the raison d�etre for the existence of theagency. Delivery of service to the consumer thenbecomes the core objective. It has been observed thatgood project preparation drives restructuring in thesector to make it more competitive.
The following are some of the steps in the processof project preparation:
� Outlining the broad contours of the project. Thiswould be largely in terms of the physical dimensionsof the project.� Analysing demand for the service/product thatwould be provided by the project. This is the trickiestpart of the process and one that is often challengedby bidders of the project at a later stage. The level ofuser fees also sometimes accompanies the analysis ofdemand.� Carrying out a brief techno-economic feasibilityanalysis of the project. This sometimes also involves
5.5 HOW MUCH MORE OF THIS INFLICTION ?:THE CASE OF THE AHMEDABAD–VADODARA EXPRESSWAY11
Amita Gupta and Sebastian Morris
11 This is based on Gupta (2000), and draws much onMorris (1990). The authors are grateful to the Shastri Indo-Canadian Institute for financial support for the former and foran updated study of delays and cost overruns in public sectorprojects.
The quality and especially the carrying capacity ofmajor arterial roads, that is national highways, is of
major concern as these, while constituting merely 3per cent of total Indian road length, carry almost 40per cent of total traffic.
State provisioning of roads is a dominant and wide-spread practice given the major market failures involvedin road building and maintenance. Principally the non-excludable character of roads, the long life of the assets
78 India Infrastructure Report 2001
created, and the network economies in the use of roadshave meant that private appropriability has been aproblem. Yet the social return is very high, becausewithout roads a modern economy with an integratedhome market is hardly possible. Additionally, in aconstrained situation the returns are even greater.
Project implementation by the public sector in Indiahas been a major aspect of state failure. Delays andoverruns in public sector investments have resulted inhigh capital-output ratios economywide, which havereduced the efficacy of investments (Morris 1986).
Government processes for appraisal and approval inIndia have typically involved multiple agencies andapproving authorities, protracted decision making,improper information being available, poor and in-complete appraisal, all of which lead to appraisal andmonitoring being more formal and ritualized thanfunctional and critical. Coordination problems betweenthese agencies have been particularly severe. Addition-ally, inadequate funding, conflicting bureaucratic pur-suits, and direct and indirect political influence innot only the choice of projects but also in priority ofexecution, have been the bases of the massive failurein state provision of infrastructure services in general.Delays and overruns in public sector projects can there-fore be understood in terms of the political economy ofthe public sector itself: the nature of the state and thebureaucracy (Morris 1986).
Delays in project implementation, unlike delays inthe approval and appraisal process, result in directadditional costs to the project enterprise, raising itscapital�output ratio. This may not only be on accountof price escalation but also because expenditures oncemade have to continue throughout the implemen-tation phase. This would result in �deadweight loss� inthe form of assets locked up for a longer period withoutpotential social contribution during the project phase.The loss is to society as a whole; unlike rents whosefirst order effect is only a transfer from society or usersto the corrupt.
Further, pervasive delays can cause deterioration inthe physical state of assets, especially road assets underconstruction. The cost of bringing them back to astate of repair could be large. Thus earthworks, con-structed culverts, cross-drains, etc., when constructedbut not used and maintained, would in a year�s timedefinitely lose their value. The deep roots of the presentconstraints and failures, point to the �hopelessness� ofany piecemeal changes.
The Ahmedabad�Vadodara Expressway, a projectof the Ministry of Surface Trnasport (MoST) presents an�archetypical� case of the delays in public-sector projectimplementation and the attendant cost overruns. After
more than twelve years since its inception it is, in theyear 2000, still only almost 61 per cent complete (asper the Public Works Department [PWD] records),when it was originally expected to be completed in fouryears, that is in 1991! Since 1996, for almost four years,the project has been deteriorating as the governmentremains undecided on the mode of its completion. It isworthwhile to note here that, during January 2000, partsof the project road were being used by a municipality�swater supply project for dumping soil and also forreinforcing the water pipelines!
In 1986, the contracts for construction were separatedinto two packages, the bridge package (comprisingsix contracts) and the road package (comprising sevencontracts). The road package was awarded to a jointventure between M/s Continental Construction Lim-ited (CCL) and Belfour Beathy Construction Limitedin 1987 which broke up in the year 1989. CCL wasreawarded the contract in 1991. Till August 1999, workon the road package was 35 per cent complete (as perPWD estimates). The bridge package was awarded toNational Building Construction Company Limited(NBCC) and Uttar Pradesh State Bridges ConstructionCompany Limited (UPSBC). The contract with NBCCwas terminated on account of poor progress of work butUPSBC was not reawarded the contract until 1993.Work on the bridge package was 86 per cent completeas of August 1999 (as per PWD records).
The anticipated cost overrun in the project worksout to 298.24 per cent and the time overrun to 300per cent on the basis of the PWD�s assessment ofcompletion dates and costs. Such large time and costoverruns necessarily warrant more in-depth analyses.The capital waste12 in the project, that is the extra�time X capital�, is estimated to be as much as 800per cent! This means that the resources used in theproject could have �financed� eight more such projects.This is only indicative of the large waste of capitalresources that characterizes public-sector project imple-mentation.
Such large delays arose because of problems in landacquisition and utility shifting, a protracted processof reawarding contracts and for obtaining foreign ex-change clearances and approvals. Revised cost estimateswere being �approved� only through deferred processeswhich were not final and hence could and were ques-tioned. The contracts required design approvals andreapprovals of changes and modifications, which againresulted in long delays because of too many sequentialstages being involved in the approval process. Besides
12 For a discussion on the notion of �capital waste� in a capital-scarce economy, see Morris (1996).
Structural Issues and Constraints 79
these, the cumbersome procedures involved in therelease of funds, which are typical of departmentalproject implementation were also responsible for delay-ing the project to the point of unviability.
The concept of rate of return in the Ahmedabad�Vadodara Expressway project had become a ritual�measure� and had lost its original meaning. The projectstarted with a high economic internal rate of return(IRR) and ended up with a negative one! The IRR in thevery first estimate, that is in 1982, before the WorldBank (the agency which could have exercised somepressure for task orientation) was 17.39 per cent. Fortwelve years, starting from 1989, toll on the projecthighway was to be collected. Working backwards weestimated the likely cost streams. These amounted toRs 21.57 crore per year for twelve years, with someassumptions. Similarly, benefit streams of the twoother estimates at different points of time work out tobe Rs 138.4 crore and Rs 118.85 crore per annum overthe life of the project respectively. The governmentoverestimated the latter two streams as subsequentdata were to show. Claimed economic IRRs were ashigh as 40.8 per cent, 43.2 per cent, and 30.5 per centat different points in time and in different reports!In reality the predicted cost streams in 1996, when theBOT proposal was submitted, showed a very differentpicture. We worked backwards using the actual coststhat had been incurred and that had yet to be spent(these include the cost of redoing certain parts of theproject road which could not be put to use in thenew expressway), and re-estimated the benefit streamswork out to be negative. The true IRR was revealed onlyat the stage when revised estimates for the project wereprepared.
A more general perverse process is illustrated by thiscase. The true costs of the project are usually notrevealed at the time of approval. This is done to get theproject approved in the first place. This secures thegrounds for revision of cost estimates during implemen-tation. Inadequacy in the appraisal shows up only whenextra works come up for approval and high quantityvariations and price escalations result. Expendituresonce made improve the chances of the further estimatesbeing approved. Even after taking into account this�game playing�, the delays and overruns are real enough,and could be more than half the originally estimatedcosts and time.
According to the government�s own norms, theapproval of the detailed project report should be com-pleted in six months. For the Ahmedabad�VadodaraExpressway project, the time taken was twenty-fivemonths! The delays in approvals resulted in expiry ofthe cost estimates, and new estimates were thus required
to be submitted. These in turn resulted in compoundingof the delays in project implementation.
The appraisal of public projects is carried out withthe help of appraising agencies like the Plan FinanceDivision of the Ministry of Finance, Project AppraisalDivision of Planning Commission, and other �con-cerned� departments and ministries, which have tosend their comments within a month of receivingthe detailed project report. This generally never happens.In the case of this project, it took almost a year forthe Planning Commission to sent its queries to thePWD. An interesting clue to the kind of appraisalthat actually takes place is revealed by the content ofthe questions. Of the sixteen queries, half asked forsome missing �vital� information, and another 40 per centwere clarifications on account of ambiguities in thememorandum sent for approval of the cost estimates in1996.
Appraisal has become a formal process and thecontent of the project if it is at all contained in thepapers is hidden away in the appendices. Improperpreparation of agenda papers and too little time beingavailable to high-level government officers making thedecision affect the quantity and timelines of appraisal.The time limit of one month is hardly sufficient ormeaningful. The actual time taken is much more andthat normally lost in formalities and processes is verylarge. This indicates that the norms and standards thatthe government has set up for itself are at best proceduralrather than functional. In any case, nearly all its normsend up being violated.
Who or what is really responsible for this state ofaffairs? The project enterprise that is providing in-complete and ambiguous information, the appraisingagency/agencies have their own hierarchical and bureau-cratically oriented processes, limited technical expertise,or the administrative ministry or department which isresponsible for coordination? The system and proce-dures are such that there is hardly any allocation ofresponsibility or accountability for delays and slackbehaviour, with the result that blame can never beattributed to individuals or small groups, or even toorganizations.
The political expedience to fund as many projectsas possible tends to increase the number of projectstaken up. This results in spreading thin public resources,which in turn results in inadequate funding of anyparticular project. There was a sanction of Rs 18 croreagainst the Rs 60 crore originally approved for thefinancial year 1993�4 for the Ahmedabad�VadodaraExpressway. The ratio between the amount sanctionedand planned expenditure is 3:33, indicating that nearlytwo more years over and above that planned were at
80 India Infrastructure Report 2001
that time required for completing the project at the thenrate of funding for the project.
The fact that land was provided piecemeal to thecontractor delayed his work and increased his costs.There was a presumption among government officersthat work once started would face minimum resistanceallowing easy acquisition of the rest of the land. Butstay orders from courts and subsequent increments incompensation lead to an increase in the total final costof the project as well as to delays.
The process of project monitoring in the publicsector is again more formal than real and at besthelps generate data. The Department of ProgrammeImplementation (DPI) at central government leveland the implementation agency (project enterprise)�inthis case the PWD�are the important actors. The PWDis answerable to the Ministry of Surface Transport(MoST) while the DPI is an �independent� body withinthe Planning Commission which monitors all centralpublic sector projects. The monthly progress reportsprepared by the PWD are sent to six different agencieslocated at different places and the average time takenfor one such report to reach the six agencies is abouttwo months, which is too long for any corrective actionto be taken. The information provided is ambiguousand is moreover out of date by the time the decision isactually taken.
The DPI�s role is purely advisory. Any action, ifat all, has to be taken by the Roads Wing at the MoST.
The earnings for the Gujarat PWD were on account ofthe 9 per cent agency charges for project implementa-tion that it received from the MoST. This fee is notcontingent on good performance. Budgetary allocationsare not affected even in case of underutilization orunderperformance in particular projects. This is becausethe budgets of the department and the project are notseparated, and the project as such is not, or rather cannotbe, audited separately. The balance sheet in this casewould not reflect the status of the project but that ofthe department, which typically works on a soft budget,where fund allocation is essentially through grants andnot performance based.
The scope for change through internal tensions andmeasures is weak. Change would be difficult and un-likely as long as rules and procedures are seen asinflexible and punishment for poor performance isnon-existent. Corporatization of the involved publicentities, performance agreements, management contracts,hardening of budgets, etc. could to an extent help inreforming Indian public enterprise including depart-ments and departmental enterprises. In Maharashtra,for example, a public body called the MaharashtraState Road Development Corporation (MSRDC), whichfollows commercial principles, has been born out of thetrying conditions of rip off prices being quoted bythe pioneering private sector. Greater public account-ability could quickly come through transparency lawsand information access to the public.
INTRODUCTION
The high population density in India means that it isdifficult to acquire land without displacing people inlarge numbers.13 Even mountainous and semi-arid areasare much more thickly populated than similar areaselsewhere. Most infrastructure projects require largeareas of land and/or right of way in or over the land orright to use the land. The provision of infrastructure hasin the twentieth century been largely a state obligation,met through budgetary support and utilization. Land forinfrastructure and other industrial activities in India hasgenerally been acquired by the �state� for �public pur-poses�. It has been universally accepted that �eminent
domain� is inherent in sovereignty and does not ariseout of the constitution, but independently of it, andmay be exercised in respect of all property by thestate, for public use. The Constitution of India andthe legislative framework governing acquisition of landin India clearly reflect such power of eminent domainin the state. Albeit the state is obliged to follow theprinciples of natural justice and to pay just compensa-tion to the persons deprived of their land.
The urgency for development of infrastructure foroverall economic development of the nation is accompa-nied by increased resistance and opposition to land ac-quisition and the resultant involuntary displacement.The struggle by persons whose lands are sought to beacquired (or those who are otherwise likely to be ad-versely affected by the implementation of the underlyinginfrastructure project) is sometimes, being espoused or
13 There are few large countries which have comparablepopulation densities: Japan, Korea, and China, excluding its�desert� areas, come to mind.
5.6 LAND ACQUISITION: LAW AND PRACTICE
Y. M. Shivamurthy and Vinita Sinha
Structural Issues and Constraints 81
otherwise championed by external agencies includingthe media and the activist groups. There is growingdemand for �sustainable� development. Lack of transpar-ency in declaring the purpose of acquisition, definitionof public purpose, identification and enumeration ofproject-affected persons (PAPs), undue delay in complet-ing the acquisition process, inadequate and/or delayedpayment of compensation, lack of rehabilitation andresettlement plans or implementation and, sometimes,serious procedural lapses have been the prime causesof agitation and consequent delay. The non-availabilityof the required land at an appropriate stage of projectimplementation is a critical risk to be factored, addressed,and mitigated early on during the process of develop-ment of any project, by both the state and projectsponsors. It is in this context that an attempt is madeherein to take a look at the existing framework foracquisition of land and the paradigm shift that is calledfor.
PUBLIC PURPOSE
The principal legislation governing acquisition of landby the state is the Land Acquisition Act, 1894 (hereafterthe Act), with the exception of certain special legislationswhich contain separate provisions for acquisition ofland like the National Highways Act, 1956. The powerto declare a piece of land as being required for a �publicpurpose� reposes with the central government withrespect to acquisition for the purposes of the union andwith the state government with respect to acquisition forany other purposes. The central government or stategovernment as the case may be is referred to in the Actas the �appropriate government�). The appropriategovernment is not ordinarily interfered with by thejudiciary in the exercise of such power. The Act providesfor acquisition of any land when it appears to theappropriate government that such land is needed orlikely to be needed for a public purpose.
Historically, the Act did not define the term �publicpurpose�, and interpretation has remained contentious.The Supreme Court of India has observed that �publicpurpose� has not been defined in a compendious way,for the reason that it is bound to vary with the timesand the prevailing conditions, and therefore it wouldnot be a practical proposition even to attempt a com-prehensive definition of it. It has, however, consistentlyinterpreted the same as a purpose which is beneficialto the community and in which the general interest ofthe community, as opposed to the particular interestof individuals, is directly and vitally concerned.14 This
is not to say that the appropriate government�s powerto declare a tract of land as being required for a publicpurpose is unbridled. If such declaration is tantamoutto the exercise of legislative power, the same can besuccessfully challenged. The Supreme Court�s responseto public concerns not addressed by the Act wasexemplified in a matter involving Coal India Limited inwhich it held that �no development project, howeverlaudable, can possibly justify impoverishment of largesections of people and their utter destitution�.15 Conse-quent to an amendment made by the Land Acquisition(Amendment) Act, 1984 (hereafter the �Amended Act�),the Act now contains an inclusive definition of theterm �public purpose� whereby certain purposes havebeen explicitly declared as public purposes. The Act,however, continues to be silent on the criteria fordeciding what constitutes public purpose. While itmay be true that a precise definition of �public purpose�will not be able to meet the exigencies of changingsituations, the Act must provide certain guidelinesand criteria for deciding public purpose that couldwithstand public scrutiny.
The Supreme Court has held that a change of publicpurpose after the land has been acquired does not vitiatethe acquisition proceedings and that once the originalacquisition is valid and title vested in the acquiringauthority, how the said authority uses the land is ofno concern to the original owner.16 The Supreme Courthas also consistently ruled that land acquired for onepublic purpose can be used for another public purposeon account of change or surplus thereof and that aparticular scheme may serve public purpose at a givenpoint of time but due to change in circumstances itmay become essential to modify or substitute it byanother scheme.17
Thus �requirement� or a �likely requirement� for apublic purpose is sine qua non for acquisition of anyland under the provisions of the Act. Such requirementis a sufficient condition to initiate acquisition proceed-ings. The discretion to decide public purpose has beenleft entirely with the appropriate government and thejudiciary has been reluctant to interfere with the exerciseof such discretion except on the limited grounds ofmalafide. The Act mandates the requirement of a pre-liminary enquiry to ascertain objections, if any, to thepublic purpose for which the land is proposed to beacquired and payment of monetary compensation. Ex-cept for this limited responsibility, the Act does not
14 Babu Barkya Thakur�s case (1961) 1 SCR 128.
15 Lalchand Mahto & Ors vs Coal India Limited, Civil OriginalJurisdiction, MP No. 196331 of 1982.
16 Ghulam Mustafa (1976) 1 SCC 800.17 Mahadeo Deoman Rai (1990) 3 SCC 579.
82 India Infrastructure Report 2001
enjoin upon the appropriate government any obligationto assess and address the rehabilitation and resettlementand other socio-economic implications.
ACQUISITION PROCEDURE
The procedure for acquisition envisaged under theAct involves, broadly, a preliminary inquiry by theCollector to ascertain objections, if any, of the interestedpersons to the proposed acquisition, affording theinterested persons an opportunity of being heard, dec-laration as to public purpose by the appropriate govern-ment after considering the report of the Collector,passing of an award by the Collector after determiningthe true area of the land acquired, and quantification andapportionment of the compensation payable to theinterested persons. The Act has conferred a specialpower on the appropriate government to be exercisedin case of urgency, pursuant of which the appropriategovernment may take possession of the land pendingpassing of the award but subject to tendering theprescribed compensation. Prior to the enactment of theAmendment Act, there did not exist any time-frame formaking declaration by the appropriate government as topublic purpose or passing of award by the Collector.Though the Amendment Act provided for a time-framein these regards, this did not apply to cases of acquisi-tions under the urgency provisions. Thus ironically,while the time-frame operates for acquisition proceed-ings in which dispossession has not taken place, it doesnot apply to cases in which the owner is dispossessed ofhis land under the urgency provisions. This lacuna in theAmending Act has been highlighted by the SupremeCourt which has held that the time-frame prescribedunder the Act can have no application to cases ofacquisition under the urgency provisions because theland gets vested in the appropriate government and thereis no provision in the Act whereby land statutorilyvested in the appropriate government can revert to theowner.18
The appropriate government is empowered to with-draw from the acquisition proceedings upon paymentof compensation for the damage suffered by the ownerin consequence of the acquisition proceedings as longas possession has not been taken. The owner�s right todamages is restricted only to cases of withdrawal of theacquisition proceedings and does not extend to caseswhere such proceedings have lapsed due to the Collector�sfailure to make the award within the prescribed time-frame. This distinction has been upheld by the Supreme
Court.19 Due to this infirmity, the Amendment Act hasproved to be futile in benefiting owners whose land isacquired under the urgency provisions.
Besides addressing the issue of delayed acquisition byprescribing a time-frame, the Amendment Act broughtabout certain other changes in the Act including (a)better means of spreading information about the pro-posed acquisition; (b) provision for review, revision,and correction of the award before it is made final;(c) payment of 80 per cent of the amount of compen-sation when possession is taken using the special powersin case of urgency; (d) interest payment at 15 per centper annum if the deposit of compensation determinedby the court is delayed beyond a period of one year fromthe date of taking possession; and (e) remedy to seekcompensation based on determination by the Courteven by those who were not party to such determina-tion.
The existing acquisition process however continuesto adopt a residual approach to dealing with personsaffected by the land acquisition proceedings as it doesnot involve participation of such persons at the pre-proposal stage. The acquisition process invariably meetswith stiff resistance from the affected persons, who seeacquisition as not only leading to physical dislocationfrom their land and loss of income but as also causingsocial, cultural, and psychological problems in reloca-tion in new and different surroundings.
The process of land acquisition involves, amongstothers, hearing of objections and determination of claimsof all persons claiming to be interested in the compen-sation amount. While the legislative intent behind thiscannot be faulted, often serious problems arise becauseof incorrect, incomplete, or inadequate land recordsthat make identification of interested persons difficult,and often protracted, because of rival claims. One of thereasons for the inadequate land records is that land-related transaction costs are onerous. Apart from formaltransaction costs, viz. registration fees and stamp duties,there exist informal transaction costs which includethe cost of making repeated visits to the tehsildar�s andregistrar�s office, speed money payments, etc. to expe-dite issuance of relevant documents. Further, the processof effecting mutation in land records often takes decadesor longer. This problem gets accentuated with risingactivity in land markets and demographic pressure.Though the production of documents of title is obliga-tory for all such transaction relating to land, thesedocuments are private documents and do not guaranteetitle. In a large part of India no survey and settlementoperations have been undertaken after independence.
18 S. P. Jain (1993) 4 SCC 369, Awadh Bihari Yadav (1995)6 SCC 31. 19 Abdul Majeed Sahib (1997) 1 SCC 297.
Structural Issues and Constraints 83
As a consequence, updating of records has suffered andthese records no longer represent the ground realitiesrelating to ownership and possession. A centrally spon-sored scheme for computerization of land records hasstill not been implemented in most states.
COMPENSATION
The Act envisages relief by payment of monetarycompensation, based on the Collector�s assessment or asdetermined by the court upon a reference made to it.While there are certain guidelines for courts to arrive atthe compensation payable, the same are absent in caseof assessment by the Collector. The guiding factorsfor courts include a consideration of the market valueof the land acquired, damage sustained by reason oftaking of any standing crop or trees, damage on accountof severance of land from other land of the interestedperson, damage sustained to other property, movableor immovable, while taking possession, reasonableexpenses incidental to change of residence or place ofbusiness and damage bonafide resulting from diminutionof the profits of the land between the time of publicationof declaration and taking of possession. The Act alsoprovides for payment of interest of 12 per cent perannum on market value from the date of preliminarynotification to the date of taking possession and pay-ment of 30 per cent of the market value of the landas compensation for the compulsory nature of acquisi-tion.
The compensation determined by the Collector canbe objected to by owners on the grounds of measure-ment of the land, the quantum of compensation, thepersons to whom the compensation is payable, or theapportionment of compensation among the personsinterested. A reference to the court may be sought fordetermination of compensation but the Act does notprescribe any time-frame for the Collector to make thereference. This deficiency is significant for it is notunknown that the Collectors take their own time inmaking the reference prolonging the hardship caused toowners. The Supreme Court has noted that a �seriousview should be taken of the fact that applications forreference are withheld by the Land Acquisition Officerswithout disposal for time beyond any explanation�.20
Additionally, Collectors/Land Acquisition Officersdo not have the power to condone delay in makingthe application for reference. Appeals against theCollector�s order is not possible. The only remedy leftto the owners is to file a writ petition at the concernedHigh Courts.
The Amending Act that introduced a time-frame forvarious steps in the acquisition proceedings includinga time-frame for the award of compensation, did notprovide a time-frame for taking possession of the landor payment of compensation. The issue of delayedcompensation was dealt with by the Supreme Court inthe case of the Lower Manair Dam Reservoir Project inAndhra Pradesh, wherein the said Court prevented theremand of the matter to District Courts for determina-tion of compensation and observed that with risinginflation, the delayed payment lost all charm and utilityand might even get detrimental to the interests of theclaimants and that Indian agriculturists wholly dependedon land, and if uprooted would find themselves no-where. In the same matter, the Supreme Court recog-nized the need for rehabilitation to prevent theimpoverishment and starvation of such people.21
The compensation awarded by the Collector can bepredetermined by him/her on the basis of the awardof the court to which a reference is made under theAct (Reference Court). This provision was introducedby the Amendment Act with the objective of removinginequality in the payment of compensation for similarland to different persons and also to provide the remedyof seeking enhancement of compensation to thosewho had accepted the compensation awarded by theCollector. But this laudable amendment has a restrictedscope in as much as the Supreme Court has held thatredetermination can be sought only on the basis ofthe award of the Reference Court and not pursuantto enhancement by the Supreme Court or the HighCourt.22
The Supreme Court, in the early decades, dealt withcases relating to compensation merely to see if thecorrect method of valuation and suitable multiplierswere applied to determine the market value of land.In the last two decades, there has been a change in theresponse of courts to issues of compensation and therelief given by courts now ensures protection of therights of the persons affected and aims to includethem as beneficiaries of the project. The Supreme Courtin the case of acquisition of land for planned urbandevelopment by the Meerut Development Authorityobserved that the wholesome principle containedin the Delhi Development Act, 1957 relating to pro-viding of accommodation on the land developed bythe Authority to the original owners should befollowed by all Development Authorities throughoutthe country for acquisition of land in urban areas.23
20 Mangat Ram Tanwar AIR 1991 SC 1080.
21 (1988) 4 SCC 163.22 Bant Ram (1996) 4 SCC 537, Bhagti (1997) 4 SCC 473.23 (1986) 4 SCC 251.
84 India Infrastructure Report 2001
This principle was reiterated in the case of acquisitionof land for the purpose of setting up New Bombaywherein the Supreme Court went a step further, anddirected the authorities to offer alternative sites, as perthe scheme framed in 1976, to affected landowners, onthe basis of the actual cost of development by chargingthe cost of acquisition and development and no more,so that the offer of alternative site does not becomeillusory.24
Though the Act continues to mandate the paymentof monetary compensation, the Supreme Court hasshown a clear shift in looking at compensation as notmerely a valuation issue but as a human issue affectingthe lives and livelihoods of hundreds of people. In thecase of the Pong Dam on river Beas, the Supreme Courtexpressed its dismay that some of the oustees remainedunsettled even twenty-four years after acquisition andobserved that oustees who belonged to Himachal Pradeshhad been disfavoured in the matter of resettlement.The Court then went on to give detailed directions forawarding the oustees their due in the resettlementpackage.25
RESETTLEMENT AND REHABILITATION
While the Act continued to remain silent on issues ofresettlement and rehabilitation, the courts recognizedthe issue of displacements caused by developmentprojects. In the matter of resettlement under the damproject over river Karjan in Gujarat, the Supreme Courtobserved that though it understood the anxiety of thegovernment in acquiring land for building the dam, itcould not overlook the human problem arising out ofdisplacement of a large number of tribals and otherpersons belonging to the weaker section of society.It laid down conditions, in the nature of a schemewhich permitted dis-possession of land only in thepresence of NGOs or the Judicial Magistrate, mainte-nance of records of the landholders, adequate noticebefore acquisition, alternative land or employment orpayment of minimum wage every fortnight during theperiod alternative land or employment was not pro-vided, alternative dwelling, etc. It is pertinent to notethat the Supreme Court even attempted to monitorthe implementation of the scheme by directing theJudicial Magistrate to submit to it a report with regardto the implementation.26 Recently, the Supreme Courthas even touched upon the principle of minimizingdisplacement in a case relating to acquisition for
construction of a public passage for a religious proces-sion. The Court quashed the acquisition proceedingson the grounds that the route of the procession couldeasily and conveniently be diverted without disturbingthe affected person�s shop.27 This judgement upheldthe principle of resorting to displacement only after allother viable means have been considered and rejected.In the case of the Gramin Sewa Sanstha the SupremeCourt expressed its inability to understand the reasonsfor not bringing the Hasdeo Bango Dam Projectunder the Madhya Pradesh Projects Displaced Persons(Resettlement) Act, 1985 which had been enactedwith the objective and purpose of resettlement andrehabilitation of tribals uprooted by the projectsundertaken by the state government, and directed thestate government to give effect to its policy and touse the guidelines on resettlement and rehabilitationin various reports including the report of the WorldBank with regard to the dams being constructed inGujarat.28 In another case of acquisition in Mumbai,the Supreme Court upheld the contention that theGovernment of Maharashtra must implement its policydecision to offer alternative sites to affected landown-ers.29
While judicial activism has played an important rolein dealing with the larger issues arising out of landacquisition for public purposes, the absence of anynational law or policy on resettlement and rehabilitationof project-displaced persons has led some states likeMaharashtra, Madhya Pradesh, Karnataka, Rajasthan,Orissa, and corporations like the National ThermalPower Corporation, Coal India Limited, and PowerGrid Corporation of India Limited, to come out withtheir own Acts/policies on resettlement and rehabilita-tion. Projects undertaken for development purposesremain meaningless if the local population does notbenefit from the development process and continues toget impoverished. It is in this context that a nationalpolicy for resettlement and rehabilitation must be for-mulated with the objective of securing peaceful posses-sion of land with minimum displacement. The policymust introduce a regime of planned rehabilitation andresettlement by enabling the affected communities toassess and react in an informed way to the policy andensure their full participation in preparing, assessing,implementing, and monitoring the rehabilitation andresettlement schemes. The policy must incorporatethe principles of (i) minimizing displacement; (ii) estab-lishment of �national interest� and �public purpose�
24 (1993) 3 SCC 634.25 (1996) 9 SCC 749.26 (1986) Supp SCC 350.
27 Jnanedays Yogam (1999) 9 SCC 492.28 (1986) Supp SCC 578.29 (1993) 3 SCC 634.
Structural Issues and Constraints 85
before formulating the resettlement programme; (iii)expansion of the definition of displaced persons beyondlandowners to include those who depend for sustenanceon land owned by others or on common propertyresources; (iv) welfare of displaced persons as a precon-dition for the project; (v) mandatory rehabilitationleading to better lifestyle after displacement thanbefore it; (vi) advance identification of the personsaffected; (vii) replacement value to be the norm forcompensation against the present norm of market value;(viii) land for land as preferred compensation for reha-bilitation of persons affected and mandatory for tribals;(ix) making acquisition of land cost-effective by minimiz-ing resistance; (x) prevention of misuse of the rehabili-tation package; and (xi) implementation and monitoringof the rehabilitation programme.
It is interesting and indeed strange that while we stilldebate the formulation of a policy for resettlement andrehabilitation, China with a higher population has inplace a systematic and democratic resettlement policy.The Chinese policy begins with a preliminary study onresettlement at the pre-feasibility planning stage of theproject. At this stage an estimate and description of thescope of the resettlement plan is a necessary componentof acquiring state approval to proceed to the feasibilitylevel of the project. At the next, feasibility-level, study,local governments and the affected population are in-volved in the planning process. The initial surveyestablishes an administrative framework for planningand administering the resettlement programme andinforms the affected persons of the anticipated project.The resettlement programme is then developed aspart of the schedule of project construction. Beyondphysical relocation, the Chinese policy includes apost-relocation phase of the project and provides formore than the immediate needs of the relocated popu-lation within the framework of the resettlementprogramme. The resettlement policy of China isapplied uniformly throughout the country and hasnow become a benchmark for the rest of the world.(For a rather different and ham-handed approach adoptedby the Gujarat government, see Box 5.6.1).
SUGGESTED AMENDMENTS TO THE
LEGISLATIVE FRAMEWORK
The adoption of an appropriate policy for resettlementand rehabilitation should be followed by an equallyappropriate change in the legislative framework foracquisition of land and for dealing with issues arisingtherefrom. In this regard, either a comprehensiveamendment to the Act or adoption of an altogethernew legislation seems imperative and integral. The
changes in legislative framework should include (i) changein the definition of �persons interested� to includepersons who depend for sustenance on the land proposedto be acquired or on common property resources pro-posed to be utilized for any project; (ii) criteria fordeciding �public purpose�; (iii) resettlement value asthe basis for compensation in place of market value;(iv) mandatory resettlement and rehabilitation, thecost of which would be borne by the acquiringbody; (v) updation of land records and completion ofdocumentation before initiating acquisition; (vi) properdissemination of information regarding the acquisitionproceedings; (vii) mandatory payment of monetarycompensation before taking possession of the land;(viii) guidelines for determination and assessment ofcompensation; (ix) time-frame for taking possession andmaking payment of the compensation; (x) provision tocheck speculative transactions in land after the initialnotification for acquisition; (xi) provision to check ex-cessive acquisition of land, and (xii) provisions to addressthe issues highlighted by the Supreme Court in thecatena of judgements discussed earlier.
CONCLUSION
There is need for a paradigm shift in the policy andlegislative framework for acquisition of land. Withincreasing resistance to compulsory acquisitions andorganized movements of people against implementationof projects with vast societal benefits as a whole, anyprocess for acquisition of land has to be democratizedand must involve those who are likely to be adverselyaffected thereby. The objective of the policy for resettle-ment and rehabilitation should be to minimize displace-ment and provide relief to not only those who aredeprived of land but also to those who are otherwiseadversely affected by the project. �Public interest� shouldbe very clearly defined and in a manner that does notallow governments to cover all uses. Acquisition mustbe preceded by a complete study of the impact of theproject on the persons inhabiting and dependent on theland sought to be acquired, followed by a resettlementprogramme. The resettlement and rehabilitation of dis-placed persons should not be seen as a set of palliativemeasures for welfare and relief but as an integral part ofdevelopment and implementation of projects. Thenthose displaced would have the first rights to the benefitsfrom the project. In any case, �case law� would demandthat those affected should not be worse off than theywere before. Such a paradigm shift would, while smooth-ening the process of land acquisition, also facilitategrowth of infrastructure development through privatesector participation.
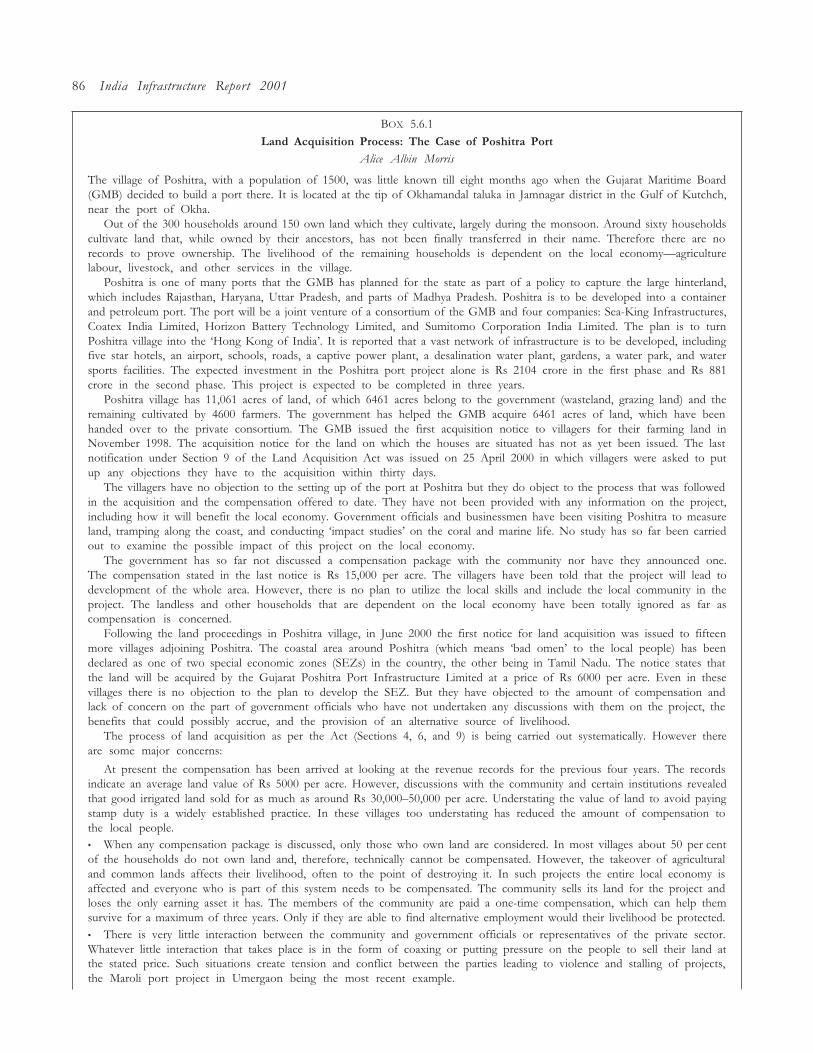
86 India Infrastructure Report 2001
BOX 5.6.1
Land Acquisition Process: The Case of Poshitra Port
Alice Albin Morris
The village of Poshitra, with a population of 1500, was little known till eight months ago when the Gujarat Maritime Board(GMB) decided to build a port there. It is located at the tip of Okhamandal taluka in Jamnagar district in the Gulf of Kutchch,near the port of Okha.
Out of the 300 households around 150 own land which they cultivate, largely during the monsoon. Around sixty householdscultivate land that, while owned by their ancestors, has not been finally transferred in their name. Therefore there are norecords to prove ownership. The livelihood of the remaining households is dependent on the local economy�agriculturelabour, livestock, and other services in the village.
Poshitra is one of many ports that the GMB has planned for the state as part of a policy to capture the large hinterland,which includes Rajasthan, Haryana, Uttar Pradesh, and parts of Madhya Pradesh. Poshitra is to be developed into a containerand petroleum port. The port will be a joint venture of a consortium of the GMB and four companies: Sea-King Infrastructures,Coatex India Limited, Horizon Battery Technology Limited, and Sumitomo Corporation India Limited. The plan is to turnPoshitra village into the �Hong Kong of India�. It is reported that a vast network of infrastructure is to be developed, includingfive star hotels, an airport, schools, roads, a captive power plant, a desalination water plant, gardens, a water park, and watersports facilities. The expected investment in the Poshitra port project alone is Rs 2104 crore in the first phase and Rs 881crore in the second phase. This project is expected to be completed in three years.
Poshitra village has 11,061 acres of land, of which 6461 acres belong to the government (wasteland, grazing land) and theremaining cultivated by 4600 farmers. The government has helped the GMB acquire 6461 acres of land, which have beenhanded over to the private consortium. The GMB issued the first acquisition notice to villagers for their farming land inNovember 1998. The acquisition notice for the land on which the houses are situated has not as yet been issued. The lastnotification under Section 9 of the Land Acquisition Act was issued on 25 April 2000 in which villagers were asked to putup any objections they have to the acquisition within thirty days.
The villagers have no objection to the setting up of the port at Poshitra but they do object to the process that was followedin the acquisition and the compensation offered to date. They have not been provided with any information on the project,including how it will benefit the local economy. Government officials and businessmen have been visiting Poshitra to measureland, tramping along the coast, and conducting �impact studies� on the coral and marine life. No study has so far been carriedout to examine the possible impact of this project on the local economy.
The government has so far not discussed a compensation package with the community nor have they announced one.The compensation stated in the last notice is Rs 15,000 per acre. The villagers have been told that the project will lead todevelopment of the whole area. However, there is no plan to utilize the local skills and include the local community in theproject. The landless and other households that are dependent on the local economy have been totally ignored as far ascompensation is concerned.
Following the land proceedings in Poshitra village, in June 2000 the first notice for land acquisition was issued to fifteenmore villages adjoining Poshitra. The coastal area around Poshitra (which means �bad omen� to the local people) has beendeclared as one of two special economic zones (SEZs) in the country, the other being in Tamil Nadu. The notice states thatthe land will be acquired by the Gujarat Poshitra Port Infrastructure Limited at a price of Rs 6000 per acre. Even in thesevillages there is no objection to the plan to develop the SEZ. But they have objected to the amount of compensation andlack of concern on the part of government officials who have not undertaken any discussions with them on the project, thebenefits that could possibly accrue, and the provision of an alternative source of livelihood.
The process of land acquisition as per the Act (Sections 4, 6, and 9) is being carried out systematically. However thereare some major concerns:
At present the compensation has been arrived at looking at the revenue records for the previous four years. The recordsindicate an average land value of Rs 5000 per acre. However, discussions with the community and certain institutions revealedthat good irrigated land sold for as much as around Rs 30,000�50,000 per acre. Understating the value of land to avoid payingstamp duty is a widely established practice. In these villages too understating has reduced the amount of compensation tothe local people.� When any compensation package is discussed, only those who own land are considered. In most villages about 50 per centof the households do not own land and, therefore, technically cannot be compensated. However, the takeover of agriculturaland common lands affects their livelihood, often to the point of destroying it. In such projects the entire local economy isaffected and everyone who is part of this system needs to be compensated. The community sells its land for the project andloses the only earning asset it has. The members of the community are paid a one-time compensation, which can help themsurvive for a maximum of three years. Only if they are able to find alternative employment would their livelihood be protected.� There is very little interaction between the community and government officials or representatives of the private sector.Whatever little interaction that takes place is in the form of coaxing or putting pressure on the people to sell their land atthe stated price. Such situations create tension and conflict between the parties leading to violence and stalling of projects,the Maroli port project in Umergaon being the most recent example.
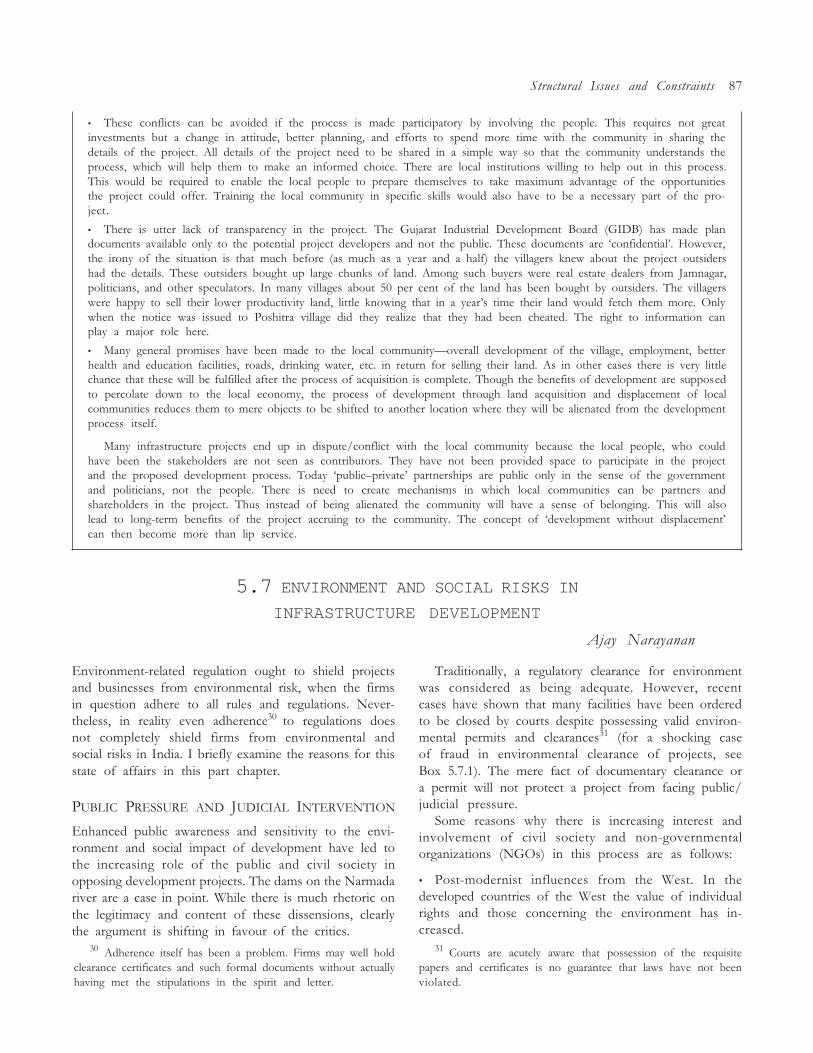
Structural Issues and Constraints 87
31 Courts are acutely aware that possession of the requisitepapers and certificates is no guarantee that laws have not beenviolated.
30 Adherence itself has been a problem. Firms may well holdclearance certificates and such formal documents without actuallyhaving met the stipulations in the spirit and letter.
� These conflicts can be avoided if the process is made participatory by involving the people. This requires not greatinvestments but a change in attitude, better planning, and efforts to spend more time with the community in sharing thedetails of the project. All details of the project need to be shared in a simple way so that the community understands theprocess, which will help them to make an informed choice. There are local institutions willing to help out in this process.This would be required to enable the local people to prepare themselves to take maximum advantage of the opportunitiesthe project could offer. Training the local community in specific skills would also have to be a necessary part of the pro-ject.
� There is utter lack of transparency in the project. The Gujarat Industrial Development Board (GIDB) has made plandocuments available only to the potential project developers and not the public. These documents are �confidential�. However,the irony of the situation is that much before (as much as a year and a half) the villagers knew about the project outsidershad the details. These outsiders bought up large chunks of land. Among such buyers were real estate dealers from Jamnagar,politicians, and other speculators. In many villages about 50 per cent of the land has been bought by outsiders. The villagerswere happy to sell their lower productivity land, little knowing that in a year�s time their land would fetch them more. Onlywhen the notice was issued to Poshitra village did they realize that they had been cheated. The right to information canplay a major role here.
� Many general promises have been made to the local community�overall development of the village, employment, betterhealth and education facilities, roads, drinking water, etc. in return for selling their land. As in other cases there is very littlechance that these will be fulfilled after the process of acquisition is complete. Though the benefits of development are supposedto percolate down to the local economy, the process of development through land acquisition and displacement of localcommunities reduces them to mere objects to be shifted to another location where they will be alienated from the developmentprocess itself.
Many infrastructure projects end up in dispute/conflict with the local community because the local people, who couldhave been the stakeholders are not seen as contributors. They have not been provided space to participate in the projectand the proposed development process. Today �public�private� partnerships are public only in the sense of the governmentand politicians, not the people. There is need to create mechanisms in which local communities can be partners andshareholders in the project. Thus instead of being alienated the community will have a sense of belonging. This will alsolead to long-term benefits of the project accruing to the community. The concept of �development without displacement�can then become more than lip service.
5.7 ENVIRONMENT AND SOCIAL RISKS IN
INFRASTRUCTURE DEVELOPMENT
Ajay Narayanan
Traditionally, a regulatory clearance for environmentwas considered as being adequate. However, recentcases have shown that many facilities have been orderedto be closed by courts despite possessing valid environ-mental permits and clearances31 (for a shocking caseof fraud in environmental clearance of projects, seeBox 5.7.1). The mere fact of documentary clearance ora permit will not protect a project from facing public/judicial pressure.
Some reasons why there is increasing interest andinvolvement of civil society and non-governmentalorganizations (NGOs) in this process are as follows:
� Post-modernist influences from the West. In thedeveloped countries of the West the value of individualrights and those concerning the environment has in-creased.
Environment-related regulation ought to shield projectsand businesses from environmental risk, when the firmsin question adhere to all rules and regulations. Never-theless, in reality even adherence30 to regulations doesnot completely shield firms from environmental andsocial risks in India. I briefly examine the reasons for thisstate of affairs in this part chapter.
PUBLIC PRESSURE AND JUDICIAL INTERVENTION
Enhanced public awareness and sensitivity to the envi-ronment and social impact of development have led tothe increasing role of the public and civil society inopposing development projects. The dams on the Narmadariver are a case in point. While there is much rhetoric onthe legitimacy and content of these dissensions, clearlythe argument is shifting in favour of the critics.
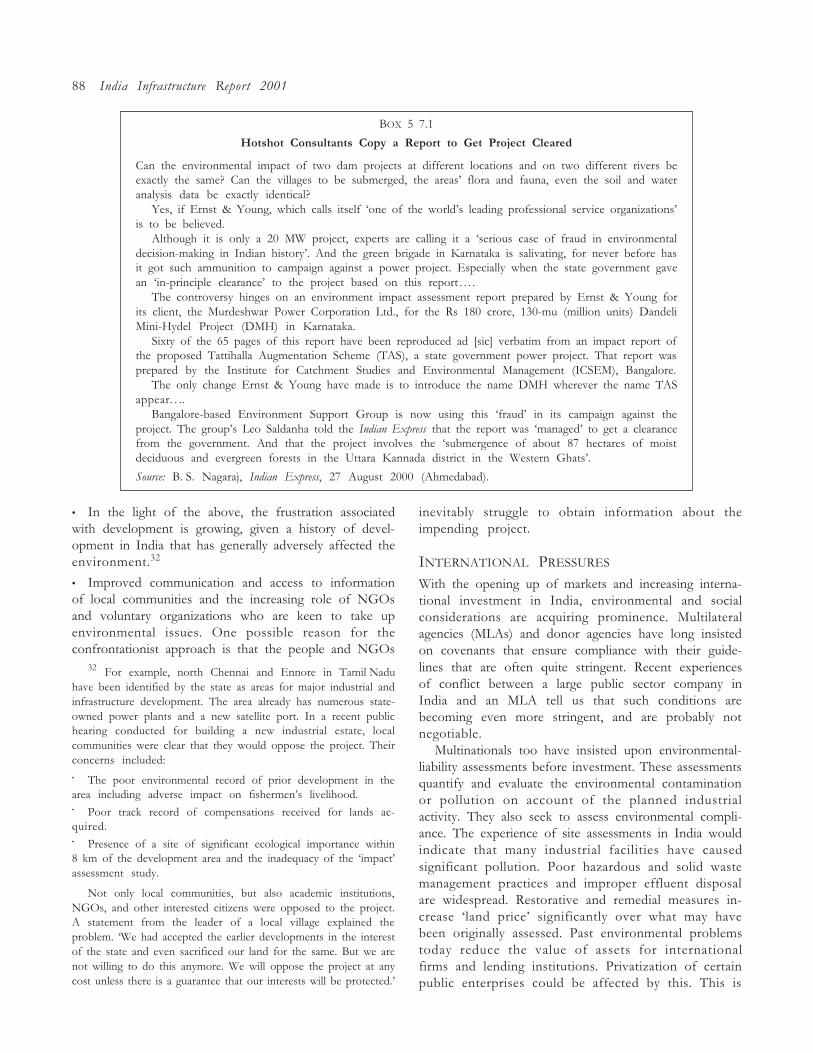
88 India Infrastructure Report 2001
BOX 5 7.1
Hotshot Consultants Copy a Report to Get Project Cleared
Can the environmental impact of two dam projects at different locations and on two different rivers beexactly the same? Can the villages to be submerged, the areas� flora and fauna, even the soil and wateranalysis data be exactly identical?
Yes, if Ernst & Young, which calls itself �one of the world�s leading professional service organizations�is to be believed.
Although it is only a 20 MW project, experts are calling it a �serious case of fraud in environmentaldecision-making in Indian history�. And the green brigade in Karnataka is salivating, for never before hasit got such ammunition to campaign against a power project. Especially when the state government gavean �in-principle clearance� to the project based on this report . . . .
The controversy hinges on an environment impact assessment report prepared by Ernst & Young forits client, the Murdeshwar Power Corporation Ltd., for the Rs 180 crore, 130-mu (million units) DandeliMini-Hydel Project (DMH) in Karnataka.
Sixty of the 65 pages of this report have been reproduced ad [sic] verbatim from an impact report ofthe proposed Tattihalla Augmentation Scheme (TAS), a state government power project. That report wasprepared by the Institute for Catchment Studies and Environmental Management (ICSEM), Bangalore.
The only change Ernst & Young have made is to introduce the name DMH wherever the name TASappear. . ..
Bangalore-based Environment Support Group is now using this �fraud� in its campaign against theproject. The group�s Leo Saldanha told the Indian Express that the report was �managed� to get a clearancefrom the government. And that the project involves the �submergence of about 87 hectares of moistdeciduous and evergreen forests in the Uttara Kannada district in the Western Ghats�.
Source: B. S. Nagaraj, Indian Express, 27 August 2000 (Ahmedabad).
32 For example, north Chennai and Ennore in Tamil Naduhave been identified by the state as areas for major industrial andinfrastructure development. The area already has numerous state-owned power plants and a new satellite port. In a recent publichearing conducted for building a new industrial estate, localcommunities were clear that they would oppose the project. Theirconcerns included:� The poor environmental record of prior development in thearea including adverse impact on fishermen�s livelihood.� Poor track record of compensations received for lands ac-quired.� Presence of a site of significant ecological importance within8 km of the development area and the inadequacy of the �impact�assessment study.
Not only local communities, but also academic institutions,NGOs, and other interested citizens were opposed to the project.A statement from the leader of a local village explained theproblem. �We had accepted the earlier developments in the interestof the state and even sacrificed our land for the same. But we arenot willing to do this anymore. We will oppose the project at anycost unless there is a guarantee that our interests will be protected.�
� In the light of the above, the frustration associatedwith development is growing, given a history of devel-opment in India that has generally adversely affected theenvironment.32
� Improved communication and access to informationof local communities and the increasing role of NGOsand voluntary organizations who are keen to take upenvironmental issues. One possible reason for theconfrontationist approach is that the people and NGOs
inevitably struggle to obtain information about theimpending project.
INTERNATIONAL PRESSURES
With the opening up of markets and increasing interna-tional investment in India, environmental and socialconsiderations are acquiring prominence. Multilateralagencies (MLAs) and donor agencies have long insistedon covenants that ensure compliance with their guide-lines that are often quite stringent. Recent experiencesof conflict between a large public sector company inIndia and an MLA tell us that such conditions arebecoming even more stringent, and are probably notnegotiable.
Multinationals too have insisted upon environmental-liability assessments before investment. These assessmentsquantify and evaluate the environmental contaminationor pollution on account of the planned industrialactivity. They also seek to assess environmental compli-ance. The experience of site assessments in India wouldindicate that many industrial facilities have causedsignificant pollution. Poor hazardous and solid wastemanagement practices and improper effluent disposalare widespread. Restorative and remedial measures in-crease �land price� significantly over what may havebeen originally assessed. Past environmental problemstoday reduce the value of assets for internationalfirms and lending institutions. Privatization of certainpublic enterprises could be affected by this. This is
Structural Issues and Constraints 89
particularly true of state-level, and infrastructure-relatedpublic enterprise.
The Bretton Woods institutions have been muchinfluenced by environmental movements includingpublic protests. The recent disruption of talks at Seattleby NGO groups is a case in point. Environment andsocial issues, human rights, child labour, social justice,and equity are no longer mere ritual statements in theannual reports of many corporates. The emergence of�voluntary� environmental reporting standards indicatesthat environmental concerns and accountability are nolonger a matter between the regulator and a company,but one integrally involving the public.
Importantly, the struggle between �development andenvironment� in India has generally been a rather inef-ficient negotiation process. Protests start well aftersignificant investment has been made. Attempts to �forcethe construction through at any cost�, with a corre-sponding response to block the project, has become anot uncommon pattern in India. And in the end irrespec-tive of who wins, society as a whole would mostcertainly have lost.33 It goes without saying that theenvironmental issues need to be addressed holistically,at the time projects are conceived.
REGULATORY FRAMEWORK FOR THE
ENVIRONMENT
Environment legislations that are critical in addressingproject development risks are as follows:
� The Environment Protection Rules that define emis-sion and discharge standards.
� The Environment Impact Assessment (EIA) notifica-tion that requires that every large project�s environmen-tal impact be evaluated and mitigated. Such an evaluationand mitigation plan is the basis for the government�sclearance for the project.
� The State Air and Water Rules that require projectsto obtain permission from State Pollution ControlBoards to establish and operate.
There are also a few notifications and legislations thatare impractical and are doomed to fail. Prominentamong these is the notification that requires that use bemade of fly ash, large quantities of which are producedin coal-burning power plants. Use of fly ash in thequantities that typical power plants produce is hardlypossible. And the notification therefore would notsucceed.
The Land Acquisition Act 1894 (the Act hereafter)and modifications subsequently contain the followingpro-visions that make land acquisition contentious, andsometimes unfair to those whose lands are acquired.
� The state has the right to acquire land for any projectdeemed to be in the �public interest�. The definition of�public interest� is unclear and has often been the locusof much controversy.
� There is usually little or no local consultation orparticipation. Notifications are served more to meetthe requirements of the law than to ensure that allconcerned have been informed.
� Comments and objections are only permitted withreference to the compensation amount.
� There is also a provision for �emergency� acquisitionof land which does away with the steps wherein publicobjections could heard. The conditions under whichemergency acquisition can be instituted are not welldefined, resulting in controversy.
� The Act as such does not provide that compensationnecessarily be paid before possession of the land istaken.34
� In many cases, after acquiring land, the governmentis unable to either use it for the original purpose or todo so only partially.35 Under such circumstances, the
33 Sardar Sarovar has already cost Gujarat state $ 1.5 billionand officials say stoppage of work on the dam is costing thegovernment $ 500,000 a day in interest alone, and delaying power,irrigation, and drinking water projects.
34 For the Hirakud dam in Orissa, 112,038.59 acres of culti-vated land were acquired in the 1950s and today, fifty yearslater, according to the Orissa government, approximately Rs 6crore (of the assessed compensation of about Rs 9 crore) has notreached the 3098 affected families.
Land for the BSF training centre near Hazaribagh in Bihar wasacquired in the 1960s. Today, thirty years later, only a few landlosers have received compensation. There are numerous similarinstances where land has been acquired but the land losers havenot been compensated. The option available to the land losers insuch instances is to approach the courts. Data illustrate that inmost cases the courts have enhanced the compensation payableand have directed the government to deposit additional funds asdecretal charges on land acquisition. However, these reach onlythe affluent few because not all the land losers have the resourcesto approach the courts for redressal.
35 The propriety of land acquisition has to go beyond thequantum of compensation. Other aspects like the purpose ofacquisition, the extent of acquisition, the probable uses of theacquired land are equally questionable. For example, in Orissa7297 and 12,195.52 acres of tribal land were acquired for twodifferent defence purposes in the 1960s and 1980s, respectively.Today, nearly half of it still lies unused or vacant. This has beena norm rather than an exception, as in the case of industrial estates,where state industrial infrastructural development bodies acquireland, set up an industrial estate, and then search for entrepreneursinterested in using the facilities. More than a third of all industrialestate space has never found use!
90 India Infrastructure Report 2001
land remains with the project or the state, unlike underEnglish law where it reverts to the original owner.
Another weakness in land-acquisition-related legisla-tion in the country is that there is no provision thatensures that the land required for a public purpose isappropriate and not excessive. Different acquisitionproposals for similar purposes in different parts of thecountry have been found to vary to the extent of 1000per cent. For example, a sugar plant in Andhra Pradeshrequired 35 acres of land, while another plant in Orissa,of the same production capacity, requested the Orissagovernment for 350 acres of land. Some tribal districtshave protective land alienation laws. It is observed thatthe overriding character of the Act is exploited to avoidthe clauses of the alienation laws. Tribal land is notifiedto be acquired in such areas either for an undefined orfictitious public purpose. Once land acquisition is over,the ownership of those lands change from �tribal� to�government� land. The purpose is then abandoned andthe said land transferred to housing cooperatives orother private bodies.
� While there is much case law (that has emerged outof the practice) that seeks to protect the interests ofproject-affected peoples (PAPs), this has not been incor-porated into legislation and the prescribed procedure.Case law can therefore apply only when a matter isreferred to court.
� The focus of the Act is on the process of acquisition,not the impact it has on PAPs. As a result the followingaspects are largely ignored:
� loss of livelihood to land owners as well as landlesslabourers;
� disarticulation of communities on account ofsettlements being divided;
� improper provisions for resettlement where liveli-hood and access to facilities are not provided in theresettlement sites;
� loss of common property and resources such aswells, grazing grounds, etc.
The Draft National Policy on Rehabilitation andResettlement (DNPR&R) that has been under consider-ation for many years attempts to address most of theabove issues but has still not seen the light of day. In theinterim there is a Draft 1998 Land Acquisition Bill thatis presently under consideration. This Bill largely ignoresmany of the principles that the DNPR&R had broughtout. While the Bill does seek to enhance compensation,it largely follows the framework of the Act and maynot be adequate to ensure that project development cantake place in a smooth and equitable manner.
THE WAY FORWARD
Suggestions for improvements in legislation and imple-mentation include:
� Rationalization of legislation and strengthening ofimplementation and monitoring. Legislation should beviewed in a holistic manner and institutional mecha-nisms for enforcement should also be defined along withthe legislation.
� The penalties for non-compliance, both on industriesas well as regulators should be considerably enhanced.
� Financial institutions and insurance companies shouldown up to being in part accountable for environmentalcompliance of a project.
� Transparency in all environment-related matters.EIA reports of projects should be easily available forpublic scrutiny. The public hearing ought to be moretransparent, and the provisions of the notification oughtto be adhered to in letter and spirit. Penalties for non-compliance by officers of government, may have to bein part personal.
� The Land Acquisition Act could usefully change toensure that the focus of the law shifts from �acquisitionof land� to �rehabilitation and resettlement�. From merecompensation for asset loss the law should aim to protectlivelihoods. The new framework should take into ac-count the case law that has evolved36 and provide for aclear and effective process to enable land acquisition fordevelopment,37 while protecting the economic status ofPAPs and local communities. Complete transparencyand involvement of local communities at an early stagein the project would be necessary.
� Provisions to ensure that land grabbing and specula-tion are discouraged while genuine landowners are ableto realize appropriate values. Protection of not onlylandowners but also landless labourers and commonresource users.
PAPS AS STAKEHOLDERS IN
PROJECT DEVELOPMENT
While it is today fashionable to consider PAPs asstakeholders in projects, in reality they are usually notin a position to negotiate their position. The state,promoters, and lenders are normally the only stakehold-ers to the development activity, who are able to effec-tively negotiate their returns commensurate with therisks they accept in the project. The project finance
36 See chapter 5.6 for some interesting rulings by the courts.37 For a view that most land acquired for industrial use need
not go through the state see chapter 1.
Structural Issues and Constraints 91
contractual documents essentially serve to allocate risksand returns to these stakeholders. The same is nothowever true for PAPs, who in a sense bear a stake inthe project by involuntarily losing their land to makethe project happen. Viewed from this perspective, PAPsare forced to bear a significant risk (of loss of assets and
livelihood as well as other environment and socialimpacts), while not being provided any tangible returns.This is where the potential for project risk arises, oftenleading to local protests and activism as well as judicialintervention, all of these having direct significant impacton the project.
5.8 THE RIGHT TO INFORMATION
AS A TOOL OF EMPOWERMENT
Abha Singhal Joshi
access to information of even non-public bodies andorganizations like large public corporations becomesnecessary. However, since presently the government isthe largest provider of public goods and services, it iswithin government that the change urgently needs to bebrought about.
The core of the issue of the right to information isvery simple: it presupposes that in a democratic set-up,the government undertakes activities for the benefit ofthe people. Its actions, therefore, must not only betransparent to the people it works for, but there shouldalso naturally be a high degree of accountability to thepeople for acts of commission or omission. This in turnpresupposes participation of the people in decision-making processes which affect their lives.
The legal and philosophical base of the right toinformation is in little doubt�no one can deny thatthese elements are core essentials of a democracy.Moreover, the courts have time and again ruled thatgovernment secrecy should be kept to the bareminimum38 and have pronounced the right to know asinherent in several fundamental rights�whether itconcerns print media and broadcasting, civil liberties,or consumer rights.
In spite of court rulings, the need was felt for alegislation which would not only spell out the right toinformation in concrete terms but would also detaileffective methods for implementation. However, the�Freedom of Information Bill 2000� (hereafter FOI Bill)which was tabled in Parliament in July 2000, has comeas a depressing reminder that a law being made withoutthe requisite political will to change the culture ofgovernance will contain in it the seeds of its own failure.
A look at the Bill shows that inspite of its loftydeclaration of purpose��In order to promote openness,
38 Manubhai D. Shah vs LIC, AIR 1981 GUJ 15, SecretaryMinistry of Information and Broadcasting, Govt. of India & Ors.vs Cricket Association of Bengal & Ors., 1995 2 SCC 161, RajNarain vs State of UP, AIR 1975 SC 865.
No society has escaped the evil of corruption in publicbodies and government, although the degree varies. InIndia the common citizen as a consumer of publicservices is its worst victim. For simple, and the mostbasic necessities like water, electricity, and sanitation, hehas to plead, and bribe, and even then denial is commonespecially for the poor. Corruption in civic bodies inIndia is treated with resignation as there is no forum forredressal open to the common man.
Even the media is far more connected with national-level scams and corruption in international deals, andin high places. The issue of routine and mundanecorruption which affects the everyday lives of peopledoes not attract media attention. But this corruptionthreatens the provision of the very basic needs ofmillions in the country. Take the case of a group ofwomen in a Delhi Basti (resettlement colony) trying toget 6 feet of a water line restored after it was damaged.They visited the Corporation office over twenty timesduring a period of two years, but were not able toachieve their end. They could not even find out who wasresponsible and whom they should contact. Similarinstances abound whether it is a question of provisionof telephones, water, electricity, ration-cards, or accessto records of any sort.
It has now been recognized that alternative ap-proaches outside the traditional system of �checks andbalances� are necessary. The �checks and balances� nolonger work. One solution which suggests itself, andwhich has received quick and almost universal attentionas a potent tool for countering corruption, is thesimple method of throwing open to public scrutiny,processes within organizations that deal with the pro-visioning of public goods and services, and governance.The �right to information� or �access to information�, or�open government�, is the vehicle for such scrutiny.
This right has been viewed primarily in the contextof public bodies and in their relationship with thepeople. However, with the onset of liberalization,
92 India Infrastructure Report 2001
transparency and accountability� in administration�itfails to address any of these stated goals. The restrictednature of the proposed law and lack of vision in draftingit are its chief failures.
To begin with, in the introduction of the Bill itself,the assurance to �provide for freedom to every citizento secure access to freedom of information� (a curiousturn of phrase) is hedged in by the words �consistentwith public interest�. The term �public interest� itselfshould be viewed with suspicion, as historically it hasbeen coterminus with �government�s interest�, and isused as such to justify appalling misuse of power andexpansion or reduction of discretion to suit the ends ofthose in power. This formulation itself could be used todeny all manner of information. Besides this, all basicelements�that common sense would demand of a free-dom of information law�as also the international expe-rience have been ignored. The twin problems of enforcingsystemic changes, and of dislodging the culture ofsecrecy in bureaucracies have completely been bypassed.
The first hurdle is the array of exceptions which areworded widely enough to net out much of the informa-tion, which must necessarily be shared with the publicfor any meaningful assessment of the working of publicprocesses. Sections 8 and 9 of the FOI Bill, operatingtogether, would further lend credence to the alwayssay no approach which has hitherto been adopted bypublic bodies and governments at all levels. The needwas to narrow down broad-based exemptions, makingthem more specific so that discretion to refuse is limitedto the possibility of actual and substantial harm ratherthan vague conjecture or even a �likelihood of harm�.For instance, section 8, which allows withholding ofinformation which would prejudicially affect �securityof the state�, �public safety and order�, �the conduct ofcentre�state relations�, could be used to refuse all mannerof information to the people. Security of the state hasrecently been invoked to apply the National SecurityAct in an innocuous situation where the local populaceof the Uttar Pradesh hills was protesting against apublication on AIDS by an NGO! Under the presentBill too, such incidents would receive the stamp ofapproval quite easily.
The common citizen would also come up againstthe provisions of section 9 which make it possible torefuse information on the grounds that it is �to bepublished at a particular time� or is �contained inmaterial available to the public�. The difficulties inaccessing government documents such as simple notifi-cations and orders, copies of schemes, and even formsfor various applications are very real. Gazettes are rarelyavailable or seen. Even if made available, they wouldcater to only the literate and those who can afford the
price of these publications. The section does nottake note of the reality of either a poor and illiteratepublic, or of the breed of middlemen who abound inselling forms and other government documents whichare never available at the official outlet. Should notthe law make it incumbent upon the public authorityitself to make sure that the requisite information is dulypublished in time in sufficient quantities and madeavailable to the public at a reasonable cost? This wouldnot only ensure the authenticity of the information,but also that all information is available at one source.Had the law really sought to allow the average useraccess to information, it would have made it mandatoryfor public bodies to publish certain kinds of educationalmaterial, and to have it distributed through channelslike post offices and ration shops.
That brings us to the issue of suo moto disclosuresby government, on which aspect the law is especiallyweak. Section 4 of the Bill restricts the �obligation� togive information voluntarily only to some aspects ofthe structure of departments, details about �importantpolicies and decisions�, and details (as available) ofprojects and schemes which �in its opinion� should beknown to people. Here again the obligation comesthrough not as a strong duty which no public authoritywould be allowed to escape, but as a weak entreaty,wrapped in nebulous terminology of wide discretion.
Taking the recent example of floods in AndhraPradesh, or the cyclone in Gujarat39 a couple of yearsago, should not the law for ensuring information topeople contain a provision, at the least, to give peopletimely, correct, and sufficient information for safeguard-ing their lives and property? Moreover, should there notbe an attendant duty to give information to people ina manner that it actually reaches them? Such a law, forour country, would build in provisions for mandatoryand effective use of communication methodologies,electronic media, and information technology.
Lack of provisions for fixing accountability andimposing penalties for unjustified refusals, delay ingiving information, or giving wrong information soundthe death knell of an already weak legislation. Moreover,upon refusal, the citizen has the right to �appeal� onlyto two governmental authorities. We may describethis more correctly as an �appeal from Caesar to Caesar�.
39 The cyclone in Gujarat claimed many lives. A warning aboutthe cyclone was flashed across the screen while the film �Sholay�was being broadcast on the national channel of Doordarshan�notin Gujarati or Hindi, but in English. The Chief Minister ofAndhra Pradesh made a public statement that the MeteorologyDepartment had not given correct and timely information aboutthe amount of rainfall expected when Andhra was under a delugein August this year.
Structural Issues and Constraints 93
To add insult to injury, the jurisdiction of the courts hasbeen circumscribed in section 15�an unprecedented stepwhere no alternative judicial forum is provided.
There are further debates on whether the decision-making processes (file notings, opinions, etc.), from locallevel to cabinet level, should be thrown open or not,but these are at best academic in nature for the moment.One would welcome a provision like the Sunshine Actof the USA, whereby public bodies have to hold openmeetings in certain areas of high public interest. Anotherprovision one would like to see, either incorporatedinto this Act or through a separate legislation, is theprotection of whistleblowers�a provision which pro-tects honest and public-spirited employees who disclosefacts in their knowledge to protect the public interest.
Freedom of information draft legislations, as arebeing churned out by state governments, as also the onepending in Parliament, have turned the whole issuearound and made the exercise a fruitless one that protectsthe preserve of government over information, ratherthan genuinely bringing about the much needed changein the equations between the citizen and the state.
The accounts of local bodies almost all over the worldare traditionally open to the ratepayer as an inherent
practice in the audit process. It is this �social audit� or�public audit�, of not only accounts but also of ongoingpublic works, which gives meaning to the exercise of theright to information. Having accessed the documentsand records of a public body as a legal right, a publichearing can be conducted with the local populace aswell as government officials and elected representatives.Comparisons can then be made between the expendi-ture/works shown on paper and the real experience ofthe people.
This method exposes the misdemeanours and/ormisappropriations in a relatively transparent manner.In some rural areas of India, social audit campaigns havebeen very successful in bringing to light the misappro-priation of local funds. But in the absence of a legallyrecognized formula for conducting such audits and aredressal mechanism following the verdict of theseaudits, not many public bodies have changed for thebetter. One solution that appears to suggest itself isto conduct such audits with the �gram sabhas� in thevillages, and with the local electorate in the urbanmunicipal areas, and to ensure the follow-up legaland other actions as decided by an independent judicialbody.
66.1 MISSING INTERCONNECTIONS IN THE POWER SYSTEMS
Puneet Chitkara, Rajiv Shekhar, and Prem K. Kalra
THE ELECTRICITY SECTOR
INTRODUCTION
The electric power system has gone from bad to worse.Power demand outstrips supply by 11.1 per cent duringpeak periods. Transmission and distribution losses area mind-boggling 24 per cent of total generation. Tariffscontinue to spiral upwards and have risen faster thanprices of inputs. Off-peak, the grid frequencies rise tohigh levels, resulting in large user side costs and some-times even in inability to use power off peak. The oneadvantage with few players especially when under stateownership is that merit order is not a worry. Yet theIndian system presents a picture of as bad a deviationfrom merit order as one can imagine.
Progressive states such as Karnataka and Maharastraface severe power shortages which hamper development.States such as West Bengal have excess capacities whichare dumped on the national grid with no arrangementswith any other parties for their use.
Successive governments since 1991 have made effortsto streamline and energize the power sector, as mani-fested by the numerous amendments to the electricityActs and the Indian Electricity Grid Code (IEGC). Forexample, generation (in 1991) and more recently trans-mission and distribution were opened to the privatesector to stimulate competition and thereby increase theefficiency and economy of the power sector. But thismay in fact have compounded the problem.
Thus independent power producers (IPPs) with fullcost recovery at 68.5 per cent but with terms allowingthem to operate as base load stations, violate merit order.Similarly, even before the IPP policy, the Bulk Purchaseand Sales Agreements (BPSAs) of the National ThermalPower Corporation (NTPC) with the state electricity
boards (SEBs) were wrongly crafted. While on the onehand they allowed the NTPC easier norms than mayhave been correct, the contract creates disincentivesthat result in the NTPC with usually the lowest unitvariable costs being denied the high plant load factors(PLFs) it is capable of achieving. Thus off-peak theBPSAs were such as to result in violation of meritorder lowering the PLFs of NTPC stations. Similarly,they allowed the NTPC a return of only 12 per cent onequity when even the average different cost to primeborrowers was higher. In general, the approach hasbeen one of �correcting� a distortion with another andrenewing the same, rather than identifying and removingthe source of the distortion. Today many SEBs have�incentives� for employees that are directly proportionalto the PLFs achieved. These result in indiscipline be-cause the SEB units refuse to back down when the loadsfall, pushing the grid frequency even to 51 hertz.Nobody cares about the power factor. Such absurdlystructured incentives were introduced in the easternSEBs in response to earlier very poor work practices.
While all these shortcomings and problems withthe power sector are widely acknowledged, why havethey not been appropriately dealt with? In an attemptto address this question, we briefly examine crucialelectricity statutes and current practices in generationand transmission and evaluate their role in affecting theworking of the power sector. The efficacy of statutesand current practices in generation and transmissionwill be examined with respect to the following objec-tives:
� Promoting efficiency, economy, and competitionin bulk electricity supply;
The Electricity Sector 95
� a tariff structure that (i) is fair to consumers and(ii) facilitates mobilization of adequate resources forthe power structure.
Two points need to be made here. First, we envisagecompetition as a means to attain the twin goals ofefficiency and economy, not as an end in itself. Hencethe statutes and current practices will be analysed bothwith respect to their adequacy in providing a competi-tive market and directly bringing about efficient opera-tions. Secondly, economy and efficiency cannot beviewed in isolation from the tariff structure; in fact, theirrelationship is circular in a competitive environment.
BULK TARIFFS
The total installed capacity of utilities stood at 93,245MW on March 1999. Most of this installed capacity isin the public sector, the states and Centre controllingnearly 57 and 30 per cent respectively of the power-generating capacity. Thermal power, by far, is thepredominant source of power in the country. Ofthe total installed thermal capacity of 23,637 MW inthe central sector, the NTPC�s share is 75 per cent,amounting to 17,735 MW. The present commissionedcapacity of the NTPC is 19,291 MW and its share in totalinstalled capacity of the country was 19.9 per cent on31 March 2000. More importantly, the NTPC generatedas much as 24.9 per cent of total utility power producedin 1999�2000. Recently, the NTPC has taken overTanda thermal power station (440 MW) from the UttarPradesh State Electricity Board (UPSEB). It has alsoforayed into hydro generation with the laying of thefoundation for the 800 MW Kol Dam hydroelectricpower project, located in Bilaspur district in HimachalPradesh. The NTPC plans to augment its capacitythrough takeovers, joint ventures, greenfield projects,and expansions in the capacity of existing power sta-tions. This indicates the emergence of potential domi-nance of the market by the NTPC. Consider thefollowing examples:
At the bulk supply level, electricity that is traded iseither generated by the NTPC, or is surplus from SEBs.Surplus electricity from SEBs constitutes a very smallfraction of the tradable electricity at bulk supply level.Hence, the NTPC wields a great deal of market powerat this level.1
According to the K. P. Rao Committee (KPRC)report the tariff structure for bulk electricity generationconsists of (i) fixed charge and (ii) variable charge. Thefixed charge consists of interest payments on debt,return on equity (ROE), depreciation, fixed operationsand maintenance (O&M) charges, interest on workingcapital, and taxes. Fuel costs essentially constitute thevariable charge. Calculation of various components offixed and variable charges is based on certain normativeparameters which have to be reevaluated with time.However, these norms were never revised by theMinistry of Power (MoP), except for ROE which wasincreased from 12 per cent to the current 16 per cent at68.49 per cent PLF. Furthermore, the KPRC reportrecommends that power plants be entitled to incentivesat the rate of 1 paisa per kWh above the normative PLFof 68.49 per cent. Over the years, the performance ofthe NTPC has improved considerably. For example,average PLF at NTPC plants is around 80 per cent, afigure comparable with the most efficiently operatedplants worldwide, with the Dadri-based plant recordinga PLF of over 96 per cent in 1999. Hence if norms relatedto PLF are not revised, competitive levels of tariffsare not assured to the consumers. The Central Electric-ity Regulatory Commission (CERC), in its order onAvailability Based Tariffs (ABT), to be discussed later,has suggested a target availability (availability is nor-mally greater than the PLF) of 80 per cent for all thermalplants for the recovery of fixed charges. Similarly, normsfor other components of the fixed and variable chargesmay need revision. This is important because the regu-lator has the mandate to enforce competition in anintrinsically oligopolistic market. Hence tariff design hasto simulate the beneficial impacts of competition toextract efficiency improvements for the benefit of con-sumers. With the incorporation of new technologies andmanagement practices, the cost of operating a powerplant, barring vagaries of certain components such asfuel costs, is expected to decrease.2
One possible solution to the potential problem ofmarket power of the NTPC could be to let the variousNTPC power stations operate as profit centres andcompete within each grid. For example, Dadri cancompete with Singrauli and Tanda in the northerngrid, and Talcher can compete with Farakka in theeastern grid for selling power. Even though most ofthese stations would primarily be running as base loadstations, they could still compete among themselvesand with the SEBs, with respect to surplus generation
1 The NTPC though has not thus far used this monopolypower to its advantage. It has been tied down by adverse BPSAswith SEBs and committed deliveries, at low returns. Yet theNTPC, as also some large IPPs at state/regional level couldexercise considerable market power in any future market forwholesale power, unless appropriate restrictions and rules areframed.
2 IPP contracts are even more adverse from the final consumer�spoint of view. With returns up to 30 per cent, or full recoveryat 16 per cent at 68.4 per cent PLF for base stations huge costsare being borne by consumers. See also case 3, chapter 3.
96 India Infrastructure Report 2001
during off-peak hours.3 The tariffs can be based oncompetitive bidding, with a �price cap� for electricitysupply during peak hours. In fact, an order of theCERC, dated 9 March 2000, on a petition filed by thePower Trading Corporation Ltd. (PTC) for the appli-cability of ABT to the Pipavav mega power project(MPP) signals a shift towards a tariff regime based oncompetitive bidding. Excerpts from the CERC�s orderon ABT are reproduced here:
The Commission sees no need to specify target availability aspercentage of capacity since it sees no need for PTC to specifythe installed capacity of the project. Instead, bidders shouldmake available the required power to meet the demands of thebuyers in MW & MWH.
The Commission also sees no need to specify an incentive ratefor generation above a target PLF, since the price at which thesuccessful bidder will supply energy beyond the level of off-take assured by the buyer, will be decided through the biddingprocess itself as has been mentioned by the PTC in the contextof the additional cost of fuel supply for energy generationbeyond the assured level of off-take.
It is imperative that the Commission�s directives beapplicable to the NTPC, otherwise India may end upwith a heterogeneous system of pricing bulk supplygeneration with all its attendant disadvantages. It is oftenargued that the NTPC has long-term contracts with theSEBs and hence needs to be treated separately. However,it needs to be understood that such contracts can behonoured even in a competitive environment. The SEBscan buy NTPC power at market price,4 determined inthe competitive market, and the surplus, if any, can betraded to the deficit customers. This is precisely what thecentral commission in its order on ABT has envisaged.In fact, this mechanism has the potential to mature intoa tight power pool, where individual generators withina state also see an opportunity in the bulk power marketand put in extra effort to supply during peak periods togain a few extra rupees.
BEING FAIR TO CONSUMERS
A stated policy goal could be �to bring prices in linewith costs to provide consumers with good pricesignals�. This dictum has two corollaries: (i) buyersshould have the opportunity to shop for power onthe grid, and (ii) subsidies should be rationalized.
Suppose a bulk consumer in state A wants to buyelectricity from a generating station in state B. Thiswould require that power be wheeled on the networkof the distribution companies in states A and B. How-ever, such transactions are restricted under the Electric-ity Act, 1948 (Amended in 1991), section 15(A), subsection(c), which states that �the Generating Company shallcarry on its activities within such areas as the competentgovernment or governments, may, from time to timespecify in this behalf�. Also if there is a transmissiondistribution licensee serving in either state, then FirstSchedule, Part (1), section III of the Electricity Act, 1948becomes operational and forbids such transactions. Thelegality of the above-mentioned statutes will probablybe clarified by the judgement in the Indian Railwaysversus Uttar Pradesh State Electricity Board (UPSEB)case pending before the Delhi High Court.
The Railways had decided to go ahead with a pilotproject for direct purchase of power from the NTPC,following the Delhi High Court�s refusal to grant astay on the project, as desired by the UPSEB. NorthernRailway had already spent about Rs 60 crore on theconstruction of the tower and transmission linestransporting power from the NTPC�s Dadri gas powerplant. In its order, the Court had, however, said that afinal decision on the UPSEB petition was pending,and that the Railways could carry on with the construc-tion activity at their own risk. A UPSEB notice hadearlier threatened to demolish the transmission towerand lines on the grounds that such an activity was�unauthorised and amounted to encroachment on thejurisdiction of the UPSEB� as a licensee. The UPSEB alsosaid that the Railways had no legal authority to con-struct distribution and service lines on their own. TheRailways later obtained a stay on the notice from theHigh Court.
The Railways maintain that they are legally allowedto �erect, operate, maintain or repair any electric tractionequipment, power supply and distribution installationin connection with the working of the Railways�.Moreover, railway officials point out that direct pur-chase of power from the NTPC has been approved bythe Cabinet. The Power Ministry had allocated 100 MWout of the unallocated central pool of the NTPC�s Dadrigas power plant to the Railways.
In its petition, the Railway alleged that though theUPSEB was buying power from the NTPC at the rateof Rs 1.70 per unit, it was selling it to the Railways atRs 4.15 per unit. This amounted to an annual loss ofover Rs 50 crore! The Railways had signed a powerpurchase agreement with the NTPC in March 1998 atthe cost of Rs 2.20 per unit. According to Railwayofficials, the SEBs do not want a reliable and bulk
3 Or even for all power they guarantee if a market is put inplace that replaces the BPSA and IPP contracts. See Morris (2000).
4 The clearing prices in such a market are likely to be muchhigher than the prices to which the NTPC is tied down under theBPSAs. This is one reason for the reluctance to bring the NTPConto the market (ed.). See section 6.2.
The Electricity Sector 97
customer, like the Railways, to bypass them and pur-chase power directly from the NTPC. The NTPC, onthe other hand, finds it more profitable to sell power tothe Railways than to the loss-making SEBs at very lowprices.
Two important issues emerge from the Railwaysversus UPSEB case. One, should a consumer be forcedto buy power at a higher price when cheaper optionsare available? Two, the fate of the �divorced� party,the UPSEB in the above case, needs sympathetic con-sideration. More specifically, what should be thefate of the UPSEB�s �stranded equipment�? Shouldn�tthe UPSEB be compensated for the infrastructure itset up to supply electricity to the Railways? If not, inall probability, the O&M costs of the now infructuousinfrastructure set up will be passed on to other consum-ers of the UPSEB.
SUBSIDIES
Subsidies should be a means to provide power to �needy�consumers who cannot afford the �real� price. In reality,subsidies are seldom need based, and are awarded inan ad hoc manner, as a populist election plank. Forexample, agricultural tariffs (10 horse power (HP), 20per cent LF [1089 kWh per month]) are lowest in thericher states: free in Punjab and Tamil Nadu andminimal in Gujarat (Re 0.61 per unit), Haryana (Re 0.50per unit), and Maharashtra (Re 0.38 per unit). Ironically,agricultural tariffs are among the highest in Assam(Re 1.44 per unit), Sikkim (Re 1.72 per unit), andNagaland (Re 1.50 per unit) where farmers toil underadverse conditions. Agricultural subsidy has always beena sore point since agricultural consumers constitute athird of the total consumers while contributing aminiscule 2.5 per cent towards revenue realization. Asa result, other consumers, especially industry, pay veryhigh prices. There is always a danger that in the new,liberalized economy, unseemly high tariffs may unleasha vicious cycle; industries will either migrate to anotherstate or resort to captive power generation, leading toconsiderable loss of revenue to the SEBs.5
Rationalization of tariffs is a must for the health ofthe SEBs and/or the companies engaged in generation,transmission, and distribution. Recent events in AndhraPradesh, where the state government reimbursed AndhraPradesh Transmission Company (APTRANSCO) forsubsidizing tariff decided by the APERC were indeed
heartening.6 In fact, the provision for compensatingSEBs for subsidies already exists in the Act of 1948,but has not been implemented by many state govern-ments.
RESOURCE MOBILIZATION
Giving counterguarantees or opening escrow accountsare not being considered solutions here, given theirobvious inadequacy and inefficacy, both conceptualand practically revealed.7 The incentives for investmentshould come from the opportunities the market struc-ture provides and the enabling legal environment ratherthan from economic profits due to regulation or policy.
The Central Electricity Authority (CEA) has formu-lated a national power policy which specifies optimallocation of power plants throughout the country. Un-fortunately power plant location has been subject topolitical considerations even in the era when statecoordination was supposedly necessary to choose thelowest cost location. Take the case of the NTPC�s Dadrithermal power plant whose location is such that thecost of transporting fuel is 60 per cent of fuel cost.8
Would it not have been more economical to locate theplant closer to the fuel source, and instead transportenergy to the region currently serviced by Dadri?Moreover, how long does the government want to bein the business of planning for the power sector? In acentralized planning model, peak demand forecast andthe reliability criterion determine market size and theprice of electric energy is considered secondary, whereasin a competitive market prices are set by competitionand those prices determine investments in new capacity.Here generation-related reliability criteria are comple-mented or supplemented by energy prices duringgeneration shortfalls. An enabling legal environmentimplies the ability to enforce contracts, and shouldconsist of, say, legally enforceable (i) fuel supply and(ii) cash flow agreements.
Three bidders�Siemens�Powergen combine, VewEnergy, and PSEG Global�have pulled out of the racefor the 2000 MW Pipavav mega project. It may berecalled that all the thirteen players who had submittedthe bids for the first stage had been declared �qualified�for the second stage in December 1999. According toIndiainfoline industry sources, the three bidders� back-ing out could be related to lack of policy clarity. The
5 This absurdity is already taking place as industrial tariffs arebeing pushed through the roof. The obvious need for tariffs tobe bounded by the costs of self-generation, at the very least, issometimes ignored even by regulators, and often by consultants�reports.
6 The case for direct subsidization on the grounds of moralhazard is very strong. See Morris (2000).
7 Many IPPs after being so close to financial closure, have givenup, or have withdrawn, or have changed hands on this count.
8 Even if the Railways were to price freight transport correctlyit would be a prohibitive 40�5 per cent of the fuel cost.
98 India Infrastructure Report 2001
Power Ministry had earlier announced that land wouldbe procured for mega power projects by the govern-ment. It is now understood that the promoters have toprocure the land themselves. Land prices at Pipavav havealready shot through the roof due to the upcomingpower project and speculative purchases. Bidders hadnot taken such high land prices into reckoning whilesubmitting their bids. There are other ambiguities aswell.
The reasons for such ambiguities include inter alia theprovisions in various electricity statutes. For example,the Electricity Regulations Act, 1998 (chapter III, section11(d)) mandates the central commission to promotecompetition, efficiency, and economy in the activities ofthe electricity industry. But these are subject to the viewof the central government (chapter VIII, section 38(1)),which states that �in the discharge of its functions, theCentral Commission shall be guided by such principlesin the matters of policy involving public interest as thecentral government may give to it in writing�, and hencecould change with a change in governments. Given thepolitically fluid situation in India, this has workedagainst the policy goal of mobilization of adequateresources for the power sector. Political and regulatoryrisks thus continue to remain high.
Many believe that the reforms should start withprivatization of generation. Others believe that thegovernment has started at the wrong end by not begin-ning the reform process with privatization of distribu-tion. This has to be seen as a circular problem. If thegovernment privatizes generation without improvingrevenue collection, the generators have to take intoaccount highly risky cash inflows, and would typicallyinsist upon escrow/state guarantees. If distribution isprivatized it will have to bear significant supply riskbecause of the current poor state of generators in variousstates. A possible solution is to let the same entity owngeneration and distribution. This would require legisla-tion which enables third-party access on a competitivebasis, otherwise such a structure could act as an entrybarrier for new investments in generation. Moreover,the problem remains whatever be the structure; evenstate-level regulators cannot change the tariffs charged tovarious consumer categories without the consent of thestate governments. Electricity, being on the concurrentlist, all the state governments need to pass a legislation/issue a policy statement enabling the removal of subsi-dies. But the clause in the existing statute books that thegovernment should make good all the subsidies to thegenerator�s electricity suppliers, should be removed,because no private investor would believe any of thestate governments, given their past records. Once this isdone, potential investors will have confidence in the
future revenue streams and investments could flow in.Then efficient market structure can be thought of in away that requires minimum regulation and poses mini-mum anti-competitive problems.
TRANSMISSION
Transmission is often regarded as a natural monopolyand a case is made for its regulation. One of the criteriain the design of a reform model is the identification ofsegments where competition can be introduced. In thecontext of transmission, one needs to identify variousservices that a transmission company provides. Suchan unbundling of transmission services would allowidentification of those services where competition canbe introduced and pricing of services which need tobe regulated. This is widely accepted.9 The MoP hasnotified the Power Grid Corporation of India Limited(PGCIL) as the central transmission utility (CTU). ThePGCIL operates over 39,000 Ckt km of EHV transmis-sion network across the country and has the distinctionof being ranked among the top six transmission utilitiesin the world. As the CTU it performs the followingfunctions:
(i) provides transmission facilities for interstate trans-mission of power;
(ii) controls power flow and frequency;(iii) ensures system reliability and congestion manage-
ment;(iv) undertakes energy accounting and billing;(v) provides reactive power support and voltage
control; and(vi) does investment planning.
We may usefully think of competition as potentiallyexisting at two levels: (1) competition for the market, (2)competition in the market. The Government of Indiahas allowed independent transmission service providersto set up transmission lines for interstate and intra-statetransactions, hence India potentially has competition forthe market in the provision of transmission services, butonce a company has set up transmission facilities,duplication of resources may not be worthwhile, andhence there will not be any competition in the market.However, the CTU has been given extra-ordinary pow-ers by the Electricity Laws (Amendment) Act, 1998which may act as barriers to private entry. Section 27C(2) of the Electricity Laws (Amendment) Act, 1998states that �a transmission license granted under sub-section (1) may authorise the transmission licenseeto construct, maintain, and operate any inter-state
9 See also section 6.2 in this report.
The Electricity Sector 99
transmission system under the direction, control andsupervision of the CTU�. Section 27C (4) further statesthat the applicant should first obtain the approval of theCTU. Clearly, the PGCIL simultaneously dons the mantleof both player and controller. Since the construction oftransmission lines has been opened to the private sector,identification of optimal location of transmission linesshould also be left to these investors (of course, subjectto a transparent system security investigation by theCTU and subject to verification of the same by theCERC. The PGCIL could conceivably prevent the entryof private players in the transmission sector, for exampleby allotting �inhospitable�, uneconomic regions for set-ting up and operating transmission infrastructure. Eventhough the central commission grants a licence forinterstate transmission, its decision could still be biasedbecause of information asymmetry between the PGCILand the CERC.
Section 27(A) of Part IIA of the Electricity Laws(Amendment) Act, 1998 empowers the CTU to exercisesupervision and control over the interstate transmissionsystem. The regional load despatch centres (RLDCs),which are mandated to coordinate the integrated opera-tion of the power system in a particular region, arerequired by the law to be operated by the CTU. Theownership of the RLDCs by the CTU cannot be affectedby order of the central commission.10 Since the cashflows of the PGCIL are linked to the efficient operationof the grid, ownership of RLDCs by the PGCIL maybe detrimental to the interests of the other players in themarket: In the event of a black/brown out, the respon-sibility may be shifted to the other players. Practically,it is extremely difficult for the regulator or any thirdparty to analyse the event-related information suppliedby the RLDCs. This situation may worsen after theimplementation of ABTs. Monopoly problems in-herent in the ownership of RLDCs by the PGCIL canbe mitigated to a certain extent by developing incentivesfor performance based on certain transparent param-eters. For example, sliding scale incentive schemes couldbe developed where the target values for costs (of variousservices, for example reactive power, demand forecast-ing, rescheduling, and transmission losses) are set inadvance. If the PGCIL manages to beat the target bydelivering lower costs for each of these services, it keepsa proportion of the difference between the target andactual costs. If the PGCIL does not manage to meet thetarget, it pays a proportion of the difference between
the target and the actual costs. For the determination ofsuch cost-based benchmarks, the central governmentcould consider creating a separate transmission companyin each of the regions and hence introduce �yardstickcompetition� between various transmission service pro-viders. A single company, that is the PGCIL, owningand operating the entire country�s network may notfacilitate such a yardstick mechanism.
The Indian Electricity Grid Code requires the SEBs�distribution companies to install capacitors or providevott ampere reactive (VAR) support. In the event of aparticular state overdrawing reactive power from thegrid, it is required to pay charges for reactive power.Ancillary services (which cover reactive power support)can be provided by independent service providers. If thedistribution companies pay for reactive power, then itbecomes the responsibility of the CTU to arrange forancillary service providers, and maintain a normal volt-age profile throughout the grid.
Demand forecasting is currently being done by theCEA and is a service which is not explicitly priced inthe bulk power tariffs. There are three major conten-tions regarding demand forecasting. (1) This is an ex-tremely useful service for capacity expansion and assumesgreater importance in the context of fifteen-minutescheduling (short-term load forecasting) proposedunder the ABT system and hence must be explicitlypriced. (2) A commercially interested party (in thiscase the RLDC) should provide all such services. (3) Anyerrors in forecasting, which may result in the creationof redundant capacity or in transmission congestiondue to transmission bottlenecks and hence reschedul-ing (which generally means switching on costliergeneration) must be priced and the cost borne by theagencies involved in demand forecasting. Currently allcosts due to switching on costlier generation, in thepresence of transmission bottlenecks, are passed onto the consumers. Distributors, generators, and tradersare not ideally placed to mitigate this risk, and hencethey typically do this job in decentralized and competi-tive systems.
The Power Trading Company (PTC) has been estab-lished with majority equity participation by the PGCILalong with the NTPC, the Power Finance Corporation(PFC), and other financial institutions. The PTC wouldpurchase power from identified private projects andsell it to identified SEBs. A structural arrangement,where a power transmission company has a majoritystake in a power trading (which is essentially akin toa generating company), could give it enormous mo-nopoly power. In a competitive market, such a firmcould create access problems for an independent genera-tor (that may wish not to trade through the PTC). This
10 The law states that �until otherwise specified by the CentralGovernment, the Central Transmission Utility shall operate theregional load despatch centres and the State Transmission Utilityshall operate the state load despatch centres�.
100 India Infrastructure Report 2001
would then need legislation enabling open access, whichis very difficult to monitor. Hence the creation of thePTC, with the existing ownership structure, could poseserious problems for regulation in the future. Moreover,trading is a service where competition is natural andgiven (there could be many power traders in the elec-tricity market), and this service needs to be opened tocompetition.11
Additional regulatory issues crop up as the PGCILdecides to venture into the telecom sector. To achieveits goal of establishing an integrated national grid, thePGCIL is implementing nationwide a computerizedenergy management system based on state-of-the-artfibre optic and microwave links which facilitate realtime system coordination, data acquisition, monitoring,and control. The PGCIL is also planning to diversifyinto the telecommunication business by establishing anationwide backbone network, using its existing infra-structure. The PGCIL already has about 4000 km ofoptic fibre on the transmission lines connecting variouscities, and in the next two years it plans to lay anadditional 14,000 km of optic fibre. Some of the linksare already ready and others are soon going to beoperational. The PGCIL has offered bandwidth capacityon certain routes, utilizing the right of way (RoW)provided by its extra high vottage (EHV) transmissionlines which connect the major metropolitan cities/towns, viz. Delhi, Calcutta, Chennai, Bangalore,Hyderabad, Mumbai, and others. The mechanism ofallocation of costs (multiple products with independentdemands) between power and telecom users would beimportant. The PGCIL has a monopoly in powertransmission (and hence it could increase transmissionservice charges. Business sense may lead it to charge lowprices for bandwidth capacity and hence unfairly com-pete with other bandwidth providers at the cost of thepower system users. The PGCIL further has interestsin setting up joint ventures (JVs) with the SEBs to gainconnectivity to the smaller cities, towns, and villages invarious states. Unless adequately regulated this couldlead to it exercising excessively large market power inthe telecom business.12
PRICING OF TRANSMISSION SERVICES
Transmission prices should be such as to result in: (1)incentives for new line construction in anticipation ofgrowth in demand and with a view to remove conges-tion; (2) provide equitable grid access to all its users; and(3) ensure control reliability and adequacy.
Incentives for Optimal Siting
Chapter 3 of the Indian Electricity Grid Code (IEGC)deals with the planning of interstate transmission. TheElectricity (Supply) Act, 1948 orders the CEA to �de-velop a sound, adequate and uniform national powerpolicy, formulate short term and perspective plans forpower development and coordinate the activities ofthe planning agencies in relation to the control andutilisation of national power resources�. Given thecurrent interstate transmission pricing policy in India,the entire burden of faulty capacity addition (or �excess�system redundancies) would fall on the beneficiarystates. Logically, a commercially interested party shoulddo the planning so that it may be penalized for faultyplanning.13 Hence it may be difficult for the centralcommission to ensure �fair prices� for the consumers ofelectricity, which it is mandated by the Act to do.Incentives for siting new transmission lines that wouldallow more competition in electricity generation dependon the revenues recoverable from transmission services.If siting policy is made without considering its effectson pricing, its goals may not be achieved. As opposedto the existing bulk supply transmission pricing policy,if transmission prices were to be based on actual flows(short-run marginal cost-based pricing [SRMC]), it maybe argued that SRMC may result in economic lossesfor the transmission owner. This can, however, be takencare of by two-part pricing of transmission services,which was also envisaged in the Electricity (Supply) Act,1948. The capacity component could be linked tomaximum demand and the variable component couldbe flow based. Such a pricing mechanism would leadthe private transmission owner to optimally locate thetransmission lines and ensure their utilization. Chapter 3of the IEGC recognizes that the interstate transmissionsystem and the associated intra-state transmission sys-tems are complementary and interdependent and theplanning of one affects the other�s planning and perfor-mance. The IEGC further states that the associated intra-state transmission system shall also be discussed andreviewed in respective regional standing committee
11 The logic of a power trading company in the state sectorin the current situation of state failure is hardly clear. Earlier theNTPC is known to have strongly resisted this function beingthrust on it since it knew that what was truly intended by thegovernment was to buy time from tariff reform and SEB restruc-turing, with the NTPC�s funds and debt capacity. There wouldbe attempts by buyers like the SEBs to not pay the PTC on time,and by IPPs to demand prior payment or security for sales,exposing the net worth of the PTC to erosion.
12 For a different view see chapter 2 of this report, especiallythe discussion on Convergence.
13 The probability of faulty capacity addition planning isfurther increased given the load forecasting techniques used bythe CEA (cf: any Electric Power Survey would show this).
The Electricity Sector 101
meetings on transmission planning before implementa-tion. It is then likely that the final arrangement arrivedat in such a meeting may not be in the best interests ofall the regional constituents. Revenue-sharing mecha-nisms need to be designed to ensure materialization ofan integrated grid.
Providing Access Equity AmongVarious Grid Users
The functions of the CTU are given under section27(A) of Part IIA of the Electricity Laws (Amendment)Act, 1998. One of the functions of the CTU is �toundertake transmission of energy through interstatetransmission system�. The PGCIL, at the direction ofthe Central Commission, prepared the IEGC. Suchgrid codes have also been prepared at state level by theSEBs/state transmission units (STUs) and approvedby the respective state commissions. The Central Com-mission, in one of its rulings (CERC order on the IEGC)stated:
In para 6.1 on �Operating Policy�, a suggestion was made byGRIDCO to the effect that the operating procedures shall bein conformity with the State Electricity Grid Code as well.This suggestion has not been accepted, as the responsibilityof ensuring the required consistency between SEGC andIEGC is with all the respective SEB/STUs. We are in agree-ment with CTU; for the additional reason that it is imprac-ticable to bring about conformity with differing SEGC. Thesuggestion of DVC for approval by the constituents of theoperating procedures has already been taken care of, sincethe procedures will be developed in consultation with theconstituents.
In addition to reflecting an area of conflict betweenthe Central and state commissions, this also indicates theneed for a contract that takes care of the differingeconomic interests of the regional constituents andthe region as a whole. To illustrate the point made,consider section 6.1(c) of the IEGC which states that�all the regional constituents shall comply with thisoperating code, for deriving maximum benefits fromthe integrated operation and for equitable sharing ofobligation�. An interstate transaction may maximizebenefits of the entire region; it may, however, causecongestion on the lines of the intervening state and leadto higher costs due to rescheduling and redespatch bythe state load despatch centre (SLDC) within a parti-cular state (since the IEGC recommends a loose pool).This is a case where a particular transaction is revenuemaximizing (or cost minimizing) for the region, but isnot economical for the state. This problem needs to betackled by devising a revenue-sharing mechanism suchthat the intervening state has no economic incentive to
violate the orders of the RLDCs.14 This is a classic casewhere the negative externality problem could be solvedthrough contracts without the need for the interventionof a �stick� mechanism. Since a state network may beused for interstate transmission, a host state coulddeliberately raise transmission prices to prevent compe-tition for other generators/utilities. This could be tack-led by formulating a transparent open access policybased on Articles 888 and 889 of the Federal EnergyRegulatory Commission (United States).
Efficient Prices
Currently transmission charges in India are based on theso-called �postage stamp� method, that is on averageenergy drawals from the network rather than on actualtransmission resources used in the particular case. Hencethese charges do not send the correct signal for optimaluse of the scarce resource, that is the transmissionnetwork, or even optimal location of generation sources.Also the existing pricing mechanism does not provideany incentive for capacity expansion (at optimal loca-tions, from the point of view of minimizing generationcosts and reducing the unmet energy) to the transmissionutility. Optimal prices of electricity�as proposed in theliterature and as prevalent in some countries, for ex-ample US (Pennsylvania, New Jersey, and Maryland(PJM) pool), New Zealand, and Chile�are temporallyand spatially distributed. These prices depend on genera-tion and loading conditions of the network, hence theyare very volatile. There is an inherent lack of advanceprice certainty in such a mechanism. Moreover, whenpower systems are tightly interconnected, such priceshave to be calculated many times a day and hence thewhole process becomes very cumbersome.
The need is to develop a transmission despatch andpricing model which takes into account the peculiaritiesof the Indian power system, viz. wide variations involtage and frequencies in each region, large differencesin operating frequencies between regions, generatoroperation with constrained governor action, and over-drawal by various states. The model may also have toseriously examine the creation of an options contractsmarket for transmission capacity in India.
An options contracts model would require, in addi-tion to the despatch and pricing model, a short-termload-forecasting model to study the loading conditionson different system buses under various normal andcontingency conditions and determine the optimal
14 In the absence of such contracts, the SEBs/STUs, in theirinterest, could resort to various means like deliberately declaringa power system component to be faulty, in order to prevent theinterstate transaction from taking place.
102 India Infrastructure Report 2001
despatch centres and switch yards. With present-daytechnology, it is possible to use networking and Super-visory Control and Data Acquisition (SCADA) toautomatically send the readings on hourly basis to thecontrol rooms of substations. Since controls are mostlynon-operational, the plants, machinery, and componentsare pushed beyond their operating ranges. Frequentoperation at such levels reduces the life of the plant andequipment. The returns to systems such as SCADAlinked to automatic and semi-automatic control mecha-nism could be very large.16 There ought to be guidelineswhich are derived from a suitable national transmissionstrategy for selecting technologies like HVDC versusHVAC, 400 kV versus 800 kV, SVS versus FACTS, thatoptimize and make for ease in system interconnectivity.
ABTs
The proposed ABTs for bulk power users and for thatbought by the SEBs, and for generators like the NTPC,consists of three components:
1. A fixed charge component based on capacityallocated to various beneficiary states (of the NTPC�scapacity for instance) in a particular region in Rs/MW.The fixed charge is to be recoverable at target-availabilitylevel. There is a provision for incentives based on actualgeneration above a normative level of generation.
2. A variable charge component based on normativefuel costs, in Rs/kWh.
3. A frequency-linked component, which is to becharged based on any player violating the grid disciplineresulting in frequency variation. This component isdetermined based on the costliest generation available,that is diesel generation.
Under an ABT scheme various generators and ben-eficiary states are required to submit availability anddrawal schedules to the RLDCs for every fifteen min-utes! These submissions received by the RLDCs mayhave to be revised until a final schedule of generation/drawal is arrived at. It is claimed that
by bifurcating the method of charging Capacity Charges(fixed) and Energy Charges (variable), the incentive for tradingin power is enhanced. The beneficiaries have a claim on thecapacity, which they can trade either within or outside theregion. By isolating the variable charge, a beneficiary (SEB) canagain trade such power depending upon its needs, market
price (given the objective function) of power flows invarious congested segments in the network.
Engineering Issues
In power systems, the flow of real and reactive power,and control of voltages and frequency are core manage-ment tasks. Nationally, we have accepted HVDC (highvoltage direct current) transmission as an alternative toHVAC (high voltage alternative current) transmissiondue to advantages like fast controllability of power andpossibility of interconnecting systems operating atdisparate frequencies. Furthermore, slow progress hasbeen made to realize advantages of static VAR compen-sation systems (SVS), and flexible Access Centre (AC)transmission systems (FACTS). We can enhance trans-mission capacity by installing FACT devices and im-prove voltage profiles in the distribution system byusing modern voltage control devices like SVS. The gridcode talks very little of HVDC systems and SVS, andeven when it does there is little elaboration. It mainlyfocuses on AC systems. More elaborate guidelines onreactive power exchange and requirements would helpthe operation of the system.
It is important for quality of power to have frequencyand voltage fluctuations within limits, quick clearanceor rectification of faults, minimum level of harmonicsin the systems, and least environmental impact ofoperations. FACTS devices along with other controlsmake possible fast power reversal. Good power flowcontrol could contribute towards the minimization ofpower and voltage instabilities. The Indian power sys-tem is too far away from such an �ideal� system whichis the norm not just in the advanced capitalist countriesbut in many developing countries as well. Good controlcosts money but enhances power quality and loadabilityof the system, and typically pays for itself.15
For good control to operate, the growth in real andreactive power, as also required investments in controls,would need to be estimated for the short, medium, andlong terms. Only with reasonably accurate estimates ofthese can corrective measures be taken. Load manage-ment programmes and reactive power compensationmechanisms would not succeed if there were signifi-cantly large �unapproved� loads.
Too little monitoring is done today. Power metresthemselves are hardly ever monitored except at key load
15 In India the poor state of power control arises not onlybecause of inadequate investments, but because of rampant indis-cipline and cascading effects pf �bypassing� cut-off devices. In otherwords, many safety and control devices are routinely bypassed toallow the system to �operate� at vastly different grid frequenciesand high power factors.
16 Thus Bombay Suburban Electric Supply Ltd. (BSES), aprivate company with incentives to minimize its distributionlosses and costs and improve the quality of power for itsconsumers, plans to invest at a furious pace in such systems andalso derive the economics of convergence from the joint use ofthe cables (especially optical fibre) so laid for power data andcontrol and for providing internet and networking services.
The Electricity Sector 103
demand, and the economics of power in the home state. Allthis goes to develop the market for power.
Trading of power, however, requires a healthy trans-mission system. The mandate to plan and constructany interstate transmission line rests with the CEAand PGCIL. Though the opportunities for tradingbetween southern and eastern regions have existedfor over ten years now, the 500 MW HVDC link atGazuwaka came up only as recently as in March 1999.The current transmission-pricing mechanism does notprovide any incentive for laying transmission lines. Thesocio-political constraints on the government do notallow it to let the PGCIL charge an adequate pricefor transmission services. For example, the PGCIL�sinvestments in the north-eastern region have resultedin huge financial losses to the company.
The problem of low frequency is not only a problemof grid indiscipline by the generators or the SEBs, butalso of inadequate transmission and generation capacity.With the linkage of bulk tariff to the frequency, the SEBis left with two options (if it decides not to shed load):(i) to set up its own peak load power station, which maybe diesel based; or (ii) to draw excess power from thegrid at lower frequency and pay for the same.
If the beneficiary state chooses the second option(which it may do, given the risks and time delaysinvolved in greenfield projects), the grid frequency maystill deviate from 50 Hz.
Similarly, a generator may find that backing down theunit is costlier than letting it run under light loadconditions. Then the grid frequency may still increasebeyond 50 Hz. Consequently, grid disturbances andviolent frequency fluctuations may still take place in thesystem, with resultant inconvenience to all concerned.Grid frequency management is essentially a powersystems control problem, which the ABT system pro-poses to resolve through commercial pricing. Unless thepunitive measures are very steep such an approachwould not help.
The power of direct controls available with the gridoperator is crucial to its operation. During the first weekof January 2000 severe deficit conditions were experi-enced in the northern region. The PGCIL took thefollowing specific measures in order to control thesystem parameters within the normal range:
1. It brought in additional support from the westernregion through the PGCIL�s back-to-back HVDC linkdepending on the frequency conditions prevailing inthe western region (support up to 350 MW was obtainedat 13:30 hrs on 17 January 2000).
2. Further support of around 80 MW from the easternregion on 220 kV Dehri�Sahupuri circuit was mobilized.
3. It ran two units of the Chamera (360 MW) HydelStation.
4. It persuaded different SEBs to restrict their drawalsto within schedules so as to maintain system frequencyabove 49.0 Hz.
5. It opened (cut off) 220 kV circuits breakers of thestates not adhering to their committed schedules evenunder critically low frequency conditions below 48.5 Hz.
The role of verification and certification of gridindiscipline, which leads to the imposition of unsched-uled interchange charge, rests with the RLDC, a unit ofthe CTU, which itself is a commercially interested party.Though the central commission has noted in the ABTorder that �regarding the claim for payment of UI[unscheduled interchange] charges by transmission util-ity, specific instances of dereliction on the part oftransmission utilities can always be brought up�, norational commercial organization could be expected toadversely affect its own profits by pointing out its own�dereliction�. Moreover, given that the entire data onsystems operation is available only at the RLDC, it maybe difficult for anyone outside the RLDC to know theexact nature of the power system failure.
The Central Commission, in the ABT order, notesthat
(a) Bottlenecks in evacuation of power due to constraintsor limitations etc., in the transmission system in whichcase RLDC will revise the schedule to be effective from the4th time block in which the bottleneck occurs, (b) In case ofany grid disturbance the schedule of generation and drawalsshall be deemed to have been revised for all the time (the)blocks (were) affected by grid disturbance. Certification of griddisturbance and its duration shall be done by RLDC. In thiscase for the earlier three time blocks also the schedules willbe deemed to have been revised to actuals. Bottleneck(s) shallhave to be certified by RLDC.
A revision of schedule due to transmission bottle-necks may require cheaper central generation to backdown or reduce its loading or the beneficiary states toreduce their generation in the interest of interstatetransmission. The question is �Who shall bear the costsof this rescheduling?� As stated in the grid code, it isthe responsibility of the CEA and PGCIL to plan andconstruct interstate transmission lines. So should theseorganizations not be charged for poor planning andinadequacy of transmission facilities instead of makingthe SEBs pay? In addition, in this case because ofbottlenecks in the central transmission facilities theschedules will be deemed to have been revised to actualsbefore the revised schedules are notified. However, if astate is required to change its drawal schedule becauseof intra-state transmission bottleneck disturbance, the
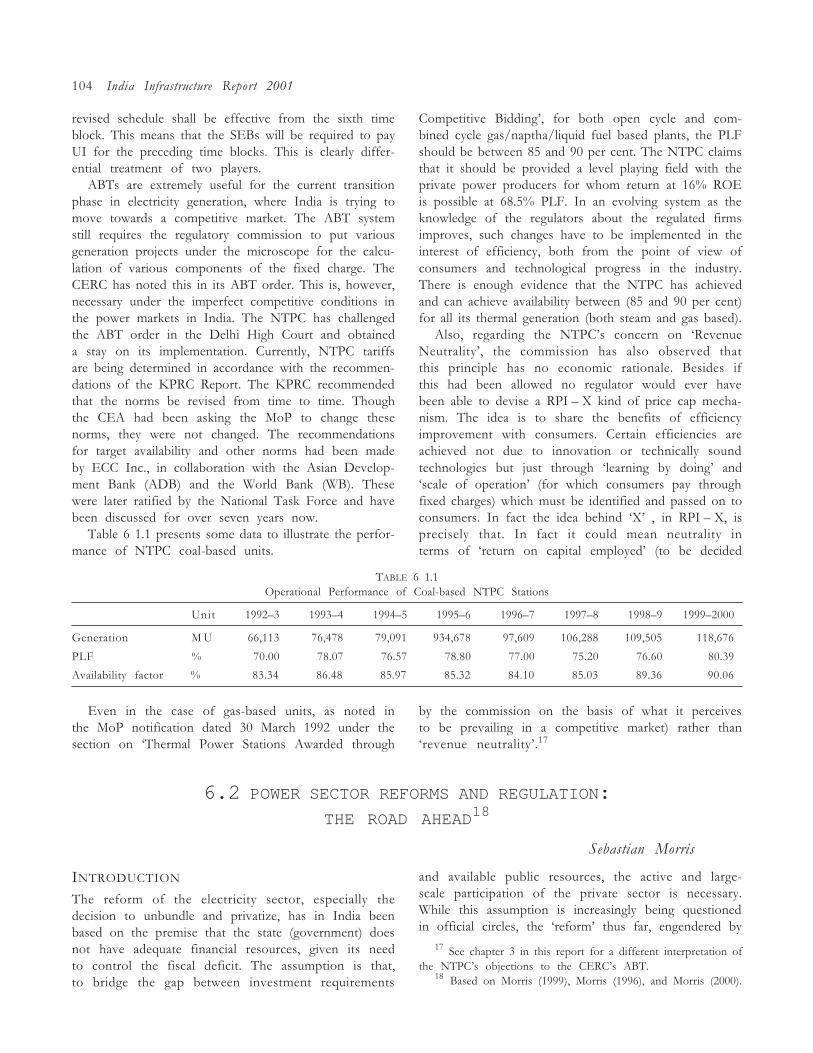
104 India Infrastructure Report 2001
revised schedule shall be effective from the sixth timeblock. This means that the SEBs will be required to payUI for the preceding time blocks. This is clearly differ-ential treatment of two players.
ABTs are extremely useful for the current transitionphase in electricity generation, where India is trying tomove towards a competitive market. The ABT systemstill requires the regulatory commission to put variousgeneration projects under the microscope for the calcu-lation of various components of the fixed charge. TheCERC has noted this in its ABT order. This is, however,necessary under the imperfect competitive conditions inthe power markets in India. The NTPC has challengedthe ABT order in the Delhi High Court and obtaineda stay on its implementation. Currently, NTPC tariffsare being determined in accordance with the recommen-dations of the KPRC Report. The KPRC recommendedthat the norms be revised from time to time. Thoughthe CEA had been asking the MoP to change thesenorms, they were not changed. The recommendationsfor target availability and other norms had been madeby ECC Inc., in collaboration with the Asian Develop-ment Bank (ADB) and the World Bank (WB). Thesewere later ratified by the National Task Force and havebeen discussed for over seven years now.
Table 6 1.1 presents some data to illustrate the perfor-mance of NTPC coal-based units.
Competitive Bidding�, for both open cycle and com-bined cycle gas/naptha/liquid fuel based plants, the PLFshould be between 85 and 90 per cent. The NTPC claimsthat it should be provided a level playing field with theprivate power producers for whom return at 16% ROEis possible at 68.5% PLF. In an evolving system as theknowledge of the regulators about the regulated firmsimproves, such changes have to be implemented in theinterest of efficiency, both from the point of view ofconsumers and technological progress in the industry.There is enough evidence that the NTPC has achievedand can achieve availability between (85 and 90 per cent)for all its thermal generation (both steam and gas based).
Also, regarding the NTPC�s concern on �RevenueNeutrality�, the commission has also observed thatthis principle has no economic rationale. Besides ifthis had been allowed no regulator would ever havebeen able to devise a RPI � X kind of price cap mecha-nism. The idea is to share the benefits of efficiencyimprovement with consumers. Certain efficiencies areachieved not due to innovation or technically soundtechnologies but just through �learning by doing� and�scale of operation� (for which consumers pay throughfixed charges) which must be identified and passed on toconsumers. In fact the idea behind �X� , in RPI � X, isprecisely that. In fact it could mean neutrality interms of �return on capital employed� (to be decided
6.2 POWER SECTOR REFORMS AND REGULATION:THE ROAD AHEAD18
Sebastian Morris
17 See chapter 3 in this report for a different interpretation ofthe NTPC�s objections to the CERC�s ABT.
18 Based on Morris (1999), Morris (1996), and Morris (2000).
INTRODUCTION
The reform of the electricity sector, especially thedecision to unbundle and privatize, has in India beenbased on the premise that the state (government) doesnot have adequate financial resources, given its needto control the fiscal deficit. The assumption is that,to bridge the gap between investment requirements
and available public resources, the active and large-scale participation of the private sector is necessary.While this assumption is increasingly being questionedin official circles, the �reform� thus far, engendered by
TABLE 6 1.1Operational Performance of Coal-based NTPC Stations
Unit 1992�3 1993�4 1994�5 1995�6 1996�7 1997�8 1998�9 1999�2000
Generation M U 66,113 76,478 79,091 934,678 97,609 106,288 109,505 118,676
PLF % 70.00 78.07 76.57 78.80 77.00 75.20 76.60 80.39
Availability factor % 83.34 86.48 85.97 85.32 84.10 85.03 89.36 90.06
Even in the case of gas-based units, as noted inthe MoP notification dated 30 March 1992 under thesection on �Thermal Power Stations Awarded through
by the commission on the basis of what it perceivesto be prevailing in a competitive market) rather than�revenue neutrality�.17

The Electricity Sector 105
this perspective, bears all its limitations. I would contendthat privatization has its own logic, in terms of overcom-ing the �principal-agency� problem, and ushering inincentives for efficiency, especially allocative efficiency.The resources gap argument is not only misleading butis inconsistent, and takes privatization in the wrongdirection. This premise is also entirely inadequate as abasis for a privatization programme, since it ignores theunderlying reasons for the financial incapacity of thestate in general and the electricity sector in particular.It takes as given the current inefficiencies and leakage ofresources from the state electricity boards (SEBs), anddoes not factor in improvements that can contribute agreat deal to the investable resources.
Similarly, the hastily crafted independent power project(IPP) programme (especially the so-called fast trackprojects) has added considerable burden on the SEBs,especially the �well�-performing SEBs of Maharashtra,Gujarat, and Karnataka. IPP proposals have come downdramatically and many very close to financial closurehave been dropped. This has happened because in asituation where basic reform was not pursued, privateparties had successfully shifted nearly all risks on tothe state sector. The contingent liabilities of state gov-ernments have as a result swelled. As state governmentshave woken up to this risk shifting, the basisfor IPPs which did not exist stands exposed. While it isprivatization of a sort, it can hardly be sustained, andthe vast potential benefits of a meaningful possibleprivatization would go unrealized. These and otherproblems had been anticipated when the first of the�reform� initiatives were announced, but the govern-ment, especially the Ministry of Power (MoP), hadchosen to ignore them. Only belatedly have some of theissues raised been recognized and corrected. Thus theearly restriction that limited local financial institutions�(FIs�) participation in IPPs to 20 per cent or less ofproject cost and constrained IPP promoters into tiedfinance from equipment manufacturers abroad and henceto high cost projects, has given way.
THE CURRENT PARADIGM
The present paradigm of reform has many other inad-equacies. I now very briefly discuss the more significantproblems.
Privatization Not Possible Without Reform
The assumption that large-scale privatization is possiblewithout reform, or delayed reform, of tariffs is question-able. Thus in most private power agreements (PPAs),private generating companies have (expectedly) insisted
upon guarantees and counterguarantees, and escrowaccounts. The cash flow position of SEBs is, therefore,worsened, since the purchase price per unit of power bySEBs is much higher than the long-run marginal cost ofgenerating the same internally. Profitability too is af-fected when this purchase price does not leave enoughroom to recover distribution costs. Equally important,the guarantees only mean that the contingent liabilityceiling is either breached or under pressure. The limitsof escrowability have already been reached in someSEBs.
The Economy Cannot Forever beResource Constrained
�Where are resources for 6000 MW plus capacity addi-tion, equal to approximately Rs 18,000 crore per annum,to come from?� is a question often rhetorically posedwith the �answer� being �from outside the sector and thecountry�. This is an obvious fallacy, which even thisInfrastructure Report is not free of. If a growing sectorcannot generate a sufficient portion of the resources thatit invests, then prima facie it is unviable for privatecapital. And most certainly foreign resources are outbecause they increase the contingent liability of thestate, and would use up the meagre surplus of the SEBsector, driving the SEBs faster to bankruptcy.19 It hasbeen shown here that at long-run incremental costpricing and assuming the marginal product of power tobe 5, given the power-constrained nature of the economy(as the government claims), the power sector becomesa �source� of net savings for the economy in less thaneight years. This is even less than the period impliedby the accelerated depreciation. Vast underutilized ca-pacities in power equipment manufacturing, and inassociated works, imply that the social cost of addingcapacity through domestic savings and indigenousequipment is far below the private cost.
IPPs WITH RISK-FREE CONTRACTS ARE NOT THE ANSWER
In privatizing generation alone or first, and in theframework of legally enforceable PPAs, there is noincentive on the part of the generating company toworry about demand. The Pakistan story inspite ofbeing all too familiar, and repeatedly pointed out, hasnevertheless been systematically ignored. Competitivebidding for generation projects, while it has the potentialto reduce project cost and tariffs, does not correct thisproblem: overinvestment or incorrect investment canstill take place�as when high cost fuels are used for base
19 Thus the Enron Project with watertight contracts continuesto be questioned by politicians, the press, regulators, and citizens�groups.
106 India Infrastructure Report 2001
power,20 or when plants are inappropriately located.The embedding of demand in the risk analysis of privategenerators has been weak when the state is the interme-diary. Considerable demand risk has therefore beenshifted on to the state.
Private generators, when operating on return oncapital basis (essentially cost plus) have little incentivefor making correct choice of technology. If bids arebased on lowest total cost of power and not also onthe composition between variable and fixed costs, insituations where merit order is not strictly enforced(or when PPAs subvert the same), the socially desiredusage of plants across all owners is vitiated. This hasseveral effects. It makes the task of a future regulatorvery difficult, since he would be burdened with priorsocially inoptimal contracts. It would also considerablydelay the process of forming a market for wholesaleelectricity. Equally importantly, the potential for pricesto be related to the load on the system (as they must befor a demand side participation in improving systemstability and fuller utilization of capital) in the nearfuture would be ruled out, or made difficult. This isbecause generators being separate from distributors andbuyers would not be too concerned about fuller utiliza-tion given the two-part tariff.21
Policy makers, and especially the bureaucracy, havefailed when they have sought and pushed �options� thatat best only shift forward the day of reckoning. In theprocess, they have not only delayed reform, but havemade sustainable reform and basic reform even moreproblematic. Thus it is quite feasible that private partieswith IPPs and PPA contracts in their pockets would beaverse to attempts to reform SEBs, that seek to lowerthe SEBs own marginal cost of generation. They would,for instance, insist on being protected against price capregulation, or against having to compete.
Foreign Funding Adds No Value in theElectricity Sector
The earlier insistence that domestic institutional fundsshould not exceed 20 per cent of project cost, has
deepened the interlocking22 of markets for foreign capitalresources and technology and equipment. Thus mostclearly IPPs based on tied finance have ended up choosinghigh cost equipment. As the policy was amended, morelocal resources could flow into IPPs. The initial �fasttrack� projects with predominantly foreign funding, ofwhich the Dhabol Power Project is a typical case, haveimposed as much as a 40 per cent service cost on foreignresources, when the upper bound of cost of foreignresources could have been barely 15 per cent. Indianplant costs are at least 15 per cent less than plants that aretied to foreign credit simply because of lower equipmentcost. Using this datum and the typical expected debt andequity returns in the Enron case it is obvious that fartoo high a foreign exchange cost has been borne inforeign funding and management of IPPs (see Table 6.2.1).
The problem really is that for a country like India,with well-developed capabilities in manufacturingplant and in its operations, an area with not too muchtechnological dynamism, there is little that foreigncapital and technology can contribute. The same wouldapply to a country like China (now), which has theShanghai Electric Corporation, manufacturing electricplant at a cost 5�20 per cent below that of the BharatHeavy Electricals Limited. Thus, if foreign capital hadto come in, the playing field had to be made partial tothe foreign player, and that is precisely what the fasttrack policy did. Besides the padding of project costs thattook place, because the Central Electricity Authority(CEA) was asked to look the other way, the entiremechanism of costing was in error. First high cost fuel-using stations were allowed to operate as base stations.Second, and perhaps more importantly, base load sta-tions were allowed full recovery of cost and earnings at16 per cent, at 68.5 per cent plant load factor (PLF),when base load stations of many SEBs were alreadyoperating at between 70 and 98 per cent PLF. The policyshould have allowed recovery of cost and earning at 16per cent, only at PLFs above the average of base loadstations of good SEBs. Indeed the approach should havebeen to buy power at a total cost that was least throughlong-term contracts rather than to worry about PLFs.A utility-buying base power should negotiate for thelowest unit cost of power. It is only when buying20 As naptha prices have gone up, certain IPPs that came up
with naptha-linked PPAs have stopped working. But the SEBscontinue to pay the cost at 16.0 per cent return on equity (ROE)on investments as per the PPAs. The plants could have quicklyfitted gas connection kits. But they have no incentive to do so.
21 The two-part tariff is a good mechanism for a robust, well-diversified utility to contract with a few generators for peakingpower (at the margin). It assumes that the utility retains the�advantage� and sets the terms, and gains from shielding thegenerator from demand, and variability risks. It cannot havegeneral validity in all situations of bulk power purchase.
22 Interlocking of markets for credit or funds and equipmentis too well known. Earlier, tied �aid�, especially bilateral credit,was important. Today private global institutions like GE Capitalhave emerged to push GE equipment in global markets particu-larly in the less developed countries (LDCs). It is inappropriatemacro-economic policies that have raised the cost of domesticresources for Indian firms. And the large �fischer-open� differentialbetween India and international capital markets would mean thatneither do they have access to foreign funds.
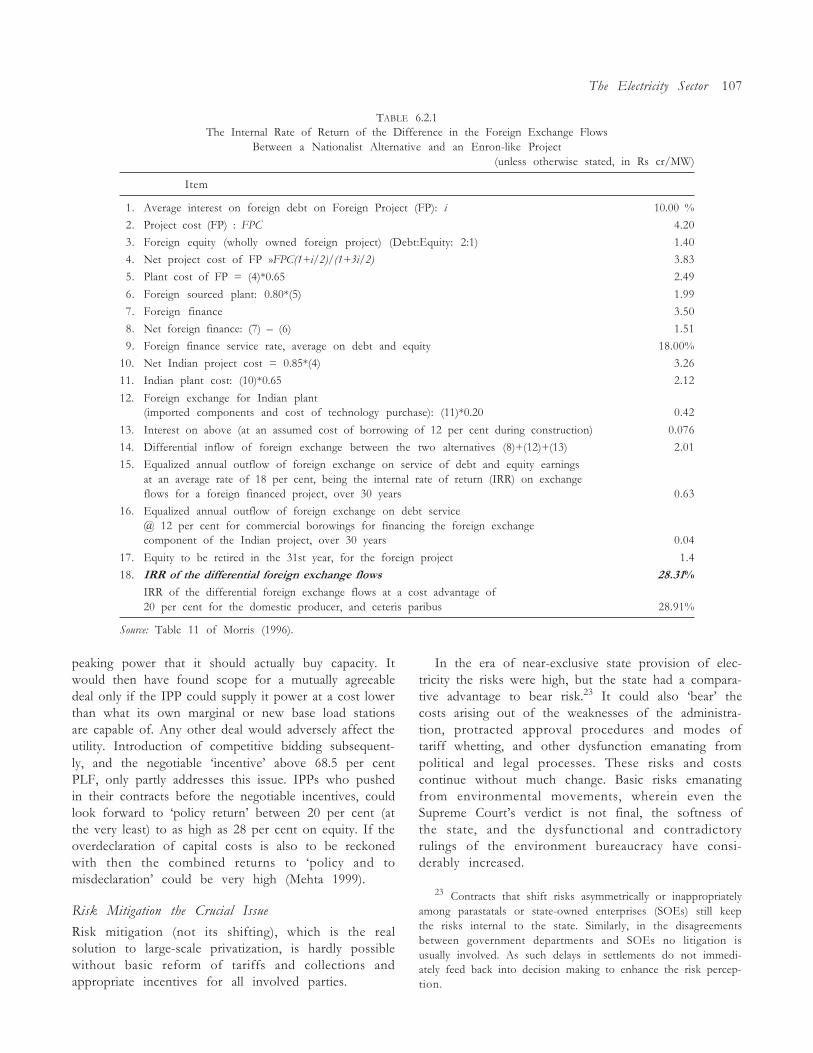
The Electricity Sector 107
TABLE 6.2.1The Internal Rate of Return of the Difference in the Foreign Exchange Flows
Between a Nationalist Alternative and an Enron-like Project(unless otherwise stated, in Rs cr/MW)
Item
01. Average interest on foreign debt on Foreign Project (FP): i 10.00 %
02. Project cost (FP) : FPC 4.20
03. Foreign equity (wholly owned foreign project) (Debt:Equity: 2:1) 1.40
04. Net project cost of FP »FPC(1+i/2)/(1+3i/2) 3.83
05. Plant cost of FP = (4)*0.65 2.49
06. Foreign sourced plant: 0.80*(5) 1.99
07. Foreign finance 3.50
08. Net foreign finance: (7) � (6) 1.51
09. Foreign finance service rate, average on debt and equity 18.00%
10. Net Indian project cost = 0.85*(4) 3.26
11. Indian plant cost: (10)*0.65 2.12
12. Foreign exchange for Indian plant(imported components and cost of technology purchase): (11)*0.20 0.42
13. Interest on above (at an assumed cost of borrowing of 12 per cent during construction) 0.076
14. Differential inflow of foreign exchange between the two alternatives (8)+(12)+(13) 2.01
15. Equalized annual outflow of foreign exchange on service of debt and equity earningsat an average rate of 18 per cent, being the internal rate of return (IRR) on exchangeflows for a foreign financed project, over 30 years 0.63
16. Equalized annual outflow of foreign exchange on debt service@ 12 per cent for commercial borowings for financing the foreign exchangecomponent of the Indian project, over 30 years 0.04
17. Equity to be retired in the 31st year, for the foreign project 1.4
18. IRR of the differential foreign exchange flows 28.31%
IRR of the differential foreign exchange flows at a cost advantage of20 per cent for the domestic producer, and ceteris paribus 28.91%
Source: Table 11 of Morris (1996).
peaking power that it should actually buy capacity. Itwould then have found scope for a mutually agreeabledeal only if the IPP could supply it power at a cost lowerthan what its own marginal or new base load stationsare capable of. Any other deal would adversely affect theutility. Introduction of competitive bidding subsequent-ly, and the negotiable �incentive� above 68.5 per centPLF, only partly addresses this issue. IPPs who pushedin their contracts before the negotiable incentives, couldlook forward to �policy return� between 20 per cent (atthe very least) to as high as 28 per cent on equity. If theoverdeclaration of capital costs is also to be reckonedwith then the combined returns to �policy and tomisdeclaration� could be very high (Mehta 1999).
Risk Mitigation the Crucial Issue
Risk mitigation (not its shifting), which is the realsolution to large-scale privatization, is hardly possiblewithout basic reform of tariffs and collections andappropriate incentives for all involved parties.
In the era of near-exclusive state provision of elec-tricity the risks were high, but the state had a compara-tive advantage to bear risk.23 It could also �bear� thecosts arising out of the weaknesses of the administra-tion, protracted approval procedures and modes oftariff whetting, and other dysfunction emanating frompolitical and legal processes. These risks and costscontinue without much change. Basic risks emanatingfrom environmental movements, wherein even theSupreme Court�s verdict is not final, the softness ofthe state, and the dysfunctional and contradictoryrulings of the environment bureaucracy have consi-derably increased.
23 Contracts that shift risks asymmetrically or inappropriatelyamong parastatals or state-owned enterprises (SOEs) still keepthe risks internal to the state. Similarly, in the disagreementsbetween government departments and SOEs no litigation isusually involved. As such delays in settlements do not immedi-ately feed back into decision making to enhance the risk percep-tion.
108 India Infrastructure Report 2001
A Case for Regulation but Not Detailed Regulation
The central government�s initiative to set up a central-level regulator, and urge state governments to set upstate-level regulators while undoubtedly a step in theright direction, may unwittingly have introduced con-siderable �regulatory risk� instead of resulting in riskmitigation and bringing about transparency. The prin-cipal reason is that the regulators have little power. Therecommendations of the �Committee on DistributionPrivatization� against price cap regulation are a case inpoint. Price cap regulation, besides the well-knownadvantages, has the added merit that its costs are one-time and low, in comparison to cost plus regulation.It brings about significant clarity to potential partici-pants in distribution (and generation), can easily accom-modate the long-run �marginal� cost principle, and shieldsregulators from undue influence.24 Besides this, it hassufficient incentives for cost reduction. In a countrylike India, given its large diversity, there is need is fora �core price cap formula�, with certain parametric valuesbeing different for different locations. In the long run,as a national market for wholesale power is possiblewith (more than) adequate capacity in long-distancetransmission, the need for varying regional formulaewould no longer be there. This is as it should be, sincepower is best produced where long-term costs are low(at pit heads, and near the coast, for example), subjectto transmission costs. Price cap regulation would leavetechnology choice to the producer�distributor in themedium term. Given redundant grid capacity in thelong run, with competition, technology choice wouldbe internal to the generating companies. Scale, choice offuel, location, peaking capacity would then be internaldecisions, as they should be, driven by cost factors,demand, and willingness to pay.
Regulation an Economic Rather Than aLegal or Engineering TaskUnfortunately there are no guidelines for the involve-ment of experts from various disciplines in regulation.25
It is not sufficient to involve legal persons and engineers.
Regulation is typically an analytical exercise that de-mands not only electricity economics, but also the costof information and policy, transparency, simplicity, thevalue of time, and most importantly the �incentive�implications of regulations. In other words, regulatorswould have to worry about how best they can take theelectricity system to the planner�s optimality throughprices (rather than administrative measures or fiat,though these are not entirely avoidable). If the regulatorwere to become an authority that examines all aspectsin their specific details and has to worry about �correct�costs and prices of every project, and has to be able tojustify its rulings in courts, then the task would be quitebeyond the capacity of any reasonable-sized publicorganization. More importantly the firm and producerside costs that such a regulator would impose would bevery large.
The Particular �Philosophy� of RegulationNeeds Definition
Thus there is need for a �strategy of regulation� for thesector as a whole that addresses how transparency canbe built into the process, reduces regulatory risk, keepsregulation costs low, and exploits the full potential ofcompetition in generation and improvements thatprivatization can bring. Otherwise regulation maytake us a step backward,26 even when regulators arehonestly attempting to introduce transparency.
Restructuring of SEBs Would Have to be DerivedFrom the Regulation Strategy
The restructuring of the SEBs can hardly be addressedwithout clarity on the role of the regulator and thestrategy of regulation. Unfortunately, this has not ex-pressly been realized by the central government. Thusthe role of the State Electricity Regulatory Commissions(SERCs) is hardly as yet clear for state governments togo ahead with particular schemes, including privatizationfor restructuring.
Similarly many regulators have to take suboptimaldecisions with regard to tariffs, since there is no overalldeclared strategy of reform. That has been left to stategovernments with certain reports, like that of theCommittee on Distribution Privatization, providingwhatever framework one can infer. Ideally, the Centreshould have specified that state governments shouldrestructure towards a market model in generation. (This
24 It is almost certain that in most states the regulator wouldbe captured in due course by a privatized electricity sector, ifdetailed or cost plus mode were to be the practice. Fertilizer, steel,paper, sugar are all industries that in the control period, andfertilizers even today, generated vast rents out of regulatory prices.In contrast, in states like West Bengal, the political processes coulddrive the regulator to unviable prices for industry. Buses, trams,and Calcutta Electricity Supply Corporations�s (CESC) electricitybusiness are examples.
25 The �knee-jerk� reaction of the bureaucracy to translate theneed for independence of the regulator to the suitability of retiredjudges and civil servants, and hardly ever economists, managers,and practitioners is part of the problem.
26 The US had to go through a major deregulation effort awayfrom return on investment/RONW type of detailed regulation. Atone time, more than 50,000 �experts� and their staff were involvedin the task of regulation, and regulated industries had effectivelycaptured the regulator, as the fall in retail prices on deregulation,especially in airlines, trucking, and telecom, would indicate.
The Electricity Sector 109
may happen if the Draft Bill 2000 [NCAER 2000] isaccepted.) It should also have provided for total trade inpower across the country, with tariffs restricting the roleof inter-regional trade for a while whenever strandedassets are large, and complete and unrestricted access tothe grid for all generators and consumers above a certainsize, if it were truly interested in privatization that en-hances efficiency and provides electricity at low cost tothe consumer. At the very least it should have cried outagainst the current captive generation policies of stategovernments. Additionally, on subsidization it shouldhave ruled out anything but direct subsidization of theagricultural sector. Similarly, it should have taken a clearposition with regard to the IPPs and their status in anyfuture competitive model. Only if policy could so haveconstrained or shaped the direction of reform, could theregulatory and policy risks have been brought down.
Perverse Incentives for SEB Managers
Low tariffs for agriculture, and more importantly un-metred supply, have resulted in excessive and wastefulconsumption and consumption for unauthorized uses,besides creating the basis for moral hazard; The agency(SEB) that sells is the same as the one that reports theidentity of the consumer to the principal (the govern-ment). Since government lacks the ability to verify theidentity of the subsidized consumer, and the amountactually consumed by such consumers, exploiting theagency problem becomes a focus of the agent.
Even incentives that had a functionality earlier havebecome dysfunctional today. Unfortunately, in the early1990s and before, when PLFs were low and generationwas generally unconstrained by either demand or gridcapacity, it made sense to give performance incentivesfor generation based on achieved PLFs of plant. SomeSEBs give the incentives to plants, others to the SEBas a whole. PLFs have gone up generally and today inthe eastern region (where capacity had been overesti-mated27), there is a problem of oversupply and highgrid frequences, because SEB units refuse to back down,since the incentives tend to be linked to PLFs! Soelectricity is �burnt� on the wires and many consumershave to delink to save equipment as frequency goes upbeyond 50 hertz. To counter this a frequency-linkedavailability-based tariff is being proposed, which is anattempt to correct one distortion with another.28
Dysfunctional Tariffs
Tariffs for industry have already reached unsustainableand dysfunctional levels, in most SEBs. Most SEB ratesfor industry are already higher than the cost of self-generation even at small size (~5 MW). And evenwithin the constraints of the present captive generationpolicy, it is only the current high interest cost ofborrowed funds and generally recessionary conditionsthat prevent an exodus of bulk consumers from theSEB system. Strangely though, consultants of all huescontinue to recommend a linear rise in tariffs even goingup to Rs 6 per KwH for industries. The AdministrativeStaff College of India, Hyderabad for instance recom-mended a 20 per cent across the board increase whichwould have taken industrial tariffs to over Rs 5 per KwHin Gujarat! High tariffs affect the competitiveness ofIndian industry. In comparison to India�s competitors,especially Thailand, South Korea, and China, Indianindustry is in a particularly adverse position.
OVERCOMING THE �AGENCY PROBLEM�
Restructuring proposals cannot sidestep the agency prob-lem. Any attempt at marketization, privatization, orregulatory reform, and especially restructuring, thatdoes not squarely address the �agency problem� wouldnot be meaningful. Thus the problem of the SEBs is farmore basic than the typical �inefficiencies of the publicsector� noted worldwide. Indian bureaucracies are emi-nently capable of crafting institutions and rules that inform resemble success stories elsewhere, but in contentand behaviour continue to remain dysfunctional.29
No piecemeal or stop-gap arrangement that allowsthe continuation of the agency problem and does notrein in leakages is meaningful. Thus proposals to sellgeneration assets of SEBs, without a complete reformof distribution are of little use. Similarly, proposalsto sell assets, when there is no regulatory or strategicclarity, to state-level public sector undertakings (PSUs)would amount to arm-twisting the few PSUs with thecash reserves to cough up these resources to allow theleakages within the SEB system to continue.30
The dead-weight losses that are true social losses,and not just a transfer problem, are very large. They takethe form of losses due to unutilized and underutilized
27 In the past because capacities were estimated assuming thecontinuation of existing inefficiency and mismanagement. Indeed,the NTPC�s capacity expansion in the late 1980s and early 1990sin the east were to cover up for the failure of the Bihar, Orissa,and Bengal SEBs.
28 See section 6.1.
29 Thus the oversight of the public sector in India has witnessedall the modalities found successful elsewhere such as the contractform of the French in the MoUs and the holding company formof the Italians in our own holding companies. True success as Ihave elsewhere observed (Morris 1991) has always eluded usbecause these modalities or institutions were replicated merely inform, but not in spirit and content.
30 Apparently such proposals are being �seriously� consideredin Gujarat.
110 India Infrastructure Report 2001
capacity, both within the system (SEB) and outside(other power suppliers and captive generators). Allocativeefficiency losses resulting from inappropriate technol-ogy choice, violation of merit order, and disincentivesthat prevent demand from responding appropriately toprices are even more severe, though difficult to estimate.
The independent regulators are already in place andwould soon be working. The Gujarat Electricity Board(GEB), Maharashtra State Electricity Board (MSEB), andthe inheritor companies of the Haryana State ElectricityBoard have already asked for average tariff increasesthat are 20 per cent above current levels. In Maharashtra,the Maharashtra Electricity Regulatory Commission(MERC) has already disallowed the demand for tariffincreases, pointing to the need for the Board to plugleakages and minimize the effect of �sugar-coated� PPAsthat have raised costs of purchased power unnecessarily.The Gujarat regulatory authority too is unlikely togrant the heavy tariff increase of 20 per cent asked forsince it now has an idea of the vast inefficiencies andleakages. Similarly, the Haryana Electricity RegulatoryCommission (HERC) is closely and critically examiningthe tariff proposals. In Andhra Pradesh, though, theregulatory authority has awarded rather steep increasesin tariffs. Thus true reform of the SEB system cannotbe further postponed.
Subsidy Per Se is Not the Problem
The subsidization of agriculture (even after recognizingthat a substantial portion of the reported consumptionby the agricultural sector is fictitious), is considerable.Central government committees and enquiry reports aswell as policy statements have for some time been urgingthat this subsidization be considerably reduced oreven eliminated. Variously it has been stated that tariffshould be raised so as to achieve a minimum return of3 per cent on equity, that agriculture should be chargedat 50 paise per unit, Re 1 per unit, etc. Yet no meaning-ful measures to reduce and contain subsidies havebeen made. The only meaningful recommendationthus far is that the subsidy cost must be made good bystate governments to the SEBs, so that SEBs are ableto retain at least accounting independence from stategovernments. Yet this recommendation in itself if im-plemented could create a problem of moral hazard. Itwould result in an incentive for the SEBs to over-reporttheir subsidization costs.31 This bind of the agriculturalsector has coloured the recommendations of the centralgovernment on distribution and its privatization. It has
been generally assumed that distribution areas withlarger agricultural load would be less amenable toprivatization, or that differential costs would have to berecognized. The Report on Distribution Privatizationhas hardly appreciated the point that differential tariffin principle would be very difficult if not impossible toadminister by privatized licensed monopolies withoutthe regulator incurring the impossibly huge costs ofproducing independently verifiable information on cus-tomers� identity. Such measures open the door to fastergrowth in subsidies, or to a parallel growth of theregulator�s back office to ensure the validity of subsidyclaims.
Stepping Stone Solution to SubsidizationIt must be recognized, first, that removal or considerablescaling down of agricultural subsidies would be verydifficult since electricity-using farmers, comparing them-selves with canal water using farmers, would, even nowwith subsidies prevailing, find themselves relativelydiscriminated against.32 Second, there is no way non-agricultural rural use can be separated from agriculturaluse by the utility; and as non-agricultural use increases,subsidies would in fact become rural rather than agricul-tural. It is surprising that these simple facts have barelyfound their way in discussions within the government.
While it is true that �farmers would chose pricedpower available regularly rather than free power avail-able just four hours�, as many enlightened politicianshave stated, it is not widely recognized that farmerswould in general disbelieve that the SEBs could in factdeliver quality power. Political entrepreneurship wouldalso be necessary to translate this preference to accep-tance. There is a catch-22 situation here, since withouttariff and basic reform the system would not be able toadd capacity to ensure quality and reliable power. Thepoor credibility of the state system to do anything aboutsystemized ills is at the root of the problem. And farmersknow this. Thus a �stepping stone� solution of continuedbut capped subsidization, which provides the opportu-nity for eliminating leakages and finally makes tariffreform politically acceptable, is necessary.33
31 This is already happening on a large scale in the case of theGEB and there is no doubt at all that in the name of the ruralpoor and the farmer, vast leakages take place in Andhra Pradesh,Uttar Pradesh, and Madhya Pradesh.
32 Canal water is provided at low rates that do not even coverthe (low) maintenance costs of irrigation systems, leave asidecapital or replacement cost. Indeed the rates are far lower thanthe marginal product of water, and well below private watermarket rates (Shah 1992; Planning Commission 1992).
33 Moreover, unlike what all SEBs claim and what the accoun-tants� approach would be, the subsidy is not equal to that revenuethat would, when added to current revenues, equal the requiredreturn of 3 per cent (or 9 per cent). Even if leakages are accountedfor, the problems of differential cost of delivery and time of day thesubsidized sector uses power are important. The scattered natureof agricultural or rural demand would mean higher distribution
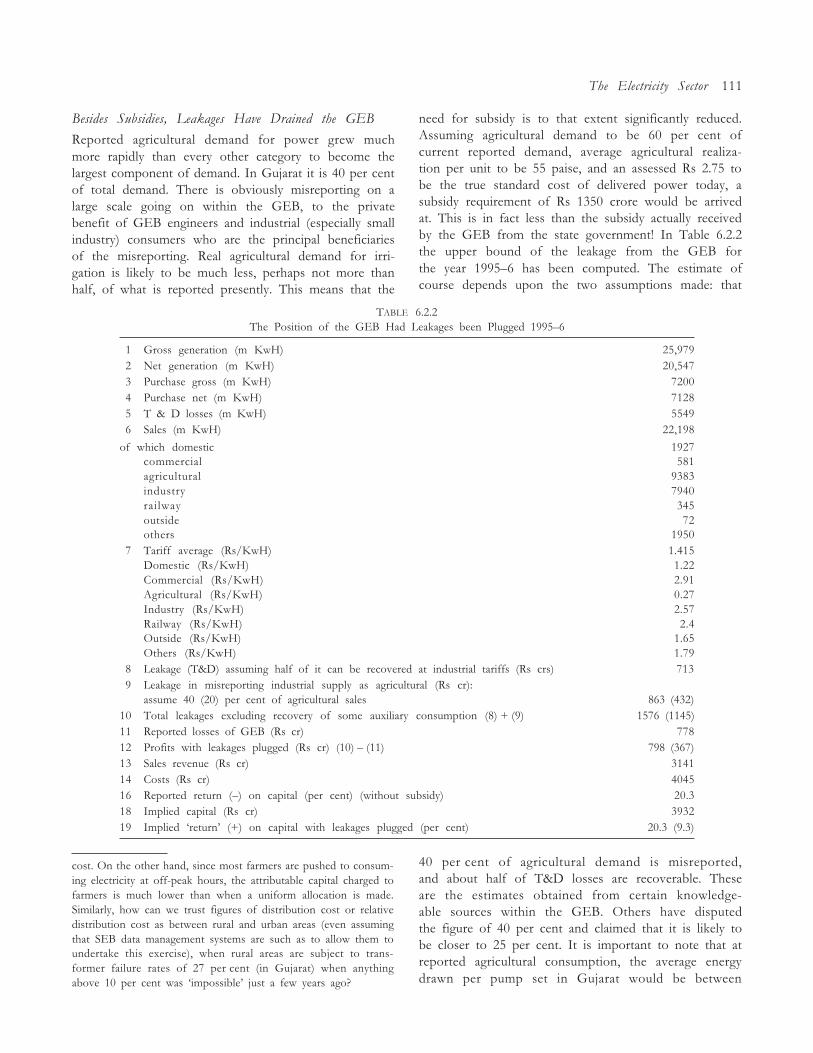
The Electricity Sector 111
Besides Subsidies, Leakages Have Drained the GEB
Reported agricultural demand for power grew muchmore rapidly than every other category to become thelargest component of demand. In Gujarat it is 40 per centof total demand. There is obviously misreporting on alarge scale going on within the GEB, to the privatebenefit of GEB engineers and industrial (especially smallindustry) consumers who are the principal beneficiariesof the misreporting. Real agricultural demand for irri-gation is likely to be much less, perhaps not more thanhalf, of what is reported presently. This means that the
need for subsidy is to that extent significantly reduced.Assuming agricultural demand to be 60 per cent ofcurrent reported demand, average agricultural realiza-tion per unit to be 55 paise, and an assessed Rs 2.75 tobe the true standard cost of delivered power today, asubsidy requirement of Rs 1350 crore would be arrivedat. This is in fact less than the subsidy actually receivedby the GEB from the state government! In Table 6.2.2the upper bound of the leakage from the GEB forthe year 1995�6 has been computed. The estimate ofcourse depends upon the two assumptions made: that
cost. On the other hand, since most farmers are pushed to consum-ing electricity at off-peak hours, the attributable capital charged tofarmers is much lower than when a uniform allocation is made.Similarly, how can we trust figures of distribution cost or relativedistribution cost as between rural and urban areas (even assumingthat SEB data management systems are such as to allow them toundertake this exercise), when rural areas are subject to trans-former failure rates of 27 per cent (in Gujarat) when anythingabove 10 per cent was �impossible� just a few years ago?
TABLE 6.2.2The Position of the GEB Had Leakages been Plugged 1995�6
01 Gross generation (m KwH) 25,97902 Net generation (m KwH) 20,54703 Purchase gross (m KwH) 720004 Purchase net (m KwH) 712805 T & D losses (m KwH) 554906 Sales (m KwH) 22,198
of which domestic 1927commercial 581agricultural 9383industry 7940railway 345outside 72others 1950
07 Tariff average (Rs/KwH) 1.415Domestic (Rs/KwH) 1.22Commercial (Rs/KwH) 2.91Agricultural (Rs/KwH) 0.27Industry (Rs/KwH) 2.57Railway (Rs/KwH) 2.4Outside (Rs/KwH) 1.65Others (Rs/KwH) 1.79
08 Leakage (T&D) assuming half of it can be recovered at industrial tariffs (Rs crs) 71309 Leakage in misreporting industrial supply as agricultural (Rs cr):
assume 40 (20) per cent of agricultural sales 863 (432)10 Total leakages excluding recovery of some auxiliary consumption (8) + (9) 1576 (1145)11 Reported losses of GEB (Rs cr) 77812 Profits with leakages plugged (Rs cr) (10) � (11) 798 (367)13 Sales revenue (Rs cr) 314114 Costs (Rs cr) 404516 Reported return (�) on capital (per cent) (without subsidy) 20.318 Implied capital (Rs cr) 393219 Implied �return� (+) on capital with leakages plugged (per cent) 20.3 (9.3)
40 per cent of agricultural demand is misreported,and about half of T&D losses are recoverable. Theseare the estimates obtained from certain knowledge-able sources within the GEB. Others have disputedthe figure of 40 per cent and claimed that it is likely tobe closer to 25 per cent. It is important to note that atreported agricultural consumption, the average energydrawn per pump set in Gujarat would be between
112 India Infrastructure Report 2001
two and three times higher than in comparable states:Maharastra, Andhra Pradesh, Tamil Nadu, Karnataka,and Madhya Pradesh.
Even ignoring some recovery that is possible fromauxiliary consumption, the estimated leakage was doublethe magnitude of the reported losses in the same year.In that year the GEB reported a loss of 20.3 per cent oncapital employed. With the leakage plugged it wouldhave in fact made a profit (including additional dutyrealization) of 20 per cent on capital employed! With theassumption of 20 per cent (rather than 40 per cent) ofagricultural demand being misreported the return wouldhave been as high as 9 per cent.
Vested Interests the Real Barrier to Reform
Thus the real barrier to reform is not so much, as isusually claimed, the politics of populism as vestedinterests within SEBs and those outside benefiting fromthe leakages. The GEB, for example, has estimated the�effective subsidy to agriculture� to be Rs 2713 crore in1997�8. In the same year it claimed that 10,089 millionKwH of electricity was sold to the agricultural sector.Even assuming for a moment that it is the true figureof actual sales to agriculture, then the subsidy per unitof sales implicit in the GEB�s reckoning is Rs 2.689 perKwH, which is untenable. At a more likely 6000 millionunits of sale to the agricultural sector for irrigationthis would be Rs 4.52 per unit! Thus the GEB hasbeen tacking all its inefficiencies and T&D losses, includ-ing theft, on to the agricultural sector, treating it as aresidual, to claim a whopping Rs 2713 crore from thegovernment. It actually received Rs 1666 crore, the restbeing covered by net cross-subsidy from the industrialand domestic sectors.
What we have in effect is the extreme instance ofmoral hazard in a situation where �subsidy administra-tion� was not separated from the SEB. This has allowedthe SEB to use the excuse of low prices to the agriculturalsector to cover up its inefficiencies and more impor-tantly graft.
Stamps-based Agricultural Subsidy
Agricultural subsidies ought to take the form of an elec-tricity stamps or coupons scheme, which is administeredby the Agriculture Department. The scheme wouldnecessitate the use of land records, records related tooperational holdings and to the identification of farmerswho need subsidy. The government would have to de-cide to what extent it needs to subsidize rich farmers;the electricity subsidy has thus far been a productionsubsidy and not poor oriented. Even if it continues tobe treated as such, farmers would have to be identified
and matched to their owned and operated agriculturallands, and issued stamps. The annual issuance ofstamps through banks can be made a very simple activitythrough appropriate design to guard against malpractice.
Should the Stamps be Made Tradable?
As long the subsidy is not poor oriented, tradabilitywould not be desirable. When the subsidy is for farmers,based on their status as poor people, tradability wouldallow those farmers who want to exchange electricityfor food or other consumption items to do so. In effectthen it would, as it should, become an income subsidy.
Stamps collected by the distribution companieswould entitle them to subsidy revenue from the govern-ment. The need for stamps or coupons in the mannerdescribed above arises because of the need to target thesubsidy better, to cap the same, and to prevent subsi-dized electricity being used for non-farm activities.Perhaps most importantly, the need for stamps arisesbecause that is one way subsidization can be entirelyseparated from the business of electricity distribution.Thereby the problem of moral hazard�overreporting ofsubsidized consumption by the company�is entirelyavoided. This would be absolutely necessary for thesuccess and credibility of a privatization programme.34
CREATING THE MARKET
The SEBs could be restructured in several ways. Whatis feasible and meaningful would of course depend onthe regulatory arrangements. Thus a regime of detailedregulation, with the power to licence being in the handsof the regulator, would largely preclude competitionin generation, which would otherwise be possible. Itwould still allow some competition in capacity costs andtherefore in capacity addition.
Similarly, recognition of the constraints in transitionwould mean that proposals would have to consider notonly the envisaged end result of reform and restructuringbut also lay out a transition path. The reform may bedefined as such reorganization and the legal and policychanges which would: (a) solve the agency and moralhazard problem in administration of subsidies; (b) createincentives for cost saving and efficient generation, trans-mission, and distribution; (c) correct the inversions inthe tariff, and lead to a scheme that would allow pricesto play their economic role of reflecting costs. The pricestructure ought also to create incentives for consumersto use electricity optimally. Prices should also signalproducers correctly.
34 It is not entirely certain that this problem of moral hazardis not there in the privatized distribution companies of Orissa.
The Electricity Sector 113
It has already been argued that separation of subsidyadministration from the SEBs is necessary. But thatalone would not be sufficient to solve the agencyproblem. In order to neutralize the vested interests,both within and outside the SEBs that have come uparound the �leakages� of revenue, it is necessary thatdistribution be privatized. The culture of tampering withmetres, coming to an agreement with the customer, etc.is too well entrenched to be removable by mere admin-istrative, financial, or formal restructuring, such ascorporatizing the SEBs or even trifurcating the organi-zations, while retaining the ownership structure intact.
Quick privatization of distribution, even before regu-latory clarity and strategy emerges, is the need of thehour, since with every month the leakages, and continu-ing inefficiency, accumulate and impose a severe burdenon the state budget.35
Such quick and revenue-enhancing privatization, thatat the same time does not retard the scope of furtherreform and change, would call for bundling of somegeneration assets with distribution. This would simulta-neously lower the demand risk for generation assets,allowing them to be privatized easily (without creatingPPAs, contingent liabilities, etc.) and simultaneouslylower the supply risk for distribution entities.
Some Bundling for Quick PrivatizationThereby, and to the extent that the assets are bundled,their value is not crucially dependent on the ability ofthe restructuring and regulatory processes to unbundleand put the system back together through elaboratemarket-creating processes. Thus the �regulatory and re-structuring risk� can be minimized for partially bundledentities. Resources can then flow from the capitalmarkets if the final tariff awards are consistent withrecovery of costs (even if they are in error with regardto recovery of particular costs). Thus the regulatoryauthority would also have the space to organize and layout its strategy, including market creation processes ingeneration, with much caution. It would also be able, ina phased manner, to implement its strategy.
This would allow for quicker privatization of distri-bution, which is the immediate requirement, becausethat alone can plug the leakages from the system.Moreover there is a period of learning, when the pricecap formulae and the rules are fine tuned and partici-pants learn, and the IT system is set up to allow for quickcontracting and settlement and monitoring of powergenerators and consumers at each of the connectionpoints on the grid. The bundling would allow for a
smoother transition than otherwise. Moreover, themarket is familiar with such companies as the BombaySuburban Electric Supply Limited (BSES), AhmedabadElectric Company (AEC), Surat Electricity Company(SEC), and Calcutta Electric Supply Corporation (CESC).These companies are licensees under the Electricity Actof 1948, and are subject to annual tariff review by thestate governments. Their investment arrangements toexpand capacity need not necessarily go through thestand-alone route. They could take advantage of balancesheet financing, for instance, to considerably lower theircost of capital.
Public Enterprise would have Problems with CompetitionLet us take the GEB as a case.36 Currently capacitywithin the GEB, in the IPPs, in captive generators, andin Gujarat�s share from the central electricity companiesis together underutilized. There is much scope to shiftdemand to off-peak hours to raise the systemwide PLFhigher and improve power quality. More efficient capac-ity utilization possibly with workable time of theday tariff (leading to shifting of demand) is not feasibleunless distribution and generation company staff havethe requisite freedom to offer substantial discounts thatdepend upon the situation and are essentially unpredict-able. Such freedom in government departments andpublic sector companies given their rule orientationwould be difficult, if not impossible. Functional (ratherthan the usual formal) monitoring of such discountswould be difficult again, unless the entity is privatelymanaged. The scope for shifting to off-peak hours islarge in Gujarat given the fact that Gujarat has a largenumber of power using industries and substantial agri-cultural demand, which could use off-peak power effec-tively. Most importantly, bringing back accountabilityand embedding responsibility in the present SEBs with-out change in ownership would be very difficult.37
Transparency of Processes Crucial to Success of ReformIn moving towards a reformed electricity system whereinprivatization of distribution and generation is the crucialaspect, the processes followed to bring about the changesare important. Success would depend upon two criticalaspects: It would be necessary to build in completetransparency and information sharing with bidders,
35 At a rough and conservative estimate the leakages per monthare in excess of Rs 80 crore per month in the case of the GEB.It is more likely to be at least 50 per cent above that level.
36 The situation in Maharashtra, Tamil Nadu, and AndhraPradesh would be quite similar to that in Gujarat. In only a fewSEBs is the elastic component of demand small enough to createspecial problems�Kerala and Delhi and possily the north-easternstates. In, most other states, with some variation, the model thatis developed here should readily apply.
37 Thus even to date GEB management has not been able toinstall transformer-level metres to bring about some accountabil-ity among its commercial staff.
114 India Infrastructure Report 2001
consultants, study groups, concerned departments ofgovernments, power users, captive generators, and citi-zens in general. Similarly the restructuring processwould have to be directed by the appointment of acredible person who not only has the necessary skills,but also independence from the SEB, the government,influential politicians, the bidders, consultants, and ad-visers. This is vital since incumbent management andstaff of the GEB, the government, or influential politi-cians and bureaucrats cannot be assumed to be uninter-ested parties.38
Equally importantly, complete transparency wouldresult in the best prices from bidders for SEBs� businessesand assets. The true status of most SEBs assets is hardlyknown39 and only complete transparency can ensurethat bidders do not bring legal claims after takeovers/assets sale. Transparency and the fairness that can comeonly with independence and expertise would also attractmany more bidders other than those who seek to gainout of government failures, or out of their ability tounduly influence the government.40
Transmission the Market MakerTransmission ought not to be fully privatized. This isto ensure that the option of a complete market solutionin generation either through pool prices or contracts iskept open and becomes easier to pursue. It avoids thedanger of �artificial� constraints in transmission segmentsthat give rise to shortages in particular territories, whichin turn could result in high realized prices for generators.
Yet since good transmission performance is alwaysin the interest of the consumer the transmission entitycould beneficially have substantial participation byconsumers, including user industries, while beingentirely free of shareholding by generation and distri-bution interests.41 Key to enhanced efficiency of the
restructured system is the degree of competition amonggenerators.
Transmission as a Regulated MonopolyTransmission is best operated as a regulated monopolywith price cap regulation. A significant but minorityshareholding of the government in transmission wouldbe desirable. Transmission business should be confinedto system integrity, investments, and operations onbehalf of buyers and sellers of power for benefit ofconsumers. The transmission company should notbuy and sell power on its own account, but shouldfacilitate selling and buying of power, in other wordsbe a market maker42 rather than participant.
Own Account Trading by TransmissionCompany Should Be InadmissibleIn principle too if the transmission company(TRANSCO) buys and sells power on its own account,then the generating company is to that extent shieldedfrom demand risk and variability in demand. TheTRANSCO then would have to bear these risks, whichwould be an intrusion into its principle business oftransmitting power, which tends to be a natural mo-nopoly.
It is important to realize that large generators wouldattempt to enhance their returns by creating congestionsituations, when connection rights are traded in amarket. This has happed in systems where connectionrights exclude other competitors. Such artificial conges-tion could also take place when grid restrictions aresignificant, even when connection rights are periodicallyassigned, as would be the case of a regulated transmissionmonopoly. To avoid or minimize such situations, theownership structure of the TRANSCO is crucial. Alsoreturns to the TRANSCO in relaxing congestion in theform of line loss charges and connection charges, shouldbe significant. In other words, the TRANSCO shouldhave appropriate incentives to maintain optimal overca-pacity.
With less than majority share held by the govern-ment, the TRANSCO would not be �state� in the courts�view and would have the requisite freedom to pay itsstaff well and in a manner that creates incentives forperformance within the organization. Similarly, the
38 The Maharashtra State Electricity Board and Tamil NaduBoard Electricity (TNB) have significantly lower leakages and thiscondition may not be strictly necessary.
39 Thus in the case of the GEB, auditors had contested or hadadditional notes to practically every major figure in the annualreport, and there were over thirty significant notings (GEB1997�8).
40 In the eyes of the people, no government today has thecredibility to pose as being corruption free. Thus even if agovernment is fair, and keeps the disinvestment process free ofcorruption, nobody would believe it. Certainly not at state level.Competitive politics would ensure that there would be question-ing of virtually every decision.
41 The Draft Bill, 2000 (NCAER 2000) also makes the pointabout transmission not being interlinked with owners of distri-bution and generation companies. We would like to go a stepfurther to say that restructuring should actually solicit theparticipation of industry farmers, and households, in transmissioncompanies.
42 The National Thermal Power Corporation (NTPC), forinstance, has resisted enormous government pressure that it be-come a power trader on behalf of the IPPs, rightly knowing thatunder the present circumstances, its cash flow would greatly de-teriorate with such operations, since the receivables from the SEBswould then mount even faster. The recent decision of the centralgovernment to set up a power-trading corporation is inexplicable.The previous section discusses the issue in greater detail.
The Electricity Sector 115
current constraint of being �state� in labour managementin general would go.
The TRANSCO would have to lay down detailedguidelines and announce connection, congestion, andline loss charges for various types and sizes of loadsconnected to the transmission network and for use ofits facilities, in consultation with the regulator. Theassets for sale would have to be valued at replacementcost minus the maintenance costs required to bring themto a state of complete repair. The initial price for servicesthrough a price cap, or the return to the transmissioncompany at 16 per cent or more would have to be fixedby the regulator. All distribution-cum-generating com-panies (DGCs), generating companies (GCs), IPPs ortheir inheritor companies, and captive producers (CPs)would have equal access to the grid.43 The TRANSCOwould have to, along with the regulator, facilitate andlay down rules for the development of a wholesalemarket. Surpluses, in the sale of generation and distri-bution assets of the SEB, and the current capital contri-butions of the state government if any, could inter aliabe used to enhance the TRANSCO�s network andquality of assets.
Costs of Immediate and Complete Separation ofDistribution and Generation May be too High
To realize the total potential of competition in gene-ration, it would be desirable to separate generationcompletely from distribution, and ensure that theHerfindahl Index (H-index) of concentration in genera-tion is not too large.44 Yet the true costs of learningto separate generation entirely from distribution andthen put them together through a �market� would haveto be reckoned with. In the initial stages, rather thangeneration going fully through the market, it may bemore appropriate to start only with the market forsurpluses and deficits;45 that is to allow some generationassets to distribution companies.
The possible abuse of vertical integration economiesby distribution-cum-generation companies no doubtexists. This can be addressed in part via a price cap
on retail electricity prices, ensuring adequate trans-mission capacity, and in stages by moving towards aretail market for electricity, as I will argue in thefollowing pages.
Structural Determinants of Competition Potential
The potential for realized competition in generationwould depend upon the following: the industrialstructure of independent generators, specifically theH-index; the distribution of variable costs, and break-even (cost recovery) outputs of each of the plants.Besides these, the potential for trade, which dependsupon the capacity of unattached generators, includingexporters, to the system, the deficits and surpluses ofutilities with their own generation capacities, andvariability in final demanded load and especially itsprice elasticity, would influence competition in thesystem. High unanticipated interseasonal and intra-dayvariability would reduce the potential of market pricesto be close to the long-run marginal costs. Anotherimportant factor in the potential for competition isthe excess capacity in the system; since transmission isin part a substitution for generation, �excess� transmis-sion capacity and �excess� generation capacity wouldtend to keep market prices low. It would most impor-tantly depend upon the ease with which bulk consumerscan choose their supplier, including taking up self-generation when they find it most suitable. Variabilityin market prices would depend upon the variability ofdemand and the response capacity of the system,especially the extent of hydropower available, the twoacting in opposite directions.
Bulk Consumers Can Provide Significant Competition
I take up the case of the Gujarat electricity system towork out the hypothetical market system. In it thenumbers of purchasers and buyers that are obtained,the concentration level, and the overall share of elasticdemand are all quite reasonable. Many systems are likelyto have values similar to that of Gujarat and as such theproposals are quite general.
Table 6.2.3 reports the average sizes of various classesof consumers, based on officially reported data of theGEB. I have modified the data and reworked the averagesize of various classes of consumers. Of reported agri-cultural consumption 40 per cent is assumed to bepotentially industrial HT. Similarly, possible savingson account of recognizing that about 12 per cent ofT&D losses are really theft and about a fourth of auxi-liary consumption could be avoided have also beenassumed. This leads to the total supply (or potentialsupply) to HT to be 14067.6 m KwH rather than the
43 The structure and object of these entities will shortly bedefined.
44 Thus collusive behaviour that raised pool prices in the E&WSystem by National Power and Power Gen, the two largestplayers in the UK market in the first few years, when the pool-trading system was introduced, did occur. This had to be correctedby specific regulatory measures including the sale of generationassets to smaller companies and closer oversight of the market bythe regulator. There is no merit in having a very large numberof small generators. The point is to ensure that the market powerof no generator is particularly large.
45 The Nord Pool of Norway and Sweden is essentially sucha market.
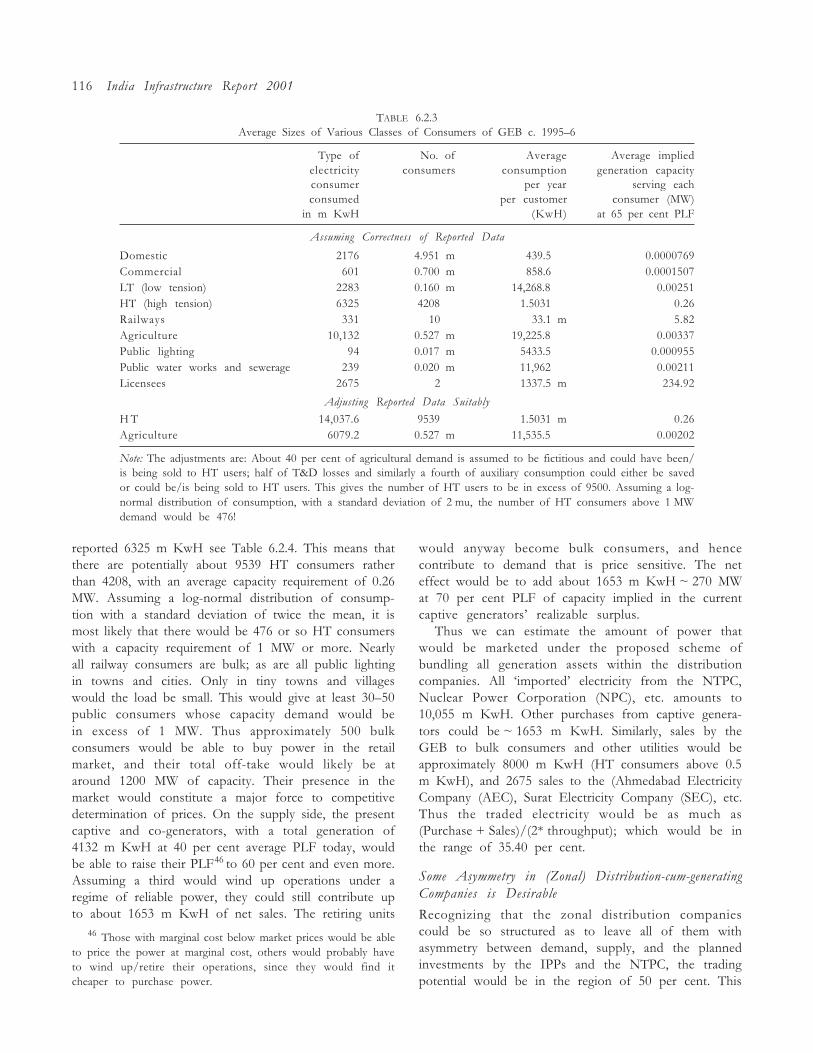
116 India Infrastructure Report 2001
TABLE 6.2.3Average Sizes of Various Classes of Consumers of GEB c. 1995�6
Type of No. of Average Average impliedelectricity consumers consumption generation capacityconsumer per year serving eachconsumed per customer consumer (MW)
in m KwH (KwH) at 65 per cent PLF
Assuming Correctness of Reported Data
Domestic 2176 4.951 m 439.5 m 0.0000769Commercial 601 0.700 m 858.6 m 0.0001507LT (low tension) 2283 0.160 m 14,268.8 m 0.00251HT (high tension) 6325 4208 m 1.5031 m 0.26Railways 331 10 m 33.1 m 5.82Agriculture 10,132 0.527 m 19,225.8 m 0.00337Public lighting 94 0.017 m 5433.5 m 0.000955Public water works and sewerage 239 0.020 m 11,962 m 0.00211Licensees 2675 2 m 1337.5 m 234.92
Adjusting Reported Data Suitably
H T 14,037.6 9539 m 1.5031 m 0.26Agriculture 6079.2 0.527 m 11,535.5 m 0.00202
Note: The adjustments are: About 40 per cent of agricultural demand is assumed to be fictitious and could have been/is being sold to HT users; half of T&D losses and similarly a fourth of auxiliary consumption could either be savedor could be/is being sold to HT users. This gives the number of HT users to be in excess of 9500. Assuming a log-normal distribution of consumption, with a standard deviation of 2 mu, the number of HT consumers above 1 MWdemand would be 476!
46 Those with marginal cost below market prices would be ableto price the power at marginal cost, others would probably haveto wind up/retire their operations, since they would find itcheaper to purchase power.
reported 6325 m KwH see Table 6.2.4. This means thatthere are potentially about 9539 HT consumers ratherthan 4208, with an average capacity requirement of 0.26MW. Assuming a log-normal distribution of consump-tion with a standard deviation of twice the mean, it ismost likely that there would be 476 or so HT consumerswith a capacity requirement of 1 MW or more. Nearlyall railway consumers are bulk; as are all public lightingin towns and cities. Only in tiny towns and villageswould the load be small. This would give at least 30�50public consumers whose capacity demand would bein excess of 1 MW. Thus approximately 500 bulkconsumers would be able to buy power in the retailmarket, and their total off-take would likely be ataround 1200 MW of capacity. Their presence in themarket would constitute a major force to competitivedetermination of prices. On the supply side, the presentcaptive and co-generators, with a total generation of4132 m KwH at 40 per cent average PLF today, wouldbe able to raise their PLF46 to 60 per cent and even more.Assuming a third would wind up operations under aregime of reliable power, they could still contribute upto about 1653 m KwH of net sales. The retiring units
would anyway become bulk consumers, and hencecontribute to demand that is price sensitive. The neteffect would be to add about 1653 m KwH ~ 270 MWat 70 per cent PLF of capacity implied in the currentcaptive generators� realizable surplus.
Thus we can estimate the amount of power thatwould be marketed under the proposed scheme ofbundling all generation assets within the distributioncompanies. All �imported� electricity from the NTPC,Nuclear Power Corporation (NPC), etc. amounts to10,055 m KwH. Other purchases from captive genera-tors could be ~ 1653 m KwH. Similarly, sales by theGEB to bulk consumers and other utilities would beapproximately 8000 m KwH (HT consumers above 0.5m KwH), and 2675 sales to the (Ahmedabad ElectricityCompany (AEC), Surat Electricity Company (SEC), etc.Thus the traded electricity would be as much as(Purchase + Sales)/(2* throughput); which would be inthe range of 35.40 per cent.
Some Asymmetry in (Zonal) Distribution-cum-generatingCompanies is Desirable
Recognizing that the zonal distribution companiescould be so structured as to leave all of them withasymmetry between demand, supply, and the plannedinvestments by the IPPs and the NTPC, the tradingpotential would be in the region of 50 per cent. This
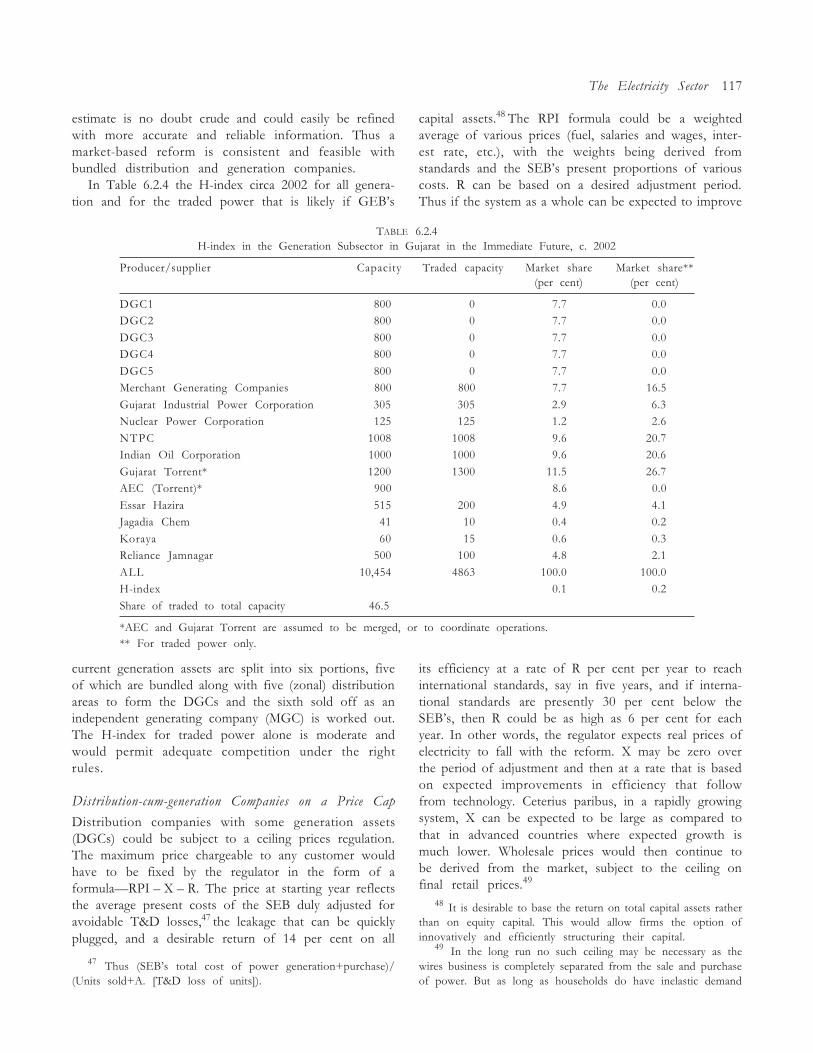
The Electricity Sector 117
estimate is no doubt crude and could easily be refinedwith more accurate and reliable information. Thus amarket-based reform is consistent and feasible withbundled distribution and generation companies.
In Table 6.2.4 the H-index circa 2002 for all genera-tion and for the traded power that is likely if GEB�s
TABLE 6.2.4H-index in the Generation Subsector in Gujarat in the Immediate Future, c. 2002
Producer/supplier Capacity Traded capacity Market share Market share**(per cent) (per cent)
DGC1 800 0 7.7 0.0DGC2 800 0 7.7 0.0
DGC3 800 0 7.7 0.0DGC4 800 0 7.7 0.0
DGC5 800 0 7.7 0.0Merchant Generating Companies 800 800 7.7 16.5
Gujarat Industrial Power Corporation 305 305 2.9 6.3Nuclear Power Corporation 125 125 1.2 2.6
NTPC 1008 1008 9.6 20.7Indian Oil Corporation 1000 1000 9.6 20.6
Gujarat Torrent* 1200 1300 11.5 26.7AEC (Torrent)* 900 8.6 0.0
Essar Hazira 515 200 4.9 4.1Jagadia Chem 41 10 0.4 0.2
Koraya 60 15 0.6 0.3Reliance Jamnagar 500 100 4.8 2.1
ALL 10,454 4863 100.0 100.0H-index 0.1 0.2
Share of traded to total capacity 46.5
*AEC and Gujarat Torrent are assumed to be merged, or to coordinate operations.** For traded power only.
47 Thus (SEB�s total cost of power generation+purchase)/(Units sold+A. [T&D loss of units]).
capital assets.48 The RPI formula could be a weightedaverage of various prices (fuel, salaries and wages, inter-est rate, etc.), with the weights being derived fromstandards and the SEB�s present proportions of variouscosts. R can be based on a desired adjustment period.Thus if the system as a whole can be expected to improve
current generation assets are split into six portions, fiveof which are bundled along with five (zonal) distributionareas to form the DGCs and the sixth sold off as anindependent generating company (MGC) is worked out.The H-index for traded power alone is moderate andwould permit adequate competition under the rightrules.
Distribution-cum-generation Companies on a Price Cap
Distribution companies with some generation assets(DGCs) could be subject to a ceiling prices regulation.The maximum price chargeable to any customer wouldhave to be fixed by the regulator in the form of aformula�RPI � X � R. The price at starting year reflectsthe average present costs of the SEB duly adjusted foravoidable T&D losses,47 the leakage that can be quicklyplugged, and a desirable return of 14 per cent on all
its efficiency at a rate of R per cent per year to reachinternational standards, say in five years, and if interna-tional standards are presently 30 per cent below theSEB�s, then R could be as high as 6 per cent for eachyear. In other words, the regulator expects real prices ofelectricity to fall with the reform. X may be zero overthe period of adjustment and then at a rate that is basedon expected improvements in efficiency that followfrom technology. Ceterius paribus, in a rapidly growingsystem, X can be expected to be large as compared tothat in advanced countries where expected growth ismuch lower. Wholesale prices would then continue tobe derived from the market, subject to the ceiling onfinal retail prices.49
48 It is desirable to base the return on total capital assets ratherthan on equity capital. This would allow firms the option ofinnovatively and efficiently structuring their capital.
49 In the long run no such ceiling may be necessary as thewires business is completely separated from the sale and purchaseof power. But as long as households do have inelastic demand
118 India Infrastructure Report 2001
VALUES OF �X�
There has been much discussion on the role of �X� inprice cap regulation.50 Given that technological changeis less unpredictable in power as compared to telecom,which is technology driven, price cap regulation is moresuitable in power than in telecom.51 Some have suggestedthat a sliding-scale regulation is better, while others haveargued that price cap regulation is no different fromdetailed regulation. The point is to not go back on an�X� that is agreed upon to be valid for a certain numberof years. If �X� is adjusted ex-post after firms make largerthan expected profits, then the value of price capregulation to provide incentives for efficiency and im-provements is attenuated. Moreover, with a backwardlooking �X�, regulatory risk enters into the picture, toraise the a priori expected returns. In the Indian situa-tion, the need of the hour is efficiency, and even if �X�is in the past known to have been smaller than desirable,there are other ways to overcome the problem than tomake �X� backward looking. Indeed, the regulator wouldhave to announce credibly that �X� would not bebackward looking.
Investment Tax Credit and �X�
It would be necessary to allow regulated distribution-cum-generating firms their high profits, provided theseare invested in infrastructure, with a sliding scale ofinvestment tax credit linked to an increasing tax scale.Such an arrangement would have the merit of directinginvestments into infrastructure and especially powerdistribution itself 52 to relax the present constraints.
Moreover, it is not difficult to predict reasonable valuesfor X in the power sector, since much of the powerindustry in India in the post-reform period would be ina catching up phase vis-à-vis other more efficientlyorganized countries. As the reform restores managerialincentives for efficiency through both competitive mea-sures and regulation, it would be not too difficult to baseX on a comparative study of happenings elsewhere. Thatwould give the regulator enough time to build thenecessary skills to arrive at X periodically.
Since retaining generation along with distributionin zonal companies would make such companiesmarketable, privatization could be very quickly carriedout (even with present levels of overmanning). Privati-zation53 would be necessary to eliminate theft andrestore managerial incentives, which would have to bethe immediate concern of any reform.
Privatization Proceeds Should Go TowardsAugmenting Transmission Assets
The considerable proceeds from such privatization(assuming that regulatory clarity has emerged by then),and a price cap regulatory formula that is entirelytransparent and valid over the next five to eight years,would release resources for the state government toput into transmission assets. We have discussed earlierwhy this is important. Analyses of deviation of tradedor market prices from generation costs across existingmarket systems reveal that the �degree of monopoly�exhibited by generators is a function not only ofconcentration, but also of grid restrictions, and theproportion of �near zero variable cost power�, typicallyhydropower, in the system.
Besides price cap regulation for transmission opera-tions in the public sector, transmission companieswould have to provide access to all potential users ofthe transmission: generating companies, distributioncompanies including those with generators� assets,outside suppliers of power, the NTPC or Central PowerCorporations (CPCs) from stations outside the SEBin question, or the adjoining SEBs, and large captive
and would not be able to shift demand over the diurnal cycle,such a cap may be necessary.
50 We have been told by one of the team members of theCentral Electricity Regulatory Commission (CERC) that theCERC rejected the price cap approach to regulation becauseProfessor Littlechild could not give a convincing answer tohow he chose �X�.
51 In telecom, detailed regulation would be even worse thanprice cap regulation. Here, beyond a price cap the regulator hasto worry about new technology and its diffusion, so that thebenefits of technological change (the major source of efficiencygain) lead to expansion of the market, new products, and lowprices to the consumer. As such ensuring an industrial structurewith low barriers to entry would be of primary importance intelecom. In telecom, it is possible to argue that regulation shouldbe concerned less with tariffs and returns, and more with ensuringthat the technological drivers are allowed full play, and thatdiffusion of cost-reducing technology takes place.
52 Indeed the investment tax credit could be linked to invest-ments in the rural and sparse component of the distributionsystem and in investments in equipment like electric metres,that allow time of use (ToU) pricing, etc. if they are envisagedright at the beginning of the reform process.
53 We know that many public sector undertakings (PSUs)in Sweden, Norway, US, Korea, and China, to name first a fewcountries, and even in India (NTPC for example), especially inutilities, perform very efficiently. It is always true that if the SEBscould be corporatized, and truly distanced from government, anddealt with through an annual contract alone, leaving its managersoperational and administrative functions, then they would per-form efficiently. But this has remained a futile hope in India, sincegovernments in India would never really �give� this autonomy. InIndia today, only disinvestment can restore managerial autonomyand bring about ownership of responsibility in PSUs that haveveered far from task orientation.
The Electricity Sector 119
generators. There is considerable potential of largecaptive generators to offer competition to utility genera-tors, especially in many SEBs with an industrial base,given fairly large installed capacity in captive generationand lower PLFs presently at such stations,54 underappropriate regulation.
MARKET CONDUCT
Captive Producers (CPs) and Bulk BuyersCrucial for Competition
Very early in the market-forming process, bulk buyersof power should be allowed to purchase their powerdirectly from any supplier generating company, anotherdistribution company not in its area, a party outside thestate, a captive generator, or any combination of these,subject only to grid restrictions and system integrityrequirements. The market for power would be a marketfor wholesale power to trade surpluses and deficits ofdistribution companies55 with generating assets, withgenerating companies and among themselves, plus amarket for bulk retail power.56 This would mean thataccess rules to distribution company assets would haveto be defined for bulk users, for whom the distributioncompany�s wires business is separate from power pur-chase.
Allowing all loads at 1 MW or above and all CPswith installed capacity 1 MW or above, the right ofaccess to the transmission/distribution lines would
be the key to bringing about competitive pressure.For such customers/entities, the sale and purchase ofpower is completely separated from its carriage. Forthem the transmission/distribution companies, includ-ing DGCs operate as common carriers (which are regu-lated).
The rules for market making would have to bespelt out by the TRANSCO, after system and marketsimulation studies, which would alert it to possiblepitfalls. But in the meantime simple rules that insistupon matched contracts by the TRANSCO, forsale and supply with less than 5 per cent variation,before allowing use of the grid to all participants,would serve the purpose. Deviations could then invitesignificant and asymmetric penalties. They would ofcourse have to be checked for systemic feasibility, giventhe grid capacities, through a simple simulation prog-ramme.
Hydropower stations should be bundled togetherand sold as a separate generating company (HYGEN).The advantage in such a company is that it couldspecialize in offering power that caters to unforeseendemand. During monsoons when the run-off is available,the HYGEN would have an incentive to lower itsprice considerably. This would make coal-using basestations schedule their annual planned maintenanceduring this period. The HYGEN would then developas a specialist peak power player and lead marketdevelopments in peaking power.
Export and Import TariffsGujarat has a long-term comparative disadvantagevis-à-vis states like Andhra Pradesh, Madhya Pradesh,Maharashtra, Bihar, and Orissa in generation of power,since it has few hydro assets and hardly any reservesof coal. Lignite remains problematic, and a gas-basedstrategy is contingent on low gas prices and quickdevelopment of coastal infrastructure. Moreover, im-ported fuels would introduce significant foreign ex-change risk for Gujarat-based generators. Similarly,interior states like Punjab and Haryana would be de-pendent upon the development of internal transportfor fuel movements. They would be particularly vulner-able to local pricing by railways and the pricing strat-egies of oil/gas pipeline companies, since primary energywould have to travel from the coast or from distantgas/oilfields. Given that transport costs continue to beadministered and oil pipelines have been suppressed inthe past, the relative advantages of the states, for coal-and gas-using power would have to be discovered asliberalization proceeds.
This means that as the national market develops, oreven before, when it becomes possible to transmit power
54 Emanating largely out of the present captive generationpolicy, which places severe restrictions on captive generatorsattempting to sell �surplus� power. It is perhaps in the captivepower policies of the SEBs that the true extent of the distortionscaused by cascading effect of the inverted tariff are revealed.Already tariffs for industrial power are higher than the cost of self-generation. If the costs of unreliability are also included, most bulkusers would have be able to install capacities to operate at evenPLFs less than 40 per cent. The current captive policy makes itdifficult or impossible to sell surplus power. CPs can sell only torelated units, at transmission/distribution costs set by the SEB atabsurdly high levels, in the hope that by �force� they can retaintheir �best� customers. Indeed, if the captive policy is completelyliberalized, the present inverted tariffs� irrationality would bequickly exposed and correct restructuring to put the electricitysystem on a rational basis can begin to be seriously considered.
55 At off-peak periods when wholesale prices are belowvariable costs of expensive distribution-cum-generating stations,they would enter the market to buy power (cheaply) from thepool suppliers.
56 It is bulk retail power that has created a market for retailpower in the UK, which first attempted markets in retail power.Even there, over 95 per cent of the retail consumers, despitechoice, buy power from their own regional distribution compa-nies. It is only the bulk users who can actually take advantage ofcompetitive structures.
120 India Infrastructure Report 2001
in larger amounts across regions,57 there would be aperiod when generators in states like Gujarat wouldface competition from outside the state.58
There is, therefore, a need to recognize this competi-tive pressure from outside the state at the outset of thereform process, and to plan for the same. To cap the riskemanating from this future possibility, the regulatorwould have to impose a tariff on imports of power fromoutside the state, with a pre-announced schedule tolower the same and ultimately eliminate it altogether.It would be necessary to �control� imports throughsuch a price-based mechanism rather than throughgrid restrictions or quantitative restrictions. Besides thewell-known advantages of tariffication, this measurewould have the added advantage of signalling thegenerators on location choice. If, for example, importsgrow faster than the Gujarat market for retail sales,then it would be clear that generating companies wouldhave to increasingly locate elsewhere to retain competi-tive potential or use better technology.59 It would alsogive the right signals to the transmission company oninvestment choice.
Variations in Value of Distribution Assetsand Territory are Not a Major Problemin Privatization
To allow even the wholesale market for deficits andsurpluses, and a �bulk retail� market for captive proce-dures (as both consumers and sellers), the compositionof the distribution-cum-generating companies is impor-tant. Distribution being a natural geographical mo-nopoly, it is desirable that the current distributionzones that have evolved naturally should constitutethe core of the distribution companies.60 Differences in
terms of consumer mix, ratio of low voltage lines to highvoltage lines, of distribution transformers to substations,should be of secondary importance. This is because ifsubsidization is taken care of externally and not throughthe distribution companies, then the issue is only one ofsmall differences. Thus a distribution zone with a largerproportion of rural customers and sparse networksand lower consumption per metre61 would show higherdistribution costs per unit of power distributed or sold.Basic asymmetry in the form of large (bulk) powerconsumers is eliminated by defining such entities as�bulk consumers� who are able to take part in the powermarket, using the distribution company�s wires for a fee.Despite this measure, it would no doubt be true that theaverage distribution cost would vary across zones, sothat the offer price for purchase of bulk power by adistribution company with high costs of distributionwould be lower, given uniform price caps on all consum-ers.
If the price cap were such as to allow all distributioncompanies, including one with (structural) high cost,the desirable returns, then those with lower costswould make high profits. This would be so unlessthe price elasticity of demand (assuming existence ofsupply) is such as to lower the final effective price toconsumers of the favourably disposed distributioncompany. This is unlikely in the immediate post-reform period, when overall supply restrictions wouldoperate. The way out would be to bundle the genera-tion plants with the lowest marginal costs to the distri-bution company with high costs, in general, to bundlegeneration assets and distribution in such a way as toensure that total costs of generation do not vary bymore than 10 per cent. Variation within this rangewould not be a problem since the market valuationwould most certainly adjust to take care of such asy-mmetry.62
57 As the planned investments by the PGCIL materialize thenational grid would take shape.
58 Thus even today a large pithead-based coal station in MadhyaPradesh/Maharashtra, or even distant Orissa, can deliver basepower at less than Rs 2.30 per unit (wholesale), with full recoveryof cost.
59 It is presumed that simultaneously reforms that bring aboutcompetition in generation would be pursued in most states, andgrid capacities developed to allow long-distance transport ofpower in large quantities. The constraints imposed by the currentgrid code are discussed in section 6.1 of this report.
60 There is a tendency among state bureaucracies to show quickprivatization of distribution to attempt to privatize a large urbanarea with much surrounding industrial demand, �separating� thesame from the rural areas to which the urban area is integrallybound. This arises from the myth of �non-viability� of zones withmuch agricultural or non-industrial demand. Thus in Gujaratthere are moves to pick the Baroda urban and suburban circlesand privatize the same, to �meet� certain conditions of the AsianDevelopment Bank from which Gujarat expects a bigger loan!
Zones have to be largely derived from the grid and distributionnetworks, their boundaries being such as to minimize the numberof segments that interconnect the zones. Otherwise, assignmentof responsibility in situations of failure or load backdown wouldbe a nightmare. The current structure of the zones and distribu-tion networks has evolved in a scientific manner, and it isimportant that the structure is not disturbed in an unnaturalcarving out of zones based on the market segments! This wouldamount to creating a structural distortion in response to a priortariff and agency distortion.
61 Official data, though, show very high consumption in agri-culture per metre.
62 The important issue here is to make available reliable anddetailed information on the status of networks, distribution loss(technical), and such other information vital to the estimation ofcosts well before the financial bids take place.
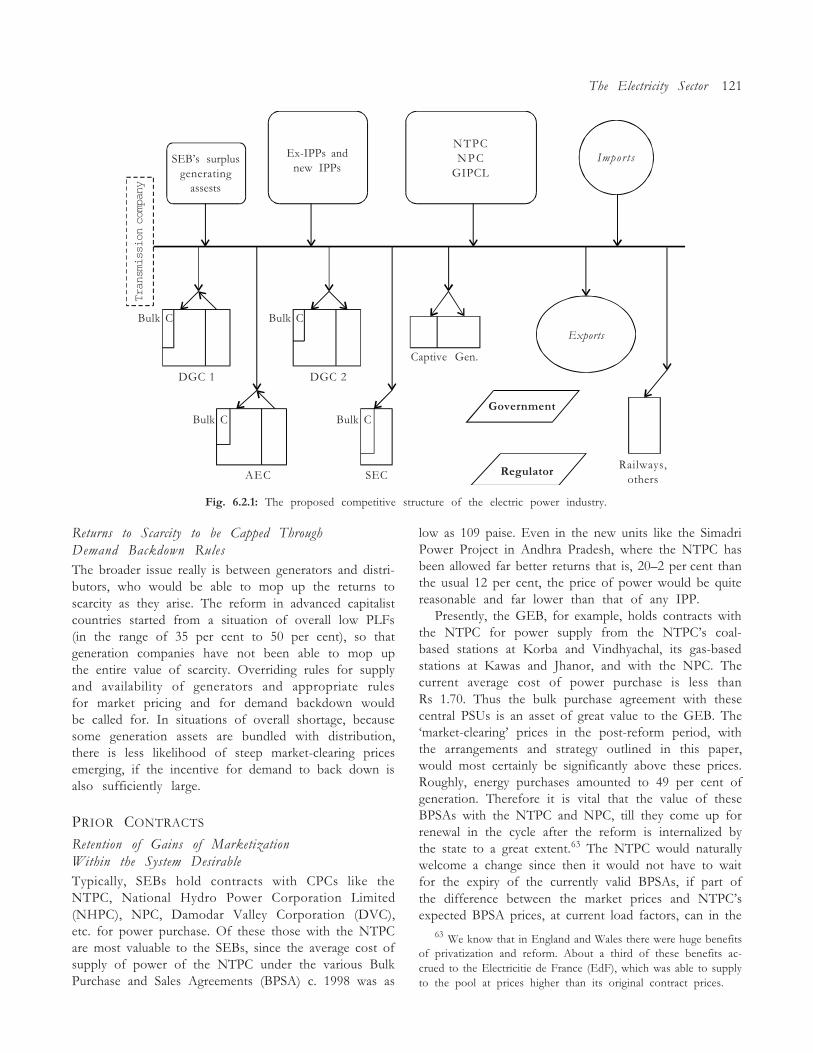
The Electricity Sector 121
63 We know that in England and Wales there were huge benefitsof privatization and reform. About a third of these benefits ac-crued to the Electricitie de France (EdF), which was able to supplyto the pool at prices higher than its original contract prices.
SEB�s surplusgenerating
assests
Ex-IPPs andnew IPPs
NTPCN P C
GIPCLImpor t s
Exports
Tran
smission
com
pany
Bulk C
Government
Regulator
DGC 1 DGC 2
Captive Gen.
AEC SECRailways,
others
Fig. 6.2.1: The proposed competitive structure of the electric power industry.
Returns to Scarcity to be Capped ThroughDemand Backdown RulesThe broader issue really is between generators and distri-butors, who would be able to mop up the returns toscarcity as they arise. The reform in advanced capitalistcountries started from a situation of overall low PLFs(in the range of 35 per cent to 50 per cent), so thatgeneration companies have not been able to mop upthe entire value of scarcity. Overriding rules for supplyand availability of generators and appropriate rulesfor market pricing and for demand backdown wouldbe called for. In situations of overall shortage, becausesome generation assets are bundled with distribution,there is less likelihood of steep market-clearing pricesemerging, if the incentive for demand to back down isalso sufficiently large.
PRIOR CONTRACTS
Retention of Gains of MarketizationWithin the System DesirableTypically, SEBs hold contracts with CPCs like theNTPC, National Hydro Power Corporation Limited(NHPC), NPC, Damodar Valley Corporation (DVC),etc. for power purchase. Of these those with the NTPCare most valuable to the SEBs, since the average cost ofsupply of power of the NTPC under the various BulkPurchase and Sales Agreements (BPSA) c. 1998 was as
low as 109 paise. Even in the new units like the SimadriPower Project in Andhra Pradesh, where the NTPC hasbeen allowed far better returns that is, 20�2 per cent thanthe usual 12 per cent, the price of power would be quitereasonable and far lower than that of any IPP.
Presently, the GEB, for example, holds contracts withthe NTPC for power supply from the NTPC�s coal-based stations at Korba and Vindhyachal, its gas-basedstations at Kawas and Jhanor, and with the NPC. Thecurrent average cost of power purchase is less thanRs 1.70. Thus the bulk purchase agreement with thesecentral PSUs is an asset of great value to the GEB. The�market-clearing� prices in the post-reform period, withthe arrangements and strategy outlined in this paper,would most certainly be significantly above these prices.Roughly, energy purchases amounted to 49 per cent ofgeneration. Therefore it is vital that the value of theseBPSAs with the NTPC and NPC, till they come up forrenewal in the cycle after the reform is internalized bythe state to a great extent.63 The NTPC would naturallywelcome a change since then it would not have to waitfor the expiry of the currently valid BPSAs, if part ofthe difference between the market prices and NTPC�sexpected BPSA prices, at current load factors, can in the
Bulk C
Bulk C Bulk C
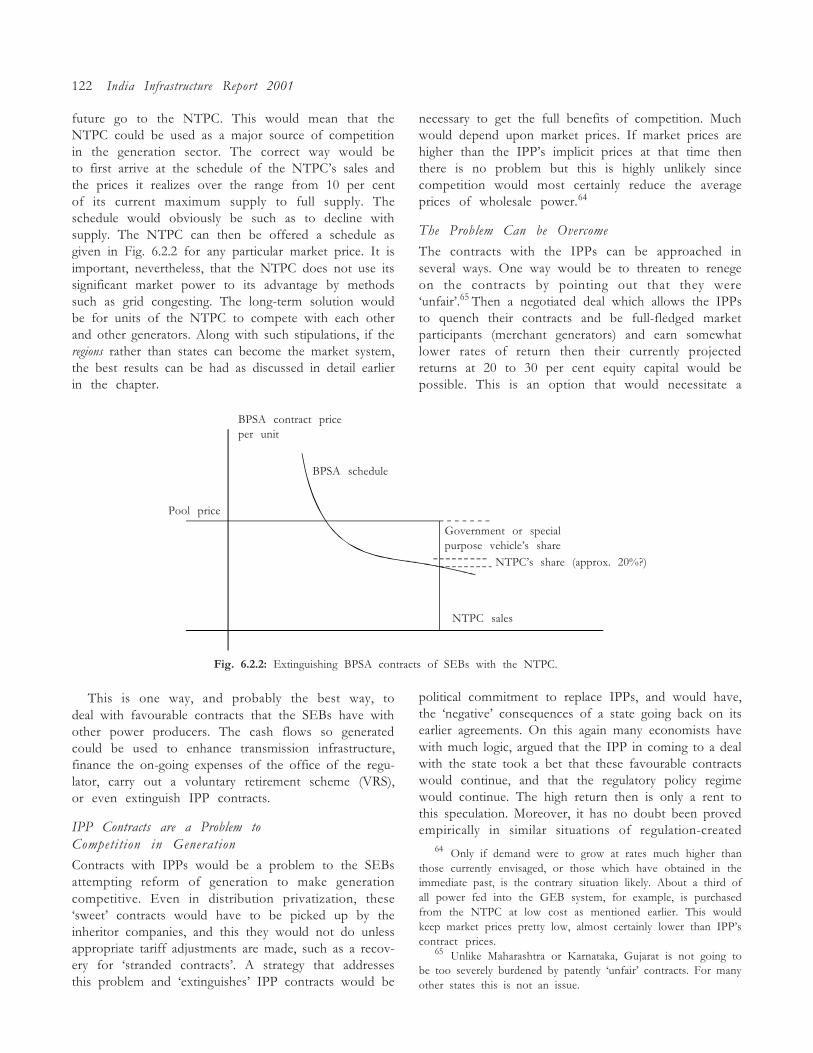
122 India Infrastructure Report 2001
future go to the NTPC. This would mean that theNTPC could be used as a major source of competitionin the generation sector. The correct way would beto first arrive at the schedule of the NTPC�s sales andthe prices it realizes over the range from 10 per centof its current maximum supply to full supply. Theschedule would obviously be such as to decline withsupply. The NTPC can then be offered a schedule asgiven in Fig. 6.2.2 for any particular market price. It isimportant, nevertheless, that the NTPC does not use itssignificant market power to its advantage by methodssuch as grid congesting. The long-term solution wouldbe for units of the NTPC to compete with each otherand other generators. Along with such stipulations, if theregions rather than states can become the market system,the best results can be had as discussed in detail earlierin the chapter.
This is one way, and probably the best way, todeal with favourable contracts that the SEBs have withother power producers. The cash flows so generatedcould be used to enhance transmission infrastructure,finance the on-going expenses of the office of the regu-lator, carry out a voluntary retirement scheme (VRS),or even extinguish IPP contracts.
IPP Contracts are a Problem toCompetition in Generation
Contracts with IPPs would be a problem to the SEBsattempting reform of generation to make generationcompetitive. Even in distribution privatization, these�sweet� contracts would have to be picked up by theinheritor companies, and this they would not do unlessappropriate tariff adjustments are made, such as a recov-ery for �stranded contracts�. A strategy that addressesthis problem and �extinguishes� IPP contracts would be
necessary to get the full benefits of competition. Muchwould depend upon market prices. If market prices arehigher than the IPP�s implicit prices at that time thenthere is no problem but this is highly unlikely sincecompetition would most certainly reduce the averageprices of wholesale power.64
The Problem Can be Overcome
The contracts with the IPPs can be approached inseveral ways. One way would be to threaten to renegeon the contracts by pointing out that they were�unfair�.65 Then a negotiated deal which allows the IPPsto quench their contracts and be full-fledged marketparticipants (merchant generators) and earn somewhatlower rates of return then their currently projectedreturns at 20 to 30 per cent equity capital would bepossible. This is an option that would necessitate a
political commitment to replace IPPs, and would have,the �negative� consequences of a state going back on itsearlier agreements. On this again many economists havewith much logic, argued that the IPP in coming to a dealwith the state took a bet that these favourable contractswould continue, and that the regulatory policy regimewould continue. The high return then is only a rent tothis speculation. Moreover, it has no doubt been provedempirically in similar situations of regulation-created
BPSA contract priceper unit
BPSA schedule
NTPC�s share (approx. 20%?)
NTPC sales
Pool price
Fig. 6.2.2: Extinguishing BPSA contracts of SEBs with the NTPC.
Government or specialpurpose vehicle�s share
64 Only if demand were to grow at rates much higher thanthose currently envisaged, or those which have obtained in theimmediate past, is the contrary situation likely. About a third ofall power fed into the GEB system, for example, is purchasedfrom the NTPC at low cost as mentioned earlier. This wouldkeep market prices pretty low, almost certainly lower than IPP�scontract prices.
65 Unlike Maharashtra or Karnataka, Gujarat is not going tobe too severely burdened by patently �unfair� contracts. For manyother states this is not an issue.
The Electricity Sector 123
rents that the market does not, with absolute certainlyexpect such returns. If events do not turn out asexpected, so be it. There is also the issue of whom tocompensate if the ownership of these contracts changes,as happens in the case of widely held corporations. Thusit would be wise on the part of a state planning truereform and marketization to begin by insisting uponwide dispersal of at least part of the shareholding.Moreover, this would have the benefit that market priceof the stock of IPPs would change to reflect increasingprobability of non-realization of rents. Naturally, anyattempt to fight back the change that removes rentswould be blunted to that extent. On the other hand,if the commitment to a fair market-based reform andrestructuring of the electricity sector is strong andcredibly pursued, and seen as such, then constituents forchange would be strong enough to overcome the diffi-culties in renegotiating these contracts on the linesoutlined here.
A second approach would be to agree to give the IPPa part of the difference in revenues at contract prices andprojected market clearing prices (which can be simu-lated), up front, in capitalized from, negotiating theperiod thus considered. In exchange the IPP gives up itsPPA contract. This arrangement has the merit of ensur-ing that the capacities of the IPP would result incompetition, but has the significant disadvantage that thestate, over the life of the PPA as envisaged originally,would pay out to the IPP. In other words, the more thereform succeeds in lowering the generation prices, thegreater is the outflow from the state!
Cajoling IPPs to Trade Political andRegulatory Risks for Market Risk
A third alternative would be as follows: As part of theregulatory strategy the state announces that its policywould be to go in for a competitive market-basedsolution for generation, and simultaneously imposesupon IPPs the condition that 20 per cent of theirstock would have to be traded in the domestic market.The stock price then would reflect the emerging uncer-tainties with regard to IPPs, and would correctly valuethe IPP/PPA contracts. The difference between marketcapitalization of the IPP and the cost of setting up asimilar capacity plant as a competitive generator, wouldbe the premium value, if any, of the IPP/PPA contract.The IPP would then be willing to give up its contractand become a player in the market, if a value close tothis premium can be transferred to it. This can bedone in several ways. One would be to provide thisdirectly from the budget once the bids for privatizationand marketization are known. An interesting waywould be to offer a bid amount handicap for the SEB
assets-distribution-cum-generation companies and otherun-attached generating companies, equal to the premiumvalue. Care would have to be taken to communicate tothe market the government�s firm intention of goingahead with a market-based competitive solution. In thatcase, the bid process would have to include the clausethat the IPP would be bundled with a distributioncompany. So a bid from a third party would have to bea joint bid for the IPP (without its contract premium)and the other bids for the two assets separately. Yet thisapproach would reduce the potential for competition.The best option would be to extinguish one of thecontracts in the manner now outlined here. Once againthe Gujarat case is used as an example. One way to lookat IPP contracts is to recognize that the original policyunder which the IPPs came about is the guaranteed 16per cent return at 68.5 per cent PLF. Returns above theseare specific to the project and the government is underno legal requirement to protect the same. These areessentially returns to �regulatory speculation� and to�efficiency�. As such only the 16 per cent on equity sharecapital need be treated as arising out of stranded con-tracts and provided for. Several options are then avail-able. One would be to buy out the IPP�s equity at avalue equal to the capitalized value of a stream of returnsat 16 per cent for twenty years (the life of the project).Thus for Re 1 of equity, the cost would be Rs 1.21approximately, at a discount rate of 12 per cent. SinceIPP costs per MW are higher than current costs, bothbecause of padding of costs, and fall in turbine and equip-ment costs since the time the IPPs reached financialclosure, the net cost of buying up IPPs and starting ona clean slate is likely to be between 0.8 crore and 1.3crore per MW. Thus, if competitive pricing of electricityis to be the norm, this loss would have to be coveredby the government, unless it wants to renege on IPPcontracts. Therefore, a certain provision for �strandedcontracts� would have to be made, but only initially. Itwould be best to provide for this uniformly across allconsumers as a separate charge per KwH of electricityconsumed, and the fund so created used to service thefinancial cost of extinguishing IPP contracts at between0.8 crore and 1.3 crore per MW, at the very beginning.
Inflow from the BPSA contracts at a rate of approxi-mately Re 1.0 on every unit from BPSA suppliers wouldaccrue to the special purpose vehicle (SPV) set up forprivatization. This is the difference between averagecontract price under various BPSA (Rs 1.38~1.50) andlong-run marginal cost of bulk power at Rs 2.5 perKwH. Thus the actual credit on this account peryear for the Gujarat system would be 1293 MW (theGEB�s share of CPCs� capacity) * 0.75 (PLF) * (1 � 0.15)(distribution losses) = Rs 849 crore per year. Assuming
124 India Infrastructure Report 2001
the BPSAs have an average residual life of five years, thiscash flow would have a present value of approximatelyRs 3000 crore. This would allow the government (whichholds these lucrative contracts) to extinguish up tobetween 2300 MW and 3800 MW of IPP capacity, if theappropriate SPV for restructuring can be created.
Thus the increase in tariffs that would have to beprovided for, for the �stranded contracts� to be extin-guished, may not be particularly large if the value of theBPSAs can be nearly fully internalized.
Alternatively an SPV to recover stranded contractscould be set up, which would buy power from IPPs andCPCs, and market and sell the same to DGCs and bulkbuyers. The SPV needs to be constituted so that it hasa life of twenty years, is completely transparent, andentirely open to the regulator and the public. It wouldhave the mandate to sell power at the lowest feasible costto DGCs and others, and shares to the same could belinked to guaranteed access to power in proportion tothe shares held by industry and others including theDGCs. This would be only an inferior solution tooutright purchase and resale of IPPs, since the SPVwould have a life of twenty years, and most importantlywould also lock the system firmly to the cost of theinflexibility of fuel choice embedded in PPA contracts.It would also mean major organization effort on thepart of the restructuring authority to create the SPVwith appropriate incentives structure for its ownersand managers to perform their tasks as visualized.
The problem of overcoming the IPP contracts maythus not be as difficult as it appears.66 A strong andcredible commitment to marketization of generationand privatization that is communicated well would bevital to the success of any approach that is finallyadopted. Indeed the distinct possibility arises thatthe IPPs, with a little nudging from the state, may bequite willing to trade political and administration riskfor market risk. That the political risks never reallydisappear in concession-based projects in a competitivedemocracy like India is obvious. Even as the Enronproject after its cancellation and re-examination by theMaharashtra government seemed to be on firm ground,the new government in Maharashtra has announcedits decision to re-examine the project (for the secondtime!), which again introduces fundamental uncertaintyinto the project. Most companies and promoters wouldnot be able to bear this kind of risk, even if the rewards
were large. It is almost given that, with changes in stategovernments, IPPs of the previous regime are closelyscrutinized. In these circumstances, a credible option totrade such uncertainties with market risk, (which tendsto be bounded, at least in the case of electricity) wouldbe welcome.67 Prior ruling to dilute the shareholdingof IPPs in the local market would be very helpful. Tosweeten the exchange of political and policy risk formarket risk, tax incentives linked to expansion ofcapacity could also be made available to the IPPs.
LABOUR AND MODALITIES
The success of the restructuring would crucially dependupon the process adopted and on fixing target dates forsignificant events in the process much before the processbegins.
The first step would be to appoint the disinvestmentand restructuring commissioner (RC) with the necessaryskills, and the power to operate independently and inthe consumers� long-term interest. The next would beto define his terms of appointment, granting him com-plete insulation from the political process and fromday-to-day functioning of government. The governmentwould have to commit to adhere to the overall philoso-phy of the restructuring and agree to pilot the requiredbills in the assembly, to amend and repeal such acts asnecessary, and bring in fresh legislation. It also has toprovide such resources as required for restructuringand for subsidization if it so chooses. The RC wouldhave to have extraordinary powers to supersede theBoard of the SEB,68 and transfer top officials if necessary,so that the process of disinvestment is not hindered byvested interests. His office would need to be providedwith funds to cover the cost of studies, preparation oflegal documents, negotiations, consultant services, andasset revaluation that may be required.
Demand for power would, in the long term, grow ataverage rates that can be expected to be no less than 4.5
66 Mr M. Y. Rao, ex-chairman of the Orissa State ElectricityBoard (OSEB), and the architect of the Orissa Reforms tells methat in the PPAs signed by the OSEB, a clause had been introducedthat the contract would not contradict any future rulings by theindependent regulator. This may provide a legal loophole to getout of IPP contracts.
67 Indeed an unwillingness to trade away political risk formarket risk by a business should alert us to the propriety of thebusiness. In well-functioning market economies, it is governmentthat should bear the political risk, not business. Business shouldand would show a tendency (rightly) to reduce the political riskthat it bears. The political risk that a company like the DabholPower Company Ltd. (DPC) bears is enormous if we admit thepossibility that states can rescind on contracts. DPC may itself bewell hedged up to a point, given that it would have taken outpolicies against such risk with the Multilateral Investment Guar-antee Agency (MIGA) and other bodies. A high return to politicalrisk is another way of saying that rents are generated in politicaluncertainty.
68 This is necessary in the majority of SEBs; but while desirablemay not be necessary in the case of Maharashtra and Tamil Nadu,where corruption is not rampant.
The Electricity Sector 125
per cent, with a GDP growth of 5 per cent, which is theleast that one can expect. In all likelihood, with the rightmacroeconomic policies for growth, the power sectorwould grow at rates in excess of 6 per cent per annumfor many years to come. Current surplus labour canpotentially be absorbed within the system in the longrun. Yet it would be desirable to quickly shed surpluslabour to the extent seen fit by the inheritor companies.This would protect systemic efficiency and remove thedistortions (in technology choice, managerial practices,and assessment of costs). Politically though, a medianpath that allows a liberal VRS for all SEB staff, especiallyfor office and commercial staff and departments wherethe excess is large, would be appropriate. The govern-ment would have to announce upfront that the restruc-turing would not result in compulsory retrenchment.The actual exercise of implementing the VRS wouldhave to be left to the inheritor companies since theywould be best able to assess the potential and value ofemployees. A fund to cover the VRS of as much as 25per cent of the current staff would have to be createdby the government, and made available to the inheritorcompanies.
Some crude estimates of the VRS cost could be arrivedat for the Gujarat system. The total wage, salary, andterminal benefit costs of 25 per cent of the employeesin 1996�7 (the latest year for which the annual reportof the GEB was available) was Rs 121 crore or Rs 0.91lakh per person for approximately 12,130 persons (ex-cess manpower). Assuming a coverage of 50 per centof current salary for the remaining working life of theemployee, and at 50 per cent of the terminal salary forpension, and with a life expectancy of 72 years andretirement age of 58 years, the VRS cost (at 3 per centreal rate of interest) would be Rs 1119 crore, or Rs 8.42lakh per person. At 70 per cent coverage of salary itwould amount to Rs 1567 crore and Rs 11.8 lakh perperson. Thus a fund of between Rs 1200 and 1600 crorewould be required to operationalize a near completeshedding of excess manpower. A commitment to makeavailable to the inheritor companies up to that amountfor the VRS would have to be made by the government.An incentive of about one-tenth the amount should beallowed to the privatized companies that retain man-power in anticipation of future requirements, for aperiod of five years. A detailed study to assess the actualdistribution of excess manpower across various locationsand activities would be necessary. The second charge onthe privatization proceeds would have to be towardscoverage of the VRS, the first being to �buy� out thestranded contracts.
The actual details of bundling generating assetswith distribution zones or territories can be left to the
bid process, as long as the overall process and objectivesof the reform are clarified early enough and completetransparency is ensured through appropriate processes.Thus the terms covering the appointment of the restruc-turing commissioner should bind him to transparentprocesses and to disclosure of information. All relevantinformation generated by the various consultancy stud-ies and other reports ought to be made public andavailable to the bidder, and they in turn should be en-couraged to make their own investigations and studies,especially with regard to excess manpower, state of assetsand equipment, and the extent and nature of demand.There is likely to be much asymmetry in the value ofassets and territories to potential bidders depending uponthe nature of their complementary assets and skills.
CONCLUSION
True reform and restructuring of any SEB in Indiawould have to start with putting the consumers� interestforemost. The agency failure in nearly all SEBs, whichhas resulted in enormous leakage of revenue from thesystem would have to be addressed first. This wouldcall for privatization of distribution and change in theinstitutional mechanism for the administration of thesubsidy.
Market competition in generation, through the devel-opment of a hybrid wholesale and retail (for bulkconsumers alone) market is the need of the hour. Inthis chapter a model for restructuring that would resultin market competition in generation has been proposed.It is not a market for all the electricity in the system,but largely a market that would allow distribution-cum-generation companies to purchase power from eachother and form pure generators; and would also allowbulk purchasers and captive generators the choice ofsupply and sale. A market for generation, while allowingdistribution companies the comfort of having somedistribution assets, would lead to quicker developmentof the market and facilitate privatization.
The transmission assets of the SEB are best managedby the state with less than 50 per cent shareholding bythe state government, all other shares being held byconsumer interests including farmers� cooperatives, house-holds and industry associations, and at least 25 per centof the stock disbursed through the stock market.
The remaining assets of the SEBs are most conve-niently split into a few (perhaps zonal) distributioncompanies, with some generating assets in-house up toabout 40�50 per cent of throughput. Surplus-generatingassets of the SEBs could be sold as an independentgenerating company. All hydel capacities need to bebundled and sold as a separate company.
126 India Infrastructure Report 2001
Distribution companies would have to be put onprice cap regulation for their distribution business.Without �light� price cap regulation, marketization wouldbe very difficult. (With detailed regulation, the best thatwould be possible is to sell the SEBs as near verticallyintegrated companies. This would introduce consider-able regulatory risk over the medium term and a highprobability that the integrated companies would capturethe regulator. The high regulatory risk in the short termwould result in low values being realized for the SEBs�assets. With detailed regulation, it may be better tomerely corporatize SEBs and offload some of the stockin the stock market, and attempt a management over-haul. The SEBs or the government on behalf of the SEBswould then have to carry the burden of the PPAs withIPPs that have already been signed.)
Good values would be realized in the privatization ofSEBs like those in Gujarat, Maharashtra, Tamil Nadu,and Rajasthan when carried out in the manner describedherein. The surplus so generated could be quickly in-vested in augmenting transmission assets of the transmis-sion company, so that a situation of no congestion, inthe normal working of the system, is quickly reached.A key to ensuring that market clearing prices are nearlong-run marginal costs would lie in having adequatecapacity in the transmission system to allow alternativesourcing for each of the segments of load, and inextinguishing IPP contracts, �forcing� IPPs to operate ascompetitive generators.
Transparency, especially with respect to informationaccess, including to common citizens, would be impor-tant in reducing the hidden risks of change. Once thefirst stage of the bid process, which checks out thefinancial and managerial capacities of bidders, is over allshortlisted bidders must be allowed to have completeaccess to all information with the SEB. Moreover, theyought to be allowed and encouraged to conduct indepen-dent studies and investigations with regard to the qualityof assets, demand and its growth, consumer mix, andsystem parameters.
Access to transmission of bulk consumers and ofcaptive generators above a certain size (1 MW for buyersand average sale equivalent to 1 MW for generators, tostart with), at standard access charges subject to price capregulation, would be necessary. This would bring incompetition for generation right at the start of thereform process.
Transmission would also have to be operated as aregulated monopoly, desirably on the RPI � X-typeformula. Ideally, the transmission charges should be athree-part tariff, each of which is subject to price cap.The three parts would have to be connection charges(which depend on the capacity connected), line-loss or
�distance� charges (based on the current losses in trans-mission), and congestion charges. The point is that thereshould be sufficient returns to congestion to allow thetransmission company to correctly identify the segmentsfor investments. Yet distortion in the tariff formulathat provides an incentive to maximize the returns tocongestion should be avoided.
The BPSA contracts with the NTPC or NPC are ex-pected to be beneficial to the system after marketization,since the implied contract prices then are likely to belower than the market prices that would prevail. Incontrast, the IPP contracts are likely to be adverse to theSEBs since the implied PPA prices then would mostcertainly be higher than the market prices. Both sets ofcontracts would have to be extinguished in ways thatwould release the full potential for competition in thesystem. The BPSAs would pose no basic problem, sincedoing nothing would mean that the NTPC, given its lowcosts, would gain from higher market prices. Thereforethey could be easily extinguished by sharing part of theprice difference (20 per cent) with the NTPC andkeeping the rest with the SEBs for subsidies and invest-ment in the transmission company.
The IPP contracts would pose a significant problemwhich would have to be carefully dealt with. The beststrategy would be to nudge them into a willingnessto exchange their current high political and regulatoryrisks for market risk. The presence of both groups inthe generation market would be vital to its functioning.And with these players the scope for price formationsignificantly above costs would be quite small.
The most optimal way to carry out the samewould be to communicate effectively and credibly thegovernment�s firm determination to move towards acompetitive market model in generation of electricity.Simultaneously the government should rule thatat least 25 per cent of the shareholding of IPPs beoffloaded in the local stock market. Then the marketprice would reflect the true premium value (if any) ofthe IPPs� contract with the SEB and the state. As thereform and restructuring takes place in earnest, thewillingness of IPPs to trade their political and regulatoryrisks for market risk would improve. IPPs could alsobe bought out at an extra cost of between Rs 0.8 and1.3 crore per MW.
Initially an import tax on electricity from outsidethe system would have to be imposed even as connectiv-ity with the national grid and the grids of contiguousstates is augmented. Yet there must be an upfront an-nouncement of the intention to reduce these tariffs andeliminate them altogether over a specified time period.This would allow some time for adjustment. Such anannouncement would ensure that fresh investments and
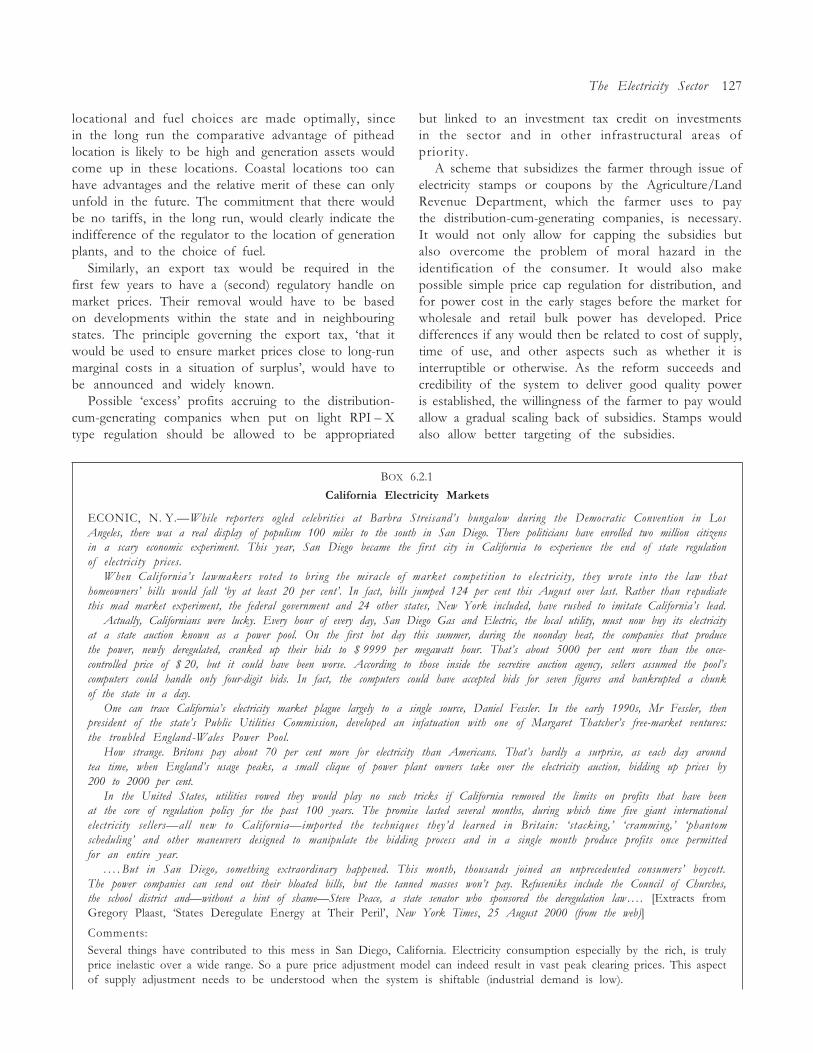
The Electricity Sector 127
locational and fuel choices are made optimally, sincein the long run the comparative advantage of pitheadlocation is likely to be high and generation assets wouldcome up in these locations. Coastal locations too canhave advantages and the relative merit of these can onlyunfold in the future. The commitment that there wouldbe no tariffs, in the long run, would clearly indicate theindifference of the regulator to the location of generationplants, and to the choice of fuel.
Similarly, an export tax would be required in thefirst few years to have a (second) regulatory handle onmarket prices. Their removal would have to be basedon developments within the state and in neighbouringstates. The principle governing the export tax, �that itwould be used to ensure market prices close to long-runmarginal costs in a situation of surplus�, would have tobe announced and widely known.
Possible �excess� profits accruing to the distribution-cum-generating companies when put on light RPI � Xtype regulation should be allowed to be appropriated
but linked to an investment tax credit on investmentsin the sector and in other infrastructural areas ofpriority.
A scheme that subsidizes the farmer through issue ofelectricity stamps or coupons by the Agriculture/LandRevenue Department, which the farmer uses to paythe distribution-cum-generating companies, is necessary.It would not only allow for capping the subsidies butalso overcome the problem of moral hazard in theidentification of the consumer. It would also makepossible simple price cap regulation for distribution, andfor power cost in the early stages before the market forwholesale and retail bulk power has developed. Pricedifferences if any would then be related to cost of supply,time of use, and other aspects such as whether it isinterruptible or otherwise. As the reform succeeds andcredibility of the system to deliver good quality poweris established, the willingness of the farmer to pay wouldallow a gradual scaling back of subsidies. Stamps wouldalso allow better targeting of the subsidies.
BOX 6.2.1
California Electricity Markets
ECONIC, N. Y.�While reporters ogled celebrities at Barbra Streisand�s bungalow during the Democratic Convention in LosAngeles, there was a real display of populism 100 miles to the south in San Diego. There politicians have enrolled two million citizensin a scary economic experiment. This year, San Diego became the first city in California to experience the end of state regulationof electricity prices.
When California�s lawmakers voted to bring the miracle of market competition to electricity, they wrote into the law thathomeowners� bills would fall �by at least 20 per cent�. In fact, bills jumped 124 per cent this August over last. Rather than r epudiatethis mad market experiment, the federal government and 24 other states, New York included, have rushed to imitate California�s lead.
Actually, Californians were lucky. Every hour of every day, San Diego Gas and Electric, the local utility, must now buy its electricityat a state auction known as a power pool. On the first hot day this summer, during the noonday heat, the companies that producethe power, newly deregulated, cranked up their bids to $ 9999 per megawatt hour. That�s about 5000 per cent more than the once-controlled price of $ 20, but it could have been worse. According to those inside the secretive auction agency, sellers assumed the pool�scomputers could handle only four-digit bids. In fact, the computers could have accepted bids for seven figures and bankrupted a chunkof the state in a day.
One can trace California�s electricity market plague largely to a single source, Daniel Fessler. In the early 1990s, Mr Fessler, thenpresident of the state�s Public Utilities Commission, developed an infatuation with one of Margaret Thatcher�s free-market ventures:the troubled England -Wales Power Pool.
How strange. Britons pay about 70 per cent more for electricity than Americans. That�s hardly a surprise, as each day aroundtea time, when England�s usage peaks, a small clique of power plant owners take over the electricity auction, bidding up prices by200 to 2000 per cent.
In the United States, utilities vowed they would play no such tricks if California removed the limits on profits that have beenat the core of regulation policy for the past 100 years. The promise lasted several months, during which time five giant internationalelectricity sellers�all new to California�imported the techniques they�d learned in Britain: �stacking,� �cramming,� �phantomscheduling� and other maneuvers designed to manipulate the bidding process and in a single month produce profits once permittedfor an entire year.
. . . . But in San Diego, something extraordinary happened. This month, thousands joined an unprecedented consumers� boycott.The power companies can send out their bloated bills, but the tanned masses won�t pay. Refuseniks include the Council of Churches,the school district and�without a hint of shame�Steve Peace, a state senator who sponsored the deregulation law . . . . [Extracts fromGregory Plaast, �States Deregulate Energy at Their Peril�, New York Times, 25 August 2000 (from the web)]
Comments:Several things have contributed to this mess in San Diego, California. Electricity consumption especially by the rich, is trulyprice inelastic over a wide range. So a pure price adjustment model can indeed result in vast peak clearing prices. This aspectof supply adjustment needs to be understood when the system is shiftable (industrial demand is low).
128 India Infrastructure Report 2001
The California system while �single�, is actually fragmented because of crucial shortages in grid capacities, a result of earlierreturn on investment (ROI) regulation which had allowed utilities to set up high cost power locally, since the cost plus regimecreated disincentives to search for globally optimal solutions. Today the rules are such that the transmission in segments canbe congested by suppliers to isolate cities and portions of the system with their large inelastic household demand. And thenprices can be made to go through the roof. This had been pointed out by some observers but was apparently ignored bythe regulator.
The regulators could have anticipated such a situation by simulation exercises, under the given rules, and realized that,until efficient capacities come up, and transmission links improve, the only solution would be a reasonable peak price (likethe stock market breaker) cap at about $ 40�50 per MwH, allowing even diesel-generating sets to operate profitably. Thiswas not done!
The other point is that transmission itself would have to be managed in a non-profit, or regulated profit mode. Alternately,restrictions on ownership of the transmission companies would have enabled other larger segments in the value added chain(generation and distribution) to be commercially directed without the need for regulation. Transmission, even with new-fangled approaches like auction of capacities, remains problematic when marketized. It may be useful to see transmissionas in part having a regulatory dimension, like a stock exchange! These niceties have not found much recognition in discussionsrelating to deregulation.
The industry structure did not get the attention it should have had from the regulator. This is despite the experience ofthe UK, where the regulator, after the pool scheme came into effect, had to fix Powergen and National Power by askingthem to disinvest out of certain assets. (The �pool� continues to have significantly higher prices than long-run average costs(LRACs.) Large players across all segments continue in the California system. The higher than anticipated growth, especiallyof California and nearby states, fuelled by the Information Technology revolution and higher overall US growth rates, hascreated very large demands especially for peaking power.
The more worrisome aspect to the whole marketization of electricity agenda is the practical soundness of the idea thatgeneration can be made competitive in a price auction market. We know that the England & Wales (EW), New Zealand(NZ), and Nord pools have worked with varying deviations of the average clearing prices from the long-run average costs;being always more than the LRAC, but not too far above. The California story calls to question the reasons that many mayhave assumed to explain success: design, competition among generators and among buyers, and competitive �structures� toenable the same such as separation of the wires business from trade. Indeed something else, viz. the competition from othersectors, bunker oil, piped gas, and excess capacity in electricity sector may have been more important. While the conditionsinternal to the sector may have been necessary, are they sufficient?
The clue that competition from other sectors may have been very important is suggested by the developments in California.Summer heat which steps up air-conditioning demand cannot be substituted with direct fuels. But winter demands can be.Among all the large centres of population California, Florida, and Texas would therefore have to be watched carefully inthe summer. Indeed, if the competition from other sectors is a necessary part of the success of the marketization model,then on this count the Indian systems are poor candidates for the market model. (This needs recognition.)
Countervailing factors, though, would work in favour of marketization in India. Presently, in India, industrial andagricultural demand shares are very large relative to richer countries. This means that the price-elastic demand componentis large, being shiftable on a diurnal cycle, so the market-making processes can build on these specificities. But in the longrun if India were as rich as the US, the problems would be more severe since cooling demand would overwhelm all otherdemands, and seasonally this would also have to be correlated with agricultural demand (diurnal cycle in summer may beless significant.) But in that distant future solar photovoltaic or absorption based air conditioning, using solar heat directly,would have possibly become cost effective. More importantly, much before that day, measurement systems may be able tofeed back current clearing prices, and rules could be set up on the home computer to back down systems like air conditionersand water heaters beyond certain prices. The separation of elastic and inelastic components of household demand would thenbe possible.
Is retail competition worth the effort? Wholesale competition works because a larger part of it is based on price elasticdemand, not so much because wholesale markets are easy to craft! But if retail consumers are a large part of the system anddo not want interruptible supplies or their price elasticity is very low, then bringing them into the day-to-day market, via�retail choice�, may be counterproductive to the market-making process. After all, inelasticity is a known basis for marketfailure! Therefore, a separate treatment of power that distinguishes between inelastic and elastic (largely individual andhousehold plus commercial) components may be necessary. While the latter should continue to have some kind of priceregulation�the best would be a price cap significantly above the LRAC because the higher the cap, the less probable it isthat the ceiling could be hit. Thus in California, and certainly in the cities like San Diego, it should have been no more than50 per cent above the LRAC. The whole idea that the retail choice is necessary is questionable. Even home based powerclearing price indicators and feedback systems to cut off power would not help if power demand is truly price inelastic, asit is in offices and for people who are very rich. Indian systems, with a lot more industrial and agricultural demand and relativelyhigh price elasticities, would actually be more effective for the competition model than the Californian system!
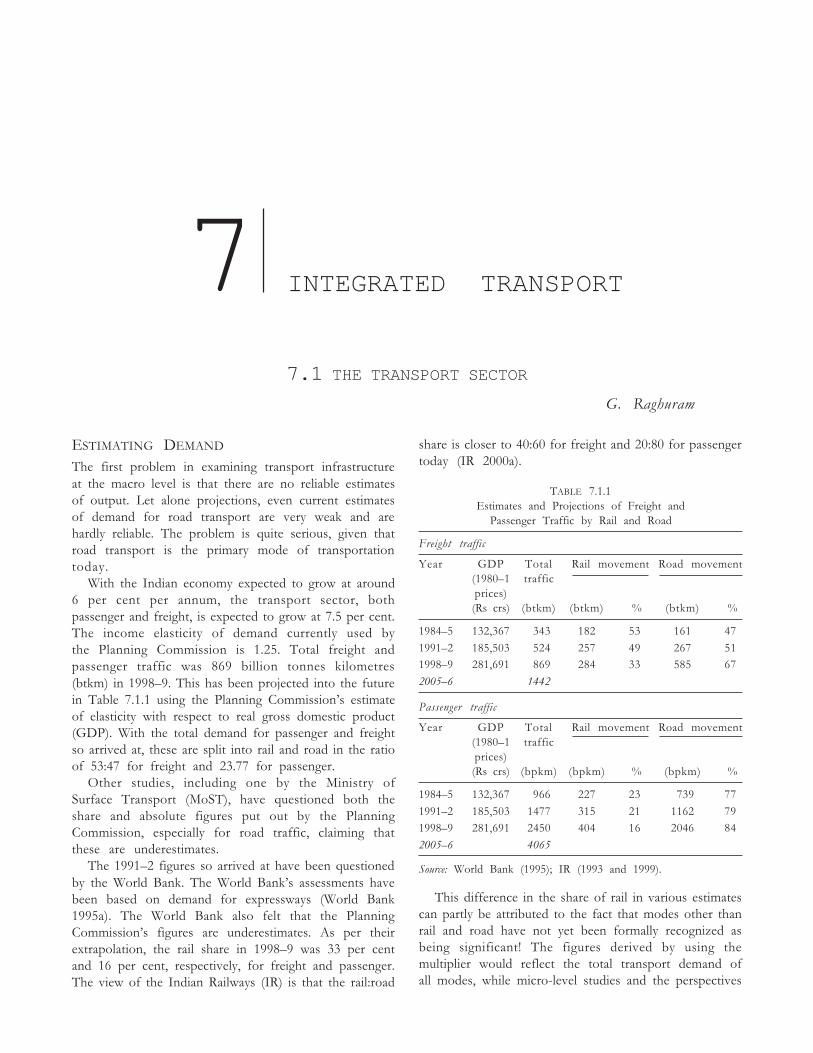
7 INTEGRATED TRANSPORT
Rakesh Basant
7.1 THE TRANSPORT SECTOR
G. Raghuram
ESTIMATING DEMAND
The first problem in examining transport infrastructureat the macro level is that there are no reliable estimatesof output. Let alone projections, even current estimatesof demand for road transport are very weak and arehardly reliable. The problem is quite serious, given thatroad transport is the primary mode of transportationtoday.
With the Indian economy expected to grow at around6 per cent per annum, the transport sector, bothpassenger and freight, is expected to grow at 7.5 per cent.The income elasticity of demand currently used bythe Planning Commission is 1.25. Total freight andpassenger traffic was 869 billion tonnes kilometres(btkm) in 1998�9. This has been projected into the futurein Table 7.1.1 using the Planning Commission�s estimateof elasticity with respect to real gross domestic product(GDP). With the total demand for passenger and freightso arrived at, these are split into rail and road in the ratioof 53:47 for freight and 23.77 for passenger.
Other studies, including one by the Ministry ofSurface Transport (MoST), have questioned both theshare and absolute figures put out by the PlanningCommission, especially for road traffic, claiming thatthese are underestimates.
The 1991�2 figures so arrived at have been questionedby the World Bank. The World Bank�s assessments havebeen based on demand for expressways (World Bank1995a). The World Bank also felt that the PlanningCommission�s figures are underestimates. As per theirextrapolation, the rail share in 1998�9 was 33 per centand 16 per cent, respectively, for freight and passenger.The view of the Indian Railways (IR) is that the rail:road
share is closer to 40:60 for freight and 20:80 for passengertoday (IR 2000a).
TABLE 7.1.1Estimates and Projections of Freight and
Passenger Traffic by Rail and Road
Freight traffic
Year GDP Total Rail movement Road movement(1980�1 trafficprices)(Rs crs) (btkm) (btkm) % (btkm) %
1984�5 132,367 0343 182 53 161 47
1991�2 185,503 0524 257 49 267 511998�9 281,691 0869 284 33 585 67
2005�6 1442
Passenger traffic
Year GDP Total Rail movement Road movement(1980�1 trafficprices)(Rs crs) (bpkm) (bpkm) % (bpkm) %
1984�5 132,367 0966 227 23 0739 77
1991�2 185,503 1477 315 21 1162 791998�9 281,691 2450 404 16 2046 84
2005�6 4065
Source: World Bank (1995); IR (1993 and 1999).
This difference in the share of rail in various estimatescan partly be attributed to the fact that modes other thanrail and road have not yet been formally recognized asbeing significant! The figures derived by using themultiplier would reflect the total transport demand ofall modes, while micro-level studies and the perspectives
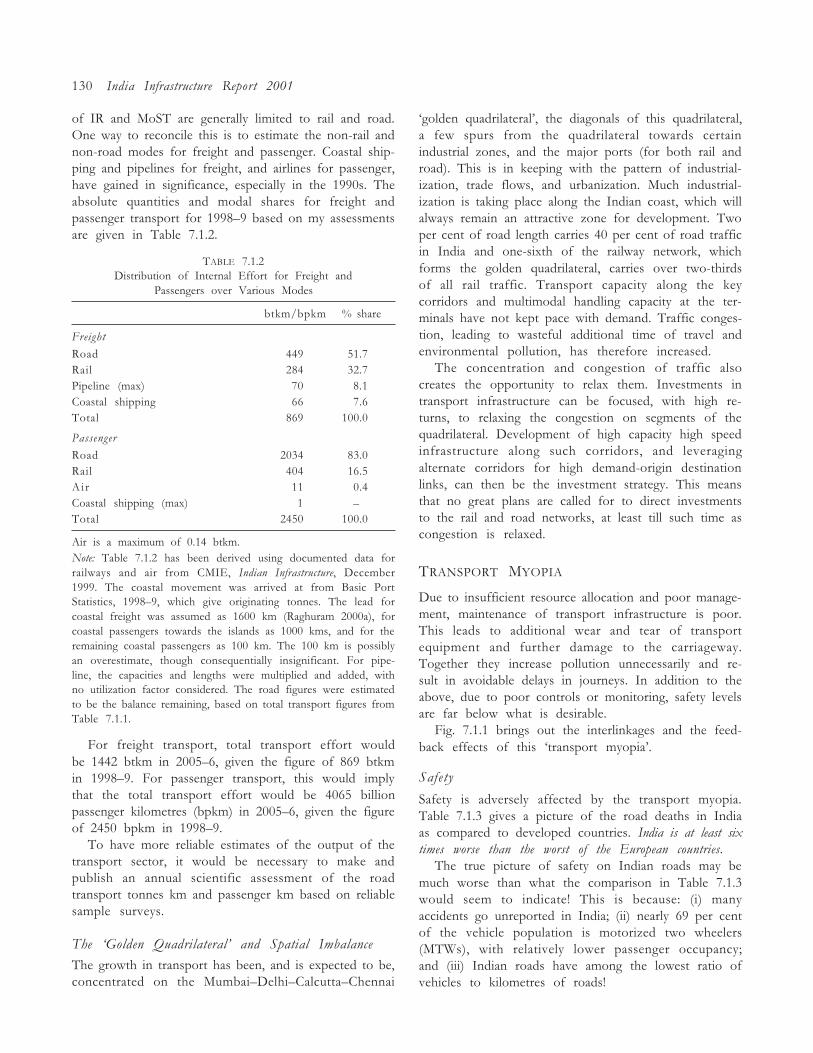
130 India Infrastructure Report 2001
of IR and MoST are generally limited to rail and road.One way to reconcile this is to estimate the non-rail andnon-road modes for freight and passenger. Coastal ship-ping and pipelines for freight, and airlines for passenger,have gained in significance, especially in the 1990s. Theabsolute quantities and modal shares for freight andpassenger transport for 1998�9 based on my assessmentsare given in Table 7.1.2.
TABLE 7.1.2Distribution of Internal Effort for Freight and
Passengers over Various Modes
btkm/bpkm % share
Freight
Road 449 51.7Rail 284 32.7Pipeline (max) 70 8.1Coastal shipping 66 7.6Total 869 100.0
Passenger
Road 2034 83.0Rail 404 16.5Ai r 11 0.4Coastal shipping (max) 1 �Total 2450 100.0
Air is a maximum of 0.14 btkm.Note: Table 7.1.2 has been derived using documented data forrailways and air from CMIE, Indian Infrastructure, December1999. The coastal movement was arrived at from Basic PortStatistics, 1998�9, which give originating tonnes. The lead forcoastal freight was assumed as 1600 km (Raghuram 2000a), forcoastal passengers towards the islands as 1000 kms, and for theremaining coastal passengers as 100 km. The 100 km is possiblyan overestimate, though consequentially insignificant. For pipe-line, the capacities and lengths were multiplied and added, withno utilization factor considered. The road figures were estimatedto be the balance remaining, based on total transport figures fromTable 7.1.1.
For freight transport, total transport effort wouldbe 1442 btkm in 2005�6, given the figure of 869 btkmin 1998�9. For passenger transport, this would implythat the total transport effort would be 4065 billionpassenger kilometres (bpkm) in 2005�6, given the figureof 2450 bpkm in 1998�9.
To have more reliable estimates of the output of thetransport sector, it would be necessary to make andpublish an annual scientific assessment of the roadtransport tonnes km and passenger km based on reliablesample surveys.
The �Golden Quadrilateral� and Spatial Imbalance
The growth in transport has been, and is expected to be,concentrated on the Mumbai�Delhi�Calcutta�Chennai
�golden quadrilateral�, the diagonals of this quadrilateral,a few spurs from the quadrilateral towards certainindustrial zones, and the major ports (for both rail androad). This is in keeping with the pattern of industrial-ization, trade flows, and urbanization. Much industrial-ization is taking place along the Indian coast, which willalways remain an attractive zone for development. Twoper cent of road length carries 40 per cent of road trafficin India and one-sixth of the railway network, whichforms the golden quadrilateral, carries over two-thirdsof all rail traffic. Transport capacity along the keycorridors and multimodal handling capacity at the ter-minals have not kept pace with demand. Traffic conges-tion, leading to wasteful additional time of travel andenvironmental pollution, has therefore increased.
The concentration and congestion of traffic alsocreates the opportunity to relax them. Investments intransport infrastructure can be focused, with high re-turns, to relaxing the congestion on segments of thequadrilateral. Development of high capacity high speedinfrastructure along such corridors, and leveragingalternate corridors for high demand-origin destinationlinks, can then be the investment strategy. This meansthat no great plans are called for to direct investmentsto the rail and road networks, at least till such time ascongestion is relaxed.
TRANSPORT MYOPIA
Due to insufficient resource allocation and poor manage-ment, maintenance of transport infrastructure is poor.This leads to additional wear and tear of transportequipment and further damage to the carriageway.Together they increase pollution unnecessarily and re-sult in avoidable delays in journeys. In addition to theabove, due to poor controls or monitoring, safety levelsare far below what is desirable.
Fig. 7.1.1 brings out the interlinkages and the feed-back effects of this �transport myopia�.
Safety
Safety is adversely affected by the transport myopia.Table 7.1.3 gives a picture of the road deaths in Indiaas compared to developed countries. India is at least sixtimes worse than the worst of the European countries.
The true picture of safety on Indian roads may bemuch worse than what the comparison in Table 7.1.3would seem to indicate! This is because: (i) manyaccidents go unreported in India; (ii) nearly 69 per centof the vehicle population is motorized two wheelers(MTWs), with relatively lower passenger occupancy;and (iii) Indian roads have among the lowest ratio ofvehicles to kilometres of roads!
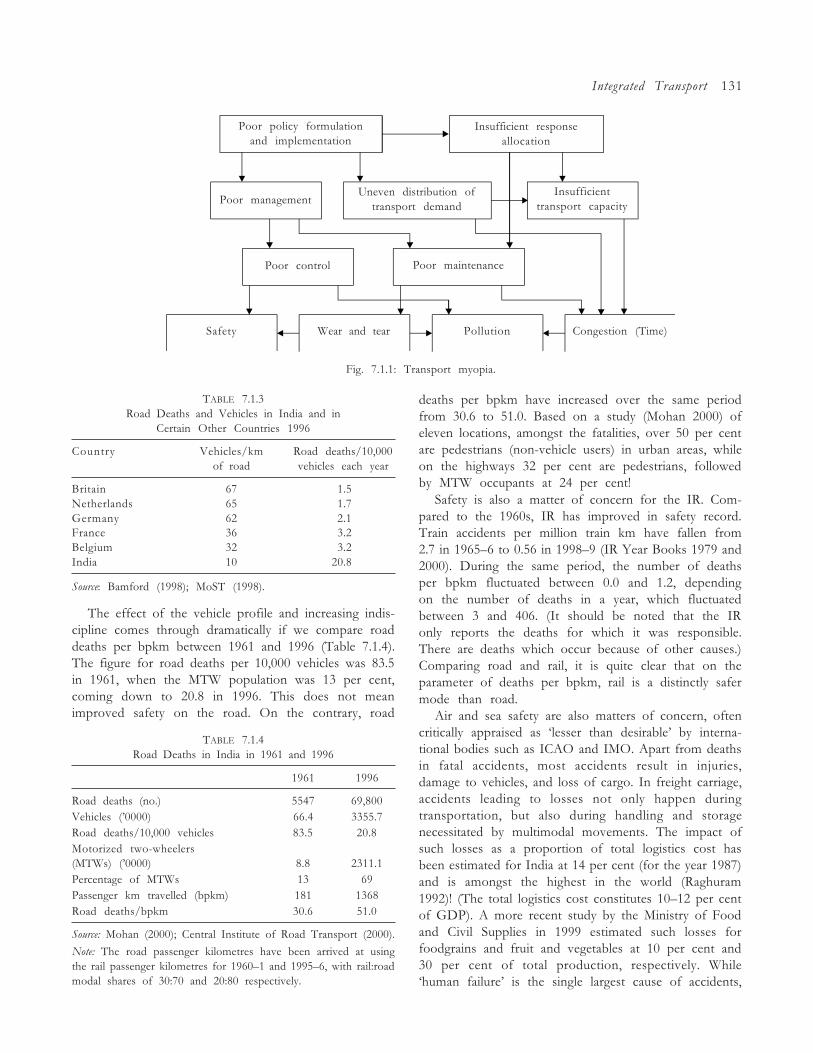
Integrated Transport 131
Poor policy formulationand implementation
Insufficient responseallocation
Uneven distribution oftransport demandPoor management
Insufficienttransport capacity
Poor control Poor maintenance
Safety Wear and tear Pollution Congestion (Time)
Fig. 7.1.1: Transport myopia.
TABLE 7.1.3Road Deaths and Vehicles in India and in
Certain Other Countries 1996
Country Vehicles/km Road deaths/10,000of road vehicles each year
Britain 67 1.5Netherlands 65 1.7Germany 62 2.1France 36 3.2Belgium 32 3.2India 10 20.8
Source: Bamford (1998); MoST (1998).
The effect of the vehicle profile and increasing indis-cipline comes through dramatically if we compare roaddeaths per bpkm between 1961 and 1996 (Table 7.1.4).The figure for road deaths per 10,000 vehicles was 83.5in 1961, when the MTW population was 13 per cent,coming down to 20.8 in 1996. This does not meanimproved safety on the road. On the contrary, road
deaths per bpkm have increased over the same periodfrom 30.6 to 51.0. Based on a study (Mohan 2000) ofeleven locations, amongst the fatalities, over 50 per centare pedestrians (non-vehicle users) in urban areas, whileon the highways 32 per cent are pedestrians, followedby MTW occupants at 24 per cent!
Safety is also a matter of concern for the IR. Com-pared to the 1960s, IR has improved in safety record.Train accidents per million train km have fallen from2.7 in 1965�6 to 0.56 in 1998�9 (IR Year Books 1979 and2000). During the same period, the number of deathsper bpkm fluctuated between 0.0 and 1.2, dependingon the number of deaths in a year, which fluctuatedbetween 3 and 406. (It should be noted that the IRonly reports the deaths for which it was responsible.There are deaths which occur because of other causes.)Comparing road and rail, it is quite clear that on theparameter of deaths per bpkm, rail is a distinctly safermode than road.
Air and sea safety are also matters of concern, oftencritically appraised as �lesser than desirable� by interna-tional bodies such as ICAO and IMO. Apart from deathsin fatal accidents, most accidents result in injuries,damage to vehicles, and loss of cargo. In freight carriage,accidents leading to losses not only happen duringtransportation, but also during handling and storagenecessitated by multimodal movements. The impact ofsuch losses as a proportion of total logistics cost hasbeen estimated for India at 14 per cent (for the year 1987)and is amongst the highest in the world (Raghuram1992)! (The total logistics cost constitutes 10�12 per centof GDP). A more recent study by the Ministry of Foodand Civil Supplies in 1999 estimated such losses forfoodgrains and fruit and vegetables at 10 per cent and30 per cent of total production, respectively. While�human failure� is the single largest cause of accidents,
TABLE 7.1.4Road Deaths in India in 1961 and 1996
1961 1996
Road deaths (no.) 5547 69,800Vehicles (�0000) 66.4 3355.7Road deaths/10,000 vehicles 83.5 20.8Motorized two-wheelers(MTWs) (�0000) 8.8 2311.1Percentage of MTWs 13 69Passenger km travelled (bpkm) 181 1368Road deaths/bpkm 30.6 51.0
Source: Mohan (2000); Central Institute of Road Transport (2000).
Note: The road passenger kilometres have been arrived at usingthe rail passenger kilometres for 1960�1 and 1995�6, with rail:roadmodal shares of 30:70 and 20:80 respectively.
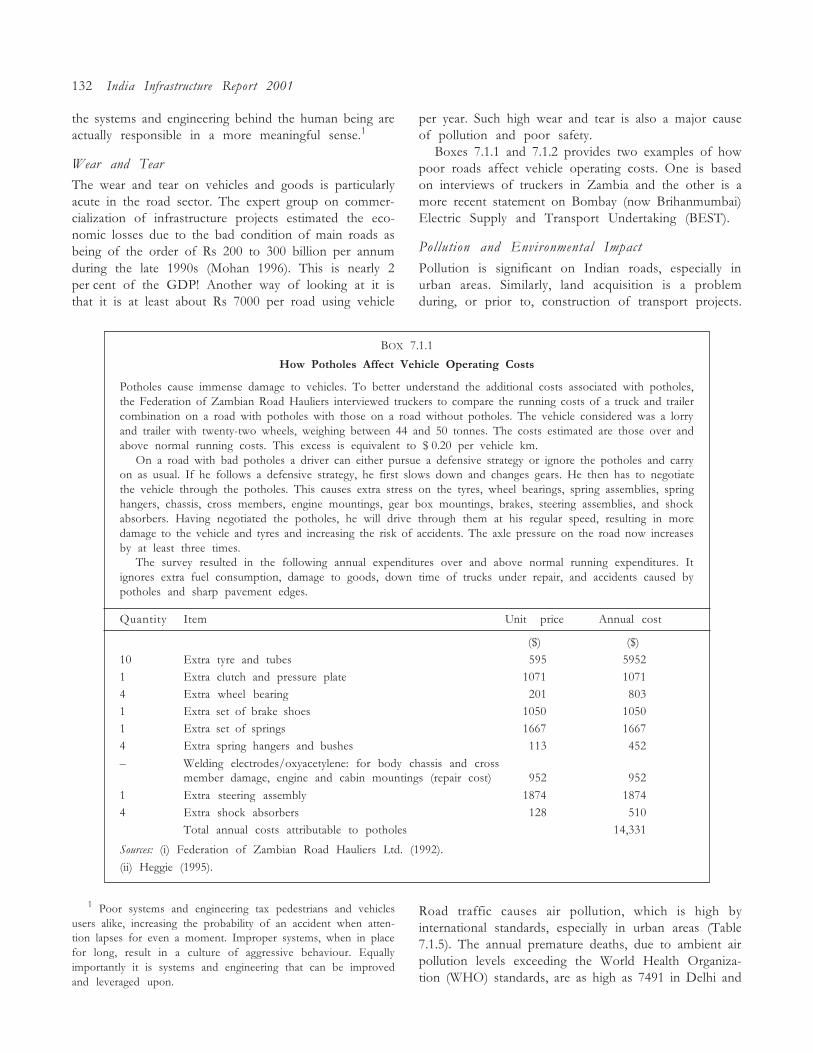
132 India Infrastructure Report 2001
the systems and engineering behind the human being areactually responsible in a more meaningful sense.1
Wear and Tear
The wear and tear on vehicles and goods is particularlyacute in the road sector. The expert group on commer-cialization of infrastructure projects estimated the eco-nomic losses due to the bad condition of main roads asbeing of the order of Rs 200 to 300 billion per annumduring the late 1990s (Mohan 1996). This is nearly 2per cent of the GDP! Another way of looking at it isthat it is at least about Rs 7000 per road using vehicle
per year. Such high wear and tear is also a major causeof pollution and poor safety.
Boxes 7.1.1 and 7.1.2 provides two examples of howpoor roads affect vehicle operating costs. One is basedon interviews of truckers in Zambia and the other is amore recent statement on Bombay (now Brihanmumbai)Electric Supply and Transport Undertaking (BEST).
Pollution and Environmental Impact
Pollution is significant on Indian roads, especially inurban areas. Similarly, land acquisition is a problemduring, or prior to, construction of transport projects.
1 Poor systems and engineering tax pedestrians and vehiclesusers alike, increasing the probability of an accident when atten-tion lapses for even a moment. Improper systems, when in placefor long, result in a culture of aggressive behaviour. Equallyimportantly it is systems and engineering that can be improvedand leveraged upon.
Road traffic causes air pollution, which is high byinternational standards, especially in urban areas (Table7.1.5). The annual premature deaths, due to ambient airpollution levels exceeding the World Health Organiza-tion (WHO) standards, are as high as 7491 in Delhi and
BOX 7.1.1
How Potholes Affect Vehicle Operating Costs
Potholes cause immense damage to vehicles. To better understand the additional costs associated with potholes,the Federation of Zambian Road Hauliers interviewed truckers to compare the running costs of a truck and trailercombination on a road with potholes with those on a road without potholes. The vehicle considered was a lorryand trailer with twenty-two wheels, weighing between 44 and 50 tonnes. The costs estimated are those over andabove normal running costs. This excess is equivalent to $ 0.20 per vehicle km.
On a road with bad potholes a driver can either pursue a defensive strategy or ignore the potholes and carryon as usual. If he follows a defensive strategy, he first slows down and changes gears. He then has to negotiatethe vehicle through the potholes. This causes extra stress on the tyres, wheel bearings, spring assemblies, springhangers, chassis, cross members, engine mountings, gear box mountings, brakes, steering assemblies, and shockabsorbers. Having negotiated the potholes, he will drive through them at his regular speed, resulting in moredamage to the vehicle and tyres and increasing the risk of accidents. The axle pressure on the road now increasesby at least three times.
The survey resulted in the following annual expenditures over and above normal running expenditures. Itignores extra fuel consumption, damage to goods, down time of trucks under repair, and accidents caused bypotholes and sharp pavement edges.
Quantity Item Unit price Annual cost
($) ($)
10 Extra tyre and tubes 595 59521 Extra clutch and pressure plate 1071 10714 Extra wheel bearing 201 8031 Extra set of brake shoes 1050 10501 Extra set of springs 1667 16674 Extra spring hangers and bushes 113 452
� Welding electrodes/oxyacetylene: for body chassis and crossmember damage, engine and cabin mountings (repair cost) 952 952
1 Extra steering assembly 1874 18744 Extra shock absorbers 128 510
Total annual costs attributable to potholes 14,331
Sources: (i) Federation of Zambian Road Hauliers Ltd. (1992).
(ii) Heggie (1995).
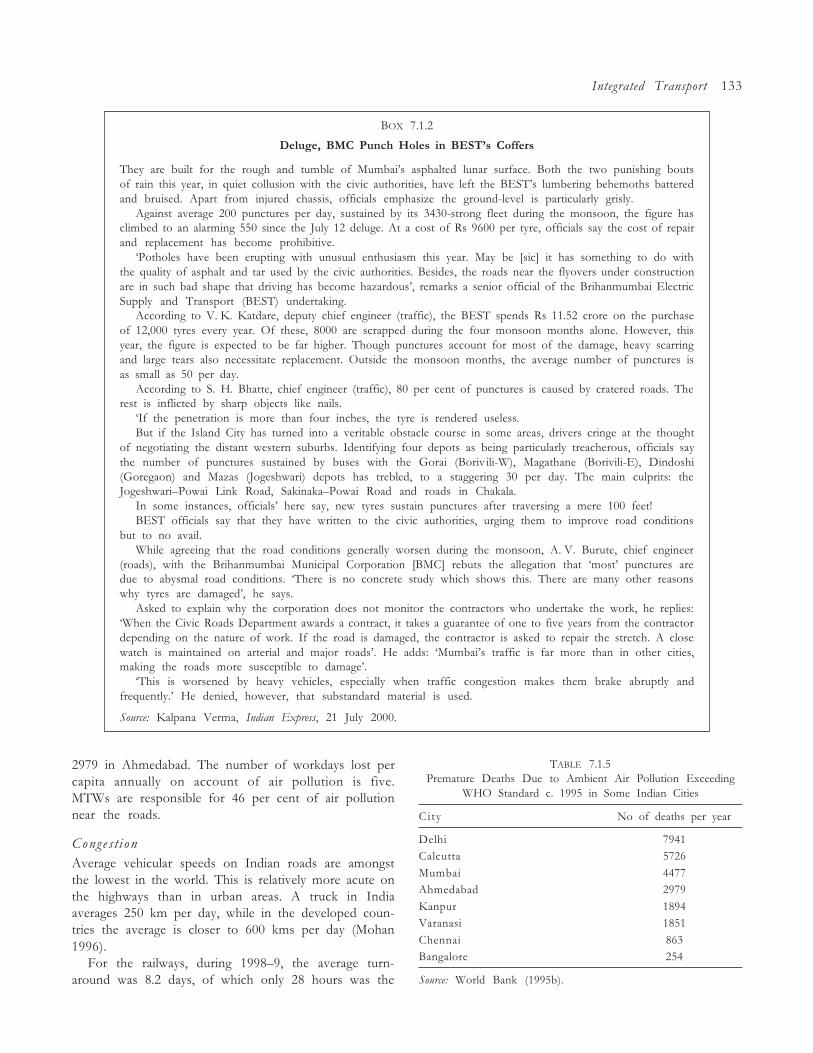
Integrated Transport 133
BOX 7.1.2
Deluge, BMC Punch Holes in BEST�s Coffers
They are built for the rough and tumble of Mumbai�s asphalted lunar surface. Both the two punishing boutsof rain this year, in quiet collusion with the civic authorities, have left the BEST�s lumbering behemoths batteredand bruised. Apart from injured chassis, officials emphasize the ground-level is particularly grisly.
Against average 200 punctures per day, sustained by its 3430-strong fleet during the monsoon, the figure hasclimbed to an alarming 550 since the July 12 deluge. At a cost of Rs 9600 per tyre, officials say the cost of repairand replacement has become prohibitive.
�Potholes have been erupting with unusual enthusiasm this year. May be [sic] it has something to do withthe quality of asphalt and tar used by the civic authorities. Besides, the roads near the flyovers under constructionare in such bad shape that driving has become hazardous�, remarks a senior official of the Brihanmumbai ElectricSupply and Transport (BEST) undertaking.
According to V. K. Katdare, deputy chief engineer (traffic), the BEST spends Rs 11.52 crore on the purchaseof 12,000 tyres every year. Of these, 8000 are scrapped during the four monsoon months alone. However, thisyear, the figure is expected to be far higher. Though punctures account for most of the damage, heavy scarringand large tears also necessitate replacement. Outside the monsoon months, the average number of punctures isas small as 50 per day.
According to S. H. Bhatte, chief engineer (traffic), 80 per cent of punctures is caused by cratered roads. Therest is inflicted by sharp objects like nails.
�If the penetration is more than four inches, the tyre is rendered useless.But if the Island City has turned into a veritable obstacle course in some areas, drivers cringe at the thought
of negotiating the distant western suburbs. Identifying four depots as being particularly treacherous, officials saythe number of punctures sustained by buses with the Gorai (Boriv ili-W), Magathane (Borivili-E), Dindoshi(Goregaon) and Mazas (Jogeshwari) depots has trebled, to a staggering 30 per day. The main culprits: theJogeshwari�Powai Link Road, Sakinaka�Powai Road and roads in Chakala.
In some instances, officials� here say, new tyres sustain punctures after traversing a mere 100 feet!BEST officials say that they have written to the civic authorities, urging them to improve road conditions
but to no avail.While agreeing that the road conditions generally worsen during the monsoon, A. V. Burute, chief engineer
(roads), with the Brihanmumbai Municipal Corporation [BMC] rebuts the allegation that �most� punctures aredue to abysmal road conditions. �There is no concrete study which shows this. There are many other reasonswhy tyres are damaged�, he says.
Asked to explain why the corporation does not monitor the contractors who undertake the work, he replies:�When the Civic Roads Department awards a contract, it takes a guarantee of one to five years from the contractordepending on the nature of work. If the road is damaged, the contractor is asked to repair the stretch. A closewatch is maintained on arterial and major roads�. He adds: �Mumbai�s traffic is far more than in other cities,making the roads more susceptible to damage�.
�This is worsened by heavy vehicles, especially when traffic congestion makes them brake abruptly andfrequently.� He denied, however, that substandard material is used.
Source: Kalpana Verma, Indian Express, 21 July 2000.
2979 in Ahmedabad. The number of workdays lost percapita annually on account of air pollution is five.MTWs are responsible for 46 per cent of air pollutionnear the roads.
Conges t ionAverage vehicular speeds on Indian roads are amongstthe lowest in the world. This is relatively more acute onthe highways than in urban areas. A truck in Indiaaverages 250 km per day, while in the developed coun-tries the average is closer to 600 kms per day (Mohan1996).
For the railways, during 1998�9, the average turn-around was 8.2 days, of which only 28 hours was the
TABLE 7.1.5Premature Deaths Due to Ambient Air Pollution Exceeding
WHO Standard c. 1995 in Some Indian Cities
C i ty No of deaths per year
Delhi 7941Calcutta 5726
Mumbai 4477Ahmedabad 2979
Kanpur 1894Varanasi 1851
Chennai 863Bangalore 254
Source: World Bank (1995b).
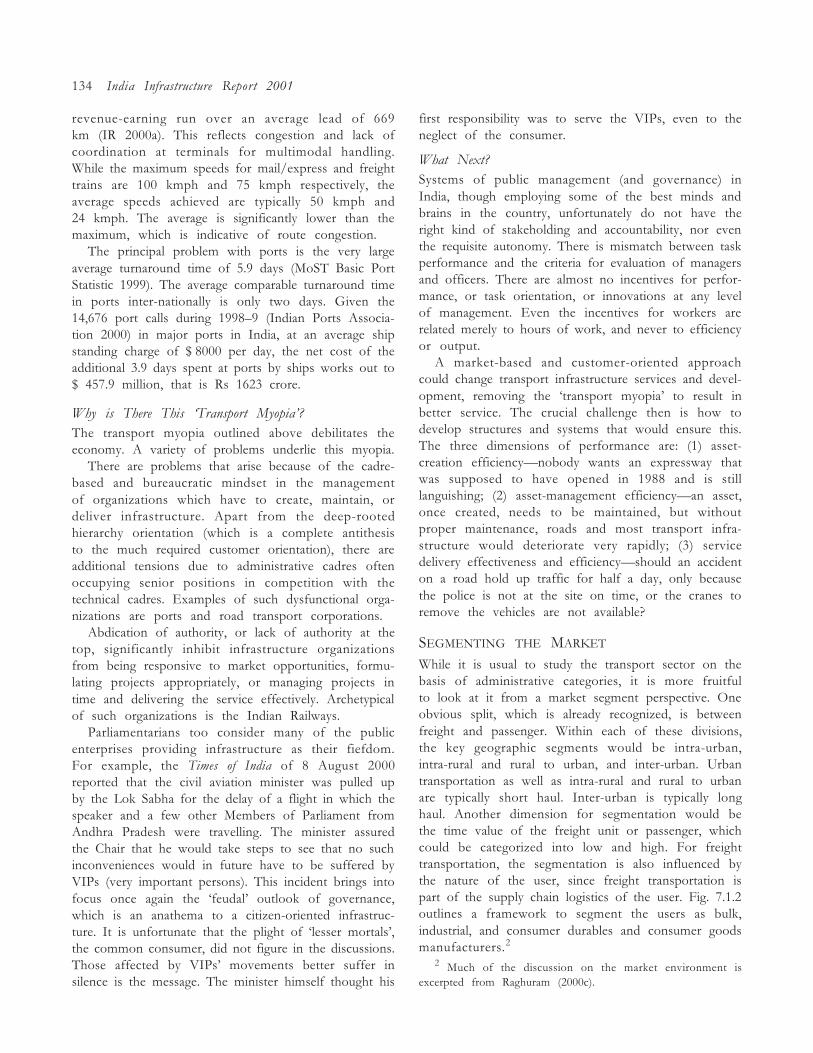
134 India Infrastructure Report 2001
revenue-earning run over an average lead of 669km (IR 2000a). This reflects congestion and lack ofcoordination at terminals for multimodal handling.While the maximum speeds for mail/express and freighttrains are 100 kmph and 75 kmph respectively, theaverage speeds achieved are typically 50 kmph and24 kmph. The average is significantly lower than themaximum, which is indicative of route congestion.
The principal problem with ports is the very largeaverage turnaround time of 5.9 days (MoST Basic PortStatistic 1999). The average comparable turnaround timein ports inter-nationally is only two days. Given the14,676 port calls during 1998�9 (Indian Ports Associa-tion 2000) in major ports in India, at an average shipstanding charge of $ 8000 per day, the net cost of theadditional 3.9 days spent at ports by ships works out to$ 457.9 million, that is Rs 1623 crore.
Why is There This �Transport Myopia�?The transport myopia outlined above debilitates theeconomy. A variety of problems underlie this myopia.
There are problems that arise because of the cadre-based and bureaucratic mindset in the managementof organizations which have to create, maintain, ordeliver infrastructure. Apart from the deep-rootedhierarchy orientation (which is a complete antithesisto the much required customer orientation), there areadditional tensions due to administrative cadres oftenoccupying senior positions in competition with thetechnical cadres. Examples of such dysfunctional orga-nizations are ports and road transport corporations.
Abdication of authority, or lack of authority at thetop, significantly inhibit infrastructure organizationsfrom being responsive to market opportunities, formu-lating projects appropriately, or managing projects intime and delivering the service effectively. Archetypicalof such organizations is the Indian Railways.
Parliamentarians too consider many of the publicenterprises providing infrastructure as their fiefdom.For example, the Times of India of 8 August 2000reported that the civil aviation minister was pulled upby the Lok Sabha for the delay of a flight in which thespeaker and a few other Members of Parliament fromAndhra Pradesh were travelling. The minister assuredthe Chair that he would take steps to see that no suchinconveniences would in future have to be suffered byVIPs (very important persons). This incident brings intofocus once again the �feudal� outlook of governance,which is an anathema to a citizen-oriented infrastruc-ture. It is unfortunate that the plight of �lesser mortals�,the common consumer, did not figure in the discussions.Those affected by VIPs� movements better suffer insilence is the message. The minister himself thought his
first responsibility was to serve the VIPs, even to theneglect of the consumer.
What Next?Systems of public management (and governance) inIndia, though employing some of the best minds andbrains in the country, unfortunately do not have theright kind of stakeholding and accountability, nor eventhe requisite autonomy. There is mismatch between taskperformance and the criteria for evaluation of managersand officers. There are almost no incentives for perfor-mance, or task orientation, or innovations at any levelof management. Even the incentives for workers arerelated merely to hours of work, and never to efficiencyor output.
A market-based and customer-oriented approachcould change transport infrastructure services and devel-opment, removing the �transport myopia� to result inbetter service. The crucial challenge then is how todevelop structures and systems that would ensure this.The three dimensions of performance are: (1) asset-creation efficiency�nobody wants an expressway thatwas supposed to have opened in 1988 and is stilllanguishing; (2) asset-management efficiency�an asset,once created, needs to be maintained, but withoutproper maintenance, roads and most transport infra-structure would deteriorate very rapidly; (3) servicedelivery effectiveness and efficiency�should an accidenton a road hold up traffic for half a day, only becausethe police is not at the site on time, or the cranes toremove the vehicles are not available?
SEGMENTING THE MARKET
While it is usual to study the transport sector on thebasis of administrative categories, it is more fruitfulto look at it from a market segment perspective. Oneobvious split, which is already recognized, is betweenfreight and passenger. Within each of these divisions,the key geographic segments would be intra-urban,intra-rural and rural to urban, and inter-urban. Urbantransportation as well as intra-rural and rural to urbanare typically short haul. Inter-urban is typically longhaul. Another dimension for segmentation would bethe time value of the freight unit or passenger, whichcould be categorized into low and high. For freighttransportation, the segmentation is also influenced bythe nature of the user, since freight transportation ispart of the supply chain logistics of the user. Fig. 7.1.2outlines a framework to segment the users as bulk,industrial, and consumer durables and consumer goodsmanufacturers.2
2 Much of the discussion on the market environment isexcerpted from Raghuram (2000c).
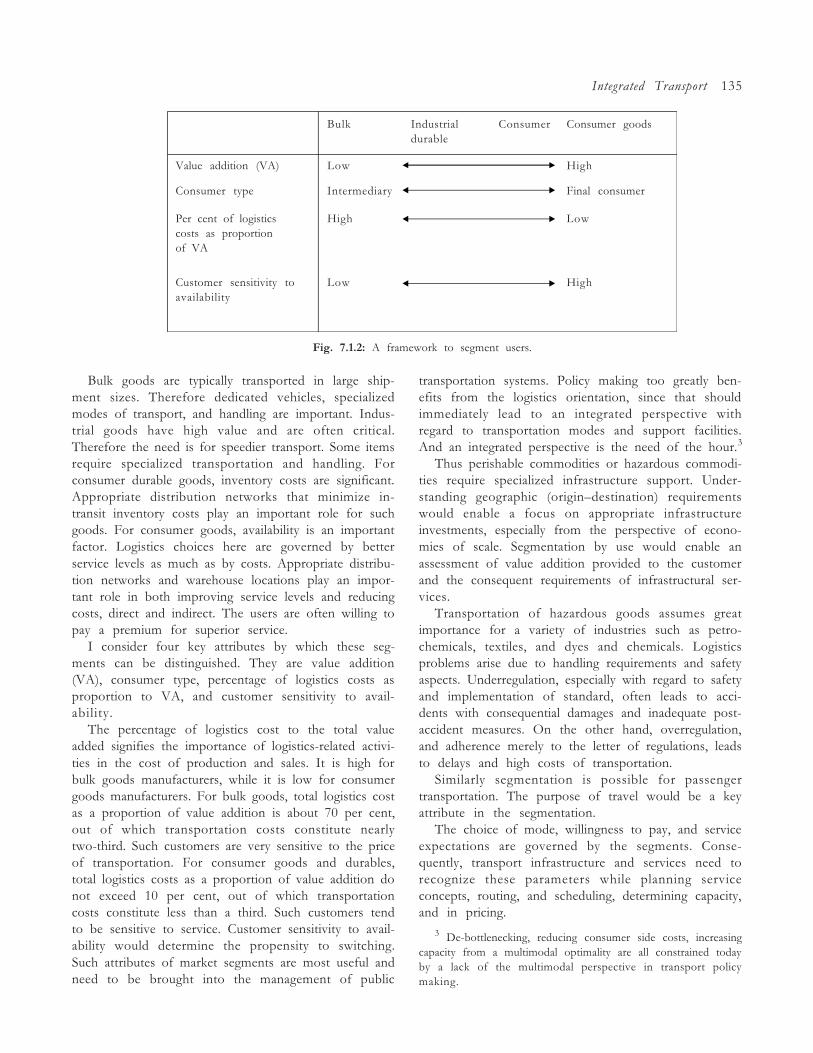
Integrated Transport 135
Fig. 7.1.2: A framework to segment users.
Bulk Industrial Consumer Consumer goodsdurable
Value addition (VA) Low High
Consumer type Intermediary Final consumer
Per cent of logistics High Lowcosts as proportionof VA
Customer sensitivity to Low Highavailability
Bulk goods are typically transported in large ship-ment sizes. Therefore dedicated vehicles, specializedmodes of transport, and handling are important. Indus-trial goods have high value and are often critical.Therefore the need is for speedier transport. Some itemsrequire specialized transportation and handling. Forconsumer durable goods, inventory costs are significant.Appropriate distribution networks that minimize in-transit inventory costs play an important role for suchgoods. For consumer goods, availability is an importantfactor. Logistics choices here are governed by betterservice levels as much as by costs. Appropriate distribu-tion networks and warehouse locations play an impor-tant role in both improving service levels and reducingcosts, direct and indirect. The users are often willing topay a premium for superior service.
I consider four key attributes by which these seg-ments can be distinguished. They are value addition(VA), consumer type, percentage of logistics costs asproportion to VA, and customer sensitivity to avail-ability.
The percentage of logistics cost to the total valueadded signifies the importance of logistics-related activi-ties in the cost of production and sales. It is high forbulk goods manufacturers, while it is low for consumergoods manufacturers. For bulk goods, total logistics costas a proportion of value addition is about 70 per cent,out of which transportation costs constitute nearlytwo-third. Such customers are very sensitive to the priceof transportation. For consumer goods and durables,total logistics costs as a proportion of value addition donot exceed 10 per cent, out of which transportationcosts constitute less than a third. Such customers tendto be sensitive to service. Customer sensitivity to avail-ability would determine the propensity to switching.Such attributes of market segments are most useful andneed to be brought into the management of public
transportation systems. Policy making too greatly ben-efits from the logistics orientation, since that shouldimmediately lead to an integrated perspective withregard to transportation modes and support facilities.And an integrated perspective is the need of the hour.3
Thus perishable commodities or hazardous commodi-ties require specialized infrastructure support. Under-standing geographic (origin�destination) requirementswould enable a focus on appropriate infrastructureinvestments, especially from the perspective of econo-mies of scale. Segmentation by use would enable anassessment of value addition provided to the customerand the consequent requirements of infrastructural ser-vices.
Transportation of hazardous goods assumes greatimportance for a variety of industries such as petro-chemicals, textiles, and dyes and chemicals. Logisticsproblems arise due to handling requirements and safetyaspects. Underregulation, especially with regard to safetyand implementation of standard, often leads to acci-dents with consequential damages and inadequate post-accident measures. On the other hand, overregulation,and adherence merely to the letter of regulations, leadsto delays and high costs of transportation.
Similarly segmentation is possible for passengertransportation. The purpose of travel would be a keyattribute in the segmentation.
The choice of mode, willingness to pay, and serviceexpectations are governed by the segments. Conse-quently, transport infrastructure and services need torecognize these parameters while planning serviceconcepts, routing, and scheduling, determining capacity,and in pricing.
3 De-bottlenecking, reducing consumer side costs, increasingcapacity from a multimodal optimality are all constrained todayby a lack of the multimodal perspective in transport policymaking.
136 India Infrastructure Report 2001
STRUCTURE OF THE TRANSPORT SECTOR4
Defining Sector Components
While many activities in the transport sector in Indiaare strictly state controlled, there are other significantsegments which are almost entirely in the private sector.It would be useful to broadly classify the transport sectorinto three primary segments, namely infrastructure(hardware), services, and regulation. There are broadlythree components of infrastructure with increasingpossibility of being attached to the specific servicesprovided: (a) right of way, (b) terminals, and (c) rollingstock and equipment. Services too can be broadlycategorized into three types with increasing closenessto the customer: (a) maintenance, (b) operations, and(c) customer services. Both maintenance and operationscan be further classified as being for the right of way,or for terminals, or rolling stock. Customer servicescan be classified into basic and special (value-added)services. Thus, the distinct activities may be seen asunder:
INFRASTRUCTURE
1. Ownership and asset creation� Right of way� Terminals� Rolling stock and equipment
SERVICES
1. Maintenance
� Right of way
� Terminals
� Rolling stock and equipment
2. Operations
� Right of way
� Terminals
� Rolling stock and equipment
3. Customer services
� Basic services
� Special services
REGULATION
1. Licensing
2. Environmental impact
3. Safety
4. Pricing
5. Service levels
The relative importance of the state and the currentstructure of provisioning of each of the above activitiesfor all the transport modes are brought in Table 7.1.6.The provider who has primary responsibility andaccountability for the infrastructure and services isalso identified. Even when activities are contracted (out),the principal continues to bear primary responsibility,though that brings in the principal�agency problem.Hence stakeholding and appropriateness of incentivesbecome important.
Air
When �air� is considered as a mode of transport, rightof way is not a significant infrastructure. However, theoperation associated with it, namely air traffic control,has significant regulatory and safety aspects. The termi-nals have also never been privatized, though they havebeen privatized in so far as the terminal buildings orportions thereof are concerned. The rolling stock andequipment, customer services, and other special services(for example reservation) are all privatized.
Rail
In the case of rail, currently all activities are beinghandled by one organization, namely Indian Railways.Only recently, certain value-added special services liketourist trains on popular tourist circuits are beginningto be offered through the private sector. The IndianRailways are viewed as providing a robust and bareminimum service, but with poor customer service.
Road
In the case of road, in contrast to rail, a variety oforganizations are involved, with regard to the �right ofway� state governments, the central government (fornational highways), and local governments are involved.Apart from these, the Defence Ministry (border roads)and large industries (project roads) too are involvedin a minor way. In recent years, some financing forrural roads has come from the Agriculture Ministry.Regarding terminals, for mass passenger transport eitherState Road Transport Undertakings (SRTUs) or localgovernments are generally involved. For freight trans-port, large industries have their own loading and unload-ing areas while smaller organizations tend to use publicroads. Trans-shipment terminals are usually provided byvarious carriers. A few cities have organized truckterminals under supervision of the local governments.The rolling stock and equipment are manufactured bya few large auto manufacturers, while ownership isdiffused across a large number of owners (usually driversthemselves). Many operators often own no more thanfive trucks.
4 This section is based on Pangotra and Raghuram (1999).
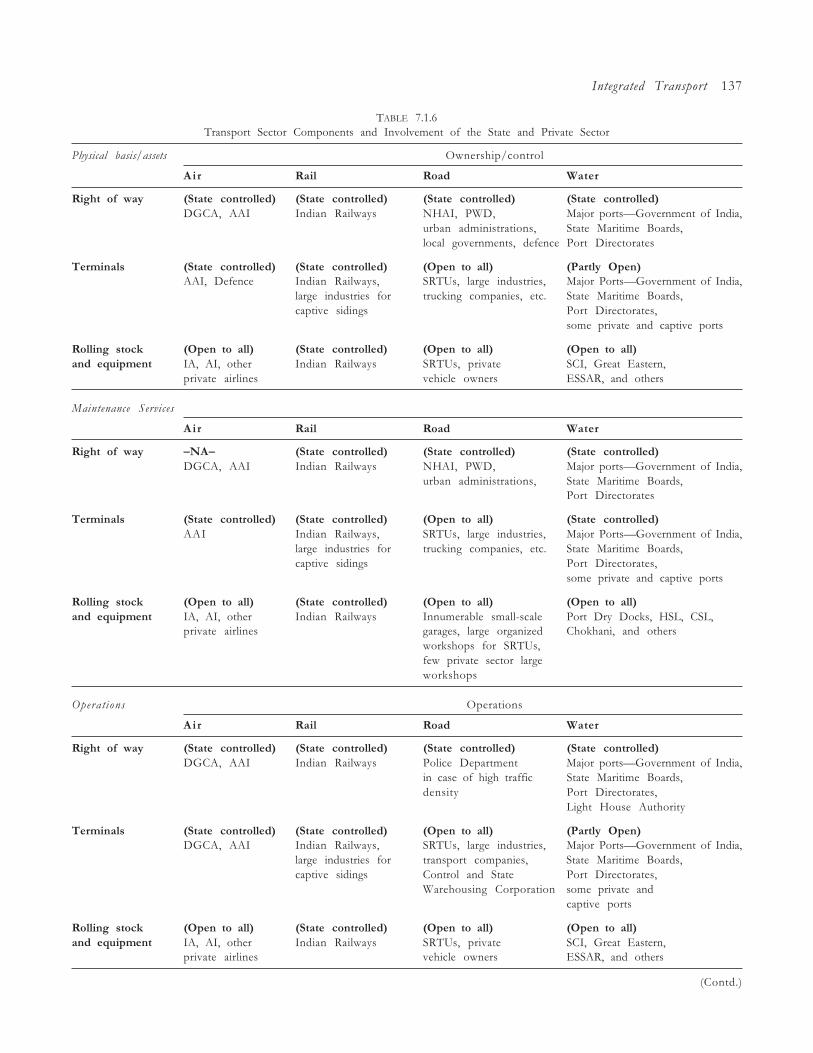
Integrated Transport 137
TABLE 7.1.6Transport Sector Components and Involvement of the State and Private Sector
Physical basis/assets Ownership/control
A ir Rail Road Water
Right of way (State controlled) (State controlled) (State controlled) (State controlled)DGCA, AAI Indian Railways NHAI, PWD, Major ports�Government of India,
urban administrations, State Maritime Boards,local governments, defence Port Directorates
Terminals (State controlled) (State controlled) (Open to all) (Partly Open)AAI, Defence Indian Railways, SRTUs, large industries, Major Ports�Government of India,
large industries for trucking companies, etc. State Maritime Boards,captive sidings Port Directorates,
some private and captive ports
Rolling stock (Open to all) (State controlled) (Open to all) (Open to all)and equipment IA, AI, other Indian Railways SRTUs, private SCI, Great Eastern,
private airlines vehicle owners ESSAR, and others
Maintenance Services
A ir Rail Road Water
Right of way �NA� (State controlled) (State controlled) (State controlled)DGCA, AAI Indian Railways NHAI, PWD, Major ports�Government of India,
urban administrations, State Maritime Boards,Port Directorates
Terminals (State controlled) (State controlled) (Open to all) (State controlled)AAI Indian Railways, SRTUs, large industries, Major Ports�Government of India,
large industries for trucking companies, etc. State Maritime Boards,captive sidings Port Directorates,
some private and captive ports
Rolling stock (Open to all) (State controlled) (Open to all) (Open to all)and equipment IA, AI, other Indian Railways Innumerable small-scale Port Dry Docks, HSL, CSL,
private airlines garages, large organized Chokhani, and othersworkshops for SRTUs,few private sector largeworkshops
Operations Operations
A ir Rail Road Water
Right of way (State controlled) (State controlled) (State controlled) (State controlled)DGCA, AAI Indian Railways Police Department Major ports�Government of India,
in case of high traffic State Maritime Boards,density Port Directorates,
Light House Authority
Terminals (State controlled) (State controlled) (Open to all) (Partly Open)DGCA, AAI Indian Railways, SRTUs, large industries, Major Ports�Government of India,
large industries for transport companies, State Maritime Boards,captive sidings Control and State Port Directorates,
Warehousing Corporation some private andcaptive ports
Rolling stock (Open to all) (State controlled) (Open to all) (Open to all)and equipment IA, AI, other Indian Railways SRTUs, private SCI, Great Eastern,
private airlines vehicle owners ESSAR, and others
(Contd.)
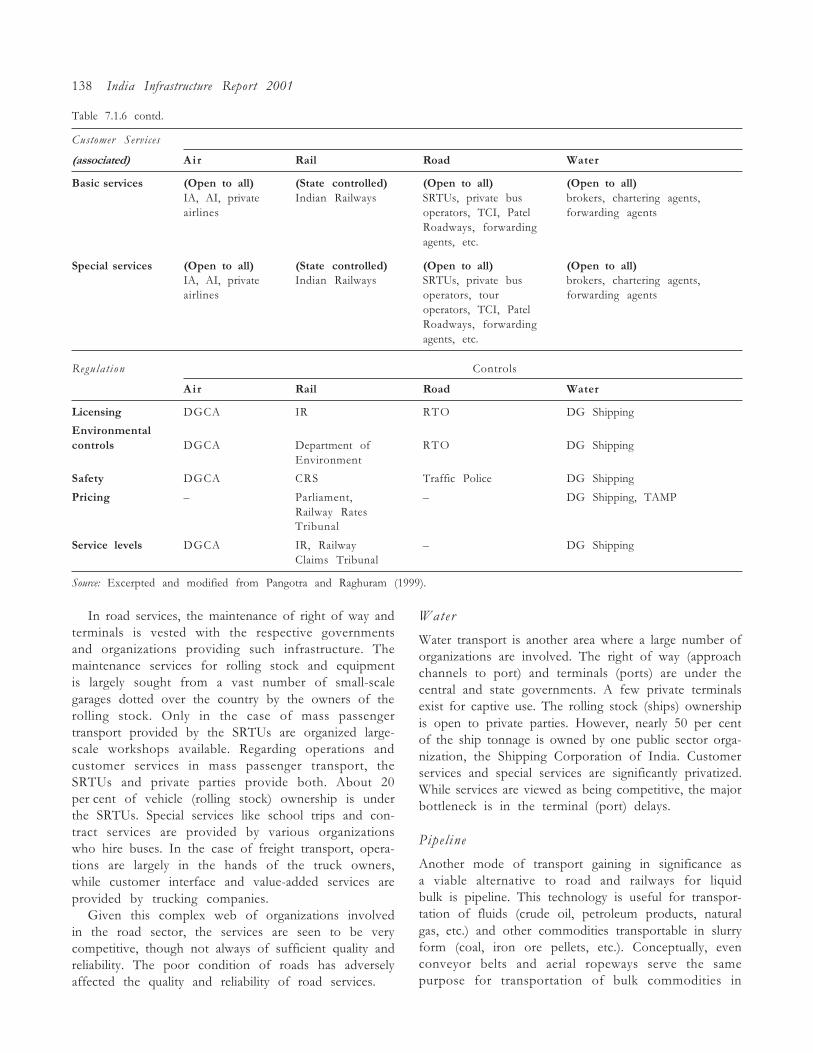
138 India Infrastructure Report 2001
Table 7.1.6 contd.
Customer Services
(associated) A ir Rail Road Water
Basic services (Open to all) (State controlled) (Open to all) (Open to all)IA, AI, private Indian Railways SRTUs, private bus brokers, chartering agents,airlines operators, TCI, Patel forwarding agents
Roadways, forwardingagents, etc.
Special services (Open to all) (State controlled) (Open to all) (Open to all)IA, AI, private Indian Railways SRTUs, private bus brokers, chartering agents,airlines operators, tour forwarding agents
operators, TCI, PatelRoadways, forwardingagents, etc.
Regulat ion Controls
A ir Rail Road Water
Licensing DGCA IR RTO DG Shipping
Environmentalcontrols DGCA Department of RTO DG Shipping
Environment
Safety DGCA CRS Traffic Police DG Shipping
Pricing � Parliament, � DG Shipping, TAMPRailway RatesTribunal
Service levels DGCA IR, Railway � DG ShippingClaims Tribunal
Source: Excerpted and modified from Pangotra and Raghuram (1999).
In road services, the maintenance of right of way andterminals is vested with the respective governmentsand organizations providing such infrastructure. Themaintenance services for rolling stock and equipmentis largely sought from a vast number of small-scalegarages dotted over the country by the owners of therolling stock. Only in the case of mass passengertransport provided by the SRTUs are organized large-scale workshops available. Regarding operations andcustomer services in mass passenger transport, theSRTUs and private parties provide both. About 20per cent of vehicle (rolling stock) ownership is underthe SRTUs. Special services like school trips and con-tract services are provided by various organizationswho hire buses. In the case of freight transport, opera-tions are largely in the hands of the truck owners,while customer interface and value-added services areprovided by trucking companies.
Given this complex web of organizations involvedin the road sector, the services are seen to be verycompetitive, though not always of sufficient quality andreliability. The poor condition of roads has adverselyaffected the quality and reliability of road services.
Water
Water transport is another area where a large number oforganizations are involved. The right of way (approachchannels to port) and terminals (ports) are under thecentral and state governments. A few private terminalsexist for captive use. The rolling stock (ships) ownershipis open to private parties. However, nearly 50 per centof the ship tonnage is owned by one public sector orga-nization, the Shipping Corporation of India. Customerservices and special services are significantly privatized.While services are viewed as being competitive, the majorbottleneck is in the terminal (port) delays.
Pipeline
Another mode of transport gaining in significance asa viable alternative to road and railways for liquidbulk is pipeline. This technology is useful for transpor-tation of fluids (crude oil, petroleum products, naturalgas, etc.) and other commodities transportable in slurryform (coal, iron ore pellets, etc.). Conceptually, evenconveyor belts and aerial ropeways serve the samepurpose for transportation of bulk commodities in
Integrated Transport 139
solid form, though usually for much shorter distances.Currently, all investments in pipelines, belts, and rope-ways are for captive use and hence managed by therespective user organizations. However, a �public� net-work of pipelines may be useful and even necessary forthe oil and gas sector. Two companies, Petronet andPetronet�LNG have been set up with equity participa-tion from the oil and gas companies for this purpose.Questions regarding the actors, the service arrange-ments, and appropriate regulation of infrastructure in-vestments, maintenance, operations and services stillhave to be resolved.5
Role of Regulation
It would appear that there is much inefficiency whereverthe state has had direct and dominant involvement intransport infrastructure. This is primarily due to lackof accountability in a commercial sense. The state�s roleis nevertheless essential in regulation and catalysinginfrastructure development and services.
The first area for regulation would be licensing, toensure proper market structuring and competition.Regulating to reduce or mitigate environmental impactis essential in both development and service provision-ing. With competition, in many areas for instancepricing of road transport or rail services could be scaleddown. But regulations related to ensuring environmentalsoundness would have to continue.
Unbundl ing
Appropriate unbundling would be an important step inattracting private participation in �smaller� and moremanageable businesses. Unbundling would also maketransparent the business transactions between thoseaspects of the market where competition can exist andthose where there is a natural monopoly.
In the above framework, the first task of unbundlingis to separate the fixed infrastructure (right of way andterminals) from movable infrastructure and services.Further unbundling can be thought of between rightof way and terminals, along geographical dimensions,and along well-defined markets with separate character-istics (passenger and freight, urban commuter, longdistance and feeder routes, etc.).
While unbundling would increase transaction costsbetween businesses, they could be offset by the increasedvalue from the focused approach to each business, andfrom competition. In this context, ensuring marketaccess is very important. A recent counter-example isthe Konkan Railway Corporation, structured as a BOT(build, operate, and transfer) project to bridge the
�Konkan Gap� from a place about 120 km south ofMumbai to Mangalore. While the asset creation wassuccessfully carried out due to the autonomy providedby the BOT structure, the operations phase has been farless successful due to market access being less thandesirable. Having direct access to the major industrialmarket of Mumbai would be a key success variable. Theproject has been flawed from the start since it beganfrom the Railways� idea of bridging the �Konkan Gap�,rather than starting from the needs of the customer.
Cherry Picking: Cross-subsidies and SubsidyOne of the possible outcomes in seeking private in-volvement for commercialization of the unbundledbusinesses is �cherry picking�. Private interests wouldnaturally be interested in those businesses which arecommercially lucrative and less risky. This would leavethe not so attractive businesses without any takers. Thereare two ways of dealing with this. One is to bundlethe not so attractive businesses with the attractive onesand view the viable market as cross-subsidizing theunviable ones. This has been attempted in the �openskies� policy for attracting private airlines. The other isto keep these businesses separate and provide a subsidyto the operator of the commercially unviable business.
The argument for cross-subsidy is not tenable unlessa good rationale can be provided for the relationshipbetween markets in terms of network economies andsuch other considerations. Apart from there beingincentive incompatibilities (private airlines are oftenknown to �drag their feet� in maintaining the committedschedules on the unviable routes), there is also a lack oftransparency in the true costs, since there is no longeran incentive to maintain separate accounts. For example,in the IR, it is often stated that freight subsidizespassenger, and the long-distance passenger subsidizesthe short-distance and urban commuter. While thesefacts may be true the degree of cross-subsidization hashardly been estimated. In any case a large part of thecosts are allocated costs and much could depend onthe basis of allocation. In trains running significantlyfaster than the average speed of trains there are negativeexternalities on the other trains which are possibly notbeing captured. In other words, sensitivity to systemiceffects would mean much more careful analysis wouldhave to be carried out. Apart from transparency on cost,the basic issue is that cross-subsidization is highlydistortionary in relation to direct subsidization.
The specific unviable business can be offered to thatoperator who is technically qualified and would managethe service obligations of the business with the leastsubsidy requirement. This would be a better way ofimproving service obligations.
5 See section 7.4 in this report for a review of the oil pipelinesector.
140 India Infrastructure Report 2001
Pri c ing
This is an important area, where due to practices ofadministered and often �placative� pricing, major distor-tions have set in. They may have been in existencelong enough to have even influenced investment deci-sions, that is resulted in allocative distortions. The mostglaring example is the shift of freight traffic from rail toroad due to inter alia pricing way above the true eco-nomic cost. This has resulted in a significant increase inroad traffic along the golden quadrilateral, where largeinvestments are now being channelized.
On the passenger side, there are demand distortionsin commuter and short haul traffic, primarily due toconcessional season tickets. There are also distortionsdue to free and subsidized rail travel provided to varioussegments, including railway employees themselves. Withnearly 1.6 million employees, and an average free traveleligible family size of three including the employee, thetotal number of persons eligible for free travel is 4.8million. The free travel privileges are available betweenthree and six times a year (depending upon the categoryof employee). Subsidized travel is also available for afew more occasions. Assuming that three free trips ayear are being made, with an average round trip distanceof 2000 km, this results in total travel of 29 bpkm. Inaddition, there were one million pensioners as of 31March 1998 (Asian Institute of Transport Development1998) eligible for free travel. Assuming two free tripsa year at an average of 1.5 persons per pensioner, withan average round trip of 2000 kms, this works to afurther 6 bpkm. Together the 35 bpkms would formnearly 9 per cent of the total IR bpkm! It goes withoutsaying that these distortions in pricing urgently need tobe corrected.
With private participation in road development,the following issues need attention: (i) whether andwhich roads should be tolled, (ii) if to be tolled, whatis the appropriate toll and toll-setting mechanism,and (iii) if not to be tolled, what is the appropriateshadow tolling mechanism for providing revenues toprivate developers. Irrespective of private involvement,many congested road segments, especially in urbanareas, could be considered for congestion-based tollingor taxes.
For most other transport infrastructure services wherethere is reasonable competition (or at least competitioncan be ensured), pricing could be left to the free market.
Low Investment Approaches to ImprovingInfrastructure Quality and Capacity
Given that congestion and wear and tear are two of themost significant consequences of the current state of
�transport myopia�, there is a lot of latent opportunityin activities that would give high returns for lowinvestments in improving quality and capacity of theinfrastructure.
For example, simulation runs by the planning groupin the Railway Board using the Long Range DecisionSupport System (LRDSS) software show that a 20per cent increase in capacity is straightaway possible byimproving wagon maintenance (and avoiding break-downs and accidents). Further increases are possible byimproving freight train speeds to reduce the variance inspeeds across categories of trains.
The capacity of the IR could substantially increaseif the cumulative effect of certain modes of workingand certain constraints are removed. The investmentsrequired would be very low in comparison to thoserequired to create fresh capacity (see Box 7.1.3).
Bottlenecks on highways and roads reduce consider-ably the service levels on highways in India, even tothe point of reducing the effective capacity of theroads. The potential gains in relaxing these constraintsare very large, and the costs very small (see Box 7.1.4).
In the case of road, speed breakers could be locatedappropriately, not on the higher speed route but onroads joining such routes. Roadside signs have neverbeen given their due role in providing information toroad users allowing them to anticipate road conditions.Very often, it is also the case that the �signage cycle� isincomplete, in that the road user is never informed thatthe special condition that he was asked to anticipate isover and normalcy has returned.
There is an urgent need to create appropriate incen-tives that would attract investors and make existingorganizations take up these low investment options torelax current constraints. The examples of toll revenue-based maintenance contracts of highway stretches inMadhya Pradesh and Maharashtra are welcome but onlysmall beginnings in this direction.
Land Acquisition and Management
Land is an asset valued dearly by everyone in India. Thismakes land acquisition and land management for trans-port infrastructure projects a significant issue. It is alsoclear that land acquisition has to necessarily stay withthe government, since it is government alone which hasthe �right of eminent domain�.6 Under this right, thegovernment can take possession of land from privatecitizens and bodies for infrastructure projects. The onlyrecourse against the government is the court, in whichonly the compensation amount can be challenged.
6 For a different view see the discussion on land acquisition inchapter 1 of this report (ed.).
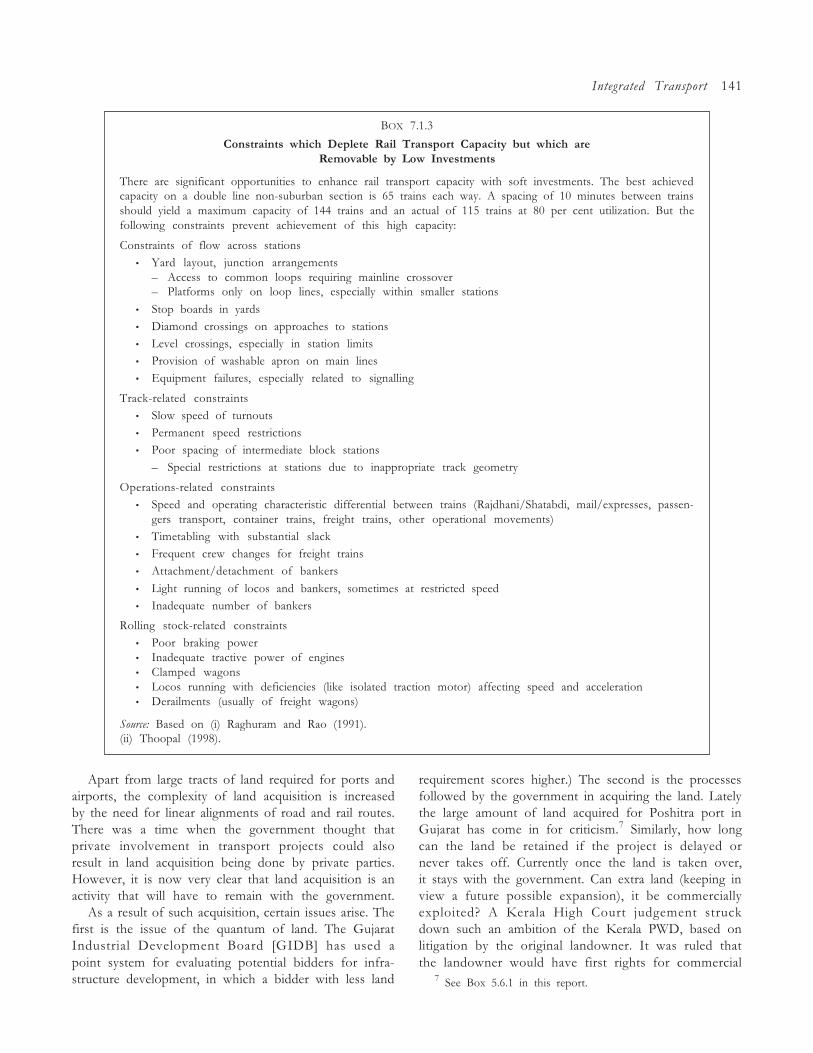
Integrated Transport 141
BOX 7.1.3
Constraints which Deplete Rail Transport Capacity but which areRemovable by Low Investments
There are significant opportunities to enhance rail transport capacity with soft investments. The best achievedcapacity on a double line non-suburban section is 65 trains each way. A spacing of 10 minutes between trainsshould yield a maximum capacity of 144 trains and an actual of 115 trains at 80 per cent utilization. But thefollowing constraints prevent achievement of this high capacity:
Constraints of flow across stations� Yard layout, junction arrangements
� Access to common loops requiring mainline crossover� Platforms only on loop lines, especially within smaller stations
� Stop boards in yards� Diamond crossings on approaches to stations� Level crossings, especially in station limits� Provision of washable apron on main lines� Equipment failures, especially related to signalling
Track-related constraints� Slow speed of turnouts� Permanent speed restrictions� Poor spacing of intermediate block stations
� Special restrictions at stations due to inappropriate track geometry
Operations-related constraints� Speed and operating characteristic differential between trains (Rajdhani/Shatabdi, mail/expresses, passen-
gers transport, container trains, freight trains, other operational movements)� Timetabling with substantial slack� Frequent crew changes for freight trains� Attachment/detachment of bankers
� Light running of locos and bankers, sometimes at restricted speed� Inadequate number of bankers
Rolling stock-related constraints� Poor braking power� Inadequate tractive power of engines� Clamped wagons� Locos running with deficiencies (like isolated traction motor) affecting speed and acceleration� Derailments (usually of freight wagons)
Source: Based on (i) Raghuram and Rao (1991).(ii) Thoopal (1998).
requirement scores higher.) The second is the processesfollowed by the government in acquiring the land. Latelythe large amount of land acquired for Poshitra port inGujarat has come in for criticism.7 Similarly, how longcan the land be retained if the project is delayed ornever takes off. Currently once the land is taken over,it stays with the government. Can extra land (keeping inview a future possible expansion), it be commerciallyexploited? A Kerala High Court judgement struckdown such an ambition of the Kerala PWD, based onlitigation by the original landowner. It was ruled thatthe landowner would have first rights for commercial
Apart from large tracts of land required for ports andairports, the complexity of land acquisition is increasedby the need for linear alignments of road and rail routes.There was a time when the government thought thatprivate involvement in transport projects could alsoresult in land acquisition being done by private parties.However, it is now very clear that land acquisition is anactivity that will have to remain with the government.
As a result of such acquisition, certain issues arise. Thefirst is the issue of the quantum of land. The GujaratIndustrial Development Board [GIDB] has used apoint system for evaluating potential bidders for infra-structure development, in which a bidder with less land 7 See Box 5.6.1 in this report.
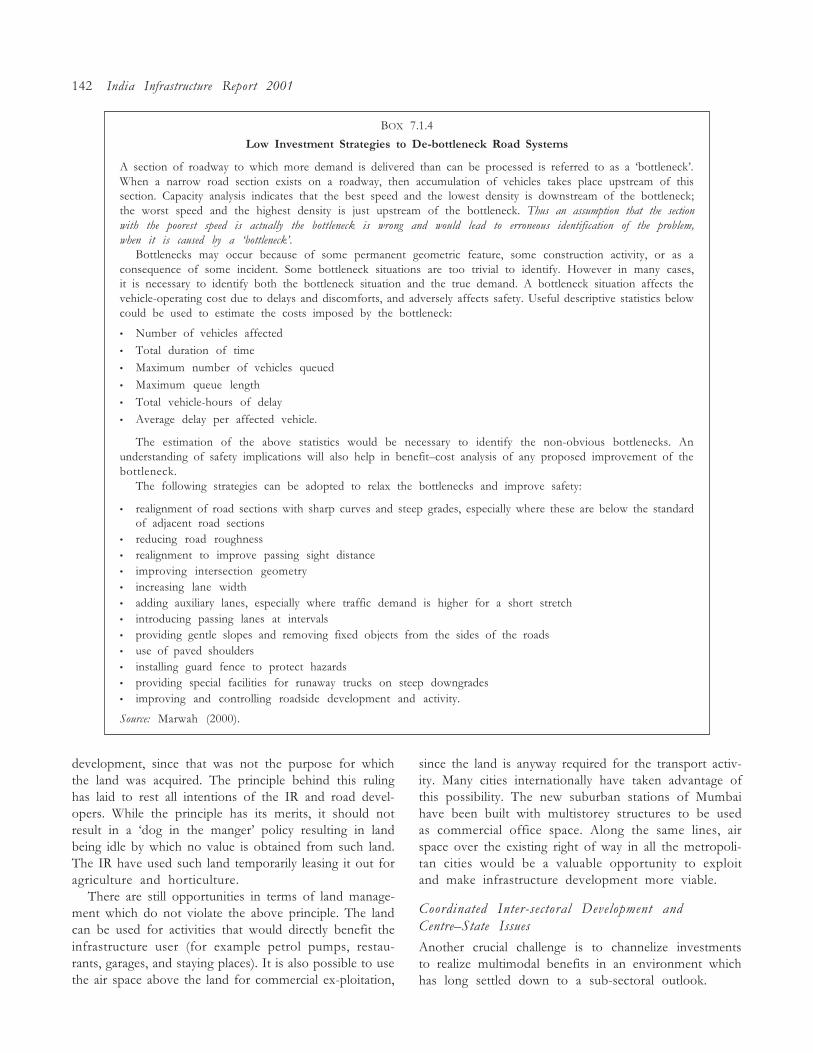
142 India Infrastructure Report 2001
BOX 7.1.4
Low Investment Strategies to De-bottleneck Road Systems
A section of roadway to which more demand is delivered than can be processed is referred to as a �bottleneck�.When a narrow road section exists on a roadway, then accumulation of vehicles takes place upstream of thissection. Capacity analysis indicates that the best speed and the lowest density is downstream of the bottleneck;the worst speed and the highest density is just upstream of the bottleneck. Thus an assumption that the sectionwith the poorest speed is actually the bottleneck is wrong and would lead to erroneous identification of the problem,when it is caused by a �bottleneck�.
Bottlenecks may occur because of some permanent geometric feature, some construction activity, or as aconsequence of some incident. Some bottleneck situations are too trivial to identify. However in many cases,it is necessary to identify both the bottleneck situation and the true demand. A bottleneck situation affects thevehicle-operating cost due to delays and discomforts, and adversely affects safety. Useful descriptive statistics belowcould be used to estimate the costs imposed by the bottleneck:
� Number of vehicles affected� Total duration of time� Maximum number of vehicles queued� Maximum queue length� Total vehicle-hours of delay� Average delay per affected vehicle.
The estimation of the above statistics would be necessary to identify the non-obvious bottlenecks. Anunderstanding of safety implications will also help in benefit�cost analysis of any proposed improvement of thebottleneck.
The following strategies can be adopted to relax the bottlenecks and improve safety:
� realignment of road sections with sharp curves and steep grades, especially where these are below the standardof adjacent road sections
� reducing road roughness� realignment to improve passing sight distance� improving intersection geometry� increasing lane width� adding auxiliary lanes, especially where traffic demand is higher for a short stretch� introducing passing lanes at intervals� providing gentle slopes and removing fixed objects from the sides of the roads� use of paved shoulders� installing guard fence to protect hazards� providing special facilities for runaway trucks on steep downgrades� improving and controlling roadside development and activity.
Source: Marwah (2000).
development, since that was not the purpose for whichthe land was acquired. The principle behind this rulinghas laid to rest all intentions of the IR and road devel-opers. While the principle has its merits, it should notresult in a �dog in the manger� policy resulting in landbeing idle by which no value is obtained from such land.The IR have used such land temporarily leasing it out foragriculture and horticulture.
There are still opportunities in terms of land manage-ment which do not violate the above principle. The landcan be used for activities that would directly benefit theinfrastructure user (for example petrol pumps, restau-rants, garages, and staying places). It is also possible to usethe air space above the land for commercial ex-ploitation,
since the land is anyway required for the transport activ-ity. Many cities internationally have taken advantage ofthis possibility. The new suburban stations of Mumbaihave been built with multistorey structures to be usedas commercial office space. Along the same lines, airspace over the existing right of way in all the metropoli-tan cities would be a valuable opportunity to exploitand make infrastructure development more viable.
Coordinated Inter-sectoral Development andCentre�State Issues
Another crucial challenge is to channelize investmentsto realize multimodal benefits in an environment whichhas long settled down to a sub-sectoral outlook.
Integrated Transport 143
There was an attempt in the mid-1980s to make aunified Ministry of Transport. The experiment failedsince in itself it did not lead to any improvement incoordination between the departments. A major oppor-tunity like coastal shipping is underexploited primarilybecause nobody has taken the onus of coordinateddevelopment at ports between various modes. The typeof coastal shipping that has taken off is that initiatedby large corporates who have invested in the requiredmultimodal logistics of their cargo movement. If aninitiative with coordinated development can takeplace, private investment in various aspects of coastalshipping would naturally flow.8
Even if the ministries9 cannot be integrated, taskforces or boards that would look at specific areas ofmultimodal development would be essential.
In the context of roads and ports, which come underboth central and state governments, there have not onlybeen situations of conflict, especially with regard tofinancing, but also competitive situations to gain controlover the activity. An example of the latter is the develop-ment of minor and intermediate ports in Gujarat andOrissa. This has no doubt served the purpose of a betterindustrialization in the states. It could also, however,lead to expensive excess capacity creation.
Common Carrier versus Captive Infrastructure
If coordinated development does not take place, thenmore �captive infrastructure� than required wouldcome about, leading to systematic inefficiencies. Thisis especially true of ports and pipelines.
While the benefit of captive infrastructure in offer-ing better control and customization for the supplychain cannot be denied (for example the port of Mul-Dwarka for Gujarat Ambuja Cement Limited), thetrade-off in terms of better utilization of infrastructurecould very well lie in open access and public infrastruc-ture.
In the case of pipelines, two organizations havebeen set up, namely Petronet and Petronet�LNG, topromote common carrier pipelines for the hydrocarbonsector. Currently, there is debate as to whether thecaptive pipelines of the petroleum companies shouldbe handed over to Petronet for use in a common carriermode.10
In the case of project roads developed by specificindustrial projects as a primary user, the government hasensured public use by providing land at subsidized ratesor even at no cost.
It is thus important that as far as possible, infrastruc-ture development be carried out under the commoncarrier principle, and preferably with stakeholding bythe primary user who would also commercially gain bythe public use.
The Neglect of R&D
One of the important determinants of efficient transportinfrastructure is technology, especially that of the �roll-ing stock� or vehicle. India suffers from poor technol-ogy. The net weight of commodity carried to the weightof the vehicle is among the lowest in the world. Thestandard truck has a ratio of 1:1 (multi-axle trucks cango up to 3:1 internationally, while in India the bestmulti-axle trucks have achieved 2.5:1). The best railwaywagons in India have a ratio which is slightly higher than2:1. Ratios greater than 4:1 have been achieved incontainer flats internationally. As far as ships are con-cerned, the ratio is typically 1.6:1, both in India andabroad.
The typical bus in India, which does not have to carrymore than 4 tonnes, uses the same chassis as a truck,which is designed to carry 10 tonnes. This has been theresult of a market oligopoly and a distorted view ofeconomies of scale. Due to these inefficiencies, especiallyon roads, the nation suffers fuel wastage and road wearand tear. It is important to have a focused effort onappropriate R&D. National-level projects funded bygovernment with contributions from industry to findsolutions to such problems, especially those where thesocial benefits are larger than the private benefits, arerequired.
Regulatory Framework
In the context of transport infrastructure, the regu-latory framework has been vested in the very sameministry, which also licenses and often is a key playerin the activity. To facilitate private infrastructuredevelopment, the player must be different from theregulator and the licensor. Even when public enter-prise is involved in provisioning, the traditional assump-tion that the public sector would act in the publicinterest is not necessarily true, especially when statefailure is widespread. This would be relevant in thecontext of railways, roads, ports, and airports, wherethe potential for privatization is significant. The licensorhas an important role in ensuring proper market struc-tures.
8 We came across certain urban administrations who wouldredefine their urban boundaries so that the passenger rail transportsystem can be kept under their control, and they would not haveto involve the IR.
9 Even if ministries are merged, the older �departments� onceformed have a life of their own and cross-departmental coordina-tion has proved to be very difficult for the Indian bureaucracy.
10 See section 7.4 in this report.
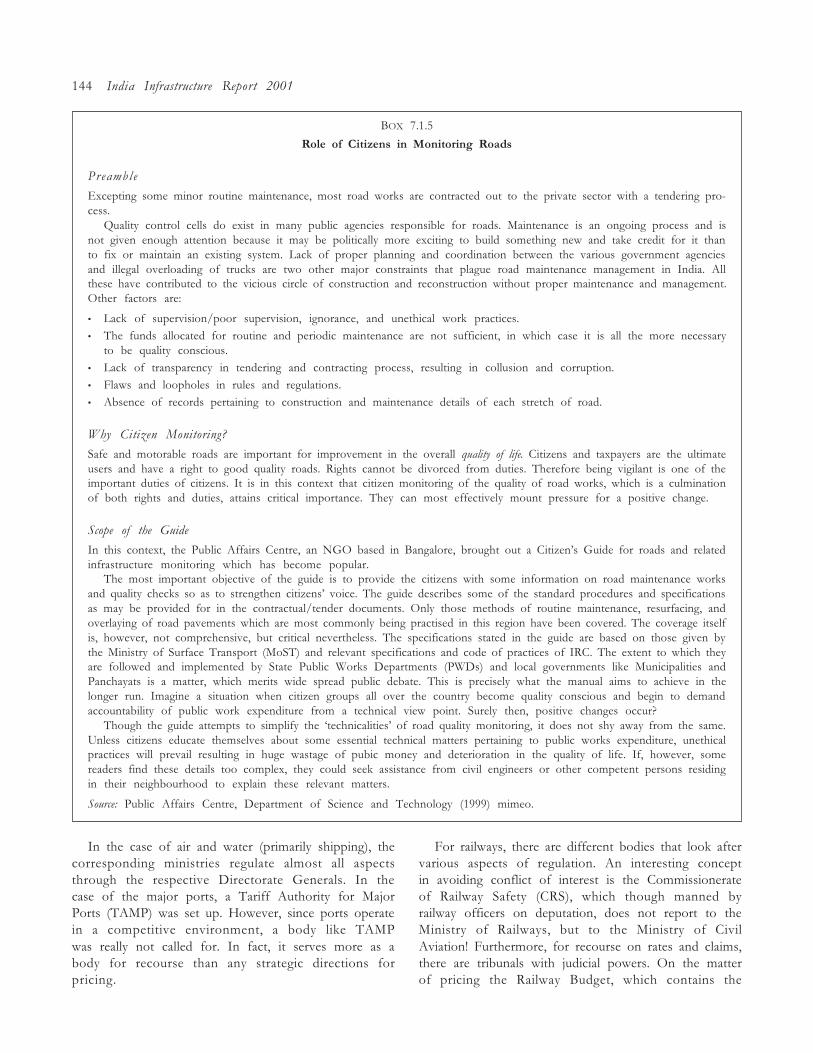
144 India Infrastructure Report 2001
BOX 7.1.5
Role of Citizens in Monitoring Roads
Preamble
Excepting some minor routine maintenance, most road works are contracted out to the private sector with a tendering pro-cess.
Quality control cells do exist in many public agencies responsible for roads. Maintenance is an ongoing process and isnot given enough attention because it may be politically more exciting to build something new and take credit for it thanto fix or maintain an existing system. Lack of proper planning and coordination between the various government agenciesand illegal overloading of trucks are two other major constraints that plague road maintenance management in India. Allthese have contributed to the vicious circle of construction and reconstruction without proper maintenance and management.Other factors are:
� Lack of supervision/poor supervision, ignorance, and unethical work practices.� The funds allocated for routine and periodic maintenance are not sufficient, in which case it is all the more necessary
to be quality conscious.� Lack of transparency in tendering and contracting process, resulting in collusion and corruption.� Flaws and loopholes in rules and regulations.� Absence of records pertaining to construction and maintenance details of each stretch of road.
Why Citizen Monitoring?
Safe and motorable roads are important for improvement in the overall quality of life. Citizens and taxpayers are the ultimateusers and have a right to good quality roads. Rights cannot be divorced from duties. Therefore being vigilant is one of theimportant duties of citizens. It is in this context that citizen monitoring of the quality of road works, which is a culminationof both rights and duties, attains critical importance. They can most effectively mount pressure for a positive change.
Scope of the Guide
In this context, the Public Affairs Centre, an NGO based in Bangalore, brought out a Citizen�s Guide for roads and relatedinfrastructure monitoring which has become popular.
The most important objective of the guide is to provide the citizens with some information on road maintenance worksand quality checks so as to strengthen citizens� voice. The guide describes some of the standard procedures and specificationsas may be provided for in the contractual/tender documents. Only those methods of routine maintenance, resurfacing, andoverlaying of road pavements which are most commonly being practised in this region have been covered. The coverage itselfis, however, not comprehensive, but critical nevertheless. The specifications stated in the guide are based on those given bythe Ministry of Surface Transport (MoST) and relevant specifications and code of practices of IRC. The extent to which theyare followed and implemented by State Public Works Departments (PWDs) and local governments like Municipalities andPanchayats is a matter, which merits wide spread public debate. This is precisely what the manual aims to achieve in thelonger run. Imagine a situation when citizen groups all over the country become quality conscious and begin to demandaccountability of public work expenditure from a technical view point. Surely then, positive changes occur?
Though the guide attempts to simplify the �technicalities� of road quality monitoring, it does not shy away from the same.Unless citizens educate themselves about some essential technical matters pertaining to public works expenditure, unethicalpractices will prevail resulting in huge wastage of pubic money and deterioration in the quality of life. If, however, somereaders find these details too complex, they could seek assistance from civil engineers or other competent persons residingin their neighbourhood to explain these relevant matters.
Source: Public Affairs Centre, Department of Science and Technology (1999) mimeo.
For railways, there are different bodies that look aftervarious aspects of regulation. An interesting conceptin avoiding conflict of interest is the Commissionerateof Railway Safety (CRS), which though manned byrailway officers on deputation, does not report to theMinistry of Railways, but to the Ministry of CivilAviation! Furthermore, for recourse on rates and claims,there are tribunals with judicial powers. On the matterof pricing the Railway Budget, which contains the
In the case of air and water (primarily shipping), thecorresponding ministries regulate almost all aspectsthrough the respective Directorate Generals. In thecase of the major ports, a Tariff Authority for MajorPorts (TAMP) was set up. However, since ports operatein a competitive environment, a body like TAMPwas really not called for. In fact, it serves more as abody for recourse than any strategic directions forpricing.
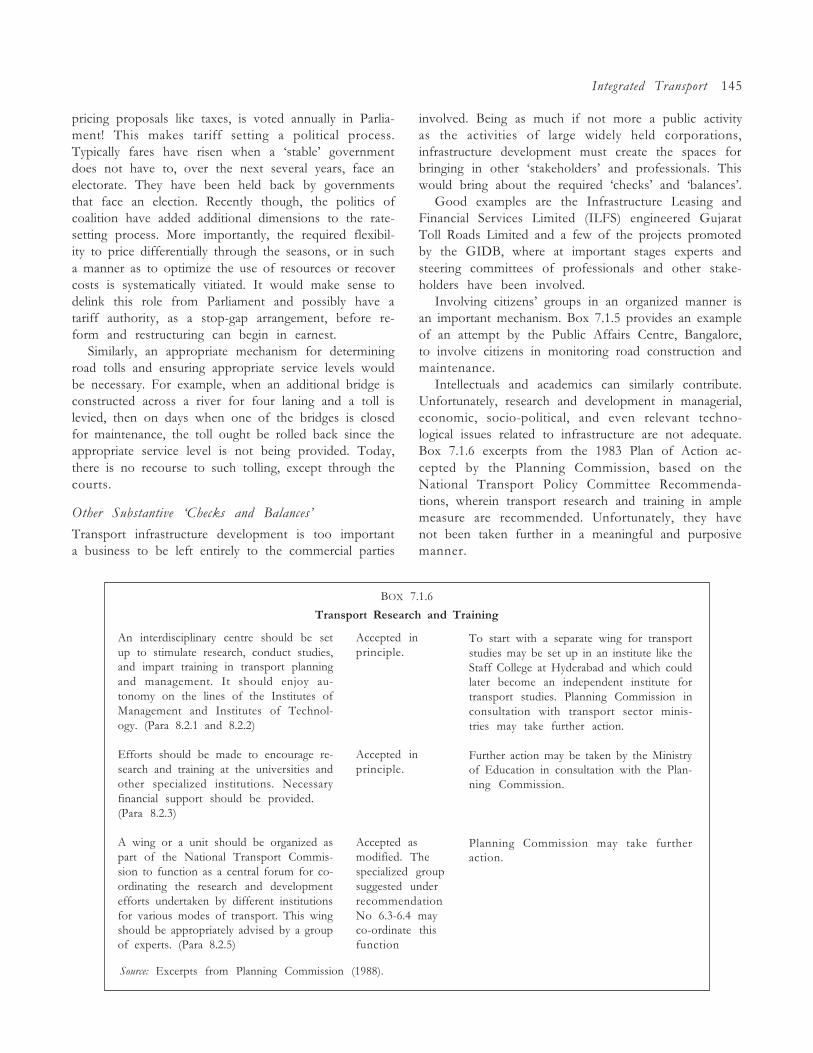
Integrated Transport 145
pricing proposals like taxes, is voted annually in Parlia-ment! This makes tariff setting a political process.Typically fares have risen when a �stable� governmentdoes not have to, over the next several years, face anelectorate. They have been held back by governmentsthat face an election. Recently though, the politics ofcoalition have added additional dimensions to the rate-setting process. More importantly, the required flexibil-ity to price differentially through the seasons, or in sucha manner as to optimize the use of resources or recovercosts is systematically vitiated. It would make sense todelink this role from Parliament and possibly have atariff authority, as a stop-gap arrangement, before re-form and restructuring can begin in earnest.
Similarly, an appropriate mechanism for determiningroad tolls and ensuring appropriate service levels wouldbe necessary. For example, when an additional bridge isconstructed across a river for four laning and a toll islevied, then on days when one of the bridges is closedfor maintenance, the toll ought be rolled back since theappropriate service level is not being provided. Today,there is no recourse to such tolling, except through thecourts.
Other Substantive �Checks and Balances�
Transport infrastructure development is too importanta business to be left entirely to the commercial parties
involved. Being as much if not more a public activityas the activities of large widely held corporations,infrastructure development must create the spaces forbringing in other �stakeholders� and professionals. Thiswould bring about the required �checks� and �balances�.
Good examples are the Infrastructure Leasing andFinancial Services Limited (ILFS) engineered GujaratToll Roads Limited and a few of the projects promotedby the GIDB, where at important stages experts andsteering committees of professionals and other stake-holders have been involved.
Involving citizens� groups in an organized manner isan important mechanism. Box 7.1.5 provides an exampleof an attempt by the Public Affairs Centre, Bangalore,to involve citizens in monitoring road construction andmaintenance.
Intellectuals and academics can similarly contribute.Unfortunately, research and development in managerial,economic, socio-political, and even relevant techno-logical issues related to infrastructure are not adequate.Box 7.1.6 excerpts from the 1983 Plan of Action ac-cepted by the Planning Commission, based on theNational Transport Policy Committee Recommenda-tions, wherein transport research and training in amplemeasure are recommended. Unfortunately, they havenot been taken further in a meaningful and purposivemanner.
BOX 7.1.6
Transport Research and Training
An interdisciplinary centre should be setup to stimulate research, conduct studies,and impart training in transport planningand management. It should enjoy au-tonomy on the lines of the Institutes ofManagement and Institutes of Technol-ogy. (Para 8.2.1 and 8.2.2)
Efforts should be made to encourage re-search and training at the universities andother specialized institutions. Necessaryfinancial support should be provided.(Para 8.2.3)
A wing or a unit should be organized aspart of the National Transport Commis-sion to function as a central forum for co-ordinating the research and developmentefforts undertaken by different institutionsfor various modes of transport. This wingshould be appropriately advised by a groupof experts. (Para 8.2.5)
Accepted inprinciple.
Accepted inprinciple.
Accepted asmodified. Thespecialized groupsuggested underrecommendationNo 6.3-6.4 mayco-ordinate thisfunction
To start with a separate wing for transportstudies may be set up in an institute like theStaff College at Hyderabad and which couldlater become an independent institute fortransport studies. Planning Commission inconsultation with transport sector minis-tries may take further action.
Further action may be taken by the Ministryof Education in consultation with the Plan-ning Commission.
Planning Commission may take furtheraction.
Source: Excerpts from Planning Commission (1988).
146 India Infrastructure Report 2001
7.2 SECTORAL ISSUES IN TRANSPORTATION
G. Raghuram
growth in domestic passengers at 8.5 per cent andinternational passengers at 6 per cent annually. At thoserates, India is expected to handle 63 million passengersby 2004�5.
In 1998�9, Mumbai and Delhi handled 51.1 per centof passenger traffic (Table 7.2.2), 63.2 per cent of cargotraffic (Table 7.2.3) and 45.0 per cent of aircraft move-ments (Table 7.2.4). International cargo constituted 67.8per cent of the total cargo (in tonnes), of which thesetwo airports handled 70.6 per cent. Chennai, followedby Calcutta and Bangalore, are next in order of impor-tance. This is followed by the airports of Hyderabad,Trivandrum, and Ahmedabad, and Goa and Calicut.These ten airports account for 84.9 per cent of passengertraffic, 95.6 per cent of cargo traffic, and 76.5 per centof aircraft movements.
The key requirement at airports is enhanced servicelevels and reduction of congestion. Towards this endthe AAI envisages an expenditure of Rs 34.21 billionin the Ninth Plan period (1997�2002). A significantshare of this is expected through private sector partici-pation. The government formulated a policy on airportinfrastructure development in 1997. This policy allowsup to 74 per cent foreign equity through automaticapproval, and 100 per cent through special permission.It proposes to set up an independent regulatory boardto fix tariffs, allot time slots, and allocate space inairports.
In May 1999, the first private sector airport built byCochin International Airport Limited at Nedumbasserynear Cochin was inaugurated. The total project cost wasRs 2.3 billion, financed through equity of Rs 0.9 billionand term loans of Rs 1.4 billion. The Kerala stategovernment has 26 per cent equity participation. Newprivate sector airports at Bangalore, Hyderabad, andGoa have been sanctioned. Privatizing a variety ofservices at Mumbai, Delhi, Calcutta, and Chennai air-ports has also been approved. The need now is to pursuethese privatization goals proactively. One of the prob-lems has been lack of consistency in the approach ofthe government. In the case of the Bangalore airport, thecontractual conditions between the interested partiesand the government were contentious. The contractdocuments were sent back and forth among the parties.There was much wasted effort, and finally the privateparties withdrew. One of the important conditionsstipulated by the parties was the closure of the existingairport, which the government after having raised theirhopes finally refused to carry out.
Herein each of the sectors that constitute transportationis examined in detail.
AIR
Air transport consists of airports, air services, aircraftmanufacture, and air traffic control. Since air trafficcontrol is closer to a public good and regulatory innature, it has been in government hands in most coun-tries. In the aircraft manufacturing sector, India hasdeveloped little or no capabilities, except in certain lowend defence aircraft. Airports and air services have muchscope for private provisioning.
Airports
There are over sixty airports, either under the Ministryof Civil Aviation and managed by the Airports Author-ity of India (AAI), or under the Ministry of Defence.The total traffic handled by them in 1998�9 was 37million passengers and 0.7 million tonnes of cargo, using0.42 million aircraft movements (Table 7.2.1). Thetraffic trends over the past four years have not shownany significant growth. What is worth noting is that thecargo traffic has gone up at a compound annual growthrate (CAGR) of 2.5 per cent and the numbers ofinternational passengers have gone up at a CAGR of 3.9per cent. Forecasts, however, had been estimating the
TABLE 7.2.1Traffic at Airports
Total traffic Units 1995�6 1996�7 1997�8 1998�9
Domest i c
Passengers (million) 25.6 24.3 23.8 24.1
Cargo (�000 tonne) 212.6 201.0 218.5 224.5
Aircraftmovement (�000) 314.7 303.3 291.4 325.1
InternationalPassengers (million) 11.5 12.2 12.8 12.9
Cargo (�000 tonne) 436.7 479.1 487.4 474.7
Aircraftmovement (�000) 92.5 92.7 95.1 99.6
Total
Passengers (million) 37.1 36.5 36.6 37.0
Cargo (�000 tonne) 649.3 680.1 705.9 699.2
Aircraftmovement (�000) 407.2 396.1 386.6 424.7
Source: CMIE (2000) and author�s analysis.
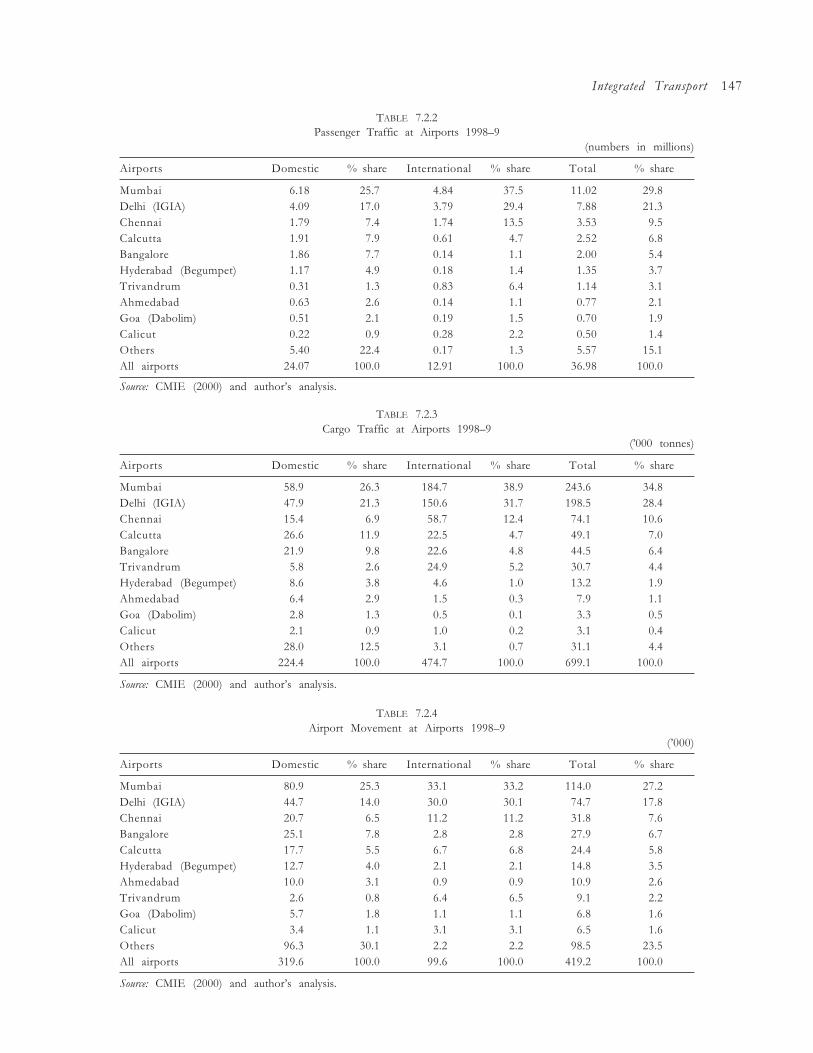
Integrated Transport 147
TABLE 7.2.2Passenger Traffic at Airports 1998�9
(numbers in millions)
Airports Domestic % share International % share Total % share
Mumbai 6.18 25.7 4.84 37.5 11.02 29.8Delhi (IGIA) 4.09 17.0 3.79 29.4 7.88 21.3Chennai 1.79 7.4 1.74 13.5 3.53 9.5Calcutta 1.91 7.9 0.61 4.7 2.52 6.8Bangalore 1.86 7.7 0.14 1.1 2.00 5.4Hyderabad (Begumpet) 1.17 4.9 0.18 1.4 1.35 3.7Trivandrum 0.31 1.3 0.83 6.4 1.14 3.1Ahmedabad 0.63 2.6 0.14 1.1 0.77 2.1Goa (Dabolim) 0.51 2.1 0.19 1.5 0.70 1.9Calicut 0.22 0.9 0.28 2.2 0.50 1.4Others 5.40 22.4 0.17 1.3 5.57 15.1All airports 24.07 100.0 12.91 100.0 36.98 100.0
Source: CMIE (2000) and author�s analysis.
TABLE 7.2.3Cargo Traffic at Airports 1998�9
(�000 tonnes)
Airports Domestic % share International % share Total % share
Mumbai 58.9 26.3 184.7 38.9 243.6 34.8Delhi (IGIA) 47.9 21.3 150.6 31.7 198.5 28.4Chennai 15.4 6.9 58.7 12.4 74.1 10.6Calcutta 26.6 11.9 22.5 4.7 49.1 7.0Bangalore 21.9 9.8 22.6 4.8 44.5 6.4Trivandrum 5.8 2.6 24.9 5.2 30.7 4.4Hyderabad (Begumpet) 8.6 3.8 4.6 1.0 13.2 1.9Ahmedabad 6.4 2.9 1.5 0.3 7.9 1.1Goa (Dabolim) 2.8 1.3 0.5 0.1 3.3 0.5Calicut 2.1 0.9 1.0 0.2 3.1 0.4Others 28.0 12.5 3.1 0.7 31.1 4.4All airports 224.4 100.0 474.7 100.0 699.1 100.0
Source: CMIE (2000) and author�s analysis.
TABLE 7.2.4Airport Movement at Airports 1998�9
(�000)
Airports Domestic % share International % share Total % share
Mumbai 80.9 25.3 33.1 33.2 114.0 27.2Delhi (IGIA) 44.7 14.0 30.0 30.1 74.7 17.8Chennai 20.7 6.5 11.2 11.2 31.8 7.6Bangalore 25.1 7.8 2.8 2.8 27.9 6.7Calcutta 17.7 5.5 6.7 6.8 24.4 5.8Hyderabad (Begumpet) 12.7 4.0 2.1 2.1 14.8 3.5Ahmedabad 10.0 3.1 0.9 0.9 10.9 2.6Trivandrum 2.6 0.8 6.4 6.5 9.1 2.2Goa (Dabolim) 5.7 1.8 1.1 1.1 6.8 1.6Calicut 3.4 1.1 3.1 3.1 6.5 1.6Others 96.3 30.1 2.2 2.2 98.5 23.5All airports 319.6 100.0 99.6 100.0 419.2 100.0
Source: CMIE (2000) and author�s analysis.
148 India Infrastructure Report 2001
which constitute the unviable, and metro to smaller cityroutes respectively.
The policy allows the required offers of seat kilometresin these categories to be traded among the private firms.However, this approach to bundling is problematicbecause the airlines have been known to drag their feetin operating the less lucrative and unviable routes andoperational monitoring by the regulator is weak. Infact, this categorization of routes should really be anapproach to unbundling, wherein airlines willing toprovide such services are allowed to bid on a minimumsubsidy basis for the unviable routes.
The current policy of private investment in domesticair transport permits 40 per cent foreign equity holdings.However, equity participation by foreign airlines isnot permitted! This aspect of the policy is questionablesince it would imply incentive incompatibility. Surelyforeign airlines� �know-how� would be an importantingredient in upgrading domestic service levels and effi-ciency.
International air services are controlled by bilateralagreements between countries. However, the route rightsare tradable, as in the recent example of Air India offeringits unused rights to Virgin Airways of the UK in theIndia�UK sector. A recent welcome policy decision isthat of privatization of Air India (to the extent of 60per cent equity), in which foreign airlines are also allowedto participate. One hopes that after the hiccups havebeen ironed out, the privatization would go through.12
Cargo traffic is completely deregulated, both in thedomestic and international segments. This has given aboost to especially international cargo traffic during the1990s. In the domestic segment, courier/third partylogistics companies entered the fray, and one (Blue Dart)still operates.
As part of the �open skies� policy of the early 1990s,non-scheduled air taxi operators were allowed free entry.Today, there are over forty operators providing air taxiservices, catering to tourist circuits, executives of indus-tries, etc. A fairly extensive infrastructure of landingfacilities across the country (thanks to British develop-ment initiatives during the Second World War) has comein handy for such air travel operations.
Safety is a matter of serious concern for air transportin India. Maintenance standards, airport landing andtake-off facilities, and disaster management need toimprove considerably. The recent examples of the aircrashes in India (Patna) and in France (Concord) pro-vided a stark contrast in disaster management abilities.
While considering new airports, location and landacquisition are important issues. Location has to be seenin conjunction with urban growth, access to key urbancentres and environmental problems, especially pollu-tion, and ease of land acquisition. While consideringaccess to urban centres, an intermodal perspective isimportant.
For example, it is possible to think of a new inter-national airport location midway between Ahmedabadand Vadodara, with direct access from the Ahmedabad�Vadodara Expressway, rather than upgrading the twoairports independently. Also, scheduled coach servicesand even rail connections could improve catchmentareas for airports, thereby allowing them to take advan-tage of economies of scale. Most European airports areexamples of good design.11 The existing airports atMumbai and Delhi are connectable by rail, since subur-ban rail lines go very close to the airport boundary. AtChennai, the situation is even easier, with the suburbanrail having a railway station very close to the terminal.However, the systems do not �feel� integrated. A dedi-cated covered walkway over a dividing highway wouldsolve the problem.
Both the proposed Bangalore and second Mumbaiairports have faced problems regarding location. Apartfrom local resistance, there are also concerns that loca-tions are being moved around to permit �insider trading�in land, in view of the expected high land compensationprices.
Air Services
One of the first areas of liberalization in the early 1990swas permitting private participation in domestic sched-uled air services. Luckily, the country had not forgottenthat air services in the country had emerged with privateentrepreneurship, until they were nationalized afterIndependence to form the Indian Airlines and Air India.Though many airlines entered the fray, only two havesurvived and one of them (Jet Airways) is now a majorcompetitor to Indian Airlines, scoring better on mostdimensions of service. Private scheduled airlines nowaccount for more than 40 per cent of domestic airtraffic.
Fares and schedules are deregulated. However, thepolicy of �bundling�, according to which a proportionof seat kilometres operated in the Category I routes(inter-metro routes, expected to be highly commerciallyviable) must be offered in Category II and III routes,
11 As the urbanization pattern in India is shifting away fromthe �extreme metropolitan� to the more normal real size mode,many more mid-sized cities are likely to emerge, creating largepotential for such strategies.
12 Newspaper reports would indicate that there is a �mafia�operating in Air India. Employees at all levels have hijacked theairlines for their private gain.
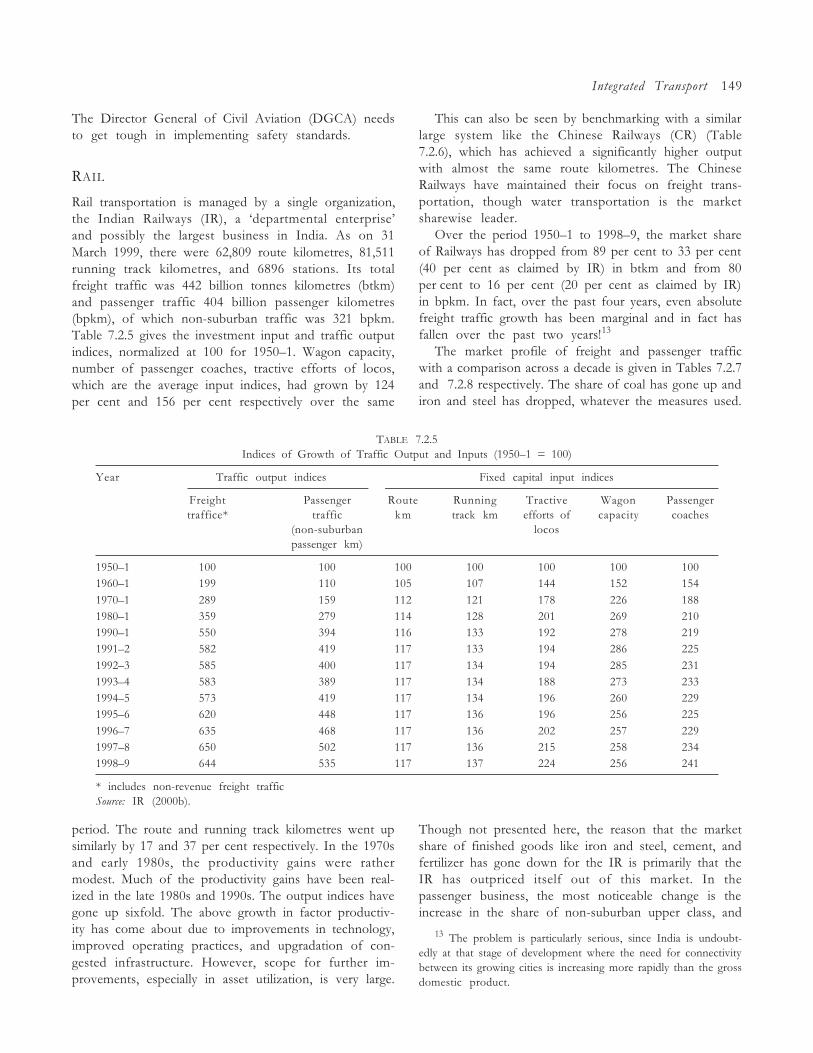
Integrated Transport 149
The Director General of Civil Aviation (DGCA) needsto get tough in implementing safety standards.
RAIL
Rail transportation is managed by a single organization,the Indian Railways (IR), a �departmental enterprise�and possibly the largest business in India. As on 31March 1999, there were 62,809 route kilometres, 81,511running track kilometres, and 6896 stations. Its totalfreight traffic was 442 billion tonnes kilometres (btkm)and passenger traffic 404 billion passenger kilometres(bpkm), of which non-suburban traffic was 321 bpkm.Table 7.2.5 gives the investment input and traffic outputindices, normalized at 100 for 1950�1. Wagon capacity,number of passenger coaches, tractive efforts of locos,which are the average input indices, had grown by 124per cent and 156 per cent respectively over the same
TABLE 7.2.5Indices of Growth of Traffic Output and Inputs (1950�1 = 100)
Year Traffic output indices Fixed capital input indices
Freight Passenger Route Running Tractive Wagon Passengertraffice* traffic km track km efforts of capacity coaches
(non-suburban locospassenger km)
1950�1 100 100 100 100 100 100 1001960�1 199 110 105 107 144 152 1541970�1 289 159 112 121 178 226 1881980�1 359 279 114 128 201 269 2101990�1 550 394 116 133 192 278 2191991�2 582 419 117 133 194 286 2251992�3 585 400 117 134 194 285 2311993�4 583 389 117 134 188 273 2331994�5 573 419 117 134 196 260 2291995�6 620 448 117 136 196 256 2251996�7 635 468 117 136 202 257 2291997�8 650 502 117 136 215 258 2341998�9 644 535 117 137 224 256 241
* includes non-revenue freight trafficSource: IR (2000b).
period. The route and running track kilometres went upsimilarly by 17 and 37 per cent respectively. In the 1970sand early 1980s, the productivity gains were rathermodest. Much of the productivity gains have been real-ized in the late 1980s and 1990s. The output indices havegone up sixfold. The above growth in factor productiv-ity has come about due to improvements in technology,improved operating practices, and upgradation of con-gested infrastructure. However, scope for further im-provements, especially in asset utilization, is very large.
This can also be seen by benchmarking with a similarlarge system like the Chinese Railways (CR) (Table7.2.6), which has achieved a significantly higher outputwith almost the same route kilometres. The ChineseRailways have maintained their focus on freight trans-portation, though water transportation is the marketsharewise leader.
Over the period 1950�1 to 1998�9, the market shareof Railways has dropped from 89 per cent to 33 per cent(40 per cent as claimed by IR) in btkm and from 80per cent to 16 per cent (20 per cent as claimed by IR)in bpkm. In fact, over the past four years, even absolutefreight traffic growth has been marginal and in fact hasfallen over the past two years!13
The market profile of freight and passenger trafficwith a comparison across a decade is given in Tables 7.2.7and 7.2.8 respectively. The share of coal has gone up andiron and steel has dropped, whatever the measures used.
Though not presented here, the reason that the marketshare of finished goods like iron and steel, cement, andfertilizer has gone down for the IR is primarily that theIR has outpriced itself out of this market. In thepassenger business, the most noticeable change is theincrease in the share of non-suburban upper class, and
13 The problem is particularly serious, since India is undoubt-edly at that stage of development where the need for connectivitybetween its growing cities is increasing more rapidly than the grossdomestic product.
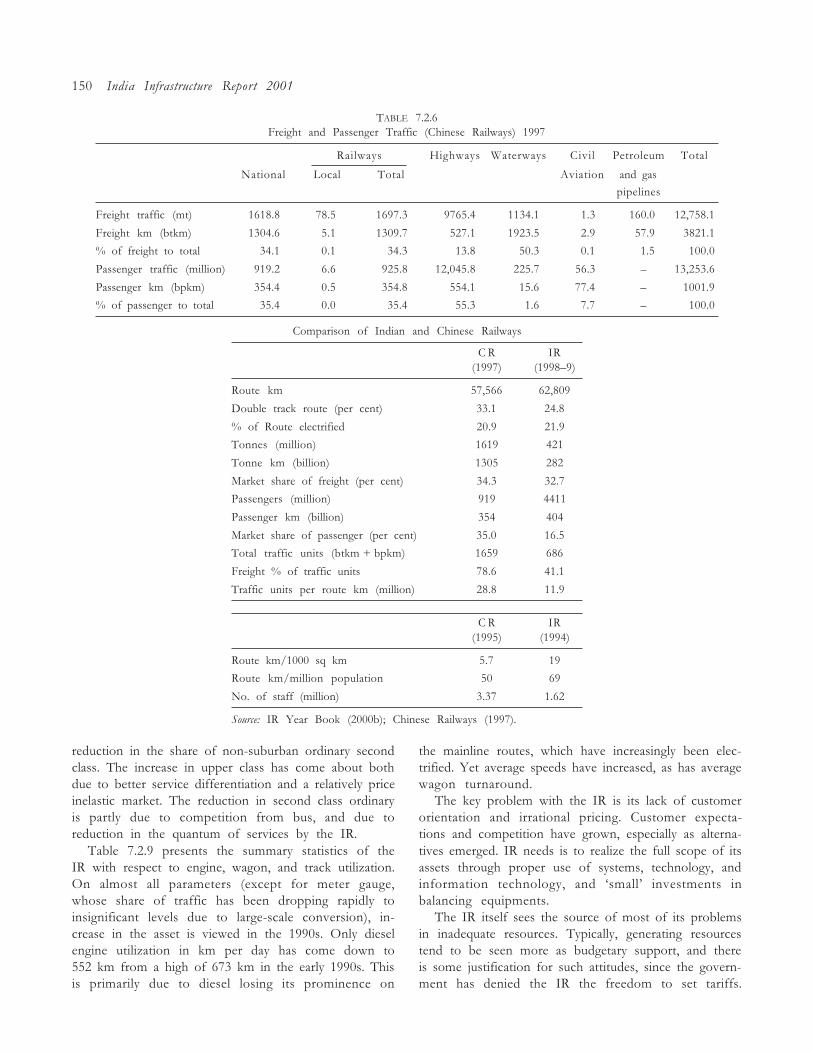
150 India Infrastructure Report 2001
TABLE 7.2.6Freight and Passenger Traffic (Chinese Railways) 1997
Railways Highways Waterways Civil Petroleum Total
National Local Total Aviation and gas
pipelines
Freight traffic (mt) 1618.8 78.5 1697.3 9765.4 1134.1 1.3 160.0 12,758.1
Freight km (btkm) 1304.6 5.1 1309.7 527.1 1923.5 2.9 57.9 3821.1
% of freight to total 34.1 0.1 34.3 13.8 50.3 0.1 1.5 100.0
Passenger traffic (million) 919.2 6.6 925.8 12,045.8 225.7 56.3 � 13,253.6
Passenger km (bpkm) 354.4 0.5 354.8 554.1 15.6 77.4 � 1001.9
% of passenger to total 35.4 0.0 35.4 55.3 1.6 7.7 � 100.0
Comparison of Indian and Chinese Railways
C R IR(1997) (1998�9)
Route km 57,566 62,809
Double track route (per cent) 33.1 24.8
% of Route electrified 20.9 21.9
Tonnes (million) 1619 421
Tonne km (billion) 1305 282
Market share of freight (per cent) 34.3 32.7
Passengers (million) 919 4411
Passenger km (billion) 354 404
Market share of passenger (per cent) 35.0 16.5
Total traffic units (btkm + bpkm) 1659 686
Freight % of traffic units 78.6 41.1
Traffic units per route km (million) 28.8 11.9
C R IR(1995) (1994)
Route km/1000 sq km 5.7 19
Route km/million population 50 69
No. of staff (million) 3.37 1.62
Source: IR Year Book (2000b); Chinese Railways (1997).
reduction in the share of non-suburban ordinary secondclass. The increase in upper class has come about bothdue to better service differentiation and a relatively priceinelastic market. The reduction in second class ordinaryis partly due to competition from bus, and due toreduction in the quantum of services by the IR.
Table 7.2.9 presents the summary statistics of theIR with respect to engine, wagon, and track utilization.On almost all parameters (except for meter gauge,whose share of traffic has been dropping rapidly toinsignificant levels due to large-scale conversion), in-crease in the asset is viewed in the 1990s. Only dieselengine utilization in km per day has come down to552 km from a high of 673 km in the early 1990s. Thisis primarily due to diesel losing its prominence on
the mainline routes, which have increasingly been elec-trified. Yet average speeds have increased, as has averagewagon turnaround.
The key problem with the IR is its lack of customerorientation and irrational pricing. Customer expecta-tions and competition have grown, especially as alterna-tives emerged. IR needs is to realize the full scope of itsassets through proper use of systems, technology, andinformation technology, and �small� investments inbalancing equipments.
The IR itself sees the source of most of its problemsin inadequate resources. Typically, generating resourcestend to be seen more as budgetary support, and thereis some justification for such attitudes, since the govern-ment has denied the IR the freedom to set tariffs.

Table 7.2.7 in wide page 151
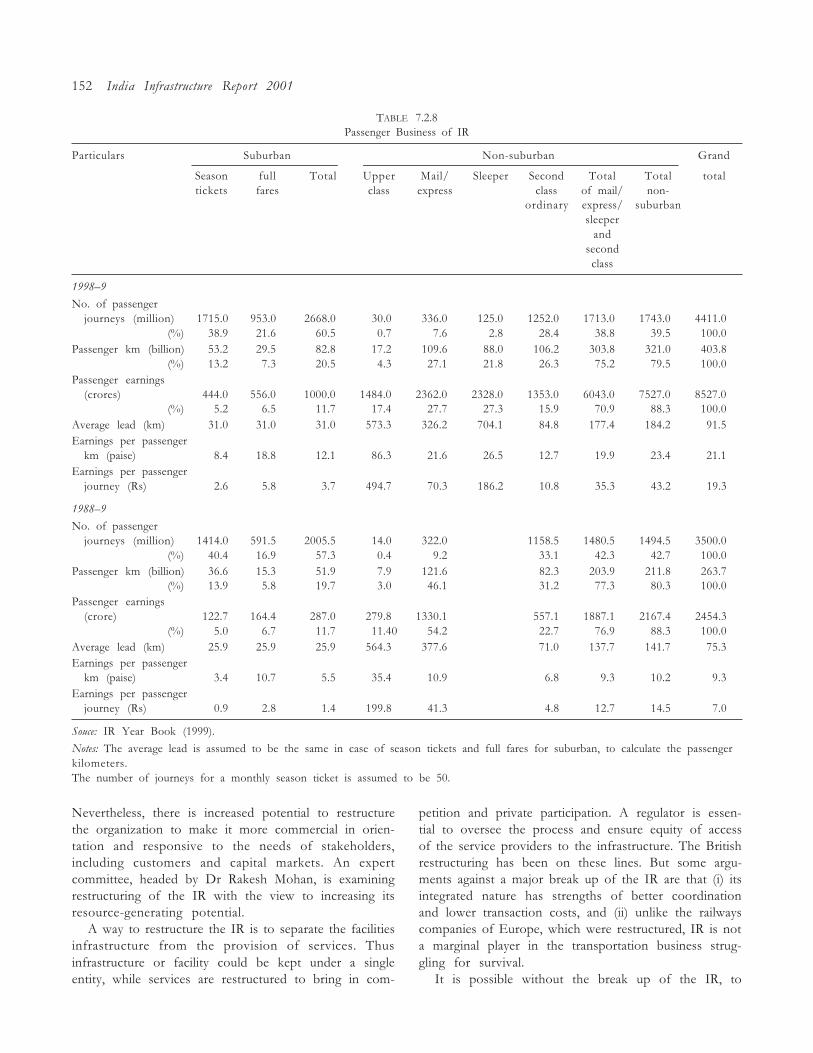
152 India Infrastructure Report 2001
TABLE 7.2.8Passenger Business of IR
Particulars Suburban Non-suburban Grand
Season full Total Upper Mail/ Sleeper Second Total Total totaltickets fares class express class of mail/ non-
ordinary express/ suburbansleeper
andsecondclass
1998�9
No. of passengerjourneys (million) 1715.0 953.0 2668.0 30.0 336.0 125.0 1252.0 1713.0 1743.0 4411.0
(%) 38.9 21.6 60.5 0.7 7.6 2.8 28.4 38.8 39.5 100.0Passenger km (billion) 53.2 29.5 82.8 17.2 109.6 88.0 106.2 303.8 321.0 403.8
(%) 13.2 7.3 20.5 4.3 27.1 21.8 26.3 75.2 79.5 100.0Passenger earnings
(crores) 444.0 556.0 1000.0 1484.0 2362.0 2328.0 1353.0 6043.0 7527.0 8527.0(%) 5.2 6.5 11.7 17.4 27.7 27.3 15.9 70.9 88.3 100.0
Average lead (km) 31.0 31.0 31.0 573.3 326.2 704.1 84.8 177.4 184.2 91.5Earnings per passenger
km (paise) 8.4 18.8 12.1 86.3 21.6 26.5 12.7 19.9 23.4 21.1Earnings per passenger
journey (Rs) 2.6 5.8 3.7 494.7 70.3 186.2 10.8 35.3 43.2 19.3
1988�9
No. of passengerjourneys (million) 1414.0 591.5 2005.5 14.0 322.0 1158.5 1480.5 1494.5 3500.0
(%) 40.4 16.9 57.3 0.4 9.2 33.1 42.3 42.7 100.0Passenger km (billion) 36.6 15.3 51.9 7.9 121.6 82.3 203.9 211.8 263.7
(%) 13.9 5.8 19.7 3.0 46.1 31.2 77.3 80.3 100.0Passenger earnings
(crore) 122.7 164.4 287.0 279.8 1330.1 557.1 1887.1 2167.4 2454.3(%) 5.0 6.7 11.7 11.40 54.2 22.7 76.9 88.3 100.0
Average lead (km) 25.9 25.9 25.9 564.3 377.6 71.0 137.7 141.7 75.3Earnings per passenger
km (paise) 3.4 10.7 5.5 35.4 10.9 6.8 9.3 10.2 9.3Earnings per passenger
journey (Rs) 0.9 2.8 1.4 199.8 41.3 4.8 12.7 14.5 7.0
Souce: IR Year Book (1999).
Notes: The average lead is assumed to be the same in case of season tickets and full fares for suburban, to calculate the passengerkilometers.The number of journeys for a monthly season ticket is assumed to be 50.
Nevertheless, there is increased potential to restructurethe organization to make it more commercial in orien-tation and responsive to the needs of stakeholders,including customers and capital markets. An expertcommittee, headed by Dr Rakesh Mohan, is examiningrestructuring of the IR with the view to increasing itsresource-generating potential.
A way to restructure the IR is to separate the facilitiesinfrastructure from the provision of services. Thusinfrastructure or facility could be kept under a singleentity, while services are restructured to bring in com-
petition and private participation. A regulator is essen-tial to oversee the process and ensure equity of accessof the service providers to the infrastructure. The Britishrestructuring has been on these lines. But some argu-ments against a major break up of the IR are that (i) itsintegrated nature has strengths of better coordinationand lower transaction costs, and (ii) unlike the railwayscompanies of Europe, which were restructured, IR is nota marginal player in the transportation business strug-gling for survival.
It is possible without the break up of the IR, to
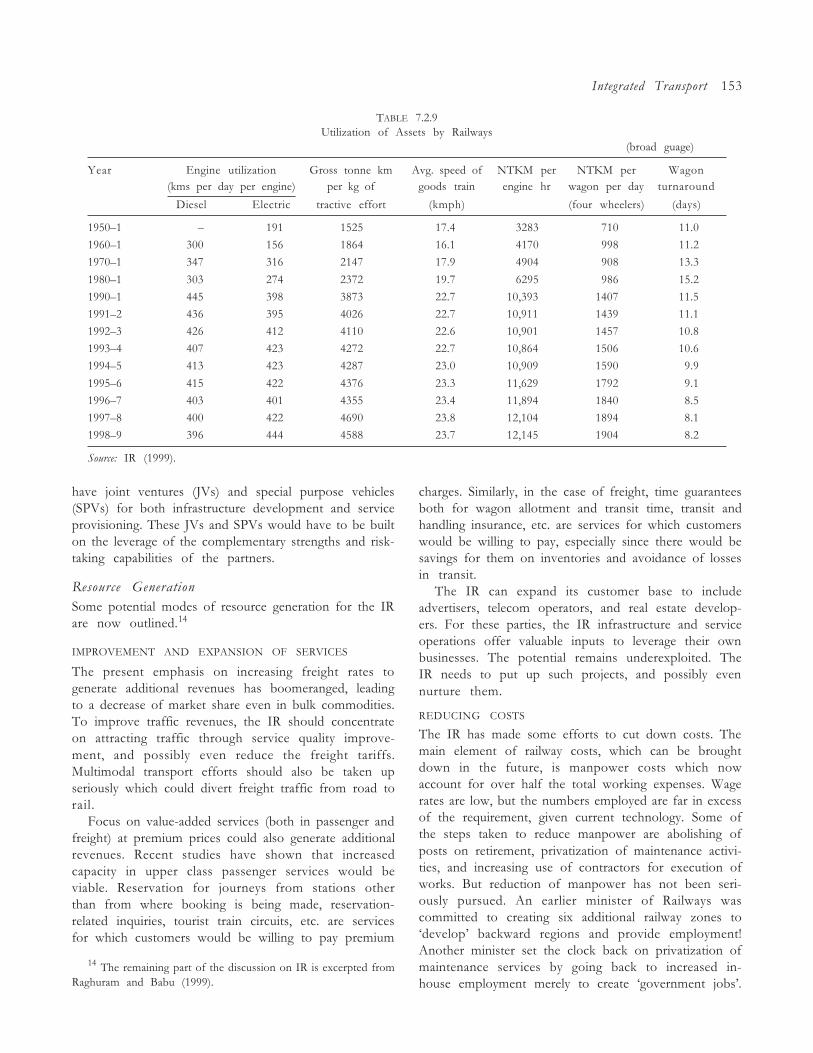
Integrated Transport 153
TABLE 7.2.9Utilization of Assets by Railways
(broad guage)
Year Engine utilization Gross tonne km Avg. speed of NTKM per NTKM per Wagon(kms per day per engine) per kg of goods train engine hr wagon per day turnaround
Diesel Electric tractive effort (kmph) (four wheelers) (days)
1950�1 � 191 1525 17.4 3283 710 11.0
1960�1 300 156 1864 16.1 4170 998 11.2
1970�1 347 316 2147 17.9 4904 908 13.3
1980�1 303 274 2372 19.7 6295 986 15.2
1990�1 445 398 3873 22.7 10,393 1407 11.5
1991�2 436 395 4026 22.7 10,911 1439 11.1
1992�3 426 412 4110 22.6 10,901 1457 10.8
1993�4 407 423 4272 22.7 10,864 1506 10.6
1994�5 413 423 4287 23.0 10,909 1590 9.9
1995�6 415 422 4376 23.3 11,629 1792 9.1
1996�7 403 401 4355 23.4 11,894 1840 8.5
1997�8 400 422 4690 23.8 12,104 1894 8.1
1998�9 396 444 4588 23.7 12,145 1904 8.2
Source: IR (1999).
charges. Similarly, in the case of freight, time guaranteesboth for wagon allotment and transit time, transit andhandling insurance, etc. are services for which customerswould be willing to pay, especially since there would besavings for them on inventories and avoidance of lossesin transit.
The IR can expand its customer base to includeadvertisers, telecom operators, and real estate develop-ers. For these parties, the IR infrastructure and serviceoperations offer valuable inputs to leverage their ownbusinesses. The potential remains underexploited. TheIR needs to put up such projects, and possibly evennurture them.
REDUCING COSTS
The IR has made some efforts to cut down costs. Themain element of railway costs, which can be broughtdown in the future, is manpower costs which nowaccount for over half the total working expenses. Wagerates are low, but the numbers employed are far in excessof the requirement, given current technology. Some ofthe steps taken to reduce manpower are abolishing ofposts on retirement, privatization of maintenance activi-ties, and increasing use of contractors for execution ofworks. But reduction of manpower has not been seri-ously pursued. An earlier minister of Railways wascommitted to creating six additional railway zones to�develop� backward regions and provide employment!Another minister set the clock back on privatization ofmaintenance services by going back to increased in-house employment merely to create �government jobs�.
have joint ventures (JVs) and special purpose vehicles(SPVs) for both infrastructure development and serviceprovisioning. These JVs and SPVs would have to be builton the leverage of the complementary strengths and risk-taking capabilities of the partners.
Resource GenerationSome potential modes of resource generation for the IRare now outlined.14
IMPROVEMENT AND EXPANSION OF SERVICES
The present emphasis on increasing freight rates togenerate additional revenues has boomeranged, leadingto a decrease of market share even in bulk commodities.To improve traffic revenues, the IR should concentrateon attracting traffic through service quality improve-ment, and possibly even reduce the freight tariffs.Multimodal transport efforts should also be taken upseriously which could divert freight traffic from road torail.
Focus on value-added services (both in passenger andfreight) at premium prices could also generate additionalrevenues. Recent studies have shown that increasedcapacity in upper class passenger services would beviable. Reservation for journeys from stations otherthan from where booking is being made, reservation-related inquiries, tourist train circuits, etc. are servicesfor which customers would be willing to pay premium
14 The remaining part of the discussion on IR is excerpted fromRaghuram and Babu (1999).
154 India Infrastructure Report 2001
Similarly, asset utilization has much potential to re-duce the overall unit cost of output. This is especially sowith regard to rolling stock and track, the principal assetsof any railway systems. In 1996�7 a broad gauge wagonmoved 158 km in a day. With the average goods trainspeed being 23 kmph, a wagon was effectively runningfor seven hours a day. Similarly, broad gauge electric anddiesel locomotives moved an average of just over 400 kmin a day, giving an average utilization of just about 16hours in a day. Passenger coaches for broad gauge mail/express services achieved a utilization of over 500 km perday, giving an average of ten hours a day at an averagespeed of 50 kmph. Even if one accounts, for time spentat yards and terminals, and for maintenance, the scopefor improving rolling stock utilization is very high.Track utilization can improve on the golden quadrilat-eral to great advantage. Even though these are highdensity tracks that presently carry over 70 trains eachway on double track sections, the potential to carry atleast 100 trains each way can be immediately exploitedthrough improved signalling and information systems!Since the quadrilateral accounts for over 60 per cent oftraffic, and there is no shortage of demand (with the rightprices), such improvement in asset utilization couldresult in an increase of at around 30 per cent in turnover!
MARKET BORROWINGS
Domestic market borrowings are expensive, with inter-est rates being over 15 per cent. The average return(revenues less expenses, but before dividend payment) onequity (budgetary support) has been 14.9 per centand 11.7 per cent during 1995�6 and 1996�7, respectively.The average return on total investment has been 10.4per cent and 8.1 per cent during these years. A study in1997 by Mckinsey Consultants on behalf of the AsianDevelopment Bank thought railways in India to be a�sunrise sector� for investments. However, customer andcommercial orientation within the IR and the internalorganizational structure would have to undergo dramaticchanges for the IR to be able to attract large investments.
BOT
The only experience to date under a BOT (build, operate,and transfer) scheme in the IR is the Konkan RailwayCorporation (KRC). While the Special Purpose Vehicle(SPV) set up for this gained from reduced pro-ject financ-ing and completion risks, it was a victim of perversecontracts that enhanced market risk and denied it marketaccess. With no direct access to major traffic originating/terminating points, the KRC is dependent on neighbour-ing railway zones for traffic. The existing railway zoneswould like to hold on to their traffic to post betterfinancial results at a time when overall freight market
growth for rail traffic is uncertain or falling.15 The KRCwould certainly have been better off with direct accessinto the Mumbai area, as also other areas in the south.
A vanilla BOT model can hardly be applied withoutsubstantial modification for a part of a large intercon-nected network. Specific clauses to share revenues, as inoriginating and distributing demand and interconnectaspects, have to be part of an enhanced BOT. The BOTconcept though would have ready application in value-added services like tourist circuits, catering services,terminal operations, multimodal operations, freightforwarding, and consolidation services. In such areas themarket can be directly accessed by the BOT operator.In some of these where the life of the assets is notsubstantially longer than the term of the debt, theprojects need not be BOT. BOO (build, own andoperate) would be better.
BOLT
The BOLT (build, operate, lease, and transfer) schemehas not been successful since projects under it are beingtreated conventionally in awarding and finalizing con-tracts. The potential of the scheme is difficult to assesssince sufficient experience has not yet been built up.
To make BOLT schemes successful, the IR needs toappreciate the fact that the risks faced by the BOLToperator are quite high and different from small con-tracts. The BOLT operator should also be capable ofabsorbing the expected down swing in business. Theoperator should have a long-term interest in the project.The IR should attempt to build long-term relationshipswith potential BOLT operators based on mutual inter-est. Case by case approach is best avoided. To offereconomies of scale to the operator, especially for hissupply contracts, equipment purchase and deployment,either large projects or bundling of smaller projects maybe necessary.
The present procedures for obtaining clearances andclarifications from ministries like finance and environ-ment do not, in all cases, explicitly recognize the BOLToperator as a body different from the IR! Matters thatcould be taken for granted or even dealt with duringthe project execution stage between ministries wouldhave to be consciously considered prior to the projectaward stage. Similarly, hidden costs such as use of rollingstock, transport of material and men, and use of captivecommunication facilities need to be explicitly consid-ered. These could significantly affect project viability.
BUDGETARY SUPPORT
While it is clear that budgetary support would dec-rease, the IR should renegotiate an annual contribution
15 Because of absurdly high prices, over which the Railwaysas such have little control.
Integrated Transport 155
towards social obligations imposed on it by the govern-ment. The extent of social service obligation during1996�7 was assessed at Rs 1826 crores on account of:
(i) transport of essential commodities carried at verylow rates;
(ii) concessional passenger fares to season ticketholders and a variety of social welfare constituents,including �forced� operation of certain unremunerativepassenger trains;
(iii) investment in uneconomic railway lines on na-tional considerations and �forced� operation of uneco-nomic branch lines.
The first step in this exercise would be to develop arobust valuation model that can use various assumptionsof alternative use of the capacity. With regular �subsidy�contribution coming from the government it would benecessary to calculate the same in a manner that istransparent and convincing.
Further, to make a strong case for such contributions,the present costing system of the IR is inadequate andneeds to be redesigned. Regarding item (iii) above, therehave been situations in which other ministries likeDefence, or state governments, have contributed partof the costs. The government has also declared theRs 2100 crore Udhampur�Srinagar�Baramula line inJammu & Kashmir to be a national project and hasagreed to fully fund the project.
While renegotiating government support, financialrestructuring of the capital at charge (which was nearlyRs 31,000 crore by the end of 1996�7 and is likely tobe about Rs 35,000 crore by the end of 1998�9) as equitywould have to be considered.16 This would enable theIR to hold back the obligatory dividend payment, whichhas been of the order of Rs 1500 crore per annum inrecent years.
ROAD TRANSPORT
Roads
The total road length in the country is 2.5 millionkm, which represents about a sevenfold growth over thepast fifty years. The net outcome of this has been �exten-sive connectivity� across the country. However, the qualityof the connectivity in terms of reduction of journeytimes may not have been much. More importantly incom-parison to other countries in East Asia and else-where, this achievement is very much below the average!
Roads are classified as national highways, statehighways, other district roads (all three of which are
maintained by the Public Works Department [PWD]),panchayat raj roads, urban roads, project roads, and JRY(Jawahar Rozgaar Yojana) roads.
Village connectivity still remains a problem. Only37.5 per cent of villages with population less than athousand were connected as of 31 March 1994! Besidesthe capacity and quality of even many national highwaysegments is very poor. The same is true of many of thestate highways and many of the urban roads.
An important aspect of road development is safety.Unfortunately this is not integral to the design ofroad and highway systems in India (Dinesh 2000). Table7.2.10 gives statewise data on various safety parameters,for the year 1994�5. Safety indicators with regard tovehicles, such as accidents per 10,000 vehicles or personskilled per 10,000 vehicles are presented. At an all-Indialevel, while the parameters with respect to vehicleshave come down, they have gone up with respect to theroad length. This is a reflection of both increased trafficon roads and the vehicle profile having changed. Theproportion of motorized two wheelers (MTWs)has gone up substantially (Table 7.2.11). MTWs areaccident-prone, especially in conjunction with heavyvehicles. Some inter-state comparisons with respect tovehicles would not be valid, since the base is againstnumber of vehicles registered, while accidents could beon any vehicle passing through the state. For example,a state like Arunachal Pradesh, which has fewer regis-tered vehicles, would reflect poorer performance com-pared to Delhi, Pondicherry, or Chandigarh on thevehicle-related statistics.
Another significant aspect is developing higher capac-ity roads on key segments, to take advantage of the factthat less than 2 per cent of the roads carry over 40 per centof the tonne km traffic. Success of private involvementin long stretch road development has been poor, whilede-bottlenecking investments in bypasses, bridges, andover/under passes have been more successful.
The late 1980s saw the initiation of discussions overinvolvement of private players in toll road development.A case in point is the acquisition of land for the purpose.As the government itself was very vulnerable to localpolitical and other forces, and consequent litigation, itwas expected that the private sector could �manage� itsway better towards land acquisition!
Much has changed since then, and the governmentcan acquire land and hand it over to private sector roaddevelopers prior to the project. It is only the govern-ment which can operate under the principle of �eminentdomain�, to attempt land acquisition in the larger inter-est of society. Over the years, project structuring hasincreasingly provided for greater incentives. These in-clude roadside concessions (for licensing petrol pumps,
16 The idea of an obligatory dividend payment is an anathemato any business, and especially a cyclical industry like the railway.
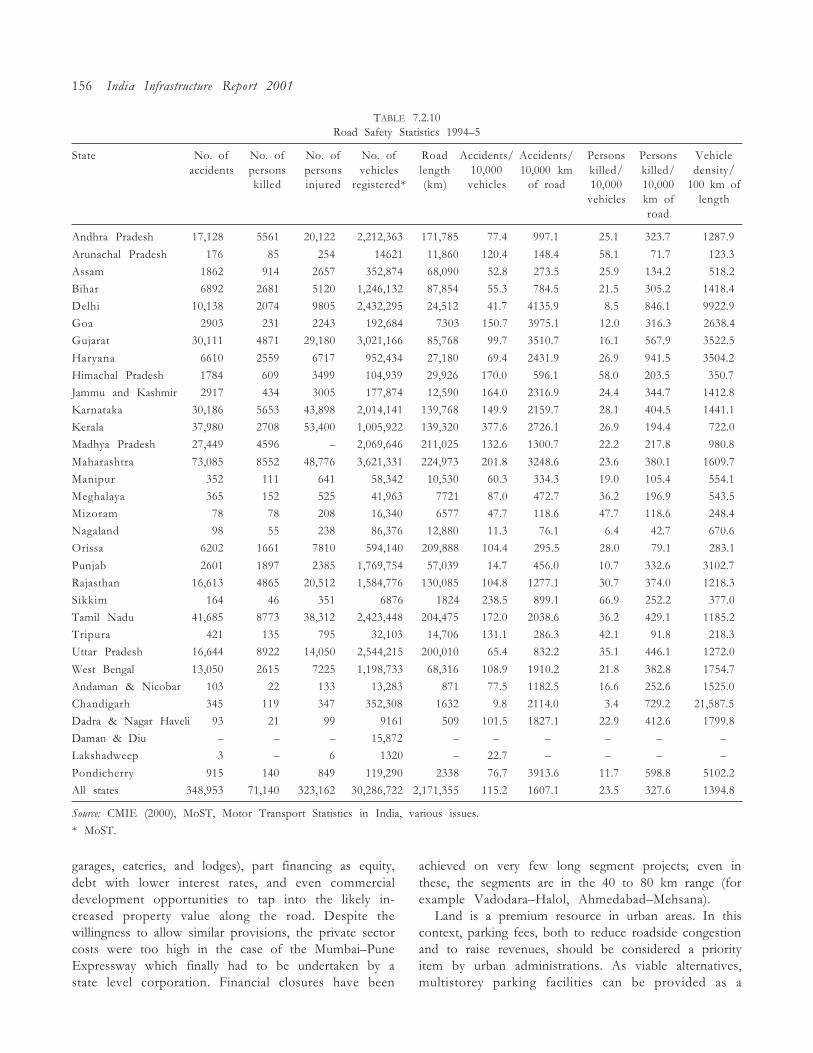
156 India Infrastructure Report 2001
TABLE 7.2.10Road Safety Statistics 1994�5
State No. of No. of No. of No. of Road Accidents/ Accidents/ Persons Persons Vehicleaccidents persons persons vehicles length 10,000 10,000 km killed/ killed/ density/
killed injured registered* (km) vehicles of road 10,000 10,000 100 km ofvehicles km of length
road
Andhra Pradesh 17,128 5561 20,122 2,212,363 171,785 77.4 997.1 25.1 323.7 1287.9
Arunachal Pradesh 176 85 254 14621 11,860 120.4 148.4 58.1 71.7 123.3
Assam 1862 914 2657 352,874 68,090 52.8 273.5 25.9 134.2 518.2
Bihar 6892 2681 5120 1,246,132 87,854 55.3 784.5 21.5 305.2 1418.4
Delhi 10,138 2074 9805 2,432,295 24,512 41.7 4135.9 8.5 846.1 9922.9
Goa 2903 231 2243 192,684 7303 150.7 3975.1 12.0 316.3 2638.4
Gujarat 30,111 4871 29,180 3,021,166 85,768 99.7 3510.7 16.1 567.9 3522.5
Haryana 6610 2559 6717 952,434 27,180 69.4 2431.9 26.9 941.5 3504.2
Himachal Pradesh 1784 609 3499 104,939 29,926 170.0 596.1 58.0 203.5 350.7
Jammu and Kashmir 2917 434 3005 177,874 12,590 164.0 2316.9 24.4 344.7 1412.8
Karnataka 30,186 5653 43,898 2,014,141 139,768 149.9 2159.7 28.1 404.5 1441.1
Kerala 37,980 2708 53,400 1,005,922 139,320 377.6 2726.1 26.9 194.4 722.0
Madhya Pradesh 27,449 4596 � 2,069,646 211,025 132.6 1300.7 22.2 217.8 980.8
Maharashtra 73,085 8552 48,776 3,621,331 224,973 201.8 3248.6 23.6 380.1 1609.7
Manipur 352 111 641 58,342 10,530 60.3 334.3 19.0 105.4 554.1
Meghalaya 365 152 525 41,963 7721 87.0 472.7 36.2 196.9 543.5
Mizoram 78 78 208 16,340 6577 47.7 118.6 47.7 118.6 248.4
Nagaland 98 55 238 86,376 12,880 11.3 76.1 6.4 42.7 670.6
Orissa 6202 1661 7810 594,140 209,888 104.4 295.5 28.0 79.1 283.1
Punjab 2601 1897 2385 1,769,754 57,039 14.7 456.0 10.7 332.6 3102.7
Rajasthan 16,613 4865 20,512 1,584,776 130,085 104.8 1277.1 30.7 374.0 1218.3
Sikkim 164 46 351 6876 1824 238.5 899.1 66.9 252.2 377.0
Tamil Nadu 41,685 8773 38,312 2,423,448 204,475 172.0 2038.6 36.2 429.1 1185.2
Tripura 421 135 795 32,103 14,706 131.1 286.3 42.1 91.8 218.3
Uttar Pradesh 16,644 8922 14,050 2,544,215 200,010 65.4 832.2 35.1 446.1 1272.0
West Bengal 13,050 2615 7225 1,198,733 68,316 108.9 1910.2 21.8 382.8 1754.7
Andaman & Nicobar 103 22 133 13,283 871 77.5 1182.5 16.6 252.6 1525.0
Chandigarh 345 119 347 352,308 1632 9.8 2114.0 3.4 729.2 21,587.5
Dadra & Nagar Haveli 93 21 99 9161 509 101.5 1827.1 22.9 412.6 1799.8
Daman & Diu � � � 15,872 � � � � � �
Lakshadweep 3 � 6 1320 � 22.7 � � � �
Pondicherry 915 140 849 119,290 2338 76.7 3913.6 11.7 598.8 5102.2
All states 348,953 71,140 323,162 30,286,722 2,171,355 115.2 1607.1 23.5 327.6 1394.8
Source: CMIE (2000), MoST, Motor Transport Statistics in India, various issues.
* MoST.
garages, eateries, and lodges), part financing as equity,debt with lower interest rates, and even commercialdevelopment opportunities to tap into the likely in-creased property value along the road. Despite thewillingness to allow similar provisions, the private sectorcosts were too high in the case of the Mumbai�PuneExpressway which finally had to be undertaken by astate level corporation. Financial closures have been
achieved on very few long segment projects; even inthese, the segments are in the 40 to 80 km range (forexample Vadodara�Halol, Ahmedabad�Mehsana).
Land is a premium resource in urban areas. In thiscontext, parking fees, both to reduce roadside congestionand to raise revenues, should be considered a priorityitem by urban administrations. As viable alternatives,multistorey parking facilities can be provided as a
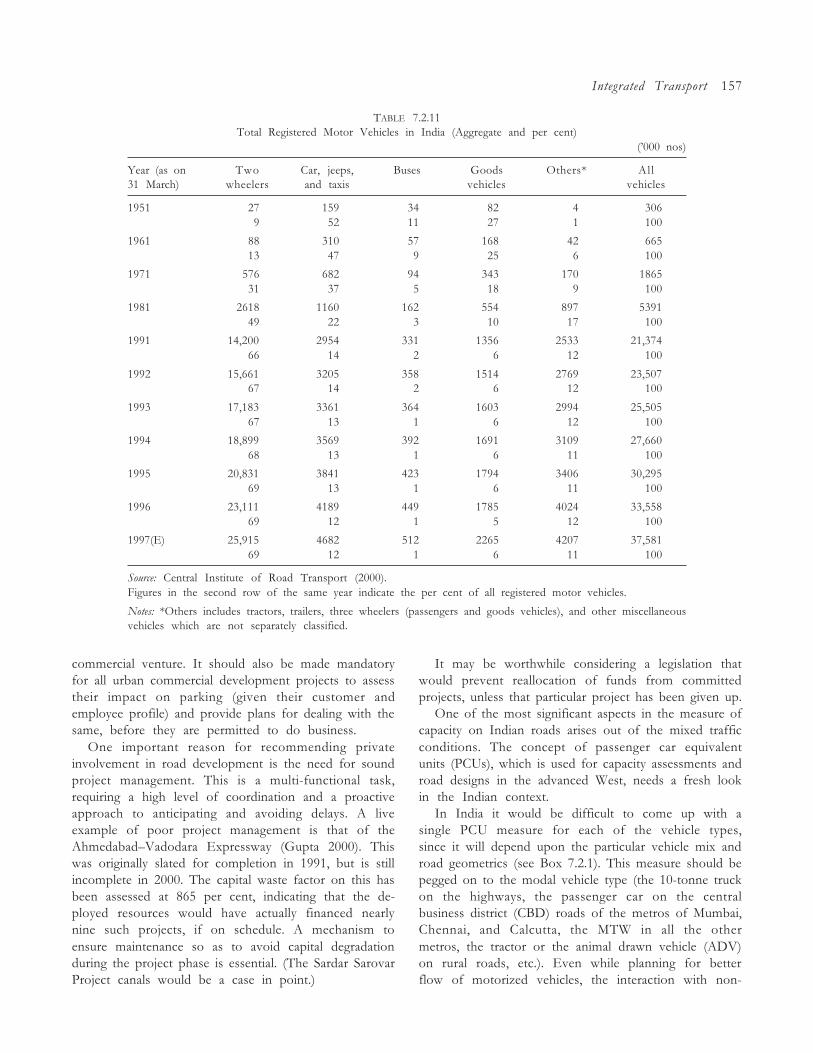
Integrated Transport 157
TABLE 7.2.11Total Registered Motor Vehicles in India (Aggregate and per cent)
(�000 nos)
Year (as on Two Car, jeeps, Buses Goods Others* All31 March) wheelers and taxis vehicles vehicles
1951 27 159 34 82 4 3069 52 11 27 1 100
1961 88 310 57 168 42 66513 47 9 25 6 100
1971 576 682 94 343 170 186531 37 5 18 9 100
1981 2618 1160 162 554 897 539149 22 3 10 17 100
1991 14,200 2954 331 1356 2533 21,37466 14 2 6 12 100
1992 15,661 3205 358 1514 2769 23,50767 14 2 6 12 100
1993 17,183 3361 364 1603 2994 25,50567 13 1 6 12 100
1994 18,899 3569 392 1691 3109 27,66068 13 1 6 11 100
1995 20,831 3841 423 1794 3406 30,29569 13 1 6 11 100
1996 23,111 4189 449 1785 4024 33,55869 12 1 5 12 100
1997(E) 25,915 4682 512 2265 4207 37,58169 12 1 6 11 100
Source: Central Institute of Road Transport (2000).Figures in the second row of the same year indicate the per cent of all registered motor vehicles.
Notes: *Others includes tractors, trailers, three wheelers (passengers and goods vehicles), and other miscellaneousvehicles which are not separately classified.
commercial venture. It should also be made mandatoryfor all urban commercial development projects to assesstheir impact on parking (given their customer andemployee profile) and provide plans for dealing with thesame, before they are permitted to do business.
One important reason for recommending privateinvolvement in road development is the need for soundproject management. This is a multi-functional task,requiring a high level of coordination and a proactiveapproach to anticipating and avoiding delays. A liveexample of poor project management is that of theAhmedabad�Vadodara Expressway (Gupta 2000). Thiswas originally slated for completion in 1991, but is stillincomplete in 2000. The capital waste factor on this hasbeen assessed at 865 per cent, indicating that the de-ployed resources would have actually financed nearlynine such projects, if on schedule. A mechanism toensure maintenance so as to avoid capital degradationduring the project phase is essential. (The Sardar SarovarProject canals would be a case in point.)
It may be worthwhile considering a legislation thatwould prevent reallocation of funds from committedprojects, unless that particular project has been given up.
One of the most significant aspects in the measure ofcapacity on Indian roads arises out of the mixed trafficconditions. The concept of passenger car equivalentunits (PCUs), which is used for capacity assessments androad designs in the advanced West, needs a fresh lookin the Indian context.
In India it would be difficult to come up with asingle PCU measure for each of the vehicle types,since it will depend upon the particular vehicle mix androad geometrics (see Box 7.2.1). This measure should bepegged on to the modal vehicle type (the 10-tonne truckon the highways, the passenger car on the centralbusiness district (CBD) roads of the metros of Mumbai,Chennai, and Calcutta, the MTW in all the othermetros, the tractor or the animal drawn vehicle (ADV)on rural roads, etc.). Even while planning for betterflow of motorized vehicles, the interaction with non-
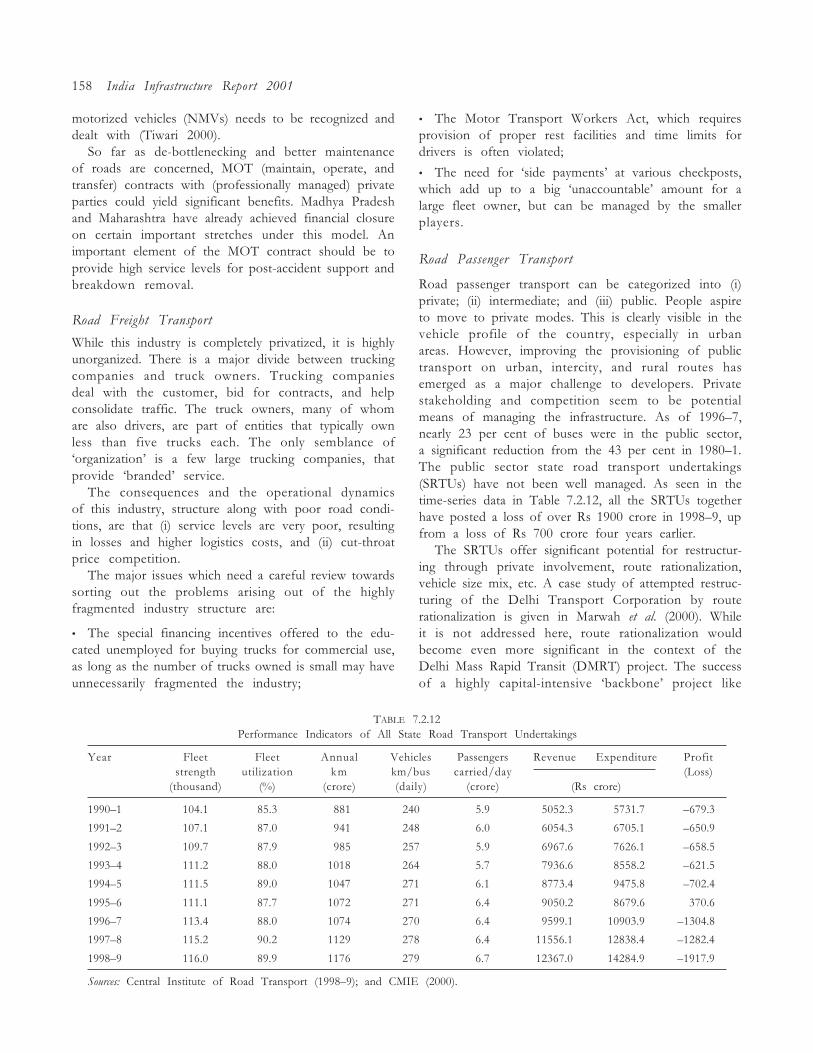
158 India Infrastructure Report 2001
motorized vehicles (NMVs) needs to be recognized anddealt with (Tiwari 2000).
So far as de-bottlenecking and better maintenanceof roads are concerned, MOT (maintain, operate, andtransfer) contracts with (professionally managed) privateparties could yield significant benefits. Madhya Pradeshand Maharashtra have already achieved financial closureon certain important stretches under this model. Animportant element of the MOT contract should be toprovide high service levels for post-accident support andbreakdown removal.
Road Freight Transport
While this industry is completely privatized, it is highlyunorganized. There is a major divide between truckingcompanies and truck owners. Trucking companiesdeal with the customer, bid for contracts, and helpconsolidate traffic. The truck owners, many of whomare also drivers, are part of entities that typically ownless than five trucks each. The only semblance of�organization� is a few large trucking companies, thatprovide �branded� service.
The consequences and the operational dynamicsof this industry, structure along with poor road condi-tions, are that (i) service levels are very poor, resultingin losses and higher logistics costs, and (ii) cut-throatprice competition.
The major issues which need a careful review towardssorting out the problems arising out of the highlyfragmented industry structure are:
� The special financing incentives offered to the edu-cated unemployed for buying trucks for commercial use,as long as the number of trucks owned is small may haveunnecessarily fragmented the industry;
� The Motor Transport Workers Act, which requiresprovision of proper rest facilities and time limits fordrivers is often violated;
� The need for �side payments� at various checkposts,which add up to a big �unaccountable� amount for alarge fleet owner, but can be managed by the smallerplayers.
Road Passenger Transport
Road passenger transport can be categorized into (i)private; (ii) intermediate; and (iii) public. People aspireto move to private modes. This is clearly visible in thevehicle profile of the country, especially in urbanareas. However, improving the provisioning of publictransport on urban, intercity, and rural routes hasemerged as a major challenge to developers. Privatestakeholding and competition seem to be potentialmeans of managing the infrastructure. As of 1996�7,nearly 23 per cent of buses were in the public sector,a significant reduction from the 43 per cent in 1980�1.The public sector state road transport undertakings(SRTUs) have not been well managed. As seen in thetime-series data in Table 7.2.12, all the SRTUs togetherhave posted a loss of over Rs 1900 crore in 1998�9, upfrom a loss of Rs 700 crore four years earlier.
The SRTUs offer significant potential for restructur-ing through private involvement, route rationalization,vehicle size mix, etc. A case study of attempted restruc-turing of the Delhi Transport Corporation by routerationalization is given in Marwah et al. (2000). Whileit is not addressed here, route rationalization wouldbecome even more significant in the context of theDelhi Mass Rapid Transit (DMRT) project. The successof a highly capital-intensive �backbone� project like
TABLE 7.2.12Performance Indicators of All State Road Transport Undertakings
Year Fleet Fleet Annual Vehicles Passengers Revenue Expenditure Profitstrength utilization km km/bus carried/day (Loss)
(thousand) (%) (crore) (daily) (crore) (Rs crore)
1990�1 104.1 85.3 0881 240 5.9 05052.3 05731.7 �679.3
1991�2 107.1 87.0 0941 248 6.0 06054.3 06705.1 �650.9
1992�3 109.7 87.9 0985 257 5.9 06967.6 07626.1 �658.5
1993�4 111.2 88.0 1018 264 5.7 07936.6 08558.2 �621.5
1994�5 111.5 89.0 1047 271 6.1 08773.4 09475.8 �702.4
1995�6 111.1 87.7 1072 271 6.4 09050.2 08679.6 370.6
1996�7 113.4 88.0 1074 270 6.4 09599.1 10903.9 �1304.8
1997�8 115.2 90.2 1129 278 6.4 11556.1 12838.4 �1282.4
1998�9 116.0 89.9 1176 279 6.7 12367.0 14284.9 �1917.9
Sources: Central Institute of Road Transport (1998�9); and CMIE (2000).
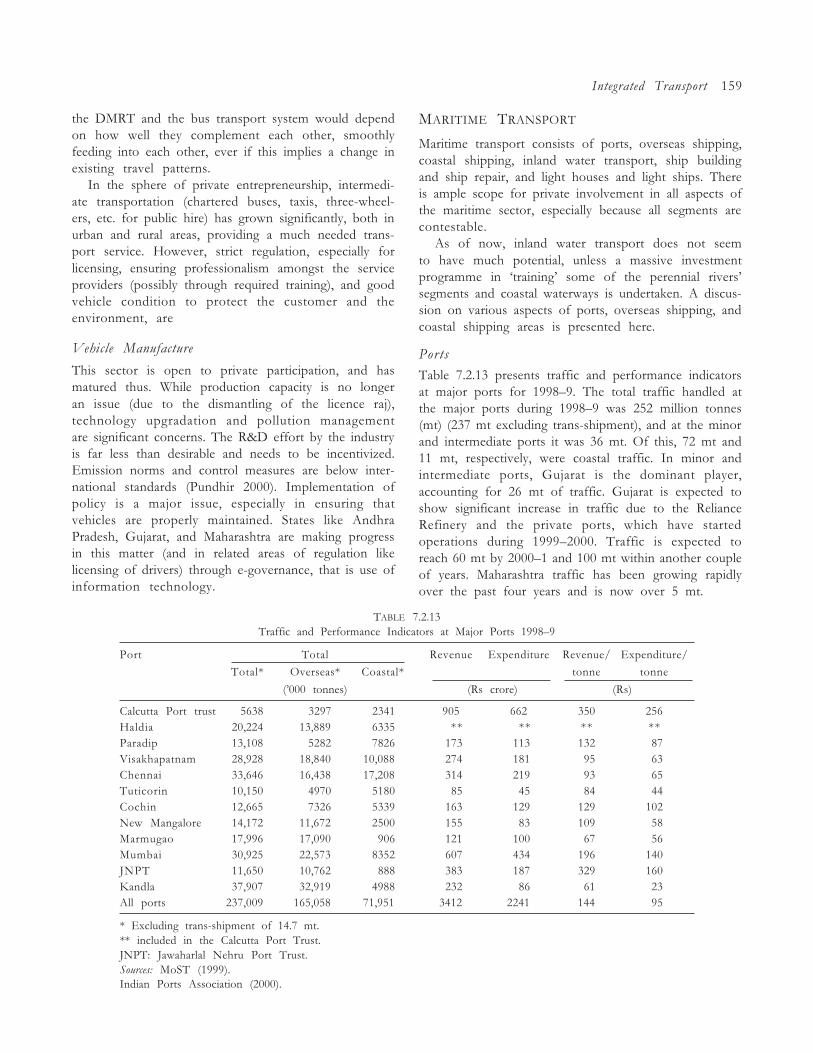
Integrated Transport 159
the DMRT and the bus transport system would dependon how well they complement each other, smoothlyfeeding into each other, ever if this implies a change inexisting travel patterns.
In the sphere of private entrepreneurship, intermedi-ate transportation (chartered buses, taxis, three-wheel-ers, etc. for public hire) has grown significantly, both inurban and rural areas, providing a much needed trans-port service. However, strict regulation, especially forlicensing, ensuring professionalism amongst the serviceproviders (possibly through required training), and goodvehicle condition to protect the customer and theenvironment, are
Vehicle Manufacture
This sector is open to private participation, and hasmatured thus. While production capacity is no longeran issue (due to the dismantling of the licence raj),technology upgradation and pollution managementare significant concerns. The R&D effort by the industryis far less than desirable and needs to be incentivized.Emission norms and control measures are below inter-national standards (Pundhir 2000). Implementation ofpolicy is a major issue, especially in ensuring thatvehicles are properly maintained. States like AndhraPradesh, Gujarat, and Maharashtra are making progressin this matter (and in related areas of regulation likelicensing of drivers) through e-governance, that is use ofinformation technology.
MARITIME TRANSPORT
Maritime transport consists of ports, overseas shipping,coastal shipping, inland water transport, ship buildingand ship repair, and light houses and light ships. Thereis ample scope for private involvement in all aspects ofthe maritime sector, especially because all segments arecontestable.
As of now, inland water transport does not seemto have much potential, unless a massive investmentprogramme in �training� some of the perennial rivers�segments and coastal waterways is undertaken. A discus-sion on various aspects of ports, overseas shipping, andcoastal shipping areas is presented here.
Ports
Table 7.2.13 presents traffic and performance indicatorsat major ports for 1998�9. The total traffic handled atthe major ports during 1998�9 was 252 million tonnes(mt) (237 mt excluding trans-shipment), and at the minorand intermediate ports it was 36 mt. Of this, 72 mt and11 mt, respectively, were coastal traffic. In minor andintermediate ports, Gujarat is the dominant player,accounting for 26 mt of traffic. Gujarat is expected toshow significant increase in traffic due to the RelianceRefinery and the private ports, which have startedoperations during 1999�2000. Traffic is expected toreach 60 mt by 2000�1 and 100 mt within another coupleof years. Maharashtra traffic has been growing rapidlyover the past four years and is now over 5 mt.
TABLE 7.2.13Traffic and Performance Indicators at Major Ports 1998�9
Port Total Revenue Expenditure Revenue/ Expenditure/
Total* Overseas* Coastal* tonne tonne
(�000 tonnes) (Rs crore) (Rs)
Calcutta Port trust 5638 3297 2341 905 662 350 256Haldia 20,224 13,889 6335 ** ** ** **Paradip 13,108 5282 7826 0173 0113 132 087Visakhapatnam 28,928 18,840 10,088 0274 0181 095 063Chennai 33,646 16,438 17,208 0314 0219 093 065Tuticorin 10,150 4970 5180 0085 0045 084 044Cochin 12,665 7326 5339 0163 0129 129 102New Mangalore 14,172 11,672 2500 0155 0083 109 058Marmugao 17,996 17,090 906 0121 0100 067 056Mumbai 30,925 22,573 8352 0607 0434 196 140JNPT 11,650 10,762 888 0383 0187 329 160Kandla 37,907 32,919 4988 0232 0086 061 023All ports 237,009 165,058 71,951 3412 2241 144 095
* Excluding trans-shipment of 14.7 mt.** included in the Calcutta Port Trust.JNPT: Jawaharlal Nehru Port Trust.Sources: MoST (1999).Indian Ports Association (2000).
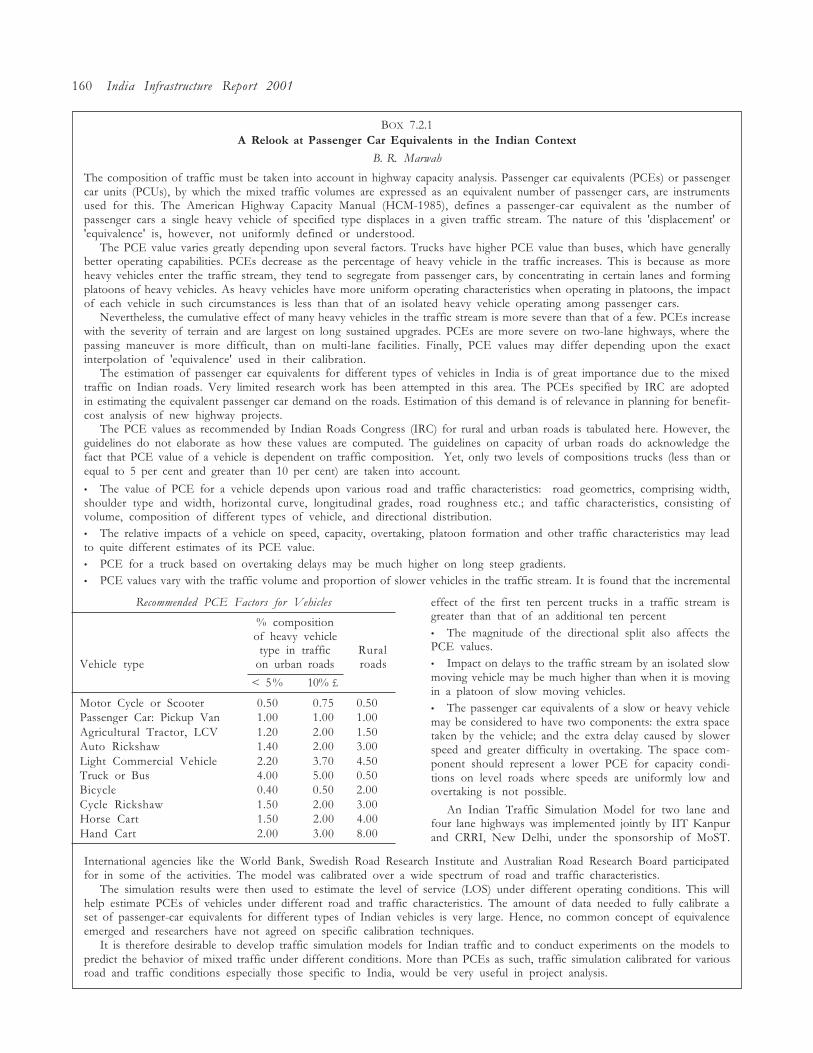
160 India Infrastructure Report 2001
BOX 7.2.1A Relook at Passenger Car Equivalents in the Indian Context
B. R. Marwah
The composition of traffic must be taken into account in highway capacity analysis. Passenger car equivalents (PCEs) or passengercar units (PCUs), by which the mixed traffic volumes are expressed as an equivalent number of passenger cars, are instrumentsused for this. The American Highway Capacity Manual (HCM-1985), defines a passenger-car equivalent as the number ofpassenger cars a single heavy vehicle of specified type displaces in a given traffic stream. The nature of this 'displacement' or'equivalence' is, however, not uniformly defined or understood.
The PCE value varies greatly depending upon several factors. Trucks have higher PCE value than buses, which have generallybetter operating capabilities. PCEs decrease as the percentage of heavy vehicle in the traffic increases. This is because as moreheavy vehicles enter the traffic stream, they tend to segregate from passenger cars, by concentrating in certain lanes and formingplatoons of heavy vehicles. As heavy vehicles have more uniform operating characteristics when operating in platoons, the impactof each vehicle in such circumstances is less than that of an isolated heavy vehicle operating among passenger cars.
Nevertheless, the cumulative effect of many heavy vehicles in the traffic stream is more severe than that of a few. PCEs increasewith the severity of terrain and are largest on long sustained upgrades. PCEs are more severe on two-lane highways, where thepassing maneuver is more difficult, than on multi-lane facilities. Finally, PCE values may differ depending upon the exactinterpolation of 'equivalence' used in their calibration.
The estimation of passenger car equivalents for different types of vehicles in India is of great importance due to the mixedtraffic on Indian roads. Very limited research work has been attempted in this area. The PCEs specified by IRC are adoptedin estimating the equivalent passenger car demand on the roads. Estimation of this demand is of relevance in planning for benefit-cost analysis of new highway projects.
The PCE values as recommended by Indian Roads Congress (IRC) for rural and urban roads is tabulated here. However, theguidelines do not elaborate as how these values are computed. The guidelines on capacity of urban roads do acknowledge thefact that PCE value of a vehicle is dependent on traffic composition. Yet, only two levels of compositions trucks (less than orequal to 5 per cent and greater than 10 per cent) are taken into account.
� The value of PCE for a vehicle depends upon various road and traffic characteristics: road geometrics, comprising width,shoulder type and width, horizontal curve, longitudinal grades, road roughness etc.; and taffic characteristics, consisting ofvolume, composition of different types of vehicle, and directional distribution.� The relative impacts of a vehicle on speed, capacity, overtaking, platoon formation and other traffic characteristics may leadto quite different estimates of its PCE value.� PCE for a truck based on overtaking delays may be much higher on long steep gradients.� PCE values vary with the traffic volume and proportion of slower vehicles in the traffic stream. It is found that the incremental
International agencies like the World Bank, Swedish Road Research Institute and Australian Road Research Board participatedfor in some of the activities. The model was calibrated over a wide spectrum of road and traffic characteristics.
The simulation results were then used to estimate the level of service (LOS) under different operating conditions. This willhelp estimate PCEs of vehicles under different road and traffic characteristics. The amount of data needed to fully calibrate aset of passenger-car equivalents for different types of Indian vehicles is very large. Hence, no common concept of equivalenceemerged and researchers have not agreed on specific calibration techniques.
It is therefore desirable to develop traffic simulation models for Indian traffic and to conduct experiments on the models topredict the behavior of mixed traffic under different conditions. More than PCEs as such, traffic simulation calibrated for variousroad and traffic conditions especially those specific to India, would be very useful in project analysis.
Recommended PCE Factors for Vehicles
% compositionof heavy vehicle
type in traffic RuralVehicle type on urban roads roads
< 5% 10% £
Motor Cycle or Scooter 0.50 0.75 0.50Passenger Car: Pickup Van 1.00 1.00 1.00Agricultural Tractor, LCV 1.20 2.00 1.50Auto Rickshaw 1.40 2.00 3.00Light Commercial Vehicle 2.20 3.70 4.50Truck or Bus 4.00 5.00 0.50Bicycle 0.40 0.50 2.00Cycle Rickshaw 1.50 2.00 3.00Horse Cart 1.50 2.00 4.00Hand Cart 2.00 3.00 8.00
effect of the first ten percent trucks in a traffic stream isgreater than that of an additional ten percent� The magnitude of the directional split also affects thePCE values.� Impact on delays to the traffic stream by an isolated slowmoving vehicle may be much higher than when it is movingin a platoon of slow moving vehicles.� The passenger car equivalents of a slow or heavy vehiclemay be considered to have two components: the extra spacetaken by the vehicle; and the extra delay caused by slowerspeed and greater difficulty in overtaking. The space com-ponent should represent a lower PCE for capacity condi-tions on level roads where speeds are uniformly low andovertaking is not possible.
An Indian Traffic Simulation Model for two lane andfour lane highways was implemented jointly by IIT Kanpurand CRRI, New Delhi, under the sponsorship of MoST.
Integrated Transport 161
Of the 252 mt of traffic handled at the major portsin 1998�9, non-POL (petroleum oil and lubricant) (prod-ucts and crude), coal, and iron ore accounted for 71per cent traffic, at 107 mt, 39 mt, and 34 mt respectively(Table 7.2.14). This was followed by container handlingat 24 mt, fertilizer (finished) at 4.7 mt, fertilizer (rawmaterial) at 4.3 mt, and foodgrains at 3.5 mt. These sevencommodities constituted 86 per cent of total traffic.
Soon even the JNPT could be out of reckoning since6000 plus TEU vessels are expected to come in.
The primary issue in port development is congestionat ports, resulting in unacceptable average turnaroundtimes of 5.9 days (Table 7.2.19). The net cost of conges-tion at the major ports in India, benchmarking with anacceptable average of two days at ports internationally,was $ 457.9 million, that is Rs 1623 crores for 1998�9.17
The total tonnage of 24 mt through containerswas handled across 1.93 million twenty feet equivalentunits (TEUs) (Table 7.2.15). Over the eight years pre-ceding 1998�9, container tonnage grew at 14.5 per centCAGR, while the TEUs grew at 13.9 per cent CAGR.The major portwise containers handled for 1998�9 aregiven in Table 7.2.16. While container traffic has beengrowing in India, the total TEUs handled across all theports are still less than the tenth port among developingcountries. The top two ports in the world classified asbeing in the developing countries handled over 16million TEUs, that is over 8 times the total TEUshandled at all Indian ports (Table 7.2.17).
Another issue with respect to containers is that mostof the containers from/to Indian ports are serviced byfeeder vessels for/after trans-shipment at the ports inColombo, the Middle East, or Singapore. Table 7.2.18provides data on this, from which we see that exceptthe Jawaharlal Nehur Port Trust (JNPT), all the otherports handle transhipped containers anywhere from 80to 100 per cent. One of the reasons for this is ourinconsistent cabotage policy. Draft restrictions thatprevent mother vessels from being directly received atIndian ports is another. Currently the JNPT is the onlyport that can receive mother vessels of up to 4000 TEUs.
Good multimodal evacuation infrastructure re-mains a problem. Three of the oldest ports (Calcutta,Chennai, and Mumbai) are located in the city centre,constraining evacuation to and from the port. Each ofthese ports now has an �alternate�, namely Haldia,Ennore, and JNPT respectively. (Ennore port, the firstcorporate port under the central government, is nearingcompletion and is expected to begin operations duringthis financial year.) The other major ports have scope
TABLE 7.2.15Container Traffic Handled at Major Ports
(�000s)
Year Tonnage total TEUs total
1990�1 8042 6811991�2 7627 6831992�3 9009 7991993�4 12,249 10521994�5 15,358 12571995�6 17,618 14491996�7 20,590 16981997�8 23,299 18911998�9 23,782 1932
Source: Indian Ports Association (2000).17 See section 7.2.
TABLE 7.2.14Commodity-wise Cargo Traffic Handled at Major Ports
(�000 tonnes)
Year POL Coal Iron ore Container Fertilizer Food- Others Total of which(%) (%) (%) (%) finished raw grains (%)
(%) material (%)(%)
Unloaded Loaded
1991�2 44 14 20 5 2 3 1 12 157,598 84,853 69,327
1992�3 44 14 18 5 2 2 0 13 166,611 95,810 67,380
1993�4 43 15 19 7 2 2 1 12 179,260 100,492 78,768
1994�5 42 15 18 8 2 2 0 13 197,262 113,776 83,486
1995�6 42 15 16 8 3 2 1 13 215,338 126,629 88,709
1996�7 43 15 15 9 1 2 1 13 227,257 139,208 88,049
1997�8 41 15 16 9 2 2 1 13 251,659 155,977 95,682
1998�9 43 16 14 9 2 2 1 14 251,720 164,601 87,119
Source: Indian Ports Association (2000).
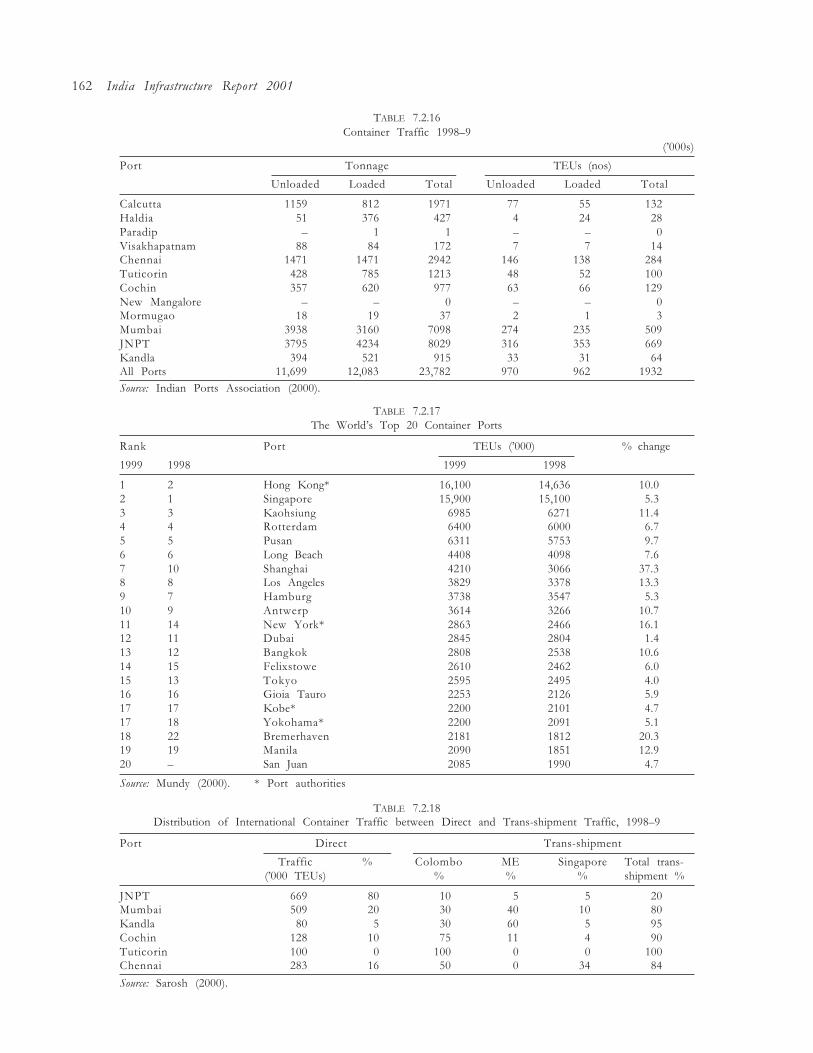
162 India Infrastructure Report 2001
TABLE 7.2.16Container Traffic 1998�9
(�000s)
Port Tonnage TEUs (nos)
Unloaded Loaded Total Unloaded Loaded Total
Calcutta 1159 812 1971 77 55 132Haldia 51 376 427 4 24 28Paradip � 1 1 � � 0Visakhapatnam 88 84 172 7 7 14Chennai 1471 1471 2942 146 138 284Tuticorin 428 785 1213 48 52 100Cochin 357 620 977 63 66 129New Mangalore � � 0 � � 0Mormugao 18 19 37 2 1 3Mumbai 3938 3160 7098 274 235 509JNPT 3795 4234 8029 316 353 669Kandla 394 521 915 33 31 64All Ports 11,699 12,083 23,782 970 962 1932Source: Indian Ports Association (2000).
TABLE 7.2.17The World�s Top 20 Container Ports
Rank Port TEUs (�000) % change
1999 1998 1999 1998
1 2 Hong Kong* 16,100 14,636 10.02 1 Singapore 15,900 15,100 5.33 3 Kaohsiung 6985 6271 11.44 4 Rotterdam 6400 6000 6.75 5 Pusan 6311 5753 9.76 6 Long Beach 4408 4098 7.67 10 Shanghai 4210 3066 37.38 8 Los Angeles 3829 3378 13.39 7 Hamburg 3738 3547 5.310 9 Antwerp 3614 3266 10.711 14 New York* 2863 2466 16.112 11 Dubai 2845 2804 1.413 12 Bangkok 2808 2538 10.614 15 Felixstowe 2610 2462 6.015 13 Tokyo 2595 2495 4.016 16 Gioia Tauro 2253 2126 5.917 17 Kobe* 2200 2101 4.717 18 Yokohama* 2200 2091 5.118 22 Bremerhaven 2181 1812 20.319 19 Manila 2090 1851 12.920 � San Juan 2085 1990 4.7
Source: Mundy (2000). * Port authorities
TABLE 7.2.18Distribution of International Container Traffic between Direct and Trans-shipment Traffic, 1998�9
Port Direct Trans-shipment
Traffic % Colombo ME Singapore Total trans-(�000 TEUs) % % % shipment %
JNPT 669 80 10 5 5 20Mumbai 509 20 30 40 10 80Kandla 80 5 30 60 5 95Cochin 128 10 75 11 4 90Tuticorin 100 0 100 0 0 100Chennai 283 16 50 0 34 84
Source: Sarosh (2000).
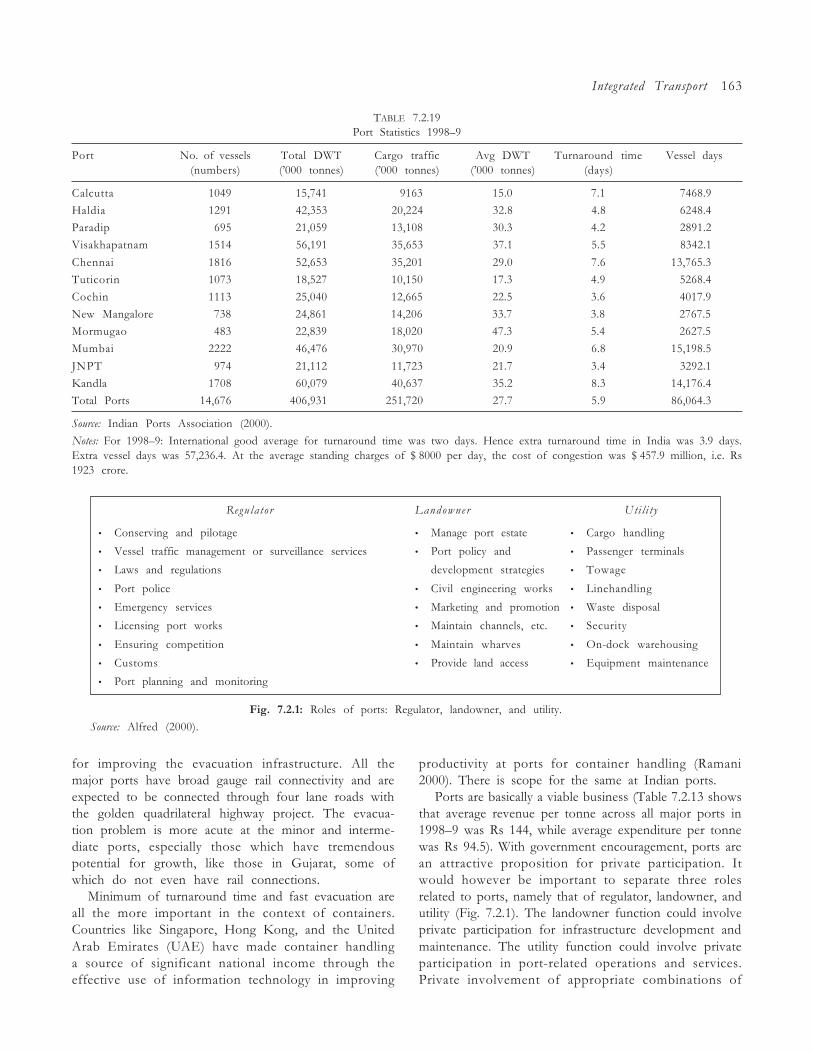
Integrated Transport 163
TABLE 7.2.19Port Statistics 1998�9
Port No. of vessels Total DWT Cargo traffic Avg DWT Turnaround time Vessel days(numbers) (�000 tonnes) (�000 tonnes) (�000 tonnes) (days)
Calcutta 1049 15,741 9163 15.0 7.1 07468.9
Haldia 1291 42,353 20,224 32.8 4.8 06248.4
Paradip 695 21,059 13,108 30.3 4.2 02891.2
Visakhapatnam 1514 56,191 35,653 37.1 5.5 8342.1
Chennai 1816 52,653 35,201 29.0 7.6 13,765.3
Tuticorin 1073 18,527 10,150 17.3 4.9 5268.4
Cochin 1113 25,040 12,665 22.5 3.6 4017.9
New Mangalore 738 24,861 14,206 33.7 3.8 2767.5
Mormugao 483 22,839 18,020 47.3 5.4 2627.5
Mumbai 2222 46,476 30,970 20.9 6.8 15,198.5
JNPT 974 21,112 11,723 21.7 3.4 3292.1
Kandla 1708 60,079 40,637 35.2 8.3 14,176.4
Total Ports 14,676 406,931 251,720 27.7 5.9 86,064.3
Source: Indian Ports Association (2000).
Notes: For 1998�9: International good average for turnaround time was two days. Hence extra turnaround time in India was 3.9 days.Extra vessel days was 57,236.4. At the average standing charges of $ 8000 per day, the cost of congestion was $ 457.9 million, i.e. Rs1923 crore.
Regulator
� Conserving and pilotage
� Vessel traffic management or surveillance services
� Laws and regulations
� Port police
� Emergency services
� Licensing port works
� Ensuring competition
� Customs
� Port planning and monitoring
Utility
� Cargo handling
� Passenger terminals
� Towage
� Linehandling
� Waste disposal
� Security
� On-dock warehousing
� Equipment maintenance
Landowner
� Manage port estate
� Port policy and
development strategies
� Civil engineering works
� Marketing and promotion
� Maintain channels, etc.
� Maintain wharves
� Provide land access
Fig. 7.2.1: Roles of ports: Regulator, landowner, and utility.
Source: Alfred (2000).
for improving the evacuation infrastructure. All themajor ports have broad gauge rail connectivity and areexpected to be connected through four lane roads withthe golden quadrilateral highway project. The evacua-tion problem is more acute at the minor and interme-diate ports, especially those which have tremendouspotential for growth, like those in Gujarat, some ofwhich do not even have rail connections.
Minimum of turnaround time and fast evacuation areall the more important in the context of containers.Countries like Singapore, Hong Kong, and the UnitedArab Emirates (UAE) have made container handlinga source of significant national income through theeffective use of information technology in improving
productivity at ports for container handling (Ramani2000). There is scope for the same at Indian ports.
Ports are basically a viable business (Table 7.2.13 showsthat average revenue per tonne across all major ports in1998�9 was Rs 144, while average expenditure per tonnewas Rs 94.5). With government encouragement, ports arean attractive proposition for private participation. Itwould however be important to separate three rolesrelated to ports, namely that of regulator, landowner, andutility (Fig. 7.2.1). The landowner function could involveprivate participation for infrastructure development andmaintenance. The utility function could involve privateparticipation in port-related operations and services.Private involvement of appropriate combinations of
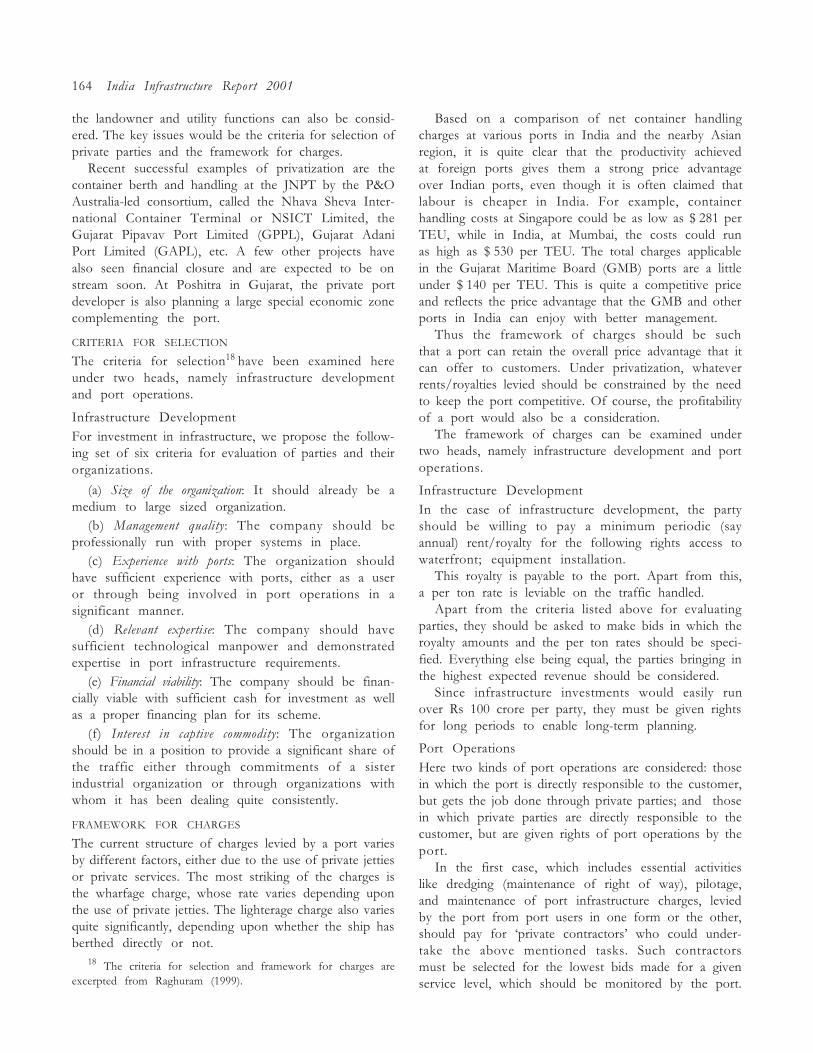
164 India Infrastructure Report 2001
the landowner and utility functions can also be consid-ered. The key issues would be the criteria for selection ofprivate parties and the framework for charges.
Recent successful examples of privatization are thecontainer berth and handling at the JNPT by the P&OAustralia-led consortium, called the Nhava Sheva Inter-national Container Terminal or NSICT Limited, theGujarat Pipavav Port Limited (GPPL), Gujarat AdaniPort Limited (GAPL), etc. A few other projects havealso seen financial closure and are expected to be onstream soon. At Poshitra in Gujarat, the private portdeveloper is also planning a large special economic zonecomplementing the port.
CRITERIA FOR SELECTION
The criteria for selection18 have been examined hereunder two heads, namely infrastructure developmentand port operations.
Infrastructure DevelopmentFor investment in infrastructure, we propose the follow-ing set of six criteria for evaluation of parties and theirorganizations.
(a) Size of the organization: It should already be amedium to large sized organization.
(b) Management quality: The company should beprofessionally run with proper systems in place.
(c) Experience with ports: The organization shouldhave sufficient experience with ports, either as a useror through being involved in port operations in asignificant manner.
(d) Relevant expertise: The company should havesufficient technological manpower and demonstratedexpertise in port infrastructure requirements.
(e) Financial viability: The company should be finan-cially viable with sufficient cash for investment as wellas a proper financing plan for its scheme.
(f) Interest in captive commodity: The organizationshould be in a position to provide a significant share ofthe traffic either through commitments of a sisterindustrial organization or through organizations withwhom it has been dealing quite consistently.
FRAMEWORK FOR CHARGES
The current structure of charges levied by a port variesby different factors, either due to the use of private jettiesor private services. The most striking of the charges isthe wharfage charge, whose rate varies depending uponthe use of private jetties. The lighterage charge also variesquite significantly, depending upon whether the ship hasberthed directly or not.
Based on a comparison of net container handlingcharges at various ports in India and the nearby Asianregion, it is quite clear that the productivity achievedat foreign ports gives them a strong price advantageover Indian ports, even though it is often claimed thatlabour is cheaper in India. For example, containerhandling costs at Singapore could be as low as $ 281 perTEU, while in India, at Mumbai, the costs could runas high as $ 530 per TEU. The total charges applicablein the Gujarat Maritime Board (GMB) ports are a littleunder $ 140 per TEU. This is quite a competitive priceand reflects the price advantage that the GMB and otherports in India can enjoy with better management.
Thus the framework of charges should be suchthat a port can retain the overall price advantage that itcan offer to customers. Under privatization, whateverrents/royalties levied should be constrained by the needto keep the port competitive. Of course, the profitabilityof a port would also be a consideration.
The framework of charges can be examined undertwo heads, namely infrastructure development and portoperations.
Infrastructure DevelopmentIn the case of infrastructure development, the partyshould be willing to pay a minimum periodic (sayannual) rent/royalty for the following rights access towaterfront; equipment installation.
This royalty is payable to the port. Apart from this,a per ton rate is leviable on the traffic handled.
Apart from the criteria listed above for evaluatingparties, they should be asked to make bids in which theroyalty amounts and the per ton rates should be speci-fied. Everything else being equal, the parties bringing inthe highest expected revenue should be considered.
Since infrastructure investments would easily runover Rs 100 crore per party, they must be given rightsfor long periods to enable long-term planning.
Port OperationsHere two kinds of port operations are considered: thosein which the port is directly responsible to the customer,but gets the job done through private parties; and thosein which private parties are directly responsible to thecustomer, but are given rights of port operations by theport.
In the first case, which includes essential activitieslike dredging (maintenance of right of way), pilotage,and maintenance of port infrastructure charges, leviedby the port from port users in one form or the other,should pay for �private contractors� who could under-take the above mentioned tasks. Such contractorsmust be selected for the lowest bids made for a givenservice level, which should be monitored by the port.
18 The criteria for selection and framework for charges areexcerpted from Raghuram (1999).
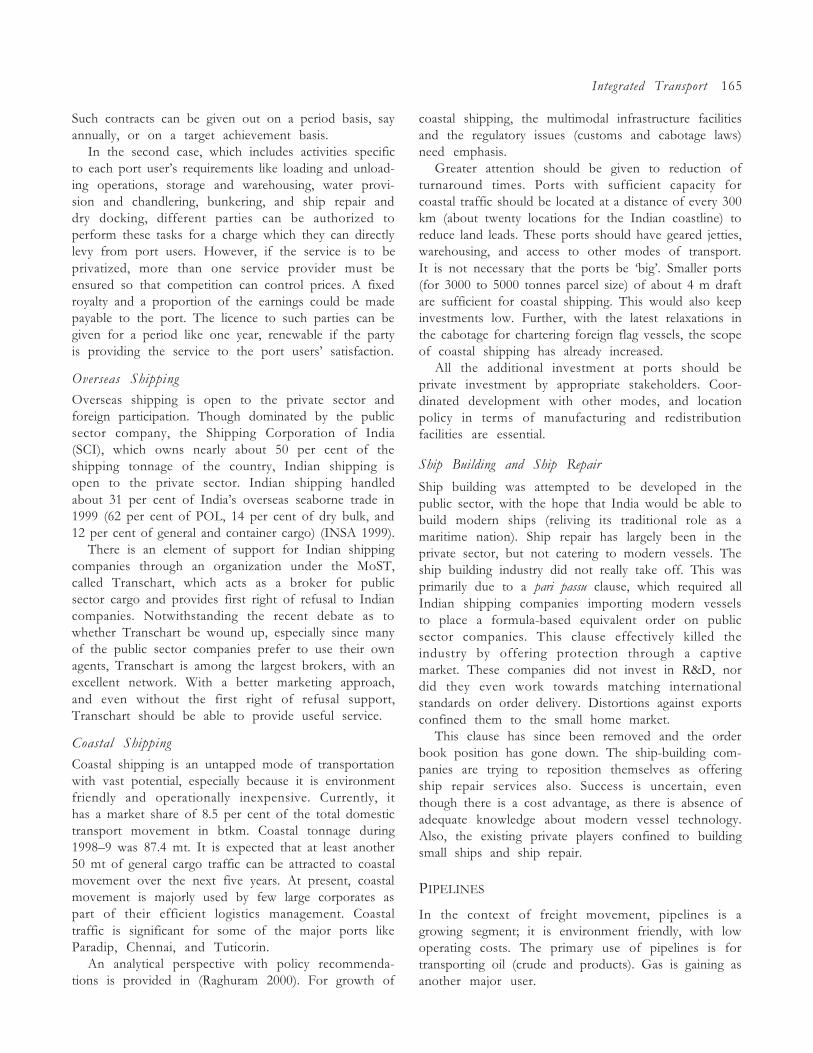
Integrated Transport 165
Such contracts can be given out on a period basis, sayannually, or on a target achievement basis.
In the second case, which includes activities specificto each port user�s requirements like loading and unload-ing operations, storage and warehousing, water provi-sion and chandlering, bunkering, and ship repair anddry docking, different parties can be authorized toperform these tasks for a charge which they can directlylevy from port users. However, if the service is to beprivatized, more than one service provider must beensured so that competition can control prices. A fixedroyalty and a proportion of the earnings could be madepayable to the port. The licence to such parties can begiven for a period like one year, renewable if the partyis providing the service to the port users� satisfaction.
Overseas Shipping
Overseas shipping is open to the private sector andforeign participation. Though dominated by the publicsector company, the Shipping Corporation of India(SCI), which owns nearly about 50 per cent of theshipping tonnage of the country, Indian shipping isopen to the private sector. Indian shipping handledabout 31 per cent of India�s overseas seaborne trade in1999 (62 per cent of POL, 14 per cent of dry bulk, and12 per cent of general and container cargo) (INSA 1999).
There is an element of support for Indian shippingcompanies through an organization under the MoST,called Transchart, which acts as a broker for publicsector cargo and provides first right of refusal to Indiancompanies. Notwithstanding the recent debate as towhether Transchart be wound up, especially since manyof the public sector companies prefer to use their ownagents, Transchart is among the largest brokers, with anexcellent network. With a better marketing approach,and even without the first right of refusal support,Transchart should be able to provide useful service.
Coastal Shipping
Coastal shipping is an untapped mode of transportationwith vast potential, especially because it is environmentfriendly and operationally inexpensive. Currently, ithas a market share of 8.5 per cent of the total domestictransport movement in btkm. Coastal tonnage during1998�9 was 87.4 mt. It is expected that at least another50 mt of general cargo traffic can be attracted to coastalmovement over the next five years. At present, coastalmovement is majorly used by few large corporates aspart of their efficient logistics management. Coastaltraffic is significant for some of the major ports likeParadip, Chennai, and Tuticorin.
An analytical perspective with policy recommenda-tions is provided in (Raghuram 2000). For growth of
coastal shipping, the multimodal infrastructure facilitiesand the regulatory issues (customs and cabotage laws)need emphasis.
Greater attention should be given to reduction ofturnaround times. Ports with sufficient capacity forcoastal traffic should be located at a distance of every 300km (about twenty locations for the Indian coastline) toreduce land leads. These ports should have geared jetties,warehousing, and access to other modes of transport.It is not necessary that the ports be �big�. Smaller ports(for 3000 to 5000 tonnes parcel size) of about 4 m draftare sufficient for coastal shipping. This would also keepinvestments low. Further, with the latest relaxations inthe cabotage for chartering foreign flag vessels, the scopeof coastal shipping has already increased.
All the additional investment at ports should beprivate investment by appropriate stakeholders. Coor-dinated development with other modes, and locationpolicy in terms of manufacturing and redistributionfacilities are essential.
Ship Building and Ship Repair
Ship building was attempted to be developed in thepublic sector, with the hope that India would be able tobuild modern ships (reliving its traditional role as amaritime nation). Ship repair has largely been in theprivate sector, but not catering to modern vessels. Theship building industry did not really take off. This wasprimarily due to a pari passu clause, which required allIndian shipping companies importing modern vesselsto place a formula-based equivalent order on publicsector companies. This clause effectively killed theindustry by offering protection through a captivemarket. These companies did not invest in R&D, nordid they even work towards matching internationalstandards on order delivery. Distortions against exportsconfined them to the small home market.
This clause has since been removed and the orderbook position has gone down. The ship-building com-panies are trying to reposition themselves as offeringship repair services also. Success is uncertain, eventhough there is a cost advantage, as there is absence ofadequate knowledge about modern vessel technology.Also, the existing private players confined to buildingsmall ships and ship repair.
PIPELINES
In the context of freight movement, pipelines is agrowing segment; it is environment friendly, with lowoperating costs. The primary use of pipelines is fortransporting oil (crude and products). Gas is gaining asanother major user.
166 India Infrastructure Report 2001
No data are available on the tonne km movement ofwater through pipelines. However, for oil, one canarrive at such a figure using the data provided by Baruaand Madhavan in this report.19 Assuming that maximumcapacity exists throughout the pipeline and capacityutilization is 100 per cent, the total btkm would be 70.2(51.5 btkm of crude and 18.7 of products). This wouldamount to about an 8 per cent share of total domesticmovement. In terms of share of originating tonnes ofproduct from refineries/imports, pipelines currentlyaccount for 20 per cent of the mode primary movement.This is expected to reach 40 per cent in the next coupleof years.
The crucial issue in pipeline development is enablingit to become a �common carrier�, as opposed to a captivecarrier. This requires appropriate institutional infra-structure and regulation. Petronet and Petronet�LNGare two companies which have been set up as holdingSPVs, with equity participation from the oil companies.While each new pipeline being developed has stake-holding by the primary user in its specific SPV, the issueof making it a common carrier is still not resolved.Further, the issue of opening up the existing not-so-insignificant pipeline network from its captive formatstill remains. Issues related to government policy,regulation, and tariff gain significance in this context.This chapter criticizes the current SPV route for pipelinedevelopment and recommends that the oil majors shouldbe allowed to build the infrastructure and a regulatorkept in place to ensure common carrier access. Theunderlying issue is that of incentive compatibility fordriving infrastructure development.
MULTIMODAL TRANSPORT
Unless the movement is by road all the way, almostevery commodity and passenger would require to usemore than one mode, since at least the �first� and the�last� miles would be by road (or on foot). Ensuringsmooth inter-modal transfer is essential. Today,multimodal transport gains even more importance withmore than one mode constituting significant segments oftransportation. Apart from appropriate infrastructure,this requires a �single window� service interface. Forfreight movement, containerization as a technology hasenabled multimodal freight transport substantiallythroughout the world. India is catching up, but has along way to go.
During 1998�9, out of 1.93 million export/importTEUs handled at major ports, 0.58 million (30 per cent)originated at container freight stations (CFSs) other than
port sites. Out of this, 0.33 million (17 per cent) wereconnected with inland locations by rail through inlandcontainer depots (ICDs) (Indian Ports Association 2000).The slow movement towards using networked com-puter services, especially electronic data interchange(EDI), is also an indication of the growing preference forcontainerization.
Apart from multimodal transport for the export/import business, the potential for domestic transporta-tion remains far from being fully exploited. Multimodaltransport also needs to be a focus area for carryingpassengers. It has a significant bearing on developmentof high speed, high capacity corridors (intercity andintracity), and location of terminals (airports, railwaystations, ferry ports, etc.).
Various infrastructural issues20 were identified in astudy by the then Shipping Credit and InvestmentCorporation of India (SCICI) (now a division of theIndustrial Credit and Investment Corporation of India[ICICI] in the mid-1990s.
In the first place, the container handling facilities at the portsare not adequate to attract main line container vessels whocontinue to rely to a large extent on feeder services entailingadditional cost. Secondly, the cost of moving a containerthrough an Indian port is comparatively higher than the costin other South-East Asian ports. Thirdly, both road transportand rail transport have not been adequately developed asyet for the inland movement of containers. The nationalhighways are already overburdened to cope with the increas-ing volume of container traffic. The position in regard to railtransport is not satisfactory either. The quality of rail servicefor catering to container traffic needs improvement. Moreregular scheduled rail services carrying containerized cargoconnecting ICDs and gateway ports are necessary. Besides, theprogress in the modernization and technological upgradationof Railways in several areas such as electrification, trackrenewal, conversion of narrow gauges into broad gauges,signaling system computerization, etc. have been slow, obvi-ously due to resources crunch. Apart from these factors, thetrade appears to be besieged with a number of problemsrelating to documentation, handling and more importantlylack of coordination among the agencies involved such asports, customs, Railways, carriers agents, etc. As a result, mostshippers, consignees and shipping lines are still wary ofpatronizing ICDs to the maximum extent. There are severalinter-related and complementary elements�procedures andformalities�at different points in the multimodal transportchain which need to be coordinated preferably under theoverall control of a single authority in order to ensure smoothand efficient operations. The need for establishing such a highpowered national coordinating body for the purpose has beenemphasized at several forums in the recent past.
20 The following issues are modified excerpts from Raghuram(1999).19 See section 7.4.
Integrated Transport 167
Multimodal transport requires significant investmentsin the following:
� Ships (container ships, pallet ships, roll-on�roff-off(ro�ro) ships, barge carriers, multipurpose ships, etc.).� Cargo units (pallets, containers, wheeled units, barges,etc.).� Port facilities (container berths/multipurpose berths,gantry cranes, mobile cranes, forklift trucks, straddlecarriers, etc.).� Transport vehicles (trucks, trailers, etc.).� Inland transport facilities (roads, railways, inlandwaterways, etc.).� Inland container depots with handling and storagefacilities.� Container freight stations, warehouses, packagingorganizations, etc.
All the above would be attractive for private invest-ment and operation. Ensuring of coordinated develop-ment would be the only responsibility of the state.
IR has the potential of becoming a major player inthe multimodal (export/import and domestic) transportsystem in India. The following are some of the areaswhich would need examination:
� Development of non-containerized multimodaltransport through appropriate rail�road and rail�water
trans-shipment facilities, under a single transport docu-ment. Joint ventures could be a possible organizationalform to ensure this.� Development of containerized multimodal transportby :
� improving service levels to the Container Corpo-ration of India (CONCOR) through guaranteed de-parture and transit times and associated incentives andpenalties;� providing unutilized and strategically located rail-way land for ICD and CFS use, both for internationaland domestic trade;� manufacturing and maintaining railway wagonflats for carrying containers;� offering innovative �bridge� routes, possibly incollaboration with CONCOR (for example tea ex-ports to the Middle East and Europe from the north-east could be minibridged to Mumbai port rather thanbeing exported through Calcutta which involvesfeedering via Singapore);� nominating certain routes for �no electrification�so that double stack container trains can be run onhigh container traffic routes, exploiting cost econo-mies;� appropriate pricing strategies, as a function ofservice levels and value offered to the customers.
7.3 PORT AND SHIPMENT MANAGEMENT AT SINGAPORE PORT:THE REVOLUTION IN THE USE OF ELECTRONIC DATA INTERCHANGE
K. V. Ramani
Singapore had its humble beginnings as a riverine porton the banks of the Singapore river in 1819. TodaySingapore port is the busiest seaport in the world,handling more than 15 million containers per year. Inthe last few years, international trade handled annuallyby the Port of Singapore Authority (PSA), valued atUS $ 300 billion, has been almost four times the grossdomestic product (GDP) of Singapore itself. The PSA,which is a major trans-shipment port, serves as a superlogistics hub for the entire Asia�Pacific region.
Dubai is another example of a port that serves anentire region. The Dubai Ports Authority (DPA), whichoperates the twin terminals of Port Rashid and Jebel Ali,is positioning itself as one of the most prominent playerson the economic scene in Dubai and the Middle East.The DPA does more than channel goods to and fromthe domestic market. It acts as the distribution hubfor the whole region which includes the Organizationof the Petroleum Exporting Countries (OPEC), Iran,
the Indian subcontinent, and the Commonwealth ofIndependent States. It is worthwhile to mention herethat Jebel Ali Port in Dubai is a man-made port,strategically constructed by the DPA to promote theeconomic development of the Gulf region.
India has several natural ports but has not beenable to attract a significant level of the internationalcargo traffic. Several other countries such as Sri Lanka,Malaysia, Indonesia, and the Philippines offer muchbetter port facilities. If India is to actively participatein international trade, and get even a share of interna-tional shipping proportional to its trade, it has tomodernize its seaports and improve working efficiency.
Port planning has undergone several fundamentalchanges over a period of time; some of these are des-cribed here. Traditional ports were designed to serve thelocal community around the port, while modern portsare designed as trans-shipment ports to serve the needsof a geographically larger dispersed community. Port
168 India Infrastructure Report 2001
configurations and operations in the past were influ-enced by the demand for multipurpose cargo handling.As a result, most traditional ports handled all types ofcargo, though not very effectively. Today�s trend is tobuild dedicated ports or at least terminals for handlingeach type of cargo (such as containers) effectively andefficiently, thereby offering high quality of service.
Developments in ship technology, port technology,and information technology (IT) are providing newinsights into port planning and configuration. Con-tainer traffic is rapidly gaining popularity on accountof security, safety, and cost effectiveness. Bigger andbigger ships, such as Post-Panamax vessels carrying 6000containers, demand sophisticated port facilities. Evencountries like India which have policies and modes ofoperation that discriminate against containerizationand multimodal traffic are forced to containerize due tothe pressure of exports and imports. Port operationshave perhaps seen the sharpest fall in labour intensity,especially blue collar work. Indeed, the handlingtechnologies and port work flow organization havechanged enough to render the older intense labour-usingmodes absolutely inefficient. The logistics and systemicgains possible with containerization are denied if anefficient factory shopfloor-like organization of portsis not maintained.
Non-POL (petroleum oil and lubricant) bulk includesfertilizers, coal, foodgrains, and other such cargo usuallyassumed to be not amenable to containerization. POLhandling almost from the very beginning, has beenthrough dedicated terminals. POL handling has techno-logical characteristics very different from that of con-tainers. Many bulk items like ores, fertilizers, andfoodgrains have characteristics of material handling andmay impose negative externalities on other more generalcargo and container operations, when carried out closeto container berths.
Container traffic has been growing rapidly sinceits introduction in the US coastal services in 1957�8. TheAustralian coastal trade was containerized in 1959; theEurope�North America trade in 1966, the Far West�North American trade in 1967, and the Europe�Far Easttrade in 1971. By the mid-1970s container traffic hadbecome very popular on all the three arterial traderoutes of the world, namely the Pacific, Atlantic, andAsia�Pacific routes. Today, more than 90 per cent ofinternational cargo moves through seaports and 80per cent of seaborne cargo moves in containers throughmajor seaports.
MANAGEMENT OF CONTAINER TERMINALS
The most important tasks in the management of acontainer terminal consist of berth allocation, yard
planning, stowage planning, and logistics planning ofcontainer operations.
Information regarding the status of a ship, whichindicates whether the ship is a priority ship or not,besides the nature of its cargo, is an important determi-nant in berth allocation. Berth allocation is extremelyimportant since it has significant influence on theperformance of both the ship and the berth. Mostinternational seaports use computer-based expert sys-tems for berth allocation, which assign berths to shipsby matching the ship and the port characteristics.
Yard planning thus involves optimal allocation ofstorage areas for import, export, and trans-shipmentcontainers. Most major international seaports use com-puter-based expert systems for yard planning. Whileyard planning assigns storage locations to the containersin the yard, stowage planning assigns storage locationsto the containers in the bay of the ship. Stowageplanning is also usually done with the help of expertsystems which match the ship�s bay characteristics withcontainer details and marine considerations. Logisticsplanning deals with assigning and coordinating theoperations of port equipment such as quay cranes, primemovers, and yard cranes in the transportation of contain-ers between the ship�s bay and the storage yards.Logistics planning and its execution are the most chal-lenging of all the operations at ports. It is here, throughappropriate information and communication technol-ogy and a disciplined approach, that ports like Jebel Alior Singapore have been able to take the lead. Thechallenge for ports is to reduce the overall average timea ship waits in unloading and loading while restrictingthe maximum time taken by any ship within the givenconstraints of availability of cranes, prime movers,storage yards, or spaces within ships. Much administra-tion is possible through operations research (OR) andon-line (on time) data generation and use.
The second level of technological change that hasthe potential to greatly decrease the role of white collarworkers and remove dead-weight losses to the economyis in automation of documentation, which is generatedin the interface of the port, the customer, and manyother agencies. Indeed, ports and countries in thisrace would be pushed into the feeder and secondarymarkets. More importantly, such ports would imposehuge relative costs on their international traders.
Numerous government bodies usually regulateinternational trade through ports. In addition, portcustoms, immigration, health, shipping, security andother governmental authorities or their agents (such asbanks), and operators and their agents all claim a needfor detailed and repetitive documentation. Although thebasic information regarding shipment of goods is quite
Integrated Transport 169
simple, each of the parties or agencies to the shipmentdemands this information in its own preferred or tradi-tional format and at particular times and locations.
The extent of this documentation work far exceedsmany real requirements. However, the tremendousimportance of streamlining this paperwork can beseen from the following excerpts from a report21 by theDepartment of Transportation and the National Com-mittee of International Trade Documentation, USA.
� A total of 46 different types of firms and governmentagencies are regularly involved in international trade inthe United States.� As many as 28 of these parties may participate in anexport shipment.� A total 125 different types of documents are in regularand special use.� The 125 types of documents represent more than1000 separate forms.� A total of 80 types of documents are in regular use,and the remaining 45 types of documents are in specialuse.� Average shipments involve 46 separate documents,with an average of over 360 copies of documents inspecial use.� US international trade annually creates an estimated828 million documents and these generate an estimated6.5 billion copies.� Average export and import shipments require 64man-hours to prepare and process.� Total US international trade documentation annuallyconsumes more than one billion man-hours, equivalentto more than 144 million days of work and equal to600,000 work years.� Average documentation cost per international ship-ment amounted to US $ 351.04 [in 1982].� On the basis of current shipping volumes, totaldocumentation costs aggregate to almost US $ 6.5 billiona year and represented 7.5 per cent of the value of totalUS export and import shipments [in 1982].� The report recommends the elimination of 85 docu-ments. If achieved, this would eliminate over 400 millionseparate papers (and almost 4 billion copies per year)with an aggregate saving of an estimated US $ 3 billionper year.
It can be seen from this that the port interface withother departments and agencies is governed by a mul-titude of processes and procedures and requires a tremen-dous amount of paperwork involving many governmentand private agencies. Studies by international trade
bodies estimate the cost of documentation at 7�10per cent of the value of goods transacted. Even a possiblesaving of 1 per cent in trade documentation costswould lead to a substantial saving for any countryinvolved in international trade. Potentially much ofthese costs can be saved through computerization, in-cluding use of the Internet, and the potential excesswhite collar manpower is large.
Port operations are very complex, especially themanagement of container terminals. Container termi-nals are highly capital intensive. They have to be wellmanaged in order to realize their potential capacity andachieve a reasonable level of efficiency and serviceperformance.
Advancements in IT provide a wide range of optionsfor port management to computerize operations to saveon capital invested in ports and also costs for clients.
Some of the IT applications for port management arein the areas of:
� Management Information Systems (MIS) to monitorport performance indicators such as ship turnaroundtime, port resource utilization, and costs for providingservices (Holguin-Veras and Walton 1994).
� Executive Information System for investment deci-sions and port planning decisions.
� Decision Support System to facilitate the logisticsplanning of port operations for loading and unloadingcargo of various types (Ramani 1996).
� Expert Systems for berth allocation, stowage plan-ning, and yard planning.
� Computer simulations to support port operationalplanning.
Electronic Data Interchange (EDI), to facilitate theport interface with other departments and agenciesinvolved in trade and commerce (Ramani 1995), is thekey to the next revolution in port management.
Trade documentation is a complex and expensiveactivity. The Trade Development Board (TDB), a statu-tory board responsible for managing all incoming andoutgoing trade activities at the Singapore port, washandling about 10,000 declarations daily in 1986 and thenumber was rising. Yeo Seng Techm, chief executiveofficer of the TDB, Singapore, explained the situation hisagency faced in 1987:
Our agency was loaded with paperwork in 1987 we werehandling about 10,000 declarations each day, and the numberwas rising. And TDB was only part of the system. The tradeprocess involves agencies such as the port authorities, customs,and so on, each with its own rules. Shipping agents andfreight forwarders prepared all the documents and physicallycarried them to service centres where they would be handled21 �Paperwork or Profits�, 1982.
170 India Infrastructure Report 2001
manually by government officials and clerks. Two-day turn-around was common. The cost of these transactions washigh for all concerned. Swedish and US studies of the costs oftrade documentation in those countries estimated the cost at4.7 per cent of the values of goods shipped. And suchtransactions are error prone. A British study estimated thathalf of all Letter of Credit (LoC) applications were turneddown on first application due to errors in completion. Thisseemed like a lot of work with little payoff. It also providedan opportunity for us. Singapore is a small country. We haveno natural resources. Our population has stabilised. We knowwe cannot compete by just bringing in new labour. If we areto be successful, we must improve our competitiveness inevery way and especially in external trade, which is our largestbusiness sector. This means cutting costs. That 4.7 per cent wasthe best place to start.
EDI offers a convenient and cost-effective alternativefor processing and exchanging documents and informa-tion electronically. For example, Singapore achieved asaving of more than S $ 2 billion with the help ofTRADENET, an EDI application (King and Konsynski1990).
TRADENET, an electronic network to facilitateinternational trade, integrates all the processing proce-dures for import, export, and trans-shipment documentsand licences. It uses a single document to satisfy all thetrade documentation needs of Singapore. The samedocument is routed electronically through all the partiesassociated with trading such as traders, freight forward-ers, shipping lines, and the various government andcontrolling agencies. All these parties22 are linked toeach other electronically under a large IBM mainframecomputer system owned and operated by the SingaporeNetwork Services (SNS) Pvt. Ltd.
The host computer at SNS acts as an electronicclearing house for TRADENET. It receives and trans-mits trading papers and forwards them to the relevantgovernment agencies for processing and approval.For example, a trader can obtain approval from the TDBby filling up a TDB declaration form available on hisPersonal Computer (PC). The TRADENET softwarethen automatically establishes communications with theTRADENET computer at SNS, transmits his declara-tion to the TDB and receives the TDB approval in hiselectronic mailbox. Subsequently, this approval is trans-mitted to other parties such as customs and shippinglines for further processing. The software also ensures
confidentiality and integrity of all the communicationbetween trading partners and the approving authorities.It permits all payments for government duties and feesfor TDB, customs, and other controlling agencies to bemade electronically. It also offers an on-line enquirysystem, which gives the status of any trade declarationat any point in time, twenty-four hours a day. UnderTRADENET, most of the transactions are processedwithin 15 to 30 minutes.
TRADENET also provides a comprehensive infor-mation service. Direct access to critical company andbusiness information such as company and businessinformation and trade opportunities facilitates users inmaking key decisions quickly so as to gain an edge overtheir competitors. Traders can gain access to third-partydatabases owned by PSA, the Civil Aviation Authorityof Singapore (CAAS), etc. on shipping schedules, airlineschedules, and related information. Its electronic bulle-tin board has eliminated the need to subscribe tomultiple information providers. With informationservices, TRADENET subscribers are able to enjoyeffective business communication and speedy informa-tion.
Starting with a pilot group of 50 users in 1989,TRADENET has more than 2000 users today account-ing for almost 90 per cent of the traders. Several freightforwarders have reported savings of 25 to 30 per centin handling trade documentation on account ofTRADENET. The total time for documentation pro-cessing has been reduced from an average of two daysin 1987 to less than half a day in 1991. Governmentalagency duties, such as customs and excise, are paideven before the cargo arrives. But the biggest pay-offfrom TRADENET is perhaps the enormous growthin international trade over the last few years, makingthe Singapore economy very competitive.
PORTNET, another EDI network of the PSA, pro-vides an on-line computer service to support the dailyoperations at the port. For example, the shipping lines/agents can input the sailing schedule of their vesselinto PORTNET and obtain information on servicesthey need, such as identifying a second carrier for theirtransshipment cargo. The TRADENET�PORTNETlink provides an interface between the maritime andtrading communities to electronically exchange real-time operational and trade information.
To better serve the maritime and trading communi-ties, a new system called Maritime Information System(MAINS) is currently under development. MAINSwill generate cargo manifests, match them againstimport/export permits electronically and eliminatesome manual procedures, such as storage/despatch ofpaper manifests to TDB and customs and endorsing
22 These are the Trade Development Authority (TDA), thePort of Singapore (PSA), customs, controlling bodies, the CivilAviation Authority of Singapore (CAAS), Changi InternationalAir Services (CIAS), for passenger traffic, Singapore AirlinesTransport Services (SATS) for cargo, air cargo agents, traders,freight forwarders, shipping agents, among others!
Integrated Transport 171
of customs permits by ship masters. It will provideinstantaneous confirmation to shippers about theirimport/export consignments. Shipping lines will receivetheir bills of lading electronically from their shippers.Above all, MAINS will have an on-line real-time com-prehensive database of shipping schedules and cargoconsignments to meet almost all the needs of themaritime and trading communities.
Why should a port be concerned with cost and timereduction for shippers and others? Clearly, the port itselfwould not be able to internalize all or even a great dealof the gains. The gains would be largely external. Yetthe port, of all institutions involved in internationaltrade, is crucially placed to bring about this revolution-ary change. Are Indian ports ready to begin thinkingabout this next round of technological change?
7.4 AT THE CROSSROADS:PIPELINE INFRASTRUCTURE FOR OIL PRODUCTS
Samir K. Barua and T. Madhavan
INTRODUCTION
There are two types of oil pipelines: crude oil pipelinesand product pipelines. While the former carry crude oilto refineries, the latter transport refined products suchas gasoline, kerosene, jet fuel, and heating oil fromrefineries to the market. Offshore (submarine) pipelinesare needed for transporting oil from offshore wells tooverland pipelines, which further transport the oil to arefinery. They are more expensive and difficult to buildthan overland pipelines. Several developments in thelast fifty years such as the use of �pigs� to clean theinterior of pipelines, the use of �batching� to transportdifferent petroleum products through the same pipeline,the use of cathodic protection to reduce corrosion ofpipelines, and the use computers and communicationtechnologies to monitor and control pipeline operationshave seen pipelines emerge as the preferred mode oftransport. Pipelines are safer and more convenient andreliable and environment friendly than other modes oftransport for bulk liquids. Although most countrieshave an extensive network of pipelines, its contributionand importance to the economy goes unrecognized bythe general public. These are now discussed.
OPERATION
Modern long distance pipelines operations are largelyautomated. The various flow parameters are automati-cally monitored and the requisite feedback sent tooperate the valves and pumps attached to pipelines.Manual intervention is essentially needed to direct dif-ferent batches of liquids to different temporary storagetanks or when the systems must be shut down or re-started.
ADVANTAGES OF PIPELINE TRANSPORTATION
� Transit losses are also lower in pipeline transporta-tion vis-à-vis other modes.
� Pipeline transportation consumes the least energy;hence it has lower energy intensiveness (see Figs 7.4.1and 7.4.2).� Pipelines also offer large-scale economies in transpor-tation.� It is a reliable mode.� As the handling of products is minimal, it is a safemode.� Environmental impact during construction, opera-tion, and maintenance is negligible and reversible. Thusit is environment friendly (see Box 7.4.1).� Unlike other modes, in which different containersmay be required for different products, pipeline trans-portation can handle multiple products.� Pipeline transportation is flexible, as the volumetransported can be increased/decreased quickly and atnegligible cost.� Additional energy consumption for transportation ofdead-weight of containers is not incurred in pipelinetransportation.
OIL PIPELINES IN INDIA
Despite a well-established industrial base, India�s con-sumption of oil and gas as primary sources of energy(Table 7.4.1) is well below world percentages.
The growth rate in the consumption of oil products inIndia over the last three decades, however, has beenamong the highest in the world (Table 7.4.2). The con-sumption of oil products has grown at the rate of about5.5�6 per cent per annum over the thirty-year period. Incontrast, world consumption of oil grew at the rate ofabout 1.5 per cent per annum in the 1990s. In India percapita consumption at 93 kg per annum is about one-tenth that of the world, which is 920 kg. A comparisonof growth rates of oil consumption and gross domesticproduct (GDP) shows that the elasticity of oil consump-tion has declined over the years. It is currently less than 1.
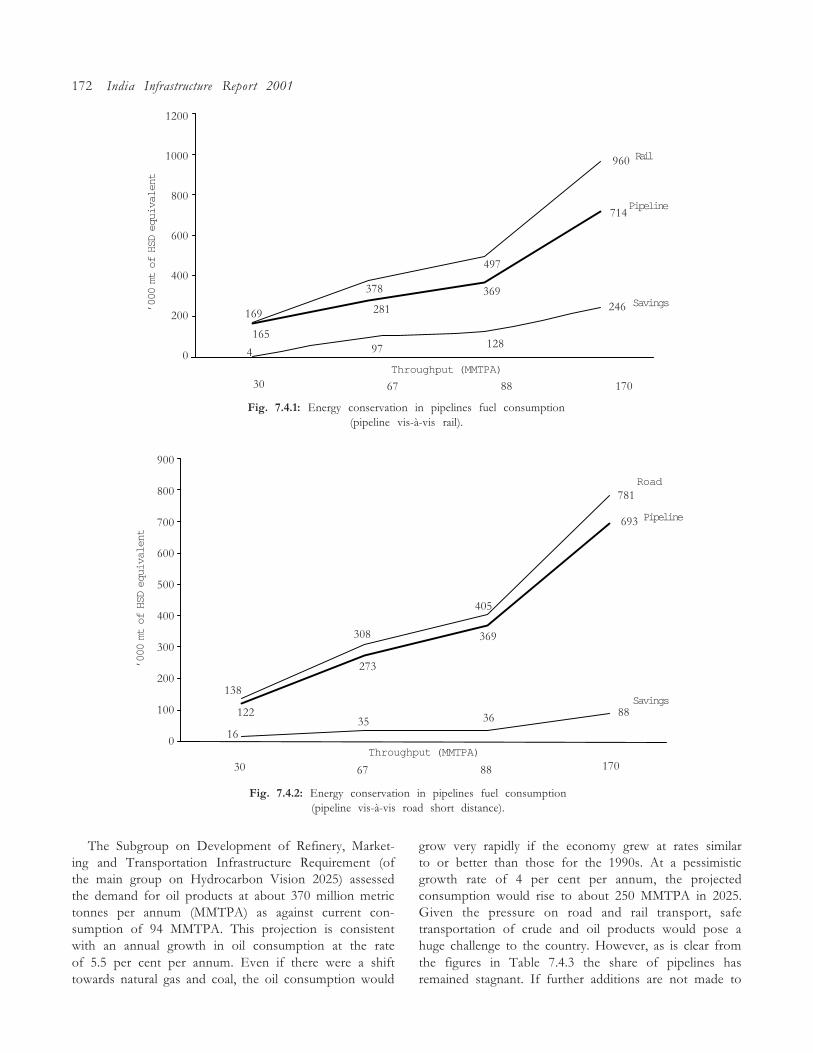
172 India Infrastructure Report 2001
1200
1000
800
600
400
200
0
’000
mt o
f HS
D eq
uiva
lent
169
165
4
378
281
97
497
369
128
960
714
246
The Subgroup on Development of Refinery, Market-ing and Transportation Infrastructure Requirement (ofthe main group on Hydrocarbon Vision 2025) assessedthe demand for oil products at about 370 million metrictonnes per annum (MMTPA) as against current con-sumption of 94 MMTPA. This projection is consistentwith an annual growth in oil consumption at the rateof 5.5 per cent per annum. Even if there were a shifttowards natural gas and coal, the oil consumption would
grow very rapidly if the economy grew at rates similarto or better than those for the 1990s. At a pessimisticgrowth rate of 4 per cent per annum, the projectedconsumption would rise to about 250 MMTPA in 2025.Given the pressure on road and rail transport, safetransportation of crude and oil products would pose ahuge challenge to the country. However, as is clear fromthe figures in Table 7.4.3 the share of pipelines hasremained stagnant. If further additions are not made to
Throughput (MMTPA)
170886730
Rail
Pipeline
Savings
Fig. 7.4.1: Energy conservation in pipelines fuel consumption(pipeline vis-à-vis rail).
900
800
700
600
500
400
300
200
100
0
’000
mt o
f HS
D eq
uiva
lent
30 67 88 170Throughput (MMTPA)
16
122
138
35
273
308
405
369
36
781
693
88
Road
Pipeline
Savings
Fig. 7.4.2: Energy conservation in pipelines fuel consumption(pipeline vis-à-vis road short distance).
Integrated Transport 173
pipeline infrastructure in India, the percentage share ofpipelines in transportation of oil would go down sub-stantially by 2025. There is therefore an urgent need toplan and implement a network of pipelines for distribu-tion of crude and oil products.
TABLE 7.4.1Primary Sources of Energy: India and World
(per cent)
Source India World
Oil 32 40
Gas 8 23
Others 60 37
TABLE 7.4.2Growth Rates in Consumption of Oil
(per cent)
Period Compounded annual Compounded annualgrowth rate in oil GDP growth rate
consumption
1971�80 5.63 3.20
1981�90 6.13 5.60
1991�9 5.64 5.80
The growth rate in demand for pipelines is likely toincrease more rapidly than that of oil for several reasons.Given the environment friendly nature of pipelinetransportation, 60�70 per cent of transportation of oilproducts is done through pipelines in most developedcountries. A comparison of the shares of variousmodes between India and the United States (Table 7.4.4)clearly shows that with increasing urbanization andgreater concern for environment and safety, the share ofpipeline transportation is likely to increase in India. Thegrowth in pipelines stagnated to accommodate the de-mand from railways to use oil tankers for transportationof oil. With the dismantling of controls in the oil sector,the formal and informal restraints on adding pipelineswould cease. There is therefore likely to be an explosiveaddition to pipeline capacity in the near future.
The major existing crude and oil products pipelinesin India are listed in Table 7.4.5. The projected additionto capacity, based on the plans of various companies, ispresented in Table 7.4.6.
The 11,500 km of pipelines under consideration orconceptualization would require an investment of overRs 15,000 crore. These pipelines have been conceived tocreate a network that could be connected to form a grid.As of now, the density of pipelines in southern India isdistinctly low.
EXISTING POLICY
While energy consumption varies between 50 and 135British thermal units (BTU) per tonne km for transpor-tation of oil products by pipelines, movement byrail consumes about 320 BTU per tonne km. The rail-ways are facing increasing constraints in movement ofoil products due to saturation and mismanagementof track capacity and non-availability of locomotivesand tank wagons. The utilization of tank wagons hasshown little improvement. Recognizing the importanceof creating oil pipeline infrastructure, the governmentformed a working group of general managers from
TABLE 7.4.3Shares of Alternative Modes for Transportation of Oil in India
Mode 1993�4 1994�5 1995�6 1996�7
MMT per cent MMT per cent MMT per cent MMT per centshare share share share
Road 15.3 25.2 17.9 27.3 22.2 30.6 23.4 30.3
Rail 26.1 42.9 28.1 42.9 29.3 40.4 29.1 37.7
Pipeline 14.5 23.8 14.9 22.8 15.5 21.4 18.9 24.5
Coastal 4.9 8.1 4.6 7.0 5.5 7.6 5.8 7.5
Total 60.8 100.0 65.5 100.0 72.5 100.0 77.2 100.0
BOX 7.4.1
Ambient Air Quality and Noise
Parameter Ambient Performanceair quality of pipelinesstandrads
(µg/m3) (µg/m3)
SO2 80 14.3�17.1NO x 80 7.4�8.0
Suspended Particulate 360 156�168matter (SPM)
Noise 75 69�72(continuous 8 hours) db db
Exhaust emission is localized in pump stations where largediesel/crude oil engines are operated.
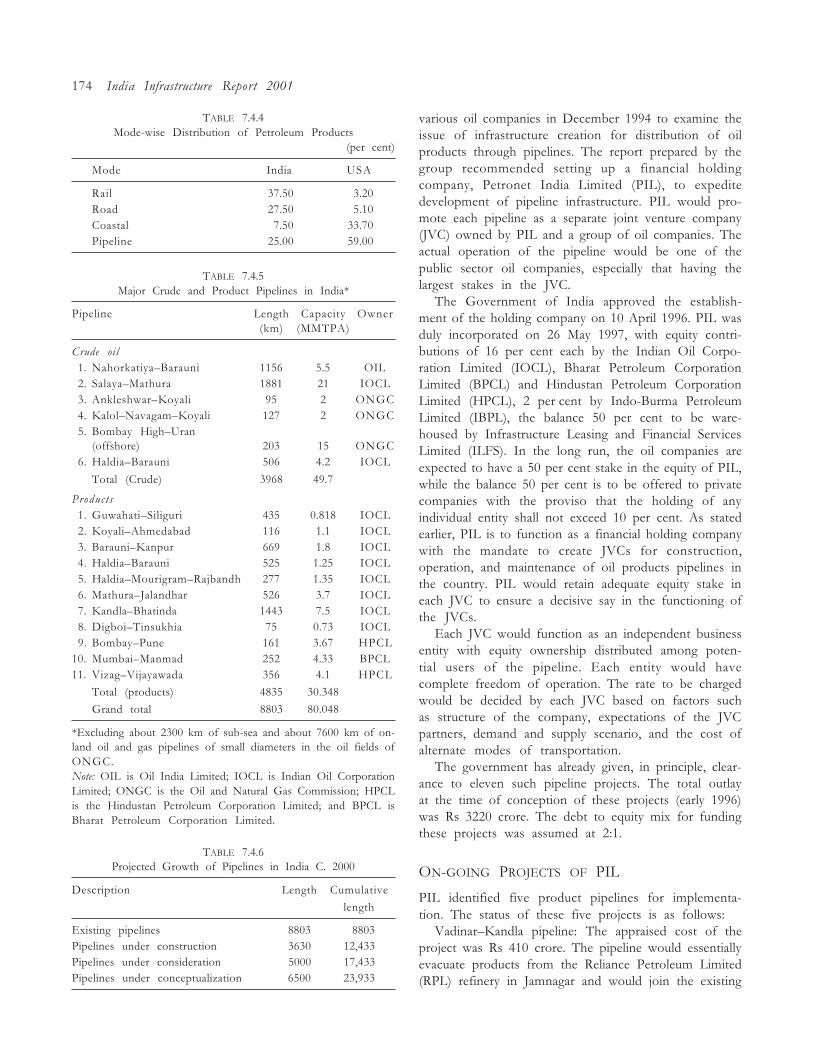
174 India Infrastructure Report 2001
various oil companies in December 1994 to examine theissue of infrastructure creation for distribution of oilproducts through pipelines. The report prepared by thegroup recommended setting up a financial holdingcompany, Petronet India Limited (PIL), to expeditedevelopment of pipeline infrastructure. PIL would pro-mote each pipeline as a separate joint venture company(JVC) owned by PIL and a group of oil companies. Theactual operation of the pipeline would be one of thepublic sector oil companies, especially that having thelargest stakes in the JVC.
The Government of India approved the establish-ment of the holding company on 10 April 1996. PIL wasduly incorporated on 26 May 1997, with equity contri-butions of 16 per cent each by the Indian Oil Corpo-ration Limited (IOCL), Bharat Petroleum CorporationLimited (BPCL) and Hindustan Petroleum CorporationLimited (HPCL), 2 per cent by Indo-Burma PetroleumLimited (IBPL), the balance 50 per cent to be ware-housed by Infrastructure Leasing and Financial ServicesLimited (ILFS). In the long run, the oil companies areexpected to have a 50 per cent stake in the equity of PIL,while the balance 50 per cent is to be offered to privatecompanies with the proviso that the holding of anyindividual entity shall not exceed 10 per cent. As statedearlier, PIL is to function as a financial holding companywith the mandate to create JVCs for construction,operation, and maintenance of oil products pipelines inthe country. PIL would retain adequate equity stake ineach JVC to ensure a decisive say in the functioning ofthe JVCs.
Each JVC would function as an independent businessentity with equity ownership distributed among poten-tial users of the pipeline. Each entity would havecomplete freedom of operation. The rate to be chargedwould be decided by each JVC based on factors suchas structure of the company, expectations of the JVCpartners, demand and supply scenario, and the cost ofalternate modes of transportation.
The government has already given, in principle, clear-ance to eleven such pipeline projects. The total outlayat the time of conception of these projects (early 1996)was Rs 3220 crore. The debt to equity mix for fundingthese projects was assumed at 2:1.
ON-GOING PROJECTS OF PIL
PIL identified five product pipelines for implementa-tion. The status of these five projects is as follows:
Vadinar�Kandla pipeline: The appraised cost of theproject was Rs 410 crore. The pipeline would essentiallyevacuate products from the Reliance Petroleum Limited(RPL) refinery in Jamnagar and would join the existing
TABLE 7.4.4Mode-wise Distribution of Petroleum Products
(per cent)
Mode India USA
Rail 37.50 3.20Road 27.50 5.10Coastal 7.50 33.70Pipeline 25.00 59.00
TABLE 7.4.5Major Crude and Product Pipelines in India*
Pipeline Length Capacity Owner(km) (MMTPA)
Crude oil01. Nahorkatiya�Barauni 1156 5.5 OIL02. Salaya�Mathura 1881 21 IOCL03. Ankleshwar�Koyali 95 2 ONGC04. Kalol�Navagam�Koyali 127 2 ONGC05. Bombay High�Uran
(offshore) 203 15 ONGC06. Haldia�Barauni 506 4.2 IOCL
Total (Crude) 3968 49.7
Products01. Guwahati�Siliguri 435 0.818 IOCL02. Koyali�Ahmedabad 116 1.1 IOCL03. Barauni�Kanpur 669 1.8 IOCL04. Haldia�Barauni 525 1.25 IOCL05. Haldia�Mourigram�Rajbandh 277 1.35 IOCL06. Mathura�Jalandhar 526 3.7 IOCL07. Kandla�Bhatinda 1443 7.5 IOCL08. Digboi�Tinsukhia 75 0.73 IOCL09. Bombay�Pune 161 3.67 HPCL10. Mumbai�Manmad 252 4.33 BPCL11. Vizag�Vijayawada 356 4.1 HPCL
Total (products) 4835 30.348
Grand total 8803 80.048
*Excluding about 2300 km of sub-sea and about 7600 km of on-land oil and gas pipelines of small diameters in the oil fields ofONGC.Note: OIL is Oil India Limited; IOCL is Indian Oil CorporationLimited; ONGC is the Oil and Natural Gas Commission; HPCLis the Hindustan Petroleum Corporation Limited; and BPCL isBharat Petroleum Corporation Limited.
TABLE 7.4.6Projected Growth of Pipelines in India C. 2000
Description Length Cumulative
length
Existing pipelines 8803 8803Pipelines under construction 3630 12,433Pipelines under consideration 5000 17,433Pipelines under conceptualization 6500 23,933
Integrated Transport 175
Kandla�Bhatinda pipeline of the Indian Oil Corpora-tion Limited (IOCL). The project, being implementedby the IOCL, has been completed.
Chennai�Trichi�Madurai pipeline: The appraisedcost of the project is Rs 539 crore. It is to be completedby July 2001 and the IOCL is the lead company for theproject. In view of the proposed refinery at Cuddalore,the viability of the project is being re-examined.
Environmental and right of way (ROW) clearanceshave been received for the Mangalore�Hasan�Bangalorepipeline (Rs 667 crore) and the Cochin�Coimbatore�Karur pipeline (Rs 535 crore). Engineers (India) Limited(EIL) has also completed the detailed route surveys andthe processes and design for these projects. TheBina�Jhansi�Kanpur pipeline is still in the preliminarystages of implementation.
Though, in principle, financial institutions haveagreed to fund these projects, they have held up theactual disbursement of funds pending the signing of�take or pay� contracts. The institutions insist on suchcontracts to eliminate uncertainty associated with cashinflows. However, given high commercial and opera-tional uncertainties, potential users are unwilling to signlong-term �take or pay� contracts at rates that would beattractive for the pipeline projects. The governmentis yet to take a final view on issues connected withtariff. PIL has therefore put these projects on hold,pending resolution of the above issues.
TARIFF
The tariff regime prevailing under the administeredpricing mechanism (APM) for the petroleum sectoressentially guarantees a 12 per cent return on networth. Operating costs are reimbursed under a predeter-mined formula. The compensation paid by the OilCo-ordination Committee (OCC) today for investmentin pipelines is quite inadequate:
� The return provided is less than 1 per cent basedon the replacement cost of the assets; as a result, themargins are inadequate to plan replacement of existingpipelines.
� The norms for cost computations are unrealistic.There is no compensation for escalation in the costs ofchemicals and power tariff. The actual working capitalrequired is much higher than the normative workingcapital used for reimbursement of expenses.
� The compensation is based on quantity deliveredand not received; transit losses, if any are borne by thepipeline operators.
� There is no compensation if pipeline usage decreasesbecause of non-availability of products.
It is absolutely imperative to evolve a new sensibletariff structure to ensure that requisite investmentsare made in the creation of pipeline infrastructure. Thetariff structure will have to balance the requirementsof different constituencies. Users would prefer a com-petitive tariff structure that is transparent and devoidof intractable cross-subsidization. They would be reluc-tant to sign long-term �take or pay� contracts as thatwould constrain both their distribution and marketingactivities. Lenders would look for stable and guaranteedcash inflows to ensure repayment of debt. They wouldobviously prefer long-term �take or pay� contracts withcredible parties. Shareholders would look for returnsthat justify the various risks to which they are exposed.They would obviously prefer pipeline companies tocharge rates based on the market capacity to pay.Regulators would be interested in ensuring that mo-nopoly gains do not accrue to the owners of pipelines.They would also like to ensure that equitable rates arecharged so that the customers do not suffer.
PIPELINE PROJECTS REMAIN UNBANKABLE
Like other infrastructure projects, pipeline projectsalso require large investments and have long gestationperiods. The risks associated with these projects arisefrom time and cost overruns, high uncertainty in de-mand over the long operating life of the projects, limitedpossibility of alternative uses of assets created, anduncertainty about the regulatory regime in which theprojects would have to operate.
The chief sources for delays in completion of a pipe-line project are delays in acquisition of ROW. Despiteparliamentary sanctity in the form of the Petroleumand Pipeline Act, 1975, protracted litigations do arisewhile acquiring land. Heightened concern about theenvironment, particularly in situations where therecould be permanent displacement of a population due tonon-reversible changes in land use pattern can also be amajor source of delay in completion.
In India, pipelines have operated at 100 per centcapacity since these are captive pipelines of oil compa-nies. However, if pipelines were to be operated undera common carrier principle, they would face uncertaintyin utilization arising from demand�supply dynamics.The viability of a pipeline project crucially depends onthe demand for the facility in the future. Since theseare projects with long lives, high capacity utilizationover long periods becomes a prerequisite for financialviability. Demand may many a time be affected bydevelopments outside the control of the pipeline com-pany. A case in point is the poor utilization of theKandla�Bhatinda pipeline till demand picked up from
176 India Infrastructure Report 2001
the Panipat refinery. The setting up of the PanipatRefinery has also had an impact on the utilization ofthe Mathura�Jalandhar pipeline which serves the Delhi�Ambala consumption zone. The throughput in theVadinar�Kandla pipeline, specifically set up to evacuateproducts of RPL, would also be seriously affected ifRPL were to resort to exporting products as a result ofoversupply in the country. These uncertainties aboutsustained demand for capacity are a major concern offinanciers of pipeline projects.
In the Indian context, financiers also have to contendwith regulatory risk. The regulatory regime that wouldbe in force in the post-APM era is still unclear. To attractinvestments it would be necessary for the governmentto frame stable and credible guidelines for tariff deter-mination and disclose its regulatory and restructuringintentions.
TARIFF DETERMINATION
IN THE US AND UK
In the United States, no approval is required for con-struction of pipelines. Pipelines have to be operatedunder the �common carrier� principle. Tariff is fixed bythe pipeline company every year through negotiationswith users. It is subject to a ceiling based on the oil priceindex. The Federal Energy Regulatory Commissionregulates the tariff and practices of oil pipeline compa-nies. In the UK, pipeline companies are assured a fixedreturn by the government. In France and Spain, pipelinecompanies require government approval for operation.A two-part tariff structure is followed for compensationof fixed and variable expenses.
THE ROAD AHEAD
In India the government appears to have gone wrongfrom the very beginning. The creation of PIL as afinancial holding company, and the setting up of aseparate JVC for each pipeline, is an incorrect policychoice. The supply�demand scenario is so uncertainthat each JVC would face enormous commercial risks.Since financing is being done independently, the stake-holders in each JVC would demand compensation forthe risks assumed which would be quite high. Instead,if these pipelines belonged to one or a fewer number ofcompanies, the risks would be considerably reduceddue to the portfolio effect. The losses incurred on somepipelines could have been off-set by profits realizedon the others. But with each pipeline as a separatecompany, all projects are ex ante exposed to the demandrisk. It would therefore be very difficult to achievefinancial closure of these projects. In addition, even if
funds were available, the interest rate demanded wouldbe high to reflect the high risk. As is already evident forthe projects conceived by PIL, lenders are justifiablydemanding tariff contracts which provide them therequired protection. A better policy would be to permitthe major refining and marketing companies such asthe IOCL, BPCL, and HPCL to expand their existingpipeline infrastructures such that a grid is created forthe entire country, and simultaneously to set up apipeline regulatory authority to ensure equitable opera-tion of the network. These companies have the necessaryresources as well as the experience to quickly set up thenetwork.
REGULATORY FRAMEWORK IS NECESSARY
Since pipelines create natural monopolies, a comprehen-sive regulatory framework is required. The role of theregulatory authority would include ensuring adherenceto stipulated safety and quality norms, ensuring thatfacilities are not needlessly duplicated, and determiningthe tariff that is attractive to investors and yet doesnot exploit consumers. The issue that would requireresolution is the demand by financial institutions thatthe projects should enter into long-term �take or pay�contracts. Acceding to this demand would largely violatethe common carrier principle that attempts to ensureequitable access to all users. If �take or pay� contracts areto be permitted to a limited extent, then should thetariff be different for those who sign such contracts andthose who do not? How should this difference, if any,be determined?
The principles governing the tariff structure shouldensure adequate competition among various modecombinations, fair return to investors, that is returnscommensurate with the risks assumed, equitable accessto all users, and equitable costs to consumers. While itis easy to enunciate the broad principles, implementingthem would be an extremely complex task given thepeculiarities of the situation. Since the pipelines wouldessentially be links in a multimodal network of pathsfor transportation of oil products, a change in the tariffof any one pipeline or segment would change the flowpattern in the entire network with sometimes significantconsequences for the other links (pipelines) in thenetwork. For example, reducing the tariff for onepipeline could make several other pipelines financiallyunviable. The authors have experimented with a com-prehensive optimization model for production, import,and distribution of oil products and found that the tariffstructure creates significant interdependencies in thefinancial performance of various pipelines and modes. Inaddition, as was discussed earlier, setting up of a new
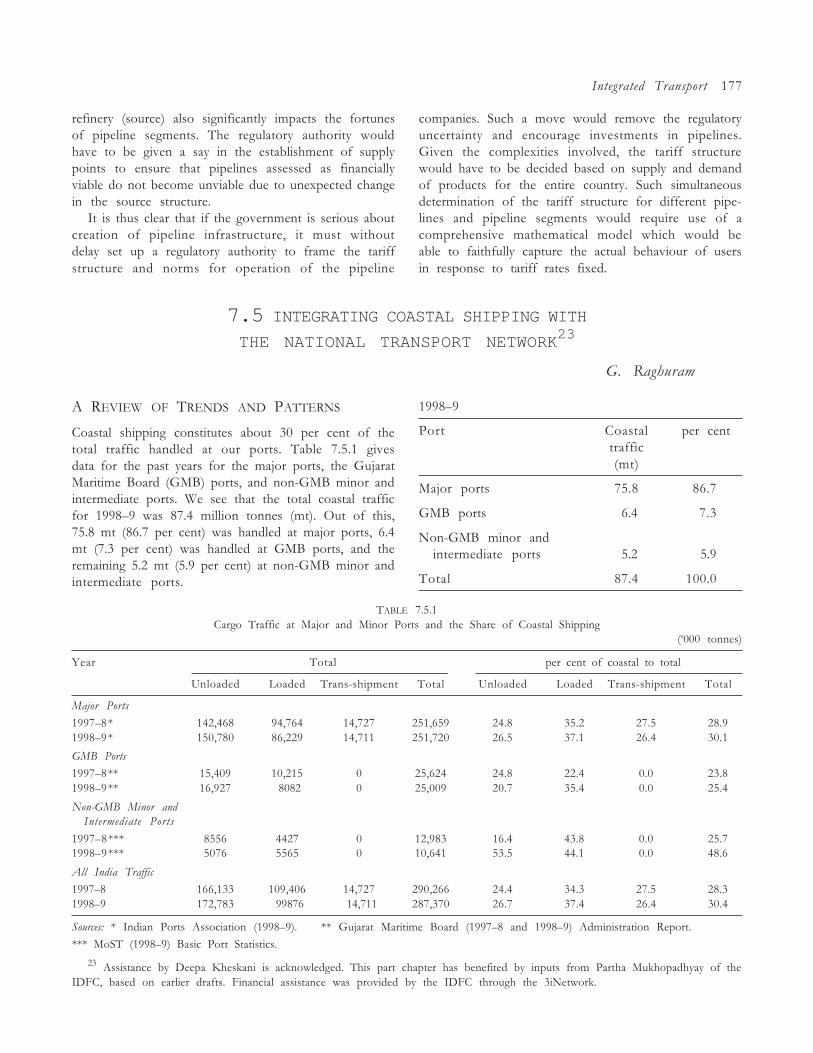
Integrated Transport 177
refinery (source) also significantly impacts the fortunesof pipeline segments. The regulatory authority wouldhave to be given a say in the establishment of supplypoints to ensure that pipelines assessed as financiallyviable do not become unviable due to unexpected changein the source structure.
It is thus clear that if the government is serious aboutcreation of pipeline infrastructure, it must withoutdelay set up a regulatory authority to frame the tariffstructure and norms for operation of the pipeline
companies. Such a move would remove the regulatoryuncertainty and encourage investments in pipelines.Given the complexities involved, the tariff structurewould have to be decided based on supply and demandof products for the entire country. Such simultaneousdetermination of the tariff structure for different pipe-lines and pipeline segments would require use of acomprehensive mathematical model which would beable to faithfully capture the actual behaviour of usersin response to tariff rates fixed.
7.5 INTEGRATING COASTAL SHIPPING WITH
THE NATIONAL TRANSPORT NETWORK23
G. Raghuram
A REVIEW OF TRENDS AND PATTERNS
Coastal shipping constitutes about 30 per cent of thetotal traffic handled at our ports. Table 7.5.1 givesdata for the past years for the major ports, the GujaratMaritime Board (GMB) ports, and non-GMB minor andintermediate ports. We see that the total coastal trafficfor 1998�9 was 87.4 million tonnes (mt). Out of this,75.8 mt (86.7 per cent) was handled at major ports, 6.4mt (7.3 per cent) was handled at GMB ports, and theremaining 5.2 mt (5.9 per cent) at non-GMB minor andintermediate ports.
1998�9
Port Coastal per centtraffic(mt)
Major ports 75.8 86.7
GMB ports 6.4 7.3
Non-GMB minor andintermediate ports 5.2 5.9
Total 87.4 100.0
TABLE 7.5.1Cargo Traffic at Major and Minor Ports and the Share of Coastal Shipping
(�000 tonnes)
Year Total per cent of coastal to total
Unloaded Loaded Trans-shipment Total Unloaded Loaded Trans-shipment Total
Major Ports
1997�8* 142,468 94,764 14,727 251,659 24.8 35.2 27.5 28.91998�9* 150,780 86,229 14,711 251,720 26.5 37.1 26.4 30.1
GMB Ports
1997�8** 15,409 10,215 0 25,624 24.8 22.4 0.0 23.81998�9** 16,927 8082 0 25,009 20.7 35.4 0.0 25.4
Non-GMB Minor andIntermediate Ports
1997�8*** 8556 4427 0 12,983 16.4 43.8 0.0 25.71998�9*** 5076 5565 0 10,641 53.5 44.1 0.0 48.6
All India Traffic
1997�8 166,133 109,406 14,727 290,266 24.4 34.3 27.5 28.31998�9 172,783 99876 14,711 287,370 26.7 37.4 26.4 30.4
Sources: * Indian Ports Association (1998�9). ** Gujarat Maritime Board (1997�8 and 1998�9) Administration Report.
*** MoST (1998�9) Basic Port Statistics.
23 Assistance by Deepa Kheskani is acknowledged. This part chapter has benefited by inputs from Partha Mukhopadhyay of theIDFC, based on earlier drafts. Financial assistance was provided by the IDFC through the 3iNetwork.
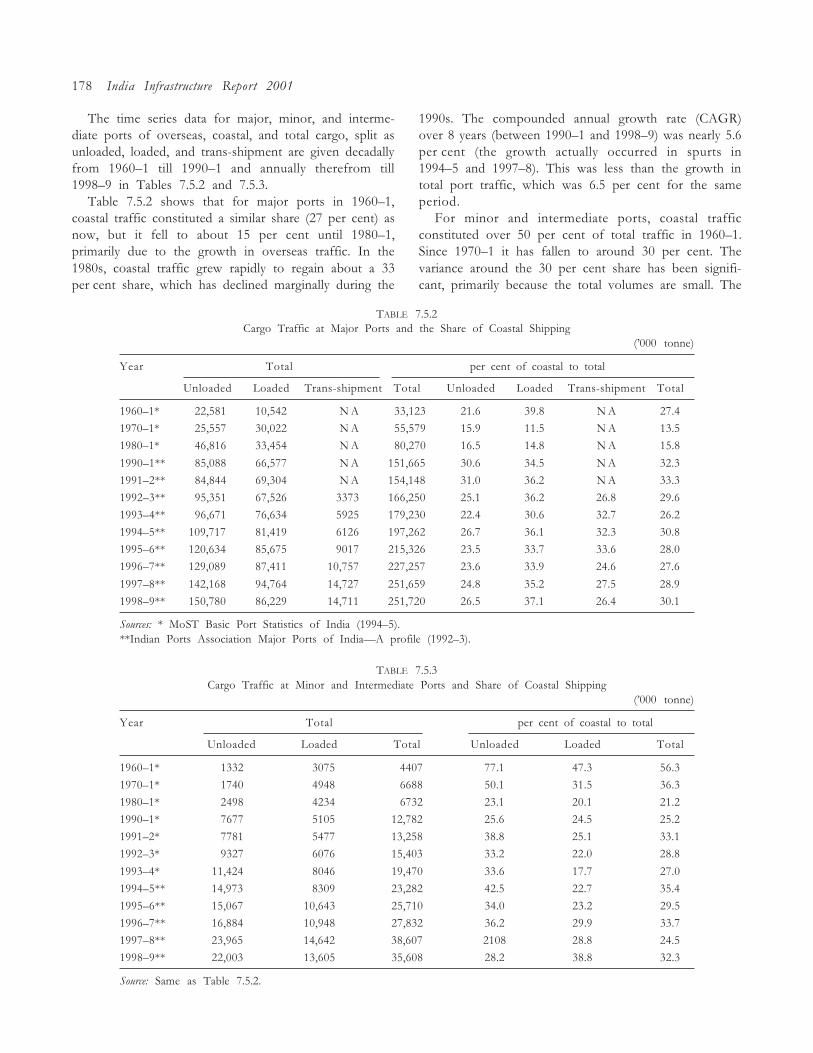
178 India Infrastructure Report 2001
The time series data for major, minor, and interme-diate ports of overseas, coastal, and total cargo, split asunloaded, loaded, and trans-shipment are given decadallyfrom 1960�1 till 1990�1 and annually therefrom till1998�9 in Tables 7.5.2 and 7.5.3.
Table 7.5.2 shows that for major ports in 1960�1,coastal traffic constituted a similar share (27 per cent) asnow, but it fell to about 15 per cent until 1980�1,primarily due to the growth in overseas traffic. In the1980s, coastal traffic grew rapidly to regain about a 33per cent share, which has declined marginally during the
1990s. The compounded annual growth rate (CAGR)over 8 years (between 1990�1 and 1998�9) was nearly 5.6per cent (the growth actually occurred in spurts in1994�5 and 1997�8). This was less than the growth intotal port traffic, which was 6.5 per cent for the sameperiod.
For minor and intermediate ports, coastal trafficconstituted over 50 per cent of total traffic in 1960�1.Since 1970�1 it has fallen to around 30 per cent. Thevariance around the 30 per cent share has been signifi-cant, primarily because the total volumes are small. The
TABLE 7.5.2Cargo Traffic at Major Ports and the Share of Coastal Shipping
(�000 tonne)
Year Total per cent of coastal to total
Unloaded Loaded Trans-shipment Total Unloaded Loaded Trans-shipment Total
1960�1* 022,581 10,542 N A 033,123 21.6 39.8 N A 27.4
1970�1* 025,557 30,022 N A 055,579 15.9 11.5 N A 13.5
1980�1* 046,816 33,454 N A 080,270 16.5 14.8 N A 15.8
1990�1** 085,088 66,577 N A 151,665 30.6 34.5 N A 32.3
1991�2** 084,844 69,304 N A 154,148 31.0 36.2 N A 33.3
1992�3** 095,351 67,526 3373 166,250 25.1 36.2 26.8 29.6
1993�4** 096,671 76,634 5925 179,230 22.4 30.6 32.7 26.2
1994�5** 109,717 81,419 6126 197,262 26.7 36.1 32.3 30.8
1995�6** 120,634 85,675 9017 215,326 23.5 33.7 33.6 28.0
1996�7** 129,089 87,411 10,757 227,257 23.6 33.9 24.6 27.6
1997�8** 142,168 94,764 14,727 251,659 24.8 35.2 27.5 28.9
1998�9** 150,780 86,229 14,711 251,720 26.5 37.1 26.4 30.1
Sources: * MoST Basic Port Statistics of India (1994�5).**Indian Ports Association Major Ports of India�A profile (1992�3).
TABLE 7.5.3Cargo Traffic at Minor and Intermediate Ports and Share of Coastal Shipping
(�000 tonne)
Year Total per cent of coastal to total
Unloaded Loaded Total Unloaded Loaded Total
1960�1* 1332 3075 4407 77.1 47.3 56.3
1970�1* 1740 4948 6688 50.1 31.5 36.3
1980�1* 2498 4234 6732 23.1 20.1 21.2
1990�1* 7677 5105 12,782 25.6 24.5 25.2
1991�2* 7781 5477 13,258 38.8 25.1 33.1
1992�3* 9327 6076 15,403 33.2 22.0 28.8
1993�4* 11,424 8046 19,470 33.6 17.7 27.0
1994�5** 14,973 8309 23,282 42.5 22.7 35.4
1995�6** 15,067 10,643 25,710 34.0 23.2 29.5
1996�7** 16,884 10,948 27,832 36.2 29.9 33.7
1997�8** 23,965 14,642 38,607 2108 28.8 24.5
1998�9** 22,003 13,605 35,608 28.2 38.8 32.3
Source: Same as Table 7.5.2.
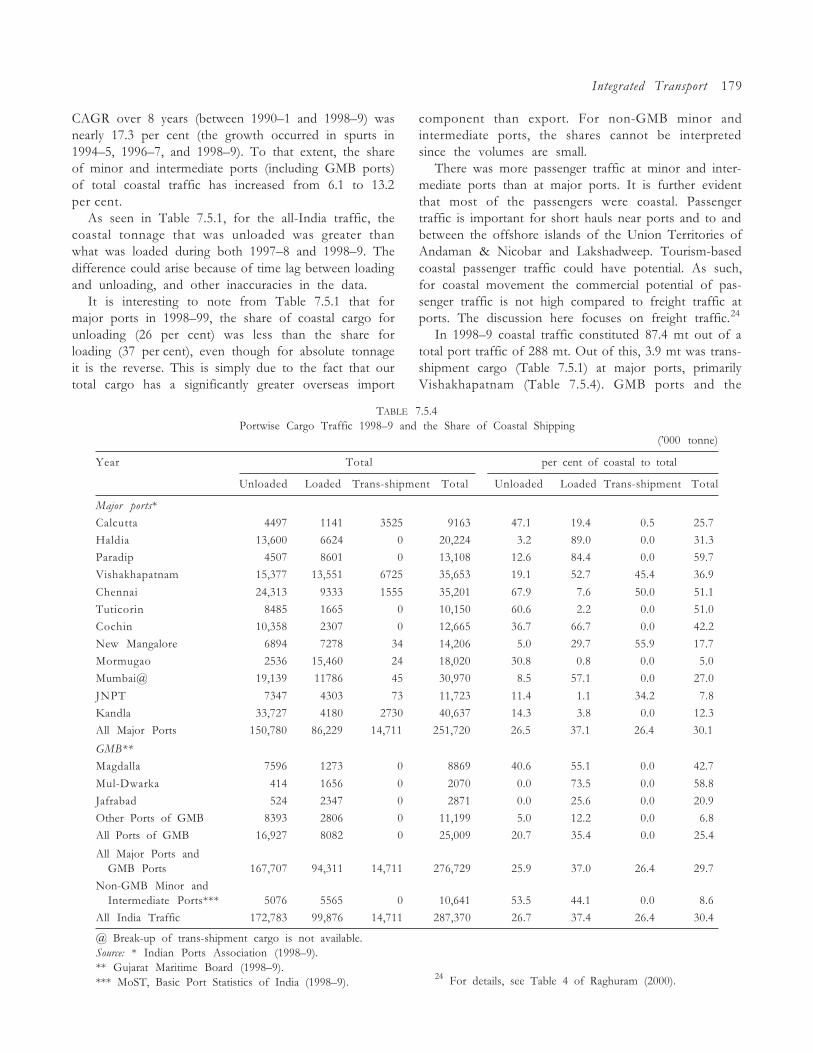
Integrated Transport 179
CAGR over 8 years (between 1990�1 and 1998�9) wasnearly 17.3 per cent (the growth occurred in spurts in1994�5, 1996�7, and 1998�9). To that extent, the shareof minor and intermediate ports (including GMB ports)of total coastal traffic has increased from 6.1 to 13.2per cent.
As seen in Table 7.5.1, for the all-India traffic, thecoastal tonnage that was unloaded was greater thanwhat was loaded during both 1997�8 and 1998�9. Thedifference could arise because of time lag between loadingand unloading, and other inaccuracies in the data.
It is interesting to note from Table 7.5.1 that formajor ports in 1998�99, the share of coastal cargo forunloading (26 per cent) was less than the share forloading (37 per cent), even though for absolute tonnageit is the reverse. This is simply due to the fact that ourtotal cargo has a significantly greater overseas import
component than export. For non-GMB minor andintermediate ports, the shares cannot be interpretedsince the volumes are small.
There was more passenger traffic at minor and inter-mediate ports than at major ports. It is further evidentthat most of the passengers were coastal. Passengertraffic is important for short hauls near ports and to andbetween the offshore islands of the Union Territories ofAndaman & Nicobar and Lakshadweep. Tourism-basedcoastal passenger traffic could have potential. As such,for coastal movement the commercial potential of pas-senger traffic is not high compared to freight traffic atports. The discussion here focuses on freight traffic.24
In 1998�9 coastal traffic constituted 87.4 mt out of atotal port traffic of 288 mt. Out of this, 3.9 mt was trans-shipment cargo (Table 7.5.1) at major ports, primarilyVishakhapatnam (Table 7.5.4). GMB ports and the
24 For details, see Table 4 of Raghuram (2000).
TABLE 7.5.4Portwise Cargo Traffic 1998�9 and the Share of Coastal Shipping
(�000 tonne)
Year Total per cent of coastal to total
Unloaded Loaded Trans-shipment Total Unloaded Loaded Trans-shipment Total
Major ports*
Calcutta 4497 1141 3525 9163 47.1 19.4 0.5 25.7
Haldia 13,600 6624 0 20,224 3.2 89.0 0.0 31.3
Paradip 4507 8601 0 13,108 12.6 84.4 0.0 59.7
Vishakhapatnam 15,377 13,551 6725 35,653 19.1 52.7 45.4 36.9
Chennai 24,313 9333 1555 35,201 67.9 7.6 50.0 51.1
Tuticorin 8485 1665 0 10,150 60.6 2.2 0.0 51.0
Cochin 10,358 2307 0 12,665 36.7 66.7 0.0 42.2
New Mangalore 6894 7278 34 14,206 5.0 29.7 55.9 17.7
Mormugao 2536 15,460 24 18,020 30.8 0.8 0.0 5.0
Mumbai@ 19,139 11786 45 30,970 8.5 57.1 0.0 27.0
JNPT 7347 4303 73 11,723 11.4 1.1 34.2 7.8
Kandla 33,727 4180 2730 40,637 14.3 3.8 0.0 12.3
All Major Ports 150,780 86,229 14,711 251,720 26.5 37.1 26.4 30.1
GMB**
Magdalla 7596 1273 0 8869 40.6 55.1 0.0 42.7
Mul-Dwarka 414 1656 0 2070 0.0 73.5 0.0 58.8
Jafrabad 524 2347 0 2871 0.0 25.6 0.0 20.9
Other Ports of GMB 8393 2806 0 11,199 5.0 12.2 0.0 6.8
All Ports of GMB 16,927 8082 0 25,009 20.7 35.4 0.0 25.4
All Major Ports andGMB Ports 167,707 94,311 14,711 276,729 25.9 37.0 26.4 29.7
Non-GMB Minor andIntermediate Ports*** 5076 5565 0 10,641 53.5 44.1 0.0 8.6
All India Traffic 172,783 99,876 14,711 287,370 26.7 37.4 26.4 30.4
@ Break-up of trans-shipment cargo is not available.Source: * Indian Ports Association (1998�9).** Gujarat Maritime Board (1998�9).*** MoST, Basic Port Statistics of India (1998�9).
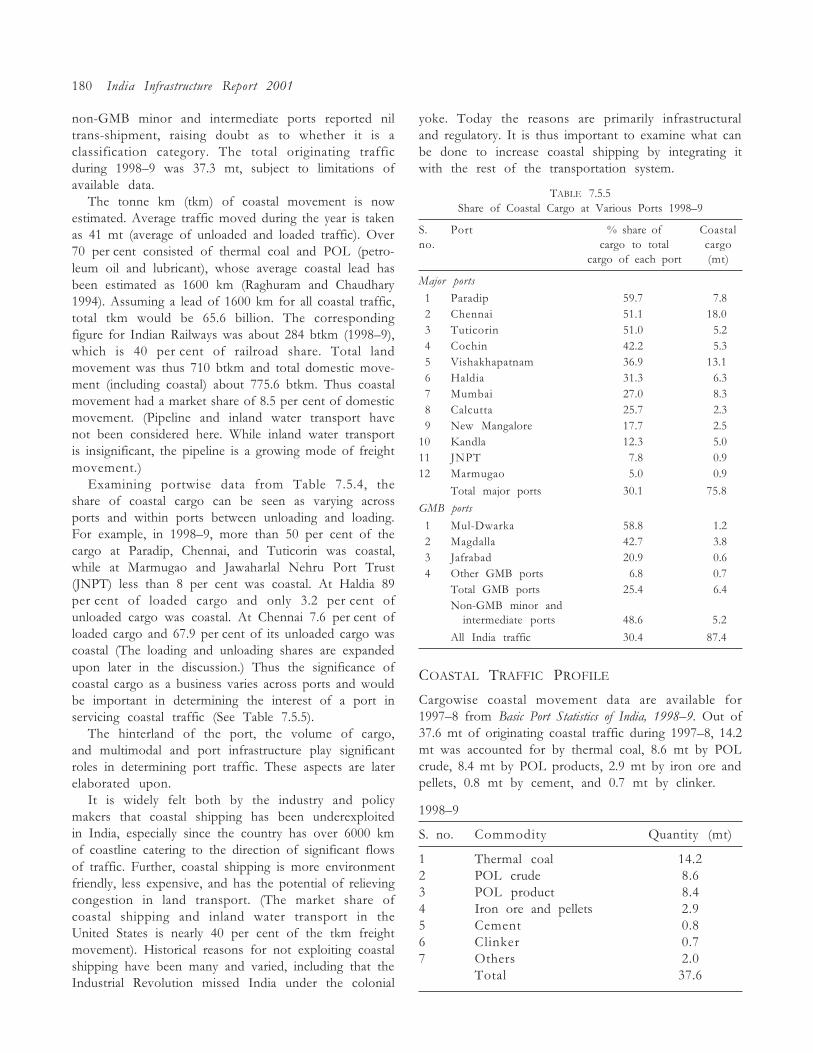
180 India Infrastructure Report 2001
non-GMB minor and intermediate ports reported niltrans-shipment, raising doubt as to whether it is aclassification category. The total originating trafficduring 1998�9 was 37.3 mt, subject to limitations ofavailable data.
The tonne km (tkm) of coastal movement is nowestimated. Average traffic moved during the year is takenas 41 mt (average of unloaded and loaded traffic). Over70 per cent consisted of thermal coal and POL (petro-leum oil and lubricant), whose average coastal lead hasbeen estimated as 1600 km (Raghuram and Chaudhary1994). Assuming a lead of 1600 km for all coastal traffic,total tkm would be 65.6 billion. The correspondingfigure for Indian Railways was about 284 btkm (1998�9),which is 40 per cent of railroad share. Total landmovement was thus 710 btkm and total domestic move-ment (including coastal) about 775.6 btkm. Thus coastalmovement had a market share of 8.5 per cent of domesticmovement. (Pipeline and inland water transport havenot been considered here. While inland water transportis insignificant, the pipeline is a growing mode of freightmovement.)
Examining portwise data from Table 7.5.4, theshare of coastal cargo can be seen as varying acrossports and within ports between unloading and loading.For example, in 1998�9, more than 50 per cent of thecargo at Paradip, Chennai, and Tuticorin was coastal,while at Marmugao and Jawaharlal Nehru Port Trust(JNPT) less than 8 per cent was coastal. At Haldia 89per cent of loaded cargo and only 3.2 per cent ofunloaded cargo was coastal. At Chennai 7.6 per cent ofloaded cargo and 67.9 per cent of its unloaded cargo wascoastal (The loading and unloading shares are expandedupon later in the discussion.) Thus the significance ofcoastal cargo as a business varies across ports and wouldbe important in determining the interest of a port inservicing coastal traffic (See Table 7.5.5).
The hinterland of the port, the volume of cargo,and multimodal and port infrastructure play significantroles in determining port traffic. These aspects are laterelaborated upon.
It is widely felt both by the industry and policymakers that coastal shipping has been underexploitedin India, especially since the country has over 6000 kmof coastline catering to the direction of significant flowsof traffic. Further, coastal shipping is more environmentfriendly, less expensive, and has the potential of relievingcongestion in land transport. (The market share ofcoastal shipping and inland water transport in theUnited States is nearly 40 per cent of the tkm freightmovement). Historical reasons for not exploiting coastalshipping have been many and varied, including that theIndustrial Revolution missed India under the colonial
yoke. Today the reasons are primarily infrastructuraland regulatory. It is thus important to examine what canbe done to increase coastal shipping by integrating itwith the rest of the transportation system.
TABLE 7.5.5Share of Coastal Cargo at Various Ports 1998�9
S. Port % share of Coastalno. cargo to total cargo
cargo of each port (mt)
Major ports
01 Paradip 59.7 7.802 Chennai 51.1 18.003 Tuticorin 51.0 5.204 Cochin 42.2 5.305 Vishakhapatnam 36.9 13.106 Haldia 31.3 6.307 Mumbai 27.0 8.308 Calcutta 25.7 2.309 New Mangalore 17.7 2.510 Kandla 12.3 5.011 JNPT 7.8 0.912 Marmugao 5.0 0.9
Total major ports 30.1 75.8
GMB ports
01 Mul-Dwarka 58.8 1.202 Magdalla 42.7 3.803 Jafrabad 20.9 0.604 Other GMB ports 6.8 0.7
Total GMB ports 25.4 6.4Non-GMB minor and
intermediate ports 48.6 5.2
All India traffic 30.4 87.4
COASTAL TRAFFIC PROFILE
Cargowise coastal movement data are available for1997�8 from Basic Port Statistics of India, 1998�9. Out of37.6 mt of originating coastal traffic during 1997�8, 14.2mt was accounted for by thermal coal, 8.6 mt by POLcrude, 8.4 mt by POL products, 2.9 mt by iron ore andpellets, 0.8 mt by cement, and 0.7 mt by clinker.
1998�9
S. no. Commodity Quantity (mt)
1 Thermal coal 14.22 POL crude 8.63 POL product 8.44 Iron ore and pellets 2.95 Cement 0.86 Clinker 0.77 Others 2.0
Total 37.6
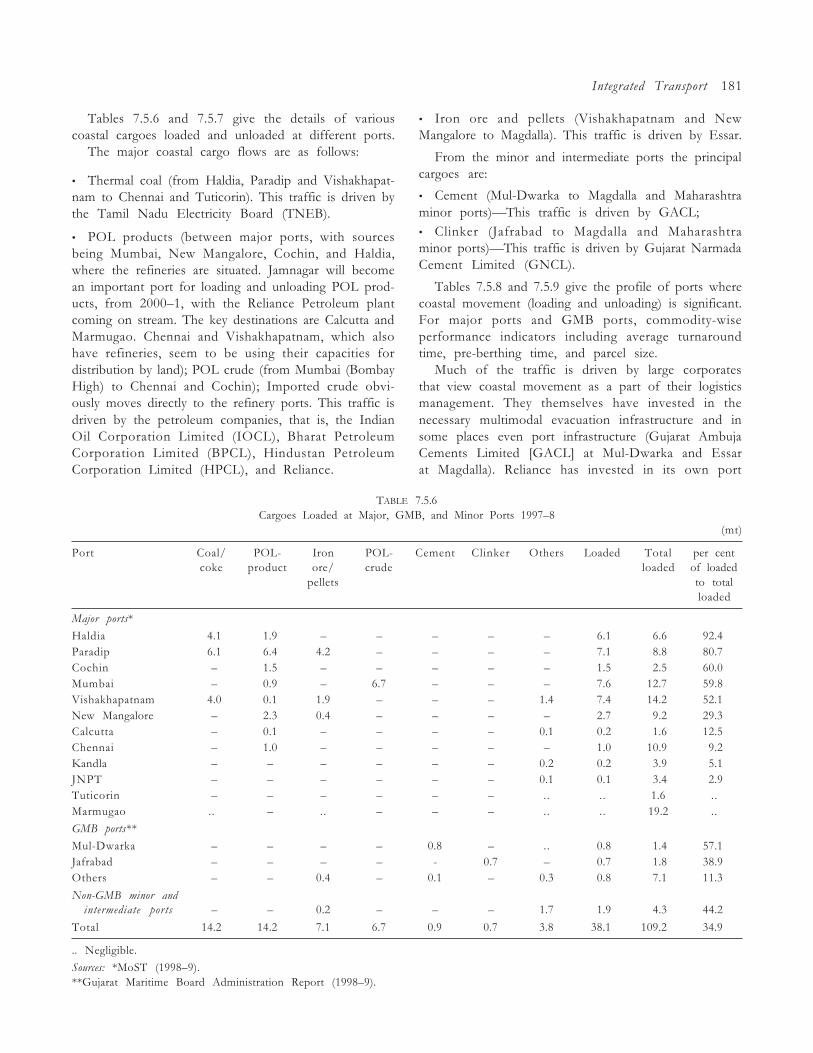
Integrated Transport 181
Tables 7.5.6 and 7.5.7 give the details of variouscoastal cargoes loaded and unloaded at different ports.
The major coastal cargo flows are as follows:
� Thermal coal (from Haldia, Paradip and Vishakhapat-nam to Chennai and Tuticorin). This traffic is driven bythe Tamil Nadu Electricity Board (TNEB).
� POL products (between major ports, with sourcesbeing Mumbai, New Mangalore, Cochin, and Haldia,where the refineries are situated. Jamnagar will becomean important port for loading and unloading POL prod-ucts, from 2000�1, with the Reliance Petroleum plantcoming on stream. The key destinations are Calcutta andMarmugao. Chennai and Vishakhapatnam, which alsohave refineries, seem to be using their capacities fordistribution by land); POL crude (from Mumbai (BombayHigh) to Chennai and Cochin); Imported crude obvi-ously moves directly to the refinery ports. This traffic isdriven by the petroleum companies, that is, the IndianOil Corporation Limited (IOCL), Bharat PetroleumCorporation Limited (BPCL), Hindustan PetroleumCorporation Limited (HPCL), and Reliance.
� Iron ore and pellets (Vishakhapatnam and NewMangalore to Magdalla). This traffic is driven by Essar.
From the minor and intermediate ports the principalcargoes are:
� Cement (Mul-Dwarka to Magdalla and Maharashtraminor ports)�This traffic is driven by GACL;� Clinker (Jafrabad to Magdalla and Maharashtraminor ports)�This traffic is driven by Gujarat NarmadaCement Limited (GNCL).
Tables 7.5.8 and 7.5.9 give the profile of ports wherecoastal movement (loading and unloading) is significant.For major ports and GMB ports, commodity-wiseperformance indicators including average turnaroundtime, pre-berthing time, and parcel size.
Much of the traffic is driven by large corporatesthat view coastal movement as a part of their logisticsmanagement. They themselves have invested in thenecessary multimodal evacuation infrastructure and insome places even port infrastructure (Gujarat AmbujaCements Limited [GACL] at Mul-Dwarka and Essarat Magdalla). Reliance has invested in its own port
TABLE 7.5.6Cargoes Loaded at Major, GMB, and Minor Ports 1997�8
(mt)
Port Coal/ POL- Iron POL- Cement Clinker Others Loaded Total per centcoke product ore/ crude loaded of loaded
pellets to totalloaded
Major ports*
Haldia 04.1 01.9 � � � � � 6.1 6.6 92.4Paradip 06.1 06.4 4.2 � � � � 7.1 8.8 80.7Cochin 0� 01.5 � � � � � 1.5 2.5 60.0Mumbai 0� 00.9 � 6.7 � � � 7.6 12.7 59.8Vishakhapatnam 04.0 00.1 1.9 � � � 1.4 7.4 14.2 52.1New Mangalore 0� 02.3 0.4 � � � � 2.7 9.2 29.3Calcutta 0� 00.1 � � � � 0.1 0.2 1.6 12.5Chennai 0� 01.0 � � � � � 1.0 10.9 9.2Kandla 0� 0� � � � � 0.2 0.2 3.9 5.1JNPT 0� 0� � � � � 0.1 0.1 3.4 2.9Tuticorin 0� 0� � � � � .. .. 1.6 ..Marmugao .. 0� .. � � � .. . . 19.2 ..
GMB ports**
Mul-Dwarka 0� 0� � � 0.8 � .. 0.8 1.4 57.1Jafrabad 0� 0� � � - 0.7 � 0.7 1.8 38.9Others 0� 0� 0.4 � 0.1 � 0.3 0.8 7.1 11.3
Non-GMB minor andintermediate ports 0� 0� 0.2 � � � 1.7 1.9 4.3 44.2
Total 14.2 14.2 7.1 6.7 0.9 0.7 3.8 38.1 109.2 34.9
.. Negligible.
Sources: *MoST (1998�9).**Gujarat Maritime Board Administration Report (1998�9).
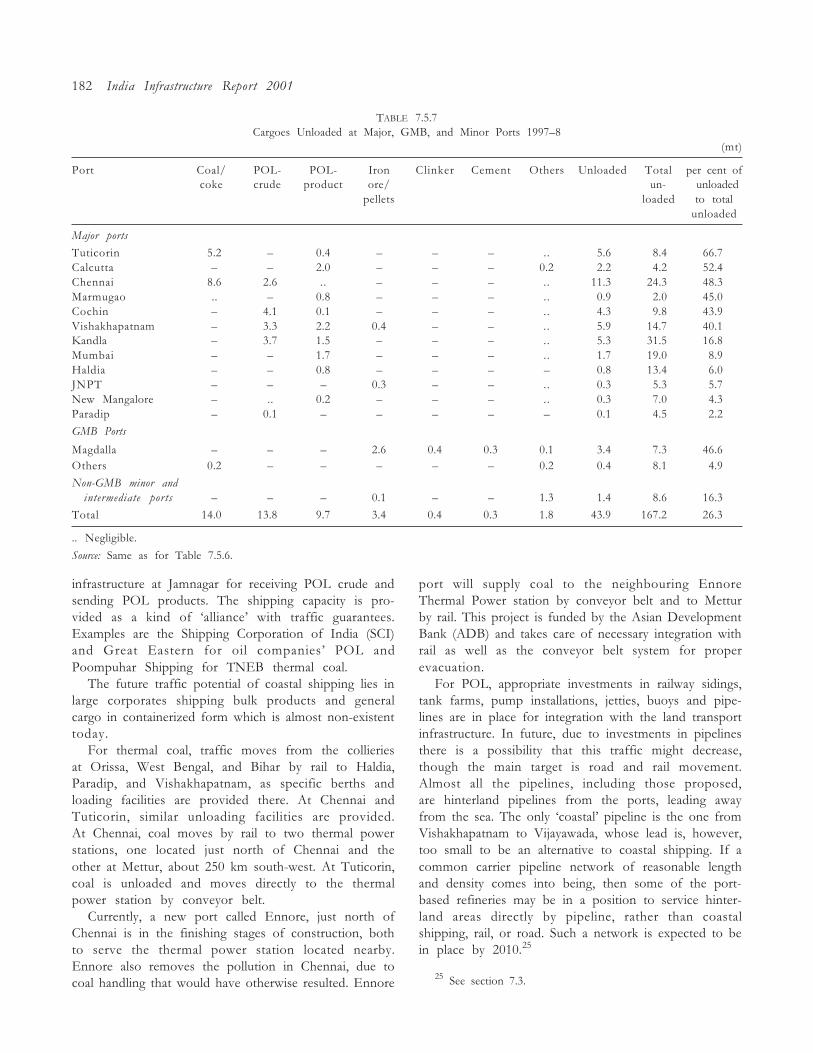
182 India Infrastructure Report 2001
TABLE 7.5.7Cargoes Unloaded at Major, GMB, and Minor Ports 1997�8
(mt)
Port Coal/ POL- POL- Iron Clinker Cement Others Unloaded Total per cent ofcoke crude product ore/ un- unloaded
pellets loaded to totalunloaded
Major ports
Tuticorin 05.2 0� 0.4 � � � .. 5.6 8.4 66.7Calcutta 0� 0� 2.0 � � � 0.2 2.2 4.2 52.4Chennai 08.6 02.6 .. � � � .. 11.3 24.3 48.3Marmugao 0.. 0� 0.8 � � � .. 0.9 2.0 45.0Cochin 0� 04.1 0.1 � � � .. 4.3 9.8 43.9Vishakhapatnam 0� 03.3 2.2 0.4 � � .. 5.9 14.7 40.1Kandla 0� 03.7 1.5 � � � .. 5.3 31.5 16.8Mumbai 0� 0� 1.7 � � � .. 1.7 19.0 8.9Haldia 0� 0� 0.8 � � � � 0.8 13.4 6.0JNPT 0� 0� � 0.3 � � .. 0.3 5.3 5.7New Mangalore 0� 0.. 0.2 � � � .. 0.3 7.0 4.3Paradip 0� 00.1 � � � � � 0.1 4.5 2.2
GMB Ports
Magdalla 0� 0� � 2.6 0.4 0.3 0.1 3.4 7.3 46.6Others 00.2 0� � � � � 0.2 0.4 8.1 4.9
Non-GMB minor andintermediate ports 0� 0� � 0.1 � � 1.3 1.4 8.6 16.3
Total 14.0 13.8 9.7 3.4 0.4 0.3 1.8 43.9 167.2 26.3
.. Negligible.
Source: Same as for Table 7.5.6.
25 See section 7.3.
infrastructure at Jamnagar for receiving POL crude andsending POL products. The shipping capacity is pro-vided as a kind of �alliance� with traffic guarantees.Examples are the Shipping Corporation of India (SCI)and Great Eastern for oil companies� POL andPoompuhar Shipping for TNEB thermal coal.
The future traffic potential of coastal shipping lies inlarge corporates shipping bulk products and generalcargo in containerized form which is almost non-existenttoday.
For thermal coal, traffic moves from the collieriesat Orissa, West Bengal, and Bihar by rail to Haldia,Paradip, and Vishakhapatnam, as specific berths andloading facilities are provided there. At Chennai andTuticorin, similar unloading facilities are provided.At Chennai, coal moves by rail to two thermal powerstations, one located just north of Chennai and theother at Mettur, about 250 km south-west. At Tuticorin,coal is unloaded and moves directly to the thermalpower station by conveyor belt.
Currently, a new port called Ennore, just north ofChennai is in the finishing stages of construction, bothto serve the thermal power station located nearby.Ennore also removes the pollution in Chennai, due tocoal handling that would have otherwise resulted. Ennore
port will supply coal to the neighbouring EnnoreThermal Power station by conveyor belt and to Metturby rail. This project is funded by the Asian DevelopmentBank (ADB) and takes care of necessary integration withrail as well as the conveyor belt system for properevacuation.
For POL, appropriate investments in railway sidings,tank farms, pump installations, jetties, buoys and pipe-lines are in place for integration with the land transportinfrastructure. In future, due to investments in pipelinesthere is a possibility that this traffic might decrease,though the main target is road and rail movement.Almost all the pipelines, including those proposed,are hinterland pipelines from the ports, leading awayfrom the sea. The only �coastal� pipeline is the one fromVishakhapatnam to Vijayawada, whose lead is, however,too small to be an alternative to coastal shipping. If acommon carrier pipeline network of reasonable lengthand density comes into being, then some of the port-based refineries may be in a position to service hinter-land areas directly by pipeline, rather than coastalshipping, rail, or road. Such a network is expected to bein place by 2010.25
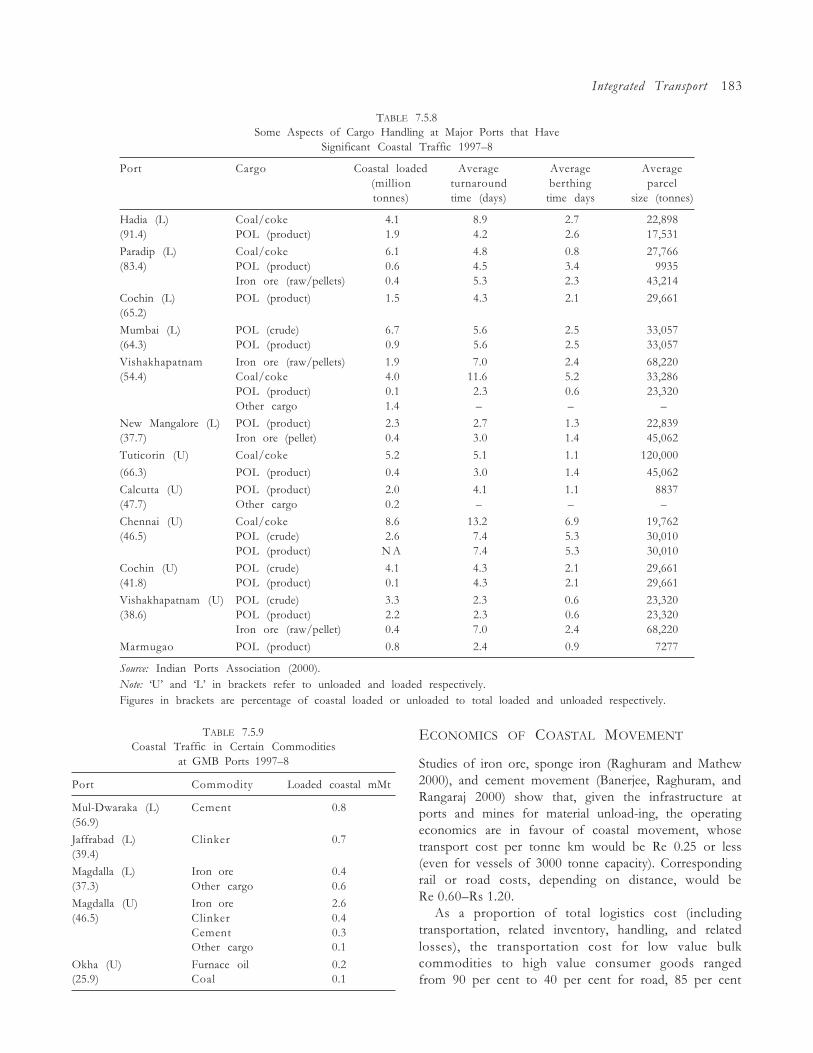
Integrated Transport 183
TABLE 7.5.8Some Aspects of Cargo Handling at Major Ports that Have
Significant Coastal Traffic 1997�8
Port Cargo Coastal loaded Average Average Average(million turnaround berthing parceltonnes) time (days) time days size (tonnes)
Hadia (L) Coal/coke 4.1 8.9 2.7 22,898(91.4) POL (product) 1.9 4.2 2.6 17,531
Paradip (L) Coal/coke 6.1 4.8 0.8 27,766(83.4) POL (product) 0.6 4.5 3.4 9935
Iron ore (raw/pellets) 0.4 5.3 2.3 43,214
Cochin (L) POL (product) 1.5 4.3 2.1 29,661(65.2)
Mumbai (L) POL (crude) 6.7 5.6 2.5 33,057(64.3) POL (product) 0.9 5.6 2.5 33,057
Vishakhapatnam Iron ore (raw/pellets) 1.9 7.0 2.4 68,220(54.4) Coal/coke 4.0 11.6 5.2 33,286
POL (product) 0.1 2.3 0.6 23,320Other cargo 1.4 � � �
New Mangalore (L) POL (product) 2.3 2.7 1.3 22,839(37.7) Iron ore (pellet) 0.4 3.0 1.4 45,062
Tuticorin (U) Coal/coke 5.2 5.1 1.1 120,000
(66.3) POL (product) 0.4 3.0 1.4 45,062
Calcutta (U) POL (product) 2.0 4.1 1.1 8837(47.7) Other cargo 0.2 � � �
Chennai (U) Coal/coke 8.6 13.2 6.9 19,762(46.5) POL (crude) 2.6 7.4 5.3 30,010
POL (product) N A 7.4 5.3 30,010
Cochin (U) POL (crude) 4.1 4.3 2.1 29,661(41.8) POL (product) 0.1 4.3 2.1 29,661
Vishakhapatnam (U) POL (crude) 3.3 2.3 0.6 23,320(38.6) POL (product) 2.2 2.3 0.6 23,320
Iron ore (raw/pellet) 0.4 7.0 2.4 68,220
Marmugao POL (product) 0.8 2.4 0.9 7277
Source: Indian Ports Association (2000).Note: �U� and �L� in brackets refer to unloaded and loaded respectively.Figures in brackets are percentage of coastal loaded or unloaded to total loaded and unloaded respectively.
TABLE 7.5.9Coastal Traffic in Certain Commodities
at GMB Ports 1997�8
Port Commodity Loaded coastal mMt
Mul-Dwaraka (L) Cement 0.8(56.9)
Jaffrabad (L) Clinker 0.7(39.4)
Magdalla (L) Iron ore 0.4(37.3) Other cargo 0.6
Magdalla (U) Iron ore 2.6(46.5) Clinker 0.4
Cement 0.3Other cargo 0.1
Okha (U) Furnace oil 0.2(25.9) Coal 0.1
ECONOMICS OF COASTAL MOVEMENT
Studies of iron ore, sponge iron (Raghuram and Mathew2000), and cement movement (Banerjee, Raghuram, andRangaraj 2000) show that, given the infrastructure atports and mines for material unload-ing, the operatingeconomics are in favour of coastal movement, whosetransport cost per tonne km would be Re 0.25 or less(even for vessels of 3000 tonne capacity). Correspondingrail or road costs, depending on distance, would beRe 0.60�Rs 1.20.
As a proportion of total logistics cost (includingtransportation, related inventory, handling, and relatedlosses), the transportation cost for low value bulkcommodities to high value consumer goods rangedfrom 90 per cent to 40 per cent for road, 85 per cent
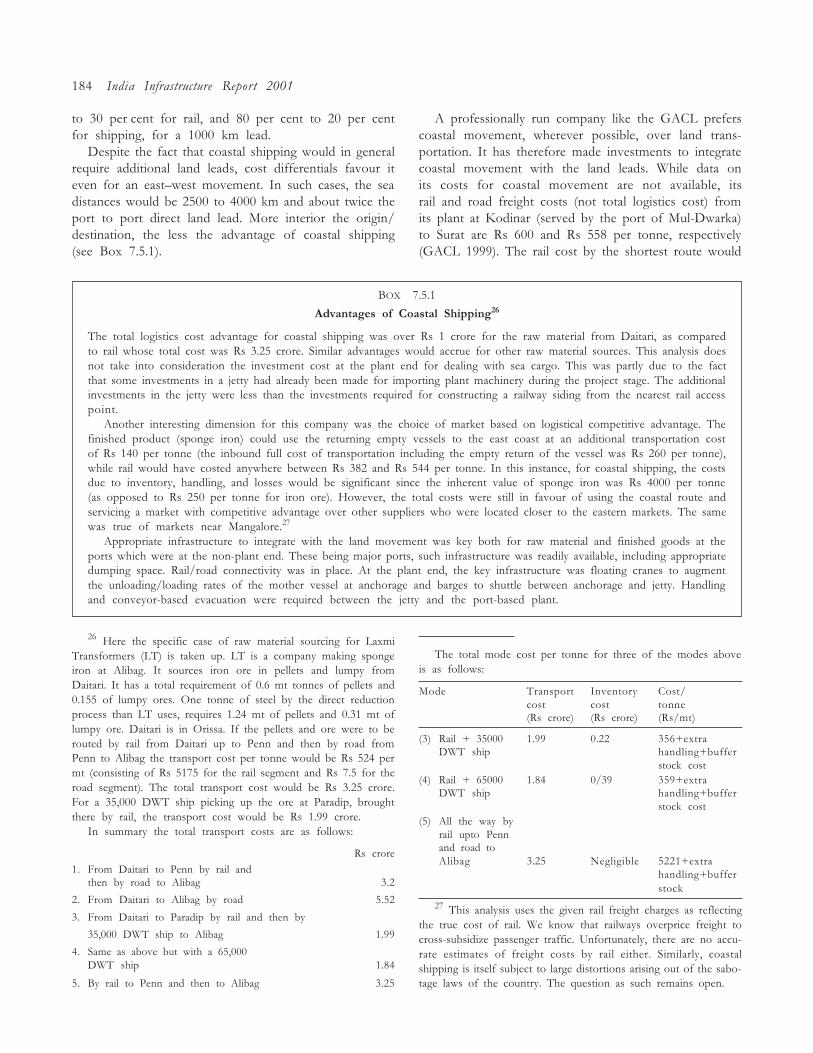
184 India Infrastructure Report 2001
to 30 per cent for rail, and 80 per cent to 20 per centfor shipping, for a 1000 km lead.
Despite the fact that coastal shipping would in generalrequire additional land leads, cost differentials favour iteven for an east�west movement. In such cases, the seadistances would be 2500 to 4000 km and about twice theport to port direct land lead. More interior the origin/destination, the less the advantage of coastal shipping(see Box 7.5.1).
A professionally run company like the GACL preferscoastal movement, wherever possible, over land trans-portation. It has therefore made investments to integratecoastal movement with the land leads. While data onits costs for coastal movement are not available, itsrail and road freight costs (not total logistics cost) fromits plant at Kodinar (served by the port of Mul-Dwarka)to Surat are Rs 600 and Rs 558 per tonne, respectively(GACL 1999). The rail cost by the shortest route would
26 Here the specific case of raw material sourcing for LaxmiTransformers (LT) is taken up. LT is a company making spongeiron at Alibag. It sources iron ore in pellets and lumpy fromDaitari. It has a total requirement of 0.6 mt tonnes of pellets and0.155 of lumpy ores. One tonne of steel by the direct reductionprocess than LT uses, requires 1.24 mt of pellets and 0.31 mt oflumpy ore. Daitari is in Orissa. If the pellets and ore were to berouted by rail from Daitari up to Penn and then by road fromPenn to Alibag the transport cost per tonne would be Rs 524 permt (consisting of Rs 5175 for the rail segment and Rs 7.5 for theroad segment). The total transport cost would be Rs 3.25 crore.For a 35,000 DWT ship picking up the ore at Paradip, broughtthere by rail, the transport cost would be Rs 1.99 crore.
In summary the total transport costs are as follows:
Rs crore
1. From Daitari to Penn by rail andthen by road to Alibag 3.2
2. From Daitari to Alibag by road 5.52
3. From Daitari to Paradip by rail and then by
35,000 DWT ship to Alibag 1.99
4. Same as above but with a 65,000DWT ship 1.84
5. By rail to Penn and then to Alibag 3.25
The total mode cost per tonne for three of the modes aboveis as follows:
Mode Transport Inventory Cost/cost cost tonne(Rs crore) (Rs crore) (Rs/mt)
(3) Rail + 35000 1.99 0.22 356+extraDWT ship handling+buffer
stock cost(4) Rail + 65000 1.84 0/39 359+extra
DWT ship handling+bufferstock cost
(5) All the way byrail upto Pennand road toAlibag 3.25 Negligible 5221+extra
handling+bufferstock
27 This analysis uses the given rail freight charges as reflectingthe true cost of rail. We know that railways overprice freight tocross-subsidize passenger traffic. Unfortunately, there are no accu-rate estimates of freight costs by rail either. Similarly, coastalshipping is itself subject to large distortions arising out of the sabo-tage laws of the country. The question as such remains open.
BOX 7.5.1
Advantages of Coastal Shipping26
The total logistics cost advantage for coastal shipping was over Rs 1 crore for the raw material from Daitari, as comparedto rail whose total cost was Rs 3.25 crore. Similar advantages would accrue for other raw material sources. This analysis doesnot take into consideration the investment cost at the plant end for dealing with sea cargo. This was partly due to the factthat some investments in a jetty had already been made for importing plant machinery during the project stage. The additionalinvestments in the jetty were less than the investments required for constructing a railway siding from the nearest rail accesspoint.
Another interesting dimension for this company was the choice of market based on logistical competitive advantage. Thefinished product (sponge iron) could use the returning empty vessels to the east coast at an additional transportation costof Rs 140 per tonne (the inbound full cost of transportation including the empty return of the vessel was Rs 260 per tonne),while rail would have costed anywhere between Rs 382 and Rs 544 per tonne. In this instance, for coastal shipping, the costsdue to inventory, handling, and losses would be significant since the inherent value of sponge iron was Rs 4000 per tonne(as opposed to Rs 250 per tonne for iron ore). However, the total costs were still in favour of using the coastal route andservicing a market with competitive advantage over other suppliers who were located closer to the eastern markets. The samewas true of markets near Mangalore.27
Appropriate infrastructure to integrate with the land movement was key both for raw material and finished goods at theports which were at the non-plant end. These being major ports, such infrastructure was readily available, including appropriatedumping space. Rail/road connectivity was in place. At the plant end, the key infrastructure was floating cranes to augmentthe unloading/loading rates of the mother vessel at anchorage and barges to shuttle between anchorage and jetty. Handlingand conveyor-based evacuation were required between the jetty and the port-based plant.
Integrated Transport 185
be Rs 545. However, since this route has restrictions dueto the Gir sanctuary, the actual cost works out to beRs 600, whereas the transportation cost from Kodinarto Surat using coastal movement would not exceedRs 150 per tonne including the land leads. Part of thesaving is also due to the shorter coastal lead across theGulf of Khambat.
TRAFFIC POTENTIAL
Given such advantages for bulk movement as in thecase of GACL and Laxmi Transformers, the scope forincreased use of coastal shipping, with appropriateinfrastructure to integrate with the rest of the transportnetwork, is quite large.
It would be difficult to quantify the traffic potentialfor coastal movement, since much of it would dependon the port and multimodal infrastructure and industrialand distribution centre location strategies. Of thedomestic originating tonnes, the railways handled about420 mt in 1998�9. Assuming that traffic using road asthe primary movement had similar leads as rail andgiven that road share in tkm is one and a half times therail share, the originating traffic for primary roadmovement would be about 630 mt. (�Primary� is empha-sized since almost every unit of traffic starts its journeyby road, but then could be serviced by rail or sea, bothcoastal and overseas, with very short leads. A primarymovement would not include such movements.)
Out of the resultant total of over 1 billion tonnes ofdomestic originating traffic, a 5 per cent share capturedby coastal shipping would amount to 50 mt. This wouldbe in addition to the 41 mt of originating coastal trafficfor 1998�9. With a five-year horizon it ought to bepossible for coastal shipping to capture 50 mt of traffic.In fact, this figure would be less than the annual growthin originating tonnes in India. This would amount toa 14 per cent annual growth rate compared with thefigure of 41 mt in 1998�9 to reach about 90 mt in 2004�5.At a macro level, the transport demand effort multiplierfor India has been estimated at 1.5, which means thetotal tkm of traffic would grow at 1.5 times the grossdomestic product (GDP) growth rate. Over the next fewyears, with an estimated 6�7 per cent gross domesticproduct (GDP) growth rate, transportation demandwould grow at 10 per cent per year. The expectation forcoastal movement growth is thus higher.
The scope for increasing coastal traffic would be themovement of coal (along the east coast and from eastto west, with port-based distribution centres), iron ore(east to west and along the west coast), fertilizers, andcement (port-based plant to port-based distributioncentres), salt (along the west coast and west to east),
foodgrains (north to south, partly by land and coast),and plantation produce (south to north, partly by coastand partly by land).
Projection of additional coal movement from Paradipfor power plants in Tamil Nadu by 2004�5 is 13 mt, outof which 8 mt would be to the new port at Ennore,3.5 mt to Cuddalore, and 1.5 mt to Tuticorin. Anotherforecast for 2006�7 suggests a total that ranges from16 mt to 30 mt, covering the thermal coal requirementsthrough Chennai and Ennore (Ennore Port 1999). Thiscompares with the current (1998�9) thermal coal unload-ing of about 10 mt at Chennai.
Much of the increased tonnage on coastal shippingwould be driven by corporates and investments depend-ing on the nature of the cargo.
There is also scope of moving higher value manufac-tured goods in a containerized manner from industrialconcentrations to redistribution centres. The Mumbaiarea is one possible source; industrial zones which couldbe developed near port locations are others. There is alsothe possibility of moving tea from Assam to the westcoast consumption points of Gujarat and Maharashtra.
The government of Gujarat has done some work onthis issue of joint development of industry and ports(for example Dahej) and has come out with a vision docu-ment (Gujarat Infrastructure Development Board 1999).
A study (Banerjee, Raghuram, and Rangaraj 2000)was made of the use of the Konkan Railway Corporation(KRC) to assess the traffic potential along the westcoast. Thirteen companies were studied and their inputsclosely considered. The study did not quantify the likelymarket realization but concluded that the KRC shouldfocus on marketing service concepts since customers�willingness to shift modes was a function of the desiredservices being offered. A study by RITES (RITES 1996)provided a list of commodities and the quantity esti-mates moving to and from Kerala on the westernnorth�south axis. These were taken up for analysis.(Banerjee, Raghuram, and Rangaraj 2000). For the year2005�6 the south to north and north to south trafficfor Kerala was estimated at 67,000 and 131,000 tonnesper day respectively, amounting to about 25 mt (southto north) and 50 mt (north to south) per year. Coastalshipping could compete for such large and significantmovements.
UTILIZATION OF SHIPS
In terms of number of vessels, there has been a gradualincrease in the coastal share, while in terms of grossregistered tonnage (GRT) the share has remained steady.The average GRT of a coastal vessel is 2500 while thatof an overseas vessel is 26,400. Coastal vessels also
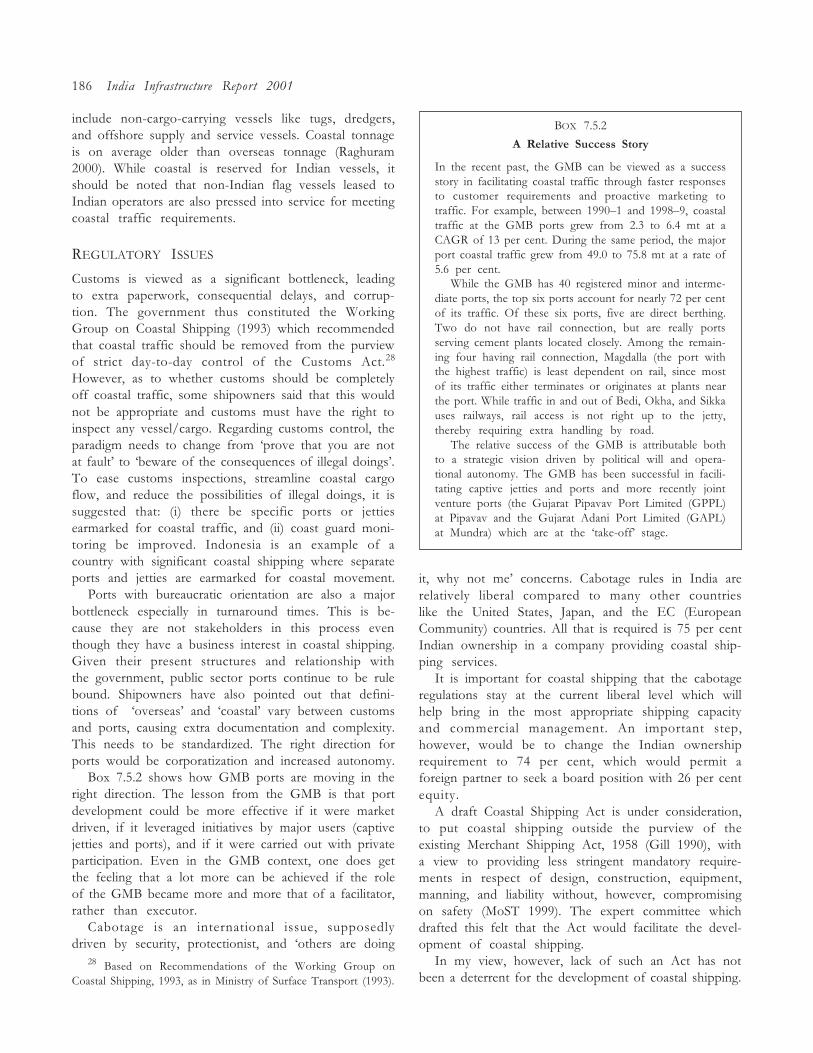
186 India Infrastructure Report 2001
include non-cargo-carrying vessels like tugs, dredgers,and offshore supply and service vessels. Coastal tonnageis on average older than overseas tonnage (Raghuram2000). While coastal is reserved for Indian vessels, itshould be noted that non-Indian flag vessels leased toIndian operators are also pressed into service for meetingcoastal traffic requirements.
REGULATORY ISSUES
Customs is viewed as a significant bottleneck, leadingto extra paperwork, consequential delays, and corrup-tion. The government thus constituted the WorkingGroup on Coastal Shipping (1993) which recommendedthat coastal traffic should be removed from the purviewof strict day-to-day control of the Customs Act.28
However, as to whether customs should be completelyoff coastal traffic, some shipowners said that this wouldnot be appropriate and customs must have the right toinspect any vessel/cargo. Regarding customs control, theparadigm needs to change from �prove that you are notat fault� to �beware of the consequences of illegal doings�.To ease customs inspections, streamline coastal cargoflow, and reduce the possibilities of illegal doings, it issuggested that: (i) there be specific ports or jettiesearmarked for coastal traffic, and (ii) coast guard moni-toring be improved. Indonesia is an example of acountry with significant coastal shipping where separateports and jetties are earmarked for coastal movement.
Ports with bureaucratic orientation are also a majorbottleneck especially in turnaround times. This is be-cause they are not stakeholders in this process eventhough they have a business interest in coastal shipping.Given their present structures and relationship withthe government, public sector ports continue to be rulebound. Shipowners have also pointed out that defini-tions of �overseas� and �coastal� vary between customsand ports, causing extra documentation and complexity.This needs to be standardized. The right direction forports would be corporatization and increased autonomy.
Box 7.5.2 shows how GMB ports are moving in theright direction. The lesson from the GMB is that portdevelopment could be more effective if it were marketdriven, if it leveraged initiatives by major users (captivejetties and ports), and if it were carried out with privateparticipation. Even in the GMB context, one does getthe feeling that a lot more can be achieved if the roleof the GMB became more and more that of a facilitator,rather than executor.
Cabotage is an international issue, supposedlydriven by security, protectionist, and �others are doing
28 Based on Recommendations of the Working Group onCoastal Shipping, 1993, as in Ministry of Surface Transport (1993).
BOX 7.5.2
A Relative Success Story
In the recent past, the GMB can be viewed as a successstory in facilitating coastal traffic through faster responsesto customer requirements and proactive marketing totraffic. For example, between 1990�1 and 1998�9, coastaltraffic at the GMB ports grew from 2.3 to 6.4 mt at aCAGR of 13 per cent. During the same period, the majorport coastal traffic grew from 49.0 to 75.8 mt at a rate of5.6 per cent.
While the GMB has 40 registered minor and interme-diate ports, the top six ports account for nearly 72 per centof its traffic. Of these six ports, five are direct berthing.Two do not have rail connection, but are really portsserving cement plants located closely. Among the remain-ing four having rail connection, Magdalla (the port withthe highest traffic) is least dependent on rail, since mostof its traffic either terminates or originates at plants nearthe port. While traffic in and out of Bedi, Okha, and Sikkauses railways, rail access is not right up to the jetty,thereby requiring extra handling by road.
The relative success of the GMB is attributable bothto a strategic vision driven by political will and opera-tional autonomy. The GMB has been successful in facili-tating captive jetties and ports and more recently jointventure ports (the Gujarat Pipavav Port Limited (GPPL)at Pipavav and the Gujarat Adani Port Limited (GAPL)at Mundra) which are at the �take-off� stage.
it, why not me� concerns. Cabotage rules in India arerelatively liberal compared to many other countrieslike the United States, Japan, and the EC (EuropeanCommunity) countries. All that is required is 75 per centIndian ownership in a company providing coastal ship-ping services.
It is important for coastal shipping that the cabotageregulations stay at the current liberal level which willhelp bring in the most appropriate shipping capacityand commercial management. An important step,however, would be to change the Indian ownershiprequirement to 74 per cent, which would permit aforeign partner to seek a board position with 26 per centequity.
A draft Coastal Shipping Act is under consideration,to put coastal shipping outside the purview of theexisting Merchant Shipping Act, 1958 (Gill 1990), witha view to providing less stringent mandatory require-ments in respect of design, construction, equipment,manning, and liability without, however, compromisingon safety (MoST 1999). The expert committee whichdrafted this felt that the Act would facilitate the devel-opment of coastal shipping.
In my view, however, lack of such an Act has notbeen a deterrent for the development of coastal shipping.
Integrated Transport 187
While the proposed Coastal Shipping Act couldlend focus to this transport mode, it should in no waybring in greater controls or bureaucracy in decisionmaking.
INFRASTRUCTURE FOCUS AREAS
Turnaround Times
One of the key, if not the most important, concerns ofcoastal movement is turnaround times at ports. Giventhat coastal movements would by definition be ofshort duration (in Europe, similar services are called�short sea shipping�), the port turnaround times shouldalso be small. With a speed of 10 knots per hour (25 kmper hour), distances of 1000, 2000, and 3000 km wouldbe completed in 40 (1.66), 80 (2.33), and 120 (5) hours(days) respectively. However, as per Table 7.5.8, theaverage turnaround times range from 3 to 5 days at mostports and up to 8 days at Chennai and Visakhapatnamfor coastal cargo. At Magdalla, due to lighterage opera-tions, the turnaround time for iron ore and pelletscould be as high as 15 days. The pre-berthing detentionsrange from 0.5 to 2 days at most ports and up to 6 daysat Chennai. Greater attention is, therefore, called forin reducing the pre-berthing detention and turnaroundtimes. Priority for coastal vessels including dedicatedjetties, direct berthing, and better loading, unloading,and evacuation systems would be essential.
Parcel Sizes
From Table 7.5.8, it can be seen that the average parcelsize for thermal coal is about 30,000 tonnes, for POLproducts between 8000 and 30,000 tonnes, POL crudeabout 29,000 tonnes, and iron ore and pellets between47,000 and 67,000 tonnes. All this cargo is handled at themajor ports both for loading and unloading, except ironore and pellets which are unloaded at Magdalla with afloating crane for lighterage. Cement and clinker move-ment takes place in vessels and barges with parcel sizesbetween 3000 to 5000 tonnes.
Other commodities which could potentially use coastalshipping would move in parcel sizes at the smaller endof the range, that is 3000 to 5000 tonnes. This would alsobe applicable for containerized general cargo, to thatextent requiring lesser consolidation efforts. Such vesselswould typically run with 150 to 250 twenty feet equiva-lent units (TEUs).
The smaller parcel sizes are in line with the just-in-time concept of supply chain management. Even thoughthe economies of scale for ship movement would not befully exploited, the cost advantage over land transportis still significant. Another major advantage is that
draft requirements (about 4 m) for such vessels wouldbe low, thereby offering flexibility in locating new portsfor coastal traffic.
It is important to think �small� (3000 to 5000 tonnesparcel size), while considering infrastructure for coastalmovement, especially in terms of handling equipment,jetties, and shipping capacity. The draft requirementfor jetties/ports handling such parcel sizes would beabout 4 m. This is especially so the non-captive coastalshipping. Coastal shipping by captive users couldthink of parcel sizes most economical to their operations(for example TNEB coal, POL oil companies, andESSAR iron ore).
Evacuation infrastructure at each of the port sites,both road and rail access, needs to be provided. Whilethinking of rail and coastal shipping integration, theparcel sizes should be multiples of rake sizes. This willenable quick evacuation, without having to consolidatecargo across vessels.
Even though ports with low draft are being proposedhere, in view of the small parcel size approach, the portsneed to be geared well to permit quick loading andunloading. The emphasis on gearing is all the more criti-cal since (i) ports are usually not well equipped and(ii) the small parcel size low draft vessels would be moreeconomical with no gear. The ports also need to permitround-the-clock and round-the-year operations. Only thenwould the desired flexibility and service levels be achievedto ensure a growing market for coastal shipping.
Elsewhere the economies of gearing at ports versusthat in ships have been examined (Raghuram 2000). Thisyields that for a given level of non-bulk originatingcoastal traffic (say 50 mt), 667 ships of 3000 dwt and 140jetties are needed. For the same loading/unloadingeffectiveness, a crane on a ship is more expensive notonly in terms of investment, but also in terms ofoperating costs. Moreover, the numbers of shipboardgearing requirement alone would be more than fourtimes those for port gearing. Thus port-based gearingwould be more economical than ship-based gearing andalso easier to implement since private sector shipownerswould want to keep their investments low.
In Europe and the United States, coastal shippingis also integrated well with inland water transportationfor through movement and evacuation. Unfortunately,our potential inland waterways have not been properlymaintained and thus cannot really be integratedwith the coastal system. If at all, the options are thethree national waterways, namely Hooghly�Ganga,Brahmaputra, Kerala coastal waterway, and also theGodavari. Currently, it would be difficult to envisageparcel sizes even as small as 300 tonnes moving in areliable manner!
188 India Infrastructure Report 2001
Port Locations
To facilitate coastal movement and reduce land leads,ports would need to be spaced all along the coastline,with a gap of no more than say 300 km. This wouldrequire about 20 port locations along India�s 6400 kmcoastline, of which 10 could be at or adjacent to theexisting major ports. Locations should be easily acces-sible from sea and have good land evacuation facilities.Some locations may be captive to industries. Otherswould serve the purpose of decongesting existingmajor ports, both in terms of berthing capacity andevacuation access. Chennai and Calcutta would need tobe bypassed on account of these criteria. Visakhapatnamand Ennore could be allocatives for Chennai and Haldiafor Calcutta. Haldia could be an alternate for Calcuttaand Ennore for Chennai. Similarly, alternatives toMumbai need to be considered.
Port Economics
For an additional 50 mt of originating coastal traffic, wewould need 140 jetties spread over 20 locations, that is,7 jetties per port. The typical cost of a 4 m draft, seven-geared jetty port would be in the range of Rs 50 to 100crore, depending on the hydrographics (based on inter-views with port executives and shipowners). Accordingto sources from the GMB, a berth for up to seven 5000dwt ships would need to be 350 m long (50 m per ship).With a 30 m backup area, the total berth area would be10,500 sq. m. The cost per sq. m for a 4 m draft jettywould be Rs 40,000, thus amounting to a total of Rs 42crore. Seven cranes with a 60 tonne capacity would berequired to ensure unloading/loading within 24 hours ata 100 per cent peak berth occupancy. Each such cranewould cost Rs 2 crore. Thus total crane cost would beRs 14 crore. Warehousing and rail/road access wouldcost an additional Rs 4 crore. The total cost of the port,excluding any navigation dredging would be Rs 60 crore.
The annual operating and maintenance costs ofsuch a port would be around 30 per cent of investmentcost, that is about Rs 20 crore per annum. Since each
additional port is expected to handle about 5 mt perannum, even at the low end revenue per tonne of Rs 100,the total revenue would be Rs 50 crore per annum. Thesurplus would be more than sufficient for financingcosts, thus making ports for coastal operations a viablebusiness. A port business is in general a very viable one.This may have much to do with the fact that all ourports are financially healthy.
Private Investment
All this additional investment should take place withprivate investment of appropriate stakeholders (highintensity users, shipping companies, and other organiza-tions with significant multimodal/maritime experience).Tying up investments for industry and/or distributioncentres near ports, along with easy integration with landtransport would be key requirements for success. Whatis really important is coordinated development.
Shipping Capacity and Manning
Shipping capacity as such is not a problem, since vesselsrequired for coastal operations can either be manufac-tured in India or sourced in through a bare boat charteror even, as per latest relaxations, chartering in of aforeign flag vessel.
Further, depending on the economics of the market,Indian owners can easily change the registration ofvessels between coastal and overseas.
The manning requirements of coastal vessels areless stringent than overseas vessels, thereby offeringscope for economy. Some shipowners state that thereis further room to reduce manning requirements.However, the crucial issue in manning is the qualityof manpower, since better take home salaries are avail-able in overseas shipping. In the words of one coastalshipowner, coastal vessels are manned by �grandfathers�.There does not seem to be any solution to this �problem�other than being able to pay higher salaries, whichwould only happen with better market conditions andutilization of vessels.
8 THE TELECOM SECTOR
Rakesh Basant
8.1 A REVIEW OF THE INDIAN TELECOM SECTOR1
Rekha Jain
and appropriate policy is complex. In a developingcountry, resource shortages, lack of technology andtrained personnel, and political expediency make thetask even more difficult.
Past experience of reform across many countriessuggests that the fundamental issue that must be ad-dressed in telecom reform is effective separation ofthe basic functions of policy making, operationalmanagement, and regulation (ITU Report 1989). Thesecond level of consideration is access to capital andhuman resources. The third level of concern is theintroduction of competition for efficiency. Compe-tition is perhaps more important than right ownership,if ever there was anything like it, in bringing aboutefficiency.
The Indian telecom sector was wholly under govern-ment ownership until 1984, and was characterized byunderinvestment, outdated equipment, and growth wellbelow the potential of the market. In the mid-1980s,telecom was included by the government as a part of theso-called �Technology Missions��a set of dedicated,welfare-oriented, and well focused programmes thenimplemented at national level (Dhir 1992).
This chapter provides an overview of the variousorganizations in the Indian telecom sector and assessespolicy initiatives from the standpoint of separation ofroles, competition, growth, and sequencing of reforms.Have the new organizations that have been created, suchas the Telecom Regulatory Authority of India (TRAI),been able to respond better? Have the roles and inter-organizational relationships facilitated or hindered policyimplementation? How successful have these attemptsbeen?
INTRODUCTION
Technological changes in telecommunications andcomputers have radically changed the business scenario.In turn, the new demands of business have spurred manytelecom-based technological innovations. In order toexploit these innovations for competing in global mar-kets, the business community the world over has beenputting pressure on governments to revise the policy,regulation, and structure of the telecom sector. Severalcountries across the world have responded by restruc-turing the state-controlled telecom service provider,increasing private participation, and deregulating serviceprovision. The emergent organizations have attemptedto be more responsive to the business needs and haveevolved mechanisms to remain competitive even undertremendous pressures (Uehara 1990; Glynn 1992; Kim,Kim, and Yoon 1992; Laidlaw 1994).
Over the past several years, developing countrieshave also recognized the important role a responsive,business-oriented, and technologically advanced telecomsector plays in the growth of the economy. Manydeveloping countries now see the constraints of astate monopoly in telecom as standing in the way of aresponse to the twin challenges of spurring internalgrowth and competing in an increasingly global economy(Donaldson 1994; Jussawala 1992; Melody 1986; Jain1995; Pisciotta 1994; Tyler and Bednarizyk 1993; Scherer1994; Wellenius 1990; Wellenius 1994). The process ofintroduction of new organizational forms and structures
1 Research assistance provided by Ms Trupti Patel is gratefullyacknowledged.
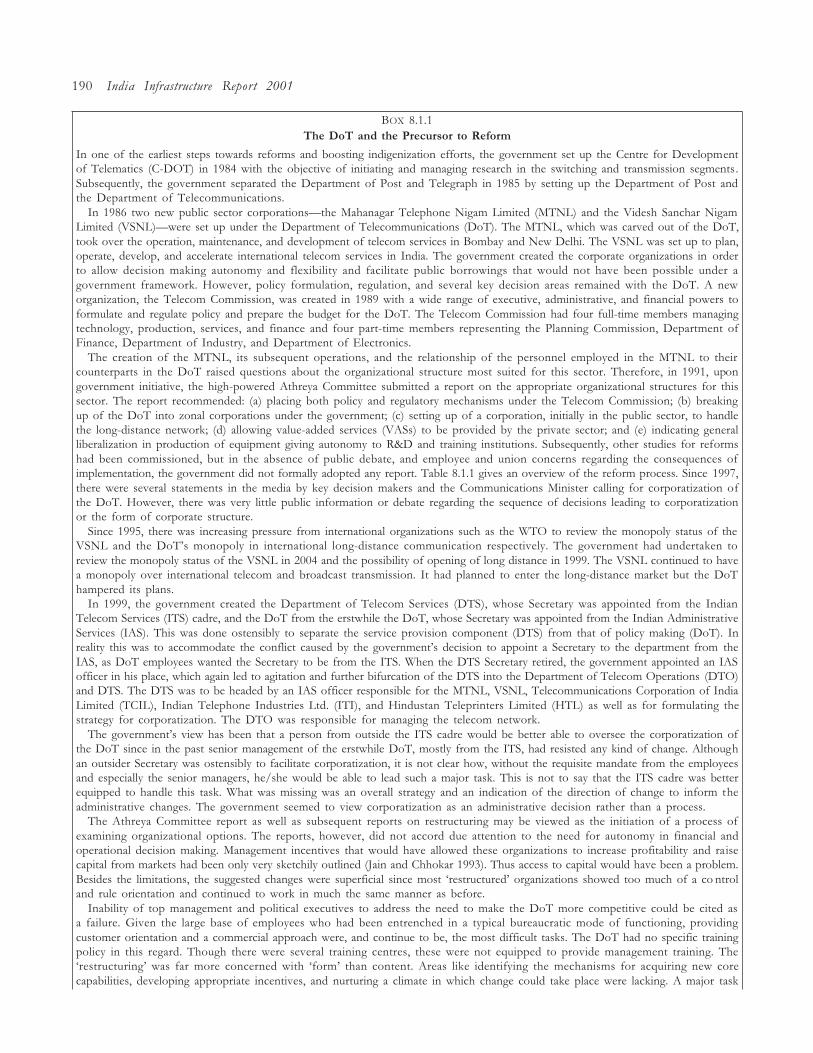
190 India Infrastructure Report 2001
BOX 8.1.1The DoT and the Precursor to Reform
In one of the earliest steps towards reforms and boosting indigenization efforts, the government set up the Centre for Developmentof Telematics (C-DOT) in 1984 with the objective of initiating and managing research in the switching and transmission segments.Subsequently, the government separated the Department of Post and Telegraph in 1985 by setting up the Department of Post andthe Department of Telecommunications.
In 1986 two new public sector corporations�the Mahanagar Telephone Nigam Limited (MTNL) and the Videsh Sanchar NigamLimited (VSNL)�were set up under the Department of Telecommunications (DoT). The MTNL, which was carved out of the DoT,took over the operation, maintenance, and development of telecom services in Bombay and New Delhi. The VSNL was set up to plan,operate, develop, and accelerate international telecom services in India. The government created the corporate organizations in orderto allow decision making autonomy and flexibility and facilitate public borrowings that would not have been possible under agovernment framework. However, policy formulation, regulation, and several key decision areas remained with the DoT. A neworganization, the Telecom Commission, was created in 1989 with a wide range of executive, administrative, and financial powers toformulate and regulate policy and prepare the budget for the DoT. The Telecom Commission had four full-time members managingtechnology, production, services, and finance and four part-time members representing the Planning Commission, Department ofFinance, Department of Industry, and Department of Electronics.
The creation of the MTNL, its subsequent operations, and the relationship of the personnel employed in the MTNL to theircounterparts in the DoT raised questions about the organizational structure most suited for this sector. Therefore, in 1991, upongovernment initiative, the high-powered Athreya Committee submitted a report on the appropriate organizational structures for thissector. The report recommended: (a) placing both policy and regulatory mechanisms under the Telecom Commission; (b) breakingup of the DoT into zonal corporations under the government; (c) setting up of a corporation, initially in the public sector, to handlethe long-distance network; (d) allowing value-added services (VASs) to be provided by the private sector; and (e) indicating generalliberalization in production of equipment giving autonomy to R&D and training institutions. Subsequently, other studies for reformshad been commissioned, but in the absence of public debate, and employee and union concerns regarding the consequences ofimplementation, the government did not formally adopted any report. Table 8.1.1 gives an overview of the reform process. Since 1997,there were several statements in the media by key decision makers and the Communications Minister calling for corporatization ofthe DoT. However, there was very little public information or debate regarding the sequence of decisions leading to corporatizationor the form of corporate structure.
Since 1995, there was increasing pressure from international organizations such as the WTO to review the monopoly status of theVSNL and the DoT�s monopoly in international long-distance communication respectively. The government had undertaken toreview the monopoly status of the VSNL in 2004 and the possibility of opening of long distance in 1999. The VSNL continued to havea monopoly over international telecom and broadcast transmission. It had planned to enter the long-distance market but the DoThampered its plans.
In 1999, the government created the Department of Telecom Services (DTS), whose Secretary was appointed from the IndianTelecom Services (ITS) cadre, and the DoT from the erstwhile the DoT, whose Secretary was appointed from the Indian AdministrativeServices (IAS). This was done ostensibly to separate the service provision component (DTS) from that of policy making (DoT). Inreality this was to accommodate the conflict caused by the government�s decision to appoint a Secretary to the department from theIAS, as DoT employees wanted the Secretary to be from the ITS. When the DTS Secretary retired, the government appointed an IASofficer in his place, which again led to agitation and further bifurcation of the DTS into the Department of Telecom Operations (DTO)and DTS. The DTS was to be headed by an IAS officer responsible for the MTNL, VSNL, Telecommunications Corporation of IndiaLimited (TCIL), Indian Telephone Industries Ltd. (ITI), and Hindustan Teleprinters Limited (HTL) as well as for formulating thestrategy for corporatization. The DTO was responsible for managing the telecom network.
The government�s view has been that a person from outside the ITS cadre would be better able to oversee the corporatization ofthe DoT since in the past senior management of the erstwhile DoT, mostly from the ITS, had resisted any kind of change. Althoughan outsider Secretary was ostensibly to facilitate corporatization, it is not clear how, without the requisite mandate from the employeesand especially the senior managers, he/she would be able to lead such a major task. This is not to say that the ITS cadre was betterequipped to handle this task. What was missing was an overall strategy and an indication of the direction of change to inform theadministrative changes. The government seemed to view corporatization as an administrative decision rather than a process.
The Athreya Committee report as well as subsequent reports on restructuring may be viewed as the initiation of a process ofexamining organizational options. The reports, however, did not accord due attention to the need for autonomy in financial andoperational decision making. Management incentives that would have allowed these organizations to increase profitability and raisecapital from markets had been only very sketchily outlined (Jain and Chhokar 1993). Thus access to capital would have been a problem.Besides the limitations, the suggested changes were superficial since most �restructured� organizations showed too much of a co ntroland rule orientation and continued to work in much the same manner as before.
Inability of top management and political executives to address the need to make the DoT more competitive could be cited asa failure. Given the large base of employees who had been entrenched in a typical bureaucratic mode of functioning, providingcustomer orientation and a commercial approach were, and continue to be, the most difficult tasks. The DoT had no specific trainingpolicy in this regard. Though there were several training centres, these were not equipped to provide management training. The�restructuring� was far more concerned with �form� than content. Areas like identifying the mechanisms for acquiring new corecapabilities, developing appropriate incentives, and nurturing a climate in which change could take place were lacking. A major task
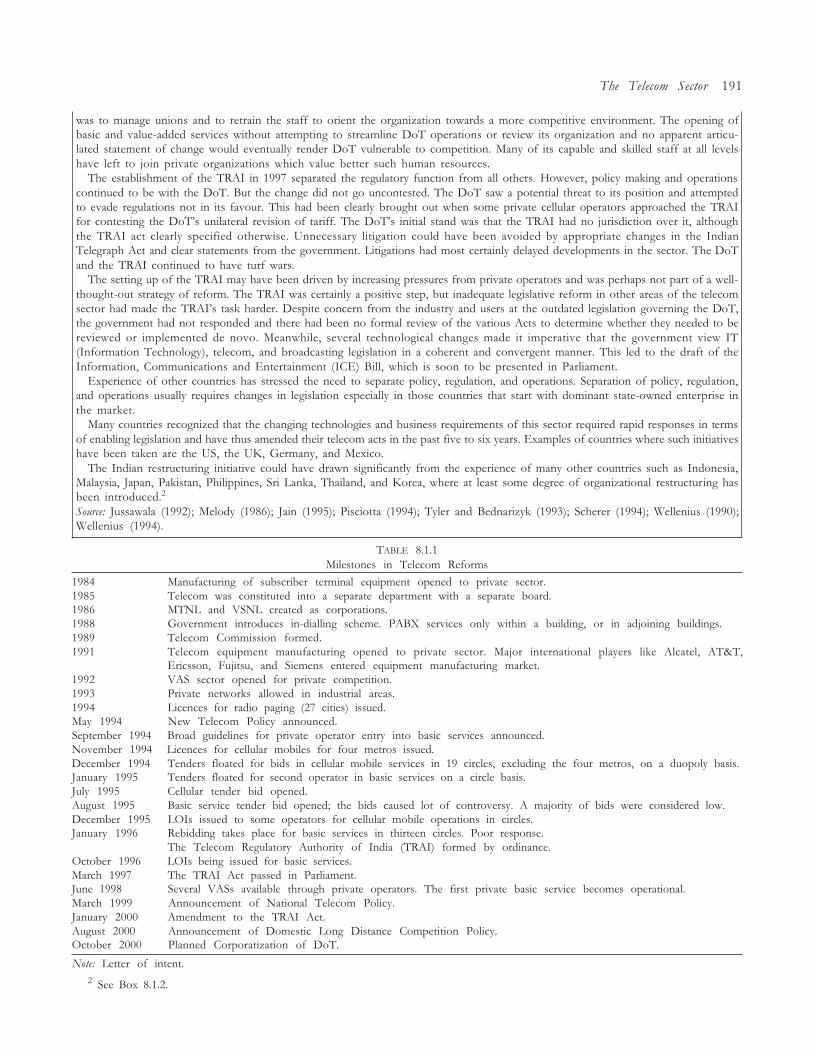
The Telecom Sector 191
was to manage unions and to retrain the staff to orient the organization towards a more competitive environment. The opening ofbasic and value-added services without attempting to streamline DoT operations or review its organization and no apparent articu-lated statement of change would eventually render DoT vulnerable to competition. Many of its capable and skilled staff at all levelshave left to join private organizations which value better such human resources.
The establishment of the TRAI in 1997 separated the regulatory function from all others. However, policy making and operationscontinued to be with the DoT. But the change did not go uncontested. The DoT saw a potential threat to its position and attemptedto evade regulations not in its favour. This had been clearly brought out when some private cellular operators approached the TRAIfor contesting the DoT�s unilateral revision of tariff. The DoT�s initial stand was that the TRAI had no jurisdiction over it, althoughthe TRAI act clearly specified otherwise. Unnecessary litigation could have been avoided by appropriate changes in the IndianTelegraph Act and clear statements from the government. Litigations had most certainly delayed developments in the sector. The DoTand the TRAI continued to have turf wars.
The setting up of the TRAI may have been driven by increasing pressures from private operators and was perhaps not part of a well-thought-out strategy of reform. The TRAI was certainly a positive step, but inadequate legislative reform in other areas of the telecomsector had made the TRAI�s task harder. Despite concern from the industry and users at the outdated legislation governing the DoT,the government had not responded and there had been no formal review of the various Acts to determine whether they needed to bereviewed or implemented de novo. Meanwhile, several technological changes made it imperative that the government view IT(Information Technology), telecom, and broadcasting legislation in a coherent and convergent manner. This led to the draft of theInformation, Communications and Entertainment (ICE) Bill, which is soon to be presented in Parliament.
Experience of other countries has stressed the need to separate policy, regulation, and operations. Separation of policy, regulation,and operations usually requires changes in legislation especially in those countries that start with dominant state-owned enterprise inthe market.
Many countries recognized that the changing technologies and business requirements of this sector required rapid responses in termsof enabling legislation and have thus amended their telecom acts in the past five to six years. Examples of countries where such initiativeshave been taken are the US, the UK, Germany, and Mexico.
The Indian restructuring initiative could have drawn significantly from the experience of many other countries such as Indonesia,Malaysia, Japan, Pakistan, Philippines, Sri Lanka, Thailand, and Korea, where at least some degree of organizational restructuring hasbeen introduced.2
Source: Jussawala (1992); Melody (1986); Jain (1995); Pisciotta (1994); Tyler and Bednarizyk (1993); Scherer (1994); Wellenius (1990);Wellenius (1994).
TABLE 8.1.1Milestones in Telecom Reforms
1984 Manufacturing of subscriber terminal equipment opened to private sector.1985 Telecom was constituted into a separate department with a separate board.1986 MTNL and VSNL created as corporations.1988 Government introduces in-dialling scheme. PABX services only within a building, or in adjoining buildings.1989 Telecom Commission formed.1991 Telecom equipment manufacturing opened to private sector. Major international players like Alcatel, AT&T,
Ericsson, Fujitsu, and Siemens entered equipment manufacturing market.1992 VAS sector opened for private competition.1993 Private networks allowed in industrial areas.1994 Licences for radio paging (27 cities) issued.May 1994 New Telecom Policy announced.September 1994 Broad guidelines for private operator entry into basic services announced.November 1994 Licences for cellular mobiles for four metros issued.December 1994 Tenders floated for bids in cellular mobile services in 19 circles, excluding the four metros, on a duopoly basis.January 1995 Tenders floated for second operator in basic services on a circle basis.July 1995 Cellular tender bid opened.August 1995 Basic service tender bid opened; the bids caused lot of controversy. A majority of bids were considered low.December 1995 LOIs issued to some operators for cellular mobile operations in circles.January 1996 Rebidding takes place for basic services in thirteen circles. Poor response.
The Telecom Regulatory Authority of India (TRAI) formed by ordinance.October 1996 LOIs being issued for basic services.March 1997 The TRAI Act passed in Parliament.June 1998 Several VASs available through private operators. The first private basic service becomes operational.March 1999 Announcement of National Telecom Policy.January 2000 Amendment to the TRAI Act.August 2000 Announcement of Domestic Long Distance Competition Policy.October 2000 Planned Corporatization of DoT.
Note: Letter of intent.2 See Box 8.1.2.
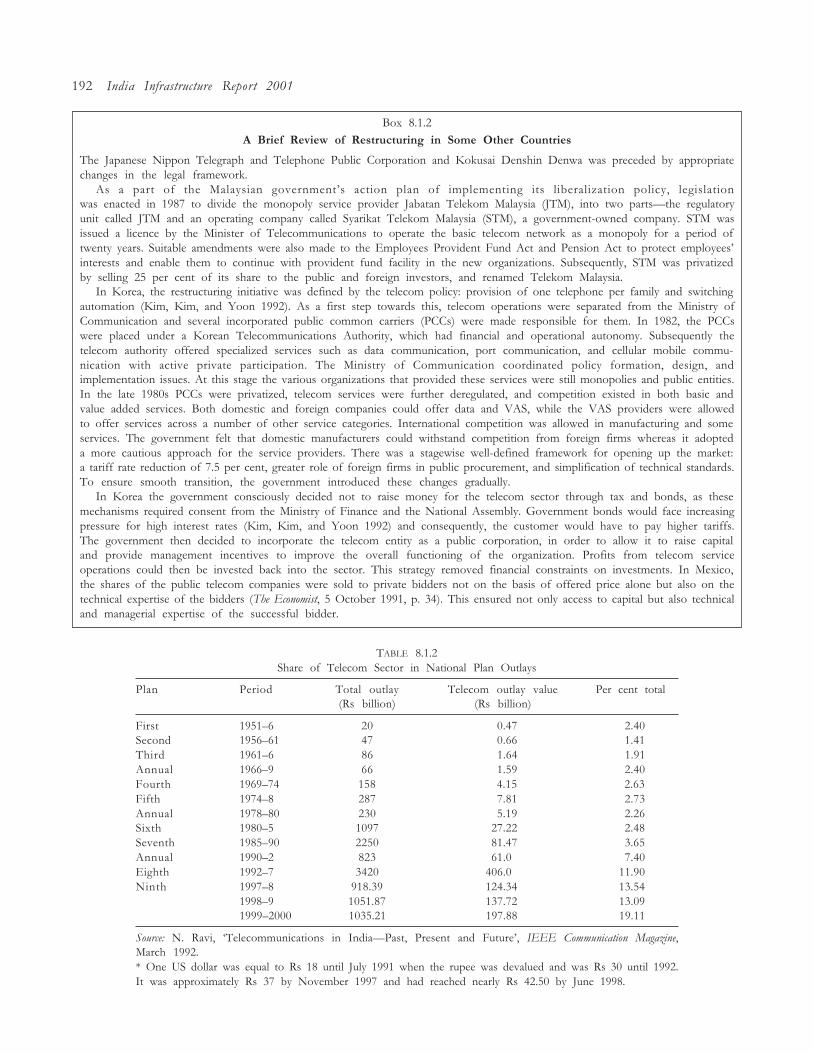
192 India Infrastructure Report 2001
Box 8.1.2A Brief Review of Restructuring in Some Other Countries
The Japanese Nippon Telegraph and Telephone Public Corporation and Kokusai Denshin Denwa was preceded by appropriatechanges in the legal framework.
As a part of the Malaysian government�s action plan of implementing its liberalization policy, legislationwas enacted in 1987 to divide the monopoly service provider Jabatan Telekom Malaysia (JTM), into two parts�the regulatoryunit called JTM and an operating company called Syarikat Telekom Malaysia (STM), a government-owned company. STM wasissued a licence by the Minister of Telecommunications to operate the basic telecom network as a monopoly for a period oftwenty years. Suitable amendments were also made to the Employees Provident Fund Act and Pension Act to protect employees�interests and enable them to continue with provident fund facility in the new organizations. Subsequently, STM was privatizedby selling 25 per cent of its share to the public and foreign investors, and renamed Telekom Malaysia.
In Korea, the restructuring initiative was defined by the telecom policy: provision of one telephone per family and switchingautomation (Kim, Kim, and Yoon 1992). As a first step towards this, telecom operations were separated from the Ministry ofCommunication and several incorporated public common carriers (PCCs) were made responsible for them. In 1982, the PCCswere placed under a Korean Telecommunications Authority, which had financial and operational autonomy. Subsequently thetelecom authority offered specialized services such as data communication, port communication, and cellular mobile commu-nication with active private participation. The Ministry of Communication coordinated policy formation, design, andimplementation issues. At this stage the various organizations that provided these services were still monopolies and public entities.In the late 1980s PCCs were privatized, telecom services were further deregulated, and competition existed in both basic andvalue added services. Both domestic and foreign companies could offer data and VAS, while the VAS providers were allowedto offer services across a number of other service categories. International competition was allowed in manufacturing and someservices. The government felt that domestic manufacturers could withstand competition from foreign firms whereas it adopteda more cautious approach for the service providers. There was a stagewise well-defined framework for opening up the market:a tariff rate reduction of 7.5 per cent, greater role of foreign firms in public procurement, and simplification of technical standards.To ensure smooth transition, the government introduced these changes gradually.
In Korea the government consciously decided not to raise money for the telecom sector through tax and bonds, as thesemechanisms required consent from the Ministry of Finance and the National Assembly. Government bonds would face increasingpressure for high interest rates (Kim, Kim, and Yoon 1992) and consequently, the customer would have to pay higher tariffs.The government then decided to incorporate the telecom entity as a public corporation, in order to allow it to raise capitaland provide management incentives to improve the overall functioning of the organization. Profits from telecom serviceoperations could then be invested back into the sector. This strategy removed financial constraints on investments. In Mexico,the shares of the public telecom companies were sold to private bidders not on the basis of offered price alone but also on thetechnical expertise of the bidders (The Economist, 5 October 1991, p. 34). This ensured not only access to capital but also technicaland managerial expertise of the successful bidder.
TABLE 8.1.2Share of Telecom Sector in National Plan Outlays
Plan Period Total outlay Telecom outlay value Per cent total(Rs billion) (Rs billion)
First 1951�6 20 0.47 2.40Second 1956�61 47 0.66 1.41Third 1961�6 86 1.64 1.91Annual 1966�9 66 1.59 2.40Fourth 1969�74 158 4.15 2.63Fifth 1974�8 287 7.81 2.73Annual 1978�80 230 5.19 2.26Sixth 1980�5 1097 27.22 2.48Seventh 1985�90 2250 81.47 3.65Annual 1990�2 823 61.0 7.40Eighth 1992�7 3420 406.0 11.90Ninth 1997�8 918.39 124.34 13.54
1998�9 1051.87 137.72 13.091999�2000 1035.21 197.88 19.11
Source: N. Ravi, �Telecommunications in India�Past, Present and Future�, IEEE Communication Magazine,March 1992.* One US dollar was equal to Rs 18 until July 1991 when the rupee was devalued and was Rs 30 until 1992.It was approximately Rs 37 by November 1997 and had reached nearly Rs 42.50 by June 1998.
The Telecom Sector 193
Box 8.1.3The Telecom Network3 and the DoT
Unlike the meagre investments that were made before 1990, in the last decade of the century, the governmentsubstantially increased the outlay for this sector (Table 8.1.2). This led to more than trebling of telephone lines fromnearly 5 million in 1990�1 to 17.8 million by 1997�8. The massive investments required to achieve this connectivity(of the order of nearly US $ 1 billion at 1995 prices) inter alia led the government to seek private participation.
More than 80 per cent of the telephones were in urban areas serving nearly 26 per cent of the population. About30 per cent of these were concentrated in the four metros of Mumbai, Calcutta, Chennai, and New Delhi. The telephonenetwork had been expanding at the rate of 22 per cent direct exchange lines (DELs) added since 1993�4 and accountedfor 178 lakh lines at the end of 1997�8, which at the end of 1999 had grown to 213 lakh lines. Table A.8.1.1 givesvarious indicators related to the telecom sector since 1991�2. The registered waitlist demand was for nearly 27 lakhDELs. The ratio of registered demand to DELs available was on an average 20 per cent since 1993�4. During 1998,this decreased to 15 per cent, showing improvement. However, the registered demand was not a good indicator ofpotential demand, as when the connection charges were reduced by the MTNL from Rs 3000 to 1500, 2 lakh moresubscribers registered for connections.
Despite this impressive growth rate in India, the waiting list for telephones was 2.65 million which is still about8 per cent of the installed base. Information on circlewise waiting list data is shown in Table A.8.1.2. This being onlythe registered demand it does not necessarily indicate full potential demand for basic services. There was a large elementof latent demand amply reflected in the immediate bouncing back of the waiting list no sooner than it was wiped out,which was despite sustained high growth in network expansion and provision of new connections.
Although the DoT had set a target of at least one phone per village by 1997, as of March 1996, nearly 60 per centof the villages still remained uncovered. By March 1999, 310,687 villages were covered (a little more than half the totalvillages). During 1998�9, 42,855 more villages were covered. Although this represents a growth of 16 per cent over theprevious year, it was far below the DoT�s own target of 83,000 villages. According to newspaper reports (Financial Express,25 August 1999), this target was likely to be delayed as the DoT had not found sufficient interest in vendors for WLL(wireless in local loop) technology, which it had chosen to deploy in the villages. It is possible that since the thirdgeneration of cellular mobile technology had started to be deployed in some of the western countries, vendors were notkeen to continue with this technology.4 There was thus far no available blueprint for third generation deployment.
India�s satellite programme had been fairly successful with the development and launch of indigenous multi-purposesatellite systems. The satellites were being used by both the Communications Ministry and the Information andBroadcasting Ministry.
The effective trunk calls per DEL were decreasing until 1998. This could be indicative of slowness of investmentsin trunk lines, but more importantly could arise because market segments now buying telephone connections havea lower propensity to make trunk calls. Given the impending competition in domestic long distance, DoT increasedits investments in the segment from 1998 onwards, expanding net switching capacity from 260.50 lakh lines to 326.45lakh lines and trunk automatic exchange capacity from 14.70 lakh to 19.47 lakh. On the other hand, examination ofthe international circuits per DEL revealed that the numbers decreased, showing a slow-down in growth vis-à-vis DELs.This also implies that there were lower revenues due to incomplete calls.
The number of phone faults per 100 stations per month did not show significant decline since 1992�3. The averagewas 17.4 faults per month per 100 telephones. This indicates that despite the introduction of new technologies, theDoT was not able to enhance the performance of the network and make it more reliable.
The expenditure per employee rose from nearly Rs 1.43 lakh in 1993�4 to 2.57 lakh by 1997�8, a rise of nearly80 per cent. This, at 15.8 per cent per annum, is significantly higher than rise in the consumer price index for non-manual urban workers at about 8.43 per cent. The conclusion therefore is inescapable that there has been little controlover wage increase.
Although employees per 1000 DELs had been decreasing and had reached 24 employees per 1000 DEL by 2000,these need to be reduced significantly, since manning in the DoT in relation to the total value of business is knownto be about three times that of progressive state-owned telecos in the nearly industrialized countries (NICs). At theaverage present rate of decrease (for the last five years), it will be another five years until the DoT reaches ten employeesper 1000 DELs.
Although in 1992�3 the revenue per DEL per annum increased from Rs 9120 to 10,304 in 1997�8, the rate increasedonly 13 per cent, while overall inflation during the same period averaged 6�7 per cent. While total revenues had grownat an average of 24 per cent since 1992�3, expenses grew at an average of nearly 22 per cent. Although the DoT generated
3 Data for this Box are largely taken from the Annual Reports of the Department of Telecommunications, Government of India,1986�95 and the Rakesh Mohan Committe Report, 1997 on India�s infrastructure.
4 The interlocking international finance and technology and equipment markets at a time when the cost of funds is to high forIndian players is a factor. High licence fees and larger than optimal circles for WLL may have been additional factors. See section 8.2of this report.
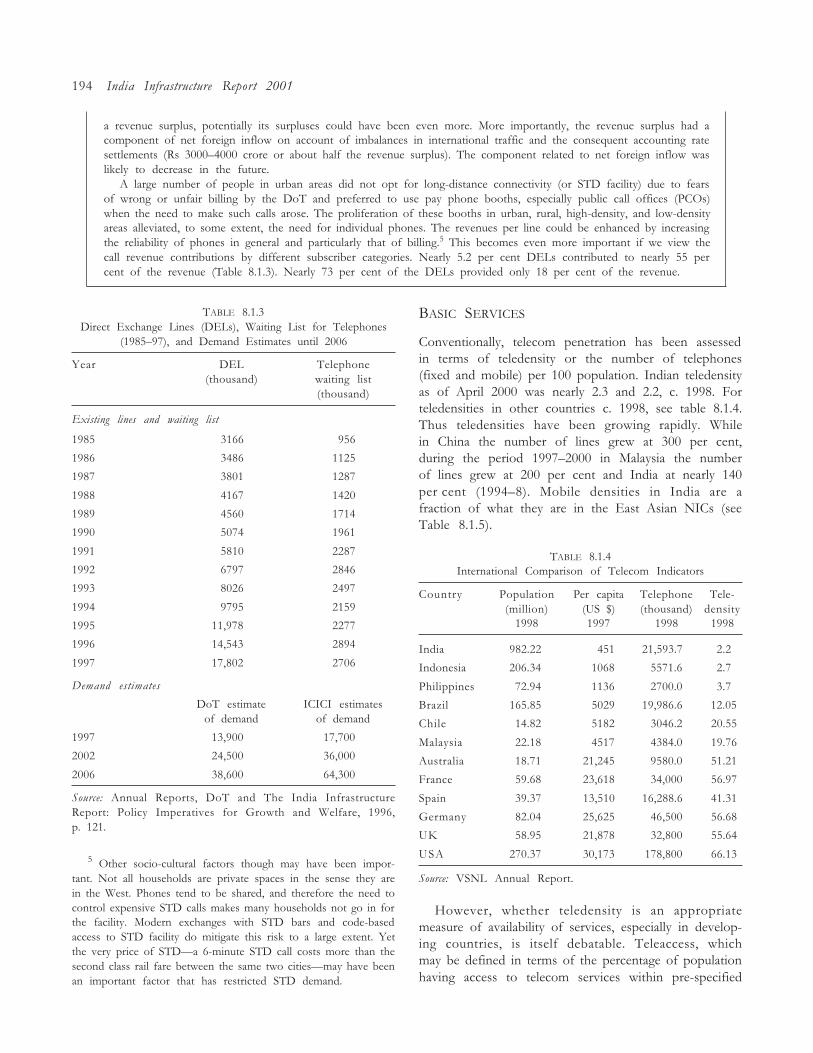
194 India Infrastructure Report 2001
a revenue surplus, potentially its surpluses could have been even more. More importantly, the revenue surplus had acomponent of net foreign inflow on account of imbalances in international traffic and the consequent accounting ratesettlements (Rs 3000�4000 crore or about half the revenue surplus). The component related to net foreign inflow waslikely to decrease in the future.
A large number of people in urban areas did not opt for long-distance connectivity (or STD facility) due to fearsof wrong or unfair billing by the DoT and preferred to use pay phone booths, especially public call offices (PCOs)when the need to make such calls arose. The proliferation of these booths in urban, rural, high-density, and low-densityareas alleviated, to some extent, the need for individual phones. The revenues per line could be enhanced by increasingthe reliability of phones in general and particularly that of billing.5 This becomes even more important if we view thecall revenue contributions by different subscriber categories. Nearly 5.2 per cent DELs contributed to nearly 55 percent of the revenue (Table 8.1.3). Nearly 73 per cent of the DELs provided only 18 per cent of the revenue.
TABLE 8.1.3Direct Exchange Lines (DELs), Waiting List for Telephones
(1985�97), and Demand Estimates until 2006
Year DEL Telephone(thousand) waiting list
(thousand)
Existing lines and waiting list
1985 3166 956
1986 3486 1125
1987 3801 1287
1988 4167 1420
1989 4560 1714
1990 5074 1961
1991 5810 2287
1992 6797 2846
1993 8026 2497
1994 9795 2159
1995 11,978 2277
1996 14,543 2894
1997 17,802 2706
Demand estimates
DoT estimate ICICI estimatesof demand of demand
1997 13,900 17,700
2002 24,500 36,000
2006 38,600 64,300
Source: Annual Reports, DoT and The India InfrastructureReport: Policy Imperatives for Growth and Welfare, 1996,p. 121.
5 Other socio-cultural factors though may have been impor-tant. Not all households are private spaces in the sense they arein the West. Phones tend to be shared, and therefore the need tocontrol expensive STD calls makes many households not go in forthe facility. Modern exchanges with STD bars and code-basedaccess to STD facility do mitigate this risk to a large extent. Yetthe very price of STD�a 6-minute STD call costs more than thesecond class rail fare between the same two cities�may have beenan important factor that has restricted STD demand.
BASIC SERVICES
Conventionally, telecom penetration has been assessedin terms of teledensity or the number of telephones(fixed and mobile) per 100 population. Indian teledensityas of April 2000 was nearly 2.3 and 2.2, c. 1998. Forteledensities in other countries c. 1998, see table 8.1.4.Thus teledensities have been growing rapidly. Whilein China the number of lines grew at 300 per cent,during the period 1997�2000 in Malaysia the numberof lines grew at 200 per cent and India at nearly 140per cent (1994�8). Mobile densities in India are afraction of what they are in the East Asian NICs (seeTable 8.1.5).
TABLE 8.1.4International Comparison of Telecom Indicators
Country Population Per capita Telephone Tele-(million) (US $) (thousand) density
1998 1997 1998 1998
India 982.22 451 21,593.7 2.2
Indonesia 206.34 1068 5571.6 2.7
Philippines 72.94 1136 2700.0 3.7
Brazil 165.85 5029 19,986.6 12.05
Chile 14.82 5182 3046.2 20.55
Malaysia 22.18 4517 4384.0 19.76
Australia 18.71 21,245 9580.0 51.21
France 59.68 23,618 34,000 56.97
Spain 39.37 13,510 16,288.6 41.31
Germany 82.04 25,625 46,500 56.68
UK 58.95 21,878 32,800 55.64
USA 270.37 30,173 178,800 66.13
Source: VSNL Annual Report.
However, whether teledensity is an appropriatemeasure of availability of services, especially in develop-ing countries, is itself debatable. Teleaccess, whichmay be defined in terms of the percentage of populationhaving access to telecom services within pre-specified
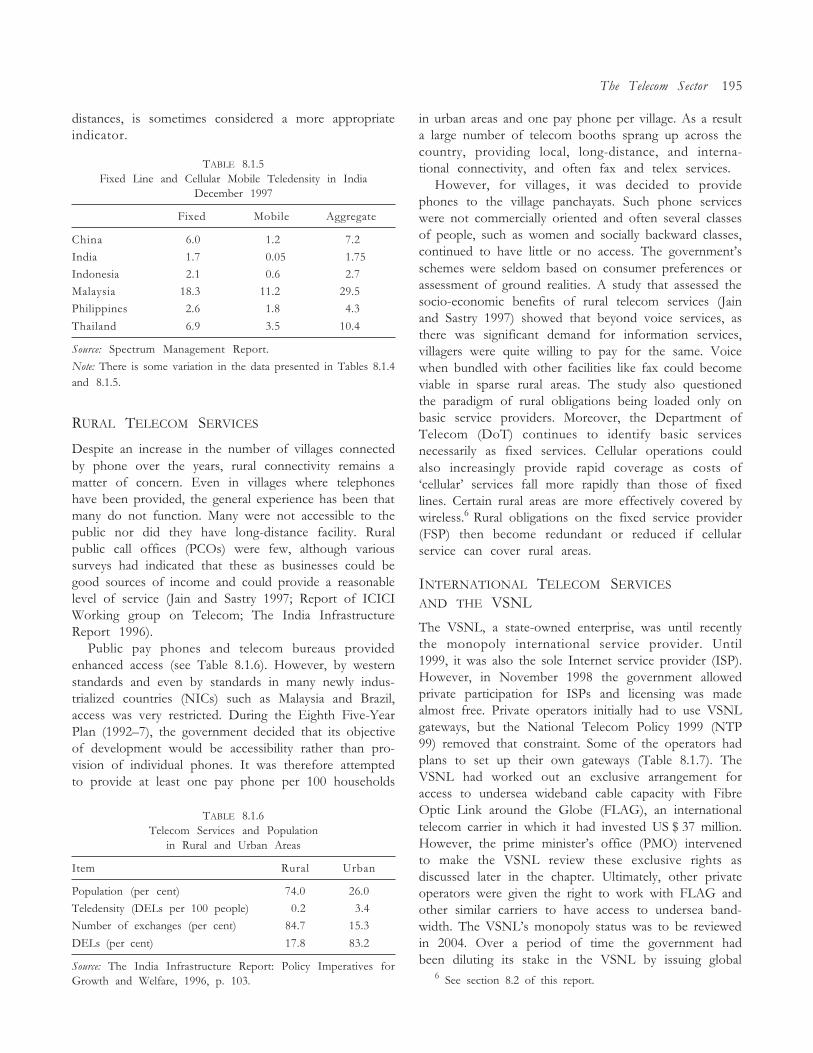
The Telecom Sector 195
distances, is sometimes considered a more appropriateindicator.
TABLE 8.1.5Fixed Line and Cellular Mobile Teledensity in India
December 1997
Fixed Mobile Aggregate
China 6.0 1.2 7.2
India 1.7 0.05 1.75
Indonesia 2.1 0.6 2.7
Malaysia 18.3 11.2 29.5
Philippines 2.6 1.8 4.3
Thailand 6.9 3.5 10.4
Source: Spectrum Management Report.
Note: There is some variation in the data presented in Tables 8.1.4and 8.1.5.
RURAL TELECOM SERVICES
Despite an increase in the number of villages connectedby phone over the years, rural connectivity remains amatter of concern. Even in villages where telephoneshave been provided, the general experience has been thatmany do not function. Many were not accessible to thepublic nor did they have long-distance facility. Ruralpublic call offices (PCOs) were few, although varioussurveys had indicated that these as businesses could begood sources of income and could provide a reasonablelevel of service (Jain and Sastry 1997; Report of ICICIWorking group on Telecom; The India InfrastructureReport 1996).
Public pay phones and telecom bureaus providedenhanced access (see Table 8.1.6). However, by westernstandards and even by standards in many newly indus-trialized countries (NICs) such as Malaysia and Brazil,access was very restricted. During the Eighth Five-YearPlan (1992�7), the government decided that its objectiveof development would be accessibility rather than pro-vision of individual phones. It was therefore attemptedto provide at least one pay phone per 100 households
in urban areas and one pay phone per village. As a resulta large number of telecom booths sprang up across thecountry, providing local, long-distance, and interna-tional connectivity, and often fax and telex services.
However, for villages, it was decided to providephones to the village panchayats. Such phone serviceswere not commercially oriented and often several classesof people, such as women and socially backward classes,continued to have little or no access. The government�sschemes were seldom based on consumer preferences orassessment of ground realities. A study that assessed thesocio-economic benefits of rural telecom services (Jainand Sastry 1997) showed that beyond voice services, asthere was significant demand for information services,villagers were quite willing to pay for the same. Voicewhen bundled with other facilities like fax could becomeviable in sparse rural areas. The study also questionedthe paradigm of rural obligations being loaded only onbasic service providers. Moreover, the Department ofTelecom (DoT) continues to identify basic servicesnecessarily as fixed services. Cellular operations couldalso increasingly provide rapid coverage as costs of�cellular� services fall more rapidly than those of fixedlines. Certain rural areas are more effectively covered bywireless.6 Rural obligations on the fixed service provider(FSP) then become redundant or reduced if cellularservice can cover rural areas.
INTERNATIONAL TELECOM SERVICES
AND THE VSNL
The VSNL, a state-owned enterprise, was until recentlythe monopoly international service provider. Until1999, it was also the sole Internet service provider (ISP).However, in November 1998 the government allowedprivate participation for ISPs and licensing was madealmost free. Private operators initially had to use VSNLgateways, but the National Telecom Policy 1999 (NTP99) removed that constraint. Some of the operators hadplans to set up their own gateways (Table 8.1.7). TheVSNL had worked out an exclusive arrangement foraccess to undersea wideband cable capacity with FibreOptic Link around the Globe (FLAG), an internationaltelecom carrier in which it had invested US $ 37 million.However, the prime minister�s office (PMO) intervenedto make the VSNL review these exclusive rights asdiscussed later in the chapter. Ultimately, other privateoperators were given the right to work with FLAG andother similar carriers to have access to undersea band-width. The VSNL�s monopoly status was to be reviewedin 2004. Over a period of time the government hadbeen diluting its stake in the VSNL by issuing global
TABLE 8.1.6Telecom Services and Population
in Rural and Urban Areas
Item Rural Urban
Population (per cent) 74.0 26.0
Teledensity (DELs per 100 people) 00.2 03.4
Number of exchanges (per cent) 84.7 15.3
DELs (per cent) 17.8 83.2
Source: The India Infrastructure Report: Policy Imperatives forGrowth and Welfare, 1996, p. 103. 6 See section 8.2 of this report.
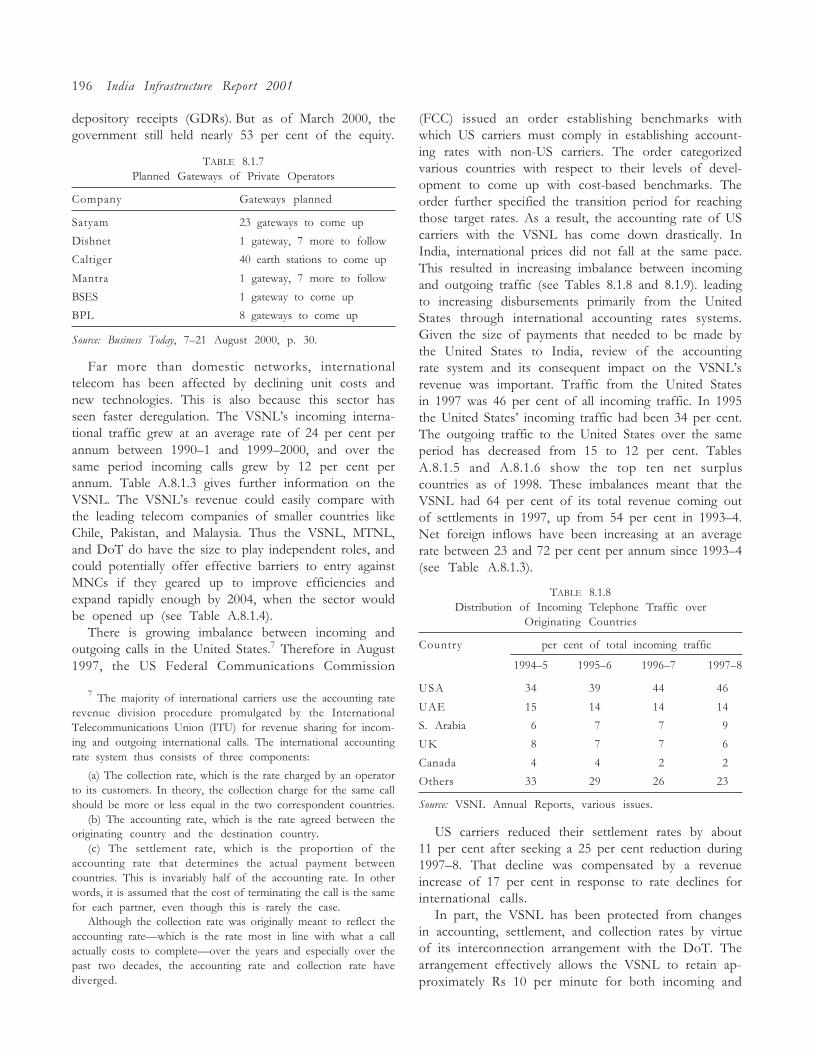
196 India Infrastructure Report 2001
depository receipts (GDRs). But as of March 2000, thegovernment still held nearly 53 per cent of the equity.
TABLE 8.1.7Planned Gateways of Private Operators
Company Gateways planned
Satyam 23 gateways to come up
Dishnet 1 gateway, 7 more to follow
Caltiger 40 earth stations to come up
Mantra 1 gateway, 7 more to follow
BSES 1 gateway to come up
BPL 8 gateways to come up
Source: Business Today, 7�21 August 2000, p. 30.
Far more than domestic networks, internationaltelecom has been affected by declining unit costs andnew technologies. This is also because this sector hasseen faster deregulation. The VSNL�s incoming interna-tional traffic grew at an average rate of 24 per cent perannum between 1990�1 and 1999�2000, and over thesame period incoming calls grew by 12 per cent perannum. Table A.8.1.3 gives further information on theVSNL. The VSNL�s revenue could easily compare withthe leading telecom companies of smaller countries likeChile, Pakistan, and Malaysia. Thus the VSNL, MTNL,and DoT do have the size to play independent roles, andcould potentially offer effective barriers to entry againstMNCs if they geared up to improve efficiencies andexpand rapidly enough by 2004, when the sector wouldbe opened up (see Table A.8.1.4).
There is growing imbalance between incoming andoutgoing calls in the United States.7 Therefore in August1997, the US Federal Communications Commission
7 The majority of international carriers use the accounting raterevenue division procedure promulgated by the InternationalTelecommunications Union (ITU) for revenue sharing for incom-ing and outgoing international calls. The international accountingrate system thus consists of three components:
(a) The collection rate, which is the rate charged by an operatorto its customers. In theory, the collection charge for the same callshould be more or less equal in the two correspondent countries.
(b) The accounting rate, which is the rate agreed between theoriginating country and the destination country.
(c) The settlement rate, which is the proportion of theaccounting rate that determines the actual payment betweencountries. This is invariably half of the accounting rate. In otherwords, it is assumed that the cost of terminating the call is the samefor each partner, even though this is rarely the case.
Although the collection rate was originally meant to reflect theaccounting rate�which is the rate most in line with what a callactually costs to complete�over the years and especially over thepast two decades, the accounting rate and collection rate havediverged.
(FCC) issued an order establishing benchmarks withwhich US carriers must comply in establishing account-ing rates with non-US carriers. The order categorizedvarious countries with respect to their levels of devel-opment to come up with cost-based benchmarks. Theorder further specified the transition period for reachingthose target rates. As a result, the accounting rate of UScarriers with the VSNL has come down drastically. InIndia, international prices did not fall at the same pace.This resulted in increasing imbalance between incomingand outgoing traffic (see Tables 8.1.8 and 8.1.9). leadingto increasing disbursements primarily from the UnitedStates through international accounting rates systems.Given the size of payments that needed to be made bythe United States to India, review of the accountingrate system and its consequent impact on the VSNL�srevenue was important. Traffic from the United Statesin 1997 was 46 per cent of all incoming traffic. In 1995the United States� incoming traffic had been 34 per cent.The outgoing traffic to the United States over the sameperiod has decreased from 15 to 12 per cent. TablesA.8.1.5 and A.8.1.6 show the top ten net surpluscountries as of 1998. These imbalances meant that theVSNL had 64 per cent of its total revenue coming outof settlements in 1997, up from 54 per cent in 1993�4.Net foreign inflows have been increasing at an averagerate between 23 and 72 per cent per annum since 1993�4(see Table A.8.1.3).
TABLE 8.1.8Distribution of Incoming Telephone Traffic over
Originating Countries
Country per cent of total incoming traffic
1994�5 1995�6 1996�7 1997�8
USA 34 39 44 46
UAE 15 14 14 14
S. Arabia 06 07 07 09
UK 08 07 07 06
Canada 04 04 02 02
Others 33 29 26 23
Source: VSNL Annual Reports, various issues.
US carriers reduced their settlement rates by about11 per cent after seeking a 25 per cent reduction during1997�8. That decline was compensated by a revenueincrease of 17 per cent in response to rate declines forinternational calls.
In part, the VSNL has been protected from changesin accounting, settlement, and collection rates by virtueof its interconnection arrangement with the DoT. Thearrangement effectively allows the VSNL to retain ap-proximately Rs 10 per minute for both incoming and
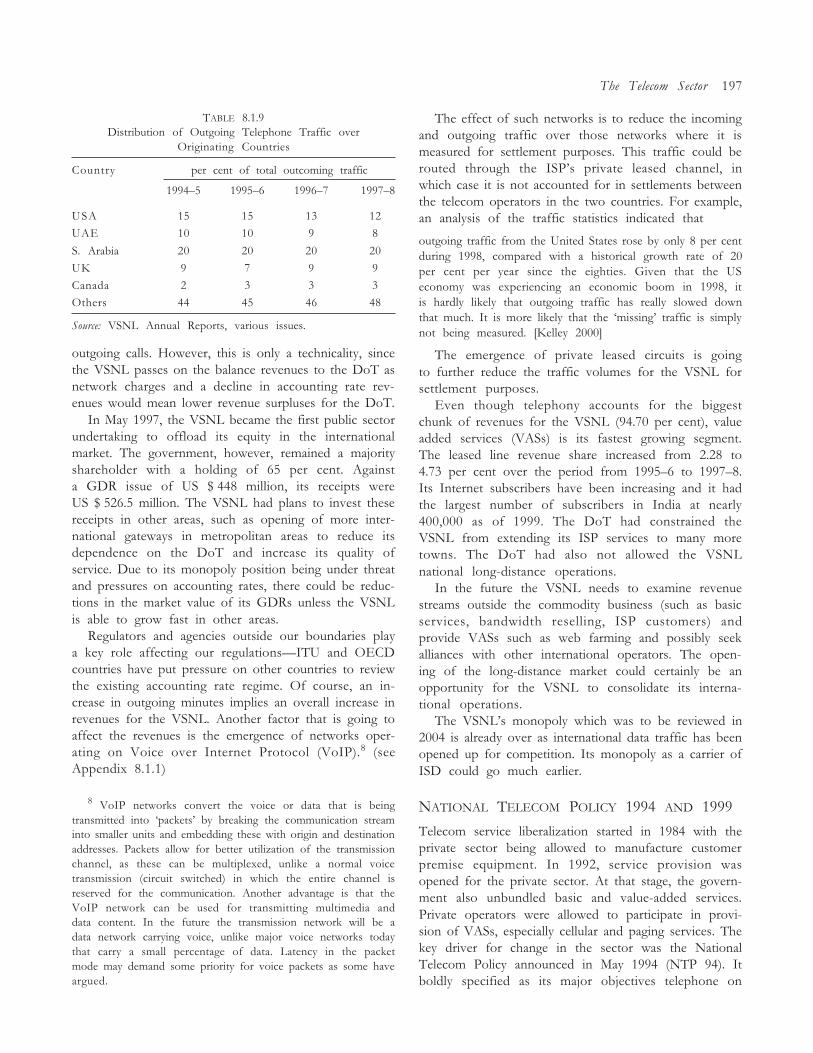
The Telecom Sector 197
The effect of such networks is to reduce the incomingand outgoing traffic over those networks where it ismeasured for settlement purposes. This traffic could berouted through the ISP�s private leased channel, inwhich case it is not accounted for in settlements betweenthe telecom operators in the two countries. For example,an analysis of the traffic statistics indicated that
outgoing traffic from the United States rose by only 8 per centduring 1998, compared with a historical growth rate of 20per cent per year since the eighties. Given that the USeconomy was experiencing an economic boom in 1998, itis hardly likely that outgoing traffic has really slowed downthat much. It is more likely that the �missing� traffic is simplynot being measured. [Kelley 2000]
The emergence of private leased circuits is goingto further reduce the traffic volumes for the VSNL forsettlement purposes.
Even though telephony accounts for the biggestchunk of revenues for the VSNL (94.70 per cent), valueadded services (VASs) is its fastest growing segment.The leased line revenue share increased from 2.28 to4.73 per cent over the period from 1995�6 to 1997�8.Its Internet subscribers have been increasing and it hadthe largest number of subscribers in India at nearly400,000 as of 1999. The DoT had constrained theVSNL from extending its ISP services to many moretowns. The DoT had also not allowed the VSNLnational long-distance operations.
In the future the VSNL needs to examine revenuestreams outside the commodity business (such as basicservices, bandwidth reselling, ISP customers) andprovide VASs such as web farming and possibly seekalliances with other international operators. The open-ing of the long-distance market could certainly be anopportunity for the VSNL to consolidate its interna-tional operations.
The VSNL�s monopoly which was to be reviewed in2004 is already over as international data traffic has beenopened up for competition. Its monopoly as a carrier ofISD could go much earlier.
NATIONAL TELECOM POLICY 1994 AND 1999
Telecom service liberalization started in 1984 with theprivate sector being allowed to manufacture customerpremise equipment. In 1992, service provision wasopened for the private sector. At that stage, the govern-ment also unbundled basic and value-added services.Private operators were allowed to participate in provi-sion of VASs, especially cellular and paging services. Thekey driver for change in the sector was the NationalTelecom Policy announced in May 1994 (NTP 94). Itboldly specified as its major objectives telephone on
TABLE 8.1.9Distribution of Outgoing Telephone Traffic over
Originating Countries
Country per cent of total outcoming traffic
1994�5 1995�6 1996�7 1997�8
USA 15 15 13 12
UAE 10 10 9 8
S. Arabia 20 20 20 20
UK 9 7 9 9
Canada 2 3 3 3
Others 44 45 46 48
Source: VSNL Annual Reports, various issues.
outgoing calls. However, this is only a technicality, sincethe VSNL passes on the balance revenues to the DoT asnetwork charges and a decline in accounting rate rev-enues would mean lower revenue surpluses for the DoT.
In May 1997, the VSNL became the first public sectorundertaking to offload its equity in the internationalmarket. The government, however, remained a majorityshareholder with a holding of 65 per cent. Againsta GDR issue of US $ 448 million, its receipts wereUS $ 526.5 million. The VSNL had plans to invest thesereceipts in other areas, such as opening of more inter-national gateways in metropolitan areas to reduce itsdependence on the DoT and increase its quality ofservice. Due to its monopoly position being under threatand pressures on accounting rates, there could be reduc-tions in the market value of its GDRs unless the VSNLis able to grow fast in other areas.
Regulators and agencies outside our boundaries playa key role affecting our regulations�ITU and OECDcountries have put pressure on other countries to reviewthe existing accounting rate regime. Of course, an in-crease in outgoing minutes implies an overall increase inrevenues for the VSNL. Another factor that is going toaffect the revenues is the emergence of networks oper-ating on Voice over Internet Protocol (VoIP).8 (seeAppendix 8.1.1)
8 VoIP networks convert the voice or data that is beingtransmitted into �packets� by breaking the communication streaminto smaller units and embedding these with origin and destinationaddresses. Packets allow for better utilization of the transmissionchannel, as these can be multiplexed, unlike a normal voicetransmission (circuit switched) in which the entire channel isreserved for the communication. Another advantage is that theVoIP network can be used for transmitting multimedia anddata content. In the future the transmission network will be adata network carrying voice, unlike major voice networks todaythat carry a small percentage of data. Latency in the packetmode may demand some priority for voice packets as some haveargued.
198 India Infrastructure Report 2001
demand, achievement of universal service obligation(USO), assurance of world class service to subscribers,universal availability of basic telecom services, so as tocover all 600,000 villages in the country and provide aPCO for every 500 persons in urban areas by the year1997. This policy also paved the way for private sectorparticipation in telecom services. Telecom services werecategorized into domestic basic (which included basictelephony, telex, and fax), domestic VAS which coveredall other services such as paging, cellular, and dataservices, VSAT, and international basic and VAS. Newtechnologies, rapid growth, and worldwide trends ush-ering in competition, exposed the limitations of NTP 94.In 1999, NTP 99 was announced to replace NTP 94.Since then, opening up national long-distance services(NLDS) has been another landmark policy, which wasannounced on 14 August 2000 by the Prime Minister.9
Since 1994, private participation in basic, cellular, andVASs has been seen as a vehicle for rapid telecomdevelopment. The Rakesh Mohan Committee reporthoped that the private sector would invest in telecomRs 425 billion and Rs 581 billion between 1996 and 2001and between 2002 and 2006, respectively. Private invest-ment so far has been much more modest. Out of theexpected licence fee of Rs 27,408 crore for the six circles,in the revenue-sharing scheme, operators have paidnearly Rs 1600 crore as a one-time entry fee. On theother hand, during the same periods, the DoT wasexpected to invest Rs 315 billion and Rs 581 billion,respectively. Investment estimates up to 2000 indicatedthat Rs 354 billion had already been spent, so that theDoT has invested more than it was projected to spend!
Drafted by the DoT, NTP 94 ostensibly facilitatedprivate entry, but the poor design of auctions and thelicensing conditions resulted in delays. Subsequent litiga-tion further delayed services. Contentious issues regard-ing interconnections had to be resolved prior to offtakein services. Consequently, until 1997, provision of basicservices by the private sector did not fructify. In effectthere was little competition, due to the stipulated duopolyin both cellular and basic operations. While cellularservices were a private duopoly, for basic services theDoT and an additional operator were licensed.
NTP 9910 provided guidelines for managing conten-tious issues such as high licence fee, interconnections,constraints on service provision (provision of PCOsthrough cellular operations), and opening up of satelliteservices to foreign companies.
The key objectives of NTP 99 were as follows:
� Availability of telephone on demand.
� Teledensity of 7 per cent by 2005 and 15 per cent by2010.
� To provide Internet access to all district headquartersby 2000.
� To provide high speed data and multimedia cap-ability using technologies including ISDN (integratedservices digital network) to all towns with a populationgreater than 2 lakh by the year 2002.
� Provision of world class services at reasonable rates.
� Emergence of India as a major manufacturing/export-ing base of equipment.
NTP 99 changed the competitive scenario by liberallyreviewing licence conditions. The highlights of NTP 99are as follows:
� It allowed operators to carry their own intra-circletraffic without seeking an additional licence.
� Operators could interconnect to any other serviceprovider including another cable service provider (CSP),which was not earlier allowed.
� Direct interconnectivity to the VSNL was also pos-sible, after domestic long distance was opened up (targetdate 1 January 2000).
� Operators were eligible for licences for any numberof areas.
� Licence fee was to restructured as a one-time entryfee and recurring revenue share (later fixed at 15 per cent).
� Entry of more operators would be based on therecommendations of TRAI and the situation would bereviewed every two years.
� Licences were to be available for 20 years, and wereextendible by 10 years.
� Both voice and data traffic could be carried by theservice provider.
� Direct interconnectivity between the licensed serviceprovider and any other type of service provider in theirarea of operation and sharing of infrastructure with anyother type of service provider was possible under NTP99.
� Interconnectivity between service providers of differ-ent service areas was to be reviewed in consultationwith the TRAI and the same was to be announced aspart of the structure for opening up NLDS.
� Providing services would require a payment of a one-time entry fee (as a percentage of the original licence bid)and licence fee, based on revenue share. The number of
9 Developments in India promise to be very exciting with thePMO�s initiative. Essentially, the approach of the PMO wouldindicate that it understands that telecom in increasing segmentsis contestable, and as such the �licence� mode is inappropriate.
10 See http://www.trai.gov.in/npt1999.htm.
The Telecom Sector 199
players, their mode of selection, appropriate level ofentry fee, and percentage of revenue share were to berecommended by the TRAI.
There was to be free entry in basic services FSP andcellular mobile service provider (CMSP) for each areaof operation. FSPs were required to pay an additionalone-time fee for using frequencies for the Gas Authoritywireless in local loop (WLL) provision. In addition, FSPoperators using WLL were required to pay additionallicence fee in the form of a revenue share for spectrumutilization. The TRAI would have to suggest the fee.
NTP 99 also envisaged the participation of CSPsin providing last mile linkage and switched serviceswithin their areas of operation. It permitted direct inter-connectivity between CSPs (who would be required toacquire an FSP licence) and any other type of serviceprovider including sharing of infrastructure within theirareas of operation.
A key fallout of NTP 99 was the development of amigration package according to which all FSPs wouldpay their licence dues as of 31 July 1999 as a one-timeentry fee as well as a stipulated percentage of theirrevenue as licence fee. Potential licensees were requiredto bid for the entry fees.
Earlier the TRAI had recommended free competitionin national long distance, with open entry. Revenueshare at 5 per cent or less of the licensee�s revenue anda fee in the form of a bank guarantee were additionalfeatures of the TRAI�s recommendations. However,the Telecom Commission recommended restrictingthe total number of players including the DoT to fourand increasing the revenue share to 15 per cent. Sub-sequently, the PMO recommended open entry, towhich the Telecom Commission responded by placingrestrictions on carriage of intra-circle traffic sayingthat it would hurt the revenues of existing basic serviceproviders. However, there are only three significantbasic service providers with very limited operation.Moreover, when the switch to revenue sharing wasmade, the operators had agreed to open entry.
Licensing criteria for the recently announced Na-tional Long Distance Policy are as follows:
� one-time entry fee of Rs 100 crore;
� bank guarantee of Rs 400 crore which will be re-funded in phases on fulfilment of network obligations;
� paid-up capital of Rs 250 crore of the applicantcompany with a total networth of the promoters atRs 2500 an Indian registration with a maximum foreignequity of 49 per cent;
� network roll-out obligations covering all the districtsin seven years;
� revenue sharing fixed at 15 per cent;
� DTS spared from paying entry fee, but will be sharingrevenue.
Two types of competition are envisaged, facilitiesbased and service based. In the first type, infrastructureproviders who only provide end to end services forcarrying traffic may be licensed.
Cellular traffic and the potential introduction ofInternet telephony have been ignored in the TRAIconsultation paper as discussed later. Alternativescenarios should have been generated. The TRAI con-sultation paper also did not take into account conver-gence. In the future, networks such as Bharti Telecomor new players like Zee may use the existing cable TVnetwork to provide connectivity. Capacity or networkprovision by government bodies like the Gas Authorityof India Limited (GAIL) and the Railways will lead toincreased capacity and therefore a fall in rates. As aresult, traffic is expected to increase at the rate of about20 per cent per annum. Some companies are alreadyplanning alternate revenue streams (such as the exportof software services) so that cross subsidization of long-distance services is possible in case of a future price war.
The TRAI has not specified a framework for equalaccess and interconnections. This has implications forthe extent to which the DoT can exercise its monopolypower. If intra-circle long-distance traffic had not beenopened to the private sector, the DoT would have re-tained a monopoly of over 65�70 per cent of the market.Moreover, since the national long distance operator(NLDO) is required to follow network roll-out condi-tions, such as coverage of all districts within seven years,carrying of intra-circle traffic should be allowed. In theory,NLDOs are allowed to seek interconnections with exist-ing service providers in basic services at circle level onmutually agreeable terms for onward carriage to theprivate operators� network. However, in reality, privateoperators� have a minuscule presence. This implies thatNLDOs would have to rely on carrying DoT trafficunless they spread their own networks into the circles.
NTP 99 leaves several issues unresolved. Wouldinfrastructure lease be considered a facility? Couldone infrastructure player be allowed to sell facilitiesto more than one player? Could an infrastructurebuilder sell facilities, and also be a player in the nationallong distance market?
PRIVATE PARTICIPATION
Basic Services
As per NTP 94, basic service provision had beenplanned as a duopoly between the DoT and a selected
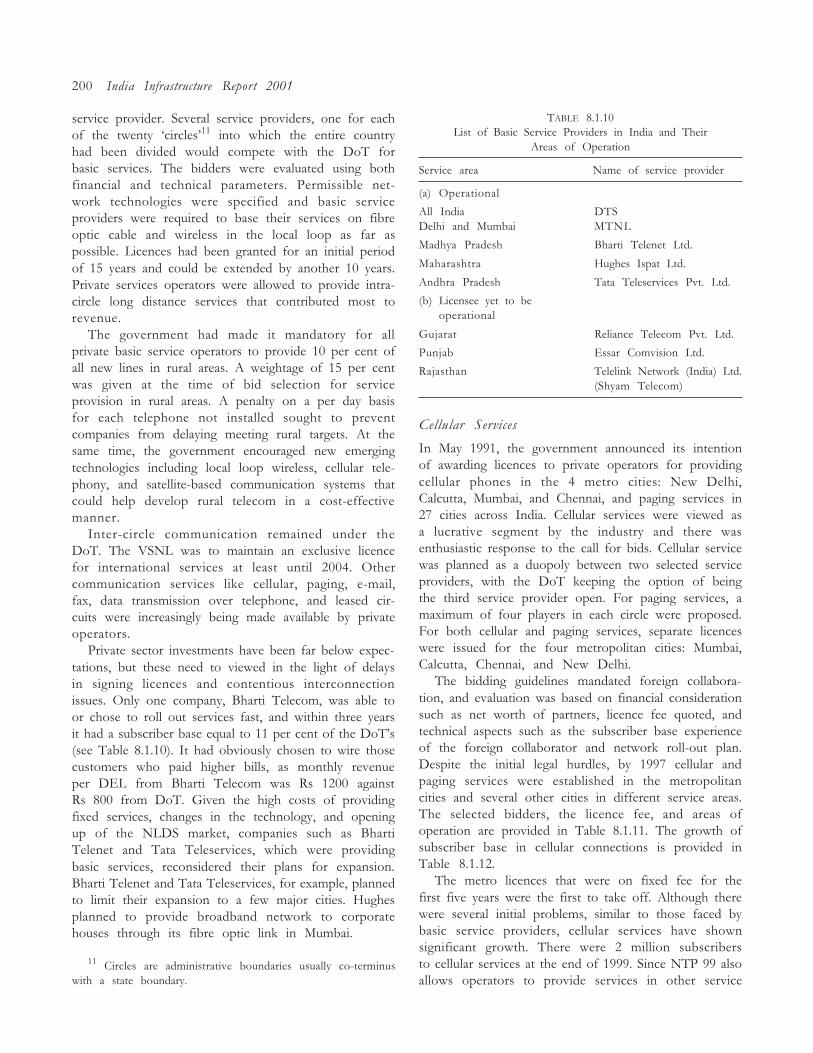
200 India Infrastructure Report 2001
service provider. Several service providers, one for eachof the twenty �circles�11 into which the entire countryhad been divided would compete with the DoT forbasic services. The bidders were evaluated using bothfinancial and technical parameters. Permissible net-work technologies were specified and basic serviceproviders were required to base their services on fibreoptic cable and wireless in the local loop as far aspossible. Licences had been granted for an initial periodof 15 years and could be extended by another 10 years.Private services operators were allowed to provide intra-circle long distance services that contributed most torevenue.
The government had made it mandatory for allprivate basic service operators to provide 10 per cent ofall new lines in rural areas. A weightage of 15 per centwas given at the time of bid selection for serviceprovision in rural areas. A penalty on a per day basisfor each telephone not installed sought to preventcompanies from delaying meeting rural targets. At thesame time, the government encouraged new emergingtechnologies including local loop wireless, cellular tele-phony, and satellite-based communication systems thatcould help develop rural telecom in a cost-effectivemanner.
Inter-circle communication remained under theDoT. The VSNL was to maintain an exclusive licencefor international services at least until 2004. Othercommunication services like cellular, paging, e-mail,fax, data transmission over telephone, and leased cir-cuits were increasingly being made available by privateoperators.
Private sector investments have been far below expec-tations, but these need to viewed in the light of delaysin signing licences and contentious interconnectionissues. Only one company, Bharti Telecom, was able toor chose to roll out services fast, and within three yearsit had a subscriber base equal to 11 per cent of the DoT�s(see Table 8.1.10). It had obviously chosen to wire thosecustomers who paid higher bills, as monthly revenueper DEL from Bharti Telecom was Rs 1200 againstRs 800 from DoT. Given the high costs of providingfixed services, changes in the technology, and openingup of the NLDS market, companies such as BhartiTelenet and Tata Teleservices, which were providingbasic services, reconsidered their plans for expansion.Bharti Telenet and Tata Teleservices, for example, plannedto limit their expansion to a few major cities. Hughesplanned to provide broadband network to corporatehouses through its fibre optic link in Mumbai.
TABLE 8.1.10List of Basic Service Providers in India and Their
Areas of Operation
Service area Name of service provider
(a) Operational
All India DTSDelhi and Mumbai MTNL
Madhya Pradesh Bharti Telenet Ltd.
Maharashtra Hughes Ispat Ltd.
Andhra Pradesh Tata Teleservices Pvt. Ltd.
(b) Licensee yet to beoperational
Gujarat Reliance Telecom Pvt. Ltd.
Punjab Essar Comvision Ltd.
Rajasthan Telelink Network (India) Ltd.(Shyam Telecom)
Cellular Services
In May 1991, the government announced its intentionof awarding licences to private operators for providingcellular phones in the 4 metro cities: New Delhi,Calcutta, Mumbai, and Chennai, and paging services in27 cities across India. Cellular services were viewed asa lucrative segment by the industry and there wasenthusiastic response to the call for bids. Cellular servicewas planned as a duopoly between two selected serviceproviders, with the DoT keeping the option of beingthe third service provider open. For paging services, amaximum of four players in each circle were proposed.For both cellular and paging services, separate licenceswere issued for the four metropolitan cities: Mumbai,Calcutta, Chennai, and New Delhi.
The bidding guidelines mandated foreign collabora-tion, and evaluation was based on financial considerationsuch as net worth of partners, licence fee quoted, andtechnical aspects such as the subscriber base experienceof the foreign collaborator and network roll-out plan.Despite the initial legal hurdles, by 1997 cellular andpaging services were established in the metropolitancities and several other cities in different service areas.The selected bidders, the licence fee, and areas ofoperation are provided in Table 8.1.11. The growth ofsubscriber base in cellular connections is provided inTable 8.1.12.
The metro licences that were on fixed fee for thefirst five years were the first to take off. Although therewere several initial problems, similar to those faced bybasic service providers, cellular services have shownsignificant growth. There were 2 million subscribersto cellular services at the end of 1999. Since NTP 99 alsoallows operators to provide services in other service
11 Circles are administrative boundaries usually co-terminuswith a state boundary.
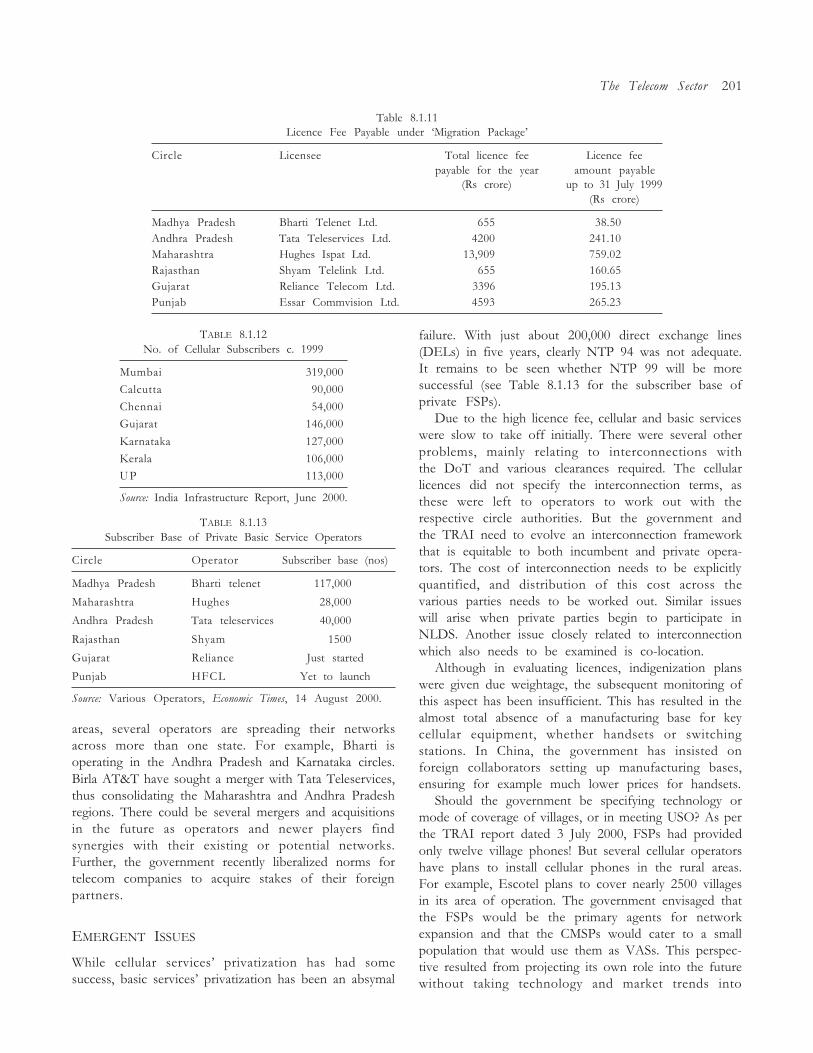
The Telecom Sector 201
Table 8.1.11Licence Fee Payable under �Migration Package�
Circle Licensee Total licence fee Licence feepayable for the year amount payable
(Rs crore) up to 31 July 1999(Rs crore)
Madhya Pradesh Bharti Telenet Ltd. 655 38.50Andhra Pradesh Tata Teleservices Ltd. 4200 241.10Maharashtra Hughes Ispat Ltd. 13,909 759.02Rajasthan Shyam Telelink Ltd. 655 160.65Gujarat Reliance Telecom Ltd. 3396 195.13Punjab Essar Commvision Ltd. 4593 265.23
TABLE 8.1.12No. of Cellular Subscribers c. 1999
Mumbai 319,000
Calcutta 90,000
Chennai 54,000
Gujarat 146,000
Karnataka 127,000
Kerala 106,000
UP 113,000
Source: India Infrastructure Report, June 2000.
TABLE 8.1.13Subscriber Base of Private Basic Service Operators
Circle Operator Subscriber base (nos)
Madhya Pradesh Bharti telenet 117,000
Maharashtra Hughes 28,000
Andhra Pradesh Tata teleservices 40,000
Rajasthan Shyam 1500
Gujarat Reliance Just started
Punjab HFCL Yet to launch
Source: Various Operators, Economic Times, 14 August 2000.
failure. With just about 200,000 direct exchange lines(DELs) in five years, clearly NTP 94 was not adequate.It remains to be seen whether NTP 99 will be moresuccessful (see Table 8.1.13 for the subscriber base ofprivate FSPs).
Due to the high licence fee, cellular and basic serviceswere slow to take off initially. There were several otherproblems, mainly relating to interconnections withthe DoT and various clearances required. The cellularlicences did not specify the interconnection terms, asthese were left to operators to work out with therespective circle authorities. But the government andthe TRAI need to evolve an interconnection frameworkthat is equitable to both incumbent and private opera-tors. The cost of interconnection needs to be explicitlyquantified, and distribution of this cost across thevarious parties needs to be worked out. Similar issueswill arise when private parties begin to participate inNLDS. Another issue closely related to interconnectionwhich also needs to be examined is co-location.
Although in evaluating licences, indigenization planswere given due weightage, the subsequent monitoring ofthis aspect has been insufficient. This has resulted in thealmost total absence of a manufacturing base for keycellular equipment, whether handsets or switchingstations. In China, the government has insisted onforeign collaborators setting up manufacturing bases,ensuring for example much lower prices for handsets.
Should the government be specifying technology ormode of coverage of villages, or in meeting USO? As perthe TRAI report dated 3 July 2000, FSPs had providedonly twelve village phones! But several cellular operatorshave plans to install cellular phones in the rural areas.For example, Escotel plans to cover nearly 2500 villagesin its area of operation. The government envisaged thatthe FSPs would be the primary agents for networkexpansion and that the CMSPs would cater to a smallpopulation that would use them as VASs. This perspec-tive resulted from projecting its own role into the futurewithout taking technology and market trends into
areas, several operators are spreading their networksacross more than one state. For example, Bharti isoperating in the Andhra Pradesh and Karnataka circles.Birla AT&T have sought a merger with Tata Teleservices,thus consolidating the Maharashtra and Andhra Pradeshregions. There could be several mergers and acquisitionsin the future as operators and newer players findsynergies with their existing or potential networks.Further, the government recently liberalized norms fortelecom companies to acquire stakes of their foreignpartners.
EMERGENT ISSUES
While cellular services� privatization has had somesuccess, basic services� privatization has been an absymal
202 India Infrastructure Report 2001
account. Falling costs of cellular service make it worth-while for CMSPs to expand the network possibly intosmaller towns and villages. China�s experience of thefaster growth of cellular services to reach an installedbase comparable to that of fixed lines should perhapshave informed government telecom policy.
Spectrum availability for rapid expansion is anotherconstraint in India. While operators in metros havebeen given 7 MHz each in the Group Special Mobile(GSM) band, circle operators have been given barely 5MHz. In most countries, nearly 25 MHz has been pro-vided to operators for roll-out of GSM based networks.
The decision on the implementation of the callingparty pays (CPPs) regime was long awaited. A drop incustoms duty on handsets from 25 to 5 per cent and thelow figures per line for the MTNL�s proposed GSMnetwork augur well for the cellular industry.
The auction of 3G licences abroad may reduce thenumber of players for the remaining vacant circles, asplayers would want to assess the new technology beforeservice roll-outs in India.
There is a need to bring about coherence and conver-gence regarding policy making with respect to variousservices. For example, while NLDOs are required tosubmit a rather hefty licence fee, ISP licences arevirtually free. With VoIP, in the future, licence for theNLDOs could be an anomaly.
Before NTP 94 developments in data communicationwere rather modest. NTP 94 provided a major impetusfor growth in this area (see Appendix 8.1.2.).
NTP 99 provided for more liberal terms to VSATservice providers, for example:
� granting of licences on a non-exclusive basis for aninitial period of 20 years extendible by 10 years;
� unrestricted entry based on a one-time entry fee anda revenue share;
� connectivity to other service providers;
� interconnectivity outside the service area to be re-viewed upon opening up of long-distance service.
STRENGTHENING THE TRAI
The TRAI was a regulatory body set up without teeth.It was set up to �independently� decide upon the modeof interconnection between the cellular networks andthe fixed network of the DoT. Its judgements couldbe challenged in the High Court, even though it washeaded by a retired High Court Chief Justice. DoTofficials were members of the apex committee and therewere inevitable turf wars between the DoT and TRAI.The TRAI had to be headed by an individual withjudicial background and was precluded from regulating
broadcast services and had no role in the allocation ofthe spectrum.
Over a period of time, the TRAI established aparticipative style of functioning by making the issuesunder consideration public, seeking comments from avariety of sources, and having open house sessions. Itmade a review of tariffs with the objective of bringingthem closer to costs. However, the implementation ofthe interconnection regime, in which the calling partywould pay for calls between the fixed and mobileservices, led to a review of the TRAI�s structure.
In January 2000, to strengthen its regulatory powersthe government amended the TRAI Act and bifurcatedits adjudicating powers to the Telecom Disputes Settle-ment and Appellate Tribunal to be headed by anindividual with a judicial background. The Tribunalwas also authorized to adjudicate disputes �between alicensor and a licensee�, unlike the earlier TRAI Actthat precluded the TRAI from doing so. Moreover, thedecisions of the Tribunal could only be appealed againstin the Supreme Court, unlike earlier when appealsagainst TRAI orders could be made in the High Court.
Under the amendment, the TRAI�s composition wasstreamlined, reducing total membership from sevento five. Moreover, the chairperson no longer had nec-essarily to have a judicial background. Further, theTRAI also acquired the power to fix interconnectionrates between service providers. The central governmentwas given the right to notify other services as telecomservices, including broadcasting services. The recom-mendatory role of the TRAI was expanded to includeefficient management of spectrum, timing of local andlong-distance service provision, and need and timing andterms and conditions of new licences (to be awardedby the government). (The details of the functions areprovided in Appendix 8.1.3.)
With the separation of the regulatory aspects thatdeal with the spread of the network, increased access,etc. from the adjudicating role of the TRAI, increasedpowers, and reduction in the steps in appeal againstTRAI decisions, regulation has been considerablystrengthened. This has been welcomed by the industry,as given the dominant position of the DoT, it feels thatfair terms of operation can only be worked out withina well-functioning regulatory framework.
However, the TRAI needs to be able to stand on itsown and avoid regulatory capture by the DoT. Itsspineless recommendations for opening long-distancecompetition may be viewed as inability on its partto exploit the flexibility provided to it. The earlier TRAIhad recommended open entry, while the Telecom Com-mission subsequently recommended only four players.The new TRAI reviewed these recommendations and
The Telecom Sector 203
suggested five players. The PMO had to intervene toremove restrictions on the number of players. ThePMO�s intervention shows that the Ministry ofCommunications is unable to deal with contentiousissues vis-à-vis the department and, further, that theTRAI needs to more aggressively push for consumerinterest.
While it appears that the institutional framework isin place, ground realities are somewhat different.All decisions of the TRAI that could have significantbearing on the growth of the sector are examined andreviewed by the Telecom Commission, staffed by peoplefrom the DoT. While it is only to be expected that anincumbent would not easily give up its turf, as exempli-fied in the cases of China Telecom, British Telecom(BT), and several others. It is for the top managementof the DoT and the administrative ministry to takethe steps to strengthen the DoT, so that when theinevitable competition comes about the organizationcan respond positively. Another actor that has steppedinto the picture is the PMO. Increasingly, the PMO hasissued policy directions that are more open than thoseformulated by the Telecom Commission. The NationalLong Distance Policy was announced by the PMOrather than the Telecom Commission. The TelecomCommission had to accept the free entry provisionannounced by PMO but insisted on restricting themarket only to inter-circle calls. It is expected that thePMO would see through the holding out operation ofthe Telecom Commission and insist on removing thisand other restrictions now being pushed by the TelecomCommission. The purist would no doubt be concernedabout the several points of decision making that haveemerged. But the PMO�s initiatives are far reaching, anddo not attempt to protect either the incumbent or thosewho had entered in the first flush of reforms. Theseinitiatives are based on the understanding that technol-ogy and competition would be important drivers, ascontestability improves with the high growth that ispossible.
With the introduction of the ICE bill soon, it is hopedthat a review of the TRAI�s powers within the �conver-gent framework� will be provided.
ISSUES IN LICENSING
Telecom licensing as a mechanism to bridge fiscal deficitwas first implemented in the United States. The largeamounts of revenues generated there lent a great dealof visibility to this mechanism. However, one mustrecognize that these licences were for additional servicesover a large customer base already using basic servicesof high quality. When governments are driven by the
need to manage fiscal deficits, entry fee and licence feeappear suitable instruments. Ultimately, subscribers paythe licence fee as costs in terms of higher prices. Indeveloped markets where different service providershave existing large bases, paying a high licence feewould imply spreading the cost of licence over a largenumber of customers and the ability of customers topay may no longer affect subscriber growth. Companiespaying licence fees would naturally recover the samefrom consumers, or through efficiency gains. In anycase the price to consumers would be higher thanotherwise without license fees but with competition. InIndia higher prices would retard the growth of thenetwork.
While auctions are viewed as instruments for assign-ing licences to those who value them most, the firstmover advantage in attracting customers and potentialrevenue from VASs invariably drives up the licence bids.
Another mechanism could be to award the licenceto the bidder who would charge customers the lowestrates for a specified basket of services. This would,however, not lead to revenue maximization. In Brazil,bidding for the poorly developed areas was based onwillingness to accept the lowest subsidy. The paymentof subsidy was contingent upon completing roll-outconditions as specified.
To make the licences attractive, ability to bundle avariety of services such as broadband on the samenetwork is important. However, until NTP 99, licenceswere exclusively for voice. NTP 99 provides for dataservices (to be separately licensed over the same net-works). In an era of convergence, such inequities shouldbe removed.
BUNDLING
The TRAI is considering whether to bundle the unat-tractive category C licences along with other moreattractive licences. This would immediately raise theissue of which circles to bundle together. Since basicservices per se are not seen as being commerciallyattractive, this may also lead to private capital shyingaway from the more attractive circles. If some operatorschoose category A with C because of geographicalcontiguity or the ability to exploit the network infra-structure in category C for national long distance,then that circle is not unattractive. For example, BhartiTelenet views operations in Madhya Pradesh (categoryB) as attractive because Madhya Pradesh bordersseven other states and in a competitive long-distancescenario, putting backbone infrastructure in place forbasic services would be commercially attractive. Bun-dling also leads to issues of determining the quantum,
204 India Infrastructure Report 2001
INTERCONNECTION ISSUES
Interconnection has emerged as the major contentiousissue between the DoT/MTNL and Cellular MobileService Providers (CMSPs) due to the absence of aninterconnection agreement. (Most calls in the earlystages of development of cellular services are fixed tomobile or mobile to fixed, with few being mobile tomobile. This is only natural.) In India the receiver paysfor cellular calls. While CMSPs were required to pay theDoT for carrying calls on the fixed network, the DoTdid not pay any interconnection charges for carriage offixed to mobile calls to CMSPs.
In the early years of CMSPs, the DoT insisted onproviding a single point of interconnection in eachservice area as this enabled it to charge STD rates forcarrying CMSP traffic. From the CMSP�s perspective,having multiple points of interconnection would enableit to minimize the traffic carried on the DoT network,leading to lower payments to the DoT. The DoTincreased the per minute peak time charge payable byCMSPs for interconnection to an amount that wasequivalent to twenty-four local calls! As with a singlepoint of interconnection, a fixed to mobile call oftenhad to travel 100�200 km. The CMSPs went to the HighCourt, which stayed the DoT order. The court order ledto the setting up of the TRAI, which, upon closeexamination of the issue, mandated multiple points ofinterconnection.
Subsequently, in 1999 the TRAI came up with revisedtariffs for the CMSPs, which decreased the connectioncharges from Rs 600 to Rs 475 per month as well as theper minute usage charges. It also recommended the imple-mentation of the CPP regime and sharing of revenuebetween CMSPs, the DoT, and the MTNL. While theCMSPs felt that the CPP would lead to an increase inrevenues because of an expansion in subscriber base aswell as interconnection revenue share, the DoT and theMTNL felt that they would lose revenue through havingto share it, and that it would increase the load of pay-ment on fixed line subscribers to the benefit of cellularsubscribers. Several rounds of negotiations took placebetween the DoT, MTNL, and TRAI. Subsequently, theMTNL and consumer organization, Telecom Watchdog,went to the High Court with the plea that the TRAI didnot have the authority to review already existing inter-connection agreements, as this would entail change inthe existing licence conditions that the TRAI was notempowered to make. Moreover, it was argued that theMTNL would not only lose revenue, it would have tobear the cost of implementing the CPP. Telecom Watch-dog pleaded that the CPP would lead to an increase of100�200 per cent in the fixed line subscriber bill.
revenue potential, and so forth�attributes that aredifficult to assess, especially over a twenty-year timehorizon.
UNIT OF BIDDING
It has been argued that the unit of bidding (that is, acircle) is too big to licence to private operators. Com-parisons are made with cable operators who have spreadrapidly within geographically small areas. Together,their 60 million plus customer base achieved in less thana decade remains unmatched. However, in cable thereis no need to interconnect networks nor is there needfor billing software. Similarly, quality and price aretradeable to some extent. These characteristics as well aslack of regulation of any kind allowed small operatorsto enter and run their businesses successfully. Thepotential for convergence, and ability of cable to carryvoice and Internet, has led to cable consolidation amongcable operators, especially in the metros and large cities.
A feasible small operator model could consist ofplayers who cover any particular area unconstrained byadministrative notions of boundaries, but who wouldnaturally avoid each other�s turf, at least to start with.As they jostle each other, and with competitive pressuresin and around their boundaries, the need for intercon-nection would drive them to consolidation. Smallerareas are feasible for certain types of telecom servicesas was exemplified by the personal communicationservice (PCS) licence in the United States in which theentire country was divided into 51 major and 493 basictrading areas. In India the unit of licensing has beenselected on the basis of administrative simplicity fromthe DoT�s perspective.
BID DESIGN
Until now the government has chosen the single round,sealed highest bid form. This has been fraught withproblems such as too high bids, subsequent winner�scurse, and inability to share information regardingother players� estimates. Based on its own experience inthe past, the TRAI has now come out with a newmechanism involving multi-stage bidding preceded bya pre-qualification round. All information regardingthe bidders, bid prices, etc. is to be made known toother bidders. This design is similar to the US PCSauction that has been adopted by several other countriessuch as the UK for its 3G licenses. One key learningacross all countries has been that such a design workswell when there are a large number of bidders and thedetails for the conduct of the auction are well thoughtout.
The Telecom Sector 205
The Delhi High Court examined whether the TRAIhad the power to issue any regulation that wouldaffect the rights of individuals under contract or wouldoverride terms and conditions of government-issuedlicences. It ruled that the TRAI had no authority toissue the tariff order implementing the CPP, as thiswould effectively change the licence conditions, thusstriking down the Tariff Amendment and the Intercon-nection Amendment Orders as they related to the CPPregime. However, it suggested that the TRAI shouldtake suitable steps to ensure that the benefits arising outof changes in the licence fee structure are passed on toconsumers, even if the CPP regime is not implemented.Cellular operators agreed to implement the reducedtariffs without the CPP features. This judgement alsoled the government to review the TRAI�s mandate.It came up with an amendment to the TRAI Act, 1997that gave the TRAI the power to fix interconnectioncharges. The amendment also increased its regulatoryscope to recommend steps for efficient management ofthe spectrum.
UNIVERSAL SERVICE OBLIGATIONS (USOS)
Since infrastructure generally, and telecom specifically,is regarded as a �public� service, there are usually obli-gations imposed on the private (and public) players to�serve� some of the low paying, or high cost to serve,subscribers. The private players in basic services wereexpected to provide 10 per cent of their coverage in ruralareas. However, with the coverage of a mere 12�15villages that has so far been achieved a serious effort inthis direction can hardly be said to have begun. TheDoT�s own record in this regard has also been dismal.Its rural coverage as a percentage of total coverage is1.75. As cited earlier, its plans for rural coverage arelikely to be delayed due to changes in the DoT�sspecifications for rural telecom from WLL to 3G ser-vices. Innovative approaches that do not distinguishon the basis of the mode of access are necessary tomake a significant dent in rural coverage.12
The TRAI has brought out a consultation paperon universal service obligations. In that paper NLDOsare required to contribute 5 per cent of their revenueto the proposed Universal Access Levy Fund. Butquestions such as who would administer the fund, onwhat basis would the allocations be made, and howthe selected service areas would be chosen remain tobe addressed. Would this fund receive 5 per cent ofthe revenue from the basic and cellular service provider
as a part of the 15 per cent revenue sharing that isalready in place?
The DoT has always vociferously claimed that thehigh cost of serving rural areas prevents it from expand-ing rural coverage. In that context, Ram Vilas Paswan�s(the Minister of Telecommunications) allocation offree phones to the nearly 300,000 employees of the DoTwho do not have a phone needs to be reviewed. The totalcost of such a provision would be more than Rs 600crore, or 10 per cent of its existing revenue surpluses(as per the DoT�s estimate, the cost of providing aDEL is Rs 21,000�25,000).13 Is this pure politicalexpendiency to win a vote bank of close to a millionpeople? Or is it the price that �has� to be paid to get theemployees� agreement to a possible reform of the DoTas an organization? Only time will tell. Similar concernsarise regarding the free telecom services available toministers and bureaucrats whose telephone bills areastronomical! There was a proposal to give a third freephone line to ministers so that they could access theInternet. If the department seeks subsidies for ruralcoverage, such hidden subsidies that taxpayers provideto ministers and bureaucrats would need to be explicitlyrecognized.14
DEMAND ESTIMATES
Demand estimates are critical for market assessment. TheTRAI has been carrying out such assessments in itsconsultation papers. The concern here is with the robust-ness with which such estimates are generated. While itis true that in new service areas it is difficult to assessdemand, there ought to be mechanisms to generate alter-nate scenarios. For example, in assessing demand forbasic services, in its consultation paper �Issues in FixedService Provision�, the TRAI considered the issue oflatent demand. But latent demand has to be linked to theprice at which the services would be available. For ex-ample, the demand is very sensitive to the one-timeconnection fee as has often been shown before.
The TRAI has carried out a demand assessment ofDELs based on affordability criteria as well as on theDoT�s projections. DoT growth rate projections wereavailable only for the two years up to 2001�16 and 20per cent respectively. Affordability assessments weremade on the basis of NCAER (National Council ofApplied Economics Research) data. Given the rentals in
12 In section 8.3 inter alia a concrete plan to quickly providevery large coverage of this report both voice and data is presented.
13 The immediate cost could also be less if indeed much of thisdemand can be accommodated by exchanges with excess switchingcapacity and outdoor works that are already in place.
14 Such largesse from the bureaucracy, that controls publicenterprise, to the politician have been used to delay and subvertreform and privatization. Air India is another such example.
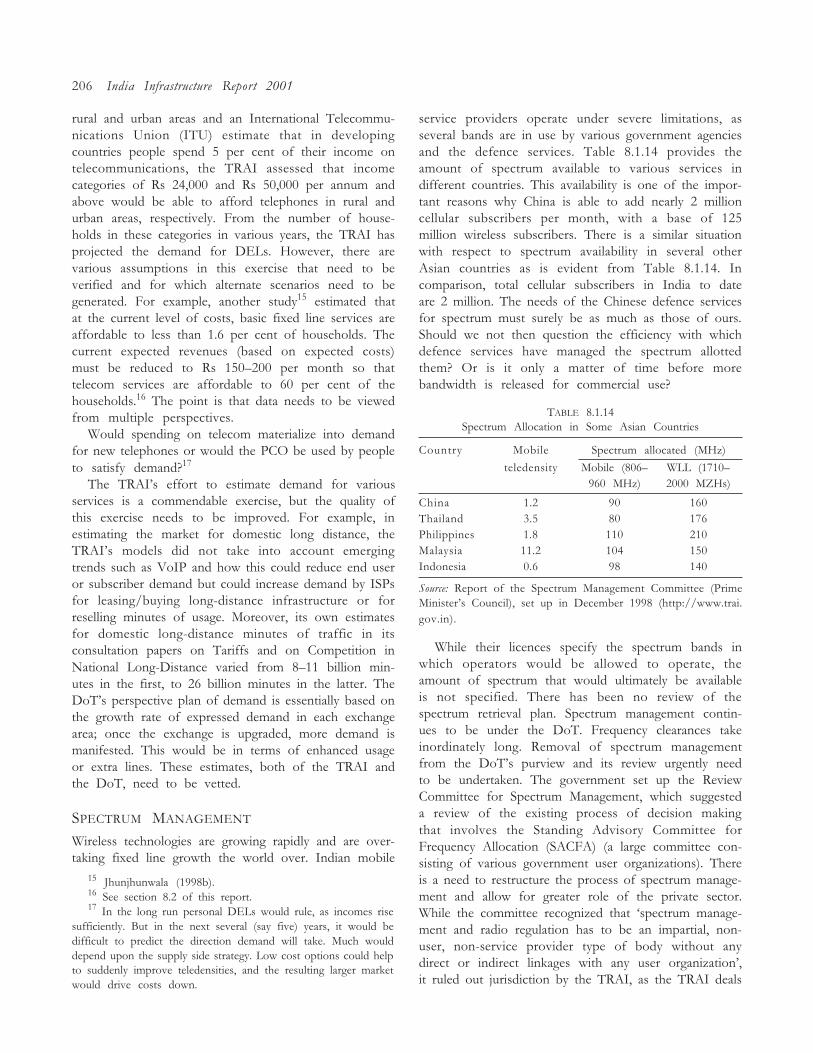
206 India Infrastructure Report 2001
rural and urban areas and an International Telecommu-nications Union (ITU) estimate that in developingcountries people spend 5 per cent of their income ontelecommunications, the TRAI assessed that incomecategories of Rs 24,000 and Rs 50,000 per annum andabove would be able to afford telephones in rural andurban areas, respectively. From the number of house-holds in these categories in various years, the TRAI hasprojected the demand for DELs. However, there arevarious assumptions in this exercise that need to beverified and for which alternate scenarios need to begenerated. For example, another study15 estimated thatat the current level of costs, basic fixed line services areaffordable to less than 1.6 per cent of households. Thecurrent expected revenues (based on expected costs)must be reduced to Rs 150�200 per month so thattelecom services are affordable to 60 per cent of thehouseholds.16 The point is that data needs to be viewedfrom multiple perspectives.
Would spending on telecom materialize into demandfor new telephones or would the PCO be used by peopleto satisfy demand?17
The TRAI�s effort to estimate demand for variousservices is a commendable exercise, but the quality ofthis exercise needs to be improved. For example, inestimating the market for domestic long distance, theTRAI�s models did not take into account emergingtrends such as VoIP and how this could reduce end useror subscriber demand but could increase demand by ISPsfor leasing/buying long-distance infrastructure or forreselling minutes of usage. Moreover, its own estimatesfor domestic long-distance minutes of traffic in itsconsultation papers on Tariffs and on Competition inNational Long-Distance varied from 8�11 billion min-utes in the first, to 26 billion minutes in the latter. TheDoT�s perspective plan of demand is essentially based onthe growth rate of expressed demand in each exchangearea; once the exchange is upgraded, more demand ismanifested. This would be in terms of enhanced usageor extra lines. These estimates, both of the TRAI andthe DoT, need to be vetted.
SPECTRUM MANAGEMENT
Wireless technologies are growing rapidly and are over-taking fixed line growth the world over. Indian mobile
service providers operate under severe limitations, asseveral bands are in use by various government agenciesand the defence services. Table 8.1.14 provides theamount of spectrum available to various services indifferent countries. This availability is one of the impor-tant reasons why China is able to add nearly 2 millioncellular subscribers per month, with a base of 125million wireless subscribers. There is a similar situationwith respect to spectrum availability in several otherAsian countries as is evident from Table 8.1.14. Incomparison, total cellular subscribers in India to dateare 2 million. The needs of the Chinese defence servicesfor spectrum must surely be as much as those of ours.Should we not then question the efficiency with whichdefence services have managed the spectrum allottedthem? Or is it only a matter of time before morebandwidth is released for commercial use?
TABLE 8.1.14Spectrum Allocation in Some Asian Countries
Country Mobile Spectrum allocated (MHz)
teledensity Mobile (806� WLL (1710�960 MHz) 2000 MZHs)
China 1.2 90 160Thailand 3.5 80 176Philippines 1.8 110 210Malaysia 11.2 104 150Indonesia 0.6 98 140
Source: Report of the Spectrum Management Committee (PrimeMinister�s Council), set up in December 1998 (http://www.trai.gov.in).
While their licences specify the spectrum bands inwhich operators would be allowed to operate, theamount of spectrum that would ultimately be availableis not specified. There has been no review of thespectrum retrieval plan. Spectrum management contin-ues to be under the DoT. Frequency clearances takeinordinately long. Removal of spectrum managementfrom the DoT�s purview and its review urgently needto be undertaken. The government set up the ReviewCommittee for Spectrum Management, which suggesteda review of the existing process of decision makingthat involves the Standing Advisory Committee forFrequency Allocation (SACFA) (a large committee con-sisting of various government user organizations). Thereis a need to restructure the process of spectrum manage-ment and allow for greater role of the private sector.While the committee recognized that �spectrum manage-ment and radio regulation has to be an impartial, non-user, non-service provider type of body without anydirect or indirect linkages with any user organization�,it ruled out jurisdiction by the TRAI, as the TRAI deals
15 Jhunjhunwala (1998b).16 See section 8.2 of this report.17 In the long run personal DELs would rule, as incomes rise
sufficiently. But in the next several (say five) years, it would bedifficult to predict the direction demand will take. Much woulddepend upon the supply side strategy. Low cost options could helpto suddenly improve teledensities, and the resulting larger marketwould drive costs down.
The Telecom Sector 207
with �commercial public operators�. It recommended anautonomous status for the WPC (Wireless Planningand Co-ordination wing) under the ministry, but thatwould not be a sufficient measure, as the DoT is a userorganization and would hardly be an impartial actor.The committee did not bring forth actionable policyguidelines for spectrum use and management and theappropriate blueprint for making available the alreadyallocated spectrum to various agencies. While citingthe experience of auctions of spectrum in the UnitedStates, the committee had based its conclusion onfactually incorrect data; not all firms that bid forspectrum went bankrupt. Those that went bankruptdid so on account of poor judgement. A very similarauction design to that used in the United States is beingused quite successfully by Australia, New Zealand, andUK. This is not to suggest that bidding for spectrum isthe recommended method for spectrum allocation.
While on the one hand spectrum was scarce, onthe other, government policies did not encourage effi-cient use of spectrum. For example, spectrum requestswere considered on the basis of number of subscribers,rather than allocating a band and letting an operatorcome out with spectrum-efficient technologies with thegrowth in number of subscribers.
It is possible that the government wants to addressthe issue of spectrum management through the ICEBill. Spectrum management should be within the regu-latory agencies� jurisdiction. The recommendation ofthis report is that the �convergent� regulator shouldbe responsible for policy guidelines and managementof spectrum. New broadcast, telecom and IT applica-tions would require that there be a single agencyhandling spectrum management. In several countries,including the United States and the UK, spectrummanagement has been the domain of regulatory agencies.
ROLE OF COMPETITION
Initially telecom licences were limited to a duopoly, buteven now there are few players. Since the policy requirescircle-level licences, it is possible that smaller playerswould not be willing to come forward. Due to the fluxin telecom policies, players have desisted from investingin the sector. This is evident from the delays in serviceprovision of basic and cellular licences. For example,Spice Telecom and Bharti Telenet are consolidating andexpanding their services beyond their initial service areasby looking at geographically contiguous areas. A fewlarge players are likely to emerge at the circle or nationallevel while niche players would also emerge as VASproviders, or those who have strong regional presence,or those who can provide a bundle of services. Thuslimiting the number of players would deprive the Indian
subscriber of the benefits of competition. It could alsoresult in slower growth, if the few players are successfulin reaching their target returns on a small customer basewith high margins. In other words, the probability oflow volume strategies succeeding is high.
China has been creating competition through stateenterprises even though they may continue to be underthe control of a ministry.18 In China, top leadership19
saw competition to China Telecom as an importantcomponent of network expansion. It therefore formedUnited Telecom (Unicom), a new organization fromthe Ministry of Railways, Power, and Electronics to starttelecom services. Its objective was to obtain 10 per centof the domestic, long-distance, and international marketand 30 per cent of the cellular market. China�s focus onwireless as the engine of growth has, inter alia, resultedin subscriber numbers growing at a phenomenal rate.Recognizing that Internet access through personalcomputers (PCs) may be limited for a large part of theChinese population, it is leveraging access through the320 million television sets and has worked with Microsoftand local IT firms to develop a system to surf the netin the Chinese language. The Chinese Academy ofSciences, State Administration of Radio and Television,and the Ministry of Railways, Power, and Electronicshave begun to develop a high speed Internet backboneto directly compete with China Telecom.
China Telecom (Hong Kong) was set up by theMinistry of Post and Telecommunications under itsdirect control to explore investment opportunities inHong Kong for the cellular market on the mainland.The Chinese government separated the regulator andoperator by forming companies from existing ministries.The principal instrument of regulation is the Opinionof the Ministry of Post and TelecommunicationsMarkets, 1993. The absence of a legislative frameworkhas led to �problems� especially with the involvement offoreign parties however, the stupendous pace of growthin Chinese incomes and competition enhancing policyhave enabled China to expand very rapidly and allowedthe Chinese access to cheaper services.
The Chinese telecom sector has focused on internalcompetition as a mechanism for meeting the challengesof opening up the sector, especially to foreign invest-ment. The Chinese government has not been very opento foreign capital. It has, for example, excluded it fromservice provision. Yet it has recognized the need to opentelecom services to foreign capital to be able to join theWorld Trade Organisation (WTO). It therefore brokeChina Telecom into four companies dealing with fixed
18 The Economist, 22 July 2000, p. 22.19 In India the fear of loss of bureaucratic privileges and loss
of trust remain principal retardants to reform.
208 India Infrastructure Report 2001
telecommunications, mobile communications, paging,and satellite systems with the idea of creating strongentities before the advent of foreign competition.
The DoT, generally, lagged in its level of technol-ogy.20 India�s indigenization programme in the switch-ing segment carried out by C-DOT was successful inthe introduction of rural exchanges designed specificallyfor Indian conditions characterized by dust, heat, andhumidity. It was also able to licence this technology toprivate vendors for incorporating in the DoT network.C-DOT�s efforts at developing medium and large sizedexchanges had been slow (Business Today, January 1992)but it has been quite successful lately. C-DOT, whichbegan with government support for its programme,based on the championing of the idea of technology forthe masses had support at the highest political levelthat allowed its mentor Sam Pitroda to cut across redtape. With Sam Pitroda leaving C-DOT, the momentumcould not be sustained. C-DOT�s initial success demon-strated the capability of Indians in a highly sophisti-cated technological field and resulted in the governmentbeing able to negotiate far cheaper prices for otherimported exchanges. Subsequent developments in tech-nology, deregulation in the sector, and the absence of avisionary at the top left C-DOT without focus.
Lessons from Korea�s experience of successfully de-veloping indigenous switching technology are worthnoting. The key components of this strategy were thealliance between the telecom authorities, equipmentmanufacturers, and telecom research institutions. Con-tinued and stable financial support from the governmentand its role in effectively coordinating the interlinkagesbetween business and research institutes were important
instruments in this programme. Further, the govern-ment closely monitored the progress and removedbottlenecks during the development phase.
Some developing countries have been able to success-fully coordinate the efforts of internal R&D units withthose of foreign collaborators. The Korean governmentnot only negotiated for technology transfer but also fora range of auxiliary services such as financing, training,and channelizing for excess output. Monitoring theabsorption of technology was incorporated as a part ofthe negotiation with the foreign supplier. In addition,the government was successfully able to coordinate theefforts of various ministries and was actively involvedin the implementation at various stages.
In contrast, the Indian attempt at indigenization21
suffered from lack of resources, few if any linkageswith business and research institutions, delays in absorp-tion, diffusion, and indigenization (Mani 1992), andsupport based on a single individual�s relationship withpoliticians (India Today, 11 January 1991, pp. 115�19).C-DOT�s initial success and its ability to recruit high-quality manpower, indicated the availability of pro-fessional and technical expertise in the country. Thecritical issue was harnessing this expertise within aninstitutional framework and establishing sustainableand responsive high-tech organizations.
Indigenous development of technology and its subse-quent commercialization today are hampered by avail-ability of finances and the virtual abdication of the statein R&D. R&D has been pushed on to the Departmentof Science and Technology. Sector departments do notsee any role for cooperative R&D with state funding,to overcome the market failure that is known to exist inR&D.22 For example, while foreign equipment vendorsare able to provide easy credit terms or deferred pay-ments, Indian service providers such as C-DOT or thefirms spawned by the Indian Institute of Technology(IIT), Madras, which have indigenized WLL, are not ableto do so. Telecom policy needs to recognize this.
20 For a review of efforts at the Indian Telephone IndustriesLtd. (ITI) and Electronics Corporation of India Ltd. (ECIL) seeMani (1992). The organizational constraints of the public sectorwere strong enough to thwart not only the development of newproducts, but also adaptation of new technology until SamPitroda�s efforts in developing the Rural Automatic Exchange(RAX) technology which was productionized by several publicsector undertakings (PSUs) including the Bharat Heavy ElectricalsLtd. (BHEL) and the ITI. India was at least one age behind othercountries, including less developed countries (LDCs), with regardto its exchanges. The ITI�s products suffered severely from poorquality and reliability which may have been one more reason forover-employment in the DoT. The monopoly of the ITI invirtually all equipment segments meant that its organizationfailure ensured the failure of indigenous technological develop-ment. The potential of indigenous technology was very high aswas to be proved by subsequent efforts by C-DOT and the privatesector. Increasing deregulation had also resulted in the ITI beingin dire financial straits. The ITI was too poorly organized, lackedvision, and was unduly influenced by its vendors to be able torespond to the challenges of the 1990s. The signs of its failure werealready to be seen in the 1980s. See Nagaraj (1984).
21 For a long time, until the 1990s, the Department ofElectronics suffered from the megalomania of trying to indigenizeeverything from D-RAM chips to full assemblies. Thus efforts atdevelopment of calculators, not to speak of entertainment elec-tronic goods, computers, or peripherals, were rendered impossiblebecause basic components like chips and high performance tran-sistors were not easily imported. Even the C-DOT effort washampered by the absurdity of such policy. C-DOTs CEO, SamPitroda, was charismatic enough to enthuse his �boys to smugglein chips� to make the RAX possible! That one failure of thedepartment in the 1980s may have cost the nation the lead inmanufacturing in electronic goods.
22 Semantech and the Advanced Turbine Projects of the UnitedStates government are recent examples of state-led cooperativesuccess in R&D.
The Telecom Sector 209
Close to half the foreign direct investment (FDI)inflow in the country since the opening up to foreigninvestment has taken place in telecom, especially incellular services. This was to be expected, given thepolicy to attract FDI and because the cellular industrywas entirely new to the economy. In basic services,on the other hand, the dominant status of the DoTallowed it to rapidly expand reducing the need for FDI.The combination of a technology gap between theIndian parties and foreign players and the differential
cost of funds underlies the large flows of FDI into thetelecom sector (see Table 8.1.15).
The mode of disinvestment and corporatization ofthe DoT, VSNL, and MTNL would be crucial to thedevelopment of telecom, and for a positive responseto the multinational challenge after 2004. While FDIis desirable, the best in FDI can be brought outwhen there are strong domestic firms that can offereffective competition. Therefore rapid growth of these�public sector� companies is important. The need to be
Box 8.1.4STD Calls are Not a Preserve of the Rich
In the 1980s while much of the rest of the world saw telephone call prices falling, as a result of the introduction of moderntechnology and increased competition, Indian consumers just about began to sense this trend. Even today the cost of a 10 minutecall from say Ahmedabad to Trivandrum is comparable to that of second class rail travel between the two places! This is a reflectionboth of high administered prices of telephone calls, especially long distance calls, and the very low prices in India, for rail travel.
Until the so called public call office (PCO) revolution was ushered in by Sam Pitroda in the latter half of the 1980s throughthe installation of an network of franchised PCOs, the reach of telephones in the country, especially in rural and semi- ruralareas was very limited. Long wait lists in urban areas confirm that the problem was essentially one of the failure of the stateto appreciate the �network� nature of the product. The user side costs in using telephone booths and post offices were large.Personal telephones too were highly unreliable, and imposed large user side costs.
PCOs made long-distance communication easier, but not cheaper. India�s monopoly service provider, the Department ofTelecommunications (DoT), continued to keep tariffs high, access charges relatively low, and local call charges, low. The profileof the people using the phones was undergoing much change. But no studies appear to have been conducted by the DoT or anyother agency to ascertain the profile of the DoT�s PCO users.
Users of PCOs and owners of telephones23 in Ahmedabad city, Nadiad (a large town in the state); and six villages in Nadiaddistrict were studied.
A substantial number of PCO users were found to belong to the lower income categories. Those with income less than Rs6500 per month accounted for nearly 65 per cent and those with less than Rs 4500 per month for nearly 48 per cent of PCOusers. The percentage of PCO users owning telephones was 60 per cent in Ahmedabad and 32 per cent in Nadiad but only 10per cent in the rural areas.
The owners of telephones were found to be relatively better off than PCO users, but not much better off. About 41 per centhad monthly incomes of less than Rs 6500 and 24 per cent had incomes less than Rs 4500. The similarity of the profiles of PCOusers and those who own phones was remarkable. This may be partly because many phone owners are also users of PCOs anda substantial percentage of owners did not use their own phones for making long distance calls. But one thing is clear: phonesare not owned or used by the rich alone.
The average number of STD calls made, whether from PCOs or by owners from their homes, was surprisingly high. It was17.62 calls per month by owners (considering that nearly a quarter of them had their STDs barred, this means that the rest makearound 21 calls per month) and 10.07 calls per month by PCO users. Even more surprisingly, it was rural users who made morecalls than urban users: 19.84 calls per month by rural owners as against 16.33 calls by Ahmedabad owners and 18.56 calls permonth by Nadiad users. A similar pattern was observed among PCO users also: 12.62 calls per month by rural users, 10.89 byNadiad users, and 8.96 by Ahmedabad users. The average number of calls made per month by the different socio-economic groupswere also not too different. They varied between 13.3 and 18.7 with no discernible relationship with income.
We studied the distribution of the purposes of STD calls by users of PCOs as well as telephone owners, categorizing purposeinto four types: personal calls, social calls, business calls, and emergency calls. We found that the better off sections used phonesfor business purposes to a somewhat greater extent than the relatively lower income sections.
However, telephones in general are becoming a need for the �less affluent� sections too. Gone are the days when people bornin a village tended to stay in the village their whole lives; today family members go out in search of work and they would verymuch like to keep in touch with their relatives through long distance calls. Small farmers and businessmen like to have up-to-date information on markets and prices. Thus the need for long distance communication has percolated to the lower incomelevels to a greater extent than is perhaps realized. Many in the well-to-do segments, especially in rural areas, may be using theirtelephones mainly to receive incoming calls. The policy that justifies higher prices for long distance on the basis of richer peoplehaving a higher propensity to use the same is therefore fallacious.
Source: S. Manikutty (1997).23 Many owners of telephones still use PCOs, especially for long distance calls, for various reasons, the most important of which
being fear of high bills due to irresponsible usage by family members, and arbitrary billing by DOT.
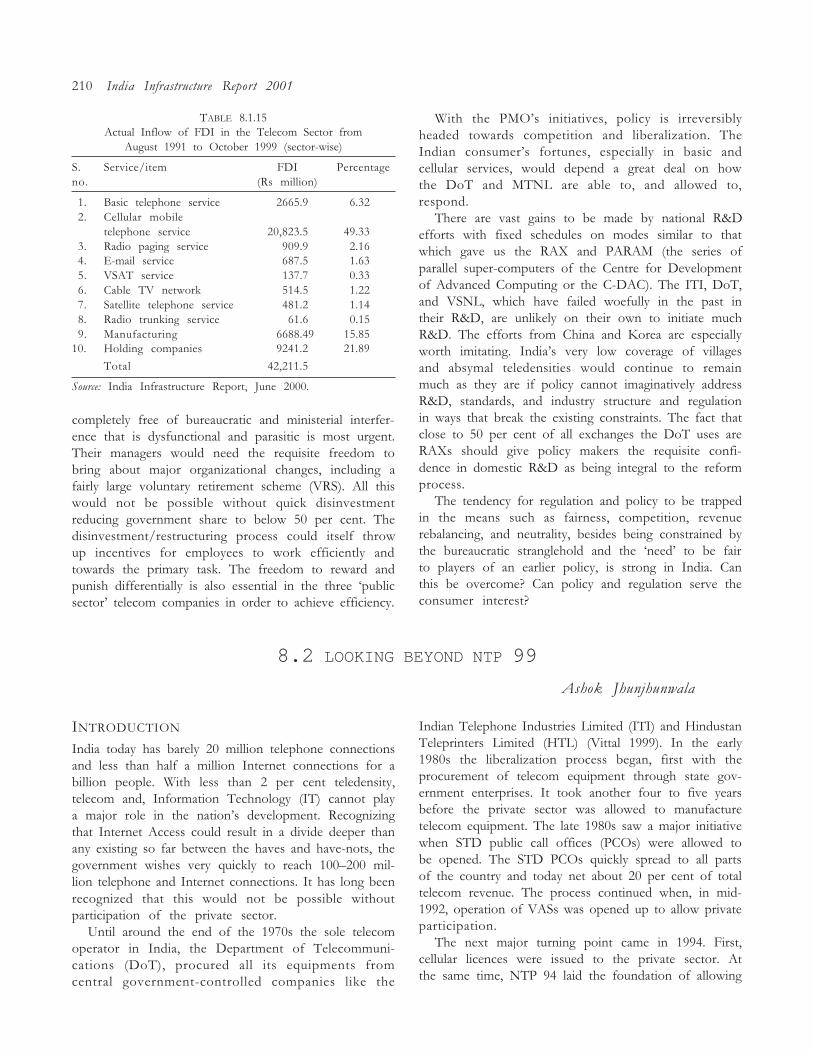
210 India Infrastructure Report 2001
With the PMO�s initiatives, policy is irreversiblyheaded towards competition and liberalization. TheIndian consumer�s fortunes, especially in basic andcellular services, would depend a great deal on howthe DoT and MTNL are able to, and allowed to,respond.
There are vast gains to be made by national R&Defforts with fixed schedules on modes similar to thatwhich gave us the RAX and PARAM (the series ofparallel super-computers of the Centre for Developmentof Advanced Computing or the C-DAC). The ITI, DoT,and VSNL, which have failed woefully in the past intheir R&D, are unlikely on their own to initiate muchR&D. The efforts from China and Korea are especiallyworth imitating. India�s very low coverage of villagesand absymal teledensities would continue to remainmuch as they are if policy cannot imaginatively addressR&D, standards, and industry structure and regulationin ways that break the existing constraints. The fact thatclose to 50 per cent of all exchanges the DoT uses areRAXs should give policy makers the requisite confi-dence in domestic R&D as being integral to the reformprocess.
The tendency for regulation and policy to be trappedin the means such as fairness, competition, revenuerebalancing, and neutrality, besides being constrained bythe bureaucratic stranglehold and the �need� to be fairto players of an earlier policy, is strong in India. Canthis be overcome? Can policy and regulation serve theconsumer interest?
TABLE 8.1.15Actual Inflow of FDI in the Telecom Sector from
August 1991 to October 1999 (sector-wise)
S. Service/item FDI Percentageno. (Rs million)
01. Basic telephone service 2665.9 6.3202. Cellular mobile
telephone service 20,823.5 49.3303. Radio paging service 909.9 2.1604. E-mail service 687.5 1.6305. VSAT service 137.7 0.3306. Cable TV network 514.5 1.2207. Satellite telephone service 481.2 1.1408. Radio trunking service 61.6 0.1509. Manufacturing 6688.49 15.8510. Holding companies 9241.2 21.89
Total 42,211.5
Source: India Infrastructure Report, June 2000.
completely free of bureaucratic and ministerial interfer-ence that is dysfunctional and parasitic is most urgent.Their managers would need the requisite freedom tobring about major organizational changes, including afairly large voluntary retirement scheme (VRS). All thiswould not be possible without quick disinvestmentreducing government share to below 50 per cent. Thedisinvestment/restructuring process could itself throwup incentives for employees to work efficiently andtowards the primary task. The freedom to reward andpunish differentially is also essential in the three �publicsector� telecom companies in order to achieve efficiency.
8.2 LOOKING BEYOND NTP 99
Ashok Jhunjhunwala
Indian Telephone Industries Limited (ITI) and HindustanTeleprinters Limited (HTL) (Vittal 1999). In the early1980s the liberalization process began, first with theprocurement of telecom equipment through state gov-ernment enterprises. It took another four to five yearsbefore the private sector was allowed to manufacturetelecom equipment. The late 1980s saw a major initiativewhen STD public call offices (PCOs) were allowed tobe opened. The STD PCOs quickly spread to all partsof the country and today net about 20 per cent of totaltelecom revenue. The process continued when, in mid-1992, operation of VASs was opened up to allow privateparticipation.
The next major turning point came in 1994. First,cellular licences were issued to the private sector. Atthe same time, NTP 94 laid the foundation of allowing
INTRODUCTION
India today has barely 20 million telephone connectionsand less than half a million Internet connections for abillion people. With less than 2 per cent teledensity,telecom and, Information Technology (IT) cannot playa major role in the nation�s development. Recognizingthat Internet Access could result in a divide deeper thanany existing so far between the haves and have-nots, thegovernment wishes very quickly to reach 100�200 mil-lion telephone and Internet connections. It has long beenrecognized that this would not be possible withoutparticipation of the private sector.
Until around the end of the 1970s the sole telecomoperator in India, the Department of Telecommuni-cations (DoT), procured all its equipments fromcentral government-controlled companies like the
The Telecom Sector 211
private sector into the operation of basic services (oneoperator in addition to the DoT for each circle or state).This policy document attempted to clearly enunciate thegoals of the liberalization process. Universal and reliableservice was the principal goal to be singlemindedlypursued.
In itself NTP 94 was a momentous step but subse-quent developments left much to be desired. The highlicence fees bid by operators initially created euphoriabut later a great deal of confusion. Long-distance servicewas not opened up as expected and remained a DoTmonopoly. With the interconnection, spectrum utiliza-tion, and right-of-way policies lacking clarity all effortsslowed down. Further, the expected corporatization ofDoT never took place.
But despite being dogged by these problems thereform process moved ahead and the establishment in1997 of the Telecom Regulatory Authority of India(TRAI) was a major step forward, though once againthere was much subsequent confusion about its roleand power. The next major initiative was the 1998Internet Policy. This freed Internet operation com-pletely, with Internet service providers (ISPs) beingallowed to establish their own access networks.
The year 1999 saw a major initiative from the TRAI.For the first time, it talked about the cost of establishinga telecom network and corresponding prices that providea minimum return. Over the years there had been drasticreduction in the cost of setting up a long-distancenetwork, but the increase in cost of providing an accessnetwork had nullified this reduction. The TRAI sug-gested significant reduction in long-distance chargesand a simultaneous increase in rentals and local callcharges to bring prices closer to cost. Unfortunately thestep was not popular politically.24 The second majorinitiative of the TRAI was to reduce leased circuitcharges which enabled significant development in Inter-net and Intranet services.
But by 1999, the major problem for the reformprocess was that the basic and cellular licensees wereunable to pay their licence fees. There was fear of large-scale collapse. The operators pleaded with the govern-ment to do something so that the telecom liberalizationprocess would not be totally derailed. It is in thisenvironment that NTP 99 was born. The key featuresof NTP 99 are:
� licence fees for basic and cellular operation convertedto revenue sharing plus entry fee;
� removal of the restriction earlier imposed on multipleoperators in the same circle;� existing operators allowed to shift to revenue sharing;the payments already made by them to be taken as entryfee;� national and international long distance operation tobe opened up in 2000 and 2003, respectively.
It is unfortunate that NTP 99 was born as a reactionto imminent private telecom sector collapse. But evenso it is part of a twenty-year process; a process typicallyconsisting of a step forward, new problems resultingtherefrom, and steps for the correction of these prob-lems. The process had and continues to have the aim ofproviding everyone a telephone and Internet connec-tion. On the whole, the NTP takes us forward. But willNTP 99 take us more rapidly towards the main objec-tive? This chapter analyses the limitations of NTP 99,particularly in the area of basic services operation.
WHERE DID THE OPERATORS GO WRONG?
The operators, both mobile as well as basic serviceoperators (BSOs), bid very high licence fees�operatorsfor some of the circles bid in excess of Rs 100 billionto be paid for a fifteen-year licence�payable by them inreturn for duopoly rights.
It is this high licence fee which has rendered privatetelecom operation unviable within just three to fouryears. Today�s evaluation is that the bid amount washigh�by a factor of five! It is important to understandthe reasons for such an error. The high bids were basedon (a) the assumption that India is a very large marketwith over 100 million middle-class customers; and (b)the assumption that this large number of potentialsubscribers has a reasonable ability to pay.
In fact, the first assumption was not too far off themark. Most cellular licensees received more subscribersin the first two years than they had hoped for. But itis in the estimate of the ability to pay that the errorseems to have been made.25 India is indeed a largepotential market, but with very limited ability to spend.
The issue today is whether the reform process is nowindeed more market savvy, or is going to continue toblunder its way forward?
SOME IMPLICATIONS OF REVENUE SHARING
The most important aspect of NTP 99 is that theoperators have a revenue sharing rather than licence fee
24 The day after the announcement of new rates by TRAI,there was a hue and cry in Parliament, with some of the partiessupporting the ruling coalition threatening to walk out. Thegovernment withdrew the revised tariff, which was brought backafter some revision a few weeks later.
25 Almost all cellular operators in the country, except thoseoperating in Delhi and Mumbai, have a revenue income from eachsubscriber far less than was envisaged. There are many people whokeep cellular phones, but use them only sparingly. Even the uppermiddle class find the cellular airtime charges too high.
212 India Infrastructure Report 2001
arrangement. This, of course, solves the immediateproblem of operator insolvency. But why revenuesharing instead of simply a lowering of the licence fees?Perhaps it may have been politically suicidal to acceptlower licence fees.
The more serious implication, however, is that licencefee bidding, unlike revenue sharing, requires solid under-standing of the market. The switch from license feebidding to revenue sharing is a sort of acknowledgementof the inability to accurately estimate the market and,in fact, points to the major uncertainties therein.
The obvious question now is, what prevents privateoperators from concentrating on providing service toonly a few high-paying subscribers? It makes perfectbusiness sense as less than 20 per cent of subscribers todaycontribute 80 per cent of revenue. Even if high costtechnology and systems are used to provide service tothese few subscribers, operators are likely to make aprofit. In a fixed licence fee regime, as the subscriber baseis expanded, gains (vis-à-vis licence fee payment) arelikely even with marginal revenue from new subscribers.This is not the case with revenue sharing. Why botherto provide service to subscribers who are small consum-ers, at least to begin with? In fact a few of the BSO todayrefuse to provide service to all but corporate subscrib-ers�a direct consequence of using high-cost importedtechnology. Is revenue sharing going to encourage thisfurther?
BSOs taking high-paying subscribers away from theDoT could hardly have been the goal of the country�stelecom policy and privitization process.26 The entireprivatization process started with a promise of universalservice (providing telephone and Internet to all).
In the light of this, the removal of universal serviceobligation for the BSOs in NTP 99 is likely to be veryproblematic. A universal service tax (a certain percent-age) is to replace this universal service obligation.Does this imply that private companies are to serve thehigh-paying subscribers, from whom a nominal tax willbe collected and used to provide service to the masses?
At best, NTP 99 is not a comprehensive policytowards telecom and IT for all. It has addressed animmediate problem and found the best available meansto solve it. One has to go beyond NTP 99 to look atseveral of these problems afresh.
What Does It Take to Rapidly Expand the Network?It is often believed that vital for network expansion are:� technology and� finance.
There is a prevailing assumption that both thesecomponents are not available in India. The nationalpolicy is therefore naturally designed to attract multina-tional corporations with their technology and finance.This is considered crucial at the current stage of infra-structure development for the country.
However, the above assumption has a basic fallacy.Mine is not an argument against multinationals, butmarket and affordability in India have unfortunatelynot been considered basic starting points; and marketand affordability are key if one wishes to install hundredsof millions of telephone and Internet connections inIndia.
Technology
Today it costs about Rs 32,000 to install a telephone linein India (Annual Report, DoT 1996�7; Jhunjhunwala,Ramamurthi, and Gonsalves 1998). For Internet accessa telephone is a must. If one takes 15 per cent as thefinance cost and 15 per cent as operation, maintenance,and obsolescence cost (the operation and obsolescencecost will in fact be higher), it requires an income of 30per cent of Rs 32,000 per year from each line for theoperator to just break even (this does not include licencefee, interconnectivity charges, or spectrum charges).This amounts to Rs 9600 per year or Rs 800 per monthand less than 2 per cent of the population in India canspend this amount. Thus at the current cost, even withcross-subsidy, not more than 3 per cent could affordtelephones. This simple computation stares one in theface, but is often ignored.
Will foreign technology help to overcome thisproblem? The cost of installing a telephone line in theWest is US $ 1000. It is unlikely to drop substantiallyin the coming years. A US $ 1000 investment requiresan income of US $ 300 per year taking into accountfinance, operation, and obsolescence. At US $ 25 permonth, it is affordable to about 95 per cent of the people.Therefore there is no incentive to reduce cost. Instead,to stay in the market, telecom companies in the Westhave to attempt to provide a larger basket of services atthe same cost. The emphasis of technology is thereforeon providing more services and features, keeping thecost constant. Similarly, the cost of the personal com-puter (PC) has stayed constant for the last fifteen yearsin spite of major technological developments.
In India, we require telecom technology that isaffordable to the majority. Of course, sharing of linesenhances affordability significantly.27 But to provide
26 Unfortunately, however, all private operators are aiming atexactly this, particularly in the first few years of operation. Onecannot fault them as it is sound business policy.
27 An example of such sharing is the STD PCOs, which areavailable today at in every nook and cranny of at least urbanIndia. Around 15 per cent of population finds this affordable, and
The Telecom Sector 213
telecom service even to 25 per cent of homes wouldrequire technology costing no more than Rs 10,000per line, for which a revenue of only about Rs 250per line per month would be needed to break even.With cross-subsidy, the revenue required could godown to Rs 100 per month; and this would be affordableto about 20 per cent of the population.
It is true that such technology is not availabletoday. Would such a drastic reduction (from aroundRs 32,000 to Rs 10,000 per line) ever be possible? Theanswer to such a question is why not? The R&Dcommunity in the West have had a totally differentfocus. But many of their innovations and inventionsmay be useful to R&D groups with the goal of costreduction. The goal may be tough and not achievableimmediately, but there is no reason to believe that itwould be impossible in the long term.
Appendix 8.2.1 briefly describes the efforts in thisdirection of the Telecommunication and ComputerNetwork (TeNeT) group. This group at IIT, Madras,along with several companies formed by its alumni,has been carrying out R&D to develop telecom andcomputer networking technologies for developingcountries like India. The aim is to significantly reducecost such that 100 to 200 million telephone and Internetconnectivity becomes a reality in India. With aboutfive years (and about 1000 man-years) of effort behindit, the group is currently planning citywide telecom andInternet network for operators, such that cost per lineis close to Rs 18,000. It provides simultaneous voice andInternet service for over 50 per cent of the connections.The cost is likely to drop to about Rs 15,000 per linein about a year. Beyond this, new technological devel-opments will be required to further reduce costs. Whatis important is that costs are not much higher in ruralareas. It costs only about Rs 3000�4000 more per lineto provide voice plus 35/70 kbps Internet in rural areas.(Jhunjhunwala 1998).
A note of caution is in order. The efforts of theTeNeT group demonstrate that it is possible to signifi-cantly reduce cost and create a basis for providing telecomand Internet connectivity to large sections of people. Ifthe dream of 100 to 200 million telephone and Internetconnectivity is, however, to materialize, several similaryet innovative efforts would be required.28 Fortunately,
there are a large number of companies in India thathave the technical ability to take up such a task. Mostof them today concentrate on providing services tocompanies in the West and thus work for the Westernmarket. They do not believe that this large Indian marketcan really be tapped because of the enormous bureau-cratic wrangling in the country. The success of TeNeTgroup in large-scale deployment of its technologies istherefore crucial to confidence building; the process ofIndian IT and telecom companies looking inwards anddeveloping products affordable in India (and other devel-oping countries) could then easily take off.
To sum up, availability of affordable telecom andInternet solutions is the basic requirement of universalconnectivity in India (and most other developing coun-tries). As such products are not available in the West,the development of these products becomes a keypriority.
WILL THESE TECHNOLOGIES BE ACCEPTABLE
TO OPERATORS?
Is availability of these cost-reducing technologies theonly bottleneck to fast expansion of the telecom net-work in the country? Would such technologies beacceptable in the country and can adequate financialresources be generated?
Let us look at the switches developed by C-DOT.This organization designed and developed switches inIndia in the late 1980s. It faced serious obstacles in itsinitial years, with the multinational lobby, along witha few officials, running down the product using all kindsof arguments. However, the persistence of those whobelieved that indigeneous development is the key toaffordability paid in the long run. By the end of 2000,10 million of the total of 20 million installed telephonelines in India will use C-DOT exchanges. C-DOT ex-changes are working in rural areas, small towns, andeven in large cities. The product has been proven in timeto be not only as reliable as any imported exchange butin fact better adapted to the harsh Indian environment.Today, the exchanges have been exhaustively tested forup to 40,000 line capacity. The exchanges have beenupgraded with signalling software for SS7, V5.1 andV5.2, ISDN, and even intelligent network (IN) services.The most important thing is that today a C-DOT linecosts Rs 2700 as opposed to Rs 4300 for importedexchanges; in fact, if C-DOT exchanges were not avail-able, the cost of an imported exchange would probablyhave exceeded Rs 6000 per line.29
even make long-distance calls at late nights. It generates around20 per cent of total telecom revenue.
28 For example, bringing Internet connection to home stillrequires massive investment in a computer, which well over 95per cent of families in India cannot afford. Low cost Accessterminals using TV or an integrated telephone, TV, and InternetAccess terminal definitely need to be developed.
29 For a year or two in the mid-1990s C-DOT exchange manu-facturers were in financial trouble as the DoT was not buyingCDOT exchanges, the multinationals took advantage of this andsignificantly increased the per line price of their exchanges.
214 India Infrastructure Report 2001
However, the C-DOT exchange has so far not beenused by even one BSO. Why is this so even thoughany field-level DoT engineer will swear to its reliabilityand its costs are less than two-thirds those of importedexchanges?
The first reason is that often the foreign partners ofthe BSOs, would like to sell their own or their partnercompany�s products. They therefore prevail on theBSOs to buy the more expensive product.
The more important reason is finance. Multinationalcompanies offer vendor financing for their products.They are ready to provide even equity financing, ifthe BSOs are willing to use their products. The financeterms they offer are attractive�LIBOR (London InterBank Offer Rate) of around 6 per cent plus 0.5per cent interest rate and, more importantly, a five-year moratorium on all payments. Most of the BSOsare short of finance, and a five-year moratorium onpayment implies that payment starts only after theyare likely to break even and are in a position to pay.Thus the more expensive imported products getthe go ahead. But where does this leave the goal ofuniversal access? With more expensive inputs BSOsare likely to be further oriented away from marketexpansion.
Finance
WHAT ARE THE FINANCING OPTIONS?
Some of the most innovative initiatives that have beentaken in India over the last ten years include thelaunching of STD PCOs, cable TV operation, andcomputer training institutes. These have mushroomedall over the country. Cable TV operation is probablythe most widespread. Today cable TV reaches some 35million homes in India, even more remarkable whenone remembers that it was non-existent in 1992. Theimportant thing is that this happened without anyinitiatives from the government or any R&D institute,multinational, large Indian corporate house, or theWorld Bank or Asian Development Bank. It happenedbecause a couple of youngsters in each locality wouldput in Rs 300,000�500,000 by borrowing money andeven mortaging family jewellery. They provide servicein a neighbourhood, going house to house to sellconnections and returning to collect the Rs 50�150monthly fee from each. They live in the neighbourhoodand are known people. When something goes wrong,one has only to go down the street corner and complain.Service is provided round the clock and on weekdaysand weekends. If the service is not good enough, thesubscriber can opt for another operator; one pays at theend of the month at one�s doorstep only if one is
satisfied. This is what Mahatma Gandhi referred to asface-to-face society.30
Leaving aside the implications this has in terms ofservice quality, let us examine the financing issue. Withabout 35 million cable TV connections existing withan average cost of Rs 300 per connection, the totalinvestment in this operation is around Rs 10 billion (1000crore). Where has this investment come from? Is it notan excellent example of internal resource mobilization?
This is not to argue that telecom in India does notneed international finance. In fact, all financial resourcesneed to be tapped and international finance may be key.But financing must not be allowed to force expensivenetwork choices. Having viable alternate sources of localfinance will ensure that international finance is alsodeployed cost effectively.
NTP 99: SOME SPECIFIC ISSUES
Having discussed some of the key issues which needto be tackled to enable rapid expansion of the telecomand Internet network in India, let us get back to NTP99. What needs to be done now in terms of policies? Wetake up some specific issues.
NTP Must Focus on Reduction of Network Cost
It is clear that the national telecom policy must focuson reduction of network cost if universal communica-tion is to be made possible in India in a short time. Howis this to be done?
Can incentives be provided to operators for usinglow-cost indigenous products? And what kinds of incen-tives and to what extent? The incentives could be interms of better revenue-sharing terms to operators forusing such products. For example, operators usingCDOT�s exchanges and IIT, Madras (TeNeT) group�saccess product could be given a more favourable revenueshare as compared to those not doing so. Alternatively,incentives can be provided in terms of lower or deferredentry fee or deferred revenue-sharing payments. But canthe incentives compensate favourable vendor financingterms available for imported equipment?
One has to look at World Trade Organization (WTO)agreements and other commitments that the countryhas made while proceeding on these lines. But as theincentives are only to compensate an attractive vendor
30 This is a running theme in several works of MahatmaGandhi. He contrasted this face-to-face service with the serviceprovided by a beauracratic faceless body, to which you can onlypetition for a service. The methods advocated by Gandhijidefinitely need a closer look, specifically in view of a situationwhere service from the organized sector in India is either becom-ing too expensive or is totally breaking down.
The Telecom Sector 215
finance package available for imports, it should bepossible to find a way.
Import BillIf 100 million lines are to be commissioned over the next8�10 years and even if we assume a modest equipmentcost of Rs 15,000 per line, the total cost works outto Rs 1500 billion. What will be the source of all thisequipment? Will this go on the import bill? Going bythe current volume of manufacturing in India and thetrend adopted by the BSOs, it appears that all equipmentwill be imported. Can India afford this?
If not, what kinds of incentives can be providedfor local manufacturing? Can such incentives be builtinto licence agreements? Once again, it requires detailedstudy of the WTO regulations to find a way. With suchimport-based developments of the network 100 milliontelephones and Internet connections will simply neverbe a reality.
Why Only Large Operators?NTP 99 did attempt to make the operations of CMSPs(cellular mobile service providers) and BSOs viable byconverting the committed licence fees to revenue shar-ing. But the reasons behind it having recommendedan entry fee barrier for new operators are not at all clear.Why have such barriers at all? Why not use the samepolicy as adopted for Internet service? Second, whycontinue to think in terms of statewide (circle-wide)operators only? Why not in terms of smaller operators?
As discussed earlier, some of the most successfuloperations in India have been cable TV and STD PCOoperations. Why not allow similar operations in telecom?Why not allow small operators (franchise operators)providing 500 to 1000 line connections in a neighbour-hood?
Today, the access network costs 65�70 per cent of thetotal per-line cost of the telecom network. Further, it isthe access part of the network that requires maximumcare and maintenance. As this kind of service is bestprovided by a local person in a neighbourhood, it is bestto have a franchise operator put up the access networkand provide the service. The backbone networks couldbe provided by a statewide operator (the DoT or a BSO).As such a franchise operator puts up 65�70 per cent ofthe cost, he/she must get at least 50 per cent of therevenue.
Incentives for Universal ServiceThere should be specific incentives to encourage anoperator to provide service as widely as possible. Somesuggestions are as follows:
� Incentives should given to provide service in smalltowns and rural areas:
� revenue share accruing to the government foroperation in small towns should be zero;� revenue share accruing to the government foroperation in rural areas should be negative, implyingthat the operator can offset part of the revenue sharethat he/she has to pay to the government for opera-tion in urban areas by providing more telephones inrural areas.
� To discourage an operator from focusing only onhigh-paying customers in urban areas, the revenueshare to be paid should decrease as teledensity providedby the operator in a city increases.
It is important to point out that universal service taxcannot compensate for universal service obligations.Instead incentives to widen customer base would greatlyhelp.
Incoming and Outgoing CallsIn the international arena, the difference between call-minutes originating from one country to another andcall-minutes terminating in the first country from theother are used for settlement. In other words, as manymore call-minutes originate from the United States toIndia as compared to the other way around, the VSNLgets paid for by US operators.
The reasons why more calls originate in one countryrather than another vary. Of course the reason is oftenlower tariffs in one country. The other important reasonis that income levels in one country may be higher thanin the other. For example, when Indians leave India andsettle in the United States, they earn in dollars andtherefore much more in absolute terms as compared totheir relatives in India. Even if tariff in the two countrieswere the same (in absolute terms), many more calls arelikely to be made from the United States to India thanthe other way round. However, it requires a telephonein both countries to complete the call. Recognizing this,the international settlement is carried out.
Similar situations exist within India between rural andurban areas. Very often the family breadwinner leavesthe village and comes to a town to work. It is he/she whohas much more money to make the call to the village.
It is imperative that settlement between the incomingand outgoing call-minutes in rural areas be carried out.Otherwise, the operators who serve rural and backwardareas of the country will be at a disadvantage.
CONCLUSION
Some policy initiatives to strengthen NTP 99 and renderits goals more achievable have been highlighted. Thereare several other specific policy decisions that need tobe taken as one moves beyond NTP 99. For example,
216 India Infrastructure Report 2001
it is surprising that NTP 99 did not try to resolve themobile versus fixed wireless service tangle. NTP 99 didwhat was imperative at the time. The point is to moveon. The principal goal of telecom policy needs to beunderscored once again�to provide reliable telephoneand Internet connectivity to all.
Such a goal is achievable only with clear policyinitiatives. A push is required such that Indian compa-nies and institutes take up the task to design and develop
such telecom and IT that is affordable to people inIndia. Initiatives need to be taken to encourage large-scale efficient manufacturing in India. Finally, policyinstruments need to be used to provide incentives toexpand telecom and Internet operations in small townsand rural areas and to provide service to lower-incomegroups in urban areas. Only such explicit policies willenable India to expand its network to the requiredextent.
BOX 8.2.1Enabling Telecom and Internet Connectivity in Small Towns and Rural India
Ashok Jhunjhunwala and Bhaskar Ramamurthi
There are a little over 300 Class I towns (over 100,000 population in the 1991 Census) in India. These are the only towns inwhich the DoT makes a profit on its services. In other places (Class II, III, IV towns and rural areas), the DoT either barely breakseven or loses money. Private BSOs today are putting up their operations in the largest cities and have very little interest in goingbeyond. At most, a few may cover some larger Class II cities. The ISPs also largely confine their operations to the larger Class Icities.
The world over, telephone revenue continues to significantly exceed revenue obtained from Internet connections. Telecomrevenue has been used to build the Internet. However, in the future the Internet is likely to yield large revenues and also changeways of living and doing business.
The IT taskforce took a very bold step in freeing the setting up of Internet service anywhere in the country virtually licence free.It has led to the emergence of a large number of ISPs all over India. But today, they largely depend on the telecom network to provideaccess to subscribers. Not only are they denied a part of the resulting telecom revenue, but in fact subscribers have to pay Rs 26per hour to the DoT (or BSOs) as access charges in addition to paying Internet service charges. Such a low revenue share for an ISPout of the total amount paid by a subscriber for Internet access implies that an ISP can be successful only in larger cities.
Development of telecom and Internet in smaller towns and rural areas requires telecom and Internet revenue to be combined tomake the operation commercially viable. Further it requires a local business focusing on the region to optimize its costs.
The following measures are therefore recommended:Telecom operations in all areas of the country other than Class I cities be entirely licence free. A local service provider (LSP) could
set up a telecom network and provide telephones in all such areas (in addition to Internet service which is today virtually licencefree) by simply registering itself. The region of operation could be small or large�one town, one district, one block, or even oneneighbourhood. The local operator be allowed to connect to the nearest statewide telecom operator (the DoT/BSO) by payingconnectivity charges as per norms similar to those applicable for BSOs today.
A BSO today pays (a) a revenue share (15 to 20 per cent) to the government for licence in addition to a one-time entry fee forthe entire state (circle); (b) for physical connectivity to the nearest DoT (digital E1 connections) exchange; (c) thirty-three per centof STD charges for all calls routed through the DoT network; (d) fifty per cent of international STD charges for calls routed throughthe DoT/VSNL network.
To help the telecom and Internet network grow in small towns and rural areas, licence fee and revenue share (as in (a) above)should be zero for fifteen years. The charges as in (b), (c), and (d) for a LSP should be the same as for a BSO, or even less, in orderto encourage LSPs. However, for connections in rural areas, the LSP should get the universal service (USO) benefits that the DoTand BSO would.
The interface between exchanges used today in India is digital E1 lines. The signalling used is R2-MF or SS7; R2-MF signallingdominates though it is progressively being changed to SS7. The LSP should be allowed to connect to the DoT/BSO on E1 lineswith R2-MF signalling. As and when the DoT/BSO as well as LSP have the capability to upgrade the connection to SS7, theupgrading should be allowed. The LSP should require only this E1 interface approval for connection to the DoT/BSO.
Frequency spectrum is a valuable resource and frequencies must be used and reused efficiently by the country. The frequencycharges must be such as to encourage this. However, in small towns and rural areas, where usage is less, charges should be madezero for the first ten years in order to rapidly enhance telecom and Internet services in these areas. The target for such connectionsin these areas should be at least 30 million in the next five years.
The charges stated in (b), (c), and (d) are reasonable, as the access part of the telecom network is 65 to 70 per cent (the percentagesare even higher in rural areas) of the total cost of installing a telephone line. The backbone network is only a small percentage ofthe total cost. This policy will enable tens of thousands of small local operators to come up, providing telecom and Internet servicein small towns and rural areas. The operating costs of these small entrepreneurs would be much less than those of the DoT and BSOs.Further, being local, they would provide better services. India�s phenomenal cable TV expansion in small towns and rural areas isan example of the success of this approach. The DoT and BSOs do not lose by this policy, as currently they do not profit financiallywhen they provide connections in small towns and rural areas.
The Telecom Sector 217
8.3 NUMBER PORTABILITY: WHY DO WE NEED IT ?31
Dheeraj Sanghi
Many countries that have opened up their local tele-phony markets have found that the incumbent localexchange carrier (ILEC) continues to dominate themarket long after a competitive local exchange carrier(CLEC) starts providing local service in the same mar-ket. This is true even when the CLEC provides betterservice at similar or lower rates. For a CLEC, the costof entry is typically very high. Besides the high initialcapital costs, marketing costs are also huge. It is typicallymuch costlier to acquire a new customer than to keepan existing one. Inertia of customers preventing a switchto a new carrier may be one reason. But there is anothersignificant reason. Customers will lose their originaltelephone numbers if they switch to a CLEC. This willcause hardship as they will have to inform all theirfriends, relatives, businesses, and everyone else who mayneed to contact them of the change. They will have todiscard their business cards and other stationery. Cus-tomers will not be willing to switch their telephoneservice if the cost of the switch in terms of bothhardships and actual economic cost is going to besubstantial. Hence it is clear that true competition in thelocal market cannot develop without number portabil-i ty .
The Telecommunications Act, 1996, in the UnitedStates was instrumental in promoting competition inthe telecom market. It made it obligatory for all ILECsto open their networks to competitors. It removed legaland regulatory barriers to entry and specifically men-tioned number portability as a mechanism to promotecompetition in the local access market. The Act definednumber portability as �the ability of users of telecom-munication services to retain existing telecommunica-tions numbers without impairment of quality, reliability,or convenience when switching from one telecommuni-cations carrier to another�.
The first example of number portability was thefreephone service in the United States (800-NXX-XXXXnumbers, where the party who receives the call paysfor it). For a long time, carriers were allocated specificthree-digit codes (NXX) and were free to assign the lastfour digits of the freephone number. So each codemeant a block of 10,000 numbers. The three-digit codedetermined the routing of the freephone call to theappropriate carrier. If a subscriber wanted to changethe service provider, then the three-digit code (andhence the freephone number) would also change. Com-panies invest large sums of money in advertising theirfreephone numbers. Therefore, they would not opt tochange their number and would rather use the sameprovider.
In May 1993, the United States switched to a systemwhereby a database was created for all freephone num-bers. In this database, each freephone number wasassociated with the public switched telephone network(PSTN) number, the name of the carrier, and some otherdetails necessary for routing the call. Every time a callwas to be made to a freephone number, a query was firstsent to this database and based on the informationreturned the call was handed over to a particular carrier.As a result the numbers became completely portable.Switching a carrier was as simple as changing the data-base entry without changing the number. This databasewas managed by an independent party (BellCore at thattime) and not by long-distance operators.
This allowed even the smallest of carriers or resellerswho did not have presence in all areas to offer thisservice. This increased competition. And it resulted indrastic improvement in the quality of service at muchlower costs. Enhanced services included routing the callbased on the time of day and originating number. It wasalso possible to state in the database that a portion ofthe traffic could be carried on one carrier and the reston another. The companies started providing guaranteeson uptime and fault tolerance. Meanwhile the cost of thecall was decreasing.
There are three aspects of a telecom service, viz.geographical location, service (like ISDN [integrated-switched digital network] versus PSTN), and serviceprovider. There are three types of corresponding port-ability that affect competition. Service provider portabil-ity implies that the customer retains the same numberif she switches the service provider but location and thetype of service remain the same. Service portability
31 This article has references to the Federal CommunicationsCommission (FCC), FCC�95�284, 1995; FCC 96�286, July 1996;FCC�97�074, March 1997; FCC�97�289, August 1997; FCC�98�082,May 1998; The Number Portability Site, www.ported.com;www.fcc.gov; OFTEL, www.oftel.gov.uk; Office of the Telecom-munication Authority (OFTA), Honkong, www.ofta.gov.hk;Australian Communications Authority, www.aca.gov.au; Tele-communications Standards Advisory Council of Canada,www.tsacc.ic.gc.ca; America�s Networks magazine, www.americasnetwork.com; N. Mulachy and P. Waters (1997); Tele-phone Number mapping working group of IETF, www.ietf.org/html.charters/enum-charter. html; International Telecommunica-tion Union, www.itu.int.
218 India Infrastructure Report 2001
implies that the customer retains the same number if sheswitches the type of service (for example PSTN toISDN) at the same location and with the same serviceprovider. Finally, location portability implies that thecustomer retains the same number if he/she changes his/her location but continues to receive the same type ofservice from the same service provider. Ideally, onewould like to have all three types of portability, that isfreedom to change all three and still keep the samenumber. But in the immediate context of providing alevel playing field to the CLECs, service providerportability is the most important. It is also referred toas local number portability (LNP). If wireless servicebecomes significantly cheaper to the extent that asubscriber may switch from fixed line service to wireless,then service portability will become important to en-hance competition. This type of portability is calledwireless number portability (WNP). (WNP is quitesimilar to LNP except that the rate areas of wirelessservice and fixed line service are different. If one switchesfrom wireless to fixed-line service, the numbers that onecould call free of charge earlier may no longer be freeto call. Between two fixed-line service providers, thisproblem rarely arises since the rate areas are usuallyidentical.)
There are four mechanisms to implement LNP. Inthe simplest case, the donor network (the previousservice provider) simply routes the call to the newrouting number (all phones/terminal devices have aninternal routing number that is used to route thecall through the telecom network). The donor networkwill maintain a mapping between the old telephonenumber and the new routing number. This is simple andeasy to implement, but the resources of the donornetwork are being used throughout the duration ofevery call. The donor network will demand substantialcompensation for providing this service. The secondproblem is the delay, particularly if the number is portedmore than once.
The second mechanism involves the donor networkdropping the call and informing the source networkabout the new routing number. This requires the donornetwork to keep the mapping between the telephonenumber and the new routing number for all times tocome. The mechanism will require simple enhancementsin the signalling protocol. Overall, this is an improve-ment over the previous scheme, but the delay in settingup the call could be slightly higher.
Another obvious problem in this scheme is therequirement that the donor network keep the mappingfor all times to come. This continued dependence on thedonor network even after the customer has switched toa new service provider is not very desirable, except in
the interim period. Also it continues to reinforce thebelief that the numbers are owned by service providers.Ideally, an independent authority should deal withnumbers (assign numbers, keep the information aboutportability, etc.).
In the third scheme, called �query on release�, the callconnection request goes to the donor network, whichonly replies that it no longer serves the number. It neednot provide (or even have) the current routing informa-tion. Now the source network queries the database andfinds the latest routing information and then establishesthe call. This scheme requires setting up additionaldatabase infrastructure and upgrading signalling on alltelecom switches to permit querying this database. Butsetting up such an infrastructure is the next logical stepfor providing all kinds of portability, or �one numberfor life�.� The problem is the delay involved in settingup the call. There is one roundtrip time delay withrespect to the donor network, another roundtrip to thedatabase, and a third roundtrip to the new network.
The fourth scheme cuts down on this delay by alwayssending the request to the database first. This reduces thedelay for ported numbers by avoiding the first roundtriptime to the donor network. But it increases the delay fornon-ported numbers, which now have an additionalquery and response time. However, querying for all callscan have additional advantages, such as the ones notedin the case of freephone service. This will be a precursorto the �one number for life� goal in telecommunications.The additional benefit is that the donor network is notat all involved in the operation.
All four schemes have different costs involved, bothin terms of investment in upgrading the network andswitches as well as in maintaining and running thesystem. There is a need to study the advantages anddisadvantages of these schemes, conduct a cost�benefitanalysis of different schemes and finally decide the modelto facilitate cost sharing between different service pro-viders and customers.
The costs of implementing LNP are usually sharedbetween all service providers and customers. Eachservice provider will upgrade its own network at itscost. The cost of database or shared infrastructure is paidfor by the service providers. It can be based on actualusage (number of queries, for example), but it is morelikely that the ILEC would need to pay a larger shareof the cost. The argument given is that the ILEC hasbenefited the most from the monopoly situation,and now it should be made to promote a level playingfield. Service providers will in turn charge customerssome additional money. This additional charge cannotbe solely paid for by those who actually port theirnumbers, since it will be enormous in that case. The
The Telecom Sector 219
charges to a large extent have to be shared by allcustomers, because everyone benefits from the increasedcompetition made possible by LNP. Thus the benefitsof LNP are in its availability, not necessarily in its useby a large number of customers. There are a largenumber of cost-sharing models in place in differentmarkets and India will have to find its own when itimplements LNP.
The cost of implementing LNP (including upgradingall switches and creating a database) is estimated ataround US $ 10 per telephone line in urban areas.Considering that the cost of setting up of a new networkis around US $ 400 per line, it is very small by compari-son. The US (Federal Communications Commission(FCC) has allowed initial cost recovery from all existingcustomers. The per month charges vary from 23 centsin the case of Bell Atlantic customers to 48 cents forSprint Local customers. These charges are expected tocome down further and in any case will disappear whenthe initial costs are fully recovered. The saving tocustomers in the medium term, because of efficiencyenforced by competition, is expected to be much higher.The estimates of saving on account of not having to printnew stationery upon changing the service provider areupwards of US $ 1 billion per year.
There are several countries that are implementingLNP. In fact, almost all countries that are openingup their basic telecom services are making it man-datory for operators to implement LNP. The UnitedStates, for example, has already implemented LNP inmost of its markets and has also started implement-ing WNP. In the UK, Australia, and Hong Kong tooLNP is being implemented. There are at least thirtyother countries, where the regulatory bodies are lookingat issues related to LNP and are likely to mandate itsoon.
Besides enhancing competition in the local telecommarket, number portability has other benefits. Ithad already been stated that this is the path towards asingle lifelong number. It also conserves number space.The FCC has mandated number pooling in all areaswhere LNP implementation is complete. When LNP isnot supported, then each CLEC is allocated a block ofnumbers in each rate area where it intends to provideservice. Each block may be as large as 10,000 numbers,even though the number of actual customers may bevery small. This wastes the numbering resource andforces an increase in the size of telephone numberssooner than would otherwise be necessary. With num-ber pooling, each exchange code is shared betweendifferent local exchange carriers (LECs), thereby effec-tively allocating smaller blocks of addresses to differentLECs. Number pooling requires LNP, since routing
information will be retrieved from the number data-base.
Having said all this, it must be mentioned thatnumber portability is not immediately relevant to thecurrent Indian telecom scenario. The Telecom Regula-tory Authority of India (TRAI) is currently planning tocompletely change the national numbering plan. Thenine-digit numbers (including the national destinationcode and the subscriber number but not counting theinitial �zero� of the STD code) will soon be insufficientin the country. Cellular and paging services have alreadybeen allowed 10-digit numbers. Last year the TRAIpublished a discussion paper on the new numberingplan for the country. It is likely that the new numberingplan will be adopted within about a year. LNP shouldbe taken up only after the new numbering plan has beenadopted and implemented.
But implementing number portability is a trickybusiness. The TRAI needs to discuss different possibleschemes to implement LNP. It needs to decide whetherWNP should also be adopted. It then needs to givesufficient time to carriers to implement LNP and testtheir networks. Another important regulatory issuewill be the allocation of costs. Who pays for the networkupgradation as well as the running cost? Should this beshared by all existing telecom customers, since theywill all eventually benefit from the competition evenif they do not actually switch their service. Shouldit be paid largely by those customers who actuallyswitch their service? Should this cost be forced uponthe ILEC, since it should be the responsibility ofthe monopoly carrier to support competition? ILECshave long benefited from monopoly. And is it the timefor them to pay back? All three ideas of cost sharinghave some merits and perhaps all three will sharesome parts of the cost. But who should share howmuch is a difficult question that the TRAI will have todetermine.
The experience of other countries shows that it takesat least two years to decide on the regulatory aspects ofLNP and two more years to implement and test it. Evenif the process can be speeded up by learning from others�experience, it will still take a minimum of three years.India certainly will be ready for LNP in three years. Sothe discussion on number portability has to start today.Also, it is to be noted in the proposed numbering planthat fixed-line service has been given a different numberspace from wireless telephony. It is likely that Indiamight consider WNP to be more important. Having twodifferent number spaces for wireless and fixed linephones will be an impediment to WNP. Therefore,portability issues should be carefully discussed beforedeciding on the numbering plan.
220 India Infrastructure Report 2001
APPENDICES
APPENDIX 8.1.1
NOTE ON IP TELEPHONY AND VOICE OVER
INTERNET PROTOCOL (VOIP)
What is Packet Telephony?
Packet telephony is a transport service providing voicecommunication on a packet-based data network. Realtime voice communication refers to standard telephonecalls where maintaining accurate speech structure iscritical. Other types of potential packet communicationsinclude fax, voice messaging, e-mail, video, and data.Other terms used to describe packet telephony are: voiceover Internet protocol (VoIP), Internet telephony, voiceover frame relay, voice over Asynchronous TransferMode (ATM).
How Does Packet Telephony Work?
The circuit-switched telephone conversation is con-verted to a format suitable for transmission over a datanetwork. The signal is first encoded, then it is com-pressed, and finally it is packetized. The final convertedsignal can be transported over a frame relay, ATM, orInternet protocol (IP) network.
Why is Packet Telephony Getting So MuchAttention in the Industry?
Packet telephony is less expensive and more efficientthan circuit-switched telephony. It takes advantage ofseveral significant trends in technology. The first trenddeals with the development of digital signal processor(DSP) products. DSP products perform the signal con-version process and are doubling in processing powerevery eighteen months (this is referred to as Moore�sLaw). The second is that since 1997 more data havebeen transmitted on the �network� than voice. The thirdis the ability to use one infrastructure to transport voice,video, and data (convergence).
How Does Packet Telephony Work With theCircuit Switched Network?
There are several ways packet telephony can work inconjunction with the public-switched telephone net-work (PSTN). Our current implementation will providea gateway device attached to the host digital terminal(HDT). From the HDT, the service provider has theability to utilize either network. To what degree thePSTN is used depends on where the IP conversionprocess takes place and to what extent an alternativeservice provider can carry the packets on a managedbackbone. In all instances, a gateway device is requiredthat performs voice conversion.
Will Current Customer Premise Equipment (CPE)Work with an IP System?
For the near term, packet telephony will be transparentto the end user. Any subscriber can place packet tele-phony calls with his/her standard telephone. In thistopology, the IP conversion process will take placewithin the network via gateways. Future productswill migrate the conversion functionality towards thesubscriber.
What are the Growth Projections?
IDC (International Data Corporation�an organizationengaged in research in information technology andtelecommunication) predicts that by the year 2002,the Internet could carry 11 per cent of the US andinternational long-distance traffic. Continued growthwill be determined by a combination of standards,regulation, and the availability of a managed backbonewhere delay will not effect voice quality. Market esti-mates regarding the future share of IP telephony varyconsiderably. Tarifica�s Internet Consultancy Practiceestimated that by the year 2003, IP telephony couldtake as much as 43 per cent share of the total globalmarket. The market is expected to reach US $ 290million, up from US $ 130 million in 1998. By 2003, IDCbelieves the total worldwide market will exceed US $ 1.8billion. As per Yankee Group�s estimate (1995), IPminutes of usage would be 9 per cent by 2004 and 15per cent by 2006.
What Benefits does Packet Telephony OfferCompared to Circuit Switched?
The benefits are as follows:
� combines voice, video, and data on one transmissionnetwork;
� eliminates wasted bandwidth by not transportingsilence (about 60 per cent of normal speech is silence);
� can achieve greater compression (64 kbps to as littleas 6 kbps);
� is currently unregulated and offers a viable means ofbypassing the existing PSTN at a significant saving.
Who Will Deliver Services Using Packet Telephony?
Multiple service operators (MSOs) that want to offerthree or more simultaneous services to their subscriberswould benefit from packet telephony. The servicesoffered need to be full featured, low cost, and providecustom local area signalling services (CLASS). TheMSOs would be able to offer lifeline/primary service at
The Telecom Sector 221
a significant discount and combine voice, video, and datacommunications on a single point of presence. Thisoffering fits well with the residential customer, whoseservice demands are currently driven by price andadditional features in the future.
Are There International Applications forPacket Telephony?
A variety of companies around the world have an-nounced plans for IP deployment:
� SouthNet Telecom & Deutsche Telecom to useAscend gear for VoIP service� Telestra uses NetSpeak for VoIP trials� Telnor signs contract with Ericsson to includeEricsson�s Gatekeeper in Telenor�s Public H.323 Net-work� Bezeq to use VocalTec equipment for phone to phoneInternet trial� Exit2Europe to offer Internet telephony usingVocalTec�s equipment� TVS to use Array Telecom�s gateways for IP networkin Japan� Digitcom teams with providers to offer IP Telephonyin Egypt and Russia� Swisscom testing Inter-Tel�s technology for VoIPservice� ITXC announces global connectivity for IP Tele-phony calls.
What Standards are Relevant for Packet Telephony?
H.323 is one of the primary standards for packettelephony. SGCP is the interface standard for the inter-action between a cable client and the circuit switch-network gateway. ADC fully supports both of thesestandards.
There are additional standards that cover the specificfunctions of transmission. G.723.1 is one of the Inter-national Telecommunications Union (ITU) standardsfor encoding voice. H.323 Rev 2 for wide area network-ing recommends G.723.1 for voice/video and G.729 forvoice only.
Which Organizations are Involved withCreating Standards?
The following is a list of the organizations:
1. European Telecommunications Standards InstituteTelephone.
2. Internet Protocol Harmonization Over Networks(TIPHON).
3. International Telecommunications Union (ITU).
4. Internet Engineering Task Force (IETF).
5. Intelligent Network Forum (INF).
6. Forums also exist for voice over frame relay/ATM/IP.
7. Managing Cisco Network Security (MCNS)/DataOver Cable System Interface Specification (DOCSIS).
Does Packet Telephony Offer Toll Quality?
Factors affecting packet telephony voice quality includethe voice conversion process, the delay associated withgetting from point to point, and the variable delay at thefar end gateway as it reconstructs the signal (jitter).Digital signal processor (DSP) products embedded in thegateway device have the processing power to handle thevoice conversion with toll quality. The principle issuetoday involves the delay associated with transmission.The more routers or �hops� that the packet experienceson the network, the more delay.
What are the differences between Voice over ATM,Frame Relay, and IP?
ATM is a connection-based protocol similar to circuit-switched service. ATM was designed to supportmultimedia applications and will see future implemen-tations as a backbone application. Frame relay and IPare connectionless-based protocols. Frame relay hasits strength in the corporate environment as it evolvedfrom X.25 technology. IP is geared more to the residen-tial market with its ties to the Internet and its globalacceptance. Most gateway manufactures are designingproducts to support multiple protocols.
Will Packet Telephony be Regulated?
It is not really a question of whether packet telephonywill be regulated but when, and what form the regula-tion will take. It is important to note that even if itbecomes regulated, there are still significant advantagesto combining voice, video, and data on the same trans-mission platform.
Will Web Browsers Have an Effect onMy IP-Based Phone Calls?
Using the Internet or an Internet protocol-based net-work there will have to be some method to prioritizevoice packets over others. IPv6 has been developed toaddress this issue along with Resource ReservationProtocol (RSVP), a protocol that ensures minimal delayfor voice packets.
Source: http://www.adc.com/Education/HFC/topics/voiceIP/pg3.html#4Copyright (c) 1999 ADC Telecommunications, Inc. Allrights reserved.
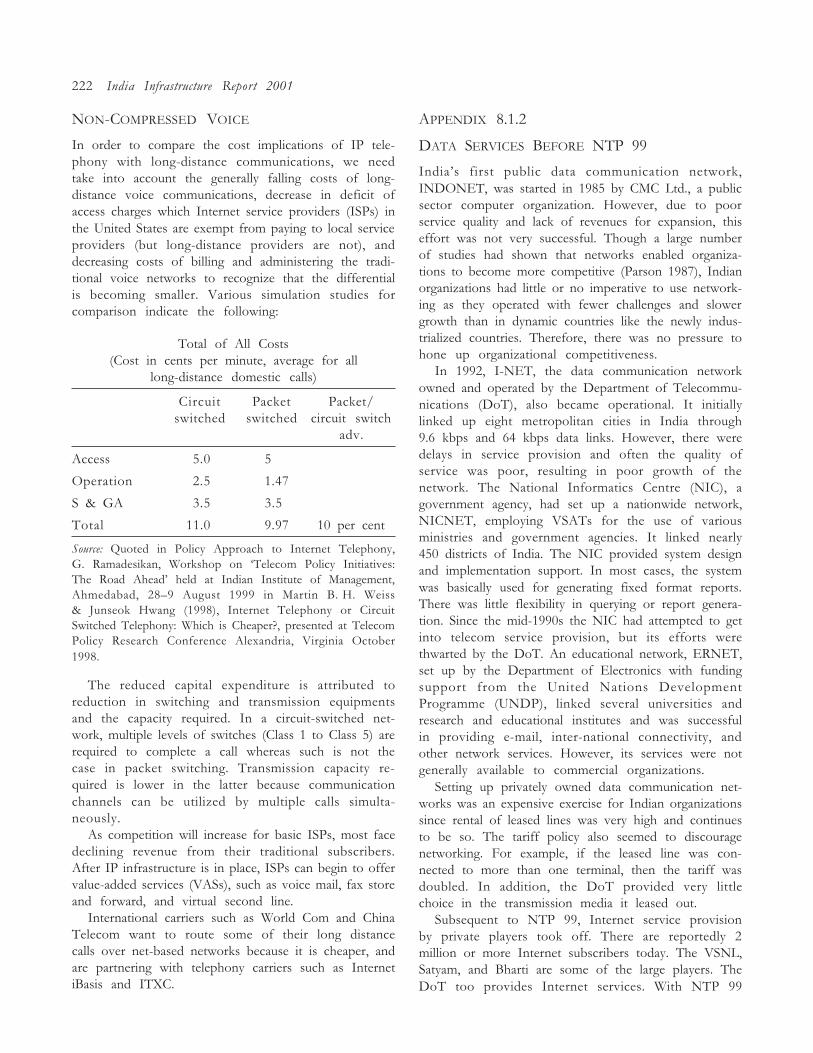
222 India Infrastructure Report 2001
NON-COMPRESSED VOICE
In order to compare the cost implications of IP tele-phony with long-distance communications, we needtake into account the generally falling costs of long-distance voice communications, decrease in deficit ofaccess charges which Internet service providers (ISPs) inthe United States are exempt from paying to local serviceproviders (but long-distance providers are not), anddecreasing costs of billing and administering the tradi-tional voice networks to recognize that the differentialis becoming smaller. Various simulation studies forcomparison indicate the following:
Total of All Costs(Cost in cents per minute, average for all
long-distance domestic calls)
Circuit Packet Packet/switched switched circuit switch
adv.
Access 5.0 5
Operation 2.5 1.47
S & GA 3.5 3.5
Total 11.0 9.97 10 per cent
Source: Quoted in Policy Approach to Internet Telephony,G. Ramadesikan, Workshop on �Telecom Policy Initiatives:The Road Ahead� held at Indian Institute of Management,Ahmedabad, 28�9 August 1999 in Martin B. H. Weiss& Junseok Hwang (1998), Internet Telephony or CircuitSwitched Telephony: Which is Cheaper?, presented at TelecomPolicy Research Conference Alexandria, Virginia October1998.
The reduced capital expenditure is attributed toreduction in switching and transmission equipmentsand the capacity required. In a circuit-switched net-work, multiple levels of switches (Class 1 to Class 5) arerequired to complete a call whereas such is not thecase in packet switching. Transmission capacity re-quired is lower in the latter because communicationchannels can be utilized by multiple calls simulta-neously.
As competition will increase for basic ISPs, most facedeclining revenue from their traditional subscribers.After IP infrastructure is in place, ISPs can begin to offervalue-added services (VASs), such as voice mail, fax storeand forward, and virtual second line.
International carriers such as World Com and ChinaTelecom want to route some of their long distancecalls over net-based networks because it is cheaper, andare partnering with telephony carriers such as InternetiBasis and ITXC.
APPENDIX 8.1.2
DATA SERVICES BEFORE NTP 99
India�s first public data communication network,INDONET, was started in 1985 by CMC Ltd., a publicsector computer organization. However, due to poorservice quality and lack of revenues for expansion, thiseffort was not very successful. Though a large numberof studies had shown that networks enabled organiza-tions to become more competitive (Parson 1987), Indianorganizations had little or no imperative to use network-ing as they operated with fewer challenges and slowergrowth than in dynamic countries like the newly indus-trialized countries. Therefore, there was no pressure tohone up organizational competitiveness.
In 1992, I-NET, the data communication networkowned and operated by the Department of Telecommu-nications (DoT), also became operational. It initiallylinked up eight metropolitan cities in India through9.6 kbps and 64 kbps data links. However, there weredelays in service provision and often the quality ofservice was poor, resulting in poor growth of thenetwork. The National Informatics Centre (NIC), agovernment agency, had set up a nationwide network,NICNET, employing VSATs for the use of variousministries and government agencies. It linked nearly450 districts of India. The NIC provided system designand implementation support. In most cases, the systemwas basically used for generating fixed format reports.There was little flexibility in querying or report genera-tion. Since the mid-1990s the NIC had attempted to getinto telecom service provision, but its efforts werethwarted by the DoT. An educational network, ERNET,set up by the Department of Electronics with fundingsupport from the United Nations DevelopmentProgramme (UNDP), linked several universities andresearch and educational institutes and was successfulin providing e-mail, inter-national connectivity, andother network services. However, its services were notgenerally available to commercial organizations.
Setting up privately owned data communication net-works was an expensive exercise for Indian organizationssince rental of leased lines was very high and continuesto be so. The tariff policy also seemed to discouragenetworking. For example, if the leased line was con-nected to more than one terminal, then the tariff wasdoubled. In addition, the DoT provided very littlechoice in the transmission media it leased out.
Subsequent to NTP 99, Internet service provisionby private players took off. There are reportedly 2million or more Internet subscribers today. The VSNL,Satyam, and Bharti are some of the large players. TheDoT too provides Internet services. With NTP 99
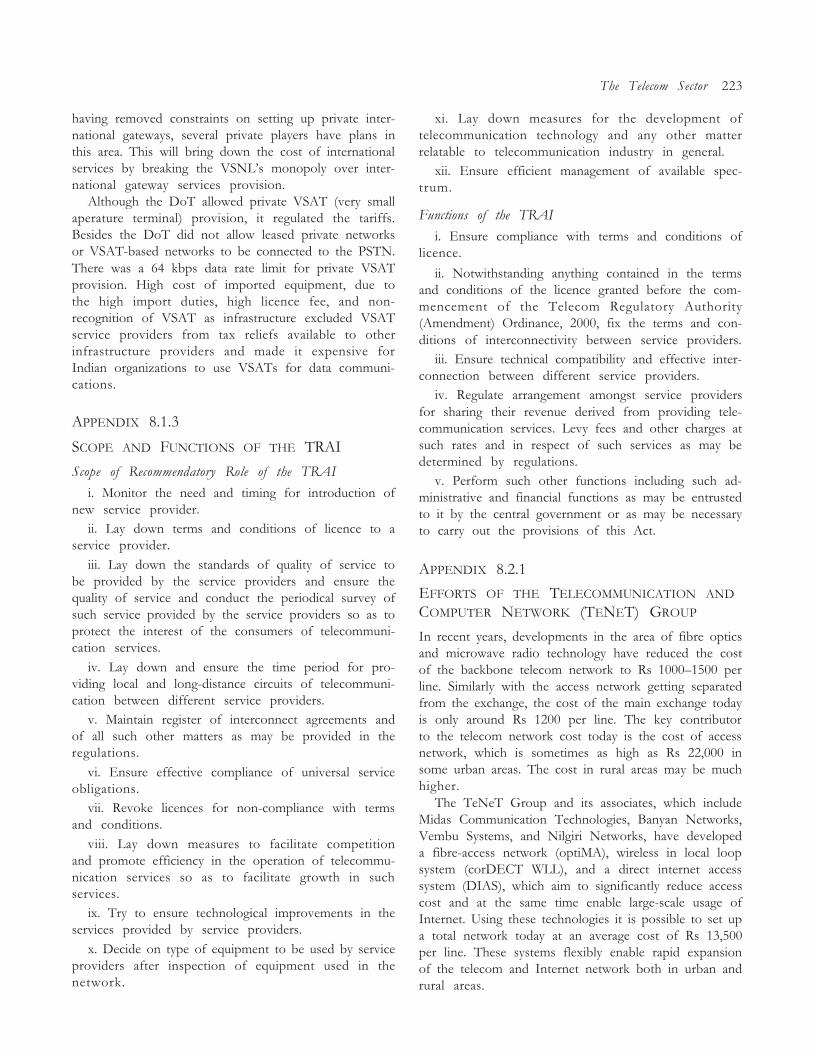
The Telecom Sector 223
having removed constraints on setting up private inter-national gateways, several private players have plans inthis area. This will bring down the cost of internationalservices by breaking the VSNL�s monopoly over inter-national gateway services provision.
Although the DoT allowed private VSAT (very smallaperature terminal) provision, it regulated the tariffs.Besides the DoT did not allow leased private networksor VSAT-based networks to be connected to the PSTN.There was a 64 kbps data rate limit for private VSATprovision. High cost of imported equipment, due tothe high import duties, high licence fee, and non-recognition of VSAT as infrastructure excluded VSATservice providers from tax reliefs available to otherinfrastructure providers and made it expensive forIndian organizations to use VSATs for data communi-cations.
APPENDIX 8.1.3
SCOPE AND FUNCTIONS OF THE TRAI
Scope of Recommendatory Role of the TRAI
i. Monitor the need and timing for introduction ofnew service provider.
ii. Lay down terms and conditions of licence to aservice provider.
iii. Lay down the standards of quality of service tobe provided by the service providers and ensure thequality of service and conduct the periodical survey ofsuch service provided by the service providers so as toprotect the interest of the consumers of telecommuni-cation services.
iv. Lay down and ensure the time period for pro-viding local and long-distance circuits of telecommuni-cation between different service providers.
v. Maintain register of interconnect agreements andof all such other matters as may be provided in theregulations.
vi. Ensure effective compliance of universal serviceobligations.
vii. Revoke licences for non-compliance with termsand conditions.
viii. Lay down measures to facilitate competitionand promote efficiency in the operation of telecommu-nication services so as to facilitate growth in suchservices.
ix. Try to ensure technological improvements in theservices provided by service providers.
x. Decide on type of equipment to be used by serviceproviders after inspection of equipment used in thenetwork.
xi. Lay down measures for the development oftelecommunication technology and any other matterrelatable to telecommunication industry in general.
xii. Ensure efficient management of available spec-trum.
Functions of the TRAI
i. Ensure compliance with terms and conditions oflicence.
ii. Notwithstanding anything contained in the termsand conditions of the licence granted before the com-mencement of the Telecom Regulatory Authority(Amendment) Ordinance, 2000, fix the terms and con-ditions of interconnectivity between service providers.
iii. Ensure technical compatibility and effective inter-connection between different service providers.
iv. Regulate arrangement amongst service providersfor sharing their revenue derived from providing tele-communication services. Levy fees and other charges atsuch rates and in respect of such services as may bedetermined by regulations.
v. Perform such other functions including such ad-ministrative and financial functions as may be entrustedto it by the central government or as may be necessaryto carry out the provisions of this Act.
APPENDIX 8.2.1
EFFORTS OF THE TELECOMMUNICATION AND
COMPUTER NETWORK (TENET) GROUP
In recent years, developments in the area of fibre opticsand microwave radio technology have reduced the costof the backbone telecom network to Rs 1000�1500 perline. Similarly with the access network getting separatedfrom the exchange, the cost of the main exchange todayis only around Rs 1200 per line. The key contributorto the telecom network cost today is the cost of accessnetwork, which is sometimes as high as Rs 22,000 insome urban areas. The cost in rural areas may be muchhigher.
The TeNeT Group and its associates, which includeMidas Communication Technologies, Banyan Networks,Vembu Systems, and Nilgiri Networks, have developeda fibre-access network (optiMA), wireless in local loopsystem (corDECT WLL), and a direct internet accesssystem (DIAS), which aim to significantly reduce accesscost and at the same time enable large-scale usage ofInternet. Using these technologies it is possible to set upa total network today at an average cost of Rs 13,500per line. These systems flexibly enable rapid expansionof the telecom and Internet network both in urban andrural areas.
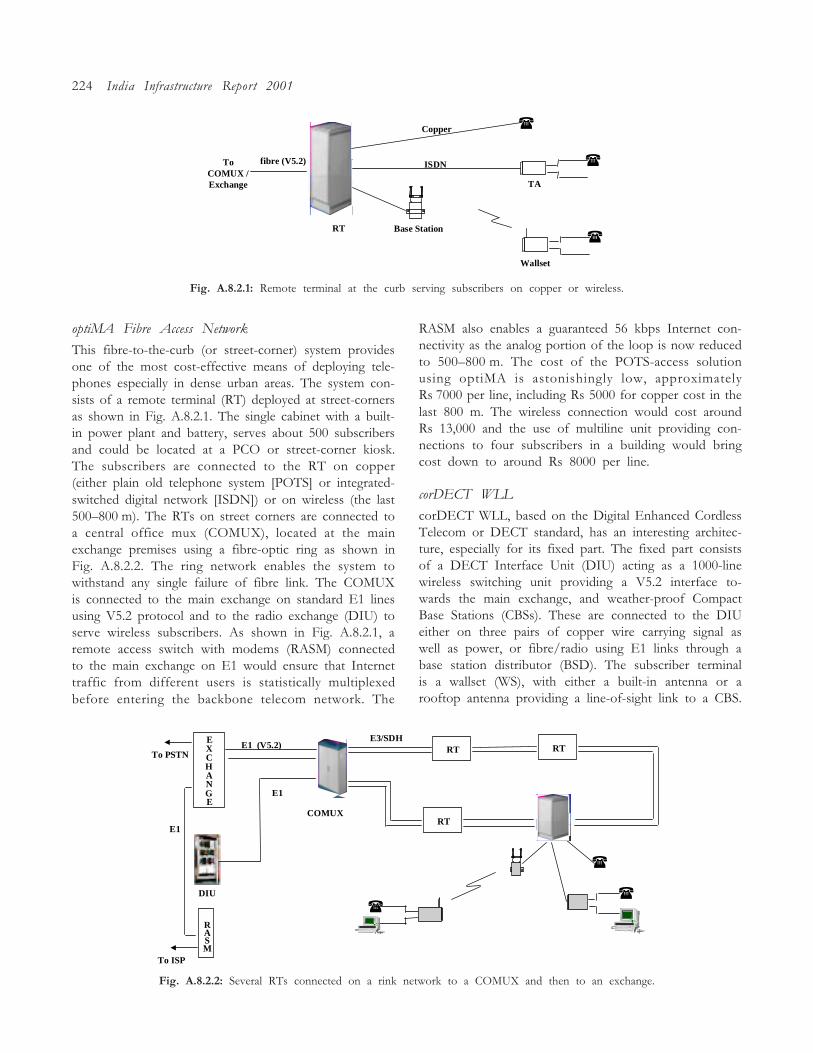
224 India Infrastructure Report 2001
Fig. A.8.2.1: Remote terminal at the curb serving subscribers on copper or wireless.
optiMA Fibre Access Network
This fibre-to-the-curb (or street-corner) system providesone of the most cost-effective means of deploying tele-phones especially in dense urban areas. The system con-sists of a remote terminal (RT) deployed at street-cornersas shown in Fig. A.8.2.1. The single cabinet with a built-in power plant and battery, serves about 500 subscribersand could be located at a PCO or street-corner kiosk.The subscribers are connected to the RT on copper(either plain old telephone system [POTS] or integrated-switched digital network [ISDN]) or on wireless (the last500�800 m). The RTs on street corners are connected toa central office mux (COMUX), located at the mainexchange premises using a fibre-optic ring as shown inFig. A.8.2.2. The ring network enables the system towithstand any single failure of fibre link. The COMUXis connected to the main exchange on standard E1 linesusing V5.2 protocol and to the radio exchange (DIU) toserve wireless subscribers. As shown in Fig. A.8.2.1, aremote access switch with modems (RASM) connectedto the main exchange on E1 would ensure that Internettraffic from different users is statistically multiplexedbefore entering the backbone telecom network. The
RASM also enables a guaranteed 56 kbps Internet con-nectivity as the analog portion of the loop is now reducedto 500�800 m. The cost of the POTS-access solutionusing optiMA is astonishingly low, approximatelyRs 7000 per line, including Rs 5000 for copper cost in thelast 800 m. The wireless connection would cost aroundRs 13,000 and the use of multiline unit providing con-nections to four subscribers in a building would bringcost down to around Rs 8000 per line.
corDECT WLL
corDECT WLL, based on the Digital Enhanced CordlessTelecom or DECT standard, has an interesting architec-ture, especially for its fixed part. The fixed part consistsof a DECT Interface Unit (DIU) acting as a 1000-linewireless switching unit providing a V5.2 interface to-wards the main exchange, and weather-proof CompactBase Stations (CBSs). These are connected to the DIUeither on three pairs of copper wire carrying signal aswell as power, or fibre/radio using E1 links through abase station distributor (BSD). The subscriber terminalis a wallset (WS), with either a built-in antenna or arooftop antenna providing a line-of-sight link to a CBS.
RT
COMUX
E3/SDH
RT
RT
(
(
EXCHANGE
E1 (V5.2)
DIU
RASM
(
E1
E1
To PSTN
To ISP
Fig. A.8.2.2: Several RTs connected on a rink network to a COMUX and then to an exchange.
Base Station
TA
(
(
ToCOMUX /Exchange
fibre (V5.2)
Copper
ISDN
(RT
Wallset
The Telecom Sector 225
Internet serviceprovider
E1
PSTNIP
Router
(
DIUiKon RAS
CBS WS
Fig. A.8.2.3: corDECT WLL.
The WS has an interface for a standard telephone (orfax machine, modem, or payphone) and an additionalRS232 interface for a computer, enabling Internet con-nection at 35 or 70 Kbps. No modem is required forInternet access, since all links between the WS and DIUare digital, as shown in Fig. A.8.2.3.
Efficient transmission of packet-switched Internetdata on a circuit-switched network is achieved by com-bining a remote access switch (RAS) with the corDECTsystem. The connection is digital all the way fromsubscriber to internet service provider (ISP). The Internetcall from a WS to a RAS does not enter the exchange atall, but terminates in the access network itself. Only theconcentrated IP traffic from the RAS to the ISP traversesthrough the exchange and PSTN (public switched tele-phone network).
All subsystems are built primarily using digital signalprocessors (DSPs), with the DIU having nearly 100DSPs. This soft solution, while cutting down develop-ment time and providing design flexibility, also ensuresthat the cost of the fixed part is no more than 15 percent of total per-line cost in a fully loaded corDECTsystem. This allows deployment flexibility for bothdense urban and sparse rural areas.
A new operator who wishes to initially deploylines in a mid-sized town or city in the very firstyear would use the deployment scenario using acluster of about 12�15 CBSs (each serving 50�70 sub-scribers at 0.1 Erlangs each), along with the backhaulmicrowave equipment, mounted on a 15 m rooftoptower to serve an area of 2�3 km. This deploymentuses no cables and can be made operational in two tothree months at a total deployed cost of Rs 15,000 persubscriber.
Later, the operator could increase the number oflines by using an optical fibre grid to connect BSDs tothe DIUs. A CBS cluster now serves 1000 subscriberswithin a 700 m to 1 km radius. Here, many subscriberinstallations may not need line-of-sight links to theCBS. Once again, the total deployed cost of the accesssolution is under Rs 15,000 per subscriber, including thecost of optical fibre cable and cable laying.
The corDECT system also offers an excellent deploy-ment opportunity for a small town and its surroundingrural areas at a similar cost. The mode of deploymentuses DIU at the tower base. To serve about 1000 sub-scribers, an operator needs a tower (about 35 m high)in the town centre. The microwave link connects theDIU to the nearest trunk exchange. The base stationsnow serve subscribers within a radius of 10 km usingwallsets with rooftop antennas providing line-of-sightlinks.
Deployment in sparse rural areas is possible usingthe corDECT relay base station (RBS). A two-hopDECT link is used to provide connection to thesubscriber as shown in Fig. A.8.2.4. One link is fromthe WS to the RBS, which is mounted on a towertypically 25 m in height. The other DECT link isfrom the RBS to CBS, which is also mounted on a talltower (say 40 m). Both the RBS and CBS use high-gaindirectional antennas, making a 25 km link possible. The5 km maximum link distance due to the guard-timelimitation of DECT is overcome by the use of autoranging and timing adjustment. This technique is usedin the RBS to support a 25 km link, and to enhancethe CBS range to 10 km. This provides subscriberdensity as low as 0.5 subscriber/km2 at a total cost ofRs 18,000 per line.
Direct Internet Access System
The direct internet access system (DIAS) allows serviceproviders to provide high bandwidth Internet accessto residential and corporate subscribers, in addition tovoice services, without any changes to the existing cablinginfrastructure. In contrast to current residential PSTNand ISDN dial-up access, the DIAS provides an alwayson Internet access that is permanently available at thecustomer�s premises. Using Digital Subscriber Looper(DSL) techniques, seamless voice and data connectivityis provided to the customer over the same pair of copperwires.
This system is implemented using the existing cableplant. All that is required is the installation of the IAN(integrated access node) at the exchange and a DSU
ISP
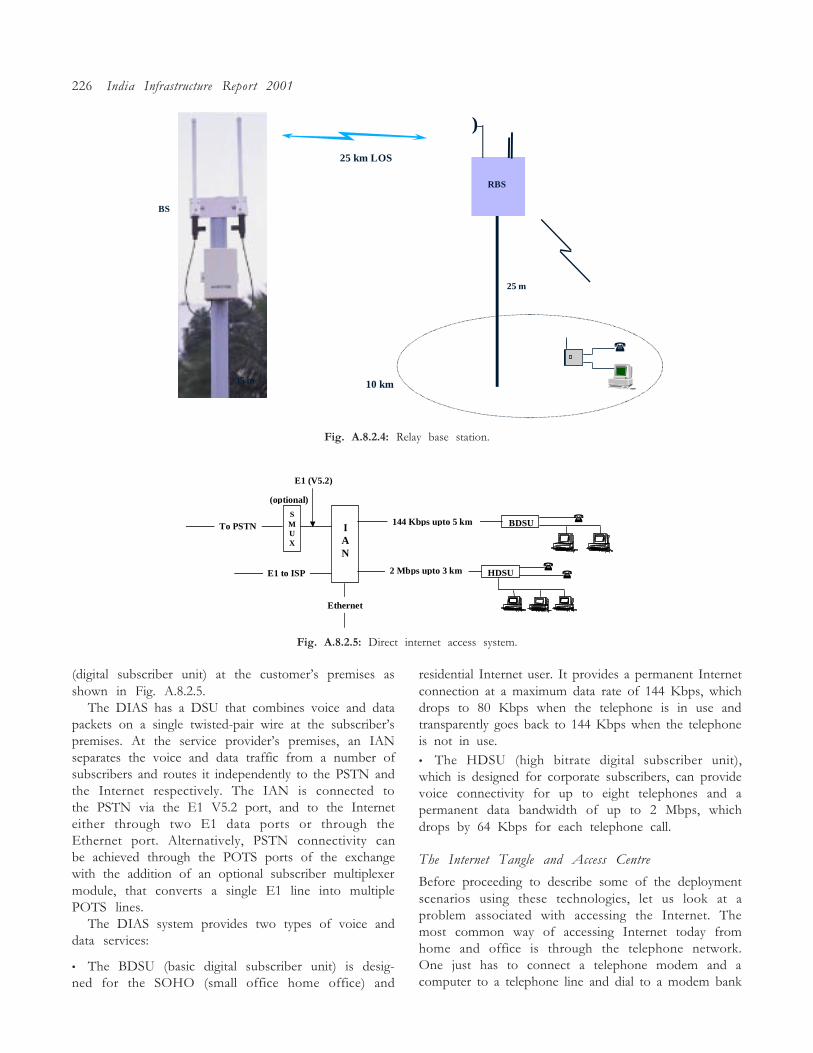
226 India Infrastructure Report 2001
(
)
35 m
BS
25 km LOS
25 m
RBS
10 km
Fig. A.8.2.4: Relay base station.
IAN
BDSU (
HDSU(
(
(optional)
E1 (V5.2)
2 Mbps upto 3 km
144 Kbps upto 5 kmSMUX
E1 to ISP
To PSTN
Ethernet
Fig. A.8.2.5: Direct internet access system.
(digital subscriber unit) at the customer�s premises asshown in Fig. A.8.2.5.
The DIAS has a DSU that combines voice and datapackets on a single twisted-pair wire at the subscriber�spremises. At the service provider�s premises, an IANseparates the voice and data traffic from a number ofsubscribers and routes it independently to the PSTN andthe Internet respectively. The IAN is connected tothe PSTN via the E1 V5.2 port, and to the Interneteither through two E1 data ports or through theEthernet port. Alternatively, PSTN connectivity canbe achieved through the POTS ports of the exchangewith the addition of an optional subscriber multiplexermodule, that converts a single E1 line into multiplePOTS lines.
The DIAS system provides two types of voice anddata services:
� The BDSU (basic digital subscriber unit) is desig-ned for the SOHO (small office home office) and
residential Internet user. It provides a permanent Internetconnection at a maximum data rate of 144 Kbps, whichdrops to 80 Kbps when the telephone is in use andtransparently goes back to 144 Kbps when the telephoneis not in use.� The HDSU (high bitrate digital subscriber unit),which is designed for corporate subscribers, can providevoice connectivity for up to eight telephones and apermanent data bandwidth of up to 2 Mbps, whichdrops by 64 Kbps for each telephone call.
The Internet Tangle and Access Centre
Before proceeding to describe some of the deploymentscenarios using these technologies, let us look at aproblem associated with accessing the Internet. Themost common way of accessing Internet today fromhome and office is through the telephone network.One just has to connect a telephone modem and acomputer to a telephone line and dial to a modem bank
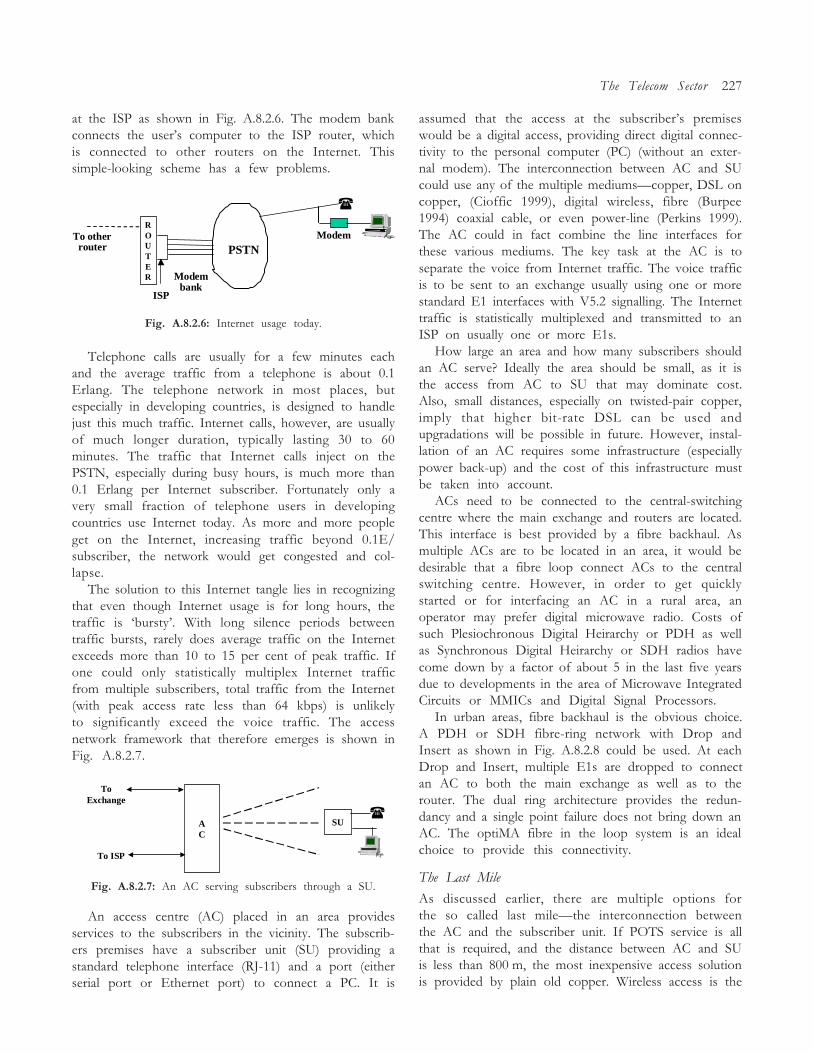
The Telecom Sector 227
assumed that the access at the subscriber�s premiseswould be a digital access, providing direct digital connec-tivity to the personal computer (PC) (without an exter-nal modem). The interconnection between AC and SUcould use any of the multiple mediums�copper, DSL oncopper, (Cioffic 1999), digital wireless, fibre (Burpee1994) coaxial cable, or even power-line (Perkins 1999).The AC could in fact combine the line interfaces forthese various mediums. The key task at the AC is toseparate the voice from Internet traffic. The voice trafficis to be sent to an exchange usually using one or morestandard E1 interfaces with V5.2 signalling. The Internettraffic is statistically multiplexed and transmitted to anISP on usually one or more E1s.
How large an area and how many subscribers shouldan AC serve? Ideally the area should be small, as it isthe access from AC to SU that may dominate cost.Also, small distances, especially on twisted-pair copper,imply that higher bit-rate DSL can be used andupgradations will be possible in future. However, instal-lation of an AC requires some infrastructure (especiallypower back-up) and the cost of this infrastructure mustbe taken into account.
ACs need to be connected to the central-switchingcentre where the main exchange and routers are located.This interface is best provided by a fibre backhaul. Asmultiple ACs are to be located in an area, it would bedesirable that a fibre loop connect ACs to the centralswitching centre. However, in order to get quicklystarted or for interfacing an AC in a rural area, anoperator may prefer digital microwave radio. Costs ofsuch Plesiochronous Digital Heirarchy or PDH as wellas Synchronous Digital Heirarchy or SDH radios havecome down by a factor of about 5 in the last five yearsdue to developments in the area of Microwave IntegratedCircuits or MMICs and Digital Signal Processors.
In urban areas, fibre backhaul is the obvious choice.A PDH or SDH fibre-ring network with Drop andInsert as shown in Fig. A.8.2.8 could be used. At eachDrop and Insert, multiple E1s are dropped to connectan AC to both the main exchange as well as to therouter. The dual ring architecture provides the redun-dancy and a single point failure does not bring down anAC. The optiMA fibre in the loop system is an idealchoice to provide this connectivity.
The Last Mile
As discussed earlier, there are multiple options forthe so called last mile�the interconnection betweenthe AC and the subscriber unit. If POTS service is allthat is required, and the distance between AC and SUis less than 800 m, the most inexpensive access solutionis provided by plain old copper. Wireless access is the
at the ISP as shown in Fig. A.8.2.6. The modem bankconnects the user�s computer to the ISP router, whichis connected to other routers on the Internet. Thissimple-looking scheme has a few problems.
Fig. A.8.2.6: Internet usage today.
PSTN
ROUTER
To otherrouter
Modembank
(
Modem
ISP
Telephone calls are usually for a few minutes eachand the average traffic from a telephone is about 0.1Erlang. The telephone network in most places, butespecially in developing countries, is designed to handlejust this much traffic. Internet calls, however, are usuallyof much longer duration, typically lasting 30 to 60minutes. The traffic that Internet calls inject on thePSTN, especially during busy hours, is much more than0.1 Erlang per Internet subscriber. Fortunately only avery small fraction of telephone users in developingcountries use Internet today. As more and more peopleget on the Internet, increasing traffic beyond 0.1E/subscriber, the network would get congested and col-lapse.
The solution to this Internet tangle lies in recognizingthat even though Internet usage is for long hours, thetraffic is �bursty�. With long silence periods betweentraffic bursts, rarely does average traffic on the Internetexceeds more than 10 to 15 per cent of peak traffic. Ifone could only statistically multiplex Internet trafficfrom multiple subscribers, total traffic from the Internet(with peak access rate less than 64 kbps) is unlikelyto significantly exceed the voice traffic. The accessnetwork framework that therefore emerges is shown inFig. A.8.2.7.
AC
SU(
ToExchange
To ISP
Fig. A.8.2.7: An AC serving subscribers through a SU.
An access centre (AC) placed in an area providesservices to the subscribers in the vicinity. The subscrib-ers premises have a subscriber unit (SU) providing astandard telephone interface (RJ-11) and a port (eitherserial port or Ethernet port) to connect a PC. It is
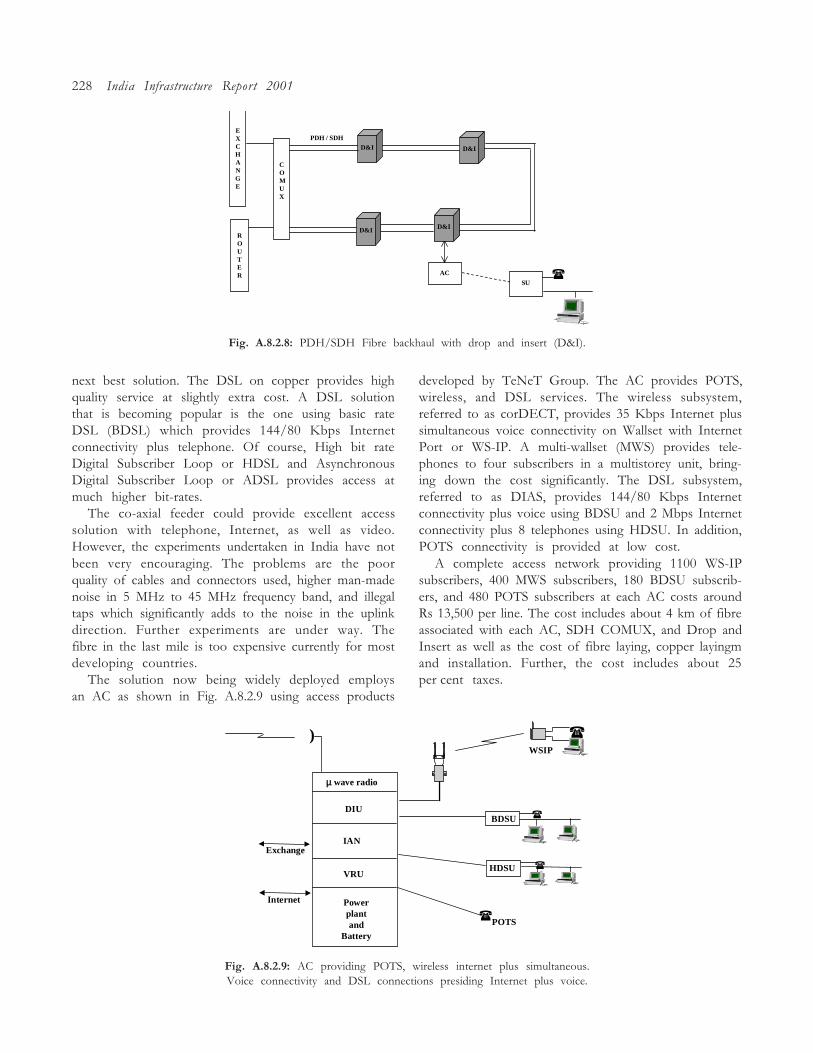
228 India Infrastructure Report 2001
ROUTER
EXCHANGE
COMUX
(SU
AC
PDH / SDHD&I
D&I
D&I
D&I
Fig. A.8.2.8: PDH/SDH Fibre backhaul with drop and insert (D&I).
next best solution. The DSL on copper provides highquality service at slightly extra cost. A DSL solutionthat is becoming popular is the one using basic rateDSL (BDSL) which provides 144/80 Kbps Internetconnectivity plus telephone. Of course, High bit rateDigital Subscriber Loop or HDSL and AsynchronousDigital Subscriber Loop or ADSL provides access atmuch higher bit-rates.
The co-axial feeder could provide excellent accesssolution with telephone, Internet, as well as video.However, the experiments undertaken in India have notbeen very encouraging. The problems are the poorquality of cables and connectors used, higher man-madenoise in 5 MHz to 45 MHz frequency band, and illegaltaps which significantly adds to the noise in the uplinkdirection. Further experiments are under way. Thefibre in the last mile is too expensive currently for mostdeveloping countries.
The solution now being widely deployed employsan AC as shown in Fig. A.8.2.9 using access products
developed by TeNeT Group. The AC provides POTS,wireless, and DSL services. The wireless subsystem,referred to as corDECT, provides 35 Kbps Internet plussimultaneous voice connectivity on Wallset with InternetPort or WS-IP. A multi-wallset (MWS) provides tele-phones to four subscribers in a multistorey unit, bring-ing down the cost significantly. The DSL subsystem,referred to as DIAS, provides 144/80 Kbps Internetconnectivity plus voice using BDSU and 2 Mbps Internetconnectivity plus 8 telephones using HDSU. In addition,POTS connectivity is provided at low cost.
A complete access network providing 1100 WS-IPsubscribers, 400 MWS subscribers, 180 BDSU subscrib-ers, and 480 POTS subscribers at each AC costs aroundRs 13,500 per line. The cost includes about 4 km of fibreassociated with each AC, SDH COMUX, and Drop andInsert as well as the cost of fibre laying, copper layingmand installation. Further, the cost includes about 25per cent taxes.
Fig. A.8.2.9: AC providing POTS, wireless internet plus simultaneous.Voice connectivity and DSL connections presiding Internet plus voice.
(
WSIP
Exchange
Internet
BDSU (
HDSU (
(POTS
µ wave radio
DIU
VRU
IAN
Powerplantand
Battery
)
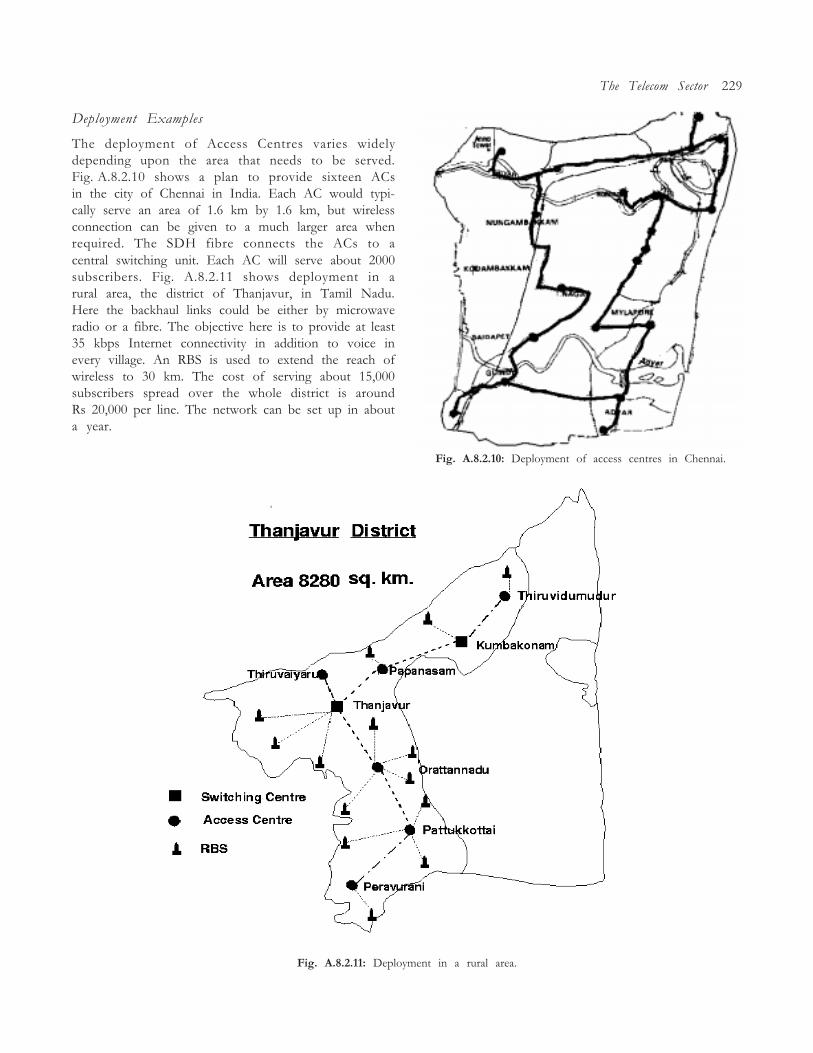
The Telecom Sector 229
Fig. A.8.2.11: Deployment in a rural area.
Deployment Examples
The deployment of Access Centres varies widelydepending upon the area that needs to be served.Fig. A.8.2.10 shows a plan to provide sixteen ACsin the city of Chennai in India. Each AC would typi-cally serve an area of 1.6 km by 1.6 km, but wirelessconnection can be given to a much larger area whenrequired. The SDH fibre connects the ACs to acentral switching unit. Each AC will serve about 2000subscribers. Fig. A.8.2.11 shows deployment in arural area, the district of Thanjavur, in Tamil Nadu.Here the backhaul links could be either by microwaveradio or a fibre. The objective here is to provide at least35 kbps Internet connectivity in addition to voice inevery village. An RBS is used to extend the reach ofwireless to 30 km. The cost of serving about 15,000subscribers spread over the whole district is aroundRs 20,000 per line. The network can be set up in abouta year.
Fig. A.8.2.10: Deployment of access centres in Chennai.

Appendix Table 1 in wide page 230

Appendix Table 1 contd. in wide page 231
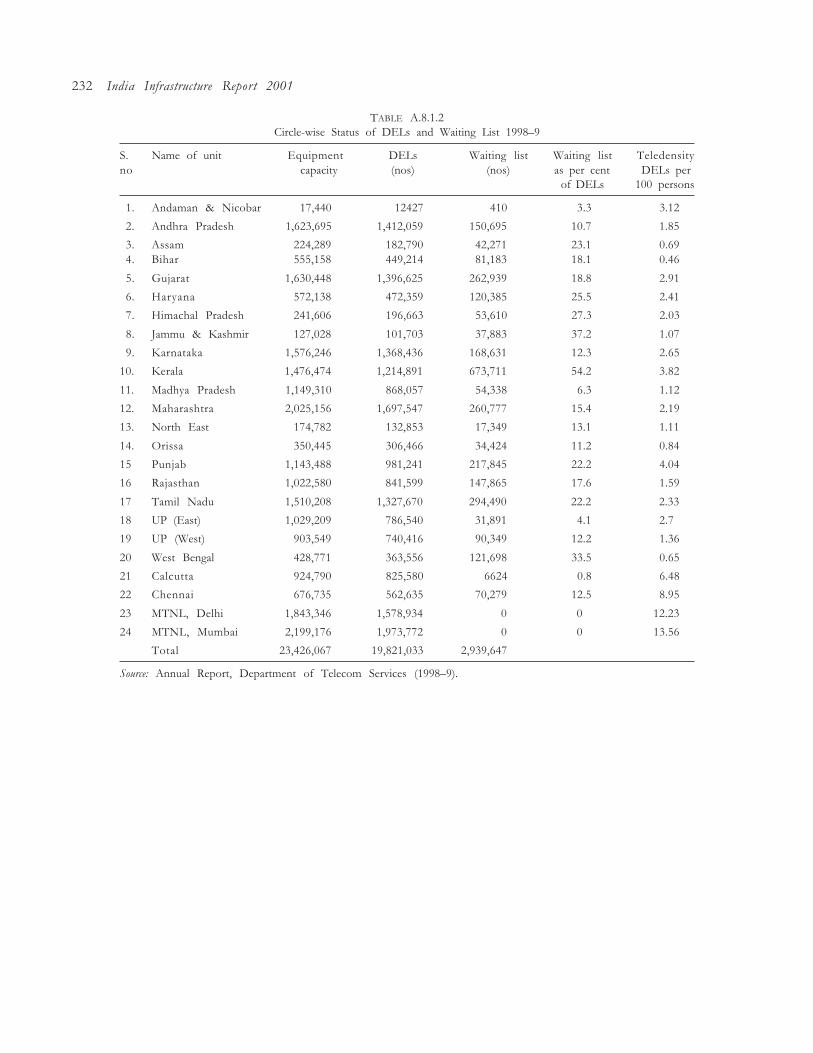
232 India Infrastructure Report 2001
TABLE A.8.1.2Circle-wise Status of DELs and Waiting List 1998�9
S. Name of unit Equipment DELs Waiting list Waiting list Teledensityno capacity (nos) (nos) as per cent DELs per
of DELs 100 persons
01. Andaman & Nicobar 17,440 12427 410 3.3 3.12
02. Andhra Pradesh 1,623,695 1,412,059 150,695 10.7 1.85
03. Assam 224,289 182,790 42,271 23.1 0.6904. Bihar 555,158 449,214 81,183 18.1 0.46
05. Gujarat 1,630,448 1,396,625 262,939 18.8 2.91
06. Haryana 572,138 472,359 120,385 25.5 2.41
07. Himachal Pradesh 241,606 196,663 53,610 27.3 2.03
08. Jammu & Kashmir 127,028 101,703 37,883 37.2 1.07
09. Karnataka 1,576,246 1,368,436 168,631 12.3 2.65
10. Kerala 1,476,474 1,214,891 673,711 54.2 3.82
11. Madhya Pradesh 1,149,310 868,057 54,338 6.3 1.12
12. Maharashtra 2,025,156 1,697,547 260,777 15.4 2.19
13. North East 174,782 132,853 17,349 13.1 1.11
14. Orissa 350,445 306,466 34,424 11.2 0.84
15 Punjab 1,143,488 981,241 217,845 22.2 4.04
16 Rajasthan 1,022,580 841,599 147,865 17.6 1.59
17 Tamil Nadu 1,510,208 1,327,670 294,490 22.2 2.33
18 UP (East) 1,029,209 786,540 31,891 4.1 2.7
19 UP (West) 903,549 740,416 90,349 12.2 1.36
20 West Bengal 428,771 363,556 121,698 33.5 0.65
21 Calcutta 924,790 825,580 6624 0.8 6.48
22 Chennai 676,735 562,635 70,279 12.5 8.95
23 MTNL, Delhi 1,843,346 1,578,934 0 0 12.23
24 MTNL, Mumbai 2,199,176 1,973,772 0 0 13.56
Total 23,426,067 19,821,033 2,939,647
Source: Annual Report, Department of Telecom Services (1998�9).

Appendix Table 3 contd. in wide page 233
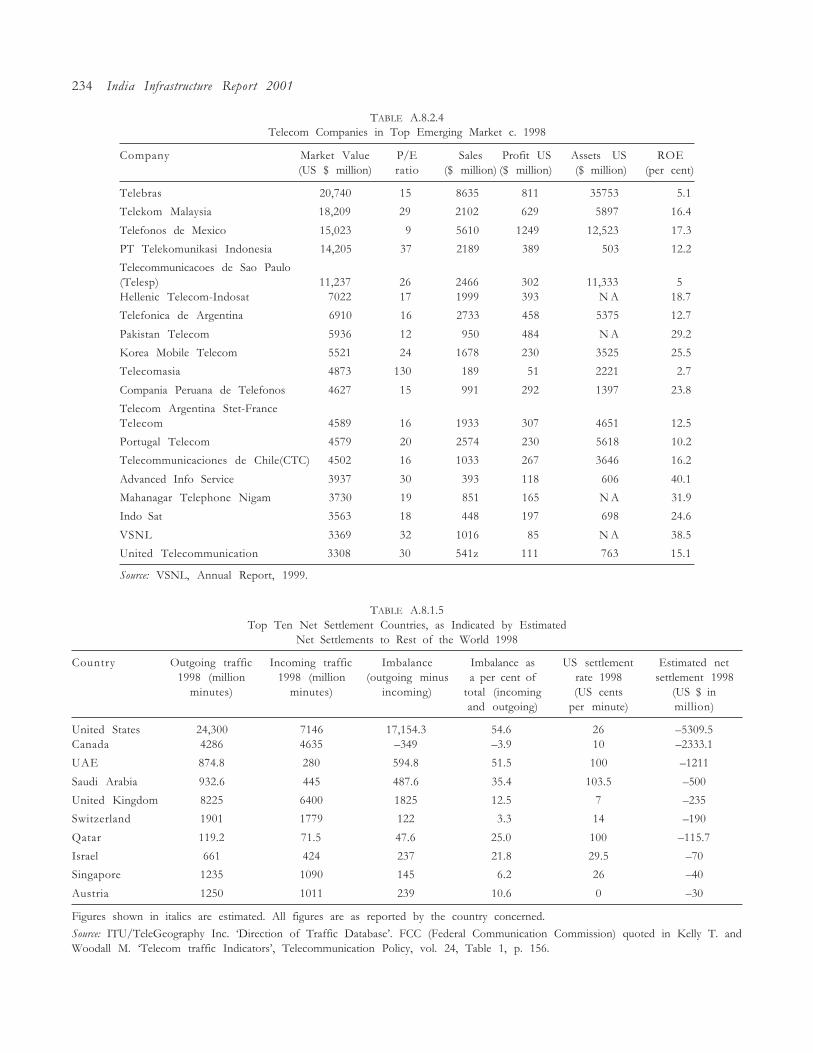
234 India Infrastructure Report 2001
TABLE A.8.2.4Telecom Companies in Top Emerging Market c. 1998
Company Market Value P/E Sales Profit US Assets US ROE(US $ million) ratio ($ million) ($ million) ($ million) (per cent)
Telebras 20,740 15 8635 811 35753 5.1
Telekom Malaysia 18,209 29 2102 629 5897 16.4
Telefonos de Mexico 15,023 9 5610 1249 12,523 17.3
PT Telekomunikasi Indonesia 14,205 37 2189 389 503 12.2
Telecommunicacoes de Sao Paulo(Telesp) 11,237 26 2466 302 11,333 5Hellenic Telecom-Indosat 7022 17 1999 393 N A 18.7
Telefonica de Argentina 6910 16 2733 458 5375 12.7
Pakistan Telecom 5936 12 950 484 N A 29.2
Korea Mobile Telecom 5521 24 1678 230 3525 25.5
Telecomasia 4873 130 189 51 2221 2.7
Compania Peruana de Telefonos 4627 15 991 292 1397 23.8
Telecom Argentina Stet-FranceTelecom 4589 16 1933 307 4651 12.5
Portugal Telecom 4579 20 2574 230 5618 10.2
Telecommunicaciones de Chile(CTC) 4502 16 1033 267 3646 16.2
Advanced Info Service 3937 30 393 118 606 40.1
Mahanagar Telephone Nigam 3730 19 851 165 N A 31.9
Indo Sat 3563 18 448 197 698 24.6
VSNL 3369 32 1016 85 N A 38.5
United Telecommunication 3308 30 541z 111 763 15.1
Source: VSNL, Annual Report, 1999.
TABLE A.8.1.5Top Ten Net Settlement Countries, as Indicated by Estimated
Net Settlements to Rest of the World 1998
Country Outgoing traffic Incoming traffic Imbalance Imbalance as US settlement Estimated net1998 (million 1998 (million (outgoing minus a per cent of rate 1998 settlement 1998
minutes) minutes) incoming) total (incoming (US cents (US $ inand outgoing) per minute) million)
United States 24,300 7146 17,154.3 54.6 26 �5309.5Canada 4286 4635 �349 �3.9 10 �2333.1
UAE 874.8 280 594.8 51.5 100 �1211
Saudi Arabia 932.6 445 487.6 35.4 103.5 �500
United Kingdom 8225 6400 1825 12.5 7 �235
Switzerland 1901 1779 122 3.3 14 �190
Qatar 119.2 71.5 47.6 25.0 100 �115.7
Israel 661 424 237 21.8 29.5 �70
Singapore 1235 1090 145 6.2 26 �40
Austria 1250 1011 239 10.6 0 �30
Figures shown in italics are estimated. All figures are as reported by the country concerned.
Source: ITU/TeleGeography Inc. �Direction of Traffic Database�. FCC (Federal Communication Commission) quoted in Kelly T. andWoodall M. �Telecom traffic Indicators�, Telecommunication Policy, vol. 24, Table 1, p. 156.
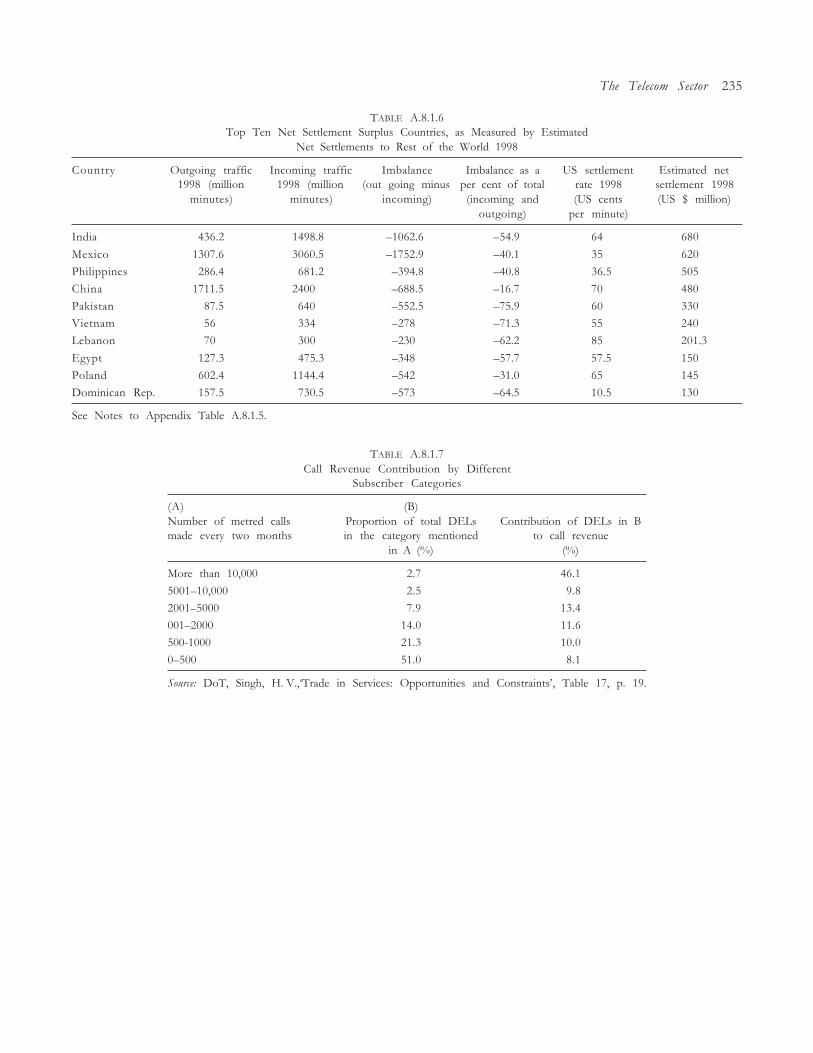
The Telecom Sector 235
TABLE A.8.1.6Top Ten Net Settlement Surplus Countries, as Measured by Estimated
Net Settlements to Rest of the World 1998
Country Outgoing traffic Incoming traffic Imbalance Imbalance as a US settlement Estimated net1998 (million 1998 (million (out going minus per cent of total rate 1998 settlement 1998
minutes) minutes) incoming) (incoming and (US cents (US $ million)outgoing) per minute)
India 436.2 1498.8 �1062.6 �54.9 64 680
Mexico 1307.6 3060.5 �1752.9 �40.1 35 620
Philippines 286.4 681.2 �394.8 �40.8 36.5 505
China 1711.5 2400 �688.5 �16.7 70 480
Pakistan 87.5 640 �552.5 �75.9 60 330
Vietnam 56 334 �278 �71.3 55 240
Lebanon 70 300 �230 �62.2 85 201.3
Egypt 127.3 475.3 �348 �57.7 57.5 150
Poland 602.4 1144.4 �542 �31.0 65 145
Dominican Rep. 157.5 730.5 �573 �64.5 10.5 130
See Notes to Appendix Table A.8.1.5.
TABLE A.8.1.7Call Revenue Contribution by Different
Subscriber Categories
(A) (B)Number of metred calls Proportion of total DELs Contribution of DELs in Bmade every two months in the category mentioned to call revenue
in A (%) (%)
More than 10,000 02.7 46.1
5001�10,000 02.5 09.8
2001�5000 07.9 13.4
001�2000 14.0 11.6
500-1000 21.3 10.0
0�500 51.0 08.1
Source: DoT, Singh, H. V.,�Trade in Services: Opportunities and Constraints�, Table 17, p. 19.
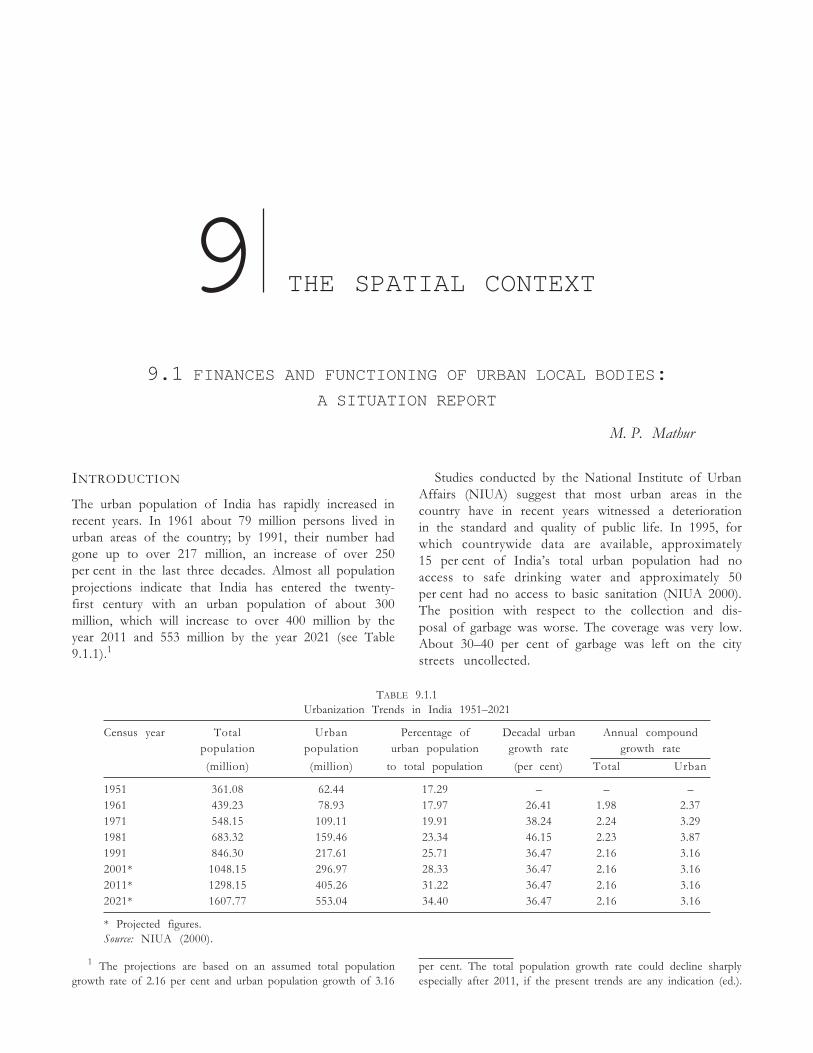
9 THE SPATIAL CONTEXT
Rakesh Basant
9.1 FINANCES AND FUNCTIONING OF URBAN LOCAL BODIES:A SITUATION REPORT
M. P. Mathur
INTRODUCTION
The urban population of India has rapidly increased inrecent years. In 1961 about 79 million persons lived inurban areas of the country; by 1991, their number hadgone up to over 217 million, an increase of over 250per cent in the last three decades. Almost all populationprojections indicate that India has entered the twenty-first century with an urban population of about 300million, which will increase to over 400 million by theyear 2011 and 553 million by the year 2021 (see Table9.1.1).1
Studies conducted by the National Institute of UrbanAffairs (NIUA) suggest that most urban areas in thecountry have in recent years witnessed a deteriorationin the standard and quality of public life. In 1995, forwhich countrywide data are available, approximately15 per cent of India�s total urban population had noaccess to safe drinking water and approximately 50per cent had no access to basic sanitation (NIUA 2000).The position with respect to the collection and dis-posal of garbage was worse. The coverage was very low.About 30�40 per cent of garbage was left on the citystreets uncollected.
1 The projections are based on an assumed total populationgrowth rate of 2.16 per cent and urban population growth of 3.16
per cent. The total population growth rate could decline sharplyespecially after 2011, if the present trends are any indication (ed.).
TABLE 9.1.1Urbanization Trends in India 1951�2021
Census year Total Urban Percentage of Decadal urban Annual compoundpopulation population urban population growth rate growth rate
(million) (million) to total population (per cent) Total Urban
1951 361.08 62.44 17.29 � � �1961 439.23 78.93 17.97 26.41 1.98 2.371971 548.15 109.11 19.91 38.24 2.24 3.291981 683.32 159.46 23.34 46.15 2.23 3.871991 846.30 217.61 25.71 36.47 2.16 3.162001* 1048.15 296.97 28.33 36.47 2.16 3.162011* 1298.15 405.26 31.22 36.47 2.16 3.162021* 1607.77 553.04 34.40 36.47 2.16 3.16
* Projected figures.Source: NIUA (2000).
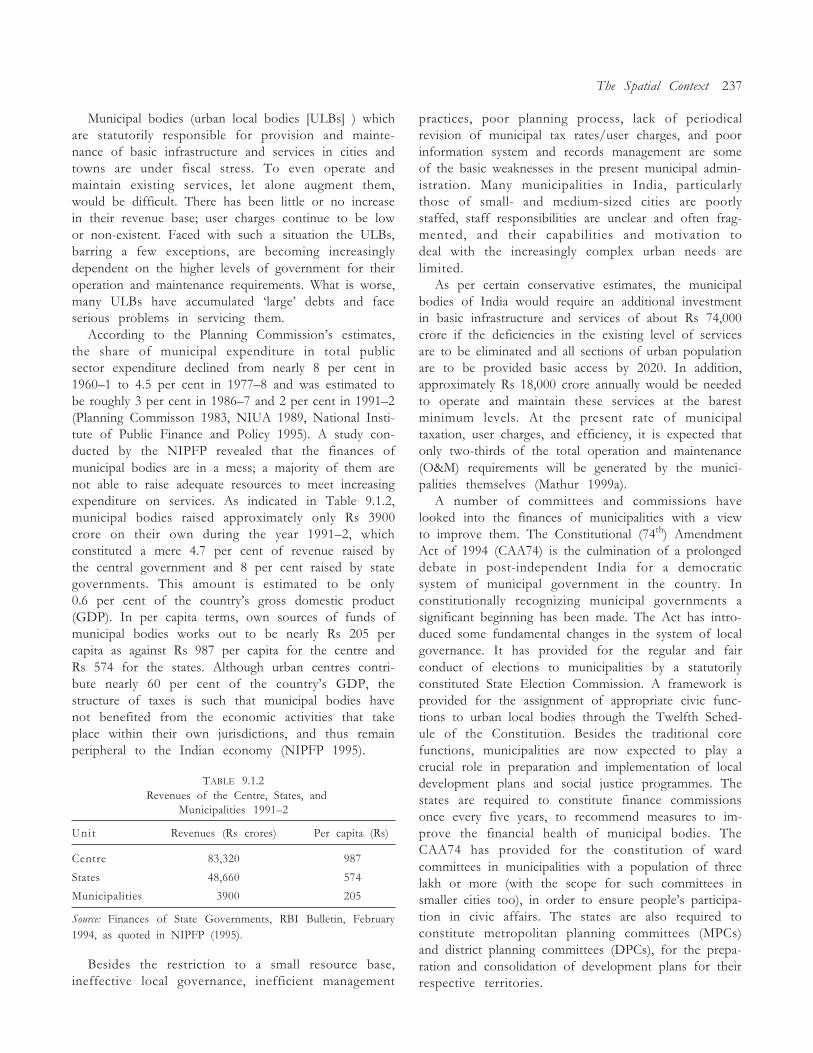
The Spatial Context 237
Municipal bodies (urban local bodies [ULBs] ) whichare statutorily responsible for provision and mainte-nance of basic infrastructure and services in cities andtowns are under fiscal stress. To even operate andmaintain existing services, let alone augment them,would be difficult. There has been little or no increasein their revenue base; user charges continue to be lowor non-existent. Faced with such a situation the ULBs,barring a few exceptions, are becoming increasinglydependent on the higher levels of government for theiroperation and maintenance requirements. What is worse,many ULBs have accumulated �large� debts and faceserious problems in servicing them.
According to the Planning Commission�s estimates,the share of municipal expenditure in total publicsector expenditure declined from nearly 8 per cent in1960�1 to 4.5 per cent in 1977�8 and was estimated tobe roughly 3 per cent in 1986�7 and 2 per cent in 1991�2(Planning Commisson 1983, NIUA 1989, National Insti-tute of Public Finance and Policy 1995). A study con-ducted by the NIPFP revealed that the finances ofmunicipal bodies are in a mess; a majority of them arenot able to raise adequate resources to meet increasingexpenditure on services. As indicated in Table 9.1.2,municipal bodies raised approximately only Rs 3900crore on their own during the year 1991�2, whichconstituted a mere 4.7 per cent of revenue raised bythe central government and 8 per cent raised by stategovernments. This amount is estimated to be only0.6 per cent of the country�s gross domestic product(GDP). In per capita terms, own sources of funds ofmunicipal bodies works out to be nearly Rs 205 percapita as against Rs 987 per capita for the centre andRs 574 for the states. Although urban centres contri-bute nearly 60 per cent of the country�s GDP, thestructure of taxes is such that municipal bodies havenot benefited from the economic activities that takeplace within their own jurisdictions, and thus remainperipheral to the Indian economy (NIPFP 1995).
TABLE 9.1.2 Revenues of the Centre, States, and
Municipalities 1991�2
Unit Revenues (Rs crores) Per capita (Rs)
Centre 83,320 987
States 48,660 574
Municipalities 3900 205
Source: Finances of State Governments, RBI Bulletin, February1994, as quoted in NIPFP (1995).
Besides the restriction to a small resource base,ineffective local governance, inefficient management
practices, poor planning process, lack of periodicalrevision of municipal tax rates/user charges, and poorinformation system and records management are someof the basic weaknesses in the present municipal admin-istration. Many municipalities in India, particularlythose of small- and medium-sized cities are poorlystaffed, staff responsibilities are unclear and often frag-mented, and their capabilities and motivation todeal with the increasingly complex urban needs arelimited.
As per certain conservative estimates, the municipalbodies of India would require an additional investmentin basic infrastructure and services of about Rs 74,000crore if the deficiencies in the existing level of servicesare to be eliminated and all sections of urban populationare to be provided basic access by 2020. In addition,approximately Rs 18,000 crore annually would be neededto operate and maintain these services at the barestminimum levels. At the present rate of municipaltaxation, user charges, and efficiency, it is expected thatonly two-thirds of the total operation and maintenance(O&M) requirements will be generated by the munici-palities themselves (Mathur 1999a).
A number of committees and commissions havelooked into the finances of municipalities with a viewto improve them. The Constitutional (74th) AmendmentAct of 1994 (CAA74) is the culmination of a prolongeddebate in post-independent India for a democraticsystem of municipal government in the country. Inconstitutionally recognizing municipal governments asignificant beginning has been made. The Act has intro-duced some fundamental changes in the system of localgovernance. It has provided for the regular and fairconduct of elections to municipalities by a statutorilyconstituted State Election Commission. A framework isprovided for the assignment of appropriate civic func-tions to urban local bodies through the Twelfth Sched-ule of the Constitution. Besides the traditional corefunctions, municipalities are now expected to play acrucial role in preparation and implementation of localdevelopment plans and social justice programmes. Thestates are required to constitute finance commissionsonce every five years, to recommend measures to im-prove the financial health of municipal bodies. TheCAA74 has provided for the constitution of wardcommittees in municipalities with a population of threelakh or more (with the scope for such committees insmaller cities too), in order to ensure people�s participa-tion in civic affairs. The states are also required toconstitute metropolitan planning committees (MPCs)and district planning committees (DPCs), for the prepa-ration and consolidation of development plans for theirrespective territories.
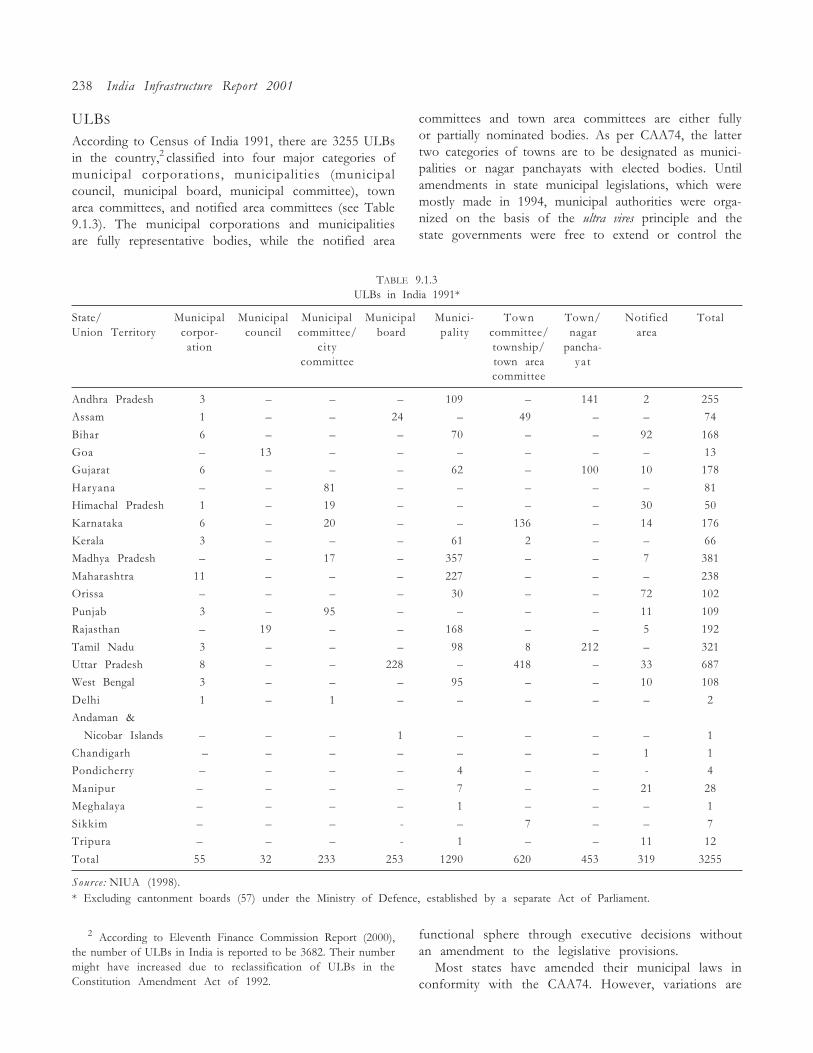
238 India Infrastructure Report 2001
committees and town area committees are either fullyor partially nominated bodies. As per CAA74, the lattertwo categories of towns are to be designated as munici-palities or nagar panchayats with elected bodies. Untilamendments in state municipal legislations, which weremostly made in 1994, municipal authorities were orga-nized on the basis of the ultra vires principle and thestate governments were free to extend or control the
ULBS
According to Census of India 1991, there are 3255 ULBsin the country,2 classified into four major categories ofmunicipal corporations, municipalities (municipalcouncil, municipal board, municipal committee), townarea committees, and notified area committees (see Table9.1.3). The municipal corporations and municipalitiesare fully representative bodies, while the notified area
2 According to Eleventh Finance Commission Report (2000),the number of ULBs in India is reported to be 3682. Their numbermight have increased due to reclassification of ULBs in theConstitution Amendment Act of 1992.
TABLE 9.1.3ULBs in India 1991*
State/ Municipal Municipal Municipal Municipal Munici- Town Town/ Notified TotalUnion Territory corpor- council committee/ board pality committee/ nagar area
ation city township/ pancha-committee town area ya t
committee
Andhra Pradesh 03 � � � 109 � 141 2 255
Assam 01 � � 24 � 49 � � 74
Bihar 06 � � � 70 � � 92 168
Goa 0� 13 � � � � � � 13
Gujarat 06 � � � 62 � 100 10 178
Haryana 0� � 81 � � � � � 81
Himachal Pradesh 01 � 19 � � � � 30 50
Karnataka 06 � 20 � � 136 � 14 176
Kerala 03 � � � 61 2 � � 66
Madhya Pradesh 0� � 17 � 357 � � 7 381
Maharashtra 11 � � � 227 � � � 238
Orissa 0� � � � 30 � � 72 102
Punjab 03 � 95 � � � � 11 109
Rajasthan 0� 19 � � 168 � � 5 192
Tamil Nadu 03 � � � 98 8 212 � 321
Uttar Pradesh 08 � � 228 � 418 � 33 687
West Bengal 03 � � � 95 � � 10 108
Delhi 01 � 1 � � � � � 2
Andaman &
Nicobar Islands 0� � � 1 � � � � 1
Chandigarh 00� � � � � � � 1 1
Pondicherry 0� � � � 4 � � - 4
Manipur � � � � 7 � � 21 28
Meghalaya � � � � 1 � � � 1
Sikkim � � � - � 7 � � 7
Tripura � � � - 1 � � 11 12
Total 55 32 233 253 1290 620 453 319 3255
Source: NIUA (1998).* Excluding cantonment boards (57) under the Ministry of Defence, established by a separate Act of Parliament.
functional sphere through executive decisions withoutan amendment to the legislative provisions.
Most states have amended their municipal laws inconformity with the CAA74. However, variations are
The Spatial Context 239
found in the definitions of small and large urban areas,as well as transitional areas.3
Among all urban local governments, municipal cor-porations are the most important as they have greaterdegree of fiscal autonomy, and most urban functions aretheir responsibility functions. Their local governmentshave larger populations, more diversified economic bases,and deal with the state governments directly and frompositions of much countervailing power. On the otherhand, municipalities have less autonomy, smaller juris-dictions, and have to deal with state governments throughthe Directorate of Municipalities or the collector of adistrict. These local bodies are subject to detailed �super-visory control and guidance� by state governments.
FUNCTIONAL DOMAIN OF ULBS
Municipal bodies are vested with a long list of functionsdelegated to them by the state governments under the
municipal legislation.4 These functions broadly relateto public health, welfare, regulatory functions, publicsafety, public works, and development activities. Publichealth includes water supply, sewerage and sanitation,eradication of communicable diseases, etc.; welfare in-cludes public facilities such as education and recreation;regulatory functions relate to prescribing and enforcingbuilding bye-laws, encroachments on public land, regis-tration of births and deaths, etc.; public safety includesfire protection, street lighting, etc.; public works in-cludes measures such as construction and maintenanceof inner city roads; and development functions relatedto town planning and development of commercialmarkets. In addition to the legally assigned functions,the sectoral departments of state governments oftenassign to municipalities unilaterally, and on agency basis,various functions such as family planning, nutrition,slum improvement, and disease and epidemic control.
The Twelfth Schedule of the Constitution (Article243 W) provides an illustrative list of eighteen functionsthat may be entrusted to the municipalities. Besides thetraditional core functions of municipalities, it also in-cludes development functions like planning for eco-nomic development and social justice, urban povertyalleviation programmes, and promotion of cultural,educational, and aesthetic aspects. However, conformitylegislations enacted by state governments indicatewide variations in this regard.5 There is a lot of differencein the assignment of obligatory and discretionary func-tions to the municipal bodies among states. Whereasfunctions like planning for the social and economicdevelopment, urban forestry and protection of theenvironment, and promotion of ecological aspects areobligatory functions for the municipalities ofMaharashtra, in Karnataka these are discretionary func-tions (NIPFP 2000).
However, none of the state governments has paidserious attention to the requisite change in the institu-tional arrangements for urban infrastructure and therole of municipal governments vis-à-vis those of paras-tatal agencies. Municipal governments in many statesare assisted by parastatal agencies, operating either atstate or city level to carry out various functions includ-ing water supply and sanitation. Parastatal agencies
3 States like Tamil Nadu have used the income criterion, othersonly population, and still others additional criterion such asdensity and percentage of non-agricultural employment to defineand identify urban areas. The amended Municipal Act of AndhraPradesh provides for all three types of municipal bodies, viz. nagarpanchayats, municipalities, and municipal corporations. In addi-tion to the population criterion, the Andhra Act uses density ofpopulation, percentage of employment in non-agricultural activi-ties, revenue of local body, and economic importance of a city ortown for constituting different types of urban local governments.The Andhra Act has further stated that all the district headquar-ters should be classified as not lower than first grade municipalitieswhile the nagar panchayats should be treated as equivalent to thirdgrade municipalities irrespective of annual income or such otherindicators. It may be mentioned that the earlier classification ofmunicipalities in Andhra was largely based upon the incomecriterion and is still being continued in the state. The amendedState Municipal Law also provides for a township committee forspecific industrial areas.
Amended municipal laws of Maharashtra have provided clas-sification of municipalities both on the basis of population as wellas percentage of employment in non-agricultural activities. Ac-cording to the Act, municipal corporations are to be constitutedin the larger urban areas, only if they have a population of notless than 3 lakh. In case of municipal councils, a minimum of25,000 population and 35 per cent employment in non-agriculturalactivities is necessary. For nagar panchayats, the Maharashtra ActNo. XLI of 1994 has provided that no area shall be specified as a�transitional area� unless it has a population of not less than 10,000and not more than 25,000, is not more than 25 km away fromthe territorial limits of any municipal corporation or �A� classmunicipal council, and the percentage of employment in non-agricultural activities is not less than 25 per cent. Besides the abovetypes of urban local governments, the Maharashtra Act alsocontains provisions for empowering the state government tonotify an industrial area developed by the Maharashtra IndustrialDevelopment Corporation or the area of a cooperative industrialestate as an �industrial township� (Mathur 1999b).
4 See section 9.4 of this report.5 Whereas Bihar, Gujarat, Himachal Pradesh, Haryana,
Manipur, Punjab, and Rajasthan have included all the functionsas enlisted in the Twelfth Schedule in their amended statemunicipal laws, Andhra Pradesh has not made any changes in theexisting list of municipal functions. Karnataka, Kerala, MadhyaPradesh, Maharashtra, Orissa, Tamil Nadu, Uttar Pradesh, andWest Bengal have amended their municipal laws to add some ofthese additional functions.
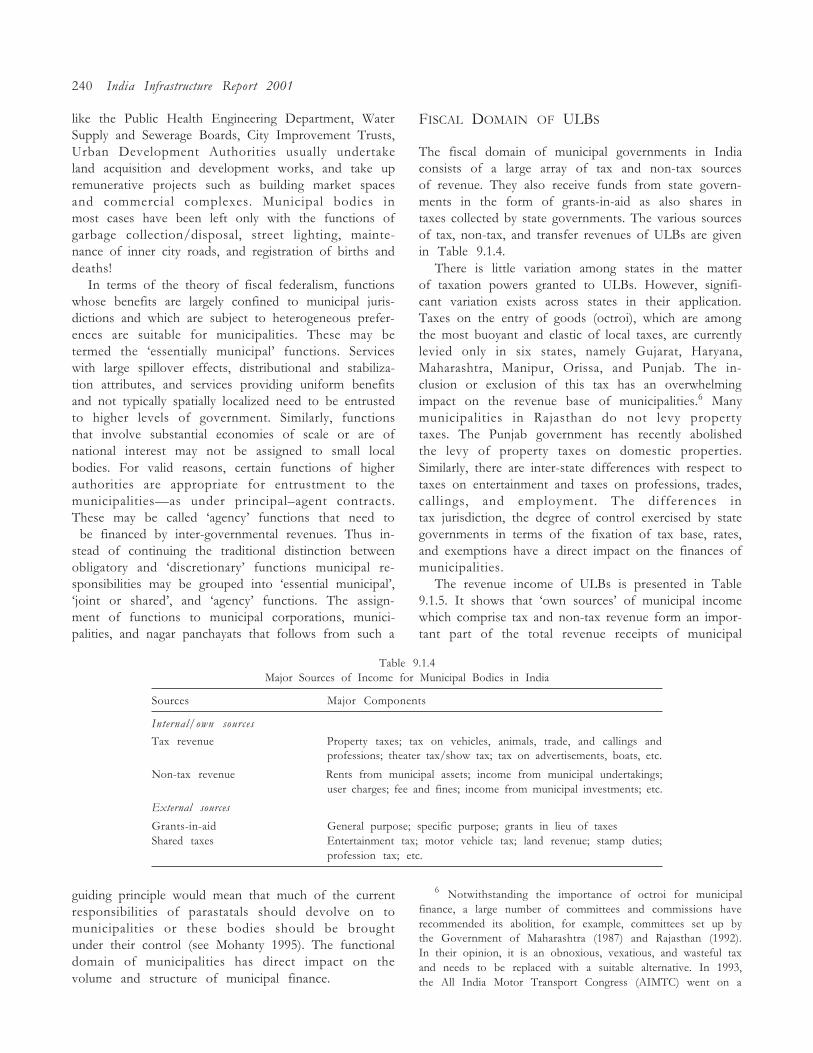
240 India Infrastructure Report 2001
like the Public Health Engineering Department, WaterSupply and Sewerage Boards, City Improvement Trusts,Urban Development Authorities usually undertakeland acquisition and development works, and take upremunerative projects such as building market spacesand commercial complexes. Municipal bodies inmost cases have been left only with the functions ofgarbage collection/disposal, street lighting, mainte-nance of inner city roads, and registration of births anddeaths!
In terms of the theory of fiscal federalism, functionswhose benefits are largely confined to municipal juris-dictions and which are subject to heterogeneous prefer-ences are suitable for municipalities. These may betermed the �essentially municipal� functions. Serviceswith large spillover effects, distributional and stabiliza-tion attributes, and services providing uniform benefitsand not typically spatially localized need to be entrustedto higher levels of government. Similarly, functionsthat involve substantial economies of scale or are ofnational interest may not be assigned to small localbodies. For valid reasons, certain functions of higherauthorities are appropriate for entrustment to themunicipalities�as under principal�agent contracts.These may be called �agency� functions that need to be financed by inter-governmental revenues. Thus in-stead of continuing the traditional distinction betweenobligatory and �discretionary� functions municipal re-sponsibilities may be grouped into �essential municipal�,�joint or shared�, and �agency� functions. The assign-ment of functions to municipal corporations, munici-palities, and nagar panchayats that follows from such a
FISCAL DOMAIN OF ULBS
The fiscal domain of municipal governments in Indiaconsists of a large array of tax and non-tax sourcesof revenue. They also receive funds from state govern-ments in the form of grants-in-aid as also shares intaxes collected by state governments. The various sourcesof tax, non-tax, and transfer revenues of ULBs are givenin Table 9.1.4.
There is little variation among states in the matterof taxation powers granted to ULBs. However, signifi-cant variation exists across states in their application.Taxes on the entry of goods (octroi), which are amongthe most buoyant and elastic of local taxes, are currentlylevied only in six states, namely Gujarat, Haryana,Maharashtra, Manipur, Orissa, and Punjab. The in-clusion or exclusion of this tax has an overwhelmingimpact on the revenue base of municipalities.6 Manymunicipalities in Rajasthan do not levy propertytaxes. The Punjab government has recently abolishedthe levy of property taxes on domestic properties.Similarly, there are inter-state differences with respect totaxes on entertainment and taxes on professions, trades,callings, and employment. The differences intax jurisdiction, the degree of control exercised by stategovernments in terms of the fixation of tax base, rates,and exemptions have a direct impact on the finances ofmunicipalities.
The revenue income of ULBs is presented in Table9.1.5. It shows that �own sources� of municipal incomewhich comprise tax and non-tax revenue form an impor-tant part of the total revenue receipts of municipal
Table 9.1.4Major Sources of Income for Municipal Bodies in India
Sources Major Components
Internal/own sources
Tax revenue Property taxes; tax on vehicles, animals, trade, and callings andprofessions; theater tax/show tax; tax on advertisements, boats, etc.
Non-tax revenue Rents from municipal assets; income from municipal undertakings;user charges; fee and fines; income from municipal investments; etc.
External sources
Grants-in-aid General purpose; specific purpose; grants in lieu of taxesShared taxes Entertainment tax; motor vehicle tax; land revenue; stamp duties;
profession tax; etc.
guiding principle would mean that much of the currentresponsibilities of parastatals should devolve on tomunicipalities or these bodies should be broughtunder their control (see Mohanty 1995). The functionaldomain of municipalities has direct impact on thevolume and structure of municipal finance.
6 Notwithstanding the importance of octroi for municipalfinance, a large number of committees and commissions haverecommended its abolition, for example, committees set up bythe Government of Maharashtra (1987) and Rajasthan (1992).In their opinion, it is an obnoxious, vexatious, and wasteful taxand needs to be replaced with a suitable alternative. In 1993,the All India Motor Transport Congress (AIMTC) went on a
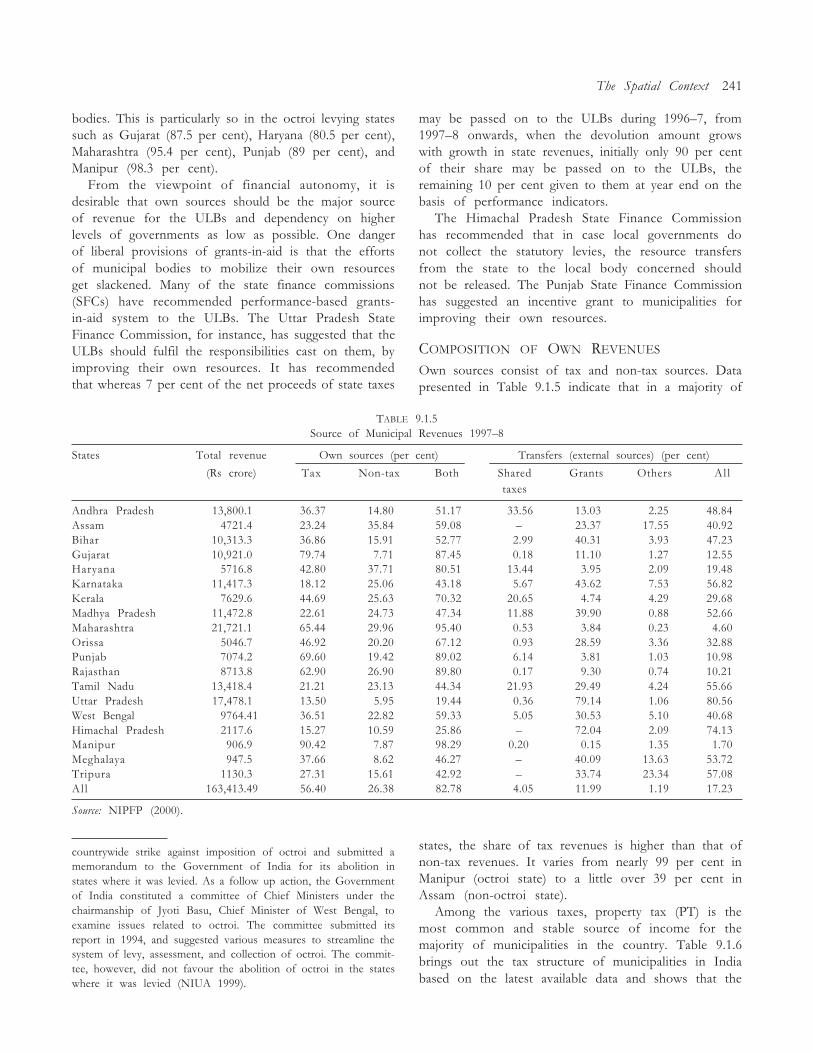
The Spatial Context 241
bodies. This is particularly so in the octroi levying statessuch as Gujarat (87.5 per cent), Haryana (80.5 per cent),Maharashtra (95.4 per cent), Punjab (89 per cent), andManipur (98.3 per cent).
From the viewpoint of financial autonomy, it isdesirable that own sources should be the major sourceof revenue for the ULBs and dependency on higherlevels of governments as low as possible. One dangerof liberal provisions of grants-in-aid is that the effortsof municipal bodies to mobilize their own resourcesget slackened. Many of the state finance commissions(SFCs) have recommended performance-based grants-in-aid system to the ULBs. The Uttar Pradesh StateFinance Commission, for instance, has suggested that theULBs should fulfil the responsibilities cast on them, byimproving their own resources. It has recommendedthat whereas 7 per cent of the net proceeds of state taxes
may be passed on to the ULBs during 1996�7, from1997�8 onwards, when the devolution amount growswith growth in state revenues, initially only 90 per centof their share may be passed on to the ULBs, theremaining 10 per cent given to them at year end on thebasis of performance indicators.
The Himachal Pradesh State Finance Commissionhas recommended that in case local governments donot collect the statutory levies, the resource transfersfrom the state to the local body concerned shouldnot be released. The Punjab State Finance Commissionhas suggested an incentive grant to municipalities forimproving their own resources.
COMPOSITION OF OWN REVENUES
Own sources consist of tax and non-tax sources. Datapresented in Table 9.1.5 indicate that in a majority of
countrywide strike against imposition of octroi and submitted amemorandum to the Government of India for its abolition instates where it was levied. As a follow up action, the Governmentof India constituted a committee of Chief Ministers under thechairmanship of Jyoti Basu, Chief Minister of West Bengal, toexamine issues related to octroi. The committee submitted itsreport in 1994, and suggested various measures to streamline thesystem of levy, assessment, and collection of octroi. The commit-tee, however, did not favour the abolition of octroi in the stateswhere it was levied (NIUA 1999).
states, the share of tax revenues is higher than that ofnon-tax revenues. It varies from nearly 99 per cent inManipur (octroi state) to a little over 39 per cent inAssam (non-octroi state).
Among the various taxes, property tax (PT) is themost common and stable source of income for themajority of municipalities in the country. Table 9.1.6brings out the tax structure of municipalities in Indiabased on the latest available data and shows that the
TABLE 9.1.5Source of Municipal Revenues 1997�8
States Total revenue Own sources (per cent) Transfers (external sources) (per cent)
(Rs crore) Tax Non-tax Both Shared Grants Others Al ltaxes
Andhra Pradesh 13,800.1 36.37 14.80 51.17 33.56 13.03 2.25 48.84Assam 4721.4 23.24 35.84 59.08 � 23.37 17.55 40.92Bihar 10,313.3 36.86 15.91 52.77 2.99 40.31 3.93 47.23Gujarat 10,921.0 79.74 7.71 87.45 0.18 11.10 1.27 12.55Haryana 5716.8 42.80 37.71 80.51 13.44 3.95 2.09 19.48Karnataka 11,417.3 18.12 25.06 43.18 5.67 43.62 7.53 56.82Kerala 7629.6 44.69 25.63 70.32 20.65 4.74 4.29 29.68Madhya Pradesh 11,472.8 22.61 24.73 47.34 11.88 39.90 0.88 52.66Maharashtra 21,721.1 65.44 29.96 95.40 0.53 3.84 0.23 4.60Orissa 5046.7 46.92 20.20 67.12 0.93 28.59 3.36 32.88Punjab 7074.2 69.60 19.42 89.02 6.14 3.81 1.03 10.98Rajasthan 8713.8 62.90 26.90 89.80 0.17 9.30 0.74 10.21Tamil Nadu 13,418.4 21.21 23.13 44.34 21.93 29.49 4.24 55.66Uttar Pradesh 17,478.1 13.50 5.95 19.44 0.36 79.14 1.06 80.56West Bengal 9764.41 36.51 22.82 59.33 5.05 30.53 5.10 40.68Himachal Pradesh 2117.6 15.27 10.59 25.86 � 72.04 2.09 74.13Manipur 906.9 90.42 7.87 98.29 0.20 0.15 1.35 1.70Meghalaya 947.5 37.66 8.62 46.27 � 40.09 13.63 53.72Tripura 1130.3 27.31 15.61 42.92 � 33.74 23.34 57.08Al l 163,413.49 56.40 26.38 82.78 4.05 11.99 1.19 17.23
Source: NIPFP (2000).
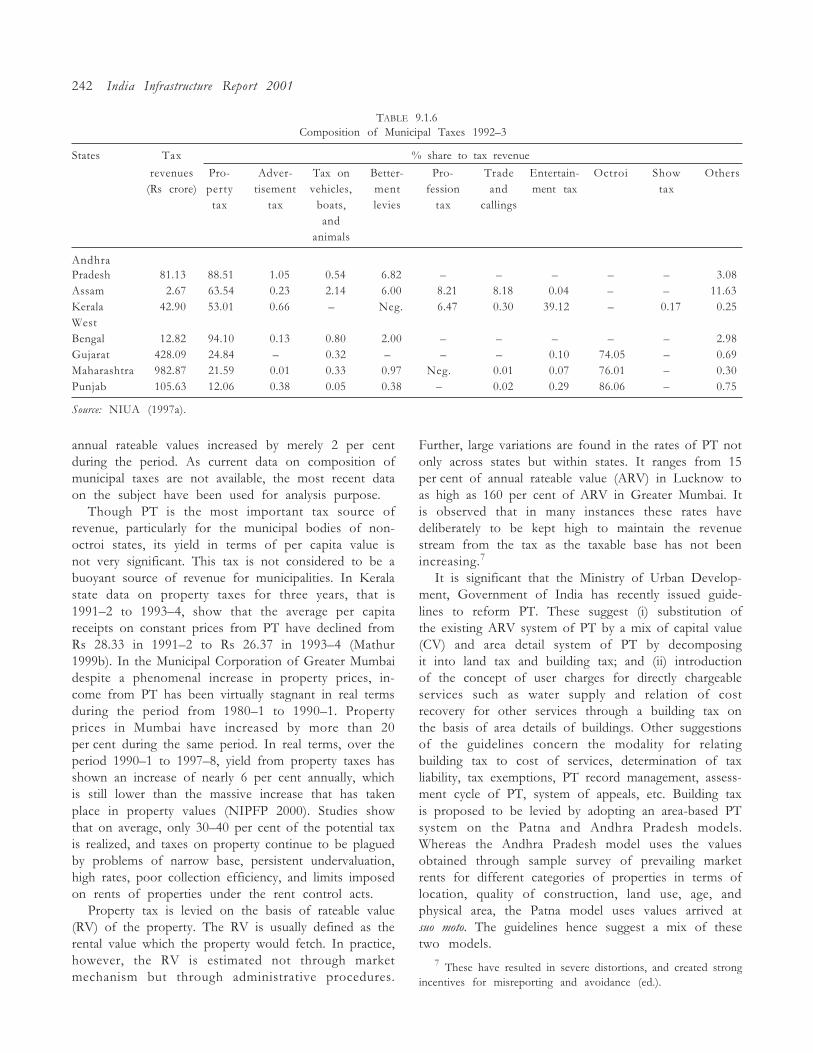
242 India Infrastructure Report 2001
TABLE 9.1.6Composition of Municipal Taxes 1992�3
States Tax % share to tax revenue
revenues Pro- Adver- Tax on Better- Pro- Trade Entertain- Octroi Show Others(Rs crore) perty tisement vehicles, ment fession and ment tax tax
tax tax boats, levies tax callingsand
animals
AndhraPradesh 81.13 88.51 1.05 0.54 6.82 � � � � � 3.08Assam 2.67 63.54 0.23 2.14 6.00 8.21 8.18 0.04 � � 11.63Kerala 42.90 53.01 0.66 � Neg. 6.47 0.30 39.12 � 0.17 0.25WestBengal 12.82 94.10 0.13 0.80 2.00 � � � � � 2.98Gujarat 428.09 24.84 � 0.32 � � � 0.10 74.05 � 0.69Maharashtra 982.87 21.59 0.01 0.33 0.97 Neg. 0.01 0.07 76.01 � 0.30Punjab 105.63 12.06 0.38 0.05 0.38 � 0.02 0.29 86.06 � 0.75
Source: NIUA (1997a).
7 These have resulted in severe distortions, and created strongincentives for misreporting and avoidance (ed.).
annual rateable values increased by merely 2 per centduring the period. As current data on composition ofmunicipal taxes are not available, the most recent dataon the subject have been used for analysis purpose.
Though PT is the most important tax source ofrevenue, particularly for the municipal bodies of non-octroi states, its yield in terms of per capita value isnot very significant. This tax is not considered to be abuoyant source of revenue for municipalities. In Keralastate data on property taxes for three years, that is1991�2 to 1993�4, show that the average per capitareceipts on constant prices from PT have declined fromRs 28.33 in 1991�2 to Rs 26.37 in 1993�4 (Mathur1999b). In the Municipal Corporation of Greater Mumbaidespite a phenomenal increase in property prices, in-come from PT has been virtually stagnant in real termsduring the period from 1980�1 to 1990�1. Propertyprices in Mumbai have increased by more than 20per cent during the same period. In real terms, over theperiod 1990�1 to 1997�8, yield from property taxes hasshown an increase of nearly 6 per cent annually, whichis still lower than the massive increase that has takenplace in property values (NIPFP 2000). Studies showthat on average, only 30�40 per cent of the potential taxis realized, and taxes on property continue to be plaguedby problems of narrow base, persistent undervaluation,high rates, poor collection efficiency, and limits imposedon rents of properties under the rent control acts.
Property tax is levied on the basis of rateable value(RV) of the property. The RV is usually defined as therental value which the property would fetch. In practice,however, the RV is estimated not through marketmechanism but through administrative procedures.
Further, large variations are found in the rates of PT notonly across states but within states. It ranges from 15per cent of annual rateable value (ARV) in Lucknow toas high as 160 per cent of ARV in Greater Mumbai. Itis observed that in many instances these rates havedeliberately to be kept high to maintain the revenuestream from the tax as the taxable base has not beenincreasing.7
It is significant that the Ministry of Urban Develop-ment, Government of India has recently issued guide-lines to reform PT. These suggest (i) substitution ofthe existing ARV system of PT by a mix of capital value(CV) and area detail system of PT by decomposingit into land tax and building tax; and (ii) introductionof the concept of user charges for directly chargeableservices such as water supply and relation of costrecovery for other services through a building tax onthe basis of area details of buildings. Other suggestionsof the guidelines concern the modality for relatingbuilding tax to cost of services, determination of taxliability, tax exemptions, PT record management, assess-ment cycle of PT, system of appeals, etc. Building taxis proposed to be levied by adopting an area-based PTsystem on the Patna and Andhra Pradesh models.Whereas the Andhra Pradesh model uses the valuesobtained through sample survey of prevailing marketrents for different categories of properties in terms oflocation, quality of construction, land use, age, andphysical area, the Patna model uses values arrived atsuo moto. The guidelines hence suggest a mix of thesetwo models.
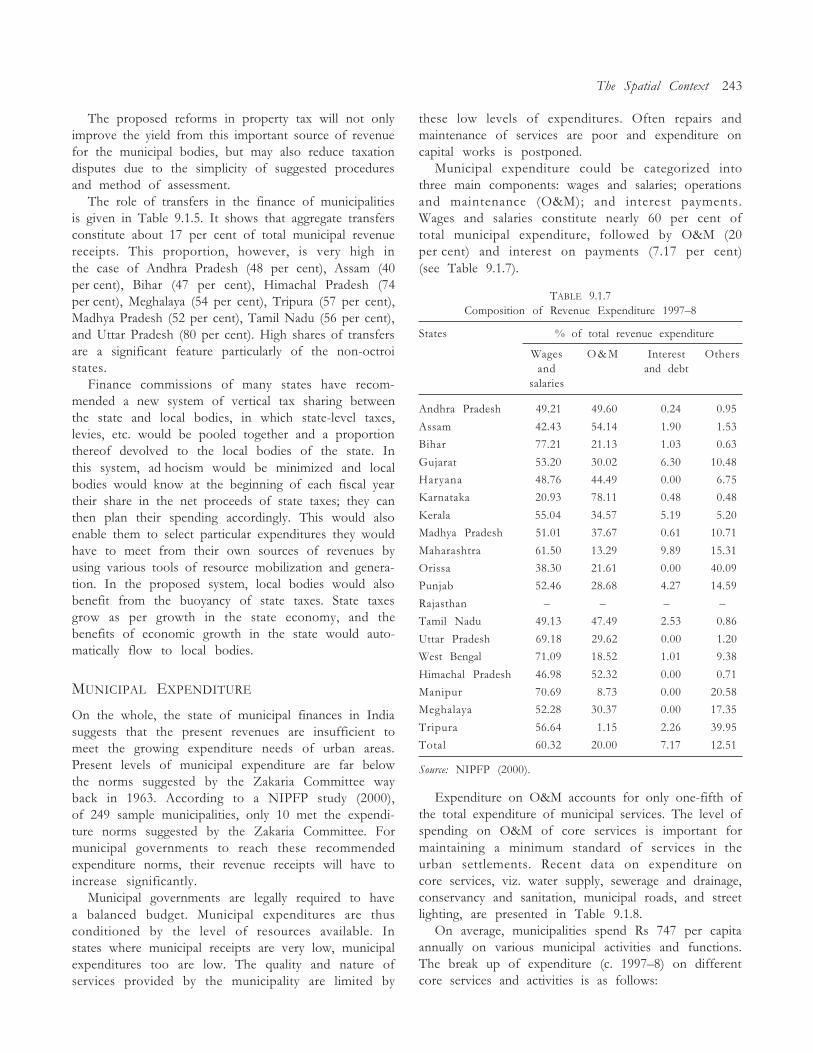
The Spatial Context 243
The proposed reforms in property tax will not onlyimprove the yield from this important source of revenuefor the municipal bodies, but may also reduce taxationdisputes due to the simplicity of suggested proceduresand method of assessment.
The role of transfers in the finance of municipalitiesis given in Table 9.1.5. It shows that aggregate transfersconstitute about 17 per cent of total municipal revenuereceipts. This proportion, however, is very high inthe case of Andhra Pradesh (48 per cent), Assam (40per cent), Bihar (47 per cent), Himachal Pradesh (74per cent), Meghalaya (54 per cent), Tripura (57 per cent),Madhya Pradesh (52 per cent), Tamil Nadu (56 per cent),and Uttar Pradesh (80 per cent). High shares of transfersare a significant feature particularly of the non-octroistates.
Finance commissions of many states have recom-mended a new system of vertical tax sharing betweenthe state and local bodies, in which state-level taxes,levies, etc. would be pooled together and a proportionthereof devolved to the local bodies of the state. Inthis system, ad hocism would be minimized and localbodies would know at the beginning of each fiscal yeartheir share in the net proceeds of state taxes; they canthen plan their spending accordingly. This would alsoenable them to select particular expenditures they wouldhave to meet from their own sources of revenues byusing various tools of resource mobilization and genera-tion. In the proposed system, local bodies would alsobenefit from the buoyancy of state taxes. State taxesgrow as per growth in the state economy, and thebenefits of economic growth in the state would auto-matically flow to local bodies.
MUNICIPAL EXPENDITURE
On the whole, the state of municipal finances in Indiasuggests that the present revenues are insufficient tomeet the growing expenditure needs of urban areas.Present levels of municipal expenditure are far belowthe norms suggested by the Zakaria Committee wayback in 1963. According to a NIPFP study (2000),of 249 sample municipalities, only 10 met the expendi-ture norms suggested by the Zakaria Committee. Formunicipal governments to reach these recommendedexpenditure norms, their revenue receipts will have toincrease significantly.
Municipal governments are legally required to havea balanced budget. Municipal expenditures are thusconditioned by the level of resources available. Instates where municipal receipts are very low, municipalexpenditures too are low. The quality and nature ofservices provided by the municipality are limited by
these low levels of expenditures. Often repairs andmaintenance of services are poor and expenditure oncapital works is postponed.
Municipal expenditure could be categorized intothree main components: wages and salaries; operationsand maintenance (O&M); and interest payments.Wages and salaries constitute nearly 60 per cent oftotal municipal expenditure, followed by O&M (20per cent) and interest on payments (7.17 per cent)(see Table 9.1.7).
TABLE 9.1.7Composition of Revenue Expenditure 1997�8
States % of total revenue expenditure
Wages O & M Interest Othersand and debt
salaries
Andhra Pradesh 49.21 49.60 0.24 0.95
Assam 42.43 54.14 1.90 1.53
Bihar 77.21 21.13 1.03 0.63
Gujarat 53.20 30.02 6.30 10.48
Haryana 48.76 44.49 0.00 6.75
Karnataka 20.93 78.11 0.48 0.48
Kerala 55.04 34.57 5.19 5.20
Madhya Pradesh 51.01 37.67 0.61 10.71
Maharashtra 61.50 13.29 9.89 15.31
Orissa 38.30 21.61 0.00 40.09
Punjab 52.46 28.68 4.27 14.59
Rajasthan � � � �
Tamil Nadu 49.13 47.49 2.53 0.86
Uttar Pradesh 69.18 29.62 0.00 1.20
West Bengal 71.09 18.52 1.01 9.38
Himachal Pradesh 46.98 52.32 0.00 0.71
Manipur 70.69 8.73 0.00 20.58
Meghalaya 52.28 30.37 0.00 17.35
Tripura 56.64 1.15 2.26 39.95
Total 60.32 20.00 7.17 12.51
Source: NIPFP (2000).
Expenditure on O&M accounts for only one-fifth ofthe total expenditure of municipal services. The level ofspending on O&M of core services is important formaintaining a minimum standard of services in theurban settlements. Recent data on expenditure oncore services, viz. water supply, sewerage and drainage,conservancy and sanitation, municipal roads, and streetlighting, are presented in Table 9.1.8.
On average, municipalities spend Rs 747 per capitaannually on various municipal activities and functions.The break up of expenditure (c. 1997�8) on differentcore services and activities is as follows:
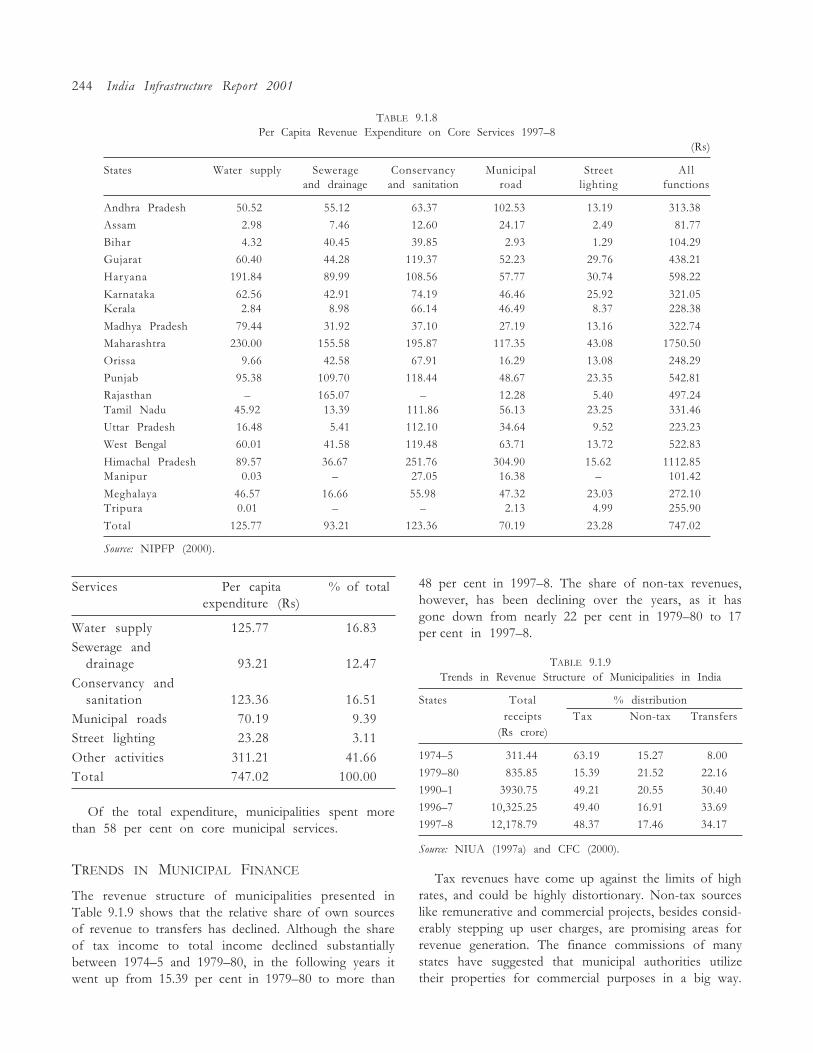
244 India Infrastructure Report 2001
TABLE 9.1.8Per Capita Revenue Expenditure on Core Services 1997�8
(Rs)
States Water supply Sewerage Conservancy Municipal Street Al land drainage and sanitation road lighting functions
Andhra Pradesh 50.52 55.12 63.37 102.53 13.19 313.38
Assam 2.98 7.46 12.60 24.17 2.49 81.77
Bihar 4.32 40.45 39.85 2.93 1.29 104.29
Gujarat 60.40 44.28 119.37 52.23 29.76 438.21
Haryana 191.84 89.99 108.56 57.77 30.74 598.22
Karnataka 62.56 42.91 74.19 46.46 25.92 321.05Kerala 2.84 8.98 66.14 46.49 8.37 228.38
Madhya Pradesh 79.44 31.92 37.10 27.19 13.16 322.74
Maharashtra 230.00 155.58 195.87 117.35 43.08 1750.50
Orissa 9.66 42.58 67.91 16.29 13.08 248.29
Punjab 95.38 109.70 118.44 48.67 23.35 542.81
Rajasthan � 165.07 � 12.28 5.40 497.24Tamil Nadu 45.92 13.39 111.86 56.13 23.25 331.46
Uttar Pradesh 16.48 5.41 112.10 34.64 9.52 223.23
West Bengal 60.01 41.58 119.48 63.71 13.72 522.83
Himachal Pradesh 89.57 36.67 251.76 304.90 15.62 1112.85Manipur 0.03 � 27.05 16.38 � 101.42
Meghalaya 46.57 16.66 55.98 47.32 23.03 272.10Tripura 0.01 � � 2.13 4.99 255.90
Total 125.77 93.21 123.36 70.19 23.28 747.02
Source: NIPFP (2000).
Services Per capita % of totalexpenditure (Rs)
Water supply 125.77 16.83Sewerage and
drainage 93.21 12.47Conservancy and
sanitation 123.36 16.51Municipal roads 70.19 9.39Street lighting 23.28 3.11Other activities 311.21 41.66Total 747.02 100.00
Of the total expenditure, municipalities spent morethan 58 per cent on core municipal services.
TRENDS IN MUNICIPAL FINANCE
The revenue structure of municipalities presented inTable 9.1.9 shows that the relative share of own sourcesof revenue to transfers has declined. Although the shareof tax income to total income declined substantiallybetween 1974�5 and 1979�80, in the following years itwent up from 15.39 per cent in 1979�80 to more than
48 per cent in 1997�8. The share of non-tax revenues,however, has been declining over the years, as it hasgone down from nearly 22 per cent in 1979�80 to 17per cent in 1997�8.
TABLE 9.1.9Trends in Revenue Structure of Municipalities in India
States Total % distributionreceipts Tax Non-tax Transfers
(Rs crore)
1974�5 311.44 63.19 15.27 08.00
1979�80 835.85 15.39 21.52 22.16
1990�1 3930.75 49.21 20.55 30.40
1996�7 10,325.25 49.40 16.91 33.69
1997�8 12,178.79 48.37 17.46 34.17
Source: NIUA (1997a) and CFC (2000).
Tax revenues have come up against the limits of highrates, and could be highly distortionary. Non-tax sourceslike remunerative and commercial projects, besides consid-erably stepping up user charges, are promising areas forrevenue generation. The finance commissions of manystates have suggested that municipal authorities utilizetheir properties for commercial purposes in a big way.
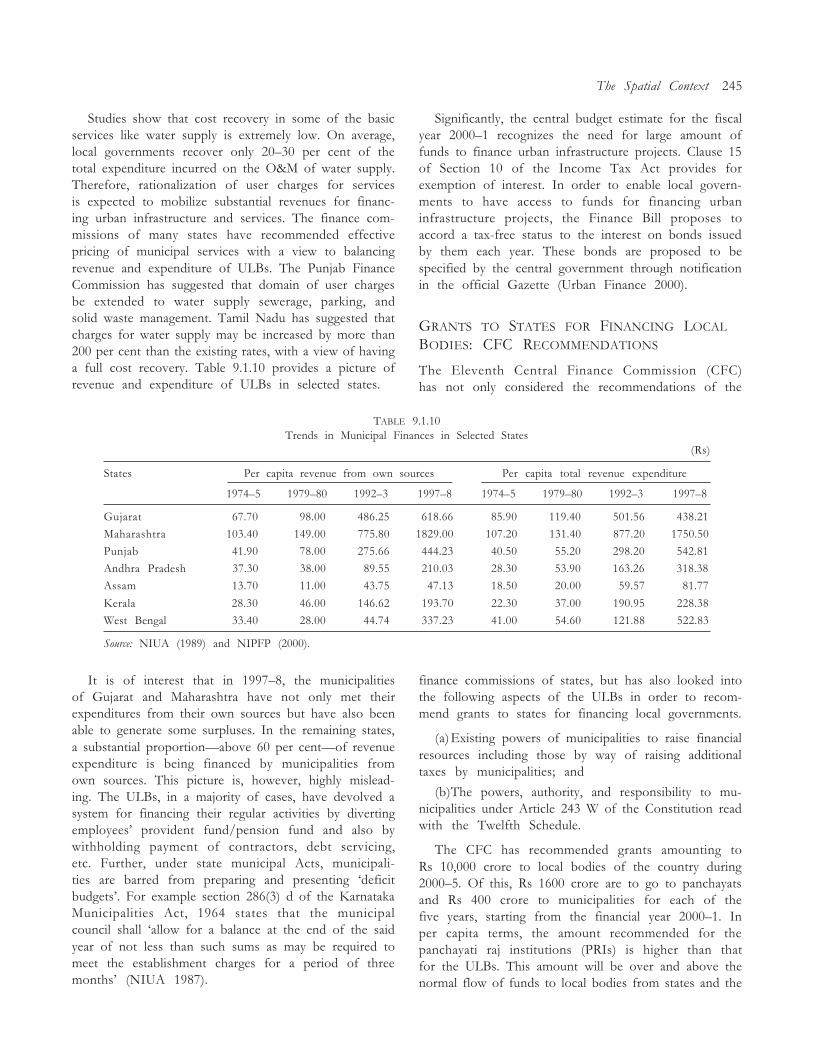
The Spatial Context 245
Studies show that cost recovery in some of the basicservices like water supply is extremely low. On average,local governments recover only 20�30 per cent of thetotal expenditure incurred on the O&M of water supply.Therefore, rationalization of user charges for servicesis expected to mobilize substantial revenues for financ-ing urban infrastructure and services. The finance com-missions of many states have recommended effectivepricing of municipal services with a view to balancingrevenue and expenditure of ULBs. The Punjab FinanceCommission has suggested that domain of user chargesbe extended to water supply sewerage, parking, andsolid waste management. Tamil Nadu has suggested thatcharges for water supply may be increased by more than200 per cent than the existing rates, with a view of havinga full cost recovery. Table 9.1.10 provides a picture ofrevenue and expenditure of ULBs in selected states.
TABLE 9.1.10Trends in Municipal Finances in Selected States
(Rs)
States Per capita revenue from own sources Per capita total revenue expenditure
1974�5 1979�80 1992�3 1997�8 1974�5 1979�80 1992�3 1997�8
Gujarat 67.70 98.00 486.25 618.66 85.90 119.40 501.56 438.21
Maharashtra 103.40 149.00 775.80 1829.00 107.20 131.40 877.20 1750.50
Punjab 41.90 78.00 275.66 444.23 40.50 55.20 298.20 542.81
Andhra Pradesh 37.30 38.00 89.55 210.03 28.30 53.90 163.26 318.38
Assam 13.70 11.00 43.75 47.13 18.50 20.00 59.57 81.77
Kerala 28.30 46.00 146.62 193.70 22.30 37.00 190.95 228.38
West Bengal 33.40 28.00 44.74 337.23 41.00 54.60 121.88 522.83
Source: NIUA (1989) and NIPFP (2000).
It is of interest that in 1997�8, the municipalitiesof Gujarat and Maharashtra have not only met theirexpenditures from their own sources but have also beenable to generate some surpluses. In the remaining states,a substantial proportion�above 60 per cent�of revenueexpenditure is being financed by municipalities fromown sources. This picture is, however, highly mislead-ing. The ULBs, in a majority of cases, have devolved asystem for financing their regular activities by divertingemployees� provident fund/pension fund and also bywithholding payment of contractors, debt servicing,etc. Further, under state municipal Acts, municipali-ties are barred from preparing and presenting �deficitbudgets�. For example section 286(3) d of the KarnatakaMunicipalities Act, 1964 states that the municipalcouncil shall �allow for a balance at the end of the saidyear of not less than such sums as may be required tomeet the establishment charges for a period of threemonths� (NIUA 1987).
Significantly, the central budget estimate for the fiscalyear 2000�1 recognizes the need for large amount offunds to finance urban infrastructure projects. Clause 15of Section 10 of the Income Tax Act provides forexemption of interest. In order to enable local govern-ments to have access to funds for financing urbaninfrastructure projects, the Finance Bill proposes toaccord a tax-free status to the interest on bonds issuedby them each year. These bonds are proposed to bespecified by the central government through notificationin the official Gazette (Urban Finance 2000).
GRANTS TO STATES FOR FINANCING LOCAL
BODIES: CFC RECOMMENDATIONS
The Eleventh Central Finance Commission (CFC)has not only considered the recommendations of the
finance commissions of states, but has also looked intothe following aspects of the ULBs in order to recom-mend grants to states for financing local governments.
(a)Existing powers of municipalities to raise financialresources including those by way of raising additionaltaxes by municipalities; and
(b)The powers, authority, and responsibility to mu-nicipalities under Article 243 W of the Constitution readwith the Twelfth Schedule.
The CFC has recommended grants amounting toRs 10,000 crore to local bodies of the country during2000�5. Of this, Rs 1600 crore are to go to panchayatsand Rs 400 crore to municipalities for each of thefive years, starting from the financial year 2000�1. Inper capita terms, the amount recommended for thepanchayati raj institutions (PRIs) is higher than thatfor the ULBs. This amount will be over and above thenormal flow of funds to local bodies from states and the
246 India Infrastructure Report 2001
amount that would flow from the implementation ofSFC recommendations (CFC 2000).
The grants would be untied except that they shouldnot be used for payment of salaries and wages. In orderto improve the financial health of local bodies, theCFC has suggested reforms in local taxes and ratesincluding property tax and user charges. It has alsoemphasized a need for improvements in budgetaryand accounting systems beside capacity building oflocal governments in various fields of municipal admin-istration and management.
The Commission has recommended a special grant ofRs 200 crore for development of a data base on financesof PRIs and ULBs and Rs 98.61 crore for maintenanceof accounts. The Commission has recommended thefollowing criteria for distribution of grants to PRIs andULBs:
Indicator Weightage (%)
(a) Population 40
(b) Index of decentralization 20
(c) Distance from higher percapita income 20
(d) Revenue effort 10(e) Geographical area 10
The Government of India has accepted the recom-mendations of the Eleventh CFC subject to certainconditions (CFC 2000).
The Eleventh CFC award of grants for local bodiesis ten times more than the Tenth Finance Commission�srecommended amount of Rs 1000 crore. However, theamount would still not be adequate. Local resources,especially through rational user charges, are the onlysolution.
The recommendations of the First State FinanceCommissions show wide variation between differentstates on various issues concerning the devolution offunctional and financial powers to ULBs. While someSFCs have made clear recommendations about thedevolution, others have been quite vague in this regard.The major shortcomings in the recommendations ofSFCs are as follows:
� The term-period of the CFC in most cases did notcoincide with the tenure of the First State FinanceCommissions. As a consequence, the recommendationsof the CFC and the SFCs were not for the similar period,leading to problems in allocation of grants.
� While making recommendations for the devolutionof funds from state governments to local bodies, mostSFCs did not consider the functional domain of the
ULBs and hence the devolutions may not be related toactual needs.
� The grants, to be provided to ULBs out of stategovernment funds, recommended by the SFCs weredetermined arbitrarily in most cases.
� The grants recommended were mostly made in abso-lute terms with respect to certain services and notconsidered as percentages of any particular revenuesource of state governments. As such these amountsmay remain fixed over the years.
� The gap between income and expenditure as deter-mined by the SFCs to decide about the devolution offunds did not take into account the overwhelmingliabilities of the ULBs.
To sum up, the reports of the First State FinanceCommissions are silent on several issues concerningsound financial management of the ULBs. The recom-mendations made have rarely been justified with a de-tailed analysis of the situation and the sharing formulahas not been worked out in many cases for devolutionof funds from states to ULBs. Similarly, in many cases,the measures suggested for improving the financialhealth of the ULBs have been of a very general nature,like the recommendation that property tax assessmentshould be simplified or made more transparent andscientific. The main objective of the SFCs should be,therefore, to ensure a predictable, practical, comprehen-sive, and unambiguous system of devolution of fundsfrom state governments to local bodies. The focusshould be on achieving �self-reliance� at local level byaddressing issues concerning sound financial health ofthe ULBs.
Although CAA74 provides full autonomy to theULBs, state-level functionaries are hesitant about hand-ing over financial and functional powers to these localgovernments. The CAA74 is also silent on issuesconcerning financial devolution to the ULBs in linewith functional devolution as provided in the TwelfthSchedule. Had the Act given direct financial powersto municipalities commensurate with functions to beassigned to them, real autonomy at local level wouldhave been provided and civic bodies made more respon-sible and accountable to citizens� need.
WATER SUPPLY, SANITATION, AND
SOLID WASTE DISPOSAL
Urban India presents a grim picture with regard toavailability of basic services (Table 9.1.11). At aggregatelevel although nearly 84 per cent of urban populationis reported to have access to safe drinking water, thereare severe deficiencies with regard to the quantity of
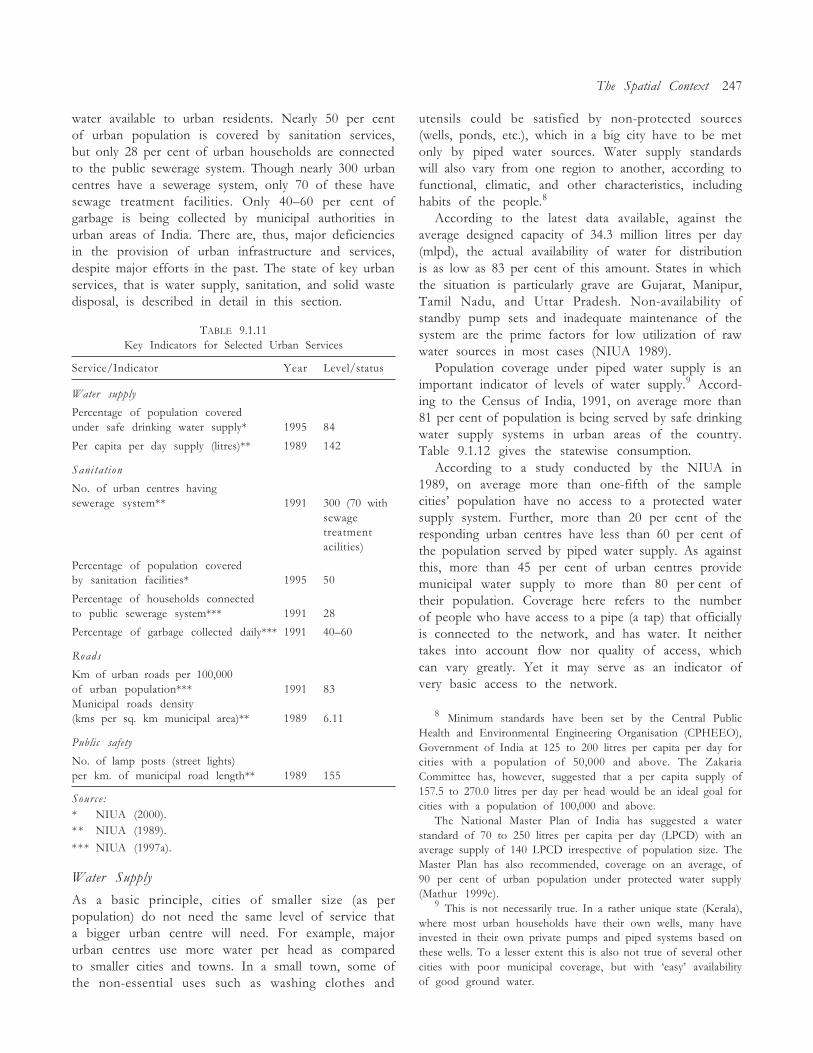
The Spatial Context 247
water available to urban residents. Nearly 50 per centof urban population is covered by sanitation services,but only 28 per cent of urban households are connectedto the public sewerage system. Though nearly 300 urbancentres have a sewerage system, only 70 of these havesewage treatment facilities. Only 40�60 per cent ofgarbage is being collected by municipal authorities inurban areas of India. There are, thus, major deficienciesin the provision of urban infrastructure and services,despite major efforts in the past. The state of key urbanservices, that is water supply, sanitation, and solid wastedisposal, is described in detail in this section.
TABLE 9.1.11Key Indicators for Selected Urban Services
Service/Indicator Year Level/status
Water supply
Percentage of population coveredunder safe drinking water supply* 1995 84
Per capita per day supply (litres)** 1989 142
Sanitation
No. of urban centres havingsewerage system** 1991 300 (70 with
sewagetreatmentacilities)
Percentage of population coveredby sanitation facilities* 1995 50
Percentage of households connectedto public sewerage system*** 1991 28
Percentage of garbage collected daily*** 1991 40�60
Roads
Km of urban roads per 100,000of urban population*** 1991 83Municipal roads density(kms per sq. km municipal area)** 1989 6.11
Public safety
No. of lamp posts (street lights)per km. of municipal road length** 1989 155
Source:* NIUA (2000).* * NIUA (1989).
*** NIUA (1997a).
Water Supply
As a basic principle, cities of smaller size (as perpopulation) do not need the same level of service thata bigger urban centre will need. For example, majorurban centres use more water per head as comparedto smaller cities and towns. In a small town, some ofthe non-essential uses such as washing clothes and
utensils could be satisfied by non-protected sources(wells, ponds, etc.), which in a big city have to be metonly by piped water sources. Water supply standardswill also vary from one region to another, according tofunctional, climatic, and other characteristics, includinghabits of the people.8
According to the latest data available, against theaverage designed capacity of 34.3 million litres per day(mlpd), the actual availability of water for distributionis as low as 83 per cent of this amount. States in whichthe situation is particularly grave are Gujarat, Manipur,Tamil Nadu, and Uttar Pradesh. Non-availability ofstandby pump sets and inadequate maintenance of thesystem are the prime factors for low utilization of rawwater sources in most cases (NIUA 1989).
Population coverage under piped water supply is animportant indicator of levels of water supply.9 Accord-ing to the Census of India, 1991, on average more than81 per cent of population is being served by safe drinkingwater supply systems in urban areas of the country.Table 9.1.12 gives the statewise consumption.
According to a study conducted by the NIUA in1989, on average more than one-fifth of the samplecities� population have no access to a protected watersupply system. Further, more than 20 per cent of theresponding urban centres have less than 60 per cent ofthe population served by piped water supply. As againstthis, more than 45 per cent of urban centres providemunicipal water supply to more than 80 per cent oftheir population. Coverage here refers to the numberof people who have access to a pipe (a tap) that officiallyis connected to the network, and has water. It neithertakes into account flow nor quality of access, whichcan vary greatly. Yet it may serve as an indicator ofvery basic access to the network.
8 Minimum standards have been set by the Central PublicHealth and Environmental Engineering Organisation (CPHEEO),Government of India at 125 to 200 litres per capita per day forcities with a population of 50,000 and above. The ZakariaCommittee has, however, suggested that a per capita supply of157.5 to 270.0 litres per day per head would be an ideal goal forcities with a population of 100,000 and above.
The National Master Plan of India has suggested a waterstandard of 70 to 250 litres per capita per day (LPCD) with anaverage supply of 140 LPCD irrespective of population size. TheMaster Plan has also recommended, coverage on an average, of90 per cent of urban population under protected water supply(Mathur 1999c).
9 This is not necessarily true. In a rather unique state (Kerala),where most urban households have their own wells, many haveinvested in their own private pumps and piped systems based onthese wells. To a lesser extent this is also not true of several othercities with poor municipal coverage, but with �easy� availabilityof good ground water.
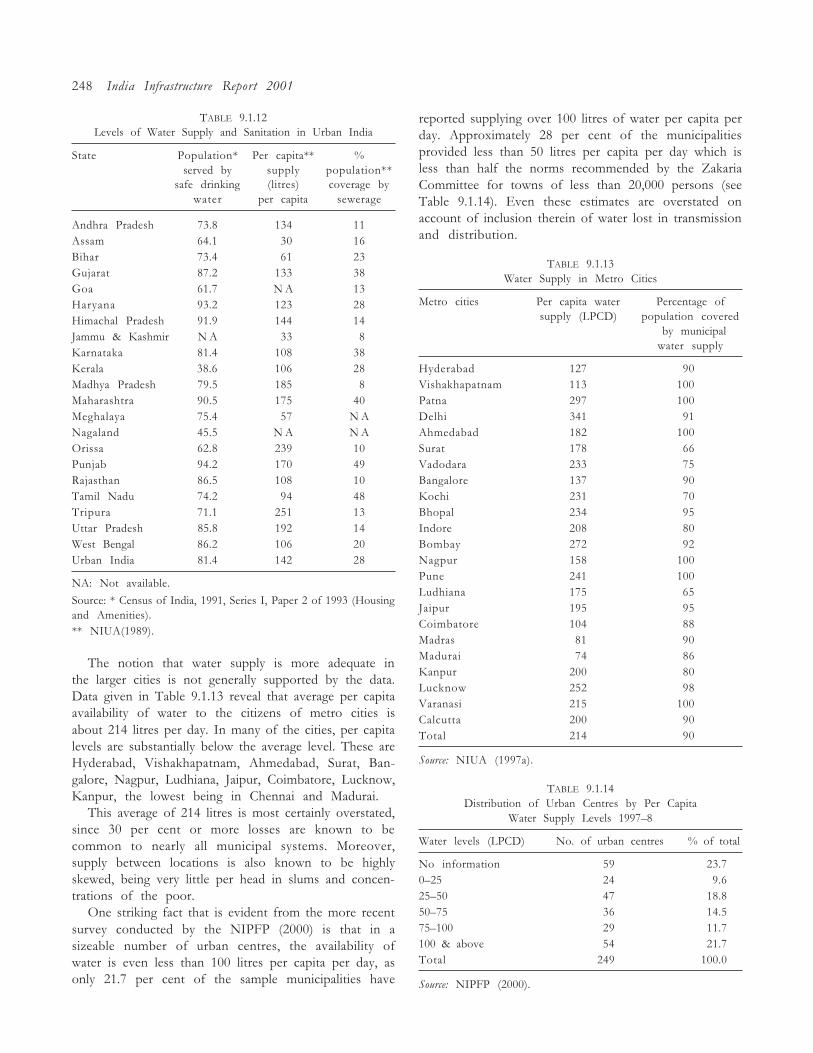
248 India Infrastructure Report 2001
TABLE 9.1.12Levels of Water Supply and Sanitation in Urban India
State Population* Per capita** %served by supply population**
safe drinking (litres) coverage bywater per capita sewerage
Andhra Pradesh 73.8 134 11Assam 64.1 030 16Bihar 73.4 061 23Gujarat 87.2 133 38Goa 61.7 N A 13Haryana 93.2 123 28Himachal Pradesh 91.9 144 14Jammu & Kashmir N A 033 08Karnataka 81.4 108 38Kerala 38.6 106 28Madhya Pradesh 79.5 185 08Maharashtra 90.5 175 40Meghalaya 75.4 057 N ANagaland 45.5 N A N AOrissa 62.8 239 10Punjab 94.2 170 49Rajasthan 86.5 108 10Tamil Nadu 74.2 094 48Tripura 71.1 251 13Uttar Pradesh 85.8 192 14West Bengal 86.2 106 20Urban India 81.4 142 28
NA: Not available.
Source: * Census of India, 1991, Series I, Paper 2 of 1993 (Housingand Amenities).** NIUA(1989).
The notion that water supply is more adequate inthe larger cities is not generally supported by the data.Data given in Table 9.1.13 reveal that average per capitaavailability of water to the citizens of metro cities isabout 214 litres per day. In many of the cities, per capitalevels are substantially below the average level. These areHyderabad, Vishakhapatnam, Ahmedabad, Surat, Ban-galore, Nagpur, Ludhiana, Jaipur, Coimbatore, Lucknow,Kanpur, the lowest being in Chennai and Madurai.
This average of 214 litres is most certainly overstated,since 30 per cent or more losses are known to becommon to nearly all municipal systems. Moreover,supply between locations is also known to be highlyskewed, being very little per head in slums and concen-trations of the poor.
One striking fact that is evident from the more recentsurvey conducted by the NIPFP (2000) is that in asizeable number of urban centres, the availability ofwater is even less than 100 litres per capita per day, asonly 21.7 per cent of the sample municipalities have
reported supplying over 100 litres of water per capita perday. Approximately 28 per cent of the municipalitiesprovided less than 50 litres per capita per day which isless than half the norms recommended by the ZakariaCommittee for towns of less than 20,000 persons (seeTable 9.1.14). Even these estimates are overstated onaccount of inclusion therein of water lost in transmissionand distribution.
TABLE 9.1.13Water Supply in Metro Cities
Metro cities Per capita water Percentage ofsupply (LPCD) population covered
by municipalwater supply
Hyderabad 127 90Vishakhapatnam 113 100Patna 297 100Delhi 341 91Ahmedabad 182 100Surat 178 66Vadodara 233 75Bangalore 137 90Kochi 231 70Bhopal 234 95Indore 208 80Bombay 272 92Nagpur 158 100Pune 241 100Ludhiana 175 65Jaipur 195 95Coimbatore 104 88Madras 81 90Madurai 74 86Kanpur 200 80Lucknow 252 98Varanasi 215 100Calcutta 200 90Total 214 90
Source: NIUA (1997a).
TABLE 9.1.14Distribution of Urban Centres by Per Capita
Water Supply Levels 1997�8
Water levels (LPCD) No. of urban centres % of total
No information 59 23.70�25 24 9.625�50 47 18.850�75 36 14.575�100 29 11.7100 & above 54 21.7Total 249 100.0
Source: NIPFP (2000).
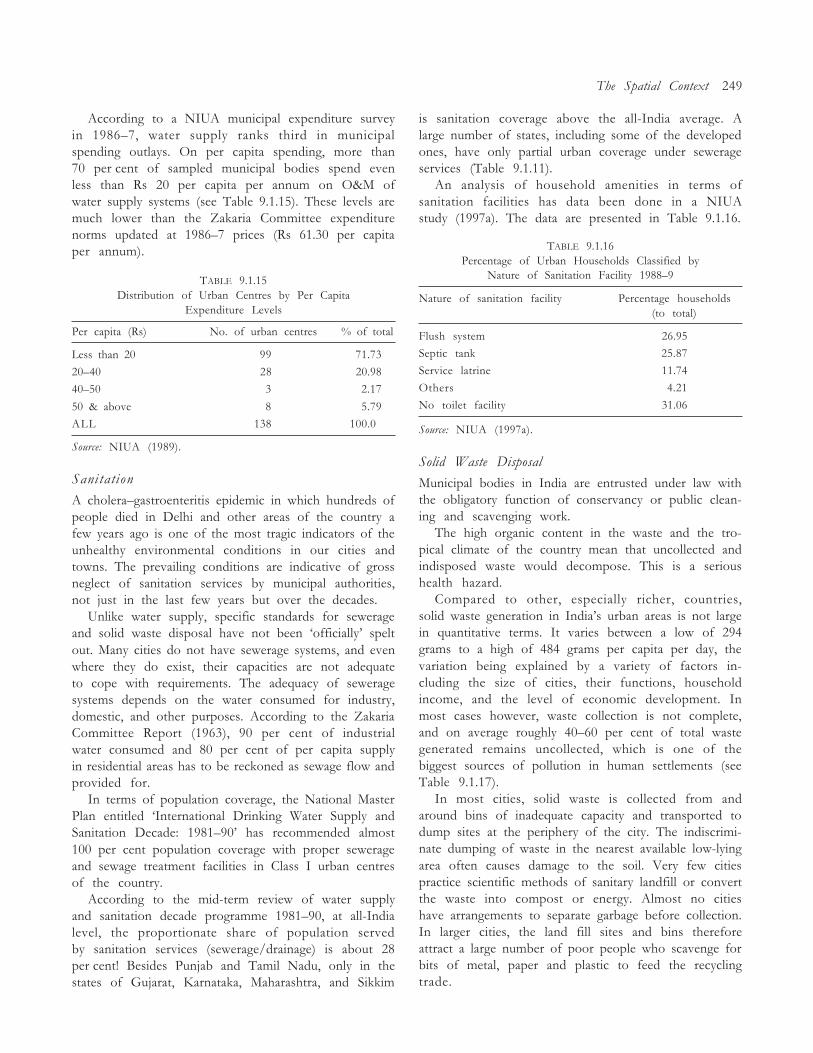
The Spatial Context 249
According to a NIUA municipal expenditure surveyin 1986�7, water supply ranks third in municipalspending outlays. On per capita spending, more than70 per cent of sampled municipal bodies spend evenless than Rs 20 per capita per annum on O&M ofwater supply systems (see Table 9.1.15). These levels aremuch lower than the Zakaria Committee expenditurenorms updated at 1986�7 prices (Rs 61.30 per capitaper annum).
TABLE 9.1.15Distribution of Urban Centres by Per Capita
Expenditure Levels
Per capita (Rs) No. of urban centres % of total
Less than 20 99 71.73
20�40 28 20.98
40�50 3 2.17
50 & above 8 5.79
ALL 138 100.0
Source: NIUA (1989).
Sanitation
A cholera�gastroenteritis epidemic in which hundreds ofpeople died in Delhi and other areas of the country afew years ago is one of the most tragic indicators of theunhealthy environmental conditions in our cities andtowns. The prevailing conditions are indicative of grossneglect of sanitation services by municipal authorities,not just in the last few years but over the decades.
Unlike water supply, specific standards for sewerageand solid waste disposal have not been �officially� speltout. Many cities do not have sewerage systems, and evenwhere they do exist, their capacities are not adequateto cope with requirements. The adequacy of seweragesystems depends on the water consumed for industry,domestic, and other purposes. According to the ZakariaCommittee Report (1963), 90 per cent of industrialwater consumed and 80 per cent of per capita supplyin residential areas has to be reckoned as sewage flow andprovided for.
In terms of population coverage, the National MasterPlan entitled �International Drinking Water Supply andSanitation Decade: 1981�90� has recommended almost100 per cent population coverage with proper sewerageand sewage treatment facilities in Class I urban centresof the country.
According to the mid-term review of water supplyand sanitation decade programme 1981�90, at all-Indialevel, the proportionate share of population servedby sanitation services (sewerage/drainage) is about 28per cent! Besides Punjab and Tamil Nadu, only in thestates of Gujarat, Karnataka, Maharashtra, and Sikkim
is sanitation coverage above the all-India average. Alarge number of states, including some of the developedones, have only partial urban coverage under sewerageservices (Table 9.1.11).
An analysis of household amenities in terms ofsanitation facilities has data been done in a NIUAstudy (1997a). The data are presented in Table 9.1.16.
TABLE 9.1.16Percentage of Urban Households Classified by
Nature of Sanitation Facility 1988�9
Nature of sanitation facility Percentage households(to total)
Flush system 26.95
Septic tank 25.87
Service latrine 11.74
Others 04.21
No toilet facility 31.06
Source: NIUA (1997a).
Solid Waste Disposal
Municipal bodies in India are entrusted under law withthe obligatory function of conservancy or public clean-ing and scavenging work.
The high organic content in the waste and the tro-pical climate of the country mean that uncollected andindisposed waste would decompose. This is a serioushealth hazard.
Compared to other, especially richer, countries,solid waste generation in India�s urban areas is not largein quantitative terms. It varies between a low of 294grams to a high of 484 grams per capita per day, thevariation being explained by a variety of factors in-cluding the size of cities, their functions, householdincome, and the level of economic development. Inmost cases however, waste collection is not complete,and on average roughly 40�60 per cent of total wastegenerated remains uncollected, which is one of thebiggest sources of pollution in human settlements (seeTable 9.1.17).
In most cities, solid waste is collected from andaround bins of inadequate capacity and transported todump sites at the periphery of the city. The indiscrimi-nate dumping of waste in the nearest available low-lyingarea often causes damage to the soil. Very few citiespractice scientific methods of sanitary landfill or convertthe waste into compost or energy. Almost no citieshave arrangements to separate garbage before collection.In larger cities, the land fill sites and bins thereforeattract a large number of poor people who scavenge forbits of metal, paper and plastic to feed the recyclingtrade.
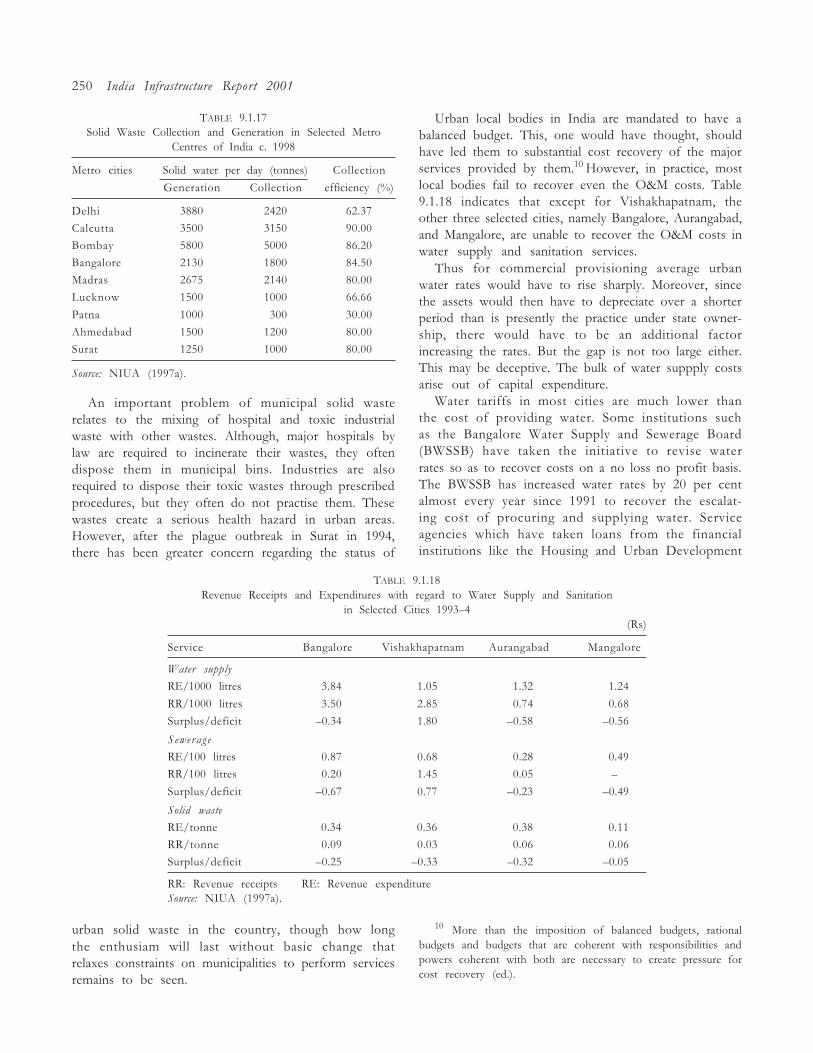
250 India Infrastructure Report 2001
TABLE 9.1.17Solid Waste Collection and Generation in Selected Metro
Centres of India c. 1998
Metro cities Solid water per day (tonnes) Collection
Generation Collection efficiency (%)
Delhi 3880 2420 62.37
Calcutta 3500 3150 90.00
Bombay 5800 5000 86.20
Bangalore 2130 1800 84.50
Madras 2675 2140 80.00
Lucknow 1500 1000 66.66
Patna 1000 0300 30.00
Ahmedabad 1500 1200 80.00
Surat 1250 1000 80.00
Source: NIUA (1997a).
An important problem of municipal solid wasterelates to the mixing of hospital and toxic industrialwaste with other wastes. Although, major hospitals bylaw are required to incinerate their wastes, they oftendispose them in municipal bins. Industries are alsorequired to dispose their toxic wastes through prescribedprocedures, but they often do not practise them. Thesewastes create a serious health hazard in urban areas.However, after the plague outbreak in Surat in 1994,there has been greater concern regarding the status of
Urban local bodies in India are mandated to have abalanced budget. This, one would have thought, shouldhave led them to substantial cost recovery of the majorservices provided by them.10 However, in practice, mostlocal bodies fail to recover even the O&M costs. Table9.1.18 indicates that except for Vishakhapatnam, theother three selected cities, namely Bangalore, Aurangabad,and Mangalore, are unable to recover the O&M costs inwater supply and sanitation services.
Thus for commercial provisioning average urbanwater rates would have to rise sharply. Moreover, sincethe assets would then have to depreciate over a shorterperiod than is presently the practice under state owner-ship, there would have to be an additional factorincreasing the rates. But the gap is not too large either.This may be deceptive. The bulk of water suppply costsarise out of capital expenditure.
Water tariffs in most cities are much lower thanthe cost of providing water. Some institutions suchas the Bangalore Water Supply and Sewerage Board(BWSSB) have taken the initiative to revise waterrates so as to recover costs on a no loss no profit basis.The BWSSB has increased water rates by 20 per centalmost every year since 1991 to recover the escalat-ing cost of procuring and supplying water. Serviceagencies which have taken loans from the financialinstitutions like the Housing and Urban Development
TABLE 9.1.18Revenue Receipts and Expenditures with regard to Water Supply and Sanitation
in Selected Cities 1993�4(Rs)
Service Bangalore Vishakhapatnam Aurangabad Mangalore
Water supply
RE/1000 litres 3.84 1.05 1.32 1.24
RR/1000 litres 3.50 2.85 0.74 0.68
Surplus/deficit �0.34 1.80 �0.58 �0.56
Sewerage
RE/100 litres 0.87 0.68 0.28 0.49
RR/100 litres 0.20 1.45 0.05 �
Surplus/deficit �0.67 0.77 �0.23 �0.49
Solid waste
RE/tonne 0.34 0.36 0.38 0.11
RR/tonne 0.09 0.03 0.06 0.06
Surplus/deficit �0.25 �0.33 �0.32 �0.05
RR: Revenue receipts RE: Revenue expenditureSource: NIUA (1997a).
urban solid waste in the country, though how longthe enthusiam will last without basic change thatrelaxes constraints on municipalities to perform servicesremains to be seen.
10 More than the imposition of balanced budgets, rationalbudgets and budgets that are coherent with responsibilities andpowers coherent with both are necessary to create pressure forcost recovery (ed.).
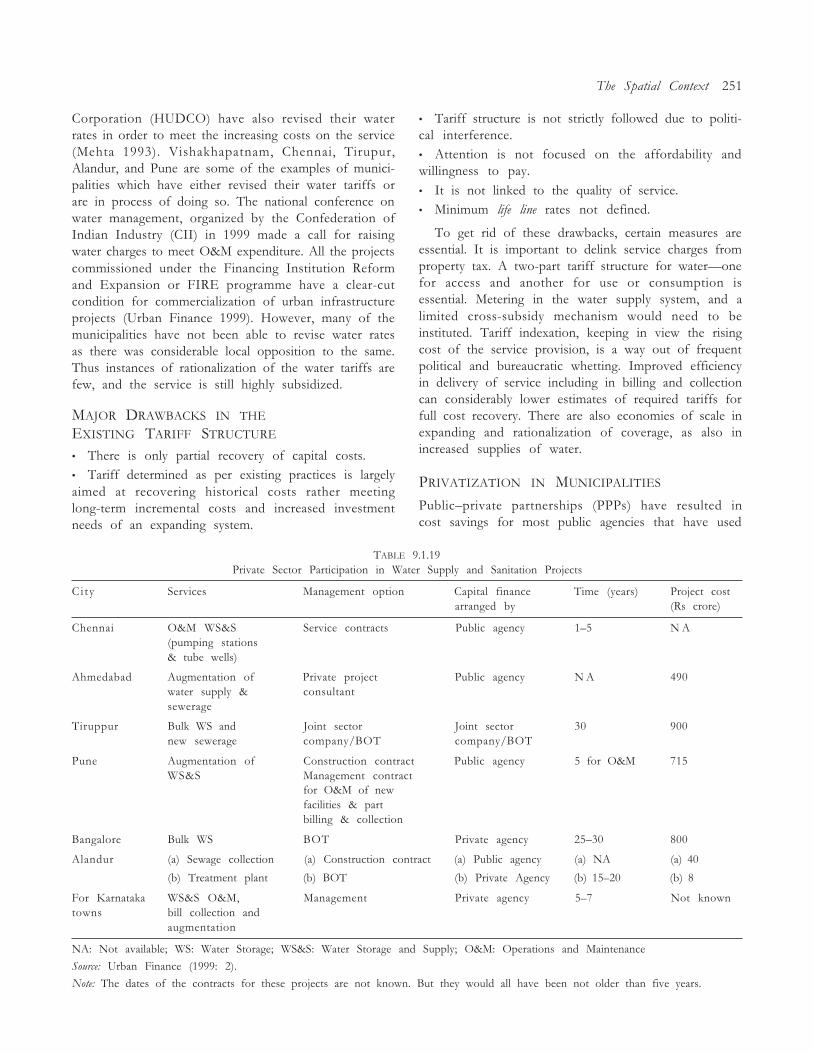
The Spatial Context 251
Corporation (HUDCO) have also revised their waterrates in order to meet the increasing costs on the service(Mehta 1993). Vishakhapatnam, Chennai, Tirupur,Alandur, and Pune are some of the examples of munici-palities which have either revised their water tariffs orare in process of doing so. The national conference onwater management, organized by the Confederation ofIndian Industry (CII) in 1999 made a call for raisingwater charges to meet O&M expenditure. All the projectscommissioned under the Financing Institution Reformand Expansion or FIRE programme have a clear-cutcondition for commercialization of urban infrastructureprojects (Urban Finance 1999). However, many of themunicipalities have not been able to revise water ratesas there was considerable local opposition to the same.Thus instances of rationalization of the water tariffs arefew, and the service is still highly subsidized.
MAJOR DRAWBACKS IN THE
EXISTING TARIFF STRUCTURE
� There is only partial recovery of capital costs.� Tariff determined as per existing practices is largelyaimed at recovering historical costs rather meetinglong-term incremental costs and increased investmentneeds of an expanding system.
� Tariff structure is not strictly followed due to politi-cal interference.� Attention is not focused on the affordability andwillingness to pay.� It is not linked to the quality of service.� Minimum life line rates not defined.
To get rid of these drawbacks, certain measures areessential. It is important to delink service charges fromproperty tax. A two-part tariff structure for water�onefor access and another for use or consumption isessential. Metering in the water supply system, and alimited cross-subsidy mechanism would need to beinstituted. Tariff indexation, keeping in view the risingcost of the service provision, is a way out of frequentpolitical and bureaucratic whetting. Improved efficiencyin delivery of service including in billing and collectioncan considerably lower estimates of required tariffs forfull cost recovery. There are also economies of scale inexpanding and rationalization of coverage, as also inincreased supplies of water.
PRIVATIZATION IN MUNICIPALITIES
Public�private partnerships (PPPs) have resulted incost savings for most public agencies that have used
TABLE 9.1.19Private Sector Participation in Water Supply and Sanitation Projects
C i ty Services Management option Capital finance Time (years) Project costarranged by (Rs crore)
Chennai O&M WS&S Service contracts Public agency 1�5 N A(pumping stations& tube wells)
Ahmedabad Augmentation of Private project Public agency N A 490water supply & consultantsewerage
Tiruppur Bulk WS and Joint sector Joint sector 30 900new sewerage company/BOT company/BOT
Pune Augmentation of Construction contract Public agency 5 for O&M 715WS&S Management contract
for O&M of newfacilities & partbilling & collection
Bangalore Bulk WS BOT Private agency 25�30 800
Alandur (a) Sewage collection (a) Construction contract (a) Public agency (a) NA (a) 40
(b) Treatment plant (b) BOT (b) Private Agency (b) 15�20 (b) 8
For Karnataka WS&S O&M, Management Private agency 5�7 Not knowntowns bill collection and
augmentation
NA: Not available; WS: Water Storage; WS&S: Water Storage and Supply; O&M: Operations and Maintenance
Source: Urban Finance (1999: 2).
Note: The dates of the contracts for these projects are not known. But they would all have been not older than five years.
252 India Infrastructure Report 2001
such arrangements. The extent of savings achieved variesacross cities as it depends upon the ability of thepublic agency to accurately calculate the cost of provi-sion of any given service as well as its ability to invitea sufficient number of private operators for providingthe service.
Role and Responsibilities of Local Bodies in PPPs
A series of PPPs in provision of municipal services hasemerged in different cities and towns. A few examplesare given in the following paragraphs.
RAJKOT
The Rajkot Municipal Corporation (RMC) has con-tracted out maintenance of street lights, solid wasteremoval and transportation, cleaning of public toilets,maintenance of gardens, afforestation, etc. The RMChas also undertaken various entertainment projects withthe help of private entrepreneurs. By using the servicesof the private sector, the RMC has been able to save asignificant amount of money and has been able to closethe gap between demand and supply. Huge investmentsthat are needed for acquiring capital equipment suchas tractors and trollies have now been given over toprivate contractors. However, the RMC has not re-trenched any of its staff but has stopped fresh recruit-ment. The RMC continues to use its present manpoweras well as equipment in certain areas of the city. Thisalso serves as contingency in case of service disruptiondue to problems with the private contractors. For itsprimary solid waste removal in 1991�2 the RMC spentRs 16.95 lakh. The private agency to which the workhas now been contracted out does the same in Rs 14.36lakh.
PALI
In Pali (Rajasthan), the municipal body has given themaintenance of street lights to the private sector. Indoing so it has been able to maintain street lights atone-fifth the cost it would have incurred had it main-tained the service itself!
CIDCO
The City and Industrial Development Corporation(CIDCO), a public sector institution in New Mumbai,has had a very successful experience with privatizationefforts. The privatization experience includes mainte-nance of sewerage pumps and water pumps, meterreading and billing, maintenance of parks and gardens,and collection of CIDCO�s service charges. CIDCOhas given out the collection of its service charges tothe Senior Citizens Club (an association of retired
persons) whom it pays 1 per cent as commission. IfCIDCO were to collect the charges on its own it wouldcost it three times more.
Road sweeping, garbage collection and disposal,maintenance of drains, spraying of insecticides, etc.have been assigned (1992�3) to 15 contractors in allof the 7 townships under CIDCO. The work is allottedto different contractors for a group of sectors on yearlybasis. The work done by the contractor is supervisedby the sanitary inspectors of CIDCO. This systemhas been functioning for over eight years and hasresulted in well-maintained streets. The total cost of allcontracts in seven townships is Rs 42.6 lakh per year.If this work had been done departmentally by CIDCOit would have to have at least 400�500 sweepers and20 trucks. The all-inclusive maintenance cost wouldhave cost around Rs 100 lakh. (NIUA 1997b).
EXNORA
Exnora is an non-governmental organization (NGO)started by non-resident Indians (NRIs) to improve civicamenities in Chennai. The NGO helps in garbageremoval not only in well-off localities but also inslums. The households pay a nominal charge of Rs 10to Rs 20 per month for the service. In the slums, thehouseholds pay less but provide labour instead. Exnorahas directly employed rag pickers for garbage removal.It has been successful in its attempt to help keep thecity clean and has extended its services to many localitiesin the city.
SRISHTI
Srishti is a Delhi-based NGO using Residents Associa-tions to implement community-level municipal solidwaste disposal. It is working in several Delhi colonieswith the involvement of about 900 to 1000 households.Garbage which is handled by them reduces the burdenof the Municipal Corporation of Delhi (MCD) on thecollection front. Srishti�s aim is to assist local residentsto interact with the MCD and take on much greaterresponsibility for their garbage.
ALANDUR
The Alandur Sewerage Project is proposed to be imple-mented in Alandur (Tamil Nadu), on the basis of a PPP.There will be a construction contract for the sewagecollection system, whereas the treatment plants will beon a build, operate, and transfer (BOT) basis. In addi-tion, there will be an O&M contract for the collectionsystem as well as treatment plant. The operator isexpected to make capital investment for the treatmentplant and to recover the same over a period of 15 to 20years. The local body will recover the costs through a
The Spatial Context 253
combination of sewerage tax, sewerage charge, connec-tion charge, general revenues, and state governmentsupport. The expected gains from more efficient andcost-effective working are likely to be large.
SURAT
Surat suffered an outbreak of plague in 1994. Followingfrom a change in administrative leadership, the SuratMunicipal Corporation introduced several innovativemeasures for improving urban management throughPPPs in delivery of water and sanitation services. Theprivate sector has been involved in solid waste collectionand transportation, maintenance of street lighting,construction of roads, tree planting, and operation ofwater treatment plants. As a result of private collectionand transportation of garbage, collection efficiency in-creased from 30 per cent in 1995 to above 90 per cent.By contracting out street-lights maintenance to a privatecompany, the level of service has greatly improved:over 95 per cent of street lights are now in workingcondition, whereas previously they had been less than50 per cent at any time.
Local bodies should primarily concentrate on essen-tial urban services such as water supply, sewerage,drainage, and solid waste disposal. They should notinvolve themselves in provision of other merit goodssuch as education, which are not locationally con-strained, and where state governments and privateparties would have the upper hand. The cost of provid-ing these services is substantial and could be betterutilized for development and improvement of core civicservices.
Specific Provisions for Involving the Private Sector
Most ULBs have not seriously thought of privatesector participation in the provision of urban services,as there are no �enabling� legal provisions that facilitatethe use of the non-government sector. While the Munici-pal Acts do not precisely use the term �private sector�,a serious reading of the legal provisions suggests thatthe Acts do permit the use of any person for deliveringspecific services. The Hyderabad Municipal Corpora-tion Act, 1955 (No. 11 of 1956), for example, clearlystates that �the Commissioner when authorized bythe Corporation can enter into an arrangement withany person for supply of water� (Section 342).
This could include construction and maintenance ofwater works, purchasing or taking on lease any waterworks, and storing and conveyance of water. More orless similar clauses are found in the other MunicipalActs.
With the passing of the CAA74 all states are expectedto make amendments to their respective Municipal
Acts, incorporating the necessary changes to provide arole for the private sector. This has already been donein a majority of states. Amended municipal legislationsin Maharashtra contain a provision to the effect thatwhere any duty has been imposed or any function hasbeen assigned to a municipality by law, the municipalitymay either discharge such duty or perform throughany agency. Thus inserting specific clauses enablingthe involvement of the private sector will go a longway in improving the quality of services in the urbanareas of the country. The finance commissions ofsome states�Kerala, Madhya Pradesh, Punjab, andTamil Nadu�have recommended contracting out ofcertain municipal services to private agencies. The TamilNadu State Finance Commission, for example, hassuggested contracting out of garbage, maintenance ofcommercial assets, etc. to private agencies in order toreduce the financial burden on municipal bodies onthe one hand and improve the delivery of services on theother. In Punjab, ULBs have been given full powers toget civic amenities delivered through private agencies.Similarly, the Madhya Pradesh Finance Commissionsuggested that the collection and disposal of garbageshould be given out to private agencies.
INNOVATIONS IN MUNICIPAL
ACCOUNTING SYSTEMS
The existing accounting system in a large number oflocal bodies is based on simple single cash accountingwhich does not throw any light on the financialstatus of municipal bodies. It is neither conducive tocredit rating nor accessing the capital market. It doesnot reveal even the expenditure liabilities postponeddue to compelling fiscal reasons which is generally arampant practice and which camouflages the finan-cial status of municipalities. Suitable changes in theaccounting system have been an important issue inmunicipal financial management for many years. TheChennai Municipal Corporation was the first municipalauthority in the country to have switched over to adouble entry accounting system under the aegis of aWorld Bank funding of urban development in thelate 1980s.
In Gujarat, many cities are in the process of imple-menting new accounting systems. The AhmedabadMunicipal Corporation replaced the manual cash-basedsystem with a double entry accrual-based computerizedsystem. The Surat Municipal Corporation has alsoadopted a computerized double entry accounting sys-tem. In other states such as Karnataka and Tamil Nadu,attempts have been made in recent years to introducea new system of accounting and financial reporting
254 India Infrastructure Report 2001
system. However, these innovations are on a limitedscale.
Considering the need for such an accounting systemfor efficient functioning of urban local governments inthe country, the Institute of Chartered Accountants ofIndia is developing a technical guide for municipalaccounting based on a double entry accrual system.This guide is expected to provide financial reportingformats based on generally accepted accounting prin-ciples and instructions for preparation of financialstatements.
It is important that for accessing the capital market,municipalities develop their creditworthiness. Devolu-tion of additional taxes, rationalized user charges, andfiscal autonomy to set their own rates are necessarychanges. Though there is an increasing trend on the partof municipal bodies to go in for credit rating, this islimited to only a few cities in the more prosperous andprogressive parts of the country. Proper standards andtransparent accounting systems have to be in placebefore municipalities can go to the market withoutgovernment guarantees for funds.
CONCLUSION
The CAA74 aimed in spirit to empower the ULBs insuch a way that they function smoothly, efficiently,and effectively as autonomous, self-sustained city gov-ernments. To achieve this, there is need to have unifor-mity in state legislations with respect to tenure andpowers of mayors/chairpersons. They should havepowers of administration, supervision, and control overall employees of municipalities.
Functions of ULBs should be clearly specified. Allthe subjects mentioned in the Twelfth Schedule shouldbe transferred to ULBs along with transfer of funds andfunctionaries.
Property tax is one of the main sources of income forthe municipalities. This should be simplified and ratio-nalized. Exemptions from property tax should be mini-mized and central government properties should alsopay service charges in lieu of property tax.
There is scope for improvement in collection andplugging the leakage. In Hyderabad, for example, PTcollection during the last three years has doubled asa result of improvement in the PT administrationsystem.
Taxes which are local in nature such as entertainmenttax, motor vehicle tax, and stamp duty should eitherbe transferred to local bodies or a reasonable share begiven to local bodies.
ULBs should be given autonomy to fix tax rates anduser charges.
The state governments should prepare necessaryguidelines and enabling legislation to further privatizationby the ULBs.
A major problem among the ULBs, as pointed out bymany studies and committees, is the lack of expertise.11
Thus there is need for capacity building and trainingof municipal officials, particularly to take up the chal-lenges offered by the new functions assigned to themunder the Twelfth Schedule. The District and MetroPlanning Committees would need to be constituted asper the provisions of the CAA74. Those committees willhave to ensure formulation of realistic and effectiveurban development planning systems incorporatingresource mobilization plans, institutional mechanismsfor implementation, etc. for which municipal institu-tions have no expertise. Therefore, there is need tomodify the existing recruitment rules of the ULBs toenable them to function as a vibrant and efficient unitof planning at local level. Technical support groupsshould also be constituted in every municipality tosupervise works at local level.
The Municipal Acts of each state differ widely. Thusthere is need to replace the existing state MunicipalActs with a model Municipal Act which should beuniformly applicable to all local bodies of the country.
A National Urban Development Fund could beestablished to extend loans and financial aid to theULBs for infrastructure development.12
Innovative strategies are thus required to be devel-oped by the ULBs to finance urban infrastructureand services. The existing funds available from planallocation could be supplemented by accessing thecapital market. Already the cities of Ahmedabad andBangalore have accessed the capital market to mobilizefunds for urban infrastructure financing. This in turnwill mean improvements in the record managementand accounting systems beside good governance andurban management systems.
The CAA74 has already provided for strengtheningof urban governance and management. This needs to bemade operational by ensuring devolution of functionsas per the Twelfth Schedule and devolution of adequatefinancial resources to keep cities running. Box 9.1.1provides a picture of local governance in small townsin Gujarat since the CAA74.
11 ULBs need not have such expertise in-house. It would bebetter to not to since real expertise has it own logic of scale andorganization. The point is the ULB�s elected representativesshould have the right to contract with private parties, and partiesother than those imposed upon them by the state (ed.).
12 The disbursals from such a fund could be linked to thecharges and improvements brought about institutionally and inthe finances of the ULBs.
The Spatial Context 255
BOX 9.1.1Local Governance in Small Towns in Gujarat since the CAA74: First Impressions
Alice Albin Morris and Vivek Raval
In order to strengthen local self-governments in rural and urban areas, the Parliament enacted the historic 73rd and 74th
Constitutional Amendment Acts (CAAs), focusing on Panchayati Raj institutions and municipalities, respectively. Since then,though much interest has been shown in Panchayati Raj, very little has been done to improve municipal governance. Evenamong NGOs, with the exception of the Public Affairs Centre (PAC) in Bangalore, Exnora International in Chennai, andFoundation for Public Interest (FPI) in Ahmedabad, little interest has been generated by the CAA. Since 1994, when thefollow-up legislation was passed in Gujarat, it met with little enthusiasm amongst grassroots institutions, be they municipalitiesor citizens� groups.
With a view to developing a plan for a larger comprehensive study, Unnati13 carried out a pilot study of four nagarpanchayats (municipalities) in Gujarat: Dholka, Khedbrahma, Dharampur, and Amreli�essentially small and medium sizedtowns.
Khedbrahma and Dharampur are category D nagar panchayats (with a population of 15,000�25,000); Dholka is categoryC (with a population of 25,000�50,000); and Amreli is category B (with a population of 50,000�100,000). Some of the issuesthat emerged from the study are highlighted here.
Politics of Superseding Municipalities
The CAA74 sought to provide stability to the political existence of local governing institutions. The new law was to discouragesupersession of town municipalities which arises out of narrow political interests. However, it has not yet effectivelydiscouraged such politics.
The superseding of the Dholka municipality is one such example. In the municipal elections of 1995, the Bharatiya JanataParty (BJP) and Nagarik Samiti (i.e. Congress in disguise) won 12 and 14 seats respectively; one seat went to an independentcandidate. The Nagarik Samiti, with the support of the independent councillor, obtained control of the administration. Theopposition BJP sought supersession of the municipality on charges of mismanagement. After the state government supersededthe town�s elected body, the ruling party, i.e. Nagarik Samiti, obtained a stay order from the High Court against thesupersession till the final hearing of the case. In the meantime, certain councillors changed their political alliances and thusthe BJP came to govern the municipality. Even though there is an anti-defection law to discourage such politics in municipalbodies, changing the ruling party was not difficult.
Similarly, in Khedbrahma the Congress initially had marginal majority in the nagar panchayat with the support of someindependents. But later in 1999, the BJP gained a majority after seven independent councillors switched support to the BJP.
Municipalities and Other Parastatal Bodies
The municipalities depend on parastatal bodies like the GWSSB and the Gujarat Electricity Board (GEB) for infrastructuraldevelopment. The terms of reference and format of the relationships between these parastatal bodies and the municipalityare usually decided by the state government. No transparency or accountability could be discovered in this relationship, sinceno municipal functionary had any information; all seemed to think that another department was responsible for crucialmunicipal services. For example, the sewer lines in Dholka were not yet operational. Although much of the work had beencompleted by the GWSSB, it had yet to hand the facility over to the municipality. The GEB had also not provided the electricityconnection to operate the pumping stations because of the municipality�s pending dues.
Empowerment of Women and Weaker Sections
After the CAA74 there has been a definite and welcome change in the composition of municipalities, though caste andcommunity continue to be the principal bases of coalitions. Women, though formally holding positions, have very littleinvolvement in the governance. Very few women councillors were found to spend time in the municipality offices. In oneinstance, the woman president spent only three hours at the municipality office, but her husband spent the entire day theredoing her work! In Khedbrahma, as an effort towards actualizing local governance by popular participation, women councillorshad come together to involve the people (largely women) in cleaning up garbage in the town. However, the then presidentconstantly discouraged them and told them not to interfere in the work. The otherwise articulate women were �forced� toremain quiet by the chairman who insisted that women should not get involved in such �problems�.
Citizens� Participation
The CAA74 sought to encourage participation of citizens in town administration. However, unlike Panchayats where thereis a provision for holding Gram Sabhas every year, there is no format for contacting citizens for public meetings.
13 An NGO concerned with development education and people�s participation in development in Gujarat and Rajasthan.
256 India Infrastructure Report 2001
In Dharampur, officials talked of citizens� contribution in laying of sewer lines. But on closer examination, the citizens��contribution� was, in fact, nothing but payment of the connection fee. The estimate of citizens� contribution was thereforemerely a projection of the money the municipality would receive if all citizens paid for their connections. The meaning ofcitizens� participation is not as yet clear. But since it is deemed important in the current development scenario, the bureaucracytries to pass off anything as citizens� participation.
In the four municipalities in this study, no planning process had yet been initiated. Municipalities were still very unclearabout the role that they were to perform. The follow-up legislation in Gujarat did not further devolve responsibilities, nordid it spell out any expectation from local governments to participate in planning and development. Additionally, in the pastthere had been no efforts to create capacities within municipalities to do the planning, or even to deal with other competentbodies that can do the job.
Strengthening Municipal Finances
As of local fiscal autonomy, upon the recommendations of the State Finance Commission, principles were to be enunciatedfor tax assignments, sharing of taxes, and grants-in-aid. All the towns are fiscally stressed. Tax collections have not improved.The practice of octroi collection is corrupt. The dues to agencies like the Gujarat Electricity Board (GEB) have mounted.The time-frame in which the State Finance Commission is to submit its recommendations is not clear. Further delays bythe state government could effectively put off the implementation of the Commission�s recommendations.
Devolution of Powers and Responsibilities to Municipalities
The powers devolved to the municipalities through the CAA74 do not give them the autonomy to appoint even one sweeper!These municipalities were seeking permission from the state government to make such appointments. Further, they weremaking �ad hoc� appointments irresponsibly to serve narrow selfish political interests of the elected members. Due to lackof actual devolution of power, the elected representatives considered it to be the responsibility of the state government topay the salaries of employees!
After the CAA74 the term of chairman of the municipality was reduced to one year. This period is barely sufficient formost individuals to even familiarize themselves with the �system�. In all the municipalities, the presidents during their tenure,had indulged in nepotism through ad hoc recruitment in the municipalities.
Transparency and Information Availability to the Citizens
Information sharing regarding the town and its development programmes was almost non-existent. The chaotic state of recordsremains the most problematic aspect of the present system. They had widely varying formats for accounting incomes andexpenditures; the documents were cumbersome and often unclear. The multiplicity of development schemes made it difficulteven for municipal employees to identify relevant details. We attempted to find how much money had been spent inDharampur under various schemes. Though the employees could tell us the total expenditure made on roads, drains, waterpipelines, etc. in their aggregate, they could not provide details of schemewise expenditure. On the other hand, in other towns,information on expenditure was available schemewise but no functionaries could provide the expenditure either on specificservices or in the aggregate!
Conclusion
Besides reforms related to regular elections, reservations of women and weaker sections, and reorganization of wards, etc.the effect of the CAA74 in terms of day-to-day functioning and the financial status of municipalities is negligible.
9.2 URBAN AND INTER- URBAN ROAD DESIGNS IN INDIA :ISSUES CONCERNING MIXED TRAFFIC
Geetam Tiwari
the registered vehicles are MTWs. Cars account for only5�20 per cent of the total vehicle fleet. The road networkis used by at least seven categories of motorized vehicles(MVs) and NMVs. Public transport is the predominantmode of motorized travel in megacities. Buses carry20�65 per cent of the total trips excluding walk trips.
TRAFFIC PATTERNS AND PLANNING ISSUES
IN INDIAN CITIES
A high share of non-motorized vehicles (NMVs) andmotorized two-wheelers (MTW) characterizes the trans-port system of Indian cities. Nearly 45�80 per cent of
The Spatial Context 257
Because bicyclists and pedestrians continue to shareroad space with MVs in the absence of infrastructurespecifically designed for NMVs, they are exposed tohigher risks of road accidents. Unlike cities in the West,pedestrians, bicyclists, and MTWs constitute 75 per centof the total fatalities in road traffic crashes. Buses andtrucks are involved in more than 60 per cent of thefatal crashes. In addition, many indigenously designedvehicles, such as tempos, three-wheeler scooter taxis,and �Vikrams�14 are present on the roads of Indian citiesbecause of the absence of efficient and comfortablepublic transport services. These vehicles operate asparatransit modes, thus serving a useful role in thecontext of social sustainability. However, they haveunique safety and pollution problems, which the Westhas never experienced.
Unlike the traffic in high-income countries, in Indiabicycles and other NMVs are present in significantnumbers on the arterial roads and inter-city highways,which are designed for fast moving, uninterruptedflow of MVs. All modes of traffic use one-, two-, andthree-lane roads. Traffic laws and road designs do notsegregate bicycle traffic and enforcement of speed limitsis minimal. MVs and NMVs have different densities atpeak traffic hours at different locations of cities. Theexisting traffic characteristics, modal mix, location de-tails, geometric design, land use characteristics, and otheroperating characteristics present a unique situation whereeconomic and travel demand compulsions not antici-pated generally have overwhelmed official plans.
The integration of MVs and NMVs has occurred�naturally� on city roads. On two- and three-lane roads,bicycles primarily use the outermost lane on the left,that is the curbside lane, which MVs do not use evenwhen bicycle density is low. Bicyclists use middle lanesonly when making a right-hand turn. Even at one-lanesites, bicyclists occupy the left extreme, giving space tothe MV traffic.
THE �CRITICAL ELEMENT� IN
THE CITY TRANSPORT FABRIC:VULNERABLE ROAD USERS
If urban transport infrastructure does not meet theneeds of vulnerable road users, then the mobility ofother modes is adversely affected. Despite a low levelof vehicle ownership, a high share of public transport,and the presence of NMVs, in most Indian cities the
concentrations of various pollutants exceed levels laiddown in World Health Organization (WHO) standardsfor ambient air quality.
It is evident that investments in projects that aredirected entirely to benefit only car users have not beenable to significantly improve urban speeds. Therebythey may not even have benefited car users as much aswas anticipated.
Congestion relief has been short-lived due to theimpact of latent travel demand. Construction of capital-intensive systems like (MRTS: Mass Rapid TransportSystem) metros has also not resulted in a decreasein congestion and air pollution. In fact, some ofthe intended congestion relief measures (constructionof flyovers, expressways) may have contributed togreater NMV and pedestrian fatalities due to increasedspeeds.
Urban transport systems in Indian cities can becomesustainable and provide mobility with minimal adverseeffects on the environment only if safe and affordabletransport for all sections of population becomes avail-able. Nearly 50 per cent of the people in these citiesneed to live close to places of employment. For survival,they need access to inexpensive modes of travel to work.If the planned transport system does not provide fortheir travel need, they are forced to operate undersuboptimal conditions. In the process, they continue toutilize space that has not been planned for such use.Consequently, land use and transport plans are violatedand all modes of transport operate under suboptimalconditions. The experience of past decades of long-termintegrated land use transport plan exercises suggeststhat the existence of the informal sector and its travelneeds must be recognized in order to prepare effectiveplans. This should encourage mixed land use patternsand transport infrastructure especially designed for bi-cycles and other NMVs.
AVOIDED COSTS THROUGH INVESTMENTS IN
BICYCLE-/NMV-FRIENDLY INFRASTRUCTURE
Providing a separate bicycle/NMV track would makemore space available for MVs and make bicycling lesshazardous. Studies in Delhi carried out for this reportshow that on urban arterials the curbside lane (3.5 m)is used primarily by bicycle and other NMVs. Becauseof the presence of bicycles and NMVs in this lane, busesare forced to stop in the middle lane at bus-stops. MVsdo not use the curbside lane even when bicycle/NMVdensities are low.
A segregated bicycle/NMV lane needs only 2.5 m andsince most of the major arterials in Delhi have a serviceroad, as do some other Indian cities where planned
14 These vehicles have the advantage of flexibility, and are evenable to match the prices of public bus transport. When trafficspeeds are slow enough, they do not impose negative externalitieson faster bus transport, which they otherwise do.
258 India Infrastructure Report 2001
development has taken place after the 1960s, the existingroad space is wide enough to accommodate such a lane.This would not require additional right of way onexisting roads. A detailed study completed in Delhishows how existing roads can be redesigned within thegiven right of way to provide for an exclusive lane forNMVs (Tiwari et al. 1998).
Since a majority of the bicyclists in Indian citiesare daily commuters (captive riders�people who usebicycles despite poor facilities due to lack of options)the proposed network must enable direct and safebicycle travel within a coherent system. The proposedroutes must guarantee a coherent network structure,minimize trip length (directness), and minimize thenumber of encounters between cyclists and MVs (safety).The success of the bicycle/NMV route design dependsupon meeting the requirement of convenience for usersof bicycles and NMVs. Otherwise they are forced toshare the road space with MVs resulting in suboptimalconditions for all vehicles. If the design of arterial roadsincludes integrated NMV lanes along with dedicatedlanes for buses, pedestrian paths and service roads, itwould benefit all road users as discussed in the followingsections.
Increased Capacity
If a separate segregated lane is constructed for bicycles,the curbside lane, which is currently used by bicyclists,becomes available to MVs. This relatively small invest-ment in bicycle lanes can increase the road space forMVs by 50 per cent on three-lane roads. Bicycle lanesalso result in better space utilization. For instance, a 3.5m lane has a carrying capacity of 1800 cars per hour,whereas it can carry 5400 bicycles per hour (Replogle1991). Average occupancy of a car is 1.15 persons (IndianRoads Congrees 1990) and a bicycle carries one person.This implies that in order to move the same number ofpeople in cars, we would need 2.6 times the road areathat would be required for bicyclists. Given the fact thatthere is little space available to expand existing roads, thefuture mobility needs and projected trips can only bemet by increasing the capacity of the existing roadnetwork. This can only be achieved by encouragingmodes that are more efficient in terms of space utiliza-tion�bicycles and buses.
MVs benefit because of improved capacity of theroad and improvement in speeds. Capacity estimationsof a typical arterial road in Delhi (Tiwari 1999) showimprovement in corridor capacity by 19�23 per centthrough providing an exclusive bicycle track. If thefull capacity of the corridor is utilized, that is provisionof a high capacity bus lane in the curbside lane, itcan lead to 56�73 per cent improvement in capacity
(increasing the present carrying capacity of 23,000passengers per hour to 45,000 passengers per hour).
Improved Speeds
Improvement in speeds of MVs will be experienced untilthe corridor is full to capacity due to realization ofinduced demand. Major beneficiaries of speed improve-ment are buses because the curbside lane becomesavailable to them without interference from slow ve-hicles. Estimations of time savings experienced bybus commuters, car occupants, and two-wheeler com-muters on a typical arterial corridor in Delhi (Tota 1999)show 48 per cent reduction in time costs due to 50per cent improvement in the speed of buses (increasingthe present average speed of 15 km per hour to 30 kmper hour) and 30 per cent improvement in the speed ofcars and two-wheelers.
Reduced Congestion
Congestion has long been recognized as an environmen-tal problem. Other than causing delay, it creates noiseand fumes and increases health risks of road users andresidents. Delhi and other Indian cities have invested ingrade separated junctions and flyovers as one of themajor congestion relief measures at an average cost ofRs 100 million to Rs 300 million for each intersection.However, detailed simulations of a major intersectionin Delhi show that replanning the junction to includeseparate NMV lanes and a bus priority lane can effectan 80 per cent improvement in the present level ofdelays. The cost of this measure is 25 times less than theproposed grade separated junction (Karthik 1998).
Increased Safety
By creating segregated bicycle lanes and redesigningintersections, conflicts between MVs and bicyclistscan be reduced substantially, leading to a sharp decreasein the number of accidents and fatalities for bicyclistsand users of MTWs. Safety benefits estimated for atypical arterial road in Delhi show 46 per cent reductionin accident costs. This is because a segregated facilityreduces injury accidents by 40 per cent and fatalities by50 per cent.
Reduced Pollution and Energy Consumption
MVs are reported to be the single largest source of airpollution (70 per cent of total air pollution in Delhi)(Central Pollution Control Board 1998). This is a seriousconcern to bicyclists, pedestrians, and motorists as airquality is worse in or near built-up roads. Bicyclistssuffer the adverse affects of pollution because of heavierbreathing whilst exercising close to the source of exhaust
The Spatial Context 259
pollution. A dedicated infrastructure can reduce thisproblem to some extent. While motorized transport isone of the most polluting of all human activities,bicycling is the least polluting mode of all, as it generatesno noise pollution or toxic emissions. Therefore thereis a need to make cycling more popular. A better bicycleinfrastructure can play an important role in increasingthe modal share of bicycles and thus reduce air pollutionand adverse health effects of pollution.
Energy consumption and pollution also decreasebecause MVs have smoother driving and improvedaverage speeds. Estimations for Delhi corridor show 28per cent reduction in fuel consumption and 29 per centreduction in health externalities related to air pollution(Tota 1999).
Induced Bicycle Trips
There are approximately 1 million households in themiddle to high income category in Delhi. If the averagetrip rate of these households is two per day, at least10 per cent of these trips, especially by school-goingchildren and young adults, could become bicycle tripsfor recreation and school journeys. This group benefitsby expanding their opportunity space to participatein different activities. It is difficut to express this benefitin money terms.
INTER�URBAN TRANSPORT ISSUES
On national and state highways speed variation ondifferent types of highways is primarily because four-lane divided highways also have better quality pave-ments and, therefore, higher average speeds compared tosingle-lane and undivided highways.
The presence of small towns and villages along themain highways changes the character of Indian high-ways. Speed, volume, and density data on sections awayfrom villages and towns measure well enough on theparameter. It is the density of villages and towns alongthe highway that may be considerably slowing down thejourney speeds of long-distance traffic. In other words,when long-distance traffic passes through villages andtowns along the highway, the presence of local trafficand �conflict� between local and long-distance trafficresults in lower speeds and low level of service. There-fore, one can expect improvement in the level of serviceof a given highway by resolving the conflict betweenlocal and long-distance traffic sharing the carriageway.This may require a different cross-sectional design of thehighway that is conventional.
Generally slow-moving vehicles, for example bicycles,tractors, and animal carts, are not present in largenumbers (low flow rates compared to other MVs) on our
inter-city highways. However, because of low speeds,they have much higher shares in densities as comparedto volume shares. They consume a large capacity of theroad because of low speeds. Their presence on the maincarriageway, even if it is in small numbers, results inreduced capacity. In a four-lane highway, the curbsidelane is occupied by slow-moving vehicles and only themiddle lanes are available for fast MVs.
Single-lane and two-lane highways present fewerovertaking opportunities because of the presence ofslow-moving vehicles. On four-lane highways, over-taking opportunities also decrease because of a fewslow-moving vehicles. The deterioration in the level ofservice occurs because of mixing of slow-moving andfast-moving vehicles.
Higher average speeds on four-lane highways areexplained by the presence of cars and trucks movingat higher speeds. Lower average speed of MVs onsingle-lane highways is explained by the presence oftractors and trucks moving at lower speeds. Comparisonbetween two-lane highways without shoulders andthose with 1.5 m and 2.5 m shoulders shows thatthe reduction in the average speed of MVs is higherin the former option compared to the latter. Clearly,the presence of shoulders seems to make a differencein traffic performance. Shoulders provide space forslow-moving vehicles and better overtaking opportuni-ties.
Future highway designs must account for the users ofdifferent transport modes having conflicting require-ments. They must take into consideration MVs� need forclear roads for uninterrupted traffic flow. At the sametime they must address the needs of bicyclistsand pedestrians for shady trees, kiosks for drinks andfood, bicycle repair shops, etc. at shorter distances.Highway planning standards provide for servicesneeded by MV users. However, there are no standardsfor providing services needed by NMVs. These servicesmushroom along urban or inter-city highways tofulfil the demands of road users. However, their exist-ence is viewed as �illegal encroachment� on the designedroad space. Rather than view these as illegal, it isimportant for town and highway planners to incorpo-rate the existence and functionality of such informalservices into their models and designs.
MVs are designed to operate at much higher speedsfor better fuel economy and emission levels. Roads arealso designed to increase throughput of MVs only. Thesemeasures decrease safety of NMV occupants and pedes-trians sharing the same road space.
Urban arterials passing through commercially devel-oped areas and highways passing through small townsserve multiple purposes. They carry through traffic.
260 India Infrastructure Report 2001
However, the adjacent land use generates cross trafficand demands multiple space usage, for example spacefor parking vehicles, hawkers, and informal shopping.The existing design standards do not account for theconflicting demand between local traffic and throughtraffic, resulting in suboptimal conditions for bothkinds.
There is a need to accommodate the conflictingrequirements of NMV occupants and pedestrians andmotorized traffic on our urban and inter-city highways.This includes redesigning the road cross-section settingmore exclusive space for pedestrians and NMVs andgiving pedestrians and bicyclists priority over cars atcertain places.
9.3 VEHICULAR AIR POLLUTION IN INDIA :RECENT CONTROL MEASURES AND RELATED ISSUES
B. P. Pundir
For all industrial and economic activities, personalmobility is essential. Flexibility, door-to-door conve-nience, and often shorter total journey time have re-sulted the world over in the growth of cars andpersonalized motor vehicles. Even where public trans-port is available and subsidized, personal motor cardemand has grown substantially. In India, between 1987and 1997 vehicle population grew threefold from 12.6to 37.2 million. In the West and Japan, actions tocontrol vehicle-generated air pollution started in theearly 1970s and very high success has been achieved. Thesame, however, cannot be said about the third worldcountries, in spite of the wealth of information andexperience available from the advanced countries.15
Delhi is one of most polluted cities in the world.16
This could be attributed to a large number of old andobsolete technology vehicles, a prepondrance of highlypolluting vehicles, bad maintenance, congested trafficconditions, fuel adulteration, and weak enforcement oftraffic discipline and emission regulations. The city ofDelhi has a vehicle mix that is typical of some thirdworld countries and common to much of India. It hasa large number of two- and three-wheelers.
Table 9.3.1 shows that the number of two-wheelersin the country as well as in Delhi is very large compared
to passenger cars due to their low initial and runningcosts as a means of personal transport.17 ThroughoutIndia their numbers have risen by more than 37 per centover the last several years. Cars too have grown at ratesexceeding 30 per cent per cent per annum. The corre-sponding figures for Delhi are 34.7 per cent for two-wheelers and 19.5 per cent for cars. In comparison, thenumber of buses increased by only 26.7 per cent. Similartrends are likely in most other large cities in India exceptMumbai, where two-wheelers are not generally pre-ferred and the number of cars per person is much smallerthan in Delhi. The difference in the composition ofvehicles between Delhi and Mumbai is striking. Theexistence of mass transit systems like suburban railwaysand other efficient means of public transport is animportant reason for the much lower vehicle populationin Mumbai.18
VEHICULAR AIR POLLUTION AND
EMISSION REGULATIONS
In India, to curb growing vehicular air pollution, vehicleemission regulations were implemented for the first timefor vehicles registering in 1991�2. Standards for in-service vehicles were already in place even before 1991in several cities and states. The road transport depart-ments have been issuing certificates to individual ve-hicles annually or half-yearly in the form of PollutionUnder Control (PUC) stickers. Since then, after muchdeliberation, several ad hoc and other steps have beentaken, especially with regard to Delhi. Some of the majordecisions have been as follows:
17 Indeed, the scooter is to India what the car was to the UnitedStates in the 1920s.
18 Another reason could well be the income distribution: thevery large number of upper middle and middle classes in Delhicould be a factor.
15 Tokyo was one of the most polluted cities in the mid-1960s.Since the 1970s pollution levels have come down dramatically, aswith the sharp rise in incomes the willingness and ability to payfor pollution control measures have increased. In poor cities withlower overall �value of life� and inter alia limited capacity tocorrect pollution, they remain high.
16 Thus World Resources (1998�9) reported Delhi to have 415µg/m3 of total suspended particulate matter and over 24 µg/m3
of SO2, and 41 µg/m3 of NO2. Other cities of India were notsignificantly better, and most cities of China were as bad as Delhi.Korea and Taiwan have shown reasonable improvement, andChina is likely to follow suit as incomes rise. Mexico hascontinued to show high urban pollution for well over threedecades.
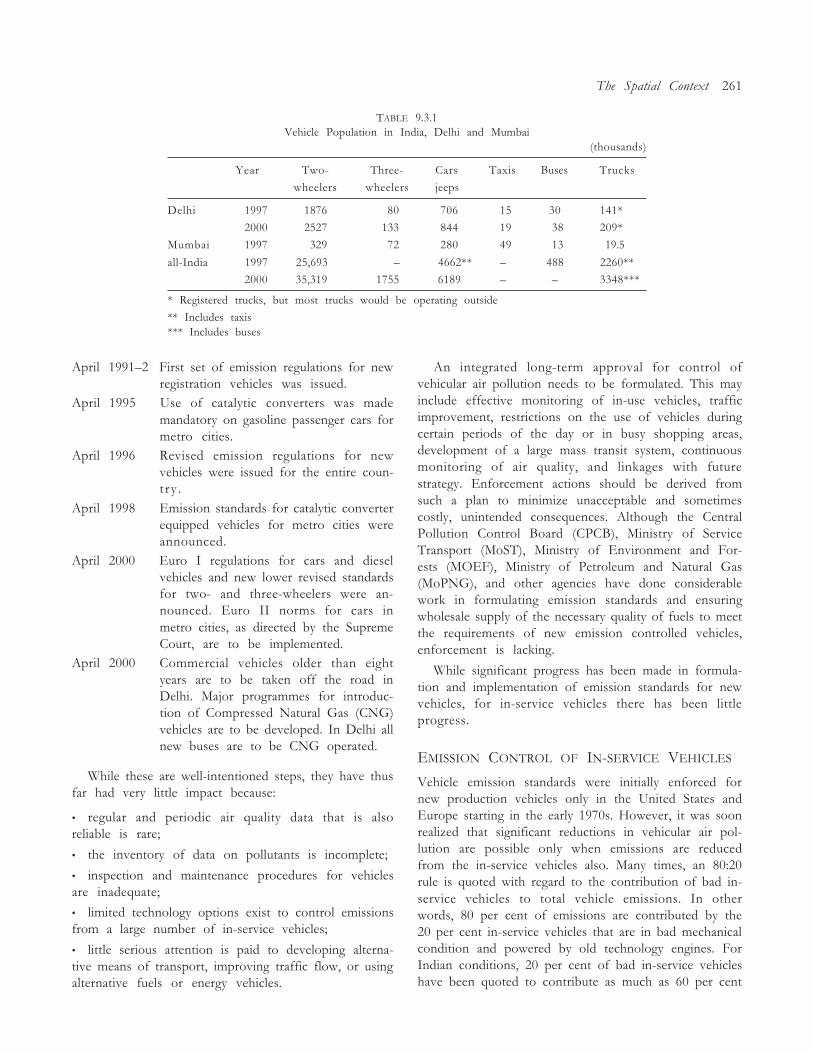
The Spatial Context 261
TABLE 9.3.1Vehicle Population in India, Delhi and Mumbai
(thousands)
Year Two- Three- Cars Taxis Buses Trucks
wheelers wheelers jeeps
Delhi 1997 1876 80 706** 015 30 141*
2000 2527 133 844** 019 038 209*
Mumbai 1997 329 72 280** 049 013 19.5
all-India 1997 25,693 � 4662** � 488 2260**
2000 35,319 1755 6189** � � 3348***
* Registered trucks, but most trucks would be operating outside
** Includes taxis*** Includes buses
April 1991�2 First set of emission regulations for newregistration vehicles was issued.
April 1995 Use of catalytic converters was mademandatory on gasoline passenger cars formetro cities.
April 1996 Revised emission regulations for newvehicles were issued for the entire coun-try .
April 1998 Emission standards for catalytic converterequipped vehicles for metro cities wereannounced.
April 2000 Euro I regulations for cars and dieselvehicles and new lower revised standardsfor two- and three-wheelers were an-nounced. Euro II norms for cars inmetro cities, as directed by the SupremeCourt, are to be implemented.
April 2000 Commercial vehicles older than eightyears are to be taken off the road inDelhi. Major programmes for introduc-tion of Compressed Natural Gas (CNG)vehicles are to be developed. In Delhi allnew buses are to be CNG operated.
While these are well-intentioned steps, they have thusfar had very little impact because:
� regular and periodic air quality data that is alsoreliable is rare;
� the inventory of data on pollutants is incomplete;
� inspection and maintenance procedures for vehiclesare inadequate;
� limited technology options exist to control emissionsfrom a large number of in-service vehicles;
� little serious attention is paid to developing alterna-tive means of transport, improving traffic flow, or usingalternative fuels or energy vehicles.
An integrated long-term approval for control ofvehicular air pollution needs to be formulated. This mayinclude effective monitoring of in-use vehicles, trafficimprovement, restrictions on the use of vehicles duringcertain periods of the day or in busy shopping areas,development of a large mass transit system, continuousmonitoring of air quality, and linkages with futurestrategy. Enforcement actions should be derived fromsuch a plan to minimize unacceptable and sometimescostly, unintended consequences. Although the CentralPollution Control Board (CPCB), Ministry of ServiceTransport (MoST), Ministry of Environment and For-ests (MOEF), Ministry of Petroleum and Natural Gas(MoPNG), and other agencies have done considerablework in formulating emission standards and ensuringwholesale supply of the necessary quality of fuels to meetthe requirements of new emission controlled vehicles,enforcement is lacking.
While significant progress has been made in formula-tion and implementation of emission standards for newvehicles, for in-service vehicles there has been littleprogress.
EMISSION CONTROL OF IN-SERVICE VEHICLES
Vehicle emission standards were initially enforced fornew production vehicles only in the United States andEurope starting in the early 1970s. However, it was soonrealized that significant reductions in vehicular air pol-lution are possible only when emissions are reducedfrom the in-service vehicles also. Many times, an 80:20rule is quoted with regard to the contribution of bad in-service vehicles to total vehicle emissions. In otherwords, 80 per cent of emissions are contributed by the20 per cent in-service vehicles that are in bad mechanicalcondition and powered by old technology engines. ForIndian conditions, 20 per cent of bad in-service vehicleshave been quoted to contribute as much as 60 per cent
262 India Infrastructure Report 2001
to total vehicular emissions. Unless these old or badlytuned vehicles are regularly monitored, repaired, orscrapped, no significant gains towards pollution controlare likely to emerge.
Emission regulations for in-service vehicles have beenin existence since the early 1980s at least in Mumbai,Delhi, and other large cities. For enforcement of theseregulations, a large number of petrol/diesel retail sta-tions and some garages have been authorized to carryout PUC checks biannually or annually for a nominalfee. Despite such checks being in force for more thanfifteen years, a large number of heavily smoking dieselbuses, trucks, and three-wheelers on the road. Petrolcars are expected to be in an equally high pollutingcondition, but as the pollutants from petrol cars areinvisible these do not attract public criticism. Thereasons are not far to seek. The principal reasons thatmake in-use vehicle inspection more or less fruitless oralmost farcical are:
� petrol stations and garages that carry out this activityhave no incentive to do such work correctly;� regular and proper calibration of gas analysers andsmokemeters is rarely done;� inspectors lack training;� the ritual of inspection, rather than the purpose, hastaken precedence. Inspection centres are not equippedto, nor are they required to, adjust or correct pollutingvehicles.
REMEDIAL MEASURES
�Centralised Inspection Centres�, under direct supervi-sion of the police or other authority, are known to beeffective elsewhere. Also, follow-up of failed vehicles toensure that these are repaired and resubmitted forinspection is far easier when carried out by a centralizedinspection. In addition to emissions, these centres carryout safety-related checks, for example wheel alignment,brake tests, and under-carriage inspection, using auto-mated systems. Such centres, in reducing the time forinspection and measurement, also have synergy withother customer needs.
Each well-equipped centre has four to eight test lanesand thus can inspect 1.5 to 3 lakh vehicles every year.Initial investment, excluding land, could be between Rs10 and 20 crore for a four-lane inspection centre. Fivesuch centres have recently been established in Bangladesh,two in Dhaka and three in other cities. In Mexico, thirtysuch centres each with eight test lanes have been estab-lished for a total vehicle stock of 2.6 million.
Stringent new vehicle emission standards also re-quire better quality fuels. Requirements include lead-free
gasoline, low sulphur gasoline and diesel fuels, andupgradation of other properties, for example low aro-matics, high diesel ignition quality, narrow range of fueldensity, lower final boiling point, and use of multifunc-tional additives. Use of oxygenates in petrol can reducepollution.
BENZENE
Following trends in the United States and Europe,environmental agencies in India too are pushing forlowering the benzene in petrol to a maximum 1 per centby volume. But with the high incentive to adulteratepetrol with benzene and other solvents19 remaining,there is little hope of the air quality in cities improving.Two- and three-wheelers that constitute the bulk ofvehicles in urban areas are particularly polluting becausethey use two-stroke engines that exhaust almost 15�25per cent of the fuel unburned outside the engine.
Most of these in-service vehicles are not equippedwith catalytic converters. In view of this, the expectedenvironmental benefits of reducing benzene content inpetrol would not be obtained.
OXYGENATES
Various oxygenated compounds, for example methanol,ethanol, and Methyl tertiary butyle or MTBE, have beenmixed in petrol to reduce carbon monoxide and un-burned fuel emissions from in-use vehicles. However,there has been rethinking on this issue in the UnitedStates and other advanced countries. For example,methanol, being toxic, is no longer permitted for blend-ing by the US Environmental Protection Agency (EPA).MTBE is now thought to be carcinogenic and its use isbeing restricted in certain US states, for example Colo-rado. Ethanol blending, although acceptable, is agricul-tural based and thus is not likely to be cost-effective.20
CNG
The Supreme Court of India has directed in its orderdated 12 August 1998 that the Delhi government mustsubmit and follow a time-bound plan to switch its citybus fleet over on to a clean fuel mode in the NationalCapital Region. The Environmental Pollution (Preven-tion and Control) Authority for the National CapitalRegion accordingly set the following targets for variousagencies with regard to the use of CNG:
19 The recent large-scale adulteration of petrol with industrialsolvents in Gujarat is a case in point.
20 This would be especially so in a land-scarce economy likeIndia.
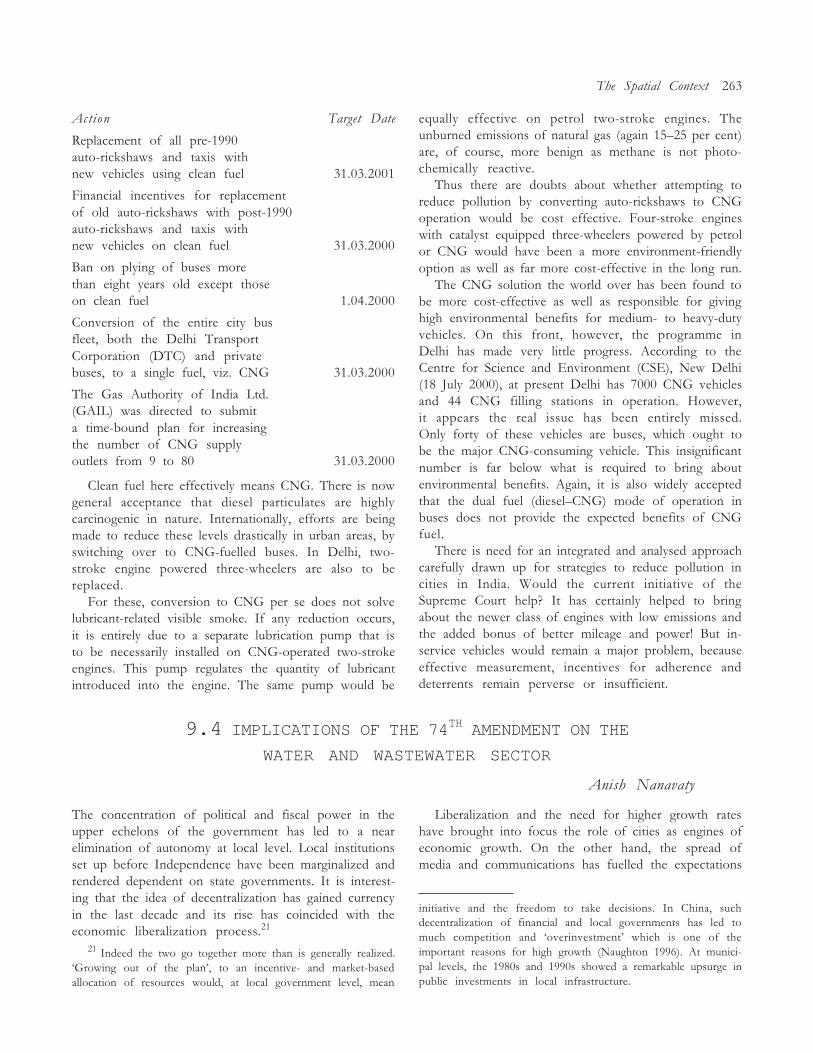
The Spatial Context 263
Action Target Date
Replacement of all pre-1990auto-rickshaws and taxis withnew vehicles using clean fuel 31.03.2001
Financial incentives for replacementof old auto-rickshaws with post-1990auto-rickshaws and taxis withnew vehicles on clean fuel 31.03.2000
Ban on plying of buses morethan eight years old except thoseon clean fuel 1.04.2000
Conversion of the entire city busfleet, both the Delhi TransportCorporation (DTC) and privatebuses, to a single fuel, viz. CNG 31.03.2000
The Gas Authority of India Ltd.(GAIL) was directed to submita time-bound plan for increasingthe number of CNG supplyoutlets from 9 to 80 31.03.2000
Clean fuel here effectively means CNG. There is nowgeneral acceptance that diesel particulates are highlycarcinogenic in nature. Internationally, efforts are beingmade to reduce these levels drastically in urban areas, byswitching over to CNG-fuelled buses. In Delhi, two-stroke engine powered three-wheelers are also to bereplaced.
For these, conversion to CNG per se does not solvelubricant-related visible smoke. If any reduction occurs,it is entirely due to a separate lubrication pump that isto be necessarily installed on CNG-operated two-strokeengines. This pump regulates the quantity of lubricantintroduced into the engine. The same pump would be
equally effective on petrol two-stroke engines. Theunburned emissions of natural gas (again 15�25 per cent)are, of course, more benign as methane is not photo-chemically reactive.
Thus there are doubts about whether attempting toreduce pollution by converting auto-rickshaws to CNGoperation would be cost effective. Four-stroke engineswith catalyst equipped three-wheelers powered by petrolor CNG would have been a more environment-friendlyoption as well as far more cost-effective in the long run.
The CNG solution the world over has been found tobe more cost-effective as well as responsible for givinghigh environmental benefits for medium- to heavy-dutyvehicles. On this front, however, the programme inDelhi has made very little progress. According to theCentre for Science and Environment (CSE), New Delhi(18 July 2000), at present Delhi has 7000 CNG vehiclesand 44 CNG filling stations in operation. However,it appears the real issue has been entirely missed.Only forty of these vehicles are buses, which ought tobe the major CNG-consuming vehicle. This insignificantnumber is far below what is required to bring aboutenvironmental benefits. Again, it is also widely acceptedthat the dual fuel (diesel�CNG) mode of operation inbuses does not provide the expected benefits of CNGfuel.
There is need for an integrated and analysed approachcarefully drawn up for strategies to reduce pollution incities in India. Would the current initiative of theSupreme Court help? It has certainly helped to bringabout the newer class of engines with low emissions andthe added bonus of better mileage and power! But in-service vehicles would remain a major problem, becauseeffective measurement, incentives for adherence anddeterrents remain perverse or insufficient.
9.4 IMPLICATIONS OF THE 74TH AMENDMENT ON THE
WATER AND WASTEWATER SECTOR
Anish Nanavaty
The concentration of political and fiscal power in theupper echelons of the government has led to a nearelimination of autonomy at local level. Local institutionsset up before Independence have been marginalized andrendered dependent on state governments. It is interest-ing that the idea of decentralization has gained currencyin the last decade and its rise has coincided with theeconomic liberalization process.21
21 Indeed the two go together more than is generally realized.�Growing out of the plan�, to an incentive- and market-basedallocation of resources would, at local government level, mean
Liberalization and the need for higher growth rateshave brought into focus the role of cities as engines ofeconomic growth. On the other hand, the spread ofmedia and communications has fuelled the expectations
initiative and the freedom to take decisions. In China, suchdecentralization of financial and local governments has led tomuch competition and �overinvestment� which is one of theimportant reasons for high growth (Naughton 1996). At munici-pal levels, the 1980s and 1990s showed a remarkable upsurge inpublic investments in local infrastructure.
264 India Infrastructure Report 2001
of the people. It is becoming increasingly evident thaturban management and governance need dramatic im-provement to ensure the efficiency and sustainabilityof infrastructure. The 74th Constitutional AmendmentAct (CAA74) of 1992 has significant implications forthe water and wastewater sector. The CAA74 is hereviewed in the light of certain key reforms required forthe development of the sector, and the extent to whichit would aid the reform process is examined.
KEY FEATURES
The CAA74 has been flaunted as an initiative to decen-tralize power and strengthen democracy at local level.The CAA74 accords constitutional status to urban localbodies (ULBs) and prescribes a near uniform localgovernance structure valid across the country. It pro-vides a framework for electing local-level governmentsand for their �effective� functioning to ensure provisionof urban services and infrastructure.
It envisages certain fundamental changes in local self-government and is apparently a step towards opera-tionalizing the Directive Principles of State Policy. TheCAA74 mandates compulsory reconstitution of muni-cipal bodies within a stipulated time-frame, thus ensur-ing continuity of local representatives. The TwelfthSchedule of the CAA74 suggests specific functions andresponsibilities to local bodies. These are:
� urban planning, including town planning;
� regulation of land use and construction of buildings;
� planning for economic and social development;
� roads and bridges;
� water supply for domestic, industrial, and commer-cial purposes;
� public health, sanitation, conservancy, and solid wastemanagement;
� fire services;
� urban forestry, protection of the environment, andpromotion of ecological aspects;
� safeguarding the interests of weaker sections of soci-ety, including the handicapped and mentally retarded;
� slum improvement and upgradation;
� urban poverty alleviation;
� provision of urban amenities and facilities such asparks, gardens, and playgrounds;
� promotion of cultural, educational, and aestheticaspects;
� burials and burial grounds; cremation grounds andelectric crematoria;
� cattle pounds; prevention of cruelty to animals;
� vital statistics, including registration of births anddeaths;
� public amenities including street lighting, parkinglots, bus-stops, and public conveniences;
� regulation of slaughterhouses and tanneries.
Importantly, the CAA74 expressly recognizes arole for the ULBs within the constitutional frameworkand provides for devolution of financial powers fromthe state government for strengthening of municipalfinances.
WATER SECTOR IMPLICATIONS
The Twelfth Schedule includes water supply for domes-tic, industrial, and commercial purposes and publichealth, sanitation, conservancy, and solid waste manage-ment among the recommended municipal functions.The implications of the CAA74 in the light of the keyissues facing the development of urban water and sew-erage are now examined.
EXTENT OF DEVOLUTION
Since water and sewerage services are primarily operatedand maintained by the ULBs, the actual delegation ofthis responsibility may not be a significant issue.
In this regard, it needs to be mentioned that while theCAA74 has explicitly outlined the functions to bedevolved, it has not been as explicit in terms of fiscalpowers. Fiscal devolution has been referred to therespective state finance commissions. Going by therecommendations of the reports already submitted, widevariation has been reported in the extent of fiscaldevolution and furtherance of sectoral reform. Theextent of devolution has been left open to interpretation,and it is likely to be exploited by state governments tomaintain status quo.
However, state governments, through parastatal agen-cies such as state water supply and sewerage boards,industrial development corporations, and city levelboards, have been involved in planning, design, execu-tion, and commissioning of water supply projects.For example, in Maharashtra, the Maharashtra JeevanPradhikaran owns, operates, and maintains 35 urbanwater supply of which 24 involve retail distribution.The Maharashtra Industrial Development Corpora-tion (MIDC) and the Gujarat Industrial Development
The Spatial Context 265
Corporation (GIDC) have been supplying water forindustrial purposes within their industrial estates. Incertain cities such as Chennai, Hyderabad, Bangalore,and most recently Delhi, water and wastewater ser-vices have been delegated to a city-level body whichis directly under the control of the respective stategovernment.
There is an argument that parastatals exist becauseULBs do not have adequate project implementationcapacity. This is precisely the stand that state govern-ments would advance in order to persist with parastatalagencies and delay devolution. Thus, to what extentstate governments will take this opportunity to re-evaluate the industry structure and promote genuinedecentralization is still an open question, in spite ofthe CAA74.
While the larger municipal corporations andcity-level bodies enjoy reasonable autonomy withrespect to planning, design, execution, operation,maintenance, and tariff setting for water and waste-water facilities, other local bodies lack the capacityto plan and implement large infrastructure projects.Hence parastatal agencies arrange financing and under-take planning, design, execution and commissioning ofthe schemes for municipal councils. The schemes aretransferred to local bodies for operation and mainte-nance (O&M).
To the extent that the local ULB is responsiblefor O&M and presumably has the freedom to takedecisions relevant to the task, such an arrangementis justified. But the principal failure of governmentswith regard to water and wastewater is allocative fail-ure�they have not been able to cover as much of thepopulation as they should have. A state monopolymodel has failed in sectors such as power, telecom,insurance, banking, and media and is well on its wayto being discarded. However, there is precious littledebate and thinking on the need for a similar redefinitionin the water sector.
The state water supply and sewerage boards are, ineffect, monopolist technical and financial consultancyorganizations wholly controlled by the government.In the current dispensation, parastatal agencies are theonly agencies that ULBs can approach for assistance inproject implementation. Given the subsidiary natureof the ULB, the parastatal (as a state governmentagency) assumes the more powerful position. Such amonopolistic structure contributes to both erosionof resourcefulness and initiative at ULB level and tolack of innovation and the high cost structure in thesector.
Besides these problems the stifling relationshipbetween smaller ULBs and parastatal bodies results
in displacement of responsibility. The problem goesbeyond water and sewerage to practically all urbanfunctions where an artificial hiatus exists between capac-ity creation and the maintenance of the service. Such ahiatus creates dysfunctions in the task of providingservices in a situation of growing demand. Efficientoperations can improve coverage and better design hasmuch effect on costs and the scope for efficient opera-tions. But perhaps the organizational failure that thusdivided �responsibility� creates is more serious. Urbancouncillors and elected members cannot actually beheld responsible even when they want to do the rightthings, since they have to typically depend upon theparastatals. There is no way the elected representativescan hold the (state-level) offices under their control anddemand their accountability. Inevitably, organizationalstability is reached when the primary task, that ofproviding the service, is displaced by processes that arerule oriented, even in the absence of corruption.More typically, the displacement of responsibility andthe lack of accountability that the relationships en-gender creates the scope for private gain, which can beexploited by both the bureaucracy and the electedmembers.
The standard argument for giving parastatals the rolethey currently enjoy is that most urban bodies, exceptthose of large cities lack the expertise! While this isundoubtedly true, the conclusion that therefore mo-nopolist parastatals must exist, with no freedom ofchoice for the ULBs, and that funds for water develop-ment should be routed through these organizations isfallacious. After all, the capacity to design and build canalways be procured from many sources.
My assertion is that such technical and financialexpertise (which could include public enterprise dis-tanced from government) should ideally reside in theprivate sector and can be separated from the govern-ment. Ideally, the ULB, as the client, should be able tochoose between competing agencies on the basis ofinnovativeness, scope for cost reduction, suitability tolocal conditions, or any such condition and enterinto formal contracts for provision of such services.Simultaneously, agencies possessing technical expertiseshould also be allowed to bid for and execute projectsfor other utilities in the country or abroad. The industrystructure needs to undergo radical change in order toenable such transfer of expertise. The restructuring ofthese agencies is crucial to development of the waterand wastewater sector. The subject still needs furtherinquiry.22 It is only when ULBs have the choice to
22 More is at stake probably than the lack of a correctunderstanding of how organizational (and inter-organizational)
266 India Infrastructure Report 2001
go to other organizations, including private consultantsand developers and even other states� parastatals, thatthey can be held accountable by the people.
Industrial Water Supply
Local bodies should benefit from greater decentrali-zation and sustainable revenue sources. However, asignificant revenue source in most municipal corpora-tions has largely been retained by state governments.The state industrial corporations have continued tosupply water to industrial estates, even within primaryurban areas! As a result, cities with a significantindustrial base, such as Aurangabad, Surat, Indore, andNashik, have been deprived of a buoyant revenuesource and a significant cross-subsidization opportunity.On the other hand, utilities such as the BrihanmumbaiMunicipal Corporation and Hyderabad Metro WaterBoard have benefited in being able to supply to indus-trial customers within their limits. (It needs to bementioned that cross-subsidization is not the solutionand there are limits to its use.) But, that apart, the mixof consumers that industrial use brings, and the roomit creates for a convergence of pricing through thereform process, is being denied to the ULBs. Stateindustrial development corporations in the states ofMaharashtra and Gujarat have been generating surpluseson the water supply account. Local bodies deprived ofthe most lucrative customer segment continue to faceresource constraints that prevent them from becomingindependent entities.
It is important that the entire gamut of activities withregard to water and wastewater service provision beentrusted to the ULBs. This could also be the case withregard to other municipal functions such as roads,streets, lighting, education, health care, and housing,although the dysfunctionalities in the current arrange-ments in these sectors have not yet been looked at.Moreover, the CAA74 expressly includes industrialwater supply as a responsibility of the local body.Such a transfer of responsibility should enable ULBs toview and develop water and wastewater management(including industrial effluents) in an integrated manner.They should also be able to view city developmentin a holistic fashion. This should be seen as a steptowards giving city councillors and mayors a role in
attracting investment to the city and, perhaps, a steptowards the improvement of urban life.
Financing
Water sector projects have been principally financedthrough budgetary allocation and state governmentguaranteed debt. Parastatal agencies have acted as con-duits for multilateral agency funds and capital marketaccess. Given the fiscal situation of most of thestate governments and recent Reserve Bank of India(RBI) directives with respect to greater disclosureson contingent liabilities and capital adequacy require-ments for investee banks, such a financing strategyhas become unsustainable. Indeed the rationale forparastatal agencies continuing as monopolies in thestate sector can be questioned given the objective ofgreater decentraliztion and an understanding of marketfailure.23
A second major issue relates to the need for greateremphasis on cost recovery (of both operating and capitalexpenditure) in project formulation and in credit allo-cation. Such a shift will help in evolution of municipalfinancing institutions such as bond banks and otherpooled financing mechanisms. In this regard, the ULBswill require independent and sustainable sources ofrevenue24 and powers to contract in innovative ways.This is an area that the CAA74 has left for the statefinance commissions to devise. Objective criteria fordevolution of state government funds, including incen-tives for financial prudence, would be of immense helpin sectoral reform.
structures and processes work. As the process of the �contractionof the state� from economic activities is on, the bureaucracy hasbeen particularly active at state level to promote �newer� organi-zations that have the potential to secure and retain certainfinancial privileges that government offices do not have, butmanagers of public enterprise (parastatals) can have.
23 Water supply and sewerage do not have appropriability (orexcludability) problems even in slums if the appropriate organi-zational innovations of �Pani Panchayat� like systems can becreated. Moreover, the function of design, consultancy, andconstruction of water supply projects can be completely un-bundled and would be entirely a competitive activity. There islittle fundamental difference between building a housing colony,a factory, or a water supply scheme. Market failure is largelylimited to the distribution segment of the urban water.
24 Thus far ULBs have not really been free of state governmentsto decide upon user charges. Where they have had a modicum ofautonomy, user charges have been such as to recover as much as80 per cent or more of cost as in the case of Chennai Metrowater.The point is, what is not possible or difficult at the level of theentire state, viz. to have rational and sustainable tariffs, may wellbe possible at a smaller level in a few instances. But once thefunctionality of rational user charges is proved in a few ULBs,others could change by following them. The many ULBs explor-ing various options in a period of financial stress and increasingexpectations are necessary to break the �all or none� kind of bindthat typically holds back state governments, from rational usercharges.
The Spatial Context 267
Local bodies in India have still not been exposedto private sector participation, except by way ofawarding construction contracts. Access to alternatesources of funding would entail efficient utilization.While such models have been considered by certainULBs, all of them have been abandoned. A successstory still eludes this sector. The CAA74, while ithas transferred responsibilities to ULBs, has notgiven them powers to enter into contracts with otherparties to carry these out. An amendment to thateffect would greatly strengthen the ability of ULBsto conceptualize and develop projects involving theprivate sector.
Tariffs
Inadequate cost recovery has been a major impedimentto the development of the water sector in the country.One of the major causes has been low water tarifflevels. A fraction of the O&M expenses are recoveredthrough user charges by local bodies. The averagerecovery, even in progressive states such as Maharashtraand Gujarat, is 68 per cent and 59 per cent respectivelyand it is probably worse in other states. The deficits arebridged either through state government grants orthrough octroi revenues (in the case of municipal cor-porations in Maharashtra and Gujarat). Such a situationis clearly unsustainable.25
The setting and revision of tariffs have been subjectto the approval of the standing committee (composedof elected representatives) in the case of municipalcorporations, and are dictated by state governments inthe case of municipal councils. Elected representativeshave avoided regular tariff revisions for populist rea-sons26 and the local bodies have neglected the O&M ofthe water supply networks. None of the cities in Indiahas a twenty-four hour water supply and only 48 percent of the population have access to drainage facilities.The urban populace, for its part, has been reluctant topay for want of better service. However, the same
consumer is willing to pay premium prices for bottledwater!
Clearly, the autonomy enjoyed by elected represen-tatives has been inimical to the sustainability of thesector. Experience in other sectors suggests that thepolitical class has been reluctant to take tough measures,while independent regulators have been able to enforcediscipline. To correct the situation, it is essential thatsuch an approach be applied to the water sector as welland the tariff revision process be depoliticized. Thepowers related to setting and revision of tariffs need tobe transferred from the elected body to an independentregulatory authority with judicial powers. This apparentcurtailment of powers of the local representatives wouldneed to be reconciled with the decentralization envisagedin the CAA74 through a suitable public consultationmechanism.
Accounting Standards
While complying with the respective Municipal Actsand prescribed formats in recording accounts, the ULBshave been maintaining accounts on a cash basis as againstthe generally accepted accrual-based accounting. In orderto develop a vibrant municipal debt market, it is essentialthat accounting standards be uniformly and strictlyapplied across states. However, the task of makingprovisions with respect to maintenance of accounts andaudit has been vested with state governments! A causeof worry is that given the variance in approachesadopted by the various state finance commissions, it islikely that standards may vary across states, which coulddelay27 the development of the municipal bond market.The Act has provisions that require ULBs to maintainaccounts in accordance with the standards prescribed,and it is hoped that this opportunity will be used by stategovernments and the ULBs to make their accountingsystems and disclosure standards transparent enough toenable investors to analyse them without imposing toohigh a cost.
the infrastructure. Hence it cannot go to the public with aprogramme of increased coverage or better quality linked to tariffincreases.
27 Variation in standards impose large costs on the markets, todevelop familiarity with the intricacies of several different systemsand approaches to accounting.
25 Octroi is a highly distortionary tax and there are huge dead-weight losses in octroi collections. Replacement of octroi with�entry� tax as some governments are planning is no solution either.User charges and collection of local taxes need to improve.
26 An elected body or a group, given the dysfunctional-ities, lacks the credibility to ensure quality supplies through atime bound programme of expansion and improvement of
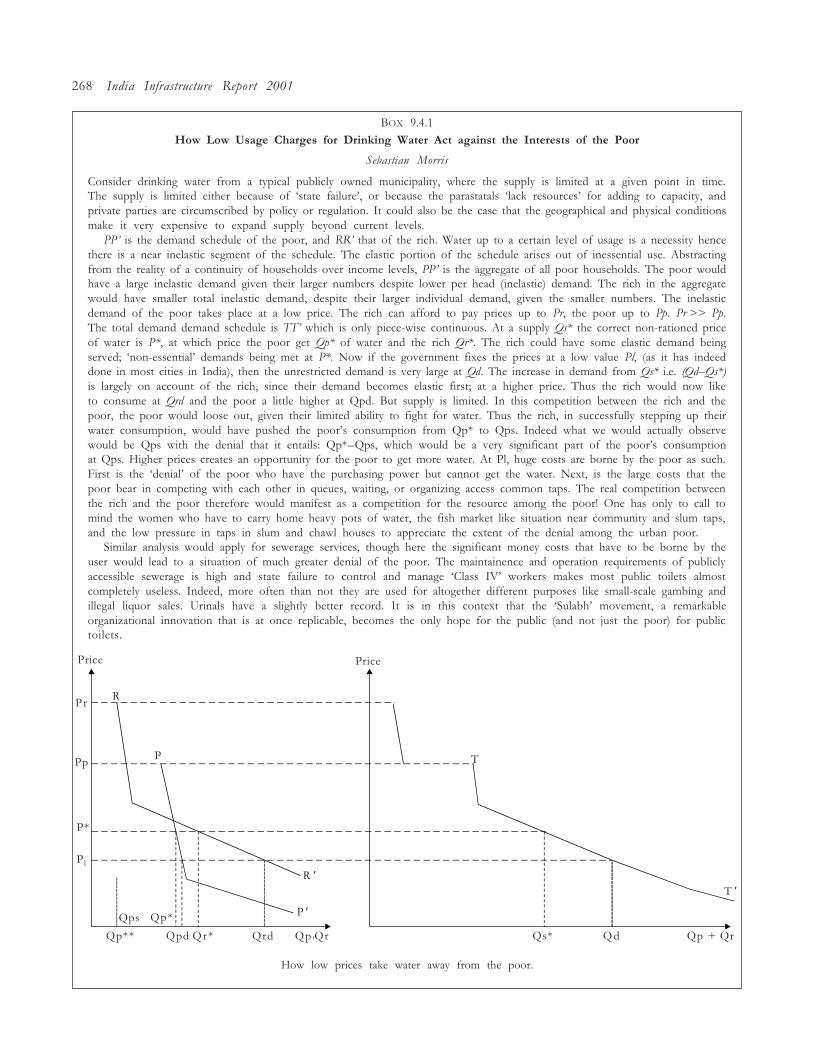
268 India Infrastructure Report 2001
BOX 9.4.1How Low Usage Charges for Drinking Water Act against the Interests of the Poor
Sebastian Morris
Consider drinking water from a typical publicly owned municipality, where the supply is limited at a given point in time.The supply is limited either because of �state failure�, or because the parastatals �lack resources� for adding to capacity, andprivate parties are circumscribed by policy or regulation. It could also be the case that the geographical and physical conditionsmake it very expensive to expand supply beyond current levels.
PP� is the demand schedule of the poor, and RR� that of the rich. Water up to a certain level of usage is a necessity hencethere is a near inelastic segment of the schedule. The elastic portion of the schedule arises out of inessential use. Abstractingfrom the reality of a continuity of households over income levels, PP� is the aggregate of all poor households. The poor wouldhave a large inelastic demand given their larger numbers despite lower per head (inelastic) demand. The rich in the aggregatewould have smaller total inelastic demand, despite their larger individual demand, given the smaller numbers. The inelasticdemand of the poor takes place at a low price. The rich can afford to pay prices up to Pr, the poor up to Pp. Pr >> Pp.The total demand demand schedule is TT� which is only piece-wise continuous. At a supply Qs* the correct non-rationed priceof water is P*, at which price the poor get Qp* of water and the rich Qr*. The rich could have some elastic demand beingserved; �non-essential� demands being met at P*. Now if the government fixes the prices at a low value Pl, (as it has indeeddone in most cities in India), then the unrestricted demand is very large at Qd. The increase in demand from Qs* i.e. (Qd�Qs*)is largely on account of the rich, since their demand becomes elastic first; at a higher price. Thus the rich would now liketo consume at Qrd and the poor a little higher at Qpd. But supply is limited. In this competition between the rich and thepoor, the poor would loose out, given their limited ability to fight for water. Thus the rich, in successfully stepping up theirwater consumption, would have pushed the poor�s consumption from Qp* to Qps. Indeed what we would actually observewould be Qps with the denial that it entails: Qp*�Qps, which would be a very significant part of the poor�s consumptionat Qps. Higher prices creates an opportunity for the poor to get more water. At Pl, huge costs are borne by the poor as such.First is the �denial� of the poor who have the purchasing power but cannot get the water. Next, is the large costs that thepoor bear in competing with each other in queues, waiting, or organizing access common taps. The real competition betweenthe rich and the poor therefore would manifest as a competition for the resource among the poor! One has only to call tomind the women who have to carry home heavy pots of water, the fish market like situation near community and slum taps,and the low pressure in taps in slum and chawl houses to appreciate the extent of the denial among the urban poor.
Similar analysis would apply for sewerage services, though here the significant money costs that have to be borne by theuser would lead to a situation of much greater denial of the poor. The maintainence and operation requirements of publiclyaccessible sewerage is high and state failure to control and manage �Class IV� workers makes most public toilets almostcompletely useless. Indeed, more often than not they are used for altogether different purposes like small-scale gambing andillegal liquor sales. Urinals have a slightly better record. It is in this context that the �Sulabh� movement, a remarkableorganizational innovation that is at once replicable, becomes the only hope for the public (and not just the poor) for publictoilets.
Price Price
Pr R
Pp P
P*
Pl
R '
P 'Qp*
Qp** Qpd Qr* Qrd Qp 'Qr Qs* Q d Qp + Qr
T '
T
How low prices take water away from the poor.
Qps
The Spatial Context 269
9.5 RURAL DRINKING WATER SUPPLY: ISSUES AND STRATEGIES28
Keshab Das
28 The author is deeply indebted to Sebastian Morris foroffering, as always, engagingly critical comments on an earlierdraft. Sincere thanks are due to Nikku Bala Raju, Tara Nair,and participants at the Writers� Workshop held at the IndianInstitute of Management, Ahmedabad for constructive suggestionsand support.
29 This overestimates the average output of a hand pump set.It means that a hand pump is working eight hours a day at 20 litresper minute, not realizable in any but the most ideal conditions.More typically and especially in regions with groundwater tableshundreds of feet below the surface, a hand pump per 50 or 100persons may be required.
INTRODUCTION
Making available clean and safe drinking water, a basicingredient for survival and health, has emerged as amajor challenge facing development in India, especiallyin rural regions. The fast rising demand for the resourcefrom the bourgeoning urban dwellers, industrial units,and agriculturalists, mainly large and medium ones, hasbeen exercising tremendous pressure on current avail-ability, not only in the arid and semi-arid regions butalso in regions traditionally known to be well endowedwith surface and groundwater. With the unmindfulexploitation of groundwater, estimated to be providing80 to 90 per cent of domestic water supply in rural areas,the provisioning of drinking water on a sustainable basisinto the future has become an issue of great concern(Bhatia 1992, Nigam et al. 1998: 10, and Shah et al. 1998:76�81). (See Box 9.5.1 for means of checking this overexploitation.)
Deterioration of the quality of water bodies, bothsurface and underground, due to pollution and misman-agement has affected the quality of water available ad-versely. It may even have affected the quantity inwater-scarce regions that have witnessed overexploitationof groundwater. Releasing untreated or ill-treated indus-trial waste (including harmful chemicals) to rivers oragricultural fields, letting domestic solid and liquid wastescontaminate local sources (including open access sourceslike stand posts (hand pumps), wells, and streams), andallowing commingling of fertilizer and pesticide particleswith field channels are some environmentally most un-desirable end serious acts of commission (Murty et al.1999: 1�8). By thus polluting freshwater resources, suchpractices render potential drinking water supply bothunavailable and unsustainable, irrespective of the issueof affordability. Using polluted or unsafe water resultsin diseases that kill over 1.5 million children (under 5years of age) every year in rural areas. An annual lossof over 200 million person days of work to the nation(Parikh et al. 1999: 2, quoting information from theMinistry of Rural Development) is another result.
As per the prevailing norms (for �fully covered� or FChabitations) for rural water supply through public safe
sources, for 40 litres of drinking water per capita per day(lpcd) are required to be provided, or, in operationalterms, a public stand post or hand pump every 25029
persons. The location of the source of water should notbe beyond 1.6 km in the plains and 100 m in hilly areas.Based upon these norms, as on 1 April 1997, whereas asmany as 61,724 rural habitations (hamlets) did not haveaccess to any public source of safe water (categorized as�not covered� or NC habitations), a substantial 3.78 lakhhabitations were classified as �partially covered� (PC).Further, 1.51 lakh habitations suffered from major waterquality problems, such as excess fluoride, salinity, iron,and arsenic (Planning Commission 2000:409). At aroundthe same period, it is estimated, a staggering 90 millionpeople in Indian villages did not have any access to safedrinking water sources!
As detailed in Fig. 9.5.1, there are a number of factors,both endogenous and exogenous, which can and doadversely affect water supply status in rural areas. Giventhe potential threat of regression of the status of safewater supply, the important issue is whether these setnorms of rural water supply are realizable. Also, can anadequate level of provision of the resource be achievedon a sustainable basis?
STATAL ROLE: CHASING CHANGING TARGETS
In India, although the issue of water supply in rural areashas been assigned importance since the very inceptionof the five year plans, the actualization of stated goalslacked earnestness. The Rural Water Supply Programmewas initiated during the First Five Year Plan and a fewyears later, in 1954, a programme of water supply andsanitation was taken up in the social welfare sector aspart of central health schemes. However, the programmefailed to achieve its objectives within the specifiedtime-frame. It was not until 1972�3 that the drinkingwater issue could be addressed in any comprehensivemanner, when the Accelerated Rural Water SupplyProgramme (ARWSP) was introduced. In 1974�5 withthe launching of the Minimum Needs Programme (MNP),which incorporated the rural water supply component,
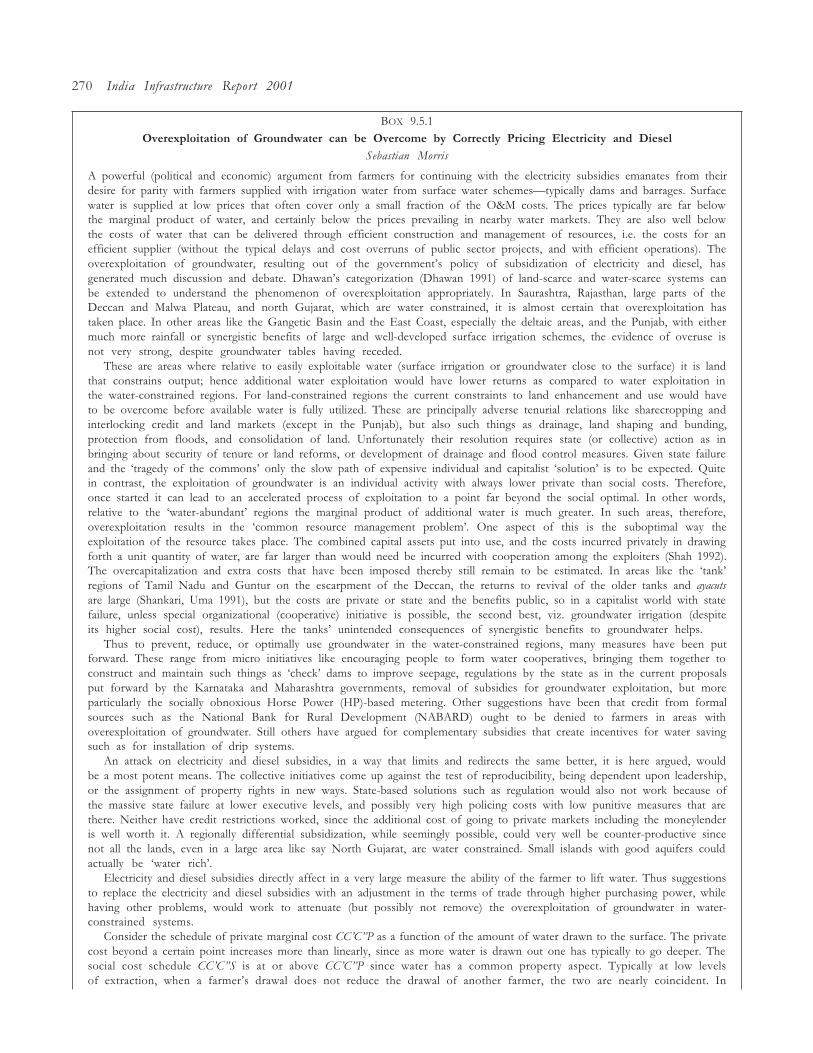
270 India Infrastructure Report 2001
BOX 9.5.1Overexploitation of Groundwater can be Overcome by Correctly Pricing Electricity and Diesel
Sebastian Morris
A powerful (political and economic) argument from farmers for continuing with the electricity subsidies emanates from theirdesire for parity with farmers supplied with irrigation water from surface water schemes�typically dams and barrages. Surfacewater is supplied at low prices that often cover only a small fraction of the O&M costs. The prices typically are far belowthe marginal product of water, and certainly below the prices prevailing in nearby water markets. They are also well belowthe costs of water that can be delivered through efficient construction and management of resources, i.e. the costs for anefficient supplier (without the typical delays and cost overruns of public sector projects, and with efficient operations). Theoverexploitation of groundwater, resulting out of the government�s policy of subsidization of electricity and diesel, hasgenerated much discussion and debate. Dhawan�s categorization (Dhawan 1991) of land-scarce and water-scarce systems canbe extended to understand the phenomenon of overexploitation appropriately. In Saurashtra, Rajasthan, large parts of theDeccan and Malwa Plateau, and north Gujarat, which are water constrained, it is almost certain that overexploitation hastaken place. In other areas like the Gangetic Basin and the East Coast, especially the deltaic areas, and the Punjab, with eithermuch more rainfall or synergistic benefits of large and well-developed surface irrigation schemes, the evidence of overuse isnot very strong, despite groundwater tables having receded.
These are areas where relative to easily exploitable water (surface irrigation or groundwater close to the surface) it is landthat constrains output; hence additional water exploitation would have lower returns as compared to water exploitation inthe water-constrained regions. For land-constrained regions the current constraints to land enhancement and use would haveto be overcome before available water is fully utilized. These are principally adverse tenurial relations like sharecropping andinterlocking credit and land markets (except in the Punjab), but also such things as drainage, land shaping and bunding,protection from floods, and consolidation of land. Unfortunately their resolution requires state (or collective) action as inbringing about security of tenure or land reforms, or development of drainage and flood control measures. Given state failureand the �tragedy of the commons� only the slow path of expensive individual and capitalist �solution� is to be expected. Quitein contrast, the exploitation of groundwater is an individual activity with always lower private than social costs. Therefore,once started it can lead to an accelerated process of exploitation to a point far beyond the social optimal. In other words,relative to the �water-abundant� regions the marginal product of additional water is much greater. In such areas, therefore,overexploitation results in the �common resource management problem�. One aspect of this is the suboptimal way theexploitation of the resource takes place. The combined capital assets put into use, and the costs incurred privately in drawingforth a unit quantity of water, are far larger than would need be incurred with cooperation among the exploiters (Shah 1992).The overcapitalization and extra costs that have been imposed thereby still remain to be estimated. In areas like the �tank�regions of Tamil Nadu and Guntur on the escarpment of the Deccan, the returns to revival of the older tanks and ayacutsare large (Shankari, Uma 1991), but the costs are private or state and the benefits public, so in a capitalist world with statefailure, unless special organizational (cooperative) initiative is possible, the second best, viz. groundwater irrigation (despiteits higher social cost), results. Here the tanks� unintended consequences of synergistic benefits to groundwater helps.
Thus to prevent, reduce, or optimally use groundwater in the water-constrained regions, many measures have been putforward. These range from micro initiatives like encouraging people to form water cooperatives, bringing them together toconstruct and maintain such things as �check� dams to improve seepage, regulations by the state as in the current proposalsput forward by the Karnataka and Maharashtra governments, removal of subsidies for groundwater exploitation, but moreparticularly the socially obnoxious Horse Power (HP)-based metering. Other suggestions have been that credit from formalsources such as the National Bank for Rural Development (NABARD) ought to be denied to farmers in areas withoverexploitation of groundwater. Still others have argued for complementary subsidies that create incentives for water savingsuch as for installation of drip systems.
An attack on electricity and diesel subsidies, in a way that limits and redirects the same better, it is here argued, wouldbe a most potent means. The collective initiatives come up against the test of reproducibility, being dependent upon leadership,or the assignment of property rights in new ways. State-based solutions such as regulation would also not work because ofthe massive state failure at lower executive levels, and possibly very high policing costs with low punitive measures that arethere. Neither have credit restrictions worked, since the additional cost of going to private markets including the moneylenderis well worth it. A regionally differential subsidization, while seemingly possible, could very well be counter-productive sincenot all the lands, even in a large area like say North Gujarat, are water constrained. Small islands with good aquifers couldactually be �water rich�.
Electricity and diesel subsidies directly affect in a very large measure the ability of the farmer to lift water. Thus suggestionsto replace the electricity and diesel subsidies with an adjustment in the terms of trade through higher purchasing power, whilehaving other problems, would work to attenuate (but possibly not remove) the overexploitation of groundwater in water-constrained systems.
Consider the schedule of private marginal cost CC�C�P as a function of the amount of water drawn to the surface. The privatecost beyond a certain point increases more than linearly, since as more water is drawn out one has typically to go deeper. Thesocial cost schedule CC�C�S is at or above CC�C�P since water has a common property aspect. Typically at low levelsof extraction, when a farmer�s drawal does not reduce the drawal of another farmer, the two are nearly coincident. In
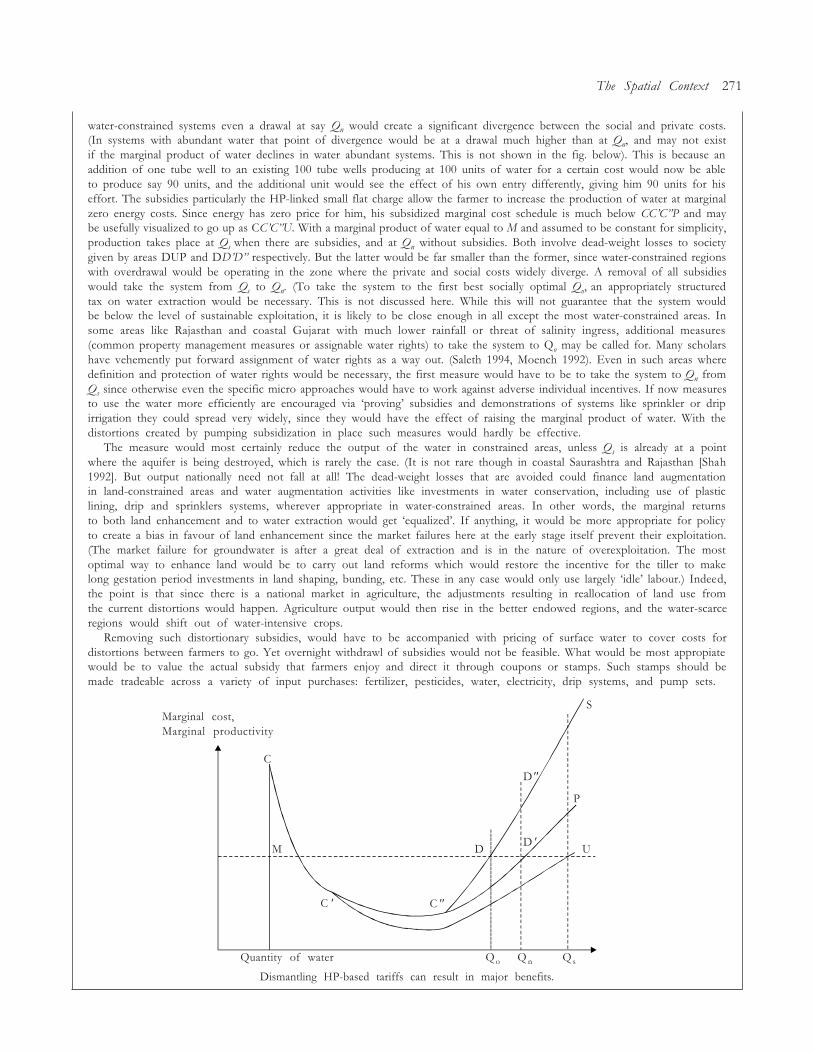
The Spatial Context 271
water-constrained systems even a drawal at say Qn would create a significant divergence between the social and private costs.(In systems with abundant water that point of divergence would be at a drawal much higher than at Qn, and may not existif the marginal product of water declines in water abundant systems. This is not shown in the fig. below). This is because anaddition of one tube well to an existing 100 tube wells producing at 100 units of water for a certain cost would now be ableto produce say 90 units, and the additional unit would see the effect of his own entry differently, giving him 90 units for hiseffort. The subsidies particularly the HP-linked small flat charge allow the farmer to increase the production of water at marginalzero energy costs. Since energy has zero price for him, his subsidized marginal cost schedule is much below CC�C�P and maybe usefully visualized to go up as CC�C�U. With a marginal product of water equal to M and assumed to be constant for simplicity,production takes place at Qs when there are subsidies, and at Qn without subsidies. Both involve dead-weight losses to societygiven by areas DUP and DD�D� respectively. But the latter would be far smaller than the former, since water-constrained regionswith overdrawal would be operating in the zone where the private and social costs widely diverge. A removal of all subsidieswould take the system from Qs to Qn. (To take the system to the first best socially optimal Qo, an appropriately structuredtax on water extraction would be necessary. This is not discussed here. While this will not guarantee that the system wouldbe below the level of sustainable exploitation, it is likely to be close enough in all except the most water-constrained areas. Insome areas like Rajasthan and coastal Gujarat with much lower rainfall or threat of salinity ingress, additional measures(common property management measures or assignable water rights) to take the system to Qo may be called for. Many scholarshave vehemently put forward assignment of water rights as a way out. (Saleth 1994, Moench 1992). Even in such areas wheredefinition and protection of water rights would be necessary, the first measure would have to be to take the system to Qn fromQs since otherwise even the specific micro approaches would have to work against adverse individual incentives. If now measuresto use the water more efficiently are encouraged via �proving� subsidies and demonstrations of systems like sprinkler or dripirrigation they could spread very widely, since they would have the effect of raising the marginal product of water. With thedistortions created by pumping subsidization in place such measures would hardly be effective.
The measure would most certainly reduce the output of the water in constrained areas, unless Qs is already at a pointwhere the aquifer is being destroyed, which is rarely the case. (It is not rare though in coastal Saurashtra and Rajasthan [Shah1992]. But output nationally need not fall at all! The dead-weight losses that are avoided could finance land augmentationin land-constrained areas and water augmentation activities like investments in water conservation, including use of plasticlining, drip and sprinklers systems, wherever appropriate in water-constrained areas. In other words, the marginal returnsto both land enhancement and to water extraction would get �equalized�. If anything, it would be more appropriate for policyto create a bias in favour of land enhancement since the market failures here at the early stage itself prevent their exploitation.(The market failure for groundwater is after a great deal of extraction and is in the nature of overexploitation. The mostoptimal way to enhance land would be to carry out land reforms which would restore the incentive for the tiller to makelong gestation period investments in land shaping, bunding, etc. These in any case would only use largely �idle� labour.) Indeed,the point is that since there is a national market in agriculture, the adjustments resulting in reallocation of land use fromthe current distortions would happen. Agriculture output would then rise in the better endowed regions, and the water-scarceregions would shift out of water-intensive crops.
Removing such distortionary subsidies, would have to be accompanied with pricing of surface water to cover costs fordistortions between farmers to go. Yet overnight withdrawl of subsidies would not be feasible. What would be most appropiatewould be to value the actual subsidy that farmers enjoy and direct it through coupons or stamps. Such stamps should bemade tradeable across a variety of input purchases: fertilizer, pesticides, water, electricity, drip systems, and pump sets.
Dismantling HP-based tariffs can result in major benefits.
Marginal cost,Marginal productivity
Quantity of water Qo Q n Qs
M D UD '
D"
P
S
C
C"C '
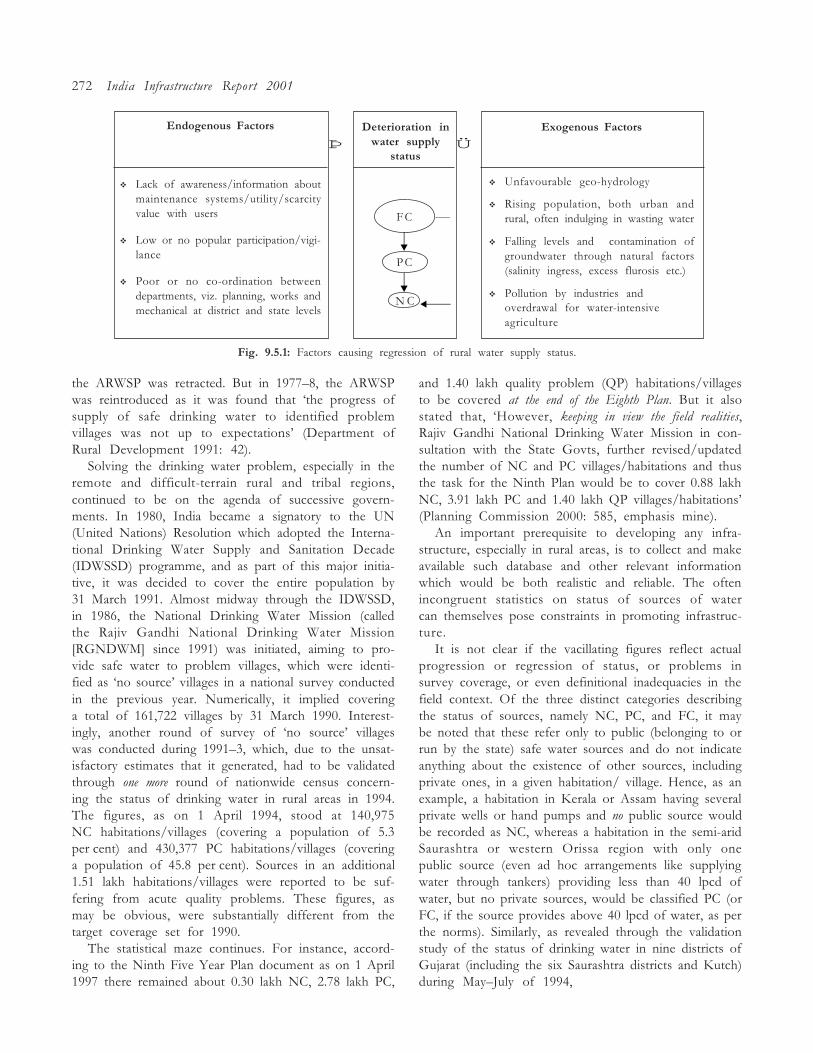
272 India Infrastructure Report 2001
Endogenous Factors
v Lack of awareness/information aboutmaintenance systems/utility/scarcityvalue with users
v Low or no popular participation/vigi-lance
v Poor or no co-ordination betweendepartments, viz. planning, works andmechanical at district and state levels
Deterioration inwater supply
status
Exogenous Factors
v Unfavourable geo-hydrology
v Rising population, both urban andrural, often indulging in wasting water
v Falling levels and contamination ofgroundwater through natural factors(salinity ingress, excess flurosis etc.)
v Pollution by industries andoverdrawal for water-intensiveagriculture
Þ Ü
Fig. 9.5.1: Factors causing regression of rural water supply status.
the ARWSP was retracted. But in 1977�8, the ARWSPwas reintroduced as it was found that �the progress ofsupply of safe drinking water to identified problemvillages was not up to expectations� (Department ofRural Development 1991: 42).
Solving the drinking water problem, especially in theremote and difficult-terrain rural and tribal regions,continued to be on the agenda of successive govern-ments. In 1980, India became a signatory to the UN(United Nations) Resolution which adopted the Interna-tional Drinking Water Supply and Sanitation Decade(IDWSSD) programme, and as part of this major initia-tive, it was decided to cover the entire population by31 March 1991. Almost midway through the IDWSSD,in 1986, the National Drinking Water Mission (calledthe Rajiv Gandhi National Drinking Water Mission[RGNDWM] since 1991) was initiated, aiming to pro-vide safe water to problem villages, which were identi-fied as �no source� villages in a national survey conductedin the previous year. Numerically, it implied coveringa total of 161,722 villages by 31 March 1990. Interest-ingly, another round of survey of �no source� villageswas conducted during 1991�3, which, due to the unsat-isfactory estimates that it generated, had to be validatedthrough one more round of nationwide census concern-ing the status of drinking water in rural areas in 1994.The figures, as on 1 April 1994, stood at 140,975NC habitations/villages (covering a population of 5.3per cent) and 430,377 PC habitations/villages (coveringa population of 45.8 per cent). Sources in an additional1.51 lakh habitations/villages were reported to be suf-fering from acute quality problems. These figures, asmay be obvious, were substantially different from thetarget coverage set for 1990.
The statistical maze continues. For instance, accord-ing to the Ninth Five Year Plan document as on 1 April1997 there remained about 0.30 lakh NC, 2.78 lakh PC,
and 1.40 lakh quality problem (QP) habitations/villagesto be covered at the end of the Eighth Plan. But it alsostated that, �However, keeping in view the field realities,Rajiv Gandhi National Drinking Water Mission in con-sultation with the State Govts, further revised/updatedthe number of NC and PC villages/habitations and thusthe task for the Ninth Plan would be to cover 0.88 lakhNC, 3.91 lakh PC and 1.40 lakh QP villages/habitations�(Planning Commission 2000: 585, emphasis mine).
An important prerequisite to developing any infra-structure, especially in rural areas, is to collect and makeavailable such database and other relevant informationwhich would be both realistic and reliable. The oftenincongruent statistics on status of sources of watercan themselves pose constraints in promoting infrastruc-ture.
It is not clear if the vacillating figures reflect actualprogression or regression of status, or problems insurvey coverage, or even definitional inadequacies in thefield context. Of the three distinct categories describingthe status of sources, namely NC, PC, and FC, it maybe noted that these refer only to public (belonging to orrun by the state) safe water sources and do not indicateanything about the existence of other sources, includingprivate ones, in a given habitation/ village. Hence, as anexample, a habitation in Kerala or Assam having severalprivate wells or hand pumps and no public source wouldbe recorded as NC, whereas a habitation in the semi-aridSaurashtra or western Orissa region with only onepublic source (even ad hoc arrangements like supplyingwater through tankers) providing less than 40 lpcd ofwater, but no private sources, would be classified PC (orFC, if the source provides above 40 lpcd of water, as perthe norms). Similarly, as revealed through the validationstudy of the status of drinking water in nine districts ofGujarat (including the six Saurashtra districts and Kutch)during May�July of 1994,
F C
P C
N C
The Spatial Context 273
there were many villages/habitations not covered by anypublic source, but not included in the original list [of NChabitations of the 1991�3 survey, which were being validatedin the 1994 survey] provided by the RGNDWM. Interestingly,from the given RGNDWM list, nothing could be knownabout the habitations which would have turned NC, from PCor FC status during the 1991�3 survey. Possibly, these unac-counted NC habitations were classified as either PC or FC inthe previous survey, when some sources of water still re-mained active during winter. [Das and Kumar 1995: 4]
It is important to note the period of survey throughwhich the status is assigned. Surveys conducted duringnon-summer seasons are most likely to come up withgross underestimates of NC habitations, particularly inthe large arid and semi-arid regions of India.
Inexactitude in the data on rural drinking watersupply status notwithstanding, with the massive backlogin the coverage the Ninth Plan has estimated therequired funds for full coverage to be to the tune ofRs 40,000 crore, including the costs of operation andmaintenance (O&M) and quality control. On average,as suggested by the RGNDWM, about 6 per cent of thecapital investment is required annually for appropriaterepairs and maintenance of the systems. It is clear thatsuch resources cannot continue to be provided throughthe 10 per cent MNP/ARWSP plan funds and limitednon-plan resources of the states. Given the economic andfinancial scenario, it is difficult to visualize publicresources of such magnitude coming forth and hence theneed for involvement of communities, institutions, andthe private sector is urgent.
THE PROBLEM OF MOBILIZING FINANCE
Irrespective of the fact that water, especially in ruralareas, has been viewed and used �largely due to allocativeanomalies and also misplaced notions about the copious-ness of the resource as often reinforced through politicalplatitudes�as a �free� good (which the government isobliged to provide), the very phenomenon of emergingscarcity and continuing inefficient use qualifies it asan �economic� good. However, unlike in urban watersupply, where user charges are not uncommon and areacceptable, the concept of charging users for water fordomestic use in rural areas has been �less widely en-dorsed�, as it is held that the large number of people inpoverty in Indian villages cannot afford to pay for �sucha thing as water�. But as has been argued perceptively,even the adoption of a �free� water policy can, in effect,act against the interests of the poorest and vulnerablegroups. For this section of the population
such notions as �free� water bear little relation to their actualsituation since they continue to pay a high price for water in
terms of time and energy expended in obtaining sources ofdrinking water and, in severely affected areas, they buy waterfrom private vendors during water-scarce seasons of the year.[Secretariat for Global Consultation 1990: 42]
It has been observed that in order to improve infra-structure for rural water supply the required capitalinvestment would be very large, also it would involvelong periods before pay off. It would hence be difficultto attract private investors to such a sector where returnsto investment would not only be uncertain but delayed.�High-risk, long payback periods and pricing limitationsof the Rural Water Supply and Sanitation or RWSSsector as presently structured, serve as serious disincen-tives to potentially interested parties. Such disincentivesdiscourage even government-sponsored credit facilities�(World Bank 1999: 41). It may not be incorrect to holdthat water, at least in rural areas, has the characteristicsof both public and open access goods. Whereas itsexcludability is low because of dual identity, thesubtractability is also low, it being a publc good. As hasbeen aptly remarked, �Private firms do not engage inactivities with low excludability because it is difficult toget consumers pay. Where low substitutability exists,market forces will not produce an optimal level ofinvestment� (Easter et al. 1998: 581). Towards promotingand sustaining new and existing capital investment,much would, hence, depend upon a demand-drivenapproach that would reflect the nature and extent ofusers� willingness to participate in managing the systemand, more importantly, to share both capital cost aswell as maintenance (World Bank 1999: 45).
So far as plan investment for rural water supply as aproportion of public sector plan is concerned, there hasbeen a gradual, and slow, rise from 0.15 to 2.47 per centduring the eight plans. The persistent low priority (interms of investment, if not intentions) attached to thissector in successive plans per se makes user financingalmost a necessity. The case for recognizing the growingcost and its sharing by the beneficiaries has been gettingstronger, especially in concerned global conventions.Demand responsiveness, instead of the conventionalsupply-driven approach and direct involvement of thelocal community have been emphasized as the mosteffective mechanisms to ensure proper management anddelivery of water to rural population (Pendley 1997: 10).
Statewise estimates for user charges for water supplyin rural India have been calculated by Pushpangadan andMurugan (1997), using Faulhaber�s (1975) methodologyon cross-subsidization. As may be clear from the esti-mates, reproduced in Table 9.5.1, in case of the ruralpoor (defined as those living below the official povertyline) being fully cross-subsidized by the better-off users,the monthly expenditure per family paying user charges

Table 9 v.1 in wide page 274
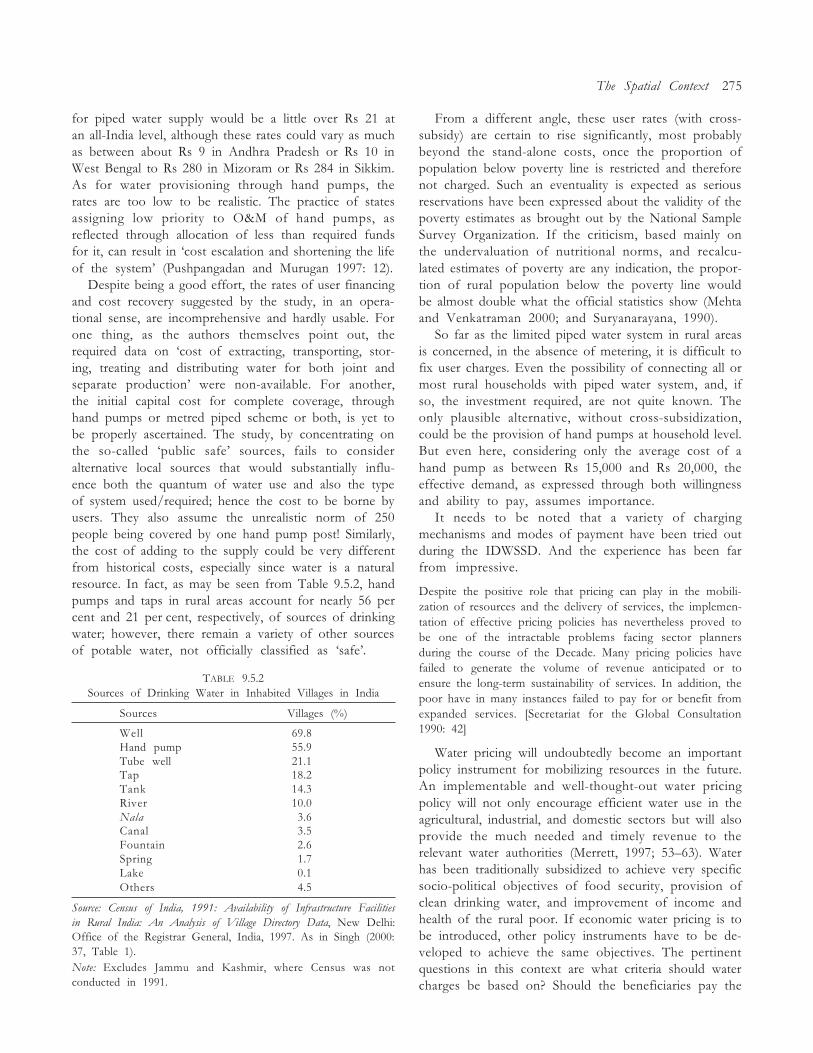
The Spatial Context 275
for piped water supply would be a little over Rs 21 atan all-India level, although these rates could vary as muchas between about Rs 9 in Andhra Pradesh or Rs 10 inWest Bengal to Rs 280 in Mizoram or Rs 284 in Sikkim.As for water provisioning through hand pumps, therates are too low to be realistic. The practice of statesassigning low priority to O&M of hand pumps, asreflected through allocation of less than required fundsfor it, can result in �cost escalation and shortening the lifeof the system� (Pushpangadan and Murugan 1997: 12).
Despite being a good effort, the rates of user financingand cost recovery suggested by the study, in an opera-tional sense, are incomprehensive and hardly usable. Forone thing, as the authors themselves point out, therequired data on �cost of extracting, transporting, stor-ing, treating and distributing water for both joint andseparate production� were non-available. For another,the initial capital cost for complete coverage, throughhand pumps or metred piped scheme or both, is yet tobe properly ascertained. The study, by concentrating onthe so-called �public safe� sources, fails to consideralternative local sources that would substantially influ-ence both the quantum of water use and also the typeof system used/required; hence the cost to be borne byusers. They also assume the unrealistic norm of 250people being covered by one hand pump post! Similarly,the cost of adding to the supply could be very differentfrom historical costs, especially since water is a naturalresource. In fact, as may be seen from Table 9.5.2, handpumps and taps in rural areas account for nearly 56 percent and 21 per cent, respectively, of sources of drinkingwater; however, there remain a variety of other sourcesof potable water, not officially classified as �safe�.
TABLE 9.5.2Sources of Drinking Water in Inhabited Villages in India
Sources Villages (%)
Well 69.8Hand pump 55.9Tube well 21.1Tap 18.2Tank 14.3River 10.0Nala 3.6Canal 3.5Fountain 2.6Spring 1.7Lake 0.1Others 4.5
Source: Census of India, 1991: Availability of Infrastructure Facilitiesin Rural India: An Analysis of Village Directory Data, New Delhi:Office of the Registrar General, India, 1997. As in Singh (2000:37, Table 1).Note: Excludes Jammu and Kashmir, where Census was notconducted in 1991.
From a different angle, these user rates (with cross-subsidy) are certain to rise significantly, most probablybeyond the stand-alone costs, once the proportion ofpopulation below poverty line is restricted and thereforenot charged. Such an eventuality is expected as seriousreservations have been expressed about the validity of thepoverty estimates as brought out by the National SampleSurvey Organization. If the criticism, based mainly onthe undervaluation of nutritional norms, and recalcu-lated estimates of poverty are any indication, the propor-tion of rural population below the poverty line wouldbe almost double what the official statistics show (Mehtaand Venkatraman 2000; and Suryanarayana, 1990).
So far as the limited piped water system in rural areasis concerned, in the absence of metering, it is difficult tofix user charges. Even the possibility of connecting all ormost rural households with piped water system, and, ifso, the investment required, are not quite known. Theonly plausible alternative, without cross-subsidization,could be the provision of hand pumps at household level.But even here, considering only the average cost of ahand pump as between Rs 15,000 and Rs 20,000, theeffective demand, as expressed through both willingnessand ability to pay, assumes importance.
It needs to be noted that a variety of chargingmechanisms and modes of payment have been tried outduring the IDWSSD. And the experience has been farfrom impressive.
Despite the positive role that pricing can play in the mobili-zation of resources and the delivery of services, the implemen-tation of effective pricing policies has nevertheless proved tobe one of the intractable problems facing sector plannersduring the course of the Decade. Many pricing policies havefailed to generate the volume of revenue anticipated or toensure the long-term sustainability of services. In addition, thepoor have in many instances failed to pay for or benefit fromexpanded services. [Secretariat for the Global Consultation1990: 42]
Water pricing will undoubtedly become an importantpolicy instrument for mobilizing resources in the future.An implementable and well-thought-out water pricingpolicy will not only encourage efficient water use in theagricultural, industrial, and domestic sectors but will alsoprovide the much needed and timely revenue to therelevant water authorities (Merrett, 1997; 53�63). Waterhas been traditionally subsidized to achieve very specificsocio-political objectives of food security, provision ofclean drinking water, and improvement of income andhealth of the rural poor. If economic water pricing is tobe introduced, other policy instruments have to be de-veloped to achieve the same objectives. The pertinentquestions in this context are what criteria should watercharges be based on? Should the beneficiaries pay the
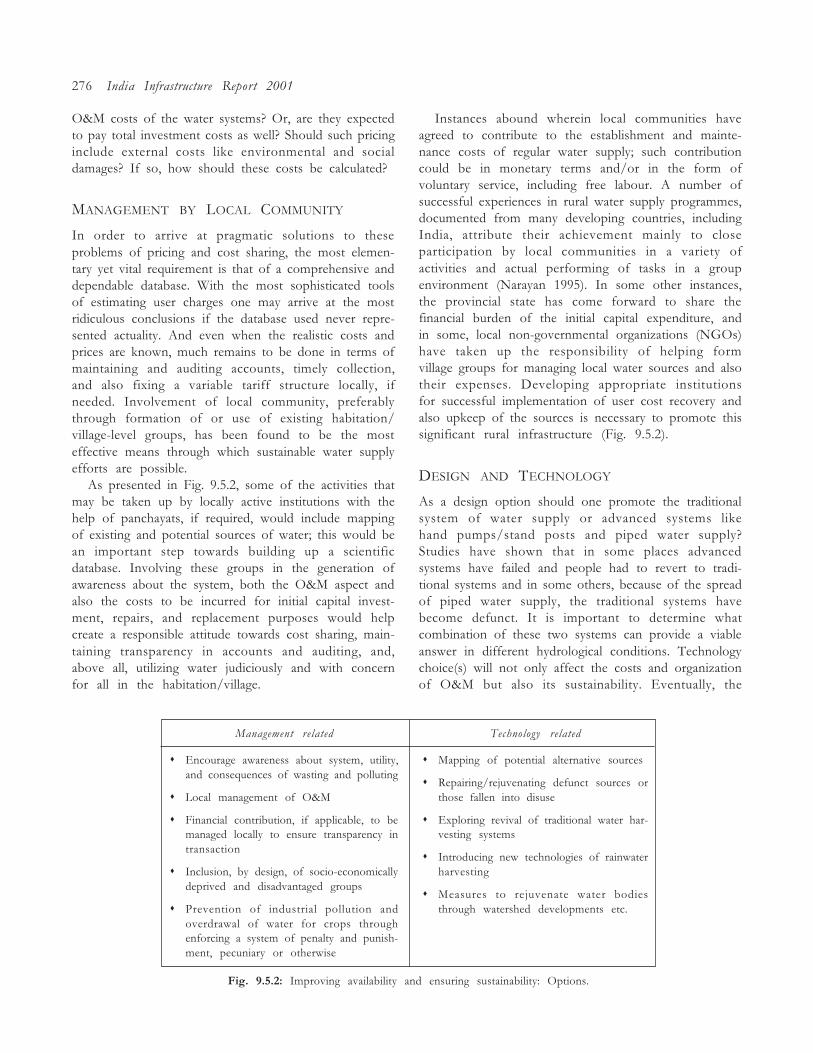
276 India Infrastructure Report 2001
O&M costs of the water systems? Or, are they expectedto pay total investment costs as well? Should such pricinginclude external costs like environmental and socialdamages? If so, how should these costs be calculated?
MANAGEMENT BY LOCAL COMMUNITY
In order to arrive at pragmatic solutions to theseproblems of pricing and cost sharing, the most elemen-tary yet vital requirement is that of a comprehensive anddependable database. With the most sophisticated toolsof estimating user charges one may arrive at the mostridiculous conclusions if the database used never repre-sented actuality. And even when the realistic costs andprices are known, much remains to be done in terms ofmaintaining and auditing accounts, timely collection,and also fixing a variable tariff structure locally, ifneeded. Involvement of local community, preferablythrough formation of or use of existing habitation/village-level groups, has been found to be the mosteffective means through which sustainable water supplyefforts are possible.
As presented in Fig. 9.5.2, some of the activities thatmay be taken up by locally active institutions with thehelp of panchayats, if required, would include mappingof existing and potential sources of water; this would bean important step towards building up a scientificdatabase. Involving these groups in the generation ofawareness about the system, both the O&M aspect andalso the costs to be incurred for initial capital invest-ment, repairs, and replacement purposes would helpcreate a responsible attitude towards cost sharing, main-taining transparency in accounts and auditing, and,above all, utilizing water judiciously and with concernfor all in the habitation/village.
Instances abound wherein local communities haveagreed to contribute to the establishment and mainte-nance costs of regular water supply; such contributioncould be in monetary terms and/or in the form ofvoluntary service, including free labour. A number ofsuccessful experiences in rural water supply programmes,documented from many developing countries, includingIndia, attribute their achievement mainly to closeparticipation by local communities in a variety ofactivities and actual performing of tasks in a groupenvironment (Narayan 1995). In some other instances,the provincial state has come forward to share thefinancial burden of the initial capital expenditure, andin some, local non-governmental organizations (NGOs)have taken up the responsibility of helping formvillage groups for managing local water sources and alsotheir expenses. Developing appropriate institutionsfor successful implementation of user cost recovery andalso upkeep of the sources is necessary to promote thissignificant rural infrastructure (Fig. 9.5.2).
DESIGN AND TECHNOLOGY
As a design option should one promote the traditionalsystem of water supply or advanced systems likehand pumps/stand posts and piped water supply?Studies have shown that in some places advancedsystems have failed and people had to revert to tradi-tional systems and in some others, because of the spreadof piped water supply, the traditional systems havebecome defunct. It is important to determine whatcombination of these two systems can provide a viableanswer in different hydrological conditions. Technologychoice(s) will not only affect the costs and organizationof O&M but also its sustainability. Eventually, the
Management related
s Encourage awareness about system, utility,and consequences of wasting and polluting
s Local management of O&M
s Financial contribution, if applicable, to bemanaged locally to ensure transparency intransaction
s Inclusion, by design, of socio-economicallydeprived and disadvantaged groups
s Prevention of industrial pollution andoverdrawal of water for crops throughenforcing a system of penalty and punish-ment, pecuniary or otherwise
Technology related
s Mapping of potential alternative sources
s Repairing/rejuvenating defunct sources orthose fallen into disuse
s Exploring revival of traditional water har-vesting systems
s Introducing new technologies of rainwaterharvesting
s Measures to rejuvenate water bodiesthrough watershed developments etc.
Fig. 9.5.2: Improving availability and ensuring sustainability: Options.
The Spatial Context 277
system(s) that would enhance the availability of watermust prevail between competing options. Exploringthe economic and managerial potential of traditionalwater harvesting systems and also encouraging suchwater harnessing strategies as watershed developmentare important steps in the context of rural watersupply efforts. Fig. 9.5.2 provides a list of technologicaloptions to augment water availability and ensuresustainability.
CONCLUDING OBSERVATIONS
Provision of safe drinking water must ensure bothcontinuous availability and equitable access. An impor-tant study by the World Bank (1999) recommends avariety of ways and means through which user costrecovery and private participation are possible, gradu-ally though surely. An important issue, however, re-mains if the rural poor should also pay for drinkingwater in order to meet the �efficiency� criterion, espe-cially in a growth scenario where �the gains of [even]faster economic growth since 1980�1 have been un-equally shared by different sections of the Indian society.[And] Growth has favoured urban India, organisedsector, richer states and property owners�against ruralIndia, unorganised sector, poorer states and wage earn-ers� (Nagaraj 2000: 2838).
The major obstacles to achieving equity, efficiency,and sustainability remain quality degradation due touneconomical exploitation as also overcrowding on theresource. This underscores the need for optimum utili-zation of water. A comprehensive water policy, to beeffective and to have a semblance of concern for equity,must take into account such issues as overdrawal,wastage, and polluting acts by competing sectors and/or individuals. It is not adequate to merely incorporatethe �polluter pays principle�, but to ensure that thepriorities are properly defined and strictly enforced. Theenormous costs of such unchecked tapping of freshwater bodies and polluting not only amount to shiftingthe financial burden to the hapless and underprivileged,but also increasing their vulnerability to disease, andeven death. Moreover, such irresponsible use of watercan actually result in dwindling of the availability ofwater for the future. Such considerations must precedeformulation of any rational pricing structure, especiallyfor the rural poor. The role of community participationcannot be underplayed so far as introduction, and O&Mof the appropriate technology are concerned. It maycheck inappropriate resource discharge and conserva-tion. Further, it may be most useful to consider drinkingwater as a resource not in isolation but with regard toother basic need resources such as housing, nutrition,and health.
9.6 BUS TRANSPORT IN DELHI
B. R. Marwah, V. K. Sibal, and Sujata Sawant
INTRODUCTION
Large cities require large-scale movements of people dueto three reasons�increase in total volume because ofgrowth in population, rising per capita trip rate, andincrease in travel distance. Additionally, unscientificstructures when imposed on cities, under the guise ofplanning impose unnecessary need for movement.30
Such large-scale movements, if done by personalizedmodes of transport create congestion on roads and thusinvolve high costs, excessive energy consumption, ex-tended journey times, and environmental pollution.31
Moreover, most urban residents in Indian cities cannotafford personalized transport. An efficient, reliable, andspeedy public transport system constitutes one of theimportant needs of urban living and acts as a catalyst tothe growth of urban economy.
In Indian cities, buses will continue to form thebackbone of any public transport system in urbancentres in the foreseeable future due to flexible operationand easy accessibility. Even in those cities where highcapacity mass rail transit systems (MRTs) are provided.32
bus transport will still be very important.
30 Delhi would be a prime example, where the inverse densityof population and built-up spaces has lengthened travel distances.
31 This is always true because the private costs of personaltransport remain well below its social costs and the two divergegreatly not only because of pollution, but also because of conges-tion. While in the advanced countries with well-developed publictransport, congestion pricing is the only �solution� to this diver-gence, in many Indian cities, adequate and correct investments inpublic transport as also appropriate lane planning, sometimes
including separation of slow and �fast� moving traffic, bettersignals, and a concerted attempt to identify and relax bottlenecksare necessary, even while congestion pricing ensures that privatevehicles are �priced out� of urban central streets (ed.).
32 Unless of course such mass transit systems are very large andcomprehensive and are designed to take care of a large part of themovement. Today, only the highly congested Mumbai suburbanrailway system and perhaps the Howrah suburban railway system
278 India Infrastructure Report 2001
INADEQUACY OF THE BUS TRANSPORT
SYSTEM IN DELHI
The National Capital Territory of Delhi covers an areaof 1483 sq. km. Delhi is planned on a ring-radial patternwith a hierarchical road network and its total roadlength is 22,487 km. Ring Road and Outer Ring Roadare among the most important arterial roads. Ring Roadis connected with most of the important roads and nodalpoints of the city.
The the population of Delhi has been growing at therate of about 4 per cent per annum since 1961 and isexpected to be 13.2 million in the year 2001.
The total number of vehicles in Delhi is now morethan the total number of vehicles in the three othermetropolitan cities of Mumbai, Calcutta, and Chennaiput together! The number of vehicles in Delhi was about2.8 million in 1997; about two-third of these are two-wheelers. The sharp increase in the number of vehiclesand especially two-wheelers could be attributed to theimproved economic status of people and inadequatepublic transport.33
The number of accidents in Delhi has been increasingat an alarming rate with over 11,000 accidents recordedin 1997, 24 per cent of which were fatal! The proportionof fast moving vehicles was 84 per cent in 1994. Theaverage modal composition of traffic on selected arterialroads of Delhi in 1994 shows a 62 per cent share of buses.Average bus speed in Delhi is observed to be only 18km per hr. The public transport demand in Delhi isexpected to increase sharply over the years. In 1997,about 7 million passengers, including passengers usingmore than one bus per trip, were being carried by stagecarriage buses, while 0.7 million passengers were beingcarried by contract carriage buses, operating as charteredbuses. Daily bus passenger demand is estimated to be11.2 million for the year 2001. The average trip lengthis over 10 km.
The public transport system of Delhi is primarilyroad based and the share of rail-based public transportis almost negligible. The bus system in Delhi is a mix
could quality. All planned MRTs, including Metro rail of Calcuttaare not serious contenders because they would only carry a smallfraction of total traffic. Bus capacities can be added as the needarises, especially on non-congested roads. This, apart from itsflexibility, is an important factor in the growth of bus traffic incities; and especially so when the organizational and financialcapacity to conceive and execute large MRTs is lacking.
33 While lack of a rail-based public transport system is usuallyidentified as the reason, income distribution, with a larger pro-portion of middle and upper middle families, is part of the reason.The vast state expenditures and rents which are generated andspent in Delhi are no doubt the underlying reason (ed.).
of public and �private�. Public buses are operated by theDelhi Transport Corporation (DTC)34 whereas privatebuses are operated mostly by individual agencies basedon stage and contract carriage (chartered bus) permits.In 1997�8, the regular (stage carriage) bus system com-prised 4000 private buses under the State TransportAuthority (STA) and 3870 DTC buses including 1200private buses under the administrative control of theDTC. About 5000 chartered buses provided point-to-point service during peak hours supplementing theregular bus services. End November 1996, there wereover 3900 buses being operated privately, including over2600 under the infamous Red/Blue Line scheme.
GROWTH OF THE DTC
In 1985�6, the DTC fleet (including private buses) andmanpower grew to 5400 and 41,000, respectively. In1988, the operation of private buses under the kilometerscheme was discontinued and later, in 1996, the fleetdepleted sharply to 2700.
Before 1992, the city bus services in Delhi weremostly state owned. Private sector participation in thestage carriage public transport system was very limited.The revision of the Motor Vehicles Act in 1988 liber-alized permit conditions and paved the way for induc-tion of private buses on city routes on a larger scale. In1992, Delhi became the first city to adopt large-scaleprivatization of bus services.
The problems of the present bus system from passen-ger, operator, and management points of view lie espe-cially in the stage carriage system:
� lengthy and zig-zag routes;
� long waiting time;
� unreliable bus service;
� overcrowded buses and uncomfortable journey;
� poor accessibility for newly developed residential/commercial centres;
� unsafe operation;
� absence of published information regarding routesand timings;
34 The nationalized bus services came into existence in Delhiin 1948 with the formation of the Delhi Transport Service (DTS)under the Ministry of Transport, Government of India. In 1950,the Delhi Road Transport Authority was constituted by an Actof Parliament to control the operations of the DTS. In 1958, theDelhi Transport Undertaking (DTU) was established under thecontrol of the Delhi Municipal Corporation. In 1971, the centralgovernment took over the DTU and the Delhi Transport Cor-poration (DTC) was formed. In August 1996, the DTC wastransferred to the Government of the National Capital Territoryof Delhi (GNCTD)
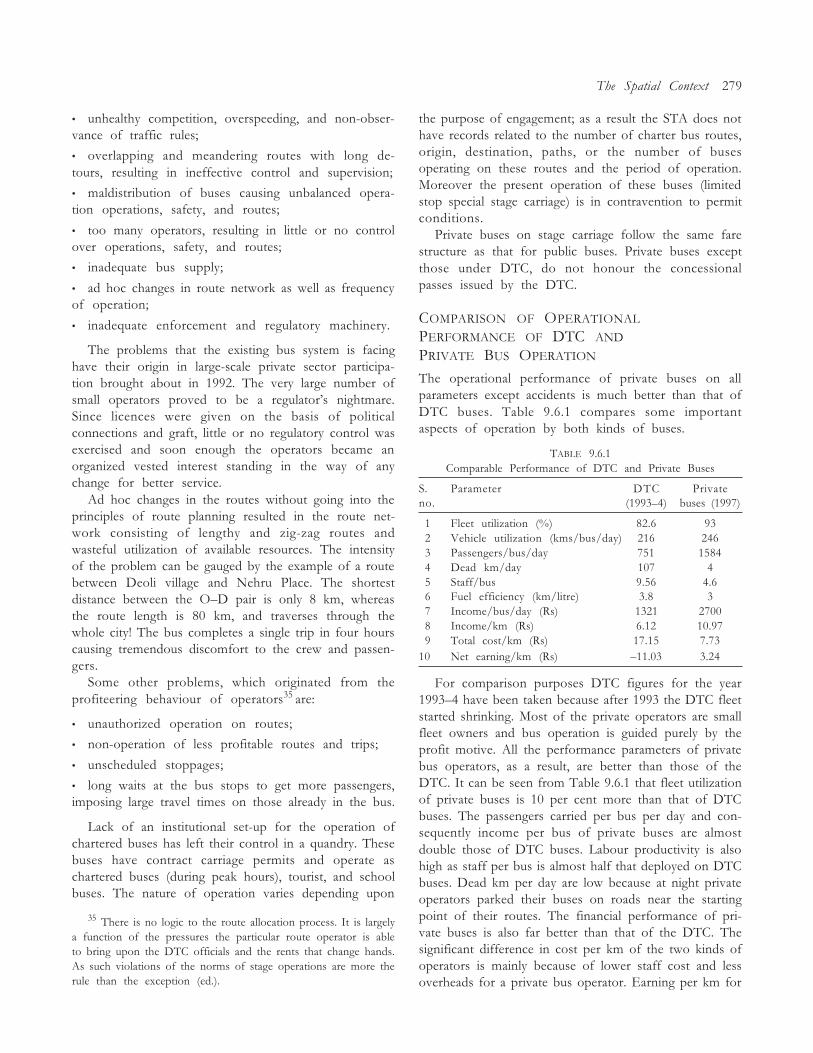
The Spatial Context 279
� unhealthy competition, overspeeding, and non-obser-vance of traffic rules;
� overlapping and meandering routes with long de-tours, resulting in ineffective control and supervision;
� maldistribution of buses causing unbalanced opera-tion operations, safety, and routes;
� too many operators, resulting in little or no controlover operations, safety, and routes;
� inadequate bus supply;
� ad hoc changes in route network as well as frequencyof operation;
� inadequate enforcement and regulatory machinery.
The problems that the existing bus system is facinghave their origin in large-scale private sector participa-tion brought about in 1992. The very large number ofsmall operators proved to be a regulator�s nightmare.Since licences were given on the basis of politicalconnections and graft, little or no regulatory control wasexercised and soon enough the operators became anorganized vested interest standing in the way of anychange for better service.
Ad hoc changes in the routes without going into theprinciples of route planning resulted in the route net-work consisting of lengthy and zig-zag routes andwasteful utilization of available resources. The intensityof the problem can be gauged by the example of a routebetween Deoli village and Nehru Place. The shortestdistance between the O�D pair is only 8 km, whereasthe route length is 80 km, and traverses through thewhole city! The bus completes a single trip in four hourscausing tremendous discomfort to the crew and passen-gers.
Some other problems, which originated from theprofiteering behaviour of operators35 are:
� unauthorized operation on routes;
� non-operation of less profitable routes and trips;
� unscheduled stoppages;
� long waits at the bus stops to get more passengers,imposing large travel times on those already in the bus.
Lack of an institutional set-up for the operation ofchartered buses has left their control in a quandry. Thesebuses have contract carriage permits and operate aschartered buses (during peak hours), tourist, and schoolbuses. The nature of operation varies depending upon
the purpose of engagement; as a result the STA does nothave records related to the number of charter bus routes,origin, destination, paths, or the number of busesoperating on these routes and the period of operation.Moreover the present operation of these buses (limitedstop special stage carriage) is in contravention to permitconditions.
Private buses on stage carriage follow the same farestructure as that for public buses. Private buses exceptthose under DTC, do not honour the concessionalpasses issued by the DTC.
COMPARISON OF OPERATIONAL
PERFORMANCE OF DTC AND
PRIVATE BUS OPERATION
The operational performance of private buses on allparameters except accidents is much better than that ofDTC buses. Table 9.6.1 compares some importantaspects of operation by both kinds of buses.
TABLE 9.6.1Comparable Performance of DTC and Private Buses
S. Parameter DTC Privateno. (1993�4) buses (1997)
01 Fleet utilization (%) 82.6 9302 Vehicle utilization (kms/bus/day) 216 24603 Passengers/bus/day 751 158404 Dead km/day 107 4050 Staff/bus 9.56 4.6060 Fuel efficiency (km/litre) 3.8 307 Income/bus/day (Rs) 1321 270008 Income/km (Rs) 6.12 10.9709 Total cost/km (Rs) 17.15 7.7310 Net earning/km (Rs) �11.03 3.24
For comparison purposes DTC figures for the year1993�4 have been taken because after 1993 the DTC fleetstarted shrinking. Most of the private operators are smallfleet owners and bus operation is guided purely by theprofit motive. All the performance parameters of privatebus operators, as a result, are better than those of theDTC. It can be seen from Table 9.6.1 that fleet utilizationof private buses is 10 per cent more than that of DTCbuses. The passengers carried per bus per day and con-sequently income per bus of private buses are almostdouble those of DTC buses. Labour productivity is alsohigh as staff per bus is almost half that deployed on DTCbuses. Dead km per day are low because at night privateoperators parked their buses on roads near the startingpoint of their routes. The financial performance of pri-vate buses is also far better than that of the DTC. Thesignificant difference in cost per km of the two kinds ofoperators is mainly because of lower staff cost and lessoverheads for a private bus operator. Earning per km for
35 There is no logic to the route allocation process. It is largelya function of the pressures the particular route operator is ableto bring upon the DTC officials and the rents that change hands.As such violations of the norms of stage operations are more therule than the exception (ed.).
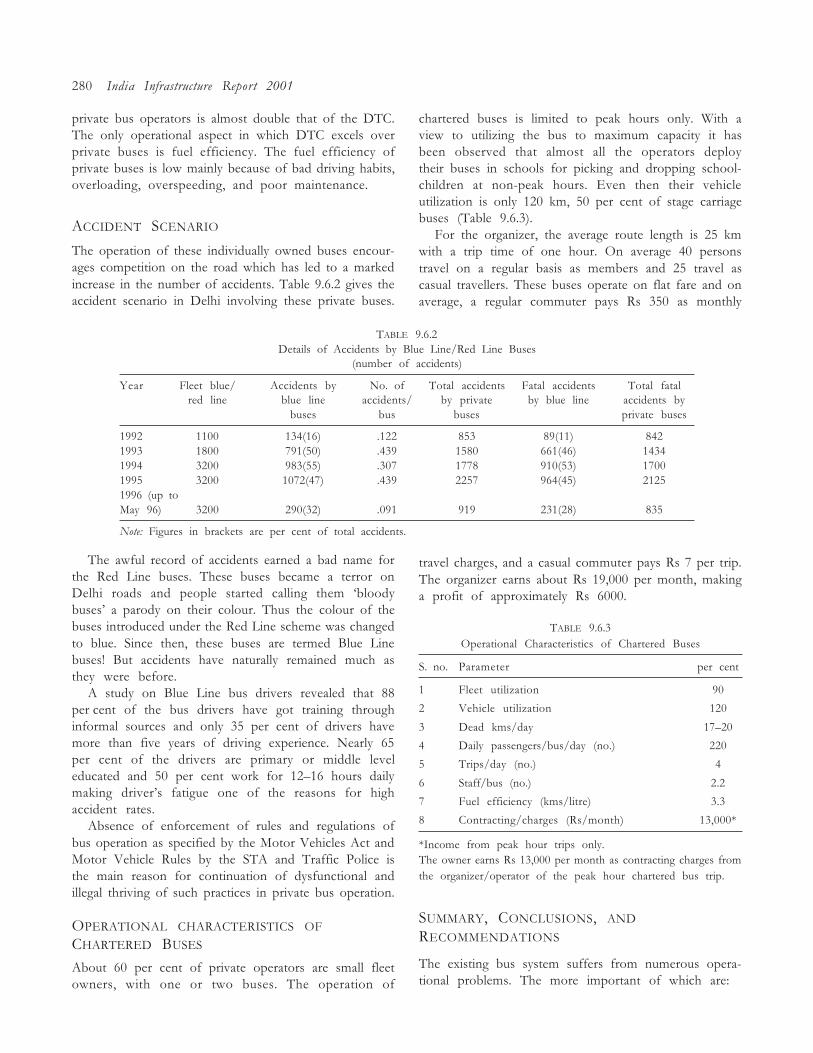
280 India Infrastructure Report 2001
private bus operators is almost double that of the DTC.The only operational aspect in which DTC excels overprivate buses is fuel efficiency. The fuel efficiency ofprivate buses is low mainly because of bad driving habits,overloading, overspeeding, and poor maintenance.
ACCIDENT SCENARIO
The operation of these individually owned buses encour-ages competition on the road which has led to a markedincrease in the number of accidents. Table 9.6.2 gives theaccident scenario in Delhi involving these private buses.
chartered buses is limited to peak hours only. With aview to utilizing the bus to maximum capacity it hasbeen observed that almost all the operators deploytheir buses in schools for picking and dropping school-children at non-peak hours. Even then their vehicleutilization is only 120 km, 50 per cent of stage carriagebuses (Table 9.6.3).
For the organizer, the average route length is 25 kmwith a trip time of one hour. On average 40 personstravel on a regular basis as members and 25 travel ascasual travellers. These buses operate on flat fare and onaverage, a regular commuter pays Rs 350 as monthly
TABLE 9.6.2Details of Accidents by Blue Line/Red Line Buses
(number of accidents)
Year Fleet blue/ Accidents by No. of Total accidents Fatal accidents Total fatalred line blue line accidents/ by private by blue line accidents by
buses bus buses private buses
1992 1100 134(16) .122 853 89(11) 8421993 1800 791(50) .439 1580 661(46) 14341994 3200 983(55) .307 1778 910(53) 17001995 3200 1072(47) .439 2257 964(45) 21251996 (up toMay 96) 3200 290(32) .091 919 231(28) 835
Note: Figures in brackets are per cent of total accidents.
travel charges, and a casual commuter pays Rs 7 per trip.The organizer earns about Rs 19,000 per month, makinga profit of approximately Rs 6000.
TABLE 9.6.3Operational Characteristics of Chartered Buses
S. no. Parameter per cent
1 Fleet utilization 90
2 Vehicle utilization 120
3 Dead kms/day 17�20
4 Daily passengers/bus/day (no.) 220
5 Trips/day (no.) 4
6 Staff/bus (no.) 2.2
7 Fuel efficiency (kms/litre) 3.3
8 Contracting/charges (Rs/month) 13,000*
*Income from peak hour trips only.The owner earns Rs 13,000 per month as contracting charges fromthe organizer/operator of the peak hour chartered bus trip.
SUMMARY, CONCLUSIONS, AND
RECOMMENDATIONS
The existing bus system suffers from numerous opera-tional problems. The more important of which are:
The awful record of accidents earned a bad name forthe Red Line buses. These buses became a terror onDelhi roads and people started calling them �bloodybuses� a parody on their colour. Thus the colour of thebuses introduced under the Red Line scheme was changedto blue. Since then, these buses are termed Blue Linebuses! But accidents have naturally remained much asthey were before.
A study on Blue Line bus drivers revealed that 88per cent of the bus drivers have got training throughinformal sources and only 35 per cent of drivers havemore than five years of driving experience. Nearly 65per cent of the drivers are primary or middle leveleducated and 50 per cent work for 12�16 hours dailymaking driver�s fatigue one of the reasons for highaccident rates.
Absence of enforcement of rules and regulations ofbus operation as specified by the Motor Vehicles Act andMotor Vehicle Rules by the STA and Traffic Police isthe main reason for continuation of dysfunctional andillegal thriving of such practices in private bus operation.
OPERATIONAL CHARACTERISTICS OF
CHARTERED BUSES
About 60 per cent of private operators are small fleetowners, with one or two buses. The operation of
The Spatial Context 281
� lengthy, zig zag, and overlapping destination-orientedroutes: route lengths varying from 8 to 80 km;
� long journey hours, including long waiting time atbus stops;
� low frequency of buses on many routes;
� inadequate enforcement and regulatory machinery;
� fierce competition, overspeeding, and non-observanceof traffic rules by private operators;
� very high rates of accident by buses, especially privatebuses, on the streets of Delhi.
Chartered buses are playing an unexpected role inmeeting the transport demand and have become anindispensable part of the bus system of Delhi. Theill-planned routes, suiting individual operator�s greedrather than consumer needs, have resulted in criss-crossroutes. The absences of an institutional set-up to regulateand control their operations have made the managementof their operations a difficult task.
Rational route planning and a strong enforcementmachinery for ensuring punctual rendering of trips/services would go a long way relaxing some of theharassments that the Delhi user of buses goes through.
9.7 DEALING WITH DROUGHT
Saumyen Guha
While considering the strategies of drought manage-ment, it is necessary to distinguish between differentsituations of water shortage. Even normally high rainfallareas may occasionally face a failure of rain, conse-quently upsetting normal human and economic activi-ties. Where such occurrences are not frequent, say lessthan ten years, part-time relief measures prove to beadequate and separate long-term strategies are called for.But where normal rainfall itself is low, as in the case ofthe Deccan plateau, the life supporting hydrologic sys-tem is always in a delicate balance. Hence more compre-hensive and long-term attention is required in such areasfor establishing a stronger and more stable economicbase. Since Independence the government has investedheavily in water resources development. Its primaryconcern has been twofold (Agarwal 2000): irrigationdevelopment for increasing Green Revolution-styleagricultural production; and drinking water supply prog-rammes.
Drinking water supply schemes focused primarily ongroundwater exploitation fuelled by the spread of cheaprural electricity and liberal subsidies, with little or noattention to recharge especially in smaller towns andrural areas (Patwardhan 1988; Gadkari 1977; Rakshit1997). At present, over 90 per cent of rural Indiansdepend on groundwater for their drinking water supply(Agarwal 2000). Groundwater tables are falling all overthe country which poses a serious problem in the yearswhen the rainfall is low. Tube wells and boreholes areconstructed primarily by rich farmers and the poor, whodepend on dug wells, suffer the most.
The technology of traditional rainwater harvest-ing has its strengths. The document �Dying Wisdom�,by the Center for Science and Environment (CSE), givesan account of extensive rainwater harvesting cultures
that once successfully existed in India (Agarwal andNarain 1997). Even today the technology is relevant forIndia.
Drinking water requirements of a village can be metwith a very small amount of land. The amount of landneeded to meet the drinking water needs of an averagevillage will vary from 0.1 ha in Arunachal Pradesh wherevillages are small (average population 236 people) andrainfall high, to 8.46 ha in Delhi where villages are big(average population 4769 people) and rainfall low(Agarwal 2000). In Rajasthan, the land required will varyfrom 1.68 to 3.64 ha in different meteorological regionsand in Gujarat, it will vary between 1.72 and 3.3 ha(Agarwal 2000). This will leave a lot of land for capturingrainwater for irrigation with a good combination ofrainwater harvesting and groundwater recharge. Indiagets most of its rain during a short period of time. Thegreatest technological challenge is to store that water.There are basically three options: (a) building large damsand creating large reservoirs with large catchments; (b)creating small ponds with small catchments; and (c)groundwater recharge. Studies conducted by the CentralSoil and Water Conservation Research Institute at Agra,Bellary, and Kota, and another study conducted in thehigh rainfall region of Shillong, have observed thatsmaller watersheds give higher amounts of water per haof catchment area. In the light of these findings, it shouldnot be surprising that the large number of medium-sizedams that have been constructed in Saurashtra havestored very little water in this drought year and havestarted going dry by December (Agarwal 2000).
In addition to ponds and tanks, groundwater rechargethrough percolation tanks, check dams, subsurface dams/barriers, and injection wells will go a long way, espe-cially during drought years, in keeping essential water
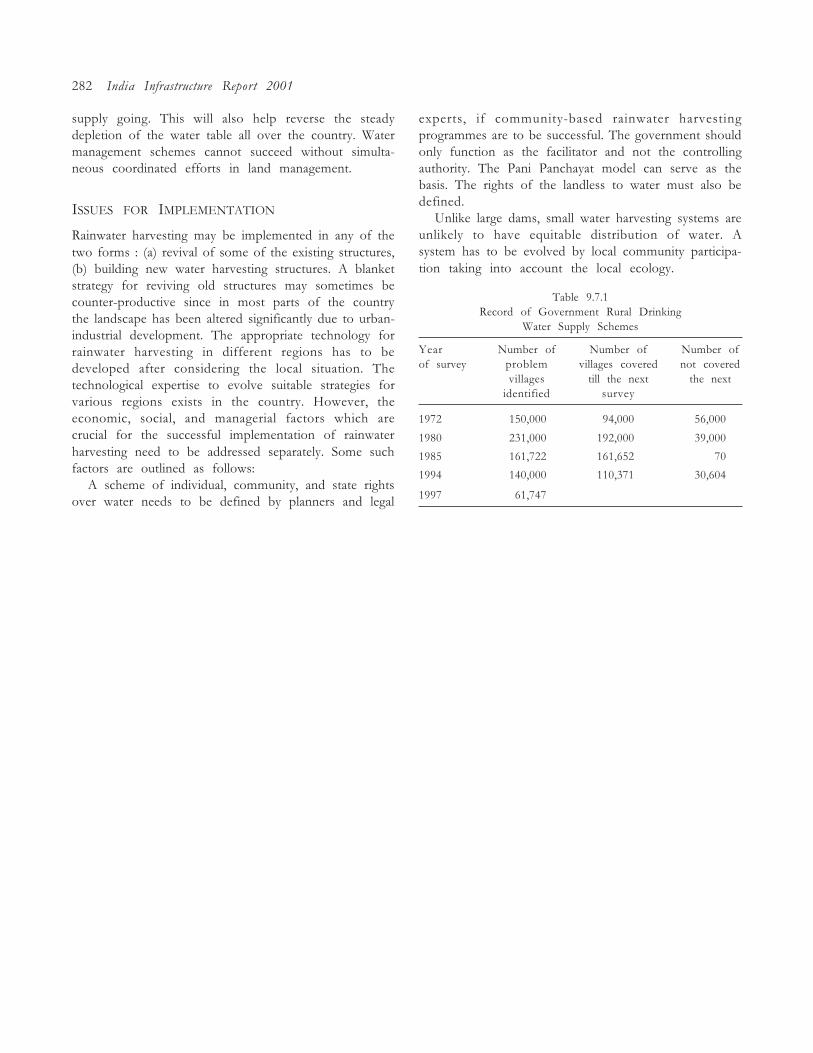
282 India Infrastructure Report 2001
supply going. This will also help reverse the steadydepletion of the water table all over the country. Watermanagement schemes cannot succeed without simulta-neous coordinated efforts in land management.
ISSUES FOR IMPLEMENTATION
Rainwater harvesting may be implemented in any of thetwo forms : (a) revival of some of the existing structures,(b) building new water harvesting structures. A blanketstrategy for reviving old structures may sometimes becounter-productive since in most parts of the countrythe landscape has been altered significantly due to urban-industrial development. The appropriate technology forrainwater harvesting in different regions has to bedeveloped after considering the local situation. Thetechnological expertise to evolve suitable strategies forvarious regions exists in the country. However, theeconomic, social, and managerial factors which arecrucial for the successful implementation of rainwaterharvesting need to be addressed separately. Some suchfactors are outlined as follows:
A scheme of individual, community, and state rightsover water needs to be defined by planners and legal
experts, if community-based rainwater harvestingprogrammes are to be successful. The government shouldonly function as the facilitator and not the controllingauthority. The Pani Panchayat model can serve as thebasis. The rights of the landless to water must also bedefined.
Unlike large dams, small water harvesting systems areunlikely to have equitable distribution of water. Asystem has to be evolved by local community participa-tion taking into account the local ecology.
Table 9.7.1Record of Government Rural Drinking
Water Supply Schemes
Year Number of Number of Number ofof survey problem villages covered not covered
villages till the next the nextidentified survey
1972 150,000 94,000 56,000
1980 231,000 192,000 39,000
1985 161,722 161,652 70
1994 140,000 110,371 30,604
1997 61,747

BIBLIOGRAPHY
Agarwal, A. and Narain, S. (1997). Dying Wisdom: Rise, Falland Potential of India�s Traditional Water Harvesting Sys-tems, Centre for Science and Environment, New Delhi.
Akwule, R. U. (1992). �Telecommunications in Kenya: Devel-opment and Policy Issues� in Telecommunications Policy,September�October, pp. 603�11.
All India Reporter Private Ltd. (various issues). All IndiaReporter, edited by VR Manohar, Nagpur.
Amann, C. A. (1998). �The Stretch for Better Passenger CarFuel Economy: A Critical Look, Part 2�, AutomotiveEngineering International, March, pp. 71�6.
America�s Networks at http://www.americasnetwork.com.Amreli Nagarpalika (1999). Citizen�s Charter, Amreli.����� (various issues). Income and Expenditure Statement,
1996�7, 1997�8 and 1998�9, Amreli.Asian Development Bank and the Ministry of Surface Trans-
port (1993). Policy Reforms in the Indian Ports and ShippingSector: Inception Report, TechEcon, Hong Kong.
Asian Development Bank and Ministry of Surface Transport(1999). Strategic Development Plan for Ennore Port, HarrisInc., New Delhi.
Asian Institute of Transport Development (1998). Greying ofIR, New Delhi.
Asif, Mohammed (1999). �Land Acquisition Act: Need for anAlternative Paradigm�, Economic and Political Weekly,vol. 24, no. 25, pp. 1564�6.
Australian Communications Authority, www.aca.gov.auAutomotive Engineering (1997). �Gasoline�Reforming Fuel
Cell�, February, pp. 151�2.Automotive Engineering International (1998). �Electric Vehicle
Drive Systems�, February, pp. 115�17.����� (1998). �Electric Vehicle Drive Systems�, February,
pp. 259�65.����� (1998). �NEBUS Fuel-Cell Municipal-Transit Bus�,
July 1998, pp. 54�5.Bagchi, Amaresh (1993). �Financing Urban Local Govern-
ments: Issues and Approaches�, Economic and PoliticalWeekly, vol. 28, no. 37, pp. 1920�3.
����� (1997). �Reforming the Property Tax Base, Need fora New Direction�, Economic and Political Weekly, vol. 32,no. 47, pp. 3005�10.
Baird, Alfred (2000). �Port Privatization: Objectives, Extent,Process, and the UK Experience�, International Journal ofMaritime Economics, vol. 2, no. 3, pp. 177�94.
Bamford C. G. (1998). Transport Economics, Heinemann Pub-lishers, Oxford.
Banerjee, Bibek, G. Raghuram and Narayan Rangaraj (2000).�Konkan Railway Corporation Limited�, Vikalpa, vol. 25,no. 1, pp. 89�109
Barnes, F. (1998). �Regulating Telecommunications� in DeiterHelm and Tim Jenkinson (ed.) Competition in RegulatedIndustries, Oxford University Press, UK.
Basant, Rakesh and Morris Sebastian (2000). CompetitionPolicy in India: Issues for a Globalising Economy, Reportprepared for the Ministry of Industry, Indian Institute ofManagement, Ahmedabad.
Batra, V. S. and Ajay Mathur (1999). �Challenges and Promisesof Fuel Cell Vehicles� in Conference on Automobile andFuel Technologies�Solutions for the Environment, TataEnergy Research Institute, New Delhi.
Beesley, M. E. and S. C. Littlechild (1989). �The Regulation ofPrivatized Monopolies in the United Kingdom�, RandJournal of Economics, vol. 20, pp. 454�72.
Benjamin, Solomon and Gururaja Budhya (1999). �UrbanGovernance, Civic Society and Local Economic Develop-ment: An Agenda Note�, mimeo, Bangalore.
Berta, G. L. (1993). �Engines for Hybrid Vehicles: Require-ments and Perspectives�, SAE Paper No. 931486, Societyof Automotive Engineers, Washington, DC.
Bhatia, Bela (1992). �Lush Fields and Parched Throats: ThePolitical-Economy of Groundwater in Gujarat�, WIDERWorking Paper No. 100, United Nations University,Helsinki.
Bhatt, Sanjeev (1990). �Palace on Wheels�, unpublished case,Indian Institute of Management, Ahmedabad.
Bizer, John and Tod Ragsdale (2000). �The Development ofResettlement Policy in China�, http://www.his.com/~mesas/Chinapol
Bond, G. and Carter, L. (1994). �Financing Private Infrastruc-ture Projects: Emerging Trends from IFC�s Experience�,International Finance Corporation Discussion Paper 23,World Bank, Washington, DC.

284 Bibliography
Burpee, D. S. and P. W. Shumate, Jr (1994). �Emerging Resi-dential Broadband Communications�, IEEE Communica-tion Magazine, vol. 82, April, pp. 604�14.
Census of India (1997). Series I, Paper 2 of 1993 (Housing andAmenities) Census of India�1991, Controller of Publica-tion, New Delhi.
����� (1997). �Availability of Infrastructural Facilities inRural India: An Analysis of Village Directory Data�,Census of India�1991, Office of the Registrar General,New Delhi.
Central Electricity Authority (various issues), Electric PowerSurvey, 13th, 14th and 15th, CEA, New Delhi.
Central Finance Commission, (2000). Report of the EleventhFinance Commission for 2000�5, Special Supplement No. 3of 2000, Akalanle Publications, Delhi.
Central Institute of Road Transport (2000). State TransportUndertakings: Profile and Performance, 1998�9 , CIRT,Pune.
Central Pollution Control Board (1998). Pollution Statistics inDelhi of 1993, Ministry of Environment and Forests, NewDelhi.
Central Statistical Organisation (various issues). NationalAccounts Statistics, CSO, New Delhi.
Centre for Monitoring the Indian Economy (2000). Infrastruc-ture Statistics Report, CMIE, Mumbai.
Cernea, Michael M. (1999). �Why Economic Analysis IsEssential to Resettlement?�, Economic and Political Weekly,vol. 34, no. 31, pp. 2149�58.
Chaloner, W. H. and W. M. Stern (eds) (1969). Essays inEuropean Economic History, 1789�1914, Edward Arnold,London.
Chinese Railways (1997). Annual Statistics, China RailwaySociety, Beijing.
Ciofffic, John M. (1999). �Very High Speed Digital SubscriberLines�, IEEE Communication Magazine, vol. 87, pp. 72�9.
Consulting Engineering Services Limited (1987). �Estimationof Total Road Transport Freight and Passenger Move-ment in India,� mimeo.
Container Corporation of India Ltd. (various issues). AnnualReport, 1997�8 and 1998�9, CONCOR, New Delhi.
Crouzet, Francois (1969). In Essays in European EconomicHistory: 1789�1914, Edward Arnold, London.
Customs Act, 1962 (2000). �Provisions Relating to CoastalGoods and Vessels Carrying Coastal Goods�, CurrentPublications, Mumbai, pp 50-1.
Das, K. (1999). �Underdevelopment by Design? NationalPlanning and Vital Infrastructure in Orissa�, WorkingPaper No. 107, Gujarat Institute of Development Re-search, Ahmedabad.
����� (1997). �Politics of Industrial Location: IndianFederalism and Development Decisions�, Economic andPolitical Weekly, vol. 32, no. 51, pp. 3268-74.
Das, Keshabananda and B. L. Kumar (1998). �A ValidationStudy of Habitations Not Covered Under the RuralDrinking Water Programme in Gujarat�, mimeo, GujaratInstitute of Development Research, Ahmedabad.
Datta, Abhijit (1995). �Municipal Reforms in India: Compara-tive Models and Processes�, Economic and Political Weekly,vol. 30, no. 38, pp. 2395�8.
Department of Rural Development (1991). Annual Report1990�1, Ministry of Agriculture, New Delhi.
Department of Telecom Services (various issues). AnnualReport, DTS, Ministry of Communications, New Delhi.
Department of Telecommunications (various issues). AnnualReport, DoT, New Delhi.
����� (1991). Report of the High Level Committee onReorganisation of Telecom Department, mimeo, DoT, NewDelhi.
Devli, Anil (2000). �Shipping as Infrastructure: The CoastalAlternative�, Indian Shipping, vol. 52, no. 3�4, pp. 29�31.
Dharampur Nagarpalika (1999). Citizen�s Charter, Dharampur.Dhawan, B. D. (1991). �Developing Groundwater Resources:
Merits and Demerits�, Economic and Political Weekly, vol.26, no. 8, pp. 425�9.
Dhir, K. S. (1992). �The Challenges of Introducing AdvancedTelecommunications in India� in Palvia, Palvia and Ziegler(ed.) The Global Issues of Information Technology Manage-ment, Idea Group Publishing, Harrisburg, PA.
Dholka Nagarpalika (various issues). Income and ExpenditureStatement, 1993�4, 1994�5, 1995�6, and 1996�7, Dholka.
Dieter, Helm and Tim Jenkinson (ed.) (1998). Competition inRegulated Industries, Oxford University Press, UK.
Dobbin, F. (1994). Forging Industrial Policy: The United States,Britain and France in the Railway Age, Cambridge Univer-sity Press, Cambridge.
Donaldson, H. (1994). �Telecommunication Liberalization andPrivatization: The New Zealand Experience� in B.Wellenius and P.A. Stern (ed.), Implementing Reforms inthe Telecom Sector , World Bank, Washington, DC,pp. 253�60.
Dutta, S. A., and B. Sengupta (1998). �Air Quality Goals forDelhi: Options to meet Them by Year 2005�, paperpresented at the Workshop on Integrated Approach toVehicular Pollution Control in Delhi, New Delhi.
Easter, K. William, Nir Becker and Yacov Tsur (1998).�Economic Mechanisms for Managing Water Resources:Pricing, Permits, and Markets�, in Asit K. Biswas (ed.),Water Resources: Environmental Planning, Management,and Development, Tata McGraw Hill Publishing Com-pany, New Delhi.
Economist (1991). �Telecommunications�, vol. 3221, no. 7727,p. 34.
����� (2000). �When India Wires Up�, vol. 356, no. 8180,pp. 27�30.
����� (2000). �Wired China: The Flies Swarm�, vol. 356,no. 8180, p. 22.
Eichengreen, B. (1994). �Financing Infrastructure in Develop-ing Countries: Lessons from the Railway Age�, Back-ground Paper for the World Development Report 1994,Policy Research Working Paper 1379, World Bank,Washington, DC.
Electricity (Supply) Act 1948: Act No. 54 of 1948 (1979). As
Bibliography 285
amended up-to-date by Act 23 of 1978, Ram Narain LalBeni Prasad, Allahabad.
Enos, J. L. and W. H. Park (1988). The Adoption and Diffusionof Imported Technology: The Case of Korea, Croom Helm,London.
Evenari, M., L. Shanan, and N. Tadmor (1982). The Negev: TheChallenge Of A Desert, second edition, Harvard UniversityPress, Cambridge, MA.
Faulhaber, G. R. (1975). �Cross-Subsidization: Pricing in Pub-lic Enterprises�, American Economic Review, vol. 65, no. 5,pp. 966�77.
Federal Communications Commission (1995). TelephoneNumber Portability: Notice, FCC�95�284, Washington,DC.
����� (1996). Number Portability: First Report and Order,FCC�96�286, Washington, DC.
����� (1997). Number Portability: Second Report andOrder, FCC�97�289, Washington, DC.
����� (1997). Number Portability: First ReconsiderationOrder, FCC-97-074, Washington, DC.
����� (1998). Number Portability: Third Report andOrder, FCC-98-082, Washington, DC.
Federal Communications Commission at www.fcc.gov.Federation of Zambian Road Hauliers Ltd (1992). Annual
Report, Road Hauliers Ltd., Harare.Fernandes, Walter (1998). �Land Acquisition (Amendment)
Bill, 1998�, Economic and Political Weekly, vol. 33, no. 42�3,pp. 2703�6.
Ferreira, D. and K. Khatami (1996). �Financing PrivateInfrastructure in Developing Countries�, World BankDiscussion Paper 343, World Bank, Washington,DC.
Foundation for Public Interest (1998). Performance Rating ofMunicipal Services in Nagarpalikas: Case Study of Gujarat,Ahmedabad.
Frankel, Ernst G. (1986). Port Planning and Development, JohnWiley & Sons, New York.
Gadkari, A. D. (1977). �Groundwater Potential in DroughtProne Areas of Maharashtra�, Journal of Indian WaterWorks Association, vol. 9, no. 4, pp. 323�9.
Garg, Pooja (2000). �The End of Monopoly�, Business Today,vol. 9, no. 15, p. 30.
Gill, J. S. (1990). �Control of Indian Ships And Ships Engagedin Coasting Trade� in Manual of Merchant Shipping Act,1958, Bhandarkar Publications, Bombay.
Glynn, S. (1992). �Japan�s Success in TelecommunicationRegulation: A Unique Regulatory Mix�, Telecommunica-tions Policy, pp. 5�12.
Godbole, Madhav (1999). �Right to Information: A Long Wayto Go�, Lokayan Bulletin, Special Issue on the Right toInformation, vol. 16, no. 3, p. 11�28.
Government of Gujarat (1964). The Gujarat Municipalities Act,1963, Gujarat Act No. 34, Gandhinagar.
����� (1999a). Gujarat Infrastructure Development Act,1999, Gandhinagar.
����� (1999b). Gujarat Infrastructure Agenda: Vision 2010,Gujarat Infrastructure Development Board, Gandhinagar.
����� (1999c). Final Report of Gujarat InfrastructureDevelopment Board (GIDB) on Institutional Strengthening ,mimeo, Gandhinagar.
Government of India (1983). Recommendations of the NationalTransport Policy Committee, Planning Commission, GoI,New Delhi.
����� (2000). Report of the Group on India HydrocarbonsVision 2025, Prime Ministers Office, GoI, New Delhi.
����� (1997). The India Infrastructure Report, volumes I, II
and III, The Rakesh Mohan Committee, NCAER andGoI, New Delhi.
����� (1995). Hydrocarbons Perspective 2010, report of thestudy group, Ministry of Petroleum and Natural Gas,GoI, New Delhi.
Guislain, Pierre (1997). The Privatisation Challenge: A Strategic,Legal and Institutional Analysis of International Experience,World Bank Regional and Sectoral Studies, World Bank,Washington, DC.
Gujarat Electricity Board (1997). Annual Report, GujaratElectricity Board, Gandhinagar.
Gujarat Government Gazette Extraordinary (1993). The Con-stitutional (Seventy-Fourth) Amendment Act, 1992, vol. 34,17 August.
Gujarat Maritime Board (various issues). Administration Re-port, Gandhinagar.
Gujarat Municipal Finance Board (1999). A Report on theServices in Municipalities and Need Assessment, GoI,Gandhinagar.
Gupta, Amita (2000). �An Investigation into Delays andOverruns in Public Sector Projects: A Case of Ahmedabad�Vadodara Expressway�, Masters dissertation, School ofPlanning, Center for Environmental Science and Tech-nology, Ahmedabad.
Heggie Ian G. (1995). �Management Financing of Roads: AnAgenda for Reform�, Working Paper No. 8, Sub-SaharanAfrica Transport Policy Program, World Bank, Washing-ton, DC.
Holguin-Veras, Jose and Michael Walton (1994). An AnnotatedBibliography on the Performance Analysis of Port Opera-tions, Center for Transportation Research, University ofTexas, Austin.
HUDCO (1995). Report of the Sub-group on Commercializationof Urban Infrastructure Projects, Expert Group constitutedby the Government of India, New Delhi.
Hyun, D. and J. A. Lent (1999). �Korean Telecom Policy inGlobal Competition: Implications for Developing Coun-tries�, Telecommunications Policy, vol. 23, no. 5, pp. 389�401.
Indian Infrastructure (1999). �Petroleum Transportation: Cre-ating a Common Grid�, vol. 1, no. 6, pp. 26�8.
Indian National Shipowners� Association (various issues).Annual Review, Mumbai.
Indian Ports Association (2000). Major Ports of India: A Pro-file�1998-99, New Delhi.
Indian Railways (various issues). Year Book, Ministry of Rail-ways, New Delhi.
����� (2000). Draft Corporate Plan: 2000�2012, New Delhi.
286 Bibliography
Indian Road Congress (1990). Guidelines for Capacity of UrbanRoads in Plain Areas, New Delhi.
Indira Gandhi Institute of Development Research (1999).Clean Water: Environmental Governance-1, Mumbai.
International Finance Corporation (1996). Financing PrivateInfrastructure: Lessons of Experience, World Bank, Wash-ington, DC.
International Telecommunication Union, www.itu.int.����� (1989). �The Changing Telecommunications Envi-
ronment: Policy Considerations for Members of theITU�, ITU Report, Report of the Advisory Group onTelecommunication Policy, Geneva.
Jain, K. C. (1984). Land Acquisition Act, Jain Publishers, NewDelhi.
Jain, R. (1995). �A Review of Regulatory Issues in DevelopingCountries�, paper presented at the conference on Regula-tory Frameworks: The Lessons of Experience for DevelopingCountries, Commonwealth Telecom Organisation, KualaLampur, Malaysia.
����� (1997). �Operationalizing a Regulatory Frameworkin India�, Vikalpa, vol. 23, no. 3, pp. 29�37.
Jain, R. and J. Chhokar (1993). �Reorganisation of the TelecomSector: Past and Future�, Economic Times, 3 February.
Jain, R. and T. Sastry (1997). �Rural Telecom Services inIndia�, paper presented at the Telecom Policy ResearchWorkshop, Indian Institute of Management, Ahmedabad.
Jhunjhunwala, Ashok (1998b). �Can Telecom and InformationTechnology be for the Disadvantaged?�, Journal of RuralDevelopment, vol. 17, no. 2, pp. 321�7.
Jhunjhunwala Ashok, Bhaskar Ramamurthi, and Timothy A.Gonsalves (1998). �The Role of Technology in TelecomExpansion in India�, IEEE Communication Magazine,November.
����� (1999). �Indian Telecom and Internet Tangle:What is the way out?� in Emerging Communication Tech-nologies and Society, Narosa Publishing House, NewDelhi.
Joshi, S. (1990). Keynote address at the Seminar on TraditionalWater Harvesting Systems of India, Centre for Scienceand Environment, New Delhi.
Jussawala, M. (1992). �Is the Communications Link StillMissing?�, Telecommunications Policy, vol. 16, no. 6,pp. 485�503.
Kanpur Development Authority (2000). Swarna Jayanti ViharScheme, mimeo, Satabari.
Kanpur Development Authority (2001). Financial Report2000�1: Income and Expenditure.
Kartik, V. (1998). Comparison of Alternate Measures at AIIMSIntersection, B. Tech Thesis, Department of Civil Engi-neering, Indian Institute of Technology, Delhi.
Kelly T. and Woodall M. (2000). �Telecom Traffic Indicator�,Telecommunications Policy, vol. 23, no. 3, pp. 155�9.
Khedbrahma Nagarpalika (various issues). Income and Expen-diture Statement, 1993�4, 1994�5, and 1997�8, Khedbrahma,Gujarat.
Kim, C., Y. K. Kim, and C. Yoon (1992). �Korean Telecom-munications Development: Achievement and Cautionary
Lesson�, World Development, vol. 26, no. 12, pp. 1829�41.
King, John and Benn Konsynski (1990). �Singapore Tradenet:A Tale of One City�, case material, Harvard BusinessSchool, MA.
Klein M. (1998). �Network Industries� in Dieter Helm, andJenkinson Tim (ed.) Competition in Regulated Industries,Oxford University Press, UK.
Kumar, Neeraja (2000). �DoT may drop WLL in Fixed Tele-phony�, Financial Express, 23 August, p. 1.
Laidlaw, B. (1994). �Evolution of Telecommunication Policyin the United Kingdom in Implementing Reforms in theTelecom Sector� in B. Wellenius and P. A. Stern (eds),Implementing Reforms in the Telecom Sector, World Bank,Washington, DC, pp. 285�92.
Landes, D. (1956). �The Old Bank and the New: The FinancialRevolution of the Nineteenth Century�, translated intoEnglish by Max A. Lehmann in W. H. Chaloner andW. M. Stern (eds) (1969), Essays in European EconomicHistory: 1789�1914, Edward Arnold, London.
Le Blanc, N., R. Larsen, and M. Duoba, (1996). �The 1995 HEVChallenge :Results and Technology Summary�, SAE Pa-per No. 960741, Washington, DC.
Lewis, C. (1938). America�s State in International Investments,quoted in B. Eichengreen (1994), �Financing Infrastruc-ture in Developing Countries: Lessons from the RailwayAge�, World Bank, Washington, DC.
Leys, Colin (1975). Underdevelopment in Kenya: The PoliticalEconomy of Neo-colonialism, Heinemann, London.
Mahanagar Telephone Nigam Ltd. (1991). �MTNL CompletesFive Years�, mimeo, New Delhi.
Mahapatra, L. K. (1999). Resettlement, Impoverishment andReconstruction in India , Vikas Publications, NewDelhi.
�Maharashtra�, Journal of Indian Works Association, vol. 9,no. 4, pp. 323�9.
Mani, S. (1992). Foreign Technology in Public Enterprise, Oxford& IBH, New Delhi.
Manikutty S. (1997). �Telecom Services in Urban and Corpo-rate Segments: A Consumer Perspective�, Vikalpa, vol. 22,no. 3, pp. 15�20.
Manubhai D. Shah Vs. LIC (1981). All India Reporter, GUJ 15,Secy.
Maritime Monitor (2000). �A Survey on Coastal Shipping inIndia�, April.
Maritime Monitor (2000). �Sabotage Law in India: An Interna-tional Comparison�, April.
Martin, B., H. Weiss, and Junseok Hwang (1998). �InternetTelephony or Circuit Switched Telephony: Which isCheaper?�, paper presented at Telecom Policy ResearchConference, Alexandria, VA.
Marwah, B. R. (2000). �A Relook at Passenger Car Equivalentsin the Indian Context,� mimeo, Indian Institute of Tech-nology, Kanpur.
����� (2000). �Strategy for Identification and Evaluation ofBottlenecks on Road System�, mimeo, Indian Institute ofTechnology, Kanpur.
Bibliography 287
Marwah, B. R., V. K. Sibal, and S. Savant (2000). �Bus Trans-port in Urban India: A Case Study of Delhi�, mimeo,Indian Institute of Technology, Kanpur.
Mathur, H.M. and David Mardsen (1998). Development Projectsand Impoverishment Risks, Oxford University Press, NewDelhi.
Mathur, M.P. (1995). �Financial Requirements for MunicipalServices: Need for Alternative Arrangements�, paper pre-sented at the Seminar on Finances of Local Bodies inKerala, State Finance Commission, Trivandrum.
����� (1999a). �Upgrading Municipal Services: FinancialNeeds and Strategies for Resource Generation�, paperpresented at the National Seminar on ResourceMobilisation for Urban Services at Decentralized Level,DTUDP, Centre for Development Studies and UP Acad-emy of Administration, Nainital.
����� (1999b). �The Constitution (74th) Amendment Actand Urban Local Governments: An Overview�, UrbanIndia, vol. 19, no. 1.
����� (1999c). �Norms and Standards of Infrastructure andServices in India: A Review and Methodological Assess-ment�, FIRE (D�II) Working Paper Series, no.1, NationalInstitute of Urban Affairs, New Delhi.
Mathur, O. P., P. Sengupta, and A. Bhaduri (2000). Option forclosing the Revenue Gap of Municipalities, 2000�1 to 2004-5, National Institute of Public Finance and Policy, NewDelhi.
Mehta, Abhay (1991). Power Play, Orient Longman, NewDelhi.
Mehta, Jaya and Shanta Venkatraman (2000). �Poverty Statis-tics: Barmecide�s Feast�, Economic and Political Weekly,vol. 35, no. 27, p. 2377.
Mehta, M. (1993). �Pricing of Water Supply�, All India HousingDevelopment Association Journal, February.
Melody, W.H. (1986). �Efficiency and Social Policy in Tele-communication: Lesson from the US Experience�, Journalof Economic Issues, September.
����� (1991). �Telecommunication Reform: Which Sectorsto Privatize�, paper presented at the ITU Conference,Geneva.
Mendler, Charles (1997). �Taking a New Look at HybridElectric Vehicle Efficiency: A Critical Look�, AutomotiveEngineering, February, pp. 67�70.
Merrett, Stephen (1997). Introduction to the Economics of WaterResources: An International Perspective, UCL Press Ltd.,London.
Miller, N. P. (1994). �Regulation: Reconciling Policy Objec-tives in Implementing Reforms in the Telecom Sector� inB. Wellenius and P. A. Stern (eds), Implementing Reformsin the Telecom Sector, World Bank, Washington, DC, pp.485-504.
Ministry of Information and Broadcasting (1995). Governmentof India and Ors. vs. Cricket Association of Bengal and Ors,2 SCC 161.
Ministry of Surface Transport (various issues). Motor TransportStatistics of India, Government of India, New Delhi.
����� (various issues). Pocket Book on Transport Statistics
of India, 1997 and 1998, Government of India, NewDelhi.
����� (1993). Report of the Working Group on Develop-ment of Coastal Shipping, Government of India, NewDelhi.
����� (1997). Report of the National Shipping Policy Com-mittee, Government of India, New Delhi.
����� (1999). Basic Port Statistics of India: 1998-99, Govern-ment of India, New Delhi.
����� (1999). Report of the Expert Committee on DraftCoastal Shipping Act, Government of India, New Delhi.
Moench, Marcus (1992). �Drawing Down the Buffer: Scienceand Politics of Ground Water Management in India�,Economic and Political Weekly, Review of Agriculture, 28March, pp. A7�A14.
Mohan, Dinesh (2000). �Accidents on Indian Roads�, mimeo,Indian Institute of Technology, Delhi.
Mohanty, P. K. (1995). �Reforming Municipal Finances: SomeSuggestions in the Context of India�s DecentralizationInitiative�, Urban India, vol. 15, no. 1.
Morris, Alice (2000). �Land Acquisition Process: The Case ofPoshitra Port�, mimeo, Unnati, Ahmedabad.
Morris, Sebastian (1990). �Cost and Time Overruns in PublicSector Projects�, Economic and Political Weekly, vol. 25,no. 47, pp. 154�68.
����� (1991). �Holding Companies, Performance Con-tracts and Task Orientation in Public Sector�, Economicand Political Weekly, 30 November, pp. M137�44.
����� (1996). �The Political Economy of Electrical Powerin India�, Parts I and II, Economic and Political Weekly,vol. 31, nos 20 and 21.
����� (1997). �Why not Push for a 9 per cent GrowthRate?� , Economic and Political Weekly , 17�24 May,pp. 1153�65.
����� (1999). �GEB Reforms: A Note on RegulatoryStrategy and an Approach to Privatisation�, WPNo. 99�11�04, Indian Institute of Management,Ahmedabad.
����� (2000). �Restructuring Gujarat Electricity Board:Outline of a Strategy and Proposal for Action�, WPNo. 2000�03�12, Indian Institute of Management,Ahmedabad.
����� (2000a). �Regulatory Strategy and Restructuring:Model for Gujarat Power Sector�, Economic and PoliticalWeekly, vol. 35, no. 23.
Motor Vehicle Emission Regulations and Fuel Specifications (1996).Part 1, Report No 5/97, CONCAWE Publications, Brus-sels.
Mundy, Mike (2000). �Containership Markets�, Global Ship-ping Digest: Industry in Perspective, Mike Mundy Associ-ates.
Murty, M. N., A. J. James and Smita Misra (1999). Economicsof Water Pollution: The Indian Experience, Oxford Univer-sity Press, Delhi.
Nagaraj, B. S. (2000). �Hotshot Consultants Copy a Report toget Project Cleared�, Indian Express, 27 August, Ahmedabadedition.
288 Bibliography
Nagaraj, R. (1984). �Subcontracting in Indian Industries: Analy-sis, Evidence and Issues�, Economic and Political Weekly,vol. 19, nos 31, 32 and 33, pp. 1435�53.
����� (2000). �Indian Economy since 1980: Virtuous Growthor Polarisation?�, Economic and Political Weekly, vol. 35,no. 32, pp. 2831�9.
Nalatwadmath, S. K., M. S. Rama Mohan Rao, and M.Padmaiah (1997). �Joladarasi Model Watershed Develop-ment Programme in Bellary District of Karnataka: ADiagnostic Evaluation�, Journal of Rural Development,vol. 16, no. 2, pp. 313�28.
Nanjundiah, Y. N. and J. M. Barot (1989). �A New Dimensionin Rural Watersupply Programme�, Journal of IndianWater Works Association, pp. 239�43.
Narayan, Deepa (1995). �The Contribution of People�s Partici-pation: Evidence from 121 Rural Water Supply Projects�,Environmentally Sustainable Development OccasionalPaper Series No. 1, The World Bank, Washington,DC.
National Council of Applied Economic Research (2000). TheDraft Electricity Bill 2000,version 5, NCAER, New Delhi.
National Institute of Public Finance and Policy (1995). Rede-fining State-Municipal Fiscal Relations: Options and Perspec-tive for the State Finance Commissions, NIPFP, New Delhi.
National Institute of Urban Affairs (1983). A study of theFinancial Resources of Urban Local Bodies in India and theLevel of Services Provided, NIUA, New Delhi.
����� (1986). Management of Urban Services, NIUA, NewDelhi.
����� (1987). The Nature and Dimensions of Urban FiscalCrisis, NIUA, New Delhi.
����� (1989). Upgrading Municipal Services: Norms andFinancial Implications, vols 1 and 2, NIUA, New Delhi.
����� (1995). Norms and Standards of Expenditure forMunicipal Services, paper prepared for the National Work-shop on the Role and Functions of the State FinanceCommissions, NIUA, Mussoorie.
����� (1997a). Financing Urban Infrastructure in India,NIUA, New Delhi.
����� (1997b). Scope and Practice of Privatization of UrbanServices in India, NIUA, New Delhi.
����� (1998a). A Compendium of Municipal Legislations inConformity with Constitution (74th) Amendment Act, 1992,NIUA, New Delhi.
����� (1998b). Project Development Experience in UrbanEnvironmental Infrastructure, vols I and II, compiled byGangadhar Jha, NIUA, New Delhi.
����� (1998c). Strategy for Capacity Building of UrbanGovernment Institution in India, , NIUA New Delhi.
����� (2000a). �First State Finance Commissions: Recom-mendations Regarding Transfers, Sharing and Devolu-tion of Taxes�, background paper prepared for theNational Meet on Approach to State�Municipal Fiscal Rela-tions, NIUA, NIPFP and Indo-US FIRE Project, NewDelhi.
����� (2000b). Urban Statistics: Hand Book 2000, NIUA,New Delhi.
����� Synthesis Report of the UBSP Benchmark Survey, volsI and II, New Delhi.
National Telecom Policy (1999) at http://www.trai.gov.in/ntp1999.htm
Naughton, Barry (1996). Growing out of the Plan: ChineseEconomic Reform,1978�1993, Cambridge University Press,UK.
Nigam, Ashok, Biksham Gujja, Jayanta Bandyopadhyay andRupert Talbot (1998). Fresh Water for India�s Children andNature: Learning from Local-Level Approaches, UNICEFand WWF, New Delhi.
Number Portability Site at www.ported.com.Nuttall R. and Vickers J. (1996). �Competition Policy for
Regulated Utility Industries in Britain�, Regulation Initia-tive Discussion Papers Series No 1, Oxford University,UK.
Oei, D. G. (1997). �Fuel Cell Engines for Vehicles�, AutomotiveEngineering, February, pp. 115�17.
Office for Telecom Authority, Hong Kong, at www.ofta.gov.hk.
Office for Telecommunications at www.oftel.gov.uk.Operations Research Group (1989). Delivery and Financing of
Urban Services, Mumbai.Pangotra, Prem (1999). �Resource Mobilization Strategies
for Financing of Transport Infrastructure and Services�,in G. Raghuran et al. (ed.), Infrastructure Development andFinancing, Macmillan India, New Delhi.
Parikh, Kirit (ed.) (1999). India Development Report 1999�2000,Oxford University Press, New Delhi.
Parson, G. L. (1987). �Strategic Information Technology�, inE. K. Somogyi and R. D. Galliers (ed.) Towards StrategicInformation Systems, Abacus Press, Cambridge.
Patwardhan, S. S. (1988). �Urban Water Supply during DroughtConditions: Case Study of a Town�, Journal of IndianWater Works Association, pp. 15�20.
Paul, Samuel (1993). �Bangalore�s Public Services: A ReportCard�, Economic and Political Weekly, vol. 28, no. 52,p. 2901.
Pendley, Charles (1997). �A Demand-based Approach to RuralWater Supply and Sanitation�, in K. Pushapangadan(ed.), Proceedings of the National Seminar on Rural WaterSupply and Sanitation, Centre for Development Studies,Trivandrum.
Perkins, Stephen, and Alan Gatherer (1999). �Two-way Broad-band CATV-HFC Networks: State-of-the-art and FutureTrends�, Computer Networks, vol. 31, pp. 313�26.
Pisciotta, A.A. (1994). �Privatization of Telecommunication:The Case of Venezuela in Implementing Reforms in theTelecom Sector� in B.Wellenius and P. A. Stern (eds),Implementing Reforms in the Telecom Sector, World Bank,pp. 185�94.
Plaast, Gregory (2000). �States Deregulate Energy at TheirPeril�, New York Times, 25 August.
Planning Commission (1983). Task Force on Housing and UrbanDevelopment: Financing Urban Development , PlanningCommission, Government of India, New Delhi.
����� (1992). Report of the Committee on Pricing of
Bibliography 289
Irrigation Water, Planning Commission, Government ofIndia, New Delhi.
����� (1998). Perspective Planning for Transport Develop-ment: Report of Steering Committee, New Delhi.
����� (2000). Compilation of Ninth Five Year Plan:1997�2000, Nabhi Publications, New Delhi.
PricewaterHouseCoopers (1999). Report On InstitutionalStrengthening of GIDB, Asian Development Bank Tech-nical Assistance No.2716-IND, mimeo.
Public Affairs Centre, (1999). Monitoring the Quality of RoadWorks: A Citizen�s Guide, Department of Science andTechnology, Bangalore.
Pundir B. P. (2000). �Vehicular Air Pollution in India: RecentControl Measures and Related Issues�, Indian Institute ofTechnology, Kanpur.
Purswani, R. (1988). �Need of Reservoirs to Meet Droughtsand Floods�, Journal of Indian Water Works Association,pp. 11�13.
Pushpangadan, K. and G. Murugan (1997). �User Financingand Collective Action: Relevance for Sustainable RuralWater Supply in India�, Working Paper No. 274, Centrefor Development Studies, Trivandrum.
Raghuram G. (1992). �Logistics Management: An IntroductoryNote�, Vikalpa, vol. 17, no. 1.
����� (1996). �Towards a National Shipping Policy: AStudy of the Indian Shipping Industry�, PSG Monograph,Indian Institute of Management, Ahmedabad.
����� (2000a). �Coastal Shipping: Scope of Integratingwith the National Transport Network�, Working PaperNo. 2000�10�04, Indian Institute of Management,Ahmedabad.
����� (2000b). �Experiences of Various Forms of Commer-cial Partnerships in Indian Railway�, mimeo, Indian Insti-tute of Management, Ahmedabad.
����� (2000c). �Logistics Infrastructure in India andits Implications for Supply Chain Management� inG. Raghuram and N. Rangaraj (ed.), Logistics and SupplyChain Management: Cases and Concepts, Macmillan IndiaLimited, New Delhi.
����� (2000d). �Regulation and Privatisation: A Compara-tive Case Study of Gujarat Maritime Board and JawaharlalNehru Port Trust�, Indian Institute of Management,Ahmedabad.
Raghuram G. and V. V. Rao (1991). �A Decision SupportSystem for Improving Railway Line Capacity�, PublicEnterprise, vol. 11, no. 1.
Rai, Kuldip and D. K. Bhalla (2000). �Computerisation of LandRecords in India� at http://www.csdms.org/magazine/April 2000
Raj Narain vs. State of UP (1975). All India Reporter SC865.
Rakshit, R. N. (1977). �Development of Groundwater Re-sources for Drinking Water Supply in The Rural WaterAreas of Maharashtra State�, Journal of Indian WaterWorks Association, vol. 9, no. 4, pp. 315�21.
Ramadesikan, G. R. (1999a). �Policy Approach to InternetTelephony�, paper presented at the Workshop on Telecom
Policy Initiatives: The Road Ahead, Indian Institute ofManagement, Ahmedabad.
����� (1999b). �Technological Convergence: A Note�,mimeo, Indian Institute of Management, Ahmedabad.
Ramani, K. V. (1993). �IT Applications in Transportation�, CSICommunications , October.
����� (1995). �Port Management: Some EDI Applicationsin Singapore�, CSI Communications, May, pp. 25�7.
����� (1996). �An Interactive Simulation Model for theLogistics Planning of Container Operations in Seaports�,Simulation Journal, vol. 66, no. 5, pp. 291�300.
����� (2000). �Port Management: India�s Preparedness toFace Global Challenges�, mimeo, Indian Institute ofManagement, Ahmedabad.
Replogle, M. (1998). �Nonmotorised Vehicles in Asia: Issuesand Strategies�, World Bank, Washington, DC.
Report of the Spectrum Management Committee (1998). PrimeMinister�s Council at http://www.trai.gov.in.
Reserve Bank of India (1994). �Finances of State Govern-ments�, RBI Bulletin, February issue, Mumbai.
Roth, Gabriel (1996). Roads in a Market Economy, AshgatePublishing Ltd., London.
Saleth, Maria R. (1994). �Towards a New Water Institution:Economics, Lawand Policy�, Economic and Political Weekly,Review of Agriculture, 24 Sep, pp. A�147�55.
Sapte, Wilde (1997). Project Finance: The Guide to FinancingBOT Project, Economy Publication, PLC, UK.
Sarkar, P. K. (1998). Law of Acquisition of Land in India:Including Requisition and Acquisition of Immovable Prop-erty, Eastern Law House, Calcutta.
Sarosh, Bana (2000). �Young Port in a Hurry�, Business India,7�20 August.
Satyanarayan, G. (1999). Development, Displacement and Reha-bilitation, Rawat Publications, New Delhi.
Scherer, P. R. (1994). �Telecommunication Reform in Devel-oping Countries� in B. Wellenius and P. A. Stern (eds)Implementing Reforms in the Telecom Sector, World Bank.
Secretariat for Global Consultation (1990). �Global Consulta-tion on SafeWater and Sanitation for the 1990s�, Back-ground Paper, Government of India, New Delhi.
Seshan, T. N. (1990). Speech at the Seminar on TraditionalWater Harvesting Systems of India, Centre for Scienceand Environment, New Delhi.
Shah, Mihir, Debashis Banerji, P. S. Vijayshankar andPramathesh Ambasta (1998). India�s Drylands: TribalSocieties through Environmental Regeneration . OxfordUniversity Press, Delhi.
Shah, Rajiv (2000). Times of India, 27 August, Ahmedabadedition.
Shah, Tushaar (1992). �Sustainable Development of Ground-water Resource: Lessons from Junagadh District�,Economic and Political Weekly, 7�14 March, pp. 515�20.
Shankari, Uma, (1991). �Tanks: Major Problems in MinorIrrigation, Economic and Political Weekly, vol. 26, no. 39,pp. A115�A125.
Shetty, S. L. (1978). �Structural Retrogression in the Indian
290 Bibliography
Economy since the Mid-sixties�, Economic and PoliticalWeekly, annual number.
Shipping Corporation of India Ltd. (1999). Annual Report1997�8, Mumbai.
Shivji, Issa (1976). �Class Struggles in Tanzania� MonthlyReview Press, New York.
Shu, Jet P. H., Wei-Li Chiang, Bing-Ming Lin, and Ming-ChouCheng (1997). �The Development of the Electric Propul-sion System for the Zero Emission Scooter in Taiwan�,SAE Paper No. 972107, Society of Automotive Engineers,Washington, DC.
Singh, J. P. (2000). �Availability of Potable Water in RuralIndia�, Kurukshetra, vol. 48, no. 12.
Singh, P. K., J. Singh, S. C. Mahnot, and S. Modi (1995).�Watershed Approach in Improving the Socio-economicStatus of Tribal Areas: A Case Study�, Journal of RuralDevelopment, vol. 14, no. 2, pp. 107�16.
Singh, R.P. (1993). �Dryland Agriculture and TechnologicalOptions: Issuesand approaches for Watershed Develop-ment�, Journal of Rural Development, vol. 12, no. 1,pp. 21�3.
Sinha, S. K. (1990). Speech at the Seminar on TraditionalWater Harvesting Systems of India, Centre for Scienceand Environment, New Delhi.
Sreenivas, J. (2000a). �Forget the Sensex for a Second, Lookwhat Else is Going Down�, Indian Express, 19 April, NewDelhi, p. 1.
����� (2000b). �Once a Fortnight, They get a Few Dropsand That too for Twenty Minutes�, Indian Express, 19April, p. 1, New Delhi.
Superstratum (1997). Proceedings of Euroforum conference onTelecom Regulation, Frankfurt.
Supreme Court Cases (various issues), SCC, Eastern BookCompany, Lucknow.
Supreme Court Reports (various issues), SCR, Government ofIndia, New Delhi.
Teagon, P., C. Ross, N. Whitton, and D. Arthur (1999).�Impact of New Generation Vehicle Technology on OilIndustry�, paper presented at the Third InternationalPetroleum Conference and Exhibition, New Delhi.
Tee, Kam U. (1995). �Commercialization and Privatizationof Water and Sewage Supplies: The Case of Malaysia�,UMP-Asia Occasional Paper No. 23, Kuala Lumpur.
Telecom Regulatory Authority of India (1997a). �ConsultationPaper on Tariff�, TRAI, New Delhi.
����� (1997b). �Telecom Regulatory Authority of IndiaAct 1997�, no. 24, TRAI, New Delhi.
����� (1999a). �Consultation Paper on Competition inDomestic Long Distance�, TRAI, New Delhi.
����� (1999b). �Telecom Tariff Order, 1999, Annex A,Explanatory Memorandum�, TRAI, New Delhi.
����� (2000). �Consultation Paper on Licensing IssuesRelating to Fixed Service Providers�, TRAI, NewDelhi.
Telecommunications Standards Advisory Council of Canadaat www.tsacc.ic.gc.ca.
Telematics India (1991). �The C-DOT Baby Matures�, pp 24�6.
Telephone Number Mapping Working Group of IETF atwww.ietf.org/html.charters/enum-charter.html.
Tewari, Vinod K. and M. P. Mathur (1999). �Octroi Issues andAlternatives�, National Institute of Urban Affairs, NewDelhi.
Thoopal, R. K. (1998). �Strategy for Increasing Throughput onHigh Density Routes�, OSD West Central Railway,Jabalpur.
Thukral, Enakshi Ganguly, �The Displaced and the Dispos-sessed�.
Times Research Foundation (1998). Municipalities in India: TheDevolution Paradox, study supported by USAID, TRF,Delhi.
Tiwari, G. (1993). �Pedestrians and Bicycle Crashes in Delhi�,paper presented at theWorld Injury Conference, Atlanta,GA.
����� (1998). �Bicycle Master Plan for Delhi�, Final Reportsubmitted to Transport Department, Delhi Government,TRIPP, Indian Institute of Technology, Delhi.
����� (1999). �Planning for non-motorized traffic: A pre-requisite for sustainable transport system�, IATSS Re-search, vol. 23, no. 2, pp. 70�7.
����� (2000). �Urban and Inter-Urban Designs in India:Issues Concerning Mixed Traffic�, TRIPP, Indian Insti-tute of Technology, Delhi.
Tota, Katarzyna (1999). �The role of non-motorised trans-port in sustainable urban transport systems: A prelimi-nary analysis of costs and benefits of non-motorizedand bus priority measures on Vikas Marg�, TERI,Delhi.
Tyler, M. and S. Bednarizyk (1993). �Regulatory Institutionsand Processes in Telecommunications: An InternationalStudy of Alternatives�, TelecomPolicy, December, pp. 650�76.
Uehara, T. (1990). �Privatization and Reorganisation of NipponTelegraph and Telephone� in Restructuring and Managingthe Telecommunication Sector, pp. 67�9.
Ulmer, M. J. (1960). Capital in Transportation, Communica-tions, and Public Utilities: Its Formation and Financing,NBER Study, Princeton University Press, NJ.
United Nations Conference on Trade and Development (1985).�Operations Planning in Ports�, monograph no. 4,UNCTAD, New York.
����� (1987). �Measuring and Evaluating Port Performanceand Productivity�, monograph no. 6, UNCTAD, NewYork.
Urban Finance (1998). �Urban Infrastructure Finance: Need fora Change in Strategy�, vol. 1, no. 3.
����� (1999). �Private Sector Participation in Urban WaterSupply and Sanitation Sector in India�, vol. 2, no. 3.
Urban Finance (2000). �Budgetary Incentives for Urban Infra-structure Financing�, vol. 3, no. 1.
Vani, M.S. (1990). �Role of Panchayat Institutions in IrrigationManagement in Tamil Nadu and Karnataka�, paper pre-sented at the Seminar on Traditional Water HarvestingSystems of India, Centre for Science and Environment,New Delhi.
Bibliography 291
Varma, J. R. (1998). �Asian Crisis and Finance Theory�, Vikalpa,vol. 23, no. 4, pp. 23�34.
Verma, Kalpana (2000). �Deluge, BMC Punch Holes in BEST�sCoffers�, Indian Express, 21 July.
Videsh Sanchar Nigam Ltd. (various issues). Annual Report,VSNL, New Delhi.
Vittal, N. (1999). �The Course, Content and Consequence ofthe Reforms in Indian Telecommunications�, Journal ofthe CTMS, vol. 8, no. 6, pp. 13�21.
Webb M. and M. Tayler (1998). �Light-handed Regulation ofTelecommunications in New Zealand: Is Generic Com-petition Law Sufficient?�, paper presented at the Interna-tional Telecommunications Society Twelfth BiennialConference, Stockholm.
Wellenius, B. and P. A. Stern (1994). Implementing Reforms inthe Telecom Sector, World Bank, Washington, DC.
Wellenius, B. (1990). �Beginning of Sector Reform in theDeveloping World� in Restructuring and Managing theTelecommunication Sector, pp. 89�98.
����� (1994). World Development Report 1994: Infrastruc-ture for Development. Oxford University Press, NewYork.
����� (1995a). India Port Sector: Strategy Report, South AsiaRegional Office.
����� (1995b). India Transport Sector: Long Term Issues,report no. 13192-IN, Infrastructure Operations DivisionCountry Department II, India and South Asia RegionalOffice, Washington, DC.
����� (1995c). World Health Organization Report, AsianEnvironment Division.
����� (1999). Rural Water Supply and Sanitation, SouthAsia Rural Development Series, Washington, DC.
����� (2000). World Development Report 1999�2000: Enter-ing the Twentieth Century. Oxford University Press, NewYork.
World Resources Institute (1999). World Resources, OxfordUniversity Press, New York.
Yankee Group (1995) at http://www.adc.com/Education/HFC/topics/voiceIP/pg.3.html#4
Yoon, C. (1999). �Liberalisation Policy, Industry Structure andProductivity Changes in Korea�s TelecommunicationsIndustry�, Telecommunications Policy, vol. 23, nos 3�4,pp. 289�306.
Zakaria Committee (1963). Augmentation of Financial Re-sources of Urban Local Bodies, Report of the Committee ofMinisters constituted by the Central Council of LocalSelf-government, Government of India, New Delhi.