tea plantation infrastructure
TRANSCRIPT
1
NRPPD Discussion PaperNRPPD Discussion PaperNRPPD Discussion PaperNRPPD Discussion PaperNRPPD Discussion Paper
2929292929
PLANTATION INFRASTRUCTURE AND THE
PERFORMANCE OF ASSAM’S TEA
SECTOR: AN ANALYSIS ON THE
SMALLHOLDING TEA PLANTATION
SECTOR
Kalyan Das
2013

2
3
PLANTPLANTPLANTPLANTPLANTAAAAATION INFRASTRTION INFRASTRTION INFRASTRTION INFRASTRTION INFRASTRUCTURE UCTURE UCTURE UCTURE UCTURE AND AND AND AND AND THETHETHETHETHEPERFORMANCE OF PERFORMANCE OF PERFORMANCE OF PERFORMANCE OF PERFORMANCE OF ASSAM’S ASSAM’S ASSAM’S ASSAM’S ASSAM’S TEA SECTTEA SECTTEA SECTTEA SECTTEA SECTOR:OR:OR:OR:OR:
AN AN AN AN AN ANANANANANALALALALALYSIS ON YSIS ON YSIS ON YSIS ON YSIS ON THE SMALLHOLDINGTHE SMALLHOLDINGTHE SMALLHOLDINGTHE SMALLHOLDINGTHE SMALLHOLDINGTEA PLANTTEA PLANTTEA PLANTTEA PLANTTEA PLANTAAAAATIONTIONTIONTIONTION SECTOR SECTOR SECTOR SECTOR SECTOR
Kalyan DasKalyan DasKalyan DasKalyan DasKalyan Das
2013
4
ABSTRAABSTRAABSTRAABSTRAABSTRACTCTCTCTCT
It has appeared that in the highly productive tea smallholding
sector of Assam there is mismatch of production of green tea leaves and
the processing capacity of the factories to accommodate the flush. The
limit set by the factories on the supply of tea leaves produced by the
smallholders has few repercussions. In addition to the possibility that a
proportion of tea leaves remain un-plucked or not plucked, a fair price
for tea leaves is not ensured to the smallholders in an unregulated
environment of price fixation. This limits margin of profit, which finally
affects investment in maintenance in the smallholdings. Moreover, an
assessment on the operational hours lost by the tea factories due to
erratic electricity supply reveal additional constraints in the tea sector.
Arrangement of alternative power though has prevented the wastage
level of green tea leaves it raises operational costs of the factories. The
decision to acquire a backup power is however considered a rational
decision on the part of the factories as the cost of not having backup is
larger in frequent power cut situation. This paper consolidates the
argument that adequate provisioning of public infrastructure help to
reduce the cost of production and thus raise competitiveness and
inclusiveness of a production sector. While the bearing of low
productivity and high labour cost on competitiveness has attracted the
attention, the influence factors like infrastructure in production,
processing and marketing seems to have not received much attention.
Hence this paper explores the influence of infrastructure on the
performance of tea sector by taking the case of smallholding sector in
Assam.
5
IntroductionIntroductionIntroductionIntroductionIntroduction
It is often argued that the competitiveness of India’s tea sector is
adversely affected by low productivity1 and high labour costs2. The low
productivity arises inter alia because of the predominance of old
plantations and negligence in maintenance. In India about 44 per cent
of the area under tea is more than 40 years old waiting for re-plantations.
Since 1991 no single year shows more than 0.4 per cent re-plantation in
the tea acreages (Tea Statistics, Tea Board of India various years). No
doubt these old plantations lead to lack of competitiveness of the tea
sector in the world market. The share of Indian tea in the world market
stood at 11 per cent in 2011behind Kenya, Sri Lanka and China.
Although India has a huge domestic market, the survival in an open
economy context is contingent on international competitiveness.
Moreover, Indian tea at present is not commanding best prices in the
world market as compared to Sri Lanka, Kenya, Mauritius and Japan
(Tea Statistics, and Annual Bulletin of Tea Board of India, various years).
While the bearing of low productivity and high labour cost on
competitiveness has attracted the attention, the influence of other factors
like infrastructure in production, processing and marketing seems to
have not received the attention of scholars that it deserves. Hence, the
present paper explores the influence of infrastructure on the performance
of tea sector by taking the case of Assam.
The inquiry assumes added importance in the context of recent
changes in the holding structure of tea plantations. It has been shown
that, during the recent past there is a clear trend towards the domination
of smallholdings. Area under tea smallholdings in 1991 (captured by
the Tea Board of India with size class of less than 8.1 hectare) was just
6
10,853 hectares or 2.6 per cent of the total tea acreages. The smallholdings
were concentrated mostly in the South India. Over the years the
smallholdings have emerged in the areas dominated by estates (Assam
and West Bengal). In the year 2006 areas under tea smallholdings
constituted 154,099 hectares (27.2 percent of total acreages of tea) with
a size class of less than 10.1 hectare (the size criterion revised by Tea
Board of India) and accounted for 25.4 per cent of total production. On
the other hand, acreages under estate sector of tea declined in India from
409,684 hectare to 401,512 hectare (-1.99 per cent) during 1991 to
2006. In Sri Lanka smallholdings now compensates the failure of the
estate sector contributing 66 per cent of the total production from 44 per
cent tea acreages under its possession.
Tea smallholdings in Assam initiated in early 1980s and the
number had increased to 48,292 in 2005 (Tea Board of India, 2006)3. In
that year tea smallholdings in Assam occupied 22.7 per cent of the total
299,502 hectares under tea (Tea Board, Guwahati, 2009). A recent survey
conducted by Industries and Commerce Department, Government of
Assam (2011) indicates the number of tea smallholdings at 68,459
hectares with plantations area of 48,426 hectares. Since 1999 onwards
the surveillance system of Tea Board of India had started to include the
acreages under smallholdings, but the data were amalgamated with
overall acreages under tea. The result is that we see significant rise in tea
acreages under the estate sector of Assam (230,978 ha in 1998 to 257,735
ha in 1999, 299,502 ha in 2005 and 311,822 ha in 2006). Leaving aside
the holdings of less than 10.1 hectares in size, acreages under estate
sector tea plantations stood at 231,591 ha in 2005 and 231,277 ha in
2006 in the state. All reveal that the rise in tea acreages in the state is
largely because of the rise in tea smallholdings and the area under estate
sector has shown stagnancy.
Now the issue is to what extent the smallholdings fill the space
left open by the estate sector and usher in the tea economy with its new
7
plantation led high productivity (Das, 2012 a). The context and space
the tea smallholders of Assam are now placed, however, are not congenial to
place smallholdings a dominant production mode in the tea sector. Issues on
infrastructural constraints at processing level of green tea leaves and forwarding
the final product to market are occasionally raised, but data in public domain
are not available to have a clear understanding on infrastructural deficiencies
and assess the wastage level of the primary produce.
This paper, drawing from a primary field survey, tries to assess the
adequacy of infrastructures at the processing level to accommodate the
production boom contributed by the tea smallholding sector. Moreover,
on energy front, an assessment is made to understand how erratic supply
of electricity puts constraints on operation of the tea factories to
accommodate the supplies made by the tea smallholders. In addition to
these two factors an assessment is made on highly oscillating and
unacceptable prices of green tea leaves during the year in the smallholding
sector, which indicates infrastructure deficiency as well as absence of
regulatory provisions to ensure a fair price. On the tea smallholders’ front
it is inferred that the prices received for the green tea leaves influence
investment decisions in their holdings. Overall the paper observes that
inadequacy of infrastructures at the processing level and absence of a
mechanism to ensure fair return to the tea smallholders have a bearing on
the performance, influencing competitiveness of the sector.
II.II.II.II.II. Crisis: Overproduction or Deficiency in ProcessingCrisis: Overproduction or Deficiency in ProcessingCrisis: Overproduction or Deficiency in ProcessingCrisis: Overproduction or Deficiency in ProcessingCrisis: Overproduction or Deficiency in ProcessingInfrastructure?Infrastructure?Infrastructure?Infrastructure?Infrastructure?
The tea smallholders of Assam at present are in crisis. The crisis
primarily is about the anxiety and uncertainty over the prices they receive
for green tea leaves. The smallholders having no processing factories of
their own, and hence depend entirely on the large estates and bought
leaf tea factories (BLTFs)4 to sell their output. The deceleration of price
of green tea leaves was so fast during 2011 season5 that the price offered
by the tea factories had come down from Rs. 21 a kg in August 2011 to
8
Rs. 3 in October 2011. Such phenomenon raises the issue of distributive
justice considering the fact that in the retail market of tea we do not see
high oscillations of prices. This issue created uproar and protest among
the tea smallholders and demanded state intervention for a mechanism
that ensures a fair price for the green leaves6. The form of protest registered
was so anguished that on October 15, 2011 the smallholders had thrown
10 lakh kg of tea leaves on the highways7.
This is not that for the first time the tea smallholders faced crisis
over the uncertain and undetermined prices. The history of the crisis
could be traced back to the beginning of 21st century, with periodic
return of low, which has no linkages to the country’s or region’s tea
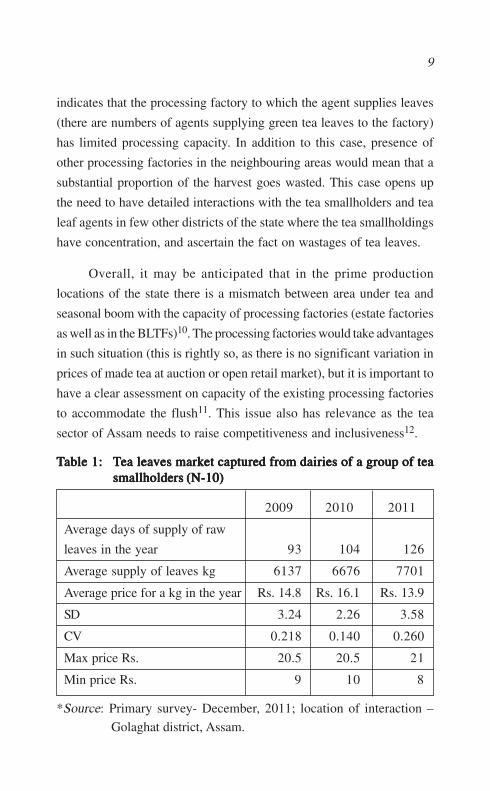
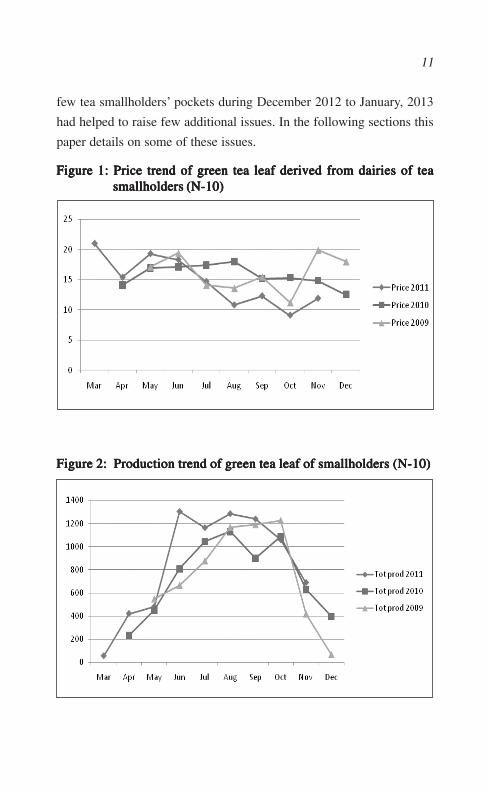
market price8. Analysis of dairies of a group of smallholders reveal that
the year 2011 had hit low in prices of green tea leaves compared to the
two previous years, that too with more oscillations (figure 1). The lows
having no linkages with the auction market prices of tea would mean
that the smallholders have little bargaining power. This issue, however,
requires in depth investigation. On the other hand the rising number of
supply days and quantum of supply made by the smallholders indicate that
2011 was a better year production wise (figure 2), which certainly influenced
the fall in the price of green tea leaves (Table 1). Overall the crisis leads to
two issues. Expression of inability or unwillingness to purchase green tea
leaves from the smallholders would mean that the processing factories
have their limit to process. On the other hand, a meager price offered for
the tea leaves would indicate that the processing factories take the
advantage of abundant supply of this perishable product.
Tea leaves being a perishable product it is important to have a
look at the capacity of the processing factories in the producing zones
to accommodate the seasonal flush. Interaction with a tea leaf agent9 in
the Golaghat district of the state had revealed a few issues. In the month
of August 2011 the agent was asked to limit the supply below 1000 kg
of tea leaves a day. Price during that month declined to Rs. 12 a kg. It
9
indicates that the processing factory to which the agent supplies leaves
(there are numbers of agents supplying green tea leaves to the factory)
has limited processing capacity. In addition to this case, presence of
other processing factories in the neighbouring areas would mean that a
substantial proportion of the harvest goes wasted. This case opens up
the need to have detailed interactions with the tea smallholders and tea
leaf agents in few other districts of the state where the tea smallholdings
have concentration, and ascertain the fact on wastages of tea leaves.
Overall, it may be anticipated that in the prime production
locations of the state there is a mismatch between area under tea and
seasonal boom with the capacity of processing factories (estate factories
as well as in the BLTFs)10. The processing factories would take advantages
in such situation (this is rightly so, as there is no significant variation in
prices of made tea at auction or open retail market), but it is important to
have a clear assessment on capacity of the existing processing factories
to accommodate the flush11. This issue also has relevance as the tea
sector of Assam needs to raise competitiveness and inclusiveness12.
TTTTTable 1:able 1:able 1:able 1:able 1: TTTTTea leaea leaea leaea leaea leavvvvves markes markes markes markes market captured from dairies of a group of teaet captured from dairies of a group of teaet captured from dairies of a group of teaet captured from dairies of a group of teaet captured from dairies of a group of teasmallholders (N-10)smallholders (N-10)smallholders (N-10)smallholders (N-10)smallholders (N-10)
2009 2010 2011
Average days of supply of raw
leaves in the year 93 104 126
Average supply of leaves kg 6137 6676 7701
Average price for a kg in the year Rs. 14.8 Rs. 16.1 Rs. 13.9
SD 3.24 2.26 3.58
CV 0.218 0.140 0.260
Max price Rs. 20.5 20.5 21
Min price Rs. 9 10 8
*Source: Primary survey- December, 2011; location of interaction –
Golaghat district, Assam.
10
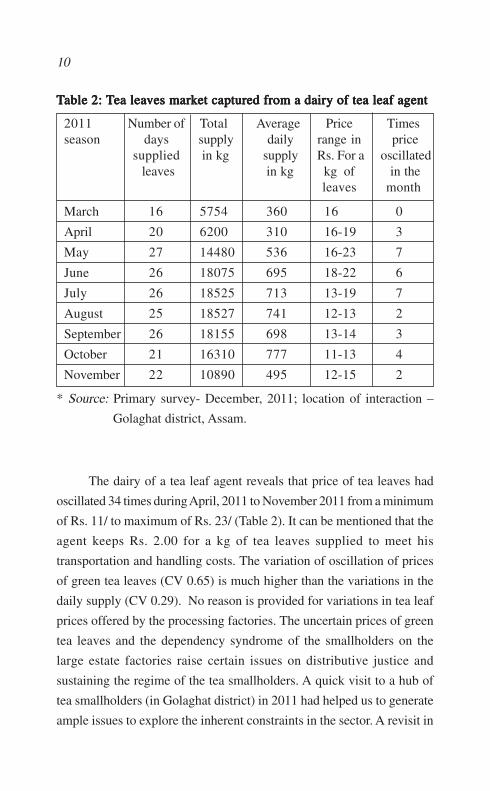
TTTTTableableableableable 2: 2: 2: 2: 2: TTTTTea leaea leaea leaea leaea leavvvvves markes markes markes markes market captured from a dairy of tea leaf agentet captured from a dairy of tea leaf agentet captured from a dairy of tea leaf agentet captured from a dairy of tea leaf agentet captured from a dairy of tea leaf agent
2011 Number of Total Average Price Timesseason days supply daily range in price
supplied in kg supply Rs. For a oscillated leaves in kg kg of in the
leaves month
March 16 5754 360 16 0
April 20 6200 310 16-19 3
May 27 14480 536 16-23 7
June 26 18075 695 18-22 6
July 26 18525 713 13-19 7
August 25 18527 741 12-13 2
September 26 18155 698 13-14 3
October 21 16310 777 11-13 4
November 22 10890 495 12-15 2
* Source: Primary survey- December, 2011; location of interaction –
Golaghat district, Assam.
The dairy of a tea leaf agent reveals that price of tea leaves had
oscillated 34 times during April, 2011 to November 2011 from a minimum
of Rs. 11/ to maximum of Rs. 23/ (Table 2). It can be mentioned that the
agent keeps Rs. 2.00 for a kg of tea leaves supplied to meet his
transportation and handling costs. The variation of oscillation of prices
of green tea leaves (CV 0.65) is much higher than the variations in the
daily supply (CV 0.29). No reason is provided for variations in tea leaf
prices offered by the processing factories. The uncertain prices of green
tea leaves and the dependency syndrome of the smallholders on the
large estate factories raise certain issues on distributive justice and
sustaining the regime of the tea smallholders. A quick visit to a hub of
tea smallholders (in Golaghat district) in 2011 had helped us to generate
ample issues to explore the inherent constraints in the sector. A revisit in
11
few tea smallholders’ pockets during December 2012 to January, 2013
had helped to raise few additional issues. In the following sections this
paper details on some of these issues.
Figure 1: Price trend of green tea leaf derived from dairies of teaFigure 1: Price trend of green tea leaf derived from dairies of teaFigure 1: Price trend of green tea leaf derived from dairies of teaFigure 1: Price trend of green tea leaf derived from dairies of teaFigure 1: Price trend of green tea leaf derived from dairies of teasmallholders (N-10)smallholders (N-10)smallholders (N-10)smallholders (N-10)smallholders (N-10)
Figure 2: Production trend of green tea leaf of smallholders (N-10)Figure 2: Production trend of green tea leaf of smallholders (N-10)Figure 2: Production trend of green tea leaf of smallholders (N-10)Figure 2: Production trend of green tea leaf of smallholders (N-10)Figure 2: Production trend of green tea leaf of smallholders (N-10)
12
III. Infrastructure and on Performance of the III. Infrastructure and on Performance of the III. Infrastructure and on Performance of the III. Infrastructure and on Performance of the III. Infrastructure and on Performance of the TTTTTea Sectorea Sectorea Sectorea Sectorea Sector
Pricing of green tea leaves, reduced profit margins and the
constraints associated with the field operations of smallholding
plantations would explain only one part of limitation and
incompetitiveness. As indicated in Section I the issue of infrastructure
deficiencies at the processing level has been raised now, the data is not
available to indicate a clear understanding and picture on infrastructural
deficiencies as well as assessment on wastage of the primary produce,
leading to a rise in cost of production in the process.
Few newspapers reportage on erratic and inadequate power supply
and bad road conditions to approach the tea plantations13 are good
enough to infer the situation. Tea Association of India reports that
uncertain power supply and inadequate road connectivity increase the
cost of output. This to a large extent affects competitiveness of the
sector. Erratic power supply, which forces the plantations to rely on
diesel, raises the cost of production (Poor infrastructure hits Barak valley
tea units, Times of India, April, 30, 2012). Similar situation is also reported
in all five major tea producing districts in Brahmaputra valley of the
state; namely Dibrugarh, Tinsukia, Sibsagar, Jorhat and Golaghat. In
these production hubs processing factories in about half of the tea estates
run on gas supplies by Oil India Ltd. Frequent bandhs call by numerous
organisations often affect the supply of gas, and even to restore the
supply of gas the Assam Gas Company Ltd requires time to build the
pressure in their pipelines. The result is that there is interruption in the
production process. This reportedly forces many tea processing factories
to stop buying green tea leaves from the smallholdings and even stop
plucking leaves from their own plantations (Tea production in Assam
affected due to non-supply of gas, Business Standard, June 2, 2012).
Data on public domain is not available on the loss of processing
capacity by the tea factories due to unavailability of power. Moreover,
some additional estimates would indicate the wastage of green tea leaves.
13
Information on quantity of tea leaves the factories declined to purchase
from the tea smallholdings during the power crisis period and number of
off-days of plucking (could be because of numerous reasons including
unavailability of labour) in the smallholding plantations would indicate
wastage of this perishable produce.
Along with the issue of power few additional evidences would
indicate deficiencies of infrastructure in the tea sector. In the new
plantations of tea smallholdings productively is high and the supply of
green tea leaves has increased at the processing market. It is now obvious
that, over production has induced a fall in price and subsequent crisis
(Das, 2012 b). Tea leaves being a perishable product it is important to
have a look at the capacity of the processing factories in producing
zones to accommodate the seasonal flush14. Data generated by the
baseline survey on tea smallholdings, conducted by the government of
Assam (2011) are available at the website of Tea Board of India, north
east zonal office. These data to a good extent help understand the
capacity of the processing factories, their outturn and cost of
manufacturing of tea. This paper tries to infer the situation using this
data base. Government of Assam data however has not incorporated the
issue on power infrastructure, which is a major determinant in functioning
of the tea industry. It may be noted here that, CAG (2012) indicated cost
on power and fuel including packaging account for 15.3 per cent of the
total costs of producing one kg of tea.
IVIVIVIVIV. Insights from Field . Insights from Field . Insights from Field . Insights from Field . Insights from Field VVVVVisitsisitsisitsisitsisits
This paper tries to have an estimate on capacity utilisation of the
BLTFs15 and the proportion of underutilisation explained by the erratic
power supply. A rise in the cost of production is anticipated due to the
use of alternative and standby power system in the tea factories. In
addition to this, there are evidences of wastages of green tea leaves
because of inadequacy of processing infrastructure.
14
A primary survey was conducted to address the issues on
infrastructure front. Information was collected from three sources - the
BLTFs, tea leaf agents and the tea smallholders. The field survey tried to
concentrate on the BLTFs and excluded the tea factories in the organised
estate sector located within the large tea estates16.
A brief questionnaire was administered to the BLTFs to understand
their processing capacity and production, power availability and
operational hour utilisation, costs on power and fuel, processing capacity
loss due to erratic power supply and provisioning of alternative power.
Interaction with the tea leaf agents had helped to acquire information
on their supplies to the factories, variations in supplies and oscillations
of prices of green tea leaves. In addition to these the tea smallholders as
well as the leaf agents mentioned certain operational problems in the
production process and in supplying green tea leaves to the factories.
Visit to some production hubs of tea smallholders17 has helped to
examine their dairies and records on production and supply of tea leaves,
the movement of prices of green tea leaves and problems related to
operation and maintenance. The tea smallholders keep the records of
the tea leaves plucked and sales in their registers and tiny dairies. As the
tea smallholding sector does not have an organised surveillance system
these registers and diaries to a great extent help to understand the trend,
seasonal as well as yearly variations in production. Anticipation is that
the level of adequacy/inadequacy of infrastructures in the tea sector-
particularly those related to the smallholding sector has bearing on
performance, influencing competitiveness of the sector.
Bought leaf tea factories (BLTFs) set limit on the supply of green teaBought leaf tea factories (BLTFs) set limit on the supply of green teaBought leaf tea factories (BLTFs) set limit on the supply of green teaBought leaf tea factories (BLTFs) set limit on the supply of green teaBought leaf tea factories (BLTFs) set limit on the supply of green tealeavesleavesleavesleavesleaves
Interaction with the tea leaf agents18 revealed certain phenomena
which are indicative that the tea sector of Assam is not performing to the
optimum level and there are wastages. A question was raised to the tea
15
leaf agents whether the tea factories set a daily limit on their supplies in
particular months?
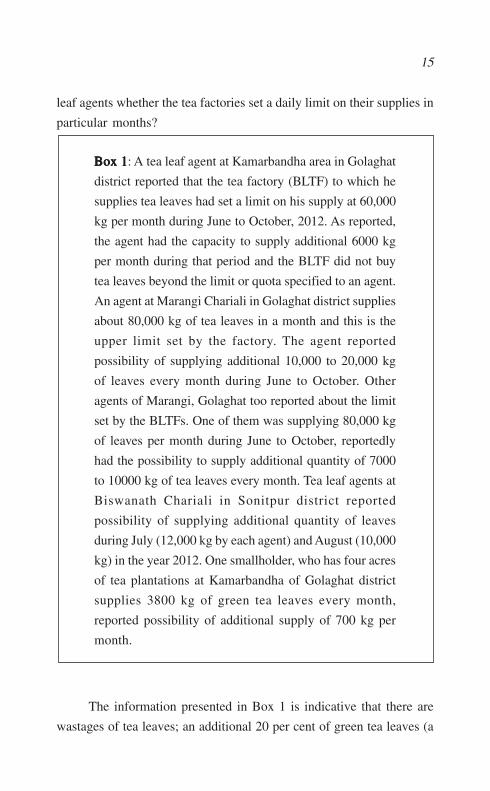
Box 1Box 1Box 1Box 1Box 1: A tea leaf agent at Kamarbandha area in Golaghat
district reported that the tea factory (BLTF) to which he
supplies tea leaves had set a limit on his supply at 60,000
kg per month during June to October, 2012. As reported,
the agent had the capacity to supply additional 6000 kg
per month during that period and the BLTF did not buy
tea leaves beyond the limit or quota specified to an agent.
An agent at Marangi Chariali in Golaghat district supplies
about 80,000 kg of tea leaves in a month and this is the
upper limit set by the factory. The agent reported
possibility of supplying additional 10,000 to 20,000 kg
of leaves every month during June to October. Other
agents of Marangi, Golaghat too reported about the limit
set by the BLTFs. One of them was supplying 80,000 kg
of leaves per month during June to October, reportedly
had the possibility to supply additional quantity of 7000
to 10000 kg of tea leaves every month. Tea leaf agents at
Biswanath Chariali in Sonitpur district reported
possibility of supplying additional quantity of leaves
during July (12,000 kg by each agent) and August (10,000
kg) in the year 2012. One smallholder, who has four acres
of tea plantations at Kamarbandha of Golaghat district
supplies 3800 kg of green tea leaves every month,
reported possibility of additional supply of 700 kg per
month.
The information presented in Box 1 is indicative that there are
wastages of tea leaves; an additional 20 per cent of green tea leaves (a
16
rough estimate) could have been plucked and processed had the factories
not set the limit in procurement. These indicate limitation of the tea
processing factories on their processing capacity. The government of
Assam (2011) data also gives an indication on accommodative capacity
of the BLTFs to the production contributed by the smallholding
plantations. Data shows that the BLTFs can accommodate 65.5 per cent
of the total green leaves produced by the smallholders (Appendix Table
2). This table also indicates that the accommodative capacity of the
BLTFs has no linkages or association with the price offered to the tea
smallholders. For example the BLTFs of Dibrugarh district has
accommodative capacity of about 94 per cent, to process the total green
tea leaves supplied or produced by the smallholders in the district. On
the other hand, accommodative capacity of BLTFs of Sibsagar district is
just 20 per cent to the total green tea leaf supplied in the district. Still
data (Government of Assam, 2011) indicates that tea factories of Sibsagar
district paid a better price (Rs. 15/ for a kg of green tea leaves) to the
smallholders than in Dibrugarh district (Rs. 13/). It may be noted that
the tea factories located in the large plantation estates now procures 20
per cent of the total leaves produced by the tea smallholdings and
procurement from smallholdings by the tea estate factories shows a
rising trend (Appendix Table 3). Overall it can be commented that
production boom in the smallholdings has created a mismatch with the
processing capacity of the tea factories.
The limit set by the BLTFs has few repercussions. In addition to
the possibility that a proportion of green tea leaves remain un-plucked
or not plucked, the surplus leaves are sold to sub-agents or even to large
agents at a very low price, who explore the possibilities to sell them at
places wherever they have contacts19. The ultimate result is that a fair
price for tea leaves is not ensured to the smallholders. This squeezes
their margin of profit, which finally affect their capacity to invest in
maintenance of their holdings. Field survey did not try to address this
issue, but there is scope to investigate the impact of uncertain and low
17
prices on the maintenance and performance of the tea smallholding
sector. The smallholders during the visits indicated that uncertainty on
pricing front acts as disincentives to invest in their plantations. The
consequences of this can be anticipated in the long run.
VVVVVariation within the state- BLariation within the state- BLariation within the state- BLariation within the state- BLariation within the state- BLTFs and estates tea fTFs and estates tea fTFs and estates tea fTFs and estates tea fTFs and estates tea factoriesactoriesactoriesactoriesactories
Some tea leaf agents, particularly in Sonitpur and Lakhimpur
districts reported that estates factories do not set limit on supply of
green tea leaves20. The tea leaf agents however reported irregular payment
made by the factories as one of the major problems faced by them.
Moreover, as reported the price of green tea leaves is determined by the
factory, so smallholders and leaf agents are mere price takers leading to
a kind of dependency syndrome in the tea smallholding sector. The tea
leaf agents in Sonitpur district reported that during 2012 there was no
surplus production in their locality21.
Some leaf agents have good relations with the estate tea factories.
During the Puja holidays (October) these agents procure and buy all the
excess tea from other leaf agents and sub-agents and supply to the estate
factories. It is also found from the records (diaries) that this category of
agents receives a uniform price for their supplies! This brings in an
important issue for discussion on pricing front. Moreover, largely stable
price of made tea during the year (2012) indicates that the tea factories
are capable of ensuring a uniform and fair price for the green tea leaves
supplied by the smallholders. This also brings the issue of
implementation of the TMCO, 2003 regulations22.
Spatial distribution/concentration of bought leaf tea factoriesSpatial distribution/concentration of bought leaf tea factoriesSpatial distribution/concentration of bought leaf tea factoriesSpatial distribution/concentration of bought leaf tea factoriesSpatial distribution/concentration of bought leaf tea factories
Leaving aside the tea factories in the estate sector, consolidation
and expansion of tea smallholdings in the state has provided enough
incentives to the investors to set up the BLTFs in the tea producing areas
of the state23. The BLTFs too have created a convenient place for the
smallholders to sell their produces. There are 213 bought leaf factories
18
in the state (Tea Board, Guwahati24) producing about 140 million kg of
made tea per year which is about 30 per cent of total production of the
state (Economic Times, December 24, 2012). Data uploaded on the
website of Tea Board, north east zone office however indicate presence
of 177 BLTFs in Assam with production of 94.45 million kg of made tea
(Data revealed for the year 2008). We here see some mismatch of the
data made available on production front in the tea smallholdings.
Few questions arise on spatial distribution of BLTFs. Are the BLTFs
uniformly distributed across the areas of tea smallholdings in the state?
Data shows concentration of BLTFs in certain pockets of the state and
this may have intensified competition to procure green tea leaves and
the smallholders in the process compromise on quality of plucking! It is
also likely that lack of factories in optimum numbers has lead to wastage
of tea leaves in certain locations. In subsequent part of this paper some
inferences are drawn on these issues.
It appears that government of Assam is concerned about
intensification of unhealthy competition among the tea factories leading
to deterioration of quality of the tea produced. There are 756 tea factories
in the state, of which 527 are in the organised estate sector (as per this
information 229 factories are BLTFs or in the unorganised sector!). For
the last three years (2009-12), the state government had put a hold on
the issue of fresh registration of the BLTFs as a quality control measure.
Sources in Tea Board said: “The process of giving fresh registration has
started recently. Factors like concentration of small tea growers, non
availability of factories are considered while giving the no-objection
certificate” (Assam to allow more bought leaf factories, Economic Times,
December 24, 2012).
Would stringent criteria (on spatial distribution front) for setting
up of the factories help? The state government was insisting on a detailed
survey before giving permission to the new BLTFs. The state industry’s
department has done an extensive survey on this and suggested certain
19
criteria for setting up the BLTFs. There is now decision to categorise the
BLTFs into two groups – one comprising those who do not have their
own plantations and the other comprising the ones having their own
plantations of at least 100 acres of land. On an average, 500,000 kg of
green tea leaves is produced on 100 acres of plantations in a year.
Application of the second category of entrepreneurs, who have their
own plantations of the above 100 acres, would get preference over those
grouped in the first category. One of the important criteria proposed for
this purpose is the availability of green leaf per BLTF should be at least
2,500,000 kg per annum25 (Criteria for setting up bought leaf tea factories
fixed, Assam Tribune June 1, 2011). The issue now is how all these
conditions help the tea smallholders to sell their output at a right price?
On efficiency front of the tea sector the second criterion of mandatory
possession of 100 acres of own plantations by the BLTFs could help to
ensure an uninterrupted production, as well as ensure an uniform quality
of tea. It can be assumed that the criterion of possession of 100 acres of
plantations by the factories was fixed on the assumption of prevalence
of rampant competitions among the BLTFs to procure green tea leaves
from the smallholders leading to deterioration of quality of plucked
leaves. On pricing front of green tea leaves, however, this category of
BLTFs would be in an advantageous position to bargain over the
smallholders, unless stringent regulations on the pricing front are not
implemented. Moreover, issues emerged from field interactions, that the
BLTFs limit the supply of green tea leaves and data generated by the
government of Assam (2011) survey indicate, the crisis is primarily due
to abundant production in the tea smallholdings.
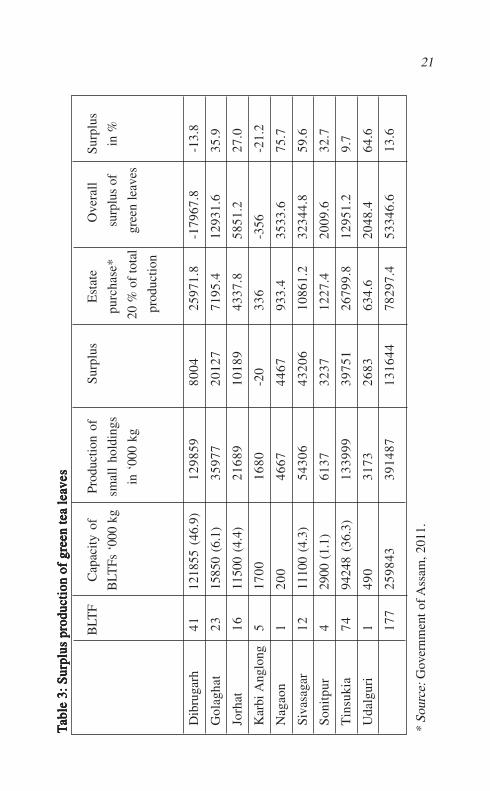
A look at the spatial distribution of BLTFs reveals that
concentration is primarily in Tinsukia district (74 factories with 36.3 %
production capacity of total the BLTFs in the state), Dibrugarh (41
factories with 46.9% production capacity), Golaghat (23 factories with
6.1% production capacity) and followed by Jorhat and in Sibasagar
districts (Table 3). As indicated by the dataset of government of Assam
20
(2011), these 177 BLTFs manufactured 94.45 million kg of tea in 2008
(Appendix Table 1). It means that on an average a BLTF manufactures
533,593 kg of made tea. To make 94.45 million kg of made tea the
BLTFs altogether purchased 453.9 million kg of green leaves during
2008; and to make a kg of made tea 4.8 kg of green tea leaves were used
by the BLTFs. Contrary to this information the smallholders in Assam
produced 391.5 million kg of green tea leaves in 2008. In this context
some mismatch is observed on the dataset made available by government
of Assam (2011).
Table 3 may make the picture clearer. Data of the survey conducted
by the government of Assam (2011) reveals that processing capacity of
the 177 BLTFs in Assam is 259.8 million kg of green leaves; whereas the
production of the smallholdings in Assam stood at 391.5 million kg (in
2008). The survey data also indicates that the estate sector of tea
plantations purchased 20 per cent of the total leaves produced in the
smallholdings. Overall it indicates that 13 per cent of the total produce
in the tea smallholdings remain unutilised and there is considerable
spatial variation in surplus production (Table 3).
The data of government of Assam (2011) also give an indication
on the accommodative capacity of the BLTFs to the production
contributed by the smallholding plantations. The BLTFs can
accommodate 65.5 per cent of the total green leaves produced by the tea
smallholders (Appendix Table 2). There is however spatial variation in
accommodative capacity. Overall it appears that the BLTFs cannot
accommodate the production of tea smallholdings indicating the level
of infrastructure deficiency in tea processing in the state.
Contrary to this there are reportages in newspapers about the cut-
throat competition among BLTFs in an attempt to procure more tea
leaves has hit production of quality tea in recent times. The Assam
Bought Leaf Tea Manufacturers’ Association had apprised the state
21TTTT T
able
3:
Sur
plus
pro
duct
ion
of g
reen
tea
lea
able
3:
Sur
plus
pro
duct
ion
of g
reen
tea
lea
able
3:
Sur
plus
pro
duct
ion
of g
reen
tea
lea
able
3:
Sur
plus
pro
duct
ion
of g
reen
tea
lea
able
3:
Sur
plus
pro
duct
ion
of g
reen
tea
lea
vvvv v eseseses es
BLT
FC
apac
ity o
fPr
oduc
tion
ofS
urpl
usE
stat
eO
vera
llS
urpl
us
BLT
Fs ‘
000
kgsm
all
hold
ings
purc
hase
* s
urpl
us o
fin
%
in ‘
000
kg 2
0 %
of
tota
l g
reen
lea
ves
pro
duct
ion
Dib
ruga
rh41
1218
55 (
46.9
)12
9859
8004
2597
1.8
-179
67.8
-13.
8
Gol
agha
t23
1585
0 (6
.1)
3597
720
127
7195
.412
931.
635
.9
Jorh
at16
1150
0 (4
.4)
2168
910
189
4337
.858
51.2
27.0
Kar
bi A
nglo
ng5
1700
1680
-20
336
-356
-21.
2
Nag
aon
120
046
6744
6793
3.4
3533
.675
.7
Siva
saga
r12
1110
0 (4
.3)
5430
643
206
1086
1.2
3234
4.8
59.6
Son
itpu
r4
2900
(1.
1)61
3732
3712
27.4
2009
.632
.7
Tin
suki
a74
9424
8 (3
6.3)
1339
9939
751
2679
9.8
1295
1.2
9.7
Uda
lgur
i1
490
3173
2683
634.
620
48.4
64.6
177
2598
4339
1487
1316
4478
297.
453
346.
613
.6
* So
urce
: Gov
ernm
ent o
f Ass
am, 2
011.
22
government on this development. “setting up of new factories has resulted
in demand for more green leaves and the rising demand has forced the
small tea growers to pluck coarse leaves and this resulted in production
of poor quality tea”, as stated by the chairman of the association, in a
letter to state industries minister (Too many factories spoil brew-
association plea for steps, The Telegraph, April 26, 2011). The
apprehension from the state side too is that there has been a shortage of
green tea leaves and with the establishment of new factories, the demand
for green tea leaves has increased manifold. This has reportedly
encouraged the tea smallholders to go for rampant plucking and supply
coarse tea leaves to meet the growing demand. The price trend of tea
leaves, extracted from the diaries of smallholders however reveals an
altogether different scenario. In addition to this, government of Assam
(2011) data generates ample issues which would require serious attention
on infrastructure front.
Along with the BLTFs, several big tea companies possessing large
estate plantations are now buying green tea leaves from smallholders
(Banerjee, 2012). The procurement made by the estate sector now shows
a rising trend in a bid to produce more tea at a low cost and remain
competitive in the market (Appendix Table 3).
Infrastructure deficiency and pricesInfrastructure deficiency and pricesInfrastructure deficiency and pricesInfrastructure deficiency and pricesInfrastructure deficiency and prices
This section argues that a fair pricing mechanism of green tea
leaves for the tea smallholders could have enhanced efficiency and
investments in the tea sector.
Section II of this paper had mentioned about high oscillations
and uncertain of prices of green tea leaves that loom large over the tea
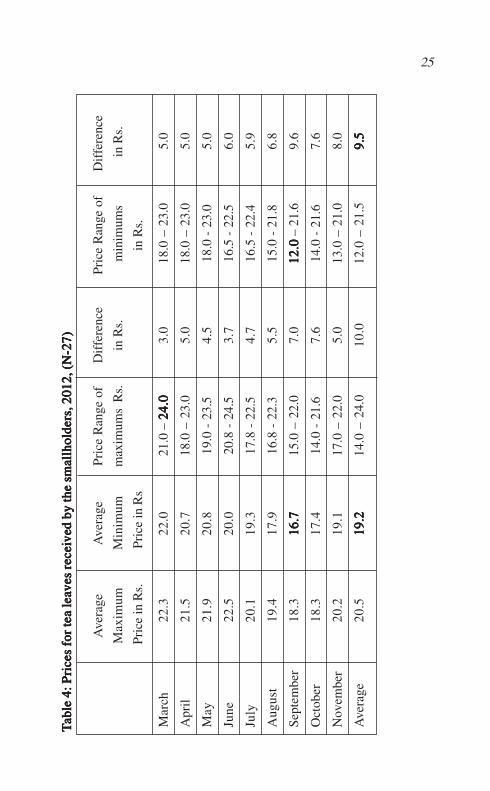
smallholding sector of Assam. The year 2012, also saw fall in the prices
of green tea leaves from Rs 22 per kg in August to Rs 8/10 per kg in
September, in most of the tea producing areas, having concentration of
tea smallholders (Tea Board meet to address price fall, The Telegraph,
23
28 September, 2012; also see table 4). The smallholders allege that
green leaf buyers (the BLTFs and organised tea estates) have been creating
a monopoly and artificially bringing down the prices. The allegation is
that the green leaf buyers are not following the price-sharing mechanism
as envisaged in the TMCO, 2003 and as directed by the government of
Assam.
Data shows that the average price realised by each registered
manufactures at the auction market varies significantly. Seasonal
average price for the year 2012 at Guwahati auction was Rs. 130.4
with a maximum of Rs. 227.2 and minimum of Rs. 86.0. There emerges
argument what auction price (weekly or monthly) one should accept
in determination of the price of green tea leaves. Moreover, the
auction price realised by the registered manufactures varies, which
would lead to multiplicity of prices received by the smallholders in
different locations. The stated clause in TMCO, 2003 ‘the reasonable
price for the green tea leaves according to the price sharing formula
shall be determined taking into account the sale proceeds received
by the registered manufacturer’, would lead to multiplicity of price
of green tea leaves and price could range from Rs. 12.4 to 34.3
for a kg26.
Time series data indicate that the average price of made-tea had not
fallen in the tea auction market to the extent that it could cause such a low
in the price of green tea leaves. Argument here is that non implementation
of TMCO, 2003 leads to high variation in pricing, which acts as
disincentive to maintain plantations (applications of fertiliser and pest
control; and making investments in infrastructure such as on irrigation)
ultimately leading to inefficiency in the production spaces. Field survey,
however, finds regional variations in the prices received by the smallholders
and in a few pockets the smallholders receive fair prices.
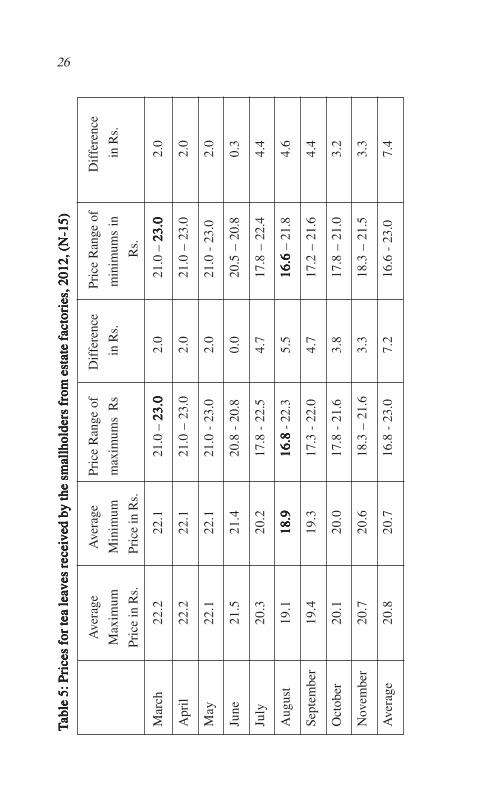
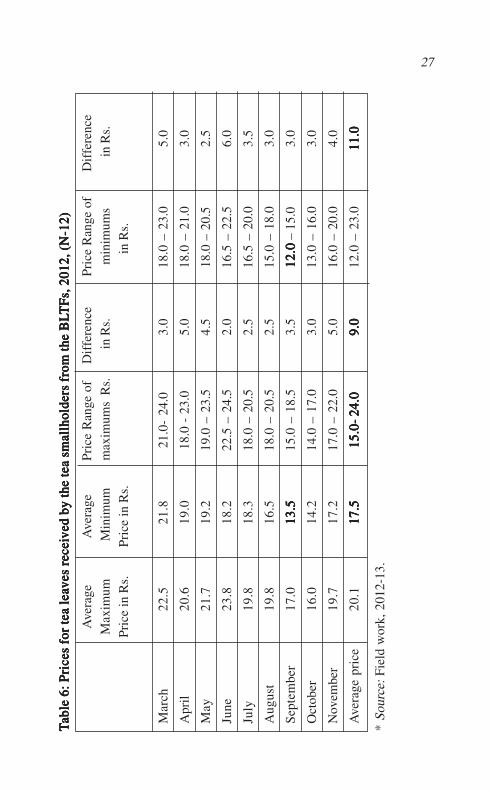
During December 2012 to January 2013, visit was made to
altogether 27 tea smallholders. Among the 27 smallholders, 12 were in
24
Golaghat district, supplying tea leaves to BLTFs, mostly though the
agents. The smallholders in Sonitpur and Lakhimpur districts (altogether
15 in our sample) directly supplied leaves to estate factories (these two
districts have lower concentration of BLTFs- Appendix Table 1). It has
emerged that the smallholders in Sonitpur and Lakhimpur districts
supplying tea leaves to the estate factories are receiving better prices
(average of minimums stood at Rs. 20.7 during March – November,
2012, Table 5) compared to the smallholders in Golaghat district (average
of minimums stood at Rs. 17.5 during 2012, Table 6) who supply leaves
to BLTFs27. The lowest average price received by the tea smallholders
supplying leaves to estate factories was Rs. 18.9 in August, 2012 (Highest
being Rs. 22.1 during March to May28). On the other hand the lowest
average price received by the tea smallholders supplying leaves to
BLTFs was Rs. 13.5 per kg in September, 2012 (Highest minimum average
being Rs. 21.8 in March 2012).
Moreover, the price range of maximums and as minimums is also
higher in case of supplies to the BLTFs (Tables 5 and 6). The price
received by the smallholders supplying to the BLTFs ranged from Rs.
12 a kg to Rs. 24 a kg (a difference of Rs. 12); whereas the price range
was lower (Rs. 16.6 a kg to Rs. 23 a kg, a difference of Rs. 6.4) in case to
the supplies made to estate factories.
Appendix Table 2 indicates the average leaf price received by
the tea smallholders from BLTFs. Comparison of the two tables (Table
6 and Appendix Table 2), shows some improvement in the price
received by the smallholders (minimum average of Rs. 17.5 in 2012
from Rs. 11 in 2008), in Golaghat district; though the price range
(Rs. 12 - Rs. 24) is still slender to the estimated range of Rs. 12.4 per
kg to 34.3 for a kg (linking this to the auction market price and the
price sharing formula).
25 TTTT T
able
4: P
rice
s fo
r te
a le
aab
le 4
: Pri
ces
for
tea
lea
able
4: P
rice
s fo
r te
a le
aab
le 4
: Pri
ces
for
tea
lea
able
4: P
rice
s fo
r te
a le
a vvvv ves
rec
eies
rec
eies
rec
eies
rec
eies
rec
eivvvv v
ed b
y th
e sm
allh
olde
rs, 2
012,
(N
-27)
ed b
y th
e sm
allh
olde
rs, 2
012,
(N
-27)
ed b
y th
e sm
allh
olde
rs, 2
012,
(N
-27)
ed b
y th
e sm
allh
olde
rs, 2
012,
(N
-27)
ed b
y th
e sm
allh
olde
rs, 2
012,
(N
-27)
Ave
rage
Ave
rage
Pric
e R
ange
of
Dif
fere
nce
Pric
e R
ange
of
Dif
fere
nce
Max
imum
Min
imum
max
imum
s R
s.in
Rs.
min
imum
s in
Rs.
Pri
ce in
Rs.
Pri
ce in
Rs
in R
s.
Mar
ch22
.322
.021
.0 –
24.
024
.024
.024
.024
.03.
018
.0 –
23.
05.
0
Apr
il21
.520
.718
.0 –
23.
05.
018
.0 –
23.
05.
0
May
21.9
20.8
19.0
- 2
3.5
4.5
18.0
- 2
3.0
5.0
June
22.5
20.0
20.8
- 2
4.5
3.7
16.5
- 2
2.5
6.0
July
20.1
19.3
17.8
- 2
2.5
4.7
16.5
- 2
2.4
5.9
Aug
ust
19.4
17.9
16.8
- 2
2.3
5.5
15.0
- 2
1.8
6.8
Sept
embe
r18
.316
.716
.716
.716
.716
.715
.0 –
22.
07.
012
.012
.012
.012
.012
.0 –
21.
69.
6
Oct
ober
18.3
17.4
14.0
- 2
1.6
7.6
14.0
- 2
1.6
7.6
Nov
embe
r20
.219
.117
.0 –
22.
05.
013
.0 –
21.
08.
0
Ave
rage
20.5
19.2
19.2
19.2
19.2
19.2
14.0
– 2
4.0
10.0
12.0
– 2
1.5
9.5
9.5
9.5
9.5
9.5
26 TTTT T
able
5: P
rice
s fo
r te
a le
aab
le 5
: Pri
ces
for
tea
lea
able
5: P
rice
s fo
r te
a le
aab
le 5
: Pri
ces
for
tea
lea
able
5: P
rice
s fo
r te
a le
a vvvv ves
rec
eies
rec
eies
rec
eies
rec
eies
rec
eivvvv v e
d by
the
smal
lhol
ders
fro
m e
stat
e f
ed b
y th
e sm
allh
olde
rs f
rom
est
ate
fed
by
the
smal
lhol
ders
fro
m e
stat
e f
ed b
y th
e sm
allh
olde
rs f
rom
est
ate
fed
by
the
smal
lhol
ders
fro
m e
stat
e f a
ctor
ies,
201
2, (
N-1
5)ac
tori
es, 2
012,
(N
-15)
acto
ries
, 201
2, (
N-1
5)ac
tori
es, 2
012,
(N
-15)
acto
ries
, 201
2, (
N-1
5)
Ave
rage
Ave
rage
Pric
e R
ange
of
Dif
fere
nce
Pri
ce R
ange
of
Dif
fere
nce
Max
imum
Min
imum
max
imum
s R
s in
Rs.
min
imum
s in
in R
s.
Pric
e in
Rs.
Pri
ce in
Rs.
Rs.
Mar
ch22
.222
.121
.0 –
23.
023
.023
.023
.023
.02.
021
.0 –
23.
023
.023
.023
.023
.02.
0
Apr
il22
.222
.121
.0 –
23.
02.
021
.0 –
23.
02.
0
May
22.1
22.1
21.0
- 2
3.0
2.0
21.0
- 2
3.0
2.0
June
21.5
21.4
20.8
- 2
0.8
0.0
20.5
– 2
0.8
0.3
July
20.3
20.2
17.8
- 2
2.5
4.7
17.8
– 2
2.4
4.4
Aug
ust
19.1
18.9
18.9
18.9
18.9
18.9
16.8
16.8
16.8
16.8
16.8
- 22
.35.
516
.6
16.6
16
.6
16.6
16
.6 –
21.
84.
6
Sept
embe
r19
.419
.317
.3 -
22.
04.
717
.2 –
21.
64.
4
Oct
ober
20.1
20.0
17.8
- 2
1.6
3.8
17.8
– 2
1.0
3.2
Nov
embe
r20
.720
.618
.3 –
21.
63.
318
.3 –
21.
53.
3
Ave
rage
20.8
20.7
16.8
- 2
3.0
7.2
16.6
- 2
3.0
7.4
27TTTT T
able
6: P
rice
s fo
r te
a le
aab
le 6
: Pri
ces
for
tea
lea
able
6: P
rice
s fo
r te
a le
aab
le 6
: Pri
ces
for
tea
lea
able
6: P
rice
s fo
r te
a le
a vvvv ves
rec
eies
rec
eies
rec
eies
rec
eies
rec
eivvvv v
ed b
y th
e te
a sm
allh
olde
rs f
rom
the
BL
ed b
y th
e te
a sm
allh
olde
rs f
rom
the
BL
ed b
y th
e te
a sm
allh
olde
rs f
rom
the
BL
ed b
y th
e te
a sm
allh
olde
rs f
rom
the
BL
ed b
y th
e te
a sm
allh
olde
rs f
rom
the
BL
TF
s, 2
012,
(N
-12)
TF
s, 2
012,
(N
-12)
TF
s, 2
012,
(N
-12)
TF
s, 2
012,
(N
-12)
TF
s, 2
012,
(N
-12)
Ave
rage
Ave
rage
Pric
e R
ange
of
Dif
fere
nce
Pri
ce R
ange
of
Dif
fere
nce
Max
imum
Min
imum
max
imum
s R
s. in
Rs.
min
imum
s in
Rs.
Pric
e in
Rs.
Pric
e in
Rs.
in R
s.
Mar
ch22
.521
.821
.0-
24.0
3.0
18.0
– 2
3.0
5.0
Apr
il20
.619
.018
.0 -
23.
05.
018
.0 –
21.
03.
0
May
21.7
19.2
19.0
– 2
3.5
4.5
18.0
– 2
0.5
2.5
June
23.8
18.2
22.5
– 2
4.5
2.0
16.5
– 2
2.5
6.0
July
19.8
18.3
18.0
– 2
0.5
2.5
16.5
– 2
0.0
3.5
Aug
ust
19.8
16.5
18.0
– 2
0.5
2.5
15.0
– 1
8.0
3.0
Sep
tem
ber
17.0
13.5
13.5
13.5
13.5
13.5
15.0
– 1
8.5
3.5
12.0
12.0
12.0
12.0
12.0
– 1
5.0
3.0
Oct
ober
16.0
14.2
14.0
– 1
7.0
3.0
13.0
– 1
6.0
3.0
Nov
embe
r19
.717
.217
.0 –
22.
05.
016
.0 –
20.
04.
0
Ave
rage
pri
ce20
.117
.517
.517
.517
.517
.515
.0- 2
4.0
15.0
- 24.
015
.0- 2
4.0
15.0
- 24.
015
.0- 2
4.0
9.0
9.0
9.0
9.0
9.0
12.0
– 2
3.0
11.0
11.0
11.0
11.0
11.0
* So
urce
: Fi
eld
wor
k, 2
012-
13.
28
Crisis of labour supplyCrisis of labour supplyCrisis of labour supplyCrisis of labour supplyCrisis of labour supply
Skilled surplus labour from the nearby tea estates29 is one of the
prime determinants30 that have influenced expansion of tea smallholdings
in Assam in certain locations, particularly in Upper Assam districts31. In
recent times, however, the issue of labour crisis in the smallholding tea
sector has come to the fore. Several factors could explain the decline in
labour supply in this unorganised sector. Field survey for this paper did
not incorporate the issue on labour. Still, it can be inferred that the emerging
economy has created opportunities in certain sectors (transportation,
construction as well as opportunities offered by the flagships development
programmes of the State) and relative high wages in these sectors have
pulled the youth from plantation workers’ community32. Moreover, studies
now have indicated that the organised estate sector tea plantations despite
being under the domain of PLA, 1951 has failed to ensure a fair labour
standard33. The condition of workers engaged in the smallholding sector,
which does not come under labour regulations in such context cannot be
assumed better. The workers in the tea smallholding get themselves
engaged just to supplement their household income. It is now evident
that the tea smallholdings thrive on sheer flexibility of labour front and
most of the workers are called to clear the seasonal flush and very few are
employed on a regular basis.
During the field visits the tea smallholders in the districts of
Sonitpur, Lakhimpur and Golaghat reported scarcity of labour to work
in their holdings. Labour shortage affects timely plucking of leaves and
late and untimely plucking affects the quality. The quantum of leaves
remain unplucked or quality of plucks deteriorated due to the labour
factor is in an unexplored issues in the tea sector34. This could explain
a part of incompetitiveness in the sector.
Quality issue of the leaves plucked by the tea smallholdersQuality issue of the leaves plucked by the tea smallholdersQuality issue of the leaves plucked by the tea smallholdersQuality issue of the leaves plucked by the tea smallholdersQuality issue of the leaves plucked by the tea smallholders
An issue that the tea smallholders do not maintain the quality of
tea leaf plucked is often raised in the tea sector of Assam. Few leaf agents
29
in Sonitpur district reported that tea factories maintain stringent quality
control on the tea leaves supplied. Leaf agents reported incidences of
rejection of the supply made by them to the tea factories.
Sanjib Ghimire in Bedeti, Sonitpur district reported that
tea factories maintain stringent quality control on the tea
leaves supplied. Reportedly the tea factory to which Mr.
Ghimire supplies leaves had rejected 225 kg leaf supplied
by him during 2012. This was also reported by Manoj
Phukan of Ajoha Dhemaji that estate factory rejected 120
kg of leaves supplied by him in 2012.
In the areas where the smmallholdings have boomed there are
now rising numbers of leaf agents. There is scope to argue that rising
number of agents generates intense competition to procure tea leaves
from the smallholders and this may be a factor of poor quality plucking!
As indicated earlier labour shortage is also an explanation of poor quality
plucking. It may be also argued that the prices received for green tea
leaves are not enough to ensure a fair return for the workers’ effort,
which subsequently affect the quality of tea plucked.
Bad roads and rising cost of transportation of green tea leavesBad roads and rising cost of transportation of green tea leavesBad roads and rising cost of transportation of green tea leavesBad roads and rising cost of transportation of green tea leavesBad roads and rising cost of transportation of green tea leaves
Bad road communication is one of the major problems faced by
tea leaf agents. Tea leaf agents in Lakimpur and Dhemaji districts (these
two districts are severely flood affected) reported rise in transport costs
of tea leaves from the smallholdings to the factories, particularly during
the monsoon floods. It may indicate that the agents raise the share of
rising costs of transportation from the tea smallholders.
The case of irrigationThe case of irrigationThe case of irrigationThe case of irrigationThe case of irrigation
During the field visits the tea smallholders raised the issue of
water supply and irrigation in their holdings. Recent times the state of
Assam has seen high seasonal variability in weather and rainfall35. The
30
smallholders mentioned that productivity of their plantations could
have been raised further with the provision of irrigation. It is also inferred
from the discussion that uncertain pricing of green tea leaves negatively
influence smallholders’ investment decisions on irrigation. Moreover,
ground water quality (high iron contents in tube wells) has influenced
the quality of water sprinkled in the smallholdings. Some smallholders
consider drawing water from nearby rivers as a solution. But it will
require substantial investments. The approaches of Tea Board of India
reflect that the Board has understood this issue very well. The irregularity
in the monsoon (both in terms of lack of adequate rainfall and prolonged
dry spell) is forcing the tea industry to invest on irrigation infrastructure.
Moreover, large scale replanting along with the expansion of
smallholding plantations would bring large area under young bushes
and these new plantations require much more water supply than the
older bushes. Tea Board of India focuses this aspect in the XII Plan
period (Outcome budget, Tea Board of India, 2012-13). Currently the
irrigation subsidy is being offered at 25 per cent of the total expenditure
subject to a maximum of Rs. 10,000 per hectare. Moreover, the total
expenditure per garden is also capped at a maximum of Rs. 10 lakhs.
Considering the current cost of creating conventional irrigation facility
(estimated to be around Rs. 70,000 per hectare), this ceiling is considered
too low. Moreover many tea estates are now willing to go for large scale
investments in irrigation covering more than 100 hectares of area at one
time. Tea Board of India also proposes to provide interest subsidy @5%
annually for seven years on the 50 per cent of the planting cost availed
as loan from banks. Tea Plantation Development Scheme (XI Plan period)
of Tea Board of India earlier had made certain items – sprinkler
equipment, drip irrigation system, pipelines, motors, pump sets with
electric line connection and accessories and creation of irrigation sources
such as check dams, tube wells etc. were eligible for subsidy for creation
of irrigation facilities. In creation of irrigation infrastructures the
smallholders, however, would face certain constraints. As indicated
31
earlier, the costs involved in creation of irrigation infrastructure is high;
and only with regulatory supports on pricing front of green tea leaves
the smallholders would get incentives to invest. Moreover, most of the
tea smallholdings are not located in continuous patches. Collective
investments in such context will require spatial planning, and for this
formation of smallholders’ association at village level would help.
VVVVV. Impact of Unreliable Po. Impact of Unreliable Po. Impact of Unreliable Po. Impact of Unreliable Po. Impact of Unreliable Power Supply on wer Supply on wer Supply on wer Supply on wer Supply on TTTTTea Fea Fea Fea Fea Factoriesactoriesactoriesactoriesactories
There are studies across the world revealing rising costs of
production and incompetitiveness caused by inadequate provisioning
of public infrastructures. These studies provide insights to understand
and address the constraints of the tea sector.
Energy infrastructure meaningfully explains why some countries
have managed to industrialise while others have been less successful
(Isaksson, 2009). Isaksson (2009) finds that the impact of adequate energy
infrastructure is greatest for the poorest economies and offers an
explanation for differentiated industrial growth rates. Isaksson (2009)
further tells that while erratic supplies of electricity disrupt production,
voltage fluctuations negatively affect the durability of machines. Better
electricity-related infrastructure can, thus, raise the efficiency and
durability of physical capital and create a multiplier effect in the progress
of an economy. According to the World Bank’s investment climate
assessments, 55 per cent of survey respondents in Latin America and the
Caribbean considered infrastructure to be a major or severe obstacle to
the operations and growth of their business (Andres et al, 2008).
Moreover, problems with electricity and transport services especially
deter foreign direct investment and export participation.
Adenikinju (2005) analysed the cost of power outages to the
business sector of the Nigerian economy and finds that the poor state of
electricity supply has imposed significant costs on its business sector.
The bulk of these costs come in the form of acquisition of very expensive
32
backup power - where firms spend as much as 20 to 30 percent of initial
investment on the acquisition of facilities to enhance electricity supply
and reliability, has a significant negative impact on the cost
competitiveness of the manufacturing sector. However, the decision to
acquire a backup is actually a rational decision on the part of the firm in
order to insure it from larger losses arising from frequent and long power
fluctuations. Furthermore, as the results show the small-scale operators
are more heavily affected by the infrastructure failures because of the
affordability factor. Foster and Steinbuks (2009) in African context show
that unreliable public power supplies is far from being the only or even
the largest factor driving generator ownership. Firm characteristics have
a major influence, and, in particular, the probability owning a generator
doubles in large firms relative to small ones. Overall, own generation by
the firms - which has been on the rise in recent years - accounts for about
6 percent of installed generation capacity in Sub-Saharan Africa
(equivalent to at least 4,000 MW of installed capacity). However, this
share doubles to around 12 percent in the low-income countries of Sub-
Saharan Africa. The costs of own generation, driven mainly by the
variable cost of diesel is about three times as high as the price of
purchasing (subsidised) electricity from the public grid.
Fernandes and Pakes (2008) in Indian context show that firms
which suffer more production losses due to electricity outages are less
productive within their states and underutilise both labour and capital
more than firms in states with less production losses due to electricity
outages. Fernandes and Pakes (2008) study further finds that the extent
of underutilisation of labour differs substantially across Indian states. In
particular, states with higher GDP per capita (so better infrastructure)
exhibit much less underutilisation of labour. These insights help to
draw indication that power infrastructure has significant role to usher
inclusive growth and ensure distributive justice. This factor is of much
relevance in context of tea smallholding sector36.
33
PoPoPoPoPower crisis and the cost of tea processingwer crisis and the cost of tea processingwer crisis and the cost of tea processingwer crisis and the cost of tea processingwer crisis and the cost of tea processing
Assam at present is experiencing an average peak power demand
of 1100 MW. This is more than two times what it was five years back.
Since no power generation project is commissioned in recent times the
gap of demand and supply is widening. Total availability of power in
the state is around 800 MW of which 540 MW is allocation of central
sector power generating station (CSGS) and 260 MW is from own
generation of the state37.
Visit was made to 11 BLTFs in three tea smallholders’ hubs -
Dibrugarh, Golaghat and Sonitpur districts of the state. Objective was to
have an assessment on power supply scenario and its effects in the
production process.
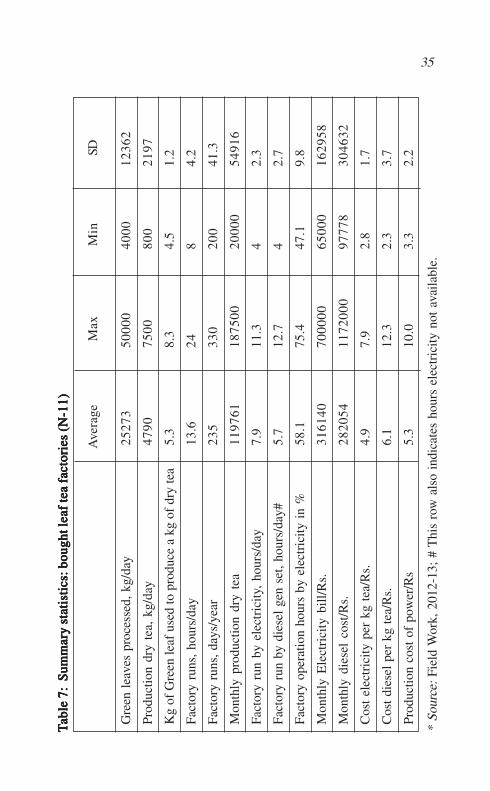
The BLTFs, on an average, operate nine months during the year,
from March to November38. As reported the BLTFs run 13-14 hours a
day. The BLTFs largely rely on electric power supplied by the Assam
Power Distribution Company Ltd (APDCL) to process the green tea
leaves. All the BLTFs reported irregular supply of electricity and load
shedding for an average of six hours during the day; from a minimum of
4 hours to 12 hours in the sampled factories (Table 7). It was also reported
that the situation of power availability gets worsened during the summer.
As the tea factories cannot afford to lose operational hours, all of them
have made provision for alternative power in diesel generation sets39. It
is estimated from the sample that 42 per cent of operational hours are
lost due to unavailability of electricity which is supplemented by power
generated from diesel generation sets.
Alternative arrangement of power made by the BLTFs has helped
to accommodate all the tea leaves supplied and purchased40 for
processing and there is no reported wastage. However, there arise a few
negative externalities due to frequent power cuts during the day. As
reported by the management of the tea factories, the quality of the made
34
tea gets affected due to frequent breakdowns in the power supply.
Moreover, frequent switching to alternative power sources consume
time and the result is that the factories need to be run for additional
hours during the day to clear the stocks. It thus raises the cost on labour41.
A rough estimate on the rising cost of production is made due to
use of alternative power and fuel. The estimated average recurring cost
incurred only on the use of electric power for production of a kg of made
tea is Rs. 4.9/ in the 11 sampled BLTFs. Recurring cost to make a kg of
made tea using alternative power (diesel) is estimated at Rs. 6.1 (Table
7). It requires a detailed study to have a precise estimate on the rise of
operational costs due to irregular and interrupted power supply. A rough
estimate from the data derived from the sample BLTFs indicate about 10
per cent rise in cost of fuel or power in the production process.
The size of the sampled BLTFs varies with processing capacity of
4000 kg to 50000 kg green tea leaves a day (average 25300 kg). The
samples factories on an average produce 4790 kg of made tea a day, from
a minimum of 800 kg to maximum 7500 kg. The factories run average
235 days a year (minimum 200 to maximum 330 days) (Table 7).
Some narration on the tea factories would help us to understand
the power crisis situation better. Sonaguri tea factory at Morongi in
Golaghat district of Assam runs 70 per cent of its operational hours
based on electric power supplied by the APDCL. The factory which
processes 33000 kg of green tea leaves a day requires 35 liters of diesel
to run its backup power generation sets for an hour. In particular days,
because of frequent power cuts and to accommodate the flushes,
consumption of diesel shoots up to 800 liters a day. Moreover, the factory
keeps three engineers to look after the machineries and the diesel powered
generation sets. Premier tea factory in Golaghat district needs 120 liters
of diesel every day. Since all factories have made source of alternative
power through diesel generation sets there is no wastages of tea leaves
at processing level except that a rise in cost of production. It overall
35TTTT T
able
7:
Sum
mar
y st
atis
tics
: bou
ght l
eaf
tea
fab
le 7
: S
umm
ary
stat
isti
cs: b
ough
t lea
f te
a f
able
7:
Sum
mar
y st
atis
tics
: bou
ght l
eaf
tea
fab
le 7
: S
umm
ary
stat
isti
cs: b
ough
t lea
f te
a f
able
7:
Sum
mar
y st
atis
tics
: bou
ght l
eaf
tea
f act
orie
s (N
-11)
acto
ries
(N
-11)
acto
ries
(N
-11)
acto
ries
(N
-11)
acto
ries
(N
-11)
Ave
rage
Max
Min
SD
Gre
en l
eave
s pr
oces
sed,
kg/
day
2527
350
000
4000
1236
2
Prod
uctio
n dr
y te
a, k
g/da
y47
9075
0080
021
97
Kg
of G
reen
leaf
use
d to
pro
duce
a k
g of
dry
tea
5.3
8.3
4.5
1.2
Fact
ory
runs
, ho
urs/
day
13.6
248
4.2
Fact
ory
runs
, day
s/ye
ar23
533
020
041
.3
Mon
thly
pro
duct
ion
dry
tea
1197
6118
7500
2000
054
916
Fact
ory
run
by e
lect
rici
ty,
hour
s/da
y7.
911
.34
2.3
Fact
ory
run
by d
iese
l ge
n se
t, ho
urs/
day#
5.7
12.7
42.
7
Fact
ory
oper
atio
n ho
urs
by e
lect
rici
ty i
n %
58.1
75.4
47.1
9.8
Mon
thly
Ele
ctri
city
bil
l/R
s.31
6140
7000
0065
000
1629
58
Mon
thly
die
sel
cost
/Rs.
2820
5411
7200
097
778
3046
32
Cos
t el
ectr
icity
per
kg
tea/
Rs.
4.9
7.9
2.8
1.7
Cos
t di
esel
per
kg
tea/
Rs.
6.1
12.3
2.3
3.7
Prod
uctio
n co
st o
f po
wer
/Rs
5.3
10.0
3.3
2.2
* So
urce
: Fi
eld
Wor
k, 2
012-
13;
# T
his
row
als
o in
dica
tes
hour
s el
ectr
icity
not
ava
ilabl
e.
36
indicates that opportunity costs of not keeping alternative power backup
is higher than a rise in cost of production using diesel as source of fuel;
findings which are similar to Adenikinju (2005).
VI. Conclusion: Institutions and Regulations to Ensure CoherenceVI. Conclusion: Institutions and Regulations to Ensure CoherenceVI. Conclusion: Institutions and Regulations to Ensure CoherenceVI. Conclusion: Institutions and Regulations to Ensure CoherenceVI. Conclusion: Institutions and Regulations to Ensure Coherenceand Competitivenessand Competitivenessand Competitivenessand Competitivenessand Competitiveness
It has appeared that in the tea smallholding sector of Assam there
is mismatch of production of green tea leaves and the processing capacity
of the factories to accommodate the flush. Challenges for the State (or
Tea Board of India) are now to regulate the distortion in the market of
green tea leaves in certain locations of the state. In Sri Lanka’s context
such distortion to a large extent is addressed. Three major reasons are
cited for the success of Sri Lanka tea smallholding sector to regulate and
correct the distortion. One, geographical compactness of the tea sector
and proximity to the processing factories; two, efficiency and
inclusiveness of the Colombo auction system, which accounts for 96
per cent of total sale and three, presence of a coherent institution (the
Tea Smallholders Development Authority) with adequate manpower to
address the need of the smallholders (Banerjee, 2012). Considering these
contexts it can be said that the tea smallholdings of Assam are yet to
take a coherent form.
The baseline survey on tea smallholdings conducted by the
government of Assam (2011) has indicated deficits in processing
infrastructures (Appendix Table 2). This issue requires further
assessments including establishment of a supply network considering
the connectivity factors. In this context the newly established directorate
of tea smallholdings, which is located in Assam, could facilitate steps
for corrective measures. The review of sales through the Gauhati Tea
Auction Centre (GTAC) now see disheartening scenario and rising
quantum of sale of made tea now is through private mode. Hazarika (nd)
indicates certain constraints (windfall at brokerage level, which does
not ensure a fair return to the tea producers) to sell tea through the
37
auction market and realisation of poor prices42. All have repercussions
on the tea manufactures as well as on the smallholders, and call for
corrective measures. Establishment of a mechanism to fix and ensure a
fair price of green tea leaves is now the call of the hour. It is inferred from
the field that a fair price of green tea leaves to a large extent determines
the decision on plucking and investments (particularly in maintenance)
in the tea smallholdings.
On the infrastructural front, adequate public provisioning would
help to reduce the cost of production and enhance competitiveness and
inclusiveness of the tea sector, particularly of the smallholding sector.
Arrangement of alternative power no doubt has prevented the wastage
level of green tea leaves. But it has raised the cost on fuel by 10 per cent
in our sample tea factories. Moreover, the energy used (diesel) in this
process is not environmentally friendly. In addition to this, there is
reported to be high consumption of energy in the processing factories
because of inefficiency in the use and outdated machineries43 (Banerjee,
2012).
The Tea Board of India has proposed an outlay of Rs 316 crores
for tea smallholders’ development scheme in the 12th five Year Plan.
The underlying objective is to help smallholders to become more
organised so that they do not become vulnerable to the more powerful
intermediaries and factories. Tea Board of India is aware of smallholders’
inability to influence price, unscientific practices in agricultural
operations and absence of adequate number of processing units in their
vicinity (Outcome Budget, Tea Board of India- www.teaboard.gov.in).
Such initiatives reflect realisation on the part of the State and Tea Board
of India that there is deficiency or mismatch of tea processing
infrastructure along with a regulatory support system to ensure fair price
for green tea leaves44.
Tea Board of India has also realised the need for micro- irrigation
scheme for the smallholders and need of financial support for such
38
schemes and on machineries. “The above scheme should also be available
to self-help groups having contiguous areas that can be brought under
the coverage of common irrigation facilities45”. Moreover, the new
directorate for the tea smallholders has made a provision for one
development officer for every 3,000 smallholders and one factory
advisory officer for every 25 BLTFs. It is understandable that such
complementary provisioning would help enhancing the competitiveness
of the smallholding as well as of the tea sector as a whole.
Government of Assam, in January 2011 had announced a policy
named ‘Cess46 Utilisation Policy for Development and Welfare of Small
Tea Growers of Assam, 2010’ to provide infrastructure for setting up
green leaf collection and auction Centres, assistance to STGs/SHGs to
set up small orthodox/CTC factory (Tea Board, Guwahati,
www.teaboardguwahati.com/stg.pdf accessed on 4th March 2011). There
are some proposed initiatives to address infrastructural issues in the
smallholdings. All approaches however need to be holistic to address
the problems faced by the sector effectively.
39
AcknowledgementAcknowledgementAcknowledgementAcknowledgementAcknowledgement
The author is extremely grateful to Mrinal Baruah, Surajeet
Saikia and Sankar Rajkhowa for excellent field support
to write the paper. Thanks are also to the members of the
Research Advisory Committee of NRPPD for the
suggestions made during the project workshop.
Comments on earlier drafts by an anonymous referee and
Prof K.J. Joseph were is very helpful in improving the
paper.
Kalyan DasKalyan DasKalyan DasKalyan DasKalyan Das ([email protected]) is with OKD
Institute of Social Change and Development, Guwahati.
40
NotesNotesNotesNotesNotes
1. To ensure productivity of the tea plantations age old plantations needs to bereplaced by re-plantations. The yearly required norm of re-plantations istwo percent of the total tea acreages, which was never followed in practicein Assam tea estates. Data shows that on an average just about 0.5 teaacreages gets replanted every year. In Assam about 37 percent tea acreagesare more than 50 years old (Government of Assam, 2010).
2. The estate sector plantations of Assam follows a system of payment to theworkers which is somewhat wage as well as output contract. To get thestipulated daily wage a worker needs to pluck a minimum quantum of 23kg of leaves. Labour demand as well as fulfillment of minimum pluckingtask requires maintaining of certain level of uniform productivity over allthe extent of the plantations. This ensures optimum work for the workers.Along with field productivity, slope of plantations and weather also influenceproductivity of the workers. Unlike the contract mode of deployment, inthe context of regular deployment of the workers in the estate sector, lowproductivity lead to underutilisation of workers and higher cost of productionin this labour intensive sector.
3. Tea Board of from 2005 onwards has started to indicate areas undersmallholdings separately. This is the reason that we do not see segregateddata on acreages under smallholdings of earlier years.
4. Most of the tea processing factories in Assam are located in large plantationestates. In past one decade there has been emergence of bought leaf teaprocessing factories in private initiatives.
5. A look at the 2012 prices of green tea leaves (field visit information)however did not reveal low compared to the year 2011. The smallholdersreported decline in flushes and production in 2012 because of rainfallvariability in the state. In the entire debate on crisis in tea smallholding, theweather and climate factors too deserve attention.
6. The Ministry of Commerce and Industry, Government of India had initiateda step towards ensuring a fair price for raw tea leaves by forcing the Tea(Marketing) Control Order, 2003. The tea smallholders association in thestate feels that the TMCO, 2003 lacks the punch of an Act and skepticalabout its probable impacts (Small tea growers threaten agitation over TMCO,Business Standard, November 24, 2011; Tea growers not hopeful of recoveryof falling price of leaves, Times News Network, November 28, 2011).
7. Most of the local newspapers in Assam reported this incidence on 16th
October 2011.
8. Data on auction price of tea in Indian market show a rising trend over theyears except in 2005. Average price of made tea in Indian auction marketwas Rs. 48 in 1995 which had increased to Rs. 105.6 in 2009. Month wisedata for 2009 showed a low of Rs. 80 in February and a high of Rs. 119 in
41
May. Seasonal average price for the year 2012 at Guwahati auction stood atRs. 130.4 with a maximum of Rs. 227.2 and minimum of Rs. 86.0.
9. The tea leaf agents create the link between the smallholders and the factories,both the BLTFs and estate factories. It is observed and learned that thesuppliers play a vital role in placing the green tea leaves in the marketproduced by the smallholders, particularly by the tiny holders.
10. Contrary to this assumption, issue is also raised that emergence of BLTFs inlarge numbers has led to an unhealthy competition in procurement of green tealeaves in the smallholders’ hubs. This reportedly is leading to deterioration ofquality of green tea leaves. We will discuss this issue in later part of this paper.
11. Tea leaves in Assam flush in late March and early April with arrival of pre-monsoonal rain. Price offered by tea factories for green leaves is highduring this period as there are limited supplies. Abundant flush of leavesduring the monsoon (June-October) results in decline in prices offered(figure 1). The production and supply declines in the post monsoon periodand virtually stops in December. Prices offered by factories declines at thisphase for poor quality of flush of tea leaves. Most of the tea factories in thestate close in December and reopens in March-April.
12. The present level of productivity of the estate sector tea plantations ofAssam is not acceptable to ensure competitiveness in the market and thenew plantation led productivity of the smallholdings have able set a normor standard. Labour requirement and absorption (more labour will berequired to pluck more as well as to maintain the plantations) is likely to bemore in the highly productive smallholdings. This is feasible provided thepricing of green tea leaves is right enough to ensure enthusiasm of thesmallholders and infrastructure is adequate to prevent any form of wastage.
13. Such reportages primary indicated at the organised estate plantations, butconditions equally apply to the tea smallholdings as well as for the BLTFs.
14. This would be a stupendous task to capture information on processingfactories. The Tea (Marketing) Control Order, 2003 guidelines howevercould help to improve the surveillance system. It is important to haveinformation on quantity of leaf sourced from estates and smallholdingsseparately by the registered manufacturers and the capacity of the factories.A regulation, compelling each registered manufactures to submit the monthlyreturn to the registering authority and state, would make it possible to havea concrete data base. These TMCO, 2003 guidelines are however not followedin practice.
15. The BLTFs in the state have emerged banking on the production boomushered by the tea smallholdings. The smallholdings too depend on theBLTFs to a great extent. The proportion of green tea leaves bought by theBLTFs from smallholdings stood at 80 percent in 2009, GoA (2011).
16. This is because the smallholders largely depend on the BLTFs. The estatefactories have their own plantations to cater their need, though in the large
42
estate factories too, the issue of deficiency in power supply is raised anddiscussed.
17. During December 2012 and January 2013, field survey was conducted infew pockets some of them were visited earlier in December 2011.
18. There are advantages as well as disadvantages of being dependent on tealeaf agents. There are competitions among the agents to procure leavesfrom the smallholders and in this context road conditions and inaccessibilitytake a backseat. In this process the price for green tea leaves received by thesmallholders is less compared to the direct supply to the factories. Still thesmallholders are in advantageous position that the agents collect the leavesfrom their holdings and relieve the smallholders to compromise with thebad roads; this also save their time and efforts. The leaves however need tobe collected on time. The impact of delay in collection means that moisturein leaves gets evaporated leading to loss in weight and so the prices fetched.
19. The large plantations estates factories reportedly accommodate the surplus.Data show inefficiency in production and rise in costs in large plantationestates of Assam. The estates sector of tea now looks for relatively cheapprocurement of green tea leaves from the smallholding plantations(considered as a mode of outsourcing) limiting expansion of own acreageslargely to avoid the labour costs (Das, 2012 c).
20. In some tea producing hubs, particularly in north Assam districts of Sonitpurand Lakhimpur, do not have concentration of BLTFs. In these localities thetea leaves produced by the smallholders supplied to the estate factories (seethe appendix table 1).
21. Variability in rainfall and weather now comes to forefront in performanceof the tea sector. This will require an analysis on changing weather andclimatology of the region. This also brings in the issue of creation ofinfrastructure on micro-irrigation for the tea smallholders.
22. The Tea (Marketing) Control Order, 2003 of Ministry of Commerce andIndustry, Government of India has a clause on fixation of price sharingformula of raw tea leaves. It states that every registered manufacturer engagedin purchase of green tea leaves shall pay to the supplier a reasonable priceaccording to the price sharing formula. This may be specified by theRegistering Authority, from time to time and implemented in a manner asdetermined by the Registering Authority, with the prior approval of theCentral Government. The reasonable price for the green tea leaves accordingto the price sharing formula shall be determined taking into account the saleproceeds received by the registered manufacturer. The TMCO, 2003,however nowhere stated or indicated on what basis the price of tea for rawleaves would be shared. Word of mouth and vernacular newspapers of thestate however indicate that 65 percent of the realised price from the sale ofdry tea would go to the suppliers of raw tea leaves and 35 percent would bekept by the manufacturers.
23. The industrial policy of the state as well as the north east industrial policy,1997 offer a host of subsidies and concessions to establish industrial units in
43
the region. There is capital investment subsidy of 30 percent to a ceiling of25 lakhs for EoUs, there are interest subsidy on working capital and subsidyon power (see Das, 2012 d). It may be assumed that the BLTFs have utilisedthe provisions of the NEIP, 1997.
24. Information was extracted from www.teaboardguwahati.com/stg.pdf,accessed on 4th March 2013. Tea Board data is based the first SurveyReport and Data Bank on Small Tea Growers of Assam, conducted by thedepartment of Industries, Government of Assam. The report was releasedon 13th January, 2011.
25. Survey of 11 sampled BLTFs in the state reveal that these factories processon an average 5,800,000 kg of green tea leaves during the year. Yearlyprocessing capacities in the sampled factories ranged from 884,000 lakh kgto 10,000,000 lakh kg (Table 5).
26. In determining this price it is assumed that to prepare a kg of dry tea thereis requirement of 4.5 kg of green tea leaves and production costs in thefields account for 65 percent costs of production. The ratio of made tea togreen leaf is termed as “recovery percentage” alternatively, as “out turn”.This ratio varies depending on the initial moisture content of the leaf. Leafwith moisture content of about 83% during wet period produces 16.5 kgblack tea from 100 kg of green leaf. Similarly, leaf with moisture content of72% during dry period produces as much as 27.5 kg of tea from 100 kg ofgreen leaf. Taking an average of 77-78% moisture for the whole season,22.5 kg of made tea is expected from every 100 kg of green leaf (a note onwithering tea manufacture- Tea Research Association, Toklai, Jorhat,www.tocklai.net/TeaManufacture/withering.aspx accesssed on 13thDecember, 2011).
27. It may be noted that the tea leaf agents keep a margin for their efforts andservices. This could be between Rs. 1 to 2 for a kg of leaves.
28. Pre-monsoon showers though lead to flushes of tea leaves, productionreaches peak during the monsoon (June-October period). In the starting ofthe plucking season (March -April), there is demand from the factories toprocure leaves and this result in higher prices.
29. Poor wages and casualisation of workforce in the estate sector plantationsindicate unlimited supply of labour in the tea sector. However, it may be amyth to assume that the tea sector still attracts labour to work in thesmallholdings, where jobs are intermittent and wages are meager.
30. Other determinants are abundance of uplands, suitable soil and climates, aconvenient market to sale green tea leaves in estate factories etc.
31. See appendix Table 2.
32. In, India, the implementation of the National Rural Employment GuaranteeAct (which guarantees one hundred days of wage-employment in a financialyear to a rural household whose adult members volunteer to do unskilledmanual work), has led to a shortage of casual labour in tea estates, hitting
44
smallholders the most. There is also a danger of lower productivity andpoorer quality of leaf plucking (coarse plucking), which has an impact onprice realisation (Banerjee, 2012).
33. There are few primary studies by North Eastern Social Research Centre(2004) and the National Campaigns for Labour Rights (1999) reveal thatthe tea sector of Assam lacks labour standard.
34. The quick survey did not viasualise the emerging crisis of labour supply;but this issue has created space for further research.
35. A report on rainfall variations projected decline in overall the number ofrainy days in Assam, but intensities would increase (INCCA Report, 2010).Time series data (1970-2010) analysis by Upadhyay (nd) on rainfall indicatesannual variability in the state.
36. Joseph (2012) makes a point that the plantation sector of India is not just aforeign exchange earner but a ‘key sector’ in achieving inclusivedevelopment as envisioned in India’s 11th and 12th five year plans. Thesector’s role comes to prominence in its contribution in employmentgeneration, especially women (about 55 percent worker engaged in the teasector are women), and a source of good income earning opportunities forthe small and marginal holders.
37. For detail note on power supply situation see the website of APDCL-www.apdcl.gov.in
38. Tea leaves in Assam flush in late March and early April with arrival of pre-monsoonal rain. Production and supply declines in the post monsoon periodand virtually stops in December. Most of the BLTFs in the state are closed inDecember and reopens in March. The factories get engaged in overhaulingand maintenance during the closure.
39. The capacity of diesel powered generation sets vary in sampled factories –from 62.5 KVA to 320 KVA; some factories have installed multiple generationsets.
40. As mentioned earlier the BLTFs set a limit on the supplies made by the teasmallholders and tea leaf agents. The factories thus procure that much ofquantity which they can afford to process.
41. The survey did not try to have an estimate on the cost of labour increased inthis process. The situation was not visualised prior to the field visit thatfrequent switching to alternative power sources consumes time forcing theBLTFs to extend work hours.
42. Better price fetched by tea at auction market would help the smallholders,provided there is an institutional mechanism to share the prices fetched inthe market and ensure the benefits.
43. A project for energy conservation in small sector tea processing units inSouth India was initiated by the Tea Board of India in 2008, supported by
45
the United Nations Development Programme (UNDP) - Global EnvironmentFacility (GEF). The objective of the project is communication and awarenesscreation to the stake-holders for the procurement and adoption of energyefficient/renewable-energy equipments and their relation to their mediumto long-term profitability.
44. To ensure fair price, government of Assam in 2011 had contemplated tointroduce a bill to penalise tea factories defying the TMCO, 2003. Theoutcome is not known. The implementation of TMCO was proposed by theState Industries Minister from April 2012; we still do not see any concretestep in this regard. Apart from the issue of fair pricing of tea leaves, thesmallholders now have raised the issue of availability of fertiliser andpesticides at fair price. Smallholders reported high incidences of pest attacksin their plantations. This issue however calls for provisioning of effectiveextensions services (from assessing soil quality and scientific mitigation ofpests) to ensure productivity in the sector.
45. For a detailed note see Tea Plantation Development Scheme for the XI planperiod, Tea Board of India, teaboard.giv.in accessed on 22nd April, 2013;and Goswami (2012).
46. It may be noted that tea smallholders pay Rs. 0.25/ as cess to the governmentof Assam for every kg of green tea leaves they produced.
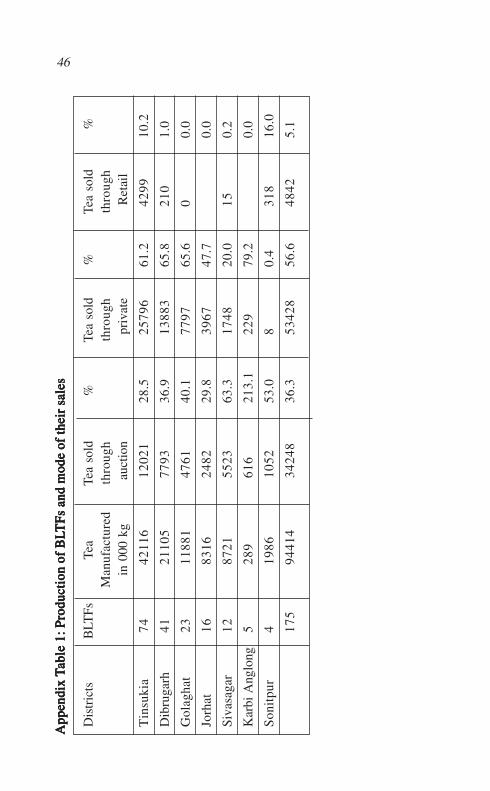
46A
ppen
dix
App
endi
x A
ppen
dix
App
endi
x A
ppen
dix
TTTT Tab
le 1
: Pro
duct
ion
of B
Lab
le 1
: Pro
duct
ion
of B
Lab
le 1
: Pro
duct
ion
of B
Lab
le 1
: Pro
duct
ion
of B
Lab
le 1
: Pro
duct
ion
of B
LT
Fs
and
mod
e of
thei
r sa
les
TF
s an
d m
ode
of th
eir
sale
sT
Fs
and
mod
e of
thei
r sa
les
TF
s an
d m
ode
of th
eir
sale
sT
Fs
and
mod
e of
thei
r sa
les
Dis
tric
tsB
LTFs
Tea
Tea
sold
%Te
a so
ld%
Tea
sold
%M
anuf
actu
red
thro
ugh
thro
ugh
thro
ugh
in 0
00 k
g a
uctio
n p
riva
te R
etai
l
Tin
suki
a74
4211
612
021
28.5
2579
661
.242
9910
.2
Dib
ruga
rh41
2110
577
9336
.913
883
65.8
210
1.0
Gol
agha
t23
1188
147
6140
.177
9765
.60
0.0
Jorh
at16
8316
2482
29.8
3967
47.7
0.0
Siva
saga
r12
8721
5523
63.3
1748
20.0
150.
2
Kar
bi A
nglo
ng5
289
616
213.
122
979
.20.
0
Son
itpu
r4
1986
1052
53.0
80.
431
816
.0
175
9441
434
248
36.3
5342
856
.648
425.
1
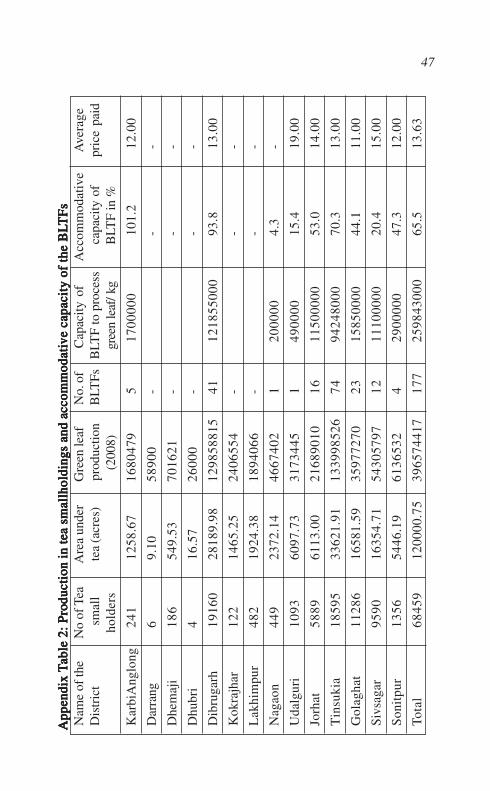
47 A
ppen
dix
App
endi
x A
ppen
dix
App
endi
x A
ppen
dix
TTTT Tab
le 2
: P
rodu
ctio
n in
tea
sm
allh
oldi
ngs
and
acco
mm
odat
iab
le 2
: P
rodu
ctio
n in
tea
sm
allh
oldi
ngs
and
acco
mm
odat
iab
le 2
: P
rodu
ctio
n in
tea
sm
allh
oldi
ngs
and
acco
mm
odat
iab
le 2
: P
rodu
ctio
n in
tea
sm
allh
oldi
ngs
and
acco
mm
odat
iab
le 2
: P
rodu
ctio
n in
tea
sm
allh
oldi
ngs
and
acco
mm
odat
i vvvv ve
capa
city
of
the
BL
e ca
paci
ty o
f th
e B
Le
capa
city
of
the
BL
e ca
paci
ty o
f th
e B
Le
capa
city
of
the
BL
TF
sT
Fs
TF
sT
Fs
TF
sN
ame
of th
eN
o of
Tea
Are
a un
der
Gre
en le
afN
o. o
fC
apac
ity o
fA
ccom
mod
ativ
eA
vera
geD
istr
ict
sm
all
tea
(acr
es)
pro
duct
ion
BLT
Fs B
LTF
to p
roce
ss c
apac
ity o
fpr
ice
paid
hold
ers
(20
08)
gre
en le
af/ k
g B
LTF
in %
Kar
biA
nglo
ng24
112
58.6
716
8047
95
1700
000
101.
212
.00
Dar
rang
69.
1058
900
--
-
Dhe
maj
i18
654
9.53
7016
21-
--
Dhu
bri
416
.57
2600
0-
--
Dib
ruga
rh19
160
2818
9.98
1298
5881
541
1218
5500
093
.813
.00
Kok
rajh
ar12
214
65.2
524
0655
4-
--
Lak
him
pur
482
1924
.38
1894
066
--
-
Nag
aon
449
2372
.14
4667
402
120
0000
4.3
-
Uda
lgur
i10
9360
97.7
331
7344
51
4900
0015
.419
.00
Jorh
at58
8961
13.0
021
6890
1016
1150
0000
53.0
14.0
0
Tin
suki
a18
595
3362
1.91
1339
9852
674
9424
8000
70.3
13.0
0
Gol
agha
t11
286
1658
1.59
3597
7270
2315
8500
0044
.111
.00
Sivs
agar
9590
1635
4.71
5430
5797
1211
1000
0020
.415
.00
Son
itpu
r13
5654
46.1
961
3653
24
2900
000
47.3
12.0
0
Tota
l68
459
1200
00.7
539
6574
417
177
2598
4300
065
.513
.63
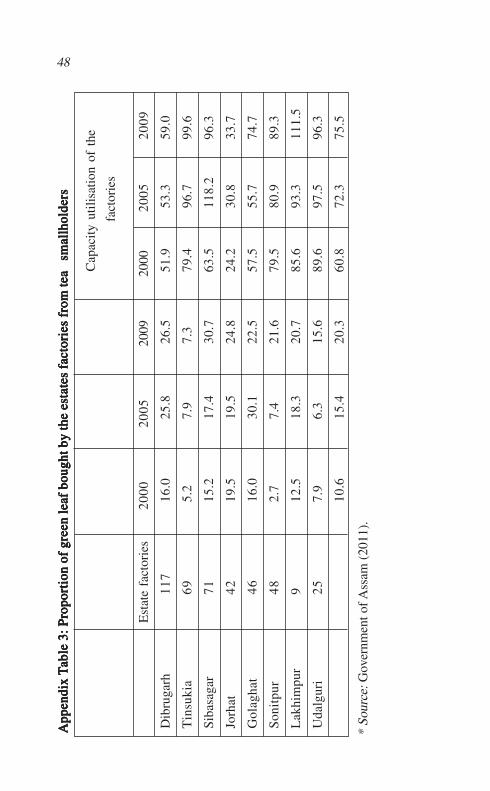
48 A
ppen
dix
App
endi
x A
ppen
dix
App
endi
x A
ppen
dix
TTTT Tab
le 3
: Pro
port
ion
of g
reen
leaf
bou
ght b
y th
e es
tate
s f
able
3: P
ropo
rtio
n of
gre
en le
af b
ough
t by
the
esta
tes
fab
le 3
: Pro
port
ion
of g
reen
leaf
bou
ght b
y th
e es
tate
s f
able
3: P
ropo
rtio
n of
gre
en le
af b
ough
t by
the
esta
tes
fab
le 3
: Pro
port
ion
of g
reen
leaf
bou
ght b
y th
e es
tate
s f a
ctor
ies
from
tea
sm
allh
olde
rsac
tori
es f
rom
tea
sm
allh
olde
rsac
tori
es f
rom
tea
sm
allh
olde
rsac
tori
es f
rom
tea
sm
allh
olde
rsac
tori
es f
rom
tea
sm
allh
olde
rs
Cap
acity
util
isat
ion
of t
he
fac
tori
es
Est
ate
fact
orie
s20
0020
05
200
9
2000
2005
2009
Dib
ruga
rh11
716
.025
.826
.551
.953
.359
.0
Tin
suki
a69
5.2
7.9
7.3
79.4
96.7
99.6
Siba
saga
r71
15.2
17.4
30.7
63.5
118.
296
.3
Jorh
at42
19.5
19.5
24.8
24.2
30.8
33.7
Gol
agha
t46
16.0
30.1
22.5
57.5
55.7
74.7
Son
itpu
r48
2.7
7.4
21.6
79.5
80.9
89.3
Lak
him
pur
912
.518
.320
.785
.693
.311
1.5
Uda
lgur
i25
7.9
6.3
15.6
89.6
97.5
96.3
10.6
15.4
20.3
60.8
72.3
75.5
* So
urce
: Gov
ernm
ent o
f Ass
am (
2011
).
49
ReferencesReferencesReferencesReferencesReferences
Adenikinju, A (2005) ‘Analysis of the Cost of Infrastructure Failures in
a Developing Economy: The Case of the Electricity Sector in
Nigeria’, AERC Research Paper 148, Nairobi, AERC.
Andres, L A; Guasch, A L; Haven, T; Foster, V (2008) The Impact ofPrivate Sector Participation in Infrastructure: Lights, Shadowsand the Road Ahead, Washington, DC: World Bank.
Banerjee, B (2012) ‘Contribution of Smallholders to the Tea Sub Sector
and Policies Required to Enhance their Livelihood’,
Intergovernmental group on Tea, Twentieth Session, Colombo,
January 30- February 1.
Comptroller and Auditor General of India (2012) Role of Tea Board inTea Development in India, Report No. 10 of 2011-12, New Delhi.
Das, K (2012a) ‘Can Smallholding Plantations add Competitiveness to
Assam’s Tea Sector? Drawing Sri Lankan Experiences in Raising
Inclusiveness of the Tea Plantation Sector’, Seminar on BuildingCompetitiveness in a Globalised World, National Research
Programme on Plantation Development, Centre for Development
Studies, India, 23-24 January.
Das, K (2012b) ‘Tea Smallholding in Assam’, Economic and PoliticalWeekly, March 17.
Das, K (2012c) How High is the Road? Structural Changes, Institutionsand Wellbeing in Tea Plantations of South Asia, Lambert
Academic Publishers, Berlin.
Das, K (2012d) Understanding Sluggish Industrialisation Process inNortheast India: How the Industrial Policies Help? Research
Paper Series No. 2/2012, OKD Institute of Social Change and
Development.
Fernandes, A M; Pakes, A (2008) ‘Factor Utilization in Indian
Manufacturing: A Look at the World Bank Investment Climate
50
Surveys Data’, NBER Working Paper, No. 14178, Cambridge,
MA: NBER.
Foster, V; Steinbuks, J (2009) ‘Paying the Price for Unreliable Power
Supplies’. Policy Research Working Paper, No. 4913, Washington,
DC: World Bank.
Goswami R, (2012) Scheme for Small Tea Growers, The Telegraph,
February 1, 2012.
Government of Assam (2010) Statistical Handbook of Assam, Directorate
of Economics and Statistics, Guwahati.
Government of Assam (2011) ‘Survey Report and Data Bank on Small
Tea Growers of Assam, conducted by the Department of Industries,
Government of Assam’; extracted from
www.teaboardguwahati.com/stg.pdf, accessed on 4th March2013.
Hazarika K (nd) ‘Tea Auction Market: with a special reference to
Guwahati tea Auction Centre’, www.nits.ac.in/department/
humanities accessed on 12th April, 2013.
Indian Network for Climate Change Assessment (2010), Climate Change
and India: A 4x4 Assessment, a Sectoral and Regional Analysis
for 2030s; quoted in Assam State Action Plan on Climate Change,
2012 – 2017, prepared by the Energy and Resources Institute,
New Delhi.
Isaksson, A (2009) ‘Energy Infrastructure and Industrial Development’,
Research and Statistics Branch, Working Paper No. 12/2009,
UNIDO.
Joseph, K J (2012) ‘In Search of Spaces of Social Exclusion in Innovation
Systems: The Case of Plantation Agriculture in India’.
International Seminar on Innovation Systems and InclusiveInnovation, Federal University of Brazil, Rio de Janeiro, 27-28
August.
51
National Campaigns for Labour Rights (1999), Brewed in the Sweat ofForced Labour, Report on the Conditions of Tea Plantation
Labour, CEC, New Delhi.
North Eastern Social Research Center (2004) “Struggles of Tea Garden
Workers in Assam” http://www.thesouthasian.org/archives/2008/
struggles_of_tea_worker_1.html, accessed on 17th January 2009.
Upadhyay, Jyoti (nd) Climate Change and its Impact on Rice
Productivity in Assam, Electronic copy available at: http://
ssrn.com, accessed on 4th Match 2013.