india entertainment & media - idfc
TRANSCRIPT

2
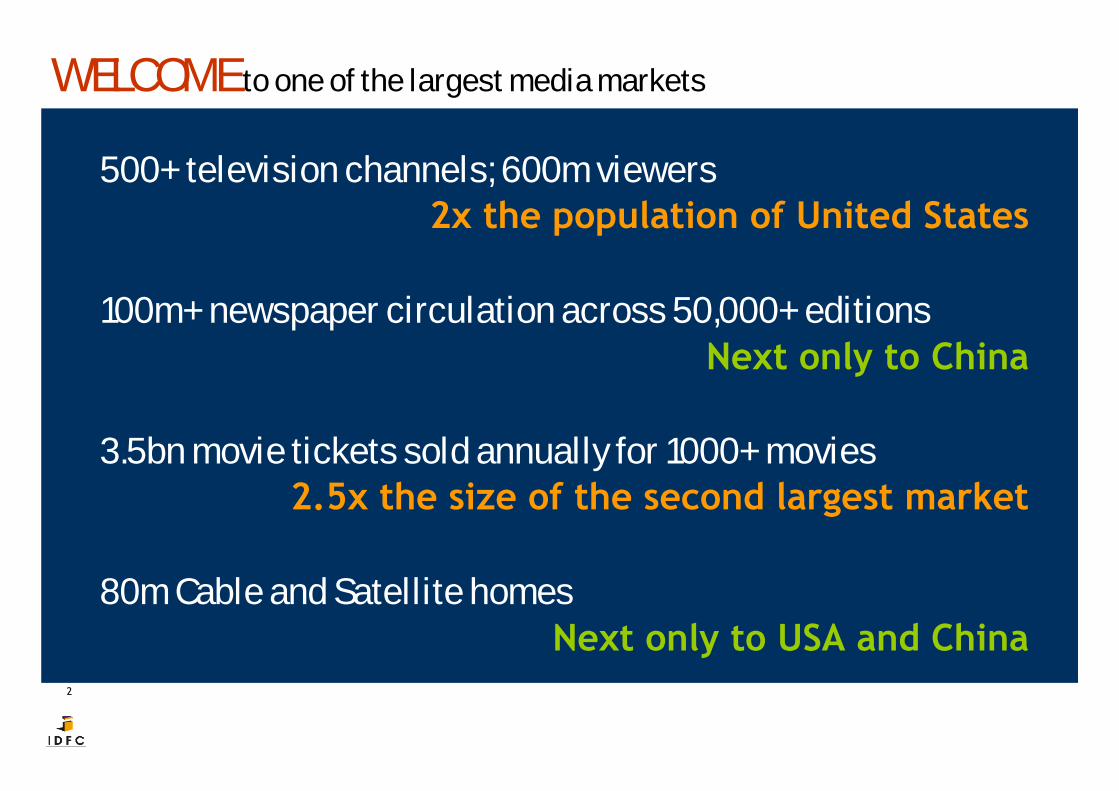
WELCOME to one of the largest media markets
500+ television channels; 600m viewers2x the population of United States
100m+ newspaper circulation across 50,000+ editionsNext only to China
3.5bn movie tickets sold annually for 1000+ movies2.5x the size of the second largest market
80m Cable and Satellite homesNext only to USA and China
3
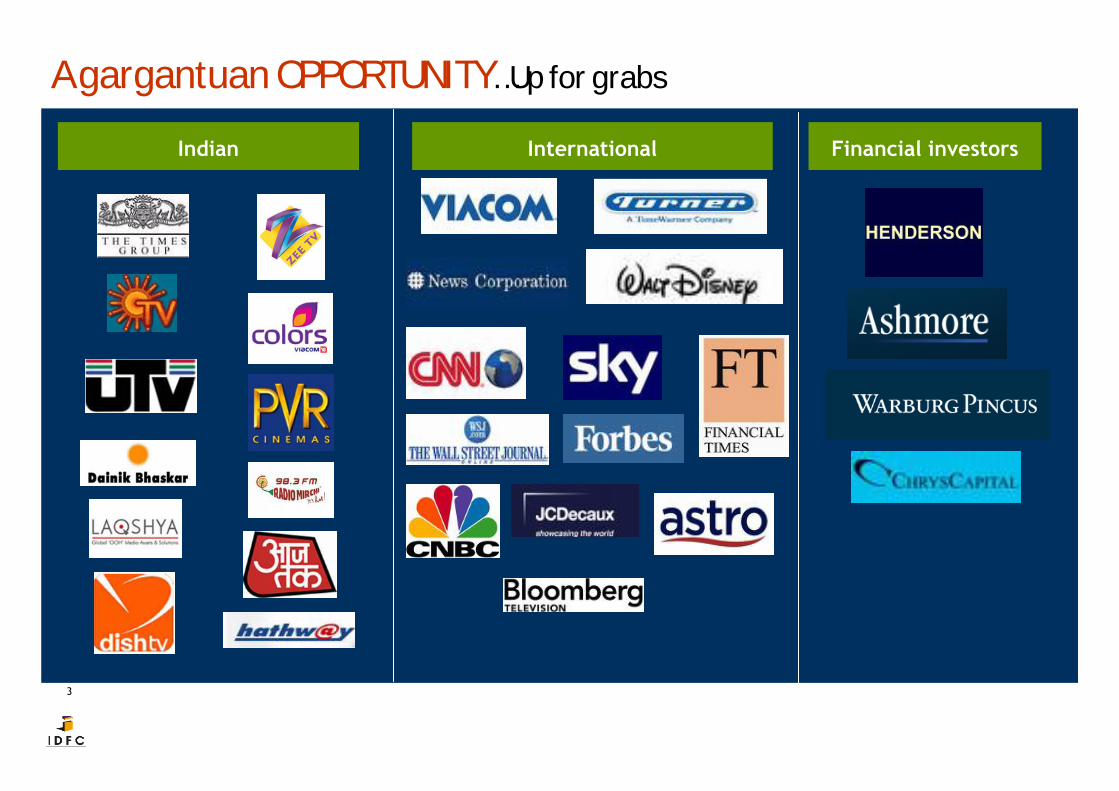
A gargantuan OPPORTUNITY…Up for grabs
Indian International Financial investors
4
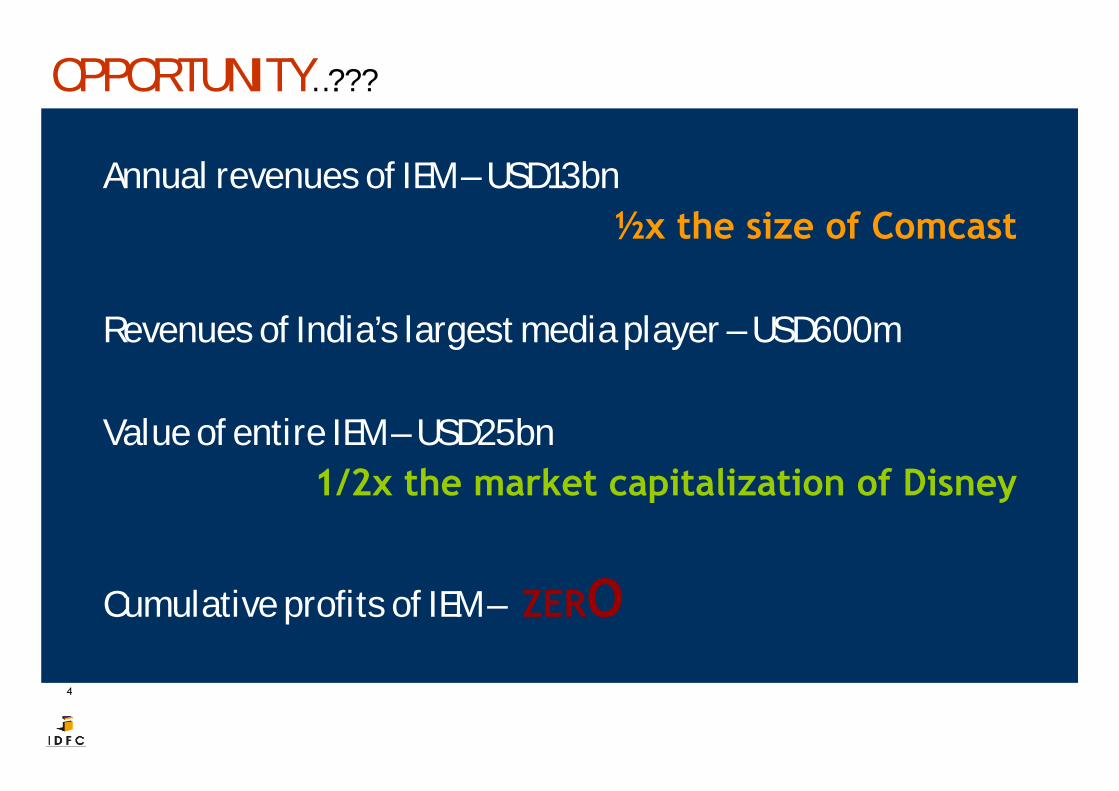
OPPORTUNITY…???
Annual revenues of IEM – USD13bn½x the size of Comcast
Revenues of India’s largest media player – USD600m
Value of entire IEM – USD25bn1/2x the market capitalization of Disney
Cumulative profits of IEM – ZERO
55
0%
50%
Gro
wth
Rs130bn
Rs184bn
Rs125bn
Rs90bn
Rs15bn
Rs9bn
Rs17bn
Rs7.5bn
Rs13bn
Televisionbroadcasting Print Distribution Filmed
entertainment Multiplexes Radio OOH MusicInternet &interactive
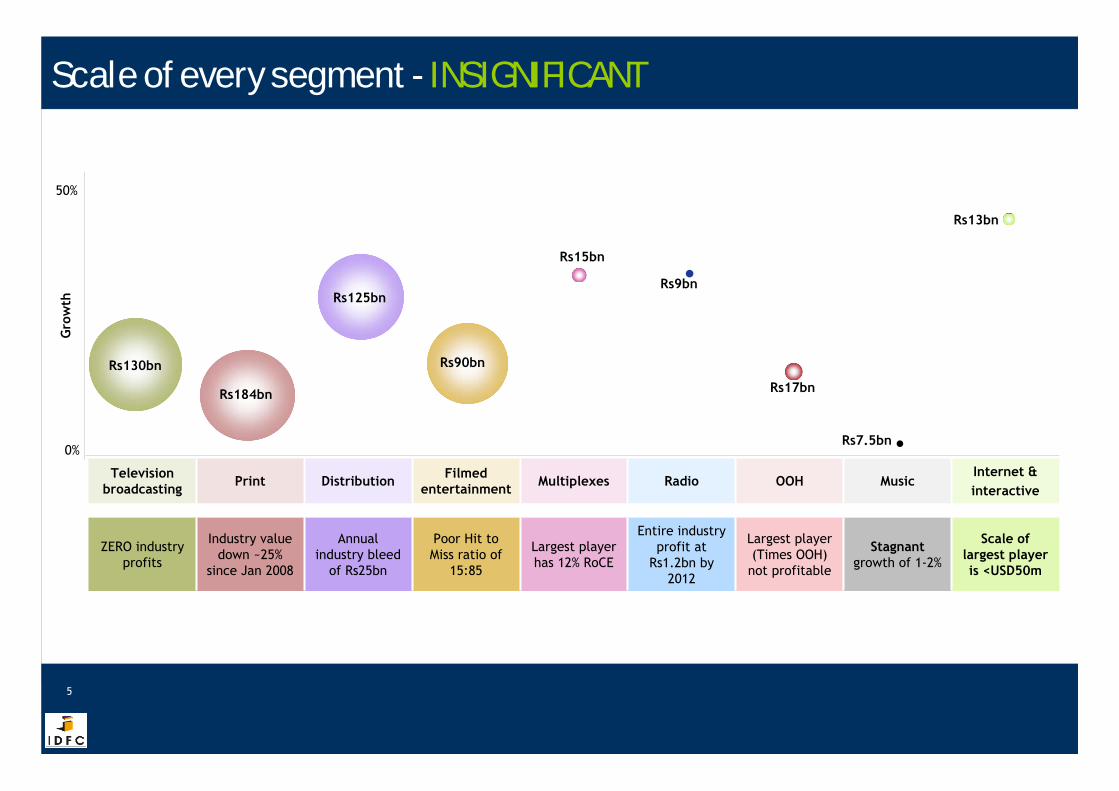
Scale of every segment - INSIGNIFICANT
5
ZERO industry profits
Industry value down ~25%
since Jan 2008
Annual industry bleed
of Rs25bn
Poor Hit to Miss ratio of
15:85
Largest player has 12% RoCE
Entire industry profit at
Rs1.2bn by 2012
Largest player (Times OOH) not profitable
Stagnantgrowth of 1-2%
Scale of largest player is <USD50m
6
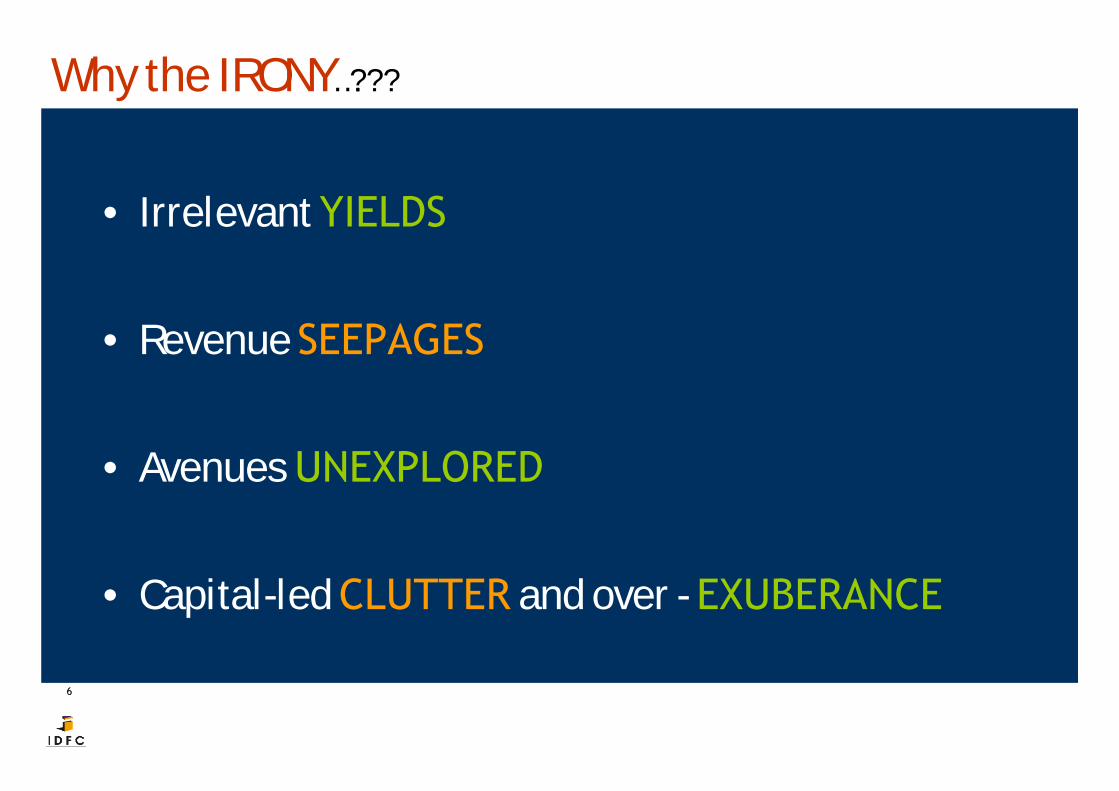
Why the IRONY…???
• Irrelevant YIELDS
• Revenue SEEPAGES
• Avenues UNEXPLORED
• Capital-led CLUTTER and over - EXUBERANCE
7
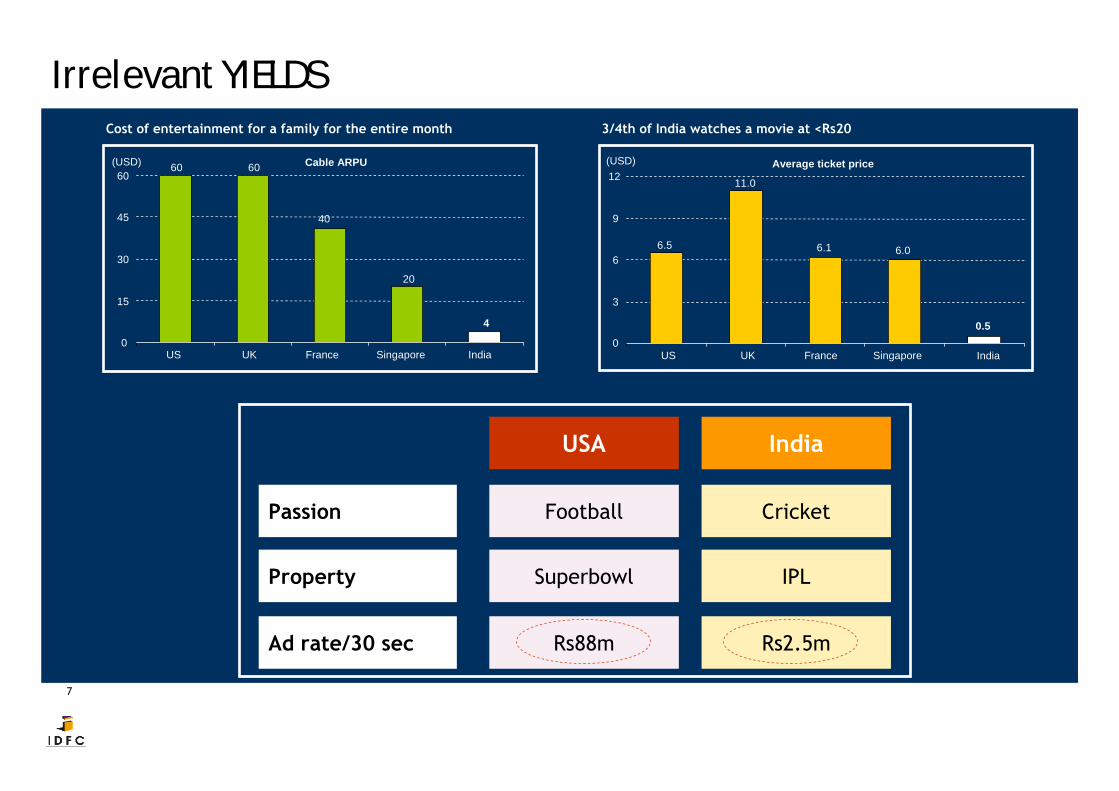
Irrelevant YIELDS
Average ticket price
6.5
11.0
6.1 6.0
0.50
3
6
9
12
US UK France Singapore India
(USD)
Passion
Property
Football Cricket
USA India
Superbowl IPL
Rs88m Rs2.5mAd rate/30 sec
Cable ARPU
0
15
30
45
60
US UK France Singapore India
(USD) 60 60
40
20
4
Cost of entertainment for a family for the entire month 3/4th of India watches a movie at <Rs20
8
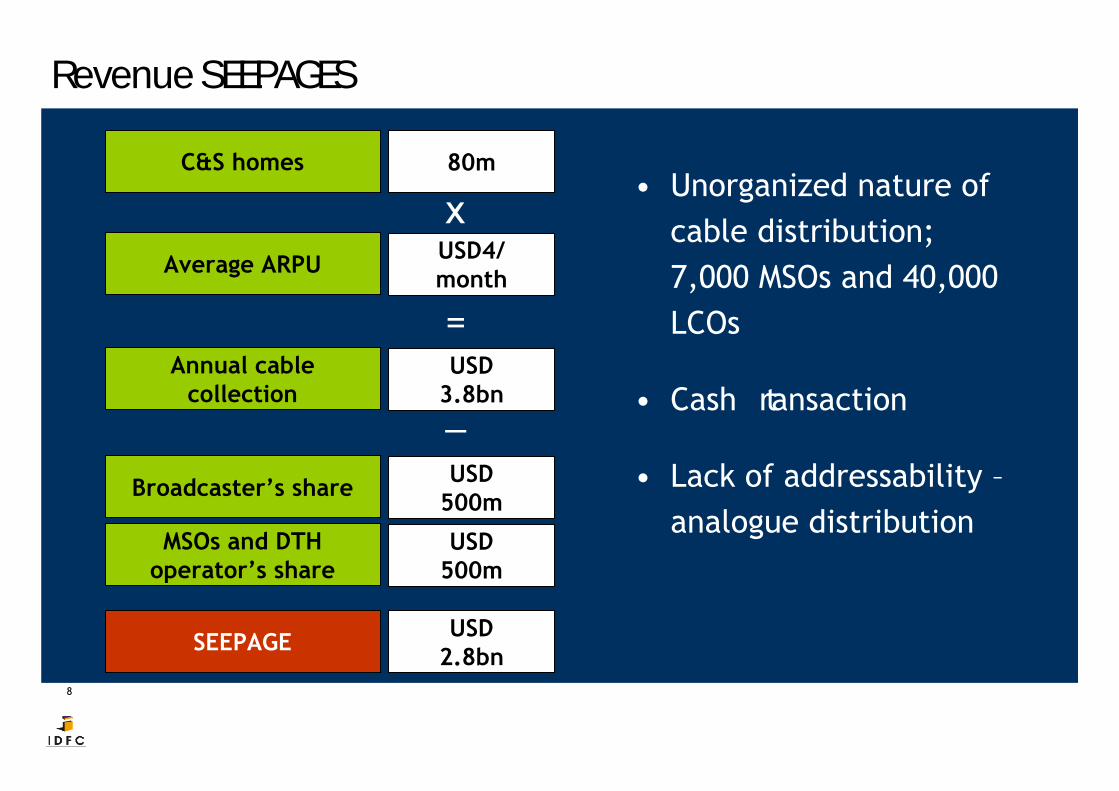
Revenue SEEPAGES
• Unorganized nature of cable distribution; 7,000 MSOs and 40,000 LCOs
• Cash transaction
• Lack of addressability –analogue distribution
C&S homes 80m
Average ARPU USD4/month
x
Annual cable collection
USD3.8bn
=
Broadcaster’s share USD500m
_
MSOs and DTH operator’s share
USD500m
SEEPAGE USD2.8bn
9
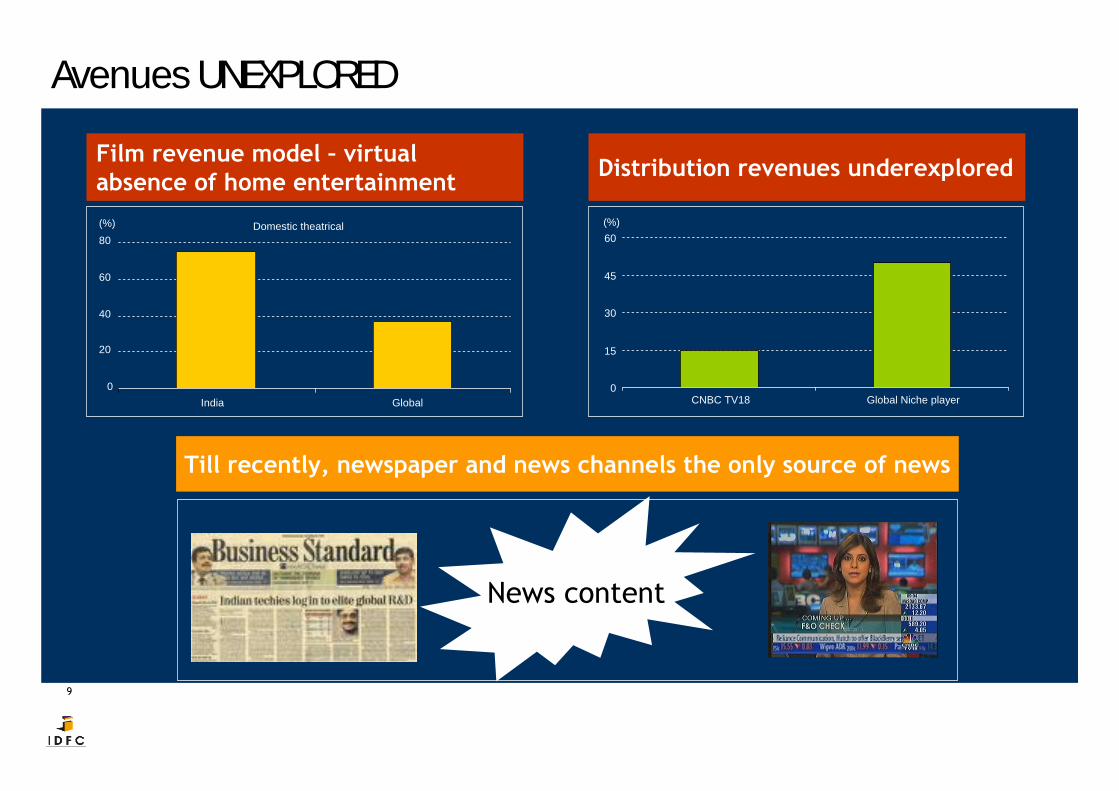
Avenues UNEXPLOREDFilm revenue model – virtual absence of home entertainment Distribution revenues underexplored
Domestic theatrical
0
20
40
60
80
India Global
(%)
0
15
30
45
60
CNBC TV18 Global Niche player
(%)
News content
Till recently, newspaper and news channels the only source of news
10
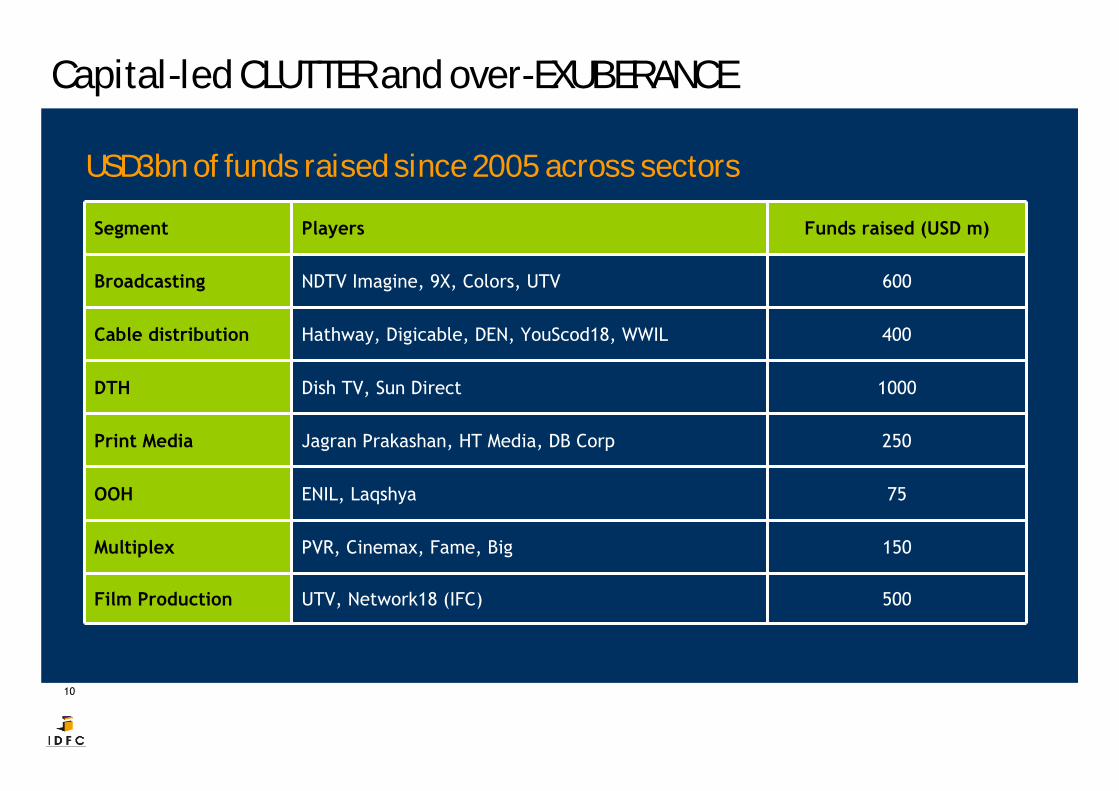
Capital-led CLUTTER and over-EXUBERANCE
Segment Players Funds raised (USD m)
Broadcasting NDTV Imagine, 9X, Colors, UTV 600
Cable distribution Hathway, Digicable, DEN, YouScod18, WWIL 400
DTH Dish TV, Sun Direct 1000
Print Media Jagran Prakashan, HT Media, DB Corp 250
OOH ENIL, Laqshya 75
Multiplex PVR, Cinemax, Fame, Big 150
Film Production UTV, Network18 (IFC) 500
USD3bn of funds raised since 2005 across sectors
11
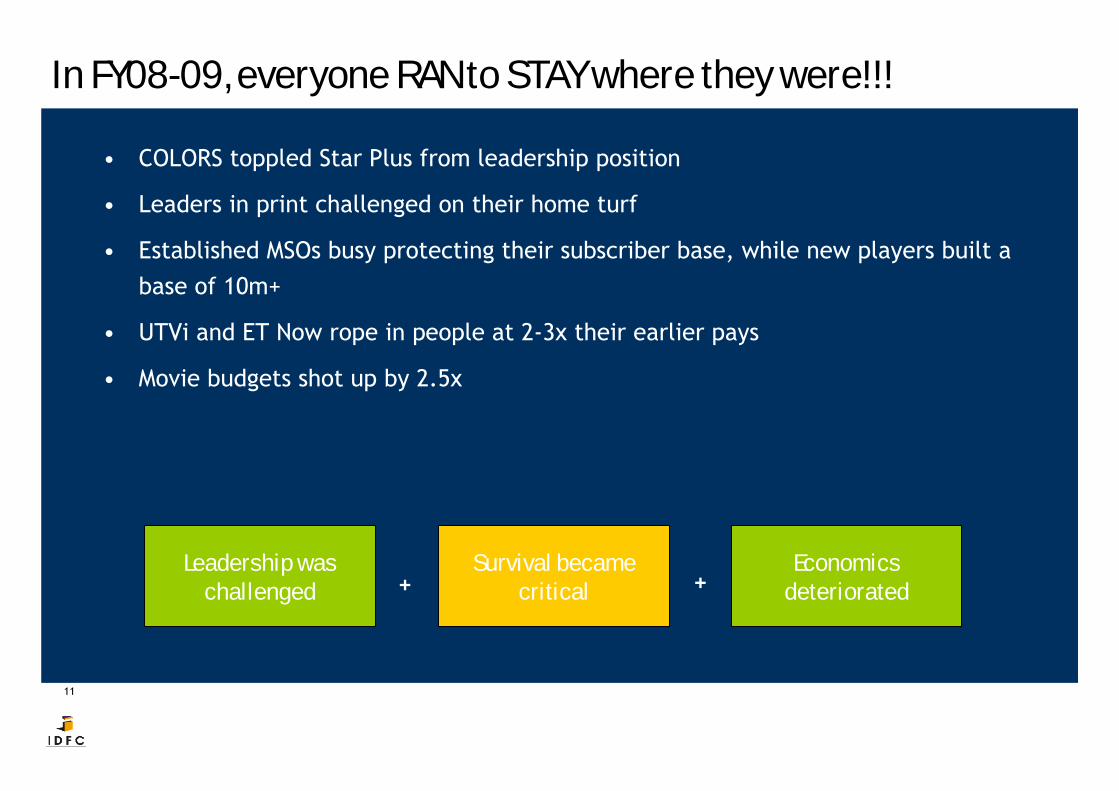
In FY08-09, everyone RAN to STAY where they were!!!
• COLORS toppled Star Plus from leadership position
• Leaders in print challenged on their home turf
• Established MSOs busy protecting their subscriber base, while new players built a base of 10m+
• UTVi and ET Now rope in people at 2-3x their earlier pays
• Movie budgets shot up by 2.5x
Leadership was challenged +
Survival became critical +
Economics deteriorated
12
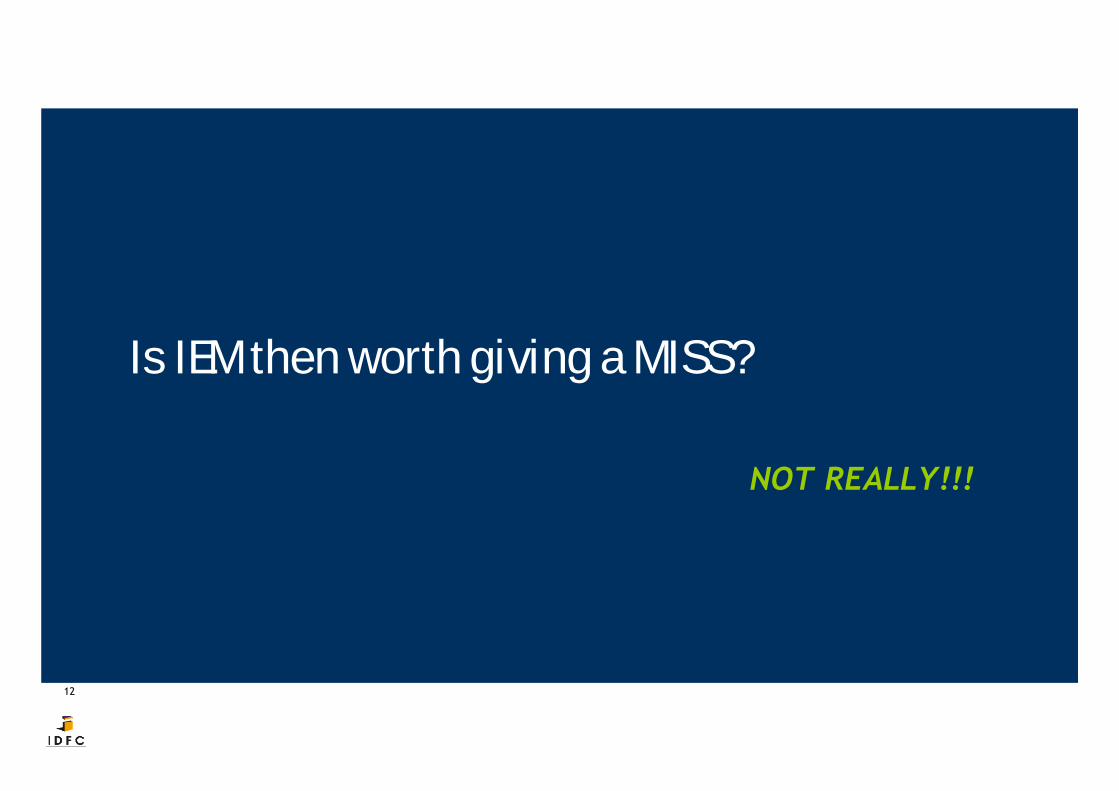
Is IEM then worth giving a MISS?
NOT REALLY!!!

13
OPPORTUNITY to REALITY – change is underway
14
Advertising pie – USD9bn by 2013E
15
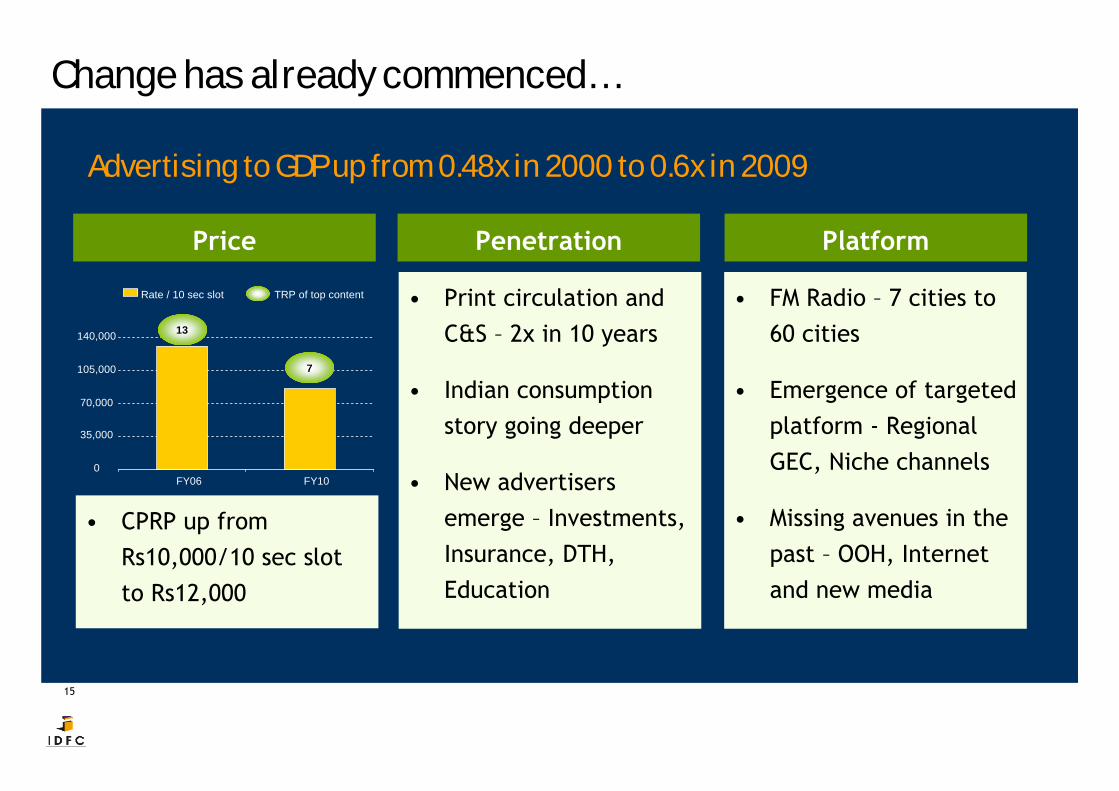
Change has already commenced…
Advertising to GDP up from 0.48x in 2000 to 0.6x in 2009
Price
• Print circulation and C&S – 2x in 10 years
• Indian consumption story going deeper
• New advertisers emerge – Investments, Insurance, DTH, Education
• FM Radio – 7 cities to 60 cities
• Emergence of targeted platform - Regional GEC, Niche channels
• Missing avenues in the past – OOH, Internet and new media
Penetration Platform
• CPRP up from Rs10,000/10 sec slot to Rs12,000
0
35,000
70,000
105,000
140,000
FY06 FY10
Rate / 10 sec slot TRP of top content
13
7
16
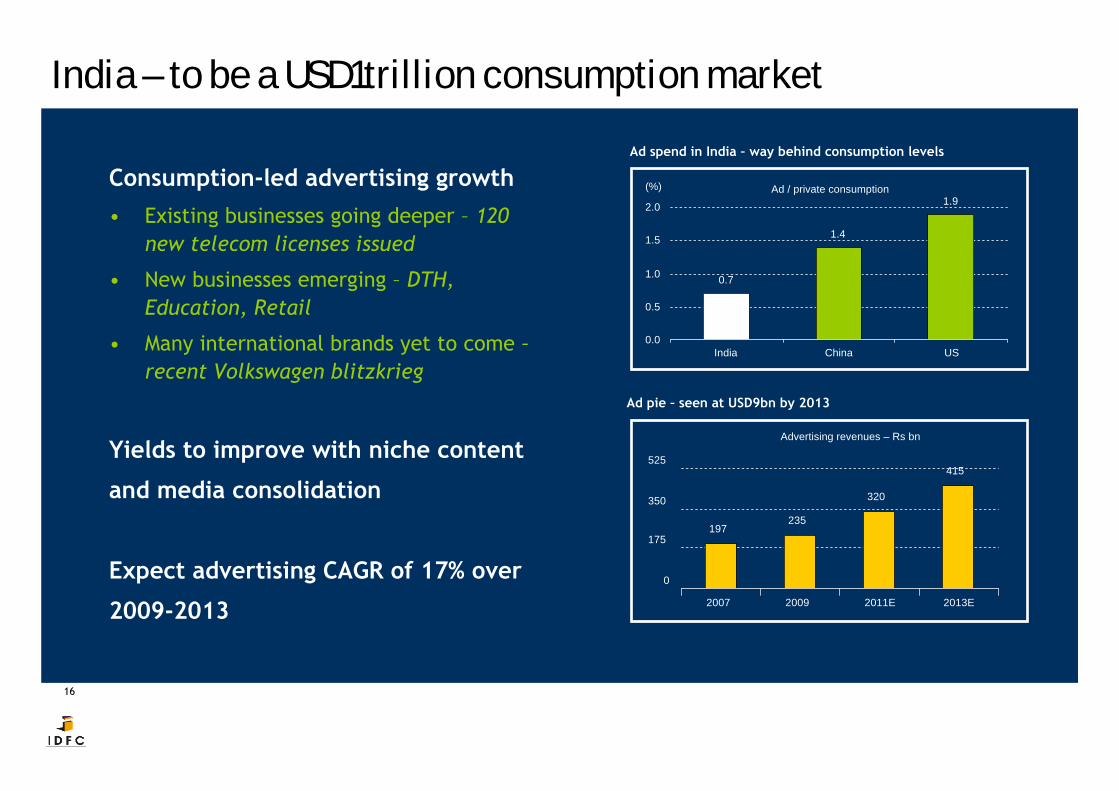
India – to be a USD1trillion consumption market
Ad / private consumption
0.7
1.4
1.9
0.0
0.5
1.0
1.5
2.0
India China US
(%)
Advertising revenues – Rs bn
197235
320
415
0
175
350
525
2007 2009 2011E 2013E
Consumption-led advertising growth• Existing businesses going deeper – 120
new telecom licenses issued
• New businesses emerging – DTH, Education, Retail
• Many international brands yet to come –recent Volkswagen blitzkrieg
Yields to improve with niche content
and media consolidation
Expect advertising CAGR of 17% over
2009-2013
Ad spend in India – way behind consumption levels
Ad pie – seen at USD9bn by 2013
17
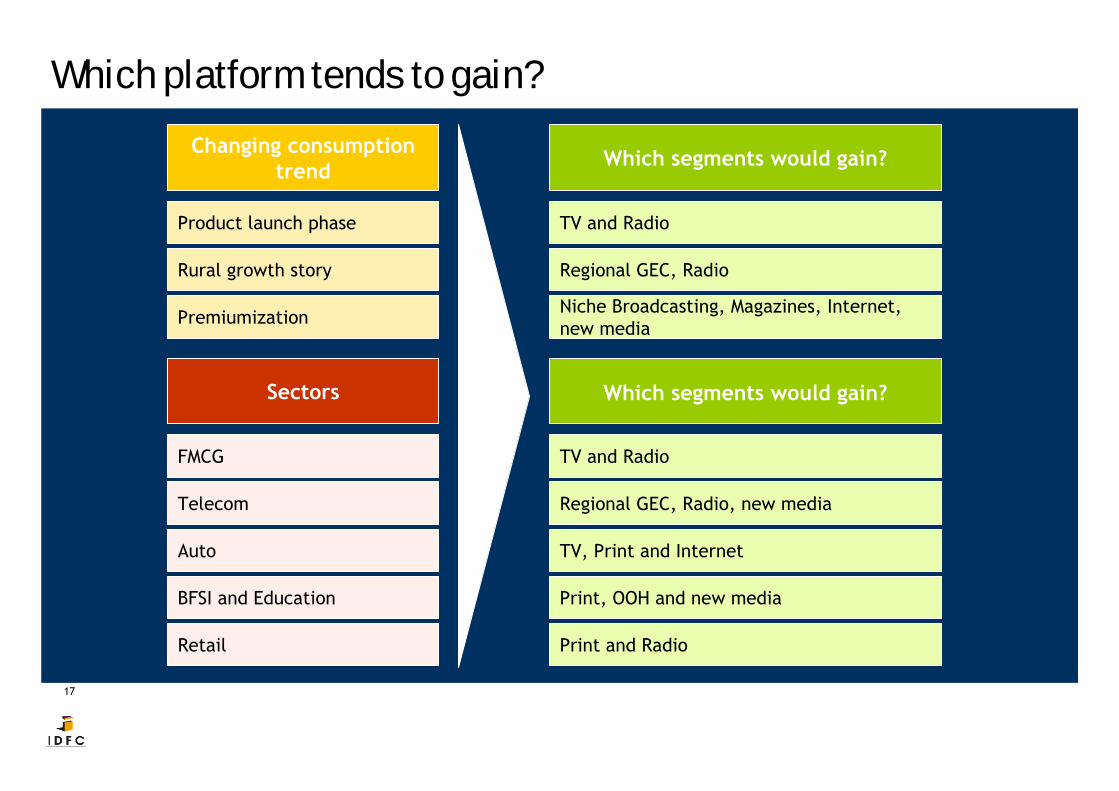
Which platform tends to gain?Changing consumption
trend Which segments would gain?
Product launch phase TV and Radio
Rural growth story Regional GEC, Radio
Premiumization Niche Broadcasting, Magazines, Internet, new media
Sectors Which segments would gain?
FMCG TV and Radio
Telecom Regional GEC, Radio, new media
Auto TV, Print and Internet
BFSI and Education Print, OOH and new media
Retail Print and Radio
18
Pay revenues – Higher addressability and better ARPU
19
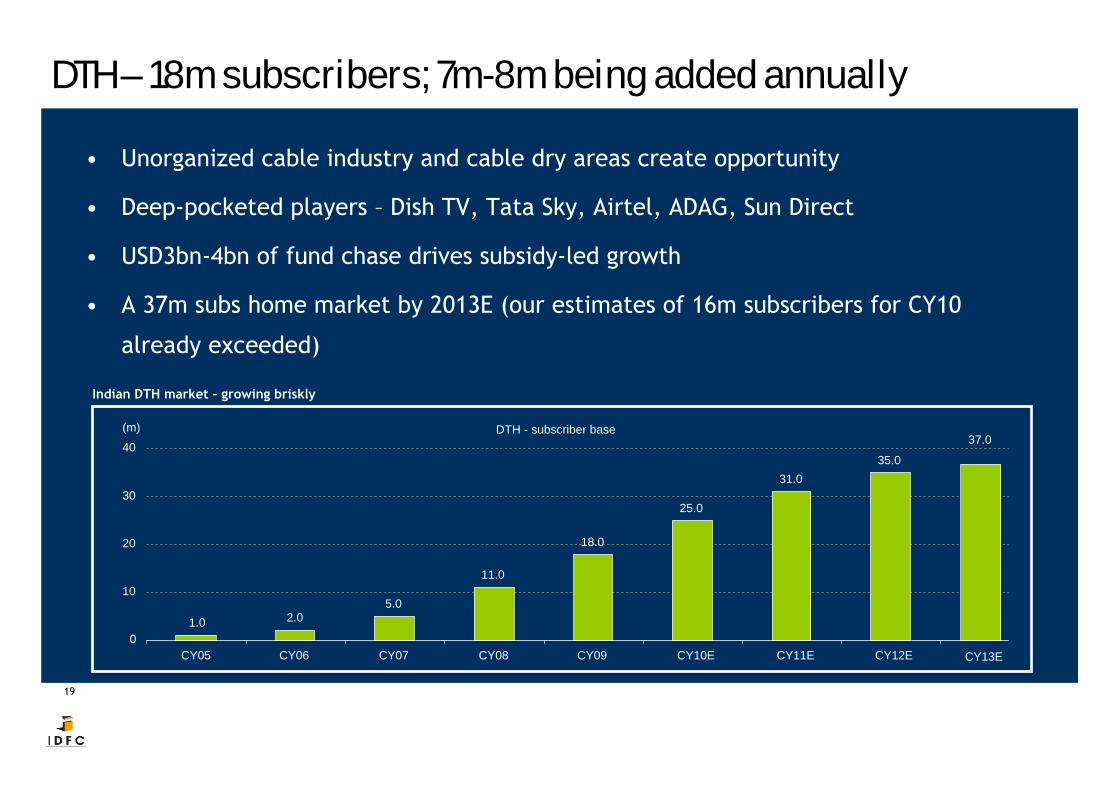
DTH – 18m subscribers; 7m-8m being added annually
• Unorganized cable industry and cable dry areas create opportunity
• Deep-pocketed players – Dish TV, Tata Sky, Airtel, ADAG, Sun Direct
• USD3bn-4bn of fund chase drives subsidy-led growth
• A 37m subs home market by 2013E (our estimates of 16m subscribers for CY10
already exceeded)
DTH - subscriber base
1.0 2.05.0
11.0
18.0
25.0
31.035.0
0
10
20
30
40
CY05 CY06 CY07 CY08 CY09 CY10E CY11E CY12E CY13E
37.0(m)
Indian DTH market – growing briskly
20
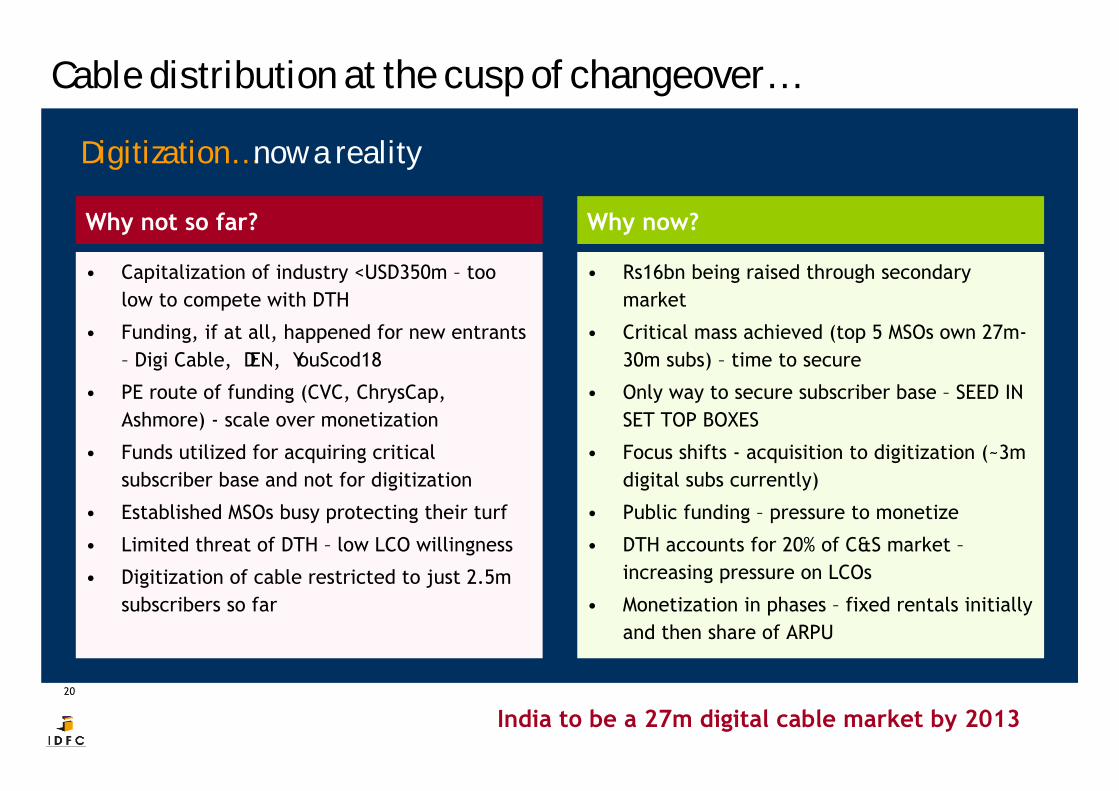
Cable distribution at the cusp of changeover…
Digitization… now a reality
Why not so far? Why now?
• Capitalization of industry <USD350m – too low to compete with DTH
• Funding, if at all, happened for new entrants – Digi Cable, DEN, YouScod18
• PE route of funding (CVC, ChrysCap, Ashmore) - scale over monetization
• Funds utilized for acquiring critical subscriber base and not for digitization
• Established MSOs busy protecting their turf
• Limited threat of DTH – low LCO willingness
• Digitization of cable restricted to just 2.5m subscribers so far
• Rs16bn being raised through secondary market
• Critical mass achieved (top 5 MSOs own 27m-30m subs) – time to secure
• Only way to secure subscriber base – SEED IN SET TOP BOXES
• Focus shifts - acquisition to digitization (~3m digital subs currently)
• Public funding – pressure to monetize
• DTH accounts for 20% of C&S market –increasing pressure on LCOs
• Monetization in phases – fixed rentals initially and then share of ARPU
India to be a 27m digital cable market by 2013
21
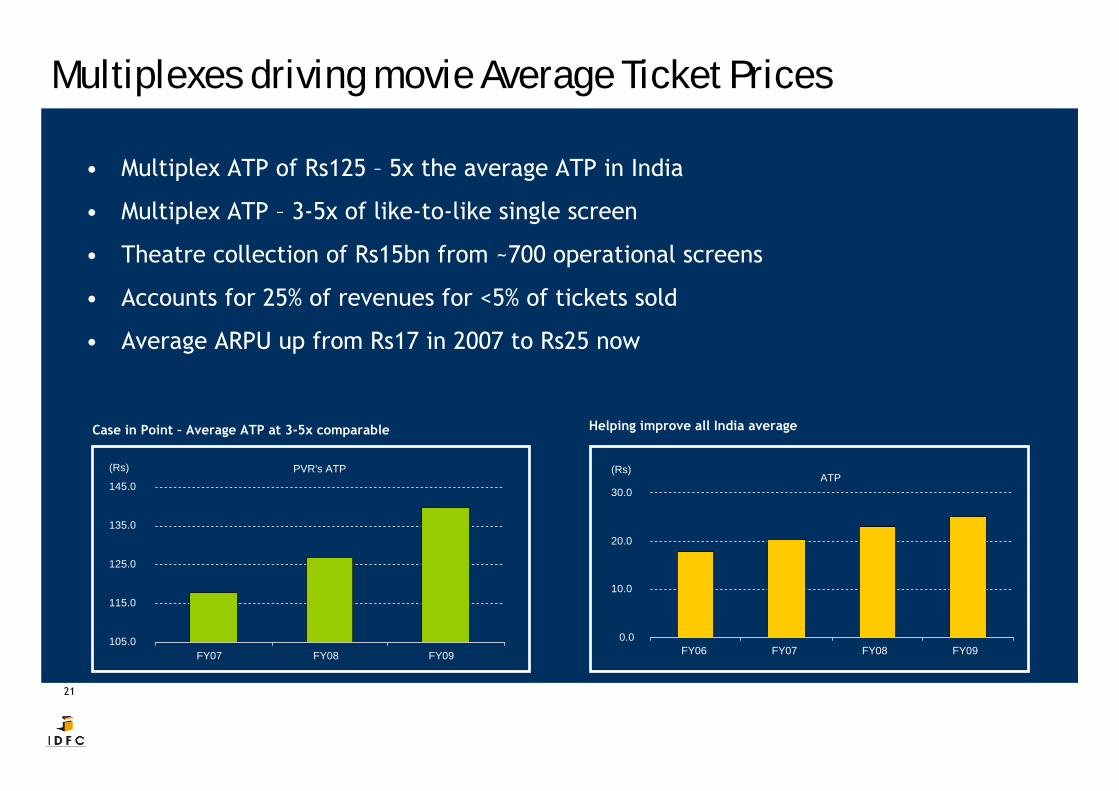
Multiplexes driving movie Average Ticket Prices
• Multiplex ATP of Rs125 – 5x the average ATP in India
• Multiplex ATP – 3-5x of like-to-like single screen
• Theatre collection of Rs15bn from ~700 operational screens
• Accounts for 25% of revenues for <5% of tickets sold
• Average ARPU up from Rs17 in 2007 to Rs25 now
PVR's ATP
105.0
115.0
125.0
135.0
145.0
FY07 FY08 FY09
(Rs)ATP
0.0
10.0
20.0
30.0
FY06 FY07 FY08 FY09
(Rs)
Case in Point – Average ATP at 3-5x comparable Helping improve all India average

22
As these things play out…
23
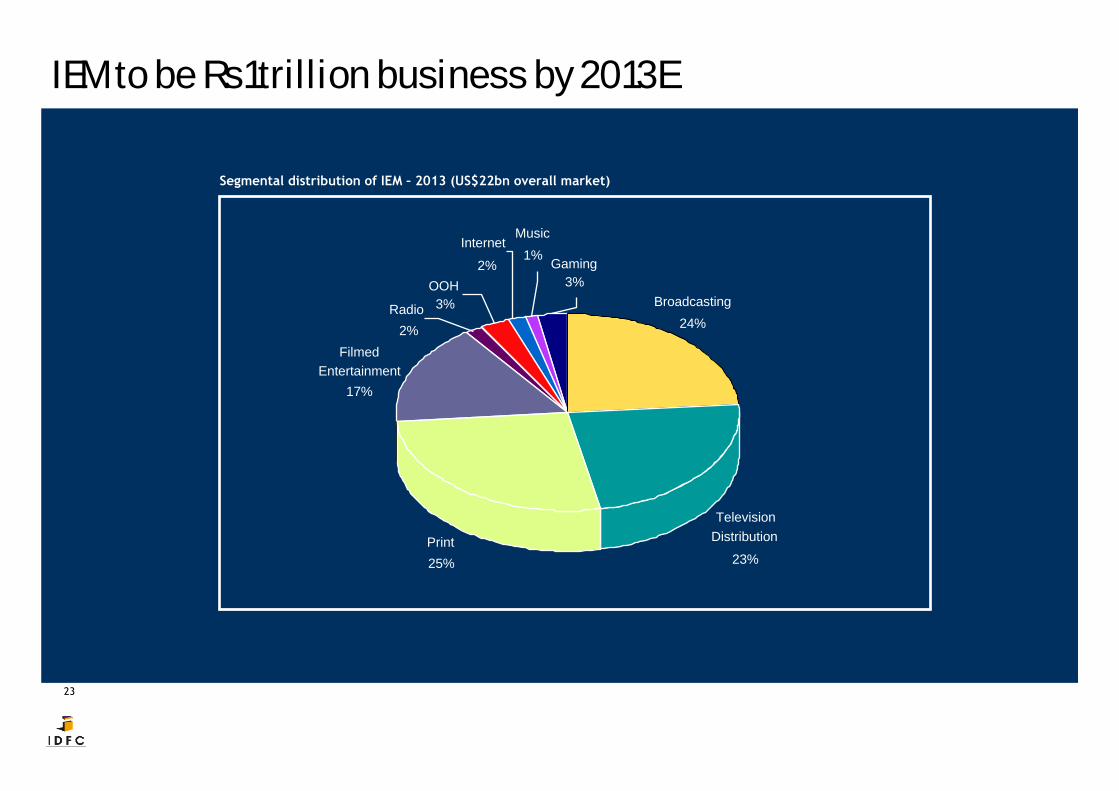
IEM to be Rs1trillion business by 2013E
Television Distribution
23%Print25%
Internet
2% Gaming3%
Filmed Entertainment
17%
Broadcasting24%
OOH3%
Music1%
Radio2%
Segmental distribution of IEM – 2013 (US$22bn overall market)
24
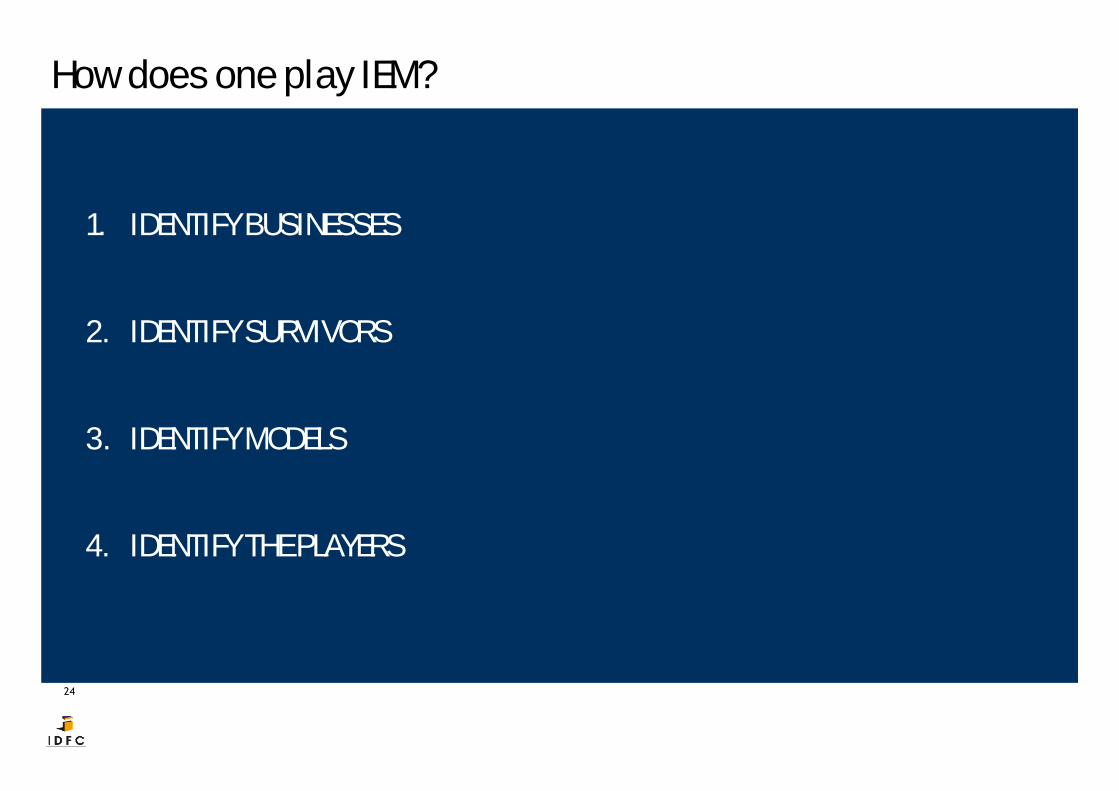
How does one play IEM?
1. IDENTIFY BUSINESSES
2. IDENTIFY SURVIVORS
3. IDENTIFY MODELS
4. IDENTIFY THE PLAYERS
25
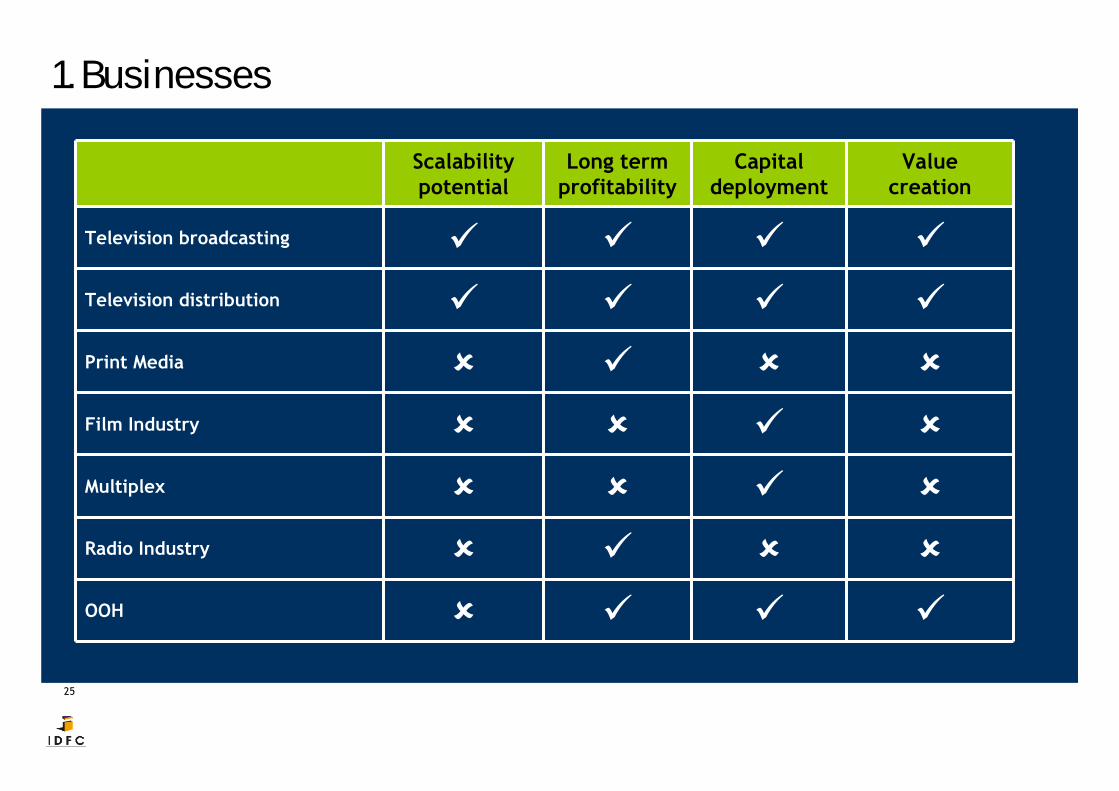
1. Businesses
Scalability potential
Long term profitability
Capital deployment
Valuecreation
Television broadcasting
Television distribution
Print Media
Film Industry
Multiplex
Radio Industry
OOH
26
DTH Distribution – the pain is behind
27
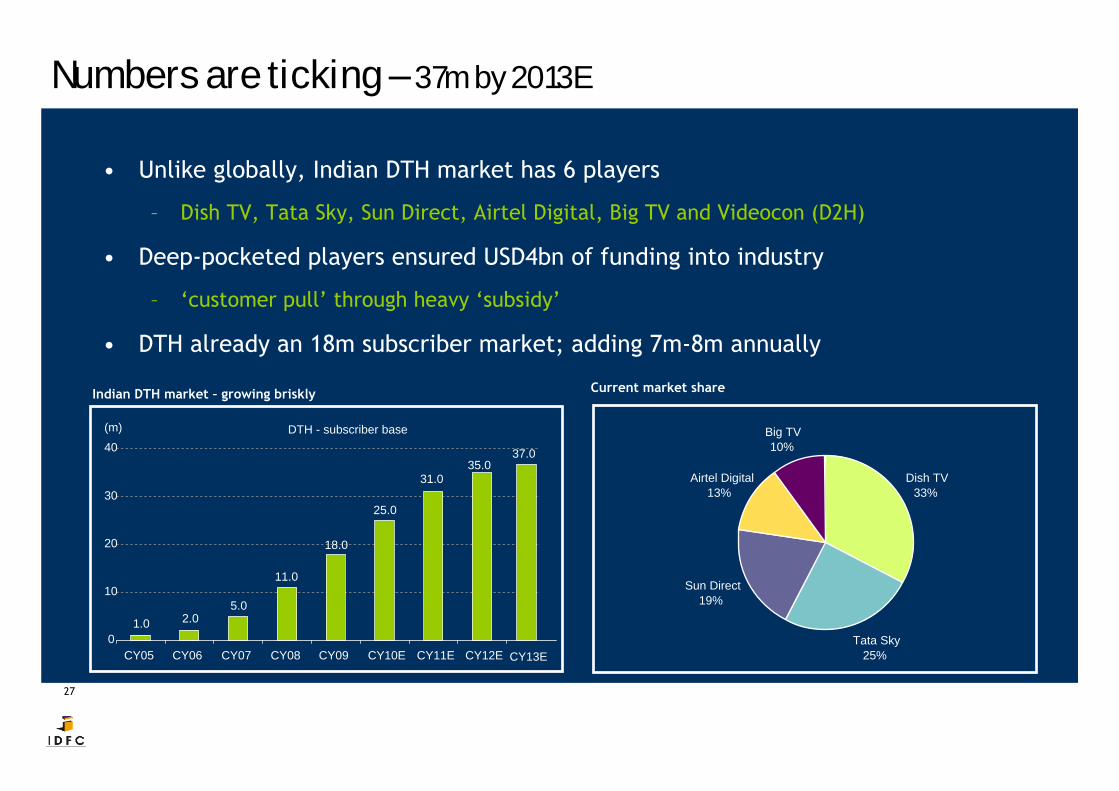
Numbers are ticking – 37m by 2013E
• Unlike globally, Indian DTH market has 6 players
– Dish TV, Tata Sky, Sun Direct, Airtel Digital, Big TV and Videocon (D2H)
• Deep-pocketed players ensured USD4bn of funding into industry
– ‘customer pull’ through heavy ‘subsidy’
• DTH already an 18m subscriber market; adding 7m-8m annually
Dish TV33%
Tata Sky25%
Sun Direct19%
Airtel Digital13%
Big TV10%
DTH - subscriber base
1.0 2.05.0
11.0
18.0
25.0
31.035.0
0
10
20
30
40
CY05 CY06 CY07 CY08 CY09 CY10E CY11E CY12E CY13E
37.0
(m)
Indian DTH market – growing briskly Current market share
28
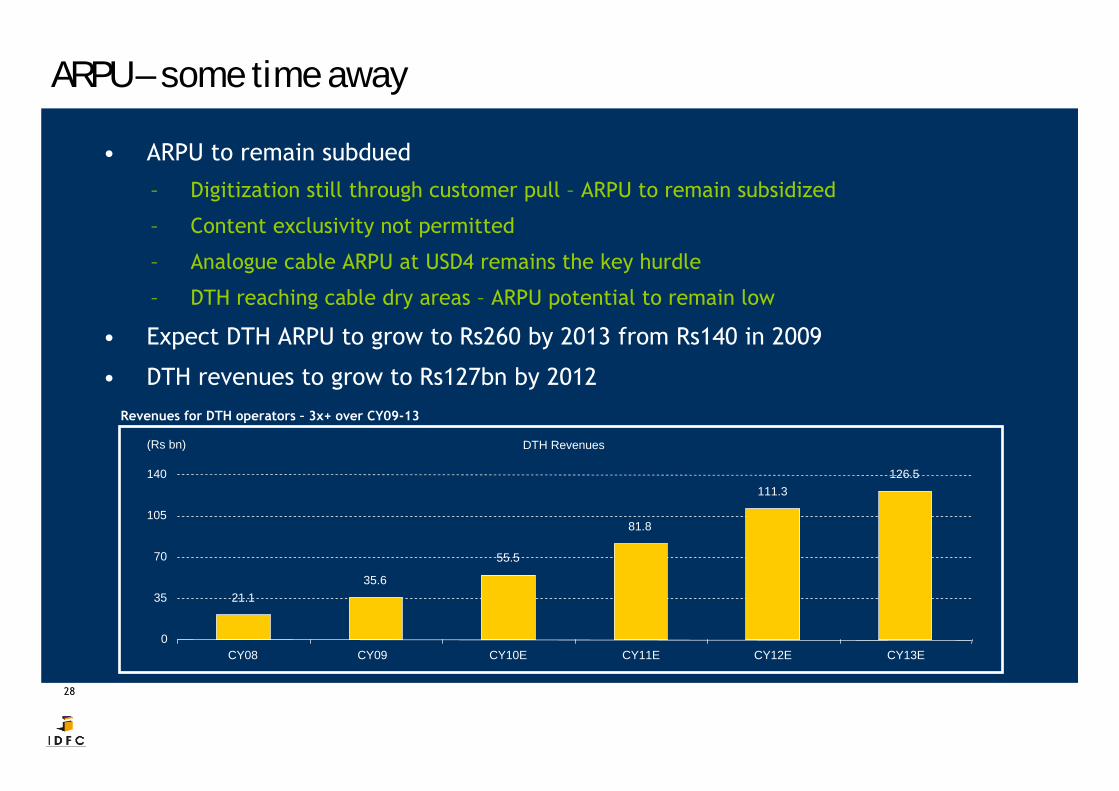
ARPU – some time away
• ARPU to remain subdued
– Digitization still through customer pull – ARPU to remain subsidized
– Content exclusivity not permitted
– Analogue cable ARPU at USD4 remains the key hurdle
– DTH reaching cable dry areas – ARPU potential to remain low
• Expect DTH ARPU to grow to Rs260 by 2013 from Rs140 in 2009
• DTH revenues to grow to Rs127bn by 2012
DTH Revenues
21.135.6
55.5
81.8
111.3126.5
0
35
70
105
140
CY08 CY09 CY10E CY11E CY12E CY13E
(Rs bn)
Revenues for DTH operators – 3x+ over CY09-13
29
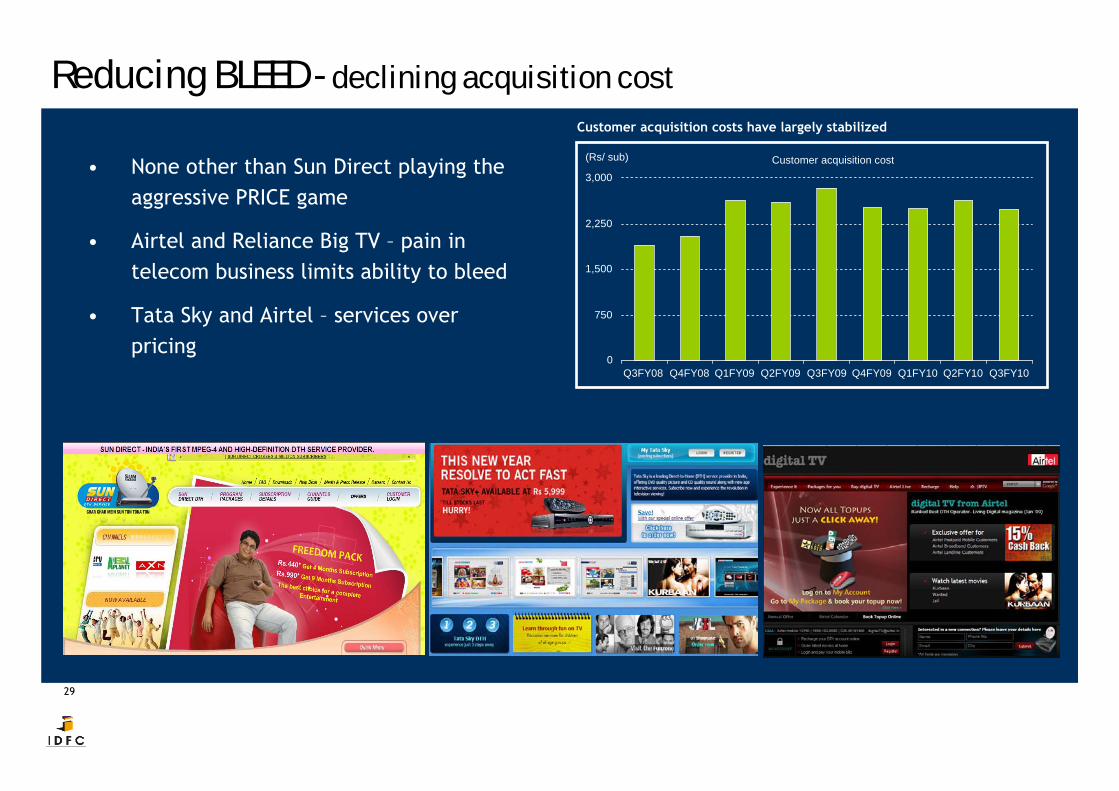
Reducing BLEED - declining acquisition cost
• None other than Sun Direct playing the aggressive PRICE game
• Airtel and Reliance Big TV – pain in telecom business limits ability to bleed
• Tata Sky and Airtel – services over pricing
Customer acquisition costs have largely stabilized
Customer acquisition cost
0
750
1,500
2,250
3,000
Q3FY08 Q4FY08 Q1FY09 Q2FY09 Q3FY09 Q4FY09 Q1FY10 Q2FY10 Q3FY10
(Rs/ sub)
30
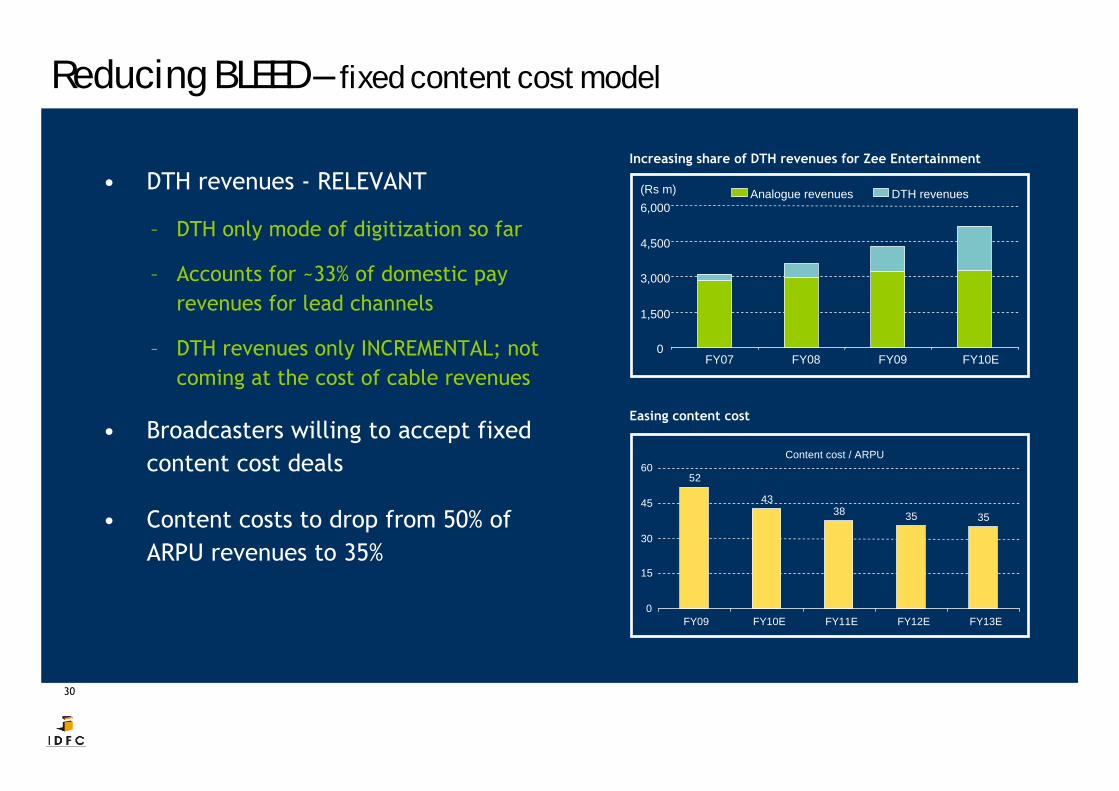
Reducing BLEED – fixed content cost model
• DTH revenues - RELEVANT
– DTH only mode of digitization so far
– Accounts for ~33% of domestic pay revenues for lead channels
– DTH revenues only INCREMENTAL; not coming at the cost of cable revenues
• Broadcasters willing to accept fixed content cost deals
• Content costs to drop from 50% of ARPU revenues to 35%
Increasing share of DTH revenues for Zee Entertainment
Easing content cost
0
1,500
3,000
4,500
6,000
FY07 FY08 FY09 FY10E
Analogue revenues DTH revenues(Rs m)
Content cost / ARPU
52
4338 35 35
0
15
30
45
60
FY09 FY10E FY11E FY12E FY13E
31
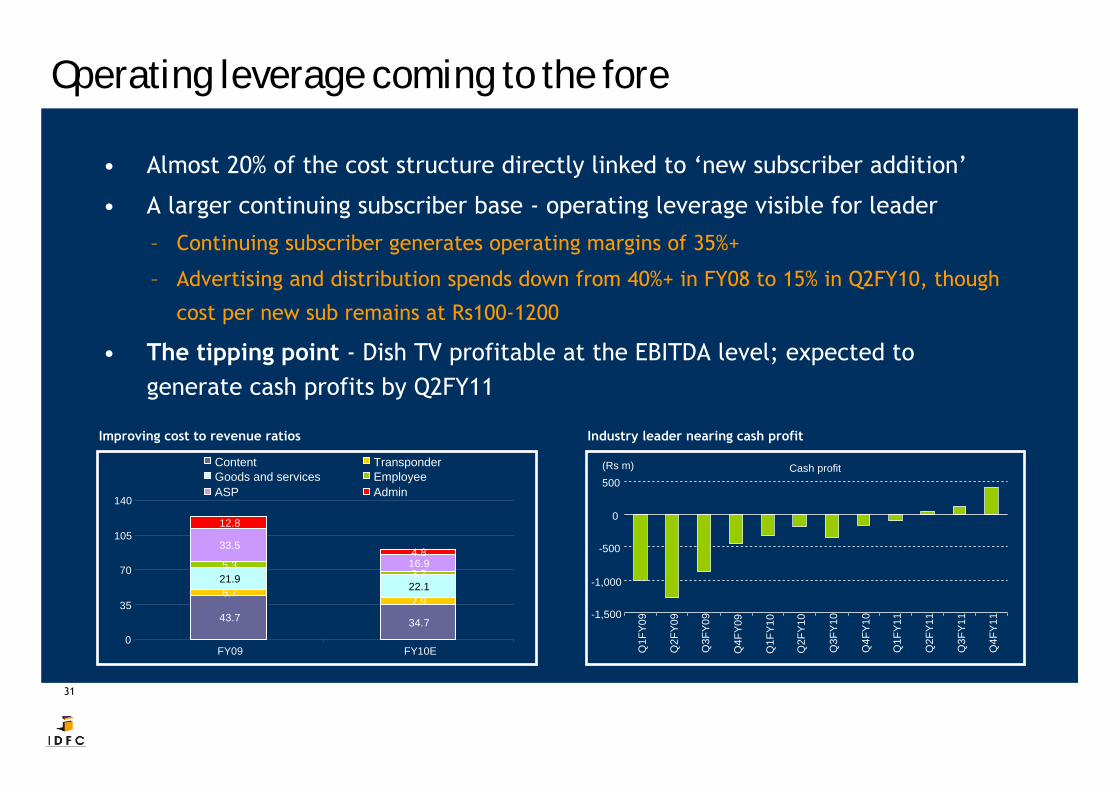
Operating leverage coming to the fore
• Almost 20% of the cost structure directly linked to ‘new subscriber addition’
• A larger continuing subscriber base - operating leverage visible for leader
– Continuing subscriber generates operating margins of 35%+
– Advertising and distribution spends down from 40%+ in FY08 to 15% in Q2FY10, though
cost per new sub remains at Rs100-1200
• The tipping point - Dish TV profitable at the EBITDA level; expected to generate cash profits by Q2FY11
Improving cost to revenue ratios Industry leader nearing cash profit
43.7 34.7
6.77.9
21.922.1
5.33.7
33.5
16.9
12.8
4.8
0
35
70
105
140
FY09 FY10E
Content TransponderGoods and services EmployeeASP Admin
Cash profit
-1,500
-1,000
-500
0
500
Q1F
Y09
Q2F
Y09
Q3F
Y09
Q4F
Y09
Q1F
Y10
Q2F
Y10
Q3F
Y10
Q4F
Y10
Q1F
Y11
Q2F
Y11
Q3F
Y11
Q4F
Y11
(Rs m)
32
Cable Distribution – capital going for good use
33
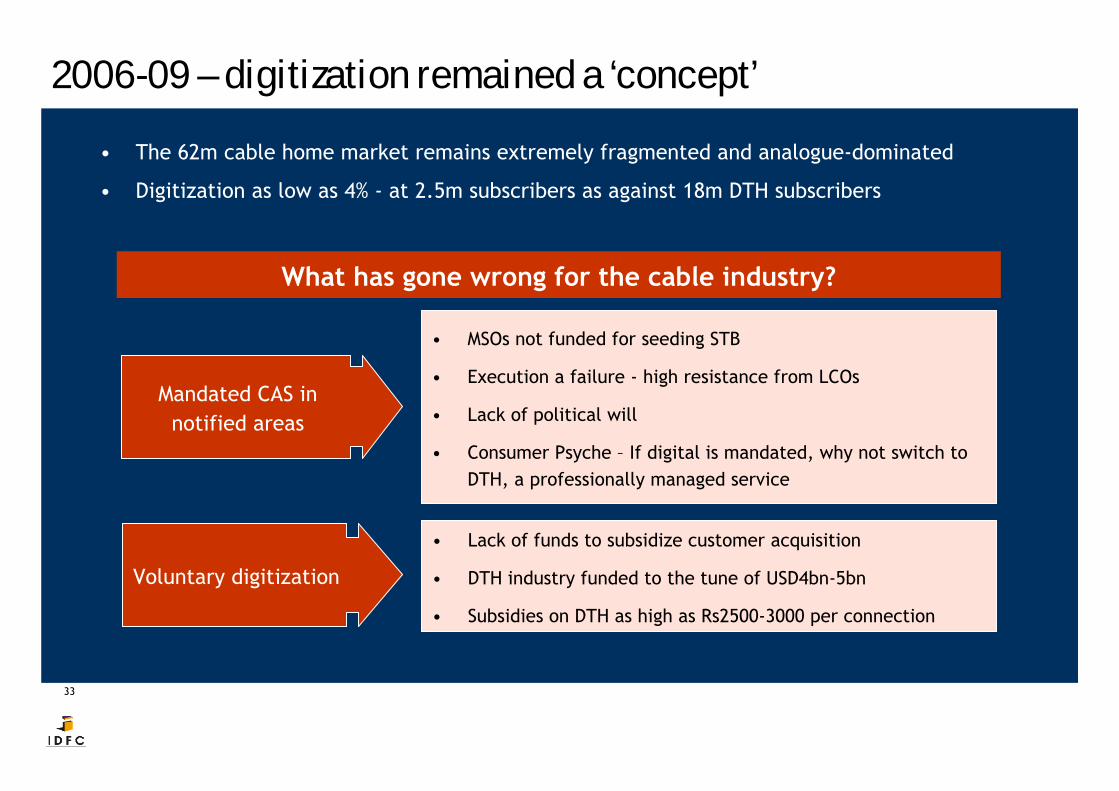
2006-09 – digitization remained a ‘concept’• The 62m cable home market remains extremely fragmented and analogue-dominated
• Digitization as low as 4% - at 2.5m subscribers as against 18m DTH subscribers
Mandated CAS in notified areas
What has gone wrong for the cable industry?
• MSOs not funded for seeding STB
• Execution a failure - high resistance from LCOs
• Lack of political will
• Consumer Psyche – If digital is mandated, why not switch to DTH, a professionally managed service
Voluntary digitization
• Lack of funds to subsidize customer acquisition
• DTH industry funded to the tune of USD4bn-5bn
• Subsidies on DTH as high as Rs2500-3000 per connection
34
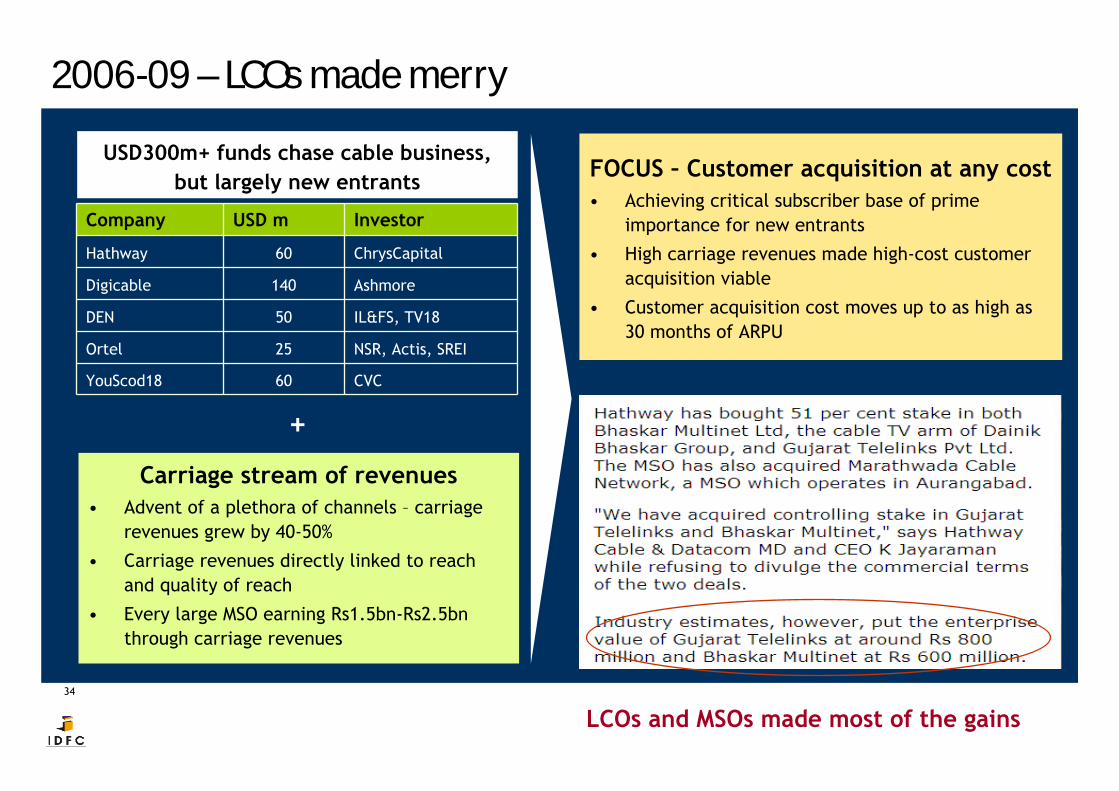
2006-09 – LCOs made merryUSD300m+ funds chase cable business,
but largely new entrants
Carriage stream of revenues• Advent of a plethora of channels – carriage
revenues grew by 40-50%
• Carriage revenues directly linked to reach and quality of reach
• Every large MSO earning Rs1.5bn-Rs2.5bn through carriage revenues
+
FOCUS – Customer acquisition at any cost• Achieving critical subscriber base of prime
importance for new entrants
• High carriage revenues made high-cost customer acquisition viable
• Customer acquisition cost moves up to as high as 30 months of ARPU
LCOs and MSOs made most of the gains
Company USD m Investor
Hathway 60 ChrysCapital
Digicable 140 Ashmore
DEN 50 IL&FS, TV18
Ortel 25 NSR, Actis, SREI
YouScod18 60 CVC
35
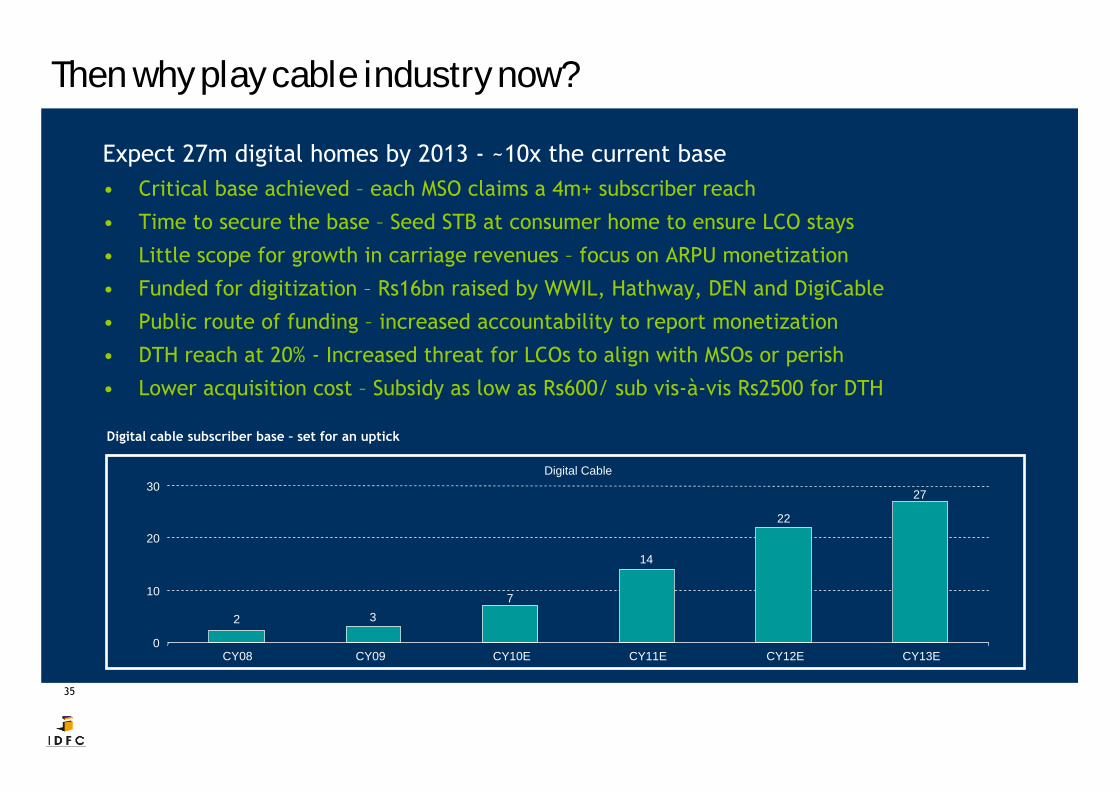
Then why play cable industry now?
Expect 27m digital homes by 2013 - ~10x the current base• Critical base achieved – each MSO claims a 4m+ subscriber reach
• Time to secure the base – Seed STB at consumer home to ensure LCO stays
• Little scope for growth in carriage revenues – focus on ARPU monetization
• Funded for digitization – Rs16bn raised by WWIL, Hathway, DEN and DigiCable
• Public route of funding – increased accountability to report monetization
• DTH reach at 20% - Increased threat for LCOs to align with MSOs or perish
• Lower acquisition cost – Subsidy as low as Rs600/ sub vis-à-vis Rs2500 for DTH
Digital cable subscriber base – set for an uptick
Digital Cable
2 37
14
22
27
0
10
20
30
CY08 CY09 CY10E CY11E CY12E CY13E
36
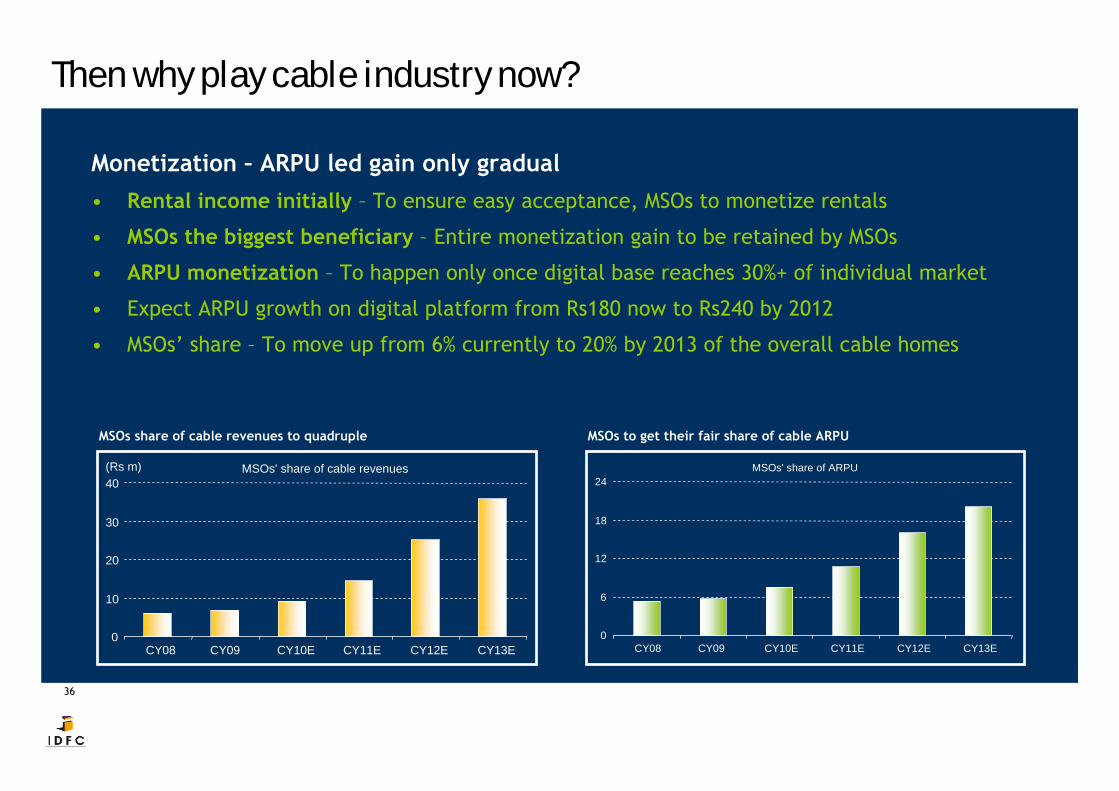
Then why play cable industry now?
Monetization – ARPU led gain only gradual• Rental income initially – To ensure easy acceptance, MSOs to monetize rentals
• MSOs the biggest beneficiary – Entire monetization gain to be retained by MSOs
• ARPU monetization – To happen only once digital base reaches 30%+ of individual market
• Expect ARPU growth on digital platform from Rs180 now to Rs240 by 2012
• MSOs’ share – To move up from 6% currently to 20% by 2013 of the overall cable homes
MSOs share of cable revenues to quadruple MSOs to get their fair share of cable ARPU
MSOs' share of cable revenues
0
10
20
30
40
CY08 CY09 CY10E CY11E CY12E CY13E
(Rs m) MSOs' share of ARPU
0
6
12
18
24
CY08 CY09 CY10E CY11E CY12E CY13E
37
Play the television distribution opportunity
• There is need for CAPITAL (Industry needs USD5bn)
• Ability to tide over the GESTATION phase
• Will need COUPLE of rounds of subsequent funding
• Superior revenue model - ANNUITY MODEL
• Highly profitable business – 35%+ margins in the long run
• Distribution the highest VALUE CREATING business – Comcast
• SCALABILITY in the long run as the market consolidates
38
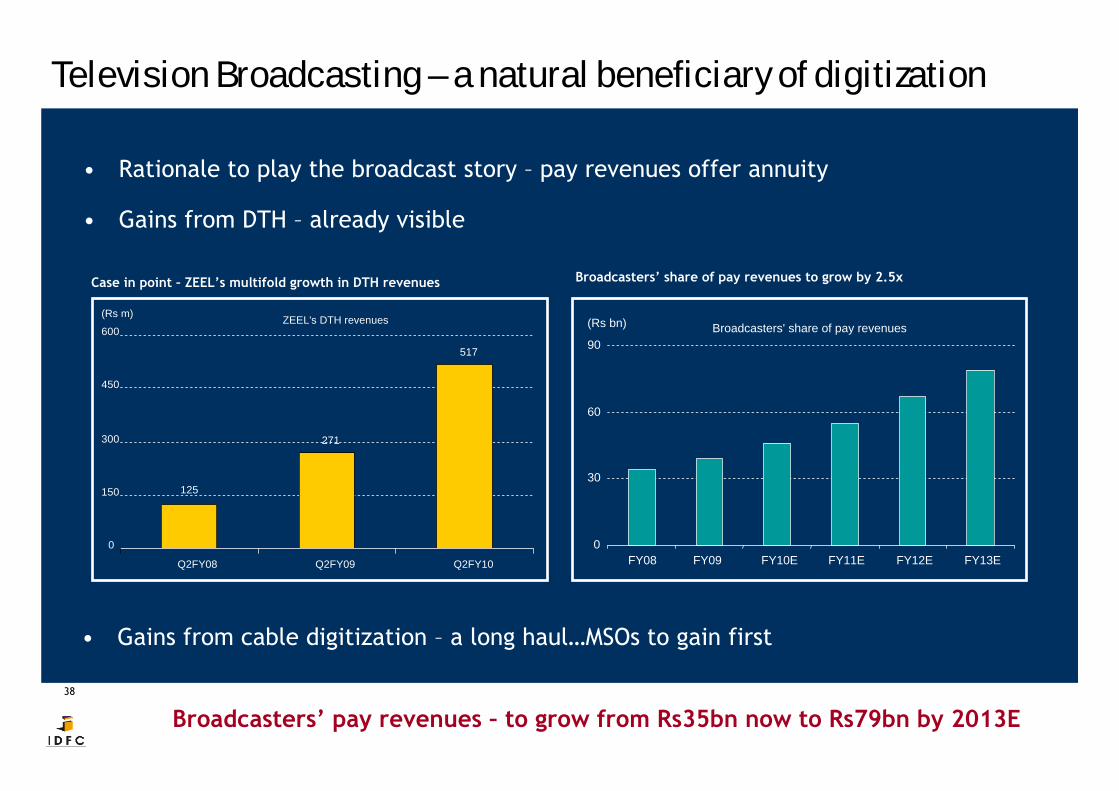
Television Broadcasting – a natural beneficiary of digitization
Broadcasters’ pay revenues – to grow from Rs35bn now to Rs79bn by 2013E
• Rationale to play the broadcast story – pay revenues offer annuity
• Gains from DTH – already visible
• Gains from cable digitization – a long haul…MSOs to gain first
ZEEL's DTH revenues
125
271
517
0
150
300
450
600
Q2FY08 Q2FY09 Q2FY10
(Rs m)Broadcasters' share of pay revenues
0
30
60
90
FY08 FY09 FY10E FY11E FY12E FY13E
(Rs bn)
Case in point – ZEEL’s multifold growth in DTH revenues Broadcasters’ share of pay revenues to grow by 2.5x
39
Emerging segments – The opportunity is BIG
40
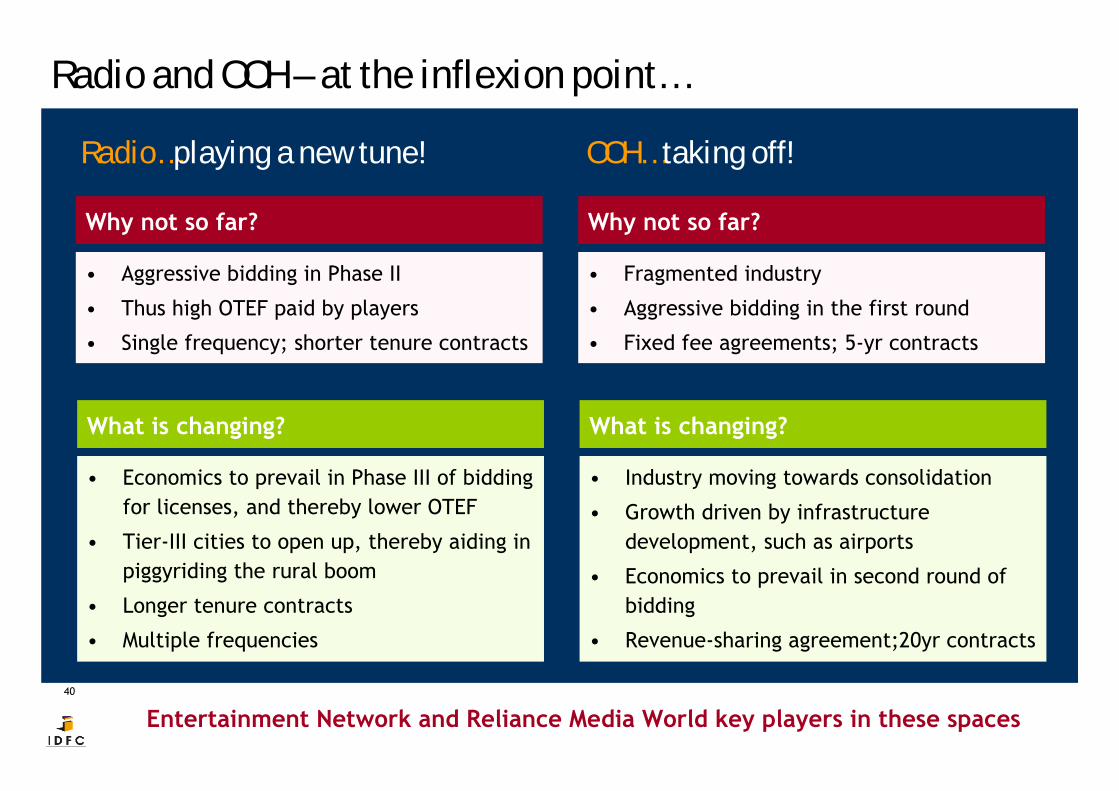
Radio and OOH – at the inflexion point…
Radio…playing a new tune!
Why not so far?
What is changing?
• Aggressive bidding in Phase II
• Thus high OTEF paid by players
• Single frequency; shorter tenure contracts
• Economics to prevail in Phase III of bidding for licenses, and thereby lower OTEF
• Tier-III cities to open up, thereby aiding in piggyriding the rural boom
• Longer tenure contracts
• Multiple frequencies
Entertainment Network and Reliance Media World key players in these spaces
Why not so far?
What is changing?
• Fragmented industry
• Aggressive bidding in the first round
• Fixed fee agreements; 5-yr contracts
• Industry moving towards consolidation
• Growth driven by infrastructure development, such as airports
• Economics to prevail in second round of bidding
• Revenue-sharing agreement;20yr contracts
OOH… taking off!
41
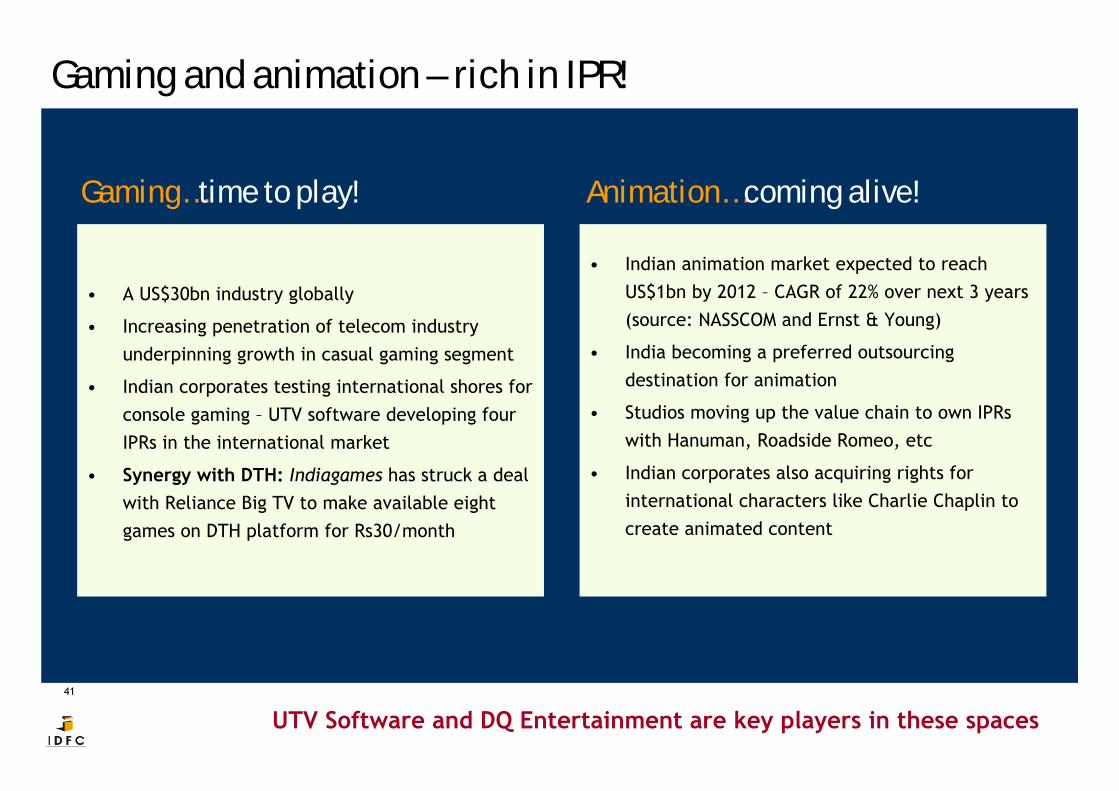
Gaming and animation – rich in IPR!
Gaming…time to play!
• A US$30bn industry globally
• Increasing penetration of telecom industry underpinning growth in casual gaming segment
• Indian corporates testing international shores for console gaming – UTV software developing four IPRs in the international market
• Synergy with DTH: Indiagames has struck a deal with Reliance Big TV to make available eight games on DTH platform for Rs30/month
• Indian animation market expected to reach US$1bn by 2012 – CAGR of 22% over next 3 years (source: NASSCOM and Ernst & Young)
• India becoming a preferred outsourcing destination for animation
• Studios moving up the value chain to own IPRswith Hanuman, Roadside Romeo, etc
• Indian corporates also acquiring rights for international characters like Charlie Chaplin to create animated content
Animation… coming alive!
UTV Software and DQ Entertainment are key players in these spaces
42
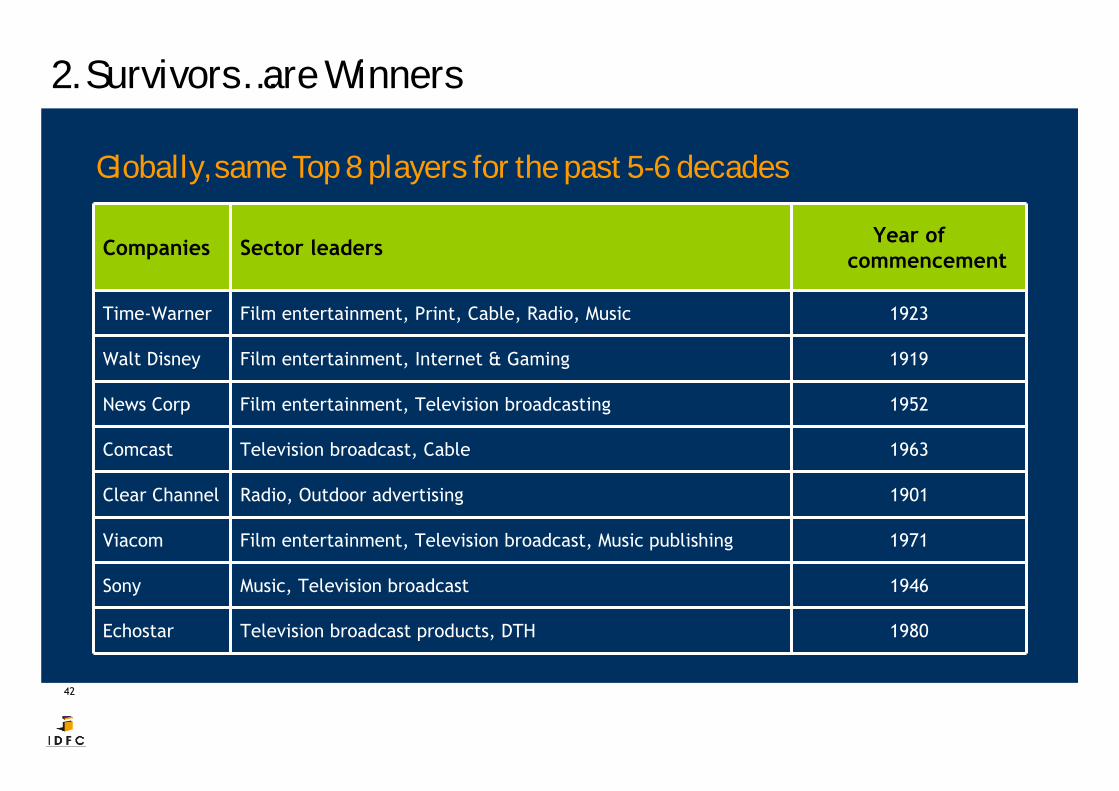
2. Survivors…are Winners
Globally, same Top 8 players for the past 5-6 decades
Companies Sector leaders Year of commencement
Time-Warner Film entertainment, Print, Cable, Radio, Music 1923
Walt Disney Film entertainment, Internet & Gaming 1919
News Corp Film entertainment, Television broadcasting 1952
Comcast Television broadcast, Cable 1963
Clear Channel Radio, Outdoor advertising 1901
Viacom Film entertainment, Television broadcast, Music publishing 1971
Sony Music, Television broadcast 1946
Echostar Television broadcast products, DTH 1980
43
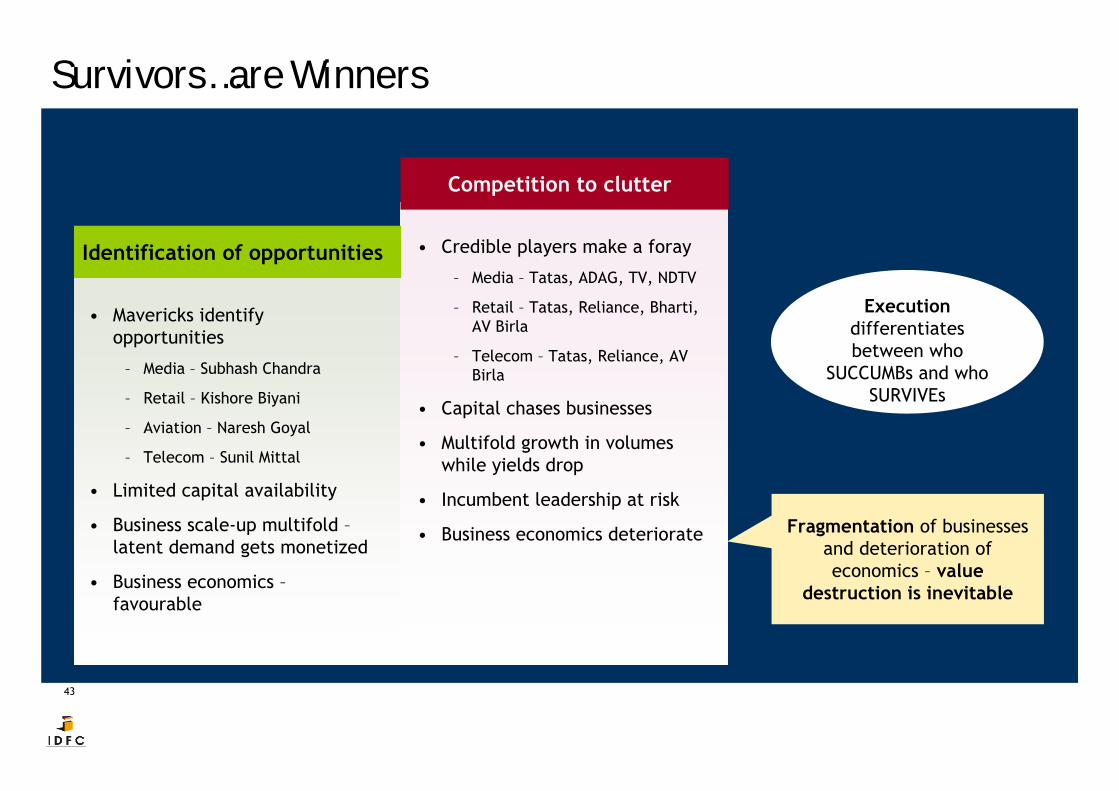
Survivors…are Winners
• Mavericks identify opportunities
– Media – Subhash Chandra
– Retail – Kishore Biyani
– Aviation – Naresh Goyal
– Telecom – Sunil Mittal
• Limited capital availability
• Business scale-up multifold –latent demand gets monetized
• Business economics –favourable
• Credible players make a foray
– Media – Tatas, ADAG, TV, NDTV
– Retail – Tatas, Reliance, Bharti, AV Birla
– Telecom – Tatas, Reliance, AV Birla
• Capital chases businesses
• Multifold growth in volumes while yields drop
• Incumbent leadership at risk
• Business economics deteriorate Fragmentation of businesses and deterioration of economics – value
destruction is inevitable
Execution differentiates between who
SUCCUMBs and who SURVIVEs
Identification of opportunities
Competition to clutter

44
A few strong survivors…in the Indian context
Sector Company Characteristics
Broadcasting Zee Entertainment 2 cycles of toughest competition in past decade, yet among the top 3 broadcast players
Regional broadcasting Sun TV Remains the most dominant player in the South India Regional GEC market
Distribution Dish TVDespite entry of 5 new players in DTH space, remains the largest player and accounts for 25% of the incremental market
Radio ENIL Remains the largest and the only profitable FM Radio player
45
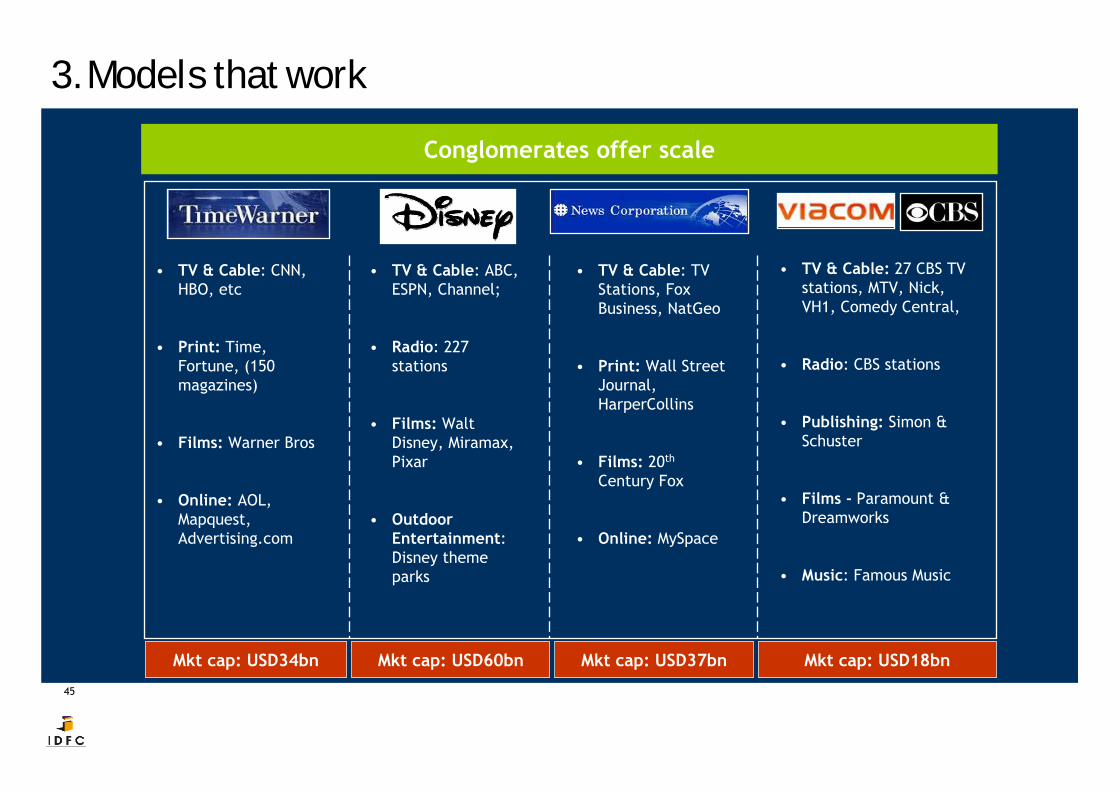
3. Models that workConglomerates offer scale
• TV & Cable: CNN, HBO, etc
• Print: Time, Fortune, (150 magazines)
• Films: Warner Bros
• Online: AOL, Mapquest, Advertising.com
• TV & Cable: ABC, ESPN, Channel;
• Radio: 227 stations
• Films: Walt Disney, Miramax, Pixar
• Outdoor Entertainment: Disney theme parks
• TV & Cable: TV Stations, Fox Business, NatGeo
• Print: Wall Street Journal, HarperCollins
• Films: 20th
Century Fox
• Online: MySpace
• TV & Cable: 27 CBS TV stations, MTV, Nick, VH1, Comedy Central,
• Radio: CBS stations
• Publishing: Simon & Schuster
• Films - Paramount & Dreamworks
• Music: Famous Music
Mkt cap: USD34bn Mkt cap: USD60bn Mkt cap: USD37bn Mkt cap: USD18bn
46
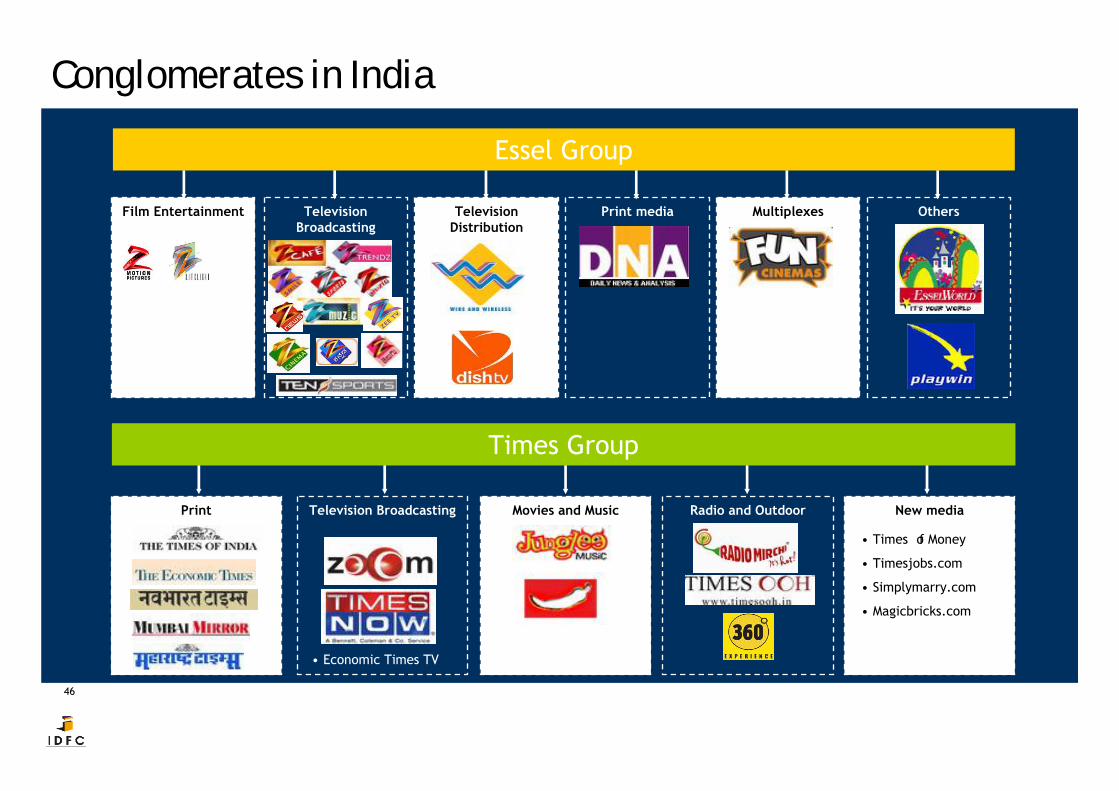
Essel Group
Film Entertainment Television Broadcasting
Television Distribution
Print media Multiplexes Others
Conglomerates in India
Times Group
Print Television Broadcasting Movies and Music Radio and Outdoor New media
• Economic Times TV
• Times of Money
• Timesjobs.com
• Simplymarry.com
• Magicbricks.com
47
Film Entertainment
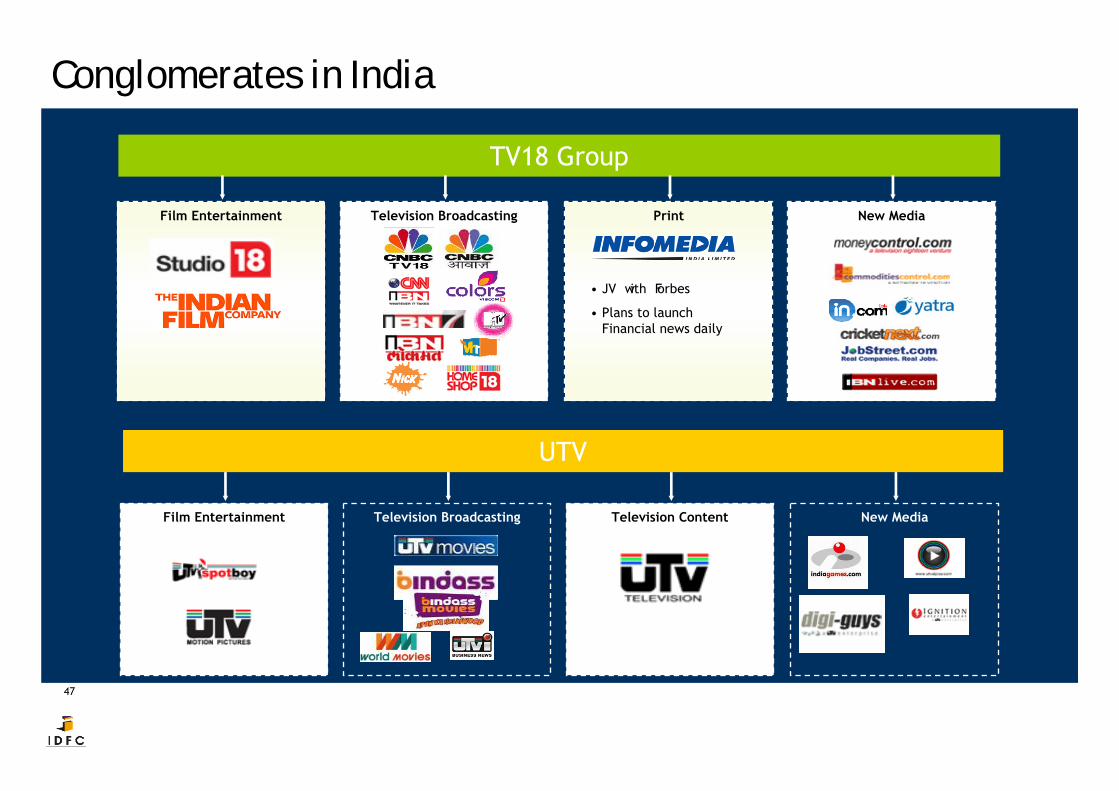
UTV
Television Broadcasting Television Content New Media
Conglomerates in India
TV18 Group
Film Entertainment Television Broadcasting New MediaPrint
• JV with Forbes
• Plans to launch Financial news daily
48
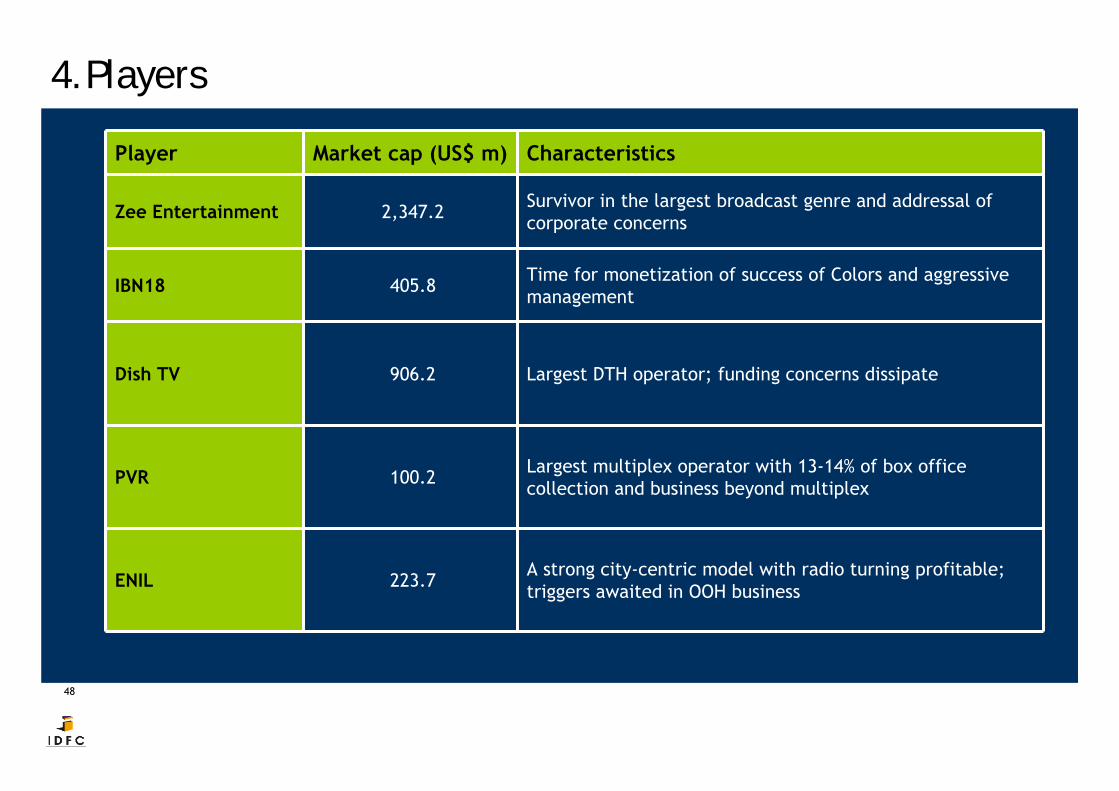
4. PlayersPlayer Market cap (US$ m) Characteristics
Zee Entertainment 2,347.2 Survivor in the largest broadcast genre and addressal of corporate concerns
IBN18 405.8 Time for monetization of success of Colors and aggressive management
Dish TV 906.2 Largest DTH operator; funding concerns dissipate
PVR 100.2 Largest multiplex operator with 13-14% of box office collection and business beyond multiplex
ENIL 223.7 A strong city-centric model with radio turning profitable; triggers awaited in OOH business
49
DisclaimerThis document ha s been p repared by IDF C-SSKI Secu rities Ltd (I DFC-SSKI). IDFC-SSKI and its s ubsidiaries and as sociated companies ar e full-service, integrated inve stment banking , inve stment management and brokerage group. Ou r research analysts and sales persons provide important input into our investment banking activities.
This document does not constitute an offer or solicitation for the purchase or sale of any financial instrument or as an official confirmation of any transaction.
The in formation contained h erein is f rom publicly available data or othe r sources bel ieved to be re liable. W hile we would e ndeavor to update the information he rein on reasonable basis , IDFC-SSKI, it s s ubsidiaries and associated companies, their directors and employees (“IDFC-SSKI and af filiates”) are under no obligation to update or keep the information current. Al so, there may be reg ulatory, compliance, or other reasons that may prevent IDF C-SSKI and affiliates from doing so.
We do not represent that information contained herein is accurate or complete and it should not be relied upon as such. This document is prepared for assistance only and is not intended to be and must not alone betaken as the basis for an investment decision. The user assumes the entire risk of any use made of this inf ormation. Each recipient of this docume nt should make such investigations as it deems necessary to arrive at an inde pendent evaluation of an investment in the securities of companies referred to in this document (including the merits and risks involved). The investment discussed or views expressed may not be suitable for all investors.
Affiliates of IDFC-SSKI may have issued other reports that are inconsistent with and reach different conclusion from the information presented in this report.
This report is not directed or intended for distribution to, or use by, any person or entity who is a citizen or resident of or located in any locality, state, country or other jurisdiction, where such distribution, publication, availability or use would be contrary to law, regulation or which would subject IDFC-SSKI and affiliates to any registration or l icensing requirement within such jurisdiction. The securities described herein may or may not be eligible for sale in all jurisdictions or to certain category of investors. Persons in whose possession this document may come are required to inform themselves of and to observe such restriction.
Reports based on technical analysis centers on studying charts of a stock's price movement and trading volume, as opposed to focusing on a company's fundamentals and as such, may not match with a report on a company's fundamentals.
IDFC-SSKI & affiliates may have used the information set forth herein before publication and may have positions in, may from time to time purchase or sell or may be materially interested in any of the securities mentioned or related securities. IDFC-SSKI and affiliates may from time to time solicit from, or perform investment banking, or other services for, any company mentioned herein. Without limiting any of the foregoing, in no event shall IDFC-SSKI, any of its affiliates or any third party involved in, or related to, computing or compiling the information have any liability for any damages of any kind. Any comments or statements made herein are those of the analyst and do not necessarily reflect those of IDFC-SSKI and affiliates.
This Document is subject to changes without prior notice and is intended only for the person or entity to which it is addressed to and may contain confidential and/or privileged material and is not for any type of circulation. Any review, retransmission, or any other use is prohibited.
Though disseminated to all the customers simultaneously, not all customers may receive this report at the same time. IDFC-SSKI will not treat recipients as customers by virtue of their receiving this report.
Explanation of Ratings:
1. Outperformer: More than 10% to Index
2. Neutral: Within 0-10% to Index
3. Underperformer: Less than 10% to Index
Disclosure of interest:
1. IDFC - SSKI and its affiliates may have received compensation from the company covered herein in the past twelve months fo r Issue Management, Capital Structure, Mergers & Acquisitions, Buyback of shares and Other corporate advisory services.
2. Affiliates of IDFC - SSKI may have mandate from the subject company.
3. IDFC - SSKI and its affiliates may hold paid up capital of the company.
4. IDFC - SSKI and its affiliates, their directors and employees may from time to time have positions in or options in the company and buy or sell the securities of the company(ies) mentioned herein.
Copyright in this document vests exclusively with IDFC - SSKI
50
Thank you