global entertainment & media outlook 2020-2024 - iab hong
TRANSCRIPT
Global E&M Outlook 2020-2024: Hong Kong summary
Global Entertainment & Media Outlook 2020-2024: Hong Kong summary
October 2020

Global E&M Outlook 2020-2024: Hong Kong summary
Contents
Overview: Entertainment & Media
Outlook - Global and Hong Kong
New trend
Segment deep dive
01
02
03
03
15
32
2

Global E&M Outlook 2020-2024: Hong Kong summary
Overview:
Entertainment &
Media Outlook –
Global and
Hong Kong
3Global E&M Outlook 2020-2024: Hong Kong summary
Global E&M Outlook 2020-2024: Hong Kong summary
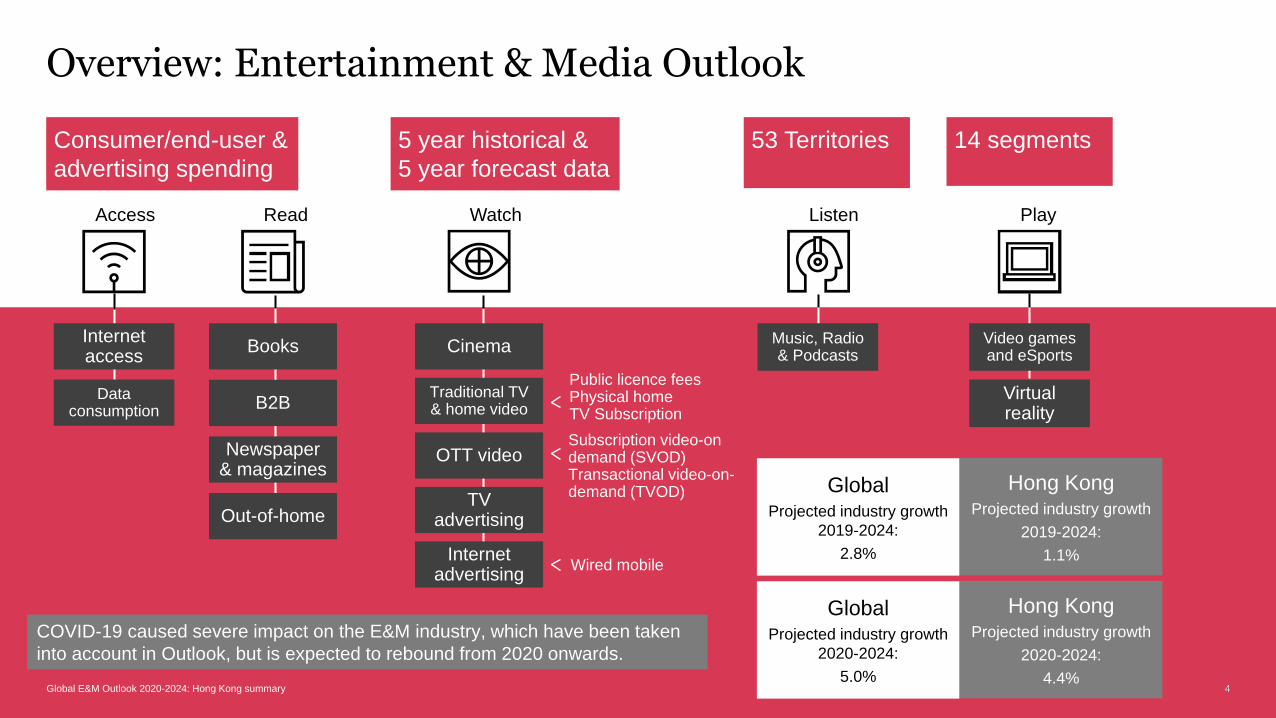
Overview: Entertainment & Media Outlook
4
Hong Kong Projected industry growth
2019-2024:
1.1%
GlobalProjected industry growth
2019-2024:
2.8%
PlayListenWatchReadAccess
Internet access
Books CinemaMusic, Radio& Podcasts
Video games and eSports
B2B
Newspaper & magazines
Out-of-home
Traditional TV & home video
OTT video
TV advertising
Internet advertising
Virtual reality
Consumer/end-user &
advertising spending
5 year historical &
5 year forecast data
53 Territories 14 segments
Wired mobile
Subscription video-on demand (SVOD) Transactional video-on-demand (TVOD)
Public licence feesPhysical homeTV Subscription
Data consumption
4Global E&M Outlook 2020-2024: Hong Kong summary
Hong Kong Projected industry growth
2020-2024:
4.4%
GlobalProjected industry growth
2020-2024:
5.0%
COVID-19 caused severe impact on the E&M industry, which have been taken
into account in Outlook, but is expected to rebound from 2020 onwards.
Global E&M Outlook 2020-2024: Hong Kong summary
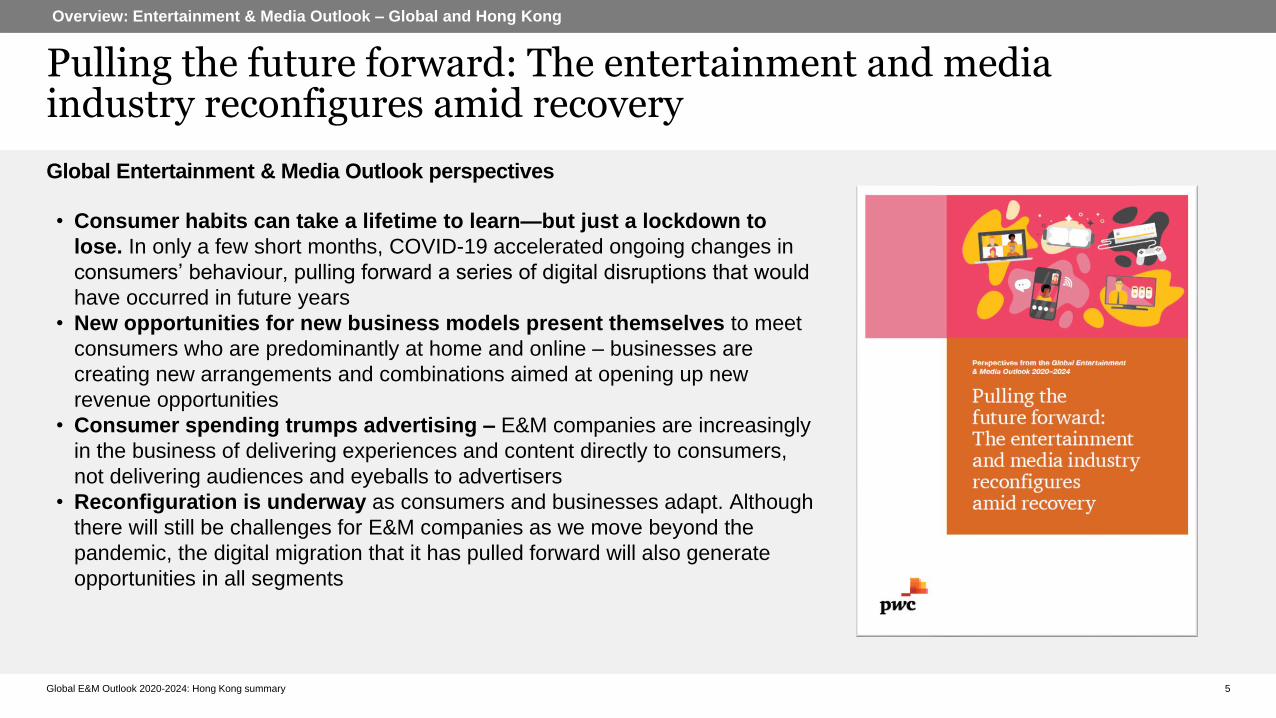
Pulling the future forward: The entertainment and media industry reconfigures amid recovery
5
• Consumer habits can take a lifetime to learn—but just a lockdown to
lose. In only a few short months, COVID-19 accelerated ongoing changes in
consumers’ behaviour, pulling forward a series of digital disruptions that would
have occurred in future years
• New opportunities for new business models present themselves to meet
consumers who are predominantly at home and online – businesses are
creating new arrangements and combinations aimed at opening up new
revenue opportunities
• Consumer spending trumps advertising – E&M companies are increasingly
in the business of delivering experiences and content directly to consumers,
not delivering audiences and eyeballs to advertisers
• Reconfiguration is underway as consumers and businesses adapt. Although
there will still be challenges for E&M companies as we move beyond the
pandemic, the digital migration that it has pulled forward will also generate
opportunities in all segments
Global Entertainment & Media Outlook perspectives
Overview: Entertainment & Media Outlook – Global and Hong Kong
Global E&M Outlook 2020-2024: Hong Kong summary
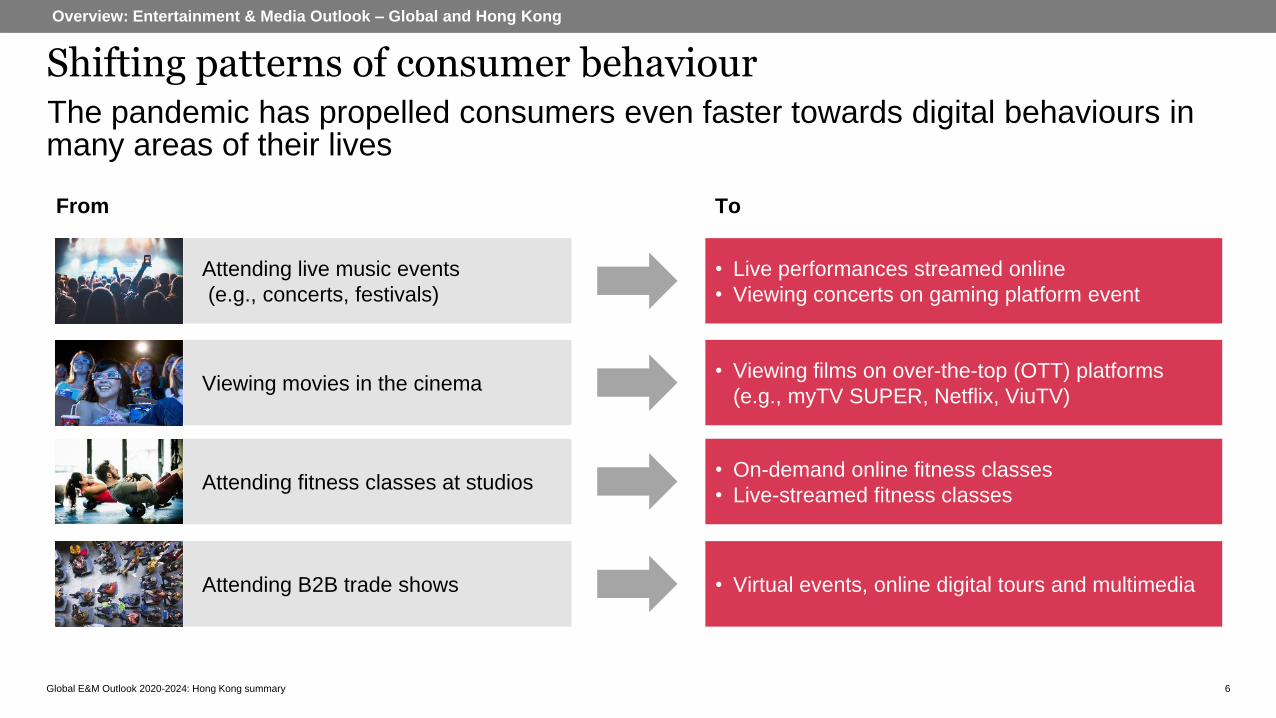
Shifting patterns of consumer behaviour
6
The pandemic has propelled consumers even faster towards digital behaviours in many areas of their lives
Overview: Entertainment & Media Outlook – Global and Hong Kong
From To
Attending live music events
(e.g., concerts, festivals)
Viewing movies in the cinema
Attending fitness classes at studios
• Live performances streamed online
• Viewing concerts on gaming platform event
• Viewing films on over-the-top (OTT) platforms
(e.g., myTV SUPER, Netflix, ViuTV)
• On-demand online fitness classes
• Live-streamed fitness classes
Attending B2B trade shows • Virtual events, online digital tours and multimedia
Global E&M Outlook 2020-2024: Hong Kong summary
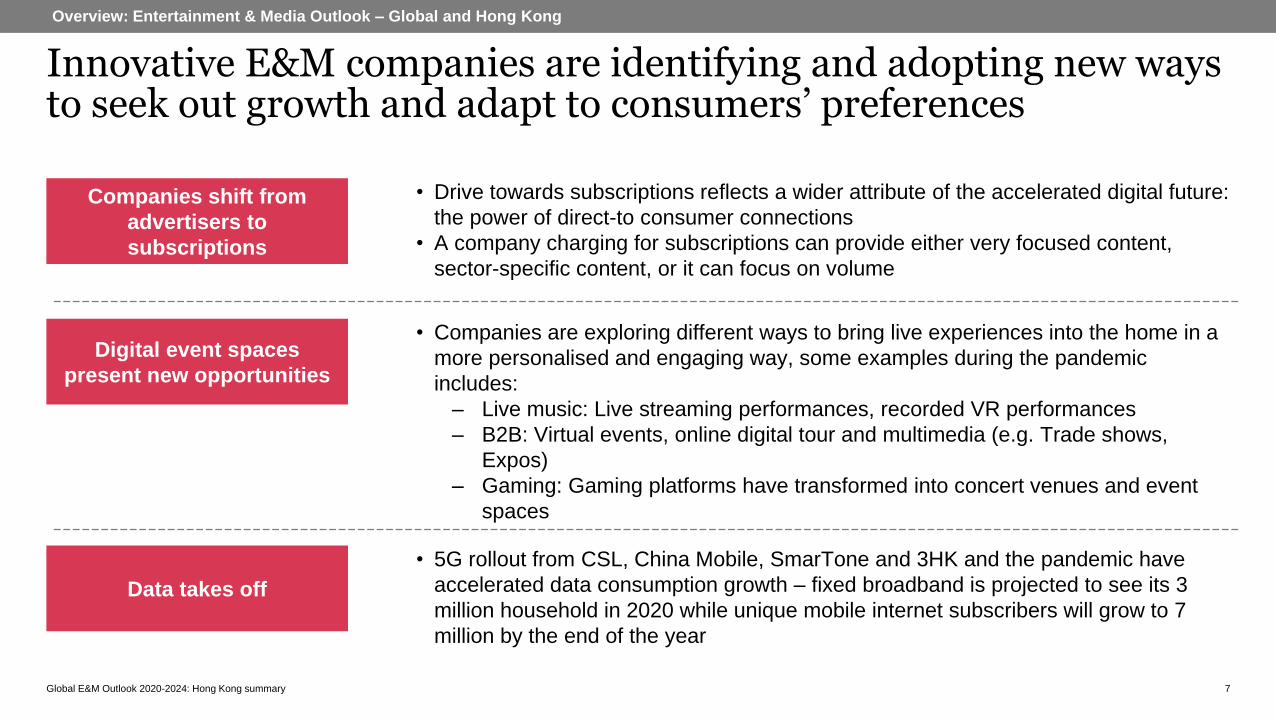
Innovative E&M companies are identifying and adopting new ways to seek out growth and adapt to consumers’ preferences
7
Overview: Entertainment & Media Outlook – Global and Hong Kong
Companies shift from
advertisers to
subscriptions
• Drive towards subscriptions reflects a wider attribute of the accelerated digital future:
the power of direct-to consumer connections
• A company charging for subscriptions can provide either very focused content,
sector-specific content, or it can focus on volume
Digital event spaces
present new opportunities
• Companies are exploring different ways to bring live experiences into the home in a
more personalised and engaging way, some examples during the pandemic
includes:
– Live music: Live streaming performances, recorded VR performances
– B2B: Virtual events, online digital tour and multimedia (e.g. Trade shows,
Expos)
– Gaming: Gaming platforms have transformed into concert venues and event
spaces
Data takes off
• 5G rollout from CSL, China Mobile, SmarTone and 3HK and the pandemic have
accelerated data consumption growth – fixed broadband is projected to see its 3
million household in 2020 while unique mobile internet subscribers will grow to 7
million by the end of the year
Global E&M Outlook 2020-2024: Hong Kong summary
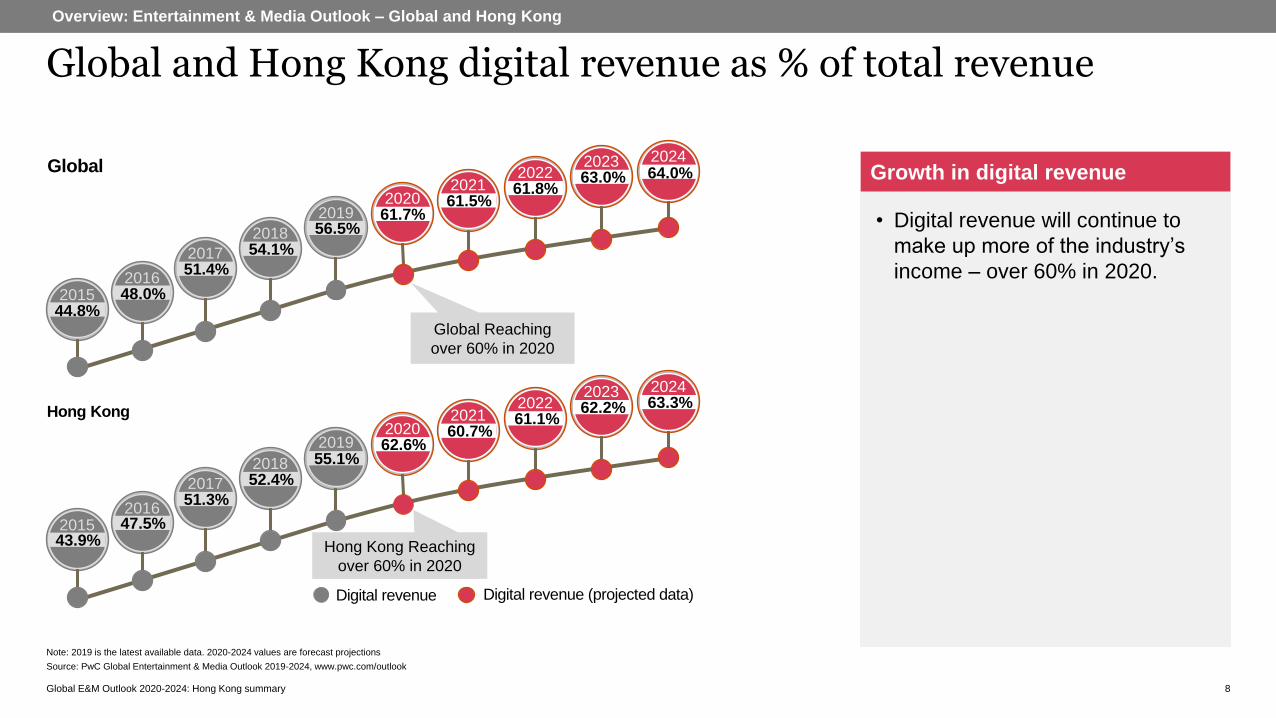
Global and Hong Kong digital revenue as % of total revenue
8
Overview: Entertainment & Media Outlook – Global and Hong Kong
• Digital revenue will continue to
make up more of the industry’s
income – over 60% in 2020.
Growth in digital revenue
在过去21年历史中,从未出现过如此糟糕的年份
Digital revenue Digital revenue (projected data)
44.8%2015 48.0%
201651.4%2017 54.1%
2018 56.5%2019 61.7%
2020 61.5%2021 61.8%
2022 63.0%2023
64.0%2024
Global Reaching
over 60% in 2020
43.9%2015 47.5%
201651.3%2017 52.4%
2018 55.1%2019 62.6%
2020 60.7%2021 61.1%
2022 62.2%2023
63.3%2024
Hong Kong Reaching
over 60% in 2020
Global
Hong Kong
Note: 2019 is the latest available data. 2020-2024 values are forecast projections
Source: PwC Global Entertainment & Media Outlook 2019-2024, www.pwc.com/outlook
Global E&M Outlook 2020-2024: Hong Kong summary
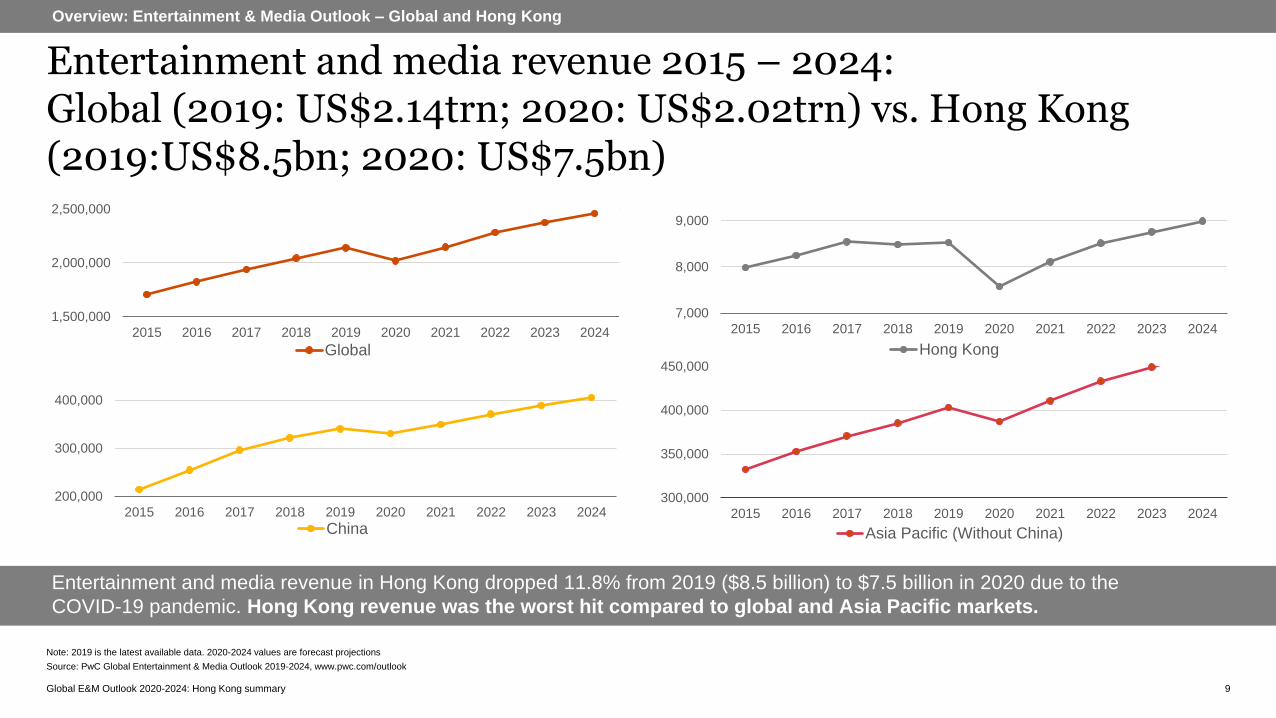
Entertainment and media revenue 2015 – 2024:Global (2019: US$2.14trn; 2020: US$2.02trn) vs. Hong Kong (2019:US$8.5bn; 2020: US$7.5bn)
9
Overview: Entertainment & Media Outlook – Global and Hong Kong
Entertainment and media revenue in Hong Kong dropped 11.8% from 2019 ($8.5 billion) to $7.5 billion in 2020 due to the
COVID-19 pandemic. Hong Kong revenue was the worst hit compared to global and Asia Pacific markets.
2019至2024年复合年均增长率(有/无互联网接入)
1,500,000
2,000,000
2,500,000
2015 2016 2017 2018 2019 2020 2021 2022 2023 2024
Global
7,000
8,000
9,000
2015 2016 2017 2018 2019 2020 2021 2022 2023 2024
Hong Kong
Note: 2019 is the latest available data. 2020-2024 values are forecast projections
Source: PwC Global Entertainment & Media Outlook 2019-2024, www.pwc.com/outlook
200,000
300,000
400,000
2015 2016 2017 2018 2019 2020 2021 2022 2023 2024
China
300,000
350,000
400,000
450,000
2015 2016 2017 2018 2019 2020 2021 2022 2023 2024
Asia Pacific (Without China)
Global E&M Outlook 2020-2024: Hong Kong summary
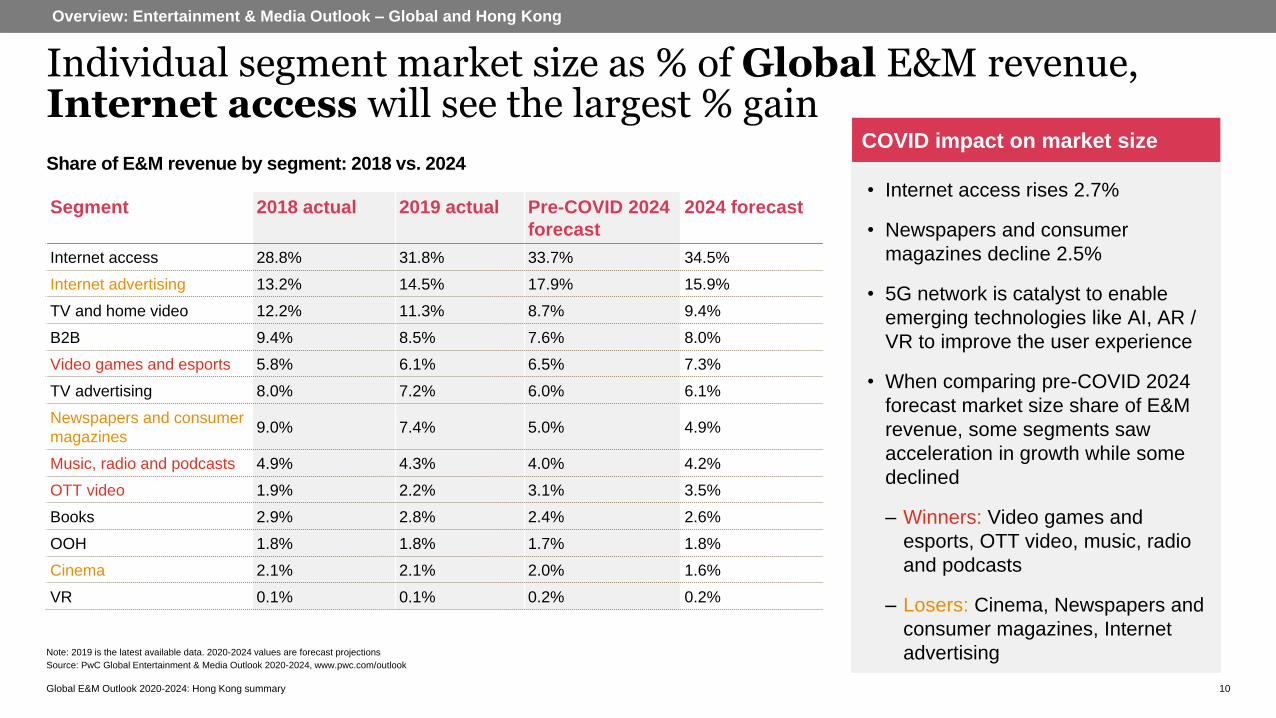
Individual segment market size as % of Global E&M revenue, Internet access will see the largest % gain
10
Overview: Entertainment & Media Outlook – Global and Hong Kong
Source: PwC Global Entertainment & Media Outlook 2020-2024, www.pwc.com/outlook
Note: 2019 is the latest available data. 2020-2024 values are forecast projections
Segment 2018 actual 2019 actual Pre-COVID 2024
forecast
2024 forecast
Internet access 28.8% 31.8% 33.7% 34.5%
Internet advertising 13.2% 14.5% 17.9% 15.9%
TV and home video 12.2% 11.3% 8.7% 9.4%
B2B 9.4% 8.5% 7.6% 8.0%
Video games and esports 5.8% 6.1% 6.5% 7.3%
TV advertising 8.0% 7.2% 6.0% 6.1%
Newspapers and consumer
magazines9.0% 7.4% 5.0% 4.9%
Music, radio and podcasts 4.9% 4.3% 4.0% 4.2%
OTT video 1.9% 2.2% 3.1% 3.5%
Books 2.9% 2.8% 2.4% 2.6%
OOH 1.8% 1.8% 1.7% 1.8%
Cinema 2.1% 2.1% 2.0% 1.6%
VR 0.1% 0.1% 0.2% 0.2%
Share of E&M revenue by segment: 2018 vs. 2024
• Internet access rises 2.7%
• Newspapers and consumer
magazines decline 2.5%
• 5G network is catalyst to enable
emerging technologies like AI, AR /
VR to improve the user experience
• When comparing pre-COVID 2024
forecast market size share of E&M
revenue, some segments saw
acceleration in growth while some
declined
– Winners: Video games and
esports, OTT video, music, radio
and podcasts
– Losers: Cinema, Newspapers and
consumer magazines, Internet
advertising
COVID impact on market size
Global E&M Outlook 2020-2024: Hong Kong summary
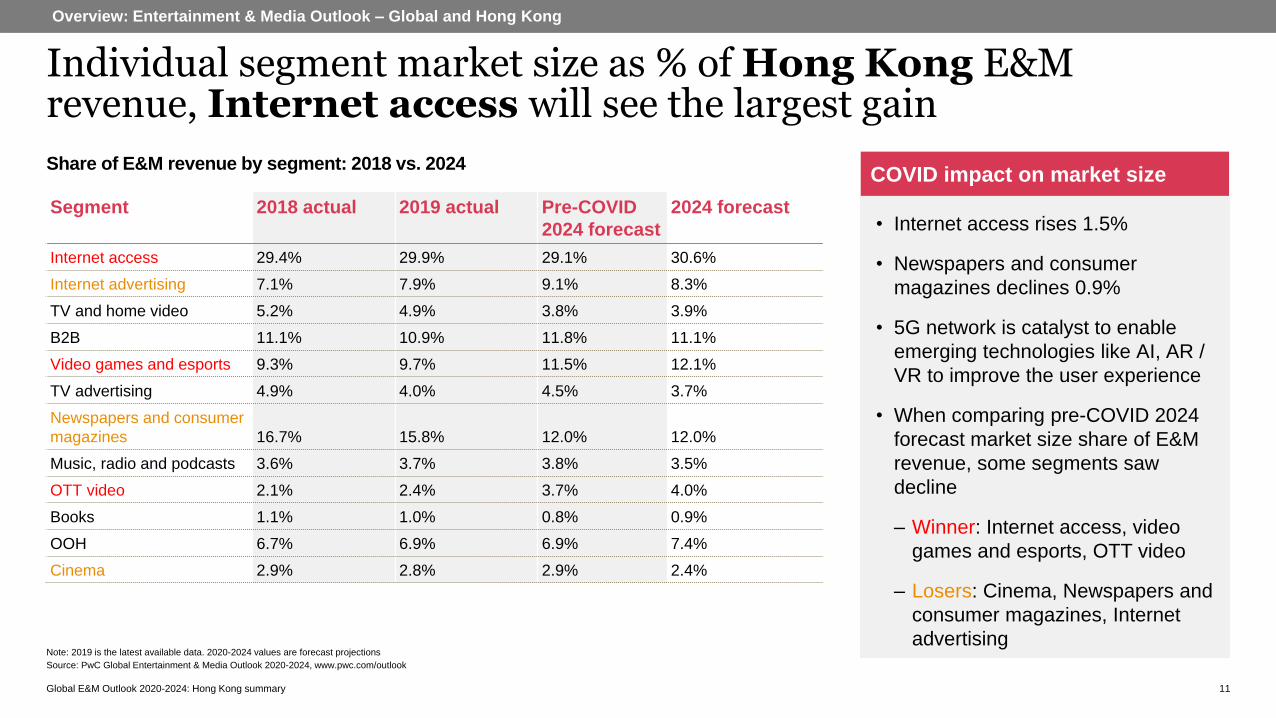
Individual segment market size as % of Hong Kong E&M revenue, Internet access will see the largest gain
11
Overview: Entertainment & Media Outlook – Global and Hong Kong
Source: PwC Global Entertainment & Media Outlook 2020-2024, www.pwc.com/outlook
Note: 2019 is the latest available data. 2020-2024 values are forecast projections
Segment 2018 actual 2019 actual Pre-COVID
2024 forecast
2024 forecast
Internet access 29.4% 29.9% 29.1% 30.6%
Internet advertising 7.1% 7.9% 9.1% 8.3%
TV and home video 5.2% 4.9% 3.8% 3.9%
B2B 11.1% 10.9% 11.8% 11.1%
Video games and esports 9.3% 9.7% 11.5% 12.1%
TV advertising 4.9% 4.0% 4.5% 3.7%
Newspapers and consumer
magazines 16.7% 15.8% 12.0% 12.0%
Music, radio and podcasts 3.6% 3.7% 3.8% 3.5%
OTT video 2.1% 2.4% 3.7% 4.0%
Books 1.1% 1.0% 0.8% 0.9%
OOH 6.7% 6.9% 6.9% 7.4%
Cinema 2.9% 2.8% 2.9% 2.4%
Share of E&M revenue by segment: 2018 vs. 2024
• Internet access rises 1.5%
• Newspapers and consumer
magazines declines 0.9%
• 5G network is catalyst to enable
emerging technologies like AI, AR /
VR to improve the user experience
• When comparing pre-COVID 2024
forecast market size share of E&M
revenue, some segments saw
decline
– Winner: Internet access, video
games and esports, OTT video
– Losers: Cinema, Newspapers and
consumer magazines, Internet
advertising
COVID impact on market size
Global E&M Outlook 2020-2024: Hong Kong summary
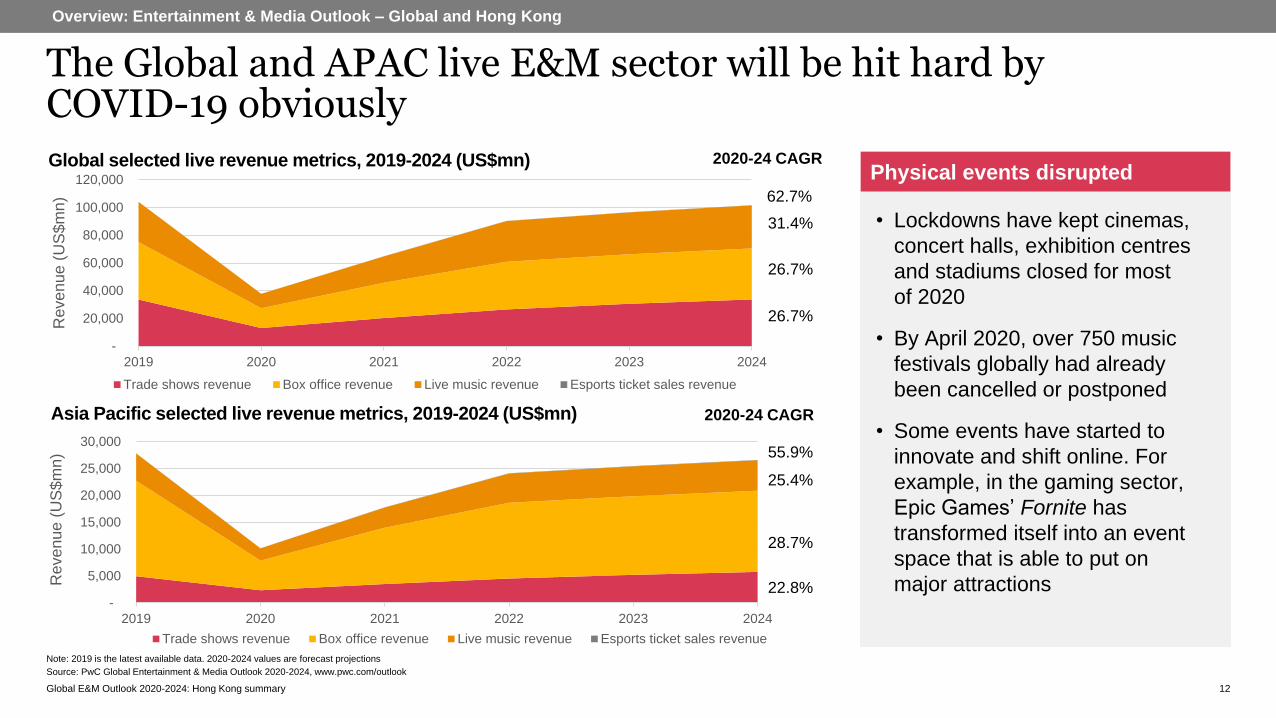
The Global and APAC live E&M sector will be hit hard by COVID-19 obviously
12
Overview: Entertainment & Media Outlook – Global and Hong Kong
Source: PwC Global Entertainment & Media Outlook 2020-2024, www.pwc.com/outlook
Note: 2019 is the latest available data. 2020-2024 values are forecast projections
Global selected live revenue metrics, 2019-2024 (US$mn)
• Lockdowns have kept cinemas,
concert halls, exhibition centres
and stadiums closed for most
of 2020
• By April 2020, over 750 music
festivals globally had already
been cancelled or postponed
• Some events have started to
innovate and shift online. For
example, in the gaming sector,
Epic Games’ Fornite has
transformed itself into an event
space that is able to put on
major attractions
Physical events disrupted
-
20,000
40,000
60,000
80,000
100,000
120,000
2019 2020 2021 2022 2023 2024
Revenue (
US
$m
n)
Trade shows revenue Box office revenue Live music revenue Esports ticket sales revenue
Asia Pacific selected live revenue metrics, 2019-2024 (US$mn)
-
5,000
10,000
15,000
20,000
25,000
30,000
2019 2020 2021 2022 2023 2024
Revenue (
US
$m
n)
Trade shows revenue Box office revenue Live music revenue Esports ticket sales revenue
55.9%
2020-24 CAGR
25.4%
28.7%
22.8%
62.7%
2020-24 CAGR
31.4%
26.7%
26.7%
Global E&M Outlook 2020-2024: Hong Kong summary
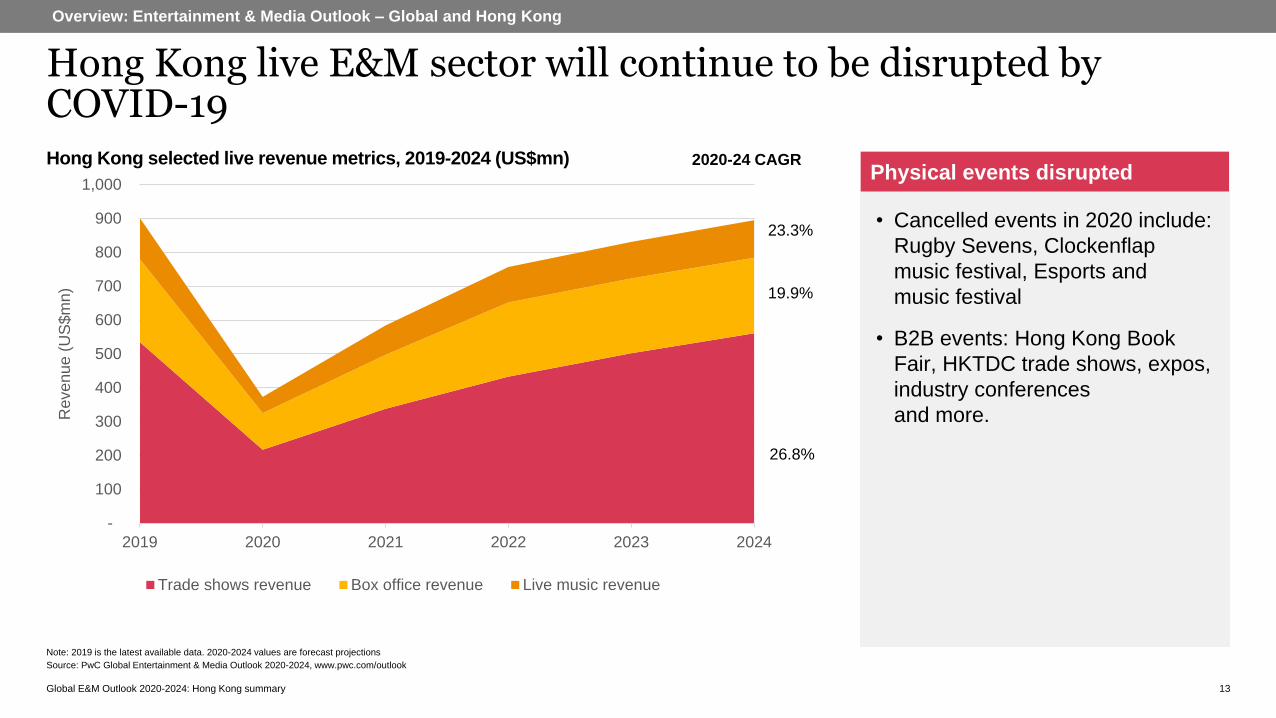
Hong Kong live E&M sector will continue to be disrupted by COVID-19
13
Overview: Entertainment & Media Outlook – Global and Hong Kong
Source: PwC Global Entertainment & Media Outlook 2020-2024, www.pwc.com/outlook
Note: 2019 is the latest available data. 2020-2024 values are forecast projections
Hong Kong selected live revenue metrics, 2019-2024 (US$mn)
-
100
200
300
400
500
600
700
800
900
1,000
2019 2020 2021 2022 2023 2024
Reven
ue (
US
$m
n)
Trade shows revenue Box office revenue Live music revenue
23.3%
2020-24 CAGR
19.9%
26.8%
• Cancelled events in 2020 include:
Rugby Sevens, Clockenflap
music festival, Esports and
music festival
• B2B events: Hong Kong Book
Fair, HKTDC trade shows, expos,
industry conferences
and more.
Physical events disrupted
Global E&M Outlook 2020-2024: Hong Kong summary
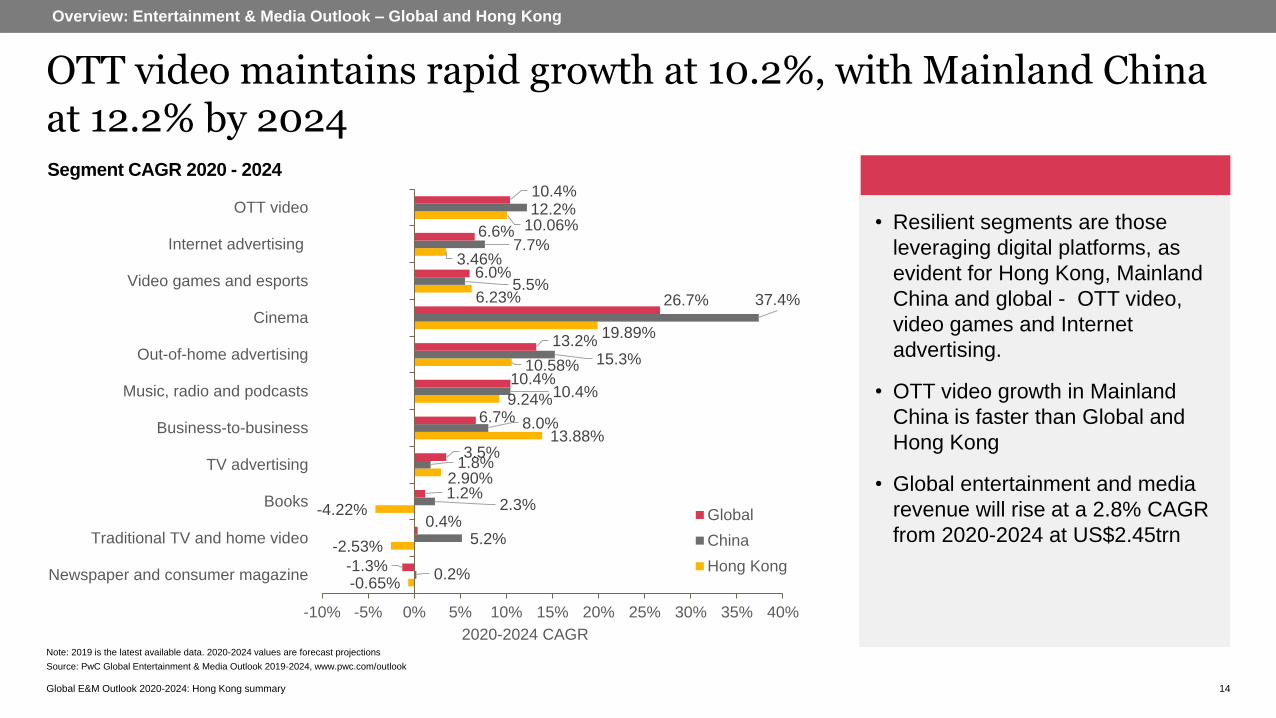
Segment CAGR 2020 - 2024
Note: 2019 is the latest available data. 2020-2024 values are forecast projections
Source: PwC Global Entertainment & Media Outlook 2019-2024, www.pwc.com/outlook
14
Overview: Entertainment & Media Outlook – Global and Hong Kong
• Resilient segments are those
leveraging digital platforms, as
evident for Hong Kong, Mainland
China and global - OTT video,
video games and Internet
advertising.
• OTT video growth in Mainland
China is faster than Global and
Hong Kong
• Global entertainment and media
revenue will rise at a 2.8% CAGR
from 2020-2024 at US$2.45trn
OTT video maintains rapid growth at 10.2%, with Mainland China at 12.2% by 2024
-0.65%
-2.53%
-4.22%
2.90%
13.88%
9.24%
10.58%
19.89%
6.23%
3.46%
10.06%
0.2%
5.2%
2.3%
1.8%
8.0%
10.4%
15.3%
37.4%5.5%
7.7%
12.2%
-1.3%
0.4%
1.2%
3.5%
6.7%
10.4%
13.2%
26.7%
6.0%
6.6%
10.4%
-10% -5% 0% 5% 10% 15% 20% 25% 30% 35% 40%
Newspaper and consumer magazine
Traditional TV and home video
Books
TV advertising
Business-to-business
Music, radio and podcasts
Out-of-home advertising
Cinema
Video games and esports
Internet advertising
OTT video
2020-2024 CAGR
Global
China
Hong Kong

Global E&M Outlook 2020-2024: Hong Kong summary
Segment
deep dives
15Global E&M Outlook 2020-2024: Hong Kong summary

Global E&M Outlook 2020-2024: Hong Kong summary
Segment
deep diveInternet advertising
16Global E&M Outlook 2020-2024: Hong Kong summary
Global E&M Outlook 2020-2024: Hong Kong summary
Relentless shift to Internet
17
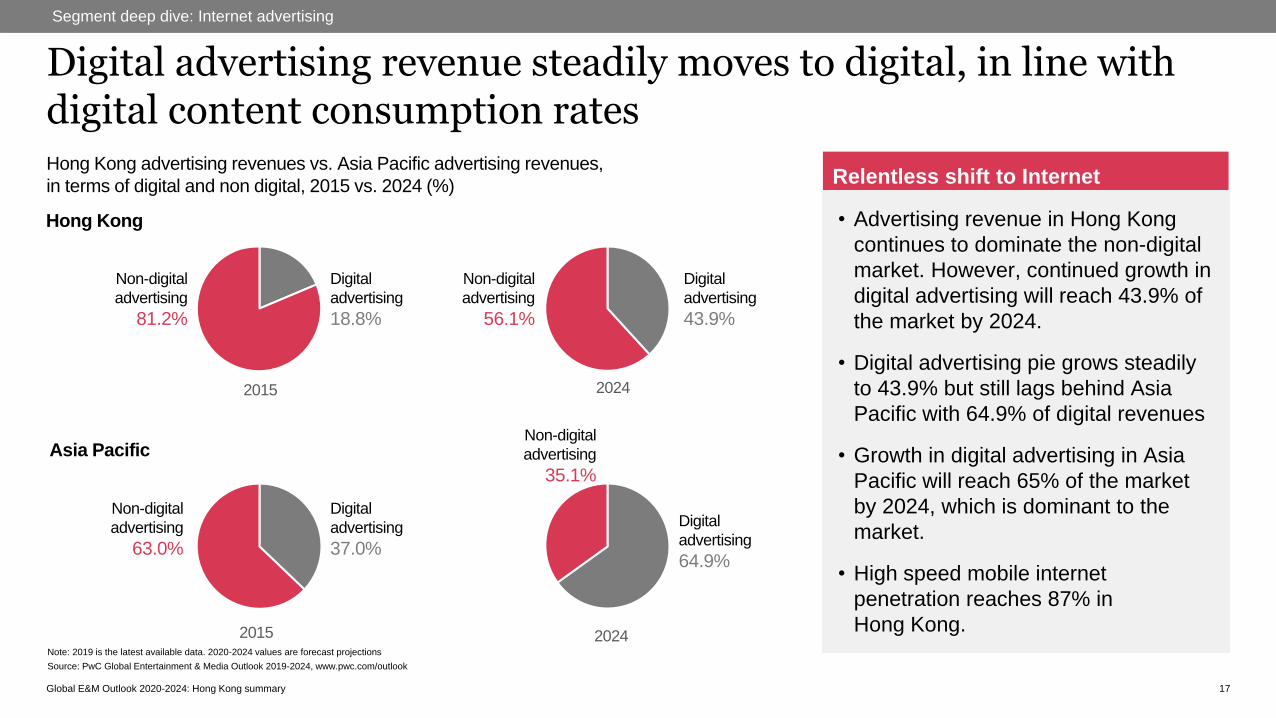
Hong Kong advertising revenues vs. Asia Pacific advertising revenues,
in terms of digital and non digital, 2015 vs. 2024 (%)
Segment deep dive: Internet advertising
• Advertising revenue in Hong Kong
continues to dominate the non-digital
market. However, continued growth in
digital advertising will reach 43.9% of
the market by 2024.
• Digital advertising pie grows steadily
to 43.9% but still lags behind Asia
Pacific with 64.9% of digital revenues
• Growth in digital advertising in Asia
Pacific will reach 65% of the market
by 2024, which is dominant to the
market.
• High speed mobile internet
penetration reaches 87% in
Hong Kong.
Digital advertising revenue steadily moves to digital, in line with digital content consumption rates
17
2015 2024
Digital
advertising
18.8%
Non-digital
advertising
81.2%
Digital
advertising
43.9%
Non-digital
advertising
56.1%
Note: 2019 is the latest available data. 2020-2024 values are forecast projections
Source: PwC Global Entertainment & Media Outlook 2019-2024, www.pwc.com/outlook
Digital
advertising
37.0%
Non-digital
advertising
63.0%
2015 2024
Digital
advertising
64.9%
Non-digital
advertising
35.1%
Hong Kong
Asia Pacific
Global E&M Outlook 2020-2024: Hong Kong summary
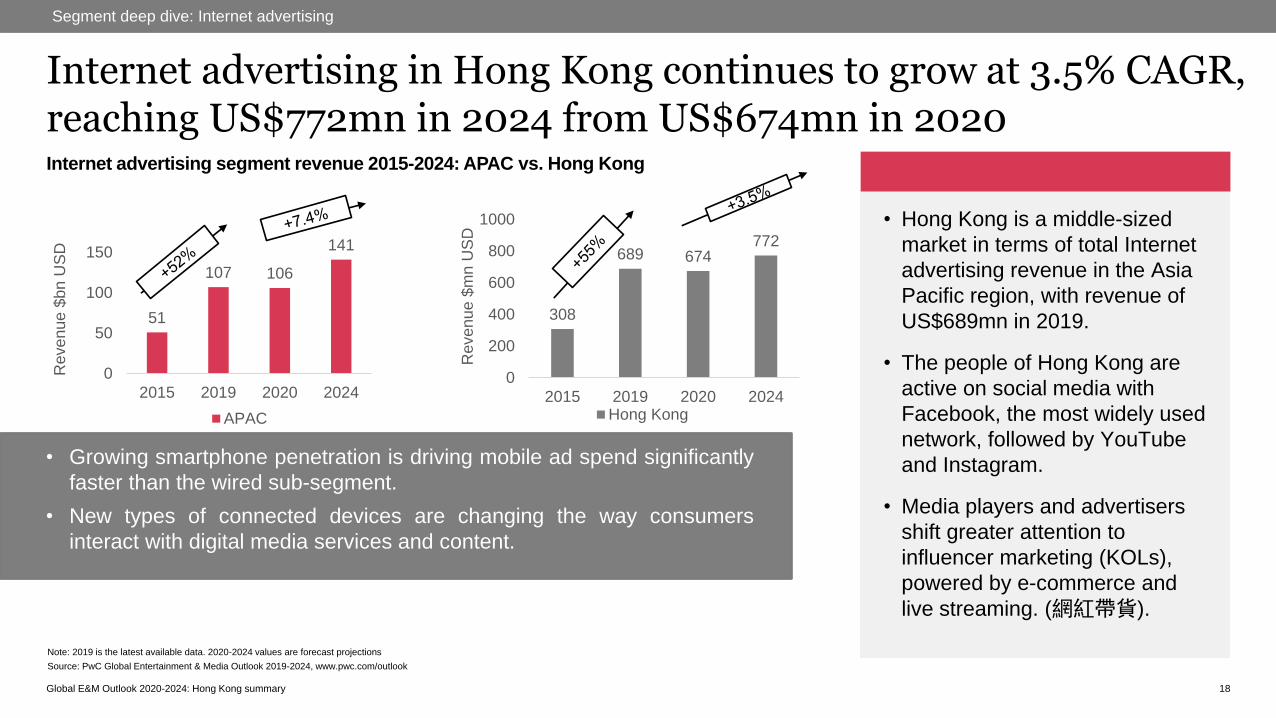
• Growing smartphone penetration is driving mobile ad spend significantly
faster than the wired sub-segment.
• New types of connected devices are changing the way consumers
interact with digital media services and content.
Internet advertising segment revenue 2015-2024: APAC vs. Hong Kong
308
689 674772
0
200
400
600
800
1000
2015 2019 2020 2024
Revenue $
mn U
SD
Hong Kong
51
107 106
141
0
50
100
150
2015 2019 2020 2024
Revenue $
bn U
SD
APAC
Segment deep dive: Internet advertising
18
• Hong Kong is a middle-sized
market in terms of total Internet
advertising revenue in the Asia
Pacific region, with revenue of
US$689mn in 2019.
• The people of Hong Kong are
active on social media with
Facebook, the most widely used
network, followed by YouTube
and Instagram.
• Media players and advertisers
shift greater attention to
influencer marketing (KOLs),
powered by e-commerce and
live streaming. (網紅帶貨).
Internet advertising in Hong Kong continues to grow at 3.5% CAGR, reaching US$772mn in 2024 from US$674mn in 2020
Note: 2019 is the latest available data. 2020-2024 values are forecast projections
Source: PwC Global Entertainment & Media Outlook 2019-2024, www.pwc.com/outlook

Global E&M Outlook 2020-2024: Hong Kong summary
至 2024年来自中国 OTT 视频市场的收入
Segment deep dive: Internet advertising
19
• Hong Kong wired internet
advertising remains stagnant.
• Mobile internet advertising is
growing at 7.62% CAGR and
gaining market share.
• In line with 5G uptake and rising
consumption of OTT video, this
will spur growth in mobile internet
advertising.
Mobile Internet advertising growth at 7.62% CAGR to reach US$377mn in 2024, bypassing wired paid search
0
50
100
150
200
250
300
350
400
HK Mobile Internet advertising
HK Wired paid search Internet advertising
0
50
100
150
200
250
300
350
400
450
HK Mobile Internet advertisingHK Wired Internet advertising
Hong Kong mobile vs. wired Internet
advertising revenue (US$ mn)
Hong Kong mobile Internet advertising
vs. wired paid search Internet
advertising revenue(US$ mn)
7.62%
2020--24
CAGR
0.13%
2020--24
CAGR
7.62%
2020--24
CAGR
-0.92%
2020--24
CAGR
Note: 2019 is the latest available data. 2020-2024 values are forecast projections
Source: PwC Global Entertainment & Media Outlook 2019-2024, www.pwc.com/outlook
Revenue $
mn U
SD
Revenue $
mn U
SD

Global E&M Outlook 2020-2024: Hong Kong summary 20
Segment deep dive: Internet advertising
Hong Kong mobile video Internet advertising vs total wired display Internet
advertising 2015-2024 (US$ mn)
Video will become an increasingly
important part of the mobile display
mix due to:
• Continued focus on video by
mobile social platforms;
• Shifts towards out-stream video
inventory on publishers’ mobile
sites and apps;
• Increased mobile video
consumption driven by faster and
more reliable mobile connectivity.
Importance of mobile video
advertising rises
0
20
40
60
80
100
120
140
160
180
2015 2016 2017 2018 2019 2020 2021 2022 2023 2024
Mobile other display Internet advertising
Mobile video Internet advertising
Mobile paid search Internet advertising
5.33%
2020--24
CAGR
11.47%
2020--24
CAGR
8.23%
2020--24
CAGR
Hong Kong mobile video Internet advertising grows at 11.47% to US$57mn in 2020, similar to Asia Pacific growth of 19.24%
Note: 2019 is the latest available data. 2020-2024 values are forecast projections
Source: PwC Global Entertainment & Media Outlook 2019-2024, www.pwc.com/outlook

Global E&M Outlook 2020-2024: Hong Kong summary
Segment deep diveOTT video
21Global E&M Outlook 2020-2024: Hong Kong summary
Global E&M Outlook 2020-2024: Hong Kong summary
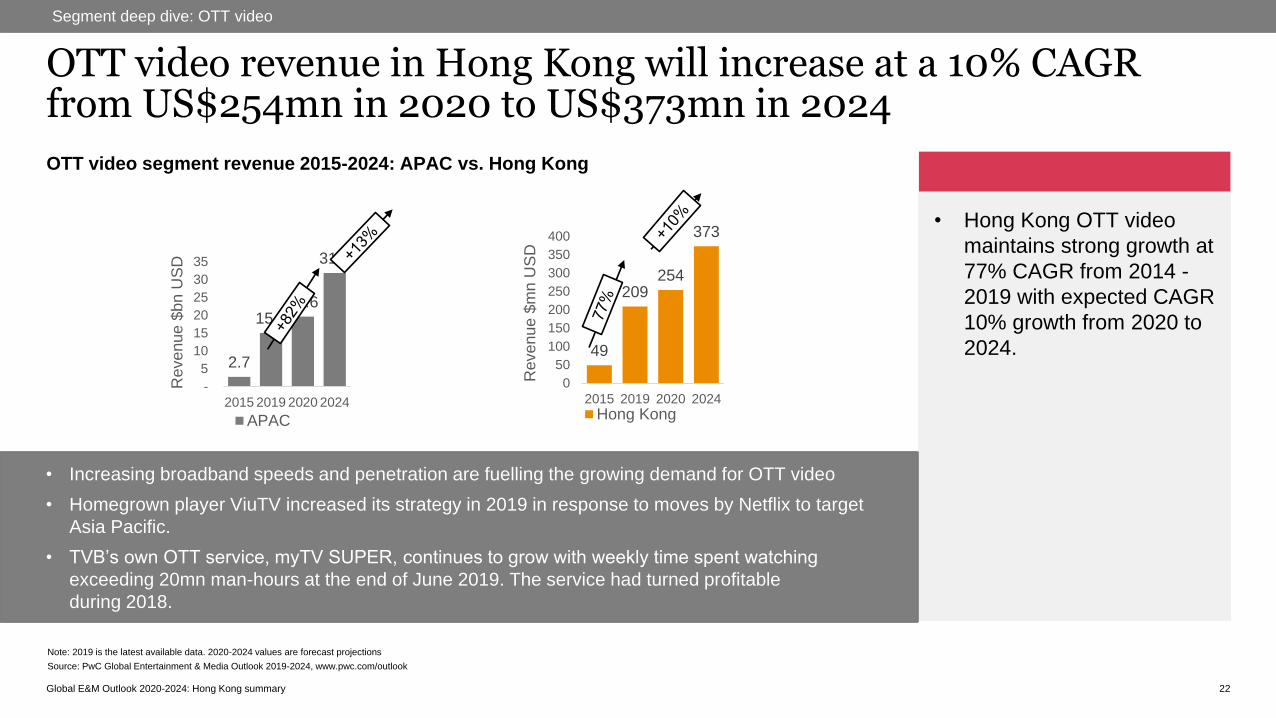
OTT video segment revenue 2015-2024: APAC vs. Hong Kong
Segment deep dive: OTT video
22
OTT video revenue in Hong Kong will increase at a 10% CAGR from US$254mn in 2020 to US$373mn in 2024
• Hong Kong OTT video
maintains strong growth at
77% CAGR from 2014 -
2019 with expected CAGR
10% growth from 2020 to
2024.
• Increasing broadband speeds and penetration are fuelling the growing demand for OTT video
• Homegrown player ViuTV increased its strategy in 2019 in response to moves by Netflix to target
Asia Pacific.
• TVB’s own OTT service, myTV SUPER, continues to grow with weekly time spent watching
exceeding 20mn man-hours at the end of June 2019. The service had turned profitable
during 2018.
Note: 2019 is the latest available data. 2020-2024 values are forecast projections
Source: PwC Global Entertainment & Media Outlook 2019-2024, www.pwc.com/outlook
2.7
15.019.6
31.9
-
5
10
15
20
25
30
35
2015 2019 2020 2024
Revenue $
bn U
SD
APAC
49
209254
373
0
50
100
150
200
250
300
350
400
2015 2019 2020 2024
Revenue $
mn U
SD
Hong Kong
Global E&M Outlook 2020-2024: Hong Kong summary
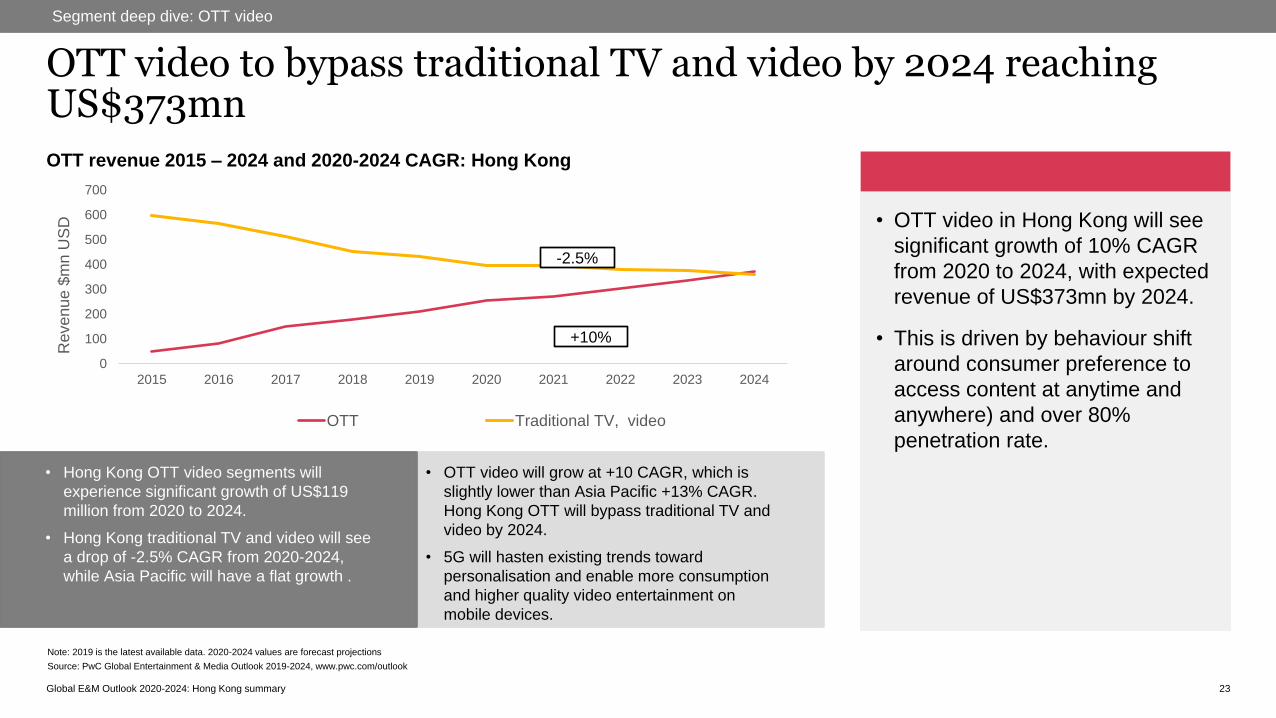
OTT revenue 2015 – 2024 and 2020-2024 CAGR: Hong Kong
Segment deep dive: OTT video
23
OTT video to bypass traditional TV and video by 2024 reaching US$373mn
• OTT video in Hong Kong will see
significant growth of 10% CAGR
from 2020 to 2024, with expected
revenue of US$373mn by 2024.
• This is driven by behaviour shift
around consumer preference to
access content at anytime and
anywhere) and over 80%
penetration rate.
• OTT video will grow at +10 CAGR, which is
slightly lower than Asia Pacific +13% CAGR.
Hong Kong OTT will bypass traditional TV and
video by 2024.
• 5G will hasten existing trends toward
personalisation and enable more consumption
and higher quality video entertainment on
mobile devices.
• Hong Kong OTT video segments will
experience significant growth of US$119
million from 2020 to 2024.
• Hong Kong traditional TV and video will see
a drop of -2.5% CAGR from 2020-2024,
while Asia Pacific will have a flat growth .
Note: 2019 is the latest available data. 2020-2024 values are forecast projections
Source: PwC Global Entertainment & Media Outlook 2019-2024, www.pwc.com/outlook
0
100
200
300
400
500
600
700
2015 2016 2017 2018 2019 2020 2021 2022 2023 2024
Revenue $
mn U
SD
OTT Traditional TV, video
-2.5%
+10%
Global E&M Outlook 2020-2024: Hong Kong summary
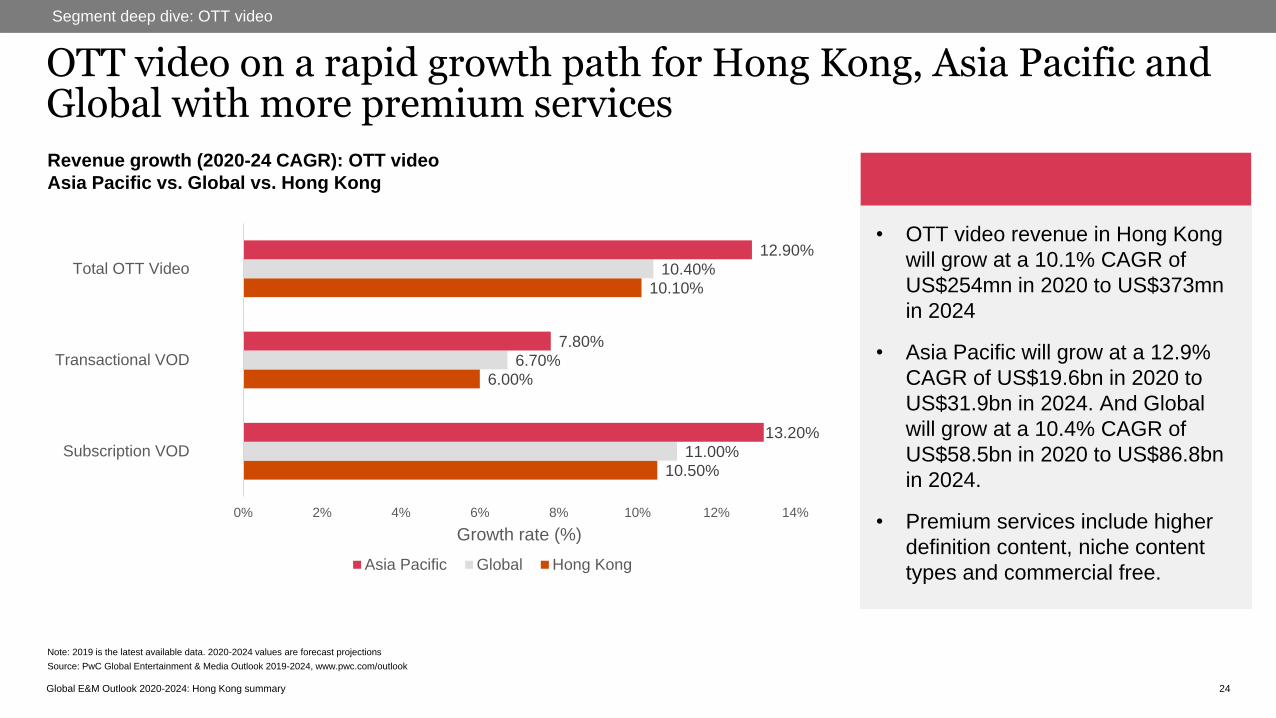
Revenue growth (2020-24 CAGR): OTT video
Asia Pacific vs. Global vs. Hong Kong
Segment deep dive: OTT video
24
OTT video on a rapid growth path for Hong Kong, Asia Pacific and Global with more premium services
Note: 2019 is the latest available data. 2020-2024 values are forecast projections
Source: PwC Global Entertainment & Media Outlook 2019-2024, www.pwc.com/outlook
• OTT video revenue in Hong Kong
will grow at a 10.1% CAGR of
US$254mn in 2020 to US$373mn
in 2024
• Asia Pacific will grow at a 12.9%
CAGR of US$19.6bn in 2020 to
US$31.9bn in 2024. And Global
will grow at a 10.4% CAGR of
US$58.5bn in 2020 to US$86.8bn
in 2024.
• Premium services include higher
definition content, niche content
types and commercial free.
10.50%
6.00%
10.10%
11.00%
6.70%
10.40%
13.20%
7.80%
12.90%
0% 2% 4% 6% 8% 10% 12% 14%
Subscription VOD
Transactional VOD
Total OTT Video
Growth rate (%)
Asia Pacific Global Hong Kong
Global E&M Outlook 2020-2024: Hong Kong summary
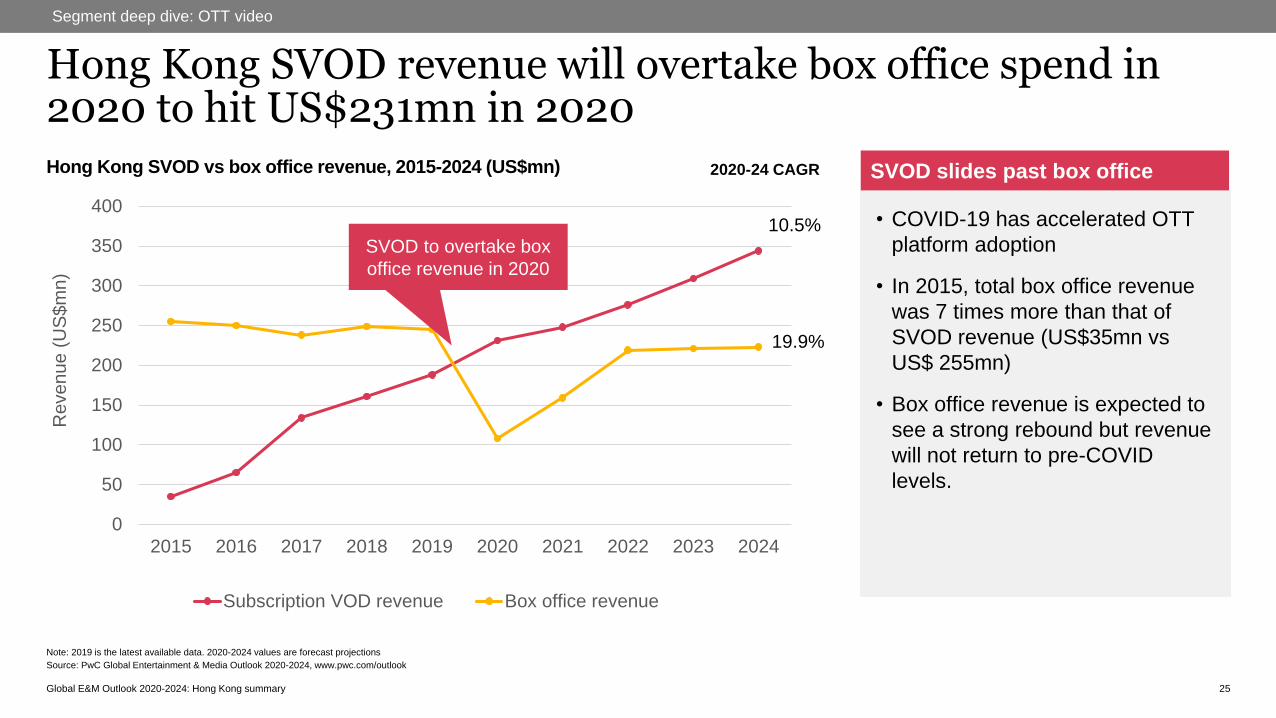
Hong Kong SVOD revenue will overtake box office spend in 2020 to hit US$231mn in 2020
25
Segment deep dive: OTT video
Source: PwC Global Entertainment & Media Outlook 2020-2024, www.pwc.com/outlook
Note: 2019 is the latest available data. 2020-2024 values are forecast projections
0
50
100
150
200
250
300
350
400
2015 2016 2017 2018 2019 2020 2021 2022 2023 2024
Reven
ue
(U
S$m
n)
Subscription VOD revenue Box office revenue
Hong Kong SVOD vs box office revenue, 2015-2024 (US$mn)
• COVID-19 has accelerated OTT
platform adoption
• In 2015, total box office revenue
was 7 times more than that of
SVOD revenue (US$35mn vs
US$ 255mn)
• Box office revenue is expected to
see a strong rebound but revenue
will not return to pre-COVID
levels.
SVOD slides past box office
SVOD to overtake box
office revenue in 2020
10.5%
19.9%
2020-24 CAGR

Global E&M Outlook 2020-2024: Hong Kong summary
Segment deep diveVideo games
26Global E&M Outlook 2020-2024: Hong Kong summary
Global E&M Outlook 2020-2024: Hong Kong summary 27
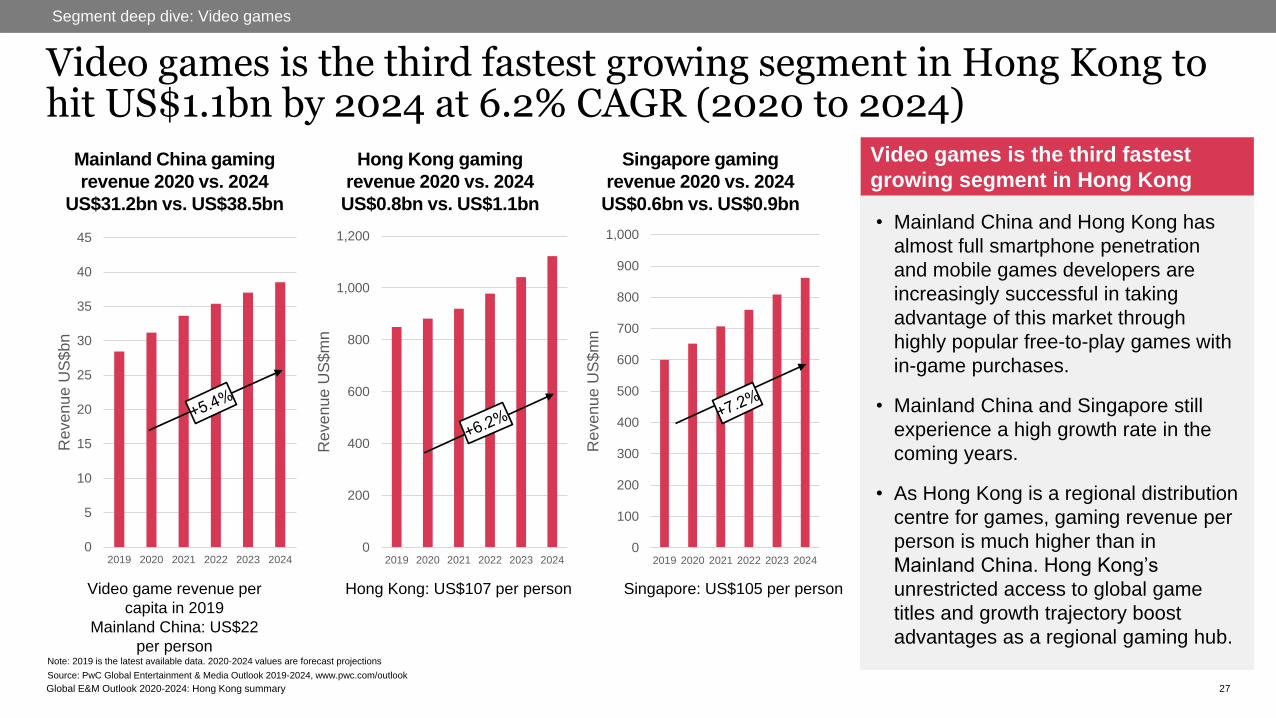
Segment deep dive: Video games
Video games is the third fastest growing segment in Hong Kong to hit US$1.1bn by 2024 at 6.2% CAGR (2020 to 2024)
• Mainland China and Hong Kong has
almost full smartphone penetration
and mobile games developers are
increasingly successful in taking
advantage of this market through
highly popular free-to-play games with
in-game purchases.
• Mainland China and Singapore still
experience a high growth rate in the
coming years.
• As Hong Kong is a regional distribution
centre for games, gaming revenue per
person is much higher than in
Mainland China. Hong Kong’s
unrestricted access to global game
titles and growth trajectory boost
advantages as a regional gaming hub.
Video games is the third fastest
growing segment in Hong KongMainland China gaming
revenue 2020 vs. 2024
US$31.2bn vs. US$38.5bn
0
5
10
15
20
25
30
35
40
45
2019 2020 2021 2022 2023 2024
Revenue U
S$bn
Note: 2019 is the latest available data. 2020-2024 values are forecast projections
Source: PwC Global Entertainment & Media Outlook 2019-2024, www.pwc.com/outlook
Hong Kong gaming
revenue 2020 vs. 2024
US$0.8bn vs. US$1.1bn
0
200
400
600
800
1,000
1,200
2019 2020 2021 2022 2023 2024
Revenue U
S$m
n
Singapore gaming
revenue 2020 vs. 2024
US$0.6bn vs. US$0.9bn
0
100
200
300
400
500
600
700
800
900
1,000
2019 2020 2021 2022 2023 2024
Revenue U
S$m
nVideo game revenue per
capita in 2019
Mainland China: US$22
per person
Hong Kong: US$107 per person Singapore: US$105 per person
Global E&M Outlook 2020-2024: Hong Kong summary 28
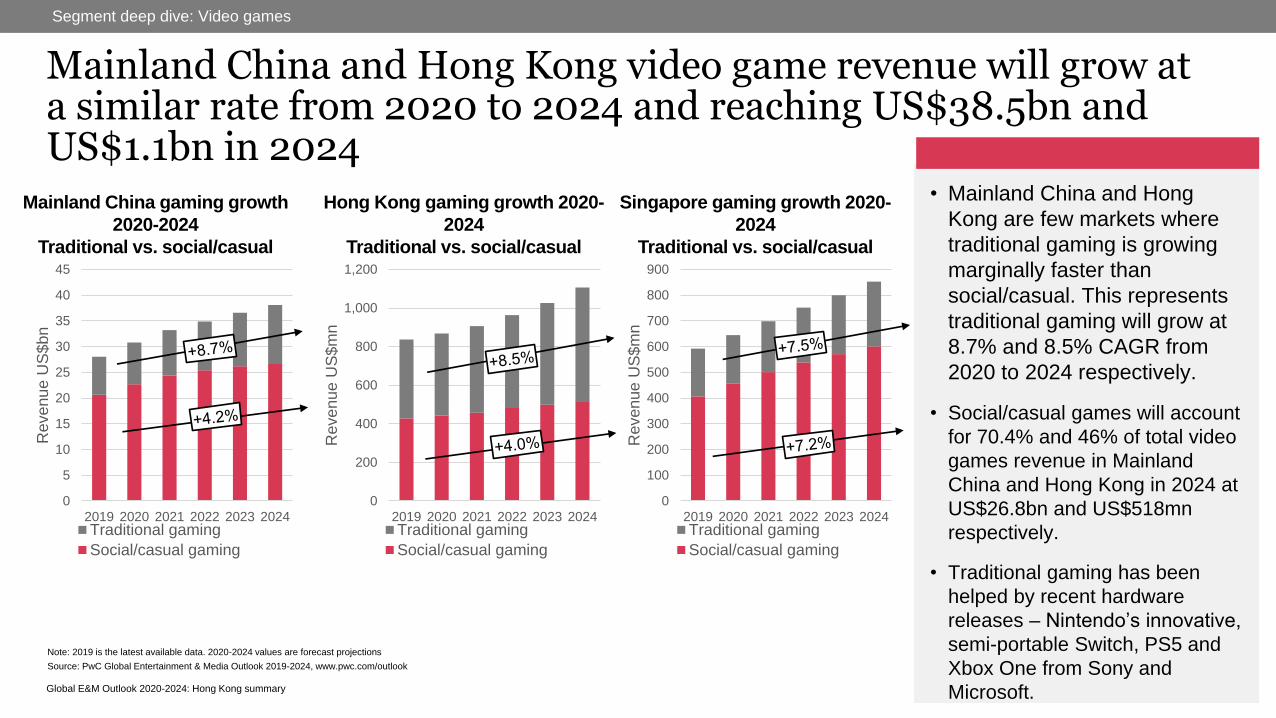
Segment deep dive: Video games
Mainland China and Hong Kong video game revenue will grow at a similar rate from 2020 to 2024 and reaching US$38.5bn and US$1.1bn in 2024
• Mainland China and Hong
Kong are few markets where
traditional gaming is growing
marginally faster than
social/casual. This represents
traditional gaming will grow at
8.7% and 8.5% CAGR from
2020 to 2024 respectively.
• Social/casual games will account
for 70.4% and 46% of total video
games revenue in Mainland
China and Hong Kong in 2024 at
US$26.8bn and US$518mn
respectively.
• Traditional gaming has been
helped by recent hardware
releases – Nintendo’s innovative,
semi-portable Switch, PS5 and
Xbox One from Sony and
Microsoft.
Hong Kong gaming growth 2020-
2024
Traditional vs. social/casual
0
200
400
600
800
1,000
1,200
2019 2020 2021 2022 2023 2024
Revenue U
S$m
n
Traditional gaming
Social/casual gaming
Note: 2019 is the latest available data. 2020-2024 values are forecast projections
Source: PwC Global Entertainment & Media Outlook 2019-2024, www.pwc.com/outlook
Mainland China gaming growth
2020-2024
Traditional vs. social/casual
0
5
10
15
20
25
30
35
40
45
2019 2020 2021 2022 2023 2024
Revenue U
S$bn
Traditional gaming
Social/casual gaming
Singapore gaming growth 2020-
2024
Traditional vs. social/casual
0
100
200
300
400
500
600
700
800
900
2019 2020 2021 2022 2023 2024
Re
ven
ue
US
$m
n
Traditional gaming
Social/casual gaming

Global E&M Outlook 2020-2024: Hong Kong summary 29
Segment deep dive: Video games
Video games top countries by 2024 revenue and growth 2020-2024
US, Mainland China, Japan and South Korea dominates the video game market. They will represent 61% market share by 2024 t 61
Top 10 video game countries
by revenue 2024
1. Mainland China
2. US
3. Japan
4. South Korea
5. UK
6. Germany
7. France
8. Italy
9. India
10.Canada
Country on both lists
India
Top 10 countries with highest
CAGR 2020-2024
1. Pakistan
2. Nigeria
3. India
4. Peru
5. Egypt
6. Norway
7. Philippines
8. Indonesia
9. Kenya
10.Brazil
Note: 2019 is the latest available data. 2020-2024 values are forecast projections
Source: PwC Global Entertainment & Media Outlook 2019-2024, www.pwc.com/outlook
Global E&M Outlook 2020-2024: Hong Kong summary 30
Segment deep dive: Video games
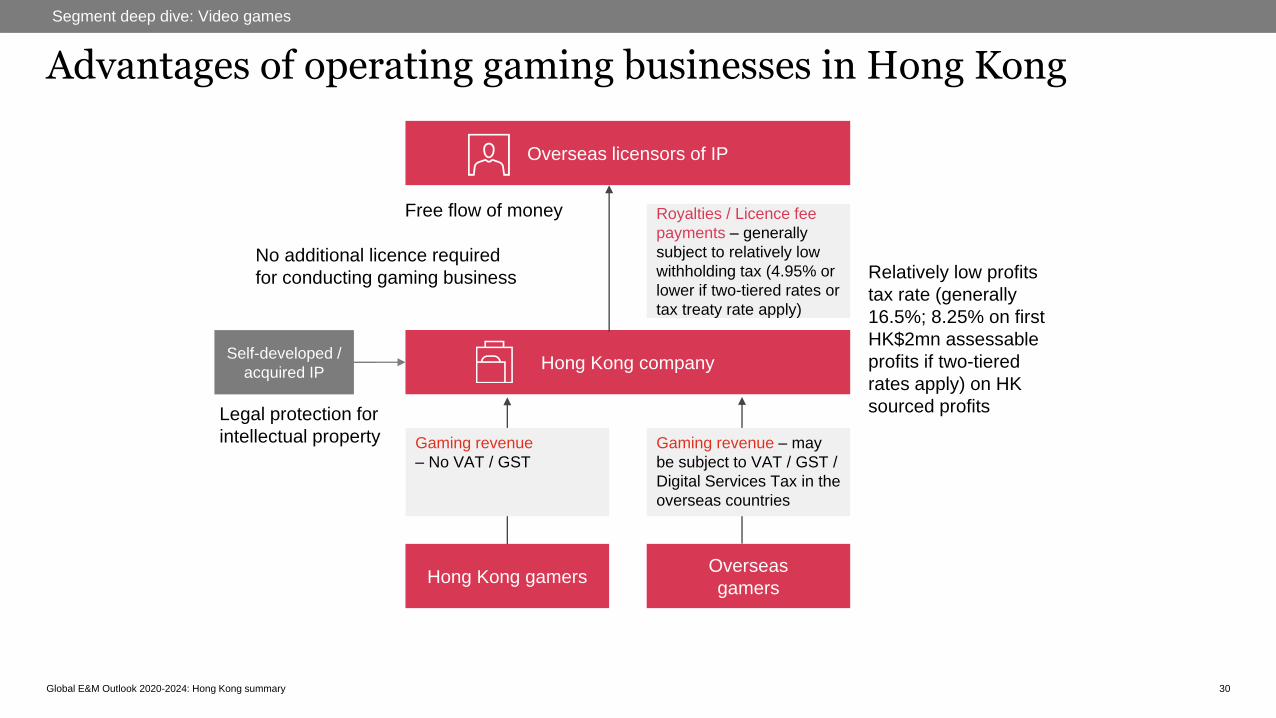
Advantages of operating gaming businesses in Hong Kong
Overseas licensors of IP
Hong Kong company
Relatively low profits
tax rate (generally
16.5%; 8.25% on first
HK$2mn assessable
profits if two-tiered
rates apply) on HK
sourced profitsLegal protection for
intellectual property
Free flow of money
No additional licence required
for conducting gaming business
Self-developed /
acquired IP
Hong Kong gamersOverseas
gamers
Gaming revenue – may
be subject to VAT / GST /
Digital Services Tax in the
overseas countries
Gaming revenue
– No VAT / GST
Royalties / Licence fee
payments – generally
subject to relatively low
withholding tax (4.95% or
lower if two-tiered rates or
tax treaty rate apply)
Global E&M Outlook 2020-2024: Hong Kong summary 31
Segment deep dive: Video games
What can we learn from other jurisdictions to increase our competitiveness in the region?
• Programmes to nurture / attract talents
➢ e.g. universities in Mainland China and Singapore offer courses on gaming studies in order to build talent
pipeline for the industry; incubation and mentorship programmes arranged by Singapore government
• Financial support
➢ e.g. Singapore government’s funding schemes for games industry
• Relevant tax incentives
➢ e.g. Mainland China’s preferential tax rates for High and New Technology Enterprises / software industries;
various preferential schemes in Singapore
• Enhanced tax laws regarding IP
➢ e.g. more friendly provisions for claiming deductions and double tax relief

Global E&M Outlook 2020-2024: Hong Kong summary
New trendSmart speakers,
podcasts
32Global E&M Outlook 2020-2024: Hong Kong summary
Global E&M Outlook 2020-2024: Hong Kong summary
New trend
33
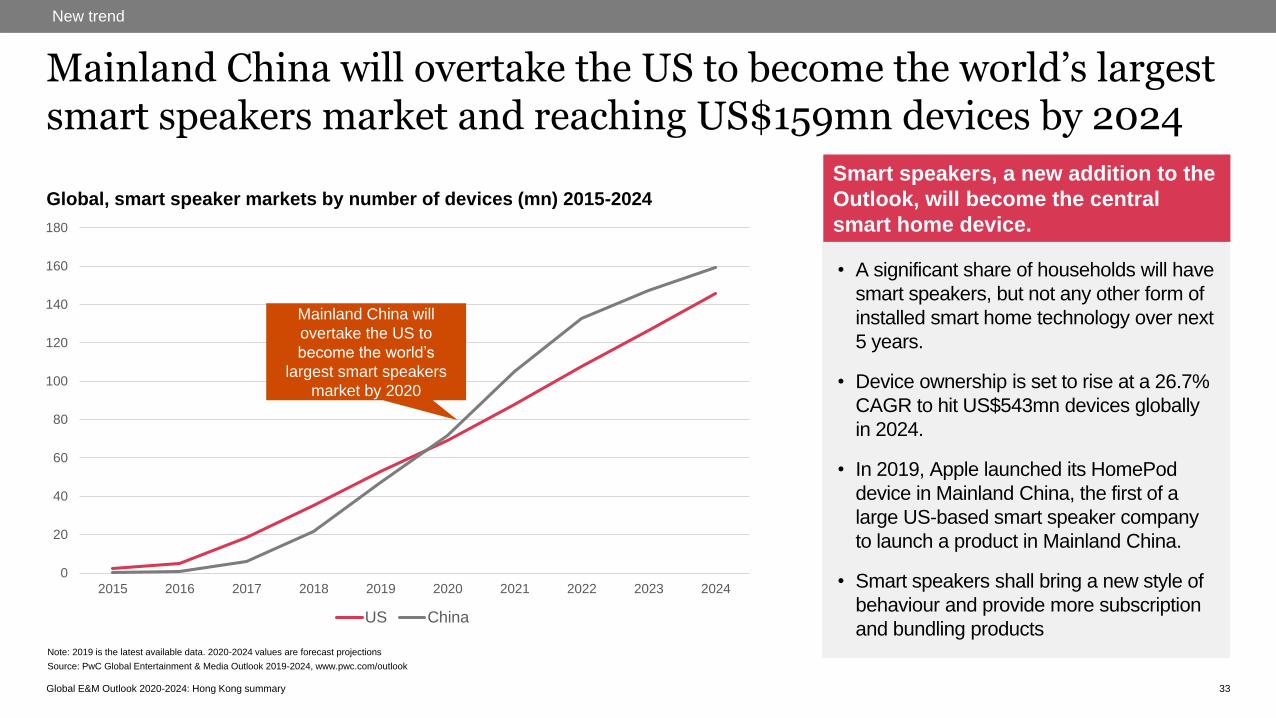
• A significant share of households will have
smart speakers, but not any other form of
installed smart home technology over next
5 years.
• Device ownership is set to rise at a 26.7%
CAGR to hit US$543mn devices globally
in 2024.
• In 2019, Apple launched its HomePod
device in Mainland China, the first of a
large US-based smart speaker company
to launch a product in Mainland China.
• Smart speakers shall bring a new style of
behaviour and provide more subscription
and bundling products
Smart speakers, a new addition to the
Outlook, will become the central
smart home device.
Mainland China will overtake the US to become the world’s largest smart speakers market and reaching US$159mn devices by 2024
Note: 2019 is the latest available data. 2020-2024 values are forecast projections
Source: PwC Global Entertainment & Media Outlook 2019-2024, www.pwc.com/outlook
Global, smart speaker markets by number of devices (mn) 2015-2024
0
20
40
60
80
100
120
140
160
180
2015 2016 2017 2018 2019 2020 2021 2022 2023 2024
US China
Mainland China will
overtake the US to
become the world’s
largest smart speakers
market by 2020
Global E&M Outlook 2020-2024: Hong Kong summary
New trend
34
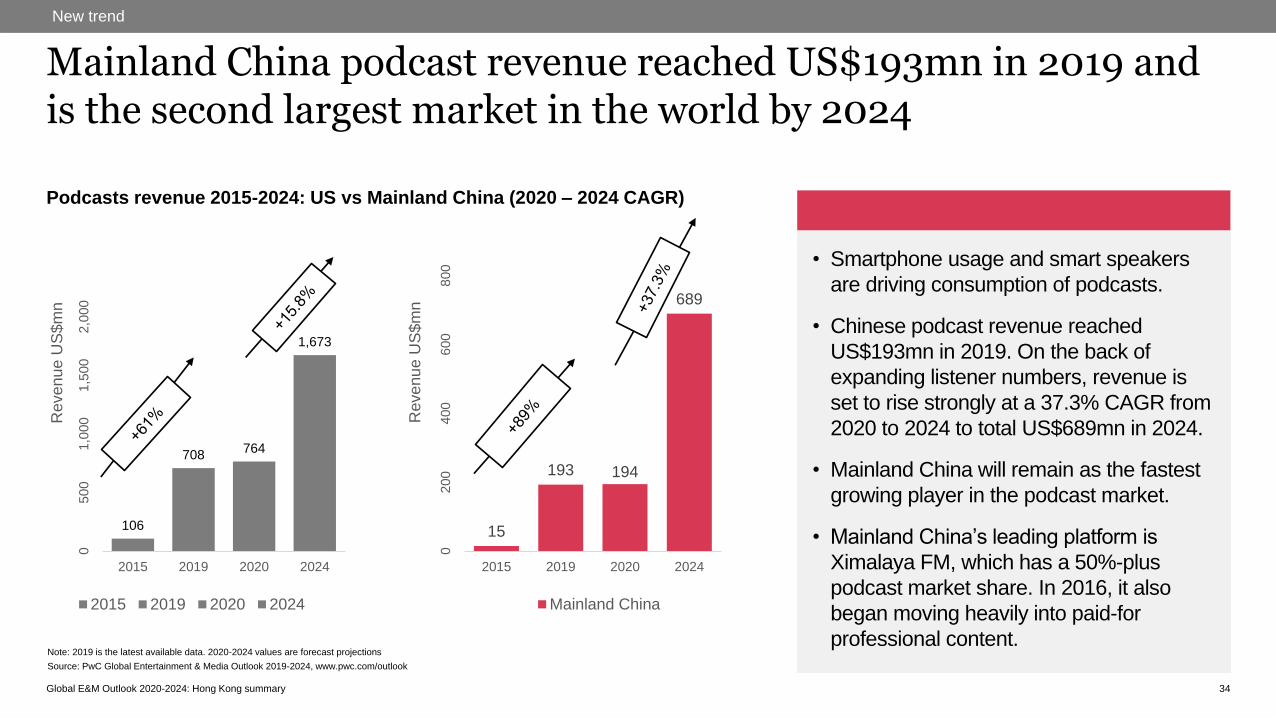
• Smartphone usage and smart speakers
are driving consumption of podcasts.
• Chinese podcast revenue reached
US$193mn in 2019. On the back of
expanding listener numbers, revenue is
set to rise strongly at a 37.3% CAGR from
2020 to 2024 to total US$689mn in 2024.
• Mainland China will remain as the fastest
growing player in the podcast market.
• Mainland China’s leading platform is
Ximalaya FM, which has a 50%-plus
podcast market share. In 2016, it also
began moving heavily into paid-for
professional content.
Mainland China podcast revenue reached US$193mn in 2019 and is the second largest market in the world by 2024
Note: 2019 is the latest available data. 2020-2024 values are forecast projections
Source: PwC Global Entertainment & Media Outlook 2019-2024, www.pwc.com/outlook
Podcasts revenue 2015-2024: US vs Mainland China (2020 – 2024 CAGR)
106
708764
1,673
05
00
1,0
00
1,5
00
2,0
00
2015 2019 2020 2024
Revenue U
S$m
n
2015 2019 2020 2024
15
193 194
689
02
00
400
600
800
2015 2019 2020 2024
Revenue U
S$m
n
Mainland China
Global E&M Outlook 2020-2024: Hong Kong summary
New trend
35
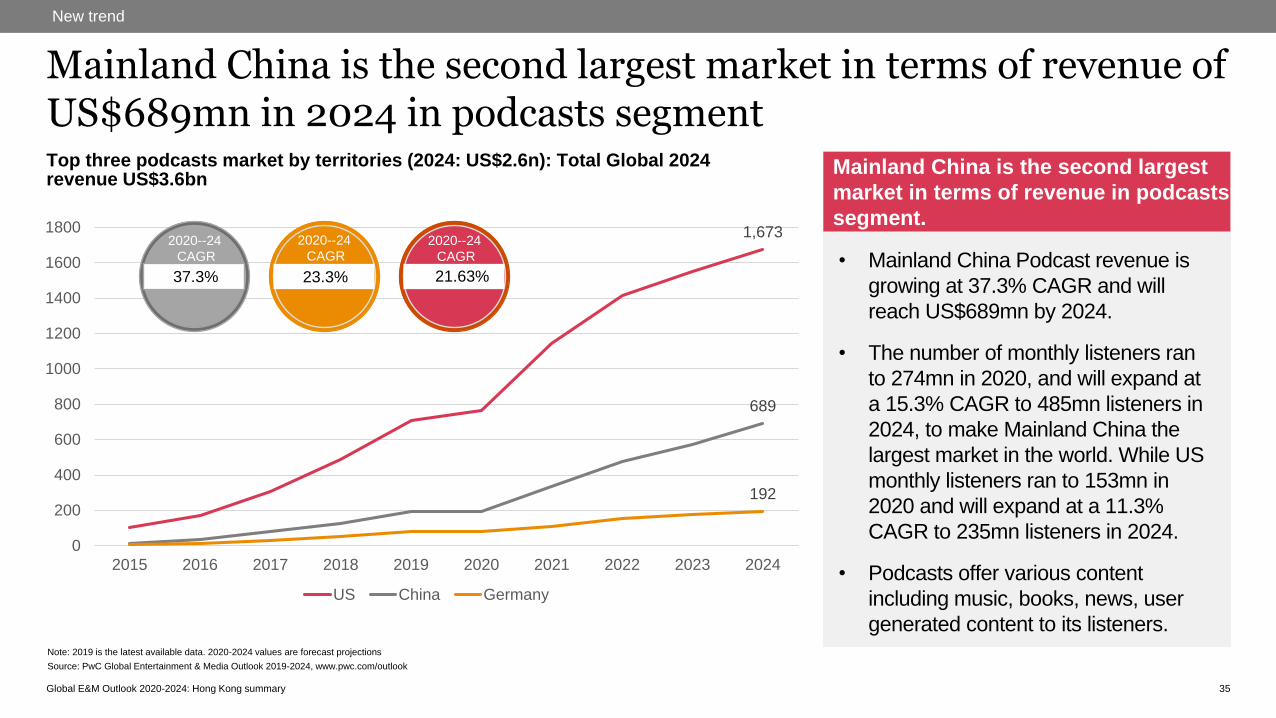
• Mainland China Podcast revenue is
growing at 37.3% CAGR and will
reach US$689mn by 2024.
• The number of monthly listeners ran
to 274mn in 2020, and will expand at
a 15.3% CAGR to 485mn listeners in
2024, to make Mainland China the
largest market in the world. While US
monthly listeners ran to 153mn in
2020 and will expand at a 11.3%
CAGR to 235mn listeners in 2024.
• Podcasts offer various content
including music, books, news, user
generated content to its listeners.
Mainland China is the second largest market in terms of revenue of US$689mn in 2024 in podcasts segment
Note: 2019 is the latest available data. 2020-2024 values are forecast projections
Source: PwC Global Entertainment & Media Outlook 2019-2024, www.pwc.com/outlook
Top three podcasts market by territories (2024: US$2.6n): Total Global 2024 revenue US$3.6bn
1,673
689
192
0
200
400
600
800
1000
1200
1400
1600
1800
2015 2016 2017 2018 2019 2020 2021 2022 2023 2024
US China Germany
37.3%
2020--24
CAGR
23.3%
2020--24
CAGR
21.63%
2020--24
CAGR
Mainland China is the second largest
market in terms of revenue in podcasts
segment.

Global E&M Outlook 2020-2024: Hong Kong summary
How companies are adopting new innovation models to seize growth and adapt to new consumer preferences
36
Challenges and opportunities
4
1
2
3
Global polarisation
looms
5G vision for the future
of media experiences
Pandemic boosts
virtualisation AI in the home
Global E&M Outlook 2020-2024: Hong Kong summary 37
About the Global Entertainment & Media Outlook and glossary
• PwC’s 21st annual edition of the Global Entertainment &
Media Outlook is a comprehensive online source of
global analysis for consumer and advertising spending.
With like-for-like, five-year historical and five-year
forecast data and commentary for 14 defined industry
segments in 53 territories, the Outlook makes it easy to
compare and contrast consumer and advertising
spending across segments and territories. Find out
more at www.pwc.com/outlook.
• A total of 53 countries are represented within the
Outlook spread across North America, Western
Europe, Central Europe, Middle East & Africa, Latin
America and Asia Pacific.
Global Entertainment & Media Outlook
• Revenue includes: Advertising and consumer
revenue streams
• Digital revenue - Digital is revenue delivered through
the Internet. Internet access revenue is obviously
included in, and the majority part of, “digital.” In
advertising, this is effectively Internet advertising and
digital OOH advertising. In consumer it's areas like OTT
video revenue, digital forms of
books/newspaper/magazine purchases, video game
downloads and online/microtransaction revenue, VR
revenue, and digital music revenue (downloads,
streaming, ringtones).
Glossary

Global E&M Outlook 2020-2024: Hong Kong summary
Key contacts
38
Cecilia Yau
PwC Mainland China and
Hong Kong Media Leader
Wilson Chow
PwC Global TMT Industry Leader
pwc.com/outlook
Thank you.
The information contained in this presentation is of a general nature only. It is not meant to be comprehensive and does not constitute the rendering of legal, tax or other
professional advice or service by PricewaterhouseCoopers Ltd ("PwC"). PwC has no obligation to update the information as law and practices change. The application
and impact of laws can vary widely based on the specific facts involved. Before taking any action, please ensure that you obtain advice specific to your circumstances
from your usual PwC client service team or your other advisers.
The materials contained in this presentation were assembled in Oct 2020 and were based on the law enforceable and information available at that time.
© 2020 PricewaterhouseCoopers Limited. All rights reserved. PwC refers to the Hong Kong member firm, and may sometimes refer to the PwC network. Each member
firm is a separate legal entity. Please see www.pwc.com/structure for further details.