hp diagnostics release notes - support
TRANSCRIPT
HP DiagnosticsFor the Windows, UNIX and Linux operating systems
Software Version: 9.23
Release Notes
Document Release Date: May 2014
Software Release Date: May 2014
Legal Notices
WarrantyThe only warranties for HP products and services are set forth in the express warranty statements accompanying such products and services. Nothing herein should beconstrued as constituting an additional warranty. HP shall not be liable for technical or editorial errors or omissions contained herein.
The information contained herein is subject to change without notice.
Restricted Rights LegendConfidential computer software. Valid license from HP required for possession, use or copying. Consistent with FAR 12.211 and 12.212, Commercial ComputerSoftware, Computer Software Documentation, and Technical Data for Commercial Items are licensed to the U.S. Government under vendor's standard commerciallicense.
Copyright Notice© Copyright 2005 - 2014 Hewlett-Packard Development Company, L.P.
Trademark NoticesAdobe™ is a trademark of Adobe Systems Incorporated.
Microsoft® and Windows® are U.S. registered trademarks of Microsoft Corporation.
UNIX® is a registered trademark of The Open Group.
Java is a registered trademark of Oracle and/or its affiliates.
Oracle® is a registered trademark of Oracle and/or its affiliates.
AcknowledgementsThis product includes software developed by the Apache Software Foundation (http://www.apache.org/).
This product includes software developed by the Spice Group (http://spice.codehaus.org).
For information about open source and third-party license agreements, see theOpen Source and Third-Party Software License Agreements document in theDocumentation directory on the product installation media.
Documentation UpdatesThe title page of this document contains the following identifying information:
l Software Version number, which indicates the software version.l Document Release Date, which changes each time the document is updated.l Software Release Date, which indicates the release date of this version of the software.
To check for recent updates or to verify that you are using the most recent edition of a document, go to: http://h20230.www2.hp.com/selfsolve/manuals
This site requires that you register for an HP Passport and sign in. To register for an HP Passport ID, go to: http://h20229.www2.hp.com/passport-registration.html
Or click theNew users - please register link on the HP Passport login page.
You will also receive updated or new editions if you subscribe to the appropriate product support service. Contact your HP sales representative for details.
SupportVisit the HP Software Support Online web site at: http://www.hp.com/go/hpsoftwaresupport
This web site provides contact information and details about the products, services, and support that HP Software offers.
HP Software online support provides customer self-solve capabilities. It provides a fast and efficient way to access interactive technical support tools needed to manageyour business. As a valued support customer, you can benefit by using the support web site to:
l Search for knowledge documents of interestl Submit and track support cases and enhancement requestsl Download software patchesl Manage support contractsl Look up HP support contactsl Review information about available servicesl Enter into discussions with other software customersl Research and register for software training
Most of the support areas require that you register as an HP Passport user and sign in. Many also require a support contract. To register for an HP Passport ID, go to:
http://h20229.www2.hp.com/passport-registration.html
To find more information about access levels, go to:
http://h20230.www2.hp.com/new_access_levels.jsp
HP Diagnostics (9.23) Page 2 of 49

HP Software Solutions Now accesses the HPSW Solution and Integration Portal Web site. This site enables you to explore HP Product Solutions to meet yourbusiness needs, includes a full list of Integrations between HP Products, as well as a listing of ITIL Processes. The URL for this Web site ishttp://h20230.www2.hp.com/sc/solutions/index.jsp
Release Notes
HP Diagnostics (9.23) Page 3 of 49
Contents
Contents 4
Installation Notes 5
Diagnostics Components Compatibility 5
What's New in 9.23 IP2 6
What's New in 9.23 IP1 7
What's New in 9.23 8
New Features in 9.23 9
What's New in 9.21 14
New Features in 9.21 14
What's New in 9.20 19
New Features in 9.20 19
System Requirements 34
Notes and Limitations 35
Java Agent 35
.NET Agent 39
Integrations (BSM, PC, LR, TV, SaaS) 40
Collectors (Oracle, SAP, MQ, TIBCO EMS, SQL Server, webMethods, VMware) 42
Java Profiler 43
.NET Profiler 43
Diagnostics Server 44
User Interface 45
Documentation 47
Translated Versions 47
Localization and Globalization 48
We appreciate your feedback! 49
HP Diagnostics (9.23) Page 4 of 49
Installation NotesDiagnostics Server, Agent and Collector installation requirements and detailed instructions areprovided in the Diagnostics Server Installation and Administration Guide, Collector Guide, andAgent Guides.
Diagnostics 9.23 contains a full replacement of the Diagnostics components but note that there arespecial upgrade installation instructions you must follow. Please refer to the upgrade and patchinstallation instructions provided in the HP Diagnostics Server Installation and AdministrationGuide. The upgrade installation instructions are also provided as Diagnostics_Upgrade_Patch_Install_Instructions.pdf in the download .zip file or in the Documentation directory on the installationDVD as a convenience.
Diagnostics Components CompatibilityThe Diagnostics components in your deployment have the following requirements:
l All Diagnostics Servers in the deployment must be at the same version.
l The Diagnostics Server must be at a version higher than or equal to the highest version ofconnected agents or collectors.
To obtain the maximum monitoring coverage and functionality from HP Diagnostics, follow theserecommendations:
l Have all agents, collectors and servers in your deployment use the same version.
l Use the most current version of each component.
Check the HP Software Download Center ( http://support.openview.hp.com/downloads.jsp) forany updates and patches to the Diagnostics components. This web site requires an HPPassport login. Locate the Diagnostics information and choose the appropriate link fordownloading the Diagnostics software.
The 9.23 Diagnostics Server continues to support working with the following earlier agent andcollector versions, however monitoring coverage and functionality is limited to what theagent/collector at that version provides:
l Java Agent 8.x, 9.0x, 9.1x, 9.2x
l .NET Agent 8.x, 9.0x, 9.1x, 9.2x
l Python Agent 9.2x
l Collectors 8.x, 9.0x, 9.1x, 9.2x
For information about Diagnostics Server compatibility with BSM, see the BSM SystemRequirements and Support Matrices.
HP Diagnostics (9.23) Page 5 of 49
What's New in 9.23 IP2
Security FixesProvides an update that fixes the Heartbleed vulnerability issue associated withOpenSSL. Fordetails, see http://heartbleed.com and the HP Security Bulletin.
System Requirements ChangesSupports JRE version 8 for the Diagnostics Enterprise UI client.
Compatibility Changesl Supports LoadRunner version 12.00
l Supports Performance Center version 12.00
RUM-Diagnostics IntegrationImprovements have been made to the RUM-Diagnostics integration, using the .NET Agent to injectthe RUM JavaScript. For details, refer to the RUM-Diagnostics Integration Guide available on theHP Software Support Online Product Manuals site.
Release NotesWhat's New in 9.23 IP2
HP Diagnostics (9.23) Page 6 of 49
What's New in 9.23 IP1
Platform Support Changesl Added support for Microsoft Windows Server 2012 R2 64-bit
l Added support for Oracle Linux (OEL) 6.x
Documentation ChangesThe following new PDF guides are available on the HP Software Support Online Product Manualssite:
l Diagnostics System Requirements Guide
l RUM-Diagnostics Integration Guide
RUM-Diagnostics IntegrationImprovements have been made to the RUM-Diagnostics integration. For details, refer to the RUM-Diagnostics Integration Guide available on the HP Software Support Online Product Manuals site.
Release NotesWhat's New in 9.23 IP1
HP Diagnostics (9.23) Page 7 of 49
What's New in 9.23
Platform Support Changesl Subsequent releases of Diagnostics after version 9.2x will NO LONGER support Servers
and Collectors on Solaris operating systems. After Diagnostics 9.2x, Servers andCollectors will only be supported on Windows and Linux operating systems.
l Added support for Microsoft Windows Server 2012 Enterprise Edition (HP Operations ManagerEvent and Metrics Integration is not supported in Diagnostics running on Windows Server 2012)
l Added support for Mozilla Firefox 24.0 ESR
l Added support for Microsoft Internet Explorer (IE) 10.0
l Dropped support for Java Agents monitoring of Java 1.4 applications
Version 9.23 Java agents no longer support monitoring of applications running on version 1.4JVMs. If you require monitoring of a Java 1.4 JVM, use the 9.21 Java agent.
Documentation ChangesThe HP Diagnostics Installation and Configuration guide has been divided up into separatemanuals, as follows:
l Server Installation and Administration Guide
l Collector Guide
l Java Agent Guide
l NET Agent Guide
l Python Guide
l BSM-Diagnostics Integration Guide
l LoadRunner/Performance Center-Diagnostics Integration Guide
This will allow readers to more easily find the information related to the installation and setup of aspecific workflow or component. The guides are packaged with their respective components oravailable as downloads from HP Software Support Online. See Documentation Updates in the frontmatter of this guide for more information about downloading documentation.
HP Diagnostics (9.23) Page 8 of 49
Defect FixesDiagnostics 9.23 has a large number of defect fixes.
For details on fixed defects see the patch notes on the HP support site where you downloaded thepatch: http://support.openview.hp.com/selfsolve/patches/
New Features in 9.23The 9.23 release includes the following new features.
l Java Agent Monitoring Profiles
Background: Diagnostics is a versatile and flexible product which can be used in differentenvironments, ranging from development desktops to systems deployed in production.However, customization of all Java Agent configuration settings to match the expectedscalability or overhead level vs. the amount of collected data can be a tedious task, especiallyfor novice users.
Description: The Java Agent configuration is now managed by a monitoring profile. MonitoringProfiles offer a predefined set of settings that control the instrumentation points, metricscollection, and other properties for the probe from a single location. Monitoring profiles are a safeand easy way to manage the impact of the probe on the monitored system and still obtain theneeded performance data.
See the new chapter "Monitoring Profiles" in the Diagnostics Java Agent Guide for moreinformation.
Benefits: Usability
l Java Agent Auto-deployment on JBoss and Tomcat
Background: To enable monitoring of an application by the Java Agent, users perform thefollowing: Instrument the JRE used by the application server (Diagnostics’ JRE instrumentationdoes not modify the installed JRE, but rather places copies of instrumented classes under theJava Agent installation directory); and then modify the application server startup script to specifythe JVM parameters to invoke the agent and use the instrumented JRE when the applicationstarts. This procedure varies for each type of application server.
Description: The Java Agent Setup program can now perform the instrumentation andmodifications to the application server startup script automatically for agents running on JBossand Tomcat application servers. Users need only to restart the application server after the AgentSetup program completes to pick up the changes to the script.
See the chapter "Installing Java Agents" in the Diagnostics Java Agent Guide for moreinformation.
Benefits: Usability
Release NotesWhat's New in 9.23
HP Diagnostics (9.23) Page 9 of 49
l Java Agents in Cloud Environments
Background: Previous versions of Diagnostics were difficult to use when deployed in a cloudenvironment, such as Stackato. The are two major sources of the difficulties:
n probe configuration challenges: manual probe id configuration hardly works in the cloud,hostnames do not exist, and the IP address of the box is not resolved by the Java runtime.
n dynamic assignment of IP addresses and Database URIs makes it not only difficult for theuser to find the relevant data, but also causes unlimited growth of the Diagnostics symboltable.
Description: Java Agents can now monitor applications running in Stackato or HP aPaaS.
See the new section "Java Agents in Cloud Environments" in the Diagnostics Java Agent Guidefor more information.
Benefits: Functionality, Usability
l Mediator Server Auto-Assignment for Large Deployments
Background: In a large deployment environment with many probes, deployments often share aJava Agent installation with multiple probe instances since they all use similar configuration. Inthis kind of setup, the probe.id and registrar.url is set and overridden in the startup JVM options.This allows multiple probes to share the same configuration, but still have unique probe.id andmediators they are reporting their data too.
Description: Probe auto-assignment is now available for these types of environments. Users donot have to assign each individual probe to a specific mediator. When enabled, the probe willalways ask the commander for the registrar.url when it starts instead of relying on a the versionspecified in dispatcher.properties.
See the section "Configure Monitoring of Multiple Java Processes on an Application Server" inthe Diagnostics Java Agent Guide for more information.
Benefits: Functionality, Usability
l .NET Agent Call Stack Sampling
Background: In previous versions, a user viewing the Call Profile view may see that sometimesthe instrumented methods have long execution times, while they are sufficiently quick in mostcases. Adding additional instrumentation for the callees of such a method is often not desirable,because the instrumentation overhead affects all invocations, not only those with long runningtimes. Such overhead would be especially high for callees invoked many times during eachinvocation of a caller, i.e. in a loop.
Release NotesWhat's New in 9.23
HP Diagnostics (9.23) Page 10 of 49
Furthermore, adding instrumentation may require multiple steps (instrumenting callees of thefirst level callees, etc.), application re-starts, and sometimes may not be even possible, forexample when the calls are made using reflection.
Description: Asynchronous thread stack trace sampling for .NET applications can now be usedto discover what the application is doing when exceptionally long executing times for a methodare observed. It is a collection technique in which some threads are periodically looked at andtheir state is recorded.
The main advantage of thread stack trace sampling is its ease of use, because no applicationrestart is required, sampling can be turned on and off dynamically and there's no additionaloverhead while sampling is turned off.
See the new section "Asynchronous Thread Stack Trace Sampling for .NET Applications" in theDiagnostics Users Guide and "Configuring Thread Stack Trace Sampling" in the Diagnostics.NET Agent Guide for more information.
This feature is also available for the Java Agent.
Benefits: Functionality, Usability
l .NET Agent Thread Diagnostics
Description: The .NET Agent now offers Thread Diagnostics on its monitored applications.TheThread Diagnostics can be turned on or off on demand to diagnose issues as they occur.
The Threads window displays thread performance metrics for the threads that are running in a.NET probed application and provides a way for you to capture stack traces for the runningthreads. There is also a thread state analyzer that displays approximate thread state distributionpercentage for each thread. This page can be useful for helping to diagnose the followingsituations:
n Incorrect thread pooling or attempting to do too much in a single thread.
n Performance problems caused by deadlocks or concurrency-related issues.
n Problems that go deep into the interactions with the OS kernel where you need to see theCPU time broken into user and kernel times.
See the new section "Threads Windows Description" in the "Diagnostics Profiler for .NET"chapter in the Diagnostics .NET Agent Guide for more information.
This feature is intended to provide the metrics to feed features like "Thread State Analyzer,""Thread Dumps," and "Thread Monitoring," which are currently available in the Java Agent.
Benefits: Functionality, Usability
Release NotesWhat's New in 9.23
HP Diagnostics (9.23) Page 11 of 49
l .NET SharePoint Monitoring and New Views in the Enterprise UI
Background: In previous versions, a user would need to use the Probes view to view informationabout the .NET Agent monitoring a SharePoint application.
Description: Automatic discovery and recognition of SharePoint probes and assignedapplication server as “Microsoft SharePoint Server” consolidated into the following new views:
n Summary: High level dashboard view of SharePoint hosts and probes
n SharePoint Probes: List of all SharePoint Probes and related metrics
n SharePoint SQL: List of sorted (by latency) SQL calls executed within SharePointenvironment
See the new section "Microsoft SharePoint Views" in the Diagnostics Users Guide for moreinformation.
Benefits: Functionality, Usability
l .NET Parameter Capture
Description: You can now configure and aggregate HTTP requests on specified queryparameters. This is useful where the latency of Server Requests may depend on the queryparameters.
See the new section "<httpcaptureparams>" in the Diagnostics .NET Agent Guide for moreinformation.
Benefits: Functionality, Usability
l .NET Automatic URI Collapsing
Background: In previous versions, each unique server requests was identified and reported inthe Call Profile view. In some applications this resulted in the Diagnostics Server being floodedwith a large number of unique server requests.
Description: The .NET Automatic URI Collapsing feature uses mathematical rules to collapsebranches of frequently used URI paths common in REST environments which have resource(ids) at the end of the paths.
n Replaces frequently used URI branches with *
n On by default. Limits defined by simple numbers separated by ‘/’ representing path limits nURI paths are retained over application restarts by persistence of applied rules and observedURI instances
n “Original URI” property available on “collapsed” Server Request call profile views
Release NotesWhat's New in 9.23
HP Diagnostics (9.23) Page 12 of 49
See the new section "<uriautocollapsing>" in the Diagnostics .NET Agent Guide for moreinformation.
Benefits: Functionality, Usability
l MyBSM Diagnostics Dashboard views now contain CIs of type WebService and WebServiceOperations
Description: In the MyBSM Diagnostics Dashboard, it is now possible to select CIs of typesWeb Service or Web Service Operation in the View Explore and see new views for those CIs.
Benefits: Functionality, Usability
l VM Heap Utilization % Metric
Description: The Java Probes view shows a new metric related to heap utilization: VM HeapUtilization %. This metric reports the percentage of heap used by the selected application beingmonitored by this probe. The heap is measured immediately after the last GC cycle, thereforeheap growth to be controlled by the GC cycle does not affect the reported percentage.
This metric is only available for probes running on an IBM or Hotspot JVM. For other JVMs, seethe VM Heap Used metrics in the Details pane.
Benefits: Functionality, Usability
Release NotesWhat's New in 9.23
HP Diagnostics (9.23) Page 13 of 49
What's New in 9.21
Platform Support Changesl Subsequent releases of Diagnostics after version 9.2x will NO LONGER support Servers
and Collectors on Solaris operating systems. After Diagnostics 9.2x, Servers andCollectors will only be supported on Windows and Linux operating systems.
Diagnostics 9.21 has a large number of defect fixes and new features, details on the new featuresare provided below.
For details on fixed defects see the patch notes on the HP support site where you downloaded thepatch: http://support.openview.hp.com/selfsolve/patches/
New Features in 9.21The 9.21 release includes the following new features.
l A new Diagnostics Python Agent and a new Python Probes view in the Enterprise UI
Description: A new Diagnostics Python Agent is available in 9.21. The Python agent capturesmethod invocations, server requests and system metrics from Python applications. Out of thebox instrumentation is included for OpenStack Cloud Computer Platform, Django webframework and WSGI. Custom instrumentation can be added. The Python agent is installed onthe same machine as the Python application under test. See the Python Agent Guide for detailson Installing and Configuring the Python Agent.
Benefits: Functionality
l User can search for an application name/group in the welcome page & for views in sidebar
Background: In prior versions, it was very difficult to find applications when a large number ofapplications exists, it’s very, very difficult to find the application of interest.
Description: The user can now enter a few characters in a box above the list of applications andthe list of applications will be immediately filtered.
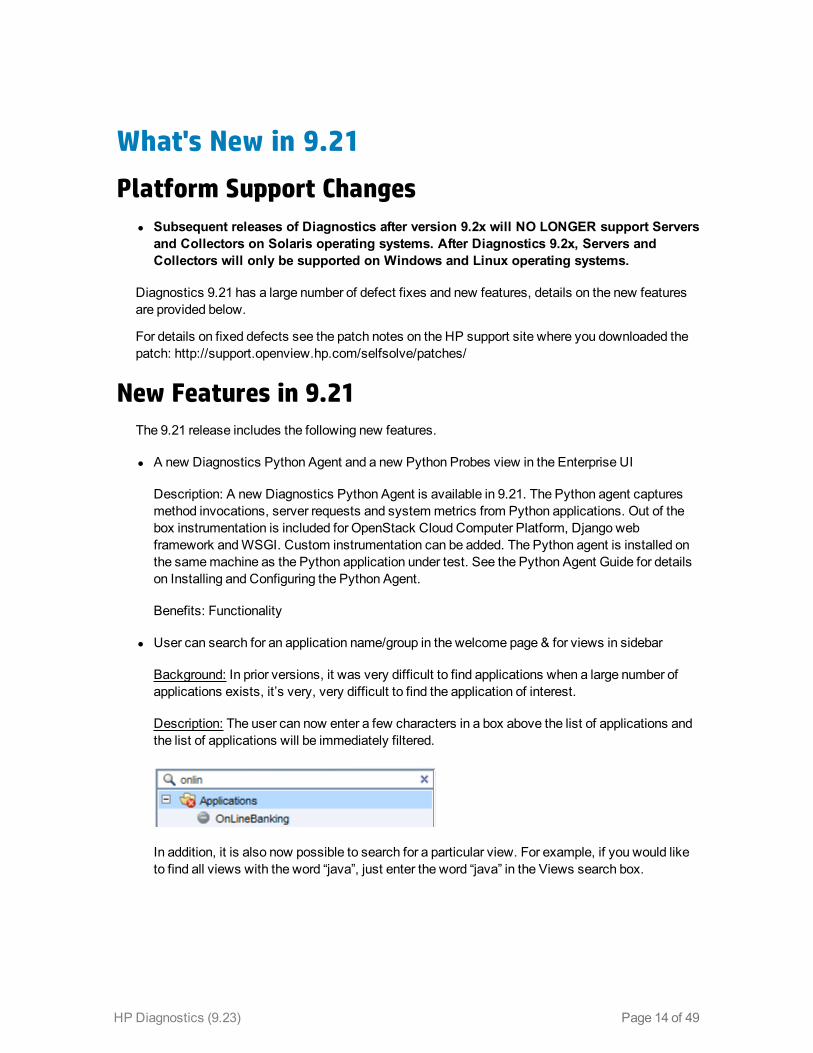
In addition, it is also now possible to search for a particular view. For example, if you would liketo find all views with the word “java”, just enter the word “java” in the Views search box.
HP Diagnostics (9.23) Page 14 of 49
Benefits: Functionality, Usability
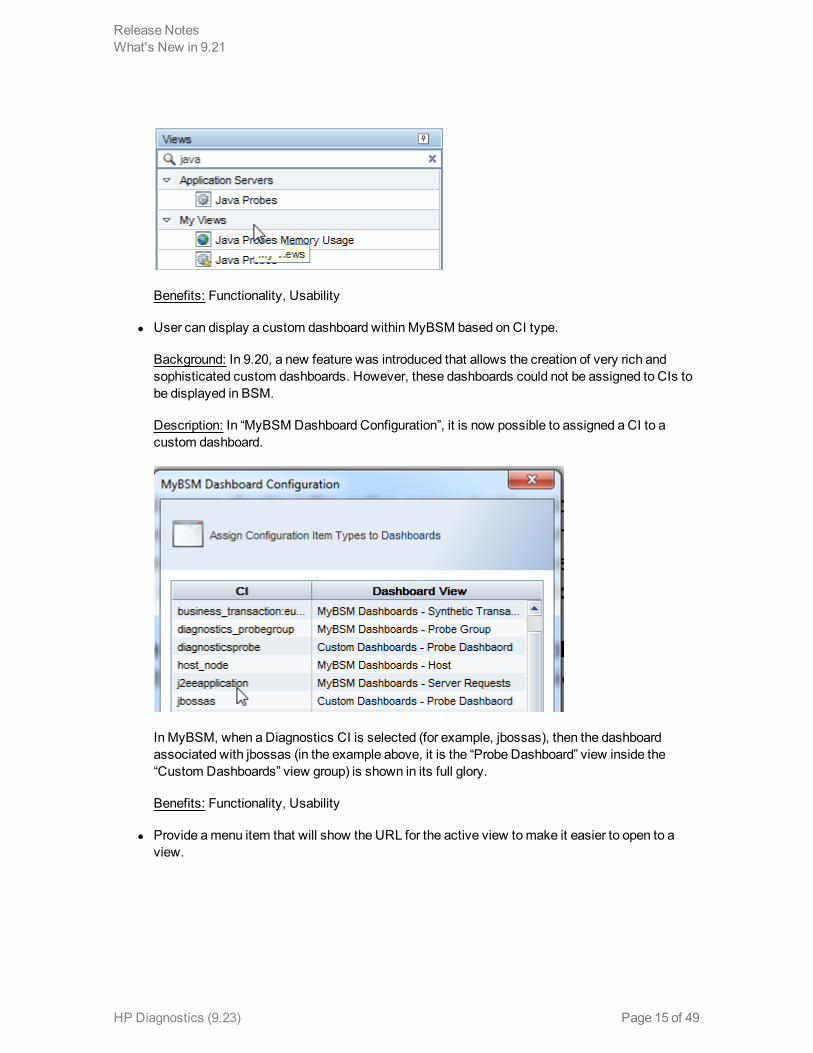
l User can display a custom dashboard within MyBSM based on CI type.
Background: In 9.20, a new feature was introduced that allows the creation of very rich andsophisticated custom dashboards. However, these dashboards could not be assigned to CIs tobe displayed in BSM.
Description: In “MyBSM Dashboard Configuration”, it is now possible to assigned a CI to acustom dashboard.
In MyBSM, when a Diagnostics CI is selected (for example, jbossas), then the dashboardassociated with jbossas (in the example above, it is the “Probe Dashboard” view inside the“Custom Dashboards” view group) is shown in its full glory.
Benefits: Functionality, Usability
l Provide a menu item that will show the URL for the active view to make it easier to open to aview.
Release NotesWhat's New in 9.21
HP Diagnostics (9.23) Page 15 of 49
Background: In past releases, it was possible to jump directly to a screen if the right URL wascreated. However, the creation of the URL was manual and error prone. An example URL mighthave been:
http://server:2006/topaz/appmon/tcAPI?action=showTxBd&customer_name=DefaultClient&view=virtual_machines_java_screen
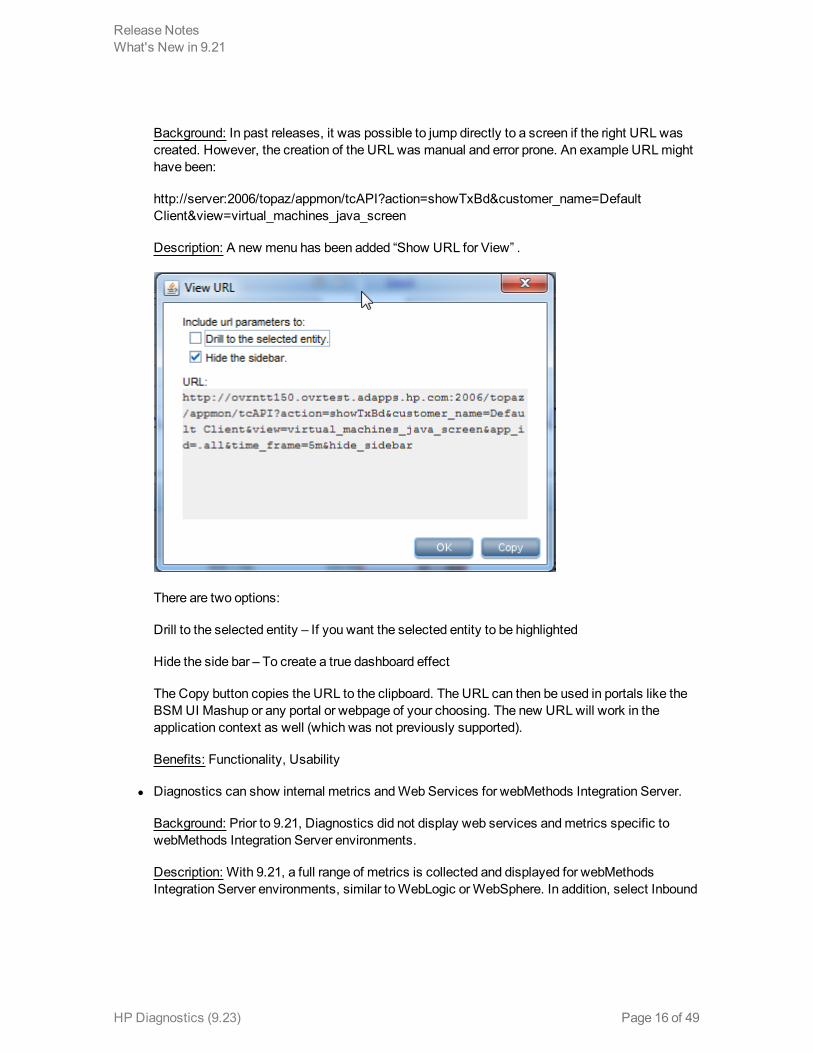
Description: A new menu has been added “Show URL for View” .
There are two options:
Drill to the selected entity – If you want the selected entity to be highlighted
Hide the side bar – To create a true dashboard effect
The Copy button copies the URL to the clipboard. The URL can then be used in portals like theBSM UI Mashup or any portal or webpage of your choosing. The new URL will work in theapplication context as well (which was not previously supported).
Benefits: Functionality, Usability
l Diagnostics can show internal metrics and Web Services for webMethods Integration Server.
Background: Prior to 9.21, Diagnostics did not display web services and metrics specific towebMethods Integration Server environments.
Description: With 9.21, a full range of metrics is collected and displayed for webMethodsIntegration Server environments, similar to WebLogic or WebSphere. In addition, select Inbound
Release NotesWhat's New in 9.21
HP Diagnostics (9.23) Page 16 of 49
and Outbound Web Services are captured and displayed in the UI along with Consumer IDs,Soap Faults, and Soap Payloads.
Benefits: Functionality
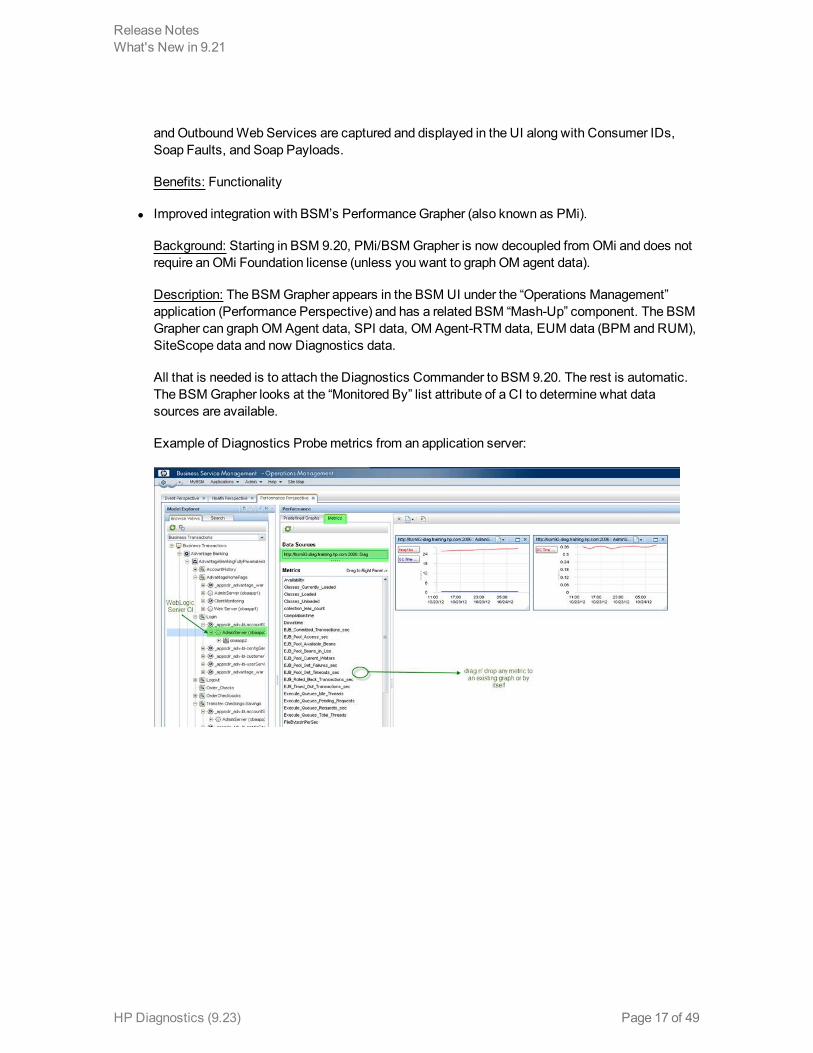
l Improved integration with BSM’s Performance Grapher (also known as PMi).
Background: Starting in BSM 9.20, PMi/BSM Grapher is now decoupled from OMi and does notrequire an OMi Foundation license (unless you want to graph OM agent data).
Description: The BSM Grapher appears in the BSM UI under the “Operations Management”application (Performance Perspective) and has a related BSM “Mash-Up” component. The BSMGrapher can graph OM Agent data, SPI data, OM Agent-RTM data, EUM data (BPM and RUM),SiteScope data and now Diagnostics data.
All that is needed is to attach the Diagnostics Commander to BSM 9.20. The rest is automatic.The BSM Grapher looks at the “Monitored By” list attribute of a CI to determine what datasources are available.
Example of Diagnostics Probe metrics from an application server:
Release NotesWhat's New in 9.21
HP Diagnostics (9.23) Page 17 of 49
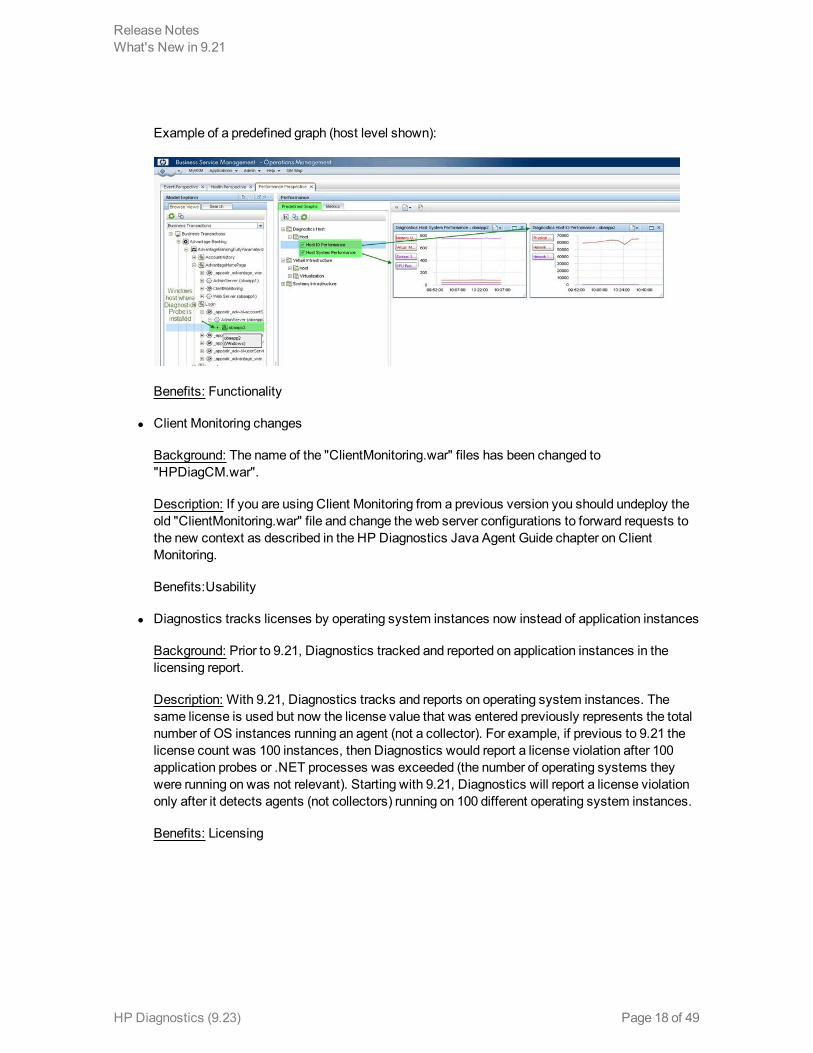
Example of a predefined graph (host level shown):
Benefits: Functionality
l Client Monitoring changes
Background: The name of the "ClientMonitoring.war" files has been changed to"HPDiagCM.war".
Description: If you are using Client Monitoring from a previous version you should undeploy theold "ClientMonitoring.war" file and change the web server configurations to forward requests tothe new context as described in the HP Diagnostics Java Agent Guide chapter on ClientMonitoring.
Benefits:Usability
l Diagnostics tracks licenses by operating system instances now instead of application instances
Background: Prior to 9.21, Diagnostics tracked and reported on application instances in thelicensing report.
Description: With 9.21, Diagnostics tracks and reports on operating system instances. Thesame license is used but now the license value that was entered previously represents the totalnumber of OS instances running an agent (not a collector). For example, if previous to 9.21 thelicense count was 100 instances, then Diagnostics would report a license violation after 100application probes or .NET processes was exceeded (the number of operating systems theywere running on was not relevant). Starting with 9.21, Diagnostics will report a license violationonly after it detects agents (not collectors) running on 100 different operating system instances.
Benefits: Licensing
Release NotesWhat's New in 9.21
HP Diagnostics (9.23) Page 18 of 49
What's New in 9.20
Platform Support Changesl Subsequent releases of Diagnostics after version 9.20 will NO LONGER support Servers
and Collectors on Solaris operating systems. After Diagnostics 9.20, Servers andCollectors will only be supported on Windows and Linux operating systems.
Diagnostics 9.20 has a large number of defect fixes and new features, details are provided below.
New Features in 9.20The 9.20 release includes the following new features.
l Some Diagnostics views have improved default graphs plus new default views.
Background: Diagnostics has many out of the box default views. An effort is made with eachrelease to improve the default views.
Description: The following views have improved graphs:
• Application Servers – Java Probes
• Application Servers – Application Explorer – Resource Utilization Metrics tab
• Java Probe Summary (drill down from Java Probe)
• .NET Probe Summary (drill down from .NET Probe)
• New view for JVM’s based on Sun/Oracle – Click on any application server based on aSun/Oracle JVM, right click and choose “Open in Custom View” and choose “JVM Health(Oracle)” to see a view with some interesting metrics unique to Sun/Oracle JVM’s.
Benefits: Functionality, Usability
l Views are easier to navigate in new tree structure and numerous overall UI improvements.
• The Outlook style left pane has been replaced with a hierarchical tree structure. The tree ismade up of a number of view groups such as “Applications”, “Application Servers”,“Infrastructure”, etc. Some of the view groups have sub groups such as “DatabaseàOracle”.The bottom leaf of a tree is a view. This new approach makes it significantly easier to navigateto the many views within Diagnostics. Many of the views are restructured into new view groups,so it will take a little while to familiarize yourself with the new structure. Note that the view groupnodes in the tree (for example “Infrastructure”) do not have any action or view associated withthem, they are simple a way to structure the views.
HP Diagnostics (9.23) Page 19 of 49
• Actions have been consolidated into one menu . Go here for all possible actions, includingHelp and Configuration. In addition to this consolidated action menu, you can right mouse on aview group or view to get a context sensitive list of actions for that view.
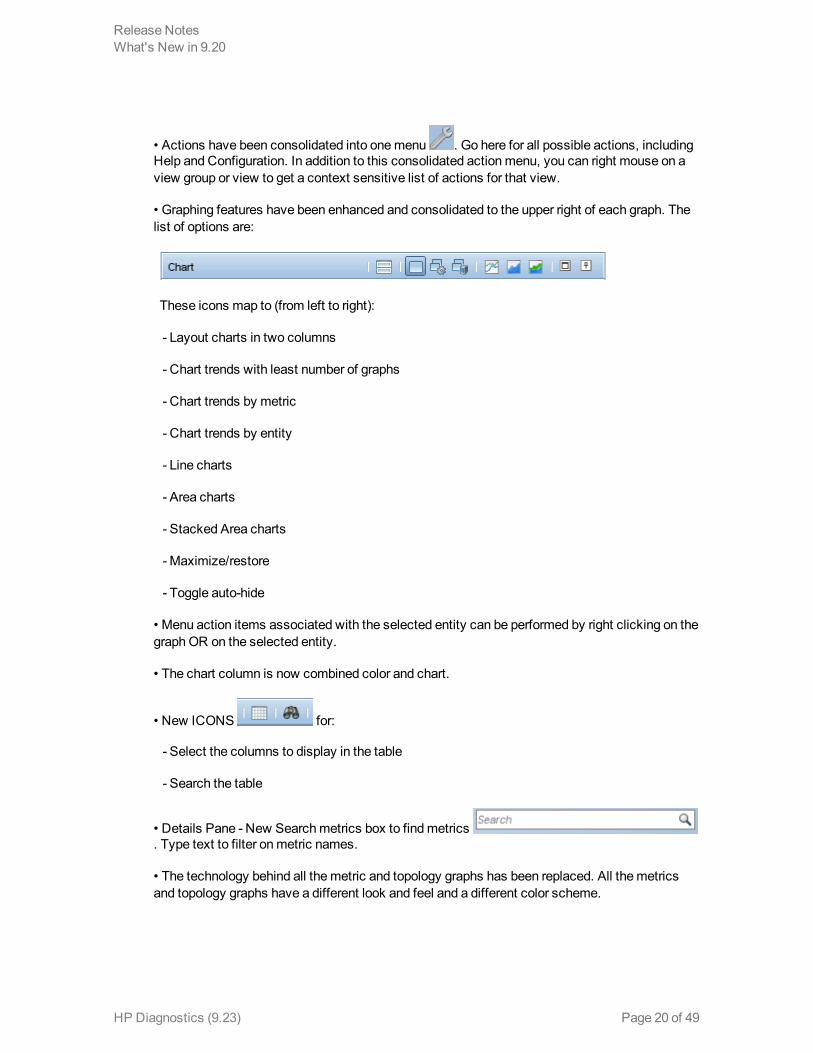
• Graphing features have been enhanced and consolidated to the upper right of each graph. Thelist of options are:
These icons map to (from left to right):
- Layout charts in two columns
- Chart trends with least number of graphs
- Chart trends by metric
- Chart trends by entity
- Line charts
- Area charts
- Stacked Area charts
- Maximize/restore
- Toggle auto-hide
• Menu action items associated with the selected entity can be performed by right clicking on thegraph OR on the selected entity.
• The chart column is now combined color and chart.
• New ICONS for:
- Select the columns to display in the table
- Search the table
• Details Pane - New Search metrics box to find metrics. Type text to filter on metric names.
• The technology behind all the metric and topology graphs has been replaced. All the metricsand topology graphs have a different look and feel and a different color scheme.
Release NotesWhat's New in 9.20
HP Diagnostics (9.23) Page 20 of 49
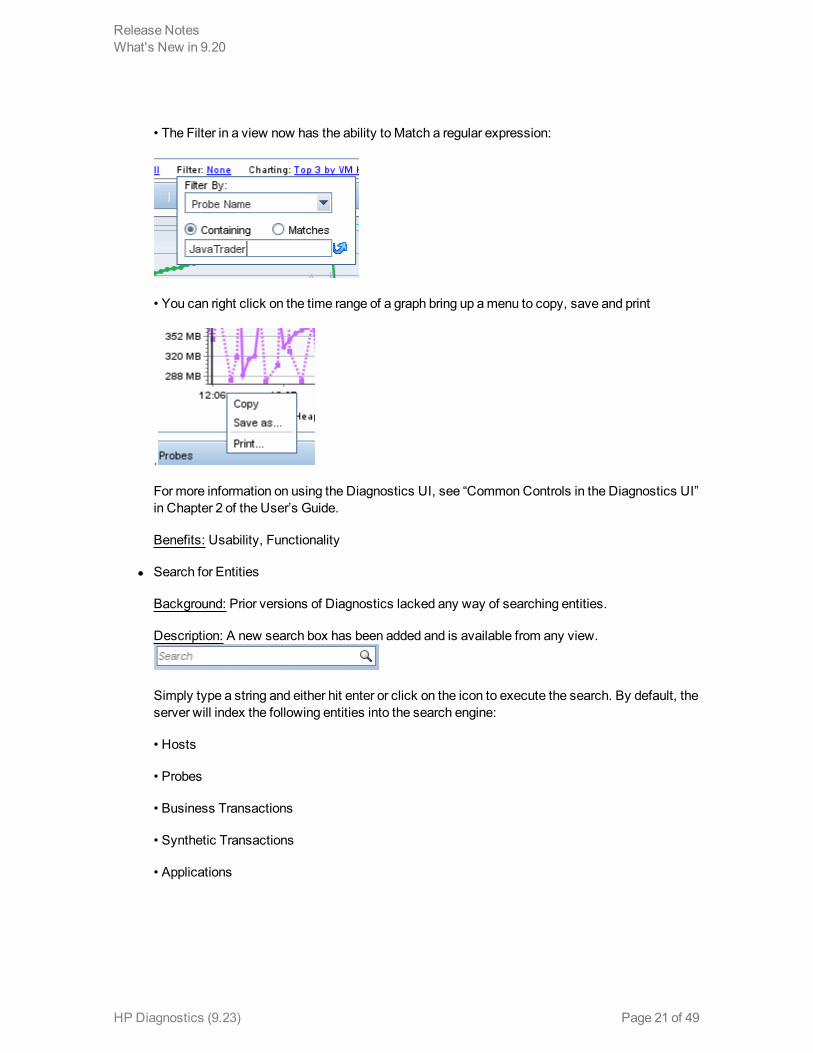
• The Filter in a view now has the ability to Match a regular expression:
• You can right click on the time range of a graph bring up a menu to copy, save and print
.
For more information on using the Diagnostics UI, see “Common Controls in the Diagnostics UI”in Chapter 2 of the User’s Guide.
Benefits: Usability, Functionality
l Search for Entities
Background: Prior versions of Diagnostics lacked any way of searching entities.
Description: A new search box has been added and is available from any view.
Simply type a string and either hit enter or click on the icon to execute the search. By default, theserver will index the following entities into the search engine:
• Hosts
• Probes
• Business Transactions
• Synthetic Transactions
• Applications
Release NotesWhat's New in 9.20
HP Diagnostics (9.23) Page 21 of 49
Server Request indexing is disabled by default. If you wish to enable this on all of your servers,you need to set:
• searchindexer.include.server_requests=true
in:
• server.properties
on the commander and every mediator.
The search is enabled by default in 9.20 (except for Server Requests) and it only takes a fewminutes to index the entire server. If you suspect that the index needs to be rebuilt (this shouldnot happen), it can be manually rebuilt in seconds via:
• http://<servername>:2006/search.
By clicking on .
For more information, see “Common Controls in the Diagnostics UI” in Chapter 2 of the User’sGuide.
Benefits: Functionality, Usability
l Client Monitoring
Background: Diagnostics now provides client (browser) side instrumentation to measure theexact time a request takes from the client to the server.
Description: New in 9.20 is the ability to captures total, server and render time of a “page” asexperienced by the user (browser). This feature will show the “true” user experience (includesdownload of components and render time). After you deploy the ClientMonitoring.war file to yourapplication server and update your webserver configuration to provide external access,the clientmonitoring feature automatically enables itself within the Java Agent and no further configurationor user interaction is needed. After the JSP’s are instrumented, performance data can bedisplayed in the UI in the following way:
• By URL
• By Browser Type
• By Location
Diagnostics has the ability to automatically instrument JSP’s for select technologies. Theseinclude:
• Tomcat
• JBoss
Release NotesWhat's New in 9.20
HP Diagnostics (9.23) Page 22 of 49
• WebLogic
• WebSphere
For more details on this new feature, please see “Client Monitoring Views”, Chapter 39 of theUser’s Guide.
Benefits: Functionality
l Dashboard Creator
Background: In prior Diagnostics versions, it was possible to create a “Dashboard” or customview by creating a new view and dragging and dropping completed views (either stock orcustom) into the different sections. This capability was limited and did not allow complex, robustdashboard views to be created easily.
Description: In 9.20, there is a Dashboard View Creator feature which has a large number of newfeatures. The dashboard can include any number of sections, any size or rectangular shape,each including one of the following choices:
• Time Series Chart as Line charts, Area charts or Stacked Area charts
• Summary Chart with Pie or Bar charts
• Table
• Status
• Image
• Probe topology
For each section or feature (except for the probe topology), the user is allowed to choose fromthe following entities:
• Application
• Business Transaction
• Host
• Layer
• Outbound Call
• Probe
• Server Request
• SQL
Release NotesWhat's New in 9.20
HP Diagnostics (9.23) Page 23 of 49
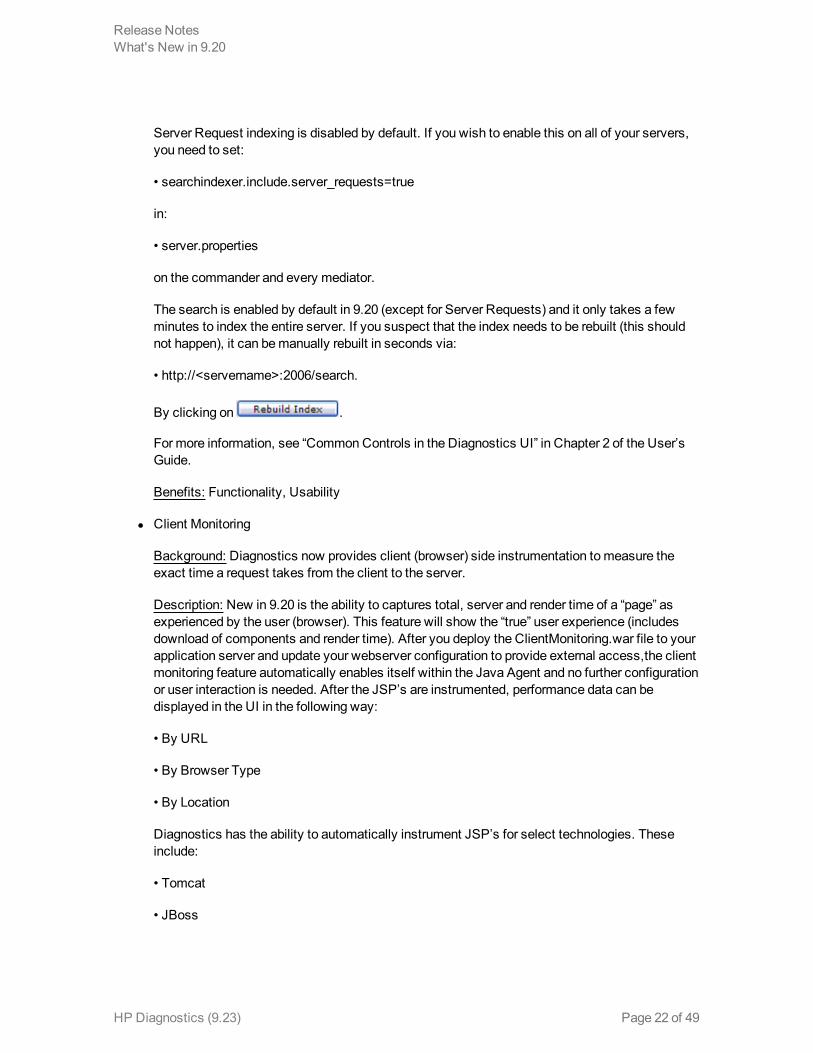
• Synthetic Transaction
See “Working with Custom Views and Dashboards” in Chapter 7 of the User’s Guide for moredetails on how to get started with this new feature. Here is an example of what can be created:
Benefits: Functionality, Usability
l Open in Custom View
Background: In prior Diagnostics versions, it was possible to select an entity such as a JavaProbe and right mouse to select “Open in Custom View”. However, this feature was very limitedbefore the addition of the Dashboard Creator feature.
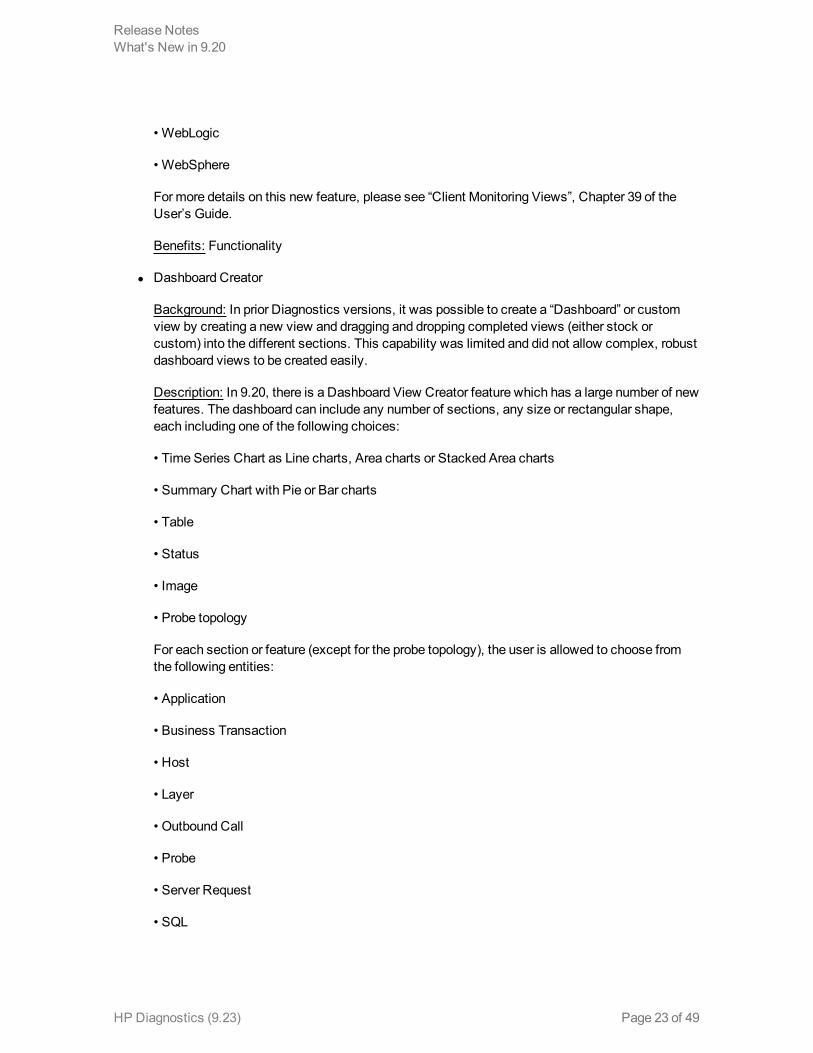
Description: The best way to explain this feature is by showing an example. In this example, acustom dashboard was created that looks like this for Java probes:
Release NotesWhat's New in 9.20
HP Diagnostics (9.23) Page 24 of 49
The graph has the following components:
1. Top Left – Time Series chart with Throughput and Latency (Avg) for the application server
2. Top Right - A bar chart showing the top 7 server requests by Latency (Avg)
3. Bottom Left – This is an advanced component that has 3 tabs:
- A tab with a table of SQL statements for the application server (not shown)
- A tab with a topology graph of the application server (shown)
- A tab with pie chart of the layers in the application server showing Latency (not shown)
4. Middle Right – A table of all the Server Requests for the probe
5. Bottom Right – Status of the probe
When the template is created, it’s easiest to see what it would look like if you filter on a specificprobe when you create each graph, but this is not a strict requirement. Since it is just a template,it does not matter. Do whatever it takes to make the template look as desired. Once thetemplate is in place, to use the template, go to the Java Probe view and select any probe, rightclick and “Open in Custom View” and open it with the view you created. The result will look likethis:
Release NotesWhat's New in 9.20
HP Diagnostics (9.23) Page 25 of 49
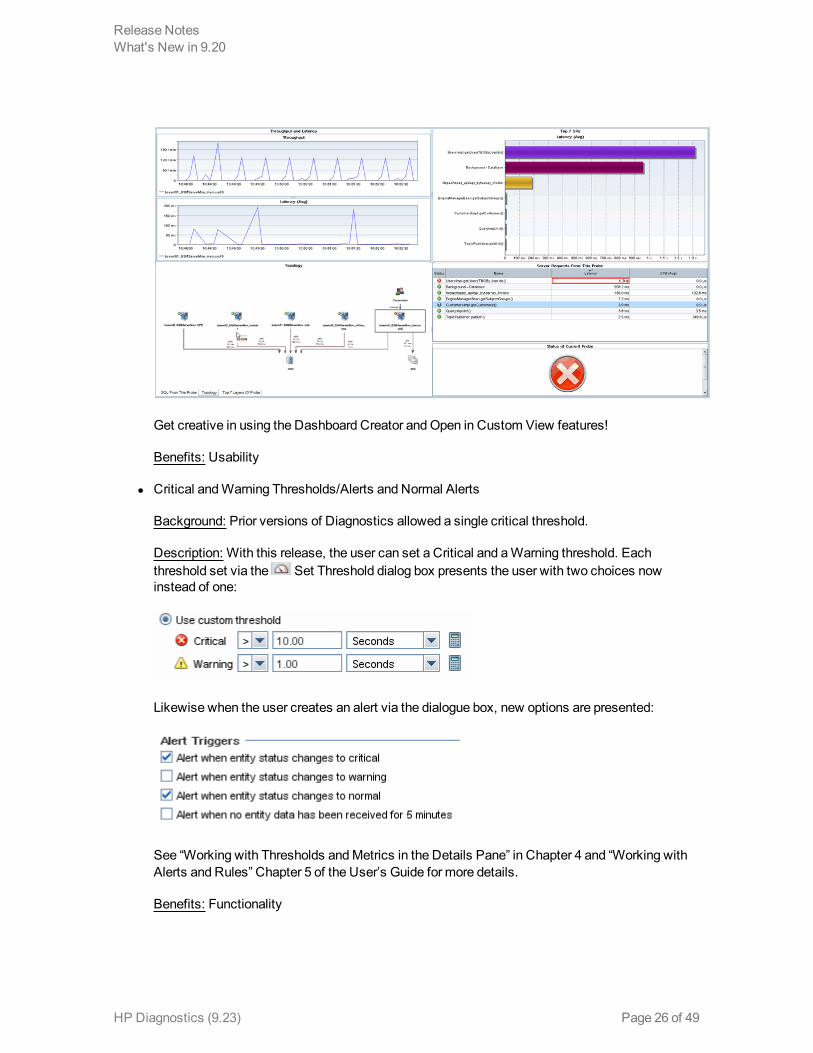
Get creative in using the Dashboard Creator and Open in Custom View features!
Benefits: Usability
l Critical and Warning Thresholds/Alerts and Normal Alerts
Background: Prior versions of Diagnostics allowed a single critical threshold.
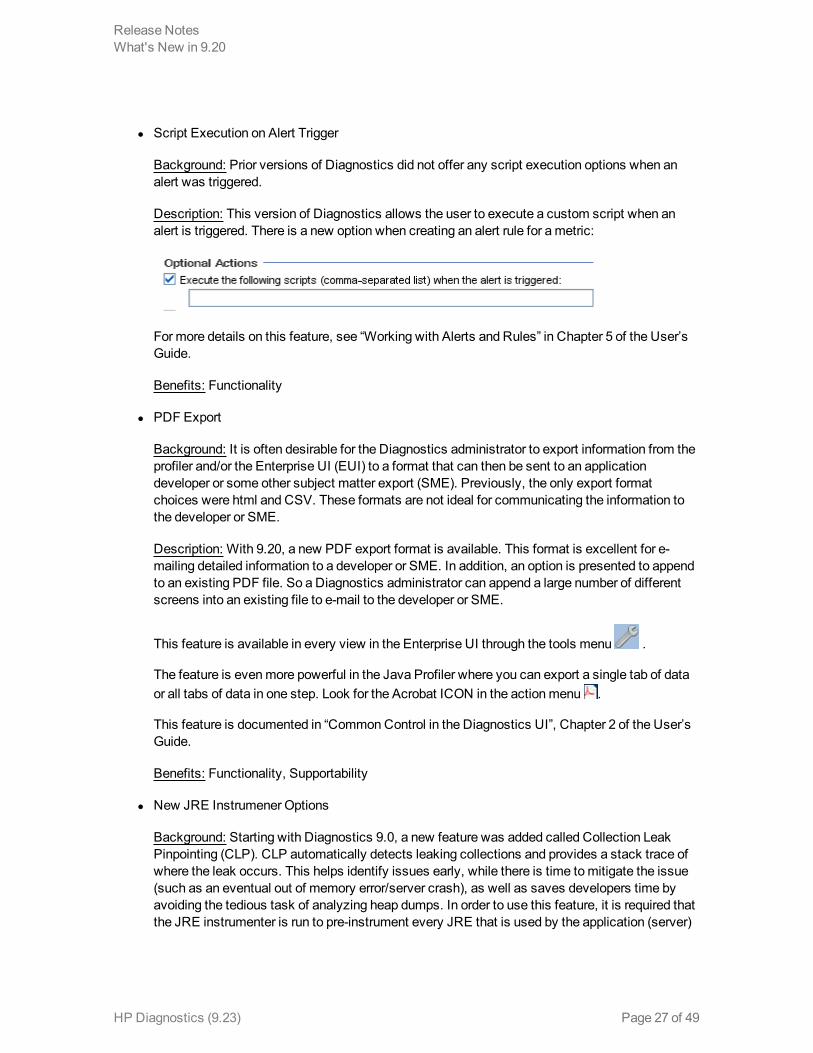
Description: With this release, the user can set a Critical and a Warning threshold. Eachthreshold set via the Set Threshold dialog box presents the user with two choices nowinstead of one:
Likewise when the user creates an alert via the dialogue box, new options are presented:
See “Working with Thresholds and Metrics in the Details Pane” in Chapter 4 and “Working withAlerts and Rules” Chapter 5 of the User’s Guide for more details.
Benefits: Functionality
Release NotesWhat's New in 9.20
HP Diagnostics (9.23) Page 26 of 49
l Script Execution on Alert Trigger
Background: Prior versions of Diagnostics did not offer any script execution options when analert was triggered.
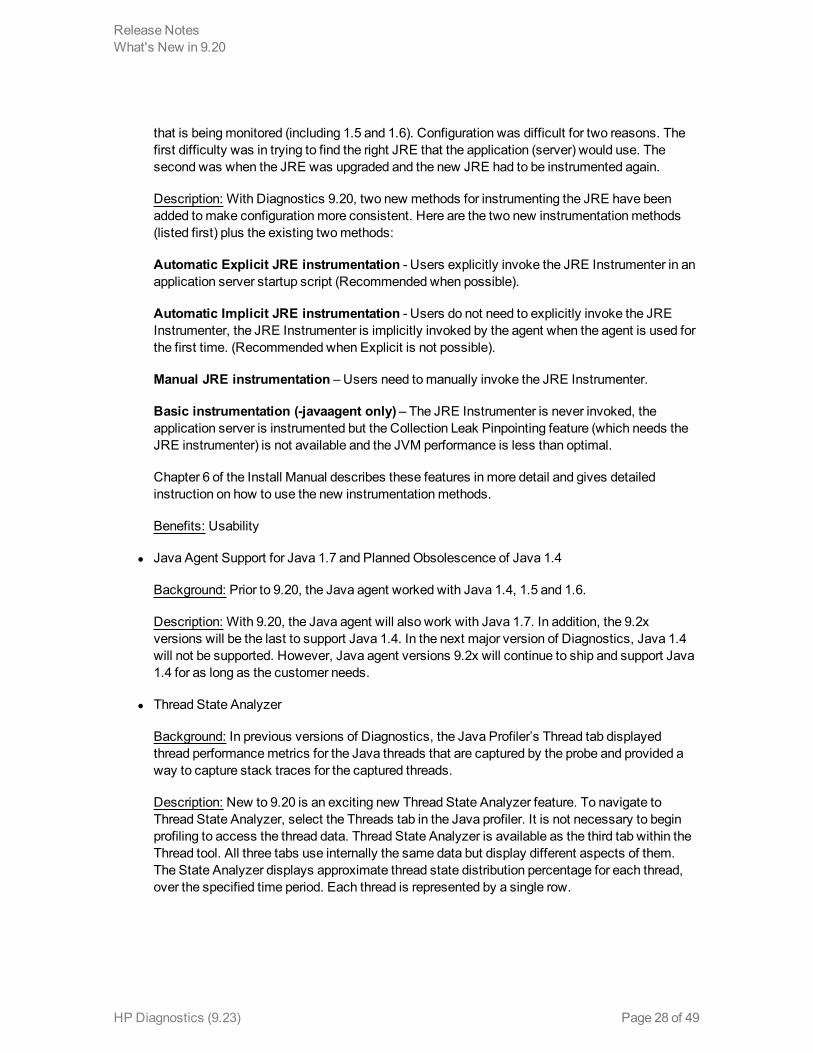
Description: This version of Diagnostics allows the user to execute a custom script when analert is triggered. There is a new option when creating an alert rule for a metric:
For more details on this feature, see “Working with Alerts and Rules” in Chapter 5 of the User’sGuide.
Benefits: Functionality
l PDF Export
Background: It is often desirable for the Diagnostics administrator to export information from theprofiler and/or the Enterprise UI (EUI) to a format that can then be sent to an applicationdeveloper or some other subject matter export (SME). Previously, the only export formatchoices were html and CSV. These formats are not ideal for communicating the information tothe developer or SME.
Description: With 9.20, a new PDF export format is available. This format is excellent for e-mailing detailed information to a developer or SME. In addition, an option is presented to appendto an existing PDF file. So a Diagnostics administrator can append a large number of differentscreens into an existing file to e-mail to the developer or SME.
This feature is available in every view in the Enterprise UI through the tools menu .
The feature is even more powerful in the Java Profiler where you can export a single tab of dataor all tabs of data in one step. Look for the Acrobat ICON in the action menu .
This feature is documented in “Common Control in the Diagnostics UI”, Chapter 2 of the User’sGuide.
Benefits: Functionality, Supportability
l New JRE Instrumener Options
Background: Starting with Diagnostics 9.0, a new feature was added called Collection LeakPinpointing (CLP). CLP automatically detects leaking collections and provides a stack trace ofwhere the leak occurs. This helps identify issues early, while there is time to mitigate the issue(such as an eventual out of memory error/server crash), as well as saves developers time byavoiding the tedious task of analyzing heap dumps. In order to use this feature, it is required thatthe JRE instrumenter is run to pre-instrument every JRE that is used by the application (server)
Release NotesWhat's New in 9.20
HP Diagnostics (9.23) Page 27 of 49
that is being monitored (including 1.5 and 1.6). Configuration was difficult for two reasons. Thefirst difficulty was in trying to find the right JRE that the application (server) would use. Thesecond was when the JRE was upgraded and the new JRE had to be instrumented again.
Description: With Diagnostics 9.20, two new methods for instrumenting the JRE have beenadded to make configuration more consistent. Here are the two new instrumentation methods(listed first) plus the existing two methods:
Automatic Explicit JRE instrumentation - Users explicitly invoke the JRE Instrumenter in anapplication server startup script (Recommended when possible).
Automatic Implicit JRE instrumentation - Users do not need to explicitly invoke the JREInstrumenter, the JRE Instrumenter is implicitly invoked by the agent when the agent is used forthe first time. (Recommended when Explicit is not possible).
Manual JRE instrumentation – Users need to manually invoke the JRE Instrumenter.
Basic instrumentation (-javaagent only) – The JRE Instrumenter is never invoked, theapplication server is instrumented but the Collection Leak Pinpointing feature (which needs theJRE instrumenter) is not available and the JVM performance is less than optimal.
Chapter 6 of the Install Manual describes these features in more detail and gives detailedinstruction on how to use the new instrumentation methods.
Benefits: Usability
l Java Agent Support for Java 1.7 and Planned Obsolescence of Java 1.4
Background: Prior to 9.20, the Java agent worked with Java 1.4, 1.5 and 1.6.
Description: With 9.20, the Java agent will also work with Java 1.7. In addition, the 9.2xversions will be the last to support Java 1.4. In the next major version of Diagnostics, Java 1.4will not be supported. However, Java agent versions 9.2x will continue to ship and support Java1.4 for as long as the customer needs.
l Thread State Analyzer
Background: In previous versions of Diagnostics, the Java Profiler’s Thread tab displayedthread performance metrics for the Java threads that are captured by the probe and provided away to capture stack traces for the captured threads.
Description: New to 9.20 is an exciting new Thread State Analyzer feature. To navigate toThread State Analyzer, select the Threads tab in the Java profiler. It is not necessary to beginprofiling to access the thread data. Thread State Analyzer is available as the third tab within theThread tool. All three tabs use internally the same data but display different aspects of them.The State Analyzer displays approximate thread state distribution percentage for each thread,over the specified time period. Each thread is represented by a single row.
Release NotesWhat's New in 9.20
HP Diagnostics (9.23) Page 28 of 49
The left panel provides the thread name. The center panel provides the thread state data. Thetotal height of the colored bar represents 100%. If a thread has been in more than one stateduring the observation period, multiple colors are used to display the corresponding states,proportionally to the time spent in those states. For automatic updates, the observation period isthe same as the configured refresh period.
The right panel displays the current method name with line number, if available. If the stacktraces collected for the thread over the observation period are all the same, the method name isdisplayed using a bold font. If different stack traces were observed, the displayed method is thetopmost common method for the collected stack traces, and its display uses a regular font. If nosuch common method could be found, nothing is displayed.
The following thread states are presented by the Thread State Analyzer:
• Deadlocked - the thread participates in a deadlock cycle
• Blocked - the thread is delayed (suspended) when trying to enter a Java monitor. This canhappen when the thread tries to invoke a synchronized method, enter a synchronized block, orre-enter the Java monitor after being awaken from the waiting state, while another thread has notleft the Java monitor yet.
• Running - the thread is actively consuming CPU time
• I/O - the thread is performing an I/O operation. It does not use any CPU time. The notion of I/Ocovers not only the traditional operations on files or sockets, but also covers any multimedia orgraphics operations. In general, the thread is waiting for an external (out-of-process) event
• Sleeping - the thread is delayed after invoking the Thread.sleep() method
• Waiting - the thread is delayed, usually having executed Object.wait(). However, threads canget into this state by other means. In general, the thread is waiting for an internal (in-process)event
• Starving - the thread is runnable, i.e. not suspended by any I/O, wait(), sleep() or Java monitoroperation, but is not running. This can be caused by insufficient number of CPUs available,Garbage Collection pauses, excessive paging, or by a virtual machine guest OS experiencing ashortage of resources
• Unknown - the Diagnostics Agent was unable to determine the state of the thread
Benefits: Functionality
l Developers Performance Report for their JUnit Tests
Description: Developers can add the Java agent when running their JUnit tests and configure itso that it generates a performance report for all of the unit tests.
This is useful to find out if the performance (latency/CPU) of a particular test has changed overtime. When the unit test finishes, the probe creates a CSV file for each server request and a
Release NotesWhat's New in 9.20
HP Diagnostics (9.23) Page 29 of 49
complete listing of all methods that were part of the test case. The CSV file can be opened in aSpreadsheet program to analyze and visualize performance characteristics (the Filter function inExcel is very helpful to select specific methods).
Benefits: Functionality, Performance
l Oracle RAC Support
Background: Prior versions of the Diagnostics Oracle collector did not support Oracle RAC.
Description: New to this release is the ability to connect to Oracle RAC and have the Oraclecollector automatically monitor all instances of the cluster. See Chapter 4 of the HP DiagnosticsInstallation and Configuration Guide for more details.
Benefits: Functionality
l VMware CI and HI Population
Background: Prior to this release, HP Diagnostics did not populate Configuration Items (CI’s) orHealth Indicators (HI’s) with VM Ware information from the VM Ware collector.
Description: If Diagnostics server is registered with BSM and the Diagnostics VMware Collectoris installed and configured to collect from a vSphere instance, when the Diagnostics UI“VMware Hosts” and “VMware Guests” views contain instances, the user can view in BSMApps -> SH -> Top View -> Virtualization_Infrastructure the VMware host instances as VMwareESX Server CI's in which each CI has a composition link to a vmware_hypervisor CI which inturn has execution_environment links to Computer CIs (or Windows or Unix sub-types)corresponding to the VMware guests contained in the VMware host as displayed by theDiagnostics UI.
In addition to the population of CI's, the following subset of the HIs are sent to VMware host andguest CIs:
• CPULoad
• MemoryUsageLevel
• HostDiskUtilization
• InterfaceUtilization
Benefits: Functionality
l New Online Help System
Background: HP Software is migrating to a common look and feel for the online help system.Diagnostics 9.20 has switched to this new help system along with BSM.
Description: You can launch the new online help system from the Tools menu .
Release NotesWhat's New in 9.20
HP Diagnostics (9.23) Page 30 of 49
Blue tabs on the bottom left of the help window let you switch between Contents, Search andFavorite pane.
Buttons at the top right let you go to next topic/prev topic, print and add to favorites.
Let us know if you have any feedback on the help or other documentation.
Benefits: Consistency with other HP products
l .NET Agent Azure Pack for 9.20
Background: The enhancements of the .NET Azure pack address some of the limitations of the9.12 Azure pack and updated for changes in the 9.20 Agent.
Description: The following list reflects the new features available through these changes.
The AzurePack will install the metrics agent so that the Host Metrics can be reported to theDiagnostics Server
The AzurePack startup will be changed to accommodate the .NET Agent Http WebServerchanges.
For a single host cloud deployment, the user can view the profiler using port 35000.
Benefits: Host metrics and limited profiler support in Azure deployed applications
l .NET Agent WCF Service Support for HTTP and TCP Transport Based Bindings
Background: Previous .NET Agent versions supported limited number of Bindings viz.
1. BasicHTTP
2. WSHTTP
3. netTCP.
We ran into other bindings with customer engagements like CustomBinding, WebHttpBinding,etc which we did not support. We need to expand our WCF binding support as the technologybecomes more prevalent and popular.
Description: The WCF support is redesigned around transport type instead of binding type. Thisenables support for many more standard and custom bindings. The Webservice entityidentification has also been modified to make it non-ambiguous over different types of transportsand bindings.
Benefits: Wider support for WCF based services and applications.
l .NET Agent FIPS Compliance
Background: Previous .NET Agent versions used Rijndael cryptoservice provider to encrypt the
Release NotesWhat's New in 9.20
HP Diagnostics (9.23) Page 31 of 49
profiler passwords. This algorithm is not FIPS compliant and the library not available on FIPScompliant windows OSes. To support FIPS compliant OSes, we added a default OOBencryption using TripleDESCryptoService Provider which is FIPS compliant.
Description: The default OOB encryption algorithm for profiler password is now theTripleDESCryptoService Provider. We maintain backward compatibility with the followingconfiguration option.
<profiler authenticate="true" usefipscryptoprovider="true"/>.
Setting usefipscryptoprovider="false" will revert to pre 9.20 behavior. Also the PassGen utilitywhich encrypts passwords will use the TripleDESCryptoService by default. To use the previousRijndael encryption use the “\r” option.
Benefits: Acceptance and greater sales opportunities in Federal accounts where FIPScompliance is often mandated.
l .NET Agent Web Server Redesign, Replace TCP Based Webserver with HTTP Based
Background: Previous .NET Agent versions had a webserver which was built on simple TCPIPsockets interface and limited home-grown HTTP processing. This made it less efficient(andstable) and difficult to enhance in terms of new HTTP requests. This redesign will provide easierenhancements and integrations for the much desired eventual .NET profiler UI make-over.
Description: The new HTTP based web-server is more efficient, stable and easier to enhancethan the older implementation. In this version there are no significant profiler changes. The oneenhancement added is more support related, i.e. now you can access the .NET Probe log andconfiguration files remotely using the web interface
http://hostname:35000/profiler/logfile - Domain Log file
http://hostname:35000/profiler/ilogfile - Instrumentation log file
http://hostname:35000/profiler/config - probe_config.xml file
Benefits: Efficiency, Stability and Enhancement of the .NET Profiler. Better support tools due toavailability of the log and configuration files using the web interface.
l .NET Agent URI Pattern Replacement Capability
Background: Static content served by a website creates a lot of uninteresting Server Requestsfor a probe. This was more apparent in SharePoint websites which deliver documents and otherartifacts. Also as web-design is moving towards javascript based rendering and logic, theprevalence of static\uninteresting Server requests has increased. This also caused over-population in the Diagnostics Server symbol table. To reduce the amount of uninteresting ServerRequests and to be able to aggregate certain types of static data, we have introduced thecapability of replacing URI patterns with pre-configured and customizable rules.
Release NotesWhat's New in 9.20
HP Diagnostics (9.23) Page 32 of 49
Description: Added configuration options which will allow URI replacement based on rules.Pattern searching is defined using regular expression syntax. The option in the probe_config.xmlfile is noted below with the default options
<symbols>
<urireplacepattern enabled="true">
<pattern value="s#(;|/?\\!).*$##" />
<pattern value="s#(?<word1>^.*)(/.*\.(js|css|jpg|gif|png|pdf|html|doc|docx)$)#$word1/StaticContent" />
</urireplacepattern>
</symbols>
Benefits: Fewer uninteresting Server Requests. Better support for Sharepoint deployments dueto the ability to rename URIs to consolidate static content and team site requests.
l Diagnostics is integrated with Continuous Delivery Automation
Description: The Continuous Delivery Automation (CDA) product provides a model drivenapproach to DevOps collaboration, automation of application deployment and monitoring. Thisenables customers to focus on their core applications and in driving business value whilereducing costs, risks and time to perform provisioning and deployment tasks. The core featuresprovided include:
- Application and Infrastructure modeling and Configuration management including versioncontrol, role based access, lifecycle management
- Application Deployment management using the tools of customer choice
- Infrastructure Provisioning management
- Embedded monitoring deployment in conjunction with application deployment
Benefits: Functionality, efficiency.
Release NotesWhat's New in 9.20
HP Diagnostics (9.23) Page 33 of 49
System RequirementsThe new Diagnostics System Requirements Guide contains information about systemrequirements for all Diagnostics components. This guide is available as a PDF on the HP SoftwareSupport Online Product Manuals site. Access requires an HP Passport login (register for an HPPassport).
For details about supported environments, refer to the Diagnostics Product Availability Matrix athttp://support.openview.hp.com/sc/support_matrices.jsp.
HP Diagnostics (9.23) Page 34 of 49
Notes and LimitationsNotes and limitations are provided for the following component areas (click the links below to seedetails). Note that the defect tracking number shown (for example 35266) is generally prefixed withQCCR1I.
l "Java Agent" below
l ".NET Agent" on page 39
l "Integrations (BSM, PC, LR, TV, SaaS)" on page 40
l "Collectors (Oracle, SAP, MQ, TIBCO EMS, SQL Server, webMethods, VMware)"
l "Java Profiler" on page 43
l ".NET Profiler" on page 43
l "Diagnostics Server" on page 44
l "User Interface" on page 45
l "Documentation" on page 47
l "Translated Versions" on page 47
Java Agentl When the dynamic property enable.stack.trace.sampling is set to "auto" (the default value), it
activates stack trace sampling with the limitations described below: (38822) (43937)
n On any Java 1.5 implementation with the following limitations:
o For HotSpot JVM, version 1.5.0_04 or later is required
o For JRockit JVM, JRockit version R27.4 or later is required
n On any Java 1.6 implementation with the following limitations:
o For PA-RISC HP-UX, JRE version 1.6.0.03 or later is required
o "Too many open files" erros after deploying probe on an IBM Java 6 64-bit JVM (60289)
A bug in some versions of IBM's Java implementation may (APAR IZ 99243) cause theapplication to crash with a "too many open files" error when used with Diagnostics Agent.The affected JVMs do not run any object finalizers when invoked with a -javaagent optionpointing to an agent which declares its capability to instrument classes dynamically ("Can-Redefine-Classes" is set to true in the manifest file).
HP Diagnostics (9.23) Page 35 of 49
Workaround: Invoke the Diagnostics Agent without using "-javaagent". After running thejreinstrumenter for the JRE in question, use the java options recommended by thejreinstrumenter with the -javaagent option removed, and with<probe_install_dir>/classes/boot directory added to the - Xbootclasspath.For example:
-Xbootclasspath/p:/opt/MercuryDiagnostics/JavaAgent/DiagnosticsAgent/classes/IBM/1.6.0/instr.jre:/opt/MercuryDiagnostics/JavaAgent/DiagnosticsAgent/classes/boot -Xshareclasses:none
l JBoss application fails to startup with RMI instrumentation (62520)
Problem: After RMI instrumentation has been activated on a JBOSS v9 application server, thereis an Exception on the JBOSS start-up log as seen below.
Caused by: java.lang.ClassNotFoundException: No ClassLoaders found for:com.mercury.opal.capture.RMIRemoteProxy (no security manager: RMI class loader disabled)
Resolution: Customer should setup JBoss such that there is a security manager with anappropriate policy that includes permissions for codebase pathscodebase = "file:<probe_install_dir>/etc/file:<probe_install_dir>/classes/ file:<probe_install_dir>/lib/probe.jarfile:<probe_install_dir>/lib/ThirdPartyLibs.jar".
The following example enables a security manager with all permissions. Customer should setuppolicy with restrictions as appropriate:
-Djava.security.manager -Djava.security.policy=<full_path_name_of_policy_file>
on the client side.
grant
permission java.security.AllPermission;
l When using basic or automatic implicit JRE instrumentation with an IBM 1.6.0 2.6 JVM, a JVMcrash will occur. (72394)
For example:
17:31:40.791 0x4839d09000 j9mm.141 * ** ASSERTION FAILED ** at./ParallelScavenger.cpp:2312: ((false))
JVMDUMP006I Processing dump event "traceassert", detail "" - please wait.
Workaround. To work-around this problem, use the new Diagnostics 9.20 Automatic ExplicitJRE instrumentation mode or the older Manual JRE instrumentation mode to avoid the problem.
l Special configuration needed to support SAP JVM NetWeaver 7.1 and later (43388)
Release NotesNotes and Limitations
HP Diagnostics (9.23) Page 36 of 49
Because NetWeaver 7.1 runs in a clustered environment, you will need to do one of the followingin order to distinguish the probes in the cluster:
n Find a way to set the probe.id for each individual server process in your cluster (an expertSAP administrator might be able to help).
n If the above is not possible, then you need to specify the keyword %0 in the probe name.Doing this will name each probe in the cluster uniquely. For example, if you specify "-Dprobe.id=myProbe%0" then the first probe that comes up will be called "myProbe0", thesecond one "myProbe1" and so on.
l There is a potential issue on HP-UX 11.23 with IBM WebSphere: When multiple probes areinstalled on the same system, it can happen that the probe's communication port (35000) will beoverwritten with each startup of the probe. In this case, simply specify a different port range foreach of the probes in etc/webserver.properties, for example:
n jetty.port=36000
n jetty.max.port=36100
Or specify the above parameters on the app server's startup configuration (via -D). (44062)
l Using the Heapwalker feature with JRockit JVM version 27.3 may cause the application tocrash. Versions 27.2 and 27.4 and higher work as expected, so the problem is only with version27.3. Please upgrade to a higher version of JRockit to fix this problem. (43993)
l When instrumenting an IBM 1.6 JVM on z/OS only, using the output of the JRE Instrumenter,the JVM will fail to start with a java/lang/NoClassDefFoundError exception. (50969)
To correct this issue, modify the -Xbootclasspath parameter by appending ":<probe_install_dir>/classes/boot" substituting for <probe_install_dir> appropriately. In particular note therequired colon after instr.jre.
For example, if the output of the JRE Instrumenter was:
"-Xbootclasspath/p:/opt/JavaAgent/DiagnosticsAgent/classes/IBM/1.6.0/instr.jre""-javaagent:/opt/JavaAgent/DiagnosticsAgent/lib/probeagent.jar"-Xshareclasses:none
Change it to:
"-Xbootclasspath/p:/opt/JavaAgent/DiagnosticsAgent/classes/IBM/1.6.0/instr.jre:/opt/JavaAgent/DiagnosticsAgent/classes/boot""-javaagent:/opt/JavaAgent/DiagnosticsAgent/lib/probeagent.jar"-Xshareclasses:none
l When the Diagnostics/TransactionVision Agent is run in "dual" mode, there is a limitation onJDBC calls. "Dual" mode means that both Diagnostics Java probe and TransactionVision Java
Release NotesNotes and Limitations
HP Diagnostics (9.23) Page 37 of 49
sensor are enabled on the system. In this configuration, Diagnostics has the followinglimitations:
1) No data will show up from nodes in "dual" mode in the "SQL Statements" view.
2) When drilling down to a Call Profile, JDBC calls will not show the SQL statement in theArguments of the call.
This problem will be fixed in a future release of Diagnostics. (42989)
l GC Time Spent in Collections metric may be inaccurate (JRockit JREs only)
The problem is caused by a bug in JRockit JRE which reports the time spent in GC innanoseconds rather than in milliseconds, as specified.
Workaround: either upgrade JRockit to version 1.5.0_10, build R27.2.0 (or later) or modify theRate setting as follows:
In <probe_install_dir>/etc/metrics.config, change "[0.1]" to "[0.0000001]" in the line whichdefines "GC Time Spent in Collections" metric. For example:
Java\ Platform/java.lang\:type\=GarbageCollector,*.CollectionTime = RATE[0.0000001](GC Time Spent inCollections|percent|GC) (42344)
l If the following WARN message is found in the probe.log file on the probe system:
2006-11-28 07:07:27,171 WARN com.mercury.opal.capture [ExecuteThread: `8' for queue:`weblogic.kernel.Default'] Maximum number of SQL queries cached (4096). The values of someprepared SQL queries will be lost. See sql.cache.size in capture.properties.
Then you will need to increase the sql.cache.size in the capture.properties file on the probesystem. (40639)
l By default, Diagnostics does not monitor server requests that always execute in under 51milliseconds. These requests are trimmed-no information is captured about them. SQLstatement executions made from these trimmed requests are not recorded, even if those sameSQL statements are timed and recorded in the context of executing other server requests. Inaddition, the probe-level layer breakdown does not include time taken by trimmed serverrequests.
An exception to this is in a case where, on at least one occasion, a server request takes longerthan 51ms to execute. Future executions of that server request are recorded, even if thesubsequent requests are faster than 51ms. The reason for this behavior is to report accurateaverages (and not mislead the user into thinking that this request only ran once or twice when inactual fact it is constantly running, just very quickly). This "Always Record" flag lasts for 1 hourfrom the last time an execution over 51ms was seen.
You can redefine the 51ms trimming threshold. For the Java Probe integrated with LoadRunneror Performance Center, you configure this setting in the <diagnostics_server_install_
Release NotesNotes and Limitations
HP Diagnostics (9.23) Page 38 of 49
dir>\etc\trimming.properties file. For the Java Probe in all modes, you configure this setting inthe minimum.fragment.latency property in the <probe_install_dir>\etc\dispatcher.properties file.(40631)
l A defect in the JVM on Linux (http://bugs.sun.com/bugdatabase/view_bug.do?bug_id=6330858)results in the thread CPU times being the same for all threads in BEA WebLogic 9.0. This bugwas fixed in JDK 1.5.0_07. (40391, 39387)
l The Java Probe causes core dump at startup of WebLogic 9.1 when used with JRockit VMversion 150_04. The JRockit bug is fixed on jdk1.5.0_06. (38545)
l By default, for performance reasons, Diagnostics does not capture target information forDatabase calls.
l VM Heap Breakdown is based on an experimental api (JVMPI) in the JVM and is not expected towork in the following JVMs:
n Sun 1.4.2_01: http://bugs.sun.com/bugdatabase/view_bug.do?bug_id=4861809
n Sun 1.4.2: http://bugs.sun.com/bugdatabase/view_bug.do?bug_id=4899339 open
n IBM JREs in general do not have a stable API implementation for this API
l Running the profiler directly on z/OS is not supported. The script "profiler.sh" has been removedin the 7.50 version of the z/OS probe, it will exist in previous versions but cannot be successfullyrun on z/OS. To run the profiler for a probe on a z/OS system, do so from a platform other thanz/OS. (42369)
.NET Agentl After installing the .NET agent, Microsoft SharePoint 2013 may not function correctly. To fix this
you can apply the following workaround:
a. Open the SharePoint web.config file for editing. By default this file is located inC:\inetpub\wwwroot\wss\VirtualDirectories\80.
b. Change the legacyCasModel setting from true to false, as follows:
<trust level="Full" originUrl="" legacyCasModel="false" />
c. Restart IIS by using either IIS Manager or the IISReset command-line utility. (82212)
l By default, Diagnostics does not monitor server requests that always execute in under 51milliseconds. These requests are trimmed-no information is captured about them. SQLstatement executions made from these trimmed requests are not recorded, even if those sameSQL statements are timed and recorded in the context of executing other server requests. In
Release NotesNotes and Limitations
HP Diagnostics (9.23) Page 39 of 49
addition, the probe-level layer breakdown does not include time taken by trimmed serverrequests.
An exception to this is in a case where, on at least one occasion, a server request takes longerthan 51ms to execute. Future executions of that server request are recorded, even if thesubsequent requests are faster than 51ms. The reason for this behavior is to report accurateaverages (and not mislead the user into thinking that this request only ran once or twice when inactual fact it is constantly running, just very quickly). This "Always Record" flag lasts for 1 hourfrom the last time an execution over 51ms was seen.
You can redefine the 51ms trimming threshold. For the .NET Probe in all modes you configurethis setting in the <diagnostics_server_install_dir>\etc\trimming.properties file. All .NET Probetrimming configuration is done in the <.NET_ probe_install_dir>\etc\probe_config.xml file.(40631)
l By default, for performance reasons, Diagnostics does not capture target information forDatabase calls. Therefore, these calls do not show up in the Outbound Calls view. You canenable it as follows:
n For .NET Probes, set create.database.fragmentArcs=true in the server.properties file for theDiagnostics Server in Mediator mode. You should also use this workaround ifenable.probe.aggregation in the Java probe has been changed from its default value of true tofalse.
Once capturing of Outbound database calls has been enabled, these calls will be displayed inthe Outbound Calls view. (40722)
l On platforms where Windows Process Activation (WPAS) is installed, the .NET Diagnosticsagent uninstall has an implicit runtime dependency on up to four "listener adapter" services.During the uninstall, MSI pops up a "The following processes need to be closed beforecontinuing..." dialog if any of the listener adapter services are started. Stopping them(temporarily) allows the uninstall to continue. However, the services do NOT have to be stoppedin order for removal to end successfully. The user can select the "Ignore" button on this dialogand continue uninstallation. (38151)
l If you have a problem displaying probe metrics by .NET Agent, note that if you have done theconfiguration described in the KnowledgeBase articlehttp://support.microsoft.com/default.aspx?scid=kb;EN-US;282884Diagnostics .NET agent will not be able to show probe metrics.
Integrations (BSM, PC, LR, TV, SaaS)l The logs indicate OOM errors are happening to the embedded Diagnostics UI in LoadRunner
Controller. (64938)
When you open the J2EE/.NET Diagnostics tab in LoadRunner Controller during a load test, thesystem CPU spikes and sometimes stays high.
Release NotesNotes and Limitations
HP Diagnostics (9.23) Page 40 of 49
Workaround: Upgrade the JRE on the LoadRunner system.
l Diagnostics Server does not work with IIS Basic Authentication with Business AvailabilityCenter and BSM Reverse Proxy Server. (43987)
l In the BSM-Diagnostics integration (Admin>Diagnostics) we get an error on short-name andthere is no way to re-enter the FQDN. (62229)
You should use the FQDN when registering the Diagnostics Server with BSM. However if youentered a non-FQDN for the Diagnostics Server you could get stuck in a registration problemloop.
Workaround. Use the URL below and substitute the "topazhost" name in the URL with theFQDN BSM 9.10 Gateway Server to clear the Diagnostics Configuration page in BSM.
http://topazhost/opal/uibridge/action/registration.do?action=set_registration&customer_name=Default%20Client&opal_protocol=&opal_port=&opal_full_host=
l During installation of Operations agent components, certificate requests from Diagnostics (andIA, and SiteScope) nodes are blocked at Load Balancer/Reverse Proxy if BSM has beenconfigured for HTTPS communication. (QCCR1A122094)
During installation of Operations agents, a certificate request is sent to the certificate server.The protocol used for the request is HTTP. If the BSM Reverse Proxy/Load Balancer isconfigured for HTTPS communication, it blocks all HTTP communication including thecertificate request.
Workaround. Generate a certificate manually and install it manually on theIA/SiteScope/Diagnostics node. You can refer to the topic "Configure HP Operations Agentmanually" in the HP BSM Integration Adapter Installation and Upgrade Guide in the BSMdocumentation library and do something similar for Diagnostics.
l Offline vs. Online. The following features and functionality in LoadRunner Offline Analysis aredifferent from the Diagnostics Online.
n Data in the profiler that is not sent into the Diagnostics Server will not be in the offlineanalysis after Performance Center/LoadRunner runs. This includes LWMD, HeapBreakdown, Allocation Analysis, Exceptions, SOAP Faults and SOAP payloads.
n Oracle 10g data will not show up in offline analysis.
n Instance trees will not be available in the offline analysis only aggregate trees after theneeded drill down.
l When configuring Real User Monitoring in Business Availability Center to use a Page definitionincluding parameters, Diagnostics will not be able to make a match unless parameter capturinghas been enabled. To enable this option on the Java Probe, list all desired parameter names inreverse alphabetical order in the args_by_class property in auto_detect.points under the "[HttpCorrelation]" section. (40496)
Release NotesNotes and Limitations
HP Diagnostics (9.23) Page 41 of 49
l In BSM’s Transaction Management Admin UI > Monitoring tab > Search Criteria, when the Typedropdown list is expanded, duplicate or triplicate Server Request types are shown. (60740)
l HP Performance Center offline files are kept by default. To manage offline files, you need toconfigure the Diagnostics Servers in Mediator mode so that they delete these files. You do thisby setting the property distributor.offlinedelivery.preserveFiles to true in the <diagnostics_server_install_dir>/etc/server.properties file. When set to true, this property causes the run-specific “offline” files stored in the server's data directory to be retained for the amount of timespecified in the facade.run_delete_delay property in the server's webserver.properties file(default period is 5 days). During this retention period, the run can be successfully collated.Sometime after the retention period has ended, the associated offline files will be deleted fromthe system. (40739)
l Performance Center users that drill to Diagnostics get full admin privileges to the DiagnosticsServer and to the Probes that are connected to it. All restricted actions (for example, changingthresholds, alerts, and Custom Attributes) are accessible by all Performance Center users.Furthermore, every custom screen created by a Performance Center user is shared by allPerformance Center users. (40133)
l Starting in Diagnostics 7.0, many instrumented methods have been flagged when-root-renamein auto_detect.points to prevent many spurious and uninteresting server requests from beingcreated and displayed in the UI. Should these methods execute outside the context of anotherserver request, they will still be recorded, but into a pseudo server request with the name“Background - <Layer>”, where <Layer> is the layer name for the method.
For example, the Background JDBC connection testing that WebLogic runs used to be reportedinto a few separate server requests, such as netJDBCPreparedStatement.executeQuery(), butwill now be recorded as invocations of a “Background – Database” pseudo server request.
In addition, when using LoadRunner, these new pseudo server requests will not appear inLoadRunner Offline Analysis. Should you wish to keep the old behavior for a particularinstrumentation point and see these entries in LoadRunner Offline Analysis, carefully removethe when-root-rename detail parameter from the auto_detect.points. (42127)
l When Diagnostics is integrated with HP Software-as-a-Service (SaaS), you must log on throughBusiness Availability Center when viewing data for customers other than "Default Client".Failing to do so will cause several subtle issues with how data is reported. You can still use thestandalone login to view the "Default Client" data. (42178)
l LoadRunner Collate fails when the Diagnostics Server was restarted during Performance Centerrun/load test. (34682)
Collectors (Oracle, SAP, MQ, TIBCO EMS, SQLServer, webMethods, VMware)
l To maintain accurate MS SQL Server metrics, the database option AUTO_CLOSE must be setto OFF. If AUTO_CLOSE is set to ON, MS SQL Server metrics will show up with incorrect and
Release NotesNotes and Limitations
HP Diagnostics (9.23) Page 42 of 49
negative values after certain database operations (bcp, backup, shrink, etc) (43075).
l NPE for legacy (pre-9.10) MQ collector data. (54829)
Workaround. MQ channel data will populate in the BSM RTSM when 9.10 MQ collector isinstalled.
Java Profilerl Starting with Diagnostics 9.0, the JAVA Profiler requires JVM 1.6 to run. However, on HP-UX,
the default JVM that is installed with the Java Profiler is 1.5. Therefore in order to run standaloneJava profiler, the following must be performed. NOTE - The Java Profiler runs fine on HP-UXwhen launched from the enterprise UI. To run the Java profiler in standalone mode, do thefollowing:
n Set JAVA_HOME to your java 1.6 installation location
n export JAVA_HOME=<java 1.6 home directory path>
n example: export JAVA_HOME=/opt/java6
n Run the java profiler: $PROBE_HOME/bin/profiler.sh &
l NPE and HTMLEditorKit prevents UI from starting more than once (55258)
Fixed this JRE issue (http://bugs.sun.com/bugdatabase/view_bug.do?bug_id=6993073) byimplementing the workaround(http://bugs.sun.com/bugdatabase/view_bug.do?but_id=6993691) in Diagnostics so the JREdoes not throw an exception.
But it is important to note that since the Java probe install includes the Profiler UI - then eachprobe where you run the Profiler UI also needs to be updated or patched to get this fix. Otherwisethe Profiler UI applet will only load once in the browser. You can download a patch for Javaprobe versions 8.0x or 9.0x and the fix is also included if you upgrade the Java probe to version9.10.
.NET Profilerl When running the .NET Profiler under locales that use an Asian character set, the default font
size may be too small. In such cases, change the text size used by the Web browser. (43070)
l Launching the .NET Profiler from the Diagnostics Enterprise UI fails for .NET Agents runningthe Probe Aggregator Service
Problem. Selecting theView Profiler command on a .NET probe that is using the ProbeAggregator Service prompts for credentials. However valid credentials are not accepted.
Workaround. Access the .NET Profiler in standalone mode.
Release NotesNotes and Limitations
HP Diagnostics (9.23) Page 43 of 49
If standalone mode access is not an appropriate solution, you can fix the access from theDiagnostic Enterprise UI as follows:
a. On the .NET Agent host, edit the <probe_install_dir>/etc/probe_config.xml.
b. Change the following entry:
<diagnosticsserver url="http://127.0.0.1:45000/commander" />
to
<diagnosticsserver url="http://<mediator>:<port>/commander" />
where <mediator> is the host name or IP address of the Diagnostics Mediator Server towhich the probe is sending collected data to and <port> is the mediator port. For example,url="http://mymediatorhost:2006/commander".
c. After a few seconds, try to access the .NET Profiler from the Diagnostics Enterprise UI. Youdo not need to restart the application, the probes will dynamically re-register using this newsetting.
(QCCR1I92693)
Diagnostics Serverl Server Install fails - Permission denied. (51729)
If the Diagnostics commanding server will be integrated with Business Service Management9.00 or later, root access is required during the Diagnostics Server installation. Root access isrequired for the installation of the OM Agent and IAPA component.
Workaround. If you need to install the Diagnostics Server without root access you can chose tonot install these two components and install them later manually. When you see the dialog box:OM Agent and IAPA component installations leave the box unchecked and install later.
l When enabling HTTPS between Diagnostics components the user should monitor the <install_dir>/MercuryDiagnostics/server/log/jetty.log for warnings similar to:
2008-11-17 15:33:07,528: WARNING : WARN!! [RangeSocketListener-69]org.mortbay.http.SocketListener.isOutOfResources(SocketListener.java:358)22> OUT OFTHREADS:[email protected]:84432008-11-17 15:33:35,582: INFO : EVENT [RangeSocketListener-14]org.mortbay.http.SocketListener.isLowOnResources(SocketListener.java:325)04> LOW ONTHREADS ((200-198+7)<10) on [email protected]:8443
Workaround. If these messages appear, increase the value of jetty.threads.max by incrementsof 100 in the <install_dir>/MercuryDiagnostics/server/etc/webserver.properties file.
Release NotesNotes and Limitations
HP Diagnostics (9.23) Page 44 of 49
Continue to monitor and increase if necessary. (44007)
l After configuring the Diagnostics Server in Mediator mode, if it appears missing or inactive in theDiagnostics Server in Commander mode view, then it is possible that “commander.url” inserver.properties has an ending “/” on it. For example, if you open server.properties on theDiagnostics Server in Mediator mode and set to commander.url=http://amkisty01:2006/ insteadof commander.url=http://amkisty01:2006 (Note that the difference is the appending /), then theDiagnostics Server in Mediator mode will appear missing or inactive. (40527)
l Broadly scoped allocation instrumentation may fill up perm-gen and cause the VM to crash.Users should avoid widely scoped instrumentation and instead make instrumentation as narrowas useful to minimize system impact. (39339)
l When average latencies are less than 50ms, users may see CPU time slightly higher thanlatencies because of resolution differences. (39690)
l Entity purging results in contribution/breakdown not summing up to the total because the deletedentities data was already rolled up and is not recalculated at this point. (39344)
l Running the Diagnostics Server from a network drive, or configuring it to store the archive on anetwork drive, is not supported.
l When you configure the Diagnostics Server to run only in SSL mode, it only affects port 2006.The Diagnostics Server also has an embedded Diagnostics Probe (for internal troubleshootingpurposes) that listens, as usual, on port 35000. If you are trying to lock your environment to SSLonly for security purposes, you will also need to re-configure that embedded probe to listen onlyover SSL.
l (Documentation Correction) If you are importing threshold and alert definitions from ascript.thresholding file, the script.thresholding file must be placed into the <diagnostics_server_install_ dir>/storage/thresholding/once/Default Client directory. Be sure to includethe space in the "Default Client" directory name, otherwise the import will fail. (QCCR1I92662)
User Interfacel If a custom view, for example, is to be used for a Java probe and one of the features in that
custom view shows Top 7 Business Transactions, because business transactions are not sub-entities of a Java probe, the graph feature will be blank.
Workaround. Save the opened view. The data will then be shown in the view.
l When a custom view is created and the view is used with "Open in Custom View", the UI willattempt to open all features with the appropriate filters for that entity. If a feature in the customview does not match the filters for the entity, then the view will be blank. (71123)
l When a custom view is created from a detail view (as opposed to a dashboard view), whennavigating away from the view via a drill or other navigation, often the UI will prompt the user if
Release NotesNotes and Limitations
HP Diagnostics (9.23) Page 45 of 49
changes should be saved, even though nothing was changed. Always press "Yes" and continue.Pressing "No" will result in a blank screen and an error stating that the view is corrupt (althoughno permanent damage occurs). This situation will be fixed in a patch release of Diagnostics 9.20in the near future. (71505)
Workaround. Press Yes if prompted.
l With IE 8 the Maintenance Link is missing on the Diagnostics Enterprise UI when launched fromwithin BSM UI (BSM and Diagnostics are running on the same system). (55189)
Workaround. Close the BSM UI and the Diagnostics Standalone UI, and re-launch theDiagnostics Standalone UI. Also note it works fine when running with IE7 or launched stand-alone in IE8 (not inside of BSM).
l The ability to delete more than one alert rule at a time in the UI is currently not supported.
Workaround. Select and delete one alert rule at a time.
l NPE and HTMLEditorKit prevents UI from starting more than once (55258)
Fixed this JRE issue (http://bugs.sun.com/bugdatabase/view_bug.do?bug_id=6993073) byimplementing the workaround ( http://bugs.sun.com/bugdatabase/view_bug.do?but_id=6993691) in Diagnostics so the JRE does not throw an exception.
But it is important to note that since the Java probe install includes the Profiler UI – then eachprobe where you run the Profiler UI also needs to be updated or patched to get this fix. Otherwisethe Profiler UI applet will only load once in the browser. You can download a patch for Javaprobe versions 8.0x or 9.0x and the fix is also included if you upgrade the Java probe to version9.10.
l Enterprise UI: OutOfMemoryError after repeatedly drilling down to Java profilers. (57043)
Workaround. Sometimes, when launching the profiler from the Enterprise UI, the entire UI (EUI,profiler and Java console) will hang and, shortly thereafter, the profile and Java console windowsdisappear and the remaining EUI window would not repaint. This problem can be eliminated byupgrading the JRE used by the user's browser to a more current version of 1.6.
l NPE when loading System Health. (57363)
Workaround. Open a new browser or you can use the new System Health view group availablein the Enterprise UI.
l Prior to exporting an Application Explorer view to pdf or html you should examine all of the tabsto activate the population to the desired charts, otherwise the exported chart could be empty.(28801)
l Navigation menu items on the popup (context) menu are different when right-clicked alone vs.selected and then right-clicked. This occurs because only limited information is available whenthe first right-click on an entity occurs, and the context menu is populated with what is known at
Release NotesNotes and Limitations
HP Diagnostics (9.23) Page 46 of 49
that time. However, the right-click operation immediately kicks off a query to the DiagnosticsServer to find out more about this entity, and so subsequent right-click operations use thereturned data and the popup menu includes more options. (29253)
l In a custom 2-way view, both of the Navigation controls are updated with the navigations for theselected entity. (29097)
l When an application is selected (Application Explorer view) or a Probe Group is selected (ServerSummary view) you may see two "View Probe" navigations. This will happen when theApplication or Probe Group contains both .Net and Java Probes. (26471)
l The navigation control only tracks the global time control. (29268)
l Drilling from some alerts to "View Threshold Violation" results in a view that is empty except forthe message "Either no data is available for the selected time range, or the data at this level ofdetail has been purged from the database."
This generally happens when the violating entity is 2 levels below the alert entity. For example, aprobe group alert from a server request threshold or a probe alert on a portal component--lifecycle method alert.
Workaround: Notice the breadcrumb of the empty view. This indicates the view that shows thedata causing threshold violation. Add the alert to a snapshot. From the snapshot, use theNavigations pane to drill-down. In most cases, you would navigate to Probes first and thedestination view below that. For Life Cycle Methods, navigate to Portal Components (underProbes) first. For better navigation from alerts to threshold violations, keep alert rules closer tothe entities being monitored. (27612)
l For server requests under 10 ms, Minimum Time will always be reported as zero. (34125)
Documentationl When the Diagnostics Server is installed on 64-bit Linux systems (only) the docs directory is not
created and so the manuals are not accessible from the <diagnostics_server_install_dir>/docsdirectory. Copies of the pdf files can be found on the installation media and in the <diagnostics_server_install_dir>/html/opal/docs/eng/help/pdfs directory. You can also download thedocumentation from the HP Support web site. See Documentation Updates in the front matter ofthis guide.
l If you experience a JavaScript error when opening the HP Diagnostics online help system,disable the "Show Exception Dialog Box" in the Java Console and open the help again.
Translated VersionsDiagnostics has been translated into a number of languages. When using Diagnostics,occasionally text that should be translated will be shown in English. This is due to limitations in thirdparty components that are used by Diagnostics. We apologize for any inconvenience that this maycause.
Release NotesNotes and Limitations
HP Diagnostics (9.23) Page 47 of 49
Localization and GlobalizationLocalization is the process by which software applications are adapted to suit a specific localmarket or locale. Globalization is the process of designing products or services for the globalmarketplace so that they can be sold anywhere in the world with only minor revision.
HP supplies Diagnostics localized software in these languages:
l English
l Simplified Chinese
l Korean
l Japanese
l French
l German
l Spanish
l Russian
HP supplies Diagnostics localized documentation in these languages:
l Japanese
l Simplified Chinese
HP Diagnostics (9.23) Page 48 of 49
We appreciate your feedback!If you have comments about this document, you can contact the documentation team by email. Ifan email client is configured on this system, click the link above and an email window opens withthe following information in the subject line:
Feedback on Release Notes (Diagnostics 9.23)
Just add your feedback to the email and click send.
If no email client is available, copy the information above to a new message in a web mail client,and send your feedback to [email protected].
HP Diagnostics (9.23) Page 49 of 49