magnetic resonance diagnostics: a new technology for high-throughput clinical diagnostics
TRANSCRIPT
Rapid and Sensitive Detection of Mycobacterium DNAUsing Cepheid SmartCycler® and Tube Lysis System,Martin Jones,1* David Alland,2 Salvatore Marras,3 HiyamEl-Hajj,2 Michael T. Taylor,1 and William McMillan1 (1 Ce-pheid, Inc., 1190 Borregas Ave., Sunnyvale, CA 94089;2 Montefiore Medical Center, Bronx, NY 10467; 3 PublicHealth Research Institute, New York, NY 10016; * authorfor correspondence: fax 408-541-4192, e-mail [email protected])
The detection of microbial DNA in clinical samples bynucleic acid amplification methods is often limited by thelow concentration of organisms present in the specimen.Adequate amounts of target DNA are produced onlythrough time-consuming or inefficient manual concentra-tion and lysis methods, or expensive, dedicated equip-ment.
There is a need for new sample-processing systems thatare quick, reliable, and efficient and that avoid the use oftoxic or hazardous chemicals and bulky, expensive equip-ment. Clinical, epidemiologic, and cost concerns dictatethat these systems must maintain high assay sensitivityand a short time to results. It is also desirable that thesesystems have the capability to function in point-of-care orcritical-care environments.
The two fundamental areas for sample processing arethe recovery of organisms from the clinical specimen insufficient amounts and lysis of the organisms to free thenucleic acid for subsequent amplification and detectionsteps. Ideally, the recovery step would also be capable ofconcentrating the organism from large volumes andwashing away sample inhibitors.
The GeneXpert system, which is being developed byCepheid, Inc., addresses the above sample-processingissues with a disposable plastic cartridge containing fil-tration and ultrasonic lysis functions. This system cap-tures the organisms on the filter membrane, washes thesample to remove inhibitors, and ultrasonically rupturesthe organisms to free nucleic acid. The nucleic acid is thenable to pass through the filter membrane during thesubsequent elution step. Sample processing can be com-bined in a complete instrument system for real-timefluorescent detection of PCR-amplified target organismDNA.
We developed a stand-alone filtration and lysis moduleto study DNA recovery and PCR sensitivity. Dilute con-centrations of Bacillus Calmette-Guerin (BCG; an avirulentstrain of Mycobacterium bovis) were used as a modelorganism. BCG is an appropriate model organism becauseit is a surrogate for Mycobacterium tuberculosis (Mtb) andcan be processed by procedures identical to those used forclinical samples. These procedures were designed toprovide a severe test for the filtration/lysis module be-cause the sample is typically very dilute, the digestantsused to liquefy sputum are PCR-inhibitory, and the or-ganism’s cellular wall is lipid-rich, rendering it difficult toeffectively lyse.
Initially ultrasonic lysis of BCG was evaluated with theCepheid tube lysis system. In this device, an ultrasonic
horn is coupled by a spring-loaded holder to a special100-mL vessel half-filled with silica beads. Power to thehorn is provided by an ultrasonic power generator withcontrollable amplitude. Output energy is recorded vs timeby a digital-analog converter interface with the appropri-ate software. The output energy is an indicator of thephysical coupling of the ultrasonic horn and lysis vesseland can be used to monitor and standardize the ultrasonicenergy applied to a sample preparation.
The Cepheid one-piece valve body combines filtration,wash, and lysis functions. It is a molded plastic housingcontaining an immobilized submicrometer filter, lysisbeads (,106 mm in diameter) within a chamber that is indirect contact with the filter surface, and chamber inletand outlet ports. The domed exterior opposite the portsfunctions as the ultrasonic interface. Fluid is forcedthrough the filter by a syringe piston, and all filtrate iscollected in secondary containers. Different fluids may beused in sequence, allowing first the sample and thenbuffers of various compositions to successively filter-concentrate and then wash the trapped material. Thevalve body is clamped in place so that contact is main-tained with a spring-loaded ultrasonic horn. Amplitudeand duration are independently controlled, and the hornoutput is recorded as for the tube lysis system.
BCG Montreal was cultured to midlog phase in Middle-brook 7H9 medium containing 0.5 mL/L Tween 80, 0.2mL/L glycerol, and 100 g/L oleic-albumin dextrose com-plex. The sample was briefly sonicated to break upclumps, and serial 10-fold dilutions were made. A 100-mLaliquot of each dilution was plated to determine colonyforming units (CFU) per unit volume. A second 100-mLaliquot of each dilution was used for the tube lysis orvalve body experiments. Separate cultures and dilutionswere used for the two lysis protocols.
The tube lysis experiments were performed as follows.Each 100-mL aliquot of BCG was pelleted by microcen-trifugation, resuspended in an equal volume of water, andadded to the 100-mL lysis vessel containing silica beads.The sample was lysed for 30 s at 80% amplitude. PCR wasperformed on the lysed material. Sample dilutions beganat 145 CFU/100 mL.
All valve body filtration and lysis experiments wereperformed with blinded aliquots of BCG culture dilutionsin phosphate-buffered saline that were prepared using thestandard clinical laboratory protocol for liquefying spu-tum samples. The aliquots were randomly tested, and theactual concentrations were not known until the experi-ments were complete. A 50-mL aliquot of each BCGculture dilution was added to 3 mL of phosphate-bufferedsaline with concentrations beginning at 12 170 CFU/mL.This was mixed 1:1 with 20 g/L NaOH, 14.5 g/L sodiumcitrate, and 5 g/L N-acetyl-l-cysteine. The contents weregently swirled and incubated for 15 min at room temper-ature. The NaOH, citrate, and N-acetyl-l-cysteine mixtureis routinely used to liquefy and decontaminate sputumsamples for culture of Mtb. This digestant mixture is thendiluted severalfold with buffer to minimize further activ-ity of the reagents. This was achieved by bringing the
Abstracts of Oak Ridge Posters
Clinical Chemistry 47, No. 10, 2001 1917
volume to 25 mL with 0.067 mol/L phosphate buffer, pH6.8. The entire 25-mL volume was injected into a valvebody using a programmable syringe drive. The filteredsamples were washed with 5 mL of water and then lysedfor ; 20 s. After the lysis step, the material was forcedthrough the filter by air pressure, and PCR was performedon aliquots of the filtered lysate. Typically, 100 mL offiltered lysate was recovered.
All real-time fluorescence (RTF)-PCR reactions wereperformed using Cepheid SmartCycler® instrumentationand reaction tubes. The Mtb-specific primers and 6-car-boxyfluorescein-labeled Molecular Beacon probes are de-scribed elsewhere (El-Hajj H, Marras SA, Tyagi S, KramerFR, Alland D. A multiplex multi-colored Molecular Bea-con assay for the rapid identification of Mycobacteriumtuberculosis and rifampin resistance in clinical sputumsamples, manuscript in preparation). Thermocycling con-ditions were 2 min at 95 °C, followed by 50 cycles of 10 sat 95 °C, 15 s at 58 °C, and 10 s at 72 °C. Fluorescence wasmeasured during the 58 °C steps.
RTF-PCR results demonstrated the effectiveness of ul-trasonic lysis for rupturing the BCG in the tube lysissystem. When we used 10-fold serial dilutions of culturedcells, 14 CFU/100-mL aliquot were detected. This demon-strated that ultrasonic lysis with silica beads was effectiveon BCG cells.
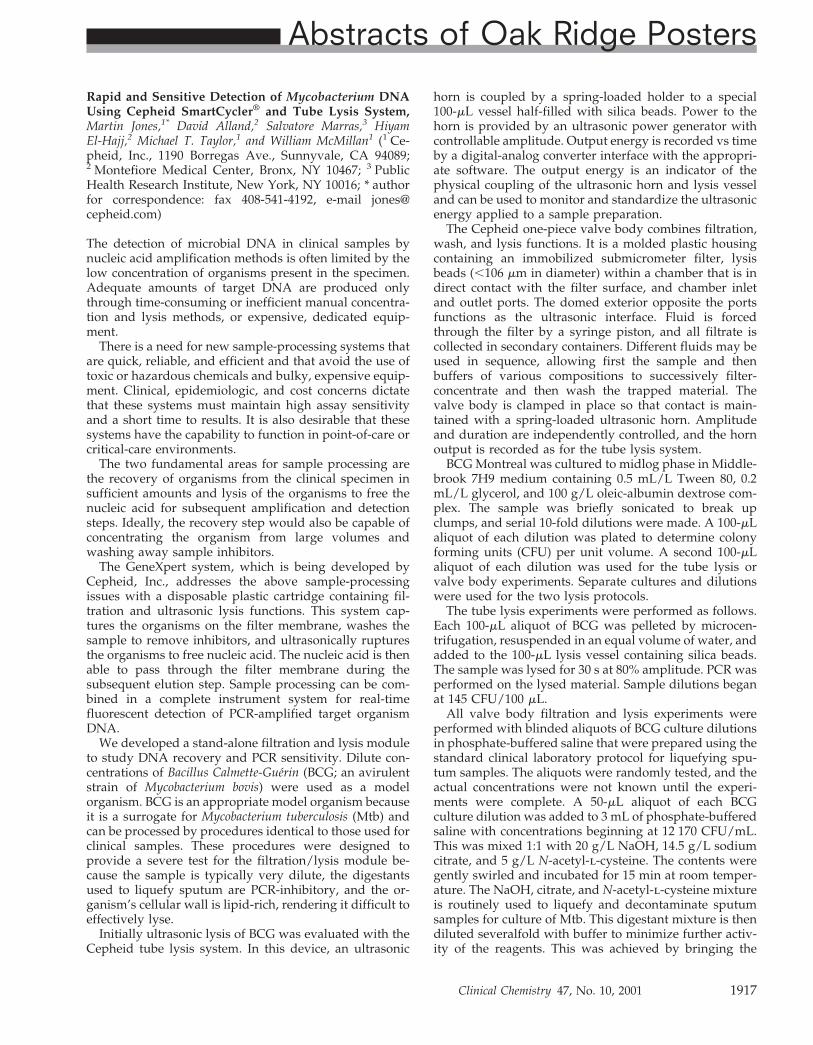
Serial 10-fold dilutions of BCG from 1480 to 0.015CFU/mL were processed using the one-piece valve bodyand then analyzed by RTF-PCR.
The results for several of the samples, tested in dupli-cate, are shown in Fig. 1. Sample 1 is purified Mtb DNA(single result), sample 2 is 148 CFU/mL, sample 3 is 14.8CFU/mL, and sample 6 is 0.015 CFU/mL. Samples with,14.8 CFU/mL were not detected in this series of exper-iments. Control experiments showed that ultrasonic lysiswas required for DNA detection and that the NaOHsolution was PCR-inhibitory.
These data from experiments using prototype filtra-tion/lysis devices demonstrate the sample processingcapabilities of the valve body component of the GeneX-pert cartridge. The system effectively lyses BCG by use ofultrasonic energy and concentrates dilute, large volumesamples by filtration. An additional advantage of thesystem is the ability to remove inhibitors of PCR bywashing the captured sample. Removal of inhibitors willallow the use of current sputum digestant reagents, whichwill be important for comparison studies with culture andacid-fast bacteria staining methods of Mtb detection. Thevalve body is also capable of handling small or largesample volumes. These qualities are important for therange of applications planned for this system.
Release of detectable amounts of DNA without lysiswas not observed. This implies that the system canconcentrate and wash intact organisms, efficiently con-centrating the target DNA after a subsequent lysis step.On the basis of the CFU calculations, a titer not detectableby PCR was concentrated to easily detectable concentra-tions.
Future efforts will investigate areas important for ana-
lytical sensitivity and user requirements of rapid detec-tion. Such areas will include filter surface area, pore sizeand material, valve body contained volume, fluid pump-ing rates, buffer composition, and ultrasonic lysis condi-tions, and other variables.
Finally, currently developed RTF multiplex PCR assaysfor Mtb single-nucleotide polymorphisms important inrifampin drug resistance will be adapted to the GeneXpertsystem. This may provide the final, critical technologiccapability for the rapid, simultaneous, sensitive detectionof Mtb and the presence of antibiotic resistance.
Technical assistance was provided by Molly Miranda,Rick Faeth, and Kristen Lloyd.
Magnetic Resonance Diagnostics: A New Technologyfor High-Throughput Clinical Diagnostics, David S.Wishart,1 Lori M.M. Querengesser,2* Brent A. Lefebvre,2 NoahA. Epstein,2 Russ Greiner,3 and Jack B. Newton2 (1 2123Dentistry/Pharmacy Center, Faculty of Pharmacy andPharmaceutical Sciences, University of Alberta, Edmon-ton, Alberta, T6G 2N8 Canada; 2 Chenomx Inc., 2007,8308-114 Street, Edmonton, Alberta, T6G 2E1 Canada;3 122 Athabasca Hall, Artificial Intelligence Group, De-partment of Computing Science, University of Alberta,Edmonton, Alberta, T6G 2E8 Canada; * author for cor-respondence: fax 780-432-3388, e-mail [email protected])
Magnetic resonance diagnostics (MRD) uses automated,high-throughput nuclear magnetic resonance (NMR)spectroscopy for the rapid identification and quantifica-tion of small-molecule metabolites in biofluid mixtures(blood, urine, saliva, cerebrospinal fluid, and others).Specifically, MRD involves using a high-field (400 MHz)NMR instrument equipped with a small-volume flow
Fig. 1. RTF results for purified Mtb DNA (Sample 1), 148 CFU/mL BCG(Sample 2), 14.8 CFU/mL BCG (Sample 3), and 0.015 CFU/mL BCG(Sample 6).
1918 Oakridge Conference
probe and robotic sample handler to rapidly load biofluidsamples and to collect their 1H NMR spectra. Spectraldeconvolution software automatically assigns individualpeaks to particular compounds and calculates concentra-tions from peak areas. MRD uses the principle of chemicalshift separation to physically separate and identify indi-vidual compounds directly from 1H NMR spectra, thusavoiding chromatographic separation steps (e.g., HPLC,gas chromatography, and capillary electrophoresis). MRDis useful for rapid (,2 min per sample) qualitative andquantitative assessment of small-molecule metabolites.
NMR spectroscopy is not new to the field of clinicalchemistry. Indeed several important applications havealready been demonstrated in the area of diagnosis andtherapeutic monitoring of metabolic disorders (1–4), intoxicologic and renal testing (5, 6), and in the profiling ofblood lipoproteins and cholesterol (7 ). An emerging ap-proach to enable high-throughput in vivo toxicology iscalled metabonomics, which uses high-resolution NMR torapidly evaluate the metabolic status of an animal (8, 9).
A key limitation to all of these NMR approaches is thatthey depend on manual sample handling and/or manual(i.e., expert) spectral analysis. This has made most NMRapproaches to clinical analyses far too slow or too costlyfor routine chemical profiling or high-throughput screen-ing. Because MRD is fully automated (sample handling,spectral collection, and spectral analysis are all handledby robots or computers), this technique offers the poten-tial for high-throughput, comprehensive, and inexpensivechemical analysis of a wide range of biofluid samples.
To demonstrate the potential of MRD for high-through-put clinical screening and metabolic profiling, we con-structed a simulated test-run of 1000 urine samples pro-cessed by a prototype MRD instrument developed jointlyby our laboratory and Varian Inc. (Palo Alto, CA). Ourintent was to investigate the performance of the MRDinstrument and software under the demands of a high-throughput clinical testing laboratory. The instrumentwas assessed on sample-processing speed, robustness ofsample handling, and accuracy of identifying samplesand compounds.
We followed protocols and conditions approved by theUniversity of Alberta’s Health Research Ethics Board tocollect 1000 anonymous urine samples. A total of 925samples were obtained from healthy adult volunteerswho had completed consent forms. Seventy-five samples(63 children, 12 adults) were obtained as anonymous“discards” from several hospitals and clinics across Can-ada and were from patients with a wide variety of inbornerrors of metabolism, neuroblastoma, and alcohol poison-ing. All of the abnormal samples used in this test had beenidentified previously as such through conventional clini-cal screens. Among the abnormal samples were the fol-lowing: 14 with propionic acidemia; 11 with methylma-lonic aciduria; 11 with cystinuria; 6 with alkaptonuria; 4with glutaric aciduria I; 3 each with pyruvate decarbox-ylase deficiency, ketosis, Hartnup disorder, cystinosis,neuroblastoma, phenylketonuria, ethanol toxicity, glyc-erol kinase deficiency, and hydroxymethylglutaryl-CoA-
lyase deficiency; and 2 with carbamoylphosphate syn-thetase deficiency.
For MRD analysis, 990-mL portions from each urinesample were transferred to 1.8-mL autosampler vials, towhich 0.5 mmol/L (10 mL of a 50 mmol/L solution)3-(trimethylsilyl)-1-propane-sulfonic acid, sodium salt(Sigma-Aldrich) was added. We manually adjusted thesamples to pH 6.5 using HCl(aq) or NaOH(aq), as necessary.Manual pH adjustment was necessary because the soft-ware module required to automatically measure the pHand adjust the spectral deconvolution process was notcompleted in time for this study.
The prototype MRD instrument consisted of a 400 MHzVarian NMR spectrometer equipped with a 60-mL tripleresonance-flow probe with an interchangeable flow celland a modified Varian VAST (Versatile Automatic Sam-ple Transport) system. The VAST system uses a roboticliquid handler (Gilson Model 215) and three computer-controlled switching valves, which direct sample flow toand from the flow probe through small-diameter Teflontubing. Each urine sample (250 mL) was automaticallyloaded into the NMR spectrometer and a one-dimensional1H NMR spectrum collected (12 scans, 1.998 s; acquisitiontime, 0.5 s; acquisition delay, 6000 Hz sweepwidth) atambient temperature (21.5 °C 6 0.5 °C). After data collec-tion, the urine sample was ejected and the flow probeextensively rinsed with distilled water before the nextsample was loaded. Sample carryover was ,1%.
NMR spectra were autoprocessed (e.g., transformed,phased, and referenced) and deconvolved with a suite ofspecially developed software applications and databases.The deconvolution process allows for the automatedidentification and quantification of components inbiofluid mixtures through spectral database comparisons.We tested for 149 compounds currently contained in ourspectral database.
The instrument automatically loaded and analyzed all1000 samples in 35.2 h (1 sample every 2.1 min) withminimal human supervision. The mean sample loadingand rinsing time was 93 s, whereas spectral acquisitionhad a mean of 32 s. The mean times for spectral process-ing and deconvolution (which can be performed in par-allel with sample loading and data acquisition) were 7.1and 72 s, respectively. During the test run, one sample-loading failure occurred, but did not lead to instrumentdowntime.
The deconvolution software was tested for accuracy forthe following: (a) identification and quantification ofurinary metabolites, (b) identification of nonpathologicand abnormal urine samples, and (c) identification ofspecific disease states or conditions. We evaluated com-pound-identification and/or -quantification accuracy pri-marily through detailed analysis of the abnormal samples.Specifically, the 15 disorders found in the abnormal urinesamples were characterized by 34 unique or abnormallyabundant metabolites (e.g., homogentisic acid, glycerol,glutaric acid, and others). Our results indicate that theMRD software succeeded in correctly identifying all 34abnormal metabolites in all 75 abnormal samples. All 34
Clinical Chemistry 47, No. 10, 2001 1919
metabolites had been identified previously through con-ventional HPLC, gas chromatography–mass spectrome-try, or amino acid or organic acid analysis. In some cases,these metabolites were also detected in nonpathologicurine samples, but at concentrations too low to be ofsignificance or at concentrations well within the referenceinterval (10 ).
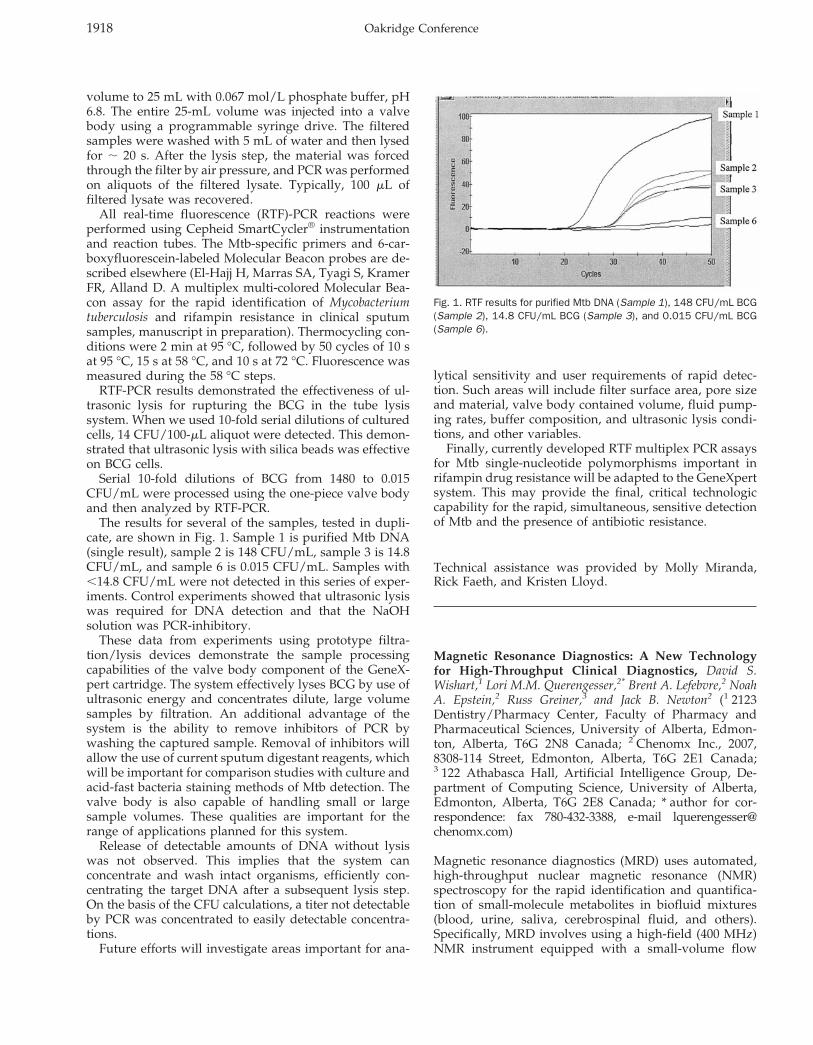
Although it was not possible to verify the MRD-mea-sured concentrations for all metabolites (most conven-tional tests provide only qualitative results), our resultsfor those metabolites that could be reliably quantifiedindicated a correlation coefficient between conventionallymeasured concentrations and MRD-measured concentra-tions of 0.99 (spanning a concentration range of 400mmol/L to 550 mmol/L). An example of compoundidentification and quantification achieved by this MRDsoftware is shown in Fig. 1, which shows an abnormalurine NMR spectrum (specifically, methylmalonic acidur-ia), along with the MRD-calculated NMR spectrum. Thecalculated spectrum was generated from individual NMRspectra of MRD-identified and -quantified compounds.
Among nonpathologic urine samples, 87 6 11 com-pounds were routinely identified and quantified by theMRD software on average. The identification and concen-tration of these metabolites were partially verifiedthrough manual spectral analysis of three randomly cho-sen samples and their subsequent chemical analysis. Itwas not practical to attempt to verify the identity of allcompounds in the nonpathologic urine samples via con-ventional assays. The MRD software failed to consistentlyidentify citrate, glycine, and histidine, probably becauseof the extreme sensitivity of their chemical shifts to pHand/or calcium ion concentrations.
A simple concentration-threshold algorithm achieved96% sensitivity and 100% specificity, with 72 of 75 abnor-mal samples being detected and all 925 nonpathologicsamples being correctly classified as nonpathologic. Thethree missed abnormal samples were cystinuria, glutaricaciduria, and carbamoylphosphate synthetase deficiency.This misclassification arose from the fact that these threesamples exhibited relatively modest concentrations ofabnormal metabolites. This particular algorithm com-pared MRD-quantified metabolite data with those valuesreported by Tietz (10 ), a database of “normal” and“abnormal” metabolite concentrations (both absolute andrelative to creatinine) tabulated from several literaturesources, as well as metabolite data collected from our ownassays. Age- and gender-related adjustments were notincluded in the classification scheme.
Tests of the disease classification accuracy (for 1 healthystate and 15 diseases or conditions) yielded 95.5% and92.4% for sensitivity and specificity, respectively. Interest-ingly, all false positives were confined to those urinesamples already classified as abnormal. In particular, fourfalse positives were identified for propionic aciduria,three false positives for phenylketonuria, two false posi-tives were identified for cystinuria, and one false positivefor ethanol toxicity. These classification problems likelyarose from the age-independent, all-or-none classification
scheme used by our algorithm. A probabilistic assessmentthat included age- or gender-related values would likelyhave improved the results or revealed multiple diseasepossibilities.
Overall, this prototype instrument was rapid, robust,and accurate. It rapidly identified and quantified keymetabolic markers of both common conditions (ethanoltoxicity) and rare disorders (neuroblastoma). It appears tooffer a high-throughput, inexpensive approach to meta-bolic profiling, with possible applications in medical
Fig. 1. NMR spectrum compared with software-generated spectrum.(A), 1H NMR spectrum of a urine sample from a patient with methylmalonicaciduria. (B), calculated NMR spectrum derived from summing the individualspectra of the compounds and concentrations determined by the MRD software.(Inset), an enlargement of the region between 1.9 and 4.1 ppm. Peak labels areas follows: (i), urea; (ii), 2-methyl malonate; (iii), 2,2-dimethyl-2-silapentanesul-fonic acid; (iv), creatinine.
1920 Oakridge Conference
diagnostics, drug compliance testing, toxicology, andfood testing.
We wish to thank the University of Alberta Hospital,Toronto Hospital for Sick Children, Children’s & Wom-en’s Health Centre of British Columbia, and Health Sci-ences Centre (Winnipeg, Manitoba) for contributing sam-ples for this study. We also thank Dr. Fiona Bamforth(Department of Laboratory Medicine and Pathology, Uni-versity of Alberta) for invaluable advice.
References1. Lindon JC, Nicholson JK, Everett JR. NMR Spectroscopy of Biofluids. Annu
Rep NMR Spectrosc 1999;38:1–88.2. Wevers RA, Engelke UFH, Moolenaar SH, Brautigam C, De Jong JGN, Duran
R, et al. 1H-NMR spectroscopy of body fluids: inborn errors of purine andpyrimidine metabolism. Clin Chem 1999;45:539–48.
3. Bamforth FJ, Dorian V, Vallance H, Wishart DS. Diagnosis of inborn errors ofmetabolism using 1H NMR spectroscopic analysis of urine. J Inherit MetabDis 1999;22:297–301.
4. Burns SP, Woolf DA, Leonard JV, Iles RA. Investigation of urea cycle enzymedisorders by 1H-NMR spectroscopy. Clin Chim Acta 1992;209:47–60.
5. Komoroski E M, Komoroski RA, Valentine JL, Pearce JM, Kearns GL. The useof nuclear magnetic resonance spectroscopy in the detection of drugintoxication. J Anal Toxicol 2000;24:180–7.
6. Foxall PJD, Mellotte GJ, Bending MR, Lindon JC, Nicholson JK. NMRspectroscopy as a novel approach to the monitoring of renal transplantfunction. Kidney Int 1993;43:234–45.
7. Freedman DS, Otvos JD, Jeyarajah EJ, Barboriak JJ, Anderson AJ, Walker JA.Relation of lipoprotein subclasses as measured by proton nuclear magneticresonance spectroscopy to coronary artery disease. Arterioscler ThrombVasc Biol 1998;18:1046–53.
8. Nicholson JK, Lindon JC, Holmes E. ’Metabonomics’: understanding themetabolic responses of living systems to pathophysiological stimuli viamultivariate statistical analysis of biological NMR spectroscopic data.Xenobiotica 1999;29:1181–9.
9. Robertson DG, Reily MD, Sigler RE, Wells DF, Paterson DA, Braden TK.Metabonomics: evaluation of nuclear magnetic resonance (NMR) and pat-tern recognition technology for rapid in vivo screening of liver and kidneytoxicants. Toxicol Sci 2000;57:326–37.
10. Tietz, NW, ed. Clinical guide to laboratory tests, 3rd ed. Philadelphia: WBSanders Press, 1995:1–760.
The Use of Inosine 5*-Monophosphate Dehydrogenase(IMPDH) in the Development of a New Liquid Homo-geneous Enzyme Immunoassay Technology, Allan R.Dorn,* Larry D. Mountain, Mitali Ghoshal, Raymond A. Hui,Lisa K. Klinedinst, Janice E. Rugaber, Andrew F. Schamerloh,and Salvatore J. Salamone (Roche Diagnostics Corporation,Centralized Diagnostics Business Unit, 9115 Hague Rd.,PO Box 50457, Indianapolis, IN 46250-0457; * author forcorrespondence: fax 317-521-3085, e-mail [email protected])
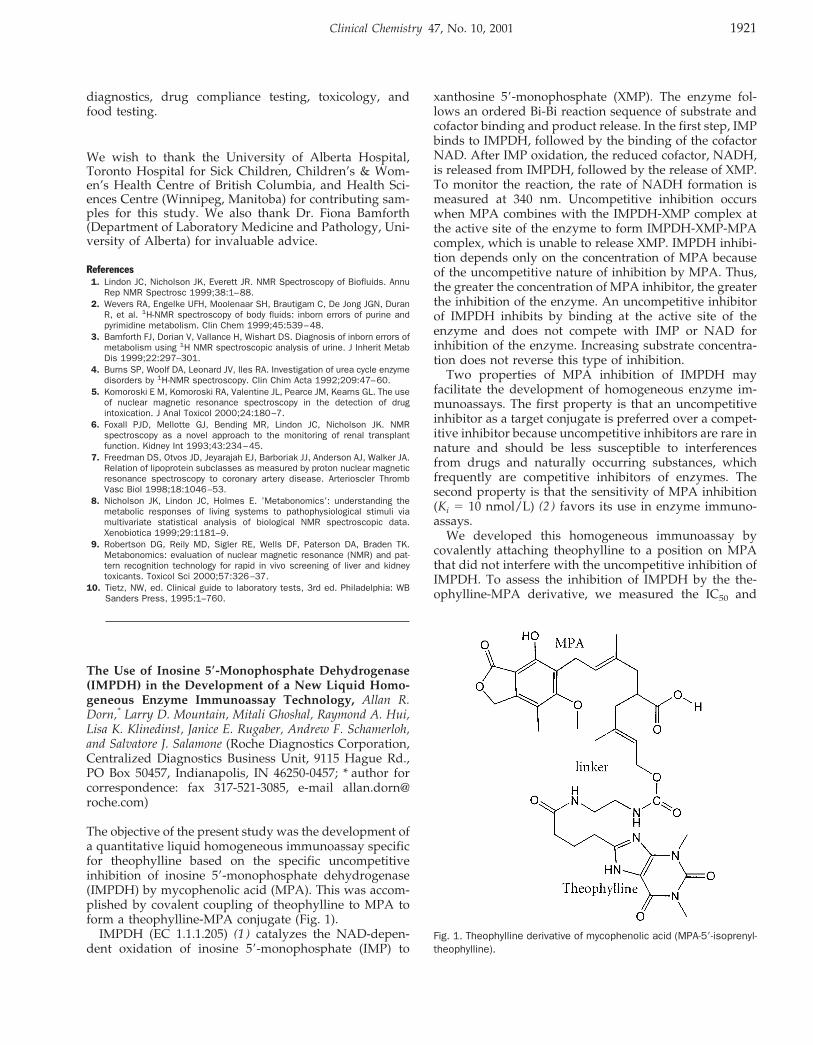
The objective of the present study was the development ofa quantitative liquid homogeneous immunoassay specificfor theophylline based on the specific uncompetitiveinhibition of inosine 59-monophosphate dehydrogenase(IMPDH) by mycophenolic acid (MPA). This was accom-plished by covalent coupling of theophylline to MPA toform a theophylline-MPA conjugate (Fig. 1).
IMPDH (EC 1.1.1.205) (1 ) catalyzes the NAD-depen-dent oxidation of inosine 59-monophosphate (IMP) to
xanthosine 59-monophosphate (XMP). The enzyme fol-lows an ordered Bi-Bi reaction sequence of substrate andcofactor binding and product release. In the first step, IMPbinds to IMPDH, followed by the binding of the cofactorNAD. After IMP oxidation, the reduced cofactor, NADH,is released from IMPDH, followed by the release of XMP.To monitor the reaction, the rate of NADH formation ismeasured at 340 nm. Uncompetitive inhibition occurswhen MPA combines with the IMPDH-XMP complex atthe active site of the enzyme to form IMPDH-XMP-MPAcomplex, which is unable to release XMP. IMPDH inhibi-tion depends only on the concentration of MPA becauseof the uncompetitive nature of inhibition by MPA. Thus,the greater the concentration of MPA inhibitor, the greaterthe inhibition of the enzyme. An uncompetitive inhibitorof IMPDH inhibits by binding at the active site of theenzyme and does not compete with IMP or NAD forinhibition of the enzyme. Increasing substrate concentra-tion does not reverse this type of inhibition.
Two properties of MPA inhibition of IMPDH mayfacilitate the development of homogeneous enzyme im-munoassays. The first property is that an uncompetitiveinhibitor as a target conjugate is preferred over a compet-itive inhibitor because uncompetitive inhibitors are rare innature and should be less susceptible to interferencesfrom drugs and naturally occurring substances, whichfrequently are competitive inhibitors of enzymes. Thesecond property is that the sensitivity of MPA inhibition(Ki 5 10 nmol/L) (2 ) favors its use in enzyme immuno-assays.
We developed this homogeneous immunoassay bycovalently attaching theophylline to a position on MPAthat did not interfere with the uncompetitive inhibition ofIMPDH. To assess the inhibition of IMPDH by the the-ophylline-MPA derivative, we measured the IC50 and
Fig. 1. Theophylline derivative of mycophenolic acid (MPA-59-isoprenyl-theophylline).
Clinical Chemistry 47, No. 10, 2001 1921
compared it with the IC50 for MPA (3 ). Both compoundswere diluted to eight different concentrations in 750mL/L dimethyl sulfoxide (DMSO)–250 mL/L H2O (75%DMSO in H2O). IMPDH-II was diluted to 3 U/L in 100mmol/L Tris-HCl, 100 mmol/L KCl, 3 mmol/L EDTA,100 mg/L bovine serum albumin, 5 mmol/L tris(2-carboxyethyl)phosphine-HCl, pH 8.0. The reaction bufferwas 125 mmol/L Tris-HCl, 125 mmol/L KCl, 3.75mmol/L EDTA, 125 mg/L bovine serum albumin, 0.0625mmol/L IMP, 0.125 mmol/L NAD, pH 8.0. The theoph-ylline-MPA derivative was synthesized by Roche Diag-nostics Corp. Human IMPDH-II was used in all assaysand was produced by recombinant techniques. The en-zyme was partially purified by ammonium sulfate pre-cipitation. The IC50 assay was performed on the RocheCOBAS FARA II analyzer. The assay reaction temperaturewas 40 °C. Before the assay, 40 mL of sample (DMSO-H2Oblank or eight concentrations of test compound) and 320mL of reaction buffer were pipetted together and incu-bated for 5 min to warm to reaction temperature. Thereaction was started by pipetting 40 mL of enzyme reagentinto the cuvette. The absorbance at 340 nm was read every30 s for 10.5 min.
Results were calculated as DA340/min with a readwindow of 0.5–10.5 min. Each concentration of MPA andtheophylline-MPA was run three times in triplicate (totalof nine tests). In each analytical run, triplicate values wereaveraged and entered into Sigma Plot Ver. 4.01, whichwas then used to calculate the IC50 by a hyperbolic decaytwo-parameter regression: y 5 ab/(b 1 x). The averageIC50 (three analytical runs) for each compound was re-ported. The results were as follows: MPA, IC50 5 34nmol/L (CV 5 6.0%; R2 5 0.995); MPA-59-isoprenyl-theophylline (racemic), IC50 5 116 nmol/L (CV 5 1.8%;R2 5 0.984). Thus, the theophylline-MPA derivative in-hibited IMPDH activity but was less inhibitory than MPAitself.
Immunoassays for theophylline were performed on theHitachi 917 analyzer as follows: 3 mL of sample wasadded to a cuvette, and 150 mL of R1 reagent was added,mixed, and incubated at 37 °C for 5 min. R2 reagent (150mL) was then added and mixed. The change in absorbanceat 340 nm was monitored during the 3.5–5.0-min intervalafter the addition of the R2 reagent. In-house theophyllinecalibrators were used with the Hitachi 917 analyzer forthe theophylline-MPA method. Roche Integra theophyl-line calibrators and a Roche Integra fluorescence polariza-tion theophylline reagent cassette were used with theRoche Integra 700 analyzer for the method-comparisonstudies.
The R1 reagent formulation used was 100 mmol/L Tris,100 mmol/L KCl, 80 mmol/L IMP, 4 mmol/L TCEP, 6mmol/L EDTA, 1.47 mmol/L theophylline-MPA, 4mmol/L Suttocide A, 0.1 g/L (theophylline) monoclonalantibody, IMPDH-II (adjusted to rate), final pH 8.0. TheR2 reagent formulation used was 1 mmol/L NAD, 4mmol/L Suttocide A, 1.75 mL/L Nonidet P-40 (0.175%),final pH 6.0. The (theophylline) monoclonal antibody wasa purified Roche Diagnostics monoclonal.
The principle of the assay is as follows: Theophylline-specific antibody binds theophylline-MPA in the ab-sence of theophylline and thus prevents the inhibition ofIMPDH by theophylline-MPA. The enzyme activity isgreatest when theophylline is absent. Theophylline, whenpresent, binds to its antibody, thus freeing up theophyl-line-MPA. Free theophylline-MPA binds to catalyticallyactive IMPDH and inhibits the enzyme by preventing therelease of XMP. The rate of formation of NADH ismeasured at 340 nm and is correlated to theophyllineconcentration. The rates observed with 0, 5, 10, 20, and 40mg/L theophylline calibrators were, respectively: 105, 98,93, 85, and 78 milliabsorbance units/min at 340 nm on theHitachi 917 analyzer.
We used Passing–Bablok regression statistics to com-pare the theophylline-MPA method on the Hitachi 917with the fluorescence polarization method on the Integra700. Patient plasma samples were used in the methodcomparison. Regression statistics were as follows: y 50.962x 1 0.077; median distance (95) 5 1.991; n 5 51; R 50.982; median, 11.3 (x), 10.8 (y); minimum, 8.3 (x), 8.8 (y);maximum, 29.5 (x), 31.0 (y).
We conclude that these results indicate the potential useof IMPDH as a homogeneous enzyme immunoassaytechnology as shown for theophylline.
References1. Fleming MA, Chambers SP, Connelly PR, Nimmersgern E, Fox T, Bruzzese FJ,
et al. Inhibition of IMPDH by mycophenolic acid: dissection of forward andreverse pathways using capillary electrophoresis. Biochemistry 1996;22:6990–7.
2. Carr SF, Papp E, Wu JC, Natsumeda Y. Characterization of human type I andtype II IMP dehydrogenases. J Biol Chem 1993;36:27286–90.
3. Nelson PH, Carr SF, Devens BH, Eugui EM, Franco F, Gonzalez C, et al.Structure-activity relationships for inhibition of inosine monophosphate dehy-drogenase by nuclear variants of mycophenolic acid. J Med Chem1996;21:4181–96.
Active Electronic Arrays for Genotyping of NAT2 Poly-morphisms, Youvraj R. Sohni,1 Brian Dukek,1 William Tay-lor,2 Elena Ricart,3 William J. Sandborn,3 and Dennis J.O’Kane1,2* (1 Department of Laboratory Medicine and Pa-thology, 2 Mayo Clinic Cancer Center, and 3 Division ofGastroenterology and Hepatology, Mayo Clinic, Roches-ter, MN 55905; * address correspondence to this author at:Hilton 730, Department of Laboratory Medicine and Pa-thology, Mayo Clinic, Rochester, MN 55905; fax 507-284-9758, e-mail [email protected])
The N-acetyltransferase 2 (NAT2) gene is autosomal,dominant, and intronless with an open reading frame of870 bp. It is located on chromosome 8p22. NAT2 enzymedetoxifies and inactivates drugs and xenobiotics in theliver. NAT2 polymorphisms confer phenotypes catego-rized as slow, intermediate, or rapid acetylators withbroad interethnic variation. There are 26 known alleles,and each allelic variant is a combination of one, two,three, or four nucleotide substitutions. Within the coding
1922 Abstracts of Oak Ridge Posters
region there are seven missense mutations (G191A,T341C, A434C, G590A, A803G, A845C, and G857A) andfour silent mutations (T111C, C282T, C481T, and C759T)(1, 2). The wild-type NAT2*4 allele is associated with therapid acetylator phenotype and does not have any nucle-otide substitutions. The phenotype can be predicted with95% accuracy by genotyping. (3–5).
We present a method for performing multiple-poly-morphism genotyping of the NAT2 gene. A single ampli-fication of NAT2 is performed with sequential probing formultiple polymorphisms by active electronic arrays. Themethod permits application of multiple DNA samples insingleton for high-throughput genotyping. Rapid high-throughput determination of genotypes may aid in clini-cal epidemiology studies and in routine clinical practice.
Published primer sequences were used to perform PCRto generate a 1212-bp amplicon (6 ). The primers were59-AAT TAG TCA CAC GAG GA-39 (forward) and 59-biotin-TCT AGC ATG AAT CAC TCT G-39 (reverse). Thebiotinylated primers permit capturing of the amplicons tothe microarray surface where they remain embeddedthrough interaction with streptavidin in the permeationlayer. The agarose permeation layer containing streptavi-din coats the microarray, separating the biological mate-rials from the harsh electrochemical environment, andallows binding of biotinylated amplicons (7 ).
The PCR reaction mixture consisted of 5 mL of 103buffer (Applied Biosystems), 1 mL of dNTPs (10 mM eachdNTP; Roche), 5 mL (50 mM) of each primer, 0.25 U ofAmpliTaq Gold, and 200–400 ng of DNA template. Thethermal cycling conditions were as follows: 95 °C for 10min; 30 cycles of 94 °C for 1 min, 55 °C for 1 min, and72 °C for 2 min; and final extension at 72 °C for 5 min. Atthe end of PCR, the products were desalted on Multi-Screen® PCR plates (Millipore) and resuspended in water.
We prepared hybridization mixtures to address theamplicons to NanochipTM array sites (Nanogen). A hy-bridization mixture consisted of 5–40 nmol/L desaltedamplicons, 250 nmol/L each stabilizer oligonucleotide,and 40 mL of 100 mmol/L l-histidine buffer in a totalvolume of 80 mL. The following stabilizer oligonucleo-tides were used: 59-TGA CAG GAA TTA CAT TGT CGATGC-39 (NAT2*T341C), 59-AAA TAT ATT TAA GAT TTCCTT GGG GAG AAA TCT CGT G-39 (NAT2*A803G), and59-GGG TGG GTG GTG TCT CCA GGT CAA T-39(NAT2*G191A). The hybridization mixtures were dena-tured at 95 °C for 10 min before they were transferred toa Nunc V-bottomed plate for loading. The Nunc platescontaining the hybridization mixtures were loaded in theinstrument loader. A mapping protocol was used toelectronically address biotinylated amplicons to user-designated sites on the microarray. Instrument softwarewas used to create a map to address the hybridizationmixtures to designated sites on the chip array. A negativecontrol oligonucleotide (ATA5) and a l-histidine bufferblank were addressed to the array simultaneously withthe test amplicons.
Temperature was used to discriminate betweenmatched and mismatched reporters. The reporters had the
single-nucleotide polymorphism (SNP) as the 39 terminalbase and a fluorophore at the 59 end. The wild-typereporter probe was labeled with Cy5 and the polymor-phism probe with Cy3 in all cases. The following reporterprobes were synthesized: 59-CAG GTG ACC AT/C-39(T341C), 59-GAA GTG CTG AA/G-39 (A803G), and 59-AAG AAG AAA CCG-39 and 59-TAA GAA GAA ACCA-39 (G191A; Integrated DNA Technologies). The SNPreporting mixture consisted of 500 nmol/L each reporterand 48 mL of high-salt buffer in a final volume of 50 mL.The microarray was imaged using separate lasers for bothCy5 and Cy3. The optimal temperature was determinedfor each locus by a temperature-ramping fluorescencereader protocol. A user-designated protocol was designedby which the array was subjected to 2 °C increments intemperature followed by scans at ambient temperatureafter each ramp. Initially, the array was scanned over awide range of temperatures. The optimal temperaturewas selected for scanning the array for fluorescenceintensity.
Known heterozygotes were used to normalize hybrid-ization efficiency between Cy5 and Cy3 dye-labeled re-porters. Heterozygotes were verified by dye-terminatorsequencing on ABI 377 DNA sequencers in both forwardand reverse directions. A biallelic fluorescence intensityratio #1:3 was defined as heterozygous and a ratio $1:5was defined as homozygous. Genotypes were assignedusing the manufacturer’s recommended biallelic fluores-cence intensity ratios. No genotype designations weremade for fluorescence intensity ratios between 1:3 and 1:5.Homozygous wild-type alleles hybridized with Cy5-la-beled reporter probe, whereas homozygous polymorphicalleles hybridized only with Cy3-labeled reporter probes.Each heterozygous complex hybridized with both labeledprobes for each allele pair tested.
Sequential probing with reporter probe pairs was usedto analyze each SNP in the amplicon. The A803G poly-morphism was detected first because of the relativelylower Tm for its reporters. At the end of the first reporting,the array was subjected to a reporter dehybridizationprotocol in the fluorescence reader. Using this protocol,we stripped the probes from the array by ramping thetemperature to 40 °C followed by a l-histidine bufferwash. We confirmed complete probe dehybridization byverifying the absence of any fluorescence signal. We thensequentially reprobed with the reporters for G191A fol-lowed by T341C.
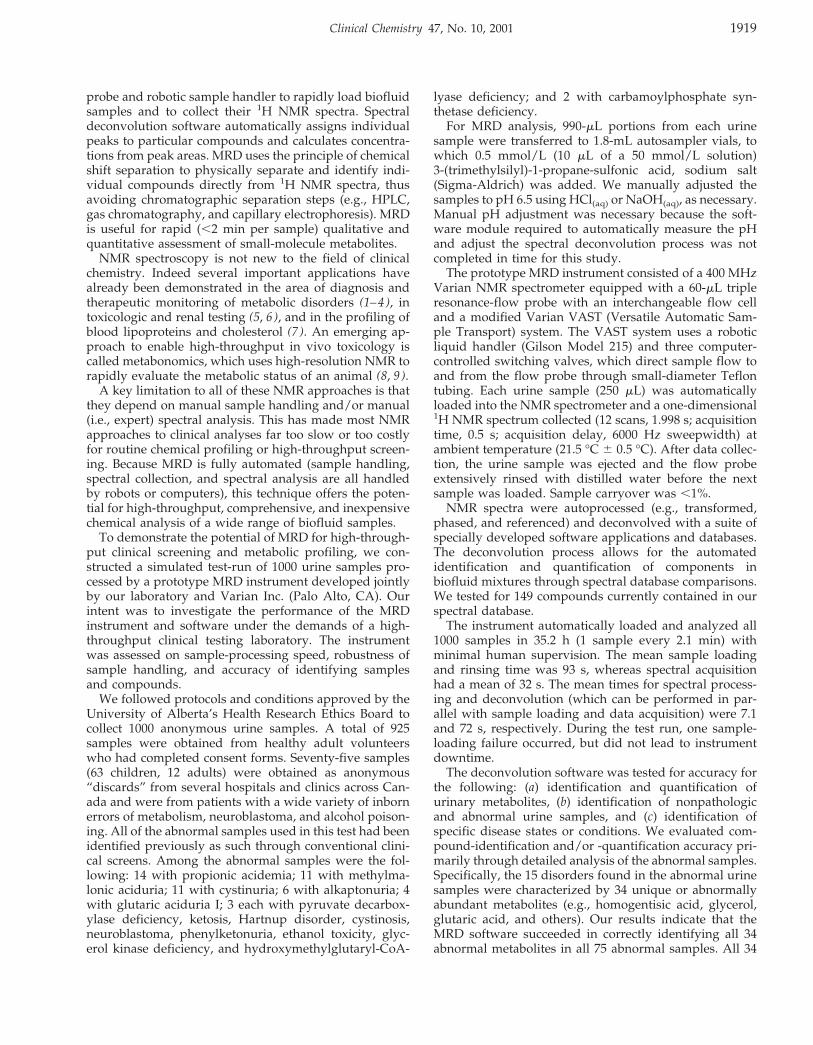
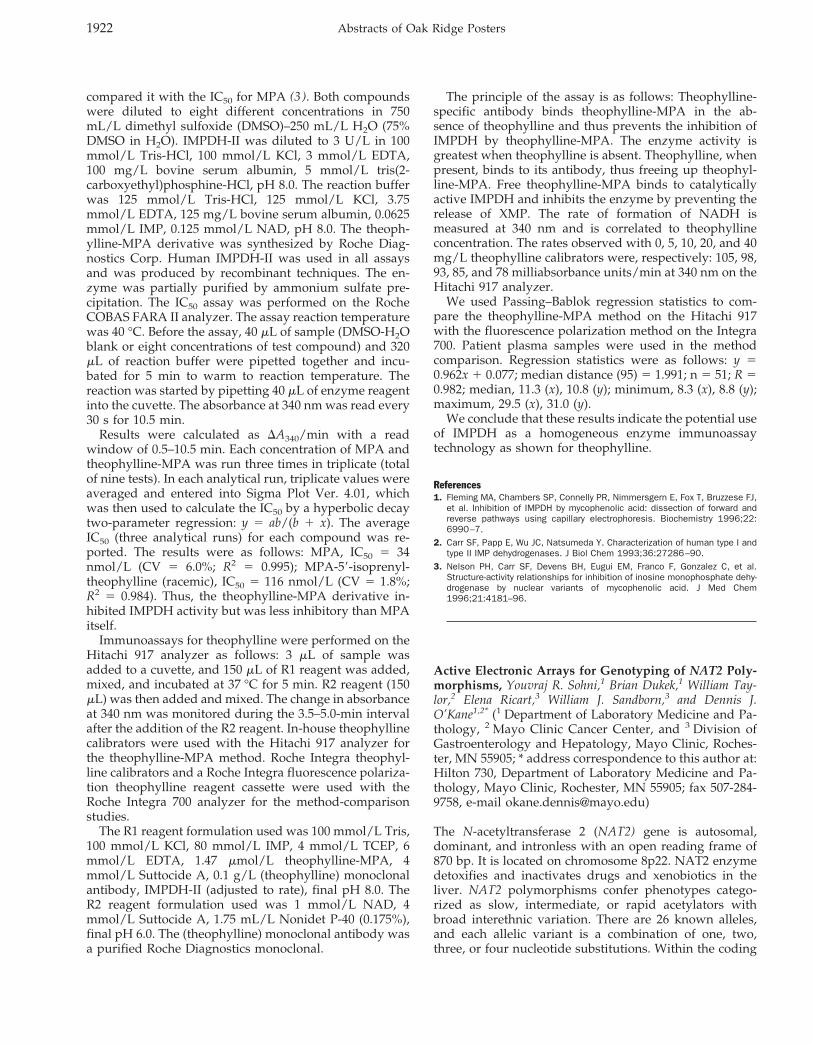
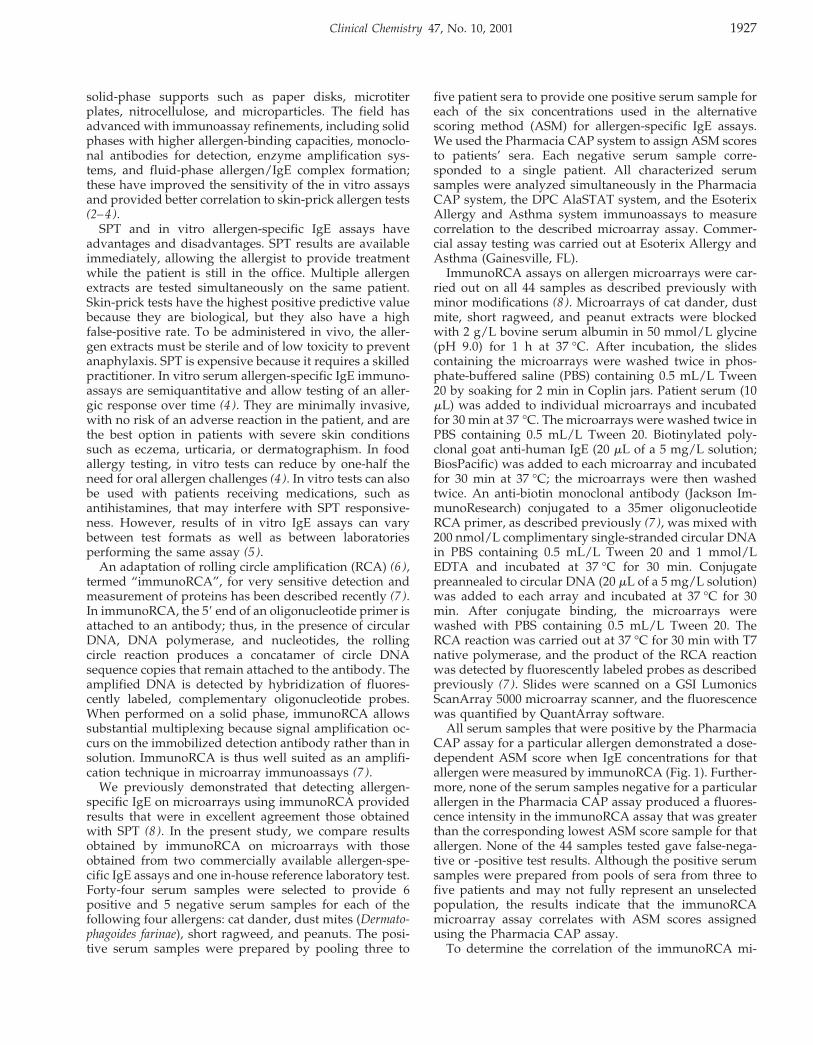
Representative genotyping results for the NAT2*T341Cpolymorphism are shown in Fig. 1. The genotype desig-nation for amplicon 1 is homozygous for the polymorphicallele. This is based on a fluorescence intensity ratio $1:5between Cy3 and Cy5 dye-labeled reporters. Further-more, the data are normalized with a known heterozygoteconfirmed previously by sequencing. Similarly, the geno-type designation for amplicon 10 is homozygous for thewild-type allele. The genotypes for the remaining sampleamplicons shown in Fig. 1 are designated as heterozygouswith Cy5/Cy3 biallelic fluorescence ratios #1:3.
Overall, for NAT2*T341C, 79 of 83 (95.2%) amplicons
Clinical Chemistry 47, No. 10, 2001 1923
were genotyped in a single hybridization run on onemicroarray. Of these, 32.5% were wild type, 50.6% wereheterozygous, and 12% were homozygous for the poly-morphism (Table 1). For NAT2*A803G, 80 of 83 (96.4%)amplicons were genotyped in a single hybridization runon a microarray, of which 34.9% were wild type, 49.4%were heterozygous, and 12% were homozygous for thepolymorphism. For NAT2*G191A, 71 of 83 (86%) ampli-cons were genotyped in a single run, of which 100% werewild type.
In practice, ,100% of samples could be genotyped in asingle run. For NAT2*T341C, there were three ampliconsthat could not be assigned a genotype because the biallelicratio was between 1:3 and 1:5. There were two ampliconsfor NAT2*A803G and six amplicons for NAT2*G191A thatwere not assigned a genotype for the same reason. Of the83 amplicons that were analyzed, there was only oneDNA sample that could not be genotyped for any of theSNPs because of failed PCR. This may be attributable tothe poor quality of the template DNA used for PCR or tohuman error in either the PCR set-up or genotyping steps.In some cases, in spite of successful PCR, the amplicon(s)had a lower DNA concentration than required. Therewere five NAT2*G191A amplicons for which the fluores-cence signals were too low to make a designation. Fur-thermore, three sets of stabilizers and reporters were usedfor the three different SNPs that were analyzed. Althoughsequential probing was done on the same amplicon, theamplicon concentration thresholds required for the threeSNPs were different. This is because of differences inbase-pairing interactions among the stabilizers and targetDNA as well as differences in base-stacking interactionsbetween stabilizer and reporter pairs. It is therefore pos-sible that, whereas one SNP could be assayed successfully
for a test amplicon, analysis of another SNP on the sameamplicon failed.
Microarray genotyping results were confirmed by di-rect DNA sequencing with 100% concordance. Sequentialscanning for polymorphisms within an amplicon could beperformed up to five times without significant degrada-tion of the signal-to-noise ratio. This approach has beenextended to four additional four SNPs (C282T, C481T,G590A, and G857A), using a second microarray, andachieved comparable results.
Sequential probing is a rapid and accurate method forgenotyping multiple polymorphisms in large ampliconsand intronless genes. The method can be applied to testlarge number of samples, using active electronic arrays.This sequential probing approach is particularly useful inepidemiologic studies because of its relative simplicityand high sample throughput, which could improve thecost-effectiveness for genotyping.
References1. Grant DM, Hughes NC, Janezic SA, Goodfellow GH, Chen HJ, Gaedigk A, et al.
Human acetyltransferase polymorphisms. Mutat Res 1997;376:61–70.2. Hein DW, Doll MA, Fretland AJ, Leff MA, Webb SJ, Xiao GH, et al. Molecular
genetics and epidemiology of the NAT1 and NAT2 acetylation polymorphisms.Cancer Epidemiol Biomark Prev 2000;9:29–42.
3. Hickman D, Sim E. N-Acetyltransferase polymorphism: comparison of pheno-type and genotype in humans. Biochem Pharmacol 1991;42:1007–14.
4. Grant DM. Molecular genetics of the N-acetyltransferases. Pharmacogenetics1993;3:45–50.
5. Cascorbi I, Drakoulis N, Brockmoller J, Mauer A, Sperling K, Roots I. ArylamineN-acetyltransferase (NAT2) mutations and their allelic linkage in unrelatedCaucasian individuals: correlation with phenotypic activity. Am J Hum Genet1995;57:581–92.
6. Agundez JAG, Martinez C, Olivera M, Ledesma MC, Ladero JM, Benitez J.Molecular analysis of the arylamine N-acetyltransferase polymorphism in aSpanish population. Clin Pharmacol Ther 1994;56:202–9.
7. Gilles PN, Wu DJ, Foster CB, Dillon PJ, Chanock SJ. Single nucleotidepolymorphic discrimination by an electronic dot blot assay on semiconductormicrochips. Nature Biotechnol 1999;17:365–70.
Mass Spectroscopy as a Discovery Tool for IdentifyingSerum Markers for Prostate Cancer, John J. Hlavaty,1 AlanW. Partin,2 Felicity Kusinitz,1 Matthew J. Shue,2 Adam Stieg,1
Kate Bennett,1 and Joseph V. Briggman1* (1 Matritech, Inc.,330 Nevada St., Newton, MA 02460; 2 The James BuchananBrady Urological Institute, The Johns Hopkins Hospital,Baltimore, MD 21287-0033; * author for correspondence: fax617-928-0821, e-mail [email protected])
Prostate cancer is the second most common malignancy inmen, after skin cancer, and the second most commoncause of cancer death in men over age 60 years, after lungcancer. This year, ;198 100 new cases of prostate cancerwill be diagnosed in the US, and an estimated 31 500 menwill die of prostate cancer (1 ). Five-year survival is closeto 100% when the disease is diagnosed and treated withdefinitive local therapy while it is still organ-confined, butin approximately one-third of men diagnosed with clini-cally localized disease, the disease has spread beyond theconfines of the prostate at the time of surgery (2, 3).
The Food and Drug Administration approved a serum
Fig. 1. Representative genotyping results for the NAT2*T341C poly-morphism.
Table 1. Genotyping results for NAT2 polymorphisms inthis study.
SNP Genotyped/single runWildtypea Heterozygous Mutanta
T341C (n 5 83) 79/83 (95.2%) 32.5% 50.6% 12%A803G (n 5 83) 80/83 (96.4%) 34.9% 49.4% 12%G191A (n 5 83) 71/83 (86%) 100% 0 0
a Homozygous.
1924 Abstracts of Oak Ridge Posters
test for prostate-specific antigen (PSA) in the 1980s. Withan upper reference limit in serum of 4 mg/L, 67–80% ofprostate cancers can be detected, for a positive predictivevalue of 24% (4, 5). Combining the serum PSA test with adigital rectal examination can improve the positive pre-dictive value (3, 6, 7). Despite the availability of the PSAtest and the moderately high compliance with routinetesting recommendations, ;20–30% of prostate cancersare missed by the current early detection protocols. Theidentification of more accurate serum markers for pros-tate cancer could improve the current clinical capabilitiesfor cancer detection and may reduce cancer mortality.
Proteomics, the large-scale comparison of protein ex-pression patterns, can be used to identify proteins that areassociated with disease states such as cancer. These stud-ies have been enhanced by the development of powerfuland sensitive new methods, such as matrix-assisted laserdesorption/ionization time-of-flight mass spectrometry(MALDI-TOF). In this technique, proteins are adsorbed toa solid matrix, desorbed with a pulsed laser beam toproduce gas-phase ions that traverse a field-free flighttube, and then separated according to their velocities,which depend on their mass/charge ratio. The sensitivityof this method for protein identification has been im-proved by the development of surface-enhanced laserdesorption/ionization time-of-flight mass spectrometry(SELDI-MS). SELDI is an affinity-based MS method inwhich proteins are selectively adsorbed to a chemicallymodified surface, impurities are removed by washingwith buffer, an energy-absorbing material is layered ontop, and the proteins are identified by laser desorptionmass analysis. SELDI protein analysis has been used todetect prostate cancer-associated proteins in cancer celllysates, seminal plasma, and serum (8, 9). We report herethe use of SELDI to identify a putative prostate cancer-specific protein in the preoperative serum of patients withhistologically confirmed prostate cancer.
Serum samples were obtained from The Johns HopkinsSchool of Medicine (Baltimore, MD). For men with pros-tate cancer, serum samples were obtained before surgery.Serum samples also were obtained from age-matchedcontrols clinically determined to be cancer-free (serumPSA concentration ,2 mg/L and an unremarkable digitalrectal exam). All samples were collected with informedconsent according to protocols approved by the Institu-tional Review Board. Serum samples were stored at280 °C before analysis.
The serum samples were partially purified to removeinterfering serum components, fractionated by ion-ex-change chromatography, and analyzed by SELDI in aprocess known as “retentate mapping”. Briefly, sera weretreated with 1,1,2-trichloro-trifluoroethane to remove lip-ids, passed over a HiTrap Protein G column (PharmaciaBiotech) to remove immunoglobulins, and then passedover a HiTrap Blue column (Pharmacia Biotech) to re-move human serum albumin. The samples were fraction-ated over a Protein-Pak Q 8HR column (Waters) with a14-step NaCl step gradient in the concentration range of
0–1 mol/L. Throughout sample preparation, 50 mmol/LNaH2PO4, pH 7.0, was used as the buffer.
Cancer-specific serum protein markers were identifiedby a three-stage screening strategy. In the first stage, a setof putative prostate cancer biomarkers was identified bycomparing sera from five patients whose prostate cancershowed capsular penetration with sera from five cancer-free controls. Each of the 14 fractions from each samplewas applied to four different ProteinChipsTM (CiphergenBiosystems): H4, which has a hydrophobic surface forreversed-phase binding; WCX-2, which binds cationicproteins; IMAC-3-Ni21, which binds proteins with anaffinity for nickel; and SAX-2, which binds anionic pro-teins. Samples were analyzed in a Ciphergen Series PBS-IProteinChip System (SELDI mass spectrometer). Cipher-gen system software was used to produce compositespectra for each fraction assayed on each chip from theprostate cancer and control samples. The software gener-ated difference spectra that identified four novel peaks(59.7, 22.7, 21.4, and 50.8 kDa) that were present in thecancer samples but not in the controls. These peaks wereidentified with the H4, WCX-2, and IMAC-3 Protein-Chips. A novel peak was defined as having an amplitudeat least threefold greater than the baseline.
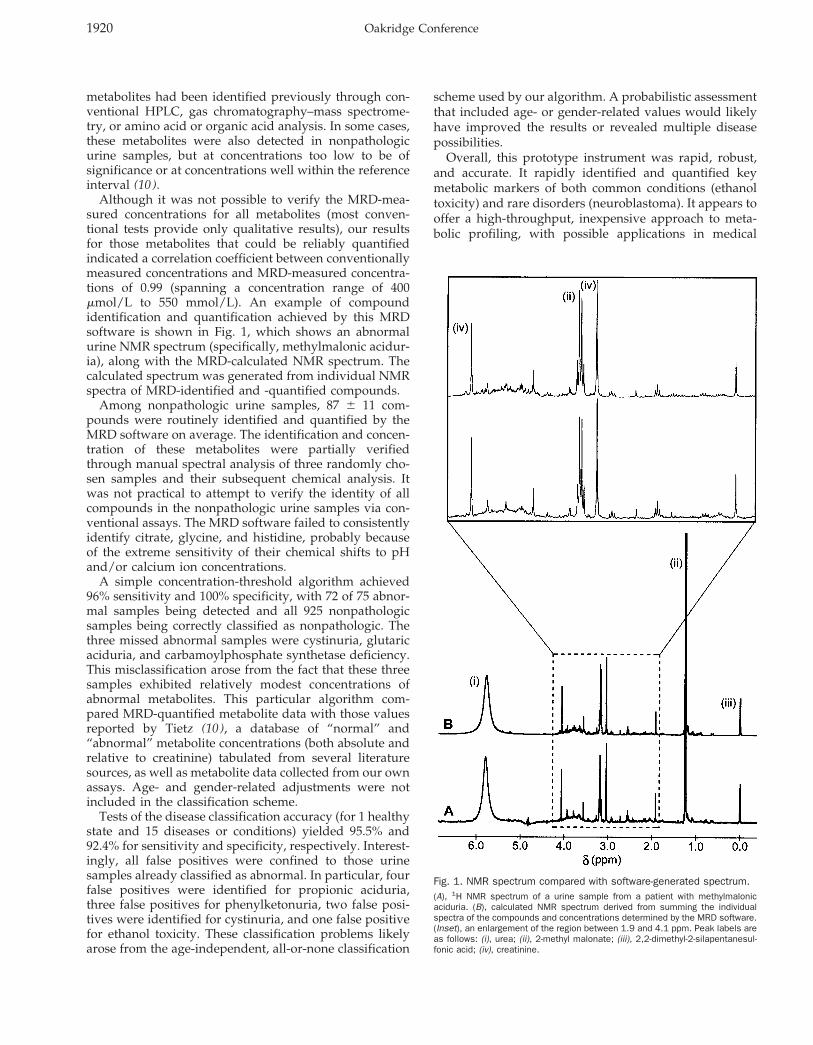
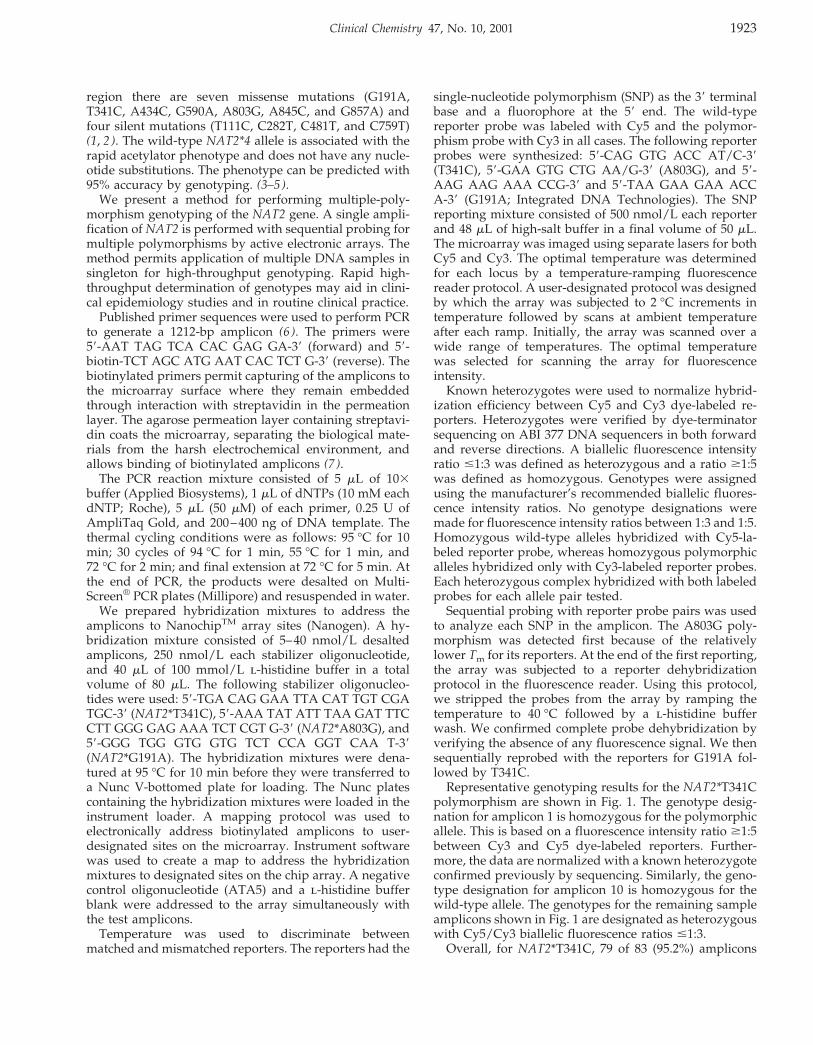
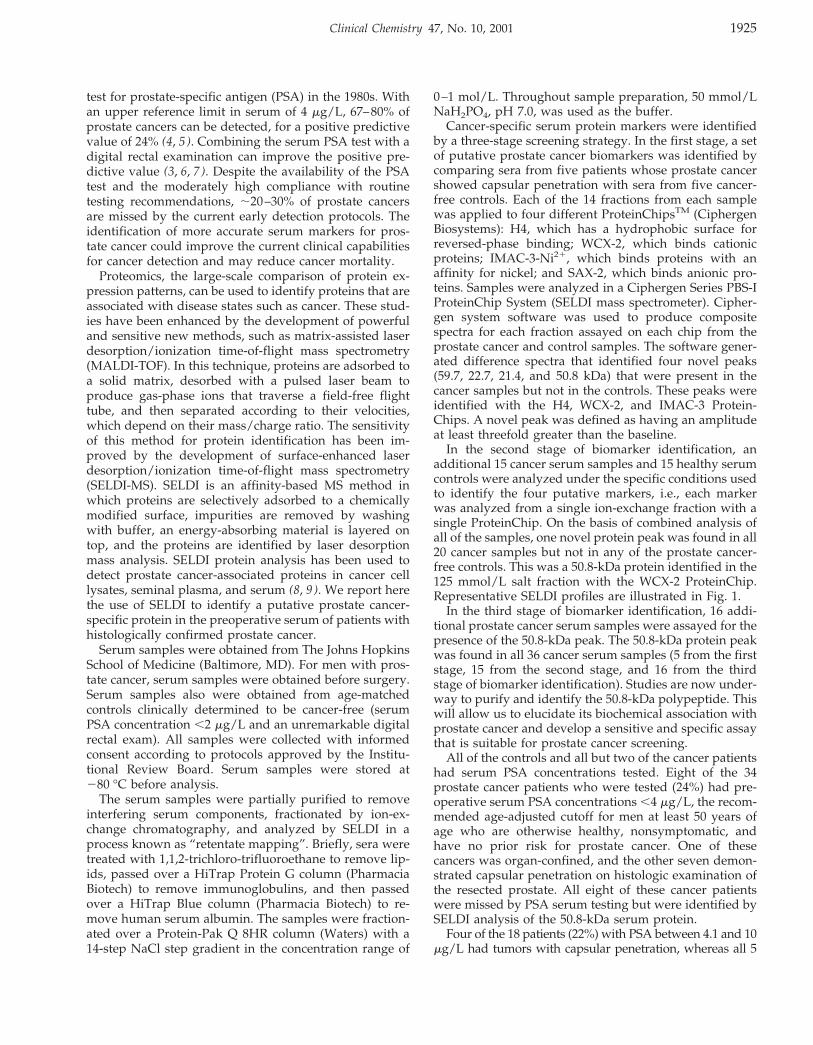
In the second stage of biomarker identification, anadditional 15 cancer serum samples and 15 healthy serumcontrols were analyzed under the specific conditions usedto identify the four putative markers, i.e., each markerwas analyzed from a single ion-exchange fraction with asingle ProteinChip. On the basis of combined analysis ofall of the samples, one novel protein peak was found in all20 cancer samples but not in any of the prostate cancer-free controls. This was a 50.8-kDa protein identified in the125 mmol/L salt fraction with the WCX-2 ProteinChip.Representative SELDI profiles are illustrated in Fig. 1.
In the third stage of biomarker identification, 16 addi-tional prostate cancer serum samples were assayed for thepresence of the 50.8-kDa peak. The 50.8-kDa protein peakwas found in all 36 cancer serum samples (5 from the firststage, 15 from the second stage, and 16 from the thirdstage of biomarker identification). Studies are now under-way to purify and identify the 50.8-kDa polypeptide. Thiswill allow us to elucidate its biochemical association withprostate cancer and develop a sensitive and specific assaythat is suitable for prostate cancer screening.
All of the controls and all but two of the cancer patientshad serum PSA concentrations tested. Eight of the 34prostate cancer patients who were tested (24%) had pre-operative serum PSA concentrations ,4 mg/L, the recom-mended age-adjusted cutoff for men at least 50 years ofage who are otherwise healthy, nonsymptomatic, andhave no prior risk for prostate cancer. One of thesecancers was organ-confined, and the other seven demon-strated capsular penetration on histologic examination ofthe resected prostate. All eight of these cancer patientswere missed by PSA serum testing but were identified bySELDI analysis of the 50.8-kDa serum protein.
Four of the 18 patients (22%) with PSA between 4.1 and 10mg/L had tumors with capsular penetration, whereas all 5
Clinical Chemistry 47, No. 10, 2001 1925
patients with PSA between 10.1 and 20 mg/L and all 3patients with PSA .20 mg/L had tumors with capsularpenetration. The probability of organ confinement decreaseswith increasing preoperative serum PSA concentrations,although PSA testing alone is not completely predictive (2).SELDI analysis conducted in the way we describe is onlyqualitative, so no direct correlation of concentration could bemade with either PSA concentration or tumor grade.
PSA is synthesized predominately in the epithelium ofthe prostate gland and the periurethral glands; therefore,serum PSA should disappear after radical prostatectomybecause the tissue source is removed. Serum PSA concen-tration is used as a surrogate endpoint for postoperativedisease management: the failure of serum PSA to disap-pear after surgery indicates the presence of persistentdisease, and the recurrence of serum PSA signals eithercancer recurrence or metastasis. Patients with metastaticprostate cancer typically undergo androgen ablation ther-apy, which can be effective in suppressing recurrence andmetastasis. However, because PSA synthesis and secre-tion require hormonal influence, androgen suppressioncan reduce PSA production (4 ). Therefore, even if occultmetastatic sites should develop, they might not secrete
enough PSA into the serum to exceed the diagnosticthreshold set for routine screening. Another serummarker, preferably androgen-independent, would be agreat asset for monitoring prostate disease after surgery.
All of the serum samples tested in this study werecollected preoperatively. The findings in this work arepromising, but preliminary. It would be informative totest postoperative serum samples for the disappearance ofthe 50.8-kDa protein and to compare this with serum PSAand clinical disease progression.
We acknowledge Natalie S. Rudolph for help in preparingthe manuscript.
References1. Greenlee R, Hill-Harmon MB, Murray T, Thun M. Cancer statistics, 2001. CA
Cancer J Clin 2001;51:15–36.2. Partin A, Kattan MW, Subong ENP, Walsh PC, Wojno KJ, Oesterling JE, et al.
Combination of prostate-specific antigen, clinical stage and Gleason score topredict pathological stage of localized prostate cancer. JAMA 1997;277:1445–51.
3. Smith R, von Eschenbach AC, Wender R, Levin B, Rothenberger D, Brooks D,et al. American Cancer Society Guidelines for the early detection of cancer:update of early detection guidelines for prostate, colorectal, and endometrialcancers and update 2001: testing for early lung cancer detection. CA CancerJ Clin 2001;51:38–75.
4. Polascik TJ, Oesterling JE, Partin AW. Prostate specific antigen: a decade ofdiscovery—what we have learned and where we are going. J Urol 1999;162:293–306.
5. Carroll P, Coley C, McLeod D, Schellhammer P, Sweat G, Wasson J, et al.Prostate-specific antigen best practice policy. Part I. Early detection anddiagnosis of prostate cancer. Urology 2001;57:217–24.
6. Catalona W, Richie J, Ahmann F, Hudson M, Scardino P, Flanigan R, et al.Comparison of digital rectal examination and serum prostate specific antigenin the early detection of prostate cancer: results of a multicenter clinical trialof 6,630 men. J Urol 1994;151:1283–90.
7. National Cancer Institute. CancerNet PDQ cancer information summaries.Screening for prostate cancer. http://www.cancernet.nci.nih.gov/pdq.html(accessed May 19, 2001).
8. Paweletz C, Gillespie J, Ornstein D, Simone, NL, Brown MR, Cole KA, et al.Rapid protein display profiling of cancer progression directly from humantissue using a protein biochip. Drug Dev Res 2000;49:34–42.
9. Wright G, Cazares L, Leung S, Nasim S, Adam B, Yip T, et al. ProteinChipsurface enhanced laser desorption/ionization (SELDI) mass spectrometry: anovel protein biochip technology for detection of prostate cancer biomarker incomplex protein mixtures. Prostate Cancer Prostate Dis 1999;2:264–76.
Allergen-specific IgE Detection on Microarrays UsingRolling Circle Amplification: Correlation with in VitroAssays for Serum IgE, Michael C. Mullenix,1* Steve Wilt-shire,1 Weiping Shao,1 Gary Kitos,2 and Barry Schweitzer1
(1 Molecular Staging Inc., 300 George St., Suite 701, NewHaven, CT 06511; 2 Esoterix Inc., 201 Summit View Dr.,Suite 100, Brentwood, TN 37027; * author for correspon-dence: fax 203-772-5276, e-mail [email protected])
Allergen-specific IgE antibody in patient serum is used topredict an allergic response in individuals with concor-dant clinical history. For more than 30 years, in vitroassays for allergen-specific IgE have been used along withor in place of skin-prick allergen testing (SPT) (1 ). In vitrotest methods include various immunoassay formats with
Fig. 1. Representative SELDI protein profiles from fractionated serumsamples from three prostate cancer patients (A–C) and three controls(D–F).Samples collected in 125 mmol/L NaCl from a Protein-Pak Mono-Q ion-exchangecolumn were applied to WCX-2 ProteinChips and analyzed in a Ciphergen PBS-1ProteinChip reader. A single protein peak appearing at 50.8 kDa was found in all36 prostate cancer samples but in none of the 20 clinically determined prostatecancer-free controls. A novel peak was defined as having an amplitude at leastthreefold greater than the baseline.
1926 Abstracts of Oak Ridge Posters
solid-phase supports such as paper disks, microtiterplates, nitrocellulose, and microparticles. The field hasadvanced with immunoassay refinements, including solidphases with higher allergen-binding capacities, monoclo-nal antibodies for detection, enzyme amplification sys-tems, and fluid-phase allergen/IgE complex formation;these have improved the sensitivity of the in vitro assaysand provided better correlation to skin-prick allergen tests(2–4).
SPT and in vitro allergen-specific IgE assays haveadvantages and disadvantages. SPT results are availableimmediately, allowing the allergist to provide treatmentwhile the patient is still in the office. Multiple allergenextracts are tested simultaneously on the same patient.Skin-prick tests have the highest positive predictive valuebecause they are biological, but they also have a highfalse-positive rate. To be administered in vivo, the aller-gen extracts must be sterile and of low toxicity to preventanaphylaxis. SPT is expensive because it requires a skilledpractitioner. In vitro serum allergen-specific IgE immuno-assays are semiquantitative and allow testing of an aller-gic response over time (4 ). They are minimally invasive,with no risk of an adverse reaction in the patient, and arethe best option in patients with severe skin conditionssuch as eczema, urticaria, or dermatographism. In foodallergy testing, in vitro tests can reduce by one-half theneed for oral allergen challenges (4 ). In vitro tests can alsobe used with patients receiving medications, such asantihistamines, that may interfere with SPT responsive-ness. However, results of in vitro IgE assays can varybetween test formats as well as between laboratoriesperforming the same assay (5 ).
An adaptation of rolling circle amplification (RCA) (6 ),termed “immunoRCA”, for very sensitive detection andmeasurement of proteins has been described recently (7 ).In immunoRCA, the 59 end of an oligonucleotide primer isattached to an antibody; thus, in the presence of circularDNA, DNA polymerase, and nucleotides, the rollingcircle reaction produces a concatamer of circle DNAsequence copies that remain attached to the antibody. Theamplified DNA is detected by hybridization of fluores-cently labeled, complementary oligonucleotide probes.When performed on a solid phase, immunoRCA allowssubstantial multiplexing because signal amplification oc-curs on the immobilized detection antibody rather than insolution. ImmunoRCA is thus well suited as an amplifi-cation technique in microarray immunoassays (7 ).
We previously demonstrated that detecting allergen-specific IgE on microarrays using immunoRCA providedresults that were in excellent agreement those obtainedwith SPT (8 ). In the present study, we compare resultsobtained by immunoRCA on microarrays with thoseobtained from two commercially available allergen-spe-cific IgE assays and one in-house reference laboratory test.Forty-four serum samples were selected to provide 6positive and 5 negative serum samples for each of thefollowing four allergens: cat dander, dust mites (Dermato-phagoides farinae), short ragweed, and peanuts. The posi-tive serum samples were prepared by pooling three to
five patient sera to provide one positive serum sample foreach of the six concentrations used in the alternativescoring method (ASM) for allergen-specific IgE assays.We used the Pharmacia CAP system to assign ASM scoresto patients’ sera. Each negative serum sample corre-sponded to a single patient. All characterized serumsamples were analyzed simultaneously in the PharmaciaCAP system, the DPC AlaSTAT system, and the EsoterixAllergy and Asthma system immunoassays to measurecorrelation to the described microarray assay. Commer-cial assay testing was carried out at Esoterix Allergy andAsthma (Gainesville, FL).
ImmunoRCA assays on allergen microarrays were car-ried out on all 44 samples as described previously withminor modifications (8 ). Microarrays of cat dander, dustmite, short ragweed, and peanut extracts were blockedwith 2 g/L bovine serum albumin in 50 mmol/L glycine(pH 9.0) for 1 h at 37 °C. After incubation, the slidescontaining the microarrays were washed twice in phos-phate-buffered saline (PBS) containing 0.5 mL/L Tween20 by soaking for 2 min in Coplin jars. Patient serum (10mL) was added to individual microarrays and incubatedfor 30 min at 37 °C. The microarrays were washed twice inPBS containing 0.5 mL/L Tween 20. Biotinylated poly-clonal goat anti-human IgE (20 mL of a 5 mg/L solution;BiosPacific) was added to each microarray and incubatedfor 30 min at 37 °C; the microarrays were then washedtwice. An anti-biotin monoclonal antibody (Jackson Im-munoResearch) conjugated to a 35mer oligonucleotideRCA primer, as described previously (7 ), was mixed with200 nmol/L complimentary single-stranded circular DNAin PBS containing 0.5 mL/L Tween 20 and 1 mmol/LEDTA and incubated at 37 °C for 30 min. Conjugatepreannealed to circular DNA (20 mL of a 5 mg/L solution)was added to each array and incubated at 37 °C for 30min. After conjugate binding, the microarrays werewashed with PBS containing 0.5 mL/L Tween 20. TheRCA reaction was carried out at 37 °C for 30 min with T7native polymerase, and the product of the RCA reactionwas detected by fluorescently labeled probes as describedpreviously (7 ). Slides were scanned on a GSI LumonicsScanArray 5000 microarray scanner, and the fluorescencewas quantified by QuantArray software.
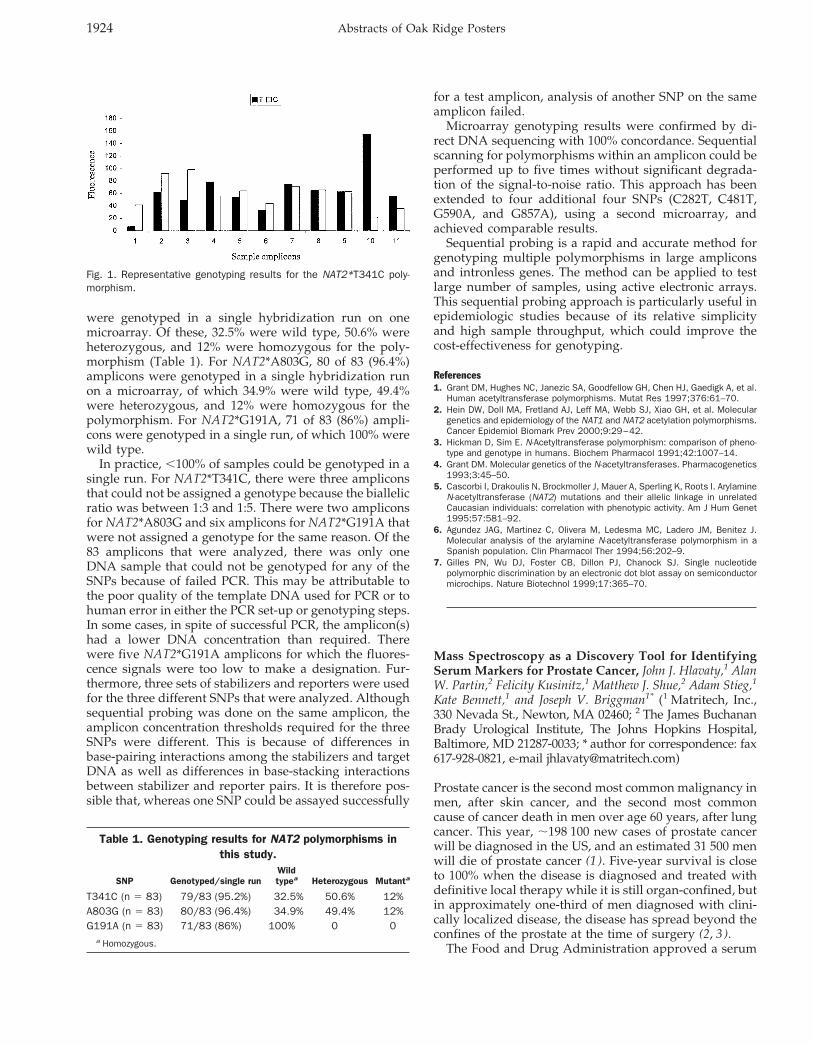
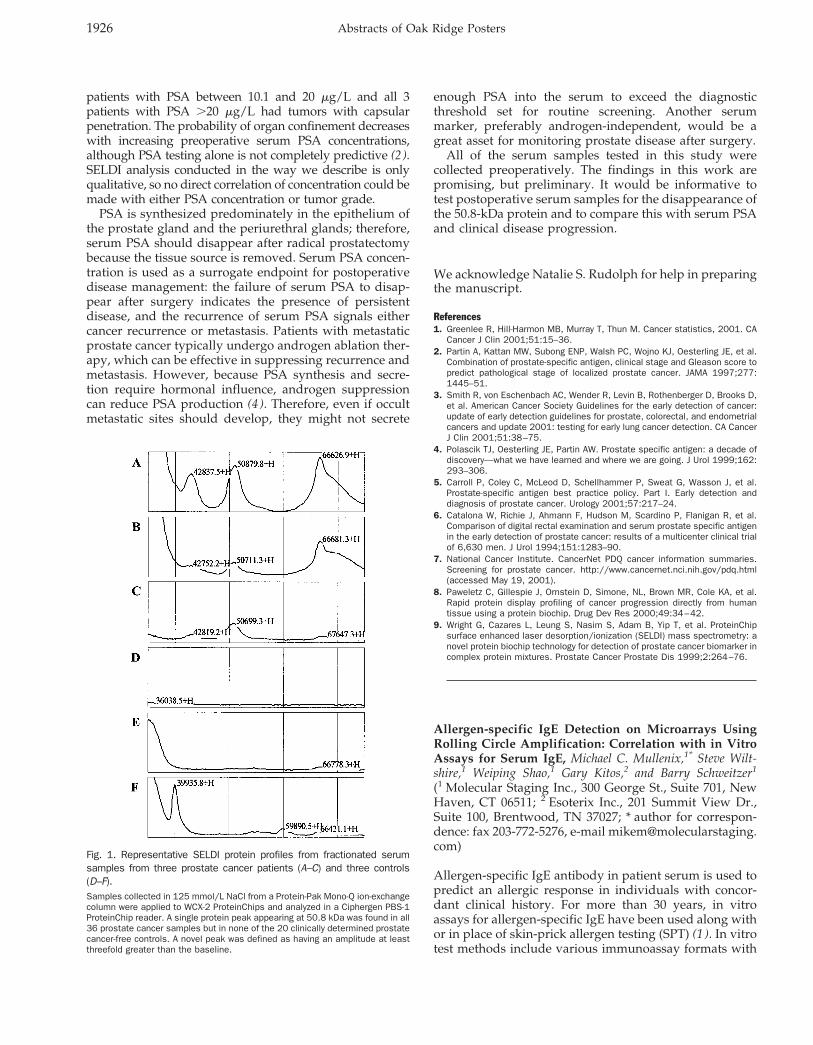
All serum samples that were positive by the PharmaciaCAP assay for a particular allergen demonstrated a dose-dependent ASM score when IgE concentrations for thatallergen were measured by immunoRCA (Fig. 1). Further-more, none of the serum samples negative for a particularallergen in the Pharmacia CAP assay produced a fluores-cence intensity in the immunoRCA assay that was greaterthan the corresponding lowest ASM score sample for thatallergen. None of the 44 samples tested gave false-nega-tive or -positive test results. Although the positive serumsamples were prepared from pools of sera from three tofive patients and may not fully represent an unselectedpopulation, the results indicate that the immunoRCAmicroarray assay correlates with ASM scores assignedusing the Pharmacia CAP assay.
To determine the correlation of the immunoRCA mi-
Clinical Chemistry 47, No. 10, 2001 1927
croarray assay with other commercial assays, the positiveand negative serum samples were tested simultaneouslyin three commercial allergen-specific IgE assays, andcorrelation coefficients were calculated based on all 44samples (Table 1). All of the comparisons producedcorrelation coefficients .0.9, indicating a high correlationbetween the immunoRCA microarray assay and the othercommercial methods. The results indicate that the speci-ficity and sensitivity of the immunoRCA microarray im-munoassay for allergen-specific IgEs are comparable tothose for commercial assays.
To demonstrate the lower limit of detection and dy-namic range of the immunoRCA assay, the peanut-posi-tive serum with an ASM score of 6 was serially diluted innegative serum and tested on microarrays and in the threecommercial assays (data not shown). The immunoRCAassay was linear over a 4456-fold dilution range, and thelower limit of detection was at least 10-fold lower than thedetection limits for the commercial assays.
An important advantage of microarray assays is theability to multiplex. The immunoRCA microarray assay is
capable of simultaneously screening hundreds of aller-gens. Microarrays also include internal control spots andcalibrators, allowing more rigorous standardization of theresults than is possible in other formats. Microarrayassays require ,1 nL of allergen extract per test, whichallows the use of the more expensive allergen extractsused for SPT in microarray production. Use of the SPTextracts may be a factor behind the superior clinicalaccuracy reported for the microarray allergen-specific IgEassay (8 ) compared with the CAP assay, which uses crudeallergen extracts. Another advantage of microarray as-says, which may be of particular value in pediatricpatients, is the requirement for only 10 mL of serum inthese assays. The 10-mL serum volume may allow the useof finger pricks in place of venipuncture for collection oftest samples.
ImmunoRCA allergen-specific IgE microarray assayscan provide a powerful screening tool for allergists.Microarray assays for use in an allergy clinic can beseparated into panels of allergens to be tested concur-rently. The panels can cover allergens falling into similarcategories, such as inhaled allergens, food allergens, ordrug allergens. Arrays corresponding to these panels canbe customized to reflect regional differences in environ-mental allergens. The immunoRCA microarray assay usesa 16-well format in which the arrays are separated by aTeflon mask. The wells can hold 100–400 spots, thusallowing thousands of assays to be completed per slide.Additionally, the microarray layout allows the assay to beautomated using a Beckman BioMek liquid-handling ro-bot.
ImmunoRCA microarray assays are capable of provid-ing quantitative results (7 ). Quantitative allergen-specific
Fig. 1. ImmunoRCA allergen-specific IgE detection on microarrays.Six positive and five negative serum samples for each of four allergens were tested in the immunoRCA microarray allergen-specific IgE assay. Samples are designatedE1 for cat dander, F13 for peanut, W1 for short ragweed, and D2 for dust mite (D. farinae). Negative samples are identified with an N after the hyphen. In positivesamples, the number after the hyphen indicates the ASM score.
Table 1. Correlationa between microarray assay andcommercial clinical allergen-specific IgE assays.
Allergen
Correlation coefficient
DPC AlaSTAT Esoterix Modified RAST Pharmacia CAP
Peanut 0.900 0.900 0.984Cat dander 0.982 0.906 0.971Short ragweed 0.954 0.992 0.986Mite (D. farinae) 0.975 0.996 0.999
a Correlation coefficients were calculated to compare two data sets withdifferent units of measurement (9 ).
1928 Abstracts of Oak Ridge Posters
IgE assays allow allergists to accurately monitor immu-notherapy techniques, screen infants and small childrenfor atopic allergen sensitivities, limit the need for oralchallenges with food allergens, and monitor the effective-ness of allergen avoidance strategies (4 ). Quantitativemicroarray assays are calibrated with calibration curvesgenerated from serial dilutions of target analytes or dilu-tions of target analytes immobilized directly on the sur-face of each microarray. The advantage to the secondapproach is that each microarray contains its own internalcalibration curve, eliminating the effects of variabilitybetween arrays. We anticipate that immunoRCA microar-ray allergen-specific IgE assays will provide allergistswith quantitative results and more information in a rapidtime frame, increasing cost-effectiveness and the qualityof patient care.
We would like to acknowledge Dr. R. Murli Krishna andMehul Patel for technical assistance. We thank Drs. Ste-phen Kingsmore and David Edgar for expert advice andclinical insight.
References1. Dolen WK. It is not yet time to stop skin testing, but . . . . J Allergy Clin
Immunol 2000;105:1074–6.2. Corey JP, Liudahl JJ, Young SA, Rodman SM. Diagnostic efficacy of in vitro
methods vs skin testing in patients with inhalant allergies. Otolaryngol HeadNeck Surg 1991;104:299–302.
3. Corey JP, Nelson RS, Lai V. Comparison of modified PhadezymeRAST,ImmunoCAP, and serial dilution titration skin testing by receiver operatingcurve analysis. Otolaryngol Head Neck Surg 1995;112:665–9.
4. Yunginger, JW, Ahlstedt S, Eggleston PA, Homburger HA, Nelson HS, OwnbyDR, et al. Quantitative IgE antibody assays in allergic diseases. J Allergy ClinImmunol 2000;105:1077–84.
5. Szeinbach SL, Barnes JH, Sullivan TJ, Williams PB. Precision and accuracy ofcommercial laboratories’ ability to classify positive and/or negative allergen-specific IgE results. Ann Allergy Asthma Immunol 2001;86:373–81.
6. Lizardi PM, Huang X, Zhu Z, Bray-Ward P, Thomas DC, Ward DC. Mutationdetection and single-molecule counting using isothermal rolling-circle ampli-fication. Nat Genet 1998;19:225–32.
7. Schweitzer B, Wiltshire S, Lambert J, O’Malley S, Kukanskis K, Zhu Z, et al.Immunoassays with rolling circle amplification: a versatile platform forultrasensitive antigen detection. Proc Natl Acad Sci U S A 2000;97:10113–9.
8. Wiltshire S, O’Malley S, Lambert J, Kukanskis K, Edgar D, Kingsmore S, et al.Detection of multiple allergen-specific IgEs on microarrays by immunoassaywith rolling circle amplification. Clin Chem 2000;46:1990–3.
9. Miller JC, Miller JN. Statistics for analytical chemistry, 2nd ed. Chichester:Ellis Horwood Limited, 1992:104–9.
Rapid and Automated Cartridge-based Extraction ofLeukocytes from Whole Blood for Microsatellite DNAAnalysis by Capillary Electrophoresis, Phillip Belgrader,Fariba Raisi, Rekha Joshi, Peter Nguyen, William McMillan,Jesus Ching,* Ron Chang, and M. Allen Northrup (Cepheid,1190 Borregas Ave., Sunnyvale, CA 94089; * author for cor-respondence: fax 408-541-4191, e-mail [email protected])
The human genome contains microsatellite sequences,consisting of 2- to 5-bp repeats, randomly distributedamong the chromosomes. These sequences, also calledshort tandem repeats (STRs), have been demonstrated asimportant markers for disease diagnostics, genetic map-
ping, and human identification. The list of human hered-itary diseases associated with the unusual expansion ordeletion of specific microsatellite loci continues to in-crease. The two most understood diseases of this type arethe CGG repeats in fragile-X syndrome (1 ) and the CAGrepeats in Huntington disease (2 ). However, other dis-eases, such as cancer of the colon, head, neck, gastroin-testinal track, urinary bladder, liver, lung, breast, andleukocytes [white blood cells (WBCs)], have been shownto be linked to microsatellite instability (3–14).
The growing importance of microsatellite markers indiagnostics has motivated us to develop rapid, automateddevices to integrate sample preparation, PCR, and capil-lary electrophoresis (CE) analysis. The work presentedhere demonstrates an efficient filtration cartridge (15 ) toautomatically process WBCs in a sample of blood for PCRamplification and CE analysis. A flow-through samplepreparation procedure is used that does not requirevortex-mixing, precipitation, and centrifugation, and isamenable to integration into a microfluidic circuit. TH01,a well-characterized microsatellite locus, served as themodel for this study. TH01, a gene for human tyrosinehydroxylase, is a 4-bp repeat and comprises seven alleles(16 ).
Samples of whole blood collected from seven individ-uals were obtained from Stanford Blood Bank (Palo Alto,CA). The blood (;10 mL) was drawn into tubes contain-ing citrate as the anticoagulant and then stored in arefrigerator until processed on a cartridge fluidic system.For each cartridge run, sample (200 mL), isotonic solution(6.5 mL), and lysis buffer (600 mL of 10 mmol/L Tris, 150mmol/L NaCl, 1 mL/L Triton X-100, pH 8.5) were loadedin the appropriate chambers in the cartridge (Fig. 1A). Thecartridge contained a WBC extraction chamber that har-bored a Leukosorb filter (Pall Corp) and a flexible mem-brane that interfaced with an ultrasonic transducer. Theextraction chamber had a sweepable volume of ;100 mL.The blood was pumped pneumatically through the filterat a rate of 0.5 mL/min. WBCs were collected on the filter,whereas all other material (i.e., red blood cells andplasma) passed through to a waste chamber. The trappedWBCs were washed with the isotonic solution, and then200 mL of lysis buffer was pumped into the extractionchamber to displace the isotonic buffer. The WBCs werelysed on the filter by sonication for 15 s at 47 kHz. Lysisbuffer (400 mL) was pumped into the extraction chamber,displacing the WBC lysate out to another chamber. TheWBC lysate was manually collected and subjected to PCRand CE analysis. Six runs on the cartridge system wereperformed for each sample and were compared with runsusing the QIAamp DNA Blood Mini Kit (Qiagen) as areference. The cartridge run time was 9 min/sample.
PCR amplification was accomplished on the SmartCycler (Cepheid) using 25-mL reactions containing 13TH01 STR (Fluorescein) primer pair (Promega), 13 STRbuffer (Promega), 0.05 U/mL Platinum Taq DNA poly-merase (Life Technologies), 13 Smart Cycler additive (0.2g/L bovine serum albumin, 150 mmol/L trehalose, 2mL/L Tween 20), and 2.5 mL of WBC lysate obtained from
Clinical Chemistry 47, No. 10, 2001 1929
the cartridge. The thermal cycling conditions were asfollows: an initial hold at 90 °C for 30 s; 10 cycles of 94 °Cfor 60 s, 60 °C for 30 s, and 70 °C for 45 s; 20 cycles of 90 °Cfor 30 s, 60 °C for 30 s, and 70 for 45 s; and a final hold at60 °C for 60 s. Because the Smart Cycler exhibited fastramp rates and precise temperature control, the cyclingtime was reduced to 55 min compared with 2.5 h on aconventional thermal cycler. CE was accomplished usingthe P/ACE MDQ system (Beckman) with a fused-silicacapillary (ABI) filled with POP4 polymer (ABI) and 103
CE Buffer (ABI). PCR product was injected electrokineti-cally for 30 s at 5.0 kV. Separation and detection wereperformed for 15 min at 9.0 kV at 25 °C.
The mean amount of DNA collected from a 200-mLaliquot of blood processed on the cartridge system was2.24 mg. A WBC extraction efficiency of 51% was calcu-lated based on the relative yield of DNA obtained usingthe QIAamp Kit. The lower yield was partially attribut-able to a 25% loss of intact WBCs during storage of theblood (only intact WBCs are trapped by the filter). A
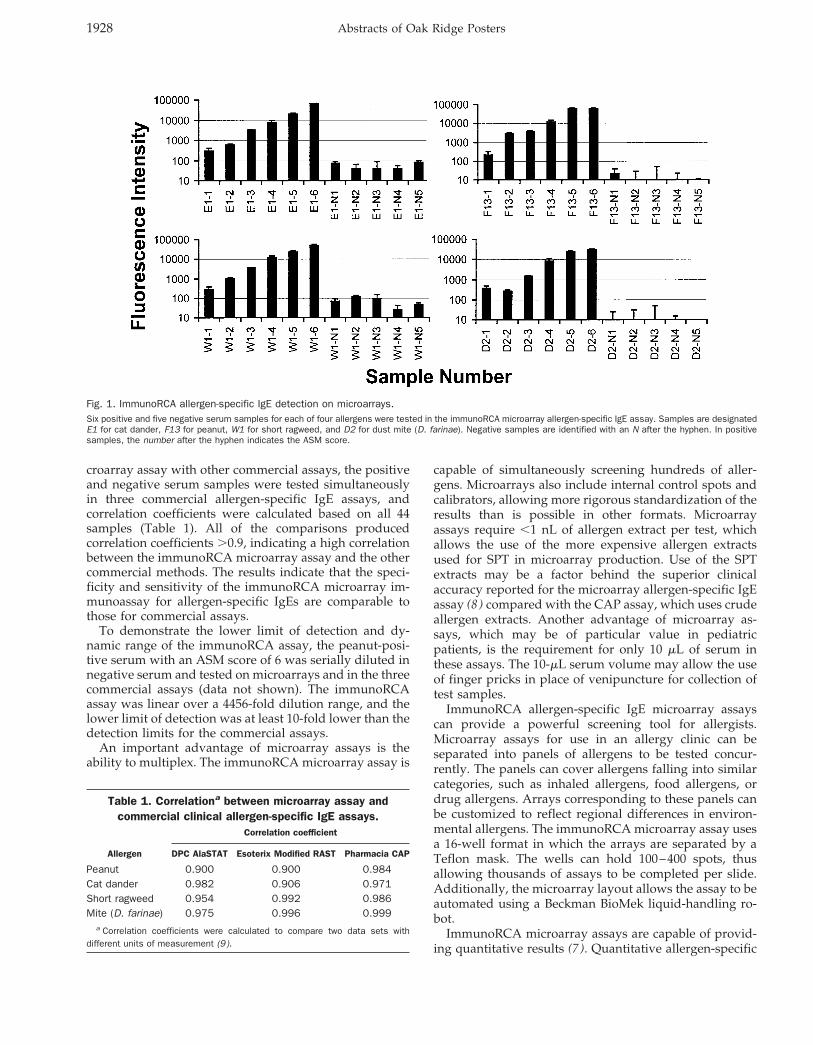
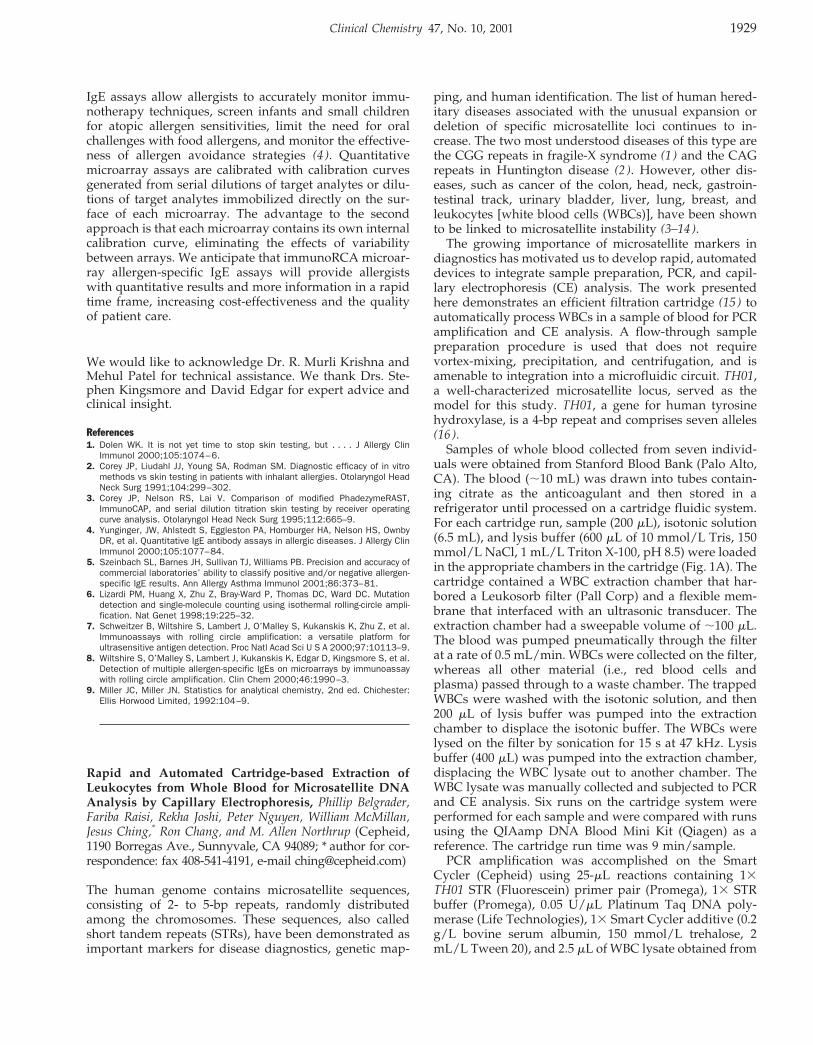
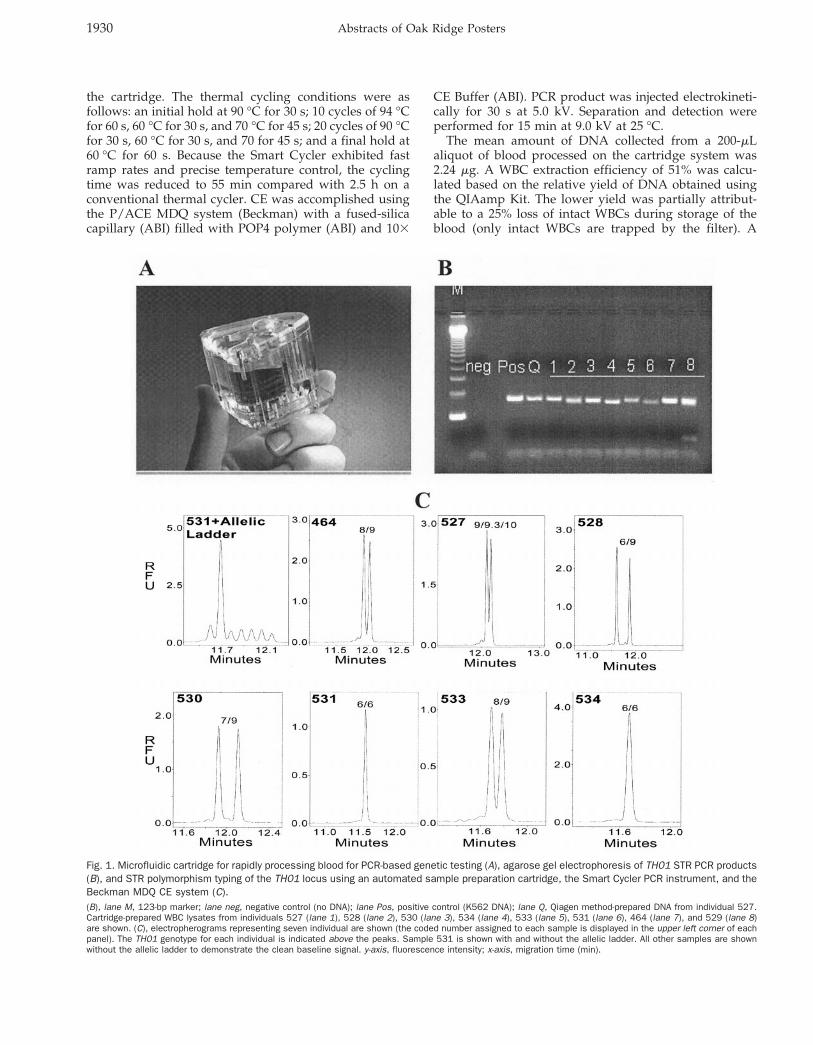
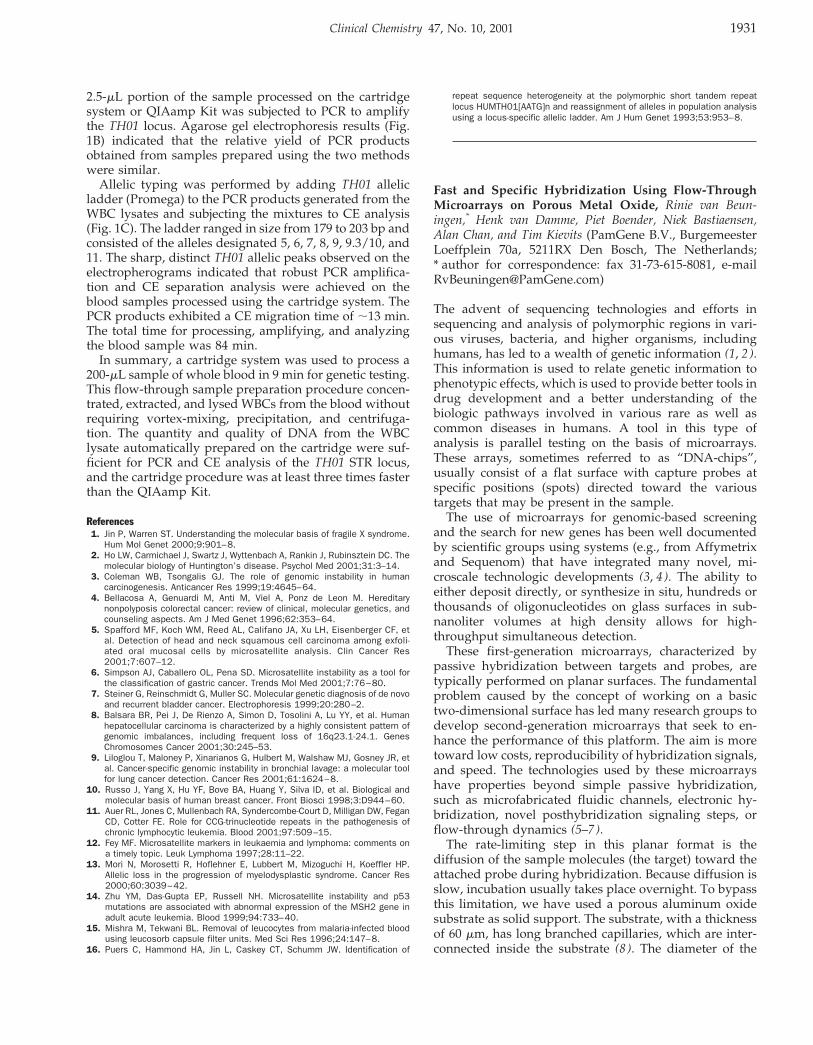
Fig. 1. Microfluidic cartridge for rapidly processing blood for PCR-based genetic testing (A), agarose gel electrophoresis of TH01 STR PCR products(B), and STR polymorphism typing of the TH01 locus using an automated sample preparation cartridge, the Smart Cycler PCR instrument, and theBeckman MDQ CE system (C).(B), lane M, 123-bp marker; lane neg, negative control (no DNA); lane Pos, positive control (K562 DNA); lane Q, Qiagen method-prepared DNA from individual 527.Cartridge-prepared WBC lysates from individuals 527 (lane 1), 528 (lane 2), 530 (lane 3), 534 (lane 4), 533 (lane 5), 531 (lane 6), 464 (lane 7), and 529 (lane 8)are shown. (C), electropherograms representing seven individual are shown (the coded number assigned to each sample is displayed in the upper left corner of eachpanel). The TH01 genotype for each individual is indicated above the peaks. Sample 531 is shown with and without the allelic ladder. All other samples are shownwithout the allelic ladder to demonstrate the clean baseline signal. y-axis, fluorescence intensity; x-axis, migration time (min).
1930 Abstracts of Oak Ridge Posters
2.5-mL portion of the sample processed on the cartridgesystem or QIAamp Kit was subjected to PCR to amplifythe TH01 locus. Agarose gel electrophoresis results (Fig.1B) indicated that the relative yield of PCR productsobtained from samples prepared using the two methodswere similar.
Allelic typing was performed by adding TH01 allelicladder (Promega) to the PCR products generated from theWBC lysates and subjecting the mixtures to CE analysis(Fig. 1C). The ladder ranged in size from 179 to 203 bp andconsisted of the alleles designated 5, 6, 7, 8, 9, 9.3/10, and11. The sharp, distinct TH01 allelic peaks observed on theelectropherograms indicated that robust PCR amplifica-tion and CE separation analysis were achieved on theblood samples processed using the cartridge system. ThePCR products exhibited a CE migration time of ;13 min.The total time for processing, amplifying, and analyzingthe blood sample was 84 min.
In summary, a cartridge system was used to process a200-mL sample of whole blood in 9 min for genetic testing.This flow-through sample preparation procedure concen-trated, extracted, and lysed WBCs from the blood withoutrequiring vortex-mixing, precipitation, and centrifuga-tion. The quantity and quality of DNA from the WBClysate automatically prepared on the cartridge were suf-ficient for PCR and CE analysis of the TH01 STR locus,and the cartridge procedure was at least three times fasterthan the QIAamp Kit.
References1. Jin P, Warren ST. Understanding the molecular basis of fragile X syndrome.
Hum Mol Genet 2000;9:901–8.2. Ho LW, Carmichael J, Swartz J, Wyttenbach A, Rankin J, Rubinsztein DC. The
molecular biology of Huntington’s disease. Psychol Med 2001;31:3–14.3. Coleman WB, Tsongalis GJ. The role of genomic instability in human
carcinogenesis. Anticancer Res 1999;19:4645–64.4. Bellacosa A, Genuardi M, Anti M, Viel A, Ponz de Leon M. Hereditary
nonpolyposis colorectal cancer: review of clinical, molecular genetics, andcounseling aspects. Am J Med Genet 1996;62:353–64.
5. Spafford MF, Koch WM, Reed AL, Califano JA, Xu LH, Eisenberger CF, etal. Detection of head and neck squamous cell carcinoma among exfoli-ated oral mucosal cells by microsatellite analysis. Clin Cancer Res2001;7:607–12.
6. Simpson AJ, Caballero OL, Pena SD. Microsatellite instability as a tool forthe classification of gastric cancer. Trends Mol Med 2001;7:76–80.
7. Steiner G, Reinschmidt G, Muller SC. Molecular genetic diagnosis of de novoand recurrent bladder cancer. Electrophoresis 1999;20:280–2.
8. Balsara BR, Pei J, De Rienzo A, Simon D, Tosolini A, Lu YY, et al. Humanhepatocellular carcinoma is characterized by a highly consistent pattern ofgenomic imbalances, including frequent loss of 16q23.1-24.1. GenesChromosomes Cancer 2001;30:245–53.
9. Liloglou T, Maloney P, Xinarianos G, Hulbert M, Walshaw MJ, Gosney JR, etal. Cancer-specific genomic instability in bronchial lavage: a molecular toolfor lung cancer detection. Cancer Res 2001;61:1624–8.
10. Russo J, Yang X, Hu YF, Bove BA, Huang Y, Silva ID, et al. Biological andmolecular basis of human breast cancer. Front Biosci 1998;3:D944–60.
11. Auer RL, Jones C, Mullenbach RA, Syndercombe-Court D, Milligan DW, FeganCD, Cotter FE. Role for CCG-trinucleotide repeats in the pathogenesis ofchronic lymphocytic leukemia. Blood 2001;97:509–15.
12. Fey MF. Microsatellite markers in leukaemia and lymphoma: comments ona timely topic. Leuk Lymphoma 1997;28:11–22.
13. Mori N, Morosetti R, Hoflehner E, Lubbert M, Mizoguchi H, Koeffler HP.Allelic loss in the progression of myelodysplastic syndrome. Cancer Res2000;60:3039–42.
14. Zhu YM, Das-Gupta EP, Russell NH. Microsatellite instability and p53mutations are associated with abnormal expression of the MSH2 gene inadult acute leukemia. Blood 1999;94:733–40.
15. Mishra M, Tekwani BL. Removal of leucocytes from malaria-infected bloodusing leucosorb capsule filter units. Med Sci Res 1996;24:147–8.
16. Puers C, Hammond HA, Jin L, Caskey CT, Schumm JW. Identification of
repeat sequence heterogeneity at the polymorphic short tandem repeatlocus HUMTH01[AATG]n and reassignment of alleles in population analysisusing a locus-specific allelic ladder. Am J Hum Genet 1993;53:953–8.
Fast and Specific Hybridization Using Flow-ThroughMicroarrays on Porous Metal Oxide, Rinie van Beun-ingen,* Henk van Damme, Piet Boender, Niek Bastiaensen,Alan Chan, and Tim Kievits (PamGene B.V., BurgemeesterLoeffplein 70a, 5211RX Den Bosch, The Netherlands;* author for correspondence: fax 31-73-615-8081, [email protected])
The advent of sequencing technologies and efforts insequencing and analysis of polymorphic regions in vari-ous viruses, bacteria, and higher organisms, includinghumans, has led to a wealth of genetic information (1, 2).This information is used to relate genetic information tophenotypic effects, which is used to provide better tools indrug development and a better understanding of thebiologic pathways involved in various rare as well ascommon diseases in humans. A tool in this type ofanalysis is parallel testing on the basis of microarrays.These arrays, sometimes referred to as “DNA-chips”,usually consist of a flat surface with capture probes atspecific positions (spots) directed toward the varioustargets that may be present in the sample.
The use of microarrays for genomic-based screeningand the search for new genes has been well documentedby scientific groups using systems (e.g., from Affymetrixand Sequenom) that have integrated many novel, mi-croscale technologic developments (3, 4). The ability toeither deposit directly, or synthesize in situ, hundreds orthousands of oligonucleotides on glass surfaces in sub-nanoliter volumes at high density allows for high-throughput simultaneous detection.
These first-generation microarrays, characterized bypassive hybridization between targets and probes, aretypically performed on planar surfaces. The fundamentalproblem caused by the concept of working on a basictwo-dimensional surface has led many research groups todevelop second-generation microarrays that seek to en-hance the performance of this platform. The aim is moretoward low costs, reproducibility of hybridization signals,and speed. The technologies used by these microarrayshave properties beyond simple passive hybridization,such as microfabricated fluidic channels, electronic hy-bridization, novel posthybridization signaling steps, orflow-through dynamics (5–7).
The rate-limiting step in this planar format is thediffusion of the sample molecules (the target) toward theattached probe during hybridization. Because diffusion isslow, incubation usually takes place overnight. To bypassthis limitation, we have used a porous aluminum oxidesubstrate as solid support. The substrate, with a thicknessof 60 mm, has long branched capillaries, which are inter-connected inside the substrate (8 ). The diameter of the
Clinical Chemistry 47, No. 10, 2001 1931
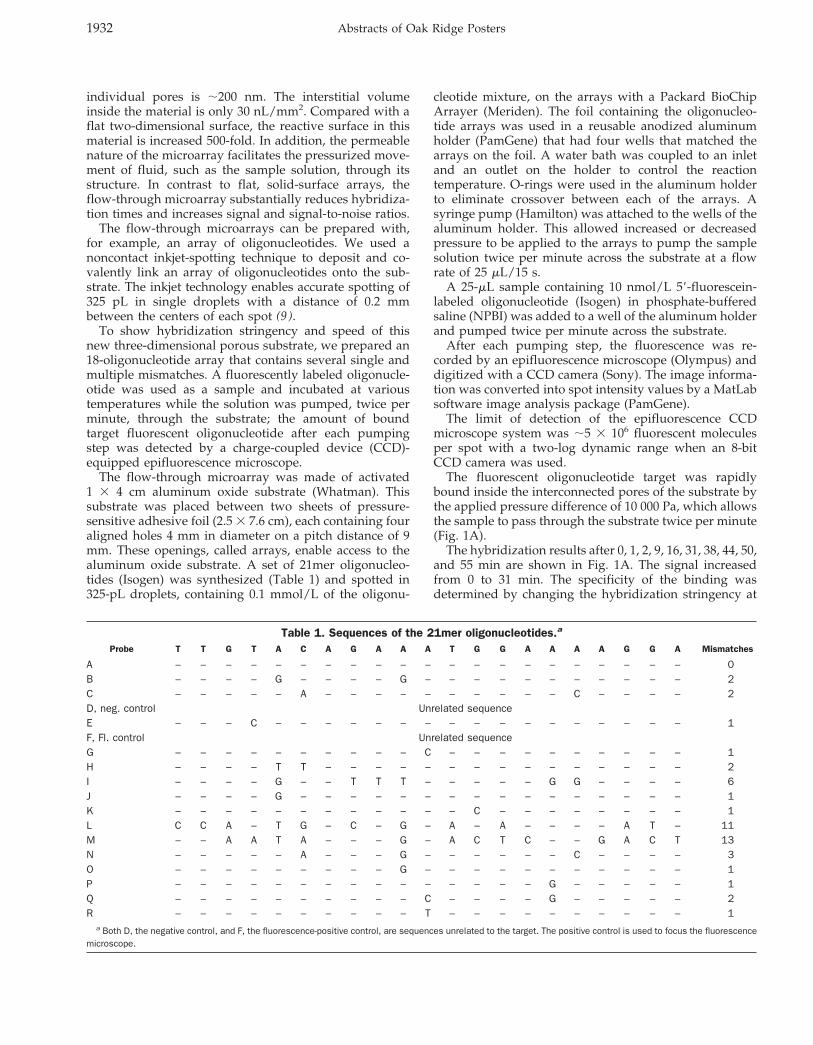
individual pores is ;200 nm. The interstitial volumeinside the material is only 30 nL/mm2. Compared with aflat two-dimensional surface, the reactive surface in thismaterial is increased 500-fold. In addition, the permeablenature of the microarray facilitates the pressurized move-ment of fluid, such as the sample solution, through itsstructure. In contrast to flat, solid-surface arrays, theflow-through microarray substantially reduces hybridiza-tion times and increases signal and signal-to-noise ratios.
The flow-through microarrays can be prepared with,for example, an array of oligonucleotides. We used anoncontact inkjet-spotting technique to deposit and co-valently link an array of oligonucleotides onto the sub-strate. The inkjet technology enables accurate spotting of325 pL in single droplets with a distance of 0.2 mmbetween the centers of each spot (9 ).
To show hybridization stringency and speed of thisnew three-dimensional porous substrate, we prepared an18-oligonucleotide array that contains several single andmultiple mismatches. A fluorescently labeled oligonucle-otide was used as a sample and incubated at varioustemperatures while the solution was pumped, twice perminute, through the substrate; the amount of boundtarget fluorescent oligonucleotide after each pumpingstep was detected by a charge-coupled device (CCD)-equipped epifluorescence microscope.
The flow-through microarray was made of activated1 3 4 cm aluminum oxide substrate (Whatman). Thissubstrate was placed between two sheets of pressure-sensitive adhesive foil (2.5 3 7.6 cm), each containing fouraligned holes 4 mm in diameter on a pitch distance of 9mm. These openings, called arrays, enable access to thealuminum oxide substrate. A set of 21mer oligonucleo-tides (Isogen) was synthesized (Table 1) and spotted in325-pL droplets, containing 0.1 mmol/L of the oligonu-
cleotide mixture, on the arrays with a Packard BioChipArrayer (Meriden). The foil containing the oligonucleo-tide arrays was used in a reusable anodized aluminumholder (PamGene) that had four wells that matched thearrays on the foil. A water bath was coupled to an inletand an outlet on the holder to control the reactiontemperature. O-rings were used in the aluminum holderto eliminate crossover between each of the arrays. Asyringe pump (Hamilton) was attached to the wells of thealuminum holder. This allowed increased or decreasedpressure to be applied to the arrays to pump the samplesolution twice per minute across the substrate at a flowrate of 25 mL/15 s.
A 25-mL sample containing 10 nmol/L 59-fluorescein-labeled oligonucleotide (Isogen) in phosphate-bufferedsaline (NPBI) was added to a well of the aluminum holderand pumped twice per minute across the substrate.
After each pumping step, the fluorescence was re-corded by an epifluorescence microscope (Olympus) anddigitized with a CCD camera (Sony). The image informa-tion was converted into spot intensity values by a MatLabsoftware image analysis package (PamGene).
The limit of detection of the epifluorescence CCDmicroscope system was ;5 3 106 fluorescent moleculesper spot with a two-log dynamic range when an 8-bitCCD camera was used.
The fluorescent oligonucleotide target was rapidlybound inside the interconnected pores of the substrate bythe applied pressure difference of 10 000 Pa, which allowsthe sample to pass through the substrate twice per minute(Fig. 1A).
The hybridization results after 0, 1, 2, 9, 16, 31, 38, 44, 50,and 55 min are shown in Fig. 1A. The signal increasedfrom 0 to 31 min. The specificity of the binding wasdetermined by changing the hybridization stringency at
Table 1. Sequences of the 21mer oligonucleotides.a
Probe T T G T A C A G A A A T G G A A A A G G A Mismatches
A – – – – – – – – – – – – – – – – – – – – – 0B – – – – G – – – – G – – – – – – – – – – – 2C – – – – – A – – – – – – – – – – C – – – – 2D, neg. control Unrelated sequenceE – – – C – – – – – – – – – – – – – – – – – 1F, Fl. control Unrelated sequenceG – – – – – – – – – – C – – – – – – – – – – 1H – – – – T T – – – – – – – – – – – – – – – 2I – – – – G – – T T T – – – – – G G – – – – 6J – – – – G – – – – – – – – – – – – – – – – 1K – – – – – – – – – – – – C – – – – – – – – 1L C C A – T G – C – G – A – A – – – – A T – 11M – – A A T A – – – G – A C T C – – G A C T 13N – – – – – A – – – G – – – – – – C – – – – 3O – – – – – – – – – G – – – – – – – – – – – 1P – – – – – – – – – – – – – – – G – – – – – 1Q – – – – – – – – – – C – – – – G – – – – – 2R – – – – – – – – – – T – – – – – – – – – – 1
a Both D, the negative control, and F, the fluorescence-positive control, are sequences unrelated to the target. The positive control is used to focus the fluorescencemicroscope.
1932 Abstracts of Oak Ridge Posters
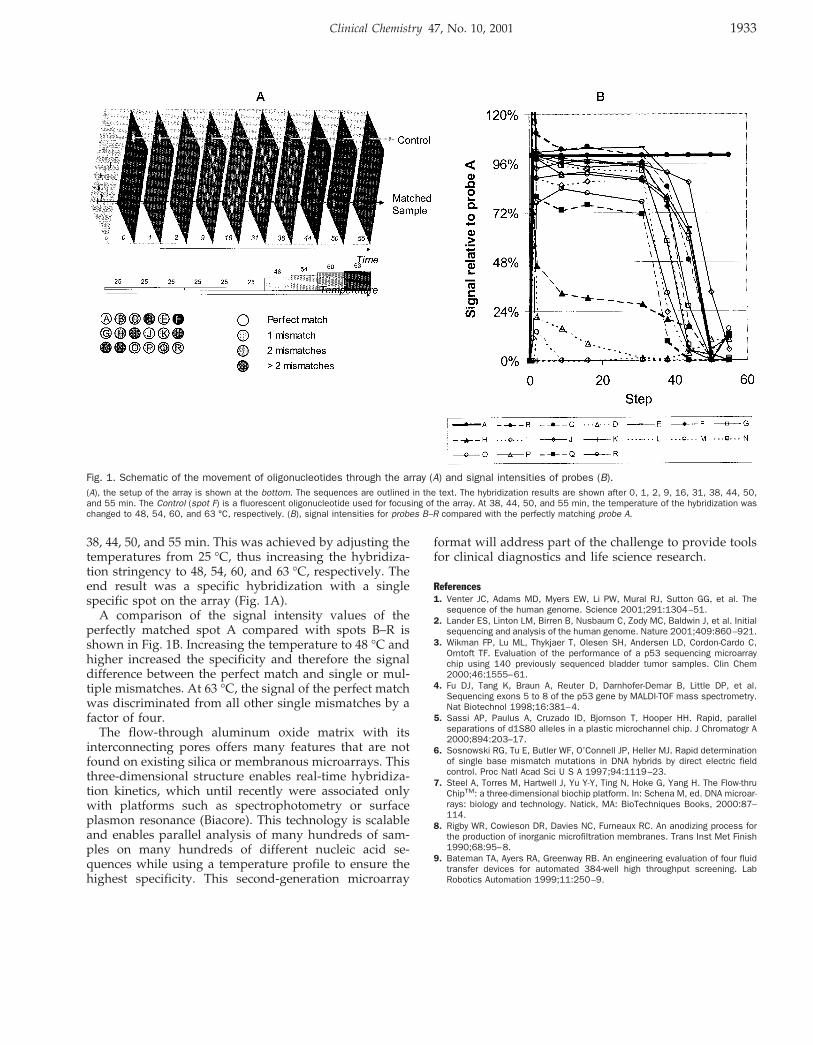
38, 44, 50, and 55 min. This was achieved by adjusting thetemperatures from 25 °C, thus increasing the hybridiza-tion stringency to 48, 54, 60, and 63 °C, respectively. Theend result was a specific hybridization with a singlespecific spot on the array (Fig. 1A).
A comparison of the signal intensity values of theperfectly matched spot A compared with spots B–R isshown in Fig. 1B. Increasing the temperature to 48 °C andhigher increased the specificity and therefore the signaldifference between the perfect match and single or mul-tiple mismatches. At 63 °C, the signal of the perfect matchwas discriminated from all other single mismatches by afactor of four.
The flow-through aluminum oxide matrix with itsinterconnecting pores offers many features that are notfound on existing silica or membranous microarrays. Thisthree-dimensional structure enables real-time hybridiza-tion kinetics, which until recently were associated onlywith platforms such as spectrophotometry or surfaceplasmon resonance (Biacore). This technology is scalableand enables parallel analysis of many hundreds of sam-ples on many hundreds of different nucleic acid se-quences while using a temperature profile to ensure thehighest specificity. This second-generation microarray
format will address part of the challenge to provide toolsfor clinical diagnostics and life science research.
References1. Venter JC, Adams MD, Myers EW, Li PW, Mural RJ, Sutton GG, et al. The
sequence of the human genome. Science 2001;291:1304–51.2. Lander ES, Linton LM, Birren B, Nusbaum C, Zody MC, Baldwin J, et al. Initial
sequencing and analysis of the human genome. Nature 2001;409:860–921.3. Wikman FP, Lu ML, Thykjaer T, Olesen SH, Andersen LD, Cordon-Cardo C,
Orntoft TF. Evaluation of the performance of a p53 sequencing microarraychip using 140 previously sequenced bladder tumor samples. Clin Chem2000;46:1555–61.
4. Fu DJ, Tang K, Braun A, Reuter D, Darnhofer-Demar B, Little DP, et al.Sequencing exons 5 to 8 of the p53 gene by MALDI-TOF mass spectrometry.Nat Biotechnol 1998;16:381–4.
5. Sassi AP, Paulus A, Cruzado ID, Bjornson T, Hooper HH. Rapid, parallelseparations of d1S80 alleles in a plastic microchannel chip. J Chromatogr A2000;894:203–17.
6. Sosnowski RG, Tu E, Butler WF, O’Connell JP, Heller MJ. Rapid determinationof single base mismatch mutations in DNA hybrids by direct electric fieldcontrol. Proc Natl Acad Sci U S A 1997;94:1119–23.
7. Steel A, Torres M, Hartwell J, Yu Y-Y, Ting N, Hoke G, Yang H. The Flow-thruChipTM: a three-dimensional biochip platform. In: Schena M, ed. DNA microar-rays: biology and technology. Natick, MA: BioTechniques Books, 2000:87–114.
8. Rigby WR, Cowieson DR, Davies NC, Furneaux RC. An anodizing process forthe production of inorganic microfiltration membranes. Trans Inst Met Finish1990;68:95–8.
9. Bateman TA, Ayers RA, Greenway RB. An engineering evaluation of four fluidtransfer devices for automated 384-well high throughput screening. LabRobotics Automation 1999;11:250–9.
Fig. 1. Schematic of the movement of oligonucleotides through the array (A) and signal intensities of probes (B).(A), the setup of the array is shown at the bottom. The sequences are outlined in the text. The hybridization results are shown after 0, 1, 2, 9, 16, 31, 38, 44, 50,and 55 min. The Control (spot F) is a fluorescent oligonucleotide used for focusing of the array. At 38, 44, 50, and 55 min, the temperature of the hybridization waschanged to 48, 54, 60, and 63 °C, respectively. (B), signal intensities for probes B–R compared with the perfectly matching probe A.
Clinical Chemistry 47, No. 10, 2001 1933