throughput and nurses' workloads - scholarlycommons
TRANSCRIPT
University of Pennsylvania University of Pennsylvania
ScholarlyCommons ScholarlyCommons
Publicly Accessible Penn Dissertations
2013
Throughput and Nurses' Workloads: Influences on Nurse and Throughput and Nurses' Workloads: Influences on Nurse and
Patient Outcomes Patient Outcomes
Lisa Winter Quinn University of Pennsylvania, [email protected]
Follow this and additional works at: https://repository.upenn.edu/edissertations
Part of the Nursing Commons
Recommended Citation Recommended Citation Quinn, Lisa Winter, "Throughput and Nurses' Workloads: Influences on Nurse and Patient Outcomes" (2013). Publicly Accessible Penn Dissertations. 914. https://repository.upenn.edu/edissertations/914
This paper is posted at ScholarlyCommons. https://repository.upenn.edu/edissertations/914 For more information, please contact [email protected].
Throughput and Nurses' Workloads: Influences on Nurse and Patient Outcomes Throughput and Nurses' Workloads: Influences on Nurse and Patient Outcomes
Abstract Abstract Patient turnover, or throughput, through nursing units can significantly impact the workloads of nurses. However, very few staffing measures account for patient throughput, thus underestimating nurses' workloads. Research has shown that when nurse staffing is more favorable, patient and nurse outcomes are more favorable. What is not known, and what this study examined, was how adjusting nurse staffing measures for patient throughput influenced the relationship between staffing and patient and nurse outcomes while also accounting for the nurse work environment, which also has significant relationships with patient and nurse outcomes. This study was a secondary analysis of hospital administrative data, patient discharge data, and nurse survey data in four states. Nurse survey data from more than 25,000 nurses were merged with administrative data from nearly 600 hospitals to study nurse outcomes, which included burnout, job dissatisfaction, and intent to leave. These data were then merged with patient discharge data from over 1.6 million surgical patients to study patient outcomes, which included 30-day mortality and failure to rescue. The novel nurse survey data provided information on hospital system-related factors, such as staffing, throughput, and the nurse work environment. Three measures of throughput-adjusted staffing were described, developed, and compared to unadjusted staffing measures as well as acuity-adjusted staffing and patient length of stay-adjusted staffing. Contrary to the hypotheses, the adjusted staffing measures did not have stronger relationships with patient or nurse outcomes compared to unadjusted staffing measures. The nurse work environment was a significant predictor of both patient and nurse outcomes. Patients treated in hospitals with the most favorable nurse work environments had about 14% lower odds of death and 16% lower odds of failure to rescue compared to patients treated in hospitals with the least favorable work environments. Compared to nurses working in hospitals with the least favorable work environments, nurses in hospitals with mixed work environments were about 30% less likely to be burned out, 40% less likely to report job dissatisfaction, and 38% less likely to intend to leave their jobs. These differences were even more pronounced for nurses working in hospitals with the best work environments. Compared to nurses working in hospitals with the least favorable work environments, nurses in hospitals with the best work environments were about 46% less likely to be burned out, 60% less likely to report job dissatisfaction, and 55% less likely to intend to leave their jobs. The work environment also moderated the influence of staffing on both patient and nurse outcomes. This study was the largest study of throughput and nurse workloads to date and the first to explore throughput in relation to nurse outcomes. Although throughput-adjusted staffing did not provide significantly more information than unadjusted staffing in relation to patient and nurse outcomes, further research is needed to explore how throughput influences nurse workloads across different nursing units or work environments. Improvements in nurse work environments are promising approaches to improve both patient and nurse outcomes in hospitals.
Degree Type Degree Type Dissertation
Degree Name Degree Name Doctor of Philosophy (PhD)
Graduate Group Graduate Group Nursing
First Advisor First Advisor Ann Kutney-Lee

Keywords Keywords burnout, failure to rescue, intent to leave, job dissatisfaction, nurse workloads, throughput
Subject Categories Subject Categories Nursing
This dissertation is available at ScholarlyCommons: https://repository.upenn.edu/edissertations/914
THROUGHPUT AND NURSES’ WORKLOADS: INFLUENCES ON
NURSE AND PATIENT OUTCOMES
Lisa Winter Quinn
A DISSERTATION
in
Nursing
Presented to the Faculties of the University of Pennsylvania
in
Partial Fulfillment of the Requirements for the
Degree of Doctor of Philosophy
2013
Supervisor of Dissertation
_____________________________
Ann Kutney-Lee, PhD, RN
Assistant Professor of Nursing
Graduate Group Chairperson
______________________________
Barbara J. Riegel, DNSc, RN, FAAN, FAHA
Professor of Nursing
Dissertation Committee
Linda H. Aiken, PhD, RN, FAAN
Professor of Nursing and Sociology
Matthew McHugh, PhD, JD, MPH, CRNP, RN
Associate Professor of Nursing

ii
Dedication
to Marjorie
“What has happened? The representations which were produced in reaction to certain stimulus
have been misinterpreted as its causes... Most of our general feelings — every kind of inhibition,
pressure, tension, and impulsion in the ebb and flow of our physiology, and particularly in the
state of the nervous system — excites our causal instinct: we want to have a reason for feeling
this way or that — for feeling bad or good. We are never satisfied merely to state the fact that we
feel this way or that: we admit this fact only — become conscious of it only — when we have
fabricated some kind of explanation for it. Memory, which swings into action in such cases
without our awareness, brings up earlier states of the same kind, together with the causal
interpretations associated with them — not their actual causes. Of course, the faith that such
representations or accompanying conscious processes are the causes is also brought forth by
memory. Thus originates a habitual acceptance of a particular causal interpretation, which, as a
matter of fact, inhibits any investigation into the real cause — it even excludes it.”
Friedrich Nietzsche, Twilight of the Idols, 1888

iii
Acknowledgement
First and foremost, I would like to thank my dissertation chair, Dr. Ann Kutney-Lee for
guiding me through this process. Without her direction, I would be lost. She kept her expectations
high which truly helped shape me into a better researcher. I want to thank Dr. Linda Aiken for her
expert advice, helping me frame my work in a larger context, and for seeing my potential before I
could. I must also thank Dr. Matthew McHugh for his patience and candid mentorship approach. I
am thankful to Dr. Eileen Lake for being supportive of my goals. I am grateful for Dr. Kelly
Wiltse-Nicely for her authenticity and accessibility. I would also like to thank Doug Sloane for
helping me develop my statistical models.
Of course, I would never have made it this far without my fellow colleagues, who I am
proud to call my friends after my 3 years at Penn. It has been quite a (rewarding) experience,
Ehriel Fannin, Jill Vanak, Molly Kreider, Briana Lafferty, Justine Sefcik, Monica Rochman,
Deena Kelly, Olga Jarrín, and Amy Witkoski Stimpfel! And my home away from home, Amelia
Wiffin, thank you for being the best!
I must thank my Lunder 9 family at Massachusetts General Hospital: Barbara Cashavelly,
Maureen Heavey, Claire Kane, Ashleigh Smith, Bonnie Filicicchia, Hannah Lyons, Gayle
Peterson, Kate Donaldson, Megan Hughes, Chantal Mammen, Lisette Packer, and Jess Berry. The
six hour commute was worth it when I worked with these nurses.
Last but not least, I thank my father. Daddy, you have always believed in me. Thank you
for always being there for me, Jamie, and Jen (and Anya). Now you can finally call me the
“PhDude”.

iv
ABSTRACT
THROUGHPUT AND NURSES’ WORKLOADS: INFLUENCES ON
NURSE AND PATIENT OUTCOMES
Lisa Winter Quinn
Ann Kutney-Lee
Patient turnover, or throughput, through nursing units can significantly impact the
workloads of nurses. However, very few staffing measures account for patient throughput, thus
underestimating nurses’ workloads. Research has shown that when nurse staffing is more
favorable, patient and nurse outcomes are more favorable. What is not known, and what this
study examined, was how adjusting nurse staffing measures for patient throughput influenced the
relationship between staffing and patient and nurse outcomes while also accounting for the nurse
work environment, which also has significant relationships with patient and nurse outcomes. This
study was a secondary analysis of hospital administrative data, patient discharge data, and nurse
survey data in four states. Nurse survey data from more than 25,000 nurses were merged with
administrative data from nearly 600 hospitals to study nurse outcomes, which included burnout,
job dissatisfaction, and intent to leave. These data were then merged with patient discharge data
from over 1.6 million surgical patients to study patient outcomes, which included 30-day
mortality and failure to rescue. The novel nurse survey data provided information on hospital
system-related factors, such as staffing, throughput, and the nurse work environment. Three
measures of throughput-adjusted staffing were described, developed, and compared to unadjusted
staffing measures as well as acuity-adjusted staffing and patient length of stay-adjusted staffing.
Contrary to the hypotheses, the adjusted staffing measures did not have stronger relationships
with patient or nurse outcomes compared to unadjusted staffing measures. The nurse work

v
environment was a significant predictor of both patient and nurse outcomes. Patients treated in
hospitals with the most favorable nurse work environments had about 14% lower odds of death
and 16% lower odds of failure to rescue compared to patients treated in hospitals with the least
favorable work environments. Compared to nurses working in hospitals with the least favorable
work environments, nurses in hospitals with mixed work environments were about 30% less
likely to be burned out, 40% less likely to report job dissatisfaction, and 38% less likely to intend
to leave their jobs. These differences were even more pronounced for nurses working in hospitals
with the best work environments. Compared to nurses working in hospitals with the least
favorable work environments, nurses in hospitals with the best work environments were about
46% less likely to be burned out, 60% less likely to report job dissatisfaction, and 55% less likely
to intend to leave their jobs. The work environment also moderated the influence of staffing on
both patient and nurse outcomes. This study was the largest study of throughput and nurse
workloads to date and the first to explore throughput in relation to nurse outcomes. Although
throughput-adjusted staffing did not provide significantly more information than unadjusted
staffing in relation to patient and nurse outcomes, further research is needed to explore how
throughput influences nurse workloads across different nursing units or work environments.
Improvements in nurse work environments are promising approaches to improve both patient and
nurse outcomes in hospitals.
vi
Table of Contents
Dedication ii
Acknowledgement iii
Abstract iv
Table of Contents vi
List of Tables ix
List of Figures xi
CHAPTER 1: INTRODUCTION
The Problem 1
Study Purpose, Specific Aims, and Hypotheses 2
Study Significance 4
CHAPTER 2: BACKGROUND
Introduction 7
Evolution of nurse workload and its measurement 7
Why study throughput? 10
Conceptual Framework 13
Nurse Workloads and Efficiency 13
Organizational Sociology 14
Quality Health Outcomes Model 17
Quality Health Outcomes Model in Health Services Research 19
Synthesis of Existing Literature 21
System 21
Throughput 21
Definition, Conceptualization, and Measurement 21
Empirical Studies 23
Limitations of Previous Studies 25
Summary 26
Nurse Staffing 27
Nurse Work Environment 29
Measuring the Nurse Work Environment 30
Hospital Structural Characteristics 31
Client 32
Patient Characteristics and Outcomes 33
vii
Interventions 33
Surveillance 34
Outcomes 36
Patient Outcomes 36
Mortality 37
Failure to Rescue 38
Nurse Outcomes 39
Burnout 39
Job Dissatisfaction 40
Intent to Leave 41
Significance to broader audience 42
Innovation 42
CHAPTER 3: METHODS AND DESIGN
Introduction 44
Datasets 44
Sample 46
Variables and Instruments 47
Preliminary Analyses 57
Data Analysis 58
Human Subjects 67
CHAPTER 4: RESULTS
Introduction 68
Characteristics of study population 69
Analysis of Aim 1 74
Description of Throughput and Turnover 74
Development of Throughput-Adjusted Staffing Measures 86
Interpreting Throughput-Adjusted Staffing Measures 86
Standardized Throughput-Adjusted Staffing 86
Additive Throughput-Adjusted Staffing 89
Time-Based Throughput-Adjusted Staffing 91
Summary of Specific Aim 1 Results 97
Analysis of Specific Aim 2 98
Specific Aim 2a 98
viii
Specific Aim 2b 106
Summary of Specific Aim 2 Results 109
Analysis of Specific Aim 3 109
Specific Aim 3a 109
Specific Aim 3b 118
Summary of Specific Aim 3 Results 121
CHAPTER 5: DISCUSSION
Principal Findings 122
Development of Throughput-Adjusted Staffing Measures 122
Throughput-Adjusted Staffing Measures and Patient Outcomes 124
Throughput-Adjusted Staffing Measures and Nurse Outcomes 127
Limitations 129
Implications 130
Future Research 131
Summary 132
REFERENCES 134
ix
List of Tables
Table 1. Study Variables, Measurement, Sources, and Level of Analysis
Table 2. Reliability of Hospital-Aggregated Scores Based on Minimum Number of Nurses Per
Hospital
Table 3. Nurse Characteristics
Table 4. Patient Characteristics
Table 5. Hospital Characteristics
Table 6. Distribution of Staffing and Throughput Measures by Unit Type and Hospital
Characteristics
Table 7. Distribution of Turnover Measures by Unit Type and Hospital Characteristics
Table 8. Mean Throughput and Turnover by Unit Type
Table 9. Hospital-Level Truncated Turnover by Categories of Hospital-Level Staffing
Table 10. Hospital-Level Throughput by Categories of Hospital-Level Staffing
Table 11. Hospital-Level Throughput by Categories of Nurse Work Environment
Table 12. Correlation Matrix of Nursing Variables Related to Staffing, Throughput, and the Work
Environment
Table 13. Standardized Throughput-Adjusted Workload Examples Based on Alternative Staffing
and Throughput Values
Table 14. Development of Additive Adjustment Throughput Term
Table 15. Time-Based Adjusted Workload Examples Based on Alternative Staffing, Throughput,
and Shift Length Values
Table 16. Hospital-Level Staffing and Adjusted-Staffing Measures Summary Statistics
Table 17. Descriptive Statistics of Hospital-Level LOS
Table 18. Spearman Correlation Matrix for Hospital-Level Staffing and Adjusted-Staffing
Variables
Table 19. Mean Patients Per Nurse Using Each Staffing Measure Over Quartiles of Patient
Outcomes
Table 20. Odds Ratios Estimating Effects of Different Measures of Nurse Staffing and Work
Environment on 30-Day Mortality

x
Table 21. Odds Ratios Estimating Effects of Different Measures of Nurse Staffing and Work
Environment on Failure to Rescue
Table 22. Effect of Standardized Staffing Measures on Patient Outcomes
Table 23. Mean Patients Per Nurse Using Each Staffing Measure Over Quartiles of Nurse
Outcomes
Table 24. Odds Ratios Estimating Effects of Different Measures of Nurse Staffing and Work
Environment on Nurse Burnout
Table 25. Odds Ratios Estimating Effects of Different Measures of Nurse Staffing and Work
Environment on Nurse Job Dissatisfaction
Table 26. Odds Ratios Estimating Effects of Different Measures of Nurse Staffing and Work
Environment on Nurse Intent to Leave
Table 27. Effect of Standardized Staffing Measures on Nurse Outcomes

xi
List of Figures
Figure 1. Quality Health Outcomes Model
Figure 2. Curve for Standardized Method for Throughput-Adjustment
Figure 3. Distribution of Hospital Level Throughput
Figure 4. Distribution of Hospital-Level Truncated Turnover
Figure 5. Frequency of Hospital CMI Levels

1
Chapter 1: Introduction
The Problem
Over the past two decades, patient acuity in hospitals has risen and length of stay (LOS)
has decreased (HCUP, 2009; Unruh & Fottler, 2006), increasing patient care intensity and nurses’
workloads (Beglinger, 2006; Carayon & Gurses, 2008). As nurses’ workloads increase, the
potential is greater for patient care quality to decrease because nurses have less time to provide
care and conduct patient surveillance (Kutney-Lee, Lake, & Aiken, 2009; Shever, 2011).
Surveillance is “the purposeful and ongoing acquisition, interpretation, and synthesis of patient
information for clinical decision-making” (Henneman, Gawlinski, & Guiliano, 2012, p. 9). In
hospitals, nurses use their knowledge and skills to provide close surveillance for patients every
hour of every day. Nurses are usually the first to notice subtle changes in patient condition and
are in an optimal position to respond quickly should their patients need it. Therefore, it is
imperative that nurse staffing match patient needs. Measuring nurses’ workloads adequately is
critical to ensuring safe patient care; however, a widely accepted workload measure remains
elusive due to its complex nature (Twigg & Duffield, 2009).
To measure nurses’ workloads, most researchers have relied on patient to nurse ratios and
rough estimates of patient acuity (Dexter, Wachtel, & Epstein, 2006), such as case mix (Mark &
Harless, 2011). Indeed, nurse to patient ratios have been used in several landmark studies that
have established the association between nurse staffing with patient outcomes, including
complications and mortality (Aiken et al., 2002; Estabrooks, Midodzi, Cummings, Ricker, &
Giovannetti, 2005; Needleman, Buerhaus, Mattke, Stewart, & Zelevinsky, 2002) as well as nurse
outcomes, such as burnout and job dissatisfaction (Aiken et al., 2010; Sheward, Hunt, Hagen,
Macleod, & Ball, 2005; Faller, Gates, Georges, & Connelly, 2011; Gallagher & Gormley, 2009;
Aiken et al., 2002). Although the number and acuity of patients are important factors that
2
influence nurses’ workloads, these studies have not considered the impact of throughput.
Throughput, or patient turnover, refers to the rate or speed at which patients are admitted,
discharged, or transferred in hospitals. Throughput has long been recognized a significant
component of nurse workload (Unruh & Fottler, 2006; Cooper & Zaske, 1987; Shamian, Hagen,
Hu, & Fogarty, 1994; O’Brien-Pallas, et al., 1997; Seago, 2002), yet few studies to date have
considered throughput in measures of nurses’ workloads. This study addresses this gap in the
literature by examining whether a measure of throughput provides additional information beyond
nurse staffing ratios that improves estimates of the effects of nurse workloads on patient and
nurse outcomes.
Study Purpose, Specific Aims and Hypotheses
Study Purpose
The purpose of this study was to explore how throughput-adjusted staffing differs from a
traditional measure of nurse staffing and its influences on both nurse (burnout, job dissatisfaction,
and intent to leave) and patient (mortality and failure to rescue) outcomes. Nurses’ workloads are
often approximated using staffing levels, but the number of patients assigned per nurse may not
be an adequate proxy for all the work that nurses do. Throughput, or patient turnover, can
significantly influence nurses’ workloads but is rarely considered directly in research of nurses’
workloads (Duffield, Diers, Aisbett, & Roche, 2009). This study first explores the construct of
throughput in the context of health care. Then, it investigates whether directly measuring
throughput adds any significant additional information to patient to nurse ratios that would
improve how measures of nurse workloads influence patient and nurse outcomes. This study has
three specific aims:

3
Specific Aims
Aim 1: To develop and describe a measure of nurse staffing that appropriately accounts for
patient throughput.
Aim 2a: To determine whether throughput-adjusted staffing is associated with patient
outcomes (mortality and failure to rescue).
Hypothesis 2a: Patients treated in hospitals with more favorable throughput-adjusted
staffing levels will have lower odds of mortality and failure to rescue.
Aim 2b: To determine whether throughput-adjusted staffing has stronger associations with
patient outcomes compared to traditional staffing measures (patient to nurse ratios), acuity
adjusted staffing measures (adjusted for case mix), and length of stay-adjusted staffing.
Hypothesis 2b: Throughput-adjusted staffing will be more strongly associated with
patient outcomes than traditional staffing, case mix-adjusted staffing, and length of stay-
adjusted staffing.
Aim 3a: To determine whether throughput-adjusted staffing is associated with nurse outcomes
(burnout, job dissatisfaction, and intent to leave).
Hypothesis 3a: Nurses working in hospitals with more favorable throughput-adjusted
staffing levels will have lower odds of burnout, job dissatisfaction, and intent to leave.
Aim 3b: To determine whether throughput-adjusted staffing has stronger associations with
nurse outcomes compared to traditional staffing measures (patient to nurse ratios), acuity
adjusted staffing measures (adjusted for case mix), and length of stay-adjusted staffing.
Hypothesis 3b: Throughput-adjusted staffing will be more strongly associated with nurse
outcomes than traditional staffing, case mix-adjusted staffing, and length of stay-adjusted
staffing.
4
Study Significance
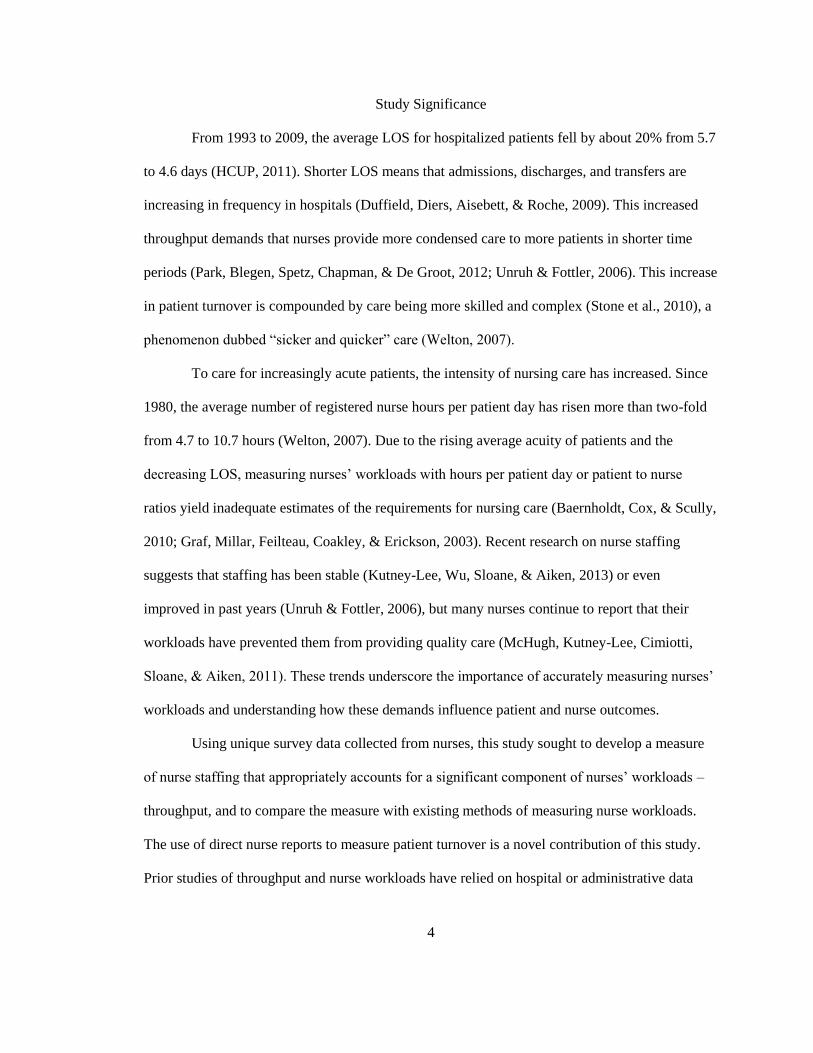
From 1993 to 2009, the average LOS for hospitalized patients fell by about 20% from 5.7
to 4.6 days (HCUP, 2011). Shorter LOS means that admissions, discharges, and transfers are
increasing in frequency in hospitals (Duffield, Diers, Aisebett, & Roche, 2009). This increased
throughput demands that nurses provide more condensed care to more patients in shorter time
periods (Park, Blegen, Spetz, Chapman, & De Groot, 2012; Unruh & Fottler, 2006). This increase
in patient turnover is compounded by care being more skilled and complex (Stone et al., 2010), a
phenomenon dubbed “sicker and quicker” care (Welton, 2007).
To care for increasingly acute patients, the intensity of nursing care has increased. Since
1980, the average number of registered nurse hours per patient day has risen more than two-fold
from 4.7 to 10.7 hours (Welton, 2007). Due to the rising average acuity of patients and the
decreasing LOS, measuring nurses’ workloads with hours per patient day or patient to nurse
ratios yield inadequate estimates of the requirements for nursing care (Baernholdt, Cox, & Scully,
2010; Graf, Millar, Feilteau, Coakley, & Erickson, 2003). Recent research on nurse staffing
suggests that staffing has been stable (Kutney-Lee, Wu, Sloane, & Aiken, 2013) or even
improved in past years (Unruh & Fottler, 2006), but many nurses continue to report that their
workloads have prevented them from providing quality care (McHugh, Kutney-Lee, Cimiotti,
Sloane, & Aiken, 2011). These trends underscore the importance of accurately measuring nurses’
workloads and understanding how these demands influence patient and nurse outcomes.
Using unique survey data collected from nurses, this study sought to develop a measure
of nurse staffing that appropriately accounts for a significant component of nurses’ workloads –
throughput, and to compare the measure with existing methods of measuring nurse workloads.
The use of direct nurse reports to measure patient turnover is a novel contribution of this study.
Prior studies of throughput and nurse workloads have relied on hospital or administrative data
5
(Needleman, Buerhaus, Pankratz, Leibson, Stevens, & Harris, 2011; Park et al., 2012; Unruh &
Fottler, 2006). Past studies of the relationship between throughput and outcomes have also not
considered the role of the surrounding work environment of nurses. The environment in which
nurses work gives information about the other conditions, such as the level of professional
autonomy and relationships with other providers, that influence nurses’ workloads beyond patient
to nurse ratios. It is important to concurrently consider the organizational factors that influence
nurses’ work because nurses and patients do not interact in isolation, but in a larger context.
Finally, this work is the largest study of throughput to date and the first to examine the influence
of throughput on nurse outcomes.
The findings of this study are valuable to nurses, hospital administrators, and policy-
makers concerned with the allocation of nursing resources. Staffing decisions should be dynamic
and evidence-based. If throughput-adjusted staffing is a strong predictor of nurse and patient
outcomes, incorporating throughput into staffing algorithms may be warranted. Drawing attention
to the importance of throughput on nurses’ workloads also emphasizes ways in which healthcare
organizations can adapt to promote better patient outcomes and nurse retention.
6
Chapter 2: Background
Introduction
Nurse workloads have not always been a prominent topic in health services research. This
chapter reviews how nurse workloads came to be a key research subject; first estimated by
staffing measures, then adjusted for patient acuity, and finally the beginnings of accounting for
patient turnover. The rationale and importance of patient turnover as a component of nurse
workloads are discussed followed by the conceptual framework for studying throughput as a
hospital characteristic. This chapter then synthesizes what is currently known about throughput,
staffing, and the nurse work environment and explains how this study addresses gaps and
limitations in the existing literature.
Evolution of nurse workload and its measurement
Since the Medicare Prospective Payment System was implemented in 1983, average
hospital patient length of stay has decreased significantly and there has been a significant shift to
treating more patients in outpatient or home settings (Qian, Russel, Valiyeva, & Miller, 2007;
Stearns, 1991; Steinwald & Dummit, 1989). The combination of shorter lengths of stay and shift
of care to outpatient and home has resulted in an increase in the complexity and severity of
hospitalized patients (Beglinger, 2006; Steinwald & Dummit, 1989). From 2000 to 2007 alone,
the average case mix (measure of Medicare population’s “sickness”) in American hospitals rose
about 10% (Deb, 2010).
Because patients are no longer admitted to hospitals before surgery, each surgical
admission to a nursing unit is a patient in the acute phase of recovery from surgery in need of
nursing care and close surveillance. Today patients are discharged sooner after surgery when in
the past, they would have continued with the early stages of their recovery in the hospital
(AHRQ, 2004). Likewise, most medical patients are admitted in acute distress, which increases

7
the intensity of nursing care needed (Beglinger, 2006). Patients no longer have lengthy inpatient
stays and thus are discharged with multiple complex needs that require detailed discharge
education to recover successfully at home or a rehabilitation center. Since the average LOS is
only 4.6 days in acute general hospitals (HCUP, 2011), patient turnover is rapid. This adds to
nurses’ workloads and responsibilities regarding the processes of admitting and discharging
patients in addition to providing acute nursing care for all patients (Park et al., 2012). While
patient to nurse staffing ratios have declined over time, there is considerable debate about
whether nurse staffing has improved enough to offset the higher acuity levels resulting from short
lengths of stay and rapid turnover of patients (Clarke & Donaldson, 2008; Needleman et al.,
2002).
Many studies have measured nurses’ workloads in terms of average patients per nurse or
hours of nursing care per patient (Aiken et al., 2002; Glance et al., 2012; Mark & Harless, 2007;
Sochalski, 2004; Van den Heede et al., 2009). These crude measures of staffing may not
accurately describe the nursing care that patients require; the intensity of nursing care impacts
nurses’ workloads also (Unruh & Fottler, 2006). To better estimate this intensity, some
researchers have attempted to adjust nurse staffing for patient acuity. Patient acuity has been
defined as the patients’ requirements for nursing care (Jennings, 2008). To draw comparisons
about quality of care across hospitals, nurse staffing measurements must account for patient
acuity (Mark & Harless, 2011) because as patient acuity rises, so does the need for nursing care
(Jennings, 2008). Often, researchers use the case mix index (CMI), which was developed using
diagnosis-related group (DRG) assignments by Medicare to compare the total resource intensity
for patients across hospitals (Mark & Harless, 2011).
To adjust staffing by CMI is to make two assumptions. First, that CMI is an appropriate
proxy for a patient’s needs for nursing care (Mark & Harless, 2011), but may not accurately
8
reflect actual patients’ needs for nursing care (Norrish & Rundall, 2001). The second assumption
is that DRG assignments based on Medicare patients are appropriate for all patients in a hospital
(Mark & Harless, 2011). In response to the CMI and DRG acuity measurement suggestions, an
expert panel of nurses who were focused on patients’ nursing needs developed another measure
called “nursing intensity weights”, but significant differences among these measures across
hospitals were found (Mark & Harless, 2011, p. 112). Some of the differences were related to
hospital characteristics such as hospital size, teaching status, and ownership but these differences
were not systematic or consistent in size or direction across these hospital characteristics (Mark &
Harless, 2011, p. 112). Mark and Harless (2011) posit that the lack of standardized methods for
acuity measurement may be because patient acuity overlaps with patients’ severity of illness and
comorbidities and these concepts are all related to requirements for nursing care (p. 113).
Indeed, some hospitals utilize systems to measure nurse workloads that incorporate
patient acuity. These patient classification systems (PCSs) attempt to measure the amount of
nursing time required to care for particular patients rather than the patient’s medical acuity
(Norrish & Rundall, 2001). One example of a PCS is at Massachusetts General Hospital (MGH)
where the QuadraMed WinPFSTM
Productivity and Benchmarking system is used (Graf et al.,
2003). This system requires that nurses update patient profiles daily, reflecting the patients’ needs
for nursing care over the course of a patient’s stay (Graf et al., 2003). These data are merged with
the hospital’s Admitting/Discharge/Transfer system so that an acuity- weighted census is
calculated for each nursing unit (Graf et al., 2003). From 1993 to 2001, researchers at MGH
showed that as patient length of stay decreased, average patient acuity increased, which required
increasing nursing skill mix (Graf et al., 2003). The number of patients, their acuity, and the
frequency at which they are treated all influence nurses’ workloads but these factors are only
rarely measured together. However, there is little evidence to support that computer systems such
9
as the QuadraMed WinPFSTM
system are capturing all which nurse workloads encompass.
Results from this work may be useful in creating measures that offer a more comprehensive and
accurate estimate of nurses’ workloads. Better estimates of nurse workloads would allow
managers and administrators to better allocate nursing resources based on patients’ needs.
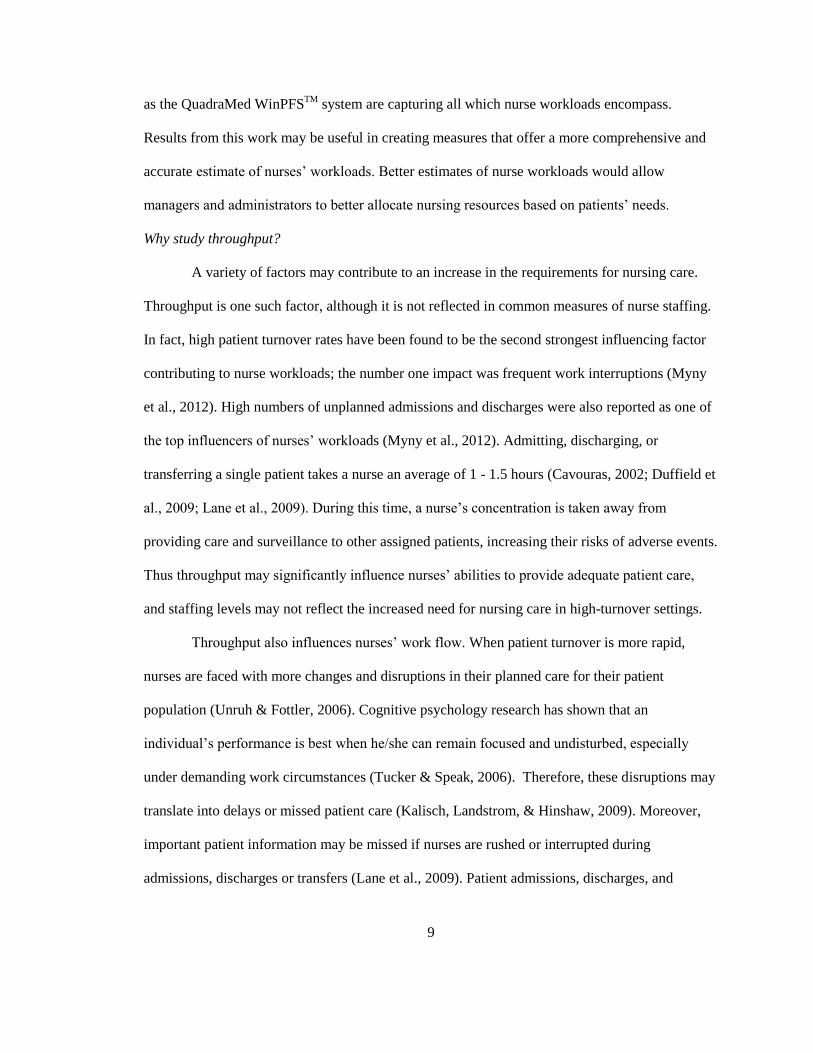
Why study throughput?
A variety of factors may contribute to an increase in the requirements for nursing care.
Throughput is one such factor, although it is not reflected in common measures of nurse staffing.
In fact, high patient turnover rates have been found to be the second strongest influencing factor
contributing to nurse workloads; the number one impact was frequent work interruptions (Myny
et al., 2012). High numbers of unplanned admissions and discharges were also reported as one of
the top influencers of nurses’ workloads (Myny et al., 2012). Admitting, discharging, or
transferring a single patient takes a nurse an average of 1 - 1.5 hours (Cavouras, 2002; Duffield et
al., 2009; Lane et al., 2009). During this time, a nurse’s concentration is taken away from
providing care and surveillance to other assigned patients, increasing their risks of adverse events.
Thus throughput may significantly influence nurses’ abilities to provide adequate patient care,
and staffing levels may not reflect the increased need for nursing care in high-turnover settings.
Throughput also influences nurses’ work flow. When patient turnover is more rapid,
nurses are faced with more changes and disruptions in their planned care for their patient
population (Unruh & Fottler, 2006). Cognitive psychology research has shown that an
individual’s performance is best when he/she can remain focused and undisturbed, especially
under demanding work circumstances (Tucker & Speak, 2006). Therefore, these disruptions may
translate into delays or missed patient care (Kalisch, Landstrom, & Hinshaw, 2009). Moreover,
important patient information may be missed if nurses are rushed or interrupted during
admissions, discharges or transfers (Lane et al., 2009). Patient admissions, discharges, and
10
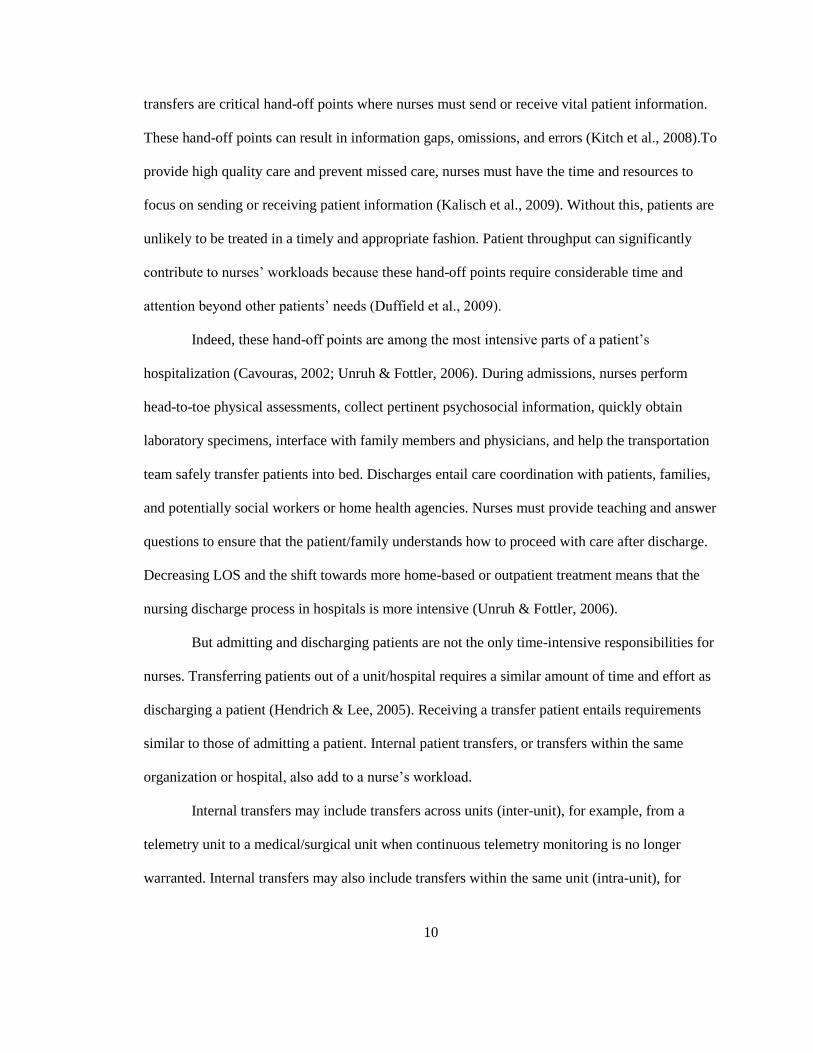
transfers are critical hand-off points where nurses must send or receive vital patient information.
These hand-off points can result in information gaps, omissions, and errors (Kitch et al., 2008).To
provide high quality care and prevent missed care, nurses must have the time and resources to
focus on sending or receiving patient information (Kalisch et al., 2009). Without this, patients are
unlikely to be treated in a timely and appropriate fashion. Patient throughput can significantly
contribute to nurses’ workloads because these hand-off points require considerable time and
attention beyond other patients’ needs (Duffield et al., 2009).
Indeed, these hand-off points are among the most intensive parts of a patient’s
hospitalization (Cavouras, 2002; Unruh & Fottler, 2006). During admissions, nurses perform
head-to-toe physical assessments, collect pertinent psychosocial information, quickly obtain
laboratory specimens, interface with family members and physicians, and help the transportation
team safely transfer patients into bed. Discharges entail care coordination with patients, families,
and potentially social workers or home health agencies. Nurses must provide teaching and answer
questions to ensure that the patient/family understands how to proceed with care after discharge.
Decreasing LOS and the shift towards more home-based or outpatient treatment means that the
nursing discharge process in hospitals is more intensive (Unruh & Fottler, 2006).
But admitting and discharging patients are not the only time-intensive responsibilities for
nurses. Transferring patients out of a unit/hospital requires a similar amount of time and effort as
discharging a patient (Hendrich & Lee, 2005). Receiving a transfer patient entails requirements
similar to those of admitting a patient. Internal patient transfers, or transfers within the same
organization or hospital, also add to a nurse’s workload.
Internal transfers may include transfers across units (inter-unit), for example, from a
telemetry unit to a medical/surgical unit when continuous telemetry monitoring is no longer
warranted. Internal transfers may also include transfers within the same unit (intra-unit), for
11
instance, if a patient needs to move from a double-occupancy room to a single room for dialysis
or infectious disease reasons. Each time a patient is transported, the workload for nurses
increases, which may contribute to errors (Hendrich & Lee, 2005). If throughput is not considered
in determining staffing levels, these functions associated with throughput can displace nurses’
time and energy away from their other patients. Furthermore, nurses may not be able to
obtain/send comprehensive or quality patient information, contributing to information “falling
between the cracks”. Throughput therefore has considerable potential to influence nurse
workloads, though hospitals rarely consider it in staffing metrics.
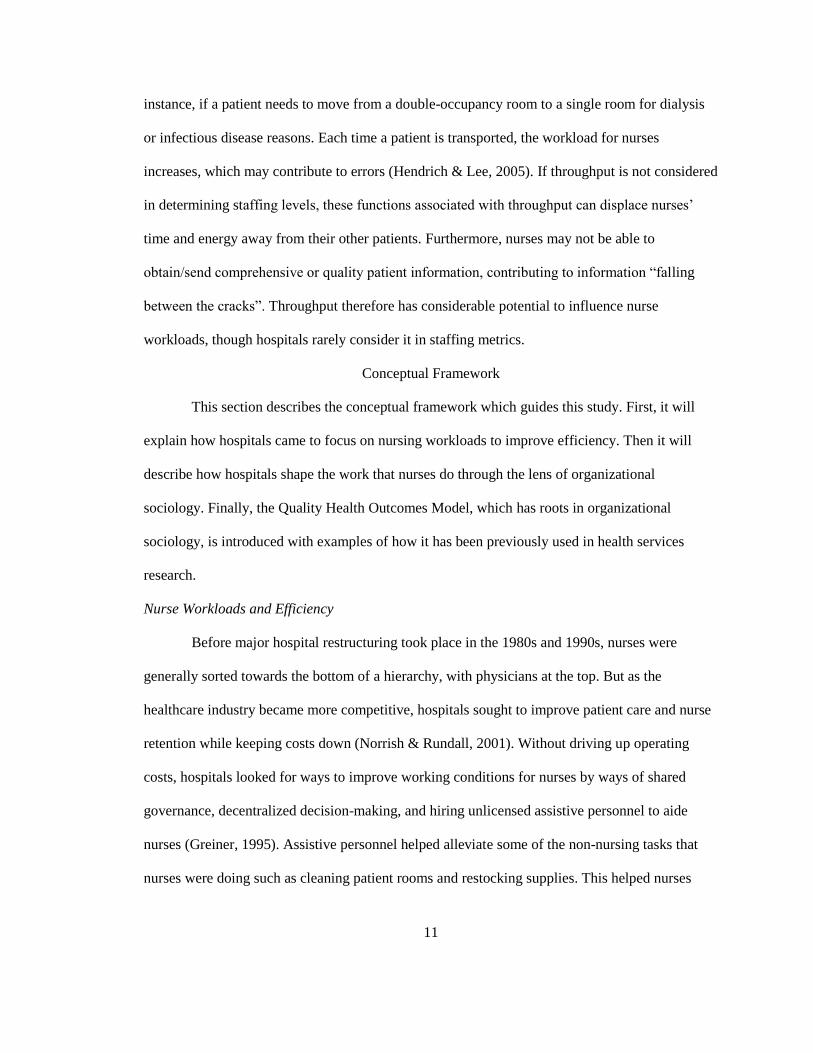
Conceptual Framework
This section describes the conceptual framework which guides this study. First, it will
explain how hospitals came to focus on nursing workloads to improve efficiency. Then it will
describe how hospitals shape the work that nurses do through the lens of organizational
sociology. Finally, the Quality Health Outcomes Model, which has roots in organizational
sociology, is introduced with examples of how it has been previously used in health services
research.
Nurse Workloads and Efficiency
Before major hospital restructuring took place in the 1980s and 1990s, nurses were
generally sorted towards the bottom of a hierarchy, with physicians at the top. But as the
healthcare industry became more competitive, hospitals sought to improve patient care and nurse
retention while keeping costs down (Norrish & Rundall, 2001). Without driving up operating
costs, hospitals looked for ways to improve working conditions for nurses by ways of shared
governance, decentralized decision-making, and hiring unlicensed assistive personnel to aide
nurses (Greiner, 1995). Assistive personnel helped alleviate some of the non-nursing tasks that
nurses were doing such as cleaning patient rooms and restocking supplies. This helped nurses

12
focus clinically on patients for more of their time, which hospital administrators saw as improved
efficiency (Norrish & Rundall, 2001).
During this time, the Medicare Prospective Payment System also forced hospitals to
address efficiency in terms of patient throughput. While hospitals focus on their bottom line,
throughput of patients is seen as an outcome in itself (Kobis & Kennedy, 2006). This viewpoint
stems from the discipline of economics where throughput is a measure of organizational
efficiency. To treat more patients more quickly improves hospital efficiency and decreases waste
time and costs (Chadaga et al., 2012; Porta et al., 2013). But from a nursing perspective,
increased throughput increases the demands for nursing care and thus the workload. These
different perspectives lie behind a tension between professional nurses and hospital
administrators. While nurses are more focused on patient care and safety regarding patient
throughput (Park et al., 2012), hospital administrators have a more economics-based lens (Kobis
& Kennedy, 2006). When negotiating with administrators for additional resources, nurses cite
research on the relationship between nurse staffing (a component of workload) and patient
outcomes that suggests heavier patient workloads are associated with negative patient and nurse
outcomes (Aiken et al., 2002; Clarke & Donaldson, 2008; Kane et al., 2007). However, the
evidence surrounding the influence of throughput, another component of nurses’ workloads, on
patient and nurse outcomes is lacking. The following presents a lens through which nurse
workloads and outcomes have been conceptualized in research and a conceptual framework to
serve as the foundation for this work.
Organizational Sociology
Organizational sociology is the study of the structure and processes of human
organizations and how they achieve their goals (Godwyn & Gittell, 2012). Instead of viewing
organizations as the sum of individual pieces, organizational sociology focuses on the integrated
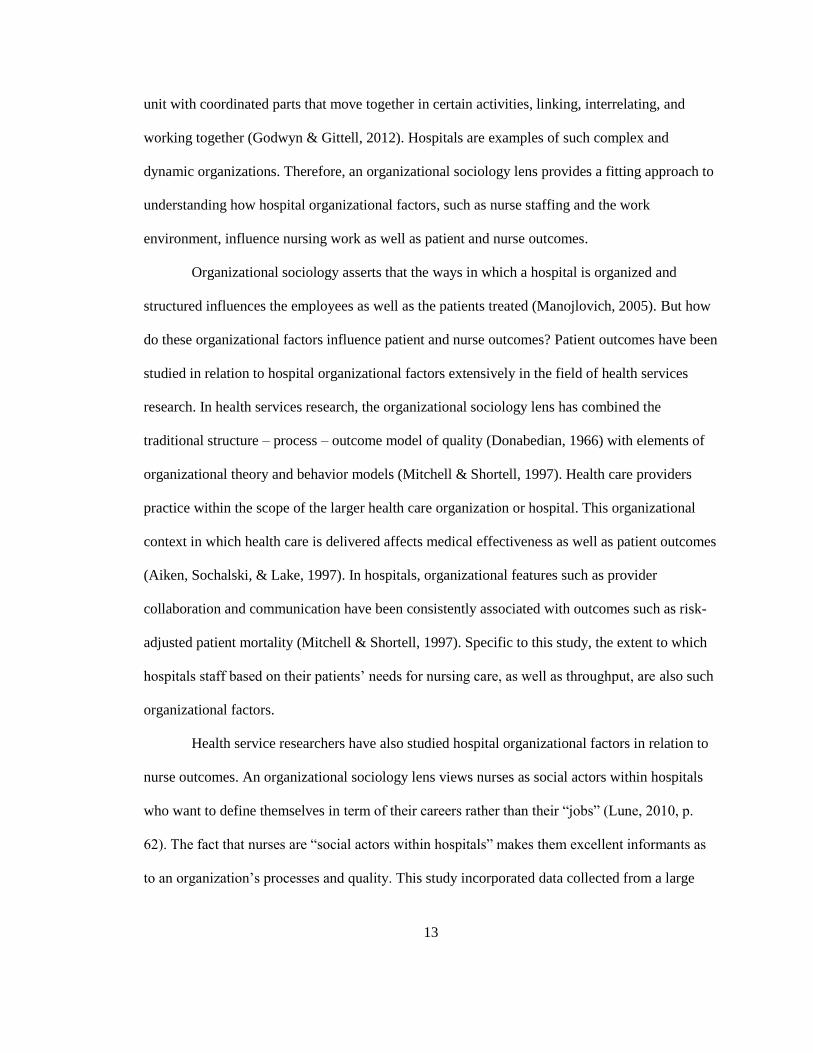
13
unit with coordinated parts that move together in certain activities, linking, interrelating, and
working together (Godwyn & Gittell, 2012). Hospitals are examples of such complex and
dynamic organizations. Therefore, an organizational sociology lens provides a fitting approach to
understanding how hospital organizational factors, such as nurse staffing and the work
environment, influence nursing work as well as patient and nurse outcomes.
Organizational sociology asserts that the ways in which a hospital is organized and
structured influences the employees as well as the patients treated (Manojlovich, 2005). But how
do these organizational factors influence patient and nurse outcomes? Patient outcomes have been
studied in relation to hospital organizational factors extensively in the field of health services
research. In health services research, the organizational sociology lens has combined the
traditional structure – process – outcome model of quality (Donabedian, 1966) with elements of
organizational theory and behavior models (Mitchell & Shortell, 1997). Health care providers
practice within the scope of the larger health care organization or hospital. This organizational
context in which health care is delivered affects medical effectiveness as well as patient outcomes
(Aiken, Sochalski, & Lake, 1997). In hospitals, organizational features such as provider
collaboration and communication have been consistently associated with outcomes such as risk-
adjusted patient mortality (Mitchell & Shortell, 1997). Specific to this study, the extent to which
hospitals staff based on their patients’ needs for nursing care, as well as throughput, are also such
organizational factors.
Health service researchers have also studied hospital organizational factors in relation to
nurse outcomes. An organizational sociology lens views nurses as social actors within hospitals
who want to define themselves in term of their careers rather than their “jobs” (Lune, 2010, p.
62). The fact that nurses are “social actors within hospitals” makes them excellent informants as
to an organization’s processes and quality. This study incorporated data collected from a large
14
nurse survey to ascertain their assessments of hospital organizational factors and for the first time,
used nurses’ reports of patient throughput on their units to develop hospital nurse workload
measures.
The processes by which hospital organizational factors influence nurse outcomes, and
consequently, patient outcomes, is rooted in human relations theory (Hage & Finsterbusch, 1989).
This approach to improving organizations focuses on improving workers’ performance through
improving communication and group processes (Hage & Finsterbusch, 1989, p. 33). Leaders in
hospitals are also important because they create a climate and culture that influences the
organization in which nurses work (Clarke & Donaldson, 2008). When organizational features
such as job design, career opportunities, employee autonomy and participation in hospital
decisions, and professional cooperation are improved, employees are more motivated and can
fully actualize themselves (Hage & Finsterbusch, p. 33). When the process of patient throughput
is acknowledged by hospitals as important to nurses’ workloads, staffing and resources can be
better allocated so that nurses can provide the best possible care to their patients.
The following conceptual model depicts these organizational factors and how they are
related to nurses’ work (interventions), patient and nurse (client) factors, and outcomes.
Organizational sociology is embedded within this model as it specifically features organizational
factors as important elements in health services research.
Quality Health Outcomes Model
The Quality Health Outcomes Model (QHOM) was developed based on a classic model
by Donabedian (1966). The Donabedian model was developed by Avedis Donabedian in 1966 as
a paradigm for evaluating quality of care in health services research. The first element in
Donabedian’s (1966) framework is “structure”. Structural organizational characteristics include
size, teaching status, and technological sophistication (Hearld, Alexander, Fraser, & Jiang, 2008).

15
Structural characteristics are necessary precursors to quality health services, but not sufficient in
and of themselves (Hearld et al., 2008). The second element in Donabedian’s (1966) framework
is “process”. Organizational processes are defined as dynamic activities, distinct from the stable
more structural characteristics (Hearld et al., 2008). Examples of organizational process measures
include leadership, collaboration, and communication (Hearld et al., 2008). Outcomes, according
to Donabedian (1966), are frequently used as indicators of quality of care and include measures
such as surgical mortality and complications. Outcomes are more concrete and are more
amenable to empirical measurement (Donabedian, 1966, p. 168). Donabedian’s (1966) structure –
process – outcome model continues to be a popular framework in health services research. Some
have posited, however, that this linear structure – process – outcome model is inadequate because
it suggests that structure affects processes which then affect outcomes (Mitchell, Ferketich, &
Jennings, 1998). Patient characteristics are not well represented in Donabedian’s model, nor how
they relate to the other elements.
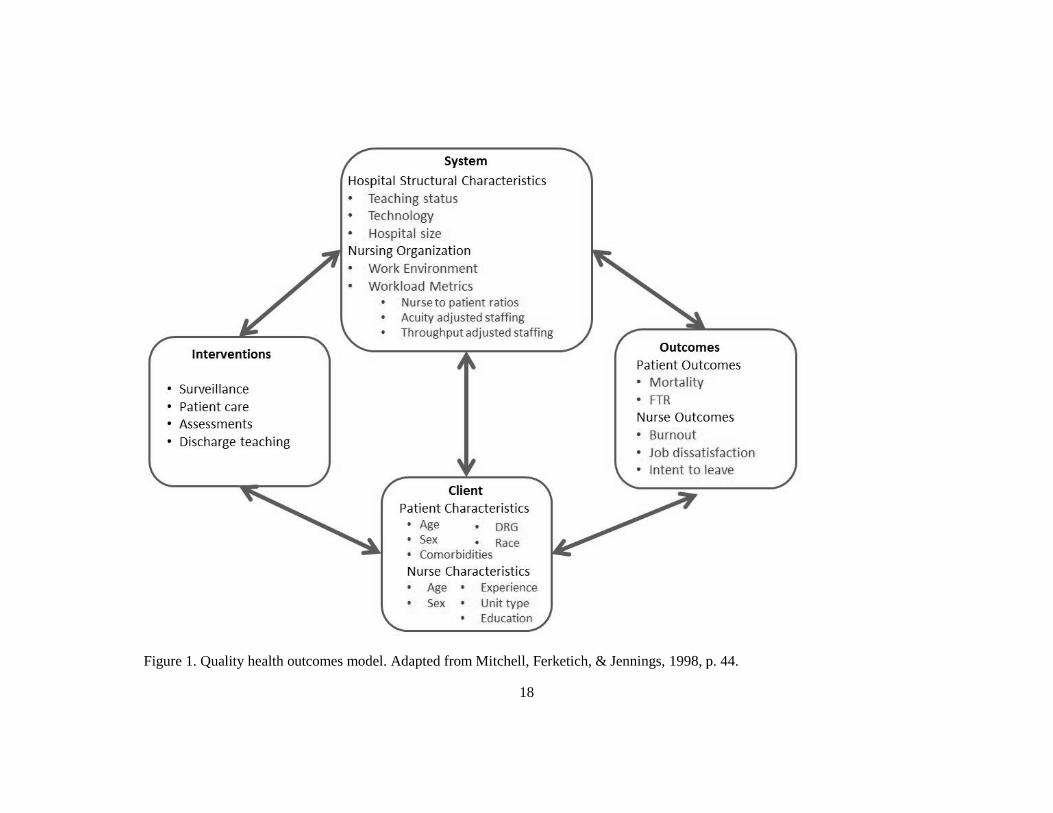
To address these issues, the QHOM was developed (Mitchell, Ferketich, & Jennings,
1998). The QHOM (Figure 1) depicts the dynamic relationships among organizations,
interventions, clients, and outcomes (Mitchell, Ferketich, & Jennings, 1998). The QHOM
improves upon Donabedian’s linear one-way model (1966), as it depicts feedback relationships
among its elements. Outcomes are not necessarily viewed as “end points”, but rather dynamic
elements that react with organizational characteristics as well as patients. A main feature of the
QHOM is that interventions, rather than directly, act through patient and organizational
characteristics in their influence on outcomes.
Although interventions are important in evaluating health care outcomes, they are not the
focus of this study. This study focuses on the remaining system, client, and outcome components
of the QHOM. The system component, which includes throughput, is represented with
16
characteristics of the organization, or hospital, in which each patient was treated. There are two
types of system characteristics in this study: structural and organizational characteristics.
Structural characteristics are relatively stable traits such as throughput, hospital size, teaching
status, and level of technology; similar to Donabedian’s definition of structure. Organizational
characteristics are more modifiable for hospitals and include measures of nursing, such as the
nurse work environment and nurse staffing.
The client, or patient, factors are represented with patient demographic and acuity
variables that were used to risk adjust in predicting patient outcomes. Examples of these patient
factors include age, sex, race, and Diagnosis Related Group (DRG). Furthermore, in estimating
nurse outcomes, individual nurse age, sex, years of experience, education level, and unit type
were included as client factors. Patient outcomes, namely mortality and failure to rescue (FTR),
are explored in this study. Failure to rescue refers to a patient death following a complication
(Silber, Romano, Rosen, Wang, Even-Shoshan, & Volpp, 2007). Additionally, this study
examines three nurse outcomes (i.e. burnout, job dissatisfaction, and intent to leave) because of
their importance in nurse retention (Aiken et al., 2002; Aiken et al., 2008).
Quality Health Outcomes Model in Health Services Research
The QHOM is used to explain and predict how characteristics of a system influence
outcomes (Kelly & Vincent, 2011). Nursing care is so intimate and personalized to individual
patient needs that it is often lost as to specifically what nurses do. The invisible nature of nursing
work has created a black box concealing the mechanisms and relationships between nursing
organization and outcomes (Cornell et al., 2010; Meyer & O’Brien-Pallas, 2010). Instead of
trying to explicate the detailed duties and tasks and of nurses’ work, health services researchers
often look at the broader context in which nurses do their work. This broader context lends to a
systems perspective which considers multiple levels of parts that constitute the whole system at a
17
more abstract level, which actually lends itself to the study of complex phenomena (Brewer,
Verran & Stichler 2008). The QHOM has been used to study patient and nurse outcomes in
relation to such system-level factors as policy changes (McHugh et al., 2011), staffing levels
(Aiken et al., 2002), education levels (Aiken et al., 2011), hospitals’ racial minority concentration
(Brooks-Carthon et al., 2011), and the design of specialty nursing units (Aiken, Sloane, Lake,
Sochalski, & Weber, 1999).
18
Figure 1. Quality health outcomes model. Adapted from Mitchell, Ferketich, & Jennings, 1998, p. 44.
19
Synthesis of Existing Literature
System:
The “System” component of the QHOM refers to the context and organization of the
delivery of care. Here, the system refers to hospitals, but systems can describe various levels of
the organization of health care. Many studies have examined the relationships between system
factors, such as nurse staffing and the work environment, and patient and nurse outcomes (Aiken,
Cimiotti, Sloane, Smith, Flynn, & Neff, 2011; Aiken, Clarke, Cheung, Sloane, & Silber, 2003;
Bae, 2011; Blegen, Goode, Park, Vaughn, & Spetz, 2013; Brennan, Daly & Jones, 2013;
Estabrooks et al., 2005). In this study, there are two groups of system factors: structural
characteristics and organizational characteristics. Structural characteristics, such as throughput,
bed size, teaching status, and level of technology are less modifiable compared to nursing
organizational characteristics, which include workload metrics and the nurse work environment.
The following will summarize what is known about these system-level nursing characteristics as
well as hospital structural characteristics associated with nurse and patient outcomes as identified
in the research literature.
Throughput
Definition, Conceptualization, and Measurement
Throughput refers to patient turnover, or patient “churn” (Duffield et al., 2009). In this
study, the term “throughput” refers to the number of admitted, discharged, or transferred patients
whereas “turnover” refers to the ratio of “throughput” patients to assigned patients of nurses’
workloads. Though a handful of research studies have attempted to define and measure
throughput (Chadaga et al., 2012; Needleman et al., 2011; Park et al., 2012; Cunningham,
Hayduk, & Sowney, 2005), there is currently no established or accepted definition for throughput
20
in the literature. While these studies are describing essentially the same phenomenon, their
definitions and measurement approaches differ.
One of the main reasons researchers define and measure throughput differently is based
on whether throughput is viewed as an outcome or a system characteristic. In studies that
conceptualize throughput as an outcome, throughput has generally been measured in terms of
time: as the minutes patients wait for beds or operating rooms (Chadaga et al., 2012; Bellow,
Flottemesch, & Gillespie, 2012; Porta et al., 2013) or by using Little Law, an estimate of “flow
rate”, or the number of patients treated divided by the time it takes to treat the patients (Hultman
et al., 2012). This viewpoint that throughput is an outcome stems from the discipline of
economics where throughput is a measure of organizational efficiency (Kobis & Kennedy, 2006).
Though efficiency is certainly important for hospital financial reasons this study uses a nursing
lens with a greater focus on nurse and patient outcomes, rather than cost. Here, throughput is
conceptualized as a system characteristic (Figure 1). However, since throughput (structural
characteristic) is combined with staffing (organizational characteristic) in workload measures in
this study, these two factors are inherently linked. Although hospitals may not be able to
discernibly change their throughput levels, they can change staffing levels, which are the other
component of the workload measures.
Conceptualizing throughput as a structural characteristic but combining it with an
organizational characteristic (staffing) emphasizes the dynamic nature of organizations and their
abilities to adapt to their patient population’s needs. Throughput-adjusted staffing aims to better
measure nurses’ workloads by accounting for the additional demands that admission, discharges
and transfers place on their time and resources. Studying the effects of throughput-adjusted
staffing may offer a better understanding of the impact of nurse workloads on nurse and patient
outcomes.

21
In research that conceptualizes throughput as a system characteristic, throughput has been
measured as the ratio of patients admitted, discharged, or transferred to the total number of
patients on the census (Wagner, Budreau, & Everett, 2005) and transformed measures of patient
LOS (Unruh & Fottler, 2006). Throughput has also been quantified as “turnover interval”, or the
number of days a bed is left unoccupied between admissions (Cunningham, Kernohan, &
Sowney, 2005). Similar to the approach of Wagner and colleagues (2005), Park and colleagues
(2012) calculated throughput volume as the sum of admissions, discharges, transfers in, transfers
out, and observation stays. Patient turnover was then a ratio of throughput volume to the midnight
census volume. In a single-institution study utilizing shift-level data, Needleman and colleagues
(2011) defined “turnover” as the sum of admissions, discharges, and transfers as a proportion of
the start-of-shift census at the nursing unit-level (p. 1039). Then “high turnover” shifts were
defined as those that were at least one standard deviation above the mean day-shift turnover for
that unit (Needleman et al., 2011, p. 1039). These diverse definitions of throughput have
produced mixed results about the relationship between throughput, staffing, and patient outcomes
in empirical studies. Furthermore, patient turnover rates vary significantly across studies, making
it difficult to compare findings. Patient turnover rates have been calculated as low as 0-14%
(Needleman et al., 2011) and as high as 45-56% (Park et al., 2012).
Empirical Studies
The following studies comprise the few published studies about throughput and nurse
staffing and/or patient outcomes. In a study that clearly presented the case for incorporating
throughput into staffing measures, Unruh and Fottler (2006) tested two methods of adjusting
nurse staffing measures for patient turnover in a longitudinal design. They showed that compared
to a commonly used staffing measure, nurse staffing was significantly lower once patient turnover
was included. The first measure assumed a one-to-one inverse relationship between LOS and
22
nursing intensity and the second measure, the square root of the inverse of LOS assumed that
efficiencies in care delivery are found when LOS decreases (Unruh & Fottler, 2006, p. 602). The
authors found that there were significant discrepancies between unadjusted staffing measures and
measures that were adjusted for patient turnover and acuity. Unadjusted staffing measures
underestimated the intensity of nursing care required (Unruh & Fottler, 2006). They showed that
from 1994-2001 in Pennsylvania hospitals, unadjusted staffing improved slightly but that once
patient turnover and acuity were incorporated into the staffing measures, staffing actually
worsened over this 8 year period (Unruh & Fottler, 2006).
Similar to Unruh & Fottler’s (2006) work, Wagner and colleagues (2005) described how
throughput has increased over time, yet the midnight patient census remains the predominant
basis for staffing procedures. In a single hospital, they paired hourly patient data with actual nurse
availability to show that the midnight census severely under-represented actual nursing care
involved in admitting, transferring, and discharging patients.
Results from studies of throughput and patient outcomes follow similar trends seen in the
literature about nurse staffing. Like staffing, higher throughput (increased workload) is associated
with less favorable patient outcomes such as increased odds of mortality (Needleman et al.,
2011), FTR (Park et al., 2012), and higher rates of infection (Cunningham et al., 2005). These
studies underscore the rationale for including throughput in measures of nurses’ workloads in
studying patient outcomes.
Needleman and colleagues (2011) examined the relationship between staffing and patient
mortality while controlling for turnover. Using longitudinal unit- and shift-level data from 2003-
2006 in a single Magnet® hospital, they measured patients’ exposure to “high workload shifts”,
or shifts where staffing was below-target or patient turnover was high. A shift was an 8-hour
block of time matching commonly understood 24-hour based shifts (i.e. 07:00-15:00, 15:00-
23
23:00, and 23:00-07:00). Staffing was “below-target” if it did not meet the target RN hours
calculated by a commercial patient classification system. This detailed measurement of staffing
even accounted for the time patients were off the unit for anesthesia-related procedures. If actual
staffing was below target staffing for an 8-hour shift, that shift was flagged. They found that
patients’ exposure to high-turnover shifts was significantly associated with an increased risk of
death (hazard ratio of 1.04; Needleman et al., 2011, p.1042).
Park and colleagues (2012) examined the influence of patient turnover on the relationship
between staffing and FTR in a sample of 42 teaching hospitals from the University HealthSystem
Consortium (UHC). It was the first study to examine the influence of patient turnover on the
relationship between staffing and FTR using administrative data from multiple hospitals. This
study included the volume of patients classified as “observation” or “short stay” in measuring
throughput along with admissions, discharges, transfers in, and transfers out. The authors posited
that “observation” or “short stay” patients undergoing evaluation for admission, waiting for a
procedure, or recovering from a procedure contribute to increasing patient throughput (Park et al.,
2012, p. 281). The results indicated that the main effect of patient turnover did not significantly
predict FTR in either ICUs or non-ICUs. The interaction between patient turnover and staffing
was only a significant predictor of FTR for non-ICUs, meaning that the relationship between
staffing and FTR varied significantly depending on the level of throughput. The authors found
that non-ICUs with higher turnover needed higher staffing levels to produce the same FTR rates
as non-ICUs with lower turnover, indicating that throughput significantly changed the
relationship between staffing and FTR (Park et al., 2012).
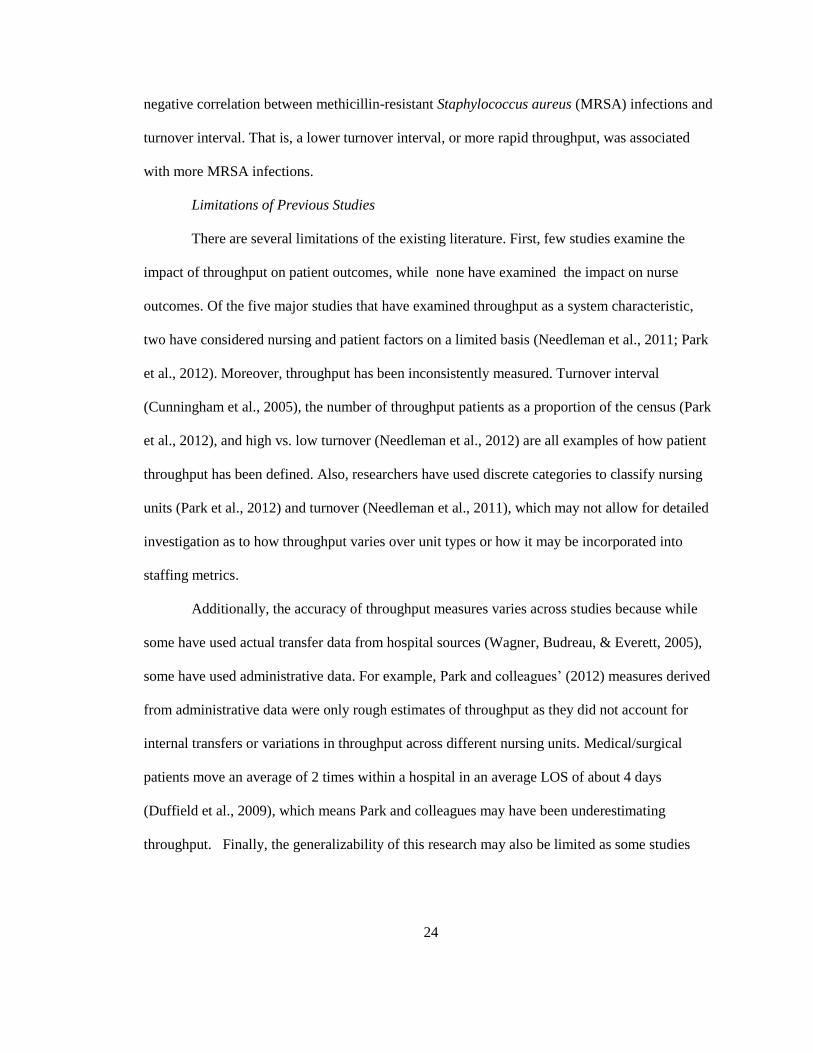
Finally, in a study in Northern Ireland, Cunningham and colleagues (2005) measured
throughput as the “turnover interval”, or the average number of days a hospital bed remained
unoccupied between one patient’s discharge and another’s admission. They found a significant
24
negative correlation between methicillin-resistant Staphylococcus aureus (MRSA) infections and
turnover interval. That is, a lower turnover interval, or more rapid throughput, was associated
with more MRSA infections.
Limitations of Previous Studies
There are several limitations of the existing literature. First, few studies examine the
impact of throughput on patient outcomes, while none have examined the impact on nurse
outcomes. Of the five major studies that have examined throughput as a system characteristic,
two have considered nursing and patient factors on a limited basis (Needleman et al., 2011; Park
et al., 2012). Moreover, throughput has been inconsistently measured. Turnover interval
(Cunningham et al., 2005), the number of throughput patients as a proportion of the census (Park
et al., 2012), and high vs. low turnover (Needleman et al., 2012) are all examples of how patient
throughput has been defined. Also, researchers have used discrete categories to classify nursing
units (Park et al., 2012) and turnover (Needleman et al., 2011), which may not allow for detailed
investigation as to how throughput varies over unit types or how it may be incorporated into
staffing metrics.
Additionally, the accuracy of throughput measures varies across studies because while
some have used actual transfer data from hospital sources (Wagner, Budreau, & Everett, 2005),
some have used administrative data. For example, Park and colleagues’ (2012) measures derived
from administrative data were only rough estimates of throughput as they did not account for
internal transfers or variations in throughput across different nursing units. Medical/surgical
patients move an average of 2 times within a hospital in an average LOS of about 4 days
(Duffield et al., 2009), which means Park and colleagues may have been underestimating
throughput. Finally, the generalizability of this research may also be limited as some studies
25
have been conducted in single institutions (Needleman et al. 2011; Wagner, Budreau, & Everett,
2005).
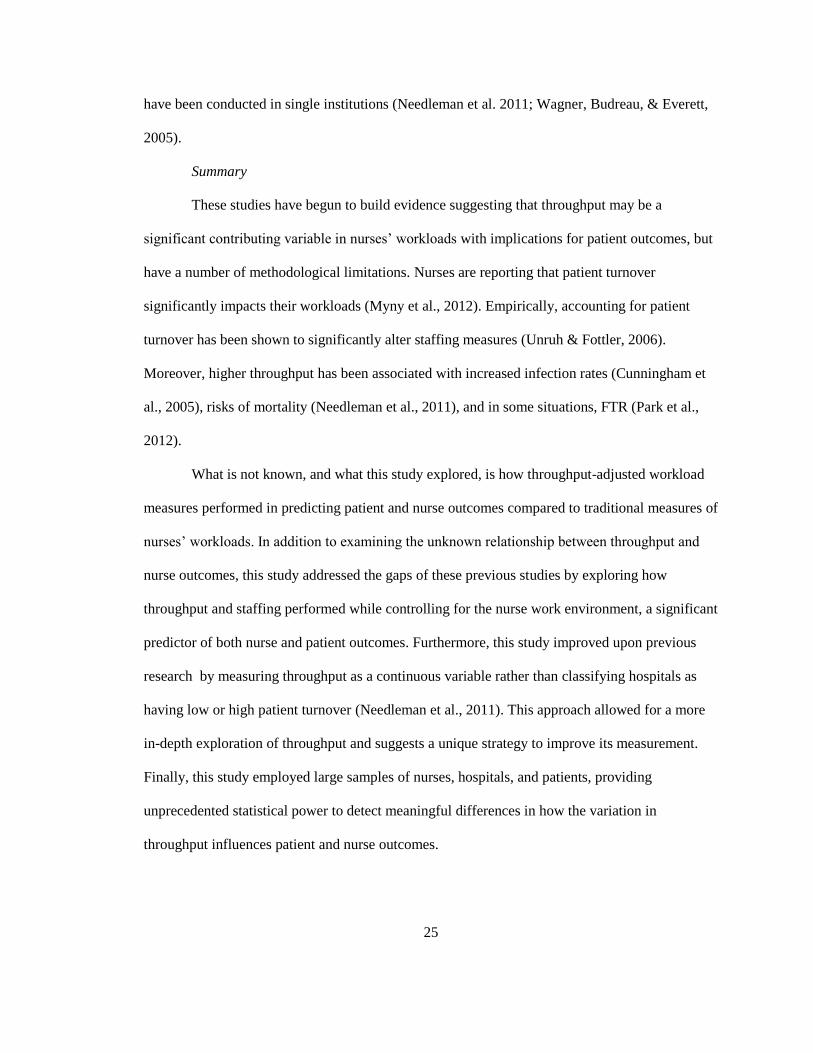
Summary
These studies have begun to build evidence suggesting that throughput may be a
significant contributing variable in nurses’ workloads with implications for patient outcomes, but
have a number of methodological limitations. Nurses are reporting that patient turnover
significantly impacts their workloads (Myny et al., 2012). Empirically, accounting for patient
turnover has been shown to significantly alter staffing measures (Unruh & Fottler, 2006).
Moreover, higher throughput has been associated with increased infection rates (Cunningham et
al., 2005), risks of mortality (Needleman et al., 2011), and in some situations, FTR (Park et al.,
2012).
What is not known, and what this study explored, is how throughput-adjusted workload
measures performed in predicting patient and nurse outcomes compared to traditional measures of
nurses’ workloads. In addition to examining the unknown relationship between throughput and
nurse outcomes, this study addressed the gaps of these previous studies by exploring how
throughput and staffing performed while controlling for the nurse work environment, a significant
predictor of both nurse and patient outcomes. Furthermore, this study improved upon previous
research by measuring throughput as a continuous variable rather than classifying hospitals as
having low or high patient turnover (Needleman et al., 2011). This approach allowed for a more
in-depth exploration of throughput and suggests a unique strategy to improve its measurement.
Finally, this study employed large samples of nurses, hospitals, and patients, providing
unprecedented statistical power to detect meaningful differences in how the variation in
throughput influences patient and nurse outcomes.
26
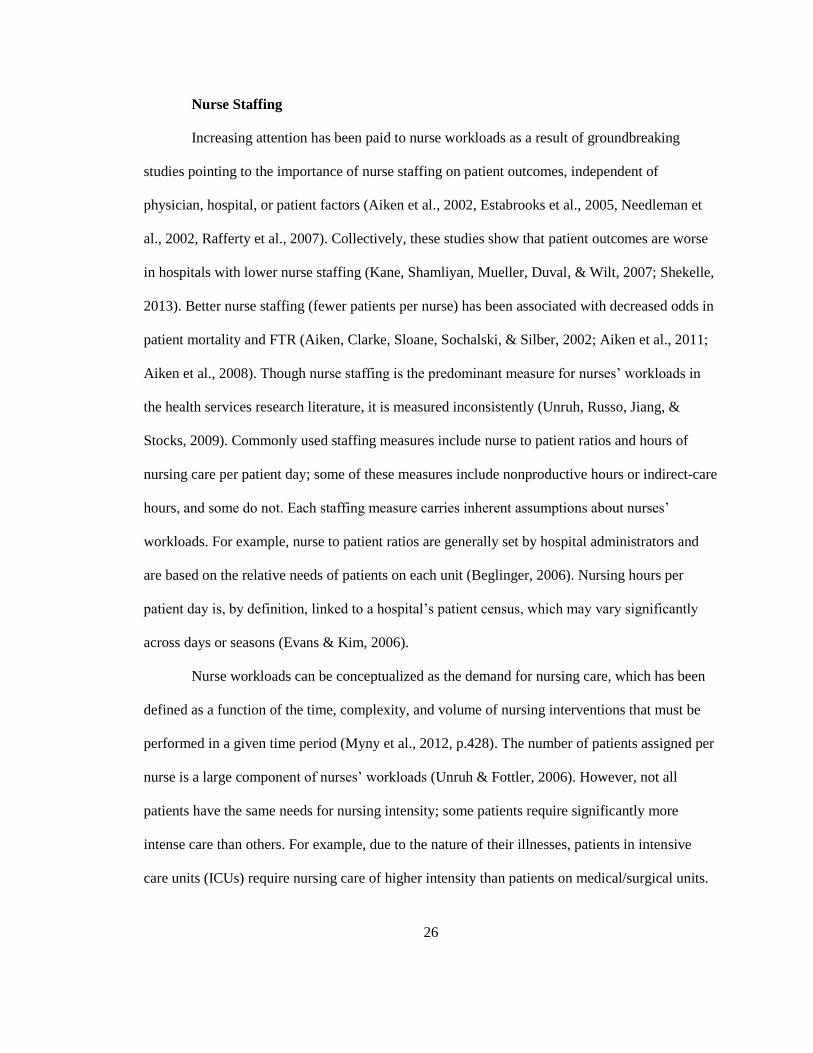
Nurse Staffing
Increasing attention has been paid to nurse workloads as a result of groundbreaking
studies pointing to the importance of nurse staffing on patient outcomes, independent of
physician, hospital, or patient factors (Aiken et al., 2002, Estabrooks et al., 2005, Needleman et
al., 2002, Rafferty et al., 2007). Collectively, these studies show that patient outcomes are worse
in hospitals with lower nurse staffing (Kane, Shamliyan, Mueller, Duval, & Wilt, 2007; Shekelle,
2013). Better nurse staffing (fewer patients per nurse) has been associated with decreased odds in
patient mortality and FTR (Aiken, Clarke, Sloane, Sochalski, & Silber, 2002; Aiken et al., 2011;
Aiken et al., 2008). Though nurse staffing is the predominant measure for nurses’ workloads in
the health services research literature, it is measured inconsistently (Unruh, Russo, Jiang, &
Stocks, 2009). Commonly used staffing measures include nurse to patient ratios and hours of
nursing care per patient day; some of these measures include nonproductive hours or indirect-care
hours, and some do not. Each staffing measure carries inherent assumptions about nurses’
workloads. For example, nurse to patient ratios are generally set by hospital administrators and
are based on the relative needs of patients on each unit (Beglinger, 2006). Nursing hours per
patient day is, by definition, linked to a hospital’s patient census, which may vary significantly
across days or seasons (Evans & Kim, 2006).
Nurse workloads can be conceptualized as the demand for nursing care, which has been
defined as a function of the time, complexity, and volume of nursing interventions that must be
performed in a given time period (Myny et al., 2012, p.428). The number of patients assigned per
nurse is a large component of nurses’ workloads (Unruh & Fottler, 2006). However, not all
patients have the same needs for nursing intensity; some patients require significantly more
intense care than others. For example, due to the nature of their illnesses, patients in intensive
care units (ICUs) require nursing care of higher intensity than patients on medical/surgical units.
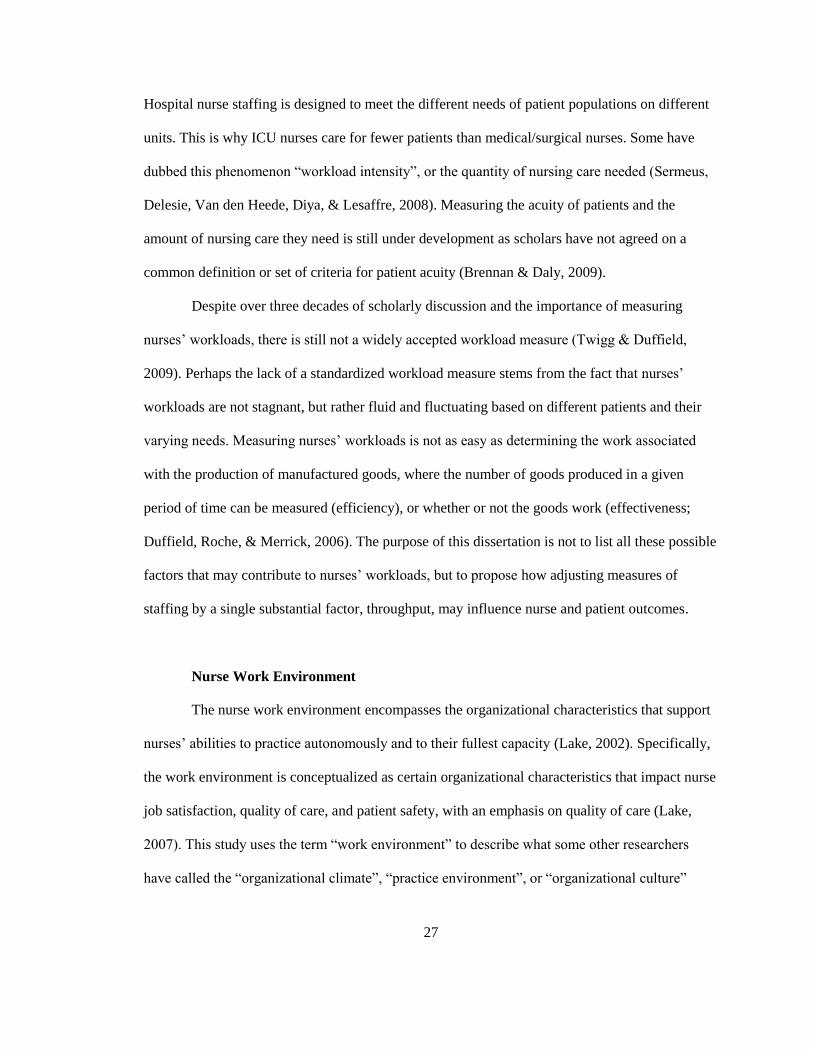
27
Hospital nurse staffing is designed to meet the different needs of patient populations on different
units. This is why ICU nurses care for fewer patients than medical/surgical nurses. Some have
dubbed this phenomenon “workload intensity”, or the quantity of nursing care needed (Sermeus,
Delesie, Van den Heede, Diya, & Lesaffre, 2008). Measuring the acuity of patients and the
amount of nursing care they need is still under development as scholars have not agreed on a
common definition or set of criteria for patient acuity (Brennan & Daly, 2009).
Despite over three decades of scholarly discussion and the importance of measuring
nurses’ workloads, there is still not a widely accepted workload measure (Twigg & Duffield,
2009). Perhaps the lack of a standardized workload measure stems from the fact that nurses’
workloads are not stagnant, but rather fluid and fluctuating based on different patients and their
varying needs. Measuring nurses’ workloads is not as easy as determining the work associated
with the production of manufactured goods, where the number of goods produced in a given
period of time can be measured (efficiency), or whether or not the goods work (effectiveness;
Duffield, Roche, & Merrick, 2006). The purpose of this dissertation is not to list all these possible
factors that may contribute to nurses’ workloads, but to propose how adjusting measures of
staffing by a single substantial factor, throughput, may influence nurse and patient outcomes.
Nurse Work Environment
The nurse work environment encompasses the organizational characteristics that support
nurses’ abilities to practice autonomously and to their fullest capacity (Lake, 2002). Specifically,
the work environment is conceptualized as certain organizational characteristics that impact nurse
job satisfaction, quality of care, and patient safety, with an emphasis on quality of care (Lake,
2007). This study uses the term “work environment” to describe what some other researchers
have called the “organizational climate”, “practice environment”, or “organizational culture”
28
(Lake & Friese, 2006). While a variety of labels exist to describe essentially the same concept,
there are fundamental factors that transcend definitions. These factors include leadership or
management style, shared decision making, professional collaboration, and cohesion (Lake &
Friese, 2006).
Overall, the work environment molds the professional practice of nurses. When nurses
feel more supported by management, better able to practice autonomously, respected by other
health care professionals, and involved in the governance of the hospital, they experience more
positive feelings about their jobs (Miller, 2011). With these positive feelings comes a greater
sense of accomplishment, engagement, and confidence (Miller, 2011). Accomplished, engaged,
and confident nurses are less likely to experience burnout and job dissatisfaction, and are less apt
to want to leave their jobs. Nurse work environments, as measured by the PES-NWI, have been
linked with nurse job outcomes in the literature, specifically nurse burnout, job dissatisfaction,
and intent to leave (Aiken et al., 2008; Aiken et al., 2002; Kelly, McHugh & Aiken, 2011; Liu et
al., 2012). These outcomes are important because they are associated with nurse retention and
maintaining an adequate nursing workforce (Aiken, Sochalski, & Anderson, 1996).
In terms of patient outcomes, some studies have shown strong correlations between the
PES-NWI while others have had null findings (Warshawsky & Havens, 2011). Nevertheless, the
PES-NWI demonstrates high external validity because the subscales have been tested in a variety
of settings and cultures (Warshawsky & Havens, 2011). Of those studies that have found strong
relationships between the PES-NWI and patient outcomes, the correlations have been negative.
That is, hospitals with better nurse work environments have been associated with decreased risk-
adjusted mortality rates in surgical patients (Aiken et al., 2011). Moreover, compared to hospitals
with less favorable work environments, hospitals with better work environments have fewer
29
reports of missed care and patient safety issues (Sochalski, 2004) and more satisfied patients
(Kutney-Lee et al., 2009; Vahey, Aiken, Sloane, Clarke, & Vargas, 2004).
Measuring the Nurse Work Environment
This work will measure the work environment using the Practice Environment Scale of
the Nursing Work Index (PES-NWI) because it has been endorsed by the National Quality Forum
and is the most commonly used tool to measure the environments in which nurses work (Lake,
2007). The Nursing Work Index (NWI) was developed in the early 1980s as a result of the
American Academy of Nursing’s study of “magnet” hospitals, or hospitals which could attract
and retain nurses despite large nursing shortages at the time (Lake, 2002; McClure, Poulin, Sovie,
& Wandelt, 1983). The top 41 hospitals in the nation were selected and nurses and nursing
directors in these hospitals were then interviewed (Lake, 2002; McClure et al., 1983). The
interviewers asked questions about nurses’ satisfaction, the image of nursing, nurses’ roles in
quality care, recruitment and retention, and professional relationships (Lake, 2002).
Lessons learned from this study were common characteristics among these magnet
hospitals that made them good places for nurses to work (Lake, 2002). These characteristics
included decentralized decision making, strong and supportive nurse leadership, nurse autonomy
and accountability for patient care, enough staff, and flexible shift scheduling (Lake, 2002, p.
177; McClure et al., 1983). Sixty-five items from the magnet study were identified as important
to nurses’ responses to three key statements: “This is important to my job satisfaction,” “This is
important to my being able to give quality patient care,” and “This factor is present in my current
job situation” (Lake, 2002, p. 177) and the NWI was established (Kramer & Hafner, 1989).
A decade later, a modified NWI was used to measure organizational attributes of
hospitals using only the third statement: “This factor is present in my current job situation”
(Aiken et al., 1999; Lake, 2002, p. 177). This research laid the foundation for Lake’s (2002) work
30
which extricated aspects of the NWI to develop a practice environment scale that dealt
specifically with professional nursing issues and less with factors related to physicians or hospital
programs such as affiliations with schools of nursing or medicine (p. 179). Exploratory factor
analysis of the NWI yielded a more parsimonious 31-item PES-NWI scale, down from the 65-
item original NWI (Lake, 2002). These 31 items are divided across the following five subscales:
(1) nurse participation in hospital affairs, (2) nursing foundations for quality of care, (3) nurse
manager ability, leadership, and support of nurses, (4) staffing and resource adequacy, and (5)
collegial nurse-physician relations (Lake, 2002, p. 181). The PES-NWI has since been translated
into several languages (Cho, Choi, Kim, Yoo, & Lee, 2011; Fuentelsaz-Gallego, Moreno-Casbas,
& González-María, 2013; Warshawsky & Havens, 2011) and modified for different health care
settings (Friese, 2012; Hanrahan, 2007).
Hospital Structural Characteristics
Structural characteristics of hospitals, such as size, physician teaching status, or level of
technology are important factors to account for because evidence suggests that they are associated
with patient outcomes (Brand et al., 2012; Fink, Yano, & Brook, 1989; Iezzoni et al., 1994).
However, the literature has not uniformly identified which hospital structural characteristics are
the most important in their relationships with patient outcomes. One study of California hospitals
in 1988 found that hospitals that are larger, able to perform open heart surgery (indicator of
technology), and teaching facilities had significantly higher risk-adjusted complication rates
(Iezzoni et al., 1994). In a meta-analysis of 22 articles, teaching status, hospital size and its
associated service volume were positively associated with better patient outcomes (Fink et al.,
1989). More recently, a literature review of studies on hospital characteristics and performance
confirmed that hospital size was consistently and significantly associated with lower adverse

31
events, such as mortality and FTR (Brand et al., 2012). Hospital size, technology, and teaching
status have also been shown to be significant predictors of FTR after complications from a
pancreatectomy (Ghaferi, Osborne, Birkmeyer, & Dimick, 2010). In general surgical patient
populations, FTR showed strong associations with hospital size, teaching status, and in some
cases, level of technology (Silber et al., 2007).
Hospital size, teaching status, and level of technology have been measured somewhat
inconsistently across studies, but they are regularly included as control variables in research about
the organization of nursing and patient outcomes (Aiken et al., 2002; Aiken et al., 2003; Park et
al., 2012; Silber et al., 2007). Only one study has considered hospital structural characteristics in
models with throughput in predicting patient outcomes. This study included level of technology
because hospital size and teaching status did not determine systematic differences in patient
outcomes across hospitals (Park et al., 2012, p. 281). The current study is innovative in that it will
include all three major hospital structural characteristics (bed size, teaching status, level of
technology) as covariates in predicting outcomes. Controlling for these structural characteristics
is important because these hospital characteristics have been associated with differences in both
patient outcomes and organizational innovation (Greenhalgh, Robert, Macfarlane, Bate, &
Kyriakidou, 2004; McHugh, Kelly, Smith, Wu, Vanak, & Aiken, 2013).
Client:
Client, or patient, characteristics encompass the main element that distinguishes the
Donabedian structure – process – outcome model from the QHOM. Patient characteristics are
considered vital to any form of risk-adjustment when examining patient outcomes. Although
debate still exists as to how well researchers can risk-adjust patients based on administrative data
(Iezzoni, 2003), the following outlines the importance of and methods for controlling for patient
characteristics in measuring quality health care outcomes.
32
Patient Characteristics and Outcomes
Patient characteristics are very important to consider when studying health care quality
because patient characteristics influence how organizational factors and interventions result in
outcomes. Common surgical procedures have standards of care across hospitals so variations in
complication rates are primarily due to patient characteristics on admission (Silber, Williams,
Krakauer, & Schwartz, 1992). Patients’ risk for mortality and FTR vary greatly depending on age,
sex, diagnosis, and severity of disease (Burns & Wholey, 1991; Iezzoni et al., 1994; Silber et al.,
1992). Mortality is consistently positively associated with severity of illness (Burns & Wholey,
1991). Death is a rare occurrence in general, orthopedic, and vascular surgical patients, with an
overall mortality rate of about 1.2% and about 3.4% in those that developed a complication
(Aiken et al., 2011). Surgical admissions to general hospitals account for approximately 46% of
all admissions to nonfederal hospitals (CDC, 2010). Failure to rescue and mortality are
commonly studied outcomes in this population because well-validated risk-adjustment methods
from administrative data exist (Elixhauser comorbidity index) for predicting FTR and mortality in
surgical patients (Aiken et al., 2002; Silber et al., 2007) whereas the predictive power for medical
patients is not as accurate due to the chronic and complex nature of many medical patients.
Almost half of all patients admitted to hospitals undergo at least one surgical procedure during
hospitalization (CDC, 2010).
Interventions:
The third element of the QHOM is “interventions”; located on the left of the model.
According to the QHOM, interventions do not directly influence outcomes, but act through
system and client characteristics. Interventions are clinical processes and actions (Mitchell,
Ferketich, & Jennings, 1998). In this work, interventions are related to admitting, transferring, or
discharging patients as well as continuous surveillance. The clinical processes related to
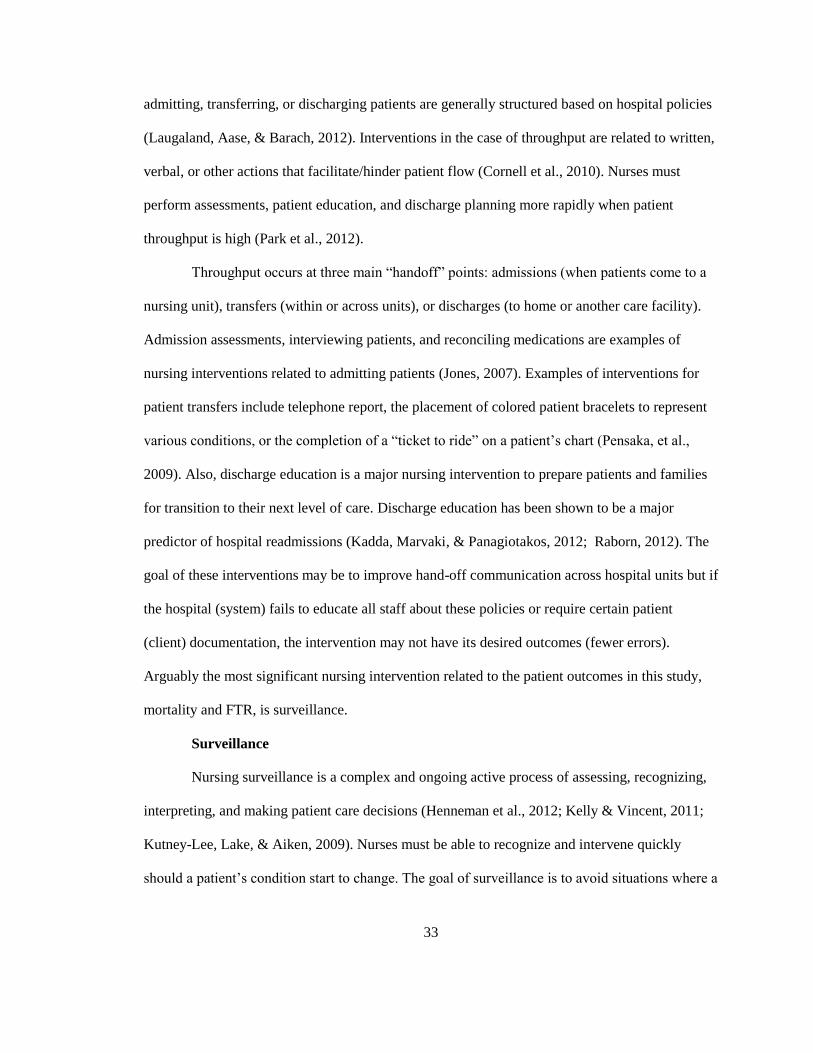
33
admitting, transferring, or discharging patients are generally structured based on hospital policies
(Laugaland, Aase, & Barach, 2012). Interventions in the case of throughput are related to written,
verbal, or other actions that facilitate/hinder patient flow (Cornell et al., 2010). Nurses must
perform assessments, patient education, and discharge planning more rapidly when patient
throughput is high (Park et al., 2012).
Throughput occurs at three main “handoff” points: admissions (when patients come to a
nursing unit), transfers (within or across units), or discharges (to home or another care facility).
Admission assessments, interviewing patients, and reconciling medications are examples of
nursing interventions related to admitting patients (Jones, 2007). Examples of interventions for
patient transfers include telephone report, the placement of colored patient bracelets to represent
various conditions, or the completion of a “ticket to ride” on a patient’s chart (Pensaka, et al.,
2009). Also, discharge education is a major nursing intervention to prepare patients and families
for transition to their next level of care. Discharge education has been shown to be a major
predictor of hospital readmissions (Kadda, Marvaki, & Panagiotakos, 2012; Raborn, 2012). The
goal of these interventions may be to improve hand-off communication across hospital units but if
the hospital (system) fails to educate all staff about these policies or require certain patient
(client) documentation, the intervention may not have its desired outcomes (fewer errors).
Arguably the most significant nursing intervention related to the patient outcomes in this study,
mortality and FTR, is surveillance.
Surveillance
Nursing surveillance is a complex and ongoing active process of assessing, recognizing,
interpreting, and making patient care decisions (Henneman et al., 2012; Kelly & Vincent, 2011;
Kutney-Lee, Lake, & Aiken, 2009). Nurses must be able to recognize and intervene quickly
should a patient’s condition start to change. The goal of surveillance is to avoid situations where a
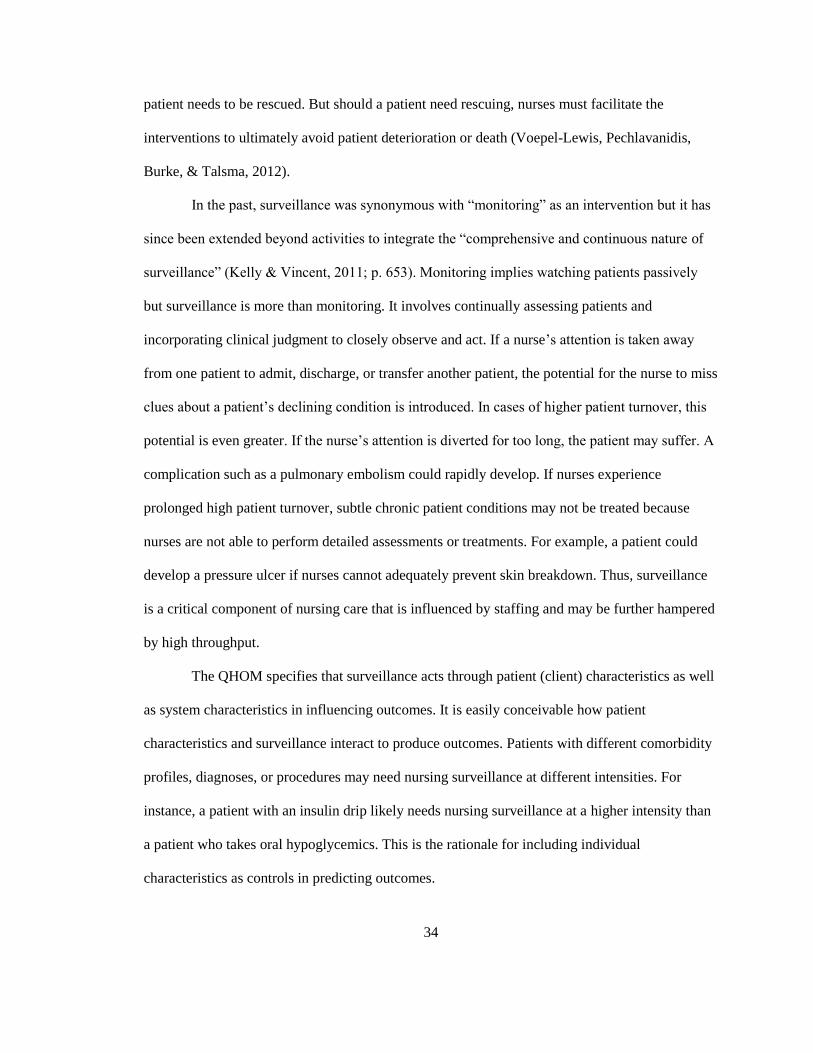
34
patient needs to be rescued. But should a patient need rescuing, nurses must facilitate the
interventions to ultimately avoid patient deterioration or death (Voepel-Lewis, Pechlavanidis,
Burke, & Talsma, 2012).
In the past, surveillance was synonymous with “monitoring” as an intervention but it has
since been extended beyond activities to integrate the “comprehensive and continuous nature of
surveillance” (Kelly & Vincent, 2011; p. 653). Monitoring implies watching patients passively
but surveillance is more than monitoring. It involves continually assessing patients and
incorporating clinical judgment to closely observe and act. If a nurse’s attention is taken away
from one patient to admit, discharge, or transfer another patient, the potential for the nurse to miss
clues about a patient’s declining condition is introduced. In cases of higher patient turnover, this
potential is even greater. If the nurse’s attention is diverted for too long, the patient may suffer. A
complication such as a pulmonary embolism could rapidly develop. If nurses experience
prolonged high patient turnover, subtle chronic patient conditions may not be treated because
nurses are not able to perform detailed assessments or treatments. For example, a patient could
develop a pressure ulcer if nurses cannot adequately prevent skin breakdown. Thus, surveillance
is a critical component of nursing care that is influenced by staffing and may be further hampered
by high throughput.
The QHOM specifies that surveillance acts through patient (client) characteristics as well
as system characteristics in influencing outcomes. It is easily conceivable how patient
characteristics and surveillance interact to produce outcomes. Patients with different comorbidity
profiles, diagnoses, or procedures may need nursing surveillance at different intensities. For
instance, a patient with an insulin drip likely needs nursing surveillance at a higher intensity than
a patient who takes oral hypoglycemics. This is the rationale for including individual
characteristics as controls in predicting outcomes.
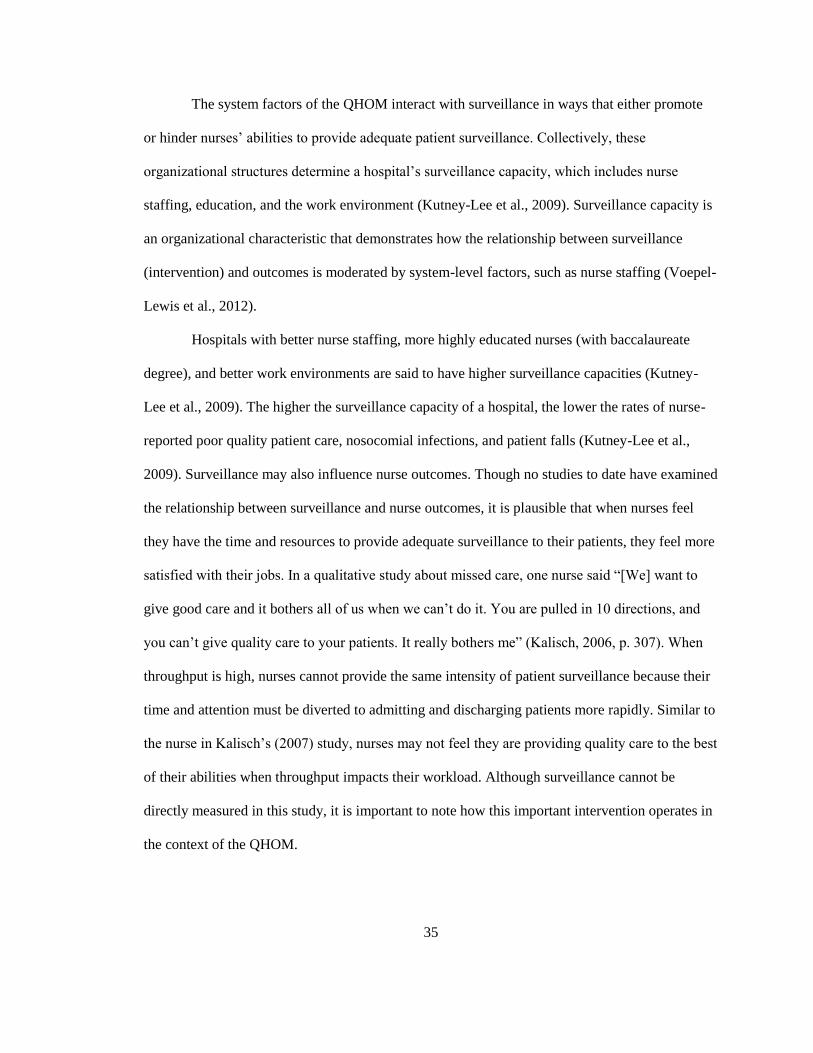
35
The system factors of the QHOM interact with surveillance in ways that either promote
or hinder nurses’ abilities to provide adequate patient surveillance. Collectively, these
organizational structures determine a hospital’s surveillance capacity, which includes nurse
staffing, education, and the work environment (Kutney-Lee et al., 2009). Surveillance capacity is
an organizational characteristic that demonstrates how the relationship between surveillance
(intervention) and outcomes is moderated by system-level factors, such as nurse staffing (Voepel-
Lewis et al., 2012).
Hospitals with better nurse staffing, more highly educated nurses (with baccalaureate
degree), and better work environments are said to have higher surveillance capacities (Kutney-
Lee et al., 2009). The higher the surveillance capacity of a hospital, the lower the rates of nurse-
reported poor quality patient care, nosocomial infections, and patient falls (Kutney-Lee et al.,
2009). Surveillance may also influence nurse outcomes. Though no studies to date have examined
the relationship between surveillance and nurse outcomes, it is plausible that when nurses feel
they have the time and resources to provide adequate surveillance to their patients, they feel more
satisfied with their jobs. In a qualitative study about missed care, one nurse said “[We] want to
give good care and it bothers all of us when we can’t do it. You are pulled in 10 directions, and
you can’t give quality care to your patients. It really bothers me” (Kalisch, 2006, p. 307). When
throughput is high, nurses cannot provide the same intensity of patient surveillance because their
time and attention must be diverted to admitting and discharging patients more rapidly. Similar to
the nurse in Kalisch’s (2007) study, nurses may not feel they are providing quality care to the best
of their abilities when throughput impacts their workload. Although surveillance cannot be
directly measured in this study, it is important to note how this important intervention operates in
the context of the QHOM.
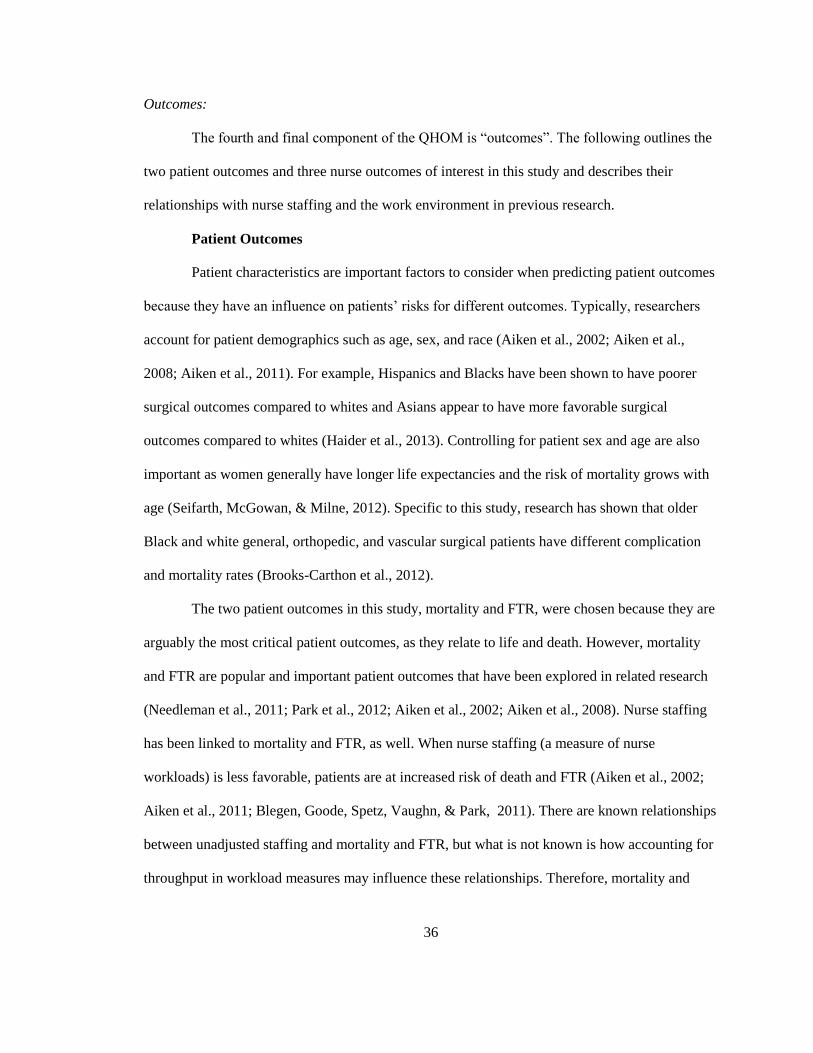
36
Outcomes:
The fourth and final component of the QHOM is “outcomes”. The following outlines the
two patient outcomes and three nurse outcomes of interest in this study and describes their
relationships with nurse staffing and the work environment in previous research.
Patient Outcomes
Patient characteristics are important factors to consider when predicting patient outcomes
because they have an influence on patients’ risks for different outcomes. Typically, researchers
account for patient demographics such as age, sex, and race (Aiken et al., 2002; Aiken et al.,
2008; Aiken et al., 2011). For example, Hispanics and Blacks have been shown to have poorer
surgical outcomes compared to whites and Asians appear to have more favorable surgical
outcomes compared to whites (Haider et al., 2013). Controlling for patient sex and age are also
important as women generally have longer life expectancies and the risk of mortality grows with
age (Seifarth, McGowan, & Milne, 2012). Specific to this study, research has shown that older
Black and white general, orthopedic, and vascular surgical patients have different complication
and mortality rates (Brooks-Carthon et al., 2012).
The two patient outcomes in this study, mortality and FTR, were chosen because they are
arguably the most critical patient outcomes, as they relate to life and death. However, mortality
and FTR are popular and important patient outcomes that have been explored in related research
(Needleman et al., 2011; Park et al., 2012; Aiken et al., 2002; Aiken et al., 2008). Nurse staffing
has been linked to mortality and FTR, as well. When nurse staffing (a measure of nurse
workloads) is less favorable, patients are at increased risk of death and FTR (Aiken et al., 2002;
Aiken et al., 2011; Blegen, Goode, Spetz, Vaughn, & Park, 2011). There are known relationships
between unadjusted staffing and mortality and FTR, but what is not known is how accounting for
throughput in workload measures may influence these relationships. Therefore, mortality and
37
FTR are fitting outcomes to study so as to compare results of this study to previous studies and
build upon this body of research.
Mortality
Mortality rates are the most frequently used outcome in health services research and have
long been used to compare quality of care across hospitals (Silber et al., 1992). Specifically,
mortality has been studied in the context of the quality of nursing care in hospitals. More
favorable nurse staffing levels and work environments have been linked to lower odds of risk-
adjusted mortality for patients (Aiken et al., 2002; Aiken et al., 2008; Aiken et al., 2011; Glance,
Dick, Osler, & Mukamel, 2006; Park et al., 2012). Risk-adjusted mortality rates aim to account
for differences in intrinsic health risks of different populations, or “level the playing field” for
hospitals that treat sicker patients (Iezzoni, 2003). Mortality is common enough for rigorous
statistical modeling (Iezzoni, 2003, p. 7) and it is measured the same way across institutions,
which makes it an appropriate benchmark for comparisons. Thirty-day mortality, or death within
30 days of hospital admission, is a commonly used window of observation because this period
measures the full impact of hospitalization, even post-discharge, while not allowing for too many
other competing risks to be involved (Silber et al., 1992).
Failure to Rescue
Failure to rescue (FTR) is defined as a death following a complication (Silber et al.,
2007). Failure to rescue and mortality rates are calculated using the same numerators (number of
patients who died) but different denominators. Whereas mortality rates are calculated based on
the number of patients who died out of the entire patient sample, FTR rates are calculated based
on the number of patients who died out of only those patients who suffered complications.
In a landmark study that coined the term “failure to rescue”, mortality and complication
rates were associated with both hospital and patient characteristics, but FTR rates were more
38
strongly associated with hospital characteristics (Silber et al., 1992). Therefore, FTR rates are
barometers of a hospital’s ability to “rescue” a patient in the event a complication develops
(Silber et al., 1992).
In general, hospitals cannot choose their patient populations’ demographics/risk profiles
(however, surgeons can choose to not operate on certain candidates), which are associated with
mortality and complication rates. But hospitals can change certain mutable characteristics that
may be associated with FTR, namely the organization of nursing care. As previously mentioned
nurses are responsible for 24-hour surveillance of surgical patients and are optimally positioned
to intervene if a patient’s condition deteriorates. For these reasons, FTR is a fitting outcome
measure to evaluate nursing’s influence on patients. In fact, multiple studies have demonstrated
the link between various aspects of nursing and FTR (Aiken et al., 2008; Aiken et al., 2011;
Brooks-Carthon, Kutney-Lee, Jarrín, Sloane, & Aiken, 2012; Park et al., 2012).
Nurse Outcomes
The nurse outcomes in this study are occupational outcomes that relate to nurse
recruitment and retention. These outcomes are important for hospitals because nurse job turnover
can be extremely costly (PriceWaterhouseCoopers, 2007) and can have detrimental effects on the
morale of remaining staff (Duffield, Roche, Blay, Thoms & Stasa, 2011).
Burnout
Burnout first appeared in the nursing literature in the 1970s to describe a type of physical
and emotional exhaustion nurses were experiencing (Lavandero, 1981). Although this
phenomenon was not necessarily new, it was common among “helping professions” such as
social workers, clergy, and other health care workers (Maslach, Schaufeli, & Leiter, 2001).
Burnout is characterized by alienating and cynical feelings that interfere with worker’s
39
effectiveness (Lavandero, 1981) and may result in a worker being unable to feel any positive
feelings, sympathy, or respect for patients (Maslach, Schaufeli, & Leiter, 2001).
Therefore, nurse burnout has implications for patient care. Burned out nurses may not
have the emotional capacity to fully connect with their patients may spend less time or distance
themselves from their patients (Lavandero, 1981). Moreover, nurse burnout is associated with
more frequent absenteeism, increased incidence of physical illness for nurses, and premature
nurse turnover (Lavandero, 1981). As Lavandero (1981) points out, “burned out professionals are
frequent job hoppers (p. 18). Maslach (1981) was one of the first researchers to study burnout and
developed a tool to measure it. The Maslach Burnout Inventor (MBI) measures three main areas
of burnout: (1) emotional exhaustion, (2) depersonalization, and (3) personal accomplishment
(Maslach & Jackson, 1981). Because the emotional exhaustion area has been most closely linked
with nursing burnout and intent to leave (Erickson & Grove, 2008), the emotional exhaustion
scale was chosen to measure burnout in this study.
Nurse staffing and the nurse work environment have been linked with nurse burnout.
When nurse staffing and/or the work environment are less favorable, nurses report higher levels
of burnout (Aiken et al., 2002; Aiken et al., 2008; Sheward et al., 2005). However, no studies to
date have explored the influence of patient throughput on nurse burnout. The results of this study
may therefore help to further understand the relationship between nurse staffing and burnout.
Job Dissatisfaction
Research on nurses’ job dissatisfaction also dates back to the 1970s (Godfrey, 1978).
Similar to burnout, nurses’ dissatisfaction with their jobs has implications for both patient care
and organizational outcomes, such as costly premature nurse turnover. Nurses who are burned out
may also be dissatisfied with their jobs, but the presence of burnout does not determine job
dissatisfaction (Faller et al., 2011). Although causes of burnout and job dissatisfaction may
40
overlap, job dissatisfaction is distinct from burnout because it is directly related to the day-to-day
job, or tasks. Nurses who are dissatisfied with their jobs may not be dissatisfied with nursing
necessarily (Godfrey, 1978). Admitting, discharging, and transferring patients are common duties
of nurses’ jobs and excessive throughput in the presence of inadequate staffing may be a source
of dissatisfaction. For this reason, throughput-adjusted staffing may offer a more complete picture
of the relationship between nurse staffing and job dissatisfaction.
Commonly cited reasons for nursing job dissatisfaction include unsafe practice (including
inadequate staffing), poor leadership, poor communication, having to perform duties that could be
performed by less qualified/educated personnel (Godfrey, 1978), and poor opportunities for
advancement (Coomber & Barriball, 2007). Nurse staffing (Aiken et al., 2002; Aiken et al., 2008;
Rafferty et al., 2007) and extended shift lengths (Stimpfel, Sloane, & Aiken, 2012) have also been
associated with an increased likelihood of job dissatisfaction. However, the single most
commonly cited factor contributing to nurse job satisfaction is the nurse work environment
(Aiken et al., 2008; Faller et al., 2011; Kelly, McHugh, & Aiken, 2011; Purdy, Spence
Laschinger, Finegan, Kerr, & Olivera, 2010). Efficient communication (a component of the nurse
work environment) has strong correlates of job satisfaction (Marrett, Hage, & Aiken, 1975) and
innovation (Aiken & Hage, 1971). Job satisfaction has been described as a mediating factor that
depends on both the individual and the environment (Stewart et al., 2011). Unlike individual
characteristics, managers and administrators do have the power to change the nurse work
environment to improve nurse job satisfaction. In the context of this study, nurse job
dissatisfaction was chosen as a nurse outcome of interest not only because of its relation to
burnout, but because it can be changed with improvements in the work environment. For
example, improvements can be made regarding the staffing and resource adequacy subscale of the
PES-NWI, of which staffing and throughput-adjusted staffing may prove influential. This study is

41
therefore important to better understanding the links between staffing, throughput, and nurse job
dissatisfaction.
Intent to Leave
The final nurse outcome examined in this study builds upon burnout and job
dissatisfaction and is a measure of nurses’ intent to leave their jobs. Reports of intent to leave
have been linked to actual nurse turnover (Lake, 1998), which can be costly for hospital operating
budgets. The financial costs of losing a single nurse have been estimated to be equal to
approximately twice the nurse’s annual salary (Atencio, Cohen, & Gorenberg, 2003). On average,
hospitals can expect to lose about $300,000 each year for just a 1% increase in nurse turnover
(PriceWaterhouseCoopers, 2007). Not all nurses plan to leave their jobs as a result of job
dissatisfaction or burnout. Some may plan on returning to school to further their education or
retiring from the workforce all together. These cases would not be considered “bad” for hospitals.
The premature voluntary nurse turnover which does result from job dissatisfaction or burnout is
what is really troublesome for hospitals. Unfortunately, job dissatisfaction and poor working
conditions are the most commonly reported reasons nurses intend to leave their jobs (Estryn-
Behar, Van Der Heijden, Fry, & Hasselhorn, 2010; McCarthy, Tyrrell, & Lehane, 2007; Rambur
et al., 2003).
Like burnout and job dissatisfaction, nurse intent to leave has also been linked with the
work environment. Nurses working in hospitals with better work environments and more
favorable staffing levels are less likely to report intent to leave their jobs (Aiken et al., 2002;
Aiken et al., 2008; Kelly, McHugh & Aiken, 2011; Lin, Chiang & Chen, 2011). High levels or
poorly managed patient throughput may contribute to nurses’ job dissatisfaction and in turn,
intentions to leave their jobs. Therefore, throughput-adjusted staffing may be a better barometer
of nurses’ intent to leave than unadjusted staffing.
42
Significance to broader audience:
Findings from this research will enable the research community to more completely
capture what it is that nurses do and measure and quantify their importance in promoting patient
outcomes. Hospital administrators, policy makers, and nurse managers may be interested in this
research as it could influence the ways in which evidence-based nurse staffing ratios are
determined. If throughput-adjusted staffing is associated with nurse and patient outcomes,
hospital administrators and nurse managers may consider incorporating throughput into staffing
algorithms.
Throughput is generally not a factor in determining staffing needs, but Unruh and Fottler
(2006) argue that patient turnover should be taken into account for staffing assessments and
decision making (p. 599). Patient throughput has increased over the years primarily due to
changes in hospital reimbursement, but it is unclear if these changes have been carried over to
changes in nurse staffing metrics. Patient profiles and needs have changed over the years, but
nurse staffing has remained stable, which may not prove adequate to care for patients in this
“sicker and quicker” phenomenon (Welton, 2007). By including throughput in staff planning,
these stakeholders may help prevent nurse attrition while improving patient outcomes.
Innovation:
This study uses data from large samples of nurses and patients to explore how
incorporating throughput into staffing measures influences nurse and patient outcomes. Previous
research on the relationship between staffing and nurse and patient outcomes have largely ignored
throughput, which is a potentially significant contributor to nurses’ workloads. By incorporating
throughput into staffing measures, this study develops and describes several novel ways to
measure nurse workloads while building upon previous research on nurse staffing. This study is
particularly innovative because it relies on nurse reports of throughput rather than administrative
43
data containing data such as inpatient census, staffing, or patient LOS. Additionally, researchers
who have measured throughput as the inverse of LOS have neglected to account for internal
patient transfers or the composition of nursing unit types. The measurements constructed from the
survey data used in the current study differ from previous measures of throughput because it
asked nurses not only how many patients they admitted and discharged on their last shifts, but
also how many they transferred. Because throughput was measured using admissions, discharges,
and transfers, this study more accurately estimate nurses’ workloads. The combination of unique
nurse survey data, hospital administrative data and patient-level discharge data offer a novel way
to study the influence of throughput, nurse characteristics, hospital characteristics, and nurse and
patient outcomes.
44
Chapter 3: Methods and Design
Introduction
The purpose of this study was to explore how throughput-adjusted staffing differs from a
traditional measure of nurse staffing and its influences on both nurse and patient outcomes. This
chapter first presents the data sets used in this study followed by a description of the patient
nurse, and hospital samples included. Then, each of the variables of interest and how they were
measured is defined. Results from preliminary analyses are presented followed by the analysis
plan for each of the three specific aims.
Data Sets
This study was a secondary analysis of cross-sectional data which was linked from four
data sources: 1) the Multi-State Nursing Care and Patient Safety Survey, 2) the American
Hospital Association (AHA) Annual Survey, 3) state hospital discharge abstract databases, and 4)
Medicare and Medicaid Services (CMS) Case Mix Index file.
The first source is the Multi-State Nursing Care and Patient Safety survey, conducted by
researchers at the Center for Health Outcomes and Policy Research at the University of
Pennsylvania. Random samples of registered nurses in Pennsylvania (40%), California (40%),
and New Jersey (50%) were surveyed by mail using the Dillman method (Dillman, 1978) in
2006-2007 and nurses in Florida (25%) were surveyed a year later in 2007-2008 (Aiken et al.,
2011).Over 270,000 nurses were included in the sampling frame. Nurses’ names and addresses
were obtained through their respective state boards of nursing. The overall response rate was 39%
(Aiken et al., 2011). Because this response rate was somewhat low, researchers conducted a
follow-up survey of 1300 non-responders from the original survey in California and Pennsylvania
and achieved a 91% response rate (Aiken et al., 2011; Smith 2008). This follow-up survey was a
shorter version of the original survey conducted primarily to assess non-response bias (Aiken et

45
al., 2011) The results of the follow-up survey showed no significant differences between
responders and non-responders on how they rated hospital organizational characteristics (Aiken et
al., 2011; Smith, 2008); therefore, responses from the follow-up survey were not included in this
study. Additionally, the representativeness of the nurse sample was checked with nurse
demographic data from the 2004 National Sample Survey of Registered Nurses (NSSRN, U.S.
Department of Health and Human Services Health Resources and Services Administration
Bureau of Health Professions, 2006). The demographic characteristics in both samples of nurses
were similar, except the percentage of nurses with a diploma or associate degree was higher in the
study sample than the NSSRN sample (58.9% vs. 51.8%; Kendall-Gallagher, Aiken, Sloane, &
Cimiotti, 2011).
On the survey, nurses were asked to respond to a series of items related to demographics
(i.e. age, education), work setting, quality of care, satisfaction with various aspects of their jobs,
the work environment, and workload, including how many patients they were assigned, admitted,
discharged or transferred on their last shift worked. Nurses were asked to provide the name of
their employer, which allowed linkage of nurse data from the surveys with the other three data
sources in this study. Additionally, nurses were asked to report their unit type (i.e. telemetry,
adult ICU, medical/surgical), allowing this study to focus on nurses who reported caring for adult
patients in acute care hospitals.
The second data source was the 2006 AHA Annual Survey, which contains structural
information about hospitals, such as teaching status, technology status, and number of beds. The
AHA Annual Survey has been conducted by the American Hospital Association since 1946 and
contains as many as 1,000 data fields such as geographic location, expenses, and inpatient
utilization on approximately 6,500 hospitals (Health Forum, 2012).
46
Patient discharge data was derived from state discharge abstract databases, including: the
Office of Statewide Healthcare Planning and Development in California, the Agency for Health
Care Administration in Florida, the Department of Health and Senior Service in New Jersey, and
the Pennsylvania Health Care Cost Containment Council in Pennsylvania. These data came from
2006-2007, except for Florida because nurses in Florida were surveyed in 2007-2008. Therefore,
Florida patient data discharge data came from 2007-2008. Each state’s health department agency
data set contained information about patient age, sex, race, type of surgical procedure,
comorbidities, potential complications, and was linked with vital statistics data to obtain
information about 30-day mortality.
The fourth data source was the Center for Medicare and Medicaid Services Case Mix
Index (CMI) file. The CMI reflects the average relative weight of DRGs, or resource intensity
(Mark & Harless, 2011) assigned to hospitalized patients (Iezzoni, 2003, p. 107). Higher CMIs
often translate to higher costs for administrators and greater severity of illness and risk for
mortality for clinicians (Mark & Harless, 2011). It is important to note that CMI is measured
relative to other hospitals and is based on Medicare patients only.
Sample
Patients
Adult general, vascular, or orthopedic surgical patients admitted to California,
Pennsylvania, New Jersey, or Florida non-federal adult acute care hospitals were included in the
patient sample. This patient population was chosen because of the availability of well-validated
risk adjustment models (Aiken et al., 2002; Silber et al., 2007) and to build upon previous
research using the same surgical patient population (Aiken et al., 2002; Aiken et al., 2003; Aiken
et al., 2008; Aiken et al, 2011). Patients less than 18 years of age or more than 89 years of age at
admission were excluded, following the criteria of previous studies (Aiken et al., 2002; Aiken et
47
al., 2003; Aiken et al., 2008). Patients were included if they had a length of stay of at least one
day. Only index admissions were included so as not to count individual patients more than once
in the analyses.
Nurses
Using the Multi State Nursing Care and Patient Safety survey, the sample included nurses
who reported working in hospitals as staff nurses providing direct patient care. Nurses who
reported working in long term care or outpatient facilities were excluded from the sample. The
final sample included 25,193 registered nurses. Nurses who work in outpatient settings or long-
term care/skilled nursing facilities were excluded from this study to better link nurses who may
care for adult surgical patients.
Hospitals
All adult acute-care non-federal hospitals with at least 10 nurse respondents and AHA
data available were included in this sample. Including hospitals with at least 10 nurse respondents
follows the methods of previous research (Aiken et al., 2002; Aiken et al., 2008). The final
sample included 599 hospitals including 232 hospitals in California, 72 hospitals in New Jersey,
141 hospitals in Pennsylvania, and 154 hospitals in Florida.
Variables and Instruments
The following section lists the variables used in this study, identifies their sources, and
describes their measurement.
Patient Characteristics (derived from state discharge abstract data)
Age: Patient age rounded to the nearest whole years was used as a control variable in the
regressions for patient outcomes (Burns & Wholey, 1991; Iezzoni et al., 1994; Silber et al.,
1992).
48
Sex: Sex was measured as a dichotomous variable as either male or female. Men and women
may have different risk profiles regarding mortality and FTR (Iezzoni et al., 1994).
Race: To account for potential racial disparities in predicting mortality and FTR (Burns &
Wholey, 1991; Iezzoni et al., 1994), race, as reported in the state discharge abstracts, served
as a covariate in data analysis. Race was measured as a categorical variable including Black,
Hispanic, White, Asian, American Indian, or Pacific Islander. Each racial/ethnic category was
transformed into a dichotomous variable for the analysis.
Diagnosis Related Group (DRG): Patient needs and outcomes vary significantly across
diagnosis related groups (Iezzoni et al., 1994; Silber et al., 1992). To account for this
variation and the differences in relative complexities and risks of each surgery, patient DRG
was used to control for the type of surgery. Table 1 displays the DRG codes for the surgical
procedures that were included in this study.
Elixhauser Comorbidity Index: Like DRGs, patient needs and outcomes vary greatly
depending on patients’ chronic conditions, or comorbidities. The Elixhauser Comorbidity
Index takes into account patient characteristics such as hypertension, chronic pulmonary
disease, diabetes, and renal disease (Elixhauser et al., 1998) to more accurately measure
patient severity of illness. Though detailed clinical data would be the best way to adjust for
patient severity, these data are not available for the large patient populations in this study.
The Elixhauser Comorbidity Index was developed using large administrative inpatient
datasets to compare heterogeneous patient populations (Elixhauser, Steiner, Harris, & Coffey,
1998). The Elixhauser Comorbidity Index has been demonstrated superior in predicting in-
hospital mortality, especially in surgical patient populations (Van Walraven, Austin,
Jennings, Quan, & Forster, 2009) and has the advantage of not requiring information about
previous admissions compared to the Deyo/Charlson method (Stuckenborg, Wagner, &
49
Connors, 2001). The index consists of 29 unweighted comorbidities; however, this study
excluded fluid and electrolyte imbalances and coagulopathy because evidence suggests that
these disorders should not be included in risk adjustment when examining quality of care
(Aiken et al., 2011; Glance, Dick, Osler, & Mukamel, 2006; Quan et al., 2005). This study
used a 180-day look back to previous hospitalizations to distinguish between complications
and comorbidities, following the method of Aiken and colleagues (2002).
Measures of individual-level nursing characteristics (derived from nurse survey data)
Age: Nurses were asked to report their age, which was used as a covariate in the regression
models. The rationale for including nurse age is that younger nurses may have different
predispositions to burnout, job dissatisfaction, and intent to leave compared to older nurses
(Erickson & Graves, 2008). This is measured as a continuous variable.
Sex: Nurses reported their sex as a binary variable: either male or female. This variable was
included in the regression models to control for differences between the sexes in terms of
their predisposition to burnout, job dissatisfaction, and intent to leave.
Years of experience: Nurses were asked to report how many years they have been working in
the nursing profession, rounded to the nearest whole number. This is measured as a
continuous variable.
Education: Nurse education is coded as a binary variable. Nurses who reported having at least
a bachelor’s degree (BSN) or higher in nursing are compared to those without (associate’s or
diploma degree in nursing). The rationale for including this variable as a control in the
regression models is that nurses with a BSN degree have different predispositions to burnout
(Bellefield & Gessner, 2010).
Unit Type: Nurses who reported working their last shifts on a specific unit were designated to
that unit type since the survey specifically asks questions relating to nurses’ last shifts. If
50
nurses did not answer on which unit they worked last, but did report their permanent unit,
they were assigned to their permanent unit for analysis. There were 18 unit type choices, of
which 2 were excluded from analysis (long term care and outpatient). The remaining 16 unit
types included: 1) Float Pool, 2) Medical/Surgical, 3) Pediatric, 4) Adult ICU, 5) Pediatric
ICU, 6) Neonatal ICU, 7) Stepdown/Intermediate Care, 8) Telemetry, 9) Oncology, 10)
Emergency Room, 11) Subacute/Transitional Care, 12) Behavioral/Psychiatric, 13)
Nursery/Postpartum, 14) Labor and Delivery, 15) Operating Room, and 16) Recovery Room
(PACU). Individual unit type was measured as a categorical covariate in the nurse outcome
analyses.
Measures of hospital-level nursing characteristics (derived from nurse survey data)
Nurse work environment: The Practice Environment Scale of the Nursing Work Index (PES-
NWI) is a 31-item questionnaire which is broken down into 5 subscales. The subscales of the
PES-NWI are intended for hospital RN’s and include the following: 1) Nursing Participation
in Hospital Affairs, 2) Nursing Foundations for Quality of Care, 3) Nurse Manager Ability,
Leadership, and Support of Nurses, 4) Staffing Resource Adequacy, and 5) Collegial Nurse-
Physician Relations (Lake, 2002). Previous work has shown high individual internal
consistency with Chronbach’s alpha of over 0.8 across subscales (except Collegial Nurse-
Physician Relations, with Chronbach’s alpha = 0.71) and high intraclass correlations, ranging
from 0.88-0.97 (Lake, 2002, p. 182). To more easily interpret and communicate meaningful
changes in hospitals’ work environments, hospitals were categorized into 3 categories based
on the mean aggregate PES score at the hospital level. The staffing and resource adequacy
was not used in calculating these scores for the hospitals because it is empirically related to
our variables of interest, staffing (Aiken et al., 2008). Hospitals with PES scores falling
51
below the 25th percentile had “poor” work environments. Hospitals within the middle 50%
had “mixed” work environments and the top 25% had the “best” work environments.
Staffing: In the nurse surveys, nurses were asked to report the number of patients for whom
they cared on their last shift. Only nurses reporting caring for between 1 and 19 patients on
the last shift will be included in the analyses because caring for 20 or more patients on the
last shift is inconsistent with current standard hospital staffing and probably signifies that the
nurse has administrative responsibility or provides limited care rather than holding primary
responsibility for surveillance and treatment (Aiken et al., 2002; Aiken et al., 2011). Staffing
was aggregated to the hospital level to estimate the mean number of patients per nurse in a
particular hospital. Though other staff, such as licensed practical nurses (LPNs) or unlicensed
personnel, such as nursing assistants (NAs) may help relieve some of the patient care burden,
only RNs are qualified to perform and document the patient assessments and education
necessary for admissions and discharges, according to their scope of practice. For this reason,
staffing was measured as only RN staffing in this study.
Percentage of Critical Care Nurses: The percentage of critical care nurses (adult, pediatric, or
neonatal ICU nurses) was calculated for each hospital and used as a control variable in patient
outcome models. Critical care units are staffed differently than other hospital units and
service different patient populations. Therefore, it is important to account for the percentage
of critical care nurses reporting from each hospital.
Percentage of Medical/Surgical Nurses: The percentage of medical/surgical nurses was also
calculated for each hospital. Medical/surgical units are generally staffed differently than other
hospital units, such as ICUs or the operating room. For this reason, the percentage of
medical/surgical nurses in each hospital was included as a control variable in patient outcome
models.
52
Structural hospital characteristics
Teaching Status (derived from AHA data): It is important to control for the teaching status of
hospitals because the teaching hospitals may attract different patients and providers than non-
teaching hospitals (Brand et al., 2012). Teaching status was coded into three categories: non-
teaching, minor-teaching, or major-teaching status depending on the ratio of medical
residents to hospital beds. Major teaching hospitals were those with a resident to bed ratio of
at least 1:4, minor teaching hospitals with a ratio of less than 1:4 and non-teaching hospitals
with no medical residents.
Technology (derived from AHA data): A hospital’s level of technology may be associated
with patient self-selection, where certain patients choose hospitals with higher levels of
technology (Blustein & Weitzman, 1995). For this study, level of technology was divided as a
dummy variable into high and low categories. Hospitals with high technology are those that
have the capacity for open heart surgery and/or major organ transplantation, otherwise
hospitals were considered having low technology, following the definitions in previous
studies (Silber et al., 1992).
Hospital Size (derived from AHA data): This study controlled for relative hospital size as
defined by the number of available inpatient beds. There is evidence that hospitals that treat
more patients may have better outcomes, as a result of more experience with various patient
populations (Brand et al., 2012). Hospitals were assigned to one of three categories based on
their sizes: small (fewer than 100 beds), medium (between 100-249 beds), and large (250 or
more beds).
Case Mix Index (derived from Medicaid & Medicare Services Case Mix Index file): A
hospital’s case mix index (CMI) is a single continuous variable that represents the relative
weight of its Medicare patient population’s weighted DRGs compared to other hospitals. A
53
higher CMI signifies a patient population with a higher severity of illness and a greater
intensity for resources (CMS, 2006).
Throughput (derived from nurse survey data)t: For each nurse, throughput was calculated as
the sum of admissions and discharges/transfers on the last shift. The surveys asked nurses two
questions: 1) how many patients they admitted on their last shift, and 2) how many patients
they discharged/transferred on their last shift. The responses to these two questions were
added together and truncated at 19 each since staffing was truncated at 19 patients per nurse.
Throughput was aggregated to the hospital level and calculated as the mean of each
individual nurse’s reported patient throughput.
Turnover (derived from nurse survey data): The turnover ratio for each nurse was calculated
as throughput divided by the nurse staffing value. The turnover measure, which indicates how
many throughput patients relative to assigned patients per nurse, was then aggregated to the
hospital level so that it can be interpreted as the mean turnover ratio for nurses in a hospital.
Turnover levels were ultimately truncated at 100% so values over 100% were given a value
of 100% (Table 7). This continuous variable then ranged from 0-1 in the analyses.
Patient Outcomes (derived from state discharge abstract data)
Mortality: 30-day mortality was measured as a dichotomous variable representing whether an
individual patient lived or died within 30 days of hospital admission and includes deaths
occurring outside the hospital.
Failure to Rescue (FTR): Failure to rescue is defined as an in-hospital death following a
complication such as aspiration pneumonia or septicemia (Silber et al., 2002; Silber, Romano,
Rosen, Wang, Even-Shoshan, & Volpp, 2007). FTR has been studied extensively in surgical
patient populations (Friese, Earle, Silber, & Aiken, 2010; Rafferty et al., 2007; Silber et al.,
54
2002). Patients who died after surgery were assumed to have developed a complication even
in the absence of complication codes in their discharge abstracts (Silber et al., 2007). To
determine if patients experienced a complication, International Classification of Diseases,
Ninth Revision, Clinical Modification (ICD-9-CM) codes in the secondary diagnosis or
procedure fields of discharge abstracts were scanned for evidence of 39 clinical events
suggestive of a complication (Aiken et al., 2011; Silber et al., 2007).
Nurse Outcomes (derived from nurse survey)
Burnout: Burnout was measured by the Emotional Exhaustion subscale of the MBI (Maslach
& Jackson, 1981). A total MBI score was generated to evaluate the presence of burnout. MBI
scores range from 0 to 30 and a score of more than 27 on the MBI indicates high emotional
exhaustion, which is a main feature of job burnout (Maslach & Jackson, 1981). A dummy
variable was created to indicate whether or not the nurse had high emotional exhaustion.
Job Dissatisfaction: The survey contained a single question asking nurses about their overall
satisfaction with their current jobs. On a 4-point Likert scale, nurses were asked to rate their
satisfaction: “1” meaning very satisfied, “2” meaning somewhat satisfied, “3” meaning a little
dissatisfied, and “4” meaning very dissatisfied. Nurses who answered that they are “very
satisfied” or “somewhat satisfied” with their jobs were categorized as “satisfied” and
responses of “a little dissatisfied” or “dissatisfied” were categorized as “dissatisfied”.
Intent to leave: Intent to leave is measured as a dichotomous variable that was derived from
an item on the nurse survey that asked “Do you plan to be with your current employer in one
year from now?” If nurses answered no, then they were considered as intending to leave.
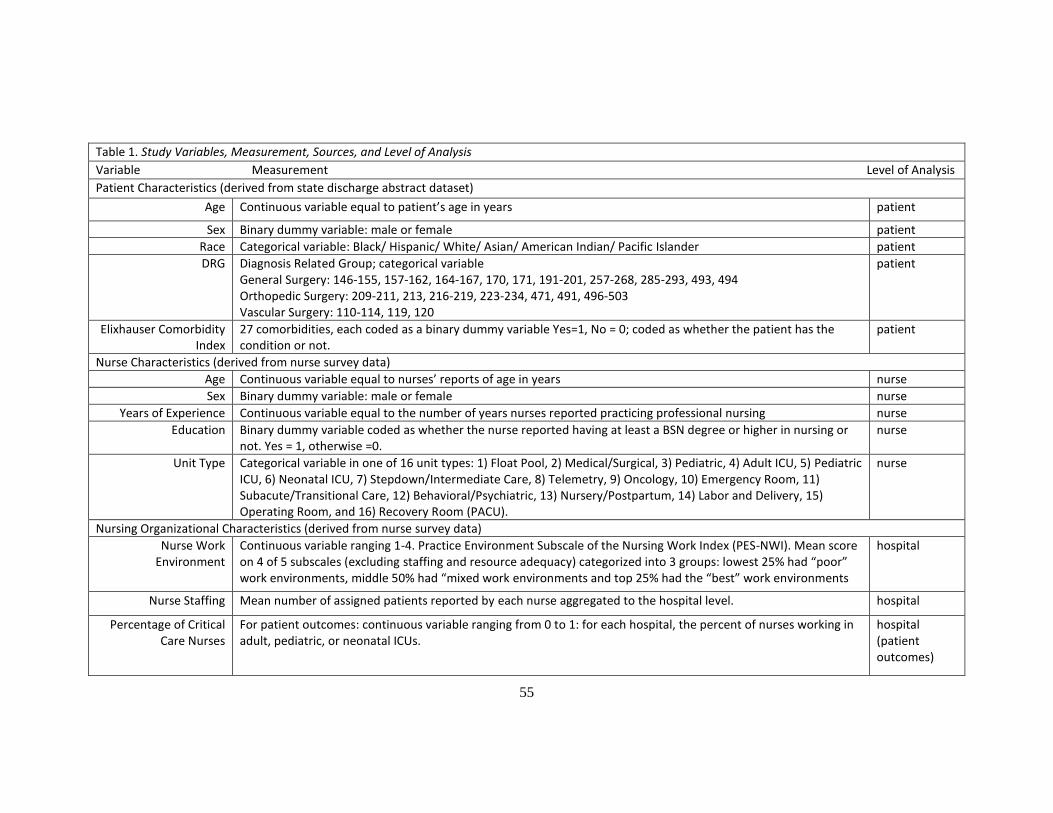
55
Table 1. Study Variables, Measurement, Sources, and Level of Analysis
Variable Measurement Level of Analysis
Patient Characteristics (derived from state discharge abstract dataset)
Age Continuous variable equal to patient’s age in years patient
Sex Binary dummy variable: male or female patient
Race Categorical variable: Black/ Hispanic/ White/ Asian/ American Indian/ Pacific Islander patient
DRG Diagnosis Related Group; categorical variable General Surgery: 146-155, 157-162, 164-167, 170, 171, 191-201, 257-268, 285-293, 493, 494 Orthopedic Surgery: 209-211, 213, 216-219, 223-234, 471, 491, 496-503 Vascular Surgery: 110-114, 119, 120
patient
Elixhauser Comorbidity Index
27 comorbidities, each coded as a binary dummy variable Yes=1, No = 0; coded as whether the patient has the condition or not.
patient
Nurse Characteristics (derived from nurse survey data)
Age Continuous variable equal to nurses’ reports of age in years nurse
Sex Binary dummy variable: male or female nurse
Years of Experience Continuous variable equal to the number of years nurses reported practicing professional nursing nurse
Education Binary dummy variable coded as whether the nurse reported having at least a BSN degree or higher in nursing or not. Yes = 1, otherwise =0.
nurse
Unit Type Categorical variable in one of 16 unit types: 1) Float Pool, 2) Medical/Surgical, 3) Pediatric, 4) Adult ICU, 5) Pediatric ICU, 6) Neonatal ICU, 7) Stepdown/Intermediate Care, 8) Telemetry, 9) Oncology, 10) Emergency Room, 11) Subacute/Transitional Care, 12) Behavioral/Psychiatric, 13) Nursery/Postpartum, 14) Labor and Delivery, 15) Operating Room, and 16) Recovery Room (PACU).
nurse
Nursing Organizational Characteristics (derived from nurse survey data)
Nurse Work Environment
Continuous variable ranging 1-4. Practice Environment Subscale of the Nursing Work Index (PES-NWI). Mean score on 4 of 5 subscales (excluding staffing and resource adequacy) categorized into 3 groups: lowest 25% had “poor” work environments, middle 50% had “mixed work environments and top 25% had the “best” work environments
hospital
Nurse Staffing Mean number of assigned patients reported by each nurse aggregated to the hospital level. hospital
Percentage of Critical Care Nurses
For patient outcomes: continuous variable ranging from 0 to 1: for each hospital, the percent of nurses working in adult, pediatric, or neonatal ICUs.
hospital (patient outcomes)
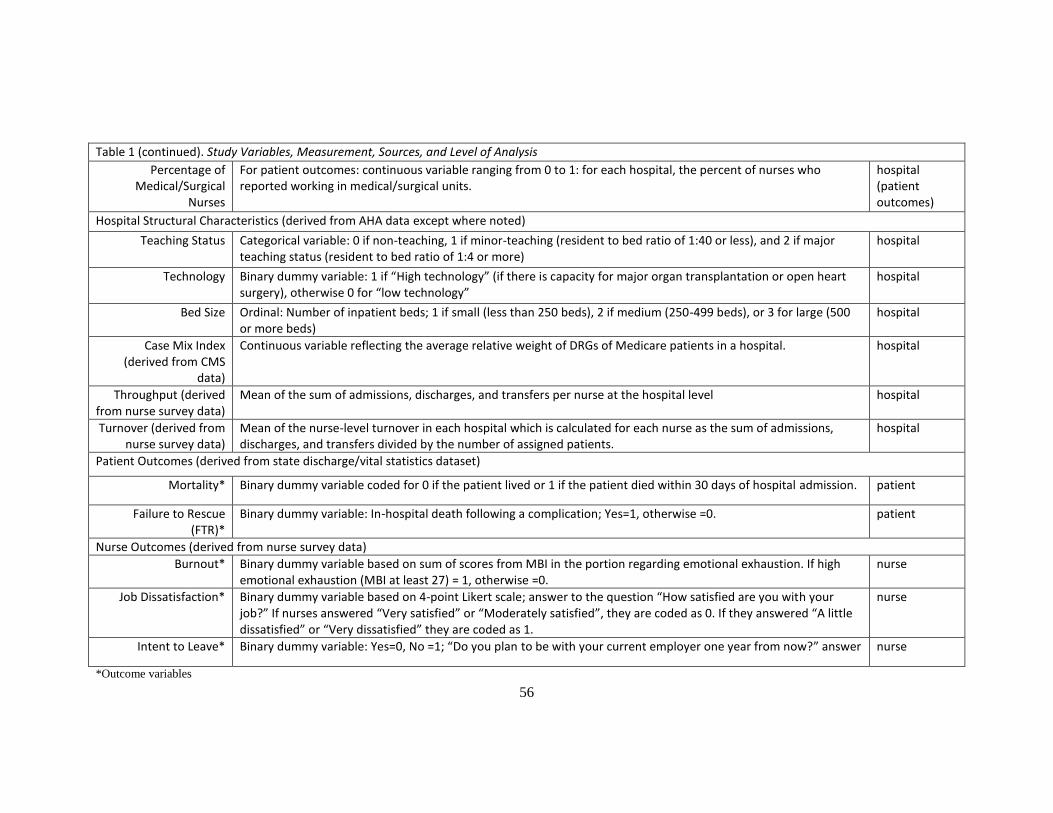
56
Table 1 (continued). Study Variables, Measurement, Sources, and Level of Analysis
Percentage of Medical/Surgical
Nurses
For patient outcomes: continuous variable ranging from 0 to 1: for each hospital, the percent of nurses who reported working in medical/surgical units.
hospital (patient outcomes)
Hospital Structural Characteristics (derived from AHA data except where noted)
Teaching Status Categorical variable: 0 if non-teaching, 1 if minor-teaching (resident to bed ratio of 1:40 or less), and 2 if major teaching status (resident to bed ratio of 1:4 or more)
hospital
Technology Binary dummy variable: 1 if “High technology” (if there is capacity for major organ transplantation or open heart surgery), otherwise 0 for “low technology”
hospital
Bed Size Ordinal: Number of inpatient beds; 1 if small (less than 250 beds), 2 if medium (250-499 beds), or 3 for large (500 or more beds)
hospital
Case Mix Index (derived from CMS
data)
Continuous variable reflecting the average relative weight of DRGs of Medicare patients in a hospital. hospital
Throughput (derived from nurse survey data)
Mean of the sum of admissions, discharges, and transfers per nurse at the hospital level hospital
Turnover (derived from nurse survey data)
Mean of the nurse-level turnover in each hospital which is calculated for each nurse as the sum of admissions, discharges, and transfers divided by the number of assigned patients.
hospital
Patient Outcomes (derived from state discharge/vital statistics dataset)
Mortality* Binary dummy variable coded for 0 if the patient lived or 1 if the patient died within 30 days of hospital admission. patient
Failure to Rescue (FTR)*
Binary dummy variable: In-hospital death following a complication; Yes=1, otherwise =0. patient
Nurse Outcomes (derived from nurse survey data)
Burnout* Binary dummy variable based on sum of scores from MBI in the portion regarding emotional exhaustion. If high emotional exhaustion (MBI at least 27) = 1, otherwise =0.
nurse
Job Dissatisfaction* Binary dummy variable based on 4-point Likert scale; answer to the question “How satisfied are you with your job?” If nurses answered “Very satisfied” or “Moderately satisfied”, they are coded as 0. If they answered “A little dissatisfied” or “Very dissatisfied” they are coded as 1.
nurse
Intent to Leave* Binary dummy variable: Yes=0, No =1; “Do you plan to be with your current employer one year from now?” answer nurse
*Outcome variables
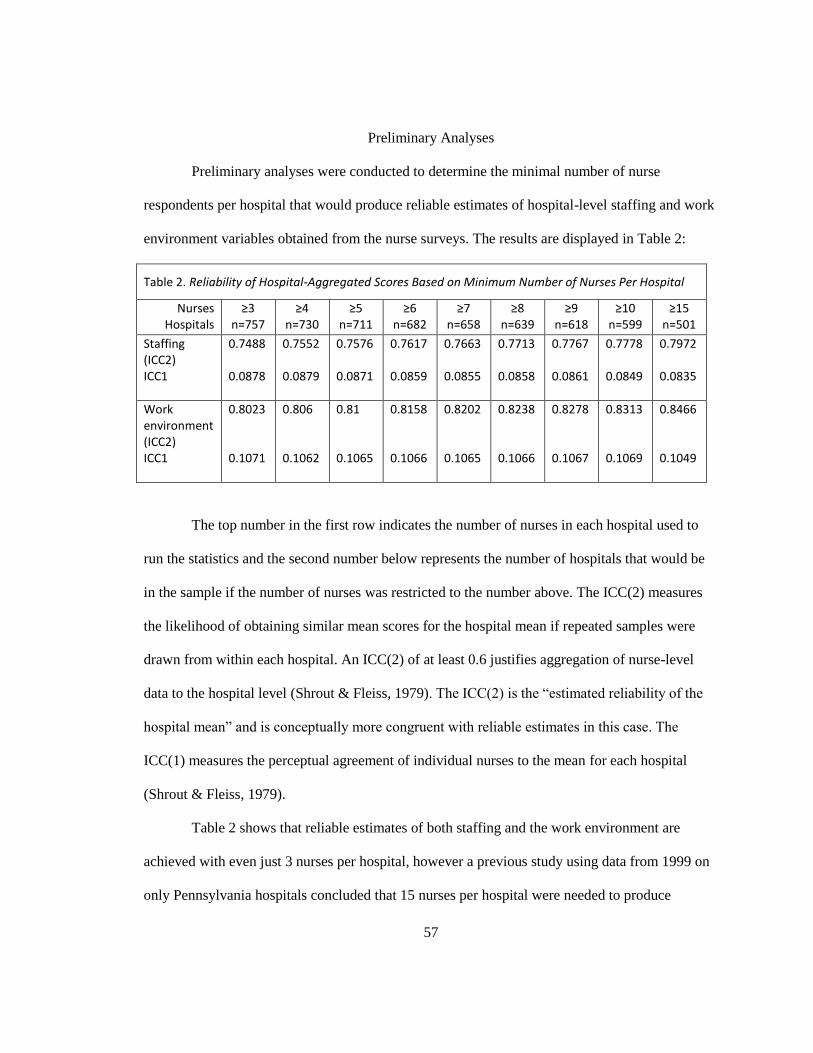
57
Preliminary Analyses
Preliminary analyses were conducted to determine the minimal number of nurse
respondents per hospital that would produce reliable estimates of hospital-level staffing and work
environment variables obtained from the nurse surveys. The results are displayed in Table 2:
Table 2. Reliability of Hospital-Aggregated Scores Based on Minimum Number of Nurses Per Hospital
Nurses Hospitals
≥3 n=757
≥4 n=730
≥5 n=711
≥6 n=682
≥7 n=658
≥8 n=639
≥9 n=618
≥10 n=599
≥15 n=501
Staffing (ICC2) ICC1
0.7488 0.0878
0.7552 0.0879
0.7576 0.0871
0.7617 0.0859
0.7663 0.0855
0.7713 0.0858
0.7767 0.0861
0.7778 0.0849
0.7972 0.0835
Work environment (ICC2) ICC1
0.8023 0.1071
0.806 0.1062
0.81 0.1065
0.8158 0.1066
0.8202 0.1065
0.8238 0.1066
0.8278 0.1067
0.8313 0.1069
0.8466 0.1049
The top number in the first row indicates the number of nurses in each hospital used to
run the statistics and the second number below represents the number of hospitals that would be
in the sample if the number of nurses was restricted to the number above. The ICC(2) measures
the likelihood of obtaining similar mean scores for the hospital mean if repeated samples were
drawn from within each hospital. An ICC(2) of at least 0.6 justifies aggregation of nurse-level
data to the hospital level (Shrout & Fleiss, 1979). The ICC(2) is the “estimated reliability of the
hospital mean” and is conceptually more congruent with reliable estimates in this case. The
ICC(1) measures the perceptual agreement of individual nurses to the mean for each hospital
(Shrout & Fleiss, 1979).
Table 2 shows that reliable estimates of both staffing and the work environment are
achieved with even just 3 nurses per hospital, however a previous study using data from 1999 on
only Pennsylvania hospitals concluded that 15 nurses per hospital were needed to produce
58
reliable estimates (Lake & Friese, 2006). However, requiring 15 nurses per hospital would
decrease the hospital sample size by almost 100 hospitals (501 hospitals) compared to only
requiring 10 nurse respondents per hospital (sample size 599 hospitals). To maintain a large
sample of hospitals and to make comparisons from previous studies (Aiken et al., 2008; Aiken et
al., 2011), at least 10 nurse respondents per hospital was chosen as the final inclusion criteria.
Data Analysis
This study was a secondary analysis of retrospective cross-sectional observational data.
Two analytic databases were created for the study. For the nurse outcomes, three datasets were
merged: the AHA Annual Survey, the Multi-State Nurse Survey data, and the CMS Case Mix
Index file. The data were linked using common hospital identification numbers. Before merging
onto the nurse survey dataset, hospital structural characteristics were extracted from the AHA
Annual Survey dataset and each hospital’s CMI value was extracted from the CMS Case Mix
Index file.
For the patient outcomes, all four datasets (the AHA Annual Survey, the Multi-State
Nurse Survey, CMS Case Mix Index file, and state discharge abstracts) were merged. The data
were linked using common hospital identification numbers. Prior to merging onto the patient
data, nursing characteristics were aggregated to the hospital level within the nurse survey dataset,
the CMI variable for each hospital was extracted from the CMS Case Mix Index file, and
structural characteristics came from the AHA Annual Survey dataset.
Descriptive statistics are used to display pertinent demographic data on nurses and
patients in this sample. Then, correlations between variables are examined. For each measure of
nursing and hospital structural characteristics, means, standard deviations, and ranges are
presented for continuous variables, while frequencies and percentages are presented for
categorical variables. Missing data was treated as missing in the cases of item non-response so
59
that no values were imputed if missing. In the analysis of Aim 1, throughput is described in detail
as it varies across nursing unit types and hospitals with different work environments. As
throughput is calculated based on admissions and discharges/transfers, the relative contribution of
each of these two factors into each throughput measure is described. Then the development of
three throughput-adjusted staffing measures is described. Finally, each of the workload measures
(throughput-adjusted staffing measures, an unadjusted staffing measure, case-mix adjusted
staffing, and LOS-adjusted staffing) are tested in relation to patient and nurse outcomes. The
measures are compared in terms of their performance in predicting outcomes as well as effect
sizes. Data were analyzed using Stata12 (StataCorp LP, 2011). Statistical significance was set at
the p <0.05 level.
Aim 1: To develop and describe a measure of nurse staffing that appropriately accounts for
patient throughput.
Descriptive analyses proceeded as follows:
First, individual nurse throughput was explored and displayed in tables. Throughput (the
number of patients admitted/discharged/transferred) and turnover (the ratio of throughput to
patients assigned) is displayed as it varies over types of nursing units (i.e. medical/surgical, ICU,
telemetry, etc.), hospital characteristics (bed size, teaching status, and technology level).
Descriptive statistics include means, standard deviations, and percentages when applicable.
Because throughput and turnover are computed from both admissions and discharges/transfers,
these variables are displayed as they vary over unit types, hospital characteristics, and states.
Because throughput-adjusted staffing is a relatively new variable with no current measurement
standards, three methods to measure throughput-adjusted staffing were explored. The following
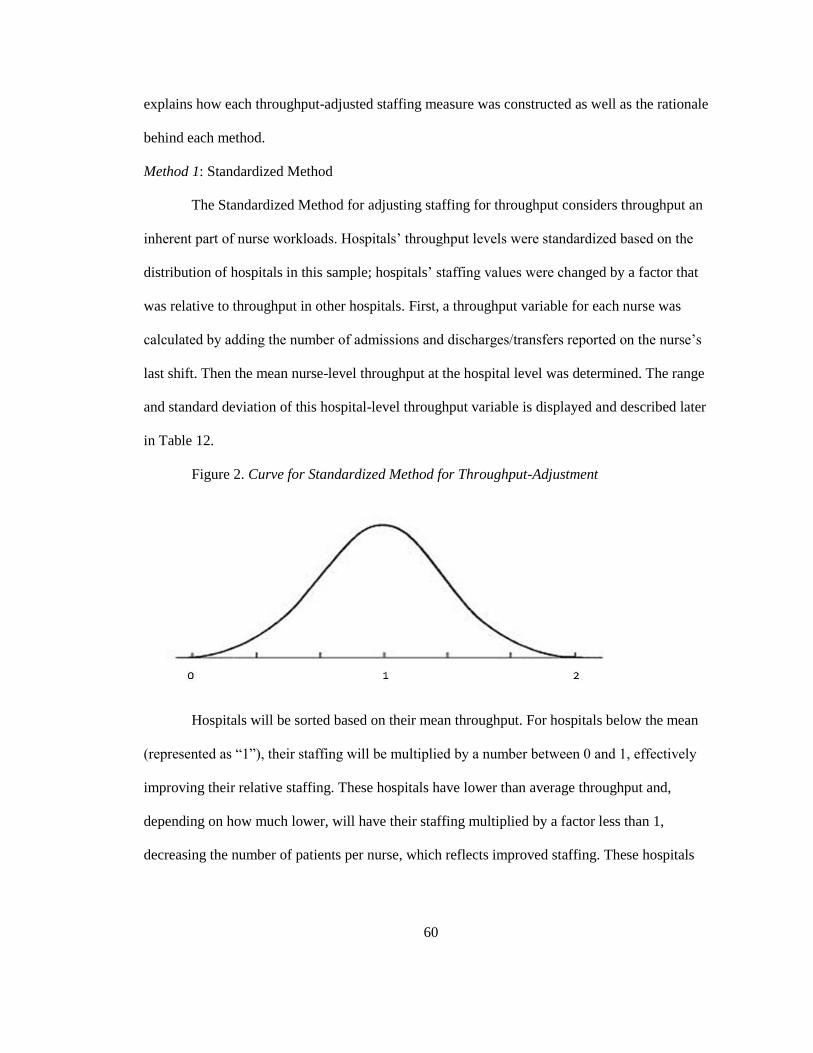
60
explains how each throughput-adjusted staffing measure was constructed as well as the rationale
behind each method.
Method 1: Standardized Method
The Standardized Method for adjusting staffing for throughput considers throughput an
inherent part of nurse workloads. Hospitals’ throughput levels were standardized based on the
distribution of hospitals in this sample; hospitals’ staffing values were changed by a factor that
was relative to throughput in other hospitals. First, a throughput variable for each nurse was
calculated by adding the number of admissions and discharges/transfers reported on the nurse’s
last shift. Then the mean nurse-level throughput at the hospital level was determined. The range
and standard deviation of this hospital-level throughput variable is displayed and described later
in Table 12.
Figure 2. Curve for Standardized Method for Throughput-Adjustment
Hospitals will be sorted based on their mean throughput. For hospitals below the mean
(represented as “1”), their staffing will be multiplied by a number between 0 and 1, effectively
improving their relative staffing. These hospitals have lower than average throughput and,
depending on how much lower, will have their staffing multiplied by a factor less than 1,
decreasing the number of patients per nurse, which reflects improved staffing. These hospitals
61
would fall to the left of the mean on Figure 2. The factor between 0 and 1 will rely on the
percentage below the mean for a particular hospital.
For instance, if Hospital A has a throughput value that is 20% below the mean, Hospital
A’s staffing value (patients per nurse) would be multiplied by 0.8. On the other hand, for
hospitals with above average throughput, their staffing values would be multiplied by a factor
greater than 1, increasing the number of patients per nurse, which reflects worsening staffing
levels. These hospitals would fall to the right of the mean on Figure 2. If Hospital B has a
throughput value that is 25% above the mean, Hospital B’s staffing value (patients per nurse) will
be multiplied by 1.25. Hospitals at the mean had unchanged staffing values. These modified
staffing variables reflected the relative impact of throughput on staffing at the hospital level.
Method 2: Additive Method
The Additive method is based on the premise that throughput is an additional
responsibility for nurses beyond their given patient assignment. Each additional patient admitted,
discharged, or transferred is similar to taking care of another patient, but not a “whole” patient.
The challenge, then, was to define how much each throughput patient counts, relative to the
patients a nurse is already assigned. To facilitate comparisons between measures developed in
this study and traditional staffing measures used in other studies, the measures will be interpreted
as throughput-adjusted patients per nurse.
Hospital level throughput-adjusted staffing2 = hospital level staffing +
Where T is the mean of the sum of patients admitted, discharged, or transferred per nurse in a
given hospital and,
62
α is an adjustment for the relative impact of an additional patient admitted, discharged, or
transferred as
where t = throughput and s = staffing from the following regression:
“staff ” =
Where “staff” represents the staffing and resource adequacy subscale of the PES-NWI and was
measured as an ordinal variable (4-point Likert scale) representing nurses’ agreement or
disagreement to the statement that there are enough staff to get the work done in their primary
jobs. The higher the value for “staff”, the more the nurse agreed that there is enough staff to get
the work done.
The “staff” regression provided coefficients for staffing and throughput which show how
nurses felt about an additional “assigned” patient or “throughput” patient and the availability of
staff to get the work done. The coefficient for staffing (β1) reflected the relative importance of
having and additional patient assigned on feelings of having enough staff to get the work done.
Similarly, the coefficient for throughput (β2 ) reflected the relative importance of having to
admit, discharge, or transfer another patient. If β1 were equal to β2, admitting, discharging, or
transferring a patient would be the same as taking care of another patient, according to these
nurses. So then the adjustment factor, α, would equal 1. Research suggests that it is not likely that
an admission, discharge, or transfer is the same as caring for an entire additional patient
(Cavouras, 2002; Duffield et al., 2009). So the ratio
represented the weight of an additional
admission, discharge, or transfer relative to the weight of a patient already assigned to a nurse.
This factor, α, can then be conceptualized as the “percent of a whole” patient that each additional
admission, discharge, or transfer contributes to a nurse’s workload. The factor α is constant across

63
hospitals but hospital-level staffing and T (mean number of patients admitted, discharged, or
transferred per nurse) varies across hospitals.
Method 3: Time-Based Method
The third method to measure throughput-adjusted staffing was based on a combination of
the two previous methods. The idea of throughput being an additional burden on nurses’
workloads was taken from method 2. Method 1 (standardized method) allowed for some
hospitals’ staffing to appear “better” than its unadjusted staffing if its throughput was lower than
the mean. To avoid placing too much emphasis on throughput as a component of nurse
workloads, method 3 ensures that staffing does not fall below unadjusted staffing, similar to
method 2. However, method 2 may be somewhat biased depending on the coefficient, or the
ratio of
. Method 3 takes into account the relative weight of a throughput patient to a patient
already assigned to a nurse in a different way. As already noted, research has shown that
admitting, discharging, or transferring a single patient takes a nurse an average of 1 - 1.5 hours
(Cavouras, 2002; Duffield et al., 2009; Lane et al., 2009). Taking a conservative estimate, each
throughput patient takes 1 hour of a nurse’s shift. For example, if a nurse works 12 hours and has
1 admission, the nurse theoretically only has 11 hours to provide care to the other patients. For
this reason, method 3 was calculated as follows:
Hospital level throughput-adjusted staffing3 = hospital level staffing x
Where, just as in method 2,
T = the mean number of patients admitted, discharged, or transferred and,
SHIFT = the mean shift length worked by nurses in a given hospital
The nurse surveys asked nurses how long they worked on their last shift, which was used
to calculate a hospital-level mean for the third throughput-adjusted method. The number “1” was
64
added to the throughput/shift ratio so that the ultimate adjusted staffing measure would never fall
below the unadjusted staffing level.
Additionally, hospitals were ranked and sorted according to the following variables
(hospital-level staffing and adjusted-staffing variables) and Spearman correlations were tested to
assess how similar/different each of the measures were from each other once they were
developed:
1. Unadjusted staffing
2. Throughput-adjusted staffing (method 1)
3. Throughput-adjusted staffing (method 2)
4. Throughput-adjusted staffing (method 3)
5. Medicare case mix (CMI)-adjusted staffing
6. Inverse of length of stay (LOS)-adjusted staffing*
*based on Unruh & Fottler’s (2006) measure
Aim 2: To determine whether throughput-adjusted staffing is associated with patient
outcomes (mortality and failure to rescue).
To gauge the presence of discernible relationships between each of the staffing measures
and patient outcomes, hospitals were sorted and categorized based on their rates of 30-day
mortality and FTR. Then, the means of each of the staffing variables were examined across
quartiles of the patient outcomes.
To empirically test these relationships, a series of logistic regressions were performed to
determine the association between the six hospital-level staffing variables (separately) and
mortality and FTR. Robust standard errors were calculated to account for clustering of patients

65
within hospitals. The strength, direction, and statistical significance of the variables are examined
and the measures of throughput-adjusted staffing are compared. Models are compared for fit
using F-statistics and predictive power using adjusted R-squared statistics.
1. Model 1 examined the bivariate (unadjusted) relationship between each of the six
hospital-level staffing measures and each patient outcome (mortality and FTR).
Patient outcome = β0 + β1(hospital-level staffing or adjusted-staffing variable) + ε
2. Model 2 used logistic regression models of each hospital-level staffing measure,
controlling for individual patient demographic data (age, sex, race), hospital characteristics (bed
size, teaching status, level of technology, percent of medical/surgical nurses responding, percent
of critical care nurses responding), each patient’s DRGs, whether or not the patient had each of
the 27 comorbidities classified under the Elixhauser Index, and finally, the state.
Patient outcome = β0+ β1(hospital-level staffing variable) + β2(age) + β3(sex) + β4(race) +
β5(bedsize) + β6 (teaching status) + β7(technology) + β8(state) + β9(percent medical/surgical RNs)
+ β10(percent critical care RNs) + β11 (DRGs) + β12 (Elixhauser comorbidities #1-27) + ε (error)
3. Finally, model 3 (fully adjusted model) used logistic regression models of each
hospital-level staffing measure, controlling for all the aforementioned variables in model 2, with
the addition of a measure of the hospital-level nurse work environment as measured by the three
categories of the PES-NWI (poor, mixed, best).
Patient outcome = β0+ β1(hospital-level staffing variable) + β2(age) + β3(sex) + β4(race) +
β5(bed size) + β6 (teaching status) + β7(technology) + β8(state) + β9(percent medical/surgical RNs)
+ β10(percent critical care RNs) + β11 (DRGs) + β12 (Elixhauser comorbidities #1-27) + β10 (work
environment) + ε (error)
66
The coefficients of each of the hospital-level staffing measures were compared in terms
of size using standardized coefficients and the log likelihood of each of the full models are
compared to evaluate which of these variables performs best in predicting nurse outcomes.
Aim 3: To determine whether throughput-adjusted staffing is associated with nurse
outcomes (burnout, job dissatisfaction, and intent to leave).
The analysis for Specific Aim 3 followed that of Specific Aim 2. To gauge the presence
of discernible relationships between each of the staffing measures and nurse outcomes, hospitals
were sorted and categorized based on their rates of burnout, job dissatisfaction, and intent to
leave. Then, the means of each of the staffing variables were examined across quartiles of the
nurse outcomes. The means of each of the staffing variables over categories of each of the
outcomes were calculated. To test whether these associations were statistically significant, a
series of logistic regressions were performed for each of the three nurse outcomes (burnout, job
dissatisfaction, and intent to leave), separately using each of the six hospital-level staffing or
adjusted-staffing measures as predictors in the models. Robust standard errors were used to
account for the clustering of nurses within hospitals. The strength, direction, and statistical
significance of the variables were examined and the measures of throughput-adjusted staffing
were compared.
1. Model 1 used unadjusted logistic regression models using each of the six hospital-level
staffing measures to separately predict nurse burnout, job dissatisfaction, and intent to leave.
Nurse outcome = β0 + β1(hospital-level staffing or adjusted-staffing variable) + ε (error)
67
2. Model 2 used logistic regression models for each hospital-level throughput-adjusted
staffing variable, controlling for the individual nurse demographic information (sex, age, years of
experience, unit type, and education) as well as hospital structural characteristics (bed size,
teaching status, level of technology, and state) to separately predict burnout, job dissatisfaction,
and intent to leave.
Nurse outcome = β0 + β1(hospital-level staffing variable) + β2(sex) + β3(age) +
β4(education) + β5(years experience) + β6(bed size) + β7(teaching status) + β8(technology) +
β9(state) + ε (error)
3. Finally, Model 3 (fully adjusted model) used regression models of each hospital-level
staffing measure, controlling for all the aforementioned variables in model 2, with the addition of
a measure of the hospital-level nurse work environment as measured by the three categories of
the PES-NWI (poor, mixed, best).
Nurse outcome = β0 + β1(hospital-level staffing variable) + β2(sex) + β3(age) +
β4(education) + β5(years experience) + β6(bed size) + β7(teaching status) + β8(technology) +
β9(state)+ β10(work environment) + ε (error)
The coefficients of each of the hospital-level staffing measures are compared in terms of
size using standardized coefficients and the log likelihood of each of the full models are
compared to evaluate which of these variables performs best in predicting nurse outcomes.
Human Subjects
This study used de-identified patient data from four states’ discharge abstract databases,
de-identified nurse survey data and hospital survey data. The nurse surveys were considered low
risk to the nurses. In 2005, the University of Pennsylvania Institutional Review Board (IRB)
68
approved the original Multi-State Nursing and Patient Safety Survey Study (Protocol #176400 for
“Outcomes of Nurse Practice Environments”, Aiken, L.H., PI). Nurses’ confidentiality was
maintained because no names or addresses were recorded. A letter at the front of each survey
notified nurses that by participating in the survey, they were giving their informed consents for
their responses to be used. The survey protocol underwent continuing review and was most
recently approved on February 27, 2012. The databases were electronically stored and statistical
analyses were performed on a password-protected server which is maintained by the University
of Pennsylvania School of Nursing Office of Technology and Information Services. This study
received exempt review and was approved by the University of Pennsylvania IRB as of January
22, 2013 (Protocol #817202).
69
Chapter 4: Results
Introduction
The purpose of this study was to examine the relationship between throughput-adjusted
staffing and the outcomes of patients (mortality and failure to rescue) and nurses (burnout, job
dissatisfaction, and intent to leave). Because very few researchers have examined patient
throughput in the context of nurse workloads, it was important to first develop and describe
measures of throughput and adjusted staffing measures. Two pre-existing adjustment methods –
an acuity proxy (Medicare case mix) and length of stay-adjustment – were also included to
compare to the unadjusted and created throughput-adjusted staffing measures. It was
hypothesized that nurses working in hospitals with higher throughput-adjusted staffing (more
patients per nurse) would have increased odds of nurse burnout, job dissatisfaction, and intent to
leave, while patients in hospitals with more unfavorable throughput-adjusted staffing would have
higher odds of patient mortality and failure to rescue. Additionally, it was hypothesized that
throughput-adjusted staffing measures would be associated more strongly with nurse and patient
outcomes compared to unadjusted staffing measures in terms of their effect sizes.
The final sample included 25,193 nurses and 1,642,787 surgical patients from California,
New Jersey, Pennsylvania (2005-2006), and Florida (2007-2008). Descriptive statistics were used
to examine nurse, patient, and hospital characteristics.
Following a description of the nurses, patients, and hospitals in the sample, the remainder
of the chapter describes this study’s results in order of the specific aims. Each of the four staffing
measures derived from the nurse surveys (unadjusted staffing, Standardized method for
throughput-adjusted staffing, Additive method for throughput-adjusted staffing, and Time-Based
method for throughput-adjusted staffing) as well as case mix-adjusted staffing and LOS-adjusted
staffing are displayed as they vary over nursing unit types and hospital characteristics. To
70
compare these data to those of similar previous studies, patient turnover ratios were calculated
and displayed to portray how they varied over nursing unit types and hospital characteristics.
Throughput and turnover are displayed as they vary over categories of nursing units followed by
a distribution of hospitals in various categories of turnover and staffing. Next, the relationships
amongst the staffing measures and aspects of the nurse work environment are shown in a
correlation matrix. Finally, the staffing measures of interest to this study are displayed in a
Spearman rank correlation matrix to evaluate the strength of the associations among the
measures. Using STATA, logistic regressions using sequential model building were performed to
analyze patient and nurse outcomes. All models account for patient and nurse clustering within
hospitals.
Characteristics of study population
Table 3 displays demographic characteristics of the nurses in this sample as well as the
units on which they worked. The vast majority (93%) of nurses in this sample were females. On
average, the nurses were 44 years old with 15.5 years of experience as registered nurses. Almost
three quarters of the nurses (74.1%) self-reported as white and approximately 10% self-reported
as Filipino. Less than 5% self-reported as Asian or Black/African American. The most
represented units were adult ICUs and medical/surgical units with about 16% of nurses working
in each. There were also substantial proportions of nurses working in telemetry units (7.5%),
emergency departments (9%), labor and delivery (6.4%), and operating rooms (6%). About 1 in 9
nurse respondents had missing data regarding unit type but this missing data was treated as
missing as opposed to using multiple imputation or similar methods to estimate the unit type.
Over 40% of nurses in this sample reported having a BSN or higher degree in nursing. Almost
one third (32%) of the nurses in this sample were from the largest state, California. About a
quarter of nurses were from Pennsylvania. Florida and New Jersey each represented over 20% of

71
the nurses in this sample. Over one third (35%) of nurses reported being burned out, one quarter
reported being dissatisfied with their jobs, and about 14% intended to leave their jobs within the
next year.

72
Table 3. Nurse Characteristics n=25,193
Female, n (%) 23314 (93)
Age, mean (SD) 44.4 (10.7)
Years experience, mean (SD) 15.5 (11)
BSN or higher, n (%) 10278 (40.8)
Burnout, n (%) 8,864 (35.2)
Job Dissatisfaction, n (%) 6,327 (25.1)
Intent to leave, n (%) 3,567 (14.2)
Location, n (%)
California 8070 (32)
Florida 5488 (21.8)
New Jersey 5259 (20.9)
Pennsylvania 6376 (25.3)
Race, n (%)
white 18633 (74.1)
Filipino 2573 (10.2)
Asian 1023 (4.1)
Pacific Islander 25 (0.1)
Black/African American 1125 (4.5)
American Indian 36 (0.1)
Mixed Race 372 (1.5)
Other Race 761 (3)
Unit Type, n (%)
Float Pool 330 (1.3)
Medical/Surgical 3995 (15.9)
Pediatrics 580 (2.3)
Adult ICU 4052 (16.1)
Pediatric ICU 235 (0.9)
Neonatal ICU 1223 (4.9)
Stepdown 947 (3.8)
Telemetry 1895 (7.5)
Oncology 581 (2.3)
Emergency Department 2270 (9)
Subacute 216 (0.8)
Psychiatric 539 (2.1)
Nursery/Postpartum 1327 (5.3)
Labor & Delivery 1617 (6.4)
Operating Room 1514 (6)
PACU/Recovery 1090 (4.3)
Missing 2782 (11)
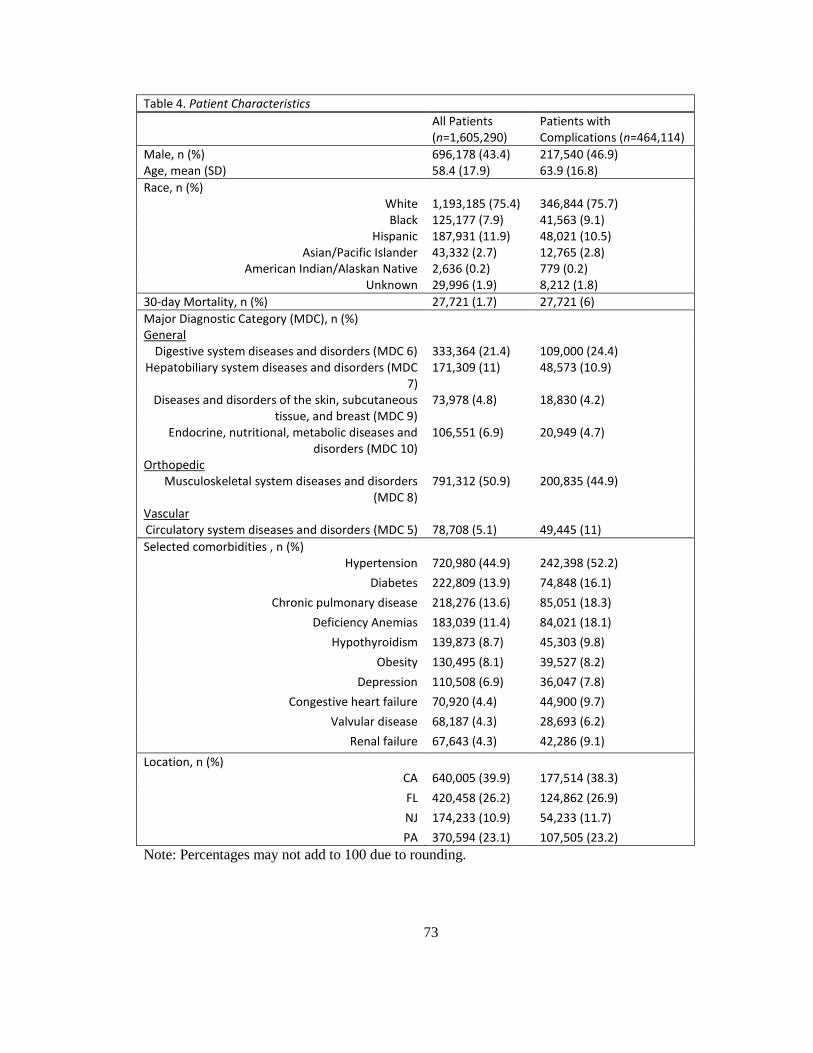
73
Note: Percentages may not add to 100 due to rounding.
Table 4. Patient Characteristics
All Patients (n=1,605,290)
Patients with Complications (n=464,114)
Male, n (%) 696,178 (43.4) 217,540 (46.9) Age, mean (SD) 58.4 (17.9) 63.9 (16.8)
Race, n (%) White 1,193,185 (75.4) 346,844 (75.7) Black 125,177 (7.9) 41,563 (9.1)
Hispanic 187,931 (11.9) 48,021 (10.5) Asian/Pacific Islander 43,332 (2.7) 12,765 (2.8)
American Indian/Alaskan Native 2,636 (0.2) 779 (0.2) Unknown 29,996 (1.9) 8,212 (1.8)
30-day Mortality, n (%) 27,721 (1.7) 27,721 (6)
Major Diagnostic Category (MDC), n (%) General
Digestive system diseases and disorders (MDC 6) 333,364 (21.4) 109,000 (24.4) Hepatobiliary system diseases and disorders (MDC
7) 171,309 (11) 48,573 (10.9)
Diseases and disorders of the skin, subcutaneous tissue, and breast (MDC 9)
73,978 (4.8) 18,830 (4.2)
Endocrine, nutritional, metabolic diseases and disorders (MDC 10)
106,551 (6.9) 20,949 (4.7)
Orthopedic Musculoskeletal system diseases and disorders
(MDC 8) 791,312 (50.9) 200,835 (44.9)
Vascular Circulatory system diseases and disorders (MDC 5) 78,708 (5.1) 49,445 (11)
Selected comorbidities , n (%) Hypertension 720,980 (44.9) 242,398 (52.2)
Diabetes 222,809 (13.9) 74,848 (16.1)
Chronic pulmonary disease 218,276 (13.6) 85,051 (18.3)
Deficiency Anemias 183,039 (11.4) 84,021 (18.1)
Hypothyroidism 139,873 (8.7) 45,303 (9.8)
Obesity 130,495 (8.1) 39,527 (8.2)
Depression 110,508 (6.9) 36,047 (7.8)
Congestive heart failure 70,920 (4.4) 44,900 (9.7)
Valvular disease 68,187 (4.3) 28,693 (6.2)
Renal failure 67,643 (4.3) 42,286 (9.1)
Location, n (%) CA 640,005 (39.9) 177,514 (38.3)
FL 420,458 (26.2) 124,862 (26.9)
NJ 174,233 (10.9) 54,233 (11.7)
PA 370,594 (23.1) 107,505 (23.2)

74
Table 4 displays the demographic and surgical data of interest for the patients in this
sample. There were over 1.6 million adult surgical patients included in this study. Men accounted
for 43% of all patients, and 47% of those who suffered complications. On average, patients were
about 58 years old but those that suffered complications were, on average, about 6 years older.
About three quarters of all patients as well as patients who suffered complications were white.
While Blacks represented about 8% of all patients, they represented 9% of those who suffered
complications. Hispanics represented about 12% of all patients, but only about 10.5% of those
who suffered complications. Less than 3% of patients in both categories were Asian/Pacific
Islander and only 0.2% of patients in both categories were Native American or Alaskan Native.
About 2% of all patients as well as patients who suffered complications had missing data or their
races were unknown.
The overall 30-day mortality rate in this sample was 1.7% but for those that suffered
complications, the mortality (or failure to rescue) rate was much higher at 6%. The most common
surgery type was orthopedic surgery (50.9%), followed by general surgery, which accounted for
about 44% of all surgeries and represented about an equal proportion of those that suffered
complications (44.2%). Orthopedic surgery patients represented approximately 45% of those who
had complications. Only about 5% of surgeries were vascular surgeries but, patients that had
vascular surgeries accounted for over 10% of complications. The remaining major diagnostic
categories had relatively even proportions in both the whole patient sample as well as the
subgroup of those that had complications.
The top ten most frequent comorbidities are displayed in order of the most prevalent in
the whole patient sample. The most common comorbidity was hypertension or high blood
pressure (45%). The next most common comorbidities were diabetes and chronic pulmonary
(lung) disease, which were present in about 14% of patients. All of the comorbidities were more

75
prevalent in the subgroup of patients who experienced complications, underscoring the
importance of controlling for these comorbidities when comparing failure to rescue rates.
Table 5 describes the hospital characteristics in this sample. The largest proportion of
hospitals (39%) was located in California and about a quarter each was in Florida and
Pennsylvania. Just 12% of the hospitals came from the smallest state, New Jersey. Only about
10% of the hospitals in this sample were considered small with fewer than 100 beds and the
remaining hospitals were evenly split between medium and large hospitals with about 45% of
hospitals falling into the two latter categories. Hospitals were dichotomized into low and high
technology based on whether they had the capacity for open heart surgery or major organ
transplantation (Silber et al., 1992). Based on these criteria, more hospitals were considered to
have low technology (57%) than high technology (43%). More than half of hospitals (52%) were
not teaching facilities. About 41% were minor teaching facilities with a ratio of medical residents
to inpatient beds of 1:4 or less and few (8%) were major teaching facilities a ratio of greater than
1:4.
Table 5. Hospital Characteristics n=599
Location, n (%) California 232 (38.7%)
Florida 154 (25.7%)
New Jersey 72 (12%)
Pennsylvania 141 (23.5%)
Bed Size, n (%) Small (<100) 63 (10.5%)
Medium (100-249) 270 (45.1%) Large (>249) 266 (44.4%)
Technology, n (%) Low 339 (56.6%) High 260 (43.4%)
Teaching Status, n (%) Non-teaching 310 (51.8%)
Minor teaching 244 (40.7%)
Major teaching 45 (7.5%) Note: Percentages may not add to 100 due to rounding
76
Analysis of Specific Aim 1
Specific Aim 1
To develop and describe a measure of nurse staffing that appropriately accounts for patient
throughput.
Description of Throughput and Turnover
Table 6 displays the means, standard deviations, and ranges for staffing (patients per
nurse), throughput (the sum of admissions, discharges, and transfers), admissions, and
discharges/transfers by nursing unit types, hospital characteristics, and states. On average, nurses
in this sample cared for 4.76 patients on their last shift but this number varied considerably over
unit types. Nurses working in adult ICU’s cared for the fewest patients on average (2.2) while
nurses in emergency departments cared for an average of over 8 patients. Medical/surgical nurses
cared for an average of 6 patients on their last shifts. California had the lowest average nurse
staffing compared to the other 3 states, with an average of 4 patients per nurse which is consistent
with the staffing mandate, Assembly Bill 394, that was passed there in 1999 and went into effect
in 2004 (McHugh, Kelly, Sloane, & Aiken, 2011).
As expected, emergency department and post-anesthesia care unit (PACU) nurses had the
highest numbers of throughput patients on their last shifts with almost 11 and 10 respectively.
Patients do not typically have lengthy stays on these units, so the patient throughput is high.
Conversely, pediatric and neonatal intensive care units (ICUs) typically have patients with longer
stays, so patient throughput on these units is much lower – on average, less than one throughput
patient per shift. Because throughput is constructed as the sum of admissions and
discharges/transfers, it is expected that the highest numbers of admissions and
discharges/transfers are seen in those units that have the highest throughput, namely the
emergency department and PACU.
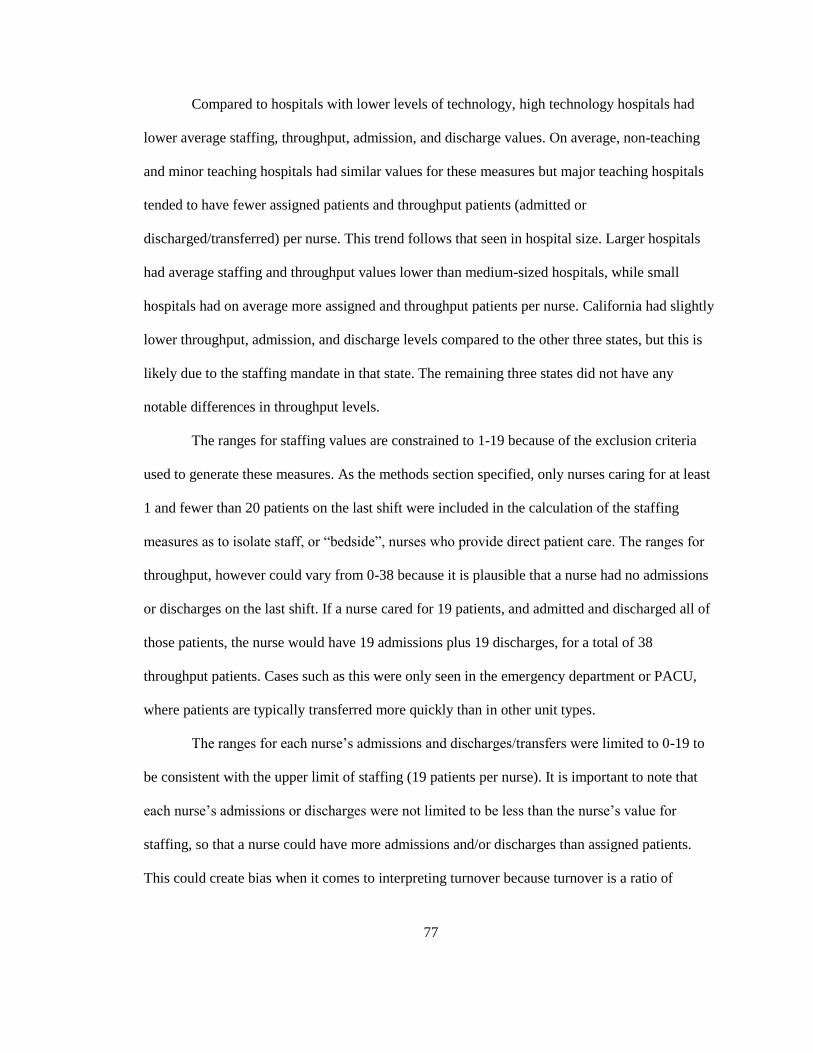
77
Compared to hospitals with lower levels of technology, high technology hospitals had
lower average staffing, throughput, admission, and discharge values. On average, non-teaching
and minor teaching hospitals had similar values for these measures but major teaching hospitals
tended to have fewer assigned patients and throughput patients (admitted or
discharged/transferred) per nurse. This trend follows that seen in hospital size. Larger hospitals
had average staffing and throughput values lower than medium-sized hospitals, while small
hospitals had on average more assigned and throughput patients per nurse. California had slightly
lower throughput, admission, and discharge levels compared to the other three states, but this is
likely due to the staffing mandate in that state. The remaining three states did not have any
notable differences in throughput levels.
The ranges for staffing values are constrained to 1-19 because of the exclusion criteria
used to generate these measures. As the methods section specified, only nurses caring for at least
1 and fewer than 20 patients on the last shift were included in the calculation of the staffing
measures as to isolate staff, or “bedside”, nurses who provide direct patient care. The ranges for
throughput, however could vary from 0-38 because it is plausible that a nurse had no admissions
or discharges on the last shift. If a nurse cared for 19 patients, and admitted and discharged all of
those patients, the nurse would have 19 admissions plus 19 discharges, for a total of 38
throughput patients. Cases such as this were only seen in the emergency department or PACU,
where patients are typically transferred more quickly than in other unit types.
The ranges for each nurse’s admissions and discharges/transfers were limited to 0-19 to
be consistent with the upper limit of staffing (19 patients per nurse). It is important to note that
each nurse’s admissions or discharges were not limited to be less than the nurse’s value for
staffing, so that a nurse could have more admissions and/or discharges than assigned patients.
This could create bias when it comes to interpreting turnover because turnover is a ratio of

78
throughput patients to assigned patients. Therefore, nurses could have turnover values greater
than 100%. This measure and potential alternatives to quantifying turnover are presented in Table
7.

79
Table 6. Distribution of Staffing and Throughput Measures by Unit Type and Hospital Characteristics
Staffing Throughput Admissions Discharges/Transfers Mean, (SD) n=22701 Range Mean, (SD) n=22186 Range Mean, (SD) n=22765 Range Mean, (SD) n=22478 Range All 4.76 (2.87) 1-19 3.19 (4.14) 0-38 1.52 (2.01) 0-19 1.73 (2.7) 0-19 Unit Type
Float Pool 5.62 (2.22) 1-18 2.60 (3.00) 0-24 1.44 (1.98) 0-13 1.28 (1.87) 0-18
Medical/Surgical 5.96 (1.86) 1-19 2.36 (2.24) 0-28 1.28 (1.31) 0-15 1.09 (1.35) 0-16 Pediatrics 4.13 (1.73) 1-13 2.20 (2.14) 0-23 1.15 (1.11) 0-12 1.05 (1.46) 0-19 Adult ICU 2.20 (0.96) 1-13 1.13 (1.56) 0-25 0.57 (0.84) 0-15 0.56 (0.96) 0-15
Pediatric ICU 2.16 (1.08) 1-8 0.96 (1.26) 0-6 0.56 (0.76) 0-4 0.42 (0.68) 0-3 Neonatal ICU 2.65 (1.24) 1-14 0.67 (1.43) 0-16 0.40 (0.86) 0-11 0.29 (0.82) 0-11
Stepdown 4.31 (1.44) 1-18 2.14 (2.20) 0-24 1.10 (1.18) 0-12 1.04 (1.25) 0-12 Telemetry 5.38 (1.42) 1-17 2.48 (2.05) 0-25 1.31 (1.10) 0-11 1.17 (1.32) 0-15
Oncology 5.39 (1.71) 1-15 1.82 (2.25) 0-22 0.97 (1.26) 0-11 0.89 (1.42) 0-15 Emergency 8.06 (4.35) 0-19 10.91 (5.58) 0-38 4.05 (2.83) 0-19 6.85 (4.45) 0-19
Subacute 7.03 (3.18) 2-16 1.52 (2.60) 0-20 0.80 (1.33) 0-10 0.73 (1.45) 0-10 Psychiatric 7.23 (3.40) 1-19 2.28 (2.65) 0-26 1.22 (1.45) 0-13 1.09 (1.62) 0-13
Postpartum 6.38 (2.52) 1-19 3.20 (3.00) 0-28 1.66 (1.70) 0-15 1.56 (1.91) 0-13
Labor & Delivery 2.60 (1.77) 1-19 2.79 (2.39) 0-16 1.51 (1.49) 0-16 1.33 (1.45) 0-13 Operating Room 4.15 (2.56) 1-18 3.93 (4.62) 0-30 1.55 (2.64) 0-18 2.55 (2.77) 0-17 PACU/Recovery 5.77 (2.83) 1-18 9.83 (5.68) 0-38 4.37 (3.36) 0-19 5.55 (3.12) 0-19
Technology Low 5.13 (3.01) 1-19 3.45 (4.25) 0-38 1.60 (2.01) 0-19 1.93, (2.90) 0-19 High 4.51 (2.75) 1-19 3.01 (4.06) 0-38 1.46 (2.00) 0-19 1.60 (2.56) 0-19
Teaching Status
Non-teaching 4.84 (2.90) 1-19 3.30 (4.24) 0-38 1.54 (2.03) 0-19 1.83 (2.83) 0-19
Minor teaching 4.85 (2.89) 1-19 3.32 (4.14) 0-34 1.56 (2.03) 0-18 1.73 (2.67) 0-19
Major teaching 4.24 (2.66) 1-19 2.73 (3.80) 0-32 1.32 (1.84) 0-16 1.46 (2.41) 0-19
Bed Size Small 5.03 (2.98) 1-19 3.46 (4.34) 0-38 1.58 (2.03) 0-19 1.95 (2.95) 0-19
Medium 4.69 (2.81) 1-19 3.08 (4.02) 0-32 1.50 (1.98) 0-18 1.64 (2.58) 0-19
Large 4.50 (2.80) 1-19 2.99 (4.05) 0-38 1.46 (2.02) 0-19 1.59 (2.54) 0-19 Location
California 4.00 (2.45) 0-19 2.93 (3.90) 0-38 1.36 (1.88) 0-19 1.62 (2.55) 0-19
Florida 4.87 (2.80) 0-19 3.32 (4.20) 0-38 1.62 (2.07) 0-19 1.80 (2.78) 0-19 New Jersey 5.32 (3.03) 0-19 3.49 (4.33) 0-34 1.69 (2.12) 0-19 1.86 (2.83) 0-19
Pennsylvania 5.18 (3.08) 0-19 3.15 (4.20) 0-38 1.48 (1.99) 0-19 1.71 (2.72) 0-19
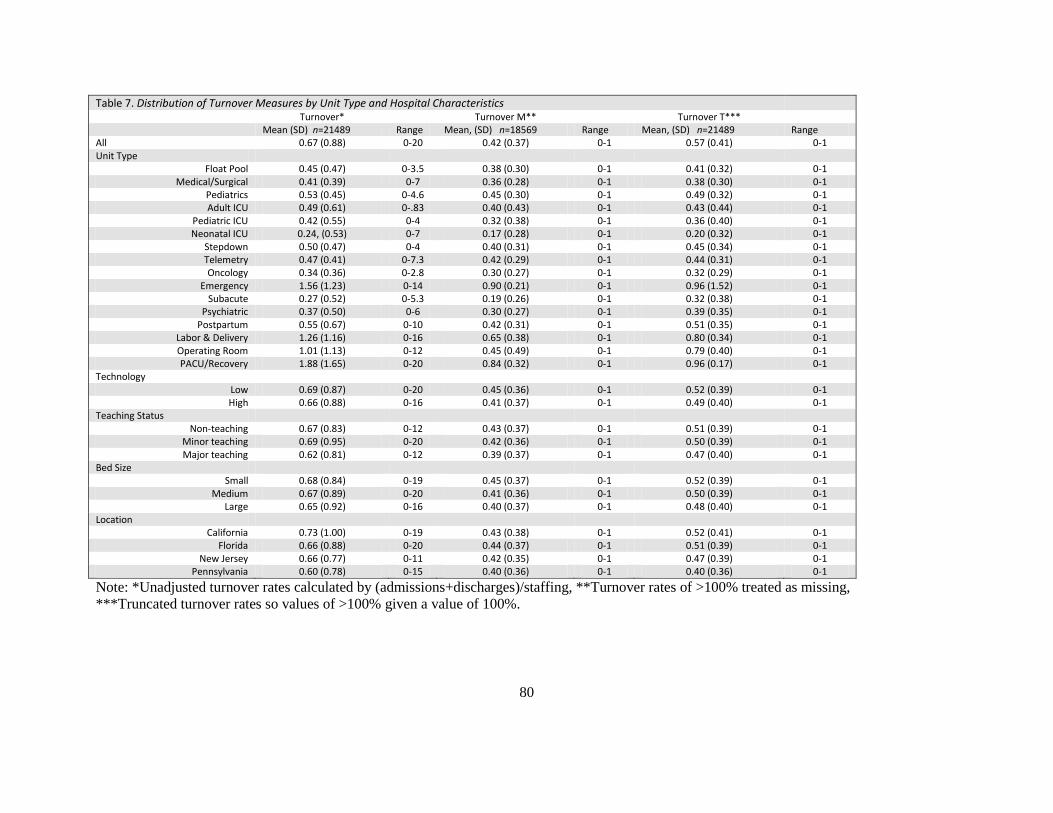
80
Table 7. Distribution of Turnover Measures by Unit Type and Hospital Characteristics
Turnover* Turnover M** Turnover T*** Mean (SD) n=21489 Range Mean, (SD) n=18569 Range Mean, (SD) n=21489 Range All 0.67 (0.88) 0-20 0.42 (0.37) 0-1 0.57 (0.41) 0-1 Unit Type
Float Pool 0.45 (0.47) 0-3.5 0.38 (0.30) 0-1 0.41 (0.32) 0-1 Medical/Surgical 0.41 (0.39) 0-7 0.36 (0.28) 0-1 0.38 (0.30) 0-1
Pediatrics 0.53 (0.45) 0-4.6 0.45 (0.30) 0-1 0.49 (0.32) 0-1 Adult ICU 0.49 (0.61) 0-.83 0.40 (0.43) 0-1 0.43 (0.44) 0-1
Pediatric ICU 0.42 (0.55) 0-4 0.32 (0.38) 0-1 0.36 (0.40) 0-1 Neonatal ICU 0.24, (0.53) 0-7 0.17 (0.28) 0-1 0.20 (0.32) 0-1
Stepdown 0.50 (0.47) 0-4 0.40 (0.31) 0-1 0.45 (0.34) 0-1 Telemetry 0.47 (0.41) 0-7.3 0.42 (0.29) 0-1 0.44 (0.31) 0-1 Oncology 0.34 (0.36) 0-2.8 0.30 (0.27) 0-1 0.32 (0.29) 0-1
Emergency 1.56 (1.23) 0-14 0.90 (0.21) 0-1 0.96 (1.52) 0-1 Subacute 0.27 (0.52) 0-5.3 0.19 (0.26) 0-1 0.32 (0.38) 0-1
Psychiatric 0.37 (0.50) 0-6 0.30 (0.27) 0-1 0.39 (0.35) 0-1 Postpartum 0.55 (0.67) 0-10 0.42 (0.31) 0-1 0.51 (0.35) 0-1
Labor & Delivery 1.26 (1.16) 0-16 0.65 (0.38) 0-1 0.80 (0.34) 0-1 Operating Room 1.01 (1.13) 0-12 0.45 (0.49) 0-1 0.79 (0.40) 0-1 PACU/Recovery 1.88 (1.65) 0-20 0.84 (0.32) 0-1 0.96 (0.17) 0-1
Technology Low 0.69 (0.87) 0-20 0.45 (0.36) 0-1 0.52 (0.39) 0-1 High 0.66 (0.88) 0-16 0.41 (0.37) 0-1 0.49 (0.40) 0-1
Teaching Status Non-teaching 0.67 (0.83) 0-12 0.43 (0.37) 0-1 0.51 (0.39) 0-1
Minor teaching 0.69 (0.95) 0-20 0.42 (0.36) 0-1 0.50 (0.39) 0-1 Major teaching 0.62 (0.81) 0-12 0.39 (0.37) 0-1 0.47 (0.40) 0-1
Bed Size Small 0.68 (0.84) 0-19 0.45 (0.37) 0-1 0.52 (0.39) 0-1
Medium 0.67 (0.89) 0-20 0.41 (0.36) 0-1 0.50 (0.39) 0-1 Large 0.65 (0.92) 0-16 0.40 (0.37) 0-1 0.48 (0.40) 0-1
Location California 0.73 (1.00) 0-19 0.43 (0.38) 0-1 0.52 (0.41) 0-1
Florida 0.66 (0.88) 0-20 0.44 (0.37) 0-1 0.51 (0.39) 0-1 New Jersey 0.66 (0.77) 0-11 0.42 (0.35) 0-1 0.47 (0.39) 0-1
Pennsylvania 0.60 (0.78) 0-15 0.40 (0.36) 0-1 0.40 (0.36) 0-1
Note: *Unadjusted turnover rates calculated by (admissions+discharges)/staffing, **Turnover rates of >100% treated as missing,
***Truncated turnover rates so values of >100% given a value of 100%.
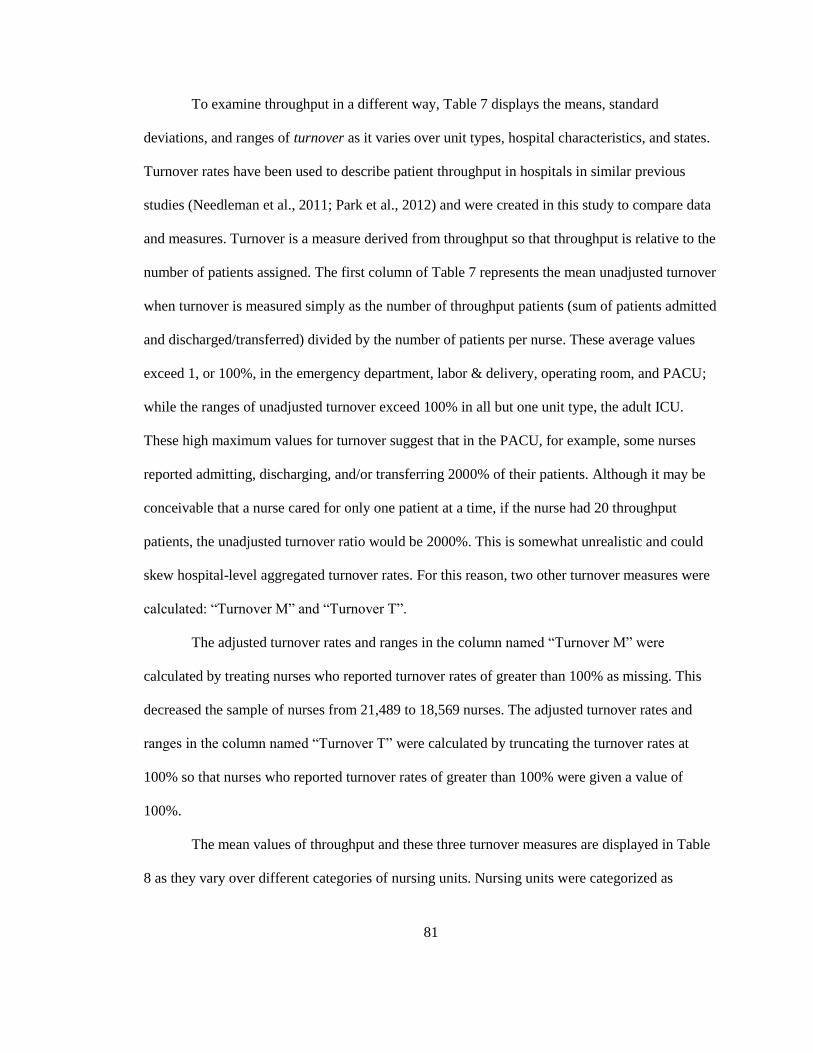
81
To examine throughput in a different way, Table 7 displays the means, standard
deviations, and ranges of turnover as it varies over unit types, hospital characteristics, and states.
Turnover rates have been used to describe patient throughput in hospitals in similar previous
studies (Needleman et al., 2011; Park et al., 2012) and were created in this study to compare data
and measures. Turnover is a measure derived from throughput so that throughput is relative to the
number of patients assigned. The first column of Table 7 represents the mean unadjusted turnover
when turnover is measured simply as the number of throughput patients (sum of patients admitted
and discharged/transferred) divided by the number of patients per nurse. These average values
exceed 1, or 100%, in the emergency department, labor & delivery, operating room, and PACU;
while the ranges of unadjusted turnover exceed 100% in all but one unit type, the adult ICU.
These high maximum values for turnover suggest that in the PACU, for example, some nurses
reported admitting, discharging, and/or transferring 2000% of their patients. Although it may be
conceivable that a nurse cared for only one patient at a time, if the nurse had 20 throughput
patients, the unadjusted turnover ratio would be 2000%. This is somewhat unrealistic and could
skew hospital-level aggregated turnover rates. For this reason, two other turnover measures were
calculated: “Turnover M” and “Turnover T”.
The adjusted turnover rates and ranges in the column named “Turnover M” were
calculated by treating nurses who reported turnover rates of greater than 100% as missing. This
decreased the sample of nurses from 21,489 to 18,569 nurses. The adjusted turnover rates and
ranges in the column named “Turnover T” were calculated by truncating the turnover rates at
100% so that nurses who reported turnover rates of greater than 100% were given a value of
100%.
The mean values of throughput and these three turnover measures are displayed in Table
8 as they vary over different categories of nursing units. Nursing units were categorized as
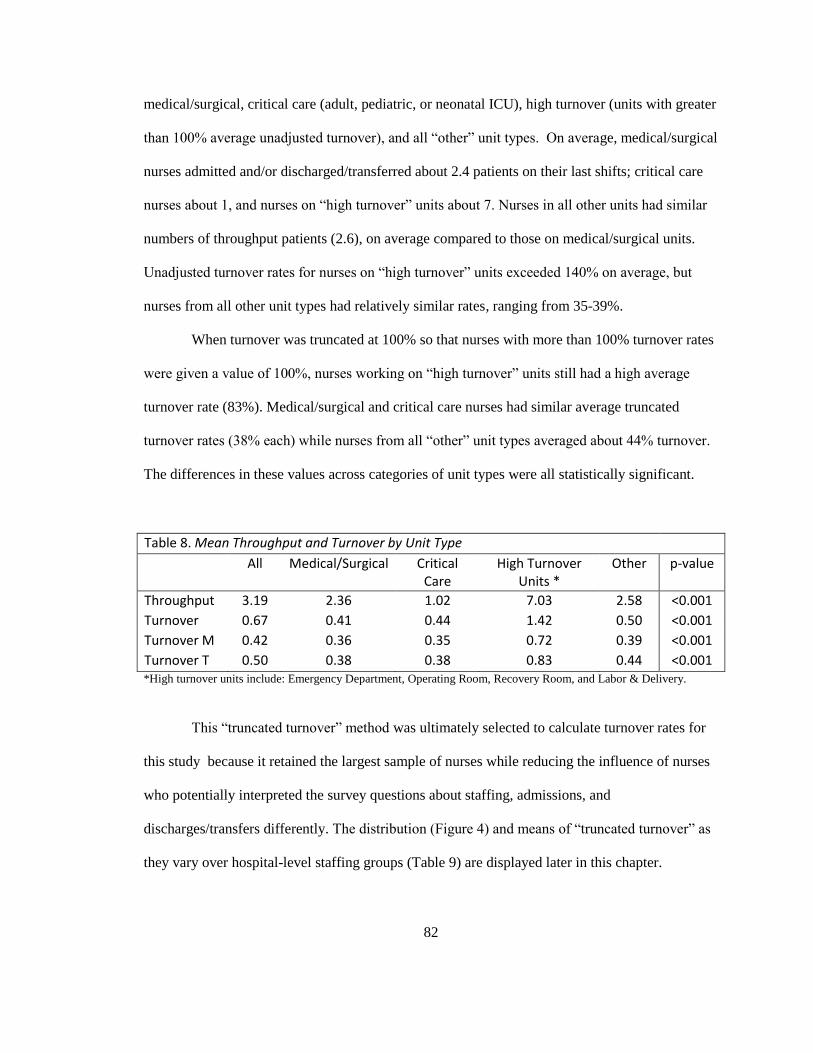
82
medical/surgical, critical care (adult, pediatric, or neonatal ICU), high turnover (units with greater
than 100% average unadjusted turnover), and all “other” unit types. On average, medical/surgical
nurses admitted and/or discharged/transferred about 2.4 patients on their last shifts; critical care
nurses about 1, and nurses on “high turnover” units about 7. Nurses in all other units had similar
numbers of throughput patients (2.6), on average compared to those on medical/surgical units.
Unadjusted turnover rates for nurses on “high turnover” units exceeded 140% on average, but
nurses from all other unit types had relatively similar rates, ranging from 35-39%.
When turnover was truncated at 100% so that nurses with more than 100% turnover rates
were given a value of 100%, nurses working on “high turnover” units still had a high average
turnover rate (83%). Medical/surgical and critical care nurses had similar average truncated
turnover rates (38% each) while nurses from all “other” unit types averaged about 44% turnover.
The differences in these values across categories of unit types were all statistically significant.
Table 8. Mean Throughput and Turnover by Unit Type
All Medical/Surgical Critical Care
High Turnover Units *
Other p-value
Throughput 3.19 2.36 1.02 7.03 2.58 <0.001
Turnover 0.67 0.41 0.44 1.42 0.50 <0.001
Turnover M 0.42 0.36 0.35 0.72 0.39 <0.001
Turnover T 0.50 0.38 0.38 0.83 0.44 <0.001 *High turnover units include: Emergency Department, Operating Room, Recovery Room, and Labor & Delivery.
This “truncated turnover” method was ultimately selected to calculate turnover rates for
this study because it retained the largest sample of nurses while reducing the influence of nurses
who potentially interpreted the survey questions about staffing, admissions, and
discharges/transfers differently. The distribution (Figure 4) and means of “truncated turnover” as
they vary over hospital-level staffing groups (Table 9) are displayed later in this chapter.
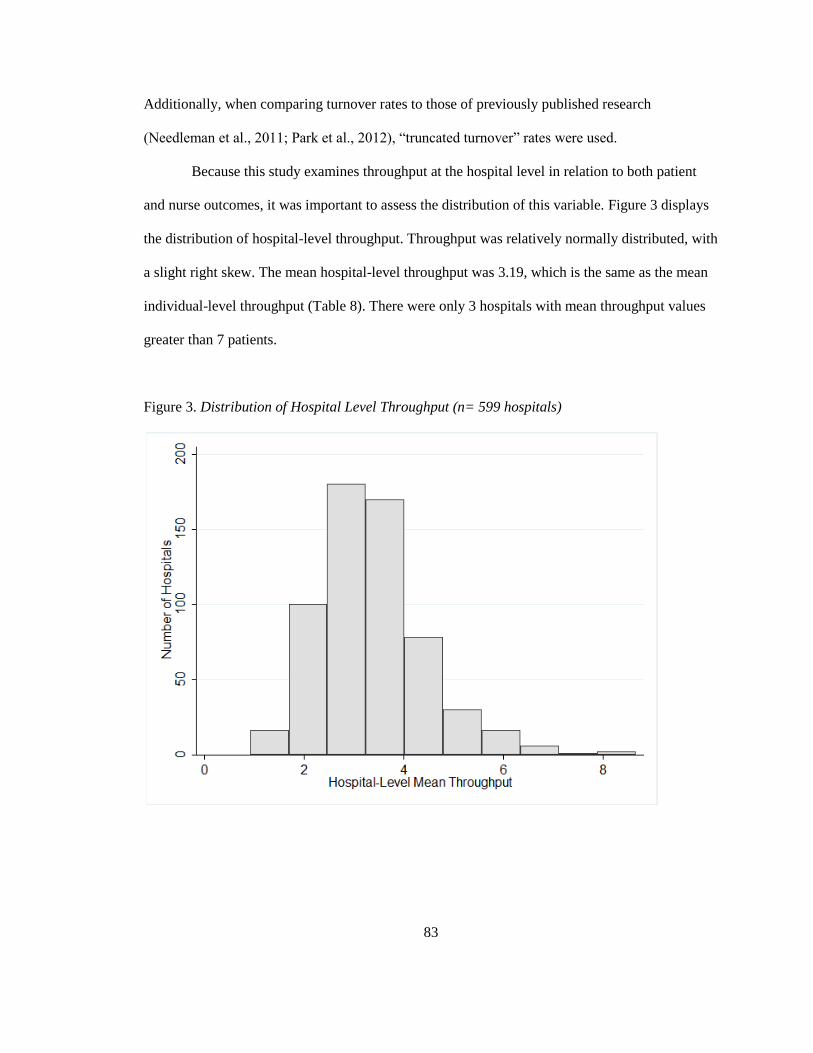
83
Additionally, when comparing turnover rates to those of previously published research
(Needleman et al., 2011; Park et al., 2012), “truncated turnover” rates were used.
Because this study examines throughput at the hospital level in relation to both patient
and nurse outcomes, it was important to assess the distribution of this variable. Figure 3 displays
the distribution of hospital-level throughput. Throughput was relatively normally distributed, with
a slight right skew. The mean hospital-level throughput was 3.19, which is the same as the mean
individual-level throughput (Table 8). There were only 3 hospitals with mean throughput values
greater than 7 patients.
Figure 3. Distribution of Hospital Level Throughput (n= 599 hospitals)
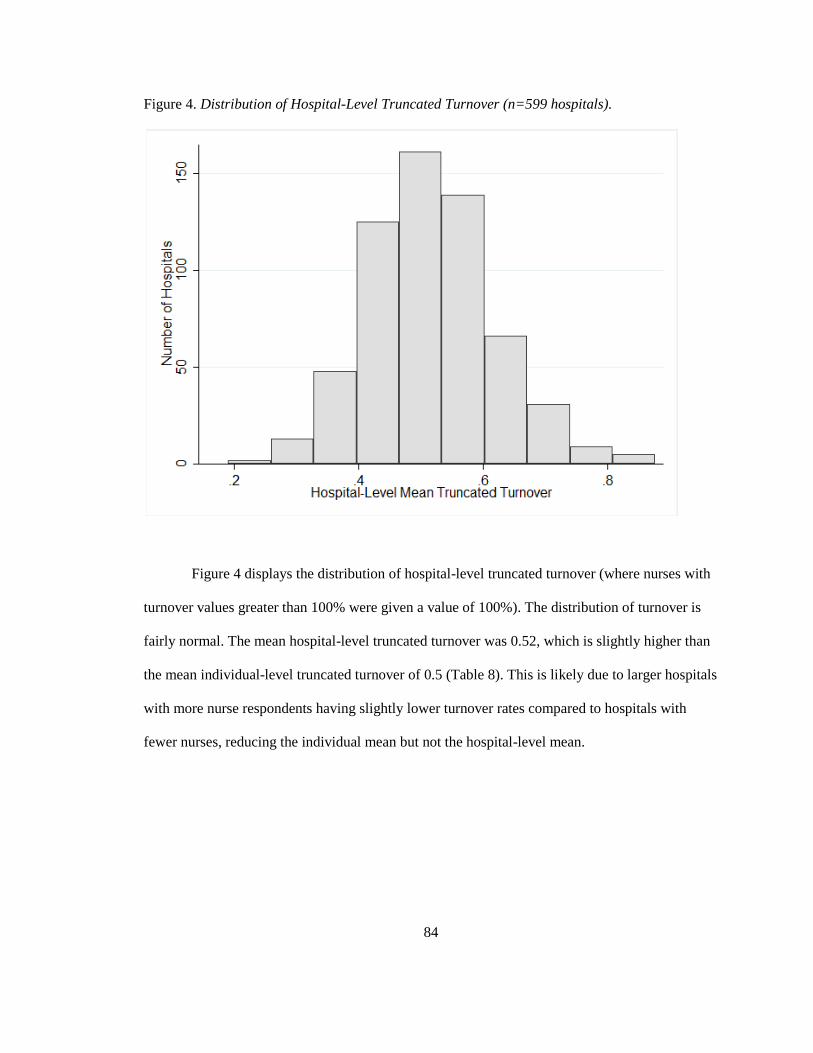
84
Figure 4. Distribution of Hospital-Level Truncated Turnover (n=599 hospitals).
Figure 4 displays the distribution of hospital-level truncated turnover (where nurses with
turnover values greater than 100% were given a value of 100%). The distribution of turnover is
fairly normal. The mean hospital-level truncated turnover was 0.52, which is slightly higher than
the mean individual-level truncated turnover of 0.5 (Table 8). This is likely due to larger hospitals
with more nurse respondents having slightly lower turnover rates compared to hospitals with
fewer nurses, reducing the individual mean but not the hospital-level mean.
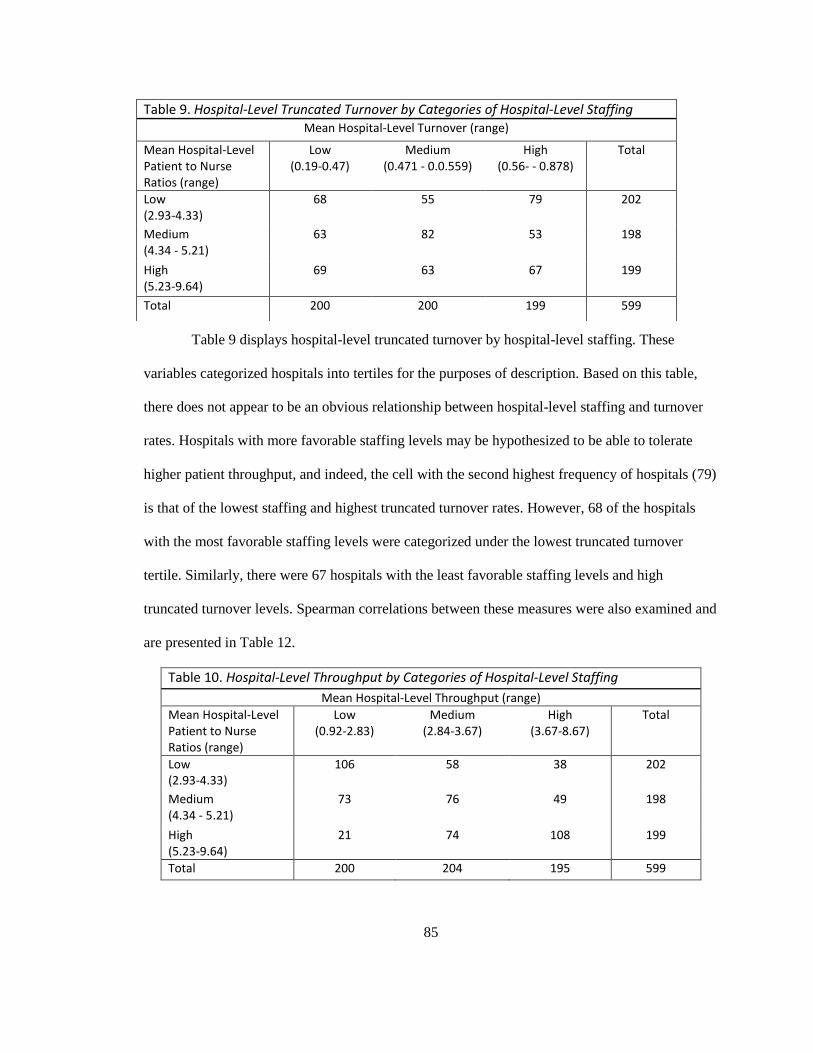
85
Table 9 displays hospital-level truncated turnover by hospital-level staffing. These
variables categorized hospitals into tertiles for the purposes of description. Based on this table,
there does not appear to be an obvious relationship between hospital-level staffing and turnover
rates. Hospitals with more favorable staffing levels may be hypothesized to be able to tolerate
higher patient throughput, and indeed, the cell with the second highest frequency of hospitals (79)
is that of the lowest staffing and highest truncated turnover rates. However, 68 of the hospitals
with the most favorable staffing levels were categorized under the lowest truncated turnover
tertile. Similarly, there were 67 hospitals with the least favorable staffing levels and high
truncated turnover levels. Spearman correlations between these measures were also examined and
are presented in Table 12.
Table 10. Hospital-Level Throughput by Categories of Hospital-Level Staffing
Mean Hospital-Level Throughput (range)
Mean Hospital-Level Patient to Nurse Ratios (range)
Low (0.92-2.83)
Medium (2.84-3.67)
High (3.67-8.67)
Total
Low (2.93-4.33)
106 58 38 202
Medium (4.34 - 5.21)
73 76 49 198
High (5.23-9.64)
21 74 108 199
Total 200 204 195 599
Table 9. Hospital-Level Truncated Turnover by Categories of Hospital-Level Staffing Mean Hospital-Level Turnover (range)
Mean Hospital-Level Patient to Nurse Ratios (range)
Low (0.19-0.47)
Medium (0.471 - 0.0.559)
High (0.56- - 0.878)
Total
Low (2.93-4.33)
68 55 79 202
Medium (4.34 - 5.21)
63 82 53 198
High (5.23-9.64)
69 63 67 199
Total 200 200 199 599
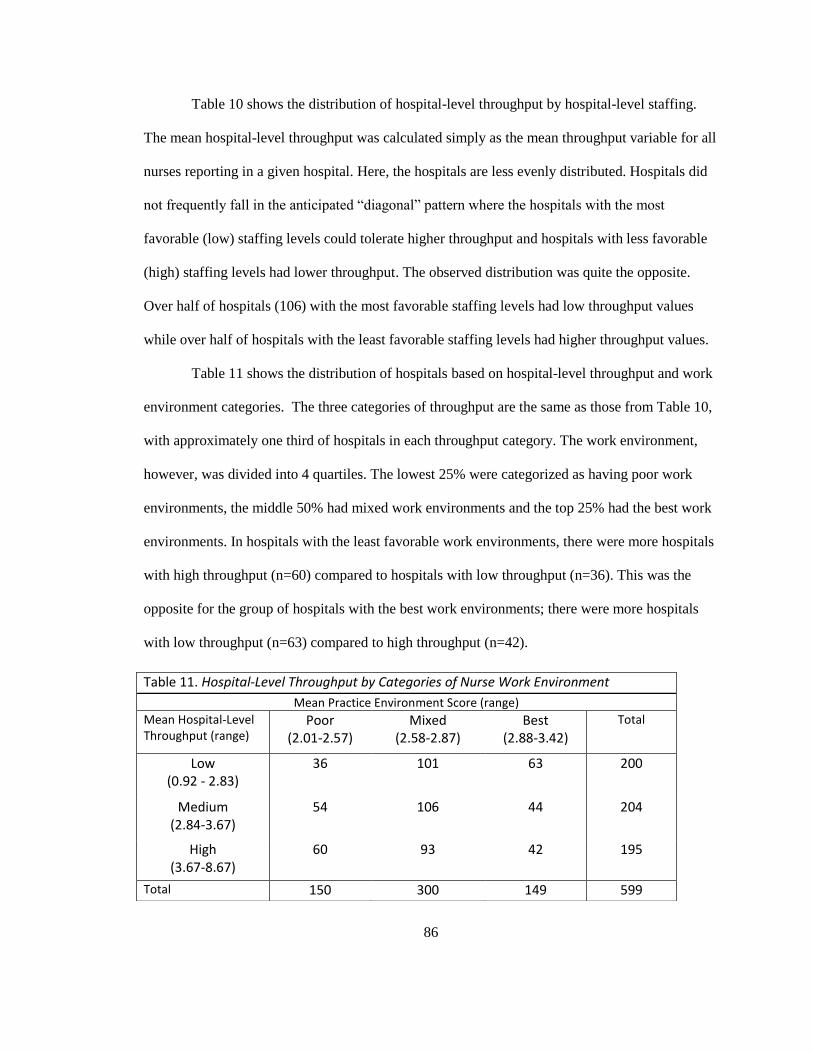
86
Table 10 shows the distribution of hospital-level throughput by hospital-level staffing.
The mean hospital-level throughput was calculated simply as the mean throughput variable for all
nurses reporting in a given hospital. Here, the hospitals are less evenly distributed. Hospitals did
not frequently fall in the anticipated “diagonal” pattern where the hospitals with the most
favorable (low) staffing levels could tolerate higher throughput and hospitals with less favorable
(high) staffing levels had lower throughput. The observed distribution was quite the opposite.
Over half of hospitals (106) with the most favorable staffing levels had low throughput values
while over half of hospitals with the least favorable staffing levels had higher throughput values.
Table 11 shows the distribution of hospitals based on hospital-level throughput and work
environment categories. The three categories of throughput are the same as those from Table 10,
with approximately one third of hospitals in each throughput category. The work environment,
however, was divided into 4 quartiles. The lowest 25% were categorized as having poor work
environments, the middle 50% had mixed work environments and the top 25% had the best work
environments. In hospitals with the least favorable work environments, there were more hospitals
with high throughput (n=60) compared to hospitals with low throughput (n=36). This was the
opposite for the group of hospitals with the best work environments; there were more hospitals
with low throughput (n=63) compared to high throughput (n=42).
Table 11. Hospital-Level Throughput by Categories of Nurse Work Environment
Mean Practice Environment Score (range)
Mean Hospital-Level Throughput (range)
Poor (2.01-2.57)
Mixed (2.58-2.87)
Best (2.88-3.42)
Total
Low (0.92 - 2.83)
36 101 63 200
Medium (2.84-3.67)
54 106 44 204
High (3.67-8.67)
60 93 42 195
Total 150 300 149 599
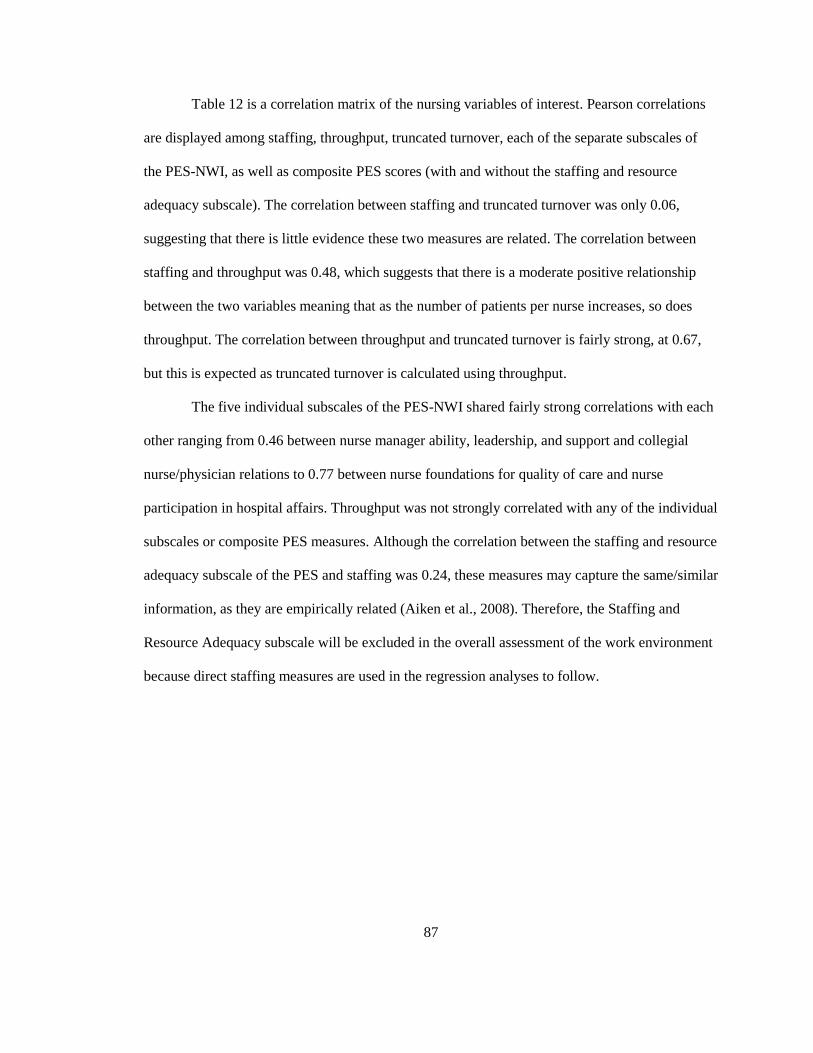
87
Table 12 is a correlation matrix of the nursing variables of interest. Pearson correlations
are displayed among staffing, throughput, truncated turnover, each of the separate subscales of
the PES-NWI, as well as composite PES scores (with and without the staffing and resource
adequacy subscale). The correlation between staffing and truncated turnover was only 0.06,
suggesting that there is little evidence these two measures are related. The correlation between
staffing and throughput was 0.48, which suggests that there is a moderate positive relationship
between the two variables meaning that as the number of patients per nurse increases, so does
throughput. The correlation between throughput and truncated turnover is fairly strong, at 0.67,
but this is expected as truncated turnover is calculated using throughput.
The five individual subscales of the PES-NWI shared fairly strong correlations with each
other ranging from 0.46 between nurse manager ability, leadership, and support and collegial
nurse/physician relations to 0.77 between nurse foundations for quality of care and nurse
participation in hospital affairs. Throughput was not strongly correlated with any of the individual
subscales or composite PES measures. Although the correlation between the staffing and resource
adequacy subscale of the PES and staffing was 0.24, these measures may capture the same/similar
information, as they are empirically related (Aiken et al., 2008). Therefore, the Staffing and
Resource Adequacy subscale will be excluded in the overall assessment of the work environment
because direct staffing measures are used in the regression analyses to follow.
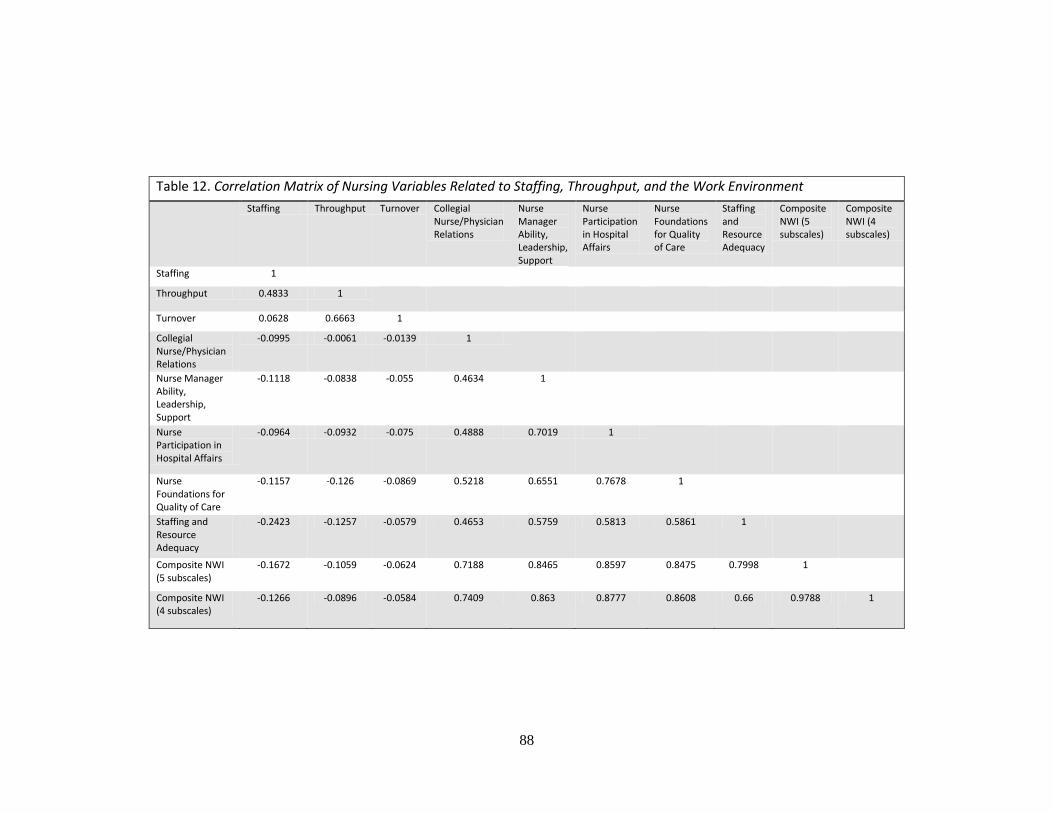
88
Table 12. Correlation Matrix of Nursing Variables Related to Staffing, Throughput, and the Work Environment
Staffing Throughput Turnover Collegial Nurse/Physician Relations
Nurse Manager Ability, Leadership, Support
Nurse Participation in Hospital Affairs
Nurse Foundations for Quality of Care
Staffing and Resource Adequacy
Composite NWI (5 subscales)
Composite NWI (4 subscales)
Staffing 1
Throughput 0.4833 1
Turnover 0.0628 0.6663 1
Collegial Nurse/Physician Relations
-0.0995 -0.0061 -0.0139 1
Nurse Manager Ability, Leadership, Support
-0.1118 -0.0838 -0.055 0.4634 1
Nurse Participation in Hospital Affairs
-0.0964 -0.0932 -0.075 0.4888 0.7019 1
Nurse Foundations for Quality of Care
-0.1157 -0.126 -0.0869 0.5218 0.6551 0.7678 1
Staffing and Resource Adequacy
-0.2423 -0.1257 -0.0579 0.4653 0.5759 0.5813 0.5861 1
Composite NWI (5 subscales)
-0.1672 -0.1059 -0.0624 0.7188 0.8465 0.8597 0.8475 0.7998 1
Composite NWI (4 subscales)
-0.1266 -0.0896 -0.0584 0.7409 0.863 0.8777 0.8608 0.66 0.9788 1
89
Development of Throughput-Adjusted Staffing Measures
Up to this point, staffing and throughput have been described as separate variables. The
goal of the first aim, however, was to develop and describe a measure of nurse staffing that
accounts for throughput so these two variables must be combined. Nurse staffing was adjusted for
throughput and not turnover because the combination of throughput and staffing more accurately
captures nurse workloads. Because turnover is a percentage, hospitals with the same turnover, but
different staffing levels, would be adjusted by the same amount. For example, if one hospital has
an average of 4 patients per nurse and another hospital has an average of 8 patients per nurse and
both had a turnover rate of 50%, they would both be transformed by the same turnover rate of
50% though turning over 2 patients per shift is very different than 4 patients per shift in terms of
nurse workloads. Throughput-adjusted staffing also has the benefit of being more easily
interpreted as patients per nurse to compare to unadjusted staffing (patients per nurse).
Interpreting Throughput-Adjusted Staffing Measures
The methods section outlined three novel ways for combining throughput and staffing
into a singular measure. Each of the three throughput-adjusted staffing measures must be
interpreted in slightly different manners. These differences are important when interpreting the
logistic regression results in the following sections. Therefore, each throughput-adjusted measure
is reviewed and compared to unadjusted staffing here for explanatory purposes. Methodological
implications of these measures are evaluated more specifically in Chapter 5.
Standardized Throughput-Adjusted Staffing
Method 1 standardized nurses’ workloads by multiplying the unadjusted staffing for a
hospital (average number of patients cared for on the last shift per nurse) by a ratio of the
hospital’s throughput to the mean throughput of the other hospitals in this sample. Table 13
90
displays how this method of throughput adjustment functions using example values for
hypothetical hospitals. Hospitals A and B were given equal unadjusted staffing values but
different values for throughput whereas hospitals C and D had different staffing values but equal
throughput values.
The first row displays the unadjusted staffing levels followed by the mean hospital-level
throughput values in the second row. The third row provides examples of the calculation used to
derive the “Standardized Method” of calculating throughput-adjusted staffing. That is, the value
from row 1 (staffing) is multiplied by the ratio of row 2 (throughput) to the mean throughput
(3.19) for all hospitals. The fourth row displays the new throughput-adjusted workload if one
“adjusted” patient were added to the mean standardized workload. The fifth row shows the
unadjusted patient workload equivalent of adding one throughput-standardized patient to
hospitals’ throughput-adjusted workloads. In other words, the fifth row translates the addition of
one throughput-standardized patient into actual (unadjusted) patients. This is calculated with
simple algebra:
new standardized workload = x *[mean throughput/3.19]
Where x is the unadjusted patient equivalent (row 5). The new standardized workload is given in
row 4. The last row shows differences in unadjusted workloads for the addition of one
throughput-standardized patient.
The Standardized throughput-adjusted staffing method only produces adjusted-staffing
values greater than those of unadjusted staffing for hospitals with throughput values above the
mean (3.19). Because Hospital A has a throughput value of 2, which is less than 3.19, the
throughput-adjusted staffing could not exceed its unadjusted staffing value of 5 patients per nurse.
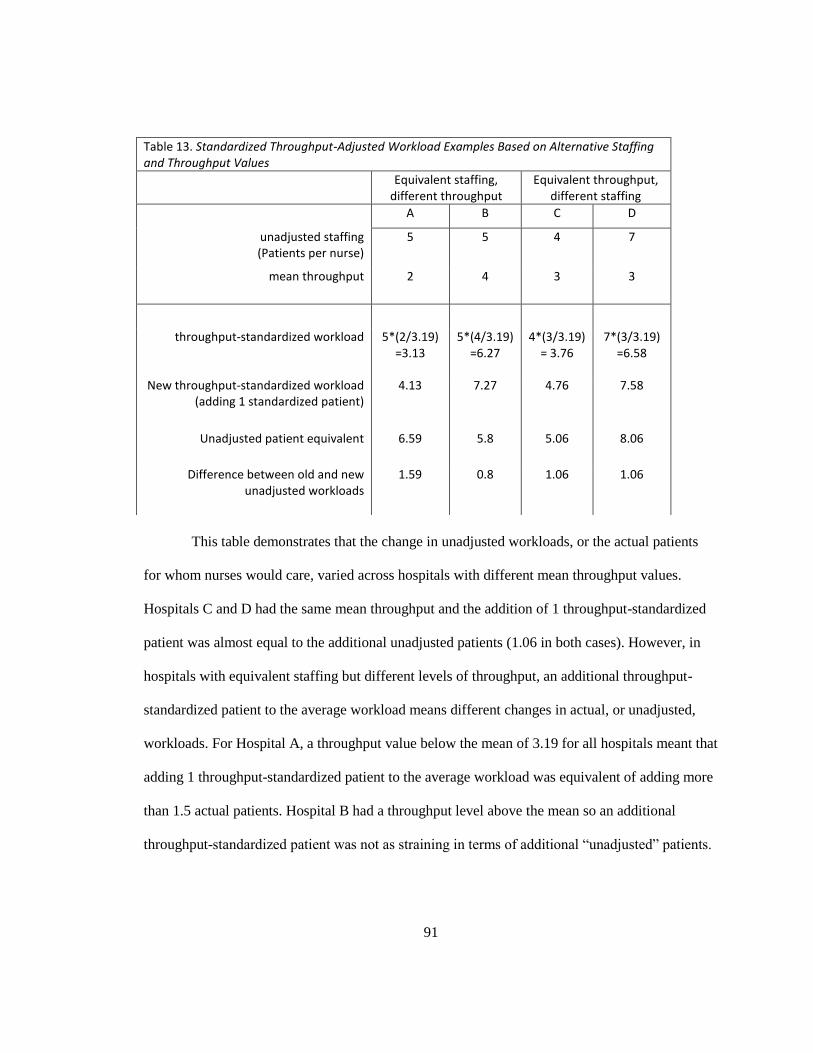
91
This table demonstrates that the change in unadjusted workloads, or the actual patients
for whom nurses would care, varied across hospitals with different mean throughput values.
Hospitals C and D had the same mean throughput and the addition of 1 throughput-standardized
patient was almost equal to the additional unadjusted patients (1.06 in both cases). However, in
hospitals with equivalent staffing but different levels of throughput, an additional throughput-
standardized patient to the average workload means different changes in actual, or unadjusted,
workloads. For Hospital A, a throughput value below the mean of 3.19 for all hospitals meant that
adding 1 throughput-standardized patient to the average workload was equivalent of adding more
than 1.5 actual patients. Hospital B had a throughput level above the mean so an additional
throughput-standardized patient was not as straining in terms of additional “unadjusted” patients.
Table 13. Standardized Throughput-Adjusted Workload Examples Based on Alternative Staffing and Throughput Values
Equivalent staffing, different throughput
Equivalent throughput, different staffing
A B C D
unadjusted staffing (Patients per nurse)
5 5 4 7
mean throughput 2 4 3 3
throughput-standardized workload 5*(2/3.19) =3.13
5*(4/3.19) =6.27
4*(3/3.19) = 3.76
7*(3/3.19) =6.58
New throughput-standardized workload (adding 1 standardized patient)
4.13 7.27 4.76 7.58
Unadjusted patient equivalent 6.59 5.8 5.06 8.06
Difference between old and new unadjusted workloads
1.59 0.8 1.06 1.06
92
Additive Throughput-Adjusted Staffing
The Additive Method weighted throughput patients by a constant factor which attempted
to capture the contribution of a throughput patient relative to an assigned patient in nurses’
workloads. To accomplish this, the Additive Method used hospitals’ unadjusted staffing values
and added a small fraction (constant weight) of the mean throughput to obtain an adjusted
workload measure. This adjusted workload can be interpreted similarly to unadjusted staffing as
patients per nurse. This method was created to make each throughput patient add to nurse
workloads above and beyond assigned patients. Simply adding throughput to unadjusted staffing
would not yield realistic workload estimates because a throughput patient may not be present for
the entirety of a nurse’s shift, thus likely requiring fewer nursing resources than an assigned
patient present on the unit for the entire shift. This method attempted to capture how much each
throughput patient should count relative to assigned patients. As previously noted, this method
carries an inherent assumption that all throughput patients are reported above and beyond nurses’
reported patient assignments and that nurses considered them separately.
This throughput adjustment weight was derived from data within the nurse surveys. A
constant relative weight of each throughput patient to each assigned patient was calculated using
nurses’ reports of hospitals’ staffing and resource adequacy (a subscale of the PES-NWI). The
staffing and resource adequacy subscale was calculated as the mean for each nurse based on four
4-point Likert (strongly disagree, disagree, agree, strongly agree) questions asking the degree to
which nurses agreed with the following 4 statements about their jobs: There are (1) enough staff
to get the work done, (2) enough registered nurses to provide adequate patient care, (3) adequate
support services to allow me to spend time with my patients, and (4) enough time and opportunity
to discuss patient care problems with other nurses (Lake, 2002, p. 181). To calculate the weight,
nurse-level throughput and nurse-level staffing were regressed linearly on the staffing and

93
resource adequacy subscale, accounting for clustering of nurses within hospitals. The results from
this regression are displayed below (Table 14).
Table 14. Development of Additive Adjustment Throughput Term
All Nurses n=25,193
Medical/Surgical Nurses n=3,995
Staffing -0.06 -0.12
p-value <0.001 <0.001 95% CI -0.07 - -0.06 -0.13 - -0.01
Throughput -0.002 -0.04
p-value 0.239 <0.001 95% CI -0.01 – 0.00 -0.05 - -0.03
Ratio of throughput to staffing coefficients 0.03 0.34
Note: Dependent variable= (staffing and resource adequacy), mean of 4 Likert PES-NWI
questions asking nurses the degree to which they feel staffing and resources are adequate
in their current positions.
The ratio of the throughput coefficient to the staffing coefficient for all nurses was then
used as the constant which was multiplied by each hospital’s throughput level to obtain adjusted
workloads. These ratios can be interpreted as the weight of a throughput patient in terms of an
assigned patient in nurses’ assessments of staffing and resource adequacy. In terms of actual
patients, this method estimated that each additional patient admitted, discharged, or transferred
was equivalent to adding about 3% of a patient to the average nurse workloads.
A sensitivity analysis was conducted to assess whether this term might be applicable to
nurses from all unit types (and therefore hospitals with different proportions of nursing unit types
represented in the data). When the same methods were applied to only medical/surgical nurses,
the weight of a throughput patient was much higher (0.34).
For these nurses, admitting, discharging, or transferring a patient was similar to caring for
about an additional one third of a patient. Both staffing and throughput were significant predictors
of nurses’ ratings of staffing and resource adequacy for medical/surgical nurses while only
94
staffing was a statistically significant predictor of staffing and resource adequacy for all nurses.
That a throughput patient counts as only about 3% of an assigned patient may be considered an
understated estimate, especially because the sensitivity analysis shows that medical/surgical
nurses placed higher value on throughput in their ratings of staffing and resource adequacy.
Though this coefficient ratio was considerably lower for all nurses compared to medical/surgical
nurses, the ratio for all nurses was chosen as the adjustment factor for the Additive Method of
throughput-adjusted staffing to keep a sufficient sample of nurses and hospitals.
Time-Based Throughput-Adjusted Staffing
As defined in the methods section, the third throughput-adjustment measure combines
elements of the two previous methods. This Time-Based method merges the elements of
standardization from Method 1 and a relative weight of throughput patients to assigned patients
similar to Method 2. However, the Time-Based method is distinct from the Standardized method
because the resulting throughput-adjusted workloads cannot be lower than unadjusted staffing.
The Time-Based method also does not base the relative weight of a throughput patient on nurses’
perceptions of staffing and resource adequacy, which varied depending on the specialty of nurses
included in the calculation (Table 14).
Instead, the Time-Based method drew upon previous research that has demonstrated that
admitting, discharging, or transferring a single patient requires approximately 1-1.5 hours of a
nurse’s time (Cavouras, 2002; Duffield et al., 2009; Lane et al., 2009). The Time-Based method
incorporated both unadjusted staffing and throughput into the weight of a throughput patient
using not only assigned and throughput patients as reported by nurses, but the time they had
available (shift length) and time required to care for each throughput patient. Again, this makes
an assumption that all throughput patients are in addition to, not built into nurses assigned patient
workloads. For example, if Nurse A worked a 12 hour shift and had 4 patients, theoretically, 3
95
hours of care could be provided to each patient. Nurse B also worked 12 hours with 4 assigned
patients, but discharged one patient then admitted another (for a throughput of 2 patients), and if
each admission and discharge conservatively took 1 hour, Nurse B would only have 10 hours to
divide among the 4 patients. Each of Nurse B’s patients would then receive 2.5 hours. This
example describes nurse workloads at the individual level but serves as the practical impetus
behind aggregating these measures to the hospital level.
This method employed a conservative estimate of 1 hour per throughput patient (based on
previous research). Because mean nurse shift lengths vary over hospitals, each hospital’s mean
nurse shift length was used to calculate the weight of throughput patients. Hospital-level mean
shift lengths ranged from 8.17 to 12.94 hours with a mean of 11.19 hours. Table 15 displays
adjusted workload examples calculated using given staffing and throughput values. Row 1 shows
the given staffing value where column pair A and B has equal staffing and unequal throughput
and shift length values. The column pair C and D has equal throughput values but unequal
staffing and shift length values. Column pair E and F has equal shift length values but unequal
staffing and throughput values. The values displayed in row 4 were calculated based on the
formula provided in Chapter 3:
Hospital level throughput-adjusted staffing3 = hospital level staffing x
Where hospital level staffing = row 1, T = row 2, and SHIFT = value in row 3
Row 5 was calculated by subtracting the values in row 4 from row 1. Row 5 represents the
additional workload that throughput patients contribute above and beyond the assigned patients
(row 1). Values in row 6 were calculated by dividing the number of throughput patients (row 2)
by the additional workload (row 5) to give a relative value for each throughput patient.
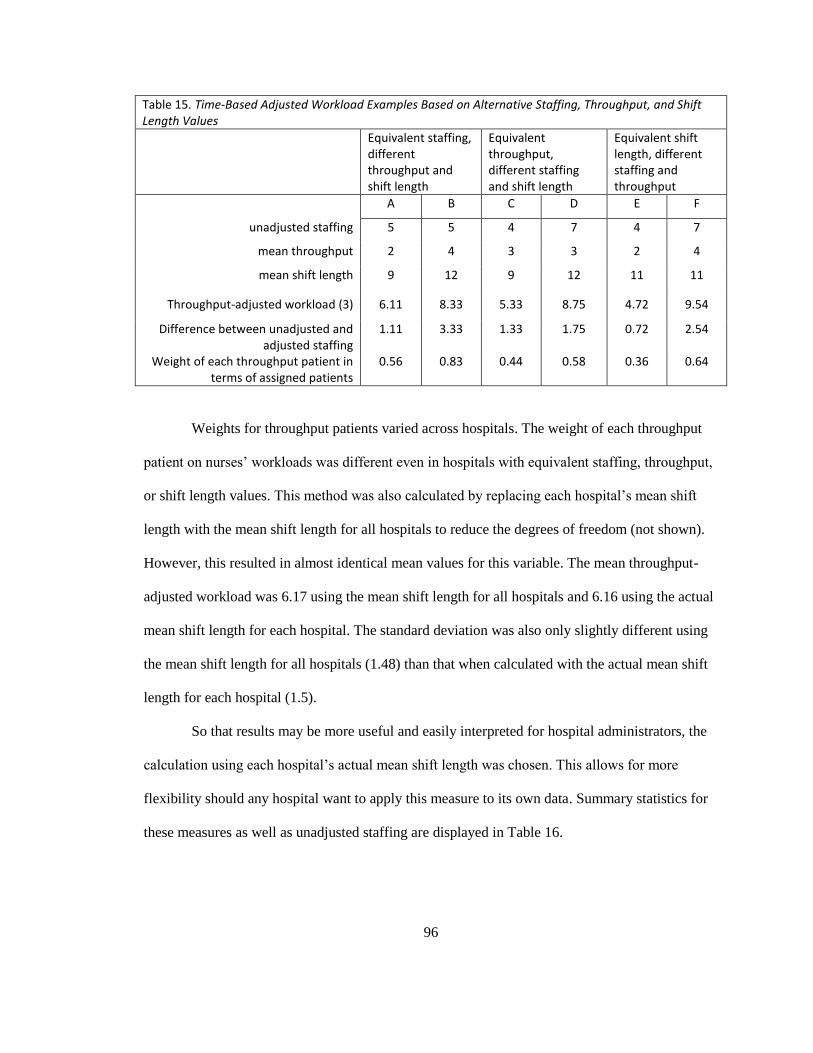
96
Table 15. Time-Based Adjusted Workload Examples Based on Alternative Staffing, Throughput, and Shift Length Values
Equivalent staffing, different throughput and shift length
Equivalent throughput, different staffing and shift length
Equivalent shift length, different staffing and throughput
A B C D E F
unadjusted staffing 5 5 4 7 4 7
mean throughput 2 4 3 3 2 4
mean shift length 9 12 9 12 11 11
Throughput-adjusted workload (3) 6.11 8.33 5.33 8.75 4.72 9.54
Difference between unadjusted and adjusted staffing
1.11 3.33 1.33 1.75 0.72 2.54
Weight of each throughput patient in terms of assigned patients
0.56 0.83 0.44 0.58 0.36 0.64
Weights for throughput patients varied across hospitals. The weight of each throughput
patient on nurses’ workloads was different even in hospitals with equivalent staffing, throughput,
or shift length values. This method was also calculated by replacing each hospital’s mean shift
length with the mean shift length for all hospitals to reduce the degrees of freedom (not shown).
However, this resulted in almost identical mean values for this variable. The mean throughput-
adjusted workload was 6.17 using the mean shift length for all hospitals and 6.16 using the actual
mean shift length for each hospital. The standard deviation was also only slightly different using
the mean shift length for all hospitals (1.48) than that when calculated with the actual mean shift
length for each hospital (1.5).
So that results may be more useful and easily interpreted for hospital administrators, the
calculation using each hospital’s actual mean shift length was chosen. This allows for more
flexibility should any hospital want to apply this measure to its own data. Summary statistics for
these measures as well as unadjusted staffing are displayed in Table 16.

97
Table 16. Hospital-Level Staffing and Adjusted-Staffing Measures Summary Statistics
N Mean SD Range
Staffing 599 4.89 1.07 2.93-9.64
Standardized Throughput-adjusted staffing (1)
599 5.32 2.06 0.91-20.48
Additive Throughput-adjusted staffing (2)
599 5.00 1.09 2.99-9.77
Time-Based Throughput-adjusted staffing (3)
599 6.42 1.75 3.32-13.89
CMI-Adjusted Staffing 563 5.51 2.20 0.00 - 25.81
1/LOS Adjusted Staffing 590 0.99 0.33 0.03 - 2.53
Note: Sample sizes differ due to missing data.
On average, nurses cared for about 4.9 patients on their last shifts. This value was
calculated based on all inpatient nurse respondents aggregated to the hospital-level. Using
Method 1: Standardized Method, throughput-adjusted staffing (1) was calculated. This method
transformed the hospital-level staffing mean to 5.32 from 4.89, which appears to be a modest
boost. Because hospitals with throughput lower than the mean for all hospitals had their staffing
values multiplied by a factor less than 1, their staffing values decreased. However, hospitals with
throughput much higher than the mean could have their staffing values multiplied by a factor
greater than 1, and in some cases, greater than 2 so that their adjusted staffing values were
inflated by over 200%. This is reflected in the range of Standardized throughput-adjusted staffing
(1) having a minimum value (0.91) below the minimum value of unadjusted staffing (2.93) and a
maximum value (20.48) greater than the maximum value for unadjusted staffing (9.64). The
standard deviation for throughput-adjusted staffing (1) was almost twice as that of unadjusted
staffing.
Using Method 2: the Additive method to calculate throughput-adjusted staffing resulted
in very slight changes to the mean, standard deviation, and range of the unadjusted staffing
measure. The mean value of hospital-level staffing was transformed from 4.89 to 5 patients per
nurse. The standard deviation and range barely increased. The minimum value of the hospital-
98
level Additive throughput-adjusted staffing (2.99) did not move beyond the lower bound of
unadjusted staffing (2.93) and the maximum value (9.77) barely exceeded that of unadjusted
staffing (9.64).
The last throughput-adjusted staffing measure (3) was calculated based on Method 3: the
Time-Based method which combines elements of the first two methods. Using the Time-Based
method, the hospital-level staffing mean was 6.4 throughput-adjusted patients per nurse,
compared to 4.9 unadjusted patients per nurse. The standard deviation (1.75) was larger than that
of unadjusted staffing (1.07), but less than the standard deviation of the Standardized method
(2.06). The Time-Based method did not allow for hospitals to have more favorable staffing if they
have lower than average throughput. The minimum value (3.32) did not fall below the minimum
for unadjusted staffing (2.93). The upper bound (13.89) did exceed that of unadjusted staffing
(9.64), but not by as much as the Standardized method. The Time-Based method appears to be a
reasonable midpoint between Standardized throughput-adjusted staffing, which may have over-
adjusted, and Additive throughput-adjusted staffing, which did not appear to adjust staffing for
throughput enough.
CMI-adjusted staffing and 1/LOS-adjusted staffing could not be calculated for all 599
hospitals due to missing data and because 19 hospitals in this sample did not participate in the
2006 AHA Survey. CMI-adjusted staffing aimed to estimate patient acuity-adjusted staffing. The
hospital-level mean CMI-adjusted staffing was about 5.5 patients per nurse, which is relatively
similar to the means for each of the throughput-adjusted staffing measures. However, the range of
CMI-adjusted staffing ranged from 0-25.81 due to the uneven and skewed distribution of CMI
(Figure 5).
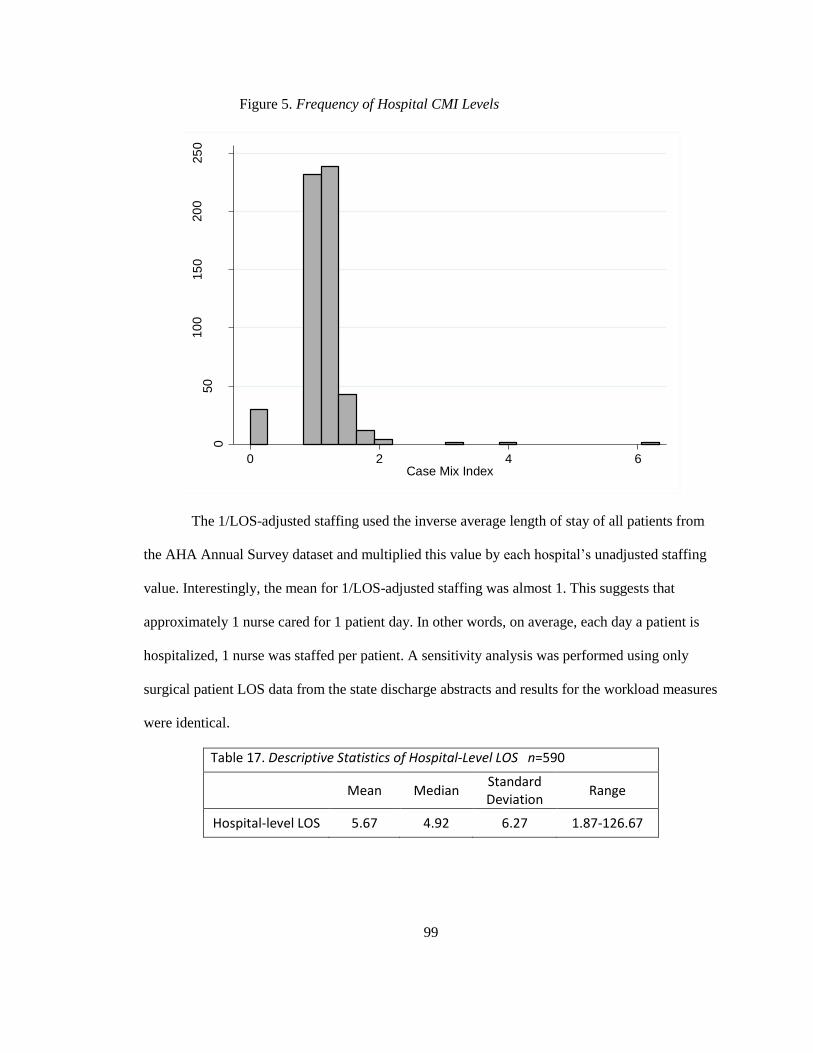
99
Figure 5. Frequency of Hospital CMI Levels
The 1/LOS-adjusted staffing used the inverse average length of stay of all patients from
the AHA Annual Survey dataset and multiplied this value by each hospital’s unadjusted staffing
value. Interestingly, the mean for 1/LOS-adjusted staffing was almost 1. This suggests that
approximately 1 nurse cared for 1 patient day. In other words, on average, each day a patient is
hospitalized, 1 nurse was staffed per patient. A sensitivity analysis was performed using only
surgical patient LOS data from the state discharge abstracts and results for the workload measures
were identical.
Table 17. Descriptive Statistics of Hospital-Level LOS n=590
Mean Median
Standard Deviation
Range
Hospital-level LOS 5.67 4.92 6.27 1.87-126.67
050
10
015
020
025
0
Nu
mbe
r of H
osp
itals
0 2 4 6Case Mix Index
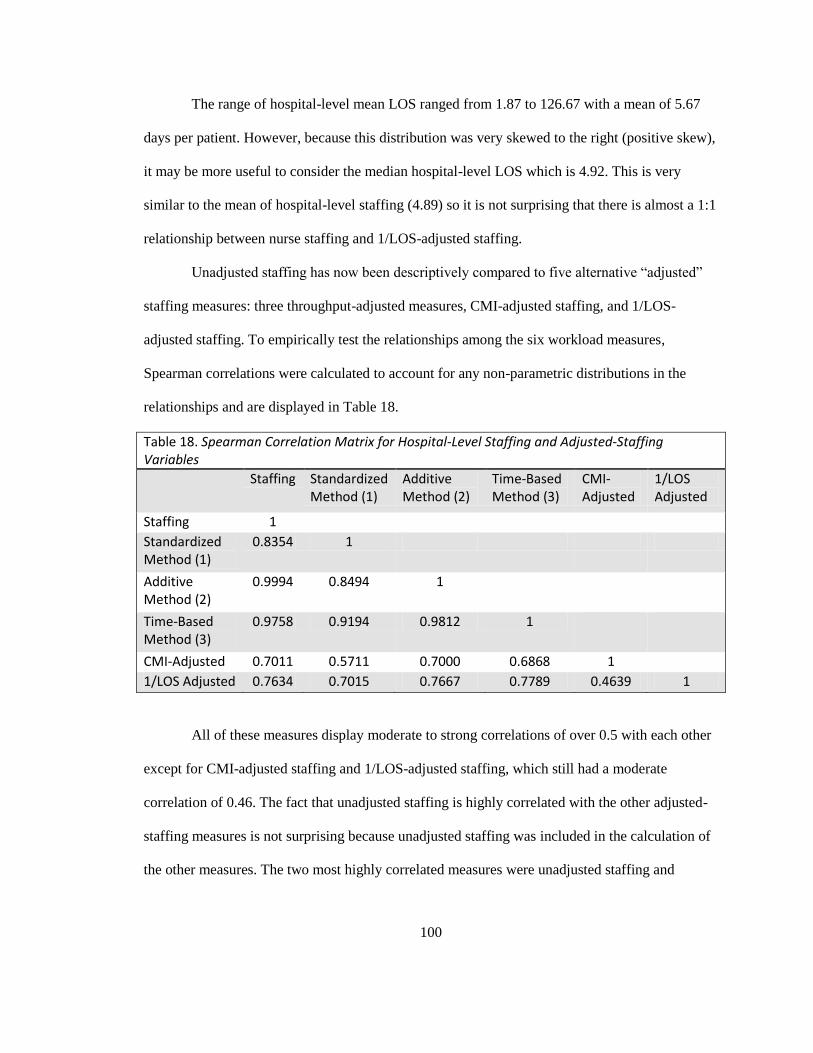
100
The range of hospital-level mean LOS ranged from 1.87 to 126.67 with a mean of 5.67
days per patient. However, because this distribution was very skewed to the right (positive skew),
it may be more useful to consider the median hospital-level LOS which is 4.92. This is very
similar to the mean of hospital-level staffing (4.89) so it is not surprising that there is almost a 1:1
relationship between nurse staffing and 1/LOS-adjusted staffing.
Unadjusted staffing has now been descriptively compared to five alternative “adjusted”
staffing measures: three throughput-adjusted measures, CMI-adjusted staffing, and 1/LOS-
adjusted staffing. To empirically test the relationships among the six workload measures,
Spearman correlations were calculated to account for any non-parametric distributions in the
relationships and are displayed in Table 18.
Table 18. Spearman Correlation Matrix for Hospital-Level Staffing and Adjusted-Staffing Variables
Staffing Standardized Method (1)
Additive Method (2)
Time-Based Method (3)
CMI-Adjusted
1/LOS Adjusted
Staffing 1
Standardized Method (1)
0.8354 1
Additive Method (2)
0.9994 0.8494 1
Time-Based Method (3)
0.9758 0.9194 0.9812 1
CMI-Adjusted 0.7011 0.5711 0.7000 0.6868 1
1/LOS Adjusted 0.7634 0.7015 0.7667 0.7789 0.4639 1
All of these measures display moderate to strong correlations of over 0.5 with each other
except for CMI-adjusted staffing and 1/LOS-adjusted staffing, which still had a moderate
correlation of 0.46. The fact that unadjusted staffing is highly correlated with the other adjusted-
staffing measures is not surprising because unadjusted staffing was included in the calculation of
the other measures. The two most highly correlated measures were unadjusted staffing and
101
Additive Throughput-Adjusted Staffing (r=1). Standardized throughput-adjusted staffing had the
weakest correlation with unadjusted staffing compared to the other two throughput-adjusted
measures, although the correlation was r=0.84, which is suggestive of a strong relationship. The
third, or Time-Based method, had a very strong correlation of r=0.98 with unadjusted staffing.
Summary of Specific Aim 1 Results
Specific Aim 1 was achieved by developing and describing three throughput-adjusted
workload measures. These measures were compared to one another as well as unadjusted staffing,
CMI-adjusted staffing, and 1/LOS-adjusted staffing using Spearman rank correlations. CMI-
adjusted staffing had the lowest correlation with unadjusted staffing at about 0.7, which was still
considerably strong. The Additive throughput-adjustment method had the strongest correlation
with unadjusted staffing. In fact the correlation was almost 1, indicating that this measure may
not be much different than unadjusted staffing. The Time-Based method of throughput-adjusted
staffing appeared to be a midpoint between the Standardized and Additive methods in terms of
both range and Spearman correlation with unadjusted staffing. The ranges for CMI-adjusted and
1/LOS-adjusted workloads deviated the most from the range of unadjusted hospital-level staffing.
Analysis of Specific Aim 2
Specific Aim 2a
To determine whether throughput-adjusted staffing is associated with patient outcomes (mortality
and failure to rescue).
Before examining the relationships between each of the staffing measures and patient
outcomes using regression models, descriptive tables were made to display how each of the
staffing and adjusted-staffing measures varied over hospitals placed in quartiles based on their
30-day mortality and FTR rates. Additionally, one-way analyses of variance were conducted to
observe if these mean staffing values varied significantly across quartiles of patient outcomes.
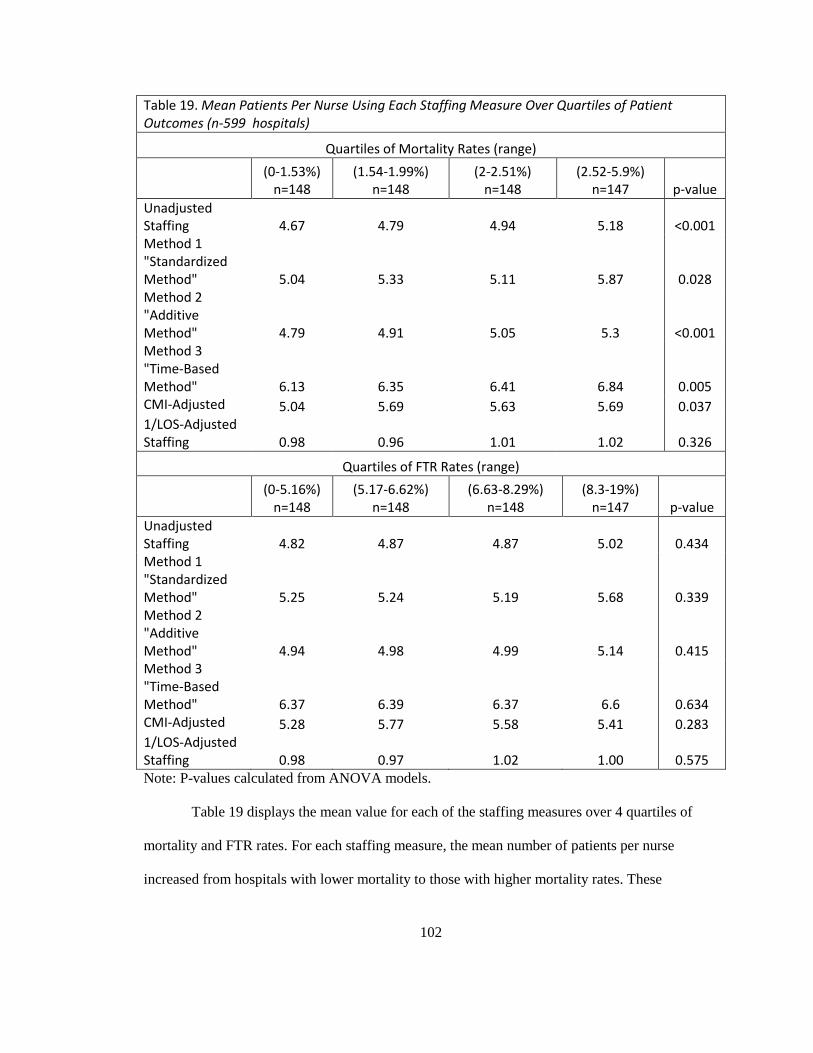
102
Table 19. Mean Patients Per Nurse Using Each Staffing Measure Over Quartiles of Patient Outcomes (n-599 hospitals)
Quartiles of Mortality Rates (range)
(0-1.53%) n=148
(1.54-1.99%) n=148
(2-2.51%) n=148
(2.52-5.9%) n=147 p-value
Unadjusted Staffing 4.67 4.79 4.94 5.18 <0.001 Method 1 "Standardized Method" 5.04 5.33 5.11 5.87 0.028 Method 2 "Additive Method" 4.79 4.91 5.05 5.3 <0.001 Method 3 "Time-Based Method" 6.13 6.35 6.41 6.84 0.005 CMI-Adjusted 5.04 5.69 5.63 5.69 0.037 1/LOS-Adjusted Staffing 0.98 0.96 1.01 1.02 0.326
Quartiles of FTR Rates (range)
(0-5.16%) n=148
(5.17-6.62%) n=148
(6.63-8.29%) n=148
(8.3-19%) n=147 p-value
Unadjusted Staffing 4.82 4.87 4.87 5.02 0.434 Method 1 "Standardized Method" 5.25 5.24 5.19 5.68 0.339 Method 2 "Additive Method" 4.94 4.98 4.99 5.14 0.415 Method 3 "Time-Based Method" 6.37 6.39 6.37 6.6 0.634 CMI-Adjusted 5.28 5.77 5.58 5.41 0.283 1/LOS-Adjusted Staffing 0.98 0.97 1.02 1.00 0.575 Note: P-values calculated from ANOVA models.
Table 19 displays the mean value for each of the staffing measures over 4 quartiles of
mortality and FTR rates. For each staffing measure, the mean number of patients per nurse
increased from hospitals with lower mortality to those with higher mortality rates. These
103
differences across categories of hospitals based on mortality rates were statistically significant for
all except 1/LOS-adjusted staffing. The differences in staffing values across hospitals categorized
based on their FTR rates were not significantly different across categories but did trend upward
somewhat from low to high FTR rate categories. That is, there were slightly more assigned or
adjusted patients per nurse in hospitals with higher compared to lower FTR rates.
To assess whether each or any of the throughput-adjusted staffing measures were
significantly associated with mortality and FTR, a series of logistic regressions were performed.
By using sequential model building, it was possible to see if these measures were significant in
bivariate analyses as well as with the introduction of control variables. For comparison, these
sequential regressions were performed on unadjusted staffing as well as CMI-adjusted staffing
and 1/LOS-adjusted staffing.
The following tables present three models for each of the two patient outcomes (mortality
and FTR). As outlined in the methods section, 3 models were created sequentially so that Model 2
builds upon Model 1 and Model 3 (fully adjusted model) builds upon Model 2. For both patient
outcomes, model 1 represents the unadjusted, or bivariate, logistic regression results. Model 2
controls for patient characteristics and structural hospital characteristics, and Model 3 controls for
the same variables as Model 2 with the addition of the nurse work environment. Again, hospitals
were categorized into three nurse work environment categories based on their aggregate mean
score of 4 subscales of the PES-NWI (excluding staffing and resource adequacy). Hospitals in the
lowest 25% were categorized as “poor”, the middle 50% were “mixed”, and the top 25% had the
“best” work environments.
The results of the logistic regressions for each of the six staffing measures (unadjusted,
throughput adjusted methods 1-3, CMI-adjusted, and 1/LOS-adjusted) are displayed in Tables 20
(30-day mortality) and 21 (FTR). All models account for the clustering of patients within
104
hospitals. Each staffing measure was modeled separately using the same control variables. Of
note, the sample size (n) in each of these tables is different because mortality rates are calculated
from death rates based on the whole sample of surgical patients whereas failure to rescue is based
on only those who suffered complications. The first column in each model, titled “OR”, stands for
the odds ratios and the third column in each model, “95% CI” stands for the confidence interval
associated with each odds ratio estimate.
Table 20 displays the results for 30-day mortality. Unadjusted staffing was a statistically
significant predictor of patient 30-day mortality in all of the models. In the fully adjusted model,
an increase of one patient to a hospital’s average nurse workload was associated with a 5%
increase in the odds of death in this surgical patient population. The three methods for measuring
throughput-adjusting staffing were all significantly associated with 30-day mortality as well.
CMI-adjusted staffing and 1/LOS adjusted staffing were not statistically significant predictors of
30-day mortality in any of the models, including the unadjusted bivariate models.
How do those measures that were significantly associated with 30-day mortality compare
to one another? Unadjusted staffing was the basis for comparison for the three throughput-
adjusted staffing measures. The Standardized and Time-Based methods resulted in lower odds
ratios than those seen with unadjusted staffing. Additive throughput-adjusted staffing resulted in
slightly higher odds ratios in models 1 and 2 but when the nurse work environment was
introduced in model 3, the odds ratios for Additive throughput-adjusted and unadjusted staffing
were the same (1.05).
The odds ratios associated with Standardized throughput-adjusted staffing (Method 1)
can be interpreted as the effect of the addition of one more throughput-adjusted patient to a
nurse’s workload. A throughput-adjusted patient is not a constant value across all hospitals, as
demonstrated in Table 13. According to Method 1, each throughput-adjusted patient “counts”

105
differently in hospitals with different staffing levels. The mean for hospital-level staffing was
about 4.9 (Table 13). Because a hospital’s staffing value is multiplied by its mean turnover and
then divided by the mean throughput (3.19), an additional throughput-adjusted patient can be
considered equivalent to that hospital’s staffing value divided by 3.19. As outlined in Table 13,
this may translate to more or less than 1 “actual”, or unadjusted, patient as would be measured in
unadjusted staffing.
The odds ratios associated with the Additive and Time-Based throughput-adjusted
staffing measures are interpreted differently. One more Additive-adjusted patient is very similar
to one more unadjusted patient for nurse workloads because throughput patients counted very
little towards nurse workloads (only about 3% of an assigned patient). On the other hand, one
more patient when calculated using the Time-Based method, holding all else (throughput and
shift length) constant, is interpreted as an additional assigned patient given time and throughput
constraints. In other words, it is the change in nurses’ workloads if assigned one more patient
while still caring for the same amount of throughput patients in the same time period.
In the fully adjusted models (Model 3), patients treated in hospitals with mixed work
environments did not have statistically different odds of mortality compared to patients treated in
hospitals with poor work environments in models for five of the six staffing measures. When
1/LOS-adjusted staffing was used in the model, the difference in the odds of mortality between
patients treated in hospitals with mixed work environments as compared to poor were 6% lower.
In all fully-adjusted models using any of the six staffing measures, patients treated in hospitals
with the best work environments had about 13-14% lower odds of death compared to patients
treated in hospitals with the least favorable work environments. This effect was slightly more
pronounced when CMI-adjusted staffing or 1/LOS-adjusted staffing were used in the models (15-
16% lower odds of death).

106
When the work environment was added to the models, the p-values for the unadjusted
and throughput-adjusted measures become slightly larger (though still statistically significant at
the 0.01 level). In addition, the odds ratios decreased slightly for all except the Standardized
throughput-adjusted measure. The coefficient for the unadjusted staffing measure went from 1.06
to 1.05, the Additive measure went from 1.07 to 1.05, and the Time-Based measure went from
1.04 to 1.03. This suggests that the work environment explained some of the effect of the
workload measures on mortality.
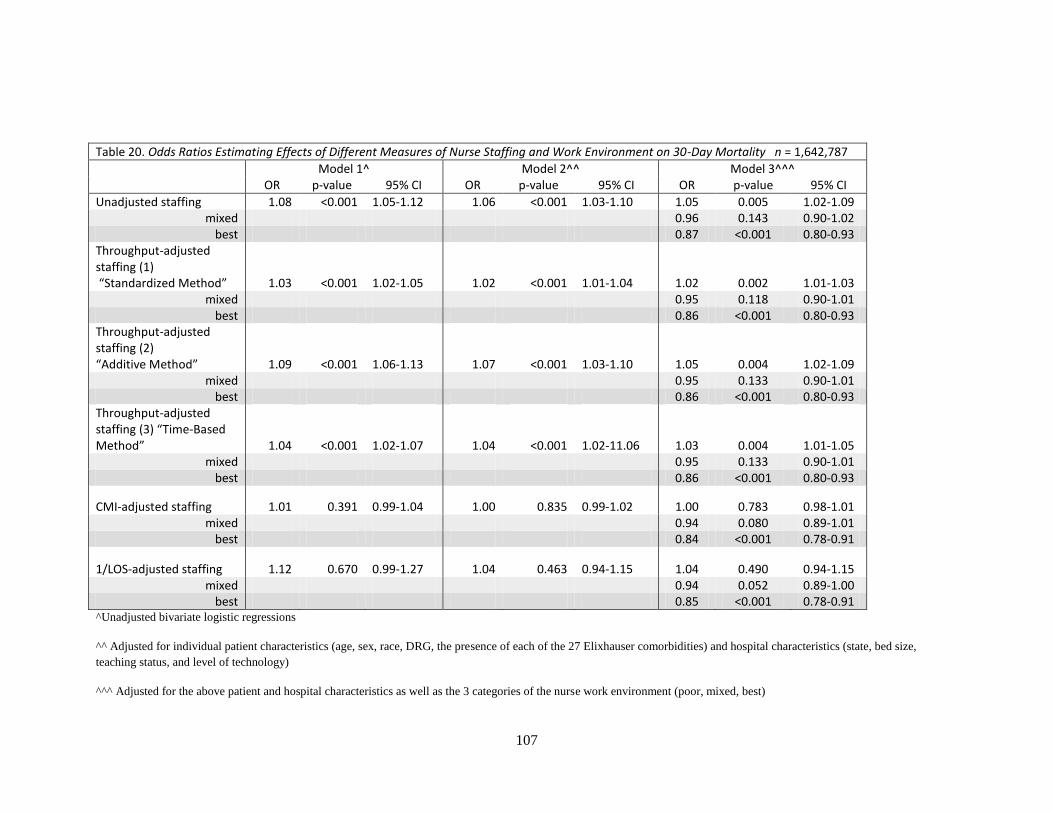
107
Table 20. Odds Ratios Estimating Effects of Different Measures of Nurse Staffing and Work Environment on 30-Day Mortality n = 1,642,787
Model 1^ Model 2^^ Model 3^^^ OR p-value 95% CI OR p-value 95% CI OR p-value 95% CI
Unadjusted staffing 1.08 <0.001 1.05-1.12 1.06 <0.001 1.03-1.10 1.05 0.005 1.02-1.09 mixed 0.96 0.143 0.90-1.02
best 0.87 <0.001 0.80-0.93 Throughput-adjusted staffing (1) “Standardized Method” 1.03 <0.001 1.02-1.05 1.02 <0.001 1.01-1.04 1.02 0.002 1.01-1.03
mixed 0.95 0.118 0.90-1.01 best 0.86 <0.001 0.80-0.93
Throughput-adjusted staffing (2) “Additive Method” 1.09 <0.001 1.06-1.13 1.07 <0.001 1.03-1.10 1.05 0.004 1.02-1.09
mixed 0.95 0.133 0.90-1.01 best 0.86 <0.001 0.80-0.93
Throughput-adjusted staffing (3) “Time-Based Method” 1.04 <0.001 1.02-1.07 1.04 <0.001 1.02-11.06 1.03 0.004 1.01-1.05
mixed 0.95 0.133 0.90-1.01 best 0.86 <0.001 0.80-0.93
CMI-adjusted staffing 1.01 0.391 0.99-1.04 1.00 0.835 0.99-1.02 1.00 0.783 0.98-1.01 mixed 0.94 0.080 0.89-1.01
best 0.84 <0.001 0.78-0.91
1/LOS-adjusted staffing 1.12 0.670 0.99-1.27 1.04 0.463 0.94-1.15 1.04 0.490 0.94-1.15 mixed 0.94 0.052 0.89-1.00
best 0.85 <0.001 0.78-0.91 ^Unadjusted bivariate logistic regressions
^^ Adjusted for individual patient characteristics (age, sex, race, DRG, the presence of each of the 27 Elixhauser comorbidities) and hospital characteristics (state, bed size,
teaching status, and level of technology)
^^^ Adjusted for the above patient and hospital characteristics as well as the 3 categories of the nurse work environment (poor, mixed, best)
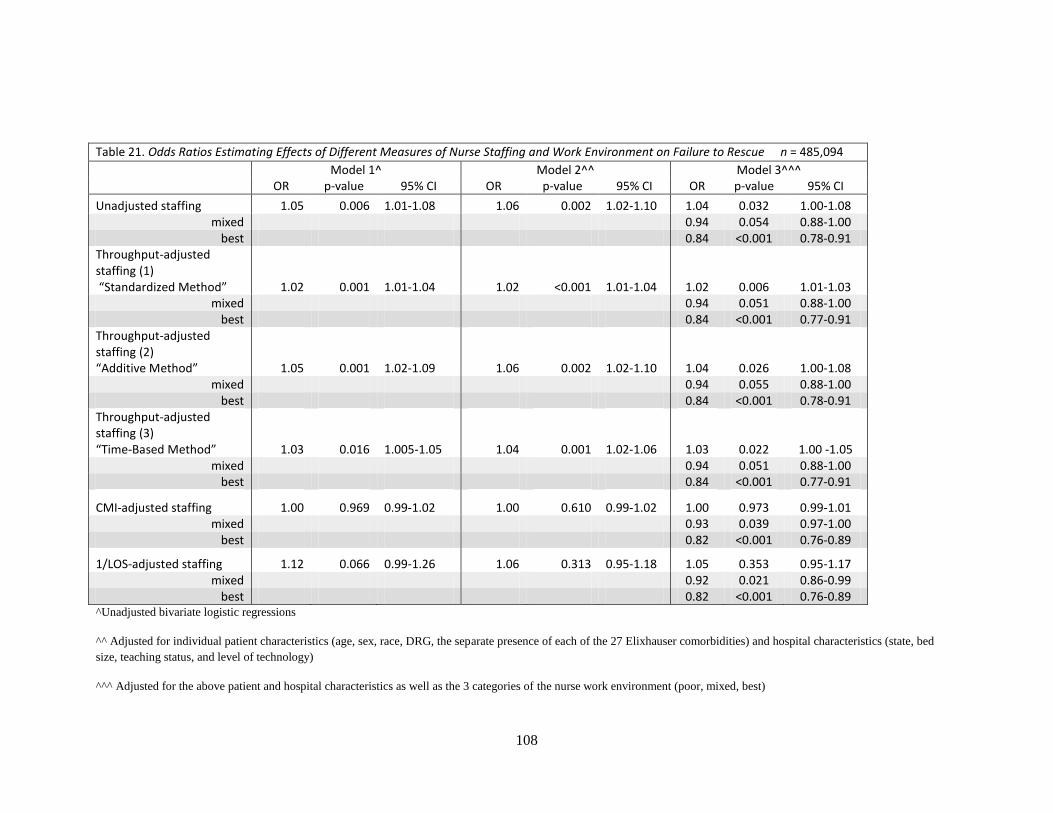
108
Table 21. Odds Ratios Estimating Effects of Different Measures of Nurse Staffing and Work Environment on Failure to Rescue n = 485,094
Model 1^ Model 2^^ Model 3^^^ OR p-value 95% CI OR p-value 95% CI OR p-value 95% CI
Unadjusted staffing 1.05 0.006 1.01-1.08 1.06 0.002 1.02-1.10 1.04 0.032 1.00-1.08 mixed 0.94 0.054 0.88-1.00
best 0.84 <0.001 0.78-0.91 Throughput-adjusted staffing (1) “Standardized Method” 1.02 0.001 1.01-1.04 1.02 <0.001 1.01-1.04 1.02 0.006 1.01-1.03
mixed 0.94 0.051 0.88-1.00 best 0.84 <0.001 0.77-0.91
Throughput-adjusted staffing (2) “Additive Method” 1.05 0.001 1.02-1.09 1.06 0.002 1.02-1.10 1.04 0.026 1.00-1.08
mixed 0.94 0.055 0.88-1.00 best 0.84 <0.001 0.78-0.91
Throughput-adjusted staffing (3) “Time-Based Method” 1.03 0.016 1.005-1.05 1.04 0.001 1.02-1.06 1.03 0.022 1.00 -1.05
mixed 0.94 0.051 0.88-1.00 best 0.84 <0.001 0.77-0.91
CMI-adjusted staffing 1.00 0.969 0.99-1.02 1.00 0.610 0.99-1.02 1.00 0.973 0.99-1.01 mixed 0.93 0.039 0.97-1.00
best 0.82 <0.001 0.76-0.89
1/LOS-adjusted staffing 1.12 0.066 0.99-1.26 1.06 0.313 0.95-1.18 1.05 0.353 0.95-1.17 mixed 0.92 0.021 0.86-0.99
best 0.82 <0.001 0.76-0.89 ^Unadjusted bivariate logistic regressions
^^ Adjusted for individual patient characteristics (age, sex, race, DRG, the separate presence of each of the 27 Elixhauser comorbidities) and hospital characteristics (state, bed
size, teaching status, and level of technology)
^^^ Adjusted for the above patient and hospital characteristics as well as the 3 categories of the nurse work environment (poor, mixed, best)
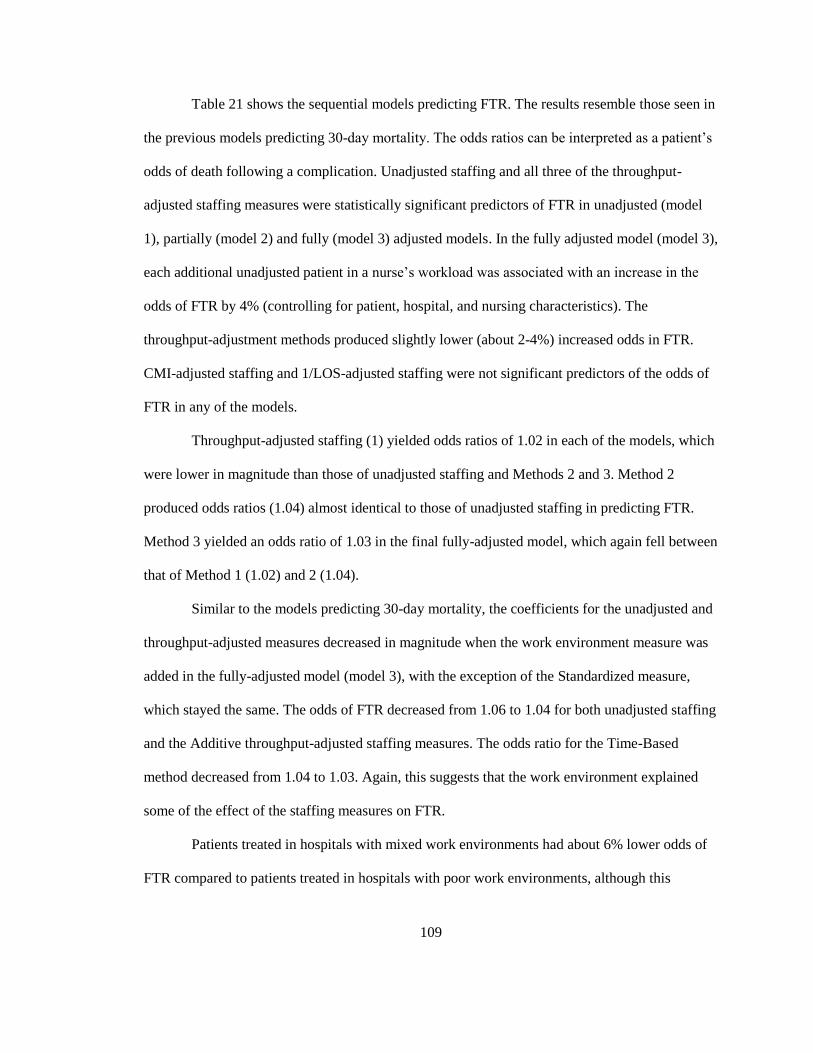
109
Table 21 shows the sequential models predicting FTR. The results resemble those seen in
the previous models predicting 30-day mortality. The odds ratios can be interpreted as a patient’s
odds of death following a complication. Unadjusted staffing and all three of the throughput-
adjusted staffing measures were statistically significant predictors of FTR in unadjusted (model
1), partially (model 2) and fully (model 3) adjusted models. In the fully adjusted model (model 3),
each additional unadjusted patient in a nurse’s workload was associated with an increase in the
odds of FTR by 4% (controlling for patient, hospital, and nursing characteristics). The
throughput-adjustment methods produced slightly lower (about 2-4%) increased odds in FTR.
CMI-adjusted staffing and 1/LOS-adjusted staffing were not significant predictors of the odds of
FTR in any of the models.
Throughput-adjusted staffing (1) yielded odds ratios of 1.02 in each of the models, which
were lower in magnitude than those of unadjusted staffing and Methods 2 and 3. Method 2
produced odds ratios (1.04) almost identical to those of unadjusted staffing in predicting FTR.
Method 3 yielded an odds ratio of 1.03 in the final fully-adjusted model, which again fell between
that of Method 1 (1.02) and 2 (1.04).
Similar to the models predicting 30-day mortality, the coefficients for the unadjusted and
throughput-adjusted measures decreased in magnitude when the work environment measure was
added in the fully-adjusted model (model 3), with the exception of the Standardized measure,
which stayed the same. The odds of FTR decreased from 1.06 to 1.04 for both unadjusted staffing
and the Additive throughput-adjusted staffing measures. The odds ratio for the Time-Based
method decreased from 1.04 to 1.03. Again, this suggests that the work environment explained
some of the effect of the staffing measures on FTR.
Patients treated in hospitals with mixed work environments had about 6% lower odds of
FTR compared to patients treated in hospitals with poor work environments, although this

110
difference was only marginally significant with p-values just above 0.05 for the unadjusted
staffing and throughput-adjusted staffing measures (model 3). The differences in odds ratios were
statistically significant between poor and mixed work environments when either the CMI-
adjusted staffing or 1/LOS-adjusted staffing measures were used. With either of these adjustment
methods, patients treated in hospitals with mixed work environments had about 7-8% lower odds
of FTR compared to patients treated in hospitals with poor work environments.
However, the differences between the odds of FTR in poor and the best work
environments were significant regardless of which staffing measure was used in the model.
Patients treated in hospitals with the best work environments had about 16% lower odds of FTR
compared to patients treated in hospitals with the least favorable work environments. This effect
was slightly more pronounced when CMI-adjusted staffing or 1/LOS-adjusted staffing were used
in the models (18 % lower odds of FTR). These results are also similar to previous research that
has shown about 12% lower odds of FTR in patients treated in the most favorable compared to
the least favorable work environments (Aiken et al., 2008).
Specific Aim 2b
To determine whether throughput-adjusted staffing has stronger associations with patient
outcomes compared to traditional staffing measures (patient to nurse ratios), acuity adjusted
staffing measures (adjusted for case mix), and length of stay-adjusted staffing.
To determine which of these staffing measures was most strongly associated with patient
outcomes, standardized measures for each were calculated so that the following results can be
interpreted as the change in the outcome given a 1 standard deviation increase in the staffing
measure. Standardizing variables allows for direct comparison of the magnitude of coefficients of
variables that may have different distributions, such as those of 1/LOS-adjusted staffing and
unadjusted staffing. Each of these standardized variables were tested in fully-adjusted models
(including work environment). Standardizing predictor variables – each of the six staffing
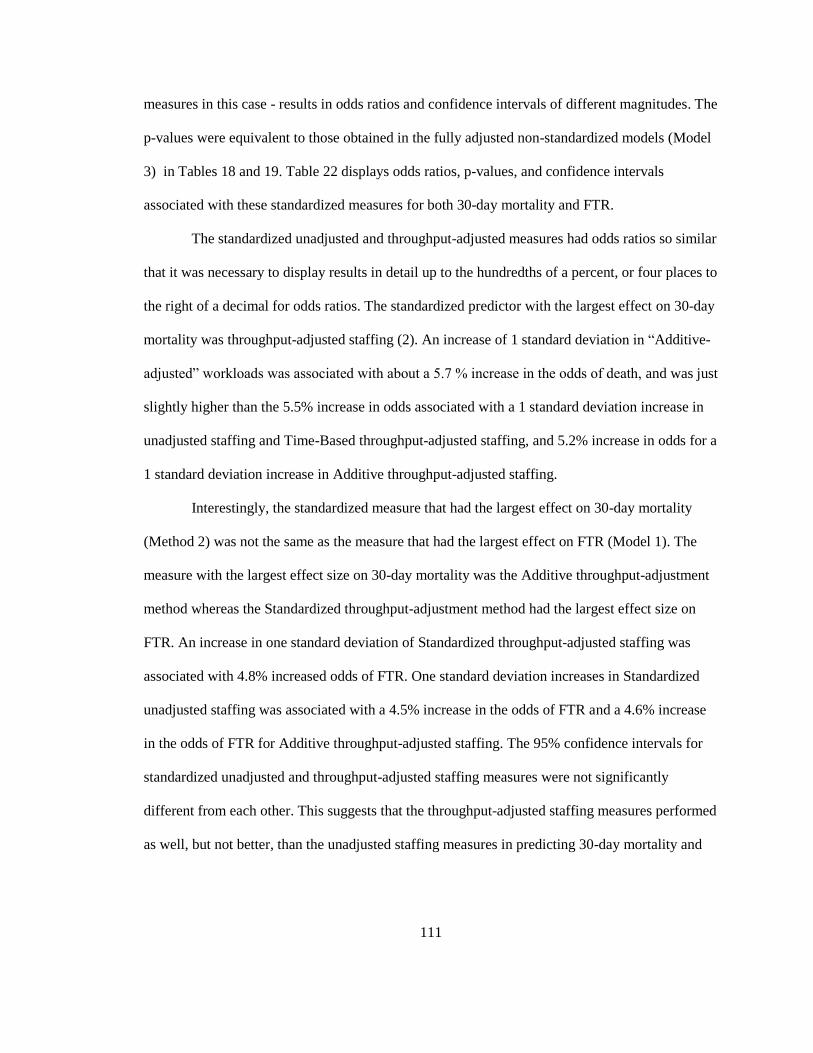
111
measures in this case - results in odds ratios and confidence intervals of different magnitudes. The
p-values were equivalent to those obtained in the fully adjusted non-standardized models (Model
3) in Tables 18 and 19. Table 22 displays odds ratios, p-values, and confidence intervals
associated with these standardized measures for both 30-day mortality and FTR.
The standardized unadjusted and throughput-adjusted measures had odds ratios so similar
that it was necessary to display results in detail up to the hundredths of a percent, or four places to
the right of a decimal for odds ratios. The standardized predictor with the largest effect on 30-day
mortality was throughput-adjusted staffing (2). An increase of 1 standard deviation in “Additive-
adjusted” workloads was associated with about a 5.7 % increase in the odds of death, and was just
slightly higher than the 5.5% increase in odds associated with a 1 standard deviation increase in
unadjusted staffing and Time-Based throughput-adjusted staffing, and 5.2% increase in odds for a
1 standard deviation increase in Additive throughput-adjusted staffing.
Interestingly, the standardized measure that had the largest effect on 30-day mortality
(Method 2) was not the same as the measure that had the largest effect on FTR (Model 1). The
measure with the largest effect size on 30-day mortality was the Additive throughput-adjustment
method whereas the Standardized throughput-adjustment method had the largest effect size on
FTR. An increase in one standard deviation of Standardized throughput-adjusted staffing was
associated with 4.8% increased odds of FTR. One standard deviation increases in Standardized
unadjusted staffing was associated with a 4.5% increase in the odds of FTR and a 4.6% increase
in the odds of FTR for Additive throughput-adjusted staffing. The 95% confidence intervals for
standardized unadjusted and throughput-adjusted staffing measures were not significantly
different from each other. This suggests that the throughput-adjusted staffing measures performed
as well, but not better, than the unadjusted staffing measures in predicting 30-day mortality and

112
FTR in this patient population. Standardized measures of acuity-adjusted staffing and LOS-
adjusted staffing were not significant predictors of either 30-day mortality or FTR.
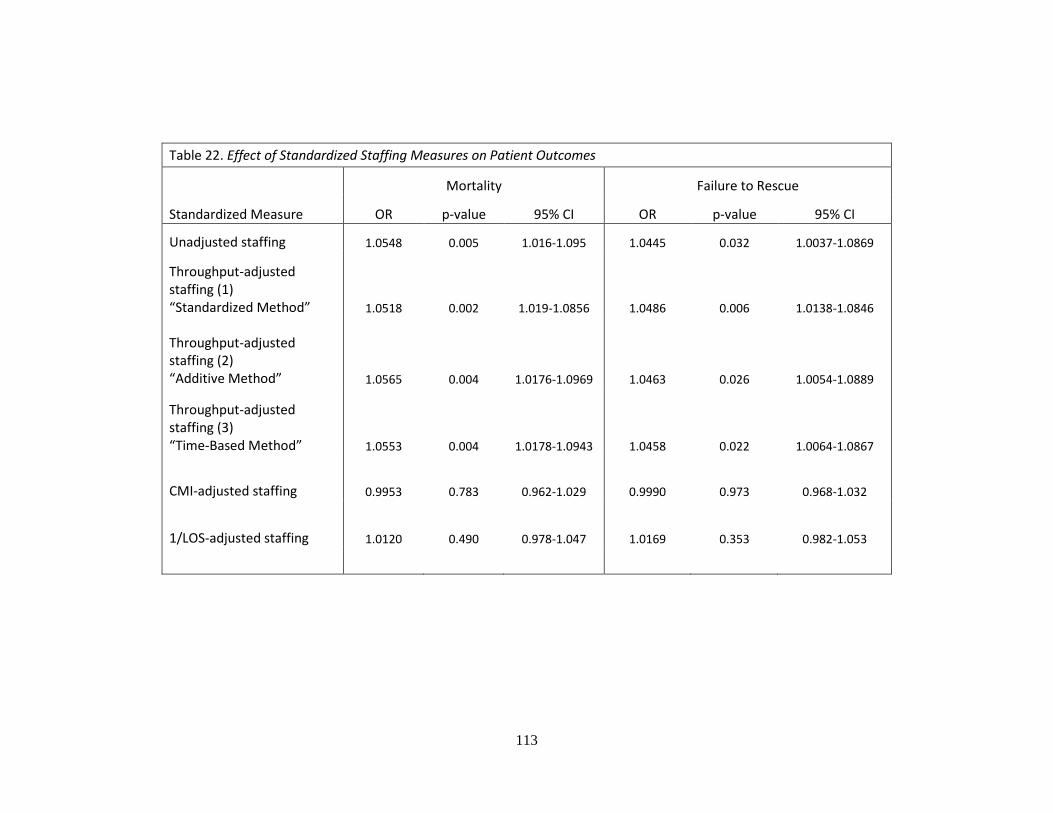
113
Table 22. Effect of Standardized Staffing Measures on Patient Outcomes
Mortality Failure to Rescue
Standardized Measure OR p-value 95% CI OR p-value 95% CI
Unadjusted staffing 1.0548 0.005 1.016-1.095 1.0445 0.032 1.0037-1.0869
Throughput-adjusted staffing (1) “Standardized Method” 1.0518 0.002 1.019-1.0856 1.0486 0.006 1.0138-1.0846
Throughput-adjusted staffing (2) “Additive Method” 1.0565 0.004 1.0176-1.0969 1.0463 0.026 1.0054-1.0889
Throughput-adjusted staffing (3) “Time-Based Method” 1.0553 0.004 1.0178-1.0943 1.0458 0.022 1.0064-1.0867
CMI-adjusted staffing 0.9953 0.783 0.962-1.029 0.9990 0.973 0.968-1.032
1/LOS-adjusted staffing 1.0120 0.490 0.978-1.047 1.0169 0.353 0.982-1.053
114
Summary of Specific Aim 2 Results
Each of the three throughput-adjusted staffing measures was a statistically significant
predictor of 30-day mortality and FTR. Neither CMI-adjusted staffing nor 1/LOS-adjusted
staffing were significant predictors of 30-day mortality or FTR, even in the bivariate regressions.
However, once these workload measures were standardized in the analysis of Specific Aim 2b,
there were no significant differences among the effect sizes of unadjusted staffing and each of the
throughput-adjusted staffing measures.
The work environment was also a significant predictor of 30-day mortality and FTR.
Patients treated in hospitals with the best work environments had about 14% lower odds of
mortality and about 16% lower odds of FTR compared to patients treated in hospitals with poor
work environments. There were not significant differences in the odds of mortality for patients
treated in hospitals with poor compared to mixed work environments. However, the odds of FTR
were about 6% lower in mixed work environments as compared to poor. When the work
environment was added to the models (Models 3), the odds ratios for the staffing measures were
slightly lower, suggesting that the work environment moderated some of the influence of staffing
on patient outcomes.
Analysis of Specific Aim 3
Specific Aim 3a
To determine whether throughput-adjusted staffing is associated with nurse outcomes (burnout,
job dissatisfaction, and intent to leave).
Before testing the relationships between each of the staffing measures and nurse
outcomes, descriptive tables were made to display how each of the staffing and adjusted-staffing
measures varied over hospitals placed in quartiles based on their burnout, job dissatisfaction, and
intent to leave rates. Additionally, one-way analyses of variance were conducted to see if these
mean staffing values varied significantly across quartiles of nurse outcomes.
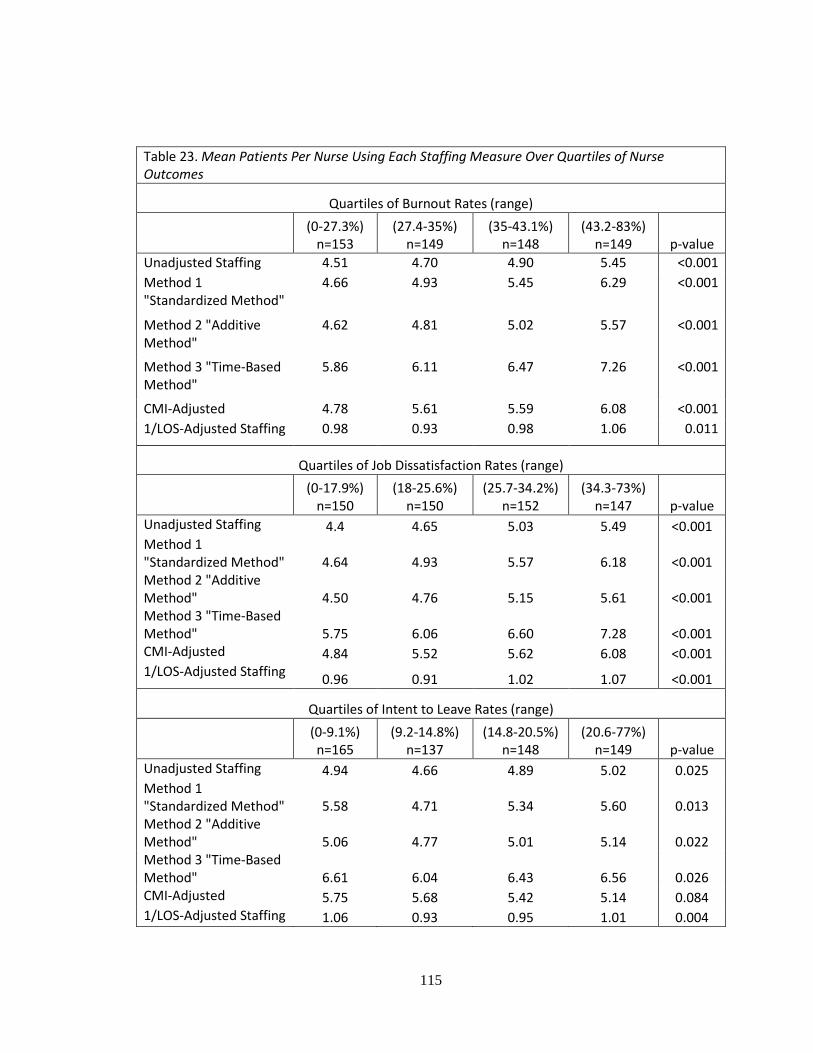
115
Table 23. Mean Patients Per Nurse Using Each Staffing Measure Over Quartiles of Nurse Outcomes
Quartiles of Burnout Rates (range)
(0-27.3%) n=153
(27.4-35%) n=149
(35-43.1%) n=148
(43.2-83%) n=149 p-value
Unadjusted Staffing 4.51 4.70 4.90 5.45 <0.001
Method 1 "Standardized Method"
4.66 4.93 5.45 6.29 <0.001
Method 2 "Additive Method"
4.62 4.81 5.02 5.57 <0.001
Method 3 "Time-Based Method"
5.86 6.11 6.47 7.26 <0.001
CMI-Adjusted 4.78 5.61 5.59 6.08 <0.001
1/LOS-Adjusted Staffing 0.98 0.93 0.98 1.06 0.011
Quartiles of Job Dissatisfaction Rates (range)
(0-17.9%) n=150
(18-25.6%) n=150
(25.7-34.2%) n=152
(34.3-73%) n=147 p-value
Unadjusted Staffing 4.4 4.65 5.03 5.49 <0.001 Method 1 "Standardized Method" 4.64 4.93 5.57 6.18 <0.001 Method 2 "Additive Method" 4.50 4.76 5.15 5.61 <0.001 Method 3 "Time-Based Method" 5.75 6.06 6.60 7.28 <0.001 CMI-Adjusted 4.84 5.52 5.62 6.08 <0.001 1/LOS-Adjusted Staffing
0.96 0.91 1.02 1.07 <0.001
Quartiles of Intent to Leave Rates (range)
(0-9.1%) n=165
(9.2-14.8%) n=137
(14.8-20.5%) n=148
(20.6-77%) n=149 p-value
Unadjusted Staffing 4.94 4.66 4.89 5.02 0.025 Method 1 "Standardized Method" 5.58 4.71 5.34 5.60 0.013 Method 2 "Additive Method" 5.06 4.77 5.01 5.14 0.022 Method 3 "Time-Based Method" 6.61 6.04 6.43 6.56 0.026 CMI-Adjusted 5.75 5.68 5.42 5.14 0.084 1/LOS-Adjusted Staffing 1.06 0.93 0.95 1.01 0.004
116
Table 23 displays the mean number of patients per nurse calculated using each of the six
staffing measures across quartiles of each of the nurse outcomes. In general, as hospital burnout
and job dissatisfaction, and intent to leave rates increased, so did the average number of patients
per nurse. These trends were pronounced across quartiles of hospital burnout and job
dissatisfaction rates and less so across quartiles of intent to leave rates. CMI-adjusted staffing was
the only measure that did not display a significant trend across quartiles of intent to leave. These
trends were similar when any one of the six staffing measures was used to calculate workload
values.
Tables 24-26 show odds ratios for the effects of each of the six staffing measures on
burnout (Table 24), job dissatisfaction (Table 25), and intent to leave (Table 26). For each of
these tables, model 1 displays odds ratios for unadjusted, or bivariate, logistic regressions using
the staffing measure alone. The second models display odds ratios for each staffing measure
controlling for hospital structural characteristics as well as individual nurse characteristics, while
the final models control for all the covariates in models 2 with the addition of the work
environment. For each model, the first column titled “OR” stands for the odds ratios and the third
column, “95% CI” stands for the confidence interval associated with each odds ratio estimate. All
models account for clustering of nurses within hospitals. For each outcome, the models are built
sequentially. Model 1 displays the results for the unadjusted bivariate logistic regressions. Model
2 controls for individual nurse characteristics (age, sex, education, and unit type) and hospital
structural characteristics (state, bed size, technology level, and teaching status). Model 3 controls
for all of the variables from Model 2 with the addition of categories of the work environment
(poor, mixed, best).
Table 24 displays the results for nurse burnout. All of the staffing measures were
statistically significant predictors of burnout across all models. The Additive method for
throughput-adjusted staffing produced almost identical results compared to unadjusted staffing in
predicting burnout. Using each method, an increase in one patient per nurse was associated with a
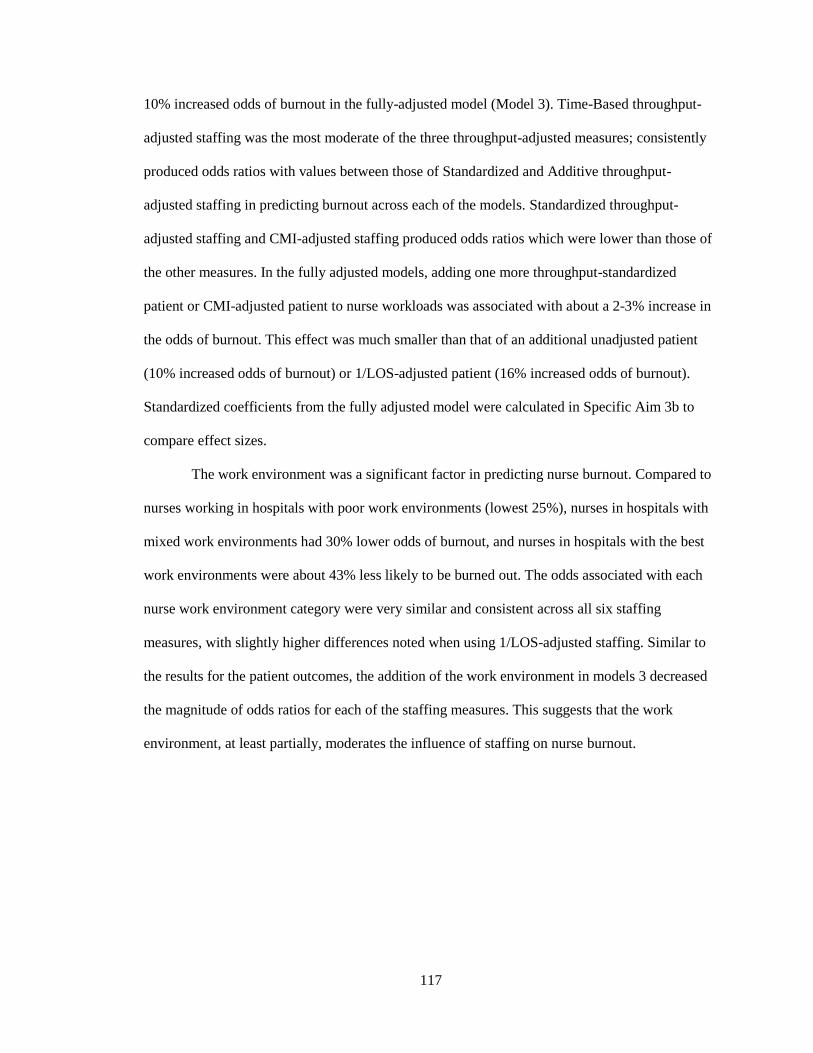
117
10% increased odds of burnout in the fully-adjusted model (Model 3). Time-Based throughput-
adjusted staffing was the most moderate of the three throughput-adjusted measures; consistently
produced odds ratios with values between those of Standardized and Additive throughput-
adjusted staffing in predicting burnout across each of the models. Standardized throughput-
adjusted staffing and CMI-adjusted staffing produced odds ratios which were lower than those of
the other measures. In the fully adjusted models, adding one more throughput-standardized
patient or CMI-adjusted patient to nurse workloads was associated with about a 2-3% increase in
the odds of burnout. This effect was much smaller than that of an additional unadjusted patient
(10% increased odds of burnout) or 1/LOS-adjusted patient (16% increased odds of burnout).
Standardized coefficients from the fully adjusted model were calculated in Specific Aim 3b to
compare effect sizes.
The work environment was a significant factor in predicting nurse burnout. Compared to
nurses working in hospitals with poor work environments (lowest 25%), nurses in hospitals with
mixed work environments had 30% lower odds of burnout, and nurses in hospitals with the best
work environments were about 43% less likely to be burned out. The odds associated with each
nurse work environment category were very similar and consistent across all six staffing
measures, with slightly higher differences noted when using 1/LOS-adjusted staffing. Similar to
the results for the patient outcomes, the addition of the work environment in models 3 decreased
the magnitude of odds ratios for each of the staffing measures. This suggests that the work
environment, at least partially, moderates the influence of staffing on nurse burnout.
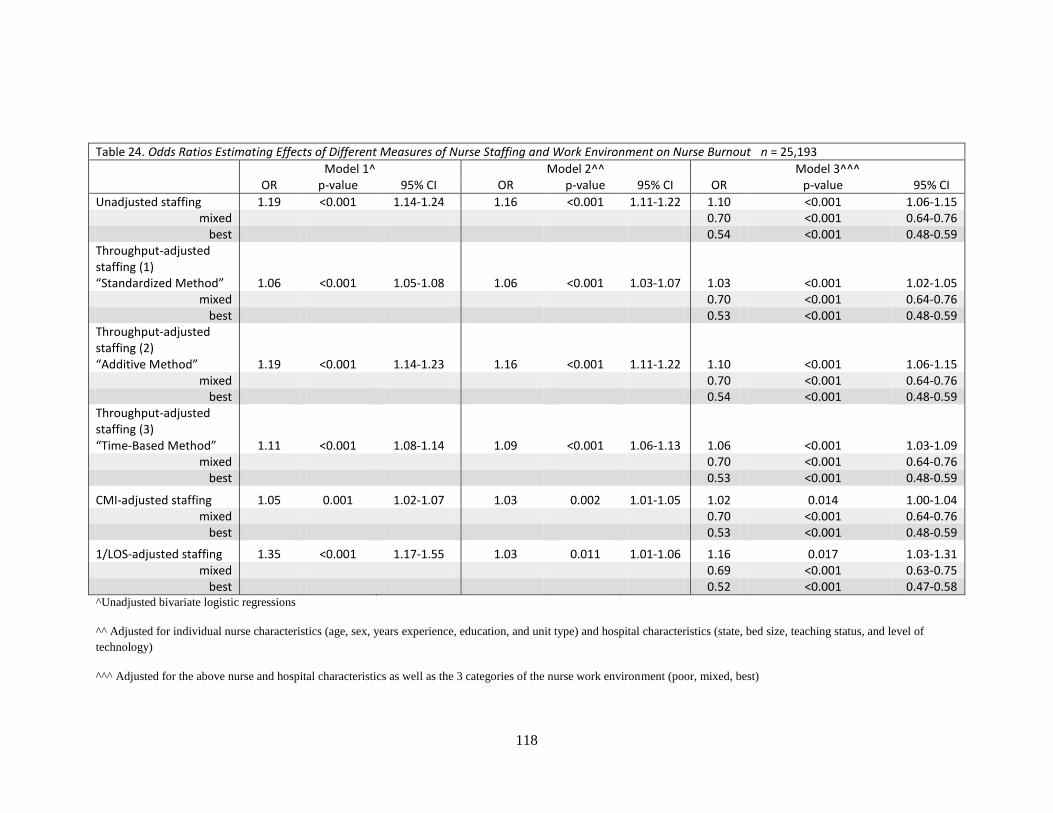
118
Table 24. Odds Ratios Estimating Effects of Different Measures of Nurse Staffing and Work Environment on Nurse Burnout n = 25,193
Model 1^ Model 2^^ Model 3^^^ OR p-value 95% CI OR p-value 95% CI OR p-value 95% CI
Unadjusted staffing 1.19 <0.001 1.14-1.24 1.16 <0.001 1.11-1.22 1.10 <0.001 1.06-1.15 mixed 0.70 <0.001 0.64-0.76
best 0.54 <0.001 0.48-0.59 Throughput-adjusted staffing (1) “Standardized Method” 1.06 <0.001 1.05-1.08 1.06 <0.001 1.03-1.07 1.03 <0.001 1.02-1.05
mixed 0.70 <0.001 0.64-0.76 best 0.53 <0.001 0.48-0.59
Throughput-adjusted staffing (2) “Additive Method” 1.19 <0.001 1.14-1.23 1.16 <0.001 1.11-1.22 1.10 <0.001 1.06-1.15
mixed 0.70 <0.001 0.64-0.76 best 0.54 <0.001 0.48-0.59
Throughput-adjusted staffing (3) “Time-Based Method” 1.11 <0.001 1.08-1.14 1.09 <0.001 1.06-1.13 1.06 <0.001 1.03-1.09
mixed 0.70 <0.001 0.64-0.76 best 0.53 <0.001 0.48-0.59
CMI-adjusted staffing 1.05 0.001 1.02-1.07 1.03 0.002 1.01-1.05 1.02 0.014 1.00-1.04 mixed 0.70 <0.001 0.64-0.76
best 0.53 <0.001 0.48-0.59
1/LOS-adjusted staffing 1.35 <0.001 1.17-1.55 1.03 0.011 1.01-1.06 1.16 0.017 1.03-1.31 mixed 0.69 <0.001 0.63-0.75
best 0.52 <0.001 0.47-0.58 ^Unadjusted bivariate logistic regressions
^^ Adjusted for individual nurse characteristics (age, sex, years experience, education, and unit type) and hospital characteristics (state, bed size, teaching status, and level of
technology)
^^^ Adjusted for the above nurse and hospital characteristics as well as the 3 categories of the nurse work environment (poor, mixed, best)
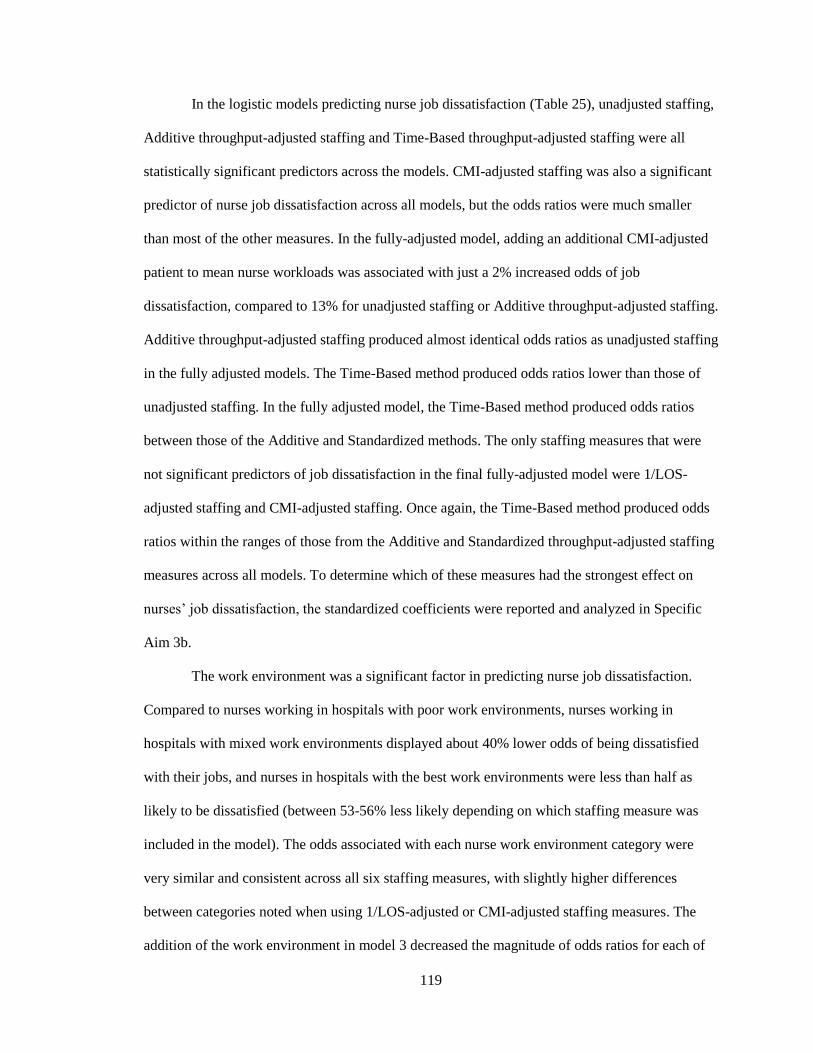
119
In the logistic models predicting nurse job dissatisfaction (Table 25), unadjusted staffing,
Additive throughput-adjusted staffing and Time-Based throughput-adjusted staffing were all
statistically significant predictors across the models. CMI-adjusted staffing was also a significant
predictor of nurse job dissatisfaction across all models, but the odds ratios were much smaller
than most of the other measures. In the fully-adjusted model, adding an additional CMI-adjusted
patient to mean nurse workloads was associated with just a 2% increased odds of job
dissatisfaction, compared to 13% for unadjusted staffing or Additive throughput-adjusted staffing.
Additive throughput-adjusted staffing produced almost identical odds ratios as unadjusted staffing
in the fully adjusted models. The Time-Based method produced odds ratios lower than those of
unadjusted staffing. In the fully adjusted model, the Time-Based method produced odds ratios
between those of the Additive and Standardized methods. The only staffing measures that were
not significant predictors of job dissatisfaction in the final fully-adjusted model were 1/LOS-
adjusted staffing and CMI-adjusted staffing. Once again, the Time-Based method produced odds
ratios within the ranges of those from the Additive and Standardized throughput-adjusted staffing
measures across all models. To determine which of these measures had the strongest effect on
nurses’ job dissatisfaction, the standardized coefficients were reported and analyzed in Specific
Aim 3b.
The work environment was a significant factor in predicting nurse job dissatisfaction.
Compared to nurses working in hospitals with poor work environments, nurses working in
hospitals with mixed work environments displayed about 40% lower odds of being dissatisfied
with their jobs, and nurses in hospitals with the best work environments were less than half as
likely to be dissatisfied (between 53-56% less likely depending on which staffing measure was
included in the model). The odds associated with each nurse work environment category were
very similar and consistent across all six staffing measures, with slightly higher differences
between categories noted when using 1/LOS-adjusted or CMI-adjusted staffing measures. The
addition of the work environment in model 3 decreased the magnitude of odds ratios for each of

120
the staffing measures. This suggests that the work environment, at least partially, moderates the
influence of staffing on nurse job dissatisfaction.
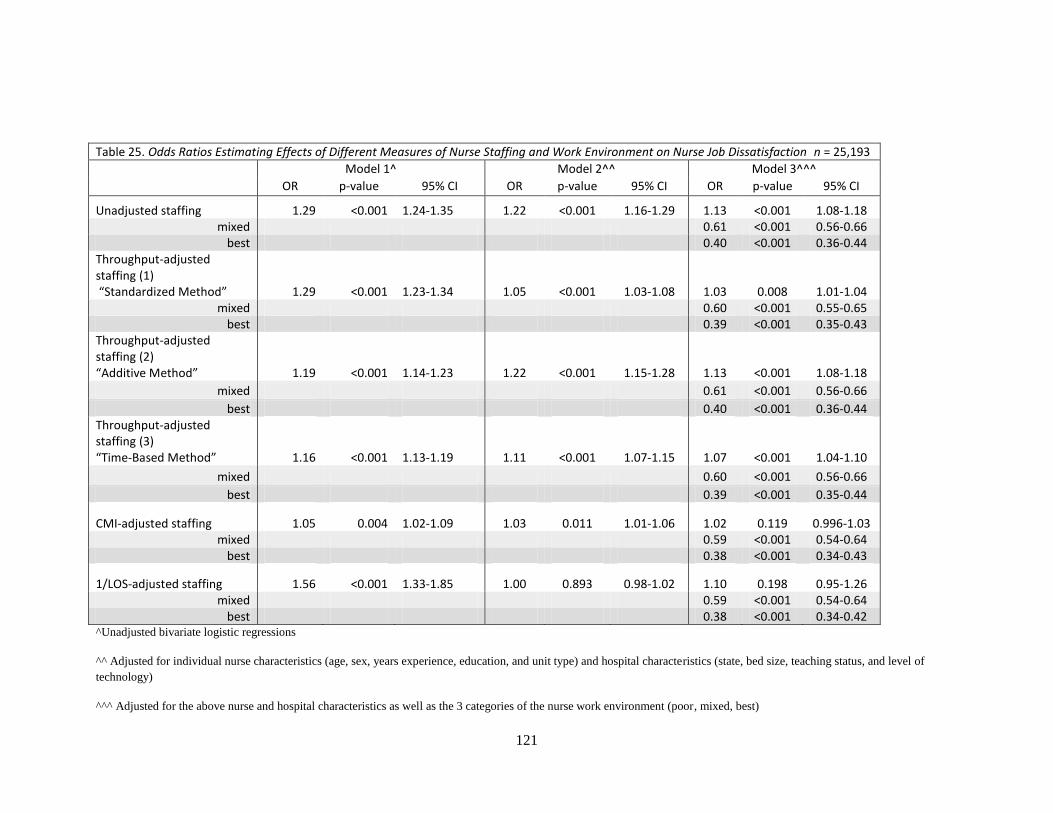
121
Table 25. Odds Ratios Estimating Effects of Different Measures of Nurse Staffing and Work Environment on Nurse Job Dissatisfaction n = 25,193
Model 1^ Model 2^^ Model 3^^^
OR p-value 95% CI OR p-value 95% CI OR p-value 95% CI
Unadjusted staffing 1.29 <0.001 1.24-1.35 1.22 <0.001 1.16-1.29 1.13 <0.001 1.08-1.18 mixed 0.61 <0.001 0.56-0.66
best 0.40 <0.001 0.36-0.44 Throughput-adjusted staffing (1) “Standardized Method” 1.29 <0.001 1.23-1.34 1.05 <0.001 1.03-1.08 1.03 0.008 1.01-1.04
mixed 0.60 <0.001 0.55-0.65 best 0.39 <0.001 0.35-0.43
Throughput-adjusted staffing (2) “Additive Method” 1.19 <0.001 1.14-1.23 1.22 <0.001 1.15-1.28 1.13 <0.001 1.08-1.18
mixed 0.61 <0.001 0.56-0.66
best 0.40 <0.001 0.36-0.44 Throughput-adjusted staffing (3) “Time-Based Method” 1.16 <0.001 1.13-1.19 1.11 <0.001 1.07-1.15 1.07 <0.001 1.04-1.10
mixed 0.60 <0.001 0.56-0.66
best 0.39 <0.001 0.35-0.44
CMI-adjusted staffing 1.05 0.004 1.02-1.09 1.03 0.011 1.01-1.06 1.02 0.119 0.996-1.03 mixed 0.59 <0.001 0.54-0.64
best 0.38 <0.001 0.34-0.43
1/LOS-adjusted staffing 1.56 <0.001 1.33-1.85 1.00 0.893 0.98-1.02 1.10 0.198 0.95-1.26 mixed 0.59 <0.001 0.54-0.64
best 0.38 <0.001 0.34-0.42 ^Unadjusted bivariate logistic regressions
^^ Adjusted for individual nurse characteristics (age, sex, years experience, education, and unit type) and hospital characteristics (state, bed size, teaching status, and level of
technology)
^^^ Adjusted for the above nurse and hospital characteristics as well as the 3 categories of the nurse work environment (poor, mixed, best)
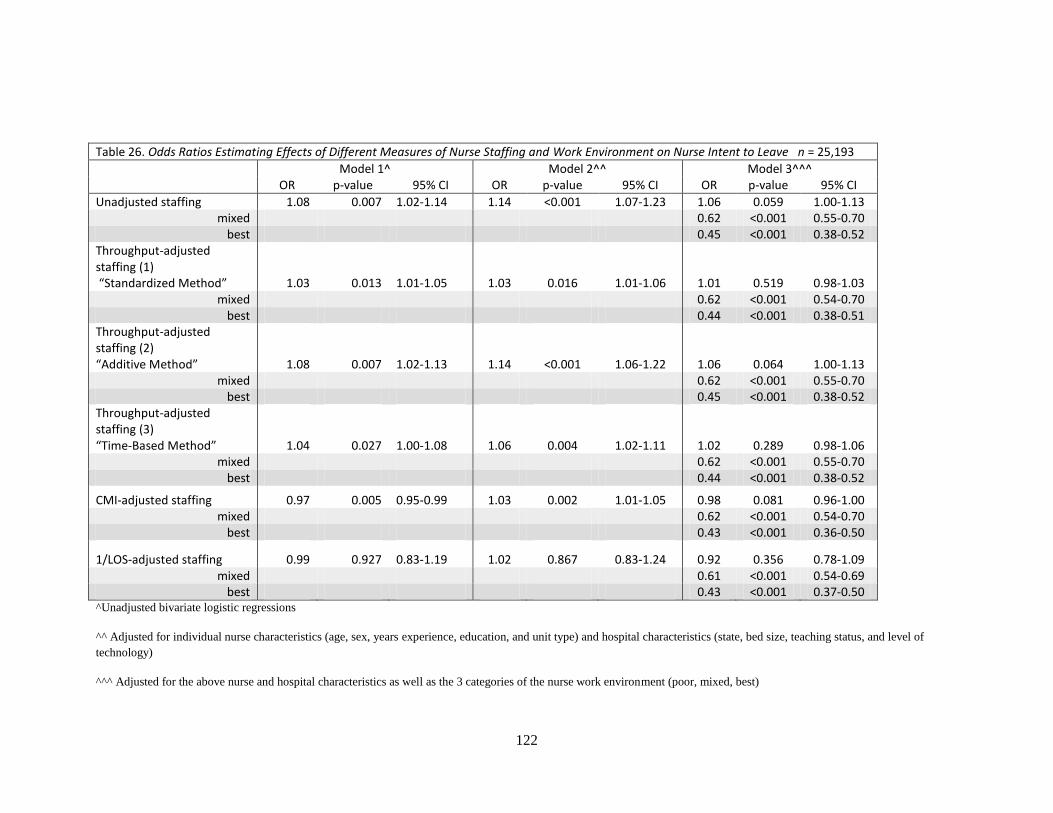
122
Table 26. Odds Ratios Estimating Effects of Different Measures of Nurse Staffing and Work Environment on Nurse Intent to Leave n = 25,193
Model 1^ Model 2^^ Model 3^^^ OR p-value 95% CI OR p-value 95% CI OR p-value 95% CI
Unadjusted staffing 1.08 0.007 1.02-1.14 1.14 <0.001 1.07-1.23 1.06 0.059 1.00-1.13 mixed 0.62 <0.001 0.55-0.70
best 0.45 <0.001 0.38-0.52 Throughput-adjusted staffing (1) “Standardized Method” 1.03 0.013 1.01-1.05 1.03 0.016 1.01-1.06 1.01 0.519 0.98-1.03
mixed 0.62 <0.001 0.54-0.70 best 0.44 <0.001 0.38-0.51
Throughput-adjusted staffing (2) “Additive Method” 1.08 0.007 1.02-1.13 1.14 <0.001 1.06-1.22 1.06 0.064 1.00-1.13
mixed 0.62 <0.001 0.55-0.70 best 0.45 <0.001 0.38-0.52
Throughput-adjusted staffing (3) “Time-Based Method” 1.04 0.027 1.00-1.08 1.06 0.004 1.02-1.11 1.02 0.289 0.98-1.06
mixed 0.62 <0.001 0.55-0.70 best 0.44 <0.001 0.38-0.52
CMI-adjusted staffing 0.97 0.005 0.95-0.99 1.03 0.002 1.01-1.05 0.98 0.081 0.96-1.00 mixed 0.62 <0.001 0.54-0.70
best 0.43 <0.001 0.36-0.50
1/LOS-adjusted staffing 0.99 0.927 0.83-1.19 1.02 0.867 0.83-1.24 0.92 0.356 0.78-1.09 mixed 0.61 <0.001 0.54-0.69
best 0.43 <0.001 0.37-0.50 ^Unadjusted bivariate logistic regressions
^^ Adjusted for individual nurse characteristics (age, sex, years experience, education, and unit type) and hospital characteristics (state, bed size, teaching status, and level of
technology)
^^^ Adjusted for the above nurse and hospital characteristics as well as the 3 categories of the nurse work environment (poor, mixed, best)

123
Table 26 displays the odds ratios for the change in intent to leave associated with a single
unit increase in each of the workload measures. In the bivariate model, all odds ratios except for
those of the CMI-adjusted and 1/LOS-adjusted staffing measures suggested positive associations
between increased workloads and nurse intent to leave. The unadjusted and throughput-adjusted
staffing measures were all significant predictors of intent to leave in the bivariate models. For
instance, an increase of 1 patient in the average nurse workload using both the unadjusted and
Additive throughput-adjusted measures was associated with an 8% increase in the odds of intent
to leave in the bivariate models. However, once the nurse work environment was accounted for in
the fully adjusted models, these staffing measures were rendered insignificant in predicting nurse
intent to leave. This suggests that the work environment is more influential on nurses’ intent to
leave than the staffing measures,
Though none of the staffing measures were statistically significant in the fully adjusted
models, the work environment was a statistically significant factor in predicting nurse intent to
leave. Compared to nurses working in hospitals with the least favorable work environments,
nurses in hospitals with mixed work environments were about 38% less likely to report intent to
leave while nurses working in hospitals with the best work environments were more than half as
likely to want to leave their positions (55-56% depending on which staffing measure was used in
the model).
Specific Aim 3b
To determine whether throughput-adjusted staffing has stronger associations with nurse
outcomes compared to traditional staffing measures (patient to nurse ratios), acuity adjusted
staffing measures (adjusted for case mix), and length of stay-adjusted staffing.
To compare the strength of associations, or the effect sizes, standardized measures were
calculated for each of the six staffing measures and tested in models controlling for all covariates
included in model 3 (fully-adjusted models). Table 27 shows the odds ratios associated with an

124
increase in one standard deviation in these staffing measures. While most of these staffing
measures were significantly associated with nurse burnout and job dissatisfaction, nurse intent to
leave was not associated with any of the staffing measures. Nevertheless, nurse intent to leave is
displayed along with burnout and job dissatisfaction.
Because the formula to calculate Additive throughput-adjusted staffing changed
unadjusted staffing so slightly, it can be concluded that Additive throughput-adjusted staffing did
not provide significantly more information than unadjusted staffing. The Time-Based
throughput-adjusted staffing measure was the strongest predictor of burnout, as a one standard
deviation increase in the measure was associated with an 11% increase in the odds of burnout.
This estimate, however, was not significantly different from the effects of the other measures.
Unadjusted staffing and Additive throughput-adjusted staffing were the strongest predictors of
nurse job dissatisfaction as a one standard deviation increase in each of these measures was
associated with about a 14% increase in job dissatisfaction. None of the standardized measures
were significant predictors of intent to leave, though the standardized unadjusted measure
approached significance with a p-value of 0.059.
It can therefore be concluded that the throughput-adjusted, CMI-adjusted, and 1/LOS-
adjusted measures did not have stronger associations with nurse outcomes compared to
unadjusted staffing measures. The implications of this finding are discussed in Chapter 5.
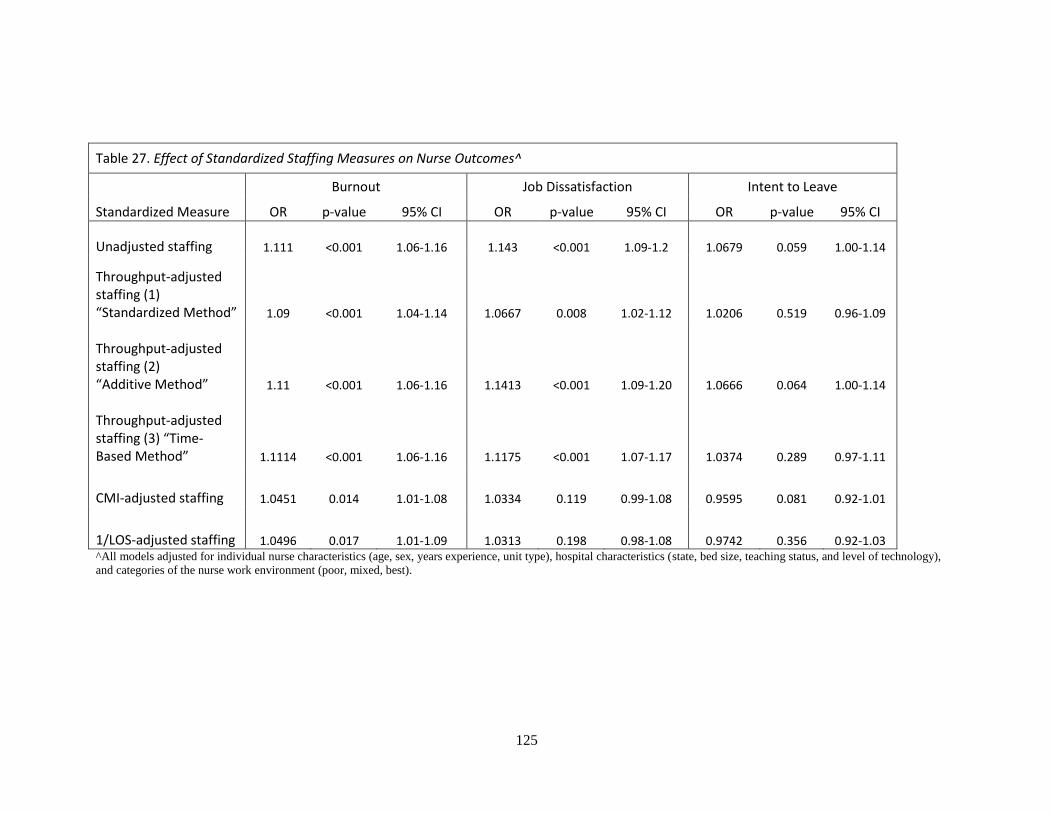
125
Table 27. Effect of Standardized Staffing Measures on Nurse Outcomes^
Burnout Job Dissatisfaction Intent to Leave
Standardized Measure OR p-value 95% CI OR p-value 95% CI OR p-value 95% CI
Unadjusted staffing 1.111 <0.001 1.06-1.16 1.143 <0.001 1.09-1.2 1.0679 0.059 1.00-1.14
Throughput-adjusted staffing (1) “Standardized Method” 1.09 <0.001 1.04-1.14 1.0667 0.008 1.02-1.12 1.0206 0.519 0.96-1.09
Throughput-adjusted staffing (2) “Additive Method” 1.11 <0.001 1.06-1.16 1.1413 <0.001 1.09-1.20 1.0666 0.064 1.00-1.14
Throughput-adjusted staffing (3) “Time-Based Method” 1.1114 <0.001 1.06-1.16 1.1175 <0.001 1.07-1.17 1.0374 0.289 0.97-1.11
CMI-adjusted staffing 1.0451 0.014 1.01-1.08 1.0334 0.119 0.99-1.08 0.9595 0.081 0.92-1.01
1/LOS-adjusted staffing 1.0496 0.017 1.01-1.09 1.0313 0.198 0.98-1.08 0.9742 0.356 0.92-1.03 ^All models adjusted for individual nurse characteristics (age, sex, years experience, unit type), hospital characteristics (state, bed size, teaching status, and level of technology),
and categories of the nurse work environment (poor, mixed, best).
126
Summary of Specific Aim 3 Results
Generally, increased nurse workloads were associated with increased odds of poorer
nurse outcomes, however the influence of poor nurse work environments on the odds of
developing these outcomes was larger. All of the staffing measures were significant predictors of
nurse burnout. Only 1/LOS-adjusted staffing and CMI-adjusted staffing were not significant
predictors of job dissatisfaction. And none of the staffing measures were significant predictors of
nurse intent to leave. However, the nurse work environment was consistently and significantly
associated with all three nurse outcomes. As nurse work environments improved, there were
significant decreases in the odds of burnout, job dissatisfaction, and intent to leave. When the
work environment was included in the models, the odds ratios of each of the staffing measures
decreased slightly and, in the case of intent to leave, were rendered insignificant.
Of the two outcomes that were significantly influenced by at least one of the staffing
measures (burnout and job dissatisfaction), CMI-adjusted staffing produced the lowest effect
sizes. Additive throughput-adjusted staffing produced almost identical results as unadjusted
staffing, even after comparing standardized effect sizes. Time-Based throughput-adjusted staffing
produced odds ratios and effect sizes within the range of those from Standardized and Additive
throughput-adjusted staffing.
127
Chapter 5: Discussion
The first aim of this study was to develop and describe a measure of nurse staffing that
appropriately accounts for patient throughput. This study developed and described three
throughput-adjusted staffing measures and compared them to existing methods of measuring
nurses’ workload, including patient to nurse ratios, acuity-adjusted staffing and LOS-adjusted
staffing (Unruh & Fottler, 2006). The findings suggested that one of these throughput-adjusted
measures (the Time-Based measure) may be a more reasonable and realistic way than the other
two measures developed to incorporate throughput into staffing measures.
The second and third aims of this study were to test whether these throughput-adjusted
measures were associated with patient and nurse outcomes. The findings suggested that the
adjusted workload measures were not more strongly associated with — nor performed better in
predicting — patient or nurse outcomes compared to unadjusted staffing. This chapter discusses
the principal findings of this study organized by specific aim, followed by its limitations,
implications for hospital administrators and policy-makers, and ends with a discussion of future
research recommendations.
Principal Findings
Development of Throughput-Adjusted Staffing Measures
Patient turnover rates in this sample were about 30-40%, which is much higher than the 0
– 14% seen in previous research from a single institution (Needleman et al., 2011). This may
suggest that nurses’ experiences with patient turnover are actually more frequent than
administrative data report. Staffing and throughput levels varied significantly across different
nursing unit types. Therefore previous research that has grouped nursing units (Park et al., 2012)
and turnover levels (Needleman et al., 2011) into few discrete categories may have missed
potentially important variation.

128
Contrary to expectations, hospitals with higher patient turnover or throughput levels were
generally not those with more favorable staffing levels to accommodate the more frequent patient
transfers. The correlation between staffing and throughput (0.48) was moderate (Table 11). Since
throughput and staffing were capturing different aspects of nurse workloads, throughput was
incorporated into staffing metrics. Because throughput-adjustment is not currently widely used in
staffing measures, three separate throughput-adjusted staffing methods were developed and tested
in relation to patient and nurse outcomes.
The Standardized Throughput-Adjustment Method may have over-adjusted staffing for
throughput. This measure was significantly influenced by hospitals’ relative throughput levels.
The mean hospital-level throughput in this sample was about 3.2 patients per nurse, but it is
unknown whether this is representative of all hospitals. Hospitals above the mean received credit
for having above-average throughput and their staffing values reflected increased workloads.
However, hospitals with below-average throughput were effectively penalized with seemingly
lower nurse workloads. Penalizing or crediting hospital staffing values based on throughput
assumes that all hospitals incorporate throughput into planned nurse staffing to a certain degree.
This may be a stronger assumption than that of Additive throughput-adjusted staffing,
which designated all throughput patients as additional to nurse workloads. The Additive
throughput-adjustment method did not provide much more information than unadjusted staffing
because the two measures were so similar. Additive throughput-adjusted staffing changed the
unadjusted staffing values so slightly that these measures were essentially equivalent (Table 16).
The correlation between the Additive Method and unadjusted staffing was almost 1 (Table 12).
Because the ratio of the coefficients for staffing and throughput in predicting nurses’ ratings of
staffing and resource adequacy were so imbalanced, throughput patients only counted for about
3% of assigned patients in the adjusted-staffing measure. This measure likely underestimates the
129
influence of throughput patients on nurse workloads. Moreover, when a sensitivity analysis was
performed on a subsample of only medical/surgical nurses (Table 14), it was found that the
influence of an additional throughput patient on nurses’ assessments of their hospitals’ staffing
and resource adequacy was significantly different than that of all nurses combined. Therefore,
there may be significant differences in how throughput influences nurse workloads across unit
types that were not captured because all inpatient nurse respondents were included in this sample.
The Time-Based method combined elements of the Standardized and Additive
throughput-adjustment methods and was ultimately the most appropriate throughput-adjusted
staffing measure of those developed in this study. The Time-Based method designed throughput
patients to be in addition to assigned patients, but placed greater weight on them compared to the
Additive method. Throughput patients were weighted in terms of time, or the average nurse shift
length in a given hospital. Each throughput patient requires approximately 1 hour of a nurse’s
time (Cavouras, 2002; Duffield et al., 2009; Lane et al., 2009), which would be taken away from
the nurse’s entire time (shift length) to provide patient care. This Time-Based method attempted
to capture the time element and adjust nurse workloads for the time required for each throughput
patient. The Time-Based method was still highly correlated with unadjusted staffing, but not as
closely as was Additive throughput-adjusted staffing.
CMI-adjusted and 1/LOS adjusted workloads were influenced by variables with non-
normal and skewed distributions. Consequently, these two measures had lower correlations with
unadjusted staffing than the three throughput-adjusted measures. CMI-adjusted staffing yielded a
mean value similar to those seen in the unadjusted and throughput-adjusted measures but the
hospital-level range was very different, ranging from 0 to 25.8 patients per nurse (Table 13) due
to the skewed nature of the distribution of the case mix index variable (Figure 5). The 1/LOS
measure yielded an average of about 1 LOS-adjusted patient per nurse and ranged from 0.03 to
130
2.5 (Table 13). Additionally, the 1/LOS-adjusted staffing measure did not easily lend itself to
interpreting nurse workloads in terms of patients per nurse, likely because it was created using
nursing hours per patient day from administrative data (Unruh & Fottler, 2006).
Throughput-Adjusted Staffing Measures and Patient Outcomes
The results of this study did not support the stated hypotheses. None of the three
throughput-adjusted staffing measures were shown to be more strongly associated with patient
outcomes compared to unadjusted staffing as evidenced by the standardized coefficient models.
Unadjusted staffing was consistently associated with 30-day mortality and FTR, and although
some of the throughput-adjusted measures had essentially equivalent effect sizes on patient
outcomes, none provided significantly more information than unadjusted staffing. The effect sizes
on 30-day mortality and FTR did not differ significantly between unadjusted staffing and each of
the throughput-adjusted staffing measures. Based on these results, throughput does not appear to
significantly influence the relationship between staffing and 30-day mortality or FTR. However,
there is evidence that the influence of throughput on nurse workloads may differ by unit type,
which is supported by previous research (Park et al., 2012).
When observing general relationships between each of the staffing measures (except
1/LOS-adjusted staffing) and 30-day mortality, trends were noted that as the number of patients
per nurse increased, so did 30-day mortality rates. These trends were not seen across hospitals
with different FTR rates, however. The relationships between staffing measures and patient
outcomes were then tested empirically using logistic regressions that controlled for hospital and
patient characteristics. The results of the logistic regression models showed that unadjusted as
well as the three throughput-adjusted staffing measures were significantly and positively
associated with increased odds in 30-day mortality and FTR. The CMI-adjusted and 1/LOS-
adjusted staffing were not associated with either patient outcome in the fully adjusted models.
131
The four measures that were significantly related to both 30-day mortality and FTR rates
were unadjusted, Standardized, Additive, and Time-Based throughput-adjusted staffing. Additive
throughput-adjusted staffing produced almost identical results as unadjusted staffing in predicting
both patient outcomes. This is not surprising as the correlation between Additive throughput-
adjusted staffing and unadjusted staffing was almost 1. The Time-Based Method consistently
produced odds ratios between those of the Additive and Standardized methods in predicting
patient outcomes (Table 20). This suggests that the Time-Based method generated workload
estimates that fell between the values produced by the Standardized and Additive throughput-
adjustment measures and did not fall into either extreme of over- or under-weighting the effects
of throughput on nurse workloads. The CMI-adjusted and 1/LOS-adjusted staffing measures were
not significantly associated with either patient outcome. The Additive throughput-adjustment
method had the largest effect size on 30-day mortality while the Standardized throughput-
adjustment method had the largest effect size on FTR, though these effects were not significantly
larger than the other measure. This suggests that the ways in which throughput influences the
relationship between nurse staffing and patient outcomes may be different depending on the
outcome of interest. However, it should be noted that these data do not suggest that there are
significant differences in the measures as the confidence intervals for the effect sizes of
unadjusted and the three throughput-adjusted measures overlapped for both 30-day mortality and
FTR.
The results of this study are similar to those of previous studies which have shown higher
rates of FTR (Park et al., 2012) and mortality (Needleman et al., 2011) when patient throughput
was higher. The findings from Cunningham and colleagues (2005) that showed higher patient
throughput was associated with poorer patient outcomes were also similar, though they did not
control for nurse or patient characteristics. The addition of the work environment did alter the
132
relationship between the unadjusted and throughput-adjusted staffing measures for both 30-day
mortality and FTR. Additionally, perhaps Park and colleagues (2012) were able to detect
differences in FTR rates in non-ICUs that were lost in aggregation methods used in this work.
The sensitivity analysis performed on medical/surgical nurses only, which would be considered
non-ICU nurses, suggested that there may be differences in how patient throughput impacts nurse
workloads across different units, a finding supported by the research of Park and colleagues
(2012) who analyzed unit-level staffing and patient turnover data. For patient outcomes, exposure
to shifts with high patient turnover was associated with an increased hazard of death of about 4%
(Needleman et al., 2011, p. 1044) whereas this study found, depending on which staffing measure
was used, there was about a 3- 5% increased odds of death with increased nurse workloads.
Although Needleman and colleagues’ (2011) definition of high patient turnover was somewhat
different from this study’s examination of throughput-adjusted staffing (one was measured at the
patient level and the other was measured at the nurse level, respectively), the increased risk of
patient mortality was similar.
Adding the work environment to the final patient outcome models did not render any
significant staffing measures insignificant, although the p-values for the staffing measures did
increase somewhat. The odds ratios associated with each coefficient also decreased when the
work environment was added to the models, suggesting that the work environment was
explaining some of the variation in 30-day mortality and FTR rates that were previously being
explained by the staffing variables. Compared to hospitals with the least favorable nurse work
environments, patients treated in hospitals with the most favorable nurse work environments had
about 10% lower odds of 30-day mortality and 12% lower odds of FTR. These odds ratios are
congruent with the results from previous research (Aiken et al., 2008).
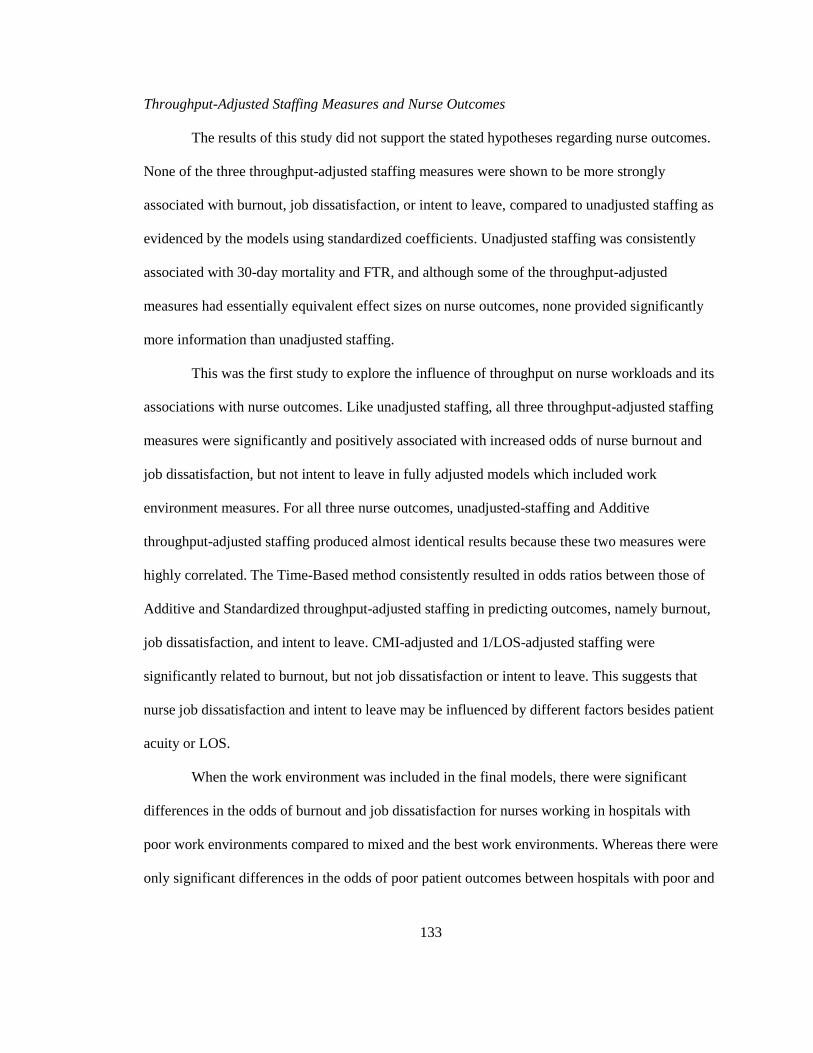
133
Throughput-Adjusted Staffing Measures and Nurse Outcomes
The results of this study did not support the stated hypotheses regarding nurse outcomes.
None of the three throughput-adjusted staffing measures were shown to be more strongly
associated with burnout, job dissatisfaction, or intent to leave, compared to unadjusted staffing as
evidenced by the models using standardized coefficients. Unadjusted staffing was consistently
associated with 30-day mortality and FTR, and although some of the throughput-adjusted
measures had essentially equivalent effect sizes on nurse outcomes, none provided significantly
more information than unadjusted staffing.
This was the first study to explore the influence of throughput on nurse workloads and its
associations with nurse outcomes. Like unadjusted staffing, all three throughput-adjusted staffing
measures were significantly and positively associated with increased odds of nurse burnout and
job dissatisfaction, but not intent to leave in fully adjusted models which included work
environment measures. For all three nurse outcomes, unadjusted-staffing and Additive
throughput-adjusted staffing produced almost identical results because these two measures were
highly correlated. The Time-Based method consistently resulted in odds ratios between those of
Additive and Standardized throughput-adjusted staffing in predicting outcomes, namely burnout,
job dissatisfaction, and intent to leave. CMI-adjusted and 1/LOS-adjusted staffing were
significantly related to burnout, but not job dissatisfaction or intent to leave. This suggests that
nurse job dissatisfaction and intent to leave may be influenced by different factors besides patient
acuity or LOS.
When the work environment was included in the final models, there were significant
differences in the odds of burnout and job dissatisfaction for nurses working in hospitals with
poor work environments compared to mixed and the best work environments. Whereas there were
only significant differences in the odds of poor patient outcomes between hospitals with poor and
134
the best nurse work environments, nurse outcomes were more sensitive to the quality of the work
environment.
Even when none of the staffing measures predicted intent to leave in the fully-adjusted
models, better nurse work environments were associated with significantly lower odds of nurses
reporting intent to leave their jobs within the next year. The work environment was therefore
more influential on nurses’ intent to leave their jobs than any of the staffing measures tested in
this study. The addition of the work environment in the final model decreased the odds ratios
associated with each of the staffing measures, suggesting that the work environment was actually
responsible for some of the variation in burnout and job dissatisfaction that were previously
explained by the associated staffing variables. Moreover, the work environment was a significant
predictor of nurse intent to leave when none of the staffing measures were. Though the
correlation between the composite nurse work environment score and staffing was only about -
0.17, it seems that staffing explained some of the variation in intent to leave prior to the
introduction of the work environment in the fully-adjusted models. The work environment was
therefore a stronger predictor of intent to leave than any of the staffing measures. These results
were similar to those from previous studies showing the relationship between better nurse work
environments and more favorable nurse outcomes (Aiken et al., 2008; Aiken et al., 2012; Cho et
al., 2011).
Limitations
There are several limitations to this study which are described in this section. These data
are cross-sectional so conclusions about the causal nature of the relationships observed are
limited. Longitudinal studies would provide better conclusions about causality. There were
potential unmeasured confounding variables. For example, it is unknown if hospitals in this
sample employed dedicated nurses or teams who assisted with admission assessments and
135
discharge planning. However, these positions are rare and still relatively new (Spiva & Johnson,
2012). Although comprehensive risk adjustment methods were used, it is also possible that the
Elixhauser comorbidity index, CMI, and DRG-adjustments may not adequately account for
patient needs. It would be beneficial to include more detailed patient needs information, such as
that from clinical data or “dependency” classifications (Hurst, 2005; Twigg & Duffield, 2009),
but the data used for this study did not contain this information.
There was an overall response rate of 39% to the original nurse surveys. Though this may
be considered a low response rate, the follow-up survey of non-responders showed that there was
no significant difference in how responders and non-responders rated hospital organizational
characteristics (Aiken et al., 2011; Smith, 2008). Moreover, the instruments and measures show
reliability and representativeness of nurses in a large and unbiased sample of hospitals (Aiken, et
al., 2011).
Another limitation of this study was the inability to differentiate between discharges and
transfers because of the original survey design. The survey question asked nurses how many
patients they discharged/transferred combined on their last shift, so it was not possible to
differentiate the two. Furthermore, this study cannot ascertain whether nurses answered the
question about their patient assignment as the total number of patients they encountered during
their last shift, including admissions and discharges, or if nurses reported the number of patients
they were assigned at any given time excluding admissions and discharges. This study viewed all
throughput patients as additional to assigned patients for nurses. It is also unknown whether
nurses reported intent to leave based on their job satisfaction or other factors that may influence
their decisions to leave their job, such as retirement, family issues or pursuing graduate degrees.
Not all nurses who intend to leave their jobs do so prematurely as a result of job dissatisfaction
(Erickson & Graves, 2008).

136
To retain a large sample of nurses and hospitals, all inpatient staff nurse respondents from
each hospital were included in the analyses. However, there was evidence that throughput and
staffing may have different relationships in different nursing unit type (Table 14). Mean
throughput varied significantly over unit types, which raises the question as to whether
aggregating throughput for all nurses to the hospital-level is meaningful. The influence of
throughput on nurse workloads may not be similar across nursing units, so separating units into
unit types, similar to the methods of Park and colleagues (2012) may be beneficial. This would
allow a more detailed look at the influence of throughput on nurse workloads and its influence on
patient and nurse outcomes.
Medicare CMI may not be the most fitting patient acuity measure for all surgical patients
in this study’s sample (Mark & Harless, 2011), and likely does not reflect accurate needs for
nursing resources (Norrish & Rundall, 2001). Additionally, the mean LOS at the hospital level
was based on all patients, not just surgical patients who likely have shorter hospitalizations than
other patient populations.
Implications
The results of this study do not support the wide-spread adoption of throughput-adjusted
staffing metrics at this time. It is possible that hospitals are already incorporating throughput into
staffing metrics to some extent. There were significant differences in throughput and turnover
across nursing unit types, similar to results from previous research (Wagner, Budreau & Everett,
2005). Administrators of hospitals with different concentrations of these nursing unit types,
particularly PACUs, Emergency Departments, Operating Rooms, or Labor & Delivery units
where throughput is more rapid, may investigate how throughput ranges in their specific
institutions. Though hospital-level throughput did not significantly change staffing measures,
unit-specific measures may yield different results. None of the adjusted-staffing measures were
137
significantly better than unadjusted staffing in predicting patient and nurse outcomes in this study,
but the work environment was a consistent factor. Recreating nurse staffing metrics to incorporate
throughput may not be supported by the results of this study. But investing in the nurse work
environment was demonstrated to substantially reduce patient mortality and FTR, as well as nurse
burnout and job dissatisfaction.
Future Research
More research on how throughput impacts nurse workloads in practice settings is needed.
For instance, an examination of the presence and impact of nursing admission/discharge teams in
assisting staff nurses with throughput patients would be beneficial (Spiva & Johnson, 2012). In
this study, discharges and transfers were combined in the same measure but exploring
admissions, discharges, and transfers separately would be useful, especially because nurses are
responsible for discharge education, which could have implications for unanticipated hospital
readmissions if nurses do not have the time to provide adequate patient discharge education.
Additionally, patients’ ratings of their care are progressively becoming more important to hospital
administrators. Therefore readmissions and patients’ ratings of their hospital experiences could be
two future outcomes to explore in the context of patient throughput and nurse staffing. Frequent
transfers within and among nursing units may influence patients’ experiences of being
hospitalized. Furthermore, these data did not discern between planned and unplanned admissions,
discharges, and transfers. Planned patient throughput is likely less “disruptive” for nurses’ work
flow and their abilities to provide adequate surveillance. Moreover, on units where rapid patient
throughput is common, throughput may have less of an influence on outcomes. Future research
on nurses’ experiences of throughput and workload would be well-suited to time-motion studies
which could capture detailed data about the time involved in admitting, discharging, and
transferring patients.
138
This notion of uncertainty (both for patients and nurses) may be a valuable distinction for
future study designs. Of course, there is an inherent element of uncertainty and unpredictability in
hospitals. But certain hospitals (or unit types) may be better able to absorb and manage the
uncertainty than others. This has been suggested in previous work (Park et al., 2012) and future
research may explore the influence of throughput on nurse workloads across different unit types.
The work environment was a significant factor in terms of both patient and nurse outcomes.
Previous research has shown that the influence of staffing on patient outcome is conditional on
the work environment (Aiken et al., 2011). Future research could include exploring how the
influence of throughput may be conditional on the nurse work environment. Moreover, we might
as whether the components of the work environment are better barometers than throughput-
adjusted staffing of how well hospitals manage throughput? Again, the five subscales of the work
environment are: (1) nurse participation in hospital affairs, (2) nursing foundations for quality of
care, (3) nurse manager ability, leadership, and support of nurses, (4) staffing and resource
adequacy, and (5) collegial nurse-physician relations (Lake, 2002, p. 181).
Other throughput-adjusted staffing measures may be warranted. The 1/LOS-adjusted
staffing measure did not perform well in these models, but as Unruh & Fottler (2006) pointed out,
this assumes a 1:1 inverse relationship between LOS and nursing intensity. Future research using
LOS as a staffing adjustment factor may consider transforming this ratio and using an alternative
measure, such as the square root of 1/LOS (Unruh & Fottler, 2006).
Summary
This work has described how nurse workloads may be considerably influenced by patient
throughput but the empirical results did not substantiate this claim. Throughput-adjusted staffing
measures were no better (or worse) at predicting patient or nurse outcomes than unadjusted
staffing measures presently used in nursing research. Significant differences in staffing and

139
throughput were found across nursing unit types, which warrant further research as to how
throughput may influence workloads differently in different units or hospitals with different nurse
work environments. As in previous research, better nurse work environments were associated
with significantly lower odds of death and FTR for patients and lower odds of burnout, job
dissatisfaction, and intent to leave for nurses. The nurse work environment was the single most
important organizational factor in predicting patient and nurse outcomes. Administrators may
focus on improving work environments as a means of improving patient outcomes and nurse
retention in their institutions.
140
References
Agency for Healthcare Research and Quality [AHRQ]. (2012). Guide to Patient and Family
Engagement: Environmental Scan Report (AHRQ Publication No. 12-0042-EF). Rockville, MD:
Agency for Healthcare Research and Quality.
Aiken, L. H., Cimiotti, J. P., Sloane, D. M., Smith, H. L., Flynn, L., & Neff, D. F. (2011). Effects
of nurse staffing and nurse education on patient deaths in hospitals with different nurse work
environments. Medical Care, 49(12), 1047-1053.
Aiken, L. H., Clarke, S. P., Cheung, R. B., Sloane, D. M., & Silber, J. H. (2003). Educational
levels of hospital nurses and surgical patient mortality. Journal of the American Medical
Association, 290(12), 1617-1623.
Aiken, L. H., Clarke, S. P., Sloane, D. M., Lake, E. T., & Cheney, T. (2008). Effects of hospital
care environment on patient mortality and nurse outcomes. Journal of Nursing Administration,
38(5), 223-229.
Aiken, L. H., Clarke, S. P., Sloane, D. M., Sochalski, J., & Silber, J. H. (2002). Hospital nurse
staffing and patient mortality, nurse burnout, and job dissatisfaction. Journal of the American
Medical Association, 288(16), 1987-1993.
Aiken, L. H., Sermeus, W., Van Den Heede, K., Sloane, D. M., Busse, R., McKee, M… Kutney-
Lee, A. (2012). Patient safety, satsifactin, and quality of hospital care: Cross sectional surveys of
nurses and patients in 12 countries in Europe and the United States. BMJ (Online), 344(e7851).
Aiken, L. H., Sloane, D. M., Cimiotti, J. P., Clarke, S. P., Flynn, L., Seago, J. A., Spetz, J., &
Smith, H. L. (2010). Implications of the California nurse staffing mandate for other states:
Nursing and home care. Health Services Research, 45(4), 904-921.
Aiken, L. H., Sloane, D. M., Lake, E. T., Sochalski, J., & Weber, A. L. (1999). Organization and
outcomes of inpatient AIDS care. Medical Care, 37(8), 760-772.
Aiken, L. H., Sochalski, J. & Anderson, G. F. (1996). Downsizing the hospital nursing workforce.
Health Affairs, 15(4), 88-92.
Aiken, L. H., Sochalski, J., & Lake, E. T. (1997). Studying outcomes of organizational change in
health services. Medical Care, 35(11 SUPPL. 1), NS6-NS18.
Aiken, L.H., Xue, Y., Clarke, S.P., & Sloane, D.M. (2007) Supplemental nurse staffing in
hospitals and quality of care. Journal of Nursing Administration, 37(7-8), 335-342.
Aiken, M. & Hage, J. (1971). The organic organization and innovation. Sociology, 5(1), 63-82.
Atencio, B., Cohen, J., Gorenberg, B. (2003). Nurse retention: Is it worth it? Nursing Economic$,
21(6), 262-268, 299, 259.
Bae, S. (2011). Assessing the relationships between nurse working conditions and patient
outcomes: Systematic literature review. Journal of Nursing Management, 19(6), 700-713.

141
Baernholdt, M., Cox, K., & Scully, K. (2010). Using clinical data to capture nurse workload:
Implications for staffing and safety. CIN - Computers Informatics Nursing, 28(4), 229-234.
Beglinger, J. E. (2006). Quantifying patient care intensity: An evidence-based approach to
determining staffing requirements. Nursing Administration Quarterly, 30(3), 193-202.
Bellefield, S. & Gessner, G. (2010). Factors influencing the advancement of professional
education of nurses at a Magnet hospital. Retrieved from:
https://blogs.commons.georgetown.edu/gtg6/files/final-research-paper.pdf.
Bellow, A. A., Flottemesch, T. J., & Gillespie, G. L. (2012). Application of the emergency
department census model. Advanced Emergency Nursing Journal, 34(1), 55-64.
Blegen, M. A., Goode, C. J., Park, S. H., Vaughn, T., & Spetz, J. (2013). Baccalaureate education
in nursing and patient outcomes. Journal of Nursing Administration, 43(2), 89-94.
Blegen, M. A., Goode, C. J., Spetz, J., Vaughn, T., & Park, S. H. (2011). Nurse staffing effects on
patient outcomes safety-net and non-safety-net hospitals. Medical Care, 49(4), 406-414.
Blegen, M. A., Vaughn, T. E., & Goode, C. J. (2001). Nurse experience and education: Effect on
quality of care. Journal of Nursing Administration, 31(1), 33-39.
Blustein, J. & Weitzman, B. C. (1995). Access to hospitals with high-technology cardiac services:
How is race important? American Journal of Public Health, 85(3), 345-351.
Brand, C. A., Barker, A. L., Morello, R. T., Vitale, M. R., Evans, S. M., Scott, I. A., Stoelwinder,
J. U., & Cameron, P. A. (2012). A review of hospital characteristics associated with improved
performance. International Journal for Quality in Health Care, 24(5), 483-494.
Brennan, C. W. & Daly, B. J. (2009). Patient acuity: A concept analysis. Journal of Advanced
Nursing, 65(5), 1114-1126.
Brennan, C. W., Daly, B. J., & Jones, K. R. (2013). State of the science: The relationship between
nurse staffing and patient outcomes. Western Journal of Nursing Research, 35(6), 760-794.
Brewer, B. B., Verran, J. A. & Stichler, J. F. (2008). The systems research organizing model: a
conceptual perspective for facilities design. Health Environments Research and Design, 1(4), 7-
19.
Brooks Carthon, J. M., Kutney-Lee, A., Jarrín, O., Sloane, D., & Aiken, L. H. (2012). Nurse
staffing and postsurgical outcomes in black adults. Journal of the American Geriatrics Society,
60(6), 1078-1084.
Burns, L. R., & Wholey, D. R. (1991). The effects of patient, hospital, and physician
characteristics on length of stay and mortality. Medical Care, 29(3), 251-271.
Carayon, P. & Gurses, A.P. (2008).Nursing workload and patient safety – A human factors
engineering perspective. In R.G. Hughes (Ed.), Patient safety and quality: An evidence-based
142
handbook for nurses (chapter 30). Rockville, MD: Agency for Healthcare Research and Quality.
Retrieved on November 20, 2012 from: http://www.ncbi.nlm.nih.gov/books/NBK2657/
Cavouras, C. A. (2002). Nurse staffing levels in American hospitals: A 2001 report. Journal of
Emergency Nursing, 28(1), 40-43.
Centers for Disease Control and Prevention (CDC). (2010). Number and standard error of
discharges from short-stay hospitals with and without procedures and percentage with
procedures and standard error by selected characteristics: United States, 2010 [Data file].
Retrieved on April 17, 2013 from:
http://www.cdc.gov/nchs/data/nhds/4procedures/2010pro_numberpercentage.pdf.
Centers for Medicare and Medicaid Services [CMS]. (2006). Case Mix Index [Data file].
Retrieved August 7, 2013 from: http://www.cms.gov/Medicare/Medicare-Fee-for-Service-
Payment/AcuteInpatientPPS/Acute-Inpatient-Files-for-Download-Items/CMS1255496.html.
Chadaga, S. R., Shockley, L., Keniston, A., Klock, N. E., Van Dyke, S., Davis, Q., & Chu, E. S.
(2012). Hospitalist-led medicine emergency department team: Associations with throughput,
timeliness of patient care, and satisfaction. Journal of Hospital Medicine, 7(7), 562-566.
Chan, T. C., Killeen, J. P., Vilke, G. M., Marshall, J. B., & Castillo, E. M. (2010). Effect of
mandated nurse-patient ratios on patient wait time and care time in the emergency department.
Academic Emergency Medicine, 17(5), 545-552.
Choi, J., Choi, J. E., & Fucile, J. M. (2011). Power up your staffing model with patient acuity.
Nursing Management, 42(9), 40-43.
Cho, E., Choi, M., Kim, E., Yoo, I. Y., & Lee, N. (2011). Construct validity and reliability of the
Korean version of the practice environment scale of nursing work index for Korean nurses.
Journal of Korean Academy of Nursing, 41(3), 325-332.
Clarke, S. P. (2007). Hospital work environments, nurse characteristics, and sharps injuries.
American Journal of Infection Control, 35(5), 302-309.
Clarke, S. P., & Donaldson, N. E. (2008). Nurse staffing and patient care quality and safety. In R.
G. Hughes (Ed.), Patient safety and quality: An evidence-based handbook for nurses. Rockville,
MD: Agency for Healthcare Research and Quality.
Clarke, S. P., Rockett, J. L., Sloane, D. M., & Aiken, L. H. (2002). Organizational climate,
staffing, and safety equipment as predictors of needlestick injuries and near-misses in hospital
nurses. American Journal of Infection Control, 30(4), 207-216.
Coomber, B. & Barriball, K. (2007). Impact of job satisfaction components on intent to leave and
turnover for hospital-based nurses: A review of the research literature. International Journal of
Nursing Studies, 44(2), 297-314.
Cooper, S., & Zaske, D. (1987). Relationship between intensity of hospital services and pharmacy
workload. American Journal of Hospital Pharmacy, 44, 2267-2271.
143
Cornell, P., Herrin-Griffith, D., Keim, C., Petschonek, S., Sanders, A. M., D'Mello, S., Golden,
T.W., & Shepherd, G. (2010). Transforming nursing workflow, part 1: The chaotic nature of
nurse activities. Journal of Nursing Administration, 40(9), 366-373.
Cummings, G. G., Hayduk, L., Estabrooks, C. A. (2006). Is the Nursing Work Index measuring
up? Moving beyond reliability to testing validity. Nursing Research, 55(2), 82-93.
Cunningham, J. B., Kernohan, W. G., & Sowney, R. (2005). Bed occupancy and turnover interval
as determinant factors in MRSA infections in acute settings in Northern Ireland: 1 April 2001 to
31 March 2003. Journal of Hospital Infection, 61(3), 189-193.
Deb, P. (2010). Trends in case-mix in the Medicare population. Washington DC: American
Hospital Association. Retrieved from: http://www.aha.org/content/00-10/100715-CMItrends.pdf.
Dexter, F., Wachtel, R. E., & Epstein, R. H. (2006). Impact of average patient acuity on staffing
of the phase I PACU. Journal of Perianesthesia Nursing, 21(5), 303-310.
Dillman, D. A. (1978). Mail & telephone surveys: The total design method. New York: Wiley.
Donabedian, A. (1966). Evaluating the quality of medical care. Milbank Memorial Fund
Quarterly, 44(2),166-206.
Duffield, C., Diers, D., Aisbett, C., & Roche, M. (2009). Churn: Patient turnover and mix.
Nursing Economics, 27(3), 185-191.
Duffield, C., Roche, M., Blay, N., Thoms, D., & Stasa, H. (2011). The consequences of executive
turnover. Journal of Research in Nursing, 16(6), 503-514.
Duffield, C., Roche, M., Merrick, E. (2006). Methods of measuring nursing workload in
Australia. Collegian, 13(1), 16-22.
Elixhauser, A., Steiner, C., Harris, D. R., & Coffey, R. M. (1998). Comorbidity measures for use
with administrative data. Medical Care, 36(1), 8-27.
Erickson, R. & Grove, W. (2008). Why emotions matter: Age, agitation, and burnout among
registered nurses. Online Journal of Issues in Nursing. (13), 1. Retrieved from:
http://www.nursingworld.org/MainMenuCategories/ANAMarketplace/ANAPeriodicals/OJIN/Ta
bleofContents/vol132008/No1Jan08/ArticlePreviousTopic/WhyEmotionsMatterAgeAgitationand
BurnoutAmongRegisteredNurses.html.
Estabrooks, C. A., Midodzi, W. K., Cummings, G. G., Ricker, K. L., & Giovannetti, P. (2005).
The impact of hospital nursing characteristics on 30-day mortality. Nursing Research, 54(2), 74-
84.
Estryn-Behar, M., Van Der Heijden, B. I. J. M., Fry, C., & Hasselhorn, H. (2010). Longitudinal
analysis of personal and work-related factors associated with turnover among nurses. Nursing
Research, 59(3), 166-177.
144
Evans, W. N., & Kim, B. (2006). Patient outcomes when hospitals experience a surge in
admissions. Journal of Health Economics, 25(2), 365-388.
Faller, M. S., Gates, M. G., Georges, J. M., & Connelly, C. D. (2011). Work-related burnout, job
satisfaction, intent to leave, and nurse-assessed quality of care among travel nurses. Journal of
Nursing Administration, 41(2), 71-77.
Fink, A., Yano, E. M., & Brook, R. H. (1989). The condition of the literature on differences in
hospital mortality. Medical Care, 27(4), 315-336.
Friese, C. R. (2012). Practice environments of nurses employed in ambulatory oncology settings:
Measure refinement. Oncology Nursing Forum, 39(2), 166-172.
Friese, C. R., Earle, C. C., Silber, J. H., & Aiken, L. H. (2010). Hospital characteristics, clinical
severity, and outcomes for surgical oncology patients. Surgery, 147(5), 602-609.
Fuentelsaz-Gallego, C., Moreno-Casbas, M. T., & González-María, E. (2013). Validation of the
Spanish version of the questionnaire practice environment scale of the nursing work index.
International Journal of Nursing Studies, 50(2), 274-280.
Gallagher, R., & Gormley, D. K. (2009). Perceptions of stress, burnout, and support systems in
pediatric bone marrow transplantation nursing. Clinical Journal of Oncology Nursing, 13(6), 681-
685.
Ghaferi, A. A., Osborne, N. H., Birkmeyer, J. D., & Dimick, J. B. (2010). Hospital characteristics
associated with failure to rescue from complications after pancreatectomy. Journal of the
American College of Surgeons, 211(3), 325-330.
Glance, L. G., Dick, A. W., Osler, T. M., & Mukamel, D. B. (2006). Does date stamping ICD-9-
CM codes increase the value of clinical information in administrative data? Health Services
Research, 41(1), 231-251.
Glance, L. G., Dick, A. W., Osler, T. M., Mukamel, D. B., Li, Y., & Stone, P. W. (2012). The
association between nurse staffing and hospital outcomes in injured patients. BMC Health
Services Research, 12(1).
Godfrey, M. A. (1978). Job satisfaction--or should that be dissatisfaction? how nurses feel about
nursing. part one. Nursing, 8(4), 89-100, 102.
Godwyn, M. & Gittell, J. H. (Eds.). (2012). Sociology of Organizations: Structures and
Relationships. Los Angeles, CA: Sage.
Graf, C. M., Millar, S., Feilteau, C., Coakley, P. J., & Erickson, J. I. (2003). Patients' needs for
nursing care: Beyond staffing ratios. Journal of Nursing Administration, 33(2), 76-81.
Greenhalgh, T., Robert, G., Macfarlane, F., Bate, P., & Kyriakidou, O. (2004). Diffusion of
innovations in service organizations: Systematic review and recommendations. Milbank
Quarterly, 82(4), 581-629.
145
Greiner, A. (1995). Cost and Quality Matters: Workplace Innovations in the Health Care
Industry. Washington, DC: Economic Policy Institute.
Haider, A. H., Scott, V. K., Rehman, K. A., Velopulos, C., Bentley, J. M., Cornwell III, E. E., &
Al-Refaie, W. (2013). Racial disparities in surgical care and outcomes in the United States: A
comprehensive review of patient, provider, and systemic factors. Journal of the American College
of Surgeons, 216(3), 482-492.e12.
Hage, J. & Finsterbusch, K. (1989). Three strategies of organizational change: Organizational
development, organizational theory, and organizational design. International Review of
Administrative Sciences, 5(1), 29-57.
Hanrahan, N. P. (2007). Measuring inpatient psychiatric environments: Psychometric properties
of the Practice Environment Scale-Nursing Work Index. The International Journal of Psychiatric
Nursing Research, 12(3), 1521-1528.
Health Forum. (2012). AHA Annual Survey Database Fiscal Year 2011. Retrieved on March 12,
2013 from: http://www.ahadataviewer.com/book-cd-products/aha-survey/.
Healthcare Cost and Utilization Project [HCUP]. (2011). Facts and Figures 2009. Agency for
Healthcare Research and Quality, Rockville, MD. Retrieved on March 29, 2013 from:
http://www.hcup-us.ahrq.gov/reports/factsandfigures/2009/exhibit1_2.jsp.
Hearld, L. R., Alexander, J. A., Fraser, I., & Jiang, H. J. (2008). How do hospital organizational
structure and processes affect quality of care? A critical review of research methods. Medical
Care Research and Review, 65(3), 259-299.
Hendrich, A. L., & Lee, N. (2005). Intra-unit patient transports: Time, motion, and cost impact on
hospital efficiency. Nursing Economics, 23(4), 157-164.
Henneman, E. A., Gawlinski, A., & Giuliano, K. K. (2012). Surveillance: A strategy for
improving patient safety in acute and critical care units. Critical Care Nurse, 32(2), e9-e18.
Hultman, C. S., Tong, W. T., Surrusco, M., Roden, K. S., Kiser, M., & Cairns, B. A. (2012). To
everything there is a season: Impact of seasonal change on admissions, acuity of injury, length of
stay, throughput, and charges at an accredited, regional burn center. Annals of Plastic Surgery,
69(1), 30-34.
Hurst, K. (2005). Relationship between patient dependency, nursing workload, and quality.
International Journal of Nursing Studies, 42(1), 75-84.
Iezzoni, L. I. (2003). Risk adjustment for measuring health care outcomes (3rd
ed.). Chicago, IL:
Health Administration Press.
Iezzoni, L. I., Daley, J., Heeren, T., Foley, S. M., Hughes, J. S., Fisher, E. S., Duncan, C. C., &
Coffman, G. A. (1994). Using administrative data to screen hospitals for high complication rates.
Inquiry, 31(1), 40-55.
146
Institute of Medicine. (2011). The future of nursing: Leading change, advancing health.
Washington, DC: National Academies Press.
Jennings, B. M. (2008). Patient acuity. In R. G. Hughes (Ed.), Patient safety and quality: An
evidence-based handbook for nurses. Rockville, MD: Agency for Healthcare Research and
Quality. Retrieved March 29, 2013 from:
http://www.ahrq.gov/legacy/qual/nurseshdbk/docs/JenningsB_PA.pdf.
Jones, A. (2007). Admitting hospital patients: A qualitative study of an everyday nursing task.
Nursing Inquiry, 14(3), 212-223.
Kadda, O., Marvaki, C., & Panagiotakos, D. (2012). The role of nursing education after a cardiac
event. Health Science Journal, 6(4), 634-646.
Kalisch, B. J. (2006). Missed nursing care: A qualitative study. Journal of Nursing Care Quality,
21(4), 306-313.
Kalisch, B. J., Landstrom, G. L., & Hinshaw, A. S. (2009). Missed nursing care: A concept
analysis. Journal of Advanced Nursing, 65(7), 1509-1517.
Kane, R. L., Shamliyan, T. A., Mueller, C., Duval, S., & Wilt, T. J. (2007). The association of
registered nurse staffing levels and patient outcomes: Systematic review and meta-analysis.
Medical Care, 45(12), 1195-1204.
Kelly, L. A., McHugh, M. D., & Aiken, L. H. (2011). Nurse outcomes in Magnet® and non-
Magnet hospitals. Journal of Nursing Administration, 41(10), 428-433.
Kelly, L. A., & Vincent, D. (2011). The dimensions of nursing surveillance: A concept analysis.
Journal of Advanced Nursing, 67(3), 652-661.
Kendall-Gallagher, D., Aiken, L. H., Sloane, D. M., & Cimiotti, J. P. (2011). Nurse specialty
certification, inpatient mortality, and failure to rescue. Journal of Nursing Scholarship, 43(2),
188-194.
Kitch, B. T., Cooper, J. B., Zapol, W. M., Marder, J. E., Karson, A., Hutter, M., & Campbell, E.
G. (2008). Handoffs causing patient harm: A survey of medical and surgical house staff. Joint
Commission Journal on Quality and Patient Safety, 34(10), 563-570.
Kobis, D. A., & Kennedy, K. M. (2006). Capacity management and patient throughput: Putting
this problem to bed. Healthcare Financial Management: Journal of the Healthcare Financial
Management Association, 60(10), 88-92, 94.
Kramer, M. & Hafner, L., (1989). Shared values: Impact on staff nurse job satisfaction and
perceived productivity. Nursing Research, 38, 172-177.
Kutney-Lee, A., Lake, E. T., & Aiken, L. H. (2009). Development of the hospital nurse
surveillance capacity profile. Research in Nursing and Health, 32(2), 217-228.
147
Kutney-Lee, A., McHugh, M. D., Sloane, D. M., Cimiotti, J. P., Flynn, L., Neff, D. F., & Aiken,
L. H. (2009). Nursing: A key to patient satisfaction. Health Affairs, 28(4), w669-w677.
Kutney-Lee, A., Wu, E. S., Sloane, D. M., & Aiken, L. H. (2013). Changes in hospital nurse work
environments and nurse job outcomes: An analysis of panel data. International Journal of
Nursing Studies, 50(2), 195-201.
Lake, E. T. (1998). Advances in understanding and predicting nurse turnover. Research in the
Sociology of Health Care, 15, 147-171.
Lake, E. T. (2002). Development of the practice environment scale of the nursing work index.
Research in Nursing and Health, 25(3), 176-188.
Lake, E. T. (2007). The nursing practice environment: Measurement and evidence. Medical Care
Research and Review, 64(2 SUPPL.), 104S-122S.
Lake, E. T., & Friese, C. R. (2006). Variations in nursing practice environments: Relation to
staffing and hospital characteristics. Nursing Research, 55(1), 1-9.
Lane, B. S., Jackson, J., Odom, S. E., Cannella, K. A. S., & Hinshaw, L. (2009). Nurse
satisfaction and creation of an admission, discharge, and teaching nurse position. Journal of
Nursing Care Quality, 24(2), 148-152.
Laugaland, K., Aase, K., & Barach, P. (2012). Interventions to improve patient safety in
transitional care - A review of the evidence. Work, 41(SUPPL.1), 2915-2924.
Lavandero, R. (1981). Nurse burnout: What can we learn? Journal of Nursing Administration,
11(11-12), 17-23.
Leiter, M. P., & Laschinger, H. K. S. (2006). Relationships of work and practice environment to
professional burnout: Testing a causal model. Nursing Research, 55(2), 137-146.
Lin, S., Chiang, H., & Chen, I. (2011). Comparing nurses' intent to leave or stay: Differences of
practice environment perceptions. Nursing and Health Sciences, 13(4), 463-467.
Liu, K., You, L., Chen, S., Hao, Y., Zhu, X., Zhang, L., & Aiken, L. H. (2012). The relationship
between hospital work environment and nurse outcomes in Guangdong, China: A nurse
questionnaire survey. Journal of Clinical Nursing, 21(9-10), 1476-1485.
Lune, H. (2010). Understanding organizations. Cambridge, UK: Polity Press.
Manojlovich, M. (2005). Predictors of professional nursing practice behaviors in hospital settings.
Nursing Research, 54(1), 41-47.
Mark, B. A., & Harless, D. W. (2007). Nurse staffing, mortality, and length of stay in for profit
and not for profit hospitals. Inquiry, 44(2), 167-186.
Mark, B. A., & Harless, D. W. (2011). Adjusting for patient acuity in measurement of nurse
staffing: Two approaches. Nursing Research, 60(2), 107-114.
148
Marrett, C. B., Hage, J., & Aiken, M. (1975). Communication and satisfaction in organizations.
Human Relations, 28(7), 611-626.
Maslach, C. & Jackson, S. E. (1981). The measurement of experienced burnout. Journal of
Occupational Behavior, 2, 99-113.
Maslach, C., Schaufeli, W. B., & Leiter, M. P. (2001). Job burnout. Annual Review of
Psychology, 52, 397-422.
McCarthy, G., Tyrrell, M. P., & Lehane, E. (2007). Intention to 'leave' or 'stay' in nursing.
Journal of Nursing Management, 15(3), 248-255.
McClure, M. L., Poulin, M. A., Sovie, M. D., & Wandelt, M. A. (1983). Magnet hospitals:
Attraction and retention of professional nurses. Kansas City, MO: American Nurses Association.
McHugh, M. D., Kelly, L. A., Sloane, D. M., & Aiken, L. H. (2011). Contradicting fears,
California’s nurse-to-patient mandate did not reduce the skill level of the nursing workforce in
hospitals. Health Affairs, 30(7), 1299-1306.
McHugh, M. D., Kelly, L. A., Smith, H. L., Wu, E. S., Vanak, J. M., & Aiken, L. H. (2013).
Lower mortality in Magnet hospitals. Medical Care, 51(5), 382-388.
McHugh, M. D., Kutney-Lee, A., Cimiotti, J. P., Sloane, D. M., & Aiken, L. H. (2011). Nurses'
widespread job dissatisfaction, burnout, and frustration with health benefits signal problems for
patient care. Health Affairs, 30(2), 202-210.
McHugh, M. D., & Stimpfel, A. W. (2012). Nurse reported quality of care: A measure of hospital
quality. Research in Nursing and Health, 35(6), 566-575.
Meyer, R. M., & O'Brien-Pallas, L. L. (2010). Nursing services delivery theory: An open system
approach. Journal of Advanced Nursing, 66(12), 2828-2838.
Miller, J. F. (2011). Burnout and its impact on good work in nursing. Journal of Radiology
Nursing, 30(4), 146-149.
Mitchell, P. H., Ferketich, S., & Jennings, B. M. (1998). Quality health outcomes model. Journal
of Nursing Scholarship, 30(1), 43-46.
Mitchell, P. H., & Shortell, S. M. (1997). Adverse outcomes and variations in organization of
care delivery. Medical Care, 35(11 SUPPL. 1), NS19-NS32.
Myny, D., Van Hecke, A., De Bacquer, D., Verhaeghe, S., Gobert, M., Defloor, T., & Van
Goubergen, D. (2012). Determining a set of measurable and relevant factors affecting nursing
workload in the acute care hospital setting: A cross-sectional study. International Journal of
Nursing Studies, 49(4), 427-436.
Needleman, J., Buerhaus, P., Mattke, S., Stewart, M., & Zelevinsky, K. (2002). Nurse-staffing
levels and the quality of care in hospitals. New England Journal of Medicine, 346(22), 1715-
1722.
149
Needleman, J., Buerhaus, P., Pankratz, V. S., Leibson, C. L., Stevens, S. R., & Harris, M. (2011).
Nurse staffing and inpatient hospital mortality. New England Journal of Medicine, 364(11), 1037-
1045.
Norrish, B. R., & Rundall, T. G. (2001). Hospital restructuring and the work of registered nurses.
Milbank Quarterly, 79(1), 55-79.
O'Brien-Pallas, L., Irvine, D., Peereboom, E., & Murray, M. (1997). Measuring nursing
workload: Understanding the variability. Nursing Economic$, 15(4), 171-182.
Park, S. H., Blegen, M. A., Spetz, J., Chapman, S. A., & De Groot, H. (2012). Patient turnover
and the relationship between nurse staffing and patient outcomes. Research in Nursing and
Health, 35(3), 277-288.
Pesanka, D. A., Greenhouse, P. K., Rack, L. L., Delucia, G. A., Perret, R. W., Scholle, C. C.,
Johnson, M.S., Janov, C. L. (2009). Ticket to ride: Reducing handoff risk during hospital patient
transport. Journal of Nursing Care Quality, 24(2), 109-115.
Pines, J. M., Decker, S. L., & Hu, T. (2012). Exogenous predictors of national performance
measures for emergency department crowding. Annals of Emergency Medicine, 60(3), 293-298.
Purdy, N., Spence Laschinger, H. K., Finegan, J., Kerr, M., & Olivera, F. (2010). Effects of work
environments on nurse and patient outcomes. Journal of Nursing Management, 18(8), 901-913.
Porta, C. R., Foster, A., Causey, M. W., Cordier, P., Ozbirn, R., Bolt, S., Allison, D., &. Rush, R.
(2013). Operating room efficiency improvement after implementation of a postoperative team
assessment. Journal of Surgical Research, 180(1), 15-20.
PriceWaterhouseCoopers. (2007). What works: Healing the healthcare staffing shortage.
PriceWaterhouseCoopers, LLP.
Qian, X., Russell, L. B., Valiyeva, E., & Miller, J. E. (2007). Medicare’s Prospective Payment
System for hospitals: New evidence on transitions among health care settings. Rutgers University
Department of Economics[Working paper]. Retrieved from:
ftp://165.230.152.149/Rutgers/wp/2007-07.pdf.
Quan, H., Sundararajan, V., Halfon, P., Fong, A., Burnand, B., Luthi, J., Saunders, L. D., Beck,
C. A., Feasby, T. E., & Ghali, W. A. (2005). Coding algorithms for defining comorbidities in
ICD-9-CM and ICD-10 administrative data. Medical Care, 43(11), 1130-1139.
Raborn, N. (2012). Preventing avoidable heart failure readmissions: The university hospital
experience. Journal of Clinical Outcomes Management, 19(10), 460-464.
Rafferty, A. M., Clarke, S. P., Coles, J., Ball, J., James, P., McKee, M., & Aiken, L. H. (2007).
Outcomes of variation in hospital nurse staffing in English hospitals: Cross-sectional analysis of
survey data and discharge records. International Journal of Nursing Studies, 44(2), 175-182.
150
Ravikumar, T. S., Sharma, C., Marini, C., Steele, G. D., Ritter, G., Barrera, R., . . . Nelson, K.
(2010). A validated value-based model to improve hospital-wide perioperative outcomes:
Adaptability to combined medical/surgical inpatient cohorts. Annals of Surgery, 252(3), 486-496.
Ridley, R. T. (2008). The relationship between nurse education level and patient safety: An
integrative review. Journal of Nursing Education, 47(4), 149-156.
Rothberg, M. B., Abraham, I., Lindenauer, P. K., & Rose, D. N. (2005). Improving nurse-to-
patient staffing ratios as a cost-effective safety intervention. Medical Care, 43(8), 785-791.
Seago, J. (2002). The California experiment. Journal of Nursing Administration, 31(1), 48-58.
Sermeus, W., Aiken, L. H., Van den Heede, K., Rafferty, A. M., Griffiths, P., Moreno-Casbas, M.
T., . . . Zikos, D. (2011). Nurse forecasting in Europe (RN4CAST): Rationale, design and
methodology. BMC Nursing, 10(6).
Sermeus, W., Delesie, L., Van den Heede, K., Diya, L., & Lesaffre, E. (2008). Measuring the
intensity of nursing care: Making use of the Belgian nursing minimum data set. International
Journal of Nursing Studies, 45(7), 1011-1021.
Shamian, J., Hagen, T., Hu, W., & Fogarty, T. (1994). The relationship between length of stay
and required nursing care hours. Journal of Nursing Administration, 24(7/8), 52-57.
Shekelle, P. G. (2013). Nurse-patient ratios as a patient safety strategy: A systematic review.
Annals of Internal Medicine, 158(5 PART 2), 404-409.
Shever, L. L. (2011). The impact of nursing surveillance on failure to rescue. Research and
Theory for Nursing Practice, 25(2), 107-126.
Sheward, L., Hunt, J., Hagen, S., Macleod, M., & Ball, J. (2005). The relationship between UK
hospital nurse staffing and emotional exhaustion and job dissatisfaction. Journal of Nursing
Management, 13(1), 51-60.
Shrout, P., & Fleiss, J. (1979). Intraclass correlations: Uses in assessing rater reliability.
Psychological Bulletin, 86(2), 420-428.
Silber, J. H., Kennedy, S. K., Even-Shoshan, O., Chen, W., Mosher, R. E., Showan, A. M., &
Longnecker, D. E. (2002). Anesthesiologist board certification and patient outcomes.
Anesthesiology, 96(5), 1044-1052.
Silber, J. H., Romano, P. S., Rosen, A. K., Wang, Y., Even-Shoshan, O., & Volpp, K. G. (2007).
Failure-to-rescue comparing definitions to measure quality of care. Medical Care, 45(10), 918-
925.
Silber, J. H., Williams, S. V., Krakauer, H., & Schwartz, J. S. (1992). Hospital and patient
characteristics associated with death after surgery: A study of adverse occurrence and failure to
rescue. Medical Care, 30(7), 615-629.
151
Smith, H. L. (2008). A double sample to minimize bias due to non-response in a mail survey. In
A. Ruiz-Gazen, P. Guilbert, D. Haziza, & Y. Tille (Eds.), Survey Methods: Applications to
longitudinal studies, to health, to electoral studies and to studies in developing countries (334-
339). Paris: Dunod.
Sochalski, J. (2004). Is more better?: The relationship between nurse staffing and the quality of
nursing care in hospitals. Medical Care, 42(2 Suppl), II67-73.
Spetz, J. (1998). Hospital employment of nursing personnel: Has there really been a decline?
Journal of Nursing Administration, 28(3), 20-27.
Spiva, L., & Johnson, D. (2012). Improving nursing satisfaction and quality through the creation
of admission and discharge nurse team. Journal of Nursing Care Quality, 27(1), 89-93.
StataCorp LP. (2011). Stata/MP 12.1 for Windows [computer software]. College Station: TX.
Stearns, S. C. (1991). Hospital discharge decisions, health outcomes, and the use of unobserved
information on case-mix severity. Health Services Research, 26(1), 27-51.
Steinwald, B., & Dummit, L. A. (1989). Hospital case-mix change: Sicker patients or DRG
creep? Health Affairs, 8(2), 35-47.
Stewart, N. J., D'Arcy, C., Kosteniuk, J., Andrews, M. E., Morgan, D., Forbes, D., . . . Pitblado, J.
R. (2011). Moving on? Predictors of intent to leave among rural and remote RNs in Canada.
Journal of Rural Health, 27(1), 103-113.
Stimpfel, A. W., Sloane, D. M., & Aiken, L. H. (2012). The longer the shifts for hospital nurses,
the higher the levels of burnout and patient dissatisfaction. Health Affairs, 31(11), 2501-2509.
Stone, P.W., Glied, S. A., McNair, P. D., Matthes, N., Cohen, B., Landers, T. F., & Larson, E. L.
(2010). CMS changes in reimbursement for HAIs: Setting a research agenda. Medical Care, 48,
433-439.
Stover-Baker, B., Stahlman, B., & Pollack, M. (2012). Triage nurse prediction of hospital
admission. Journal of Emergency Nursing, 38(3), 306-310.
Stukenborg, G. J., Wagner, D. P., & Connors Jr., A. F. (2001). Comparison of the performance of
two comorbidity measures, with and without information from prior hospitalizations. Medical
Care, 39(7), 727-739.
Twigg, D., & Duffield, C. (2009). A review of workload measures: A context for a new staffing
methodology in Western Australia. International Journal of Nursing Studies, 46(1), 131-139.
Unruh, L. Y., & Fottler, M. D. (2006). Patient turnover and nursing staff adequacy. Health
Services Research, 41(2), 599-612.
Unruh, L., Russo, C. A., Jiang, H. J., & Stocks, C. (2009). Measuring up: Are nurse staffing
measures adequate for health services research? Advances in Health Care Management, 8, 115-
154.
152
Vahey, D. C., Aiken, L. H., Sloane, D. M., Clarke, S. P., & Vargas, D. (2004). Nurse burnout and
patient satisfaction. Medical Care, 42(2 Suppl), II57-66.
Van den Heede, K., Sermeus, W., Diya, L., Clarke, S. P., Lesaffre, E., Vleugels, A., & Aiken, L.
H. (2009). Nurse staffing and patient outcomes in Belgian acute hospitals: Cross-sectional
analysis of administrative data. International Journal of Nursing Studies, 46(7), 928-939.
Van Walraven, C., Austin, P. C., Jennings, A., Quan, H., & Forster, A. J. (2009). A modification
of the Elixhauser comorbidity measures into a point system for hospital death using
administrative data. Medical Care, 47(6), 626-633.
Voepel-Lewis, T., Pechlavanidis, E., Burke, C., & Talsma, A. N. (2012). Nursing surveillance
moderates the relationship between staffing levels and pediatric postoperative serious adverse
events: A nested case-control study. International Journal of Nursing Studies,
Volpp, K. G., Friedman, W., Romano, P. S., Rosen, A., & Silber, J. H. (2010). Residency training
at a crossroads: Duty-hour standards 2010. Annals of Internal Medicine, 153(12), 826-828.
Wagner, C., Budreau, G., & Everett, L. Q. (2005). Analyzing fluctuating unit census for timely
staffing intervention. Nursing Economics, 23, 85-90.
Wakefield, M. (2001). Hard numbers, hard choices: Seeking solutions to the nursing shortage.
Nursing Economics, 19(2), 80-83.
Wan, T. T. (1992). Hospital variations in adverse patient outcomes. Quality Assurance and
Utilization Review : Official Journal of the American College of Utilization Review Physicians,
7(2), 50-53.
Warshawsky, N. E., & Havens, D. S. (2011). Global use of the practice environment scale of the
nursing work index. Nursing Research, 60(1), 17-31.
Welton, J. M. (2007). Mandatory hospital nurse to patient staffing ratios: Time to take a different
approach. The Online Journal of Issues in Nursing, 12(3). Retrieved March 2, 2013 from:
http://nursingworld.org/MainMenuCategories/ANAMarketplace/ANAPeriodicals/OJIN/TableofC
ontents/Volume122007/No3Sept07/MandatoryNursetoPatientRatios.html.