how to calculate systemic risk surcharges - citeseerx
TRANSCRIPT
1
How to Calculate Systemic Risk Surcharges
Viral V. Acharya, Lasse H. Pedersen,
Thomas Philippon and Matthew Richardson1
Abstract
There is a growing view that systemic risk arises due to loss of intermediation for the overall
economy – a negative externality – when the financial sector becomes under-capitalized as a
whole. In turn, the systemic risk contribution of an individual financial firm can be defined as its
share of this negative externality. Motivated by this intuition, a number of authors have proposed
a “Pigovian tax” that would charge each firm in relation to its marginal potential impact on the
aggregate risk of the financial sector. This paper discusses and analyzes several measurement
strategies that could be used to estimate such systemic risk surcharges. Some empirical evidence
is provided which shows how these measurements line up with the loss of capitalization of
financial firms during the financial crisis of 2007-2009.
1 The authors are all at New York University Stern School of Business, 44 West 4th St., New York, NY, 10012, and
members of the NBER. We are grateful for useful comments from Rob Engle, Jim Poterba, participants at the
Research Conference on Quantifying Systemic Risk organized by the NBER and the Federal Reserve Bank of
Cleveland, our discussants Mathias Drehmann and Dale Gray, the reviewers and the organizers Joseph Haubrich and
Andrew Lo.
2
I. Introduction
Current and past financial crises show that systemic risk emerges when aggregate
capitalization of the financial sector is low. The intuition is straightforward. When a financial
firm’s capital is low, it is difficult for that firm to perform financial services, and, when capital is
low in the aggregate, it is not possible for other financial firms to step into the breach. This
breakdown in financial intermediation is the reason there are severe consequences for the
broader economy. Systemic risk therefore can be broadly thought of as the failure of a significant
part of the financial sector leading to a reduction in credit availability that has the potential to
adversely affect the real economy.
Existing financial regulations such as the Basel capital requirements seek to limit each
institution’s risk. However, unless the external costs of systemic risk are internalized by each
financial institution, the institution will have the incentive to take risks that are borne by others in
the economy. That is, each individual firm may take actions to prevent its own collapse but not
necessarily the collapse of the system. It is in this sense that a financial institution’s risk can be
viewed as a negative externality on the system.2 An illustration from the current crisis is that
financial institutions took bets on securities and portfolios of loans (such as AAA-rated sub-
prime mortgage backed tranches) which faced almost no idiosyncratic risk, but large amounts of
systematic risk.
As a result, a growing part of the literature argues that financial regulation should be
focused on limiting systemic risk, that is, the risk of a crisis in the financial sector and its
spillover to the economy at large. Indeed, there is a plethora of recent papers that provide
measures of systemic risk in this context.3 Several papers in particular – Acharya, Pedersen,
Philippon and Richardson (2010a, 2010b) (hereafter APPR), Korinek (2010), Morris and Shin
2 An analogy can be made to an industrial company that produces emissions which lower its own costs but pollute
the environment. 3 See, for example, Acharya, Cooley, Richardson and Walter (2010a), Acharya, Pedersen, Philippon and Richardson
(2010a), Adrian and Brunnermeier (2009), Billio, Getmansky, Lo and Pelizzon (2010), de Jonghe (2009), Gray,
Merton and Bodie (2008), Gray and Jobst (2009), Goodhart and Segoviano (2009), Hartmann, Straetmans and De
Vries (2005), Huang, Zhou and Zhu (2009), Lehar (2005), Perotti and Suarez (2011), and Tarashev, Borio and
Tsatsaronis (2009), among others.
3
(2008) and Perotti and Suarez (2011) – provide theoretical arguments and explore the optimality
properties of a “Pigovian tax” as a potential regulatory solution to the problem of systemic risk.
In these frameworks, each financial institution must face a “surcharge” that is based on
the extent to which it is likely to contribute to systemic risk (defined, for example, by APPR as
the realization of states of the world in which the financial sector as a whole becomes
undercapitalized). The idea of systemic risk surcharges is that they provide incentives for the
financial firm to limit its contributions to systemic risk, that is, to lower its surcharge by reducing
size, leverage, risk and correlation with the rest of the financial sector and economy.
This paper analyzes various schemes to estimate such a surcharge: (i) regulatory stress
tests of financial institutions that measure their capital losses in adverse scenarios; (ii) statistical-
based measures of capital losses of financial firms extrapolated to crisis periods, (iii) pricing of
contingent capital insurance for systemic risk, that is, government-run insurance for each firm
against itself becoming undercapitalized when the financial sector as a whole becomes
undercapitalized, and (iv) market-based discovery of the price of such risk insurance that
financial institutions must purchase partly from the private sector and mostly from the
government or the central bank.
While the paper provides a discussion of each scheme, we perform a detailed analysis of
scheme (iii). In particular, we provide an explicit calculation formula for contingent capital
insurance and illustrate how the systemic risk surcharge varies with the size of the institution, its
leverage, risk (volatility), and importantly, correlation with rest of the economy or the
systemically important part of the financial sector. In applying the method to the period prior to
the start of the financial crisis in July 2007, the measure of systemic risk sorts well on the firms
that ended up running aground in the crisis, e.g., only 18 firms show up in the top 15 systemic
firms in all four 4 years of 2004-2007. These firms are a who’s who of the current crisis,
including A.I.G, Bank of America, Bear Stearns, Citigroup, Countrywide, Fannie Mae, Freddie
Mac, Goldman Sachs, Hartford Financial, JP Morgan, Lehman Brothers, Lincoln National,
Merrill Lynch, Metlife, Morgan Stanley, Prudential Financial, Wachovia and Washington
Mutual. Moreover, the measure is not just size-based as many of these firms also show up, once
adjusted for their market capitalization.
4
The paper is organized as follows. Section II reviews the recent literature on systemic risk
measurement and regulation, focusing in particular on the APPR paper. In the context of the
description in Section II, Section III describes various approaches to estimating systemic risk
surcharges. Section IV presents a detailed analysis of one of the schemes to charge financial
firms based on price of their contingent capital insurance for their systemic risk contributions.
We provide an exact formula for the price of each firm’s contingent capital insurance and
calibrate it using data prior to the start of the financial crisis starting in the summer of 2007.
Section V concludes.
II. Surcharges on Systemic Risk
As described above, systemic risk can be broadly considered to be the joint failure of
financial institutions or markets which lead to the impairing of the financial intermediation
process. In the recent crisis, full-blown systemic risk emerged only when, in the early Fall of 08,
the GSEs, Lehman, AIG, Merrill Lynch, Washington Mutual, Wachovia, and Citigroup, among
others, effectively failed. Consider the impact of the financial crisis of 2007-2009 on the
economy. In the late fall and winter of 2008-2009, the worldwide economy and financial markets
collapsed. The stock market fell 42% in the U.S. and, on a dollar-adjusted basis, the market
dropped 46% in the U.K., 49% in Europe at large, 35% in Japan, and around 50% in the larger
Latin American countries. Likewise, global GDP fell by 0.8% (the first contraction in decades),
with the decline in advanced economies a sharp 3.2%. Furthermore, international trade fell
almost 12%. When economists describe the impact of systemic risk, this is generally what they
mean.
While the mechanism by which many financial firms fail simultaneously – aggregate
shock, a “bank” run, counterparty risk, fire sales – may differ, the end result is invariably a
capital shortfall of the aggregate financial sector. Individual firms do not have the incentive to
take into account their contribution to this aggregate capital shortfall. By its very nature,
therefore, systemic risk is a negative externality imposed by each financial firm on the system. A
number of researchers and policymakers have argued that a major failure of the current crisis
was that existing financial sector regulations seek to limit each institution’s risk seen in isolation
and are not sufficiently focused on systemic risk. As a result, while individual firm’s risks are
5
properly dealt with in normal times, the system itself remains, or is in fact encouraged to be,
fragile and vulnerable to large macroeconomic shocks.
As mentioned in the introduction, there is a growing literature in economics and finance that
analyzes the problem of systemic risk of financial firms. APPR suggest a methodology to get around
this market and regulatory failure and induce financial institutions to internalize the negative
externality of systemic risk. Firms are often regulated to limit their pollution or charged based on
the externality they cause (see, for example, the classic regulation theory of Stigler, 1971, and
Peltzman, 1976). Similarly, APPR derive a “Pigovian tax” on financial firms’ contribution to
systemic risk.4
Specifically, in (i) a model of a banking system in which each bank has limited liability
and maximizes shareholder value, (ii) the regulator provides some form of a safety net (i.e.,
guarantees for some creditors such as deposit or too-big-to-fail insurance), and (iii) the economy
faces systemic risk (i.e., system-wide costs) in a financial crisis when the banking sector’s equity
capitalization falls below some fraction of its total assets and that these costs are proportional to
the magnitude of this shortfall, the costs of each financial firm can be shown to equal the sum of
two components:
Costs to society of the financial firm = Expected losses of the firm’s guaranteed debt
upon default + Expected systemic costs in a crisis per dollar of capital shortfall ×
Expected capital shortfall of the firm if there is a crisis
i. The expected losses upon default of the liabilities that are guaranteed by the
government:
That is, the government guarantees in the system need to be priced, in other
words, financial firms must pay for the guarantees they receive. Because the price of
these guarantees will vary across firms due to the firm’s risk characteristics, the firm
will choose an optimal level of leverage and risk-taking activities at a more prudent
4 See, for example, Baumol (1972) and, in the context of the financial crisis, Korinek (2010) and Perotti and Suarez
(2011).
6
level. Currently, the Federal Deposit Insurance Corporation (FDIC) in the United
States chooses the level of FDIC premiums on a risk- adjusted basis. However, in
reality, premiums are only charged when the fund is poorly capitalized so the current
FDIC scheme will in general not achieve this optimal policy.
ii. The firm’s contribution to expected losses in the crisis (i.e., the contribution of
each firm to aggregate losses above a certain threshold) multiplied by the
expected systemic costs when the financial sector becomes undercapitalized
Thus, the systemic risk also needs to be priced, that is, financial institutions need to
internalize the costs of the negative externality imposed on the system. There are
two terms to this component of the surcharge. The first term – expected systemic
costs –involves estimating the probability of a systemic crisis and the external costs of such a
crisis, and represents the level of the surcharge. This can be considered the time-series
component of the surcharge. There is substantial evidence on what leads to financial
crises and the costs to economies of such crises beyond the impact of a normal
economic downturn.5 The second term - the firm’s contribution of each institution to
the financial sector collapse – measures which institutions pay more surcharge. This
can be considered the cross-sectional component of the surcharge. The key ingredient
is the expected capital shortfall of the firm in a crisis, denoted
Crisis)Shortfall Capital( i FirmE .
The main goal of systemic risk surcharges are to incentivize firms to limit systemic risk
taking or to be well capitalized against systemic risk in order to reduce the cost of these
surcharges. In the next section, we describe several approaches to calculating systemic risk
surcharges.
5 There is growing evidence of large bailout costs and real economy welfare losses associated with banking crises.
For example, Hoggarth, Reis and Saporta (2002) estimate output losses somewhere between 10-15% of GDP.
Caprio and Klingebiel (1996) argue that the bailout of the thrift industry cost $180 billion (3.2% of GDP) in the US
in the late 1980s, and document that the estimated cost of bailouts were 16.8% for Spain, 6.4% for Sweden and 8%
for Finland. Honohan and Klingebiel (2000) find that countries spent 12.8% of their GDP to clean up their banking
systems whereas Claessens, Djankov and Klingebiel (1999) set the cost at 15-50% of GDP. The above papers
outline the costs of financial crises. Of equal importance is the probability of such crises occurring. In an extensive
analysis across many countries and time periods, Reinhart and Rogoff (2008a, 2008b) look at the factors that lead to
banking crises, thus providing some hope of probabilistic assessments of such crises. Borio and Drehmann (2009)
study leading indicators for banking systems affected by the current crisis.
7
III. Estimating Capital Shortfalls in a Crisis
Within the APPR framework given above, calculating the relative contribution of systemic risk
surcharges is equivalent to estimating the expected capital shortfall of a financial firm in a financial crisis.
The firm’s relative contribution is simply its expected shortfall over the expected aggregate shortfall.
Interestingly, if a firm had an expected capital surplus in a crisis, then it would actually reduce the
systemic costs of the financial sector and should be “subsidized”. The intuition is that firms which have
plenty of capital, less risky asset holdings or safe funding, can still provide financial intermediation
services when the aggregate financial sector is weak. In this section, we describe various ways to estimate
and consider related measures of Crisis)Shortfall Capital( i FirmE .]
This measure is closely related to the standard risk measures used inside financial firms, namely
Value-at-Risk (VaR) and Expected-Shortfall (ES). These seek to measure the potential loss incurred by
the firm as a whole in an extreme event. Specifically, VaR is the most that the bank loses with confidence
1-α, where α is typically taken to be 1% or 5%. For instance, with α = 5%, VaR is the most that the bank
loses with 95% confidence. Hence, VaR = -qα , where qα is the α quantile of the bank’s return R:
The expected shortfall (ES) is the expected loss conditional on something bad happening, that is, the loss
conditional on the return being less than the α quantile:
Said differently, the expected shortfall is the average returns on days when the portfolio exceeds its VaR
limit. ES is often preferred because VaR can be gamed in the sense that asymmetric, yet very risky, bets
may not produce a large VaR. For risk management, transfer pricing, and strategic capital allocation,
banks need to know how their possible firm-wide losses can be broken down into its components or
contributions from individual groups or trading desks. To see how, let us decompose the bank’s return R
into the sum of each group’s return ri, that is, R= ∑i yi ri, where yi is the weight of group i in the total
portfolio. From the definition of ES, we see that
From this expression we see the sensitivity of overall risk to exposure yi to each group i:
}z]<Pr[R|sup{z q
qRREES |
i
i
i
MESqRrEy
ES
|
i
ii qRrEyES |
8
where MESi is group i’s marginal expected shortfall. The marginal expected shortfall measures how
group i’s risk taking adds to the bank’s overall risk. In words, MES can be measured by estimating group
i’s losses when the firm as a whole is doing poorly.
These standard risk-management practices are then completely analogous to thinking about the
overall risk of the financial system. For this, we can consider the expected shortfall of the overall banking
system by letting R be the return of the aggregate banking sector. Then each bank’s contribution to this
risk can be measured by its MES. Hence, a financial system is constituted by a number of banks, just like
a bank is constituted by a number of groups, and it is helpful to consider each components risk
contribution to the whole. As shown below in Section III.B, MES is an important component of
measuring expected capital shortfall.
A. Government Stress Tests
One of the advantages of the above approach is that the regulator has a quantifiable measure
of the relative importance of a firm’s contribution to overall systemic risk and thus the
percentage of total systemic surcharges it must pay. The surcharge component captures in one
fell swoop many of the characteristics considered important for systemic risk such as size,
leverage, concentration and interconnectedness, all of which serve to increase the expected
capital shortfall in a crisis. But the surcharge measure also provides an important addition, most
notably the co-movement of the financial firm’s assets with the aggregate financial sector in a
crisis. The other major advantage of this surcharge component is that it makes it possible to
understand systemic risk not just in terms of an individual financial firm but in the broader
context of financial subsectors. For example, since expected capital shortfall is additive, it is just
one step to compare the systemic risk surcharges of say the regional banking sector versus a
large complex bank.
Most important, however, is the fact that U.S. regulators can implement the above approach
using current tools at their disposal. In particular, stress tests are a common tool used by
regulators and are now mandatory under various sets of regulation including both the Dodd-
Frank Act of 2010 and the proposed Basel III accords. Stress tests measure whether financial
firms will have enough capital to cover their liabilities under severe economic conditions, in
other words, an estimate of Crisis)Shortfall Capital( i FirmE .
9
For example, the Supervisory Capital Assessment Program (SCAP) initiated in the United
States in February 2009 and concluded in May 2009 was originated amidst the credit crisis
which had cast into doubt the future solvency of many large and complex financial firms. The
idea was to conduct a stress test in order to assess the financial ability of the largest U.S. Bank
Holding Companies (BHC) to withstand losses in an even more adverse economic environment.
The SCAP focused on the 19 largest financial companies which combined held 2/3 of assets and
more than ½ of loans in the U.S. banking system, and whose failure was deemed to pose a
systemic risk. The goal of the SCAP was to measure the ability of these financial firms to absorb
losses in the case of a severe macroeconomic shock. In particular, the scenarios were two-year-
ahead what-if exercises and considered losses across a range of products and activities (such as
loans, investments, mortgages and credit card balances), and potential trading losses and
counterparty credit losses. Specifically, the stress test measured the ability of a firm to absorb
losses in terms of its Tier 1 capital with more emphasis on Tier 1 Common Capital “reflecting
the fact that common equity is the first element of the capital structure to absorb losses”. Firms
whose capital buffers were estimated small relative to estimated losses under the adverse
scenario would be required to increase their capital ratios. The size of the SCAP buffer was
determined in accordance with the estimated losses under the worst scenario and the ability of a
firm to have a Tier 1 risk-based ratio in excess of 6% at year-end 2010 and its ability to have a
Tier 1 Common capital risk-based ratio in excess of 4% at year-end 2010.
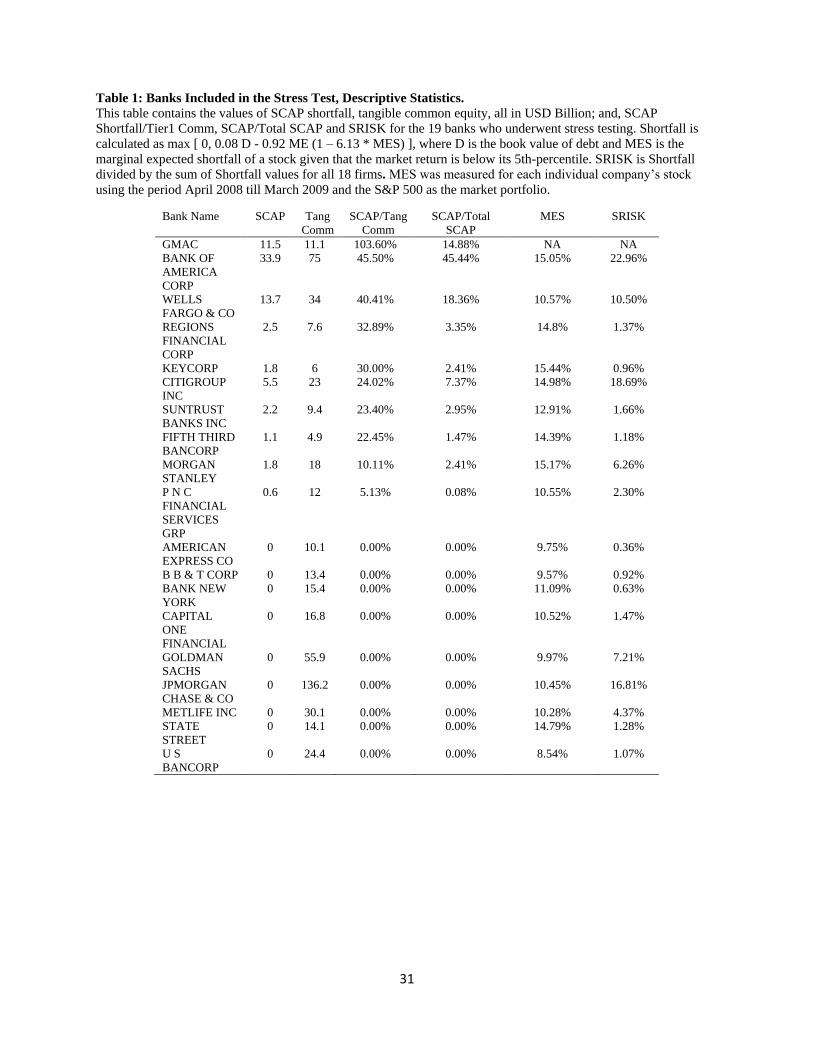
The idea of conducting joint stress tests across the largest firms was that regulators could
cross-check` each firm’s estimate of their own losses across these products and therefore get a
more precise and unbiased estimate of what the losses should be. Table 1 summarizes the results
for each bank. The main finding was that 10 of the 19 original banks needed to raise additional
capital in order to comply with the capital requirements set forth in the SCAP. In all cases the
additional buffer that had to be raised was due to inadequate Tier 1 Common Capital. In total
around $75 billion had to be raised, though there were significant variations across the firms
ranging from $0.6 to $33.9 billion. The number is much smaller than the estimated two-year
losses which were at $600 billion or 9.1% on total loans. The total amount of reserves already in
place was estimated to be able to absorb much of the estimated losses. Only using data up to the
end of 2008, the required additional buffer that had to be raised was estimated at $185 billion.
10
However, together with the adjustments after the first quarter of 2009, the amount was reduced
to $75 billion.
It should be clear however that in the SCAP the regulators in effect were estimating expected
capital shortfalls albeit under a given scenario and over a limited two-year time period. More
generally, the methodology would need to be extended to estimate systemic risk, i.e.,
Crisis)Shortfall Capital( i FirmE . Specifically, the first, and most important step, would be to
create a range of economic scenarios or an average scenario that necessarily leads to an
aggregate capital shortfall. This would be a substantial departure from the SCAP and recent
stress tests performed in the U.S. and in Europe. The question here is a different one than asking
whether an adverse economic scenario imperils the system, but instead asks: if the system is at
risk, which firm contributes to this risk?
In addition, the set of financial firms investigated by these stress tests would have to be
greatly expanded beyond the current set of large bank holding companies. This expansion would
in theory include insurance companies, hedge funds, possibly additional asset management
companies, and other financial companies. This is not only necessary because some of these
companies may be important contributors to the aggregate capital shortfall of the financial sector,
but also because their interconnections with other firms may provide valuable information about
estimated counterparty losses.6 Finally, an important element of a financial crisis is illiquidity,
that is, the difficulty in converting assets into cash. Basel III has laid out a framework for banks
to go through stress tests scenarios during a liquidity crisis. It seems natural that liquidity shocks
would be part of the “doomsday” scenario of systemic risk. The application of such a scenario
would be that firms subject to capital withdrawals, whether through wholesale funding of banks,
investors in asset management funds, or even (less sticky) policyholders at insurance companies,
6 In order to have any hope of assessing interconnectedness of a financial institution and its pivotal role in a network,
detailed exposures to other institutions through derivative contracts and interbank liabilities is a must. This requires
legislation that compels reporting, such that all connections are registered in a repository immediately after they are
formed or when they are extinguished, along with information on the extent and form of the collateralization and the
risk of collateral calls when credit quality deteriorates. These reports could be aggregated by risk and maturity types
to obtain an overall map of network connections. What is important from the standpoint of systemic risk assessment
is that such reports, and the underlying data, be rich enough to help estimate potential exposures to counterparties
under infrequent but socially costly market- or economy-wide stress scenarios. For instance, it seems relevant to
know for each systemically important institution (i) what are the most dominant risk factors in terms of losses and
liquidity risk (e.g., collateral calls) likely to realize in stress scenarios; and, (ii) what are its most important
counterparties in terms of potential exposures in stress scenarios. A transparency standard that encompasses such
requirements is needed with ready access to information for purposes of macro-prudential regulation.
11
would have to take a substantial haircut on the portion of its assets that must be sold and are
illiquid in light of these withdrawals. Regulators would need to assess both the level of a
financial firm’s systemically risky funding and the liquidity of its asset holdings. Cross-checking
against likewise institutions would be particularly useful in this regard.
B. Statistical Models of Expected Capital Shortfall
A major problem with stress tests is that from a practical point of view the analysis is only
periodic in nature and is limited by the applicability of the stress scenarios. Financial firms’ risks
can change very quickly. This problem suggests that the stress tests need to be augmented with
more up-to-date information. It is possible to address this question by conducting a completely
analogous estimate of systemic risk, i.e., Crisis)Shortfall Capital( i FirmE , using state-of-the-art
statistical methodologies based on publicly available data.
Table 1 summarized the stress tests of large bank holding companies conducted by the U.S.
government in May 2009. The table also provides statistical estimates of expected equity return
losses in a crisis (denoted as marginal expected shortfall (MES)) and the percentage capital
shortfall in the sector (denoted as SRISK) developed by APPR (2010a), Brownlees and Engle
(2010) and the NYU Stern Systemic Risk Rankings described in Acharya, Brownlees, Engle,
Farazmand and Richardson (2010).7 These estimates are based on historical data on equity and
leverage, and statistical models of joint tail risk. Table 1 implies that these estimates, while not
perfectly aligned with the stress tests, load up quite well on the firms that required additional
capital. For example, ignoring GMAC for which there is not publicly available stock return data,
the eight remaining firms in need of capital based on the SCAP belonged to the top ten MES
firms. Moreover, the financial firms that represented the higher percentage of SCAP shortfalls
such as Bank of America, Wells Fargo, Citigroup, etc…, also had the highest levels of the
corresponding statistical measure SRISK. That said, there are type I errors with the SRISK
measure. Alternatively, one could argue that the stress test was not harsh enough as it did not
generate an aggregate capital shortfall.
7 For more information on the NYU Stern Systemic Risk rankings, see http://vlab.stern.nyu.edu/welcome/risk .
12
In order to better understand the statistical measures, note that a financial firm has an
expected capital shortfall in a financial crisis if its equity value (denote iE ) is expected to fall
below a fraction Ki of its assets, i.e., its equity value plus its obligations (denote 0iD ):
.Crisis)Shortfall Capital( i Firm crisisAEKcrisisEEE iii
Rearranging into return space, we get the following definition:
,11Crisis)Shortfall Capital(
0
0
i Firm
iiii
i
LKMESKE
E
where the leverage ratio .0
00
0
0
i
ii
i
iio
E
ED
E
AL
Estimating the expected capital shortfall in a crisis as a fraction of current equity is
paramount to estimation of crisisREMES titti ,1, . Of course, there are a variety of statistical
methods at one’s disposal for estimating this quantity. For example, APPR (2010a) estimate the
crisis as the market’s worst 5% days and derive a nonparametric measure of MES; Brownlees
and Engle (2010) condition on daily market moves less than 2%, derive a full-blown statistical
model based on asymmetric versions of GARCH, DCC and non-parametric tail estimators, and
extrapolate this to a crisis, i.e., to MES; and a number of other researchers develop statistical
approaches that could easily be adjusted to measure MES, such as de Jonghe (2009), Hartmann,
Straetmans and de Vries (2006) and Huang, Zhou, and Zhu (2009), among others.
Table 2 ranks the 10 financial firms contributing the greatest fraction to expected aggregate
capital shortfall of the 100 largest financial institutions for three dates ranging from July 1, 2007
through March 31, 2009. Estimates of MES are also provided. The methodology used is that of
Brownlees and Engle (2010) and the numbers and details are available at
www.systemicriskranking.stern.nyu.edu. The dates are chosen to coincide with the start of the
financial crisis (July 1, 2007), just prior to the collapse of Bear Stearns (March 1, 2008), and the
Friday before Lehman Brother’s filing for bankruptcy (September 12, 2008).
The important thing to take from Table 2 is that the methodology picks out the firms that
created most of the systemic risk in the financial system and would be required to pay the greater
fraction of systemic risk surcharges. Of the major firms that effectively failed during the crisis,
13
i.e., either failed, were forced into a merger or were massively bailed out - Bear Stearns, Fannie
Mae, Freddie Mac, Lehman Brothers, A.I.G., Merrill Lynch, Wachovia, Bank of America and
Citigroup -, all of these firms show up early as having large expected capital shortfalls during the
period in question. For example, all but Bank of America, A.I.G. and Wachovia are in the top ten
on July 1, 2007. And by March 2008, both Bank of America and A.I.G have joined the top ten,
with Wachovia 11th
ranked.
In addition, most of expected aggregate capital shortfall is captured by just a few firms. For
example, in July 2007, just 5 firms capture 58.2% of the systemic risk in the financial sector. By
March 1, 2008, however, as the crisis was impacting many more firms, the systemic risk is more
even spread with 43% covered by 5 firms. As the crisis was just about to go pandemic with
massive failures of a few institutions, the concentration creeps back up, reaching 51.1% in
September 2008 (where we note that the SRISK% have been scaled up to account for the capital
shortfalls of failed institutions). These results suggest therefore that had systemic risk surcharges
been in place prior to the crisis, a relatively small fraction of firms would have been responsible
for those surcharges. As the theory goes, these surcharges would have then discouraged behavior
of these firms that led to systemic risk.
To the extent systemic risk remains, these levies would have then gone towards a general
“systemic crisis fund” to be used to help pay for the remaining systemic costs, either injecting
capital into solvent financial institutions affected by the failed firms or even supporting parts of
the real economy hurt by the lack of adequate financial intermediation. Going back to Section II,
only those losses due to the default of the liabilities that are guaranteed by the government would
be covered by a separate FDIC-like fund. The purpose of the “systemic crisis fund” is not to bail
out failed institutions but to provide support to financial institutions, markets and the real
economy that are collateral damage caused by the failed institution.
C. Contingent Claim Pricing Models of Expected Capital Shortfall
An alternative methodology to estimating expected capital shortfalls would be to set an
economic price for such shortfalls, i.e., contingent capital insurance.8 These insurance charges
8 A related method would be to require financial institutions to hold in their capital structure a new kind of “hybrid”
claim that has a forced debt-for-equity conversion whenever a pre-specified threshold of distress (individual and
systemic) is met. These hybrid securities have been called contingent capital bonds. Examples in the literature of
14
would allow the regulator to determine the proportionate share of expected losses contributed by
each firm in a crisis, in other words, the relative systemic risk of each firm in the sector. This
would be used to determine who pays their share of the overall systemic surcharge. The regulator
would then take this proportionate share of each firm and multiply it by the expected systemic
costs of a crisis to determine the level of the surcharge.
Putting aside for the moment who receives the insurance payments, suppose we require
(relying on results and insights from APPR) that each financial firm take out government
insurance against itself becoming undercapitalized when the financial sector as a whole becomes
undercapitalized. This would be similar in spirit to how deposit insurance schemes are run. The
pricing of such an insurance contracts fits into the literature on pricing multivariate contingent
claims (see, for example, Margrabe (1978), Stulz (1982), Stapleton and Subrahmanyam (1984),
Kishimoto (1989), Rosenberg (2000) and Camara (2005)). This literature develops contingent-
claim valuation methodologies for cases in which the valuation of claims depends on payoffs that
are based on the realizations of multiple stochastic variables. Here, the insurance contract only
pays off if the financial institutions’ results are extremely poor when the aggregate sector is in
distress.9
To make the argument more formal, let itX and tM be the value of the financial
institution i’s and the aggregate market’s (e.g., financial sector or public equity market)
particular measure of performance (e.g., equity value, equity value/debt value, writedowns, etc.).
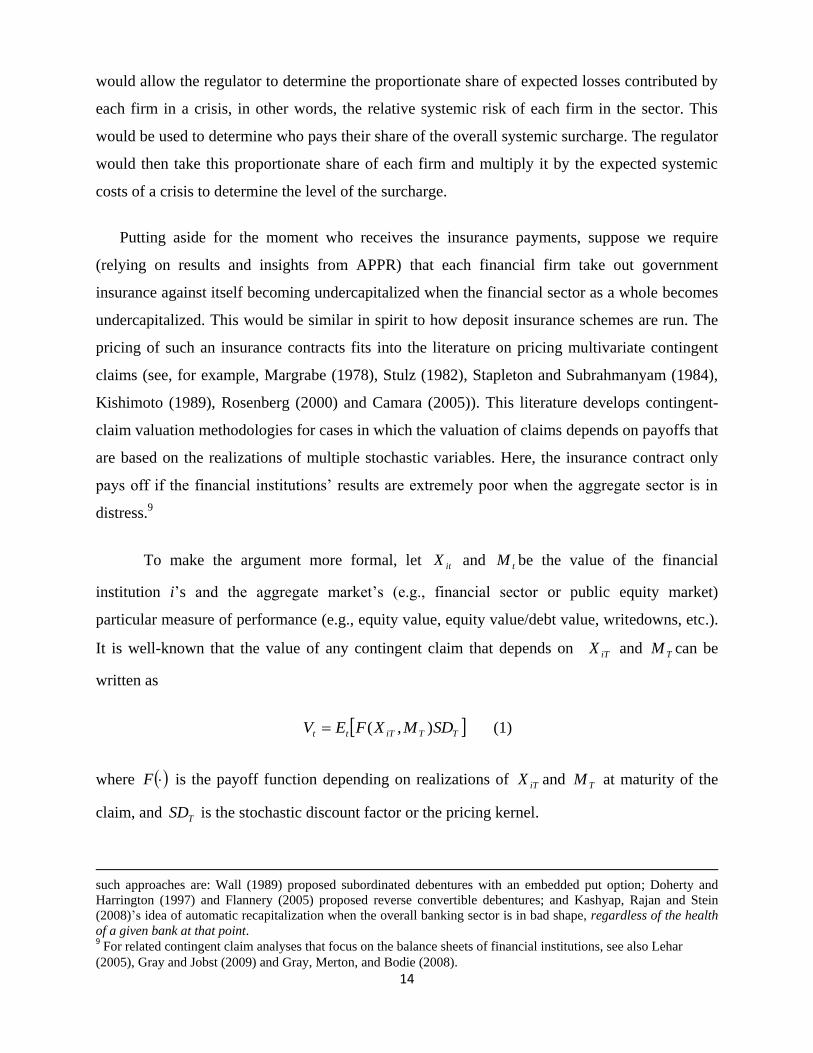
It is well-known that the value of any contingent claim that depends on iTX and TM can be
written as
TTiTtt SDMXFEV ),( (1)
where F is the payoff function depending on realizations of iTX and TM at maturity of the
claim, and TSD is the stochastic discount factor or the pricing kernel.
such approaches are: Wall (1989) proposed subordinated debentures with an embedded put option; Doherty and
Harrington (1997) and Flannery (2005) proposed reverse convertible debentures; and Kashyap, Rajan and Stein
(2008)’s idea of automatic recapitalization when the overall banking sector is in bad shape, regardless of the health
of a given bank at that point. 9 For related contingent claim analyses that focus on the balance sheets of financial institutions, see also Lehar
(2005), Gray and Jobst (2009) and Gray, Merton, and Bodie (2008).
15
Beyond assumptions about the stochastic process followed by the variables, the problem
with equation (1) is that it requires estimates of preference parameters, such as the level of risk-
aversion and the rate of time discount. Alternatively, assuming continuous trading, one can try
and set up a self-financing strategy that is instantaneously riskless. Then, as in Black and Scholes
(1973), one can solve the resulting partial differential equation with the preference parameters
being embedded in the current value of the assets. Valuation techniques such as Cox and Ross
(1976) can then be applied.
Appealing to Brennan (1979) and Rubinstein (1976), Stapleton and Subrahmanyam
(1984) show that risk-neutral valuation can be applied in a multivariate setting even when the
payoffs are functions of cash flows and not traded assets as may be the case for our setting. In
particular, under the assumption that aggregate wealth and the stochastic processes are
multivariate lognormal and the representative agent has constant relative risk aversion
preferences, one can apply risk neutral valuation methods to the pricing equation (1).10
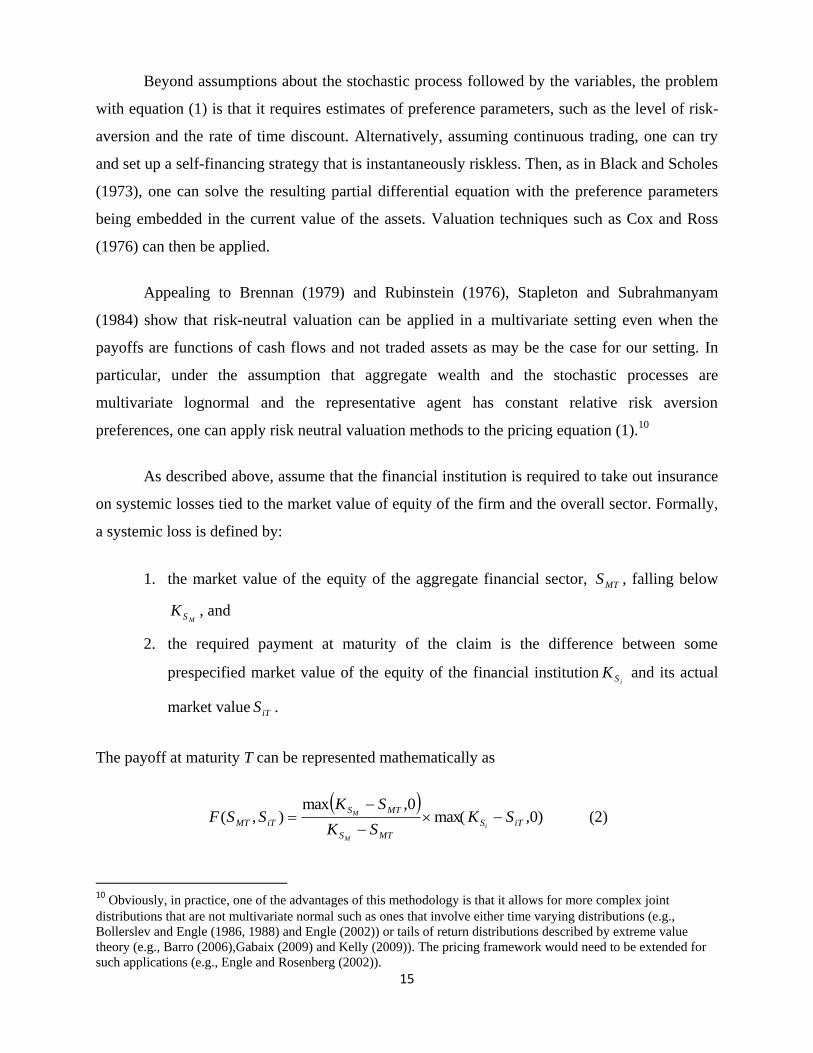
As described above, assume that the financial institution is required to take out insurance
on systemic losses tied to the market value of equity of the firm and the overall sector. Formally,
a systemic loss is defined by:
1. the market value of the equity of the aggregate financial sector, MTS , falling below
MSK , and
2. the required payment at maturity of the claim is the difference between some
prespecified market value of the equity of the financial institutioniSK and its actual
market value iTS .
The payoff at maturity T can be represented mathematically as
)0,max(
0,max),( iTS
MTS
MTS
iTMT SKSK
SKSSF
i
M
M
(2)
10 Obviously, in practice, one of the advantages of this methodology is that it allows for more complex joint
distributions that are not multivariate normal such as ones that involve either time varying distributions (e.g.,
Bollerslev and Engle (1986, 1988) and Engle (2002)) or tails of return distributions described by extreme value
theory (e.g., Barro (2006),Gabaix (2009) and Kelly (2009)). The pricing framework would need to be extended for
such applications (e.g., Engle and Rosenberg (2002)).
16
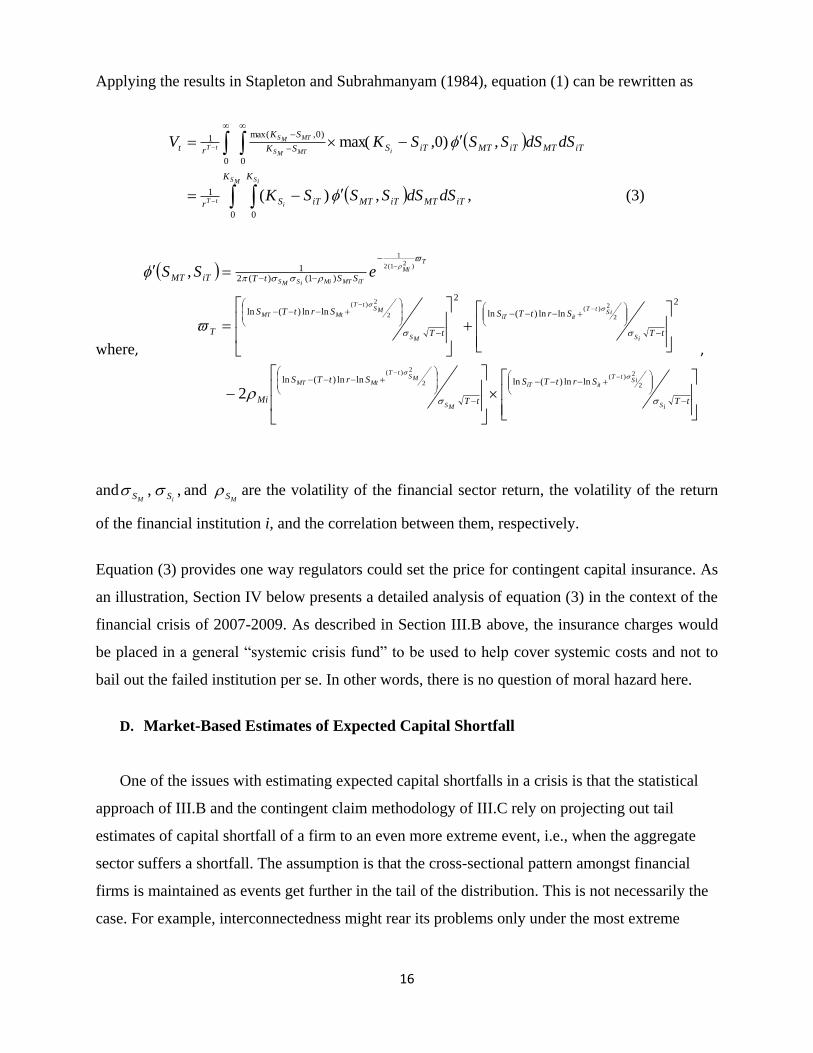
Applying the results in Stapleton and Subrahmanyam (1984), equation (1) can be rewritten as
(3) ,, )(
, )0,max(
00
1
0
)0,max(
0
1
iTMTiTMT
K
iTS
K
r
iTMTiTMTiTSSK
SK
rt
dSdSSSSK
dSdSSSSKV
iS
i
MS
tT
iMTMS
MTMS
tT
where,
tT
SrtTS
tT
SrtTS
Mi
tT
SrtTS
tT
SrtTS
T
SStTiTMT
iS
SitT
itiT
MS
MStT
MtMT
iS
SitT
itiT
MS
MStT
MtMT
T
Mi
iTMTMiiSMSeSS
2
2)(2
2)(
2
2)(2
2)(
)21(2
1
lnln)(lnlnln)(ln
2
lnln)(ln
2
lnln)(ln
)1()(21
2
,
,
and ,MS ,
iS and MS are the volatility of the financial sector return, the volatility of the return
of the financial institution i, and the correlation between them, respectively.
Equation (3) provides one way regulators could set the price for contingent capital insurance. As
an illustration, Section IV below presents a detailed analysis of equation (3) in the context of the
financial crisis of 2007-2009. As described in Section III.B above, the insurance charges would
be placed in a general “systemic crisis fund” to be used to help cover systemic costs and not to
bail out the failed institution per se. In other words, there is no question of moral hazard here.
D. Market-Based Estimates of Expected Capital Shortfall
One of the issues with estimating expected capital shortfalls in a crisis is that the statistical
approach of III.B and the contingent claim methodology of III.C rely on projecting out tail
estimates of capital shortfall of a firm to an even more extreme event, i.e., when the aggregate
sector suffers a shortfall. The assumption is that the cross-sectional pattern amongst financial
firms is maintained as events get further in the tail of the distribution. This is not necessarily the
case. For example, interconnectedness might rear its problems only under the most extreme
17
circumstances. If some firms are more interconnected than others, then the estimation and
pricing methodology will not capture this feature.
Moreover, measurement errors are likely, especially if some financial firms have fatter tail
distributions, or face different individual term structure volatilities than other firms. A natural
way to rectify this problem would be to allow market participants to estimate and trade on these
insurance costs. In a competitive market, it is likely that the measurement errors would be
reduced.
A market-based approach that uses market prices, assuming market efficiency will reflect all
available information, may be able to uncover the tail distributions and give a more robust
estimate of the cross-sectional contribution of each firm to aggregate expected capital shortfall.
The core idea of a market-based plan to charge for systemic risk is that each financial firm would
be required to buy private insurance against its own losses in a systemic risk scenario in which
the whole financial sector is doing poorly. In the event of a pay off on the insurance, the payment
would not go to the firm itself, but to the regulator in charge of managing systemic risk and
stabilizing the financial sector. This contingent capital insurance cost, however, is not necessarily
equal to the systemic risk surcharge. It would be used to determine the proportionate share of
each financial firm’s contribution to the total systemic risk surcharge. The level of the systemic
risk surcharge would be determined by the expected systemic costs of a financial crisis times the
proportionate share of each firm.11
The important point is that each firm’s share would be
determined by the private market for insurance.
This scheme would in theory not only provide incentives for the firm to limit its
contributions to systemic risk, but also provide a market-based estimate of the risk (the cost of
insurance), and avoid moral hazard (because the firm does not get the insurance pay off). The
problem with private insurance markets, however, is that are not set up to insure against systemic
risks. By their very nature, systemic risks cannot be diversified away. The underlying capital
required to cover these losses therefore is quite large even though the possibility of such an event
is very small. Examples of this problem can be found in the recent financial crisis with the major
monoline insurers, such as Ambac Financial Group and MBIA, and, of course, the division of
A.I.G. named A.I.G. Financial Products. These monolines guarantee repayment when an issuer
11 The expected systemic costs may be higher or lower than the contingent capital insurance costs. The insurance
costs assume a dollar systemic cost for every dollar of loss of the firm in a systemic risk scenario.
18
defaults. Going into the crisis, their businesses focused more and more on structured products,
such as asset-backed securities, collateralized debt obligations and collateralized loan obligations
which already represent well-diversified portfolios. Moreover, the majority of insurance was
placed on the so-called AAA super senior portions. Almost by construction, the AAA-tranches’
only risk is systemic in nature.12
Undercapitalized relative to the systemic event, almost all the
monolines and A.I.G. Financial Products were effectively insolvent.
Since the role of the private sector in providing such insurance is primarily for price
discovery and the amount of private capital available to provide such systemic insurance likely to
be limited, it seems natural that most of the insurance would be purchased from the government.
Acharya, Pedersen, Philippon and Richardson (2009, 2010b) describe how private-public
contingent capital insurance might work in practice. Each regulated firm would be required to
buy insurance against future losses, but only losses during a future general crisis. For example,
each financial institution would have a “target capital” of, say, 8% of current assets in the event
of a crisis.13
For every dollar that the institution’s capital falls below the target capital in the
crisis, the insurance company would have to pay N cents to the regulator (e.g., a systemic risk
fund).14
This way, the insurance provider would have every incentive to correctly estimate the
systemic risk of a firm in a competitive market and charge the firm accordingly. The financial
firms would need to keep acquiring insurance, and thus pay surcharges, on a continual basis to
ensure continual monitoring and price discovery, and to prevent sudden high insurance
premiums from causing funding problems because the purchases of premiums are spread out. For
example, each month, each firm would need to buy a fractional amount of insurance to cover the
next future 5 years. Hence, the coverage of the next month would be provided by the insurance
purchased over the last 5 years.
12 Coval, Jurek and Stafford (2009) call these securities economic catastrophe bonds and show that the securities’
underlying economics is akin to out-of-the-money put options on the aggregate market. 13 A crisis would be ex ante defined by the regulator as a time when the aggregate losses in the financial industry (or
the economy at large) exceed a specified amount. 14 N cents represents the proportional share of the private market’s participation in the insurance component of the
public-private plan. If the proposal were simply contingent capital insurance in which the firm got recapitalized if
the firm were doing poorly in a crisis, then the government’s share of the payout to the firm would be 100-N cents
on the dollar, and the government would receive (100-N/100)% of the insurance premiums. To avoid double
taxation, the fees paid to the insurance company would be subtracted from the firm’s total systemic surcharge bill
paid to the regulator.
19
Note that the surcharge proceeds are not meant to bail out failed institutions, but to support
the affected real sector and solvent institutions. In other words, to the extent systemic risk still
remains once the surcharge has been imposed, the proceeds of the surcharge are to cover
systemic risk costs. Future expected bailouts, i.e., government guarantees, need to be priced
separately. As described in Section II, this portion equals the expected loss on its guaranteed
liabilities, akin to the FDIC premium but to be charged irrespective of the size of the resolution
fund.
As described above, the major disadvantage of private insurance is that, even for extremely
well-capitalized institutions, the insurance sector has struggled for a number of years of with
providing open-ended (albeit diversifiable) catastrophe insurance. An extensive literature has
studied this topic. While the models differ, the primary reason boils down to the inability of
insurers to be capitalized well enough to cover large losses. See, for example, the evidence and
discussion in Jaffee and Russell (1997), Froot (2001, 2007) and Ibragimov, Jaffee, and Walden
(2008). The solution in the catastrophe insurance markets has generally been greater and greater
backing by the Federal and state governments (e.g., Federal primary coverage against floods in
1968, insurance against hurricanes after 1992 by Florida, and earthquake coverage by California
after 1994). The idea behind these approaches is that private insurers help price the insurance
while the government provides significant capital underlying the insurance.
The question arises whether such public-private insurance markets can exist for systemic
risk. While some reinsurance schemes have been looked at by the FDIC, most recently in 1993,
with the conclusion that the market is not viable, there do exists such markets today. Financial
markets in general have become much more sophisticated in how they develop niche markets. As
case in point is that co-insurance programs are not without precedent; indeed, motivated by the
events of September 11, 2001, the Terrorism Risk Insurance Act (TRIA) was first passed in
November 2002, and offers federal reinsurance for qualifying losses from a terrorist attack. It
remains an open question whether this can be extended to financial crises.
20
IV. Contingent Capital Insurance and the Financial Crisis
of 2007-2009
Section III.C above described a methodology for uncovering the price of expected capital
shortfalls of financial firms in a crisis. In this section, we explore this idea in greater detail. First,
for a given set of parameter values describing the multivariate process for the financial firm’s
stock price and the final sector’s stock price, we can estimate the value of the insurance contract
using Monte Carlo simulation. We provide some examples and comparative statics to describe
some of the underlying economic intuition for the price of this insurance contract. Second, we
apply this analysis to the financial crisis of 2007-2009.
A. Comparative Statics
Figure 1 graphs the insurance costs as a % of the equity of the financial firm as a function
of the correlation between the firm’s equity return and the market return, and as a function of the
strike rate of the insurance contract. Specifically, the payoff is triggered when the market drops
40% and the firm’s ratio of market value of equity to (total liabilities + market equity value) falls
below some strike rate, ranging from 1% to 10%. For example, 1% would be a very weak capital
requirement while 10% would be strict. We assume the following parameters based on recent
history: market volatility of 16%, firm equity volatility of 27%, risk-free rate of 4% and a current
firm’s ratio of market value of equity to (total liabilities + market equity value) equal to 10%.
The contract has a four-year maturity.
The figure shows that the insurance costs are nonlinearly increasing the stronger the
capital requirement and the higher the correlation between the firm’s equity return and the
market’s return. Most important, these factors interact nonlinearly, so the greatest impact by far
is when the trigger takes place closer to 10% and the correlation is very high. To better
understand the magnitude of the insurance cost, consider a firm with $100 billion market value
of equity, $1 trillion of assets, highly correlated with the market, and facing a trigger close to
10%. Even for these extreme values, the four-year cost is only around $1 billion, which
illustrates the fact that the likelihood of both the firm and the market collapsing is a rare event.
While clearly the insurance trigger and correlation are key factors, what else drives the
magnitude of the insurance cost? Figures 2A-2C depict insurance charges as a % of equity value
21
as a function of the volatility of the firm’s equity return and the volatility of the market return for
three given strike rates of the insurance contract, namely 10%, 7.5% and 5%. As before, the
payoff is triggered when the market drops 40% and the firm’s ratio of market value of equity to
(total liabilities + market equity value) falls below the strike rate of 10%. We also assume the
following parameters based on recent history: correlation between the firm equity return and the
market return of 55%, risk-free rate of 4% and a current firm’s ratio of market value of equity to
(total liabilities + market equity value) equal to 10%. The contract again has a four-year
maturity.
The figures show the importance of the interaction between firm volatility, market
volatility and the triggers. A few observations are in order. First, across the different strike rates,
the three dimensional shape is quite similar. The pattern shows a highly nonlinear relationship
that requires both the firm and market volatilities to be high. This should not be surprising given
that the payoff occurs only in states where both the firm and market are undercapitalized.
Second, in comparison to Figure 1, the key factor in determining the insurance cost is the level of
volatility. For example, for firm and market volatilities of 50% and 25% respectively, the
insurance costs runs as high as 6%, 4% and 2% of equity value for the strike rates of 10%, 7.5%
and 5%. This is important for understanding the properties of contingent capital insurance. Since
volatility tends to be pro-cyclical (high in bad times and low in booms), the cost of contingent
capital insurance in general will be pro-cyclical as well. In order therefore to reduce pro-
cyclicality of insurance charges, the regulator would have to make the strike rates countercyclical
(higher strikes in good times), setting the overall insurance cost such as to avoid an over-
leveraged financial sector and an over-heated economy. This design issue is similar to the trade-
off the FOMC must make in connection with setting interest rates.
In the next subsection, we apply the insurance model of Section III.C to available data
preceding the financial crisis of 2007-09. In particular, we comment on both the insurance
charges and systemic risk contributions that would have emerged if the plan had been put in
place during the 2004-2007 period.
B. The Financial Crisis of 2007-2009
This section empirically analyzes systemic risk surcharges based on contingent capital
insurance for U.S. financial institutions around the recent financial crisis. Here, the institutions
22
have been selected according to (i) their role in the U.S. financial sector, and (ii) their market cap
as of end of June 2007 being in excess of 5bln USD. The companies can be categorized into the
following four groups: Depository Institutions (e.g., JPMorgan, Citigroup, Washington Mutual,
etc.), Security and Commodity Brokers (e.g., Goldman Sachs, Morgan Stanley, etc.), Insurance
Carriers (e.g., AIG, Berkshire Hathaway, etc.) and Agents, Brokers and Service (e.g., Metlife,
Hartford Financial, etc.) and a group called Others consisting of non-depository institutions, real
estate firms, etc. The total number of firms that meet all these criteria is 102.
Table 3 contains descriptive year-by-year statistics of the implied $ insurance charge for
these 102 firms across the four groups, that is, Depository Institutions, Security and Commodity
Brokers, Insurance, and Others over the period 2004-2007. As with the simulations provided in
Section IV.A above, the insurance payoff is triggered when the aggregate stock market falls
40%, and the payoff is based on the fall in the firm’s equity value when the ratio of equity value
over total assets drops below 10%. The amounts are in $millions and represent the cost over a
four-year period. The main parameter inputs - volatilities and correlations - are estimated over
the prior year, and the current ratio of equity value over total assets is computed accordingly
from CRSP and COMPUSTAT.
Several observations are in order. First, there is a clear ordering of the insurance cost
across the type of institution. In particular, broker/dealers face the highest costs every year;
insurance companies the lowest. Second, for most years, and most of the institution types, there
is significant skewness in the cross-section of insurance charges, in other words, the mean is
multiple times the median. While this finding is mostly due to skewness in the distribution of
asset size across firms, the results of Section IV.A showed that high costs are due to
simultaneous extreme parameters and the moneyness of the option, properties likely to affect just
a few firms. Third, there is considerable variation through time in the insurance fees, with a
general decline in the level of these fees from 2004-2007. The reason for this variation is the
general decline of volatilities over this same period.
This latter finding points to the need to state a few caveats. Table 3 provides results on
insurance fees based on short-term volatility estimates of the financial firms and the market.
Acharya, Cooley, Richardson and Walter (2010b) present evidence that, during the latter years of
the relevant period, the term structure of volatility was sharply upward sloping. While higher

23
expected volatility in the future may not affect the cross-sectional rankings or proportional share
estimates of who pays the systemic risk surcharge, it clearly impacts the contingent capital
insurance costs. The latter year calculations provided in Table 3 therefore are underestimated.
Similarly, the contingent capital insurance pricing model of Section III.C makes a number of
assumptions about equity return distributions, most notably multivariate normality. To the extent
conditional normality produces unconditional fat tails, this assumption may not be as unpalatable
as it first seems. Nevertheless, there is evidence that return distributions have some conditional
fat tailness which would also increase the level of the insurance fees.
To better understand what determines the fees during this period, Table 4 provides results
of cross-sectional regressions of the insurance charges for each firm, both in $ amounts (Table
4A) and as a percentage of equity value (Table 4B), against parameters of interest, including
leverage (i.e., the moneyness of the trigger), correlation with the market, the firm’s volatility and
the institutional form. Generally, across each year, the R-squared’s roughly double from the mid
20s to around 50% when the institutional form is included in the regression. The broker/dealer
dummy is especially significant. This is interesting to the extent that much of the systemic risk
emerging in the crisis derived from this sector. Table 4 shows that, as early as 2004, the
contingent capital insurance costs of the broker/dealer sector would have been a red flag.
Table 4 brings several other interesting empirical facts to light. First, in every year,
leverage is a key factor explaining the insurance costs across firms. This result should not be
surprising given that the contingent capital trigger is based on leverage. But if one believes the
trigger does capture systemic risk, it suggests that higher capital requirements will have a first-
order effect in containing systemic risk. Second, the correlation between the firm’s return and the
market return is a key variable, possibly more important than firm volatility itself. The reason is
that without sufficient correlation the probability that both the firm and market will run aground
is remote, pushing down the cost of insurance. Finally, Table 3 showed that there was significant
variation in the mean insurance costs over the 2004-2007. Table 4 runs a cross-sectional stacked
regression over the 2004-2007 period but also includes market volatility as an additional factor.
While the R-squared does drop from the mid 20s in the year-by-year regressions to 16% (in
Table 4A) and 19% (in Table 4B) for the stacked regressions, the drop is fairly small. This is
because the market volatility factor explains almost all the time-series variation.
24
This result highlights an important point about contingent capital insurance. Just prior to
the crisis starting in June 2007, market volatility was close to an all-time low. Putting aside the
previously mentioned issues of short- versus long-term volatility and conditional fat tails, this
low volatility necessarily implies low insurance charges. Consistent with Table 3’s summary,
Table 5 presents the $ and % insurance charges firm by firm. For almost all the financial firms,
the capital contingent insurance costs seem quite low especially in light of what happened just a
few months later.
Interestingly, Table 5 shows an important difference between contingent capital
insurance and the systemic risk surcharge. Recall that the systemic risk surcharge separates into
the product of two components - the expected systemic costs and the proportional share of
systemic risk. Table 5 provides an estimate of this share across the 102 firms, and therefore is a
measure of the latter component of the systemic risk surcharge. Using the capital insurance
charge as its basis, just 5 firms provide over 50% of all the risk, and 15 firms 92% of the risk.
This is a key finding and perhaps not surprising given the outcome of the crisis that followed,
namely that most of the systemic risk is concentrated in just a few places. Note that in order of
importance, Table 5 lists Morgan Stanley, Citigroup, Merrill Lynch, JP Morgan, Goldman Sachs,
Freddie Mac, Fannie Mae, Lehman Brothers, Bear Stearns, Metlife, Bank of America, Prudential
Financial, Hartford Financial, Countrywide and Wachovia as the leading systemic firms. At least
9 of these firms either failed or required extraordinary capital infusions or guarantees. In fact,
probably only JP Morgan and to a lesser extent Goldman Sachs was considered somewhat safe at
the height of the crisis in the late Fall of ’08 and the Winter of ’09.
Table 6A and 6B show that this finding is not a fluke by also reporting the rankings of the
insurance costs in the earlier periods of 2004, 2005 and 2006. For example, Table 6B reports the
$ charges in all four periods and shows that the exact same firms (albeit in different order) show
up consistently in the top 15. In fact, the only additions to the list are Washington Mutual, A.I.G.
and Lincoln National, two of which failed in the crisis. On a preliminary basis, these results
suggest that a measure like the one calculated here, i.e., the cost of contingent capital insurance,
does a good job of deciphering which firms are systemic and should pay the share of the
surcharge. Of some importance, Table 6A shows that these rankings are not solely size-based as
most of these firms also show up on a percentage of equity basis as well, and APPR provide
25
more extensive evidence of this type for predicting the realized performance of financial firms
during the stress- test (SCAP) exercise, the crisis period of 2007-09, and other crises of the past.
The APPR approach to measuring systemic risk has its limitations. The basic assumption
in that paper is that the negative externality gets triggered in a proportional amount to each dollar
of aggregate capital that falls below the aggregate capital threshold level. Therefore, irrespective
of the type of financial institution or how that institution is funded, its capital loss contribution is
treated the same below the threshold. To take just one example, in Table 5, large insurance
companies like Metlife, Prudential Financial and Hartford Financial show up as systemically
quite risky. Their presence is due to their large offerings of guaranteed investment products
which exposed them to aggregate risk and a large MES. Is this a fair outcome? While their
funding via insurance premiums is stickier than a large bank which relies on wholesale funding,
it is not obvious that these firms don’t pose systemic risk. For example, insurance premiums
represent almost 10% of GDP, insurance policies are subject to limited runs and, most important,
as the largest buyer of corporate debt, insurance companies provide an important financial
intermediation service. Disruptions in any of these activities would have important
consequences. A final comment on the APPR concept of systemic risk is that the basic intuition
is all financial firms are part of the entire system in that well-capitalized financial institutions
could takeover poorly capitalized institutions. This is of course not possible when aggregate
capital losses exceed a large enough threshold.
V. Concluding Remarks
Based on a recent literature that focuses on systemic risk surcharges, the centerpiece
underlying these surcharges is the measurement of a firm’s share of expected losses conditional
on the occurrence of a systemic crisis. In this paper, we describe and analyze various ways to
estimate these expected capital shortfalls. As an example of one particular way to measure the
firm’s share of systemic risk, we analyze the pricing of contingent capital insurance from both a
theoretical and empirical point of view. Using the current crisis as an illustration, the measure
appears to successfully choose the systemic firms, consistent with recent statistical-based
measures of systemic risk (e.g., Acharya, Pedersen, Philippon and Richardson (2010a) and
Brownlees and Engle (2010), among others).
26
References
Acharya, Viral V., Christian Brownless, Farhang Farazmand, Robert Engle and Matthew
Richardson (2010) “Measuring Systemic Risk”, Chapter 4 in Regulating Wall Street: The Dodd-
Frank Act and the New Architecture of Global Finance, editors Viral V. Acharya, Thomas
Cooley, Matthew Richardson and Ingo Walter, Princeton University Press.
Acharya, Viral V., Thomas Cooley, Matthew Richardson and Ingo Walter (2010a), Regulating
Wall Street: The Dodd-Frank Act and the New Architecture of Global Finance, Princeton
University Press.
Acharya, Viral V., Thomas Cooley, Matthew Richardson and Ingo Walter (2010b)
“Manufacturing Tail Risk: A Perspective on the Financial Crisis of 2007-09”, forthcoming,
Foundations and Trends in Finance, volume (4).
Acharya, Viral V., Lasse H. Pedersen, Thomas Philippon and Matthew Richardson (2009)
“Regulating Systemic Risk”, Chapter 13 in Restoring Financial Stability: How to Repair a
Failed System, editors Viral V. Acharya and Matthew Richardson, New York University Stern
School of Business, John Wiley and Sons, March 2009.
Acharya, Viral V., Lasse H. Pedersen, Thomas Philippon and Matthew Richardson (2010a)
“Measuring Systemic Risk”, working paper, New York University Stern School of Business.
Acharya, Viral V., Lasse H. Pedersen, Thomas Philippon and Matthew Richardson (2010b)
“Taxing Systemic Risk”, Chapter 5 in Regulating Wall Street: The Dodd-Frank Act and the New
Architecture of Global Finance, editors Viral V. Acharya, Thomas Cooley, Matthew Richardson
and Ingo Walter, Princeton University Press.
Adrian, Tobias and Markus Brunnermeier (2008) “CoVaR”, working paper, Federal Reserve
Bank of New York.
Barro, R. (2006) “Rare disasters and asset markets in the twentieth century," The Quarterly
Journal of Economics, 121, 823-866.
Baumol, W. J. (1972), "On Taxation and the Control of Externalities", American Economic
Review 62 (3): 307–322.
Billio, Monica, Mila Getmansky, Andrew W. Lo and Loriana Pelizzon (2010) “Econometric
Measures of Systemic risk in the Finance and Insurance Sectors,” NBER working paper no.
16223.
Black, Fischer and Myron Scholes (1973) “The Pricing of Options and Corporate Liabilities”,
The Journal of Political Economy, 81(3), 637-654.
Bollerslev, Tim and Robert F. Engle (1986) “Modelling the Persistence of Conditional
Variances,” Econometric Reviews, 5(1), 1-50.
27
Bollerslev, Tim and Robert F. Engle (1988) “A Capital Asset Pricing Model with Time-Varying
Covariances,” The Journal of Political Economy, 96(1), 116-131.
Borio, Claudio and Mathias Drehmann (2009), “Assessing the Risk of Banking Crises –
revisited,” BIS Quarterly Review, March, 29-46.
Brennan, Michael J. (1979) “The Pricing of Contingent Claims in Discrete Time Models”,
Journal of Finance 34, 53-68.
Brownlees, Christian and Robert F. Engle (2010) “Volatility, Correlation and Tails for Systemic
Risk Measurement,” working paper, NYU Stern School of Business.
Camara, A. (2005) “Option Prices Sustained by Risk-Preferences”, Journal of Business 78,
1683-1708.
Caprio, Gerard and Daniela Klingebiel (1996) “Bank Insolvencies: Cross Country Experience”,
World Bank, Policy Research Working Paper No. 1620.
Claessens, Stijn, Simeon Djankov and Daniela Klingebiel (1999) “Financial Restructuring in
East Asia: Halfway There?”, World Bank, Financial Sector Discussion Paper No. 3.
Cox, J. and S. A. Ross (1976) “The Valuation of Options for Alternative Stochastic Processes,”
Journal of Financial Economics, 3, 145-166.
Coval, J, J. Jurek and E. Stafford (2009), “Economic Catastrophe Bonds,” forthcoming in
American Economic Review.
De Jonge, Olivier (2009) “Back to the Basics in Banking? A Micro-Analysis of Banking
System Stability," Journal of Financial Intermediation, forthcoming.
Dewatripont, Mathias and Jean Tirole (1993). The Prudential Regulation of Banks, the MIT
Press, Cambridge.
Doherty, Neil A., and Harrington, Scott (1997) “Managing Corporate Risk with Reverse
Convertible Debt”, Working Paper, Wharton.
Engle, Robert F. (2002) “Dynamic Conditional Correlation,” Journal of Business and Economic
Statistics, 20(3), 339-350.
Engle, Robert F. and Joshua Rosenberg (2002) “Empirical Pricing Kernels,” Journal of
Financial Economics, 64(3), 341-372.
Flannery, Mark J. (2005) “No Pain, No Gain? Effecting Market Discipline via Reverse
Convertible Debentures”, in Scott, Hal S. (Ed.) (2005), “Capital Adequacy beyond Basel:
Banking, Securities, and Insurance”, Oxford University Press Hal Scott (2005).
28
Froot, Kenneth (2001), “The Market for Catastrophe Risk: A Clinical Examination” Journal of
Financial Economics, vol. 60, no. 2, pp. 529-571.
Froot, Kenneth (2007), “Risk Management, Capital Budgeting, and Capital Structure Policy for
Insurers and Reinsurers,” The Journal of Risk and Insurance, Vol. 74, No. 2, 273-299.
Gabaix, Xavier (2009) “Power Laws in Economics and Finance," Annual Review of
Economics,1(1), 255-294.
Gray, Dale and Jobst, Andreas A., 2009, “Tail Dependence Measures of Systemic Risk Using
Equity Options Data – Implications for Financial Stability,” Forthcoming Working Paper,
International Monetary Fund (IMF), Washington, D.C.
Gray, Dale F., Robert C. Merton, and Zvi Bodie, 2008, “New Framework for Measuring and
Managing Macrofinancial Risk and Financial Stability,” Working Paper No. 09-015 (Cambridge,
Massachusetts: Harvard Business School, August).
Hartmann, P, S. Straetmans and C. de Vries (2005) \Banking System Stability: A Cross-
Atlantic Perspective", NBER working paper 11698.
Hoggarth, Glenn, Reis, Ricardo and Victoria Saporta (2002) “Costs of Banking System
Instability: Some Empirical Evidence”, Journal of Banking and Finance, 26 (5), 825-855.
Honohan, Patrick and Daniela Klingebiel (2000) “Controlling Fiscal Costs of Bank Crises”,
World Bank, Working Paper #2441.
Huang, Xin, Hao Zhou, and Haibin Zhu, 2009, “A Framework for Assessing the Systemic Risk
of Major Financial Institutions”, Journal of Banking & Finance, Volume 33, Issue 11, November
2009, Pages 2036-2049
Ibragimov, Rustam, Dwight Jaffee, and Johan Walden (2008), “Nondiversification Traps in
Catastrophe Insurance Markets,” forthcoming, Review of Financial Studies.
Jaffee, Dwight and Thomas Russell (1997),“Catastrophe Insurance, Capital Markets, and
Uninsurable Risks," Journal of Risk and Insurance, Vol 64, No 2, pp 205-230.
Kashyap, Anil, Rajan, Raghuram, and Stein, Jeremy (2008) “Rethinking Capital Regulation”,
Kansas City Symposium on Financial Stability.
Kelly, Bryan (2009), “Risk Premia and the Conditional Tails of Stock Returns," working
paper, NYU Stern School of Business.
Kishimoto, N (1989) “Pricing Contingent Claims Under Interest Rate and Asset Price. Risk,”
Journal of Finance, 45(3), 571-589.
Korinek, Anton (2010) “Systemic Risk-Taking: Amplification effects, Externalities, and
Regulatory Responses,” working paper, University of Maryland.
29
Lehar, A., 2005, “Measuring systemic risk: A risk management approach”, Journal of Banking
and Finance 29, 2577–2603.
Margrabe, William (1978) “The Value of an Option to Exchange One Asset for Another”,
Journal of Finance, 33, 177–186.
Mitchell, Mark, Lasse Heje Pedersen, and Todd Pulvino (2007), “Slow Moving Capital,” The
American Economic Review, P&P, vol. 97, no. 2, pp. 215-220.
Morris, Stephen and Hyun Song Shin (2008) “Financial Regulation in a System Context,”
Brookings Papers on Economic Activity, Fall, 229-274.
Peltzman, Sam (1976) “Toward a More General Theory of Regulation,” Journal of Law and
Economics 19, 211-240.
Perotti, Enrico and Javier Suarez (2011) “A Pigovian Approach to Liquidity Regulation,” CEPR
Discussion Paper no. DP8271.
Reinhart, Carmen M. (2008a), “Is the 2007 US Sub-Prime Financial Crisis So Different: An
International Historical Comparison,” American Economic Review: Papers & Proceedings, 98:2,
339-344.
Reinhart, Carmen M. (2008b), “This Time Is Different: A Panoramic View of Eight Centuries of
Financial Crises,” NBER working paper. Rosenberg, Joshua (2000) “Asset Pricing Puzzles: Evidence from Options Markets,” New York
University, Leonard N. Stern School Finance Department Working Paper Series 99-025.
Rubinstein, Mark (1976) “The valuation of uncertain income streams and the pricing of options,”
Bell Journal of Economics and Management Science, 7, 407-425.
Segoviano, Miguel and Charles Goodhart, (2009), “Banking Stability Measures,” IMF Working
Paper 09/04 (Washington: International Monetary Fund).
Stapleton, R. C. and M. G. Subrahmanyam (1984) “The Valuation of Multivariate Contingent
Claims in Discrete Time Models,” Journal of Finance, 39, 207-228.
Stigler, George (1971) “The Theory of Economic Regulation”, Bell Journal of Economics and
Management Science 2, 3-21. Stulz, Rene M. (1982) “Options on the minimum or the maximum of two risky assets: Analysis
and applications,” Journal of Financial Economics, 10(2), 161-185.
Tarashev, Nikola, Claudio Borio and Kostas Tsatsaronis (2009) “Allocating Systemic Risk to
Individual Institutions: Methodology and Policy Applications”, Working Paper, Bank for
International Settlements.

30
Wall, Larry (1989) “A Plan for Reducing Future Deposit Insurance Losses: Puttable
Subordinated Debt”, Federal Reserve Bank of Atlanta Economic Review 74 (4).
31
Table 1: Banks Included in the Stress Test, Descriptive Statistics.
This table contains the values of SCAP shortfall, tangible common equity, all in USD Billion; and, SCAP
Shortfall/Tier1 Comm, SCAP/Total SCAP and SRISK for the 19 banks who underwent stress testing. Shortfall is
calculated as max [ 0, 0.08 D - 0.92 ME (1 – 6.13 * MES) ], where D is the book value of debt and MES is the
marginal expected shortfall of a stock given that the market return is below its 5th-percentile. SRISK is Shortfall
divided by the sum of Shortfall values for all 18 firms. MES was measured for each individual company’s stock
using the period April 2008 till March 2009 and the S&P 500 as the market portfolio.
Bank Name SCAP Tang
Comm
SCAP/Tang
Comm
SCAP/Total
SCAP
MES SRISK
GMAC 11.5 11.1 103.60% 14.88% NA NA
BANK OF
AMERICA
CORP
33.9 75 45.50% 45.44% 15.05% 22.96%
WELLS
FARGO & CO
13.7 34 40.41% 18.36% 10.57% 10.50%
REGIONS
FINANCIAL
CORP
2.5 7.6 32.89% 3.35% 14.8% 1.37%
KEYCORP 1.8 6 30.00% 2.41% 15.44% 0.96%
CITIGROUP
INC
5.5 23 24.02% 7.37% 14.98% 18.69%
SUNTRUST
BANKS INC
2.2 9.4 23.40% 2.95% 12.91% 1.66%
FIFTH THIRD
BANCORP
1.1 4.9 22.45% 1.47% 14.39% 1.18%
MORGAN
STANLEY
1.8 18 10.11% 2.41% 15.17% 6.26%
P N C
FINANCIAL
SERVICES
GRP
0.6 12 5.13% 0.08% 10.55% 2.30%
AMERICAN
EXPRESS CO
0 10.1 0.00% 0.00% 9.75% 0.36%
B B & T CORP 0 13.4 0.00% 0.00% 9.57% 0.92%
BANK NEW
YORK
0 15.4 0.00% 0.00% 11.09% 0.63%
CAPITAL
ONE
FINANCIAL
0 16.8 0.00% 0.00% 10.52% 1.47%
GOLDMAN
SACHS
0 55.9 0.00% 0.00% 9.97% 7.21%
JPMORGAN
CHASE & CO
0 136.2 0.00% 0.00% 10.45% 16.81%
METLIFE INC 0 30.1 0.00% 0.00% 10.28% 4.37%
STATE
STREET
0 14.1 0.00% 0.00% 14.79% 1.28%
U S
BANCORP
0 24.4 0.00% 0.00% 8.54% 1.07%
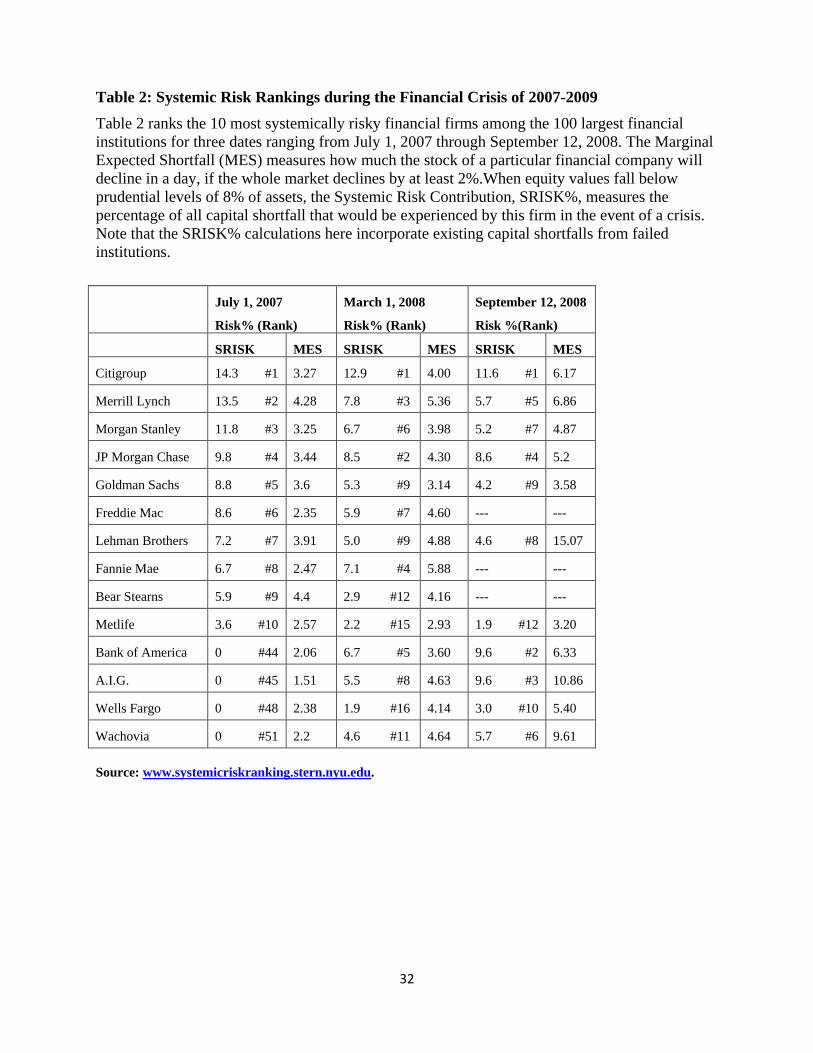
32
Table 2: Systemic Risk Rankings during the Financial Crisis of 2007-2009
Table 2 ranks the 10 most systemically risky financial firms among the 100 largest financial
institutions for three dates ranging from July 1, 2007 through September 12, 2008. The Marginal
Expected Shortfall (MES) measures how much the stock of a particular financial company will
decline in a day, if the whole market declines by at least 2%.When equity values fall below
prudential levels of 8% of assets, the Systemic Risk Contribution, SRISK%, measures the
percentage of all capital shortfall that would be experienced by this firm in the event of a crisis.
Note that the SRISK% calculations here incorporate existing capital shortfalls from failed
institutions.
July 1, 2007
Risk% (Rank)
March 1, 2008
Risk% (Rank)
September 12, 2008
Risk %(Rank)
SRISK MES SRISK MES SRISK MES
Citigroup 14.3 #1 3.27 12.9 #1 4.00 11.6 #1 6.17
Merrill Lynch 13.5 #2 4.28 7.8 #3 5.36 5.7 #5 6.86
Morgan Stanley 11.8 #3 3.25 6.7 #6 3.98 5.2 #7 4.87
JP Morgan Chase 9.8 #4 3.44 8.5 #2 4.30 8.6 #4 5.2
Goldman Sachs 8.8 #5 3.6 5.3 #9 3.14 4.2 #9 3.58
Freddie Mac 8.6 #6 2.35 5.9 #7 4.60 --- ---
Lehman Brothers 7.2 #7 3.91 5.0 #9 4.88 4.6 #8 15.07
Fannie Mae 6.7 #8 2.47 7.1 #4 5.88 --- ---
Bear Stearns 5.9 #9 4.4 2.9 #12 4.16 --- ---
Metlife 3.6 #10 2.57 2.2 #15 2.93 1.9 #12 3.20
Bank of America 0 #44 2.06 6.7 #5 3.60 9.6 #2 6.33
A.I.G. 0 #45 1.51 5.5 #8 4.63 9.6 #3 10.86
Wells Fargo 0 #48 2.38 1.9 #16 4.14 3.0 #10 5.40
Wachovia 0 #51 2.2 4.6 #11 4.64 5.7 #6 9.61
Source: www.systemicriskranking.stern.nyu.edu.
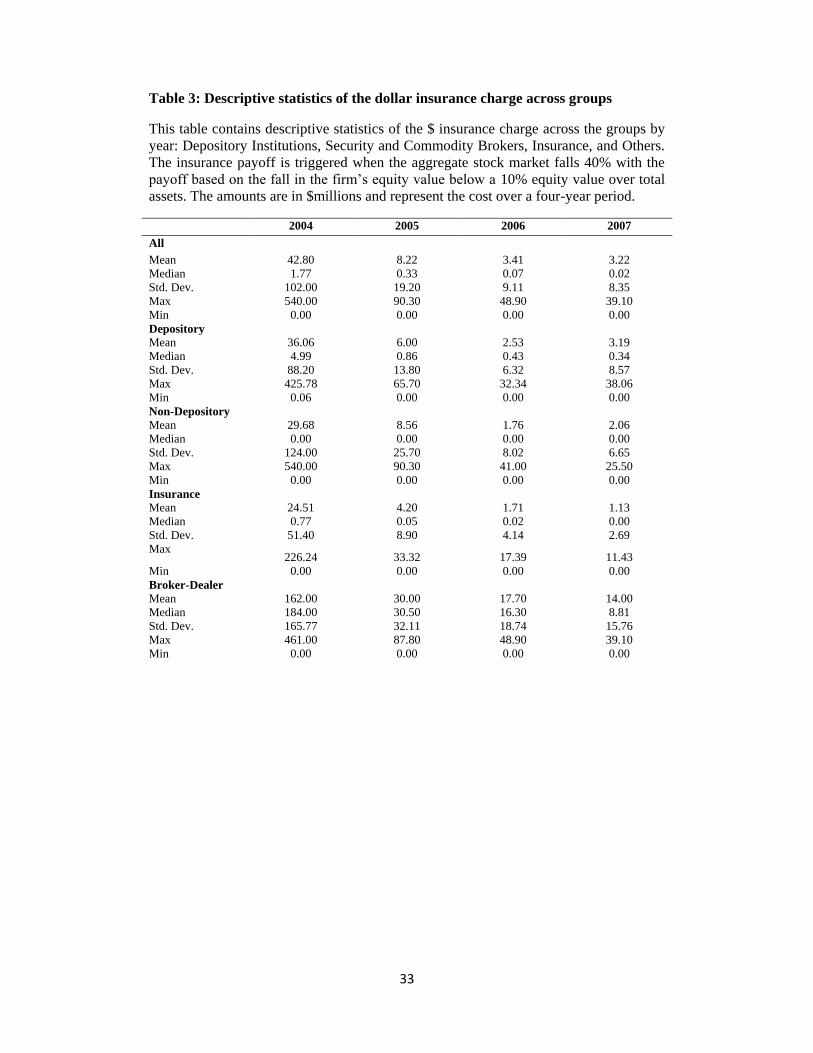
33
Table 3: Descriptive statistics of the dollar insurance charge across groups
This table contains descriptive statistics of the $ insurance charge across the groups by
year: Depository Institutions, Security and Commodity Brokers, Insurance, and Others.
The insurance payoff is triggered when the aggregate stock market falls 40% with the
payoff based on the fall in the firm’s equity value below a 10% equity value over total
assets. The amounts are in $millions and represent the cost over a four-year period.
2004 2005 2006 2007
All Mean 42.80 8.22 3.41 3.22
Median 1.77 0.33 0.07 0.02
Std. Dev. 102.00 19.20 9.11 8.35
Max 540.00 90.30 48.90 39.10
Min 0.00 0.00 0.00 0.00
Depository
Mean 36.06 6.00 2.53 3.19
Median 4.99 0.86 0.43 0.34
Std. Dev. 88.20 13.80 6.32 8.57
Max 425.78 65.70 32.34 38.06
Min 0.06 0.00 0.00 0.00
Non-Depository
Mean 29.68 8.56 1.76 2.06
Median 0.00 0.00 0.00 0.00
Std. Dev. 124.00 25.70 8.02 6.65
Max 540.00 90.30 41.00 25.50
Min 0.00 0.00 0.00 0.00
Insurance
Mean 24.51 4.20 1.71 1.13
Median 0.77 0.05 0.02 0.00
Std. Dev. 51.40 8.90 4.14 2.69
Max 226.24 33.32 17.39 11.43
Min 0.00 0.00 0.00 0.00
Broker-Dealer
Mean 162.00 30.00 17.70 14.00
Median 184.00 30.50 16.30 8.81
Std. Dev. 165.77 32.11 18.74 15.76
Max 461.00 87.80 48.90 39.10
Min 0.00 0.00 0.00 0.00
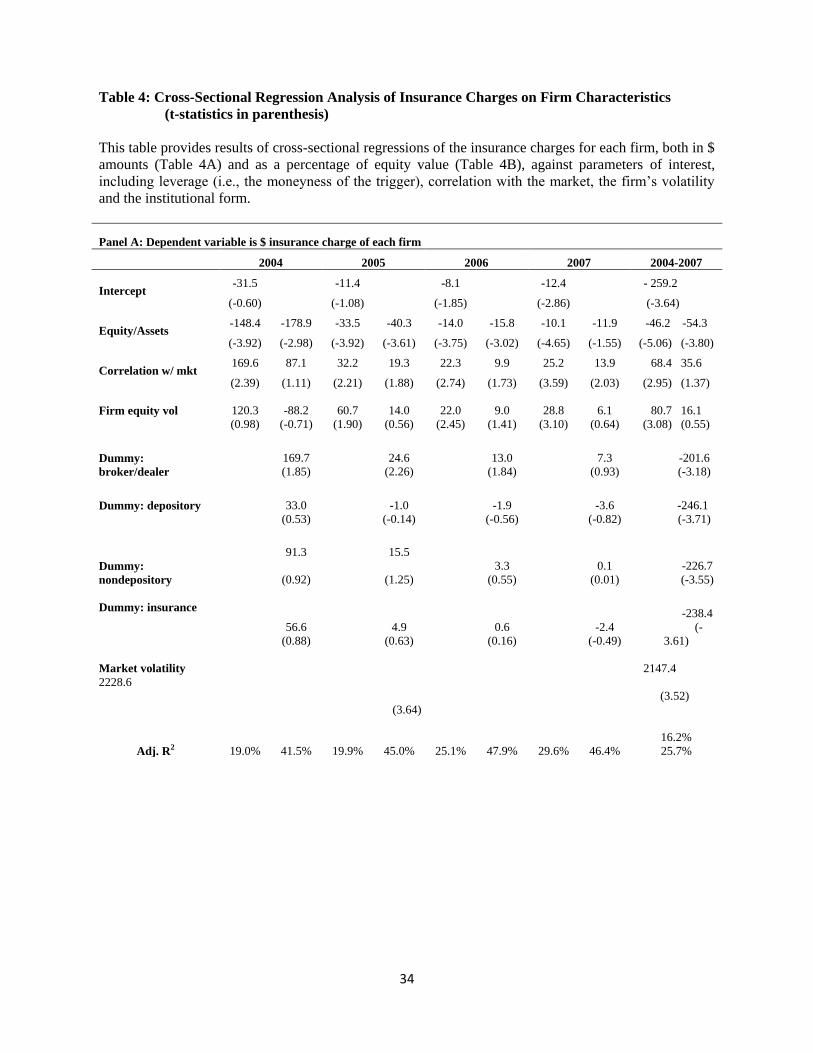
34
Table 4: Cross-Sectional Regression Analysis of Insurance Charges on Firm Characteristics
(t-statistics in parenthesis)
This table provides results of cross-sectional regressions of the insurance charges for each firm, both in $
amounts (Table 4A) and as a percentage of equity value (Table 4B), against parameters of interest,
including leverage (i.e., the moneyness of the trigger), correlation with the market, the firm’s volatility
and the institutional form.
Panel A: Dependent variable is $ insurance charge of each firm
2004 2005 2006 2007 2004-2007
Intercept -31.5 -11.4 -8.1 -12.4 - 259.2
(-0.60) (-1.08) (-1.85) (-2.86) (-3.64)
Equity/Assets -148.4 -178.9 -33.5 -40.3 -14.0 -15.8 -10.1 -11.9 -46.2 -54.3
(-3.92) (-2.98) (-3.92) (-3.61) (-3.75) (-3.02) (-4.65) (-1.55) (-5.06) (-3.80)
Correlation w/ mkt 169.6 87.1 32.2 19.3 22.3 9.9 25.2 13.9 68.4 35.6
(2.39) (1.11) (2.21) (1.88) (2.74) (1.73) (3.59) (2.03) (2.95) (1.37)
Firm equity vol
120.3
(0.98)
-88.2
(-0.71)
60.7
(1.90)
14.0
(0.56)
22.0
(2.45)
9.0
(1.41)
28.8
(3.10)
6.1
(0.64)
80.7 16.1
(3.08) (0.55)
Dummy:
broker/dealer
169.7
(1.85)
24.6
(2.26)
13.0
(1.84)
7.3
(0.93)
-201.6
(-3.18)
Dummy: depository
33.0
(0.53)
-1.0
(-0.14)
-1.9
(-0.56)
-3.6
(-0.82)
-246.1
(-3.71)
91.3 15.5
Dummy:
nondepository
Dummy: insurance
(0.92) (1.25)
3.3
(0.55)
0.1
(0.01)
-226.7
(-3.55)
56.6
(0.88)
4.9
(0.63)
0.6
(0.16)
-2.4
(-0.49)
-238.4
(-
3.61)
Market volatility 2147.4
2228.6
(3.52)
(3.64)
Adj. R2 19.0% 41.5% 19.9% 45.0% 25.1% 47.9% 29.6% 46.4%
16.2%
25.7%
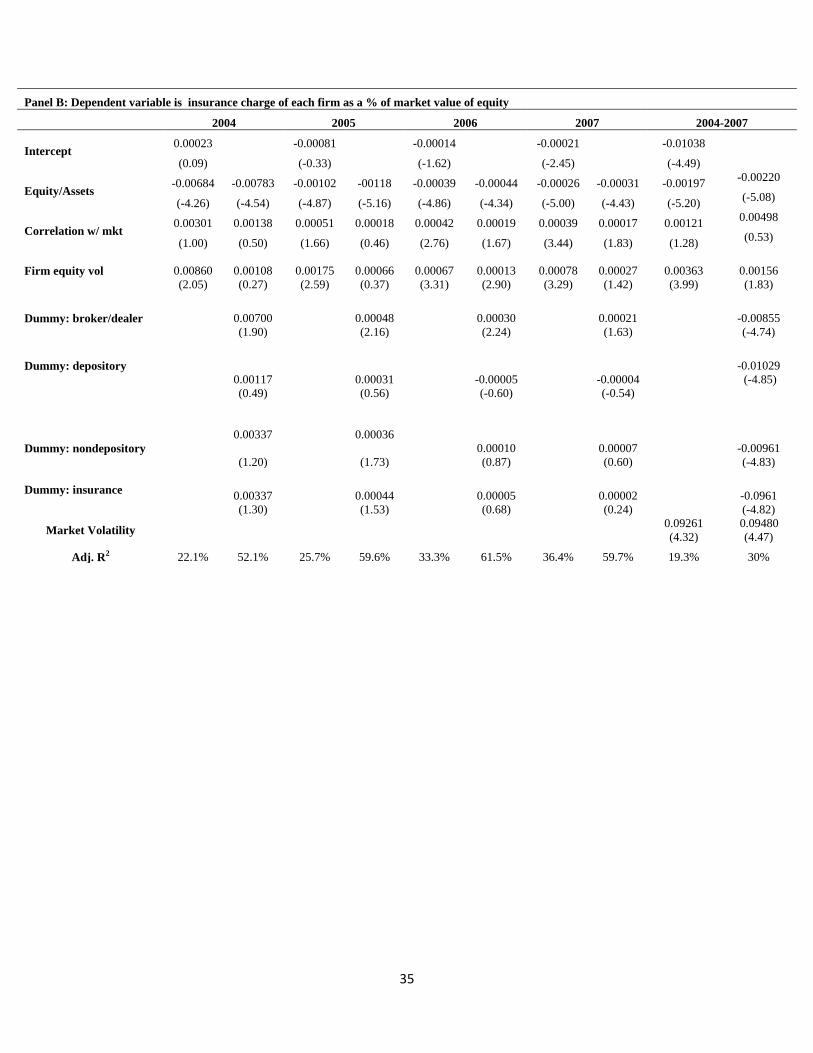
35
Panel B: Dependent variable is insurance charge of each firm as a % of market value of equity
2004 2005 2006 2007 2004-2007
Intercept 0.00023 -0.00081 -0.00014 -0.00021 -0.01038
(0.09) (-0.33) (-1.62) (-2.45) (-4.49)
Equity/Assets -0.00684 -0.00783 -0.00102 -00118 -0.00039 -0.00044 -0.00026 -0.00031 -0.00197
-0.00220
(-4.26) (-4.54) (-4.87) (-5.16) (-4.86) (-4.34) (-5.00) (-4.43) (-5.20) (-5.08)
Correlation w/ mkt 0.00301 0.00138 0.00051 0.00018 0.00042 0.00019 0.00039 0.00017 0.00121
0.00498
(1.00) (0.50) (1.66) (0.46) (2.76) (1.67) (3.44) (1.83) (1.28) (0.53)
Firm equity vol
0.00860
(2.05)
0.00108
(0.27)
0.00175
(2.59)
0.00066
(0.37)
0.00067
(3.31)
0.00013
(2.90)
0.00078
(3.29)
0.00027
(1.42)
0.00363
(3.99)
0.00156
(1.83)
Dummy: broker/dealer
0.00700
(1.90)
0.00048
(2.16)
0.00030
(2.24)
0.00021
(1.63)
-0.00855
(-4.74)
Dummy: depository
0.00117
(0.49)
0.00031
(0.56)
-0.00005
(-0.60)
-0.00004
(-0.54)
-0.01029
(-4.85)
0.00337 0.00036
Dummy: nondepository
Dummy: insurance
(1.20) (1.73)
0.00010
(0.87)
0.00007
(0.60)
-0.00961
(-4.83)
0.00337
(1.30)
0.00044
(1.53)
0.00005
(0.68)
0.00002
(0.24)
-0.0961
(-4.82)
Market Volatility
0.09261
(4.32)
0.09480
(4.47)
Adj. R2 22.1% 52.1% 25.7% 59.6% 33.3% 61.5% 36.4% 59.7% 19.3% 30%
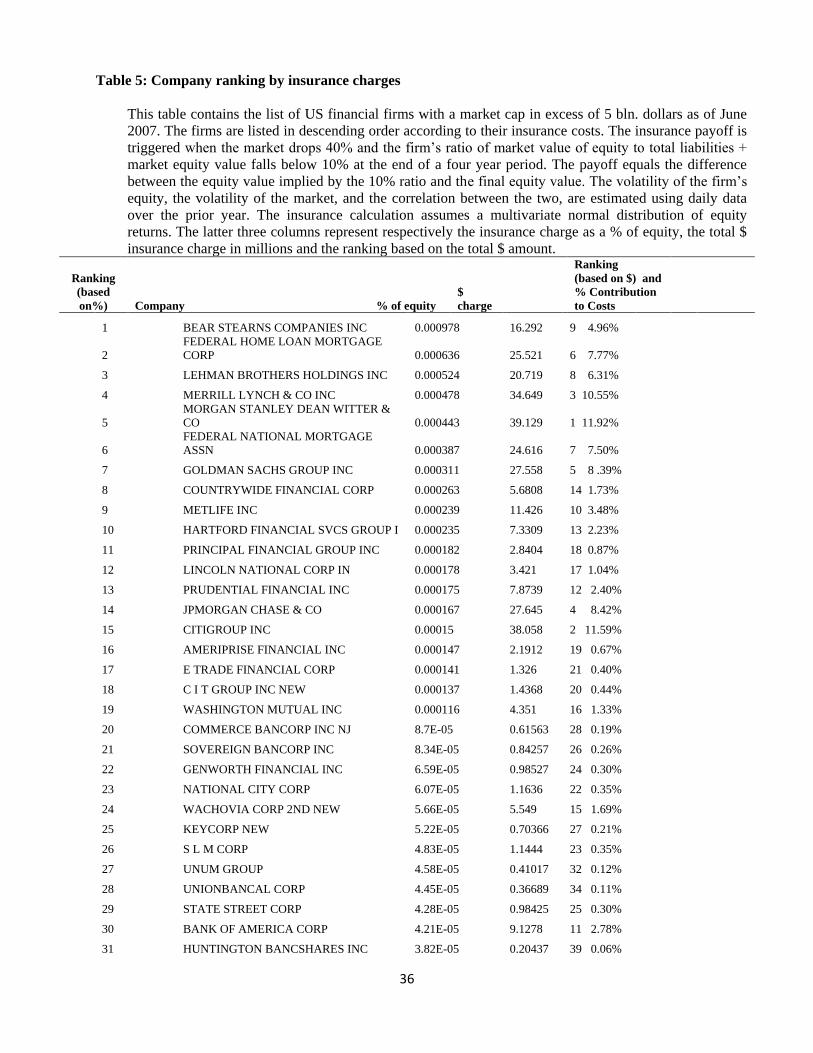
36
Table 5: Company ranking by insurance charges
This table contains the list of US financial firms with a market cap in excess of 5 bln. dollars as of June
2007. The firms are listed in descending order according to their insurance costs. The insurance payoff is
triggered when the market drops 40% and the firm’s ratio of market value of equity to total liabilities +
market equity value falls below 10% at the end of a four year period. The payoff equals the difference
between the equity value implied by the 10% ratio and the final equity value. The volatility of the firm’s
equity, the volatility of the market, and the correlation between the two, are estimated using daily data
over the prior year. The insurance calculation assumes a multivariate normal distribution of equity
returns. The latter three columns represent respectively the insurance charge as a % of equity, the total $
insurance charge in millions and the ranking based on the total $ amount.
Ranking
(based
on%) Company % of equity
$
charge
Ranking
(based on $) and
% Contribution
to Costs
1 BEAR STEARNS COMPANIES INC 0.000978 16.292 9 4.96%
2
FEDERAL HOME LOAN MORTGAGE
CORP 0.000636 25.521 6 7.77%
3 LEHMAN BROTHERS HOLDINGS INC 0.000524 20.719 8 6.31%
4 MERRILL LYNCH & CO INC 0.000478 34.649 3 10.55%
5
MORGAN STANLEY DEAN WITTER &
CO 0.000443 39.129 1 11.92%
6
FEDERAL NATIONAL MORTGAGE
ASSN 0.000387 24.616 7 7.50%
7 GOLDMAN SACHS GROUP INC 0.000311 27.558 5 8 .39%
8 COUNTRYWIDE FINANCIAL CORP 0.000263 5.6808 14 1.73%
9 METLIFE INC 0.000239 11.426 10 3.48%
10 HARTFORD FINANCIAL SVCS GROUP I 0.000235 7.3309 13 2.23%
11 PRINCIPAL FINANCIAL GROUP INC 0.000182 2.8404 18 0.87%
12 LINCOLN NATIONAL CORP IN 0.000178 3.421 17 1.04%
13 PRUDENTIAL FINANCIAL INC 0.000175 7.8739 12 2.40%
14 JPMORGAN CHASE & CO 0.000167 27.645 4 8.42%
15 CITIGROUP INC 0.00015 38.058 2 11.59%
16 AMERIPRISE FINANCIAL INC 0.000147 2.1912 19 0.67%
17 E TRADE FINANCIAL CORP 0.000141 1.326 21 0.40%
18 C I T GROUP INC NEW 0.000137 1.4368 20 0.44%
19 WASHINGTON MUTUAL INC 0.000116 4.351 16 1.33%
20 COMMERCE BANCORP INC NJ 8.7E-05 0.61563 28 0.19%
21 SOVEREIGN BANCORP INC 8.34E-05 0.84257 26 0.26%
22 GENWORTH FINANCIAL INC 6.59E-05 0.98527 24 0.30%
23 NATIONAL CITY CORP 6.07E-05 1.1636 22 0.35%
24 WACHOVIA CORP 2ND NEW 5.66E-05 5.549 15 1.69%
25 KEYCORP NEW 5.22E-05 0.70366 27 0.21%
26 S L M CORP 4.83E-05 1.1444 23 0.35%
27 UNUM GROUP 4.58E-05 0.41017 32 0.12%
28 UNIONBANCAL CORP 4.45E-05 0.36689 34 0.11%
29 STATE STREET CORP 4.28E-05 0.98425 25 0.30%
30 BANK OF AMERICA CORP 4.21E-05 9.1278 11 2.78%
31 HUNTINGTON BANCSHARES INC 3.82E-05 0.20437 39 0.06%
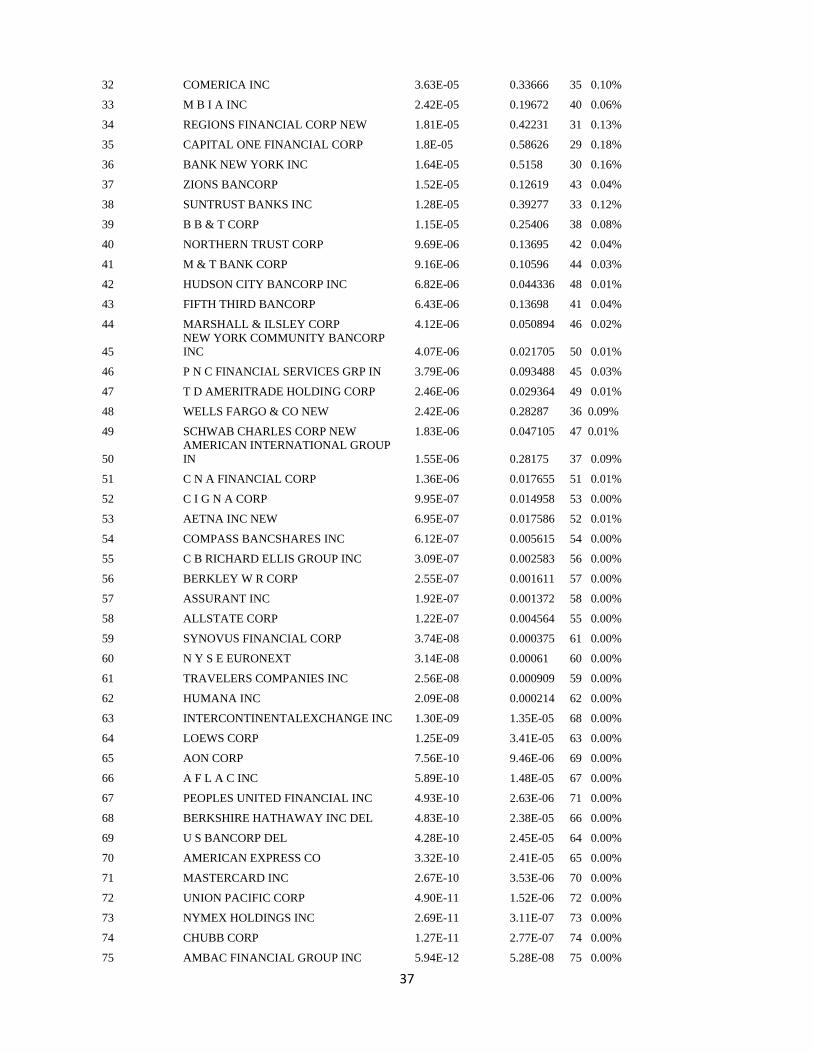
37
32 COMERICA INC 3.63E-05 0.33666 35 0.10%
33 M B I A INC 2.42E-05 0.19672 40 0.06%
34 REGIONS FINANCIAL CORP NEW 1.81E-05 0.42231 31 0.13%
35 CAPITAL ONE FINANCIAL CORP 1.8E-05 0.58626 29 0.18%
36 BANK NEW YORK INC 1.64E-05 0.5158 30 0.16%
37 ZIONS BANCORP 1.52E-05 0.12619 43 0.04%
38 SUNTRUST BANKS INC 1.28E-05 0.39277 33 0.12%
39 B B & T CORP 1.15E-05 0.25406 38 0.08%
40 NORTHERN TRUST CORP 9.69E-06 0.13695 42 0.04%
41 M & T BANK CORP 9.16E-06 0.10596 44 0.03%
42 HUDSON CITY BANCORP INC 6.82E-06 0.044336 48 0.01%
43 FIFTH THIRD BANCORP 6.43E-06 0.13698 41 0.04%
44 MARSHALL & ILSLEY CORP 4.12E-06 0.050894 46 0.02%
45
NEW YORK COMMUNITY BANCORP
INC 4.07E-06 0.021705 50 0.01%
46 P N C FINANCIAL SERVICES GRP IN 3.79E-06 0.093488 45 0.03%
47 T D AMERITRADE HOLDING CORP 2.46E-06 0.029364 49 0.01%
48 WELLS FARGO & CO NEW 2.42E-06 0.28287 36 0.09%
49 SCHWAB CHARLES CORP NEW 1.83E-06 0.047105 47 0.01%
50
AMERICAN INTERNATIONAL GROUP
IN 1.55E-06 0.28175 37 0.09%
51 C N A FINANCIAL CORP 1.36E-06 0.017655 51 0.01%
52 C I G N A CORP 9.95E-07 0.014958 53 0.00%
53 AETNA INC NEW 6.95E-07 0.017586 52 0.01%
54 COMPASS BANCSHARES INC 6.12E-07 0.005615 54 0.00%
55 C B RICHARD ELLIS GROUP INC 3.09E-07 0.002583 56 0.00%
56 BERKLEY W R CORP 2.55E-07 0.001611 57 0.00%
57 ASSURANT INC 1.92E-07 0.001372 58 0.00%
58 ALLSTATE CORP 1.22E-07 0.004564 55 0.00%
59 SYNOVUS FINANCIAL CORP 3.74E-08 0.000375 61 0.00%
60 N Y S E EURONEXT 3.14E-08 0.00061 60 0.00%
61 TRAVELERS COMPANIES INC 2.56E-08 0.000909 59 0.00%
62 HUMANA INC 2.09E-08 0.000214 62 0.00%
63 INTERCONTINENTALEXCHANGE INC 1.30E-09 1.35E-05 68 0.00%
64 LOEWS CORP 1.25E-09 3.41E-05 63 0.00%
65 AON CORP 7.56E-10 9.46E-06 69 0.00%
66 A F L A C INC 5.89E-10 1.48E-05 67 0.00%
67 PEOPLES UNITED FINANCIAL INC 4.93E-10 2.63E-06 71 0.00%
68 BERKSHIRE HATHAWAY INC DEL 4.83E-10 2.38E-05 66 0.00%
69 U S BANCORP DEL 4.28E-10 2.45E-05 64 0.00%
70 AMERICAN EXPRESS CO 3.32E-10 2.41E-05 65 0.00%
71 MASTERCARD INC 2.67E-10 3.53E-06 70 0.00%
72 UNION PACIFIC CORP 4.90E-11 1.52E-06 72 0.00%
73 NYMEX HOLDINGS INC 2.69E-11 3.11E-07 73 0.00%
74 CHUBB CORP 1.27E-11 2.77E-07 74 0.00%
75 AMBAC FINANCIAL GROUP INC 5.94E-12 5.28E-08 75 0.00%

38
76 WESTERN UNION CO 2.57E-12 4.14E-08 76 0.00%
77 FIDELITY NATIONAL FINL INC NEW 1.94E-12 1.02E-08 78 0.00%
78 LEGG MASON INC 1.92E-12 2.49E-08 77 0.00%
79 JANUS CAP GROUP INC 1.72E-12 8.88E-09 79 0.00%
80 EDWARDS A G INC 1.26E-12 8.07E-09 80 0.00%
81 SAFECO CORP 6.11E-13 4.04E-09 82 0.00%
82 HEALTH NET INC 3.85E-13 2.28E-09 84 0.00%
83 BLACKROCK INC 3.42E-13 6.21E-09 81 0.00%
84
AMERICAN CAPITAL STRATEGIES
LTD 1.46E-13 1.13E-09 86 0.00%
85 PROGRESSIVE CORP OH 1.25E-13 2.18E-09 85 0.00%
86 UNITEDHEALTH GROUP INC 3.71E-14 2.54E-09 83 0.00%
87 CINCINNATI FINANCIAL CORP 2.28E-14 1.70E-10 87 0.00%
88 MARSH & MCLENNAN COS INC 7.75E-15 1.33E-10 88 0.00%
89 TORCHMARK CORP 7.25E-16 4.64E-12 89 0.00%
90
CHICAGO MERCANTILE EXCH HLDG
IN 5.69E-17 1.06E-12 90 0.00%
91 FIDELITY NATIONAL INFO SVCS INC 1.12E-17 1.17E-13 91 0.00%
92 COVENTRY HEALTH CARE INC 2.57E-20 2.32E-16 93 0.00%
93 WELLPOINT INC 1.42E-20 6.96E-16 92 0.00%
94 BERKSHIRE HATHAWAY INC DEL 2.79E-22 3.32E-17 94 0.00%
95 LOEWS CORP 4.34E-23 3.64E-19 95 0.00%
96 LEUCADIA NATIONAL CORP 1.18E-23 9.04E-20 96 0.00%
97 C B O T HOLDINGS INC 1.78E-25 1.94E-21 98 0.00%
98 ALLTEL CORP 1.36E-25 3.15E-21 97 0.00%
99 FRANKLIN RESOURCES INC 1.83E-34 6.05E-30 99 0.00%
100 T ROWE PRICE GROUP INC 2.36E-41 3.25E-37 100 0.00%
101 S E I INVESTMENTS COMPANY 3.69E-51 2.10E-47 101 0.00%
102 EATON VANCE CORP 5.56E-59 3.08E-55 102 0.00%
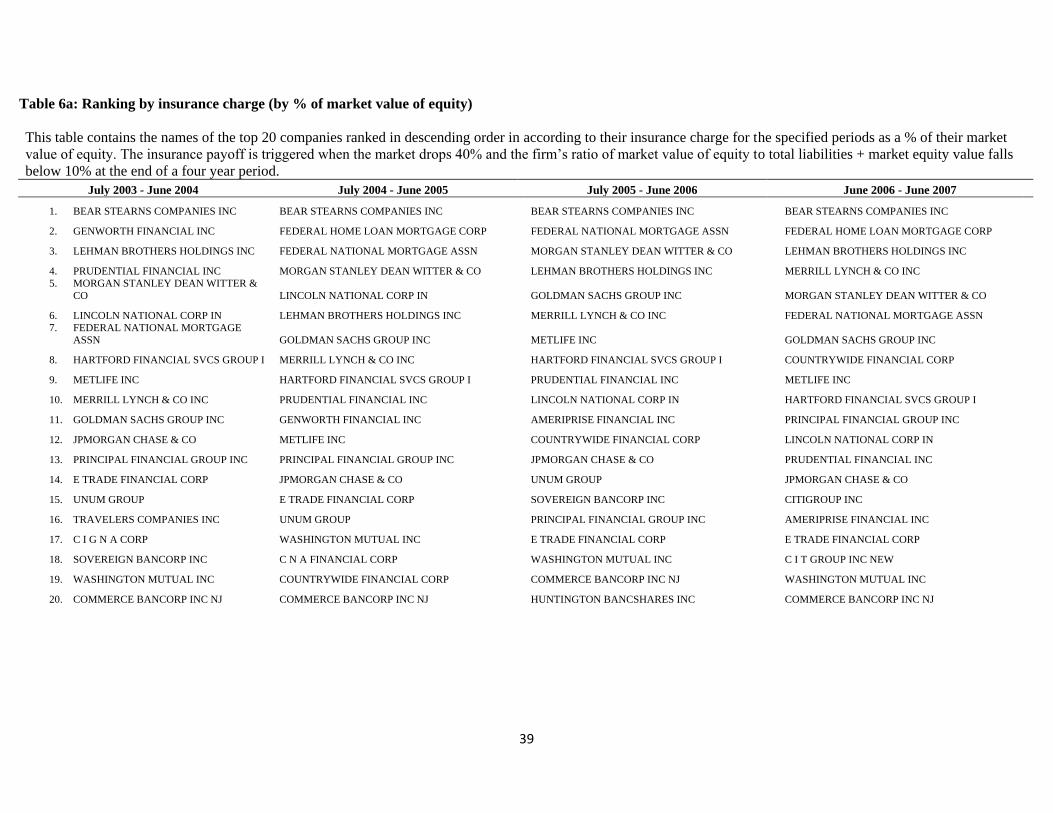
39
Table 6a: Ranking by insurance charge (by % of market value of equity)
This table contains the names of the top 20 companies ranked in descending order in according to their insurance charge for the specified periods as a % of their market
value of equity. The insurance payoff is triggered when the market drops 40% and the firm’s ratio of market value of equity to total liabilities + market equity value falls
below 10% at the end of a four year period.
July 2003 - June 2004 July 2004 - June 2005 July 2005 - June 2006 June 2006 - June 2007
1. BEAR STEARNS COMPANIES INC BEAR STEARNS COMPANIES INC BEAR STEARNS COMPANIES INC BEAR STEARNS COMPANIES INC
2. GENWORTH FINANCIAL INC FEDERAL HOME LOAN MORTGAGE CORP FEDERAL NATIONAL MORTGAGE ASSN FEDERAL HOME LOAN MORTGAGE CORP
3. LEHMAN BROTHERS HOLDINGS INC FEDERAL NATIONAL MORTGAGE ASSN MORGAN STANLEY DEAN WITTER & CO LEHMAN BROTHERS HOLDINGS INC
4. PRUDENTIAL FINANCIAL INC MORGAN STANLEY DEAN WITTER & CO LEHMAN BROTHERS HOLDINGS INC MERRILL LYNCH & CO INC
5. MORGAN STANLEY DEAN WITTER &
CO LINCOLN NATIONAL CORP IN GOLDMAN SACHS GROUP INC MORGAN STANLEY DEAN WITTER & CO
6. LINCOLN NATIONAL CORP IN LEHMAN BROTHERS HOLDINGS INC MERRILL LYNCH & CO INC FEDERAL NATIONAL MORTGAGE ASSN
7. FEDERAL NATIONAL MORTGAGE
ASSN GOLDMAN SACHS GROUP INC METLIFE INC GOLDMAN SACHS GROUP INC
8. HARTFORD FINANCIAL SVCS GROUP I MERRILL LYNCH & CO INC HARTFORD FINANCIAL SVCS GROUP I COUNTRYWIDE FINANCIAL CORP
9. METLIFE INC HARTFORD FINANCIAL SVCS GROUP I PRUDENTIAL FINANCIAL INC METLIFE INC
10. MERRILL LYNCH & CO INC PRUDENTIAL FINANCIAL INC LINCOLN NATIONAL CORP IN HARTFORD FINANCIAL SVCS GROUP I
11. GOLDMAN SACHS GROUP INC GENWORTH FINANCIAL INC AMERIPRISE FINANCIAL INC PRINCIPAL FINANCIAL GROUP INC
12. JPMORGAN CHASE & CO METLIFE INC COUNTRYWIDE FINANCIAL CORP LINCOLN NATIONAL CORP IN
13. PRINCIPAL FINANCIAL GROUP INC PRINCIPAL FINANCIAL GROUP INC JPMORGAN CHASE & CO PRUDENTIAL FINANCIAL INC
14. E TRADE FINANCIAL CORP JPMORGAN CHASE & CO UNUM GROUP JPMORGAN CHASE & CO
15. UNUM GROUP E TRADE FINANCIAL CORP SOVEREIGN BANCORP INC CITIGROUP INC
16. TRAVELERS COMPANIES INC UNUM GROUP PRINCIPAL FINANCIAL GROUP INC AMERIPRISE FINANCIAL INC
17. C I G N A CORP WASHINGTON MUTUAL INC E TRADE FINANCIAL CORP E TRADE FINANCIAL CORP
18. SOVEREIGN BANCORP INC C N A FINANCIAL CORP WASHINGTON MUTUAL INC C I T GROUP INC NEW
19. WASHINGTON MUTUAL INC COUNTRYWIDE FINANCIAL CORP COMMERCE BANCORP INC NJ WASHINGTON MUTUAL INC
20. COMMERCE BANCORP INC NJ COMMERCE BANCORP INC NJ HUNTINGTON BANCSHARES INC COMMERCE BANCORP INC NJ
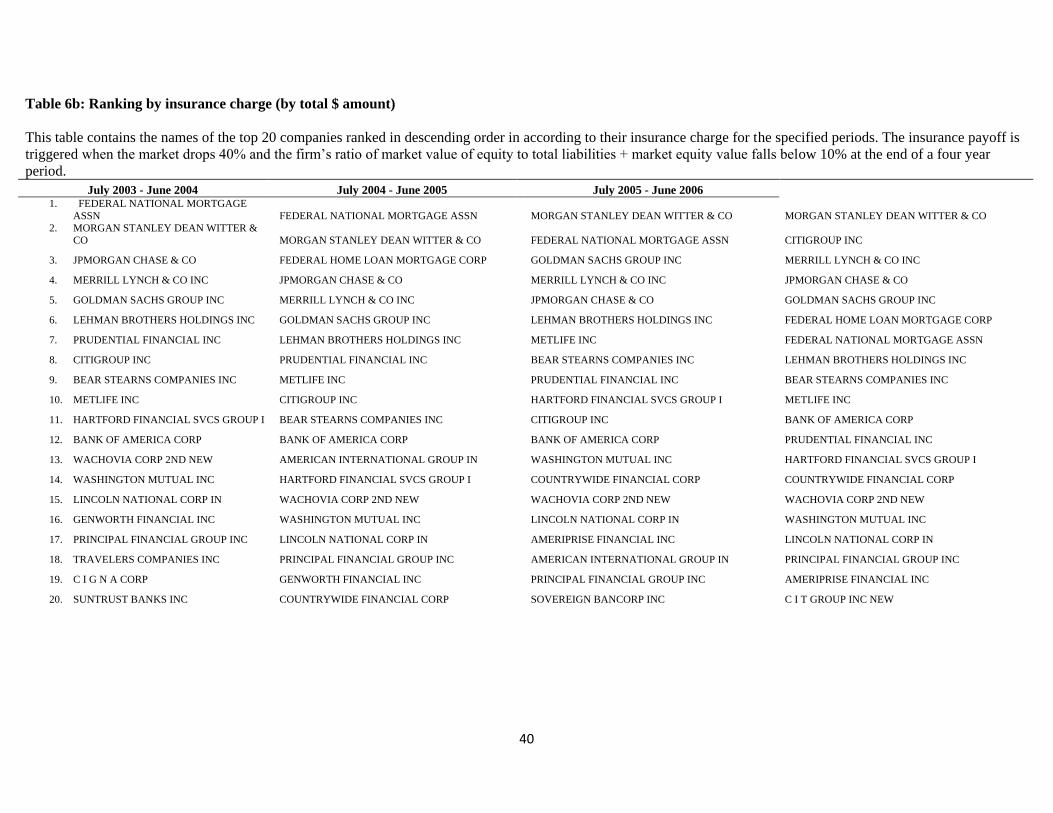
40
Table 6b: Ranking by insurance charge (by total $ amount)
This table contains the names of the top 20 companies ranked in descending order in according to their insurance charge for the specified periods. The insurance payoff is
triggered when the market drops 40% and the firm’s ratio of market value of equity to total liabilities + market equity value falls below 10% at the end of a four year
period.
July 2003 - June 2004 July 2004 - June 2005 July 2005 - June 2006 1. FEDERAL NATIONAL MORTGAGE
ASSN FEDERAL NATIONAL MORTGAGE ASSN MORGAN STANLEY DEAN WITTER & CO MORGAN STANLEY DEAN WITTER & CO
2. MORGAN STANLEY DEAN WITTER &
CO MORGAN STANLEY DEAN WITTER & CO FEDERAL NATIONAL MORTGAGE ASSN CITIGROUP INC
3. JPMORGAN CHASE & CO FEDERAL HOME LOAN MORTGAGE CORP GOLDMAN SACHS GROUP INC MERRILL LYNCH & CO INC
4. MERRILL LYNCH & CO INC JPMORGAN CHASE & CO MERRILL LYNCH & CO INC JPMORGAN CHASE & CO
5. GOLDMAN SACHS GROUP INC MERRILL LYNCH & CO INC JPMORGAN CHASE & CO GOLDMAN SACHS GROUP INC
6. LEHMAN BROTHERS HOLDINGS INC GOLDMAN SACHS GROUP INC LEHMAN BROTHERS HOLDINGS INC FEDERAL HOME LOAN MORTGAGE CORP
7. PRUDENTIAL FINANCIAL INC LEHMAN BROTHERS HOLDINGS INC METLIFE INC FEDERAL NATIONAL MORTGAGE ASSN
8. CITIGROUP INC PRUDENTIAL FINANCIAL INC BEAR STEARNS COMPANIES INC LEHMAN BROTHERS HOLDINGS INC
9. BEAR STEARNS COMPANIES INC METLIFE INC PRUDENTIAL FINANCIAL INC BEAR STEARNS COMPANIES INC
10. METLIFE INC CITIGROUP INC HARTFORD FINANCIAL SVCS GROUP I METLIFE INC
11. HARTFORD FINANCIAL SVCS GROUP I BEAR STEARNS COMPANIES INC CITIGROUP INC BANK OF AMERICA CORP
12. BANK OF AMERICA CORP BANK OF AMERICA CORP BANK OF AMERICA CORP PRUDENTIAL FINANCIAL INC
13. WACHOVIA CORP 2ND NEW AMERICAN INTERNATIONAL GROUP IN WASHINGTON MUTUAL INC HARTFORD FINANCIAL SVCS GROUP I
14. WASHINGTON MUTUAL INC HARTFORD FINANCIAL SVCS GROUP I COUNTRYWIDE FINANCIAL CORP COUNTRYWIDE FINANCIAL CORP
15. LINCOLN NATIONAL CORP IN WACHOVIA CORP 2ND NEW WACHOVIA CORP 2ND NEW WACHOVIA CORP 2ND NEW
16. GENWORTH FINANCIAL INC WASHINGTON MUTUAL INC LINCOLN NATIONAL CORP IN WASHINGTON MUTUAL INC
17. PRINCIPAL FINANCIAL GROUP INC LINCOLN NATIONAL CORP IN AMERIPRISE FINANCIAL INC LINCOLN NATIONAL CORP IN
18. TRAVELERS COMPANIES INC PRINCIPAL FINANCIAL GROUP INC AMERICAN INTERNATIONAL GROUP IN PRINCIPAL FINANCIAL GROUP INC
19. C I G N A CORP GENWORTH FINANCIAL INC PRINCIPAL FINANCIAL GROUP INC AMERIPRISE FINANCIAL INC
20. SUNTRUST BANKS INC COUNTRYWIDE FINANCIAL CORP SOVEREIGN BANCORP INC C I T GROUP INC NEW
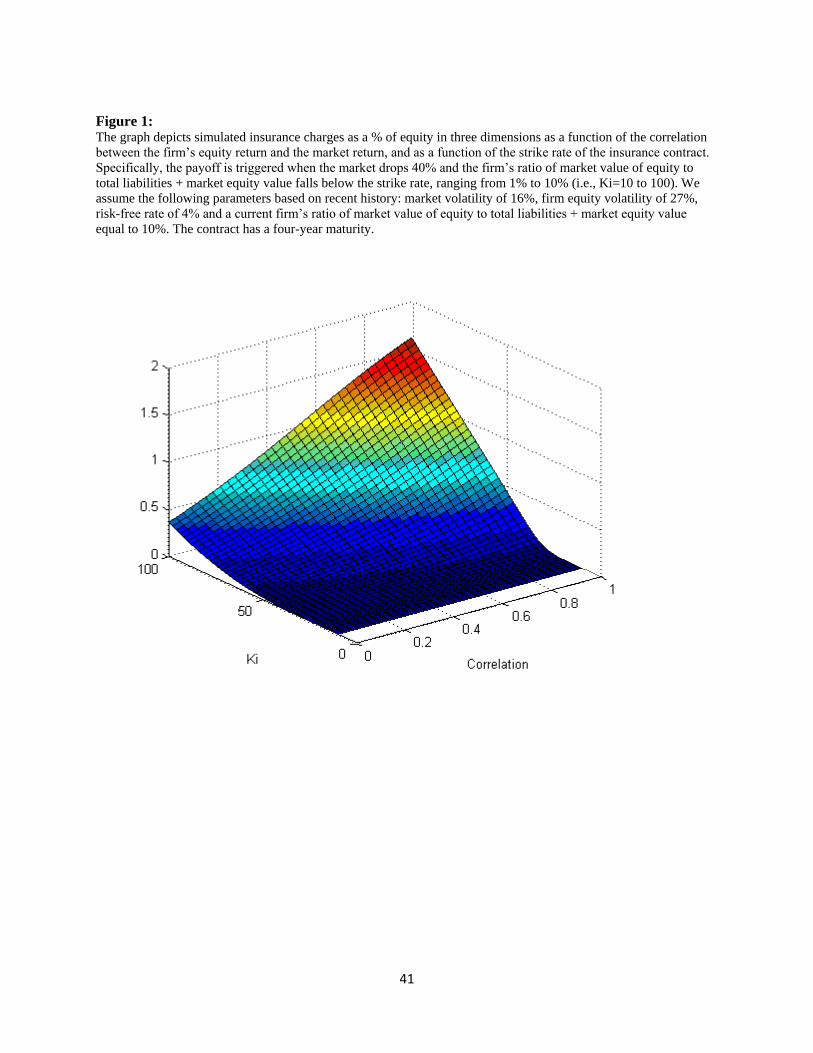
41
Figure 1: The graph depicts simulated insurance charges as a % of equity in three dimensions as a function of the correlation
between the firm’s equity return and the market return, and as a function of the strike rate of the insurance contract.
Specifically, the payoff is triggered when the market drops 40% and the firm’s ratio of market value of equity to
total liabilities + market equity value falls below the strike rate, ranging from 1% to 10% (i.e., Ki=10 to 100). We
assume the following parameters based on recent history: market volatility of 16%, firm equity volatility of 27%,
risk-free rate of 4% and a current firm’s ratio of market value of equity to total liabilities + market equity value
equal to 10%. The contract has a four-year maturity.

42
Figure 2a: The graph depicts simulated insurance charges as a % of equity in three dimensions as a function of the volatility of
the firm’s equity return and the volatility of the market return for a given strike rate of the insurance contract.
Specifically, the payoff is triggered when the market drops 40% and the firm’s ratio of market value of equity to
total liabilities + market equity value falls below the strike rate of 10%. We assume the following parameters based
on recent history: correlation between the firm equity return and the market return of 55%, risk-free rate of 4% and a
current firm’s ratio of market value of equity to total liabilities + market equity value equal to 10%. The contract has
a four-year maturity.
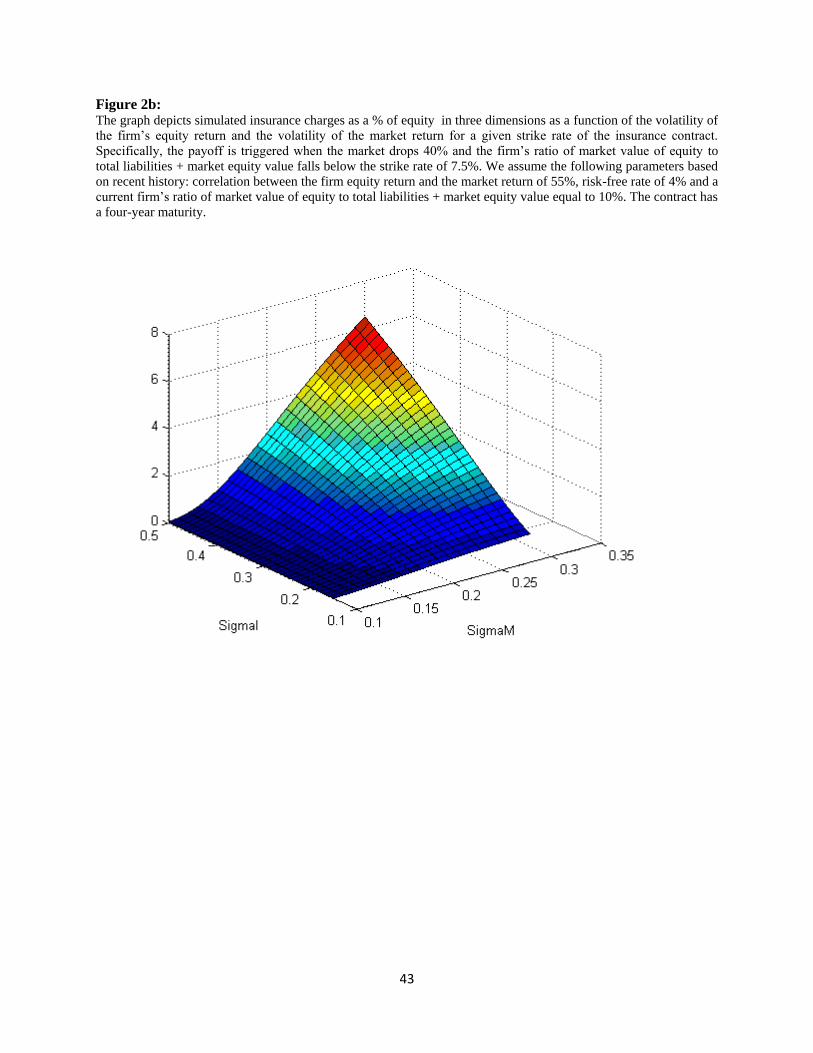
43
Figure 2b: The graph depicts simulated insurance charges as a % of equity in three dimensions as a function of the volatility of
the firm’s equity return and the volatility of the market return for a given strike rate of the insurance contract.
Specifically, the payoff is triggered when the market drops 40% and the firm’s ratio of market value of equity to
total liabilities + market equity value falls below the strike rate of 7.5%. We assume the following parameters based
on recent history: correlation between the firm equity return and the market return of 55%, risk-free rate of 4% and a
current firm’s ratio of market value of equity to total liabilities + market equity value equal to 10%. The contract has
a four-year maturity.
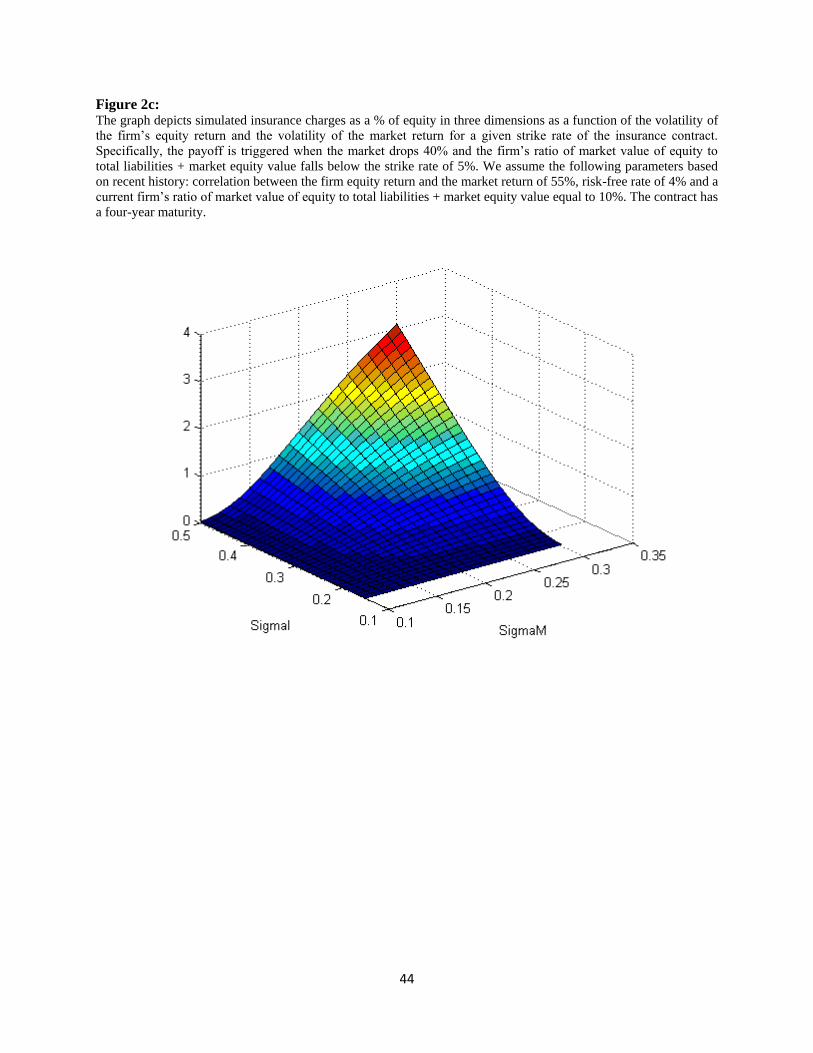
44
Figure 2c: The graph depicts simulated insurance charges as a % of equity in three dimensions as a function of the volatility of
the firm’s equity return and the volatility of the market return for a given strike rate of the insurance contract.
Specifically, the payoff is triggered when the market drops 40% and the firm’s ratio of market value of equity to
total liabilities + market equity value falls below the strike rate of 5%. We assume the following parameters based
on recent history: correlation between the firm equity return and the market return of 55%, risk-free rate of 4% and a
current firm’s ratio of market value of equity to total liabilities + market equity value equal to 10%. The contract has
a four-year maturity.
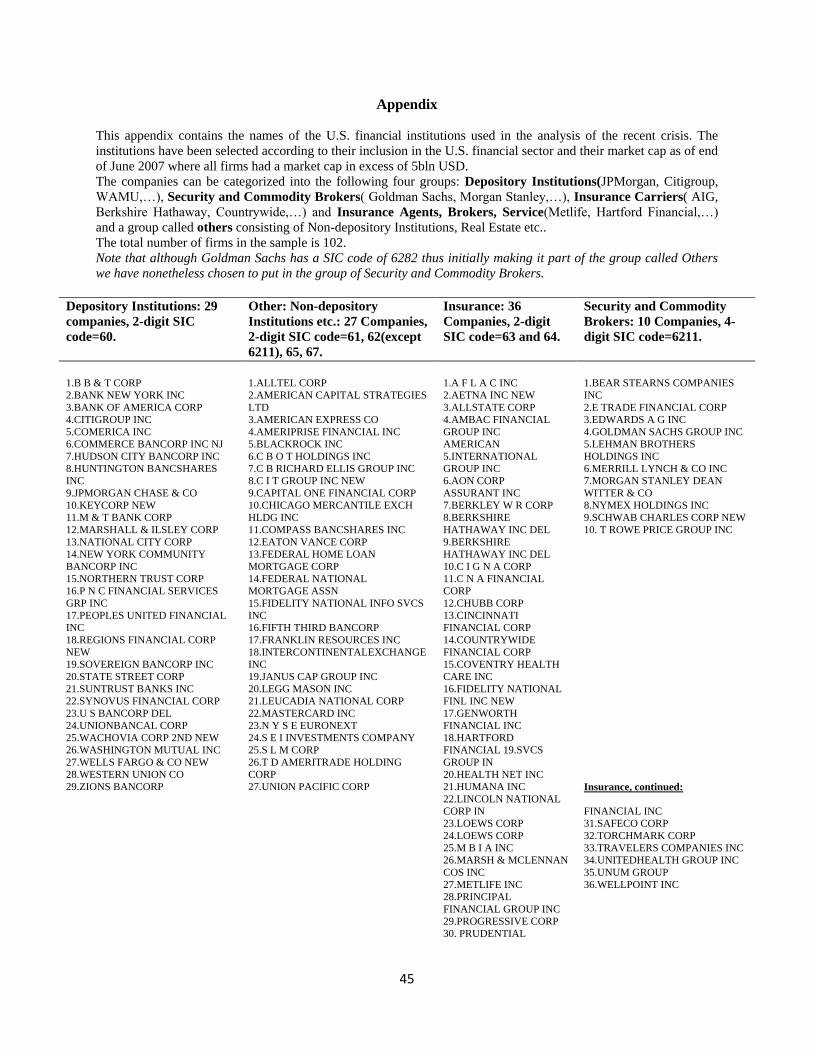
45
Appendix
This appendix contains the names of the U.S. financial institutions used in the analysis of the recent crisis. The
institutions have been selected according to their inclusion in the U.S. financial sector and their market cap as of end
of June 2007 where all firms had a market cap in excess of 5bln USD.
The companies can be categorized into the following four groups: Depository Institutions(JPMorgan, Citigroup,
WAMU,…), Security and Commodity Brokers( Goldman Sachs, Morgan Stanley,…), Insurance Carriers( AIG,
Berkshire Hathaway, Countrywide,…) and Insurance Agents, Brokers, Service(Metlife, Hartford Financial,…)
and a group called others consisting of Non-depository Institutions, Real Estate etc..
The total number of firms in the sample is 102.
Note that although Goldman Sachs has a SIC code of 6282 thus initially making it part of the group called Others
we have nonetheless chosen to put in the group of Security and Commodity Brokers.
Depository Institutions: 29
companies, 2-digit SIC
code=60.
Other: Non-depository
Institutions etc.: 27 Companies,
2-digit SIC code=61, 62(except
6211), 65, 67.
Insurance: 36
Companies, 2-digit
SIC code=63 and 64.
Security and Commodity
Brokers: 10 Companies, 4-
digit SIC code=6211.
1.B B & T CORP
2.BANK NEW YORK INC
3.BANK OF AMERICA CORP
4.CITIGROUP INC
5.COMERICA INC
6.COMMERCE BANCORP INC NJ
7.HUDSON CITY BANCORP INC
8.HUNTINGTON BANCSHARES
INC
9.JPMORGAN CHASE & CO
10.KEYCORP NEW
11.M & T BANK CORP
12.MARSHALL & ILSLEY CORP
13.NATIONAL CITY CORP
14.NEW YORK COMMUNITY
BANCORP INC
15.NORTHERN TRUST CORP
16.P N C FINANCIAL SERVICES
GRP INC
17.PEOPLES UNITED FINANCIAL
INC
18.REGIONS FINANCIAL CORP
NEW
19.SOVEREIGN BANCORP INC
20.STATE STREET CORP
21.SUNTRUST BANKS INC
22.SYNOVUS FINANCIAL CORP
23.U S BANCORP DEL
24.UNIONBANCAL CORP
25.WACHOVIA CORP 2ND NEW
26.WASHINGTON MUTUAL INC
27.WELLS FARGO & CO NEW
28.WESTERN UNION CO
29.ZIONS BANCORP
1.ALLTEL CORP
2.AMERICAN CAPITAL STRATEGIES
LTD
3.AMERICAN EXPRESS CO
4.AMERIPRISE FINANCIAL INC
5.BLACKROCK INC
6.C B O T HOLDINGS INC
7.C B RICHARD ELLIS GROUP INC
8.C I T GROUP INC NEW
9.CAPITAL ONE FINANCIAL CORP
10.CHICAGO MERCANTILE EXCH
HLDG INC
11.COMPASS BANCSHARES INC
12.EATON VANCE CORP
13.FEDERAL HOME LOAN
MORTGAGE CORP
14.FEDERAL NATIONAL
MORTGAGE ASSN
15.FIDELITY NATIONAL INFO SVCS
INC
16.FIFTH THIRD BANCORP
17.FRANKLIN RESOURCES INC
18.INTERCONTINENTALEXCHANGE
INC
19.JANUS CAP GROUP INC
20.LEGG MASON INC
21.LEUCADIA NATIONAL CORP
22.MASTERCARD INC
23.N Y S E EURONEXT
24.S E I INVESTMENTS COMPANY
25.S L M CORP
26.T D AMERITRADE HOLDING
CORP
27.UNION PACIFIC CORP
1.A F L A C INC
2.AETNA INC NEW
3.ALLSTATE CORP
4.AMBAC FINANCIAL
GROUP INC
AMERICAN
5.INTERNATIONAL
GROUP INC
6.AON CORP
ASSURANT INC
7.BERKLEY W R CORP
8.BERKSHIRE
HATHAWAY INC DEL
9.BERKSHIRE
HATHAWAY INC DEL
10.C I G N A CORP
11.C N A FINANCIAL
CORP
12.CHUBB CORP
13.CINCINNATI
FINANCIAL CORP
14.COUNTRYWIDE
FINANCIAL CORP
15.COVENTRY HEALTH
CARE INC
16.FIDELITY NATIONAL
FINL INC NEW
17.GENWORTH
FINANCIAL INC
18.HARTFORD
FINANCIAL 19.SVCS
GROUP IN
20.HEALTH NET INC
21.HUMANA INC
22.LINCOLN NATIONAL
CORP IN
23.LOEWS CORP
24.LOEWS CORP
25.M B I A INC
26.MARSH & MCLENNAN
COS INC
27.METLIFE INC
28.PRINCIPAL
FINANCIAL GROUP INC
29.PROGRESSIVE CORP
30. PRUDENTIAL
1.BEAR STEARNS COMPANIES
INC
2.E TRADE FINANCIAL CORP
3.EDWARDS A G INC
4.GOLDMAN SACHS GROUP INC
5.LEHMAN BROTHERS
HOLDINGS INC
6.MERRILL LYNCH & CO INC
7.MORGAN STANLEY DEAN
WITTER & CO
8.NYMEX HOLDINGS INC
9.SCHWAB CHARLES CORP NEW
10. T ROWE PRICE GROUP INC
Insurance, continued:
FINANCIAL INC
31.SAFECO CORP
32.TORCHMARK CORP
33.TRAVELERS COMPANIES INC
34.UNITEDHEALTH GROUP INC
35.UNUM GROUP
36.WELLPOINT INC

46