ltural~. - citeseerx
TRANSCRIPT

Aa
-. 44
* ro
14~
ltural~. De,e.pmn

AGROECOSYSTEM ANALYSIS FOR
RESEARCH AND DEVELOPMENT
GORDON R.CONWAY
Centre for Environmental Technology Imperial College of Science and Technology
London SW7 1LU United Kingdom
WINROCK INTERNATIONAL INSTITUTE
FOR AGRICULTURAL DEVELOPMENT BANGKOK

1986
WINROCK INTERNATIONAL P.O. Box 1172, Nana Post Office Bangkok 10112, Thailand
Winrock International Institute for Agricultural Development has been created from the merger of Agricultural Development Council (A/D/C), International Agricultural Development Service (lADS) and Winrock International Livestock Researclk and Training Center (WILRTC).
Suggested citation:
Gordon R. CONWAY, Agroecosystem Analysis for Research and Development. Bangkok: Winrock International, 1986.
The publication and distribution of the Papers On Survey Research Methodology have been r.;ade possible by a grant to A/D/C (before its merger into Winrock International) for its Regional Research and Training Program by the Ford Foundation, Jakarta, Indonesia. The Ford Foundation does not review or neces. sarily endorse the materials chosen or the views presented.
ii

CONTENTS
List of Tables v
List of Figures vii
Acknowledgements ix
1. Introduction 13
2. Concepts 19
3. Agroeccsystem Analysis for Research 31
4. Agroecosystem Analysis for Development 51
5. Agroecological Design 71
81References Appendices
A. Organisation of an agroecosystem analysis for research workshop 86
B.Organisation of an agroecosystem analysis for development workshop 103
III

LIST OF TABLES
page number
1. Agricultural development is a function of 26 agroecosystem properties
2. Hypothetical evolution of an upland agroecosystem 27
3. Indicators of performance in the tidal swampland 28 of Kalimantan, Indonesia
4. Timetable for a week-long workshop of agroecosystem 33 analysis for research
5. Examples of key relationships and variables determining 45 the system properties of agroecosystems of Northeastern Thailand
6. Examples of key questions from agroecosystem 48 analysis and development workshops
7. Timetable for an agroecosystem analysis for aevelopment workshop 54
8. Key variables and ?roce-,7es affecting the system 66 properties in villages of the northern areas of Pakistan
9. Examples of key questions 68
10. Innovation assessment for the village of Passu 70
V

LIST OF FIGURES
page number
1. Ramifying consequences of the substitution of 14 tractors for buffalo power in Sri Lanka
2. The hierarchies of biology and agriculture and their 20 related disciplines
3.. The ricefield as an agroecosystem 22
4. The system properties ef agroecosystems 24
5. The procedure for agroecosystem analysis 32
6. Spatial patterns in the Chiang Mal Valley, Thailand 36
7. Transect of a miniwatershed in Northeastern Thailand 37
8. Seasonal calendar for an area of Northeastern Thailand 38
9. Rice production in Northeastern Thailand 39
10. Annual fluctuations in price and planted area for 40 major crops in Northeastern Thailand
11. Declining rice yields under intensive cropping in a 41 research station in Northern Thailand
12. Fluctuations in soil acidity under three cropping 41 systems in Northern Thailand
13. Flow diagram of rice production, economic and-labour 42 relations for Northeastern Thailand
14. Components of farm income for 16 adjoining villages 43 in Northeastern Thailand (22 baht=US$ 1 approximately)
15. Decision tree for farming strategies in one area of 44 Northeastern Thailand
VII

16. Diagram showing points of contact and overlap in irrigation 46 decision making in Northern Thailand
17. The procedure of agroecosystem analysis for 53 development
18. The Passu village agroecosystem 55
19. System hierarchy for Passu 56
20. Historical profile of Passu 57
21. Agroecological zones of Passu 58
22. Transect of Passu 59
23. Seasonal calendar for Passu 60-61
24. Bar diagram showing sources of income, amounts of 62 wheat purchased, and size of working population for three farmers in Passu
25. Flow diagram of seed potato production and marketing 63
in Passu
26. Decision tree for livelihood systems in Passu 64
27. Decision tree for farming systems on new land in Passit 64
28. Venn diagram of institutional overlap in Passu 65
29. A new cropping system for the red-yellow podzolic 72 soils of Indonesia
30. The hierarchy of agroecosystems and the relative 74 inputs from Integrated Rural Development (IRD), Farming Systems Research (FSR) and Agroecosystem Technology
VIII

ACKNOWLEDGEMENTS
This publication is based on four previously published papers and reports. Extracts from these are reproduced here with the appropriate permissions:
Conway, G.R. 1985a. Agroecosystem Analysis. Agricultural Administration. 20, 31-55
Conway, G.R. 1985b. Agricultural ecology and farming systems research. In Remenyi, J.V. (ed.), Australian Systems Research for Third World Agriculture (Proceedings of a Workshop held at Hawkesbury Agricultural College, Richmond, NSW, 12-15 May, 1985), Canberra, Australian Council for International Agricultural Research.
Conway, G.R. 1984. The Organisation of an Agroecosystem Analysis Workshop. London, Centre for Environmental Technology, ICCET Series 84-E-1
Conway, G.R., Alam, Z., Husain, T. and Mian, M.A. 1985. An Agroecosystem Analysis for the Northern Areas of Pakistan, Gilgit, Pakistan, Aga Khan Rural Support Programme.
The agroecosystem analysis workshops have so far involved a total of over three hundred people, too many to name individually here. Each workshop has produced new insights and refinements to the concepts and methods of the approach and I am grateful to all the participants for their contributions.
Financial support for the workshops has been provided by the Aga Khan Foundation, the Ford Foundation and the US Agency for International Development.
This publication has been supported by a direct grant from the Ford Foundation.
Ix

13
CHAPTER ONE
INTRODUCTION*
Agriculture and Environment
Rural development is beset by a large number of problems. One set of problems is created by the inevitable and ubiquitous link between agricultureand the environment. We depend on the environment, the resources of land, water, sunlight and biological organisms for agricultural production. But in the process of agricultural development we introduce new man-made elements, such as pesticides, fertilisers, machinery and specially bred plants and animals. These interact with the environment, often adversely and sometimes to such an extent that natural resources essential to agriculture are harmed or destroyed.
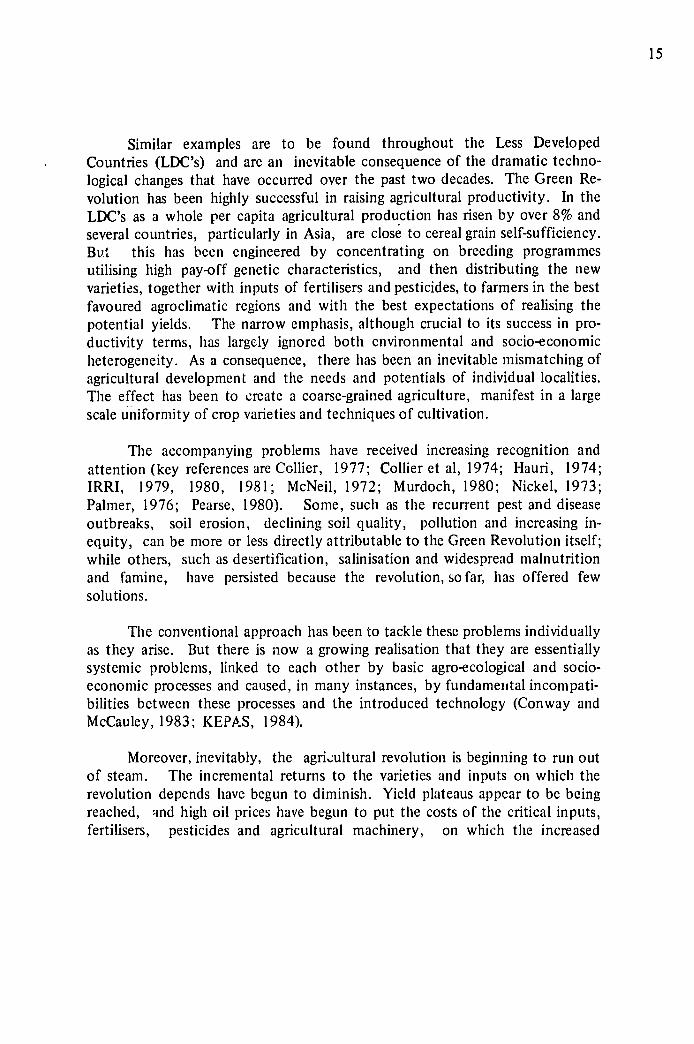
A good example of the ramifying environmental consequences of technological innovation has recently been given by Senanayake (1984) (figure 1).At first sight the substitution of tractor for buffalo power in the villages of Sri Lanka seems to involve a straightforward trade-off between more timely plantingand labour saving, on the one hand, and the provision of milk and manure, on the o+'xer. But associated with buffaloes are buffalo wallows and these in turn provide a surprising number of benefits. In the dry season they are a refuge for fish who then move back to the ricefields in the rainy season. Some fish are caught and eaten by the farmers and by the landless providing valuable protein,others eat the larvae of mosquitoes that carry malaria. The thickets harbour snakes that eat rats that eat rice, and lizards that eat the crabs that make destructive holes in the ricebunds. The wallows are also used by the villagers to prepare coconut fronds for thatching. If the wallows go, so do these benefits. Moreover, the adverse consequences may not stop there. If pesticides are brought in to kill the rats and crabs or mosquito larvae then pollution or pesticide resistance can become a problem. Similarly if tiles are substituted for the thatch this may hasten forest destruction since firewood is required to fire the tiles.
This chapter is largely based on Coutway, G. R., 1985b. Agricultural ecology and farming systems research. In Remenyi J. (ed) Australian Systems Research fcr Third World Agriculture. Canberra, Australian Council for Agricultural Research.

14
TRACTOR versus BUFFALO
Timely planting Milk+curds Less labour at manure
peak times
BUFFALO WALLOWS
REFUGE FOR FISH SURROUNDING COCONUT IN DRY SEASON THICKETS FROND
PREPARATION
Lizards
fish in ricefield Snakes
KCrabs Thatch Mosquito Rats
larvae
BundsI
t t Other Tiles Protein Pesticides Source FirewoodI !I
TAGE RESIS T ANCE DESTRUCTION
MULTIPL1 [NTERATED EST1 CROPING MANAGEMNT FOR T RY
Figure 1. Ramifying consequences of the substitution of tractors for buffalo power in Sri Lanka (Based on Senanayake, 1984;Conway, 1985b)
15
Similar examples are to be found throughout the Less Developed Countries (LDC's) and are an inevitable consequence of the dramatic technological changes that have occurred over the past two decades. The Green Revolution has been highly successful in raising agricultural productivity. In the LDC's as a whole per capita agricultural production has risen by over 8% and several countries, particularly in Asia, are close to cereal grain self-sufficiency. But this has been engineered by concentrating on breeding programmes utilising high pay-off genetic characteristics, and then distributing the new varieties, together with inputs of fertilisers and pesticides, to farmers in the best favoured agroclimatic regions and with the best expectations of realising the potential yields. The narrow emphasis, although crucial to its success in productivity terms, has largely ignored both environmental and socio-economic heterogeneity. As a consequence, there has been an inevitable mismatching of agricultural development and the needs and potentials of individual localities. The effect has been to create a coarse-grained agriculture, manifest in a large scale uniformity of crop varieties and techniques of cultivation.
The accompanying problems have received increasing recognition and attention (key references are Collier, 1977; Collier et al, 1974; Hauri, 1974; IRRI, 1979, 1980, 1981; McNeil, 1972; Murdoch, 1980; Nickel, 1973; Palmer, 1976; Pearse, 1980). Some, such as the recurrent pest and disease outbreaks, soil erosion, declining soil quality, pollution and increasing inequity, can be more or less directly attributable to the Green Revolution itself; while others, such as desertification, salinisation and widespread malnutrition and famine, have persisted because the revolution, so far, has offered few solutions.
The conventional approach has been to tackle these problems individually as they arise. But there is now a growing realisation that they are essentially systemic problems, linked to each other by basic agro-ecological and socioeconomic processes and caused, in many instances, by fundamental incompatibilities between these processes and the introduced technology (Conway and McCauley, 1983; KEPAS, 1984).
Moreover, inevitably, the agri,:ultural revolution is beginning to run out of steam. The incremental returns to the varieties and inputs on which the revolution depends have begun to diminish. Yield plateaus appear to be being reached, and high oil prices have begun to put the costs of the critical inputs, fertilisers, pesticides and agricultural machinery, on which the increased

16
production is heavily dependent, beyond the reach of farmers with poor access to credit. Partly for these reasons, the focus of development is also increasinglyshifting to the so-called marginal lands (Conway, Manwan and McCauley,1983). Here the new technologies are particularly inappropriate and, as experience has already shown, their application, either directly or indirectly, may often worsen an already fragile situation.
The next phase of agricultural development would thus seem to require a radically different approach, one that is holistic and also more sensitive to the complexities of agro-ecological and socio-economic processes. The pay-offswould come from the breeding of specifically adapted varieties and the design of inputs and techniques specially tailored to the needs of specific agroecosystems, at the level of the region, the farm and indeed the field. The target would be a more Fine-grained agriculture, based on a mosaic of varieties, inputs and techniques each fitting a particular ecological, social and economic niche.
Multidisciplinary Analysis
A second set of problems facing rural development is posed by the multidisciplinary nature of this t,)sk. Successful development requires the genuineintegration of a wide range of skills and knowledge, ranging from anthropology to entomology. Bringing such varied disciplines together in an efficient and productive way to prcduce a common agreement on worthwhile action is an enormous challenge. It is relatively easy to physically bring different specialists together but the process of interaction may remain casual, often producing results that are superficial and mundane. Experience suggests that the generation of good interdisciplinary insights also requires organising conceptsand frameworks and a relative'y formal working procedure which encourages and engineers cross-disciplinary exchange.
To date there have been two significant responses to this challenge as it applies to the Third World. The first has been Farming Systems Research (FSR)characterised by its focus on the small farm as the basic system for research and development, and by the strong involvement of the farmers themselves at all stages in the research and development (R and D) process (Gilbert et al, 1980;Harwood, 1979; Norman, 1980; Shaner et al, 1982). The second responsehas been Integrated Rural Development (IRD) which is even more holistic in

17
scope, focussing on projects that go beyond improving agriculture to encompass fish, forest and handicraft production, off-farm employment, and the provision of health, education and other communal services (Conde et al, 1979; FAO, 1975; Gomez and Juliano, 1978). In practice IRD projects are commonly seen as a means of improving coordination and better working relations betwepn different government agencies.
Here I present a third approach, Agroecosystem Analysis and Development (AAD). This differs from FSR and IRD in two important respects. First, it can deal with all levels in the hierarchy of agroecosystems, from field through farm, village and watershed, to region and nation. Second, it provides a technique of analysis and packages of technology that focus not only on productivity, but also, explicitly, on other indicators of performance - stability, sustainability and equitability - and on the trade-offs between them. However, it is not intended as an alternative to FSR or IRD, but is offered as an approach that can be used within the framework of FSR or IRD and indeed in any multidisciplinary agricultural R and D programme, at whatever level of intervention.
AAD is based on the disciplines of agricultural ecology and human ecology, and in the next chapter I present some of the key concepts.
19
CHAPTER TWO
CONCEPTS*
Systems
The concepts of Agroecosystem Analysis are simple and basic, involving a minimal set of assumptions that are hopefully acceptable to all the disciplines that participate in rural development. The cenral concept is that of the system; related to it are the concepts of system hierarchy, system properties and the agroecosystem.
A system is here defined as an assemblage of elements contained within a boundary such that the elements withii the boundary have strong functional relationships with each other, but limited, weak or non-existent relationships with elements in other assemblages; the combined outcome of the strong functional relationships within the boundary is to produce a distinctive behaviour of the assemblage such that it responds to stimuli as a whole, even if the stimulus is only applied to one part.
System Hierarchies
We can conceive of the natural living world as a nested hierarchy of such systems from the gene through to the ecosystem (figure 2). In the process of agricultural development, these systems are modified for the purpose of food Or fibre production, so creating hybrid agroecosystems. They, also, can be arranged in a hierarchic scheme. Agricultural ecology provides the bridge between the two hierarchies, linking the pure ecology of natural living systems with the multiplicity of disciplines that lie within the broad remit of agriculture. Human ecology provides the bridge between both these hierarchies and the hierarchy of social systems - family, kin group, tribe, etc.
This chapter is largely based on Conway, G. R., 1985a. Agroecosystem Analysis. Agricultural Administration, 20, 31.55
Previous Page Blank

20
ECOSYSTEM -- --- AGROECOSYSTEM Agriculturaleconomics
Rural sociology
Soil science
tAnimal husbandry 0 o U I
Agronomy Horticulture
COMMUNITY - - -- CROPPING Eo lour SYSTEM Ertomology
Lu -Plant pathology U sw weed science
POPULATION - - - ------- CROP
ORGANISM
Plant physiology Crop physiology
TISSUE
Cytology CELLI Genetics GENE Plant breeding
Figure 2. The hierarchies of biology and agriculture and their relateddisciplines (KEPAS, 1984)

21
It is also a basic feature of such hierarchies that the behaviour of higher systems in the hierarchy is not readily discerned simply from a study of the behaviour of lower systems. Each level in the hierarchy has to be analysed in its own right and this is consequently an important feature of Agroecosystem Analysis (Checkland, 1981; Milsum, 1972 ; Simon, 1962; Whyte et al, 1969).
Agroecosystems
The transformation of an ecosystem into an agroecosystem involves a number of significant changes. The system itself becomes more clearly defined, at least in terms of its biological and physico-chemical boundaries. These become sharper and less permeable, the linkages with other systems being limited and channelled. The system is also simplified by the elimination of much of the natural fauna and flora and by the loss of many natural physico-chemical processes. However, at the same time, the system is made more complex through the introduction of human management and activity.
An example of an agroecosystem that illustrates these points is the ricefield (figure 3).The water-retaining dyke or bund forms a strong, easily recognisable boundary, while the irrigation inlets and outlets represent some of the limited outside linkages. The great diversity of wildlife in the original natural ecosystem is reduced to a restricted assemblage of crops, pests and weeds. The basic ecological processes, such as competition between the rice and the weeds, herbivory of the rice by the pests and predation of the pests by their natural enemies remain, but are now overlain by the agricultural processes of cultivation, subsidy, control and harvesting.
It is this new complex agro-socio-economic-ecological system that I call an agroecosystem. Essentially the same picture can be drawn for higher levels ii the hierarchy of agroecosystems, for the farm, village or watershed, but the increasing complexity of the interactions makes a simple representation difficult, if not impossible.

--
22
IRRIGATION hADYKE
Ft Comnpetition
MICROORGANISMS*
soil.&WATER NUTRIENTS 4-----'" II-I' 'K ,
Coptiin Co Corner1tioCo nptiin omptition
00 0 J I/!-" FISHRICE .. e ' -WEEDS 4.-, CRABS -SPLANTS
- , HUMANS PL NT\U % U ,/----I'----
-Herbivory
\\ I \
I
PESTS4- --- 5\" _4 4
Predation
NATURAL ENEMIES
V Figure 3. The ricefield as an agroecosystem (Conway, 1985b)

23
Agroecosystem Properties
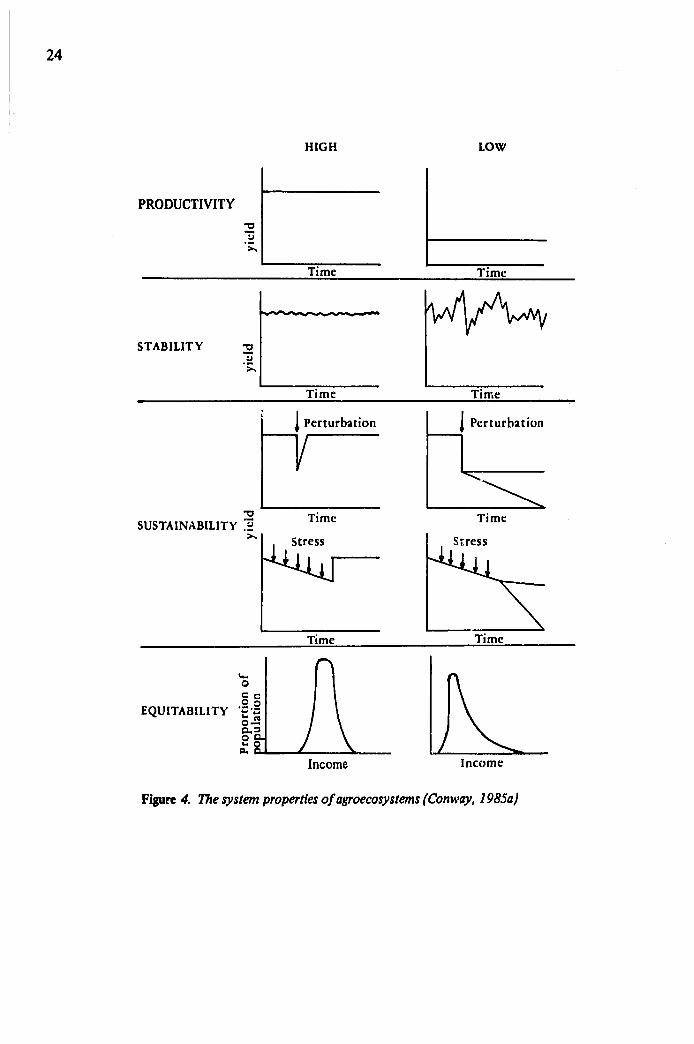
However this complexity, at least in terms of its dynamic consequences, can be captured by four system properties which, together, desciibe the essential behaviour of agroecosystems (Conway, 1983, 1985a). These are productivity, stability, sustainability and equitability. They are relatively easy to define (figure 4), although not equally easy to measure:
Productivity is the net increment in valued product per unit of resource (land, labour, energy or capital). It is commonly measured as annual yield or net income per hectare or man hour or unit of energy or investment.
Stability is the degree to which productivity remains constant in spite of normal, small scale fluctuations in environmental variables, such as climate, or in the economic conditions of the market; it is most conveniently measured by the reciprocal of the coefficient of variation in productivity.
Sustainability can be defined as the ability of a system to maintain its productivity when subject to stress or perturbation. A stress is here defined as a regular, sometimes continuous, relatively small and predictable disturbance, for example the effect of growing soil salinity or indebtedness. A perturbation, by contrast, is an irregular, infrequent, relatively large and unpredictable disturbance, such as is caused by a rare drought or flood or a new pest. Unfortunately, measurement is difficult and can often only be done retrospectively. Lack of sustainability may be indicated by declining productivity but equally, as experience suggests, collapse may come suddenly and without warning.
Equitability is a measure of how evenly the productivity of the agroecosystem is distributed among its human beneficiaries. The more equitable the system the more evenly are the agricultural products, the food or the income or the resources, shared among the population of the farm, village, region or nation. It can be represented by a statistical distribution or by a measure such as the Gini coefficient.
24
HIGH LOW
PRODUCTIVITY
Time Time
STABILITY -a
Time Time
Perturbation Perturbation
Time TimeSUSTAINABILITY .E
>~Stress Stress
Time Time
o0
.°0EQUITABILITY C2. I s0.! 0
Income Income
Figure 4. The system propertiesofagroecosystems(Conway, 1985a)

25
Evolution of Agroecosystem
These four properties are essentially descriptive in nature, summarising the status of the agroecosystem. But they can also be used in a normative fashion, as indicators of performance, and in this way can be employed both to trace the historical evolution of an agroecosystem and to evaluate its potential, given different forms of land use or the introduction of new technologies.
Experience shows that in agricultural development there is almost inevitably some degree of trade-off between the different system properties. New forms of land use or new technologies may have the immediate effect of increasing productivity, but this is often at the expense of lowered values of one or more of the other properties. There are, almost invariably, significant trade-offs involved between productivity and stability on the one hand and sustainability and equitability on the other, and indeed between all the properties. Agricultural development thus typically involves a progression of changes in the relative values of these properties, successive phases of development producing different priorities.
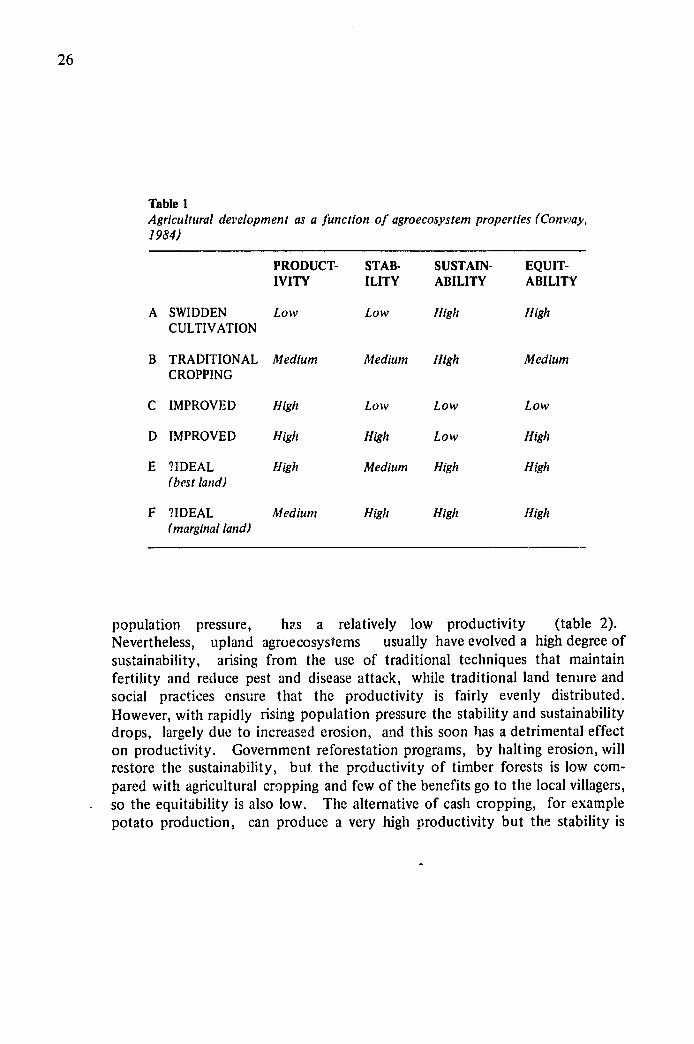
Traditional agricultural systems such as swidden cultivation (shifting cultivation) generally have low productivity and stability, but lgh equitability and sustainability (pattern A in table 1). Traditional sedentary cropping systems tend to be more productive and stable, yet retain a high degree of sustainability and some of the equitability (B). However, the introduction of new technology, while greatly increasing the productivity, is likely also to lead to lower values of the other properties (C). This was particularly true, for example, of the introduction of the new high yielding rice varieties, such as IR8 and its relatives, in the 1960's; yields fluctuated widely, but have tended to decline, in part due to growing pest and disease attack. More recent varieties combine high productivity with high stability, but still have poor sustainability (D). The ideal goal could be pattern E or on marginal lands, where there is a conflict between productivity and sustainability, pattern F may be more appropriate.
Two further examples show how such a scheme of analysis can be applied to particular locations. The first concerns the upland watersheds of East Java and was produced at an AAD workshop held in 1984 (KEPAS, 1985a). Typically, traditional cultivation in the' uplands under a low
26
Table I Agricultural development as a function of agroecosystem properties(Conway, 1984)
PRODUCT-IVITY
STAB-ILITY
SUSTAIN-ABILITY
EQUIT-ABILITY
A
B
SWIDDEN CULTIVATION
TRADITIONAL
Low
Medium
Low
Medium
High
High
High
Medium
CROPPING
C IMPROVED High Low Low Low
D IMPROVED High High Low High
E ?IDEAL (best land)
High Medium High High
F ?IDEAL (marginalland)
Medium High High High
population pressure, has a relatively low productivity (table 2). Nevertheless, upland agroecosysterms usually have evolved a high degree of sustainability, arising from the use of traditional techniques that maintain fertility and reduce pest and disease attack, while traditional land tenure and social practices ensure that the productivity is fairly evenly distributed. However, with rapidly rising population pressure the stability and sustainability drops, largely due to increased erosion, and this soon has a detrimental effect on productivity. Government reforestation programs, by halting erosion, will restore the sustainability, but the productivity of timber forests is low compared with agricultural cropping and few of the benefits go to the local villagers, so the equitability is also low. The alternative of cash cropping, for example potato production, can produce a very high productivity but the stability is

27
Table 2 Hypotheticalevolution ofan uplandagroecosystem (KEPAS. 1985a)
PRODUCT- STAB- SUSTAIN- EQUIT-IVITY ILITY ABILITY ABILITY
TRADITIONAL Low Medium High High CULTIVATION (Low population)
TRADITIONAL CULTIVATION Very Very Low Medium (High population) low low
REFORESTATION Low High High Low
CASH CROPPING High Low Low Low
TREE GARDENS AND CASH Medium Medium Medium Medium CROPPING
INTEGRATED TREE AND High Medium High High HOME GARDENS
often low due to pest and disease attack, while erosion and pesticide resistance result in lowered sustainability. The common pattern of land tenure which accompanies cash cropping also results in a lowered equitability. Interplanting of tree gardens with cash cropping usually restores some of the stability and
sustainability, due to the buffering effect produced by the greater diversity of cropping. The equitability is often higher, but it is usually at the expense of a somewhat lowered overall productivity compared with sole cash cropping. In theory an integrated pattern of tree and home gardens, by reducing erosion and pest and disease attack and by exploiting the intensity and diversity of multiple species cropping, could produce high values in all of the system properties (table 2).

28
Table 3 Indicators of performance in the tidal swampland of Kalimantan, Indonesia (KEPAS, 1985b)
RICE COCONUTS
PRODUCTIVITY
Yield Poor-High Moderate Income Rp 100,000-500,000 Rp 400.000
STABILITY
Yield (by area) Variable Constant Yield (byv year) Variable Constant Yield (b v season) Single harvest Constant Price Low at harvest Varies seasonally
SUSTAINABILITY
Salinity/acidity Susceptible Resistant Flood/drought Susceptible Resistant Rats Serious Moderate attacks Insects Many, serious None
EQUITABILITY
Agrochenicals Several None Labour Hiredseasonally Steady family labour Land Needs good land Suitableforany land
The second example comes from an AAD Workshop held in Kalimantan, Indonesia which focussed on the development of the swamplands (KEPAS, i985b). These have been designated as rice growing areas by the Indonesian government, but they suffer from severe problems, largely stemming from the acid sulpnate potential of the soils. The workshop revealed that the farmers in the arc" were progressively transforming their ricefields into a pattern of coconut plantings separated by fish ponds. Our analysis suggested that, although the rice is sometimes more productive, the coconuts appear superior in terms of stability, sustainability and equitability (table 3) and this is the

29
probable explanation of why the farmers are switching crops. The government,of course, may well be correct in terms of its national priorities, but the analysis highlighted the need for research and. development to correct the problems of rice production so restoring its favourability.

31
CHAPTER THREE
AGROECOSYSTEM ANALYSIS FOR RESEARCH *
The procedure of Agroecosystein Analysis (Conway, 1985a) has evolved over the past five years from one originally designed for the analysis of natural ecosystems (Walker et al, 1978). It rests on the concepts described above and on four further assumptions :
1. It is not necessary to know everything about an agroecosystem in order to produce a realistic and useful analysis.
2. Understanding the behaviour and important properties of an agroecosystem requires knowledge of only a few key functional relationships.
3. Producing significant improvements in the performance of an agroecosystem requires changes in only a few key management decisions.
4. Identification and understanding of these key relationships and decisions requires that a l'mited number of appropriate key questions are defined and answered.
The steps of the procedure are described in figure 5. Experience has shown that the procedure is best followed in a seminar or workshop environment in which meetings of the whole team arc interspersed with intensive work sessions involving small groups of individuals. Although the first workshop (Gypmantasiri et al, 1980) ran intermittently for a period of a year, more recently they have been confined to one week, but with a month-long preparatory period for data acquisition. Table 4 suggests an appropriate timetable.
This chapter is largely based on Conway, G.R., 1985a. Agroecosystem Analysis. Agricultural Administration, 20, 31-55
Previous Page Blank

32
SOBJECTIVES
SYSTEM BOUNDARIES DEFIN ITION HIERARCHY
SPACE 4 -TIME
PATTERN INDICATORS ANALYSIS PERFOANc
FLOW + - DECISIONS
KEY QUESTIONS
GUIDELINES
RESEARCH LABORATORY EXPERIMENTS FIELD EXPERIMENTSDESIGN
AND FIELD SURVEYS EXTENSION TRIALS
DEVELOPMENT EXPERIMENTS
Figure 5. The procedurefor agroecosystemanalysis(Conway, 1983)

33
Table 4
Timetablefor a week4ong workshop of agroecosystemanalysisfor research
Day 1 Participantintroductions. Conceptualbasisand details of procedure. Introduction to study area or theme.
Day 2 Briefing on Case Study data. System Definitionby whole workshop team. Break intogroups, each assigned a level in the system hierarchy (eg. field plot-farm-village-region)orone of a series ofagroecosystems (eg. different farms or villages). Each group carriesout Pattern Analysis.
Day 3 Continuationof Day 2 in groups.Analysis of System Properties and Key Question Identification.
Day 4 Field visits to casestudy sites.
Day 5 Revision of analyses followingfield visits.
Day 6 Presentationby groups of theirfindings.
Day 7 Whole team discussion of Key Questions andReseatch Design and Implementation.
Day 8-9 Writing of draft report by editorialteam.
The key to success lies in clear communication between the different disciplines present. In the Pattern Analysis phase, in particular, it is important for the participants to strive to present their disciplinary and specialist knowledge in such a fashion that all other members of the workshop can easily grasp its significance. This process is greatly helped by the use of diagrams and extensive use has been made in the workshops of maps, transects, graphs, histograms, flow diagrams, decision trees, venn diagrams and any other pictorial device that appears to aid communication. One practical, but essential, reqpirement is for the workshop room to be well equipped with overhead projectors, transparencies, pin boards, graph, etc. (a guide to the organisation of a workshop is given in appendix A).

34
Objectives and Definitions
Objectives
As in all exercises in systems analysis the quality of the final results depends crucially on a having a definition of objectivs at the outset which is couched in simple, precise and unambiguous language and is acceptable to all members of the team. For example, a workshop may have as an objective:.
To identify research priorities that will lead to improvements in the level and stability of net income of farm households in the x region.
Precise definition of targets is essential. For example, is the objective to improve mean agricultural productivity of an area, or the productivity of the poor farmers in the area (the former may not imply the latter)? Also, is the aim to increase productivity only, or is improved stability, sustainability or equitability to be explicitly included ?
System Definition
This phase involves identification of systems, system boundaries and system hierarchies.
At the outset the identification of systems and their boundaries is subjective and tentative. The biological and chemico-physical boundaiies are often fairly clear: the ricefield is bounded by a dyke; the valley by the extent of the watershed. But the cultural and socio-economic boundaries are more extensive. For example,defining a farm household solely in terms of the farm itself- the land that is cultivated' or otherwise exploited - is frequently inadequate. A member of the faim household may be deriving income from far away; the sale of produce may depend on distant markets; and the farmer's goals and values may be influenced by political or religious movements of a complexorigin. In Northeastern Thailand members of the family may be working temporarily in Saudi Arabia; the price of a major crop, cassava, is influenced by quotas established by the European Economic Community; and the values of Buddhist farmers may be influenced by religious developments in Sri Lanka.

35
The systems and boundaries can be revised as the workshop proceeds and as more knowledge is acquired of the key functional relationships that determine the system properties. The procedure of analysis will also indicate which systems are important in terms of the objectives of the workshop and increasingly the participants will focus on these systems.
Pattern Analysis
Four patterns are chosen as likely to reveal the key functional relationships that determine system properties. Three of these - space,time and flow are known to be important in tmd:drstanding the properties of ecological systems (May, 1981). All three patterns have also the virtue of being neutral with respect to scientific disciplines. Space, time and flow are equally important patterns for both natural and social science analysis and hence provide a basis for the generation of cross-disciplinary insights. The fourth pattern -decisions-reflects the processes of human management of agroecosystems and its analysis contributes to an understanding of all four system properties. Although this pattern is primarily the province of socio-economic analysis, experience shows that it generates lively discussion among both social and natural scientists.
Space
Spatial patterns are most readily revealed by simple maps and transects. Overlays are particularly useful in uncovering potentially important functional relationships. Thus, in the Chiang Mai Valley of Northern Thailand they indicated that cropping intensity was determined by the form of irrigation system rather than by soil type (figure 6). Subsequent analysis of the pattern of irrigation decisions (figure 16) suggested that triple cropping is more feasible in tiaditional and in tube or shallow dug-well systems than in government systems. 7armers exercise greater control over traditional systems and hence the water supply is more reliable.
Transects are particularly useful in defining system boundaries and in identifying problem areas. In the analysis of Northeastern Thailand agroecosystems the recognition of the mini-watershed agroecosystem and its subdivisions pinpointed the role of the upper paddy fields as the generator of instability in rice production (figure 7).

!---'] ainfed
m Single cropping RID systems
Double cropping Traditional systems
Triple cropping '"ure wells
a. b
Figure 6. Spatial patternsin the ChiangMai Valley, Thailand: (a) cropping intensity,(b) government (RID)andnon-government irrigation systems (Gypmantasiriet at, 1980)

Hamlet Field shelter
Upland Upper Paddy Lower Paddy Upper Paddy Upland
Soils Paleustult Paleaquuh/ Paleaquuk Paleustult
Cassava Cassava Ricc Kenaf Rice followed by Sugarcane vegetables Water melon
Problems Drought Insufficient Occasional Erosion water flooding
Figure 7. Transect of a miniwatershedin Northeastern Thailand(KKU-Ford CroppingSystems Proiect,1982a)

38
Time
Patterns in time are best expressed by simple graphs. Three patterns appear to be important for agroecosystems. The first is that of seasonal change and can be analysed by crop calendars in which cropping sequences, labour, credit peaks, prices, etc., are graphed on various agrometeorological parameters. This helps, in particular, to identify those periods in the year when the timing of operations and the availability of resources is ciitical for pi'oductivity and stability (figure 8).
300.--- . - rainfall.evaporation
: C 1-200 X o
C1.
NNN ENAF ___ ENAF
,RICE X TOBACCQ'
Glutinous rice 4
3.
2-I
0
Tobacco
100-Clnnrita __ _
'-80
~60-S40-
S20 I
Kenaf
MA M J J A SONDJ MA M J J A S
Figure 8. Seasonalcalendarfor an areaofNortheasternThailand(KKU-FordCropping Systems Project,1982a)

39
Longer term changes, in prices, production, climate, demographic parameters, etc., can be graphed in a conventional manner (10 years of data aA---
minimum requirement). These reveal trends in productivity and a measure of stability (figure 9), possible time lags in the system and other cases of
I I)
8-8
6- 6
6 0 0
0 0a
M 0
Regional rice requirement 2 -"2
1960 1952 1964 1966 1968 1970 1972 1974 197 1978 Year
Figure 9. Rice productionin Northeastern Thailand (KKU-FordCroppingSystems Project, 1982a)
instability (figure 10) and any signs of lack of sustainability (figure 11).
The final pattern in time is of the response of important variables to stress and perturbation. Stresses, as defined earlier, include soil deficiencies and toxicities, pests, diseases and weeds, etc. Perturbations include major floods or droughts or a sudden outbreak of a pest or disease. The distinction between the two forms of disturbance rests on the degree of predictability. In some regions of the world, for example in Northeastern Thailand, floods and droughts are so common as to constitute stresses; in Northern Thailand where wet season rice pests are relatively unimportant an outbreak of a new pest, such as the brown planthopper (Nilaparvata lugens), would ccnstitute a perturbation. In the analysis, actual and possible stresses and perturbations need to be identified and the known or likely responses of the variables graphed (figure 12).

40
8-
Cassava
to7 Kenaf
-~ -4 Maize -6
'0 2
2
uN
.0
4
6.3 o
O!! II
1971 1973 1975 1977 1979 Year
Figure 10.Annuial fluctuations in price and planted areafor major crops in Northeastern Thailand ('22 baht = US$1I approximately; I rai =3..6 ha) (KKU - Ford Cropping Systems Project, 1982a)

41
7.0
(,.0"
4.0
I I I I I I I I I | ! 7)1969 "I 73 75 77
Figure 11. Declining rice yields under intensive cropping in a research station in Northern
Thailand(Gypmantasiriet al, 1980).
6.5.cRoP- I I jCROP2 /
rice- so)ybcan- mungbXan
/ ricc-soybCan- fallow
SFLOODED / N
5.5/ O /F rice- garlic- fallow
pH
P %
4.5 -5,
I ! I I4.0 J A S N D J F M A M J J A S o N D
Figure 12 Fluctuations in soil acidity under three cropping systems in Northern Thailand (Gypmantasiriet al, 1980)

42
Flow
Included under this heading are the patterns of flows and transformations of energy, materials, money, information, etc., in thc agroecosystems. While these may be described by conventional flow diagrams the aim should not be to trace out all the detailed relationships. Flows should be principally analysed for the major causes and effects and for the presence of stabilising or destabilising feedback loops (Levins. 1974). The flow diagrams should thus be kept as simple as possible(figure 13). Tables, matrices, bar histograms (figure 14) and regression graphs may also be useful in indicating important relationships.
.....-urban Poor +
Rice Price r Emigration
+ Early patd + !Lbu
Rain Area LRi'-r
, 7 apita J
+ Production Sper farm
Late Rain id
Figure 13. Flow diagram of rice production, economic and labour relationsforNorlheastern Thailand.

43
26,000- Net farm income: R- rice, C cash crop
] Trade, home industry, etc. 22,000- off-farm income
income from livestock 18,000
14,000-
E
6,00-IM
Villages
Figure 14. Components of farm income for 16 adjofning villages in Northeast Thailand(22 baht = US$ Iapproximately) (KKU - FordCropping"ystems Project, 1982a)
Decisions
Decisions, ranging from those of national agricultural policy to the individual farmer's day-to-day choices, occur at all levels in the hierarchy of agroecosystems. Two patterns are important. The first is of the choices made in a given agroecosystem under differing conditions and is best described by means of a decision tree. Construction of the tree helps to reveal both the goals of the decision maker and the constraints on choice that are present in the agroecosystem. Decision trees produced for Northeast ,rn Thailand agroecosystems suggested the importance of labour and land type constraints on farm and village production (figure 15).

STRATEGIESSTRAEGIE land suitable for | No
nIs
high quality tobacco? Off-farm employment
NNo
e TOB A CCO ORO F F R Tobacco growing
Does ice rop under contract subsstene? esyes\
--watermelon MEONRiceWAT kenaf grown
x Imprvemet?
DoesS~ilreqire No/ continuously'
atemelonO rice-ROtaton ,WATERMELON by twofollowedYes rice onlydiseaeDoes S croyearsDoes riceSi
5. Decision tree for faning strategies in one area of NortheasternThailand Conway, 1985a) Figure

45
The second pattern is of the spheres of influence of decision makers. Here analysis is primarily required in order to identify the critical decision makers in the system hierarchy and simple diagrams are useful in distinguishing the points of contact and overlap in decision making. Analysis of irrigation water control in the Chiang Mai Valley, for example, revealed the extent of farmer participation in decision making under different systems (figure 16).
System Properties
Discussion of system properties should guide the form of pattern analysis, helping to indicate the likely key relationships and decisions. However, at the end of the pattern analysis phase it may be useful to summarise what has been learnt of system properties and to tabulate the most important contributing relationships and variables (table 5).
Table S Examples of key relationships and variables determiing the system properties of agroecosystems ofNorth eastern Thailand (Conway, I 985a).
PRODUCTIVITY Demand by world markets (especially EEC) Government rice ar d fertilizer policies Water resource development
STABILITY Rainfall, especially floods and droughts Rice production in upper paddy fields Human migration Diversification ofproduction
SUSTAINABILITY Increasing salinity Increasing indebtedness Deterioration of communal, mutual help arrangements
EQUITABILITY Subsistence rice crop Diversification ofproduction Government rural works programme A vailability of credit

46
Catchment
Dam&Laterals
a.
... -RID Head office
-- -
Project Engineer Water Masters
/ ----q ..Zonemcn
G;ate lenders
Farm Ditch
Field Ditch
Association
Common irrigator
Farmer
Dam
Catchment b.
Annual Meeting of .ng Leaders
Village SHeadman
\Muang LeaderFamDth Field Ditch Fre
Figure 16. Diagram showing points of contact and overlap in irrigation decision making in Northern Thailand: (a) government (RID) systems; (b)traditionalsystems (in each diagramthe physical systems are in the left and the decision makingsystems are the right)(Conway, 1985a)

.47
Key Questions
Key questions arise throughout the procedure, during system definition, pattern analysis and the discussion of system properties. They should be noted down as they emerge and then collectively revised by the participants in the light of all the information available. Experience suggests that a field trip to the agroecosystem sites is useful at this stage: some key questions may be quickly answered; others may be revealed as poorly based or inappropriate. Subsequent to the field visit the full list of key questions should then be extensiveiy discussed by the workshop team as a whole.
Good key questions are usually of a multidisciplinary nature but are nevertheless highly focussed. They need to be framed as virtual hypotheses and hence be in a form that is readily capable of being answered. Formulation of general research and policy issues or problems is not a sufficient outcome of the workshop. Thus for the upland workshop (KEPAS, 1985a) identification of "The integration of perennial and annual cropping" (a research issue), "The improvement of farmers' income in the uplands" (a policy issue), "The prevention of erosion" (a research problem) or a general question such as " How can erosion be prevented? " were not regarded as acceptable outcomes. Key questions, by contrast, are of the form " Are tree gardens superior to. bench terracing in reducing erosion, and in increasing and stabilising farmers' net income? " Table 6 lists some of the key questions from the workshops which have been held to date.
As far as possible the key questions should be turned into carefully phrased, testable hypotheses so that by the end of the workshop there is a list of questions each accompanied by a hypothesis, a discussion of the issues involved, and some indication of the investigations now required.
Research Design and Implementation
The remaining phase of the procedure is one of conventional research. The hypotheses are tested as appropriate: by laboratory or field experiments, field surveys or extension trials. The multidisciplinary activity of the workshop may or may not extend into the research phase; many of the key questions will be phrased in terms of single disciplines and are best answered by the

48
Table 6
Examples of key questions from Agroecosystem Analysis and Development Workshops
1. Can new rice varieties be bred to produce more stable yields on the upper poorly watered paddy fields? (Northeast Thailand)
2. What is the optimal application of fertilisers to traditional rice varieties under highly variable rain-fed conditions? (Northeast (Thailand)
3. How is the form and productivity of cropping systems in the Chiang Mai Valley affected by the government policy on the price of rice? (North Thailand)
4. To what extent are the gains in productivity and stability from land consolidation in the Chiang Mai Valley likely to be offset by a decline in sustainability and equitability? (North Thailand)
5. What is the best time to close irrigation systems for maintenance so as to improve cropping systems options? (North Thailand)
6. Do present tenancy patterns prevent better soil erosion control in potato cultivation? (East Java)
7. Are lack of capital and of feed the main constraints to improved livestock production? (East Java)
8. Would the productivity and sustainability of village forest lands be improved by giving villagers rights to grow fruit trees and forage grass there? (East Java)
9. In what ways can government transmigration schemes benefit from the organisation,techniques and methods ofspontaneous migrants? (Kalimantan)
10. Can farmer income and income stability be improved by cooperative marketing of coconuts and local coconut processing? (Kalimantan)

49
appropriate specialists. To this extent the outcome of the workshop may appear superficially similar to research programmes arising from a collection of individual initiatives. But they will differ crucially in that the individual research projects are the direct consequence of a multidisciplinary systems analysis and the results feed back to, and modify, that analysis. The research has thus a better contextual basis and is likely to be more appropriate and relevant, while the results have a greater chance of being acted upon.
It is, of course, not necessary that all the key questions be tackled by the workshop team. Some of the questions may raise issues or require methods of approach that lie outside the competence of the group. But if the questions are well phrased and their importance clearly justified,they should interest and excite other research workers to find answers.

51
CHAPTER FOUR
AGROECOSYSTEM ANALYSIS FOR DEVELOPMENT*
The first half dozen Agroecosystem Analysis workshops were primarily concerned with identifying key questions for research. Participants in the workshops were university or research institute worker,, although there were usually a number of development specialists present. The outcomes were agreed programmes of research, applied in orientation but not necessarily leading to immediately applicable results. More recently, however, the procedure has been adapted as a tool for setting priorities for development action, the participants being development managers, specialists and extension workers (Conway et a), 1985).
The underlying concepts remain the same but the procedure is modified in a number of respects to make it both more action focussed and less time consuming.
Rapid Rural Appraisal
A typical research orientated Agroecosystem Analysis workshop is preceded by a month or more of relatively intensive data gathering in the case study sites and the collection together of all relevant secondary data. Development teams, however, can rarely afford this amount of time. The solution is to restrict the preliminary data collection to a one or two days' Rapid Rural Appraisal (RRA) at each site.
RRA covers a wide range of techniques which have in common the objective of quickly acquiring critical information about an area during one or more brief visits. The techniques rely primarily on careful observation coupled
This chapter is largely based on Conway et al. 1985. An Agroecosystem Analysis
for the Northern Areas .of Pakistan, Cilgit, Pakistan, Aga Khan Rural Support Programme.
P.relous Page Blank

52
with semi-structured interviewing of farmers and local leaders and officials. The variations in approach are presentea by various authors in volume 8, pages 405-495 (1981) of the Journal Agricultural Administration (see also Chambers, 1981; Rhoades, 1982).
RRA as applied to Agroecosystem Analysis consists of acquiring sufficient information to produce the essential diagrams for pattern analysis. Experience, so far, suggests that the following are the basic set
1. A diagrammatic history of the area 2. Sketch map showing key features and agroecological zones 3. One or two transects with zones and problems 4. Seasonal calendars comprising climate, crops, livestock, labour,
prices, etc. 5. Bar diagram of sources of income for selected fanners 6. Flow diagram of resources and marketing 7. Decision tree for major farming systems 8. Venn diagram of institutional responsibilities for decision making
Although this represents a considerable amount of information, an efficient field team of four to six people should be able to complete the task in one or two full days in the field.
The Procedure
The procedure of analysis as described in the previous chapter had as its outcome the set of key research questions. In the development version it is modified by adding an extra phase after the identification of key questions in which guidelines and working hypotheses for development are identified. Following this the proposed innovations contained in the hypotheses are then assessed and the final list of development priorities is produced .(figure 17).
To meet the time constraints of development programs the workshop itself is also reduced to two days and follows a fairly strict timetable (table 7).Details of the organisation of such a workshop and of the preceding RRA are givcn in appendix B.

53
OBJECTIVES I
I SBOUNDARIES
HIERRHE
SPACE TIME
PATTERN SYSTEMt I ANALYSIS / PROPERTIES
ILOW 9 - " DECISIONS
I
DEVELOPMENTWOKN ANALYSIS GUIDELINES HYPOTHESES
ASSESSMENT
PRIORITIES -
IMPLEMENTATION FARMER TRIALS
EXTENSION TRIALS
DEVELOPMENT EXPERIMENTS
MONIfORING
Figure 17. The procedure of agroecosystem analysis for development (Conway et al, 1985)

54
Table 7 Timetable ]br an Agroecosystem Analysis fo,% Development Workshop
Day I Introductionto the workshop Overview ofdevelopment area and profect Briefing on case study data Case study teams a. System definition b. Pattern analysis c. System properties d. Key questions e. Guidelines and working hypotheses for development
Day 2 Pre.%,'ntations by case study teams Dik: ::.ion of key questions, guidelines and working hypotheses Innovation assessment Agreed development priorities Preliminary plans
In the following I highlight those features of the procedure that differ from those described in chapter three, using examples from a workshop carried out in the northern areas of Pakistan (Conway et al, 1985).
Objectives and Definitions
Objectives
The workshop in the northern areas of Pakistan took two contrasting villages and defined its objective as
to identify working hypotheses for development that will lead t ianprovements in the agricultural productivity on a stable, sut;tainable and equitable basis.

55
System Definition
As before, this involves the identification of the principal systems and their irterrel.tionhips. The diagrams need not be too complicated but should attempt to reveal how extensive the boundaries are. In figure 18, for example, which depicts the village of Passu, it is clear that although the village is tiny, consisting of only 60 households, the resource base extends over thousands of square miles.
I0 MILES
"-WATERSHED
\ SUMMER PASTURE If.\ / KARAKORAM
\k .. "-, ",,HIGHWAY1 -IGHW TO CHINA
Technology HIGHW",-- MAY PASTURENEW .", ,'' -BA.':'."
25,540 -- 'tAsst tI15,000
Climbers PASTURE Tourists IWATERSHED
KARAKORAM
Technology HIGHWAY PASSU VILLAGE+I
Grants CROP LAND
Loans Loans BankingAKRSAP
FAO/UNDP
Figure 18. The Passuvillage agroecosystemT FrL.t
(Conway et a,1985) A
ISUD ARAE PUNJAB
Students Labour students Pctatocs Labour Fruit

56
Following this definition the system hierarchy is constructed (figure 19), using as the base systems the agroecological zones described during the RRA.
SOUTH WESTI ASIA
PAKISTAN
INDUS RIVER BASIN
HUNZA RIVER BASIN
KHUNJARAB PASSU GLACIER BATURA GLACIER WATERSHED WATERSHED WATERSHED
WINTER SUMMER NEW PASTURE PASSU VILLAGE PASTURE PROJECT
UPPER MIDDLE LOWER TERRACE TERRACE TERRACE
/V ND2 ND 3RD
CROP FIELD ORCHARD HOME GARDEN TERRACE TERRACE
Figure 19. System hierarchyforPassu (Conway et al, 1985)
The final task is to define the system in terms of its history by means of a simple historical profile (figure 20).

57
ORIGIN OF VILLAGE SETTLED FROM
BADAKHSHAN & TURKISTAN
800-1000 YRS. PREVIOUS
1910 - PASSU GLACIER DESTRUCTION
1930
1940
1950,
. - COOP. SHOP
1960
1970- - END OF MIRDOM
- INTRODUCTION OF ROTATION OF DEHQAN FOR
'78 - KKH OPENED WINTER PASTURE 1980 '79 - SHIMSHAL FLOOD
- THRESHER INTRODUCED .
'82 - AKRSP PROJECT FOR NEW W/CHANNEL WOMEN ORGANISATION FORMED SEED
BEGUN POTATO
Figu20. HINTRODUCED
Figure 20. Historicalprofile ofPassu (Conway et al, 1985)
58
Pattern Analysis
Space
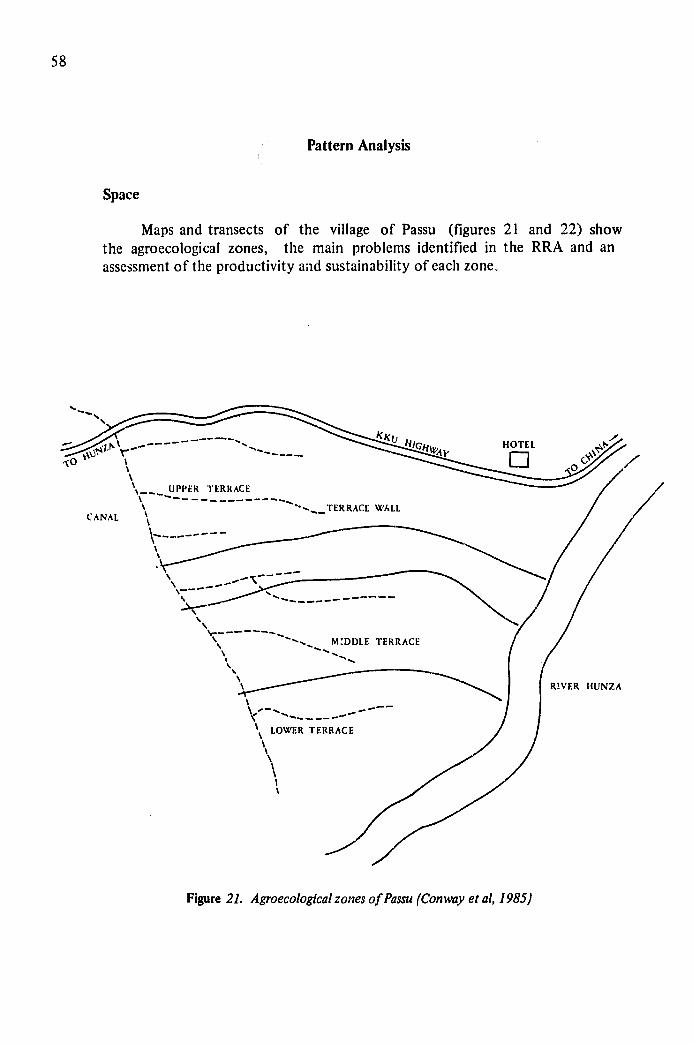
Maps and transects of the village of Passu (figures 21 and 22) show the agroecological zones, the main problems identified in the RRA and an assessment of the productivity and sustainability of each zone.
IG/. HOTEL... ..
UPPER TERRACE
- WALL CANAL
' ' -- "" ' ... M'DDLE TERRACE
, .... RIVER IHUNZA
\LOWER TERRACE
Figure 21. Agroecologicalzones of Passu(Conway et al, 1985)

H UPPER TERRACE MIDDLE TERRACE- TERRACE I WALL LOWERTERRACE
Ifruit I - orchard I rI- I Home
Ii FC- garden
Apple II"
Apricot ,Apricot ,Peach Apple I I
Wheat Willow Wheat Peach ICrops Barley Onion Brle mulberry Broad beFruit trees
Potatoes Spinach I Potatoes ISpinach jPea ULivestockI "L--- I _ _J._ _ _I__ _
Recent cultivation I I I Comments Steep I
More fertile a III 4
Wheat smut Wheat smut I I Fodder Problems weeds I Codling mothiweeds Codling livestock
Potential virus Potential virus I I I diseasesmothI Idiess
Barley 3-4 mds. ( H ) Fruit High High 1 Fruit High Medium HighProductivity wheat 60 (VH) Veg. High I HighIVeg. High High Medium
Potatoes 25 " ( M ) (M)l High( 1 1
Wheat High I High i I Sustainability Medium I I Medium I Medium I Medium
Potatoes Medium I Medium I I ItII _ _ _ I _ _ _ I
Figure 22. TransectofPassu(Conway et al,1985)
I
IWheat
1 BarleyI_ _ _ _ _ _ _ _
I Wheat smut weeds Erosion by riverIEoonbrvr
Low to medium
I Low
I
'.0 L

60
Time
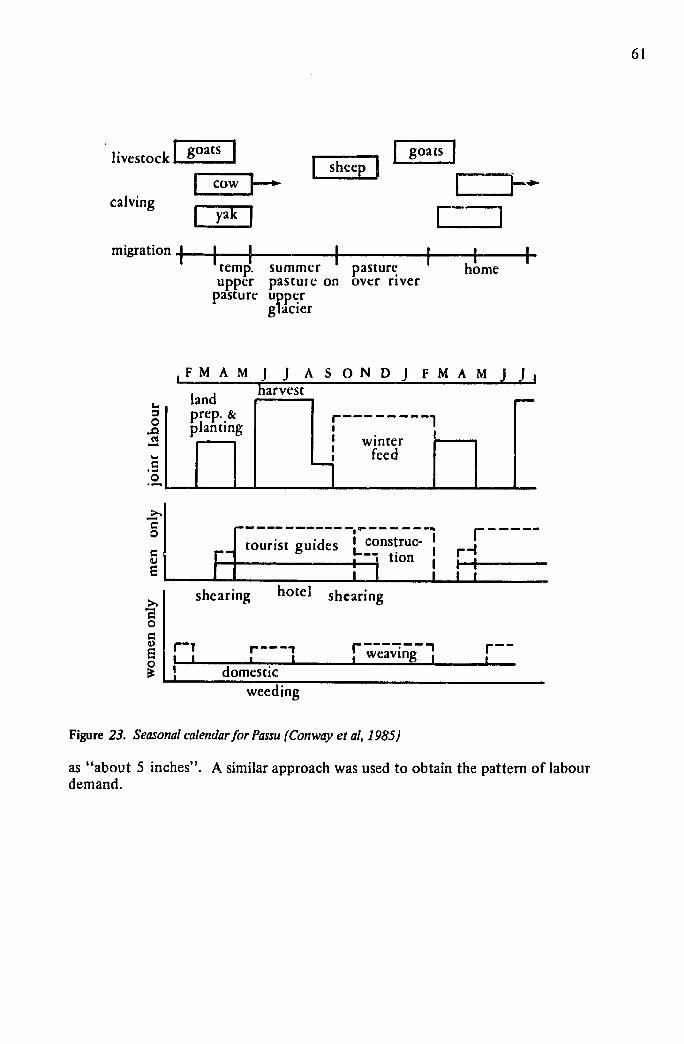
The seasonal calendar (figure 23) covers both crops and livestock. Because no quantitative information existed on climate and labour, these were assessed qualitatively on the basis of farmer interview. Farmers were asked which was the wettest month (August) and then asked in sequence how the neighbouring months compared (July " virtually none ", June " a little ", April and May "half of August," etc.) They also estimated the August rainfall
T c'.- . C! r- - -
'I RAINFALL MAX. SNOWFALL&
301:MX SO' SNOW' TEMPERATURE
20- MIN.
I10
. 'F M A MJ J A S O N DJ F M A M J J
J RANGE OF START OF SNOW MELT
WATER CHANNEL
FLOW r
IFIMIAIMIJI JIAIs IOINIDIJI FIMIAIMI JIJI
barley
I whea o I
CROPSI broad bean7 II Pea Iturnip, radish I I Z ]
spinach 1I I I
E: alfalfa (7-8 yrs.)
61
livestock g sI shee goatsow k calving yak
migration I temp. summer pasture home upper pastute on over river
pasture upperglacier
FMAM J J A S OND J FMA M J
harvestland o prep. &
X.~ planting' I feed
toust guidesI construci- i - l ll'-"to,guds~ tion
shearing hotel shearing
0
rweaving I domestic
weeding
Figure 23. Seasonal calendarfor Passu (Conway et al, 1985)
as "about 5 inches". A similar approach was used to obtain the pattern of labour demand.

_ _
62
Flows
Interviews with farmers representing large, medium and small farmers are summarised in bar diagrams giving the sources of income (figure 24).. These clearly show that in this village the proportion of different sources remains remarkably consistent over the range of holdings.
18"
16- WHEAT
C4- BARLEY C4a [ SEED 012- POTATOES
- LOCALJio- POTATOES
BROAD BEANS
II .WORKING ADULTS
4
2
ED APPLES
APRICOTS0] 4PEACH []_ MULBERRY
go-m SHEEP. L J GOATS
160- COWS
Ii POULTRY-40° Z 2o- [] YAKS
z 8 AMOUNT OF
IN4A-UI WHEAT PURCHASED
3 FARMlERS IN PASSU
Figure 24. Bar diagrmr. showing sources of income, amounts of wheat purchased,and size of workingpopulationfor threefarmers in Passu(Conway et al, 1985)
63
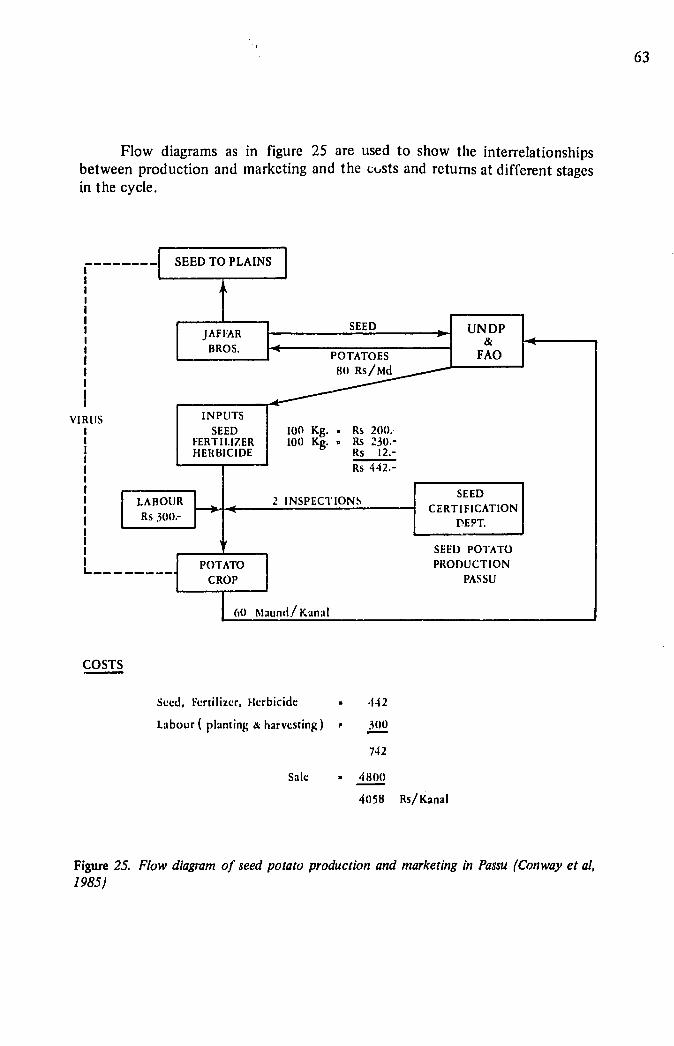
Flow diagrams as in figure 25 are used to show the interrelationships between production and marketing and the custs and returns at different stages in the cycle.
- -SEED TO PLAINS
BROSt-POTATOES FAO
VIRUS I 1
INPUTS SEED
FERTILIZER HERBICIDE
2
100 Kg.100 Kg.
ISCTO
- Rs 200. - Rs 230.-
Rs 12.-
Rs 442.-
CERTIFICATION
POTATO
CROP
i 0 lau/Kanal
SEED POTATO PRODUCTION
PASSU
COSTS
Seed, Fertilizer, Herbicide
Labour ( planting & harvesting)
Sale
P
-
.142
300
742
480o
4058 Rs/Kanal
Figure 25. Flow diagram of seed potato production and marketing in Passu (Conway et al, 1985)

64
Decisions
Decision trees in the case of the village of Passu (figures 26 and 27) are simple because of the undifferentiated nature of the livelihood systems.
Basic Additional Livelihood Sources of
Income
ED PO A OE WHEAT
BARLEY Gc¢r'". ,,,,F BROAD BEANS
LOCAL POTATOES
ALL FARMERS FRUIT SHEEP,wGOATS -1 -'- YAKS
TOURIST GUIDES
Figure 2Z Decision tree forfarming systems on new landin Passu(Conway etal, 1985)
RECLAMATION AFTERWARDS
POPLAR, WILLOW, WHEAT BARLE Y
RUBIN IA, HA, ALY
ALFALFA VEGETABLES
APPLE, APRICOT, WHEAT. BARLEY. PEACH, 0. VEGETABLES,
ALFALFA POTATOES
Figure 26. Decision treefor livelihoodsystems in Passu(Conway et al, 1985).

65
However a Venn diagram of the institutional overlaps reveals certain gaps (figure 28).
N VILLAGE
NUMBARD,\R ISMAILI LOCALCOUNCIL
WATER UNION
SUPPLY COUNCI L MULTI -CCTE PURPOSE
VILLAGE
UNCEF PO TATO
GROWER
LINKS BROS.•
Figure 28. Venn diagram of institutional overlap in Passu (WO = Womens Organisation) (Conway et al, 1985)
System Properties
As before at this stage, it is useful to summarise what has been learnt of system properties and to tabulate the most important contributing relationships and variables (table 8).

66
Table 8 Key variables and processes affecting the system properties in villages of the northernareasofPakistan(Conway et al, 1985)
Positive
Karakoram Highway Land development Fertilisers New varieties Seed potatoes Credit Knowledge
Integrated livestock/crops Co-operative mcrketing
1armyard manure Crop rotation
Traditional co-operation Village organisation Rotation ofpasturing
PRODUCTIVITY
STABILITY
SUSTAINABILITY
EQUITABILITY
Negative
Land shortage Water shortage Weeds Seasonal labourshortage
Crop diseases Crop pests Livestock diseases Temperature fluctuations
qlacier movement Mudflows, avalanches Earthquakes Erosion Potato virus Pesticide use
Sale of land Education Emigrant labour

67
Key Questions, Guidelines and WorlIing Hypotheses
As before, key questions, guidelines and working hypotheses arise throughout the procedure, during system definition, pattern analysis and the discussion of system properties. They should be noted down as they emerge and then collectively revised by the participants in the light of all the information available.
Key questions for development may be of the form
" How can soil development be speeded up while at the same time providing a high return? "
Such questions then generate a set of guidelines and working hypotheses. Guidelines are based on well established knowledge, derived from experience in the area or elsewhere, or reflecting fundamental principles of development. A guideline relating to the above key question might then be :
"Use deep rooted, high quality fodder crops and manage them intensively. "
The related working hypotheses reflect a greater uncertainty about development. They are based on knowledge and experience and on the previous steps of analysis but still need to be tested. A working hypothesis related to the key question might be :
" Soil development can be most profitably speeded up by planting alfalfa at a high density, cutting twice a year and resowing, after ploughing in, every three years. "
As before, each set of key questions, guidelines and working hypotheses should be justified by a detailed discussion.
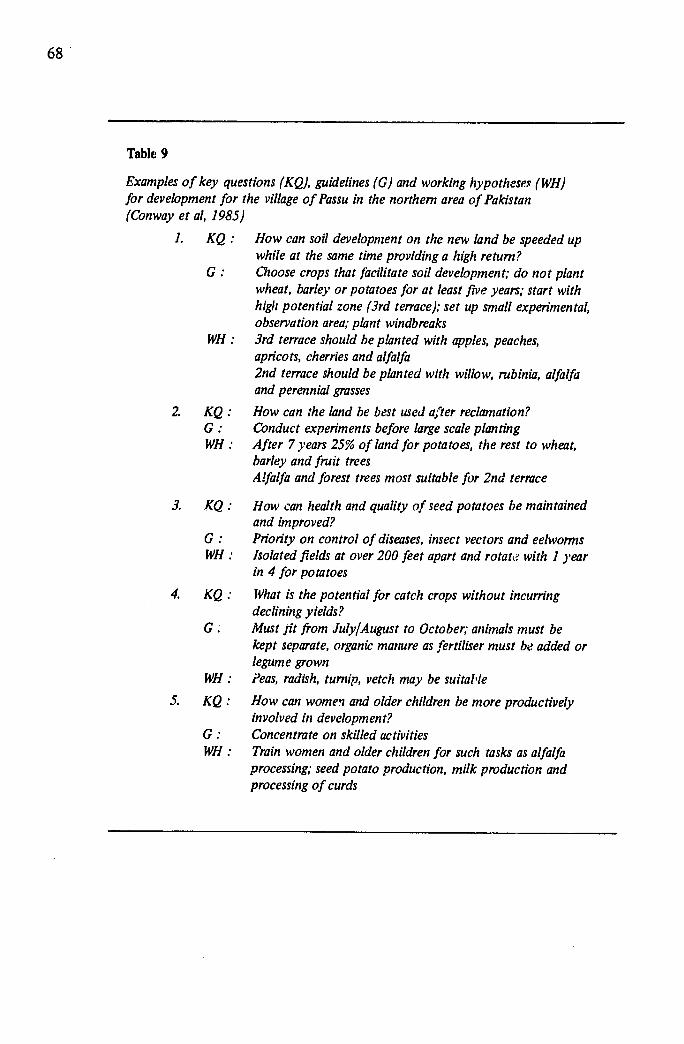
Table 9 lists some of the key questions, guidelines and working hypotheses for development generated for the village of Passu in the northern areas of Pakistan
68
Table 9
Examples of key questions (KQ), guidelines (G) and working hypotheses (WH) for development for the village of Passuin the northern area ofPakistan (Conway et al, 1985)
1. KQ: How can soil development on the new land be speeded up while at the same time providinga high return?
G: Choose crops thatfacilitate soil development; do not plant wheat, barley or potatoesfor at least five years; start with high potential zone (3rd terrace);set up small experimental, observation area;plant windbreaks
WH: 3rd terraceshould be planted with apples, peaches, apricots,cherries and alfalfa 2nd terrace should be planted with willow, rubinia,alfalfa and perennialgrasses
2. KQ: How can the land be best used after reclamation? G : Conduct experiments before largescale planting WH: After 7 years 25% of land for potatoes, the rest to wheat,
barley and fruit trees Alfalfa andforest trees most suitablefor 2nd terrace
3. KQ : How can health and quality of seed potatoes be maintained and improved?
G: Priorityon control of diseases, insect vectors and eelworms WH : Isolated fields at over 200 feet apartand rotat&with 1 year
in 4 for potatoes
4. KQ: What is the potentialfor catch crops without incurring decliningyields?
G. Must fit from July/August to October;animals must be kept separate,organic manure as fertilisermust be added or legume grown
WH : Peas, radish, turnip, vetch may be suitalle
S. KQ : How can women and older children be more productively involved in development?
G: Concentrate on skilled activities WH: Train women and older children for such tasks as alfalfa
processing;seed potato production, milk production and processing of curds

69
Innovation Assessment
Contained within the guidelines and working hypotheses will be a number of proposed innovations. These may be technological or socio-economic in character. They then need to be assessed by the whole workshop team on a number of criteria and assigned priorities. One set of criteria are the systemproperties or indicators of performance and each innovation needs to be assessed for its impact (positive or negative) on productivity, stability, sustainability and equitability. Estimates also need to be made of the cost of the proposed innovation, the time Lorizon over which its benefits can be expected and its technical and operational feasibility (table 10). These assessments are made in terms of the village agroecosystem as a whole, eg. in terms of village level productivity, or the cost to the village. Once this is done for all the innovations they can then be ranked by the workshop participants in terms of their priorities.
Research Design and Implementation
The remaining phase of the procedure is one of conventional development activity. The hypotheses are tested as appropriate: by farmer or extension trials, or by development experiments, and these trials carefully monitored.

Table 10 Innovation assessment for the village of Passu (+ positive, -negative, 0 neutral effects, H high,M medium, S short orsmall, L long) (Conway et al, 1985)
Product- Stability Sustain- Equit- Cost Time Feasibility Priority ivity ability ability horizon
Development of 2nd terrace + + ++ ++ H M H 3
Development of3rd terrace +++ + +(?0) + H L H 1
Artificial insemination ++ + ? M M M 2
Catch crops + + + 0 S S L 3
River bunding 0 + + + H S M 4
Potatointensification +++ + - + S S M 2
Involvement of women ++ + +++ S M L 2

71
CHAPTER FIVE
AGROECOLOGICAL DESIGN *
The key questions generated during Agroecosystem Analysis pose a number of important challenges for agroecosystem design, for technology assessment and development and for implementation, and I discuss these in this final chapter.
Given the "ideal" goals as described earlier in table 1, an important question is: how can they be reached speedily and efficiently? For example, is it possible to go direct from traditional agricultural systems to the " ideal " systems without passing through the Green Revolution phase of high productivity and low sustainability? Recent development work suggests that it may be possible, given sufficient skill arid sensitivity. Thr-, in Indonesia the Central Research Institute for Field Crops has designed a productive and apparently sustainable cropping system for the red-yellow podzolic soils, hitherto regarded as highly marginal and unproductive (McIntosh et al, 1981). The system, which replaces traditional mixed cultivation followed by a fallow of alang-alang ( Imperata cylindrica.), consists of a more organised inter- and relay cropping of corn, upland rice, cassava, peanuts and cowpeas, grown in a continuous cycle without a fallow (figure 29). Sparing, but targeted, application of fertiliser, together with the return of all crop residues as mulch, maintains a high fertility, producing experimental yields in food calorie terms ranging from 12 - 25 tons/ha of paddy rice equivalent. But clearly just how sustainable and equitable a system it will be in practice must depend on how and where it is implemented and on its appropriateness to the specific ecological and socio-economic conditions of each locality.
There is also evidence from regions such as the Chiang Mai valley in Northern Thailand that farmers may achieve such a goal with a minimum of
This chapter is largely based on Conway, G. R. 1985b. Agricultural ecology and farming systems research. In Remenyi, J. Australian Systems Research for Third World Agriculture. Canberra, Australian Council for International Agricultural Research.

72
400
300- ii
200
z
-/ - I-7
0ON D J F M A M J J A S
COR N - - / E NINTRODUCED UPLAND RICE PANTT /
CWAO P A PATTERNCASV
F~igure 29. A new cropping system for the red-yellow podzolic soils of Indonesia (McIntosh etal, 1981)
government 'help (Gypmantasiri et al, 1980). The valley has a thousandyear-old tradition of communal irrigation on which new government schemes have been grafted. There are also excellent transport and marketing systems. The farmers have responded to these opportunities by developing over 20 different kinds of rotational cropping pattern, usually of rice followed by one or two cash crops. Yields are high yet the rice is a traditional type, with over 60 different local varieties in current use, and the crop receives no pesticides (there are no important pests and diseases ) and very little, if any, fertiliser.
Agroecosystem Technology Assessment
Frequently the questions that are generated by agroecosystemn analysis and design focus on the viability and impact of different, and often alternative, technologies. But, far too often, such technology assessment has been carried out on the basis of potential productivity alone, with only passing reference to other consequences. A more holistic and revealing assessment could be achieved by explicit use of all four indices of performance - stability,

73
sustainability and equitability as well as productivity. I believe this should be done as a matter of course, ideally within the context of Agroecosystem Analysis workshops as I have indicated in the previous chapter.
As an example, such an assessment is urgently needed for current proposals in the genetic engineering of crop plants. Clearly if genetic engineering can develop plants that fix their omn nitrogen, or are resistant to pathogens, then this may be highly desirable. But these achievements must not be judged in isolation. If the end result is to produce new plants which produce higher yields while requiring even more inputs and protection, then on balance it may be a retrograde step.
Agroecosystem Technology Development
Implicit in the agroecosystem approach to analysis, design and assessment that I have described above is a rqeed to change the emphasis of agricultural R and D, away from support of distinct, specific techniques toward the development of more broadly based packages of technology. To some extent this is alre2dy happening under FSR but the current interest in such techniques as genetic engineering is resulting in strong pressure to reverse the process. Techniques of genetic engineering or zero-tillage or controlled droplet application, to name only a few, clearly have considerable potential application in agriculture and deserve support. But if agricultural innovation is to satisfy not only the demand for increased productivity but also for enhanced stability, sustainability and equitability of production, exploitation of these techniques needs to be firmly embedded in the development of packages of closely integrated techniques and policies explicitly designed with all the appropriate criteria in mind.
Such packages complement those developed under the rubrics of FSR and IRD, partly because of their greater relative emphasis on properties other than productivity. But they also differ in that their primary focus is not at the level of the farm (as in FSR) or the village or watershed or region (as in IRD or Watershed Development Projects) but rather at all the intermediate levels in the agroecosystem hierarchy (figure 30). In FSR terms they are component system packages, but explicitly designed to simultaneously satisfy the agroecosystem goals of high productivity, stability, sustainability and equitability.

74
Rcgion "'__
IRD 4'watcrshe
I AGROECOSN'STEM I TECHNOLOGY
Fa.-rrm PACKAGES
Individual Plant
Figure 30. The hierarchy of agroecosystems and the relative inputs from IntegratedRural Development (IRD), Farming Systems Research (FSR) and Agroecosystem Technology (Conway, 1985b)
While Agroecosystem Analysis starts with the farm, village or region as its target of investigation, the key questions that the analysis generates are focussed not on the target agroecosystem as a whole, but on the key processesand decisions that it contains. Furthermore, the experience of the agroecosystem workshops that have been held so far suggests that certain key processes, for example the interrelationships between crops and livestock, or the integration of pest control and multiple cropping, and certain key decisions, such as are involved in the communal control of water or the provision of credit for cropping systems, recur again and again, not only in different places but at different levels in the agroecosystem hierarchy.
It is these ubiquitous key processes and decisions that focus and shape the technology packages. Some of the packages are already well known and receiving R and D support; others are less well defined. The following is only a partial set

75
Integrated Pest Management
Both in concept and practice this approach to pest control is over thirty years old, yet it still receives relatively little support. Viewed primarily as a means of reducing pesticide use while increasing the efficiency of control it has clear benefits for sustainability (fewer upset pests, less likelihood of pesticide resistance) and for equitability (lower costs and fewer health hazards). It has a potentially strong, but still underexploited, linkage with multiple cropping practices.
Multiple Cropping
Again a relatively well developed technology package, at least in experimental terms. But as a topic for research it was seen initially as simply a way of increasing productivity. Hence the emphasis on Leaf Area Indices and Land Equivalent Ratios. Its role in terms of maintaining stability and sustainability of production and in promoting equitability, particularly in terms of labour employment has so far received relatively little attention.
Agroforestry
A more recent topic of research interest which is not as yet very well focussed. Its greatest potential contribution to the development of sustainable agriculture appears to lie in its role in the control of upland erosion, as an alternative to conventional engineering and forestry approaches. Successful erosion control depends crucially on the provision of incentives to upland dwellers, but conventional approaches are usually inequitable, taking away resources from the upland dweller and providing very little by way of return. Agroforestry can provide both immediate and longer term incomes and, if designed well, can minimise erosion. There is, however, a need for more basic research on the physiological interactions between perennial tree and annual understorey crops, particularly with reference to the effects on soil quality and structure.

76
Crop-livestock Polyculture
The emphasis on food grain production that has characterised the Green Revolution has inevitably meant a relative neglect of other food crops and in particular of livestock production on the small farm. Apart from the obvious benefits of increased income and a protein rich food supply, livestock production has the capacity to both employ resources and generate subsistence and cash products on a sustainable year-round basis. Coupled with this, its " banking " component provides an important means of overcoming adverse periods. However, on the small farm success depends crucially on the close integration of livestock and crops in terms of land, labour, capital and the products and byproducts themselves. This needs f6r more multidisciplinary R and D.
Soil Ecology
In many respects this is the oldest focus of sustainable agriculture, identified in the West with work under the rubric of " organic farming ". Much of that work has been concerned with arguments over the relative benefits and drawbacks of inorganic and organic fertilising. In the Third World the benefits of inorganic fertilisers have been amply demonstrated over the past thirty years, while problems in terms of nitrate pollution and soil deterioration have yet to occur to any significant extent. The contribut.ion of soil ecology, in this context, thus lies more in the search for biological and on-site sources of fertility to provide a sustainable alternative to increasingly costly outside inputs, which, at the same time, will preserve soil structure and quality.
Selection for Agroecosystems
Plant breeding programmes during the Green Revolution stressed, quite rightly, the importance of developing crops that were widely adapted, early maturing and high yielding under a very considerable range of conditions. In this the breeders were highly successful. However, in many cases, this results in plant types that will do extremely well in very favourable environments but only moderately well under more marginal conditions. In general, plants that do extremely well in marginal environments will do poorly in better conditions, and hence have not been favoured by plant breeders. In the post

77
Green Revolution phase, however, such plant types should be receiving priority attention in programmes to breed crops (and livestock) specifically adapted to target agroecosystems, as part of the aim of developing a fine-grained agriculture. To some extent this is already happening in breeding programmes for special conditions, such as acidity, toxicity and microelement deficiency, but target agroecosystems for breeding need to be more broadly defined, in particular to include socio-economic as well as physical variables.
Communal Self-Help
There has been interest for many years in promoting various self-help arrangements at the village level, but too often they have been seen as exercises in social engineering rather than as pragmatic solutions to problems of sustainability and equitability of production. There consequently have been many failures, particularly where the schemes attempted to be all encompassing. At the same time traditional communal systems of self-help, and especially those concerned with the provision of support at times of famine and hardship, have been eroded by the growth of freer market economies and the institution of national relief schemes. R and D is needed to help to define more precisely the relative importance and potential roles of communal, governmental and market institutions in such areas as the provision of credit, the regulation of prices, the supply of labour and the provision for disaster.
Communal Water Management
In some ways this is a subset of the preceding package, since the success of communal arrangements for water control depends on the extent to which they are seen as of mutual benefit to all participants. On engineering and other criteria traditional systems may well appear inefficient, but their clear advantages in terms of sustainability and equitability may often ba overriding. Again this is a topic on which there is already a considerable body of research. The priorities would seem to lie in finding ways of integrating traditional communal systems with larger scale government funded irrigation, so as to combine the best features of each and, with the decline in support for such large scale projects, in developing new small scale engineering designs that are explicitly meant to be operated on strictly communal lines.

78
Social Forestry
This parallels, in terms of objectives, the preceding package, but with the difference that large scale communal control over forest management and exploitation is rarer. The traditions lie mostly with hunter-gatherer and swidden cultivation communities and it is not yet clear how much of this is transferable to the management of forests in the context of settled, intensive agriculture. Probably new forms of communal control need to be developed.
Village Resources
Closely interlinked with several of the preceding packages is the role of communal resources, in particular common land, village ponds, woodlots, grazing pastures and forage land, in the sustainability and equitability of production at the village level. The benefits of such resources are often underestimated in conventional analyses of farm budgets and their role in supporting the subsistence livelihoods of the landless is also often forgotten. Work is needed to quantify these benefits more precisely, to unravel their connections and to determine what and how improvements can be made.
Non-agricultural Production
As a final package in this preliminary list I have included the role of nonagricultural production on the farm. This includes, in particular, the manufacture of handcrafts, such as silk, other textiles, pottery, basketwork, etc., where at least some of the resources apart from the labour are providedfrom within the local agroecosystem. The benefits lie in the " banking " component, providing resilience at times of hardship, and in the greater equitability of income within the farm household that often occurs. Again, however, not only these but the immediate benefits in terms of production are often ignored in conventional farm analysis and it is still rare for improvements in cropping or livestock husbandry to be designed with the implications of changes in labour, products and byproducts for handcraft manufacture in mind.

79
Implementation
I want to conclude with a few comments on the implementation of sustainable agriculture. The approach adopted in the fuitherance of the Green Revolution, which was a key component of its success, was to design new varieties and their accompanying package, on experiment stations, test them in a number of differing locations and then transfer them as widely as possible to receptive farmers, :iher through the conventional extension service or via a specially created implementation programme. This conforms essentially to the classical linear model of R and D and was made possible by the deliberately engineered wide adaptability of the new technology. To some extent this approach has persisted in FSR, particularly where such programmes have been under the wing of one of the International Agricultural Research Centres. Often such FSR has attempted to emulate the Green Revolution approach by producing cropping system or even whole farm system packages with, hopefully, broad adaptability and extending them in the same fashion.
However, it is becoming increasingly clear that the post Green Revolution phase of agricultural development requires a very different and, in many ways, more challenging approach (Chambers, 1985). This is partly because a finegrained agriculture, with technologies specifically adapted to individual agroecosystems, will be impossibly demanding in terms of manpower, resources and time if the traditional linear model approach to implementation is adopted. However, there is also a more fundamental difficulty. As the FSR work is beginning to show, it is virtually impossible, from outside, to optimally design a'whole cropping system, let alone a whole farming system, for an individual farm. Only the farmer can carry out the final optimisation, because only he or she has access to much of the information, including essential details of the local environment, the local culture and his or her real goals. The R and D worker has i great deal to offer and can bring about highly significant changesbut in the final analysis there is a limit beyond which advice is either irrelevant or counterproductive. It is primarily for this reason that I bl!p,,.e the future of sustainable agriculture R and D lies in the kind of agroecosystem technology packages I have discussed above.
Increasingly, agricultural R and D and extension in the Third World is going to approach the patterns now predominating in the West, ie. a situation in which each farmer is presented with a " supermarket " of packaged technologies from which to choose, and out of which he or she produces an

80
optimal farm design. The important task that faces those responsible for R and D policy is thus to ensure that the individual packages in the " supermarket " have arisen by way of the proci,:ses of analysis, design, assessment and development that I have described above and hence, when integrated by farmers into their farming systems, will help to fulfill the goals of an agriculture which is not dnly more productive, but is more sustainable and equitable.

81
REFERENCES
Chambers, R. 1981. Rapid rural appraisal: rationale and repertoire. Public Administration and Development 1(2)
Chambers, R. 1985. Agricultural research for resource-poor farmers: the farmers-first and last model. Agricultural Administration 20, 1-30
Checkland, P. 1981. Systems Thinking, Systems Practice. Chichester, John Wiley & Sons
Collier, W. L. 1977. Technology and peasant production: a discussion. Development and Change 8, 351-362.
Collier, W. L., Soentoro, Wiradi, G. and Makali 1974. Agricultural technology and institutional change in Java. Food Research Institute Studies 13, 169-194.
Conde, J., Paraiso, M. J. and Ayassou, V. K. 1979. The Integrated Approach to Rural Development Health and Population. Paris, Development Centre Sludies, Development Centre of the O.E.C.D.
Conway, G. R. 1983. Applying Ecology: Inaugural Lecture, December 7, 1982. London, Imperial College of Science and Technology, Centre for Environmental Technology
Conway., G. R. 1984. Rural Resource Conflicts in the UK and the Third World - Issues for Research Policy. Papers in Science, Technology and Public Policy no 6. London, Imperial College of Science and Technology
Conway, G. R. 1985a. Agroecosystem Analysis. Agricultural Administration. 20,31-55

82
Conway, G. R. 1985b. Agricultural ecology and farming systems research. In Remenyi, J. (ed) Australian Systems Research for Third World Agriculture. Canberra, Australian Council for Agricultural Research
Conway, G. R. and McCauley, D.S. 1983. Intensifying tropical ag'iculture: the Indonesian experience. Nature, 302, 288-289
Conway, G. R., Manwan, I. and McCauley, D.S. 1983. The development of marginal lands in the tropics. Nature, 304, 392
F.A.O. 1975. Integrated Rural Development. Romo, Food & Agriculture Organisation
Gilbert, E. H., Norman, D.W. and Winch, F.E. 1980. Farming Systems Research: A Critical Appraisal. MSU Rural Development Paper no 6. East Lansing, Michigan, Department of Agricultural Economics, Michigan State University
Gomez, A. A. and Juliano, P.A. (eds). 1978. Rural Development: The Philippine Experience. Laguna, Philippines, The Philippine Training Center for Rural Development, University of the Philippines at Los Banos
Gypmantasiri, R., Wiboonpongse, A., Rerkasem, B., Craig, I., Rerkasem, K., Ganjapan, L., Titayawan, M., Seetisarn, M., Thani. P., Jaisaard, R., Ongprasert, S., Radanachaless, T., and Conway, G.R. 1980. An 5nterdisciplinary Perspective of Cropping Systems in the Chiang Mai Valle: KeyQuestions for Research. Chiang Mai, Thailand, Faculty of Agriculture, University of Chiang Mai
Harwood, R. R. 1979. Small Farm Development: Inderstanding and Improving Farming Systems in the Humid Tropics. Boulder, Colorado, Westview Press

83
Hauri, I. 1974. Le project cereaher en Tunisie: Etudes aux niveaux national et local. Geneva, UNRISD Report No. 74.4
IRRI. 1979. Brown Planthopper: Threat to Rice Production in Asia. Los Banos, Philippines, International Rice Research Institute.
IRRI. 1980. Control and management of rice pests. In: Annual Report for 1979. Los Banos, Philippines, International Rice Research Institute, pp 202-207
IRRI. 1981. Control and management of rice pests. In: Annual Reportfor 1980. Los Banos, Philippines, International Rice Research Institute, pp 202-203
KEPAS. 1984 The Sustainability of Agricultural Intensification in Indonesia: A Report of Two Workshops of the Research Group on Agroecosystems, Jakarta, Indonesia. Jakarta, Kelompok Penelitian Agro-Ekosistem, Agency for Agricultural Research and Development. 115 pp
KEPAS. 1985a. The Upland Agroecosystems of East Java. Jakarta, Kelompok Penelitian Agro-Ekosistem, Agency for Agricultural Research and Development. (in press)
KEPAS. 1985b. Swampland Agroecosystems of Southern Kalimantan. Jakarta, Kelompok Penelitian Agro-Ekosistem, Agency for Agricultural Research and Development. (in press)
KEPAS. 1985c. Semi-arid Agroecosystems of West Timor. Jakarta, KelompokPenelitian Agro-Ekosistem, Agency for Agricultural Research and Developmefit. (in press)
KKU-Ford Cropping Systems Project. 1982a. An Agroecosystem Analysis of Northeast Thailand. Khon Kaen, Thailand, Faculty of Agriculture, University of Khon Kaen.

84
KKU-Ford Cropping Systems Project. 1982b. Tambon and Village Agricultural Systems in Northeast Thailand, Khon Kaen, Thailand, Faculty of Agriculture, University of Khon Kaen.
Levins, R. 1974. Qualitative analysis of partially specified systems. Annals N.Y. Acad. Sci. 231, 123-138.
Limpinuntana, V. and Patanothai, A. 1982. Handbook of the NERAD Tambons. Tha Phra, Khon Kaen, Thailand, Northeast Rainfed Agricultural Development Project, Northeast Regional Office of Agriculture and Cooperatives.
May, R. M.(ed). 1981. Theoretical Ecology: Principles and Applications. Oxford, Blackwell Sci. Publns.
McIntosh, J. L., Ismail, I. G., Effendi, S. and Sudjadi, M. 1981. Cropping systems to preserve fertility of red-yellow podzolic soils in Indonesia. Proc. Int. Symp. on Distribution, Characteristics and Utilisation of Problem Soils. TARC, Tsukuba, Japan, Oct.19-26, 1981.
McNeil, M. 1972. Lateritic soils in distinct tropical environments: Southern Sudan and Brazil. In: Farvar, M.T. and Milton, J.P. (eds), The Careless Technology: Ecology and International Development. New York, The Natural History Press, Doubleday and Co., pp 591-608
Milsum, J. H. 1972. The hierarchical basis for general living systems. In: Klir, G.J. (ed). Trends in General Systems Theory. New York, Wiley
Murdoch, W. W. 1980. The Poverty of Nations: The Political Economies of Hunger and Population. Baltimore, John Hopkins Press
Nickel, J. L. 1973. Pest situations in changing agricultural systems - a review. Bull. Ent. Soc. Am., 19, 136-142

85
Norman, D.W. 1980 The Farming Systems Approach- Relevance for the Small Farmer. MSU Rural Development Paper No. 5: East Lansing, Michigan 48824, Department of Agricultural Economics, Michigan State University
Palmer, I. 1976. The New Rice in Asia: Conclusions from Fir Country Studies. Geneva, UNRISD Report No. 76.6
Pearse, A. 1980. Seeds of Poverty, Seeds of Want: Social and Economic Implications of the Green Revolution. Oxford, Clarendon Press
Rhoades, R. E. 1982. The Art of the Informal Agricultural Survey. Social Science Department Training Document 1981. Lima, Peru, International Potato Center
Senanayake, R. 1984. The ecological, energetic and agronomic systems of ancient and modem Sri Lanka. In: Douglass, G.K. (ed) Agricultural Sustainability in a Changing World Order. Boulder, Colorado, Westview Press. pp 227-238
Shaner, W. W., Wilson, A. G. and Wilson, D. 1982. Farming Systems Research and Development: Guidelines for Developing Countries. Boulder, Colorado, Westview Press
Simon, H. A. 1962. The architecture of complexity. Proc. Amer. Phil. Soc. 106, 467-482
Walker, B. H., Norton,G.A., Barlow, N. D., Conway, G. R., Bailey, M. and Comins, H. N. 1978. A procedure for multidisciplinary ecosystem research with reference to the South African Savanna Ecosystem Project. J. .Appl. Ecol. 15, 481-502
Whyte, L. L., Wilson, A. G. and Wilson, D. (eds) 1969. Hierarchical Structures. New York, Elsevier

86
APPENDIX A
ORGANISATION OF AN AGROECOSYSTEM ANALYSIS FOR RESEARCH WORKSHOP
Initial Planning
1. Start at least three months prior to workshop (preferably six months). 2. Establish organising committee. 3. Set dates for workshop (seven days minimum). 4. Arrange funding as required.
5. Identify host institution. 6. Identify geographic or other focus, eg. a region, watershed, type of
agroecosystem, village, etc.
7. Identify different case study sites. Usually four, possibly three or five. These may be different watersheds or districts or projects or villages or farms, etc.
8. Appoint the following: A. A Co-ordinator or Chairman
Responsibility for co-ordinating.the preparations for the workshop.
B. A Workshop Adviser This should be someone with previous experience of running such workshops. Responsibilities include: a) Advising on preliminary data collection b) Planning the workshop timetable c) Introducing the method to the workshop participants d) Guiding the workshop

87
C. A General Logistics Organiser Responsibilities include: a) Invitations to workshop b) Facilities c) Transport d) Background documentation
D. A Host Institution Logistics Organiser Responsibilities Include: a) Local facilities b) Local transport c) Local supplies
E. A Pilot Case Studies Team Leader Responsibilities include: a) Organising teams to produce initial data on case studies b) Assembling relevant secondary data c) Preparation of reports on data for workshop
F. An Editor Responsible for production of final report following the workshop
G. A Financial Officer Responsible for budget of workshop
9. Appoint teams or committees to assist the above appointments where appropriate or desirable.
Logistics
Shared responsibility of General Logistics Organiser and Host Institution
Logistics Organiser and Financial Officer.
Invitations
1. Send out official invitations to participants (at least two months before workshop). Minimum of 20, maximum of 50. Invitations should include natural and social scientists from a wide range of disciplines.

88
2. Send out special invitations to those requested to make formal presentations at the workshop.
3. Send out special invitations to selected dignitaries for opening session or other days of workshop as appropriate, eg. head of host institution (Rector of University, Head of Research Station), senior government officials.
4. One month before workshop send out summaries of agroecosystem analysis procedure.
Facilities
I. Book meeting hall. This should be big enough to hold all participants in preliminary session and as working groups. It should be equipped with tables and chairs that can be rearranged as required.
2. Organise accommodation and meals.
3. Book transport to and from workshop.
Permissions (if required)
1. Obtain permission to hold workshop.
2. Obtain permission for field visits.
Workshop Supplies
I. Overhead projectors and screens (at least one per case study) 2. White boards (at least one per case study) 3. Transparency sheets (at least 200) 4. Transparency pens (at least four packets) 5. White board pens (at least four packets)

89
6. Graph paper (at least 50 sheets) 7. Writing pads and pens (one per participant)
8. Slide projector 9. Public address system
10. Photocopying facilities
11. Secretarial and typing facilities
Reference Material for Workshop
I. Library of relevant books and reports 2. Photocopies of case study reports 3. Photocopies of invited presentations 4. Photocopies of agroecosystem procedure and concepts paper
Field Visit
1. Organise transport.
2. Organise food and drink.
Pilot Case Studies
Responsibility of Pilot Case Studies Organiser with advice from Workshop Adviser.
I. Form piiot case study teams (in most cases these will be drawn primarily from the host institution).

90
2. Assemble secondary data on region and case study areas from government reports and government offices and from any other sources that are available.
3. Prepare simple maps of region containing case study sites. Maps should show topography, soils, rainfall, vegetation types, population density, ethnic groups, communications, etc.
4. Visit case study areas.
5. Obtain data from local government officials and local leaders.
6. Carry out farm surveys - random samples or stratify by farm size or income or agroecological zones. Suggest following information
a) Size, age and education of family b) Land holding and individual parcels by land type c) Crops and cropping systems for each parcel plus yields d) Livestock holdings e) Diagram of home garden f) Inputs (amounts and costs) - labour, seed, fertiliser, fuel, pesticides,
etc. g) Credit - how much, from where, interest and use h) Income by sources i) Perceived problems - soils, pests, diseases, credit, administration, etc.
7. Prepare basic data. NB: all diagrams should be simple sketches. Select from following as seems appropriate a) Overall description b) Diagrammatic history of site
Major events - eg. new road, school, electricity, new crops, well, etc. c) Maps - make basic map of site, roughly to scale and include site
boundary, roads, rivers, other landmarks. Prepare large number copies for survey team.

91
Produce individual maps: topography soils infrastructure settlements social groups land ownership main patterns of land use
d) Transects Large scale:
topography soils land use problems
Small scale: fields tree gardens farm gardens
e) Seasonal Calendars - produce on 18 month span Climate- rainfall, evapotranspiration, maximum and minimum
temperatures, etc. Crop sequences - planting to harvesting Perennial and wild crop harvests Livestock - births, rearing and sales Non-farm activities - weaving, off-farm employment Labour requirements - land preparation, planting, harvesting Capital requirements Income Monthly prices
f) Long Term Graphs - preferably over 20 years Prices Yields Acreages Population - birth rates, death rates, immigration, migration,
education

92
g) Stress and Perturbation Graphs Actual or possible effects of salinity, debt, toxicity, pests, weeds, floods, drought, etc.
h) Bar Diagrams Sources of income Farm budgets Land ownership
i) Flow Diagrams Marketing Resources Nutrients Transactions Cropping cycles
j) Decision Trees Decisions determining different livelihood and farming systems
k) tierarchies and Venn Diagrams Administrative hierarchies Overlaps of decision makers
8. Prepare pilot study reports including tables, figures and diagrams. Convert to overheads.
Workshop Timetable
Responsibility of Co-ordinator and Workshop Adviser. The prime objective of the workshop is to produce a multidisciplinary
analysis of the case studies and a list of key research questions. Experience suggests this takes seven days except where the team is highly experienced in the use of the procedure. Other objecives may be added but should take only a small traction of the time or the workshop should be extended in duration. Success in the workshop depends critically on having a thorough analysis, strong interdisciplinary discussion and argument and a final list of well focussed

93
key questions that are fully agreed upon.
1. Draw up timetable, roughly on the following lines:
2. Day I Registration Welcoming add. i.sses Introductions Summary of timetable - Co-ordinator Focus of workshop - invited presentation Review paper (s) - invited presentation Policy issues paper - invited presentation(s)Agroecosystem theory and concepts - workshop adviser Agroecosystem analysis procedure - workshop adviser (Reception in evening) (Note:the first four or five items of Day 1 could be held on the evening of the previous day).
3. Day 2 Presentation of pilot case studies - Pilot Case Study Organiser and team Discussion of pilot case studies Set tasks of case study working groups - workshop adviser Divide into case study working groups:
a) objectives b) hierarchies and system boundaries
Plenary: discussion of objectives and hierarchies Continue case study working groups:
a) Pattern analysis - space, time, flows, decisions
4. Day 3 Plenary : review of progress Divide into case study working groups:
a) analyse system properties - productivity, stability, sustainability, equitability
b) prepare preliminary list of key questions Rapid rural appraisal - presentation of methods - Workshop Adviser (Optional free afternoon)
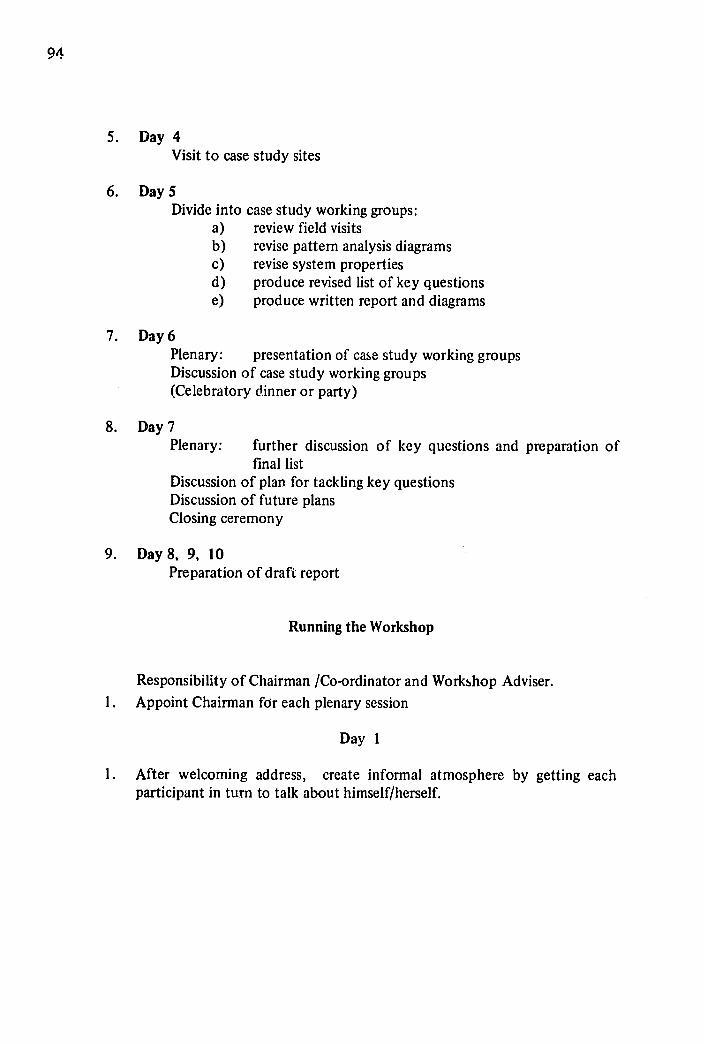
94
5. Day 4 Visit to case study sites
6. Day 5 Divide into case study working groups:
a) review field visits b) revise pattern analysis diagrams c) revise system properties d) produce revised list of key questions e) produce written report and diagrams
7. Day 6 Plenary: presentation of case study working groups Discussion of case study working groups (Celebratory dinner or party)
8. Day 7 Plenary: further discussion of key questions and preparation of
final list Discussion of plan for tackling key questions Discussion of future plans Closing ceremony
9. Day 8, 9, 10 Preparation of draft report
Running the Workshop
Responsibility of Chairman /Co-ordinator and Workshop Adviser. 1. Appoint Chairman for each plenary session
Day 1
1. After welcoming address, create informal atmosphere by getting each participant in turn to talk about himself/herself.

95
2. Review of timetable : ensure that participants understand what is expected by the end of the workshop.
3. Invited papers : these should help to orientate participants and consist of one or more of the following a) Introduction to focus of workshop (locality or type of agroecosystem) b) Review of relevant research or studies carried out to date c) Review of key policy issues
4. Agroecosystem theory, concepts and procedure - Workshop Adviser. This should be broken into two presentations each followed by discussions. As far as possible examples should be drawn from the locality or type of agroecosystem that is the workshop focus.
5. Distribute pilot case study reports.
Day 2
1. Introduction to day, indicating objectives of the day's work 2. Presentation of case studies : each study shoi',i be three quarters of an
hour maximum and illustrated by overheads and slides.
3. Discussion : general question and answer session 4. Allocate participants to case study working groups. Ensure multidis
ciplinary mix in each group. 5. Appoint Chairman for each working group, preferably someone with
experience of the procedure. Working groups should each rapporteur to report their findings.
6. Explain tasks of working groups (see next section). These approximately as follows on the first day : a) Read pilot case study reports and discuss. b) System definition. c) Prepare brief report. d) Conduct pattern analysis.
appoint a
should be

96
7. Break into case study working groups. 8. Return to plenary and present hierarchies from different working groups
and discuss. 9. Return to case study working groups to complete analyses.
Day 3
1. Review progress so far. Discuss problems in analysis. 2. Explain tasks for day's case study working group meetings.
These should be approximately as follows: a) identify key factors and processes affecting system properties of
productivity, stability, sustainability and equitability b) produce preliminary li:t of key questions
3. Return to plenary and present techniques of rapid rural appraisal, explaining conceptual tools, semi-structured interviewing, etc.
4. Discuss objectives of field visit. These should be approximately as follows: a) review of hierarchy b) review of pattern analysis diagramsc) review of technologies and effects on system properties d) answering and revising key questions
Day 4
1. Visit to case study sites 2. Leader of each site team may be different to the Chairman of the working
group 3. Orientation 4. Interview local officials and community leaders
97
5. Each team should then break into sub-teams of no more than three people each, for field surveys and interviews.
6. Lunchtime - team to reassemble for discussion of work so far. 7. Afternoon - continue field visit.
Day 5
1. Review progress and set tasks for case study working groups. These should be approximately as follows: a) review field visit b) revise pattern analysis diagrams and produce new diagrams as
appropriate c) revise discussion of system, properties d) refine key questions. e) prepare written report
2. Break into case study working groups.
Day 6
1. Plenary session: presentation of case studies 2. Discussion of case studies 3. Discussion of key questions
Day 7
1. Plenary session: further discussionii of key questions 2. Discussion of plans for answering key questions 3. Discu-rion of future plans 4. Closing session. Thank yous.

98
Day 8,9, 10
1. Preparation of draft report with editorial team
Working Group Tasks
1. Read pilot case study reports and discuss. 2. Hierarchies and system boundaries
a) discuss and improve classification 3. Maps
a) discuss correlations and factors in land use b) identify new forms of land use
4. Transects a) discuss problems b) discuss system properties c) suggest potential solutions to problems d) identify potential intensifications
5. Seasonal calendars a) discuss constraints b) discuss opportunities
6. Long term trends a) discuss past trends b) predict future trends
7. Stress and perturbation graphs a) discuss likely causes of collapse b) identify potential prevention measures or remedies
8. Bar diagrams a) discuss sources of production and income b) identify new potential sources of income

99
9. Flow diagrams a) discuss productivity, stability, sustainability and equitability of
flows b) identify missing links c) identify potential intensification
10. Decision trees a) discuss key factors in decision making b) identify possible new farming and livelihood systems
11. Venn diagrams a) discuss missing links and gaps in organisation b) identify possible new organisational links
12. System properties a) produce table of key factors, variables and processes as follows:
(see also table 8) b) discuss means of:
increasing productivity increasing stability increasing sustainability increasing equitability
c) identify trade-offs 13. Key questions
a) identify and write down each key question b) write discussion of each question (three or four sentences) c) suggest research plan broken down as follows:
rapid rural appraisal three to twelve month surveys, t.rial-, and experiments greater than one year trials and experiments

100
-Ye +ve
PRODUCTIVITY
Factors increasing Constraints, limiting productivity factors
STABILITY
Stabilising factors Destabilising factors
SUSTAINABILITY
Processes preventing Stresses and perturbations collapse
EQUITABILITY
Factors increasing Factors producing equitability inequity
Follow-up
Report Preparation
I. Editor assembles editorial team 2. Editor to colleu, case study reports and diagrams as they are produced
3. Editor to collect manuscripts of invited papers

101
4. The report can take one or more of the following forms: A. Executive summary type report
a) objectives b) description of case studies with selected diagrams c) policy issues d) appendix of key questions
B. Full report a) executive summary b) invited papers c) case studies d) key question e) policy issues, and research priorities references
appendix: agroecosystem theory and procedure
C. Handbook D. Published papers, etc.
Research Follow-up
1. Identify institutions and individuals to carry out research 2. Arrange funding 3. Hold regular seminars to follow up on research 4. Plan major seminar or repeat workshop in one year to discuss findings
General Points
Although the above orgaiiisational details suggest a rather rigid approach the procedure is essentially meant to be flexible. Experience shows that new ideas, new approaches and new conceptual tools are produced in each workshop and this should actively be encouraged.

102
The workshop should also be seen as part of a longer term training and .institution building exerci. For example, joint workshop advisers or joint
chairman of case study working groups may be appointed with one of the individuals preparing to take over these roles at future workshops.
There is likely to be an increasing role for microcomputers in these workshops. They have already been used as word processors to produce the pilot case study reports and to produce some of the time series diagrams.Eventually programmes may become available to produce other diagrams as appropriate.

103
APPENDIX B
ORGANISATION OF AN AGROECOSYSTEM ANALYSIS FOR DEVELOPMENT WORKSHOP
Initial Planning
I. Start at least one month prior to workshop 2. Establish organising committee 3. Set dates for RRA (2 days per site) and workshop (2 days) 4. Arrange funding as required 5. Identify geographic or other focus, eg. a region, watershed, or project 6. Identify different case study sites. Usually four, possibly three or
five. These will usually be individual villages or hamlets 7. Appoint the following:
A. ACo-ordinator or Chairman Responsibility for co-ordinating the preparations for the workshop.
B. A Workshop Adviser This should be someone with previous experience of running such workshops. Responsibilities include: a) Advising on preliminary RRA b) Planning the workshop timetable c) Introducing the method to the workshop participants d) Guiding the workshop

104
C. A General Logistics Organiser Responsibilities include: a) Invitations to workshop b) Facilities c) Transport d) Background documentation.
D. A RRA Team Leader Responsibilities inch'Mde: a) Organising tehnls to carry out RRA's on case studies b) Assembling relevant secondary data c) Preparation of reports on data for workshop
E. An Editor Responsible for production of final report following the workshop
F. A Financial Officer Responsible for budget of workshop.
8. Appoint teams or committees to assist the above appointments where appropriate or desh-able.
Logistics
As for Research Workshop where appropriate.
Rapid Rural Appraisal
Responsibilities of RRA Team Leader with advice from Workshop Adviser.
I1. Form RRA study teams (4-6 people each) 2. Assemble secondary data on region and case study areas from government
reports and government offices and from any other sources that are available.

105
2. Assemble secondary data on region and case study areas from government reports and government offices and from any other sources that are available.
3. Prepare simple maps of region containing case study sites. Maps should show topography, soils, rainfall, vegetation types, population density, ethnic groups, communications, etc.
4. Visit case study areas (2 days). 5. Obtain data from local government officials and local leaders. 6. Carry out farm surveys - random samples or stratify by farm size or
income or agroecological zones. Suggest following information: a) Size, age and education of family b) Land holding and individual parcels by 'and type c) Crops and cropping systems for each parcel plus yields d) Livestock holdings e) Diagram of home garden f) Inputs (amounts and costs) - labour, seed, fertiliser, fuel, pesticides,
etc. g) Credit - how much, from where, inzerest and use h) Income by sources i) Purchase cf grain, etc. j) Perceived problems - soils, pests, diseases, credit, administration, etc.
7. Prepare basic data. NB: all diagrams should be simple sketches. a) Diagrammatic history of site
Major events - eg. new road, straighter, electricity, new crops, well, etc. b) Hierarchy of site c) Map - make basic map of site, roughly to scale and include sit;
boundary, roads, rivers, oth.r landmarks. Add ecological zones. d) Transects - construct one or two transects of sites showing:
topography soils land use probl!ms opportunities

106
e) Seasonal Calendar - produce on 18-month span, showing Climate - rainfall, maximum and minimum temperatures, etc. Crop sequences - planting to harvesting Perennial and -;,J!,1 crop harvests Livestock - births, rearing and sales Non-farm activities - weaving, off-farm employment Laboilr requirements - land preparation, planting, harvesting Capital requirements Income Monthly prices
f) Long Term Graphs - preferably over 20 years Prices Yields Acreages Population - birth rates, death rates, immigration, migration,
education g) Bar Diagrams - for ilterviewed farmers
Sources of income Family size Purchased inputs
i) Flow Diagrams Marketing and prodtction for major products Flows of income
j) Decision Tree Decisions determining different farming and livelihood systems
k) Venn Diagram Overlapping institutions in decision making
8. Pr ;pare RRA reports including -hese tables, figures and diagrams. Convert to overheads.

107
The Workshop
Responsibility of Co-ordinator and Workshop Adviser.
The prime objective of the workshop is to produce a multidisciplinary analysis of the case studies and a list of key questions, guidelines and working hypotheses for development.
Draw up timetable, roughly on the following lines:
Day 1
1. Introductions and summary of timetable - Co-ordinator 2. Review of project area and development policies - invited presentation 3. Agroecosystem analysis proceduie - Workshop Adviser (if required) 4. Set tasks of case study working groups - Workshop Adviser 5. Divide into case study working groups:
a) System Definition b) Pattern Analysis c) System Properties d) Key Questions e) Guidelines for Development f) Working Hypotheses for Development g) Prepare report
Day 2
1. Presentation of working group reports. 2. Discussion of key questions, guidelines and working hypotheses 3. Innovation Assessment (see table 10)

108
a) list potential innovations in technology, social and institutional organisation and policy contained in working hypotheses
b) discuss effects on productivity, stability, sustainability and equitability
c) discuss costs, time horizons of benefits and feasibility 4. Agree development priorities 5. Discuss preliminary development plans
Working Group Tasks
1. Read pilot case study reports and discuss. 2. Hierarchies and system boundaries
a) discuss and improve classification 3. Maps
a) discuss correlations and factors in land use b) identify new forms of land use
4. Transects a) discuss problems b) discuss system properties c) suggest potential solutions to problems d) identify potential intensifications
5. Seasonal calendars a) discuss constraints b) discuss opportunities
6. Long term trends a) discuss past trends b) predict future trends

109
7. Bar diagrams a) discuss sources of production and income b) identify nf.w potential sources of income
8. Flow diagrams a) discuss productivity, stability, sustainability and equitability of
flows b) identify missing links c) identify potential intensification
9. Decision trees a) discuss key factors in decision making b) identify possible new farming and livelihood systems
10. Venn diagrams a) discuss missing links and gaps in organisation b) identify possible new organisational links
11. System Properties a) produce table of key factors, variables and processes as follows
(see also table 8) b) discuss means of:
increasing productivity increasing stability increasing sustainability increasing equitability
c) identify trade-offs

1.10
-ye +ve
PRODUCTMITY
Factors increasing Constraints, limiting factors productivity
STABILITY
Stabilising factors Destabilising factors
SUSTAINABILITY
Processes preventing Stresses and perturbations collapse
EQUITABILITY
Factors increasing Factors producing inequity equitability
12. Key Questions for Development a) identify and write down each key question
13. Guidelines for Development a) identify and write down guidelines
14. Working Hypotheses for Development a) identify, clearly define and write down working hypotheses b) justify hypotheses and describe underlying reasoning (three or
four sentences)

Follow-Up
Report Preparation
1. Editor assembles editorial team 2. Editor to collect case study reports and diagrams as they are produced 3. Editor to collect manuscripts of invited presentations 4. The report should take the following form:
a) introduction b) invited presentations c) case studies d) discussion
Development Follow-up
1. Prepare development plan 2. Arrange funding 3. Carry out plan and monitor results 4. Hold regular seminars to follow up on progress 5. Plan major seminar or repeat workshop in one year to discuss findings.

Winrock International Institute for Agricultural Development
T he Winrock International Institutefor Agricultural Development is a Private, nonprofit institution founded to help alleviate human
hunger and poverty through agricultural development.
It was created from the merger of the Agricultural Development Council (A/D/C), the International Agricultural Development Service (lADS), and the Winrock International Livestock Research and Training Center (WILRTC). These three organizations shared a common heritage stemming from the philanthropic traditions of the Rockefeller family.
With the merger on July 1, 1985, Winrock International incorporated more than 50 years of combined agricultural development experience of the three organizations.
Headquarters: Washington D.C. Office:
Route 3, Morrilton, AR 72110, USA 1611 North Kent Street, Arlington, VA 22209, USA Telephone (501) 727-5435 Telephone (703) 525-9430
Telex: 910-720-6616 WINROCK MRLT Telex: 248589 IADS UR
Asian Office:
133 Sukhumvit 21, Nana P.O. Box 1172 Bangkok 10112, Thailand
Telex: 21340 WINROCK TH