ee.leee.e - citeseerx
TRANSCRIPT

RD-ft ES 24? FLOTING BRERIUTER PROTOTYPE TEST PRORAM: SETTLE 1/3
MASHINGTON(U) COASTAL ENGINECERING RESEARCH CENTERVICKSBURG MS E E NELSON ET AL. MAR 06 CERC-MP-B6-3
UNCLASSIFIED F/0 13/2 N
EE.LEEE.E

- .7,' ~ 'W ~~~J'r1 Tfl fll
-- St.'
'St
4$S~
St
'9..A
.5
* 'S'S
'S9.-S4-
'S -- S.
.9. --S.'-
.5
A, -,
N * *SS'S
III-__ ~L at
5. 11111 hL 36
9.11111~
- 11111 I .b 4.''''11.25 11111 14 *-1.
I 7..J~2--)-AL-:4-
MICROCOpy PESO' IITION TEST CHART (p. -.
,59
-.4r
A, cr
'S
1~
'S
S--.--.---.-t*-*~*-............-..--..,..............-.... IS S ............S - . - . - -
- S --.- ~ 5 9.. 5 % 5 %\x~.-.-. \k.As\SflicA.v X-.t~.~.~A*2-.A -X~A-A '~

II MISCELLANEOUS PAPER CERC-86-3
FLOATING BREAKWATER PROTOTYPE TEST-. PROGRAM: SEATTLE, WASHINGTON
* byEric E. Nelson
Ci~~1US Army Engineer District, SeattleP0 Box C-3755, Seattle, Washington 981 24-2255
/ andLaurie L. Broderick
* _US Army Engineer District, PortlandP0 Box 2946, Portland, Oregon 97208-2946
'j ?AADTIC
APR 02 1986D4 ~March 1986..........
Final Report
Approved For Public Release; Distribution Unlimited
H~i Prepared for
DEPARTMENT OF THE ARMY
Washington DC 20314-1000
364/3
- 96:!

Destroy this report when no longer needed. Do not returnit to the originator.'A
The findings in this report are not to h)e construed as an official(* Department ofthe Army position unless so designated
hy other authorized documents.(
The cnntents of this report are not to he Used forardver tis: n, p)Uhcaition, or promotional PUrposes.Citation of trade namnes (does 110t ConIstitutL' Zirofficial endlorsemnent or approval of the! use Of
su~ch commercial products.
p ( .

UnclassifiedSECURITY CLASSIFICATION OF THIS PAGE 01%. Dae. Entered)e," "-
REPORT DOCUMENTATION PAGE READ INSTRUCTIONS RM.
1REPORT NUMBER BEOR COMPETIN OR2. GOVT ACCESSION NO 3. RECIPIENT'S CATALOG NUMBER
Miscellaneous Paper CERC-86-3 qD/g y' _
4. TITLE (and Subtitle) S. TYPE OF REPORT & PERIOD COVERED
FLOATING BREAKWATER PROTOTYPE TEST Final reportPROGRAM: SEATTLE, WASHINGTON 6. PERFORMING ORG. REPORT NUMBER
7. AUTHOR() S. CONTRACT OR GRANT NUMBERi.)Eric E. Nelson
." ~~Laurie L. Broderick .'..:
S. PERFORMING ORGANIZATION NAME AND ADDRESS ,0. PROGRAM ELEMENT. PROJECT, TASKAREA & WORK UNIT NUMBERS
US Army Engineer District, SeattlePO Box 4-3755, Seattle, Washington 98124-2255 12. REPORT DAT.
March 1986.-,':.US Army Engineer Waterways Experiment Station 13. NUMBER OF PAGES
Coastal Engineering Research Center 2Q2PO Box 631, Vicksburg, Mississippi 39180-0631 IS. SECURITY CLASS. (olthi. report)
11. CONTROLLING OFFICE NAME AND ADDRESS Unclassified
DEPARTMENT OF THE ARMYUS Army Corps of Engineers I*DELIFC-NDNGAN
Washington, DC 20314-1000 SCHEDULE
f4. MONITORING AGENCY NAME & ADDRESS(I1 different froe Conto llins Office)
IS. DISTRIBUTION STATEMENT (of this Report)
Approved for public release; distribution unlimited.
17. DISTRIBUTION STATEMENT (of the ebetrect entered In Block 20. If different Irom, Report)
Ill. SUPPLE* ENTARY NOTES
19. KEY WORDS (Continue on rovo* e side ilflele*aIy end Identify by block ntanber)
Anchor line forces Puget Sound, WashingtonField monitoring Wave attenuationFloating breakwaters fl
2& AWSTrACT (CAWNmO m ete fif Nne F Md Idemify by block nuber)
Because of increased interest in the use of floating breakwaters to pro-vide wave protection, the US Army Corps of Engineers initiated the FloatingBreakwater Prototype Test Program in February 1981. The objectives of theprogram, which utilized two types of breakwaters--a concrete box and a pipe- .•tire mat--was designed to answer several important engineering questions which
included the following: determining the most efficient breakwater for aparticular wave climate, predicting the forces that act upon structures and
! 40 (Continued)DD 1 1473 EITIOU OF I NOV GS ISOBSOLETE&A Unclassified
SECURITY CLASSIFICATION OF THIS PAGE (When Date Entered)
4 ,': .:..-
.- ,.' .'. %, • -. -. -. . .' .',.', ., , . -. -. ,, % , ' *'% -° *'." - ,,-.. '. '. ',#" . ... " .- .-... '. '.- . . . " "... . - .... ,.' _" '. '.- L .L , ,,_ '" " '' '.' " ,t ,._ .r:,: . .,_¢ ,. .. : , .... '''.', ' - ', . .",'l ,..'..-\, .","'-".. .

S UnclassifiedSECURITY CLASSIFICATION OF THIS PAGE(lWhw Da £fltffrd
20. ABSTRACT (Concluded):
,,anchoring systems, determining the optimum construction materials, and pro-* viding a low-cost means of connecting or fendering the individual breakwater
modules. After construction and mooring at an exposed site in Puget Sound,the breakwaters were monitored to evaluate their performance and structuralresponse. The results are being compiled to aid designers of future floatingbreakwaters.
I%
*J JUnclasifie .9
Sg~jI~yCLASIFIATIO OFTmiSPAG(Whe Da Fnfrod

VI~~~~ ~ ~ ~ %7V 27.77- 7.V " . -
FOREWORD
In February 1981 the US Army Corps of Engineers initiated a prototype test
program to provide guidance for floating breakwater applications in semipro-
teeted coastal waters, lakes, and reservoirs. The test was designed not only
to obtain field information on construction methods and materials, connector .
systems, and maintenance problems but also to measure wave transmission char-
acteristics, anchor loads, and structural response. Program planning, engi-
neering, and design work were completed in September 1981. Monitoring and
data collection ended in January 1984.
The Office, Chief of Engineers (OCE), US Army Corps of Engineers, had over-
- all responsibility for program management. Technical guidance was provided
throughout the program by the Prototype Test Working Group. The membership
of the group changed over the 4-year span of the program; however, all mem-
bers contributed to its successful completion. The following individuals com-
prised the Prototype Test Working Group: Messrs. Bruce L. McCartney, Jesse A.
Pfeiffer, Jr., Fred A. Anderson, and Ivar R. Paavola, OCE; Messrs. Robert M.
Sorenson, Richard L. Weggel, Rudolph P. Savage, and D. Donald Davidson,
Coastal Engineering Research Center (CERC) of the US Army Engineer Waterways
Experiment Station (WES); Mr. Paul F. Mlakar, Structures Laboratory, WES;
Ms. Laurie L. Broderick, formerly at CERC/WES; Mr. John G. Oliver, US Army
Engineer Division, North Pacific; and Messrs. A. David Schuldt and Eric E.
Nelson, US Army Engineer District, Seattle.
Additional guidance was provided by the faculty and staff of the University
of Washington, including Professors Eugene P. Richey, Billy J. Hartz, and
Ronald E. Nece and Mr. Derald R. Christensen. Guidance was also provided by
Dr. Volker W. Harms, University of California, Berkeley. Observations and
photographs of the marine flora and fauna that inhabited the breakwaters
were provided by two Seattle Aquarium biologists, Mr. Richard Hocking and
Ms. Kristine Nelson.
'w,"-'

PREFACE
The study herein was conducted between 5 February 1981 and 31 January 1985, *
during which time personnel of the US Army Engineer District, Seattle (NPS),
had primary responsibility for carrying out the design, construction, and
testing phases. Analysis of the collected data was done by the Coastal Engi-
neering Research Center (CERC) of the US Army Engineer Waterways Experiment
Station (WES). The study was authorized by the Office, Chief of Engineers
(OCE), US Army Corps of Engineers, with overall program management responsi-
bilities being shared by Messrs. Bruce L. McCartney, Directorate of Civil
Works, OCE, and Jesse A. Pfeiffer, Jr., Directorate of Research and Develop-
ment, OCE.
The initial report, prepared for NPS, was written by Mr. Eric E. Nelson, NPS,
and Ms. Laurie L. Broderick, US Army Engineer District, Portland (formerly
with CERC). Commanders of NPS during the 4-year study were Colonels Leon K.
Moraski, Norman C. Hintz, and Roger F. Yankoupe. 9...
The final report was prepared for publication utilizing funds from Work ".
Unit 31679, "Design of Floating Breakwaters," by Mr. Peter J. Grace, Wave
Research Branch, CERC. The report was written under general supervision of
Dr. James R. Houston, Chief, CERC; Messrs. Charles C. Calhoun, Jr., Assistant '"
Chief, CERC; C. Eugene Chatham, Chief, Wave Dynamics Division; and D. Donald -
Davidson, Chief, Wave Research Branch. This report was edited by
Ms. Shirley A. J. Hanshaw, Publications and Graphic Arts Division, WES. -
Director of WES during publication of this report was COL Allen F. Grum, USA. ,'-
Technical Director was Dr. Robert W. Whalin.
2~. . . . . . . . . . . . . . .. ,*. . . . .

WW. UU _N -w -- -: 7-
TABLE OF CONTENTS
Pagek
FOREWORD............................................................... 1
PREFACE................................................................ 2
CONVERSION FACTORS, SI TO NON-SI (METRIC) UNITS OF MEASUREMENT ........... 4
SUMMARY................................................................ 5
1.0 Introduction ................................................. 7
2.0 Design and Construction....................................... 7
3.0 Observations of Performance and Durability ..................... 12 . ~4.0 Data Collection .............................................. 15
Co at nlsis and.Recommendation...............................20
REFEREN and Maintenance...............................................Al3
Appendix A CoPipete Breakwater: Design, Construction, Operationand Maintenance ........................................... BAl
Appendix C -iAnchore Syseke: Design, Construction, Operationand Maintenance ........................................... CB1
Appendix D -Connector Testing ......................................... D1
Appendix E -Boat Wake Testing ......................................... El
Appendix F - Monitoring Program ........................................ F1
*.Appendix G -Test Results.............................................. GI
Appendix H - Chronology of Major Events................................. H1
Accesion For
NTIS CRAMIOTIC TAB
Uannounced Dusti ication .....---.-----------.-
Dist ibA-,tof I
Availabifity Codes
Avai a -dlIor
istV-I .i............

CONVERSION FACTORS, SI TO NON-SI (METRIC)UNITS OF MEASUREMENT
Non-SI units of measurement used in this report can be converted to SI. 1, ..
(metric) units as follows:
Multiply By To Obtain
cubic feet 0.02831685 cubic metres
Fahrenheit degrees 5/9 Celsius degrees or Kelvins*
feet 0.3048 metres
foot-pounds (force) 1.355818 metre-newtons or joules
inches 2.54 centimetres
kips (force) 4.448222 kilonewtons
knots (international) 0.5144444 metres per second
miles (US statute) 1.609347 kilometres
ounces (US fluid) 0.02957353 cubic decimetres
pounds (force) 4.448222 newtons
pounds (mass) 0.4535924 kilograms
pounds (force) per foot 14.5939 newtons per metre
pounds (force) per square foot 47.88026 pascals
pounds (force) per square inch 6.894757 kilopascals
slugs (mass) per cubic foot 515.3788 kilograms per cubic metre
square feet 0.09290304 square metres
tons (2,000 pounds, mass) 907.1847 kilograms
To obtain Celsius (C) temperature readings from Fahrenheit (F) readings,use the following formula: C (5/9) (F - 32) To obtain Kelvin (K) read- %
ings, use: K (5/9) (F - 32) + 273.15
14
____ ____ ___ ____ ___ ____ ___ ___-...

- SUMMARY
The US Army Corps of Engineers (Corps) initiated the Floating Breakwater Pro-
totype Test Program with the following objectives: determining the most
efficient breakwater for a particular wave climate, predicting the forces that
act upon structures and anchoring systems, determining the optimum construe-
tions materials, and providing a low cost means of connecting or fendering the
individual concrete breakwater modules. This breakwater study involved the
testing of two types of breakwaters--a concrete box and a pipe-tire structure. -.-
After they had been constructed and moored at an exposed site in Puget Sound, .
the breakwaters were monitored for 18 months to collect data on performance
and structural response.
Results of the program indicate that the breakwaters provided wave protection
which was similar to that predicted by model tests. However, anchor forces:.,-
and internal concrete strains were lower than predicted. None of the flexible .: <
connector designs for the concrete breakwater survived undamaged, but both
fendering and rigidly connecting the individual breakwater modules proved .
successful. The pipe-tire breakwater proved to be durable; however, several
of the longitudinal pipes broke as a result of faulty welds, and the break-
water had to be removed from the test site 6 months ahead of schedule. The
concrete breakwater was undamaged by the testing and was reused in a nearby
Corps marina project.
S.2.
'p -°
6t'
- .. . .;
p5 " . .""-1%

I ~~VANCOUVER ~ACUECANADA
ISLAND UNITED STATES NBELLINGHAM
....... ETVERTT....... TEST..SITE
.................... E A TT...E
4iI ....
I. ........ .......
FIGURE . LocaionEMa
TEST SITE
........
.. . .. .. .

v4
FLOATING BREAKWATER PROTOTYPE TEST
PROGRAM: SEATTLE, WASHINGTON
1.0 Introduction. This report documents a 4-year program in which two pro-
totype floating breakwater designs were extensively field tested. The break-
water test site was in Puget Sound off West Point at Seattle, Washington (fig- :'ure 1). This site was chosen to ensure that, within the period available for
testing, wave conditions would approximate design waves normally associated
with sites considered suitable for floating breakwaters. Water depth at the
site varied between 30 and 50 ft* at mean lower low water (MLLW), and bottom
materials consisted of gravel and sand. The diurnal tide range at the site
was 11.3 ft, and the extreme range was 19.4 ft.
The prototype structures that were built and monitored were of two types: a
concrete box (figure 2) and a pipe-tire design (figure 3). The 150-ft-long
concrete breakwater was composed of two 75-ft-long units, each 16 ft wide and
5 ft deep (draft of 3.5 ft). The pipe-tire breakwater was composed of nine
"- 16-in.-diam steel pipes and 1,650 truck tires fastened together with conveyor
belting to form a structure that was 45 ft wide and 100 ft long.
2.0 Design and Construction. The concrete structure design was based on
field and design experience from numerous floating structures now in use,
available model test data, and detailed structural analysis of similar struc-
tures (references I through 4). The pipe-tire breakwater construction was
based on a Sea Grant funded design by Harms (reference 5) and modified based
on local site conditions and personal discussion with him. Other types of
floating breakwaters, such as log bundles, twin pontoons, and A-frames, were i-
considered; but either high construction costs, lack of broad applicability,
or overall test program budget limited testing to the concrete box float and
the scrap tire structures. Also, because Coastal Engineering Research Center
(CERC) field studies (references 6 and 7) revealed that these two types of
breakwaters were commonly used, the Prototype Test Working Group felt that
* A table of factors for converting non-SI to SI (metric) units of measure-C- ments is presented on page 4.
-. 77
- -. .. - ....

:k- - .. -.- Y.- .. %T.- -277- -7 -...-7 7l " -- e S
F S W
WL.'.' FIGURE~~~h 2.Cncee rakae
45'*
NOT TO SCALE
FIGURE 2. pConcre Breakwater

future. Based on available design information, the breakwaters were sized to
provide acceptable wave attenuation under conditions typical of sites where
the future use of floating breakwaters is anticipated (i.e., significant wave
• height, Hs = 2 to 4 ft , wave period, T = 2 to 4 sec). However, the struc-
tures and anchor systems were designed to withstand the maximum wave predicted
for the West Point site (Hs : 6 ft , T : 5 sec).
2.01 Concrete Breakwater Construction. The two 75-ft-long concrete break-
-'". water units were cast in Bellingham, Washington, 90 miles from the test site. -" -
" Work on these units began with the erection of exterior plate steel forms.
Welded wire fabric (3/8 in. diam) were then placed on the sides, ends, and
bottom of the forms, with the top left open to allow placement of styrofoam
blocks during the concrete placement process. All small pieces of reinforc-
ing steel were epoxy coated, and the welded wire parts were galvanized for
corrosion protection. Prior to casting of the breakwater units, 16 rebar
• :strain gages were fastened into the deck, sides, bottom, and corners of the
". west float as part of the monitoring system. The concrete placement began
with pouring of the 4-3/4-in.-thick bottom. The styrofoam blocks that served
as the interior forms were then dropped into place (photograph 1). Two-by-
* fours and PVC pipe were used as spacers to keep the reinforcing steel located
properly between the styrofoam blocks and the outer steel plate forms. Steel
beams were placed across the deck, and then wedges were hammered between these
*. beams and the foam to keep the foam from floating up as the sides of the float
• "were placed. After the sides of the floats had been placed to within 1 ft of
"" the deck surface, the spacers and steel hold-down beams were removed. The
"- deck reinforcing steel was laid, and the final stage of the concrete placement
was begun (photograph 2). Placing and finishing of the deck completed the
casting process (photograph 3). Test samples of concrete were taken through-
out the placement. The concrete weight varied between 131 and 134 pcf, with
an average 7-day strength of 4,000 to 5,000 psi and a 28-day strength of 5,000 ..
IF. to 6,000 psi. After the concrete had cured for 7 days, the ten 1/2-in.-diam
strands in each of the six posttensioning tendons were tensioned to 25,000 lb
(photograph 4).
On 28 May 1982, the 140-ton units were lifted from the casting area and
9 *.
.-. o.........................b ' . .. ..... • .. j - =.

lowered into the waterway (photograph 5). The longitudinal strain gages in .. ,,.
the lower center edges of the west float were monitored during the launch-
ing. A maximum strain of 1,700 microstrains was recorded, indicating that
loads were about two-thirds of the yield strength of the reinforcing steel.
After both units were launched, they were joined, end-to-end, with two
flexible connectors (photograph 6) and towed approximately 90 miles south to
the West Point test site. A detailed description of the concrete breakwater
construction is given in Appendix A.
2.02 Pipe-Tire Breakwater Construction. The pipe-tire breakwater was as-
sembled, one bay at a time, on a construction platform located adjacent to
a waterway. As each 12- by 45-ft bay was completed, it was moved into the
waterway (photograph 7). Construction of the breakwater followed closely the
sequence described by Harms (reference 5). The prefoamed tires were brought
to the assembly platform (photograph 8) where they were arranged as shown in
figure 4 but without those tires labeled "free tires" (i.e., tires not con-
nected to a conveyor belt). The matrix of 1,650 truck tires was bound by
loops of 5-1/2-in.-wide, 3-ply conveyor belting. A special tool fabricated
from a car Jack was used to tighten the belting (photograph 9) before the
loop ends were joined with five 1/2-in.-diam by 2-in.-long nylon bolts. The
ends of the bolt threads were melted with a welding torch to prevent the nuts %
.,r1(45' longl, 12' apart) /
.ELT LOOP
2ROWS '-"-*
,". . .-,, T IR R E T A IN ER - .- .r~~.,.- .
TUC "FREE', TIRES
TRUCK TIRES (40" die.) i-6 TIRES PER PIPE it TIRES PER ROW .""SWL (V '(V*\''
45'.. . .-
NOT TO SCALE p." .
FIGURE 4. Pipe-Tire Breakwater Module
10
p . - . p* C . C - .,. . . . .. .. ,. •. . . _ . . .. . . . . ... . - . . . . . ." ,.

from working off the bolts. After 12 rows of 11 tires had been fastened to-
gether, additional tires were forced into the open spaces (free tire spaces)
in the 45-ft-long beamwise row of tires.
The breakwater was then ready to have a 16-in.-diam styrofoam filled pipe in-
serted into the beamwise row. Because the tires were not perfectly aligned,
a nose cone was placed on the end of the pipe. The pipe was moved into place
with a large overhead crane and was shoved through the row of tires with a
,- forklift (photograph 10). A tight structure was produced by compressing one
additional tire onto each end of the pipe before the keeper pipes were in-
stalled (photograph 11). This procedure brought the total number of tires on
each pipe to 66. The completed bay was dragged into the adjacent waterway by
using the overhead crane and a small tugboat (photograph 12). This process
was repeated for each of the eight bays (nine pipes). After construction pro-
cedures had been perfected, assembly time for each bay was approximately 8 hr
for two men. Adding the free tires, inserting the pipe, and moving the com-
pleted bay off the assembly platform required an additional two men and took
approximately 4 hr. Construction time was reduced by the use of heavy equip-
ment and the special tools fabricated by the contractor. A detailed descrip-
tion of the pipe-tire breakwater construction is given in Appendix B.
2.03 Anchoring. The concrete breakwater was anchored in place by ten""-"
30-ft-long steel H-piles (HP 14 by 102) embedded their full length (photo-
graph 13). The pilings were driven using a Vulcan 010 hammer with a
10,000-lb ram weight and an 8,000-lb mandrel (photograph 14). A special
fitting was attached to the mandrel to hold the piling in proper alinement
while it was being driven. Anchor lines consisted of 1-3/8-in.-diam gal-
vanized bridge rope with 15 to 25 ft of 1-1/4-in. stud link chain at each
end. Anchor line lengths were sized to provide a scope no steeper than
1 vertical to 4.5 horizontal, and initial anchor line tensions were 5,000
± 1,000 lb. A 2,000-lb concrete clump weight was attached 44 ft from the
upper end of Lach anchor line. The purpose of this design was to produce "I
a more even anchor line tension over the full range of tides and thereby
to reduce the horizontal excursions of the breakwater, particularly at lower
tide elevations. Four months prior to the termination of the field test,
the clump weights were removed. During this 4-month period, the effects of
1 1 -:','"

this clump weight removal on float motions, anchor forces, and wave attenua-
tion were monitored.
The pipe-tire breakwater was anchored about 30 ft from the end of the concrete
breakwater with ten 20-ft-long steel H-piles (HP 12 by 53) (photograph 15).
Anchor lines consisting of 1-1/4-in.-diam three-strand nylon rope, with 10 ft
of 3/4-in. stud link chain at each end, were attached to both ends of each
pipe. The scope for these anchor lines was not steeper than 1 vertical to
4 horizontal. The center and end H-piles had one anchor line each, while the
remaining four anchor piles were attached to three anchor lines apiece. The
four end pilings were offset at an outward angle to counteract the opposing
longitudinal component of force from the adjacent anchor lines. Anchoring
details are given in Appendix C.
3.0 Observations of Performance and Durability. The prototype breakwater
test site at West Point was selected because of its exposure to wind waves.
This choice proved to be more than adequate for providing the desired wave
conditions. During the 18-month test period, more than 20 storms moved
through Puget Sound. One storm brought winds in excess of 60 knots and
generated waves over 4 ft high. Most often, storm winds were in the 20-
to 40-knot range with wave heights between 2 and 3.5 ft (photograph 16).
Access to the breakwater was difficult when winds exceeded 10 knots;
15-knot winds made working conditions potentially hazardous.
Visual comparisons of incident and transmitted wave heights indicated that,
under all observed wave conditions, the pipe-tire and the concrete breakwaters
provided an adequate and very similar degree of wave protection for both wind
waves and boat wakes (photograph 17). Moreover, the concrete breakwater re-
flected the wave energy, but the pipe-tire breakwater dissipated it through
viscous damping. As a result of wave reflection, the windward side of the
concrete breakwater was always noticeably rougher than the windward side of
the pipe-tire breakwater (photograph 18).
Overtopping of the concrete breakwater by ship wakes and wind waves was quite
pronounced (photograph 19). Sheet flow 6 in. deep was common. As a result,
a lush crop of algae thrived on the deck of the structure, making the surface
12................................****. .... .. <;'.....

treacherously slippery. The actual freeboard of the concrete breakwaters was
about 13 in., 4 to 5 in. less than anticipated in the original design. The
reduced freeboard undoubtedly contributed to the amount of overtopping.
The relatively high initial tension in the anchor lines of the concrete break-
water (5,000 lb with the 2,000-lb clump weights attached and 1,500 lb without
the clump weights) appeared to minimize the lateral travel of the floats even
during low tides and fast tidal current flows (2 knots). Lateral displace-
ments were estimated to be less than 2 ft, even when the clump weights were
removed.
Lateral displacement of the pipe-tire breakwater did not appear excessive
(about 15 ft), but tidal currents running at a 45-deg angle to the anchor
lines tended to carry the pipe-tire breakwater in a longitudinal direction -
to the near end of the concrete breakwater, a distance of about 30 ft.
Water leakage into the hollow end compartments of the concrete breakwater was
a serious problem early in the test. Primary leak points were at the access
hatches and the 2-in.-diam posttensioning bolt holes that were used when mak-
ing the rigid connections between the two floats. Because calculations indi-
cated that the breakwater could sink if the end compartments filled, emergency ".
pumping operations were carried out on several occasions. Eventually, rework- #. *
ing the hatch covers and filling the bolt holes with sealant reduced the leak-
age rate to manageable levels.
One of the major goals of the test program was to investigate various methods
of connecting (or fendering) the two 140-ton floats. Four different connec-
tion methods were tested: flexible connectors (two types), complete discon-
nection (with fendering), and rigid bolting of the units. Both the fendering
(photograph 20) and the rigid connection were successful. None of the flex-
ible connector designs survived their test period undamaged, although consid-
erable progress was made toward a viable flexible connection design. Details
of the connector testing are given in Appendix D.
Advantage was taken of calm periods to make repairs and to conduct additional
tests. Four boat wake tests and an anchor line stiffness (pull) test were
13 • •%"•

conducted at various times in the program. For two of the boat wake tests,
41-ft Coast Guard cutters were used to generate waves (photograph 21). The
other two tests used large (75- and 11O-ft) tugboats. Boat generated waves
were in the 2- to 3-ft range (see Appendix E for details). For the anchor
stiffness test, a 4,COO-horsepower tugboat was used to pull on the breakwater
with varying loads, while surveying instruments measured displacements, and
load cells in the anchor lines monitored anchor forces (photograph 22). This
test was conducted to obtain simultaneous measurements of breakwater lateral
displacement and the resisting anchor force, which are properties of the an-
chor system that affect overall float motions and internal loads.
Upon completion of the field test, diver inspections of the anchor lines
and the concrete floats were made. No significant damage, wear, or cracking
was found on the floats. The galvanized steel anchor lines were visibly cor-
roded, and the shackles used to attach the clump weights to the anchor lines
were worn; otherwise, the anchor line hardware, including the chain, was found
to be in excellent condition.
For nearly a year, the pipe-tire breakwater proved to be remarkably durable.
Except for minor repairs to the keeper pipes, it withstood the winter storms
of 1982 without any maintenance (photograph 23). But in June 1983, almost a
year to the day after the pipe-tire breakwater was installed, the first prob-
lem of any consequence developed. After a minor storm, routine inspection
revealed that one of the longitudinal pipes had broken (photograph 24). A
closer inspection revealed that the 45-ft pipe had been fabricated from a
LO-ft section and a 5-ft section. A poor weld between the two sections had
finally failed because of a combination of corrosion and fatigue, allowing the .,,.
two pipe sections to pull out of the tires. One month later, when a second
pipe failed in exactly the same manner, a decision was made to terminate test-
ing of the pipe-tire breakwater. During the removal process, the anchor lines
were inspected, and no major problems were found in the nylon anchor lines or
connecting hardware. After the breakwater was removed, it was surplused and 777
eventually reinstalled at a private marina in southern Puget Sound. Monitor-
ing of the long-term durability of this unit is planned. .. .... ,
While the Prototype Test Program was under way, two projects using floating
14

breakwaters were designed and constructed by the US Army Engineer District,
Seattle. In 1983, a 600-ft-long breakwater was constructed for the 800-boatI- I.
* East Bay Marina at Olympia, Washington (photograph 25). A year later, another
floating breakwater, 1,600 ft long, was anchored at Friday Harbor, Washington
(photograph 26). As originally planned, the prototype test breakwater was
" refurbished and incorporated into the Friday Harbor Project. Throughout the
test program, information obtained from the construction and operation of ,.'
the prototype breakwater was used to refine the East Bay and Friday Harbor V-
" designs. Preliminary prototype test data were used to confirm float sizing.
Construction specifications were broadened to allow the use of either light-
* weight or standard weight concrete, with appropriate adjustments in float
draft. Details of the East Bay connector system were changed to reduce main-
tenance, and the Friday Harbor fender system is a direct spinoff of the one
. developed during the prototype testing.
4.0 Data Collection. The monitoring program for the prototype test was con-
- ducted by the Civil Engineering Department of the University of Washington
under contract with the US Army Corps of Engineers (Corps). The purpose of
the monitoring program was to collect data that would serve as a basis for
establishing and evaluating the fundamental behavior of the two breakwater
• "types under study. The University designed a system to measure and record
" pertinent environmental and structural variables that are involved in the
-" design and mathematical modeling of the test breakwaters and similar struc-
. tures. The parameters that were measured included incident and transmitted
: waves, wind speed and direction, anchor line forces, stresses in the concrete
units, relative float motion, rotational and linear accelerations, pressure
'] distribution on the concrete breakwater, water and air temperatures, and tidal
current data.
Off-the-shelf transducers for measuring many of the parameters were not avail-
able. A major effort was required to design and fabricate anchor force load
cells (photograph 27), wave measuring spar buoys, a relative motion sensor
(photograph 28), pressure sensor housings, and embedment strain gages. By the
end of the monitoring program, approximately 60 transducers had been installed
in and around the breakwater. Over 3 miles of underwater electrical cable
was required to feed signals to the onboard data acquisition system that was
15
r"

housed on the concrete breakwater (photograph 29). Using large lead-acid
batteries for power, the system was completely self-contained. In addition to
01 the input transducers, the system included a microprocessor controlled data
logger and special purpose signal conditioning electronics which were designed
and built by the University of Washington (photograph 30). The data acquisi-tion system was programmed to sample selected transducers for 1 min on an
hourly basis (because of power and storage requirements, the system was later
programmed to take 1-min data every 2 hr). When either wind speed, current
speed, anchor force, or significant wave height exceeded a preset threshold
value, an 8-min record of all transducers was made at a sampling rate of 4 Hz.
The microprocessor was capable of a limited amount of data processing, includ-
ing calculations of maximum, minimum, mean, and standard deviation of selected
parameters. After each data tape was retrieved from the breakwater, it was
processed at the University. Selected statistics and data plots were analyzed
to determine whether all critical components of the data acquisition system
were operating properly. When problems were detected, repairs were made as
soon as the breakwater was safely accessible. Keeping this complicated and
extensive system operational in such a hostile environment proved to be a
challenging enterprise. Salt water flooded instrumentation, waves and tidal -
currents broke transducers and tore out electrical leads, and logs, fish nets,
and other debris caused damage continuously. Despite these difficulties in
the 18 months of data collection, 121 data tapes were recorded, representing
approximately one-quarter billion measurements. After initial processing at
the University, the data were transferred to the Coastal Engineering Research
Center for detailed analysis. Details of the monitoring program are given in
Appendix F.
5.0 Data Analysis. Detailed analysis of the data was initiated in June 1984, WJ
with the major effort being directed toward the transmission and anchor force
characteristics of the breakwaters. These two parameters had the highest pri-
ority because they were considered to be key factors in the effort to optimize
the cost effectiveness of floating breakwater design. Other parameters such ow
as the internal concrete strains and wave pressures were checked to ensure the
reliability of the data, but detailed analysis was deferred.
Figures 5 and 6 present the wave transmission characteristics and anchor line
16
777=

1.0
* 0.8
0.6 LA S £
0 0
0.4 - 0 a
0.2
0 12 3 4 5HI, FT
LEGEND
* RIGID CONNECTION, WITH CLUMP WEIGHTSARIGID CONNECTION. NO CLUMP WEIGHTS* FLEXIBLE CONNECTION. NO CLUMPIWEIGHTS
FIGURE 5. Transmission Coefficient versus Incident
3- I I I
A
00
0
0 ~
A
1 2 3 4 5HI, FT
LEGEND "
§ RIGID CONNECTION. WITH CLUMP WEIGHTS -PRETENSIONING-50L-)& RIGID CONNECTION. NO CLUMP WEIGHTS
SFLEXIBLE CONNECTION , NO CLUMP WEIGHTS E .'5 0 L
FIGURE 6. Peak Anchor Line Force versus IncidentWave Height - Concrete Breakwater
.
17
., •* - ".,..-.
01• • • ;" or

forces for the concrete breakwater. Results for the three configurations of
the concrete breakwater (rigidly connected with clump weights, rigidly con-
nected without clump weights, and flexibly connected without clump weights),
are represented by different symbols. For all three configurations the wave
transmission coefficients (transmitted height/incident height) plotted in
figure 5 are centered on a value of 0.40. This value was near the expected
level of performance, and it indicates that this size breakwater would pro-
vide adequate protection for waves up to approximately 3 ft high. The peak
forces measured in the concrete breakwater's anchor lines are shown in fig-
ure 6. The anchor line forces increased only slightly with increasing wave
height and averaged approximately 40 lb/ft of breakwater (in addition to the
initial tension). The various configurations of the concrete breakwater
seemed to have little effect on the peak anchor force. Figures 7 and 8 pre-
sent the wave transmission characteristics and the anchor line forces for the
pipe-tire breakwater. The average wave transmission coefficient of 0.42 is
close to the expected value for the wave heights tested (figure 7). The peak
anchor loads for the tire breakwater shown in figure 8 average approximately
75 lb/ft. Again, as for the concrete breakwater, the peak anchor load does
not vary significantly over the range of wave heights measured during the
test.
The variation of transmission coefficient with wave period, typical of most
laboratory tests, does not appear in the prototype measurements. At the West
Point test site the generation of large wave heights and periods was limited
by the relatively short fetches, and the breakwaters were not subjected to
wave conditions that would produce high transmission coefficients. At the
lower end of the scale, waves and boat wakes up to 1 ft high occurred fre-
quently, even on the leeward side of the breakwater. This background noise
resulted in relatively high transmission coefficients for smaller wave
heights regardless of how well the breakwater was attenuating the incident
waves. These site-specific characteristics resulted in a concentration of
wave attenuation measurements around 0.40. Selection of the concrete break-
water size was based on two-dimensional model tests which indicated a trans-
mission coefficient of 0.40 could be expected for a range of wave periods
for 2.0 to 3.5 sec. Prototype performance appears to closely follow the
model test results, at least for this relatively narrow range of wave periods.
18 .H,."-. . . . . . . . . . . . . . . . . . . . . . . . . . . . . . . . . . . .. . . . .

1.0 I
000
0.4
0
0 12 3 4 5H1. FT
FIGURE 7. Transmission Coefficient versus IncidentWave Height -Pipe-Tire Breakwater
2
LL.
0.0
'i V 2&0 0 LEGEND
A CHANNEL 9
O CHANNEL 10
0 CHANNEL 11y CHANNEL 12
0 10 1 2 3 4 5
Hl FT
FIGURE 8. Peak Anchor Line Force versus IncidentWave Height -Pipe-Tire Breakwater
19
While the test site periods were limited, they do represent the most important
range for floating breakwater applications in semiprotected waters.
The measured wave loads on the concrete breakwater anchor lines were about
one-half of the predicted loads, but the predicted loads on the pipe-tire
breakwater were similar to measured values for wave heights less than 2 ft.
The anchor line forces, plotted in figures 6 and 8, do not show the antici-
pated increase with increasing wave height. This lack of sensitivity to
wave height changes may result from a combination of factors. Anchor force
predictions for the concrete breakwater did not account for viscous losses.
These losses increase when larger waves break over the breakwater and when ->
the breakwater motion becomes more extreme. The anchor system for the pipe-
tire breakwater was much more compliant than those used in a previous proto-
type test or in model tests, and wave impact loads probably were absorbed
more readily by the prototype-test anchor lines than by those used previ- z
ously. Finally, the random nature of the wind waves at the test site com-
plicates the correlation of the prototype test results with monochromatic
model test data. The data analyses and results are discussed in more detail
in Appendix G.
6.0 Conclusions and Recommendations. The following conclusions and recom-
mendations are based on test results reported herein and on field experience
gained during the test and concurrent construction of two Corps floating
breakwater projects in Puget Sound.
a. Wind generated wave heights measured at the test site compared
favorably with the predicted values (table 1).
b. Measured values of wave transmission for both the concrete and the
pipe-tire breakwater were similar to the predict ,alues (tables 2 and 3).
Both breakwaters provide satisfactory protection (transmitted wave of 1 ft . .,
or less) for waves up to 3 ft high.
c. For the concrete breakwater, measured values of anchor forces were
about 50 percent of the predicted loads if the long-period sway component of -''"
the predicted value is ignored (table 2). The prototype test anchor force
.. -°
20 " ."-". -
** a
.? .-. -'--i' i.. - . ". • ' . . " " ." -"w.

records do not show the long-period component that was present in previous
anchor line force measurements. The lack of this long-period force may be ,
due to the relatively high initial tension and rapidly increasing anchor
stiffness that was characteristic of the prototype test anchor system.
d. For the pipe-tire breakwater, the measured values of anchor forces
were similar to the predicted loads for incident wave heights less than 2 ft.
Comparisons of existing model test anchor forces and the prototype data set
are difficult because of differences between the model test anchor system
and the prototype anchor system.
e. Measurements from the strain gages embedded in the concrete break-
water indicated that bending moments were less than 50 percent of the pre-
dicted values (table 2). The highest strain was measured during the launch-
ing process. Loads encountered during launching and towing may govern struc-
tural requirements.
f. Most of the urethane foam flotation in the crowns of the tires of
the pipe-tire breakwater remained securely intact and in place throughout the
test. The durability of the foam was enhanced by the physical protection pro-
vided by the very stiff sidewalls of the truck tires. If more flexible auto-
mobile tires were used, the foam probably would be more vulnerable to damage.
In one year, the average foam weight increased 250 percent because of the
absorption of water. This absorption, combined with underfilling of tires
during the original construction, could have led eventually to buoyancy prob-
lems. The long-term water absorption rate of foam flotation remains a concern
and should be taken into account when flotation requirements are being calcu-
lated. The pipe-tire breakwater original design flotation requirement of
75-lb positive buoyancy for tires, other than those on the beamwise pipes,
probably is not overly conservative for long-term use.
g. The keeper pipes on the pipe-tire breakwater should be redesigned.
If a single 4-in.-diam by 40-in.-long keeper pipe were welded in place, the
expensive 4-way cross coupler and 2-in. ID pipes which were vulnerable to
corrosion and loosening could be eliminated. Also, designers should consider
the potential for corrosion of all small metal parts such as cotter keys.
21
'*i .. "-'. .

h. Although a number of the bolted connections had one or two broken
bolts, none of the connections failed. Binding the tires of the pipe-tire
breakwater with loops of conveyor belting and fastening the loops together
with nylon bolts appeared to produce a strong durable structure, providing the
.-. bolt ends are melted and flattened to prevent the nuts from backing off.
i. The 16-in.-diam pipe for the pipe-tire breakwater should be used in
standard lengths to avoid welding. If welding is required, all welds should Pbe carefully inspected.
J. Construction cost of the prototype 150-ft-long concrete breakwater
was approximately $2,600 per linear foot (1981). In 1983, construction of a
1,600-ft-long breakwater of similar design (anchored in a similar depth) cost
$1,200 per linear foot indicating a considerable cost reduction.
k. Construction cost of the prototype test 100- by 45-ft pipe-tire
breakwater was $1,600 per linear foot (1981) including anchors. Uncertain-
ties in availability of used truck tires and in construction methods resulted
in this relatively high cost.
22
.*K-
-w
K l--

REFERENCES
1. Adee, B. H., Richey, E. P., and Christensen, D. R., "Floating BreakwaterField Assessment Program for Friday Harbor, Washington," Final Report.Ocean Engineering Research Laboratory, University of Washington, Seattle,Washington, 1976.
2. Carver, R. D., "Floating Breakwater Wave Attenuation Tests for the EastBay Marina, Olympia Harbor, Washington," Hydraulic Model Investigation. -U. S. Army Engineer Waterways Experiment Station, Technical Report HL-79-13, Vicksburg, Mississippi, 1979. WE
3. Davidson, D. D., "Wave Transmission and Mooring Force Tests of FloatingBreakwaters at Oak Harbor, Washington," Hydraulic Model Investigation.U. S. Army Engineer Waterways Experiment Station, Technical Report H-71-3,Vicksburg, Mississippi, 1971.
4. Hales, L. Z., "Floating Breakwaters: State-of-the-Art Literature Review,"
CERC Technical Report No. 81-1, U. S. Army Engineer Waterways ExperimentStation, Vicksburg, Mississippi, 1981.
5. Harms, V. W., Westerink, J. J., Sorensen, R. M., and McTamany, J. E.,"Wave Transmission and Mooring-Force Characteristics of Pipe-Tire FloatingBreakwaters," CERC Technical Paper No. 82-4, U. S. Army Engineer WaterwaysExperiment Station, Vicksburg, Mississippi, 1982.
6. Richey, E. P., "Floating Breakwater Field Experience, West Coast," CERCMiscellaneous Report No. 82-5, U. S. Army Engineer Wat-rways ExperimentStation, Vicksburg, Mississippi, 1982.
7. Baird, A. V., and Ross, N. W., "Field Experiences with Floating Break-waters in the Eastern United States," CERC Miscellaneous Report No. 82-4,U. S. Army Engineer Waterways Experiment Station, Vicksburg, Mississippi,1982.
23-.N -,.
:;*:[i.
"" ~23 --

TABLE 1
COMPARISON OF PREDICTED AND MEASURED WAVES
Significant Wave Height, H. Wave Period, TWind Speed 1/ (ft) (sec)
(mph) Predicted Measured Predicted Measured
15 1.3 1.5 2.5 2.815 1.3 1.8 2.5 3.0
16 1.4 2.1 2.6 3.3*2/ -- 4.o -- 4.3
1/ Measurements of unlimited duration.2/ No wind speed measurements obtained due to equipment malfunction.
TABLE 2
COMPARISON OF FIELD MEASUREMENT WITH PREDICTEDVALUE FOR CONCRETE BREAKWATER
Significant Wave Attenuation Peak Anchor Force MomentWave Height Coefficient, Ct (lb/ft) (it-kips)
Hs Pre- Mea- Pre- Mea- Pre- Mea-(ft) dicted sured dicted 1/ sured 2/ dicted 3/ sured . .
1.5 o.4 o.4 105 50 125 471.8 0.4 0.5 130 70 178 972.1 o.4 0.5 145 75 256 79 ."4.0 0.8 0.7 500 97 745 *4/
. 1/ Calculated using Miche-Rundgren method, neglecting sway load withwave load acting on a portion of the structure equal to the wave length, L= 5.12T2 ; i.e., spatial correlation factor (SCF) = 1 ; also assumes 50 per-cent loss due to viscous effects. (Neither the predicted nor the measuredanchor forces include either the anchor line pretension or long period loadssuch as current drag.)
2/ Peak load calculated statistically assuming wave loads follow Rayleighdistribution; F peak defined as equal to the average of the I percent high-
" est loads; F peak = F1% = 1.67 F significant," 3/ Heave moments calculated using FLOATX.
4/ No strain data available for Hs :4.0 ft
24 . .'

TABLE 3
COMPARISON OF FIELD MEASUREMENT WITH PREDICTEDVALUE FOR PIPE-TIRE BREAKWATER 1/
Significant Wave AttenuationWave Height Coefficient.. e .. Peak Anchor Force.-',.
H sC (lb/ft)
(ft) Predicted Measured Predicted 2/ Measured 3/ -C.-:.
1.5 0.2 0.5 60 771.8 0.2 0.4 75 632.1 0.4 0.7 100 753.2 0.5 * 4/ 250 134
1/ Neither the predicted nor the measured anchor forces include longperiod loads such as current drag. Anchor line pretension was negligible for PI&the pipe-tire breakwater.
2/ From reference 5, figure 46.3/ Peak load calculated statistically assuming wave loads follow Rayleigh
distribution; F peak defined as equal to the average of the 1 percent high-est loads; F peak = f1% 1.67 F significant
4/ No transmitted wave height data available for Hs 3.2 ft
1! ..
.-.- A.-
25
'w'.'-

,% - ----w. - - --7 7. V. - 1. 7' - , .1 o .. .
. . . .'. .
- - .rIF- AV
Photo 1. Starting concrete breakwater Photo 2. Placing concrete in--. "placement; internal foam blocks being sides and internal walls.•--"
i positioned.
I.
Photo 3. Placing and leveling deck. Photo 4. Posttensioning ofconcrete units.
*Photo 5. Launching of concrete Photo 6. Joining units withbreakwater. flexible connectors.
26
w",°"
- * . °_° - -. . . . . . .,_-:L:b.:*°,

* ~ M - - - - - I. ~ .. ~.. .. - .. .. d..- . .•
*- "& -; '";~
-.7% ~ ~ ~ ~ ~ .7%7 7 77 7 7.W- 07 7 7-- r--T - I - ,;.,.- _.
Photo 7. Assembling pipe-tire break- Photo 8. Assembling a module.water (Four modules are complete).
Photo 9. Tensioning of belting using Photo 10. Shoving steel pipe -..
a modified car jack. through tires (tires around pipesnot foamed).
Photo 11. Keeper pipes being secured Photo 12. Launching of pipe-tire(welding of keepers required to breakwater.prevent loosening).
27
°* . , . • .S-.--.-.'.,".". ,-..,'--,.-'-. .,. .-.-.. .-. . ... ...-..-- '..: .".---'-. . .. ,-.;.. < 9 .,.- A-.-

VT T- V Tb. . - - - - - - - - . . 9- 1-kU I-V .
Ink
%"%..
-,
, .. .'
Photo 13. Photo showing H-pile with Photo 14. Anchor piles beingchain and steel rope attached (anchor driven at test site.force cell in chain).
Photo 15. Final anchoring of break- Photo 16. Waves reflecting from thewaters at test site. concrete breakwater sending spray
20 ft into the air.
..... ____
Photo 17. Example of both break- Photo 18. Waves reflecting fromwaters providing good protection windward side of concrete float.from storm waves.
28
- m~ -- -S ____________.

P41M. .4.. -4. W. X7 IV W-- T Wr T TW . V OW)rW_,TW r,.
. ,-.
*Photo 19. 1.5-ft waves overtopping Photo 20. Concrete units in discon-the concrete breakwaters. nected and fendered configuration.
U-..° ,
Photo 21. 41-ft Coast Guard cutter Photo 22. 4,000 hp tugboatpassing the breakwaters during a boat pulling on concrete breakwater towake test. determine anchor line stiffness.
aim*"
Photo 23. Pipe-tire breakwater after Photo 24. A broken longitudinalhaving weathered numerous storms, pipe pulling out of the tires.
29
29 ... 5 .. ." -.

Photo 25. Photo showing the 16-ft- Photo 26. Test units after beingwide by 600-ft-long piling moored connected to the floating break-breakwater at East Bay, Washington. water at Friday Harbor, Washington.
Photo 27. Underwater photo depicting Photo 28. Relative motion sensorupper load cell in anchor line. being used during test of flexi-
ble connector.
Photo 29. Photo showing the deckhouse Photo 30. Photo showing two her-that protected equipment from the metically sealed cases that housedelements (wave buoy in foreground). the on-board computer.
30
..
-: -_. _ -- _ > _ -. - . . ,....- . ., -. . . - - . . ... .

APPENDIX A
CONCRETE BREAKWATER: DESIGN, CONSTRUCTION,OPERATION, AND MAINTENANCE
1.0 Design.
1.01 Wave Analysis. Prior to the designing of the prototype test structures,
wave heights at the West Point test site were estimated using methods outlined
in the Shore Protection Manual (SPM) (reference A-i). The test site location,
effective fetch lengths, hydrographic data, and wind data are shown in fig-
ures A-i through A-6. Wave estimates are listed in table A-i. The design
wave with a height, HS , of 6 ft and a period of 5 sec, was estimated to be
equal to the significant wave calculated for the maximum storm condition on
record (24 years). During the 18-month test period, storm conditions, with
winds over 20 mph, occurred on more than 40 days. A maximum wind speed of
70 mph and a maximum wave height of 4 ft (4-sec period) were recorded. On
one occasion, the wind speed continuously exceeded 35 mph for 24 hr.
1.02 Tides. Tides at West Point are typical of the Pacific coast of North
America. Tides are of the mixed type, with two unequal highs and lows each
day. The diurnal tide range at the site was 11.3 ft, and the extreme range
was 19.4 ft. Tidal datums for the West Point vicinity, as published by the
National Ocean Service, are shown in figure A-3.
1.03 Tidal Currents. In the vicinity of West Point, tidal currents flow in
a southwesterly direction on the floodtide and in a northwesterly direction
on the ebb, with flood and ebb surface velocities about equal. Maximum cur-
rent speed predicted by the National Oceanic and Atmospheric Administration
(NOAA) is 1.3 knots (2.2 fps), with average daily maximum speeds of 0.7 knots
(1.2 fps). A site-specific field study was performed by U. S. Army Engineer
District, Seattle, on 20 April 1981. During this study, current speeds of
approximately 1.5 fps were measured during both ebbtide and floodtide. NOAA-
predicted currents for the time of the study, in the general vicinity of West
Point, were 0.9 fps on both the floodtide and ebbtide. Based on this infor-
mation, the maximum tidal current speed at the test site was estimated to
be 3.7 fps, and the average daily maximum speed was estimated to be 2 fps. .
A-1
i .'.--'..'. .-

BR ITISH COLUMBIA_ CANADA _
-- UNITED STATES
WASHINGTON
BELL INGHAM4
SAN 'AISLANDS
VANCO~ER~\ASNORTEA
I SLAND
U 0 ~ NACPORT
POR PORTLE
SC L I LES10 0 1042
FIREA-i.Tes itNocto
TACOMA
A -2

-- z
%5
6:4.
PON
SSTIDE GAG
SCAE . 5.,
IG
__________ dto

%%
* Sg N *N
S8 V. Q
6 Ot J*;
00 ;('~ ".5 ~ 0 Lo
~ "S.%
0
01
TIDE DATA
1GMWATR.____ 11.2LE
MEAN HIGH.WATER. 10.47
MEAN (HALF) 66.L.
MEAN SEA LEVEL. 6.25
MEAN LOW WATER. 2.82 __ SCALE
EALWRR. __.00_ 20G 0 200 400 FT.LOWEST TD. -4.60
9-FIGURE A-3. Hydrographic Survey Map
A-~4

80.. . .. . . . . . . . . . . . . . .
NOEIHS UVSRPESENTATIVE.. OFPGT ON
N:THESE CURVES REOEP R-
24 YEAR RECORD AT SEA-TAOAIRPORT AND SELECTED STORMRECORDS AT WESTPOINT SEWERAGE
60 i TREATMENT PLANT.
o5 0 ~
0-
Z 40 - -
30 - --------------------------- N&NW
- -- -- - E&SE- NE--
0 3 4 5 6DURATION IN HOURS
FIGURE A-14. Wind Velocity Duration Curvesfrom Seattle-Tacoma Airport
A-5
FF
.................................. ..... .*..

wr E
.44
PECNTCLM%163
(0Oto 3 mph)
LEGENDVELOCITY RANGE in MPH
OVER 3TO 12OVER 12 TO 24OVER -14
FIGURE A-5. Wind Rose from Seattle-Tacoma Airport (19418-1969)
A-6

MAXIMUM STORM CONDITIONS
PERCENT CALM: 16.3
WAVE ESTIMATES ARE BASED ONMAXI-*TJM STOF-M CONDITIONS SHORE PROTECTION MANUAL. ~
WIND DATA ARE FROM SEA-TACH - 4.0WIND ROSE AND WIND DURATIONT-42CURVES FOR UNSHELTERED ~ -
COASTAL REGIONS OF PUGET SOUND.*...
MAXIMUM STORM CONDITIONSNTOCRE E
SS
MAXIMUM STORM CONDITIONS
o MAXIMUM STORM CONDITIONS
H- 6.0TS w 5.0
LEGEND
CHARACTERISTIC WAVE
NS (T)To (SEC)
UP TO HS- 1.0. Ts -2.0
Hs 1.0, To 2.0 TO HS 2.5, Tg 3.5
OVER Hs 2.5,T1" 3.5
FIGURE A-6. Wave Rose for West Point, Washington
A-7

'r v .'.° P
During the field test, current speeds were measured using a drogue and were
found to be 1 to 2 fps.
1.04 Wind-Generated Currents. Since wind-generated and tidal currents can
combine their effects in producing drag forces on the breakwaters, the maxi-
mum wind-generated current at the test site was estimated using the results
of a recent NOAA study (reference A2). This study found that wind-generated
surface currents were approximately equal to 3 percent of the wind speed.
Drag forces were estimated for the simultaneous occurrence of the design wind
(47 mph) and the average daily maximum tidal current of 2 fps. The wind-
generated current under these conditions is (0.03)(47 mph) 1.I+ mph
2 fps , yielding a total tidal and wind-generated current speed of 4 fps.
1.05 Pressure Drag Loading. Pressure drag on the concrete breakwater due to ,..
the wind, wind-generated surface currents, and tidal currents is as follows:
a. Design wind speed, U , :47 mph
b. Wind-generated current speed = (0.03)(U) : 1.4 mph : 2.0 fps
c. Tidal current speed = 2.0 fps
d. Total current speed, u , : 2.0 fps + 2.0 fps :4.0 fps
e. Wind pressure drag : negligible
f. Pressure drag coefficient, CD , = 2.0 (reference A-3)
g. Breakwater draft : 3.5 ft
h. Density of seawater, p ,=2 slugs/ft3 - .-. '
2i. Hydraulic pressure drag CD u (Draft) (reference A-3)
= 112 lb/ft of breakwater length
A-8-* ~.3~-~ ~ - -, P .~ k .3,. ~ ~ - .. .. &..&...LL1 ~ ~3, J3 3 *. . ~ --3. 3,

1.06 Estimated Wave and Anchor Loads. Loads on the concrete breakwater
were calculated in such a manner that they retained the same features ob-
served in previous field measurements (figure A-7). These forces are a
combination of short period wave forces superimposed on a long period sway
force. Wave forces were calculated using the Miche-Rundgren method for non- e.W
breaking waves on a vertical wall with a design wave height of 6.0 ft and aperiod of 5.0 sec.
For this design wave, the wave attenuation capabilities of the breakwater
would be decreased considerably because of the relatively long wave period.
The predicted wave attenuation coefficient, Ct H transmitted/H incident
= 0.9 would result in a 5.4-ft-high transmitted wave. Since wave energy is
proportional to the square of the wave height, approximately 80 percent of
the energy of the design wave would pass the breakwater.
Assuming 80 percent of the wave energy is transmitted past the breakwater
and 20 percent is reflected, and assuming no viscous losses, the maximum wave
loading was calculated to be 1,750 lb/ft of breakwater length (figure A-8).
The maximum sway force was calculated as being equal to 5 percent of the
structure displacement (180 lb/ft). This value was based on forces measured
on the breakwater at Tenakee, Alaska. When wave and sway forces combine, they-"
produce a total estimated load on the structure of about 1,930 lb/ft of break-
water length for a 16-ft-wide structure with a draft of 3.5 ft (figure A-9).
Available information from model tests and from prototype observations (refer-
ence A-4) suggested that only a portion of the wave force, calculated by the
Miche-Rundgren method, is ultimately transmitted to the anchor lines. For
this reason, the load at the breakwater anchor line connection was set equal
to 50 percent of the wave induced force plus 100 percent of the sway force.
When the adjusted wave force was combined with the sway force, the total esti-
mated load was 1,055 lb/ft of breakwater, or about 40,000 ib on each anchor,
assuming an anchor line spacing of 37.5 ft. Tidal and wind-driven currents
contributed an additional pressure drag force of 112 lb/ft of breakwater
length for a maximum force on each anchor line of 44,000 lb. .
A-9
,.,M.r.

al
7t 0. *%
U'(U
U))
U).
LILL00
UC)3c0
L, L
W -4
A-10
L.%

WAVE DATA BREAYMATER DATA
3. .
Water Depth = 55 ft Transmission coefficient =0.9
LANDWARD SEAWARD LANDWARD SEAWARD NET WAVE SWAY 4ELEVATION, Z PRESSURE, PL PRESSURE, P5 FORCE, FL FORCE, F5 FORCE. FNET FORCE, FSWAY
(FT) (LB/FT 2 ) (LB/FT 2 ) (LB/PT) (LB/FT) ILOIFT) (LB/PT) -
+1.5 210 -- -- 100 306 UK- -. -7--
-3.5488 78 1,777 31 1,750 - * ~:~
Htr 54' H-6.0'
z~Z L
SWL '5-
____ ___ ___ ___ ___Z- -35'
LANDWARD SEAWARDSIDE ISIDE
SECTION VIEW
FIGURE A-8. Estimated Wave Pressures and Forces on Concrete Breakwater
A-il
- . .

WA VE FORCE
SWA Y FORCE 5% DISPLACEMENT (1750U LB/FT YPICALMAXIMUM RS LNT
(180 LB/FT TYPICAL) 128 FT TYPICAL)
j FLOATING BREAKWATER
PLAN VIEW, APPLIED WAVE AND SWAY FORCE
ON CONCRETE FLOATING BREAKWATERNOT TO SCALE
DESIGN WAVE: Hs =6.0 FTT =5.0 SEC
NOTE: FORCES SHOWN ARE FOR 75' BY 5' BY 16' FLOATWITH A DRAFT OF 3.5'.
-'FIGURE A-9. Estimated Wave and Sway Forceon Concrete Floating Breakwater .
A-12

- - - "-.- -• -.
1.07 Predicted Wave Attenuation. The basic design of the concrete break-
water was adapted from the structure planned for a Corps of Engineers project
at Friday Harbor, Washington, but with modifications to accommodate the more
severe wave climate at the West Point test site. The test breakwater con-
sisted of two rectangular units, each unit being 75 ft long and 16 ft wide,
with a draft of 3.5 ft and a freeboard of 1.5 ft. The float dimensions were Z
selected to provide a wave transmission coefficient (Ct Ht/Hi) of 0.4 under
design storm conditions for Friday Harbor (Hs = 2.7 ft , T = 2.6 sec). Wave
- transmission characteristics of the floats were based on 1:10 scale model
• .tests conducted at the U. S. Army Engineer Waterways Experiment Station (WES)
(reference 2, main report).
2.0 Construction.
2.01 Construction Sequence. The two 75-ft-long concrete breakwater units
were cast in Bellingham, Washington, and towed approximately 90 miles south
to the West Point test site. Construction drawings for the concrete break-
water are shown in figures A-10 through A-17. Work on these units began in
May 1982 with the erection of the exterior plate steel forms on a special con-
crete pad. Three-eights-in.-diam welded wire fabric (WWF 12 x 4 - W12 x W12 )
was placed on the sides, ends, and bottom of the breakwater, with the top left
open to allow placement of styrofoam blocks during the casting process. The
extensive steelwork in the anchor hawser hole areas and around the post-
tensioning anchors required many man-hours of tedious wire tying. For cor-
rosion protection, all small pieces of reinforcing steel were epoxy coated,
and the larger pieces of welded wire fabric were galvanized. The concrete
placement for each unit began at 5:00 a.m., and by sunrise the 4-3/4-in.-
thick bottom had been completed. The styrofoam blocks which served as the
interior forms were then dropped into place. Wood two-by-fours and PVC pipe
were used as spacers to keep the mesh located properly between the styrofoam
blocks and the outer steel plate forms. Steel beams were placed across the
deck, and wedges were hammered in between the beams and the foam to keep the .
foam from floating up as the sides of the float were placed. Some difficulty
was encountered in obtaining a satisfactory amount of concrete cover over the
steel while keeping wall thickness within tolerances. This problem was par-
ticularly pronounced in the transverse bulkheads. Placing of the sides of
A-13
,.. -.x.-.:.....

Jii
ol'. 7.4.
A-14
7 .. . . . . .

*..................~ --. t - - - . - - --- '.-------
.-. '.,
/
~5* 4. *:~*
____________ ____________ .5* -. 5.
~ :.~. .. j S
* ~
1 . LI:!, 5 .
I-
~II~i~______________ ~ iii ~: ~12
jji II*5
.~'- ~
-I
,.~ *5*~- ~ '~4~-5*r _ Ii
.1~
I - CV)
~ 5~' 1
I ~ - ~ -~~j- -I-4
-. Cu
* 0 - *0
~5 I CuI; ~
- ,.
t ~ iQ
I C)
S. I A/
-' - *-- - S 5
4~L I. Ai
- C,
7 -
.5- .* SI
* I
_________________ ~;jji -.'~c- ~.5
*1 *~ -.5 -
* ~7t. .
'.5
2 -~ -
.5.-
.5..
- . I
*1
4-15
55 - * *~ *. *~ *~ -- . . . .- --- 5 . . .- 5. * ..- 5.........
5. - . *5.*S* * **.......... -
. *~.*.*.*.**

op
.--- ~- .---.-.
J. l.
IIozu
% "e
A-16
- .0

h.T
Q___ 4
I C
JI.It
A- 17
oo

*1
-'--2 -
2~
o~4-1,~., ~-
"1 ~2.
7 '-r'-'----*~ flI L~ 1 LiiI1~Ll~ A H Cu
I 5 4)
/ I I I I /*/'~ ~(~\ I -~
~z~rV~>FYT y I-2
p. Ii:, ~ 0
ii 0 -
-- I' IIY~' ~ff ~q 4)
* -,__ Cu
p K H
I r II ~I- I
_ _ __ Ci2
~, 1,/A
I'' K7~L~-~~- f2~ , .
-r i .L~.
* A
I *~A SI'.' -
4 - Mt
A- 18
~ -~ -.. - S.. ~. *~. ~. ~*~~1 *~t~ ~. ffi ~iL:-:K,->i-.--.-.-~

-~~~2 -. 'C' - -.-
oil..
- --. 9 . ~i__ __ _ __ _.. 1
4 I I'"
-. -
A-19

p i m r r -- -
ptb
'It~ ~ 4 ._
- ~ ~ d
A-2

-~ 1 1
% -6I
-~ Ii
L Ig
Srl
-A 2

the float was done in three lifts of about 1 ft each. Handheld electric
vibrators were used to reduce the possibility of voids. After the sides of
the floats had been poured to within 1 ft of the deck, the spacers and steel ,''
holddown beams were removed. The reinforcing mesh was laid on the deck, and
the final stage of the placement was begun. Final placing and finishing of
the deck were completed by midafternoon.
Test samples of the lightweight concrete were taken throughout the place-
ment. Concrete weight varied between 131 ant 134 pcf, with an average 7-day
strength of 4,000 to 5,000 psi and a 28-day strength of 5,000 to 6,000 psi.
To obtain the required lightweight and high strength concrete, a good quality
lightweight aggregate was imported from Coalville, Utah (Utelite Corporation).
In addition, a wetting agent was used to increase workability while keeping
water-cement ratio down to 0.35. After the concrete had been cured for
7 days, the ten 1/2-in.-diam strands in each of the six posttensioning tendons
were tensioned to 25,000 lb (photos A-i through A-12).
Next, hardware and fittings were added, including the battery box for the
onboard monitoring system, conduit for mounting the pressure sensors, lift-
ing eyes for launching the floats, and neoprene gaskets and cover plates to
seal the bolt holes that were used in rigidly connecting the floats. Several
truckloads of styrofoam were removed from the end compartments of each float.
These compartments were needed to provide a place for the data acquisition
system and to allow access for bolting the floats together. Entry to the
compartments was through watertight, flush-mounted hatches. On 28 May 1982,
the 600-ton derrick Haakon lifted the floats from the casting pads.-i,
During the lifting process, 11-ft-long steel bars were stowed and sealed in-
side the precast holes for use in rigidly connecting the floats later in the
test program. Then the floats were lowered into the adjacent waterway. The
longitudinal strain gages in the lower center edges of the B-float were moni-
tored during the launching, and a maximum strain of 1,700 microstrains was re-
corded, indicating that the loads were about two-thirds of the yield strength
of the steel reinforcing. After both units were launched, they were Joined,
end-to-end, with two flexible connectors and towed to the West Point test site
with a 60-ft, 500-hp tug (photos A-13 through A-18).
A-22
Whim".* ° . . °.* .- * ° .- °. **a- r.. . ..... .. .

The two concrete breakwater units arrived at the test site on 1 July 1982.
Some difficulties were encountered in locating the buoys for the anchor lines,
and divers were required to retrieve several of the lines. Ten days was re-
quired to attach the 2,000-lb clump weights to the anchor lines and then con-
nect the 10 anchor lines (five on each side) to the breakwater. Final ten- .
sioning of the anchor lines took place on 16 July when each of the lines was
tightened to 5,000 lb (±1,000 lb).
2.02 Concrete Mixture Proportioning. Early design work on the test break-water anticipated the use of standard weight concrete. During the job adver-°".".- "'
tisement, last minute calculations showed that additional reinforcing, re-
quired because of the severe test environment, had increased the weight of the
floats substantially. Either the float draft had to be increased, or the
float weight had to be reduced. Weight reduction by using lightweight con- .
crete was chosen as the most expedient means of correcting the problem.
Test samples of the concrete were taken throughout the casting process for
both floats. Testing was done according to the following American Society for
Testing and Materials (ASTM) standards:
C 39-80 Standard Test Method for Compressive Strengthof Cylindrical Concrete Specimens
C 136-76 Sieve or Screen Analysis of Fine and CoarseAggregates
C 94-80 Ready Mix Concrete
C 138-77 Unit Weight, Yield, and Air Content(Gravimetric) of Concrete
C 173-78 Air Content of Freshly Mixed Concrete by theVolumetric Method
C 567-80 Unit Weight of Structural Lightweight Concrete
Results of these tests as well as other pertinent information are shown below:
Mix 8 sack, 130 pcf .."."
Cement Type II, low alkali p.4Aggregate Sand, pea gravel, and Utelite (see --.
aggregate test report, figure A-18)
Slump 6 to 8 in.-_""
(Continued)
A-23:--?.>:
.. .

___________BUILDERS BUILDERS UTELITE '%__PASSING_ # 8 PEA SAND ____
2-1/2 IN_____ ______*
2 IN._____ _
1-1/2 IN. __ _ __ _ _ _
1-114 IN.ef
1 IN. J_____ _____
3/4 IN. 100
1/2 IN. 100 90
-3/8 IN. 83 55
p.' ~~~~~~14 IN._______ _______
NO. 4 14 100 8 _____
NO- 8 2 87 1 _ _ _ _
NO. 16 0 63
NO. 30 43
NO. 50 18 _____
NO. 100 4
NO. 200
F M. 2.85 ______ __ ____
S EORC V
SPECIF IC GRAVITY 2.68 2.67
'ABSORPTION
SCREEN OPENING IN INCHES0 0029 0.0059 0.0117 0.232 0.0469 0.0937 0.25 0.50 1.0 2.0 3.0
0
80 BUILDERS 8PAUTELITE
70 0200 ~ 1008 50z_ 40A E
30 2 6 1. / ' 3/8 1/2 1/" -12 " 3SCEE0UME
6C
FIGUE A-8. Agregte Tst Rpor4-f2
.........................S. . ~.--~~. .. . * ~- .2... ~ .- ~ ,-.*-

Air Content 6.1% - 7.3%; 6.6% avg.Water Cement Ratio 0.35
Admix Zeecon - H, 7.0 oz/100; % Jb
MBAE -10, 4.5 oz/cu yd
Unit Weight 131.0 - 134.5 pcf; 132.6 pcf avg.
Weather and Clear, 550 - 750 F tea
Temperature
Concrete Temperature 620 - 680 F
7-Day Strength 4,060 - 4,930 psi; 4,605 psi, avg.
28-Day Strength 4,846 - 6,540 psi; 5,722 psi, avg.
Post-Tension Grout 2,500 psi at 7 days
2.03 Costs. Costs for the prototype test's concrete breakwater are presented
below. Also presented are costs for a longer breakwater (at Friday Harbor) of
very similar design.
Prototype Breakwater 1/ Friday Harbor Breakwater 2/1981 1983
Per Foot Cost Total Cost Per Foot Cost Total Cost($) ($) ,-
Concrete Breakwater 1,913 287,000 1,011 1,618,000
Anchor System(50-ft-Depth) 687 103,000 215 344,000
Total 2,600 390,000 1,226 1,962,000
1/ 150 ft long.
2/ 1,600 ft long.
3.0 Operation and Maintenance.
3.01 Freeboard and Overtopping. The initial freeboard of the floats varied
from 15 to 18 in. No additional ballast was required to trim the breakwater.
After the anchor lines had been secured, the additional vertical anchor line
load lowered the freeboard to 13 in., 5 in. lower than originally desired.
The increased draft (and reduced freeboard) may have improved the wave atten-
uation capabilities slightly, but the reduced freeboard undoubtedly caused
an increase in the amount of wave overtopping. Incident waves estimated to
A-25
I.~ .. ~ J ~ * *,:- . > -. '

be 2 ft high caused 6-in.-deep water to flow across the deck (photo A-19).
This made moving about on the rolling, slippery deck an extremely precarious
proposition (photo A-20). On more than one occasion, tools and equipment
were swept overboard, and life vests were a standard dress item. In addi-
tion, care had to be exercised in mooring the work boat to avoid swamping it
with the water which ran off the leeward side of the breakwater (photo A-21).
3.02 Float Motion and Accessibility. The relative motion between the break- *
water and workboats which were tied up alongside resulted in some minor damage
to the workboats. A 13-ft fiberglass skiff was carried up onto the center of
the breakwater by a tugboat wake. Tugboat wakes also swamped a 17-ft aluminum
workboat and knocked a 30-ft steel workboat against the breakwater, damaging
the boat's wheelhouse. When work was being done on the breakwater in rough
water conditions, the workboats had to be watched continuously to avoid damage
or swamping (photo A-21). Access to the moving deck of the breakwater from .
the workboats required careful timing to prevent a person's falling into the
water or being caught between the boat and the breakwater. Measurements of
relative float motion (with the two breakwater units in the fendered, un-
connected configuration) were made during the first of the boat wake tests.
The maximum relative displacement was ±9 in. vertically and ±12 in. horizon-
tally. The wake was about 2 ft high with a 2.5-sec period (see Appendix F
for details).
3.03 Leakage. Aside from damage done to the various connectors (discussed
in Appendix D), the concrete structure survived the test period undamaged;
however, water leaking into the end compartment provided a few anxious mo-
ments. The leaks occurred at the entrance hatches and at the through-hull
Dywidag bolt holes. The hatches were designed to be flush with the deck to
facilitate the future use of the floats in the Friday Harbor Marina project.
Unfortunately the hatches were the low point of the deck, and faulty seals
turned the hatches into drains for overtopping waves. Quick calculations
indicated that the floats might be negatively buoyant if the end compart-
ments were filled with water, and on two occasions emergency pumping oper- ]-. [.
ations were carried out to avoid field verification of the buoyancy calcu-
lations (photos A22 and A-23). Leaks also developed where the neoprene
gaskets sealed the twenty 1-3/4-in.-diam bolt holes cast into the end of
A-26
.i'!
."." .-"-' " . ." ." . % -"°. *" . ,- -, . . ."". '. "° ."." , % / ." , ." ."- . ." ."-" ." . , ." . . - " .° .a."," W ."4". "

each float. Eventually the hatch seals were reworked and made watertight,
and the bolt holes were sealed with injected urethane foam and plumbing
corks. P
3.04 Debris Effects. On several occasions, storms, accompanied by extreme
high tides, produced large amounts of floating debris. Logs as large as small
automobiles were found on the breakwater deck one day and were gone the next.
While the logs took their toll of monitoring instrumentation, no damage to the
floats themselves was attributed to debris (photo A-24).
3.05 Structure Durability. A visual inspection of the concrete breakwater,
including a diver inspection of the sides and bottom, revealed only minor
cracks and chips in the concrete. There were some very small 1-in.-diam chips
in the vicinity of hawse pipes on the bottom of the floats, probably a result
of the unanchoring and reanchoring exercises carried out at various times in
the field test. The wood fenders and bull rails showed considerable wear and 4
tear by the end of the test period and had to be replaced when the breakwater
was salvaged for reuse at the Friday Harbor Marina.
3.06. Environmental Effects. When the prototype test program was initiated,
no adverse impacts to fish and wildlife were anticipated. The breakwater ....
was expected to have an artificial reef effect and attract various types of
marine life. The breakwater did prove to be a popular habitat for many spe-
cies of marine plants and animals which attached to the bottom and sides of
the floats. The cover and food supply provided by the breakwater attracted
numerous perch and rock fish. Sea birds, such as gulls, auklets, western
grebe, and sandpipers, also took up residence on or around the breakwater.
In October 1982, 4 months after the breakwater was first anchored at the
test site, a brief biological assessment was made by marine biologists from
the Seattle Aquarium. Mussels (Mytilus edulis) were found to cover 20 per-
cent of the bottom and 98 percent of the sides of the floats. Barnacles
(Balanus sp.) covered 80 percent of the float bottom but were nearly nonex-
istent on the sides. Tunicates (Corella willermeriana) were numerous (ap- d
proximately 5/sq ft) as were hydroids (Obelia longissima) and amphipods
(Caprella equilibria). Many nudibranchs (Dorid sp.) also were found. Asdescribed earlier, the West Point site is subject to swift currents and
A-27
i "° w

heavy wave action, and the breakwater developed a marine life community rep-
resentative of many other exposed rocky areas in Puget Sound.
Some additional information on the design, construction, and use of concrete
breakwaters is provided in references A-5 and A-6.
m7..
*'¢ -'u-u.
5%~ u*
S.. 5 5
'.- 5
5* .. s° ,*°- - -

APPENDIX A
REFERENCES
A-i. Shore Protection Manual, 4th ed., 2 vols, U. S. Army Engineer WaterwaysExperiment Station, Coastal Engineering Research Center, U. S. Govern-ment Printing Office, Washington, D. C., 1984.
A-2. Holbrook, J. R., Muench, R. D., Kachel, D. G., and Wright, C., "Circula-tion in the Strait of Juan de Fuca: Recent Oceanographic Observationsin the Eastern Basin," Technical Report ERL 412, PMEL 33, National Oce-anic and Atmospheric Administration, Washington, D. C., April 1980.
A-3. Olson, R. M., Essentials of Engineering Fluid Mechanics, 2nd ed., Inter-national Book Co., Scranton, Pennsylvania, 1966.
A-4. Davidson, D. D., "Wave Transmission and Mooring Force Tests of FloatingBreakwaters, Oak Harbor, Washington," Technical Report H-71-3, U. S.Army Engineer Waterways Experiment Station, Vicksburg, Mississippi,April 1971.
A-5. Lorman, W. R., "Concrete Cover in Thin Wall Reinforced Concrete FloatingPiers," Technical Note N-1447, Civil Engineering Laboratory, Naval Con-struction Battalion Center, Port Hueneme, California.
A-6. Western Canada Hydraulic Laboratories Ltd., "Development of a Manual forthe Design of Floating Breakwaters," Canadian Manuscript Report of Fish-eries and Aquatic Sciences No. 1629, Department of Fisheries and Oceans,Small Craft Harbours Branch, Ottawa, Ontario, November 1981.
-,.2
.-- 1 .-. ,
N.W. .
A-29iiii

e.
TABLE A-iWAVE ESTIMATES FOR WEST POINT TEST SITE
Effective Wind Wave WaveFetch, F Duration, t Height, H Period, TDrco (m Feff hr) 2/ d Speed, U s
Direction (mi) 1/ (hr) 21 (mph) 2/ (ft) 3/ (sec) 3/
North 9.0 1.7 36 4.3 4.1435 4.1 4.430 3.5 4.025 2.8 3.620 2.2 3.212 1.2 2.4
South 6.8 1.2 52 6.0 5.050 5.8 4.940 4.2 4.330 3.1 3.725 2.5 3.420 1.9 3.012 1.1 2.2
Southwest 4.9 0.9 50 4.9 4.640 3.8 4.130 2.8 3.525 2.2 3.120 1.7 2.713 1.1 2.2
West 3.3 1.1 50 4.1 4.1
40 3.3 3.730 2.3 3.225 1.9 2.920 1.5 2.615 1.1 2.2
Northwest 6.3 1.3 38 4.0 4.235 3.7 4.030 3.0 3.725 2.5 3.320 1.9 2.912 1.1 2.2
1/ Effective fetch calculated with an arc width of ±t45 deg.2/ The wind speed duration curves used were developed from Seattle-Tacoma
Airport records._3/ The wave theory used was the Sverdrup-Munk-Bretschneider (SMB) method
(reference A-i).
A-30
-. .:. -,1

i ....
Photo A-i. Forms being erected for Photo A-2. Reinforcing steel beingcasting a 75- by 16- by 5-ft float, placed in the forms.
Photo A-3. Reinforcing steel being Photo A-4. Blocks of styrofoaminstalled around hawse pipes and chain being checked for proper fit. " .locker.
"-'14 " 1. . - rift
: " ' '""
Photo A-5. Styrofoam being lowered Photo A-6. Steel angles, 2 by 4's,after bottom of float was placed. and PVC pipe being used to keep
styrofoam located properly.
A-31
L ',_L' ,'_.'J.=-,'. _,.'.-,-,-'_ ".-,..- :.. ,. ................................................................-......,...... a.~ x._,... . .,'.'

-~~~~~ r WC. Vv -wr-
:..
, Photo A-7. 3/8-in. welded wire fabric Photo A-8. Fabric being placedbeing laid on the deck. carefully in corner areas (crossed
rebar strain gages near center of-,.. ~photo).- .. -
, - - ...-; -.
Photo A-9. Placing and finishing the Photo A-10. Using a broom todeck. create a nonskid surface.
,OIL
..
Photo A-11. Taking concrete samples Photo A-12. Preparing for post-(done throughout the placement). tensioning.
', A-32
... ..... ....

IA-~
Photo A-13. Photo depicting original Photo A-114. Pressure transducerbattery box and access hatch to mounting locations being verified.equipment compartment.
awa
Photo A-15. Photo showing 600 cu ft Photo A-16. A large derrick lift-of styrofoam that was "mined" from the ing one of the 140-ton floats.end compartments of each float.
r4.7
Photo A-17. 11-ft-long bolts being Photo A-18. Rubber patches beingstowed inside one of the floats for glued over the bolt holes (laterlater use. covered by steel angles).
A-33
.......................,....,......",............ ........ ".-JI

- - - -Si- - -,. - . -.. .-
Phot A-9. avesovetoping he ow hotoA-2. Wrk cntiuin
dec (1*.)febadalwn on atosyo h lpey
sieal waeoetopn.rlln ek
*Photo A-21. Weve ertopping thee lowpin Photo A-22. Wbok 3,0 continuin
a work skiff. being pumped from ah end com-partment after a storm.
Photo A-23. Pumping out another end Photo A-214. Photo showing type .-
compartment (the deck is nearly of debris which washed acrossawash). the deck.
A-34

APPENDIX B
PIPE-TIRE BREAKWATER: DESIGN, CONSTRUCTION, h, . .
*1 OPERATION, AND MAINTENANCE
1.0 Design.
1.01 Waves and Tidal Currents. For design calculations, wave, tide, and wind
conditions were assumed to be identical for both the pipe-tire and concrete
breakwaters. (See Appendix A, paragraphs 1.01 through 1.04 for a discussion
of anticipated design conditions.)
1.02 Pressure Drag Loading. Pressure drag on the pipe-tire breakwater due to
the wind, wind-generated surface currents, and tidal currents was calculated
as follows:
a. Design wind speed, U , : 47 mph
b. Wind-generated current speed : (O.03)(U) 1.4 mph 2.0 fps
c. Tidal current speed = 2.0 fps
d. Total current speed, u , = 2.0 fps 2.0 fps = 4.0 fps
e. Wind pressure drag = negligible
f. Pressure drag coefficient, CD 0.65 (reference B-i)
g. Breakwater draft = 3.3 ft (40 in.)
h. Density of seawater, p , 2 slugs/ft3
2 -'
i. Hydraulic pressure drag CD _ (Draft)
. .:.:-3535 lb/ft of breakwater length(reference B-2) .. '
B-I
27..'

1.03 Estimated Wave and Anchor Loads. Mooring loads for the pipe-tire -* "•
breakwater were calculated for the 6-ft, 5-sec design wave using an empirical
equation based on prototype data taken at the US Army Corps of Engineers
Coastal Engineering Research Center (CERC) (reference 5, main report). As -
recommended by the originator of the pipe-tire design, the calculated anchor
force was increased by 70 lb/ft as an added safety factor for design purposes.
The resulting mooring load, due to waves, was estimated to be about 500 lb/ft '
of breakwater length (figure B-i). Current drag was estimated to be 35 lb/ft,
producing a total of 535 lb/ft of breakwater, or a maximum design load of
about 6,000 lb on each of the nine (12 ft on center) anchor lines.
1.04 Buoyancy Calculations. During the design process the buoyancy of the
pipe-tire breakwater was calculated from the difference between the total
-" buoyant force and the weight of the breakwater with its mooring system at-
tached plus the vertical component of the load on each anchor line. The
styrofoam filled 16-in.-diam pipes contributed approximately 40 lb of buoyant
force per linear foot of pipe. The other major source of buoyancy was the
urethane foam in the crowns of the tires, anticipated to be 75 lb per tire for
880 tires. The weights used for buoyancy calculations were (1) 15 lb per tire
for 1,650 tires (submerged weight), (2) 11 lb per tire for sediment and bio-
fouling, (3) 1,540 lb for submerged anchor lines, and (4) 13,000 lb for total
vertical component of anchor load with design wave loading and wind/tidal cur-
* rent force applied. The buoyant force and weights combined to produce a cal-
culated net positive buoyancy of about 16,000 lb.
2.0 Construction.
2.01 Construction Sequence. Construction of the pipe-tire breakwater began
in late March 1982 (see figure B-2 for construction drawing). The 1,650 truck
tires required for the job were brought to the contractor's workyard where
they were arranged into rows and held in a vertical orientation by two 4 by
4's running parallel to the rows. A hole was drilled in each tire to allow
the water to drain, after which a two-part urethane foam was sprayed into the
crown of 880 tires (see figure B-2 for foam specifications). The tires were
assembled into bays on a construction platform located adjacent to a waterway.
As each bay was completed, the breakwater was moved (one bay at a time) into
B-2
. . .. *

U)
4-)
LL.
>0000
LO.
cr CL
0 LLa
.4 0 C
.4-4
0 >
z 003
WL 4-)~
lo-p
B-3
z 416

gill'? Y'~ -, 2 , ;v
It - !
INI
Si 99 1
. .3~ . ~......I~I *ES 3~ co
~ CIO~ ~WWI
-- ~'- --
CL
.717
JL L

the waterway. Construction of the breakwater closely followed the sequence
described by Harms (reference 5, main report). A forklift brought the tires
to the assembly platform where they were bound by loops of 5-1/2-in.-wide,
3-ply conveyor belting. A special tool fabricated from a car Jack was used
to tighten the belting. Holes were cut in the belting with another special
tool, and the belting was fastened with five 1/2-in.-diam by 2-in.-long nylon
bolts. The ends of the bolt thread were melted with a welding torch to pre-
vent the nuts from working off the bolts. After 12 rows of 11 tires each
had been fastened together, additional tires were forced into the open spaces
(free tire spaces) in the 45-ft-long beamwise row of tires using a device nor-
mally used for driving sheetpiling. The breakwater was then ready to have a
16-in.-diam by 45-ft-long, schedule 40, pipe inserted into the beamwise row.
This pipe was chosen because the 16-in.-diam was the largest standard size
that would readily fit inside the 20-in.-diam rim of the truck tires. How-
ever, the maximum standard length of this size pipe is 40 ft. The specified
length of 45 ft resulted in structural failures which are discussed in para-
graph 3.01. Because the tires were not perfectly aligned, a nose cone was
placed on the end of the pipe which was moved into place using a large over-
head crane and then shoved through the row of tires with the forklift. To .. . -
produce as tight a structure as possible, one additional tire was compressed
onto each end of the pipe before the keeper pipes were installed. (This
brought the total number of tires on each pipe to 66.) The completed bay
was dragged into the adjacent waterway using the overhead crane and a small ..
tugboat. This process was repeated for each of the eight bays, with launch-
ing of the completed breakwater taking place on 29 April 1982 (photos B-I to
B-21). After construction procedures had been perfected, assembly time for
each bay was approximately 8 hr for two men. Adding the free tires, insert-
ing the pipe, and moving the completed bay off the assembly platform required
an additional two men and took approximately 4 hr. Construction time was con-
siderably reduced by the use of heavy equipment and the special tools fabri-
cated by the contractor. The pipe-tire breakwater was the first of the test
structures to be moored at the test site. Hookup of the anchor lines was
relatively simple and was completed on 21 June 1982 (photo B-22).
2.02 Costs. Costs for the prototype test's pipe-tire breakwater are pre-
sented below:
B-5
~.......- .,
• " _ . . . . . . . . . ... .. ° *

Cost per TotalLinear Foot Cost
Pipe-Tire Breakwater (100 ft) 930 93,000Anchor System 640 64,000
Total 1/ 1,570 157,000
1/ Cost per square foot was $35.00.
3.0 Operation and Maintenance.
3.01 Field Observations. After only 3 days at the test site, five of the
tire retaining keeper pipe assemblies on the end of the 45-ft-long pipes had
worked loose. A close examination revealed that wave action was causing the
tires on the steel pipe to roll back and forth around the axis of the pipe.
The end tires rubbed against the keeper pipes and eventually unscrewed the
pipes from the cross couplers. By the time repairs were made, over 20 indi-
vidual keeper pipes were missing, but because the tires were held together by
the conveyor belting and since each pipe had an anchor line which prevented ..
the tires from escaping, the structure was not in danger of failing (or losing -
tires) in the relatively light summer winds. The solution to the problem was
to lift the ends of the 16-in. pipes out of the water, to replace the 2-in.
keeper pipes and cross couplers, and then to weld the keeper pipes in place.
Throughout the winter of 1982 the performance and durability of the pipe-tire
breakwater were observed closely. Wave attenuation appeared to be similar to
that of the concrete breakwater (photos B-23 and B-24). Wave action tended to
. compress the tires on the pipes, somewhat reducing the effective width of the
breakwater (photo B-25), and diffraction around the ends of the breakwater was
obvious, particularly in aerial photographs of the test site. The low profile
of the tires made visibility of the breakwater very difficult from a distance.
Often the large amount of debris that collected on top of the tires was the
most visible part of the structure (photo B-26). While the visual aesthetics
of the tire breakwater were debated, marine life in the area did not seem to
object to its presence. Harbor seals and sea birds readily appropriated the
above water portion of the breakwater as a convenient refuge, while the tires
provided a habitat for mussels, barnacles, and numerous species of fish under- .. -?
water. A dense growth of kelp (Nereocystis luetkeana) attached to the nylon -
B-6 " v''.,
.o

*. . . .. . . . . .
anchor lines. The upper portion of the anchor lines became heavily covered
• .with diatoms, hydroids, mussels (Mylitis edulis), and the red alga
(Neoagardhiella). Pile perch (Rhacochilus vacca) and striped surfperch
(Embiotoca lateralis) resided near the surface by the tire reef. There were
both adult and young of the year of these species present. The undersides of
many tires were heavily covered with barnacles (Balanus glandula), but the
* mussels seemed to be mainly on the tire beads (the inner rims). Inside the
casings, some barnacles grew along with the jingle shell (Pododesmus cepio)
and a translucent tunicate (Corella wilmeriana) (photos B-27, B-28,
and B-29). , -
Even though the breakwater had hundreds of bolted connections that were being
flexed continuously, the only maintenance performed during the winter storm
period was to one keeper pipe assembly. This repair lasted through the win-
ter, but by April 1983 the keeper pipe was completely gone; and the tires
began falling off the end of the pipe and sliding down the anchor line. A
switch in wind direction caused most of the tires to work their way back onto
the pipe, and a makeshift repair was made (photo B-30).
Up to this point, all of the damage was relatively minor and could be re-
paired onsite. The first serious damage occurred during a storm on 9-10 June
1983. This storm caused one of the 16-in.-diam pipes to break at a point ap-
proximately 5 ft from one end (photo B-31). The short 5-ft section sank, but
the long 40-ft section was recovered. Both sections remained attached to
their respective anchor lines. An inspection of the break revealed an edge
that had been prepared for welding but which had been only partially welded.
The weld failed, and the pipe sections parted. On 12 July 1983, a second pipe
broke, lost its styrofoam flotation, and sank before it could be recovered.
On 19 July 1983, the tire keeper pipes on the north side of the center pipe
failed, and the pipe was protruding approximately 20 ft to the south
(photo B-32). The 45-ft-long pipe was still intact, and both anchor lines
were holding.
The two 45-ft-long pipes which broke were located adjacent to each other on
the west end of the tire breakwater. This situation permitted a considerable
amount of wave transmission through the gap between the concrete float and the
B-7
S. ....- *. . . .

tire breakwater; consequently, any wave attenuation data collection while the
breakwater was in this condition was suspect. Also, since only the center
pipe anchor lines were instrumented with anchor load cells, failure of the
retaining pipe on the north side of the center pipe complicated interpretation W
of anchor force readings. The high probability that no meaningful data were
being collected prompted a decision to remove the breakwater to prevent fur-
ther deterioration.
On 5 August 1983, after 414 days of testing, the pipe-tire breakwater was re-
. moved from the West Point test site. Four Corps personnel disconnected the
breakwater in approximately 3 hr. The breakwater was towed 3 miles from the
test site to the Lake Washington Ship Canal by a Corps workboat (31 ft,
300 hp). The tow required 6 hr, even though tidal currents were relatively
minor (photo B-33).
3.02 Posttest Inspection. On 12 August 1983 an inspection of the tire break-
water was conducted. . "
The short 5-ft sections of the two broken 16-in.-diam pipes were recovered.
Both showed evidence of a complete, but poor, ring weld (photo B-34). The
45-ft pipe was found to have been constructed from two pieces of pipe (40 and
5 ft). Corrosion and continual flexing led to eventual failure. While the
breakwater was being removed from the test site, the application of minor lat-
eral loads inadvertently broke three more 16-in.-diam pipes. All the breaks
occurred at exactly the same welded joint, 5 ft from the end of the pipe.
Ten conveyor belt connections were inspected. Eight of the connections,
which use five 1/2- by 2-in. nylon bolts, had one or more broken bolts. Only
those connections on the perimeter of the breakwater were accessible for in-
spection. Two bolt patterns were used in fastening the belting together,but no conclusions regarding their relative performance could be drawn
(photos B-14 and B-15).'..-
One conveyor belt section showed evidence of heavy wear, with approximately
25 percent of the material worn away. Otherwise the conveyor belting was in "
excellent condition (photo B--5).
B-8

The beads of many of the tires that encircled the pipes had worn down to the
wire reinforcing. The loose wire was found wrapped tightly around the 16-in.
pipes. The wear on the beads did not appear to weaken the tires signifi-
cantly. The surface of the 16-in. pipe was pitted, but corrosion was not
severe enough to compromise the structural integrity. The reinforced portion
of the pipe where the anchor line connection was made showed very little wear.
None of the cotter keys that secured the anchor line clevises were made of
stainless steel. All were corroded and could often b broken off by hand.
Some pitting of the clevises was noted.
Of the 14 keeper pipes on the seven remaining 16-in. pipes, four had partly
failed, and two had failed completely. Several of the 2-in.-diam keeper pipes
were badly corroded, particularly in the vicinity of the threads at the cross r.
coupler.
The urethane foam flotation was removed from four tires. The samples were
weighed immediately and then dried for several months and reweighed
(photo B-36). The displaced volume of each sample was then measured to allow
a calculation of foam density. Foam flotation data are presented in the table
below.
Density .."""Dry Wet Saltwater Volume Denit
Sample Weight Weight Displacement (lb/ft3 )Number (lb) (lb) (lb) (ft3 ) Dry Wet
1 1.1 3.4 28.5 0.42 2.7 8.22 0.8 1.8 20.5 0.31 2.6 5.93 0.8 2.4 18.6 0.28 2.9 8.54 1.9 4.3 21.8 0.33 5.7 13.1
Average 1.2 3.0 22.4 0.34 3.5 8.9
Based on this information the actual flotation provided by each foamed tire
was far lower than the desired 75 lb. The fact that the breakwater did not
appear to have flotation problems can be accounted for by a lack of any silta-,
tion (original estimate was 11.0 lb/tire for sediment and biofouling) and much
lower than anticipated anchor line forces. (The actual vertical component ofthe anchor line load was approximately 20 percent of the original design
B-9
::; ,,o .

estimate.) With these two corrections to the buoyancy calculations, the re-
serve buoyancy of the breakwater was 5,000 to 10,000 lb even if each of the
4 ~880 foamed tires provided only an average of 22.41 lb of flotation. *
Additional information on the design, construction, and use of floating tire
-~~ breakwaters is available from references B-3 through B-6.
B-1

APPENDIX B
REFERENCES
B-I. Harms, V. W., "Design Criteria for Floating Tire Breakwaters," Journalof the Waterway, Port, Coastal and Ocean Division, ASCE, Vol. 105,No. WW2, Proc. Paper 14570, May 1979.
B-2. Olson, R. M., Essentials of Engineering Fluid Mechanics, 2nd ed., In-ternational Textbook Company, Scranton, Pennsylvania, 1966.... iij
B-3. Bishop, C. T., "Drag Tests on Pipe-Tire Floating Breakwaters," NationalWater Research Institute, Canada Centre for Inland Waters, Burlington, .-
Ontario, Canada, November 1981.
B-4. Bishop, C. T., Harms, V. W., and Westerink, J. J., "Pipe-Tire Break-water Model Tests Data Report," National Water Research Institute,Canada Centre for Inland Waters, Burlington, Ontario, Canada, March1982. "'"
B-5. Bishop, C. T., "Floating Tire Breakwater Buoyancy Requirements,"National Water Research Institute, Canada Centre for Inland Waters,Burlington, Ontario, Canada, May 1982.
B-6. Cornell University, "Guidelines for the Effective Use of Tire Break-waters," Bulletin No. 197, Cornell University, Ithaca, New York, 1982.
. '. %~
B-11
....... A...

Photo B1. Truck tires (1,650) being Photo B-2. Closeup showing holeprepared for assembly of the pipe- for draining water from tires.
* tire breakwater.
*Photo B-3. Photo depicting urethane Photo B-4. A fork lift movingfoam that was sprayed into the tires. tires to the assembly platform.
-" . . - °
Itt
Photo B-5. Placing the first row of Photo B-6. Belting being placed11 tires (note belting around center around the first row of tires.3 tires).
B-12

Ir-.~~~~~ ~ ~ ~ ~ W. -. r:V;W .WUV--rVTW
v-.,Photo B-7. Center tires of two Photo B-8. Belting being shoved"''
vadjacent rows being joined with through the tire row on a woodit
belting plank.
Photo B-9. A device, fashioned from Photo B-10. Close-up of devicean auto jack, being used to tighten for tightening belting.belting.
Photo B-Il. Marking the hole pattern Photo B-12. Holes being drilledon the belting. in belting (locking pliers
holding belting in place).
13~
- . . . . . . . . . . . ..-.... *.~

Photo B-13. Closeup showing a punch- Photo B-14. Melting the ends ofshaped bit used to make holes in the the 1/2-in.-diam nylon boltstires and belting. (note 2-1-2 bolt pattern).
Photo B-15. Photo depicting 3-2 bolt Photo B-16. Closeup showing boltpattern used for the majority of which fastened the belting to theconnections. tires (all such bolts broke, with
no adverse consequences).
Photo B-17. Photo showing two bays of Photo B-18. Free tires beingtires after being assembled on the shoved into the beamwise row priorplatform. to insertion of the pipe.
B-14
.V-
• ' ._2 . , B;-2 "

Photo B-19. Styrofoam-filled pipe Photo B-20 Securing the keeperbeing shoved through a beamwise row pipes.of tires.
Photo B-21. Launching of completed Photo B-22. Pipe-tire break6,-Ler*pipe-tire breakwater. in position at the West Point test
site.
Photo B-23. 1.5-ft-high waves washing Photo B-241. Photo showing thieonto the pipe-tire wave breakwater. wave attenuation capabilities
of the breakwaters to be equal.ir
B-15

.~~ ~ . .
Photo B-25. Wave action compressing Photo B-26. Photo illustrating'"-"
the tires on the pipes. low visibility of the pipe-tire -;:.
breakwater during bad weather. _ "
KK:
rrr~n• -'- ----
Photo B-27. Harbor seal resting on Photo B-28. Birds resting on the
the tires (note kelp attached to pipe-tire breakwater.anchor lines).
'. - <, - -. '--'
. I.
* .]
Photo B-29. Underwater photo showing Photo B-30. Photo showing keeper -
how the inside of the tires provided pipe repair which prevented addi-an excellent habitat for mussels. tional tires from falling off.
B-16
. . .- ,. •. .,.
[,:... ..................... ..................... y:>
4 ', •- ' '* * L _.'%."
-- ,- *. :c.'.. " •"• - - """ """ "~ ,--. " * * t. * """ '" .L ._" - " _,,; ,, , ,-:,,.' ° ] .. A ' .. Ji, ],, -,

Photo B-31. A 45-ft pipe pulling out Photo B-32. The center pipe pro-after breaking at a welded joint. truding from the breakwater after
failure of keeper pipes.
-I -_=:.
Photo B-33. The tire breakwater Photo B-34. Photo showing a ...being removed from the test site clearly broken 5ft section of
20~~ pecn) .a tire.
on 5 August 1983. pipe indicating an incomplete'"
weld. ; -
B-17-.7
I..: + / . .. \, .
20- p.ercent),
a*** tire..

-.- - .- -7 . .e . -J V .710-.2 W7 T. -.1
h
APPENDIX C
ANCHOR SYSTEM: DESIGN, CONSTRUCTION,OPERATION, AND MAINTENANCE .
1.0 Anchor System Design.
1.01 Original Design Assumptions. Design anchor line loads for both the
concrete breakwater and the pipe-tire breakwater were calculated for the
design wave condition of H. = 6 ft , T = 5 sec combined with tidal and
wind driven current of 4 fps. The total estimated maximum anchor loads
were 44,000 lb per anchor for the concrete breakwater and 6,000 lb per
anchor for the pipe-tire breakwater.
1.02 Description of Concrete Breakwater Anchor System. The concrete
breakwater was anchored in place by ten 30-ft-long steel H-piles (HP 14
by 102) embedded their full length (photo C-I). Anchor lines consisted
of 1-3/8-in.-diam galvanized bridge rope with 15 to 30 ft of 1-1/4-in. stud
link chain at each end (photos C-2 and C-3). Details of the concrete break-
water anchor system are shown on the construction drawings in figure A-11.
The bridge rope anchor line was chosen because, when combined with an
anodic corrosion protection system, it appeared to be a cost-effective de-
sign if maintenance over a 50-yr life is taken into account. The prototype
test breakwater anchor lines did not have anodes attached because of the
short test duration. For the design conditions, the steel H-piles were
considered the most suitable type of anchor for this project because the
cost of steel pile anchors was considerably less than alternatives such as
gravity (concrete block) or ship-type (stockless) anchors, and the conse-
quences of dragging a gravity or ship-type anchor over either a sewer out-
fall lying to the north or a cable area to the south were potentially very
serious.
Anchor line lengths were sized to provide a scope no steeper than 1 vertical
to 4.5 horizontal. Actual catinary measurements of the concrete breakwater's
anchor line No. 7 were made by divers during the test program. Results of
these measurements are shown in figure C-i. Positioning of the four corner
C-1.')'

4 -.- -- -. k ~LI N7A,-.~. . -.. x :
.44)
~t4
-AJ
0'4
LU Q
.JJ
Cc0
CCU
cc VZ <
0 i.- ACC~
*~c U., ..
zt
C-2
-1J"

, , r- r:- , - -:.-, ,.-,. -. . . ,- w = - - 7 - r ,- 7 - .- -* ,- -I7i-. -v _ -- -rw~-L : -7
H-pile anchors at a 5-deg inward angle was designed to provide resistance to
longitudinal displacement of the breakwater.
A 2,000-lb (submerged weight) concrete clump weight was attached 44 ft from
, the upper end of each anchor line. The purpose of this design was to produce
*' a more even anchor line tension over the full range of tides and thereby to
reduce the horizontal excursions of the breakwater, particularly at lower tide
elevations. Initial anchor line tensions were 5,000 ± 1,000 lb. In September
1983, the clump weights were removed for the last 4 months of testing to de-
termine how their absence would affect float motions, anchor forces, and wave
attenuation. Initial (i.e., ambient) anchor line tensions dropped from
5,000 lb to approximately 1,500 lb after removal of the clump weights.
1.03 Description of Pipe-Tire Breakwater Anchor System. The pipe-tire break-
water was anchored alongside the concrete breakwater with ten 20-ft-long steel
H-piles (HP 12 by 53). Anchor lines consisting of 1-1/4-in.-diam, three-
strand nylon rope with 10 ft of 3/4-in. stud link chain at each end were at-
tached to both ends of each 16-in.-diam pipe (photo C-4). The scope for these
anchor lines was no steeper than about 1 vertical to 4 horizontal. The center
and end H-piles had one anchor line each, while the remaining four anchor
piles were attached to three anchor lines apiece. The four end pilings were
offset at an outward angle to counteract the opposing longitudinal component
of force from the adjacent anchor lines. Details of the pipe-tire breakwater
anchor system are shown on the construction drawing in figure A-11.
1.04 Laboratory Tests of Anchor Lines. Prior to the installation of the
breakwaters at the West Point test site, the specified breaking strength of d :
the anchor lines was verified in laboratory tests conducted at the University
of Washington's 2.4-million-pound Baldwin testing machine (photo C-5). The
1-3/8-in.-diam steel rope failed in the center of the test specimen (at a load
of 204,000 lb), 29,400 lb above its rated strength of 175,000 lb. Elongation
of the 10-ft-long test specimen, when the break occurred, was 1.8 percent.
The socket that was attached to each end of the test rope was the same type
used on the concrete breakwater's anchor lines.
The 1-1/4-in.-diam nylon rope was available in two stiffnesses: soft lay and
C-3 ..

hard lay. Ten-foot-long test specimens of each stiffness were tested both
dry and wet (1-month soak in fresh water). The table below shows the breaking
strength and elongation at failure. Only the hard lay test specimen had a
breaking strength greater than the required 37,500 lb (photo C-6). The hard
lay breaking strength was nearly 25 percent greater than that for the soft lay
for the dry test specimens. Soaking the test specimens in water reduced the
breaking strength by 14 percent for the hard lay and 10 percent for the soft . .
lay. In June 1984 an 11-ft-long section of one nylon anchor line was recov-
ered from the test site to determine the effects of wear and aging. This rope
was tested by the U. S. Army Engineer Waterways Experiment Station, Structures
Laboratory. Two of the three strands broke 3 ft from one end at a load of
27,000 lb, with an elongation of 65 percent at maximum load. The original
stiffness of this test specimen (hard or soft) could not be determined.
Depending on its original stiffness, the breaking strength of the used anchor
line was reduced by either 19 percent (soft lay) or 32 percent (hard lay).
Test Maximum Load ElongationSpecimen (lb) (%)
Hard Lay, Dry 45,900 44Hard Lay, Dry 46,600 46Hard Lay, Wet 39,750 44Soft Lay, Dry 37,450 40Soft Lay, Dry 36,800 45Soft Lay, Wet 33,400 33
2.0 Anchor System Installation.
2.01 Foundation Conditions. Prior to final selection of West Point as the
prototype test site, an investigation of the foundation conditions at the site
was made. In April 1981, a drill barge was used to take bore samples at five
locations near the proposed anchor pile positions (photo C-7). The investiga-
tion found that the anchor locations were on a relatively steep (approximately
1 vertical on 6 horizontal) marine slope characterized by a thick mantle of
medium dense sand and gravelly sand with the gravel content usually increasing
with depth. These materials are probably underlain by very dense glacial de-
posits at depths greater than 35 ft. Foundation exploration at the anchor .'..
c-4-
•w.°

pile extremities was conducted at the locations shown in figure C-2, and bor-
ing logs are shown in figure C-3. The borings indicated that stake pile an-
chors could be driven to depths of 25 to 35 ft.
2.02 Pile Driving. The pilings were driven using a Vulcan 010 hammer with a
10,000-lb ram weight and an 8,000-lb mandrel (photo C-8). A special fitting
E1604000 E1605000
N N24500
~ 81-WB-4
PROPOSED BREAKWA TER
81 -WB-2* ELEVATIONS GIVEN IN FEET
DATUM PLANE MLLW (NOAA)
C 0 LAMBERT GRID COORDINATES
FIGURE C-2. Foundation Exploration Test Hole Locations
C-5
------------------------------------.-.. .

SILTY SAND; FINE-MED; SHELL AND WOOD FRAGMENTS. 8-WB4
10 GRAVELS AT BOTTOM.
' - " -2 0 N = 2 8,: . ?20
SILTY SANDY GRAVEL; 2" MINUS; SHELL FRAGMENTS. I N=29
8 ~~~N==69" xr.81 -WB-3
30SILTY SAND: MINOR WOOD AND SHELL
FRAGMENTS; GRAVEL % INCREASES WITHDEPTH
40
81-WB- N=7MED. TO COARSE SAND WITH SILTY SAND, FINE,
50 2" GRAVELS; SHELL FRAGMENTS. ORANICS AND SHELL
FRAGMENTS 81-WB-581-WB-2 OCASSIONAL I" GRAVEL
BELOW 32'.
60
II 1N=45
-7 [SILTY SANDY GRAVEL; 11/2" MINUS
70 SHELL AND WOOD FRAGMENTS.3" MINUS GRAVELS AT BOTTOM.
GRAVELLY SILTY SAND; N=38MED. TO COARSE
80 I/2" MINUS GRAVELS. 'HI-GRAVELSHELL AND WOOD ALL ELEVATIONS ARE MINUS (-)
FRAGMENTS. rn 2" SPLIT SPOON; 30" STROKE; 140# HAMMER3" SPLIT SPOON (FOR SAMPLE ONLY)DATUM IS M.L.L.W. ow-,
90
SN=38
FIGURE C-3. Foundation Exploration Boring Logs
C-6

was attached to the mandrel to hold the piling in proper alignment while it
was being driven (photo C-9). Two 1/2-in.-diam bolts held the piling and fit-
ting together until the piling was lowered to the bottom. The first blow of
the pile driver hammer sheared the bolts, allowing the mandrel to be brought
back to the surface after the piling had been driven approximately 3 ft below
the mudline (photo C-l0). Typical pile driving records for the 30-ft and for
the 20-ft-long piling are shown in figures C-4 and C-5.
The pilings were driven with the anchor lines attached. Piling No. 7, a
30-ft-long piling on the north side of the concrete breakwater, was inadver-
tently driven on top of the steel anchor cable, and an attempt was made to re-
move the piling by pulling on the anchor line. A horizontal load of 20 tons
and a vertical load of 50 tons were applied with no effect. The problem was
solved by using divers to excavate the top of the piling and to cut the cable.
After the cable was resocketed, an extra length of chain was attached to the
anchor, and the steel cable was reattached.
2.03 Anchor Line Tensioning. After the pilings had been driven and the con-
crete breakwater brought in position, the clump weights were attached near
the upper end of the anchor line (photo C-11). The anchor lines then were
pulled up through the hawse pipes with hawsers put in place during the
launching process. After an appropriate number of links of the upper chain
had been pulled through the hawse pipe, a slotted keeper plate was placed
around one of the chain links, and the anchor line was secured by lowering
the chain until the keeper plate was jammed against the bottom of the chain
locker (photo C-12). The amount of tension applied to each anchor line was
monitored with a dynamometer (photo C-13). Initial anchor line tensions
were approximately 5,000 lb. (After removal of the 2,000-lb clump weights
in September 1983, the ambient anchor line tensions dropped to approximately
1,500 lb).
Since the anchor lines crossed under the breakwater (a typical design to pro-
vide keel clearance for vessel tie-up), the hawse pipes were angled in oppo-
site directions to produce about a 1-ft horizontal clearance at the crossing
point. Anchor lines (Nos. 1 and 6) were pulled up in the wrong sequence,
and they rubbed against each other. By the time an underwater inspection
C-7

PILE PLACEMENT LOG Date_________________ t of 21 * ~
Floating Breakwater Prototype Test Program American Construction Co.,* Inc.West Point, Seattle.Washington 411-13th Street S
Contract No. DACW67-81-C-0208 Everett. WA 98201Job No. 50-81
Pile: Type l+P 1?.x S3. Hammner: Make & Mod. h.c-..oiLength 2 Stroke_____________
Ram Weight IOp k'Q~oPenetration calculation:
Mandrel: Material Z4 Z; kee PnBefore pile is driven and with pile Weight____________tip resting on the bottom: Length_______
Water line reading Driving: Finish Time /#sop3on mandrel ___Start Time 14 f8
Driving Time_________+ pile length ___
*tip to water line ____Coordinates:
-tide reading Calculated: N a 4-3% o o=bottom elevation E 4- E . 4-oe.oo>
Final: N___________After pile is driven: E___5__A________F:
Water line reading Remarks: fA/-ApchiecI .A',d eq/on mandrel $
-Tide reading r. - 4y !.e r c ) ,^*Top of pile elev. ___
FtBos Pile No. _ _ _ _ _ _ _ _ _ _ _-
Ft Bows FtrB ows Ft;Blos_ 11: j __ 12 31_ __ _ __ _
~~ 13~ 23 31_ _ _ __ _ _ _ _
4- 14i 4-_ __24_ __4
15. 267 365______________________
29 9 Recorder
ttF L o 01 10
FIGURE C-14. Pile Placement Log I
C-8

M-71~~~~- - 4 ~r0 VWT
*PILE PLACEMENT LOG Dae/a 198Z sheetllof 21
Floating Breakwater Prototype Test Program American Construction Co., Inc.West Point, Seattle,Washington 411-13th StreetContract No. DACW67-81-C-0208 Everett, WA 98201
Pile Typ HP i4'.o~-Harmer: Job No. 50-81
Pile:_ype _HP_____~___Hammer:__ Make & Mod.. Vjttc qv 1Length 30 Stroke_____________
Ram Weight J0,000Penetration calculation: 1
Before pile is driven and with pile Madel Waeialt ?'0c o0ee as5tip resting on the b9ttom: Length___________
Water line reading' Driving: Finish Time_________on mandrel ___Start Time / /7
Driving Time__________+ pile length ___
*tip to water line Coordinates:-tide reading Calculated: N L 4 4-)3O=bottom elevation 43Ei &oa4.F ?
Final: N___________After pile is driven: E____________
Water line reading Remarks:________________on mandrel ?7, 1 /
-Tide readingTop of pile elev. __
____~~~~O __________ pc.r y:Ft 81 ws Pile No.
I Ft,!BlowsFt Blows Fti~Tos
2 121 4-___32!__/__4-
3 ky 131 231 'i 3 3,1
ji_ _ _ __ _ _ _ __ _ _
I.i
5'7- 1 7 25
6 161 9261 )q __ _ _ __ _
8 _ 18 _ 8 387__
191 a~ Recorder 6 5
FIGURE C-5. Pile Placement Log 11
discovered the problem 3 months later, several tenths-of-an-inch of the steel
anchor chain had been worn away (photo C-14). Anchor l1ne No. 6 was replaced rwith the aid of commercial hard-hat divers and US Army Corps of Engineers .-
(Corps) equipment and personnel (photo C-15).
Emergency operations such as this, which required the use of commercial
C-9

i- 7 - 7 -- r ---- 7 - --T 7 -- 777-
divers, a large Corps floating plant, and six to eight deck personnel (in
addition to a four-man dive team) cost approximately $3,000 per day of work.
The exposed location of the test site added the complication of uncertain
weather. On several occasions, scheduled repair work had to be canceled be-
cause of high winds. Cancellations of this sort cost between $500 and $1,000
each.
2.04 Anchor Line Stiffness Test (Pull Test). On 18 August 1983, a marine
tugboat was used to pull on the concrete breakwater with varying loads while
surveying instruments measured horizontal displacements of the breakwater, and
load cells monitored anchor line forces and tow line loads (photos C-16 and
C-17). This test was conducted to obtain simultaneous measurements of break-
water lateral displacement and the resisting anchor force. Results of the
test are shown on the plot of anchor line force versus horizontal displacement
(figure C-6). The anchor stiffness (slope of this line at any point) varied
5,5
4
0
z 3 "[ -i
o L
0 2 3 4 5 6 '. .
HORIZONTAL DISPLACEMENT, FT , , ,
FIGURE C-6. Concrete Breakwater Anchor Line Pull Test: ..Anchor Line Load versus Horizontal Displacement
C-)1
c- -
2-%=%'
o[1L'[[

-..
from 300 lb/ft when the load in the anchor line was 2,000 lb above ambient,
to 1,700 lb/ft at a load of 5,000 lb above ambient. The rapidly increasing
anchor stiffness measured in this test explains why visual observations of the
concrete breakwater did not detect a measurable lateral displacement even in
fast currents or high waves (photo C-18).
At the time of the pull test, the two concrete floats were rigidly bolted to-
gether, and the clump weights were still attached to the anchor lines. The
ends of a Y-shaped pulling line were attached to the breakwater at the lifting
* eyes located 15 ft in from each end of the floats. The pulling hawser from
the tug was attached to a snatch block which was allowed to move freely on the
cable running between the two lifting eyes. This arrangement was used to as-
sure that the same pulling load was applied to each end of the breakwater.
Load cells were placed in both ends of the pulling line near each lifting eye.
The tugboat had considerable difficulty pulling exactly at a right angle to
the breakwater. Since the anchor system was fairly compliant along the longi-
tudinal axis, large excursions were measured when the tug pulled to one side
or the other. Longitudinal movements of up to 34 ft were measured; so care
was taken during the analysis of the pull test data to select only those mea- W7
*[ surements that were made when the tug was pulling perpendicular to the break-
- water (i.e., minimal excursions in the longitudinal east and west directions).
3.0 Operation and Maintenance.
"' 3.01 Wear and Corrosion. Except for the installation difficulties discussed
previously in this appendix, no problems at all were experienced with the
anchor systems of the test breakwaters. On the concrete breakwater anchor
line, very little wear was observed on the keeper plates, chain, shackles,
* and sockets in the anchor line itself (photo C-19). The only significant
wear point appeared at the shackle that attached the clump weights to the
anchor lines (photo C-20). The shackles that attached the7 clump weights to
* the anchor lines of the south side of the breakwater were worn considerably
more than those on the north side. The predominant wave approach was from . .
the south, but exactly why this should cause a marked difference in the wear
of the clump weight shackles can only be surmised. Corrosion of the concrete I
! .°. . N -.

-R166 247 FLOATING BREAKWATER PROTOTYPE TEST PROGRM: SEATTLE 2/3URSHINGTON(U) COASTAL ENGINEERING RESEARCH CENTERVICKSBURG HS E E NELSON ET AL. NRR 06 CERC-NP-896-3
UNCLASSIFIED F/G 13/2 NL"
nIE-EEEEmhuEEilENhEE/l/EhIEllEEEEllElllEEllllEEEEEEEEEIEEEEllllllIlEIlllll/IllEEEEE

.'I SI
IIIII ~ 122
1 1135
i1111
MICR()CCPY RES,TO N rf~ TEST CHARTj

breakwater anchor line hardware did not appear to be significant; however,
the galvanizing was completely gone from the steel bridge rope, and all the
individual strands of the bridge rope that were examined were noticeably
rusted (photo C-21). Several strands in the vicinity of the clump weight
attachment clamp had broken. Some algae attached to the upper chains of the
concrete breakwater anchor lines. Virtually no marine growth took hold on . .
the galvanized anchor lines, but mussels, tunicates, and anemones had begun %
to attach to the clump weights by the time these weights were removed in
October 1983 (photo C-22).
The pipe-tire breakwater anchor line showed only minor wear at the attachment
points. The eye splices, shackles, and chain were in excellent condition
after 1 yr of hard use. However, the cotter keys that secured the shackle,'. .-
nuts were obviously not made of corrosion resistant material and were nearly
destroyed by the time testing of the pipe-tire breakwater was complete
(photo C-23). (All cotter keys on the concrete breakwater were stainless
steel and were not corroded.) The pipe-tire breakwater anchor lines proved
to be an excellent substrate for marine growth (photo C-24). Because the
anchor lines descended at a shallow angle, kelp attached to them and grew
to the water surface in an area 50 ft to either side of the breakwater. The
kelp was an additional attraction for the artificial reef community that was-_--_-.
establishing itself in, on, and around the breakwater.
3.02 Anchoring and Unanchoring Procedures. After the initial anchoring of
the test breakwaters, the concrete breakwater was removed three times and re-
anchored twice. The pipe-tire breakwater was not removed until the end of its
test period.
The first time the concrete breakwater was unanchored, the Corps' debris boat,
Puget, was used to lower each anchor line to the bottom with a 70-ft-long,
1/2-in.-diam steel rope (photo C-25). The reanchoring plan called for re-
trieving the anchor lines without using divers; consequently, surface floats
and 100-ft-long lengths of 3/4-in.-diam polypropylene rope were fastened to
each of the 1/2-in, steel ropes. When the breakwater was brought back to the
test site by the Puget for the first reanchoring, divers were hired to stand
by in case the original plan failed. Soon after the Puget arrived at the
C-12
,w.-.-.S*.*.*.*.*'*• • o. . . . - •. ° , , . ' * - . - - - . * . / • .

- - .. . .. . .-
site, the complexity of the situation became evident. The divers reported
that all the retrieving lines were severely tangled. Several hours of work by .4
hard-hat divers were required to straighten the retrieving lines and reanchor
the breakwater (photos C-26 and C-27).
Another method of unanchoring and reanchoring was tried when the breakwater
was removed for the second time. Large polypropylene hawsers were attached
to the clump weight shackle on the four corner anchors by divers. Then the
anchor lines were lowered to the bottom with a double length of 3/4-in. poly
line which was retrieved after the anchor line was resting on the bottom
(photos C-28 and C-29). Care had to be exercised in choosing the dropping
order to avoid applying a twisting torque to the breakwater. Upon returning
to the test site, the divers temporarily moored the breakwater to the four
corner hawsers which had been left floating free during the breakwater's
absence. A diver then attached a lifting rope to each of the anchor lines
which were laid out on the bottom in perfect order (photo C-30). This time,
the reanchoring process went very smoothly and was completed in less than
1 hr of diving time (photos C-31 and C-32).
The final unanchoring was the easiest of all. After the breakwater had
been secured to the four large hawsers (still attached to the clump weight
shackles), the Puget's crane raised the anchor chains in the hawse pipe; and ,S
the keeper plate was removed. A Peck and Hall quick-release hook was used to
connect the lifting line to the anchor chain. After the keeper plate had been
removed, the release hook was tripped, and the anchor line was dropped to the -
bottom (photos C-33 through C-36).
Unanchoring the pipe-tire breakwater was less dramatic. The nylon anchor -7J
lines were fished to the surface with a grappling hook, the shackle holding
the upper chain to the rope was unfastened, and the rope was released. All
work was done by hand from small skiffs.
Additional information on anchor system design is available in references C-i 7F
through C-5.
C-13
*4 C-1 3•
* -:

APPENDIX C
REFERENCES
C-i. Bitting, K. R., "Fatigue Failure in Nylon Rope," Marine TechnologySociety Journal, November 1980.
C-2. Boivin, M. J., "The Effects of Mooring Cable Connecting Location onthe Operating Characteristics of a Twin Pontoon Floating Breakwater,"Master of Science Thesis, University of Washington Department of CivilEngineering, Seattle, Washington, November 1970.
C-3. Atturio, J. M., Valent, P. J., and Taylor, R. J., "Preliminary Selec-tion of Anchor Systems for OTEC," Technical Report R853, Naval CivilEngineering Laboratory, Port Hueneme, California, March 1977.
C-4. Olsen, 0. A., Kvalstad, T., Lereim, J., Lohne, P. W., and Namork, J.,"Deepwater Operations Demand Safe, Stable Anchoring," Petroleum Engi- Pneer International, May 1982.
C-5. Berteaux, H. 0., "Design of Deep Sea Mooring Lines," American Societyof Civil Engineers Preprint 1199, ASCE National Structural EngineeringMeeting, Portland, Oregon, April 1970.
C*1..4
C-14 ,",".-
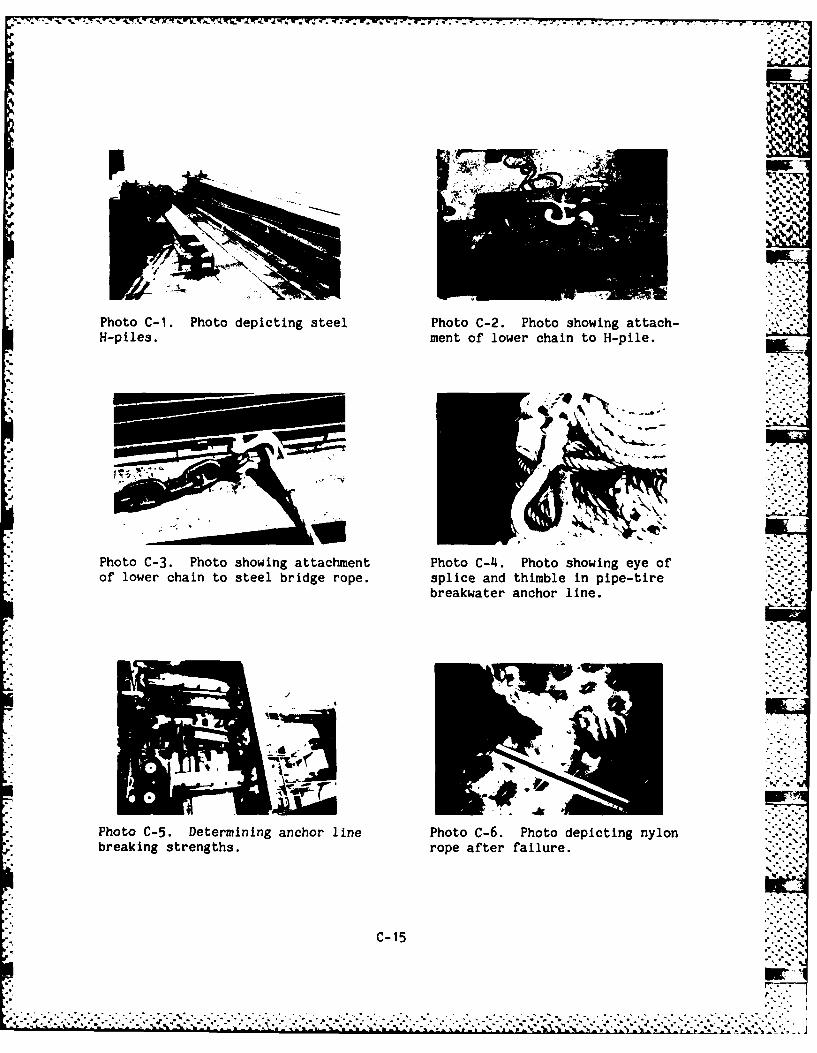
~ "% %'
Photo C-i. Photo depicting steel Photo C-2. Photo showing attach-H-piles. ment of lower chain to H-pile.
tt,.
Photo C-3. Photo showing attachment Photo C-4. Photo showing eye ofof lower chain to steel bridge rope. splice and thimble in pipe-tire
breakwater anchor line.
b strengths. " a f
C11Photo C-5. Determining anchor line Photo C-6. Photo depicting nylon "''''breaking strengths. rope after failure.,-€. ,.. -,-
C-i5;..'.
N -X .- a a-.. --. • " -". ..... ...... . "'. '-"a*. .*. ", , .'- . -." ".. . .' ", " 4 .... 4 .. " a. , *-...-'

a-
Photo C-7. Drill barge taking bore Photo C-8. Piling being driven.samples at the test site.
,>
7.
Photo C-9. Photo showing special fit- Photo C-10. Close-up of fittingting used to hold H-piles in proper used to drive H-piles. .,..,, -
alignment for driving.
• --. .-.'-.'
Photo C-11. Attaching clump weights to Photo C-12. Upper chain being ,the concrete breakwater's anchor lines, placed in slotted keeper plate ,,
on concrete breakwater.
."..
• 4.- C-i 6.:2;- .,..- _. -,/< ::: 2 ' : . : _:: !: :i-i i :-:: .:- . _. :::__- :-;.;>:•: >:- :S

L .
Photo C-13. Monitoring anchor line Photo C-14. Underwater photo oftension. anchor lines rubbing against each
other.
Photo C-15. A new anchor chain being Photo C-16. Tugboat pulling toreadied for installation, determine anchor line stiffness. LJ'
I.- -*.-.
Photo C-17. The concrete breakwater Photo C-18. Vertical photo oftipping in response to the tug's fast currents running past thepull. breakwaters (note current gen-
erated waves).
C-17
. .. .

r . .1,
..b
*1
°! , p. . ,.
Photo C-19. Photo depicting good Photo C-20. Photo depicting
condition of anchor line hardware at shackles that attached clumptest completion. weights to worn anchor lines.
Photo C-21. Photo depicting clump Photo C-22. Removing clump weightsweight attachment hardware (note cor- (note numerous marine organismsroded steel bridge rope anchor line), attached to the weights).
Photo C-23. Photo depicting corrosion Photo C-24. Photo of marineof the mild steel cotter key in a growth covering the nylonshackle bolt. anchor line..
C-"18
w

• ...W7
Photo C-25. Photo depicting the de- Photo C-26. Encountering some.[-.'.bris boat, Puget, which was used ex- difficulties during the first """tensively throughout the test program. reanchoring operation. -,..
It
Photo C-29. Anresuine dtensioneing Photo C-30. Utilizirng diver to'.tmoare dritea nng siplf the secon coceeberae horie ng.'--
I i i"C-19
:. . . . . .. . . . . . . . . . .. . . . . . . . . .. . , .. . . '..::,
-"."-.v' Photo"-"- C.-' -2 . "Poodpitn h de-"--".'',". - Photo,' .'-. ",C."-[,'-." 26,' ."" "'"'.""-.-",".-".-". " .- ". Encouterin"somz_.z.*bris_ b=L' o t , P ug,_L ,.,pe , which t= was used.. .. ex dficlte duin the. first =-=g,=#,: . ..

7-T~~.. -T,.7 7 - Q
-Photo C-31. Raising of an anchor Photo C-32. Resuming monitoring*line after it was connected to a of the second reanchoring.
I lifting cable by divers.
Photo C-33. A quick-release hook Photo C-34I. Removing the keeperbeing used for the third and final plate prior to dropping the anchorunanchoring. line. --
*Photo C-35. Anchor line falling Photo C-36. Towing the break--away after tripping release hook, water from the test site for
the final time.
C-20

APPENDIX D
CONNECTOR TESTING
1.0 Introduction. One of the major goals of the test program was to investi-
gate various methods of connecting (or fendering) the two 140-ton concrete
floats. Four different connection methods were tested. The first two methods
involved two types of flexible connections. The third method involved com-
plete disconnection (with fendering), and the fourth involved rigidly bolting
the units together. The rigid connection and the fendering (with one modifi-
cation) were successful, but neither of the flexible connector designs sur-
vived their test period undamaged.
2.0 Vertical Fender Connector. Both types of flexible connectors using com- ".:.-:
mercially available butyl rubber marine fenders were of the same basic design,
except that the fenders were oriented vertically in the original connector and
horizontally in the second. Each of the vertical connectors was composed of
two 4-ft, 11-in.-high fenders bolted nose-to-nose with 1-in.-diam bolts (pho-
to D-1). The fenders were secured to 5-ft-long steel angles by 10-3/4-in.-
diam by 1-ft 6-in.-long bolts (see construction drawings, figures A-12 and
A-15). After the connectors were assembled, the angles were fastened to the
ends of the east float by six 1-in.-diam threaded anchors which were embedded
in the concrete (photo D-2). After both floats were launched, the connector
was bolted to the west float, and the connection process was completed.
Within 5 days after the breakwater arrived at West Point, wave action had
loosened the nuts from the 1-in. bolts which held the butyl rubber fenders
together (photo D-3). With considerable difficulty, the nuts were rein-
stalled. The bolts were then double nutted, and an attempt was made to de-
form the exposed threads. This repair transferred the problem to the 3/4-in.
bolts which fastened the fenders onto each float. A number of these bolts
sheared, and eventually all were replaced with 3/4-in., high-strength steel
pins. The nuts continued to slip off the 1-in. bolts, and eventually only
four bolts were holding the two units together. A means of holding the fen-
ders together was required, but the difficult working conditions and a reluc-
tance to expose the floats to possible damage by removing the fenders at the
D- 1 .

test site limited the options available. Connecting each pair of fenders with
a U-shaped bracket was the eventual choice. The bracket was fabricated from
5-ft-long by 4-in.-diam extra strong pipes welded to a 24- by 12-in. plate of
3/4-in.-thick steel (photo D-4). It was installed by lowering the bracket
below the fenders and raising the pipes through the large vertical opening
in each fender. A second plate was then placed over the pipes and pinned in
place (photo D-5). This connection method lasted for 7 weeks, from late
August to mid-October. By mid-October 1982, wave action caused by two storms P.had deformed the pipes and broken one of the 3/4-in. steel plates (photo D-6).
To prevent further damage, the fenders were disconnected from each other, and
testing of the fendering alternative was begun.
3.0 Fendering. The fendered float configuration that evolved as a result of
emergency field modifications to keep the floats from colliding was not antic-
ipated in the original test plan. For this reason, the large rubber fenders
were removed from the east float, and wood fenders were attached to the steel
angles which had held the rubber fenders in place. (The angles could not be
removed because they sealed the twenty 1-3/4-in.-diam bolt holes which were
to be used when rigidly connecting the floats.) Large lag bolts were used tofasten bumper plates to the angles, and 3- by 12-in. timbers were bolted
horizontally between the two bumper plates (photos D-7 and D-8). The rubber
fenders were left in place on the west float.
At the beginning of the test program, the center anchor lines (Nos. 3 and 8)
were attached only to the west float. The connector was intended to transfer'. -
loads from the east float to the anchor lines through the west float. When
the floats were disconnected from each other to test the fender system, lat-
eral support for the end of the east float was provided by adding a 25-ft Ilength of 1-1/4-in. chain between the upper end of each center anchor line
and the east float. This Y-shaped anchor connection prevented excessive rel-
ative displacements between the floats while avoiding the problems associated
with using the connector to restrain the motions of the 140-ton structures
(see figure A-11 and photo D-9).
The two horizontal timbers were torn off during the next storm, leaving only
the wood bumper plates. Signs of wear on both the bumper plates and the
D-2
6in _

rubber fenders began to appear. Within 2 months the bumper plates had been
worn enough to expose the lag bolts. The next storm dislodged it completely
(photos D-1O and D-11). Just before the arrival of yet another storm system,
emergency repairs were carried out to fasten new rubber fenders and new bumper-- -
plates made of iron bark (photo D-12). This combination survived the next
month (4 storms) with no sign of wear, and 7 months of modification and
testing had finally yielded a viable connection method. On 8 February 1983,
the concrete breakwater was unanchored and towed 3 miles to the protected
waters of the Seattle District (NPS) work yard at the Hiram M. Chittenden
Locks to make the rigid connection between the two floats. .-
4.0 Rigid Connection. To allow work on the connection to be done in a dry -
environment, NPS personnel designed and constructed a wood cofferdam. The
dam was placed under the end of each float and pumped dry. Next the rubber
fenders, wood bumper plates, and angles were removed. After the embedded
bolts were cut off, the concrete surface was ground smooth. A 15/64-in.-thick mhigh density rubber pad was placed between the two floats to accommodate any
unevenness in the surfaces, and the twenty 1-1/2-in.-diam by 11-ft-long high-
strength bolts, which had been stored in the float ends for the first 7 months
of the test, were shoved through from one float to the other (photos D-13
through D-18). The cofferdam was flooded and the floats were drawn together.
Each of the 20 bolts was tensioned to 135,000 lb, and on 1 February 1983, the
breakwater was towed back to the test site to continue the test (photos D-19
through D-24). Sixteen working days (approximately 450 man-hours) were re-
quired to make the rigid connection which did not require any maintenance ormodification during the next 9 months of testing.
5.0 Horizontal Fender Connector. In July 1983, the test program was extended
by 1 year to allow additional testing of flexible connectors. The new connec-
tor again used large rubber fenders, but this time they were fastened to the
floats in a horizontal orientation. On 1 November 1983, the concrete break-
water was removed from the test site again to make this last modification.
The cofferdam was pulled into place at the connection, and the 20 connection
bolts were detensioned using a hydraulic Jack. The floats were parted about
18 in. with wedges and a small hydraulic Jack. After the cofferdam was pumped
dry, the connecting bolts were cut in half and removed. A careful inspection
D-3

of the surfaces of the two floats was made, and no spalling or cracking was
found. The rubber pad had 4-in.-square tears around several bolts in the two
lower corners and in the upper center. Otherwise the materials used in rig-
idly connecting the floats showed no evidence of damage or wear.
K Additional bolt holes were drilled in the concrete for fastening the new con-
nector brackets to the floats, and sixteen 1-in.-diam bolts were cemented into
place with epoxy grout. Each bracket was bolted in place with sixteen
3/4-in.-diam bolts (in addition to eight grouted bolts). Finally, the rubber
fenders were lowered into place and fastened to the brackets with 2-in.-diam
-" by 2-ft-long bolts (figure D-1). The cofferdam was flooded and removed, and
on 1 December 1983 the breakwater was reanchored at the test site (photos D-25
through D-35). The concrete clump weights were not reattached to the anchor %"
*. lines for the test of the horizontal fender connector.
This connector proved to be much more durable than the first (vertical fender)
* configuration. Until a posttest inspection, the connector appeared to be un-
damaged after 2 months (December and January), but a close inspection found
that three of the vertical bolts had been pulled through the rubber fender on
the north side of the breakwater (photo D-36). This damage appeared to be
progressive, and continued testing probably would have resulted in additional
- damage.
D-. 4
oJ

K, X- x. AL ]
X-4
NEW-
UNIROYAL DELTA 23A MARINE FENDER2 EACH CONNECTOR
PLAN VIEW
718" DIAM x 5'-5" L ONG BOL TS10 EACH SIDE
2" DIAM x29" LONG BOLTS
2" DIAM x 23" LONG BOLTS
SECTIONIA-
FIGURE D-1. Horizontal Fender Connector
D-5

| In ,
.- A
Photo D-1. Vertical fender connector Photo D-2. Vertical fender con- "' "*'
before being attached to the breakwater. nectors being attached to oneIft float.
Photo D-3. Vertical fender con- Photo D-4. A U-shaped bracketnector separating after 3 days being fabricated to connectat the test site. the rubber fenders.
,- " U a
Photo D-5. Photo depicting U-shaped Photo D-6. Photo depicting fail- "bracket in place. ure of U-shaped brackets aftor
7 weeks.
D-6
77-

AA
Photo D-7. Wood bumper plate being Photo D-8. Two 3- by 12-in.fastened in place of a rubber fender. timbers being bolted between
the bumper plates..--
lEEPhoto D-9. Underwater photo of Photo D-10. Photo depicting worn '.
Y-connection joining both floats condition of soft fir bumperto a common anchor line, plates after 2 months.
- - .
A',
,.. 2
Photo D-11. Ship fenders being hung Photo D-12. Photo depicting thebetween the floats after dislodging new ironwood bumper plate whichof damaged plate. proved to be more durable.
D-7
. . . .. . . .. .. . .° . * *,~
F :. ....... .... .. .. .- ..... . .. .. .. .. •.. . .. .. ...... ...-.-. ... . . ....-. .--::;; '.. .

". .% .° h "o
*Photo D-13. A wood cofferdam being Photo D-14. Cofferdamn being-placed to allow work to be done in lowered between the floats.
a dry environment.
-Photo D-15. The cofferdami being Photo D-16. Fender system hard-*dewatered after being secured. ware being removed.
*Photo D-17. Photo showing the end Photo D-18. Photo depicting*of the float after being cleaned Dywidag 1-1/4-in.-diam. steel*and ground smooth. bars and 1/4-in.-thick
Fabrieka rubber pad in place.
D-8
................ ,

*Photo D-19. Photo depicting inside Photo D-20. Photo depicting in- :-...of float with four tensioned bars side of float with six tensioned..I'
*near center line, bars near sidewall.
Y77
Photo D-21. Photo depicting joint Photo D-22. New deckhouse being.,4°•''between rigidly connected floats, lowered into place. '.
% %
I- .
Photo D-23. Returning to the Photo D-20. Resuming monitoringtest site. of rigidly connected breakwater.
D-9
• p t

% %
Photo D-25. Floats being parted Photo D-26. Connection bars beingafter rigid connection bars have cut after cofferdam is in placebeen detensioned. and dewatered.
Photo D-27. Additional bolt holes Photo D-28. Lowering connectorbeing drilled in floats, anchoring plates into position.
Photo D-29. Anchoring plates being Photo D-30. Horizontal connector ,bolted in place (water activated being lowered between the floats.sealant oozes from bolt holes).
D-10
D- O .. ....Or

-. ' -- - -~.. . . .r v---------------------------------------
'N',
.- -.
Photo D-31. New flexible connectors Photo D-32. Flexible connectorsbeing "coaxed" into position. being bolted to the anchoring
plates with 2.5-ft-long, 2-in.-diam bolts. l-
.. 2- 7. j
Photo D-33. Horizontal flexible con- Photo D-34. Photo depicting com-nector being inspected. pleted flexible connection (note
relative motion sensor betweenfloats).
Photo D-35. Waves washing over new Photo D-36. Photo depicting theflexible connection. area where the 2-in.-diam bolts
tore out of the three outermostholes of the north connector.
D-11:.?L..-

APPENDIX E
BOAT WAKE TESTING
1.0 Introduction. Because most floating breakwater applications are in
semiprotected coastal waters, lakes, and reservoirs where wind wave energy V..\S.is limited, boat wakes can be as large as the design wind waves. The size
of the boat wakes, therefore, becomes another design consideration. To obtain
additional design data on boat wake attenuation characteristics of floatingbreakwaters, four boat wake tests were conducted at various times during the . .
prototype test program. The first two tests, conducted on 31 January 1983
and 22 April 1983, used a 41-ft Coast Guard cutter to generate waves. The
third test, conducted 18 August 1983, used a 110-ft marine tug. The last
test, conducted 29 October 1983, used a 73-ft harbor tug. Details of the
boat wake tests are discussed in references E-1 and E-2.
2.0 Test Description. The first boat wake test was conducted 31 January
1983 using a 41-ft Coast Guard cutter (photo E-1). The two concrete break-
water units were in a disconnected but fendered configuration, with the
2,000-lb clump weights in place on the anchor lines. The pipe-tire break-
water was located approximately 30 ft due east of the concrete breakwater.
After the test had been completed, the data acquisition system was found to
have been malfunctioning, and no transmission data were obtained. However,
an 8mm movie camera mounted on the west float was used to film a target
on the east float (photo E-2). An analysis of the movies indicated that
the maximum excursion of one float relative to the other was approximately
±1 ft horizontally and ±9 in. vertically. The wakes were estimated to be
about 2.5 ft high with a period of 2.5 see.
The second boat wake test, conducted 22 April 1983, used the same Coast Guard
cutter. The sailing lines alternated from parallel to the breakwater to an
angle of 45 deg with respect to the breakwater (photos E-3 and E-4). The
distance from the sailing line to the breakwater varied from 50 to 250 ft.
Vertical aerial photographs documented details such as the distance from the
sailing line to the breakwater, wave approach angle, wave lengths, and dif-
fraction of waves around the breakwaters (photos E-5 and E-6). The concrete
S E-1
.*-*.S..

-.
breakwater connection had been modified to the rigid configuration that Joined
the two floats into a continuous 150-ft-long unit. No changes had been made
to the concrete breakwater anchor system (i.e., the clump weights were still .,
attached), and the pipe-tire breakwater was still in position. This time the
data acquisition system did record data on incident and transmitted waves as
well as anchor forces for both breakwaters and internal strains and wave pres-
sures on the concrete breakwater.
The third boat wake test was conducted 18 August 1983 using a 110-ft-long
marine tug (photo E-7). The size of this vessel was determined by require-
ment of the anchor line pull test which was conducted on the same day (see ac.'
Appendix C). By the time this test was conducted, the pipe-tire breakwater
had been removed. The concrete breakwater was still in the rigidly connected
configuration, and the clump weights remained attached to the anchor lines.
To make attenuation measurements, an attempt was made to orient the tug's
sailing line so that the wake crests would be parallel with the length of the
breakwater (photos E-8 and E-9). In addition, several wakes were generated
so that their crests were perpendicular to the long axis of the breakwater
(photos E-10 and E-11). This was done in an attempt to induce large bending
moments in the structure.
The fourth and final boat wake test was conducted 29 October 1983 with a 73-ft
harbor tug being used to generate wakes (photo E-12). The clump weights had
been removed from the anchor lines of the concrete breakwater, but the floats
remained rigidly connected. An eight-buoy wave array was anchored where the
pipe-tire breakwater had been located. Shortly after the test started, the
gage that measured transmitted waves was found to be malfunctioning. For this
reason, no wave attenuation data were recorded, but some information on wave
pressures, internal concrete strains, and float motions was obtained. In ad-
dition, 8mm motion pictures were taken from the fixed wave gage piling at the
east end of the test site. A rough estimate of transmitted wave heights was
made from these films.
3.0 Test Results. Analysis of the boat wake test data indicated that neither
breakwater attenuated boat wakes as well as it did wind waves of comparable
periods. Transmission coefficients, Ct H transmitted/H incident , varied
E-2
.- L~~ . . - .

between 0.3 and 0.7 for the pipe-tire breakwater with an average of 0.5. For ,-.S
the concrete breakwater, which performed slightly better, Ct varied between
0.2 and 0.6, with an overall average of 0.45. The maximum anchor loads mea-
sured were 72 lb/ft for the concrete breakwater and 134 lb/ft for the pipe-
tire breakwater. Visual observations of the incident and transmitted wakes
estimated incident heights at 2 to 3 ft and transmitted heights between 6 in.
and 1 ft. The individual waves in each boat wake were far from uniform, and 'r
the breakwater response was difficult to correlate with any particular height.
In addition, wave diffraction around the relatively short structures, back-
ground noise created by passing boats, and varying approach angles of the
incident waves were all complicating factors when the boat wake data were .
analyzed.
:,.-'v'
w.
E-3 -.

%APPENDIX E
REFERENCES
E-1. Skjelbreia, N. K., "Boat Wake Transmission Tests of a Floating Break-* water," Master's Thesis, University of Washington, Seattle, Washington,
1984.
E-2. Nece, R. E., and Skjelbreia, N. K., "Ship-Wake Attenuation Tests of a_____________________Prototype Floating Breakwater," 19th International Conference on CoastalEngineering, Houston, Texas, 19814.
E-4i

.. .:,.... '-,.'
. - - -
'I.- - "-i-..'
Photo E-1. 41-ft Coast Guard cutter Photo E-2. A movie camera andbeing used in boat wake tests Nos. 1 target being used to recordand 2. relative heave and sway motions.
Photo E-3. The cutter traveling on a Photo E-4. The cutter traveling. line parallel to the breakwater, on a line at a 45-deg angle with
respect to the breakwater.
Photo E-5. Aerial photo depicting Photo E-6. Aerial photo depictingcutter on parallel sailing line. cutter on 45-deg sailing line
(other boat wakes complicated dataanalysis).
E-5

--
A. 4
Photo E-7. The 110-ft tug being used Photo E-8. Tug generating wakefor boat wake test No. 3. with crest nearly parallel to
breakwater.
Photo E-9. Wake crests approaching Photo E-10. Tug generating wakeparallel to breakwater (note with crest perpendicular todiffraction around end). breakwater.
- .
-L -
- --
Photo E-11. Pet prests akh Photo E-12. 73-ft tug gentraveling dow breakae t, r. eraing w por test No. 4.
. - .. . . . . . . . . . . -. -

APPENDIX F
MONITORING PROGRAM
1.0 System Description. The monitoring program for the prototype test was
conducted by the Civil Engineering Department of the University of Washington
under contract with the US Army Corps of Engineers (Corps). The purpose of
the monitoring program was to collect data that would serve as a basis for
establishing and evaluating the fundamental behavior of the two breakwater
types under study. The University designed a system to measure and record
pertinent environmental and structural variables that were involved in the
design and mathematical modeling of the test breakwaters and similar struc-
tures. The parameters that were measured included incident and transmitted
waves, wind speed and direction, anchor line and connector forces, stresses
in the concrete units, relative float motion, rotational and linear accelera-
tions, pressure distribution on the concrete breakwater, water and air temper-
atures, and tidal current data. The table below lists the parameters, the
channel on which the data were recorded, and the transducer range.
Channel TransducerParameters Number Range
Anchor Forces - Concrete 1-8 0-50 kipsAnchor Forces - Tire 10-12 0-10 kipsWave and Tide Gage 16 0-25 ftWave Buoys 17-21 0-8 ftDynamic Pressures 22-44 0-5 psi
Concrete Strains 45-60 0-3,000 usAccelerometers 61-66 0-1 gRelative Motions 67-72 0-8 in.Wind Speed 73-74 0-100 mphWind Direction 75-76 0-360 deg
Current Velocity 76-77 0-5 knotsUnused 79-82Voltages 83-88 As requiredTemperatures 89-92 0-1000 CWave Array 9-12 0-8 ft
Wave Array 17, 19, 21, 22 0-8 ft -. ::.Rubber Connector Forces 23, 28, 29, 43 0-50 kips -.Rigid Connector Forces 71, 72 0-100 kips
F-1 '" "'*
-.-l-'-*

In addition to the transducers for measuring these parameters, the monitoring
system included an onboard data logger and equipment for processing the re-
trieved data tapes. (See figures F-i and F-2 for an instrumentation layout
and system diagram.) Detailed information on the monitoring system hardware
and software is provided in the University's final report on the monitoring
program (reference F-I).
Design criteria for the monitoring system placed the following requirements on
the recording instrumentation:
a. Automatic recording of data from 74 input channels.
b. Low-power consumption to allow battery operation.
c. Retrievable data storage medium.
d. Automatic hourly observations of selected parameters.
e. System activation if a preset threshold valve of selected parameterswas exceeded.
f. Packaging to allow mounting recorder inside an end compartment of theconcrete breakwater (i.e., fit through 23-in.-diam hatch).
As a result of these constraints, combined with a modest budget and a lack of
suitable off-the-shelf instrumentation, the University designed and fabricated
much of the monitoring equipment in-house.
Work on the monitoring system began in October 1981 Special purpose elec-
, tronics, such as signal conditioning cards, were built specifically for
"" this project. Throughout the winter, work progressed on the manufacture of
16 embedded strain gages, 8 wave measuring spar buoys, 14 anchor force cells,
23 pressure sensor housings, and a relative motion sensor. The pressure sen-
sors, anemometer, current meter, and accelerometers were the only instruments
for which suitable transducers were commercially available.
F-2i "i--i--'
i" "" ".w
"- -."i- 2 ./ i . , . _.__.'.-'.'. . .. . . . ...- . . ..-. .'*. . .-° .' - *-? " , -.i---iii--- '-.-',- -.--.--- :.---l .----.-- * -.ll-,'i --2;

W~ ~U' L V~V'C(X~P~1Y.X...T~r ~ U 1 ~ ~ qj 'J~ ~.' V ~~ - ~ " .
Q..
L* -I
LLLJ
0~0
C)-
>0 cc
00
o__ 0
0 Z- 0 c rj._j co -
00LLJ T -1-4
F-3

.'~~~~~~~~~-~- -- j~.~ .'~ . Y J '- ~ Y "..' J6 . z Wipn,. .7 r -- LP l--W-.p - giK w -JR
L-i
7zLU 0
LU - w30 - i w -. * -
400
2) <r,04 0 Z V)tt0
< 0 Z4J4
0 . < L
4 -i cr 0. c LJ U) Zr L C>0 < w (
< <.Z Zj 0 u w / i
Ir 0C)Cl 0 J
<U zu / U- Z X /
i L)U) -.. 0 ~bU) -JpLU UZx 0
zW0
F- 04j 4 j
2 Dw zz u I I (U) <
a. 00 z1
LU Uw
cc <I r
- Z 5-

,% 4P.i
2.0 Equipment Description.
2.01 Data Acquisition System. The onboard data acquisition system developed
by the University was a microprocessor controlled data logger capable of sam-
pling each of 80 channels at a rate of up to 8 Hz (photo F-i). An RCA micro--. %"
board system was used with a Quantex 4-track cartridge tape drive. A signal
conditioning board was designed to accommodate signals from the various input
transducers, and 45 of these boards (two channels per board) were assembled
and mounted in a separate watertight case (photo F-2). The entire system was
powered by four lead acid truck batteries. The system required 10 man-months "
to design and assemble at a cost of approximately $50,000. L
2.02 Load Cell. Forces in the anchor lines were measured close to the break-
waters and close to the anchor piles, as shown in figure F-I. Since the inci-
"" dent waves would approach the test site from both the north and the south and .
because leeward anchor forces were of interest, gages had to be placed in the
- anchor lines on opposing sides of the breakwater.
- The design for the anchor force gage is shown in figures F-3 and F-4. It is a
University of Washington design, using a stainless steel O-ring sealed strain
gage load cell similar in construction to the standard laboratory load cell.
The gages were calibrated using laboratory test equipment. Four lO-kip load
cells with an ultimate strength of 25 kips were placed on the pipe-tire break-
water, and eight 50-kip cells with an ultimate strength of 125 kips were
- placed on the concrete breakwater (photo F-3 and figure A-17). Waterproofconnectors, capable of being plugged and unplugged underwater, were used on
each anchor force gage (figure F-5).
Each load cell signal conditioning circuit consists of a load cell bridge
. power supply and balancing circuit, a high gain precision instrumentation
amplifier, and a low pass analog filter.
*. The strain sensing element of the load cell is a strain gage bridge circuit ".
having four active legs with two strain gages per leg. Mounting of the straingages in the load cell is illustrated in photo F-4 and figure F-6. The stress
concentration at the edge of the hole is assumed to be a factor of three over
.... F-9

.375 0 x .750hole, for turn-ing with inser-
Round stock Stainless ted eye boltSteel 3.40________
2.785.000,.002Eyebolts to.785.000-.00fit here
u) C NIMild CarbonSteel
Weld in Place
Parke 0-Rin No. 335
Looe1it
Stainless StelA)0
01~~, CO n >
FIUEF3 enKpLa el ceai
C 2.50
LO1wd.......................................L - ...........~fI..t..t~j ..1.0

%~
.2.2
.375 0 x .750hole, for turn-..ing with eye-
*Round Stock Stainless bolt inserted
* Steel 4.______85 __
.970+000, .002Eyebolts to fit
C fNFFMild CarbonCO M Steel
Weld in Place
Parke 0-n, No. 33
9~~~ .002 0 C
F-7-
L. .
Pakr -inNo 3

.10.
4.).
t~i u uj Q
Cc4 %. 4
LU CO)CO LL 1-
r~C)
U. 0Cc)
04 -t
ku
4114
P 70.1 T
F-8C
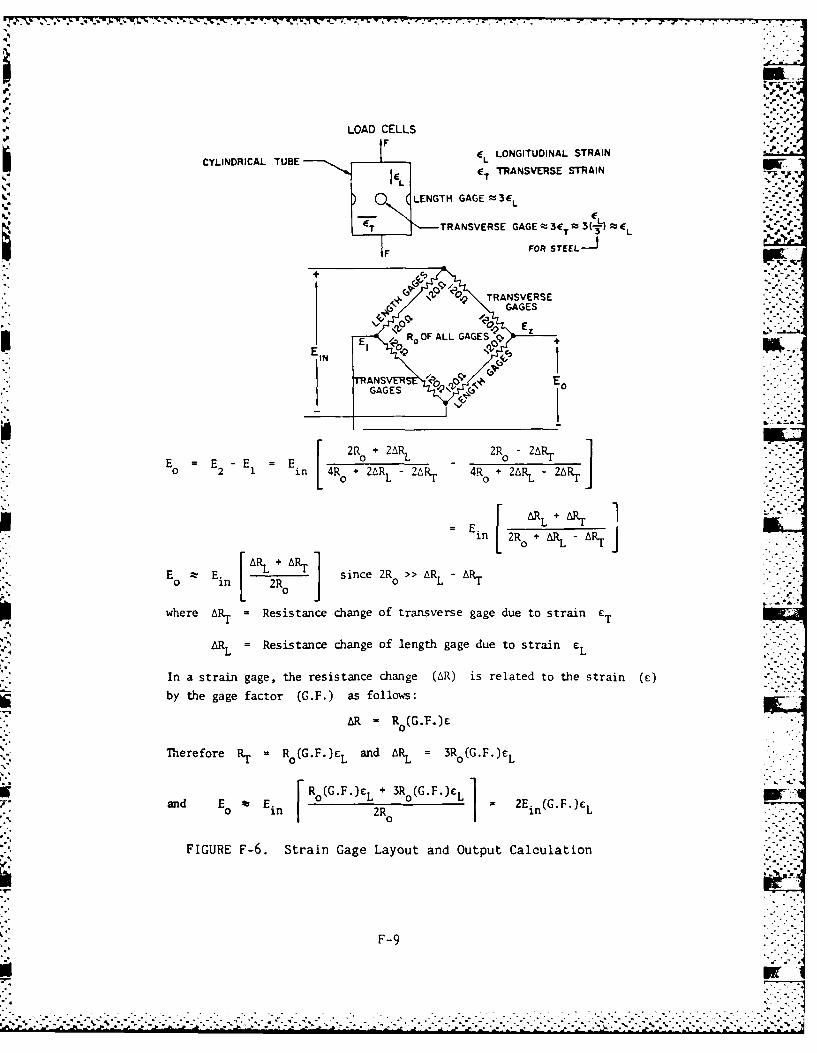
LOAD CELLS
CYLINDRICAL TUBE eL LONGITUDINAL STRAIN '
JEL C T TRANSVERSE STRAIN
LENGTH GAGE= 3EL
ET " TRANSVERSE GAGE 53 = 36h :eL
IF FOR STEEL-
IIANSVER %EO
= E E =E [ 2R + 2ARL 2- R0 2AR1 .0 2 1 in [4R + 2 6RL 2A~ 4RO + 2ARL 2ART
EAR+ ART
E ~ ~ ~ ~ ~ i 2R +. [R ART1T] ic R ~LA
where A~RT = Resistance change of transverse gage due to strain cT
AL= Resistance change of length gage due to strain E
In a strain gage, the resistance change (AR) is related to the strain (c)
by the gage factor (G.F.) as follows:
AR Ro(G.F.)c
Therefore R1. R0(G.F .)cL and ARL =3R 0(G.F. )E:L
K RO(G.F.)E L + 3R (G.F.) Lcand E a; 0 E ] E n(G.F.)cL
FIGURE F-6. Strain Gage Layout and Output Calculation
F-9
r- .

the average stress in the corresponding direction. This is only a rough ap-proximation, which is nearly true if the hole diameter is very small compared
with the tube diameter. However, this condition is not quite the case here;
so the approximation serves only to give the order of magnitude values for the
output voltage from the bridge circuit for design purposes. Because of this ,.;..
unknown factor, it was necessary to calibrate the load cells, i.e., measure
the output under known applied loads to obtain the actual relationship between r
load force and output voltage. Each load cell cost approximately $3,000.
2.03 Wave Gages. The five wave gages were arranged as shown in figure F-i.
Gages 18 through 21 were spar buoys as shown in figure F-7. Gage 16, mounted
I on the stationary piling, served as a tide gage as well. The spar buoys con-
sisted of a 15-ft-long, 6-in.-diam polyvinyl chloride (PVC) pipe with a
2-1/2-ft-diam damper plate, on which is mounted a 12-ft section of 3-1/2-in.
PVC pipe with a spirally wound wire to form a resistance gage (photo F-5).
- The necessary electronics were installed in the top of the upper section. .
Gage 16 was a 25-ft-long 3/4-in.-diam PVC pipe attached to a steel cage that -
was bolted to the piling. This gage served as both a wave gage and a tide
gage, and, therefore, extended from -5 ft mean lower low water (MLLW) to
+20 ft MLLW (figure F-8).
Between mid-October 1983 and late January 1984 when the breakwater was re-
moved, the eight-gage linear wave buoy array was anchored where the rubber
tire breakwater was originally located. These gages were at a 5-ft spacing
and located 67 ft due west of the tide gage. The longitudinal alignment of
the array was parallel with the breakwater (figure F-9).
2.04 Wave Staff Design. A block diagram of the wave staff and associated
electronic circuits is shown below:
S°"RJ BIAT RA PRECISION'''',"
WAVE CURRENTOSCILLATOR SOURCE .I'AND VARIABL
. The wave staff itself consists of a length of PVC tubing that is spirally
wound with a resistance wire such that when it is immersed in seawater, the
F-10
-" 17 - i. . 1

0
N C.-45- -.
itt
00
.0's
Cl
CC-
1 .. I

I~ w
ANEMOMETER
kW
172"
6ir5
1 1" 14 AGEIO
12" x 14" RP DT ANGLE O
AND FASTEN TO PILING
FIGURE F-8. Tide Gage Details
F-12
-~~~. . . .'. . ' . ' . . . .. .

- --- - - - - - ---. - - -
I-~ -
I.
Cl)-4
4-)ci)
C
0
0
L.L.
aci)
Cu
a.,
CzJ
C.,
"4
--K
*-
4 F'-13 .;.
F-

electrical resistance varies in direct proportion to the length of the exposed
staff.
The electronic circuits driving the wave staff consist of a fixed frequency
square wave oscillator (having a precisely controlled output amplitude) driv-
ing a precision bilateral current source with an output current directly pro- . .-
portional to the input voltage. Thus, the wave staff is driven by a current -"
source of constant magnitude, but it changes direction with each half cycle
of the square wave oscillator. The output of the wave staff then is a square
4ave voltage with a magnitude (peak-to-peak) that is directly proportional to
the length of exposed wave staff. This output is fed to a high input imped-
ance voltage follower circuit, which serves as a buffer between the wave staff
and the AC detector circuit. The precision AC detector circuit uses two oper-
ational amplifiers in conjunction with two diodes to form a precision full
wave rectifier circuit that is capable of operating at very low input volt-
ages. A gain control has been incorporated in the detector circuit so that
full scale output can be set at any positive value up to +10 V with a wave
staff resistance of 300 ohms up to 3,000 ohms. (See figure F-10 for the wave
staff electronic circuit diagram.) Alternating current is used to drive the
wave staff to avoid both the corrosion effects that would occur if direct cur-
rent were used and the DC offset that would occur as a result of the use of
dissimilar metals in a conducting solution. The latter is eliminated by use
of AC coupling in the output from the wave staff.
Bench tests of the wave staff electronic circuits were made using a
1,000-ohm variable precision resistor in place of the wave staff. The cir-
cuit was adjusted to produce an output range of 0 to 10 V with the resistance
varied from 0 to 1,000 ohms. Linearity was determined to be 0.1 percent of
full scale over this range. Overall accuracy, including end points, is about
3 percent. If the range of operation is reduced so as not to use the last
1 ft on each end of the wave staff, the accuracy is improved to about 1 per-
cent. The natural periods for the buoys in heave and roll are approximately
18 and 14 sec, respectively, which are well out of the range of wave periods
expected at the breakwater site (between 3 and 5 sec). Visual observations of
the buoy in waves in excess of 1-1/2 ft indicated little heave or roll motion,
but some yaw about the anchor line was caused by the current and wind. See
F-14.
rp,--1

4**-
_j
CL.
C)
-j
-.j OZI
U.
C) -,o
0 --. -oQ.(-
ZL- -
0I LL ., N
-C) -
N) C
N.-O > H+ ~ I)
C4 C- m 0
ZZ z -:1 VINI
N oZ
F- 15
K.>t. CD *< j,>: A1 - § <> .~ i-- :~: -K

.., paragraphs 3.0 and 4.02 of this appendix for a further description of instal-,. -
'.- lation and maintenance of the wave gages. Cost of the spar buoy wave gages .-
. :* ..
"o ~was approximately $3,000 each. ,o
2.05 Pressure Sensors. Sixteen pressure sensors were mounted on the sides of :]
the concrete pontoons, and seven were mounted on the bottom of the west pon- ,/
toon only (figure F-11 and photo F-6). All of the side-mounted units were
damaged early in the project and were not replaced until late summer 1983. .-.
. -o°.%
The mounting details for the improved method for attaching the side-mounted .•. '°_
gages are shown in figure F-12. ?--.:
The pressure sensors used were a Kulite Model IPT-750, 0 to 5-psi range. They ,.-.are semiconductor strain gage devices with a flush stainless steel ofinsta-
diaphragm. The basic specifications are as follows:ave•age
a. 0 to 5-psi range. pAsd
b. 0.85 percent overall accuracy. h f a cn es ot
c. Infinite resolution.
d. 75-my output full scale•..-.
e -40s to 250 F temperature range.
The original pressure transducers cost approximately $450 each. s"ag.Te
2.06 Accelerometers. Linear accelerometers measuring normal (to the deck, orheave) and transverse (or sway) acceleration and a angular accelerometer mea-
suring rotation about the longitudinal axis (or roll) were employed on each
float. See figures F-13 and F-14 for mounting details. Although some change-
of equipment and repair took place during the life of the project, all accel-
erometers employed were of the highly accurate servo type. The design incor-
porates a feedback mechanism whereby motion of the displacement pickoff pro-
duces a countering force (or moment) that accelerates the seismic mass so thatit undergoes only a minute displacement from the applied input motion. Thisallac
F- 16
*' . . .. .. . .. . .. .

I--
D cc
LLI
I ~ 0U)
w cc cc
zcc w
0 Z
0 x
V
CRCd
I0 C
l-.' ." I,-
U 0 Lqa. . .
F-17

PAPA,0
.Ov -o
9- o_ S
K - uO I -HIS
L) 02
I, '
F-18

-X19 ~ ~ ~ ~ ~ ~ .19 in P 9 'l.*wV. WKW
WEATHERPROOF ~
aBOX
BREA KWA TERMODULE
NrN
L INE RA.CE-E
END CAPANGULAR ACCELE-ROMETER
FIGURE F-13. Mounting Details of' Acceleration Transducers -
F- 19
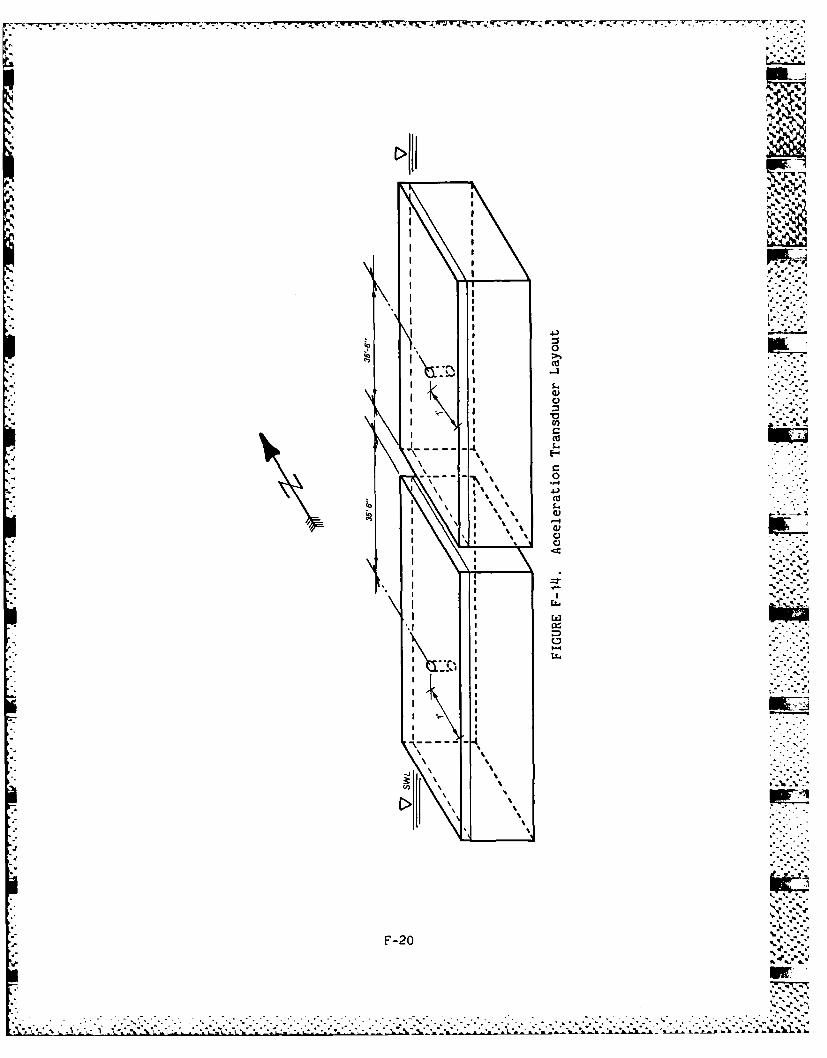
0
A S.
7N- - L.
0
I ' ~ Z;
R4)
IW'2
F-20 L

-s, ' " -. - -- " . . I-r . . "•-_J2 7 - F
W- w7*! w7w'T-..7
n
feature, combined with a flexural suspension system, provided for accurate ac-
celeration measurement with minimal nonlinearities and negligible hysteresis.
Internal filtering mechanisms provided very clean data; therefore, no addi- t .
tional filtering or detrending was required. Some results of the motion mea-
surements are presented in reference F-2. The accelerometers cost approxi-
* mately $1,200 each.
2.07 Relative Motions. The relative displacement between the two concrete
pontoons while they were connected, using the later rubber connector design,
was monitored with the use of a specially designed articulated mechanical
transducer. The unit was constructed of anodized aluminum with a U-Joint
fixture at each end and a rotating extendable tubular section between them.
The device measured the rotation about the perpendicular axes, in the plane of
the end sections of the floats, and the relative distance and rotation between
the two floats. (See figures F-15 and F-16 for more details.) From this con-
figuration, all six degrees of freedom associated with the relative motion of
the two pontoons were computed.
The five rotational motions were sensed using Vernitech Model 106 Sine-Cosine
potentiometers with an overall accuracy of 0.3 percent. The single linear
measurement used a Model-ill linear potentiometer with a full range of 8 in.
and an overall accuracy of 0.015 percent. Cost of this instrument was esti-
mated to be $5,500.
2.08 Wind Speed and Direction. A cup anemometer (photo F-7) was mounted on a
pole atop the piling where wave gage No. 5 was attached. The anemometer was
set at a height of approximately 30 ft above MLLW and was used to measure
speed and direction. Duration was deduced from the anemometer records. The
anemometer was operated continuously and was used to turn on the complete mon-
itoring system when the wind speed reached a preselected speed duration level.
The cost of the anemometers was $450 each.
"" 2.09 Concrete Strain. Measurements of internal concrete strains were made at
12 locations on the west module using rebar strain gages (figures F-17 through
F-25). The gages, which were built at the University, were constructed using
F-21
°." . . .. *~~~*7-~ *. .*- . . . . . . . . . . . . . . . . . . .- - • . . . -

7% 71F T-i
0 10 0
7Tmfl~c~hH,
z4 Fil .
--
0o
Ui e
aso aF7) j -
0.i
zZ t
0-)
et a 009
sk t~ a !t o.S
0 - 0o
. ~ 0.
of000
W0000
p0 000,
0 .01
0,,
04-
wew0> -. cca__ _ _ __ _
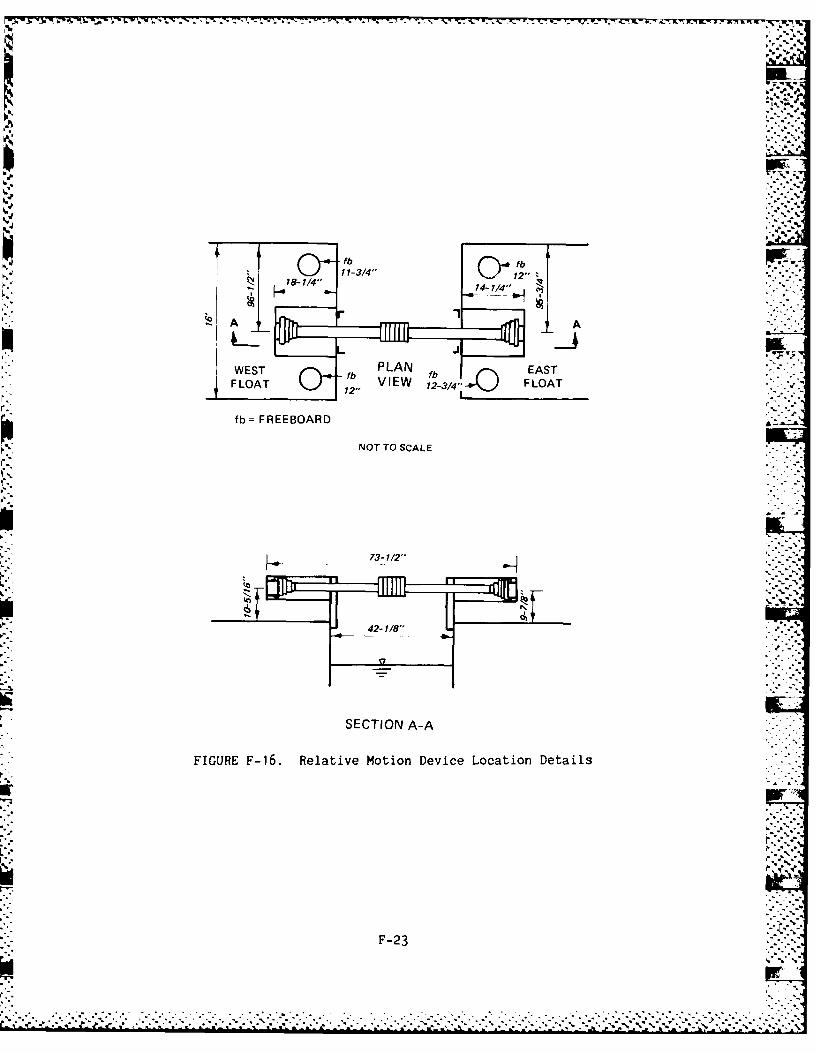
Pik -
WEST PAN EAS
FLOAT
fb= FREEBOARD
NOT TO SCALE
SECTION A-A
FIGURE F-16. Relative Motion Device Location Details
F-23
. . . . . . . . . . . . . . . . . . . . .. . . . . . . .

~0 <.. .. .. . .. .. . .. .. ... .. . .. .. . .. .. .
F-2

A- '
37'6" 0
T6'5- 114" 7'5"
CH 57 CH 45
CH 54, U-T2
-- _ _ _ -- CH 53, UT 1 % '. A
CH 59CH4
FIGURE F-18. Concrete Strain Gage Layout, Top Plan
37'6" b'
6'5-11/4" /75
CH 58 CH 46 ,
CH 52, BT 2
CH 51,BT1 I .A
CH 60 CH 47
-F 7'5"
FIGURE F-19. Concrete Strain Gage Layout, Bottom Plan
F-25

37'6"
65-114" 75
B CH 57 CH [45~-
-H49 NT 1
*~~40 {~c 5 ~ T -0~-4 ~4
L B LI:2 CoArt
FIGUE F20. onceteStrain GageLayot, NrthElevation
37'6"
B KA
B 4CH 59 CH T1C48
CH 56, ST 2 -.
BCH 60 47 74
FIGURE F-21. Concrete Strain GageLayout, South Elevation
F-26

fCH 45 2-/" CH 481
S CH 46 CH 47
FIGURE F-22. Concrete Strain Gage .--N Layout, Section A-A
16'0"
S CH 57 r CH59
CH CH 60
FIGURE F-23. Concrete Strain GageLayout, Section B-B
F-27

SMOOTH GROUND SURFA-CE (3. SMOOTH
M-M TRAN GAE, A06TRANSITION1,250 OPTION LE
-000:.. ,
, .. I II~iIII :=: _ I . ..-
-"# 5 RE-BAR Pr::: i:
M-M BONDABLE TERMINAL, 'N 4 CONDUCTOR, "-3"
.TF- 000 BRAIDED,
GAGE & TERMINAL LOCATIONS SHIELDED, 22AWG TINNED,
STRANDED COP-HEA T SHRINK TUBING WITH SEALANT, PER
." ~~AMP PIN 54026-5 ":": :
.-. ~~ALUVINUM FOIL .-....
;5 RE-BA R
COATINGS & HEAT SHRINK
36"
::: , .".".~
S5 RE-BA R 134 "." ," "
i'-. ~ ~HEAT SHRINK.-.-
COMPLETED ASSEMBLY .,"-
FIGURE F-24. Concrete Strain Gage, Mechanical Detail _,.i
F-28

0 0
LL-J _j -J
Oo-
w ccZ
- ~ ~ c I ,
-L < - S.
D D0 0 z z t 4)
> 0 (D00 zz z z zLU - I
040
41.)
20J 0
C0
CL) 4)
Z 4 LZ
<0c~cc
n -- C/zc -. 0U C~
F-29 "4
z cr >

a 3-ft piece of No. 5 rebar machined to 1/2-in. diam over a 6-in. section at
the center. Four strain gages were attached and wired into a complete bridge
circuit. The gages were then sealed, using standard strain gage sealants;
then a self-adhesive heat shrink tube was placed over the finished unit for %
both mechanical protection and as a final sealant (photo F-8). Two sets of
gages and lead wires were attached to each unit. Each gage was checked (cal-
ibrated) and the gages and electrical leads were attached to the breakwater
reinforcing steel using standard wire ties. The lead wires were routed along
the rebar to the instrument compartment. Cost of the internal concrete strain
gages is estimated to be $450 each.
2.10 Temperature. The temperature sensors used were manufactured by Analog
Devices (Model AC2626). They are laser-calibrated two-terminal transducers.
The electrical output is a current linearly proportional to absolute tempera-
ture. Because of the unit's high impedence current output, it is insensitive
to voltage drops over long lines, thus enabling remote monitoring with no need
for costly transmitters or special wire. The unit is also insensitive to sup-
ply voltage changes above 3 V, thus allowing for battery operation. The units
used were housed in a stainless steel tube 3/16 in. by 3 in. Measurements
were made of surface water, air, and internal data recorder temperatures. The
overall accuracy of each was ±0.80 C. The cost of each temperature sensor was Ile
$20.
2.11 Current Speed and Direction. An off-the-shelf Series 500 Marsh McBirney
electromagnetic water current meter was used in an attempt to measure the x
and y components of water velocity. The Model 512 unit with a 1-1/2-in, probewas used. The current probe was mounted under the center of the pontoon. For
a number of reasons, satisfactory current measurements were never obtained.
The cost of this current meter was $4,500.
2.12 Rubber Connector. Strainsert, Inc., standard internally gaged hex head
steel bolts were used to measure the axial forces on the flexible connectors
(photo F-9). Two different connectors were used in the breakwater experiment.
In both cases, four bolts were used to monitor the axial forces between the
rubber sections (figures F-26 and F27). The bolts were instrumented by drill-
ing a 0.15-in. hole in the end of the bolt approximately 3 to 4 bolt diam
F-30
*~ * *'- •. .-.. "

UNIRO YA L DEL TA DUAL MOUN TED MODEL20A MARINE FENDER OR EQUAL
ONE-INCH-DIAMETERSTRAIN GAGED BOL TTOP AND BOTTOM 0BOTH NB TOM- ELECTRICAL CABLE
TO DATA ACQUISITION
PLAN VIEW- MODULE CONNECTION DETAI LFLEXIBLE CONNECTOR
FIGURE F-26. Vertical Fender Connector,Load Sensing Bolt Locations
deep. A complete strain gage bridge was then mounted at the bottom of the
hole using an inflatable Teflon tube and special adhesives techniques. Cost
of the bolts was $400 each for the 1-in.-diam bolts and $700 each for the
2-in.-diam bolts.
2.13 Rigid Connection. Four of the 1-1/4-in.-diam, 11-ft-long, high-
strength steel bars, that were used to bolt the two c Jrete floats together
rigidly, were instrumented in the same manner as the rubber connector bolts.
These bars were placed in the four outer corner positions in the rigid con-
nection (figure F-28 and photo F-10). The cost for instrumenting the bars
was $1,200 each.
3.0 Monitoring System Installation and Operation. Strain gages for mea-
suring internal concrete strains were the first of the monitoring instruments
to be installed. Fourteen gages were attached to the reinforcing steel at
11 locations on the western float the day before the concrete was placed
* (photo F-I1). Two more (crossed) gages were mounted in the deck reinforcing
steel while the concrete was being placed (photo F-12). Eight of the gages
F -3 1
.4.
....
. ..
,
,'-j',j* ', -. ._ . - '-- d. A.- f ,- .- . - - .. . .. ..- .,. .P. .. ... .* ,,- . .,. ,~\~ . . . . • .. . .-.

*1 LOAD SOL TS (OUTERTWO SOL TS ONL Y)
H-URIZONTAL FLEXIBLECONNEC TOR, UNIROYAL23 DUAL DELTAL OA D BOLTS (OUTERTWO BOL TS ONL Y)
PLAN VIEW
SECTIONITA-A
Load SENSING BoL LTin
N. - .* .. . -.... .. N .. . . . . . . .SECTION A-A

., * ........ . . . . ..... . . . ... ... :::-:
.ii
:..,'-- .-.:
ELECTRICAL CABLETO DATA ACQUISITIONSYSTEM--
STRAIN GAGED BARTOP AND BOTTOMBOTH SIDES OF FLOAT '7 j-
1- 1/4" DIA STEEL BAR, ASTM A72211"-0" LONG
PLAN VIEW - MODULE CONNECTION DETAILRIGID CONNEu [OR
FIGURE F-28. Rigid Connector, Load Sensing Bolt (Bar) Locations
measured longitudinal strains at the top and bottom edges of the float, while
the remaining eight gages were installed in pairs to measure shear strains in
the four float surfaces. Leads for the gages were routed through the rein-
forcing steelwork to the area that would eventually become the hollowed out
end compartment housing the data acquisition system.
* Final anchoring of the concrete breakwater was completed on 16 July 1982.
Then, installation of the monitoring equipment began. Working conditions
F-33
-'77V

at the West Point test site were fairly difficult (photo F-13). Even in a
dead calm, tidal currents swept past much of the time; and unannounced ship
wakes poured water across the decks into the equipment compartment through _____
the flush mounted deck hatch. Immediately, the need for a secondary hatch . 1
with a combing became apparent if the end compartment were to be accessible. :
The new hatch (photo F-14) was not completely watertight, but it allowed
access into the float so that installation of the data recorder could pro-
ceed. In the period between early August and mid-September, the pressure
transducers were bolted onto the sides and bottoms of the floats. Five
wave staffs were anchored in place, and the tide gage and anemometer were
attached to the fixed piling at the east end of the test site (photo F-15).
Electrical leads from all these transducers, as well as those from the
12 anchor load cells, were fed through a conduit located under the center
of the west float. The conduit opening was located under the center of the
float to minimize the motion of the wire bundle, but this was done at the
expense of accessibility since divers were required every time a lead was
replaced. Batteries were brought on board and placed in the battery box
which also housed the portable generator used to recharge the batteries and
provide power to the equipment compartment while work was being done below
deck (photo F-16).
The equipment installation process was complicated by the early onset of .
what was to be an abnormally severe winter storm season. Water leaked into
the interior storage compartment from waves which continually washed over the
deck creating an unusually cold and damp working environment (photo F-17). . -
Shortly after being anchored in place, three of the spar buoys were found
broken. All the buoys were broken where the 8-ft-long staff joined to the
main body of the buoy. A third buoy was missing completely. The probable
cause of the damage was fast tidal currents and/or waves. The opening of
the gillnet fishing season caused additional problems. Although the test
site location had been well publicized to all mariners, particularly local
fishermen, 600 ft of gill net became entangled in the breakwater and broke
one of the two remaining wave staffs. Two new buoys were deployed; but,
within a week, one buoy had broken and another had been torn out by a large
wave-borne log (photo F-18). By the end of the first week in October 1982,
seven spar buoys had been damaged or destroyed (photo F-19). By mid-October,
F-34
•... ... . . . .. .. .... ,-. . .... .... .-... .,.. .. . •.. ..-. .-..... . ..%' ... _,

-."
the attempt to repair the flexible connectors between the two concrete floats
was abandoned, and fenders and bumpers were put in their place. All four of
the strain-gaged bolts in the original flexible connector were destroyed be-
fore any measurements could be made. The relative motion between the discon-
nected floats was great enough to pull apart the leads which had to bridge
the connector gap. These leads carried signals from all the accelerometers
and pressure transducers mounted on the east float. -
When the data acquisition system became fully operational in mid-November,
only one spar buoy on the north side of the concrete breakwater remained.
Most of the pressure transducers had been torn off the south side of the
breakwater by waves, and electrical leads to 10 of the 12 anchor load cells
were broken. On 9 December, commercial divers hired by the University con-
nected new leads to three upper and two lower concrete breakwater anchor
load cells. The three repaired upper load cell leads lasted less than a
month before divers were again hired to replace them. The load cells them-
selves remained undamaged throughout the test, but the unarmored four conduc-
tor wires leading to them proved to be vulnerable to damage; and before the
test program ended on 31 January 1983, a total of 18 electrical leads (ap-
proximately 2,500 ft of wire) was replaced at the test site (photo F-20).
Shortly after the data acquisition system was brought on board, a second
generator had to be purchased for use while the first was being overhauled
because of saltwater damage. Even with a new generator, very little battery
charging time was available between storm systems; so backup batteries were
charged on shore and then taken to the breakwater at about 2-week intervals.
Each of the four large batteries required to operate the system weighed over
100 lb. Their replacement was a difficult and time consuming task. Several
times the batteries were not replaced soon enough, and the system turned off.
Such was the case when the worst storm of the entire test program occurred
on 21 December 1982.
Even though the unusually stormy weather showed no sign of easing, success in
the collection of data improved as the winter wore on. After the replacement
of seven wave buoy staffs, reinforced staffs and modified buoy moorings nearly
eliminated the breakage problem. With the frequent use of divers, a majority
F- 35
...............................

- . r . ' . -. >-..--*...*. -rT-~ Wfl~V. °.r o° .
*%
of the anchor load cells were kept operating. The anemometer and incident
(piling mounted) wave/tide gage proved to be reliable. By the time theconcrete breakwater was removed from the test site on 7 February 1983 for 0.1%the purpose of making the rigid connection between the modules, approximately
20 tapes of data had been collected.
Addition of the steel deckhouse during the rigid connection work was a major
improvement (photo F-21). The deckhouse provided a dry storage area for the
electronic components, two complete sets of lead .cid batteries, and the gen-
erator. At the test site, work on the system could continue even during rela-
tively rough conditions, dramatically increasing the amount of time that the
breakwater data acquisition system was accessible for making repairs and
adjustments.
Throughout the early spring of 1983, considerable progress was made in rein-
stalling wave buoys and reconnecting anchor load cells. Four spar buoys were
securely anchored in place (one on the north and south side of each break-
water), 10 of the 12 anchor load cells were successfully reconnected, and a
backup anemometer was mounted on top of the new deckhouse. By the end of
June, 11 pressure transducers had been salvaged by divers and remounted on
the side of the breakwater using an improved attachment method.
After the pipe-tire breakwater was removed from the test site in August,
a spar buoy was anchored in the vacated spot to serve as a backup to the
incident wave gage mounted on the piling. Eventually, an eight-buoy direc-
tional wave array was anchored in this location (photo F-22). See refer-
ence F-3 for details of the directional array study.
In November 1983 the concrete breakwater was removed from the test site.
The two rigidly connected floats were parted, and the redesigned flexible
connectors were fastened between them. A relative motion sensor mounted be-
tween the two floats and four strain gaged bolts (located in the outer edges
of each connector) completed the monitoring program's large complement of in-
strumentation (photo F-23). The breakwater was reanchored at the test site
on 1 December 1983, and the wave and anchor force transducer leads were re-
connected to the data acquisition system. A week later, a Waverider wave
F-36w *

L
measuring buoy was anchored 600 ft south of the incident (piling mounted)
wave gage to allow a comparison of records from the two types of wave mea-
suring devices (photo F-24). At this time, 13 wave gages were connected
to the data acquisition system (1 piling mounted, 8 spar buoys in the array, r-
2 spar buoys on the north side of the breakwater, 1 on the south side, and
the Waverider buoy).
The deckhouse addition, increased experience, and a return to a more normal
weather pattern all contributed to a continual improvement in the data collec-
tion success rate. By the end of the monitoring program on 31 January 1984,
121 data tapes containing approximately 1,000, 8-min time series of 80 input
channels each had been obtained.
4.0 Equipment Evaluation.
4.01 Data Acquisition System. Of approximately 8,000 hr that the data acqui-
sition system could have been collecting data on board the breakwater, it was
operational for 4,500 hr or 56 percent of the time. Time spent adjusting the
system or recharging the batteries on board the breakwater is not included in
either the hours available for data collection or hours operational. After
initial installation problems were solved, the system was removed from the
breakwater six times for repairs and was entirely absent from the test site
approximately 750 hr, exclusive of the time the concrete breakwater itself
spent removed from the test site for connector modifications.
No single part in the system appeared to be particularly prone to failure.
Component failures occurred on the transducer signal conditioning cards, on
the serial cards, on the analog to digital cards (A to D cards), and in the
tape drive electronics. Some programming errors had to be corrected in the
software that controlled the system, and several electrical connector prob-
lems occurred. .
Power supply problems were the major source of system downtime. For a number
of reasons, the amount of power required was higher than originally antici-
pated. For several weeks, near the start of the monitoring program, persis-
tent high winds caused an 8-min time series of all 80 channels to be made each -
F-37
. . . . ... . . . . . . . . . .... . .

.' .6
hour. More power was required to record the unanticipated abundance of data.
Also, because the tape was continuous, storm data, in at least one instance,
were written over before the tape could be removed. Additionally, short
circuits caused by broken transducer leads were believed to be a source of
power drain, but the most serious problem developed when one of the power
supply's DC to DC converters failed. The converter was not a standard item
and had about a 4-month delivery time. A spare had been purchased and was on
hand, but the specification plate had been mislabeled at the factory. The
replacement unit was not usable, and a simple removal and replacement job
turned into a complicated problem. A temporary power supply was assembled
from available components, but problems with the system, related to the power
supply, continued until a new converter was installed 4 months later. The
increased power requirements and the difficulties involved in keeping the
batteries charged combined to shutdown the system several times, particularly
during the first winter of monitoring.
- By the end of the monitoring program, the data acquisition system had become
a well used piece of equipment. Even the capability for system interrogation
via telephone lines for transducer monitoring and data transmission was uti-
lized for a short period of time. A 2,000-ft-long electrical cable was laid
from the breakwater to shore, and some data transmission was accomplished, but
waves and tidal currents soon broke the connection. A second cable was laid
with similar results, and no further attempts to provide remote access to the
system were made.
4.02 Wave Buoys. Overall performance of the wave measuring buoys was good
considering the conditions under which they had to operate. The buoys ap-
peared to be stable in all observed wave conditions, except for a slight low-
frequency horizontal (sway) oscillation. The buoys were relatively easy to
- transport and install, and their modular design made repair or replacement of
parts a simple task.
-,, After the upper portion of the buoys was reinforced to solve the initial prob-
V,' lem with breakage, the buoys proved to be very durable. Arriving at a satis-
factory method for anchoring the buoys in place was a more difficult problem.
Initially each wave buoy was tethered between two taut-line floats, which were
F-38

anchored with 250-lb concrete anchors. When tidal current speeds exceeded one
knot, the buoys were pulled under the surface or were displaced laterally from
the desired wave measurement location. To solve the mooring problem, the
buoys were tied into the breakwater anchor systems as shown in figure F-9. NWThis modification, combined with adjustment of the vertical
location of the attachment collar, finally produced an acceptable anchoring
arrangement. %hA number of other problems with the wave gages were encountered, but they
were considered routine maintenance. The electrical leads running from the
buoys to the data acquisition system were damaged and had to be replaced
several times. Also, after several months of use, the stainless steel re-
sistance wire on the staffs tended to break, either because of corrosion or
debris impact damage; and on one occasion a small brass screw retaining the
upper end of the resistance wire corroded and caused electrical problems.
Although not a common problem, some of the circuit boards inside the wave
staffs did fail and had to be replaced. Finally, some of the buoys slowly
lost buoyancy, and empty Clorox bottles were tied on to raise them to the
proper height.
4.03 Piling-Mounted Wave Gage. The operating principal of the piling-
mounted wave/tide gage was identical to that of the wave buoys, and exactly
the same electronics were used in both instruments. An open framework gal-
vanized steel cage protected the gage from debris damage. The original gage
operated for 6 months before numerous breaks in the stainless steel resist-
ance wire caused it to fail. A backup gage was installed in April 1983.
The gage electronics failed once during the second winter of testing, and
a spare circuit card had to be used during the last several months of test-
ing. Breakage of the resistance wire was a problem common to both the pil-
ing mounted and buoy mounted staffs. Some form of corrosion in the vicinity
of an epoxy bead that held the wire in place is suspected as a cause of the
problem.
.04 Anchor Force Load Cells. The anchor force load cells were the most
difficult transducers to maintain because of the vulnerability of the elec- -
trical leads. Divers were used six times to lay new wires, and several other
F-39

m
attempts were aborted because of bad weather. The Electro-Oceanic underwater
connectors on the load cells allowed each replacement of the wires by divers.
However, because of the small changes in voltage associated with these trans-
ducer signals, those connectors were probably responsible for an excessive
amount of electrical noise and drift in many of the records. Four of the
load cells were recovered at the end of the test program; and although they
were somewhat scarred by 2 years of service underwater, posttest calibrations
indicated they were still operating normally.
4.05 Embedded Strain Gages. Except for minor connection problems, the
16 embedded strain gages operated normally throughout the test program.
Strains in the concrete proved to be much lower than originally anticipated,
and most of the data collected during the first winter were in the noise re-
gion. This problem was corrected on 26 May 1983 when the gains of all the
gages were doubled. Data collected from this time on were suitable for
analysis.
4.06 Strain Gaged Connector Bolts. As described previously, the first
flexible connectors were destroyed before any measurements could be made by
four 1-in.-diam strain gaged bolts located at the top and bottom of each
connector. In the rigid connection configuration, each of the four corner,
1-1/4-in.-diam by 11-ft-long, bolts had a strain gage bridge inserted in a
0.15-in.-diam hole that was drilled 17 in. into the bolt. While the rigid
connection was being made, the bolts were submerged in water, and all the
gages were damaged. Readings were obtained for a short period of time from
only one of the bolts. The second pair of flexible connectors was instru-
mented also with two 2-in.-diam load sensing bolts each. All four bolts
were operational initially, and data were collected for a number of storms;
but one by one, they all failed over the 2 months that the second flexible
connector was being tested. Failure of the gages was due to the leads be-
ing twisted as the bolts rotated in their holes. Two of the leads were com-
pietely twisted off, and the other two were wrapped into balls around the
heads of the bolts. Some data were obtained from these bolts during a
number of storms that occurred in the last 2 months of testing.
4.07 Pressure Transducers. All of the pressure transducers that were
F -40
. . . . . . . . . . . . .. . . . . . . *. m .S

mounted on the south side of the breakwater were lost in the first 3 months
of testing. An electrical conduit attached to the side of the floats was''
the main support for the transducers. The conduit, installed as part of the
breakwater construction contract, was not able to resist wave forces and de-
bris impacts. As each section of conduit was torn off, the attached trans- %
ducers went with it. Transducers mounted on the bottom of the float fared
somewhat better. All survived physically, but electrical leads to four of
them were damaged during the test period. Three of the gages operated con-
tinuously. Parts of the side-mounted transducers were recovered by divers,
new housings were made, and they were reattached in August 1983. The new
attachment method, designed by the University, worked very well; and all of
the transducers provided data throughout the rest of the test.
4.08 Anemometer. A Weather Measure anemometer was mounted on top of the
fixed piling at the test site. This type of instrument was selected because
it combined a relatively low cost and adequate reliability for the short du-
ration of the test program. In January 1983 a backup anemometer was mounted ..-
on top of the newly added deckhouse at an elevation of approximately 10 ft.
Both of the anemometers were replaced once during the test program.
4.09 Accelerometers. The water-tight compartments in which the acceler-
ometers were to be mounted were usually completely filled with salt water.
The University's original housing for the accelerometers was not designed
to be hermetically sealed, and saltwater corrosion of the accelerometers
was a problem initially. After modifications were made to the housings,
a considerable amount of acceleration data were obtained during the later
portions of the test program.
4.10 Current Meter. The Marsh-McBirney electromagnetic current meter was
mounted on the 4-in.-diam conduit attached to the bottom of the concrete
breakwater. Because collecting current data was assigned a low priority,
the meter was not installed until well into the test program. After it was
installed, erratic data were collected for a short time before it failed en-
tirely. When the meter was recovered at the end of the test, the sensor ap-
peared to have been damaged either at the time of its installation or by ..
debris that was carried under the breakwater by tidal currents.
F-41'
"% •" . % -" . *." " . . .. . . . . •. . . .. . ., . .. .- . .• - . ° . " °o ° , ,•.* °o°*. •. .- .° . .° ° °

4.11 Relative Motion Sensor. The relative motion sensor was the most elab-
orate transducer designed and fabricated by the University. It was fastened
between the two concrete units only during the test of the second flexible
connector design in January and February 1984. The sensor was removed and
• [] replaced twice for repairs because water leaked past the rubber boots which ...
* surrounded the sliding and rotating parts. The quantity of data obtained
from this transducer is yet to be determined.
5.0 Data Analysis. Original planning for the monitoring program did not
. address details of the methods and equipment required for processing the
data to provide basic statistical data and auto and cross-spectral analyses.
The University of Washington planned to use in-house data processing equip-
ment and graduate student assistants for writing data analysis programs.
Because of the effort that was expended in attending to the problems that
arose during the initial installation of the monitoring equipment, the de-
velopment of data analysis procedures did not receive full attention until
November 1983. Although results from the first of the data tapes to be
analyzed indicated that several key transducers might not be operating prop- .
erly, data analysis techniques had not been refined enough to pinpoint the
problems. Efficient maintenance of the data acquisition system was found
to require rapid analysis of the data tapes as they were retrieved from the
breakwater, but the capacity of the University's microcomputer was taxed,
and data analysis was tedious and time consuming. Work on software was at
a fairly advanced point when the computer failed. Repeated repair attempts
were futile. Finally the University was authorized to purchase a new and
more powerful machine. By the beginning of the second year of monitoring,
computer programs for spectral analysis, filtering, and removing signal
drift had been developed. The capability to analyze data tapes quickly
during the last 4 months of the project helped dramatically in the early
detection and repair of problems in the data acquisition system and the. -
monitoring transducers.
6.0 Monitoring Cost. The initial cost reimbursable contract with the
University of Washington was for 2 years at an estimated $280,000. Unan-
ticipated costs for repair and replacement of equipment added $79,000, and
F-42
.7. .-

extension of the monitoring program by 1 year increased the total program
cost from $230,000 to $589,000. This $589,000 was distributed as follows:
$140,000 for initial purchase and fabrication of hardware, $20,000 for sup-
port equipment, $202,000 for salaries of University personnel, $92,000 for
University overhead, $105,000 for repair parts and materials, and $30,000
for data analysis equipment. An estimated $90,000 in equipment was returned
to the Corps at the end of the monitoring program.
-. W.F
F-143
'a -.
-- a-i:

APPENDIX F -
REFERENCES .4.. .
F-I. Christensen, D. R., "Installation, Operation, and Maintenance Manual forBreakwater Data Acquisition System," Water Resources Series TechnicalReport No. 91, University of Washington, Department of Civil Engineer-
11
ing, Seattle, Washington, 198.4.
F-2. Miller, R. W., Christensen, D. R., Nece, R. E., and Hartz, B. J., "RigidBody Motion of a Floating Breakwater: Safekeeping Predictions and FieldMeasurements," Water Resources Series Technical Report No. 84, Univer-sity of Washington, Department of Civil Engineering, Seattle, Washing-ton, 1984.
F-3. Ratnayake, S. C. B., Christensen, D. R., Nece, R. E., and Hartz, B. J.,"Linear and Nonlinear Dynamic Response of Floating Breakwaters in Direc-tional Seas," Water Resources Series Technical Report No. 90, University " "'of Washington, Department of Civil Engineering, Seattle, Washington,1984.. --
F-44
.- . --. .

I,. -.
ii: ..- ....-
Photo F-I. Photo depicting data acqui- Photo F-2. Photo depicting signalsition system (data logger on left, conditioning cards.
, signal conditioning cards on right).
Photo F-3. Attaching anchor force Photo F-4. Strain gages beingload cell to anchor line, attached to the load cell. -
I *. ,
Photo F-5. Photo depicting 25-ft-high Photo F-6. Photo depictingspar buoys. pressure sensor on bottom of
float.
F-45
77*. -1I

,- J
Photo F-7. Photo depicting Weather Photo F-8. Photo depicting aMeasure anemometer. rebar embedment strain gage.
AL
Photo F-9. Photo depicting load Photo F-10. Strain gages measur-sensing bolt in vertical fender ing loads in the corner bolts ofconnection. the rigid connection.
i'uli\|/ifl!:Ii F\L4
Photo F-li. Photo depicting embedded Photo F-12. Strain gages beingstrain gages in sidewall and upper placed in ieck during construction "and lower edges. of concrete float.
F-46

.,.-, .-.V- •. .
Photo F-13. Photo depicting typical Photo F-l4. Photo showing second-working conditions during first ary hatch to keep waves from wash-summer. ing into the equipment compartment.
"4 .
,,. _ --- -
',," -. '
Photo F-15. Photo depicting piling Photo F-16. Photo showing originalthat supported the tide gage and storage box for the generator andanemometer, batteries.
Photo F-17. Working under adverse Photo F-18. A large log destroyingconditions inside the float, several wave buoys and pressure
transducers.
F-47- ,.-

Photo F-19. Photo showing drifting Photo F-20. A diver installing akelp typical of debris which caused new electrical lead to an anchordamage continuously, force load cell.
Photo F-21. Photo depicting deck- Photo F-22. Photo showing thehouse which greatly improved work- wave array anchored in the vacanting conditions. pipe-tire breakwater location.
4 ..
Photo F-23. Photo showing relative Photo F-24. A Waverider buoy .motion sensor which was used when collecting additional wave .
the horizontal fender connector was data.tested.
F-48
5.!

APPENDIX G .
TEST RESULTS
1.0 Introduction. During the course of the Prototype Floating Breakwater
Project, 121 data tapes containing approximately 20 megabytes of data per
tape were collected. The parameters that were measured included incident
and transmitted waves, wind speed and direction, anchor line forces, stresses
in the concrete units, relative float motion, rotational and linear accelera-
tions, pressure distribution on the concrete breakwater, water and air temper-
atures, and tidal current data. The data analysis methods for wave attenua-
tion and anchor force measurement results are presented in this appendix.
Analysis of the Prototype Test data will continue, and results will be pre-
sented in future reports.
2.0 Method of Data Analysis. The data analysis process was carried out in i
two steps: (a) retrieving measurements from the data tapes and (b) analyzing
Sstatistical data. In the field, the Data Acquisition System (DAS) collected
a 1-min-long record of data every 2 hr. Summary statistics of these data were
computed automatically and recorded on the tape. (Summary statistics included
the mean, minimum, maximum, and standard deviation.) After the statistics
were recorded, the DAS would check to see if any of the preset thresholds on
selected parameters were exceeded. If triggered, the DAS would initiate a
time series collection during which 512 sec of data were collected from each
of 80 channels. The sampling rate was 4 Hz for all data collection (240 sam-
ples per channel for a 1-min record and 2,048 samples per channel for a time
series).
After each data tape was retrieved from the breakwater, a summary or map was
made showing how many 1-min records and time series were recorded on the tape.
Included in the mapping of the tape was a listing of the 1-min summary statis-
tics. Figure G-1 is an example of a tape summary for tape number 54, and fig-
ure G-2 presents the statistics for 1-min record number 12. The tape summary
shows also how many glitches exist and where they are on the tape. A glitch
is any spot on the tape where the tape drive cannot retrieve the data. (Nor-
mally only a few samples of data per channel are lost when a glitch occurs,
G-"1
.... ... ... .... ... ... ... .* .. ... . .* .- *. .. . * * . * .. ** .* * . . . . .~*..* -|

STATISTICAL RECORD AND GLITCH MAP
TAPE IN 7112183 5: 00 Ali
TAPE OUT :7114/83 11:00 All
TAPE # 54
TRACK I
SRI 151
SR2 152
5R3 TS3
SR4 T54 S
SR5 T55
SR6 756 *
5R7 T57
T RPCK 2 LEGEND
SR - ONE MINUTE RECORD STATISTICS
TS a-TIME SERIESSRB 18 $a GLITCH
SR9 T59SRIO T510
5R11 T511
SR12 TS12
SR13 T513
SR14 1S14
TRACK 3
SR15 1515
SR16 TS16
SR17 TS17
SRI9 TSI9
SR20 T520
TRACK 4
SA21 T521
FIGURE G-1. Data Tape Summary Sheet S
G-2

1 MINl. STATISTICAL DATA SLRIMARY
TAPE * 54TAPE IN : 7112183 5:00 AMTAPE OUT 7i14/83 11:00 AM .# OF SAMPLES - 120
TAPE TRACK = 2I MIN REC. No. = 12 7113183 4:59 AM
QUANTITY/CH.# MEAN STD.DEV MAX MIN
ANCH. FORCE 7) 2662.54 33.23 2722 2526ANCH.FORCE(81 614.25 1468.34 4095 0TIDE HT(16) 914.84 39.93 984 788 ,VERT.ACC(61) 115.43 8.51 127 55WIND SP.(731 95.93 6.78 109 82WIND DIR.(75) 236.60 13.50 254 168
SINGLE SAMPLE VALUES
CUAR.VEL.X177) 255
CURR.VEL.Y(7TB 255
WINO SP. (74) 77
WIND DIR. (75) 234-IOV (8a) 138
+10V (84) 114-24V (85) 156+24V (86) 91-SV (87) 127+5V 8i 125
WATER TEMP (89) 0
FIGURE G-2. One-Minute Record Statistics Sheet
and the time series is still of value. There is no apparent cause for aglitch, but it is probably a function of temperature and/or a malfunction of
the DAS.)
Once the mapping was completed, the 2,048 measurements that were made for each
G-3
.. . . . . . . .-... "

of the 80 channels during a time series were reformatted, and summary statis-
tics were computed. An example of the time series summary statistics is shown
in figures G-3 and G-4. In figure G-3 the tape number, 1-min record number,
and scale factors are shown. The scale factor converts the data recorded on
the tapes to physical units. For example, when the data recorded
Summary of Statistical Data for West Point Floating Breakwater Project 7112183 to 7114163Number of samples per event =2048 Sampling Rate = 4.00 hertzI Dais 0 Hrs. 3 Min. from beginning of tape (All Min, Max values Measured from Zero Mean) ."-
Tape Number 54
I Minute Record Number 12Time Series Number 12
SUMMARY OF SCALE FACTORS
CH.NO. 1 2 3 4 5 6 7 a 9 10L CODE LNWC LNEC UNWC USWC UNEC USEC LSWC LSEC LNT UT"SFACT. .027 .027 .027 .027 .027 .027 .027 .027 .019 .019
CH.NO. 11 12 13 14 15 16 17 16 19 20L CODE UST LST FRS FRC FRN TIDE INC BUOY WY-MW WV-IE WV-SWSFACT. .019 .019 1.000 1.000 1.000 .012 1.000 .031 .031 .031
CH. kO. 21 22 23 24 25 26 27 28 29 30L CODE WU-SE P1-NU P2-NL P3-BNC P4-BEO PS-SEI P6-BCC P7-BWI PS-BWO P9-85CSFACT. .031 .004 1.000 .004 .004 .004 .004 1.000 .004 .004
CH.NO. 31 32 33 34 35 36 37 38 39 40
L CODE P1O-SCU PiI-SWI P12-SW2 P13-SW3 P14-SCL PiS-SE3 P16-SE2 P17-SEI Pl8-EP1 P19-EP2SFACT. 1.000 1.000 1.000 1.000 1.000 1.000 1.000 1.000 1.000 1.000 A.
CH. NO. 41 42 43 44 45 46 47 48 49 50L CODE P20-EP3 P21-EP4 P22-EP5 P23-EP6 NLLE NBLE 5BLE SULE NT1 NT2SFACT. 1.000 1.000 1.000 1.000 1.470 1.470 1.470 1.470 1.470 1.470
CH.NO. 51 52 53 54 55 56 57 58 59 60L CODE BTI BT2 UTI UT2 5T2 ST1 NLLC NBLC SLLC SBLCSFACT. 1.470 1.470 1.470 1.470 1.470 1.470 1.470 1.470 1.470 1.470
CN.NO. 61 62 63 64 65 66 67 68 69 70L CODE W VERT W HOkZ W ROT E VERT E HORIZ E ROT WVR WHA EVR EHRSFACT. 1.000 1.000 1.000 1.000 1.000 1.000 1.000 1.000 1.000 1.000 E.-
CH.NO. 71 72 73 74 75 76 77 78 79 80L CODE CLU CRP WIND SP WIND SP WINO DIR WIND DIR N-S E-W CONI CON2SFACT. 1.000 1.000 .400 .400 1.412 1.412 1.000 1.000 1.000 1.000
FIGURE G-3. Time Series Summary Statistics, Tape Number,1-Min Record Number, and Scale Factors
G-4
-- - - - -. -.

4-~~~~- 4.. 74 T4 4 - 4 ..
PROBLEM PROBLEM PROBLEM
IMIt4 MEAN) (NO DATA) IBAD CHANNEL)
CH.NO. 1 3 4 5 6 7 8 9 10MAX. 4.905 .000 24.141 .617 5.193 .000 4.293 46.588 1.478 6.722MIN. -5.949 .000 -9.825 -87.970 -3.177 .000 -5.211 -63.977 -.764 -6.046
MEAN 40.023 .000 9,825 109.948 3.177 .000 78.651 63.977 15.166 13.114STDEV. 2.025 .000 7.806 7.077 1.735 .000 2.533 54.578 .451 2.184
CHNO. 11 12 13 14 15 16 17 18 19 20MAX. .501 4.062 .000 .000 28.027 1.263 25.505 .000 .523 .000MIN. -.956 -.080 .000 .000 -19.973 -3.393 -18.495 .000 -.469 .000MEAN 12.945 .080 .000 .000 1719.973 10.593 178.495 .000 3.290 7.905
STDEV. .133 .356 .000 .000 7.596 .612 11.287 .000 .203 .000
CH.NO. 21 22 23 24 25 26 27 28 29 30MAX. .000 .049 13.466 .000 .027 .000 .000 .000 .000 .000MIN. .000 -.043 -10.534 .000 -.029 .000 .000 .000 .000 .000MEAN 7.905 .607 151.534 .000 .065 .000 1.020 255.000 1.020 1.020STDEV. .000 .019 4.378 .000 .011 .000 .000 .000 .000 .000
Di. NO. 31 32 33 34 35 36 37 38 39 40MAX. 8.742 122.883 5.776 7.662 6.746 7.532 7.018 76.342 155.875 9.214MIN. -8.258 -132117 -.224 -9.338 -8.254 -10.468 -8.982 -102.658 -99.125 -90.786
MEAN 12.258 132.117 .224 128.338 153.254 127.468 123.982 178.658 99.125 245.786STDEV. 2.810 86.428 .659 3.210 2.896 3.267 3.267 38.563 46.894 20.313
CH.NO. 41 42 43 44 45 46 47 48 49 50 -"
MAX. 78.061 .000 13.039 81.570 22.626 O.435 32.575 12.726 5.761 5.960MIN. -111.939 .000 -6.961 -98.430 -25.884 -Z2.195 -36.515 -13.734 -4.529 -4.330MEAN 176.939 255,000 135.961 155.430 240.504 258.865 255.545 232.764 188.279 157.210 .,.'-
STOEV. 41.846 .000 3.345 24.777 8.007 5.478 10.587 5.238 1.657 1.481
CH.NO. 51 52 53 54 55 56 57 58 59 60MAX. 6.160 9.358 5.461 13.405 6.932 11.853 18.674 11.044 8.873 20.052KIN. -5.600 -11.222 -4.829 -10.115 -9.238 -8.727 -16.606 -6.596 -5.827 -22.57BMEAN 167.300 177.332 200.339 211.505 170.938 141.027 122.446 172.706 121.957 165.168STDEV. 1.412 3.064 1.508 2.895 2.176 2.638 5.481 2.008 1.460 6,088
CH.NO. 61 62 63 64 65 66 67 68 69 70MAX. 21.912 28.423 22.507 1.273 13.200 .000 166.392 166.935 166.977 168.185MIN. -23.088 -24.577 -23.493 -1.727 -2.800 .000 -52,608 -55.065 -54.023 -53.815MEAN 116.088 120.577 124.493 101.727 2.800 255.000 88.608 88.065 88.023 86.615S*1EV. 7.212 9.387 7.034 .495 3.180 .000 80.383 80.634 80.645 81.231
CH.NO. 71 72 73 74 75 76 77 78 79 80MAX. 205.157 7.122 49.637 50.639 .589 .049 .000 .000 29.921 28.569MiN. -49.843 -21.878 -16.763 -16.561 -23.415 -8.423 .000 .000 -24.079 -24.431MEAN 49.843 247.878 52.363 51.361 359.470 360.011 255.000 255.000 70.079 69,431
SDEV. 98.930 8.692 11.954 11.520 2.349 .468 .000 .000 8.987 8.990
FIGURE G-4. Time Series Summary Statistics, Channel Statisticsfor BW54R12, Tape Number 54, and 1-Min Record Number 12
G-5
4. .. . ...-.. .. . . - . . . . . . . . . . . . • . ..

for channel 16 (the tide gage) is multiplied by 0.012, the values are con-
verted to units of feet. An explanation of the acronyms used in figure G-3
and the physical units of each channel is found in Table G-1. Figure G-4
provides a listing of the channel statistics for BW54R12, tape number 54,
and 1-min record number 12. Sensor and DAS malfunctions can be evaluated to
a limited extent by examining the channel statistics. In figure G-4 some of
the problems that occur on the summary statistics are shown. Additional in-
formation on system performance was obtained from point by point (row) plots
of the data. These row plots were particularly useful for evaluating elec-
trical noise and null point drift.
The final step in the statistical analysis was the production of spectral
plots of the data from selected channels using fast Fourier transforms
(FFT's). Because these plots show the variation of energy with frequency,
the data were filtered a final time to remove energy contributions which were
caused by effects with frequencies outside the range of interest. A 0.08 Hz
"low pass" filter was used to remove the long period effects, such as tidal
variations, and a 1.0 Hz "high pass" filter was used to remove the contribu-
tion of very short period phenomena such as ripples. Results of the spectral
analysis were used to calculate, statistically, the significant wave heights
and peak (highest 1 percent) anchor loads; and breakwater wave transmission
coefficients, Ct were determined by comparing the incident and transmitted
wave spectra. .. ..
3.0 Data Results. The data presented are based on the summary statistics and
the results of the FFT's. Assuming the data follow a Rayleigh distribution,
the following relationships exist:=x%
xs X amo
x 0.6265x : 2.51o
x 1.27xs 5.08o and5..-- .
x 1 1.67x = 6.68 as
. . ... . "
. . . . . . . . . . . . . . . . . . . .

where I.xs = significant value or average of highest one third
Xmo = significant value based on energy .
a standard deviation
x = mean
= average of highest 10 percent
x, = average of highest 1 percent (reference A-i)"-
The Rayleigh distribution assumption was checked by looking at several time
series for wave heights, anchor forces, strains, pressures, and accelerations.
When the data are examined, the significant or 1 percent value is only one .>- :
factor involved. Since the response of floating structures to waves is very
dependent on wave period, the period of peak energy density, Tp , of the in-
cident wave field was calculated from the FFT, as shown in figure G-5. The
peak energy period of the incident wave field appears to be an important pa-
rameter to consider because the peak energy period of other data such as the
anchor forces and concrete strains often corresponded to the measured T .
pWhen the periods did not correspond they were normally shifted by one spectral
bandwidth which could be a function of the averaging done when calculating the
32
BW54R12 CH 16
24 VAR = 0.234S(FM) = 3.11
Fmax = 0.3594Hz
TP (Fmax)1
2616
i I t:-., .
• .-U.
8
-10
10
00 4 8 12 16 20
HERTZ. 10* -"
5.0 2.5 1.5 1.0PERIOD (SEC)
FIGURE G-5. Results of Fast Fourier Transform
G-7
.. ,

-"
FFT. Peak values of the anchor force data were of the most interest, but be-
cause the data were filtered to remove high frequency noise the peaks were not
valid, and a statistical value of the average of the highest 1 percent was
used to represent the peak force.
3.01 Concrete Breakwater. Several configurations of the concrete breakwater
existed during the test program; however, because of structural damage to the
breakwater or to the DAS malfunction, data, as listed in Table G-2, exist for
" only three of the five configurations tested. The three configurations are
a. The two concrete floats rigidly connected with clump weights.
b. The two concrete floats rigidly connected without clump weights.
c. The two concrete floats flexibly connected without clump weights.
Figures G-6 and G-7 show wave transmission characteristics of the three float-
ing breakwater configurations. In figure G-6 the wave transmission coeffi-
cient, Ct , is plotted versus the incident wave height, Hi The trans-
mission coefficient is centered on 0.4. Previous model test data show that,
normally, wave transmission characteristics are very dependent on the wave
period. However, as described in paragraph 5 of the main report, the geo-
graphical features of the West Point test site limited the range of wave pe-
riods for which meaningful data could be collected. This conclusion is con-
firmed by figure G-7 which is a plot of transmission coefficient versus wave
period. The transmission coefficient converges on 0.4, and the range of wave
periods is limited. Because of this limited range of wave period, no definite
conclusions can be made about wave period effect. Figures G-6 and G-7 indi-
cate also that the various configurations of the concrete floats had no sig-
nificant effect on the wave transmission coefficient.
The anchor force data for channels 4 and 7, upper and lower load cells on the
southwest mooring line, are shown in figures G-8, G-9, G-10, and G-11. Fig-
ures G-8 and G-10 are plots of the mooring line force, Fp , measured in one
mooring line versus incident wave height, Hi ; whereas, figures G-9 and G-11
present the mooring line force versus the wave period of peak energy density,
G-8 .,.
Mr'
,i%. n-

1.0
0.80
0.4 0 00A
0.42U ~ *
0I 0 1 2 3 4T
LEGEND
* RIGID CONNECTION. WITH CLUMP WEIGHTS
ARIGID CONNECTION. NO CLUMP WEIGHTS
0 FLEXIBLE CONNECTION, NO CLUMPIWEIGHTS
FIGURE G-6. Transmission Coefficient, C~ versus
Incident Wave Height, Hi, Concrete Breakwater
%1.0 I
0.8
0.6 U.-
A
0.4
0 0 e 0
0.2
00 1.0 2.0 3.0 4.0 5.0
Tp. SEC
LEGEND
0 RIGID CONNECTION, WITH CLUMP WEIGHTS
a RIGID CONNECTION, NO CLUMP WEIGHTS0 FLEXIBLE CONNECTION, NO CLUMP WEIGHTS
FIGURE G-7. Transmission Coefficient, Ct versus
Wave Period, Tp1 Concrete Breakwater
G-9

- . . . r .. C•*~ * ~ * J * . -- O w17.' 2
3?
A 75
2
-" 2 -• *p. SZ uA
" ', 50
AA A-A25 OD- IAL# •~ .M
4w
LEGEND _"
a RIGID CONNECTION, WITH CLUMP WEIGHTS (PRETENSIONING =5000 LB)A RIGID CONNECTION, NO CLUMP WEIGHTS 1
FLEIBL CI- (PRETENSIONING --- 1500 LB)* FLEXIBLE CONNECTION. NO CLUMP WEIGHTS J
oI I I I0 -
1 2 3 4 5
H, FT
FIGURE G-8. Peak Anchor Line Force, Fp versus Incident
Wave Height, Hi , Concrete Breakwater (Channel 4) """
II I I I3A
75
A
2
50 M 0"
CJ<
A 6
A 25 U
LEGEND
0 F I II( ONNE( . IOf, WITH CLUMP' WFU ITS (PRE TENSIONING - 15000 LB)
A ' . '.J? ITl()% NOCtUMP WEIGHTS 1(PRE rE NSION ING -1500 LEII
<' ,i F CONN.ECTION, NO CLUMP WE I3HTSJ
2 3 4 b
SL(C
TFI URE G-9. Peak Anchor Line Force, Fp , versus Wave
Perio d. , Concrete Breakwater (Channel 4)
G-10
~. . . . . ... 1:..-- ... ,
. . . . . . . . . . . . . . . . . . . . . . . . . . . . . .. . . .. * . " %

75
2
50 c~
W U
AAA-J C
A A W
a RIGID CONNECTION, WITH CLUMP WEIGHTS (PRETENSION ING 5000 LB)
A RIGID CONNECTION, NO CLUMP WEIGHTSNSNG LB--
*FLEXIBLE CONNECTION, NO CLUMPIWEIGHTS J0 I0
0 1 2 3 4 5
H., F T
FIGURE G-10. Peak Anchor Line Force, Fp versus Incident
Wave Height, H1 Concrete Breakwater (Channel 7)
75
2 z
50 c: a:
m Ua i
A oCr& 'E<
f 25
LEGEND
* F~~iUC(~1NF~1 C v'~I (I !~,1 V 1 6AT5 WHETENSIONINI, j,0
F FLXIHL I CONNL rT (N No CLI Jr1~P VE(,JJT t IPH ET INSIJN IN(.- 1500 LB)1 - 0
r) 12 4
FIGURE G-11. Peak Anchor Line Force, Fp erus av
Period, Tp Concrete Breakwater (Channel 7)
G-11

Tp. There does not appear to be a strong dependence of anchor forces versus v.*.- Jo
wave height or wave period. The data plots indicate in general that
a. The load in the upper load cell (Channel 4) is approximately 25 per-
cent larger than that in the lower load cell (Channel 7).
b. For the rigid connection, the peak loads in the lower load cell
(Channel 7) decreased when the clump weights were removed, but peak loads
in the upper load cell (Channel 4) increased.
c. The type of connection (rigidly or flexibly connected) does not seem
to affect the anchor force. OIL"
Analysis of the structural data is just beginning, but Table G-3 includes
some data showing the effect of the connectors on the floats. Table G-3 is
a listing of strain magnitudes as measured by the longitudinal strain gages
in the east end and center of the west float, Channels 45-48. The strains
are very low, especially when compared to the strain values recorded when
the float was lifted from the construction platform and placed in the water
(1,700 v strains).
3.02 Pull Test. A 110-ft tug was used to conduct a pull test on the con-
crete breakwater. The purpose of the pull test was to determine the anchor
stiffness (spring constant) of the mooring lines, which is an important phys-
ical characteristic in the design of mooring systems. While the tug pulled
on the breakwater, the x-, y-, and z-position of the breakwater, the force on
the tow line, and the forces in the mooring lines were measured. The results
of this test are plotted in figure G-12. The anchor stiffness, in kips per
foot, gradually increases to a load of approximately 4 kips for a horizontal
displacement of 4.5 ft from the neutral position. The anchor stiffness then
increases dramatically to 5.2 kips at a displacement of 5.2 ft.*' .'. -,
3.03 Tire Breakwater. Wave transmission data and anchor force data were I.
collected for the tire breakwater. These data are tabulated in Table G-4
and graphically presented in figures G-13 through G-16. Figures G-13 and G-14
are plots of the wave transmission coefficient versus incident wave height and
G-12

125
100 :cc
0. 0-..
< 02 50 -J '
1 25
0 IIIII00 1 2 3 4 5 6 7
X, FT
FIGURE G-12. Anchor Line Force, F ,versus HorizontalDisplacement, X ,Concrete Breakwater (Channel 4)
G- 13

1.0A I
0.8
N 0.6A
0.4 A A
0.2
00 12 3 4 5
H1, FT .FIGURE G-13. Transmission Coefficient, C~ versus
Incident Wave Height, Hi Pipe-Tire Breakwater
1.0
0.8
0.6
0.4
0.2*
00
0 1 2 3 4 5 .-
TP. SEC ~
FIGURE G-14. Transmission Coefficient, Ct versus
Wave Period, Tp Pipe-Tire Breakwater
G- 14I

200
176 V
2 LL
A CHANEL 150 z~-J
Cy CHNEL1
0 ~~~ <0 10 2L 3 4
H, FT
LEEN 200ALEEN
CHNE CHNE 9 50 <zW
~ CHANNELN10 17
2~~ CHAHNNNEL11 -Uy CHANNEL 12 150
0 00, 2W34W
U- 100 - 20
CHANNE 1-175
C-C
0. 125T
0 0 r0L 10 2 3<
W C
G- 15
0 1 1 0
0~~ 1 2.

wave period, respectively. Figures G-15 and G-16 present the peak anchor
forces versus incident wave height and wave period, respectively.
For the limited range of data available (Hi = 1.0 to 2.3 ft), figure G-13 in- M
dicates that Ct is about 0.42 for incident wave heights up to about 2.0 ft.
In figure G-14 the transmission coefficient appears to increase as the wave
period increases. This increase is expected, but the wave period range during
the test project was not sufficient to show a conclusive trend.
The anchor force data (figures G-15 and G-16) do not show the expected in-
crease in anchor force as the wave height and/or wave period increases. The
anchor force is nearly constant, independent of the wave height and wave
period, as shown in figures G-15 and G-16. Several possible reasons for the
behavior of the anchor forces are discussed in paragraph 5 of the main report.+ - .4 °
4.0 Comparisons. Two comparisons will be made--one comparing the results of
the two breakwaters and another comparing these data to previous data obtained
from model studies.
4.01 Concrete and Tire Breakwater. The wave transmission characteristics of
the concrete and tire breakwaters are compared in figures G-17 and G-18, Ct
versus Hi and Ct versus Tp respectively. Both figures indicate that
the tire breakwater is slightly less effective in reducing the incident wave
field. Although the tire breakwater may be less effective in reducing wave
heights on the leeward side of the breakwater, the windward side is calmer
when compared to the corresponding side of the concrete breakwater. This
difference is due to the reflective characteristics of the breakwaters and
different methods by which each of the breakwaters reduces the wave energy.
The concrete breakwater uses reflection as the method of wave attenuation.
On the windward side of the concrete breakwater large waves are created by
the combined energy of the incident and reflected wave fields. The tire
breakwater, on the other hand, dissipates the wave energy through turbulence
as the wave moves through the breakwater, and only a small portion of the
energy is reflected. Some potential floating breakwater may be located where
the reflected waves in front of the concrete breakwater would be unaccept-
able. A tire breakwater would be a potential alternative in this situation.
G-16
'A'go 2. -; -,, .- .- .. ..." .-. --.-. , ..i , , i -..-"- -+ . - . • . " -

L~'~-'A, - .•
1.0
0.8
0.6 0 *0 0 -
o *0600,
0.4 o A
0.2
0 Io
0 I2 3 4HI, FT
LEGEND
0 CONCRETE BREAKWATER, FLEXIBLE CONNECTION, NO CLUMP WEIGHTSa CONCRETE BREAKWATER, RIGID CONNECTION, WITH CLUMP WEIGHTSA CONCRETE BREAKWATER, RIGID CONNECTION, NO CLUMP WEIGHTS
0 PIPE-TIRE BREAKWATER
FIGURE G-17. Transmission Coefficient, Ctversus Incident Wave Height, Hi
,,. - - .
1.0 I I I , ..
0.9
0.8
0.7 A 0-
0.60
U" 0.0DE 0.5 - .--
0.4 - .-0:0.0.3 - 0 D0 00 .--.--
0.2
0.1oI I I I 7 -
0 1 2 3 4 5T, SEC" "-*""
LEGEND
O CONCRETE BREAKWATER, FLEXIBLE CONNECTION, NO CLUMP WEIGHTS
3 CONCRETE BREAKWATER, RIGID CONNECTION, WITH CLUMP WEIGHTSA CONCRETE BREAKWATER., RIGID CONNECTION, NO CLUMP WEIGHTS0 PIPE-TIRE BREAKWATER
FIGURE G-18. Transmission Coefficient, Ct ,versus Wave Period, Tp
G-17
.. :..-.:!
. -. .- . -

Figure G-19 shows a comparison of the anchor forces for the two breakwaters.
In order to compare these two, the anchor force data are presented per linear
foot of breakwater. These values were calculated by assuming that the force
in an anchor line was distributed over a given length of breakwater depending
on the location of the anchor line/breakwater connection and the distance to
adjacent anchor lines. For the concrete breakwater, it was assumed that the
force on the center mooring line was distributed over a length of 37.5 ft and
that for the tire breakwater the force on the center mooring lin! was dis-.
tributed over a length of 12.5 ft. Due to extensive design differences be-
tween the two breakwaters and their anchor systems, a direct comparison is
difficult. Figure G-19 implies that the pipe-tire breakwater experienced
800
0 0
S. *..."- -
5000
80 A"
70~~~~ 0 ad 0 i-',-._j N.
50 0
o A(-V. .,
40 o g,
A.0 91600 0
30 D 0 0
20I I0 1.0 2.0 3.0 4.0 5.0
Hi, FT
LEGEND
A CONCRETE, RIGID CONNECTION, WITH CLUMP WEIGHTS
r' CONCRETE, RIGID CONNECTION, NO CLUMP WEIGHTS
0 C(rCRE T, F L-XIBLE CONNECTION, NO CLUMP WEIGHTS
0 IIH BFILAKWAIER
FIGURE G-19. Anchor Line Force per Foot of Breakwater, .'
F1 , versus Incident Wave Height, H i
G-18
:L- L .-_.. . . . . . . . . . . . . . ..-. .." -..-.. ";-- - - . - ' " "• .. - .. -z --.. .i ..;...:- -..'n

7Z -I-o,.',
L/W,
1.01 2 3 4 6 7 8 %
0.8
0.6 -0-0
040 0
0?0
0 4F
0 1.0 2.0 3.0 4.0 5.0
Tp, SEC
LEGEND
o HIGID WITH CLUMP WEIGHTS• RIGID WITHOUT CLUMP WEIGHTS
o FLEXIBLE WITHOUT CLUMP WEIGHTS- LABORATORY DATA
FIGURE G-20. Transmission Coefficient, Ct , versus Wave Period,
Tp , and Relative Wavelength, L/W , Concrete Breakwater
significantly greater anchor loads per foot of breakwater. However, it should
be noted that forces measured in individual lines on the concrete breakwater
were actually greater than those measured in individual pipe-tire breakwater
anchor lines. This is shown in figures G-9, G-11, ard G-16. Nevertheless,
because of wider spacing of the concrete breakwater lines (3 lines per 75 ft
as opposed to 9 lines per 100 ft for the tire breakwater), the force in a con-
crete breakwater line was distributed over a greater length of breakwater.
4.02 Model Data. Figures G-20 through G-22 compare the prototype data to
earlier model data. In figure G-20, the relationship between the wave trans-
mission coefficient and wave period for the concrete breakwater is compared to
model data collected for East Bay Marina (reference 2 at end of main report).
The data for East Bay Marina were chosen because the width and draft of the
%'
G-19
" -,..-. =..-*.- *.'- -.
**.*....-..-,
..... ,...-.•.........
. . . .. .. . . . ,-.',', .
,- " ,

7 . . . . . .
1.0
0.8
0.6
LEGEND
LEGEND
0.2 * PROTOTYPE DATA (Did=0.10)
- LABORATORY DATA (D/d =0.14)
0
0 1 2 3 4
4 L/W
FIGURE G-21. Transmission Coefficient, C versus
Relative Wavelength, L/W ,Pipe-Tire Breakwater
100
80 0 t
A 0 20 A6
60
LL 40LEGEND
SPROTOTYPE DATA, CH 0903 PROTOTYPE DATA, CH 10
200 PRTTPDAACH1
0 PROTOTYPE DATA, CH 1
-LABORATORY DATA
0 12 3 4
H1. FT
FIGURE G-22. Anchor Line Force per Foot of Breakwater, Ft,
versus Incident Wave Height, Hi Pipe-Tire Breakwater
G-20
Ir* . - . . . . .. . -... * . . . . . . . . . . . . _ _ _ _ _ 7_ _ _

model were the same as for the prototype. For the range of wave periods inwhich prototype data were collected, agreement between the model and the pro-
totype is good. Figure G-21 presents the wave transmission data for the tire
breakwater compared to Harms' model data (reference 5 at end of main report).
The prototype breakwater did not perform quite as well as the model predicted.
There are several possible explanations for this: the relative depth effects,
long period wave energy, and diffraction around the breakwater. The proto-
type data from both the concrete and the tire breakwaters exhibited a substan-
tial amount of scatter, which should be expected in field data. The model
data exhibited less scatter in that the model tests were necessarily conducted
under a set of rigidly controlled conditions including wave characteristics
and angle of attack, unlike the random conditions encountered in the field.
Figure G-22 compares the anchor force measurements collected in the prototype
for the tire breakwater to Harms' laboratory data . The prototype and model
data differ significantly. The anchor forces in the prototype are nearly con-W7
stant with an increasing wave height, while the model anchor forces increase
with an increasing wave height. The difference between the prototype and .'
model results probably is related to dissimilarities in the anchor system and
test conditions. The actual tire mat geometry was the same; however, there
were significant differences in the depth of water, anchoring system design,
mooring line elasticities, and ratio of breakwater draft to water depth.
5.0 Conclusions. A large amount of data were collected during this project,
and a number of valuable conclusions have been reached at this stage of the
analysis. The results indicate the following:
a. Current methods of predicting wave transmission are adequate, al-
though in critical areas a model study may be required. A model study is rec-
ommended when wave periods larger than 4 sec are expected at a proposed site.
b. Actual anchor loads can be significantly lower than what models or P
theory predict, but the loads may be drastically inflLenced by factors such
as mooring line elasticity and depth of water. Further studies related to
this area are being addressed in the general research and development studies.
G-21
-I-. " " .i - , . . . . , - . -.

m.. ..- .-. .. .
c. The concrete and tire breakwaters performed very well and are fea-
sible options to reduce wave energy. When choosing either structure, one
should consider the method of energy dissipation. The concrete breakwater
reflects the waves causing a rougher environment windward of the breakwater;
whereas the tire breakwater uses energy dissipation which reduces the amount
of reflection.
~ * .
.W7
,49L
i+.. %G-22

D-AI66 24? FLOTING REKWTER PROTOTYPE TEST PROGRM: SETTLE 3
NRSHINGTON(U) CORSTRL ENGINEERING RESEARCH CENTERVICKSBURG HS E E NELSON ET AL. MAR 86 CERC-HP-86-3
UNCLRSSIFIED F/G 13/2 NL
I.

.%
1.4
-IR r(P RE.rI.N E T H R
X-
III *.4,.
~ 132
4
:., Illl m 3 ,
MtCROC OPy RESOII"T
ION TEST CHART
./
-°5
'.

TABLE G-1
TRANSDUCER INPUT SUMMARY SHEET
Anchor Line ForcesChannel Location Physical
No. Code Location UnitsI "c2 LNWC Lower northwest on concrete breakwater kips2 LNEC Lower northeast on concrete breakwater3 UNWC Upper northwest on concrete breakwater4 USWC Upper southwest on concrete breakwater5 UNEC Upper northeast on concrete breakwater6 USEC Upper southeast on concrete breakwater7 LSWC Lower southwest on concrete breakwater8 LSEC Lower southeast on concrete breakwater
9 LNT Lower north tire breakwater10 UNT Upper north tire breakwater11 UST Upper south tire breakwater12 LST Lower south tire breakwater
Fixed References
13 South14 Center (never installed)15 North
Wave Heights
16 TIDE Tide gage ft . '.-].17 INC Incident wave buoy. .-
18 NW Northwest wave buoy19 NE Northeast wave buoy20 SW Southwest wave buoy21 SE Southeast wave buoy
-..,.,
Dynamic Pressures
22 NU North upper psi23 NL North lower24 BNC Bottom north center25 BEC Bottom east center26 BEI Bottom east inner27 BCC Bottom center28 BWI Bottom west inner29 BWO Bottom west outer30 BSC Bottom south center ,"-31 SCU South center upper
(Continued)
(Sheet 1 of 3)
G-23
... .. . . . . . . ..* . .. . .. . . . . . . . . . * . . ...... ... . . . , . . . . . . . . ,.:,_..-~~~~~~ ..'.L,-; ;"-,-",'V " ' . ." ,","" -. "- ,-,"-7''"" . ,:"" ;""" """""" ;" .',..'.. ,"., ,

TABLE G-1 (Continued)
Anchor Line ForcesChannel Location Physical
No. Code Location Units
Dynamic Pressures(Continued)
32 SWi Southwest number 1 psi33 SW2 Southwest number 234 SW3 Southwest number 335 SCL South center lower36 SE3 Southeast number 337 SE2 Southeast number 2 -"38 SEI Southeast number 139 EPI East pontoon number 1 -.
40 EP2 East pontoon number 241 EP3 East pontoon number 342 EP4 East pontoon number 4 .43 EP5 East pontoon number 5144 EP6 East pontoon number 6
Concrete Strains
45 NULE North upper longitudinal on east end is UI of pontoon
46 NBLE North bottom longitudinal on east endof pontoon
47 SBLE South bottom longitudinal on east endof pontoon
48 SULE South upper longitudinal on east end
of pontoon49 NT1 North transverse number 150 NT2 North transverse number 2 "51 BT1 Bottom transverse number 152 BT2 Bottom transverse number 253 UTI Upper transverse number 154 UT2 Upper transverse number 2
55 ST2 South transverse number 256 STI South transverse number 157 NULC North upper longitudinal at center
of pontoon
58 NBLC North bottom longitudinal at centerof pontoon
59 SULC South upper longitudinal at center
60 SBLC of pontoon
60 SBLC South bottom longitudinal at centerof pontoon
(Continued)
(Sheet 2 of 3)
G-24
,. '., " " °

TABLE G-1 (Concluded)
Anchor Line ForcesChannel Location Physical
No. Code Location Units
Accelerometer Data
61 WVA West vertical ft/sec2
62 WHA West horizontal63 WRA West rotational64 EVA East vertical65 EHA East horizontal66 ERA East rotational
Relative Motions
67 WVR West vertical rotational displacement deg68 WHR West horizontal rotational displacement69 EVR East vertical rotational displacement70 EHR East horizontal rotational displacement "71 CLM Center longitudinal motion72 CRM Center rotational motion
L .. *.
Wind Speed andDirection -" .
73 WS1 Wind speed at tide gage mph74 WS2 Wind speed at instrument house75 WD1 Wind direction at tide gage deg
76 WD2 Wind direction at instrument house
Current Velocity
77 N-S North-South ft/sec78 E-W East-West
(Sheet 3 of 3)
G-25.

L - - -.- - VV- a L- IRV" .1- . M - 3
TABLE G-2
WAVE ATTENUATION AND ANCHOR LINE FORCEDATA, CONCRETE BREAKWATER r.
Incident Transmitted Wave Anchor Line ForceWave Height Wave Height Transmission Period (Ib)
(ft) (ft) Coefficient (sec) Channel 4 Channel 7 .
Rigid Connection with Clump Weights
1.58 2.75 1,3151.21 2.75 1,276
% 1.82 3.01 1,6701.46 3.01 1,7551.50 0.62 0.41 2.75 1,495
1.49 2.54 1,5361.12 0.40 0.36 3.01 1,167 1,2441.04 0.46 0.44 2.54 1,042 1,1201.95 0.80 0.41 3.71 2,1782.10 1.09 0.52 3.32 1,982
1.79 0.74 0.41 3.01 1,6731.32 0.52 0.39 2.75 1,3511.52 0.54 0.36 2.75 1,4031.72 0.61 0.36 3.01 1,5011.29 0.47 0.36 2.75 1,346 1,424 .-,.:
0.88 0.32 0.36 2.54 1,174 1,2140.98 0.44 0.45 2.40
Rigid Connection Without Clump Weights
3.61 3.32 2,879 1,2961.56 1.03 0.66 2.05 1,369 1,1090.80 1,410 1,1490.80 3.32 1,209 1,0760.75 1,216 848
0.70 1,229 9150.40 0.19 0.48 1,082 8350.42 0.21 0.50 1,102 7620.41 1,162 8820.41 868 815
2.32 2.53 1,349 8422.35 2.35 1,376 8552.34 2.35 1,583 8752.08 2.53 1,369 8554.22 2.82 0.67 2.53 1,744 1,744
4.90 2.69 0.55 2.75 1,089 755
4.14 1.70 0.41 2.53 888 721
(Continued)(Sheet 1 of 4)
.%%
" ~~G-26 -. '"
• .- " ° .w

TABLE G-2 (Continued)
Incident Transmitted Wave Anchor Line Force ".Wave Height Wave Height Transmission Period (ib)
(ft) (ft) Coefficient (see) Channel 4 Channel 7
Rigid Connection Without Clump Weights (Continued)
2.19 0.86 0.39 2.19 975 7211.89 0.84 0.44 2.35 1,082 868 N
1.77 1.18 0.67 2.35 1,242 8222.04 0.82 0.40 2.19 1,369 8421.90 0.57 0.30 3.71 1,283 888
1.70 2.05 1,456 9082.50 2.75 2,244 9281.17 2.53 1,022 1,0150.71 2.53 1,022 1,1890.80 3.32 1,096 908
0.65 2.75 1,055 9620.83 2.53 1,142 9281.90 0.67 0.35 2.78 1,062
Flexible Connection Without Clump Weights
1.83 0.57 0.31 3.32 1,3031.8o 1,3763.73 3.03 2,6321.31 0.70 0.53 3.321.06 0.63 0.59 3.01
0.88 0.42 0.48 2.19 1,1821.72 0.52 0.30 2.751.46 0.83 0.57 3.321.84 0.78 0.42 2.75 2,131 :*-
2.35 0.83 0.35 3.01
2.47 0.78 0.32 2.351.29 0.39 0.30 2.53 9352.50 0.96 0.382.22 2.53 1,102
2.44 1.21 0.50 2.53
2.77 0.96 0.35 2.751.24 0.47 0.38 2.75 1,0690.68 1.92 1,0151.00 1,0152.49 2.75 1,403 oe :,
1.07 0.57 0.53 3.75 9890.43 2.35 1,0490.82 0.34 0.42 2.38
(Continued)(Sheet 2 of 4)
G-27 .-.
. . . . . . . . . . . . . . . . . .. . . . . . . . . . . . . . . . . . . . .

TABLE G-2 (Continued)
Incident Transmitted Wave Anchor Line ForceWave Height Wave Height Transmission Period (Ib) r
(ft) (ft) Coefficient (see) Channel 4 Channel 7
Flexible Connection Without Clump Weights (Continued) ''
2.13 0.89 0.42 3.32 1,0893.75 1,0021.39 1,0822.49 1.05 0.42 3.01 2,1112.23 1.04 0.47 2.75 2,345
1.50 0.56 0.37 2.53 1,8102.57 2.50 1,1290.90 2.35 1,0890.46 1.92 1,1291.05 2.53 1,109
1.32 2.13 1,049* 0.73 3.01 1,076
2.75 9081.55 2.53 1,0222.34 0.97 0.41 2.35
1.90 0.69 0.36 2.35 1,0961.88 0.82 0.44 2.19 1,0492.92 2.35 1,0551.38 0.51 0.37 2.53 1,0422.33 949
3.41 1.49 0.44 2.35 1,0221.70 2.75 1,0761.90 0.56 0.30 2.75 1,0691.78 1,262 1,0891.57 1,202 1,1090.93 1,690 1,1620.80 1,249 1,1021.64 1,0023.26 3.32 1,603 1,1362.22 3.01 1,236 1,082
1.94 2.05 1,249 9692.26 0.71 0.31 2.53 1,663 1,1092.50 0.81 0.32 2.35 1,403 1,0491.34 0.44 0.33 2.19 1,369 1,0021.32 0.60 0.45 2.75 1,156 1,089 -<
3.10 1,496 9873.22 1,610 9492.38 2.75 1,0152.77 3.71 1,450 942
(Continued) (Sheet 3 of 4)
G-28
€. . .. ,, ; ,. . .. ... .. .. . .. .. .. ..... , . .. .. . . . . .... .. . . . ...... ..... . ..., . .. . . ..... " .'

TABLE G-2 (Concluded)
• ..
Incident Transmitted Wave Anchor Line ForceWave Height Wave Height Transmission Period (Ib)
(ft) (ft) Coefficient (see) Channel 4 Channel 7
Flexible Connection Without Clump Weights (Continued)
2.46 1.13 0.46 2.53 1,0292.85 1,430 9222.38 1,309 9692.88 1,944 9022.97 1.74 0.59
3.11 1,476 9493.10 1,356 1,0223.14 2.35 1,396 1,029
3.80 2.75 1,490 1,0222.29 1.52 0.66 2.75 -'
3.00 1,0151.83 9821.57 9492.78 9621.11 995
0.96 1,002 . -
2.71 9423.78 9492.10 9752.18 915
3.98 9493.06 8953.93 1.82 9552.44 0.79 0.32 1.55 9751.92 2.05 935
.2.31 2.05 9422.32 2.19 1,162 9553.22 2.53 1,430 9152.50 1.00 0.40 2.05 1,316 1,0621.44 0.59 0.41 3.32 1,309 915
(Sheet 4 of 4)
G-29
Mr"- -. .

TABLE G-3
CONCRETE BREAKWATER STRAIN MEASUREMENTS
Incident Wave ChannelsWave Height Period Strain (ps) ~*.~
(ft) (see) 45 46 47 48 57 58 59 60
Rigid Connection with Clump Weights
2.10 3.32 28 18 18 4 10 4-14 121.52 2.75 15 8 10 4 6 -- 4 7
Rigid Connection Without Clump Weights
1.90 3.71 19 21 3 1 16 7 7 172.50 2.75 27 28 3 1 23 10 8 25 R
Flexible Connection Without Clump Weights
1.46 3.01 10 14 10 4 8 17 14 8
1.92 2.75 10 14 11 4 12 7 6 13
N
57 4
477
* Strain Gage Location Sketch .
G-30

TABLE G-4
WAVE ATTENUATION AND ANCHOR LINE FORCEDATA, PIPE-TIRE BREAKWATER
Trans-
Incident mitted Anchor Line ForceWave Wave Trans- Wave (1b)
Height Height mission Period Channel Channel Channel Channel(ft) (ft) Coefficient (sec) 9 10 11 12
2.75 3.32 791 7832.76 3.71 838 7833.29 4.20 838 8653.38 4.20 873 8571.51 2.75 887 855
1.34 888 8133.22 3.71 974 989 1,6781.58 0.83 0.52 2.75 940 895 8551.21 0.59 0.49 2.75 910 922 8471.82 0.75 0.41 3.01 927 995 952
1.46 0.70 0.48 3.01 912 905 9181.50 0.75 0.50 2.75 960 9201.49 0.57 0.38 2.54 952 9551.12 0.36 0.32 3.01 920 8621.04 0.84 0.81 2.54 802 748
1.95 1.33 0.68 3.71 792 8182.10 3.32 942 8081.79 0.75 0.42 3.01 792 7801.36 0.79 0.58 2.75 815 7701.52 0.79 0.52 2.75 755 807
1.72 0.89 0.52 3.01 798 7971.31 0.51 0.39 2.531.29 0.58 0.145 2.75 867 965,1.17 0.37 .31 2.531.05 0.38 0.36 3.01
1.06 0.48 0.45 2.531.00 0.140 0.140 3.000.88 0.20 0.23 2.54 675 8680.80 0.54 0.67 3.001.83 0.72 0.40 2.19
2.38 0.72 0.30 2.352.32 0.78 n 34 2.531.74 0.74 0.43 3.001.12 0.40 0.36 3.26
G-31

APPENDIX H
CHRONOLOGY OF MAJOR EVENTS
% 5 Feb 81 The prototype test is authorized and the Floating Break-
9. water Prototype Test Program Working Group is established
by M. G. Heiberg.
26-27 Feb 81 Meeting to set groundwork for prototype test and to de-
lineate program responsibilities is held in Seattle.
8 May 81 Prototype design document is completed. .'.
12 Jun 81 Meeting of working group is held in Seattle (working group
approves design document and authorizes proceeding with
plans and specifications).
27 Jul 81 Meeting of working group is held to review draft plans and
specifications.
5 Aug 81 Plans and specifications are completed.
114 Aug 81 Plans and specifications are approved.
11 Sep 81 Monitoring contract is awarded to University of Washington
for $280,000.
28 Sep 81 Construction contract is awarded to American Construction
for $576,000.
24 Mar 82 Construction of pipe-tire breakwater is begun.
29 Apr 82 Pipe-tire breakwater is completed.
27 Apr-4 May 82 Anchor piles are driven at West Point test site.
H-1 " -'
=' ° ° o .. . .. .% % ° " . ° , , - °. -% .- ° .-- . / o'- ° , , .- - -., . " -' % . "°°° ,

28 May 82 First module of concrete breakwater is placed.
10 Jun 82 Second module is placed.
p -
17 Jun 82 Pipe-tire breakwater is anchored at West Point.
28 Jun 82 Concrete modules are launched and connected. *
1 Jul 82 Upon arrival of concrete breakwater at West Point anchor- x.ing is begun.
16 Jul 82 Concrete breakwater anchor lines are tensioned to 5,000 lb
and 1,000 lb.
19 Jul 82 District Engineer inspection of breakwater is conducted.
22 Jul 82 First concrete breakwater flexible connector repair is
completed.
3 Aug 82 Instrumentation conduit is installed by electrical
contractor.
6 Aug 82 Secondary hatch is installed (to allow access to instru-
mentat ion compartment).
9 Aug 82 Final inspection of breakwater construction (connector
failure noted) is conducted.
26 Aug 82 Second flexible connector repair is completed.
13 Sep 82 Test site is inspected by working group.
3 Oct 82 Failure of U-shaped connector is detected. -;:
5 Oct 82 Emerwency fendering is installed between concrete floats.
H-2
K -4.K..i>.-.;.-

6 Oct 82 First storm of winter, with 30-knot winds from the south,
is experienced.
15 Oct 82 Concrete floats are disconnected and fendered. Mir~."A -
22 Oct 82 Second major storm, with southerly winds of 25 knots and
gusts to 38 knots, is experienced.
26 Oct 82 Third storm, with southerly winds of 31 knots and gusts
to 41 knots (horizontal timbers torn from wood fender),
is experienced.
28 Oct 82 Data Acquisition System is installed and turned on.
8 Nov 82 West end of east float is flooded, requiring emergency
pumping.
13 Dec 82 Test site is inspected by working group.
21 Dec 82 65-knot southerly winds (highest during test) are
experienced.
29 Dec 82 Emergency repairs are made to concrete breakwater fender-
ing system.
9-10 Jan 83 24 hr of southerly winds continously exceeding 30 knots
is experienced.
11 Jan 83 Emergency pumping is again required (east end of east
float).
31 Jan 83 Boat wake test No. 1 is conducted.
8 Feb 83 Concrete breakwater is unanchored and towed to U. S.
Army Corps of Engineers work area at Lake Washington
Ship Canal.
H-3
7

r I" T.' W. T - W L _ ,- u "
L7 A-. .. .'W' . . -: -. FL 'F ',' .: ' .-. - - "Z -,wf "iL- " ;. ., . " . " V .- _ . r .. " : .. . .: . =- . -r . - .
9-24 Feb 83 Rigid connection is made between floats.
25 Feb 83 Rigidly connected concrete breakwater is reanchored.
13-14 Mar 83 Strong southerly winds to 35 knots are experienced.
15 Mar 83 Onboard data acquisition system is reactivated.
30 Mar 83 Test site is inspected by working group.
9-10 Apr 83 Strong southerly winds to 25 knots are experienced.
22 Apr 83 Boat wake test No. 2 is conducted.
9-10 Jun 83 Strong southerly winds to 26 knots are experienced.
13 Jun 83 First serious structural damage to pipe-tire breakwater
(broken pipe No. 2 from west end) is noted.
23 Jun 83 Test site is inspected by working group.
5 Jul 83 Pipe-tire breakwater is removed from test site.
12 Jul 83 Second pipe (No. 1 from west end) is found broken.
18 Aug 83 Pull test/boat wake test No. 3 is conducted.
10 Sep 83 Strong southerly winds, to 26 knots, are experienced.
19 Sep 83 Clump weights are removed from concrete breakwater anchor
lines. .
20 Sep 83 Strong northerly winds, of 20 knots, are experienced.
S9 Oct 83 Strong northerly winds are experienced.
H-4.~~~,. .° . . . .° . .°
._, :i?:iw

.- wx-
22 Oct 83 Strong southerly winds, of 20-25 knots, are experienced.
29 Oct 83 Boat wake test No. 4 is conducted.
1 Nov 83 Concrete breakwater is removed and towed to Lake
Washington Ship Canal.
2-30 Nov 83 New horizontal fender flexible connector is installed.
1 Dec 83 Concrete breakwater is reinstalled at West Point.
8 Dec 83 Strong southerly winds, of 25 knots, are experienced.
12 Dec 83 Test site is inspected by working group. *.-.* -*.*
20 Dec 83 Strong northerly winds are experienced.
2-4 Jan 84 Strong southeasterly winds, of 27 knots, are experienced. . ..
23-26 Jan 84 Strong southerly winds, of 30 knots, are experienced.
31 Jan 84 Concrete breakwater is unanchored and towed to Lake
Washington Ship Canal.
5 Mar 84 Concrete breakwater is anchored at Corps' marina project
at Friday Harbor, Washington.
H-5-
2". ' .; .
"V. "o
* N* ,
w.j-=
a.:!::

*1N
'4
.~v.-.
V.. .
.4
_
-
'p
-p.~ p..'
'C.,C-'
-C.
C.
-. C
4
-~ ~ *~*-**.~*- * '- - ~C C. ~ '~ ~ d* *CC*'V~~p.C~9.'.9?Vk~rC 'C~