harnessing design space: a similarity-based exploration method for generative design
TRANSCRIPT

217
Harnessing Design Space:A Similarity-BasedExploration Method forGenerative DesignHalil Erhan, Ivy Y.Wang and Naghmi Shireen
issue 4, volume 12international journal of architectural computing
218
Harnessing Design Space:A Similarity-BasedExploration Method for Generative DesignHalil Erhan, Ivy Y.Wang and Naghmi Shireen
Working with multiple alternatives is a central activityin design; therefore, we expect computational systemsto support such work.There is a need to find out thetool features supporting this central activity so that wecan build new systems.To explore such features, wepropose a method that aims to enable interaction witha large number of design alternatives by similarity-based exploration. Using existing data analysis andvisualization techniques adopting similarity-basedsearch, we formalized the method and its elements byfocusing on systematic filtering, clustering, and choosingalternatives.We present a scenario on developingconceptual designs for a residential apartment toillustrate how the method can be applied, as well as toreveal the limitation of current tools and the potentialinteractive clustering and filtering features for the newsystems coupled with parametric design.
1. INTRODUCTION
Simon [1],Akin [2], and Woodbury and Borrow [3] showed that workingwith multiple alternatives is a central activity in design; therefore, we expectcomputational systems to support such work.The current systems used inpractice indirectly support working with multiple solutions (such as throughconfiguration management), and some direct solutions are proposed asprototype systems for demonstration only.They fall under three categoriesbased on where they propose supporting exploration: on the modelthrough side-by-side editing [4, 5]; as records in a history of action andstates [6, 7]; and on a set of alternatives created by generative methods [8,9].We have yet to know how these prototypes translate into functionalsystems or the combined effect of the three categories in a taskenvironment that is amenable for design search.
Generative and parametric design methods open possibilities forworking with a large set of solutions. Current parametric CAD tools arewidely used in various stages of design, but mainly for concept generationthrough a linear process.The challenges of using parametric modeling areprominent; such as it requires a different design paradigm for interweavingthe parametric elements and when they are used in conjunction with oneor more plug-ins with generative capabilities to algorithmically createsolutions with limited intervention from designers.The space of alternativesolutions that can be generated using a parametric model is highdimensional: due to combinatorial explosion when the number ofparameters and their value ranges increase, the growth in the number ofpossible solutions is polynomial. For a design project with few parametersand a well-defined parameter value range, the solution space can easilyinclude thousands of alternatives.The solution space expands with theintroduction of new parameters or adding new criteria. However, there isno direct and proper tool-support to augment the designers’ capability innavigating and managing this space. Hence, as part of a larger researchprogram on working with alternatives, we have developed a similarity-centered method focusing on how we can systematically filter and choosepossible alternatives from a large number of solutions generated using aparametric model.We rely on data analysis and interactive visualizationtechniques for searching possible systems features supporting designexploration activities.An informal case study using a parametric model of aresidential apartment is presented to illustrate the method.
2. DESIGN TASK ENVIRONMENT ANDALTERNATIVES
Design starts with incomplete and imprecise goals [2, 10] that at the outsetcan be achieved through many alternative solutions [11].As design goalsevolve [12], new constraints and new variables appear [13] which demandssystematic ways of looking at alternatives. Exploration of alternatives takes
219Harnessing Design Space:A Similarity-Based Exploration Method for Generative Design

place in a task environment that constitutes external representations andthe tools that manipulate them.The structure of the task environmentinfluences both (design) problem and solution spaces and consequently, thestrategies designers apply in achieving an acceptable solution. In currentdesign practice, the computational design tools present a limited taskenvironment for working with alternatives mainly because most of theminteract with representation of ‘single state (design) model’ [9]. If and whenwe can change the characteristic of this task environment, we envision thatwe can open up new possibilities for design.
Having to work in task environments with large number of alternativesposes choice overload problem, where the selection mechanism, displaystrategies, and manipulation techniques become significant factors in shapingthe design space. Studies on observing human behavior while working withmultiple objects [14] for a goal-oriented task, demonstrate that peopleconstantly organize and re-organize objects in their primary workspace andarrange objects based on importance, expected use, or as reminders.Hollan, Hutchins and Kirsh [15] propose that workspace is a resource that‘must be managed, much like time, memory, and energy’; and workspace’sspatial arrangements must simplify choice, perception, and internalcomputation. On the similar lines, Smith et al. [16] propose that theinterface solutions for working with multiple designs must be adaptable toprovide multiple ways to view alternatives, with an ability to arrange them,group them, tag them, resize them, and to reflect on them [13, 17]individually or collectively.
2.1. Generative Tools and Design Exploration
For comparison and analysis, we have classified design explorationtechniques and interfaces into four categories based on their underlyingrepresentation used for exploration and their degree of automation inperforming exploratory tasks.
Parametric Exploration: Parameterization provides a mechanism forchanging values assigned to different parameters linked to one or multipledesign features.Tuning values [4, 18] and other input mechanisms haveamplified the amount of variability one can achieve in a limited time.Together with linked editing techniques, parametric exploration has becomea type of representation on its own.
History-based Exploration: Most of the recent systems now providerich history keeping mechanism in form of a timeline [19].The timelineinterfaces amplify the opportunities presented to its users.Their interplayfacilitates better learning, improved reflection, and flexible design processwith minimum premature commitment [20]. In addition, interactive historieshave enabled playing what-if scenarios: users cannot only go back in time tomake corrections but also have a mechanism to try out variations bybranching out in the timeline [9].
220 Halil Erhan, Ivy Y.Wang and Naghmi Shireen
Rule-based Exploration: There is a considerable amount of researchin this domain with different names; some call it shape grammar [21-24] justto name few) others call it example-based exploration [25]. However theyall share the same principle that is, system learns from examples or rulesand helps user explore the potentials of the design space. On one hand withminimum computer interference, these systems help motivate explorationby giving related examples, but on the other hand the suggestions regulatedby the semi-automated systems based on shape rules or style grammar,affect the boundaries of design space.
Genetic Algorithms and Design Exploration: Genetic exploratoryinterfaces are generally suited for solving complex parameter optimizationproblems [26, 27].They are often termed as “canonical genetic algorithms”.Genetic algorithms are suitable for solving problems in creative design [28],such as combining components in a novel, creative way.
2.2. Expectations from CAD Systems
Computer-aided Design (CAD) systems are Creativity-Support Tools andare expected to enable ‘exploratory processes’ for both novices andexperts [29]. However, the current systems inherit the known challenges inCAD, they have less emphasis on exploration as discussed in [29].Althoughtheir interfaces are meant to enrich the design experience, their strength isbased on the computation and not necessarily on how designers work.Their actual success against these aspirations is limited to specific and oftentechnically involved strategies. Little research exists on matching thesesystems and design exploration and the effects of interaction on taskperformance strategies.
Smith et al. [16], focus on the interface support in CAD tools forgenerating and managing multiple ideas.They report a set of suggestionsbased on their empirical findings to improve existing systems: a) Make iteasy to switch between ideas, b) Provide a way to view multiple ideas atonce, c) Allow users to adapt the interface to their needs and preferences,d) Provide ways to label the ideas both pictorially and textually, e) Providemultiple ways to group and classify the ideas, f) Provide an explicit meansfor capturing the situation, and g) Support fluid composition anddecomposition of ideas. Combined with the qualities of creativity supporttools, these give an overall direction for development of the next generationCAD tools to better support design exploration.
Obviously, developing the next generation of CAD tools require asignificant effort.Towards contributing ideas, in this paper our focus is toenable designers to access and manage the rapidly growing design space; andif and when possible enable them to reduce the solutions from thousandsto include the most relevant design instances.
221Harnessing Design Space:A Similarity-Based Exploration Method for Generative Design
3. USING SIMILARITY AND CLUSTERING FOREXPLORATION
Our goal is to develop computational methods that allow the designers toexplore the alternatives by means of filtering and selecting sets in regard totheir own ‘designerly’ [10] preferences.Their organization becomesimportant for accessing, evaluating, sorting, branching, pruning, and cross-pollination.To achieve a final solution, reduction and subordination ofalternatives are needed.This calls for system features such as filtering,labeling, sorting, and grouping to reduce solutions to a minimum set ofmaximally differentiated alternatives.Their visual, logical, temporalorganization must help designers generate and select alternatives in differentviews. Some CAD systems can calculate cost, material complexity, structuralrobustness etc. of alternative design choices.These data allows better focuson less quantifiable design choices including subjective judgment, but onlywhen they are accessible and visible.
In order to achieve these, we propose a similarity index-based search ofdesign space using similarity matrices taking both independent and derivedparameters as input.This approach is feasible in concept exploration ascomputationally expensive comparison methods using geometry orsemantic analysis (such as thermal performance) can be less effective for therapid search of possible solutions.
3.1. Method
We propose using similarity and differences between design alternatives insearching design space by performing selection and comparison operations.Considering the increasing complexity of designs, we believe that it isimpractical—let alone can be computationally expensive—to have anexhaustive comparison. Since our goal is to provide an efficient method, wefirst define our assumptions:
• Assumption 1: A similarity measure between two designalternatives is a probable distance in design space, and is not anabsolute, decisive, and only conclusion on their similarity.
• Assumption 2: Selection of a similarity metrics depends on thedesign model structure, goal of comparisons, and if the structure isamenable for comparison. Each similarity metric can result with adifferent distance between two given design alternatives, whichtheir selection depends on the designer.
• Assumption 3: The members of any given design set can becomputationally compared with each other in relation to a set ofdesign features represented computationally that the comparisoncan reveal clustering of similar solutions. Changing the set offeatures may result with a different clustering.
222 Halil Erhan, Ivy Y.Wang and Naghmi Shireen

• Assumption 4: The similarity between design alternatives A and Bcan be calculated by comparing their independent parameters orexpressions iff A and B can be generated using the same designmodel structure.The similarity index can be initially sufficientenough to predict the similarity between any two designs withoutgenerating them. For example, the cylinders CA and CB can becompared in relation to their radius and height (independentparameters), or by their volumes derived from the radius andheight (expression calculating derived parameters), hence CA and CBcan be compared without creating these cylinders.
Based on these assumptions, we propose the following iterative processusing similarity indices in searching design space by performing selection andcomparison operations (Figure 1):
� Figure 1.The method proposed to
reduce the design space of interest to
a manageable and meaningful size.
223Harnessing Design Space:A Similarity-Based Exploration Method for Generative Design
Set parameter and value ranges: The designers evaluate and selectthe parameters or derived parameters to be considered in exploration.Thefilters can be added into the parameter selection process, which can includeexpressions or rules. (Assumptions 3 and 4)
Select and prepare similarity algorithm: Designers choose ordefine a similarity metric to compare how two given design solutions aresimilar or different.The result is an index value between 0 and 1, which 0means no similarity and 1 means close similarity. Note that 1 doesn’tnecessarily show identical solutions (Assumption 1). Each similaritymeasurement method has its own advantages and disadvantages. Forexample Euclidian similarity index works on absolute distances betweendifferent data points, however each data point is treated same, hence aweighted method can be preferred. Bray-Curtis dissimilarity index also usesabsolute distances as in Manhattan method but treats the individualcomponents of data as separate dimensions (Assumption 2).There areother statistical similarity calculation methods that their discussion isbeyond the scope of this paper.

Generate Similarity Matrix and Visualize: By computationallycomparing each solution to others, a similarity matrix (table) is generated.This is essentially an n-by-n table half-filled with similarity indices, andcolumns and rows corresponds the design alternatives sorted in the sameorder. One of the main advantages of our method is the ability to comparedesign similarities without generating the 3D models (Assumption 3 and 4).Designers can generate design models in any step when needed for rapidsearch.
Create subsets in clusters and reduce scope: Once the similaritymatrix is created, it can serve as a means to select subsets of designs basedon their similarity index values, such as by setting similarity threshold to acertain value or by interactively defining a selection range.The subset canfurther be treated as possible solution space and its scope can be narrowed(Assumption 3).The designers can eliminate or focus on alternatives in thesubsets with certain desired or undesired criteria.
3.2. Definitions:
We operationalize our approach by first introducing a formalism with itsbasic definitions (Table 1).When a similarity algorithm is applied on twodifferent design instances, the result reveals the similarity distance betweenthem in a given threshold of similarity or tolerance of similarity.Thesimilarity is calculated based on the independent or derived parameters.
Independent parameter p p has a value v such that p:={ v | minv < v < maxv
OR v ∈{v1, v2, v3…, vn}}\
Design instance, D A unique alternative generated using any generativealgorithm taking a parametric design model and a set ofindependent parameters as input.
D defined by unique tuples of p, D:={p1, p2, p3…,pn}
Design space, DS All possible design alternatives forms a design space thatcan be generated using a parametric model using anygenerative algorithms.
DS:={ D1, D2, D3,…,Dn}
Design filter f f is a rule that takes D to test if it meets the requiredcriteria
f(D):={rule expression testing features of D}
Design sub-space, DSu DSu � DS, such that every alternative design solutions inDSu meets a set of predefined criteria.
DSu:={D ∈ DS | f 1(D) & f 2(D) & f 3(D),…, f n(D) is true}
Similarity, S S is a distance between D1 and D2 that showscommonality and dissimilarity between their features.Apair of D be treated as similar if the similarity S derivedfrom a similarity algorithm ’ is above a threshold.
S:={ Di = Dj | Di, Dj ∈ DSub & ’ (Di, Dj) < Similaritythreshold.
� Table 1: Definition of basic terms
used in method
224 Halil Erhan, Ivy Y.Wang and Naghmi Shireen

3.3. Example
Imagine a parametric cylinder with three independent parameters, as shownin Figure 2, height h, radius r, and color c such that h = {0.5, 1, 2, 3}, r = {1,2, 3, 4}, and c = {red, blue, yellow, green}.The size of possible design space is|DS| = 64. If a color filter f(c) ::{blue} is applied, the result is a design sub-space |DSu|=16. Let’s assume that we apply the Euclidian similarity metricson two design instances in the DSu, D1={h=0.5, r=1, c=blue} and D2={h=1,r=3, c=blue}, and assume that we take the similarity threshold 0.7. For theclarity of the example, we standardized the parameters in their given ranges.The calculated similarity index is Es (D1, D2)=0.5. In order to decide ifthese two alternatives are similar under given filtering conditions, the indexmust be above the threshold value 0.7; hence we treat these as differentdesigns.Assume that the same similarity calculation is applied on each pairof Di, Dj∈DSu, the result is a 16x16 similarity matrix that can be visuallypresented in different formats.The similarity logic can include derivedparameters, such as volume, or expanded factors such as color saturationswith numeric values.
� Figure 2. A parametric cylinder
with four possible heights, radii and
color values can create sixty-four
alternative solutions (image courtesy
of Sheikholeslami [30]).
225Harnessing Design Space:A Similarity-Based Exploration Method for Generative Design
4. CASE STUDY: INTERACTING WITH THOUSANDSOF RESIDENTIAL BUILDING DESIGNALTERNATIVES
4.1. Design Scenario
Below, we present a hypothetical scenario demonstrating how the proposedmethod can be used in exploring conceptual design for a residential buildingusing a parametric model.The goal is to demonstrate the significance ofworking with alternatives for informed exploration, and to show that thecurrent tools fall short in meeting designers’ needs to find unlooked forpossibilities in design. In the design scenario architects are required toexplore design solutions for a residential apartment (Figure 3).The design
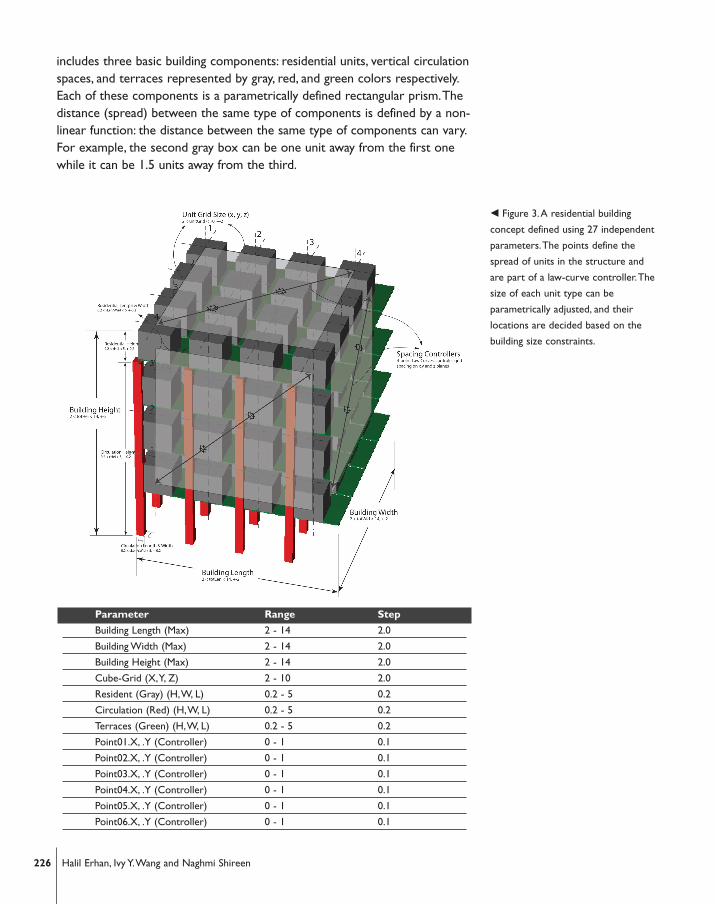
includes three basic building components: residential units, vertical circulationspaces, and terraces represented by gray, red, and green colors respectively.Each of these components is a parametrically defined rectangular prism.Thedistance (spread) between the same type of components is defined by a non-linear function: the distance between the same type of components can vary.For example, the second gray box can be one unit away from the first onewhile it can be 1.5 units away from the third.
� Figure 3.A residential building
concept defined using 27 independent
parameters.The points define the
spread of units in the structure and
are part of a law-curve controller.The
size of each unit type can be
parametrically adjusted, and their
locations are decided based on the
building size constraints.
226 Halil Erhan, Ivy Y.Wang and Naghmi Shireen
Parameter Range Step
Building Length (Max) 2 - 14 2.0
Building Width (Max) 2 - 14 2.0
Building Height (Max) 2 - 14 2.0
Cube-Grid (X,Y, Z) 2 - 10 2.0
Resident (Gray) (H,W, L) 0.2 - 5 0.2
Circulation (Red) (H,W, L) 0.2 - 5 0.2
Terraces (Green) (H,W, L) 0.2 - 5 0.2
Point01.X, .Y (Controller) 0 - 1 0.1
Point02.X, .Y (Controller) 0 - 1 0.1
Point03.X, .Y (Controller) 0 - 1 0.1
Point04.X, .Y (Controller) 0 - 1 0.1
Point05.X, .Y (Controller) 0 - 1 0.1
Point06.X, .Y (Controller) 0 - 1 0.1
4.2. Depth and Breadth Explored
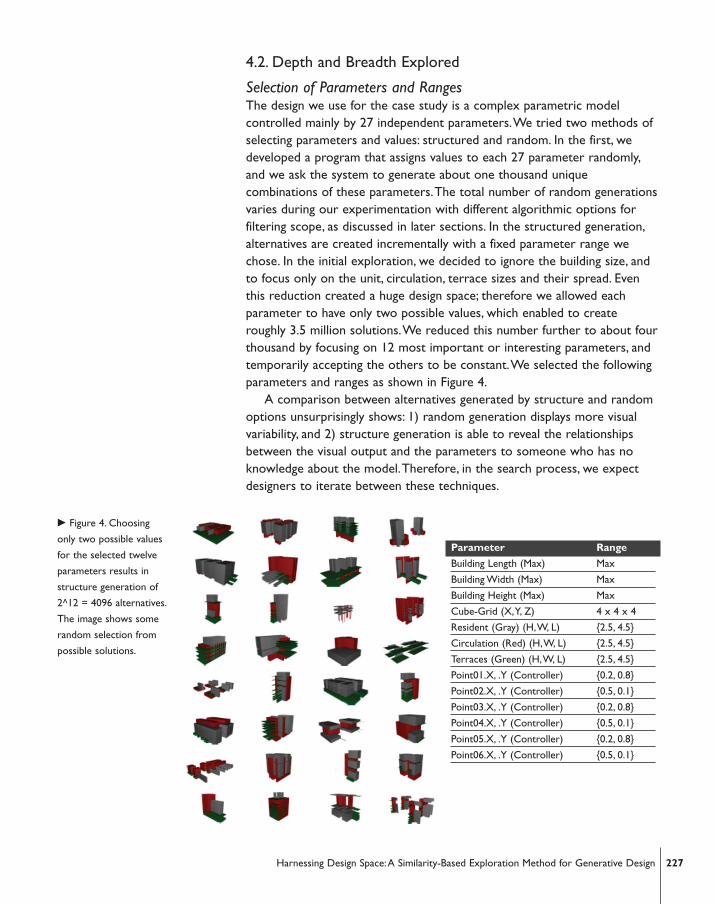
Selection of Parameters and RangesThe design we use for the case study is a complex parametric modelcontrolled mainly by 27 independent parameters.We tried two methods ofselecting parameters and values: structured and random. In the first, wedeveloped a program that assigns values to each 27 parameter randomly,and we ask the system to generate about one thousand uniquecombinations of these parameters.The total number of random generationsvaries during our experimentation with different algorithmic options forfiltering scope, as discussed in later sections. In the structured generation,alternatives are created incrementally with a fixed parameter range wechose. In the initial exploration, we decided to ignore the building size, andto focus only on the unit, circulation, terrace sizes and their spread. Eventhis reduction created a huge design space; therefore we allowed eachparameter to have only two possible values, which enabled to createroughly 3.5 million solutions.We reduced this number further to about fourthousand by focusing on 12 most important or interesting parameters, andtemporarily accepting the others to be constant.We selected the followingparameters and ranges as shown in Figure 4.
A comparison between alternatives generated by structure and randomoptions unsurprisingly shows: 1) random generation displays more visualvariability, and 2) structure generation is able to reveal the relationshipsbetween the visual output and the parameters to someone who has noknowledge about the model.Therefore, in the search process, we expectdesigners to iterate between these techniques.
� Figure 4. Choosing
only two possible values
for the selected twelve
parameters results in
structure generation of
2^12 = 4096 alternatives.
The image shows some
random selection from
possible solutions.
227Harnessing Design Space:A Similarity-Based Exploration Method for Generative Design
Parameter Range
Building Length (Max) Max
Building Width (Max) Max
Building Height (Max) Max
Cube-Grid (X,Y, Z) 4 x 4 x 4
Resident (Gray) (H,W, L) {2.5, 4.5}
Circulation (Red) (H,W, L) {2.5, 4.5}
Terraces (Green) (H,W, L) {2.5, 4.5}
Point01.X, .Y (Controller) {0.2, 0.8}
Point02.X, .Y (Controller) {0.5, 0.1}
Point03.X, .Y (Controller) {0.2, 0.8}
Point04.X, .Y (Controller) {0.5, 0.1}
Point05.X, .Y (Controller) {0.2, 0.8}
Point06.X, .Y (Controller) {0.5, 0.1}
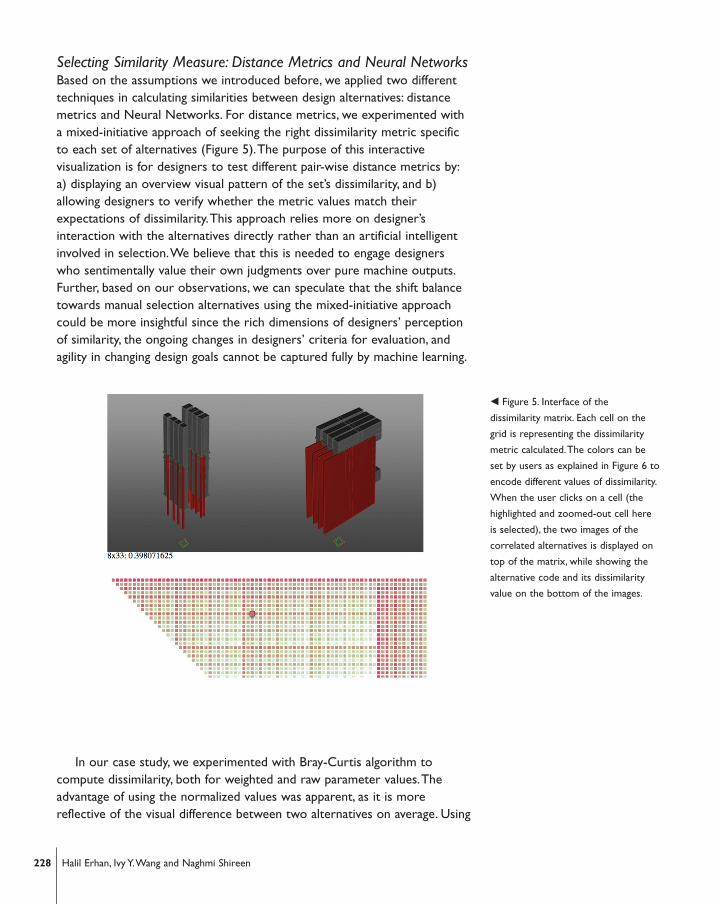
Selecting Similarity Measure: Distance Metrics and Neural NetworksBased on the assumptions we introduced before, we applied two differenttechniques in calculating similarities between design alternatives: distancemetrics and Neural Networks. For distance metrics, we experimented witha mixed-initiative approach of seeking the right dissimilarity metric specificto each set of alternatives (Figure 5).The purpose of this interactivevisualization is for designers to test different pair-wise distance metrics by:a) displaying an overview visual pattern of the set’s dissimilarity, and b)allowing designers to verify whether the metric values match theirexpectations of dissimilarity.This approach relies more on designer’sinteraction with the alternatives directly rather than an artificial intelligentinvolved in selection.We believe that this is needed to engage designerswho sentimentally value their own judgments over pure machine outputs.Further, based on our observations, we can speculate that the shift balancetowards manual selection alternatives using the mixed-initiative approachcould be more insightful since the rich dimensions of designers’ perceptionof similarity, the ongoing changes in designers’ criteria for evaluation, andagility in changing design goals cannot be captured fully by machine learning.
� Figure 5. Interface of the
dissimilarity matrix. Each cell on the
grid is representing the dissimilarity
metric calculated.The colors can be
set by users as explained in Figure 6 to
encode different values of dissimilarity.
When the user clicks on a cell (the
highlighted and zoomed-out cell here
is selected), the two images of the
correlated alternatives is displayed on
top of the matrix, while showing the
alternative code and its dissimilarity
value on the bottom of the images.
228 Halil Erhan, Ivy Y.Wang and Naghmi Shireen
In our case study, we experimented with Bray-Curtis algorithm tocompute dissimilarity, both for weighted and raw parameter values.Theadvantage of using the normalized values was apparent, as it is morereflective of the visual difference between two alternatives on average. Using
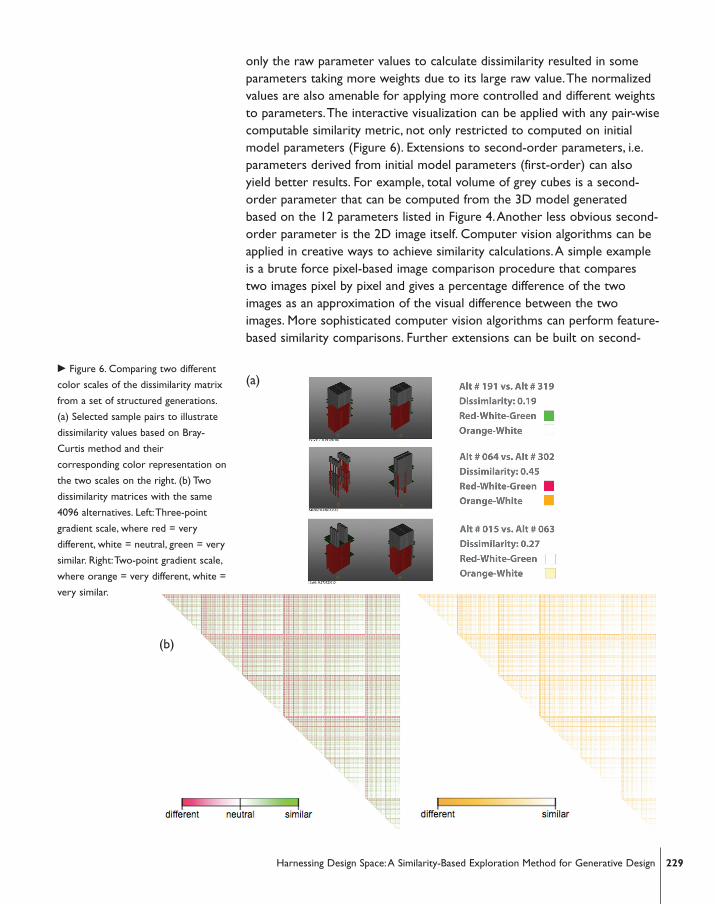
only the raw parameter values to calculate dissimilarity resulted in someparameters taking more weights due to its large raw value.The normalizedvalues are also amenable for applying more controlled and different weightsto parameters.The interactive visualization can be applied with any pair-wisecomputable similarity metric, not only restricted to computed on initialmodel parameters (Figure 6). Extensions to second-order parameters, i.e.parameters derived from initial model parameters (first-order) can alsoyield better results. For example, total volume of grey cubes is a second-order parameter that can be computed from the 3D model generatedbased on the 12 parameters listed in Figure 4.Another less obvious second-order parameter is the 2D image itself. Computer vision algorithms can beapplied in creative ways to achieve similarity calculations.A simple exampleis a brute force pixel-based image comparison procedure that comparestwo images pixel by pixel and gives a percentage difference of the twoimages as an approximation of the visual difference between the twoimages. More sophisticated computer vision algorithms can perform feature-based similarity comparisons. Further extensions can be built on second-
� Figure 6. Comparing two different
color scales of the dissimilarity matrix
from a set of structured generations.
(a) Selected sample pairs to illustrate
dissimilarity values based on Bray-
Curtis method and their
corresponding color representation on
the two scales on the right. (b) Two
dissimilarity matrices with the same
4096 alternatives. Left:Three-point
gradient scale, where red = very
different, white = neutral, green = very
similar. Right:Two-point gradient scale,
where orange = very different, white =
very similar.
229Harnessing Design Space:A Similarity-Based Exploration Method for Generative Design
(b)
(a)
order calculations for more complex evaluations, such as similarity insunlight studies.
We also used Matlab (from Mathworks Inc) to calculate the similarityusing different distance metrics (Euclidean, Standardized Euclidean,Spearman, Hamming etc) to understand how each metrics will compare.Each resulted with different similarity values since each focus on differentaspects of data. For example the correlation between Euclidean andStandardize Euclidean metrics was not very significant (p<0.12); betweenSpearman and Standard Euclidean the correlation is not significant as well(p<.28). Given the variability in the standardized methods for measuringsimilarity, we strongly suggest that a custom similarity measure developedfor consistent result with the goal of the design search. In addition, thevisualizations of similarities provided limited interactivity; we found a needto directly use these visualizations for querying, filtering, and selection likethe tools in other domains, such as visual analytics.
Filtering Scope using Similarity Indices: Global and Within Set We performed both global filtering on fixed number alternatives after theentire similarity matrix calculated, and within-set filtering that compares analternative against all previously generated ones and collected in a set. Inglobal filtering case, an average for each alternative’s dissimilarity against allother alternatives was calculated.The global filtering was performed toselect the top 1000 most dissimilar alternatives. In the within-set filteringcase, dissimilarities are evaluated on a rolling-basis only against those alreadyselected as opposed to against all generated solutions.This is beneficial interms computation time. In within-set filtering, we both structurally orrandomly selected a seed alternative, and then continue on evaluating theupcoming alternative until 1000 are selected.We only selected theupcoming alternative if it has a dissimilarity index above the threshold (e.g.0.3) with alternative that’s already in the selected set. If the upcomingalternative is similar with anything in the set then we discard it and go tothe next alternative. Each filtering method resulted with highly different setsof solutions.
Visualization of Design Space in ClustersAfter applying a set of filters, the design space for the case project can besignificantly reduced. However, still even after the filtering, possible solutionscan be significantly large. For the purpose of demonstration, let’s assume wehave selected 1000 solutions that we wish to explore.The similarity matrixwith color-coding (or another type of indicator) can visually describe howeach alternative is similar or different from the other alternatives (Figure 5).The similarity matrix is intended to serve multiple functions: (a) to visualizethe similarities between the selected solutions; (b) to pair-wise explorealternatives by selecting colored units; (c) to perform semantic zoom toinvestigate similarity indices and solutions; (d) to select ranges to furtherdevelop smaller subset of alternatives. However, the clustering of solutions
230 Halil Erhan, Ivy Y.Wang and Naghmi Shireen

is not obvious on this matrix, therefore, we applied hierarchical clusteringmethod on the similarity matrices generated using one of the distancemetrics.The clustering is visualized using a dendrogram (Figure 7).Theclustering reveals five major clusters with 50 units distance from each other.By adjusting the threshold, the number of clusters can be increased to havemore solutions to further investigate.
We also applied self-organized feature map (SOM) neural networkclustering method on the 4096 possible alternatives after training thenetwork with 1000 sample designs.As opposed to hierarchical clusteringmethod, in SOM the number of possible clusters must be predefined. Figure8 shows (a) 3x3, (b) 6x6, (c) 10x10, and (d) 20x20 clusters of designalternatives on hexagonal topologies.The first 9 clusters distribute thealternatives evenly into 512 solutions in each cluster.As one option, wecould select each of these clusters and further study the similarity betweenthe alternatives contained in them, or sample from each 9 clusters to have 9possible solutions to consider.We preferred to gradually increase thenumber of clusters on all 4096 solutions to study their spread in 36, 100,and 400 different clusters.Again any of these clusters enables us to select oreliminate design solutions. Interestingly however, the interaction with thesevisualizations is highly limited: identifying the alternative solutions in eachcluster requires querying in a separate data table. Nevertheless, our casestudy reveals the potential power of our approach when an interactivedesign tool enables partitioning a design space in accordance with thedesign criteria captured in various filtering mechanisms. Some use cases forthis tool can be: semantic-zoom to cluster, merge clusters, sample designsfrom cluster(s), create new designs by cross pollinating clusters, adddifferent filtering criteria to different clusters etc. Changing parametervalues and their ranges in the iterative process can increase the possibilityof finding more diverse and unlooked for solutions.
� Figure 7. In the
hierarchical clustering of
alternatives solutions, the
horizontal axis includes
identifiers for each
design, and vertical axis
shows the distance
measure between
alternatives.
231Harnessing Design Space:A Similarity-Based Exploration Method for Generative Design

We selected a cluster from 10x10 with 250 solutions in it.After applyingfurther filtering, the next iteration of SOM revealed an interesting spread ofsolutions on a 4x4 matrix (Figure 9). Particularly a cluster with 6 designalternatives (D2, D13, D14, D114, D127, and D142) was standing out on theupper left corner of the map, which are similar to 90 others and distinctlydifferent than the rest. Having said this, other designers may find otherclusters more interesting, which may require several more iterations of themethod in the design pipeline.We further used weighted plane visualizationto study the correlation between the values of the twelve parameters weinitially selected that generates the 250 alternatives.The lighter colorsrepresent larger weights and if the connection patterns of two parametersare very similar, we can assume that the inputs were highly correlated. Forexample parameters P2, P4, P6, P7, P8 have less weight in select cluster.
� Figure 8. Hexagon topology
mapping to clusters generated using
SOM neural network.The cells show
how many design alternatives are
associated with each cluster, and the
cell proximity shows the distance
between the clusters in terms of the
similarity between the solutions
contained.
232 Halil Erhan, Ivy Y.Wang and Naghmi Shireen

5. CONCLUSIONS
In this paper we explore possible interaction with a large number ofalternatives generated using parametric design models and we proposed amethod based on similarity metrics in managing the design space.Themethod includes parameter selection, computation of similarity betweenpairs of design alternatives and visualization of their similarity on variousforms, clustering and applying filters on the clusters to narrow the scope.We developed a prototype system that enables incorporating differentdistance metric algorithms and to produce a visualization of the similaritymatrix capturing pair similarity indices.We also used Matlab to experimentwith different various distance metrics and using neural networks inclustering design alternatives.The method is enables us to reveal possiblenew scenarios on how to manage and interact with large number ofalternatives. Its goal is to prevent or reduce the effect of the combinatorialexplosion by applying different heuristics as filters or parametric valueconstraining.
Currently, we are studying how designers work with large number ofalternatives through a series of experiments.The findings from thesimilarity-based search method we presented show a new perspective tolooking at design space and better define the characteristics of futurecomputational design tools. Like in other domains, the computationalalgorithms used in data exploration must be considered in design as well.We envision that new type interfaces will be emerging to enable designersinteractively search through design space with large number of alternatives.We expect that the interface features will bring best of the designer’s andcomputer’s capabilities together for harnessing the design space.
� Figure 9. (Left) A 4x4 cluster matrix showing spread
of previously selected 250 alternatives (Right) Weights of
each parameter in the clusters shown by color-coding
(lighter color represents stronger correlation).
233Harnessing Design Space:A Similarity-Based Exploration Method for Generative Design

ACKNOWLEDGEMENTS
This work was partially supported through the Boeing AeroInfo VisualAnalytics Project and MITACS; and the Graphics,Animation and New MediaNetwork of Centres of Excellence of Canada.The authors would like tothank Dr. Brian Fisher and Dr. Rob Woodbury for their insights on thecognition and design.
REFERENCES1. Simon, H., The Sciences of the Artificial. MIT Press, 1969.
2. Akin, O., How do architects design? Artificial intelligence and pattern recognition incomputer aided design, 1978, 65-119
3. Woodbury, R.F., and Burrow,A.L.,Whither design space? AIE EDAM:ArtificialIntelligence for Engineering Design, Analysis, and Manufacturing 2006, 20(2), 63-82.
4. Hartmann, B.,Yu, L.,Allison,A.,Yang,Y., and Klemmer, S. R., Design as exploration:creating interface alternatives through parallel authoring and runtime tuning. InProceedings of the 21st annual ACM symposium on User interface software andtechnology, ACM, 2008, 91-100.
5. Lunzer,A. and Kasper H., Subjunctive interfaces: Extending applications tosupport parallel setup, viewing and control of alternative scenarios. ACMTransactions on Computer-Human Interaction (TOCHI), 2008, 14(4), 17.
6. Jankun-Kelly,T. J., Ma, K.L. and Gertz, M.,A model and framework for visualizationexploration. Visualization and Computer Graphics, IEEE Transactions, 2007, 13(2),357-369
� Figure 10.Two interface sketches
showing how similarity distance and
clustering can be part of new tools.
234 Halil Erhan, Ivy Y.Wang and Naghmi Shireen
7. Kurlander, D. and Feiner, F., Editable graphical histories:The video. In Proceedings ofthe SIGCHI Conference on Human Factors in Computing Systems,ACM, 1991, 51-452.
8. Marks, J.,Andalman, B., Beardsley, P.A., Freeman W., Gibson, S., Hodgins, J., Kang,T.et al., Design galleries:A general approach to setting parameters for computergraphics and animation. In Proceedings of the 24th annual conference on Computergraphics and interactive techniques, .ACM Press/Addison-Wesley Publishing Co.,1997, 389-400.
9. Terry, M., Mynatt, E. D., Nakakoji, K. and Yamamoto,Y.,Variation in element andaction: supporting simultaneous development of alternative solutions. InProceedings of the SIGCHI conference on Human factors in computing systems,ACM,2004, 711-718.
10. Cross, N., Design cognition: Results from protocol and other empirical studies of designactivity, 2001, 79-103.
11. Foz,A.T.K., Some observations on designer behavior in the parti. PhD diss.,Massachusetts Institute of Technology, 1972
12. Eastman, C.M., On the analysis of intuitive design processes, Carnegie-MellonUniversity, 1968.
13. Schon, D.A., The reflective practitioner: How professionals think in action, 1984
14. Clark,A., and Chalmers, D., The extended mind, MIT Press, 1998, 7-19.
15. Hollan, J., Hutchins, E. and Kirsh, D., Distributed cognition: toward a newfoundation for human-computer interaction research. ACM Transactions onComputer-Human Interaction (TOCHI), 2000, 7(2), 174-196.
16. Smith, B. N., Xu,A.B., and Bailey, B.P., Improving interaction models for generatingand managing alternative ideas during early design work. In Proceedings of GraphicsInterface 2010, Canadian Information Processing Society, 2010, 121-128.
17. Johnson, H., and Carruthers, L., Supporting creative and reflective processes.International Journal of Human-Computer Studies, 2006, 64(10), 998-1030.
18. Krish, S.,A practical generative design method. Computer-Aided Design, 2011,43(1), 88-100.
19. Klemmer, S.R.,Thomsen, M., Phelps-Goodman, E., Lee R., and Landay, J.A.,Wheredo web sites come from?: capturing and interacting with design history. InProceedings of the SIGCHI conference on Human factors in computing systems, ACM,2002, 1-8.
20. Edwards,W. K., Igarashi,T., LaMarca,A. and Mynatt, E.D.,A temporal model formulti-level undo and redo. In Proceedings of the 13th annual ACM symposium onUser interface software and technology,ACM, 2000, 31-40
21. Stiny, G., Introduction to shape and shape grammars. Environment and Planning B:Planning and Design, 1980, 7(3), 343
22. Flemming, U., More than the sum of parts: the grammar of Queen Anne houses,Environment and Planning B: Planning and Design, 1987, 14(3), 323–350.
23. Krishnamurti, R, The construction of shapes, 1981.
24. Heisserman, J., Generative geometric design, IEEE Computer Graphics andApplications, 1994, 14, 37–45.
25. Lee, B., Srivastava, S., Kumar, R., Brafman, R. and Klemmer, S.R.. Designing withinteractive example galleries. In Proceedings of the SIGCHI Conference on HumanFactors in Computing Systems,ACM, 2010, 2257-2266.
26. Turrin, M., Buelow, P.V. and Stouffs, R. Design explorations of performance drivengeometry in architectural design using parametric modeling and geneticalgorithms. Advanced Engineering Informatics, (2011), 25(4) , 656-675.
235Harnessing Design Space:A Similarity-Based Exploration Method for Generative Design
27. Josephson, J.R., Chandrasekaran, B., Carroll, M., Iyer, N.,Wasacz, B., Rizzoni, G., Li,Q.Y. and Erb, D.A.,An architecture for exploring large design spaces. In AAAI/IAAI,1998, 143-150.
28. Xu, K., Zhang, H., Cohen-Or, D. and Chen, B.Q., Fit and diverse: set evolution forinspiring 3D shape galleries. ACM Transactions on Graphics (TOG), 2012, 31(4) , 57.
29. Shneiderman, B., Fischer, G., Czerwinski, M., Resnick, M., Myers, B., Candy, L.,Edmonds, E. et al. Creativity support tools: Report from a US National ScienceFoundation sponsored workshop. International Journal of Human-ComputerInteraction, 2006, 20(2), 61-77.
30. Sheikholeslami, M. You can get more than you make. PhD diss., School ofInteractive Arts & Technology-Simon Fraser University, 2009.
236 Halil Erhan, Ivy Y.Wang and Naghmi Shireen
Halil Erhan, Ivy Y.Wang and Naghmi Shireen
Simon Fraser University, Canada
{herhan, ivy_wang_7, nshireen}@sfu.ca