haemolysis detection in microrna-seq from clinical plasma
TRANSCRIPT
Citation: Smith, M.D.; Leemaqz, S.Y.;
Jankovic-Karasoulos, T.; McAninch,
D.; McCullough, D.; Breen, J.;
Roberts, C.T.; Pillman, K.A.
Haemolysis Detection in
MicroRNA-Seq from Clinical Plasma
Samples. Genes 2022, 13, 1288.
https://doi.org/10.3390/
genes13071288
Academic Editors: Laurent Guyon
and Matthias Zytnicki
Received: 12 April 2022
Accepted: 1 July 2022
Published: 21 July 2022
Publisher’s Note: MDPI stays neutral
with regard to jurisdictional claims in
published maps and institutional affil-
iations.
Copyright: © 2022 by the authors.
Licensee MDPI, Basel, Switzerland.
This article is an open access article
distributed under the terms and
conditions of the Creative Commons
Attribution (CC BY) license (https://
creativecommons.org/licenses/by/
4.0/).
genesG C A T
T A C G
G C A T
Article
Haemolysis Detection in MicroRNA-Seq from ClinicalPlasma SamplesMelanie D. Smith 1,2,* , Shalem Y. Leemaqz 1, Tanja Jankovic-Karasoulos 1, Dale McAninch 2 ,Dylan McCullough 1 , James Breen 3,4, Claire T. Roberts 1,2 and Katherine A. Pillman 5,*
1 Flinders Health and Medical Research Institute, Flinders University, Bedford Park, SA 5042, Australia;[email protected] (S.Y.L.); [email protected] (T.J.-K.);[email protected] (D.M.); [email protected] (C.T.R.)
2 Adelaide Medical School, University of Adelaide, Adelaide, SA 5000, Australia; [email protected] Indigenous Genomics, Telethon Kids Institute, Adelaide, SA 5000, Australia; [email protected] College of Health & Medicine, Australian National University, Canberra, ACT 2601, Australia5 Centre for Cancer Biology, University of South Australia/SA Pathology, Adelaide, SA 5000, Australia* Correspondence: [email protected] (M.D.S.); [email protected] (K.A.P.)
Abstract: The abundance of cell-free microRNA (miRNA) has been measured in blood plasma andproposed as a source of novel, minimally invasive biomarkers for several diseases. Despite improve-ments in quantification methods, there is no consensus regarding how haemolysis affects plasmamiRNA content. We propose a method for haemolysis detection in miRNA high-throughput se-quencing (HTS) data from libraries prepared using human plasma. To establish a miRNA haemolysissignature we tested differential miRNA abundance between plasma samples with known haemolysisstatus. Using these miRNAs with statistically significant higher abundance in our haemolysed group,we further refined the set to reveal high-confidence haemolysis association. Given our specific context,i.e., women of reproductive age, we also tested for significant differences between pregnant and non-pregnant groups. We report a novel 20-miRNA signature used to identify the presence of haemolysisin silico in HTS miRNA-sequencing data. Further, we validated the signature set using firstly anall-male cohort (prostate cancer) and secondly a mixed male and female cohort (radiographic kneeosteoarthritis). Conclusion: Given the potential for haemolysis contamination, we recommend thatassays for haemolysis detection become standard pre-analytical practice and provide here a simplemethod for haemolysis detection.
Keywords: microRNA; plasma; biomarker; prediction; haemolysis; bioinformatics
1. Introduction
MicroRNAs (miRNAs) represent a class of short, ~22-nucleotide single-strandednon-coding RNA transcripts found in the cytoplasm of most cells that act directly as post-transcriptional regulators of gene expression [1,2] and also coordinate extensive indirecttranscriptional responses [3]. In their canonical action, miRNAs mediate the expression ofspecific messenger RNA (mRNA) targets by binding to the 3′-untranslated region (UTR)of transcripts by either repressing translation or marking them for degradation [4]. In thecanonical miRNA pathway, target specificity requires exact nucleotide-sequence comple-mentarity between the miRNA ‘seed’ region (the first 2–7 bases at the 5′ end of the maturemiRNA transcript) and the 3′-UTR of the mRNA. Importantly, miRNAs demonstrate tissue,temporal, and spatial expression specificity and are known regulators of development, withmost mammalian mRNAs harbouring conserved targets of one or many miRNAs [1,2,5].
miRNA expression is both temporally and spatially tissue-specific, with transcriptsidentified beyond the cells in which they were synthesized, in various body fluids, includingurine, saliva, and blood plasma [6]. Circulating cell-free miRNAs identified in plasma arepackaged in microvesicles such as exosomes [7,8] or bound to protein complexes, such as
Genes 2022, 13, 1288. https://doi.org/10.3390/genes13071288 https://www.mdpi.com/journal/genes

Genes 2022, 13, 1288 2 of 15
argonaute 2 (Ago2), nucleophosmin 1 (NPM1), and high-density lipoprotein (HDL) [9–11],making them exceptionally stable [6]. This stability, coupled with their minimally invasiveaccessibility, has suggested circulating cell-free miRNAs as an important resource for theidentification of novel biomarkers.
Whilst much progress has been made in the search for novel miRNA biomarkers ofdisease processes [12–14], outcomes of this research approach are often inconsistent oreven contradictory [6]. There are many reasons for this, including variations in enrichment,extraction, and quantification methods, variation among individuals, lack of consensusregarding optimal reference miRNA for normalization, and the difficulty in quantifyingboth the amount and quality of RNA transcripts from blood plasma samples [15,16]. Animportant but often overlooked factor is the potential for sample haemolysis during bloodcollection or sample preparation resulting in miRNA from lysed red blood cells (RBCs)being spilled into and retained within the plasma sample to be assayed [15].
The issue of haemolysis altering the miRNA content of plasma and the potential forconfounding biomarker discovery has been reported previously [15,17,18]. Using RT-qPCR,Kirschner and colleagues [15] showed that contamination of plasma samples with themiRNA content of RBCs changed the abundance of both miR-16 and miR-451a. This, in turn,altered the relative abundance of potential biomarkers for mesothelioma and coronary arterydisease, including miR-92a and miR-15. Using the same technique, Pritchard et al. [18]demonstrated in plasma that 46 of the 79 circulating miRNA cancer biomarkers were highlyexpressed in more than one blood-cell type, noting that the effects of sample-specific blood-cell counts and haemolysis can alter miRNA biomarker levels in a single patient sample upto 50-fold. As a result, the authors emphasized caution in classifying blood-cell-associatedmiRNAs as biomarkers, given the possible alternate interpretation.
Haemolysis is associated with either blood collection or RNA extraction and samplepreparation. Thus, despite differences between the quantification methods, high-throughputsequencing data used in our study is equally susceptible to the confounding effects ofsample haemolysis on miRNA abundance levels in plasma as RT-qPCR. There are cur-rently two commonly used gold standard approaches in the assessment of haemolysis inplasma: (1) delta quantification cycle (∆Cq), where expression levels of a known bloodcell-associated miRNA (miR-451a) and a control miRNA (miR-23a-3p) are determinedbased on the difference between the two raw Cq values; and (2) spectrophotometry, whereabsorbance is measured at 414 nm (A414) with the use of a spectrophotometer. In the caseof ∆Cq assessment, miR-451a is known to vary and miR-23a-3p is known to be invariantin plasma affected by haemolysis [15,16]. Using spectrophotometry, haemolysis is quan-tified by assessing the presence of cell free haemoglobin by measuring the absorbance at414 nm, the absorbance maximum of free haemoglobin [19,20]. In controlled experiments,haemolysis is highly correlated with raw A414. Patient samples, however, may sometimesbe affected by sample interferences, such as lipaemia. In these cases, more sophisticatedabsorbance-based corrections to the raw A414 can improve the accuracy of haemolysisdetection [21]. A third, less commonly used, method—ELISA—can also be used to detecthaemolysis [22]. All three methods require access to sufficient amounts of the originalplasma sample and the laboratory equipment required to perform the assays. Free accessto a web tool that can perform in silico assessment of RBC contamination in human plasmawould be of exceptional value to the research community.
Whilst it is well established that haemolysis frequently occurs during extraction orprocessing of blood samples, the assessment of RBC contamination is rarely mentioned inpublications. It is even rarer that the results of any such testing are present in the metadataassigned to publicly available sequencing data. There is currently no publicly availabletool for analysis of haemolysis without access to the physical plasma specimen. Althoughthe theory underlying identification of haemolysis in plasma is relatively straightforward,surprisingly, to our knowledge, this has never before been extrapolated into a data-onlyin silico approach. The paucity of haemolysis information in the context of publicly avail-able datasets combined with the lack of tools to identify affected datasets after the fact

Genes 2022, 13, 1288 3 of 15
substantially limits the utility of this data resource and reproducibility of research find-ings. Further, it increases the risk that results obtained may unwittingly represent bloodcell-based phenomena, rather than signatures of the pathology of interest.
In this study, we assessed miRNA abundance in HTS data from libraries preparedusing human plasma from pregnant and non-pregnant women of reproductive age. Usinga set of samples with confirmed haemolysis (∆Cq (miR-23a-3p-miR-451a), we establisheda set of 20 miRNAs differentially abundant between plasma from samples with and withoutsubstantiated haemolysis. Using the expression values of these 20 miRNAs as a ‘signature’of haemolysis, we calculated the difference between the mean normalized expression levelsof these miRNAs compared to those of all other miRNAs (as a ‘background’ set). This pro-duced a quantitative metric representing the strength of the evidence of haemolysis in anindividual sample. When this metric is interpreted in the context of other samples, it can beused to identify sample(s) that display substantial evidence of haemolysis. Where direct as-sessment of haemolysis cannot (or has not) be undertaken using one of the aforementionedassays, our method allows the researcher to consider discarding problematic sample datafrom further analyses or using caution in their interpretation. We consulted the EMBL-EBIExpression Atlas (ebi.ac.uk) to ensure all signature miRNAs were identified in multiplehuman tissue types (male and female) and had no known developmental stage association.For ease of application, we developed this method into a web-based Shiny/R application,DraculR (a tool that allows a user to upload and assess haemolysis in high-throughputplasma miRNA-seq data), for use by the research community [23].
2. Materials and Methods2.1. Patient Information
Our analysis involved two prospectively collected cohorts: the first a cohort of womenof reproductive age recruited at the Adelaide Medical School during 2005–2006 whowere not pregnant at the time of blood collection, and the second a cohort of womenundergoing elective termination of pregnancy at the Pregnancy Advisory Centre, QueenElizabeth Hospital during 2016–2019. To test for differences among the means of our patientcharacteristics, we performed Student’s t-tests on dCq (miR-451a - miR-23a-3p) withinboth the pregnant and non-pregnant groups and across the cohort as a whole for eachcharacteristic, splitting age, BMI, and gestational age into equal-sized groups. For eachtest the p-value was > 0.29, indicating no significant differences. All patient samples werecollected with written, informed consent. Patient characteristics are shown in Table 1, withmore detail regarding ethnicity and pregnancy status in Table S1.
Table 1. Patient Characteristics. Age, BMI and Gestational Age presented as mean and interquartile range.
Pregnant Not Pregnant(n = 111) (n = 10)
Smoker Yes No Yes No48 63 unknown unknown
Age 26.9 (21–32) 24.1 (21–24)BMI 24.3 (21–36) 23.8 (19–25)
Gestational age (weeks) 12.5 (9–16) Not applicableBMI = body mass index.
2.2. Sample Collection
Peripheral blood (9 mL) was collected with informed, written consent from womenundergoing elective terminations of otherwise healthy pregnancies. Blood was collectedinto standard EDTA blood tubes pre-termination and stored on ice until processed. Wholeblood underwent centrifugation at 800 × g for 15 min at 4 ◦C before plasma removal andthen spun for a further 15 min to ensure any remaining cellular debris, including cellmembranes from lysed red blood cells, was removed. All samples were stored at −80 ◦Cuntil further processing. Termination samples were collected from the Pregnancy Advisory

Genes 2022, 13, 1288 4 of 15
Centre (PAC), Woodville, South Australia. Blood was also collected with informed, writtenconsent from non-pregnant volunteers at the Adelaide Medical School. Following collection,blood tubes were stored on ice until processing. Whole blood underwent centrifugation at1015 × g for 10 min at 4 ◦C. Approximately 4–6 mL plasma was collected in 2 mL aliquots.500 µL plasma (the supernatant) were aliquoted into clean tubes, and the pellet containingany remaining blood cells at the bottom of the tube was discarded. All samples were storedat −80 ◦C until further processing.
2.3. RNA Extraction and Library Preparation
For publicly available data previously published by us, raw sequencing reads weredownloaded from NCBI GEO, Study GSE151362 [24] and combined with new small-RNAdataset with sequencing as follows. miRNA was isolated from 200 µL plasma samplesusing the Qiagen miRNA serum/plasma kit (Qiagen, Hilden, Germany) according to themanufacturer’s instructions and stored at −80 ◦C.
Library preparation and sequencing was performed using Qiagen (Valencia, CA) withthe QIAseq miRNA Library and QIAseq miRNA 48 Index IL kits as per the manufacturer’sinstructions (Qiagen, Hilden, Germany). Amplified cDNA libraries underwent single-endsequencing by synthesis (Illumina v1.9) using the Illumina NovaSeq 75 bp single-end readsequencing on miRNA libraries from 42 plasma samples taken from 10 non-pregnant and32 pregnant women aged 16 to 44 years.
2.4. Haemolysis Detection by RT-qPCR
Plasma samples were examined with Qiagen (Hilden, Germany) for haemolysis basedon the expression levels of two miRNAs: miR-451a and miR-23a-3p. miR-451a (previouslynamed miR-451) is known to be highly expressed in red blood cells, whereas miR-23a-3p isknown to maintain stable abundance levels in plasma. After RNA extraction and cDNAsynthesis, 2 µL of RNA was reverse-transcribed in 10 µL reactions using a miRCURY LNART kit (Qiagen version 5). Each RT was performed using an artificial RNA spike-in (UniSp6).cDNA was diluted 50× and assayed in 10 µL PCR reactions according to the protocol formiRCURY LNA miRNA PCR, and each miRNA was assayed once by PCR using the assaysfor miR-23a-3p and miR-451a. In addition to these miRNA assays, the RNA spike-inswere assayed. The amplification was performed in a LightCycler 480 real-time PCR system(Roche, Sydney, Australia) in 384-well plates. The amplification curves were analyzed usingin-house software, both for determination of Cq (by the 2nd derivative method) and formelting curve analysis. The raw data were extracted from the LightCycler 480 software. Theevaluation of expression levels was performed based on raw Cq values. According to theQiagen protocol for haemolysis detection using the ∆∆Cq method, samples with ∆Cq <7for these two miRNAs were considered clear of contamination, ∆Cq >7 was consideredcontaminated, and ∆Cq = 7 was considered borderline.
2.5. miRNA Annotation and Abundance
Read quality-control metrics were assessed using FastQC [25] (http://www.bioinformatics.babraham.ac.uk/projects/fastqc/) to check for per base sequence quality, sequence-lengthdistribution, and duplication levels. Adapter detection and trimming were performed usingAtropos [26]. Alignment was performed using BWA version 0.7.17-r1188 (GRCh38) [27].UMI-tools was used to collapse duplicate reads mapped to the same genomic location withthe same UMI barcode. Quality-control metrics were reported using multiQC [28]. Readcounts for mature miRNAs were determined using an in-house script [29] with miRNAannotation from miRBase version 22.0 [30,31] (http://www.mirbase.org). miRNA countswere quantified as counts per million (CPM) miRNA reads.
2.6. Analysis of Potential Confounding Factors
All profile and expression analyses were conducted in the R statistical environment(v.4.0.2), using the edgeR (v.3.16.5) [32] and limma (v.3.30.11) [33] R/Bioconductor packages.

Genes 2022, 13, 1288 5 of 15
Prior to conducting the differential expression analysis between haemolysed and non-haemolysed expression data, we considered the effect of participant characteristics, suchas sex, age, smoking, pregnancy status, and ethnicity. Sex was not included here, as allsamples were taken from female participants. Maternal age was excluded from the finalregression model, as there was no strong evidence of association with the outcome, andhence, considering the sample size, a simpler model was chosen to preserve degrees offreedom. Differential miRNA abundance between pregnant and non-pregnant groups wastested using only samples with ∆Cq (miR-23a-3p-miR-451a) < 7 (i.e., not haemolysed).miRNA identified as differentially abundant between samples from pregnant and non-pregnant women was removed from the final set of haemolysis signature miRNA whencalculating the haemolysis metric for our pregnant/non-pregnant cohorts. There werethree independent sequencing batches in the data analyzed here, which are detailed inTable S2. As such, sequencing batch was also included in all regression models.
2.7. Identification of Haemolysis miRNA Signature
Prior to defining a collection of haemolysis informative miRNAs for the 121 samplesanalyzed here, pre-filtering steps were undertaken: 1) mature miRNA with fewer thanfive reads was reduced to zero independently for each sample, and 2) miRNA with fewerthan 40 counts per million (CPM) in the haemolysed group (n = 12) was removed fromfurther consideration. This was done to ensure only highly abundant miRNA likely to bepresent in most samples remained. The trimmed means of M values (TMM) normalizationmethod was used to correct for differences in the underlying distribution of miRNAexpression [34]. Next, we used limma [33] to obtain the fold change of each miRNA betweenthe haemolysed (n = 109) and non-haemolysed (n = 12) groups to identify miRNAs that weremore abundant in the plasma affected by haemolysis. To ensure the haemolysis miRNAsignature was robust, we took the intersection of the 60 miRNAs from each category ofhighest expression and lowest adjusted p-value and miRNAs with a log2FC > 0.9, revealinga set of 20 high-confidence miRNAs. To further refine the set of haemolysis informativemiRNAs, we used limma to calculate the fold change for each miRNA between the samplesfrom pregnant and non-pregnant women not affected by haemolysis and removed anyof the high-confidence miRNA which was also differentially abundant in pregnancy. Theworkflow, source code, and input files associated with this research are available at (https://github.com/mxhp75/haemolysis_maternaPlasma.git).
2.8. Classification—Haemolysis Metric
To classify the data coming from samples as haemolysed, borderline or unaffected, wefirst focused on samples from the non-pregnant group. For these, we subset the miRNAread count table into miRNA from the high-confidence haemolysis informative miRNA(n = 20) and all others (n = 169). Using this data partition, we calculated the geometric meanof the distribution of read counts using the psych package (v1.8.12) [35] and subtracted thegeometric mean of the counts of ‘other’ miRNA from that of the ‘haemolysis informative’miRNA. Next, for samples from the pregnant group, we performed the same calculationsdescribed above after first discarding miRNA that was associated with pregnancy.
2.9. Data Availability
The dataset(s) supporting the conclusions of this article are available in: NCBI’s ShortRead Archive (SRA) [36] and through BioProject accession number PRJNA824637 (https://www.ncbi.nlm.nih.gov/sra/PRJNA824637); and for previously published data, BioProjectaccession number PRJNA635621.
3. Results3.1. High-Throughput Sequencing
Using libraries with > 1 million reads for analyses, we obtained 121 libraries with anaverage of ~3.49 million reads per sample (range ~1.00–18.64 million reads). RT-qPCR was
Genes 2022, 13, 1288 6 of 15
used to analyze ∆Cq (miR-23a-3p-miR-451a), where the ratio of miR-23a-3p to miR-451a (or∆Cq (miR-23a-3p-miR-451a) ≥ 7) correlated with the degree of haemolysis. We identified12 plasma samples with a ∆Cq of 7 or above (Table S2) and determined that there was nodifference in the proportion of haemolysed and non-haemolysed data in the exclusion ofsamples, due to low library size (Fisher’s exact test p-value = 0.7). Sequence alignmentwas performed using BWA [27] to the human genome (version GRCh38) and miRNA readcounts were generated by mapping to human miRBase v22 [30,31] identifying 1133 maturemiRNAs. Further analysis of non-miRNA small RNA species identified antisense, inter-genic, and intronic (average of 13.4%, 16.9%, and 8.6% respectively) transcripts, as wellas a small abundance of long non-coding and protein-coding RNA, rRNA, snRNA, andsnoRNA transcripts (Table S3).
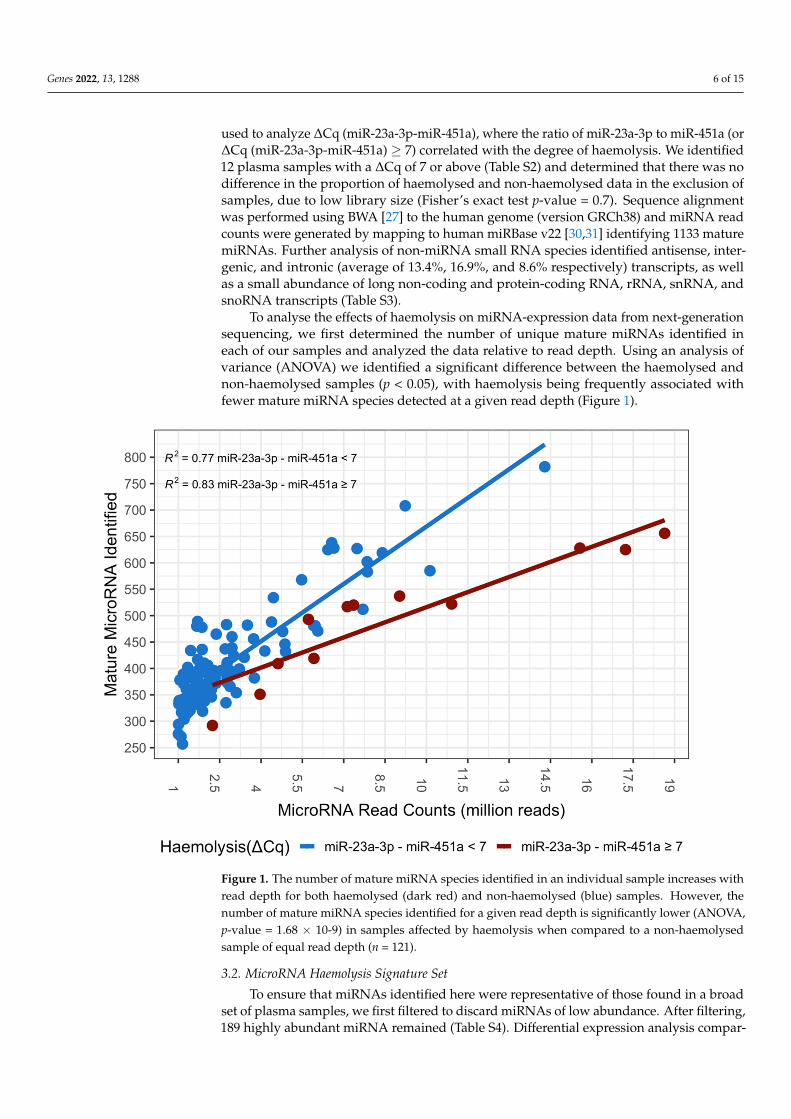
To analyse the effects of haemolysis on miRNA-expression data from next-generationsequencing, we first determined the number of unique mature miRNAs identified ineach of our samples and analyzed the data relative to read depth. Using an analysis ofvariance (ANOVA) we identified a significant difference between the haemolysed andnon-haemolysed samples (p < 0.05), with haemolysis being frequently associated withfewer mature miRNA species detected at a given read depth (Figure 1).
Figure 1. The number of mature miRNA species identified in an individual sample increases withread depth for both haemolysed (dark red) and non-haemolysed (blue) samples. However, thenumber of mature miRNA species identified for a given read depth is significantly lower (ANOVA,p-value = 1.68 × 10⁻⁹) in samples affected by haemolysis when compared to a non-haemolysedsample of equal read depth (n = 121).
3.2. MicroRNA Haemolysis Signature Set
To ensure that miRNAs identified here were representative of those found in a broadset of plasma samples, we first filtered to discard miRNAs of low abundance. After filtering,189 highly abundant miRNA remained (Table S4). Differential expression analysis compar-

Genes 2022, 13, 1288 7 of 15
ing miRNA read counts identified 100 miRNAs with a higher abundance in haemolysedcompared to non-haemolysed samples (statistically significant differentially expressedmiRNA, false discovery rate (FDR) < 0.05, with a log2 fold change (log2FC) > 0) (Figures S1and S2a,b). We further ranked the differentially expressed miRNAs based on log2FC, FDRand abundance levels, and subset the list such that only miRNAs that had a log2FC > 0.9and were in the top 60 percent of each of the FDR and abundance rank criteria remained.This resulted in a high-confidence set of 20 miRNAs indicative of a haemolysis signature(Table 2).
Table 2. Twenty miRNAs with a general-use plasma haemolysis signature set. To remove confoundingeffects within our pregnancy-specific dataset, we identified a subset of 10 abundant miRNAs thatwere invariant with respect to pregnancy.
miRNA Log2FCAverage
Expression(log2 CPM)
Adjustedp-Value Pregnancy Assoc.
miR-106b-3p 1.589 8.731 8.61 × 10⁻¹⁵ nomiR-140-3p 1.073 10.098 2.75 × 10⁻¹³ nomiR-142-5p 0.962 10.651 4.96 × 10⁻¹² nomiR-532-5p 1.288 7.237 4.96 × 10⁻¹² nomiR-17-5p 0.952 7.892 7.84 × 10⁻¹² no
miR-19b-3p 1.128 8.696 1.93 × 10−09 nomiR-30c-5p 0.950 7.325 2.48 × 10−09 nomiR-324-5p 1.304 7.186 2.50 × 10−09 nomiR-192-5p 0.941 8.944 1.37 × 10−08 nomiR-660-5p 1.305 7.620 3.45 × 10⁻¹⁰ nomiR-186-5p 1.228 8.052 2.75 × 10⁻¹³ yesmiR-425-5p 1.282 11.246 4.96 × 10⁻¹² yesmiR-25-3p 1.212 12.939 1.26 × 10⁻¹¹ yes
miR-363-3p 1.237 7.882 4.52 × 10⁻¹¹ yesmiR-183-5p 1.550 9.382 9.34 × 10⁻¹¹ yesmiR-451a 1.372 13.002 3.65 × 10⁻¹⁰ yes
miR-182-5p 1.341 10.585 2.48 × 10−09 yesmiR-191-5p 0.929 11.790 4.68 × 10−09 yesmiR-194-5p 0.937 7.679 1.85 × 10−08 yesmiR-20b-5p 0.932 7.430 1.96 × 10−08 yes
For in silico assay of haemolysis in our data, we further removed miRNAs that weredifferentially abundant between the PAC (pregnant) and NPC (non-pregnant) cohortsto avoid confounding miRNA associated with haemolysis with those associated withpregnancy. Differential expression analysis of miRNA read counts from pregnancy and non-pregnancy samples identified 127 miRNAs (FDR < 0.05) that were significantly differentiallyexpressed between the groups (Figure S3a,b). Strikingly, one of our first observationshighlighted the importance of including haemolysis analysis as an adjunct in our study:miR-451a, which is the sole haemolysis signature miRNA used in the current ∆Cq (miR-23a-3p-miR-451a) gold standard method for haemolysis detection, was discovered to be highlycorrelated with pregnancy status, indicating a strong confounding factor in pregnancystudies when haemolysis levels are estimated using RT-qPCR alone. Accordingly, whenanalysing the data from our pregnancy cohort, miR-451a was removed from calculations,along with nine other miRNAs that were differentially expressed between the pregnantand non-pregnant groups from the core set of haemolysis signature miRNA. This resultedin 10 miRNAs remaining for evaluation of haemolysis levels. Note that removing miRNAsfrom the signature set using our method also excluded those miRNA from the calculationof the distribution of background miRNAs.
Incorporating concepts from previous RT-qPCR analyses of haemolysis, we estab-lished a new measure of the inclusion of RBC-associated miRNA in human plasma. After

Genes 2022, 13, 1288 8 of 15
establishing the 20-miRNA signature associated with RBC content inclusion, we deter-mined the geometric mean of the distribution of miRNA read counts as an appropriatemeasure of abundance and summary statistic. Using this summary statistic, our methodcalculated a ‘haemolysis metric’, defined as the difference between the geometric means ofthe normalized abundance levels of the haemolysis miRNA signature set compared to thatof all other miRNAs (the ‘background’ set). Note that in a case–control study, to reducethe risk of confounding the haemolysis metric with experimental variables, any miRNAknown to be differentially expressed between groups should be excluded from both thesignature, and background sets should be reduced to exclude any miRNA known to bedifferentially expressed between groups. In this case, the geometric mean of the reducedsignature set will be calculated, as defined in Equation (1). Let Zx be the miRNA reducedsignature set (log2 CPM counts) and Zy be the background miRNA set (log2 CPM counts),where x = 1, 2, 3, . . . , p1 with p1 = the number of miRNAs in the reduced signature set andy = 1, 2.3 . . . , p2 where p2 = the number of miRNAs in the background and i = 1, 2.3, . . . , nwhere n = the sample size after filtering:
Haemolysis Metrici =p1
√√√√ p1
∏x=1
Zxi − pP2
√√√√ p2
∏y=1
Zyi (1)
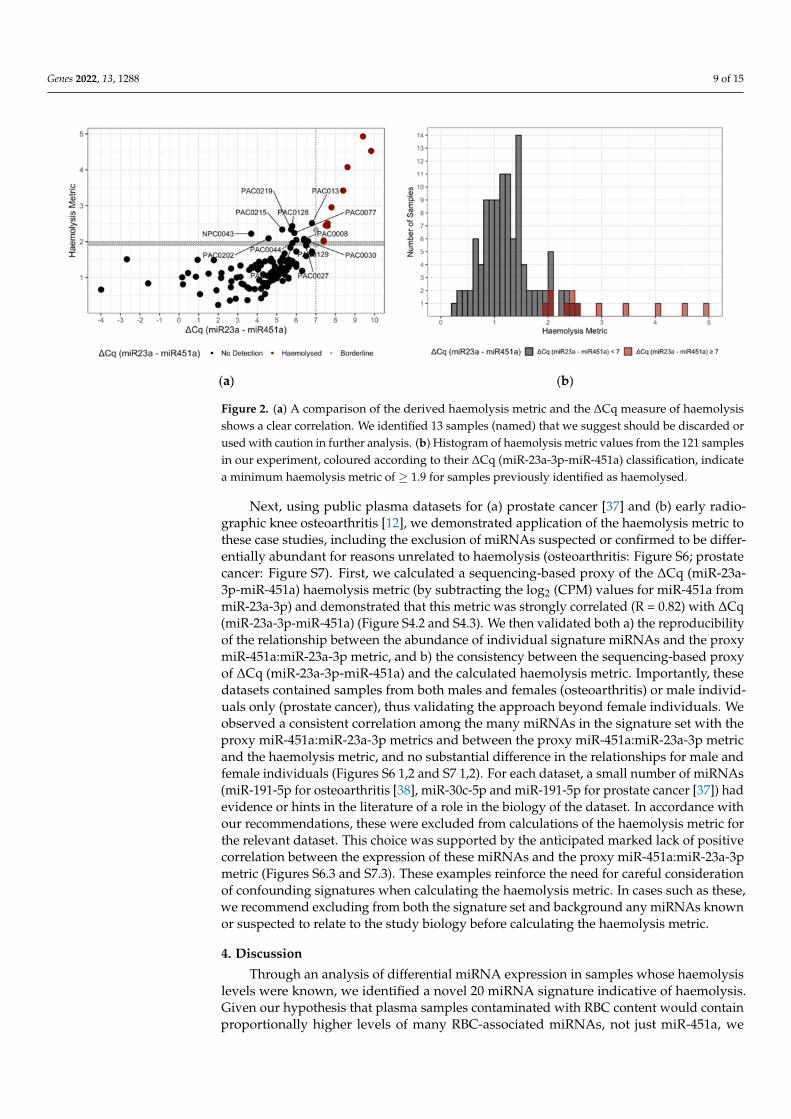
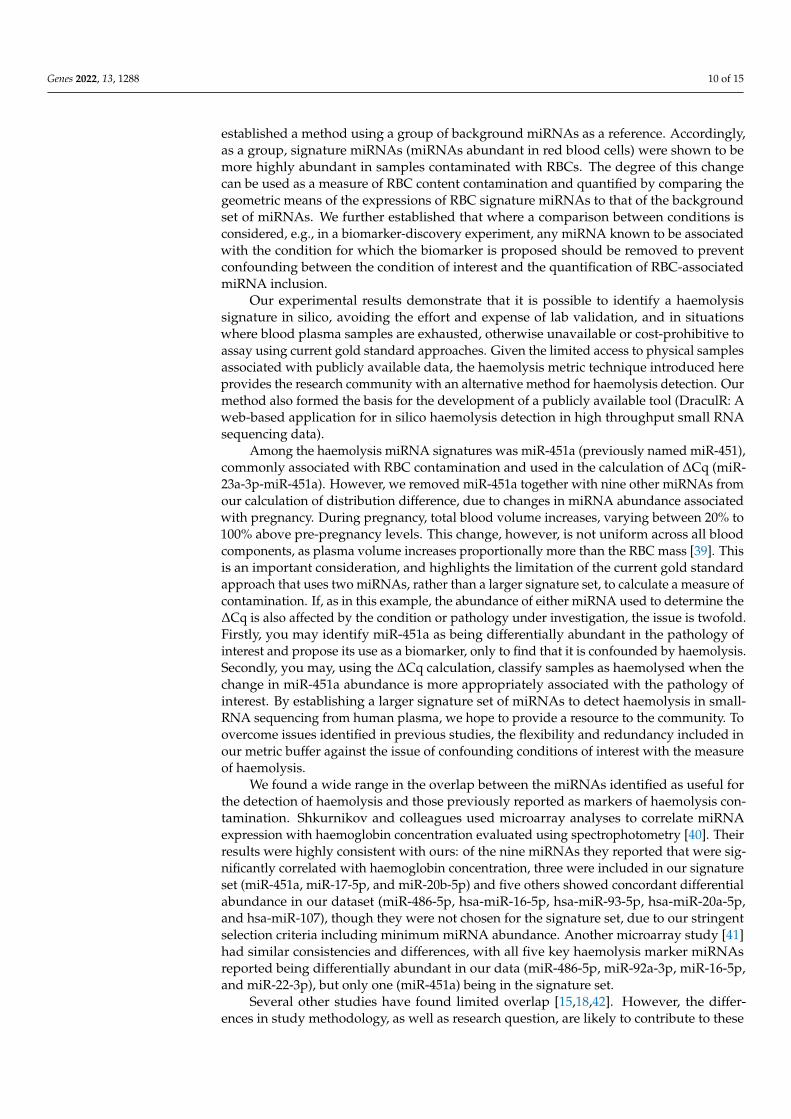
Prior to establishing a threshold for the new haemolysis metric, we measured thelinear dependence between the new haemolysis metric and the ∆Cq (miR-23a-3p-miR-451a)metric by calculating Pearson’s correlation. Our results indicated a Pearson’s correlationcoefficient of 0.64 (p < 0.0001) (Figure 2a) and also examined the linear relationship be-tween the ∆Cq (miR-23a-3p-miR-451a) metric and each individual signature set miRNA(Figure S4.1). With confidence in the correlation, to establish a threshold for the haemolysismetric, we compared the results of the ∆Cq (miR-23a-3p-miR-451a) and summary statisticmethods directly. Briefly, we compared the haemolysis metric to the ∆Cq (miR-23a-3p-miR-451a) results for sample and established a cut-off criterion for inclusion into the Clear(no haemolysis detected) and Caution (haemolysis detected) groups (Figure 2a). We chosea threshold of ≥ 1.9 for the assignment of ‘Caution’ to individual samples based on theminimum summary statistic difference of samples assayed using the ∆Cq (miR-23a-3p-miR-451a) metric of ≥ 7 (Figure 2a) and the minimal overlap between the distribution ofthe haemolysis metric in haemolysed compared to non-haemolysed samples (Figure 2b).Where a sample is assigned ‘Caution’, researchers are advised to consider removing thesample or to continue with caution. Given the correlation of the two metrics is imperfectand the arbitrary nature of choosing any cut-off, samples with a haemolysis metric closeto the 1.9 cut-off may be interrogated further prior to any decision to retain or remove.Of the 121 samples assayed, 25 samples met the criteria for Caution. Of these, 12 werepreviously determined as haemolysed or borderline using the ∆Cq (miR-23a-3p-miR-451a)assay. We found that all samples identified as ∆Cq ≥ 7 (Figure 2a, scarlet) were abovethe criteria for the haemolysis metric (Figure 2a, horizontal grey bar; threshold ≥ 1.9).Further, we identified 13 samples with a haemolysis metric ≥ 1.9 not included in the ∆Cq(miR-23a-3p-miR-451a) criteria.
To further validate the consistency and accuracy of the miRNA signature set, we per-formed two additional analyses. Firstly, we compared the results of the two gold standardmethods of determining haemolysis: ∆Cq (miR-23a-3p-miR-451a) and spectrophotometryabsorbance A414 and the haemolysis metric described here (Figure S5). These resultsshowed a high correlation (Pearson’s R > 0.82) among all methods, with the correlationsbetween the haemolysis metric and the two other methods (R = 0.87 for A414, R = 0.90for ∆Cq (miR-23a-3p-miR-451a)) being higher than that between the two gold standardmethods (R = 0.82). This is consistent with the haemolysis metric being an accurate anduseful marker of haemolysis.
Genes 2022, 13, 1288 9 of 15
Figure 2. (a) A comparison of the derived haemolysis metric and the ∆Cq measure of haemolysisshows a clear correlation. We identified 13 samples (named) that we suggest should be discarded orused with caution in further analysis. (b) Histogram of haemolysis metric values from the 121 samplesin our experiment, coloured according to their ∆Cq (miR-23a-3p-miR-451a) classification, indicatea minimum haemolysis metric of ≥ 1.9 for samples previously identified as haemolysed.
Next, using public plasma datasets for (a) prostate cancer [37] and (b) early radio-graphic knee osteoarthritis [12], we demonstrated application of the haemolysis metric tothese case studies, including the exclusion of miRNAs suspected or confirmed to be differ-entially abundant for reasons unrelated to haemolysis (osteoarthritis: Figure S6; prostatecancer: Figure S7). First, we calculated a sequencing-based proxy of the ∆Cq (miR-23a-3p-miR-451a) haemolysis metric (by subtracting the log2 (CPM) values for miR-451a frommiR-23a-3p) and demonstrated that this metric was strongly correlated (R = 0.82) with ∆Cq(miR-23a-3p-miR-451a) (Figure S4.2 and S4.3). We then validated both a) the reproducibilityof the relationship between the abundance of individual signature miRNAs and the proxymiR-451a:miR-23a-3p metric, and b) the consistency between the sequencing-based proxyof ∆Cq (miR-23a-3p-miR-451a) and the calculated haemolysis metric. Importantly, thesedatasets contained samples from both males and females (osteoarthritis) or male individ-uals only (prostate cancer), thus validating the approach beyond female individuals. Weobserved a consistent correlation among the many miRNAs in the signature set with theproxy miR-451a:miR-23a-3p metrics and between the proxy miR-451a:miR-23a-3p metricand the haemolysis metric, and no substantial difference in the relationships for male andfemale individuals (Figures S6 1,2 and S7 1,2). For each dataset, a small number of miRNAs(miR-191-5p for osteoarthritis [38], miR-30c-5p and miR-191-5p for prostate cancer [37]) hadevidence or hints in the literature of a role in the biology of the dataset. In accordance withour recommendations, these were excluded from calculations of the haemolysis metric forthe relevant dataset. This choice was supported by the anticipated marked lack of positivecorrelation between the expression of these miRNAs and the proxy miR-451a:miR-23a-3pmetric (Figures S6.3 and S7.3). These examples reinforce the need for careful considerationof confounding signatures when calculating the haemolysis metric. In cases such as these,we recommend excluding from both the signature set and background any miRNAs knownor suspected to relate to the study biology before calculating the haemolysis metric.
4. Discussion
Through an analysis of differential miRNA expression in samples whose haemolysislevels were known, we identified a novel 20 miRNA signature indicative of haemolysis.Given our hypothesis that plasma samples contaminated with RBC content would containproportionally higher levels of many RBC-associated miRNAs, not just miR-451a, we
Genes 2022, 13, 1288 10 of 15
established a method using a group of background miRNAs as a reference. Accordingly,as a group, signature miRNAs (miRNAs abundant in red blood cells) were shown to bemore highly abundant in samples contaminated with RBCs. The degree of this changecan be used as a measure of RBC content contamination and quantified by comparing thegeometric means of the expressions of RBC signature miRNAs to that of the backgroundset of miRNAs. We further established that where a comparison between conditions isconsidered, e.g., in a biomarker-discovery experiment, any miRNA known to be associatedwith the condition for which the biomarker is proposed should be removed to preventconfounding between the condition of interest and the quantification of RBC-associatedmiRNA inclusion.
Our experimental results demonstrate that it is possible to identify a haemolysissignature in silico, avoiding the effort and expense of lab validation, and in situationswhere blood plasma samples are exhausted, otherwise unavailable or cost-prohibitive toassay using current gold standard approaches. Given the limited access to physical samplesassociated with publicly available data, the haemolysis metric technique introduced hereprovides the research community with an alternative method for haemolysis detection. Ourmethod also formed the basis for the development of a publicly available tool (DraculR: Aweb-based application for in silico haemolysis detection in high throughput small RNAsequencing data).
Among the haemolysis miRNA signatures was miR-451a (previously named miR-451),commonly associated with RBC contamination and used in the calculation of ∆Cq (miR-23a-3p-miR-451a). However, we removed miR-451a together with nine other miRNAs fromour calculation of distribution difference, due to changes in miRNA abundance associatedwith pregnancy. During pregnancy, total blood volume increases, varying between 20% to100% above pre-pregnancy levels. This change, however, is not uniform across all bloodcomponents, as plasma volume increases proportionally more than the RBC mass [39]. Thisis an important consideration, and highlights the limitation of the current gold standardapproach that uses two miRNAs, rather than a larger signature set, to calculate a measure ofcontamination. If, as in this example, the abundance of either miRNA used to determine the∆Cq is also affected by the condition or pathology under investigation, the issue is twofold.Firstly, you may identify miR-451a as being differentially abundant in the pathology ofinterest and propose its use as a biomarker, only to find that it is confounded by haemolysis.Secondly, you may, using the ∆Cq calculation, classify samples as haemolysed when thechange in miR-451a abundance is more appropriately associated with the pathology ofinterest. By establishing a larger signature set of miRNAs to detect haemolysis in small-RNA sequencing from human plasma, we hope to provide a resource to the community. Toovercome issues identified in previous studies, the flexibility and redundancy included inour metric buffer against the issue of confounding conditions of interest with the measureof haemolysis.
We found a wide range in the overlap between the miRNAs identified as useful forthe detection of haemolysis and those previously reported as markers of haemolysis con-tamination. Shkurnikov and colleagues used microarray analyses to correlate miRNAexpression with haemoglobin concentration evaluated using spectrophotometry [40]. Theirresults were highly consistent with ours: of the nine miRNAs they reported that were sig-nificantly correlated with haemoglobin concentration, three were included in our signatureset (miR-451a, miR-17-5p, and miR-20b-5p) and five others showed concordant differentialabundance in our dataset (miR-486-5p, hsa-miR-16-5p, hsa-miR-93-5p, hsa-miR-20a-5p,and hsa-miR-107), though they were not chosen for the signature set, due to our stringentselection criteria including minimum miRNA abundance. Another microarray study [41]had similar consistencies and differences, with all five key haemolysis marker miRNAsreported being differentially abundant in our data (miR-486-5p, miR-92a-3p, miR-16-5p,and miR-22-3p), but only one (miR-451a) being in the signature set.
Several other studies have found limited overlap [15,18,42]. However, the differ-ences in study methodology, as well as research question, are likely to contribute to these

Genes 2022, 13, 1288 11 of 15
differences. Importantly, the method of quantification of miRNAs in these studies wastargeted RT-qPCR, rather than transcriptome-scale approaches, such as HTS (used here) ormicroarrays [40]. The limitations of RT-qPCR to investigate which miRNAs are affected byhaemolysis has been identified previously [43]. Given our use of HTS, our experiment wasable to identify differential abundance in miRNAs not quantified in Kirschner et al. [15],Pritchard et al. [18], or McDonald et al. [42], meaning that whilst many of the miRNAsassociated with previous haemolysis work were also associated here, including miR-16-5p,miR-486-5p, and miR-92a-3p, many of these were not included in the final miRNA haemol-ysis metric signature set, as they failed to pass filtering criteria for log2FC and expressionlevel. Secondary to the technical differences introduced by using different miRNA quantifi-cation technologies, it is important to note that all plasma samples used here to establishwhich miRNAs were affected by haemolysis in our primary dataset were taken from adultwomen of reproductive age. No sex or age information was included with either of thecompared studies, although it is likely these samples included specimens from men andwomen. To confirm that the use of the miRNA signature set to evaluate haemolysis couldbe generalized to male individuals, we performed two additional validation analyses toevaluate the relationship between the abundance of the miRNA signature set, haemolysislevel, and sex (Figures S6 and S7), and saw no difference in correlation for male vs. femaleindividuals. To address any potential bias from using all reproductively aged volunteers,we also ensured all miRNAs included here had previously been identified in multipletissue types and were not affected by developmental stage.
Interestingly, all signature miRNAs, with the exception of miR-325-5p, have previ-ously been reported as prognostically valuable plasma or serum biomarkers. In this smallsampling of recent miRNA-biomarker research, we identified several instances where morethan one of our haemolysis signature miRNAs were identified as disease biomarkers forthe same condition in the same experiment [44–46], which, given our findings and thoseof previous haemolysis research, further call into question their validity as biomarkersof disease or condition. In conjunction with our research, we found many miRNAs assuggested circulating biomarkers for multiple disease states. For example, miR-122-5p wasgiven biomarker potential in liver disease, lung cancer, and myasthenia gravis [14,44,47],and miR-660-5p was given biomarker potential in Alzheimer’s disease, breast cancer, andlung cancer [45,48,49], respectively. These miRNAs may represent effective biomarkers,but they may simply highlight RBC contamination or be indicative of a general stateof inflammation.
This study has limitations. Firstly, data contained in this study were obtained fromtwo cohorts (one pregnant, the other non-pregnant) of female volunteers of reproductiveage. We attempted to mitigate this by validating our approach using two publicly availablehuman plasma miRNA datasets: one male and one mixed male and female. Further,we have generalized this method such that removal (from the signature miRNA set) ofdomain-specific miRNA is built in, providing a framework that allows use within researchconducted in any human plasma context. Secondly, the plasma preparation protocol,the centrifugation step, differs between the pregnant and non-pregnant groups, whichconfounds the interpretation of differentially abundant miRNAs associated with pregnancy.Our results highlight that ignoring the issue of miRNA from RBCs leaves researchers opento the risk that newly discovered miRNA disease biomarkers could in fact be biomarkers ofhaemolysis. Future research, including validation of the miRNA signature set proposedhere using RT-qPCR, would strengthen confidence in our approach. Our research bothrecommends and enables tests for haemolysis to become standard pre-analytical practice inthe absence of a physical assay for RBC contamination.

Genes 2022, 13, 1288 12 of 15
Supplementary Materials: The following supporting information can be downloaded at: https://www.mdpi.com/article/10.3390/genes13071288/s1, Figure S1: Haemolysis signature feature selection. Rawsingle-end reads from small RNA-seq libraries are preprocessed using a range of Unix- and python-based computational tools to quantify miRNA expression in each library. Data quality is ensuredthrough quality control steps throughout the workflow. Concurrently with sequencing, ∆Cq (miR-23a-3p-miR-451) was assessed by RT-qPCR and incorporated into the differential expression analysis;Figure S2: (a) Volcano plot of differential expression. Linear regression identified 138 miRNA whichwere more highly abundant in haemolysed compared to non-haemolysed samples with FDR < 0.05(green). (b) MA plot (M (log ratio) and A (mean average)) of Log2 fold change as a function of Log2average expression indicates most miRNA have an average expression < 10 Log2 CPM. miR-451aand miR-16-5p, both highly red blood cell associated, are highly expressed and more abundant in thehaemolysed group (green); Figure S3: (a) Volcano plot of differential expression between the pregnantand non-pregnant samples. Linear regression identified 104 miRNA (FDR < 0.05) which were morehighly abundant in the pregnant population (red). Haemolysis Metric signature miRNAs are labelled(b) MA plot (M (log ratio) and A (mean average)) of Log2 fold change as a function of Log2 averageexpression indicates most miRNA have an average expression < 10 Log2 CPM. Unsurprisingly,the most differentially expressed miRNA are miR-517a-3p, miR-517b-3p, miR-516b-5p, miR-518b,which are all members of the highly placenta associated chromosome 19 miRNA cluster; Figure S4:Scatter plots of log2 signature miRNA counts per million (CPM) as a function of ∆Cq (miR-23a-3p-miR-451) (1) or the ratio of abundance (CPM) of miR-23a-3p and miR-451a (2). There is a strongcorrelation between the haemolysis signature miRNAs and the other measures of haemolysis. (3) Therelationship between the ∆Cq (miR-23a-3p-miR-451) and the ratio of abundance (CPM) of miR-23a-3pand miR-451a methods; Figure S5: Comparison of the derived Haemolysis Metric, ∆Cq PCR andSpectrophotometry Absorbance methods for estimating haemolysis. A clear correlation is presentbetween all three methods; Figure S6: Public dataset GSE151341 (radiographic knee osteoarthritis).Scatter plots of log2 signature microRNA (miRNA) counts per million (CPM) as a function of asimple, proxy, measure of haemolysis calculated by subtracting the log2 CPM expression of theinvariant miRNA miR-23a-3p from the red blood cell associated miR-451a. Signature miRNAs arepresented in ascending numeric order from miR-17-5p (a) to miR-451a (s). Importantly, in this mixedexperiment containing both male and female patients (n = 91) we see no clustering of haemolysissignature miRNA expression by sex. We found a strong correlation between our haemolysis signaturemiRNAs and the proxy measure of haemolysis. There were no signature miRNAs associated withthis data reported dysregulated in radiographic knee arthritis [12]. Notably, miR-191-5p is negativelycorrelated with the proxy measure of haemolysis. Whilst this study did not identify miR-191-5pas dysregulated in radiographic knee osteoarthritis, miR-191-3p was identified as dysregulated intheir Patient:Control experiment. Previous studies have shown miR-191-5p to be upregulated inpatients with hand osteoarthritis [38], highlighting the need for careful consideration of confoundingsignals when calculating the Haemolysis metric (1). Public dataset GSE151341 (radiographic kneeosteoarthritis). Scatter plot of the Haemolysis metric as a function of the proxy measure of haemolysiscalculated by subtracting the log2 CPM expression of the invariant miRNA miR-23a-3p from thered blood cell associated miR-451a. Both in silico measures of haemolysis show a strong correlation(2). Public dataset GSE151341 (radiographic knee osteoarthritis). Scatter plot of miR-191-5p log2CPM expression as function of the proxy haemolysis metric calculated by subtracting the log2 CPMexpression of the invariant miRNA miR-23a-3p from the red blood cell associated miR-451a. miR-191-5p is the signature miRNA dropped from calculation of the Haemolysis metric in accordance with ourrecommendations. As anticipated, miR-191-5p does not have a strong positive correlation with theproxy measure of haemolysis (3); Figure S7: Public dataset GSE118038 (prostate cancer study). Scatterplots of log2 signature microRNA (miRNA) counts per million (CPM) as a function of a simple, proxymeasure of haemolysis calculated by subtracting the log2 CPM expression of the invariant miRNAmiR-23a-3p from the red blood cell associated miR-451a. Signature miRNAs used in the calculationof the Haemolysis metric are presented in ascending numeric order from miR-17-5p (a) to miR-451a(o). Importantly, in this all-male experiment (n = 70), the haemolysis signature miRNAs correlatestrongly with the proxy measure of haemolysis. The publication associated with this data reporteddysregulation of miR-30c-5p in prostate cancer [37]. A further literature search identified miR-191-5pas dysregulated in prostate cancer with a previous study reporting this miRNA to be upregulated inpatients with prostate cancer. In accordance with our method, this miRNA was excluded, as weremiR-324-5p, miR-194-5p and miR-20b-5p that were found to have no expression profile in this dataset
Genes 2022, 13, 1288 13 of 15
(1). Public dataset GSE118038 (prostate cancer study). Scatter plot of the Haemolysis metric as afunction of the proxy measure of haemolysis calculated by subtracting the log2 CPM expression ofthe invariant miRNA miR-23a-3p from the red blood cell associated miR-451a. Both in silico measuresof haemolysis show a strong correlation (2). Public dataset GSE118038 (prostate cancer study). Scatterplots of the two signature miRNAs dropped from calculation of the Haemolysis metric in accordancewith our recommendations. As anticipated, neither miR-30c-5p (a) or miR-191-5p (b) have a strongpositive correlation with the proxy measure of haemolysis calculated by subtracting the log2 CPMexpression of the invariant miRNA miR-23a-3p from the red blood cell associated miR-451a (3);Table S1: Patient characteristics for 121 patient samples. Data includes Pregnancy Status, Age, BMI,Smoking Status, Ethnicity and Gestational Age (where appropriate); Table S2: Sample BioProject,Accession and Batch details, Fastq quality control and RT-qPCR Cq data for miR-23a-3p, miR-451aand ∆Cq (miR-23a-3p-miR-451); Table S3: Distribution of small RNA sequencing reads across RNAclasses from GRCh38 Ensembl annotation; Table S4: MicroRNA counts per million reads for allmiRNA retained for differential expression analysis.
Author Contributions: Conceptualization, M.D.S., K.A.P. and J.B.; methodology, M.D.S. and K.A.P.;software, M.D.S.; formal analysis, M.D.S. and S.Y.L.; resources, C.T.R.; data curation, M.D.S.; writing—original draft preparation, M.D.S. and K.A.P.; writing—review and editing, M.D.S., K.A.P., J.B., C.T.R.and S.Y.L.; funding acquisition, C.T.R.; investigation, T.J.-K., D.M. (Dylan McCullough) and D.M.(Dale McAninch) All authors have read and agreed to the published version of the manuscript.
Funding: This research was funded by NIH NICHD R01 (grant number HD089685-01) Maternalmolecular profiles reflect placental function and development across gestation. PI Roberts. MDSwas supported by an Australian Government Research Training Program (RTP) Scholarship. CTR issupported by a National Health and Medical Research Council Investigator Grant (grant numberGNT1174971) and a Matthew Flinders Professorial Fellowship funded by Flinders University. JB issupported by the James & Diana Ramsay Foundation. KAP is supported by the Florey Fellowshipfunded by the Adelaide Hospital Research Committee.
Institutional Review Board Statement: Ethics approval for the collection of blood from womenundergoing elective pregnancy termination between 6 and 23 weeks’ gestation was provided un-der HREC/16/TQEH/33 by the Queen Elizabeth Hospital Human Research Ethics Committee(TQEH/LMH/MH). Blood from women forming the general population group was collected afterinformed consent with ethics approval provided under HREC/H/021/2005 by the University ofAdelaide Human Research Ethics Committee.
Informed Consent Statement: Informed consent was obtained from all subjects involved in the study.
Data Availability Statement: The dataset(s) supporting the conclusions of this article are availablein NCBI’s Short Read Archive (SRA) (36) and are available through BioProject accession numbersPRJNA635621 and PRJNA824637.
Acknowledgments: We wish to acknowledge the generosity of the women who donated their bloodfor our research. Without them, this research would not be possible. We also acknowledge valuableinput from QIAGEN Genomic Services.
Conflicts of Interest: The authors declare no conflict of interest.
References1. Bartel, D.P. MicroRNAs: Genomics, Biogenesis, Mechanism, and Function. Cell 2004, 116, 281–297. [CrossRef]2. Bartel, D.P. Metazoan MicroRNAs. Cell 2018, 173, 20–51. [CrossRef] [PubMed]3. Pillman, K.A.; Scheer, K.G.; Hackett-Jones, E. Extensive transcriptional responses are co-ordinated by microRNAs as revealed by
Exon–Intron Split Analysis (EISA). Nucleic Acids Res. 2019, 47, 8606–8619. Available online: https://academic.oup.com/nar/article-abstract/47/16/8606/5542881 (accessed on 30 March 2022). [CrossRef] [PubMed]
4. Guo, H.; Ingolia, N.T.; Weissman, J.S.; Bartel, D.P. Mammalian microRNAs predominantly act to decrease target mRNA levels.Nature 2010, 466, 835–840. [CrossRef] [PubMed]
5. Friedman, R.C.; Farh, K.K.-H.; Burge, C.B.; Bartel, D.P. Most mammalian mRNAs are conserved targets of microRNAs. Genome Res.2008, 19, 92–105. [CrossRef]
6. Mitchell, P.S.; Parkin, R.K.; Kroh, E.M.; Fritz, B.R.; Wyman, S.K.; Pogosova-Agadjanyan, E.L.; Peterson, A.; Noteboom, J.;O’Briant, K.C.; Allen, A.; et al. Circulating microRNAs as stable blood-based markers for cancer detection. Proc. Natl. Acad. Sci.USA 2008, 105, 10513–10518. [CrossRef]

Genes 2022, 13, 1288 14 of 15
7. Cortez, M.A.; Calin, G.A. MicroRNA identification in plasma and serum: A new tool to diagnose and monitor diseases.Expert Opin. Biol. Ther. 2009, 9, 703–711. [CrossRef]
8. Kosaka, N.; Iguchi, H.; Ochiya, T. Circulating microRNA in body fluid: A new potential biomarker for cancer diagnosis andprognosis. Cancer Sci. 2010, 101, 2087–2092. [CrossRef]
9. Vickers, K.C.; Palmisano, B.T.; Shoucri, B.M.; Shamburek, R.D.; Remaley, A.T. MicroRNAs are transported in plasma and deliveredto recipient cells by high-density lipoproteins. Nat. Cell Biol. 2011, 13, 423–433. [CrossRef]
10. Arroyo, J.D.; Chevillet, J.R.; Kroh, E.M.; Ruf, I.K.; Pritchard, C.C.; Gibson, D.F.; Mitchell, P.S.; Bennett, C.F.; Pogosova-Agadjanyan, E.L.;Stirewalt, D.L.; et al. Argonaute2 complexes carry a population of circulating microRNAs independent of vesicles in humanplasma. Proc. Natl. Acad. Sci. USA 2011, 108, 5003–5008. [CrossRef]
11. Cortez, M.A.; Bueso-Ramos, C.; Ferdin, J.; Lopez-Berestein, G.; Sood, A.K.; Calin, G.A. MicroRNAs in body fluids—The mix ofhormones and biomarkers. Nat. Rev. Clin. Oncol. 2011, 8, 467–477. [CrossRef] [PubMed]
12. Ali, S.A.; Gandhi, R.; Potla, P.; Keshavarzi, S.; Espin-Garcia, O.; Shestopaloff, K.; Pastrello, C.; Bethune-Waddell, D.; Lively, S.;Perruccio, A.V.; et al. Sequencing identifies a distinct signature of circulating microRNAs in early radiographic knee osteoarthritis.Osteoarthr. Cartil. 2020, 28, 1471–1481. [CrossRef] [PubMed]
13. Witwer, K.W. Circulating microRNA biomarker studies: Pitfalls and potential solutions. Clin. Chem. 2015, 61, 56–63. [CrossRef][PubMed]
14. Wozniak, M.B.; Scelo, G.; Muller, D.C.; Mukeria, A.; Zaridze, D.; Brennan, P. Circulating MicroRNAs as Non-Invasive Biomarkersfor Early Detection of Non-Small-Cell Lung Cancer. PLoS ONE 2015, 10, e0125026. [CrossRef] [PubMed]
15. Kirschner, M.B.; Kao, S.C.; Edelman, J.J.; Armstrong, N.J.; Vallely, M.P.; van Zandwijk, N.; Reid, G. Haemolysis during samplepreparation alters microRNA content of plasma. PLoS ONE 2011, 6, e24145. [CrossRef]
16. Cheng, H.H.; Yi, H.S.; Kim, Y.; Kroh, E.M.; Chien, J.W.; Eaton, K.D.; Goodman, M.T.; Tait, J.F.; Tewari, M.; Pritchard, C.C. PlasmaProcessing Conditions Substantially Influence Circulating microRNA Biomarker Levels. PLoS ONE 2013, 8, e64795. [CrossRef]
17. Kirschner, M.B.; van Zandwijk, N.; Reid, G. Cell-free microRNAs: Potential biomarkers in need of standardized reporting.Front. Genet. 2013, 4, 56. [CrossRef]
18. Pritchard, C.C.; Kroh, E.; Wood, B.; Arroyo, J.D.; Dougherty, K.J.; Miyaji, M.M.; Tait, J.F.; Tewari, M. Blood cell origin of circulatingmicroRNAs: A cautionary note for cancer biomarker studies. Cancer Prev. Res. 2012, 5, 492–497. [CrossRef]
19. Livak, K.J.; Schmittgen, T.D. Analysis of Relative Gene Expression Data Using Real-Time Quantitative PCR and the 2−∆∆CTMethod. Methods 2001, 25, 402–408. [CrossRef]
20. Wong, C.-H.; Song, C.; Heng, K.-S.; Kee, I.H.C.; Tien, S.-L.; Kumarasinghe, P.; Khin, L.-W.; Tan, K.-C. Plasma free hemoglobin: Anovel diagnostic test for assessment of the depth of burn injury. Plast. Reconstr. Surg. 2006, 117, 1206–1213. [CrossRef]
21. Appierto, V.; Callari, M.; Cavadini, E.; Morelli, D.; Daidone, M.G.; Tiberio, P. A lipemia-independent NanoDrop(®)-based score toidentify hemolysis in plasma and serum samples. Bioanalysis 2014, 6, 1215–1226. [CrossRef] [PubMed]
22. Chatterjee, S.; Premachandran, S.; Bagewadikar, R.S.; Poduval, T.B. The use of ELISA to monitor amplified hemolysis by thecombined action of osmotic stress and radiation: Potential applications. Radiat. Res. 2005, 163, 351–355. [CrossRef]
23. Smith, M.D.; Leemaqz, S.Y.; Jankovic-Karasoulos, T.; McCullough, D.; McAninch, D.; Breen, J.; Roberts, C.T.; Pillman, K.A. DraculR: Aweb based application for in silico haemolysis detection in high throughput small RNA sequencing data. medRxiv 2022. [CrossRef]
24. Smith, M.D.; Pillman, K.; Jankovic-Karasoulos, T.; McAninch, D.; Wan, Q.; Bogias, K.J.; McCullough, D.; Bianco-Miotto, T.;Breen, J.; Roberts, C.T. Large-scale transcriptome-wide profiling of microRNAs in human placenta and maternal plasma at earlyto mid gestation. RNA Biol. 2021, 19, 1–14. [CrossRef] [PubMed]
25. Andrews, S. FastQC: A Quality Control Tool for High Throughput Sequence Data. 2010. Available online: http://www.bioinformatics.babraham.ac.uk/projects/fastqc/ (accessed on 30 March 2022).
26. Didion, J.P.; Martin, M.; Collins, F.S. Atropos: Specific, sensitive, and speedy trimming of sequencing reads. PeerJ 2017, 5, e3720.[CrossRef]
27. Li, H.; Durbin, R. Fast and accurate long-read alignment with Burrows–Wheeler transform. Bioinformatics 2010, 26, 589–595.[CrossRef] [PubMed]
28. Ewels, P.; Magnusson, M.; Lundin, S.; Käller, M. MultiQC: Summarize analysis results for multiple tools and samples in a singlereport. Bioinformatics 2016, 32, 3047–3048. [CrossRef]
29. Saunders, K.; Bert, A.G.; Dredge, B.K.; Toubia, J.; Gregory, P.A.; Pillman, K.A.; Goodall, G.J.; Bracken, C.P. Insufficiently complexunique-molecular identifiers (UMIs) distort small RNA sequencing. Sci. Rep. 2020, 10, 14593. [CrossRef]
30. Griffiths-Jones, S. miRBase: microRNA sequences and annotation. Curr. Protoc. Bioinform. 2010, 29, 12.9.1–12.9.10. [CrossRef]31. Kozomara, A.; Griffiths-Jones, S. MiRBase: Annotating high confidence microRNAs using deep sequencing data. Nucleic Acids
Res. 2014, 42, D68–D73. [CrossRef]32. Robinson, M.D.; McCarthy, D.J.; Smyth, G.K. edgeR: A Bioconductor package for differential expression analysis of digital gene
expression data. Bioinformatics 2009, 26, 139–140. [CrossRef] [PubMed]33. Ritchie, M.E.; Phipson, B.; Wu, D.; Hu, Y.; Law, C.W.; Shi, W.; Smyth, G.K. Limma powers differential expression analyses for
RNA-sequencing and microarray studies. Nucleic Acids Res. 2015, 43, e47. [CrossRef] [PubMed]34. Robinson, M.D.; Oshlack, A. A scaling normalization method for differential expression analysis of RNA-seq data. Genome Biol.
2010, 11, R25. [CrossRef] [PubMed]35. Revelle, W.R. psych: Procedures for Psychological, Psychometric, and Personality Research; Northwestern University: Evanston, IL, USA, 2021.
Genes 2022, 13, 1288 15 of 15
36. Sayers, E.W.; Bolton, E.E.; Brister, J.R.; Canese, K.; Chan, J.; Comeau, D.C.; Connor, R.; Funk, K.; Kelly, C.; Kim, S.; et al. Databaseresources of the national center for biotechnology information. Nucleic Acids Res. 2022, 50, D20–D26. [CrossRef]
37. Giglio, S.; De Nunzio, C.; Cirombella, R.; Stoppacciaro, A.; Faruq, O.; Volinia, S.; Baldassarre, G.; Tubaro, A.; Ishii, H.; Croce, C.M.; et al.A preliminary study of micro-RNAs as minimally invasive biomarkers for the diagnosis of prostate cancer patients. J. Exp. Clin.Cancer Res. 2021, 40, 79. [CrossRef]
38. Pekacova, A.; Baloun, J.; Sleglova, O.; Ružicková, O.; Vencovský, J.; Pavelka, K.; Šenolt, L. AB0038 Circulating MicroRNAs InHand Osteoarthritis. Ann. Rheum. Dis. 2021, 80 (Suppl. 1), 1051–1052. [CrossRef]
39. Sanghavi, M.; Rutherford, J.D. Cardiovascular physiology of pregnancy. Circulation 2014, 130, 1003–1008. [CrossRef]40. Shkurnikov, M.Y.; Knyazev, E.N.; Fomicheva, K.A.; Mikhailenko, D.S.; Nyushko, K.M.; Saribekyan, E.K.; Samatov, T.R.;
Alekseev, B.Y. Analysis of Plasma microRNA Associated with Hemolysis. Bull. Exp. Biol Med. 2016, 160, 748–750. [CrossRef]41. Landoni, E.; Miceli, R.; Callari, M.; Tiberio, P.; Appierto, V.; Angeloni, V.; Mariani, L.; Daidone, M.G. Proposal of supervised data
analysis strategy of plasma miRNAs from hybridisation array data with an application to assess hemolysis-related deregulation.BMC Bioinform. 2015, 16, 388. [CrossRef]
42. McDonald, J.S.; Milosevic, D.; Reddi, H.V.; Grebe, S.K.; Algeciras-Schimnich, A. Analysis of circulating microRNA: Preanalyticaland analytical challenges. Clin. Chem. 2011, 57, 833–840. [CrossRef]
43. Kirschner, M.B.; Edelman, J.J.B.; Kao, S.C.H.; Vallely, M.P.; Van Zandwijk, N.; Reid, G. The impact of hemolysis on cell-freemicroRNA biomarkers. Front. Genet. 2013, 4, 94. [CrossRef]
44. Nogales-Gadea, G.; Ramos-Fransi, A.; Suárez-Calvet, X.; Navas, M.; Rojas-García, R.; Mosquera, J.L.; Diaz-Manera, J.; Querol, L.;Gallardo, E.; Illa, I. Analysis of serum miRNA profiles of myasthenia gravis patients. PLoS ONE 2014, 9, e91927. [CrossRef][PubMed]
45. Guo, R.; Fan, G.; Zhang, J.; Wu, C.; Du, Y.; Ye, H.; Li, Z.; Wang, L.; Zhang, Z.; Zhang, L.; et al. A 9-microRNA Signature in SerumServes as a Noninvasive Biomarker in Early Diagnosis of Alzheimer’s Disease. J. Alzheimer’s Dis. 2017, 60, 1365–1377. [CrossRef][PubMed]
46. Poroyko, V.; Mirzapoiazova, T.; Nam, A.; Mambetsariev, I.; Mambetsariev, B.; Wu, X.; Husain, A.; Vokes, E.E.; Wheeler, D.L.;Salgia, R. Exosomal miRNAs species in the blood of small cell and non-small cell lung cancer patients. Oncotarget 2018, 9,19793–19806. [CrossRef] [PubMed]
47. Wang, X.; He, Y.; Mackowiak, B.; Gao, B. MicroRNAs as regulators, biomarkers and therapeutic targets in liver diseases. Gut 2021,70, 784–795. [CrossRef] [PubMed]
48. Zou, X.; Li, M.; Huang, Z.; Zhou, X.; Liu, Q.; Xia, T.; Zhu, W. Circulating miR-532-502 cluster derived from chromosome X asbiomarkers for diagnosis of breast cancer. Gene 2020, 722, 144104. [CrossRef]
49. Boeri, M.; Verri, C.; Conte, D.; Roz, L.; Modena, P.; Facchinetti, F.; Calabrò, E.; Croce, C.M.; Pastorino, U.; Sozzi, G. MicroRNAsignatures in tissues and plasma predict development and prognosis of computed tomography detected lung cancer. Proc. Natl.Acad. Sci. USA 2011, 108, 3713–3718. [CrossRef]