mlc-seq: de novo sequencing of full-length trnas and
TRANSCRIPT
MLC-Seq: de novo Sequencing of Full-Length tRNAsand Quantitative Mapping of Multiple RNAModi�cationsShenglong Zhang ( [email protected] )
New York Institute of Technology https://orcid.org/0000-0001-8003-7484Xiaohong Yuan
New York Institute of Technology https://orcid.org/0000-0002-9165-5197Yue Su
New York Institute of TechnologyXudong Zhang
University of California Riverside https://orcid.org/0000-0002-5964-0067Spencer Turkel
New York Institute of TechnologyShundi Shi
Columbia UniversityXuanting Wang
Columbia UniversityEun-Jin Choi
University of Texas Medical BranchWenzhe Wu
University of Texas Medical BranchHaichuan Liu
University of California San FranciscoRosa Viner
Thermo Fisher Scienti�c (United States) https://orcid.org/0000-0003-0550-5545James Russo
Columbia UniversityWenjia Li
New York Institute of Technology https://orcid.org/0000-0001-6059-6422Xiaoyong Bao
University of Texas Medical BranchQi Chen
University of California, Riverside https://orcid.org/0000-0001-6353-9589

Brief Communication
Keywords:
Posted Date: December 9th, 2021
DOI: https://doi.org/10.21203/rs.3.rs-1090754/v1
License: This work is licensed under a Creative Commons Attribution 4.0 International License. Read Full License

MLC-Seq: de novo Sequencing of Full-Length tRNAs and Quantitative Mapping of 1
Multiple RNA Modifications 2
3
4
Xiaohong Yuan1a, Yue Su1a, Xudong Zhang2, Spencer J. Turkel1a, Shundi Shi3, Xuanting Wang3, 5
Eun-Jin Choi4a, Wenzhe Wu4a, Haichuan Liu5, Rosa Viner5, James J. Russo3, Wenjia Li1b, 6
Xiaoyong Bao4a, 4b,4c,4d, Qi Chen2, Shenglong Zhang1a* 7
8
9 1aDepartment of Biological and Chemical Sciences, 1bDepartment of Computer Science, New 10
York Institute of Technology, New York, NY 10023, USA 11 2Division of Biomedical Sciences, School of Medicine, University of California, Riverside, 12
Riverside, CA 92521, USA 13 3Department of Chemical Engineering, Columbia University, New York, NY 10027, USA 14 4aDepartment of Pediatrics, 4bSealy Center for Molecular Medicine, 4cthe Institute of 15
Translational Science, 4dthe Institute for Human Infections &Immunity, University of Texas 16
Medical Branch, Galveston, TX 77555, USA 17 5Thermo Fisher Scientific, 355 River Oaks Parkway, San Jose, CA 95134, USA 18
19
20
21
22
Abstract 23
24
Despite the extensive use of next-generation sequencing of RNA, simultaneous sequencing and 25
quantitative mapping of multiple RNA modifications remain challenging. Herein, we develop 26
MLC-Seq, a mass spectrometry-based direct sequencing method allowing for simultaneously 27
unravelling the RNA sequences and quantitatively mapping different tRNA nucleotide 28
modifications site-specifically. Importantly, MLC-Seq reveals the stoichiometric changes of 29
tRNA modifications upon treatment with the dealkylating enzyme AlkB, and led to the discovery 30
of new nucleotide modifications. 31
32
33

Despite wide application of high-throughput next generation sequencing (NGS), the true 34
sequence of a RNA, i.e., identity and location of each and every nucleotide building block 35
(canonical or modified) within a full-length RNA, remains a mystery1, mainly because of the 36
lack of a general method to directly sequence any nucleotide (including unknown ones) at single-37
nucleotide resolution. tRNAs, where >100 different modifications have been discovered, cannot 38
be directly sequenced efficiently. NGS-based methods, which require cDNA synthesis, are 39
generally unable to sequence modifications, and can only be “tailored” to sequence a specific 40
RNA modification type2. Direct nanopore-based RNA sequencing has been used for sequencing 41
tRNAs3, but currently suffers from a high error rate and cannot identify or pinpoint diverse tRNA 42
modifications. Also, not all tRNA modifications are modified 100% of the time, so that site-43
specific quantification of their stoichiometries is challenging4. 44
45
Mass spectrometry (MS), in particular combined liquid chromatography and tandem mass 46
spectrometry (LC-MS/MS), is recognized as the ‘gold standard’ for RNA modification analysis, 47
because it does not require a cDNA synthesis step and is not limited to specific known 48
modification types. However, LC-MS/MS analysis of RNA modifications is often restrained to 49
the ribonucleoside level. For example, RNA samples may be completely digested, enzymatically 50
or chemically, to single nucleosides for MS analysis5-7, but location information for the RNA 51
modifications is lost. To obtain RNA sequence information, LC-MS/MS-based mapping methods 52
rely on other well-established complementary methods (e.g., previous analyses or NGS)8, and 53
can only analyze short RNA oligonucleotides (~17 nt)1, due to spectral complexity and resulting 54
difficulty in data interpretation6. Therefore, they are rarely used for de novo (without prior 55
sequence information) sequencing of RNA. 56
57
LC-MS-based de novo sequencing methods have nevertheless been developed that 58
simultaneously sequence and quantify nucleotide modifications9-12. These methods rely on a 59
complete set of MS ladders that are produced not by MS/MS, but by exactly one random and 60
unbiased cut on each RNA strand via controlled enzymatic or chemical degradation9,13-15. The 61
resulting MS ladder fragments retains the nucleotide modifications from the original parental 62
RNAs, allowing identification, quantification and location of each nucleotide modification in a 63
sample. However, each MS ladder must be perfect, i.e., without any missing fragments, in order 64
to read all nucleotides in an RNA strand9,11,16. These rigorous sample preparation requirements, 65
together with the need for higher sample loading (~1000 pmol)12 for a tRNA, short read length 66
(<35 nt per run)11, and low throughput (a single RNA strand or just a few)9,11, have restricted 67
MS-based de novo sequencing applications to less complex RNA samples, making it difficult to 68
sequence and quantify nucleotide modifications from limited amounts of tRNAs enriched from 69
cells. 70
71
To systematically address the drawbacks of previous MS-based methods, we developed a de 72
novo MS ladder complementation sequencing approach (MLC-Seq) (Fig. 1a) that circumvents 73
the perfect ladder requirement for direct MS sequencing, thereby allowing de novo MS 74
sequencing of full-length cellular tRNAs, together with all nucleotide modifications, at single-75
nucleotide stoichiometric precision. To test the power of the ladder complementation strategy for 76
sequencing of modification-rich tRNAs, we first sequenced a yeast tRNA-Phe sample containing 77
five isoforms (Fig. 1b-c), which have similar sequences but differ in as little as one nucleotide or 78
modification. None of the five isoforms yielded a perfect MS ladder (Fig. 1b) (likely due to 79

inefficient LC-separation or MS measurement of minor ladder fragments from low-abundance 80
tRNA isoforms), and thus could not be sequenced by previously developed MS sequencing 81
methods. However, after ladder complementation using our MLC-Seq method, the missed MS 82
ladder fragments were corrected to generate a perfect MS ladder, allowing for direct sequencing 83
of all five tRNA isoforms and pinpointing each nucleotide or modification difference 84
quantitatively (Fig. 1c and Fig. S1) (see Methods for details). 85
86
MLC-Seq achieves this goal by incorporating a series of systematic and innovative technical 87
advances over previous de novo MS sequencing methods (Extended Data Fig. 1). First, 88
homology search identifies RNA isoforms related to a specific tRNA in a given sample 89
(Extended Data Fig. 2). Second, MassSum, a novel MS-based algorithm, takes advantage of the 90
unique mass of each RNA molecule and site-specific cleavage of RNA phosphodiester bonds 91
under controlled acid degradation conditions15, allowing identification and computational 92
isolation of ladder fragments of the RNA in a mixed RNA sample without end-labeling 93
(Extended Data Fig. 3), which was previously required to MS sequence mixed RNA samples9,11. 94
Third, MS ladder complementation allows sequencing of low-abundance RNA samples that 95
cannot provide a perfect MS ladder and thus cannot be sequenced by previous MS sequencing 96
methods (Fig. 1b). Fourth, with the latest Orbitrap MS instrument, MLC-Seq increases read 97
length of de novo MS-based RNA sequencing from ~35 nt to ~80 nt per run, allowing 98
sequencing of the full-length tRNA without T1 digestion, which was required by previous MS 99
sequencing methods, but complicated the sequencing and data analysis11. Finally, lowering 100
sample loading ~1000-fold down to ng scale (~20 ng or ~1 pmol for a tRNA), allows sequencing 101
of cellular tRNAs. 102
103
MLC-Seq allows direct sequencing of full-length tRNAs without a cDNA intermediate and 104
preserves the sample diversity and modification information in a given tRNA sample that 105
indirect cDNA-based RNA sequencing methods cannot (Fig. 1a). After verifying the sequencing 106
method on yeast tRNA-Phe, we used MLC-Seq to sequence other tRNAs enriched from mouse 107
liver. The identity, position, and stoichiometry of each modification in wild-type tRNA-Gln and 108
tRNA-Glu is shown in Fig. 2a and Extended Data Fig. 4b, respectively. As such, MLC-Seq 109
allows direct and de novo sequencing of full-length tRNAs as well as quantitative mapping of all 110
nucleotide modifications of each specific tRNA enriched from yeast or mice at single-nucleotide 111
resolution, for which no current high-throughput sequencing methods are capable. 112
113
Importantly, our method led to the discovery of new RNA modifications, a 3,4-dihydrocytidine 114
(C′) at position 16 of tRNA-Gln (Fig. 2b) and a 2-Ox-G (G′) at position 17 of tRNA-Glu 115
(Extended Data Fig. 4c), which have not been reported before. MLC-Seq showed that when 116
reading the 5′ ladder of the tRNA-Gln in the two dimensional (2D) mass-retention time (tR) plot, 117
a new ladder started to branch out at position 16, and the mass differences of ladder fragments 118
between position 16 and 15 are 307.0276 Da and 308.0340 Da, indicating a C′ co-existing with 119
D (dihydrouridine) at position 16 (D/C′: 79% vs. 21%). We propose a structure for this newly 120
discovered nucleotide C′ (Fig. 2bII), which contains two more hydrogens in positions 3 and 4 of 121
C, based on reported structural stability analysis of the isomeric C′17. Similarly, a new sequence 122
branch indicates a G′ co-existing with G at position 17 of tRNA-Glu (G/G′: 69% vs. 31%, AlkB-123
treated) (Extended Data Fig. 4c). 124
125

Notably, to differentiate isomeric methylations such as m1A and m6A, we leveraged the 126
demethylation specificity of AlkB on its target methylation types (e.g., m1A, m1G, and m3C)18,19 127
and further successfully distinguished these methylations according to their sensitivities to AlkB 128
(Fig. 2 and Extended Data Fig. 4); this experiment has also in turn, demonstrated the accuracy of 129
MLC-seq to track the stoichiometric changes of AlkB-sensitive methylated nucleotides in 130
various tRNA samples such as tRNA-Gln and tRNA-Glu extracted from mouse liver. MLC-Seq 131
results pinpoint stoichiometric changes of methylations site-specifically in tRNA-Gln after AlkB 132
treatment. In wild type tRNA-Gln, m1A at position 57 of tRNA-Gln occurred at a frequency of 133
100% (no canonical A co-existing). However, 99% of the m1A at position 57 was demethylated 134
into A after AlkB-treatment. Reading the 3′ ladder of the wild-type tRNA in the 2D mass-tR plot 135
indicates an m1A (100%) at position 57 of the tRNA (Fig. 2c). However, after AlkB-treatment, 136
MLC-Seq showed that when reading the 3′-ladder, a ladder started to branch out at position 57, 137
and that 99% A was observed at this position with only 1% m1A remaining. In wild type tRNA-138
Glu, m1A at position 57 occurred at a frequency of 68% (vs 32% A), but all m1A demethylated 139
into A after AlkB treatment (Fig. S2-3). Similarly, in wild type tRNA-Gln, only m1G was found 140
at position 9 (no co-existing canonical G). However, only 45% of the m1G was demethylated 141
into G after AlkB-treatment (Fig. S4-5). 142
143
The full potential of the method’s sequencing read length and throughput remains to be explored, 144
especially when used with state-of-the-art LC-MS instruments and their built-in capacity for 145
automation. MLC-Seq, especially MassSum, increases the throughput of de novo MS-based 146
RNA sequencing, allowing sequencing potentially of an unlimited number of RNA sequences in 147
complex RNA samples, to the extent permitted by MS instruments, and paves the way for large 148
scale de novo MS sequencing of biological samples. It is worth noting that the methods described 149
here could be used to sequence other modified longer RNAs (e.g., rRNA, snoRNA, snRNA, Y 150
RNA, and vault RNA) and small non-coding RNAs (e.g., miRNA, piRNA, tsRNA, rsRNA, and 151
ysRNAs), and as an orthogonal approach to verify RNA sequences or modifications determined 152
by high-throughput sequencing methods. Thus, MLC-Seq will provide a general sequencing tool 153
for quantitatively studying RNA modifications, which is urgently needed more than ever, 154
considering for example that >40 unidentified nucleotide modifications have been reported in 155
SARS-CoV-2 RNA20, though their identities and functions remain unknown. 156
157
158
Data and Code Availability 159
All MS sequence datasets used in the manuscript are publicly available through the 160
corresponding repository on Github (https://github.com/rnamodifications/MLC-Seq). 161
162
Source codes implemented in Python of all the algorithms described in the manuscript (including 163
homology search, identifying acid-labile nucleotides, MassSum data separation, GapFill, ladder 164
complementing) are freely available on Github (https://github.com/rnamodifications/MLC-Seq) 165
and are distributed under the MIT open source license. 166
167
Acknowledgments 168
The authors acknowledge grant support from the USA National Institutes of Health R21 169
HG009576, R56 HG011099, and RM1 HG011563 (Co-I) to S.Z., R01 HD092431 and R01 170
ES032024 to Q.C., and R01 AI116812 and R21 AI113771to X.B. 171

172
Conflict of Interest 173
The authors have filed a patent related to the technology discussed in this manuscript. 174
H.L. and R.V. are employees of Thermo Fisher Scientific, San Jose, CA 95134, USA 175
176

References: 177
178
179
180
1 Alfonzo, J. D. et al. A call for direct sequencing of full-length RNAs to identify all 181
modifications. Nat Genet 53, 1113-1116, doi:10.1038/s41588-021-00903-1 (2021). 182
2 Helm, M. & Motorin, Y. Detecting RNA modifications in the epitranscriptome: predict 183
and validate. Nat Rev Genet 18, 275-291, doi:10.1038/nrg.2016.169 (2017). 184
3 Thomas, N. K. et al. Direct Nanopore Sequencing of Individual Full Length tRNA 185
Strands. ACS Nano 15, 16642-16653, doi:10.1021/acsnano.1c06488 (2021). 186
4 Suzuki, T. The expanding world of tRNA modifications and their disease relevance. Nat 187
Rev Mol Cell Biol 22, 375-392, doi:10.1038/s41580-021-00342-0 (2021). 188
5 Su, D. et al. Quantitative analysis of ribonucleoside modifications in tRNA by HPLC-189
coupled mass spectrometry. Nat Protoc 9, 828-841, doi:10.1038/nprot.2014.047 (2014). 190
6 Lauman, R. & Garcia, B. A. Unraveling the RNA modification code with mass 191
spectrometry. Mol Omics 16, 305-315, doi:10.1039/c8mo00247a (2020). 192
7 Wetzel, C. & Limbach, P. A. Mass spectrometry of modified RNAs: recent 193
developments. Analyst 141, 16-23, doi:10.1039/c5an01797a (2016). 194
8 Kimura, S., Dedon, P. C. & Waldor, M. K. Comparative tRNA sequencing and RNA 195
mass spectrometry for surveying tRNA modifications. Nat Chem Biol 16, 964-972, 196
doi:10.1038/s41589-020-0558-1 (2020). 197
9 Zhang, N. et al. A general LC-MS-based RNA sequencing method for direct analysis of 198
multiple-base modifications in RNA mixtures. Nucleic Acids Res 47, e125, 199
doi:10.1093/nar/gkz731 (2019). 200
10 Zhang, N. et al. A General LC-MS-Based Method for Direct and De Novo Sequencing of 201
RNA Mixtures Containing both Canonical and Modified Nucleotides. Methods Mol Biol 202
2298, 261-277, doi:10.1007/978-1-0716-1374-0_17 (2021). 203
11 Zhang, N. et al. Direct Sequencing of tRNA by 2D-HELS-AA MS Seq Reveals Its 204
Different Isoforms and Dynamic Base Modifications. ACS Chem Biol 15, 1464-1472, 205
doi:10.1021/acschembio.0c00119 (2020). 206
12 Zhang, N., Shi, S., Yoo, B., Yuan, X., Li, W., Zhang, S. . 2D-HELS MS Seq: a General 207
LC-MS Based Method for Direct and de novo Sequencing of RNA Mixtures with 208
Different Nucleotide Modifications. J. Vis. Exp. e61281 (2020). 209
13 Thomas, B. & Akoulitchev, A. V. Mass spectrometry of RNA. Trends in biochemical 210
sciences 31, 173-181 (2006). 211
14 Yoluc, Y. et al. Instrumental analysis of RNA modifications. Crit Rev Biochem Mol Biol 212
56, 178-204, doi:10.1080/10409238.2021.1887807 (2021). 213
15 Bjorkbom, A. et al. Bidirectional Direct Sequencing of Noncanonical RNA by Two-214
Dimensional Analysis of Mass Chromatograms. J Am Chem Soc 137, 14430-14438, 215
doi:10.1021/jacs.5b09438 (2015). 216
16 Bahr, U., Aygun, H. & Karas, M. Sequencing of single and double stranded RNA 217
oligonucleotides by acid hydrolysis and MALDI mass spectrometry. Anal Chem 81, 218
3173-3179, doi:10.1021/ac900100x (2009). 219
17 Snider, M. J., Lazarevic, D. & Wolfenden, R. Catalysis by entropic effects: the action of 220
cytidine deaminase on 5,6-dihydrocytidine. Biochemistry 41, 3925-3930, 221
doi:10.1021/bi011696r (2002). 222

18 Shi, J. et al. PANDORA-seq expands the repertoire of regulatory small RNAs by 223
overcoming RNA modifications. Nat Cell Biol 23, 424-436, doi:10.1038/s41556-021-224
00652-7 (2021). 225
19 Cozen, A. E. et al. ARM-seq: AlkB-facilitated RNA methylation sequencing reveals a 226
complex landscape of modified tRNA fragments. Nat Methods 12, 879-884 (2015). 227
20 Kim, D. et al. The Architecture of SARS-CoV-2 Transcriptome. Cell 181, 914-921 e910, 228
doi:10.1016/j.cell.2020.04.011 (2020). 229
230
231

232
233
Fig. 1 | MLC-Seq allows direct sequencing and quantitative mapping of all tRNA 234
modifications within their full-length sequence context at single-nucleotide resolution. 235
a, The general workflow of MLC-Seq of cellular tRNA samples. A given tRNA sample is first 236
divided into two portions; one, serving as a control, is injected directly into LC-MS to provide 237
mass and relative abundance information of all the intact tRNAs (I), while the rest is subjected to 238
the acid-degradation procedure before LC-MS to provide information including mass and related 239
retention time (tR) for tRNA ladder fragments (II). Partial nucleotide modifications or editing can 240
be first observed at the intact level and then pinpointed site-specifically at the ladder fragment 241
level. For example, at the intact level from the control sample, partial RNA modification/editing 242
such as a methylation (14 Da difference) and A-G editing (16 Da difference) can be observed 243
directly between the intact masses of the related tRNA isoforms (I). After acid degradation and 244
LC-MS, 5′- and 3′-ladders consisting of ladder fragments with various lengths corresponding to 245
nucleotides from the first to the last position on an RNA molecule, are produced and form 246
sigmoidal curves in a Mass-tR plot at the ladder fragment level (II). At this level, the specific site 247
b
a
RNA Modification/Editing (100%)
Controlled
Acid
Degradation5´-
Ladder 3
´-Ladder
Pi
OH
Pi OH
LC-MS
Data
Analysis
C C A
58
ACGCUUAA
G A C A C C U AG
CΨTGUGUm5C
C
m7GG
A
GUm5CΨ
AY
AAGmUCm
AGACC
m22GCGAGAGG
GD
D G AC U Cm2G
AU
UAGGCG
G
U
U
67
IF1
IF3
IF2
IF4
Rela
tive A
bundance
Mass (Around 24000 Da)
CH2
CH2
Ox Ox
14 Da16 Da
IF=Isoform
LC-MS Sample Diversity and
Modification Information Preserved
Partial Modification/Editing (<100%)
RNA Modification/Editing (100%)Partial Modification/Editing (<100%)
(I) Intact RNA Level
Rete
ntion T
ime (
min
)
Mass (Da)
5867
m1A
ACH
2
G
A Ox
0 25000
IF4
IF3
IF2
IF1
(II) Ladder Fragment Level
Partial Nucleotide Modification/Editing Observed
c
Imperfect: Missing
Ladder Components
Perfect: Fixed
Ladder Components
25000|
0|
20000|
15000|
10000|
5000|
Mass (Da)
PheIF1 - 5´-Ladder
PheIF2 - 5´-Ladder
PheIF4 - 5´-Ladder
PheIF3 - 5´-Ladder
PheIF5 - 5´-Ladder
PheIF2 - 5´-Ladder Converted From 3´-Ladder
PheIF1 - 5´-Ladder Converted From 3´-Ladder
PheIF4 - 5´-Ladder Converted From 3´-Ladder
PheIF3 - 5´-Ladder Converted From 3´-Ladder
PheIF5 - 5´-Ladder Converted From 3´-Ladder
ACi
CCUUAAGACACCUGCUTGUGUCUGAGGUUAGACCCGAGAGGGDDGACUCAUUUAGG Y´ G AG+C Cm+U
mAmCmGmCmG C
A
m22G CGm+A
A
* *
Position
8
4
0
De
pth
10
6
2
0 5 10 15 20 25 30 35 40 45 50 55 60 65 70 75
GCGGAUUUAm2GCUCAGDDGGGAGAGCm22GCCAGACmUGmAAY AΨmCUGGAGm7GUCm5CUGUGTΨCGm1AUCCACAGAAUUCGCACCAtRNA-Phe(Ref):
GCGGAUUUAmG CUCAGDDGGGAGAGCm22GCCAGACmUGmAAY´AUmCUGGAGmG UCmC UGUGTUCGmA UCCACAGAAUUCGCACCAPheIF2:
GCGGAUUUAmG CUCAGDDGGGAGAGCm22GCCAGACmUGmAAY´AUmCUGGAGmG UCmC UGUGTUCGmA UCCACAGAAUUCGCACCPheIF1:
GCGGAUUUAmG CUCAGDDGGGAGAGCm22GCCAGACmUGmAAY´AUmCUGGAGmG UCmC UGUGTUCGmA UCCACAGAAUUCGCACPheIF5:
GCGGAUUUAmG CUCAGDDGGGAGAGCm22GCCAGACmUGmAAY´AUmCUGGAGmG UCmC UGUGTUCGmA UCCACAGAGUUCGCACCAPheIF4:
GCGGAUUUAmG CUCAGDDGGGAGAGCm22GCCAGACmUGmAAY´AUmCUGGAGmG UCmC UGUGTUCGmA UCCACAGAGUUCGCACCPheIF3:
IF1
IF2
IF3IF4
G, 30%
A, 70%
A, 20%
m1A, 80%m1A, 80% G, 30%
De novo
Sequencing
Quantitative
Mapping
67 58
5858
6767
IF1
A, 70%
A, 20%5867

of the above-mentioned modification or editing can be further pinpointed at single-base 248
resolution. For example, at position 48 and 67, a second branch appears with a mass difference 249
of 14 Da and 16 Da between two ladder fragments at the same position (1st nucleotide after the 250
first branch site in the 2D Mas-tR plot), indicating the partial modification being A/mA and the 251
partial editing A/G occurring at the respective locations. Stoichiometric quantification of partial 252
RNA modification/editing can also be calculated based on the relative intensities of the 253
corresponding ladder fragments in their branches. Finally, combining with LC-MS datasets of 254
the controlled and acid-degraded portions, novel algorithms have been developed to identify 255
each tRNA species or isoform, and computationally separate its MS ladders from the LC-MS 256
data of a given tRNA sample for MLC-Seq (Extended Data Figs. 1-2 and Method Section). This 257
panel is for illustrative purposes only and does not represent any real tRNA sequence position 258
and stoichiometry of partial modification/editing. b, Ladder complementation of various related 259
tRNA isoforms allows direct sequencing that previous MS sequencing methods could not. For 260
example, a yeast tRNA-Phe containing five isoforms, but none of them has a perfect ladder 261
required by previous MS-based sequencing methods. However, after ladder complementation 262
using our MLC-Seq method, the missed MS ladder fragments were corrected to generate a 263
perfect MS ladder, allowing for direct sequencing of all five tRNA isoforms. All 3′- ladders were 264
converted to 5′- to keep the positions consistent. Depth on the bottom illustrates the number of 265
times each nucleotide was read from tRNA isoform ladders (3´and 5´-ladders). c, Sequences of 266
five tRNA-Phe isoforms, showing 100% coverage and accuracy as compared to the reported 267
tRNA-Phe reference sequence. For isomeric nucleotides or modifications such as pseudouridine 268
(ψ) versus U and methylation at different base positions, an extra step is required to differentiate 269
them following our MS sequencing approach as described previously (Ref. 11). 270
*The missing ladder fragments at positions 32 and 34 are due to methylations on the 2′-hydroxyl 271
group of Cm and Gm that block acid degradation. 272

273 Fig. 2 | a, MLC-Seq of tRNA-Gln extracted from mouse liver. I, MLC-Seq results for wildtype 274
tRNA-Gln, showing all the RNA modifications within their full-length tRNA sequence context 275
as well as the stoichiometry of each modification site-specifically. II, Identity, position, and 276
stoichiometry of each modification in wild-type tRNA-Gln. mU: a methylated U, but not Um (2′-277
O-methyluridine). III, Stoichiometric changes of 2 methylated nucleotides after AlkB-treatment. 278
The percentage of m1G at position 9 was reduced from 100% to 55% (with 45% G co-existing at 279
this position), and the percentage of m1A at position 57 was reduced from 100% to 1% (with 280
99% A co-existing at this position), respectively. b, MLC-Seq leading to the discovery of a novel 281
nucleotide of C′ (3,4-dihydrocytidine) at position 16 of tRNA-Gln. I, Structure and unit mass of 282
nucleotide D in MLC-Seq of RNA (exact unit mass: 308.0410 Da). II, Proposed structure of a 283
newly discovered nucleotide C′ (exact unit mass: 307.0569 Da) at position 16, which contains 284
two more hydrogens at positions 3 and 4 of nucleotide C. III, MLC-Seq showing that when 285
Position Base Percentage (%)
16
9
D : C´
m1G
79 : 21
100
20 D 100
19 D 100
48
32
m5C
Cm
100
100
49 C : m5C : mU 57 : 38 : 5
57 m1A 100
17 Gm 100
G : m1G
45% : 55%
A : m1A
99% : 1%
957
m1G
100%
m1A
100%
957
a I IIIII
AlkB-
Treatment
CC A
57
UCCA
GGU
G G C U C U A
A
CGAGm5C
A
ACCU
AA
GCU
CmAGGUC
UCACG
ADGGm
D
A AU G U G
U
CCUUGG
A9
75
CG
U
U
G
UU
C / m5C / mU
m1Gm1A16
20
32
49
D / C´
A / G68
68 A : G 97 : 3
tRNA-Gln
Wild-Type
4500...
b I IIIII
Proposed C´
307.0569 Da
I
12
14
16G
AG
UUC
Am1AA
U
Rete
ntion T
ime (
min
)
m1A1.0x103
2.5x10³
6.3x10³
1.6x10⁴
4.0x10⁴
1.0x10⁵
Inte
nsity
5000 6000 7000 8000Mass (Da)
......
60 58 56 54 52 50
Position
......
3´-Ladder
12
14
16
GA
GUUC
AAA
U
Rete
ntion T
ime (
min
)
1.0x10³
2.5x10³
6.3x10³
1.6x10⁴
4.0x10⁴
1.0x10⁵
Inte
nsity
m1A
Mass (Da)... ...5000 6000 7000 8000
Position
60 58 56 54 52 50... ...
3´-Ladder
14.0106 Da, CH2
A
m1A
Wild-Type
5500 6500 7500
12
14
16
Rete
ntion T
ime (
min
)Mass (Da)
D
C´1.0x10³
2.5x10³
6.3x10³
1.6x10⁴
4.0x10⁴
1.0x10⁵
Inte
nsity
A
A Gm+G
DD
C
307.0276 Da, C´
14 16 18 20 22Position
... ...
...
A G
308.0340 Da, D
5´-Ladder
AlkB-
Treatment
II
m1A
343.0682 Da
A
329.0525 Da
c
NH
NH2
ON
O
OHO
PO
O
OH
N
NN
N
NH
O
OHO
PO
O
OH
N
NN
N
NH2
O
OHO
PO
O
OH
NH
O
ON
O
OHO
PO
O
OH
D
308.0410 Da
5´
3´
3´
5´
3´
5´
III
99%

reading the 5′ ladder of the tRNA in the 2D mass-tR plot, a new ladder started to branch out at 286
position 16, and the mass differences of ladder fragments between position 16 and 15 are 287
307.0276 Da and 308.0340 Da, indicating a C′ 3,4-dihydrocytidine co-existing with D 288
(dihydrouridine) at position 16. c, MLC-Seq results pinpoint stoichiometric changes of m1A site-289
specifically at position 57 of tRNA-Gln after AlkB treatment. I, Structure and unit mass of m1A 290
and canonical A in MLC-Seq of RNA. Their exact masses are 343.0682 Da and 329.0525 Da, 291
respectively. II-III, 99% m1A at position 57 was demethylated into A after AlkB-treatment. 292
Reading the 3′ ladder of the wild-type tRNA in the 2D mass-tR plot indicates an m1A (100%) at 293
position 57 of the tRNA (II). However, after AlkB-treatment, MLC-Seq shows that when 294
reading the 3′-ladder of the tRNA in the 2D mass-tR plot, a ladder started to branch out at 295
position 57, and that 99% A was observed at this position with only 1% m1A remaining (III). 296
297
298
299
300
301
302
303
304
305
306
307

Extended Data 308
309
310 311
Extended Data Fig. 1 | Detailed illustration for “Data Analysis” procedure in Fig. 1. a, 312
Homology Search before acid degradation. From the intact RNA mass level, the sample diversity 313
and sequence information are obtained, showing the number of RNA species in a given sample 314
and if and how they related to a specific tRNA. I-II, Homology Search allows related tRNAs to 315
be identified. After acid degradation, in order to sequence tRNA, we developed b, A complete 316
set of stepwise innovative computational tools/algorithms to synergize MS information at both 317
ladder fragment level and intact RNA level, including: I-II, Homology Search, in this step, 318
isoform1 with masses of 24610.4911 Da before acid degradation, for example, shifted to 319
24252.3692 Da after acid degradation with a mass difference of 358.1219 Da, indicating that 320
there are acid-labile nucleotide modifications, which was further pinpointed to be a wybutosine 321
(Y) at position 37 of tRNA-Phe (Extended Data Fig. 2). III, For each isoform identified, 322
MassSum algorithm was applied to isolate all its ladder fragments (pairing one in 3′-ladder and 323
one in 5′-ladder) from the complex MS data of the RNA sample (Extended Data Fig. 3). IV, 324
Results using GapFill to find non-paired ladder fragments that are missed by MassSum. After 325
ladder separation, 3′ and 5′-ladder (V) are obtained separately. VI, Ladder Complementation to 326
perfect MS ladders, allowing direct sequencing of full-length tRNA-Phe. (See methods) This 327
figure is for illustrative purposes only. 328
b
(3)
Gap
Fill
(4)
5´-
Lad
der
(5)
Lad
der
Co
mp
lem
en
tio
n
(2) MassSum (If M(S)
>0)
I III
IV V VI
(4)
3´-
Lad
der
Mass (Da)
Re
ten
tio
n T
ime
(m
in)
13 -
14 -
15 -
|
11000
|
12000
|
13000
|
0... ...
|
25000
5´-Ladder
3´-Ladder
Isoform3
Isoform2
Isoform1
Mass (Da)
Re
ten
tio
n T
ime
(m
in)
13 -
14 -
15 -
|
11000
|
12000
|
13000
|
0... ... |
25000
5´-Ladder
3´-Ladder
Isoform3
Isoform2
Isoform1 1 -
2 -
3 -
2 -
1 -
3 -
...
|
39
|
40
|
38
|
37
|
35
|
36
|
34
|
33
|
32
|
31
Position
|
1
|
76...
Iso
form
0|
13000|
11000|
12000|
Mass (Da)... ... 25000
|
...
|
39
|
40
|
38
|
37
|
35
|
36
|
34
|
33
|
32
|
31
|
1
|
76...
5´-Ladder
3´-Ladder
Position
A UAY´AAGmU mCCm
Complemented Ladder
... ...
0|
13000|
11000|
12000|
Mass (Da)... ... 25000
|
0 5000 10000 15000 20000 25000
0
5
10
15
20
Rete
ntion T
ime (
min
)
Mass (Da)
1.0x10³
5.5x10³
3.0x10⁴
1.7x10⁵
9.1x10⁵
5.0x10⁶
Inte
nsity (
co
un
ts)
a
(1.1
) H
om
olo
gy
Searc
h
I II
329.0525 Da
A
305.0413 Da
C
3.5x10⁸
3.0x10⁸
2.5x10⁸
Inte
nsity (
co
un
ts)
2.0x10⁸
14.0157 Da
CH2
1.5x188
1.0x10⁸
Mass (Da)24300 24600 24900
IF2
IF1
IF3
IF4
IF2
M(IF2)
=24610.4911
IF4
M(IF4)
=24305.4032
IF1
M(IF1)
=24939.5478
Mass (Da)
3.5x10⁸
3.0x10⁸
2.5x10⁸
Inte
nsity (
co
un
ts)
2.0x10⁸
IF3
M(IF3)
=24925.5321
1.5x188
1.0x10⁸
24300 24600 24900
IF2´
M(IF2´)
=24252.3692
(M(IF2)
-M(S)
)
IF1´
M(IF1´)
=24581.3166
(M(IF1)
-M(S)
)A
IF3´
M(IF3´)
=24567.3347
(M(IF3)
-M(S)
)
CH2
24200 24500Mass (Da)
S=Mass Shift
Acid-Labile Nucleotide Identified if Exists
Intact RNA Level
Ladder Fragment Level
II
II
(2) MassSum(If M
(S)=0)
IF=Isoform
(1.2
) H
om
olo
gy
Searc
h

329 330
Extended Data Fig. 2 | MLC-Seq homology search for identification of related RNA 331
isoforms and RNAs with acid labile nucleotide modifications. a, The identification of acid-332
labile nucleotide Y. At intact mass region (around 24kDa), masses before and after acid 333
degradation were compared, revealing a systematic mass shift of 358.1599 Da. This is consistent 334
with a change of Y to ribose Y′ under acidic conditions. b, Homology Search result before acid 335
degradation. Here C represents that the difference between two related tRNA isoforms is a 336
nucleotide C. A represents that the difference between two related tRNA isoforms is a nucleotide 337
A. Ox represents that the difference between two related tRNA isoforms is an oxygen atom. 338
Their mass differences, 305.0413, 329.0525 and 15.9949, correspond to a unit mass of 339
nucleotide C and A, and an oxygen atom. c, Proposed structural change of Y to Y′ under the 340
acid-degradation conditions. Acid-Deg=Acid-Degradation. 341
342
343
Wybutosine (Y) Ribose(Y´)
N
N
N
O
N
O
OH
HH
HHO
PO
O
OH
H
N
NHCOOCH3O
O
OH H
HCOOHO
OH
HH
HHO
PO
O
OH
OH
Isoform
Name
Mass
(Before Acid-Deg)
PheIF1
PheIF2
PheIF3
24610.4911
24939.5478
24626.4639
24252.2692
24581.3166
24268.3038
Mass
(After Acid-Deg)
PheIF4 24955.5224 24597.3533
Isoforms
PheIF5 24305.4032 23947.2566
358.2219
358.1691
358.2312
358.1601
Mass Diff
(Before - After)
358.1466
Relative Abundance
(Before Acid-Deg)
1.000
0.076
0.598
0.147
0.017
a
b c
24300 24600 24900Mass (Da)
2.5x10⁶
4.2x10⁶
7.2x10⁶
1.2x10⁷
2.1x10⁷
3.5x10⁷
Inte
nsity (
co
un
ts)
A
A
C
PheIF1
PheIF5
PheIF2
PheIF3PheIF4
Ox
Ox
Homology Search
(Before Acid-Deg)

344
345 346
Extended Data Fig. 3 | MassSum strategy and MassSum-based computational data 347
separation. a, A purified or mixed RNA starting material is partially acid hydrolyzed under 348
controlled conditions that predominantly generates single-cut fragments. Taking a 9 nt RNA 349
strand as an illustrative example, two ladder fragments are generated as a result of acid-mediated 350
cleavage of the phosphodiester bond between the 1st and 2nd nucleotide of the 9 nt RNA strand. 351
One of them carries the original 5´-end of the RNA strand and has a newly-formed 352
ribonucleotide 3´ (2´)-monophosphate at its 3´-end (denoted F1). The other one carries the 353
original 3´-end of the RNA strand and has a newly-formed hydroxyl at its 5´-end (denoted T8). 354
b, The mass sum of any one-cut fragment pair, e.g., mass sum of F2 and T7 or of F1 and T8, is 355
constant and is equal to the mass of the 9 nt RNA plus the mass of a water molecule. Since the 356
mass sum is unique to each RNA sequence/strand, it can be used to computationally separate all 357
paired fragments of the RNA sequence/strand that were inextricable previously in the complex 358
MS datasets. c, Computational isolation of MS data for all ladder fragments derived/degraded 359
from the most abundant tRNA-Phe isoform (monoisotopic mass: 24252.2692 Da) in both the 5´- 360
and 3´-ladders out of the complex MS data of mixed samples with multiple distinct RNA strands. 361
It is then identified as the 75 nt PheIF1 with MLC-Seq. 362
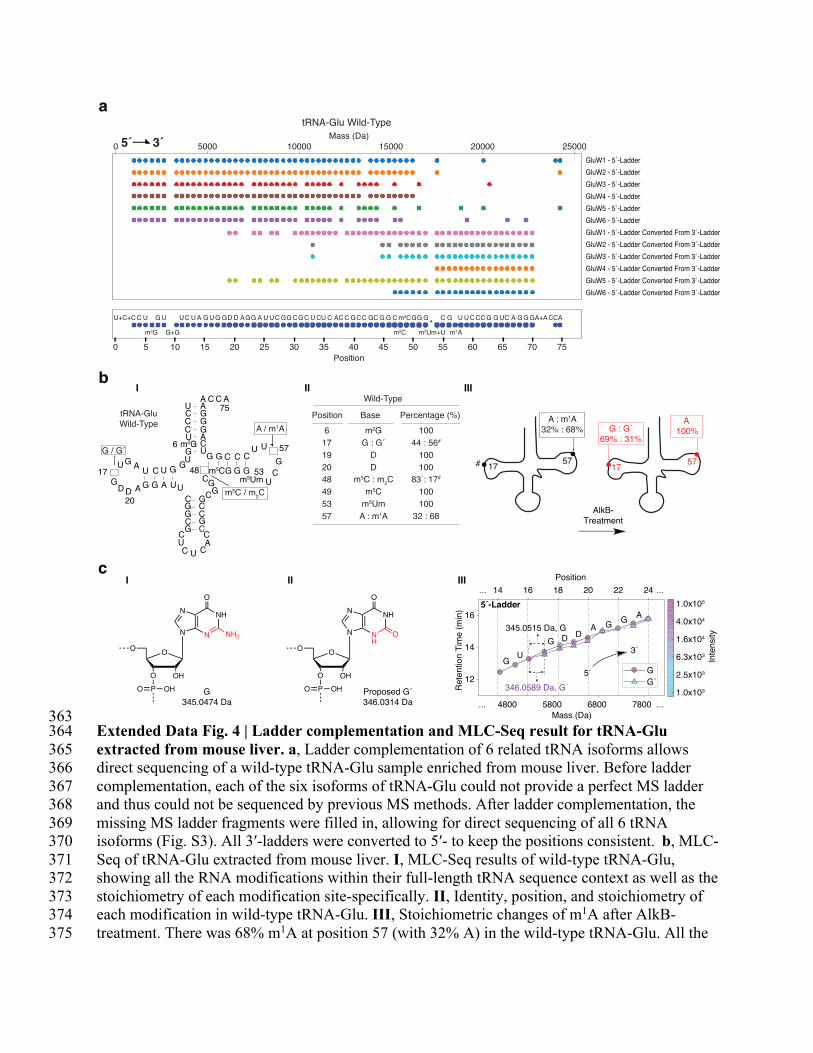
363 Extended Data Fig. 4 | Ladder complementation and MLC-Seq result for tRNA-Glu 364
extracted from mouse liver. a, Ladder complementation of 6 related tRNA isoforms allows 365
direct sequencing of a wild-type tRNA-Glu sample enriched from mouse liver. Before ladder 366
complementation, each of the six isoforms of tRNA-Glu could not provide a perfect MS ladder 367
and thus could not be sequenced by previous MS methods. After ladder complementation, the 368
missing MS ladder fragments were filled in, allowing for direct sequencing of all 6 tRNA 369
isoforms (Fig. S3). All 3′-ladders were converted to 5′- to keep the positions consistent. b, MLC-370
Seq of tRNA-Glu extracted from mouse liver. I, MLC-Seq results of wild-type tRNA-Glu, 371
showing all the RNA modifications within their full-length tRNA sequence context as well as the 372
stoichiometry of each modification site-specifically. II, Identity, position, and stoichiometry of 373
each modification in wild-type tRNA-Glu. III, Stoichiometric changes of m1A after AlkB-374
treatment. There was 68% m1A at position 57 (with 32% A) in the wild-type tRNA-Glu. All the 375
b
G : G´
69% : 31%
A
100%
1757
A : m1A
32% : 68%
1757
C C A
53
75
57
AAGGGACU
G G C C CU U
G
CUm5Um
GGGm5C
GG
C
CCGCCA
CUCUC
GCGGC
UUAGGADDG
U GA
U C U GG
U
m2GUCCCU
G
G
48
20
6
17
tRNA-Glu
Wild-Type
G / G´
A / m1A
C
m5C / m2C
Proposed G´
346.0314 Da
c
G
345.0474 Da
III
AlkB-
Treatment
Position Base
6 m2G 100
48 m5C : m2C
49 m5C 100
53 m5Um 100
57 A : m1A 32 : 68
19 D 100
20 D 100
Percentage (%)
17 G : G´ 44 : 56#
83 : 17#
Wild-TypeI IIIII
14 16 18 20 22 24
12
14
16
GU
345.0515 Da, G
G DD
A GG
A
Position
Rete
ntion T
ime (
min
)
Mass (Da)
G
G´
1.0x10³
2.5x10³
6.3x10³
1.6x10⁴
4.0x10⁴
1.0x10⁵
Inte
nsity
4800 5800 6800 7800... ...
... ...
346.0589 Da, G´
5´-Ladder
NH
NH
N
O
ON
O
OHO
PO
O
OH
NH
N
N
O
NH2N
O
OHO
PO
O
OH
I II
5´
3´
U+C+C C U G U
G+G
UC U A G U D D AGG A U UC GG CG U CU C AC C GCC GC G G C GG G
m5Um+U
C G U C C G G UC A GG GA+AU CCA
m2G
G G C
m5C
m5C*
m1A
C
Position
25000|
0|
20000|
15000|
10000|
5000|
GluW1 - 5´-Ladder
GluW2 - 5´-Ladder
GluW6 - 5´-Ladder Converted From 3´-Ladder
GluW5 - 5´-Ladder Converted From 3´-Ladder
GluW3 - 5´-Ladder
GluW5 - 5´-Ladder
GluW4 - 5´-Ladder Converted From 3´-Ladder
GluW3 - 5´-Ladder Converted From 3´-Ladder
GluW4 - 5´-Ladder
GluW1 - 5´-Ladder Converted From 3´-Ladder
tRNA-Glu Wild-Type
5´ 3´
a
GluW6 - 5´-Ladder
GluW2 - 5´-Ladder Converted From 3´-Ladder
0 5 10 15 20 25 30 35 40 45 50 55 60 65 70 75
Mass (Da)
#

m1A is demethylated to become A at position 57. c, MLC-Seq leading to the discovery of a novel 376
G′ nucleotide at position 16 of tRNA-Glu. I, Structure and unit mass of nucleotide G in MLC-377
Seq of RNA (exact unit mass: 345.0474 Da). II, Proposed structure of the newly discovered 378
nucleotide G′ (exact unit mass: 346.0314 Da) at position 16, where an -NH is substituted by -O 379
(see partial structure in red). III, MLC-Seq showing that when reading the 5′ ladder of the tRNA 380
in the 2D mass-tR plot, a new ladder started to branch out at position 16, and the mass differences 381
of ladder fragments between position 16 and 17 are 345.0515 Da and 346.0589 Da, indicating a 382
G co-existing with G′ at position 16. 383
*The missing ladder fragment at position 53 is due to the methylation on the 2′-hydroxyl group 384
of m5Um at position 53 that blocks acid degradation (Fig. S2a). 385
386
#At position 17, the ratio presented is based on the dataset that provides the most continuous 387
ladder fragments. However, this ratio is not uniformly supported by all the datasets. m2C (a 388
dimethylcytidine) at position 48 was determined from the AlkB-treated sample, not the wild-type 389
sample due to the low abundance of ladder fragments for the latter (Fig. S2b). 390
391
392
393
394
395
396
397
398
399
400
401
402
403
404
405
406
407
408
409
410
411
412
413
414
415
416
417
418
419
420
421

Methods 422
Reagents and Chemicals 423
All chemicals were purchased from commercial sources and used without further purification. 424
tRNA (phenylalanine specific from brewer’s yeast) was obtained from Sigma-Aldrich (St. Louis, 425
Missouri, USA). Formic acid (98–100%) was purchased from Merck (Darmstadt, 426
Germany). 1,1,1,3,3,3-hexafluoro-2-propanol (HFIP, 99%) and N,N-diisopropylethylamine 427
(DIPEA) (99%) were purchased from Thermo Fisher Scientific (Waltham, MA, USA). All other 428
chemicals were obtained from Sigma-Aldrich unless indicated otherwise. 429
430
Mouse liver tRNA pulldown 431
The tRNAs were purified by an affinity pulldown assay combined with gel recovery, with 432
modified protocols from the previous report1. The total RNA of mouse liver was harvested by 433
TRIzolTM reagent (InvitrogenTM 15596026) as the manufacturer instructed. The concentration 434
of total RNAs solution was adjusted to 2mg/ml by RNase-free water. Small RNAs fraction (<200 435
nt) were separated by the buffer containing 50%(w/v) PEG 8000 and 0.5M NaCl solution via 436
centrifuging at 12000rpm and 4 °C for 20mins. The supernatant was collected followed by 437
adding 1/10 volume NaAc solution (InvitrogenTM). 1 ml supernatant was added with 3 ml 438
Ethanol, and 5 ul Linear Acrylamide (InvitrogenTM) to precipitate small RNAs (<200 nt) with -439
20 °C overnight incubation followed by centrifugation at 12000rpm at 4 °C for 20 min. Small 440
RNA (<200 nt) solution was adjusted to 1mg/ml, 1 ml small RNA solution with 6 ul biotinylated 441
probe(100 uM), 26 ul 20× SSC solution (InvitrogenTM) and 15 ul RNase inhibitor (NEB) were 442
incubated at 50°C overnight. 200 ul Streptavidin Sepharose (Cytiva 17511301) was added to the 443
hybridization solution to enrich the biotin labeled probe that captured with the targeted tRNA. 444
After incubation at room temperature for 30mins, the Streptavidin Sepharose was transferred to 445
the 1.5 ml Ultrafree-MC tube (Millipore) and washed by 0.5× saline-sodium citrate (SSC) buffer, 446
the washing step was repeated five times. 500 ul nuclease-free water was added to the MC tube 447
and incubated at 70°C for 15 min followed by centrifugation at 2500g at room temperature for 1 448
min to elute the RNAs that are complementary to the biotinylated probe. The eluent was 449
collected followed by adding 1/10 volume NaAc solution (InvitrogenTM). 1 ml eluent was added 450
with 3 ml Ethanol, and 5 ul Linear Acrylamide (InvitrogenTM) to precipitate RNAs with -20 °C 451
overnight incubation followed by centrifugation at 12000rpm at 4 °C for 20 min. Nuclease-free 452
water was added to dissolve the RNAs pallets. RNAs were loaded into the 7M Urea-PAGE gel to 453
run electrophoresis, the main tRNA band was recovered from the PAGE gel as previously 454
described2 to obtain enriched tRNAs for MLC-Seq. The DNA probes for pull down experiments 455
were synthesized by IDT and the sequences were listed below: 456
tRNA-Glu pulldown probe: 5´-Biotin-CTAACCACTAGACCACCAGGGA. 457
tRNA-Gln pulldown probe: 5´-Biotin-TGGAGGTTCCACCGAGATTTGA. 458
459
Northern Blot 460
A Northern Blot was performed as previously described3 to validate capture of tRNAs (as 461
described above). RNA was separated by 10% Urea-PAGE gel stained with SYBR Gold, and 462
immediately imaged, then transferred to positively charged Nylon membranes (Roche), and UV 463
crosslinked with an energy of 0.12 J. Membranes were pre-hybridized with DIG Easy Hyb 464
solution (Roche) for 1h at 42 °C. To detect tRNAs, membranes were incubated overnight (12–465
16h) at 42 °C with DIG-labelled oligonucleotides probes synthesized by Integrated DNA 466

Technologies (IDT). The membranes were washed twice with low stringent buffer (2× SSC with 467
0.1% (wt/vol) SDS) at 42 °C for 15 min each, rinsed twice with high stringent buffer (0.1× SSC 468
with 0.1% (wt/vol) SDS) for 5 min each, and rinsed in washing buffer (1× SSC) for 10 min. 469
Following the washes, the membranes were transferred into 1× blocking buffer (Roche) and 470
incubated at room temperature for 3 h, after which the Anti-Digoxigenin-AP Fab fragments 471
(Roche,) was added into the blocking buffer at a ratio of 1:10,000 and incubated for an additional 472
30mins at room temperature. The membranes were washed four times with DIG washing buffer 473
(1× maleic acid buffer, 0.3% Tween-20) for 15 min each, followed by incubation in DIG 474
detection buffer (0.1 M TrisHCl, 0.1 M NaCl, pH 9.5) for 5 min, and then coated with CSPD 475
ready-to-use reagent (Roche), incubated in the dark for 30 min at 37 °C before imaging with 476
ChemiDoc™ MP Imaging System (BIO-RAD). Digoxigenin labeled Northern blot probe for 477
tRNA detection were synthesized by IDT and the sequence was listed below: 478
tRNA-Glu Norther blot probe: 5´-DIG-CTAACCACTAGACCACCA. 479
tRNA-Gln Northern blot probe: 5´-DIG-TGGAGGTTCCACCGAGATTT. 480
481
Treatment of tRNA with AlkB 482
200 ng tRNA was incubated in a 50 μl reaction mixture containing 50 mM Na-HEPES, pH 8.0 483
(Alfa Aesar), 75 μM ferrous ammonium sulfate (pH 5.0), 1 mM α-ketoglutaric acid (Sigma 484
Aldrich), 2 mM sodium ascorbate, 50 μg/ml BSA (Sigma-Aldrich), 2.5 μl RNase inhibitor 485
(NEB), and 200 ng AlkB enzyme at 37 °C for 30 min (the recommended mass ratio of AlkB 486
enzyme to RNA is 1:1). The mixture was added to 500 μl TRIzolTM reagent to perform the RNA 487
isolation procedure as per manufacturer instructions. 488
489
Workflow of de novo sequencing of tRNA isoform mixtures 490
A given tRNA sample is firstly divided into two portions; 1/10 is injected directly into LC-MS 491
while the remaining 9/10 is subjected to acid-degradation before LC-MS injection (Fig. 1). After 492
outputting LC-MS datasets of the control portion and acid-degraded portions, novel algorithms 493
we developed (uploaded to Github (https://github.com/rnamodifications/MLC-Seq)) were used 494
to identify each tRNA species or isoform, and computationally separate its MS ladder from the 495
LC-MS data of a given tRNA sample for MLC-Seq. 496
497
Since MS-based sequencing techniques rely on a unique mass value for identifying and locating 498
each nucleotide, in the case where modifications have isomers with identical masses but different 499
chemical structures such as ψ versus U and methylation at different base positions, an extra step 500
is required to differentiate these isomeric nucleotide modifications following our MS sequencing 501
approach as described previously when sequencing a tRNA-Phe sample4. To differentiate 502
different methylations in the tRNA-Gln and tRNA-Glu, we included an additional step in the 503
MLC Seq workflow by treating the tRNA-Gln and tRNA-Glu samples with AlkB, which is 504
known to demethylate tRNA-rich modifications such as m3C, m1A, and m1G2. 505
506
Controlled Acid Degradation of tRNA Samples 507
Formic acid was applied to degrade tRNA samples, including tRNA-Phe (Sigma-Aldrich, St. 508
Louis, Missouri, USA), tRNA-Gln and tRNA-Glu from mouse live (see Sections of tRNA 509
sample preparation), to produce mass ladders according to reported experimental protocols4-7. In 510
brief, we divided each RNA sample solution into three equal aliquots of 5 μl (each in a RNase-511
free, thin walled 0.2 ml PCR tube) for formic acid degradation, each using 50% (v/v) formic acid 512

at 40 °C in a PCR machine, with one reaction running for 2 min, one for 5 min, and one for 15 513
min. The reaction mixtures were each immediately frozen on dry ice at the specified times, 514
followed by centrifugal vacuum concentration (Labconco Co., Kansas City, MO, USA) to 515
dryness, which was typically completed within 30 min. The dried samples of three different time 516
points for each specific tRNA sample were then combined and suspended in 20 μl nuclease-free, 517
deionized water for LC-MS measurement. 518
519
LC-MS Measurement of Intact tRNA and Resulting Acid-Degraded tRNA Samples 520
Each combined acid-hydrolyzed tRNA sample was individually analyzed on an Orbitrap 521
Exploris 240 mass spectrometer (ThermoFisher Scientific, Bremen, Germany) coupled to a 522
Vanquish Horizon UHPLC using a DNAPac reversed-phase (RP) column (2.1 mm x 50 mm, 523
ThermoFisher Scientific, Sunnyvale, California, USA) with 2% HFIP and 0.1% DIPEA as eluent 524
A, and methanol, 0.075% HFIP, and 0.0375% DIPEA as eluent B. A gradient of 20% to 80% B 525
over 6.7 minutes was used for the analysis of intact RNA samples, and from 15% to 35% B over 526
20 min for acid-degraded samples. The flow rate was 0.2 or 0.4 ml/min, and all separations were 527
performed with the column temperature maintained at 70 °C. Injection volumes were 5–25 μl 528
and sample amounts were 20–200 pmol of tRNA-Phe and 1-10 pmol (or ~20 ng) of tRNA-Glu 529
and tRNA-Gln. tRNA samples were analyzed in negative ion full MS mode from 410 m/z to 530
3200 m/z with a scan rate of 2 spectra/s at 120k resolution at m/z 200. The data were processed 531
using the Thermo BioPharma Finder 4.0 (ThermoFisher Scientific), and a compound detection 532
workflow with a deconvolution algorithm was used to extract relevant spectral and 533
chromatographic information from the LC-MS experiments as described previously4-7. 534
535
Homology Search 536
Once LC-MS data is displayed as a two dimensional (2D) mass-retention time (tR) plot, we start 537
a homology search of intact tRNAs in the monoisotopic mass range of >~24k Dalton using an in-538
house developed algorithm in Python (see Github) to first identify related tRNA isoforms that 539
may share the same ancestral precursor tRNA, but are different in absolute sequence, e.g., in 540
posttranscriptional profiles of nucleotide modifications, editing, and truncations. Mass 541
differences between two intact tRNA isoforms are calculated and matched to the known mass of 542
each nucleotide or nucleotide modification in the database5. For example, known mass 543
differences between intact tRNAs of 14.0157 Da and 329.0525 Da (with parts per million (ppm) 544
difference <10 ppm)8 can be assigned to a methylation (Me/-CH2-) event and an additional A 545
nucleotide, respectively. Therefore, these intact tRNAs are assigned to the same tRNA group and 546
considered as homologous isoforms of a specific tRNA for sequencing together. 547
548
The homology search is a non-target pre-selection to group possible related tRNA isoforms 549
together for sequencing. However, only one monoisotopic mass difference of two intact masses 550
is used to identify the tRNA isoforms differing, e.g., by RNA editing/modifications and/or 3′-551
CCA truncations. Thus, there may be errors when grouping a tRNA isoform that does not belong 552
to this specific tRNA group or vice versa, missing a tRNA isoform when cataloging a group. 553
These errors can be fixed later when sequencing each group of tRNA isoforms, and sequencing 554
results can further verify the inter-connection between isoforms. 555
556
Detection of all acid-labile nucleotide modifications 557

Acid-labile nucleotides are identified using another algorithm in Python (see Github). The 558
algorithm analyzes the connections between the compounds (with a monoisotopic mass >24 K 559
Dalton for tRNAs) measured by LC-MS before acid degradation and the LC-MS-detected 560
compounds after acid degradation. For each such a compound pair, if the monoisotopic mass 561
difference can be matched to a known mass difference (calculated from the possible structural 562
change to a specific nucleotide modification during acid hydrolysis), or be matched to the mass 563
difference sum of a subset of different acid-labile nucleotide modifications, the compound pair 564
will be selected and further considered as potentially containing acid-labile nucleotide 565
modifications. In general, if the intact mass of an RNA species does not change after acid 566
degradation, this intact mass will be used for MassSum data separation (See below). Otherwise, 567
an acid-labile nucleotide may be identified by matching to the observed mass difference with the 568
theoretical mass difference caused by acid-mediated structural changes of the nucleotide (See 569
Extended Data Fig. 2). 570
571
5´- and 3´-ladder separation 572
The tR differences can be used to further computationally separate these two ladders (5´- and 3´-573
ladders), breaking two adjacent sigmoidal curves into two isolated curves: one for the 3´- and the 574
other for the 5´-ladder. Due to the large number of RNA/fragment compounds, the dividing line 575
between two subsets of 5´- and 3´-ladder fragments is not visually decisive in the 2D mass-tR 576
plot. Thus, we developed a computational tool (see Github) to separate the 5´- and 3´-fragments. 577
We roughly divide all compounds in each LC-MS data pool into two subgroup areas by circling 578
compounds in the top collective curve of the 2D mass-tR plot and marking the compounds as 5´-579
ladder fragment compounds, while the compounds in the bottom curve are marked as 3´-ladder 580
fragment compounds. The purpose of selecting the top area is to include as many 5´-fragment 581
compounds as possible, while minimizing the 3´-fragments in this area. Similarly, the purpose 582
of selecting the bottom area is to include as many 3´-fragment compounds as possible, while 583
minimizing the 5´-fragments in this area. Overlap between two selected ladder subgroups is 584
inevitable, due to limited tR differences between these two subgroups. The aim of the manual 585
selection step is not to separate the 5´- and 3´-fragments from each other completely, but to serve 586
as two input ladder fragments for MassSum algorithm (See below) to output 5´- and 3´-ladder 587
fragments separately for each tRNA isoform/species. 588
589
MassSum data separation 590
MassSum is an algorithm in Python (see Github) developed based upon the acid degradation 591
principle presented in Extended Data Fig. 3. Taking advantage of the fact that each fragmented 592
pair from two ladder groups (5´- and 3´-ladders) sums to a constant mass value that is unique to 593
each specific tRNA isoform/species, MassSum can isolate ladder compounds corresponding to a 594
specific tRNA isoform. MassSum simplifies the dataset by grouping MS ladder components into 595
subsets for each tRNA isoform/species based on its unique intact mass. Since the well-controlled 596
acid degradation reaction cleaves RNA oligonucleotides at one specific site of the 597
phosphodiester bond (on average, one cut per RNA5) the masses of two RNA fragments (Mass 3´-598
portion and Mass 5´-portion) from the same strand sum to a constant value (Masssum). 599
𝑀𝑎𝑠𝑠!!"#$%&'$( +𝑀𝑎𝑠𝑠)!"#$%&'$( = 𝑀𝑎𝑠𝑠'(&*+& +𝑀𝑎𝑠𝑠,"- = 𝑀𝑎𝑠𝑠./0 (1) 600
Taking advantage of this unique mass sum between the paired 3´- and 5´-ladder fragments 601
(Equation 1), the algorithm chooses two random compounds from the acid-degraded LC-MS 602

dataset and adds their mass values together, one pair at a time. If the sum of the two selected 603
compounds is equal to a specific Masssum, these two compounds will be selected into the pool for 604
each RNA accordingly. The process repeats until all compound pairs have been inspected. In the 605
end, MassSum will cluster the dataset into different groups; each group is a subset that contains 606
3´- and 5´-ladders of one specific RNA sequence. 607
608
GapFill 609
GapFill is another Python-based algorithm (see Github) developed as a complement to 610
MassSum. Since MassSum handles compounds in pairs, in the case that one ladder fragment is 611
missing, e.g., in the 5´-ladder, the corresponding single-cut ladder fragment, even if it exists in 612
the 3´-ladder, will not be separated/called by the MassSum algorithm. In order to extract all 613
ladder fragments from the complex MS data, a GapFill algorithm was designed to “rescue” any 614
ladder fragments missed by MassSum separation. GapFill identifies a gap that has ladder 615
fragments missing between ladder fragment compounds, e.g., two adjacent compounds with 616
Mass values Mass5´-i and Mass5´-j in the 5´-ladder which were found by MassSum algorithm. 617
Within the gap, there exist many ladder compounds in the degraded LC-MS dataset, but 618
presumably none were selected by the MassSum algorithm during data separation. GapFill 619
iterates over each potential compound in the gap in the original LC-MS dataset, and examines 620
the mass differences of this compound and the two ending compounds, Mass5´-i and Mass5´-j. If 621
the mass difference is equal to the sum of one or more nucleotides or modifications in the RNA 622
modification database5, we define it as a connection. If the compound in the gap has connections 623
with both ending compounds, this compound would be selected into a candidate pool for the later 624
sequencing process. After iteration, GapFill calculates connections of the compounds in the 625
candidate pool and assigns weights to them based on the frequency of each connection. The 626
compounds that contain the highest weights would be the ones chosen to fill in the gap. 627
628
Ladder complementation and generation of RNA sequences 629
After MassSum and GapFill, each tRNA isoform has its own set of separate 5´-and 3´-ladders 630
(not combined). Each ladder (5´- or 3´-) consists of a ladder sequence, and we can determine if 631
these ladders are perfect (without missing any ladder fragments), which would allow reading of 632
the full RNA sequence (from the first to the last nucleotide in the sequence). If not, we can 633
complement ladders from other related isoforms in order to obtain a more complete ladder for 634
sequencing (ideally no missing ladder fragment or as complete as possible). A Python-based 635
computational algorithm (see Github) was designed to align ladders from related isoforms based 636
on the position of the ladder fragment in the 5´à3´ direction. For example, we lay out each 637
tRNA-Phe isoform’s full 5´-ladder, e.g., the 5´-ladder in Fig. 1b, on top of each other vertically; 638
horizontally, we align the 5´- ladder of each isoform according to the position of each 639
corresponding ladder fragment, ranging from nucleotide position 1 to nucleotide position 76 for 640
tRNA-Phe. Ladder complementation can be performed separately on 5´- or 3´-ladders separately 641
(but not mixed ladders), resulting in one final 5´-ladder or one final 3´-ladder. Additionally, all 642
3´-ladder fragments can be converted to their corresponding 5´-ladder fragments for each tRNA 643
isoform based on the MassSum principle. As such, each tRNA isoform could have two 5´-ladder 644
fragments in each position on the 5´-ladder: one original 5´-ladder fragment, and a second ladder 645
fragment that was converted from its corresponding 3´-ladder fragment, for reaffirmation and/or 646
complementation. 647
648
Stoichiometric quantification of partial nucleotide modifications/editing 649
Stoichiometries/percentages of partial nucleotide modifications/editing were quantified 650
according to reported protocols4,6,7. In brief, to accurately determine the ratio of partial 651
modification/editing, from datasets of multiple experimental trials (n ≥ 3) of a given tRNA 652
sample, 3 pairs of ladder fragments (one in the original ladder, and the other in the branched 653
ladder) were taken among the partial modification position (first nucleotide after the branch point 654
where the partial modification was observed) or otherwise its immediate next ladder fragment in 655
the same ladder in case the ladder fragment at the partial modification position does not exist, 656
e.g., due to methylation on the 2′-hydroxyl group of Cm that blocks acid degradation. Mean ratio 657
and standard deviation were calculated. 658
659
660
661
662
663
References: 664
665
666
667
1 Drino, A. et al. Production and purification of endogenously modified tRNA-derived 668
small RNAs. RNA Biol 17, 1104-1115, doi:10.1080/15476286.2020.1733798 (2020). 669
2 Shi, J. et al. PANDORA-seq expands the repertoire of regulatory small RNAs by 670
overcoming RNA modifications. Nat Cell Biol 23, 424-436, doi:10.1038/s41556-021-671
00652-7 (2021). 672
3 Zhang, Y. et al. Dnmt2 mediates intergenerational transmission of paternally acquired 673
metabolic disorders through sperm small non-coding RNAs. Nat Cell Biol 20, 535-540, 674
doi:10.1038/s41556-018-0087-2 (2018). 675
4 Zhang, N. et al. Direct Sequencing of tRNA by 2D-HELS-AA MS Seq Reveals Its 676
Different Isoforms and Dynamic Base Modifications. ACS Chem Biol 15, 1464-1472, 677
doi:10.1021/acschembio.0c00119 (2020). 678
5 Bjorkbom, A. et al. Bidirectional direct sequencing of noncanonical RNA by two-679
dimensional analysis of mass chromatograms. J Am Chem Soc 137, 14430-14438, 680
doi:10.1021/jacs.5b09438 (2015). 681
6 Zhang, N. et al. A general LC-MS-based RNA sequencing method for direct analysis of 682
multiple-base modifications in RNA mixtures. Nucleic Acids Res 47, e125, 683
doi:10.1093/nar/gkz731 (2019). 684
7 Zhang, N., Shi, S., Yoo, B., Yuan, X., Li, W., Zhang, S. . 2D-HELS MS Seq: a General 685
LC-MS Based Method for Direct and de novo Sequencing of RNA Mixtures with 686
Different Nucleotide Modifications. J. Vis. Exp. e61281 (2020). 687
8 Brenton, A. G. & Godfrey, A. R. Accurate mass measurement: terminology and treatment 688
of data. J Am Soc Mass Spectrom 21, 1821-1835, doi:10.1016/j.jasms.2010.06.006 689
(2010). 690
691
692

Supplementary Files
This is a list of supplementary �les associated with this preprint. Click to download.
SupportingInformation�nal.docx
zhangepc�at.pdf