global green growth: clean energy industrial investments
TRANSCRIPT
GLOBAL GREEN GROWTH:Clean Energy Industrial Investments and Expanding Job Opportunities
Experiences of Brazil, Germany, Indonesia, the Republic of Korea and South Africa
Copyright © 2015
The Global Green Growth InstituteUnited Nations Industrial Development Organization The designations employed and the presentation of material in this publication do not imply the expression of any opinion whatsoever concerning the legal status of any country, territory, city or area, or of its authorities, or concerning the delimitation of its frontiers or boundaries.
Designations such as “developed”, “industrialized” and “developing” are intended for statistical convenience and do not necessarily express a judgment about the state reached by a particular country or area in the development process.
The mention of firm names or commercial products does not imply endorsement by UNIDO nor by GGGI.
Material in this publication may be freely quoted or reprinted, but acknowledgement is requested, together with a copy of the publication containing the quotation or reprint.
For reference and citation, please use: UNIDO and GGGI (2015). Global Green Growth: Clean Energy Industry Investments and Expanding Job Opportunities. Volume II: Experiences of Brazil, Germany, Indonesia, the Republic of Korea and South Africa. Vienna and Seoul.
COVER: www.http://constructionreviewonline.com
April 2015
United Nations Industrial Development Organization (UNIDO)Global Green Growth Institute (GGGI)
GLOBAL GREEN GROWTH:Clean Energy Industrial Investments and Expanding Job Opportunities
Volume IIExperiences of Brazil, Germany, Indonesia, the Republic of Korea and South Africa

Foreword It has become abundantly clear that fossil fuel powered industrialization as we have known it has had unanticipated adverse environmental impacts. One of the most significant challenges faced by global leaders today is how to achieve inclusive and sustainable industrial development, hereby creating jobs and reducing poverty, while combating climate change and resource depletion. As the world gears up for common actions to meet this end, one must ask whether current ‘green growth’ efforts towards low-carbon resource-efficient industrial development will lead to the sustained generation of new jobs.
The present paucity of policy-related information on the impact of green industrial investment on employment prevents policy makers and businesses from obtaining a full picture of the potential benefits of such investments, and thus to undertake investments that will be successful in terms of achieving both environmental protection and job creation. The absence of this information might cause the great expectation for green industries to dwindle. Indeed, it might jeopardize the global efforts to meet the emission reduction targets set by the Intergovernmental Panel on Climate Change (IPCC) to control climate change.
This project comes at a time when policy makers are focusing their national strategies on employment creation while they face a still faltering global economy with slow and uneven recovery. Against this background, there is a pressing need to combine the objectives of green growth with the broader targets for economic development in order to achieve a sustainable, low-carbon trajectory. Developing countries in particular will have to balance these objectives so as not to sacrifice opportunities to expand decent employment opportunities and reduce poverty. Designing and implementing effective industrial policies within all countries at all levels of development and effective international coordination will be critical for expanding green investments and hence facilitating the transformation to a global low-carbon economy.
The project has resulted in two reports. Volume I focuses on the employment generation opportunities of measures to reduce carbon dioxide emissions through investments in renewable energy and energy efficiency, and reviews some of the main considerations with respect to advancing effective industrial policies. The report concludes that if most countries devote about 1.5 percent of their economy’s GDP to such investments each year, it will be possible for the global economy to meet the IPCC’s 20-year intermediate emission reduction target, while also enjoying energy security for supporting sustainable growth rates.
Volume I also shows that there are clear net-gains in employment generation in shifting from conventional energy sources to renewable energy sources and enhancing energy efficiency. These gains have wider societal implications, as decent job opportunities are likely to open up for people in the informal sector with low educational attainment levels. Targeted industrial policies will need to help these groups realize such opportunities as well as providing the training and skill acquisition needed for other positions created through green investments.
Volume II examines the specific industrial policy measures promoting a low-carbon transition in five focus countries, specifically Brazil, Germany, Indonesia, the Republic of Korea and South Africa, through a compilation of expert review studies. Across all levels of development, major attention is being paid to the threats of climate change and opportunities of pursuing a low-
5
carbon development path, and dedicated efforts are presented to operate efficient industrial policies to enhance green growth. However, it is clear that the major focus in developing countries will need to be on green investments and on creating an enabling environment for such investments if the global economy is to effectively combat climate change.
It is our pleasure to note that the reports are the result of a major effort that has brought together the expertise of UNIDO and GGGI as well as experts from around the world. We hope that the findings of this project will provide policy makers, other global actors and businesses with a bigger picture of the employment generation opportunities of investing in green energy sources. At the same time, we hope that the specific attention to industrial policy will inspire countries when they formulate their own industrial development strategies and approaches, so that they are prepared to make their own effective contributions to the transformation to a global clean energy economy.
Li YongDirector General of UNIDO
Yvo de BoerDirector General of GGGI
Global Green Growth experiences
6
Acknowledgements This report was produced under a joint research project between the United Nations Industrial Development Organization (UNIDO) and the Global Green Growth Institute (GGGI). A companion report Global Green Growth: Clean Energy Industrial Investments and Expanding Job Opportunities. Volume I: Overall Findings is also being concurrently published jointly by UNIDO/GGGI. The volume was prepared by Nobuya Haraguchi (UNIDO), Ascha Lychett Pedersen (international consultant at UNIDO) and Da Yeon Choi (GGGI) under the overall guidance of Ludovico Alcorta, Director of the Research, Statistics and Industrial Policy Branch at UNIDO, and Myung Kyoon Lee, Director of Knowledge Development & Management at GGGI.
This volume is a continuation of the previous report in that it starts from its specific findings and focuses on the same group of countries. Yet it differs from the previous volume in that it expands the discussion into country specific issues while assessing the findings of the first volume from a broader green growth and national perspective. It is also written by a different set of authors. The national experts, involved in the preparation of the country studies for the report, were Alexandre d’Avignon (Federal University of Rio de Janeiro, Brazil) (Chapter 2); Wolfgang Eichhammer (Fraunhofer Institute for Systems and Innovation Research, Germany) (Chapter 3), Yayan Satyakti (Padjadjaran University, Indonesia) (Chapter 4), Sung Jin Kang (Korea University, the Republic of Korea) (Chapter 5) and Melvin Ayogu (American University of Sharjah, United Arab Emirates) (Chapter 6).
The report benefitted considerably from discussions at two workshops jointly organized by GGGI and UNIDO in Seoul on 21-22 May 2013 and New York City on 12-13 December 2013. Special thanks go to Alex Bowen (London School of Economic), Richard Freeman (Harvard University) and Ozlem Onaran (University of Greenwich) as well as other UNIDO and GGGI colleagues, who attended the workshops in Seoul and New York City, and provided insights useful to the work on the country studies. Teresa Ghilarducci, David Howell and Richard McGahey of the New School for Social Research also made valuable contributions to the New York workshop. Daniel Ogbonnaya (GGGI) provided excellent support in preparing and organizing the workshop in Seoul. The New School for Social Research generously offered meeting space in their beautiful Orozco Meeting Room as well as meals for the December 2013 workshop. Special thanks go to Dean William Milberg and Shayne Trotman for their support in this regard.
The final draft benefitted from valuable editorial support by Niki Rodousakis (UNIDO), and administrative and secretarial support was provided by Iguaraya Saavedra (UNIDO).
7

Table of ContentFOrEwOrd 5
ACknOwLEdGEmEnts 7
CHAPtEr 1: IntrOdUCtIOn And OVErVIEw 17 1.1 INTRODUCTION 17 1.2 OVERVIEW 19 1.3 THE WAY FORWARD 23
CHAPtEr 2: BrAZIL 25 2.1 INTRODUCTION 25 2.2 GHG EMISSIONS AND CLEAN ENERGY 26 2.3 POLICY FRAMEWORK FOR CLIMATE CHANGE AND
RENEWABLE ENERGY 31 2.4 PROSPECTS AND CHALLENGES TOWARDS A GREEN ECONOMY 35 2.5 JOB CREATION THROUGH INVESTMENTS IN RENEWABLE
ENERGY AND GREEN ECONOMY ACTIVITIES 39 2.6 JOB CREATION POTENTIAL OF RENEWABLE
ENERGY INVESTMENTS 48 2.7 CONCLUSION 52
CHAPtEr 3: GErmAnY 55 3.1 INTRODUCTION 55 3.2 POLICIES DRIVING EMPLOYMENT IN CLEAN ENERGY
TECHNOLOGIES 56 3.3 EVALUATION OF PRESENT EMPLOYMENT EFFECTS FROM
CLEAN ENERGY TECHNOLOGY IN GERMANY 68 3.4 EVALUATION OF FUTURE EMPLOYMENT EFFECTS FROM
CLEAN ENERGY TECHNOLOGY IN GERMANY FROM A MACROECONOMIC PERSPECTIVE 79
3.5 CAN NATIONAL TARGETS DEFINED IN VOLUME I BE MET? 88 3.6 CONCLUSION 90
CHAPtEr 4: IndOnEsIA 95 4.1 INTRODUCTION 95 4.2 HISTORICAL PERFORMANCE OF GHG EMISSIONS AND
ENERGY INDUSTRIES 96 4.3 POLICY FRAMEWORK FOR ENERGY AND CLIMATE CHANGE 102 4.4 EVALUATING THE GREEN GROWTH POTENTIAL 107 4.5 POLICIES FOR GREEN JOB CREATION 115
9
4.6 IMPACT OF CLEAN ENERGY INVESTMENTS ON JOB CREATION AND POVERTY 120 4.7 CHALLENGES FOR GREEN GROWTH IN INDONESIA 126 4.8 CONCLUSION 128 4.9 APPENDIX 130
CHAPtEr 5: tHE rEPUBLIC OF kOrEA 135 5.1 INTRODUCTION 135 5.2 OVERVIEW OF GREEN GROWTH AGENDA 136 5.3 POLICIES FOR CLEAN ENERGY INVESTMENT 140 5.4 EVALUATION OF GREEN GROWTH IN THE REPUBLIC OF KOREA 144 5.5 EMPLOYMENT GENERATION AND NEW AND
RENEWABLE ENERGY 148 5.6 METHODOLOGY FOR ESTIMATING EMPLOYMENT EFFECTS
OF GREEN INVESTMENTS 156 5.7 CONCLUSION 159
CHAPtEr 6: sOUtH AFrICA 161 6.1 INTRODUCTION 161 6.2 SOUTH AFRICA IN THE CONTEXT OF
GLOBAL GHGS EMISSIONS 162 6.3 JOB IMPLICATIONS OF CLIMATE CHANGE MITIGATION 170 6.4 PUBLIC POLICY ON EMISSION REDUCTION
AND JOB CREATION 177 6.5 CONCLUSION 182
rEFErEnCEs 185
Global Green Growth experiences
10
4.6 IMPACT OF CLEAN ENERGY INVESTMENTS ON JOB CREATION AND POVERTY 120 4.7 CHALLENGES FOR GREEN GROWTH IN INDONESIA 126 4.8 CONCLUSION 128 4.9 APPENDIX 130
CHAPtEr 5: tHE rEPUBLIC OF kOrEA 135 5.1 INTRODUCTION 135 5.2 OVERVIEW OF GREEN GROWTH AGENDA 136 5.3 POLICIES FOR CLEAN ENERGY INVESTMENT 140 5.4 EVALUATION OF GREEN GROWTH IN THE REPUBLIC OF KOREA 144 5.5 EMPLOYMENT GENERATION AND NEW AND
RENEWABLE ENERGY 148 5.6 METHODOLOGY FOR ESTIMATING EMPLOYMENT EFFECTS
OF GREEN INVESTMENTS 156 5.7 CONCLUSION 159
CHAPtEr 6: sOUtH AFrICA 161 6.1 INTRODUCTION 161 6.2 SOUTH AFRICA IN THE CONTEXT OF
GLOBAL GHGS EMISSIONS 162 6.3 JOB IMPLICATIONS OF CLIMATE CHANGE MITIGATION 170 6.4 PUBLIC POLICY ON EMISSION REDUCTION
AND JOB CREATION 177 6.5 CONCLUSION 182
rEFErEnCEs 185
LIst OF tABLEsTABLE 2.1: BRAZIL’S GHG EMISSIONS PROFILE, BY SECTOR OR INDUSTRY,
2000 AND 2010 28TABLE 2.2: BRAZIL. PROJECTIONS FOR 2020 AND SECTOR-SPECIFIC GHG REDUCTION
ESTIMATES ACCORDING TO DECREE 7.390 33TABLE 2.3: SCENARIOS FOR GHG EMISSIONS IN THE BRAZILIAN ENERGY INDUSTRY 36TABLE 2.4: POTENTIAL EMPLOYMENT GENERATION THROUGH FORESTRY
CONCESSIONS PER STATE IN BRAZIL 46TABLE 2.5: BRAZIL. RELATIONSHIP BETWEEN AREAS OF EFFECTIVE MANAGEMENT,
EMPLOYMENT GENERATION AND TAX REVENUES 46TABLE 2.6: EMPLOYMENT IN THE BRAZILIAN PALM CULTURE INDUSTRY, 2010 AND 2013 48TABLE 2.7: BRAZIL. EMPLOYMENT CREATION THROUGH INVESTMENTS IN
ALTERNATIVE ENERGY INDUSTRIES, 2005 49TABLE 2.8: BRAZIL. ESTIMATED JOB CREATION IN SELECTED INDUSTRIES,
2012-2021 (CONSERVATIVE) 50TABLE 2.9: BRAZIL. ESTIMATED JOB CREATION IN SELECTED INDUSTRIES, 2012-2021 51TABLE 3.1: “ENERGIEWENDE” TARGETS IN GERMANY, 2011-2050 57TABLE 3.2: OVERVIEW OF EU MEMBER STATES' PROGRESS UNDER THE RENEWABLE
DIRECTIVE 2009/28/EC 65TABLE 3.3: GHG REDUCTIONS IN THE EU 67TABLE 3.4: PRODUCTION OF POTENTIAL ENVIRONMENTAL PROTECTION GOODS,
IN GERMANY BY ENVIRONMENTAL PROTECTION PURPOSES, 2002-2009 70TABLE 3.5: POSITIVE AND NEGATIVE EFFECTS CAUSED BY THE ECONOMIC IMPULSES
OF CLEAN ENERGY TECHNOLOGIES 71TABLE 3.6: EMPLOYMENT FROM RENEWABLE ENERGY SOURCES IN GERMANY,
2012 AND 2013 75TABLE 3.7: GERMANY. EMPLOYMENT CREATION THROUGH INVESTMENT
IN ALTERNATIVE ENERGY INDUSTRIES, 2007 77TABLE 3.8: GERMANY. INVESTMENT IN RENEWABLE ENERGY TECHNOLOGY, 2004-2013 77TABLE 3.9: ABSOLUTE EMPLOYMENT GENERATED FROM RENEWABLE ENERGY
TECHNOLOGY IN GERMANY, 2004 AND 2013 78TABLE 3.10: EMPLOYMENT GENERATED FROM RENEWABLE ENERGY TECHNOLOGY
IN GERMANY 2004-2013 78TABLE 3.11: OVERVIEW OF RECENT STUDIES ON MACROECONOMIC IMPACTS,
INCLUDING NET EMPLOYMENT FROM CLEAN ENERGY TECHNOLOGIES 81TABLE 3.12: GERMANY. GHG EMISSIONS AND REDUCTION IN FINAL ENERGY
CONSUMPTION ACCORDING TO POLICY SCENARIOS VI, 2008-2030 83TABLE 3.13: GERMANY. ADDITIONAL INVESTMENTS IN THE ETS COMPARED
TO THE CPS (CPS-ETS) SCENARIO AND IN THE CPS COMPARED TO THE NMS (NMS-CPS) SCENARIO, 2015-2030 84
TABLE 3.14: GERMANY. IMPACTS OF THE ETS AND CPS (COMPARED TO THEIR RESPECTIVE REFERENCE) ON THE GDP COMPONENTS AS WELL AS TOTAL AND SECTORAL EMPLOYMENT, 2013-2030 86
TABLE 3.15: GERMANY. REFERENCE DEVELOPMENT AND THE LOW CARBON EMISSIONS CASE IN THE POLICY SCENARIOS VI, 2000-2030 88
TABLE 3.16: COMPARISON OF PRIMARY ENERGY CONSUMPTION IN UNIDO AND GGGI (2015) SCENARIOS BASED ON THE ENERGY CONCEPT AND THE POLICY SCENARIOS VI (MATTHES ET AL., 2013) 89
11
TABLE 4.1: THE INDONESIAN GHG EMISSION REDUCTION ACTION PLAN 104TABLE 4.2: ACTUAL AND PROJECTED GDP AND ENERGY ELASTICITIES
IN INDONESIA, 2005-2020 109TABLE 4.3: INDONESIA. PROJECTED ENERGY CONSUMPTION LEVELS UNDER
THE ENERGY PLANNING AND BAU SCENARIOS 110TABLE 4.4: AVERAGE ENERGY EFFICIENCY IN INDONESIA’S MANUFACTURING
SECTOR, 2009-2011 111TABLE 4.5: REBOUND EFFECT IN INDONESIAN MANUFACTURING
INDUSTRIES, 2009-2011 112TABLE 4.6: RENEWABLE ENERGY POTENTIAL AND TARGETS IN INDONESIA BY 2025 113TABLE 4.7: BIOMASS ENERGY POTENTIAL IN INDONESIA 114TABLE 4.8: INDONESIA. LABOUR DEMAND ELASTICITY FOR POTENTIAL
GREEN JOB INDUSTRIES, 2007-2010 118TABLE 4.9: INDONESIA. SEGREGATION INDEX OF FORMAL AND INFORMAL LABOUR
IN CLEAN ENERGY INDUSTRIES (BASELINE), 2007-2010 118TABLE 4.10: INDONESIA. EFFECT ON SEGREGATION INDEX ESTIMATES OF
FORMAL AND INFORMAL LABOUR IN CLEAN ENERGY INDUSTRIES (ACCOUNTING FOR WAGE RIGIDITY), 2007-2010 119
TABLE 4.11: INDONESIA. JOB CREATION IN CLEAN ENERGY INDUSTRIES, 2008-2010 120TABLE 4.12: PROBABILITY OF ENTRY INTO CLEAN ENERGY INDUSTRIES IN INDONESIA 123TABLE 4.13: INDONESIA. SCENARIO ANALYSIS OF GHG EMISSIONS REDUCTION
AND IMPROVING CLEAN ENERGY INVESTMENTS 125TABLE 4.14: FOSSIL FUEL RESOURCES AND RESERVES IN INDONESIA, 2011 126TABLE 4.A1: INDONESIA. ENERGY EFFICIENCY MEAN IN 2-DIGIT
MANUFACTURING SECTORS, 2009 130TABLE 4.A2: INDONESIA. ENERGY EFFICIENCY MEAN IN 2-DIGIT
MANUFACTURING SECTORS, 2010 131TABLE 4.A3: INDONESIA. ENERGY EFFICIENCY MEAN IN 2-DIGIT
MANUFACTURING SECTORS, 2011 132TABLE 4.A4: INDONESIA. ENERGY EFFICIENCY MEAN IN 2-DIGIT
MANUFACTURING SECTORS, 2009-2011 133TABLE 5.1: TIMELINE FOR THE REPUBLIC OF KOREA’S GREEN GROWTH FRAMEWORK,
2008-2012 136TABLE 5.2: STRATEGIES AND POLICY DIRECTIONS OF THE REPUBLIC OF KOREA’S
FIVE-YEAR NATIONAL PLAN FOR GREEN GROWTH 137TABLE 5.3: THE NEW AND RENEWABLE ENERGY INDUSTRY IN THE REPUBLIC
OF KOREA, 2008-2011 139TABLE 5.4: PROJECTION FOR ENERGY CONSUMPTION IN THE REPUBLIC
OF KOREA, 2011-2035 140TABLE 5.5: TIMELINE FOR RENEWABLE ENERGY POLICIES IN THE
REPUBLIC OF KOREA, 1987-2011 141TABLE 5.6: RECENT TRENDS OF GREEN GROWTH INDICATORS IN THE
REPUBLIC OF KOREA, 2007-2012 145TABLE 5.7: EMPLOYMENT RATES IN THE REPUBLIC OF KOREA, 2008-2012 149TABLE 5.8: THE REPUBLIC OF KOREA. DIRECT AND INDIRECT EMPLOYMENT
AND WORKER INDUCING EFFECTS OF GOVERNMENT EXPENDITURE ON NEW AND RENEWABLE ENERGY, 2008-2010 150
Global Green Growth experiences
12
TABLE 5.9: THE REPUBLIC OF KOREA. TOTAL EMPLOYMENT INDUCING EFFECT OF TOTAL GOVERNMENT EXPENDITURE ON NEW AND RENEWABLE ENERGY, 2008-2010 151
TABLE 5.10: THE REPUBLIC OF KOREA. TOTAL EMPLOYMENT INDUCING EFFECT OF GOVERNMENT EXPENDITURE ON THE SUPPLY OF NEW AND RENEWABLE ENERGY, 2008-2010 152
TABLE 5.11: THE REPUBLIC OF KOREA. TOTAL EMPLOYMENT INDUCING EFFECT OF GOVERNMENT EXPENDITURE ON TECHNOLOGY DEVELOPMENT OF NEW AND RENEWABLE ENERGY, 2008-2010 153
TABLE 5.12: THE REPUBLIC OF KOREA. TOTAL WORKER INDUCING EFFECT OF TOTAL GOVERNMENT EXPENDITURE ON NEW AND RENEWABLE ENERGY, 2008-2010 153
TABLE 5.13: THE REPUBLIC OF KOREA. TOTAL WORKER INDUCING EFFECT OF GOVERNMENT EXPENDITURE ON THE SUPPLY OF NEW AND RENEWABLE ENERGY, 2008-2010 154
TABLE 5.14: THE REPUBLIC OF KOREA. TOTAL WORKER INDUCING EFFECT OF GOVERNMENT EXPENDITURE ON TECHNOLOGY DEVELOPMENT OF NEW AND RENEWABLE ENERGY, 2008-2010 154
TABLE 5.15: THE REPUBLIC OF KOREA. VALUE OF FEED-IN TARIFFS IN NEW AND RENEWABLE ENERGY, 2008-2010 155
TABLE 5.16: THE REPUBLIC OF KOREA. FORWARD LINKAGE EFFECT OF FEED-IN TARIFFS IN NEW AND RENEWABLE ENERGY ON EMPLOYMENT, 2008-2010 155
TABLE 5.17: THE REPUBLIC OF KOREA. ESTIMATED BUDGET OF INVESTMENT IN GREEN INDUSTRY 2009-2013 157
TABLE 6.1: THE GREEN AGENDA POLICY TIMELINE IN SOUTH AFRICA 164TABLE 6.2: NEW GENERATION CAPACITY IN SOUTH AFRICA
TO 2030: ELECTRICITY SUPPLY MIX 171TABLE 6.3: SOUTH AFRICA. INDICATIVE PRIVATE SECTOR COST ESTIMATES
OF INVESTMENTS IN RENEWABLES AND RESULTING JOB CREATION UP TO 2030 175
LIst OF FIGUrEsFIGURE 1.1: CONCEPTUALIZING GREEN GROWTH 18FIGURE 2.1: ANNUAL DEFORESTATION IN BRAZIL, 1988-2012 27FIGURE 2.2: GHG EMISSIONS IN BRAZIL, 1990-2010 27FIGURE 2.3: BRAZIL. SHARE OF RENEWABLE ENERGY IN DOMESTIC
ENERGY SUPPLY, 2003-2012 29FIGURE 2.4: DOMESTIC ELECTRICITY SUPPLY IN BRAZIL, 2012 30FIGURE 2.5: GHG EMISSIONS, BAU AND TARGET LEVELS IN BRAZIL, 1990-2025 32FIGURE 2.6: BRAZIL. MITIGATION SCENARIOS STUDY, 2005-2030 37FIGURE 2.7: BRAZIL. MARGINAL ABATEMENT COST CURVE, SCENARIO B
VERSUS SCENARIO A, 2011-2030 38FIGURE 2.8: GERMANY. PRICES AND VOLUMES FOR WIND PROJECTS
AWARDED IN POWER AUCTIONS, 2009-2011 41FIGURE 3.1: GERMANY. DEVELOPMENT OF (NOMINAL) ELECTRICITY
PRICES FOR HOUSEHOLDS AND THE ROLE OF CHARGES FOR RENEWABLE ENERGY SOURCES, 2000-2013 60
13
FIGURE 3.2: DEVELOPMENT OF GHG EMISSIONS AND TARGETS IN GERMANY, 1990-2013 61FIGURE 3.3: DEVELOPMENT OF PRIMARY AND FINAL ENERGY
CONSUMPTION IN GERMANY, 1990-2013 62FIGURE 3.4: STRUCTURE OF GERMANY’S PRIMARY ENERGY CONSUMPTION
BY ENERGY CARRIER, 1990 AND 2012 62FIGURE 3.5: SHARE OF RENEWABLE ENERGY SOURCES IN GERMANY’S FINAL ENERGY
CONSUMPTION, 1995-2020 63FIGURE 3.6: INVESTMENT IN PLANTS FOR THE USE OF RENEWABLE
ENERGY SOURCES IN GERMANY, 2012 AND 2013 73FIGURE 3.7: TURNOVER OF ACTIVE PRODUCERS OF PLANTS FOR THE USE OF
RENEWABLE ENERGY SOURCES IN GERMANY, INCLUDING COMPONENT EXPORTS OF COMPANIES BASED IN GERMANY, 2012 AND 2013 74
FIGURE 3.8: DEVELOPMENT OF GROSS EMPLOYMENT FROM RENEWABLES IN GERMANY, 2004-2013 75
FIGURE 3.9: GERMANY. BASIC QUALIFICATIONS REQUIRED FOR JOBS RELATING TO RENEWABLE ENERGY, 2006-2010 76
FIGURE 3.10: GERMANY. IMPACTS ON NET EMPLOYMENT – CPS (COMPARED TO NMS) AND ETS (COMPARED TO CPS, WITHOUT AND WITH CROWDING OUT OF INVESTMENTS IN OTHER FIELDS) 85
FIGURE 3.11: LONG-TERM POTENTIALS FOR THE REDUCTION OF PRIMARY ENERGY IN THE EU, 2010-2050 92
FIGURE 3.12: A 2050 ELECTRICITY SUPPLY SYSTEM FOR THE EU WITH A RENEWABLE ENERGY SHARE OF 95 PERCENT IN THE POWER SECTOR 93
FIGURE 4.1: INDONESIA. GHG EMISSIONS BY INDUSTRY, 2000-2011 97FIGURE 4.2: INDONESIA. SHARE OF CO2 EMISSIONS BY ENERGY
SUB-INDUSTRY, 2000 AND 2011 98FIGURE 4.3: COMPOSITION OF FOSSIL FUELS AND RENEWABLES IN INDONESIA’S
TOTAL ENERGY MIX, 2000-2011 100FIGURE 4.4: POWER PLANT CAPACITY INSTALMENT IN THE INDONESIAN
ELECTRICITY INDUSTRY, 2005 AND 2011 101FIGURE 4.5: LANDSCAPE OF PUBLIC CLIMATE FINANCE IN INDONESIA, 2011 105FIGURE 4.6: GHG EMISSIONS AND REMOVAL PROJECTIONS IN INDONESIA, 2000-2025 107FIGURE 4.7: MARGINAL ABATEMENT COSTS OF INDONESIA’S GHG EMISSION
REDUCTION POTENTIAL 109FIGURE 4.8: INDONESIA. AVERAGE EMPLOYMENT AND WAGES IN INDUSTRIES
WITH GREEN JOB CREATION, 2008-2010 121FIGURE 4.9: INDONESIA. EDUCATION AND WAGES IN INDUSTRIES WITH
GREEN JOB CREATION, 2008-2010 122FIGURE 6.1: NEW GENERATION CAPACITY IN SOUTH AFRICA UP TO THE YEAR 2030
(DISTRIBUTION BY ENERGY SOURCE) 172FIGURE 6.2: COMPARATIVE ENERGY GENERATION SOURCE DISTRIBUTION
IN SOUTH AFRICA, 2010 AND 2030 172
Global Green Growth experiences
14
AFOLU Agriculture, forestry and other landbbl/d Barrels per dayBAU Business As UsualBTU British Thermal UnitCCS Carbon Capture and SequestrationCO2 Carbon dioxideEU European UnionGDP Gross Domestic ProductGHG Greenhouse GasGW GigaWatt (1x10⁹ watts)GWh GigaWatt-hour I-O Input-OutputIEA International Energy AgencyIPCC Intergovernmental Panel on Climate ChangeKW KilowattKWh Kilowatt-hourMmt Million metric tonsMt Metric tonsMtCO2 Metric Tons of Carbon dioxideMCO2eq Metric Tons of Carbon dioxide equivalentMW Megawatt (1x10⁶ watts)MWh Megawatt-hourPV Photovoltaic (Solar)Q-BTU Quadrillion BTU (1x10¹⁵ BTU)R&D Research and developmentROK Republic of KoreaUNFCCC United Nations Framework Convention on Climate Change
Reference to “Volume I” in this report refers to Volume I of the joint UNIDO/GGGI research project “Global Green Growth: Clean Energy Industrial Investments and Expanding Job Opportunities”.
Abbreviations and Acronyms
15

17
CHAPTER 1: INTRODUCTION AND OVERVIEW
1.1 Introduction
This report, Volume II of the joint research project “Global Green Growth: Clean Energy Industrial Investments and Expanding Job Opportunities”, examines the policy framework in place in a selected group of countries, specifically Brazil, Germany, Indonesia, the Republic of Korea (the ROK) and South Africa, for promoting green industrial growth through clean energy investments, and investigates the potential for employment creation of such investments.
Following the signing of the United Nations Framework Convention on Climate Change (UNFCCC) in 1992 and the increasing voluntary commitments to climate change targets by both developed and developing countries in subsequent international environmental treaties, the green growth agenda has gained momentum in national policy settings. This has been a reaction to the dual challenge of economic growth and climate change becoming more evident. On the one hand, the world faces increasing demand for energy from growing populations and expanding economic opportunities as people are lifted out of poverty; on the other hand, the need for energy implies a growing environmental pressure, which may compromise countries’ ability to realize these opportunities (OECD, 2011). Therefore, “transforming economic activity to improve efficiency and management of natural resources is vital to the stability and sustainability of the future economy – a green economy” (GGBP, 2014). The development of a global green economy will allow for these objectives to go hand in hand. This involves a push towards green structural change, reflecting “the growing importance of shifting towards sectors – and within them, activities – that efficiently use not only capital and labour but also natural resources to minimize environmental impact.” (UNIDO, 2013)
Crucial to this process is the replacement of fossil fuels with clean energy sources. A green industrial growth path will be realized through the promotion of investment and innovation that will foster new economic opportunities and secure sustained, green growth. Investments in clean energy technologies, in both conventional and new, alternative clean energy sources, allow for job creation, and as countries move up the productivity and technology ladder even more jobs may be created. This report will contribute to the green growth literature by, for the five selected countries, 1) highlighting the importance of green industrial growth to achieve inclusive and sustainable industrial development; 2) reviewing policy frameworks in place to promote the development of clean industrial sectors; and 3) evaluating how such frameworks have contributed to green employment creation as well as examining studies linking clean energy investment with jobs.
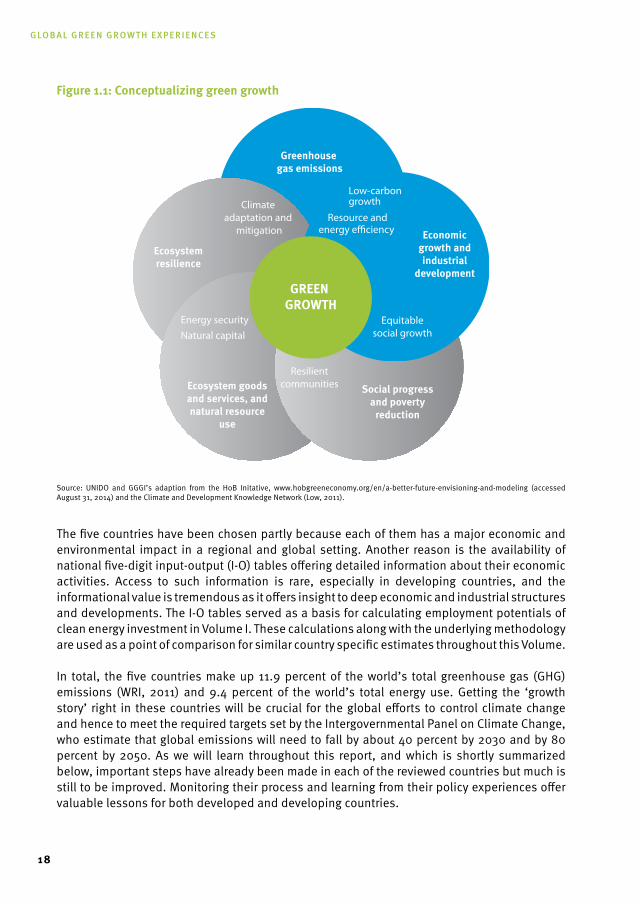
Figure 1.1 conceptualizes green growth, as it is understood in this report. It illustrates interrelations between the three dimensions - environmental, social and economic - of green growth. The blue nuanced circles highlight the areas, which are key to the country reviews but it also inevitable to touch upon the topics of the grey-tone areas.
Global Green Growth experiences
18
Figure 1.1: Conceptualizing green growth
Source: UNIDO and GGGI’s adaption from the HoB Initative, www.hobgreeneconomy.org/en/a-better-future-envisioning-and-modeling (accessed August 31, 2014) and the Climate and Development Knowledge Network (Low, 2011).
The five countries have been chosen partly because each of them has a major economic and environmental impact in a regional and global setting. Another reason is the availability of national five-digit input-output (I-O) tables offering detailed information about their economic activities. Access to such information is rare, especially in developing countries, and the informational value is tremendous as it offers insight to deep economic and industrial structures and developments. The I-O tables served as a basis for calculating employment potentials of clean energy investment in Volume I. These calculations along with the underlying methodology are used as a point of comparison for similar country specific estimates throughout this Volume.
In total, the five countries make up 11.9 percent of the world’s total greenhouse gas (GHG) emissions (WRI, 2011) and 9.4 percent of the world’s total energy use. Getting the ‘growth story’ right in these countries will be crucial for the global efforts to control climate change and hence to meet the required targets set by the Intergovernmental Panel on Climate Change, who estimate that global emissions will need to fall by about 40 percent by 2030 and by 80 percent by 2050. As we will learn throughout this report, and which is shortly summarized below, important steps have already been made in each of the reviewed countries but much is still to be improved. Monitoring their process and learning from their policy experiences offer valuable lessons for both developed and developing countries.
Greenhouse gas emissions
Ecosystemresilience
Economicgrowth andindustrial
development
Ecosystem goodsand services, andnatural resource
use
Social progressand poverty
reduction
Equitable social growth
Low-carbongrowth
Resource and energy e�ciency
Energy securityNatural capital
Resilient communities
Climate adaptation and
mitigation
GREEN GROWTH
19
1.2 Overview
Country experiences: frameworks for green industrial growth
This report’s review of country experiences in Brazil (Chapter 2), Germany (Chapter 3), Indonesia (Chapter 4), the ROK (Chapter 5) and South Africa (Chapter 6) will illuminate the relations described above. In particular, they will offer evidence of rapidly evolving national policy frameworks under which green industrial strategies are emerging, of the potential and realized benefits harvested from clean energy investments, specifically the positive effect on net-employment, and of the progress towards fulfilling national emission target commitments.
The following summarizes key findings and lessons learned from the country reviews:
Brazil has earned a unique role in the context of global climate change due to the significant progress it has made in reducing GHG emissions within a short period of time, while still expanding its economy and reducing poverty. In the course of 15 years, the country’s total emissions dropped by approximately 52 percent, mainly due to forest concessions and the expansion of renewable energy sources. Brazil’s current per capita emissions level is half the world average of 4.6 mt and therefore already achieved the global target of 2.4 mt necessary to reach the IPCC-defined 2030 targets. This has been possible due to the implementation of national policy framework that includes a set of industry-specific GHG mitigation and clean energy promotion policies with implications for job creation. Literature suggests that a vast number of green jobs have been created with the growing renewable energy industry and from forest concessions. The study also emphasizes the great prospects for job creation in alternative renewable energy, especially in biofuel; an important development as the sector historically has been linked to precarious working conditions. Conservative figures for total potential job creation amounts to approximately 189,000 between 2012 and 2021. Should appropriate technologies and enabling policy instruments be implemented, especially for the wind energy sector, the potential increases to more than 429,000 jobs. The case of Brazil serves as a good example of environmental stewardship for many developing countries. However, the future is not without challenges: hydro energy, historically a significant driver of the greening of Brazil’s energy matrix, is under threat to become scarce, and the realization of the enormous potential of pre-salt exploitation will increase the weight of the energy sector in the emission inventories. Therefore, technological innovations and targeted policy incentives that promote the use of unconventional renewable energy will become particularly important if Brazil is to stay on track towards a green economy pathway.
As the only developed country in the report, Germany represents the experience of an economy at a high development level with a sophisticated industrial structure, a flexible, dynamic labor market and advanced institutional settings. Germany, who previously was an energy intensive manufacturer, has made important progress in the transformation of its energy system (the so-called “Energiewende”): GHG emissions have been reduced by 25 percent since 1990, renewables have reached a share of over 12 percent in gross final energy consumption (more than 25 percent in gross electricity consumption), and primary energy consumption has dropped by nearly five percent since 2008. These developments have spurred large employment generation: While overall employment in green technologies is close to 2 million persons, renewables make an important contribution to total employment with around
chapter 1: introduction and overview
Global Green Growth experiences
20
370,000 jobs. Also energy efficiency generates employment in Germany though this is more difficult to describe quantitatively. In the macroeconomic projections up to 2030, additional net employment through clean energy technology lies in the range of 360,000 additional jobs compared to today. After 2030 and up to 2050, however, the current pace should be maintained to reach at least 80 percent reduction in GHG emissions and a halving of primary energy consumption as envisaged by the German government, generating further employment. By 2030, a share of renewable energy well in excess of 50 percent in gross should be reached. With the measures taken so far and the changes initiated in the frame of the “Energiewende”, Germany has made an important head start into the development of a “green economy” which has provided detailed knowledge to many other countries in Europe and worldwide on how to transform their energy systems. Further, the scope for a country like Germany to further expand through the export of technology to other countries is large. These effects have not been considered in the country review, but the experiences in Germany’s wind sector demonstrates that it is possible to generate even more jobs through exports.
With an outlook of rapid economic growth and industrialization in the years to come, Indonesia experiences an immense pressure to quickly introduce an effective policy framework that can steer industrial development towards more sustainable practices and encourage a shift from fossil fuel dependence towards renewable energy usage. Indonesia has more than 28 million people living below the international poverty line, who are extremely vulnerable to climate change as agriculture is a vital sector in the Indonesian economy. This poses a significant challenge for policymakers to integrate climate change and green industrial growth strategies into the country’s development policy framework. In response, the government has adopted a 4-track development strategy based on the pillars “pro-growth, pro-poor, pro-job and pro-environment”. These plans include investment measures to create green jobs and hereby alleviate poverty through the advancement of green skill development. An increase in green investments is estimated to result in the growth of the biofuels, bioenergy and forestry industries, which would be a quick solution for the Indonesian government to resolve the problems of energy security and poverty alleviation. It is suggested that more than 8.3 million jobs potentially could be created from clean energy investments in Indonesia of which the majority are in the agricultural sector. However, as does developing countries in particular, Indonesia faces a number of barriers to realize such investments. Two of the most urgent challenges are the lack of technological improvements in the industrial sector and the presence of high subsidies on electricity and fossil fuels that distorts the energy pricing mechanism in the domestic market. The development of clear policies that are coordinated among stakeholders will be critical for sustainable low-carbon economic growth in Indonesia.
Among the emerging economies included in this report, the rOk stands out as an extraordinary example of a country that in short time has done significant advancements in achieving its 2020 target to reduce GHG emissions to 30 percent below its Business As Usual (BAU) level through the introduction of various policies that have promoted clean energy investments. Since the introduction of Former President Lee Myungbak’s “Low Carbon, Green Growth” as a national agenda, the ROK has undertaken concerted efforts to commercialize and support the development of new and renewable in the ROK hereby enabling the transition from a fossil fuel based economy towards a low carbon, green industrial growth pathway. When examining the effects of government spending into the new and renewable energy sector on employment generation in the ROK, it is found that such spending has increased employment in the new and renewable as well as in other sectors. The initial stage of the ROK’s green industrial growth
21
efforts has resulted in a number of achievements and established the country en route to a new clean energy economy. Nationally developed environmental indicators offer useful guidance to policymakers on the impacts of implemented policies. The existing policies to promote clean energy investment and pursue green industrial growth will help the ROK adopt and expedite the economy-wide transition. Although it is possible that the ROK will reach its 2020 emission targets, the country’s biggest challenge will be to prepare the economy for the major transformation effects as it transitions into a low carbon economy progresses. Some industries will feel the economy-wide shock more severely, and worker displacement could exacerbate the on-going problem of unemployment in the ROK.
Finally, the largest emitter in the African region, south Africa has, despite the legacy of apartheid and the resulting public debt burden, achieved a remarkably widespread buy-in to the national green industry agenda and hence presents a good case study of a South-South developing country. The country uses the term “climate change resilient development” as it designs its response strategies to climate change, which it acknowledges may undermine many of the positive advances made so far in meeting the nation’s development goals and the MDGs. Two central elements of the response strategies are: 1) prioritization of mitigation interventions that hold the potential of positive job creation due to the concern that decarbonization may have financial and potential political implications; and 2) recognition of inherent interdependencies, namely the acknowledgment that South Africa’s high level of energy use and emissions per capita reflect the country’s exploitation of its comparative advantage in the low cost production of electricity. However, the Government of South Africa has so far succeeded in managing the country’s competing demands in a manner that has essentially morphed the agenda for a low-carbon economy into a positive change agent for economic transformation. A range of labor-intensive opportunities may arise from the introduction of appropriate industrial policies, particularly for the poor as well as low and low-middle income earners, to participate in the proactive energy management measures. Ultimately, financing constraints represent the biggest challenge to realize such benefits, regardless of whether all technological requirements have been adequately addressed. To reduce the risk of derailing the international community must support the transition process.
Policy lessons
The country reviews offer some valuable lessons from green industrial growth policy experiences. For many countries, their ecosystem represents a significant resource factor and source of national income and local livelihood. The effects of climate change can therefore be devastating for such economies. Experiences with forestry in Brazil and Indonesia exemplify the importance of a consistent and strong policy framework to enable continuous utilization of the rich resources in a sustainable, environmentally responsible manner. Whereas Brazil successfully decreased its deforestation rate and correspondingly its GHG emissions, a weak legal basis and upcoming governmental changes pose a significant risk for Indonesia’s plans to safeguard its forests (Norad, 2014).
Moreover, poverty alleviation is still a dominating policy objective in most developing countries, and as the potential economic benefits of investing in clean energy sectors become evident (in terms of output and jobs), the drive to realize these may happen in ways that are environmentally unsustainable. Another driver for renewable energy development in many countries is energy
chapter 1: introduction and overview
Global Green Growth experiences
22
security. Both drivers pose a challenge to the policy framework in place to ensure that the clean energy industries are developed in an environmental-friendly manner and hereby that defined climate change objectives are respected. Recent years’ policy efforts in Brazil serve as a positive example; strict forestry concession control, among other policies, has allowed for renewable sectors to emerge, ensuring the country one of the cleanest carbon electricity matrices in the world, while simultaneously lifting millions out of poverty and satisfying the country’s demand for energy.1 On the other hand, more ambitious renewable energy targets are voided in South Africa, as the associated costs are considered an inappropriate additional domestic burden in light of its costly quest to tackle poverty.
However, presently available clean energy sources do often not suffice to meet current and future domestic demand for energy to accommodate economic growth. Energy policy plans in place in many countries include incentives that promote fossil fuel production still as such sources often carry the economies. Mitigation strategies therefore include plans to encourage energy efficiency investments and to identify and promote sub-industries in the fossil fuel industry that have a potential competitive advantage but are less emission intensive. One example is South Africa, who has turned to opportunities in platinum, uranium and copper resources as an alternative to coal, which accounts for over 60 percent of the countries GHG emissions. In Germany and the ROK, the governments are explicitly targeting the development and commercialization of new advanced technologies to lower the costs for the end-users.
The quest to secure sufficient energy supplies through fossil fuel subsidies is a source of conflict as it discourages the development of renewable energy sources. This is especially a problem in Indonesia, where a sizeable oil subsidy makes electricity-based power plants incapable of competing with fossil fuel-based power plants even though a feed-in tariff has been effective in the electricity sector since 2002. Other countries have been more successful with feed-in tariffs and renewable energy subsidies in general. All of the case countries in this report have this particular type of subsidy in place and with good results on investments. In the ROK, the impacts of a feed-in tariff introduced to compensate the difference between the cost of electricity produced by generators with new and renewable energy and the market price of electricity was so effective in bringing renewable energy closer to the market that it was turned into a portfolio standards.
In the countries reviewed in this report, the development of clean energy sectors is generally explicitly targeted in national policy frameworks and programs. In few cases, polices are linked directly to green job creation but the increasing efforts to steer government regulation environmental management in a selected sectors have implicitly promoted the generation of green jobs in all countries. Germany and the ROK stand out as employment creation has been made a clear long-term objective of their comprehensive green industrial growth policy frameworks.
This leads to a final and general policy observation across the country studies. Although all countries have dedicated climate change and energy policies promoting the development of clean energy industries and energy efficiency, in most cases the policies are formulated and implemented isolated from the overall economic development framework. It is also clear that the relative weight of green industrial growth policies depend on the development stage of the
1 ‘Brazil Soars in Clean Energy Rankings’, www.renewableenergyworld.com/rea/news/article/2011/09/brazil-sets-the-pace-in-clean-energy (Accessed September 9, 2014).
23
economies and the different challenges and opportunities they face related to their national circumstances (social, economic and political).
1.3 the way Forward
Pathways to a global green economy
Common for all countries in pursuit of a low-carbon growth path is the challenge of mainstreaming green industrial growth strategies into national development policies in a way that complements and enhances country-specific economic, social and political objectives. Experiences with policy planning tell us that there are no one-size-fits-all solutions. Rather, policy design will need to take into account country-dependent factors related to settings and quality of institutions, stage of economic development, industrial structure and sophistication, natural resource constraints, and environmental protection and particular pressure points (OECD, 2011). While green industrial policies, on their own or as an element of other policy areas, can be instrumental to economic growth and job creation, a sound and flexible economic environment along with a dynamic labor market will heavily influence the likelihood of a green transition taking place and the speed with which it will occur (ibid, 2011).
For countries to succeed they will need to establish quantified and achievable targets for GHG emissions, energy consumption and energy composition that allows for sustainable economic growth rates. As also exemplified in this report, an increasing number of countries have voluntarily committed themselves to nationally defined targets. To evaluate sectoral performance and to be able to support sectors with potential for improvement, benchmarking and monitoring are important tools when designing targeted policies and instruments. Through laws and legislation as well as negotiated agreements between government and industry, countries will be able to create an enabling framework for realizing their targets, and tackle country-dependent barriers that may hamper the investment-flow needed to finance the transition from fossil fuel energy sources to a clean energy matrix as well as green structural change in industry and industrial energy efficiency improvements.
Finally, countries must be open to information exchange and international coordination, i.e. international collective action, as many of the climate change related problems they are exposed to are systemic and involve global public goods and externalities (UNIDO, 2011). For developing countries in particular, besides committing to international environmental targets and standards, it includes establishing monitoring and reporting mechanisms of production and emission data on a detailed industry level, preferably I-O tables, that can be used in international comparisons. Especially for developed countries, collective action includes pioneering or engaging in international efforts that facilitate technological and structural change, transfer of knowledge and knowhow, and either direct or indirect support to international finance projects.
chapter 1: introduction and overview

25
CHAPTER 2: BRAZIL
2.1 Introduction
This study examines the relationship between clean energy and employment in Brazil and aims to identify the job creation potential through investments in clean industries that contribute to the mitigation of GHG emissions. The focus is placed on investments in renewable energy, energy efficiency and other green activities.
Brazil has earned a unique role in the context of global climate change due to the significant progress it has made in reducing GHG emissions within a short period of time. Between 1995 and 2010, total emissions dropped by approximately 52 percent, mainly due to forest concessions and the expansion of renewable energy sources, especially in biofuels and hydroelectricity. At the 2009 Copenhagen Accord, Brazil committed itself to reduce GHG emissions by another 36 to 39 percent by 2020, compared to BAU projections.
Brazil’s commitment to climate change mitigation has been long-standing, dating back to the Rio Earth Summit in 1992, and the country is among the leading voices at international negotiations. This pledge is manifested in Brazil’s national policy framework, which has been continuously updated to rise up to the twofold challenge of rapidly catching-up economically while controlling emission increases. Although never explicitly promulgated as a component of Brazil’s growth agenda, the country’s efforts have brought it closer to a low carbon trajectory. The case of Brazil therefore serves as a good example of environmental stewardship for many developing countries.
Literature suggests that a vast number of green jobs have been created with the growth of the renewable energy industry and the increasing number of forest concessions. Brazil has implemented a set of industry-specific GHG mitigation and renewable energy promotion policies, which has had implications for job creation. However, there are few studies that establish an explicit link between employment and low carbon emissions in Brazil. According to Volume I of the UNIDO/GGGI research project “Global Green Growth: Clean Energy Industry Investments for Expanding Job Opportunities” more jobs are created within clean energy industries in Brazil than in conventional energy industries. The study also points towards immense job creation potential in alternative renewable energies, which is of particular political importance in Brazil as activities related to ethanol biofuel have historically been linked to precarious working conditions.
Section 2.2 of this study presents the development of the renewable energy sector to date. Section 2.3 then uncovers the current national policy framework to promote renewable energy and to mitigate climate change in the country. Building on this, Section 2.4 explores possible GHG scenarios up to 2030 based on the commitments made in Copenhagen. Section 2.5 explores the job creation potential of investments in a selected range of clean energy industries considered particularly prone to growth. Subsequently, based on the trends in the Brazilian clean energy industries and their surrounding policy framework, Section 2.6 discusses the
Global Green Growth experiences
26
methodology and projections in Volume I, in which a future net increase in Brazil’s green employment is foreseen. Section 2.7 concludes.
2.2 GHG Emissions and Clean Energy
Brazil’s emission profile gives it a unique role in the global efforts to effectively combat climate change. The rapid exploitation of the country’s abundant forested areas for the key purposes of crops cultivation and grazing has been the driver of Brazil’s economic development. While emissions from deforestation has placed Brazil among the six most polluting countries, the same process has enabled the rapid development of low carbon agriculture and renewables including hydropower and biofuels, leaving Brazil with one of the cleanest energy matrixes in the world. This section provides an overview of Brazil’s emission profile and energy matrix, and examines the development of the renewable energy industry in the country.
The special case of Brazil
Brazil’s GHG emission profile differs from that of developed countries, where the majority of emissions usually arise from the burning of fossil fuels. Over time, the transformation of the agricultural and livestock industries, such as cattle ranching and soybean cultivation, led to accelerated deforestation of the Amazon, the world’s largest rainforest, and the Cerrado. In the 1970s, the forest occupied over 4 million km2, an area equivalent to nearly half of continental Europe; however, today, less than 80 percent remains of its original size. According to an inventory produced by the Brazilian government (MCTI, 2013), the forestry and other land use industry (FOLU) has historically been the main source of GHG emissions. Setting aside land use change and the FOLU from GHG emission reporting, Brazil contributes 2.3 percent of emissions in the world (World Bank, 2010). Introducing effective solutions for the sustainable development of the Amazon forest, which represents a carbon reservoir of 47 billion tons (World Bank, 2010 in Philips et al., 2009), have been instrumental in reducing Brazil’s overall emission levels.
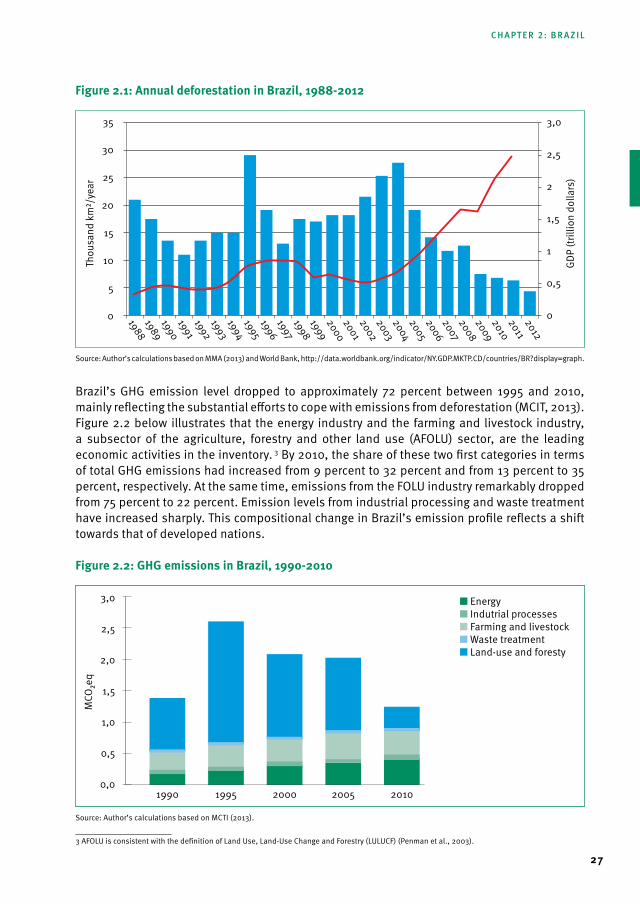
The rate of deforestation in the Amazon rose in the 2000s, peaking at 27,772 km2 in 2004, but fell sharply to about 4,571 km2 in 2012 (MMA, 2013). Between 2004 and 2012, the reduction of deforestation was around 84 percent. 2 During the same period, the country’s economy grew at an unprecedented rate, with GDP increasing by more than 300 percent. There is no direct cause-effect relationship, nevertheless, this shows that it is possible to balance economic growth and development with the preservation of the Amazon. However, it is interesting to note that the regional GDP is more dependent on timber activities than on national economic activities. Figure 2.1 shows the reduction in deforestation resulting from satellite control systems, the Amazonian Deforestation Calculation Programme (Programa de Cálculo do Desflorestamento da Amazônia) and the Real Time System for Detection of Deforestation, accompanied by more intensive inspections by environmental agencies.
2 Deforestation in the Amazon region is not homogenous and varies in the different parts of the region and over time.
27
Figure 2.1: Annual deforestation in Brazil, 1988-2012
Source: Author’s calculations based on MMA (2013) and World Bank, http://data.worldbank.org/indicator/NY.GDP.MKTP.CD/countries/BR?display=graph.
Brazil’s GHG emission level dropped to approximately 72 percent between 1995 and 2010, mainly reflecting the substantial efforts to cope with emissions from deforestation (MCIT, 2013). Figure 2.2 below illustrates that the energy industry and the farming and livestock industry, a subsector of the agriculture, forestry and other land use (AFOLU) sector, are the leading economic activities in the inventory. 3 By 2010, the share of these two first categories in terms of total GHG emissions had increased from 9 percent to 32 percent and from 13 percent to 35 percent, respectively. At the same time, emissions from the FOLU industry remarkably dropped from 75 percent to 22 percent. Emission levels from industrial processing and waste treatment have increased sharply. This compositional change in Brazil’s emission profile reflects a shift towards that of developed nations.
Figure 2.2: GHG emissions in Brazil, 1990-2010
Source: Author’s calculations based on MCTI (2013).
3 AFOLU is consistent with the definition of Land Use, Land-Use Change and Forestry (LULUCF) (Penman et al., 2003).
35
30
25
20
15
10
5
0
3,0
2,5
2
1,5
1
0,5
0
Thou
sand
km
²/ye
ar
1988198919901991199219931994199519961997199819992000200120022003200420052006200720082009201020112012
GDP
(trill
ion
dolla
rs)
3,0
2,5
2,0
1,5
1,0
0,5
0,0
MCO
₂eq
■ Energy■ Indutrial processes■ Farming and livestock■ Waste treatment■ Land-use and foresty
1990 1995 2000 2005 2010
chapter 2: brazil
Global Green Growth experiences
28
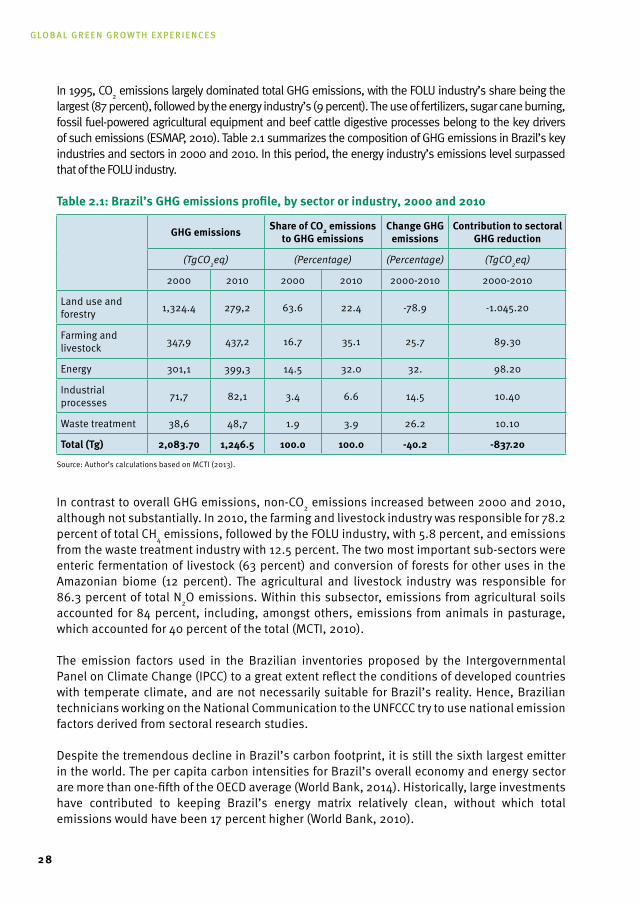
In 1995, CO2 emissions largely dominated total GHG emissions, with the FOLU industry’s share being the largest (87 percent), followed by the energy industry’s (9 percent). The use of fertilizers, sugar cane burning, fossil fuel-powered agricultural equipment and beef cattle digestive processes belong to the key drivers of such emissions (ESMAP, 2010). Table 2.1 summarizes the composition of GHG emissions in Brazil’s key industries and sectors in 2000 and 2010. In this period, the energy industry’s emissions level surpassed that of the FOLU industry.
table 2.1: Brazil’s GHG emissions profile, by sector or industry, 2000 and 2010
GHG emissions share of CO2 emissions to GHG emissions
Change GHG emissions
Contribution to sectoral GHG reduction
(TgCO2eq) (Percentage) (Percentage) (TgCO2eq)
2000 2010 2000 2010 2000-2010 2000-2010
Land use and forestry 1,324.4 279,2 63.6 22.4 -78.9 -1.045.20
Farming and livestock 347,9 437,2 16.7 35.1 25.7 89.30
Energy 301,1 399,3 14.5 32.0 32. 98.20
Industrial processes 71,7 82,1 3.4 6.6 14.5 10.40
Waste treatment 38,6 48,7 1.9 3.9 26.2 10.10
total (tg) 2,083.70 1,246.5 100.0 100.0 -40.2 -837.20
Source: Author’s calculations based on MCTI (2013).
In contrast to overall GHG emissions, non-CO2 emissions increased between 2000 and 2010, although not substantially. In 2010, the farming and livestock industry was responsible for 78.2 percent of total CH4 emissions, followed by the FOLU industry, with 5.8 percent, and emissions from the waste treatment industry with 12.5 percent. The two most important sub-sectors were enteric fermentation of livestock (63 percent) and conversion of forests for other uses in the Amazonian biome (12 percent). The agricultural and livestock industry was responsible for 86.3 percent of total N2O emissions. Within this subsector, emissions from agricultural soils accounted for 84 percent, including, amongst others, emissions from animals in pasturage, which accounted for 40 percent of the total (MCTI, 2010).
The emission factors used in the Brazilian inventories proposed by the Intergovernmental Panel on Climate Change (IPCC) to a great extent reflect the conditions of developed countries with temperate climate, and are not necessarily suitable for Brazil’s reality. Hence, Brazilian technicians working on the National Communication to the UNFCCC try to use national emission factors derived from sectoral research studies.
Despite the tremendous decline in Brazil’s carbon footprint, it is still the sixth largest emitter in the world. The per capita carbon intensities for Brazil’s overall economy and energy sector are more than one-fifth of the OECD average (World Bank, 2014). Historically, large investments have contributed to keeping Brazil’s energy matrix relatively clean, without which total emissions would have been 17 percent higher (World Bank, 2010).
29
Even with the accommodation of sub-sectors and sectors on account of the reduction of the share of AFOLU, it is clear that the tremendous weight of increased emissions is concentrated in the use of energy despite the renewable energy component.
Renewable energy influx
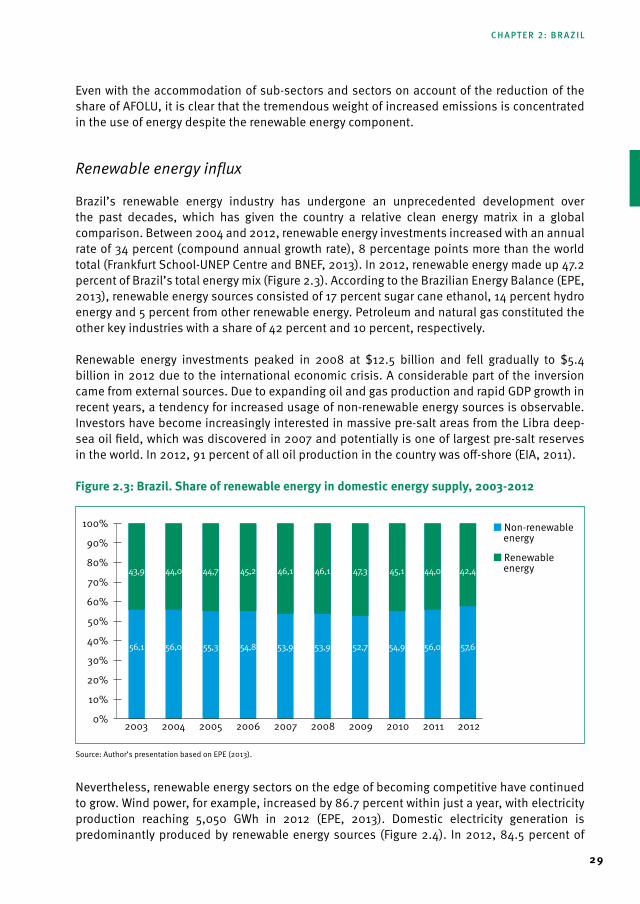
Brazil’s renewable energy industry has undergone an unprecedented development over the past decades, which has given the country a relative clean energy matrix in a global comparison. Between 2004 and 2012, renewable energy investments increased with an annual rate of 34 percent (compound annual growth rate), 8 percentage points more than the world total (Frankfurt School-UNEP Centre and BNEF, 2013). In 2012, renewable energy made up 47.2 percent of Brazil’s total energy mix (Figure 2.3). According to the Brazilian Energy Balance (EPE, 2013), renewable energy sources consisted of 17 percent sugar cane ethanol, 14 percent hydro energy and 5 percent from other renewable energy. Petroleum and natural gas constituted the other key industries with a share of 42 percent and 10 percent, respectively.
Renewable energy investments peaked in 2008 at $12.5 billion and fell gradually to $5.4 billion in 2012 due to the international economic crisis. A considerable part of the inversion came from external sources. Due to expanding oil and gas production and rapid GDP growth in recent years, a tendency for increased usage of non-renewable energy sources is observable. Investors have become increasingly interested in massive pre-salt areas from the Libra deep-sea oil field, which was discovered in 2007 and potentially is one of largest pre-salt reserves in the world. In 2012, 91 percent of all oil production in the country was off-shore (EIA, 2011).
Figure 2.3: Brazil. share of renewable energy in domestic energy supply, 2003-2012
Source: Author’s presentation based on EPE (2013).
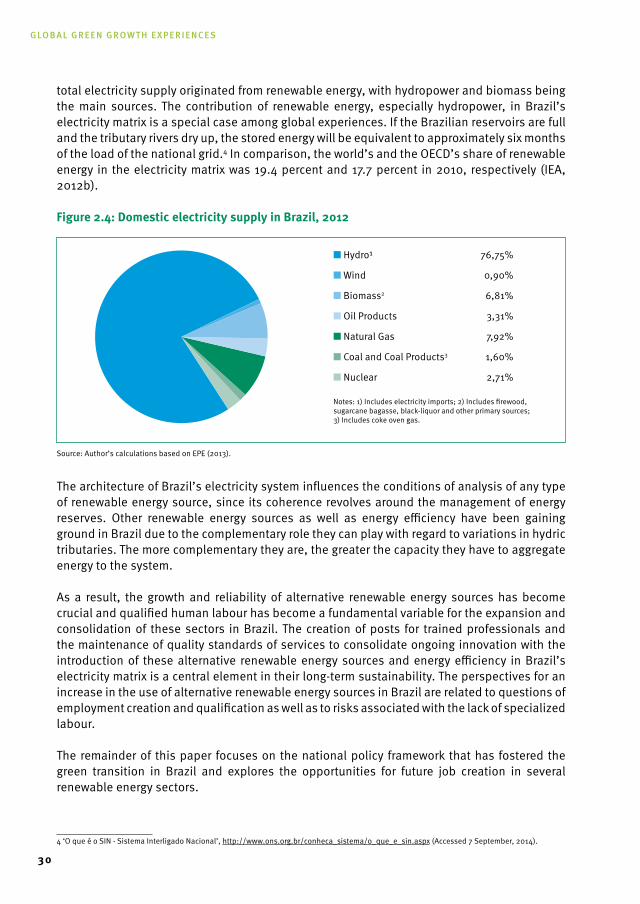
Nevertheless, renewable energy sectors on the edge of becoming competitive have continued to grow. Wind power, for example, increased by 86.7 percent within just a year, with electricity production reaching 5,050 GWh in 2012 (EPE, 2013). Domestic electricity generation is predominantly produced by renewable energy sources (Figure 2.4). In 2012, 84.5 percent of
2004 2005 2006 2007 2008 2009 2010 2011 20122003
100%
90%
80%
70%
60%
50%
40%
30%
20%
10%
0%
43,9 44,0 44,7 45,2 46,1 46,1 47,3 45,1 44,0 42,4
56,1 56,0 55,3 54,8 53,9 53,9 52,7 54,9 56,0 57,6
■ Non-renewable energy
■ Renewable energy
chapter 2: brazil
Global Green Growth experiences
30
total electricity supply originated from renewable energy, with hydropower and biomass being the main sources. The contribution of renewable energy, especially hydropower, in Brazil’s electricity matrix is a special case among global experiences. If the Brazilian reservoirs are full and the tributary rivers dry up, the stored energy will be equivalent to approximately six months of the load of the national grid.4 In comparison, the world’s and the OECD’s share of renewable energy in the electricity matrix was 19.4 percent and 17.7 percent in 2010, respectively (IEA, 2012b).
Figure 2.4: domestic electricity supply in Brazil, 2012
Source: Author’s calculations based on EPE (2013).
The architecture of Brazil’s electricity system influences the conditions of analysis of any type of renewable energy source, since its coherence revolves around the management of energy reserves. Other renewable energy sources as well as energy efficiency have been gaining ground in Brazil due to the complementary role they can play with regard to variations in hydric tributaries. The more complementary they are, the greater the capacity they have to aggregate energy to the system.
As a result, the growth and reliability of alternative renewable energy sources has become crucial and qualified human labour has become a fundamental variable for the expansion and consolidation of these sectors in Brazil. The creation of posts for trained professionals and the maintenance of quality standards of services to consolidate ongoing innovation with the introduction of these alternative renewable energy sources and energy efficiency in Brazil’s electricity matrix is a central element in their long-term sustainability. The perspectives for an increase in the use of alternative renewable energy sources in Brazil are related to questions of employment creation and qualification as well as to risks associated with the lack of specialized labour.
The remainder of this paper focuses on the national policy framework that has fostered the green transition in Brazil and explores the opportunities for future job creation in several renewable energy sectors.
4 ‘O que é o SIN - Sistema Interligado Nacional’, http://www.ons.org.br/conheca_sistema/o_que_e_sin.aspx (Accessed 7 September, 2014).
■ Hydro¹ 76,75%
■ Wind 0,90%
■ Biomass2 6,81%
■ Oil Products 3,31%
■ Natural Gas 7,92%
■ Coal and Coal Products3 1,60%
■ Nuclear 2,71%
Notes: 1) Includes electricity imports; 2) Includes firewood, sugarcane bagasse, black-liquor and other primary sources;3) Includes coke oven gas.
31
2.3 Policy Framework for Climate Change and renewable Energy
As the largest tropical country in the world, Brazil is presented with a unique set of opportunities and challenges associated with its economic development and GHG emissions. Even though Brazil - due to prudent policy planning - has achieved a competitive clean energy matrix in global comparison, its emission level is still unsustainably high. Section 2.2 indicated that renewable energy is losing weight in the overall energy balance. This section explores the government’s historical efforts to create a green policy landscape in Brazil and provides an overview of its commitments to reduce GHG emissions.
Brazil’s long-standing commitment to climate change
In 1992, Brazil demonstrated its commitment to fight climate change when it hosted the Rio Earth Summit and became a signatory of the resulting agreement, the UNFCCC, and subsequently, the Kyoto Protocol.
With the 2008 National Plan on Climate Change (approved in 2009), Brazil implemented a national framework to guide the country’s efforts of reducing carbon emissions and promoting green growth. The plan was approved by Presidential Decree and was presented to the international community during the COP14 in Poland. The National Plan on Climate Change regulates the integration and harmonization of public policies on climate change in Brazil. Even without quantified emission reduction obligations under the UNFCCC, Brazil is seeking to find a path where the primary objectives are the effectiveness of its efforts to mitigate climate change and the guaranteed welfare of its citizens. In the National Plan on Climate Change, the Government of Brazil expressed the following on the country’s mitigation and adaptation efforts:
“…Brazil’s efforts are based on the commitment to reduce social inequality and to increase income by seeking an economic dynamic with a low emissions trajectory, not repeating the pattern and the standards of the countries that have already industrialized. There are two challenges: the difficult task of significantly reducing emissions from land use change and the requirement of continuously increasing efficiency in the use of the country’s natural resources.”
The National Plan on Climate Change seeks to maintain a high share of renewable energy in the energy matrix, preserving Brazil’s spotlight position on this industry and proposing an increase in the number of energy efficiency programs to reduce GHG emissions and to foster a sustainable increase in the share of biofuels in the national transportation system. It furthermore aims to achieve a sustained reduction of deforestation in all biomes until zero illegal deforestation is reached.
In 2009, the Brazilian Congress (Law 12.187) approved the National Climate Change Policy (Política Nacional de Mudança Climática), which had been guided by the 1st National Communication to the UNFCCC and the questions discussed by the Brazilian Forum of Climate Change. The National Climate Change Policy was presented at COP15 in Copenhagen, representing Brazil’s voluntary commitment conveyed by the government at the conference. Article 12 of the National Climate Change Policy, stipulating Brazil’s voluntary commitment to
chapter 2: brazil
Global Green Growth experiences
32
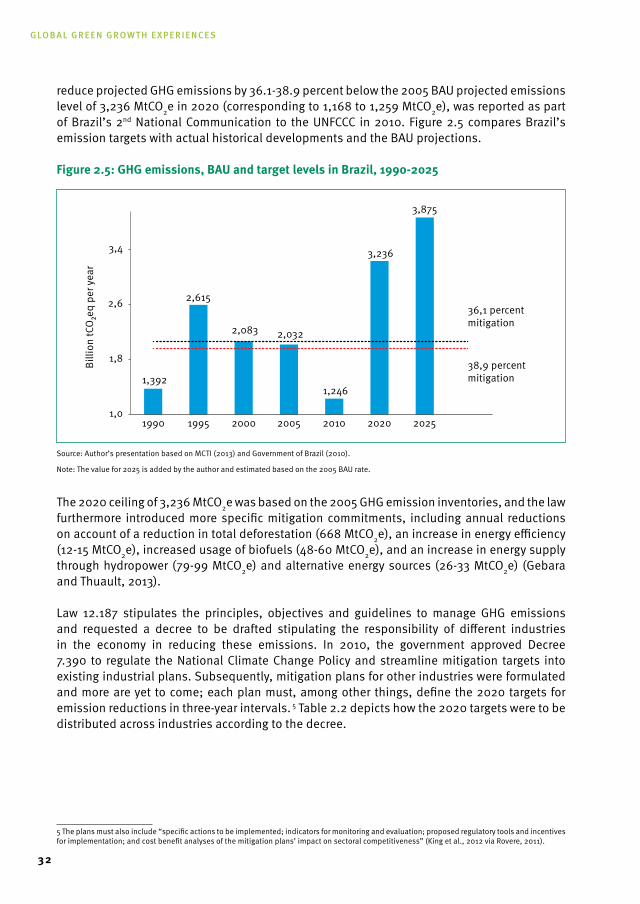
reduce projected GHG emissions by 36.1-38.9 percent below the 2005 BAU projected emissions level of 3,236 MtCO2e in 2020 (corresponding to 1,168 to 1,259 MtCO2e), was reported as part of Brazil’s 2nd National Communication to the UNFCCC in 2010. Figure 2.5 compares Brazil’s emission targets with actual historical developments and the BAU projections.
Figure 2.5: GHG emissions, BAU and target levels in Brazil, 1990-2025
Source: Author’s presentation based on MCTI (2013) and Government of Brazil (2010).
Note: The value for 2025 is added by the author and estimated based on the 2005 BAU rate.
The 2020 ceiling of 3,236 MtCO2e was based on the 2005 GHG emission inventories, and the law furthermore introduced more specific mitigation commitments, including annual reductions on account of a reduction in total deforestation (668 MtCO2e), an increase in energy efficiency (12-15 MtCO2e), increased usage of biofuels (48-60 MtCO2e), and an increase in energy supply through hydropower (79-99 MtCO2e) and alternative energy sources (26-33 MtCO2e) (Gebara and Thuault, 2013).
Law 12.187 stipulates the principles, objectives and guidelines to manage GHG emissions and requested a decree to be drafted stipulating the responsibility of different industries in the economy in reducing these emissions. In 2010, the government approved Decree 7.390 to regulate the National Climate Change Policy and streamline mitigation targets into existing industrial plans. Subsequently, mitigation plans for other industries were formulated and more are yet to come; each plan must, among other things, define the 2020 targets for emission reductions in three-year intervals. 5 Table 2.2 depicts how the 2020 targets were to be distributed across industries according to the decree.
5 The plans must also include “specific actions to be implemented; indicators for monitoring and evaluation; proposed regulatory tools and incentives for implementation; and cost benefit analyses of the mitigation plans’ impact on sectoral competitiveness” (King et al., 2012 via Rovere, 2011).
1995 2000 2005 2010 2020 20251990
3,4
2,6
1,8
1,0
Billi
on tC
O₂e
q pe
r yea
r
36,1 percent mitigation
38,9 percentmitigation1,392
2,615
2,083 2,032
1,246
3,236
3,875
33
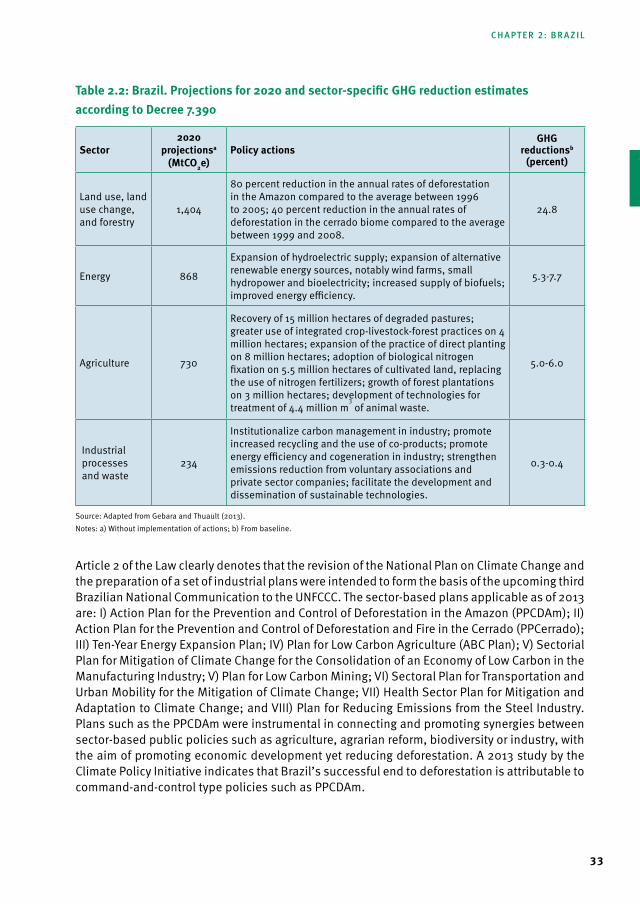
table 2.2: Brazil. Projections for 2020 and sector-specific GHG reduction estimates according to decree 7.390
sector2020
projectionsa (mtCO2e)
Policy actionsGHG
reductionsb (percent)
Land use, land use change, and forestry
1,404
80 percent reduction in the annual rates of deforestation in the Amazon compared to the average between 1996 to 2005; 40 percent reduction in the annual rates of deforestation in the cerrado biome compared to the average between 1999 and 2008.
24.8
Energy 868
Expansion of hydroelectric supply; expansion of alternative renewable energy sources, notably wind farms, small hydropower and bioelectricity; increased supply of biofuels; improved energy efficiency.
5.3-7.7
Agriculture 730
Recovery of 15 million hectares of degraded pastures; greater use of integrated crop-livestock-forest practices on 4 million hectares; expansion of the practice of direct planting on 8 million hectares; adoption of biological nitrogen fixation on 5.5 million hectares of cultivated land, replacing the use of nitrogen fertilizers; growth of forest plantations on 3 million hectares; development of technologies for treatment of 4.4 million m
3 of animal waste.
5.0-6.0
Industrial processes and waste
234
Institutionalize carbon management in industry; promote increased recycling and the use of co-products; promote energy efficiency and cogeneration in industry; strengthen emissions reduction from voluntary associations and private sector companies; facilitate the development and dissemination of sustainable technologies.
0.3-0.4
Source: Adapted from Gebara and Thuault (2013).Notes: a) Without implementation of actions; b) From baseline.
Article 2 of the Law clearly denotes that the revision of the National Plan on Climate Change and the preparation of a set of industrial plans were intended to form the basis of the upcoming third Brazilian National Communication to the UNFCCC. The sector-based plans applicable as of 2013 are: I) Action Plan for the Prevention and Control of Deforestation in the Amazon (PPCDAm); II) Action Plan for the Prevention and Control of Deforestation and Fire in the Cerrado (PPCerrado); III) Ten-Year Energy Expansion Plan; IV) Plan for Low Carbon Agriculture (ABC Plan); V) Sectorial Plan for Mitigation of Climate Change for the Consolidation of an Economy of Low Carbon in the Manufacturing Industry; V) Plan for Low Carbon Mining; VI) Sectoral Plan for Transportation and Urban Mobility for the Mitigation of Climate Change; VII) Health Sector Plan for Mitigation and Adaptation to Climate Change; and VIII) Plan for Reducing Emissions from the Steel Industry. Plans such as the PPCDAm were instrumental in connecting and promoting synergies between sector-based public policies such as agriculture, agrarian reform, biodiversity or industry, with the aim of promoting economic development yet reducing deforestation. A 2013 study by the Climate Policy Initiative indicates that Brazil’s successful end to deforestation is attributable to command-and-control type policies such as PPCDAm.
chapter 2: brazil
Global Green Growth experiences
34
Renewable energy policies
Several incentive policies to promote the use of alternative renewable energy sources exist, such as reductions in transmission fees. Among the most notable incentives is the Programme of Incentives for Alternative Sources of Electrical Energy (PROINFA or Programa Brasileiro de Incentivo às Fontes Alternativas de Energia Elétrica), established by Law 10.438 in 2002, with the purpose of encouraging the development of renewable energy and raising the share of renewable energy in the primary consumption matrix to 10 percent by 2020 (ABB, 2011; EPE, 2011; Procel Info, 2006). PROINFA is an important example of feed-in tariffs. Its costs are divided among all final consumers who are part of the national grid, in proportion to individual consumption, excluding some groups of low income consumers, through a special additional tariff in accordance with the regulations stipulated by the National Electricity Agency (ANEEL or Agência Nacional de Energia Elétrica).
Through this mechanism, a specific amount is included in the price paid by the consumer to promote the inclusion of alternative renewable energy sources of energy into the country’s energy matrix. Feed-in tariffs allow for the inclusion of such sources without introducing a specific tax or subsidy. In the more modern feed-in systems, tariffs are differentiated based on technology. Tariffs for new projects can also be regularly revised and varied in accordance with the objectives established at the time. These mechanisms should also take research and development (R&D) and staff training into account to ensure an appropriate development of the typology of alternative renewable energy sources for a tropical country like Brazil.
As noted in Section 2.2, hydro energy makes up the bulk of renewable energy in Brazil. There are, however, environmental limitations to the construction of hydroelectric plants that can no longer rely on reservoirs covering large areas, a unique feature of the Brazilian system. Furthermore, conditions not yet considered may alter the feasibility of these sources, such as the simple consideration of the relationship of complementarity between alternative renewable energy sources and conventional ones, leading to comparative advantages without incentive policies. The large-scale dams have had social and environmental impacts, and disapproval of them has been very widespread due to the extensive exploitation of forested and indigenous areas. Incentives to promote alternative renewable energy sources have therefore become increasingly important.
In general, Brazil is considered to have a “very well well-structured environmental legislation and institutional mechanisms to implement” a transition to a low-carbon economy (Caruso, 2010, p. 40). Both the National Climate Change Policy and National Plan on Climate Change have been instrumental in Brazil’s mitigation and adaptation efforts to date, and the government’s ongoing sectoral plans and policies will continue to contribute to the country’s green policy platform. Climate change has also been integrated into Brazil’s overall economic development framework with the second phase of the 2011-2014 Brazil’s Growth Acceleration Programme, a substantial infrastructure investment program combining social development and energy aspects.6
6 ‘Brazil Announces Phase Two of the Growth Acceleration Program’, http://blogs.worldbank.org/growth/brazil-announces-phase-two-growth-acceleration-program (Accessed June, 2014).
35
2.4 Prospects and Challenges towards a Green Economy
This section discusses Brazil’s potential for green growth development given the country’s emissions, energy supply and policy framework trends. By means of a scenario analysis, the section also explores the direction certain sectors and technologies may take and their mitigation potential.
The policy challenge
Despite its extraordinary story on emission reduction and its powerhouse position within renewable energy, Brazil still has a long way to go to decouple natural resource use and environmental impacts from economic growth. When excluding the FOLU sector, the country’s emission level has in fact increased over the past 15 years and emissions per capita remain comparably poor at the international level.
One pressing question is whether the current policy framework for energy and climate change will create an enabling environment in Brazil for the realization of a low carbon economy, given the expectation of a surge in economic progress, the exploration of fossil fuels and the continued growth of a population, which is becoming increasingly consumerist. Annual consumer demand is expected to grow by 4.9 percent in the coming decade (Cote and Langevin, 2013). Hence, Brazil will need to expand its energy generation to accommodate this development and enable economic growth.
Future policy design will need to take the contradictory imperatives Brazil faces on its pathway towards green growth into account (Allen, Travers and Travers, 2011); several of Brazil’s most important and fastest growing industries, particularly farming and livestock and the renewable energy industry, are highly dependent on land use, and legal restrictions on cultivation, grazing and land clearing therefore pose a challenge. At the same time, the climate effects of continued deforestation associated with the growth of these industries, such as changing rainfall patterns and extended periods of drought, can severely damage the ecosystem and harm the same industries’ economic sustainability.7 Changing to clean energy sources will be key to preventing further environmental degradation and to ensure the Brazilian economy’s sustainability. It is therefore argued that “the potential for divergence between “greenness” and “growth” in the Brazilian case is particularly great” (Allen, Travers and Travers, 2011, p.3).
The Brazilian energy industry’s central planning instruments are based on the mid-term (2020/2021) Ten Year Energy Plan PDE 2021 and the 2030 National Energy Plan PNE 2030. Brazil expects its energy demand to rise by more than 60 percent over the next decade. To accommodate such growth, the government plans to double energy supply by 2030. The Brazilian government plans investments of $121 billion on energy sources in the years up to 2021, of which $44.5 will be invested in renewable energy, $60.7 in large hydro plants and $15.8 billion in fossil fuel projects.8 A substantial part of the energy expansion is expected to come from Brazil’s
7 In this context, it is important to further underline the climate change risks Brazil faces. The country has already felt the economic and social consequences of droughts in years not associated with El Niño. For example, in 2001, an energy crisis resulting from a 40 percent rainfall deficit isolated local communities and suspended a vast line of economic activities in large parts of the country (Marengo, 2009; Marengo et al., 2011 via King et al., 2012). Less water and smaller crop yields following more frequent periods of droughts could severely affect the capacity to generate hydroelectricity and biofuels - the main sources of renewable energy in Brazil (ESMAP, 2010).
8 Brazil to Triple Renewable Energy by 2020 (Focus on Wind), http://cleantechnica.com/2011/06/09/brazil-to-triple-renewable-energy-by-2020-focus-on-wind/ (Accessed July 2014).
chapter 2: brazil
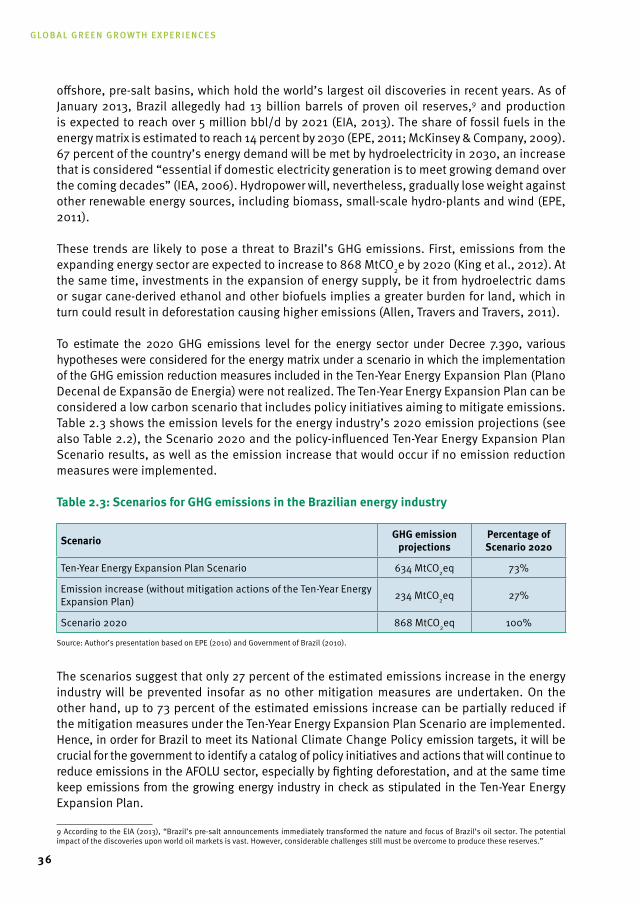
Global Green Growth experiences
36
offshore, pre-salt basins, which hold the world’s largest oil discoveries in recent years. As of January 2013, Brazil allegedly had 13 billion barrels of proven oil reserves,9 and production is expected to reach over 5 million bbl/d by 2021 (EIA, 2013). The share of fossil fuels in the energy matrix is estimated to reach 14 percent by 2030 (EPE, 2011; McKinsey & Company, 2009). 67 percent of the country’s energy demand will be met by hydroelectricity in 2030, an increase that is considered “essential if domestic electricity generation is to meet growing demand over the coming decades” (IEA, 2006). Hydropower will, nevertheless, gradually lose weight against other renewable energy sources, including biomass, small-scale hydro-plants and wind (EPE, 2011).
These trends are likely to pose a threat to Brazil’s GHG emissions. First, emissions from the expanding energy sector are expected to increase to 868 MtCO2e by 2020 (King et al., 2012). At the same time, investments in the expansion of energy supply, be it from hydroelectric dams or sugar cane-derived ethanol and other biofuels implies a greater burden for land, which in turn could result in deforestation causing higher emissions (Allen, Travers and Travers, 2011).
To estimate the 2020 GHG emissions level for the energy sector under Decree 7.390, various hypotheses were considered for the energy matrix under a scenario in which the implementation of the GHG emission reduction measures included in the Ten-Year Energy Expansion Plan (Plano Decenal de Expansão de Energia) were not realized. The Ten-Year Energy Expansion Plan can be considered a low carbon scenario that includes policy initiatives aiming to mitigate emissions. Table 2.3 shows the emission levels for the energy industry’s 2020 emission projections (see also Table 2.2), the Scenario 2020 and the policy-influenced Ten-Year Energy Expansion Plan Scenario results, as well as the emission increase that would occur if no emission reduction measures were implemented.
table 2.3: scenarios for GHG emissions in the Brazilian energy industry
scenario GHG emission projections
Percentage of scenario 2020
Ten-Year Energy Expansion Plan Scenario 634 MtCO2eq 73%
Emission increase (without mitigation actions of the Ten-Year Energy Expansion Plan) 234 MtCO2eq 27%
Scenario 2020 868 MtCO2eq 100%
Source: Author’s presentation based on EPE (2010) and Government of Brazil (2010).
The scenarios suggest that only 27 percent of the estimated emissions increase in the energy industry will be prevented insofar as no other mitigation measures are undertaken. On the other hand, up to 73 percent of the estimated emissions increase can be partially reduced if the mitigation measures under the Ten-Year Energy Expansion Plan Scenario are implemented. Hence, in order for Brazil to meet its National Climate Change Policy emission targets, it will be crucial for the government to identify a catalog of policy initiatives and actions that will continue to reduce emissions in the AFOLU sector, especially by fighting deforestation, and at the same time keep emissions from the growing energy industry in check as stipulated in the Ten-Year Energy Expansion Plan.
9 According to the EIA (2013), “Brazil’s pre-salt announcements immediately transformed the nature and focus of Brazil’s oil sector. The potential impact of the discoveries upon world oil markets is vast. However, considerable challenges still must be overcome to produce these reserves.”
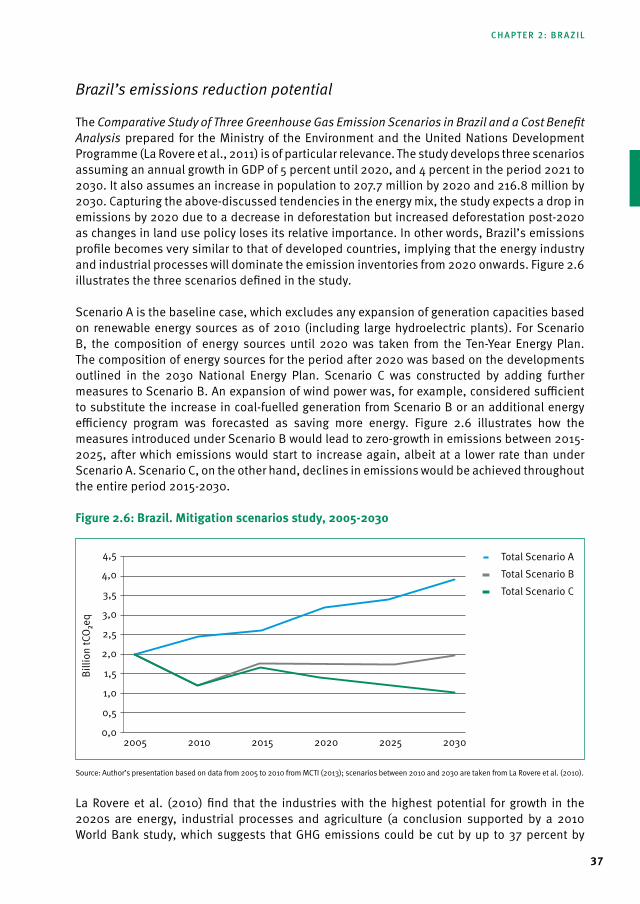
37
Brazil’s emissions reduction potential
The Comparative Study of Three Greenhouse Gas Emission Scenarios in Brazil and a Cost Benefit Analysis prepared for the Ministry of the Environment and the United Nations Development Programme (La Rovere et al., 2011) is of particular relevance. The study develops three scenarios assuming an annual growth in GDP of 5 percent until 2020, and 4 percent in the period 2021 to 2030. It also assumes an increase in population to 207.7 million by 2020 and 216.8 million by 2030. Capturing the above-discussed tendencies in the energy mix, the study expects a drop in emissions by 2020 due to a decrease in deforestation but increased deforestation post-2020 as changes in land use policy loses its relative importance. In other words, Brazil’s emissions profile becomes very similar to that of developed countries, implying that the energy industry and industrial processes will dominate the emission inventories from 2020 onwards. Figure 2.6 illustrates the three scenarios defined in the study.
Scenario A is the baseline case, which excludes any expansion of generation capacities based on renewable energy sources as of 2010 (including large hydroelectric plants). For Scenario B, the composition of energy sources until 2020 was taken from the Ten-Year Energy Plan. The composition of energy sources for the period after 2020 was based on the developments outlined in the 2030 National Energy Plan. Scenario C was constructed by adding further measures to Scenario B. An expansion of wind power was, for example, considered sufficient to substitute the increase in coal-fuelled generation from Scenario B or an additional energy efficiency program was forecasted as saving more energy. Figure 2.6 illustrates how the measures introduced under Scenario B would lead to zero-growth in emissions between 2015-2025, after which emissions would start to increase again, albeit at a lower rate than under Scenario A. Scenario C, on the other hand, declines in emissions would be achieved throughout the entire period 2015-2030.
Figure 2.6: Brazil. mitigation scenarios study, 2005-2030
Source: Author’s presentation based on data from 2005 to 2010 from MCTI (2013); scenarios between 2010 and 2030 are taken from La Rovere et al. (2010).
La Rovere et al. (2010) find that the industries with the highest potential for growth in the 2020s are energy, industrial processes and agriculture (a conclusion supported by a 2010 World Bank study, which suggests that GHG emissions could be cut by up to 37 percent by
Billi
on tC
O₂e
q
4,5
4,0
3,5
3,0
2,5
2,0
1,5
1,0
0,5
0,02005 2010 2015 20302020 2025
– Total Scenario A – Total Scenario B – Total Scenario C
chapter 2: brazil
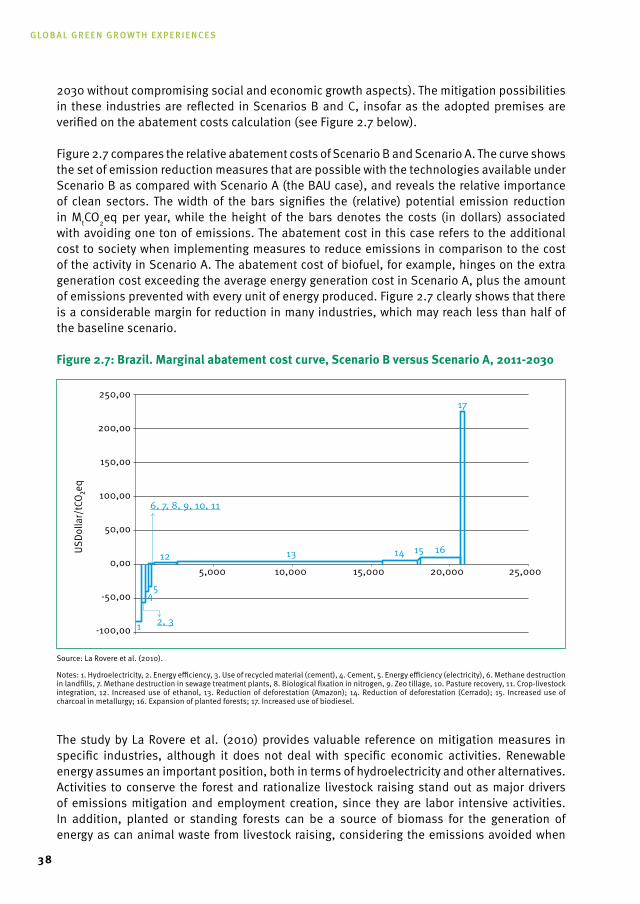
Global Green Growth experiences
38
2030 without compromising social and economic growth aspects). The mitigation possibilities in these industries are reflected in Scenarios B and C, insofar as the adopted premises are verified on the abatement costs calculation (see Figure 2.7 below).
Figure 2.7 compares the relative abatement costs of Scenario B and Scenario A. The curve shows the set of emission reduction measures that are possible with the technologies available under Scenario B as compared with Scenario A (the BAU case), and reveals the relative importance of clean sectors. The width of the bars signifies the (relative) potential emission reduction in MtCO2eq per year, while the height of the bars denotes the costs (in dollars) associated with avoiding one ton of emissions. The abatement cost in this case refers to the additional cost to society when implementing measures to reduce emissions in comparison to the cost of the activity in Scenario A. The abatement cost of biofuel, for example, hinges on the extra generation cost exceeding the average energy generation cost in Scenario A, plus the amount of emissions prevented with every unit of energy produced. Figure 2.7 clearly shows that there is a considerable margin for reduction in many industries, which may reach less than half of the baseline scenario.
Figure 2.7: Brazil. marginal abatement cost curve, scenario B versus scenario A, 2011-2030
Source: La Rovere et al. (2010).
Notes: 1. Hydroelectricity, 2. Energy efficiency, 3. Use of recycled material (cement), 4. Cement, 5. Energy efficiency (electricity), 6. Methane destruction in landfills, 7. Methane destruction in sewage treatment plants, 8. Biological fixation in nitrogen, 9. Zeo tillage, 10. Pasture recovery, 11. Crop-livestock integration, 12. Increased use of ethanol, 13. Reduction of deforestation (Amazon); 14. Reduction of deforestation (Cerrado); 15. Increased use of charcoal in metallurgy; 16. Expansion of planted forests; 17. Increased use of biodiesel.
The study by La Rovere et al. (2010) provides valuable reference on mitigation measures in specific industries, although it does not deal with specific economic activities. Renewable energy assumes an important position, both in terms of hydroelectricity and other alternatives. Activities to conserve the forest and rationalize livestock raising stand out as major drivers of emissions mitigation and employment creation, since they are labor intensive activities. In addition, planted or standing forests can be a source of biomass for the generation of energy as can animal waste from livestock raising, considering the emissions avoided when
5,000 10,000 20,000 25,00015,000
250,oo
200,oo
150,oo
100,oo
50,oo
0,oo
-50,oo
-100,oo
USDo
llar/
tCO₂
eq
1 2, 3
6, 7, 8, 9, 10, 11
45
12 13 14 15 16
17
39
manufacturing synthetic fertilizers, which can be replaced by bio-fertilizers derived from confined cattle. One compelling strategy therefore is the promotion of innovative techniques on livestock and adequate forestry use by exploiting timber and non-timber products, energy from biomass waste, tourism and biodiversity. Unconventional renewable energy such as solar and wind power could also be used to reduce carbon dioxide emissions after 2020.
Brazil was listed in Ernst & Young’s 2014 issue of Attractiveness Index for Renewable Energy Investments, ranking number 12 in the world. Since 2010, Brazil has held five renewable energy auctions, including a first auction exclusively for solar energy, which resulted in six projects totaling 123 megawatts (MW) at an average of $96 per megawatt-hour (MWh). In November 2013, 39 wind projects were approved totaling 830 MW and the auction secured over 2.3 gigawatts (GW) at an average cost of $51 per MWh. In total, auctions have attracted 35 GW of proposals in renewable energy. According to the Brazilian government, the energy matrix will be more or less unchanged by 2021 (Cote and Langevin, 2013). If the hydro and biofuel potentials are realized, the energy matrix can either maintain the percentile of renewable energy or even increase it.
Figure 2.7 shows that energy efficiency also represents an area with potential. In the Brazilian inventories, energy efficiency refers to various types of actions to reduce the energy required to meet the demands of society in the form of light, heat/cold, switching equipment on/off, transport and for use in processes. Energy efficiency actions entail technological modifications or improvements in each energetic chain and can also result in better organization, conservation and administration by the group that are part of these chains (EPE, 2012a,b). In the 2030 National Energy Plan, an energy efficiency gain through autonomous progress was established in demand projections. In the case of the electricity industry by 2030, an additional target of 5 percent from induced progress was included in addition to a reduction of 5 percent in demand, a result of autonomous progress. Energy efficiency is obviously considered an investment option to meet energy demands. 10
Based on the above identification of industries with noteworthy potential for emission mitigation and green job creation, the next section will take a closer look at such opportunities in specific renewable energy and green activity sub-industries.
2.5 Job Creation through Investments in renewable Energy and Green Economy Activities
Brazil has demonstrated that it has undertaken considerable efforts to build an enabling policy framework for the transition to a low carbon economy. The industrial plans described in Section 2.3 affirm technology and investment-inducing incentives in Brazil’s key industries, which have the potential to create green jobs. This section explores the growth opportunities in selected renewable energy and green economy industries in Brazil. More specifically, focus is placed on wind and photovoltaic (PV) energy, solar heating and biomass. Each of the industries presented entail certain specificities and new innovative policy arrangements are
10 Energy efficiency gains are achieved in one of two ways: either through autonomous progress or through induced progress. Autonomous is understood as resulting from market initiatives without any interference from public policies, in other words, through the natural replacement of equipment by similar and more efficient or new equipment, which produce the same service in a more efficient manner. Induced progress is understood as requiring stimuli through public policies. The country thus has a set of opportunities to meet social needs through energy efficiency programs, which create new employment positions.
chapter 2: brazil
Global Green Growth experiences
40
introduced to encourage activities that have a direct impact on GHG emissions. The industries were chosen based on criteria of relevance and medium-term prospects for job creation.
Wind
Although the generation of wind energy still constitutes less than 2 percent of Brazil’s electricity matrix, it has in recent years emerged as the fastest growing source of power generation in the country and has the potential to become a critical market for the international wind power industry (GWEC and ABEEolica, 2011). By 2020, the wind energy component is expected to make up 7 percent of the electricity matrix (EPE, 2011). The rapid expansion of wind farms is possible due to Brazil’s vast natural resource endowments (large areas of land with a low population density and a 9,600 km long coastline), well-designed policies targeting the wind energy industry and lower project costs on account of an oversupply of wind turbines on the international market (IRENA and GWEC, 2012). The targeted capacity goal of 16 GW set by the Ten Year Energy Plan for the industry is expected to be exceeded by 4 GW or more (Brazil Windpower, 2014). Brazil’s total wind energy potential is estimated at 143 GW, with the possibility of increasing it by well over 300 GW by using better turbine technology (IRENA and GWEC, 2012).
The import index in the industry is still high, primarily due to components with a high technological value, which has made Brazil an attractive consumer market for international suppliers of wind power machinery and equipment. To become a net exporter of raw materials for the industry, it will be necessary for Brazil to achieve further advancements in technology within the industry. This entails the necessity and opportunity to foster the development of national skills, especially in the industry’s productive chain.
Brazil’s wind power industry began developing in 2002 with the implementation of the PROINFA program (see Section 2.3). This feed-in tariff program involved 54 wind farms with a total capacity of 1.4 GW and an average price of $170 per MWh. At the time, there was no competition in the man-ufacturing of Brazilian wind turbines due to the requirement for a high level of component nation-alization (60 percent) and a devalued currency, which prevented the entrance of these farms into commercial operation (scheduled for 2012). Only when the government lifted the nationalization requirement and began organizing project-specific contract auctions after 2009 for new energy exclusively did wind power become attractive to investors, who started competing with conven-tional sources of electric energy (CGEE, 2013). The power plants auctioned in 2009 had added 1,555.5 MW to the system by the end of 2012.11 If we consider all wind farms that commenced their operations in 2012, the total value generated increases to more than 1,800 MW (ANEEL, 2012). 12
Figure 2.8 shows the auction results for wind energy prices between 2009 and 2011. Reductions in the average investment cost from $2,334 to 2,223 per kW installed over the period led to a drop in the energy prices negotiated in the auctions. According to the Brazilian Windpower Association, the costs of building a wind power plant decreased by 70 percent between 2004
11 Information from the Brazilian Wind Energy Association, ABEEólica, at www.portalabeeolica.org.br (accessed Anno 2012).
12 ANEEL data shows that between 1998 and 2012, 213 wind power projects were licensed with a total potential of 5,723,543 kW. These numbers represent 27.9 percent of the total licensed projects, and this is only lower than the figure for thermoelectric power plants. See ‘Matriz de Energia Elétrica’, www.aneel.gov.br/aplicacoes/capacidadebrasil/operacaocapacidadebrasil.asp (Accessed Anno 2012).
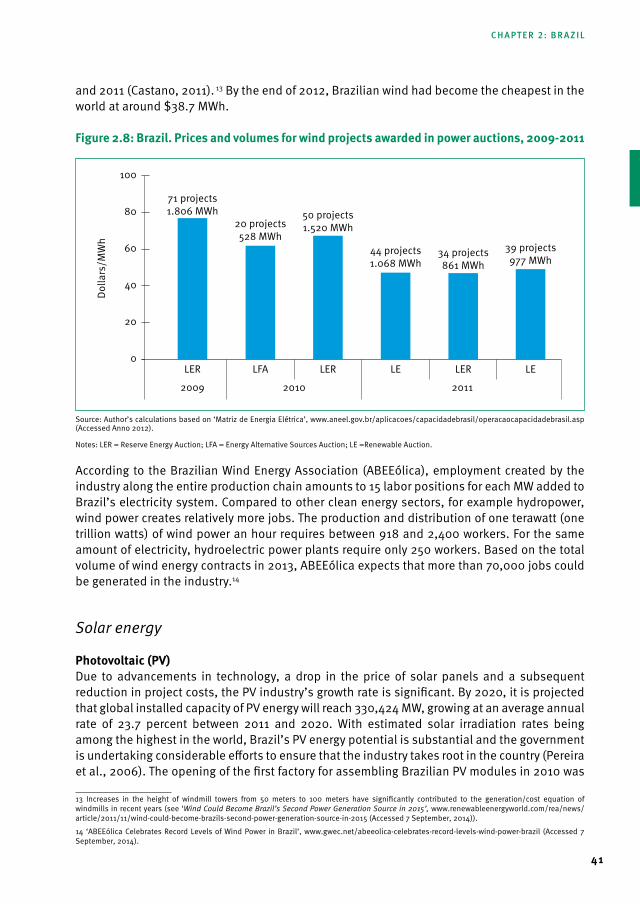
41
and 2011 (Castano, 2011). 13 By the end of 2012, Brazilian wind had become the cheapest in the world at around $38.7 MWh.
Figure 2.8: Brazil. Prices and volumes for wind projects awarded in power auctions, 2009-2011
Source: Author’s calculations based on ‘Matriz de Energia Elétrica’, www.aneel.gov.br/aplicacoes/capacidadebrasil/operacaocapacidadebrasil.asp (Accessed Anno 2012).
Notes: LER = Reserve Energy Auction; LFA = Energy Alternative Sources Auction; LE =Renewable Auction.
According to the Brazilian Wind Energy Association (ABEEólica), employment created by the industry along the entire production chain amounts to 15 labor positions for each MW added to Brazil’s electricity system. Compared to other clean energy sectors, for example hydropower, wind power creates relatively more jobs. The production and distribution of one terawatt (one trillion watts) of wind power an hour requires between 918 and 2,400 workers. For the same amount of electricity, hydroelectric power plants require only 250 workers. Based on the total volume of wind energy contracts in 2013, ABEEólica expects that more than 70,000 jobs could be generated in the industry.14
Solar energy
Photovoltaic (PV)Due to advancements in technology, a drop in the price of solar panels and a subsequent reduction in project costs, the PV industry’s growth rate is significant. By 2020, it is projected that global installed capacity of PV energy will reach 330,424 MW, growing at an average annual rate of 23.7 percent between 2011 and 2020. With estimated solar irradiation rates being among the highest in the world, Brazil’s PV energy potential is substantial and the government is undertaking considerable efforts to ensure that the industry takes root in the country (Pereira et al., 2006). The opening of the first factory for assembling Brazilian PV modules in 2010 was
13 Increases in the height of windmill towers from 50 meters to 100 meters have significantly contributed to the generation/cost equation of windmills in recent years (see ‘Wind Could Become Brazil’s Second Power Generation Source in 2015’, www.renewableenergyworld.com/rea/news/article/2011/11/wind-could-become-brazils-second-power-generation-source-in-2015 (Accessed 7 September, 2014)).
14 ‘ABEEólica Celebrates Record Levels of Wind Power in Brazil’, www.gwec.net/abeeolica-celebrates-record-levels-wind-power-brazil (Accessed 7 September, 2014).
100
80
60
40
20
0
2010 2011
Dolla
rs/M
Wh
2009
LER
71 projects1.806 MWh
LFA
20 projects528 MWh
LER
50 projects1.520 MWh
LE
44 projects1.068 MWh
LER
34 projects861 MWh
LE
39 projects977 MWh
chapter 2: brazil
Global Green Growth experiences
42
an important milestone According to ANEEL data, 15 there is currently 1.4 GW in PV plants in licensing processes and each has a potential of 30 MWp.
In 2012, ANEEL introduced new regulations to promote the integration of solar power generation into the country’s distribution planning process as well as into utility procurement.16 REN 482 is a net metering program (Sistema de Compensação de Energia), i.e. a compensation system for energy billing, that allows owners of small-scale power production generators such as residential and commercial entities to install micro- and mini solar generators of 1 MW or less to offset their own electricity expenses with credits acquired from the energy they deliver to the electrical grid. 17 If the power consumed exceeds the generated capacity, the owner will only have to pay the difference. One advantage of consumer investments in solar power is that it does not require the construction of long-distance transmission lines. On the basis of this incentive, ANEEL implemented a conjunctionary resolution, the REN481, which provides discounts of 80 percent on transmission and distribution usage charges for solar systems up to 30 MW. 18 These regulations, along with simplified procedures to access the network and advancements in the PV production chain that have resulted in a large number of challenges being overcome, are expected to strengthen the national PV market and create an attractive environment for foreign companies.
Large-scale PV projects are likely to be realized over the next few years, as the government has announced its intention to auction 3.5 GW of PV capacity by 2018 through so-called ‘reserve capacity auctions’. 19 PV was first auctioned at the A-3 and A-5 electricity auction in 2013 in regular new capacity auctions that included multiple renewable power technologies but largely fell short of the cheaper wind energy and no projects were awarded tenders. The new auctions plan to introduce a special category for PV projects, with project prices low enough to compete with other types of renewable energy.20
Earlier estimates (2012/2013) set the number of jobs created through the anticipated expansion of the industry at between 7 and 11 jobs per megawatt peak and noted that these numbers might be smaller as various parts of the production chain are still lacking in Brazil, despite the country being one of the largest producers of silicone in the world (CGEE, 2012; Cidades Solares, 2013). However, the most recent forecasts for annual PV installations in the country following the introduction of the new government’s plans may ensure more employment opportunities. By 2018, annual installations are expected to reach about 1,023 MW, a sharp contrast to the mere 167 MW that were installed in 2013.21
solar heatingEven though the usage of thermal solar energy is still limited in Brazil, the market has grown and has consolidated itself in recent years. Estimates suggest that by 2009, more than 798,000 m2
15 ‘Matriz de Energia Elétrica’, www.aneel.gov.br/aplicacoes/capacidadebrasil/operacaocapacidadebrasil.asp (Accessed Anno 2012).
16 ‘Brazil’s Attempt at Distributed Generation: Will Net Metering Work?’, www.renewableenergyworld.com/rea/news/article/2012/07/brazils-attempt-at-distributed-generation-will-net-metering-work (Accessed 7 September, 2014).
17 Ibidem.
18 Ibidem.
19 ‘Solar Expectations Rise for Brazil as Auctions Announced’, http://press.ihs.com/press-release/design-supply-chain/solar-expectations-rise-brazil-auctions-announced (Accessed 4 August, 2014).
20 ‘Brazil to Hold First Federal PV Auction this Year. PV Magazine’, www.pv-magazine.com/news/details/beitrag/brazil-to-hold-first-federal-pv-auction-this-year_100014770 (Accessed 7 September, 2014).
21 ‘Brazil’s 3.5 GW PV Plan to Catalyze Solar Growth in Latin America’, www.opticslatinamerica.org/en-us/home/news/news-articles/articles/brazil-s-3-5-gw-pv-plan-to-catalyze-solar-growth-i/ (Accessed 4 August, 2014).
43
of solar collectors had been installed, increasing to 6.4 million m² of solar collectors in 2010 (Rejman, 2012). 22 70 percent of thermal solar equipment producers in Brazil have witnessed a production increase of more than 20 percent during that period (Rejman, 2012). Thermal power accumulated to 3,641 MWth, placing Brazil among the top ten producers in the world. The National Plan on Climate Change has set out to triple the total area of installation by 2015.23
The potential to develop the industry is considered tremendous, as the climate makes it possible to use solar energy almost all year round (Federal University of Pernambuco, 2000), and thermal solar equipment could substitute electric showers, the main mode of residential water heating. Today, more than 30 million such showers are installed in Brazil with only 2 percent of households using solar heaters (Procel Info, 2006). In total, these facilities consume about 6 percent of the country’s entire electricity production and account for approximately 18 percent of the national electricity system during periods of peak demand (ABRADE, 2012). The actual potential can be better understood by comparing Brazil’s current penetration of thermal solar technology for heating water with that of other countries. According to the Solar Heating and Cooling Programme at the IEA (2012a), the world24 average is 0.04 m² per inhabitant. For Brazil to reach a similar level, the area of installed solar heaters must increase to between 35 million and 167 million m² of collectors, corresponding to 0.87 m² per inhabitant.
Several incentive programs, which are mainly part of the Strategy for Energy Efficiency in the 2030 National Energy Plan, have been introduced to promote the use of solar water heating systems in Brazil. Finding new models of financing and business that can penetrate vertical condominiums and the commercial and service sectors has been and remains the greatest challenge for Brazil’s thermal solar market. ‘My Home My Life’ (Minha Casa Minha Vida) is a social housing program under the Growth Acceleration Programme, and aims to build 1 million homes for low-income families, who can benefit from subsidized mortgages offered by the state-owned bank, Caixa Econômica Federal.25 While the first phase of the program has provided homeowners the possibility of adding the costs of a solar water heating system to their mortgage, the second phase made the installation of such a system a requirement.26 An estimated 500,000 houses had been equipped as of 2011, which is expected to have created up to 30,000 green jobs over a 5-year period (not including the jobs created in the construction sector) (ITUC, 2012). Moreover, well-designed labeling programs have ensured high quality equipment in the industry and thus the sustainability of the market.
Studies suggest that thermal solar heating poses numerous environmental, social, and often, economic advantages compared to electricity used to heat water. Thermal solar systems are advantageous on account of the modularity of their applications, the decentralization of their production, the possibility of being developed by small- and medium-sized companies, and the capacity to generate more employment per transformed unit of energy. Data from the Department of Solar Energy and the Brazilian Association of Cooling, Air Conditioning, Ventilation and Heating, suggests that the annual production from 1 million m² of collectors
22 72 percent of the total area of solar collectors in the country is residential, with 66 percent installed in single-family buildings and 6 percent in buildings with central heating systems (Rejman, 2012).
23 ‘The Use of Thermal Solar Energy in Brazil’, www.altenergymag.com/emagazine/2010/04/the-use-of-thermal-solar-energy-in-brazil/1487 (Ac-cessed 7 September, 2014).
24 Understood as the countries affiliated with the agency.
25 ‘Minha Casa Minha Vida’, www.caixa.gov.br/habitacao/mcmv/index.asp (Accessed 7 September, 2014).
26 ‘Brazil: How the “My Home my Life” Programme Can Help the Solar Water Heater Sector’, http://solarthermalworld.org/content/brazil-how-my-home-my-life-programme-can-help-solar-water-heater-sector (Accessed 7 September, 2014).
chapter 2: brazil
Global Green Growth experiences
44
could generate approximately 30,000 direct jobs and 30 indirect jobs (8,000 in industry, including micro and small industries of aggregated and related products, 14,000 installers, 4,000 salespersons and distributors and 4,000 technical workers).
Energy efficiency (building certificates)
Estimates by certificate programs, such as the LEED (Leadership in Energy and Environmental Design), AQUA (international certification for sustainable building constructions) and PROCEL (National Energy Conservation Program), suggest that energy efficiency measures have the potential to reduce energy consumption by 30 percent and 50 percent in old and new residential buildings, respectively.
For a building to use energy efficiency, a number of aspects have to be incorporated in its design. For example, the building must be properly positioned to the solar trajectory and needs properly dimensioned openings to take better advantage of natural light. The materials used must be of high quality, both for the roof and the sealing of the façades, taking account of the crossed ventilation and the winds at the location to minimize the use of air conditioners and heaters, forced exhaustion and artificial light. The lighting system should include movement sensors with long-life and low consumption bulbs, such as LEEDs (Green Building Council Brazil, 2013), which are more efficient than incandescent and fluorescent bulbs. The façades and roofing should include solar protection adapted to the type of glass used and the regional climate. The direction of winds has to also be verified and combined with the position of the building and the rooms to benefit from natural ventilation. All aspects that involve the use of energy, such as lighting, cooling, heating and ventilation, must be considered in terms of efficiency and user comfort (Tello and Riberio, 2012). Various other programs have been introduced in addition to the My House, My Life program. These are primarily funded by the labor funds, as the building industry is a major source of job creation in Brazil.
Although the workers involved in the construction of energy efficiency buildings continue to use the knowledge and conventional skills they have acquired in recent years, new knowledge and skills need to be developed. Workers have to learn to use the new machinery, equipment and construction techniques being introduced. The new techniques being used, as well as the speed of the assembly process of pre-molded pieces have an impact on skilled workers who now face abrupt changes and are left without any reference point. Another problematic factor is that the information introduced in new processes is not always sufficient to ensure that tasks are adequately carried out (SINDUSCON RIO, 2013).
According to a study of the ILO’s Green Employment Initiative (Jarvis, Varma and Ram, 2011), more than 33 percent of workers working in civil construction perform work that requires little or no specialization. Although noticeable improvements have been observed in recent years, there is still much room for improvement. The number of workers engaged in energy efficiency projects has been increasing considerably and estimates suggest that 0.5 percent of all posts are related to this type of activity.
45
Biomass
The Brazilian biomass industry is one of the most sizeable in the world. Together with the U.S., Brazil accounts for 95 percent of worldwide ethanol production and is one of the only countries in which biofuels make up a relatively large share of total transportation fuel use. In 2006, approximately 500,000 people were employed in the industry (UNEP et al., 2008). Forestry and palm culture are highlighted below as two industries with significant potential for growth and employment generation. However, the Worldwatch Institute (2007) notes that biofuel production is often characterized by poor pay and dangerous working conditions, meaning that special scrutiny must be demonstrated when estimating the number of decent jobs in the industry.
Forestry The depths of the Brazilian forests offer a major commercial potential that has not yet been fully explored.27 The activities associated with forest use are numerous. The forest industry produces a broad number of key goods such as construction materials, sanitary products, chemicals, papers, and entails both watershed and soil conservation (World Bank, 2008). The forest use sector provides millions of jobs and sustains many local communities.
In pursuit of a viable equation for balanced development between economic growth and social and environmental responsibility, Brazil grants forestry concessions to private sector partners with long-term harvesting rights and responsibilities as an economic instrument for territorial administration. In 2006, the government introduced the Public Forest Management Law (Law 11.284 as a supplement to Law 6.938 of 1981), which includes forestry concessions as one of the economic instruments of the National Environmental Policy. Forestry concession grants are developed within the structures of the Ministry of Environment, the Brazilian Forestry Service (SFB or Serviço Florestal Brasileiro) and the National Forest Development Fund (Fundo Nacional de Desenvolvimento Florestal). The concessions have proven to be a powerful instrument for sustainable forest use by discouraging illegal logging and have significantly contributed to the previously described reduction in deforestation in the country.
Law 11.284 contains the principles for administration of public forests, which make up a large part of the Amazon. Among these is the establishment of activities that promote efficient and rational use of forests and contribute to the meeting of targets for local, regional and national sustainable development. The promotion of local processing and value addition to forest products and services, as well as industrial diversification, technological development and the use and training of local entrepreneurs and regional labour are also covered in the law.
A continuous focus on incentives to promote innovative management and conservation measures will be crucial if Brazil is to preserve its forests as economic development proceeds. Sabogal et al. (2006) highlight land problems as one of the principal obstacles to the adoption of a sustainable forest administration plan (Plano de Manejo Florestal Sustentável) in the Amazon.
Table 2.4 presents the number of jobs that could be created if all estimated concession areas, corresponding to approximately 37 million hectares, were auctioned by the state and federal
27 ‘Sustainable Development and Challenging Deforestation in the Brazilian Amazon: the Good, the Bad and the Ugly’, www.fao.org/docrep/011/i0440e/i0440e03.htm (Accessed 7 September, 2014).
chapter 2: brazil
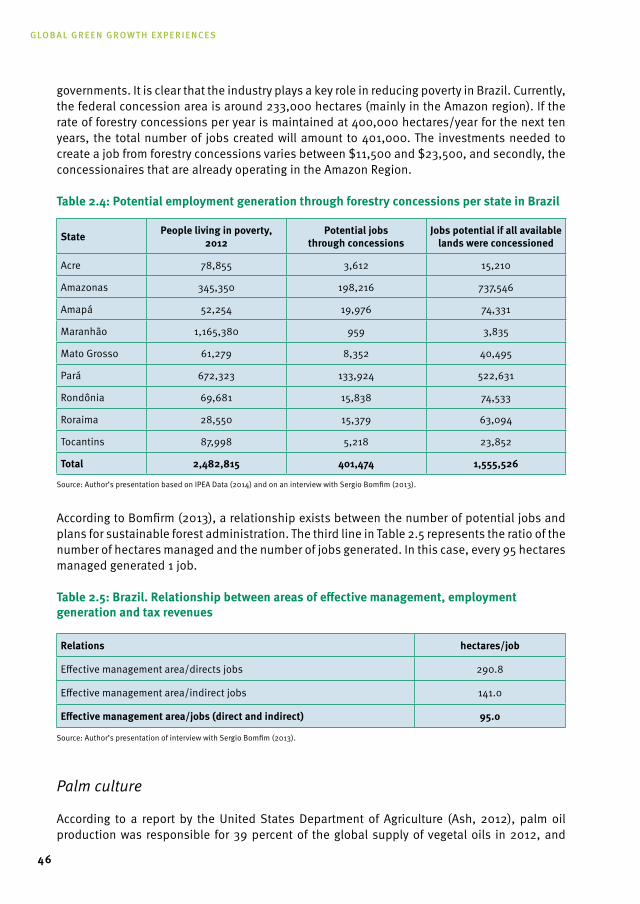
Global Green Growth experiences
46
governments. It is clear that the industry plays a key role in reducing poverty in Brazil. Currently, the federal concession area is around 233,000 hectares (mainly in the Amazon region). If the rate of forestry concessions per year is maintained at 400,000 hectares/year for the next ten years, the total number of jobs created will amount to 401,000. The investments needed to create a job from forestry concessions varies between $11,500 and $23,500, and secondly, the concessionaires that are already operating in the Amazon Region.
table 2.4: Potential employment generation through forestry concessions per state in Brazil
state People living in poverty, 2012
Potential jobs through concessions
Jobs potential if all available lands were concessioned
Acre 78,855 3,612 15,210
Amazonas 345,350 198,216 737,546
Amapá 52,254 19,976 74,331
Maranhão 1,165,380 959 3,835
Mato Grosso 61,279 8,352 40,495
Pará 672,323 133,924 522,631
Rondônia 69,681 15,838 74,533
Roraima 28,550 15,379 63,094
Tocantins 87,998 5,218 23,852
total 2,482,815 401,474 1,555,526
Source: Author’s presentation based on IPEA Data (2014) and on an interview with Sergio Bomfim (2013).
According to Bomfirm (2013), a relationship exists between the number of potential jobs and plans for sustainable forest administration. The third line in Table 2.5 represents the ratio of the number of hectares managed and the number of jobs generated. In this case, every 95 hectares managed generated 1 job.
table 2.5: Brazil. relationship between areas of effective management, employment generation and tax revenues
relations hectares/job
Effective management area/directs jobs 290.8
Effective management area/indirect jobs 141.0
Effective management area/jobs (direct and indirect) 95.0
Source: Author’s presentation of interview with Sergio Bomfim (2013).
Palm culture
According to a report by the United States Department of Agriculture (Ash, 2012), palm oil production was responsible for 39 percent of the global supply of vegetal oils in 2012, and
47
is the most produced vegetal oil in the world (55.3 Mt). Brazil is the tenth largest palm oil producer, accounting for 0.5 percent of world production. The industry offers great potential for growth in Brazil.
In 2010, the Brazilian agricultural research agency, Embrapa, published a comprehensive study with the objective to “evaluate and spatially distribute the potential of land for palm growing based on of the sustainable use of land in harmony with biodiversity”. 28 The study concluded that deforested land in the Amazon region, excluding areas with full protection (national and state parks and indigenous reservations), includes approximately 30 million hectares that are suitable for palm oil plantations (Embrapa, 2010). This is double the currently used area for the cultivation of palm oil worldwide (FAO, 2013). Around the region of Belém, where 85 percent of Brazilian palm oil production is concentrated, over 1 million hectares of preferential areas with low climatic risks were identified for cultivation. The local government of Pará expects palm oil plantations to cover 700,000 hectares by 2022 as a consequence of private expansion projects, which would make Brazil the third largest producer in the world.29
The Brazilian government has implemented several programs to accelerate the country’s palm oil production. In 2004, the Programme of Biodiesel Production and Use was established to promote a sustainable domestic market for biodiesel incorporating both family farms and large-scale cooperatives into the production chain. A key aspect of the program was to foster social inclusion by compelling biodiesel producers to buy predetermined amounts of raw materials from family farms and small producers, which are then sold to distributors on auctions organized by the National Agency of Petroleum, Natural Gas and Biofuels (Agência Nacional do Petróleo, Gás Natural e Biocombustíveis). In return, the producers are certified with the so-called ‘Social Fuel Seal’ by the Ministry of Agrarian Development and benefit from a 100 percent tax exemption for biodiesel certified with the seal (OECD and ITF, 2008).30 The programme has been deemed largely successful as a national policy framework by achieving its production goals and at the same time delivering environmental and social benefits.31
The Programme for the Sustainable Production of Palm Oil (O Programa de Produção Sustentável de Óleo de Palma) emphasizes the role of palm oil as a major feedstock for the planned expansion of biofuel. The program determines which degraded areas of the Amazon are suitable for oil palm planting, including previously cultivated land used for other crops, and exclusively funds sustainable farmers. Hence, the program prohibits any expansion of the industry at the expense of native forests and is a response to recent social and environmental concerns on the sustainability of palm oil production (for example, Fitzherbert et al., 2008; Butler and Laurance, 2009 via de Andrade and Miccolis, 2011).
Assessments by IPEA (2010) and Villela (2013) suggest that palm oil compared to other oil-seeds suitable for biomass production offers the greatest productivity with 5 tons generated per hectare annually in comparison to castor beans or peanuts, for example, which reach an annual productivity of 0.47 and 0.45 tons per hectare, respectively. In terms of income
28 The specific objectives of the study were also to a) provide assistance for the restructuring of the Brazilian energy matrix through the production of biofuels; and b) offer sustainable economic alternatives to rural producers in the region operating in enterprises or engaged in family farming.
29 ‘Oil Palm Expands on Deforested Land in Brazil’s Rainforest’, www.ipsnews.net/2013/11/oil-palm-expands-on-deforested-land-in-brazils-rainforest (Accessed 7 September, 2014).
30 ‘The Brazilian Biodiesel Program’, http://ensec.org/index.php?option=com_content&view=article&id=273:brazilian-biodiesel-program&catid=112:energysecuritycontent&Itemid=367 (Accessed 7 September, 2014).
31 Ibidem.
chapter 2: brazil
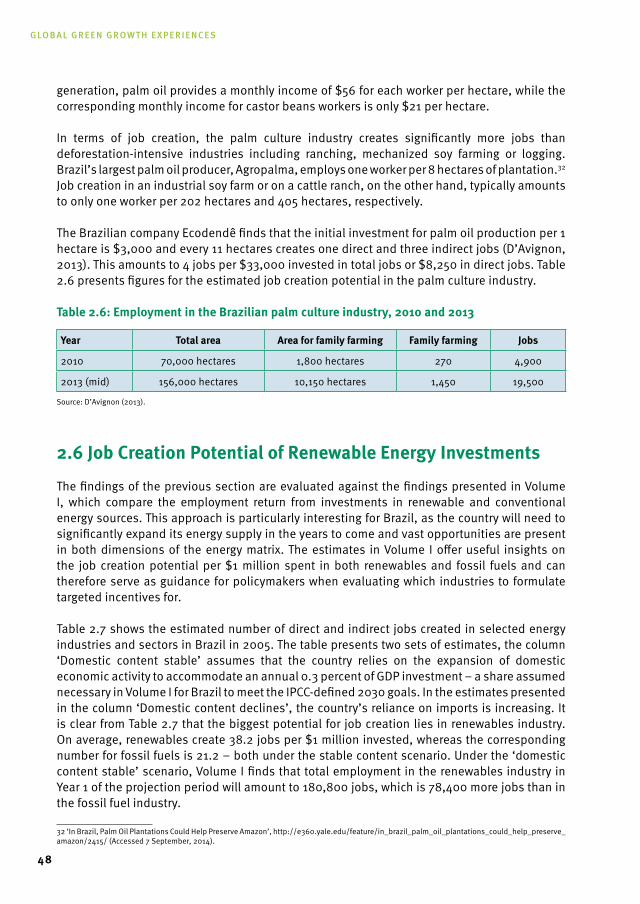
Global Green Growth experiences
48
generation, palm oil provides a monthly income of $56 for each worker per hectare, while the corresponding monthly income for castor beans workers is only $21 per hectare.
In terms of job creation, the palm culture industry creates significantly more jobs than deforestation-intensive industries including ranching, mechanized soy farming or logging. Brazil’s largest palm oil producer, Agropalma, employs one worker per 8 hectares of plantation.32 Job creation in an industrial soy farm or on a cattle ranch, on the other hand, typically amounts to only one worker per 202 hectares and 405 hectares, respectively.
The Brazilian company Ecodendê finds that the initial investment for palm oil production per 1 hectare is $3,000 and every 11 hectares creates one direct and three indirect jobs (D’Avignon, 2013). This amounts to 4 jobs per $33,000 invested in total jobs or $8,250 in direct jobs. Table 2.6 presents figures for the estimated job creation potential in the palm culture industry.
table 2.6: Employment in the Brazilian palm culture industry, 2010 and 2013
Year total area Area for family farming Family farming Jobs
2010 70,000 hectares 1,800 hectares 270 4,900
2013 (mid) 156,000 hectares 10,150 hectares 1,450 19,500
Source: D’Avignon (2013).
2.6 Job Creation Potential of renewable Energy Investments
The findings of the previous section are evaluated against the findings presented in Volume I, which compare the employment return from investments in renewable and conventional energy sources. This approach is particularly interesting for Brazil, as the country will need to significantly expand its energy supply in the years to come and vast opportunities are present in both dimensions of the energy matrix. The estimates in Volume I offer useful insights on the job creation potential per $1 million spent in both renewables and fossil fuels and can therefore serve as guidance for policymakers when evaluating which industries to formulate targeted incentives for.
Table 2.7 shows the estimated number of direct and indirect jobs created in selected energy industries and sectors in Brazil in 2005. The table presents two sets of estimates, the column ‘Domestic content stable’ assumes that the country relies on the expansion of domestic economic activity to accommodate an annual 0.3 percent of GDP investment – a share assumed necessary in Volume I for Brazil to meet the IPCC-defined 2030 goals. In the estimates presented in the column ‘Domestic content declines’, the country’s reliance on imports is increasing. It is clear from Table 2.7 that the biggest potential for job creation lies in renewables industry. On average, renewables create 38.2 jobs per $1 million invested, whereas the corresponding number for fossil fuels is 21.2 – both under the stable content scenario. Under the ‘domestic content stable’ scenario, Volume I finds that total employment in the renewables industry in Year 1 of the projection period will amount to 180,800 jobs, which is 78,400 more jobs than in the fossil fuel industry.
32 ‘In Brazil, Palm Oil Plantations Could Help Preserve Amazon’, http://e360.yale.edu/feature/in_brazil_palm_oil_plantations_could_help_preserve_amazon/2415/ (Accessed 7 September, 2014).
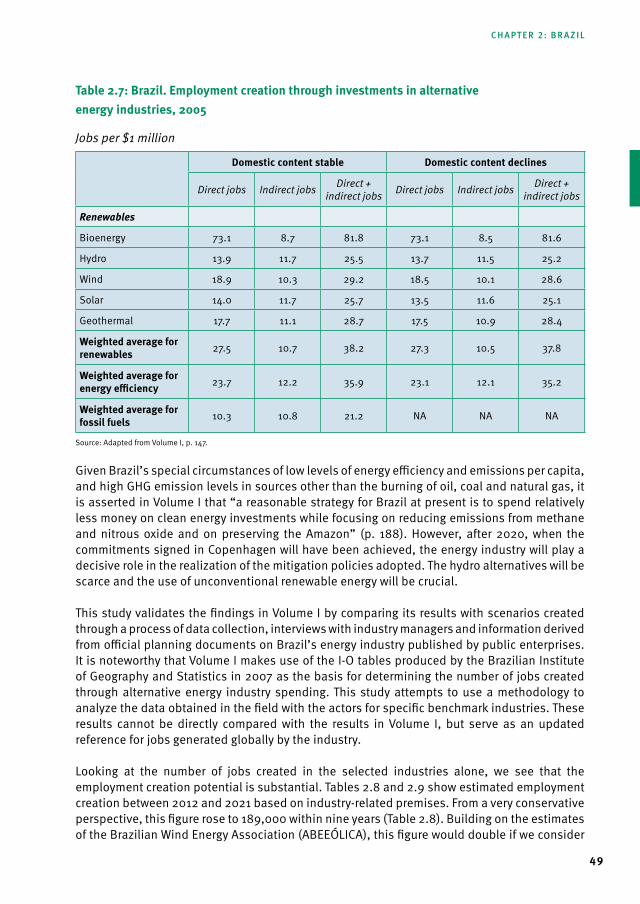
49
table 2.7: Brazil. Employment creation through investments in alternative energy industries, 2005
Jobs per $1 million
domestic content stable domestic content declines
Direct jobs Indirect jobs Direct + indirect jobs Direct jobs Indirect jobs Direct +
indirect jobs
Renewables
Bioenergy 73.1 8.7 81.8 73.1 8.5 81.6
Hydro 13.9 11.7 25.5 13.7 11.5 25.2
Wind 18.9 10.3 29.2 18.5 10.1 28.6
Solar 14.0 11.7 25.7 13.5 11.6 25.1
Geothermal 17.7 11.1 28.7 17.5 10.9 28.4
weighted average for renewables 27.5 10.7 38.2 27.3 10.5 37.8
weighted average for energy efficiency 23.7 12.2 35.9 23.1 12.1 35.2
weighted average for fossil fuels 10.3 10.8 21.2 NA NA NA
Source: Adapted from Volume I, p. 147.
Given Brazil’s special circumstances of low levels of energy efficiency and emissions per capita, and high GHG emission levels in sources other than the burning of oil, coal and natural gas, it is asserted in Volume I that “a reasonable strategy for Brazil at present is to spend relatively less money on clean energy investments while focusing on reducing emissions from methane and nitrous oxide and on preserving the Amazon” (p. 188). However, after 2020, when the commitments signed in Copenhagen will have been achieved, the energy industry will play a decisive role in the realization of the mitigation policies adopted. The hydro alternatives will be scarce and the use of unconventional renewable energy will be crucial.
This study validates the findings in Volume I by comparing its results with scenarios created through a process of data collection, interviews with industry managers and information derived from official planning documents on Brazil’s energy industry published by public enterprises. It is noteworthy that Volume I makes use of the I-O tables produced by the Brazilian Institute of Geography and Statistics in 2007 as the basis for determining the number of jobs created through alternative energy industry spending. This study attempts to use a methodology to analyze the data obtained in the field with the actors for specific benchmark industries. These results cannot be directly compared with the results in Volume I, but serve as an updated reference for jobs generated globally by the industry.
Looking at the number of jobs created in the selected industries alone, we see that the employment creation potential is substantial. Tables 2.8 and 2.9 show estimated employment creation between 2012 and 2021 based on industry-related premises. From a very conservative perspective, this figure rose to 189,000 within nine years (Table 2.8). Building on the estimates of the Brazilian Wind Energy Association (ABEEÓLICA), this figure would double if we consider
chapter 2: brazil
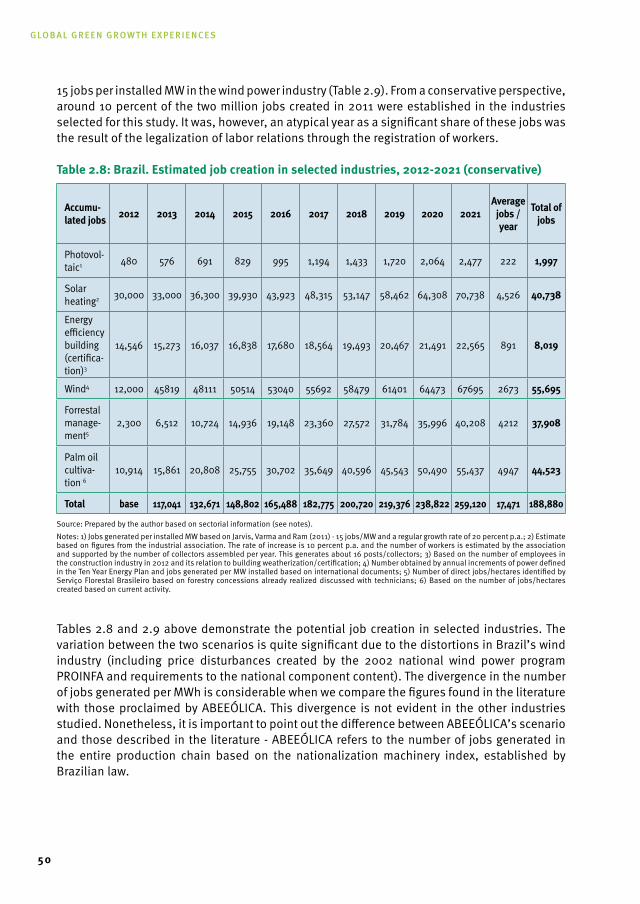
Global Green Growth experiences
50
15 jobs per installed MW in the wind power industry (Table 2.9). From a conservative perspective, around 10 percent of the two million jobs created in 2011 were established in the industries selected for this study. It was, however, an atypical year as a significant share of these jobs was the result of the legalization of labor relations through the registration of workers.
table 2.8: Brazil. Estimated job creation in selected industries, 2012-2021 (conservative)
Accumu-lated jobs 2012 2013 2014 2015 2016 2017 2018 2019 2020 2021
Average jobs / year
total of jobs
Photovol-taic1 480 576 691 829 995 1,194 1,433 1,720 2,064 2,477 222 1,997
Solar heating2 30,000 33,000 36,300 39,930 43,923 48,315 53,147 58,462 64,308 70,738 4,526 40,738
Energy efficiency building (certifica-tion)3
14,546 15,273 16,037 16,838 17,680 18,564 19,493 20,467 21,491 22,565 891 8,019
Wind4 12,000 45819 48111 50514 53040 55692 58479 61401 64473 67695 2673 55,695
Forrestal manage-ment5
2,300 6,512 10,724 14,936 19,148 23,360 27,572 31,784 35,996 40,208 4212 37,908
Palm oil cultiva-tion 6
10,914 15,861 20,808 25,755 30,702 35,649 40,596 45,543 50,490 55,437 4947 44,523
total base 117,041 132,671 148,802 165,488 182,775 200,720 219,376 238,822 259,120 17,471 188,880
Source: Prepared by the author based on sectorial information (see notes).Notes: 1) Jobs generated per installed MW based on Jarvis, Varma and Ram (2011) - 15 jobs/MW and a regular growth rate of 20 percent p.a.; 2) Estimate based on figures from the industrial association. The rate of increase is 10 percent p.a. and the number of workers is estimated by the association and supported by the number of collectors assembled per year. This generates about 16 posts/collectors; 3) Based on the number of employees in the construction industry in 2012 and its relation to building weatherization/certification; 4) Number obtained by annual increments of power defined in the Ten Year Energy Plan and jobs generated per MW installed based on international documents; 5) Number of direct jobs/hectares identified by Serviço Florestal Brasileiro based on forestry concessions already realized discussed with technicians; 6) Based on the number of jobs/hectares created based on current activity.
Tables 2.8 and 2.9 above demonstrate the potential job creation in selected industries. The variation between the two scenarios is quite significant due to the distortions in Brazil’s wind industry (including price disturbances created by the 2002 national wind power program PROINFA and requirements to the national component content). The divergence in the number of jobs generated per MWh is considerable when we compare the figures found in the literature with those proclaimed by ABEEÓLICA. This divergence is not evident in the other industries studied. Nonetheless, it is important to point out the difference between ABEEÓLICA’s scenario and those described in the literature - ABEEÓLICA refers to the number of jobs generated in the entire production chain based on the nationalization machinery index, established by Brazilian law.
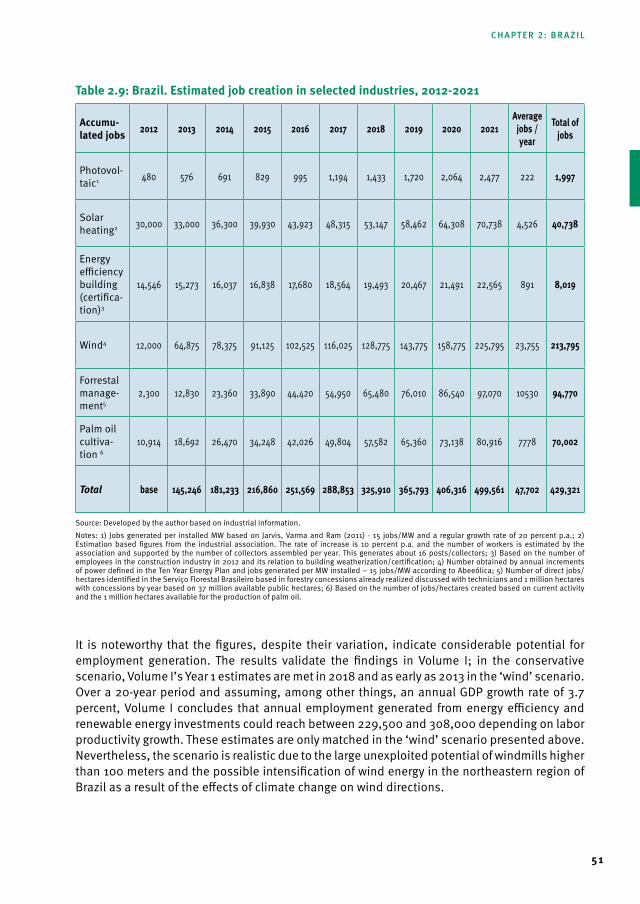
51
table 2.9: Brazil. Estimated job creation in selected industries, 2012-2021
Accumu-lated jobs 2012 2013 2014 2015 2016 2017 2018 2019 2020 2021
Average jobs / year
total of jobs
Photovol-taic1 480 576 691 829 995 1,194 1,433 1,720 2,064 2,477 222 1,997
Solar heating2 30,000 33,000 36,300 39,930 43,923 48,315 53,147 58,462 64,308 70,738 4,526 40,738
Energy efficiency building (certifica-tion)3
14,546 15,273 16,037 16,838 17,680 18,564 19,493 20,467 21,491 22,565 891 8,019
Wind4 12,000 64,875 78,375 91,125 102,525 116,025 128,775 143,775 158,775 225,795 23,755 213,795
Forrestal manage-ment5
2,300 12,830 23,360 33,890 44,420 54,950 65,480 76,010 86,540 97,070 10530 94,770
Palm oil cultiva-tion 6
10,914 18,692 26,470 34,248 42,026 49,804 57,582 65,360 73,138 80,916 7778 70,002
Total base 145,246 181,233 216,860 251,569 288,853 325,910 365,793 406,316 499,561 47,702 429,321
Source: Developed by the author based on industrial information.Notes: 1) Jobs generated per installed MW based on Jarvis, Varma and Ram (2011) - 15 jobs/MW and a regular growth rate of 20 percent p.a.; 2) Estimation based figures from the industrial association. The rate of increase is 10 percent p.a. and the number of workers is estimated by the association and supported by the number of collectors assembled per year. This generates about 16 posts/collectors; 3) Based on the number of employees in the construction industry in 2012 and its relation to building weatherization/certification; 4) Number obtained by annual increments of power defined in the Ten Year Energy Plan and jobs generated per MW installed – 15 jobs/MW according to Abeeólica; 5) Number of direct jobs/hectares identified in the Serviço Florestal Brasileiro based in forestry concessions already realized discussed with technicians and 1 million hectares with concessions by year based on 37 million available public hectares; 6) Based on the number of jobs/hectares created based on current activity and the 1 million hectares available for the production of palm oil.
It is noteworthy that the figures, despite their variation, indicate considerable potential for employment generation. The results validate the findings in Volume I; in the conservative scenario, Volume I’s Year 1 estimates are met in 2018 and as early as 2013 in the ‘wind’ scenario. Over a 20-year period and assuming, among other things, an annual GDP growth rate of 3.7 percent, Volume I concludes that annual employment generated from energy efficiency and renewable energy investments could reach between 229,500 and 308,000 depending on labor productivity growth. These estimates are only matched in the ‘wind’ scenario presented above. Nevertheless, the scenario is realistic due to the large unexploited potential of windmills higher than 100 meters and the possible intensification of wind energy in the northeastern region of Brazil as a result of the effects of climate change on wind directions.
chapter 2: brazil
Global Green Growth experiences
52
When assuming an equal amount in funding as a share of GDP, the number of jobs estimated in this study and in Volume I are equally plausible. Moreover, the benefits generated, which in Brazil extend to environmental services, are significant. From both the environmental perspective (e.g. the mitigation of GHG emissions) and from a social perspective (e.g. poverty alleviation in remote and impoverished regions such as the Brazilian Amazon), the creation of green jobs offers huge potentials.
2.7 Conclusion
Brazil’s abundant forest areas, rich biodiversity, ample water resources and large, undiscovered continental and coastal areas epitomize the country’s natural wealth. Brazil’s natural capital has proven to be a tremendous asset to the benefit of social and economic development and has laid the foundation for the advancement of an energy matrix with a heavy weight of renewable energy – especially in terms of hydropower and biofuels.33 While Brazil’s natural resources have enabled this progress, they have also contributed heavily to environmental degradation in the country; an effective policy framework has reduced illegal deforestation while still stimulating economic growth. The application of innovative policies and technological solutions has, to a large extent, reconciled growth and sustainability.34
Although Brazil belongs to the six largest GHG emitters in the world, its successful efforts to diminish deforestation have placed it on a fast track to resolving its emission problems. Brazil’s current per capita emissions level is half the world average of 4.6 mt and it has therefore already achieved the global target of 2.4 mt necessary to reach the IPCC-defined 2030 targets (see Volume I). A comprehensive study by the World Bank from 2010 suggests that Brazil could reduce its overall emission level by 37 percent within that year without jeopardizing employment and economic and social progress. Volume I finds that Brazil would be able to meet the IPCC target by lowering its emissions by just 30 percent. The Brazilian experience therefore seems to debunk the allegory that low-carbon economic growth is incompatible with economic and social development.
According to Volume I, emission reductions are possible, with Brazil devoting a mere 0.3 percent of its GDP, or $234 billion, to clean energy investments in the period up to 2030, an amount considerably less than that stated in the government’s Accelerated Growth Plan, which calculated an amount of approximately $500 billion between 2007-2010. The new relatively low level of spending will free up resources otherwise reserved for clean energy investments that can be used to “definitively control emissions from methane and nitrous oxide, as well as undertaking positive measures for preserving the Amazon” (Volume I, p. 184). The central message of both studies is that the prevention of further deforestation is Brazil’s safest way of reducing GHG emissions – and this is a major challenge given the vast amount of additional land needed to mitigate emissions and take up carbon reduction (World Bank, 2010).35
33 ‘Winds of Change – the Shifting Balance of Brazil’s Power Matrix’, http://gbroundup.com/2013/09/18/winds-of-change-the-shifting-balance-of-brazils-power-matrix/ (Accessed July 2014).
34 ‘Brazil Can Take the Lead in Green Growth, says the World Bank’, web.worldbank.org/WBSITE/EXTERNAL/COUNTRIES/LACEXT/0,,contentMD-K:22631623~pagePK:146736~piPK:64909335~theSitePK:258554,00.html (Accessed 28 July 2014).
35 More than 53 million hectares of land is needed to secure the World Bank’s (2010) low-carbon scenario that will bring about a 37 percent decrease in GHG emissions. This is particularly due to the large cattle raising industry, which requires extensive areas. It is crucial that modernizing changes are introduced in the industry to increase land-use efficiency and to foster a technological and cultural change in the way cattle is raised.
53
Targeted industrial policies to promote clean energy investments have the potential to steer the Brazilian economy onto a low-carbon, energy-resilient growth path, securing the country’s record share of renewables in its energy matrix and promising the generation of approximately 180,000 domestic jobs. These estimates in Volume I are validated by the literature review conducted for this study, which sets their job figures at a lower bar should the high potential in the wind industry not be realized. On the other hand, should the wind industry develop, over 429,000 domestic jobs could be created. Other substantial employment engines would be the forestry and biofuel industries in combination with a more intensive use of unconventional renewable energy in the Brazilian energy matrix. Regional endowments should be indicators for investments, which can create more employment. The northern and north-eastern regions are the poorest and the need for proper and legal employment is particularly high.
A number of challenges must be addressed by elaborating specific policies. Once the 2020 mitigation target is achieved, emissions are likely to begin to rise again, as the energy industry will play a decisive role in the realization of mitigation policies adopted (MCTI, 2013), especially due to the potential of pre-salt exploitation. Hydro alternatives will be scarce and the use of unconventional renewable energy will become particularly important. Moreover, the expansion of renewable energy in the energy matrix will depend on higher technologies such as PV, fuel cell or electric cars, which still face considerable barriers.
For Brazil to continue its track towards becoming a low-carbon economy, it will need to develop appropriate industrial policies and incentives for gradual substitution in heavy-emitting industries.36 Moreover, creating a link between emissions and jobs in Brazil is fundamental to achieving inclusive and sustainable industrial development. This study has demonstrated that such a link offers a tremendous opportunity for the country to further advance its renewable energy matrix and significantly reduce GHG emissions associated with job creation.
36 ‘Brazil Can Take the Lead in Green Growth, Says the World Bank’, http://go.worldbank.org/4FCZ2LFQW0 (Accessed 4 August, 2014).
chapter 2: brazil

55
CHAPTER 3: GERMANY
3.1 Introduction
Clean energy technologies are considered a major contributor to the development of an economy based on sustainable development (“green economy”). This country study explores the employment effects from clean energy technologies in Germany, specifically renewable energy and energy efficiency technologies.
With the “Energiewende” (transformation of the energy system), Germany has introduced an intensive process to transform it’s energy system towards sustainable energy supply and energy demand. It aims for complete transformation by 2050 which entails large shares of renewables (at least 80 percent), highly efficient use of energy resources by halving primary energy consumption and a reduction of GHG emissions by 80-95 percent (from 1990 baseline). Although the inception of the “Energiewende” is generally associated with a turning point in German energy policy after the 2011 Fukushima Daiichi nuclear disaster, the process of transforming the country’s energy system already started more than 20 years ago. 37
The “Energiewende” comprises five key objectives, which reiterate Germany’s old and new energy policy goals. The objectives of reducing dependance on energy imports, phasing out nuclear energy and protecting the climate have been important constants since the turn of the century or even earlier. The latter in particular has manifested itself in the formulation of both national targets and international commitments. This included the German Kyoto target of a 21 percent reduction in GHG emissions by 2012 compared to 1990; an objective that has been reached. More recent policy developments are also captured by the “Energiewende”. The government is explicitly targeting the development of new, green technologies and the generation of jobs, and aims to inspire other countries to move in the same direction by demonstrating that the transition process is feasible in a highly industrialized country such as Germany and that it simultaneously promotes economic growth. 38 Furthermore, important technologies such as on-shore wind and PVs will continue to undergo cost digression in Germany and lead to lower costs for less developed countries. Section 3.2 of this study presents an overview of the main climate and energy policies of the “Energiewende”, as well as the EU’s role to support renewable energy and energy efficiency in its Member States.
Section 3.3 provides an overview of the efforts to evaluate present employment effects from clean energy technology in Germany. We first consider the general employment effects from green technologies, of which energy technologies are an important element. We then focus on current employment effects from renewable energy sources and compare this empirical evidence with the general employment effects calculated in Volume I of the UNIDO/GGGI research project “Global Green Growth: Clean Energy Industry Investments for Expanding Job Opportunities”.
37 When the term was first used in a publication by the German Öko-Instititut in 1980, it referred only to issues of climate protection, specifically to the complete transition away from nuclear and petroleum energy.
38 Designing the Future of Germany (“Deutschlands Zukunft gestalten“), Coalition Agreement between the conservative parties CDU, CSU and the socialdemocrate party SPD, November 2013.
Global Green Growth experiences
56
Section 3.4 presents the results of a macroeconomic evaluation of future employment effects from clean energy technology in Germany.
Finally, Section 3.5 concludes and looks at the long-term perspective of the “Energiewende”.
3.2 Policies driving Employment in Clean Energy technologies
This section briefly describes the German energy and climate policy as a main driver for the employment effects discussed later on in this study. It focuses on the “Energiewende” as a major cornerstone of German energy policy, which has multiple objectives, including the creation of green jobs, and has assumed a crucial role in Germany’s international and national climate policy. It is manifested at the national level through specific targets for GHG reduction including a 40 percent reduction 40 percent by 2020 and at least 80 percent by 2050 compared to 1990. At the international level, besides being committed to the 2012 Kyoto targets as already mentioned, Germany is contributing to the EU’s 2020 GHG target of -20 percent compared to 1990 and to the envisaged target of -40 percent by 2030. It is also committed to facilitating the stabilization of the rise in global temperature at plus 2C compared to pre-industrial levels.
The road towards the “Energiewende”
The “Energiewende” aims at a complete transformation of the energy system towards, among other things, large shares of renewables in the final energy mix (at least 60 percent) and in the electricity mix (at least 80 percent) by the middle of the century. Table 3.1 summarizes these targets and presents a number of intermediate and sectoral goals. Although this set of objectives was officially and comprehensively formulated in 2011, some of the targets have been pursued for a decade, such as the long-term GHG target.
The most important of these sectoral targets are the reduction of electricity consumption by 25 percent, of transport energy consumption by 40 percent and of primary energy consumption in buildings by 80 percent by 2050. The values provided for past achievements in Table 3.1 show the substantial progress Germany has made on some of the targets in particular in terms of renewable energy expansion and GHG emission reduction, and less so in terms of energy efficiency improvements. renewable energy and GHG emission reduction than through energy efficiency.
Figures for 2013 indicate, however, that without strong efforts, development may slow down, which is already evident in the figures for 2011 and 2012 in Table 3.1. Below, we provide the main progress indicators for 2013 (all in percentages using the same metric as for the indicators in Table 3.1) and describe the distinct development for each indicator (unless otherwise stated, the main source for these figures is AGEB (2014)):
• GHG emissions (UBA, 2014): further increase of GHG to 951 mmt CO2- equivalent (+1.2 percent compared to 2012 or -23.8 percent compared to the base year 1990). This is influenced in the short term by the availability of cheap coal on the international market due to the use of non-conventional gas in the U.S. market. Estimates for 2014 indicate that GHG are lower by 40 mmt CO2- equivalent compared to 2013.
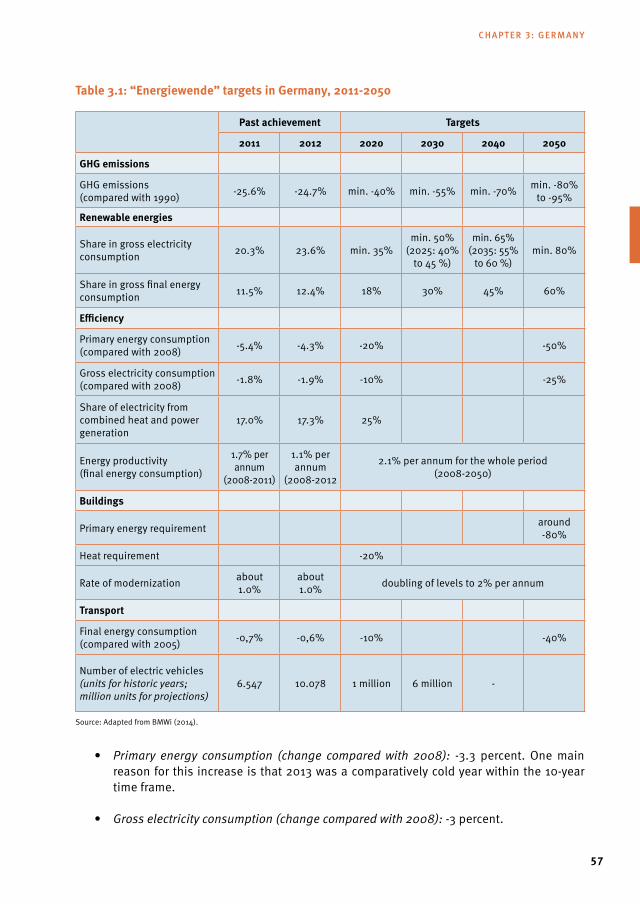
57
table 3.1: “Energiewende” targets in Germany, 2011-2050
Past achievement targets
2011 2012 2020 2030 2040 2050
GHG emissions
GHG emissions (compared with 1990) -25.6% -24.7% min. -40% min. -55% min. -70% min. -80%
to -95%
renewable energies
Share in gross electricity consumption 20.3% 23.6% min. 35%
min. 50% (2025: 40%
to 45 %)
min. 65% (2035: 55%
to 60 %)min. 80%
Share in gross final energy consumption 11.5% 12.4% 18% 30% 45% 60%
Efficiency
Primary energy consumption (compared with 2008) -5.4% -4.3% -20% -50%
Gross electricity consumption (compared with 2008) -1.8% -1.9% -10% -25%
Share of electricity from combined heat and power generation
17.0% 17.3% 25%
Energy productivity (final energy consumption)
1.7% per annum
(2008-2011)
1.1% per annum
(2008-2012
2.1% per annum for the whole period (2008-2050)
Buildings
Primary energy requirement around -80%
Heat requirement -20%
Rate of modernization about 1.0%
about 1.0% doubling of levels to 2% per annum
transport
Final energy consumption(compared with 2005) -0,7% -0,6% -10% -40%
Number of electric vehicles(units for historic years; million units for projections)
6.547 10.078 1 million 6 million -
Source: Adapted from BMWi (2014).
• Primary energy consumption (change compared with 2008): -3.3 percent. One main reason for this increase is that 2013 was a comparatively cold year within the 10-year time frame.
• Gross electricity consumption (change compared with 2008): -3 percent.
chapter 3: Germany
Global Green Growth experiences
58
• Share of renewables in gross electricity consumption: 25.3 percent. Estimates for 2014 indicate a share of 27.3 percent.
• Share of renewables in gross final energy consumption: 11.9 percent.
• Share of electricity from combined heat and power generation: increase from 91.9 TWh in 2012 to 93.5 TWh in 2013 (+1.7 percent).
The energy transition process in Germany started long before the “Energiewende” became an official part of the national energy policy. The most important dates of the transition are:
• In 1990: the first feed-in tariff law (“Stromeinspeisungsgesetz”) was introduced for renewable energy sources, and has been continuously updated and improved to bring renewable energy closer to the market. A major milestone of that law was the fact that renewable energy were given priority over fossil fuels. Utilities were allowed purchase electricity generated from renewable energy suppliers at a percentage of the prevailing retail price of electricity. The percentage offered for solar and wind power was set at 90 percent of the residential electricity price, while other technologies such as hydro power and biomass sources saw percentages ranging from 65–80 percent. The maximum capacity for which the subsidies were offered was 5 MW per project. While the law did not strongly promote more costly technologies such as PVs, it led to the expansion of lower-cost technologies such as wind, resulting in the deployment of 4,400 MW of new wind capacity between 1991 and 1999 (corresponding to one-third of the global capacity at the time).
• In 2001, the decision to phase out nuclear energy was taken by the then present Social Democrat/Green coalition government. Although this decision, along with the expansion of renewable energy, received wide public approval and continues to do so, there was no consensus on this policy among the political parties until 2011.
• In 2002, the Renewable Energy Law (“Erneuerbaren Energien Gesetz”) was introduced and has been continuously updated until the current discussion to reform the promotion scheme for renewable energy sources (see below). The law has been regularly amended to take account of the latest technological developments and the better understanding of how renewable energy perform in electricity markets. Given the success of the Renewable Energy Law, it has been taken up by the majority of EU Member States, but has also inspired renewable energy promotion schemes on a global level, replacing or complementing alternative concepts such as quota systems or Renewable Portfolio Systems (RPS) long used in the United Kingdom and the U.S., which have had much less success in spurring technologies in their early development phase.
• Afterachangeingovernmenttoaconservative/liberalcoalition,anewEnergy Concept was adopted in september 2010, which included the following key elements: 1) A strategy for the decarbonization of the energy sector with the two main pillars to significantly increase energy efficiency and meet the energy demand mainly for renewable energy; 2) Extend the use of nuclear energy by ten years. The revenues were to be partly used to support the use of renewable energy sources.
59
• FollowingtheFukushimaDaiichinucleardisasterinMarch2011andunderthepressureof public opinion and state elections in which the governing parties did not fare well, the government took the decision in July 2011 to accelerate the transformation of the energy system by introducing the “Energiewende” with its ambitious targets for energy efficiency, renewable energy and decarbonization. The second decision was taken to phase out nuclear energy by 2022, which was supported by all important political parties.
• In late 2013, the new coalition government (Conservatives/Social Democrats) reiterated the long-term goals of the “Energiewende”. Though the new government did not explicitly underscore all initial objectives, the quantitative targets of Table 3.1 continue to remain valid. The Coalition Agreement of 2013 focuses primarily on measures rather than targets, and emphasizes, in particular, that the transformation must be manageable from a financial perspective. Figure 3.1 shows that electricity has, for various reasons, become quite expensive for German households. While the promotion of renewable energy sources is one reason for this increase, other factors such as the general rise in fossil fuel prices have contributed even more. In 2013, the cost for electricity was 5.3 Euro-cents/kWh (6.9 dollar-cents), with an expected rise of another Euro-cents in 2014 to 6.24 Euro-cents/kWh (8.1 dollar-cents). The promotion of renewable energy made up 3.5 Euro-cents of the consumer’s electricity prices 4.5 dollar-cents or 12 percent and exemptions from the charge defined by the Renewable Energy Law, such as exemptions for self-generated electricity and for energy-intensive industries, constituted another 1.8 Euro-cents (2.3 dollar-cents or 6 percent). These exemptions have recently been challenged by the European Commission prompting the German government to reform the Renewable Energy Law. 39 Coalition Agreement encourages the use of direct marketing measure as to bring renewable energy closer to the market. It also defines sets growth targets for renewable energy sources (40-45 percent by 2025, 55-60 percent by 2035) with an annual monitoring of the progress with respect to target achievement, grid expansion as well as cost-related factors. Technology-specific limits, e.g. for wind offshore, have also been determined: a maximum of 6.5 GW by 2020 and 15 GW by 2030. For PVs, a tender model is to be developed by 2016. This shall ensure a steady growth of renewable energy sources while preventing the corresponding increase in costs that may result in distributional effects among different parts of the population.
Public acceptance of the “Energiewende” is a major factor in the Agreement. Any exemptions from the electricity price increase related to the promotion of renewable energy shall be reformed in conformity with requirements of the European Commission including the exceptions granted to industry. Finally, the Agreement affirms energy efficiency as the second major pillar of a German energy system and focuses on instruments to promote energy efficiency such as a top-runner program to enhance the
39 On 8 April 2014, the reform of the Renewable Energy Law was decided by the Cabinet of the German Chancellor. By the end of June 2014, the German Parliament agreed on the reform. The regulation for the exemptions of energy-intensive companies is still to be added to the draft (currently the subsi-dies in form of exemptions to industries represent $6.6 billion). The reformed Renewable Energy Law shall enter into force on 1 August 2014. However, there are still substantial discussions ongoing between the German government and the European Commission in how far the Renewable Energy Law represents state aid and in how far the national promotion scheme need to be opened to other European countries or in how far the imported green electricity has to pay the subsidy defined by the Law. The European Commission considers that if a foreign producer cannot profit from the national subsidy scheme he should also be exempted from paying the subsidy. Otherwise, the European Commission considers this as import duty, which is forbidden by the treaties. The average subsidy for all renewable energy is according to the present Renewable Energy Law about 22 dollar-cents/kWh. After the reform, this shall drop to about 15.6 dollar-cents/kWh.
chapter 3: Germany
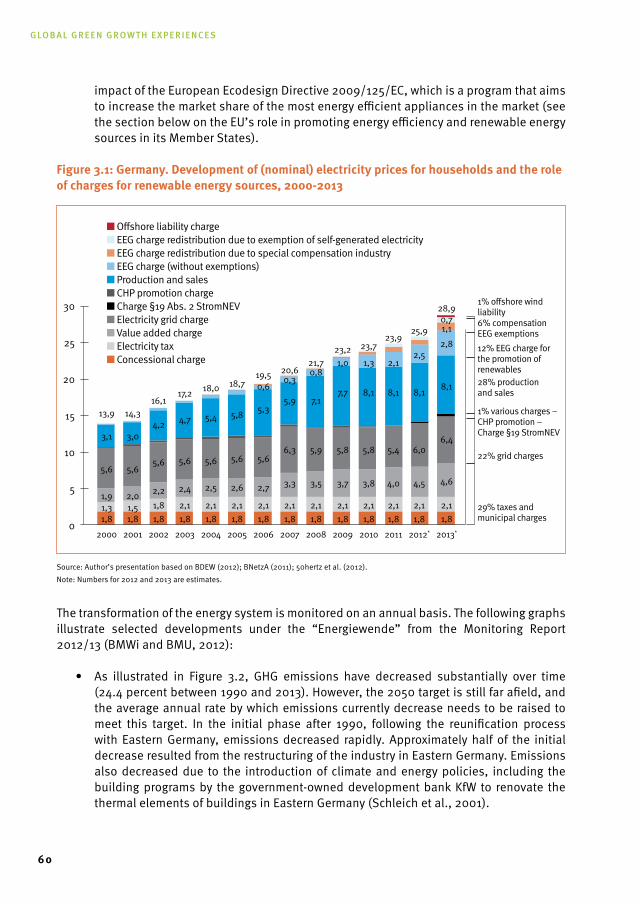
Global Green Growth experiences
60
impact of the European Ecodesign Directive 2009/125/EC, which is a program that aims to increase the market share of the most energy efficient appliances in the market (see the section below on the EU’s role in promoting energy efficiency and renewable energy sources in its Member States).
Figure 3.1: Germany. development of (nominal) electricity prices for households and the role of charges for renewable energy sources, 2000-2013
Source: Author’s presentation based on BDEW (2012); BNetzA (2011); 50hertz et al. (2012). Note: Numbers for 2012 and 2013 are estimates.
The transformation of the energy system is monitored on an annual basis. The following graphs illustrate selected developments under the “Energiewende” from the Monitoring Report 2012/13 (BMWi and BMU, 2012):
• As illustrated in Figure 3.2, GHG emissions have decreased substantially over time(24.4 percent between 1990 and 2013). However, the 2050 target is still far afield, and the average annual rate by which emissions currently decrease needs to be raised to meet this target. In the initial phase after 1990, following the reunification process with Eastern Germany, emissions decreased rapidly. Approximately half of the initial decrease resulted from the restructuring of the industry in Eastern Germany. Emissions also decreased due to the introduction of climate and energy policies, including the building programs by the government-owned development bank KfW to renovate the thermal elements of buildings in Eastern Germany (Schleich et al., 2001).
30
25
20
15
10
5
0
29% taxes and municipal charges
■ Offshore liability charge■ EEG charge redistribution due to exemption of self-generated electricity■ EEG charge redistribution due to special compensation industry■ EEG charge (without exemptions)■ Production and sales■ CHP promotion charge■ Charge §19 Abs. 2 StromNEV■ Electricity grid charge■ Value added charge■ Electricity tax■ Concessional charge
22% grid charges
28% productionand sales
1% offshore windliability6% compensation EEG exemptions
1% various charges – CHP promotion – Charge §19 StromNEV
12% EEG charge forthe promotion ofrenewables
2000
1,81,31,9
5,6
3,1
13,9
2001
1,81,52,0
5,6
3,0
14,3
1,8
2002
1,82,2
5,6
4,2
16,1
1,8
2003
2,1
2,4
5,6
4,7
17,2
1,8
2004
2,1
2,5
5,6
5,4
18,0
1,8
2005
2,1
2,6
5,6
5,8
18,7
1,8
2006
2,1
2,7
5,6
5,3
19,50,6
1,8
2007
2,1
3,3
6,3
5,9
20,60,3
1,8
2008
2,1
3,5
5,9
7,1
21,70,8
1,8
2009
2,1
3,7
5,8
7,7
23,21,0
1,8
2010
2,1
3,8
5,8
8,1
23,7
1,3
1,8
2011
2,1
4,0
5,4
8,1
23,9
2,1
1,8
2012*
2,1
4,5
6,0
8,1
25,9
2,5
1,8
2013*
2,1
4,6
6,4
8,1
28,90,71,12,8
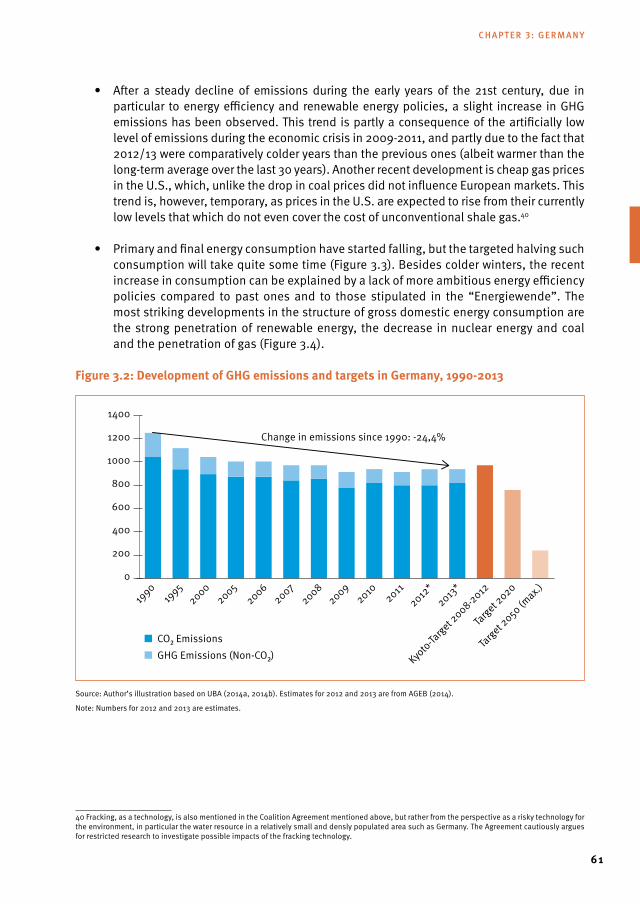
61
• After a steady decline of emissions during the early years of the 21st century, due inparticular to energy efficiency and renewable energy policies, a slight increase in GHG emissions has been observed. This trend is partly a consequence of the artificially low level of emissions during the economic crisis in 2009-2011, and partly due to the fact that 2012/13 were comparatively colder years than the previous ones (albeit warmer than the long-term average over the last 30 years). Another recent development is cheap gas prices in the U.S., which, unlike the drop in coal prices did not influence European markets. This trend is, however, temporary, as prices in the U.S. are expected to rise from their currently low levels that which do not even cover the cost of unconventional shale gas.40
• Primaryandfinalenergyconsumptionhavestartedfalling,butthetargetedhalvingsuchconsumption will take quite some time (Figure 3.3). Besides colder winters, the recent increase in consumption can be explained by a lack of more ambitious energy efficiency policies compared to past ones and to those stipulated in the “Energiewende”. The most striking developments in the structure of gross domestic energy consumption are the strong penetration of renewable energy, the decrease in nuclear energy and coal and the penetration of gas (Figure 3.4).
Figure 3.2: development of GHG emissions and targets in Germany, 1990-2013
Source: Author’s illustration based on UBA (2014a, 2014b). Estimates for 2012 and 2013 are from AGEB (2014).
Note: Numbers for 2012 and 2013 are estimates.
40 Fracking, as a technology, is also mentioned in the Coalition Agreement mentioned above, but rather from the perspective as a risky technology for the environment, in particular the water resource in a relatively small and densly populated area such as Germany. The Agreement cautiously argues for restricted research to investigate possible impacts of the fracking technology.
1990
Target 2050 (m
ax.)19
95
Target 2020
20002007
20052006
20082010
2012*
20092011
2013*
Kyoto-Ta
rget 2008-2012
Change in emissions since 1990: -24,4%
0
600
400
200
800
1000
1200
1400
■ CO₂ Emissions■ GHG Emissions (Non-CO₂)
chapter 3: Germany
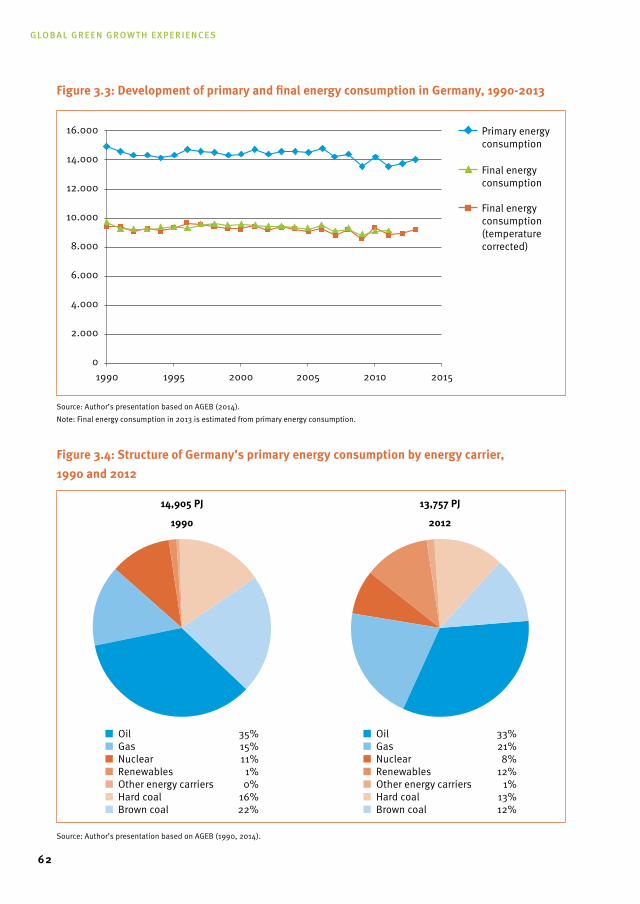
Global Green Growth experiences
62
Figure 3.3: development of primary and final energy consumption in Germany, 1990-2013
Source: Author’s presentation based on AGEB (2014). Note: Final energy consumption in 2013 is estimated from primary energy consumption.
Figure 3.4: structure of Germany’s primary energy consumption by energy carrier, 1990 and 2012
Source: Author’s presentation based on AGEB (1990, 2014).
16.000
14.000
12.000
10.000
8.000
6.000
4.000
2.000
01990 1995 2000 2005 2010 2015
Primary energy consumption
Final energy consumption
Final energy consumption(temperature corrected)
■ Oil 35%■ Gas 15%■ Nuclear 11%■ Renewables 1%■ Other energy carriers 0%■ Hard coal 16%■ Brown coal 22%
■ Oil 33%■ Gas 21%■ Nuclear 8%■ Renewables 12%■ Other energy carriers 1%■ Hard coal 13%■ Brown coal 12%
1990 2012
14,905 PJ 13,757 PJ
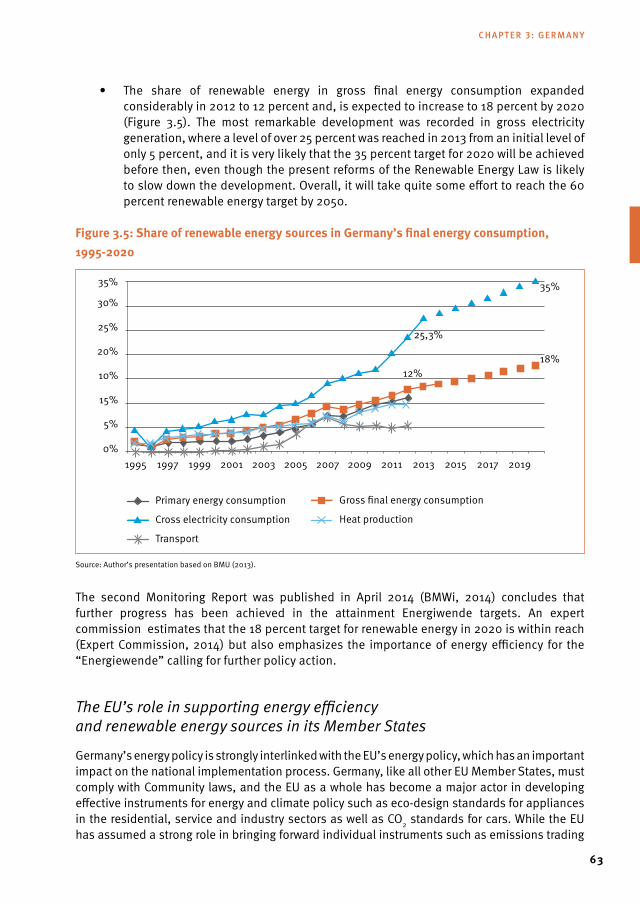
63
• The share of renewable energy in gross final energy consumption expandedconsiderably in 2012 to 12 percent and, is expected to increase to 18 percent by 2020 (Figure 3.5). The most remarkable development was recorded in gross electricity generation, where a level of over 25 percent was reached in 2013 from an initial level of only 5 percent, and it is very likely that the 35 percent target for 2020 will be achieved before then, even though the present reforms of the Renewable Energy Law is likely to slow down the development. Overall, it will take quite some effort to reach the 60 percent renewable energy target by 2050.
Figure 3.5: share of renewable energy sources in Germany’s final energy consumption, 1995-2020
Source: Author’s presentation based on BMU (2013).
The second Monitoring Report was published in April 2014 (BMWi, 2014) concludes that further progress has been achieved in the attainment Energiwende targets. An expert commission estimates that the 18 percent target for renewable energy in 2020 is within reach (Expert Commission, 2014) but also emphasizes the importance of energy efficiency for the “Energiewende” calling for further policy action.
The EU’s role in supporting energy efficiency and renewable energy sources in its Member States
Germany’s energy policy is strongly interlinked with the EU’s energy policy, which has an important impact on the national implementation process. Germany, like all other EU Member States, must comply with Community laws, and the EU as a whole has become a major actor in developing effective instruments for energy and climate policy such as eco-design standards for appliances in the residential, service and industry sectors as well as CO2 standards for cars. While the EU has assumed a strong role in bringing forward individual instruments such as emissions trading
1995 1997 1999 2001 2003 2005 2007 2009 2011 2013 2015 2017 2019
35%
30%
25%
20%
15%
10%
5%
0%
12%
35%
18%
Primary energy consumption
Cross electricity consumption
Transport
Heat production
Gross final energy consumption
25,3%
chapter 3: Germany
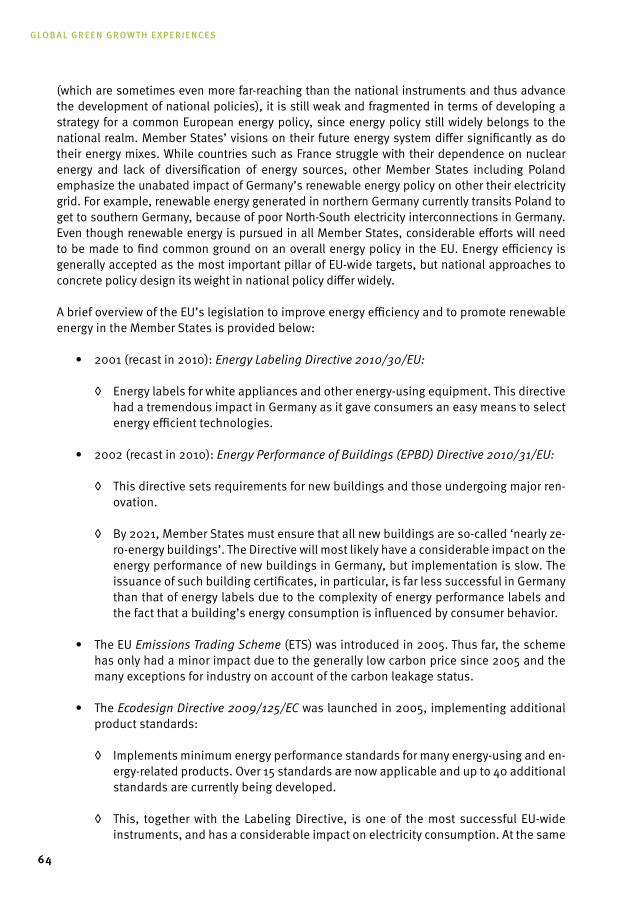
Global Green Growth experiences
64
(which are sometimes even more far-reaching than the national instruments and thus advance the development of national policies), it is still weak and fragmented in terms of developing a strategy for a common European energy policy, since energy policy still widely belongs to the national realm. Member States’ visions on their future energy system differ significantly as do their energy mixes. While countries such as France struggle with their dependence on nuclear energy and lack of diversification of energy sources, other Member States including Poland emphasize the unabated impact of Germany’s renewable energy policy on other their electricity grid. For example, renewable energy generated in northern Germany currently transits Poland to get to southern Germany, because of poor North-South electricity interconnections in Germany. Even though renewable energy is pursued in all Member States, considerable efforts will need to be made to find common ground on an overall energy policy in the EU. Energy efficiency is generally accepted as the most important pillar of EU-wide targets, but national approaches to concrete policy design its weight in national policy differ widely.
A brief overview of the EU’s legislation to improve energy efficiency and to promote renewable energy in the Member States is provided below:
• 2001(recastin2010):Energy Labeling Directive 2010/30/EU:
◊ Energy labels for white appliances and other energy-using equipment. This directive had a tremendous impact in Germany as it gave consumers an easy means to select energy efficient technologies.
• 2002(recastin2010):Energy Performance of Buildings (EPBD) Directive 2010/31/EU:
◊ This directive sets requirements for new buildings and those undergoing major ren-ovation.
◊ By 2021, Member States must ensure that all new buildings are so-called ‘nearly ze-ro-energy buildings’. The Directive will most likely have a considerable impact on the energy performance of new buildings in Germany, but implementation is slow. The issuance of such building certificates, in particular, is far less successful in Germany than that of energy labels due to the complexity of energy performance labels and the fact that a building’s energy consumption is influenced by consumer behavior.
• TheEUEmissions Trading Scheme (ETS) was introduced in 2005. Thus far, the scheme has only had a minor impact due to the generally low carbon price since 2005 and the many exceptions for industry on account of the carbon leakage status.
• TheEcodesign Directive 2009/125/EC was launched in 2005, implementing additional product standards:
◊ Implements minimum energy performance standards for many energy-using and en-ergy-related products. Over 15 standards are now applicable and up to 40 additional standards are currently being developed.
◊ This, together with the Labeling Directive, is one of the most successful EU-wide instruments, and has a considerable impact on electricity consumption. At the same
65
time it allows producers in the EU to take advantage of their industrial capability to produce energy efficient appliances.
• In2006,theEnergy Services Directive 2006/32/EC was issued:
◊ It sets an indicative target to reduce final energy demand by 9 percent in the period 2008-2016. However, as progress at the national levels and early action (i.e. policy impacts between 1995 and 2007) was accounted for in the Directive’s targets, the Directive’s major impact is attributable to the requirement for Member States to regularly publish National Energy Efficiency Action Plans (NEEAPs).
◊ Its objective is to support the energy services market and to develop business op-portunities for energy efficiency.
• Renewable Energy Directive (2009/28/EC): According to the Directive, every Member State must achieve individual targets for the overall share of renewable energy in gross final energy consumption. Germany, for example, has to attain a renewable energy share of 18 percent by 2020 (European Commission, 2014a). In 2010, Germany had reached 11 percent (see Table 3.2), exceeding the interim target by far, and has passed the 12 percent threshold in 2012 (see Figure 3.5). Germany is among the top countries in terms of increasing the share of renewable energy, but the current pace must be maintained to achieve to the 2020 target. The EU as a whole reached 12.7 percent in 2010 of the initial 20 percent target. 41 To this end, Member States will have to agree on regulations to improve grid access for electricity from renewable energy, the administrative and planning procedures and information and training of installers.
table 3.2: Overview of EU member states’ progress under the renewable directive 2009/28/EC
Renewable energy sources (RES) as a percentage of gross final energy consumption
member state rEs share 2005
rEs share 2010
rEs share 2012
1st interim target
2020 rEs target
Austria 23.3 30.1 32.1 25.4 34
Belgium 2.2 5.4 6.8 4.4 13
Bulgaria 9.4 13.8 16.3 10.7 16
Cyprus 2.9 5.7 6.8 4.9 13
Czech Republic 6.1 9.4 11.2 7.5 13
Germany 5.8 11.0 1) 12.4 8.2 18
Denmark 17 22.2 26.0 19.6 30
Estonia 18 24.3 25.8 19.4 25
Greece 6.9 9.7 13.8 9.1 18
Spain 8.7 13.8 14.3 10.9 20
41 Comparisons across countries with respect to achievement in renewable energy sources depend on a variety of variables such as the original level of renewables, the renewable energy potentials etc. Despite the fact that Germany in 2012 had just reached the EU average, the statement holds that there was a rather strong development in Germany in the field of renewable energy as compared to other Member States (see performance indicators for renewable energy in Held et al. 2010).
chapter 3: Germany
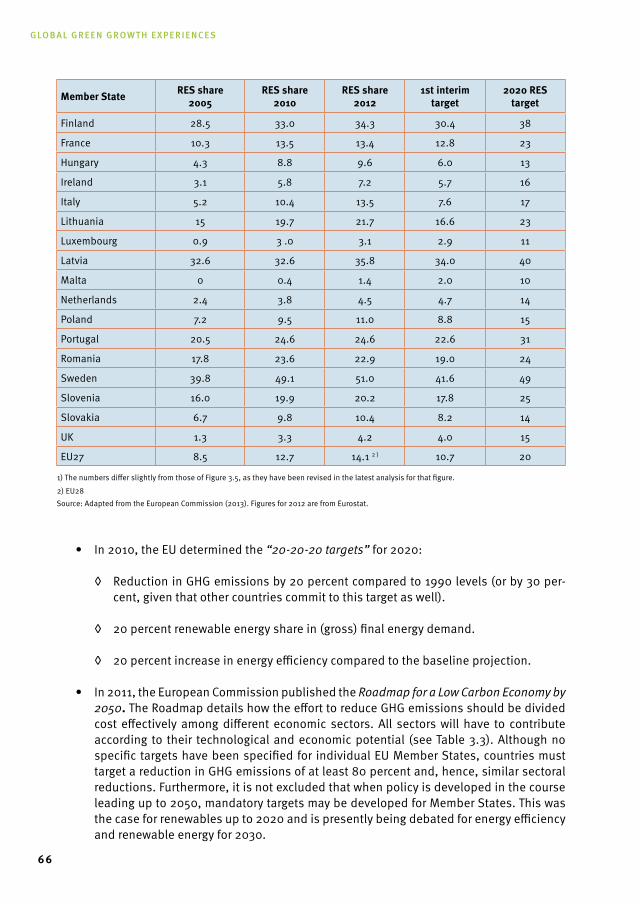
Global Green Growth experiences
66
member state rEs share 2005
rEs share 2010
rEs share 2012
1st interim target
2020 rEs target
Finland 28.5 33.0 34.3 30.4 38
France 10.3 13.5 13.4 12.8 23
Hungary 4.3 8.8 9.6 6.0 13
Ireland 3.1 5.8 7.2 5.7 16
Italy 5.2 10.4 13.5 7.6 17
Lithuania 15 19.7 21.7 16.6 23
Luxembourg 0.9 3 .0 3.1 2.9 11
Latvia 32.6 32.6 35.8 34.0 40
Malta 0 0.4 1.4 2.0 10
Netherlands 2.4 3.8 4.5 4.7 14
Poland 7.2 9.5 11.0 8.8 15
Portugal 20.5 24.6 24.6 22.6 31
Romania 17.8 23.6 22.9 19.0 24
Sweden 39.8 49.1 51.0 41.6 49
Slovenia 16.0 19.9 20.2 17.8 25
Slovakia 6.7 9.8 10.4 8.2 14
UK 1.3 3.3 4.2 4.0 15
EU27 8.5 12.7 14.1 2 ) 10.7 20
1) The numbers differ slightly from those of Figure 3.5, as they have been revised in the latest analysis for that figure.
2) EU28 Source: Adapted from the European Commission (2013). Figures for 2012 are from Eurostat.
• In2010,theEUdeterminedthe“20-20-20 targets” for 2020:
◊ Reduction in GHG emissions by 20 percent compared to 1990 levels (or by 30 per-cent, given that other countries commit to this target as well).
◊ 20 percent renewable energy share in (gross) final energy demand.
◊ 20 percent increase in energy efficiency compared to the baseline projection.
• In2011,theEuropeanCommissionpublishedtheRoadmap for a Low Carbon Economy by 2050. The Roadmap details how the effort to reduce GHG emissions should be divided cost effectively among different economic sectors. All sectors will have to contribute according to their technological and economic potential (see Table 3.3). Although no specific targets have been specified for individual EU Member States, countries must target a reduction in GHG emissions of at least 80 percent and, hence, similar sectoral reductions. Furthermore, it is not excluded that when policy is developed in the course leading up to 2050, mandatory targets may be developed for Member States. This was the case for renewables up to 2020 and is presently being debated for energy efficiency and renewable energy for 2030.
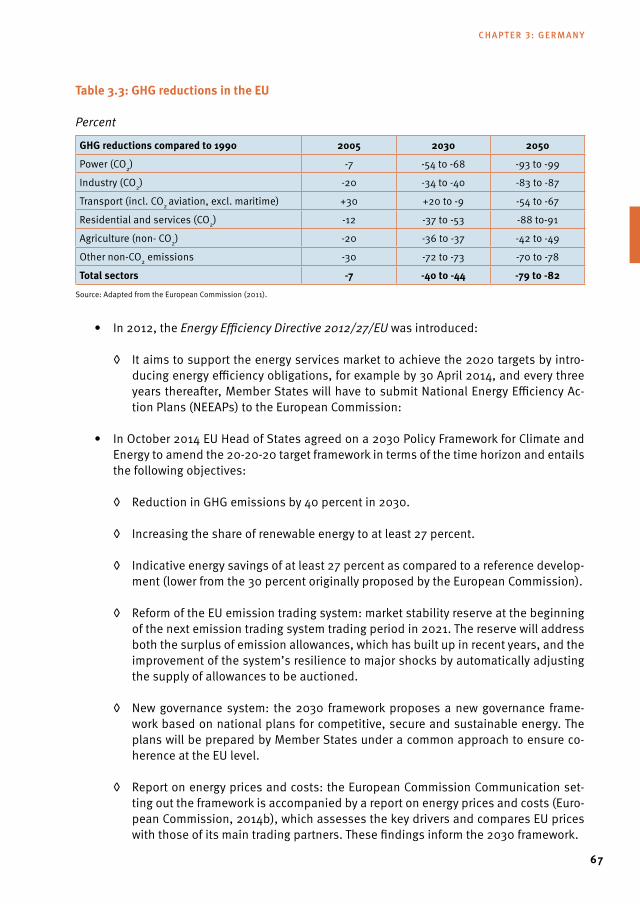
67
table 3.3: GHG reductions in the EU
Percent
GHG reductions compared to 1990 2005 2030 2050
Power (CO2) -7 -54 to -68 -93 to -99
Industry (CO2) -20 -34 to -40 -83 to -87
Transport (incl. CO2 aviation, excl. maritime) +30 +20 to -9 -54 to -67
Residential and services (CO2) -12 -37 to -53 -88 to-91
Agriculture (non- CO2) -20 -36 to -37 -42 to -49
Other non-CO2 emissions -30 -72 to -73 -70 to -78
total sectors -7 -40 to -44 -79 to -82
Source: Adapted from the European Commission (2011).
• In2012,theEnergy Efficiency Directive 2012/27/EU was introduced:
◊ It aims to support the energy services market to achieve the 2020 targets by intro-ducing energy efficiency obligations, for example by 30 April 2014, and every three years thereafter, Member States will have to submit National Energy Efficiency Ac-tion Plans (NEEAPs) to the European Commission:
• InOctober2014EUHeadofStatesagreedona2030PolicyFrameworkforClimateandEnergy to amend the 20-20-20 target framework in terms of the time horizon and entails the following objectives:
◊ Reduction in GHG emissions by 40 percent in 2030.
◊ Increasing the share of renewable energy to at least 27 percent.
◊ Indicative energy savings of at least 27 percent as compared to a reference develop-ment (lower from the 30 percent originally proposed by the European Commission).
◊ Reform of the EU emission trading system: market stability reserve at the beginning of the next emission trading system trading period in 2021. The reserve will address both the surplus of emission allowances, which has built up in recent years, and the improvement of the system’s resilience to major shocks by automatically adjusting the supply of allowances to be auctioned.
◊ New governance system: the 2030 framework proposes a new governance frame-work based on national plans for competitive, secure and sustainable energy. The plans will be prepared by Member States under a common approach to ensure co-herence at the EU level.
◊ Report on energy prices and costs: the European Commission Communication set-ting out the framework is accompanied by a report on energy prices and costs (Euro-pean Commission, 2014b), which assesses the key drivers and compares EU prices with those of its main trading partners. These findings inform the 2030 framework.
chapter 3: Germany
Global Green Growth experiences
68
3.3 Evaluation of Present Employment Effects from Clean Energy technology in Germany
This section introduces a number of important studies on the effects the policies described in Section 3.2 have had on employment in Germany. The studies introduced here are comprehensive in that they are carried out regularly (that is, they serve to monitor the employment effects of clean energy technology) and because they serve official purposes, e.g. within the scope of national reporting, reporting of climate policies to the European Commission or international reporting obligations within the scope of the UNFCCC. These studies allow a comparison with the results in Volume I on Germany, which shows that a shift towards a clean energy sources framework will generate an increase in employment in the country of between 299,900 and 404,500 per year over the next 20 years. The studies also provide empirical insights on the conclusions of the analysis in Volume I. Other studies such as Ragwitz et al. (2009) examine the broader employment impacts of renewable energy sources in the EU, with Germany assuming an important position in these studies.
Employment effects from green technologies
Every two years since 2002, the Federal Ministry for the Environment (BMU) and the Federal Environment Agency (UBA) surveys (gross) employment in the environmental protection sector. The most recent survey “Report on the Environmental Economy 2011. Facts & Figures for Germany” presents total employment of green technologies in Germany, of which clean energy technologies represent an important part. It only includes 2008 data, and does not cover some of the latest developments in the field of renewables in terms of employment. However, separate evaluations for employment in this particular field are available up to 2013.
Clean energy technologies are defined in BMU and UBA (2011) as comprising
“all companies that supply environmental goods and services. … Their range covers such widely differing fields as waste management and recycling, water conservation and wastewater treatment, air quality control, noise abatement, renewable energy sources, environmentally sound products, efficient use of energy, climate protection, and instrumentation and control (I&C) technology. The spectrum of goods manufactured is correspondingly broad … Also of great importance are environment-related services: examples include energy consulting, trade in environmentally sound products, or product support services in the service and maintenance sector.” 42
The concept of potential environmental protection goods originates from a convention that was developed by research institutions in the 1990s in collaboration with the Federal Statistical Office. Since then it has been used for studies on the technological capacity of German indus-try. It is based on a list of goods that are (capable of being) used for environmental protection purposes. In 2006, this concept was expanded at the request of the UBA to include climate protection goods.
42 The definition of the sector of Green Technologies follows OECD/Eurostat-Classifikation, see OECD/Eurostat (1999).
69
The BMU and UBA (2011) combine two approaches to estimate the impacts on employment: 43
• supply-oriented estimates use data such as sales revenue or employee numbers. Conventional statistical surveys exist in industries such as recycling and other waste management services, whereas analyses of the environmental economy are based on company surveys, panel surveys by the Institute for Employment Research (Institut für Arbeitsmarkt- und Berufsforschung) or association statistics. This makes it possible to determine the impact of environment-oriented services and, to some extent, of renewable energy on employment.
• demand-oriented estimates use data from official statistics on domestic demand and on exports of environmental goods as a basis for calculating employment effects. Model calculations based on I-O analyses are used to identify direct and indirect employment effects. Data on the effects of investments, material expenses and exports on employment are based on demand-oriented estimates.
The main results from the BMU and UBA’s 2011 survey are:
• From2006to2008,thegrowthintheproductionofenvironmentalgoodsinGermanywas well above average and reached a volume of nearly $99 billion (corresponding to 5.7 percent of total industrial production) in 2008, while the production volume decreased to $78 billion in 2009 due to the impacts of the economic crisis (see Table 3.4). In the field of green technologies for climate protection, the volume of renewables and energy efficiency is about equal, with the former, however, growing much more rapidly. Note, nevertheless, that categories such as “cleaner/efficient processes” or “cleaner/efficient products” are more difficult to accurately define than renewable energy technologies.
• Witha15.4percentshareofworldtradein2009,Germanyagainheldthetoppositioninexports of environmental goods. Germany was followed by the U.S. (13.6 percent) and China (11.8 percent), ahead of Japan, the United Kingdom and France.
• In 2008, two million persons were employed in the field of green technologies,corresponding to 4.8 percent of total employment in Germany.
• Employmentgrowthinthisfieldwaslargelydrivenbytheexpansionofrenewableenergysources (see the development of the production figures in Table 3.2) and by the export of environmental goods and services. By 2011, employment in the field of renewables comprised around 380,000 persons, up from 320,000 persons in 2008 (see Figure 3.8).
• Theimportanceof‘classical’factorsofenvironmentalprotectionsuchasthereductionof waste, noise, air and water pollution, etc. decreased, on the other hand.
Hence, the BMU and UBA (2011) study show that the production of environmental goods from 2002 to 2009 has generated a substantial number of jobs.
43 The combination of the two approaches yields a sound overview of employment in the environmen tal protection sector – though it also requires careful analysis and the elimination of double counting.
chapter 3: Germany
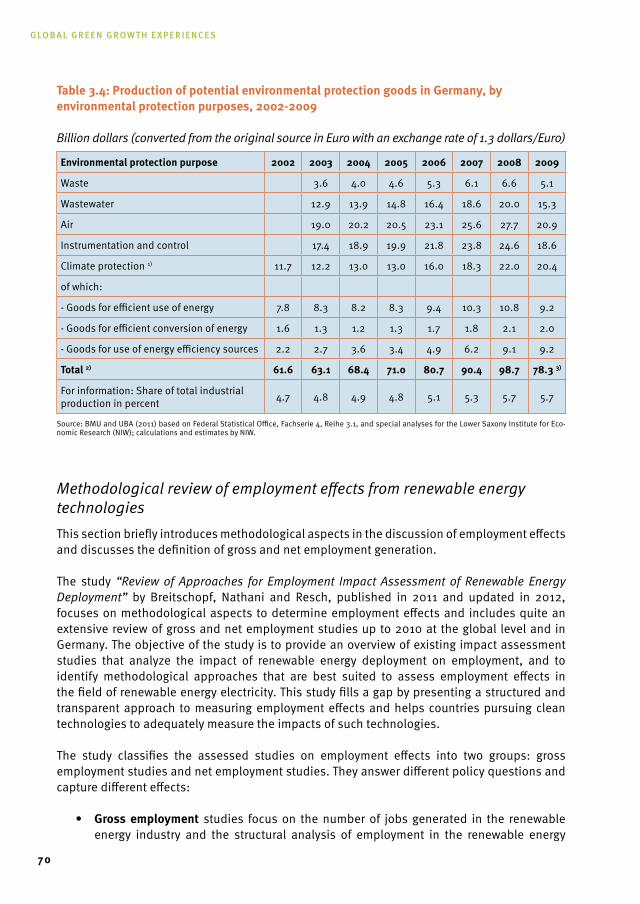
Global Green Growth experiences
70
table 3.4: Production of potential environmental protection goods in Germany, by environmental protection purposes, 2002-2009
Billion dollars (converted from the original source in Euro with an exchange rate of 1.3 dollars/Euro)
Environmental protection purpose 2002 2003 2004 2005 2006 2007 2008 2009
Waste 3.6 4.0 4.6 5.3 6.1 6.6 5.1
Wastewater 12.9 13.9 14.8 16.4 18.6 20.0 15.3
Air 19.0 20.2 20.5 23.1 25.6 27.7 20.9
Instrumentation and control 17.4 18.9 19.9 21.8 23.8 24.6 18.6
Climate protection 1) 11.7 12.2 13.0 13.0 16.0 18.3 22.0 20.4
of which:
- Goods for efficient use of energy 7.8 8.3 8.2 8.3 9.4 10.3 10.8 9.2
- Goods for efficient conversion of energy 1.6 1.3 1.2 1.3 1.7 1.8 2.1 2.0
- Goods for use of energy efficiency sources 2.2 2.7 3.6 3.4 4.9 6.2 9.1 9.2
total 2) 61.6 63.1 68.4 71.0 80.7 90.4 98.7 78.3 3)
For information: Share of total industrial production in percent 4.7 4.8 4.9 4.8 5.1 5.3 5.7 5.7
Source: BMU and UBA (2011) based on Federal Statistical Office, Fachserie 4, Reihe 3.1, and special analyses for the Lower Saxony Institute for Eco-nomic Research (NIW); calculations and estimates by NIW.
Methodological review of employment effects from renewable energy technologiesThis section briefly introduces methodological aspects in the discussion of employment effects and discusses the definition of gross and net employment generation.
The study “Review of Approaches for Employment Impact Assessment of Renewable Energy Deployment” by Breitschopf, Nathani and Resch, published in 2011 and updated in 2012, focuses on methodological aspects to determine employment effects and includes quite an extensive review of gross and net employment studies up to 2010 at the global level and in Germany. The objective of the study is to provide an overview of existing impact assessment studies that analyze the impact of renewable energy deployment on employment, and to identify methodological approaches that are best suited to assess employment effects in the field of renewable energy electricity. This study fills a gap by presenting a structured and transparent approach to measuring employment effects and helps countries pursuing clean technologies to adequately measure the impacts of such technologies.
The study classifies the assessed studies on employment effects into two groups: gross employment studies and net employment studies. They answer different policy questions and capture different effects:
• Gross employment studies focus on the number of jobs generated in the renewable energy industry and the structural analysis of employment in the renewable energy
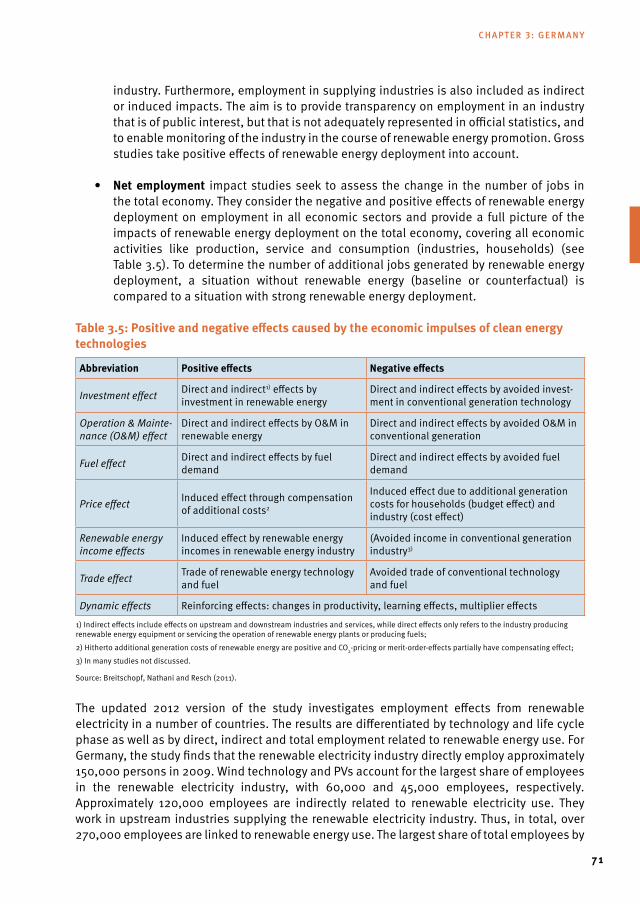
71
industry. Furthermore, employment in supplying industries is also included as indirect or induced impacts. The aim is to provide transparency on employment in an industry that is of public interest, but that is not adequately represented in official statistics, and to enable monitoring of the industry in the course of renewable energy promotion. Gross studies take positive effects of renewable energy deployment into account.
• net employment impact studies seek to assess the change in the number of jobs in the total economy. They consider the negative and positive effects of renewable energy deployment on employment in all economic sectors and provide a full picture of the impacts of renewable energy deployment on the total economy, covering all economic activities like production, service and consumption (industries, households) (see Table 3.5). To determine the number of additional jobs generated by renewable energy deployment, a situation without renewable energy (baseline or counterfactual) is compared to a situation with strong renewable energy deployment.
table 3.5: Positive and negative effects caused by the economic impulses of clean energy technologies
Abbreviation Positive effects negative effects
Investment effect Direct and indirect1) effects by investment in renewable energy
Direct and indirect effects by avoided invest-ment in conventional generation technology
Operation & Mainte-nance (O&M) effect
Direct and indirect effects by O&M in renewable energy
Direct and indirect effects by avoided O&M in conventional generation
Fuel effect Direct and indirect effects by fuel demand
Direct and indirect effects by avoided fuel demand
Price effect Induced effect through compensation of additional costs2
Induced effect due to additional generation costs for households (budget effect) and industry (cost effect)
Renewable energy income effects
Induced effect by renewable energy incomes in renewable energy industry
(Avoided income in conventional generation industry3)
Trade effect Trade of renewable energy technology and fuel
Avoided trade of conventional technology and fuel
Dynamic effects Reinforcing effects: changes in productivity, learning effects, multiplier effects
1) Indirect effects include effects on upstream and downstream industries and services, while direct effects only refers to the industry producing renewable energy equipment or servicing the operation of renewable energy plants or producing fuels;
2) Hitherto additional generation costs of renewable energy are positive and CO2-pricing or merit-order-effects partially have compensating effect;
3) In many studies not discussed.
Source: Breitschopf, Nathani and Resch (2011).
The updated 2012 version of the study investigates employment effects from renewable electricity in a number of countries. The results are differentiated by technology and life cycle phase as well as by direct, indirect and total employment related to renewable energy use. For Germany, the study finds that the renewable electricity industry directly employ approximately 150,000 persons in 2009. Wind technology and PVs account for the largest share of employees in the renewable electricity industry, with 60,000 and 45,000 employees, respectively. Approximately 120,000 employees are indirectly related to renewable electricity use. They work in upstream industries supplying the renewable electricity industry. Thus, in total, over 270,000 employees are linked to renewable energy use. The largest share of total employees by
chapter 3: Germany
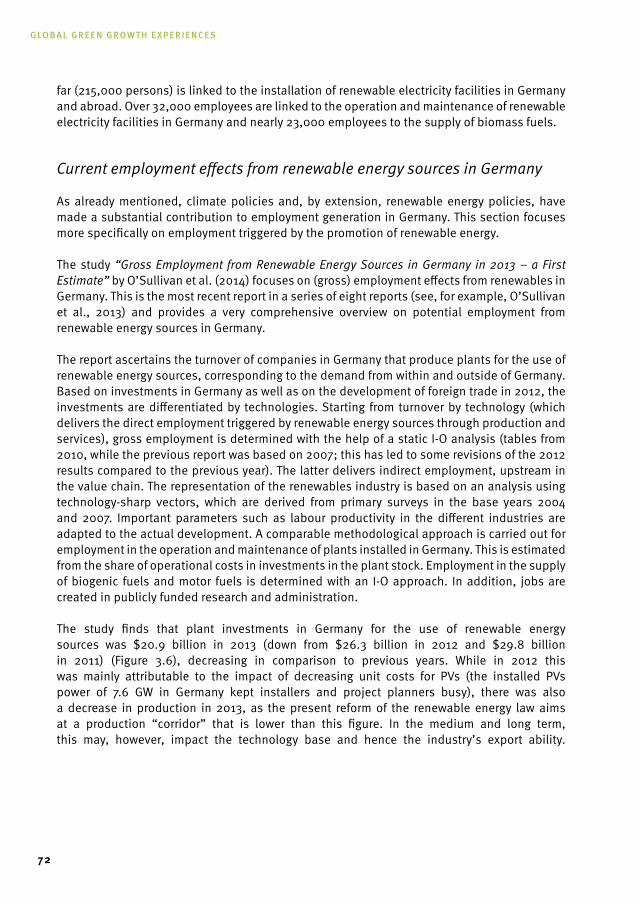
Global Green Growth experiences
72
far (215,000 persons) is linked to the installation of renewable electricity facilities in Germany and abroad. Over 32,000 employees are linked to the operation and maintenance of renewable electricity facilities in Germany and nearly 23,000 employees to the supply of biomass fuels.
Current employment effects from renewable energy sources in Germany
As already mentioned, climate policies and, by extension, renewable energy policies, have made a substantial contribution to employment generation in Germany. This section focuses more specifically on employment triggered by the promotion of renewable energy.
The study “Gross Employment from Renewable Energy Sources in Germany in 2013 – a First Estimate” by O’Sullivan et al. (2014) focuses on (gross) employment effects from renewables in Germany. This is the most recent report in a series of eight reports (see, for example, O’Sullivan et al., 2013) and provides a very comprehensive overview on potential employment from renewable energy sources in Germany.
The report ascertains the turnover of companies in Germany that produce plants for the use of renewable energy sources, corresponding to the demand from within and outside of Germany. Based on investments in Germany as well as on the development of foreign trade in 2012, the investments are differentiated by technologies. Starting from turnover by technology (which delivers the direct employment triggered by renewable energy sources through production and services), gross employment is determined with the help of a static I-O analysis (tables from 2010, while the previous report was based on 2007; this has led to some revisions of the 2012 results compared to the previous year). The latter delivers indirect employment, upstream in the value chain. The representation of the renewables industry is based on an analysis using technology-sharp vectors, which are derived from primary surveys in the base years 2004 and 2007. Important parameters such as labour productivity in the different industries are adapted to the actual development. A comparable methodological approach is carried out for employment in the operation and maintenance of plants installed in Germany. This is estimated from the share of operational costs in investments in the plant stock. Employment in the supply of biogenic fuels and motor fuels is determined with an I-O approach. In addition, jobs are created in publicly funded research and administration.
The study finds that plant investments in Germany for the use of renewable energy sources was $20.9 billion in 2013 (down from $26.3 billion in 2012 and $29.8 billion in 2011) (Figure 3.6), decreasing in comparison to previous years. While in 2012 this was mainly attributable to the impact of decreasing unit costs for PVs (the installed PVs power of 7.6 GW in Germany kept installers and project planners busy), there was also a decrease in production in 2013, as the present reform of the renewable energy law aims at a production “corridor” that is lower than this figure. In the medium and long term, this may, however, impact the technology base and hence the industry’s export ability.
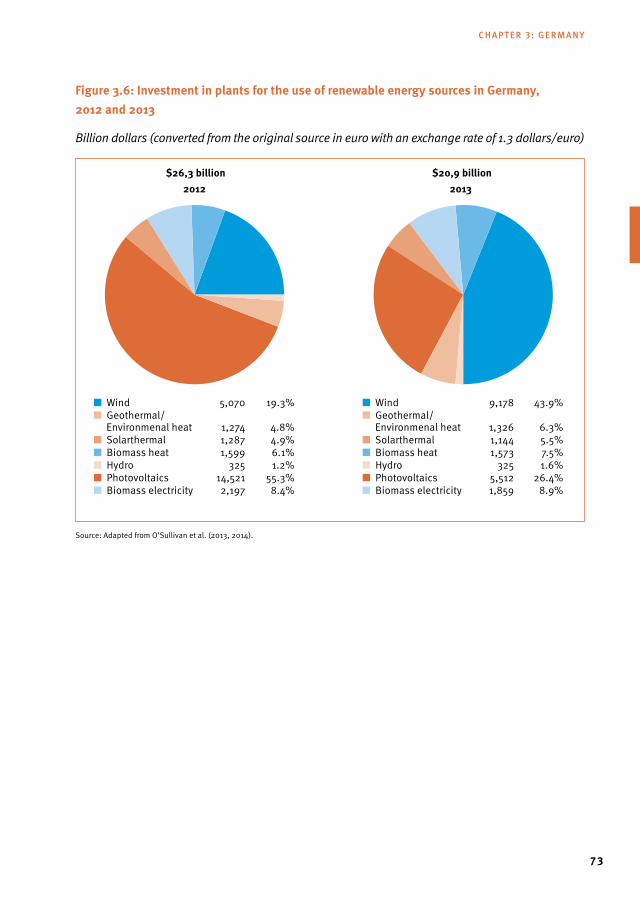
73
Figure 3.6: Investment in plants for the use of renewable energy sources in Germany, 2012 and 2013
Billion dollars (converted from the original source in euro with an exchange rate of 1.3 dollars/euro)
Source: Adapted from O’Sullivan et al. (2013, 2014).
■ Wind 5,070 19.3%■ Geothermal/ Environmenal heat 1,274 4.8%■ Solarthermal 1,287 4.9%■ Biomass heat 1,599 6.1%■ Hydro 325 1.2%■ Photovoltaics 14,521 55.3%■ Biomass electricity 2,197 8.4%
$26,3 billion2012
$20,9 billion2013
■ Wind 9,178 43.9%■ Geothermal/ Environmenal heat 1,326 6.3%■ Solarthermal 1,144 5.5%■ Biomass heat 1,573 7.5%■ Hydro 325 1.6%■ Photovoltaics 5,512 26.4%■ Biomass electricity 1,859 8.9%
chapter 3: Germany
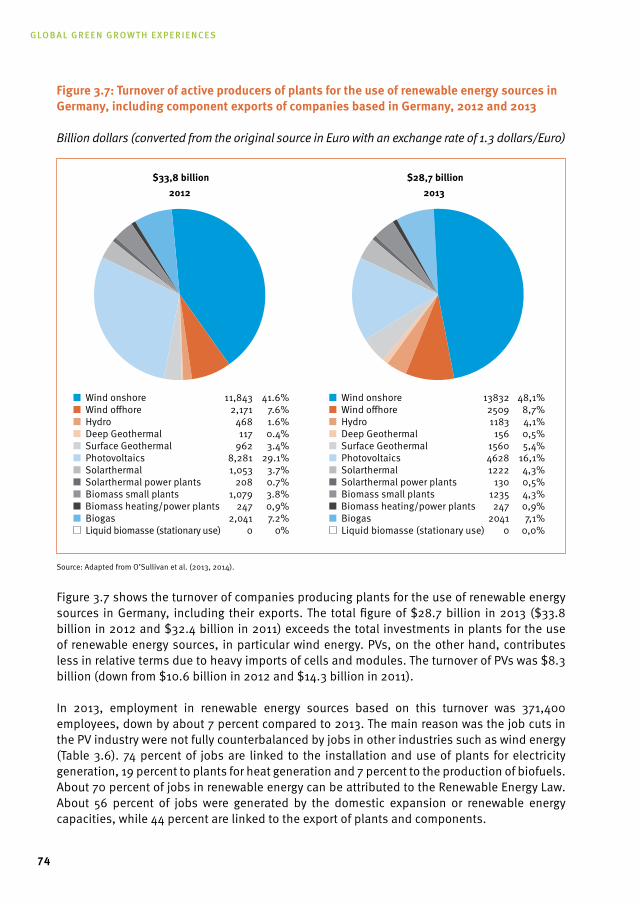
Global Green Growth experiences
74
Figure 3.7: turnover of active producers of plants for the use of renewable energy sources in Germany, including component exports of companies based in Germany, 2012 and 2013
Billion dollars (converted from the original source in Euro with an exchange rate of 1.3 dollars/Euro)
Source: Adapted from O’Sullivan et al. (2013, 2014).
Figure 3.7 shows the turnover of companies producing plants for the use of renewable energy sources in Germany, including their exports. The total figure of $28.7 billion in 2013 ($33.8 billion in 2012 and $32.4 billion in 2011) exceeds the total investments in plants for the use of renewable energy sources, in particular wind energy. PVs, on the other hand, contributes less in relative terms due to heavy imports of cells and modules. The turnover of PVs was $8.3 billion (down from $10.6 billion in 2012 and $14.3 billion in 2011).
In 2013, employment in renewable energy sources based on this turnover was 371,400 employees, down by about 7 percent compared to 2013. The main reason was the job cuts in the PV industry were not fully counterbalanced by jobs in other industries such as wind energy (Table 3.6). 74 percent of jobs are linked to the installation and use of plants for electricity generation, 19 percent to plants for heat generation and 7 percent to the production of biofuels. About 70 percent of jobs in renewable energy can be attributed to the Renewable Energy Law. About 56 percent of jobs were generated by the domestic expansion or renewable energy capacities, while 44 percent are linked to the export of plants and components.
■ Wind onshore 11,843 41.6%■ Wind offhore 2,171 7.6%■ Hydro 468 1.6%■ Deep Geothermal 117 0.4%■ Surface Geothermal 962 3.4%■ Photovoltaics 8,281 29.1%■ Solarthermal 1,053 3.7%■ Solarthermal power plants 208 0.7%■ Biomass small plants 1,079 3.8%■ Biomass heating/power plants 247 0,9%■ Biogas 2,041 7.2%
Liquid biomasse (stationary use) 0 0%
■ Wind onshore 13832 48,1%■ Wind offhore 2509 8,7%■ Hydro 1183 4,1%■ Deep Geothermal 156 0,5%■ Surface Geothermal 1560 5,4%■ Photovoltaics 4628 16,1%■ Solarthermal 1222 4,3%■ Solarthermal power plants 130 0,5%■ Biomass small plants 1235 4,3%■ Biomass heating/power plants 247 0,9%■ Biogas 2041 7,1%
Liquid biomasse (stationary use) 0 0,0%
$33,8 billion2012
$28,7 billion2013
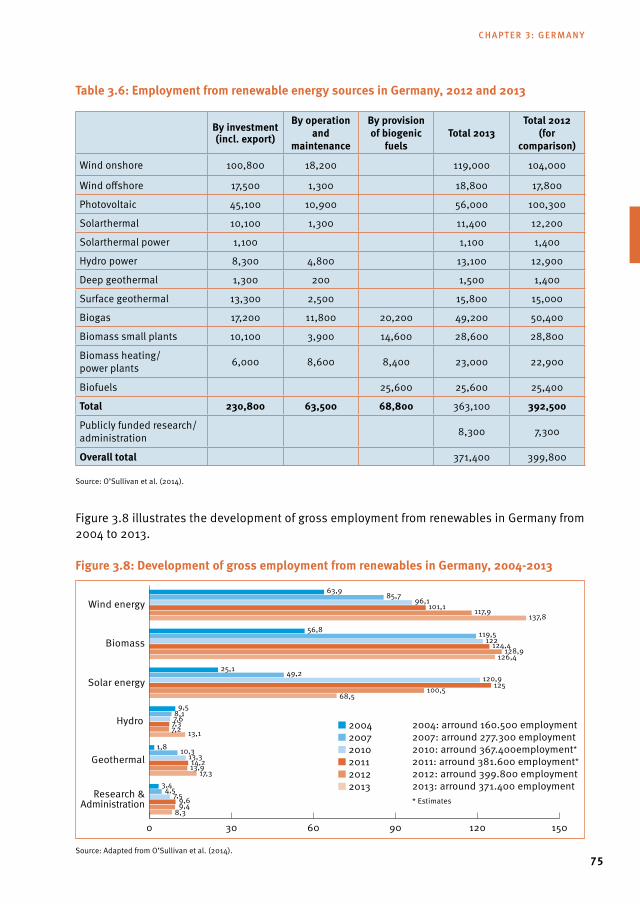
75
table 3.6: Employment from renewable energy sources in Germany, 2012 and 2013
By investment (incl. export)
By operation and
maintenance
By provision of biogenic
fuelstotal 2013
total 2012(for
comparison)
Wind onshore 100,800 18,200 119,000 104,000
Wind offshore 17,500 1,300 18,800 17,800
Photovoltaic 45,100 10,900 56,000 100,300
Solarthermal 10,100 1,300 11,400 12,200
Solarthermal power 1,100 1,100 1,400
Hydro power 8,300 4,800 13,100 12,900
Deep geothermal 1,300 200 1,500 1,400
Surface geothermal 13,300 2,500 15,800 15,000
Biogas 17,200 11,800 20,200 49,200 50,400
Biomass small plants 10,100 3,900 14,600 28,600 28,800
Biomass heating/power plants 6,000 8,600 8,400 23,000 22,900
Biofuels 25,600 25,600 25,400
total 230,800 63,500 68,800 363,100 392,500
Publicly funded research/administration 8,300 7,300
Overall total 371,400 399,800
Source: O’Sullivan et al. (2014).
Figure 3.8 illustrates the development of gross employment from renewables in Germany from 2004 to 2013.
Figure 3.8: development of gross employment from renewables in Germany, 2004-2013
Source: Adapted from O’Sullivan et al. (2014).
■ 2004■ 2007■ 2010■ 2011■ 2012■ 2013
2004: arround 160.500 employment2007: arround 277.300 employment2010: arround 367.400employment*
2011: arround 381.600 employment*
2012: arround 399.800 employment2013: arround 371.400 employment* Estimates
Wind energy
Biomass
Solar energy
Hydro
Geothermal
Research &Administration
0 30 60 90 120 150
63,985,7
96,1101,1 117,9
137,856,8 119,5
122124,4128,9
126,425,1 49,2
120,9125100,5
68,59,5
8,17,67,37,2 13,1
1,8 10,313,314,213,9
17,33,44,5
7,59,69,4
8,3
chapter 3: Germany
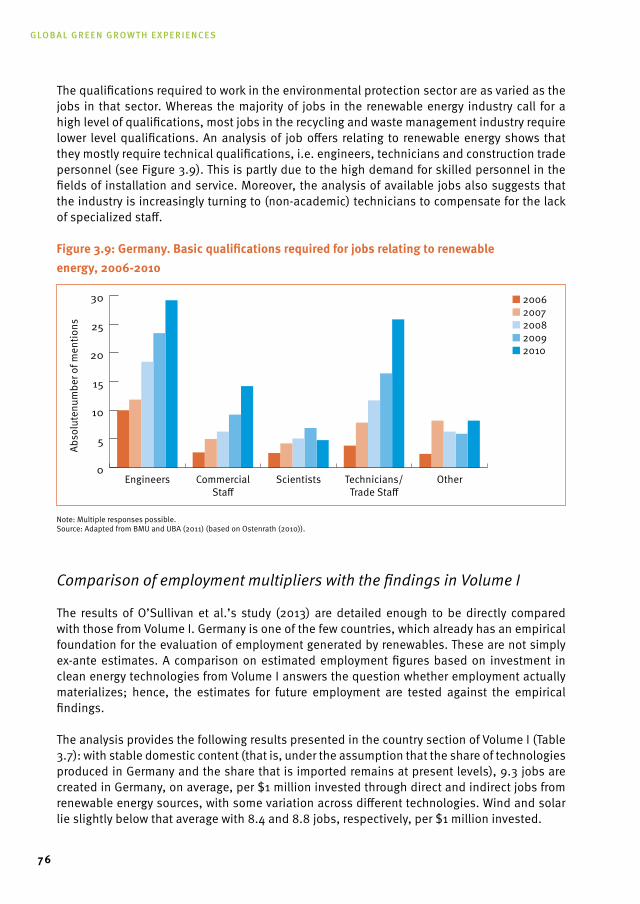
Global Green Growth experiences
76
The qualifications required to work in the environmental protection sector are as varied as the jobs in that sector. Whereas the majority of jobs in the renewable energy industry call for a high level of qualifications, most jobs in the recycling and waste management industry require lower level qualifications. An analysis of job offers relating to renewable energy shows that they mostly require technical qualifications, i.e. engineers, technicians and construction trade personnel (see Figure 3.9). This is partly due to the high demand for skilled personnel in the fields of installation and service. Moreover, the analysis of available jobs also suggests that the industry is increasingly turning to (non-academic) technicians to compensate for the lack of specialized staff.
Figure 3.9: Germany. Basic qualifications required for jobs relating to renewable energy, 2006-2010
Note: Multiple responses possible.Source: Adapted from BMU and UBA (2011) (based on Ostenrath (2010)).
Comparison of employment multipliers with the findings in Volume I
The results of O’Sullivan et al.’s study (2013) are detailed enough to be directly compared with those from Volume I. Germany is one of the few countries, which already has an empirical foundation for the evaluation of employment generated by renewables. These are not simply ex-ante estimates. A comparison on estimated employment figures based on investment in clean energy technologies from Volume I answers the question whether employment actually materializes; hence, the estimates for future employment are tested against the empirical findings.
The analysis provides the following results presented in the country section of Volume I (Table 3.7): with stable domestic content (that is, under the assumption that the share of technologies produced in Germany and the share that is imported remains at present levels), 9.3 jobs are created in Germany, on average, per $1 million invested through direct and indirect jobs from renewable energy sources, with some variation across different technologies. Wind and solar lie slightly below that average with 8.4 and 8.8 jobs, respectively, per $1 million invested.
■ 2006■ 2007■ 2008■ 2009■ 2010
Abso
lute
num
ber o
f men
tions
0
5
10
15
20
25
30
Engineers CommercialStaff
Scientists Technicians/Trade Staff
Other
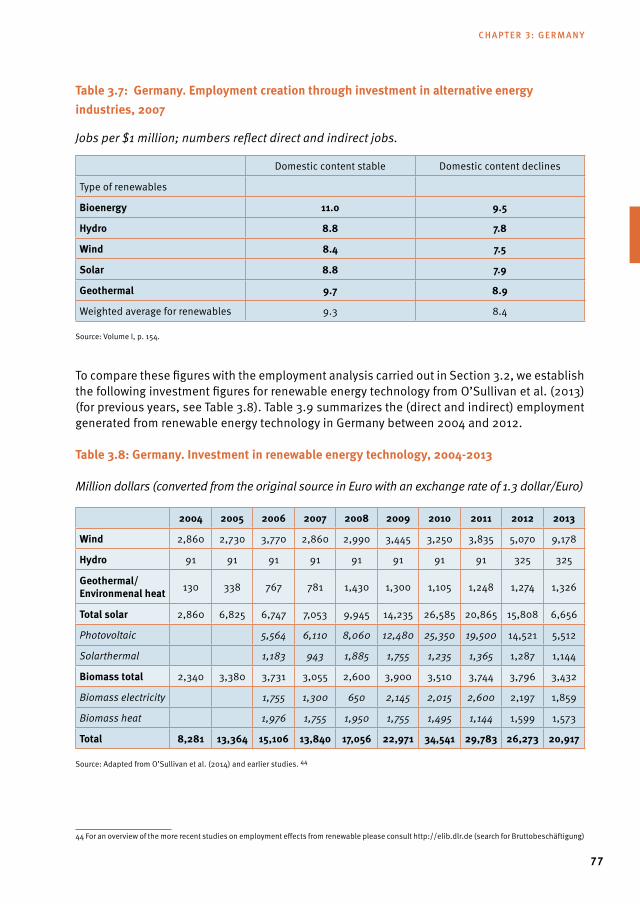
77
table 3.7: Germany. Employment creation through investment in alternative energy industries, 2007
Jobs per $1 million; numbers reflect direct and indirect jobs.
Domestic content stable Domestic content declines
Type of renewables
Bioenergy 11.0 9.5
Hydro 8.8 7.8
wind 8.4 7.5
solar 8.8 7.9
Geothermal 9.7 8.9
Weighted average for renewables 9.3 8.4
Source: Volume I, p. 154.
To compare these figures with the employment analysis carried out in Section 3.2, we establish the following investment figures for renewable energy technology from O’Sullivan et al. (2013) (for previous years, see Table 3.8). Table 3.9 summarizes the (direct and indirect) employment generated from renewable energy technology in Germany between 2004 and 2012.
table 3.8: Germany. Investment in renewable energy technology, 2004-2013
Million dollars (converted from the original source in Euro with an exchange rate of 1.3 dollar/Euro)
2004 2005 2006 2007 2008 2009 2010 2011 2012 2013
wind 2,860 2,730 3,770 2,860 2,990 3,445 3,250 3,835 5,070 9,178
Hydro 91 91 91 91 91 91 91 91 325 325
Geothermal/Environmenal heat 130 338 767 781 1,430 1,300 1,105 1,248 1,274 1,326
total solar 2,860 6,825 6,747 7,053 9,945 14,235 26,585 20,865 15,808 6,656
Photovoltaic 5,564 6,110 8,060 12,480 25,350 19,500 14,521 5,512
Solarthermal 1,183 943 1,885 1,755 1,235 1,365 1,287 1,144
Biomass total 2,340 3,380 3,731 3,055 2,600 3,900 3,510 3,744 3,796 3,432
Biomass electricity 1,755 1,300 650 2,145 2,015 2,600 2,197 1,859
Biomass heat 1,976 1,755 1,950 1,755 1,495 1,144 1,599 1,573
total 8,281 13,364 15,106 13,840 17,056 22,971 34,541 29,783 26,273 20,917
Source: Adapted from O’Sullivan et al. (2014) and earlier studies. 44
44 For an overview of the more recent studies on employment effects from renewable please consult http://elib.dlr.de (search for Bruttobeschäftigung)
chapter 3: Germany
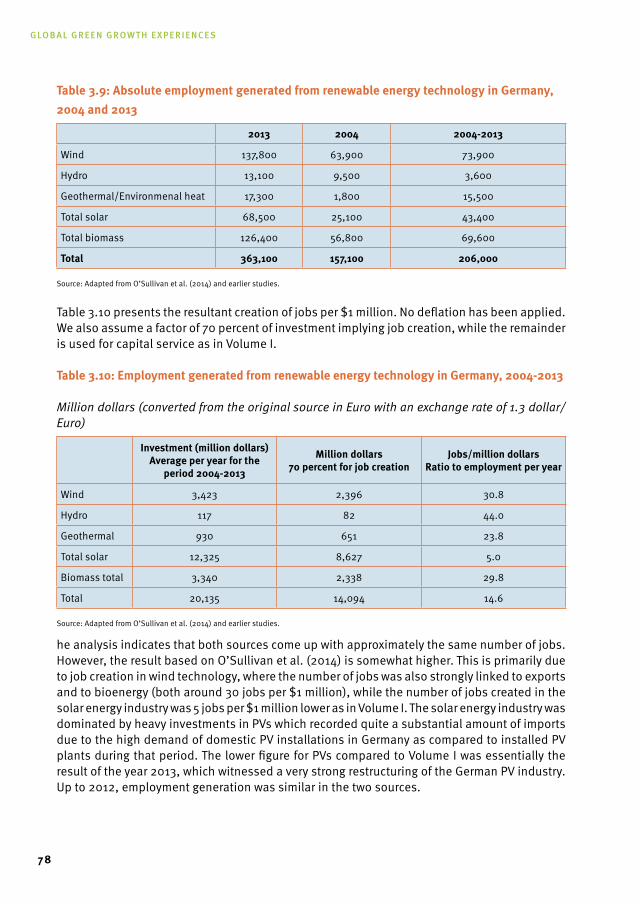
Global Green Growth experiences
78
table 3.9: Absolute employment generated from renewable energy technology in Germany, 2004 and 2013
2013 2004 2004-2013
Wind 137,800 63,900 73,900
Hydro 13,100 9,500 3,600
Geothermal/Environmenal heat 17,300 1,800 15,500
Total solar 68,500 25,100 43,400
Total biomass 126,400 56,800 69,600
total 363,100 157,100 206,000
Source: Adapted from O’Sullivan et al. (2014) and earlier studies.
Table 3.10 presents the resultant creation of jobs per $1 million. No deflation has been applied. We also assume a factor of 70 percent of investment implying job creation, while the remainder is used for capital service as in Volume I.
table 3.10: Employment generated from renewable energy technology in Germany, 2004-2013
Million dollars (converted from the original source in Euro with an exchange rate of 1.3 dollar/Euro)
Investment (million dollars)Average per year for the
period 2004-2013
million dollars70 percent for job creation
Jobs/million dollarsratio to employment per year
Wind 3,423 2,396 30.8
Hydro 117 82 44.0
Geothermal 930 651 23.8
Total solar 12,325 8,627 5.0
Biomass total 3,340 2,338 29.8
Total 20,135 14,094 14.6
Source: Adapted from O’Sullivan et al. (2014) and earlier studies.
he analysis indicates that both sources come up with approximately the same number of jobs. However, the result based on O’Sullivan et al. (2014) is somewhat higher. This is primarily due to job creation in wind technology, where the number of jobs was also strongly linked to exports and to bioenergy (both around 30 jobs per $1 million), while the number of jobs created in the solar energy industry was 5 jobs per $1 million lower as in Volume I. The solar energy industry was dominated by heavy investments in PVs which recorded quite a substantial amount of imports due to the high demand of domestic PV installations in Germany as compared to installed PV plants during that period. The lower figure for PVs compared to Volume I was essentially the result of the year 2013, which witnessed a very strong restructuring of the German PV industry. Up to 2012, employment generation was similar in the two sources.
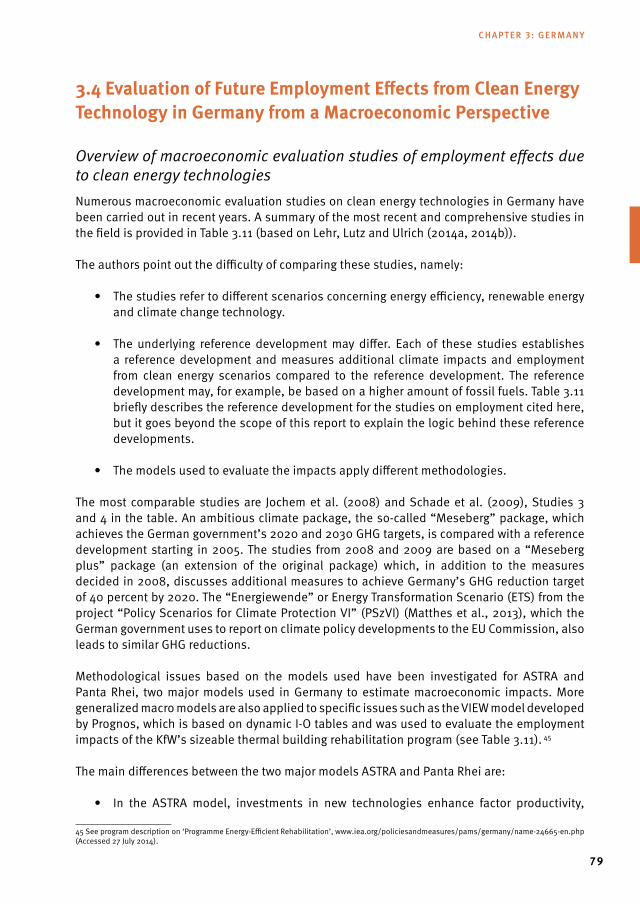
79
3.4 Evaluation of Future Employment Effects from Clean Energy technology in Germany from a macroeconomic Perspective Overview of macroeconomic evaluation studies of employment effects due to clean energy technologiesNumerous macroeconomic evaluation studies on clean energy technologies in Germany have been carried out in recent years. A summary of the most recent and comprehensive studies in the field is provided in Table 3.11 (based on Lehr, Lutz and Ulrich (2014a, 2014b)).
The authors point out the difficulty of comparing these studies, namely:
• Thestudiesrefertodifferentscenariosconcerningenergyefficiency,renewableenergyand climate change technology.
• The underlying reference developmentmay differ. Each of these studies establishesa reference development and measures additional climate impacts and employment from clean energy scenarios compared to the reference development. The reference development may, for example, be based on a higher amount of fossil fuels. Table 3.11 briefly describes the reference development for the studies on employment cited here, but it goes beyond the scope of this report to explain the logic behind these reference developments.
• Themodelsusedtoevaluatetheimpactsapplydifferentmethodologies.
The most comparable studies are Jochem et al. (2008) and Schade et al. (2009), Studies 3 and 4 in the table. An ambitious climate package, the so-called “Meseberg” package, which achieves the German government’s 2020 and 2030 GHG targets, is compared with a reference development starting in 2005. The studies from 2008 and 2009 are based on a “Meseberg plus” package (an extension of the original package) which, in addition to the measures decided in 2008, discusses additional measures to achieve Germany’s GHG reduction target of 40 percent by 2020. The “Energiewende” or Energy Transformation Scenario (ETS) from the project “Policy Scenarios for Climate Protection VI” (PSzVI) (Matthes et al., 2013), which the German government uses to report on climate policy developments to the EU Commission, also leads to similar GHG reductions.
Methodological issues based on the models used have been investigated for ASTRA and Panta Rhei, two major models used in Germany to estimate macroeconomic impacts. More generalized macro models are also applied to specific issues such as the VIEW model developed by Prognos, which is based on dynamic I-O tables and was used to evaluate the employment impacts of the KfW’s sizeable thermal building rehabilitation program (see Table 3.11). 45
The main differences between the two major models ASTRA and Panta Rhei are:
• In the ASTRA model, investments in new technologies enhance factor productivity,
45 See program description on ‘Programme Energy-Efficient Rehabilitation’, www.iea.org/policiesandmeasures/pams/germany/name-24665-en.php (Accessed 27 July 2014).
chapter 3: Germany
Global Green Growth experiences
80
while the impeding influence of higher capital cost is evident in the long term in the Panta Rhei model.
• ASTRAisaEuropean-widemodelinwhichpositiveeconomicimpactsinonecountryofthe EU lead to higher economic activity in another EU country, which in turn increases the exports of all countries. Panta Rhei does not include such feedback effects.
• There are differences in the historic data and behavioral parameters used by thetwo models. ASTRA calculations have been carried out using parameters that are considerably influenced by the economic crisis, while Panta Rhei uses more recent data. With regard to employment markets, this probably implies that wage effects are observable in the Panta Rhei model due to higher investments, which have an impeding influence on multiplicator effects. Hence, employment effects have a stronger impact in terms of higher wages than in terms of higher employment.
The employment estimates for Germany in Volume I are built on the scenarios from the Energy Concept (Schlesinger et al., 2010 - Study 1 in Table 3.11). These scenarios date back to 2010, but are official projections for GHG emissions and environmental policies. They are still fairly representative of the trends compared to other scenario projections such as the “Policy Scenarios for Climate Protection VI” (see the comparison below in this section), which the more recent study by Lehr, Lutz and Ulrich (2014b) on employment effects is based on.
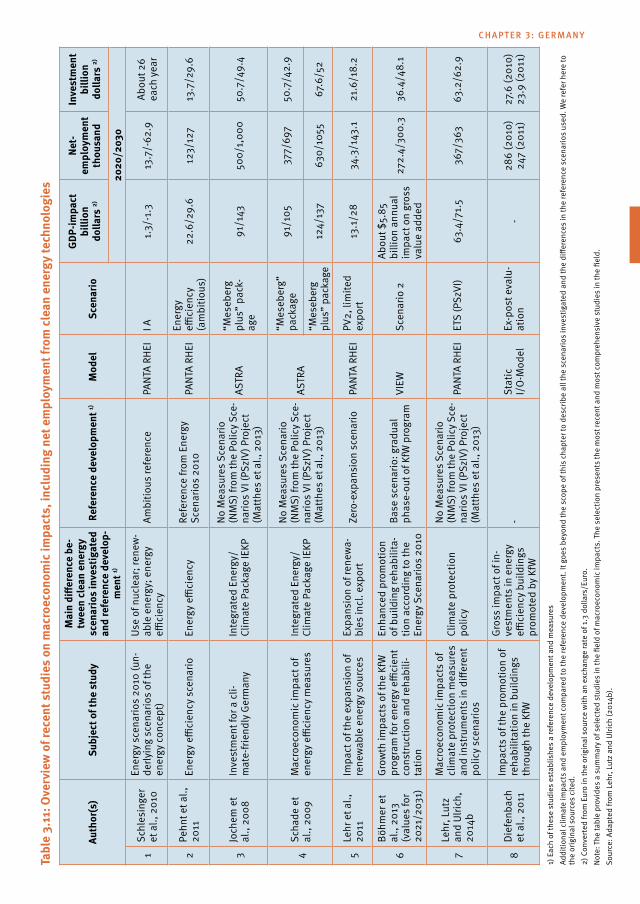
tabl
e 3.
11: O
verv
iew
of r
ecen
t stu
dies
on
mac
roec
onom
ic im
pact
s, in
clud
ing
net e
mpl
oym
ent f
rom
cle
an e
nerg
y te
chno
logi
es
Auth
or(s
)su
bjec
t of t
he s
tudy
mai
n di
ffere
nce
be-
twee
n cl
ean
ener
gy
scen
ario
s in
vest
igat
ed
and
refe
renc
e de
velo
p-m
ent 1)
refe
renc
e de
velo
pmen
t 1)m
odel
scen
ario
GdP-
impa
ctbi
llion
do
llars
2)
net-
em
ploy
men
t th
ousa
nd
Inve
stm
ent
billi
on
dolla
rs 2)
2020
/203
0
1Sc
hles
inge
r et
al.,
201
0
Ener
gy s
cena
rios
2010
(un-
derly
ing
scen
ario
s of
the
ener
gy c
once
pt)
Use
of n
ucle
ar; r
enew
-ab
le e
nerg
y; e
nerg
y effi
cien
cyAm
bitio
us re
fere
nce
PANT
A RH
EII A
1.3/
-1.3
13.7
/-62
.9Ab
out 2
6 ea
ch y
ear
2Pe
hnt e
t al.,
20
11En
ergy
effi
cien
cy s
cena
rioEn
ergy
effi
cien
cyRe
fere
nce
from
Ene
rgy
Scen
ario
s 20
10PA
NTA
RHEI
Ener
gy
effici
ency
(a
mbi
tious
)22
.6/2
9.6
123/
127
13.7
/29.
6
3Jo
chem
et
al.,
2008
Inve
stm
ent f
or a
cli-
mat
e-fri
endl
y Ge
rman
y In
tegr
ated
Ene
rgy/
Cl
imat
e Pa
ckag
e IE
KP
No M
easu
res
Scen
ario
(N
MS)
from
the
Polic
y Sce
-na
rios
VI (P
SzIV
) Pro
ject
(M
atth
es e
t al.,
201
3)
ASTR
A“M
eseb
erg
plus
” pa
ck-
age
91/1
4350
0/1,
000
50.7
/49.
4
4Sc
hade
et
al.,
2009
Mac
roec
onom
ic im
pact
of
ener
gy e
ffici
ency
mea
sure
sIn
tegr
ated
Ene
rgy/
Cl
imat
e Pa
ckag
e IE
KP
No M
easu
res
Scen
ario
(N
MS)
from
the
Polic
y Sce
-na
rios
VI (P
SzIV
) Pro
ject
(M
atth
es e
t al.,
201
3)
ASTR
A
“Mes
eber
g”
pack
age
91/1
0537
7/69
750
.7/4
2.9
“Mes
eber
g pl
us”
pack
age
124/
137
630/
1055
67.6
/52
5Le
hr e
t al.,
20
11Im
pact
of t
he e
xpan
sion
of
rene
wab
le e
nerg
y so
urce
sEx
pans
ion
of re
new
a-bl
es in
cl. e
xpor
tZe
ro-e
xpan
sion
sce
nario
PANT
A RH
EIPV
2, li
mite
d ex
port
13.1
/28
34.3
/143
.121
.6/1
8.2
6
Böhm
er e
t al
., 20
13(v
alue
s fo
r 20
21/2
031)
Grow
th im
pact
s of
the
KfW
pr
ogra
m fo
r ene
rgy
effici
ent
cons
truct
ion
and
reha
bili-
tatio
n
Enha
nced
pro
mot
ion
of b
uild
ing
reha
bilit
a-tio
n ac
cord
ing
to th
e En
ergy
Sce
nario
s 20
10
Base
sce
nario
: gra
dual
ph
ase-
out o
f KfW
pro
gram
VIEW
Scen
ario
2
Abou
t $5.
85
billi
on a
nnua
l im
pact
on
gros
s va
lue
adde
d
272.
4/30
0.3
36.4
/48.
1
7Le
hr, L
utz
and
Ulric
h,
2014
b
Mac
roec
onom
ic im
pact
s of
cl
imat
e pr
otec
tion
mea
sure
s an
d in
stru
men
ts in
diff
eren
t po
licy
scen
ario
s
Clim
ate
prot
ectio
n po
licy
No M
easu
res
Scen
ario
(N
MS)
from
the
Polic
y Sce
-na
rios
VI (P
SzIV
) Pro
ject
(M
atth
es e
t al.,
201
3)
PANT
A RH
EIET
S (P
SzVI
)63
.4/7
1.5
367/
363
63.2
/62.
9
8Di
efen
bach
et
al.,
201
1
Impa
cts
of th
e pr
omot
ion
of
reha
bilit
atio
n in
bui
ldin
gs
thro
ugh
the
KfW
Gros
s im
pact
of i
n-ve
stm
ents
in e
nerg
y effi
cien
cy b
uild
ings
pr
omot
ed b
y Kf
W
-St
atic
I/
O-M
odel
Ex-p
ost e
valu
-at
ion
-28
6 (2
010)
247
(201
1)27
.6 (2
010)
23.9
(201
1)
1) E
ach
of th
ese
stud
ies
esta
blis
hes
a re
fere
nce
deve
lopm
ent a
nd m
easu
res
Addi
tiona
l clim
ate
impa
cts
and
empl
oym
ent c
ompa
red
to th
e re
fere
nce
deve
lopm
ent.
It go
es b
eyon
d th
e sc
ope
of th
is c
hapt
er to
des
crib
e al
l the
sce
nario
s in
vest
igat
ed a
nd th
e di
ffere
nces
in th
e re
fere
nce
scen
ario
s us
ed. W
e re
fer h
ere
to
the
orig
inal
sou
rces
cite
d.2)
Con
verte
d fro
m E
uro
in th
e or
igin
al s
ourc
e w
ith a
n ex
chan
ge ra
te o
f 1.3
dol
lars
/Eur
o.No
te: T
he ta
ble
prov
ides
a s
umm
ary
of s
elec
ted
stud
ies
in th
e fie
ld o
f mac
roec
onom
ic im
pact
s. T
he s
elec
tion
pres
ents
the
mos
t rec
ent a
nd m
ost c
ompr
ehen
sive
stu
dies
in th
e fie
ld.
Sour
ce: A
dapt
ed fr
om L
ehr,
Lutz
and
Ulri
ch (2
014b
).
chapter 3: Germany
Global Green Growth experiences
82
Macroeconomic evaluation of employment effects
In this section, we focus on the specific results of the macroeconomic evaluation of employment effects in Study 7, “Gesamtwirtschaftliche Wirkungen von Klimaschutzmaßnahmen und –Instrumenten” (Macroeconomic impacts of climate protection measures and instruments) by Lehr, Lutz and Ulrich (2014b). It is the most recent macroeconomic study on climate protection measures and instruments determining net employment for 2020 and 2030 under certain scenario assumptions. The macroeconomic analysis (top-down) is based on the project “Policy Scenarios for Climate Protection VI” (hereafter referred to as Policy Scenarios VI) (Matthes et al., 2013), published by UBA, with a large number of bottom-up models (energy system models) being run to deliver investment impulses to the macro-model. This is the main projection tool used by Germany to report on the impact of climate policies to the European Commission and the UNFCCC. Study 1 cited in Table 3.11 also includes important projections undertaken for the Ministry of Economic Affairs in Germany. The projections do not significantly differ in their trends on renewable energy and energy efficiency from those in the Policy Scenarios VI. The key difference is that Study 1 was initiated with the perspective of extending the lifetime of nuclear power plants in Germany, which became obsolete following the Fukushima Daiichi nuclear disaster. Though these scenarios were built on extending the lifetime of nuclear power plants, they nevertheless implicitly incorporated a strong renewable energy and energy efficiency factor considering that the impact in terms of GHG reduction is primarily attributed to renewable energy and energy efficiency rather than to the extension of the lifetime of nuclear power plants. The key difference to the Policy Scenarios VI is that the role of the remaining fossil fuels during the transition period away from nuclear power plants is even less significant. This is why renewable energy and energy efficiency provide a suitable basis in terms of employment generation in the projections in Volume I and deliver results similar to those of Study 7 (Lehr, Lutz and Ulrich, 2014b).
The Policy Scenarios VI cluster the policy measures into two scenarios: in the Current Policy Scenario (CPS), all measures that were implemented by 8 July 2011 (the date for the region-wide agreement of the “Energiewende” in Germany) are considered. This scenario serves as the reference scenario to evaluate the impacts of the measures. In the Energy Transformation Scenario (ETS), additional measures are taken into account to achieve Germany’s climate targets by 2030 (40 percent GHG reduction by 2020 and 55 percent reduction by 2030 compared to the 1990 levels, see Table 3.1). To determine the economic valuation of the measures implemented, the ETS and CPS are compared. The two policy scenarios basically build on the same socio-economic assumptions, e.g. concerning international developments and demography. The scenarios only differ in terms of climate protection measures, which are specified extensively in Policy Scenarios VI. Additionally, for some of the policy areas, a so-called “No Measures Scenario” (NMS) is defined, which only includes measures implemented until the end of 2004. It is used in a sensitivity analysis to calculate the macroeconomic impacts of the CPS.
The study uses the macro-model Panta Rhei based on data from the German Statistical Office (59 industries) and the Working Group on Energy Balances in Germany (Arbeitsgemeinschaft Energiebilanzen) as well as international databases. A detailed model description can be found in Lehr et al. (2011).
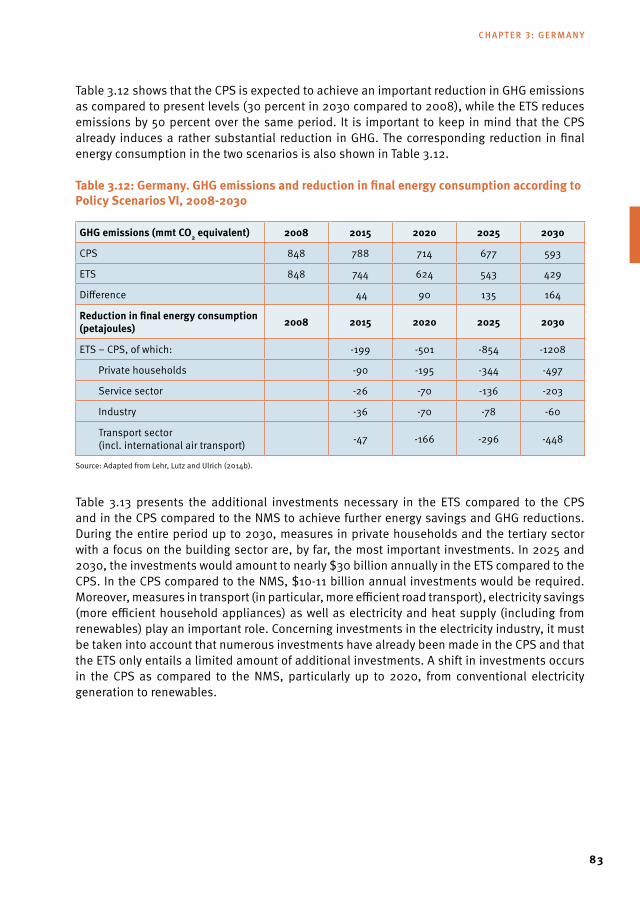
83
Table 3.12 shows that the CPS is expected to achieve an important reduction in GHG emissions as compared to present levels (30 percent in 2030 compared to 2008), while the ETS reduces emissions by 50 percent over the same period. It is important to keep in mind that the CPS already induces a rather substantial reduction in GHG. The corresponding reduction in final energy consumption in the two scenarios is also shown in Table 3.12.
table 3.12: Germany. GHG emissions and reduction in final energy consumption according to Policy scenarios VI, 2008-2030
GHG emissions (mmt CO2 equivalent) 2008 2015 2020 2025 2030
CPS 848 788 714 677 593
ETS 848 744 624 543 429
Difference 44 90 135 164
reduction in final energy consumption (petajoules) 2008 2015 2020 2025 2030
ETS – CPS, of which: -199 -501 -854 -1208
Private households -90 -195 -344 -497
Service sector -26 -70 -136 -203
Industry -36 -70 -78 -60
Transport sector (incl. international air transport) -47 -166 -296 -448
Source: Adapted from Lehr, Lutz and Ulrich (2014b).
Table 3.13 presents the additional investments necessary in the ETS compared to the CPS and in the CPS compared to the NMS to achieve further energy savings and GHG reductions. During the entire period up to 2030, measures in private households and the tertiary sector with a focus on the building sector are, by far, the most important investments. In 2025 and 2030, the investments would amount to nearly $30 billion annually in the ETS compared to the CPS. In the CPS compared to the NMS, $10-11 billion annual investments would be required. Moreover, measures in transport (in particular, more efficient road transport), electricity savings (more efficient household appliances) as well as electricity and heat supply (including from renewables) play an important role. Concerning investments in the electricity industry, it must be taken into account that numerous investments have already been made in the CPS and that the ETS only entails a limited amount of additional investments. A shift in investments occurs in the CPS as compared to the NMS, particularly up to 2020, from conventional electricity generation to renewables.
chapter 3: Germany
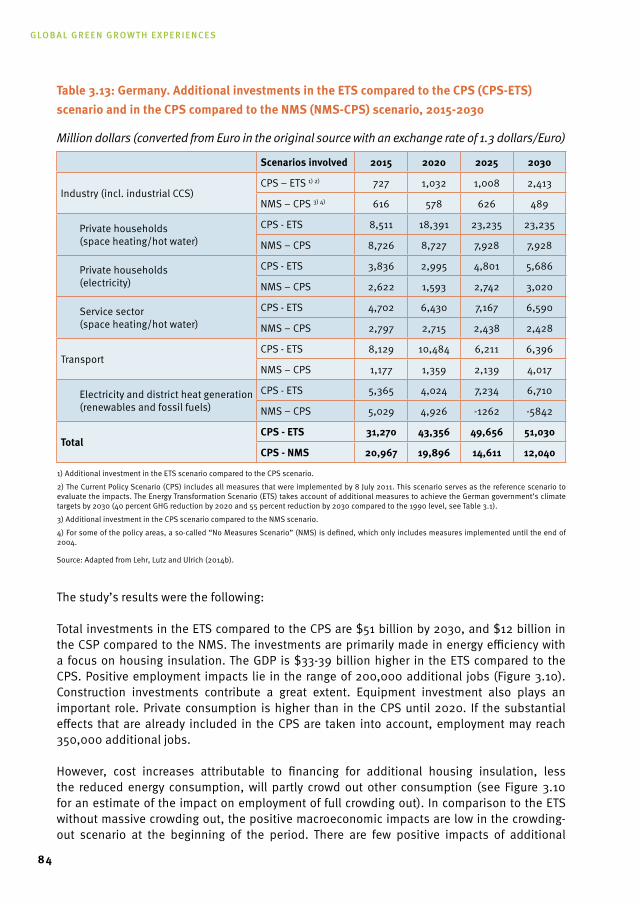
Global Green Growth experiences
84
table 3.13: Germany. Additional investments in the Ets compared to the CPs (CPs-Ets) scenario and in the CPs compared to the nms (nms-CPs) scenario, 2015-2030
Million dollars (converted from Euro in the original source with an exchange rate of 1.3 dollars/Euro)
scenarios involved 2015 2020 2025 2030
Industry (incl. industrial CCS)CPS – ETS 1) 2) 727 1,032 1,008 2,413
NMS – CPS 3) 4) 616 578 626 489
Private households (space heating/hot water)
CPS - ETS 8,511 18,391 23,235 23,235
NMS – CPS 8,726 8,727 7,928 7,928
Private households (electricity)
CPS - ETS 3,836 2,995 4,801 5,686
NMS – CPS 2,622 1,593 2,742 3,020
Service sector (space heating/hot water)
CPS - ETS 4,702 6,430 7,167 6,590
NMS – CPS 2,797 2,715 2,438 2,428
TransportCPS - ETS 8,129 10,484 6,211 6,396
NMS – CPS 1,177 1,359 2,139 4,017
Electricity and district heat generation (renewables and fossil fuels)
CPS - ETS 5,365 4,024 7,234 6,710
NMS – CPS 5,029 4,926 -1262 -5842
totalCPs - Ets 31,270 43,356 49,656 51,030
CPs - nms 20,967 19,896 14,611 12,040
1) Additional investment in the ETS scenario compared to the CPS scenario.
2) The Current Policy Scenario (CPS) includes all measures that were implemented by 8 July 2011. This scenario serves as the reference scenario to evaluate the impacts. The Energy Transformation Scenario (ETS) takes account of additional measures to achieve the German government’s climate targets by 2030 (40 percent GHG reduction by 2020 and 55 percent reduction by 2030 compared to the 1990 level, see Table 3.1).
3) Additional investment in the CPS scenario compared to the NMS scenario.
4) For some of the policy areas, a so-called “No Measures Scenario” (NMS) is defined, which only includes measures implemented until the end of 2004.
Source: Adapted from Lehr, Lutz and Ulrich (2014b).
The study’s results were the following:
Total investments in the ETS compared to the CPS are $51 billion by 2030, and $12 billion in the CSP compared to the NMS. The investments are primarily made in energy efficiency with a focus on housing insulation. The GDP is $33-39 billion higher in the ETS compared to the CPS. Positive employment impacts lie in the range of 200,000 additional jobs (Figure 3.10). Construction investments contribute a great extent. Equipment investment also plays an important role. Private consumption is higher than in the CPS until 2020. If the substantial effects that are already included in the CPS are taken into account, employment may reach 350,000 additional jobs.
However, cost increases attributable to financing for additional housing insulation, less the reduced energy consumption, will partly crowd out other consumption (see Figure 3.10 for an estimate of the impact on employment of full crowding out). In comparison to the ETS without massive crowding out, the positive macroeconomic impacts are low in the crowding-out scenario at the beginning of the period. There are few positive impacts of additional
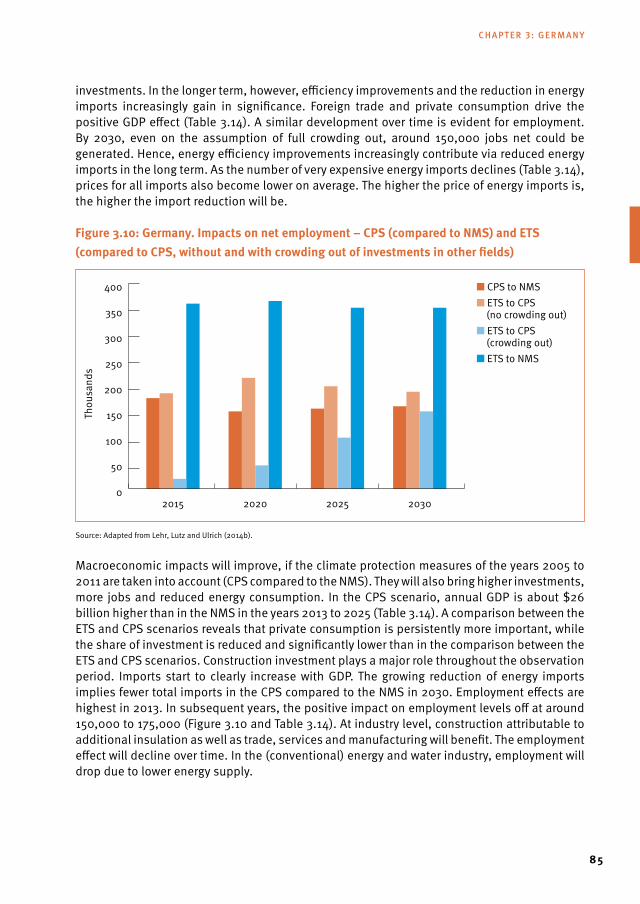
85
investments. In the longer term, however, efficiency improvements and the reduction in energy imports increasingly gain in significance. Foreign trade and private consumption drive the positive GDP effect (Table 3.14). A similar development over time is evident for employment. By 2030, even on the assumption of full crowding out, around 150,000 jobs net could be generated. Hence, energy efficiency improvements increasingly contribute via reduced energy imports in the long term. As the number of very expensive energy imports declines (Table 3.14), prices for all imports also become lower on average. The higher the price of energy imports is, the higher the import reduction will be.
Figure 3.10: Germany. Impacts on net employment – CPs (compared to nms) and Ets (compared to CPs, without and with crowding out of investments in other fields)
Source: Adapted from Lehr, Lutz and Ulrich (2014b).
Macroeconomic impacts will improve, if the climate protection measures of the years 2005 to 2011 are taken into account (CPS compared to the NMS). They will also bring higher investments, more jobs and reduced energy consumption. In the CPS scenario, annual GDP is about $26 billion higher than in the NMS in the years 2013 to 2025 (Table 3.14). A comparison between the ETS and CPS scenarios reveals that private consumption is persistently more important, while the share of investment is reduced and significantly lower than in the comparison between the ETS and CPS scenarios. Construction investment plays a major role throughout the observation period. Imports start to clearly increase with GDP. The growing reduction of energy imports implies fewer total imports in the CPS compared to the NMS in 2030. Employment effects are highest in 2013. In subsequent years, the positive impact on employment levels off at around 150,000 to 175,000 (Figure 3.10 and Table 3.14). At industry level, construction attributable to additional insulation as well as trade, services and manufacturing will benefit. The employment effect will decline over time. In the (conventional) energy and water industry, employment will drop due to lower energy supply.
■ CPS to NMS■ ETS to CPS (no crowding out)■ ETS to CPS (crowding out)■ ETS to NMS
Thou
sand
s
0
100
50
150
200
250
300
350
400
2015 2020 2025 2030
chapter 3: Germany
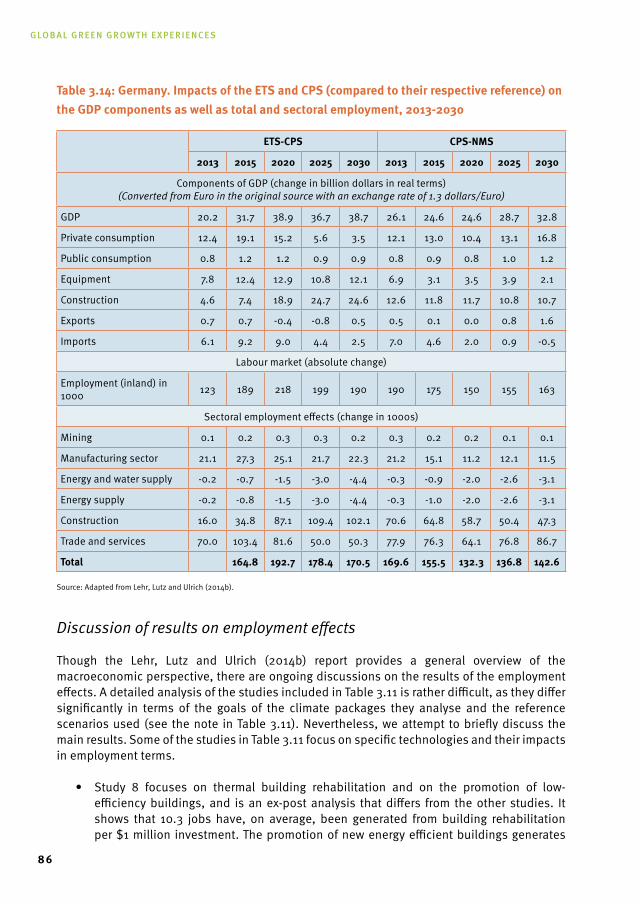
Global Green Growth experiences
86
table 3.14: Germany. Impacts of the Ets and CPs (compared to their respective reference) on the GdP components as well as total and sectoral employment, 2013-2030
Ets-CPs CPs-nms
2013 2015 2020 2025 2030 2013 2015 2020 2025 2030
Components of GDP (change in billion dollars in real terms) (Converted from Euro in the original source with an exchange rate of 1.3 dollars/Euro)
GDP 20.2 31.7 38.9 36.7 38.7 26.1 24.6 24.6 28.7 32.8
Private consumption 12.4 19.1 15.2 5.6 3.5 12.1 13.0 10.4 13.1 16.8
Public consumption 0.8 1.2 1.2 0.9 0.9 0.8 0.9 0.8 1.0 1.2
Equipment 7.8 12.4 12.9 10.8 12.1 6.9 3.1 3.5 3.9 2.1
Construction 4.6 7.4 18.9 24.7 24.6 12.6 11.8 11.7 10.8 10.7
Exports 0.7 0.7 -0.4 -0.8 0.5 0.5 0.1 0.0 0.8 1.6
Imports 6.1 9.2 9.0 4.4 2.5 7.0 4.6 2.0 0.9 -0.5
Labour market (absolute change)
Employment (inland) in 1000 123 189 218 199 190 190 175 150 155 163
Sectoral employment effects (change in 1000s)
Mining 0.1 0.2 0.3 0.3 0.2 0.3 0.2 0.2 0.1 0.1
Manufacturing sector 21.1 27.3 25.1 21.7 22.3 21.2 15.1 11.2 12.1 11.5
Energy and water supply -0.2 -0.7 -1.5 -3.0 -4.4 -0.3 -0.9 -2.0 -2.6 -3.1
Energy supply -0.2 -0.8 -1.5 -3.0 -4.4 -0.3 -1.0 -2.0 -2.6 -3.1
Construction 16.0 34.8 87.1 109.4 102.1 70.6 64.8 58.7 50.4 47.3
Trade and services 70.0 103.4 81.6 50.0 50.3 77.9 76.3 64.1 76.8 86.7
total 164.8 192.7 178.4 170.5 169.6 155.5 132.3 136.8 142.6
Source: Adapted from Lehr, Lutz and Ulrich (2014b).
Discussion of results on employment effects
Though the Lehr, Lutz and Ulrich (2014b) report provides a general overview of the macroeconomic perspective, there are ongoing discussions on the results of the employment effects. A detailed analysis of the studies included in Table 3.11 is rather difficult, as they differ significantly in terms of the goals of the climate packages they analyse and the reference scenarios used (see the note in Table 3.11). Nevertheless, we attempt to briefly discuss the main results. Some of the studies in Table 3.11 focus on specific technologies and their impacts in employment terms.
• Study 8 focuses on thermal building rehabilitation and on the promotion of low-efficiency buildings, and is an ex-post analysis that differs from the other studies. It shows that 10.3 jobs have, on average, been generated from building rehabilitation per $1 million investment. The promotion of new energy efficient buildings generates
87
even twice as much employment. More than half of the employment generated is in the construction industry. Study 6 also focuses on buildings but shows that a continuation of the KfW activities will generate a comparable number of jobs in the future. It must be noted that the KfW programs are multi-billion dollar programs which have led to annual employment generation in the field of energy efficiency similar in size to the employment impacts from renewable energy sources. Continuing these programs at a similar scale is necessary to achieve the decarbonization of the building stock by the middle of the century. At the same time, this will lead to an employment generation in the order of 200,000-300,000 jobs.
• Renewableenergysourcesprojectionsshowthat6-7jobswilltypicallybegeneratedper$1 million invested, which corresponds to the values found in Volume I.
• Theresultsofthestudiesconvergeontheviewthatcomprehensiveclimateandenergypackages, including both renewable and energy efficiency, may produce results in 2020 and beyond, employing between 300,000-400,000 persons annually (Studies 3 and 7), while the most comprehensive packages may generate up to an additional 1 million jobs in Germany by 2030 (Study 4). However, investments in the range of several billion euros annually are necessary to realize these impacts in terms of employment. It further requires a years-long stable investment climate to provide sufficient stability for potential investors.
One important question to consider is how likely the crowding out of investments is today. The closer an economy is to full employment or to full use of production factors, the more intense the crowding out will be under otherwise similar conditions. Financing has to be viewed in a similar way. The more attractive alternatives for capital investment there are, the more difficult it will be to secure investments in clean energy technology. Currently, some argue that crowding out for clean energy investments plays a fairly minor role and is adequately represented in the ETS calculations:
• Central banks across the globe are flooding currency and capital markets, bringingdown interest rates to very low levels. Investments that pay off are being sought eagerly. The real interest rates of risk-free investments are negative.
• Theinvestmentratio(investmentstoGDP)inGermanyislow,bothininternationalandhistoric comparison.
• Companiesarebeingofferedverygoodfinancingoptionsforinvestments.Additionally,the KfW secures many clean energy investments.
• Germanprivate households have a high net capital at their disposal. In viewof thenegative real interest rates, investments in clean energy technologies pay off even with very low rates of return.
There is currently a lack of attractive investment options. Non-economic barriers (IEA, 2013) prevent investments in clean energy technology that pay off from being made. Hence, investments that are economic at the micro-level do not crowd-out other planned investments.
chapter 3: Germany
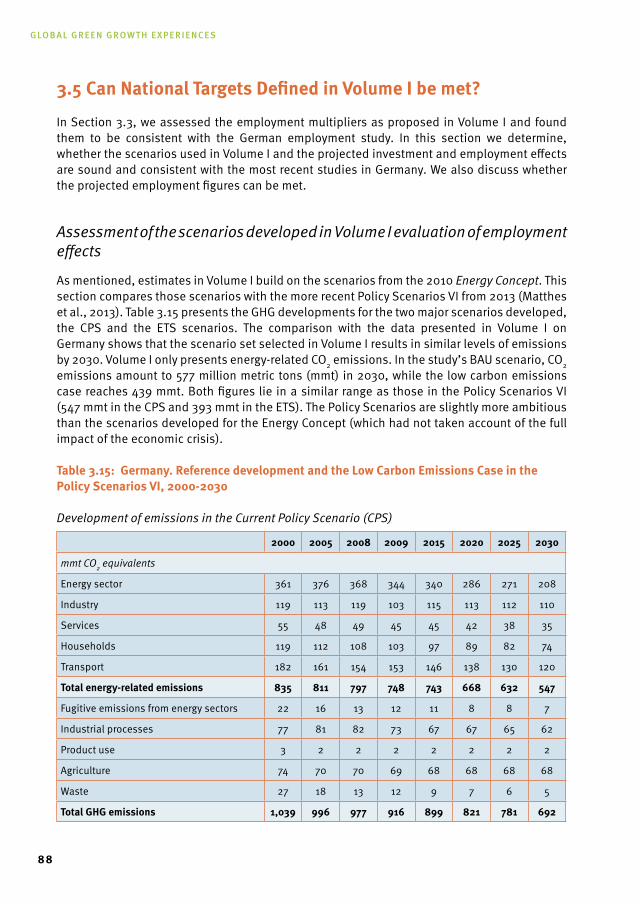
Global Green Growth experiences
88
3.5 Can national targets defined in Volume I be met?
In Section 3.3, we assessed the employment multipliers as proposed in Volume I and found them to be consistent with the German employment study. In this section we determine, whether the scenarios used in Volume I and the projected investment and employment effects are sound and consistent with the most recent studies in Germany. We also discuss whether the projected employment figures can be met.
Assessment of the scenarios developed in Volume I evaluation of employment effects
As mentioned, estimates in Volume I build on the scenarios from the 2010 Energy Concept. This section compares those scenarios with the more recent Policy Scenarios VI from 2013 (Matthes et al., 2013). Table 3.15 presents the GHG developments for the two major scenarios developed, the CPS and the ETS scenarios. The comparison with the data presented in Volume I on Germany shows that the scenario set selected in Volume I results in similar levels of emissions by 2030. Volume I only presents energy-related CO2 emissions. In the study’s BAU scenario, CO2 emissions amount to 577 million metric tons (mmt) in 2030, while the low carbon emissions case reaches 439 mmt. Both figures lie in a similar range as those in the Policy Scenarios VI (547 mmt in the CPS and 393 mmt in the ETS). The Policy Scenarios are slightly more ambitious than the scenarios developed for the Energy Concept (which had not taken account of the full impact of the economic crisis).
table 3.15: Germany. reference development and the Low Carbon Emissions Case in the Policy scenarios VI, 2000-2030
Development of emissions in the Current Policy Scenario (CPS)
2000 2005 2008 2009 2015 2020 2025 2030
mmt CO2 equivalents
Energy sector 361 376 368 344 340 286 271 208
Industry 119 113 119 103 115 113 112 110
Services 55 48 49 45 45 42 38 35
Households 119 112 108 103 97 89 82 74
Transport 182 161 154 153 146 138 130 120
total energy-related emissions 835 811 797 748 743 668 632 547
Fugitive emissions from energy sectors 22 16 13 12 11 8 8 7
Industrial processes 77 81 82 73 67 67 65 62
Product use 3 2 2 2 2 2 2 2
Agriculture 74 70 70 69 68 68 68 68
Waste 27 18 13 12 9 7 6 5
total GHG emissions 1,039 996 977 916 899 821 781 692
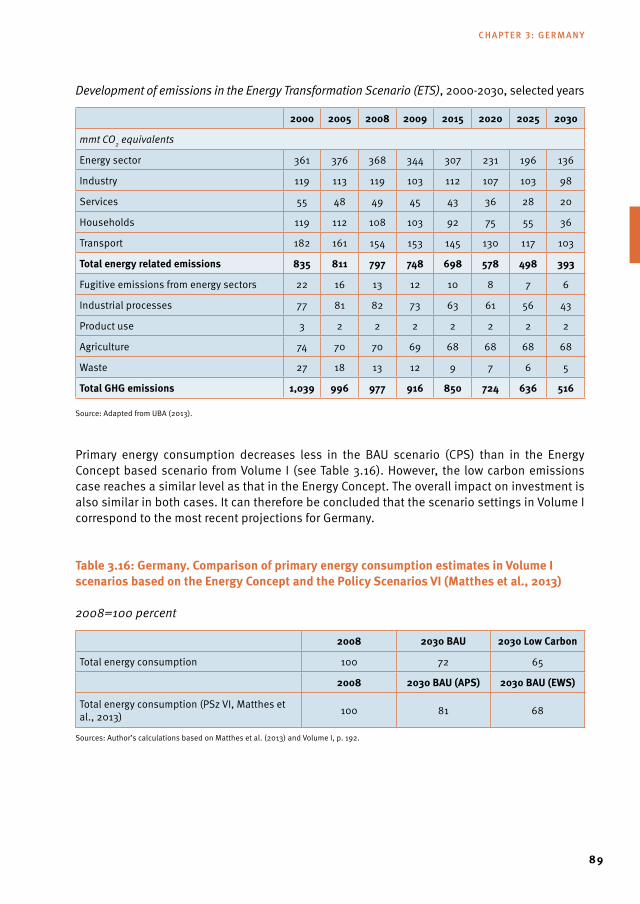
89
Development of emissions in the Energy Transformation Scenario (ETS), 2000-2030, selected years
2000 2005 2008 2009 2015 2020 2025 2030
mmt CO2 equivalents
Energy sector 361 376 368 344 307 231 196 136
Industry 119 113 119 103 112 107 103 98
Services 55 48 49 45 43 36 28 20
Households 119 112 108 103 92 75 55 36
Transport 182 161 154 153 145 130 117 103
total energy related emissions 835 811 797 748 698 578 498 393
Fugitive emissions from energy sectors 22 16 13 12 10 8 7 6
Industrial processes 77 81 82 73 63 61 56 43
Product use 3 2 2 2 2 2 2 2
Agriculture 74 70 70 69 68 68 68 68
Waste 27 18 13 12 9 7 6 5
total GHG emissions 1,039 996 977 916 850 724 636 516
Source: Adapted from UBA (2013).
Primary energy consumption decreases less in the BAU scenario (CPS) than in the Energy Concept based scenario from Volume I (see Table 3.16). However, the low carbon emissions case reaches a similar level as that in the Energy Concept. The overall impact on investment is also similar in both cases. It can therefore be concluded that the scenario settings in Volume I correspond to the most recent projections for Germany.
table 3.16: Germany. Comparison of primary energy consumption estimates in Volume I scenarios based on the Energy Concept and the Policy scenarios VI (matthes et al., 2013)
2008=100 percent
2008 2030 BAU 2030 Low Carbon
Total energy consumption 100 72 65
2008 2030 BAU (APs) 2030 BAU (Ews)
Total energy consumption (PSz VI, Matthes et al., 2013) 100 81 68
Sources: Author’s calculations based on Matthes et al. (2013) and Volume I, p. 192.
chapter 3: Germany
Global Green Growth experiences
90
Assessment of cost and employment estimates for clean energy investments
In Volume I annual clean energy investments equivalent to 1.5 percent of GDP in Germany is assumed and it is estimated that annual investments of $150 million are necessary up to 2030. This figure is a bit lower than the $163 million estimated in Lehr, Lutz and Ulrich (2014b), the most recent national study,but reaches a similar order.
Concerning employment effects induced by these investments, it is estimated in Volume I that the annual employment generated from energy efficiency and renewable energy investments up to 2030 could amount to between 299,900 and 404,500 jobs within Germany. This figure compares well with the most recent estimates of 363,000 jobs by Lehr, Lutz and Ulrich (2014b). None of these studies consider alternative investments in fossil fuels, and hence no comparison can be made with the 261,000 jobs generated through similar investments in fossil fuels. This figure appears high given the fact that fossil power plants are set up and operated with less staff than renewable energy and energy efficiency options.
3.6 Conclusion
Conclusions on employment impacts
Over the past 20 years, Germany has introduced important policies in the field of clean energy technologies, which are briefly summarized here:
• Overallemploymentingreentechnologiesiscloseto2millionpersons.
• Renewable energy makes an important contribution to total employment withapproximately 370,000 jobs. This figure is rapidly growing, but has suffered due to recent difficulties in the German solar industry. Wind energy, on the other hand, has contributed over-proportionally to the generation of jobs, especially through exports.
• NationalemploymentestimatesliewithinthesamerangeasinVolumeIthoughthereare deviations for certain technologies including wind.
• Inthemacroeconomicprojectionsupto2030,additionalnetemploymentthroughcleanenergy technology, in particular energy efficiency and renewable energy, lies in the range of 360,000 additional jobs compared to today. This corresponds to roughly 1 percent of Germany’s present day workforce and is in line with the estimated employment effects generated up to 2030 as estimated in Volume I based on the scenarios from the Energy Concept after 2010.
Overall, clean technologies have contributed substantially to the creation of employment in Germany and will continue to do so if the policies accompanying the “Energiewende” are properly implemented. Specifically, the electricity sector must be restructured to incorporate the large amount of variable renewable energy sources. By 2030, a share of renewable energy
91
well in excess of 50 percent should be reached. With the measures introduced till date, Germany has had an important headstart into the development of a “green economy”. The results achieved thus far demonstrate that it is possible to restructure an economy towards more sustainable.
However, the path to the realization of ambitious climate and energy scenarios is still long. From the present perspective, Germany is investing heavily in the energy system’s transformation process. With regard to renewable energy, if the forthcoming policy reforms in 2014 maintain the promotion system while bringing renewable energy closer to the markets, the momentum towards larger amounts of renewable energy will be upheld and the calculated employment effects will be realized. For energy efficiency, especially in the building sector, present financial instruments such as the KfW building rehabilitation programs need to be strengthened by at least a factor of 3-4 from the present level of $12.34 billion annually, or complemented with other financing instruments such as revenues from the carbon markets (which in that case needs to function properly) or from specific renewable energy funds or energy saving obligation schemes.
Long-term perspective of the “Energiewende” up to 2050
After 2030 and up to 2050, the current pace should be maintained to reach at least 80 percent reduction in GHG emissions as envisaged by the German government, hereby generating further employment. Especially, the electricity sector will need to undergo further substantial changes.
The following figures illustrate the long-term perspective of the German “Energiewende”, which must be embedded within the European context. This implies:
• A reduction of primary energy consumption by at least 50 percent at the EU level.Potentials for both the final and primary energy levels (the latter includes the penetration of renewable energy sources) are available, which in principle allow a reduction in energy consumption by two-thirds (Figure 3.11).
chapter 3: Germany
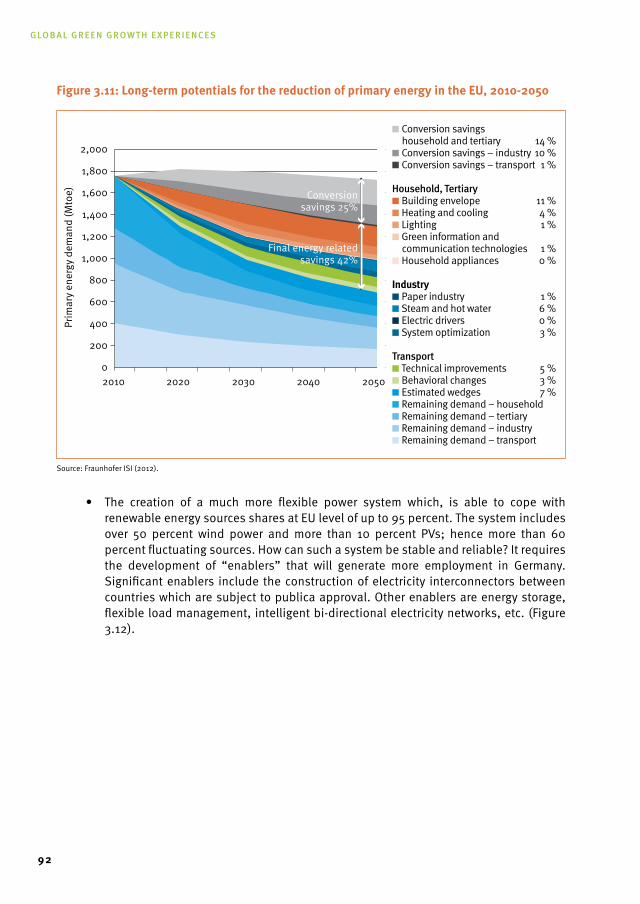
Global Green Growth experiences
92
Figure 3.11: Long-term potentials for the reduction of primary energy in the EU, 2010-2050
Source: Fraunhofer ISI (2012).
• The creation of a much more flexible power system which, is able to cope withrenewable energy sources shares at EU level of up to 95 percent. The system includes over 50 percent wind power and more than 10 percent PVs; hence more than 60 percent fluctuating sources. How can such a system be stable and reliable? It requires the development of “enablers” that will generate more employment in Germany. Significant enablers include the construction of electricity interconnectors between countries which are subject to publica approval. Other enablers are energy storage, flexible load management, intelligent bi-directional electricity networks, etc. (Figure 3.12).
Prim
ary
ener
gy d
eman
d (M
toe)
■ Conversion savings household and tertiary 14 %■ Conversion savings – industry 10 %■ Conversion savings – transport 1 % Household, Tertiary■ Building envelope 11 %■ Heating and cooling 4 %■ Lighting 1 %■ Green information and communication technologies 1 %■ Household appliances 0 % Industry■ Paper industry 1 %■ Steam and hot water 6 %■ Electric drivers 0 %■ System optimization 3 % Transport■ Technical improvements 5 %■ Behavioral changes 3 %■ Estimated wedges 7 %■ Remaining demand – household ■ Remaining demand – tertiary■ Remaining demand – industry■ Remaining demand – transport
Conversionsavings 25%
Final energy relatedsavings 42%
2,000
1,800
1,600
1,400
1,200
1,000
800
600
400
200
02010 2020 2030 2040 2050
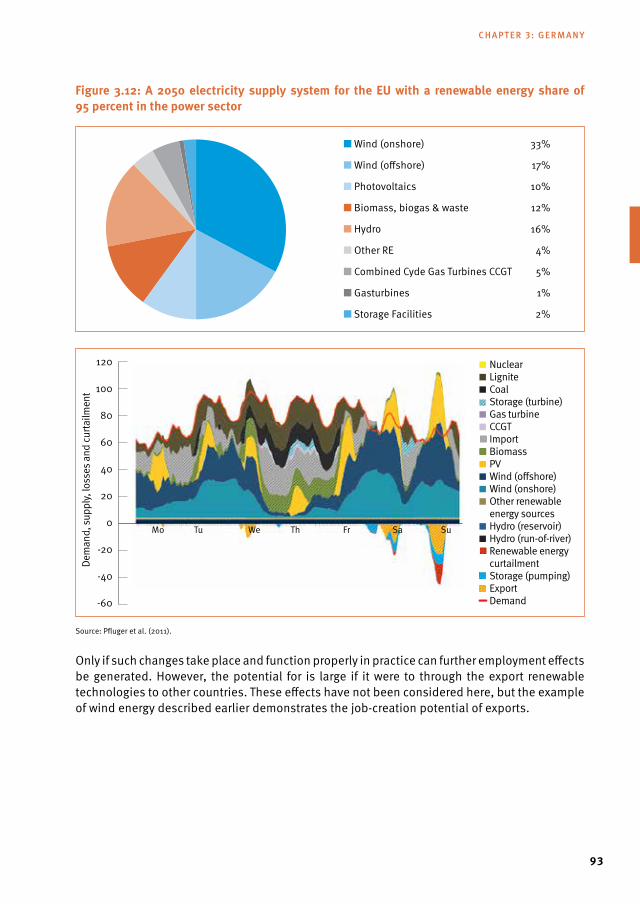
93
Figure 3.12: A 2050 electricity supply system for the EU with a renewable energy share of 95 percent in the power sector
Source: Pfluger et al. (2011).
Only if such changes take place and function properly in practice can further employment effects be generated. However, the potential for is large if it were to through the export renewable technologies to other countries. These effects have not been considered here, but the example of wind energy described earlier demonstrates the job-creation potential of exports.
■ Wind (onshore) 33%
■ Wind (offshore) 17%
■ Photovoltaics 10%
■ Biomass, biogas & waste 12%
■ Hydro 16%
■ Other RE 4%
■ Combined Cyde Gas Turbines CCGT 5%
■ Gasturbines 1%
■ Storage Facilities 2%
Dem
and,
supp
ly, lo
sses
and
curta
ilmen
t
■ Nuclear■ Lignite■ Coal Storage (turbine)■ Gas turbine■ CCGT Import Biomass■ PV■ Wind (offshore)■ Wind (onshore)■ Other renewable energy sources■ Hydro (reservoir)■ Hydro (run-of-river) Renewable energy curtailment Storage (pumping) Export Demand
Mo Tu We Th Fr Sa Su
-20
-40
-60
0
20
40
60
80
100
120
chapter 3: Germany

95
CHAPTER 4: INDONESIA4.1 Introduction
Since Indonesia signed and ratified the UNFCCC in the 1990s, climate change has with its significance as a strategic and development challenge becoming evident - gained increasing political attention in the country. In 2009, Indonesia voluntarily committed to GHG emission reduction targets of 26 percent below the BAU level by 2020, and up to 41 percent with international support, while assuming that the country will continue its rapid growth trajectory. This is supported by the adoption of a 4-track development strategy based on the pillars “pro-growth, pro-poor, pro-job and pro-environment” with the objective of promoting sustainable and inclusive growth.46
This study explores Indonesia’s green growth framework against the background of the country’s seemingly dilemmatic problems of poverty and environmental degradation. Indonesia is the fourth most populous country in the world with approximately 28 million people (11 percent of the country’s total population) living below the international poverty line. Climate change is a major impediment to poverty eradication in the country as the livelihood of the poorest communities, who primarily work in agriculture and fishery, is acutely climate sensitive (UNDP, 2007). Several studies indicate that Indonesia is one of the most vulnerable countries to climate change impact, and since agriculture continues to be a crucial sector in the Indonesian economy, this poses a risk to sustaining economic growth.
At the same time, the pressure of demand by a rapidly growing population, increasing economic growth and insufficient environmental management listed Indonesia as the third largest GHG emitter in the world in 2007 (Sari et al., 2007). According to the Indonesian Ministry of Environment (2010), land use change or deforestation, followed by fossil fuel consumption, are the main components of Indonesia’s emissions profile. However, with substantial unexploited fossil fuel resources including a thermal coal reserve estimated at 104.76 billion tons, which is expected to become a dominant export component in the future, carbon emissions from energy consumption are likely to rise considerably. As more people gain access to electricity, demand for energy generation will surge.
As the largest country in Southeast Asia, an effective response to Indonesia’s climate change issues will be essential for the entire region. This study presents developments within the renewable energy and fossil fuel industries as well as current projections for emission reductions. The Indonesian government has recognized that the main challenge is not only to tackle emissions from forestry and land use—the largest emitters—but also challenges related to energy generation given the expected surge in demand. This study therefore presents the policies introduced to promote clean energy investments.
Indonesia’s development plans include investment measures to create green jobs and to hereby alleviate poverty through the advancement of green skill development. 47 The relationship 46 ‘Comprehensive Development: OBG Talks to President Susilo Bambang Yudhoyono’, www.oxfordbusinessgroup.com/news/comprehensive-devel-opment-obg-talks-president-susilo-bambang-yudhoyono (Accessed 6 August, 2014).
47 ‘Statement by H.E. Dr Susilo Bambang Yudhoyono, President of the Republic of Indonesia, at the 100th International Labour Conference’, www.ilo.org/ilc/ILCSessions/100thSession/media-centre/speeches/WCMS_157638/lang--en/ (Accessed 5 April, 2014).
Global Green Growth experiences
96
between clean energy and employment is examined in this study and will be compared to estimates in Volume I of the UNIDO/GGGI research project “Global Green Growth: Clean Energy Industry Investments for Expanding Job Opportunities”, which conclude that a transition towards cleaner energy sources will lead to a net increase in employment in Indonesia.
The analysis is carried out against a number of obstacles Indonesia faces. First, the Indonesian government does not have a clear policy on how to reduce unemployment, and does not align with current labour supply conditions. 48 Furthermore, the domestic energy market is characterized by a high subsidy burden on electricity and fossil fuels, which distorts the energy pricing mechanism and is problematic, as Indonesia has become a net-importer of energy. This may impede the promotion of green investment and clean energy access in Indonesia. Such considerations will be included when discussing the feasibility of a successful transition of the country to a low carbon growth path.
Section 4.2 outlines Indonesia’s emissions and energy mix profiles and their recent developments. Section 4.3 explores Indonesia’s commitments to climate change as well as the country’s current policy framework for energy and climate change. To evaluate the expected effectiveness of the implemented policies, Section 4.4 compares BAU projections for emissions levels up to 2025 with established targets. Section 4.5 examines the relationship between climate change and poverty, and looks at the policy incentives in place to promote green job creation. The impact of clean investments on green job creation and, hence, poverty is subsequently assessed in Section 4.6. This includes a comparison with the results in Volume I. Finally, Section 4.7 discusses a number of challenges that are likely to influence the feasibility of Indonesia attaining a low-carbon growth path. Section 4.8 concludes.
4.2 Historical Performance of GHG Emissions and Energy Industries This section explores Indonesia’s historical emission performance and its energy industry as a framework to understand the country’s critical problem of addressing climate change mitigation when elaborating its development agenda.
Emission profile
With the fourth biggest population in the world and a rapidly growing economy, Indonesia has become one of the largest GHG emitters in the world. According to data from the World Resources Institute (2014), Indonesia ranked five in 2011, with total emissions of 2,053 million tons of CO2 equivalent (MtCO2e) and is superseded only by China, the U.S., India and the Russian Federation. Land use change and deforestation are the principal drivers of this development. In 2011, the land use change and forestry (LUCF) industry accounted for almost 60 percent (or rank 1,1218) of total emissions. Due to its vast peat land forests, Indonesia emits more forest carbon than any other country (Thorburn, 2011). Approximately 2 million hectares of forest were cleared to allow for economic activity in 2012. The forest destruction
48 ‘Cracking the Conundrum of Indonesian unemployment’, www.thejakartapost.com/news/2005/02/23/cracking-conundrum-indonesian-unem-ployment.html (Accessed 5 April, 2014).
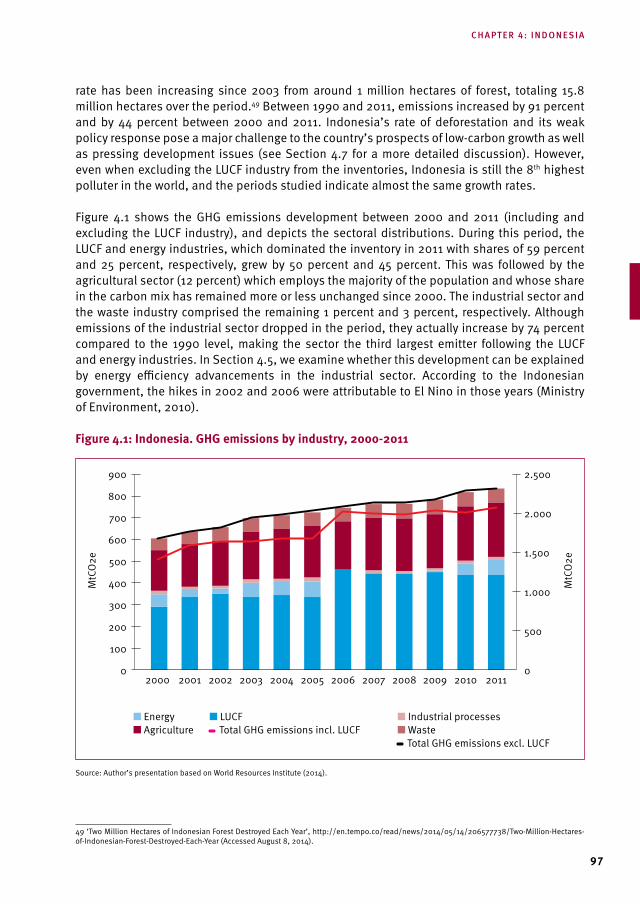
97
rate has been increasing since 2003 from around 1 million hectares of forest, totaling 15.8 million hectares over the period.49 Between 1990 and 2011, emissions increased by 91 percent and by 44 percent between 2000 and 2011. Indonesia’s rate of deforestation and its weak policy response pose a major challenge to the country’s prospects of low-carbon growth as well as pressing development issues (see Section 4.7 for a more detailed discussion). However, even when excluding the LUCF industry from the inventories, Indonesia is still the 8th highest polluter in the world, and the periods studied indicate almost the same growth rates.
Figure 4.1 shows the GHG emissions development between 2000 and 2011 (including and excluding the LUCF industry), and depicts the sectoral distributions. During this period, the LUCF and energy industries, which dominated the inventory in 2011 with shares of 59 percent and 25 percent, respectively, grew by 50 percent and 45 percent. This was followed by the agricultural sector (12 percent) which employs the majority of the population and whose share in the carbon mix has remained more or less unchanged since 2000. The industrial sector and the waste industry comprised the remaining 1 percent and 3 percent, respectively. Although emissions of the industrial sector dropped in the period, they actually increase by 74 percent compared to the 1990 level, making the sector the third largest emitter following the LUCF and energy industries. In Section 4.5, we examine whether this development can be explained by energy efficiency advancements in the industrial sector. According to the Indonesian government, the hikes in 2002 and 2006 were attributable to El Nino in those years (Ministry of Environment, 2010).
Figure 4.1: Indonesia. GHG emissions by industry, 2000-2011
Source: Author’s presentation based on World Resources Institute (2014).
49 ‘Two Million Hectares of Indonesian Forest Destroyed Each Year’, http://en.tempo.co/read/news/2014/05/14/206577738/Two-Million-Hectares-of-Indonesian-Forest-Destroyed-Each-Year (Accessed August 8, 2014).
900
800
700
600
500
400
300
200
100
0
2.500
2.000
1.500
1.000
500
0
■ Energy■ Agriculture
■ LUCF Total GHG emissions incl. LUCF
■ Industrial processes■ Waste
Total GHG emissions excl. LUCF
2000 2001 2002 2003 2004 2005 2006 2007 2008 2009 2010 2011
MtC
O2e
MtC
O2e
chapter 4: indonesia
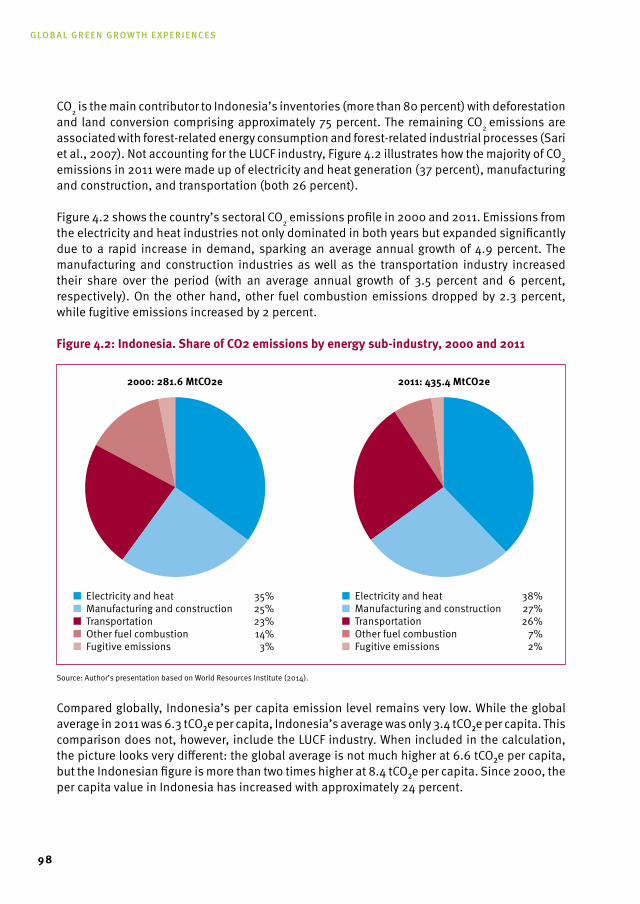
Global Green Growth experiences
98
CO2 is the main contributor to Indonesia’s inventories (more than 80 percent) with deforestation and land conversion comprising approximately 75 percent. The remaining CO2 emissions are associated with forest-related energy consumption and forest-related industrial processes (Sari et al., 2007). Not accounting for the LUCF industry, Figure 4.2 illustrates how the majority of CO2 emissions in 2011 were made up of electricity and heat generation (37 percent), manufacturing and construction, and transportation (both 26 percent).
Figure 4.2 shows the country’s sectoral CO2 emissions profile in 2000 and 2011. Emissions from the electricity and heat industries not only dominated in both years but expanded significantly due to a rapid increase in demand, sparking an average annual growth of 4.9 percent. The manufacturing and construction industries as well as the transportation industry increased their share over the period (with an average annual growth of 3.5 percent and 6 percent, respectively). On the other hand, other fuel combustion emissions dropped by 2.3 percent, while fugitive emissions increased by 2 percent.
Figure 4.2: Indonesia. share of CO2 emissions by energy sub-industry, 2000 and 2011
Source: Author’s presentation based on World Resources Institute (2014).
Compared globally, Indonesia’s per capita emission level remains very low. While the global average in 2011 was 6.3 tCO₂e per capita, Indonesia’s average was only 3.4 tCO₂e per capita. This comparison does not, however, include the LUCF industry. When included in the calculation, the picture looks very different: the global average is not much higher at 6.6 tCO₂e per capita, but the Indonesian figure is more than two times higher at 8.4 tCO₂e per capita. Since 2000, the per capita value in Indonesia has increased with approximately 24 percent.
■ Electricity and heat 35%■ Manufacturing and construction 25%■ Transportation 23%■ Other fuel combustion 14%■ Fugitive emissions 3%
■ Electricity and heat 38%■ Manufacturing and construction 27%■ Transportation 26%■ Other fuel combustion 7%■ Fugitive emissions 2%
2000: 281.6 MtCO2e 2011: 435.4 MtCO2e
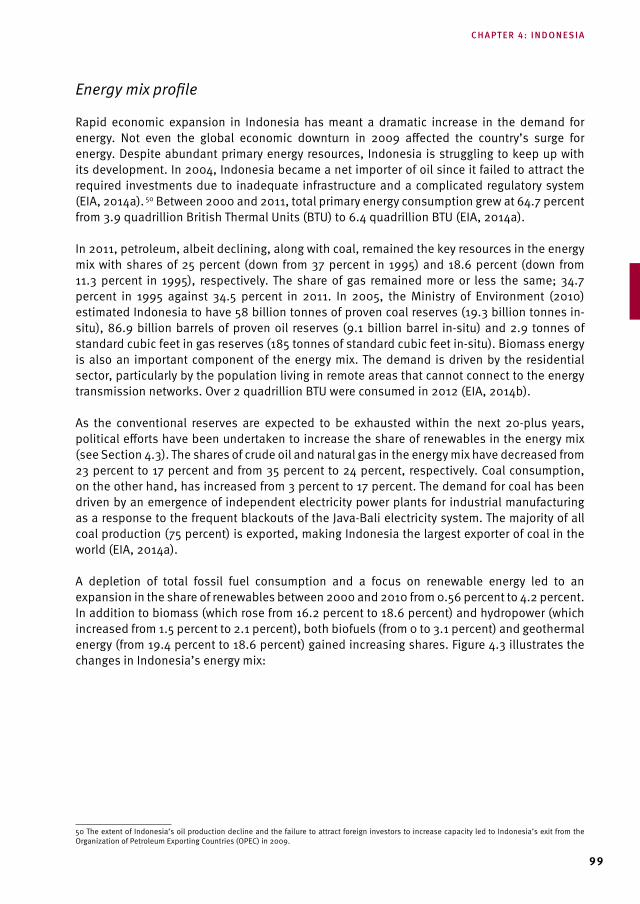
99
Energy mix profile
Rapid economic expansion in Indonesia has meant a dramatic increase in the demand for energy. Not even the global economic downturn in 2009 affected the country’s surge for energy. Despite abundant primary energy resources, Indonesia is struggling to keep up with its development. In 2004, Indonesia became a net importer of oil since it failed to attract the required investments due to inadequate infrastructure and a complicated regulatory system (EIA, 2014a). 50 Between 2000 and 2011, total primary energy consumption grew at 64.7 percent from 3.9 quadrillion British Thermal Units (BTU) to 6.4 quadrillion BTU (EIA, 2014a).
In 2011, petroleum, albeit declining, along with coal, remained the key resources in the energy mix with shares of 25 percent (down from 37 percent in 1995) and 18.6 percent (down from 11.3 percent in 1995), respectively. The share of gas remained more or less the same; 34.7 percent in 1995 against 34.5 percent in 2011. In 2005, the Ministry of Environment (2010) estimated Indonesia to have 58 billion tonnes of proven coal reserves (19.3 billion tonnes in-situ), 86.9 billion barrels of proven oil reserves (9.1 billion barrel in-situ) and 2.9 tonnes of standard cubic feet in gas reserves (185 tonnes of standard cubic feet in-situ). Biomass energy is also an important component of the energy mix. The demand is driven by the residential sector, particularly by the population living in remote areas that cannot connect to the energy transmission networks. Over 2 quadrillion BTU were consumed in 2012 (EIA, 2014b).
As the conventional reserves are expected to be exhausted within the next 20-plus years, political efforts have been undertaken to increase the share of renewables in the energy mix (see Section 4.3). The shares of crude oil and natural gas in the energy mix have decreased from 23 percent to 17 percent and from 35 percent to 24 percent, respectively. Coal consumption, on the other hand, has increased from 3 percent to 17 percent. The demand for coal has been driven by an emergence of independent electricity power plants for industrial manufacturing as a response to the frequent blackouts of the Java-Bali electricity system. The majority of all coal production (75 percent) is exported, making Indonesia the largest exporter of coal in the world (EIA, 2014a).
A depletion of total fossil fuel consumption and a focus on renewable energy led to an expansion in the share of renewables between 2000 and 2010 from 0.56 percent to 4.2 percent. In addition to biomass (which rose from 16.2 percent to 18.6 percent) and hydropower (which increased from 1.5 percent to 2.1 percent), both biofuels (from 0 to 3.1 percent) and geothermal energy (from 19.4 percent to 18.6 percent) gained increasing shares. Figure 4.3 illustrates the changes in Indonesia’s energy mix:
50 The extent of Indonesia’s oil production decline and the failure to attract foreign investors to increase capacity led to Indonesia’s exit from the Organization of Petroleum Exporting Countries (OPEC) in 2009.
chapter 4: indonesia
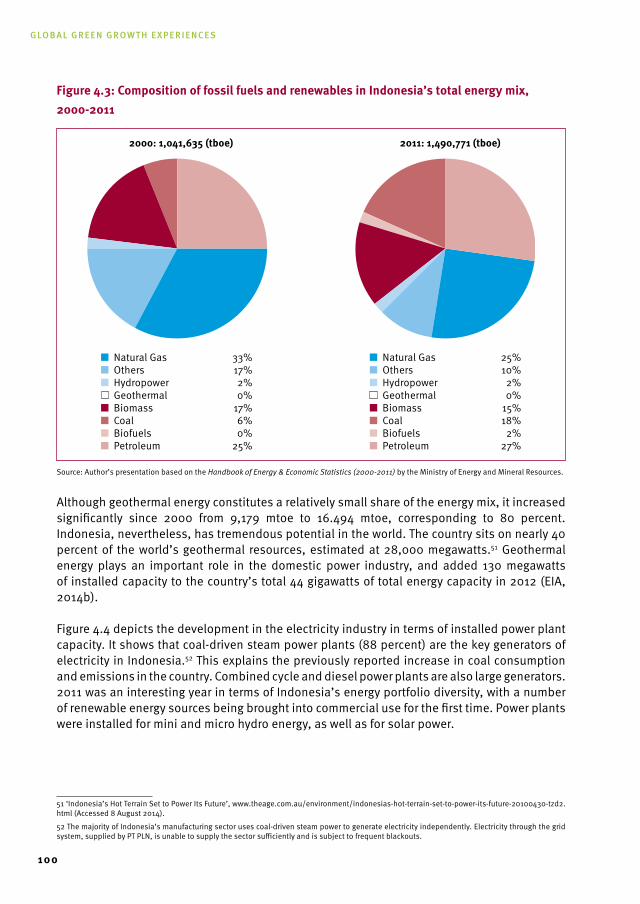
Global Green Growth experiences
100
Figure 4.3: Composition of fossil fuels and renewables in Indonesia’s total energy mix, 2000-2011
Source: Author’s presentation based on the Handbook of Energy & Economic Statistics (2000-2011) by the Ministry of Energy and Mineral Resources.
Although geothermal energy constitutes a relatively small share of the energy mix, it increased significantly since 2000 from 9,179 mtoe to 16.494 mtoe, corresponding to 80 percent. Indonesia, nevertheless, has tremendous potential in the world. The country sits on nearly 40 percent of the world’s geothermal resources, estimated at 28,000 megawatts.51 Geothermal energy plays an important role in the domestic power industry, and added 130 megawatts of installed capacity to the country’s total 44 gigawatts of total energy capacity in 2012 (EIA, 2014b).
Figure 4.4 depicts the development in the electricity industry in terms of installed power plant capacity. It shows that coal-driven steam power plants (88 percent) are the key generators of electricity in Indonesia.52 This explains the previously reported increase in coal consumption and emissions in the country. Combined cycle and diesel power plants are also large generators. 2011 was an interesting year in terms of Indonesia’s energy portfolio diversity, with a number of renewable energy sources being brought into commercial use for the first time. Power plants were installed for mini and micro hydro energy, as well as for solar power.
51 ‘Indonesia’s Hot Terrain Set to Power Its Future’, www.theage.com.au/environment/indonesias-hot-terrain-set-to-power-its-future-20100430-tzd2.html (Accessed 8 August 2014).
52 The majority of Indonesia’s manufacturing sector uses coal-driven steam power to generate electricity independently. Electricity through the grid system, supplied by PT PLN, is unable to supply the sector sufficiently and is subject to frequent blackouts.
■ Natural Gas 33%■ Others 17%■ Hydropower 2%■ Geothermal 0%■ Biomass 17%■ Coal 6%■ Biofuels 0%■ Petroleum 25%
■ Natural Gas 25%■ Others 10%■ Hydropower 2%■ Geothermal 0%■ Biomass 15%■ Coal 18%■ Biofuels 2%■ Petroleum 27%
2000: 1,041,635 (tboe) 2011: 1,490,771 (tboe)
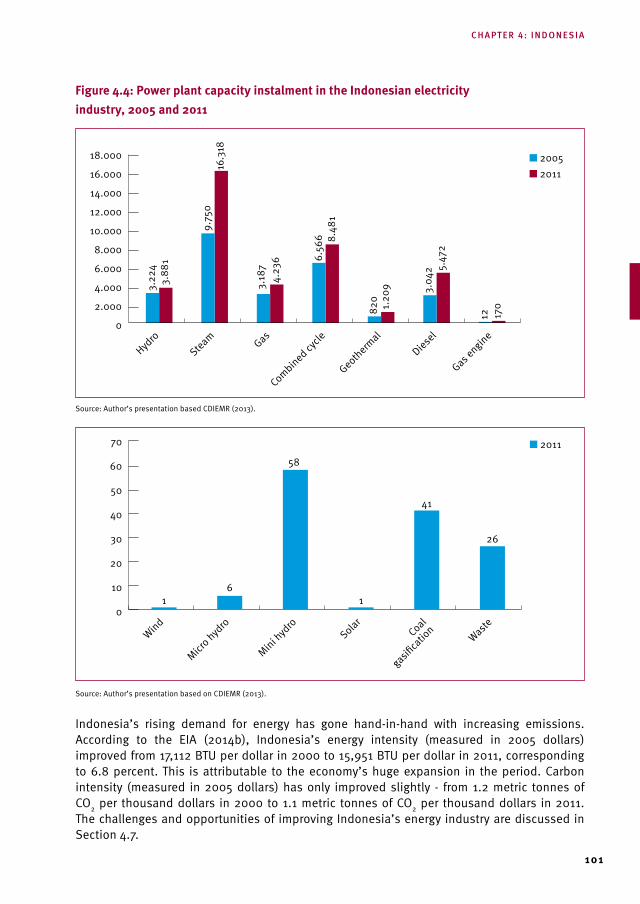
101
Figure 4.4: Power plant capacity instalment in the Indonesian electricity industry, 2005 and 2011
Source: Author’s presentation based CDIEMR (2013).
Source: Author’s presentation based on CDIEMR (2013).
Indonesia’s rising demand for energy has gone hand-in-hand with increasing emissions. According to the EIA (2014b), Indonesia’s energy intensity (measured in 2005 dollars) improved from 17,112 BTU per dollar in 2000 to 15,951 BTU per dollar in 2011, corresponding to 6.8 percent. This is attributable to the economy’s huge expansion in the period. Carbon intensity (measured in 2005 dollars) has only improved slightly - from 1.2 metric tonnes of CO2 per thousand dollars in 2000 to 1.1 metric tonnes of CO2 per thousand dollars in 2011. The challenges and opportunities of improving Indonesia’s energy industry are discussed in Section 4.7.
■ 2005■ 2011
0
6.000
4.000
2.000
8.000
10.000
12.000
14.000
16.000
18.000
Hydro
Steam Gas
Combined cycle
Geothermal
Diesel
Gas engine
3.22
43.
881
3.18
74.
236 6.
566 8.
481
820
1.20
9 3.04
2 5.47
2
12 170
9.75
016
.318
■ 2011
0
10
20
30
40
50
60
70
Wind
Micro hyd
ro
Mini hyd
roSolar
Coal
gasifica
tion
Waste
16
58
1
41
26
chapter 4: indonesia
Global Green Growth experiences
102
4.3 Policy Framework for Energy and Climate Change
The impact of climate change is becoming increasingly visible in Indonesia. According to a World Wide Fund for Nature study (Case, Ardiansyah and Spector, 2007), mean annual temperature has increased by approximately 0.1 degrees per decade, and the seasonality and patterns of precipitation have not only changed but have actually decreased by 2-3 percent. The potential consequences of such changes on the natural environment are extensive and affect the real economy as well as the health and well-being of the population (see Section 4.7). At the same time, climate change represents an opportunity for Indonesia to embark on a green growth path. This section presents the policy framework that is in place to facilitate such developments.
Commitment to climate change mitigation and adaptation
The presence of immediate and long-term risks associated with climate change has prompted reactions by the Indonesian government. Since 1992, the Indonesian government has been committed to participate in the battle against climate change and for sustainable development by signing the UNFCCC and has thus far submitted two communications on its GHG inventory and other climate change activities. At the national level, Indonesia has introduced a number of major frameworks, most significantly:
• Implementation of the pledges made at the 2009 G20 Summit in Pittsburgh intomandatory national GHG emissions reduction targets through the National Action Plan on Reducing Greenhouse Gas Emissions (Presidential Regulation No. 61/2011). By 2020, Indonesia aims to reduce its emissions by 26 percent below the estimated BAU levels and by 41 percent with international assistance (due to inadequate domestic technology). This accounts for a targeted economic growth rate of 7 percent over the specified period. The Action Plan comprises 50 categories of policies and actions in five key industries. However, the targets are mainly based upon a strategy that reduces emissions from the LUCF industry and fossil fuel-driven energy consumption while promoting sustainable economic development and energy security.
• DevelopmentofaNationalGHGInventorySystem(LawNo.06/1994,No.31/2009andNo. 32/2009) under which all government levels, including provinces and cities, are obligated to develop GHG inventories.
• Creation of the National Council on Climate Change (Dewan Nasional PerubahanIklim) in 2008 (Law No. 46/2008), which was given authority to advise and oversee the implementation and monitoring of both climate change adaptation and mitigation strategies and policies.
The Indonesian policy framework has increasingly integrated the issues related to climate change into the development agenda. Since 2004, President Susilo Yudhoyono has made “pro-growth, pro-job, pro-poor, and pro-environment” the pillars on which national development policy should be built. Their significance was highlighted again in 2011 as being essential to
103
overcoming the effects of the global recession and high unemployment rates.53
Commitment to these pillars was clearly demonstrated in the National Mid-term Development Plan 2010-2014, stage two of Indonesia’s long-term development strategy, which “recognizes that given the growing challenges of climate change, it is necessary that Indonesia’s economic development mainstreams environmental problems in its strategy through adaptation and mitigation policies.” It “calls for the rehabilitation of forests and lands through government policies, including better management of watershed, controlling of emissions and a reduction in the degradation of the environment. It also says that efforts to reduce greenhouse gas emissions should be focused on forests, peat lands, waste and energy sectors.”54
In the Second National Communication in 2010, the Indonesian government developed a number of innovative schemes to link the global climate change agenda with national development priorities. One outcome is the establishment of the Indonesian Climate Change Trust Fund (ICCTF), which aims to showcase alternative financing for climate change mitigation and adaptation programmes. It comprises five objectives (Republic of Indonesia, 2010):
1. Facilitation and acceleration of investments in renewable energy and energy efficiency while simultaneously reducing GHG emissions in the energy industry;
2. Reducing emissions from deforestation and forest degradation and stabilizing carbon stock through sustainable forest and peat land management;
3. Reducing vulnerability in coastal zones, agriculture and water industries;
4. Bridging the financial gaps necessary to address climate change mitigation and adaptation;
5. Increasing the effectiveness and impact of external finance for climate change.
Table 4.1 connects these objectives with the defined GHG emissions targets and other regulations both in terms of action as well as financial support. The regulations are designed to comply with international regulations. For all industries except for waste, a policy strategy as well as a financial policy option has been developed. The table clearly shows that the LUCF and peat land industries are priority industries, as this is where the bulk of the emissions reduction efforts will be taking place. Moreover, rubber and palm oil are prominent commodities in the agricultural sector.
Policies to promote a low-carbon economic transition
To complement the national climate change framework, the government has developed and begun to implement various policies and incentives to support the Indonesian economy’s transition to a low-carbon growth path. For example, from 2006, new policies were developed to allocate large areas of land and facilitate fossil fuel substitution, such as Law No. 01/2006 on the provision and utilization of bioenergy, particularly palm oil, as an alternative source of energy. This policy boosted the allocation of planting new crops of palm oil as bioenergy and drove the price hike to 53 ‘Indonesian President Calls for Global Coalition for Youth Employment’, http://ilo.org/ilc/ILCSessions/100thSession/media-centre/press-releas-es/WCMS_157666/lang--en/index.htm (Accessed August 10, 2014).
54 ‘National Medium-Term Development Plan 2010-2014’, http://theredddesk.org/countries/plans/national-medium-term-development-plan-2010% E2%80%902014 (Accessed August 10, 2014).
chapter 4: indonesia
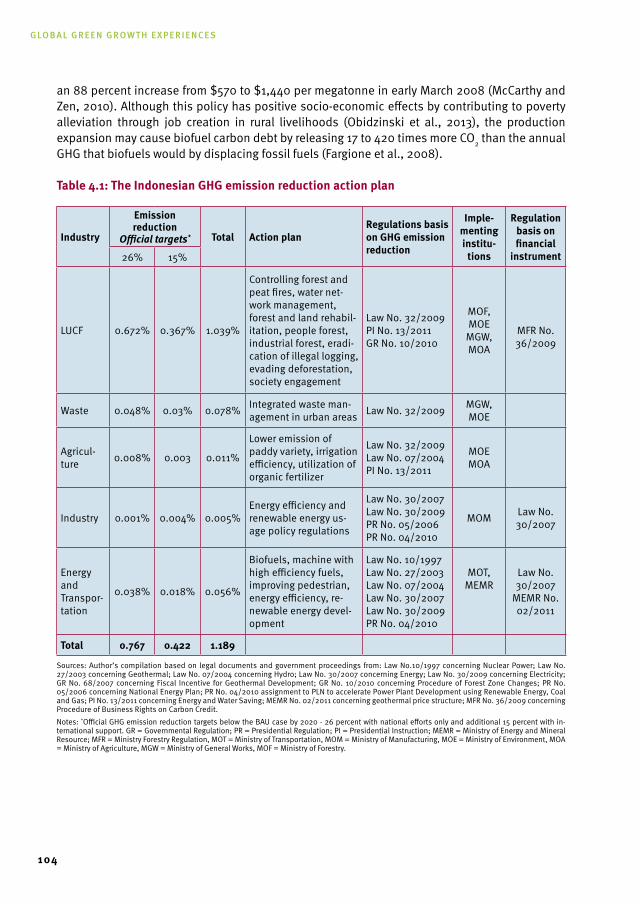
Global Green Growth experiences
104
an 88 percent increase from $570 to $1,440 per megatonne in early March 2008 (McCarthy and Zen, 2010). Although this policy has positive socio-economic effects by contributing to poverty alleviation through job creation in rural livelihoods (Obidzinski et al., 2013), the production expansion may cause biofuel carbon debt by releasing 17 to 420 times more CO2 than the annual GHG that biofuels would by displacing fossil fuels (Fargione et al., 2008).
table 4.1: the Indonesian GHG emission reduction action plan
Industry
Emission reduction
Official targets* total Action planregulations basis on GHG emission reduction
Imple-menting institu-
tions
regulation basis on financial
instrument26% 15%
LUCF 0.672% 0.367% 1.039%
Controlling forest and peat fires, water net-work management, forest and land rehabil-itation, people forest, industrial forest, eradi-cation of illegal logging, evading deforestation, society engagement
Law No. 32/2009 PI No. 13/2011GR No. 10/2010
MOF, MOE
MGW, MOA
MFR No. 36/2009
Waste 0.048% 0.03% 0.078% Integrated waste man-agement in urban areas Law No. 32/2009 MGW,
MOE
Agricul-ture 0.008% 0.003 0.011%
Lower emission of paddy variety, irrigation efficiency, utilization of organic fertilizer
Law No. 32/2009Law No. 07/2004PI No. 13/2011
MOEMOA
Industry 0.001% 0.004% 0.005%Energy efficiency and renewable energy us-age policy regulations
Law No. 30/2007Law No. 30/2009PR No. 05/2006PR No. 04/2010
MOM Law No. 30/2007
Energy and Transpor-tation
0.038% 0.018% 0.056%
Biofuels, machine with high efficiency fuels, improving pedestrian, energy efficiency, re-newable energy devel-opment
Law No. 10/1997Law No. 27/2003Law No. 07/2004Law No. 30/2007Law No. 30/2009PR No. 04/2010
MOT, MEMR
Law No. 30/2007
MEMR No. 02/2011
total 0.767 0.422 1.189
Sources: Author’s compilation based on legal documents and government proceedings from: Law No.10/1997 concerning Nuclear Power; Law No. 27/2003 concerning Geothermal; Law No. 07/2004 concerning Hydro; Law No. 30/2007 concerning Energy; Law No. 30/2009 concerning Electricity; GR No. 68/2007 concerning Fiscal Incentive for Geothermal Development; GR No. 10/2010 concerning Procedure of Forest Zone Changes; PR No. 05/2006 concerning National Energy Plan; PR No. 04/2010 assignment to PLN to accelerate Power Plant Development using Renewable Energy, Coal and Gas; PI No. 13/2011 concerning Energy and Water Saving; MEMR No. 02/2011 concerning geothermal price structure; MFR No. 36/2009 concerning Procedure of Business Rights on Carbon Credit.Notes: *Official GHG emission reduction targets below the BAU case by 2020 - 26 percent with national efforts only and additional 15 percent with in-ternational support. GR = Governmental Regulation; PR = Presidential Regulation; PI = Presidential Instruction; MEMR = Ministry of Energy and Mineral Resource; MFR = Ministry Forestry Regulation, MOT = Ministry of Transportation, MOM = Ministry of Manufacturing, MOE = Ministry of Environment, MOA = Ministry of Agriculture, MGW = Ministry of General Works, MOF = Ministry of Forestry.
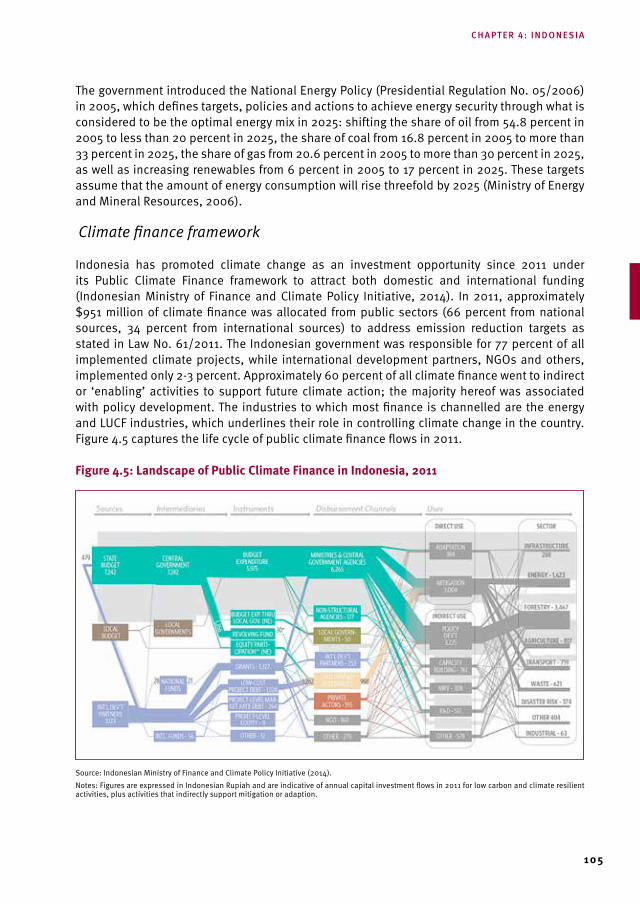
105
The government introduced the National Energy Policy (Presidential Regulation No. 05/2006) in 2005, which defines targets, policies and actions to achieve energy security through what is considered to be the optimal energy mix in 2025: shifting the share of oil from 54.8 percent in 2005 to less than 20 percent in 2025, the share of coal from 16.8 percent in 2005 to more than 33 percent in 2025, the share of gas from 20.6 percent in 2005 to more than 30 percent in 2025, as well as increasing renewables from 6 percent in 2005 to 17 percent in 2025. These targets assume that the amount of energy consumption will rise threefold by 2025 (Ministry of Energy and Mineral Resources, 2006).
Climate finance framework
Indonesia has promoted climate change as an investment opportunity since 2011 under its Public Climate Finance framework to attract both domestic and international funding (Indonesian Ministry of Finance and Climate Policy Initiative, 2014). In 2011, approximately $951 million of climate finance was allocated from public sectors (66 percent from national sources, 34 percent from international sources) to address emission reduction targets as stated in Law No. 61/2011. The Indonesian government was responsible for 77 percent of all implemented climate projects, while international development partners, NGOs and others, implemented only 2-3 percent. Approximately 60 percent of all climate finance went to indirect or ‘enabling’ activities to support future climate action; the majority hereof was associated with policy development. The industries to which most finance is channelled are the energy and LUCF industries, which underlines their role in controlling climate change in the country. Figure 4.5 captures the life cycle of public climate finance flows in 2011.
Figure 4.5: Landscape of Public Climate Finance in Indonesia, 2011
Source: Indonesian Ministry of Finance and Climate Policy Initiative (2014). Notes: Figures are expressed in Indonesian Rupiah and are indicative of annual capital investment flows in 2011 for low carbon and climate resilient activities, plus activities that indirectly support mitigation or adaption.
chapter 4: indonesia
Global Green Growth experiences
106
According to the Indonesian Ministry of Finance and the Climate Policy Initiative (2014), “domestic and international public finance resources appeared to be well aligned with Indonesia’s future policy needs and priority sectors”, p. ii. Even though public climate finance expenditures in 2011 fell short of the level of annual finance estimated by the government required to meet the defined emission reduction targets by 2020, the foreseen growth in domestic and international public finance resources is expected to compensate for such shortcomings. Although there are some barriers to implementing the policies in certain cases, particularly the uncertainty regarding adaptation and development finance, clearance of the policy and disseminating the regulation to the public as advocated by Resosudarmo et al. (2014) and Luttrell et al. (2014) will improve the policy’s effectiveness.
Policies to promote renewable energy
The government’s commitment to transforming the energy mix is highlighted in national regulations such as the National Energy Policy (Presidential Regulation No. 05/2006) and the GHG Emission Reduction Action Plan (Presidential Regulation No. 61/2011) (see Table 4.1). Through the former, the government aims to triple the share of renewable energy to 15 percent by 2025, and shall comprise biomass, geothermal and other renewables to at least 5 percent each. Based on current expectations to economic growth, a renewable energy capacity of 6.7 GW must be added to realize this goal (International Trade Administration, 2010).
Broader policies include Law No. 30/2007, which provides for government financial support to new projects on provisional and utilization of renewable energy until they reach a further economic development stage (Senoaji, 2011). Another example is Law No. 31/2009, which obligates the state-owned electricity company (which has a monopoly on electricity distribution in Indonesia) to purchase electricity up to 10MW from small and medium sized renewable energy power plants developed by cooperatives, community or business entities (Senoaji, 2011).
The government has rolled out several industrial programmes to encourage the development of renewable energy. A large number of programmes target rural electrification and interconnected power plants (Ministry of Energy and Mineral Resources, 2009). Biofuels incentives have been particularly instrumental. Since 2007, Indonesia has had numerical targets for biofuel use as a mandatory blend of 1-5 percent of bioethanol in gasoline production, and since 2009, a diesel commodities mandatory blend of 0.25-1 percent biodiesel.
Geothermal energy has been extensively promoted through tariff measures which have been continuously updated (such as Law No. 32/2009). In August 2014, the Geothermal Law was passed (replacing Law No. 27/2003), eliminating the legal barriers for the development of the country’s massive geothermal resources. Previously, applications for development of geothermal fields located in forest conservation areas were treated as a mining activity under the Forestry Law and were, if not rejected, subject to significant delays. In effect, only 9 out of the 58 geothermal working (concession) areas offered for development by the government are currently in production. Complementing the law is an update in the regulations on the ceiling for new geothermal projects.55
55 ‘Legal Barrier to Geothermal Development Removed’, www.thejakartapost.com/news/2014/08/27/legal-barrier-geothermal-development-re-moved.html (Accessed 30 August 2014).
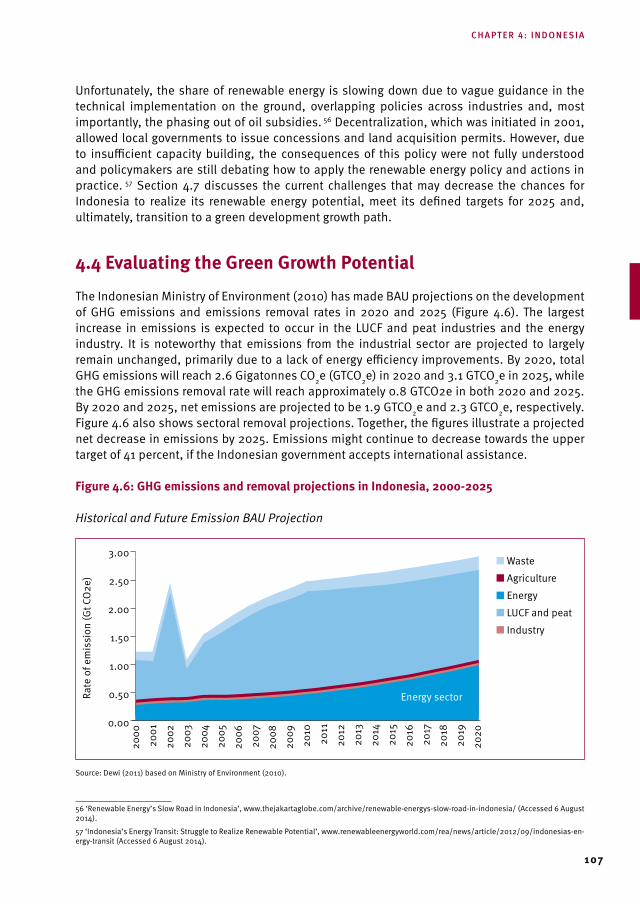
107
Unfortunately, the share of renewable energy is slowing down due to vague guidance in the technical implementation on the ground, overlapping policies across industries and, most importantly, the phasing out of oil subsidies. 56 Decentralization, which was initiated in 2001, allowed local governments to issue concessions and land acquisition permits. However, due to insufficient capacity building, the consequences of this policy were not fully understood and policymakers are still debating how to apply the renewable energy policy and actions in practice. 57 Section 4.7 discusses the current challenges that may decrease the chances for Indonesia to realize its renewable energy potential, meet its defined targets for 2025 and, ultimately, transition to a green development growth path.
4.4 Evaluating the Green Growth Potential
The Indonesian Ministry of Environment (2010) has made BAU projections on the development of GHG emissions and emissions removal rates in 2020 and 2025 (Figure 4.6). The largest increase in emissions is expected to occur in the LUCF and peat industries and the energy industry. It is noteworthy that emissions from the industrial sector are projected to largely remain unchanged, primarily due to a lack of energy efficiency improvements. By 2020, total GHG emissions will reach 2.6 Gigatonnes CO2e (GTCO2e) in 2020 and 3.1 GTCO2e in 2025, while the GHG emissions removal rate will reach approximately 0.8 GTCO2e in both 2020 and 2025. By 2020 and 2025, net emissions are projected to be 1.9 GTCO2e and 2.3 GTCO2e, respectively. Figure 4.6 also shows sectoral removal projections. Together, the figures illustrate a projected net decrease in emissions by 2025. Emissions might continue to decrease towards the upper target of 41 percent, if the Indonesian government accepts international assistance.
Figure 4.6: GHG emissions and removal projections in Indonesia, 2000-2025
Historical and Future Emission BAU Projection
Source: Dewi (2011) based on Ministry of Environment (2010).
56 ‘Renewable Energy’s Slow Road in Indonesia’, www.thejakartaglobe.com/archive/renewable-energys-slow-road-in-indonesia/ (Accessed 6 August 2014).
57 ‘Indonesia’s Energy Transit: Struggle to Realize Renewable Potential’, www.renewableenergyworld.com/rea/news/article/2012/09/indonesias-en-ergy-transit (Accessed 6 August 2014).
■ Waste■ Agriculture■ Energy■ LUCF and peat■ Industry
0.00
0.50
1.00
1.50
2.00
2.50
3.00
2000
2001
2002
2003
2004
2005
2006
2007
2008
2009
2010
2011
2012
2013
2014
2015
2016
2017
2018
2019
2020
Rate
of e
mis
sion
(Gt C
O2e
)
Energy sector
chapter 4: indonesia
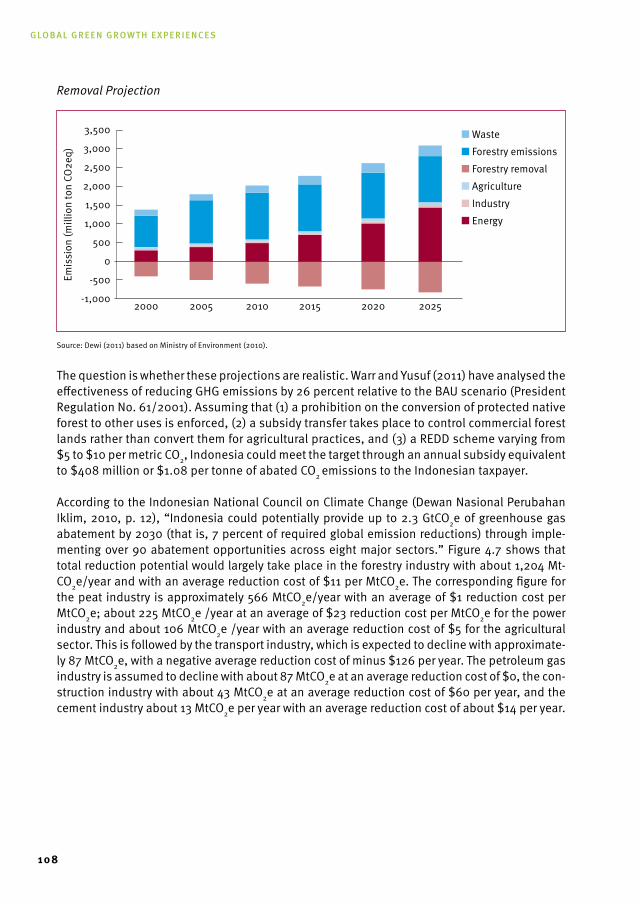
Global Green Growth experiences
108
Removal Projection
Source: Dewi (2011) based on Ministry of Environment (2010).
The question is whether these projections are realistic. Warr and Yusuf (2011) have analysed the effectiveness of reducing GHG emissions by 26 percent relative to the BAU scenario (President Regulation No. 61/2001). Assuming that (1) a prohibition on the conversion of protected native forest to other uses is enforced, (2) a subsidy transfer takes place to control commercial forest lands rather than convert them for agricultural practices, and (3) a REDD scheme varying from $5 to $10 per metric CO2, Indonesia could meet the target through an annual subsidy equivalent to $408 million or $1.08 per tonne of abated CO2 emissions to the Indonesian taxpayer.
According to the Indonesian National Council on Climate Change (Dewan Nasional Perubahan Iklim, 2010, p. 12), “Indonesia could potentially provide up to 2.3 GtCO2e of greenhouse gas abatement by 2030 (that is, 7 percent of required global emission reductions) through imple-menting over 90 abatement opportunities across eight major sectors.” Figure 4.7 shows that total reduction potential would largely take place in the forestry industry with about 1,204 Mt-CO2e/year and with an average reduction cost of $11 per MtCO2e. The corresponding figure for the peat industry is approximately 566 MtCO2e/year with an average of $1 reduction cost per MtCO2e; about 225 MtCO2e /year at an average of $23 reduction cost per MtCO2e for the power industry and about 106 MtCO2e /year with an average reduction cost of $5 for the agricultural sector. This is followed by the transport industry, which is expected to decline with approximate-ly 87 MtCO2e, with a negative average reduction cost of minus $126 per year. The petroleum gas industry is assumed to decline with about 87 MtCO2e at an average reduction cost of $0, the con-struction industry with about 43 MtCO2e at an average reduction cost of $60 per year, and the cement industry about 13 MtCO2e per year with an average reduction cost of about $14 per year.
■ Waste■ Forestry emissions■ Forestry removal■ Agriculture■ Industry■ Energy
500
0
-500
-1,000
1,000
1,500
2,000
2,500
3,000
3,500
Emis
sion
(mill
ion
ton
CO2e
q)
2000 2005 2010 2015 2020 2025
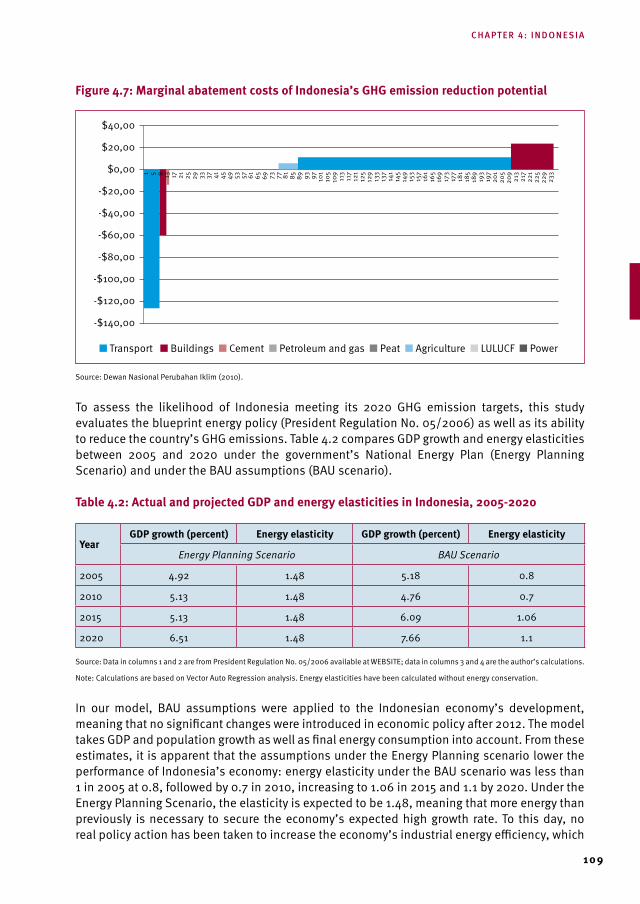
109
Figure 4.7: marginal abatement costs of Indonesia’s GHG emission reduction potential
Source: Dewan Nasional Perubahan Iklim (2010).
To assess the likelihood of Indonesia meeting its 2020 GHG emission targets, this study evaluates the blueprint energy policy (President Regulation No. 05/2006) as well as its ability to reduce the country’s GHG emissions. Table 4.2 compares GDP growth and energy elasticities between 2005 and 2020 under the government’s National Energy Plan (Energy Planning Scenario) and under the BAU assumptions (BAU scenario).
table 4.2: Actual and projected GdP and energy elasticities in Indonesia, 2005-2020
YearGdP growth (percent) Energy elasticity GdP growth (percent) Energy elasticity
Energy Planning Scenario BAU Scenario
2005 4.92 1.48 5.18 0.8
2010 5.13 1.48 4.76 0.7
2015 5.13 1.48 6.09 1.06
2020 6.51 1.48 7.66 1.1
Source: Data in columns 1 and 2 are from President Regulation No. 05/2006 available at WEBSITE; data in columns 3 and 4 are the author’s calculations.
Note: Calculations are based on Vector Auto Regression analysis. Energy elasticities have been calculated without energy conservation.
In our model, BAU assumptions were applied to the Indonesian economy’s development, meaning that no significant changes were introduced in economic policy after 2012. The model takes GDP and population growth as well as final energy consumption into account. From these estimates, it is apparent that the assumptions under the Energy Planning scenario lower the performance of Indonesia’s economy: energy elasticity under the BAU scenario was less than 1 in 2005 at 0.8, followed by 0.7 in 2010, increasing to 1.06 in 2015 and 1.1 by 2020. Under the Energy Planning Scenario, the elasticity is expected to be 1.48, meaning that more energy than previously is necessary to secure the economy’s expected high growth rate. To this day, no real policy action has been taken to increase the economy’s industrial energy efficiency, which
■ Transport ■ Buildings ■ Cement ■ Petroleum and gas ■ Peat ■ Agriculture ■ LULUCF ■ Power
$40,00
$20,00
$0,00
-$20,00
-$40,00
-$60,00
-$80,00
-$100,00
-$120,00
-$140,00
1 5 9 13 17 21 25 29 33 37 41 45 49 53 57 61 65 69 73 77 81 85 89 93 97 101
105
109
113
117
121
125
129
133
137
141
145
149
153
157
161
165
169
173
177
181
185
189
193
197
201
205
209
213
217
221
225
229
233
chapter 4: indonesia
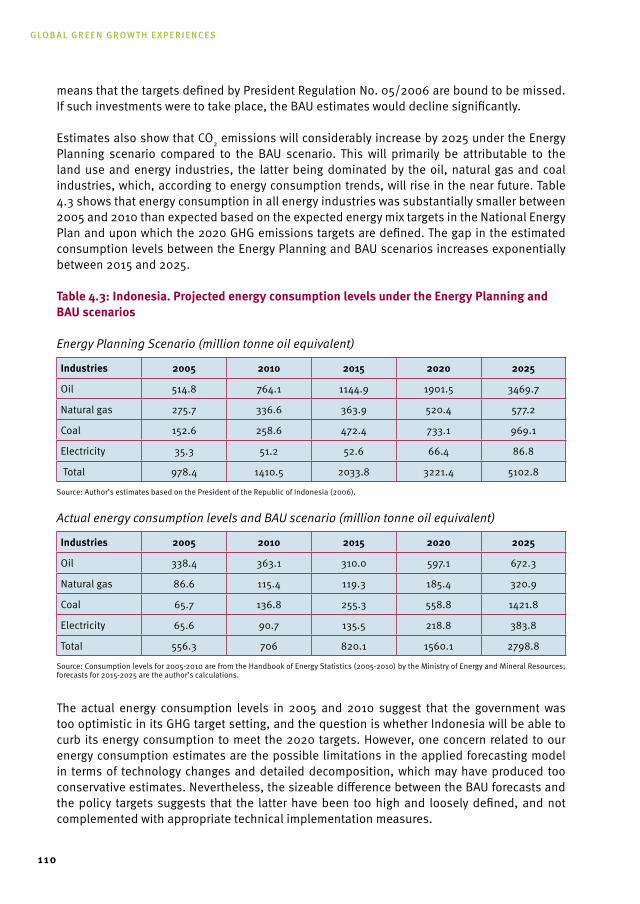
Global Green Growth experiences
110
means that the targets defined by President Regulation No. 05/2006 are bound to be missed. If such investments were to take place, the BAU estimates would decline significantly.
Estimates also show that CO2 emissions will considerably increase by 2025 under the Energy Planning scenario compared to the BAU scenario. This will primarily be attributable to the land use and energy industries, the latter being dominated by the oil, natural gas and coal industries, which, according to energy consumption trends, will rise in the near future. Table 4.3 shows that energy consumption in all energy industries was substantially smaller between 2005 and 2010 than expected based on the expected energy mix targets in the National Energy Plan and upon which the 2020 GHG emissions targets are defined. The gap in the estimated consumption levels between the Energy Planning and BAU scenarios increases exponentially between 2015 and 2025.
table 4.3: Indonesia. Projected energy consumption levels under the Energy Planning and BAU scenarios
Energy Planning Scenario (million tonne oil equivalent)
Industries 2005 2010 2015 2020 2025
Oil 514.8 764.1 1144.9 1901.5 3469.7
Natural gas 275.7 336.6 363.9 520.4 577.2
Coal 152.6 258.6 472.4 733.1 969.1
Electricity 35.3 51.2 52.6 66.4 86.8
Total 978.4 1410.5 2033.8 3221.4 5102.8
Source: Author’s estimates based on the President of the Republic of Indonesia (2006).
Actual energy consumption levels and BAU scenario (million tonne oil equivalent)
Industries 2005 2010 2015 2020 2025
Oil 338.4 363.1 310.0 597.1 672.3
Natural gas 86.6 115.4 119.3 185.4 320.9
Coal 65.7 136.8 255.3 558.8 1421.8
Electricity 65.6 90.7 135.5 218.8 383.8
Total 556.3 706 820.1 1560.1 2798.8
Source: Consumption levels for 2005-2010 are from the Handbook of Energy Statistics (2005-2010) by the Ministry of Energy and Mineral Resources; forecasts for 2015-2025 are the author’s calculations.
The actual energy consumption levels in 2005 and 2010 suggest that the government was too optimistic in its GHG target setting, and the question is whether Indonesia will be able to curb its energy consumption to meet the 2020 targets. However, one concern related to our energy consumption estimates are the possible limitations in the applied forecasting model in terms of technology changes and detailed decomposition, which may have produced too conservative estimates. Nevertheless, the sizeable difference between the BAU forecasts and the policy targets suggests that the latter have been too high and loosely defined, and not complemented with appropriate technical implementation measures.
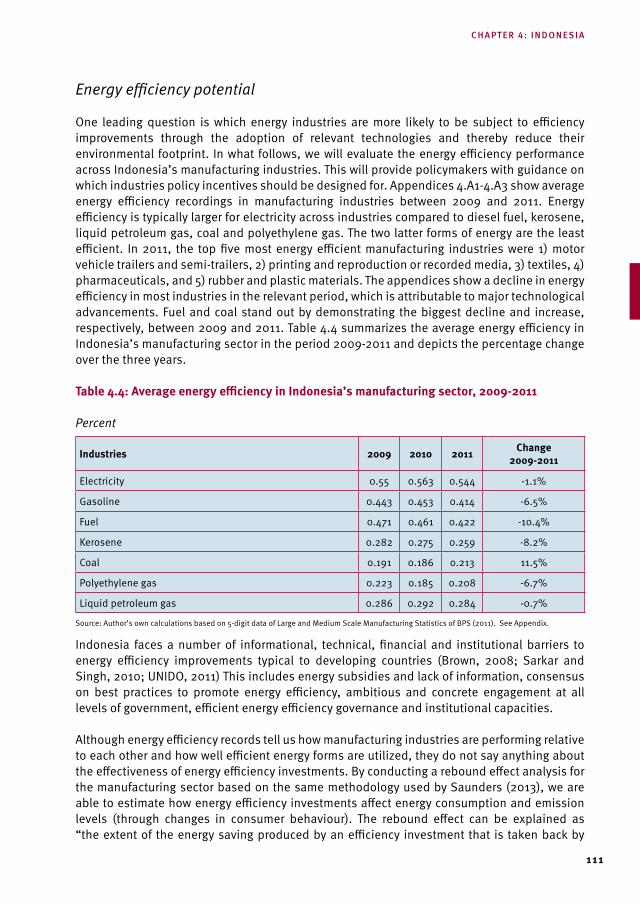
111
Energy efficiency potential
One leading question is which energy industries are more likely to be subject to efficiency improvements through the adoption of relevant technologies and thereby reduce their environmental footprint. In what follows, we will evaluate the energy efficiency performance across Indonesia’s manufacturing industries. This will provide policymakers with guidance on which industries policy incentives should be designed for. Appendices 4.A1-4.A3 show average energy efficiency recordings in manufacturing industries between 2009 and 2011. Energy efficiency is typically larger for electricity across industries compared to diesel fuel, kerosene, liquid petroleum gas, coal and polyethylene gas. The two latter forms of energy are the least efficient. In 2011, the top five most energy efficient manufacturing industries were 1) motor vehicle trailers and semi-trailers, 2) printing and reproduction or recorded media, 3) textiles, 4) pharmaceuticals, and 5) rubber and plastic materials. The appendices show a decline in energy efficiency in most industries in the relevant period, which is attributable to major technological advancements. Fuel and coal stand out by demonstrating the biggest decline and increase, respectively, between 2009 and 2011. Table 4.4 summarizes the average energy efficiency in Indonesia’s manufacturing sector in the period 2009-2011 and depicts the percentage change over the three years.
table 4.4: Average energy efficiency in Indonesia’s manufacturing sector, 2009-2011
Percent
Industries 2009 2010 2011 Change2009-2011
Electricity 0.55 0.563 0.544 -1.1%
Gasoline 0.443 0.453 0.414 -6.5%
Fuel 0.471 0.461 0.422 -10.4%
Kerosene 0.282 0.275 0.259 -8.2%
Coal 0.191 0.186 0.213 11.5%
Polyethylene gas 0.223 0.185 0.208 -6.7%
Liquid petroleum gas 0.286 0.292 0.284 -0.7%
Source: Author’s own calculations based on 5-digit data of Large and Medium Scale Manufacturing Statistics of BPS (2011). See Appendix.
Indonesia faces a number of informational, technical, financial and institutional barriers to energy efficiency improvements typical to developing countries (Brown, 2008; Sarkar and Singh, 2010; UNIDO, 2011) This includes energy subsidies and lack of information, consensus on best practices to promote energy efficiency, ambitious and concrete engagement at all levels of government, efficient energy efficiency governance and institutional capacities.
Although energy efficiency records tell us how manufacturing industries are performing relative to each other and how well efficient energy forms are utilized, they do not say anything about the effectiveness of energy efficiency investments. By conducting a rebound effect analysis for the manufacturing sector based on the same methodology used by Saunders (2013), we are able to estimate how energy efficiency investments affect energy consumption and emission levels (through changes in consumer behaviour). The rebound effect can be explained as “the extent of the energy saving produced by an efficiency investment that is taken back by
chapter 4: indonesia
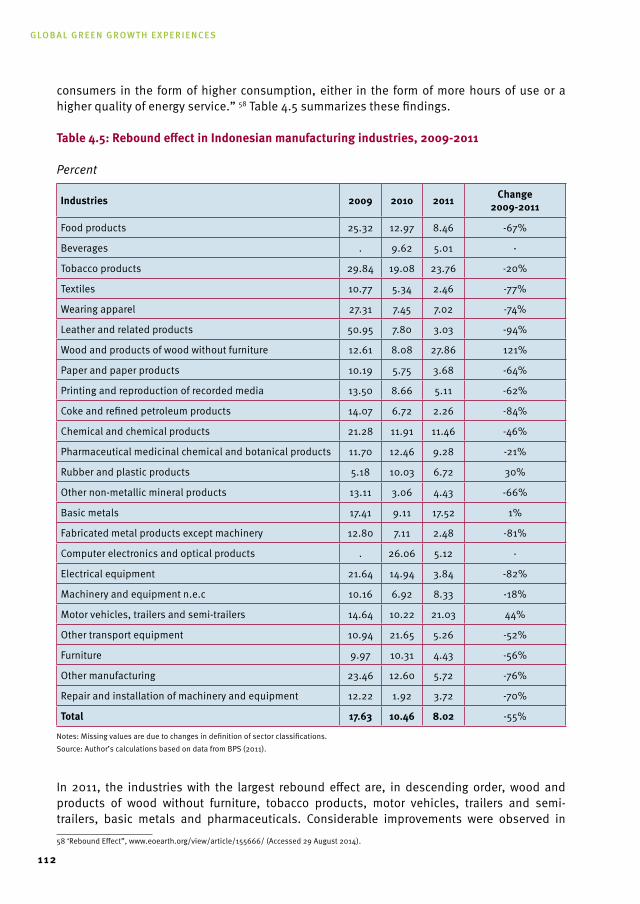
Global Green Growth experiences
112
consumers in the form of higher consumption, either in the form of more hours of use or a higher quality of energy service.” 58 Table 4.5 summarizes these findings.
table 4.5: rebound effect in Indonesian manufacturing industries, 2009-2011
Percent
Industries 2009 2010 2011 Change2009-2011
Food products 25.32 12.97 8.46 -67%
Beverages . 9.62 5.01 -
Tobacco products 29.84 19.08 23.76 -20%
Textiles 10.77 5.34 2.46 -77%
Wearing apparel 27.31 7.45 7.02 -74%
Leather and related products 50.95 7.80 3.03 -94%
Wood and products of wood without furniture 12.61 8.08 27.86 121%
Paper and paper products 10.19 5.75 3.68 -64%
Printing and reproduction of recorded media 13.50 8.66 5.11 -62%
Coke and refined petroleum products 14.07 6.72 2.26 -84%
Chemical and chemical products 21.28 11.91 11.46 -46%
Pharmaceutical medicinal chemical and botanical products 11.70 12.46 9.28 -21%
Rubber and plastic products 5.18 10.03 6.72 30%
Other non-metallic mineral products 13.11 3.06 4.43 -66%
Basic metals 17.41 9.11 17.52 1%
Fabricated metal products except machinery 12.80 7.11 2.48 -81%
Computer electronics and optical products . 26.06 5.12 -
Electrical equipment 21.64 14.94 3.84 -82%
Machinery and equipment n.e.c 10.16 6.92 8.33 -18%
Motor vehicles, trailers and semi-trailers 14.64 10.22 21.03 44%
Other transport equipment 10.94 21.65 5.26 -52%
Furniture 9.97 10.31 4.43 -56%
Other manufacturing 23.46 12.60 5.72 -76%
Repair and installation of machinery and equipment 12.22 1.92 3.72 -70%
total 17.63 10.46 8.02 -55%
Notes: Missing values are due to changes in definition of sector classifications. Source: Author’s calculations based on data from BPS (2011).
In 2011, the industries with the largest rebound effect are, in descending order, wood and products of wood without furniture, tobacco products, motor vehicles, trailers and semi-trailers, basic metals and pharmaceuticals. Considerable improvements were observed in 58 ‘Rebound Effect”, www.eoearth.org/view/article/155666/ (Accessed 29 August 2014).
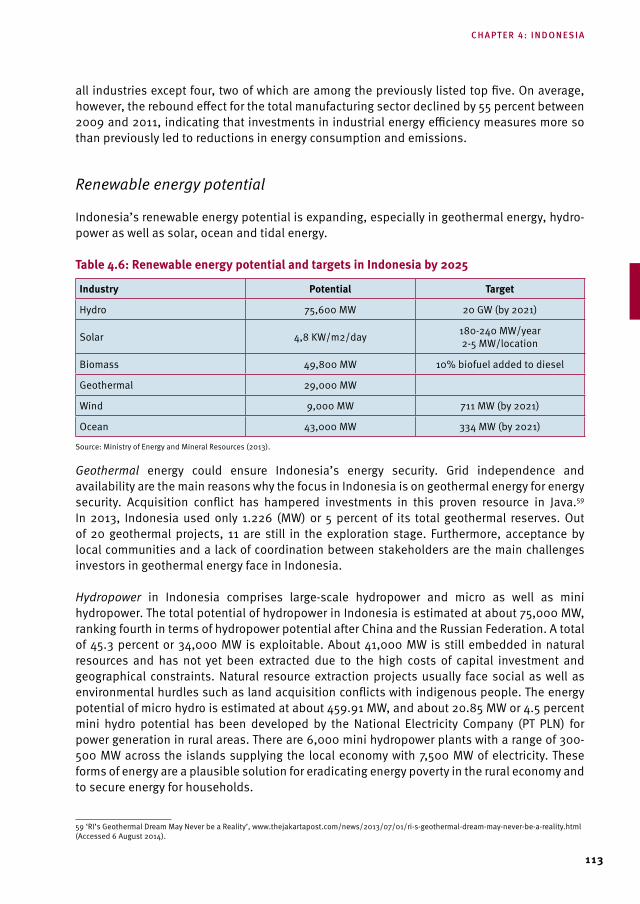
113
all industries except four, two of which are among the previously listed top five. On average, however, the rebound effect for the total manufacturing sector declined by 55 percent between 2009 and 2011, indicating that investments in industrial energy efficiency measures more so than previously led to reductions in energy consumption and emissions.
Renewable energy potential
Indonesia’s renewable energy potential is expanding, especially in geothermal energy, hydro-power as well as solar, ocean and tidal energy.
table 4.6: renewable energy potential and targets in Indonesia by 2025
Industry Potential target
Hydro 75,600 MW 20 GW (by 2021)
Solar 4,8 KW/m2/day 180-240 MW/year 2-5 MW/location
Biomass 49,800 MW 10% biofuel added to diesel
Geothermal 29,000 MW
Wind 9,000 MW 711 MW (by 2021)
Ocean 43,000 MW 334 MW (by 2021)
Source: Ministry of Energy and Mineral Resources (2013).
Geothermal energy could ensure Indonesia’s energy security. Grid independence and availability are the main reasons why the focus in Indonesia is on geothermal energy for energy security. Acquisition conflict has hampered investments in this proven resource in Java.59 In 2013, Indonesia used only 1.226 (MW) or 5 percent of its total geothermal reserves. Out of 20 geothermal projects, 11 are still in the exploration stage. Furthermore, acceptance by local communities and a lack of coordination between stakeholders are the main challenges investors in geothermal energy face in Indonesia.
Hydropower in Indonesia comprises large-scale hydropower and micro as well as mini hydropower. The total potential of hydropower in Indonesia is estimated at about 75,000 MW, ranking fourth in terms of hydropower potential after China and the Russian Federation. A total of 45.3 percent or 34,000 MW is exploitable. About 41,000 MW is still embedded in natural resources and has not yet been extracted due to the high costs of capital investment and geographical constraints. Natural resource extraction projects usually face social as well as environmental hurdles such as land acquisition conflicts with indigenous people. The energy potential of micro hydro is estimated at about 459.91 MW, and about 20.85 MW or 4.5 percent mini hydro potential has been developed by the National Electricity Company (PT PLN) for power generation in rural areas. There are 6,000 mini hydropower plants with a range of 300-500 MW across the islands supplying the local economy with 7,500 MW of electricity. These forms of energy are a plausible solution for eradicating energy poverty in the rural economy and to secure energy for households.
59 ‘RI’s Geothermal Dream May Never be a Reality’, www.thejakartapost.com/news/2013/07/01/ri-s-geothermal-dream-may-never-be-a-reality.html (Accessed 6 August 2014).
chapter 4: indonesia
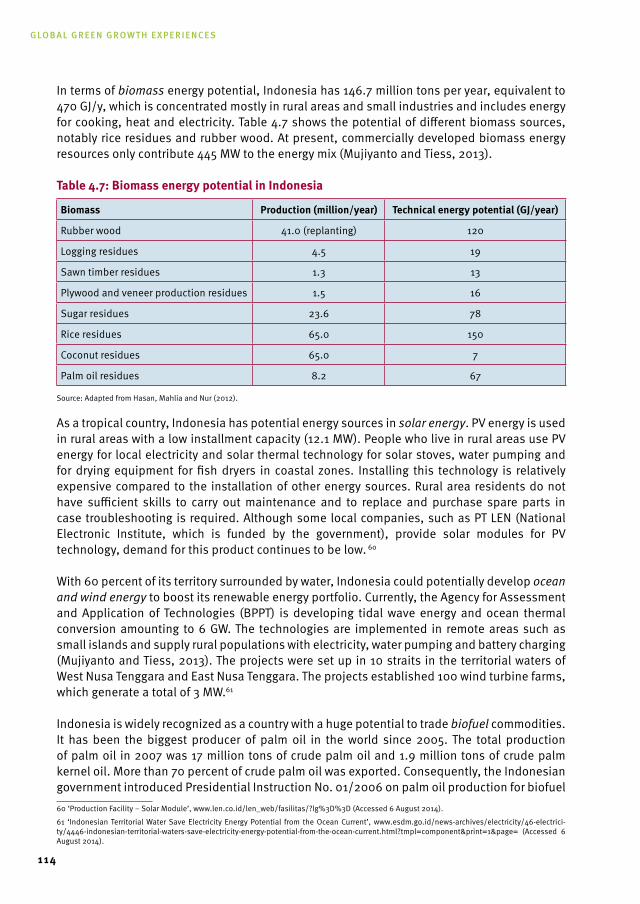
Global Green Growth experiences
114
In terms of biomass energy potential, Indonesia has 146.7 million tons per year, equivalent to 470 GJ/y, which is concentrated mostly in rural areas and small industries and includes energy for cooking, heat and electricity. Table 4.7 shows the potential of different biomass sources, notably rice residues and rubber wood. At present, commercially developed biomass energy resources only contribute 445 MW to the energy mix (Mujiyanto and Tiess, 2013).
table 4.7: Biomass energy potential in Indonesia
Biomass Production (million/year) technical energy potential (GJ/year)
Rubber wood 41.0 (replanting) 120
Logging residues 4.5 19
Sawn timber residues 1.3 13
Plywood and veneer production residues 1.5 16
Sugar residues 23.6 78
Rice residues 65.0 150
Coconut residues 65.0 7
Palm oil residues 8.2 67
Source: Adapted from Hasan, Mahlia and Nur (2012).
As a tropical country, Indonesia has potential energy sources in solar energy. PV energy is used in rural areas with a low installment capacity (12.1 MW). People who live in rural areas use PV energy for local electricity and solar thermal technology for solar stoves, water pumping and for drying equipment for fish dryers in coastal zones. Installing this technology is relatively expensive compared to the installation of other energy sources. Rural area residents do not have sufficient skills to carry out maintenance and to replace and purchase spare parts in case troubleshooting is required. Although some local companies, such as PT LEN (National Electronic Institute, which is funded by the government), provide solar modules for PV technology, demand for this product continues to be low. 60
With 60 percent of its territory surrounded by water, Indonesia could potentially develop ocean and wind energy to boost its renewable energy portfolio. Currently, the Agency for Assessment and Application of Technologies (BPPT) is developing tidal wave energy and ocean thermal conversion amounting to 6 GW. The technologies are implemented in remote areas such as small islands and supply rural populations with electricity, water pumping and battery charging (Mujiyanto and Tiess, 2013). The projects were set up in 10 straits in the territorial waters of West Nusa Tenggara and East Nusa Tenggara. The projects established 100 wind turbine farms, which generate a total of 3 MW.61
Indonesia is widely recognized as a country with a huge potential to trade biofuel commodities. It has been the biggest producer of palm oil in the world since 2005. The total production of palm oil in 2007 was 17 million tons of crude palm oil and 1.9 million tons of crude palm kernel oil. More than 70 percent of crude palm oil was exported. Consequently, the Indonesian government introduced Presidential Instruction No. 01/2006 on palm oil production for biofuel 60 ‘Production Facility – Solar Module’, www.len.co.id/len_web/fasilitas/?lg%3D%3D (Accessed 6 August 2014).
61 ‘Indonesian Territorial Water Save Electricity Energy Potential from the Ocean Current’, www.esdm.go.id/news-archives/electricity/46-electrici-ty/4446-indonesian-territorial-waters-save-electricity-energy-potential-from-the-ocean-current.html?tmpl=component&print=1&page= (Accessed 6 August 2014).
115
as an alternative fuel (biofuel). At least 15 companies have established new larger biodiesel refineries to produce 82.5 million tons. Today, 24 biodiesel producers and 14 bioethanol producers are licensed to produce biodiesel and bioethanol. The installed capacity of biodiesel is 4,659,938 KL/year and 463,980 KL/year for bioethanol.
Palm oil production on Sumatera Island is projected to increase from 18,956 hectares in 1990 to 2,431,722 hectares in 2030, and in Kalimantan from 15,982 hectares in 2000 to 1,237,534 hectares in 2030 (author’s calculation based on Miettinen et al. (2012) and MoEM (2013)). According to the government, biodiesel energy based on palm oil supplied 0.4 million kilo liters to the energy mix in 2010, and is expected to rise to 2.7 million kilo liters by 2015, 5.8 million kilo liters by 2020 and 13.5 million kilo liters in 2030. In line with Presidential Instruction No. 01/2006, Indonesia plans to reach 26.1 million hectares by 2020 through a number of plantation programs.
Finally, more than any other nation, Indonesia has the potential to gain the most in financial terms if REDD and/or REDD+ (an extension of REDD by low-carbon but high biodiversity lands) were to become practiced on a nationwide basis. As the first country, Indonesia enacted national REDD regulations in 2009 and has since been targeted by and implemented various REDD schemes across the country and in cooperation with other countries. According to a 2013 Human Rights Watch Report, “illegal logging and forest-sector mismanagement resulted in losses to the Indonesian government of more than US$7 billion between 2007 and 2011”.62 In fact, national sources project that annual revenue generation up to $765 million per five percent reduction in deforestation emissions is possible, and up to $4.5 billion in the event of a 30 percent cut (Thorburn, 2011). However, a number of risks with regard to the implementation of REDD/REDD+ have been identified. One key argument is that “by monetizing forest carbon, REDD would substantially increase the market value of forests, including those previously considered marginal, prompting central governments to increase control”.63 This poses a particular challenge to Indonesia’s indigenous peoples as they seek to have their customary forest rights recognized within the emerging legal frameworks of REDD/REDD+. To date, only two REDD projects have been implemented through the Ministry of Forestry, both of which have been financed by international institutions. Local governments are participating to ensure that those projects are implemented efficiently.
Such vast resources offer a great potential for Indonesia to increase the share of renewable energy in the energy mix substantially and create a long line of create jobs. The next section will dwell on the policies in place to realize this potential.
4.5 Policies for Green Job Creation
Although Indonesia continues to make major macroeconomic improvements, the reduction of poverty remains one of the country’s main policy objectives, as half of all households are clustered around the national poverty line. The root causes of poverty are under-employment and a low absorption rate in the formal labour market. In 2010, about 60 percent of the labour force was employed in low-wage jobs in the informal sector, working less than normal working 62 ‘Indonesia: Forestry Failures Jeopardize ‘Green Growth’, www.hrw.org/news/2013/07/16/indonesia-forestry-failures-jeopardize-green-growth (Accessed 10 August 2014).
63 ‘Rush for REDD Could Undermine Local Forest Rights’, http://uk.reuters.com/article/2010/04/16/us-carbon-forest-communities-idUK-TRE63F0SC20100416 (Accessed 10 August, 2014).
chapter 4: indonesia
Global Green Growth experiences
116
hours and resulting in low labour productivity (Statistics Indonesia, 2011). A link between poverty eradication and climate change in Indonesia could be established by intertwining these policies to target green job creation. Green jobs offer an immediate response for Indonesia to improve poverty alleviation through a sustainable low carbon development path.
According to Gunawan and Fraser (2014), any policies linked directly to green job creation have yet to be developed in Indonesia. This ‘non-focus’ on green jobs is explained by the continued priority given to improving economic activities and aversion towards the possible high costs of green investments. Nevertheless, the increasing efforts to steer government regulation both within and across ministries towards environmental management in a number of industries have implicitly promoted the generation of green jobs. Gunawan and Frasier (2014) find that such indirect effects take place in four industries, specifically the agricultural, energy, industrial and tourism industries. We will explore the efforts in the two former industries in more detail below.
Policies with green jobs implications
The agricultural sector: Law No. 41/2009 on Sustainable Agriculture Land Protection includes environmentally benign farming, participatory processes and the promotion of local knowledge. Several policies related to this matter have been introduced, such as the Ministry of Agriculture Decision No. 456/2006, the Ministry of Agriculture Regulation No. 07/2007 and the Ministry of Agriculture Regulation No. 28/2009. None of these regulations, however, explicitly target green job creation. According to Ariesusanty (2011), Indonesia has developed organic farmland of about 50,000 hectares corresponding to 0.2 percent of total farmland. For a case study in Java and North Sumatera, Jahroh (2010) reported that about 149 farmers involved in organic farming on 51 hectares which creates at least 3 jobs for each ha. Together, these studies suggest that about 150,000 jobs had been created in organic farming by 2011. Organic farming is still limited in Indonesia and conventional farmers must be educated in such methods in order for them to change their practices away from monoculture (Jahroh, 2010).
The energy industry: under Law No. 17/2007 on the National Long Term Development Plan 2005-2025, the government suggested developing renewables such as micro/mini hydro or solar energy to improve energy independence and energy security for off-grid and remote areas. Some case studies (ILO, 2013) show that a government micro and mini hydro programme (18,800 watt/18,8 kW) (President Regulation No. 05/2006) has generated approximately 4-5 jobs for each project. We will use this number as a basis for a simple calculation of potential job creation in future micro and mini hydro projects. The government has stated that micro and mini hydro projects will add 1,260 MW in 2015, 2,348.1 MW in 2020, and 330 MW in 2025 to installed capacity. Hence, using our simple assumption, such projects will generate 335,106 jobs in 2015, 624,495 jobs in 2020 and 87,766 in 2025, adding up to 1,047,367 jobs in the period 2015-2025. Until 2012, the implementation of micro and mini-hydro projects added installed capacity of 1.8 MW, which should have created 479 jobs (ILO, 2013).
Challenges to green job creation
Although Indonesia has had policy tools to promote green investment as well as green industries (see Section 4.2), and though it would appear straightforward to shift those policies
117
to generate green jobs, good governance issues have been identified as a stumbling block to turn such policies into concrete actions. Uncertainty and continued changes in elites has affected the political system at both the ministerial and technical level. Lack of commitment to organizing and coordinating the policies adds insecurity to the implementation.
Zaituni et al. (2010) also note that access to relevant skills poses yet another challenge for the creation of green jobs in Indonesia. This is a major bottleneck and may determine whether people will enter into informal or formal sectors in green industries. The adoption and dissemination of clean technologies both for manufacturing sectors as well as for workers are crucial factors for adapting the changes of environmental policies. This process is challenged by four limitations to skill development (Gunawan and Fraser, 2014):
• Anunder-educatedlabourforceworkinginagricultureandlivinginruralareas,whichcauses information lags of green knowledge transfer;
• Thecurrentcurriculumoftechnicaleducationisbasedonaconventionalsystemanddoes not encompass knowledge of green technologies. It is therefore difficult to improve the technical skills of students through formal education;
• Underutilized and unclear targeting of vocational training centers. The Ministry ofManpower and Transmigration is impeded in the promotion of green skills development and the green industry;
• Poorattentionisbeingpaidtoeducatingthepublicongreentechnologiesandgreenknowledge to support green economies, including job access to formal and informal sectors.
Creating a new green industry to incorporate the promotion of entrepreneurship and estab-lishing green jobs in the formal sector may be less beneficial than in informal sectors, whereas the majority of labour supply in Indonesia has poor skills in green job industries, and creating green jobs will therefore require additional costs to improve their skills and adopt the technol-ogy as well.
Green jobs demand
To determine the demand for labour on output we estimate the elasticity of substitution of labour supply. This estimate calculates the percentage of change of output effect on the percentage of change of labour. To obtain this parameter, we reconcile data on output and labour. Labour data was obtained from the 5-digit Indonesian Labor Survey in 2007-2009 and was then sorted according to I-O data classification. I-O tables are generated by the Indonesia Statistics Agency every five years with the most recent being from 2008. To estimate the I-O table with an annual trajectory, we followed the methodology of Wood (2011). Finally, we estimated labour supply elasticities by applying the OLS regression technique.
Appendix 4.A4 reports labour supply elasticities across 62 industries for the period 2007-2010. As shown in Table 4.8, labour demand elasticity for green job industries is dominated by the biofuels industry, including the palm oil industry. Even if we compare it with other elasticities
chapter 4: indonesia
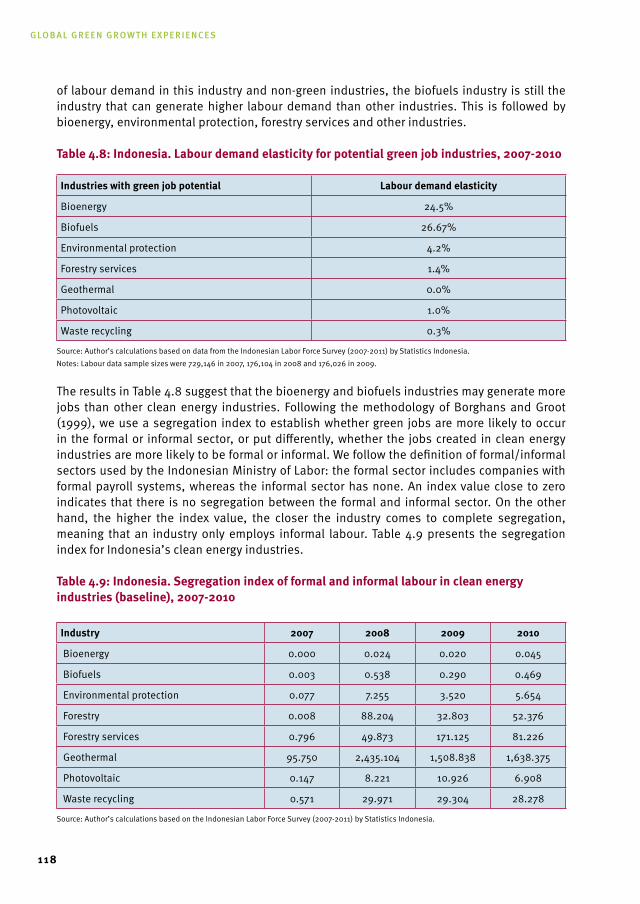
Global Green Growth experiences
118
of labour demand in this industry and non-green industries, the biofuels industry is still the industry that can generate higher labour demand than other industries. This is followed by bioenergy, environmental protection, forestry services and other industries.
table 4.8: Indonesia. Labour demand elasticity for potential green job industries, 2007-2010
Industries with green job potential Labour demand elasticity
Bioenergy 24.5%
Biofuels 26.67%
Environmental protection 4.2%
Forestry services 1.4%
Geothermal 0.0%
Photovoltaic 1.0%
Waste recycling 0.3%
Source: Author’s calculations based on data from the Indonesian Labor Force Survey (2007-2011) by Statistics Indonesia. Notes: Labour data sample sizes were 729,146 in 2007, 176,104 in 2008 and 176,026 in 2009.
The results in Table 4.8 suggest that the bioenergy and biofuels industries may generate more jobs than other clean energy industries. Following the methodology of Borghans and Groot (1999), we use a segregation index to establish whether green jobs are more likely to occur in the formal or informal sector, or put differently, whether the jobs created in clean energy industries are more likely to be formal or informal. We follow the definition of formal/informal sectors used by the Indonesian Ministry of Labor: the formal sector includes companies with formal payroll systems, whereas the informal sector has none. An index value close to zero indicates that there is no segregation between the formal and informal sector. On the other hand, the higher the index value, the closer the industry comes to complete segregation, meaning that an industry only employs informal labour. Table 4.9 presents the segregation index for Indonesia’s clean energy industries.
table 4.9: Indonesia. segregation index of formal and informal labour in clean energy industries (baseline), 2007-2010
Industry 2007 2008 2009 2010
Bioenergy 0.000 0.024 0.020 0.045
Biofuels 0.003 0.538 0.290 0.469
Environmental protection 0.077 7.255 3.520 5.654
Forestry 0.008 88.204 32.803 52.376
Forestry services 0.796 49.873 171.125 81.226
Geothermal 95.750 2,435.104 1,508.838 1,638.375
Photovoltaic 0.147 8.221 10.926 6.908
Waste recycling 0.571 29.971 29.304 28.278
Source: Author’s calculations based on the Indonesian Labor Force Survey (2007-2011) by Statistics Indonesia.
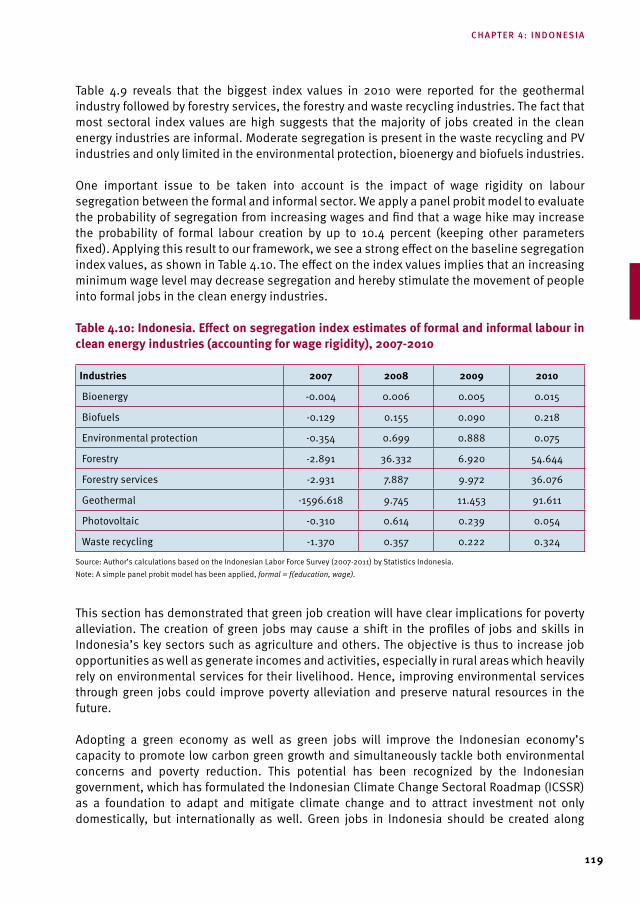
119
Table 4.9 reveals that the biggest index values in 2010 were reported for the geothermal industry followed by forestry services, the forestry and waste recycling industries. The fact that most sectoral index values are high suggests that the majority of jobs created in the clean energy industries are informal. Moderate segregation is present in the waste recycling and PV industries and only limited in the environmental protection, bioenergy and biofuels industries.
One important issue to be taken into account is the impact of wage rigidity on labour segregation between the formal and informal sector. We apply a panel probit model to evaluate the probability of segregation from increasing wages and find that a wage hike may increase the probability of formal labour creation by up to 10.4 percent (keeping other parameters fixed). Applying this result to our framework, we see a strong effect on the baseline segregation index values, as shown in Table 4.10. The effect on the index values implies that an increasing minimum wage level may decrease segregation and hereby stimulate the movement of people into formal jobs in the clean energy industries.
table 4.10: Indonesia. Effect on segregation index estimates of formal and informal labour in clean energy industries (accounting for wage rigidity), 2007-2010
Industries 2007 2008 2009 2010
Bioenergy -0.004 0.006 0.005 0.015
Biofuels -0.129 0.155 0.090 0.218
Environmental protection -0.354 0.699 0.888 0.075
Forestry -2.891 36.332 6.920 54.644
Forestry services -2.931 7.887 9.972 36.076
Geothermal -1596.618 9.745 11.453 91.611
Photovoltaic -0.310 0.614 0.239 0.054
Waste recycling -1.370 0.357 0.222 0.324
Source: Author’s calculations based on the Indonesian Labor Force Survey (2007-2011) by Statistics Indonesia. Note: A simple panel probit model has been applied, formal = f(education, wage).
This section has demonstrated that green job creation will have clear implications for poverty alleviation. The creation of green jobs may cause a shift in the profiles of jobs and skills in Indonesia’s key sectors such as agriculture and others. The objective is thus to increase job opportunities as well as generate incomes and activities, especially in rural areas which heavily rely on environmental services for their livelihood. Hence, improving environmental services through green jobs could improve poverty alleviation and preserve natural resources in the future.
Adopting a green economy as well as green jobs will improve the Indonesian economy’s capacity to promote low carbon green growth and simultaneously tackle both environmental concerns and poverty reduction. This potential has been recognized by the Indonesian government, which has formulated the Indonesian Climate Change Sectoral Roadmap (ICSSR) as a foundation to adapt and mitigate climate change and to attract investment not only domestically, but internationally as well. Green jobs in Indonesia should be created along
chapter 4: indonesia
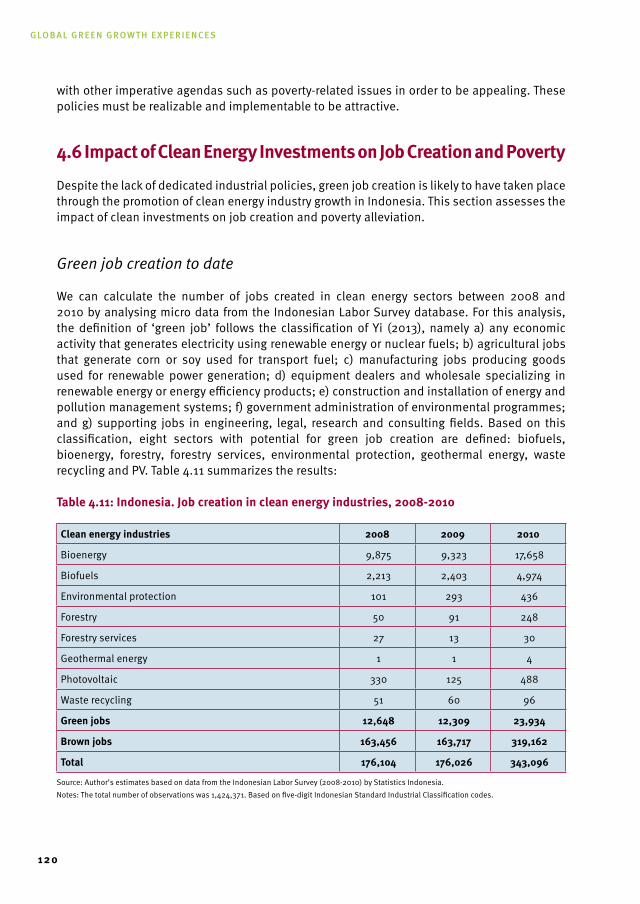
Global Green Growth experiences
120
with other imperative agendas such as poverty-related issues in order to be appealing. These policies must be realizable and implementable to be attractive.
4.6 Impact of Clean Energy Investments on Job Creation and Poverty
Despite the lack of dedicated industrial policies, green job creation is likely to have taken place through the promotion of clean energy industry growth in Indonesia. This section assesses the impact of clean investments on job creation and poverty alleviation.
Green job creation to date
We can calculate the number of jobs created in clean energy sectors between 2008 and 2010 by analysing micro data from the Indonesian Labor Survey database. For this analysis, the definition of ‘green job’ follows the classification of Yi (2013), namely a) any economic activity that generates electricity using renewable energy or nuclear fuels; b) agricultural jobs that generate corn or soy used for transport fuel; c) manufacturing jobs producing goods used for renewable power generation; d) equipment dealers and wholesale specializing in renewable energy or energy efficiency products; e) construction and installation of energy and pollution management systems; f) government administration of environmental programmes; and g) supporting jobs in engineering, legal, research and consulting fields. Based on this classification, eight sectors with potential for green job creation are defined: biofuels, bioenergy, forestry, forestry services, environmental protection, geothermal energy, waste recycling and PV. Table 4.11 summarizes the results:
table 4.11: Indonesia. Job creation in clean energy industries, 2008-2010
Clean energy industries 2008 2009 2010
Bioenergy 9,875 9,323 17,658
Biofuels 2,213 2,403 4,974
Environmental protection 101 293 436
Forestry 50 91 248
Forestry services 27 13 30
Geothermal energy 1 1 4
Photovoltaic 330 125 488
Waste recycling 51 60 96
Green jobs 12,648 12,309 23,934
Brown jobs 163,456 163,717 319,162
total 176,104 176,026 343,096
Source: Author’s estimates based on data from the Indonesian Labor Survey (2008-2010) by Statistics Indonesia. Notes: The total number of observations was 1,424,371. Based on five-digit Indonesian Standard Industrial Classification codes.
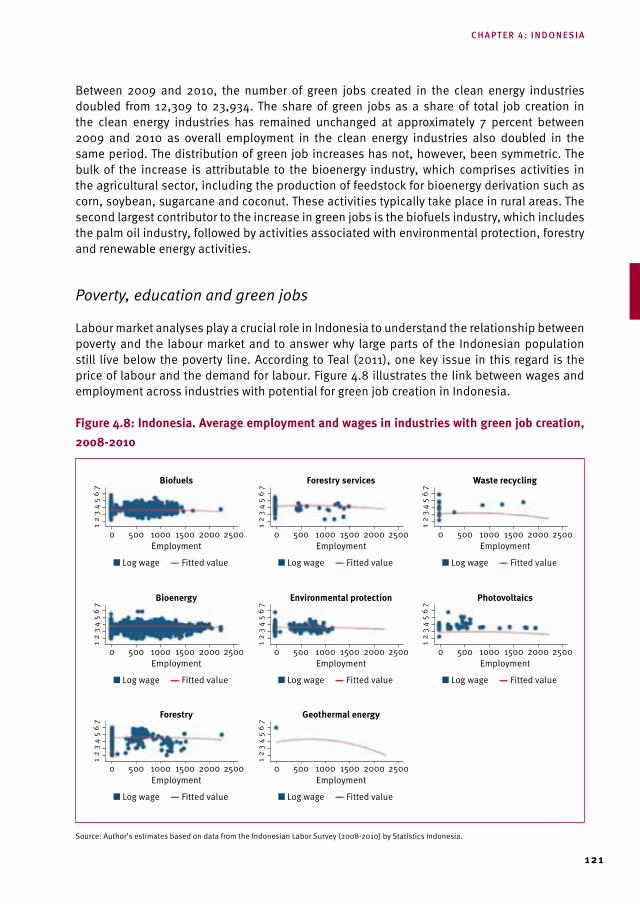
121
Between 2009 and 2010, the number of green jobs created in the clean energy industries doubled from 12,309 to 23,934. The share of green jobs as a share of total job creation in the clean energy industries has remained unchanged at approximately 7 percent between 2009 and 2010 as overall employment in the clean energy industries also doubled in the same period. The distribution of green job increases has not, however, been symmetric. The bulk of the increase is attributable to the bioenergy industry, which comprises activities in the agricultural sector, including the production of feedstock for bioenergy derivation such as corn, soybean, sugarcane and coconut. These activities typically take place in rural areas. The second largest contributor to the increase in green jobs is the biofuels industry, which includes the palm oil industry, followed by activities associated with environmental protection, forestry and renewable energy activities.
Poverty, education and green jobs
Labour market analyses play a crucial role in Indonesia to understand the relationship between poverty and the labour market and to answer why large parts of the Indonesian population still live below the poverty line. According to Teal (2011), one key issue in this regard is the price of labour and the demand for labour. Figure 4.8 illustrates the link between wages and employment across industries with potential for green job creation in Indonesia.
Figure 4.8: Indonesia. Average employment and wages in industries with green job creation, 2008-2010
Source: Author’s estimates based on data from the Indonesian Labor Survey (2008-2010) by Statistics Indonesia.
0 500 1000 1500 2000 2500
76
54
32
1
Employment
Biofuels
■ Log wage –– Fitted value
0 500 1000 1500 2000 2500
76
54
32
1
Employment
Forestry services
■ Log wage –– Fitted value
0 500 1000 1500 2000 2500
76
54
32
1
Employment
Waste recycling
■ Log wage –– Fitted value
0 500 1000 1500 2000 2500
76
54
32
1
Employment
Bioenergy
■ Log wage –– Fitted value
0 500 1000 1500 2000 2500
76
54
32
1
Employment
Environmental protection
■ Log wage –– Fitted value
0 500 1000 1500 2000 2500
76
54
32
1
Employment
Photovoltaics
■ Log wage –– Fitted value
0 500 1000 1500 2000 2500
76
54
32
1
Employment
Forestry
■ Log wage –– Fitted value
0 500 1000 1500 2000 2500
76
54
32
1
Employment
Geothermal energy
■ Log wage –– Fitted value
chapter 4: indonesia
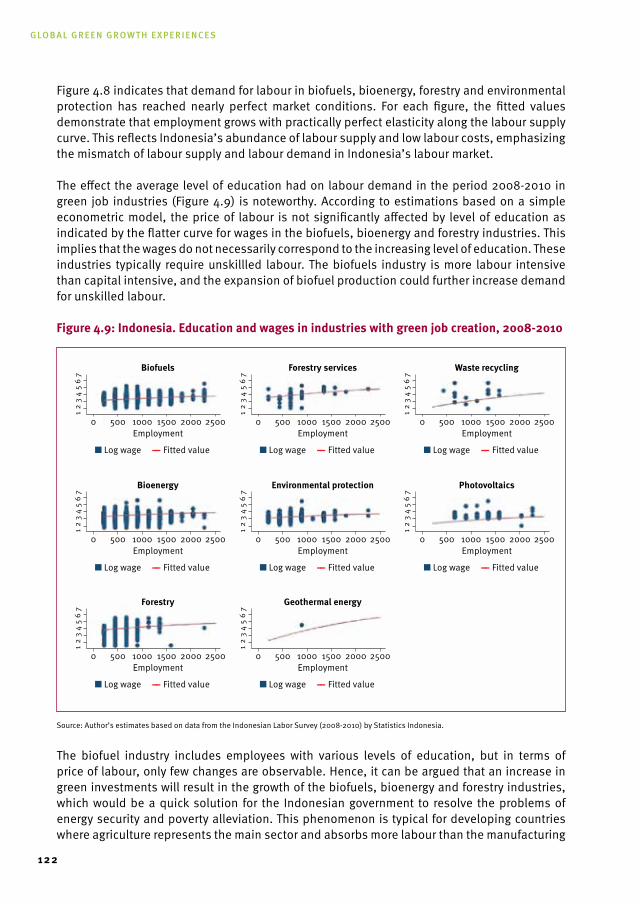
Global Green Growth experiences
122
Figure 4.8 indicates that demand for labour in biofuels, bioenergy, forestry and environmental protection has reached nearly perfect market conditions. For each figure, the fitted values demonstrate that employment grows with practically perfect elasticity along the labour supply curve. This reflects Indonesia’s abundance of labour supply and low labour costs, emphasizing the mismatch of labour supply and labour demand in Indonesia’s labour market.
The effect the average level of education had on labour demand in the period 2008-2010 in green job industries (Figure 4.9) is noteworthy. According to estimations based on a simple econometric model, the price of labour is not significantly affected by level of education as indicated by the flatter curve for wages in the biofuels, bioenergy and forestry industries. This implies that the wages do not necessarily correspond to the increasing level of education. These industries typically require unskillled labour. The biofuels industry is more labour intensive than capital intensive, and the expansion of biofuel production could further increase demand for unskilled labour.
Figure 4.9: Indonesia. Education and wages in industries with green job creation, 2008-2010
Source: Author’s estimates based on data from the Indonesian Labor Survey (2008-2010) by Statistics Indonesia.
The biofuel industry includes employees with various levels of education, but in terms of price of labour, only few changes are observable. Hence, it can be argued that an increase in green investments will result in the growth of the biofuels, bioenergy and forestry industries, which would be a quick solution for the Indonesian government to resolve the problems of energy security and poverty alleviation. This phenomenon is typical for developing countries where agriculture represents the main sector and absorbs more labour than the manufacturing
0 500 1000 1500 2000 2500
76
54
32
1
Employment
Biofuels
■ Log wage –– Fitted value
0 500 1000 1500 2000 2500
76
54
32
1
Employment
Forestry services
■ Log wage –– Fitted value
0 500 1000 1500 2000 2500
76
54
32
1
Employment
Waste recycling
■ Log wage –– Fitted value
0 500 1000 1500 2000 2500
76
54
32
1
Employment
Bioenergy
■ Log wage –– Fitted value
0 500 1000 1500 2000 2500
76
54
32
1
Employment
Environmental protection
■ Log wage –– Fitted value
0 500 1000 1500 2000 2500
76
54
32
1
Employment
Photovoltaics
■ Log wage –– Fitted value
0 500 1000 1500 2000 2500
76
54
32
1
Employment
Forestry
■ Log wage –– Fitted value
0 500 1000 1500 2000 2500
76
54
32
1
Employment
Geothermal energy
■ Log wage –– Fitted value
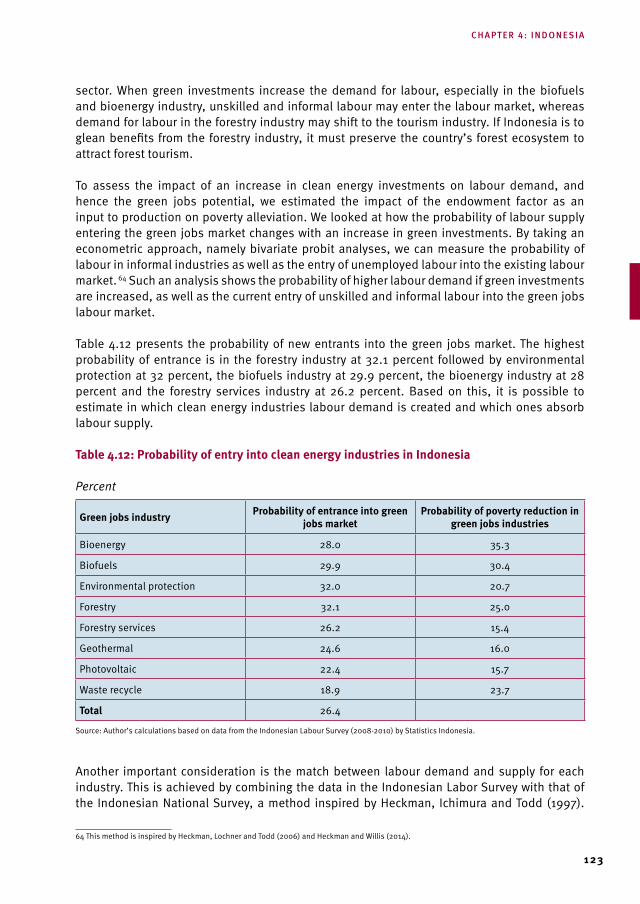
123
sector. When green investments increase the demand for labour, especially in the biofuels and bioenergy industry, unskilled and informal labour may enter the labour market, whereas demand for labour in the forestry industry may shift to the tourism industry. If Indonesia is to glean benefits from the forestry industry, it must preserve the country’s forest ecosystem to attract forest tourism.
To assess the impact of an increase in clean energy investments on labour demand, and hence the green jobs potential, we estimated the impact of the endowment factor as an input to production on poverty alleviation. We looked at how the probability of labour supply entering the green jobs market changes with an increase in green investments. By taking an econometric approach, namely bivariate probit analyses, we can measure the probability of labour in informal industries as well as the entry of unemployed labour into the existing labour market. 64 Such an analysis shows the probability of higher labour demand if green investments are increased, as well as the current entry of unskilled and informal labour into the green jobs labour market.
Table 4.12 presents the probability of new entrants into the green jobs market. The highest probability of entrance is in the forestry industry at 32.1 percent followed by environmental protection at 32 percent, the biofuels industry at 29.9 percent, the bioenergy industry at 28 percent and the forestry services industry at 26.2 percent. Based on this, it is possible to estimate in which clean energy industries labour demand is created and which ones absorb labour supply.
table 4.12: Probability of entry into clean energy industries in Indonesia
Percent
Green jobs industry Probability of entrance into green jobs market
Probability of poverty reduction in green jobs industries
Bioenergy 28.0 35.3
Biofuels 29.9 30.4
Environmental protection 32.0 20.7
Forestry 32.1 25.0
Forestry services 26.2 15.4
Geothermal 24.6 16.0
Photovoltaic 22.4 15.7
Waste recycle 18.9 23.7
total 26.4
Source: Author’s calculations based on data from the Indonesian Labour Survey (2008-2010) by Statistics Indonesia.
Another important consideration is the match between labour demand and supply for each industry. This is achieved by combining the data in the Indonesian Labor Survey with that of the Indonesian National Survey, a method inspired by Heckman, Ichimura and Todd (1997).
64 This method is inspired by Heckman, Lochner and Todd (2006) and Heckman and Willis (2014).
chapter 4: indonesia
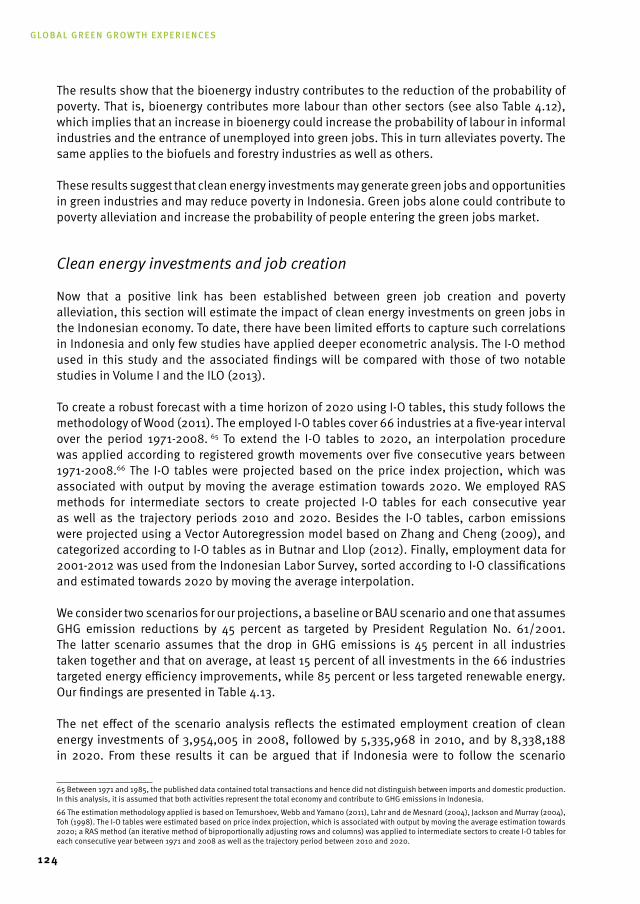
Global Green Growth experiences
124
The results show that the bioenergy industry contributes to the reduction of the probability of poverty. That is, bioenergy contributes more labour than other sectors (see also Table 4.12), which implies that an increase in bioenergy could increase the probability of labour in informal industries and the entrance of unemployed into green jobs. This in turn alleviates poverty. The same applies to the biofuels and forestry industries as well as others.
These results suggest that clean energy investments may generate green jobs and opportunities in green industries and may reduce poverty in Indonesia. Green jobs alone could contribute to poverty alleviation and increase the probability of people entering the green jobs market.
Clean energy investments and job creation
Now that a positive link has been established between green job creation and poverty alleviation, this section will estimate the impact of clean energy investments on green jobs in the Indonesian economy. To date, there have been limited efforts to capture such correlations in Indonesia and only few studies have applied deeper econometric analysis. The I-O method used in this study and the associated findings will be compared with those of two notable studies in Volume I and the ILO (2013).
To create a robust forecast with a time horizon of 2020 using I-O tables, this study follows the methodology of Wood (2011). The employed I-O tables cover 66 industries at a five-year interval over the period 1971-2008. 65 To extend the I-O tables to 2020, an interpolation procedure was applied according to registered growth movements over five consecutive years between 1971-2008.66 The I-O tables were projected based on the price index projection, which was associated with output by moving the average estimation towards 2020. We employed RAS methods for intermediate sectors to create projected I-O tables for each consecutive year as well as the trajectory periods 2010 and 2020. Besides the I-O tables, carbon emissions were projected using a Vector Autoregression model based on Zhang and Cheng (2009), and categorized according to I-O tables as in Butnar and Llop (2012). Finally, employment data for 2001-2012 was used from the Indonesian Labor Survey, sorted according to I-O classifications and estimated towards 2020 by moving the average interpolation.
We consider two scenarios for our projections, a baseline or BAU scenario and one that assumes GHG emission reductions by 45 percent as targeted by President Regulation No. 61/2001. The latter scenario assumes that the drop in GHG emissions is 45 percent in all industries taken together and that on average, at least 15 percent of all investments in the 66 industries targeted energy efficiency improvements, while 85 percent or less targeted renewable energy. Our findings are presented in Table 4.13.
The net effect of the scenario analysis reflects the estimated employment creation of clean energy investments of 3,954,005 in 2008, followed by 5,335,968 in 2010, and by 8,338,188 in 2020. From these results it can be argued that if Indonesia were to follow the scenario
65 Between 1971 and 1985, the published data contained total transactions and hence did not distinguish between imports and domestic production. In this analysis, it is assumed that both activities represent the total economy and contribute to GHG emissions in Indonesia.
66 The estimation methodology applied is based on Temurshoev, Webb and Yamano (2011), Lahr and de Mesnard (2004), Jackson and Murray (2004), Toh (1998). The I-O tables were estimated based on price index projection, which is associated with output by moving the average estimation towards 2020; a RAS method (an iterative method of biproportionally adjusting rows and columns) was applied to intermediate sectors to create I-O tables for each consecutive year between 1971 and 2008 as well as the trajectory period between 2010 and 2020.
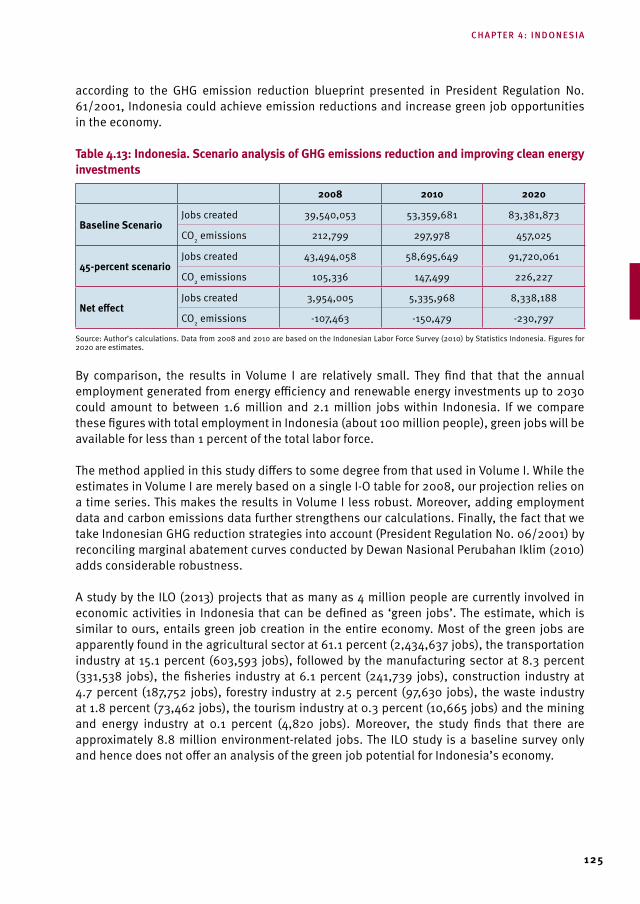
125
according to the GHG emission reduction blueprint presented in President Regulation No. 61/2001, Indonesia could achieve emission reductions and increase green job opportunities in the economy.
table 4.13: Indonesia. scenario analysis of GHG emissions reduction and improving clean energy investments
2008 2010 2020
Baseline scenarioJobs created 39,540,053 53,359,681 83,381,873
CO2 emissions 212,799 297,978 457,025
45-percent scenarioJobs created 43,494,058 58,695,649 91,720,061
CO2 emissions 105,336 147,499 226,227
net effectJobs created 3,954,005 5,335,968 8,338,188
CO2 emissions -107,463 -150,479 -230,797
Source: Author’s calculations. Data from 2008 and 2010 are based on the Indonesian Labor Force Survey (2010) by Statistics Indonesia. Figures for 2020 are estimates.
By comparison, the results in Volume I are relatively small. They find that that the annual employment generated from energy efficiency and renewable energy investments up to 2030 could amount to between 1.6 million and 2.1 million jobs within Indonesia. If we compare these figures with total employment in Indonesia (about 100 million people), green jobs will be available for less than 1 percent of the total labor force.
The method applied in this study differs to some degree from that used in Volume I. While the estimates in Volume I are merely based on a single I-O table for 2008, our projection relies on a time series. This makes the results in Volume I less robust. Moreover, adding employment data and carbon emissions data further strengthens our calculations. Finally, the fact that we take Indonesian GHG reduction strategies into account (President Regulation No. 06/2001) by reconciling marginal abatement curves conducted by Dewan Nasional Perubahan Iklim (2010) adds considerable robustness.
A study by the ILO (2013) projects that as many as 4 million people are currently involved in economic activities in Indonesia that can be defined as ‘green jobs’. The estimate, which is similar to ours, entails green job creation in the entire economy. Most of the green jobs are apparently found in the agricultural sector at 61.1 percent (2,434,637 jobs), the transportation industry at 15.1 percent (603,593 jobs), followed by the manufacturing sector at 8.3 percent (331,538 jobs), the fisheries industry at 6.1 percent (241,739 jobs), construction industry at 4.7 percent (187,752 jobs), forestry industry at 2.5 percent (97,630 jobs), the waste industry at 1.8 percent (73,462 jobs), the tourism industry at 0.3 percent (10,665 jobs) and the mining and energy industry at 0.1 percent (4,820 jobs). Moreover, the study finds that there are approximately 8.8 million environment-related jobs. The ILO study is a baseline survey only and hence does not offer an analysis of the green job potential for Indonesia’s economy.
chapter 4: indonesia
Global Green Growth experiences
126
4.7 Challenges for Green Growth in Indonesia
Indonesia’s renewable energy potential has not been realized due to a number of challenges, which we will address below:
Energy security: A number of issues related to pressure on the energy industry have emerged, including rising costs, bottlenecks in energy distribution and surging supply uncertainties – all of which have added to the threat to energy security. One of the key concerns is that the majority of Indonesia’s energy reserves are owned by multinational companies under long-term contracts. This means that the utilization of the country’s resources may not be benefiting the economy.67 For example, the multinational companies currently dominating the primary energy supply are Caltex, CNOOC, Total, Exspan, Conoco Philips and BP. Together, these companies account for 90 percent of total energy production, whereas national oil companies like Pertamina produce merely 5 percent (Hasan, Mahlia and Nur, 2012). Therefore, while the energy supply owned by foreign oil supply companies relies on imports, energy security is becoming a crucial issue since key energy resources have become scarce due to shortages in domestic production. Pertamina, Indonesia’s national oil company, is seeking to correct this shortcoming by improving oil production, rewarding oil exploitation contracts to national companies and expanding existing refineries. 68
Fossil fuels have tremendous potential in Indonesia (see Table 4.14), especially coal, 69 and the government continues to support their development to ensure energy security. For example, the Ministry of Energy and Mineral Resources has supported a fast track program for coal resources since 2004 to establish a 10,000 MW coal fired power plant as well as the use of brown coal and coal liquefaction technology. In addition, a ban was issued on coal exports to secure domestic energy security and to improve the added value of coal.
table 4.14: Fossil fuel resources and reserves in Indonesia, 2011
types of energy resources Proven reserves Production r/P ratio
(year)
Oil (million barrels)Gas (trillion cubic feet)Coal (million tonnes)Coalbed methane (trillion cubic feet)
56.6334.5104.9453
4.2108.45529
366,0567.9
275.2
11.837.418
Source: Mujiyanto and Tiess (2013).
Subsidies: It is relatively unattractive for investors to invest in the renewable energy sector because the price of renewables competes with fossil fuel subsidies. The Indonesian government’s efforts to keep the price of oil below the market price have hampered the development of the renewable energy sector. In 2005, the Ministry of Finance provided $9.7 billion equal to 3.4 percent of GDP to subsidize the oil price which was budgeted at about $2 billion, the subsidy increased fivefold due to the unexpected world oil price hike. The oil
67 ‘Exxon’s LNG Output from Indonesia’s Arun May Drop on Depleting Reserves’ ,www.bloomberg.com/news/2011-01-07/exxon-mobil-lng-output-from-arun-may-drop-in-2011-official-says.html (Accessed 12 September 2014).
68 ‘Komite Percepatan dan Perluasan Pembangunan Ekonomi Indonesia’, http://kp3ei.go.id/in/main_ind/home (Accessed 6 August 2014).
69 ‘Swallowed by Coal: UK Profits from Indonesia’s Destructive Mining Industry’. www.theguardian.com/global-development/2013/oct/30/coal-min-ing-uk-profits-indonesia (Accessed 6 August 2014).
127
price subsidy directly affected efficiency costs which potentially distorted consumption and investment decisions (Mourougane, 2010). Even though a feed-in tariff has been effective in the electricity industry since 2002, the price is still unable to compete with fossil fuel-based power plants, which are heavily subsidized.
The first impact on the economy is over-consumption of subsidized energy, and in the case of Indonesia, the country does not have sufficient oil to meet domestic demand and must rely on imports to fill the gap. In the macro context, occasional imports to meet the demand for oil may hamper the balance of payment in Indonesia, raising government expenditure in the energy industry while reducing subsidies in other industries, which may be more important, such as education and health. This approach is supported by the Ministry of Finance with a high oil price subsidy, strict fiscal balances and a reduction in fiscal space to improve renewable energy incentives as well as a reduction in the allocation for infrastructure, health, food security, poverty and education (van Tho, 2013). Vagliasindi (2012) also confirms that kerosene, in particular, is predominantly consumed by the bottom quintile group, whereas gasoline is mostly consumed by the top quintile group in Ghana, India, Pakistan, Egypt and Indonesia. Low-income groups in Indonesia do not benefit from energy subsidies, rather middle and high-income groups are beneficiaries.
Education and awareness: this issue is related to the subsidy challenge. Indonesian households do not fully understand and accept the implications of energy resource scarcity and the importance of renewable energy. They are not educated to change their consumption behavior from subsidized energy goods to non-subsidized ones. This consumption behavior was indoctrinated between 1965-1998, when the country’s leaders controlled Indonesia’s natural resources and increased their allocation among the population. While the political leadership increased resource extraction, it also increased the misallocation of natural resources, albeit ensuring social stability (Robinson, Torvik and Verdier, 2006). Subsidizing household oil consumption was a concrete action by the government to persuade households to support its re-election. Oil and electricity subsidies were invested as political preponderance but were economically unproductive projects (Kolstad and Wiig, 2009). With this policy, households became trapped in the vicious circle of oil subsidies.
Moreover, potential investors in clean energy projects face regulatory obstacles, for example, with regard to coordination between the central and local government as well as coordination in terms of spatial planning and land acquisition, which delays investment projects and increases risks because land prices continue to increase. Limitation of investments, lack of infrastructure and geographical constraints (i.e. some areas are very difficult to reach) are to some extent the root causes that disrupt Indonesia’s energy industry. These factors lead investors to cover their high risks and costs of exploration of energy resources (i.e. oil, coal and geothermal) with longer contract agreements.
Despite these circumstances, Indonesia has nevertheless realized and is pursuing green growth as a new way to achieve economic growth and development to evade environmental degradation, loss of biodiversity and unsustainable use of natural resources (OECD, 2011).
chapter 4: indonesia
Global Green Growth experiences
128
4.8 Conclusion
The Indonesian government has promulgated green investments although in practice, its policies are still unclear and require coordination among stakeholders. Biofuels and bioenergy industries seem to be growing to replace fossil fuels although in reality, implementation is still staggering due to the reluctance to phase out oil subsidies. Indonesia has the potential to create green jobs and thereby reduce poverty and GHG emissions. In this study, we show that green jobs might be able to create opportunities for people to participate in the green jobs market. According to our analysis, between 3.6-4 million green jobs have already been created in Indonesia and up to 17 million jobs could be created by 2020.
To realize these opportunities, some hurdles must be resolved, especially the barriers to investment as well as a restructuring of the domestic price mechanism for oil and electricity. The lack of technological improvements in the private sector is a crucial issue, as neither the industry nor the Indonesian population seem to currently be displaying any significant adaptation behavior because they have not yet recognized the potential benefits of green investments.
The current policy framework is insufficient to reinforce the green investment agenda and to promote the green industrial growth agenda. Indonesian policymakers must demonstrate strong commitment. They specifically will need to consider the dependencies between food security, energy security and environmental preservation when formulating a sustainable development agenda for Indonesia. Financial assistance will be a crucial success factor in supporting Indonesia’s green industrial transition. To promote well-implemented renewable energy policies in Indonesia, Havrland and Satyakti (2011) propose four areas the government should focus on:
1. Changing society’s behavior towards using renewables and preserve the limited fossil energy. This policy could be implemented if the government removes the fossil fuel subsidy to promote renewables. Public education to create awareness of the benefits of renewable energy compared to fossil fuels will be crucial;
2. Renewable energy should be adaptable, applicable and locally implementable to ensure that its technology has longer utilization. Use of the technology should be straightforward for people living in both rural and urban areas;
3. The government should intervene with specific assistance such as feed-in tariffs, renewable upstream subsidies or renewable energy micro financing;
4. Increasing access for renewables to promote poverty alleviation and energy independency by promoting micro and mini hydropower in the electricity grid in remote areas and generating energy productivity in the economy. Improving cooperation to attract international assistance through REDD+ and the Clean Development Mechanism.
There are good prospects and opportunities for Indonesia to implement enabling clean energy investment policies to realize the country’s strategic long-term development plans towards 2025. At this stage, in order to get on track with the defined emission reduction targets,
129
Indonesia must rely on international assistance to reduce the carbon footprint of the LUCF industry through well-designed carbon financing mechanisms such as a REDD mechanism and the Clean Development Mechanism. On the other hand, uncertainty of the post-Kyoto Protocol agreements as well as an economic slowdown in developed countries might complicate the realization of a clean energy investment framework in Indonesia. The removal of domestic fossil fuel subsidies will be crucial to the process as will a persistent focus on implementing and substantially expanding public education along with societal awareness about energy independence. The drivers behind the green transformation of the Indonesian economy will be the promotion of clean energy to create green jobs and alleviate poverty.
chapter 4: indonesia
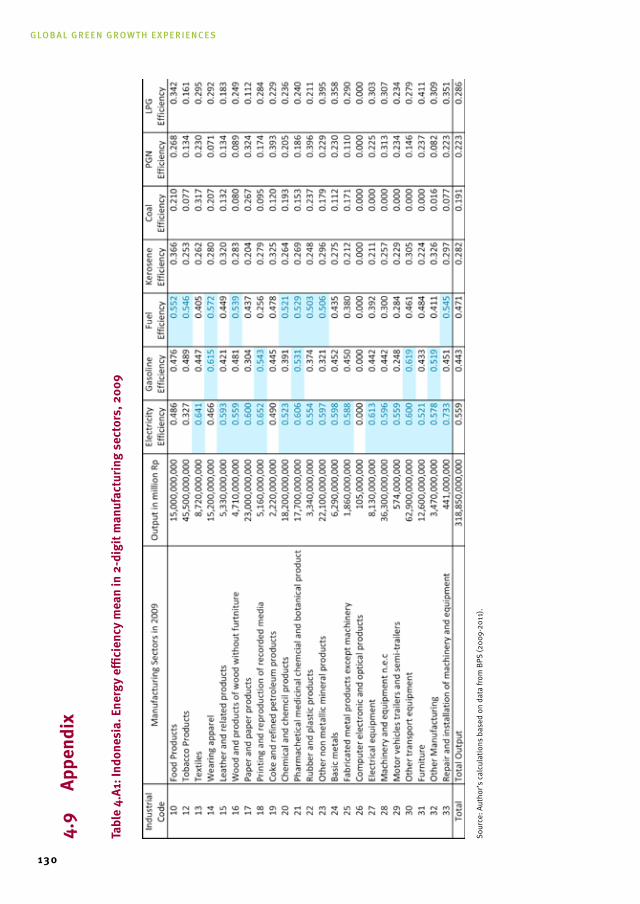
Global Green Growth experiences
130
4.9
Appe
ndix
tabl
e 4.
A1: I
ndon
esia
. Ene
rgy
effici
ency
mea
n in
2-d
igit
man
ufac
turin
g se
ctor
s, 2
009
Sour
ce: A
utho
r’s c
alcu
latio
ns b
ased
on
data
from
BPS
(200
9-20
11).
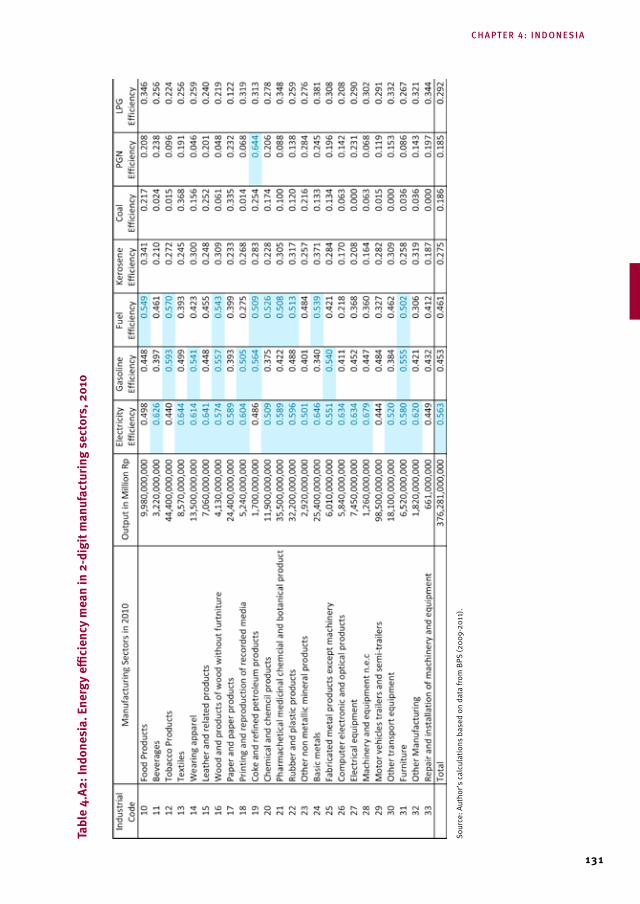
131
tabl
e 4.
A2: I
ndon
esia
. Ene
rgy
effici
ency
mea
n in
2-d
igit
man
ufac
turin
g se
ctor
s, 2
010
Sour
ce: A
utho
r’s c
alcu
latio
ns b
ased
on
data
from
BPS
(200
9-20
11).
chapter 4: indonesia
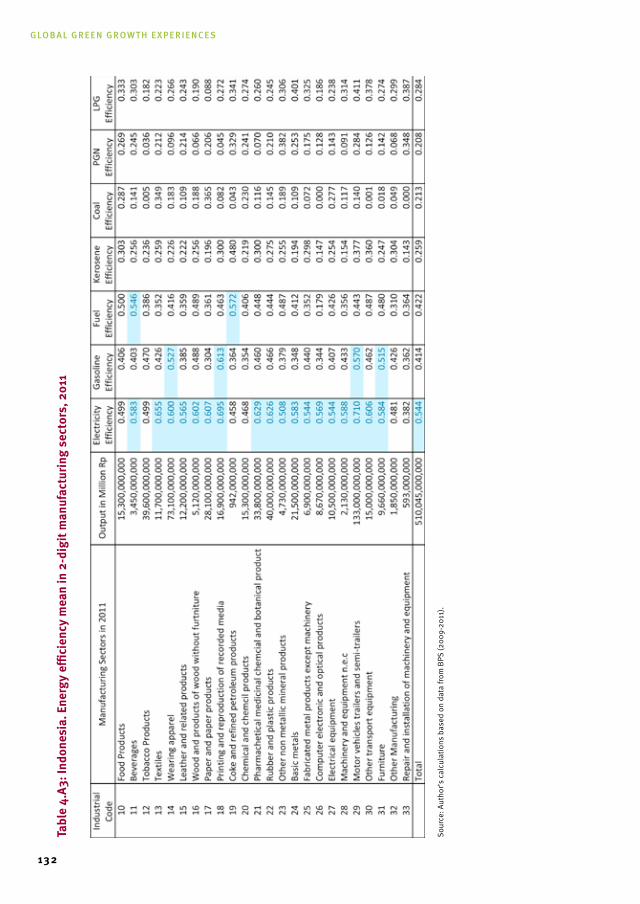
Global Green Growth experiences
132
tabl
e 4.
A3: I
ndon
esia
. Ene
rgy
effici
ency
mea
n in
2-d
igit
man
ufac
turin
g se
ctor
s, 2
011
Sour
ce: A
utho
r’s c
alcu
latio
ns b
ased
on
data
from
BPS
(200
9-20
11).
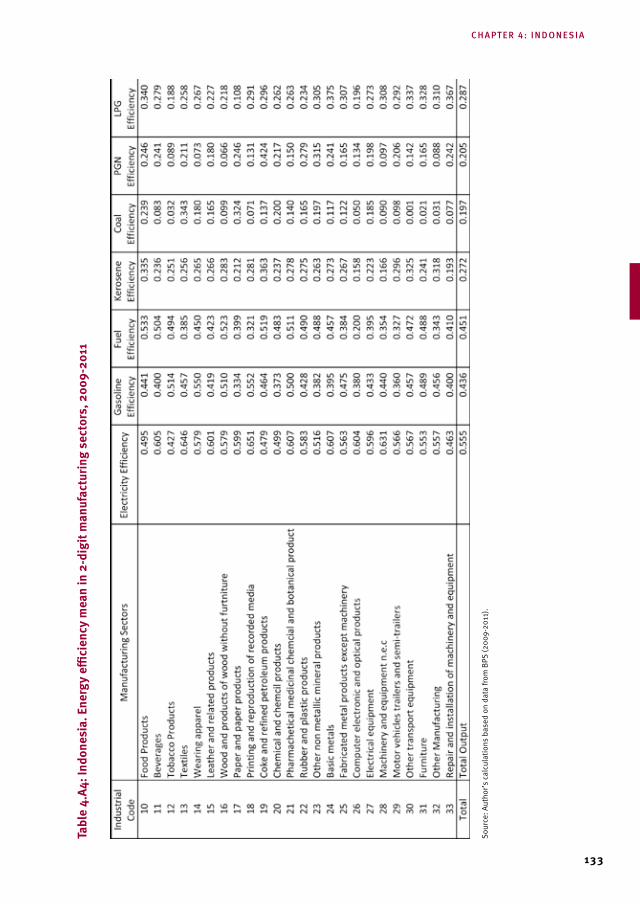
133
tabl
e 4.
A4: I
ndon
esia
. Ene
rgy
effici
ency
mea
n in
2-d
igit
man
ufac
turin
g se
ctor
s, 2
009-
2011
Sour
ce: A
utho
r’s c
alcu
latio
ns b
ased
on
data
from
BPS
(200
9-20
11).
chapter 4: indonesia

135
CHAPTER 5: THE REPUBLIC OF KOREA
5.1 Introduction
The Republic of Korea (referred to as ‘the ROK’ from this point forward) announced “Low Carbon, Green Growth” as a national agenda in 2008 emphasizing the positive interactions between pro-growth and pro-green policies. Green growth policies are necessary to promote simultaneous economic growth and protection of the environment. This study provides an overview of the ROK’s green growth efforts and policies for clean energy investments, and examines the relationship between green energy and employment.
So far, the ROK’s government’s Green Growth Five-Year Plan has reaped outstanding results. For instance, the government established the Presidential Committee on Green Growth, enacted the Framework Act on Low Carbon Green Growth, and set the goal to reduce GHG emissions to 30 percent below BAU levels by 2020. For the past five years, total GHG emissions have increased by 3.3 percent annually on average, primarily due to continued economic growth (Statistics Korea – KOSTAT, 2013). Between 2009 and 2013, the government has allocated 2 percent of GDP for the implementation of green growth policies. Moreover, with the establishment of the GGGI, which has become a renowned international organization, the ROK serves as a bridge between advanced and developing countries.
In order to promote investment in the clean energy industry, the ROK has introduced and implemented various policies such as feed-in tariffs and renewable portfolio standards. These policies are still at an initial stage, but have contributed to considerable progress in the development of the country’s clean energy industry. The share of new and renewable energy in total energy, as well as the levels of private investment and exports in the new and renewable energy industry, have been steadily increasing.
The analysis of this study suggests a mutually beneficial relationship between green energy and employment in the ROK. When examining the effects of government spending in the new and renewable energy industry on employment generation in the ROK, it is found that the direct effect of such spending increases employment in the industry, and the indirect spill-over effects increase the level of employment in other industries.
These findings are held up against estimates on green employment in Volume I of the UNIDO/GGGI research project “Global Green Growth: Clean Energy Industrial Investments and Expanding Job Opportunities”, in which it is concluded that a shift from a fossil-fuel energy framework to cleaner energy sources will bring about a net increase in employment in the ROK of between 235,400 and 315,700 jobs per year over the next 20 years. With the aim to provide deeper insight about the prospects of the ROK’s transition to a clean energy economy, the methodology in Volume I is compared with other green employment studies, in particular with estimates by Kang (2011) in Economic Spillover Effects of Green Industry, Hypothetical Approach to Green Growth Policy’s Spillover Effects. This comparison helps draw policy implications from
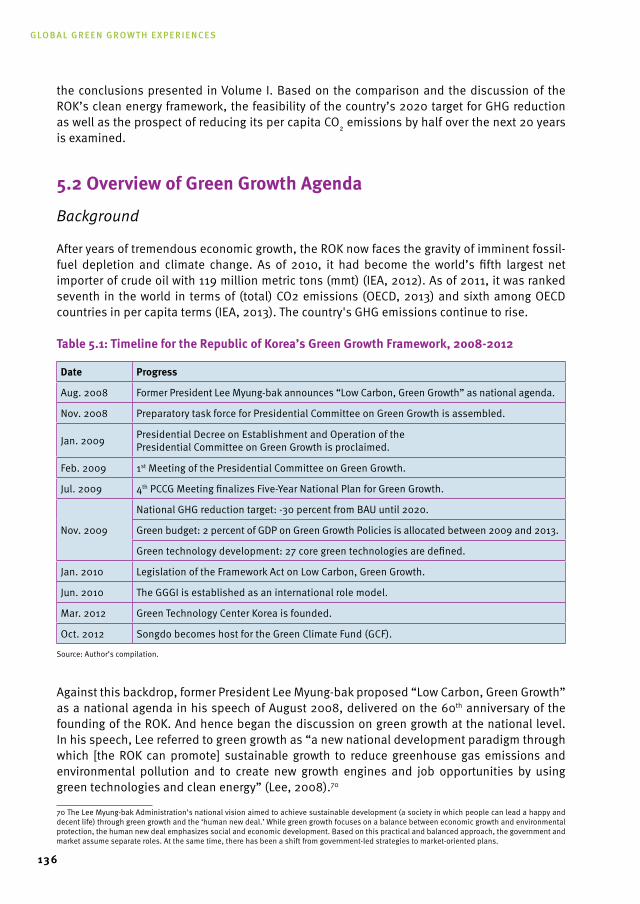
Global Green Growth experiences
136
the conclusions presented in Volume I. Based on the comparison and the discussion of the ROK’s clean energy framework, the feasibility of the country’s 2020 target for GHG reduction as well as the prospect of reducing its per capita CO2 emissions by half over the next 20 years is examined.
5.2 Overview of Green Growth Agenda
Background
After years of tremendous economic growth, the ROK now faces the gravity of imminent fossil-fuel depletion and climate change. As of 2010, it had become the world’s fifth largest net importer of crude oil with 119 million metric tons (mmt) (IEA, 2012). As of 2011, it was ranked seventh in the world in terms of (total) CO2 emissions (OECD, 2013) and sixth among OECD countries in per capita terms (IEA, 2013). The country's GHG emissions continue to rise. table 5.1: timeline for the republic of korea’s Green Growth Framework, 2008-2012
date Progress
Aug. 2008 Former President Lee Myung-bak announces “Low Carbon, Green Growth” as national agenda.
Nov. 2008 Preparatory task force for Presidential Committee on Green Growth is assembled.
Jan. 2009 Presidential Decree on Establishment and Operation of the Presidential Committee on Green Growth is proclaimed.
Feb. 2009 1st Meeting of the Presidential Committee on Green Growth.
Jul. 2009 4th PCCG Meeting finalizes Five-Year National Plan for Green Growth.
Nov. 2009
National GHG reduction target: -30 percent from BAU until 2020.
Green budget: 2 percent of GDP on Green Growth Policies is allocated between 2009 and 2013.
Green technology development: 27 core green technologies are defined.
Jan. 2010 Legislation of the Framework Act on Low Carbon, Green Growth.
Jun. 2010 The GGGI is established as an international role model.
Mar. 2012 Green Technology Center Korea is founded.
Oct. 2012 Songdo becomes host for the Green Climate Fund (GCF).
Source: Author’s compilation.
Against this backdrop, former President Lee Myung-bak proposed “Low Carbon, Green Growth” as a national agenda in his speech of August 2008, delivered on the 60th anniversary of the founding of the ROK. And hence began the discussion on green growth at the national level. In his speech, Lee referred to green growth as “a new national development paradigm through which [the ROK can promote] sustainable growth to reduce greenhouse gas emissions and environmental pollution and to create new growth engines and job opportunities by using green technologies and clean energy” (Lee, 2008).70
70 The Lee Myung-bak Administration’s national vision aimed to achieve sustainable development (a society in which people can lead a happy and decent life) through green growth and the ‘human new deal.’ While green growth focuses on a balance between economic growth and environmental protection, the human new deal emphasizes social and economic development. Based on this practical and balanced approach, the government and market assume separate roles. At the same time, there has been a shift from government-led strategies to market-oriented plans.
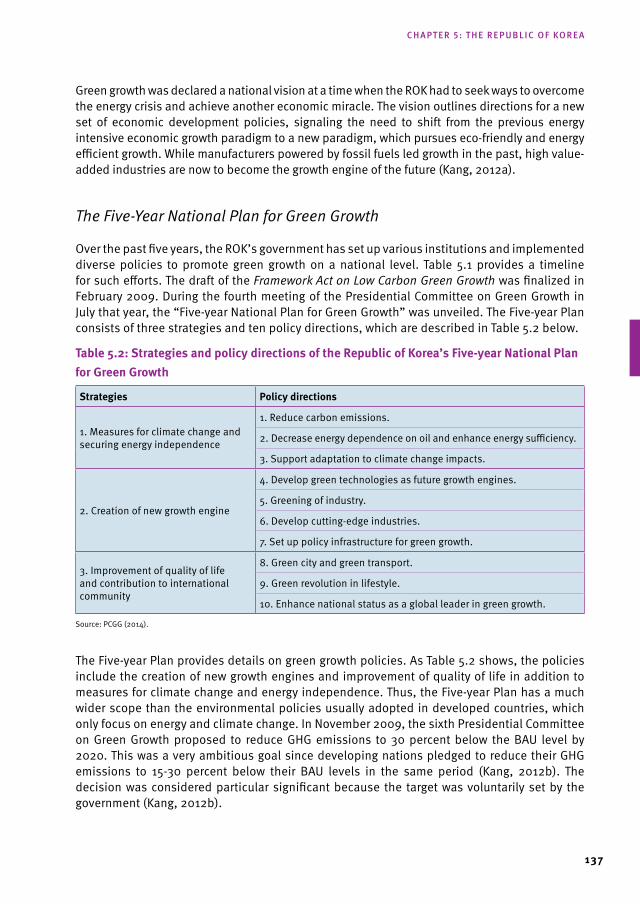
137
Green growth was declared a national vision at a time when the ROK had to seek ways to overcome the energy crisis and achieve another economic miracle. The vision outlines directions for a new set of economic development policies, signaling the need to shift from the previous energy intensive economic growth paradigm to a new paradigm, which pursues eco-friendly and energy efficient growth. While manufacturers powered by fossil fuels led growth in the past, high value-added industries are now to become the growth engine of the future (Kang, 2012a).
The Five-Year National Plan for Green Growth
Over the past five years, the ROK’s government has set up various institutions and implemented diverse policies to promote green growth on a national level. Table 5.1 provides a timeline for such efforts. The draft of the Framework Act on Low Carbon Green Growth was finalized in February 2009. During the fourth meeting of the Presidential Committee on Green Growth in July that year, the “Five-year National Plan for Green Growth” was unveiled. The Five-year Plan consists of three strategies and ten policy directions, which are described in Table 5.2 below. table 5.2: strategies and policy directions of the republic of korea’s Five-year national Plan for Green Growth
strategies Policy directions
1. Measures for climate change and securing energy independence
1. Reduce carbon emissions.
2. Decrease energy dependence on oil and enhance energy sufficiency.
3. Support adaptation to climate change impacts.
2. Creation of new growth engine
4. Develop green technologies as future growth engines.
5. Greening of industry.
6. Develop cutting-edge industries.
7. Set up policy infrastructure for green growth.
3. Improvement of quality of life and contribution to international community
8. Green city and green transport.
9. Green revolution in lifestyle.
10. Enhance national status as a global leader in green growth.
Source: PCGG (2014).
The Five-year Plan provides details on green growth policies. As Table 5.2 shows, the policies include the creation of new growth engines and improvement of quality of life in addition to measures for climate change and energy independence. Thus, the Five-year Plan has a much wider scope than the environmental policies usually adopted in developed countries, which only focus on energy and climate change. In November 2009, the sixth Presidential Committee on Green Growth proposed to reduce GHG emissions to 30 percent below the BAU level by 2020. This was a very ambitious goal since developing nations pledged to reduce their GHG emissions to 15-30 percent below their BAU levels in the same period (Kang, 2012b). The decision was considered particular significant because the target was voluntarily set by the government (Kang, 2012b).
chapter 5: the republic of Korea
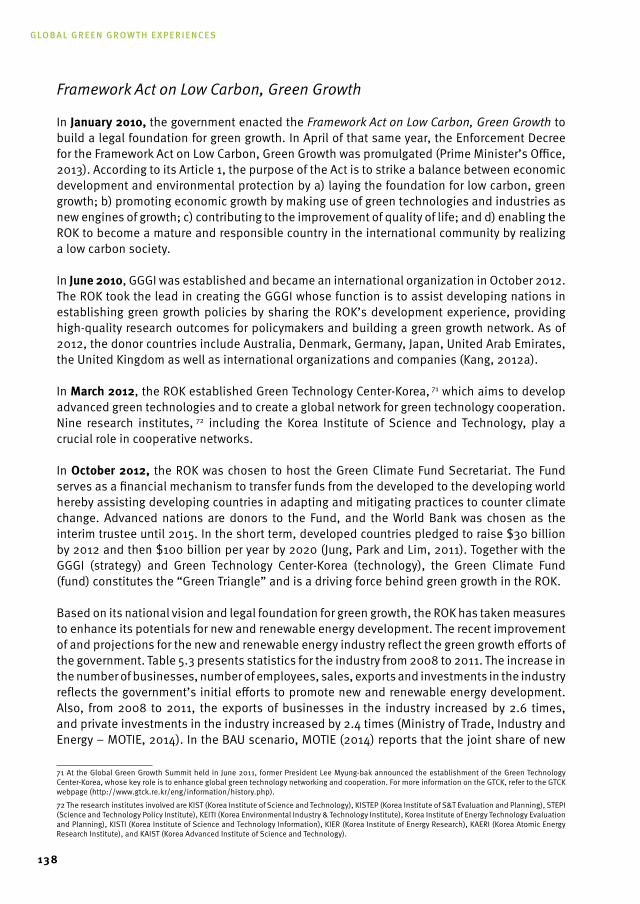
Global Green Growth experiences
138
Framework Act on Low Carbon, Green Growth
In January 2010, the government enacted the Framework Act on Low Carbon, Green Growth to build a legal foundation for green growth. In April of that same year, the Enforcement Decree for the Framework Act on Low Carbon, Green Growth was promulgated (Prime Minister’s Office, 2013). According to its Article 1, the purpose of the Act is to strike a balance between economic development and environmental protection by a) laying the foundation for low carbon, green growth; b) promoting economic growth by making use of green technologies and industries as new engines of growth; c) contributing to the improvement of quality of life; and d) enabling the ROK to become a mature and responsible country in the international community by realizing a low carbon society.
In June 2010, GGGI was established and became an international organization in October 2012. The ROK took the lead in creating the GGGI whose function is to assist developing nations in establishing green growth policies by sharing the ROK’s development experience, providing high-quality research outcomes for policymakers and building a green growth network. As of 2012, the donor countries include Australia, Denmark, Germany, Japan, United Arab Emirates, the United Kingdom as well as international organizations and companies (Kang, 2012a).
In march 2012, the ROK established Green Technology Center-Korea, 71 which aims to develop advanced green technologies and to create a global network for green technology cooperation. Nine research institutes, 72 including the Korea Institute of Science and Technology, play a crucial role in cooperative networks.
In October 2012, the ROK was chosen to host the Green Climate Fund Secretariat. The Fund serves as a financial mechanism to transfer funds from the developed to the developing world hereby assisting developing countries in adapting and mitigating practices to counter climate change. Advanced nations are donors to the Fund, and the World Bank was chosen as the interim trustee until 2015. In the short term, developed countries pledged to raise $30 billion by 2012 and then $100 billion per year by 2020 (Jung, Park and Lim, 2011). Together with the GGGI (strategy) and Green Technology Center-Korea (technology), the Green Climate Fund (fund) constitutes the “Green Triangle” and is a driving force behind green growth in the ROK.
Based on its national vision and legal foundation for green growth, the ROK has taken measures to enhance its potentials for new and renewable energy development. The recent improvement of and projections for the new and renewable energy industry reflect the green growth efforts of the government. Table 5.3 presents statistics for the industry from 2008 to 2011. The increase in the number of businesses, number of employees, sales, exports and investments in the industry reflects the government’s initial efforts to promote new and renewable energy development. Also, from 2008 to 2011, the exports of businesses in the industry increased by 2.6 times, and private investments in the industry increased by 2.4 times (Ministry of Trade, Industry and Energy – MOTIE, 2014). In the BAU scenario, MOTIE (2014) reports that the joint share of new
71 At the Global Green Growth Summit held in June 2011, former President Lee Myung-bak announced the establishment of the Green Technology Center-Korea, whose key role is to enhance global green technology networking and cooperation. For more information on the GTCK, refer to the GTCK webpage (http://www.gtck.re.kr/eng/information/history.php).
72 The research institutes involved are KIST (Korea Institute of Science and Technology), KISTEP (Korea Institute of S&T Evaluation and Planning), STEPI (Science and Technology Policy Institute), KEITI (Korea Environmental Industry & Technology Institute), Korea Institute of Energy Technology Evaluation and Planning), KISTI (Korea Institute of Science and Technology Information), KIER (Korea Institute of Energy Research), KAERI (Korea Atomic Energy Research Institute), and KAIST (Korea Advanced Institute of Science and Technology).
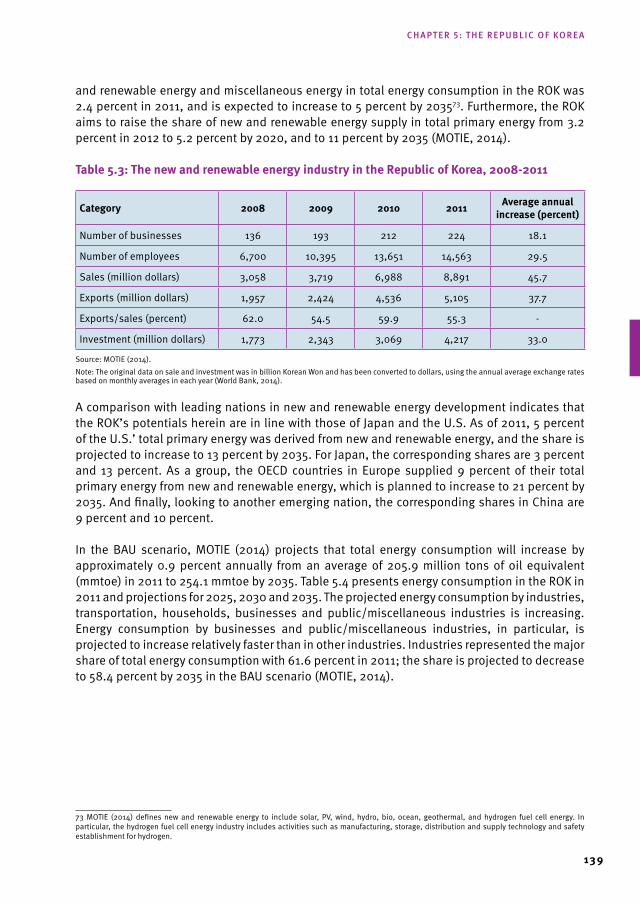
139
and renewable energy and miscellaneous energy in total energy consumption in the ROK was 2.4 percent in 2011, and is expected to increase to 5 percent by 203573. Furthermore, the ROK aims to raise the share of new and renewable energy supply in total primary energy from 3.2 percent in 2012 to 5.2 percent by 2020, and to 11 percent by 2035 (MOTIE, 2014).
table 5.3: the new and renewable energy industry in the republic of korea, 2008-2011
Category 2008 2009 2010 2011 Average annual increase (percent)
Number of businesses 136 193 212 224 18.1
Number of employees 6,700 10,395 13,651 14,563 29.5
Sales (million dollars) 3,058 3,719 6,988 8,891 45.7
Exports (million dollars) 1,957 2,424 4,536 5,105 37.7
Exports/sales (percent) 62.0 54.5 59.9 55.3 -
Investment (million dollars) 1,773 2,343 3,069 4,217 33.0
Source: MOTIE (2014).Note: The original data on sale and investment was in billion Korean Won and has been converted to dollars, using the annual average exchange rates based on monthly averages in each year (World Bank, 2014).
A comparison with leading nations in new and renewable energy development indicates that the ROK’s potentials herein are in line with those of Japan and the U.S. As of 2011, 5 percent of the U.S.’ total primary energy was derived from new and renewable energy, and the share is projected to increase to 13 percent by 2035. For Japan, the corresponding shares are 3 percent and 13 percent. As a group, the OECD countries in Europe supplied 9 percent of their total primary energy from new and renewable energy, which is planned to increase to 21 percent by 2035. And finally, looking to another emerging nation, the corresponding shares in China are 9 percent and 10 percent.
In the BAU scenario, MOTIE (2014) projects that total energy consumption will increase by approximately 0.9 percent annually from an average of 205.9 million tons of oil equivalent (mmtoe) in 2011 to 254.1 mmtoe by 2035. Table 5.4 presents energy consumption in the ROK in 2011 and projections for 2025, 2030 and 2035. The projected energy consumption by industries, transportation, households, businesses and public/miscellaneous industries is increasing. Energy consumption by businesses and public/miscellaneous industries, in particular, is projected to increase relatively faster than in other industries. Industries represented the major share of total energy consumption with 61.6 percent in 2011; the share is projected to decrease to 58.4 percent by 2035 in the BAU scenario (MOTIE, 2014).
73 MOTIE (2014) defines new and renewable energy to include solar, PV, wind, hydro, bio, ocean, geothermal, and hydrogen fuel cell energy. In particular, the hydrogen fuel cell energy industry includes activities such as manufacturing, storage, distribution and supply technology and safety establishment for hydrogen.
chapter 5: the republic of Korea
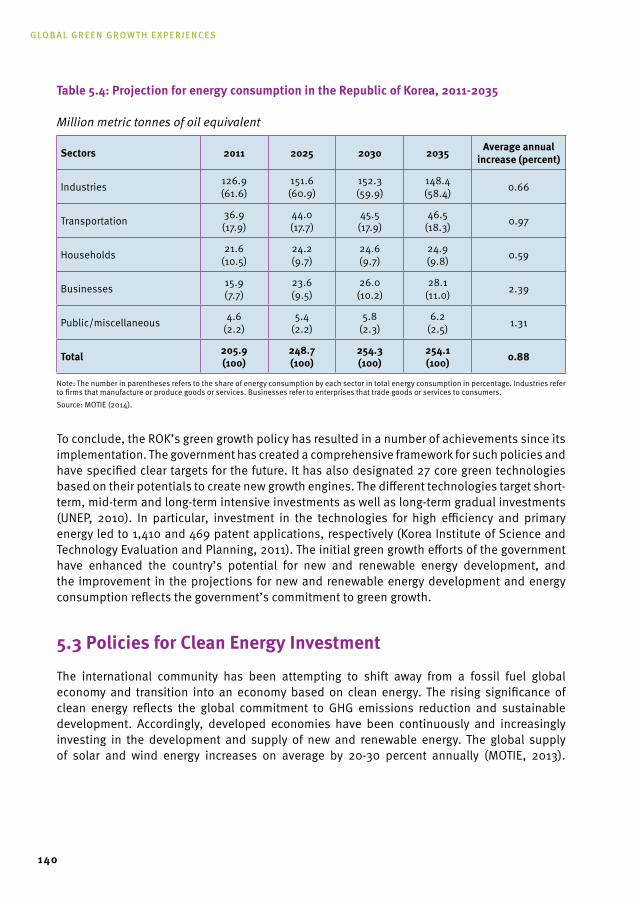
Global Green Growth experiences
140
table 5.4: Projection for energy consumption in the republic of korea, 2011-2035
Million metric tonnes of oil equivalent
sectors 2011 2025 2030 2035 Average annual increase (percent)
Industries 126.9(61.6)
151.6(60.9)
152.3(59.9)
148.4(58.4) 0.66
Transportation 36.9(17.9)
44.0(17.7)
45.5(17.9)
46.5(18.3) 0.97
Households 21.6(10.5)
24.2(9.7)
24.6(9.7)
24.9(9.8) 0.59
Businesses 15.9(7.7)
23.6(9.5)
26.0(10.2)
28.1(11.0) 2.39
Public/miscellaneous 4.6(2.2)
5.4(2.2)
5.8(2.3)
6.2(2.5) 1.31
total 205.9(100)
248.7(100)
254.3(100)
254.1(100) 0.88
Note: The number in parentheses refers to the share of energy consumption by each sector in total energy consumption in percentage. Industries refer to firms that manufacture or produce goods or services. Businesses refer to enterprises that trade goods or services to consumers.Source: MOTIE (2014).
To conclude, the ROK’s green growth policy has resulted in a number of achievements since its implementation. The government has created a comprehensive framework for such policies and have specified clear targets for the future. It has also designated 27 core green technologies based on their potentials to create new growth engines. The different technologies target short-term, mid-term and long-term intensive investments as well as long-term gradual investments (UNEP, 2010). In particular, investment in the technologies for high efficiency and primary energy led to 1,410 and 469 patent applications, respectively (Korea Institute of Science and Technology Evaluation and Planning, 2011). The initial green growth efforts of the government have enhanced the country’s potential for new and renewable energy development, and the improvement in the projections for new and renewable energy development and energy consumption reflects the government’s commitment to green growth.
5.3 Policies for Clean Energy Investment
The international community has been attempting to shift away from a fossil fuel global economy and transition into an economy based on clean energy. The rising significance of clean energy reflects the global commitment to GHG emissions reduction and sustainable development. Accordingly, developed economies have been continuously and increasingly investing in the development and supply of new and renewable energy. The global supply of solar and wind energy increases on average by 20-30 percent annually (MOTIE, 2013).
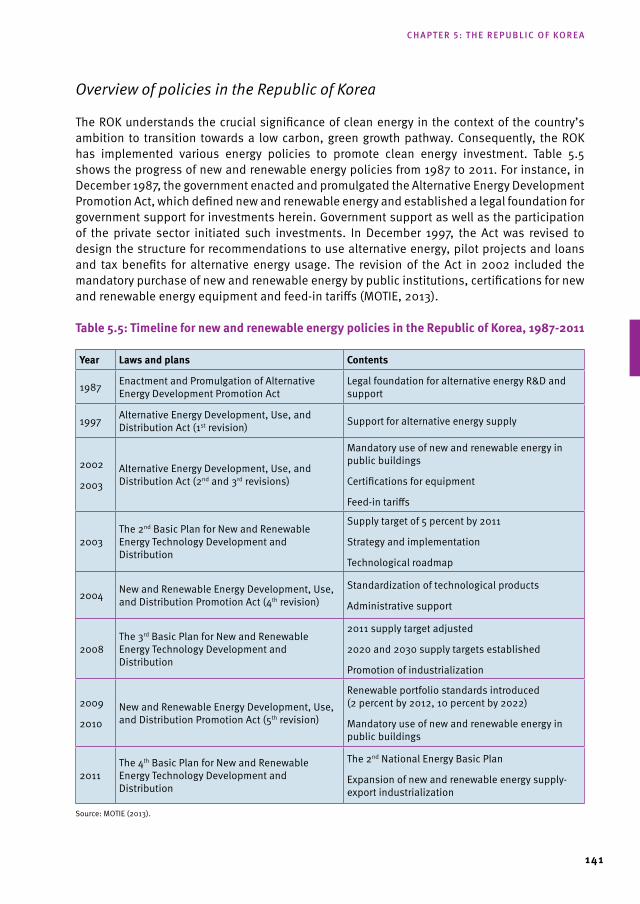
141
Overview of policies in the Republic of Korea
The ROK understands the crucial significance of clean energy in the context of the country’s ambition to transition towards a low carbon, green growth pathway. Consequently, the ROK has implemented various energy policies to promote clean energy investment. Table 5.5 shows the progress of new and renewable energy policies from 1987 to 2011. For instance, in December 1987, the government enacted and promulgated the Alternative Energy Development Promotion Act, which defined new and renewable energy and established a legal foundation for government support for investments herein. Government support as well as the participation of the private sector initiated such investments. In December 1997, the Act was revised to design the structure for recommendations to use alternative energy, pilot projects and loans and tax benefits for alternative energy usage. The revision of the Act in 2002 included the mandatory purchase of new and renewable energy by public institutions, certifications for new and renewable energy equipment and feed-in tariffs (MOTIE, 2013).
table 5.5: timeline for new and renewable energy policies in the republic of korea, 1987-2011
Year Laws and plans Contents
1987 Enactment and Promulgation of Alternative Energy Development Promotion Act
Legal foundation for alternative energy R&D and support
1997 Alternative Energy Development, Use, and Distribution Act (1st revision) Support for alternative energy supply
2002
2003Alternative Energy Development, Use, and Distribution Act (2nd and 3rd revisions)
Mandatory use of new and renewable energy in public buildings
Certifications for equipment
Feed-in tariffs
2003The 2nd Basic Plan for New and Renewable Energy Technology Development and Distribution
Supply target of 5 percent by 2011
Strategy and implementation
Technological roadmap
2004 New and Renewable Energy Development, Use, and Distribution Promotion Act (4th revision)
Standardization of technological products
Administrative support
2008The 3rd Basic Plan for New and Renewable Energy Technology Development and Distribution
2011 supply target adjusted
2020 and 2030 supply targets established
Promotion of industrialization
2009
2010New and Renewable Energy Development, Use, and Distribution Promotion Act (5th revision)
Renewable portfolio standards introduced (2 percent by 2012, 10 percent by 2022)
Mandatory use of new and renewable energy in public buildings
2011The 4th Basic Plan for New and Renewable Energy Technology Development and Distribution
The 2nd National Energy Basic Plan
Expansion of new and renewable energy supply-export industrialization
Source: MOTIE (2013).
chapter 5: the republic of Korea
Global Green Growth experiences
142
In 2004, the Act was revised again into the New and Renewable Energy Development Promotion Act and redefined the definition and scope of new and renewable energy. The redefined scope included geothermal energy, and the revised Act introduced measures to promote the supply of new and renewable energy such as the international standardization of new and renewable energy technology, the specialized enterprise system and specialized statistical agency for new and renewable energy, and the support for commercialization of the new and renewable energy technology. In order to adapt to the energy induced changes such as volatile oil prices and the Climate Change Convention and increase the supply of new and renewable energy, the subsequent revision of the Act in 2010 established the minimum ratio of such energy in total energy consumption in public buildings. The revised Act also required power generators to supply a certain amount of electricity from these energy sources (MOTIE, 2013). The initial enactment of the Act in 1997 and its subsequent revisions reflect the ROK’s commitment to clean energy investment in accordance with global efforts to address climate change and promote sustainable development.
In addition to establishing a legal foundation to promote investment in and development of new and renewable energy, the ROK devised the First Basic Plan for Alternative Energy Technology Development and Distribution in February 2001 for the systematic implementation of its policies in the field. The Plan targeted in particular the solar, wind and fuel cell industries for concentrated investments. In December 2002, the Second Basic Plan for New and Renewable Energy Technology Development, Usage, and Distribution (2003-2012) introduced incentive programmes such as tax reductions and the renewable portfolio standards to promote investment. Moreover, the second Basic Plan extended the loan periods for facilities that use or generate new and renewable energy. The Third Basic Plan for New and Renewable Energy Technology Development, Usage, and Distribution (2009-2030) sought to promote the industry as a new growth engine and provided a long-term vision for renewable development. Specifically, the Plan established targets to increase the supply of new and renewable energy to 4.3 percent by 2015, 6.1 percent by 2020 and 11 percent by 2030 (MOTIE, 2013).
Based on the legal foundation and basic plans for the clean energy framework, the government has implemented a number of policies to increase the supply of and promote investment in new and renewable energy generation equipment installation with the general and regional supply support programmes. It aims to create the initial markets and promote the commercialization of new and renewable energy technology. In particular, the government supports up to 60 percent of the installation costs for new and renewable energy generation equipment for automobiles. For solar, geothermal and bio energy generation equipment, the government supports up to 50 percent of the installation costs (Ministry of Environment – MOE, 2009).
The Million Green Home plan subsidizes the installation of new and renewable energy generation equipment in homes. By 2020, the plan intends to help one million households install PV, solar, geothermal, wind and/or fuel cell energy equipment. As of 2012, the plan had subsidized the installation of PV energy equipment in 141,468 households and the installation of solar energy equipment in 18,387 households (KEMC, 2014). In addition, the government promoted investment by providing loan support to businesses and households for the purchase, installation, reparation and production of new and renewable energy and related equipment. In 2013, the government’s loan support amounted to $72.3 million (Ministry of Knowledge Economy – MKE and KEMCCNRE, 2013).
143
Furthermore, the government implemented the feed-in tariffs policy in 2002 in order for the Korea Electric Power Corporation to compensate the difference between the cost of electricity produced by generators with new and renewable energy and the market price of electricity. As of 2009, the company had provided a total of $344.7 million to 1,308 generators for the accumulated capacity of 835 MW (MOTIE, 2013).
In 2012, the government shifted from the feed-in tariffs policy to the renewable portfolio standards to increase the supply of new and renewable energy and ease the fiscal burden. The standards require generators to supply a fixed percentage of the total amount of energy provided by using new and renewable energy. Hence, generators must install new and renewable energy facilities, purchase electricity from new and renewable energy generators or purchase new and renewable energy credits from the financial market. The renewable portfolio standards aims to increase the share of electricity generated from new and renewable energy in the total electricity generated from 2 percent in 2012 to 10 percent in 2022 (MOTIE, 2013).
Progress and evaluation
Between 1988 and 2011 - since the enactment of the Alternative Energy Development Promotion Act in 1987 - the ROK’s government has allotted a total of $4.8 billion to the new and renewable energy industry. Out of $225 million spent on investment in technology development, the government contributed about $1.4 billion, while the private sector provided approximately $0.8 billion. Government policies to promote investment in the industry ranged from funding to administrative support. Consequently, the share of new and renewable energy in total energy increased from 0.4 percent in 1990 to 2.6 percent in 2010 (MOTIE, 2013).
Moreover, MKE (2012) reports that the government’s efforts to promote such investment resulted in a substantial increase in the level of private investment and exports in the industry. Private investment increased from $653 million in 2007 to $2,792 million in 2009 and reached $4,343 million in 2011. Furthermore, the export of new and renewable energy increased from $663 million in 2007 to, $886 million in 2009, and to $6,463 million in 2011. In particular, PV energy accounted for 87 percent of exports and wind energy was 13 percent (MKE, 2012).
The increase in the number of employees in the new and renewable energy industry reflects the ROK’s commitment to new and renewable energy development and the effectiveness of its policies to promote investment in the industry. As indicated in Table 5.3, the number of employees in the industry increased from 6,700 in 2008 to 14,563 in 2011, corresponding to an average annual increase of 29.5 percent (MOTIE, 2014). According to MKE (2011), the government’s expenditure for the industry created a total of 30,065 jobs between 2008 and 2010. Therefore, the policies to promote new and renewable energy investment have not only increased the level of private investment and exports in the industry, but they have also had a positive impact on employment generation.
chapter 5: the republic of Korea
Global Green Growth experiences
144
Obstacles for clean energy investment
The transition of the ROK towards a low carbon, green growth pathway has already begun, and its emphasis on clean energy has been growing. Despite the achievements of the current clean energy investment policies, there are substantial obstacles that need to be dealt with. One of the most evident problems is that investment in clean energy still lags far behind that of other developed countries. Lee and Teske (2013) note that the ROK’s investment in the new and renewable energy technology industry was less than 10 percent of that of China or the U.S. in 2011. In that year, China invested $55 billion, while the U.S. invested $51 billion in renewable energy. By contrast, the ROK invested $235 million. Compared to China, which has established its leadership in the global market for wind and PV energy, the ROK has to invest more in order to join the frontrunners in the clean energy market (Lee and Teske, 2013).
In addition to the need to increase the level of clean energy investment, the ROK must establish stronger incentives for private investment in the clean energy industry. MOTIE (2014) reports that the domestic development of core technologies in the industry is still at its initial stage. Despite investment in the 27 core green technologies, the development of core new and renewable energy technologies is still under progress. In 2011, the average import rate of the major components, materials and tools for PV energy was 79 percent, 85 percent for wind energy and 91 percent for fuel cell energy. Along with the lack of programmes to commercialize the technologies, the slow pace of technological development could potentially limit medium- and long-term clean energy investment in the ROK. Moreover, the subsidized (low) cost of electricity continues to increase the consumption of fossil fuels and could restrict the supply of clean energy (MOTIE, 2014).
5.4 Evaluation of Green Growth in the republic of korea
Green growth indicators
Given the long-term nature of its green growth plans, many of the ROK’s strategies for successful implementation of the plans are still on-going. Yet, it is crucial to assess its present achievements in and the obstacles to green growth implementation to better understand its trajectory towards a green growth economy. One way to evaluate the current progress of its green growth is to examine its green growth indicators. To support the National Strategy for Green Growth and provide statistics for green growth policies, KOSTAT developed green growth statistics and built the framework for green growth indicators (Choi, 2010). These indicators aim to “monitor the level of progress toward green growth, make policies to foster green growth activities, and evaluate the performance of green growth policies in Korea” (Choi, 2010, p. 4). Building on policy relevance, analytical soundness and data availability, KOSTAT developed the indicators with three themes and ten sub-themes to reflect the three objectives and ten policy directions of the Five-year Green Growth Plan (Choi, 2010).
This section addresses current problems and the policy implications of the implementation of green growth based on KOSTAT’s 2013 green growth indicators. Table 5.6 depicts the recent trends of the indicators.
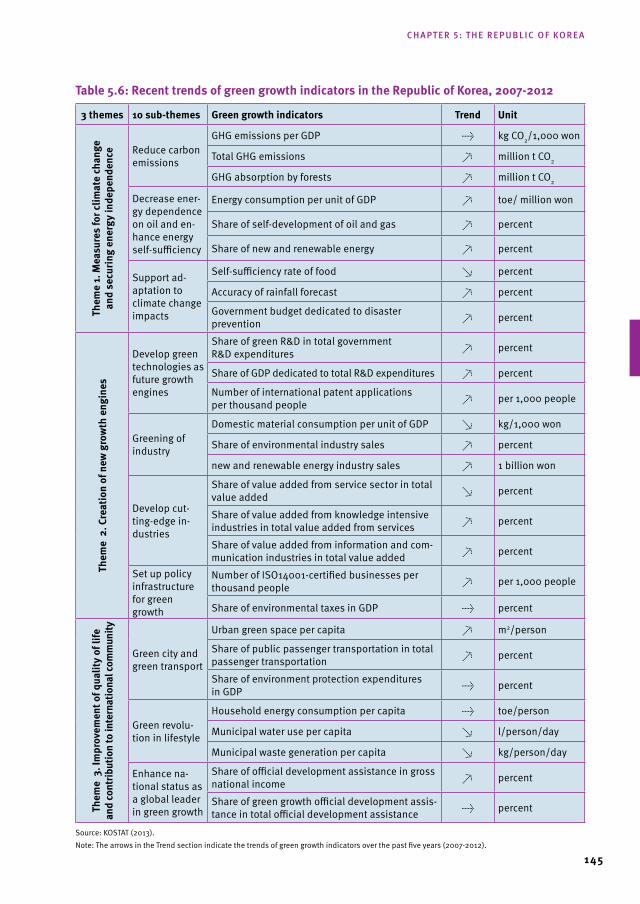
145
table 5.6: recent trends of green growth indicators in the republic of korea, 2007-2012
3 themes 10 sub-themes Green growth indicators trend Unit
them
e 1.
mea
sure
s fo
r clim
ate
chan
ge
and
secu
ring
ener
gy in
depe
nden
ce Reduce carbon emissions
GHG emissions per GDP → kg CO2/1,000 won
Total GHG emissions ↗ million t CO2
GHG absorption by forests ↗ million t CO2
Decrease ener-gy dependence on oil and en-hance energy self-sufficiency
Energy consumption per unit of GDP ↗ toe/ million won
Share of self-development of oil and gas ↗ percent
Share of new and renewable energy ↗ percent
Support ad-aptation to climate change impacts
Self-sufficiency rate of food ↘ percent
Accuracy of rainfall forecast ↗ percent
Government budget dedicated to disaster prevention ↗ percent
them
e 2
. Cre
atio
n of
new
gro
wth
eng
ines
Develop green technologies as future growth engines
Share of green R&D in total government R&D expenditures ↗ percent
Share of GDP dedicated to total R&D expenditures ↗ percent
Number of international patent applications per thousand people ↗ per 1,000 people
Greening of industry
Domestic material consumption per unit of GDP ↘ kg/1,000 won
Share of environmental industry sales ↗ percent
new and renewable energy industry sales ↗ 1 billion won
Develop cut-ting-edge in-dustries
Share of value added from service sector in total value added ↘ percent
Share of value added from knowledge intensive industries in total value added from services ↗ percent
Share of value added from information and com-munication industries in total value added ↗ percent
Set up policy infrastructure for green growth
Number of ISO14001-certified businesses per thousand people ↗ per 1,000 people
Share of environmental taxes in GDP → percent
them
e 3
. Im
prov
emen
t of q
ualit
y of
life
an
d co
ntrib
utio
n to
inte
rnat
iona
l com
mun
ity
Green city and green transport
Urban green space per capita ↗ m2/person
Share of public passenger transportation in total passenger transportation ↗ percent
Share of environment protection expenditures in GDP → percent
Green revolu-tion in lifestyle
Household energy consumption per capita → toe/person
Municipal water use per capita ↘ l/person/day
Municipal waste generation per capita ↘ kg/person/day
Enhance na-tional status as a global leader in green growth
Share of official development assistance in gross national income ↗ percent
Share of green growth official development assis-tance in total official development assistance → percent
Source: KOSTAT (2013).Note: The arrows in the Trend section indicate the trends of green growth indicators over the past five years (2007-2012).
chapter 5: the republic of Korea
Global Green Growth experiences
146
Theme 1 of the KOSTAT indicators represents the measures for climate change and securing energy independence. It consists of 3 sub-themes: reduce carbon emissions, decrease energy dependence on oil and enhance energy self-sufficiency, and support adaptation to climate change impacts. With respect to Theme 1, five out of nine indicators have shown improvement, while three indicators have deteriorated for 2008-2012 (one indicator remained constant). In the sub-theme carbon emissions reduction, GHG absorption by forests increased by 4.1 percent annually on average due to forest accumulation.
In the sub-theme decreasing energy dependence on oil and enhancing energy self-sufficiency, the share of self-development of oil and gas is an indicator that represents energy independence. It increased steadily to 13 percent in 2011 and 2012. The share of new and renewable energy was 3.2 percent of total energy supply in 2012 and increased by 0.8 percentage points compared to the 2007 level. In particular, new and renewable energy consisted of waste materials (67.8 percent), bio energy (15.1 percent) and hydroelectric energy (9.2 percent).
Among the three indicators that deteriorated, the total GHG emissions were an indicator for the sub-theme carbon emissions reduction. For the past five years, it has increased by 3.3 percent annually on average, primarily due to continued economic growth. Specifically, the increase in steel production and climate anomalies such as the heat wave and cold wave raised GHG emissions by 60 mmt to 670 mmt of CO2. For the sub-theme decreasing energy dependence on oil and enhancing energy self-sufficiency, the energy consumption per unit of GDP reflects energy consumption efficiency. It increased over the last five years, reaching 0.274 tonnes of oil equivalent (toe) per thousand dollars. In the sub-theme strengthening the capacity to adaption to climate change, the self-sufficiency rate of food recently decreased to less than 50 percent. Compared to the 2009 and 2010 levels, the self-sufficiency decreased by 10 percentage points to 45.3 percent in 2012.
Theme 2 of the KOSTAT indicators reflects the creation of new growth engines. It consists of 4-sub-themes: develop green technologies as future growth engines, greening of industry, develop cutting-edge industries, and set up policy infrastructure for green growth. With respect to Theme 2, nine out of eleven indicators have shown improvement, while one indicator deteriorated over the past five years (one indicator remained constant). In the sub-theme development of green technology, the share of green R&D in total government R&D expenditures represents the indicator enhancement of environmental technology. It decreased by 0.6 percentage points to 16 percent from 2011 to 2012, yet the current level is higher than the 2007 and 2008 levels. Also, the share of GDP allocated to total R&D expenditures reflects the ROK’s technological capability, which has increased by 0.2 percentage points annually on average over the past five years. In particular, the 2012 level of 4.4 percent was higher than the 2011 level by 0.4 percentage points. Moreover, the number of international patent applications per thousand people increased by 10.3 percent annually on average for the last five years. In 2012, the number was 0.2 and thus higher than the 2007 level by 0.1.
In the sub-theme greening of industry, domestic material consumption per unit of GDP has decreased by 1.9 percent annually on average for the past five years. Compared to the 2007 level, the 2011 level of 0.692 kg per $1 was lower by 0.033 kg per $1. Meanwhile, the share of environmental industry sales exceeded the 1 percent mark in 2010 after a steady increase. Furthermore, new and renewable energy industry sales increased by 68.5 percent annually on average for the last five years.
147
In the sub-theme developing cutting-edge industries, the share of value added from knowledge intensive industries in total value added from the service sector increased by 0.2 percentage points annually on average for the past five years. In 2012, the share reached 48.3 percent, increasing by 0.9 percentage points compared to the 2007 level. For the sub-theme setting up policy infrastructure for green growth, the number of ISO14001-certified businesses per thousand people reflects the recognition and implementation of green growth by industries. The number was 7,293 in 2012 and increased by 5.1 percent relative to the previous year. The only sub-theme indicator that deteriorated was the share of value added from the service sector in total value added. This indicator represents the structural change in industries. Since the financial crisis, it decreased below 60 percent and remained constant from 2010 to 2012.
Theme 3 of the KOSTAT indicators reflects the improvement of quality of life and the contribution to the international community. It consists of 3 sub-themes: green city and green transport, green revolution in lifestyle and enhancing the national status as a global leader in green growth. With respect to Theme 3, five out of eight indicators have shown improvement, while the other three remained generally unchanged. In the sub-theme green city and green transport, urban green space per capita has been increasing steadily. Between 2007 and 2011, the figure increased by 13.6 percent to 7.95 m2. Moreover, the share of public passenger transport in total passenger transport increased by 1.5 percentage points to 25.9 percent between 2007 and 2011. For the sub-theme green revolution in lifestyle, municipal water use per capita decreased substantially until 2009 and slightly increased subsequently. In 2007, the figure was 340 litres and decreased by 5 litres between 2007 and 2011. Also, municipal waste generation per capita has been decreasing since 2009. The 2011 level was 0.95 kg and lower than the 2010 level by 1 percent. In the sub-theme enhancing national status as a global leader in green growth, the share of official development assistance in gross national income has been increasing steadily. In 2012, total official development assistance increased by 17.1 percent to $1.55 billion compared to the 2011 level. The share of official development assistance in gross national income increased to approximately 0.1 percent between 2011 and 2012.
While the green growth indicators provide a meaningful insight about the ROK’s green growth efforts, it is important to check the quality of the indicators before drawing policy implications from them. The KOSTAT and other statistical agencies produce economic and social statistics that are used for the development of the green growth indicators. In general, these statistics are of high quality. However, Choi (2010) warns of the potential quality problems inherent in non-official statistics used for some of the green growth indicators such as the share of green R&D in the total R&D budget and the government fund for the green industry. Most of the non-official statistics were obtained from administrative data, and their definitions and classification lack consistency. Also, the environmental statistics must be viewed with caution due to methodological issues. In particular, the number of monitoring sites and their location influence the quality of the environmental statistics (Choi, 2010).
The green growth experience
The KOSTAT green growth indicators provide an insight into the current progress of the ROK’s green growth as well as its future direction. The country has made notable improvements with respect to a number of aspects covered in the green growth indicators. In particular, the share of green R&D in total government R&D expenditure increased between 2007 and 2012.
chapter 5: the republic of Korea
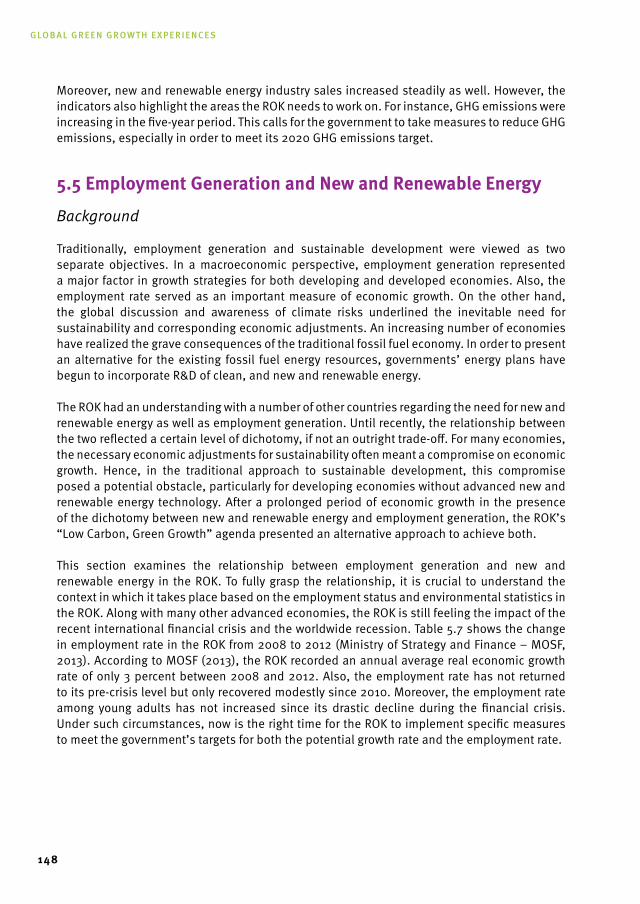
Global Green Growth experiences
148
Moreover, new and renewable energy industry sales increased steadily as well. However, the indicators also highlight the areas the ROK needs to work on. For instance, GHG emissions were increasing in the five-year period. This calls for the government to take measures to reduce GHG emissions, especially in order to meet its 2020 GHG emissions target.
5.5 Employment Generation and new and renewable Energy
Background
Traditionally, employment generation and sustainable development were viewed as two separate objectives. In a macroeconomic perspective, employment generation represented a major factor in growth strategies for both developing and developed economies. Also, the employment rate served as an important measure of economic growth. On the other hand, the global discussion and awareness of climate risks underlined the inevitable need for sustainability and corresponding economic adjustments. An increasing number of economies have realized the grave consequences of the traditional fossil fuel economy. In order to present an alternative for the existing fossil fuel energy resources, governments’ energy plans have begun to incorporate R&D of clean, and new and renewable energy.
The ROK had an understanding with a number of other countries regarding the need for new and renewable energy as well as employment generation. Until recently, the relationship between the two reflected a certain level of dichotomy, if not an outright trade-off. For many economies, the necessary economic adjustments for sustainability often meant a compromise on economic growth. Hence, in the traditional approach to sustainable development, this compromise posed a potential obstacle, particularly for developing economies without advanced new and renewable energy technology. After a prolonged period of economic growth in the presence of the dichotomy between new and renewable energy and employment generation, the ROK’s “Low Carbon, Green Growth” agenda presented an alternative approach to achieve both.
This section examines the relationship between employment generation and new and renewable energy in the ROK. To fully grasp the relationship, it is crucial to understand the context in which it takes place based on the employment status and environmental statistics in the ROK. Along with many other advanced economies, the ROK is still feeling the impact of the recent international financial crisis and the worldwide recession. Table 5.7 shows the change in employment rate in the ROK from 2008 to 2012 (Ministry of Strategy and Finance – MOSF, 2013). According to MOSF (2013), the ROK recorded an annual average real economic growth rate of only 3 percent between 2008 and 2012. Also, the employment rate has not returned to its pre-crisis level but only recovered modestly since 2010. Moreover, the employment rate among young adults has not increased since its drastic decline during the financial crisis. Under such circumstances, now is the right time for the ROK to implement specific measures to meet the government’s targets for both the potential growth rate and the employment rate.
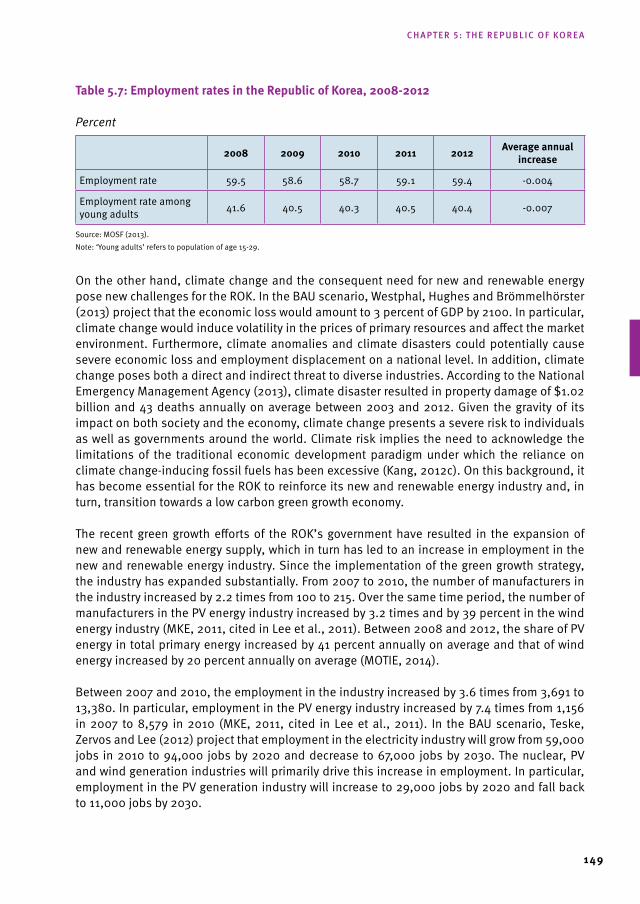
149
table 5.7: Employment rates in the republic of korea, 2008-2012
Percent
2008 2009 2010 2011 2012 Average annual increase
Employment rate 59.5 58.6 58.7 59.1 59.4 -0.004
Employment rate among young adults 41.6 40.5 40.3 40.5 40.4 -0.007
Source: MOSF (2013).Note: ‘Young adults’ refers to population of age 15-29.
On the other hand, climate change and the consequent need for new and renewable energy pose new challenges for the ROK. In the BAU scenario, Westphal, Hughes and Brömmelhörster (2013) project that the economic loss would amount to 3 percent of GDP by 2100. In particular, climate change would induce volatility in the prices of primary resources and affect the market environment. Furthermore, climate anomalies and climate disasters could potentially cause severe economic loss and employment displacement on a national level. In addition, climate change poses both a direct and indirect threat to diverse industries. According to the National Emergency Management Agency (2013), climate disaster resulted in property damage of $1.02 billion and 43 deaths annually on average between 2003 and 2012. Given the gravity of its impact on both society and the economy, climate change presents a severe risk to individuals as well as governments around the world. Climate risk implies the need to acknowledge the limitations of the traditional economic development paradigm under which the reliance on climate change-inducing fossil fuels has been excessive (Kang, 2012c). On this background, it has become essential for the ROK to reinforce its new and renewable energy industry and, in turn, transition towards a low carbon green growth economy.
The recent green growth efforts of the ROK’s government have resulted in the expansion of new and renewable energy supply, which in turn has led to an increase in employment in the new and renewable energy industry. Since the implementation of the green growth strategy, the industry has expanded substantially. From 2007 to 2010, the number of manufacturers in the industry increased by 2.2 times from 100 to 215. Over the same time period, the number of manufacturers in the PV energy industry increased by 3.2 times and by 39 percent in the wind energy industry (MKE, 2011, cited in Lee et al., 2011). Between 2008 and 2012, the share of PV energy in total primary energy increased by 41 percent annually on average and that of wind energy increased by 20 percent annually on average (MOTIE, 2014).
Between 2007 and 2010, the employment in the industry increased by 3.6 times from 3,691 to 13,380. In particular, employment in the PV energy industry increased by 7.4 times from 1,156 in 2007 to 8,579 in 2010 (MKE, 2011, cited in Lee et al., 2011). In the BAU scenario, Teske, Zervos and Lee (2012) project that employment in the electricity industry will grow from 59,000 jobs in 2010 to 94,000 jobs by 2020 and decrease to 67,000 jobs by 2030. The nuclear, PV and wind generation industries will primarily drive this increase in employment. In particular, employment in the PV generation industry will increase to 29,000 jobs by 2020 and fall back to 11,000 jobs by 2030.
chapter 5: the republic of Korea
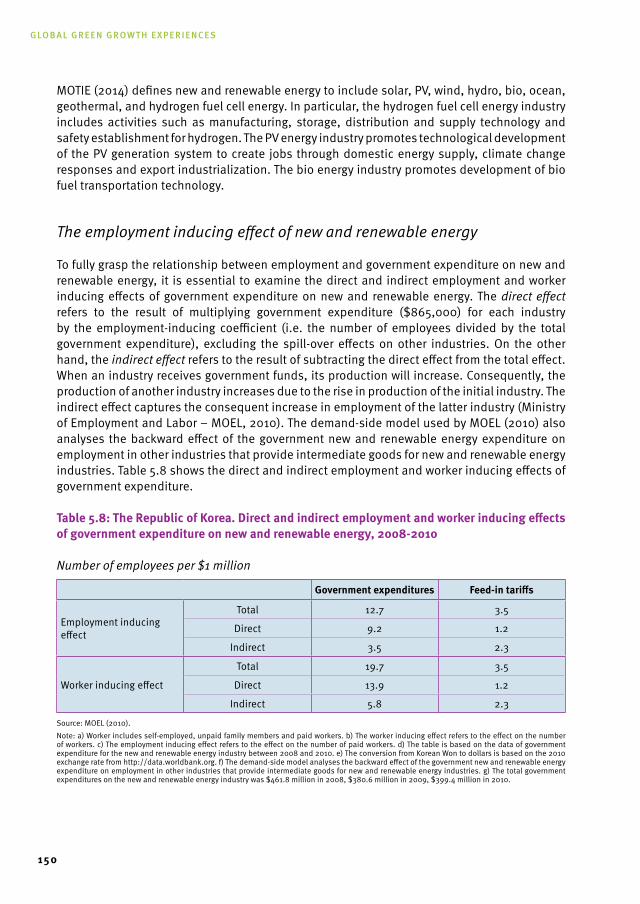
Global Green Growth experiences
150
MOTIE (2014) defines new and renewable energy to include solar, PV, wind, hydro, bio, ocean, geothermal, and hydrogen fuel cell energy. In particular, the hydrogen fuel cell energy industry includes activities such as manufacturing, storage, distribution and supply technology and safety establishment for hydrogen. The PV energy industry promotes technological development of the PV generation system to create jobs through domestic energy supply, climate change responses and export industrialization. The bio energy industry promotes development of bio fuel transportation technology.
The employment inducing effect of new and renewable energy
To fully grasp the relationship between employment and government expenditure on new and renewable energy, it is essential to examine the direct and indirect employment and worker inducing effects of government expenditure on new and renewable energy. The direct effect refers to the result of multiplying government expenditure ($865,000) for each industry by the employment-inducing coefficient (i.e. the number of employees divided by the total government expenditure), excluding the spill-over effects on other industries. On the other hand, the indirect effect refers to the result of subtracting the direct effect from the total effect. When an industry receives government funds, its production will increase. Consequently, the production of another industry increases due to the rise in production of the initial industry. The indirect effect captures the consequent increase in employment of the latter industry (Ministry of Employment and Labor – MOEL, 2010). The demand-side model used by MOEL (2010) also analyses the backward effect of the government new and renewable energy expenditure on employment in other industries that provide intermediate goods for new and renewable energy industries. Table 5.8 shows the direct and indirect employment and worker inducing effects of government expenditure.
table 5.8: the republic of korea. direct and indirect employment and worker inducing effects of government expenditure on new and renewable energy, 2008-2010
Number of employees per $1 million
Government expenditures Feed-in tariffs
Employment inducing effect
Total 12.7 3.5
Direct 9.2 1.2
Indirect 3.5 2.3
Worker inducing effect
Total 19.7 3.5
Direct 13.9 1.2
Indirect 5.8 2.3
Source: MOEL (2010).Note: a) Worker includes self-employed, unpaid family members and paid workers. b) The worker inducing effect refers to the effect on the number of workers. c) The employment inducing effect refers to the effect on the number of paid workers. d) The table is based on the data of government expenditure for the new and renewable energy industry between 2008 and 2010. e) The conversion from Korean Won to dollars is based on the 2010 exchange rate from http://data.worldbank.org. f) The demand-side model analyses the backward effect of the government new and renewable energy expenditure on employment in other industries that provide intermediate goods for new and renewable energy industries. g) The total government expenditures on the new and renewable energy industry was $461.8 million in 2008, $380.6 million in 2009, $399.4 million in 2010.
151
According to MOEL (2010), the employment inducing effect on account of government investments between 2008 and 2010 was 12.7 employees per $1 million, while the effect on account of the feed-in tariffs was 3.5 employees per $1 million. Thus, the result implies that government investments induce employment more effectively than feed-in tariffs. Moreover, the worker inducing effect indicates that government investments are more effective in terms of worker inducement than feed-in tariffs (19.7 employees per $1 million against 3.5 employees per $1 million).
Furthermore, the demand-side model provides meaningful insights on the relationship between employment and government expenditure on new and renewable energy in the ROK. MOEL (2010) reports that the total employment inducing effect of government expenditure on new and renewable energy was 21,633 employees between 2008 and 2010 (see Table 5.9). The impact on the new and renewable energy industry was 16,046 employees. The impact on the service sector was 3,441 employees and on the manufacturing sector was 1,638 employees.
table 5.9: the republic of korea. total employment inducing effect of total government expenditure on new and renewable energy, 2008-2010
Number of employees per $1 million
2008 2009 2010 total
Agriculture, fishery and forestry 32 31 29 92
Manufacturing 572 547 519 1,638
Service 1,202 1,148 1,091 3,441
Electricity, gas and water 18 17 16 62
Construction 22 20 20 61
Research Institutions 106 102 96 304
New and renewable energy 5,606 5,353 5,087 16,046
Miscellaneous 0 0 0 0
total 7,558 7,217 6,858 21,633
Source: MOEL (2010).Note: Total government expenditure on new and renewable energy is the sum of government expenditure on supply and technology development of new and renewable energy and loan support and infrastructure for new and renewable energy. The conversions from Korean Won to dollars are based on the 2008, 2009 and 2010 exchange rates, respectively, from http://data.worldbank.org.
The employment inducing effect of government expenditure on the supply of new and renewable energy was 9,203 employees between 2008 and 2010 (see Table 5.10). The impact on the new and renewable energy industry was 6,824 employees, the largest among all industries. The impact on the service sector was 1,462 employees and on the manufacturing sector was 696 employees. Moreover, the employment inducing effect of government expenditure on technology development for new and renewable energy was a total of 12,170 employees between 2008 and 2010 (see Table 5.11). The impact on the new and renewable energy industry was 9,025 employees. The impact on the service sector was 1,936 employees and the impact on the manufacturing sector was 922 employees.
chapter 5: the republic of Korea
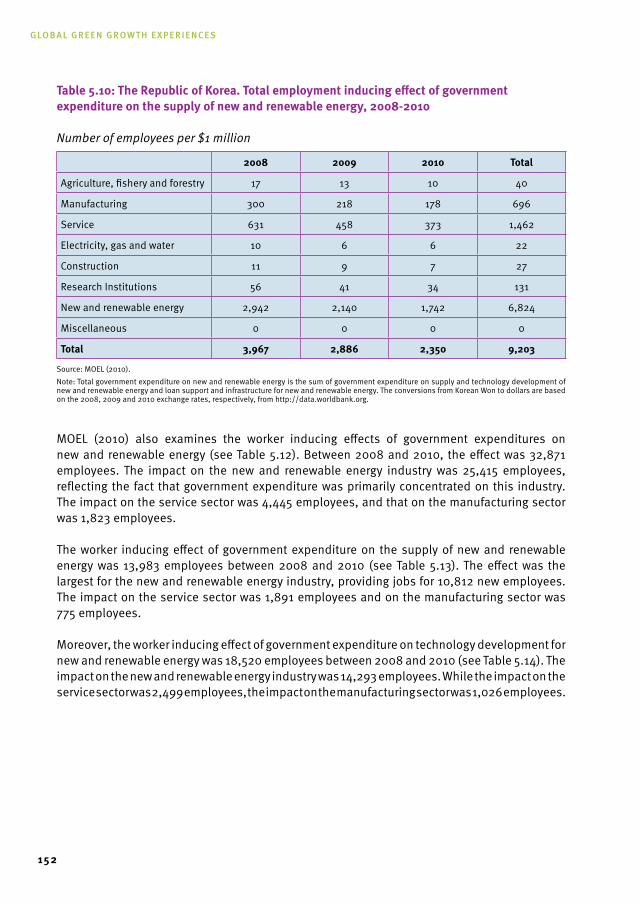
Global Green Growth experiences
152
table 5.10: the republic of korea. total employment inducing effect of government expenditure on the supply of new and renewable energy, 2008-2010
Number of employees per $1 million
2008 2009 2010 total
Agriculture, fishery and forestry 17 13 10 40
Manufacturing 300 218 178 696
Service 631 458 373 1,462
Electricity, gas and water 10 6 6 22
Construction 11 9 7 27
Research Institutions 56 41 34 131
New and renewable energy 2,942 2,140 1,742 6,824
Miscellaneous 0 0 0 0
total 3,967 2,886 2,350 9,203
Source: MOEL (2010).Note: Total government expenditure on new and renewable energy is the sum of government expenditure on supply and technology development of new and renewable energy and loan support and infrastructure for new and renewable energy. The conversions from Korean Won to dollars are based on the 2008, 2009 and 2010 exchange rates, respectively, from http://data.worldbank.org.
MOEL (2010) also examines the worker inducing effects of government expenditures on new and renewable energy (see Table 5.12). Between 2008 and 2010, the effect was 32,871 employees. The impact on the new and renewable energy industry was 25,415 employees, reflecting the fact that government expenditure was primarily concentrated on this industry. The impact on the service sector was 4,445 employees, and that on the manufacturing sector was 1,823 employees.
The worker inducing effect of government expenditure on the supply of new and renewable energy was 13,983 employees between 2008 and 2010 (see Table 5.13). The effect was the largest for the new and renewable energy industry, providing jobs for 10,812 new employees. The impact on the service sector was 1,891 employees and on the manufacturing sector was 775 employees.
Moreover, the worker inducing effect of government expenditure on technology development for new and renewable energy was 18,520 employees between 2008 and 2010 (see Table 5.14). The impact on the new and renewable energy industry was 14,293 employees. While the impact on the service sector was 2,499 employees, the impact on the manufacturing sector was 1,026 employees.
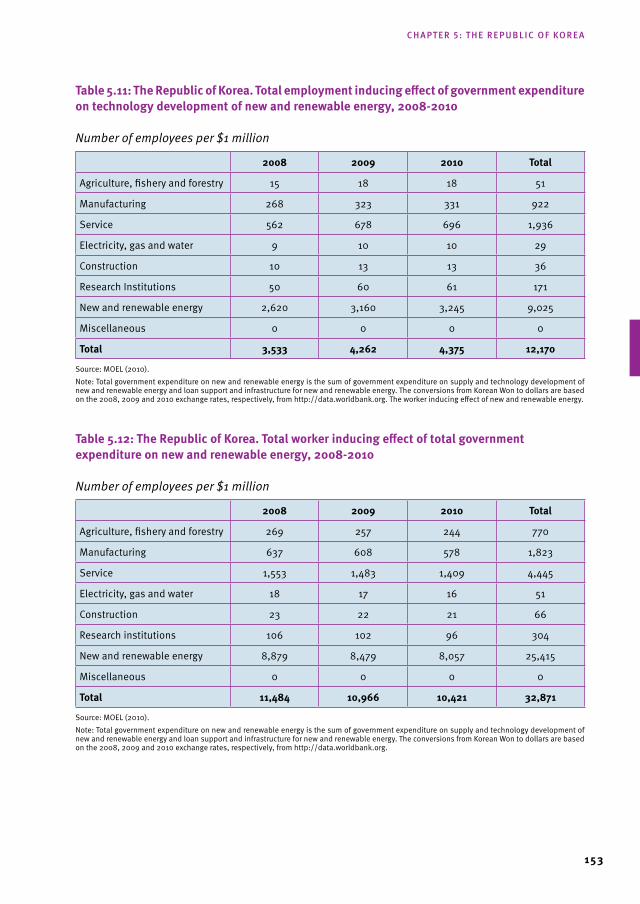
153
table 5.11: the republic of korea. total employment inducing effect of government expenditure on technology development of new and renewable energy, 2008-2010
Number of employees per $1 million
2008 2009 2010 total
Agriculture, fishery and forestry 15 18 18 51
Manufacturing 268 323 331 922
Service 562 678 696 1,936
Electricity, gas and water 9 10 10 29
Construction 10 13 13 36
Research Institutions 50 60 61 171
New and renewable energy 2,620 3,160 3,245 9,025
Miscellaneous 0 0 0 0
total 3,533 4,262 4,375 12,170
Source: MOEL (2010).Note: Total government expenditure on new and renewable energy is the sum of government expenditure on supply and technology development of new and renewable energy and loan support and infrastructure for new and renewable energy. The conversions from Korean Won to dollars are based on the 2008, 2009 and 2010 exchange rates, respectively, from http://data.worldbank.org. The worker inducing effect of new and renewable energy.
table 5.12: the republic of korea. total worker inducing effect of total government expenditure on new and renewable energy, 2008-2010
Number of employees per $1 million
2008 2009 2010 total
Agriculture, fishery and forestry 269 257 244 770
Manufacturing 637 608 578 1,823
Service 1,553 1,483 1,409 4,445
Electricity, gas and water 18 17 16 51
Construction 23 22 21 66
Research institutions 106 102 96 304
New and renewable energy 8,879 8,479 8,057 25,415
Miscellaneous 0 0 0 0
total 11,484 10,966 10,421 32,871
Source: MOEL (2010).Note: Total government expenditure on new and renewable energy is the sum of government expenditure on supply and technology development of new and renewable energy and loan support and infrastructure for new and renewable energy. The conversions from Korean Won to dollars are based on the 2008, 2009 and 2010 exchange rates, respectively, from http://data.worldbank.org.
chapter 5: the republic of Korea
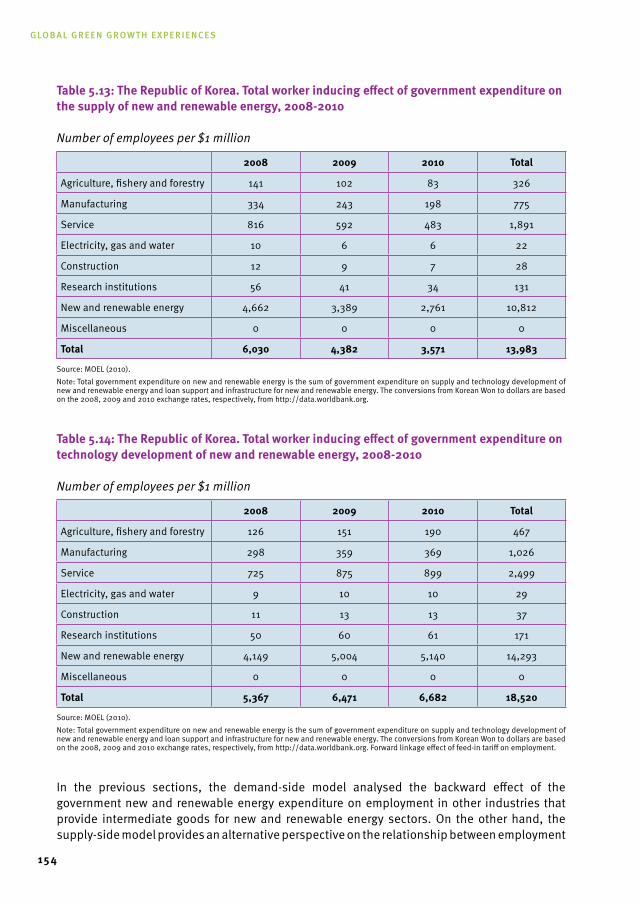
Global Green Growth experiences
154
table 5.13: the republic of korea. total worker inducing effect of government expenditure on the supply of new and renewable energy, 2008-2010
Number of employees per $1 million
2008 2009 2010 total
Agriculture, fishery and forestry 141 102 83 326
Manufacturing 334 243 198 775
Service 816 592 483 1,891
Electricity, gas and water 10 6 6 22
Construction 12 9 7 28
Research institutions 56 41 34 131
New and renewable energy 4,662 3,389 2,761 10,812
Miscellaneous 0 0 0 0
total 6,030 4,382 3,571 13,983
Source: MOEL (2010).Note: Total government expenditure on new and renewable energy is the sum of government expenditure on supply and technology development of new and renewable energy and loan support and infrastructure for new and renewable energy. The conversions from Korean Won to dollars are based on the 2008, 2009 and 2010 exchange rates, respectively, from http://data.worldbank.org.
table 5.14: the republic of korea. total worker inducing effect of government expenditure on technology development of new and renewable energy, 2008-2010
Number of employees per $1 million
2008 2009 2010 total
Agriculture, fishery and forestry 126 151 190 467
Manufacturing 298 359 369 1,026
Service 725 875 899 2,499
Electricity, gas and water 9 10 10 29
Construction 11 13 13 37
Research institutions 50 60 61 171
New and renewable energy 4,149 5,004 5,140 14,293
Miscellaneous 0 0 0 0
total 5,367 6,471 6,682 18,520
Source: MOEL (2010).Note: Total government expenditure on new and renewable energy is the sum of government expenditure on supply and technology development of new and renewable energy and loan support and infrastructure for new and renewable energy. The conversions from Korean Won to dollars are based on the 2008, 2009 and 2010 exchange rates, respectively, from http://data.worldbank.org. Forward linkage effect of feed-in tariff on employment.
In the previous sections, the demand-side model analysed the backward effect of the government new and renewable energy expenditure on employment in other industries that provide intermediate goods for new and renewable energy sectors. On the other hand, the supply-side model provides an alternative perspective on the relationship between employment
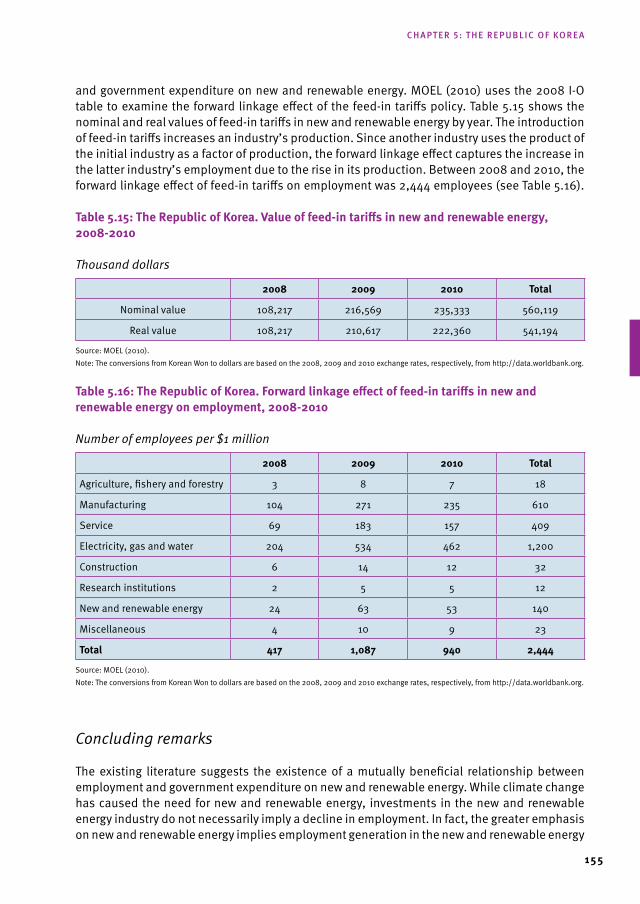
155
and government expenditure on new and renewable energy. MOEL (2010) uses the 2008 I-O table to examine the forward linkage effect of the feed-in tariffs policy. Table 5.15 shows the nominal and real values of feed-in tariffs in new and renewable energy by year. The introduction of feed-in tariffs increases an industry’s production. Since another industry uses the product of the initial industry as a factor of production, the forward linkage effect captures the increase in the latter industry’s employment due to the rise in its production. Between 2008 and 2010, the forward linkage effect of feed-in tariffs on employment was 2,444 employees (see Table 5.16).
table 5.15: the republic of korea. Value of feed-in tariffs in new and renewable energy, 2008-2010
Thousand dollars
2008 2009 2010 total
Nominal value 108,217 216,569 235,333 560,119
Real value 108,217 210,617 222,360 541,194
Source: MOEL (2010).Note: The conversions from Korean Won to dollars are based on the 2008, 2009 and 2010 exchange rates, respectively, from http://data.worldbank.org.
table 5.16: the republic of korea. Forward linkage effect of feed-in tariffs in new and renewable energy on employment, 2008-2010
Number of employees per $1 million
2008 2009 2010 total
Agriculture, fishery and forestry 3 8 7 18
Manufacturing 104 271 235 610
Service 69 183 157 409
Electricity, gas and water 204 534 462 1,200
Construction 6 14 12 32
Research institutions 2 5 5 12
New and renewable energy 24 63 53 140
Miscellaneous 4 10 9 23
total 417 1,087 940 2,444
Source: MOEL (2010).Note: The conversions from Korean Won to dollars are based on the 2008, 2009 and 2010 exchange rates, respectively, from http://data.worldbank.org.
Concluding remarks
The existing literature suggests the existence of a mutually beneficial relationship between employment and government expenditure on new and renewable energy. While climate change has caused the need for new and renewable energy, investments in the new and renewable energy industry do not necessarily imply a decline in employment. In fact, the greater emphasis on new and renewable energy implies employment generation in the new and renewable energy
chapter 5: the republic of Korea
Global Green Growth experiences
156
industry as well as direct and indirect employment generation for other industries. It is evident that a shift from a fossil fuel based economy to one based on new and renewable energy would incur worker displacement throughout the ROK’s economy. Nevertheless, it would be essential to compare this worker displacement effect with new employment generation on account of new and renewable energy investments. Incorporating this comparison into their analysis, policymakers will then be able to determine the net change in employment on account of the ROK’s transition towards a low carbon pathway.
5.6 methodology for Estimating Employment Effects of Green Investments As mentioned in previous sections, the ROK’s green growth policies have achieved tangible results in diverse aspects within a short period of time. Among others, analyses on the impact of the ROK’s green growth policies on the macro-economy including job creation are crucial to verify the significance of such policies. Indeed, a quantitative analysis before and after the implementation of the policies is essential to help policymakers revise the future direction of the ROK’s green growth pathway. This section reviews the two most important studies on the subject, Volume I and Kang (2011), and looks at the differences in research methodologies applied in these studies. A framework comparable to the ROK’s green growth is adopted in Volume I in which the effects of clean energy investments on emissions is analyzed and it is found that the ROK can realistically reduce its absolute per capita CO2 emissions by half compared to its 2010 emissions over the next 20 years. The study projects that between 235,400 and 315,700 direct and indirect jobs per year in the 20-year clean energy investment scenario will be created. Similarly, Kang analyses the impact of green investment macro-economy using an I-O analysis and concludes that national green growth policies have contributed positively to economy and job creation.
Methodology in Volume I
The methodology in Volume I builds on the two assumptions of Miller and Blair (2009). The study analyses the impact of green investment on job creation based on an I-O analysis using the 2008 I-O table published by the Bank of Korea. The research findings are examined based on gender, type of employment (wage vs. self-employment), enterprise type (micro versus non-micro enterprise) and educational level. Each subcategory above is represented by a share (percentage) of the total population. Based on estimates of each subcategory, each industry’s share with respect to total employment is used to disaggregate the estimate for employment on the I-O table into relevant labour markets.
As for the effect of job creation, weighted estimates are used in Volume I to conduct a comparative study of different countries. The estimate for job creation is adjusted to reflect the level of the ROK ‘s average wage in comparison to that of the U.S., going beyond analysing how much employment occurred for every $1 million invested. The U.S. index is 1, and an index that reflects the ROK ‘s average wage is used in the analysis.
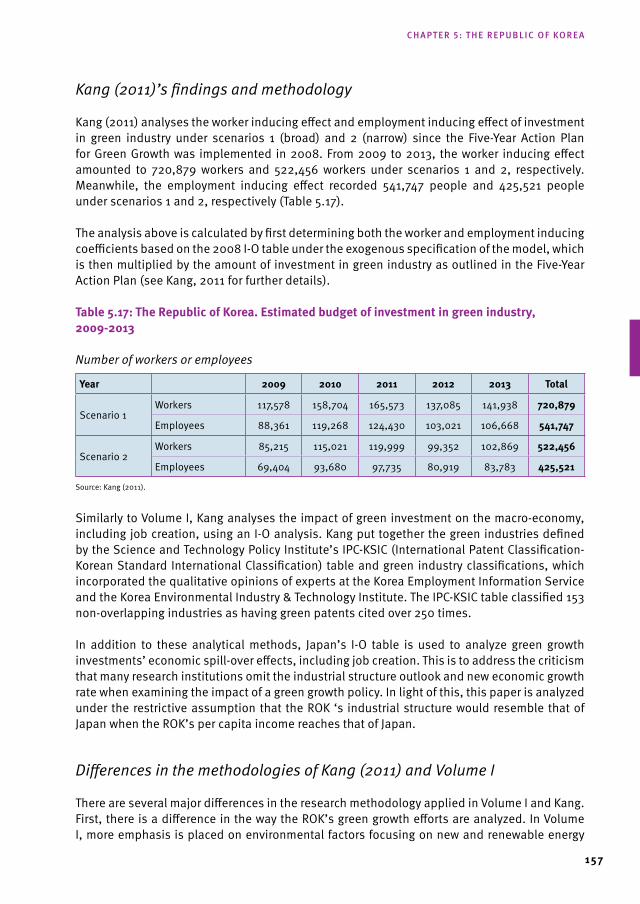
157
Kang (2011)’s findings and methodology
Kang (2011) analyses the worker inducing effect and employment inducing effect of investment in green industry under scenarios 1 (broad) and 2 (narrow) since the Five-Year Action Plan for Green Growth was implemented in 2008. From 2009 to 2013, the worker inducing effect amounted to 720,879 workers and 522,456 workers under scenarios 1 and 2, respectively. Meanwhile, the employment inducing effect recorded 541,747 people and 425,521 people under scenarios 1 and 2, respectively (Table 5.17).
The analysis above is calculated by first determining both the worker and employment inducing coefficients based on the 2008 I-O table under the exogenous specification of the model, which is then multiplied by the amount of investment in green industry as outlined in the Five-Year Action Plan (see Kang, 2011 for further details).
table 5.17: the republic of korea. Estimated budget of investment in green industry, 2009-2013
Number of workers or employees
Year 2009 2010 2011 2012 2013 total
Scenario 1Workers 117,578 158,704 165,573 137,085 141,938 720,879
Employees 88,361 119,268 124,430 103,021 106,668 541,747
Scenario 2Workers 85,215 115,021 119,999 99,352 102,869 522,456
Employees 69,404 93,680 97,735 80,919 83,783 425,521
Source: Kang (2011).
Similarly to Volume I, Kang analyses the impact of green investment on the macro-economy, including job creation, using an I-O analysis. Kang put together the green industries defined by the Science and Technology Policy Institute’s IPC-KSIC (International Patent Classification-Korean Standard International Classification) table and green industry classifications, which incorporated the qualitative opinions of experts at the Korea Employment Information Service and the Korea Environmental Industry & Technology Institute. The IPC-KSIC table classified 153 non-overlapping industries as having green patents cited over 250 times.
In addition to these analytical methods, Japan’s I-O table is used to analyze green growth investments’ economic spill-over effects, including job creation. This is to address the criticism that many research institutions omit the industrial structure outlook and new economic growth rate when examining the impact of a green growth policy. In light of this, this paper is analyzed under the restrictive assumption that the ROK ‘s industrial structure would resemble that of Japan when the ROK’s per capita income reaches that of Japan.
Differences in the methodologies of Kang (2011) and Volume I
There are several major differences in the research methodology applied in Volume I and Kang. First, there is a difference in the way the ROK’s green growth efforts are analyzed. In Volume I, more emphasis is placed on environmental factors focusing on new and renewable energy
chapter 5: the republic of Korea
Global Green Growth experiences
158
industries such as biomass, solar, wind, building weatherization and smart grid. On the other hand, Kang defines green industry based on environmental and economic classifications and uses the definition to analyze green growth efforts.
Second, there is a difference in the scope of categorization used in the I-O analysis. The I-O table published by the Bank of Korea consists of the integrated large-sized category (29 industries), medium-sized category (78 industries), small-sized category (168 industries), and smallest-sized category (403 industries). As for Volume I, a medium-sized category of the 2008 I-O table is used. However, Kang uses the I-O table’s most detailed classification composed of 403 industries to measure the green industry’s economic spill-over effect. This was done to prevent an overestimation of the spill-over effect that could occur in the integrated categories. However, in the case of the worker and employment inducing coefficients, the Bank of Korea, as already mentioned earlier, only formally provides the integrated small-sized category. Accordingly, in Kang the worker and employment inducing coefficients of 403 industries (the smallest-sized) was estimated with a limited assumption. Kang assumed that the worker and employment inducing effect of the 403 industries included in the same industry under the 168 industries is the same.
Third, the variables and terminology used to measure the job creation effect differ. In Volume I, after dividing it into two cases, one that excludes self-employment and the other that includes the self-employed only, the two cases were combined and referred to as total employment. Kang (2011) uses variables like the worker inducing coefficient and employment- inducing coefficient. It is more common in the ROK’s I-O analysis to use the worker inducing effect, which includes, paid workers, the self-employed and unpaid family members, or to use the employment inducing effect that includes paid workers only, than to use the effect of self-employment on its own. In general, the worker inducing coefficient and employment inducing coefficient are used to estimate the effects of job creation. The worker inducing coefficient is more comprehensive and has a larger value than the employment inducing coefficient.
Fourth, the methods utilized to project the impact of green investment on job creation differ. Volume I uses the I-O analysis methodology utilized by Miller and Blair (2009) and forecast future job creation under an assumption that the technical coefficient and input proportions are fixed variables. However, Kang re-examines the green growth classification and analysis under two basic scenarios using the I-O table of Japan whose industrial structure and growth pattern are similar to those of the ROK. The re-examination is based on a restrictive assumption that the ROK’s industrial structure resembles that of Japan when the ROK’s per capita income reaches that of Japan. Such limited assumption finds its root in the fact that Japan’s industrial structure is similar to that of the ROK, a manufacturing-centered country.
Fifth, while Volume I carries out an I-O analysis on industries of interest in the endogenous sector to examine the effect of green investment on job creation, Kang categorizes the relevant industries under the exogenous sector and studies the net impact those industries have on others in the endogenous sector.
Volume I and Kang represent two different approaches to analyze the ROK’s green growth efforts and their impact on employment generation based on different sets of assumptions. Given the inherent uncertainty in making projections for the future clean energy infrastructure and employment outcomes, it is essential to evaluate the current achievements and future
159
direction of the country’s green growth efforts from multiple perspectives. By analyzing the relationship between the new and renewable energy industry and employment generation in the ROK, Volume I examines its clean energy outlook based on a set of carefully considered assumptions, while Kang delves into the task of defining the green industry based on green growth agenda. When policymakers design policy measures to achieve 2020 GHG emissions target, they will benefit from taking the methodological differences of the two studies into account and modify the future direction of its transition towards a low carbon pathway accordingly.
In Volume I the prospect for the ROK to reduce its per capita CO2 emissions by half is examined based on a set of assumptions, and the assessment seems realistic. In particular, the projected net positive employment outcome from this transition seems feasible and will help convince the public of the viability of the ROK’s clean energy future. In fact, the existing literature supports this projection of the impact of new and renewable energy investments on employment generation. For instance, MOEL (2010) analyses the impact of new and renewable energy technological development, usage and supply policies on the macroeconomic variables in the ROK. According to its computable general equilibrium model, the government expenditure for the new and renewable energy industry between 2008 and 2010 will result in a long-term worker inducing effect of 51,163 employees in 2019.
However, it is important to consider some potential challenges the ROK might face in reducing its per capita CO2 emissions by half to fully understand the feasibility of the transition. In order for the ROK to achieve this over the next 20 years, it must maintain its clean energy investment framework. In fact, one of the main assumptions in Volume I is that the ROK will invest 1.5 percent of its annual GDP in clean energy every year. They align the country’s 20-year clean energy investment framework closely with its green growth strategy. Hence, it is crucial for the ROK to continue investing in its clean energy infrastructure and to expand the supply of new and renewable energy.
Another potential challenge is the inherent difficulty in transitioning from a fossil fuel based energy framework to a clean energy one. Policymakers will have to incentivize businesses and households to adopt the clean energy framework. The government could also help mitigate the shock of the transition by facilitating the transformation of businesses’ energy mix without severely sacrificing their international competitiveness. Hence, the government may have to play a major role in addressing the difficulties in implementing this transition.
5.7 Conclusion
Since the introduction of former President Lee Myungbak’s “Low Carbon, Green Growth” as a national agenda, the ROK has undertaken concerted efforts to transition from a fossil fuel based economy towards a low carbon, green growth pathway. While the transition is still at an initial phase, the ROK has established a legal foundation for the future direction of its green growth strategy and introduced various policies to expand the supply of and promote investment in new and renewable energy. Despite the traditional dichotomy between economic growth and environmental protection, the ROK’s green growth model suggests an alternative approach, which pursues both economic growth and sustainable development.
chapter 5: the republic of Korea
Global Green Growth experiences
160
The ROK’s investment in clean energy has been increasing substantially, and the government has made concerted efforts to commercialize and support the development of new and renewable energy in the ROK. If the current efforts were to continue and evolve, it seems possible that the ROK will achieve its 2020 target to reduce GHG emissions to 30 percent below its BAU level. However, a number of potential limitations and challenges will have to be considered before the feasibility of the 2020 target can be fully understood.
The change in the political environment could pose a certain degree of uncertainty with respect to the future direction of the ROK’s green growth efforts. In order for the ROK’s transition towards a low carbon green growth economy to be successful, its green growth plans require consistent support in terms of their implementation. The inherent uncertainty of the political environment could mean that the implementation of green growth efforts may take a different form. The 2020 target for GHG emissions reduction may not be as feasible if government support for new and renewable energy investment were to decrease in the near future.
Furthermore, the ROK’s economy will experience a major transformation as its transition into a low carbon economy progresses. Some industries will feel the economy-wide shock more severely, and worker displacement could exacerbate the on-going problem of unemployment in the ROK. For the transition to occur as smoothly as possible, policymakers will have to devise a policy tool to mitigate the shock. Gradual implementation of the green growth plans could provide businesses with sufficient time to adjust their business models and future plans according to the new clean energy infrastructure. In addition, the government will have to incentivize businesses as well as households to expedite the process of moving out of the existing fossil fuel based energy framework to one of new and renewable energy. It is crucial for policymakers to help businesses and households incorporate the clean energy economy as the new norm.
The analysis of the feasibility of 2020 target for GHG emissions reduction becomes particularly important considering the imminent launch of the emissions trading schemes in 2015. Beginning on 1 January 2015, about 490 of largest emitters will participate in the trading schemes either voluntarily or mandatorily (Sopher and Mansell, 2013). The emissions trading schemes in 2015 will play a crucial role in helping the ROK to achieve its 2020 target. Hence, it becomes essential to adjust the trading schemes plans based on the analysis of current achievements of green growth efforts. Moreover, the evaluation of the impact of the green growth efforts on employment generation could help policymakers as well as businesses and households better understand the outcomes of the trading schemes in 2015 and the GHG target in 2020.
The initial stage of the ROK’s green growth efforts has resulted in a number of achievements and established the country en route to a new clean energy economy. The existing policies to promote clean energy investment and pursue green growth will help the ROK adopt and expedite the economy-wide transition. With the continued support from the government and consistency in the future implementation of its green growth plans, the ROK will be able to join the frontrunners in establishing a clean energy economy.
161
CHAPTER 6: SOUTH AFRICA
6.1 Introduction
South Africa contributes 40 percent of Africa’s total CO2 emissions, making the country the largest polluter in the region. In comparison, Egypt and Algeria rank second and third, with emission values at a distant 17 and 10 percent, respectively, of total regional CO2 emissions (Urban Earth, 2012). South Africa’s climate change response strategies are pivotal to Africa’s aggregate contribution to global efforts to reduce atmospheric concentrations of GHG.74 South Africa and the ROK share similar levels of total carbon emissions and rates of per capita pollution.75 The ROK’s gross domestic output (GDP normalized on a purchasing power parity basis) is approximately three times that of South Africa (World Bank, 2011). This wide disparity between these two countries’ energy efficiency, that is, the ratio of energy consumption to economic activity, underscores South Africa’s global standing in terms of carbon emissions.
Furthermore, estimates in Volume I of the UNIDO/GGGI research project “Global Green Growth: Clean Energy Industrial Investments and Expanding Job Opportunities” place South Africa’s per capita carbon dioxide emissions at twice the global average (9.5 vs. 4.6 metric tons).76 Such high levels of energy use and emissions per capita reflect the country’s exploitation of its abundant coal resources and its comparative advantage in low cost production of electricity. Low-cost electricity has spurred growth in a large number of coal-based energy-intensive industries. The combustion of fossil fuels has emerged as the biggest source of emission. Accordingly, the mining, mineral processing, electricity, liquid fuel supply and minerals beneficiation industries are the largest polluters. Electricity and petroleum refining head the list of largest polluters. Climate change mitigation in South Africa needs to therefore clearly focus on the energy sector.
However, since “climate change has the potential of setting back the development of many countries of the global south. Countries have to fashion ways to address climate change without compromising their economic growth and development” (CLACSO, CODESRIA and IDEAS, 2014, p. 4). It is therefore important to better understand how southern countries are mainstreaming climate change policies into development plans, and their enabling public policies. It is also remarkable that the Government of South Africa has so far succeeded in managing the country’s competing demands in a manner that has essentially morphed the agenda for a low-carbon economy into a positive change agent for economic transformation, despite the legacy of apartheid and the resulting welfare burden. Put simply, South Africa has achieved a remarkably widespread buy-in to the national green agenda and hence presents a good case study of a South-South developing country. By examining traditional sources of energy, this study on South Africa presents a non-technical review of the relationship between job creation, climate change and investments in energy efficiency and clean renewable energy (hereinafter referred to as green investments). This relationship is explored in the context of South Africa’s overall
74 GHG include methane, chlorofluorocarbons and carbon dioxide that are gaseous compounds, which act as a shield trapping heat in the earth’s atmosphere. The resulting GHG effect is claimed to exacerbate global warming.
75 Total carbon emissions for the ROK and South Africa are 581 million and 473 million metric tons, respectively, whereas per capita emissions in metric tons amount to 11.7 (the ROK) and 9.5 (South Africa) (Volume I, based on EIA, 2013).
76 The estimates in Volume I are based on data from the U.S. Environmental Information Agency, the International Energy Agency’s Statistics database and the World Bank Basic Energy Indicators for 2010.
Global Green Growth experiences
162
climate change response strategy, comprising adaptation and mitigation strategies. Mitigation here refers to responses aimed at curbing the rate of climate change to its natural rate, usually taken to either mean levels that occur naturally (i.e. in a pollution-free atmosphere) or reducing atmospheric concentrations of GHG emissions.77 On the other hand, adaptation as used here refers to actions taken in response to the adverse consequences of climate change. There is a third dimension that relates to the management of any unintended adverse consequences of climate change policies on other countries. Sensitivity to the externalities induced by its own mitigation and adaptation responses is another distinct aspect of South Africa’s overall climate change plan and one that makes the country’s climate change plan effectively strategic. Actions taken under this third dimension are referred to as “response measures.”
This study is organized as follows: Section 6.2 reviews South Africa’s experience with pollution reduction, otherwise referred to as the green agenda. Section 6.3 examines the job implications of the green agenda. Section 6.4 focuses on industrial policies to promote investments in clean energy and implicitly jobs, the implementation experience and an analysis of South Africa’s performance record. Section 6.5 concludes.
6.2 south Africa in the context of global GHGs emissions
To better understand South Africa’s trajectory to date and the lessons that can be gleaned, it seems sensible to recollect the country’s initial conditions in the context of global GHG emissions parameters, the country’s efforts to fight climate change, progress achieved to date based on available data as well as the implications for employment and job creation. The underlying objective of the climate change response strategy (the green agenda) is to produce a set of instruments that is consistent with South Africa’s development framework and is derived from principles set in the country’s Constitution, the Bill of Rights, the National Environmental Management Act, the Millennium Development Goals (MDG) and the United National Framework Convention on Climate Change (UNFCC) (DEA, 2013).78 Bearing in mind the inherent interdependencies in climate change response strategies, South Africa uses the term “climate change resilient development” to reflect the fact that “an effective South African climate change response also requires the management of any response measures generated by our action as well as being able to respond to the response measures of other countries that have negative consequences for our country” (DEA, 2013, p. 13). For the purpose of implementation and performance assessment, the planning horizon is defined to be short term (five years from the date of publication of the policy), medium term (20 years ) or long term (a planning horizon beyond 2050).
Climate change: What it means for South Africa
South Africa has an abundance of natural resources such as minerals and fossil fuel, but has poor water resources. It describes itself as both a “contributor to, and victim of, global climate change given that it has an energy-intensive, fossil-fuel powered economy and is also highly vulnerable to the impacts of climate variability” (DEA, 2010, p. 7). South Africa’s response
77 GHG include methane, chlorofluorocarbons and carbon dioxide that are gaseous compounds, which act as a shield trapping heat in the earth’s atmosphere. The resulting GHG effect is claimed to exacerbate global warming.
78 Inter-generational commitment of the Environmental Right is enshrined in Section 24 of the Constitution of South Africa; see DEA (2010, p.7).
163
builds on the recognition that climate change poses one of the greatest threats to sustainable development. If climate change is not mitigated, it carries the potential to undermine many of the positive advances made so far in meeting the nation’s development goals and the MDGs. Against the backdrop of this reality, the government acknowledges that the stabilization of atmospheric concentrations of GHG at a level that prevents dangerous anthropogenic interference with the climatic system requires global cooperation on GHG emission reductions. The government is therefore committed to continue meaningful engagement in international climate change negotiations, particularly in UNFCCC negotiations, to achieve a multilateral agreement that will limit the average global temperature increase to at least below 2˚C above the pre-industrial temperature level. In the event multilateral action fails in achieving this goal, the “potential impacts on South Africa in the medium- to long-term are significant and potentially catastrophic” (DEA, 2010, p. 7). The objectives of South Africa’s engagement in climate change can be summarized as follows:
Even under emission scenarios that are more conservative than current international emission trends, it has been predicted that by mid-century the South African coast will warm by around 1-2˚C. After 2050, warming is projected to reach around 3-4˚C along the coast, and 6-7˚C in the interior. With these kinds of temperature increases, life as we know it will change completely – parts of the country will be much drier; increases in evaporation will ensure an overall decrease in water availability significantly affecting human health, agriculture…; the increased occurrence and severity of veld and forest fires especially extreme weather events such as floods and droughts …; sea level rise will negatively impact the coast and coastal infrastructure; mass extinctions of endemic plant and animal species will greatly reduce South Africa’s biodiversity.
In addition to the increased atmospheric carbon dioxide concentrations measured at Global Atmosphere Watch station at Cape Point, some climate change impacts are already being observed … the sea-level around the South African west coast is already rising by 1.87 mm per year, the south coast by 1.47 mm per year, and the east coast by 2.74 mm per year. It is also well established that observed surface air temperatures over land as well as the number of frost days have changed with statistical significance since 1950s across South Africa and that these changes are consistent with, and have sometimes exceeded the rate of mean global temperature rise. …
Given the significance of these impacts, it is clear that urgent and decisive international and local action is required to achieve real reduction of greenhouse gases in the atmosphere and in so doing limit the impacts of climate change into the future. (DEA, 2010, p. 7)
The publication of the "National Climate Response Green Paper" in 2010 for public comments was the first formal manifestation of the government’s vision of an “effective climate change response and the long term transition to a climate resilient and low-carbon economy and society” (DEA, 2010, p. 7). Subsequently, in August 2013, a "National Climate Change Response White Paper" was issued; the policy development timeline is summarized in Table 6.1. The white paper outlines South Africa’s vision of transitioning to a climate resilient and low carbon economy. The process builds on coordinated management of climate change effects, using interventions that develop and sustain social, economic and environmental resilience as well as contributing equitably to the global drive to stabilize atmospheric concentrations of GHG emissions within acceptable limits. As envisaged in the plan, acceptable limits are atmospheric
chapter 6: south africa
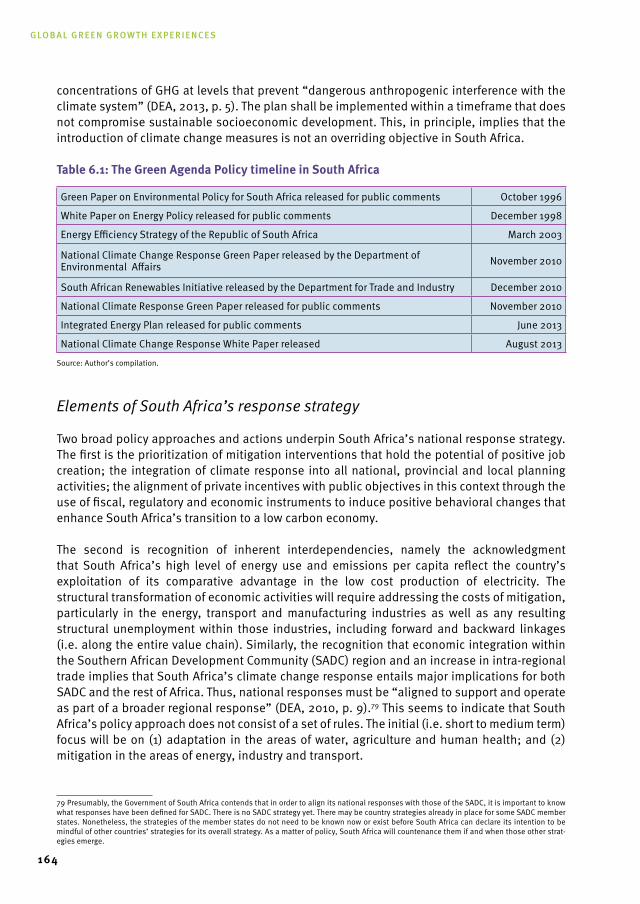
Global Green Growth experiences
164
concentrations of GHG at levels that prevent “dangerous anthropogenic interference with the climate system” (DEA, 2013, p. 5). The plan shall be implemented within a timeframe that does not compromise sustainable socioeconomic development. This, in principle, implies that the introduction of climate change measures is not an overriding objective in South Africa.
table 6.1: the Green Agenda Policy timeline in south Africa
Green Paper on Environmental Policy for South Africa released for public comments October 1996
White Paper on Energy Policy released for public comments December 1998
Energy Efficiency Strategy of the Republic of South Africa March 2003
National Climate Change Response Green Paper released by the Department of Environmental Affairs November 2010
South African Renewables Initiative released by the Department for Trade and Industry December 2010
National Climate Response Green Paper released for public comments November 2010
Integrated Energy Plan released for public comments June 2013
National Climate Change Response White Paper released August 2013
Source: Author’s compilation.
Elements of South Africa’s response strategy
Two broad policy approaches and actions underpin South Africa’s national response strategy. The first is the prioritization of mitigation interventions that hold the potential of positive job creation; the integration of climate response into all national, provincial and local planning activities; the alignment of private incentives with public objectives in this context through the use of fiscal, regulatory and economic instruments to induce positive behavioral changes that enhance South Africa’s transition to a low carbon economy.
The second is recognition of inherent interdependencies, namely the acknowledgment that South Africa’s high level of energy use and emissions per capita reflect the country’s exploitation of its comparative advantage in the low cost production of electricity. The structural transformation of economic activities will require addressing the costs of mitigation, particularly in the energy, transport and manufacturing industries as well as any resulting structural unemployment within those industries, including forward and backward linkages (i.e. along the entire value chain). Similarly, the recognition that economic integration within the Southern African Development Community (SADC) region and an increase in intra-regional trade implies that South Africa’s climate change response entails major implications for both SADC and the rest of Africa. Thus, national responses must be “aligned to support and operate as part of a broader regional response” (DEA, 2010, p. 9).79 This seems to indicate that South Africa’s policy approach does not consist of a set of rules. The initial (i.e. short to medium term) focus will be on (1) adaptation in the areas of water, agriculture and human health; and (2) mitigation in the areas of energy, industry and transport.
79 Presumably, the Government of South Africa contends that in order to align its national responses with those of the SADC, it is important to know what responses have been defined for SADC. There is no SADC strategy yet. There may be country strategies already in place for some SADC member states. Nonetheless, the strategies of the member states do not need to be known now or exist before South Africa can declare its intention to be mindful of other countries’ strategies for its overall strategy. As a matter of policy, South Africa will countenance them if and when those other strat-egies emerge.
165
Climate change adaptation
Based on South Africa’s current demographic development, water supply and water usage, the government predicts that South Africa will exceed the “limits of its economically usable, land-based water resources by 2050” (DEA, 2010, p.10). Furthermore, rainfall is low and the rates of run-off are among the lowest in the world. Rising temperatures can increase flooding and cause higher rainfall variability as well as higher average temperatures. Higher temperatures in turn increase evaporation from dams and rivers and reduce run-off on the ground, leading to less feed into the rivers and dams. As a response, the government plans to strengthen the environmental management of the natural resource base, promote optimal recycling of waste water and increase (green) investments in wastewater treatment facilities to boost capacity to meet future demand in a sustainable manner.
Agriculture is considered a key sector. Whereas the direct contribution to GDP and employment are estimated at less than 5 percent and 13 percent, respectively, agriculture’s aggregate contribution, including its multiplier effects, amount to approximately 12 percent and 30 percent of national output and employment, respectively. Given that irrigation agriculture requires significant amounts of water, accounting for over 50 percent, the risks irrigation agriculture faces from increased evapotranspiration and competing demands for other alternative uses cannot be overemphasized. “Potential adverse impacts of climate change on food production, agricultural and subsistence livelihood, rural nutrition and food security in South Africa are significant policy concerns” as are the “shifts in the preferences of consumers, particularly in the EU, away from purchasing of carbon intensive products.” 80 One of the key initiatives in climate change adaptation is a plan to link investments in education and awareness programs in rural areas to agricultural extension activities to enable all producers (subsistence and commercial) to adequately respond to the adverse consequences of climate change.
Due to the high level of wealth disparity, a substantial share of South Africans, particularly the poor, face formidable health challenges, which are exacerbated by poor living conditions. With the highest global prevalence of Human Immunodeficiency Virus and Tuberculosis, water scarcity and its implications for sanitation is a serious health hazard, especially given that these two diseases account for approximately “75 percent of premature deaths in South Africa” (DEA, 2010, p. 13). Furthermore, 3 million South Africans have no access to water and over 14 million people do not have adequate sanitation, i.e. access to solid waste facility and wastewater treatment and sewerage. Some of the key response strategies thus include the development of quality health infrastructure, improvement of health education and introduction of effective nutritional policies. These initiatives are driven by the understanding that good nutritional status among the population implies stronger resistance against opportunistic diseases. In addition, the government plans to reduce the “incidence of respiratory diseases by improving air quality through reducing ambient particulate matter … and sulphur dioxide … concentrations by legislative and other measures to ensure full compliance with the National Ambient Air Quality Standards by 2020” (DEA, 2010, p. 14).
80 For instance, the term “food mile” is now used in the food value chain to indicate physical distance from the point of production to consumption so as to capture and label the carbon emission status of a particular food item.
chapter 6: south africa
Global Green Growth experiences
166
Climate change mitigation
South Africa is a signatory to both the UNFCCC and the Kyoto Protocol. In December 2009 in Copenhagen (the Copenhagen Accord), South Africa committed to reducing its rate of emis-sions. It has agreed to the decisions of the 16th Conference under the auspices of the UNFCCC in Cancun 2010. In its formal submission to UNFCCC in 2010, South Africa pledged to “take nationally appropriate mitigation action to enable a 34% deviation below the ‘Business As Usual’ emissions growth trajectory by 2020 and a 42% deviation below the ‘Business As Usual’ emissions growth trajectory by 2025 on the condition that it receives the necessary finance, technology and support from the international community that will allow it to achieve this” (DEA, 2010, p. 16).
The focus of the country’s mitigation strategy lies in the secondary and tertiary sectors of the economy which, incidentally, have been undergoing structural change since the 1980s when the concentration of economic activities in terms of relative contribution to GDP began shift-ing from predominantly primary (i.e. mining, quarrying, agriculture, forestry and fishing) and secondary (manufacturing and construction) sectors to the tertiary sector (ibidem). The tertiary sector encompasses financial services, real estate, business services, wholesale/retail trade, catering and accommodation, transport, storage and communication. The ongoing structural shift in economic activities is significant because it signals progress towards economic diversi-fication away from primary commodity dependency. It additionally creates a reasonable expec-tation of reducing the country’s overall energy intensity. Considering that economic diversifica-tion usually generates stability and growth, South Africa could benefit from green growth in the future (i.e. economic growth coupled with carbon footprint reduction).
As commercial and manufacturing activities account for over 55 percent of total electricity con-sumption in South Africa’s economy, it is assumed that heavy intervention in this area may po-tentially lead to a significant reduction in GHG emissions, even though as noted in the Climate Change White Paper, “electricity savings at point of consumption does not necessarily trans-late into equivalent mitigation at the point of generation” (DEA, 2010, p. 18). This nonlinearity raises a pertinent public policy question that has not been addressed in the Climate Change White Paper. Given that investments in energy efficiency are a nontrivial component of South Africa’s energy mitigation strategy (which is discussed in the next subsection), the question arises whether to aim for additional investments in energy efficiency to reduce electricity by a unit demand or additional investments in renewable energy to increase the supply of clean electricity to meet a unit demand.
The conventional recommendation is that additional investments to reduce electricity demand should only be aimed at if the net marginal benefit from the investment exceeds the cost of supplying clean renewable energy to meet that additional demand. However, it must be not-ed that, as with any bulk infrastructure, investments in electricity infrastructure can be lumpy (non-convexities), with the degree of non-convexities varying in accordance with the condi-tions of the existing infrastructure and the amount of the additional investment. For instance, increasing the generating capacity by a certain scale may trigger a complementary investment into further strengthening the grid or into building new distribution infrastructure.
167
In other words, tradeoffs between varying levels of investment in renewable energy and energy efficiency may not be independent of the scale of operations (energy generation and consump-tion). This means that marginal analyses are of limited applicability when dealing with public policy questions related to energy efficiency and renewable energy (considering that the rela-tionship between demand for and supply of electricity is not uniform across all activity levels). Hence, the context in which marginal analysis is a suitable tool for decision-making in energy efficiency and renewable energy-related policy must be substantiated.
Energy efficiency initiatives seem to attract as much attention as renewable energy initiatives within the framework of South Africa’s green agenda. This seems to have been the case since the release of the White Paper on Energy Policy in 1998 (DME, 1998). In the White Paper, the Government of South Africa acknowledged that the country’s energy use is generally inefficient and that consumption behavior had to be modified through a policy of proactive demand management. Such a proactive management policy entails standards setting and appliance labeling. The Energy Efficiency Strategy of 2005 introduced consumption reduction targets as key performance drivers of the country’s energy efficiency objectives. The strategy specifically provides for the implementation of sectoral programs in three phases: from 2005-2008; 2008-2011 and 2011-2015, arriving at a final reduction in energy demand of 12 percent. This reduction is expressed as a share of the projected national energy usage in 2015, which, in turn, is based on an assumed average GDP growth of 2.8 percent and the achievement of planned energy savings across the three phases (DME, 2015). Final energy demand in 2015 is estimated to be 3200 Petajoules while electricity demand is predicted to be around 285,526 GWh in 2015 and 336,178 GWh in 2020 (DME, 2015 and DoE, 2013a).81
Electricity demand has remained below expectation since 2010 for a number of reasons, including the fact that the average rate of economic growth has been below expectation. Other reasons include a repurchase program that has resulted in demand reduction by some industrial customers. Reductions of approximately 4 TWh of electricity use are estimated to have been achieved through the buyback incentive (DoE, 2013). It is also argued that market incentives have played a major role, with increases in the price of electricity since 2008 forcing consumers to cut back their electricity usage and energy intensive industries to relocate their smelting operations to countries with lower relative electricity prices. This trend in energy demand will presumably be reinforced by the planned energy efficiency measures such as improved boiler efficiency, HVAC (heating, ventilation and air conditioning), refrigeration, water heating, and the roll out of energy management systems in buildings, including lighting and compressed air management, building-shell design, optimizing process controls and the introduction of variable speed motors. These measures do not, however, reduce the manufacturing/commercial sector’s vulnerability to punitive trade measures taken both internationally and in the future, regionally, to reduce GHG emissions. Products likely to be affected include minerals, base and precious metals, pulp and paper products, prepared foodstuffs, chemicals, cement, iron and steel. These products are derived from emission intensive and trade exposed industries such as iron and steel, non-ferrous metals, chemicals, petrochemicals, mining and quarrying, machinery and manufacturing, agriculture, transport, services and tourism.
81 The electricity demand forecast as opposed to that of total energy demand is derived from two sources, namely the System Operator and the Coun-cil for Scientific and Industrial Research (CSIR). These sources present three scenarios, low, moderate and high electricity demand. We build on the System Operator’s moderate forecast, which is the demand forecast used in the policy-adjusted IRP. The System Operator’s forecast for 2020 ranges from 315,930 GWh (low) to 336,178 GWh (high).
chapter 6: south africa
Global Green Growth experiences
168
Potential economic risks emerge from, among others, the impacts of climate change regulation, the application of trade barriers, a shift in consumer preferences, … International climate change measures, such as the EU directive on aviation and moves to bring maritime emissions into an international emissions reduction regime, could significantly impact on a variety of South Africa’s manufactured exports through increasing the costs of air freight and shipping (DEA, 2010, p. 18-19)
With coal as an energy carrier and accounting for over 60 percent of South Africa’s GHG emissions, the mining industry is at considerable risk (DEA, 2010). Therefore, part of the proposed mitigation strategy is to develop plans to identify and promote other areas of potential competitive advantage in the mining industry, which are less emission intensive such as opportunities in platinum, uranium and copper resources.
In the transport sector, the legacy of apartheid has left behind both a challenge and an opportunity. The existing transport network was designed to serve only a select few. In the post-apartheid era, the transport network is poorly integrated, with the majority of the population not only residing very far from their workplace but also using deficient (unreliable and dangerous) as well as expensive transport infrastructure to get to work. However, remedying the remnants of apartheid holds opportunity, namely the building of sustainable transport systems. Currently, the transport sector is the most rapidly growing source of GHG emissions in South Africa and already ranks second to energy as the largest source of emissions. In 2004, transport accounted for approximately 25 percent of energy demand, with road transport accounting for 84 percent (DEA, 2010).
Recognizing that transport corridors are engines of growth but mindful of the current conditions in the transport sector, the government aims to support investments in schemes that develop “green” rapid mass transit systems, resulting in a shift by commuters to low carbon forms of transport. Similar support will also be made available for investments that promote the shift of freight from the road to “green” rail transport. The government promotes urban development within the scope of an integrated development framework as specified in the Strategic Infrastructure Plan (SIP): building liveable cities in which the way people live, work, worship and play influences their demand for sustainable rapid transit, transportation and logistics.82 One example is the “integration of land use and transportation planning in cities in a manner that encourages public transport, non-motorized transport (walking and cycling) and promotes alternative communication methods such as telecommuting…” (DEA, 2010, p. 22). Additionally, investments in the development and implementation of green transport technology such as electric automobiles and hybrid cars as well as the production and adoption of cleaner fuel technology are being encouraged.
Thus far, with the few exceptions noted above such as non-motorized transport, the focus of mitigation strategies in South Africa has primarily been on demand-side management to be achieved by (1) introducing improvements in energy use, (2) encouraging a reconfiguration of the structure of economic activities to emphasize green manufacturing, i.e. technologies that use clean energy in industrial production, and (3) boosting the share of the tertiary sector’s contribution to GDP. By contrast, the mitigation strategy in the electric power industry focuses
82 In 2012, Government of South Africa established the Presidential Infrastructure Coordinating Commission (PICC) to harmonize infrastructure plan-ning and implementation across all spheres of government, state agencies and social partners. The components are classified into 18 strategic infrastructure projects known as SIPs ICC, 2013.
169
on adapting the energy mix to achieve a transition to a low carbon economy whilst minimizing disruptions to economic growth, employment and human development. Due to the differences in focus and the energy sector’s huge contribution to South Africa’s GHG emissions, the energy sector’s mitigation strategy is discussed separately.
Energy industry – climate change mitigation
The energy industry is the largest contributor to pollution in South Africa. The main energy uses are for electricity generation, petroleum refining, solid and liquid fuels manufacturing, mining, minerals processing and energy-intensive beneficiation. The principal method of energy extraction is by combustion of fossil fuels. The major sources of emissions are Eskom, the main electricity producer Sasol, the petrochemical conglomerate. Together, Eskom and Sasol account for over 80 percent of GHG emissions in South Africa. The major energy carrier in the country is coal, accounting for 92 percent of this energy source and meeting 72 percent of primary energy needs. Energy supply in South Africa is clearly carbon-intensive. Hence, any meaningful climate change mitigation strategy must target the energy sector.83
Potential intervention strategies include energy efficiency measures such as those discussed above and should be considered complementary to investments in clean energy sources. Of the clean energy sources under consideration, nuclear energy is expected to be the most significant alternative energy source in the shift away from heavy dependence on coal-based energy generation. The intervention strategies come with their own set of challenges. The costs of implementing clean energy substitutes, lead times (i.e. the length of time required to implement a new technology), the impacts of the resulting transitional phase, and how to manage these. Moreover, with regard to lead times, decision-makers need to assess the speed with which clean energy alternatives can be implemented at a scale that complements the country’s base-load requirements. One example of cost concerns, which can be distinguished from financing challenges, include the “persistent uncertainty” of nuclear capital costs (DOE, 2013a). A number of studies estimate a wide range of “generic nuclear capital costs” which, together with the relatively high set up costs of a nuclear plant, complicates the energy-mix choice.
These challenges notwithstanding, the enabling measures include renewable energy feed-in tariffs, the introduction of a levy on the generation of non-renewable electricity, increasing awareness of clean alternatives such as wind sources, solar (PV cells), concentrated solar power, hydroelectricity and biomass. The possible impact of the transition to a clean energy economy on income and employment is of utmost concern. These crucial issues are discussed in the next section.
83 Sectoral mitigation and low carbon development strategies will be formulated under the leadership of the relevant government department, spec-ifying a “suite of mitigation programmes and measures appropriate to that sector or sub-sector” (DEA, 2013, pp. 25, 28). Furthermore, South Africa’s Energy Efficiency Strategy sets an interim target of reducing power generation by 15 percent and energy consumption by the industrial and mining industries by 15 percent by 2015 (DME, 2005). Demand side management as part of the Energy Efficiency Strategy provides for a peak load reduction target of 1.37 GW in Eskom’s Integrated Energy by 2015, consisting of 0.81 GW from load shifting and 0.56 GW from energy efficiency measures.
chapter 6: south africa
Global Green Growth experiences
170
6.3 Job implications of climate change mitigation
Demand-side management of energy use through the introduction of energy efficiency technologies is strongly supported by the government and industry against the backdrop of the direct and indirect employment implications of such initiatives. A range of labour-intensive opportunities may arise from the introduction of appropriate industrial policies, particularly for the poor as well as low and low-middle income earners, to participate in the proactive energy management measures. These include LED (Light Emitting Diodes) retrofits, compressed air management schemes including upgrade of pneumatics (compressed air devices), installation of variable speed drives, upgrade of motors, thermal replacements (heat pumps) and other steam system upgrades as well as heating, ventilation, and air conditioning DEA, 2010. Solar water geysers and “geyser blankets” (the latter referring to proper insulation of water heaters to minimize convectional heat loss) are other sources that have become popular.
Clean energy and technology types
Challenges with regard to investments in energy efficiency and the employment nexus lie in (1) identification of technologies that are most suitable for widespread roll out, and (2) determination of job creating potentials implicit in the implementation of the identified technologies.
Although the job potential of different energy generation technologies have yet to be fully determined, investments in clean renewables are primarily aimed at achieving an optimal energy supply mix from diverse sources such as wind, PV, concentrated solar power, land fill gas, biomass, biofuels, shale gas and clean coal technologies. Therefore, it is useful to explore potential investments in technology types before discussing the employment implications of various feasible configurations (if any) of the energy supply mix. According to estimates in Modise (2013), South Africa’s energy outlook up to 2030 (taking regional integration into consideration) envisages a dominant role for wind, nuclear, coal, concentrated solar power, PV, gas, hydro and geothermal. The hydro option is based on the prospects for electricity imports from the Inga Dam project in the Democratic Republic of Congo.
The Integrated Resource Plan 2010-30 (IRP) for electricity provides the framework for investment in power generation technologies to promote South Africa’s climate change mitigation strategy. The IRP currently serves as the policy and technical platform for electricity, at least until the energy policy framework is promulgated; the national energy policy is still a work-in-progress and is expected to be finalized in 2014. Essentially, the IRP is a 20-year electricity plan to improve the reliability of power generation, determine investment needs to achieve the required capacity, assess environmental impacts and the effects of renewable energy technologies, as well as to provide a framework for ministerial decisions on new energy generation capacity.
The Energy Act of 2008, the primary legislative instrument governing the development and transformation of South Africa’s energy sector, complements the IRP. One of the objectives of the Energy Act is to promote the diversification of energy sources and of energy efficiency. The Act further provides for new energy generation capacity whereby the Minister of Energy may in consultation with the Energy Regulator determine how much new energy generation capacity is required. The Minister of Energy is also authorized to determine the types of energy sources
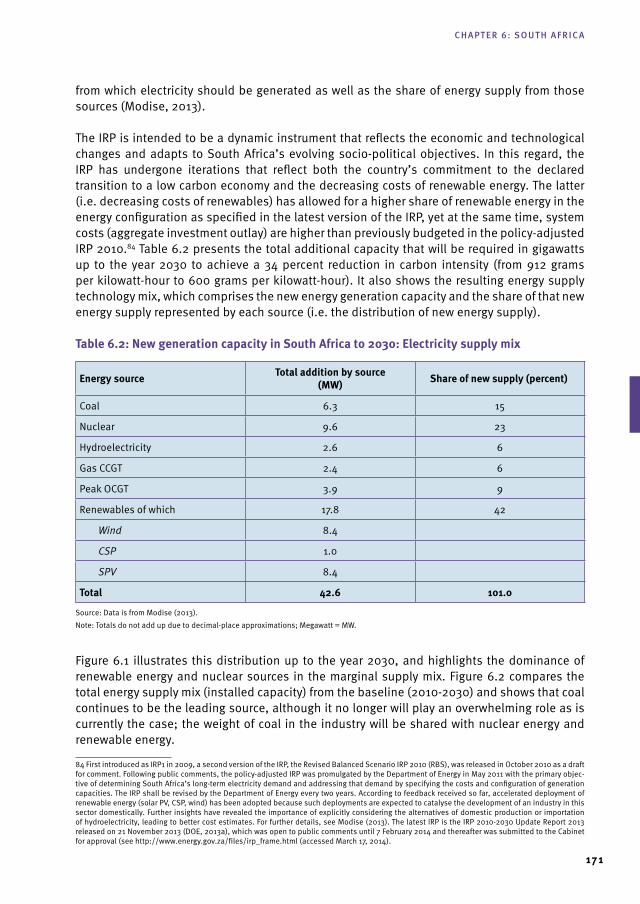
171
from which electricity should be generated as well as the share of energy supply from those sources (Modise, 2013).
The IRP is intended to be a dynamic instrument that reflects the economic and technological changes and adapts to South Africa’s evolving socio-political objectives. In this regard, the IRP has undergone iterations that reflect both the country’s commitment to the declared transition to a low carbon economy and the decreasing costs of renewable energy. The latter (i.e. decreasing costs of renewables) has allowed for a higher share of renewable energy in the energy configuration as specified in the latest version of the IRP, yet at the same time, system costs (aggregate investment outlay) are higher than previously budgeted in the policy-adjusted IRP 2010.84 Table 6.2 presents the total additional capacity that will be required in gigawatts up to the year 2030 to achieve a 34 percent reduction in carbon intensity (from 912 grams per kilowatt-hour to 600 grams per kilowatt-hour). It also shows the resulting energy supply technology mix, which comprises the new energy generation capacity and the share of that new energy supply represented by each source (i.e. the distribution of new energy supply).
table 6.2: new generation capacity in south Africa to 2030: Electricity supply mix
Energy source total addition by source (mw) share of new supply (percent)
Coal 6.3 15
Nuclear 9.6 23
Hydroelectricity 2.6 6
Gas CCGT 2.4 6
Peak OCGT 3.9 9
Renewables of which 17.8 42
Wind 8.4
CSP 1.0
SPV 8.4
total 42.6 101.0
Source: Data is from Modise (2013). Note: Totals do not add up due to decimal-place approximations; Megawatt = MW.
Figure 6.1 illustrates this distribution up to the year 2030, and highlights the dominance of renewable energy and nuclear sources in the marginal supply mix. Figure 6.2 compares the total energy supply mix (installed capacity) from the baseline (2010-2030) and shows that coal continues to be the leading source, although it no longer will play an overwhelming role as is currently the case; the weight of coal in the industry will be shared with nuclear energy and renewable energy.
84 First introduced as IRP1 in 2009, a second version of the IRP, the Revised Balanced Scenario IRP 2010 (RBS), was released in October 2010 as a draft for comment. Following public comments, the policy-adjusted IRP was promulgated by the Department of Energy in May 2011 with the primary objec-tive of determining South Africa’s long-term electricity demand and addressing that demand by specifying the costs and configuration of generation capacities. The IRP shall be revised by the Department of Energy every two years. According to feedback received so far, accelerated deployment of renewable energy (solar PV, CSP, wind) has been adopted because such deployments are expected to catalyse the development of an industry in this sector domestically. Further insights have revealed the importance of explicitly considering the alternatives of domestic production or importation of hydroelectricity, leading to better cost estimates. For further details, see Modise (2013). The latest IRP is the IRP 2010-2030 Update Report 2013 released on 21 November 2013 (DOE, 2013a), which was open to public comments until 7 February 2014 and thereafter was submitted to the Cabinet for approval (see http://www.energy.gov.za/files/irp_frame.html (accessed March 17, 2014).
chapter 6: south africa
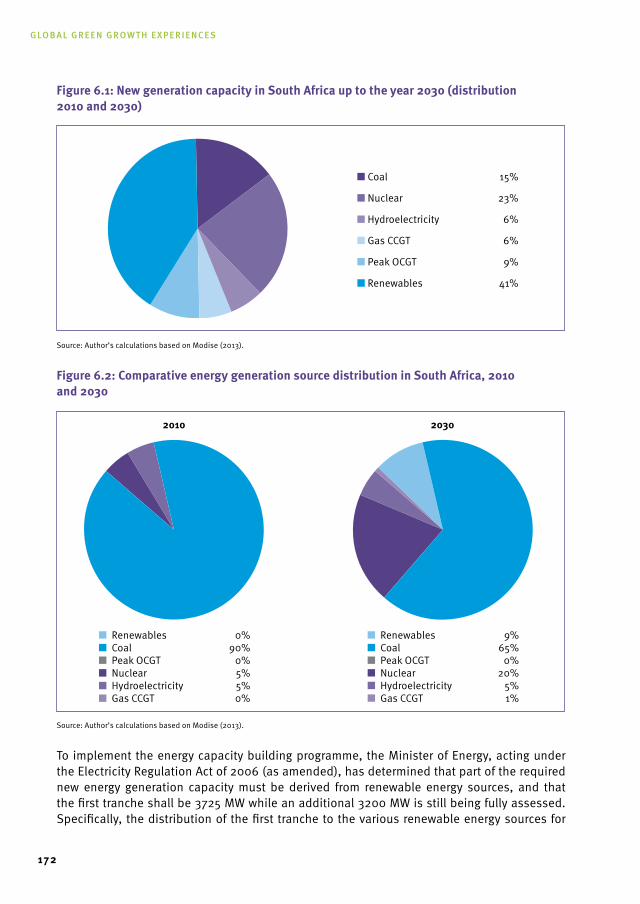
Global Green Growth experiences
172
Figure 6.1: new generation capacity in south Africa up to the year 2030 (distribution 2010 and 2030)
Source: Author’s calculations based on Modise (2013).
Figure 6.2: Comparative energy generation source distribution in south Africa, 2010 and 2030
Source: Author’s calculations based on Modise (2013).
To implement the energy capacity building programme, the Minister of Energy, acting under the Electricity Regulation Act of 2006 (as amended), has determined that part of the required new energy generation capacity must be derived from renewable energy sources, and that the first tranche shall be 3725 MW while an additional 3200 MW is still being fully assessed. Specifically, the distribution of the first tranche to the various renewable energy sources for
■ Renewables 0%■ Coal 90%■ Peak OCGT 0%■ Nuclear 5%■ Hydroelectricity 5%■ Gas CCGT 0%
■ Renewables 9%■ Coal 65%■ Peak OCGT 0%■ Nuclear 20%■ Hydroelectricity 5%■ Gas CCGT 1%
2010 2030
■ Coal 15%
■ Nuclear 23%
■ Hydroelectricity 6%
■ Gas CCGT 6%
■ Peak OCGT 9%
■ Renewables 41%
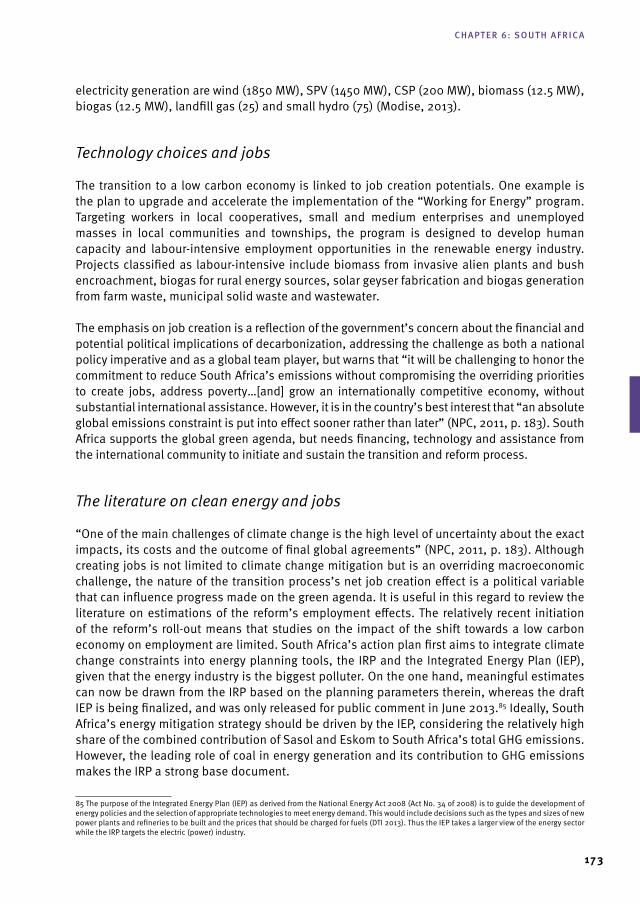
173
electricity generation are wind (1850 MW), SPV (1450 MW), CSP (200 MW), biomass (12.5 MW), biogas (12.5 MW), landfill gas (25) and small hydro (75) (Modise, 2013).
Technology choices and jobs
The transition to a low carbon economy is linked to job creation potentials. One example is the plan to upgrade and accelerate the implementation of the “Working for Energy” program. Targeting workers in local cooperatives, small and medium enterprises and unemployed masses in local communities and townships, the program is designed to develop human capacity and labour-intensive employment opportunities in the renewable energy industry. Projects classified as labour-intensive include biomass from invasive alien plants and bush encroachment, biogas for rural energy sources, solar geyser fabrication and biogas generation from farm waste, municipal solid waste and wastewater.
The emphasis on job creation is a reflection of the government’s concern about the financial and potential political implications of decarbonization, addressing the challenge as both a national policy imperative and as a global team player, but warns that “it will be challenging to honor the commitment to reduce South Africa’s emissions without compromising the overriding priorities to create jobs, address poverty…[and] grow an internationally competitive economy, without substantial international assistance. However, it is in the country’s best interest that “an absolute global emissions constraint is put into effect sooner rather than later” (NPC, 2011, p. 183). South Africa supports the global green agenda, but needs financing, technology and assistance from the international community to initiate and sustain the transition and reform process.
The literature on clean energy and jobs
“One of the main challenges of climate change is the high level of uncertainty about the exact impacts, its costs and the outcome of final global agreements” (NPC, 2011, p. 183). Although creating jobs is not limited to climate change mitigation but is an overriding macroeconomic challenge, the nature of the transition process’s net job creation effect is a political variable that can influence progress made on the green agenda. It is useful in this regard to review the literature on estimations of the reform’s employment effects. The relatively recent initiation of the reform’s roll-out means that studies on the impact of the shift towards a low carbon economy on employment are limited. South Africa’s action plan first aims to integrate climate change constraints into energy planning tools, the IRP and the Integrated Energy Plan (IEP), given that the energy industry is the biggest polluter. On the one hand, meaningful estimates can now be drawn from the IRP based on the planning parameters therein, whereas the draft IEP is being finalized, and was only released for public comment in June 2013.85 Ideally, South Africa’s energy mitigation strategy should be driven by the IEP, considering the relatively high share of the combined contribution of Sasol and Eskom to South Africa’s total GHG emissions. However, the leading role of coal in energy generation and its contribution to GHG emissions makes the IRP a strong base document.
85 The purpose of the Integrated Energy Plan (IEP) as derived from the National Energy Act 2008 (Act No. 34 of 2008) is to guide the development of energy policies and the selection of appropriate technologies to meet energy demand. This would include decisions such as the types and sizes of new power plants and refineries to be built and the prices that should be charged for fuels (DTI 2013). Thus the IEP takes a larger view of the energy sector while the IRP targets the electric (power) industry.
chapter 6: south africa
Global Green Growth experiences
174
Providing information on employment creation estimates when submitting project proposals is common practice in public tenders, but few studies have focused on formalizing or advancing a methodological framework to arrive at such estimates. Job estimates in the public and in the private sector associated with green investments (e.g. Tinte and Bischof-Niemz, 2013 and Table 6.3) are based on heuristics, which in itself is not necessarily flawed. In fact, some cognitive science scholars argue that fast and frugal heuristics may, in many circumstances, actually provide better estimates than data-intensive algorithms (Gigerenzer and Brighton, 2009). Nonetheless, since the accuracy of the estimates is an empirical matter, our review focuses on the methodological aspects of the sampled literature and their implication on the plausibility of the estimates.
Another strand of the literature focuses on green investments and jobs in South Africa and is also based on heuristics (e.g. Borel-Saladin and Turok, 2013; Edkins et al., 2010; Maia et al., 2011; Montmasson-Clair, 2012). Edkins et al. (2010) simulate alternative renewable energy generation roadmaps for South Africa and compare employment and GHG emission outcomes under this scenario with a baseline. The study concludes fallaciously that “active renewable energy policy can result in higher employment and GHG savings” (p. iii). The study sets up a renewable energy-cum-energy demand system (building on renewable energy and energy efficiency) and compares the number of jobs created from this set up with those created from brown energy generation and no demand management, with the resulting demand being met by building a highly efficient coal plant. For the results to be comparable, the treatment versus controlled setup should vary only with respect to the treatment, in this case, either clean energy alone or clean energy and specified emission constraints. As this involves a benefit-cost analysis, policymakers should look at the job per dollar generated or the job and unit GHG emissions per dollar. Yet another study (Maia et al., 2011) estimates the net direct job creation expected in the formal sector of the economy, covering a wide range of economic activities that can be collectively described as environmentally friendly. The authors note that their estimates are only indicative of the potential employment benefits and that further studies, which incorporate the cost of investment in alternative forms of energy are necessary to adequately assess the trade-offs. One example of the variety of heuristics applied in these empirical studies to arrive at estimates is the rule of analogy, which was applied in Maia et al.’s study to derive the employment potential of carbon capture and storage (CCS) technology. In their example, the authors construe that a demonstration plan in Australia generated 550 workers over three years and assigns the same number of construction workers for a similar CSS plan in South Africa. In estimating the employment potential in biodiversity conservation and ecosystem restoration, the authors use the data collected by the Department of Water Affairs and Department of Environmental Affairs under the Working for Water programme to calculate a baseline. The baseline is extrapolated to derive estimates of potential employment.
Rather than making a methodological or empirical contribution to the literature, Montmasson-Clair (2012) describes the green economy landscape in South Africa and reviews some of the green employment estimates presented in the literature on South Africa. The author concludes that going green holds potential benefits for the labour market, but that its realization essentially depends on the ability to develop the technical and managerial skills of the targeted groups. Borel-Saladin and Turok (2013) critically review the literature on South Africa, address some shortcomings in the literature such as the incomparability of estimates and variations in the underlying assumptions, but regrettably conclude that “green economic activity does appear
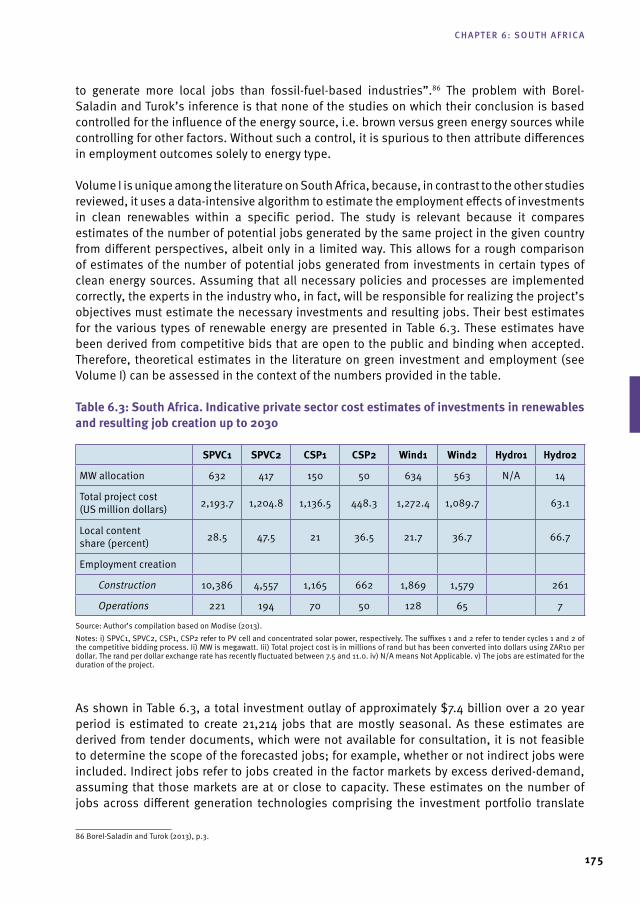
175
to generate more local jobs than fossil-fuel-based industries”.86 The problem with Borel-Saladin and Turok’s inference is that none of the studies on which their conclusion is based controlled for the influence of the energy source, i.e. brown versus green energy sources while controlling for other factors. Without such a control, it is spurious to then attribute differences in employment outcomes solely to energy type.
Volume I is unique among the literature on South Africa, because, in contrast to the other studies reviewed, it uses a data-intensive algorithm to estimate the employment effects of investments in clean renewables within a specific period. The study is relevant because it compares estimates of the number of potential jobs generated by the same project in the given country from different perspectives, albeit only in a limited way. This allows for a rough comparison of estimates of the number of potential jobs generated from investments in certain types of clean energy sources. Assuming that all necessary policies and processes are implemented correctly, the experts in the industry who, in fact, will be responsible for realizing the project’s objectives must estimate the necessary investments and resulting jobs. Their best estimates for the various types of renewable energy are presented in Table 6.3. These estimates have been derived from competitive bids that are open to the public and binding when accepted. Therefore, theoretical estimates in the literature on green investment and employment (see Volume I) can be assessed in the context of the numbers provided in the table.
table 6.3: south Africa. Indicative private sector cost estimates of investments in renewables and resulting job creation up to 2030
sPVC1 sPVC2 CsP1 CsP2 wind1 wind2 Hydro1 Hydro2
MW allocation 632 417 150 50 634 563 N/A 14
Total project cost (US million dollars) 2,193.7 1,204.8 1,136.5 448.3 1,272.4 1,089.7 63.1
Local content share (percent) 28.5 47.5 21 36.5 21.7 36.7 66.7
Employment creation
Construction 10,386 4,557 1,165 662 1,869 1,579 261
Operations 221 194 70 50 128 65 7
Source: Author’s compilation based on Modise (2013). Notes: i) SPVC1, SPVC2, CSP1, CSP2 refer to PV cell and concentrated solar power, respectively. The suffixes 1 and 2 refer to tender cycles 1 and 2 of the competitive bidding process. Ii) MW is megawatt. Iii) Total project cost is in millions of rand but has been converted into dollars using ZAR10 per dollar. The rand per dollar exchange rate has recently fluctuated between 7.5 and 11.0. iv) N/A means Not Applicable. v) The jobs are estimated for the duration of the project.
As shown in Table 6.3, a total investment outlay of approximately $7.4 billion over a 20 year period is estimated to create 21,214 jobs that are mostly seasonal. As these estimates are derived from tender documents, which were not available for consultation, it is not feasible to determine the scope of the forecasted jobs; for example, whether or not indirect jobs were included. Indirect jobs refer to jobs created in the factor markets by excess derived-demand, assuming that those markets are at or close to capacity. These estimates on the number of jobs across different generation technologies comprising the investment portfolio translate
86 Borel-Saladin and Turok (2013), p.3.
chapter 6: south africa
Global Green Growth experiences
176
into 2,867 jobs per $1 billion expenditure. These estimates are difficult to reconcile with the estimates in Volume I, which show that the annual employment generated from energy efficiency and renewable energy investments up to 2030 could amount to between 339,700 and 455,500 jobs within South Africa. The comparison is difficult because Volume I include estimates of both direct and indirect employment created by the investment portfolio. Moreover, the composition of the two energy supply portfolios differs. For instance, the cost estimates in Volume I allow for grid strengthening, which is an important driver in terms of moving into the league of utility-scale renewables energy supply. In general, renewable energy is a variable source of energy supply (highly “intermittent”), entailing potential elements of stress on the grid. Therefore, it is important to ensure that those variations do not adversely affect the grid and equally that the selected renewables are resistant to adverse conditions on the grid. Other significant differences between the estimates being reviewed here exist and apply to other relevant studies as well. While the cost estimates of South African experts relate to the clean energy mix only, the estimates in Volume I include investments in energy management. The assumptions on the costs of capital, fuel prices, technology type, plant capacity and plant construction are not fixed and are a potential source of disparity. For instance, in SPVCs, aside from differences in environmental suitability and energy efficiency between crystalline silicon wafers and thin film on glass, additional cost disparities may arise from locational factors such as whether the system is located far from the grid or embedded in it.
The general literature (i.e. the literature not focused exclusively on South Africa) on renewable energy and jobs (e.g. Borenstein, 2012; Huntington, 2009) indicates that the electric power industry does not hold a comparative advantage in terms of job creation. “Investments in roads, ground transportation and health care are likely to stimulate employment considerably more than green electric power generation. Policymakers should look askance at the claimed additional job benefits from green energy” (Huntington, 2009, p.15). Therefore, one needs to be mindful when directly comparing employment estimates without first controlling for variations among the underlying parameters (as in the examples highlighted in the preceding comparative review of the literature on South Africa).
As a critique of the general literature and taking into account that the energy industry does not have a comparative advantage in terms of employment generation, it could be argued that policymakers might be more interested in the costs of the various alternative energy supply configurations. Through such an exercise, light can be shed on the opportunity costs of various policy choices. The employment dimension enters the calculation only as spill-over benefits. To identify an optimal renewable energy policy for South Africa, analysts need to resolve the nonlinear programming problem of achieving low carbon energy supply subject to (1) the emissions reduction trajectory in accordance with the UNFCCC 2010 submission, (2) energy reliability, and (3) affordability. Such a solution would be an invaluable assessment tool against which bids for energy supply could be benchmarked. Successful bidders would be the winners whose projects are consistent with the resulting solution set. For projects that are at parity, a tie-breaker could then be taken to be the employment creation potential as well as the nature (quality and duration) of the resulting jobs.
177
6.4 Public policy on emission reduction and job creation
The key public policies on South Africa’s green agenda are developed by the Department of Environmental Affairs and the Department of Energy, whereas initiatives that link these policies to the economy form part of the gamut of supporting policies. Examples of such supporting policies are those that attempt to link the green agenda to employment and industrialization, and are just as crucial as key policies because they help promote de-carbonization efforts and thus render them sustainable.87 To the extent that economic diversification and employment creation are important development goals for South Africa, any initiative that is linked to the green agenda and has the potential to promote employment and/or economic diversification is desirable. Industrial policy is presumed to be one of those desirable initiatives. South Africa’s major industrial policy framework is the Industrial Policy Action Plan. Initially promulgated as the National Industrial Policy Framework in 2007, it has undergone five amendments and is now referred to as IPAP 2013/14-2015/16 (hereinafter IPAP). The goal of IPAP is to “prevent industrial decline and support the growth and diversification of South Africa’s manufacturing sector” (DTI, 2013, p. 6). Its explicit inclusion of the green agenda is of particular relevance, because is in line with the national strategy on climate change, all spheres of government to include the green agenda in their respective action plans to the fullest extent possible. The IPAP describes green agenda initiatives as “qualitatively new areas of intervention” (DTI, 2013, p. 119). It should be noted, however, that the Department of Trade and Industry together with the Department of Public Enterprises developed the South African Renewables Initiative in early 2010. The objective of the initiative is to “define an industrial strategy for securing the economic gains from an ambitious program of renewables development, and to design and secure the financing and associated institutional arrangements” (DTI, 2010, p. 12).
Review of industrial policy
Two spheres of discourse will be examined, namely government policies (represented by policy initiatives of the Department for Trade and Industry), and private sector perspectives on the issues being considered. The initiation of substantive industrial policy on renewable energy goes back to a recent policy directive which stipulates the objective of a low carbon roadmap for the manufacturing sector and setting two clear milestones - to specify GHG mitigation objectives for the industrial sector by the third quarter of the fiscal year 2013/2014, and to issue a draft industrial policy roadmap to achieve the stipulated objectives by the second quarter of 2014/2015. Furthermore, the directive clearly identifies a cluster of leading government departments, namely the Department of Environmental Affairs and the Department of Trade and Industry. Other relevant agencies involved in furthering these objectives are the Department of Energy and Department of Science and Technology. Also, the minimum local content requirements for renewable energy independent power producer partnerships (REIPPP) and small scale programmes have been targeted for upward revision, presumably to stimulate the development of associated industries in renewable energy. In this regard, the industrial policy strategy includes the identification of energy efficiency products to be developed in a competitive local manufacturing industry. Other measures range from setting aside $550 million for industrial financing of investments in the green economy and the establishment of an energy efficiency training centre in accordance with the planned roll out of
87 Corroborating views from the Minister of Trade and Industry of South Africa can be found in DTI (2010), p. 3.
chapter 6: south africa
Global Green Growth experiences
178
energy management training and awareness programmes to be implemented in industry and the mining industry. As the majority of initiatives are being realized in real time (in 2013/2014), it is too early to evaluate the results.
However, enthusiasm for renewable energy is obvious, and the buy-in from citizens has been consistent. It only takes a quick drive through Alex Township in Sandton City (one of the largest and oldest townships in South Africa) located in Gauteng Province (the most populous province and wealthiest in terms of GDP) to see a sea of low-pressure solar water heater installations on private residential rooftops. These energy efficiency devices were procured, installed and maintained using domestic capacity based on other government initiatives, which predate the industrial policies under discussion here. These include, for example, energy efficiency funding initiatives by the Treasury Department and managed by Eskom. Eskom’s Standard Offer Programme is a mechanism that pays large electricity users for verified energy savings. According to the program’s design, any “energy user, Energy Services Company (ESCo) or project developer that are able to deliver verifiable energy savings are invited to propose projects. If approved, the successful project implementer will be paid for verified energy savings at a fixed amount per kilowatt hour over a period of three years. The amount includes an initial payment of seventy percent of the total project incentive on completion” (M&G, 2012, p. 5). Under its Integrated Demand Management initiative, other Eskom energy efficiency programs include the High Pressure Solar Rebate Programme, the National Solar Water Heating Programme and the Residential Heat Pump Rebate Programme, some of which are now under review due to funding constraints.88 Rather than seek confirmation of policy successes at such an early stage, the lesson we can draw lies in the recognition of the opportunities this rich variety of initiatives offer and which could serve as fertile ground for current industrial policies to trigger the desired industrial development.
Outside of the industrial sector, the policy matrix consists of a gamut of incentives and yet more policy initiatives either under consideration at present and subject to public debate or being adapted to include the feedback from the public. Some of these incentives come in the form of subsidies, financing facilities and taxes. Tax incentives exist for energy efficiency investments, a carbon tax has been proposed, a carbon budget for certain commercial enterprises considered major polluters, and a carbon emissions cap which is being proposed as a more effective means to reduce emissions than imposing penalties on major polluters. A $2 billion credit facility has been established for investments in green projects, a three-year $470 million solar water heater subsidy, a 70 percent annual subsidy for solar home systems and a 50 percent annual fuel tax rebate for biodiesel (Modise, 2013). These initiatives have not yet been evaluated in terms of the objectives set, but Eskom has reported significant energy savings from its Integrated Demand Management initiatives, which are a major component of the gamut of incentives.89 Despite these encouraging initiatives, the private sector continues to be less inclined to pursue such initiatives due to concern about the government’s reluctance to restructure the electric power industry to level the playing field and thus attract private players. Currently, it essentially remains a vertically integrated industry dominated by the state utility company Eskom. In particular, the configuration of power generation, energy trading, billing and distribution calls for reforms. Solar financing, for instance, continues to be problematic despite its tremendous growth in popularity and adoption. The problem is seen as structural and political. The preference for and trend towards solar energy is reflected in a variety of
88 For more details on Eskom’s Integrated Demand Management, see www.eskom.co.za/idm.
89 For instance, Eskom reports that a savings of 591 MW was realized during the the 12-month period ending March 2013 (Eskom, 2014).
179
solutions such as rooftop, small-scale projects and off-grid installations. Off-grid installations reduce revenue from local distribution without any corresponding reduction in overhead costs and infrastructure fixed costs, thus raising the average price for residual customers. As local authorities derive a sizable share of their revenue from bulk purchases and retail distribution of electricity of which the resulting revenue cross-subsidizes other essential services, a push for reforms remains difficult.
On the other hand, the successful introduction of feed-in tariffs is considered one of the most significant policy instruments to date for promoting growth in power generation.90 Approved and promulgated in 2009, feed-in tariffs require Eskom to pay a specified rate per kilowatt hour at rand values that vary across the types of renewables, but at tariff rates which have generally exceeded the renewable energy industry’s expectations.91 Subsequently, changes have been proposed and implemented in line with adjustments in inflationary expectations. Some of the tariff adjustments have been considerable, with up to 40 percent reduction in the applicable feed-in tariffs for certain renewable energy types. Equally of note and complementing feed-in tariffs is the generation levy on non-renewable electricity. Essentially, generation levy is an environmental tax imposed by South Africa’s revenue authority on electricity generation using non-renewable (fossil) fuels and environmentally hazardous (nuclear) sources.92 The conclusion is that as a result of the ongoing initiatives, the levels of investor interest and activity in the large-scale power generation segment have been remarkable. By way of evidence, analysts emphasize the active participation in bidding rounds of construction tenders for power generation. Another example of success in the utility-scale generation segment is the emergence of REIPPP, which has “resulted in competitive bids for grid-connected renewables in South Africa…and more than R100bn of private investment committed”.93 However, to accelerate the transition to a low carbon economy, an appropriate financing framework is necessary. In turn, attracting the necessary investment requires a significant degree of industrial reorganization, namely the establishment of an unbundled energy industry.
Currently, the electric power industry is fully regulated, with electricity primarily being supplied by Eskom. Electricity generation and import is dominated by Eskom with fringe competition from municipalities and independent power producers (IPPs) arising from emerging renewables markets. The bulk of the generation of electricity is coordinated by the system operator, Eskom, as is transmission. Domestic bulk trading is virtually non-existent, although there is some cross-border activity under the Southern Africa Power Pool. The distribution and supply to end users is also dominated by Eskom with fringe participation by municipalities which purchase electricity from Eskom and supply industry, mining companies, small and medium enterprises as well as residences and agriculture.94 Establishing an independent national system operator would represent a major milestone in the restructuring process. Then, the generation, distribution, power trading and customer billing would be open for competition. In this respect, the proposed Independent System Market Operator Bill is an encouraging step towards industrial reorganization of the energy industry.
90 Renewable energy feed-in tariff (“Refit”) is the price premium given to private sector electricity generators.
91 For further information on the Refit structure, see for instance, ‘South Africa: South Africa - Feed-In Tariff Cuts Proposed, www.mondaq. com/x/129234/Renewables/South+Africa+FeedIn+Tariff+Cuts+Proposed (Accessed September 7, 2014).
92 ‘Electricity Generation’, www.sars.gov.za/ClientSegments/Customs-Excise/Excise/Environmental-Levy-Products/Pages/Electricity-Genera-tion-Levy.aspx (Accessed April 16, 2014).
93 ‘Urgent Reforms Are Needed for Responsive Power Sector’, www.bdlive.co.za/opinion/2013/11/25/urgent-reforms-are-needed-for-responsive-pow-er-sector (Accessed September 7, 2014).
94 See Bischof-Niemz (2013) for further details.
chapter 6: south africa
Global Green Growth experiences
180
The debate between the policy community and the private sector regarding the appropriate mix of incentives required to trigger the desired change in behavior towards environmental harm caused by economic activities that otherwise produce positive benefits to society has yet to be settled (Moodley, Mabugu and Hassan, 2005).95 According to economic literature, pricing externalities is the best initial response. Where property rights are well defined such as in the context of power generation or large-scale GHG emissions with clearly traceable origins, taxes on emissions or tradable permits are an option. However, policymakers have not yet brought forward convincing arguments against pricing externalities due to the lack of sufficient knowledge on which to base their policies.
One example of this knowledge gap is the lack of sound cost estimates, that in comparing alternative energy mixes, take into consideration the market value of the power generated and its related externalities to be able to compare alternative energy mixes (portfolio of generating equipment) (Borenstein, 2012). Another example of the existing knowledge gap is the question of the appropriate tradeoff, if any, between additional investments in energy efficiency versus renewable energy. Similarly, as has been noted elsewhere (e.g. Volume I) as well as in this study, the balanced costs of power generation from clean renewables as well as estimates on the number of jobs arising from investments in clean renewables vary considerably. Lacking sound evidence on these crucial decision parameters with which to argue in favor of tough public policy choices, the politically expedient response by policymakers has been to pursue populist policy interventions. “Instead of pricing externalities, the far more prevalent government response has been targeted program to promote specific alternatives to conventional electricity generation technologies…Such targeted programs also seem especially vulnerable to political manipulation” (Borenstein, 2012, p. 87). This vulnerability to political manipulation may explain why such targeted programs continue (see Bates, 2005) and suggests that even when sound evidence becomes available, policy choices may continue to be populist instead of efficient, unless the political incentives under which such choices are made are modified as well.
Case study in industrial policy implementation: Small-scale photovoltaic roll-out
The potential for PV markets in South Africa as discussed in Bischof-Niemz (2013) will be further examined in this section. This particular case is relevant for the following reasons: PV markets are a proven viable and emerging segment of clean renewables with the potential for job creation. According to estimates in Tinte and Bischof-Niemz (2013) with regard to Eskom’s internal plan to roll out PV for its facilities, the proposed investment of $3 billion in capital expenditure will produce 250 GWh of green electricity annually, prevent a total of 4 million tons of CO2 emissions, create 1,500 direct permanent jobs and train 2,000 individuals in PV design and installation (as entrepreneurs). It will also test funding opportunities from financial institutions linked to green energy particularly from a prime borrower. Based on this attractive potential of the PV segment, we provide an overview of the PV market in South Africa to infer the future of projected investments for renewables.
95 ‘Global Experience Warns SA Against Imposing Carbon Tax’, www.bdlive.co.za/opinion/2013/08/27/global-experience-warns-sa-against-impos-ing-carbon-tax (Accessed September 7, 2014).
181
Clearly, the involvement of both the private and the public sector as well as their constructive interaction is crucial for the success of the green agenda’s financing requirements.96 Acknowledgement of the government of this imperative is manifested by defining an industrial strategy to secure economic gains from “an ambitious program of renewables development, including financing and associated institutional arrangements, that would not impose an unacceptable burden on South Africa’s economy, public finances or citizens” (DTI, 2010, p .4). The need for additional financing outside of the public sector is implicit in the government’s statement that “[t]he estimated incremental costs of an ambitious renewables program would have a net present value of about US$21 billion at current feed-in tariff rates, or US$9 billion if they were reduced to a more cost competitive level. Such an additional burden to South Africa would not be appropriate and so currently prevents the more ambitious renewable targets being adopted and pursued” (DTI, 2010, p. 4).
According to Bischof-Niemz (2013), the IRP (2010) envisages an energy generation mix of 8.4 GW in PV up to 2030, including a sizable share of embedded PV. The PV market is evolving in two distinct ways; competitive tenders driven by REIPPPP and self-generation and embedded generation. Although a rising trend in the already significant number of self-consumption PVs has been reported (e.g. Bischof-Niemz, 2013), feeding into the grid is either prohibited or where permitted, feed-in occurs at unattractive rates, which then discourages the growth and development of this market segment. How the challenge of further developing this segment is addressed will be crucial. First, the cost of capital expenditure for residential installations, which is generally high can be compensated by reducing the cost of capital. Second, a mismatch exists between the residential load profile and PV output. Household energy demand is highest in the mornings and evenings, while PV power supply rises steadily throughout the day to peak at midday and drop thereafter. Consequently, if excess supply is not sold, it becomes that much more difficult to amortize the investment and literally 'kills the business case' (Bischof-Niemz, 2013, p. 14). Such an outcome would be unfortunate in a potential market of 1 million households and 10,000 commercial properties, yielding an estimated aggregate generated power of 8 GHWh.
Doing nothing will not only 'kill the business case', but will lead to adverse choices in the power market, which then creates further social inequality. Since some customers will install PVs either way, the high net worth customers and hence prime customers will choose their power supply outside of the market, thus increasing the cost for residual customers who cannot choose and are generally the poorer members in an already unequal society. Bischof-Niemz (2013) proposes a feasible mechanism to deal with incentive and participation constraints in a two-phased approach to overcome the obstacles to participation for residential customers. This approach requires the creation of a Central Power Purchasing Agency that would serve as the monopsonist for all energy spilled into the grid by embedded generators as well as the compensating agency on a net feed-in tariff for all self-generation sources. The Agency would also compensate municipalities for lost revenue due to self-generation. This would be consistent with and a test of the government’s espoused intention (DEA, 2010) to socialize the cost (to legacy enterprises) of reforms associated with the transition to a low carbon economy. Moreover, the demise of the micro-utility segment implies that all indirect job estimates associated with the training of individuals in PV design and installation vanish.
96 See, for instance, DTI (2010), p. 3.
chapter 6: south africa
Global Green Growth experiences
182
6.5 Conclusion
This study reveals that South Africa is on the path towards transition to a low carbon economy in line with its commitments to the Copenhagen Accord, notwithstanding the country’s social burden in both being a developing nation and shouldering the legacy of apartheid. Embedding mitigation of climate change into its existing institutional arrangements such as the Cabinet Clusters, the National Planning Commission, the Forum of South Africa Directors-General, the Parliamentary Portfolio Committee on Water and Environmental Affairs, the Inter-Ministerial Committee on Climate Change, the Intergovernmental Committee on Climate Change and the multi-stakeholder National Committee on Climate Change signals determination for a coordinated and far-reaching response to minimize policy slippages.97 To reduce the risk of derailing, the international community should support the transition process. This entails that international resources (technical and financial support) be made available as envisaged under the UNFCCC to “complement domestic resources to finance the cost of the transition to a climate resilient society” (DEA, 2013, p. 43; DTI, 2013, p. 119). Drawing on several sources (DTI, 2010; Frankfurt School-UNEP Centre and BNEF, 2013; and Volume I), the scale of required investments expressed in monetary terms is clearly significant for a developing country. The immensity is even more telling when such resource requirements are considered in conjunction with important socio-economic indicators such as an average annual GDP growth rate of under 3 percent over a 10-year period, a very high rate of unemployment and a public health burden caused by the prevalence of HIV-AIDS.
Modise (2013) speaks of a planned partial investment of $7.4 billion for renewables over the next 20 years. An aggregate expenditure of $148 billion is estimated in Volume I. Fifteen years ago, the government’s financing plan for renewables was estimated at $21 billion at the prevailing feed-in tariff, or $9 billion if the plan was scaled down. Those figures were back then already considered an inappropriate “additional domestic burden to South Africa” and “so currently prevents the more ambitious renewables targets being adopted and pursued” (DTI, 2010, p. 4). Ultimately, financing constraints represent the biggest challenge, regardless of whether all technological requirements have been adequately addressed. “Renewables are more costly than traditional energy sources, and will remain so for some time to come” (DTI, 2010, p. 3), but the cost differential is gradually narrowing. Also, as has been noted, investment in renewable energy is not one of the most robust or efficient ways to invest in employment creation. Therefore, as both the balanced costs of power generation and employment creation continue to be subject to large variations in estimates with no normalization scheme, it is clear that additional research is necessary on these two important pillars of investment trends in renewables, particularly as they influence decarbonization which in turn affects job creation. Other measures complementary to research efforts include creating an enabling environment for sustainable financing of the rollouts of renewable energy and energy efficiency measures.
Evidently, the transition to a low carbon economy within the framework of the New Growth Path (South Africa’s implementation strategy of its National Plan) cannot be funded from public resources alone, even with overwhelming job creation potentials, which is not even the case. South Africa’s commitment to infrastructure investments under the National Development Plan and the size of its social spending (NPC, 2011) suggest that private capital is necessary to achieve the low carbon transition, regardless of the employment potential of the planned investment. Any planned investment outlay still has to be funded before it can deliver on 97 The term “Cabinet Clusters” refers to the different functional groupings of ministerial functions for more efficient intergovernmental relations.
183
any of the promised benefits. Even ideal projects such as those that are self-financing often require bridging finance. Obviously, ‘cash is king’. Private financing requires governments’ credible commitment to respect pre-contractual obligations, an environment of accountability and a credible anti-corruption enforcement regime. The political economy analysis of the prospects of establishing such a regime in the immediate future lies outside the scope of this study. Nonetheless, the Government of South Africa is well aware that a viable financing mechanism requires a “blend of domestic commitments with concessionary resources and risk guarantee instruments channeled through inter-governmental co-operation. Provided within an appropriate institutional framework, such public resources would in turn leverage the far larger sums required from private finance at an affordable cost to South Africa” (DTI, 2010, p. 3). If this were to happen, the employment benefits may be non-trivial, regardless of what the various estimates in the literature suggest. The reason for optimism is that if investment in renewables were to be on full traction, there could be significant unanticipated job creation along new value chains (human creativity) from innovations. Economists call this phenomenon dynamic scale economies or learning by doing, which are considered important beams of industrialization.
chapter 6: south africa

185
REFERENCES
Chapter 1GGBP (Green Growth Best Practice), 2014. Green Growth in Practice: Lessons from Country Experiences. Seoul.
Low, L.P., 2011. Green Growth: Implications for Development Planning. London: Climate and Development Knowledge Network.
Norad, 2014. Real-Time Evaluation of Norway’s International Climate and Forest Initiative: Synthesising Report 2007-2013. Oslo.
OECD (Organization for Economic Development and Co-Operation), 2011. Towards Green Growth. Paris: OECD Publishing.
UNIDO (United Nations Industrial Development Organization), 2011. Industrial Development Report 2011. Industrial Energy Efficiency for Sustainable Wealth Creation: Capturing Environmental, Economic and Social Dividends. Vienna.
-------, 2013. Industrial Development Report 2013. Sustaining Employment Growth: The Role of Manufacturing and Structural Change. Vienna.
World Resources Institute, 2014. Climate Analysis Indicators Tool (CAIT 2.0): WRI’s Climate Data Explorer. Washington, DC. Available at: <http://cait2.wri.org/profile/Indonesia#Country%20GHG%20Emissions> (Accessed 30 December, 2013).
Chapter 2ABB, 2011. Trends in Global Energy Efficiency: Brazil. Zurich.
ABRADEE (Associação Brasileira de Distribuidoras de Energia Elétrica), 2008. Alíquota ICMS 2007/2008. Brasília. Available at: <www.abradee.com.br/setor-de-distribuicao/banco-de-dados/financeiro>.
Allen, B.S., Travers, C. and Travers, L., 2011. Deforestation’s Challenge to Green Growth in Brazil. Prepared for the Green Growth Economies Project, Berkeley Roundtable on the International Economy. Berkeley, CA: University of California.
Ash, M., 2012. Oil Crops Outlook. Washington, DC: United States Department of Agriculture.
Bomfim, S. Interviewed by d’Avignon, A. Personal interview. Serviço Florestal Brasileiro(SFB), Brasília, capital, October, 22th, 2013.
Brazil Windpower, 2014. Why be Part of Brazil Windpower 2014? Available at: <www.brazilwindpower.org/en/>.
Butler, R.A. and Laurance, W.F., 2009 Is Oil Palm the Next Emerging Threat to the Amazon? Tropical Conservation Science, 2(1), pp. 1-10.
Caruso, L.A.C., 2010. Skills for Green Jobs in Brazil. Unedited background study. Geneva: International Labor Organization.
CGEE (Centro de Gestão e Estudos Estratégicos), 2012. Avaliação e Percepções para o Desenvolvimento de uma Política de CT&I no Fomento da Energia Eólica no Brasil. Brasília.
-------, 2013. Policy Brief Inovação no Setor Eólico. In: Atividade - Observatório em Ciência, Tecnologia e Inovação. Brasília: Centro de Gestão e Estudos Estratégicos.
Cidades Solares, 2009. Minha Casa, Minha Vida – A Sociedade Brasileira já fez sua Escolha pelo Aquecedor Solar. Available at: <www.cidadessolares.org.br/conteudo_view.php?id=451>.
Climate Policy Initiative, 2013. The Policy Climate. Rio de Janeiro.
Cote, C. and Langevin, M.S., 2013. Brazilian Electricity 101. A BrazilWorks Briefing Paper. Washington, DC: BrazilWorks.
Global Green Growth experiences
186
D’Avignon, A., 2013. Notes taken at the AGRIBIO Congress on Developing Family Farming North and Northeast. São Paulo, São Paulo Airport Marriott Hotel, 20 August 2013.
de Andrade, R.M.T. and Miccolis, A., 2011. Policies and Institutional and Legal Frameworks in the Expansion of Brazilian Biofuels. Working Paper 71. Bogor: Center for International Forestry Research.
EIA (US Energy Information Agency), 2011. Country Analysis Briefs: Brazil. Washington, DC.
-------, 2013. Country Analysis Brief: Brazil. Washington, DC. Available at: <www.eia.gov/countries/cab.cfm?fips=BR>.
EMBRAPA (Empresa Brasileira de Pesquisa Agropecuária), 2010. Zoneamento Agroecológico do Dendezeiro para as Áreas Desmatadas da Amazônia Legal (ZAE Dendê). Rio de Janeiro.
EPE (Empresa de Pesquisa Energética), 2011. Plano Nacional de Energia. Rio de Janeiro. Available at: <www.epe.gov.br/PNE/Forms/Empreendimento.aspx>.
-------, 2012a. Plano Decenal de Energia Elétrica PDEE. Rio de Janeiro. Available at: <www.epe.gov.br/pdee/forms/epeestudo.aspx>.
-------, 2012b. Avaliação da Eficiência Energética para os Próximos 10 Anos (2012-2021). Serie ESTUDOS DE DEMANDA - NOTA TÉCNICA DEA 16/12. Rio de Janeiro.
-------, 2013. Balanço Energético Nacional – 2013 (Ano Base 2012). Rio de Janeiro.
ESMAP (Energy Sector Management Assistance Program), 2010. Low Carbon Growth Country Studies Program: Brazil Low Carbon Country Case Study. Washington, DC: The International Bank for Reconstruction and Development/The World Bank Group.
FAO (Food and Agriculture Organization), 2013. FAOSTAT. Rome. Available at: <http://faostat.fao.org/site/291/default.aspx>.
Federal University of Pernambuco, 2000. Atlas Solarimétrico do Brasil: Banco de Dados Solarimétricos. Recife.
Fitzherbert, E.B., Struebig, M.J., Morel, A., Danielsen, F., Bruhl, C.A., Donald, P.F. and Phalan, B., 2008. How Will Oil Palm Expansion Affect Biodiversity? Trends in Ecology and Evolution, 23(10), pp. 538-545.
Frankfurt School-UNEP Collaborating Centre, 2014. Global Trends in Renewble Energy Investment 2014. Frankfurt: Frankfurt School of Finance and Management.
Gebara, M.F. and Thuault, A., 2013. GHG Mitigation in Brazil’s Land Use Sector: An Introduction to the Current National Policy Landscape. Washington, DC: World Resource Institute.
Government of Brazil, 2010. National Policy on Climate Change (Decree No. 7390/2010). Available at: <www.planalto.gov.br/ccivil_03/_Ato2007-2010/2010/Decreto/D7390.htm>. (Accessed 7 September, 2014).
Green Building Council Brasil, 2013. Comunicado Importante. Available at: <www.gbcbrasil.org.br/>.
GWEC (Global Wind Energy Council) and ABEEolica (Brazilian Wind Energy Association), 2011. Analysis of the Regulatory Framework for Wind Power Generation in Brazil. Summary Report. Brussels.
IBGE (Instituto Brasileiro de Geografia e Estatística), 2012. Censo Agropecuário 2006. Revised in 2012. Rio de Janeiro.
-------, 2013. Indicadores Sociais Municioais. Available at: <www.ibge.gov.br/home/estatistica/populacao/indicadores_sociais_municipais/defaulttab.shtm> (Accessed August 26, 2014).
IEA (International Energy Agency), 2006. The Energy Situation in Brazil: An Overview. Paris: OECD Publishing.
-------, 2012a. Technology Roadmap: Solar Heating and Cooling. Paris: OECD Publishing.
-------, 2012b. Renewables Information 2012. Paris: OECD Publishing.
IPEA (Instituto de Pesquisa Econômica Aplicada), 2010. Biocombustíveis no Brasil: Etanol e Biodiesel. Série Eixos do Desenvolvimento Brasileiro No. 53. Brasília
IPEA Data (Instituto de Pesquisa Econômica Aplicada Data), 2014. Social. Available at: <www.ipeadata.gov.br/>. (Accessed August 26, 2014).
IRENA and GWEC (Global Wind Energy Council), 2012. 30 Years of Policies for Wind Energy: Lessons from 12 Wind Energy Markets. Abu Dhabi.
187
ITTO (International Tropical Tiber Organization), 2011. Status of Topical Forest Management 2011. Yokohama.
ITUC (International Trade Union Confederation), 2012. Growing Green and Decent Jobs. Brussel.
Jarvis, A., Varma, A. and Ram, J., 2011. Assessing Green Jobs Potential in Developing Countries: A Practitioner’s Guide. Geneva: International Labour Organization.
King, D., Cole, M., Tyldesley, S. and Hogarth, R., 2012. The Response of China, India and Brazil to Climate Change: A Perspective for South Africa. Oxford: Smith School of Enterprise and the Environment, University of Oxford.
La Rovere, E.L., Szklo, A. and Estefen, S.F., 2011. Estudo Comparativo entre Três Cenários enáEmissão de Gases de Efeito Estufa no Brasil e uma Análise de Custo-Benefício. New York, NY and Brasília: United Nations Development Programme and Ministry of the Environment.
Marengo, J., 2009. Climate Change, Extreme Weather and Climate Events in Brazil. Climate Change, Extreme Weather and Climate Events in Brazil. Lloyds.
Marengo, J., Chou, S., Kay, G., Alves, L., Pesquero, J., Soures, W., Santos, D., Lyra, A., Suiero, G., Betts, R., Chagas, D., Gomes, J., Bustamente, J. and Tavares, P., 2011. Development of Regional Future Climate Change Scenarios in South America Using the Eta CPTEC/HadCM3 Climate Change Projections: Climatology and Regional Analysis for the Amazon, São Francisco and Paraná River basins. Climate Dynamics.
McKinsey & Company, 2009. Pathways to a Low-Carbon Economy for Brazil. São Paulo.
MCTI (Ministério da Ciência, Tecnologia e Inovação), 2010. Segunda Comunicação Nacional do Brasil à Convenção-Quadrodas Nações Unidas sobre Mudança do Clima – Volume 2. Coordenação-Geral de Mudanças Globais do Clima Ministério da Ciência e Tecnologia Brasília.
-------, 2013. Estimativas Anuais de Emissões de Gases de Efeito Estufa no Brasil. Brasília: Ministério da Ciência, Tecnologia e Inovação, Secretaria de Políticas e Programas de Pesquisa e Desenvolvimento and Coordenação Geral de Mudanças Globais de Clima. MMA (Ministério do Meio Ambiente), 2013. Plano de Ação para Prevenção e Controle do Desmatamento na Amazônia Legal (PPCDAm): 3a Fase (2012-2015). Pelo uso Sustentável e Conservação da Florest. Brasília.
MME (Ministério de Minas e Energia), 2011. Plano Nacional de Eficiência Energética: Premissas e Diretrizes Básicas. Brasília.
OECD (Organization for Econonomic Co-operation and Development) and ITF (International Transport Forum), 2008. Biofuels: Linking Support to Performance. Round Table 138. Paris: OECD Publishing.
Penman, J., Gytarsky, M., Hiraishi, T., Krug, T., Kruger, D., Pipatti, R., Buendia, L., Miwa, K., Ngara, T., Tanabe, K. and Wagner, F. (eds.), 2003. Good Practice Guidance for Land Use, Land-Use Change and Forestry. Kanagawa: Institute for Global Environmental Strategies.
Pereira, E.B., Martins, F.R., de Abreu, S.L. and Rüther, R., 2006. Atlas Brasileiro de Energia Solar. São José Dos Campos: National Institute for Space Research.
Procel Info (Centro Brasileiro de Informação de Eficiência Energética), 2006. Normas Técnicas. Available at: <www.procelinfo.com.br/main.asp?TeamID={BC7B6991-D938-46F6-B29A-5E87FD36C980}>.
Rejman, H., 2012. Cyrela, um Símbolo de Sustentabilidade. Revista Abrava, No. 2014, p. 6.
Rovere, E., 2011. Mitigation Action in Developing Countries: Country Study for Brazil. Rio de Janeiro: MAPS.
SINDUSCON RIO, 2013. CUB 2006: Custos Unitários da Construção (Lei n° 4.591/64). Rio de Janeiro.
Tello, R. and Riberio, F.B., 2012. Guia CBIC de Boas Práticas em Sustentabilidade na Indústria da Construção. Brasília: Câmara Brasileira da Indústria da Construção; Serviço Social da Indústria; Nova Lima: Fundação Dom Cabral.
UNEP (United Nations Environmental Program), 2011. Promoting Decent Work in a Green Economy. ILO Background Note to Towards a Green Economy: Pathways to Sustainable Development and Poverty Eradication. Geneva.
UNEP (United Nations Environmental Programme), ILO (International Labour Organization), IOE (International Organisation of Employers) ITUC (International Trade Union Confederation), 2008. Green Jobs: Towards Decent Work in a Sustainable, Low-Carbon World. Nairobi: United Nations Environmental Programme.
references
Global Green Growth experiences
188
UNIDO (United Nations Industrial Development Organization) and GGGI (Global Green Growth Institute), 2015. Global Green Growth: Clean Energy Industrial Investments and Expanding Job Opportunities. Volume I: Overall Findings. Vienna and Seoul.
Villela, A.A. interviewed by d’Avignon, A. Personal interview. COPPE/UFRJ Rio de Janeiro, September 16th, 2013.
World Bank, 2010. 2008. Forests Sourcebook: Practical Guidance for Sustaining Forests in Development Cooperation. Washington, DC.
-------, Brazil Low-Carbon Country Case Study. Washington, DC.
Chapter 350hertz, Amprion, Tennet and TransnetBW, 2012. Prognose der EEG-Umlage 2013 nach AusglMechV:Prognose-
konzept und Berechnung der ÜNB. Berlin.
AGEB (AG Energiebilanzen), 1990. Energiebilanz 1990. Berlin/Köln. Available at: <www.ag-energiebilanzen.de/DE/daten-und-fakten/bilanzen-1990-2012/bilanzen-1990-2012.html>.
--------, 2014. Energieverbrauch in Deutschland im Jahr 2013. Berlin/Köln.
BDEW (German Association of Energy and Water Industries), 2012. BDEW-Strompreisanalyse Oktober 2012: Haushalte und Industrie. Berlin.
BMWi (Federal Ministry for Economic Affairs and Energy), 2014. Zweiter Monitoring-Bericht “Energie der Zukun-ft”: Kurz- und Langfassung. Berlin.
BMWi (Federal Ministry for Economic Affairs and Energy) and BMU (Federal Ministry for the Environment, Nature Conservation and Nuclear Safety), 2012. First Monitoring Report “Energy of the future”: Summary. Berlin.
BMU (Federal Ministry for the Environment, Nature Conservation and Nuclear Safety), 2013. Renewable Energy Sources in Figures. Berlin.
BMU (Federal Ministry for the Environment, Nature Conservation and Nuclear Safety) and UBA (Federal Environ-ment Agency), 2011. Report on the Environmental Economy 2011: Facts & Figures for Germany. Berlin and Dessau-Roßlau.
BNetzA (Federal Network Agency for Electricity, Gas, Telecommunications, Post and Railway), 2011. Monitoring-bericht 2011: Gemäß § 63 Abs. 4 EnWG i.V.m. § 35 EnWG. Bonn.
Breitschopf, B., Nathani, C. and Resch, G., 2011a. Methodological Guidelines for Estimating the Employment Impacts of Using Renewable Energies for Electricity Generation. “Economic and Industrial Development” EID – EMPLOY. Final report Task 1. Study commissioned by IEA-RETD (Renewable Energy Technology De-ployment), November 2011.
--------, B., Nathani, C. and Resch, G., 2012. Economic and Industrial Development. EID - EMPLOY. Final Report Task 1: Review of Approaches for Employment Impact Assessment of Renewable Energy Deployment. Study commissioned by IEA-RETD (Renewable Energy Technology Deployment). Kalsruhe.
--------, B., Ragwitz, M., Klobasa, M., Sensfuß, F., Steinbach, J., Lehr, U., Horst, J., Hauser, E., Leprich, U., Diek-mann, J., Braun, F. and Horn, M., 2011b. Einzel- und Gesamtwirtschaftliche Analyse von Kosten- und Nutzenwirkungen des Ausbaus Erneuerbarer Energien im Deutschen Strom- und Wärmemarkt. Update der Quantifizierten Kosten- und Nutzenwirkungen für 2010. Studie im Auftrag des Bundesministeriums für Umwelt, Naturschutz und Reaktorsicherheit. Karlsruhe, Osnabrück, Saarbrücken and Berlin: Fraun-hofer-Institut für System- und Innovationsforschung, Gesellschaft für Wirtschaftliche Strukturforschung, Deutsches Institut für Wirtschaftsforschung and Institut für ZukunftsEnergieSysteme.
Böhmer, M., Thamling, N., Hoch, M. and Steudle, G., 2013. Ermittlung der Wachstumswirkungen der KfW-Pro-gramme zum Energieeffizienten Bauen und Sanieren. Berlin, Basel: Prognos.
Diefenbach, N., Loga, T., Gabriel, J. and Fette, M., 2011. Monitoring der KfW-Programme „Energieeffizient Sanier-en“ 2010 und „Ökologisch/Energieeffizient Bauen“ 2006 – 2010. Darmstadt and Bremen: Institut Woh-nen und Umwelt and Bremer Energieinstitut.
Eckermann, F., 2012. Beschäftigung im Umweltschutz. Dessau-Roßlau: Federal Environment Agency.
Edler, D. and Blazejczak, J., 2011. Beschäftigungswirkungen des Umweltschutzes in Deutschland im Jahr 2008. Dessau-Roßlau and Berlin: Federal Environment Agency and Federal Ministry for the Environment, Na-ture Conservation and Nuclear Safety.
189
EC (European Commission), 2011. Communication from the Commission to the European Parliament, the Council, the European Economic and Social Committee and the Committee of the Regions A Roadmap for moving to a competitive low carbon economy in 2050. COM(2011) 112 final. Brussels.
--------, 2014b. Communication from the Commission to the European Parliament, the Council, the European Economic and Social Committee and the Committee of the Regions. Energy prices and costs in Europe. COM(2014) 21/2, Brussels, 29.1.2014, Available at: http:// http://ec.europa.eu/news/energy/140129_en.htm
--------, 2014a. Report from the Commission to the European Parliament, the Council, the European Economic and Social Committee and the Committee of the Regions. Renewable energy progress report. COM(2013) 175 final. Brussels.
Expertenkommission zum Monitoring-Prozess „Energie der Zukunft“, 2014. Stellungnahme zum zweiten Monitor-ing-Bericht der Bundesregierung für das Berichtsjahr 2012. Berlin, Mannheim, Stuttgart.
Fraunhofer ISI, 2012. Policy Report: Contribution of Energy Efficiency Measures to Climate Protection within the European Union until 2050. Berlin: Federal Ministry for the Environment, Nature Conservation and Nu-clear Safety.
Held, A., Ragwitz, M. Merkel, E, Rathmann, M. and Klessmann, C. RE-Shaping: Shaping an Effective and Efficient European Renewable Energy Market. D5 & D6 Report: Indicators Assessing the Performance of Renewa-ble Energy Support Policies in 27 Member States. Karlsruhe.
IEA (International Energy Agency), 2013. World Energy Outlook. Paris.
Jochem, E., Jaeger, C., Battaglini, A., Bradke, H., Cremer, C., Eichhammer, W., Förster, H., Haas, A., Henning, E., Id-rissova, F., Kasper, B., Köhler, J., Köwener, D., Krause, J., Lass, W., Liliestam, J., Mannsbart, W., Meißner, F., Müller, M., Pflüger, B., Radgen, P., Ragwitz, M., Rauschen, M., Reitze, F., Riffeser, L., Saure, K., Schade, W., Sensfuss, F., Toro, F., Walz, R. and Wietschel, M., 2008. Investments for a Climate-Friendly Germa-ny. Study Commissioned by the German Federal Ministry for the Environment, Nature Conservation and Nuclear Safety. Berlin: Federal ministry for the Environment, nature Conversation and nuclear Safety.
Lehr, U., Lutz, C., O’Sullivan, M., Nienhaus, K., Nitsch, J., Breitschopf, B., Bickel, P. and Ottmüller, M., 2011. Kurz- und Langfristige Auswirkungen des Ausbaus der Erneuerbaren Energien auf den Deutschen Ar-beitsmarkt. Studie im Auftrag des Bundesministeriums für Umwelt, Naturschutz und Reaktorsicherheit. Osnabrück: Gesellschaft für Wirtschaftliche Strukturforschung.
Lehr, U., Lutz, C. and Ulrich, P., 2014a. Bestandsaufnahme und Analyse von Studien zur Schätzung von Kli-maschutznutzen und -Kosten. Climate Change 20/2013. Dessau-Roßlau: Federal Environment Agency.
--------, 2014b. Gesamtwirtschaftliche Wirkungen von Klimaschutzmaßnahmen und -instrumenten. Ökonomische Analyse der Politikszenarien für den Klimaschutz VI. Climate Change 21/2013. Dessau-Roßlau: Federal Environment Agency, Januar 2014.
Lehr, U., Mönnig, A., Wolter, M. I., Lutz, C., Schade, W. and Krail, M., 2011. Die Modelle ASTRA und PANTA RHEI zur Abschätzung Gesamtwirtschaftlicher Wirkungen Umweltpolitischer Instrumente – ein Vergleich. GWS Discussion Paper 2011/4. Osnabrück: Gesellschaft für Wirtschaftliche Strukturforschung.
Matthes, F.C., Busche, J., Döring, U., Emele, L., Gores, S., Harthan, R., Hermann, H., Jörß, W., Loreck, C., Scheffler, M., Hansen, P., Diekmann, J., Horn, M., Eichhammer, W., Elsland, R., Fleiter, T., Schade, W., Schlomann, B., Sensfuß, F. and Ziesing, H.-J., 2013. Politikszenarien für den Klimaschutz VI: Treibhausgas-Emissions-szenarien bis zum Jahr 2030. Climate Change 04/2013. Dessau-Roßlau: Federal Environment Agency.
Nathani, C., Schmid, C., Resch, G. and Lehr, U., 2012. Economic and Industrial development. EID - EMPLOY. Meth-odological Guidelines for Estimating the Employment Impacts of Using Renewable Energies in Electricity Generation. Annex 2: Country Fact Sheets. RE Related Gross Employment in RETD Member Countries. Karlsruhe.
OECD (Organization for Economic Co-Operation and Development) and Eurostat, 1999. The Environmental Goods & Services Industry: Manual for Data Collection and Analysis, Paris.
Ostenrath, K., 2010. Entwicklung des Fachkräftebedarfs im Sektor Erneuerbare Energien. Presentation at the Auftaktveranstaltung EnerGO Lüchow-Dannenberg, 9. August 2010.
O’Sullivan, M., Edler, D., Bickel, P., Lehr, U., Peter, F. and Sakowski, F., 2013. Brutto-beschäftigung durch Erneu-erbare Energien in Deutschland im Jahr 2012 - eine Erste Abschätzung. Berlin: Federal Ministry for the Environment, Nature Conservation and Nuclear Safety.
references
Global Green Growth experiences
190
--------, 2014. Brutto beschäftigung durch Erneuerbare Energien in Deutschland im Jahr 2013 - eine Erste Ab-schätzung. Berlin: Federal Ministry for the Environment, Nature Conservation and Nuclear Safety. Pehnt, M., Arens, M., Duscha, M., Eichhammer, W., Fleiter, T., Gerspacher, A., Idrissova, F., Jessing, D., Jochem, E., Kutzner, F., Lambrecht, U., Lehr, U., Lutz, C., Paar, A., Reitze, F., Schlomann, B., Seefeldt, F., Thanling, N., Toro, F., Vogt, R., Wenzel, B. and Wünsch, M., 2011. Energieeffizienz: Potenziale, Volkswirtschaftliche Effekte und Innovative Handlungs- und Förderfelder für die Nationale Klimaschutzinitiative. Endberi-cht des Projektes „Wissenschaftliche Begleitforschung zu übergreifenden technischen, ökologischen, ökonomischen und strategischen Aspekten des nationalen Teils der Klimaschutzinitiative“, Heidelberg, Karlsruhe, Berlin, Osnabrück, Freiburg.
Pfluger, B., Sensfuss, F., Schubert, G. and Leisentritt, J., 2011. Tangible Ways towards Climate Protection in the Eu-ropean Union (EU Long-term scenarios 2050). Study for the Federal Ministry for the Environment, Nature Conservation and Nuclear Safety. Karlsruhe: Fraunshofer ISI.
UNIDO (United Nations Industrial Development Organization) and GGGI (Global Green Growth Institute), 2015. Global Green Growth: Clean Energy Industrial Investments and Expanding Job Opportunities. Volume I: Overall Findings. Vienna and Seoul.
Ragwitz, M., Schade, W., Breitschopf, B., Walz, R., Helfrich, N., Rathman, M., Resch, G., Panzer, C., Faber, T., Haas, R., Nathani, C., Holzhey, M., Konstantinaviciute, I., Zagamé, P., Fougeyrollas, A. and Le Hir, B., 2009. Em-ployRES - The Impact of Renewable Energy Policy on Economic Growth and Employment in the European Union. Karlsruhe: Fraunshofer ISI.
Schade, W., Lüllmann, A., Beckmann, R. and Köhler, J., 2009. Gesamtwirtschaftliche Wirkungen von Energieeffi-zienzmaßnahmen in den Bereichen Gebäude, Unternehmen und Verkehr. Studie im Auftrag des Umwelt-bundesamtes. Climate Change 08/2009. Dessau-Roßlau: Federal Environment Agency.
Schleich, J., Eichhammer, W., Böde, U., Gagelmann, F., Jochem, E., Schlomann, B. and Ziesing, H.-J., 2003. Green-house Gas Reductions in Germany - Lucky Strike or Hard Work? Climate Policy, 1(3), pp. 363-380.
Schlesinger, M., Hofer, P., Kemmler, A., Kirchner, A., Strassburg, S., Lindenberger, D., Fürsch, M., Nagl, S., Pau-lus, M., Richter, J., Trüby, J., Lutz, C., Khorushun, O., Lehr, U. and Thobe, I., 2010. Energieszenarien für ein Energiekonzept der Bundesregierung. Projekt Nr. 12/10 des Bundesministeriums für Wirtschaft und Technologie, Berlin. Basel, Köln and Osnabrück: Prognos AG, Energiewirtschaftliches Institut an der Uni-versität zu Köln and Gesellschaft für Wirtschaftliche Strukturforschung.
UBA (Umweltbundesamt), 2013. Politikszenarien für den Klimaschutz VI - Treibhausgas-Emissionsszenarien bis zum Jahr 2030. Dessau-Roßlau.
--------, 2014a. Berichterstattung unter der Klimarahmenkonvention der Vereinten Nationen und dem Kyo-to-Protokoll 2014. Nationaler Inventarbericht Zum Deutschen Treibhausgasinventar 1990 – 2012. Des-sau-Roßlau.
--------, 2014b. Treibhausgas-Emissionen in Deutschland. Dessau-Roßlau. Available at: <www.umweltbundesamt.de/daten/klimawandel/treibhausgas-emissionen-in-deutschland>.
Ulrich, P. and Lehr, U., 2013. Erneuerbar Beschäftigt in den Bundesländern: Bericht zur Aktualisierten Abschätzu-ng der Bruttobeschäftigung 2012 in den Bundesländern. Osnabrück: Gesellschaft für Wirtschaftliche Strukturforschung.
Chapter 4Ariesusanty, L., 2011. Indonesia: A Country Report. In: The World of Organic Agriculture: Statistics and Emerging
Trends 2011, eds. Willer, H. and Kilcher, L., FiBL-IFOAM Report. Bonn: International Federation of Organic Agriculture Movements, Frick: Research Institute of Organic Agriculture (FiBL).
Borghans, L. and Groot, L., 1999. Educational Presorting and Occupational Segregation. Labour Economic, 6(3), pp. 375-395.
BPS (Badan Pusat Statistik), 2009-2011, Statistics for Small and Large Manufacturing Sectors. Jakarta: Indonesia Statistical Agency.
Brown, M.A., 2008. Market Failure and Barriers as a Basis for Clean Energy Policies. Energy Policy, 29(14), pp. 1197-1207.
Butnar, I. and Llop, M., 2012. Structural Decomposition Analysis and Input-Output Subsystems: Changes in CO2 Emissions of Spanish Service Sectors (2000-2005). Ecological Economics, 70(11), pp. 2012-2019.
191
Case, M., Ardiansyah, F. and Spector, E., 2007. Climate Change in Indonesia: Implications for Humans and Na-ture. Gland: World Wide Fund for Nature.
CDIEMR (Centre for Data and Information on Energy and Mineral Resources), 2013. Handbook of Energy and Eco-nomics Statistics of Indonesia. Jakarta: Ministry of Energy and Mineral Resource of Indonesia.
Dewan Nasional Perubahan Iklim, 2010. Indonesia’s Greenhouse Gas Abatement Cost Curve. Jakarta.
Dewi, R.G., 2011. Session 1: Report of the Latest NCs (Inventories) Recently Submitted. Indonesia’s Second Na-tional Communication. The 9th Workshop on GHG Inventories in Asia (WGIA9) - ‘Capacity Building for Measurability, Reportiability and Verifiability, 13-15 July.
EIA (U.S. Energy Information Administration), 2014a. Country Briefs: Indonesia. Washington, DC.
---------, 2014b. International Energy Statistics. Washington, DC. Available at: <www.eia.gov/cfapps/ipdbproject/iedindex3.cfm?tid=5&pid=53&aid=1>.
Fargione, J., Hill, F., Tilman, D., Polasky, S. and Hawthorne, P., 2008. Land Clearing and the Biofuel Carbon Debt. Science, 319(5867), pp. 1235-1238.
Gunawan, J. and Frasier, K., 2014. Green Jobs in Indonesia: Potentials and Prospects for National Strategy. Bonn: Friedrich Ebert Stiftung.
Hasan, M.H., Mahlia, T.M.I and Nur, H., 2012. A Review on Energy Scenario and Sustainable Energy in Indonesia. Renewable and Sustainable Energy Review, 16(4), pp. 2316-2328.
Hasan, M.H., Muzammil, W.K., Mahlia, T.M.I., Jannifar, A. and Hasanuddin, I., 2012. A Review on the Pattern of Electricity Generation and Emission in Indonesia from 1987 to 2009. Renewable and Sustainable Energy Reviews, 16(5), p. 3206-3219.
Havrland, B. and Satyakti, Y., 2011. Renewable Energy Economics in Developing Countries. Ist Edition. Prague: Power Print Ltd.
Heckman, J.J., Ichimura, I. and Todd, P.E., 1997. Matching as an Econometric Evaluation Estimator: Evidence from Evaluating A Job Training Programme. Review of Economic Studies, 64(4), pp. 605-654.
---------, 2006. Earning Functions, Rates of Return and Treatment Effects: The Mincer Equation and Beyond. In Handbook of the Economics of Education, Elsevier.
Heckman, J.J. and Willis, R.J., 2014. A Beta-Logistic Model for the Analysis of Sequential Labor Force Participation by Married Women. Journal of Political Economy, 85(1), pp. 27–58.
ILO (International Labor Organization), 2013. Green Jobs Mapping Study in Indonesia. Geneva.
Indonesian Ministry of Finance and the Climate Policy Initiative, 2011. The Landscape of Public Climate Finance in Indonesia – Executive Summary. Jakarta.
International Trade Organization, 2010. Renewable Energy Market Assessment Report: Indonesia. Washington, DC.
Jackson, R. and Murray, A., 2004. Alternative Input-Output Matrix Updating Formulations. Economics Systems Research, 16(2), pp. 135-148.
Jahroh, S., 2010. Organic Farming Development in Indonesia: Lesson Learned from Organic Farming in West Java and North Sumatera. Innovation and Sustainable Development in Agriculture and Food, 28 June-1 July.
Kolstadm I. and Wiig, A., 2009. It’s the Rent, Stupid! The Political Economy of the Resource Curse. Energy Policy, 37(12), pp. 5317-5325.
Lahr, M. and de Mesnard, L., 2004. Biproportional Techniques in Input-Output Analysis: Table Updating and Structural Analysis. Economic Systems Research, 16(2), pp. 115-134.
Luttrell, C., Resosudarmo, I.A.P., Muharrom, E., Brockhaus, M. and Seymour, F., 2014. The Political Context of REDD+ in Indonesia: Constituencies for Change. Environmental Science & Policy, 35, pp. 67-75.
Mccarthy, J. and Zen, Z., 2010. Regulating the Oil Palm Boom : Assessing the Effectiveness of Environmental Governance Approaches to Agro-industrial Pollution. Law and Policy, 32(1), pp. 153-179.
Miettinen, J., Hooijer, A., Tollenaar, D., Page, S., Malins, C., Vernimmen, R., Shi, C. and Liew, S.C., 2012. Historical Analysis and Projection of Oil Palm Plantation Expansion on Peatland in Southeast Asia. White Paper No. 17. Washington, DC: International Council on Clean Transportation.
Ministry of Energy and Mineral Resources, 2009. Updates on Renewable Energy Development Program in Indone-sia. Expert Group Meeting on New Renewable Energy Technology. Jakarta.
references
Global Green Growth experiences
192
---------, 2000-2013. Handbook of Energy & Economic Statistics of Indonesia. Jakarta. Available at: <www.esdm.go.id/publikasi/handbook-of-energy-a-economics-statistics-of-indon-handbook-of-energy-a-econom-ics-statistics-of-indon-.html>.
---------, 2013. Acceleration Program of Renewable Energy Policy. Presentation Seminar by Dr. Ir. Djadjang Sukarna on Renewable Energy Policy in Indonesia, presented on October 17th 2013 in Padjadjaran University.
Ministry of Environment, 2010. Indonesia 2nd National Communication: Under The United Nations Framework Convention on Climate Change. Jakarta.
Mourougane, A., 2010. Phasing Out Energy Subsidies in Indonesia. Paris: OECD Publishing.
Mujiyanto, S. and Tiess, G., 2013. Secure Energy Supply in 2025: Indonesia’s Need for an Energy Policy Strategy. Energy Policy, 61(5), pp. 31–41.
Obidzinski, K., Takahashi, I., Dermawan, A., Komarudin, H. and Andrianto, A., 2013. Can Large Scale Land Acqui-sition for Agro-Development in Indonesia be Managed Sustainably? Land Use Policy, 30(1), pp. 952-965.
OECD (Organization for Economic Co-Operation and Development), 2011. Towards Green Growth. Paris: OECD Publishing.
UNIDO (United Nations Industrial Development Organization) and GGGI (Global Green Growth Institute), 2015. Global Green Growth: Clean Energy Industrial Investments and Expanding Job Opportunities. Volume I: Overall Findings. Vienna and Seoul.
President of the Republic of Indonesia, 2006. Regulation No. 5, 2006: About the Policy of National Energy. Avail-able at: <www.batan.go.id/ref_utama/perpres_5_2006.pdf>.
Resosudarmo, I.A.P., Atmadja, S., Ekaputri, A.D., Intarini, D.Y., Indriatmoko, Y. and Astri, P., 2014. Does Tenure Security Lead to REDD+ Project Effectiveness? Reflections from Five Emerging Sites in Indonesia. World Development, 55, pp. 68-83.
Robinson, J.A., Torvik, R. and Verdier, T., 2006. Political Foundations of the Resource Curse. Journal of Develop-ment Economics, 79(2), pp. 447–468.
Sari, A.P., Maulidya, M., Butarbutar, R.N., Sari, R.E. and Rusmantoro, W., 2007. Indonesia and Climate Change: Current Status and Policies. Jakarta: Bank Dunia, World Bank, and Department for International Devel-opment.
Sarkar, A. and Singh, J., 2010. Financing Energy Efficiency in Developing Countries - Lessons Learned and Re-maining Challenges. Energy Policy, 38(10), pp. 5560–5571.
Saunders, H.D., 2013. Historical Evidence for Energy Efficiency Rebound in 30 US Sectors and a Toolkit for Re-bound Analysts. Technological Forecasting and Social Change, 80(7), pp. 1317–1330.
Senoaji, A., 2011. Policy and Regulation of Renewable Energy in Indonesia. GIZ Workshop, Berlin, August 24.
Statistics Indonesia, 2007-2011. Indonesian Labor Force Survey. Jakarta.
Teal, F., 2011. The Price of Labour and Understanding the Causes of Poverty. Labour Economics, 18(Supplement 1), pp. S7–S15.
Temurshoev, U., Webb, C. and Yamano, N., 2011. Projection of Supply and Use Tables: Methods and Their Empir-ical Assessment. Economic Systems Research, 23(1), pp. 91–123.
Thorburn, C., 2011. The REDD Rush in Indonesia. Melbourne: Monash University.
Toh, M.-H., 1998. The RAS Approach in Updating Input–Output Matrices: An Instrumental Variable Interpretation and Analysis of Structural Change. Economic Systems Research, 10(1), pp. 63–78.
UNDP (United Nations Development Programme), 2007. The Other Half of Climate Change: Why Indonesia Must Adapt to Protect Its Poorest People. Jakarta.
UNIDO (United Nations Industrial Development Organization), 2011. Industrial Development Report 2011: Indus-trial Energy Efficiency for Sustainable Wealth Creation - Capturing Environmental, Economic, and Social Dividends. Vienna.
Vagliasindi, M., 2012. Implementing Energy Subsidy Reforms Evidence form Developing Countries. Washington DC: World Bank.
van Tho, T., 2013. The Middle-Income Trap: Issues for Members of the Association of Southeast Asian Nations. ADBI Working Paper Series No. 421. Tokyo: Asian Development Bank Institute.
193
Warr, P. and Yusuf, A.A., 2011. Reducing Indonesia’s Deforestation-Based Greenhouse Gas Emissions. Australian Journal of Agricultural and Resource Economics, 55(3), pp. 297–321.
Wood, R., 2011. Construction, Stability and Predictability of an Input–Output Time-Series for Australia. Economic Systems Research, 23(2), pp. 175–211.
World Resources Institute, 2014. Climate Analysis Indicators Tool (CAIT 2.0): WRI’s Climate Data Explorer. Wash-ington, DC. Available at: <http://cait2.wri.org/profile/Indonesia#Country%20GHG%20Emissions> (Ac-cessed 30 December, 2013).
Yi, H., 2013. Clean Energy Policies and Green Jobs : An Evaluation of Green Jobs in U.S. Metropolitan Areas. En-ergy Policy, 56, pp. 644–652.
Zaituni, F., Samuel, A.R., Imelda, H. and Tanujaya, O., 2010. Skills for Green Jobs in Indonesia. Unedited back-ground country study. Geneva: International Labor Organization.
Zhang, X.-P. and Cheng, X.-M., 2009. Energy Consumption, Carbon Emissions, and Economic growth in China. Ecological Economics, 68(10), pp. 2706–2712.
Chapter 5Choi, Y., 2010. Development of Green Growth Statistics. Daejeon: Statistics Korea.
IEA (International Energy Agency), 2013. 2012. 2012 Key World Energy Statistics. Paris.
----------, CO2 Emissions from Fuel Combustion: Highlights. [pdf] Paris: IEA. Available at: <http://www.iea.org/publications/freepublications/publication/CO2EmissionsFromFuelCombustionHighlights2013.pdf> [Accessed 14 March 2014].
Jung. J, Park, S. and Lim, S., 2011. Analysis of Monitoring and Evaluation System for Green Climate Fund. Seoul: Korea Institute for International Economic Policy.
Kang, S.J., 2011. Economic Spillover Effects of Green Industry, Hypothetical Approach to Green Growth Policy’s Spillover Effects. In Green Growth: Green Industry and Green Job. Seoul: NRCS and Daonad.
----------, 2012a. International Diffusion of Green Growth. Sejong: Presidential Committee on Green Growth.
----------, 2012b. Further Steps to Achieve Sustainable Development through Green Economy. International Association of Economic and Social Councils and Similar Institutions (AICESIS), AICESIS Contribution to the UN Conference RIO+20 on Sustainable Development.
----------, 2012c. Age of Massive Climate Change. In Choice of Future Korea: Global Co-Existence. Seoul: Donga Ilbo.
KEMC (Korea Energy Management Corporation), 2014. Green Home. Available at: < http://greenhome.kemco.or.kr/ext/itr/intr/greenHomeIntro.do> [Accessed 03 February 2014].
KISTEP (Korea Institute of Science and Technology Evaluation and Planning), 2011. Green Technology National Research Development Project Evaluation Report. [pdf] Report No. 2012-011. [Accessed 17 March 2014].
KOSTAT (Statistics Korea), 2013. 2013 Green Growth Indicators. Daejeon.
Lee, H. and Teske, S., 2013. Realization of Renewable Energy, South Korea at the Crossroads. Seoul: Greenpeace East Asia in Seoul.
Lee, M., 2008. Speech in the 60th Anniversary of the Founding of Republic of Korea.
Lee, N., Lee, S., Kim, M., and Jeon, H., 2011. Analysis of Job Creation from New Renewable Energy Industry. Seoul: Korea Research Institute for Vocational Education & Training.
Miller, R. and Blair, P., 2009. Input-Output Analysis: Foundations and Extensions. 2nd ed. New York: Cambridge University Press.
MKE (Ministry of Knowledge Economy) and KEMCCNRE (Korea Energy Management Corporation Center for New and Renewable Energy), 2013. Funding and Tax Support for New and Renewable Energy. Yongin: KEMCCNRE. Available at: <www.energy.or.kr/knrec/12/KNREC120500.asp> [Accessed 3 February 2014].
MKE (Ministry of Knowledge Economy), 2011. New and Renewable Energy and the Pathway to Green Growth. 9 August 2011. Available at: <http://www.korcham.net/EconNews/EconInfo/CRE04102R.asp?m_DataID=78623> [Accessed 22 January 2014].
references
Global Green Growth experiences
194
----------, 2012. 2012 Plan for New Renewable Technology Development and Usage. Seoul.
MOEL (Ministry of Employment and Labor), 2010. Analysis and Evaluation Series (VII) for the Effect of Government Policies on Employment: the New Renewable Energy Technology Development and Spread Promotion Policy. Seoul: Korea Employment Information Service.
MOE (Ministry of Environment), 2009. Medium and Long Term Development Strategy for Climate Change and Energy. Seoul.
MOSF (Ministry of Strategy and Finance), 2013. Economy Whitebook 2012. Sejong.
MOTIE (Ministry of Trade, Industry and Energy), 2013. 2012 Knowledge Sharing Program Energy Policy. Sejong.
----------, 2014. The Second Energy Basic Plan. Sejong. Available at: <www.motie.go.kr/motie/ne/rt/press/bbs/bbsView.do?bbs_seq_n=78654&bbs_cd_n=16> [Accessed 24 January 2014].
National Emergency Management Agency, 2013. Disaster Report 2012. Seoul, Available at: <http://www.nema.go.kr/nema_cms_iba/show_nema/board/board9s/view.jsp?cNo=202989&c_relation=39&check_the_code=5&check_the_num=142&check_up_num=165&pageNo=1> [Accessed 3 March 2014].
OECD, 2013. CO2 Emissions from Fuel Combustion. Environment: Key Tables from OECD, No. 1. [website]. Available at: <http://www.oecd-ilibrary.org/environment/co2-emissions-from-fuel-combustion_2075826x-table1> [Accessed 18 March 2014].
PCFV (Presidential Council for Future and Vision), 2009. The Way to Green Growth. Seoul: Joong Ang Books.
PCGG (Presidential Committee on Green Growth), 2014. Timeline. Sejong. Available at: <http://www.greengrowth.go.kr/?page_id=190> [Accessed 04 February 2014]
Prime Minister’s Office, 2013. Enforcement Decree of the Framework Act on Low Carbon Green Growth. Presidential Decree No. 23755. Sejong.
Sopher, P. and Mansell, A., 2013. The World’s Carbon Markets: A Case Study Gudie to Emissions Trading. Washington, DC: EDF and IETA. Available at: <http://www.ieta.org/assets/Reports/EmissionsTradingAroundTheWorld/edf_ieta_korea_case_study_may_2013.pdf> [Accessed 1 March 2014].
Teske, S., Zervos, A. and Lee, H.-S., 2012. The Advanced Energy [R]evolution: A Sustainable Energy Outlook for South Korea. Amsterdam and Brussels: Greenpeace International and European Renewable Energy Council.
UNEP (United Nations Environment Programme), 2010. Overview of the Republic of Korea’s National Strategy for Green Growth. [pdf] Geneva: UNEP. Available at: <http://www.unep.org/PDF/PressReleases/201004_unep_national_strategy.pdf> [Accessed 17 March 2014].
UNIDO (United Nations Industrial Development Organization) and GGGI (Global Green Growth Institute), 2015. Global Green Growth: Clean Energy Industrial Investments and Expanding Job Opportunities. Volume I: Overall Findings. Vienna and Seoul.
Westphal, M., Hughes, G., and Brömmelhörster, J., 2013. Economics of Climate Change in East Asia. Mandaluyong City, Philippines: ADB. Available at: < http://www.adb.org/publications/economics-climate-change-east-asia> [Accessed 3 March 2014].
World Bank, 2014. Official Exchange Rate (LCU per US$, period average). [website] Washington, DC: the World Bank. Available at: <http://data.worldbank.org/indicator/PA.NUS.FCRF?page=1> [Accessed 15 March 2014].
Chapter 6Bates, R.H., 2005. Markets and States in Tropical Africa: The Political Basis of Agricultural Policies. California,
Berkeley: University of California Press.
Bischof-Niemz, T., 2013. Potential for Embedded PV Generators in South Africa. Presentation at the SAEEC, No-vember 14, 2013. Johannesburg.
Borel-Saladin, J., I. Turok, 2013. The Impact of the Green Economy on Jobs in South Africa. South African Journal of Science, 109(9-10), p.1-4.
195
Borenstein, S., 2012. The Private and Public Economics of Renewable Electricity Generation. Journal of Economic Perspectives, 26(1), pp. 67-92.
CLACSO (El Consejo Latinoamericano de Ciencias Sociales), CODESRIA (Council for the Development of Social Science Research in Africa) and IDEAS, 2014. Inequality and Climate Change: Perspectives from the South. Background Concept Note for the 3rd Clacso-Codesria-Ideas South-South Comparative Re-search Workshop 2014. South-South Collaborative Programme, 24-25 July, 2014 Dakar, Senegal.
DEA (Department of Environmental Affairs), 2010. National Climate Change Response Green Paper 2010. Pretoria.
-------, 2013. National Climate Change Response: White Paper. Pretoria.
DoE (Department of Energy), 2013a. Integrated Resource Plan for Electricity (IRP) 2010-2030. Update Report 2013. Pretoria.
-------, 2013b. Draft 2012 Integrated Energy Planning Report: Executive Summary (for Public Consultation). Preto-ria.
DME (Department of Minerals and Energy), 1998. White Paper on the Energy Policy of the Republic of South Africa. Pretoria
-------, 2005. Energy Efficiency Strategy of the Republic of South Africa. Pretoria.
DTI (Department of Trade and Industry), 2010. Unlocking South Africa’s Green Growth Potential: South African Renewables Initiative. Pretoria.
------, 2013. Industrial Policy Action Plan: Economic Sectors and Employment Cluster - IPAP 2013/14-2015/16. Pre-toria.
Edkin, M ., A. Marquard, and H. Winkler, 2010. South Africa’s Renewable Energy Policy Roadmaps. Energy Re-search Centre, University of Cape Town.
Eskom, 2014. Impressive Demand Reduction Achievements. Sunninghill.
Frankfurt School-UNEP Centre/BNEF, 2013. Global Trends in Renewable Energy Investment 2013. Frankfurt.
Gigerenzer, G. and Brighton, H., 2009. Home Heuristicus: Why Biased Minds Make Better Inferences. Topics in Cognitive Science, 1(1), pp. 107-143.
Huntington, H.G., 2009. Creating Jobs With “Green” Power Sources. Energy Modeling Forum OP 64, April 2009. Stanford, CA: Stanford University.
ICC (Infrastructure Coordinating Commission), 2013. A Summary of the South African National Infrastructure Plan: Presidential Infrastructure Coordinating Commission Report 2012. Pretoria.
M&G (Mail & Guardian), 2012. Brighten Up Your Gym With Eskom’s Light Replacement Programme. Advertorial, September 21-27, 2012, p.5
Maia, J., T. Giordano, N. Kelder, G. Bardien, M. Bodibe, P. Du Plooy, X. Jafta, D. Jarvis, E. Kruger-Cloete, G. Kuh, R.Lepelle, L. Makaulule. K. Mosoma, S. Neoh, N. Netshitomboni, T. Ngozo, J. Swanepoel, 2011. Green Jobs: An Estimate of the Direct Employment Potential of a Greening South African Economy. Industrial Development Corporation, Development Bank of South Africa, Trade and Industrial Policy Strategies.
Modise, M., 2013. Renewable Energy Resource Assessment in South Africa. Presentation. Sofitel Hotel, Abu Dha-bi, June 22, 2013.
Montmasson-Clair, G., 2012. Green Economy Policy Framework and Employment Opportunity: A South African Case Study. TIPS Working Paper Series 2012-02.
Moodley, S., Mabugu, R.M. and Hassan, R., 2005. Analysing Scenarios for Energy Emissions Reduction in South Africa. Journal of Energy in Southern Africa, 16(4), pp. 34-40.
Newberry, D.M., 1999. Privatization, Restructuring, and Regulation of Network Utilities. Cambridge, MA: The MIT Press.
NPC (National Planning Commission), 2011. Chapter 5: Transitioning to a Low Carbon Economy. In: National De-velopment Plan: Vision for 2030. Pretoria.
UNIDO (United Nations Industrial Development Organization) and GGGI (Global Green Growth Institute) 2014, 2015. Global Green Growth: Clean Energy Industrial Investments and Expanding Job Opportunities. Volume I. The View from the Top: Overall Findings. Vienna and Seoul.
references

Global Green Growth experiences
196
Rodrik, D., 2009. Diagnostics Before Prescription. Paper prepared for a Journal of Economic Perspectives Sym-posium on Development Economics. Available at: <www.hks.harvard.edu/fs/drodrik/Research%20papers/Diagnostics%20before%20prescription.pdf>.
Tinte, L. and Bischof-Niemz, T., 2013. Eskom Ilanga PV Roll-Out. Presentation to the Gauteng Department of Infra-structure Development, October 31, 2013.
Urban Earth, 2012. South African Carbon Snapshot, February 2012. Available at: <www.urbankearth.co.za> (Ac-cessed February 23, 2014).
World Bank, 2011. The International Comparison Program. Available at: <http://siteresources.worldbank.org/ICPEXT/Resources/ICP_2011.html>. (Accessed January 27, 2014).
-------, 2013. World Development Indicators. Washington, DC. Available at: <http://data.worldbank.org/indicator/EG.USE.ELEC.KH.PC> (Accessed May 24, 2014).

references


Vienna International Centre · P.O. Box 300 1400 Vienna · Austria Tel.: (+43-1) 26026-oE-mail: [email protected]
Headquarters19F Jeongdong Bldg. · 21-15 Jeongdong-gilJung-gu Seoul 100-784 · Republic of KoreaTel.: (+82-2) 2096-9991www.gggi.org