vanguard investments funds icvc
TRANSCRIPT

Interim Report and Financial Statements | For the six months ended 30 April 2022
Vanguard Investments Funds ICVC
(An open-ended investment company incorporated with limited liability andregistered in England and Wales under registered number IC000758)

Contents
Authorised Corporate Director’s Commentaryand Statement of Responsibilities 1
Tracking Error* 3
Balanced
Vanguard SustainableLife 40-50% Equity Fund 4
Vanguard SustainableLife 60-70% Equity Fund 15
Vanguard SustainableLife 80-90% Equity Fund 31
Equity
Vanguard Active U.K. Equity Fund 42
Vanguard ESG Developed World All Cap Equity Index Fund (UK) 48
Vanguard FTSE Developed Europe ex-U.K. Equity Index Fund 87
Vanguard FTSE Developed World ex-U.K. Equity Index Fund 97
Vanguard FTSE Global All Cap Index Fund 119
Vanguard FTSE U.K. Equity Income Index Fund 181
Vanguard Global Emerging Markets Fund 189
Vanguard Global Equity Fund 196
Vanguard Global Equity Income Fund 204
Vanguard Global Sustainable Equity Fund 213
Vanguard U.S. Equity Index Fund 218
Fixed Income
Vanguard U.K. Inflation-Linked Gilt Index Fund 252
Vanguard U.K. Long Duration Gilt Index Fund 258
Further Information* 265
Additional Information From the Directors 266
Directory* Inside Back Cover
* The items with an asterisk, plus each fund’s Investment Objective, Investment Strategy, Performance Summary, Performance Comparative Table, Summary of Significant Changes and PortfolioStatement, collectively constitute the Authorised Corporate Director’s Report.

The Authorised Corporate Director (“ACD”) of Vanguard Investments Funds ICVC (the “Company”) is Vanguard Investments UK, Limited. TheACD is the sole director of the Company. The Depositary is State Street Trustees Limited and the Independent Auditors arePricewaterhouseCoopers LLP. The Company is an authorised open-ended investment company with variable capital under Regulation14 (Authorisation) of the Open-Ended Investment Companies Regulations 2001 (as amended) (the “OEIC Regulations”), and the shareholdersare not liable for the debts of the Company.
The Company is an umbrella company and currently consists of 16 sub-funds (collectively "Funds"). New Funds may be formed by the ACDsubject to regulatory approval.
The investment objective of each Fund, the Company’s policy for pursuing that objective and a review of each Fund’s investment activities forthe relevant period are set out in the individual Fund reviews contained in this Interim Report and Financial Statements.
Important Events During the Period
With effect from 17 November 2021, Katie Smith resigned as a director of Vanguard Investments UK, Limited.
The Vanguard Global Balanced Fund changed its name to Vanguard SustainableLife 60-70% Equity Fund and updated its Investment Policy on8 December 2021.
The Vanguard Global Sustainable Equity Fund, Vanguard SustainableLife 40-50% Equity Fund, and Vanguard SustainableLife 80-90% EquityFund were launched on 8 December 2021.
On 6 January 2022, the Investment Objective and Policy of both the Vanguard U.K. Inflation-Linked Gilt Index Fund and the Vanguard U.K.Long Duration Gilt Index Fund were amended to remove reference to "Barclays" in the respective names of the indices the funds are tracking(following a Bloomberg rebranding).
On 21 March 2022, the investment policy of the Vanguard ESG Developed World All Cap Equity Index Fund (UK) was updated to reflectcertain changes to the methodology applied by FTSE Russell in relation to the index of the fund, the FTSE Developed All Cap Choice Index.The changes related to revenue thresholds and permitted levels of involvement in certain activities, used in determining whether a companyis eligible for inclusion in the index.
With effect from 30 April 2022, Robyn Laidlaw and Paul Jakubowski were appointed as directors and Kathleen Bock and Sean Hagertyresigned as directors of Vanguard Investments UK, Limited.
Significant market disruptions, such as those caused by pandemics (e.g., COVID-19 pandemic), natural or environmental disasters, war (e.g.,Russia’s invasion of Ukraine), acts of terrorism, or other events, can adversely affect local and global markets and normal market operations.Any such disruptions could have an adverse impact on the value of the trust’s investments and fund performance.
Events After the Balance Sheet Date
Management has determined that no events or transactions occurred subsequent to April 30, 2022, that would require recognition ordisclosure in these financial statements.
Potential Implications of Brexit
The United Kingdom is no longer a member state of the European Union. Despite the negotiation of the UK-EU Trade and CooperationAgreement in December 2020, the future economic and political relationship between the United Kingdom and the European Union (andbetween the United Kingdom and other countries) remains uncertain and subject to further negotiation in many respects, and a period ofeconomic and political uncertainty may therefore continue in the United Kingdom and the European Union.
Political and economic uncertainty may lead to speculation and subsequent market volatility, particularly for assets denominated in Britishpounds. Vanguard continues to encourage investors to follow its core investing principles, including maintaining long-term discipline.
The implications of Brexit extend beyond the UK economy and financial markets, affecting multinational organisations globally. The relevantregulatory authorities in the United Kingdom may in the future make changes to their rules which deviate from the standards applicable in theEuropean Union. This could result in changes being made to the rules applicable in the European Union.
The nature and extent of the impact of these factors on the Funds are uncertain, but may be adverse. Vanguard remains committed tosafeguarding our investors' assets and their long-term interests and has devoted significant resources to developing plans to manage theimpact of Brexit.
Authorised Corporate Director’s Statement of Responsibilities in Relation to the Financial Statements of the Company and Funds
The Financial Conduct Authority’s Collective Investment Schemes sourcebook (“COLL”) requires the ACD to prepare Financial Statements foreach annual and half-yearly accounting period, in accordance with United Kingdom Generally Accepted Accounting Practice, which give a trueand fair view of the financial position of the Company and Funds and of their net revenue and the net capital gains/(losses) on the property ofthe Company and Funds for the period.
In preparing the Financial Statements the ACD is required to:
• prepare the Financial Statements on a going-concern basis;
• select suitable accounting policies and then apply them consistently;
Vanguard Investments Funds ICVC AuthorisedCorporate Director’s Commentary and Statement of ResponsibilitiesPeriod ended 30 April 2022
1

• make judgements and accounting estimates that are reasonable and prudent;
• prepare Financial Statements in accordance with the Statement of Recommended Practice for Authorised Funds issued by theInvestment Management Association (now the Investment Association) (the “SORP 2014 as amended in 2017”) and with FinancialReporting Standard (“FRS”) 102 & 104;
• keep adequate accounting records that are sufficient to show and explain the Funds’ transactions and disclose with reasonable accuracyat any time the financial position of the Company and Funds, and enable it to ensure that the Financial Statements comply with therequirements above.
The ACD is responsible for the management of the Company in accordance with the Company’s Instrument of Incorporation, the Prospectusand the COLL and for taking reasonable steps for the prevention and detection of fraud, error and noncompliance with law or regulations.
The ACD’s report and the Financial Statements for the period ended 30 April 2022 were signed on 21 June 2022 on behalf of the ACD by:
John Bendl, Robyn Laidlaw,Director DirectorVanguard Investments UK, Limited Vanguard Investments UK, Limitedas Authorised Corporate Director of as Authorised Corporate Director ofVanguard Investments Funds ICVC Vanguard Investments Funds ICVC
21 June 2022 21 June 2022
2
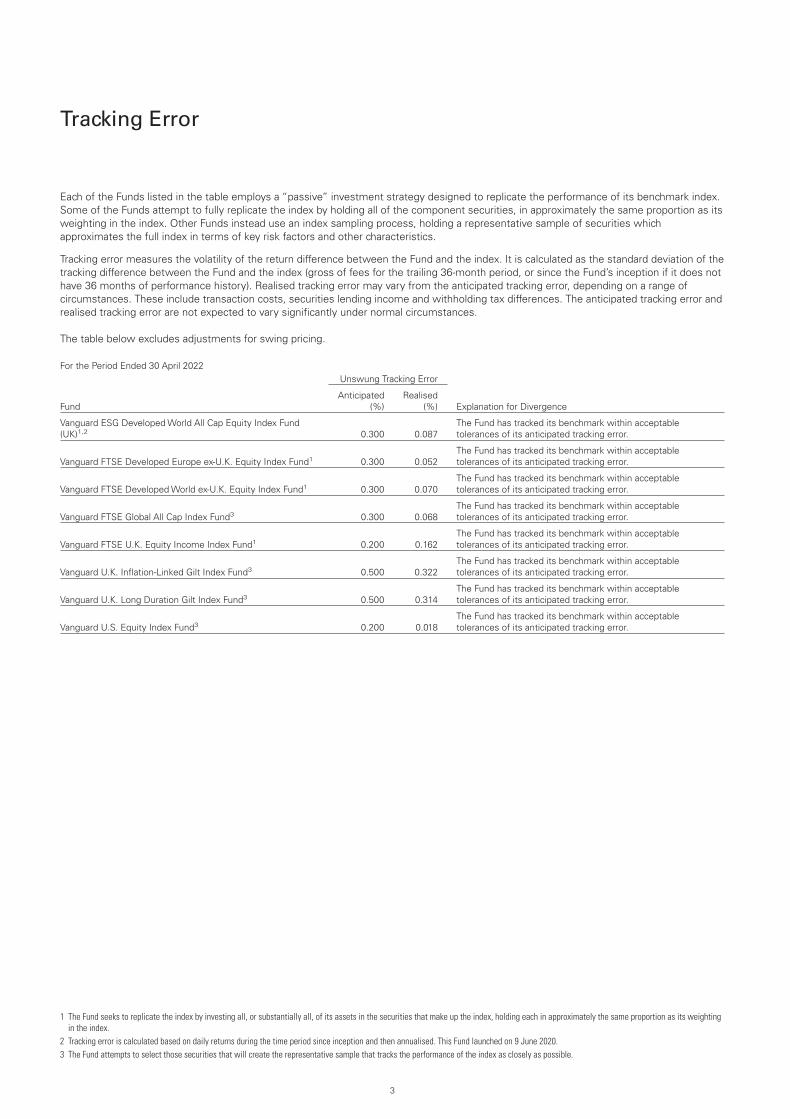
Each of the Funds listed in the table employs a “passive” investment strategy designed to replicate the performance of its benchmark index.Some of the Funds attempt to fully replicate the index by holding all of the component securities, in approximately the same proportion as itsweighting in the index. Other Funds instead use an index sampling process, holding a representative sample of securities whichapproximates the full index in terms of key risk factors and other characteristics.
Tracking error measures the volatility of the return difference between the Fund and the index. It is calculated as the standard deviation of thetracking difference between the Fund and the index (gross of fees for the trailing 36-month period, or since the Fund’s inception if it does nothave 36 months of performance history). Realised tracking error may vary from the anticipated tracking error, depending on a range ofcircumstances. These include transaction costs, securities lending income and withholding tax differences. The anticipated tracking error andrealised tracking error are not expected to vary significantly under normal circumstances.
The table below excludes adjustments for swing pricing.
For the Period Ended 30 April 2022Unswung Tracking Error
FundAnticipated
(%)Realised
(%) Explanation for Divergence
Vanguard ESG Developed World All Cap Equity Index Fund(UK)1,2 0.300 0.087
The Fund has tracked its benchmark within acceptabletolerances of its anticipated tracking error.
Vanguard FTSE Developed Europe ex-U.K. Equity Index Fund1 0.300 0.052The Fund has tracked its benchmark within acceptabletolerances of its anticipated tracking error.
Vanguard FTSE Developed World ex-U.K. Equity Index Fund1 0.300 0.070The Fund has tracked its benchmark within acceptabletolerances of its anticipated tracking error.
Vanguard FTSE Global All Cap Index Fund3 0.300 0.068The Fund has tracked its benchmark within acceptabletolerances of its anticipated tracking error.
Vanguard FTSE U.K. Equity Income Index Fund1 0.200 0.162The Fund has tracked its benchmark within acceptabletolerances of its anticipated tracking error.
Vanguard U.K. Inflation-Linked Gilt Index Fund3 0.500 0.322The Fund has tracked its benchmark within acceptabletolerances of its anticipated tracking error.
Vanguard U.K. Long Duration Gilt Index Fund3 0.500 0.314The Fund has tracked its benchmark within acceptabletolerances of its anticipated tracking error.
Vanguard U.S. Equity Index Fund3 0.200 0.018The Fund has tracked its benchmark within acceptabletolerances of its anticipated tracking error.
1 The Fund seeks to replicate the index by investing all, or substantially all, of its assets in the securities that make up the index, holding each in approximately the same proportion as its weightingin the index.
2 Tracking error is calculated based on daily returns during the time period since inception and then annualised. This Fund launched on 9 June 2020.3 The Fund attempts to select those securities that will create the representative sample that tracks the performance of the index as closely as possible.
Tracking Error
3

Investment Objective
The Vanguard SustainableLife 40-50% Equity Fund (the “Fund”) seeks to provide an increase in the value of investments over the long-term (more than 5 years)together with some money paid out from those investments as income.
Investment Strategy
The Fund seeks to achieve its investment objective by investing in a combination of shares of companies (between 40-50% of the portfolio, with an expectedallocation of 45%) and bonds (between 50-60% of the portfolio, with an expected allocation of 55%) selected in accordance with the Sustainability Policydescribed in the Prospectus.
Synthetic Risk and Reward Indicator
Lower risk
Typically lower rewards
Higher risk
Typically higher rewards
1 2 3 4 5 6 7
The Synthetic Risk and Reward Indicator (SRRI) measures the volatility of the Fund. The risk and reward category (which may range from 1 to 7) is calculatedusing historical data and may not be a reliable indicator of the Fund’s future risk profile. The risk and reward category may shift over time and is not a target orguarantee. The lowest category (i.e. category 1) does not mean “risk free”. The Fund appears in the middle range of the risk and reward indicator because thevalues of the Fund’s investments have experienced a moderate rate of change in the past.
Performance SummaryThe Performance Summary does not form part of the Financial Statements.
• Volatility surged and global financial markets slumped during the six months ended 30 April 2022. When the period began, supply bottlenecks, rising oil pricesand the prospect of less accommodative monetary policy were already weighing on market sentiment.
• Then Russia’s invasion of Ukraine injected substantial uncertainty into the markets. Energy prices soared, helping to push consumer prices to multidecadehighs across much of the world. Some central banks, including those in the United States and the United Kingdom, raised short-term interest rates. TheEuropean Central Bank continued to reduce its bond purchases and was expected to raise rates later this year.
• While consumer sentiment flagged during the period, in many markets unemployment remained low, consumer balance sheets healthy and corporate profitsrobust.
• With central banks turning less accommodative and inflation looking set to remain elevated for some time, bond yields in many markets moved higher acrossthe maturity spectrum. The Bloomberg Global Aggregate Bond Index hedged to British pounds, a global bond proxy, returned about –7% for the six months.
• Stocks regained some ground in March but finished the six months with a negative return. The FTSE Developed Index, the Fund’s equity benchmark and aproxy for global stocks, returned about –3%. The United Kingdom and Asia-Pacific were bright spots, while Europe detracted the most.
• The Fund is actively managed; it does not seek to track a benchmark. The performance information in the table below shows how the Fund’s returns comparewith those of a composite index with similar investment characteristics. From its inception on 8 December 2021 through 30 April 2022, the Fund held upsignificantly better than the index, which returned –8.81%. The Fund’s stock and bond portfolios both lagged their benchmarks.
• The United States, by far the largest market in the Fund’s equity index, drove much of the Fund’s outperformance. Japan, Switzerland and Spain were alsobright spots. In contrast, underweights in Australia and Canada and security selection in Austria and South Korea dampened the Fund’s relative performance.
• Among equity industry sectors, an underweight allocation to technology and security selection in technology, health care and industrials added the mostvalue. Security selection in basic materials, energy and consumer staples detracted.
• In the fixed income component, outperformance was driven by positioning. An underweight to credit spread duration and an overweight to Treasuriesboosted relative performance, while selection within energy and technology was a headwind.
Benchmark: SustainableLife 40-50% Equity Composite Index
Total ReturnsPeriods Ended 30 April 2022
(Annualised for periods over one year)
Ten Years orSince Inception1
GBP Acc -5.28%
Benchmark -8.81
GBP Inc -5.28%
Benchmark -8.81
Sources: Vanguard Global Advisers, LLC, FTSE and Bloomberg.Returns is based on NAV with income reinvested.
All of the returns in this report represent past performance, which is not a guarantee of future results that may be achieved by the Fund. For performance data current to the most recent month-end,which may be higher or lower than that cited, visit our website at http://global.vanguard.com. Note, too, that both investment returns and principal value can fluctuate widely, so an investor’s shares,when sold, could be worth more or less than their original cost.1 Since-inception returns: GBP Acc and GBP Inc, 8 December 2021.
Vanguard SustainableLife 40-50% Equity FundManaged by Wellington Management Company LLP.
4

Performance Comparative Table
GBP Acc†
For the PeriodEnded
30 April 2022
Closing Net Asset Value £17,081,744
Closing Number of Shares 180,434
Closing Net Asset Value Per Share1 £94.67
Operating Charges2 0.48%
GBP Inc†
Closing Net Asset Value £11,427,450
Closing Number of Shares 120,708
Closing Net Asset Value Per Share1 £94.67
Operating Charges2 0.48%
† The Fund launched on 8 December 2021.1 The net asset value per share shown may diverge from the net asset value per share used for dealing purposes as at 30 April 2022 because of any adjustments for trade date accounting, swing
pricing and any adjustments in valuation to bid prices.2 Operating charges include indirect costs incurred in the maintenance and running of the Fund, as disclosed in the detailed expenses within the Statement of Total Return.
Vanguard SustainableLife 40-50% Equity Fund
5

Summary of Significant ChangesFor the period ended 30 April 2022
Cost(£)
Largest Purchases
Bundesrepublik Deutschland Bundesanleihe 0.25%15/08/2028 1,382,236
US Treasury Note 0.750% 15/11/2024 828,132
US Treasury Note 1.375% 15/11/2031 756,633
US Treasury Note 0.000% 30/11/2023 622,661
Bundesobligation 0.000% 16/04/2027 619,269
Total 4,208,931
Total Purchases for the Period 42,397,737
Proceeds(£)
Largest Sales
Bundesrepublik Deutschland Bundesanleihe 0.250%15/08/2028 1,031,041
US Treasury Note 1.375% 15/11/2031 751,975
US Treasury Note 0.000% 30/11/2023 485,575
US Treasury Note 0.750% 15/11/2024 457,454
US Treasury Note 1.500% 31/01/2027 353,364
Total 3,079,409
Total Sales for the Period 13,136,988
Vanguard SustainableLife 40-50% Equity Fund
6

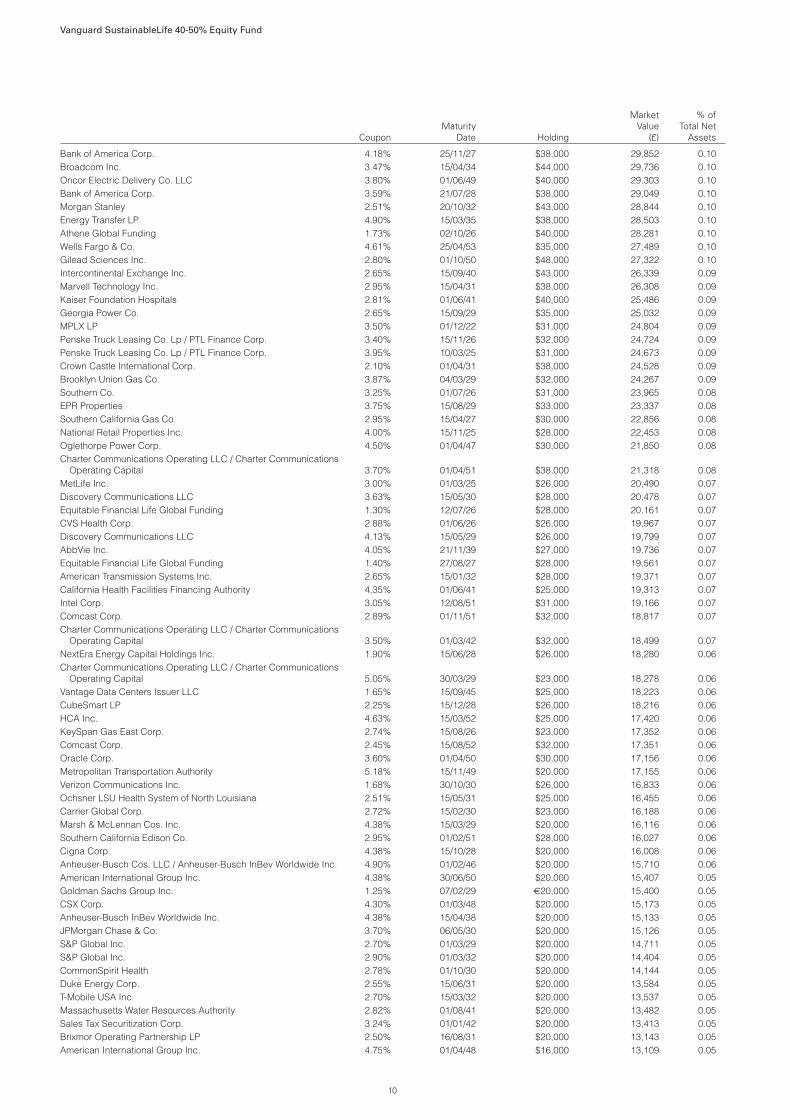
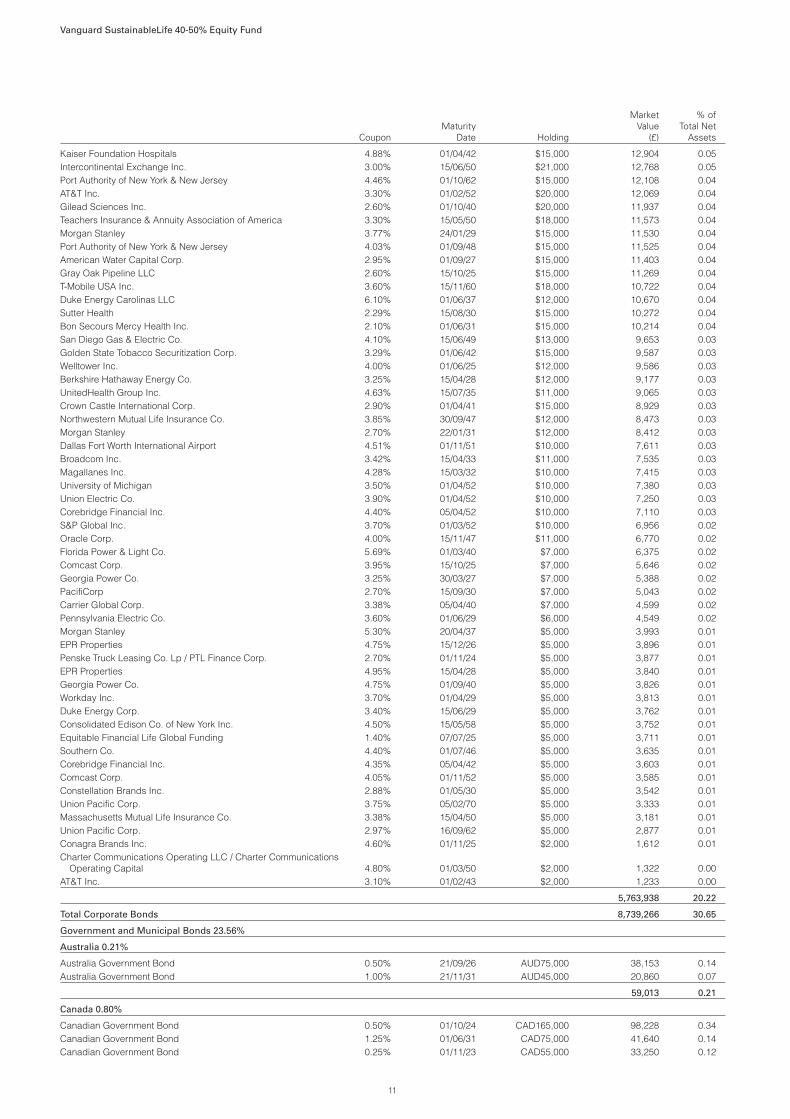
Portfolio StatementAs at 30 April 2022
Holding
MarketValue
(£)
% ofTotal Net
Assets
Equities 44.13%
Austria 0.45%
Erste Group Bank AG 5,175 128,755 0.45
128,755 0.45
Canada 0.26%
Dollarama Inc. 1,683 74,836 0.26
74,836 0.26
Finland 0.69%
Nokia Oyj (OMXH) 48,299 197,258 0.69
197,258 0.69
France 2.82%
TotalEnergies SE 3,772 149,678 0.52Arkema SA 1,610 147,661 0.52Schneider Electric SE 1,267 146,555 0.51Vinci SA 1,535 119,745 0.42Engie SA 11,370 108,168 0.38BNP Paribas SA 2,113 88,223 0.31Amundi SA 921 44,653 0.16
804,683 2.82
Germany 0.77%
MTU Aero Engines AG 1,140 184,348 0.65Bayerische Motoren Werke AG 530 34,848 0.12
219,196 0.77
Hong Kong 0.63%
AIA Group Ltd. 22,800 179,954 0.63
179,954 0.63
Japan 4.40%
Nippon Telegraph & Telephone Corp. 10,500 248,327 0.87Tokio Marine Holdings Inc. 4,370 188,300 0.66Resona Holdings Inc. 42,300 146,875 0.52Mitsubishi Estate Co. Ltd. 10,800 125,022 0.44Isuzu Motors Ltd. 12,400 115,567 0.41Mitsubishi UFJ Financial Group Inc. 23,500 108,931 0.38Marui Group Co. Ltd. 6,700 92,347 0.32Astellas Pharma Inc. 7,300 88,544 0.31Honda Motor Co. Ltd. 3,500 73,523 0.26BIPROGY Inc. 3,300 66,745 0.23
1,254,181 4.40
South Korea 0.60%
Samsung Electronics Co. Ltd. GDR 163 171,828 0.60
171,828 0.60
Spain 1.02%
Iberdrola SA 16,131 149,232 0.53CaixaBank SA 54,221 140,598 0.49
289,830 1.02
Sweden 0.73%
Lundin Energy AB 4,555 151,740 0.53Alfa Laval AB 2,438 54,905 0.20
206,645 0.73
Switzerland 2.25%
Novartis AG 3,986 282,926 0.99Nestle SA 1,773 183,316 0.64Zurich Insurance Group AG 350 128,064 0.45Julius Baer Group Ltd. 1,227 47,574 0.17
641,880 2.25
Holding
MarketValue
(£)
% ofTotal Net
Assets
Taiwan 0.65%
Taiwan Semiconductor ManufacturingCo. Ltd. ADR 2,507 185,744 0.65
185,744 0.65
United Kingdom 2.31%
AstraZeneca plc ADR 6,422 339,489 1.19WPP plc 16,016 160,961 0.57Rotork plc 23,510 68,837 0.24Prudential plc 5,305 53,580 0.19Derwent London plc 1,139 34,352 0.12
657,219 2.31
United States 26.55%
Johnson & Johnson 2,902 417,236 1.46Microsoft Corp. 1,545 341,574 1.20United Parcel Service Inc. 2,010 288,140 1.01Cisco Systems Inc. 7,213 281,453 0.99TJX Cos. Inc. 5,610 273,686 0.96Chubb Ltd. 1,581 259,886 0.91Duke Energy Corp. 2,951 258,973 0.91Mondelez International Inc. 5,033 258,445 0.91Colgate-Palmolive Co. 4,147 254,501 0.89Merck & Co. Inc. 3,531 249,490 0.88Sempra Energy 1,918 246,506 0.86Visa Inc. 1,366 231,681 0.81Texas Instruments Inc. 1,708 231,610 0.81Baxter International Inc. 4,004 226,622 0.79Comcast Corp. 7,117 225,386 0.79JPMorgan Chase & Co. 2,086 198,349 0.70Autoliv Inc. 3,332 195,541 0.69Pioneer Natural Resources Co. 1,043 192,999 0.68Curtiss-Wright Corp. 1,600 182,289 0.64Medtronic plc 2,191 182,121 0.64Alphabet Inc. Class A 98 178,095 0.62UnitedHealth Group Inc. 430 174,000 0.61American Express Co. 1,213 168,815 0.59Otis Worldwide Corp. 2,752 159,684 0.56Bank of America Corp. 5,472 155,421 0.55General Motors Co. 5,101 154,025 0.54Union Pacific Corp. 799 149,121 0.52American Tower Corp. 753 144,560 0.51Deere & Co. 459 137,897 0.48Home Depot Inc. 559 133,773 0.47Eli Lilly & Co. 573 133,330 0.47PNC Financial Services Group Inc. 965 127,706 0.45Caterpillar Inc. 630 105,632 0.37Linde plc 415 104,874 0.37McDonald's Corp. 416 82,584 0.29Accenture plc 309 73,953 0.26KLA Corp. 282 71,642 0.25BlackRock Inc. 135 67,176 0.24PepsiCo Inc. 480 65,648 0.23Intel Corp. 1,677 58,224 0.20Gilead Sciences Inc. 1,094 51,663 0.18Marsh & McLennan Cos. Inc. 383 49,328 0.17Broadcom Inc. 57 25,170 0.09
7,568,809 26.55
Total Equities 12,580,818 44.13
CouponMaturity
Date Holding
MarketValue
(£)
% ofTotal Net
Assets
Corporate Bonds 30.65%
Australia 0.25%
Macquarie Group Ltd. 2.87% 14/01/33 $106,000 70,198 0.25
70,198 0.25
Vanguard SustainableLife 40-50% Equity Fund
7

CouponMaturity
Date Holding
MarketValue
(£)
% ofTotal Net
Assets
Canada 0.37%
Toronto-Dominion Bank 3.20% 10/03/32 $70,000 50,887 0.18Canadian Pacific Railway Co. 3.00% 02/12/41 $32,000 20,734 0.07Fortis Inc. 3.06% 04/10/26 $23,000 17,575 0.06Nutrien Ltd. 4.13% 15/03/35 $23,000 17,411 0.06
106,607 0.37
Cayman Islands 0.21%
Avolon Holdings Funding Ltd. 2.53% 18/11/27 $77,000 52,653 0.18Avolon Holdings Funding Ltd. 2.13% 21/02/26 $12,000 8,537 0.03
61,190 0.21
Denmark 0.33%
Danske Bank A/S 2.25% 14/01/28 £100,000 93,731 0.33
93,731 0.33
France 1.50%
BPCE SFH SA 1.13% 12/04/30 €200,000 161,382 0.57BNP Paribas SA 2.50% 31/03/32 €100,000 80,706 0.28BNP Paribas SA 0.88% 11/07/30 €100,000 73,769 0.26Orange SA 0.63% 16/12/33 €100,000 69,941 0.24RCI Banque SA 0.50% 14/07/25 €55,000 43,073 0.15
428,871 1.50
Germany 0.94%
Volkswagen Leasing GmbH 1.38% 20/01/25 €200,000 165,527 0.58Kreditanstalt fuer Wiederaufbau 0.01% 09/11/28 €110,000 85,593 0.30Kreditanstalt fuer Wiederaufbau 0.13% 30/06/25 €20,000 16,467 0.06
267,587 0.94
Ireland 0.08%
Johnson Controls International plc 4.63% 02/07/44 $28,000 21,643 0.08
21,643 0.08
Jersey 0.91%
Galaxy Pipeline Assets Bidco Ltd. 2.16% 31/03/34 $235,411 165,041 0.58Heathrow Funding Ltd. 2.75% 13/10/29 £100,000 94,037 0.33
259,078 0.91
Netherlands 0.35%
Enel Finance International NV 0.50% 17/06/30 €125,000 90,475 0.32Shell International Finance BV 3.00% 26/11/51 $15,000 9,358 0.03
99,833 0.35
Norway 0.41%
Aker BP ASA 1.13% 12/05/29 €100,000 75,526 0.26Equinor ASA 3.00% 06/04/27 $54,000 41,723 0.15
117,249 0.41
Qatar 0.60%
Qatar Energy 2.25% 12/07/31 $245,000 170,790 0.60
170,790 0.60
Switzerland 1.36%
Credit Suisse Group AG 2.59% 11/09/25 $335,000 254,461 0.89UBS Group AG 2.75% 11/02/33 $200,000 134,028 0.47
388,489 1.36
United Kingdom 3.12%
HSBC Holdings plc 1.00% 12/09/26 $200,000 158,399 0.56Barclays plc 2.85% 07/05/26 $200,000 152,538 0.53Santander UK Group Holdings plc 1.00% 15/03/25 $200,000 150,445 0.53GSK Consumer Healthcare Capital UK plc 3.38% 29/03/38 £100,000 97,837 0.34NatWest Group plc 1.04% 14/09/32 €125,000 92,373 0.32Tritax Big Box REIT plc 1.50% 27/11/33 £100,000 82,280 0.29CSL UK Holdings Ltd. 4.25% 27/04/32 $100,000 79,019 0.28Barclays plc 1.00% 22/03/31 €100,000 77,171 0.27
890,062 3.12
United States 20.22%
Verizon Communications Inc. 2.36% 15/03/32 $248,000 166,449 0.58Alcon Finance Corp. 3.00% 23/09/29 $200,000 144,355 0.51
Vanguard SustainableLife 40-50% Equity Fund
8

CouponMaturity
Date Holding
MarketValue
(£)
% ofTotal Net
Assets
State of Illinois 5.10% 01/06/33 $130,000 105,869 0.37AT&T Inc. 2.35% 05/09/29 €125,000 105,229 0.37Nestle Holdings Inc. 2.13% 04/04/27 £105,000 103,059 0.36Walt Disney Co. 3.06% 30/03/27 CAD170,000 101,280 0.36JPMorgan Chase & Co. 2.95% 24/02/28 $130,000 97,526 0.34Charles Schwab Corp. 2.90% 03/03/32 $135,000 96,361 0.34Public Storage 0.50% 09/09/30 €122,000 85,533 0.30Morgan Stanley 2.48% 16/09/36 $132,000 84,243 0.30Bank of America Corp. 1.00% 27/04/33 €100,000 83,721 0.29Lowe’s Cos. Inc. 3.75% 01/04/32 $110,000 82,711 0.29Morgan Stanley 1.00% 21/10/25 $105,000 77,643 0.27Verizon Communications Inc. 1.25% 08/04/30 €100,000 77,291 0.27Bank of America Corp. 2.48% 21/09/36 $115,000 73,613 0.26Conagra Brands Inc. 1.38% 01/11/27 $105,000 71,014 0.25Wells Fargo & Co. 3.53% 24/03/28 $90,000 69,012 0.24Duke Energy Carolinas LLC 2.85% 15/03/32 $95,000 68,320 0.24Hess Corp. 7.30% 15/08/31 $72,000 66,641 0.23SBA Tower Trust 1.63% 15/11/26 $90,000 66,047 0.23AT&T Inc. 3.50% 15/09/53 $104,000 64,949 0.23Aviation Capital Group LLC 1.95% 30/01/26 $85,000 60,428 0.21Athene Global Funding 2.50% 24/03/28 $84,000 59,354 0.21EPR Properties 3.60% 15/11/31 $87,000 58,709 0.21Schlumberger Holdings Corp. 3.90% 17/05/28 $75,000 58,020 0.20Cox Communications Inc. 3.50% 15/08/27 $75,000 57,875 0.20Equitable Financial Life Global Funding 1.70% 12/11/26 $80,000 57,859 0.20Brighthouse Financial Global Funding 1.55% 24/05/26 $80,000 57,803 0.20Hyundai Capital America 3.50% 02/11/26 $75,000 57,494 0.20US Bancorp 2.49% 03/11/36 $85,000 56,987 0.20Gray Oak Pipeline LLC 3.45% 15/10/27 $76,000 56,715 0.20Sempra Energy 3.25% 15/06/27 $72,000 54,922 0.19Anheuser-Busch InBev Worldwide Inc. 4.50% 01/06/50 $72,000 53,691 0.19Workday Inc. 3.80% 01/04/32 $70,000 52,762 0.19Goldman Sachs Group Inc. 1.43% 09/03/27 $72,000 51,283 0.18Kyndryl Holdings Inc. 3.15% 15/10/31 $80,000 49,668 0.17Wells Fargo & Co. 4.10% 03/06/26 $59,000 46,791 0.16Union Pacific Corp. 2.80% 14/02/32 $65,000 46,513 0.16Oracle Corp. 2.88% 25/03/31 $68,000 45,939 0.16Broadcom Inc. 2.60% 15/02/33 $70,000 44,401 0.16Chicago Transit Authority Sales & Transfer Tax Receipts Revenue 6.90% 01/12/40 $45,000 44,063 0.15Municipal Electric Authority of Georgia 6.64% 01/04/57 $45,000 43,842 0.15Goldman Sachs Group Inc. 2.65% 21/10/32 $64,000 43,034 0.15Consolidated Edison Co. of New York Inc. 3.20% 01/12/51 $68,000 42,663 0.15San Diego Gas & Electric Co. 3.70% 15/03/52 $60,000 41,872 0.15Goldman Sachs Group Inc. 1.00% 24/02/33 $60,000 41,775 0.15CommonSpirit Health 3.91% 01/10/50 $60,000 41,213 0.14TWDC Enterprises 18 Corp. 4.38% 16/08/41 $53,000 40,938 0.14T-Mobile USA Inc. 2.55% 15/02/31 $60,000 40,692 0.14Citigroup Inc. 3.52% 27/10/28 $53,000 40,146 0.14Goldman Sachs Group Inc. 2.62% 22/04/32 $59,000 39,789 0.14Broadcom Inc. 2.45% 15/02/31 $60,000 39,439 0.14T-Mobile USA Inc. 2.05% 15/02/28 $56,000 39,355 0.14Enterprise Products Operating LLC 4.85% 15/03/44 $51,000 38,847 0.14Microchip Technology Inc. 0.97% 15/02/24 $51,000 38,719 0.14JPMorgan Chase & Co. 2.58% 22/04/32 $54,000 37,015 0.13JPMorgan Chase & Co. 2.55% 08/11/32 $53,000 35,821 0.13Marathon Oil Corp. 6.60% 01/10/37 $40,000 35,674 0.13Bank of America Corp. 2.57% 20/10/32 $53,000 35,662 0.13Penske Truck Leasing Co. Lp / PTL Finance Corp. 4.25% 17/01/23 $44,000 35,434 0.12Intercontinental Exchange Inc. 1.85% 15/09/32 $55,000 35,275 0.12Hyundai Capital America 0.80% 03/04/23 $45,000 35,063 0.12General Motors Co. 5.00% 01/10/28 $44,000 34,779 0.12Ryder System Inc. 2.90% 01/12/26 $45,000 34,010 0.12Burlington Northern Santa Fe LLC 4.40% 15/03/42 $43,000 33,828 0.12Boston Gas Co. 3.15% 01/08/27 $45,000 33,822 0.12Corebridge Financial Inc. 3.90% 05/04/32 $45,000 33,669 0.12Mid-Atlantic Interstate Transmission LLC 4.10% 15/05/28 $43,000 33,449 0.12AbbVie Inc. 4.25% 21/11/49 $43,000 31,398 0.11Citigroup Inc. 4.60% 09/03/26 $38,000 30,495 0.11
Vanguard SustainableLife 40-50% Equity Fund
9
CouponMaturity
Date Holding
MarketValue
(£)
% ofTotal Net
Assets
Bank of America Corp. 4.18% 25/11/27 $38,000 29,852 0.10Broadcom Inc. 3.47% 15/04/34 $44,000 29,736 0.10Oncor Electric Delivery Co. LLC 3.80% 01/06/49 $40,000 29,303 0.10Bank of America Corp. 3.59% 21/07/28 $38,000 29,049 0.10Morgan Stanley 2.51% 20/10/32 $43,000 28,844 0.10Energy Transfer LP 4.90% 15/03/35 $38,000 28,503 0.10Athene Global Funding 1.73% 02/10/26 $40,000 28,281 0.10Wells Fargo & Co. 4.61% 25/04/53 $35,000 27,489 0.10Gilead Sciences Inc. 2.80% 01/10/50 $48,000 27,322 0.10Intercontinental Exchange Inc. 2.65% 15/09/40 $43,000 26,339 0.09Marvell Technology Inc. 2.95% 15/04/31 $38,000 26,308 0.09Kaiser Foundation Hospitals 2.81% 01/06/41 $40,000 25,486 0.09Georgia Power Co. 2.65% 15/09/29 $35,000 25,032 0.09MPLX LP 3.50% 01/12/22 $31,000 24,804 0.09Penske Truck Leasing Co. Lp / PTL Finance Corp. 3.40% 15/11/26 $32,000 24,724 0.09Penske Truck Leasing Co. Lp / PTL Finance Corp. 3.95% 10/03/25 $31,000 24,673 0.09Crown Castle International Corp. 2.10% 01/04/31 $38,000 24,528 0.09Brooklyn Union Gas Co. 3.87% 04/03/29 $32,000 24,267 0.09Southern Co. 3.25% 01/07/26 $31,000 23,965 0.08EPR Properties 3.75% 15/08/29 $33,000 23,337 0.08Southern California Gas Co. 2.95% 15/04/27 $30,000 22,856 0.08National Retail Properties Inc. 4.00% 15/11/25 $28,000 22,453 0.08Oglethorpe Power Corp. 4.50% 01/04/47 $30,000 21,850 0.08Charter Communications Operating LLC / Charter Communications
Operating Capital 3.70% 01/04/51 $38,000 21,318 0.08MetLife Inc. 3.00% 01/03/25 $26,000 20,490 0.07Discovery Communications LLC 3.63% 15/05/30 $28,000 20,478 0.07Equitable Financial Life Global Funding 1.30% 12/07/26 $28,000 20,161 0.07CVS Health Corp. 2.88% 01/06/26 $26,000 19,967 0.07Discovery Communications LLC 4.13% 15/05/29 $26,000 19,799 0.07AbbVie Inc. 4.05% 21/11/39 $27,000 19,736 0.07Equitable Financial Life Global Funding 1.40% 27/08/27 $28,000 19,561 0.07American Transmission Systems Inc. 2.65% 15/01/32 $28,000 19,371 0.07California Health Facilities Financing Authority 4.35% 01/06/41 $25,000 19,313 0.07Intel Corp. 3.05% 12/08/51 $31,000 19,166 0.07Comcast Corp. 2.89% 01/11/51 $32,000 18,817 0.07Charter Communications Operating LLC / Charter Communications
Operating Capital 3.50% 01/03/42 $32,000 18,499 0.07NextEra Energy Capital Holdings Inc. 1.90% 15/06/28 $26,000 18,280 0.06Charter Communications Operating LLC / Charter Communications
Operating Capital 5.05% 30/03/29 $23,000 18,278 0.06Vantage Data Centers Issuer LLC 1.65% 15/09/45 $25,000 18,223 0.06CubeSmart LP 2.25% 15/12/28 $26,000 18,216 0.06HCA Inc. 4.63% 15/03/52 $25,000 17,420 0.06KeySpan Gas East Corp. 2.74% 15/08/26 $23,000 17,352 0.06Comcast Corp. 2.45% 15/08/52 $32,000 17,351 0.06Oracle Corp. 3.60% 01/04/50 $30,000 17,156 0.06Metropolitan Transportation Authority 5.18% 15/11/49 $20,000 17,155 0.06Verizon Communications Inc. 1.68% 30/10/30 $26,000 16,833 0.06Ochsner LSU Health System of North Louisiana 2.51% 15/05/31 $25,000 16,455 0.06Carrier Global Corp. 2.72% 15/02/30 $23,000 16,188 0.06Marsh & McLennan Cos. Inc. 4.38% 15/03/29 $20,000 16,116 0.06Southern California Edison Co. 2.95% 01/02/51 $28,000 16,027 0.06Cigna Corp. 4.38% 15/10/28 $20,000 16,008 0.06Anheuser-Busch Cos. LLC / Anheuser-Busch InBev Worldwide Inc. 4.90% 01/02/46 $20,000 15,710 0.06American International Group Inc. 4.38% 30/06/50 $20,000 15,407 0.05Goldman Sachs Group Inc. 1.25% 07/02/29 €20,000 15,400 0.05CSX Corp. 4.30% 01/03/48 $20,000 15,173 0.05Anheuser-Busch InBev Worldwide Inc. 4.38% 15/04/38 $20,000 15,133 0.05JPMorgan Chase & Co. 3.70% 06/05/30 $20,000 15,126 0.05S&P Global Inc. 2.70% 01/03/29 $20,000 14,711 0.05S&P Global Inc. 2.90% 01/03/32 $20,000 14,404 0.05CommonSpirit Health 2.78% 01/10/30 $20,000 14,144 0.05Duke Energy Corp. 2.55% 15/06/31 $20,000 13,584 0.05T-Mobile USA Inc. 2.70% 15/03/32 $20,000 13,537 0.05Massachusetts Water Resources Authority 2.82% 01/08/41 $20,000 13,482 0.05Sales Tax Securitization Corp. 3.24% 01/01/42 $20,000 13,413 0.05Brixmor Operating Partnership LP 2.50% 16/08/31 $20,000 13,143 0.05American International Group Inc. 4.75% 01/04/48 $16,000 13,109 0.05
Vanguard SustainableLife 40-50% Equity Fund
10
CouponMaturity
Date Holding
MarketValue
(£)
% ofTotal Net
Assets
Kaiser Foundation Hospitals 4.88% 01/04/42 $15,000 12,904 0.05Intercontinental Exchange Inc. 3.00% 15/06/50 $21,000 12,768 0.05Port Authority of New York & New Jersey 4.46% 01/10/62 $15,000 12,108 0.04AT&T Inc. 3.30% 01/02/52 $20,000 12,069 0.04Gilead Sciences Inc. 2.60% 01/10/40 $20,000 11,937 0.04Teachers Insurance & Annuity Association of America 3.30% 15/05/50 $18,000 11,573 0.04Morgan Stanley 3.77% 24/01/29 $15,000 11,530 0.04Port Authority of New York & New Jersey 4.03% 01/09/48 $15,000 11,525 0.04American Water Capital Corp. 2.95% 01/09/27 $15,000 11,403 0.04Gray Oak Pipeline LLC 2.60% 15/10/25 $15,000 11,269 0.04T-Mobile USA Inc. 3.60% 15/11/60 $18,000 10,722 0.04Duke Energy Carolinas LLC 6.10% 01/06/37 $12,000 10,670 0.04Sutter Health 2.29% 15/08/30 $15,000 10,272 0.04Bon Secours Mercy Health Inc. 2.10% 01/06/31 $15,000 10,214 0.04San Diego Gas & Electric Co. 4.10% 15/06/49 $13,000 9,653 0.03Golden State Tobacco Securitization Corp. 3.29% 01/06/42 $15,000 9,587 0.03Welltower Inc. 4.00% 01/06/25 $12,000 9,586 0.03Berkshire Hathaway Energy Co. 3.25% 15/04/28 $12,000 9,177 0.03UnitedHealth Group Inc. 4.63% 15/07/35 $11,000 9,065 0.03Crown Castle International Corp. 2.90% 01/04/41 $15,000 8,929 0.03Northwestern Mutual Life Insurance Co. 3.85% 30/09/47 $12,000 8,473 0.03Morgan Stanley 2.70% 22/01/31 $12,000 8,412 0.03Dallas Fort Worth International Airport 4.51% 01/11/51 $10,000 7,611 0.03Broadcom Inc. 3.42% 15/04/33 $11,000 7,535 0.03Magallanes Inc. 4.28% 15/03/32 $10,000 7,415 0.03University of Michigan 3.50% 01/04/52 $10,000 7,380 0.03Union Electric Co. 3.90% 01/04/52 $10,000 7,250 0.03Corebridge Financial Inc. 4.40% 05/04/52 $10,000 7,110 0.03S&P Global Inc. 3.70% 01/03/52 $10,000 6,956 0.02Oracle Corp. 4.00% 15/11/47 $11,000 6,770 0.02Florida Power & Light Co. 5.69% 01/03/40 $7,000 6,375 0.02Comcast Corp. 3.95% 15/10/25 $7,000 5,646 0.02Georgia Power Co. 3.25% 30/03/27 $7,000 5,388 0.02PacifiCorp 2.70% 15/09/30 $7,000 5,043 0.02Carrier Global Corp. 3.38% 05/04/40 $7,000 4,599 0.02Pennsylvania Electric Co. 3.60% 01/06/29 $6,000 4,549 0.02Morgan Stanley 5.30% 20/04/37 $5,000 3,993 0.01EPR Properties 4.75% 15/12/26 $5,000 3,896 0.01Penske Truck Leasing Co. Lp / PTL Finance Corp. 2.70% 01/11/24 $5,000 3,877 0.01EPR Properties 4.95% 15/04/28 $5,000 3,840 0.01Georgia Power Co. 4.75% 01/09/40 $5,000 3,826 0.01Workday Inc. 3.70% 01/04/29 $5,000 3,813 0.01Duke Energy Corp. 3.40% 15/06/29 $5,000 3,762 0.01Consolidated Edison Co. of New York Inc. 4.50% 15/05/58 $5,000 3,752 0.01Equitable Financial Life Global Funding 1.40% 07/07/25 $5,000 3,711 0.01Southern Co. 4.40% 01/07/46 $5,000 3,635 0.01Corebridge Financial Inc. 4.35% 05/04/42 $5,000 3,603 0.01Comcast Corp. 4.05% 01/11/52 $5,000 3,585 0.01Constellation Brands Inc. 2.88% 01/05/30 $5,000 3,542 0.01Union Pacific Corp. 3.75% 05/02/70 $5,000 3,333 0.01Massachusetts Mutual Life Insurance Co. 3.38% 15/04/50 $5,000 3,181 0.01Union Pacific Corp. 2.97% 16/09/62 $5,000 2,877 0.01Conagra Brands Inc. 4.60% 01/11/25 $2,000 1,612 0.01Charter Communications Operating LLC / Charter Communications
Operating Capital 4.80% 01/03/50 $2,000 1,322 0.00AT&T Inc. 3.10% 01/02/43 $2,000 1,233 0.00
5,763,938 20.22
Total Corporate Bonds 8,739,266 30.65
Government and Municipal Bonds 23.56%
Australia 0.21%
Australia Government Bond 0.50% 21/09/26 AUD75,000 38,153 0.14Australia Government Bond 1.00% 21/11/31 AUD45,000 20,860 0.07
59,013 0.21
Canada 0.80%
Canadian Government Bond 0.50% 01/10/24 CAD165,000 98,228 0.34Canadian Government Bond 1.25% 01/06/31 CAD75,000 41,640 0.14Canadian Government Bond 0.25% 01/11/23 CAD55,000 33,250 0.12
Vanguard SustainableLife 40-50% Equity Fund
11

CouponMaturity
Date Holding
MarketValue
(£)
% ofTotal Net
Assets
Canadian Government Bond 2.00% 01/12/51 CAD60,000 31,306 0.11Canadian Government Bond 1.50% 01/12/31 CAD45,000 24,826 0.09
229,250 0.80
France 0.11%
French Republic Government Bond OAT 0.01% 25/11/31 €43,000 31,616 0.11
31,616 0.11
Germany 4.30%
Bundesobligation 0.01% 16/04/27 €765,000 621,749 2.18Bundesrepublik Deutschland Bundesanleihe 0.25% 15/08/28 €385,000 313,518 1.10Bundesrepublik Deutschland Bundesanleihe 0.01% 15/05/35 €215,000 157,607 0.55Bundesrepublik Deutschland Bundesanleihe 1.25% 15/08/48 €152,000 133,830 0.47
1,226,704 4.30
Italy 0.24%
Italy Buoni Poliennali Del Tesoro 0.95% 01/08/30 €90,000 66,760 0.24
66,760 0.24
Japan 0.21%
Japan Government Thirty Year Bond1 0.70% 20/06/51 ¥8,200,000 47,164 0.17Japan Government Thirty Year Bond1 0.70% 20/09/51 ¥2,250,000 12,917 0.04
60,081 0.21
Romania 0.07%
Romanian Government International Bond 2.00% 14/04/33 €15,000 9,181 0.03Romanian Government International Bond 2.63% 02/12/40 €15,000 8,388 0.03Romanian Government International Bond 1.75% 13/07/30 €5,000 3,319 0.01
20,888 0.07
Spain 0.05%
Spain Government Bond 0.60% 31/10/29 €17,000 13,336 0.05
13,336 0.05
Supranational 1.05%
European Union 0.01% 04/07/29 €120,000 91,784 0.32European Union 0.01% 04/07/31 €52,000 38,245 0.14European Stability Mechanism 0.01% 15/12/26 €40,000 31,880 0.11European Investment Bank 0.01% 15/11/27 €40,000 31,587 0.11European Stability Mechanism 0.01% 16/12/24 €27,500 22,616 0.08European Union 0.40% 04/02/37 €32,000 22,371 0.08European Union 1.25% 04/02/43 €25,000 19,281 0.07European Union 0.75% 04/01/47 €22,000 14,960 0.05European Union 0.20% 04/06/36 €15,000 10,198 0.04European Investment Bank 0.38% 15/09/27 €11,000 8,886 0.03European Union 0.45% 04/07/41 €10,000 6,590 0.02
298,398 1.05
United Kingdom 1.12%
United Kingdom Gilt 0.25% 31/07/31 £306,000 263,665 0.92United Kingdom Gilt 0.63% 22/10/50 £81,000 56,816 0.20
320,481 1.12
United States 15.40%
US Treasury Note 2.50% 31/03/27 $620,000 483,950 1.70US Treasury Note 0.75% 15/11/24 $465,000 351,244 1.23US Treasury Note 1.88% 28/02/27 $435,000 329,964 1.16US Treasury Note 2.00% 15/11/41 $470,000 309,835 1.09US Treasury Note 2.25% 15/02/52 $335,000 229,095 0.80US Treasury Note 2.38% 15/02/42 $310,000 218,210 0.77US Treasury Note 1.50% 15/02/25 $260,000 199,355 0.70US Treasury Note 1.00% 15/12/24 $255,000 193,617 0.68US Treasury Note 2.63% 15/04/25 $210,000 166,062 0.58Fannie Mae 3.50% 12/05/52 $200,000 154,434 0.54Fannie Mae 3.00% 12/05/52 $200,000 150,139 0.53United States Treasury Bill 0.01% 23/06/22 $175,000 139,267 0.49US Treasury Note 0.50% 30/11/23 $170,000 131,025 0.46US Treasury Note 2.25% 31/03/24 $165,000 130,303 0.46United States Treasury Bill 0.01% 26/01/23 $150,000 118,046 0.41Fannie Mae 2.00% 13/06/52 $150,000 105,098 0.37Fannie Mae 2.50% 17/05/37 $125,000 95,271 0.33
Vanguard SustainableLife 40-50% Equity Fund
12

CouponMaturity
Date Holding
MarketValue
(£)
% ofTotal Net
Assets
US Treasury Note 1.50% 29/02/24 $120,000 93,586 0.33Fannie Mae Pool 2.50% 01/08/51 $121,299 88,609 0.31US Treasury Note 1.13% 15/01/25 $80,000 60,817 0.21US Treasury Note 1.75% 15/03/25 $75,000 57,870 0.20Fannie Mae 2.50% 12/05/52 $75,000 54,468 0.19Fannie Mae 2.50% 13/06/52 $75,000 54,357 0.19Freddie Mac Multifamily Structured Pass Through Certificates 2.25% 25/01/32 $75,000 53,767 0.19Fannie Mae 2.00% 12/05/52 $75,000 52,651 0.18Fannie Mae REMICS 3.00% 25/03/45 $55,779 41,980 0.15Government National Mortgage 2.50% 20/12/49 $52,792 39,798 0.14US Treasury Note 0.75% 31/12/23 $50,000 38,600 0.14Ginnie Mae 2.50% 19/05/52 $50,000 36,937 0.13Fannie Mae Pool 2.50% 01/11/51 $48,607 35,551 0.12Fannie Mae Pool 2.00% 01/09/51 $49,248 34,772 0.12Fannie Mae Pool 2.00% 01/07/41 $46,099 32,940 0.12US Treasury Note 1.88% 15/02/32 $45,000 32,728 0.11Ginnie Mae 3.00% 19/05/52 $25,000 18,974 0.07Ginnie Mae 2.00% 19/05/52 $25,000 18,040 0.06Fannie Mae Pool 2.00% 01/04/41 $22,955 16,402 0.06Fannie Mae Pool 2.00% 01/05/41 $22,664 16,194 0.06US Treasury Note 1.50% 31/01/27 $5,000 3,728 0.01US Treasury Note 1.88% 15/02/51 $5,000 3,121 0.01
4,390,805 15.40
Total Government and Municipal Bonds 6,717,332 23.56
Total Equities and Debt Securities 28,037,416 98.34
Number ofContracts
Long/(Short)
NotionalAmount
(£)
UnrealisedGain/(Loss)
(£)
% ofTotal Net
Assets
Financial Derivative Instruments (0.24%)
Futures Contracts 0.29%
US Treasury Note Ultra 10 Year June 2022 (8) (821,983) 56,253 0.20Euro-BUND June 2022 (3) (387,168) 27,617 0.10US Treasury Note 10 Year June 2022 (3) (284,722) 10,525 0.04United Kingdom Gilt June 2022 (2) (236,880) 7,548 0.03US Treasury Note 5 Year June 2022 (1) (89,743) 1,256 0.00Euro-Schatz June 2022 6 555,304 (7,962) (0.03)Euro-BOBL June 2022 3 320,594 (13,724) (0.05)
81,513 0.29
CurrencyBuy
Amount Currency(Sell)
Amount CounterpartySettlement
Date
UnrealisedGain/(Loss)
(£)
% ofTotal Net
Assets
Forward Currency Exchange Contracts (0.53%)
USD 4,104,313 EUR (841,000) JP Morgan Chase Bank 31/5/22 41,812 0.15USD 1,025,322 GBP (806,000) Goldman Sachs 31/5/22 9,931 0.03USD 88,102 JPY (11,280,000) JP Morgan Chase Bank 31/5/22 924 0.00USD 81,397 AUD (114,000) JP Morgan Chase Bank 31/5/22 339 0.00GBP 45,000 USD (56,268) JP Morgan Chase Bank 31/5/22 223 0.00EUR 99,000 USD (104,599) Goldman Sachs 31/5/22 (133) (0.00)EUR 71,000 USD (75,150) JP Morgan Chase Bank 31/5/22 (202) (0.00)USD 428,322 CAD (549,000) JP Morgan Chase Bank 31/5/22 (334) (0.00)GBP 160,000 USD (202,880) JP Morgan Chase Bank 31/5/22 (1,448) (0.00)GBP 16,332,000 USD (20,776,133) Goldman Sachs 31/5/22 (201,234) (0.71)
(150,122) (0.53)
Total Financial Derivative Instruments (68,609) (0.24)
MarketValue
(£)
% ofTotal Net
Assets
Portfolio of Investments 27,968,807 98.10
Net Other Assets 540,387 1.90
Net Assets Attributable to Shareholders 28,509,194 100.00
All holdings are listed on an official stock exchange or are traded on an eligible securities market, unless otherwise stated.1 Manually priced securities.
Vanguard SustainableLife 40-50% Equity Fund
13

As at
30 April 2022(£)
Assets:
Financial Assets 28,193,844Current Assets
Debtors 326,329Cash and Bank Balances 1,418,309
Total Assets 29,938,482
Liabilities:
Financial Liabilities 225,037Creditors
Bank Overdrafts 30,508Other Creditors 1,173,743
Total Liabilities 1,429,288
Net Assets Attributable to Shareholders 28,509,194
Statement of Total Return
Period Ended†
30 April 2022(£)
30 April 2022(£)
IncomeNet Capital Gains/(Losses) (1,552,324)Revenue 227,934
Expenses (47,058)
Net Revenue Before Taxation 180,876Taxation (32,016)
Net Revenue After Taxation 148,860
Total Return Before Distributions (1,403,464)
Distributions1 18,804
Change in Net Assets Attributable to
Shareholders From Investment Activities (1,384,660)
† The Fund launched on 8 December 2021.1 Includes adjustments for equalisation.
Statement of Change in Net Assets Attributable to Shareholders
Period Ended†
30 April 2022(£)
30 April 2022(£)
Amounts Received on Issue of Shares 29,970,171Amounts Paid on Cancellation of Shares (88,266)
29,881,905
Dilution Adjustment 11,949Change in Net Assets Attributable to
Shareholders From Investment Activities (1,384,660)
Closing Net Assets Attributable to Shareholders 28,509,194
† The Fund launched on 8 December 2021.
The interim financial statements for the Fund have been prepared on the same basis of the accounting policies as the annual financial statements for the year ended 31 October 2021.
Vanguard SustainableLife 40-50% Equity Fund
Balance Sheet
14

Investment Objective
Vanguard SustainableLife 60-70% Equity Fund (the “Fund”) seeks to provide an increase in the value of investments over the long term (more than 5 years)together with some money paid out from those investments as income.
Investment Strategy
The Fund seeks to achieve its investment objective by investing in a combination of shares of companies (between 60-70% of the portfolio, with an expectedallocation of 65%) and bonds (between 30-40% of the portfolio, with an expected allocation of 35%) selected in accordance with the Sustainability Policydescribed in the Prospectus.
Synthetic Risk and Reward Indicator
Lower risk
Typically lower rewards
Higher risk
Typically higher rewards
1 2 3 4 5 6 7
The Synthetic Risk and Reward Indicator (SRRI) measures the volatility of the Fund. The risk and reward category (which may range from 1 to 7) is calculatedusing historical data and may not be a reliable indicator of the Fund’s future risk profile. The risk and reward category may shift over time and is not a target orguarantee. The lowest category (i.e. category 1) does not mean “risk free”. The Fund appears in the middle range of the risk and reward indicator because thevalues of the Fund’s investments have experienced a modest rate of change in the past.
Performance SummaryThe Performance Summary does not form part of the Financial Statements.
• Volatility surged and global financial markets slumped during the six months ended 30 April 2022. When the period began, supply bottlenecks, rising oil pricesand the prospect of less accommodative monetary policy were already weighing on market sentiment.
• Then Russia’s invasion of Ukraine injected substantial uncertainty into the markets. Energy prices soared, helping to push consumer prices to multidecadehighs across much of the world. Some central banks, including those in the United States and the United Kingdom, raised short-term interest rates. TheEuropean Central Bank continued to reduce its bond purchases and was expected to raise rates later this year.
• While consumer sentiment flagged during the period, in many markets unemployment remained low, consumer balance sheets healthy and corporate profitsrobust.
• With central banks turning less accommodative and inflation looking set to remain elevated for some time, bond yields in many markets moved higher acrossthe maturity spectrum. The Bloomberg Global Aggregate Bond Index hedged to British pounds, a global bond proxy, returned about –7% for the six months.
• Stocks regained some ground in March but finished the six months with a negative return. The FTSE Developed Index, the Fund’s equity index and a proxy forglobal stocks, returned about –3%. The United Kingdom and Asia-Pacific were bright spots, while Europe detracted the most.
• Please note that in December 2021, the Fund was renamed from Vanguard Global Balanced Fund and updated its Investment Policy.
• The Fund is actively managed; it does not seek to track a benchmark. The performance information in the table below shows how the Fund’s returns comparewith those of a composite index with similar investment characteristics. For the period under review, the Fund held up significantly better than the index,which returned –5.57% for the six months. The Fund’s stock and bond portfolios both outperformed their benchmarks.
• The United States, by far the largest market in the Fund’s equity index, drove much of the Fund’s outperformance. Japan, Germany and Switzerland were alsobright spots. In contrast, the United Kingdom, Australia, France and Canada dampened the Fund’s relative performance.
• Among equity industry sectors, underweight allocations and security selection in technology, consumer discretionary and industrials added value. Securityselection in health care did as well. Positioning in energy, basic materials and consumer staples detracted.
• In the fixed income component, outperformance was driven by positioning. An underweight to credit spread duration and an overweight to Treasuriesboosted relative performance, while selection within banking, consumer noncyclicals and technology provided headwinds.
Benchmark: SustainableLife 60-70% Equity Composite Index
Total ReturnsPeriods Ended 30 April 2022
(Annualised for periods over one year)
Six Months Five YearsTen Years or
Since Inception1
GBP Acc -1.15% 6.79% 9.04%
Benchmark -5.57 7.36 9.54
GBP Inc -1.15% 6.79% 9.04%
Benchmark -5.57 7.36 9.54
Sources: Vanguard Global Advisers, LLC, FTSE and Bloomberg.Returns is based on NAV with income reinvested.
All of the returns in this report represent past performance, which is not a guarantee of future results that may be achieved by the Fund. For performance data current to the most recent month-end,which may be higher or lower than that cited, visit our website at http://global.vanguard.com. Note, too, that both investment returns and principal value can fluctuate widely, so an investor’s shares,when sold, could be worth more or less than their original cost.1 Since-inception returns: GBP Acc and GBP Inc, 25 May 2016.
Vanguard SustainableLife 60-70% Equity FundSub-managed by Wellington Management Company LLP.
15
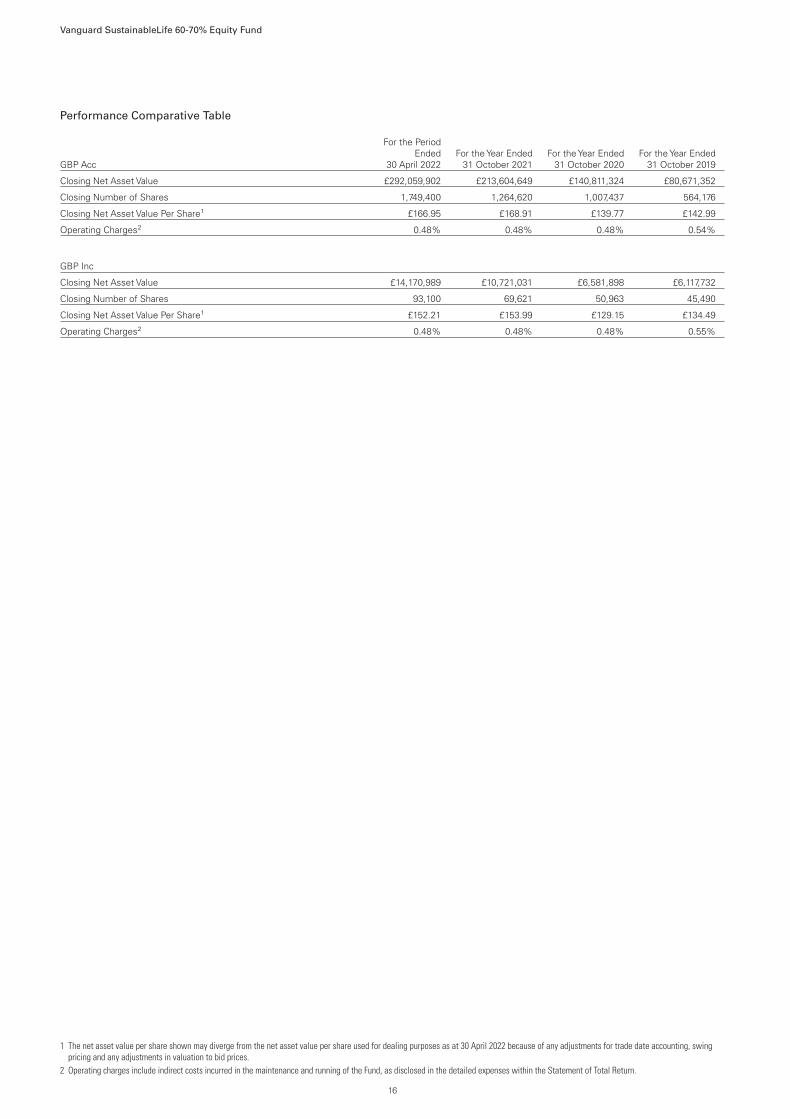
Performance Comparative Table
GBP Acc
For the PeriodEnded
30 April 2022For the Year Ended
31 October 2021For the Year Ended
31 October 2020For the Year Ended
31 October 2019
Closing Net Asset Value £292,059,902 £213,604,649 £140,811,324 £80,671,352
Closing Number of Shares 1,749,400 1,264,620 1,007,437 564,176
Closing Net Asset Value Per Share1 £166.95 £168.91 £139.77 £142.99
Operating Charges2 0.48% 0.48% 0.48% 0.54%
GBP Inc
Closing Net Asset Value £14,170,989 £10,721,031 £6,581,898 £6,117,732
Closing Number of Shares 93,100 69,621 50,963 45,490
Closing Net Asset Value Per Share1 £152.21 £153.99 £129.15 £134.49
Operating Charges2 0.48% 0.48% 0.48% 0.55%
1 The net asset value per share shown may diverge from the net asset value per share used for dealing purposes as at 30 April 2022 because of any adjustments for trade date accounting, swingpricing and any adjustments in valuation to bid prices.
2 Operating charges include indirect costs incurred in the maintenance and running of the Fund, as disclosed in the detailed expenses within the Statement of Total Return.
Vanguard SustainableLife 60-70% Equity Fund
16
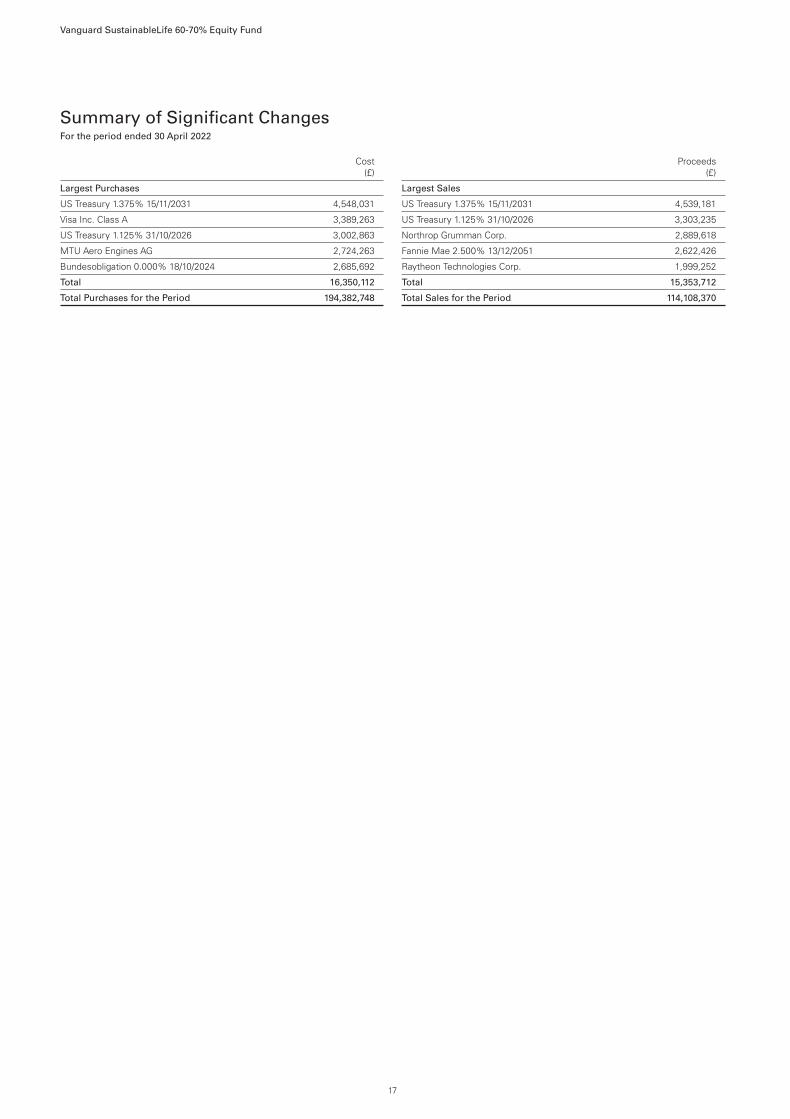
Summary of Significant ChangesFor the period ended 30 April 2022
Cost(£)
Largest Purchases
US Treasury 1.375% 15/11/2031 4,548,031
Visa Inc. Class A 3,389,263
US Treasury 1.125% 31/10/2026 3,002,863
MTU Aero Engines AG 2,724,263
Bundesobligation 0.000% 18/10/2024 2,685,692
Total 16,350,112
Total Purchases for the Period 194,382,748
Proceeds(£)
Largest Sales
US Treasury 1.375% 15/11/2031 4,539,181
US Treasury 1.125% 31/10/2026 3,303,235
Northrop Grumman Corp. 2,889,618
Fannie Mae 2.500% 13/12/2051 2,622,426
Raytheon Technologies Corp. 1,999,252
Total 15,353,712
Total Sales for the Period 114,108,370
Vanguard SustainableLife 60-70% Equity Fund
17

Portfolio StatementAs at 30 April 2022
Holding
MarketValue
(£)
% ofTotal Net
Assets
Equities 63.98% (31 October 2021: 65.05%)
Austria 0.66% (31 October 2021: 0.72%)
Erste Group Bank AG 81,570 2,029,476 0.66
2,029,476 0.66
Canada 0.38% (31 October 2021: 0.59%)
Dollarama Inc. 26,143 1,162,478 0.38
1,162,478 0.38
Finland 1.00% (31 October 2021: 0.70%)
Nokia Oyj (OMXH) 749,349 3,060,413 1.00
3,060,413 1.00
France 4.08% (31 October 2021: 4.70%)
TotalEnergies SE 58,703 2,329,417 0.76Arkema SA 25,127 2,304,514 0.75Schneider Electric SE 19,876 2,299,068 0.75Vinci SA 24,003 1,872,474 0.61Engie SA 172,939 1,645,247 0.54BNP Paribas SA 32,965 1,376,376 0.45Amundi SA 13,840 671,007 0.22
12,498,103 4.08
Germany 1.11% (31 October 2021: 0.22%)
MTU Aero Engines AG 17,774 2,874,208 0.94Bayerische Motoren Werke AG 8,109 533,171 0.17
3,407,379 1.11
Hong Kong 0.91% (31 October 2021: 0.65%)
AIA Group Ltd. 352,600 2,782,974 0.91
2,782,974 0.91
Japan 6.38% (31 October 2021: 6.08%)
Nippon Telegraph & Telephone Corp. 163,110 3,857,580 1.26Tokio Marine Holdings Inc. 69,225 2,982,848 0.97Resona Holdings Inc. 663,800 2,304,858 0.75Mitsubishi Estate Co. Ltd. 167,400 1,937,840 0.63Isuzu Motors Ltd. 190,279 1,773,381 0.58Mitsubishi UFJ Financial Group Inc. 367,040 1,701,362 0.56Marui Group Co. Ltd. 104,550 1,441,026 0.47Astellas Pharma Inc. 110,000 1,334,234 0.44Honda Motor Co. Ltd. 56,000 1,176,373 0.39BIPROGY Inc. 50,300 1,017,363 0.33
19,526,865 6.38
South Korea 0.88% (31 October 2021: 0.96%)
Samsung Electronics Co. Ltd. 63,108 2,697,353 0.88
2,697,353 0.88
Spain 1.48% (31 October 2021: 1.44%)
Iberdrola SA 252,028 2,331,585 0.76CaixaBank SA 846,538 2,195,115 0.72
4,526,700 1.48
Sweden 1.04% (31 October 2021: 1.12%)
Lundin Energy AB 69,840 2,326,569 0.76Alfa Laval AB 37,945 854,534 0.28
3,181,103 1.04
Switzerland 3.25% (31 October 2021: 3.25%)
Novartis AG 62,373 4,427,241 1.45Nestle SA 27,329 2,825,626 0.92Zurich Insurance Group AG 5,361 1,961,569 0.64Julius Baer Group Ltd. 19,085 739,971 0.24
9,954,407 3.25
Holding
MarketValue
(£)
% ofTotal Net
Assets
Taiwan 0.92% (31 October 2021: 1.19%)
Taiwan SemiconductorManufacturing Co. Ltd. 195,100 2,836,360 0.92
2,836,360 0.92
United Kingdom 3.35% (31 October 2021: 4.41%)
AstraZeneca plc ADR 100,277 5,300,980 1.73WPP plc 250,533 2,517,857 0.82Rotork plc 369,272 1,081,228 0.35Prudential plc 80,515 813,202 0.27Derwent London plc 17,708 534,073 0.18
10,247,340 3.35
United States 38.54% (31 October 2021: 39.02%)
Johnson & Johnson 45,348 6,519,923 2.13Microsoft Corp. 24,126 5,333,851 1.74United Parcel Service Inc. 31,417 4,503,727 1.47Cisco Systems Inc. 113,173 4,416,043 1.44TJX Cos. Inc. 87,600 4,273,594 1.39Chubb Ltd. 24,701 4,060,366 1.32Duke Energy Corp. 45,989 4,035,894 1.32Mondelez International Inc. 78,390 4,025,329 1.31Colgate-Palmolive Co. 64,671 3,968,855 1.30Merck & Co. Inc. 55,126 3,895,042 1.27Sempra Energy 29,465 3,786,913 1.24Texas Instruments Inc. 26,772 3,630,371 1.18Visa Inc. 21,398 3,629,222 1.18Baxter International Inc. 62,318 3,527,132 1.15Comcast Corp. 111,308 3,524,973 1.15JPMorgan Chase & Co. 32,483 3,088,665 1.01Autoliv Inc. 52,033 3,053,596 1.00Pioneer Natural Resources Co. 16,216 3,000,636 0.98Curtiss-Wright Corp. 25,025 2,851,114 0.93Medtronic plc 34,195 2,842,364 0.93Alphabet Inc. Class A 1,527 2,775,015 0.91UnitedHealth Group Inc. 6,681 2,703,475 0.88American Express Co. 18,982 2,641,755 0.86Otis Worldwide Corp. 42,822 2,484,732 0.81Bank of America Corp. 85,087 2,416,727 0.79General Motors Co. 79,763 2,408,454 0.79Union Pacific Corp. 12,248 2,285,902 0.75American Tower Corp. 11,756 2,256,907 0.74Deere & Co. 7,122 2,139,662 0.70Home Depot Inc. 8,724 2,087,714 0.68Eli Lilly & Co. 8,918 2,075,112 0.68PNC Financial Services Group Inc. 14,988 1,983,477 0.65Caterpillar Inc. 9,812 1,645,180 0.54Linde plc 6,507 1,644,377 0.54McDonald's Corp. 6,489 1,288,186 0.42Accenture plc 4,820 1,153,575 0.38KLA Corp. 4,477 1,137,382 0.37BlackRock Inc. 2,101 1,045,462 0.34PepsiCo Inc. 7,554 1,033,132 0.34Intel Corp. 25,900 899,228 0.29Gilead Sciences Inc. 16,606 784,205 0.26Marsh & McLennan Cos. Inc. 5,924 762,971 0.25Broadcom Inc. 887 391,672 0.13
118,011,912 38.54
Total Equities 195,922,863 63.98
CouponMaturity
Date Holding
MarketValue
(£)
% ofTotal Net
Assets
Bonds 32.51% (October 31, 2021: 31.26%)
Corporate Bonds 18.82% (31 October 2021: 18.55%)
Australia 0.12% (31 October 2021: 0.70%)
Macquarie Group Ltd. 2.87% 14/01/33 $560,000 370,858 0.12
Vanguard SustainableLife 60-70% Equity Fund
18

CouponMaturity
Date Holding
MarketValue
(£)
% ofTotal Net
Assets
370,858 0.12
Austria 0.00% (31 October 2021: 0.12%)
Belgium 0.00% (31 October 2021: 0.07%)
Canada 0.18% (31 October 2021: 0.24%)
Bank of Montreal 2.85% 06/03/24 CA($)455,000 279,328 0.09Canadian Pacific Railway Co. 2.45% 02/12/31 $180,000 124,754 0.04Nutrien Ltd. 4.13% 15/03/35 $80,000 60,559 0.02TransCanada PipeLines Ltd. 4.88% 15/01/26 $50,000 40,953 0.02Fortis Inc. 3.06% 04/10/26 $45,000 34,386 0.01
539,980 0.18
Cayman Islands 0.21% (31 October 2021: 0.48%)
Avolon Holdings Funding Ltd. 2.53% 18/11/27 $645,000 441,055 0.15CK Hutchison International 17 II Ltd. 2.75% 29/03/23 $200,000 159,008 0.05Avolon Holdings Funding Ltd. 2.13% 21/02/26 $37,000 26,323 0.01
626,386 0.21
Denmark 0.22% (31 October 2021: 0.32%)
Danske Bank A/S 0.50% 27/08/25 €450,000 367,240 0.12Danske Bank A/S 1.62% 11/09/26 $285,000 205,499 0.07Danske Bank A/S 2.25% 14/01/28 £120,000 112,477 0.03
685,216 0.22
Finland 0.04% (31 October 2021: 0.00%)
Danske Mortgage Bank plc 0.01% 24/11/26 €160,000 126,374 0.04
126,374 0.04
France 1.05% (31 October 2021: 0.81%)
BPCE SFH SA 1.13% 12/04/30 €1,000,000 806,913 0.26Societe Generale SFH SA 0.01% 02/12/26 €500,000 394,688 0.13BNP Paribas SA 0.50% 01/09/28 €400,000 301,782 0.10BNP Paribas SA 2.59% 20/01/28 $355,000 257,616 0.08Orange SA 1.13% 15/07/24 €300,000 253,276 0.08BPCE SA 2.28% 20/01/32 $290,000 187,827 0.06RCI Banque SA 1.38% 08/03/24 €225,000 187,511 0.06BNP Paribas SA 2.13% 23/01/27 €200,000 167,137 0.06BNP Paribas SA 2.50% 31/03/32 €200,000 161,411 0.05BNP Paribas SA 2.16% 15/09/29 $200,000 135,821 0.04AXA SA 5.13% 04/07/43 €100,000 87,831 0.03BPCE SA 1.13% 18/01/23 €100,000 84,668 0.03BNP Paribas SA 2.00% 13/09/36 £100,000 78,617 0.03Orange SA 0.63% 16/12/33 €100,000 69,941 0.02RCI Banque SA 1.63% 11/04/25 €60,000 49,165 0.02
3,224,204 1.05
Germany 0.40% (31 October 2021: 0.52%)
Kreditanstalt fuer Wiederaufbau 0.01% 09/11/28 €690,000 536,901 0.18Volkswagen Leasing GmbH 1.38% 20/01/25 €310,000 256,566 0.08Volkswagen Financial Services AG 0.13% 12/02/27 €175,000 131,347 0.04Kreditanstalt fuer Wiederaufbau 0.13% 30/06/25 €140,000 115,272 0.04Volkswagen Leasing GmbH 2.63% 15/01/24 €125,000 107,475 0.04Vantage Towers AG 0.75% 31/03/30 €100,000 72,045 0.02
1,219,606 0.40
Hong Kong 0.00% (31 October 2021: 0.04%)
Ireland 0.02% (31 October 2021: 0.17%)
Johnson Controls International plc 4.95% 02/07/64 $91,000 68,469 0.02
68,469 0.02
Italy 0.11% (31 October 2021: 0.06%)
Terna - Rete Elettrica Nazionale 0.38% 23/06/29 €250,000 186,400 0.06UniCredit SpA 1.98% 03/06/27 $200,000 140,521 0.05
326,921 0.11
Japan 0.33% (31 October 2021: 0.13%)
NTT Finance Corp. 1.16% 03/04/26 $1,235,000 888,580 0.29Takeda Pharmaceutical Co. Ltd. 2.05% 31/03/30 $200,000 134,568 0.04
1,023,148 0.33
Vanguard SustainableLife 60-70% Equity Fund
19

CouponMaturity
Date Holding
MarketValue
(£)
% ofTotal Net
Assets
Jersey 0.47% (31 October 2021: 0.43%)
Galaxy Pipeline Assets Bidco Ltd. 2.16% 31/03/34 $1,229,901 862,252 0.28Heathrow Funding Ltd. 2.75% 13/10/29 £505,000 474,887 0.16Heathrow Funding Ltd. 2.75% 09/08/49 £125,000 98,440 0.03
1,435,579 0.47
Luxembourg 0.15% (31 October 2021: 0.15%)
EIG Pearl Holdings Sarl 3.55% 31/08/36 $320,000 226,164 0.08Segro Capital Sarl 0.50% 22/09/31 €320,000 223,762 0.07
449,926 0.15
Mexico 0.01% (31 October 2021: 0.02%)
America Movil SAB de CV 6.38% 01/03/35 $45,000 41,667 0.01
41,667 0.01
Netherlands 0.72% (31 October 2021: 0.87%)
Cooperatieve Rabobank UA 0.13% 01/12/31 €600,000 432,643 0.14JAB Holdings BV 4.50% 08/04/52 $355,000 242,607 0.08Enel Finance International NV 0.50% 17/06/30 €325,000 235,236 0.08ING Groep NV 0.25% 01/02/30 €300,000 214,648 0.07GSK Consumer Healthcare Capital NL BV 2.13% 29/03/34 €245,000 197,068 0.06Cooperatieve Rabobank UA 1.11% 24/02/27 $250,000 177,756 0.06Koninklijke KPN NV 0.88% 15/11/33 €200,000 140,351 0.05Shell International Finance BV 3.00% 26/11/51 $215,000 134,125 0.04Thermo Fisher Scientific Finance I BV 1.63% 18/10/41 €175,000 117,201 0.04Shell International Finance BV 1.75% 10/09/52 £150,000 99,280 0.03Volkswagen Financial Services NV 2.13% 18/01/28 £100,000 92,047 0.03ING Groep NV 0.25% 01/02/30 €100,000 71,549 0.02BP Capital Markets BV 0.93% 04/12/40 €100,000 59,893 0.02
2,214,404 0.72
Norway 0.23% (31 October 2021: 0.23%)
Aker BP ASA 1.13% 12/05/29 €605,000 456,933 0.15Equinor ASA 3.00% 06/04/27 $175,000 135,214 0.04Aker BP ASA 4.00% 15/01/31 $160,000 120,217 0.04
712,364 0.23
Qatar 0.05% (31 October 2021: 0.06%)
Qatar Energy 2.25% 12/07/31 $200,000 139,420 0.05
139,420 0.05
Saudi Arabia 0.05% (31 October 2021: 0.07%)
Saudi Arabian Oil Co. 2.88% 16/04/24 $200,000 157,450 0.05
157,450 0.05
Spain 0.09% (31 October 2021: 0.14%)
Iberdrola Finanzas SA 1.25% 28/10/26 €200,000 166,908 0.05Telefonica Emisiones SA 4.67% 06/03/38 $150,000 111,390 0.04
278,298 0.09
Switzerland 0.72% (31 October 2021: 0.45%)
UBS Group AG 1.36% 30/01/27 $1,780,000 1,272,993 0.41Credit Suisse Group AG 3.09% 14/05/32 $540,000 360,873 0.12Credit Suisse Group AG 2.13% 15/11/29 £265,000 231,952 0.08Credit Suisse Group AG 2.88% 02/04/32 €225,000 177,315 0.06UBS Group AG 0.25% 24/02/28 €200,000 148,817 0.05
2,191,950 0.72
United Arab Emirates 0.11% (31 October 2021: 0.15%)
NBK SPC Ltd. 1.63% 15/09/27 $475,000 340,766 0.11
340,766 0.11
United Kingdom 2.07% (31 October 2021: 1.37%)
HSBC Holdings plc 0.73% 17/08/24 $1,505,000 1,154,780 0.38Santander UK Group Holdings plc 1.00% 15/03/25 $705,000 530,319 0.17Barclays plc 2.85% 07/05/26 $645,000 491,936 0.16HSBC Holdings plc 4.04% 13/03/28 $540,000 417,114 0.14LSEGA Financing plc 2.50% 06/04/31 $495,000 344,958 0.11Tritax Big Box REIT plc 1.50% 27/11/33 £290,000 238,612 0.08HSBC Holdings plc 1.00% 12/09/26 $295,000 233,638 0.08Barclays plc 1.11% 12/05/32 €325,000 229,987 0.07
Vanguard SustainableLife 60-70% Equity Fund
20

CouponMaturity
Date Holding
MarketValue
(£)
% ofTotal Net
Assets
Whitbread Group plc 3.00% 31/05/31 £250,000 226,628 0.07NatWest Group plc 1.04% 14/09/32 €280,000 206,916 0.07NatWest Group plc 2.11% 28/11/31 £225,000 204,797 0.07CSL UK Holdings Ltd. 4.25% 27/04/32 $250,000 197,547 0.06HSBC Holdings plc 2.21% 17/08/29 $275,000 188,724 0.06Scottish Hydro Electric Transmission plc 2.25% 27/09/35 £205,000 175,867 0.06HSBC Holdings plc 1.59% 24/05/27 $225,000 159,330 0.05Standard Chartered plc 0.99% 12/01/25 $200,000 151,178 0.05NatWest Group plc 3.62% 29/03/29 £150,000 148,197 0.05Barclays plc 1.00% 22/03/31 €190,000 146,624 0.05GSK Consumer Healthcare Capital UK plc 3.38% 29/03/38 £145,000 141,864 0.05BP Capital Markets plc 1.10% 15/11/34 €200,000 139,099 0.04HSBC Holdings plc 2.80% 24/05/32 $200,000 133,832 0.04BP Capital Markets plc 3.47% 15/05/25 CA($)200,000 123,833 0.04Royalty Pharma plc 3.55% 02/09/50 $190,000 112,073 0.04NatWest Group plc 0.78% 26/02/30 €150,000 110,119 0.04Royalty Pharma plc 3.35% 02/09/51 $175,000 99,207 0.03Royalty Pharma plc 3.30% 02/09/40 $45,000 27,989 0.01
6,335,168 2.07
United States 11.47% (31 October 2021: 10.95%)
Hess Corp. 7.30% 15/08/31 $960,000 888,544 0.29Nestle Holdings Inc. 2.13% 04/04/27 £700,000 687,057 0.22Charles Schwab Corp. 2.90% 03/03/32 $905,000 645,977 0.21Verizon Communications Inc. 2.36% 15/03/32 $940,000 630,896 0.21Union Pacific Corp. 2.80% 14/02/32 $810,000 579,625 0.19Alcon Finance Corp. 3.00% 23/09/29 $770,000 555,767 0.18Morgan Stanley 2.48% 16/09/36 $845,000 539,285 0.18Bank of America Corp. 0.81% 24/10/24 $700,000 535,395 0.17Wells Fargo & Co. 2.41% 30/10/25 $685,000 524,550 0.17AbbVie Inc. 3.20% 21/11/29 $680,000 504,906 0.17T-Mobile USA Inc. 2.05% 15/02/28 $690,000 484,912 0.16Bank of America Corp. 2.48% 21/09/36 $725,000 464,081 0.15Wells Fargo & Co. 3.53% 24/03/28 $575,000 440,911 0.14T-Mobile USA Inc. 2.55% 15/02/31 $650,000 440,825 0.14Goldman Sachs Group Inc. 1.09% 09/12/26 $615,000 438,479 0.14JPMorgan Chase & Co. 0.56% 16/02/25 $545,000 411,322 0.13Five Corners Funding Trust 4.42% 15/11/23 $505,000 407,391 0.13Morgan Stanley 1.00% 21/10/25 $550,000 406,702 0.13TWDC Enterprises 18 Corp. 3.15% 17/09/25 $510,000 402,142 0.13Oncor Electric Delivery Co. LLC 3.80% 01/06/49 $540,000 395,595 0.13Aviation Capital Group LLC 1.95% 30/01/26 $555,000 394,560 0.13Equitable Financial Life Global Funding 1.70% 12/11/26 $535,000 386,930 0.13JPMorgan Chase & Co. 2.58% 22/04/32 $535,000 366,719 0.12Workday Inc. 3.80% 01/04/32 $470,000 354,257 0.12Nestle Holdings Inc. 2.50% 04/04/32 £360,000 348,865 0.11SBA Tower Trust 1.63% 15/11/26 $460,000 337,573 0.11Duke Energy Carolinas LLC 2.85% 15/03/32 $460,000 330,811 0.11General Motors Financial Co. Inc. 2.20% 01/04/24 €375,000 318,599 0.10Kyndryl Holdings Inc. 3.15% 15/10/31 $500,000 310,426 0.10Goldman Sachs Group Inc. 2.62% 22/04/32 $450,000 303,473 0.10AT&T Inc. 1.60% 19/05/28 €325,000 264,625 0.09Broadcom Inc. 2.60% 15/02/33 $415,000 263,233 0.09Corebridge Financial Inc. 3.90% 05/04/32 $350,000 261,868 0.09Goldman Sachs Group Inc. 1.43% 09/03/27 $365,000 259,977 0.09Athene Global Funding 2.50% 24/03/28 $355,000 250,841 0.08CNO Global Funding 2.65% 06/01/29 $350,000 247,857 0.08Broadcom Inc. 3.47% 15/04/34 $360,000 243,292 0.08AT&T Inc. 3.50% 15/09/53 $374,000 233,566 0.08EPR Properties 3.60% 15/11/31 $345,000 232,811 0.08San Diego Gas & Electric Co. 3.70% 15/03/52 $330,000 230,298 0.08Gray Oak Pipeline LLC 3.45% 15/10/27 $305,000 227,607 0.07Penske Truck Leasing Co. LP 4.45% 29/01/26 $275,000 220,635 0.07Boston Gas Co. 3.15% 01/08/27 $290,000 217,963 0.07Enterprise Products Operating LLC 4.85% 15/03/44 $285,000 217,086 0.07Berkshire Hathaway Finance Corp. 2.00% 18/03/34 €275,000 216,718 0.07DAE Funding LLC 1.55% 01/08/24 $285,000 211,733 0.07Verizon Communications Inc. 1.50% 19/09/39 €300,000 201,308 0.07Lowe’s Cos Inc. 1.30% 15/04/28 $270,000 184,208 0.06
Vanguard SustainableLife 60-70% Equity Fund
21

CouponMaturity
Date Holding
MarketValue
(£)
% ofTotal Net
Assets
Microchip Technology Inc. 0.97% 15/02/24 $240,000 182,207 0.06AT&T Inc. 3.50% 01/06/41 $275,000 182,150 0.06Consolidated Edison Co. of New York Inc. 3.20% 01/12/51 $290,000 181,946 0.06Goldman Sachs Group Inc. 2.38% 21/07/32 $270,000 178,133 0.06Boston Gas Co. 3.00% 01/08/29 $245,000 176,997 0.06JPMorgan Chase & Co. 2.95% 24/02/28 $230,000 172,547 0.06AT&T Inc. 2.35% 05/09/29 €200,000 168,367 0.06Crown Castle International Corp. 2.10% 01/04/31 $260,000 167,821 0.05Penske Truck Leasing Co. LP / PTL Finance Corp. 3.35% 01/11/29 $220,000 164,771 0.05Kaiser Foundation Hospitals 4.88% 01/04/42 $190,000 163,445 0.05EPR Properties 3.75% 15/08/29 $230,000 162,654 0.05Prudential Financial Inc. 3.70% 13/03/51 $235,000 161,951 0.05Verizon Communications Inc. 2.36% 15/03/32 $240,000 161,080 0.05Bayer US Finance II LLC 4.25% 15/12/25 $200,000 159,820 0.05Bank of America Corp. 2.69% 22/04/32 $230,000 157,560 0.05Truist Bank 3.30% 15/05/26 $200,000 156,350 0.05Southern California Gas Co. 2.95% 15/04/27 $205,000 156,182 0.05Pernod Ricard International Finance LLC 1.63% 01/04/31 $240,000 155,009 0.05Wells Fargo & Co. 4.30% 22/07/27 $195,000 155,000 0.05Hyundai Capital America 0.80% 03/04/23 $195,000 151,940 0.05Realty Income Corp. 3.10% 15/12/29 $205,000 151,664 0.05Mid-Atlantic Interstate Transmission LLC 4.10% 15/05/28 $193,000 150,131 0.05Genting New York LLC / GENNY Capital Inc. 3.30% 15/02/26 $200,000 145,991 0.05Gilead Sciences Inc. 2.80% 01/10/50 $255,000 145,146 0.05Home Partners of America 2021-2 Trust 2.30% 17/12/26 $197,762 142,773 0.05Cleco Corporate Holdings LLC 3.74% 01/05/26 $180,000 141,838 0.05Morgan Stanley 3.13% 27/07/26 $185,000 141,247 0.05Morgan Stanley 2.70% 22/01/31 $200,000 140,202 0.05San Diego Gas & Electric Co. 1.70% 01/10/30 $210,000 138,443 0.05Realty Income Corp. 1.75% 13/07/33 £165,000 137,980 0.05Bank of America Corp. 1.73% 22/07/27 $190,000 135,833 0.04American Tower Corp. 0.45% 15/01/27 €175,000 134,065 0.04Oracle Corp. 3.95% 25/03/51 $220,000 133,258 0.04Conagra Brands Inc. 4.60% 01/11/25 $165,000 133,005 0.04T-Mobile USA Inc. 2.70% 15/03/32 $195,000 131,990 0.04Bank of America Corp. 3.31% 22/04/42 $200,000 131,109 0.04Intercontinental Exchange Inc. 1.85% 15/09/32 $200,000 128,274 0.04American Transmission Systems Inc. 2.65% 15/01/32 $185,000 127,990 0.04Realty Income Corp. 2.20% 15/06/28 $175,000 124,642 0.04Molson Coors International LP 2.84% 15/07/23 CA($)200,000 123,388 0.04CubeSmart LP 2.25% 15/12/28 $175,000 122,607 0.04General Mills Inc. 0.45% 15/01/26 €150,000 120,264 0.04AbbVie Inc. 3.80% 15/03/25 $150,000 119,647 0.04Anthem Inc 4.10% 01/03/28 $150,000 119,362 0.04JPMorgan Chase & Co. 2.55% 08/11/32 $175,000 118,278 0.04NextEra Energy Capital Holdings Inc. 1.90% 15/06/28 $165,000 116,006 0.04Public Storage 0.50% 09/09/30 €165,000 115,680 0.04Equitable Financial Life Global Funding 1.30% 12/07/26 $160,000 115,204 0.04JPMorgan Chase & Co. 2.52% 22/04/31 $165,000 114,157 0.04HCA Inc. 5.25% 15/06/49 $150,000 113,418 0.04Oglethorpe Power Corp. 4.50% 01/04/47 $155,000 112,893 0.04Kaiser Foundation Hospitals 2.81% 01/06/41 $175,000 111,500 0.04US Bancorp 2.49% 03/11/36 $166,000 111,292 0.04Marvell Technology Inc. 2.95% 15/04/31 $160,000 110,769 0.04Valero Energy Corp. 4.90% 15/03/45 $145,000 110,190 0.04CommonSpirit Health 3.91% 01/10/50 $160,000 109,902 0.04JPMorgan Chase & Co. 3.70% 06/05/30 $145,000 109,664 0.04Penske Truck Leasing Co. Lp / PTL Finance Corp. 3.95% 10/03/25 $135,000 107,447 0.04Sempra Energy 3.25% 15/06/27 $140,000 106,794 0.04Wells Fargo & Co. 4.61% 25/04/53 $135,000 106,029 0.03Goldman Sachs Group Inc. 4.22% 01/05/29 $135,000 105,187 0.03Brandywine Operating Partnership LP 3.95% 15/11/27 $135,000 104,156 0.03CommonSpirit Health 4.19% 01/10/49 $145,000 103,895 0.03Cox Communications Inc. 3.50% 15/08/27 $130,000 100,316 0.03Oracle Corp. 3.60% 01/04/50 $175,000 100,074 0.03Teledyne Technologies Inc. 2.25% 01/04/28 $140,000 99,312 0.03Charter Communications Operating LLC / Charter Communications
Operating Capital 2.30% 01/02/32 $155,000 96,431 0.03Morgan Stanley 3.77% 24/01/29 $125,000 96,081 0.03
Vanguard SustainableLife 60-70% Equity Fund
22

CouponMaturity
Date Holding
MarketValue
(£)
% ofTotal Net
Assets
UnitedHealth Group Inc. 3.85% 15/06/28 $120,000 95,858 0.03Intel Corp. 3.05% 12/08/51 $155,000 95,831 0.03Intercontinental Exchange Inc. 2.65% 15/09/40 $155,000 94,943 0.03Lowe’s Cos. Inc. 3.75% 01/04/32 $125,000 93,989 0.03Marsh & McLennan Cos. Inc. 4.38% 15/03/29 $115,000 92,665 0.03Ochsner LSU Health System of North Louisiana 2.51% 15/05/31 $140,000 92,149 0.03S&P Global Inc. 2.70% 01/03/29 $125,000 91,941 0.03S&P Global Inc. 2.90% 01/03/32 $125,000 90,026 0.03Massachusetts Mutual Life Insurance Co. 3.38% 15/04/50 $140,000 89,071 0.03Gilead Sciences Inc. 4.60% 01/09/35 $110,000 88,502 0.03Duke Energy Corp. 2.55% 15/06/31 $130,000 88,297 0.03Oglethorpe Power Corp. 6.19% 01/01/31 $100,000 87,516 0.03Vantage Data Centers Issuer LLC 1.65% 15/09/45 $120,000 87,470 0.03Niagara Mohawk Power Corp. 1.96% 27/06/30 $130,000 87,034 0.03Charter Communications Operating LLC / Charter Communications
Operating Capital 2.80% 01/04/31 $130,000 86,146 0.03American International Group Inc. 1.50% 08/06/23 €100,000 85,130 0.03Equitable Financial Life Global Funding 1.40% 27/08/27 $120,000 83,835 0.03Exxon Mobil Corp. 2.28% 16/08/26 $110,000 83,569 0.03Realty Income Corp. 2.50% 14/01/42 £100,000 83,116 0.03General Motors Co. 5.00% 01/10/28 $105,000 82,996 0.03Brixmor Operating Partnership LP 2.50% 16/08/31 $125,000 82,144 0.03Fortive Corp. 4.30% 15/06/46 $110,000 82,126 0.03CommonSpirit Health 2.78% 01/10/30 $115,000 81,326 0.03Duke Energy Corp. 3.50% 15/06/51 $130,000 81,270 0.03Oracle Corp. 2.88% 25/03/31 $120,000 81,069 0.03Goldman Sachs Group Inc. 1.25% 07/02/29 €105,000 80,850 0.03AbbVie Inc. 4.25% 21/11/49 $110,000 80,321 0.03National Retail Properties Inc. 3.90% 15/06/24 $100,000 80,131 0.03Teledyne Technologies Inc. 2.75% 01/04/31 $115,000 79,550 0.03Anthem Inc. 2.25% 15/05/30 $115,000 79,301 0.03Energy Transfer LP 4.90% 15/03/35 $105,000 78,757 0.03AT&T Inc. 3.30% 01/02/52 $130,000 78,446 0.03AT&T Inc. 2.60% 19/05/38 €100,000 78,244 0.03Cox Communications Inc. 4.80% 01/02/35 $100,000 78,116 0.03Realty Income Corp. 2.85% 15/12/32 $110,000 77,918 0.03Verizon Communications Inc. 1.25% 08/04/30 €100,000 77,291 0.03Anheuser-Busch InBev Worldwide Inc. 5.45% 23/01/39 $90,000 76,124 0.02Bank of America Corp. 2.50% 13/02/31 $110,000 75,323 0.02CommonSpirit Health 3.35% 01/10/29 $100,000 74,191 0.02Goldman Sachs Group Inc. 2.65% 21/10/32 $110,000 73,965 0.02Domino’s Pizza Master Issuer LLC 3.15% 25/04/51 $103,950 73,501 0.02HCA Inc. 4.63% 15/03/52 $105,000 73,165 0.02Bank of America Corp. 3.59% 21/07/28 $95,000 72,623 0.02Toledo Hospital 5.75% 15/11/38 $85,000 71,195 0.02Comcast Corp. 2.89% 01/11/51 $121,000 71,151 0.02NVIDIA Corp. 2.85% 01/04/30 $95,000 70,336 0.02Republic Services Inc. 2.30% 01/03/30 $95,000 65,867 0.02Georgia Power Co. 3.70% 30/01/50 $100,000 65,482 0.02Conagra Brands Inc. 1.38% 01/11/27 $95,000 64,251 0.02Verizon Communications Inc. 2.88% 20/11/50 $110,000 63,981 0.02Consolidated Edison Co. of New York Inc. 4.50% 15/05/58 $80,000 60,028 0.02Western Midstream Operating LP 4.65% 01/07/26 $75,000 58,892 0.02Morgan Stanley 2.51% 20/10/32 $85,000 57,018 0.02Citigroup Inc. 4.60% 09/03/26 $70,000 56,176 0.02Cigna Corp. 4.38% 15/10/28 $70,000 56,029 0.02Charter Communications Operating LLC / Charter Communications
Operating Capital 5.05% 30/03/29 $70,000 55,628 0.02Carrier Global Corp. 2.72% 15/02/30 $78,000 54,899 0.02Providence St Joseph Health Obligated Group 2.70% 01/10/51 $95,000 53,687 0.02CenterPoint Energy Resources Corp. 4.00% 01/04/28 $68,000 53,627 0.02Georgia Power Co. 4.75% 01/09/40 $70,000 53,558 0.02Toledo Hospital 5.33% 15/11/28 $65,000 53,004 0.02Truist Financial Corp. 3.70% 05/06/25 $65,000 51,903 0.02ERAC USA Finance LLC 4.50% 15/02/45 $70,000 51,885 0.02Charter Communications Operating LLC / Charter Communications
Operating Capital 3.85% 01/04/61 $95,000 51,648 0.02Gray Oak Pipeline LLC 2.60% 15/10/25 $66,000 49,583 0.02Anheuser-Busch InBev Worldwide Inc. 4.38% 15/04/38 $65,000 49,182 0.02
Vanguard SustainableLife 60-70% Equity Fund
23

CouponMaturity
Date Holding
MarketValue
(£)
% ofTotal Net
Assets
Anheuser-Busch InBev Worldwide Inc. 4.60% 15/04/48 $65,000 48,742 0.02Equinix Inc. 3.00% 15/07/50 $85,000 48,496 0.02Magallanes Inc. 4.28% 15/03/32 $65,000 48,196 0.02Broadcom Inc. 3.42% 15/04/33 $70,000 47,952 0.02Morgan Stanley 5.30% 20/04/37 $60,000 47,910 0.02Charter Communications Operating LLC / Charter Communications
Operating Capital 3.70% 01/04/51 $85,000 47,685 0.02General Motors Co. 4.20% 01/10/27 $60,000 46,258 0.02CSX Corp. 4.30% 01/03/48 $60,000 45,518 0.01S&P Global Inc. 3.70% 01/03/52 $65,000 45,215 0.01Fifth Third BanCorp. 2.55% 05/05/27 $60,000 44,659 0.01Duke Energy Carolinas LLC 6.10% 01/06/37 $50,000 44,460 0.01Wells Fargo & Co. 2.98% 19/05/26 CA($)75,000 44,458 0.01AbbVie Inc. 4.05% 21/11/39 $60,000 43,857 0.01AT&T Inc. 3.10% 01/02/43 $70,000 43,158 0.01Brooklyn Union Gas Co. 3.41% 10/03/26 $55,000 42,556 0.01Verizon Communications Inc. 2.99% 30/10/56 $75,000 42,510 0.01Intel Corp. 3.20% 12/08/61 $70,000 42,089 0.01Crown Castle International Corp. 2.90% 01/04/41 $70,000 41,670 0.01Comcast Corp. 2.89% 01/11/51 $70,000 41,162 0.01Northwestern Mutual Life Insurance Co. 3.85% 30/09/47 $58,000 40,951 0.01Bon Secours Mercy Health Inc. 2.10% 01/06/31 $60,000 40,857 0.01CVS Health Corp. 4.88% 20/07/35 $50,000 40,577 0.01SBA Tower Trust 1.88% 15/01/26 $55,000 40,564 0.01Union Electric Co. 3.90% 01/04/52 $55,000 39,876 0.01CVS Health Corp. 4.13% 01/04/40 $55,000 39,796 0.01Corebridge Financial Inc. 4.40% 05/04/52 $55,000 39,108 0.01Kroger Co. 5.40% 15/01/49 $45,000 38,651 0.01JPMorgan Chase & Co. 3.11% 22/04/41 $60,000 38,536 0.01Mercy Health 3.56% 01/08/27 $50,000 38,423 0.01Workday Inc. 3.70% 01/04/29 $50,000 38,133 0.01Comcast Corp. 2.80% 15/01/51 $65,000 38,034 0.01Healthpeak Properties Inc. 3.50% 15/07/29 $50,000 37,991 0.01Sutter Health 2.29% 15/08/30 $55,000 37,665 0.01Kroger Co. 4.45% 01/02/47 $50,000 37,518 0.01SCE Recovery Funding LLC 0.86% 15/11/31 $52,921 37,237 0.01Energy Transfer LP 5.35% 15/05/45 $50,000 36,420 0.01NVIDIA Corp. 3.50% 01/04/40 $50,000 36,057 0.01Comcast Corp. 4.00% 01/11/49 $50,000 35,875 0.01Chevron Corp. 2.95% 16/05/26 $45,000 35,073 0.01Brooklyn Union Gas Co. 4.27% 15/03/48 $50,000 34,659 0.01Amazon.com Inc. 4.80% 05/12/34 $40,000 34,295 0.01Oracle Corp. 3.60% 01/04/40 $55,000 33,843 0.01Charter Communications Operating LLC / Charter Communications
Operating Capital 6.38% 23/10/35 $40,000 33,359 0.01Norfolk Southern Corp. 4.05% 15/08/52 $45,000 32,542 0.01CSX Corp. 3.95% 01/05/50 $45,000 32,458 0.01Verizon Communications Inc. 1.68% 30/10/30 $50,000 32,371 0.01CVS Health Corp. 3.88% 20/07/25 $40,000 32,003 0.01SSM Health Care Corp. 3.82% 01/06/27 $40,000 31,933 0.01Florida Power & Light Co. 5.69% 01/03/40 $35,000 31,875 0.01Duke Energy Progress LLC 3.40% 01/04/32 $40,000 30,124 0.01San Diego Gas & Electric Co. 4.10% 15/06/49 $39,000 28,958 0.01Cargill Inc. 4.76% 23/11/45 $35,000 28,634 0.01Teachers Insurance & Annuity Association of America 4.90% 15/09/44 $35,000 28,491 0.01Kroger Co. 3.85% 01/08/23 $35,000 28,121 0.01Bank of America Corp. 4.45% 03/03/26 $35,000 27,957 0.01Wells Fargo & Co. 4.10% 03/06/26 $35,000 27,757 0.01EPR Properties 4.75% 15/12/26 $35,000 27,273 0.01ERAC USA Finance LLC 3.30% 01/12/26 $35,000 27,058 0.01Fiserv Inc. 3.20% 01/07/26 $35,000 27,026 0.01EPR Properties 4.95% 15/04/28 $35,000 26,877 0.01KeySpan Gas East Corp. 2.74% 15/08/26 $35,000 26,405 0.01Eastern Gas Transmission & Storage Inc. 4.60% 15/12/44 $35,000 26,063 0.01John Deere Capital Corp. 3.45% 13/03/25 $30,000 24,073 0.01Cigna Corp. 4.80% 15/08/38 $30,000 23,827 0.01AT&T Inc. 3.65% 15/09/59 $38,000 23,280 0.01American Water Capital Corp. 2.95% 01/09/27 $30,000 22,806 0.01Pennsylvania Electric Co. 3.60% 01/06/29 $29,000 21,988 0.01
Vanguard SustainableLife 60-70% Equity Fund
24

CouponMaturity
Date Holding
MarketValue
(£)
% ofTotal Net
Assets
Nevada Power Co. 3.13% 01/08/50 $35,000 21,579 0.01Union Pacific Corp. 3.84% 20/03/60 $30,000 20,903 0.01Mercy Health 4.30% 01/07/28 $25,000 20,347 0.01Comcast Corp. 3.95% 15/10/25 $25,000 20,165 0.01SBA Tower Trust 3.45% 15/03/23 $25,000 19,937 0.01Intel Corp. 4.00% 15/12/32 $25,000 19,802 0.01Gilead Sciences Inc. 4.75% 01/03/46 $25,000 19,750 0.01Carrier Global Corp. 3.38% 05/04/40 $30,000 19,709 0.01Vantage Data Centers Issuer LLC 3.19% 15/07/44 $24,333 18,873 0.01Consolidated Edison Co of New York Inc. 6.30% 15/08/37 $20,000 18,255 0.01PacifiCorp 2.70% 15/09/30 $25,000 18,010 0.01Cigna Corp. 2.40% 15/03/30 $25,000 17,459 0.01SCE Recovery Funding LLC 1.94% 15/05/38 $25,000 17,448 0.01Oracle Corp. 3.85% 01/04/60 $30,000 16,798 0.01Dignity Health 4.50% 01/11/42 $22,000 16,774 0.01Ameren Illinois Co. 3.80% 15/05/28 $20,000 15,906 0.01Alabama Power Co. 4.30% 15/07/48 $20,000 14,916 0.00Parker-Hannifin Corp. 3.25% 14/06/29 $20,000 14,876 0.00Equitable Financial Life Global Funding 1.40% 07/07/25 $20,000 14,842 0.00Corebridge Financial Inc. 4.35% 05/04/42 $20,000 14,411 0.00Norfolk Southern Corp. 2.55% 01/11/29 $20,000 14,360 0.00UnitedHealth Group Inc. 2.00% 15/05/30 $20,000 13,814 0.00Comcast Corp. 6.50% 15/11/35 $14,000 13,374 0.00Comcast Corp. 2.65% 15/08/62 $25,000 13,153 0.00UnitedHealth Group Inc. 4.63% 15/07/35 $15,000 12,362 0.00American Tower Corp. 5.00% 15/02/24 $15,000 12,247 0.00Penske Truck Leasing Co. Lp / PTL Finance Corp. 4.25% 17/01/23 $15,000 12,080 0.00Aetna Inc. 2.80% 15/06/23 $15,000 11,923 0.00CommonSpirit Health 4.35% 01/11/42 $15,000 11,149 0.00Commonwealth Edison Co. 4.00% 01/03/48 $15,000 11,112 0.00Southern Co. 4.40% 01/07/46 $15,000 10,904 0.00Georgia Power Co. 4.30% 15/03/42 $15,000 10,895 0.00SCE Recovery Funding LLC 2.51% 15/11/43 $15,000 10,801 0.00Dominion Energy South Carolina Inc. 6.63% 01/02/32 $11,000 10,363 0.00Dominion Energy South Carolina Inc. 6.05% 15/01/38 $10,000 9,179 0.00CVS Health Corp. 5.05% 25/03/48 $10,000 8,005 0.00Cox Communications Inc. 3.15% 15/08/24 $10,000 7,880 0.00UnitedHealth Group Inc. 4.20% 15/01/47 $10,000 7,710 0.00Dominion Energy South Carolina Inc. 4.60% 15/06/43 $10,000 7,702 0.00Commonwealth Edison Co. 2.95% 15/08/27 $10,000 7,630 0.00Citigroup Inc. 4.75% 18/05/46 $10,000 7,543 0.00Indiana Michigan Power Co. 4.25% 15/08/48 $10,000 7,356 0.00Providence St Joseph Health Obligated Group 3.93% 01/10/48 $10,000 7,206 0.00Microsoft Corp. 2.92% 17/03/52 $10,000 6,486 0.00Dominion Energy South Carolina Inc. 5.10% 01/06/65 $5,000 4,124 0.00Northwestern Mutual Life Insurance Co. 3.63% 30/09/59 $6,000 3,899 0.00Angel Oak Mortgage Trust I LLC 2019-4 2.99% 26/07/49 $4,465 3,556 0.00Commonwealth Edison Co. 3.65% 15/06/46 $5,000 3,525 0.00Charter Communications Operating LLC / Charter Communications
Operating Capital 4.80% 01/03/50 $5,000 3,304 0.00United Airlines 2018-1 Class B Pass Through Trust 4.60% 01/03/26 $3,402 2,606 0.00Angel Oak Mortgage Trust I LLC 2018-3 3.65% 25/09/48 $2,233 1,778 0.00
35,127,236 11.47
57,635,390 18.82
Government and Municipal Bonds 13.69% (31 October 2021: 12.71%)
Australia 0.13% (31 October 2021: 0.10%)
Australia Government Bond 1.00% 21/11/31 AU($)425,000 197,009 0.07Australia Government Bond 0.25% 21/11/24 AU($)350,000 186,174 0.06Australia Government Bond 2.75% 21/11/27 AU($)15,000 8,359 0.00
391,542 0.13
Bermuda 0.10% (31 October 2021: 0.14%)
Bermuda Government International Bond 2.38% 20/08/30 $435,000 306,173 0.10
306,173 0.10
Canada 0.50% (31 October 2021: 0.39%)
Canadian Government Bond 0.50% 01/10/24 CA($)425,000 253,012 0.08Municipal Finance Authority of British Columbia 4.95% 01/12/27 CA($)300,000 202,478 0.07
Vanguard SustainableLife 60-70% Equity Fund
25

CouponMaturity
Date Holding
MarketValue
(£)
% ofTotal Net
Assets
Canadian Government Bond 1.25% 01/06/31 CA($)320,000 177,664 0.06Canadian Government Bond 0.75% 01/09/26 CA($)300,000 173,674 0.06Canadian Government Bond 0.25% 01/03/26 CA($)235,000 133,284 0.04Province of Ontario Canada 2.90% 02/06/28 CA($)200,000 121,746 0.04Regional Municipality of York 2.15% 22/06/31 CA($)200,000 109,939 0.04City of Montreal Canada 2.40% 01/12/41 CA($)200,000 96,568 0.03Canadian Government Bond 2.00% 01/12/51 CA($)180,000 93,918 0.03City Of Montreal 3.15% 01/12/36 CA($)100,000 56,331 0.02City of Toronto Canada 3.20% 01/08/48 CA($)90,000 48,447 0.01Province of Ontario Canada 0.25% 28/06/29 CHF55,000 42,029 0.01City Of Montreal 3.50% 01/12/38 CA($)55,000 31,889 0.01
1,540,979 0.50
Cayman Islands 0.00% (31 October 2021: 0.48%)
Chile 0.00% (31 October 2021: 0.19%)
Colombia 0.06% (31 October 2021: 0.08%)
Colombia Government International Bond 4.00% 26/02/24 $220,000 172,525 0.06
172,525 0.06
Croatia 0.00% (31 October 2021: 0.08%)
Germany 2.41% (31 October 2021: 0.14%)
Bundesobligation 0.00% 18/10/24 €3,180,000 2,647,345 0.86Bundesrepublik Deutschland Bundesanleihe 0.25% 15/08/28 €2,685,000 2,186,482 0.71Bundesobligation 0.01% 16/04/27 €2,000,000 1,625,488 0.53Bundesrepublik Deutschland Bundesanleihe 1.25% 15/08/48 €575,000 506,265 0.17Bundesrepublik Deutschland Bundesanleihe 0.00% 15/05/36 €595,000 430,647 0.14
7,396,227 2.41
Japan 0.13% (31 October 2021: 0.88%)
Japan Government Thirty Year Bond 0.70% 20/06/51 ¥49,800,000 286,436 0.09Japan Government Thirty Year Bond 0.70% 20/09/51 ¥18,600,000 106,779 0.04
393,215 0.13
Kuwait 0.00% (31 October 2021: 0.07%)
Mexico 0.06% (31 October 2021: 0.11%)
Mexico Government International Bond 4.28% 14/08/41 $270,000 179,482 0.06
179,482 0.06
Panama 0.00% (31 October 2021: 0.21%)
Qatar 0.13% (31 October 2021: 0.17%)
Qatar Government International Bond 3.38% 14/03/24 $300,000 240,000 0.08Qatar Government International Bond 3.25% 02/06/26 $200,000 158,187 0.05
398,187 0.13
Romania 0.04% (31 October 2021: 0.19%)
Romanian Government International Bond 2.00% 14/04/33 €120,000 73,447 0.02Romanian Government International Bond 2.63% 02/12/40 €95,000 53,126 0.02
126,573 0.04
Saudi Arabia 0.05% (31 October 2021: 0.18%)
Saudi Government International Bond 2.88% 04/03/23 $200,000 159,713 0.05
159,713 0.05
Spain 0.03% (31 October 2021: 0.05%)
Spain Government Bond 0.60% 31/10/29 €125,000 98,061 0.03
98,061 0.03
Supranational 0.62% (31 October 2021: 0.91%)
European Union 0.01% 04/07/29 €800,000 611,893 0.20European Investment Bank 0.01% 15/11/27 €255,000 201,366 0.07European Stability Mechanism 0.01% 15/12/26 €250,000 199,249 0.07European Union 0.01% 04/07/31 €270,024 198,598 0.06European Union 0.40% 04/02/37 €205,000 143,315 0.05European Stability Mechanism 0.01% 16/12/24 €167,500 137,755 0.04European Union 1.25% 04/02/43 €150,000 115,685 0.04European Union 0.75% 04/01/47 €150,000 102,000 0.03European Union 0.20% 04/06/36 €100,000 67,988 0.02European Union 0.45% 04/07/41 €85,000 56,013 0.02European Investment Bank 0.38% 15/09/27 €66,000 53,314 0.02
1,887,176 0.62
Vanguard SustainableLife 60-70% Equity Fund
26

CouponMaturity
Date Holding
MarketValue
(£)
% ofTotal Net
Assets
United Kingdom 0.27% (31 October 2021: 0.11%)
UK Treasury 1.25% 22/07/27 £560,000 548,380 0.18UK Treasury 1.50% 22/07/47 £160,000 142,221 0.05UK Treasury 3.50% 22/01/45 £110,000 137,539 0.04
828,140 0.27
United States 9.16% (31 October 2021: 8.23%)
US Treasury Note 0.63% 15/10/24 $2,985,000 2,253,088 0.74US Treasury Note 1.50% 31/01/27 $2,495,000 1,860,102 0.61US Treasury Note 2.50% 31/03/27 $1,885,000 1,471,365 0.48US Treasury Note 2.38% 15/02/42 $1,995,000 1,404,285 0.46US Treasury Note 1.88% 28/02/27 $1,800,000 1,365,367 0.45US Treasury Note 2.00% 15/11/41 $2,055,000 1,354,705 0.44US Treasury Note 2.25% 15/02/52 $1,920,000 1,313,022 0.43Fannie Mae 3.50% 12/05/52 $1,550,000 1,196,861 0.39Fannie Mae 3.00% 12/05/52 $1,425,000 1,069,739 0.35US Treasury Note 1.75% 15/08/41 $1,215,000 766,633 0.25Fannie Mae 2.50% 17/05/37 $950,000 724,059 0.24US Treasury Note 1.88% 15/02/32 $980,000 712,753 0.23US Treasury Note 0.25% 15/05/24 $900,000 681,619 0.22State of Illinois 5.10% 01/06/33 $815,000 663,718 0.22Fannie Mae Pool 2.50% 01/08/51 $776,311 567,097 0.18US Treasury Note 0.50% 30/11/23 $725,000 558,782 0.18Fannie Mae 2.00% 13/06/52 $740,000 518,486 0.17US Treasury Note 1.50% 15/02/25 $620,000 475,386 0.16US Treasury Note 0.38% 15/07/24 $600,000 453,405 0.15US Treasury Note 0.88% 30/06/26 $595,000 435,298 0.14US Treasury Note 0.38% 15/04/24 $570,000 433,856 0.14US Treasury Note 0.88% 31/01/24 $545,000 420,881 0.14Fannie Mae REMICS 3.00% 25/03/45 $477,219 359,160 0.12US Treasury Note 1.25% 31/12/26 $480,000 354,032 0.12US Treasury Note 1.75% 15/03/25 $450,000 347,222 0.11Fannie Mae 2.50% 12/05/52 $455,000 330,441 0.11Fannie Mae 2.50% 13/06/52 $455,000 329,763 0.11US Treasury Note 0.63% 31/07/26 $410,000 296,203 0.10Ginnie Mae 2.50% 19/05/52 $375,000 277,028 0.09Fannie Mae Pool 2.50% 01/11/51 $364,549 266,635 0.09US Treasury Note 0.75% 31/05/26 $355,000 258,788 0.08Freddie Mac Multifamily Structured Pass Through Certificates 2.25% 25/01/32 $345,000 247,331 0.08Municipal Electric Authority of Georgia 6.64% 01/04/57 $246,000 239,671 0.08Fannie Mae 2.00% 12/05/52 $325,000 228,153 0.07Fannie Mae Pool 2.00% 01/09/51 $320,111 226,019 0.07US Treasury Note 1.50% 29/02/24 $275,000 214,467 0.07US Treasury Note 0.75% 31/08/26 $295,000 213,948 0.07US Treasury Note 0.25% 15/06/24 $270,000 203,931 0.07US Treasury Note 0.25% 31/10/25 $225,000 163,292 0.05Ginnie Mae 2.00% 19/05/52 $225,000 162,358 0.05Fannie Mae Pool 2.00% 01/07/41 $207,446 148,229 0.05Chicago Transit Authority Sales & Transfer Tax Receipts Revenue 6.90% 01/12/40 $150,000 146,877 0.05Freddie Mac Pool 2.00% 01/03/51 $203,012 143,061 0.05Metropolitan Transportation Authority 6.81% 15/11/40 $145,000 141,574 0.05Aligned Data Centers Issuer LLC 1.94% 15/08/46 $195,000 140,343 0.05Fannie Mae Pool 2.54% 01/07/26 $166,026 128,034 0.04California Health Facilities Financing Authority 4.35% 01/06/41 $165,000 127,469 0.04Fannie Mae Pool 2.00% 01/05/41 $135,983 97,165 0.03Ginnie Mae 3.00% 19/05/52 $125,000 94,869 0.03Fannie Mae Pool 2.00% 01/04/41 $114,774 82,010 0.03Chicago Transit Authority Sales Tax Receipts Fund 1.84% 01/12/23 $100,000 78,096 0.03US Treasury Note 1.88% 15/02/51 $125,000 78,016 0.03Port Authority of New York & New Jersey 4.03% 01/09/48 $100,000 76,835 0.02US Treasury Note 2.00% 15/08/51 $110,000 70,749 0.02Freddie Mac STACR REMIC Trust 2020-DNA5 FRN 3.09% 25/10/50 $87,448 70,177 0.02US Treasury Note 0.38% 31/01/26 $95,000 68,774 0.02Fannie Mae REMICS 3.00% 25/10/45 $86,681 68,100 0.02University of Michigan 3.50% 01/04/52 $80,000 59,042 0.02Philadelphia Authority for Industrial Development 6.55% 15/10/28 $65,000 58,970 0.02Dallas Fort Worth International Airport 4.51% 01/11/51 $75,000 57,082 0.02Port Authority of New York & New Jersey 4.46% 01/10/62 $65,000 52,467 0.02
Vanguard SustainableLife 60-70% Equity Fund
27

CouponMaturity
Date Holding
MarketValue
(£)
% ofTotal Net
Assets
Fannie Mae REMICS 2.50% 25/12/41 $62,147 47,890 0.02Kansas Development Finance Authority 2.77% 01/05/51 $75,000 45,746 0.01Fannie Mae-Aces 2.39% 25/10/36 $63,900 42,812 0.01Sales Tax Securitization Corp. 4.79% 01/01/48 $50,000 40,479 0.01Chicago Transit Authority Sales & Transfer Tax Receipts Revenue 6.90% 01/12/40 $40,000 39,197 0.01US Treasury Note 1.88% 15/11/51 $60,000 37,470 0.01Chicago Transit Authority Sales Tax Receipts Fund 6.20% 01/12/40 $35,000 32,681 0.01Foothill-Eastern Transportation Corridor Agency 4.09% 15/01/49 $45,000 32,262 0.01Connecticut Avenue Securities Trust 2021-R01 FRN 1.84% 25/10/41 $40,000 31,007 0.01Grand Parkway Transportation Corp. 3.24% 01/10/52 $45,000 29,127 0.01Foothill-Eastern Transportation Corridor Agency 3.92% 15/01/53 $40,000 27,186 0.01US Treasury Note 1.38% 15/11/31 $30,000 20,867 0.01Kansas Development Finance Authority 5.37% 01/05/26 $25,000 20,669 0.01New York State Dormitory Authority 3.11% 15/02/39 $30,000 20,560 0.01Fannie Mae Pool 3.07% 01/02/25 $25,000 19,701 0.01Port Authority of New York & New Jersey 3.18% 15/07/60 $30,000 18,546 0.01Port Authority of New York & New Jersey 5.65% 01/11/40 $20,000 18,477 0.01Fannie Mae REMICS 3.50% 25/02/48 $20,959 16,672 0.01State of Connecticut 5.77% 15/03/25 $15,000 12,735 0.00US Treasury Note 2.38% 15/05/51 $15,000 10,517 0.00Massachusetts School Building Authority 3.40% 15/10/40 $15,000 10,501 0.00Dallas Fort Worth International Airport 3.09% 01/11/40 $15,000 10,231 0.00Fannie Mae REMICS 3.00% 25/02/49 $12,881 10,092 0.00Metropolitan Transportation Authority 6.67% 15/11/39 $10,000 9,493 0.00Dallas Fort Worth International Airport 4.09% 01/11/51 $10,000 7,599 0.00US Treasury Note 1.13% 28/02/25 $10,000 7,587 0.00County of Broward FL Airport System Revenue 3.48% 01/10/43 $10,000 6,913 0.00Regents of the University of California Medical Center Pooled Revenue 6.58% 15/05/49 $5,000 5,132 0.00Chicago O’Hare International Airport 6.40% 01/01/40 $5,000 4,970 0.00Freddie Mac STACR REMIC Trust 2021-DNA1 FRN 0.94% 25/01/51 $1,148 913 0.00Freddie Mac Pool 2.50% 01/11/49 $1 1 0.00
28,044,921 9.16
Total Government and Municipal Bonds 41,922,914 13.69
Total Equities and Debt Securities 295,481,167 96.49
Number ofContracts
Long/(Short)
NotionalAmount
(£)
UnrealisedGain/(Loss)
(£)
% ofTotal Net
Assets
Financial Derivative Instruments (0.29%) (31 October 2021: (0.08%))
Futures Contracts 0.09% (31 October 2021: 0.06%)
US Treasury Note Ultra 10 Year June 2022 (36) (3,698,923) 241,801 0.08US Treasury Note 10 Year June 2022 (37) (3,511,572) 193,131 0.06Euro-BUND June 2022 (14) (1,806,783) 79,097 0.03US Ultra Bond Futures June 2022 (2) (255,575) 25,986 0.01US Treasury Note 2 Year June 2022 (2) (167,911) 6,328 0.00United Kingdom Gilt June 2022 (2) (236,880) 5,740 0.00US Treasury Note 5 Year June 2022 (2) (179,485) 5,376 0.00German Euro OAT June 2022 2 245,088 (19,729) (0.01)German Euro BTP June 2022 4 438,079 (44,753) (0.01)German Euro BUXL June 2022 2 287,336 (48,298) (0.02)Euro-BOBL June 2022 37 3,953,990 (157,070) (0.05)
287,609 0.09
CurrencyBuy
Amount Currency(Sell)
Amount CounterpartySettlement
Date
UnrealisedGain/(Loss)
(£)
% ofTotal Net
Assets
Forward Currency Exchange Contract (0.38%) (31 October 2021: (0.14%))
USD 24,871,540 EUR (23,279,000) Barclays Bank 31/5/22 228,723 0.08USD 6,115,391 GBP (4,808,000) JP Morgan Chase Bank 31/5/22 62,969 0.02USD 909,252 GBP (731,000) Barclays Bank 31/5/22 6,772 0.00USD 518,613 JPY (66,400,000) JP Morgan Chase Bank 31/5/22 4,581 0.00USD 753,989 GBP (603,000) JP Morgan Chase Bank 31/5/22 2,441 0.00USD 610,444 AUD (855,000) Barclays Bank 31/5/22 2,035 0.00USD 229,320 GBP (182,000) Barclays Bank 31/5/22 655 0.00USD 56,337 CHF (54,000) JP Morgan Chase Bank 31/5/22 510 0.00USD 485,090 GBP (385,000) JP Morgan Chase Bank 31/5/22 (1,379) (0.00)USD 2,800,205 CAD (3,589,000) Barclays Bank 31/5/22 (6,281) (0.00)
Vanguard SustainableLife 60-70% Equity Fund
28
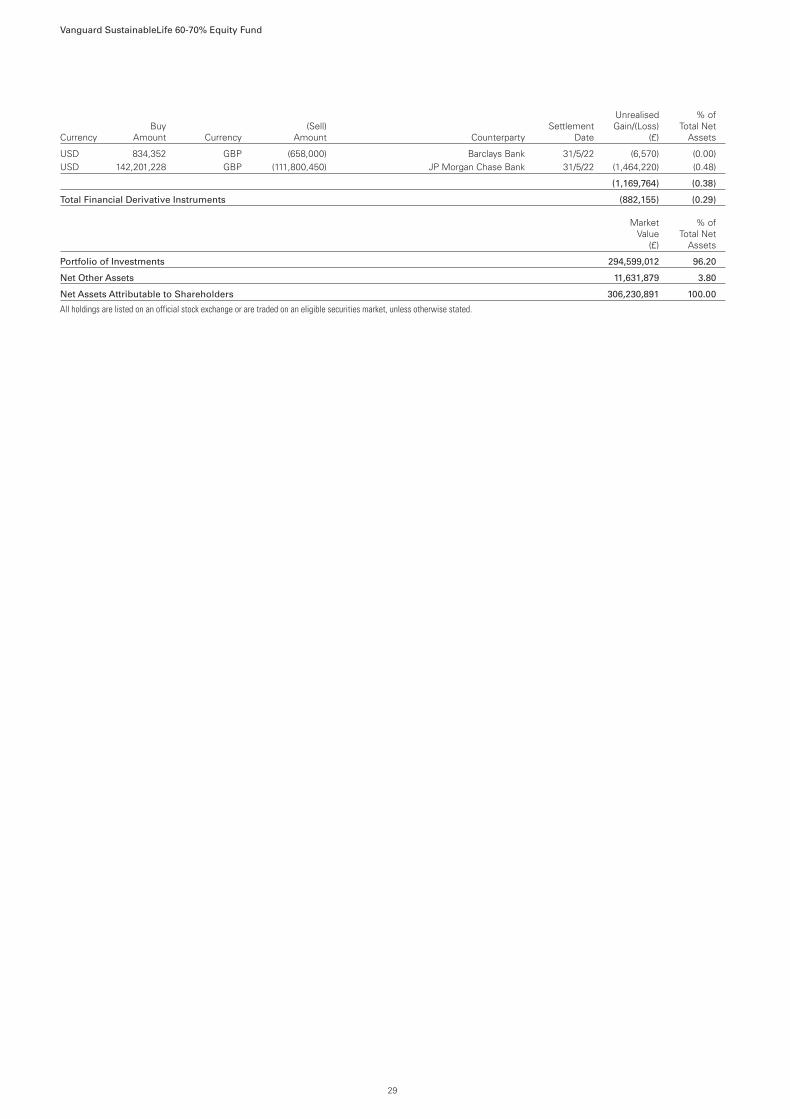
CurrencyBuy
Amount Currency(Sell)
Amount CounterpartySettlement
Date
UnrealisedGain/(Loss)
(£)
% ofTotal Net
Assets
USD 834,352 GBP (658,000) Barclays Bank 31/5/22 (6,570) (0.00)USD 142,201,228 GBP (111,800,450) JP Morgan Chase Bank 31/5/22 (1,464,220) (0.48)
(1,169,764) (0.38)
Total Financial Derivative Instruments (882,155) (0.29)
MarketValue
(£)
% ofTotal Net
Assets
Portfolio of Investments 294,599,012 96.20
Net Other Assets 11,631,879 3.80
Net Assets Attributable to Shareholders 306,230,891 100.00
All holdings are listed on an official stock exchange or are traded on an eligible securities market, unless otherwise stated.
Vanguard SustainableLife 60-70% Equity Fund
29

As at As at
30 April 2022(£)
31 October 2021(£)
Assets:
Financial Assets 296,347,312 216,328,666Current Assets
Debtors 4,315,434 4,046,467Cash and Bank Balances 17,699,441 14,694,284
Total Assets 318,362,187 235,069,417
Liabilities:
Financial Liabilities 1,748,300 459,991Creditors
Bank Overdrafts 1,965,933 1,313,629Distribution Payable — 146,892Other Creditors 8,417,063 8,823,225
Total Liabilities 12,131,296 10,743,737
Net Assets Attributable to Shareholders 306,230,891 224,325,680
Statement of Total Return
Period Ended Period Ended
30 April 2022(£)
30 April 2022(£)
30 April 2021(£)
30 April 2021(£)
IncomeNet Capital Gains/(Losses) (5,890,657) 20,679,492Revenue 3,139,501 1,718,425
Expenses (614,409) (370,215)
Net Revenue Before Taxation 2,525,092 1,348,210Taxation (366,420) (209,767)
Net Revenue After Taxation 2,158,672 1,138,443
Total Return Before Distributions (3,731,985) 21,817,935
Distributions1 337,371 73,902
Change in Net Assets Attributable to
Shareholders From Investment Activities (3,394,614) 21,891,837
1 Includes adjustments for equalisation.
Statement of Change in Net Assets Attributable to Shareholders
Period Ended Period Ended
30 April 2022(£)
30 April 2022(£)
30 April 2021(£)
30 April 2021(£)
Opening Net Assets Attributable to Shareholders 224,325,680 147,393,222
Amounts Received on Issue of Shares 86,563,524 31,565,559Amounts Paid on Cancellation of Shares (1,264,791) (27,895,582)
85,298,733 3,669,977
Dilution Adjustment 1,092 13,182Change in Net Assets Attributable to
Shareholders From Investment Activities (3,394,614) 21,891,837
Closing Net Assets Attributable to Shareholders 306,230,891 172,968,218
The interim financial statements for the Fund have been prepared on the same basis of the accounting policies as the annual financial statements for the year ended 31 October 2021.
Vanguard SustainableLife 60-70% Equity Fund
Balance Sheet
30

Investment Objective
The Vanguard SustainableLife 80-90% Equity Fund (the “Fund”) seeks to provide an increase in the value of investments over the long-term (more than 5 years)together with some money paid out from those investments as income.
Investment Strategy
The Fund seeks to achieve its investment objective by investing in a combination of shares of companies (between 80-90% of the portfolio, with an expectedallocation of 85%) and bonds (between 10-20% of the portfolio, with an expected allocation of 15%) selected in accordance with the Sustainability Policydescribed in the Prospectus.
Synthetic Risk and Reward Indicator
Lower risk
Typically lower rewards
Higher risk
Typically higher rewards
1 2 3 4 5 6 7
The Synthetic Risk and Reward Indicator (SRRI) measures the volatility of the Fund. The risk and reward category (which may range from 1 to 7) is calculatedusing historical data and may not be a reliable indicator of the Fund’s future risk profile. The risk and reward category may shift over time and is not a target orguarantee. The lowest category (i.e. category 1) does not mean “risk free”. The Fund appears in the higher range of the risk and reward indicator because thevalues of the Fund’s investments have experienced a higher rate of change in the past.
Performance SummaryThe Performance Summary does not form part of the Financial Statements.
• Volatility surged and global financial markets slumped during the six months ended 30 April 2022. When the period began, supply bottlenecks, rising oil pricesand the prospect of less accommodative monetary policy were already weighing on market sentiment.
• Then Russia’s invasion of Ukraine injected substantial uncertainty into the markets. Energy prices soared, helping to push consumer prices to multidecadehighs across much of the world. Some central banks, including those in the United States and the United Kingdom, raised short-term interest rates. TheEuropean Central Bank continued to reduce its bond purchases and was expected to raise rates later this year.
• While consumer sentiment flagged during the period, in many markets unemployment remained low, consumer balance sheets healthy and corporate profitsrobust.
• With central banks turning less accommodative and inflation looking set to remain elevated for some time, bond yields in many markets moved higher acrossthe maturity spectrum. The Bloomberg Global Aggregate Bond Index hedged to British pounds, a global bond proxy, returned about –7% for the six months.
• Stocks regained some ground in March but finished the six months with a negative return. The FTSE Developed Index, the Fund’s equity index and a proxy forglobal stocks, returned about –3%. The United Kingdom and Asia-Pacific were bright spots, while Europe detracted the most.
• The Fund is actively managed; it does not seek to track a benchmark. The performance information in the table below shows how the Fund’s returns comparewith those of a composite index with similar investment characteristics. From its inception on 8 December 2021 through 30 April 2022, the Fund held upsignificantly better than the index, which returned –7.64%.
• The United States, by far the largest market in the Fund’s equity index, drove much of the Fund’s outperformance. Japan, Switzerland and Spain were alsobright spots. In contrast, underweights in Australia and Canada and security selection in Austria and South Korea dampened the Fund’s relative performance.
• Among equity industry sectors, security selection in health care and industrials and an underweight allocation to technology added the most value. Securityselection in basic materials and consumer staples detracted.
• In the fixed income component, outperformance was driven by positioning. An underweight to credit spread duration and an overweight to Treasuriesboosted relative performance, while selection within banking, consumer cyclicals, energy and technology provided headwinds.
Benchmark: SustainableLife 80-90% Equity Composite Index
Total ReturnsPeriods Ended 30 April 2022
(Annualised for periods over one year)
Ten Years orSince Inception1
GBP Acc -1.50%
Benchmark -7.64
GBP Inc -1.50%
Benchmark -7.64
Sources: Vanguard Global Advisers, LLC, FTSE and Bloomberg.Returns is based on NAV with income reinvested.
All of the returns in this report represent past performance, which is not a guarantee of future results that may be achieved by the Fund. For performance data current to the most recent month-end,which may be higher or lower than that cited, visit our website at http://global.vanguard.com. Note, too, that both investment returns and principal value can fluctuate widely, so an investor’s shares,when sold, could be worth more or less than their original cost.1 Since-inception returns: GBP Acc and GBP Inc, 8 December 2021.
Vanguard SustainableLife 80-90% Equity FundManaged by Wellington Management Company LLP.
31

Performance Comparative Table
GBP Acc†
For the PeriodEnded
30 April 2022
Closing Net Asset Value £51,909,370
Closing Number of Shares 527,199
Closing Net Asset Value Per Share1 £98.46
Operating Charges2 0.48%
GBP Inc†
Closing Net Asset Value £37,486,414
Closing Number of Shares 380,718
Closing Net Asset Value Per Share1 £98.46
Operating Charges2 0.48%
† The Fund launched on 8 December 2021.1 The net asset value per share shown may diverge from the net asset value per share used for dealing purposes as at 30 April 2022 because of any adjustments for trade date accounting, swing
pricing and any adjustments in valuation to bid prices.2 Operating charges include indirect costs incurred in the maintenance and running of the Fund, as disclosed in the detailed expenses within the Statement of Total Return.
Vanguard SustainableLife 80-90% Equity Fund
32
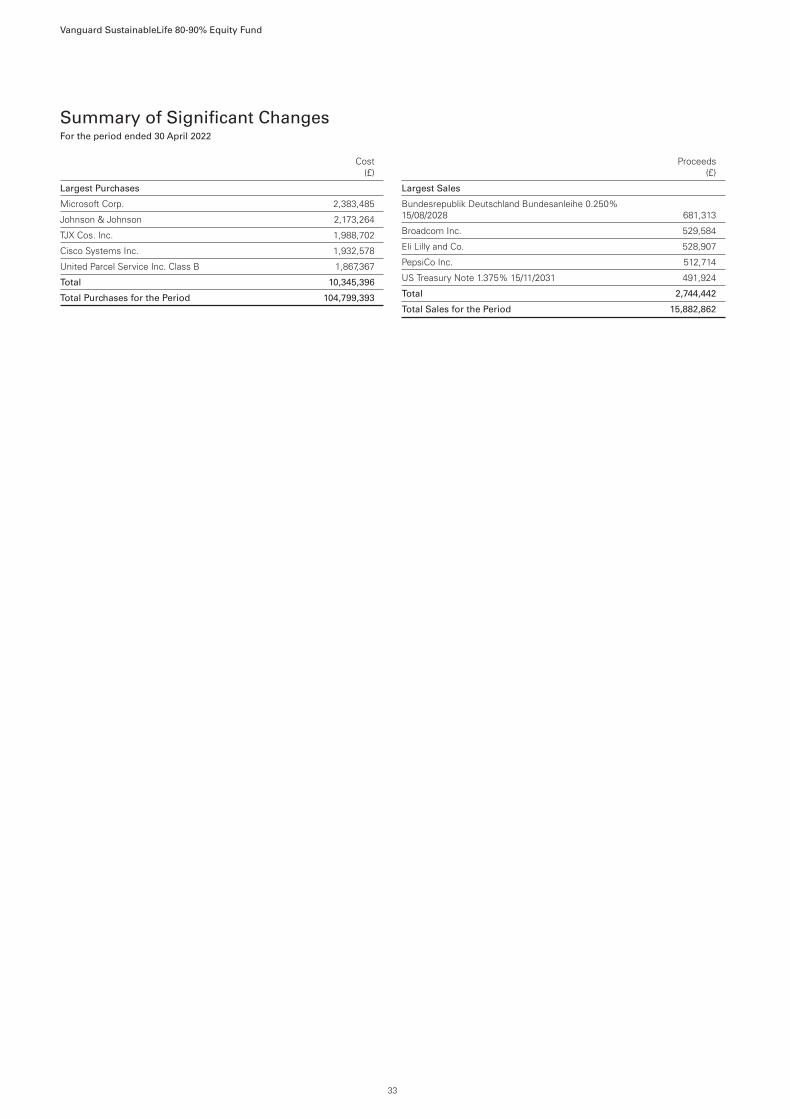
Summary of Significant ChangesFor the period ended 30 April 2022
Cost(£)
Largest Purchases
Microsoft Corp. 2,383,485
Johnson & Johnson 2,173,264
TJX Cos. Inc. 1,988,702
Cisco Systems Inc. 1,932,578
United Parcel Service Inc. Class B 1,867,367
Total 10,345,396
Total Purchases for the Period 104,799,393
Proceeds(£)
Largest Sales
Bundesrepublik Deutschland Bundesanleihe 0.250%15/08/2028 681,313
Broadcom Inc. 529,584
Eli Lilly and Co. 528,907
PepsiCo Inc. 512,714
US Treasury Note 1.375% 15/11/2031 491,924
Total 2,744,442
Total Sales for the Period 15,882,862
Vanguard SustainableLife 80-90% Equity Fund
33

Portfolio StatementAs at 30 April 2022
Holding
MarketValue
(£)
% ofTotal Net
Assets
Equities 84.13%
Austria 0.86%
Erste Group Bank AG 30,898 768,748 0.86
768,748 0.86
Canada 0.50%
Dollarama Inc. 10,044 446,618 0.50
446,618 0.50
Finland 1.32%
Nokia Oyj (OMXH) 289,525 1,182,448 1.32
1,182,448 1.32
France 5.37%
TotalEnergies SE 22,519 893,585 1.00Arkema SA 9,621 882,387 0.99Schneider Electric SE 7,587 877,592 0.98Vinci SA 9,087 708,877 0.80Engie SA 67,755 644,584 0.72BNP Paribas SA 12,476 520,906 0.58Amundi SA 5,567 269,906 0.30
4,797,837 5.37
Germany 1.47%
MTU Aero Engines AG 6,841 1,106,248 1.24Bayerische Motoren Werke AG 3,151 207,180 0.23
1,313,428 1.47
Hong Kong 1.21%
AIA Group Ltd. 136,600 1,078,146 1.21
1,078,146 1.21
Japan 8.41%
Nippon Telegraph & Telephone Corp. 62,600 1,480,501 1.66Tokio Marine Holdings Inc. 26,500 1,141,863 1.28Resona Holdings Inc. 254,000 881,943 0.99Mitsubishi Estate Co. Ltd. 65,200 754,762 0.84Isuzu Motors Ltd. 73,300 683,149 0.76Mitsubishi UFJ Financial Group Inc. 142,200 659,148 0.74Marui Group Co. Ltd. 40,400 556,838 0.62Astellas Pharma Inc. 43,100 522,777 0.58Honda Motor Co. Ltd. 21,200 445,341 0.50BIPROGY Inc. 19,300 390,360 0.44
7,516,682 8.41
South Korea 1.14%
Samsung Electronics Co. Ltd. GDR 966 1,018,320 1.14
1,018,320 1.14
Spain 1.94%
Iberdrola SA 96,812 895,636 1.00CaixaBank SA 321,736 834,277 0.94
1,729,913 1.94
Sweden 1.36%
Lundin Energy AB 26,797 892,684 1.00Alfa Laval AB 14,525 327,108 0.36
1,219,792 1.36
Switzerland 4.27%
Novartis AG 23,774 1,687,480 1.89Nestle SA 10,538 1,089,555 1.22Zurich Insurance Group AG 2,075 759,235 0.85Julius Baer Group Ltd. 7,297 282,922 0.31
3,819,192 4.27
Holding
MarketValue
(£)
% ofTotal Net
Assets
Taiwan 1.29%
Taiwan SemiconductorManufacturing Co. Ltd. ADR 14,919 1,105,348 1.24
Taiwan SemiconductorManufacturing Co. Ltd. 3,300 47,976 0.05
1,153,324 1.29
United Kingdom 4.40%
AstraZeneca plc ADR 38,357 2,027,680 2.27WPP plc 96,081 965,614 1.08Rotork plc 139,766 409,235 0.46Prudential plc 32,055 323,756 0.36Derwent London plc 6,851 206,626 0.23
3,932,911 4.40
United States 50.59%
Johnson & Johnson 17,376 2,498,240 2.79Microsoft Corp. 9,226 2,039,713 2.28United Parcel Service Inc. 12,026 1,723,965 1.93Cisco Systems Inc. 43,280 1,688,798 1.89TJX Cos. Inc. 33,502 1,634,406 1.83Chubb Ltd. 9,455 1,554,219 1.74Mondelez International Inc. 30,072 1,544,198 1.73Duke Energy Corp. 17,593 1,543,923 1.73Colgate-Palmolive Co. 24,691 1,515,285 1.69Merck & Co. Inc. 21,102 1,491,005 1.67Sempra Energy 11,335 1,456,802 1.63Visa Inc. 8,147 1,381,777 1.55Texas Instruments Inc. 10,189 1,381,662 1.54Baxter International Inc. 23,925 1,354,129 1.51Comcast Corp. 42,544 1,347,311 1.51JPMorgan Chase & Co. 12,471 1,185,812 1.33Autoliv Inc. 19,918 1,168,903 1.31Pioneer Natural Resources Co. 6,270 1,160,211 1.30Medtronic plc 13,091 1,088,153 1.22Curtiss-Wright Corp. 9,517 1,084,278 1.21Alphabet Inc. Class A 586 1,064,937 1.19UnitedHealth Group Inc. 2,568 1,039,145 1.16American Express Co. 7,206 1,002,870 1.12Otis Worldwide Corp. 16,440 953,925 1.07Bank of America Corp. 32,987 936,930 1.05General Motors Co. 30,445 919,291 1.03Union Pacific Corp. 4,813 898,273 1.00American Tower Corp. 4,515 866,786 0.97Deere & Co. 2,711 814,466 0.91Home Depot Inc. 3,349 801,439 0.90Eli Lilly & Co. 3,424 796,724 0.89PNC Financial Services Group Inc. 5,717 756,574 0.85Caterpillar Inc. 3,745 627,925 0.70Linde plc 2,484 627,729 0.70McDonald's Corp. 2,489 494,112 0.55Accenture plc 1,850 442,762 0.49KLA Corp. 1,711 434,680 0.49BlackRock Inc. 820 408,034 0.46PepsiCo Inc. 2,870 392,519 0.44Intel Corp. 10,114 351,150 0.39Gilead Sciences Inc. 6,476 305,824 0.34Marsh & McLennan Cos. Inc. 2,313 297,899 0.33Broadcom Inc. 341 150,575 0.17
45,227,359 50.59
Total Equities 75,204,718 84.13
CouponMaturity
Date Holding
MarketValue
(£)
% ofTotal Net
Assets
Corporate Bonds 7.57%
Australia 0.06%
Macquarie Group Ltd. 2.87% 14/01/33 $87,000 57,615 0.06
57,615 0.06
Vanguard SustainableLife 80-90% Equity Fund
34

CouponMaturity
Date Holding
MarketValue
(£)
% ofTotal Net
Assets
Canada 0.05%
Canadian Pacific Railway Co. 3.00% 02/12/41 $26,000 16,847 0.02Fortis Inc. 3.06% 04/10/26 $19,000 14,518 0.02Nutrien Ltd. 4.13% 15/03/35 $19,000 14,383 0.01
45,748 0.05
Cayman Islands 0.06%
Avolon Holdings Funding Ltd. 2.53% 18/11/27 $63,000 43,080 0.05Avolon Holdings Funding Ltd. 2.13% 21/02/26 $10,000 7,114 0.01
50,194 0.06
Denmark 0.11%
Danske Bank A/S 2.25% 14/01/28 £100,000 93,731 0.11
93,731 0.11
France 0.47%
BPCE SFH SA 1.13% 12/04/30 €200,000 161,383 0.18BNP Paribas SA 2.50% 31/03/32 €100,000 80,706 0.09BNP Paribas SA 0.88% 11/07/30 €100,000 73,769 0.08Orange SA 0.63% 16/12/33 €100,000 69,941 0.08RCI Banque SA 0.50% 14/07/25 €45,000 35,241 0.04
421,040 0.47
Germany 0.23%
Volkswagen Leasing GmbH 1.38% 20/01/25 €159,000 131,594 0.15Kreditanstalt fuer Wiederaufbau 0.01% 09/11/28 €80,000 62,249 0.07Kreditanstalt fuer Wiederaufbau 0.13% 30/06/25 €15,000 12,351 0.01
206,194 0.23
Ireland 0.02%
Johnson Controls International plc 4.63% 02/07/44 $23,000 17,778 0.02
17,778 0.02
Jersey 0.26%
Galaxy Pipeline Assets Bidco Ltd. 2.16% 31/03/34 $192,172 134,727 0.15Heathrow Funding Ltd. 2.75% 13/10/29 £100,000 94,037 0.11
228,764 0.26
Netherlands 0.09%
Enel Finance International NV 0.50% 17/06/30 €100,000 72,380 0.08Shell International Finance BV 3.00% 26/11/51 $12,000 7,486 0.01
79,866 0.09
Norway 0.12%
Aker BP ASA 1.13% 12/05/29 €100,000 75,526 0.08Equinor ASA 3.00% 06/04/27 $44,000 33,997 0.04
109,523 0.12
Qatar 0.16%
Qatar Energy 2.25% 12/07/31 $200,000 139,420 0.16
139,420 0.16
Switzerland 0.36%
Credit Suisse Group AG 2.59% 11/09/25 $250,000 189,896 0.21UBS Group AG 2.75% 11/02/33 $200,000 134,028 0.15
323,924 0.36
United Kingdom 0.74%
Barclays plc 2.85% 07/05/26 $205,000 156,352 0.17HSBC Holdings plc 0.73% 17/08/24 $200,000 153,459 0.17GSK Consumer Healthcare Capital UK plc 3.38% 29/03/38 £100,000 97,837 0.11Tritax Big Box REIT plc 1.50% 27/11/33 £100,000 82,280 0.09Barclays plc 0.88% 28/01/28 €100,000 77,146 0.09NatWest Group plc 1.04% 14/09/32 €100,000 73,898 0.08CSL UK Holdings Ltd. 4.25% 27/04/32 $30,000 23,706 0.03
664,678 0.74
United States 4.84%
Alcon Finance Corp. 2.75% 23/09/26 $200,000 151,557 0.17Verizon Communications Inc. 2.36% 15/03/32 $188,000 126,179 0.14Nestle Holdings Inc. 2.13% 04/04/27 £100,000 98,151 0.11Hess Corp. 7.30% 15/08/31 $104,000 96,259 0.11
Vanguard SustainableLife 80-90% Equity Fund
35

CouponMaturity
Date Holding
MarketValue
(£)
% ofTotal Net
Assets
Walt Disney Co. 3.06% 30/03/27 CAD145,000 86,386 0.10AT&T Inc. 2.35% 05/09/29 €100,000 84,183 0.09Verizon Communications Inc. 1.25% 08/04/30 €100,000 77,291 0.09Charles Schwab Corp. 2.90% 03/03/32 $105,000 74,948 0.08Corebridge Financial Inc. 3.90% 05/04/32 $100,000 74,820 0.08T-Mobile USA Inc. 2.05% 15/02/28 $101,000 70,980 0.08Public Storage 0.50% 09/09/30 €100,000 70,109 0.08Morgan Stanley 2.48% 16/09/36 $108,000 68,926 0.08Conagra Brands Inc. 1.38% 01/11/27 $86,000 58,164 0.07Bank of America Corp. 2.48% 21/09/36 $90,000 57,610 0.06Goldman Sachs Group Inc. 2.65% 21/10/32 $82,000 55,138 0.06SBA Tower Trust 1.63% 15/11/26 $70,000 51,370 0.06Wells Fargo & Co. 3.53% 24/03/28 $65,000 49,842 0.06Aviation Capital Group LLC 1.95% 30/01/26 $70,000 49,764 0.06Athene Global Funding 2.50% 24/03/28 $69,000 48,755 0.05EPR Properties 3.60% 15/11/31 $71,000 47,912 0.05Equitable Financial Life Global Funding 1.70% 12/11/26 $65,000 47,010 0.05Brighthouse Financial Global Funding 1.55% 24/05/26 $65,000 46,965 0.05Schlumberger Holdings Corp. 3.90% 17/05/28 $60,000 46,416 0.05Cox Communications Inc. 3.50% 15/08/27 $60,000 46,300 0.05Gray Oak Pipeline LLC 3.45% 15/10/27 $62,000 46,268 0.05Hyundai Capital America 3.50% 02/11/26 $60,000 45,995 0.05Sempra Energy 3.25% 15/06/27 $59,000 45,006 0.05US Bancorp 2.49% 03/11/36 $67,000 44,919 0.05Consolidated Edison Co. of New York Inc. 2.40% 15/06/31 $65,000 44,881 0.05AT&T Inc. 3.50% 15/09/53 $69,000 43,091 0.05Union Pacific Corp. 2.80% 14/02/32 $60,000 42,935 0.05Goldman Sachs Group Inc. 1.43% 09/03/27 $59,000 42,024 0.05Workday Inc. 3.80% 01/04/32 $55,000 41,456 0.05Kyndryl Holdings Inc. 3.15% 15/10/31 $65,000 40,355 0.05Wells Fargo & Co. 4.10% 03/06/26 $48,000 38,067 0.04Broadcom Inc. 2.60% 15/02/33 $60,000 38,058 0.04Anheuser-Busch InBev Worldwide Inc. 4.50% 01/06/50 $51,000 38,031 0.04Oracle Corp. 2.88% 25/03/31 $56,000 37,832 0.04Gilead Sciences Inc. 2.80% 01/10/50 $64,000 36,429 0.04JPMorgan Chase & Co. 2.96% 25/01/33 $50,000 35,088 0.04CommonSpirit Health 3.91% 01/10/50 $50,000 34,345 0.04TWDC Enterprises 18 Corp. 4.38% 16/08/41 $43,000 33,214 0.04Oncor Electric Delivery Co. LLC 2.75% 15/05/30 $45,000 32,766 0.04Citigroup Inc. 3.52% 27/10/28 $43,000 32,571 0.04Goldman Sachs Group Inc. 2.62% 22/04/32 $48,000 32,370 0.04Enterprise Products Operating LLC 4.85% 15/03/44 $42,000 31,992 0.04Microchip Technology Inc. 0.97% 15/02/24 $42,000 31,886 0.04Marathon Oil Corp. 6.60% 01/10/37 $35,000 31,215 0.04JPMorgan Chase & Co. 2.58% 22/04/32 $44,000 30,160 0.03JPMorgan Chase & Co. 2.55% 08/11/32 $43,000 29,063 0.03Penske Truck Leasing Co. Lp / PTL Finance Corp. 4.25% 17/01/23 $36,000 28,991 0.03Bank of America Corp. 2.57% 20/10/32 $43,000 28,933 0.03Hyundai Capital America 0.80% 03/04/23 $37,000 28,830 0.03General Motors Co. 5.00% 01/10/28 $36,000 28,456 0.03Ryder System Inc. 2.90% 01/12/26 $37,000 27,964 0.03Boston Gas Co. 3.15% 01/08/27 $37,000 27,809 0.03Burlington Northern Santa Fe LLC 4.40% 15/03/42 $35,000 27,535 0.03Mid-Atlantic Interstate Transmission LLC 4.10% 15/05/28 $35,000 27,226 0.03T-Mobile USA Inc. 2.55% 15/02/31 $40,000 27,128 0.03Consolidated Edison Co. of New York Inc. 3.20% 01/12/51 $43,000 26,978 0.03Oncor Electric Delivery Co. LLC 3.80% 01/06/49 $35,000 25,640 0.03AbbVie Inc. 4.25% 21/11/49 $35,000 25,557 0.03Citigroup Inc. 4.60% 09/03/26 $31,000 24,878 0.03Athene Global Funding 1.73% 02/10/26 $35,000 24,746 0.03San Diego Gas & Electric Co. 3.70% 15/03/52 $35,000 24,426 0.03Bank of America Corp. 4.18% 25/11/27 $31,000 24,353 0.03Broadcom Inc. 3.47% 15/04/34 $36,000 24,329 0.03Bank of America Corp. 3.59% 21/07/28 $31,000 23,698 0.03Wells Fargo & Co. 4.61% 25/04/53 $30,000 23,562 0.03Morgan Stanley 2.51% 20/10/32 $35,000 23,478 0.03Energy Transfer LP 4.90% 15/03/35 $31,000 23,252 0.03JPMorgan Chase & Co. 2.95% 24/02/28 $30,000 22,506 0.03
Vanguard SustainableLife 80-90% Equity Fund
36

CouponMaturity
Date Holding
MarketValue
(£)
% ofTotal Net
Assets
Intercontinental Exchange Inc. 1.85% 15/09/32 $35,000 22,448 0.03Kaiser Foundation Hospitals 2.81% 01/06/41 $35,000 22,300 0.03Marvell Technology Inc. 2.95% 15/04/31 $31,000 21,462 0.02Intercontinental Exchange Inc. 2.65% 15/09/40 $35,000 21,439 0.02Georgia Power Co. 2.65% 15/09/29 $29,000 20,740 0.02Penske Truck Leasing Co. Lp / PTL Finance Corp. 3.40% 15/11/26 $26,000 20,089 0.02Crown Castle International Corp. 2.10% 01/04/31 $31,000 20,009 0.02MPLX LP 3.50% 01/12/22 $25,000 20,003 0.02Penske Truck Leasing Co. Lp / PTL Finance Corp. 3.95% 10/03/25 $25,000 19,898 0.02Brooklyn Union Gas Co. 3.87% 04/03/29 $26,000 19,717 0.02Southern Co. 3.25% 01/07/26 $25,000 19,327 0.02EPR Properties 3.75% 15/08/29 $27,000 19,094 0.02Southern California Gas Co. 2.95% 15/04/27 $25,000 19,047 0.02National Retail Properties Inc. 4.00% 15/11/25 $23,000 18,444 0.02Vantage Data Centers Issuer LLC 1.65% 15/09/45 $25,000 18,223 0.02Charter Communications Operating LLC / Charter Communications
Operating Capital 3.70% 01/04/51 $31,000 17,391 0.02Discovery Communications LLC 3.63% 15/05/30 $23,000 16,821 0.02Equitable Financial Life Global Funding 1.30% 12/07/26 $23,000 16,561 0.02MetLife Inc. 3.00% 01/03/25 $21,000 16,549 0.02CVS Health Corp. 2.88% 01/06/26 $21,000 16,127 0.02AbbVie Inc. 4.05% 21/11/39 $22,000 16,081 0.02Equitable Financial Life Global Funding 1.40% 27/08/27 $23,000 16,068 0.02Discovery Communications LLC 4.13% 15/05/29 $21,000 15,991 0.02American Transmission Systems Inc. 2.65% 15/01/32 $23,000 15,912 0.02Intel Corp. 3.05% 12/08/51 $25,000 15,457 0.02Charter Communications Operating LLC / Charter Communications
Operating Capital 5.05% 30/03/29 $19,000 15,099 0.02Lowe’s Cos. Inc. 3.75% 01/04/32 $20,000 15,038 0.02Charter Communications Operating LLC / Charter Communications
Operating Capital 3.50% 01/03/42 $26,000 15,031 0.02NextEra Energy Capital Holdings Inc. 1.90% 15/06/28 $21,000 14,764 0.02CubeSmart LP 2.25% 15/12/28 $21,000 14,713 0.02Oglethorpe Power Corp. 4.50% 01/04/47 $20,000 14,567 0.02KeySpan Gas East Corp. 2.74% 15/08/26 $19,000 14,334 0.02Comcast Corp. 2.45% 15/08/52 $26,000 14,098 0.02Verizon Communications Inc. 1.68% 30/10/30 $21,000 13,596 0.02Carrier Global Corp. 2.72% 15/02/30 $19,000 13,373 0.02Southern California Edison Co. 2.95% 01/02/51 $23,000 13,165 0.01Ochsner LSU Health System of North Louisiana 2.51% 15/05/31 $20,000 13,164 0.01Marsh & McLennan Cos. Inc. 4.38% 15/03/29 $16,000 12,893 0.01Cigna Corp. 4.38% 15/10/28 $16,000 12,807 0.01Anheuser-Busch Cos. LLC / Anheuser-Busch InBev Worldwide Inc. 4.90% 01/02/46 $16,000 12,568 0.01American International Group Inc. 4.38% 30/06/50 $16,000 12,326 0.01CSX Corp. 4.30% 01/03/48 $16,000 12,138 0.01Anheuser-Busch InBev Worldwide Inc. 4.38% 15/04/38 $16,000 12,106 0.01JPMorgan Chase & Co. 3.70% 06/05/30 $16,000 12,101 0.01Oracle Corp. 3.60% 01/04/50 $20,000 11,437 0.01S&P Global Inc. 2.70% 01/03/29 $15,000 11,033 0.01Duke Energy Corp. 2.55% 15/06/31 $16,000 10,867 0.01T-Mobile USA Inc. 2.70% 15/03/32 $16,000 10,830 0.01S&P Global Inc. 2.90% 01/03/32 $15,000 10,803 0.01American International Group Inc. 4.75% 01/04/48 $13,000 10,651 0.01CommonSpirit Health 2.78% 01/10/30 $15,000 10,608 0.01Brixmor Operating Partnership LP 2.50% 16/08/31 $16,000 10,514 0.01HCA Inc. 4.63% 15/03/52 $15,000 10,452 0.01Intercontinental Exchange Inc. 3.00% 15/06/50 $17,000 10,336 0.01Bon Secours Mercy Health Inc. 2.10% 01/06/31 $15,000 10,214 0.01AT&T Inc. 3.30% 01/02/52 $16,000 9,655 0.01Teachers Insurance & Annuity Association of America 3.30% 15/05/50 $15,000 9,644 0.01Gilead Sciences Inc. 2.60% 01/10/40 $16,000 9,549 0.01Morgan Stanley 3.77% 24/01/29 $12,000 9,224 0.01American Water Capital Corp. 2.95% 01/09/27 $12,000 9,122 0.01Gray Oak Pipeline LLC 2.60% 15/10/25 $12,000 9,015 0.01T-Mobile USA Inc. 3.60% 15/11/60 $15,000 8,935 0.01Duke Energy Carolinas LLC 6.10% 01/06/37 $10,000 8,892 0.01Kaiser Foundation Hospitals 4.88% 01/04/42 $10,000 8,602 0.01San Diego Gas & Electric Co. 4.10% 15/06/49 $11,000 8,168 0.01Welltower Inc. 4.00% 01/06/25 $10,000 7,989 0.01
Vanguard SustainableLife 80-90% Equity Fund
37

CouponMaturity
Date Holding
MarketValue
(£)
% ofTotal Net
Assets
Morgan Stanley 5.30% 20/04/37 $10,000 7,985 0.01Berkshire Hathaway Energy Co. 3.25% 15/04/28 $10,000 7,648 0.01Duke Energy Progress LLC 3.40% 01/04/32 $10,000 7,531 0.01UnitedHealth Group Inc. 4.63% 15/07/35 $9,000 7,417 0.01Magallanes Inc. 4.28% 15/03/32 $10,000 7,415 0.01Crown Castle International Corp. 2.90% 01/04/41 $12,000 7,143 0.01Northwestern Mutual Life Insurance Co. 3.85% 30/09/47 $10,000 7,060 0.01Morgan Stanley 2.70% 22/01/31 $10,000 7,010 0.01Sutter Health 2.29% 15/08/30 $10,000 6,848 0.01Broadcom Inc. 3.42% 15/04/33 $9,000 6,165 0.01Oracle Corp. 4.00% 15/11/47 $9,000 5,539 0.01Florida Power & Light Co. 5.69% 01/03/40 $6,000 5,464 0.01Comcast Corp. 3.95% 15/10/25 $6,000 4,840 0.01Georgia Power Co. 3.25% 30/03/27 $6,000 4,618 0.01PacifiCorp 2.70% 15/09/30 $6,000 4,322 0.01Carrier Global Corp. 3.38% 05/04/40 $6,000 3,942 0.00Goldman Sachs Group Inc. 1.25% 07/02/29 €5,000 3,850 0.00Workday Inc. 3.70% 01/04/29 $5,000 3,813 0.00Pennsylvania Electric Co. 3.60% 01/06/29 $5,000 3,791 0.00Union Electric Co. 3.90% 01/04/52 $5,000 3,625 0.00EPR Properties 4.75% 15/12/26 $4,000 3,117 0.00Penske Truck Leasing Co. Lp / PTL Finance Corp. 2.70% 01/11/24 $4,000 3,101 0.00EPR Properties 4.95% 15/04/28 $4,000 3,072 0.00Georgia Power Co. 4.75% 01/09/40 $4,000 3,061 0.00Duke Energy Corp. 3.40% 15/06/29 $4,000 3,009 0.00Equitable Financial Life Global Funding 1.40% 07/07/25 $4,000 2,968 0.00Southern Co. 4.40% 01/07/46 $4,000 2,908 0.00Comcast Corp. 4.05% 01/11/52 $4,000 2,868 0.00Constellation Brands Inc. 2.88% 01/05/30 $4,000 2,833 0.00Union Pacific Corp. 3.75% 05/02/70 $4,000 2,666 0.00Massachusetts Mutual Life Insurance Co. 3.38% 15/04/50 $4,000 2,545 0.00Union Pacific Corp. 2.97% 16/09/62 $4,000 2,302 0.00Conagra Brands Inc. 4.60% 01/11/25 $2,000 1,612 0.00Charter Communications Operating LLC / Charter Communications
Operating Capital 4.80% 01/03/50 $2,000 1,322 0.00AT&T Inc. 3.10% 01/02/43 $2,000 1,233 0.00
4,329,589 4.84
Total Corporate Bonds 6,768,064 7.57
Government and Municipal Bonds 5.93%
Australia 0.05%
Australia Government Bond 0.50% 21/09/26 AUD55,000 27,979 0.03Australia Government Bond 1.00% 21/11/31 AUD40,000 18,542 0.02
46,521 0.05
Canada 0.17%
Canadian Government Bond 0.50% 01/10/24 CAD85,000 50,602 0.06Canadian Government Bond 0.25% 01/11/23 CAD60,000 36,273 0.04Canadian Government Bond 1.25% 01/06/31 CAD60,000 33,312 0.04Canadian Government Bond 2.00% 01/12/51 CAD55,000 28,697 0.03
148,884 0.17
France 0.03%
French Republic Government Bond OAT 0.01% 25/11/31 €36,000 26,469 0.03
26,469 0.03
Germany 1.35%
Bundesrepublik Deutschland Bundesanleihe 0.25% 15/08/28 €795,000 647,394 0.72Bundesobligation 0.01% 16/04/27 €415,000 337,289 0.38Bundesrepublik Deutschland Bundesanleihe 0.01% 15/05/35 €165,000 120,954 0.14Bundesrepublik Deutschland Bundesanleihe 1.25% 15/08/48 €115,000 101,253 0.11
1,206,890 1.35
Italy 0.06%
Italy Buoni Poliennali Del Tesoro 0.95% 01/08/30 €75,000 55,633 0.06
55,633 0.06
Vanguard SustainableLife 80-90% Equity Fund
38

CouponMaturity
Date Holding
MarketValue
(£)
% ofTotal Net
Assets
Japan 0.06%
Japan Government Thirty Year Bond1 0.70% 20/06/51 ¥6,700,000 38,536 0.04Japan Government Thirty Year Bond1 0.70% 20/09/51 ¥2,200,000 12,630 0.02
51,166 0.06
Romania 0.02%
Romanian Government International Bond 2.00% 14/04/33 €15,000 9,181 0.01Romanian Government International Bond 2.63% 02/12/40 €10,000 5,592 0.01Romanian Government International Bond 1.75% 13/07/30 €3,000 1,991 0.00
16,764 0.02
Spain 0.01%
Spain Government Bond 0.60% 31/10/29 €14,000 10,983 0.01
10,983 0.01
Supranational 0.27%
European Union 0.01% 04/07/29 €98,000 74,957 0.08European Union 0.01% 04/07/31 €51,000 37,509 0.04European Stability Mechanism 0.01% 15/12/26 €30,000 23,910 0.03European Investment Bank 0.01% 15/11/27 €30,000 23,690 0.02European Stability Mechanism 0.01% 16/12/24 €20,000 16,448 0.02European Union 1.25% 04/02/43 €20,000 15,425 0.02European Union 0.40% 04/02/37 €22,000 15,380 0.02European Union 0.75% 04/01/47 €18,000 12,240 0.01European Union 0.20% 04/06/36 €12,000 8,159 0.01European Union 0.45% 04/07/41 €11,000 7,249 0.01European Investment Bank 0.38% 15/09/27 €8,000 6,462 0.01
241,429 0.27
United Kingdom 0.10%
United Kingdom Gilt 0.63% 22/10/50 £71,000 49,802 0.05United Kingdom Gilt 0.25% 31/07/31 £50,000 43,083 0.05
92,885 0.10
United States 3.81%
US Treasury Note 0.75% 15/11/24 $415,000 313,476 0.35US Treasury Note 2.50% 31/03/27 $340,000 265,392 0.30US Treasury Note 2.00% 15/11/41 $315,000 207,656 0.23US Treasury Note 2.25% 15/02/52 $275,000 188,063 0.21US Treasury Note 2.38% 15/02/42 $260,000 183,015 0.20US Treasury Note 2.25% 31/03/24 $215,000 169,788 0.19US Treasury Note 1.88% 15/02/32 $200,000 145,460 0.16US Treasury Note 1.00% 15/12/24 $185,000 140,467 0.16Fannie Mae 3.00% 12/05/52 $175,000 131,371 0.15US Treasury Note 2.63% 15/04/25 $160,000 126,523 0.14Fannie Mae 3.50% 12/05/52 $150,000 115,825 0.13US Treasury Note 1.88% 28/02/27 $150,000 113,781 0.13US Treasury Note 1.50% 15/02/25 $120,000 92,010 0.10US Treasury Note 0.88% 31/01/24 $110,000 84,948 0.09State of Illinois 5.10% 01/06/33 $95,000 77,366 0.09Fannie Mae 2.50% 17/05/37 $100,000 76,217 0.09Fannie Mae 2.00% 13/06/52 $105,000 73,569 0.08Fannie Mae Pool 2.50% 01/08/51 $97,039 70,887 0.08US Treasury Note 1.75% 15/03/25 $85,000 65,586 0.07US Treasury Note 0.75% 31/12/23 $80,000 61,761 0.07US Treasury Note 0.50% 30/11/23 $80,000 61,659 0.07Freddie Mac Multifamily Structured Pass Through Certificates 2.25% 25/01/32 $60,000 43,014 0.05Chicago Transit Authority Sales & Transfer Tax Receipts Revenue 6.90% 01/12/40 $40,000 39,167 0.04Ginnie Mae 2.50% 19/05/52 $50,000 36,937 0.04Fannie Mae 2.50% 12/05/52 $50,000 36,312 0.04Fannie Mae 2.50% 13/06/52 $50,000 36,238 0.04Fannie Mae Pool 2.50% 01/11/51 $48,607 35,551 0.04Fannie Mae Pool 2.00% 01/09/51 $49,248 34,772 0.04Municipal Electric Authority of Georgia 6.64% 01/04/57 $35,000 34,100 0.04US Treasury Note 1.50% 31/01/27 $45,000 33,549 0.04Fannie Mae REMICS 3.00% 25/03/45 $43,384 32,651 0.04Fannie Mae 2.00% 12/05/52 $45,000 31,590 0.04US Treasury Note 1.13% 15/01/25 $35,000 26,608 0.03Government National Mortgage 2.50% 20/12/49 $35,195 26,532 0.03Ginnie Mae 3.00% 19/05/52 $25,000 18,974 0.02
Vanguard SustainableLife 80-90% Equity Fund
39

CouponMaturity
Date Holding
MarketValue
(£)
% ofTotal Net
Assets
Ginnie Mae 2.00% 19/05/52 $25,000 18,040 0.02Fannie Mae Pool 2.00% 01/07/41 $23,050 16,470 0.02Fannie Mae Pool 2.00% 01/04/41 $22,955 16,402 0.02Fannie Mae Pool 2.00% 01/05/41 $22,664 16,194 0.02California Health Facilities Financing Authority 4.35% 01/06/41 $20,000 15,451 0.02Metropolitan Transportation Authority 5.18% 15/11/49 $15,000 12,866 0.01Port Authority of New York & New Jersey 4.03% 01/09/48 $15,000 11,525 0.01Massachusetts Water Resources Authority 2.82% 01/08/41 $15,000 10,111 0.01Sales Tax Securitization Corp. 3.24% 01/01/42 $15,000 10,060 0.01Golden State Tobacco Securitization Corp. 3.29% 01/06/42 $15,000 9,587 0.01US Treasury Note 1.88% 15/11/51 $15,000 9,368 0.01Port Authority of New York & New Jersey 4.46% 01/10/62 $10,000 8,072 0.01Dallas Fort Worth International Airport 4.51% 01/11/51 $10,000 7,611 0.01US Treasury Note 1.38% 15/11/31 $10,000 6,956 0.01University of Michigan 3.50% 01/04/52 $5,000 3,690 0.00US Treasury Note 1.88% 15/02/51 $5,000 3,121 0.00
3,406,339 3.81
Total Government and Municipal Bonds 5,303,963 5.93
Total Equities and Debt Securities 87,276,745 97.63
Number ofContracts
Long/(Short)
NotionalAmount
(£)
UnrealisedGain/(Loss)
(£)
% ofTotal Net
Assets
Financial Derivative Instruments (0.05%)
Futures Contracts 0.10%
US Treasury Note Ultra 10 Year June 2022 (8) (821,983) 59,993 0.07Euro-BUND June 2022 (5) (645,280) 39,396 0.05United Kingdom Gilt June 2022 (1) (118,440) 2,419 0.00US Treasury Note 5 Year June 2022 (1) (89,743) 1,588 0.00Euro-Schatz June 2022 6 555,304 (7,961) (0.01)Euro-BOBL June 2022 3 320,594 (9,724) (0.01)
85,711 0.10
CurrencyBuy
Amount Currency(Sell)
Amount CounterpartySettlement
Date
UnrealisedGain/(Loss)
(£)
% ofTotal Net
Assets
Forward Currency Exchange Contracts (0.15%)
USD 3,503,786 EUR (3,279,000) JP Morgan Chase Bank 31/5/22 35,694 0.04USD 714,927 GBP (562,000) Goldman Sachs 31/5/22 6,925 0.01USD 266,676 GBP (210,000) Goldman Sachs 31/5/22 2,216 0.00USD 131,872 GBP (104,000) JP Morgan Chase Bank 31/5/22 941 0.00USD 66,865 JPY (8,561,000) JP Morgan Chase Bank 31/5/22 702 0.00USD 170,054 GBP (136,000) JP Morgan Chase Bank 31/5/22 674 0.00USD 82,100 GBP (66,000) JP Morgan Chase Bank 31/5/22 666 0.00USD 64,975 AUD (91,000) JP Morgan Chase Bank 31/5/22 270 0.00USD 68,676 EUR (65,000) Goldman Sachs 31/5/22 87 0.00EUR 71,000 USD (75,150) JP Morgan Chase Bank 31/5/22 (202) (0.00)USD 307,393 CAD (394,000) JP Morgan Chase Bank 31/5/22 (239) (0.00)USD 18,585,556 GBP (14,610,000) Goldman Sachs 31/5/22 (180,017) (0.20)
(132,283) (0.15)
Total Financial Derivative Instruments (46,572) (0.05)
MarketValue
(£)
% ofTotal Net
Assets
Portfolio of Investments 87,230,173 97.58
Net Other Assets 2,165,611 2.42
Net Assets Attributable to Shareholders 89,395,784 100.00
All holdings are listed on an official stock exchange or are traded on an eligible securities market, unless otherwise stated.1 Manually priced securities.
Vanguard SustainableLife 80-90% Equity Fund
40

As at
30 April 2022(£)
Assets:
Financial Assets 87,428,316Current Assets
Debtors 651,142Cash and Bank Balances 2,799,275
Total Assets 90,878,733
Liabilities:
Financial Liabilities 198,143Creditors
Bank Overdrafts 51,255Other Creditors 1,233,551
Total Liabilities 1,482,949
Net Assets Attributable to Shareholders 89,395,784
Statement of Total Return
Period Ended†
30 April 2022(£)
30 April 2022(£)
IncomeNet Capital Gains/(Losses) (1,888,429)Revenue 866,704
Expenses (151,570)
Net Revenue Before Taxation 715,134Taxation (131,588)
Net Revenue After Taxation 583,546
Total Return Before Distributions (1,304,883)
Distributions1 42,406
Change in Net Assets Attributable to
Shareholders From Investment Activities (1,262,477)
† The Fund launched on 8 December 2021.1 Includes adjustments for equalisation.
Statement of Change in Net Assets Attributable to Shareholders
Period Ended†
30 April 2022(£)
30 April 2022(£)
Amounts Received on Issue of Shares 91,318,198Amounts Paid on Cancellation of Shares (714,606)
90,603,592
Dilution Adjustment 54,669Change in Net Assets Attributable to
Shareholders From Investment Activities (1,262,477)
Closing Net Assets Attributable to Shareholders 89,395,784
† The Fund launched on 8 December 2021.
The interim financial statements for the Fund have been prepared on the same basis of the accounting policies as the annual financial statements for the year ended 31 October 2021.
Vanguard SustainableLife 80-90% Equity Fund
Balance Sheet
41

Investment Objective
Vanguard Active U.K. Equity Fund (the “Fund”) seeks to provide an increase in the value of investments over the long term (more than 5 years).
Investment Strategy
The Fund seeks to achieve its investment objective by investing primarily in shares of companies that are incorporated, domiciled or conduct a significant portionof their business in the UK. Such companies may also be listed in the UK. The Fund may invest in companies of all sizes and across a range of economic sectorsand industry groups. These investments are chosen mainly on the basis of an investment approach that focuses on analysing individual shares rather than stockmarkets.
Synthetic Risk and Reward Indicator
Lower risk
Typically lower rewards
Higher risk
Typically higher rewards
1 2 3 4 5 6 7
The Synthetic Risk and Reward Indicator (SRRI) measures the volatility of the Fund. The risk and reward category (which may range from 1 to 7) is calculatedusing historical data and may not be a reliable indicator of the Fund’s future risk profile. The risk and reward category may shift over time and is not a target orguarantee. The lowest category (i.e. category 1) does not mean “risk free”. The Fund appears in the higher range of the risk and reward indicator because thevalues of the Fund’s investments have experienced a higher rate of change in the past.
Performance SummaryThe Performance Summary does not form part of the Financial Statements.
• Volatility surged and global financial markets slumped during the six months ended 30 April 2022. When the period began, supply bottlenecks, rising oil pricesand the prospect of less accommodative monetary policy were already weighing on market sentiment.
• Then Russia’s invasion of Ukraine injected substantial uncertainty into the markets. Energy prices soared, helping to push consumer prices to multidecadehighs across much of the world. Some central banks, including those in the United States and the United Kingdom, raised short-term interest rates. TheEuropean Central Bank continued to reduce its bond purchases and was expected to raise rates later this year.
• While consumer sentiment flagged during the period, in many markets unemployment remained low, consumer balance sheets healthy and corporate profitsrobust.
• In the UK, the Bank of England raised its bank rate three times in an effort to combat surging inflation. Energy prices fuelled part of that rise, but so did othercommodity prices and supply chain disruptions, along with wage increases that were supported by a strong jobs market.
• With central banks turning less accommodative and inflation looking set to remain elevated for some time, bond yields in many markets moved higher acrossthe maturity spectrum. The Bloomberg Global Aggregate Bond Index hedged to British pounds, a global bond proxy, returned about –7% for the six months.
• Stocks regained some ground in March but finished the six months with a negative return. The FTSE Global All Cap Index, a proxy for global stocks, returnedabout –4%. The United Kingdom and Asia-Pacific were bright spots.
• The Fund is actively managed; it does not seek to track a benchmark. The performance information in the table below shows how the Fund’s returns comparewith those of a market index with similar investment characteristics. For the period under review, the Fund significantly underperformed the index, whichreturned 3.15% for the six months.
• For the Fund’s index, returns by sector varied widely. Energy, the very small utilities sector and basic materials posted the strongest gains, while technology,consumer discretionary and industrials recorded double-digit declines.
• The Fund’s security selection in health care, consumer discretionary and financials as well as overweights to consumer discretionary and technologydetracted the most from relative performance.
Benchmark: FTSE All-Share Index
Total ReturnsPeriods Ended 30 April 2022
(Annualised for periods over one year)
Six MonthsTen Years or
Since Inception1
GBP Acc -11.48% 0.40%
Benchmark 3.15 5.31
GBP Inc -11.48% 0.39%
Benchmark 3.15 5.31
Vanguard Global Advisers, LLC and FTSE.Returns is based on NAV with income reinvested.
All of the returns in this report represent past performance, which is not a guarantee of future results that may be achieved by the Fund. For performance data current to the most recent month-end,which may be higher or lower than that cited, visit our website at http://global.vanguard.com. Note, too, that both investment returns and principal value can fluctuate widely, so an investor’s shares,when sold, could be worth more or less than their original cost.1 Since-inception returns: GBP Acc and GBP Inc, 15 October 2019.
Vanguard Active U.K. Equity FundSub-managed by Baillie Gifford Overseas Limited and Marathon Asset Management LLP.
42

Performance Comparative Table
GBP Acc†
For the PeriodEnded
30 April 2022For the Year Ended
31 October 2021For the Year Ended
31 October 2020For the Year Ended
31 October 2019
Closing Net Asset Value £33,728,999 £38,856,957 £11,230,086 £5,251,742
Closing Number of Shares 332,352 340,678 120,637 51,693
Closing Net Asset Value Per Share1 £101.49 £114.06 £93.09 £101.59
Operating Charges2 0.45% 0.45% 0.45% 0.45%
GBP Inc†
Closing Net Asset Value £6,365,206 £6,750,145 £4,387,435 £5,079,056
Closing Number of Shares 64,726 61,077 47,822 50,006
Closing Net Asset Value Per Share1 £98.34 £110.52 £91.75 £101.57
Operating Charges2 0.45% 0.45% 0.45% 0.45%
† The Fund launched on 15 October 2019.1 The net asset value per share shown may diverge from the net asset value per share used for dealing purposes as at 30 April 2022 because of any adjustments for trade date accounting, swing
pricing and any adjustments in valuation to bid prices.2 Operating charges include indirect costs incurred in the maintenance and running of the Fund, as disclosed in the detailed expenses within the Statement of Total Return.
Vanguard Active U.K. Equity Fund
43

Summary of Significant ChangesFor the period ended 30 April 2022
Cost(£)
Largest Purchases
Softcat plc 554,034
Ashtead Group plc 508,215
Games Workshop Group plc 489,777
4imprint Group plc 483,806
Hikma Pharmaceuticals plc 469,563
Total 2,505,395
Total Purchases for the Period 8,134,519
Proceeds(£)
Largest Sales
Rightmove plc 1,355,584
Auto Trader Group plc 698,837
AVEVA Group plc 657,671
Rathbones Group plc 536,164
Schroders plc (Non-voting) 535,480
Total 3,783,736
Total Sales for the Period 8,030,450
Vanguard Active U.K. Equity Fund
44

Portfolio StatementAs at 30 April 2022
Holding
MarketValue
(£)
% ofTotal Net
Assets
Basic Materials 6.62% (31 October 2021: 5.97%)
Rio Tinto plc 18,179 1,037,294 2.59Glencore plc 176,449 877,392 2.19BHP Group Ltd. 25,724 700,722 1.75Johnson Matthey plc 1,710 38,030 0.09
2,653,438 6.62
Consumer Discretionary 19.88% (31 October 2021: 17.19%)
Games Workshop Group plc 11,204 829,656 2.074imprint Group plc 24,469 668,004 1.67Compass Group plc 35,011 595,887 1.49RELX plc 20,524 490,934 1.22Burberry Group plc 30,669 487,944 1.22SSP Group plc 146,648 347,996 0.87Howden Joinery Group plc 45,433 345,836 0.86Flutter Entertainment plc 3,870 314,554 0.78TUI AG 127,181 292,898 0.73Trainline plc 101,925 289,059 0.72easyJet plc 46,864 262,626 0.65WPP plc 25,472 255,994 0.64Pets at Home Group plc 80,980 250,552 0.62boohoo Group plc 295,017 239,672 0.60Farfetch Ltd. Class A 26,836 239,397 0.60ITV plc 299,500 222,528 0.55Wizz Air Holdings plc 6,551 207,994 0.52Entain plc 13,656 207,298 0.52ASOS plc 14,717 205,155 0.51WH Smith plc 13,089 190,445 0.47Naked Wines plc 44,580 162,004 0.40On the Beach Group plc 57,118 130,515 0.33Persimmon plc 5,260 110,302 0.27Carnival plc 7,669 98,662 0.25Taylor Wimpey plc 73,748 93,549 0.23National Express Group plc 33,699 83,776 0.21Informa plc 13,051 74,991 0.19Barratt Developments plc 11,887 58,757 0.15Playtech plc 10,707 56,105 0.14Keywords Studios plc 2,253 54,162 0.13Next plc 835 50,317 0.13Future plc 2,146 47,555 0.12Cazoo Group Ltd. 5,629 7,532 0.02
7,972,656 19.88
Consumer Staples 7.96% (31 October 2021: 8.41%)
Diageo plc 33,473 1,344,945 3.36Reckitt Benckiser Group plc 8,686 541,833 1.35Fevertree Drinks plc 20,171 366,104 0.91Unilever plc 8,760 325,741 0.81Tesco plc 103,063 280,228 0.70Ocado Group plc 28,561 263,732 0.66Devro plc 32,747 67,950 0.17
3,190,533 7.96
Energy 5.07% (31 October 2021: 3.79%)
BP plc 286,080 1,120,146 2.79Shell plc 33,880 736,213 1.84John Wood Group plc 69,056 154,202 0.38Petrofac Ltd. 18,024 24,314 0.06
2,034,875 5.07
Financials 16.27% (31 October 2021: 17.27%)
HomeServe plc 116,862 1,148,753 2.873i Group plc 48,233 638,846 1.59St James's Place plc 48,534 629,729 1.57Barclays plc 385,323 570,972 1.42Lloyds Banking Group plc 930,049 426,706 1.06Admiral Group plc 15,117 381,553 0.95Prudential plc 35,365 357,186 0.89Hargreaves Lansdown plc 37,455 343,462 0.86IG Group Holdings plc 39,914 325,499 0.81Standard Chartered plc 58,102 320,491 0.80Jupiter Fund Management plc 135,704 241,824 0.60Molten Ventures plc 34,002 235,634 0.59
Holding
MarketValue
(£)
% ofTotal Net
Assets
Lancashire Holdings Ltd. 47,882 203,115 0.51IP Group plc 192,430 160,487 0.40AJ Bell plc 60,724 151,446 0.38Provident Financial plc 30,711 78,866 0.20Rathbones Group plc 3,713 77,973 0.20Exscientia plc ADR 7,467 63,697 0.16Hiscox Ltd. 6,584 62,324 0.16International Personal Finance plc 53,955 51,797 0.13Close Brothers Group plc 4,496 49,861 0.12Non-Standard Finance plc 62,744 1,362 0.00
6,521,583 16.27
Health Care 7.61% (31 October 2021: 8.69%)
Abcam plc 44,810 560,125 1.40GlaxoSmithKline plc 28,686 515,430 1.28ConvaTec Group plc 238,119 504,812 1.26Hikma Pharmaceuticals plc 20,866 393,011 0.98Genus plc 13,743 345,774 0.86Smith & Nephew plc 24,713 321,887 0.80PureTech Health plc 82,649 142,652 0.36Creo Medical Group plc 105,347 110,614 0.28Dechra Pharmaceuticals plc 2,900 105,386 0.26Oxford Nanopore Technologies plc 17,151 52,311 0.13
3,052,002 7.61
Industrials 17.44% (31 October 2021: 16.74%)
Experian plc 38,834 1,084,245 2.70Bunzl plc 17,211 533,885 1.33Renishaw plc 12,026 511,105 1.27BAE Systems plc 68,777 508,950 1.27Intertek Group plc 8,972 449,138 1.12FDM Group Holdings plc 42,941 437,139 1.09Spirax-Sarco Engineering plc 3,300 400,950 1.00Ashtead Group plc 9,074 378,930 0.95DS Smith plc 107,168 354,619 0.88Hays plc 239,384 294,682 0.74Serco Group plc 183,698 279,405 0.70Weir Group plc 17,045 265,561 0.66Rolls-Royce Holdings plc 259,511 216,121 0.54Wise plc Class A 53,093 209,664 0.52Smart Metering Systems plc 19,121 157,557 0.39Oxford Instruments plc 5,866 136,678 0.34Melrose Industries plc 114,252 134,932 0.34Inchcape plc 15,217 108,725 0.27RWS Holdings plc 22,895 100,143 0.25Spectris plc 2,811 82,896 0.21Pagegroup plc 16,134 79,283 0.20IMI plc 5,265 71,130 0.18Ibstock plc 28,466 53,915 0.13Capita plc 182,321 43,721 0.11Rotork plc 13,688 40,078 0.10Tungsten Corp. plc 88,476 39,814 0.10Euromoney Institutional Investor plc 1,977 19,632 0.05
6,992,898 17.44
Real Estate 2.16% (31 October 2021: 5.27%)
Rightmove plc 140,384 867,854 2.16
867,854 2.16
Technology 7.48% (31 October 2021: 8.28%)
Auto Trader Group plc 137,397 872,196 2.18Baltic Classifieds Group plc 345,513 456,077 1.14Softcat plc 31,796 450,231 1.12FD Technologies plc 17,123 404,103 1.01Kainos Group plc 26,041 317,179 0.79Just Eat Takeaway.com NV 11,569 255,733 0.64AVEVA Group plc 9,106 197,965 0.49Auction Technology Group plc 3,723 32,651 0.08Moneysupermarket.com Group plc 6,341 11,084 0.03
2,997,219 7.48
Telecommunications 0.32% (31 October 2021: 0.25%)
Vodafone Group plc 104,241 126,694 0.32
Vanguard Active U.K. Equity Fund
45

Holding
MarketValue
(£)
% ofTotal Net
Assets
126,694 0.32
Utilities 0.73% (31 October 2021: 0.50%)
National Grid plc 24,545 293,067 0.73
293,067 0.73
Total Equities 36,702,819 91.54
Number ofContracts
Long/(Short)
NotionalAmount
(£)
UnrealisedGain/(Loss)
(£)
% ofTotal Net
Assets
Financial Derivative Instruments 0.24% (31 October 2021: 0.18%)
Futures Contracts 0.24% (31 October 2021: 0.18%)
FTSE 100 Index June 2022 37 2,779,810 97,008 0.24
Total Financial Derivative Instruments 97,008 0.24
Market Value(£)
% ofTotal Net
Assets
Portfolio of Investments 36,799,827 91.78
Net Other Assets 3,294,378 8.22
Net Assets Attributable to Shareholders 40,094,205 100.00
All holdings are listed on an official stock exchange or are traded on an eligible securities market, unless otherwise stated.
Vanguard Active U.K. Equity Fund
46

As at As at
30 April 2022(£)
31 October 2021(£)
Assets:
Financial Assets 36,799,827 42,204,749Current Assets
Debtors 317,518 307,627Cash and Bank Balances 3,034,717 3,281,890
Total Assets 40,152,062 45,794,266
Liabilities:
Creditors
Distribution Payable — 115,990Other Creditors 57,857 71,174
Total Liabilities 57,857 187,164
Net Assets Attributable to Shareholders 40,094,205 45,607,102
Statement of Total Return
Period Ended Period Ended
30 April 2022(£)
30 April 2022(£)
30 April 2021(£)
30 April 2021(£)
IncomeNet Capital Gains/(Losses) (5,302,183) 4,232,953Revenue 485,223 220,901
Expenses (94,732) (55,092)
Net Revenue Before Taxation 390,491 165,809Taxation — —
Net Revenue After Taxation 390,491 165,809
Total Return Before Distributions (4,911,692) 4,398,762
Distributions1 5,270 47,461
Change in Net Assets Attributable to
Shareholders From Investment Activities (4,906,422) 4,446,223
1 Includes adjustments for equalisation.
Statement of Change in Net Assets Attributable to Shareholders
Period Ended Period Ended
30 April 2022(£)
30 April 2022(£)
30 April 2021(£)
30 April 2021(£)
Opening Net Assets Attributable to Shareholders 45,607,102 15,617,521
Amounts Received on Issue of Shares 5,210,773 18,179,446Amounts Paid on Cancellation of Shares (5,842,892) (237,504)
(632,119) 17,941,942
Dilution Adjustment 25,644 86,318Change in Net Assets Attributable to
Shareholders From Investment Activities (4,906,422) 4,446,223
Closing Net Assets Attributable to Shareholders 40,094,205 38,092,004
The interim financial statements for the Fund have been prepared on the same basis of the accounting policies as the annual financial statements for the year ended 31 October 2021.
Vanguard Active U.K. Equity Fund
Balance Sheet
47

Investment Objective
Vanguard ESG Developed World All Cap Equity Index Fund (UK) (the “Fund”) seeks to track the performance of the FTSE Developed All Cap Choice Index (the“Index”).
Investment Strategy
The Fund is a passive fund that seeks to achieve its investment objective by investing in a representative sample of the component shares of the Index.
Synthetic Risk and Reward Indicator
Lower risk
Typically lower rewards
Higher risk
Typically higher rewards
1 2 3 4 5 6 7
The Synthetic Risk and Reward Indicator (SRRI) measures the volatility of the Fund. The risk and reward category (which may range from 1 to 7) is calculatedusing historical data and may not be a reliable indicator of the Fund’s future risk profile. The risk and reward category may shift over time and is not a target orguarantee. The lowest category (i.e. category 1) does not mean “risk free”. The Fund appears in the higher range of the risk and reward indicator because thevalues of the Fund’s investments have experienced a higher rate of change in the past.
Performance SummaryThe Performance Summary does not form part of the Financial Statements.
• Volatility surged and global financial markets slumped during the six months ended 30 April 2022. When the period began, supply bottlenecks, rising oil pricesand the prospect of less accommodative monetary policy were already weighing on market sentiment.
• Then Russia’s invasion of Ukraine injected substantial uncertainty into the markets. Energy prices soared, helping to push consumer prices to multidecadehighs across much of the world. Some central banks, including those in the United States and the United Kingdom, raised short-term interest rates. TheEuropean Central Bank continued to reduce its bond purchases and was expected to raise rates later this year.
• While consumer sentiment flagged during the period, in many markets unemployment remained low, consumer balance sheets healthy and corporate profitsrobust.
• With central banks turning less accommodative and inflation looking set to remain elevated for some time, bond yields in many markets moved higher acrossthe maturity spectrum. The Bloomberg Global Aggregate Bond Index hedged to British pounds, a global bond proxy, returned about –7% for the six months.
• Stocks regained some ground in March but finished the six months with a negative return. In this environment, the Fund’s benchmark Index returned –6.72%for the six months.
• The United States, which constitutes about two-thirds of the Fund’s Index, came close to matching the return of the index. Among other larger indexconstituents, the Netherlands, Germany and Sweden posted double-digit declines. At the other end of the performance spectrum, Australia and Switzerlandrecorded positive returns.
• Seven of the index’s 11 industry sectors finished in the red. Consumer discretionary, technology and the very small energy sector saw negative returns in thedouble digits. Utilities, another small sector, and consumer staples posted double-digit gains.
Vanguard ESG Developed World All Cap Equity Index Fund (UK)Managed by Vanguard Global Advisers, LLC.
48

Benchmark: FTSE Developed All Cap Choice Index
Total ReturnsPeriods Ended 30 April 2022
(Annualised for periods over one year)
Six MonthsTen Years or
Since Inception1
GBP Acc -6.77% 12.60%
Benchmark -6.72 12.88
Tracking Difference* -0.05
GBP Inc -6.77% 12.59%
Benchmark -6.72 12.88
Tracking Difference* -0.05
Institutional Plus GBP Acc -6.73% -5.78%
Benchmark -6.72 -5.69
Tracking Difference* -0.01
Institutional Plus GBP Inc -6.73% 12.67%
Benchmark -6.72 12.88
Tracking Difference* -0.01
Vanguard Global Advisers, LLC and FTSE.Returns is based on NAV with income reinvested.
All of the returns in this report represent past performance, which is not a guarantee of future results that may be achieved by the Fund. For performance data current to the most recent month-end,which may be higher or lower than that cited, visit our website at http://global.vanguard.com. Note, too, that both investment returns and principal value can fluctuate widely, so an investor’s shares,when sold, could be worth more or less than their original cost.* The tracking difference between the Fund return and the Index return over a stated period of time can be attributed to a number of factors, including, without limitation, small differences in
weightings, trading activity, swing pricing, transaction costs, and differences in the valuation and withholding tax treatment between the Fund and the index vendor.1 Since-inception returns: GBP Acc, GBP Inc, and Institutional Plus GBP Inc, 9 June 2020; Institutional Plus GBP Acc, 1 September 2021.
Vanguard ESG Developed World All Cap Equity Index Fund (UK)
49

Performance Comparative Table
GBP Acc†
For the PeriodEnded
30 April 2022For the Year Ended
31 October 2021For the Year Ended
31 October 2020
Closing Net Asset Value £248,305,797 £174,324,714 £36,975,697
Closing Number of Shares 1,984,112 1,298,743 363,602
Closing Net Asset Value Per Share1 £125.15 £134.23 £101.69
Operating Charges2 0.20% 0.20% 0.20%
GBP Inc†
Closing Net Asset Value £89,933,094 £61,964,090 £19,647,451
Closing Number of Shares 735,342 469,333 194,145
Closing Net Asset Value Per Share1 £122.30 £132.03 £101.20
Operating Charges2 0.20% 0.20% 0.20%
Institutional Plus GBP Acc†
Closing Net Asset Value £77,330,815 £46,350,015 —
Closing Number of Shares 820,572 458,724 —
Closing Net Asset Value Per Share1 £94.24 £101.04 —
Operating Charges2 0.13% 0.13% —
Institutional Plus GBP Inc†
Closing Net Asset Value £64,047,917 £66,493,315 £80,922
Closing Number of Shares 523,741 503,683 800
Closing Net Asset Value Per Share1 £122.29 £132.01 £101.20
Operating Charges2 0.13% 0.13% 0.13%
† GBP Acc, GBP Inc and Institutional Plus GBP Inc launched on 9 June 2020; Institutional Plus GBP Acc launched on 1 September 2021.1 The net asset value per share shown may diverge from the net asset value per share used for dealing purposes as at 30 April 2022 because of any adjustments for trade date accounting, swing
pricing and any adjustments in valuation to bid prices.2 Operating charges include indirect costs incurred in the maintenance and running of the Fund, as disclosed in the detailed expenses within the Statement of Total Return.
Vanguard ESG Developed World All Cap Equity Index Fund (UK)
50

Summary of Significant ChangesFor the period ended 30 April 2022
Cost(£)
Largest Purchases
Apple Inc. 7,326,123
Microsoft Corp. 6,901,927
Amazon.com Inc. 4,122,347
Tesla Inc. 2,600,715
Alphabet Inc. Class A 2,440,910
Total 23,392,022
Total Purchases for the Period 177,263,734
Proceeds(£)
Largest Sales
Coca-Cola Co. 1,485,250
Analog Devices Inc. 729,456
National Grid plc 438,147
Sempra Energy 407,101
Chipotle Mexican Grill Inc. 367,432
Total 3,427,386
Total Sales for the Period 17,345,371
Vanguard ESG Developed World All Cap Equity Index Fund (UK)
51
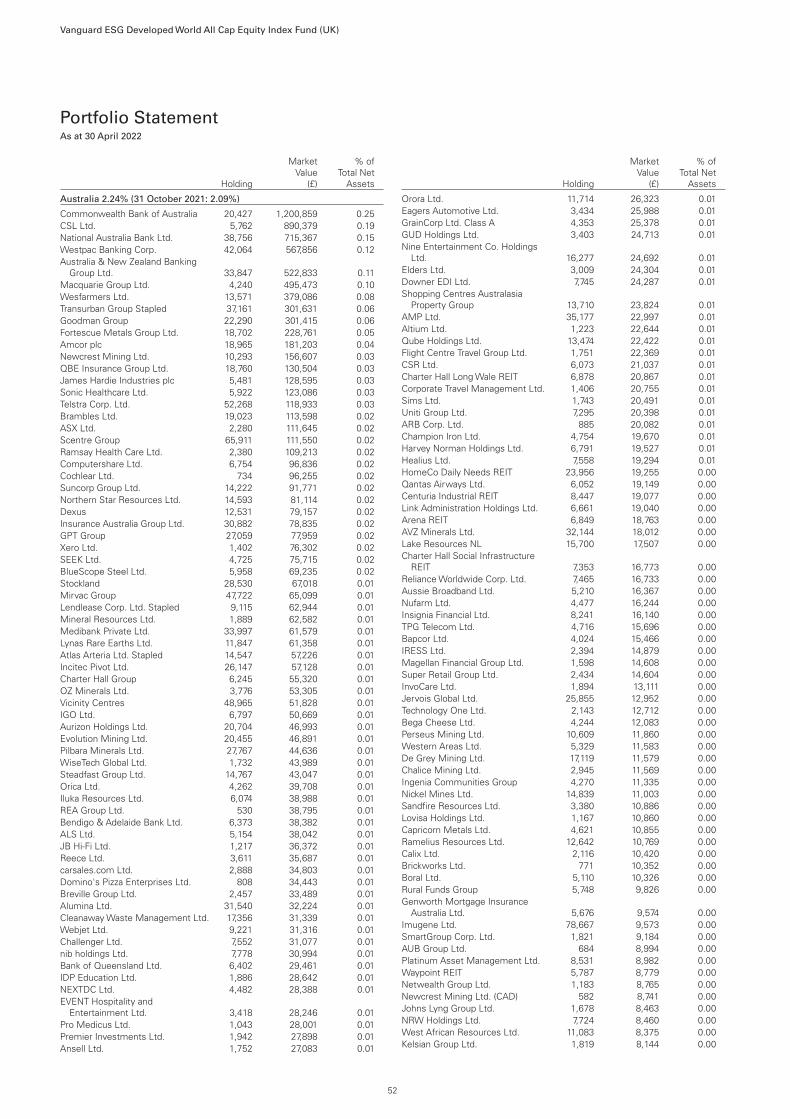
Portfolio StatementAs at 30 April 2022
Holding
MarketValue
(£)
% ofTotal Net
Assets
Australia 2.24% (31 October 2021: 2.09%)
Commonwealth Bank of Australia 20,427 1,200,859 0.25CSL Ltd. 5,762 890,379 0.19National Australia Bank Ltd. 38,756 715,367 0.15Westpac Banking Corp. 42,064 567,856 0.12Australia & New Zealand Banking
Group Ltd. 33,847 522,833 0.11Macquarie Group Ltd. 4,240 495,473 0.10Wesfarmers Ltd. 13,571 379,086 0.08Transurban Group Stapled 37,161 301,631 0.06Goodman Group 22,290 301,415 0.06Fortescue Metals Group Ltd. 18,702 228,761 0.05Amcor plc 18,965 181,203 0.04Newcrest Mining Ltd. 10,293 156,607 0.03QBE Insurance Group Ltd. 18,760 130,504 0.03James Hardie Industries plc 5,481 128,595 0.03Sonic Healthcare Ltd. 5,922 123,086 0.03Telstra Corp. Ltd. 52,268 118,933 0.03Brambles Ltd. 19,023 113,598 0.02ASX Ltd. 2,280 111,645 0.02Scentre Group 65,911 111,550 0.02Ramsay Health Care Ltd. 2,380 109,213 0.02Computershare Ltd. 6,754 96,836 0.02Cochlear Ltd. 734 96,255 0.02Suncorp Group Ltd. 14,222 91,771 0.02Northern Star Resources Ltd. 14,593 81,114 0.02Dexus 12,531 79,157 0.02Insurance Australia Group Ltd. 30,882 78,835 0.02GPT Group 27,059 77,959 0.02Xero Ltd. 1,402 76,302 0.02SEEK Ltd. 4,725 75,715 0.02BlueScope Steel Ltd. 5,958 69,235 0.02Stockland 28,530 67,018 0.01Mirvac Group 47,722 65,099 0.01Lendlease Corp. Ltd. Stapled 9,115 62,944 0.01Mineral Resources Ltd. 1,889 62,582 0.01Medibank Private Ltd. 33,997 61,579 0.01Lynas Rare Earths Ltd. 11,847 61,358 0.01Atlas Arteria Ltd. Stapled 14,547 57,226 0.01Incitec Pivot Ltd. 26,147 57,128 0.01Charter Hall Group 6,245 55,320 0.01OZ Minerals Ltd. 3,776 53,305 0.01Vicinity Centres 48,965 51,828 0.01IGO Ltd. 6,797 50,669 0.01Aurizon Holdings Ltd. 20,704 46,993 0.01Evolution Mining Ltd. 20,455 46,891 0.01Pilbara Minerals Ltd. 27,767 44,636 0.01WiseTech Global Ltd. 1,732 43,989 0.01Steadfast Group Ltd. 14,767 43,047 0.01Orica Ltd. 4,262 39,708 0.01Iluka Resources Ltd. 6,074 38,988 0.01REA Group Ltd. 530 38,795 0.01Bendigo & Adelaide Bank Ltd. 6,373 38,382 0.01ALS Ltd. 5,154 38,042 0.01JB Hi-Fi Ltd. 1,217 36,372 0.01Reece Ltd. 3,611 35,687 0.01carsales.com Ltd. 2,888 34,803 0.01Domino's Pizza Enterprises Ltd. 808 34,443 0.01Breville Group Ltd. 2,457 33,489 0.01Alumina Ltd. 31,540 32,224 0.01Cleanaway Waste Management Ltd. 17,356 31,339 0.01Webjet Ltd. 9,221 31,316 0.01Challenger Ltd. 7,552 31,077 0.01nib holdings Ltd. 7,778 30,994 0.01Bank of Queensland Ltd. 6,402 29,461 0.01IDP Education Ltd. 1,886 28,642 0.01NEXTDC Ltd. 4,482 28,388 0.01EVENT Hospitality and
Entertainment Ltd. 3,418 28,246 0.01Pro Medicus Ltd. 1,043 28,001 0.01Premier Investments Ltd. 1,942 27,898 0.01Ansell Ltd. 1,752 27,083 0.01
Holding
MarketValue
(£)
% ofTotal Net
Assets
Orora Ltd. 11,714 26,323 0.01Eagers Automotive Ltd. 3,434 25,988 0.01GrainCorp Ltd. Class A 4,353 25,378 0.01GUD Holdings Ltd. 3,403 24,713 0.01Nine Entertainment Co. Holdings
Ltd. 16,277 24,692 0.01Elders Ltd. 3,009 24,304 0.01Downer EDI Ltd. 7,745 24,287 0.01Shopping Centres Australasia
Property Group 13,710 23,824 0.01AMP Ltd. 35,177 22,997 0.01Altium Ltd. 1,223 22,644 0.01Qube Holdings Ltd. 13,474 22,422 0.01Flight Centre Travel Group Ltd. 1,751 22,369 0.01CSR Ltd. 6,073 21,037 0.01Charter Hall Long Wale REIT 6,878 20,867 0.01Corporate Travel Management Ltd. 1,406 20,755 0.01Sims Ltd. 1,743 20,491 0.01Uniti Group Ltd. 7,295 20,398 0.01ARB Corp. Ltd. 885 20,082 0.01Champion Iron Ltd. 4,754 19,670 0.01Harvey Norman Holdings Ltd. 6,791 19,527 0.01Healius Ltd. 7,558 19,294 0.01HomeCo Daily Needs REIT 23,956 19,255 0.00Qantas Airways Ltd. 6,052 19,149 0.00Centuria Industrial REIT 8,447 19,077 0.00Link Administration Holdings Ltd. 6,661 19,040 0.00Arena REIT 6,849 18,763 0.00AVZ Minerals Ltd. 32,144 18,012 0.00Lake Resources NL 15,700 17,507 0.00Charter Hall Social Infrastructure
REIT 7,353 16,773 0.00Reliance Worldwide Corp. Ltd. 7,465 16,733 0.00Aussie Broadband Ltd. 5,210 16,367 0.00Nufarm Ltd. 4,477 16,244 0.00Insignia Financial Ltd. 8,241 16,140 0.00TPG Telecom Ltd. 4,716 15,696 0.00Bapcor Ltd. 4,024 15,466 0.00IRESS Ltd. 2,394 14,879 0.00Magellan Financial Group Ltd. 1,598 14,608 0.00Super Retail Group Ltd. 2,434 14,604 0.00InvoCare Ltd. 1,894 13,111 0.00Jervois Global Ltd. 25,855 12,952 0.00Technology One Ltd. 2,143 12,712 0.00Bega Cheese Ltd. 4,244 12,083 0.00Perseus Mining Ltd. 10,609 11,860 0.00Western Areas Ltd. 5,329 11,583 0.00De Grey Mining Ltd. 17,119 11,579 0.00Chalice Mining Ltd. 2,945 11,569 0.00Ingenia Communities Group 4,270 11,335 0.00Nickel Mines Ltd. 14,839 11,003 0.00Sandfire Resources Ltd. 3,380 10,886 0.00Lovisa Holdings Ltd. 1,167 10,860 0.00Capricorn Metals Ltd. 4,621 10,855 0.00Ramelius Resources Ltd. 12,642 10,769 0.00Calix Ltd. 2,116 10,420 0.00Brickworks Ltd. 771 10,352 0.00Boral Ltd. 5,110 10,326 0.00Rural Funds Group 5,748 9,826 0.00Genworth Mortgage Insurance
Australia Ltd. 5,676 9,574 0.00Imugene Ltd. 78,667 9,573 0.00SmartGroup Corp. Ltd. 1,821 9,184 0.00AUB Group Ltd. 684 8,994 0.00Platinum Asset Management Ltd. 8,531 8,982 0.00Waypoint REIT 5,787 8,779 0.00Netwealth Group Ltd. 1,183 8,765 0.00Newcrest Mining Ltd. (CAD) 582 8,741 0.00Johns Lyng Group Ltd. 1,678 8,463 0.00NRW Holdings Ltd. 7,724 8,460 0.00West African Resources Ltd. 11,083 8,375 0.00Kelsian Group Ltd. 1,819 8,144 0.00
Vanguard ESG Developed World All Cap Equity Index Fund (UK)
52

Holding
MarketValue
(£)
% ofTotal Net
Assets
Charter Hall Retail REIT 3,211 8,124 0.00Megaport Ltd. 1,654 8,117 0.00Perpetual Ltd. 433 8,078 0.00Pendal Group Ltd. 2,685 8,024 0.00Dexus Industria REIT 4,129 7,946 0.00Lifestyle Communities Ltd. 892 7,649 0.00Deterra Royalties Ltd. 2,764 7,541 0.00Abacus Property Group 3,947 7,350 0.00Investec Australia Property Fund 6,725 7,290 0.00Centuria Capital Group 4,613 7,259 0.00BWP Trust 3,030 7,135 0.00Gold Road Resources Ltd. 7,899 6,952 0.00Silver Lake Resources Ltd. 6,281 6,613 0.00Inghams Group Ltd. 3,780 6,611 0.00Omni Bridgeway Ltd. 3,452 6,604 0.00Dicker Data Ltd. 879 6,563 0.00Blackmores Ltd. 160 6,532 0.00Credit Corp. Group Ltd. 401 6,249 0.00Costa Group Holdings Ltd. 3,253 6,095 0.00Domain Holdings Australia Ltd. 3,049 6,075 0.00MyState Ltd. 2,156 6,041 0.00Centuria Office REIT 4,753 5,892 0.00ioneer Ltd. 15,332 5,728 0.00Home Consortium 1,461 5,557 0.00Regis Resources Ltd. 4,532 5,361 0.00St Barbara Ltd. 6,950 5,232 0.00IPH Ltd. 1,197 5,109 0.00Adbri Ltd. 3,076 5,084 0.00Pinnacle Investment Management
Group Ltd. 923 4,948 0.00HUB24 Ltd. 347 4,714 0.00Growthpoint Properties Australia Ltd. 1,737 4,336 0.00Nanosonics Ltd. 1,814 4,076 0.00Monadelphous Group Ltd. 658 3,929 0.00Cromwell Property Group 8,058 3,900 0.00Australian Strategic Materials Ltd. 1,070 3,870 0.00Collins Foods Ltd. 626 3,650 0.00Clinuvel Pharmaceuticals Ltd. 365 3,417 0.00Australian Ethical Investment Ltd. 1,014 3,329 0.00Telix Pharmaceuticals Ltd. 1,265 3,272 0.00Appen Ltd. 804 3,008 0.00G8 Education Ltd. 4,854 2,967 0.00Life360 Inc. 1,257 2,846 0.00Syrah Resources Ltd. 2,516 2,798 0.00Mesoblast Ltd. 4,469 2,707 0.00Temple & Webster Group Ltd. 751 2,487 0.00Integral Diagnostics Ltd. 1,027 2,285 0.00Eclipx Group Ltd. 1,418 2,231 0.00PolyNovo Ltd. 4,015 2,159 0.00Tassal Group Ltd. 955 2,032 0.00Zip Co. Ltd. 3,169 1,955 0.00Hansen Technologies Ltd. 607 1,876 0.00Seven West Media Ltd. 4,736 1,836 0.00Tyro Payments Ltd. 2,476 1,752 0.00Select Harvests Ltd. 466 1,728 0.00Emeco Holdings Ltd. 3,245 1,543 0.00oOh!media Ltd. 1,727 1,525 0.00Accent Group Ltd. 1,608 1,306 0.00Redbubble Ltd. 2,043 1,295 0.00Baby Bunting Group Ltd. 466 1,213 0.00Southern Cross Media Group Ltd. 1,229 1,183 0.00Mayne Pharma Group Ltd. 7,197 1,141 0.00Nearmap Ltd. 1,586 1,095 0.00Australian Finance Group Ltd. 932 1,076 0.00City Chic Collective Ltd. 613 1,030 0.00Mount Gibson Iron Ltd. 2,507 972 0.00Bellevue Gold Ltd. 1,806 971 0.00Infomedia Ltd. 1,323 944 0.00Pact Group Holdings Ltd. 701 901 0.00GWA Group Ltd. 692 893 0.00EML Payments Ltd. 914 828 0.00Service Stream Ltd. 1,656 820 0.00Data#3 Ltd. 241 793 0.00Westgold Resources Ltd. 793 727 0.00McMillan Shakespeare Ltd. 97 652 0.00BWX Ltd. 605 639 0.00
Holding
MarketValue
(£)
% ofTotal Net
Assets
Sigma Healthcare Ltd. 2,099 582 0.00Paradigm Biopharmaceuticals Ltd. 828 576 0.00Starpharma Holdings Ltd. 1,112 532 0.00Marley Spoon AG 2,002 487 0.00Perenti Global Ltd. 1,119 450 0.00Bravura Solutions Ltd. 366 393 0.00Kogan.com Ltd. 117 259 0.00Resolute Mining Ltd. 1,198 237 0.00Falcon Metals Ltd. 970 187 0.00
10,727,422 2.24
Austria 0.07% (31 October 2021: 0.08%)
Erste Group Bank AG 3,802 94,595 0.02BAWAG Group AG 1,323 50,825 0.01Wienerberger AG 1,662 37,622 0.01ANDRITZ AG 730 24,732 0.01IMMOFINANZ AG 989 19,064 0.01Raiffeisen Bank International AG 1,413 12,847 0.01Lenzing AG 169 12,411 0.00Oesterreichische Post AG 464 11,969 0.00Telekom Austria AG 2,024 11,565 0.00CA Immobilien Anlagen AG 481 10,892 0.00S IMMO AG 562 10,743 0.00Strabag SE 327 10,290 0.00AT&S Austria Technologie &
Systemtechnik AG 247 10,253 0.00Vienna Insurance Group AG Wiener
Versicherung Gruppe 377 7,460 0.00DO & CO AG 95 6,697 0.00UNIQA Insurance Group AG 432 2,643 0.00
334,608 0.07
Belgium 0.26% (31 October 2021: 0.26%)
KBC Group NV 3,415 186,575 0.04Argenx SE 616 141,719 0.03UCB SA 1,447 131,799 0.03Ageas SA/NV 2,167 83,522 0.02Groupe Bruxelles Lambert SA 1,091 83,037 0.02Solvay SA 923 70,219 0.02Warehouses De Pauw CVA 2,240 69,189 0.02Elia Group SA/NV 430 54,811 0.01Sofina SA 203 50,149 0.01Cofinimmo SA 393 42,335 0.01Aedifica SA 439 41,720 0.01D'ieteren SA 294 38,291 0.01Ackermans & van Haaren NV 246 35,223 0.01Euronav NV 2,547 23,777 0.01Proximus SADP 1,482 20,584 0.01Barco NV 1,110 20,146 0.00VGP NV 89 18,472 0.00AGFA-Gevaert NV 5,703 18,401 0.00Melexis NV 210 14,637 0.00Telenet Group Holding NV 601 14,281 0.00Shurgard Self Storage SA 295 13,658 0.00KBC Ancora 399 12,988 0.00Befimmo SA 320 12,759 0.00Montea NV 110 10,518 0.00Bekaert SA 267 7,973 0.00Fagron 485 7,250 0.00Gimv NV 141 6,445 0.00Xior Student Housing NV 142 6,061 0.00Kinepolis Group NV 129 5,734 0.00Cie d'Entreprises CFE 52 5,462 0.00Retail Estates NV 81 4,935 0.00bpost SA 820 3,993 0.00Ontex Group NV 716 3,968 0.00Econocom Group SA/NV 512 1,506 0.00Orange Belgium SA 50 774 0.00Mithra Pharmaceuticals SA 66 516 0.00
1,263,427 0.26
Canada 2.98% (31 October 2021: 2.98%)
Royal Bank of Canada 16,865 1,362,365 0.28Toronto-Dominion Bank 21,761 1,257,169 0.26Bank of Nova Scotia 14,453 731,841 0.15Bank of Montreal 7,923 671,922 0.14Canadian National Railway Co. 7,104 668,521 0.14
Vanguard ESG Developed World All Cap Equity Index Fund (UK)
53

Holding
MarketValue
(£)
% ofTotal Net
Assets
Canadian Pacific Railway Ltd. 11,134 652,042 0.14Nutrien Ltd. 6,905 542,729 0.11Shopify Inc. Class A (XTSE) 1,378 469,472 0.10Canadian Imperial Bank of
Commerce 5,285 467,701 0.10Manulife Financial Corp. 23,490 367,591 0.08Waste Connections Inc. 3,198 353,125 0.07Franco-Nevada Corp. 2,393 288,903 0.06Constellation Software Inc. 228 287,050 0.06Sun Life Financial Inc. 6,881 273,809 0.06Agnico Eagle Mines Ltd. 5,331 247,846 0.05National Bank of Canada 3,931 219,653 0.05Wheaton Precious Metals Corp. 5,537 198,002 0.04Intact Financial Corp. 1,703 190,264 0.04Rogers Communications Inc. Class B 4,190 182,422 0.04CGI Inc. 2,722 173,472 0.04Magna International Inc. 3,564 171,626 0.04BCE Inc. 3,779 160,690 0.03Restaurant Brands International Inc. 3,468 158,099 0.03Thomson Reuters Corp. 1,976 157,701 0.03Dollarama Inc. 3,539 157,366 0.03First Quantum Minerals Ltd. 6,670 152,264 0.03Loblaw Cos. Ltd. 1,846 135,051 0.03Metro Inc. 2,880 126,447 0.03TELUS Corp. 5,876 117,550 0.03Shaw Communications Inc. Class B 4,874 116,094 0.02Open Text Corp. 3,584 114,806 0.02Fairfax Financial Holdings Ltd. 259 113,795 0.02West Fraser Timber Co. Ltd. 1,304 91,563 0.02George Weston Ltd. 903 89,710 0.02Hydro One Ltd. 3,589 77,435 0.02Bausch Health Cos. Inc. 4,705 71,399 0.02Gildan Activewear Inc. 2,591 70,112 0.02Toromont Industries Ltd. 969 68,089 0.01Canadiaartment Properties REIT 2,156 67,518 0.01Ritchie Bros Auctioneers Inc. 1,505 66,134 0.01Great-West Lifeco Inc. 2,977 65,678 0.01TFI International Inc. 989 63,651 0.01iA Financial Corp. Inc. 1,513 63,317 0.01CCL Industries Inc. Class B 1,751 61,110 0.01Lundin Mining Corp. 8,197 59,565 0.01Kinross Gold Corp. 14,193 57,317 0.01RioCan Real Estate Investment Trust 3,819 57,073 0.01Empire Co. Ltd. Class A 2,063 54,384 0.01TMX Group Ltd. 661 53,688 0.01Saputo Inc. 3,096 52,925 0.01Descartes Systems Group Inc. 1,021 50,611 0.01Onex Corp. 1,038 49,817 0.01FirstService Corp. 482 47,915 0.01Yamana Gold Inc. 10,562 46,537 0.01Brookfield Renewable Corp. Class A 1,585 45,438 0.01GFL Environmental Inc. (CAD) 1,894 44,960 0.01Brookfield Infrastructure Corp.
Class A (CAD) 779 43,693 0.01SSR Mining Inc. 2,340 41,066 0.01Ivanhoe Mines Ltd. Class A 6,015 38,423 0.01B2Gold Corp. 11,270 38,138 0.01Allied Properties Real Estate
Investment Trust 1,432 37,134 0.01Tricon Residential Inc. 3,178 36,740 0.01Granite Real Estate Investment Trust 619 36,648 0.01Dream Industrial Real Estate
Investment Trust 3,931 36,625 0.01Quebecor Inc. Class B 1,846 34,675 0.01Element Fleet Management Corp. 4,784 33,959 0.01Summit Industrial Income REIT 2,655 33,655 0.01Canadian Utilities Ltd. Class A 1,370 32,965 0.01SmartCentres Real Estate
Investment Trust 1,640 31,980 0.01Nuvei Corp. 700 31,257 0.01IGM Financial Inc. 1,233 31,198 0.01Lightspeed Commerce Inc. 1,750 31,192 0.01Methanex Corp. 753 30,123 0.01Colliers International Group Inc. 338 29,758 0.01CI Financial Corp. 2,829 29,443 0.01
Holding
MarketValue
(£)
% ofTotal Net
Assets
First Capital Real Estate InvestmentTrust 2,752 29,328 0.01
Atco Ltd. Class I 1,029 29,320 0.01Aritzia Inc. 1,003 28,510 0.01BRP Inc. 434 28,129 0.01Air Canada 1,986 27,848 0.01Kinaxis Inc. 313 27,672 0.01Alamos Gold Inc. Class A 4,365 27,067 0.01Cargojet Inc. 262 24,394 0.01H&R Real Estate Investment Trust 2,961 23,546 0.01Lithium Americas Corp. 1,155 23,250 0.01Bombardier Inc. Class B 28,313 22,233 0.01Premium Brands Holdings Corp. 336 21,924 0.01Canadian Western Bank 1,067 21,532 0.01Boyd Group Services Inc. 217 21,503 0.01Ballard Power Systems Inc. 3,240 21,404 0.01Boardwalk Real Estate Investment
Trust 610 21,403 0.00BlackBerry Ltd. 4,667 21,378 0.00Centerra Gold Inc. 2,879 21,262 0.00Superior Plus Corp. 3,019 21,242 0.00Choice Properties Real Estate
Investment Trust 2,167 20,420 0.00Stelco Holdings Inc. 696 20,291 0.00Canfor Corp. 1,152 17,496 0.00Maple Leaf Foods Inc. 975 17,135 0.00First Majestic Silver Corp. 1,986 16,338 0.00North West Co. Inc. 728 16,220 0.00Linamar Corp. 500 15,820 0.00Primo Water Corp. 1,354 15,535 0.00Stella-Jones Inc. 702 15,487 0.00Hudbay Minerals Inc. 3,031 15,452 0.00Chartwell Retirement Residences 2,032 15,386 0.00Osisko Gold Royalties Ltd. (CAD) 1,497 14,657 0.00IAMGOLD Corp. 6,428 14,502 0.00Westshore Terminals Investment
Corp. 652 13,933 0.00Enghouse Systems Ltd. 560 12,592 0.00Equinox Gold Corp. 2,085 11,799 0.00OceanaGold Corp. 5,586 11,105 0.00Innergex Renewable Energy Inc. 1,018 10,880 0.00Eldorado Gold Corp. 1,361 10,526 0.00ECN Capital Corp. 2,757 9,966 0.00Russel Metals Inc. 452 9,625 0.00Novagold Resources Inc. 1,710 8,515 0.00Celestica Inc. 928 8,317 0.00Laurentian Bank of Canada 341 8,288 0.00Cogeco Communications Inc. 126 8,276 0.00Canada Goose Holdings Inc. 415 7,221 0.00Home Capital Group Inc. 341 6,800 0.00Artis Real Estate Investment Trust 797 6,487 0.00Primaris Real Estate Investment
Trust 740 6,369 0.00Cascades Inc. 800 6,287 0.00Winpak Ltd. 238 6,262 0.00Torex Gold Resources Inc. 633 5,641 0.00Transcontinental Inc. Class A 510 5,095 0.00Mullen Group Ltd. 503 3,853 0.00NFI Group Inc. 448 3,272 0.00Dye & Durham Ltd. 233 3,064 0.00Martinrea International Inc. 637 3,041 0.00GFL Environmental Inc. (USD) 79 1,894 0.00Osisko Gold Royalties Ltd. (USD) 168 1,645 0.00First National Financial Corp. 69 1,562 0.00Dream Office Real Estate
Investment Trust 68 1,102 0.00
14,293,107 2.98
Denmark 0.73% (31 October 2021: 0.71%)
Novo Nordisk A/S Class B 19,057 1,754,389 0.37DSV PANALPINA A/S 2,335 308,330 0.06Vestas Wind Systems A/S 12,272 252,762 0.05Genmab A/S 697 197,064 0.04Coloplast A/S Class B 1,625 176,323 0.04Novozymes A/S Class B 2,481 139,170 0.03Pandora A/S 1,182 84,008 0.02Chr Hansen Holding A/S 1,263 78,837 0.02
Vanguard ESG Developed World All Cap Equity Index Fund (UK)
54
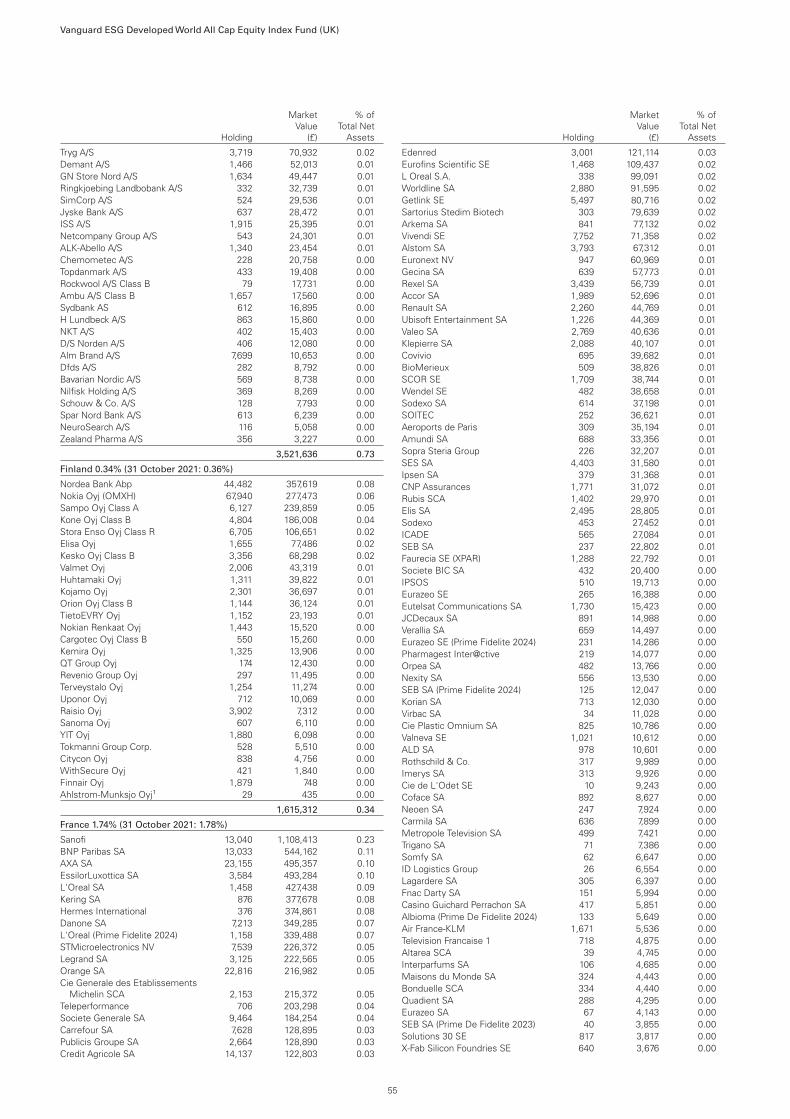
Holding
MarketValue
(£)
% ofTotal Net
Assets
Tryg A/S 3,719 70,932 0.02Demant A/S 1,466 52,013 0.01GN Store Nord A/S 1,634 49,447 0.01Ringkjoebing Landbobank A/S 332 32,739 0.01SimCorp A/S 524 29,536 0.01Jyske Bank A/S 637 28,472 0.01ISS A/S 1,915 25,395 0.01Netcompany Group A/S 543 24,301 0.01ALK-Abello A/S 1,340 23,454 0.01Chemometec A/S 228 20,758 0.00Topdanmark A/S 433 19,408 0.00Rockwool A/S Class B 79 17,731 0.00Ambu A/S Class B 1,657 17,560 0.00Sydbank AS 612 16,895 0.00H Lundbeck A/S 863 15,860 0.00NKT A/S 402 15,403 0.00D/S Norden A/S 406 12,080 0.00Alm Brand A/S 7,699 10,653 0.00Dfds A/S 282 8,792 0.00Bavarian Nordic A/S 569 8,738 0.00Nilfisk Holding A/S 369 8,269 0.00Schouw & Co. A/S 128 7,793 0.00Spar Nord Bank A/S 613 6,239 0.00NeuroSearch A/S 116 5,058 0.00Zealand Pharma A/S 356 3,227 0.00
3,521,636 0.73
Finland 0.34% (31 October 2021: 0.36%)
Nordea Bank Abp 44,482 357,619 0.08Nokia Oyj (OMXH) 67,940 277,473 0.06Sampo Oyj Class A 6,127 239,859 0.05Kone Oyj Class B 4,804 186,008 0.04Stora Enso Oyj Class R 6,705 106,651 0.02Elisa Oyj 1,655 77,486 0.02Kesko Oyj Class B 3,356 68,298 0.02Valmet Oyj 2,006 43,319 0.01Huhtamaki Oyj 1,311 39,822 0.01Kojamo Oyj 2,301 36,697 0.01Orion Oyj Class B 1,144 36,124 0.01TietoEVRY Oyj 1,152 23,193 0.01Nokian Renkaat Oyj 1,443 15,520 0.00Cargotec Oyj Class B 550 15,260 0.00Kemira Oyj 1,325 13,906 0.00QT Group Oyj 174 12,430 0.00Revenio Group Oyj 297 11,495 0.00Terveystalo Oyj 1,254 11,274 0.00Uponor Oyj 712 10,069 0.00Raisio Oyj 3,902 7,312 0.00Sanoma Oyj 607 6,110 0.00YIT Oyj 1,880 6,098 0.00Tokmanni Group Corp. 528 5,510 0.00Citycon Oyj 838 4,756 0.00WithSecure Oyj 421 1,840 0.00Finnair Oyj 1,879 748 0.00Ahlstrom-Munksjo Oyj1 29 435 0.00
1,615,312 0.34
France 1.74% (31 October 2021: 1.78%)
Sanofi 13,040 1,108,413 0.23BNP Paribas SA 13,033 544,162 0.11AXA SA 23,155 495,357 0.10EssilorLuxottica SA 3,584 493,284 0.10L'Oreal SA 1,458 427,438 0.09Kering SA 876 377,678 0.08Hermes International 376 374,861 0.08Danone SA 7,213 349,285 0.07L'Oreal (Prime Fidelite 2024) 1,158 339,488 0.07STMicroelectronics NV 7,539 226,372 0.05Legrand SA 3,125 222,565 0.05Orange SA 22,816 216,982 0.05Cie Generale des Etablissements
Michelin SCA 2,153 215,372 0.05Teleperformance 706 203,298 0.04Societe Generale SA 9,464 184,254 0.04Carrefour SA 7,628 128,895 0.03Publicis Groupe SA 2,664 128,890 0.03Credit Agricole SA 14,137 122,803 0.03
Holding
MarketValue
(£)
% ofTotal Net
Assets
Edenred 3,001 121,114 0.03Eurofins Scientific SE 1,468 109,437 0.02L Oreal S.A. 338 99,091 0.02Worldline SA 2,880 91,595 0.02Getlink SE 5,497 80,716 0.02Sartorius Stedim Biotech 303 79,639 0.02Arkema SA 841 77,132 0.02Vivendi SE 7,752 71,358 0.02Alstom SA 3,793 67,312 0.01Euronext NV 947 60,969 0.01Gecina SA 639 57,773 0.01Rexel SA 3,439 56,739 0.01Accor SA 1,989 52,696 0.01Renault SA 2,260 44,769 0.01Ubisoft Entertainment SA 1,226 44,369 0.01Valeo SA 2,769 40,636 0.01Klepierre SA 2,088 40,107 0.01Covivio 695 39,682 0.01BioMerieux 509 38,826 0.01SCOR SE 1,709 38,744 0.01Wendel SE 482 38,658 0.01Sodexo SA 614 37,198 0.01SOITEC 252 36,621 0.01Aeroports de Paris 309 35,194 0.01Amundi SA 688 33,356 0.01Sopra Steria Group 226 32,207 0.01SES SA 4,403 31,580 0.01Ipsen SA 379 31,368 0.01CNP Assurances 1,771 31,072 0.01Rubis SCA 1,402 29,970 0.01Elis SA 2,495 28,805 0.01Sodexo 453 27,452 0.01ICADE 565 27,084 0.01SEB SA 237 22,802 0.01Faurecia SE (XPAR) 1,288 22,792 0.01Societe BIC SA 432 20,400 0.00IPSOS 510 19,713 0.00Eurazeo SE 265 16,388 0.00Eutelsat Communications SA 1,730 15,423 0.00JCDecaux SA 891 14,988 0.00Verallia SA 659 14,497 0.00Eurazeo SE (Prime Fidelite 2024) 231 14,286 0.00Pharmagest Inter@ctive 219 14,077 0.00Orpea SA 482 13,766 0.00Nexity SA 556 13,530 0.00SEB SA (Prime Fidelite 2024) 125 12,047 0.00Korian SA 713 12,030 0.00Virbac SA 34 11,028 0.00Cie Plastic Omnium SA 825 10,786 0.00Valneva SE 1,021 10,612 0.00ALD SA 978 10,601 0.00Rothschild & Co. 317 9,989 0.00Imerys SA 313 9,926 0.00Cie de L'Odet SE 10 9,243 0.00Coface SA 892 8,627 0.00Neoen SA 247 7,924 0.00Carmila SA 636 7,899 0.00Metropole Television SA 499 7,421 0.00Trigano SA 71 7,386 0.00Somfy SA 62 6,647 0.00ID Logistics Group 26 6,554 0.00Lagardere SA 305 6,397 0.00Fnac Darty SA 151 5,994 0.00Casino Guichard Perrachon SA 417 5,851 0.00Albioma (Prime De Fidelite 2024) 133 5,649 0.00Air France-KLM 1,671 5,536 0.00Television Francaise 1 718 4,875 0.00Altarea SCA 39 4,745 0.00Interparfums SA 106 4,685 0.00Maisons du Monde SA 324 4,443 0.00Bonduelle SCA 334 4,440 0.00Quadient SA 288 4,295 0.00Eurazeo SA 67 4,143 0.00SEB SA (Prime De Fidelite 2023) 40 3,855 0.00Solutions 30 SE 817 3,817 0.00X-Fab Silicon Foundries SE 640 3,676 0.00
Vanguard ESG Developed World All Cap Equity Index Fund (UK)
55

Holding
MarketValue
(£)
% ofTotal Net
Assets
Elior Group SA 861 2,124 0.00Sodexo (Prime De Fidelite 2024) 35 2,121 0.00Beneteau SA 201 2,023 0.00Albioma (Prime De Fidelite 2023) 38 1,614 0.00Peugeot Invest 16 1,433 0.00Mercialys SA 184 1,424 0.00Voltalia SA 70 1,185 0.00Vicat SA 48 1,162 0.00Vilmorin & Cie SA 18 681 0.00Lisi Sa Prime De Fidelite 25 452 0.00Faurecia SE (MTTA) 21 369 0.00Tarkett SA 26 284 0.00LISI 11 198 0.00
8,331,519 1.74
Germany 2.14% (31 October 2021: 2.08%)
SAP SE 13,261 1,085,078 0.23Allianz SE 4,895 885,547 0.19Bayer AG 11,839 625,920 0.13Deutsche Telekom AG 41,083 605,214 0.13Mercedes-Benz Group AG 10,141 572,618 0.12Deutsche Post AG 11,904 408,051 0.09adidas AG 2,233 361,639 0.08Infineon Technologies AG 15,549 356,942 0.08Muenchener Rueckversicherungs-
Gesellschaft AG 1,667 318,243 0.07Deutsche Boerse AG 2,178 304,070 0.06Vonovia SE 9,236 296,302 0.06Bayerische Motoren Werke AG 3,686 242,357 0.05Merck KGaA 1,543 228,966 0.05Deutsche Bank AG 24,640 198,676 0.04Symrise AG 1,570 149,863 0.03Siemens Healthineers AG 3,272 140,656 0.03Fresenius SE & Co. KGaA 4,791 136,471 0.03Fresenius Medical Care AG & Co.
KGaA 2,522 125,877 0.03Brenntag SE 1,857 115,374 0.02Henkel AG & Co. KGaA 2,159 109,936 0.02Daimler Truck Holding AG 4,859 104,970 0.02Beiersdorf AG 1,264 101,621 0.02QIAGEN NV 2,526 93,475 0.02Sartorius AG - Preference Shares 300 90,522 0.02Hannover Rueck SE 709 88,647 0.02Zalando SE 2,783 87,598 0.02Covestro AG 2,471 85,626 0.02Siemens Energy AG 5,072 78,716 0.02HeidelbergCement AG 1,663 77,106 0.02Continental AG 1,337 74,079 0.02LEG Immobilien SE 882 72,599 0.02Puma SE 1,137 67,679 0.02Commerzbank AG 12,737 67,254 0.01Henkel AG & Co. KGaA - Preference
Shares 1,260 65,091 0.01Delivery Hero SE 2,282 64,753 0.01Aroundtown SA 15,856 64,324 0.01HelloFresh SE 1,841 62,759 0.01K+S AG 2,273 61,557 0.01GEA Group AG 1,955 61,043 0.01Bayerische Motoren Werke AG -
Preference Shares 894 52,884 0.01Scout24 SE 997 50,667 0.01Carl Zeiss Meditec AG 488 49,185 0.01Knorr-Bremse AG 851 48,796 0.01Evonik Industries AG 2,137 44,927 0.01Deutsche Lufthansa AG 6,990 41,995 0.01Aurubis AG 441 40,446 0.01KION Group AG 876 39,085 0.01Evotec SE 1,956 38,048 0.01Nemetschek SE 588 37,787 0.01CTS Eventim AG & Co. KGaA 635 35,215 0.01Bechtle AG 946 35,166 0.01AIXTRON SE 1,608 33,387 0.01Freenet AG 1,473 32,614 0.01CompuGroup Medical SE & Co.
KgaA 751 32,278 0.01United Internet AG 1,186 30,624 0.01LANXESS AG 912 28,193 0.01
Holding
MarketValue
(£)
% ofTotal Net
Assets
Encavis AG 1,497 26,478 0.01Vantage Towers AG 966 26,185 0.01TAG Immobilien AG 1,518 24,375 0.01HUGO BOSS AG 524 23,723 0.01Befesa SA 466 23,181 0.01Deutsche Pfandbriefbank AG 2,209 22,292 0.01Gerresheimer AG 379 21,225 0.01Talanx AG 633 21,180 0.01Wacker Chemie AG 161 20,414 0.01Hella GmbH & Co. KGaA 401 20,183 0.01FUCHS PETROLUB SE - Preference
Shares 781 19,871 0.01Krones AG 314 19,564 0.01Telefonica Deutschland Holding AG 7,742 18,657 0.00Fraport AG Frankfurt Airport Services
Worldwide 432 18,607 0.00Sixt SE - Preference Shares 300 17,368 0.00Nordex SE 1,491 17,364 0.00RTL Group SA 404 16,844 0.00TeamViewer AG 1,708 16,519 0.00CANCOM SE 426 16,516 0.00ProSiebenSat.1 Media SE 1,762 16,242 0.00Siltronic AG 214 16,085 0.00MorphoSys AG 928 15,728 0.00Rational AG 32 15,703 0.00Aareal Bank AG 546 14,929 0.00BayWa AG 382 14,573 0.00flatexDEGIRO AG 984 13,568 0.00Deutsche Wohnen SE 583 13,359 0.00Salzgitter AG 388 12,917 0.00Grand City Properties SA 902 12,748 0.00Stabilus SE 332 12,609 0.00Fielmann AG 287 11,619 0.00DWS Group GmbH & Co. KGaA 424 11,194 0.00Duerr AG 528 10,985 0.00KWS Saat SE & Co. KGaA 184 10,838 0.00Hypoport SE 48 10,712 0.00Software AG 427 10,620 0.00SUSE SA 400 10,426 0.00METRO AG 1,417 9,948 0.00VERBIO Vereinigte BioEnergie AG 168 9,656 0.00FUCHS PETROLUB SE 448 9,505 0.00Sixt SE 90 9,377 0.00Washtec AG 206 8,932 0.00Adesso SE 55 8,642 0.00Stroeer SE & Co. KGaA 179 8,618 0.00Suedzucker AG 823 8,534 0.00Pfeiffer Vacuum Technology AG 58 8,285 0.00Varta AG 107 8,041 0.00ADLER Group SA 1,316 8,000 0.00Jungheinrich AG - Preference Shares 401 7,898 0.00Sartorius AG 29 7,737 0.00GFT Technologies SE 236 7,545 0.00Hornbach Holding AG & Co. KGaA 66 6,294 0.00Nagarro SE 53 6,012 0.00Auto1 Group SE 704 5,901 0.00Atoss Software AG 47 5,521 0.00Wacker Neuson SE 327 5,462 0.00Deutsche EuroShop AG 401 5,310 0.00Dermapharm Holding SE 116 5,254 0.00Vitesco Technologies Group AG 151 4,852 0.00S&T AG 353 4,808 0.00STRATEC SE 53 4,783 0.001&1 Drillisch AG 283 4,761 0.00Eckert & Ziegler Strahlen- und
Medizintechnik AG 114 4,598 0.00Secunet Security Networks AG 13 4,440 0.00CECONOMY AG 1,612 4,427 0.00PATRIZIA AG 319 4,353 0.00Hamburger Hafen und Logistik AG 309 4,024 0.00GRENKE AG 188 3,981 0.00Basler AG 44 3,934 0.00DIC Asset AG 344 3,850 0.00Norma Group SE 192 3,782 0.00Schaeffler AG - Preference Shares 856 3,679 0.00Deutz AG 861 3,062 0.00
Vanguard ESG Developed World All Cap Equity Index Fund (UK)
56

Holding
MarketValue
(£)
% ofTotal Net
Assets
Instone Real Estate Group SE 244 3,006 0.00Shop Apotheke Europe NV 44 2,916 0.00New Work SE 21 2,845 0.00Vossloh AG 89 2,718 0.00Draegerwerk AG & Co. KGaA 72 2,632 0.00Deutsche Beteiligungs AG 73 1,813 0.00Takkt AG 133 1,717 0.00Wuestenrot & Wuerttembergische
AG 67 1,004 0.00SMA Solar Technology AG 26 951 0.00Koenig & Bauer AG 55 860 0.00Global Fashion Group SA 519 792 0.00ElringKlinger AG 85 567 0.00Draegerwerk AG & Co. KGaA -
Preference Shares 12 475 0.00
10,280,019 2.14
Hong Kong 0.85% (31 October 2021: 0.85%)
AIA Group Ltd. 146,600 1,157,073 0.24Hong Kong Exchanges & Clearing
Ltd. 15,400 528,089 0.11Sun Hung Kai Properties Ltd. 18,500 170,805 0.04Link REIT 24,700 170,754 0.04Techtronic Industries Co. Ltd. 15,000 161,864 0.03BOC Hong Kong Holdings Ltd. 46,500 135,240 0.03CK Asset Holdings Ltd. 23,500 127,390 0.03Hang Seng Bank Ltd. 8,400 118,954 0.03Wharf Real Estate Investment Co.
Ltd. 23,000 86,739 0.02BeiGene Ltd. 7,600 80,622 0.02Lenovo Group Ltd. 94,000 73,190 0.02MTR Corp. Ltd. 17,000 72,222 0.02Hongkong Land Holdings Ltd. 13,400 50,057 0.01ESR Cayman Ltd. 19,400 47,166 0.01WH Group Ltd. 83,705 46,310 0.01Hang Lung Properties Ltd. 30,000 45,742 0.01SITC International Holdings Co. Ltd. 17,000 45,732 0.01Henderson Land Development Co.
Ltd. 14,000 45,265 0.01Sino Land Co. Ltd. 42,000 44,512 0.01Want Want China Holdings Ltd. 61,000 43,718 0.01ASM Pacific Technology Ltd. 5,100 41,418 0.01Xinyi Glass Holdings Ltd. 23,000 41,233 0.01Wharf Holdings Ltd. 17,000 39,778 0.01Orient Overseas International Ltd. 1,500 33,530 0.01Swire Pacific Ltd. Class A 6,500 29,627 0.01Tingyi Cayman Islands Holding Corp. 20,000 29,195 0.01Chow Tai Fook Jewellery Group Ltd. 20,400 27,460 0.01PRADA SpA 5,200 25,839 0.01Samsonite International SA 13,500 23,955 0.01Shangri-La Asia Ltd. 38,000 22,991 0.01PCCW Ltd. 49,953 22,667 0.01Swire Properties Ltd. 11,000 21,194 0.01Pacific Basin Shipping Ltd. 56,000 20,749 0.01Vitasoy International Holdings Ltd. 14,000 20,209 0.01Bank of East Asia Ltd. 17,000 20,122 0.00Television Broadcasts Ltd. 36,500 17,785 0.00BOC Aviation Ltd. 2,600 16,377 0.00Champion REIT 44,000 15,365 0.00Minth Group Ltd. 8,000 15,251 0.00Kerry Properties Ltd. 7,000 15,100 0.00Hysan Development Co. Ltd. 6,000 14,100 0.00L'Occitane International SA 5,500 13,986 0.00VTech Holdings Ltd. 2,400 13,583 0.00Cathay Pacific Airways Ltd. 17,000 13,582 0.00AAC Technologies Holdings Inc. 7,000 13,132 0.00HUTCHMED China Ltd. 5,000 12,968 0.00Hang Lung Group Ltd. 8,000 12,507 0.00Swire Pacific Ltd. Class B 15,000 11,268 0.00Yue Yuen Industrial Holdings Ltd. 9,500 11,110 0.00Realord Group Holdings Ltd. 8,000 10,931 0.00Man Wah Holdings Ltd. 13,200 10,010 0.00Haitong International Securities
Group Ltd. 73,000 9,189 0.00VSTECS Holdings Ltd. 12,000 8,284 0.00Razer Inc.1 29,000 8,243 0.00MMG Ltd. 24,000 8,186 0.00
Holding
MarketValue
(£)
% ofTotal Net
Assets
Lee's Pharmaceutical Holdings Ltd. 39,000 7,879 0.00Microport Scientific Corp. 4,900 7,839 0.00HKBN Ltd. 8,000 7,439 0.00First Pacific Co. Ltd. 22,000 7,080 0.00JS Global Lifestyle Co. Ltd. 7,000 6,715 0.00Fortune Real Estate Investment Trust 9,000 6,277 0.00Uni-President China Holdings Ltd. 8,000 5,620 0.00Luk Fook Holdings International Ltd. 3,000 5,494 0.00Johnson Electric Holdings Ltd. 5,500 5,003 0.00Powerlong Real Estate Holdings Ltd. 18,000 4,897 0.00AsiaInfo Technologies Ltd. 3,600 4,868 0.00Truly International Holdings Ltd. 20,000 4,406 0.00Dairy Farm International Holdings
Ltd. 2,000 4,333 0.00Lee & Man Paper Manufacturing Ltd. 11,000 4,210 0.00Hong Kong Technology Venture Co.
Ltd. 6,000 4,038 0.00Hua Medicine 10,500 3,294 0.00Lifestyle International Holdings Ltd. 8,500 3,288 0.00EC Healthcare 4,000 3,261 0.00Jacobio Pharmaceuticals Group Co.
Ltd. 3,900 3,167 0.00Vobile Group Ltd.1 8,000 3,143 0.00Vesync Co. Ltd. 5,000 2,878 0.00Towngas Smart Energy Co. Ltd. 7,000 2,771 0.00Kerry Logistics Network Ltd. 1,500 2,759 0.00Sunlight Real Estate Investment
Trust 7,000 2,736 0.00Nexteer Automotive Group Ltd. 6,000 2,723 0.00Asia Cement China Holdings Corp. 5,000 2,573 0.00LK Technology Holdings Ltd. 2,500 2,533 0.00Cafe de Coral Holdings Ltd. 2,000 2,513 0.00CITIC Telecom International Holdings
Ltd. 8,000 2,290 0.00Vinda International Holdings Ltd. 1,000 1,921 0.00Prosperity REIT 7,000 1,912 0.00Dah Sing Banking Group Ltd. 2,800 1,885 0.00Dah Sing Financial Holdings Ltd. 800 1,864 0.00Everest Medicines Ltd. 1,000 1,858 0.00JW Cayman Therapeutics Co. Ltd. 2,500 1,835 0.00China Travel International Investment
Hong Kong Ltd. 12,000 1,730 0.00Shui On Land Ltd. 15,000 1,690 0.00Hutchison Telecommunications Hong
Kong Holdings Ltd. 12,000 1,596 0.00K Wah International Holdings Ltd. 5,000 1,492 0.00SmarTone Telecommunications
Holdings Ltd. 3,500 1,460 0.00Frontage Holdings Corp. 6,000 1,444 0.00SUNeVision Holdings Ltd. 2,000 1,324 0.00FIH Mobile Ltd. 13,000 1,280 0.00Value Partners Group Ltd. 4,000 1,222 0.00IGG Inc. 3,000 996 0.00Texhong Textile Group Ltd. 1,000 965 0.00Stella International Holdings Ltd. 1,000 836 0.00Pou Sheng International Holdings
Ltd. 6,000 554 0.00Xiabuxiabu Catering Management
China Holdings Co. Ltd. 1,000 353 0.00FIT Hon Teng Ltd. 3,000 308 0.00Glory Sun Financial Group Ltd. 40,000 296 0.00
4,077,216 0.85
Ireland 0.08% (31 October 2021: 0.09%)
Kerry Group plc Class A 1,827 161,115 0.04Kingspan Group plc 1,841 137,769 0.03Bank of Ireland Group plc 11,267 54,891 0.01Glanbia plc 1,804 17,220 0.00AIB Group plc 8,353 14,613 0.00Hibernia REIT plc 6,806 9,276 0.00Dalata Hotel Group plc 1,919 7,014 0.00
401,898 0.08
Israel 0.24% (31 October 2021: 0.20%)
Bank Leumi Le-Israel BM 18,893 159,013 0.04Nice Ltd. 799 130,192 0.03Bank Hapoalim BM 15,465 114,937 0.03
Vanguard ESG Developed World All Cap Equity Index Fund (UK)
57

Holding
MarketValue
(£)
% ofTotal Net
Assets
Israel Discount Bank Ltd. 14,567 68,993 0.02Tower Semiconductor Ltd. 1,403 53,875 0.01Mizrahi Tefahot Bank Ltd. 1,719 51,013 0.01Airport City Ltd. 1,913 34,199 0.01Azrieli Group Ltd. 471 32,423 0.01Bezeq The Israeli Telecommunication
Corp. Ltd. 22,832 29,013 0.01Mivne Real Estate KD Ltd. 7,587 22,768 0.01Big Shopping Centers Ltd. 188 22,643 0.01Nova Ltd. 275 21,205 0.01Alony Hetz Properties & Investments
Ltd. 1,609 21,055 0.01First International Bank Of Israel Ltd. 462 15,560 0.01Israel Corp Ltd. 32 14,621 0.01Hilan Ltd. 310 14,424 0.01Melisron Ltd. 216 14,066 0.00Enlight Renewable Energy Ltd. 7,712 13,329 0.00Summit Real Estate Holdings Ltd. 690 12,950 0.00One Software Technologies Ltd. 965 12,755 0.00Elco Ltd. 204 12,638 0.00Electra Ltd. 23 12,549 0.00Shikun & Binui Ltd. 2,643 12,524 0.00Shufersal Ltd. 1,798 12,090 0.00Phoenix Holdings Ltd. 1,089 10,964 0.00Ashtrom Group Ltd. 465 10,418 0.00AFI Properties Ltd. 208 10,040 0.00Israel Canada T.R Ltd. 2,517 10,013 0.00Fattal Holdings 1998 Ltd. 87 9,966 0.00Perion Network Ltd. 543 9,490 0.00Migdal Insurance & Financial
Holdings Ltd. 6,899 9,321 0.00Partner Communications Co. Ltd. 1,434 9,031 0.00Fox Wizel Ltd. 76 8,965 0.00Strauss Group Ltd. 417 8,858 0.00Clal Insurance Enterprises Holdings
Ltd. 498 8,835 0.00Energix-Renewable Energies Ltd. 3,117 8,500 0.00Harel Insurance Investments &
Financial Services Ltd. 858 8,424 0.00Sapiens International Corp. NV 429 8,025 0.00Delta Galil Industries Ltd. 146 7,792 0.00Isracard Ltd. 1,936 7,771 0.00Reit 1 Ltd. 1,488 7,753 0.00Amot Investments Ltd. 1,179 7,177 0.00Gav-Yam Lands Corp. Ltd. 709 6,249 0.00Formula Systems 1985 Ltd. 78 6,061 0.00Camtek Ltd. 247 5,785 0.00Maytronics Ltd. 376 5,350 0.00Mega OR Holdings Ltd. 164 4,996 0.00Shapir Engineering and Industry Ltd. 653 4,897 0.00Matrix IT Ltd. 188 3,796 0.00Danel Adir Yeoshua Ltd. 30 3,792 0.00AudioCodes Ltd. 194 3,631 0.00FIBI Holdings Ltd. 78 2,923 0.00Sella Capital Real Estate Ltd. 924 2,471 0.00Gazit-Globe Ltd. 303 2,277 0.00Rami Levy Chain Stores Hashikma
Marketing 2006 Ltd. 36 2,177 0.00Menora Mivtachim Holdings Ltd.1 96 1,904 0.00Allot Ltd. 122 571 0.00Compugen Ltd. 233 424 0.00
1,127,482 0.24
Italy 0.57% (31 October 2021: 0.57%)
Intesa Sanpaolo SpA 203,133 331,675 0.07Stellantis NV 24,502 267,110 0.06Ferrari NV 1,473 250,636 0.05Assicurazioni Generali SpA 15,498 235,640 0.05UniCredit SpA 25,066 186,631 0.04Atlantia SpA 5,858 112,375 0.02Moncler SpA 2,626 110,812 0.02Terna Rete Elettrica Nazionale SpA 16,765 109,681 0.02FinecoBank Banca Fineco SpA 7,617 84,900 0.02Mediobanca Banca di Credito
Finanziario SpA 9,350 75,391 0.02EXOR NV 1,337 75,068 0.02Nexi SpA 8,724 69,082 0.02
Holding
MarketValue
(£)
% ofTotal Net
Assets
Amplifon SpA 1,676 53,796 0.01Recordati Industria Chimica e
Farmaceutica SpA 1,368 52,888 0.01Banco BPM SpA 15,823 40,259 0.01Infrastrutture Wireless Italiane SpA 4,607 39,408 0.01Poste Italiane SpA 4,787 37,585 0.01DiaSorin SpA 303 31,863 0.01Unipol Gruppo SpA 7,069 31,053 0.01Telecom Italia SpA 122,860 28,679 0.01Interpump Group SpA 854 27,771 0.01Italgas SpA 5,258 27,348 0.01Azimut Holding SpA 1,592 27,262 0.01Reply SpA 227 26,932 0.01Banca Mediolanum SpA 4,402 25,700 0.01Banca Generali SpA 957 25,451 0.01Pirelli & C SpA 5,809 23,063 0.01Telecom Italia SpA - Preference
Shares 94,824 21,051 0.01Brembo SpA 2,577 20,712 0.00Banca Popolare di Sondrio SCPA 6,325 20,238 0.00Buzzi Unicem SpA 1,107 16,459 0.00UnipolSai Assicurazioni SpA 7,127 16,001 0.00Autogrill SpA 2,342 13,885 0.00El.En. SpA 1,216 13,600 0.00De' Longhi SpA 676 13,064 0.00Banca Farmafactoring SpA 2,561 12,836 0.00BPER Banca 9,433 12,674 0.00Brunello Cucinelli SpA 290 11,911 0.00Salvatore Ferragamo SpA 806 11,283 0.00Carel Industries SpA 547 10,617 0.00Falck Renewables SpA 1,233 9,133 0.00Juventus Football Club SpA 32,439 8,455 0.00Webuild SpA (MTAA) 5,891 8,044 0.00Piaggio & C. SpA 3,829 7,644 0.00Sesa SpA 61 7,068 0.00Technogym SpA 1,161 7,043 0.00Societa Cattolica di Assicurazioni SC 1,339 6,953 0.00Anima Holding SpA 1,705 6,688 0.00Gruppo MutuiOnline SpA 266 6,567 0.00Danieli & C Officine Meccaniche SpA
- Preference Shares 496 6,218 0.00MFE-MediaForEurope NV Class B 8,447 6,196 0.00Maire Tecnimont SpA 2,430 5,746 0.00Tamburi Investment Partners SpA 741 5,417 0.00Enav SpA 1,467 5,394 0.00doValue SpA 730 4,956 0.00MARR SpA 292 3,803 0.00Banca IFIS SpA 258 3,783 0.00Zignago Vetro SpA 356 3,494 0.00GVS SpA 503 3,369 0.00SOL SpA 238 3,308 0.00Rizzoli Corriere Della Sera
Mediagroup SpA 5,235 3,237 0.00Tod's SpA 72 2,290 0.00Tinexta Spa 76 1,534 0.00Cementir Holding NV 248 1,392 0.00Credito Emiliano SpA 204 999 0.00CIR SpA-Compagnie Industriali 2,629 906 0.00RAI Way SpA 159 752 0.00Italmobiliare SpA 28 708 0.00Banca Monte dei Paschi di Siena SpA 1,035 701 0.00Webuild SpA - Warrants 02/08/20301 52 22 0.00
2,734,210 0.57
Japan 6.80% (31 October 2021: 7.06%)
Toyota Motor Corp. 145,800 2,003,305 0.42Sony Corp. 14,900 1,027,759 0.22Keyence Corp. 2,200 714,657 0.15Mitsubishi UFJ Financial Group Inc. 147,200 682,325 0.14Tokyo Electron Ltd. 1,800 613,712 0.13KDDI Corp. 20,000 533,005 0.11Shin-Etsu Chemical Co. Ltd. 4,800 530,570 0.11Recruit Holdings Co. Ltd. 17,301 512,342 0.11SoftBank Group Corp. 15,700 508,171 0.11Daiichi Sankyo Co. Ltd. 22,800 456,665 0.10Nintendo Co. Ltd. 1,213 446,683 0.09
Vanguard ESG Developed World All Cap Equity Index Fund (UK)
58
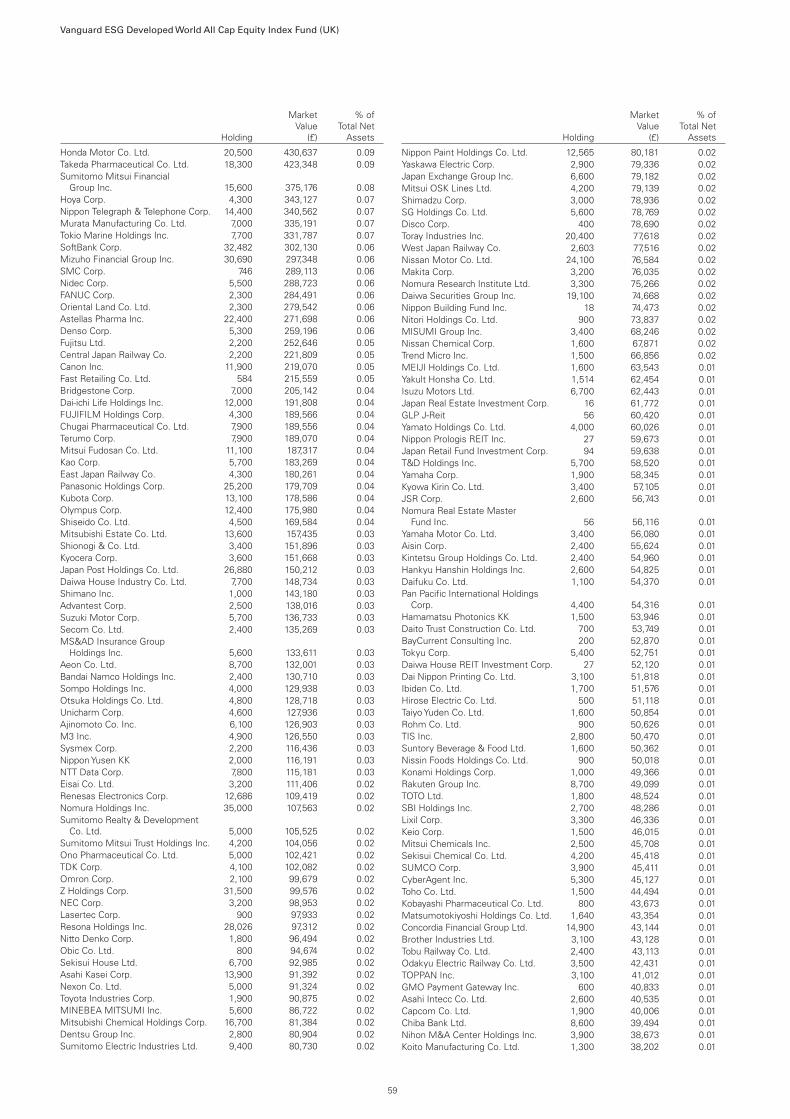
Holding
MarketValue
(£)
% ofTotal Net
Assets
Honda Motor Co. Ltd. 20,500 430,637 0.09Takeda Pharmaceutical Co. Ltd. 18,300 423,348 0.09Sumitomo Mitsui Financial
Group Inc. 15,600 375,176 0.08Hoya Corp. 4,300 343,127 0.07Nippon Telegraph & Telephone Corp. 14,400 340,562 0.07Murata Manufacturing Co. Ltd. 7,000 335,191 0.07Tokio Marine Holdings Inc. 7,700 331,787 0.07SoftBank Corp. 32,482 302,130 0.06Mizuho Financial Group Inc. 30,690 297,348 0.06SMC Corp. 746 289,113 0.06Nidec Corp. 5,500 288,723 0.06FANUC Corp. 2,300 284,491 0.06Oriental Land Co. Ltd. 2,300 279,542 0.06Astellas Pharma Inc. 22,400 271,698 0.06Denso Corp. 5,300 259,196 0.06Fujitsu Ltd. 2,200 252,646 0.05Central Japan Railway Co. 2,200 221,809 0.05Canon Inc. 11,900 219,070 0.05Fast Retailing Co. Ltd. 584 215,559 0.05Bridgestone Corp. 7,000 205,142 0.04Dai-ichi Life Holdings Inc. 12,000 191,808 0.04FUJIFILM Holdings Corp. 4,300 189,566 0.04Chugai Pharmaceutical Co. Ltd. 7,900 189,556 0.04Terumo Corp. 7,900 189,070 0.04Mitsui Fudosan Co. Ltd. 11,100 187,317 0.04Kao Corp. 5,700 183,269 0.04East Japan Railway Co. 4,300 180,261 0.04Panasonic Holdings Corp. 25,200 179,709 0.04Kubota Corp. 13,100 178,586 0.04Olympus Corp. 12,400 175,980 0.04Shiseido Co. Ltd. 4,500 169,584 0.04Mitsubishi Estate Co. Ltd. 13,600 157,435 0.03Shionogi & Co. Ltd. 3,400 151,896 0.03Kyocera Corp. 3,600 151,668 0.03Japan Post Holdings Co. Ltd. 26,880 150,212 0.03Daiwa House Industry Co. Ltd. 7,700 148,734 0.03Shimano Inc. 1,000 143,180 0.03Advantest Corp. 2,500 138,016 0.03Suzuki Motor Corp. 5,700 136,733 0.03Secom Co. Ltd. 2,400 135,269 0.03MS&AD Insurance Group
Holdings Inc. 5,600 133,611 0.03Aeon Co. Ltd. 8,700 132,001 0.03Bandai Namco Holdings Inc. 2,400 130,710 0.03Sompo Holdings Inc. 4,000 129,938 0.03Otsuka Holdings Co. Ltd. 4,800 128,718 0.03Unicharm Corp. 4,600 127,936 0.03Ajinomoto Co. Inc. 6,100 126,903 0.03M3 Inc. 4,900 126,550 0.03Sysmex Corp. 2,200 116,436 0.03Nippon Yusen KK 2,000 116,191 0.03NTT Data Corp. 7,800 115,181 0.03Eisai Co. Ltd. 3,200 111,406 0.02Renesas Electronics Corp. 12,686 109,419 0.02Nomura Holdings Inc. 35,000 107,563 0.02Sumitomo Realty & Development
Co. Ltd. 5,000 105,525 0.02Sumitomo Mitsui Trust Holdings Inc. 4,200 104,056 0.02Ono Pharmaceutical Co. Ltd. 5,000 102,421 0.02TDK Corp. 4,100 102,082 0.02Omron Corp. 2,100 99,679 0.02Z Holdings Corp. 31,500 99,576 0.02NEC Corp. 3,200 98,953 0.02Lasertec Corp. 900 97,933 0.02Resona Holdings Inc. 28,026 97,312 0.02Nitto Denko Corp. 1,800 96,494 0.02Obic Co. Ltd. 800 94,674 0.02Sekisui House Ltd. 6,700 92,985 0.02Asahi Kasei Corp. 13,900 91,392 0.02Nexon Co. Ltd. 5,000 91,324 0.02Toyota Industries Corp. 1,900 90,875 0.02MINEBEA MITSUMI Inc. 5,600 86,722 0.02Mitsubishi Chemical Holdings Corp. 16,700 81,384 0.02Dentsu Group Inc. 2,800 80,904 0.02Sumitomo Electric Industries Ltd. 9,400 80,730 0.02
Holding
MarketValue
(£)
% ofTotal Net
Assets
Nippon Paint Holdings Co. Ltd. 12,565 80,181 0.02Yaskawa Electric Corp. 2,900 79,336 0.02Japan Exchange Group Inc. 6,600 79,182 0.02Mitsui OSK Lines Ltd. 4,200 79,139 0.02Shimadzu Corp. 3,000 78,936 0.02SG Holdings Co. Ltd. 5,600 78,769 0.02Disco Corp. 400 78,690 0.02Toray Industries Inc. 20,400 77,618 0.02West Japan Railway Co. 2,603 77,516 0.02Nissan Motor Co. Ltd. 24,100 76,584 0.02Makita Corp. 3,200 76,035 0.02Nomura Research Institute Ltd. 3,300 75,266 0.02Daiwa Securities Group Inc. 19,100 74,668 0.02Nippon Building Fund Inc. 18 74,473 0.02Nitori Holdings Co. Ltd. 900 73,837 0.02MISUMI Group Inc. 3,400 68,246 0.02Nissan Chemical Corp. 1,600 67,871 0.02Trend Micro Inc. 1,500 66,856 0.02MEIJI Holdings Co. Ltd. 1,600 63,543 0.01Yakult Honsha Co. Ltd. 1,514 62,454 0.01Isuzu Motors Ltd. 6,700 62,443 0.01Japan Real Estate Investment Corp. 16 61,772 0.01GLP J-Reit 56 60,420 0.01Yamato Holdings Co. Ltd. 4,000 60,026 0.01Nippon Prologis REIT Inc. 27 59,673 0.01Japan Retail Fund Investment Corp. 94 59,638 0.01T&D Holdings Inc. 5,700 58,520 0.01Yamaha Corp. 1,900 58,345 0.01Kyowa Kirin Co. Ltd. 3,400 57,105 0.01JSR Corp. 2,600 56,743 0.01Nomura Real Estate Master
Fund Inc. 56 56,116 0.01Yamaha Motor Co. Ltd. 3,400 56,080 0.01Aisin Corp. 2,400 55,624 0.01Kintetsu Group Holdings Co. Ltd. 2,400 54,960 0.01Hankyu Hanshin Holdings Inc. 2,600 54,825 0.01Daifuku Co. Ltd. 1,100 54,370 0.01Pan Pacific International Holdings
Corp. 4,400 54,316 0.01Hamamatsu Photonics KK 1,500 53,946 0.01Daito Trust Construction Co. Ltd. 700 53,749 0.01BayCurrent Consulting Inc. 200 52,870 0.01Tokyu Corp. 5,400 52,751 0.01Daiwa House REIT Investment Corp. 27 52,120 0.01Dai Nippon Printing Co. Ltd. 3,100 51,818 0.01Ibiden Co. Ltd. 1,700 51,576 0.01Hirose Electric Co. Ltd. 500 51,118 0.01Taiyo Yuden Co. Ltd. 1,600 50,854 0.01Rohm Co. Ltd. 900 50,626 0.01TIS Inc. 2,800 50,470 0.01Suntory Beverage & Food Ltd. 1,600 50,362 0.01Nissin Foods Holdings Co. Ltd. 900 50,018 0.01Konami Holdings Corp. 1,000 49,366 0.01Rakuten Group Inc. 8,700 49,099 0.01TOTO Ltd. 1,800 48,524 0.01SBI Holdings Inc. 2,700 48,286 0.01Lixil Corp. 3,300 46,336 0.01Keio Corp. 1,500 46,015 0.01Mitsui Chemicals Inc. 2,500 45,708 0.01Sekisui Chemical Co. Ltd. 4,200 45,418 0.01SUMCO Corp. 3,900 45,411 0.01CyberAgent Inc. 5,300 45,127 0.01Toho Co. Ltd. 1,500 44,494 0.01Kobayashi Pharmaceutical Co. Ltd. 800 43,673 0.01Matsumotokiyoshi Holdings Co. Ltd. 1,640 43,354 0.01Concordia Financial Group Ltd. 14,900 43,144 0.01Brother Industries Ltd. 3,100 43,128 0.01Tobu Railway Co. Ltd. 2,400 43,113 0.01Odakyu Electric Railway Co. Ltd. 3,500 42,431 0.01TOPPAN Inc. 3,100 41,012 0.01GMO Payment Gateway Inc. 600 40,833 0.01Asahi Intecc Co. Ltd. 2,600 40,535 0.01Capcom Co. Ltd. 1,900 40,006 0.01Chiba Bank Ltd. 8,600 39,494 0.01Nihon M&A Center Holdings Inc. 3,900 38,673 0.01Koito Manufacturing Co. Ltd. 1,300 38,202 0.01
Vanguard ESG Developed World All Cap Equity Index Fund (UK)
59

Holding
MarketValue
(£)
% ofTotal Net
Assets
Kawasaki Kisen Kaisha Ltd. 900 37,901 0.01Hulic Co. Ltd. 5,578 37,550 0.01NIPPON EXPRESS HOLDINGS Inc. 800 37,526 0.01MonotaRO Co. Ltd. 2,700 37,480 0.01Keisei Electric Railway Co. Ltd. 1,900 37,261 0.01Advance Residence Investment
Corp. 17 37,206 0.01Seiko Epson Corp. 3,300 36,862 0.01Azbil Corp. 1,500 36,610 0.01Oji Holdings Corp. 9,300 35,162 0.01Japan Post Insurance Co. Ltd. 2,700 34,907 0.01Bank of Kyoto Ltd. 1,000 34,796 0.01USS Co. Ltd. 2,600 34,493 0.01Mazda Motor Corp. 6,000 34,230 0.01Haseko Corp. 3,900 34,094 0.01Industrial & Infrastructure Fund
Investment Corp. 29 33,250 0.01Kurita Water Industries Ltd. 1,200 32,939 0.01Tokyu Fudosan Holdings Corp. 7,900 32,880 0.01Nippon Shinyaku Co. Ltd. 600 32,497 0.01Asics Corp. 2,500 31,753 0.01Marui Group Co. Ltd. 2,300 31,701 0.01Nikon Corp. 3,500 31,630 0.01Shizuoka Bank Ltd. 6,100 31,501 0.01Mitsubishi HC Capital Inc. 8,710 31,271 0.01Nagoya Railroad Co. Ltd. 2,400 30,866 0.01Tokyo Ohka Kogyo Co. Ltd. 700 30,683 0.01Hoshizaki Corp. 600 30,394 0.01Persol Holdings Co. Ltd. 1,900 30,264 0.01Nippon Sanso Holdings Corp. 2,100 30,132 0.01Nisshin Seifun Group Inc. 2,800 29,917 0.01Keikyu Corp. 3,700 29,798 0.01Kobe Bussan Co. Ltd. 1,500 29,463 0.01Hakuhodo DY Holdings Inc. 3,100 29,330 0.01Orix JREIT Inc. 27 29,064 0.01Otsuka Corp. 1,100 28,842 0.01Japan Hotel REIT Investment Corp. 70 28,402 0.01Koei Tecmo Holdings Co. Ltd. 1,160 28,240 0.01Hikari Tsushin Inc. 300 28,107 0.01Showa Denko KK 1,776 27,547 0.01Maruichi Steel Tube Ltd. 1,600 27,276 0.01Aozora Bank Ltd. 1,700 27,183 0.01United Urban Investment Corp. 31 27,024 0.01NGK Spark Plug Co. Ltd. 2,200 26,969 0.01Iida Group Holdings Co. Ltd. 2,100 26,789 0.01Kansai Paint Co. Ltd. 2,400 26,514 0.01SCREEN Holdings Co. Ltd. 400 26,460 0.01ANA Holdings Inc. 1,745 26,315 0.01Japan Post Bank Co. Ltd. 4,300 25,933 0.01Square Enix Holdings Co. Ltd. 800 25,624 0.01Rinnai Corp. 500 25,544 0.01NH Foods Ltd. 1,000 25,236 0.01Nomura Real Estate Holdings Inc. 1,300 25,175 0.01Fukuoka Financial Group Inc. 1,700 24,800 0.01Kose Corp. 300 24,769 0.01Open House Group Co. Ltd. 800 24,689 0.01Toyo Suisan Kaisha Ltd. 1,000 24,591 0.01Shinko Electric Industries Co. Ltd. 700 24,529 0.01Yamada Holdings Co. Ltd. 10,300 24,442 0.01TechnoPro Holdings Inc. 1,200 24,419 0.01Japan Prime Realty Investment Corp. 10 24,222 0.01Goldwin Inc. 600 24,087 0.01Kagome Co. Ltd. 1,200 23,902 0.01Lion Corp. 2,900 23,872 0.01Seibu Holdings Inc. 3,000 23,865 0.01Dowa Holdings Co. Ltd. 700 23,798 0.01Nabtesco Corp. 1,300 23,752 0.01Kyushu Railway Co. 1,500 23,552 0.01Medipal Holdings Corp. 1,800 23,548 0.01Suzuken Co. Ltd. 1,000 23,546 0.01Tokyo Tatemono Co. Ltd. 2,100 23,535 0.01Rohto Pharmaceutical Co. Ltd. 1,100 23,364 0.01COMSYS Holdings Corp. 1,400 23,290 0.01Isetan Mitsukoshi Holdings Ltd. 3,900 23,089 0.01Toyo Corp/Chuo-ku 3,600 23,061 0.01NSK Ltd. 5,200 22,921 0.01
Holding
MarketValue
(£)
% ofTotal Net
Assets
Activia Properties Inc. 9 22,851 0.01Daiwa Office Investment Corp. 5 22,593 0.01Teijin Ltd. 2,600 22,138 0.01Casio Computer Co. Ltd. 2,600 21,658 0.01Kewpie Corp. 1,600 21,532 0.01Sekisui Kasei Co. Ltd. 8,000 21,443 0.01Yokohama Rubber Co. Ltd. 2,000 21,357 0.01Yukiguni Maitake Co. Ltd. 3,300 21,200 0.01Kuraray Co. Ltd. 3,300 21,099 0.01Hitachi Transport System Ltd. 400 20,976 0.01EM Systems Co. Ltd. 3,700 20,972 0.01Mitsui High-Tec Inc. 300 20,970 0.01Food & Life Cos Ltd. 1,100 20,964 0.01Kenedix Office Investment Corp. 5 20,902 0.01Santen Pharmaceutical Co. Ltd. 3,200 20,873 0.01Nakayama Steel Works Ltd. 7,900 20,738 0.01Mitsui Fudosan Logistics Park Inc. 6 20,546 0.01Kyoritsu Maintenance Co. Ltd. 700 20,398 0.01Resorttrust Inc. 1,500 20,223 0.01Kakaku.com Inc. 1,200 20,206 0.01Japan Airlines Co. Ltd. 1,524 20,144 0.01Kadokawa Corp. 1,000 20,072 0.01Hisamitsu Pharmaceutical Co. Inc. 900 19,753 0.01Ito En Ltd. 600 19,660 0.01Seikagaku Corp. 3,800 19,647 0.01Sekisui House Reit Inc. 42 19,623 0.01Nippon Accommodations Fund Inc. 5 19,611 0.01Tsumura & Co. 1,000 19,580 0.01Alfresa Holdings Corp. 1,800 19,575 0.01Japan Logistics Fund Inc. 10 19,519 0.01LaSalle Logiport REIT 18 19,421 0.01Stanley Electric Co. Ltd. 1,400 19,228 0.01Denka Co. Ltd. 900 19,227 0.01THK Co. Ltd. 1,200 19,122 0.01Alps Alpine Co. Ltd. 2,700 19,122 0.01Sanwa Holdings Corp. 2,600 18,957 0.01Credit Saison Co. Ltd. 2,100 18,875 0.01Keihan Holdings Co. Ltd. 1,100 18,806 0.01Sakata Seed Corp. 700 18,806 0.01ZOZO Inc. 1,100 18,604 0.01Miura Co. Ltd. 1,100 18,455 0.01ADEKA Corp. 1,200 18,450 0.01Topy Industries Ltd. 2,900 18,363 0.01DIC Corp. 1,200 18,244 0.01Welcia Holdings Co. Ltd. 1,100 18,110 0.01Kureha Corp. 300 18,000 0.01J Front Retailing Co. Ltd. 3,000 17,927 0.01Ain Holdings Inc. 500 17,921 0.01SCSK Corp. 1,400 17,807 0.01Sohgo Security Services Co. Ltd. 800 17,804 0.01GMO internet Inc. 1,100 17,738 0.01Hirogin Holdings Inc. 4,500 17,705 0.01Internet Initiative Japan Inc. 700 17,665 0.01ASKA Pharmaceutical Holdings Co.
Ltd. 2,400 17,499 0.01Nihon Kohden Corp. 900 17,373 0.01Sumitomo Forestry Co. Ltd. 1,400 17,196 0.01Wowow Inc. 1,800 17,052 0.01Zensho Holdings Co. Ltd. 900 16,958 0.01Zeon Corp. 2,000 16,955 0.01Zenkoku Hosho Co. Ltd. 600 16,820 0.01Taiheiyo Cement Corp. 1,300 16,783 0.01Amada Co. Ltd. 2,700 16,781 0.01TS Tech Co. Ltd. 2,000 16,722 0.01Japan Airport Terminal Co. Ltd. 500 16,568 0.01TV Asahi Holdings Corp. 1,800 16,389 0.01Shochiku Co. Ltd. 200 16,328 0.01Tsuruha Holdings Inc. 400 16,328 0.01Daiwa Securities Living Investments
Corp. 23 16,204 0.01BIPROGY Inc. 800 16,181 0.01Morinaga Milk Industry Co. Ltd. 500 16,107 0.01Nishi-Nippon Railroad Co. Ltd. 1,000 16,015 0.01Kyowa Exeo Corp. 1,200 15,979 0.00Iwatani Corp. 500 15,953 0.00Konica Minolta Inc. 5,700 15,874 0.00
Vanguard ESG Developed World All Cap Equity Index Fund (UK)
60

Holding
MarketValue
(£)
% ofTotal Net
Assets
Ulvac Inc. 500 15,830 0.00CAC Holdings Corp. 1,900 15,827 0.00Nippon Gas Co. Ltd. 1,400 15,785 0.00Ryohin Keikaku Co. Ltd. 2,200 15,784 0.00Inaba Denki Sangyo Co. Ltd. 1,000 15,720 0.00Taisho Pharmaceutical Holdings Co.
Ltd. 500 15,646 0.00AEON REIT Investment Corp. 17 15,593 0.00Mori Hills REIT Investment Corp. 17 15,426 0.00Oracle Corp. Japan 300 15,418 0.00Frontier Real Estate Investment
Corp. 5 15,400 0.00Amano Corp. 1,000 15,394 0.00Mitsubishi Motors Corp. 7,700 15,385 0.00Fudo Tetra Corp. 1,600 15,227 0.00SHIFT Inc. 100 15,216 0.00Hachijuni Bank Ltd. 5,800 15,190 0.00Tokai Carbon Co. Ltd. 2,300 15,186 0.00Sotetsu Holdings Inc. 1,100 15,101 0.00Nifco Inc. 900 15,099 0.00Relo Group Inc. 1,300 14,945 0.00Kamigumi Co. Ltd. 1,100 14,938 0.00Kanematsu Corp. 1,800 14,861 0.00Cosmos Pharmaceutical Corp. 200 14,841 0.00Shinsei Bank Ltd. 1,060 14,812 0.00Tokyo Century Corp. 600 14,754 0.00Fuji Corp. 1,100 14,749 0.00Chiyoda Integre Co. Ltd. 1,100 14,735 0.00Toyo Seikan Group Holdings Ltd. 1,700 14,715 0.00Jeol Ltd. 400 14,632 0.00Tanseisha Co. Ltd. 3,000 14,625 0.00Nippon Kayaku Co. Ltd. 2,100 14,614 0.00Invincible Investment Corp. 56 14,614 0.00Nippon Electric Glass Co. Ltd. 900 14,507 0.00JTEKT Corp. 2,600 14,481 0.00Sharp Corp. 2,100 14,188 0.00NSD Co. Ltd. 1,000 14,183 0.00Shimamura Co. Ltd. 200 14,177 0.00Bic Camera Inc. 2,100 14,124 0.00Benesse Holdings Inc. 1,000 13,992 0.00Comforia Residential REIT Inc. 7 13,921 0.00GS Yuasa Corp. 1,000 13,918 0.00Justsystems Corp. 400 13,918 0.00Seven Bank Ltd. 9,300 13,836 0.00Osaka Steel Co. Ltd. 1,600 13,820 0.00Money Forward Inc. 500 13,740 0.00Kurimoto Ltd. 1,400 13,736 0.00Tv Tokyo Holdings Corp. 1,100 13,735 0.00Toyo Tire Corp. 1,500 13,722 0.00St Marc Holdings Co. Ltd. 1,500 13,694 0.00Sugi Holdings Co. Ltd. 400 13,672 0.00Wacoal Holdings Corp. 1,200 13,641 0.00Kenko Mayonnaise Co. Ltd. 1,600 13,633 0.00Ehime Bank Ltd. 2,400 13,589 0.00INFRONEER Holdings Inc. 2,328 13,568 0.00SHO-BOND Holdings Co. Ltd. 400 13,476 0.00CRE Logistics REIT Inc. 11 13,457 0.00Sanrio Co. Ltd. 800 13,456 0.00Mebuki Financial Group Inc. 8,400 13,427 0.00Topcon Corp. 1,300 13,403 0.00NET One Systems Co. Ltd. 700 13,362 0.00Hino Motors Ltd. 3,200 13,240 0.00Nichirei Corp. 900 13,196 0.00en-japan Inc. 700 13,190 0.00Anritsu Corp. 1,300 13,091 0.00House Foods Group Inc. 700 13,061 0.00Cosel Co. Ltd. 2,800 13,048 0.00Mori Trust Sogo Reit Inc. 15 13,039 0.00Sundrug Co. Ltd. 700 12,975 0.00Nippon Shokubai Co. Ltd. 400 12,861 0.00Nankai Electric Railway Co. Ltd. 900 12,853 0.00Sparx Group Co. Ltd. 8,100 12,748 0.00K's Holdings Corp. 1,600 12,669 0.00Daiseki Co. Ltd. 440 12,659 0.00Futaba Corp. 3,100 12,616 0.00
Holding
MarketValue
(£)
% ofTotal Net
Assets
Coca-Cola Bottlers JapanHoldings Inc. 1,400 12,557 0.00
Chubu Shiryo Co. Ltd. 2,000 12,554 0.00Heiwa Real Estate Co. Ltd. 500 12,495 0.00NEC Networks & System Integration
Corp. 1,100 12,490 0.00AEON Financial Service Co. Ltd. 1,700 12,458 0.00Tekken Corp. 1,100 12,409 0.00Seino Holdings Co. Ltd. 1,900 12,393 0.00JP-Holdings Inc. 9,500 12,381 0.00Matsui Securities Co. Ltd. 2,500 12,357 0.00Pigeon Corp. 900 12,261 0.00Fujitec Co. Ltd. 700 12,105 0.00Ship Healthcare Holdings Inc. 900 12,040 0.00Nipro Corp. 1,900 11,961 0.00Komeri Co. Ltd. 700 11,778 0.00Kanamic Network Co. Ltd. 3,800 11,774 0.00Sumitomo Rubber Industries Ltd. 1,700 11,757 0.00Japan Excellent Inc. 15 11,757 0.00FAN Communications Inc. 4,400 11,658 0.00PALTAC Corp. 400 11,644 0.00Kenedix Residential Next Investment
Corp. 9 11,586 0.00Chudenko Corp. 900 11,553 0.00Kohnan Shoji Co. Ltd. 500 11,481 0.00Mitsubishi Estate Logistics REIT
Investment Corp. 4 11,435 0.00Calbee Inc. 800 11,420 0.00Ezaki Glico Co. Ltd. 500 11,419 0.00Daiwabo Holdings Co. Ltd. 1,100 11,415 0.00Park24 Co. Ltd. 1,000 11,410 0.00SMS Co. Ltd. 600 11,398 0.00Daido Steel Co. Ltd. 500 11,373 0.00Katitas Co. Ltd. 600 11,232 0.00Tokyo Seimitsu Co. Ltd. 400 11,078 0.00NTT UD REIT Investment Corp. 12 11,058 0.00Heiwa Real Estate Inc. 12 10,970 0.00Yamaguchi Financial Group Inc. 2,500 10,943 0.00Rakus Co. Ltd. 1,100 10,901 0.00Daiichikosho Co. Ltd. 500 10,897 0.00Yamazaki Baking Co. Ltd. 1,100 10,861 0.00Hamakyorex Co. Ltd. 600 10,774 0.00Tokyo Individualized Educational
Institute Inc. 3,000 10,771 0.00Fancl Corp. 700 10,754 0.00Yuasa Trading Co. Ltd. 600 10,693 0.00Sawai Group Holdings Co. Ltd. 400 10,672 0.00Yamashin-Filter Corp. 5,000 10,636 0.00Digital Garage Inc. 400 10,611 0.00Chugoku Bank Ltd. 1,800 10,568 0.00Toei Co. Ltd. 100 10,537 0.00ZIGExN Co. Ltd. 5,600 10,535 0.00Toyoda Gosei Co. Ltd. 900 10,513 0.00Sumitomo Bakelite Co. Ltd. 400 10,513 0.00Fuso Pharmaceutical Industries Ltd. 800 10,510 0.00DTS Corp. 600 10,509 0.00Tatsuta Electric Wire and Cable Co.
Ltd. 3,700 10,509 0.00Fujimi Inc. 300 10,476 0.00Rock Field Co. Ltd. 1,200 10,461 0.00Wacom Co. Ltd. 1,800 10,446 0.00Japan Securities Finance Co. Ltd. 1,800 10,369 0.00Outsourcing Inc. 1,300 10,350 0.00Izumi Co. Ltd. 600 10,332 0.00PeptiDream Inc. 800 10,308 0.00Happinet Corp. 1,100 10,279 0.00Toyota Boshoku Corp. 800 10,225 0.00Duskin Co. Ltd. 600 10,217 0.00Daicel Corp. 2,100 10,212 0.00Fuji Kyuko Co. Ltd. 400 10,119 0.00Tokyu REIT Inc. 9 10,098 0.00Mirait Holdings Corp. 900 10,081 0.00Sansan Inc. 1,300 9,998 0.00Hazama Ando Corp. 1,800 9,992 0.00Hulic Reit Inc. 10 9,916 0.00Tokyo Steel Manufacturing Co. Ltd. 1,200 9,900 0.00
Vanguard ESG Developed World All Cap Equity Index Fund (UK)
61

Holding
MarketValue
(£)
% ofTotal Net
Assets
JVCKenwood Corp. 8,700 9,895 0.00JDC Corp. 3,000 9,849 0.00Yahagi Construction Co. Ltd. 2,000 9,824 0.00Sankyu Inc. 400 9,713 0.00Pilot Corp. 300 9,664 0.00Mixi Inc. 700 9,652 0.00Infomart Corp. 2,400 9,649 0.00Amuse Inc. 800 9,625 0.00RPA Holdings Inc. 4,300 9,622 0.00MTI Ltd. 3,300 9,576 0.00Linical Co. Ltd. 1,900 9,496 0.00Japan Elevator Service Holdings Co.
Ltd. 900 9,483 0.00OBIC Business Consultants Co. Ltd. 328 9,457 0.00Kissei Pharmaceutical Co. Ltd. 600 9,454 0.00Ushio Inc. 900 9,412 0.00Sumitomo Warehouse Co. Ltd. 700 9,394 0.00Maruwa Co. Ltd. 100 9,381 0.00H2O Retailing Corp. 1,800 9,362 0.00Broadleaf Co. Ltd. 4,100 9,301 0.00Akatsuki Inc. 500 9,298 0.00Sumitomo Pharma Co. Ltd. 1,300 9,231 0.00Kitanotatsujin Corp. 8,700 9,199 0.00Aeon Fantasy Co. Ltd. 700 9,183 0.00Nagase & Co. Ltd. 800 9,163 0.00Information Services International-
Dentsu Ltd. 400 9,160 0.00NIPPON REIT Investment Corp. 4 9,148 0.00Sourcenext Corp. 8,100 9,113 0.00Medical Data Vision Co. Ltd. 1,500 9,102 0.00DMG Mori Co. Ltd. 900 9,080 0.00Digital Holdings Inc. 1,000 9,068 0.00Acom Co. Ltd. 4,400 9,035 0.00Kyudenko Corp. 500 9,022 0.00Round One Corp. 1,000 8,926 0.00Aoyama Trading Co. Ltd. 2,200 8,913 0.00Sanken Electric Co. Ltd. 300 8,899 0.00Shoei Co. Ltd. 300 8,890 0.00Seiren Co. Ltd. 700 8,861 0.00Icom Inc. 600 8,842 0.00Tocalo Co. Ltd. 1,100 8,818 0.00Central Sports Co. Ltd. 600 8,808 0.00Nippon Suisan Kaisha Ltd. 2,500 8,807 0.00KFC Holdings Japan Ltd. 500 8,760 0.00Key Coffee Inc. 700 8,732 0.00Yoshinoya Holdings Co. Ltd. 600 8,705 0.00Meiko Electronics Co. Ltd. 400 8,594 0.00Kaneka Corp. 400 8,558 0.00Mabuchi Motor Co. Ltd. 400 8,558 0.00Kamakura Shinsho Ltd. 2,400 8,543 0.00DCM Holdings Co. Ltd. 1,300 8,519 0.00As One Corp. 200 8,508 0.00Fuji Soft Inc. 200 8,508 0.00Meitec Corp. 200 8,508 0.00Robot Home Inc. 6,900 8,484 0.00NEC Capital Solutions Ltd. 700 8,482 0.00Kourakuen Holdings Corp. 1,100 8,460 0.00LIFULL Co. Ltd. 6,100 8,438 0.00Pronexus Inc. 1,300 8,432 0.00Kenedix Retail REIT Corp. 5 8,416 0.00Yaoko Co. Ltd. 200 8,398 0.00Gurunavi Inc. 3,200 8,341 0.00Pola Orbis Holdings Inc. 900 8,322 0.00Nippn Corp. 800 8,297 0.00Ryoden Corp. 800 8,263 0.00Mani Inc. 900 8,250 0.00Nomura Co. Ltd. 1,500 8,226 0.00Hoshino Resorts REIT Inc. 2 8,189 0.00Nisso Corp. 2,000 8,176 0.00GungHo Online Entertainment Inc. 500 8,170 0.00Nishi-Nippon Financial Holdings Inc. 1,700 8,162 0.00Fuji Pharma Co. Ltd. 1,400 8,151 0.00Toshiba TEC Corp. 300 8,143 0.00JCU Corp. 400 8,127 0.00Sanki Engineering Co. Ltd. 900 8,111 0.00Warabeya Nichiyo Holdings Co. Ltd. 800 8,110 0.00
Holding
MarketValue
(£)
% ofTotal Net
Assets
DeNA Co. Ltd. 700 8,103 0.00France Bed Holdings Co. Ltd. 1,500 8,087 0.00UACJ Corp. 600 8,052 0.00Heroz Inc. 1,400 8,039 0.00Rengo Co. Ltd. 1,700 8,037 0.00Juroku Financial Group Inc. 600 8,019 0.00OSG Corp. 800 8,017 0.00Fujikura Ltd. 2,100 8,004 0.00Nittetsu Mining Co. Ltd. 200 7,943 0.00Taikisha Ltd. 400 7,857 0.00Kyushu Financial Group Inc. 3,200 7,810 0.00Aiful Corp. 3,400 7,755 0.00Aeon Mall Co. Ltd. 800 7,731 0.00Yamato Kogyo Co. Ltd. 300 7,728 0.00PIA Corp. 400 7,660 0.00KLab Inc. 2,800 7,643 0.00Kintetsu World Express Inc. 400 7,623 0.00Daio Paper Corp. 800 7,613 0.00Nippon Paper Industries Co. Ltd. 1,200 7,599 0.00Kumiai Chemical Industry Co. Ltd. 1,400 7,557 0.00Morinaga & Co. Ltd. 300 7,451 0.00Snow Peak Inc. 500 7,429 0.00Nextage Co. Ltd. 600 7,388 0.00TerraSky Co. Ltd. 900 7,381 0.00Mitsubishi Logistics Corp. 400 7,377 0.00Aica Kogyo Co. Ltd. 400 7,375 0.00CMIC Holdings Co. Ltd. 800 7,372 0.00Nissin Sugar Co. Ltd. 700 7,363 0.00Benefit One Inc. 600 7,340 0.00Takeuchi Manufacturing Co. Ltd. 500 7,307 0.00Takasago Thermal Engineering Co.
Ltd. 700 7,294 0.00Kokuyo Co. Ltd. 700 7,281 0.00Airport Facilities Co. Ltd. 2,200 7,276 0.00Tokyo Rakutenchi Co. Ltd. 300 7,276 0.00Japan Material Co. Ltd. 600 7,267 0.00Takashimaya Co. Ltd. 1,000 7,248 0.00NHK Spring Co. Ltd. 1,400 7,238 0.00FP Corp. 400 7,222 0.00Nippon Signal Company Ltd. 1,300 7,201 0.00H.U. Group Holdings Inc. 400 7,139 0.00Gunma Bank Ltd. 3,100 7,090 0.00Dexerials Corp. 400 7,090 0.00Yamazen Corp. 1,200 7,075 0.00Rorze Corp. 100 7,045 0.00Gakken Holdings Co. Ltd. 1,300 7,041 0.00Nishimatsu Construction Co. Ltd. 300 7,036 0.00Ogaki Kyoritsu Bank Ltd. 600 7,023 0.00Hokuhoku Financial Group Inc. 1,300 7,017 0.00Japan Pulp & Paper Co. Ltd. 300 6,990 0.00I-PEX Inc. 800 6,979 0.00Iyo Bank Ltd. 1,800 6,960 0.00Menicon Co. Ltd. 400 6,849 0.00Mirai Corp. 22 6,844 0.00Nihon Parkerizing Co. Ltd. 1,200 6,787 0.00Fukuyama Transporting Co. Ltd. 300 6,704 0.00Taiho Kogyo Co. Ltd. 1,700 6,689 0.00Sumitomo Osaka Cement Co. Ltd. 300 6,649 0.00eGuarantee Inc. 500 6,646 0.00Kanto Denka Kogyo Co. Ltd. 1,100 6,620 0.00Ebase Co. Ltd. 2,500 6,609 0.00Nippon Denko Co. Ltd. 3,400 6,605 0.00Awa Bank Ltd. 500 6,593 0.00ABC-Mart Inc. 200 6,578 0.00Toho Holdings Co. Ltd. 500 6,486 0.00San-Ai Obbli Co. Ltd. 1,100 6,418 0.00Tokai Tokyo Financial Holdings Inc. 2,700 6,407 0.00Asahi Holdings Inc. 500 6,344 0.00Maxvalu Tokai Co. Ltd. 400 6,342 0.00Toyo Construction Co. Ltd. 1,100 6,296 0.00Daishi Hokuetsu Financial Group Inc. 400 6,190 0.00DyDo Group Holdings Inc. 200 6,148 0.00NOK Corp. 900 6,130 0.00Tri Chemical Laboratories Inc. 400 6,069 0.00KH Neochem Co. Ltd. 400 6,064 0.00San ju San Financial Group Inc. 700 6,055 0.00
Vanguard ESG Developed World All Cap Equity Index Fund (UK)
62

Holding
MarketValue
(£)
% ofTotal Net
Assets
Shiga Bank Ltd. 400 6,022 0.00Uchida Yoko Co. Ltd. 200 6,006 0.00Riso Kagaku Corp. 400 5,995 0.00Nisshinbo Holdings Inc. 1,000 5,982 0.00JCR Pharmaceuticals Co. Ltd. 400 5,961 0.0077 Bank Ltd. 600 5,953 0.00Lintec Corp. 400 5,951 0.00Toagosei Co. Ltd. 900 5,909 0.00Ichibanya Co. Ltd. 200 5,896 0.00Istyle Inc. 6,100 5,888 0.00Toyobo Co. Ltd. 900 5,887 0.00Tokai Rika Co. Ltd. 700 5,878 0.00Nohmi Bosai Ltd. 500 5,874 0.00Hanwa Co. Ltd. 300 5,856 0.00Chugoku Marine Paints Ltd. 1,000 5,840 0.00Jamco Corp. 1,200 5,799 0.00JAFCO Group Co. Ltd. 600 5,791 0.00Nichiha Corp. 400 5,779 0.00Joyful Honda Co. Ltd. 600 5,747 0.00OKUMA Corp. 200 5,736 0.00Fujitsu General Ltd. 400 5,688 0.00Samty Residential Investment Corp. 7 5,659 0.00Transcosmos Inc. 300 5,653 0.00Nagawa Co. Ltd. 100 5,644 0.00Okumura Corp. 300 5,634 0.00Konishi Co. Ltd. 600 5,588 0.00Japan Aviation Electronics Industry
Ltd. 500 5,582 0.00Shikoku Chemicals Corp. 700 5,560 0.00Mizuho Leasing Co. Ltd. 300 5,542 0.00Nihon Trim Co. Ltd. 400 5,533 0.00Daido Metal Co. Ltd. 1,600 5,508 0.00Organo Corp. 100 5,502 0.00Doutor Nichires Holdings Co. Ltd. 600 5,496 0.00Roland Corp. 200 5,496 0.00Kurabo Industries Ltd. 500 5,475 0.00Star Asia Investment Corp. 15 5,468 0.00Tsubakimoto Chain Co. 300 5,463 0.00Citizen Watch Co. Ltd. 1,800 5,455 0.00HIS Co. Ltd. 400 5,447 0.00Fuji Co. Ltd. 400 5,447 0.00UT Group Co. Ltd. 300 5,437 0.00Tokyo Kiraboshi Financial Group Inc. 500 5,395 0.00Takuma Co. Ltd. 600 5,371 0.00Tokuyama Corp. 500 5,321 0.00Token Corp. 100 5,312 0.00Toa Corp. 300 5,245 0.00CKD Corp. 500 5,219 0.00Furukawa Electric Co. Ltd. 400 5,211 0.00Canon Marketing Japan Inc. 300 5,208 0.00Takara Leben Real Estate Investment
Corp. 7 5,198 0.00San-In Godo Bank Ltd. 1,300 5,155 0.00Shizuoka Gas Co. Ltd. 900 5,140 0.00Monex Group Inc. 1,400 5,138 0.00Tadano Ltd. 900 5,090 0.00Miyazaki Bank Ltd. 400 5,068 0.00Systena Corp. 2,000 5,041 0.00Valor Holdings Co. Ltd. 400 5,019 0.00Macnica Fuji Electronics
Holdings Inc. 300 5,007 0.00Fukuoka REIT Corp. 5 4,980 0.00Restar Holdings Corp. 400 4,938 0.00Itochu Advance Logistics Investment
Corp. 5 4,937 0.00ARTERIA Networks Corp. 600 4,902 0.00SOSiLA Logistics REIT Inc. 5 4,841 0.00Nikkon Holdings Co. Ltd. 400 4,837 0.00TOKAI Holdings Corp. 900 4,836 0.00Kaken Pharmaceutical Co. Ltd. 200 4,832 0.00Nojima Corp. 300 4,814 0.00Takasago International Corp. 300 4,814 0.00Hioki EE Corp. 100 4,814 0.00Global One Real Estate Investment
Corp. 7 4,794 0.00Mori Trust Hotel Reit Inc. 6 4,758 0.00
Holding
MarketValue
(£)
% ofTotal Net
Assets
Future Corp. 400 4,741 0.00Bando Chemical Industries Ltd. 900 4,692 0.00Oki Electric Industry Co. Ltd. 900 4,675 0.00T Hasegawa Co. Ltd. 300 4,673 0.00Descente Ltd. 300 4,657 0.00Nitto Boseki Co. Ltd. 300 4,655 0.00Orient Corp. 6,100 4,650 0.00MEC Co. Ltd. 300 4,650 0.00Hankyu Hanshin REIT Inc. 5 4,555 0.00Hosokawa Micron Corp. 300 4,552 0.00Anicom Holdings Inc. 1,200 4,552 0.00Komori Corp. 1,000 4,525 0.00Digital Arts Inc. 100 4,506 0.00Tsugami Corp. 600 4,500 0.00Nippon Road Co. Ltd. 100 4,420 0.00Okamura Corp. 600 4,415 0.00Central Glass Co. Ltd. 300 4,408 0.00Kiyo Bank Ltd. 500 4,389 0.00Fuyo General Lease Co. Ltd. 100 4,322 0.00EDION Corp. 600 4,312 0.00Idec Corp. 300 4,253 0.00Fuji Seal International Inc. 400 4,247 0.00Mitsubishi Logisnext Co. Ltd. 900 4,238 0.00VT Holdings Co. Ltd. 1,500 4,233 0.00Prestige International Inc. 1,100 4,220 0.00Autobacs Seven Co. Ltd. 500 4,208 0.00Kotobuki Spirits Co. Ltd. 100 4,205 0.00Weathernews Inc. 100 4,187 0.00Ricoh Leasing Co. Ltd. 200 4,180 0.00TKC Corp. 200 4,180 0.00Trancom Co. Ltd. 100 4,162 0.00KOMEDA Holdings Co. Ltd. 300 4,120 0.00Ichigo Office REIT Investment Corp. 8 4,092 0.00NTN Corp. 3,200 4,072 0.00Funai Soken Holdings Inc. 300 4,015 0.00Sinko Industries Ltd. 400 4,003 0.00Wakita & Co. Ltd. 600 3,969 0.00METAWATER Co. Ltd. 300 3,960 0.00Leopalace21 Corp. 3,300 3,956 0.00COLOPL Inc. 1,000 3,941 0.00Osaka Soda Co. Ltd. 200 3,922 0.00Glory Ltd. 300 3,862 0.00Takara Bio Inc. 300 3,860 0.00Pasona Group Inc. 300 3,820 0.00Taiyo Holdings Co. Ltd. 200 3,818 0.00Doshisha Co. Ltd. 400 3,765 0.00Trusco Nakayama Corp. 300 3,740 0.00V Technology Co. Ltd. 200 3,695 0.00Nippon Light Metal Holdings Co. Ltd. 360 3,681 0.00eRex Co. Ltd. 300 3,663 0.00Nippon Koei Co. Ltd. 200 3,568 0.00Megmilk Snow Brand Co. Ltd. 300 3,567 0.00Kusuri no Aoki Holdings Co. Ltd. 100 3,541 0.00Osaka Organic Chemical Industry
Ltd. 200 3,467 0.00Sanyo Denki Co. Ltd. 100 3,449 0.00Nishio Rent All Co. Ltd. 200 3,446 0.00Fuji Media Holdings Inc. 500 3,440 0.00Nissin Electric Co. Ltd. 400 3,413 0.00Fuji Oil Holdings Inc. 300 3,394 0.00One REIT Inc. 2 3,384 0.00Belc Co. Ltd. 100 3,369 0.00Earth Corp. 100 3,363 0.00Raksul Inc. 200 3,357 0.00LITALICO Inc. 200 3,343 0.00Milbon Co. Ltd. 100 3,332 0.00Musashi Seimitsu Industry Co. Ltd. 400 3,261 0.00Nippon Steel Trading Corp. 100 3,258 0.00GLOBERIDE Inc. 200 3,247 0.00Kyokuto Kaihatsu Kogyo Co. Ltd. 400 3,216 0.00Ariake Japan Co. Ltd. 100 3,191 0.00Mitani Sekisan Co. Ltd. 100 3,178 0.00Noevir Holdings Co. Ltd. 100 3,129 0.00Gree Inc. 500 3,058 0.00Sanyo Chemical Industries Ltd. 100 3,058 0.00Tomy Co. Ltd. 400 3,037 0.00
Vanguard ESG Developed World All Cap Equity Index Fund (UK)
63

Holding
MarketValue
(£)
% ofTotal Net
Assets
RENOVA Inc. 300 2,982 0.00Japan Wool Textile Co. Ltd. 500 2,975 0.00Hirata Corp. 100 2,942 0.00Teikoku Sen-I Co. Ltd. 300 2,923 0.00Fujita Kanko Inc. 200 2,897 0.00Toridoll Holdings Corp. 200 2,896 0.00Sangetsu Corp. 300 2,872 0.00Hokuetsu Corp. 700 2,862 0.00Starts Proceed Investment Corp. 2 2,823 0.00BeNext-Yumeshin Group Co. 300 2,761 0.00Keiyo Bank Ltd. 900 2,744 0.00Daiho Corp. 100 2,742 0.00Sakai Moving Service Co. Ltd. 100 2,727 0.00Senko Group Holdings Co. Ltd. 500 2,708 0.00Star Micronics Co. Ltd. 300 2,695 0.00Japan Lifeline Co. Ltd. 400 2,666 0.00Paramount Bed Holdings Co. Ltd. 200 2,664 0.00Bank of Saga Ltd. 300 2,637 0.00Usen-Next Holdings Co. Ltd. 200 2,632 0.00JINS Holdings Inc. 100 2,622 0.00Inabata & Co. Ltd. 200 2,613 0.00Dip Corp. 100 2,610 0.00Kameda Seika Co. Ltd. 100 2,585 0.00IR Japan Holdings Ltd. 100 2,557 0.00Noritake Co. Ltd. 100 2,530 0.00Hyakugo Bank Ltd. 1,200 2,530 0.00Riken Keiki Co. Ltd. 100 2,524 0.00Arcs Co. Ltd. 200 2,506 0.00Nanto Bank Ltd. 200 2,495 0.00San-A Co. Ltd. 100 2,490 0.00M&A Capital Partners Co. Ltd. 100 2,490 0.00Makino Milling Machine Co. Ltd. 100 2,447 0.00Strike Co. Ltd. 100 2,434 0.00Alpen Co. Ltd. 200 2,423 0.00Shoei Foods Corp. 100 2,398 0.00Bunka Shutter Co. Ltd. 400 2,395 0.00Kanamoto Co. Ltd. 200 2,389 0.00Raito Kogyo Co. Ltd. 200 2,383 0.00Fuso Chemical Co. Ltd. 100 2,361 0.00ValueCommerce Co. Ltd. 100 2,361 0.00Okamoto Industries Inc. 100 2,345 0.00Yokogawa Bridge Holdings Corp. 200 2,337 0.00Sumitomo Mitsui Construction Co.
Ltd. 900 2,329 0.00Fukushima Galilei Co. Ltd. 100 2,321 0.00Gunze Ltd. 100 2,308 0.00Nachi-Fujikoshi Corp. 100 2,308 0.00Daiichi Jitsugyo Co. Ltd. 100 2,305 0.00Hokkoku Financial Holdings Inc. 100 2,293 0.00Daihen Corp. 100 2,287 0.00Mochida Pharmaceutical Co. Ltd. 100 2,265 0.00Genky DrugStores Co. Ltd. 100 2,250 0.00Tokyu Construction Co. Ltd. 600 2,221 0.00Fujimori Kogyo Co. Ltd. 100 2,201 0.00Arata Corp. 100 2,201 0.00Giken Ltd. 100 2,189 0.00Musashino Bank Ltd. 200 2,182 0.00Sekisui Jushi Corp. 200 2,174 0.00Nichicon Corp. 300 2,174 0.00Pharma Foods International Co. Ltd. 200 2,125 0.00Optex Group Co. Ltd. 200 2,112 0.00Nippon Soda Co. Ltd. 100 2,103 0.00Ai Holdings Corp. 200 2,101 0.00Axial Retailing Inc. 100 2,081 0.00Hyakujushi Bank Ltd. 200 2,077 0.00Megachips Corp. 100 2,069 0.00BML Inc. 100 2,053 0.00Jaccs Co. Ltd. 100 2,029 0.00Tamura Corp. 600 2,029 0.00Itoham Yonekyu Holdings Inc. 500 2,007 0.00Hogy Medical Co. Ltd. 100 1,995 0.00Fujibo Holdings Inc. 100 1,970 0.00ASKUL Corp. 200 1,954 0.00Nishimatsuya Chain Co. Ltd. 200 1,954 0.00Maruzen Showa Unyu Co. Ltd. 100 1,952 0.00Max Co. Ltd. 200 1,951 0.00
Holding
MarketValue
(£)
% ofTotal Net
Assets
Intage Holdings Inc. 200 1,938 0.00Elecom Co. Ltd. 200 1,914 0.00Shibaura Machine Co. Ltd. 100 1,909 0.00Exedy Corp. 200 1,906 0.00Kaga Electronics Co. Ltd. 100 1,884 0.00Argo Graphics Inc. 100 1,881 0.00Iriso Electronics Co. Ltd. 100 1,878 0.00Bank of Nagoya Ltd. 100 1,878 0.00Maruwa Unyu Kikan Co. Ltd. 200 1,865 0.00Zuken Inc. 100 1,863 0.00SBS Holdings Inc. 100 1,863 0.00Pacific Industrial Co. Ltd. 300 1,857 0.00S Foods Inc. 100 1,854 0.00MedPeer Inc. 100 1,854 0.00Maeda Kosen Co. Ltd. 100 1,831 0.00MOS Food Services Inc. 100 1,830 0.00Create SD Holdings Co. Ltd. 100 1,826 0.00Life Corp. 100 1,822 0.00Iino Kaiun Kaisha Ltd. 400 1,820 0.00North Pacific Bank Ltd. 1,200 1,815 0.00KYB Corp. 100 1,811 0.00Artnature Inc. 400 1,810 0.00Nisshin Oillio Group Ltd. 100 1,803 0.00Ichigo Inc. 1,000 1,783 0.00Comture Corp. 100 1,739 0.00YAMABIKO Corp. 200 1,732 0.00Toho Zinc Co. Ltd. 100 1,720 0.00Aeon Delight Co. Ltd. 100 1,704 0.00Nitta Corp. 100 1,699 0.00Towa Pharmaceutical Co. Ltd. 100 1,695 0.00Nissha Co. Ltd. 200 1,694 0.00Zojirushi Corp. 200 1,686 0.00Keiyo Co. Ltd. 300 1,684 0.00Oisix ra daichi Inc. 100 1,665 0.00Senshu Ikeda Holdings Inc. 1,500 1,632 0.00TOMONY Holdings Inc. 800 1,618 0.00Showa Sangyo Co. Ltd. 100 1,613 0.00S-Pool Inc. 200 1,606 0.00Godo Steel Ltd. 200 1,600 0.00Daito Pharmaceutical Co. Ltd. 100 1,600 0.00Takara Standard Co. Ltd. 200 1,598 0.00FCC Co. Ltd. 200 1,596 0.00euglena Co. Ltd. 300 1,588 0.00Yokowo Co. Ltd. 100 1,573 0.00MCJ Co. Ltd. 300 1,566 0.00SKY Perfect JSAT Holdings Inc. 600 1,546 0.00Mitsubishi Pencil Co. Ltd. 200 1,542 0.00FULLCAST Holdings Co. Ltd. 100 1,533 0.00Hosiden Corp. 200 1,531 0.00Yodogawa Steel Works Ltd. 100 1,513 0.00Okasan Securities Group Inc. 700 1,498 0.00Mitsui-Soko Holdings Co. Ltd. 100 1,490 0.00Starts Corp Inc. 100 1,480 0.00Macromill Inc. 200 1,475 0.00Maruha Nichiro Corp. 100 1,472 0.00Nippon Ceramic Co. Ltd. 100 1,464 0.00Financial Products Group Co. Ltd. 300 1,464 0.00Shibuya Corp. 100 1,440 0.00Totetsu Kogyo Co. Ltd. 100 1,437 0.00Ryosan Co. Ltd. 100 1,424 0.00Curves Holdings Co. Ltd. 300 1,409 0.00Aichi Steel Corp. 100 1,372 0.00Insource Co. Ltd. 100 1,372 0.00Seiko Holdings Corp. 100 1,368 0.00Infocom Corp. 100 1,367 0.00Okinawa Financial Group Inc. 100 1,366 0.00Topre Corp. 200 1,359 0.00United Super Markets Holdings Inc. 200 1,340 0.00Noritsu Koki Co. Ltd. 100 1,329 0.00Mizuno Corp. 100 1,314 0.00Relia Inc. 200 1,313 0.00Adastria Co. Ltd. 100 1,312 0.00Prima Meat Packers Ltd. 100 1,308 0.00Saibu Gas Holdings Co. Ltd. 100 1,305 0.00Midac Holdings Co. Ltd. 100 1,300 0.00SAMTY Co. Ltd. 100 1,290 0.00
Vanguard ESG Developed World All Cap Equity Index Fund (UK)
64

Holding
MarketValue
(£)
% ofTotal Net
Assets
giftee Inc. 200 1,281 0.00Aeon Hokkaido Corp. 200 1,271 0.00Tsukishima Kikai Co. Ltd. 200 1,263 0.00Towa Corp. 100 1,262 0.00Elan Corp. 200 1,254 0.00Mitsuuroko Group Holdings Co. Ltd. 200 1,239 0.00TechMatrix Corp. 100 1,236 0.00Joshin Denki Co. Ltd. 100 1,223 0.00ZERIA Pharmaceutical Co. Ltd. 100 1,221 0.00Sanyo Special Steel Co. Ltd. 100 1,220 0.00Kitz Corp. 300 1,219 0.00Heiwado Co. Ltd. 100 1,199 0.00Hoosiers Holdings 300 1,199 0.00IDOM Inc. 300 1,197 0.00Toyo Ink SC Holdings Co. Ltd. 100 1,188 0.00Aida Engineering Ltd. 200 1,185 0.00Nagaileben Co. Ltd. 100 1,183 0.00Plenus Co. Ltd. 100 1,169 0.00KYORIN Holdings Inc. 100 1,161 0.00Zenrin Co. Ltd. 200 1,161 0.00Nippon Seiki Co. Ltd. 200 1,156 0.00Shima Seiki Manufacturing Ltd. 100 1,137 0.00Change Inc. 100 1,121 0.00Nippon Chemi-Con Corp. 100 1,116 0.00Toho Bank Ltd. 900 1,112 0.00Sato Holdings Corp. 100 1,100 0.00United Arrows Ltd. 100 1,076 0.00LEC Inc. 200 1,075 0.00SWCC Showa Holdings Co. Ltd. 100 1,072 0.00Eiken Chemical Co. Ltd. 100 1,058 0.00Tokai Corp/Gifu 100 1,057 0.00TBS Holdings Inc. 100 1,049 0.00Nissan Shatai Co. Ltd. 300 1,040 0.00Yellow Hat Ltd. 100 997 0.00Nippon Densetsu Kogyo Co. Ltd. 100 993 0.00Nippon Sheet Glass Co. Ltd. 400 966 0.00Pressance Corp. 100 960 0.00Nichi-iko Pharmaceutical Co. Ltd. 200 955 0.00Arcland Sakamoto Co. Ltd. 100 951 0.00Koa Corp. 100 944 0.00Micronics Japan Co. Ltd. 100 943 0.00Nitto Kogyo Corp. 100 942 0.00Nippon Thompson Co. Ltd. 300 931 0.00Daikyonishikawa Corp. 300 926 0.00Noritz Corp. 100 925 0.00Bell System24 Holdings Inc. 100 920 0.00Unipres Corp. 200 918 0.00Marusan Securities Co. Ltd. 300 911 0.00Belluna Co. Ltd. 200 896 0.00PAL GROUP Holdings Co. Ltd. 100 887 0.00Matsuya Co. Ltd. 200 873 0.00Alconix Corp. 100 866 0.00Avex Inc. 100 861 0.00OSAKA Titanium Technologies Co.
Ltd. 100 822 0.00Cybozu Inc. 100 801 0.00Mandom Corp. 100 796 0.00YA-MAN Ltd. 100 763 0.00Morita Holdings Corp. 100 762 0.00Maxell Ltd. 100 714 0.00HI-LEX Corp. 100 702 0.00Ichikoh Industries Ltd. 300 693 0.00Retail Partners Co. Ltd. 100 689 0.00Qol Holdings Co. Ltd. 100 669 0.00Ryobi Ltd. 100 660 0.00Aruhi Corp. 100 614 0.00Siix Corp. 100 613 0.00Tsubaki Nakashima Co. Ltd. 100 576 0.00V-Cube Inc. 100 565 0.00Solasto Corp. 100 551 0.00Optim Corp. 100 534 0.00
32,604,062 6.80
Netherlands 1.24% (31 October 2021: 1.50%)
ASML Holding NV 4,593 2,114,911 0.44Adyen NV 357 486,857 0.10
Holding
MarketValue
(£)
% ofTotal Net
Assets
Prosus NV 10,743 420,565 0.09ING Groep NV 46,484 355,279 0.07Koninklijke Ahold Delhaize NV 11,690 275,870 0.06Koninklijke DSM NV 2,015 271,832 0.06Wolters Kluwer NV 3,148 255,468 0.05Koninklijke Philips NV 10,480 220,105 0.05Universal Music Group BV 9,260 173,279 0.04ASM International NV 596 145,181 0.03NN Group NV 3,645 143,766 0.03Akzo Nobel NV 2,007 140,140 0.03Koninklijke KPN NV 40,304 111,114 0.02Aegon NV 22,561 94,103 0.02IMCD NV 722 92,638 0.02Unibail-Rodamco-Westfield (XAMS) 1,334 76,222 0.02Randstad NV 1,228 52,459 0.01ASR Nederland NV 1,408 51,275 0.01Signify NV 1,460 49,807 0.01ABN AMRO Bank NV 4,439 44,722 0.01BE Semiconductor Industries NV 830 40,966 0.01Just Eat Takeaway.com NV 1,693 37,406 0.01TKH Group NV 840 33,047 0.01Galapagos NV (XAMS) 655 30,810 0.01OCI NV 987 30,122 0.01Boskalis Westminster 1,079 30,010 0.01JDE Peet's NV 974 22,883 0.01APERAM SA 581 18,078 0.00Basic-Fit NV 514 17,302 0.00Just Eat Takeaway.com NV ADR 3,829 16,438 0.00Intertrust NV 957 15,745 0.00Corbion NV 563 15,630 0.00Accell Group NV 303 14,576 0.00Koninklijke Vopak NV 593 12,766 0.00PostNL NV 4,023 10,574 0.00Majorel Group Luxembourg SA 388 9,585 0.00InPost SA 1,558 7,645 0.00Eurocommercial Properties NV 352 6,832 0.00Alfen Beheer BV 89 6,431 0.00CTP NV 527 5,943 0.00Flow Traders 197 5,115 0.00NSI NV 75 2,344 0.00Wereldhave NV 169 2,211 0.00TomTom NV 204 1,422 0.00Vastned Retail NV 35 712 0.00
5,970,186 1.24
New Zealand 0.12% (31 October 2021: 0.14%)
Spark New Zealand Ltd. 29,739 75,640 0.02Fisher & Paykel Healthcare Corp.
Ltd. 6,336 70,358 0.02Auckland International Airport Ltd. 14,674 59,398 0.01Mainfreight Ltd. 868 35,876 0.01Meridian Energy Ltd. 13,785 33,779 0.01Mercury NZ Ltd. 10,256 32,130 0.01Fletcher Building Ltd. 9,192 29,367 0.01a2 Milk Co. Ltd. 10,648 26,588 0.01EBOS Group Ltd. 1,211 26,544 0.01Summerset Group Holdings Ltd. 3,324 20,122 0.01Chorus Ltd. 5,295 20,119 0.00Scales Corp Ltd. 8,059 19,956 0.00Ryman Healthcare Ltd. 4,199 19,906 0.00Pacific Edge Ltd. 33,149 15,252 0.00Precinct Properties New Zealand Ltd. 19,386 15,233 0.00Kiwi Property Group Ltd. 26,298 14,411 0.00Vital Healthcare Property Trust1 6,708 10,820 0.00Arvida Group Ltd. 12,267 10,273 0.00Goodman Property Trust 6,964 8,100 0.00Air New Zealand Ltd. 17,772 8,039 0.00Heartland Group Holdings Ltd. 6,115 7,239 0.00Freightways Ltd. 1,071 6,699 0.00Vector Ltd. 2,625 5,890 0.00Stride Property Group Stapled 4,827 4,816 0.00Argosy Property Ltd. 6,212 4,191 0.00Oceania Healthcare Ltd. 5,426 2,861 0.00Pushpay Holdings Ltd. 3,401 2,303 0.00Air New Zealand Ltd. Rights
02/05/20221 5,924 2,174 0.00
Vanguard ESG Developed World All Cap Equity Index Fund (UK)
65

Holding
MarketValue
(£)
% ofTotal Net
Assets
Skellerup Holdings Ltd. 618 1,828 0.00KMD Brands Ltd. 1,221 865 0.00
590,777 0.12
Norway 0.25% (31 October 2021: 0.24%)
DNB Bank ASA 12,477 195,951 0.04Mowi ASA 5,639 128,333 0.03Norsk Hydro ASA 17,385 118,814 0.03Telenor ASA 7,014 79,693 0.02Yara International ASA 1,878 77,179 0.02Salmar ASA 847 55,938 0.01Orkla ASA 8,554 55,842 0.01TOMRA Systems ASA 1,529 48,705 0.01Storebrand ASA 5,355 37,559 0.01SpareBank 1 SMN 3,152 35,516 0.01Nordic Semiconductor ASA 1,942 31,786 0.01Gjensidige Forsikring ASA 1,818 31,334 0.01Bakkafrost P/F 550 30,469 0.01Schibsted ASA Class B 1,874 29,079 0.01Leroy Seafood Group ASA 2,758 20,903 0.01Borregaard ASA 1,300 20,005 0.01Aker ASA Class A 284 18,695 0.00Adevinta ASA 2,862 17,996 0.00NEL ASA 13,432 15,612 0.00Crayon Group Holding ASA 1,265 15,054 0.00Scatec ASA 1,494 14,733 0.00Atea ASA 1,468 14,157 0.00Bonheur ASA 463 13,696 0.00SpareBank 1 SR-Bank ASA 1,196 12,270 0.00Entra ASA 800 10,642 0.00Veidekke ASA 983 10,219 0.00Wallenius Wilhelmsen ASA 1,722 8,708 0.00Schibsted ASA Class A 514 8,688 0.00MPC Container Ships AS 3,432 8,303 0.00Kahoot! ASA 4,001 7,925 0.00Elkem ASA 2,133 7,192 0.00Austevoll Seafood ASA 508 6,506 0.00Grieg Seafood ASA 284 3,414 0.00BW LPG Ltd. 414 2,115 0.00Sparebank 1 Oestlandet 117 1,376 0.00Hexagon Composites ASA 369 1,189 0.00
1,195,596 0.25
Poland 0.07% (31 October 2021: 0.10%)
Powszechna Kasa OszczednosciBank Polski SA 11,776 69,328 0.02
Powszechny Zaklad Ubezpieczen SA 9,391 51,747 0.01Bank Polska Kasa Opieki SA 1,659 29,182 0.01Santander Bank Polska SA 533 25,581 0.01Dino Polska SA 493 25,484 0.01LPP SA 12 20,257 0.01CD Projekt SA 749 16,264 0.00Allegro.eu SA 3,695 15,274 0.00KRUK SA 247 11,305 0.00Cyfrowy Polsat SA 2,565 11,151 0.00Pepco Group NV 1,322 9,880 0.00mBank SA 158 8,451 0.00Asseco Poland SA 506 6,998 0.00Orange Polska SA 4,730 5,688 0.00Bank Millennium SA 6,234 5,628 0.00Alior Bank SA 755 4,906 0.00Warsaw Stock Exchange 292 2,018 0.00CCC SA 163 1,518 0.00AmRest Holdings SE 209 646 0.00
321,306 0.07
Portugal 0.04% (31 October 2021: 0.03%)
EDP Renovaveis SA 3,119 59,334 0.01Jeronimo Martins SGPS SA 3,065 50,993 0.01Altri SGPS SA 2,517 13,388 0.01Banco Comercial Portugues SA 93,918 11,664 0.01REN - Redes Energeticas Nacionais
SGPS SA 3,955 9,604 0.00CTT-Correios de Portugal SA 2,148 7,761 0.00Navigator Co. SA 2,159 7,108 0.00Sonae SGPS SA 7,490 6,451 0.00
Holding
MarketValue
(£)
% ofTotal Net
Assets
NOS SGPS SA 559 1,889 0.00Greenvolt-Energias Renovaveis SA 14 83 0.00
168,275 0.04
Singapore 0.45% (31 October 2021: 0.38%)
DBS Group Holdings Ltd. 22,000 430,427 0.09Oversea-Chinese Banking Corp. Ltd. 42,500 303,480 0.06United Overseas Bank Ltd. 15,400 266,390 0.06Singapore Telecommunications Ltd.
(Singtel) 90,200 144,114 0.03CapitaLand Integrated Commercial
Trust 63,111 84,817 0.02Capitaland Investment Ltd. 34,100 83,198 0.02Ascendas Real Estate Investment
Trust 44,960 74,167 0.02Wilmar International Ltd. 25,785 66,034 0.01Singapore Exchange Ltd. 8,700 49,127 0.01SATS Ltd. 15,600 40,941 0.01Singapore Airlines Ltd. 12,800 40,606 0.01Frasers Logistics & Commercial Trust 48,200 40,312 0.01Mapletree Industrial Trust 26,161 39,384 0.01Mapletree Logistics Trust 31,826 32,676 0.01Haw Par Corp Ltd. 4,300 28,969 0.01Venture Corp. Ltd. 2,900 28,687 0.01Mapletree Commercial Trust 22,200 23,945 0.01UOL Group Ltd. 5,400 22,706 0.01Suntec Real Estate Investment Trust 21,200 22,500 0.01ComfortDelGro Corp. Ltd. 25,300 21,452 0.01Mapletree North Asia Commercial
Trust 30,000 20,592 0.01Frasers Centrepoint Trust 14,201 20,068 0.01Keppel DC REIT 16,732 19,977 0.00City Developments Ltd. 3,900 19,211 0.00NetLink NBN Trust 32,500 18,746 0.00Parkway Life Real Estate Investment
Trust 5,700 15,913 0.00Keppel REIT 22,100 15,552 0.00Golden Agri-Resources Ltd. 81,200 15,222 0.00Ascott Residence Trust 17,000 11,276 0.00CapitaLand China Trust 16,267 10,978 0.00ESR-REIT 48,085 10,817 0.00Singapore Post Ltd. 25,000 10,310 0.00Raffles Medical Group Ltd. 13,200 9,136 0.00Olam Group Ltd. 8,800 8,578 0.00Sembcorp Marine Ltd. 131,777 8,209 0.00Ascendas India Trust 10,800 7,849 0.00SPH REIT1 13,700 7,704 0.00Far East Hospitality Trust Stapled 17,200 6,647 0.00Hutchison Port Holdings Trust 33,900 6,345 0.00CDL Hospitality Trusts Stapled 7,300 5,642 0.00AEM Holdings Ltd. 2,000 5,549 0.00Manulife US Real Estate Investment
Trust 10,700 5,327 0.00iFAST Corp Ltd. 1,500 4,335 0.00Cromwell European Real Estate
Investment Trust 2,160 4,174 0.00Keppel Pacific Oak US REIT 7,200 4,158 0.00Sheng Siong Group Ltd. 4,700 4,148 0.00Prime US REIT 6,600 3,890 0.00Lendlease Global Commercial REIT 7,998 3,667 0.00OUE Commercial Real Estate
Investment Trust 12,100 2,896 0.00AIMS APAC REIT 3,500 2,867 0.00Starhill Global REIT 8,300 2,848 0.00First Resources Ltd. 2,100 2,580 0.00StarHub Ltd. 3,100 2,253 0.00Wing Tai Holdings Ltd. 2,200 2,221 0.00Nanofilm Technologies International
Ltd. 1,400 2,172 0.00Asian Pay Television Trust 23,000 1,751 0.00Riverstone Holdings Ltd. 2,000 1,113 0.00
2,148,653 0.45
South Africa 0.00% (31 October 2021: 0.01%)
South Korea 1.75% (31 October 2021: 1.65%)
Samsung Electronics Co. Ltd. 56,544 2,416,795 0.51SK Hynix Inc. 6,236 442,912 0.09
Vanguard ESG Developed World All Cap Equity Index Fund (UK)
66

Holding
MarketValue
(£)
% ofTotal Net
Assets
Samsung Electronics Co. Ltd. -Preference Shares 9,827 369,546 0.08
NAVER Corp. 1,673 303,428 0.06Samsung SDI Co. Ltd. 554 214,657 0.05Hyundai Motor Co. 1,658 195,039 0.04Kakao Corp. 3,183 181,262 0.04LG Chem Ltd. 541 178,057 0.04KB Financial Group Inc. 4,704 174,509 0.04Shinhan Financial Group Co. Ltd. 5,930 158,318 0.03Celltrion Inc. 1,282 142,679 0.03Hana Financial Group Inc. 3,268 97,403 0.02Hyundai Mobis Co. Ltd. 723 94,908 0.02Samsung Biologics Co. Ltd. 164 87,049 0.02HMM Co. Ltd. 4,772 85,792 0.02LG Electronics Inc. 1,084 80,085 0.02Samsung Electro-Mechanics Co. Ltd. 683 71,899 0.02Woori Financial Group Inc. 7,405 69,030 0.02Krafton Inc. 319 50,877 0.01Samsung SDS Co. Ltd. 535 50,382 0.01LG Corp. 1,081 50,180 0.01LG Household & Health Care Ltd. 87 50,151 0.01NCSoft Corp. 178 47,522 0.01KakaoBank Corp. 1,616 43,400 0.01Celltrion Healthcare Co. Ltd. 1,009 41,015 0.01LG Innotek Co. Ltd. 179 39,616 0.01SK Square Co. Ltd. 1,162 38,760 0.01HYBE Co. Ltd. 238 37,883 0.01Korea Zinc Co. Ltd. 102 37,258 0.01Ecopro BM Co. Ltd. 123 37,152 0.01Yuhan Corp. 958 37,059 0.01Samsung SDI Co. Ltd. - Preference
Shares 191 36,882 0.01Samsung Fire & Marine Insurance
Co. Ltd. 265 35,123 0.01Hyundai Motor Co. - 2nd Preference
Shares 582 35,099 0.01Hyundai Glovis Co. Ltd. 262 34,725 0.01Amorepacific Corp. - Preference
Shares 720 34,609 0.01Samsung Engineering Co. Ltd. 1,973 32,531 0.01Samsung Life Insurance Co. Ltd. 784 32,316 0.01L&F Co. Ltd. 211 29,344 0.01Hanwha Solutions Corp. 1,437 29,115 0.01Samsung Heavy Industries Co. Ltd. 7,342 28,215 0.01Coway Co. Ltd. 619 27,792 0.01Hanall Biopharma Co. Ltd. 2,320 27,144 0.01E-MART Inc. 318 26,619 0.01POSCO Chemical Co. Ltd. 298 25,606 0.01DB Insurance Co. Ltd. 589 25,100 0.01SK Telecom Co. Ltd. 649 23,459 0.01Genexine Inc. 910 23,343 0.01LG Display Co. Ltd. 2,193 23,225 0.01LG Uplus Corp. 2,625 23,222 0.01Hotel Shilla Co. Ltd. 443 22,811 0.01Hyundai Home Shopping Network
Corp. 593 22,676 0.01Green Cross Holdings Corp. 1,591 22,297 0.01LG Electronics Inc. - Preference
Shares 583 21,554 0.01SKC Co. Ltd. 223 21,425 0.01SK IE Technology Co. Ltd. 267 21,419 0.01Mirae Asset Securities Co. Ltd. 4,138 21,072 0.01SK Biopharmaceuticals Co. Ltd. 360 20,935 0.01Industrial Bank of Korea 2,879 20,448 0.01HLB Inc. 1,031 20,301 0.01CJ Corp. 360 19,839 0.01Kolmar Korea Holdings Co. Ltd. 1,369 19,664 0.01Orion Corp. 323 19,438 0.01Samsung Securities Co. Ltd. 766 19,260 0.01Korea Investment Holdings Co. Ltd. 423 18,911 0.01Mando Corp. 539 18,594 0.01CMG Pharmaceutical Co. Ltd. 8,969 18,485 0.01Posco ICT Co. Ltd. 4,658 18,255 0.01DB HiTek Co. Ltd. 424 18,203 0.01Nexen Tire Corp. 3,969 17,216 0.01SK Bioscience Co. Ltd. 199 17,100 0.01
Holding
MarketValue
(£)
% ofTotal Net
Assets
LG Household & Health Care Ltd. -Preference Shares 54 16,985 0.01
Hyundai Steel Co. 615 16,965 0.01LG Chem Ltd. - Preference Shares 104 16,488 0.01Daeduck Electronics Co. Ltd 847 16,436 0.01Amorepacific Corp. 141 16,184 0.01Chabiotech Co. Ltd. 1,355 16,154 0.01Hyundai Elevator Co. Ltd. 714 16,119 0.01Hanjin Transportation Co. Ltd. 769 16,020 0.00SK Securities Co. Ltd. 28,474 15,619 0.00KISWIRE Ltd. 865 15,387 0.00Namsun Aluminum Co. Ltd. 7,894 15,043 0.00Songwon Industrial Co. Ltd. 864 14,903 0.00Hansol Chemical Co. Ltd. 94 14,664 0.00Meritz Fire & Marine Insurance Co.
Ltd. 507 14,243 0.00Hana Tour Service Inc. 272 14,196 0.00Hankook Tire & Technology Co. Ltd. 639 14,122 0.00CJ CheilJedang Corp. 56 14,116 0.00Chongkundang Holdings Corp. 315 13,843 0.00KH Vatec Co. Ltd. 1,078 13,843 0.00SD Biosensor Inc. 463 13,389 0.00Netmarble Corp. 219 13,263 0.00Able C&C Co. Ltd. 2,731 13,249 0.00Dong-A ST Co. Ltd. 291 12,918 0.00InBody Co. Ltd. 690 12,777 0.00Dongsung Pharmaceutical Co. Ltd. 2,401 12,775 0.00F&F Co. Ltd. 140 12,518 0.00Ilyang Pharmaceutical Co. Ltd. 794 12,512 0.00Pearl Abyss Corp. 287 12,413 0.00LEENO Industrial Inc. 110 12,347 0.00Eugene Investment & Securities Co.
Ltd. 5,805 12,093 0.00LG HelloVision Co. Ltd. 2,903 11,874 0.00Samsung Fire & Marine Insurance
Co. Ltd. - Preference Shares 114 11,748 0.00Hanmi Pharm Co. Ltd. 59 11,673 0.00BGF Co. Ltd. 3,167 11,407 0.00Hyundai Bioland Co. Ltd. 1,002 11,406 0.00Korea Asset In Trust Co. Ltd. 4,581 11,388 0.00BNK Financial Group Inc. 2,271 11,348 0.00OptoElectronics Solutions Co. Ltd. 615 11,174 0.00Huons Co. Ltd. 410 11,167 0.00Hanjin Kal Corp. 304 11,066 0.00CJ CheilJedang Corp. - Preference
Shares 98 11,062 0.00Hyundai Marine & Fire Insurance Co.
Ltd. 529 10,869 0.00Dongjin Semichem Co. Ltd. 446 10,762 0.00Kolmar Korea Co. Ltd. 360 10,718 0.00Daishin Securities Co. Ltd. 940 10,491 0.00E1 Corp. 325 10,326 0.00Hanon Systems 1,410 10,193 0.00Hansol Paper Co. Ltd. 1,095 10,173 0.00Hanwha Life Insurance Co. Ltd. 5,452 10,147 0.00Wysiwyg Studios Co. Ltd. 479 10,115 0.00Iljin Materials Co. Ltd. 180 10,034 0.00Modetour Network Inc. 695 10,005 0.00KC Co. Ltd. 697 9,835 0.00Korean Reinsurance Co. 1,587 9,782 0.00Hankook & Co. Co Ltd. 1,057 9,753 0.00LX Semicon Co. Ltd. 115 9,692 0.00NH Investment & Securities Co. Ltd. 1,392 9,534 0.00KH FEELUX Co. Ltd. 6,635 9,488 0.00Youngone Corp. 312 9,487 0.00Byucksan Corp. 3,787 9,486 0.00Fila Holdings Corp. 454 9,386 0.00ESR Kendall Square REIT Co. Ltd. 1,999 9,254 0.00Celltrion Pharm Inc. 157 9,190 0.00NICE Holdings Co. Ltd. 853 9,169 0.00Woongjin Thinkbig Co. Ltd. 4,849 9,087 0.00Seegene Inc. 351 9,026 0.00Meritz Securities Co. Ltd. 2,155 8,951 0.00Interflex Co. Ltd. 824 8,753 0.00Cheil Worldwide Inc. 527 8,455 0.00Orion Holdings Corp. 900 8,418 0.00
Vanguard ESG Developed World All Cap Equity Index Fund (UK)
67

Holding
MarketValue
(£)
% ofTotal Net
Assets
Dae Han Flour Mills Co. Ltd. 73 8,263 0.00JW Pharmaceutical Corp. 420 8,230 0.00Ecopro Co. Ltd. 148 8,072 0.00SIMMTECH Co. Ltd. 251 7,919 0.00Hyundai Mipo Dockyard Co. Ltd. 149 7,918 0.00JB Financial Group Co. Ltd. 1,393 7,897 0.00KCC Corp. 36 7,819 0.00Chunbo Co. Ltd. 44 7,799 0.00Alteogen Inc. 211 7,747 0.00JYP Entertainment Corp. 206 7,747 0.00Peptron Inc. 1,274 7,651 0.00SM Entertainment Co. Ltd. 177 7,644 0.00Hansol Holdings Co. Ltd. 3,278 7,380 0.00Kakao Games Corp. 191 7,328 0.00Hyosung Advanced Materials Corp. 24 7,267 0.00Shinsegae Inc. 46 7,249 0.00CosmoAM&T Co. Ltd. 203 7,209 0.00Meritz Financial Group Inc. 300 7,191 0.00Wemade Co. Ltd. 146 7,175 0.00Jusung Engineering Co. Ltd. 523 7,114 0.00Oscotec Inc. 409 7,055 0.00Mcnex Co. Ltd. 245 6,937 0.00LOTTE Fine Chemical Co. Ltd. 134 6,917 0.00NHN Corp. 306 6,831 0.00Daesang Corp. 422 6,797 0.00DGB Financial Group Inc. 1,200 6,796 0.00LS Electric Co. Ltd. 221 6,706 0.00Bioneer Corp. 345 6,673 0.00JR Reit XXVII 1,771 6,581 0.00SFA Semicon Co. Ltd. 1,550 6,497 0.00NEPES Corp. 332 6,421 0.00Seoul Semiconductor Co. Ltd. 746 6,410 0.00Chong Kun Dang Pharmaceutical
Corp. 101 6,334 0.00KMW Co. Ltd. 296 6,185 0.00Com2uSCorp 101 6,130 0.00Daejoo Electronic Materials Co. Ltd. 115 6,082 0.00Hyundai Department Store Co. Ltd. 126 6,049 0.00NongShim Co. Ltd. 31 5,966 0.00WONIK IPS Co. Ltd. 232 5,892 0.00S-1 Corp. 135 5,890 0.00Green Cross Corp. 49 5,857 0.00Kolon Industries Inc. 148 5,838 0.00Koh Young Technology Inc. 473 5,789 0.00HDC Hyundai Development Co-
Engineering & Construction 610 5,783 0.00AMOREPACIFIC Group 182 5,771 0.00CJ ENM Co. Ltd. 70 5,669 0.00LS Corp. 154 5,635 0.00ST Pharm Co. Ltd. 90 5,593 0.00Maeil Dairies Co. Ltd. 127 5,581 0.00Eugene Technology Co. Ltd. 202 5,534 0.00Shin Poong Pharmaceutical Co. Ltd. 285 5,530 0.00NH Special Purpose
Acquisition 11 Co. Ltd. 807 5,501 0.00Soulbrain Co. Ltd. 35 5,458 0.00AfreecaTV Co. Ltd. 78 5,441 0.00SOLUM Co. Ltd. 342 5,379 0.00Mirae Asset Daewoo Co. Ltd. - 2nd
Preference Shares 1,903 5,346 0.00Pan Ocean Co. Ltd. 1,263 5,326 0.00SSANGYONG C&E Co. Ltd. 1,006 5,282 0.00Asiana Airlines Inc. 408 5,226 0.00Green Cross LabCell Corp. 122 5,160 0.00Lotte Shopping Co. Ltd. 85 5,094 0.00CJ CGV Co. Ltd. 291 5,093 0.00KIWOOM Securities Co. Ltd. 84 5,061 0.00CS Wind Corp. 132 4,997 0.00Eo Technics Co. Ltd. 69 4,896 0.00HLB Life Science Co. Ltd. 742 4,894 0.00Doosan Bobcat Inc. 182 4,790 0.00Hyundai Bioscience Co. Ltd. 265 4,789 0.00Wonik Holdings Co. Ltd. 1,506 4,699 0.00Kyobo Securities Co. Ltd. 943 4,670 0.00Tesna Inc. 149 4,521 0.00Binggrae Co. Ltd. 129 4,499 0.00
Holding
MarketValue
(£)
% ofTotal Net
Assets
Hyosung TNC Co. Ltd. 17 4,452 0.00Hugel Inc. 56 4,450 0.00Dongsuh Cos. Inc. 259 4,394 0.00GS Retail Co. Ltd. 229 4,182 0.00Kwang Dong Pharmaceutical Co. Ltd. 904 4,179 0.00Lock&Lock Co. Ltd. 627 4,135 0.00CJ Logistics Corp. 53 4,117 0.00AbClon Inc. 402 4,002 0.00SPC Samlip Co. Ltd. 69 3,938 0.00LegoChem Biosciences Inc. 140 3,813 0.00KCC Glass Corp. 96 3,787 0.00Insun ENT Co. Ltd. 525 3,712 0.00Advanced Process Systems Corp. 237 3,645 0.00Naturecell Co. Ltd. 330 3,589 0.00Samwha Capacitor Co. Ltd. 102 3,577 0.00Ottogi Corp. 12 3,573 0.00Medipost Co. Ltd. 245 3,558 0.00Creative & Innovative System 413 3,510 0.00Hanmi Science Co. Ltd. 108 3,500 0.00Daewoong Co. Ltd. 180 3,424 0.00Sebang Global Battery Co. Ltd. 70 3,369 0.00Vidente Co. Ltd. 370 3,367 0.00Douzone Bizon Co. Ltd. 128 3,312 0.00Ecopro HN Co. Ltd. 100 3,171 0.00Humasis Co. Ltd. 401 3,166 0.00NKMax Co. Ltd. 232 3,097 0.00Sangsangin Co. Ltd. 430 3,095 0.00GeneOne Life Science Inc. 435 3,076 0.00Eubiologics Co. Ltd. 250 3,028 0.00BGF retail Co. Ltd. 26 2,984 0.00Daeduck Co. Ltd. 591 2,942 0.00Foosung Co. Ltd. 217 2,621 0.00Seobu T&D 385 2,612 0.00Dongkuk Steel Mill Co. Ltd. 212 2,534 0.00Dongwon F&B Co. Ltd. 21 2,357 0.00Tongyang Inc. 2,346 2,351 0.00Mezzion Pharma Co. Ltd. 183 2,338 0.00Hyundai Livart Furniture Co. Ltd. 247 2,310 0.00Samsung Card Co. Ltd. 108 2,288 0.00Daewoong Pharmaceutical Co. Ltd. 19 2,199 0.00Jeil Pharmaceutical Co. Ltd. 123 2,075 0.00Ahnlab Inc. 30 1,979 0.00Kumho Tire Co. Inc. 671 1,832 0.00Aprogen pharmaceuticals Inc. 3,475 1,787 0.00MedPacto Inc. 86 1,748 0.00Hanmi Semiconductor Co. Ltd. 176 1,708 0.00Hanssem Co. Ltd. 34 1,693 0.00DB Financial Investment Co. Ltd. 409 1,686 0.00Amicogen Inc. 83 1,676 0.00Hyundai Autoever Corp. 19 1,621 0.00PI Advanced Materials Co. Ltd. 53 1,612 0.00Neowiz 119 1,592 0.00YG Entertainment Inc. 41 1,479 0.00Com2uS Holdings Corp. 27 1,464 0.00Cellivery Therapeutics Inc. 64 1,437 0.00Vaxcell-Bio Therapeutics Co. Ltd. 50 1,427 0.00Medytox Inc. 16 1,387 0.00Samyang Holdings Corp. 25 1,378 0.00TKG Huchems Co. Ltd. 97 1,375 0.00Cellid Co. Ltd. 87 1,338 0.00Duk San Neolux Co. Ltd. 50 1,327 0.00Yuanta Securities Korea Co. Ltd. 572 1,299 0.00Park Systems Corp. 18 1,296 0.00Korea Electric Terminal Co. Ltd. 29 1,285 0.00Taekwang Industrial Co. Ltd. 2 1,284 0.00Handsome Co. Ltd. 57 1,281 0.00Helixmith Co. Ltd. 95 1,268 0.00IS Dongseo Co. Ltd. 37 1,255 0.00Cosmax Inc. 23 1,253 0.00Hyundai Greenfood Co. Ltd. 214 1,239 0.00RFHIC Corp. 67 1,217 0.00Innocean Worldwide Inc. 39 1,208 0.00i-SENS Inc. 65 1,195 0.00CJ Freshway Corp. 45 1,177 0.00Tokai Carbon Korea Co. Ltd. 13 1,168 0.00Hyosung Chemical Corp. 8 1,152 0.00
Vanguard ESG Developed World All Cap Equity Index Fund (UK)
68

Holding
MarketValue
(£)
% ofTotal Net
Assets
TY Holdings Co. Ltd. 70 1,128 0.00LX Hausys Ltd. 30 1,122 0.00iNtRON Biotechnology Inc. 98 1,119 0.00Daou Technology Inc. 84 1,105 0.00Hyosung Heavy Industries Corp. 31 1,097 0.00Pharmicell Co. Ltd. 150 1,084 0.00Hyundai Construction Equipment Co.
Ltd. 45 1,063 0.00Huons Global Co. Ltd. 59 1,063 0.00Bukwang Pharmaceutical Co. Ltd. 126 947 0.00DongKook Pharmaceutical Co. Ltd. 66 940 0.00Samyang Corp. 25 870 0.00Young Poong Corp. 2 862 0.00Zinus Inc. 21 860 0.00Humedix Co. Ltd. 63 845 0.00Shinsung E&G Co. Ltd. 701 842 0.00LX Holdings Co. Ltd. 126 797 0.00Korea United Pharm Inc. 41 768 0.00NICE Information Service Co. Ltd. 63 733 0.00Homecast Co. Ltd. 346 674 0.00Webzen Inc. 45 635 0.00Sam Chun Dang Pharm Co. Ltd. 20 574 0.00ABLBio Inc. 34 546 0.00NHN KCP Corp. 41 546 0.00GemVax & Kael Co. Ltd. 54 505 0.00DoubleUGames Co. Ltd. 16 505 0.00Korea Petrochemical Ind Co. Ltd. 5 480 0.00Samsung Pharmaceutical Co. Ltd. 190 478 0.00Yungjin Pharmaceutical Co. Ltd. 120 377 0.00Ace Technologies Corp. 53 350 0.00Binex Co. Ltd. 35 345 0.00CrystalGenomics Inc. 91 295 0.00ICD Co. Ltd. 38 265 0.00HLB Therapeutics Co. Ltd. 40 215 0.00Taeyoung Engineering &
Construction Co. Ltd. 29 182 0.00Telcon RF Pharmaceutical Inc. 127 164 0.00KT Skylife Co. Ltd. 24 140 0.00Enzychem Lifesciences Corp. 9 128 0.00
8,396,542 1.75
Spain 0.52% (31 October 2021: 0.43%)
Banco Santander SA 205,093 485,287 0.10Banco Bilbao Vizcaya Argentaria SA 79,552 337,966 0.07Cellnex Telecom SA 7,266 272,054 0.06Amadeus IT Group SA 5,150 261,372 0.06Telefonica SA 60,438 235,231 0.05Industria de Diseno Textil SA 12,961 218,902 0.05CaixaBank SA 52,962 137,333 0.03Aena SME SA 826 94,600 0.02Banco de Sabadell SA 79,600 49,762 0.01Bankinter SA 7,796 36,880 0.01Fluidra SA 1,591 34,839 0.01Merlin Properties Socimi SA 3,618 31,647 0.01Inmobiliaria Colonial Socimi SA 3,624 24,254 0.01Viscofan SA 522 23,049 0.01Acerinox SA 2,605 22,075 0.01Corp ACCIONA Energias Renovables
SA 701 20,793 0.01Mapfre SA 13,068 19,161 0.00Unicaja Banco SA 24,088 18,226 0.00Solaria Energia y Medio Ambiente
SA 1,002 17,942 0.00Laboratorios Farmaceuticos Rovi SA 268 14,682 0.00Melia Hotels International SA 1,831 12,239 0.00Ebro Foods SA 783 11,185 0.00Grupo Catalana Occidente SA 473 10,930 0.00Corp. Financiera Alba SA 204 9,634 0.00Mediaset Espana Comunicacion SA 2,598 9,308 0.00Sacyr SA 3,573 7,746 0.00Faes Farma SA 2,180 7,245 0.00Aedas Homes SA 386 7,136 0.00Pharma Mar SA 94 5,764 0.00Almirall SA 526 5,489 0.00Fomento de Construcciones y
Contratas SA 598 5,477 0.00
Holding
MarketValue
(£)
% ofTotal Net
Assets
Linea Directa Aseguradora SA Cia deSeguros y Reaseguros 4,632 5,328 0.00
Prosegur Cash SA 7,402 4,379 0.00Neinor Homes SA 432 3,877 0.00Prosegur Cia de Seguridad SA 2,218 3,685 0.00Construcciones y Auxiliar de
Ferrocarriles SA 112 2,748 0.00Gestamp Automocion SA 992 2,599 0.00Distribuidora Internacional de
Alimentacion SA 137,287 1,511 0.00Global Dominion Access SA 401 1,324 0.00Ence Energia y Celulosa SA 387 1,167 0.00
2,474,826 0.52
Sweden 1.00% (31 October 2021: 1.08%)
Investor AB Class B 20,293 316,718 0.07Atlas Copco AB Class A 7,358 271,327 0.06Assa Abloy AB Class B 11,255 229,484 0.05Telefonaktiebolaget LM Ericsson
Class B 35,224 228,036 0.05Essity AB Class B 7,644 162,012 0.03Atlas Copco AB Class B 4,937 157,800 0.03Swedbank AB Class A 11,842 151,209 0.03Skandinaviska Enskilda Banken AB
Class A 15,574 141,800 0.03Svenska Handelsbanken AB Class A 16,648 135,602 0.03Investor AB Class A 7,642 128,656 0.03Epiroc AB Class A 7,677 126,248 0.03Boliden AB 3,265 114,183 0.03Nibe Industrier AB 14,085 111,461 0.02Hennes & Mauritz AB Class B 10,433 105,929 0.02Telia Co. AB 31,405 104,568 0.02Svenska Cellulosa AB SCA Class B 5,701 89,139 0.02EQT AB 3,353 77,638 0.02Tele2 AB Class B 6,074 64,294 0.01Epiroc AB Class B 4,459 62,739 0.01Skanska AB Class B 4,072 62,708 0.01SKF AB Class B 4,655 61,370 0.01Getinge AB Class B 2,640 61,279 0.01Industrivarden AB Class C 2,706 55,196 0.01Holmen AB Class B 1,158 54,229 0.01Trelleborg AB Class B 3,026 53,675 0.01Fastighets AB Balder Class B 1,263 50,826 0.01Samhallsbyggnadsbolaget i Norden
AB Class D 23,421 49,335 0.01Investment AB Latour Class B 2,289 48,943 0.01Castellum AB 2,996 47,941 0.01Sagax AB Class B 2,240 46,365 0.01Husqvarna AB Class B 5,916 45,661 0.01Beijer Ref AB 3,474 45,517 0.01Industrivarden AB Class A 2,109 43,773 0.01Kinnevik AB Class B 2,592 41,076 0.01SSAB AB Class B 8,342 39,798 0.01Securitas AB Class B 4,057 38,654 0.01Electrolux AB 3,048 37,635 0.01Nordnet AB publ 2,541 35,607 0.01Swedish Orphan Biovitrum AB 1,974 33,490 0.01BillerudKorsnas AB 2,554 31,812 0.01Thule Group AB 1,123 31,556 0.01AddTech AB Class B 2,189 31,262 0.01AAK AB 2,068 28,769 0.01Fabege AB 2,890 28,440 0.01Axfood AB 1,142 27,074 0.01Catena AB 623 26,069 0.01AddLife AB Class B 1,438 25,730 0.01Avanza Bank Holding AB 1,206 24,698 0.01Sinch AB 6,796 24,411 0.01Svenska Cellulosa AB SCA Class A 1,549 24,264 0.01L E Lundbergforetagen AB Class B 614 23,211 0.01Dometic Group AB 3,159 21,874 0.01Peab AB Class B 2,778 21,441 0.01Elekta AB Class B 3,891 21,146 0.01SSAB AB Class A 3,921 20,218 0.01Loomis AB 1,007 20,114 0.01Vitrolife AB 956 19,827 0.01Intrum AB 1,011 19,635 0.01Wihlborgs Fastigheter AB 1,389 19,521 0.01
Vanguard ESG Developed World All Cap Equity Index Fund (UK)
69

Holding
MarketValue
(£)
% ofTotal Net
Assets
Nordic Entertainment Group AB 718 19,206 0.01Wallenstam AB Class B 2,047 18,230 0.00Nyfosa AB 2,008 17,899 0.00Bufab AB 643 16,996 0.00Corem Property Group AB 9,950 16,913 0.00Hexatronic Group AB 489 16,799 0.00Bravida Holding AB 1,906 15,765 0.00NCC AB Class B 1,574 15,682 0.00Instalco AB 3,169 15,650 0.00Modern Times Group MTG AB
Class B 1,750 14,873 0.00Arjo AB Class B 2,357 14,195 0.00Electrolux Professional AB Class B 3,091 14,028 0.00Sectra AB 1,374 13,946 0.00Biotage AB 803 13,375 0.00Skandinaviska Enskilda Banken AB 1,366 13,354 0.00Lindab International AB 706 13,310 0.00Mycronic AB 935 13,178 0.00Nolato AB Class B 2,257 12,602 0.00Telefonaktiebolaget LM Ericsson
Class A 1,805 12,243 0.00AddNode Group AB 352 11,866 0.00Boozt AB 1,371 11,552 0.00JM AB 589 10,884 0.00Svenska Handelsbanken AB 1,187 10,754 0.00MIPS AB 182 10,530 0.00Sdiptech AB Class B 374 10,482 0.00Bure Equity AB 504 9,682 0.00Cint Group AB 1,439 9,591 0.00Granges AB 1,343 8,858 0.00Medicover AB Class B 646 8,627 0.00Stillfront Group AB 5,194 8,525 0.00Pandox AB 749 8,431 0.00Cibus Nordic Real Estate AB 445 8,266 0.00Beijer Alma AB 485 8,165 0.00HMS Networks AB 247 8,116 0.00Vitec Software Group AB Class B 191 7,714 0.00Cary Group AB 1,275 7,658 0.00NP3 Fastigheter AB 327 7,327 0.00Hufvudstaden AB Class A 679 7,063 0.00Hemnet Group AB 642 6,433 0.00Platzer Fastigheter Holding AB 765 6,259 0.00Fagerhult AB 1,564 6,226 0.00Ratos AB Class B 1,512 6,215 0.00Kinnevik AB Class A 365 6,026 0.00Samhallsbyggnadsbolaget i Norden
AB 2,352 5,966 0.00Bilia AB Class A 523 5,810 0.00Nobia AB 1,806 5,714 0.00Munters Group AB 1,139 5,512 0.00Concentric AB 320 5,033 0.00Troax Group AB 258 4,627 0.00Atrium Ljungberg AB Class B 310 4,079 0.00SAS AB 46,690 3,917 0.00Sagax AB Class D 1,522 3,751 0.00Systemair AB 680 3,418 0.00Resurs Holding AB 1,311 3,071 0.00SkiStar AB 181 2,828 0.00Dios Fastigheter AB 390 2,810 0.00Husqvarna AB Class A 352 2,748 0.00BHG Group AB 440 2,448 0.00VNV Global AB 725 2,447 0.00Clas Ohlson AB 192 1,755 0.00Scandic Hotels Group AB 480 1,495 0.00BICO Group AB 175 1,417 0.00Cloetta AB Class B 698 1,414 0.00Mekonomen AB 144 1,339 0.00NCC AB Class A 120 1,278 0.00Investment AB Oresund 120 1,150 0.00Bonava AB Class B 285 1,119 0.00Camurus AB 79 1,041 0.00Corem Property Group AB -
Preference Shares 27 675 0.00Solid Forsakring AB 131 505 0.00
Holding
MarketValue
(£)
% ofTotal Net
Assets
Hansa Biopharma AB 94 418 0.00Attendo AB 183 397 0.00
4,794,669 1.00
Switzerland 2.92% (31 October 2021: 2.43%)
Nestle SA 32,910 3,402,662 0.71Roche Holding AG (Non-voting) 8,368 2,488,458 0.52Novartis AG 25,002 1,774,644 0.37Zurich Insurance Group AG 1,769 647,270 0.14UBS Group AG 38,602 529,464 0.11Lonza Group AG 882 418,473 0.09Givaudan SA 112 357,877 0.08Alcon Inc. 5,486 316,379 0.07Chocoladefabriken Lindt & Spruengli
AG 26 233,405 0.05Swiss Re AG 3,490 230,022 0.05Partners Group Holding AG 267 229,502 0.05Sonova Holding AG 667 194,410 0.04Geberit AG 418 192,081 0.04Swiss Life Holding AG 383 180,083 0.04Credit Suisse Group AG 29,990 165,324 0.04Swisscom AG 303 143,363 0.03Kuehne + Nagel International AG 616 139,057 0.03Roche Holding AG - Bearer Shares 363 117,003 0.03Straumann Holding AG 1,190 113,761 0.02Julius Baer Group Ltd. 2,643 102,475 0.02Logitech International SA 1,776 93,912 0.02Vifor Pharma AG 588 83,014 0.02VAT Group AG 324 81,621 0.02Swatch Group AG - Bearer Shares 365 76,226 0.02Barry Callebaut AG 41 75,766 0.02EMS-Chemie Holding AG 101 72,643 0.02Swiss Prime Site AG 878 68,805 0.02Baloise Holding AG 473 66,099 0.01Temenos AG 791 64,427 0.01Schindler Holding AG 413 64,120 0.01SIG Combibloc Group AG 3,790 63,879 0.01Adecco Group AG 1,975 61,828 0.01PSP Swiss Property AG 538 54,389 0.01Schindler Holding AG (Non-voting) 341 52,997 0.01Georg Fischer AG 1,180 51,755 0.01Belimo Holding AG 128 50,994 0.01Tecan Group AG 169 40,965 0.01Helvetia Holding AG 378 39,052 0.01DKSH Holding AG 530 36,532 0.01Siegfried Holding AG 58 33,791 0.01Galenica AG 564 33,322 0.01Clariant AG 2,389 32,875 0.01ams-OSRAM AG 3,227 32,147 0.01Allreal Holding AG 207 31,322 0.01Bucher Industries AG 100 29,131 0.01Flughafen Zurich AG 201 27,363 0.01SFS Group AG 270 27,118 0.01Banque Cantonale Vaudoise 366 24,852 0.01Huber + Suhner AG 352 24,783 0.01Bachem Holding AG Class B 66 23,191 0.01Swatch Group AG - Registered
Shares 581 23,142 0.01Idorsia Ltd. 1,572 21,607 0.01Daetwyler Holding AG 76 19,645 0.00Burckhardt Compression Holding AG 46 18,779 0.00Inficon Holding AG 24 17,626 0.00Mobimo Holding AG 76 17,431 0.00Vontobel Holding AG 293 17,215 0.00Stadler Rail AG 585 17,041 0.00COSMO Pharmaceuticals NV 342 15,491 0.00Comet Holding AG 85 14,891 0.00ALSO Holding AG 81 14,822 0.00Cembra Money Bank AG 251 14,613 0.00Landis+Gyr Group AG 318 14,300 0.00Emmi AG 17 13,545 0.00dormakaba Holding AG 34 12,694 0.00EFG International AG 2,067 12,568 0.00Basilea Pharmaceutica AG 455 12,209 0.00Interroll Holding AG 5 12,186 0.00Kardex Holding AG 75 11,509 0.00
Vanguard ESG Developed World All Cap Equity Index Fund (UK)
70

Holding
MarketValue
(£)
% ofTotal Net
Assets
Schweiter Technologies AG 14 11,339 0.00Vetropack Holding AG 338 11,191 0.00Forbo Holding AG 9 10,576 0.00Swissquote Group Holding SA 80 10,576 0.00Zehnder Group AG 159 10,007 0.00Bobst Group SA 147 10,000 0.00Conzzeta AG 15 9,995 0.00St Galler Kantonalbank AG 25 9,662 0.00Vifor Pharma AG - Blue Chip Shares 66 9,367 0.00OC Oerlikon Corp. AG 1,612 9,259 0.00Softwareone Holding AG 840 9,167 0.00APG SGA SA 59 8,957 0.00Medartis Holding AG 105 8,857 0.00Meyer Burger Technology AG 22,989 8,776 0.00Valiant Holding AG 105 8,427 0.00Dottikon Es Holding AG 34 8,175 0.00Sensirion Holding AG 81 7,816 0.00LEM Holding SA 4 7,385 0.00Arbonia AG 455 6,497 0.00Zur Rose Group AG 61 6,037 0.00Komax Holding AG 28 5,916 0.00VZ Holding AG 96 5,727 0.00Intershop Holding AG 11 5,723 0.00Aryzta AG 7,354 5,510 0.00Ascom Holding AG 510 3,637 0.00Medacta Group SA 39 3,559 0.00Leonteq AG 42 2,306 0.00Ypsomed Holding AG 19 2,167 0.00Bossard Holding AG 11 1,914 0.00u-blox Holding AG 28 1,873 0.00Bell Food Group AG 6 1,307 0.00Implenia AG 68 1,225 0.00Rieter Holding AG 10 1,096 0.00Autoneum Holding AG 8 760 0.00Mobimo Holding AG Rights
03/05/20221 76 211 0.00
14,020,943 2.92
United Kingdom 3.37% (31 October 2021: 3.36%)
AstraZeneca plc 18,559 1,983,586 0.41Unilever plc 30,568 1,136,671 0.24GlaxoSmithKline plc 58,903 1,058,369 0.22RELX plc 22,075 528,034 0.11Reckitt Benckiser Group plc 7,668 478,330 0.10Vodafone Group plc 321,096 390,260 0.08Lloyds Banking Group plc 846,678 388,456 0.08Compass Group plc 21,075 358,697 0.08London Stock Exchange Group plc 4,361 345,130 0.07Prudential plc 33,342 336,754 0.07Experian plc 11,044 308,348 0.07Barclays plc 203,921 302,170 0.06CRH plc 9,329 300,114 0.06Ferguson plc 2,641 267,797 0.06Tesco plc 93,234 253,503 0.05Ashtead Group plc 5,456 227,843 0.05Segro plc 14,493 194,569 0.04Aviva plc 44,328 192,073 0.04Legal & General Group plc 71,972 181,369 0.04Standard Chartered plc 30,475 168,100 0.043i Group plc 11,380 150,728 0.03BT Group plc 82,434 146,155 0.03Smith & Nephew plc 10,952 142,650 0.03Natwest Group plc 62,624 136,520 0.03Croda International plc 1,668 130,171 0.03WPP plc 12,939 130,037 0.03Rentokil Initial plc 23,252 127,840 0.03Bunzl plc 4,119 127,771 0.03Smurfit Kappa Group plc 3,382 115,428 0.03InterContinental Hotels Group plc 2,184 112,956 0.02Halma plc 4,567 112,805 0.02Spirax-Sarco Engineering plc 899 109,229 0.02Informa plc 18,606 106,910 0.02Next plc 1,591 95,874 0.02United Utilities Group plc 8,281 95,314 0.02Severn Trent plc 3,023 95,104 0.02Mondi plc 5,923 89,437 0.02
Holding
MarketValue
(£)
% ofTotal Net
Assets
Sage Group plc 12,086 89,098 0.02St James's Place plc 6,838 88,723 0.02Persimmon plc 4,019 84,278 0.02Burberry Group plc 4,922 78,309 0.02Whitbread plc 2,710 76,341 0.02Pearson plc 9,320 73,218 0.02DCC plc 1,198 72,790 0.02Admiral Group plc 2,855 72,060 0.02M&G plc 32,847 70,325 0.02Antofagasta plc 4,489 69,624 0.02Auto Trader Group plc 10,537 66,889 0.01Associated British Foods plc 4,073 65,412 0.01Land Securities Group plc 8,623 64,897 0.01Electrocomponents plc 6,139 64,766 0.01Barratt Developments plc 12,623 62,395 0.01Rightmove plc 9,793 60,540 0.01B&M European Value Retail SA 12,176 59,687 0.01Tritax Big Box REIT plc 24,389 59,460 0.01Kingfisher plc 23,301 59,021 0.01British Land Co. plc 11,382 58,936 0.01Phoenix Group Holdings plc 9,137 55,626 0.01Ocado Group plc 5,701 52,643 0.01Intermediate Capital Group plc 3,379 52,290 0.01Berkeley Group Holdings plc 1,267 51,694 0.01Taylor Wimpey plc 40,274 51,088 0.01Howden Joinery Group plc 6,669 50,764 0.01J Sainsbury plc 21,098 49,222 0.01Standard Life Aberdeen plc 25,587 48,411 0.01DS Smith plc 14,480 47,914 0.01Johnson Matthey plc 2,125 47,260 0.01Diploma plc 1,700 46,750 0.01UNITE Group plc 4,034 45,786 0.01Dechra Pharmaceuticals plc 1,257 45,679 0.01Coca-Cola HBC AG 2,755 45,058 0.01Hargreaves Lansdown plc 4,814 44,144 0.01JD Sports Fashion plc 32,602 43,475 0.01ConvaTec Group plc 20,485 43,428 0.01Hikma Pharmaceuticals plc 2,305 43,415 0.01Hiscox Ltd. 4,500 42,597 0.01Direct Line Insurance Group plc 16,503 41,868 0.01Spectris plc 1,392 41,050 0.01Man Group plc 17,145 40,274 0.01Pennon Group plc 3,611 40,118 0.01Tate & Lyle plc 5,066 39,363 0.01Bellway plc 1,590 38,637 0.01Schroders plc 1,347 38,255 0.01Endeavour Mining plc 1,878 36,771 0.01Marks & Spencer Group plc 26,525 36,525 0.01Games Workshop Group plc 488 36,136 0.01Avast plc 6,307 35,571 0.01IG Group Holdings plc 4,316 35,197 0.01Royal Mail plc 10,182 35,077 0.01Derwent London plc 1,094 32,995 0.01Investec plc 6,817 32,244 0.01Big Yellow Group plc 2,235 31,961 0.01HomeServe plc 3,236 31,810 0.01ITV plc 42,722 31,742 0.01Inchcape plc 4,196 29,980 0.01Grafton Group plc 3,059 29,932 0.01Britvic plc 3,451 29,575 0.01IWG plc 12,009 29,302 0.01Safestore Holdings plc 2,309 29,093 0.01TUI AG 12,157 27,998 0.01Grainger plc 9,296 27,572 0.01OSB Group plc 4,874 27,343 0.01LondonMetric Property plc 10,081 27,178 0.01Watches of Switzerland Group plc 2,609 26,638 0.01Beazley plc 6,047 26,099 0.01Future plc 1,171 25,949 0.01easyJet plc 4,571 25,616 0.01Assura plc 38,621 25,451 0.01Computacenter plc 908 24,280 0.01Virgin Money UK plc 13,819 24,163 0.01Greggs plc 1,002 23,547 0.01Brewin Dolphin Holdings plc 4,578 23,485 0.01Hays plc 18,773 23,110 0.01
Vanguard ESG Developed World All Cap Equity Index Fund (UK)
71

Holding
MarketValue
(£)
% ofTotal Net
Assets
Primary Health Properties plc 15,820 22,892 0.01Softcat plc 1,613 22,840 0.01Carnival plc 1,772 22,797 0.01Vistry Group plc 2,635 22,029 0.01Sanne Group plc 2,388 21,659 0.01Marshalls plc 3,481 21,321 0.01Quilter plc 15,802 20,827 0.01Workspace Group plc 3,118 20,797 0.01International Consolidated Airlines
Group SA 14,171 20,392 0.01WH Smith plc 1,375 20,006 0.01Shaftesbury plc 3,317 19,852 0.01Pagegroup plc 3,921 19,268 0.00Domino's Pizza Group plc 5,492 19,090 0.00Telecom Plus plc 1,127 18,596 0.00Wise plc Class A 4,658 18,394 0.00Cranswick plc 572 18,155 0.00Rathbones Group plc 855 17,955 0.00Dr. Martens plc 8,422 17,939 0.00Pets at Home Group plc 5,758 17,815 0.00Dunelm Group plc 1,767 17,334 0.00Crest Nicholson Holdings plc 6,823 17,262 0.00Great Portland Estates plc 2,421 16,572 0.00Close Brothers Group plc 1,477 16,380 0.00Mediclinic International plc 4,410 16,379 0.00Redrow plc 3,100 16,306 0.00Trainline plc 5,697 16,157 0.00Plus500 Ltd. 1,032 16,079 0.00Countryside Partnerships plc 6,320 15,888 0.00Fresnillo plc 2,046 15,861 0.00Deliveroo plc 14,209 15,744 0.00Frasers Group plc 2,315 15,719 0.00S4 Capital plc 5,144 15,679 0.00Coats Group plc 21,897 15,547 0.00Savills plc 1,421 15,389 0.00Bridgepoint Group plc 4,960 15,188 0.00Genuit Group plc 3,359 15,166 0.00Ascential plc 4,695 14,939 0.00Firstgroup plc 13,068 14,702 0.00Hammerson plc 50,784 14,672 0.00Genus plc 583 14,668 0.00Capital & Counties Properties plc 8,698 14,378 0.00Centamin plc 15,419 14,115 0.00Micro Focus International plc 3,689 13,981 0.00TP ICAP Group plc 10,519 13,864 0.00Volution Group plc 3,349 13,764 0.00LXI REIT plc 9,219 13,663 0.00Victrex plc 744 13,600 0.00Spirent Communications plc 5,726 13,239 0.00Paragon Banking Group plc 2,627 13,030 0.00Redde Northgate plc 3,261 12,930 0.00Airtel Africa plc 8,671 12,712 0.00Currys plc 13,213 12,321 0.00Ninety One plc 4,456 11,844 0.00Synthomer plc 3,877 11,825 0.00IntegraFin Holdings plc 3,268 11,771 0.00Darktrace plc 2,680 11,637 0.00Elementis plc 9,369 11,421 0.00Ashmore Group plc 5,105 11,374 0.00Sirius Real Estate Ltd. 9,180 11,126 0.00Jupiter Fund Management plc 6,140 10,941 0.00Wizz Air Holdings plc 336 10,668 0.00National Express Group plc 4,266 10,605 0.00Network International Holdings plc 3,847 10,025 0.00Molten Ventures plc 1,446 10,021 0.00IP Group plc 11,691 9,750 0.00Moneysupermarket.com Group plc 5,496 9,607 0.00JTC plc 1,214 9,481 0.00TI Fluid Systems plc 5,748 9,335 0.00Clarkson plc 238 8,782 0.00RHI Magnesita NV 364 8,729 0.00Oxford Biomedica plc 1,455 8,294 0.00THG plc 7,548 8,125 0.00Biffa plc 2,283 7,963 0.00Picton Property Income Ltd. 7,787 7,912 0.00FDM Group Holdings plc 764 7,778 0.00
Holding
MarketValue
(£)
% ofTotal Net
Assets
TBC Bank Group plc 609 7,649 0.00Vivo Energy plc 5,221 7,550 0.00Lancashire Holdings Ltd. 1,764 7,483 0.00Aston Martin Lagonda Global
Holdings plc 850 7,254 0.00Euromoney Institutional Investor plc 700 6,951 0.00Helios Towers plc 6,196 6,946 0.00Hilton Food Group plc 569 6,930 0.00Premier Foods plc 6,222 6,894 0.00Spire Healthcare Group plc 3,172 6,836 0.00UK Commercial Property REIT Ltd. 7,566 6,688 0.00Greencore Group plc 5,717 6,552 0.00Ibstock plc 3,335 6,316 0.00Bytes Technology Group plc 1,388 6,204 0.00Just Group plc 7,049 5,992 0.00Provident Financial plc 2,311 5,935 0.00Bank of Georgia Group plc 478 5,870 0.00AG Barr plc 1,011 5,864 0.00Liontrust Asset Management plc 489 5,712 0.00Kainos Group plc 448 5,457 0.00Auction Technology Group plc 619 5,429 0.00PZ Cussons plc 2,524 5,162 0.00Mitie Group plc 9,010 4,883 0.00NCC Group plc 2,431 4,439 0.00AJ Bell plc 1,772 4,419 0.00Trustpilot AS 3,990 4,158 0.00Vesuvius plc 1,258 4,068 0.00Keller Group plc 475 4,019 0.00Moonpig Group plc 2,065 3,992 0.00XP Power Ltd. 111 3,574 0.00Halfords Group plc 1,397 3,160 0.00Ferrexpo plc 1,758 2,897 0.00Cineworld Group plc 7,360 2,266 0.00BMO Commercial Property Trust Ltd. 1,863 2,198 0.00CLS Holdings plc 1,069 2,191 0.00AO World plc 2,227 1,693 0.00Helical plc 381 1,669 0.00Stagecoach Group plc 1,493 1,569 0.00Devro plc 738 1,531 0.00Hochschild Mining plc 999 1,178 0.00PureTech Health plc 400 690 0.00
16,186,154 3.37
United States 67.03% (31 October 2021: 67.92%)
Apple Inc. 185,047 23,237,351 4.85Microsoft Corp. 90,320 19,968,227 4.16Amazon.com Inc. 5,205 10,304,775 2.15Tesla Inc. 9,984 6,919,851 1.44Alphabet Inc. Class A 3,638 6,611,333 1.38Alphabet Inc. Class C 3,284 6,014,334 1.25UnitedHealth Group Inc. 11,249 4,551,923 0.95Meta Platforms Inc. 27,679 4,420,040 0.92NVIDIA Corp. 28,713 4,241,426 0.88Procter & Gamble Co. 28,712 3,673,213 0.77Visa Inc. 19,886 3,372,778 0.70JPMorgan Chase & Co. 35,148 3,342,068 0.70Mastercard Inc. 10,353 2,996,472 0.63Home Depot Inc. 12,511 2,993,969 0.62Pfizer Inc. 66,919 2,615,996 0.55AbbVie Inc. 21,182 2,476,884 0.52Bank of America Corp. 85,144 2,418,346 0.50Coca-Cola Co. 46,251 2,380,885 0.50Eli Lilly & Co. 10,148 2,361,318 0.49PepsiCo Inc. 16,455 2,250,487 0.47Costco Wholesale Corp. 5,283 2,236,784 0.47Merck & Co. Inc. 30,287 2,139,991 0.45Broadcom Inc. 4,837 2,135,869 0.45Thermo Fisher Scientific Inc. 4,679 2,061,442 0.43Cisco Systems Inc. 50,503 1,970,642 0.41Walt Disney Co. 21,774 1,936,159 0.40Abbott Laboratories 20,787 1,878,197 0.39Verizon Communications Inc. 50,194 1,851,040 0.39Accenture plc 7,620 1,823,701 0.38Adobe Inc. 5,660 1,785,052 0.37McDonald's Corp. 8,868 1,760,461 0.37Comcast Corp. 53,730 1,701,556 0.36
Vanguard ESG Developed World All Cap Equity Index Fund (UK)
72

Holding
MarketValue
(£)
% ofTotal Net
Assets
Intel Corp. 48,415 1,680,931 0.35Salesforce Inc. 11,323 1,587,293 0.33Bristol-Myers Squibb Co. 25,966 1,556,718 0.32Linde plc 6,201 1,539,704 0.32Danaher Corp. 7,567 1,513,881 0.32QUALCOMM Inc. 13,556 1,508,165 0.31Texas Instruments Inc. 11,041 1,497,196 0.31NIKE Inc. 14,831 1,472,704 0.31Union Pacific Corp. 7,644 1,426,636 0.30Advanced Micro Devices Inc. 19,650 1,338,484 0.28Medtronic plc 16,051 1,334,195 0.28AT&T Inc. 85,718 1,287,647 0.27Lowe's Cos. Inc. 8,075 1,271,096 0.27S&P Global Inc. 4,159 1,247,434 0.26Amgen Inc. 6,699 1,243,916 0.26United Parcel Service Inc. 8,655 1,240,722 0.26CVS Health Corp. 15,729 1,204,323 0.25Anthem Inc. 2,938 1,174,193 0.25Oracle Corp. 19,298 1,128,368 0.24Prologis Inc. 8,816 1,125,540 0.23Caterpillar Inc. 6,482 1,086,838 0.23Intuit Inc. 3,182 1,061,148 0.22Target Corp. 5,750 1,047,228 0.22American Tower Corp. 5,406 1,037,840 0.22American Express Co. 7,393 1,028,895 0.21Morgan Stanley 15,858 1,017,412 0.21Deere & Co. 3,349 1,006,140 0.21PayPal Holdings Inc. 14,155 990,793 0.21Charles Schwab Corp. 18,097 956,380 0.20Goldman Sachs Group Inc. 3,922 954,337 0.20Applied Materials Inc. 10,681 938,617 0.20ServiceNow Inc. 2,415 919,854 0.19Citigroup Inc. 23,786 912,980 0.19Automatic Data Processing Inc. 5,026 873,415 0.18Booking Holdings Inc. 493 867,927 0.18BlackRock Inc. 1,719 855,378 0.18Mondelez International Inc. 16,344 839,265 0.18Chubb Ltd. 5,056 831,109 0.17Starbucks Corp. 13,799 820,246 0.17Intuitive Surgical Inc. 4,276 814,773 0.17Zoetis Inc. 5,709 805,671 0.17Stryker Corp. 4,187 804,284 0.17Netflix Inc. 5,199 788,235 0.16Marsh & McLennan Cos. Inc. 6,029 776,494 0.16Cigna Corp. 3,904 767,398 0.16Crown Castle International Corp. 5,165 761,935 0.16CME Group Inc. 4,296 751,175 0.16Micron Technology Inc. 13,509 733,607 0.15CSX Corp. 26,306 719,512 0.15Gilead Sciences Inc. 15,117 713,888 0.15TJX Cos. Inc. 14,405 702,753 0.15T-Mobile US Inc. 7,094 695,782 0.15Blackstone Inc. 8,448 683,510 0.14Becton Dickinson and Co. 3,417 672,078 0.14PNC Financial Services Group Inc. 5,078 672,011 0.14Vertex Pharmaceuticals Inc. 3,066 667,193 0.14Waste Management Inc. 4,997 654,485 0.14Regeneron Pharmaceuticals Inc. 1,230 645,733 0.13Sherwin-Williams Co. 2,911 636,756 0.13Lam Research Corp. 1,705 632,513 0.13Edwards Lifesciences Corp. 7,478 629,867 0.13US Bancorp 16,041 620,303 0.13Equinix Inc. 1,077 616,845 0.13Colgate-Palmolive Co. 10,019 614,865 0.13Truist Financial Corp. 15,933 614,096 0.13Intercontinental Exchange Inc. 6,640 612,487 0.13Aon plc 2,609 597,628 0.12Progressive Corp. 6,946 594,075 0.12Estee Lauder Cos. Inc. 2,790 586,533 0.12Illinois Tool Works Inc. 3,733 586,249 0.12Fidelity National Information
Services Inc. 7,335 579,380 0.12Boston Scientific Corp. 17,092 572,864 0.12Newmont Corp. 9,713 563,594 0.12Fiserv Inc. 7,173 558,985 0.12Activision Blizzard Inc. 9,253 557,243 0.12
Holding
MarketValue
(£)
% ofTotal Net
Assets
Humana Inc. 1,545 546,884 0.11Dollar General Corp. 2,818 533,209 0.11Public Storage 1,800 532,200 0.11Ford Motor Co. 47,209 532,065 0.11Palo Alto Networks Inc. 1,168 521,846 0.11HCA Healthcare Inc. 2,942 502,776 0.11Capital One Financial Corp. 4,970 493,358 0.10Charter Communications Inc. 1,446 492,653 0.10Moody's Corp. 1,954 492,554 0.10Uber Technologies Inc. 19,559 490,260 0.10Air Products and Chemicals Inc. 2,622 489,147 0.10Archer-Daniels-Midland Co. 6,715 479,543 0.10Dow Inc. 8,913 471,952 0.10Marvell Technology Inc. 10,191 471,197 0.10KLA Corp. 1,850 469,993 0.10FedEx Corp. 2,956 467,968 0.10American International Group Inc. 10,020 466,722 0.10Marriott International Inc. 3,283 464,222 0.10Centene Corp. 6,998 448,975 0.09Kimberly-Clark Corp. 4,001 442,420 0.09McKesson Corp. 1,796 442,398 0.09MetLife Inc. 8,374 438,009 0.09Moderna Inc. 4,078 436,448 0.09NXP Semiconductors NV 3,152 429,053 0.09MercadoLibre Inc. 553 428,842 0.09Synopsys Inc. 1,848 422,133 0.09Illumina Inc. 1,759 415,575 0.09Sysco Corp. 6,058 412,745 0.09Cognizant Technology Solutions
Corp. 6,347 408,928 0.09Nucor Corp. 3,309 408,281 0.09General Mills Inc. 7,244 408,214 0.09Hilton Worldwide Holdings Inc. 3,287 406,614 0.09Johnson Controls International plc 8,454 404,014 0.08Autodesk Inc. 2,679 403,909 0.08Cadence Design Systems Inc. 3,360 403,682 0.08Corteva Inc. 8,781 403,415 0.08IQVIA Holdings Inc. 2,317 402,314 0.08Travelers Cos. Inc. 2,910 396,182 0.08Prudential Financial Inc. 4,572 395,329 0.08Digital Realty Trust Inc. 3,394 394,628 0.08Paychex Inc. 3,889 392,555 0.08Block Inc. 4,944 392,409 0.08O'Reilly Automotive Inc. 808 390,350 0.08AutoZone Inc. 249 387,823 0.08Lululemon Athletica Inc. 1,368 386,341 0.08HP Inc. 13,183 384,832 0.08Workday Inc. 2,338 384,806 0.08Crowdstrike Holdings Inc. 2,411 381,689 0.08Welltower Inc. 5,239 378,935 0.08Warner Bros Discovery Inc. 26,090 377,167 0.08Fortinet Inc. 1,625 374,067 0.08Dexcom Inc. 1,149 373,930 0.08Realty Income Corp. 6,752 373,067 0.08Kroger Co. 8,672 372,713 0.08Global Payments Inc. 3,361 366,671 0.08Simon Property Group Inc. 3,884 365,043 0.08Twitter Inc. 9,269 361,753 0.08SBA Communications Corp. 1,286 355,532 0.07Aflac Inc. 7,767 354,418 0.07Dollar Tree Inc. 2,701 349,527 0.07Motorola Solutions Inc. 2,030 345,900 0.07IDEXX Laboratories Inc. 1,007 345,275 0.07Allstate Corp. 3,395 342,204 0.07Microchip Technology Inc. 6,556 340,358 0.07Baxter International Inc. 5,956 337,103 0.07Agilent Technologies Inc. 3,538 336,131 0.07Snowflake Inc. 2,460 335,994 0.07Arthur J Gallagher & Co. 2,480 333,195 0.07Ross Stores Inc. 4,168 331,182 0.07Cintas Corp. 1,039 328,756 0.07DuPont de Nemours Inc. 6,233 327,412 0.07MSCI Inc. 974 326,877 0.07Yum! Brands Inc. 3,420 318,791 0.07eBay Inc. 7,627 315,468 0.07Hershey Co. 1,751 314,901 0.07
Vanguard ESG Developed World All Cap Equity Index Fund (UK)
73

Holding
MarketValue
(£)
% ofTotal Net
Assets
Electronic Arts Inc. 3,346 314,612 0.07Discover Financial Services 3,500 313,536 0.07Trane Technologies plc 2,810 312,938 0.07Verisk Analytics Inc. 1,885 306,359 0.06Fastenal Co. 6,897 303,841 0.06AvalonBay Communities Inc. 1,677 303,663 0.06International Flavors &
Fragrances Inc. 3,134 302,866 0.06Monster Beverage Corp. 4,436 302,729 0.06Atlassian Corp. plc Class A 1,672 299,402 0.06Bank of New York Mellon Corp. 8,921 298,930 0.06Walgreens Boots Alliance Inc. 8,629 291,413 0.06Equity Residential 4,480 290,923 0.06Alexandria Real Estate Equities Inc. 2,001 290,324 0.06Datadog Inc. 2,985 287,135 0.06M&T Bank Corp. 2,157 286,294 0.06Kraft Heinz Co. 8,378 284,471 0.06Ameriprise Financial Inc. 1,345 284,351 0.06Mettler-Toledo International Inc. 278 282,816 0.06Biogen Inc. 1,711 282,700 0.06Rockwell Automation Inc. 1,392 280,185 0.06RESMED INC-CDI 1,752 279,008 0.06Old Dominion Freight Line Inc. 1,246 277,832 0.06Aptiv plc 3,249 275,317 0.06KKR & Co. Inc. 6,731 273,422 0.06American Water Works Co. Inc. 2,207 270,869 0.06Republic Services Inc. 2,522 269,716 0.06T Rowe Price Group Inc. 2,740 268,500 0.06PACCAR Inc. 4,055 268,234 0.06CBRE Group Inc. 4,045 267,637 0.06LyondellBasell Industries NV 3,166 267,376 0.06SVB Financial Group 686 266,439 0.06Arista Networks Inc. 2,871 264,301 0.06Corning Inc. 9,204 258,049 0.05Willis Towers Watson plc 1,495 255,835 0.05First Republic Bank 2,141 254,481 0.05Cerner Corp. 3,399 253,537 0.05Keurig Dr Pepper Inc. 8,454 251,835 0.05Tyson Foods Inc. 3,365 249,795 0.05Keysight Technologies Inc. 2,208 246,758 0.05Fifth Third Bancorp 8,249 246,649 0.05Expedia Group Inc. 1,770 246,404 0.05CoStar Group Inc. 4,820 244,244 0.05Trade Desk Inc. 5,187 243,630 0.05Veeva Systems Inc. 1,678 243,206 0.05McCormick & Co. Inc. 3,023 242,297 0.05Equifax Inc. 1,476 240,228 0.05Extra Space Storage Inc. 1,587 240,167 0.05Zimmer Biomet Holdings Inc. 2,493 239,729 0.05State Street Corp. 4,372 233,173 0.05Church & Dwight Co. Inc. 2,912 226,280 0.05VMware Inc. 2,625 226,015 0.05Copart Inc. 2,487 225,127 0.05Hartford Financial Services
Group Inc. 4,029 224,411 0.05Invitation Homes Inc. 7,065 224,020 0.05West Pharmaceutical Services Inc. 891 223,591 0.05Gartner Inc. 964 223,183 0.05Tractor Supply Co. 1,379 221,277 0.05Align Technology Inc. 951 219,393 0.05Mid-America Apartment
Communities Inc. 1,400 219,227 0.05MongoDB Inc. 774 218,569 0.05Mosaic Co. 4,366 217,170 0.05CDW Corp. 1,669 216,817 0.05Vulcan Materials Co. 1,580 216,808 0.05AmerisourceBergen Corp. 1,784 214,932 0.05Ventas Inc. 4,857 214,861 0.05Cloudflare Inc. 3,129 214,706 0.05Zoom Video Communications Inc. 2,690 213,314 0.04Match Group Inc. 3,337 210,347 0.04Best Buy Co. Inc. 2,935 210,184 0.04Laboratory Corp. of America
Holdings 1,096 209,693 0.04Albemarle Corp. 1,357 208,171 0.04Martin Marietta Materials Inc. 736 207,416 0.04
Holding
MarketValue
(£)
% ofTotal Net
Assets
Essex Property Trust Inc. 789 206,925 0.04ON Semiconductor Corp. 4,984 206,704 0.04Northern Trust Corp. 2,473 203,079 0.04Ulta Beauty Inc. 638 201,548 0.04Duke Realty Corp. 4,600 200,671 0.04Horizon Therapeutics plc 2,540 199,376 0.04Enphase Energy Inc. 1,548 199,002 0.04Sun Communities Inc. 1,416 197,879 0.04Hewlett Packard Enterprise Co. 16,077 197,457 0.04Citizens Financial Group Inc. 6,202 194,631 0.04CF Industries Holdings Inc. 2,524 194,441 0.04Zebra Technologies Corp. 651 191,634 0.04Stanley Black & Decker Inc. 1,997 191,095 0.04Dover Corp. 1,791 190,041 0.04Regions Financial Corp. 11,428 188,601 0.04FleetCor Technologies Inc. 943 187,428 0.04Fortive Corp. 4,080 186,890 0.04Splunk Inc. 1,909 185,472 0.04Apollo Global Management Inc. 4,632 183,657 0.04STERIS plc 1,023 182,437 0.04Synchrony Financial 6,193 181,474 0.04Huntington Bancshares Inc. 17,155 179,543 0.04Yum China Holdings Inc. 5,389 179,376 0.04PerkinElmer Inc. 1,533 179,259 0.04Molina Healthcare Inc. 717 179,007 0.04Avantor Inc. 7,044 178,863 0.04Nasdaq Inc. 1,413 177,179 0.04Raymond James Financial Inc. 2,281 177,084 0.04Seagen Inc. 1,690 176,336 0.04Skyworks Solutions Inc. 1,953 176,229 0.04Clorox Co. 1,532 175,066 0.04Twilio Inc. 1,952 173,853 0.04International Paper Co. 4,713 173,617 0.04Markel Corp. 161 173,613 0.04Monolithic Power Systems Inc. 553 172,767 0.04Boston Properties Inc. 1,838 172,205 0.04Cincinnati Financial Corp. 1,759 171,781 0.04Principal Financial Group Inc. 3,151 171,015 0.04Genuine Parts Co. 1,636 169,477 0.04ICON plc 940 169,357 0.04Waters Corp. 701 169,295 0.04HubSpot Inc. 560 169,249 0.04KeyCorp 10,995 169,107 0.04Akamai Technologies Inc. 1,881 168,279 0.04Hologic Inc. 2,932 168,143 0.04TransUnion 2,391 166,694 0.04Darden Restaurants Inc. 1,587 166,512 0.04Teradyne Inc. 1,972 165,629 0.03Ingersoll Rand Inc. 4,719 165,156 0.03Cooper Cos. Inc. 572 164,484 0.03Healthpeak Properties Inc. 6,290 164,427 0.03Broadridge Financial Solutions Inc. 1,431 164,323 0.03Palantir Technologies Inc. 19,704 163,219 0.03ViacomCBS Inc. Class B 7,012 162,580 0.03Kellogg Co. 2,978 162,479 0.03VeriSign Inc. 1,140 162,242 0.03FMC Corp. 1,535 162,070 0.03Royal Caribbean Cruises Ltd. 2,617 162,064 0.03VF Corp. 3,848 159,375 0.03Trimble Inc. 2,997 159,172 0.03Arch Capital Group Ltd. 4,366 158,817 0.03Expeditors International of
Washington Inc. 2,010 158,639 0.03Zscaler Inc. 981 158,413 0.03Conagra Brands Inc. 5,648 157,226 0.03Bill.com Holdings Inc. 1,155 157,091 0.03UDR Inc. 3,708 156,914 0.03Camden Property Trust 1,249 156,078 0.03Cardinal Health Inc. 3,369 155,825 0.03Tyler Technologies Inc. 495 155,620 0.03Westinghouse Air Brake
Technologies Corp. 2,169 155,207 0.03Quest Diagnostics Inc. 1,453 154,906 0.03Garmin Ltd. 1,767 154,449 0.03NetApp Inc. 2,645 154,297 0.03Steel Dynamics Inc. 2,239 152,905 0.03
Vanguard ESG Developed World All Cap Equity Index Fund (UK)
74

Holding
MarketValue
(£)
% ofTotal Net
Assets
Western Digital Corp. 3,601 152,186 0.03Lennar Corp. Class A 2,455 149,588 0.03Alnylam Pharmaceuticals Inc. 1,406 149,413 0.03Atmos Energy Corp. 1,651 149,201 0.03Insulet Corp. 780 148,507 0.03BioMarin Pharmaceutical Inc. 2,292 148,492 0.03Bunge Ltd. 1,645 148,240 0.03Pool Corp. 459 148,145 0.03Iron Mountain Inc. 3,459 148,030 0.03Packaging Corp. of America 1,151 147,618 0.03DocuSign Inc. 2,285 147,419 0.03Bio-Techne Corp. 486 146,981 0.03Entegris Inc. 1,648 146,213 0.03WP Carey Inc. 2,273 146,211 0.03Xylem Inc. 2,275 145,941 0.03Seagate Technology Holdings plc 2,222 145,195 0.03Omnicom Group Inc. 2,384 144,635 0.03FactSet Research Systems Inc. 446 143,334 0.03Carnival 10,387 143,044 0.03Okta Inc. 1,492 141,773 0.03Hormel Foods Corp. 3,387 141,334 0.03Catalent Inc. 1,958 141,232 0.03Equity LifeStyle Properties Inc. 2,285 140,667 0.03Spotify Technology SA 1,736 140,664 0.03CarMax Inc. 2,058 140,626 0.03J M Smucker Co. 1,282 139,830 0.03IDEX Corp. 920 139,125 0.03Kimco Realty Corp. 6,814 137,637 0.03Host Hotels & Resorts Inc. 8,473 137,269 0.03Avery Dennison Corp. 953 137,132 0.03LPL Financial Holdings Inc. 917 137,108 0.03Brown & Brown Inc. 2,771 136,839 0.03Signature Bank 708 136,609 0.03SS&C Technologies Holdings Inc. 2,651 136,509 0.03Paycom Software Inc. 608 136,385 0.03Carlisle Cos. Inc. 654 134,998 0.03Zendesk Inc. 1,382 134,468 0.03JB Hunt Transport Services Inc. 988 134,440 0.03W R Berkley Corp. 2,537 134,377 0.03EPAM Systems Inc. 631 133,090 0.03NortonLifeLock Inc. 6,625 132,131 0.03Live Nation Entertainment Inc. 1,580 132,000 0.03Liberty Broadband Corp. Class C 1,479 131,620 0.03Bath & Body Works Inc. 3,111 130,982 0.03Generac Holdings Inc. 748 130,898 0.03Jack Henry & Associates Inc. 865 130,621 0.03CH Robinson Worldwide Inc. 1,528 129,177 0.03Incyte Corp. 2,154 128,605 0.03Teleflex Inc. 564 128,181 0.03Take-Two Interactive Software Inc. 1,341 127,617 0.03Burlington Stores Inc. 782 126,789 0.03Westrock Co. 3,206 126,478 0.03Crown Holdings Inc. 1,442 126,466 0.03Royalty Pharma plc 3,715 125,993 0.03LKQ Corp. 3,181 125,796 0.03NVR Inc. 36 125,492 0.03Ally Financial Inc. 3,939 125,339 0.03GoDaddy Inc. 1,934 124,481 0.03PTC Inc. 1,349 122,769 0.03SolarEdge Technologies Inc. 616 122,753 0.03Advance Auto Parts Inc. 769 122,219 0.03Reliance Steel & Aluminum Co. 772 121,909 0.03Check Point Software Technologies
Ltd. 1,212 121,837 0.03Dell Technologies Inc. 3,247 121,630 0.03Charles River Laboratories
International Inc. 623 119,702 0.03Citrix Systems Inc. 1,477 117,783 0.02Etsy Inc. 1,586 117,721 0.02Masco Corp. 2,770 116,249 0.02Nordson Corp. 677 116,203 0.02Interpublic Group of Cos. Inc. 4,470 116,174 0.02ABIOMED Inc. 507 115,643 0.02Qorvo Inc. 1,264 114,550 0.02Regency Centers Corp. 2,088 114,487 0.02Darling Ingredients Inc. 1,956 114,400 0.02
Holding
MarketValue
(£)
% ofTotal Net
Assets
Viatris Inc. 13,874 114,152 0.02Builders FirstSource Inc. 2,317 113,626 0.02First Horizon Corp. 6,362 113,457 0.02Rexford Industrial Realty Inc. 1,813 112,708 0.02Domino's Pizza Inc. 417 112,256 0.02DoorDash Inc. 1,718 111,441 0.02Cboe Global Markets Inc. 1,241 111,220 0.02Cognex Corp. 2,055 110,697 0.02Whirlpool Corp. 764 110,356 0.02Elanco Animal Health Inc. 5,436 109,543 0.02Medical Properties Trust Inc. 7,458 109,241 0.02Snap-on Inc. 645 109,180 0.02PulteGroup Inc. 3,272 108,858 0.02Roku Inc. 1,462 108,075 0.02Fidelity National Financial Inc. 3,401 107,868 0.02Cleveland-Cliffs Inc. 5,288 107,360 0.02Comerica Inc. 1,638 106,825 0.02Henry Schein Inc. 1,651 106,634 0.02Alleghany Corp. 160 106,605 0.02American Homes 4 Rent 3,377 106,542 0.02Hasbro Inc. 1,516 106,319 0.02Pinterest Inc. 6,459 105,566 0.02Life Storage Inc. 990 104,567 0.02Bio-Rad Laboratories Inc. 255 104,076 0.02Vail Resorts Inc. 514 103,922 0.02RPM International Inc. 1,573 103,839 0.02Avis Budget Group Inc. 483 102,955 0.02Plug Power Inc. 6,120 102,366 0.02Robert Half International Inc. 1,302 102,013 0.02Equitable Holdings Inc. 4,440 101,991 0.02Wolfspeed Inc. 1,393 101,987 0.02Everest Re Group Ltd. 465 101,956 0.02Jones Lang LaSalle Inc. 583 101,638 0.02CubeSmart 2,687 101,637 0.02Lumen Technologies Inc. 12,666 101,388 0.02Assurant Inc. 685 99,228 0.02East West Bancorp Inc. 1,748 99,227 0.02Graco Inc. 2,002 98,896 0.02Lamar Advertising Co. 1,110 97,606 0.02Exact Sciences Corp. 2,221 97,384 0.02Fortune Brands Home &
Security Inc. 1,713 97,200 0.02Coca-Cola Europacific Partners plc 2,439 97,035 0.02Lincoln National Corp. 2,022 96,872 0.02Essential Utilities Inc. 2,715 96,814 0.02F5 Inc. 725 96,667 0.02Fox Corp. Class A 3,369 96,173 0.02Service Corp. International 1,837 96,013 0.02Unity Software Inc. 1,804 95,466 0.02Aspen Technology Inc. 754 95,224 0.02Owens Corning 1,314 95,167 0.02Lyft Inc. 3,623 94,045 0.02Juniper Networks Inc. 3,723 93,468 0.02Sealed Air Corp. 1,816 92,818 0.02Allegion plc 1,020 92,811 0.02Ares Management Corp. 1,750 92,344 0.02Jazz Pharmaceuticals plc 719 91,761 0.02Lamb Weston Holdings Inc. 1,741 91,647 0.02Credicorp Ltd. 824 91,201 0.02Amdocs Ltd. 1,434 90,986 0.02Fair Isaac Corp. 305 90,968 0.02Anaplan Inc. 1,757 90,936 0.02Globe Life Inc. 1,159 90,551 0.02Annaly Capital Management Inc. 17,698 90,499 0.02Black Knight Inc. 1,722 90,235 0.02MarketAxess Holdings Inc. 429 90,075 0.02Wyndham Hotels & Resorts Inc. 1,281 89,777 0.02Williams-Sonoma Inc. 861 89,474 0.02Royal Gold Inc. 858 89,155 0.02Liberty Media Corp-Liberty Formula
One Class C 1,775 88,121 0.02Campbell Soup Co. 2,323 87,369 0.02Repligen Corp. 694 86,917 0.02Universal Health Services Inc. 888 86,650 0.02Middleby Corp. 706 86,525 0.02BorgWarner Inc. 2,949 86,462 0.02
Vanguard ESG Developed World All Cap Equity Index Fund (UK)
75

Holding
MarketValue
(£)
% ofTotal Net
Assets
Nielsen Holdings plc 4,044 86,291 0.02Lithia Motors Inc. 376 84,723 0.02American Financial Group Inc. 768 84,648 0.02Newell Brands Inc. 4,590 84,634 0.02BJ's Wholesale Club Holdings Inc. 1,638 83,942 0.02Mohawk Industries Inc. 746 83,715 0.02DENTSPLY SIRONA Inc. 2,610 83,113 0.02Manhattan Associates Inc. 794 82,499 0.02Federal Realty Investment Trust 880 82,049 0.02Globant SA 475 81,717 0.02American Campus Communities Inc. 1,583 81,501 0.02Ciena Corp. 1,853 81,411 0.02Deckers Outdoor Corp. 383 81,109 0.02Aramark 2,800 80,889 0.02Toro Co. 1,264 80,672 0.02EastGroup Properties Inc. 537 80,206 0.02United States Steel Corp. 3,296 80,044 0.02First Citizens BancShares Inc. 157 79,953 0.02Lear Corp. 784 79,936 0.02Regal Rexnord Corp. 785 79,694 0.02Western Alliance Bancorp 1,313 79,470 0.02US Foods Holding Corp. 2,641 79,135 0.02Webster Financial Corp. 1,985 79,068 0.02Watsco Inc. 372 79,046 0.02Paylocity Holding Corp. 523 79,027 0.02Zynga Inc. 11,989 78,972 0.02Liberty Global plc Class C 4,181 78,924 0.02Five Below Inc. 630 78,832 0.02XP Inc. Class A 4,009 78,551 0.02Five9 Inc. 895 78,500 0.02Neurocrine Biosciences Inc. 1,093 78,369 0.02Novocure Ltd. 1,282 78,186 0.02Tenet Healthcare Corp. 1,352 78,083 0.02Floor & Decor Holdings Inc. 1,229 78,076 0.02Tapestry Inc. 2,965 77,721 0.02AGCO Corp. 765 77,627 0.02Commerce Bancshares Inc. 1,424 77,557 0.02Organon & Co. 3,011 77,535 0.02STORE Capital Corp. 3,407 77,149 0.02Cullen/Frost Bankers Inc. 725 76,363 0.02Zions Bancorp NA 1,694 76,233 0.02GameStop Corp. 763 76,075 0.02Syneos Health Inc. 1,298 75,564 0.02Rollins Inc. 2,819 75,308 0.02Lucid Group Inc. 5,228 75,286 0.02Voya Financial Inc. 1,493 75,143 0.02News Corp. Class B 4,740 75,130 0.02Ceridian HCM Holding Inc. 1,673 74,809 0.02Knight-Swift Transportation
Holdings Inc. 1,945 74,175 0.02Kilroy Realty Corp. 1,329 74,087 0.02Guidewire Software Inc. 1,068 73,956 0.02Flex Ltd. 5,620 73,769 0.02WEX Inc. 557 73,752 0.02Kohl's Corp. 1,598 73,721 0.02AMC Entertainment Holdings Inc. 6,043 73,594 0.02Arrow Electronics Inc. 782 73,466 0.02A O Smith Corp. 1,576 73,296 0.02Macy's Inc. 3,807 73,259 0.02Pure Storage Inc. 3,116 72,719 0.02Genpact Ltd. 2,262 72,607 0.02Berry Global Group Inc. 1,615 72,485 0.02Huntsman Corp. 2,684 72,386 0.02Apartment Income REIT Corp. 1,841 72,159 0.02Delta Air Lines Inc. 2,090 71,598 0.02DISH Network Corp. 3,120 70,849 0.02Chemed Corp. 181 70,710 0.02Tradeweb Markets Inc. 1,247 70,708 0.02First Solar Inc. 1,210 70,422 0.01Clarivate plc 5,569 69,507 0.01Axon Enterprise Inc. 778 69,484 0.01United Therapeutics Corp. 490 69,318 0.01Marriott Vacations Worldwide Corp. 582 69,279 0.01Capri Holdings Ltd. 1,823 69,203 0.01National Retail Properties Inc. 1,979 69,088 0.01Reinsurance Group of America Inc. 808 69,068 0.01
Holding
MarketValue
(£)
% ofTotal Net
Assets
Dropbox Inc. 3,969 68,758 0.01Zillow Group Inc. Class C 2,164 68,617 0.01Brixmor Property Group Inc. 3,391 68,603 0.01WillScot Mobile Mini Holdings Corp. 2,451 68,523 0.01nVent Electric plc 2,545 68,475 0.01AptarGroup Inc. 746 68,236 0.01Dynatrace Inc. 2,227 68,043 0.01Starwood Property Trust Inc. 3,716 67,720 0.01Exelixis Inc. 3,772 67,118 0.01RingCentral Inc. 991 66,982 0.01Coupang LLC 6,512 66,754 0.01Norwegian Cruise Line Holdings Ltd. 4,169 66,511 0.01Gentex Corp. 2,844 66,485 0.01MKS Instruments Inc. 732 66,443 0.01DXC Technology Co. 2,899 66,316 0.01Avalara Inc. 1,086 65,800 0.01Lennox International Inc. 387 65,708 0.01Vornado Realty Trust 2,131 65,704 0.01Southwest Airlines Co. 1,766 65,675 0.01Coupa Software Inc. 954 65,568 0.01STAG Industrial Inc. 2,204 65,497 0.01Americold Realty Trust 3,117 65,493 0.01Nexstar Media Group Inc. 519 65,451 0.01RH 244 65,259 0.01DaVita Inc. 756 65,249 0.01AppLovin Corp. 2,141 65,040 0.01First American Financial Corp. 1,399 64,975 0.01Unum Group 2,666 64,829 0.01New York Times Co. 2,105 64,231 0.01Toll Brothers Inc. 1,738 64,204 0.01Smartsheet Inc. 1,661 64,019 0.01First Industrial Realty Trust Inc. 1,381 63,809 0.01Planet Fitness Inc. 998 63,616 0.01Nutanix Inc. 3,191 63,591 0.01Western Union Co. 4,752 63,549 0.01Franklin Resources Inc. 3,243 63,517 0.01RenaissanceRe Holdings Ltd. 551 62,986 0.01Stifel Financial Corp. 1,274 62,822 0.01Pinnacle Financial Partners Inc. 1,015 62,679 0.01AGNC Investment Corp. 7,177 62,652 0.01Ashland Global Holdings Inc. 748 62,521 0.01CyberArk Software Ltd. 499 62,455 0.01Bright Horizons Family Solutions Inc. 680 61,858 0.01Wayfair Inc. 1,006 61,610 0.01Independence Realty Trust Inc. 2,837 61,576 0.01Synovus Financial Corp. 1,861 61,574 0.01Masimo Corp. 684 61,530 0.01SiteOne Landscape Supply Inc. 547 61,444 0.01Texas Roadhouse Inc. 935 61,291 0.01Invesco Ltd. 4,157 60,857 0.01Envista Holdings Corp. 1,916 60,463 0.01Acadia Healthcare Co. Inc. 1,118 60,428 0.01Bruker Corp. 1,319 60,387 0.01Trex Co. Inc. 1,302 60,293 0.01Encompass Health Corp. 1,093 59,965 0.01Healthcare Trust of America Inc. 2,471 59,950 0.01Landstar System Inc. 484 59,637 0.01Cable One Inc. 64 59,385 0.01Graphic Packaging Holding Co. 3,418 59,349 0.01Elastic NV 978 59,319 0.01IAC/InterActiveCorp 897 59,214 0.01Concentrix Corp. 472 59,200 0.01Rayonier Inc. 1,711 58,887 0.01Spirit Realty Capital Inc. 1,684 58,279 0.01Harley-Davidson Inc. 2,001 58,189 0.01Synaptics Inc. 492 58,186 0.01Omega Healthcare Investors Inc. 2,867 58,185 0.01Autoliv Inc. 991 58,158 0.01Sailpoint Technologies Holdings Inc. 1,143 58,129 0.01Terreno Realty Corp. 995 57,639 0.01Guardant Health Inc. 1,171 57,426 0.01SouthState Corp. 930 57,385 0.01Advanced Drainage Systems Inc. 701 57,185 0.01Lattice Semiconductor Corp. 1,486 56,860 0.01TopBuild Corp. 394 56,842 0.01WESCO International Inc. 578 56,713 0.01
Vanguard ESG Developed World All Cap Equity Index Fund (UK)
76

Holding
MarketValue
(£)
% ofTotal Net
Assets
Southwest Gas Holdings Inc. 807 56,705 0.01Tandem Diabetes Care Inc. 738 56,653 0.01Cousins Properties Inc. 1,978 56,512 0.01Block Inc. CDI 687 56,424 0.01Old Republic International Corp. 3,213 56,301 0.01Rapid7 Inc. 740 56,300 0.01Coherent Inc. 264 56,274 0.01ASGN Inc. 620 56,015 0.01Chart Industries Inc. 415 55,710 0.01CDK Global Inc. 1,284 55,645 0.01Lumentum Holdings Inc. 859 55,556 0.01Ingredion Inc. 818 55,465 0.01Azenta Inc. 925 55,264 0.01Euronet Worldwide Inc. 571 55,249 0.01AerCap Holdings NV 1,478 54,988 0.01PVH Corp. 948 54,977 0.01Popular Inc. 882 54,789 0.01Axalta Coating Systems Ltd. 2,711 54,781 0.01Valley National Bancorp 5,735 54,678 0.01OneMain Holdings Inc. 1,493 54,607 0.01Brunswick Corp. 904 54,449 0.01Option Care Health Inc. 2,276 54,167 0.01Leggett & Platt Inc. 1,903 54,005 0.01Liberty Media Corp-Liberty SiriusXM
Class C 1,617 53,939 0.01GXO Logistics Inc. 1,139 53,716 0.01Penumbra Inc. 389 53,465 0.01Terminix Global Holdings Inc. 1,459 53,351 0.01Clean Harbors Inc. 638 53,281 0.01LHC Group Inc. 403 53,242 0.01Ultragenyx Pharmaceutical Inc. 936 52,678 0.01Brighthouse Financial Inc. 1,286 52,608 0.01SLM Corp. 3,943 52,542 0.01Saia Inc. 320 52,495 0.01Shockwave Medical Inc. 436 52,480 0.01Flowers Foods Inc. 2,480 52,405 0.01Sonoco Products Co. 1,061 52,336 0.01Donaldson Co. Inc. 1,337 52,213 0.01Acuity Brands Inc. 380 52,204 0.01Sarepta Therapeutics Inc. 903 52,029 0.01YETI Holdings Inc. 1,336 52,003 0.01Universal Display Corp. 510 51,890 0.01SEI Investments Co. 1,169 51,881 0.01Fox Corp. Class B 1,955 51,760 0.01Douglas Emmett Inc. 2,206 51,746 0.01Albertsons Cos. Inc. 2,076 51,706 0.01UiPath Inc. 3,627 51,509 0.01Valvoline Inc. 2,135 51,373 0.01Varonis Systems Inc. 1,490 51,257 0.01MSA Safety Inc. 533 51,160 0.01Tenable Holdings Inc. 1,162 51,089 0.01Hanover Insurance Group Inc. 435 50,870 0.01Ralph Lauren Corp. 612 50,866 0.01Wintrust Financial Corp. 730 50,771 0.01Silicon Laboratories Inc. 465 49,900 0.01HealthEquity Inc. 1,004 49,812 0.01Eagle Materials Inc. 506 49,701 0.01First Financial Bankshares Inc. 1,561 49,696 0.01Mandiant Inc. 2,833 49,620 0.01XPO Logistics Inc. 1,154 49,441 0.01CMC Materials Inc. 347 49,415 0.01AMERCO 116 49,397 0.01Old National Bancorp 4,079 49,221 0.01Prosperity Bancshares Inc. 943 49,107 0.01Skechers USA Inc. 1,599 48,804 0.01Vonage Holdings Corp. 3,067 48,784 0.01Selective Insurance Group Inc. 743 48,717 0.01Tempur Sealy International Inc. 2,254 48,671 0.01Vontier Corp. 2,384 48,610 0.01Louisiana-Pacific Corp. 942 48,417 0.01Biohaven Pharmaceutical Holding
Co. Ltd. 682 48,395 0.01Littelfuse Inc. 265 48,388 0.01Halozyme Therapeutics Inc. 1,521 48,338 0.01Robinhood Markets Inc. Class A 6,188 48,301 0.01Avient Corp. 1,230 48,240 0.01
Holding
MarketValue
(£)
% ofTotal Net
Assets
National Instruments Corp. 1,676 48,231 0.01Sirius XM Holdings Inc. 10,086 48,201 0.01Rogers Corp. 222 48,078 0.01TEGNA Inc. 2,733 48,021 0.01Lennar Corp. Class B 923 47,999 0.01Simpson Manufacturing Co. Inc. 581 47,970 0.01Evoqua Water Technologies Corp. 1,441 47,827 0.01Helen of Troy Ltd. 279 47,622 0.01Ionis Pharmaceuticals Inc. 1,625 47,579 0.01Peloton Interactive Inc. 3,389 47,400 0.01Choice Hotels International Inc. 423 47,323 0.01Murphy USA Inc. 254 47,270 0.01Mimecast Ltd. 744 47,218 0.01TD SYNNEX Corp. 582 46,430 0.01Blackline Inc. 870 46,421 0.01Change Healthcare Inc. 2,472 46,388 0.01EPR Properties 1,105 46,259 0.01Valmont Industries Inc. 232 45,916 0.01Univar Solutions Inc. 1,978 45,878 0.01Novanta Inc. 448 45,842 0.01Kinsale Capital Group Inc. 259 45,733 0.01Stericycle Inc. 1,133 45,284 0.01Integra LifeSciences Holdings Corp. 928 45,184 0.01National Storage Affiliates Trust 1,001 45,127 0.01Asbury Automotive Group Inc. 308 45,070 0.01NCR Corp. 1,613 45,018 0.01Alkermes plc 1,957 44,970 0.01Cirrus Logic Inc. 745 44,955 0.01Affiliated Managers Group Inc. 448 44,832 0.01FTI Consulting Inc. 356 44,719 0.01ManpowerGroup Inc. 622 44,697 0.01United Bankshares Inc. 1,684 44,625 0.01Inspire Medical Systems Inc. 272 44,584 0.01Glacier Bancorp Inc. 1,221 44,522 0.01Ryman Hospitality Properties Inc. 595 44,302 0.01IAA Inc. 1,515 44,249 0.01Globus Medical Inc. 838 44,193 0.01United Airlines Holdings Inc. 1,094 44,004 0.01Primerica Inc. 426 43,971 0.01RLI Corp. 480 43,921 0.01Janus Henderson Group plc 1,808 43,879 0.01Teladoc Health Inc. 1,632 43,871 0.01Axis Capital Holdings Ltd. 958 43,768 0.01Workiva Inc. 567 43,612 0.01Envestnet Inc. 685 43,501 0.01Kite Realty Group Trust 2,449 43,479 0.01Post Holdings Inc. 732 43,384 0.01Dolby Laboratories Inc. 701 43,249 0.01Agree Realty Corp. 797 43,103 0.01Diodes Inc. 737 42,870 0.01AMN Healthcare Services Inc. 550 42,817 0.01Affirm Holdings Inc. 1,858 42,458 0.01Power Integrations Inc. 665 42,374 0.01Yelp Inc. 1,629 42,246 0.01SL Green Realty Corp. 765 42,244 0.01Liberty Media Corp-Liberty SiriusXM
Class A 1,266 42,210 0.01Crocs Inc. 795 42,090 0.01Park Hotels & Resorts Inc. 2,681 42,067 0.01Avnet Inc. 1,203 41,825 0.01Liberty Broadband Corp. Class A 487 41,757 0.01Element Solutions Inc. 2,533 41,581 0.01Carvana Co. 899 41,495 0.01Semtech Corp. 873 41,428 0.01Hilton Grand Vacations Inc. 1,110 41,403 0.01Credit Acceptance Corp. 101 41,122 0.01Howard Hughes Corp. 513 41,007 0.01Highwoods Properties Inc. 1,258 40,941 0.01Hanesbrands Inc. 3,869 40,863 0.01UFP Industries Inc. 661 40,729 0.01Essent Group Ltd. 1,260 40,655 0.01Grand Canyon Education Inc. 530 40,513 0.01AutoNation Inc. 439 40,498 0.01Blueprint Medicines Corp. 871 40,473 0.01Steven Madden Ltd. 1,235 40,390 0.01Hyatt Hotels Corp. 534 40,389 0.01
Vanguard ESG Developed World All Cap Equity Index Fund (UK)
77

Holding
MarketValue
(£)
% ofTotal Net
Assets
Independent Bank Corp.(Massachusetts) 657 40,283 0.01
Radian Group Inc. 2,361 40,224 0.01Outfront Media Inc. 1,968 40,112 0.01Travel + Leisure Co. 907 40,080 0.0110X Genomics Inc. 1,048 39,883 0.01Healthcare Realty Trust Inc. 1,843 39,737 0.01API Group Corp. 2,685 39,671 0.01Cadence Bank 1,988 39,633 0.01Interactive Brokers Group Inc. 834 39,558 0.01Ryder System Inc. 710 39,535 0.01LivaNova plc 645 39,332 0.01Community Bank System Inc. 766 39,285 0.01MasTec Inc. 682 39,117 0.01ZoomInfo Technologies Inc. 1,036 39,105 0.01New Residential Investment Corp. 4,721 39,069 0.01Sunrun Inc. 2,449 38,973 0.01ExlService Holdings Inc. 358 38,823 0.01John Bean Technologies Corp. 412 38,686 0.01H&R Block Inc. 1,863 38,670 0.01Freshpet Inc. 518 38,486 0.01Intra-Cellular Therapies Inc. 954 38,426 0.01Cabot Corp. 732 38,375 0.01Livent Corp. 2,245 38,248 0.01Perrigo Co. plc 1,399 38,232 0.01ONE Gas Inc. 568 38,197 0.01Teradata Corp. 1,159 38,181 0.01Balchem Corp. 390 38,177 0.01ServisFirst Bancshares Inc. 596 38,153 0.01TriNet Group Inc. 540 38,151 0.01Air Lease Corp. 1,186 38,003 0.01Maximus Inc. 654 37,974 0.01Medpace Holdings Inc. 355 37,768 0.01Ormat Technologies Inc. 608 37,628 0.01Zurn Water Solutions Corp. 1,512 37,610 0.01Scotts Miracle-Gro Co. 454 37,593 0.01Leslie's Inc. 2,405 37,507 0.01Blackstone Mortgage Trust Inc. 1,566 37,469 0.01Premier Inc. 1,298 37,415 0.01Bank OZK 1,218 37,253 0.01Amedisys Inc. 366 37,212 0.01Qualys Inc. 343 37,212 0.01Westlake Corp. 369 37,194 0.01Meritage Homes Corp. 563 37,031 0.01New Jersey Resources Corp. 1,075 36,929 0.01PTC Therapeutics Inc. 1,310 36,895 0.01Assured Guaranty Ltd. 839 36,855 0.01Evercore Inc. 436 36,717 0.01Box Inc. 1,499 36,559 0.01New Relic Inc. 725 36,513 0.01Armstrong World Industries Inc. 541 36,480 0.01Omnicell Inc. 419 36,470 0.01Under Armour Inc. Class C 3,215 36,337 0.01Atkore Inc. 474 36,331 0.01Arrowhead Pharmaceuticals Inc. 1,109 36,313 0.01Farfetch Ltd. Class A 4,057 36,191 0.01Insmed Inc. 2,061 36,082 0.01QuantumScape Corp. 3,030 36,080 0.01SPS Commerce Inc. 378 36,018 0.01Houlihan Lokey Inc. 543 36,010 0.01Casella Waste Systems Inc. 550 35,988 0.01Viavi Solutions Inc. 3,152 35,976 0.01iRhythm Technologies Inc. 366 35,964 0.01Walker & Dunlop Inc. 377 35,922 0.01Hancock Whitney Corp. 964 35,911 0.01Quidel Corp. 448 35,904 0.01DigitalBridge Group Inc. 6,476 35,900 0.01Ensign Group Inc. 560 35,830 0.01Triton International Ltd. 735 35,793 0.01ICU Medical Inc. 210 35,766 0.01Eastern Bankshares Inc. 2,337 35,627 0.01Innovative Industrial Properties Inc. 309 35,586 0.01Kirby Corp. 686 35,581 0.01Liberty Media Corp-Liberty Formula
One Class A 776 35,503 0.01MGIC Investment Corp. 3,407 35,440 0.01
Holding
MarketValue
(£)
% ofTotal Net
Assets
Fabrinet 453 35,396 0.01Franklin Electric Co. Inc. 635 35,369 0.01Altair Engineering Inc. 815 35,197 0.01MSC Industrial Direct Co. Inc. 532 35,098 0.01Penske Automotive Group Inc. 420 35,069 0.01Thor Industries Inc. 574 34,943 0.01New York Community Bancorp Inc. 4,692 34,531 0.01Spire Inc. 595 34,482 0.01Adient plc 1,266 34,395 0.01Pacira BioSciences Inc. 579 34,389 0.01BankUnited Inc. 1,150 34,376 0.01United Community Banks Inc. 1,430 34,306 0.01UMB Financial Corp. 477 34,247 0.01News Corp. Class A 2,149 33,994 0.01Upstart Holdings Inc. 569 33,968 0.01JBG SMITH Properties 1,615 33,908 0.01CONMED Corp. 319 33,780 0.01MaxLinear Inc. 884 33,719 0.01CRISPR Therapeutics AG 852 33,673 0.01Intellia Therapeutics Inc. 862 33,656 0.01Liberty Global plc Class A 1,846 33,465 0.01Boise Cascade Co. 555 33,411 0.01Six Flags Entertainment Corp. 1,088 33,173 0.01Hudson Pacific Properties Inc. 1,786 33,117 0.01PotlatchDeltic Corp. 750 33,070 0.01First BanCorp (Puerto Rico) 3,048 33,066 0.01Wix.com Ltd. 550 33,057 0.01Physicians Realty Trust 2,420 33,038 0.01Cargurus Inc. 1,268 33,015 0.01Umpqua Holdings Corp. 2,498 32,889 0.01Brandywine Realty Trust 3,537 32,849 0.01Applied Industrial Technologies Inc. 394 32,835 0.01South Jersey Industries Inc. 1,203 32,779 0.01Insperity Inc. 388 32,774 0.01ACI Worldwide Inc. 1,489 32,757 0.01LXP Industrial Trust 3,247 32,457 0.01Vertiv Holdings Co. 3,242 32,330 0.01Sanderson Farms Inc. 214 32,263 0.01Navient Corp. 2,548 32,248 0.01Apple Hospitality REIT Inc. 2,285 32,177 0.01PacWest Bancorp 1,219 31,934 0.01Kornit Digital Ltd. 604 31,934 0.01Maravai LifeSciences Holdings Inc. 1,305 31,931 0.01Simply Good Foods Co. 963 31,924 0.01Silgan Holdings Inc. 903 31,912 0.01Hannon Armstrong Sustainable
Infrastructure Capital Inc. 1,001 31,892 0.01Ziff Davis Inc. 450 31,634 0.01GATX Corp. 383 31,552 0.01MicroStrategy Inc. 112 31,552 0.01FNB Corp. 3,437 31,537 0.01Home BancShares Inc. 1,824 31,395 0.01Brink's Co. 668 31,376 0.01Alteryx Inc. 613 31,336 0.01Apellis Pharmaceuticals Inc. 900 31,183 0.01Graham Holdings Co. 66 31,175 0.01Goodyear Tire & Rubber Co. 2,931 31,073 0.01Piedmont Lithium Inc. 596 31,051 0.01Sabra Health Care REIT Inc. 3,331 30,962 0.01Ameris Bancorp 926 30,756 0.01Karuna Therapeutics Inc. 346 30,700 0.01Welbilt Inc. 1,627 30,596 0.01Wendy's Co. 1,944 30,596 0.01CNO Financial Group Inc. 1,590 30,559 0.01CVB Financial Corp. 1,667 30,552 0.01Fox Factory Holding Corp. 468 30,518 0.01Victoria's Secret & Co. 813 30,500 0.01Sabre Corp. 3,651 30,447 0.01Cracker Barrel Old Country Store Inc. 344 30,411 0.01Arbor Realty Trust Inc. 2,229 30,359 0.01Signet Jewelers Ltd. 541 30,284 0.01Chegg Inc. 1,534 30,240 0.01Forward Air Corp. 388 29,965 0.01Sprouts Farmers Market Inc. 1,254 29,764 0.01Quaker Chemical Corp. 229 29,678 0.01Patterson Cos. Inc. 1,207 29,572 0.01
Vanguard ESG Developed World All Cap Equity Index Fund (UK)
78

Holding
MarketValue
(£)
% ofTotal Net
Assets
Novavax Inc. 822 29,508 0.01Atlantic Union Bankshares Corp. 1,091 29,328 0.01Sensient Technologies Corp. 435 29,312 0.01Switch Inc. 1,228 29,235 0.01Spectrum Brands Holdings Inc. 431 29,207 0.01Blackbaud Inc. 632 29,196 0.01Celsius Holdings Inc. 704 29,158 0.01Sprout Social Inc. 596 29,071 0.01Foot Locker Inc. 1,237 28,918 0.01World Wrestling Entertainment Inc. 621 28,886 0.01Cytokinetics Inc. 908 28,849 0.01Watts Water Technologies Inc. 284 28,828 0.01Washington Federal Inc. 1,189 28,818 0.01Pagseguro Digital Ltd. Class A 2,453 28,721 0.01Insight Enterprises Inc. 363 28,705 0.01Carter's Inc. 426 28,583 0.01SeaWorld Entertainment Inc. 532 28,577 0.01AtriCure Inc. 689 28,498 0.01Rambus Inc. 1,433 28,420 0.01Kemper Corp. 772 28,377 0.01Shutterstock Inc. 467 28,187 0.01Focus Financial Partners Inc. 897 28,185 0.01PS Business Parks Inc. 189 28,184 0.01Werner Enterprises Inc. 892 28,156 0.01Onto Innovation Inc. 496 28,093 0.01Ollie's Bargain Outlet Holdings Inc. 733 28,053 0.01Bloom Energy Corp. 1,895 28,029 0.01Fulton Financial Corp. 2,308 27,887 0.01Texas Capital Bancshares Inc. 681 27,858 0.01Pebblebrook Hotel Trust 1,430 27,825 0.01Enstar Group Ltd. 148 27,759 0.01Silvergate Capital Corp. 297 27,696 0.01Xencor Inc. 1,381 27,499 0.01Arvinas Inc. 629 27,485 0.01Dorman Products Inc. 349 27,397 0.01First Hawaiian Inc. 1,444 27,132 0.01Perficient Inc. 340 26,921 0.01Axonics Inc. 652 26,911 0.01Procore Technologies Inc. 609 26,911 0.01HB Fuller Co. 504 26,784 0.01Trustmark Corp. 1,204 26,717 0.01White Mountains Insurance Group
Ltd. 32 26,655 0.01Atlas Air Worldwide Holdings Inc. 484 26,577 0.01Korn Ferry 543 26,573 0.01Alaska Air Group Inc. 613 26,566 0.01Summit Materials Inc. 1,200 26,542 0.01Cathay General Bancorp 831 26,535 0.01Kadant Inc. 180 26,460 0.01NuVasive Inc. 646 26,447 0.01Hillenbrand Inc. 814 26,427 0.01Verint Systems Inc. 608 26,417 0.01Grocery Outlet Holding Corp. 985 26,408 0.01Herc Holdings Inc. 259 26,407 0.01Luminar Technologies Inc. 2,671 26,316 0.01Broadstone Net Lease Inc. 1,596 26,289 0.01Hain Celestial Group Inc. 984 26,271 0.01KB Home 1,016 26,268 0.01Pegasystems Inc. 431 26,265 0.01Beacon Roofing Supply Inc. 553 26,260 0.01Equity Commonwealth 1,258 26,252 0.01MillerKnoll Inc. 1,039 26,250 0.01Federal Signal Corp. 962 26,098 0.01O-I Glass Inc. 2,429 26,080 0.01Innospec Inc. 342 25,963 0.01Taylor Morrison Home Corp. 1,245 25,961 0.01Hostess Brands Inc. 1,434 25,916 0.01National Vision Holdings Inc. 864 25,910 0.01Simmons First National Corp. 1,360 25,857 0.01Opendoor Technologies Inc. 4,646 25,830 0.01Arcosa Inc. 603 25,729 0.01First Merchants Corp. 824 25,714 0.01Visteon Corp. 308 25,685 0.01Virtu Financial Inc. 1,111 25,547 0.01Kennedy-Wilson Holdings Inc. 1,418 25,457 0.01Columbia Sportswear Co. 388 25,397 0.01
Holding
MarketValue
(£)
% ofTotal Net
Assets
Nordstrom Inc. 1,240 25,383 0.01FormFactor Inc. 836 25,343 0.01American Equity Investment Life
Holding Co. 843 25,327 0.01WSFS Financial Corp. 794 25,316 0.01Sonos Inc. 1,390 25,254 0.01CommVault Systems Inc. 516 25,070 0.01Madison Square Garden Sports
Corp. 194 25,049 0.01Bank of Hawaii Corp. 422 24,987 0.01Virtus Investment Partners Inc. 178 24,975 0.01Comfort Systems USA Inc. 371 24,943 0.01Meritor Inc. 870 24,884 0.01Hub Group Inc. 465 24,863 0.01Global Net Lease Inc. 2,226 24,857 0.01Lazard Ltd. 947 24,718 0.01Papa John's International Inc. 340 24,657 0.01Hecla Mining Co. 5,953 24,656 0.01STAAR Surgical Co. 542 24,650 0.01Moelis & Co. 699 24,619 0.01American Airlines Group Inc. 1,643 24,563 0.01EVERTEC Inc. 781 24,491 0.01Alarm.com Holdings Inc. 503 24,475 0.01Pacific Premier Bancorp Inc. 980 24,439 0.01Group 1 Automotive Inc. 176 24,410 0.01LiveRamp Holdings Inc. 976 24,332 0.01Chimera Investment Corp. 3,044 24,294 0.01agilon health Inc. 1,716 24,288 0.01Jackson Financial Inc. 719 24,230 0.01Merit Medical Systems Inc. 490 24,205 0.01Apollo Commercial Real Estate
Finance Inc. 2,520 24,166 0.01Inari Medical Inc. 375 24,086 0.01Callaway Golf Co. 1,379 24,076 0.01John Wiley & Sons Inc. Class A 593 24,051 0.01Cogent Communications
Holdings Inc. 516 24,043 0.01Shift4 Payments Inc. 575 23,998 0.01SPX Corp. 719 23,990 0.01MP Materials Corp. 791 23,985 0.01Coty Inc. 3,709 23,959 0.01Neogen Corp. 1,140 23,953 0.01Federated Hermes Inc. 1,054 23,901 0.01ChargePoint Holdings Inc. 2,315 23,860 0.01SiTime Corp. 177 23,755 0.01Haemonetics Corp. 588 23,749 0.01R1 RCM Inc. 1,321 23,684 0.01Bread Financial Holdings Inc. 541 23,618 0.01Digital Turbine Inc. 936 23,581 0.01Natera Inc. 841 23,525 0.01Appian Corp. 617 23,491 0.01Itron Inc. 618 23,489 0.01Prestige Consumer Healthcare Inc. 539 23,462 0.01Renasant Corp. 990 23,427 0.01Retail Opportunity Investments Corp. 1,576 23,373 0.01Arconic Corp. 1,166 23,366 0.01Advanced Energy Industries Inc. 383 23,346 0.01Brady Corp. 655 23,315 0.01International Bancshares Corp. 736 23,308 0.01Herbalife Nutrition Ltd. 1,095 23,182 0.01Renewable Energy Group Inc. 475 23,094 0.01Installed Building Products Inc. 360 23,074 0.01Vishay Intertechnology Inc. 1,555 23,062 0.01Skyline Champion Corp. 566 22,987 0.01California Water Service Group 555 22,925 0.01SITE Centers Corp. 1,805 22,859 0.01Lancaster Colony Corp. 185 22,857 0.01Cushman & Wakefield plc 1,603 22,842 0.01Kulicke & Soffa Industries Inc. 617 22,808 0.01Mr Cooper Group Inc. 636 22,780 0.01Macerich Co. 2,280 22,773 0.01Cal-Maine Foods Inc. 531 22,725 0.01Ambarella Inc. 347 22,677 0.01Glaukos Corp. 601 22,676 0.01Ironwood Pharmaceuticals Inc. 2,371 22,662 0.01Dycom Industries Inc. 334 22,583 0.01
Vanguard ESG Developed World All Cap Equity Index Fund (UK)
79
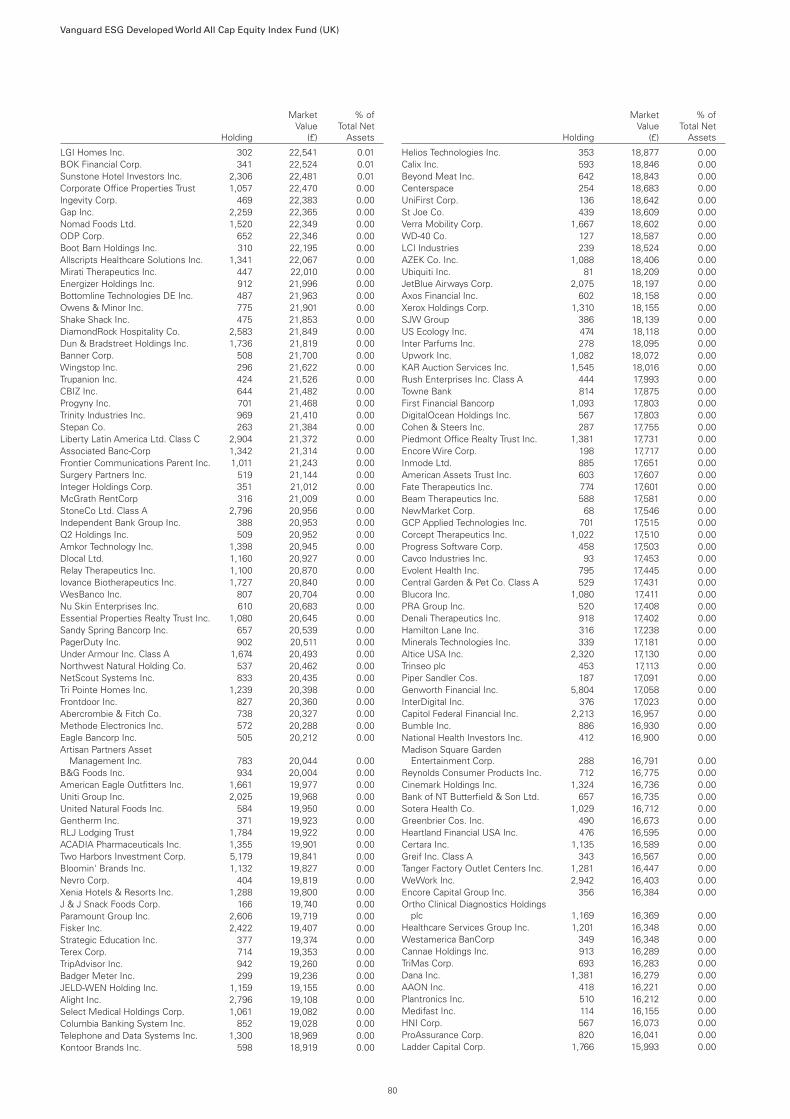
Holding
MarketValue
(£)
% ofTotal Net
Assets
LGI Homes Inc. 302 22,541 0.01BOK Financial Corp. 341 22,524 0.01Sunstone Hotel Investors Inc. 2,306 22,481 0.01Corporate Office Properties Trust 1,057 22,470 0.00Ingevity Corp. 469 22,383 0.00Gap Inc. 2,259 22,365 0.00Nomad Foods Ltd. 1,520 22,349 0.00ODP Corp. 652 22,346 0.00Boot Barn Holdings Inc. 310 22,195 0.00Allscripts Healthcare Solutions Inc. 1,341 22,067 0.00Mirati Therapeutics Inc. 447 22,010 0.00Energizer Holdings Inc. 912 21,996 0.00Bottomline Technologies DE Inc. 487 21,963 0.00Owens & Minor Inc. 775 21,901 0.00Shake Shack Inc. 475 21,853 0.00DiamondRock Hospitality Co. 2,583 21,849 0.00Dun & Bradstreet Holdings Inc. 1,736 21,819 0.00Banner Corp. 508 21,700 0.00Wingstop Inc. 296 21,622 0.00Trupanion Inc. 424 21,526 0.00CBIZ Inc. 644 21,482 0.00Progyny Inc. 701 21,468 0.00Trinity Industries Inc. 969 21,410 0.00Stepan Co. 263 21,384 0.00Liberty Latin America Ltd. Class C 2,904 21,372 0.00Associated Banc-Corp 1,342 21,314 0.00Frontier Communications Parent Inc. 1,011 21,243 0.00Surgery Partners Inc. 519 21,144 0.00Integer Holdings Corp. 351 21,012 0.00McGrath RentCorp 316 21,009 0.00StoneCo Ltd. Class A 2,796 20,956 0.00Independent Bank Group Inc. 388 20,953 0.00Q2 Holdings Inc. 509 20,952 0.00Amkor Technology Inc. 1,398 20,945 0.00Dlocal Ltd. 1,160 20,927 0.00Relay Therapeutics Inc. 1,100 20,870 0.00Iovance Biotherapeutics Inc. 1,727 20,840 0.00WesBanco Inc. 807 20,704 0.00Nu Skin Enterprises Inc. 610 20,683 0.00Essential Properties Realty Trust Inc. 1,080 20,645 0.00Sandy Spring Bancorp Inc. 657 20,539 0.00PagerDuty Inc. 902 20,511 0.00Under Armour Inc. Class A 1,674 20,493 0.00Northwest Natural Holding Co. 537 20,462 0.00NetScout Systems Inc. 833 20,435 0.00Tri Pointe Homes Inc. 1,239 20,398 0.00Frontdoor Inc. 827 20,360 0.00Abercrombie & Fitch Co. 738 20,327 0.00Methode Electronics Inc. 572 20,288 0.00Eagle Bancorp Inc. 505 20,212 0.00Artisan Partners Asset
Management Inc. 783 20,044 0.00B&G Foods Inc. 934 20,004 0.00American Eagle Outfitters Inc. 1,661 19,977 0.00Uniti Group Inc. 2,025 19,968 0.00United Natural Foods Inc. 584 19,950 0.00Gentherm Inc. 371 19,923 0.00RLJ Lodging Trust 1,784 19,922 0.00ACADIA Pharmaceuticals Inc. 1,355 19,901 0.00Two Harbors Investment Corp. 5,179 19,841 0.00Bloomin' Brands Inc. 1,132 19,827 0.00Nevro Corp. 404 19,819 0.00Xenia Hotels & Resorts Inc. 1,288 19,800 0.00J & J Snack Foods Corp. 166 19,740 0.00Paramount Group Inc. 2,606 19,719 0.00Fisker Inc. 2,422 19,407 0.00Strategic Education Inc. 377 19,374 0.00Terex Corp. 714 19,353 0.00TripAdvisor Inc. 942 19,260 0.00Badger Meter Inc. 299 19,236 0.00JELD-WEN Holding Inc. 1,159 19,155 0.00Alight Inc. 2,796 19,108 0.00Select Medical Holdings Corp. 1,061 19,082 0.00Columbia Banking System Inc. 852 19,028 0.00Telephone and Data Systems Inc. 1,300 18,969 0.00Kontoor Brands Inc. 598 18,919 0.00
Holding
MarketValue
(£)
% ofTotal Net
Assets
Helios Technologies Inc. 353 18,877 0.00Calix Inc. 593 18,846 0.00Beyond Meat Inc. 642 18,843 0.00Centerspace 254 18,683 0.00UniFirst Corp. 136 18,642 0.00St Joe Co. 439 18,609 0.00Verra Mobility Corp. 1,667 18,602 0.00WD-40 Co. 127 18,587 0.00LCI Industries 239 18,524 0.00AZEK Co. Inc. 1,088 18,406 0.00Ubiquiti Inc. 81 18,209 0.00JetBlue Airways Corp. 2,075 18,197 0.00Axos Financial Inc. 602 18,158 0.00Xerox Holdings Corp. 1,310 18,155 0.00SJW Group 386 18,139 0.00US Ecology Inc. 474 18,118 0.00Inter Parfums Inc. 278 18,095 0.00Upwork Inc. 1,082 18,072 0.00KAR Auction Services Inc. 1,545 18,016 0.00Rush Enterprises Inc. Class A 444 17,993 0.00Towne Bank 814 17,875 0.00First Financial Bancorp 1,093 17,803 0.00DigitalOcean Holdings Inc. 567 17,803 0.00Cohen & Steers Inc. 287 17,755 0.00Piedmont Office Realty Trust Inc. 1,381 17,731 0.00Encore Wire Corp. 198 17,717 0.00Inmode Ltd. 885 17,651 0.00American Assets Trust Inc. 603 17,607 0.00Fate Therapeutics Inc. 774 17,601 0.00Beam Therapeutics Inc. 588 17,581 0.00NewMarket Corp. 68 17,546 0.00GCP Applied Technologies Inc. 701 17,515 0.00Corcept Therapeutics Inc. 1,022 17,510 0.00Progress Software Corp. 458 17,503 0.00Cavco Industries Inc. 93 17,453 0.00Evolent Health Inc. 795 17,445 0.00Central Garden & Pet Co. Class A 529 17,431 0.00Blucora Inc. 1,080 17,411 0.00PRA Group Inc. 520 17,408 0.00Denali Therapeutics Inc. 918 17,402 0.00Hamilton Lane Inc. 316 17,238 0.00Minerals Technologies Inc. 339 17,181 0.00Altice USA Inc. 2,320 17,130 0.00Trinseo plc 453 17,113 0.00Piper Sandler Cos. 187 17,091 0.00Genworth Financial Inc. 5,804 17,058 0.00InterDigital Inc. 376 17,023 0.00Capitol Federal Financial Inc. 2,213 16,957 0.00Bumble Inc. 886 16,930 0.00National Health Investors Inc. 412 16,900 0.00Madison Square Garden
Entertainment Corp. 288 16,791 0.00Reynolds Consumer Products Inc. 712 16,775 0.00Cinemark Holdings Inc. 1,324 16,736 0.00Bank of NT Butterfield & Son Ltd. 657 16,735 0.00Sotera Health Co. 1,029 16,712 0.00Greenbrier Cos. Inc. 490 16,673 0.00Heartland Financial USA Inc. 476 16,595 0.00Certara Inc. 1,135 16,589 0.00Greif Inc. Class A 343 16,567 0.00Tanger Factory Outlet Centers Inc. 1,281 16,447 0.00WeWork Inc. 2,942 16,403 0.00Encore Capital Group Inc. 356 16,384 0.00Ortho Clinical Diagnostics Holdings
plc 1,169 16,369 0.00Healthcare Services Group Inc. 1,201 16,348 0.00Westamerica BanCorp 349 16,348 0.00Cannae Holdings Inc. 913 16,289 0.00TriMas Corp. 693 16,283 0.00Dana Inc. 1,381 16,279 0.00AAON Inc. 418 16,221 0.00Plantronics Inc. 510 16,212 0.00Medifast Inc. 114 16,155 0.00HNI Corp. 567 16,073 0.00ProAssurance Corp. 820 16,041 0.00Ladder Capital Corp. 1,766 15,993 0.00
Vanguard ESG Developed World All Cap Equity Index Fund (UK)
80

Holding
MarketValue
(£)
% ofTotal Net
Assets
Multiplan Corp. 4,530 15,984 0.00MDC Holdings Inc. 543 15,972 0.00iHeartMedia Inc. 1,254 15,951 0.00Oak Street Health Inc. 1,108 15,938 0.00TreeHouse Foods Inc. 635 15,917 0.00FuelCell Energy Inc. 4,861 15,836 0.00Monro Inc. 436 15,832 0.00TechTarget Inc. 295 15,818 0.00Asana Inc. 741 15,800 0.00Amicus Therapeutics Inc. 2,797 15,773 0.00Tronox Holdings plc 1,152 15,773 0.00Winnebago Industries Inc. 371 15,697 0.00ArcBest Corp. 271 15,610 0.00BancFirst Corp. 239 15,562 0.00Embecta Corp. 641 15,536 0.00Lindsay Corp. 144 15,490 0.00Momentive Global Inc. 1,229 15,476 0.00Mister Car Wash Inc. 1,343 15,404 0.00Myriad Genetics Inc. 940 15,348 0.00Hayward Holdings Inc. 1,206 15,283 0.00Gray Television Inc. 1,036 15,274 0.00BioCryst Pharmaceuticals Inc. 2,058 15,228 0.00CSG Systems International Inc. 311 15,227 0.00Edgewell Personal Care Co. 500 15,173 0.00Adtalem Global Education Inc. 647 15,099 0.00Nelnet Inc. 231 15,087 0.00Twist Bioscience Corp. 654 15,039 0.00Appfolio Inc. 182 15,027 0.00Knowles Corp. 1,015 14,997 0.00Hilltop Holdings Inc. 737 14,957 0.00Petco Health & Wellness Co. Inc. 970 14,880 0.00Overstock.com Inc. 556 14,862 0.00Newmark Group Inc. 1,534 14,809 0.00Flywire Corp. 609 14,799 0.00Coca-Cola Consolidated Inc. 42 14,756 0.00nCino Inc. 493 14,717 0.00Belden Inc. 357 14,684 0.00Urban Edge Properties 985 14,663 0.00Zillow Group Inc. Class A 474 14,596 0.00Hope Bancorp Inc. 1,282 14,581 0.00Monday.com Ltd. 141 14,531 0.00Urban Outfitters Inc. 765 14,484 0.00Patrick Industries Inc. 290 14,393 0.00Editas Medicine Inc. 1,363 14,385 0.00Sally Beauty Holdings Inc. 1,191 14,343 0.00NMI Holdings Inc. 979 14,340 0.00Masonite International Corp. 232 14,315 0.00PriceSmart Inc. 225 14,237 0.00Global Blood Therapeutics Inc. 580 14,182 0.00Empire State Realty Trust Inc. 2,052 14,105 0.00Frontline Ltd. 2,091 14,105 0.00Fastly Inc. 1,110 14,066 0.00Triumph Bancorp Inc. 253 13,993 0.00WisdomTree Investments Inc. 3,007 13,963 0.00Freedom Holding Corp/NV 374 13,926 0.00MEDNAX Inc. 942 13,888 0.00Rent-A-Center Inc. 721 13,851 0.00Dine Brands Global Inc. 240 13,700 0.00Ameresco Inc. 339 13,611 0.00NextGen Healthcare Inc. 905 13,580 0.00Flagstar Bancorp Inc. 478 13,443 0.00Oxford Industries Inc. 188 13,415 0.00Primoris Services Corp. 724 13,356 0.00Inovio Pharmaceuticals Inc. 6,091 13,341 0.00Brookdale Senior Living Inc. 2,697 13,254 0.00Covetrus Inc. 1,203 13,213 0.00Horace Mann Educators Corp. 416 13,191 0.00Granite Construction Inc. 557 13,132 0.00Compass Minerals International Inc. 279 13,124 0.00Vimeo Inc. 1,616 13,103 0.00OSI Systems Inc. 206 12,979 0.00Argo Group International Holdings
Ltd. 381 12,979 0.00IonQ Inc. 2,071 12,965 0.00Acadia Realty Trust 777 12,947 0.00Four Corners Property Trust Inc. 589 12,878 0.00
Holding
MarketValue
(£)
% ofTotal Net
Assets
E2open Parent Holdings Inc. 2,086 12,827 0.00Aurinia Pharmaceuticals Inc. 1,564 12,806 0.00Service Properties Trust 1,976 12,764 0.00CareTrust REIT Inc. 987 12,743 0.00SoFi Technologies Inc. 2,602 12,684 0.003D Systems Corp. 1,405 12,668 0.00Playtika Holding Corp. 885 12,392 0.00ACCO Brands Corp. 2,118 12,349 0.00City Holding Co. 200 12,299 0.00Coursera Inc. 816 12,219 0.00Qurate Retail Inc. 3,609 12,102 0.00Virgin Galactic Holdings Inc. 2,031 12,100 0.00Supernus Pharmaceuticals Inc. 542 12,053 0.00PennyMac Mortgage Investment
Trust 984 12,023 0.00Acushnet Holdings Corp. 370 12,015 0.00Proto Labs Inc. 351 11,907 0.00Everbridge Inc. 344 11,809 0.00Fiverr International Ltd. 278 11,791 0.00Washington Trust Bancorp Inc. 315 11,777 0.00PennyMac Financial Services Inc. 303 11,719 0.00PROG Holdings Inc. 553 11,650 0.00Huron Consulting Group Inc. 283 11,649 0.00OPKO Health Inc. 5,376 11,561 0.00First Commonwealth Financial Corp. 1,071 11,499 0.00Deluxe Corp. 533 11,492 0.00Cheesecake Factory Inc. 390 11,465 0.00Lions Gate Entertainment Corp.
Class B 1,139 11,376 0.00Dillard's Inc. 47 11,352 0.00DoubleVerify Holdings Inc. 655 11,352 0.00Cerevel Therapeutics Holdings Inc. 486 11,334 0.00Bed Bath & Beyond Inc. 1,041 11,293 0.00Gibraltar Industries Inc. 375 11,284 0.00Sana Biotechnology Inc. 1,868 11,233 0.00iRobot Corp. 278 11,217 0.00Open Lending Corp. 1,030 11,182 0.00CareDx Inc. 461 11,177 0.00Schrodinger Inc. 564 11,109 0.00iStar Inc. 826 11,079 0.00Washington REIT 576 11,052 0.00Wolverine World Wide Inc. 700 11,045 0.00Sage Therapeutics Inc. 439 11,018 0.00Matthews International Corp. 461 10,942 0.00Kymera Therapeutics Inc. 434 10,844 0.00Redfin Corp. 1,221 10,844 0.00Figs Inc. 866 10,795 0.00Agios Pharmaceuticals Inc. 615 10,762 0.00Olaplex Holdings Inc. 913 10,690 0.00Beauty Health Co. 1,024 10,685 0.00Safety Insurance Group Inc. 156 10,668 0.00TuSimple Holdings Inc. 1,291 10,643 0.00Sunnova Energy International Inc. 773 10,639 0.00CorVel Corp. 86 10,598 0.00Realogy Holdings Corp. 1,204 10,530 0.00Marathon Digital Holdings Inc. 843 10,475 0.00Driven Brands Holdings Inc. 470 10,433 0.00Emergent BioSolutions Inc. 404 10,416 0.00Jack in the Box Inc. 157 10,342 0.00Xperi Holding Corp. 830 10,313 0.00Cardlytics Inc. 379 10,261 0.00Ebix Inc. 429 10,183 0.00Alignment Healthcare Inc. 1,331 10,177 0.00Jamf Holding Corp. 414 10,143 0.00Diversified Healthcare Trust 5,617 10,066 0.00Century Communities Inc. 239 10,038 0.00Arcus Biosciences Inc. 519 10,020 0.00ADT Inc. 1,833 9,986 0.00American National Group Inc. 66 9,912 0.00Ligand Pharmaceuticals Inc. 134 9,911 0.00Zentalis Pharmaceuticals Inc. 469 9,910 0.00Mercury General Corp. 244 9,812 0.00Madrigal Pharmaceuticals Inc. 176 9,811 0.00Core & Main Inc. 517 9,801 0.00Spirit Airlines Inc. 521 9,798 0.00Green Dot Corp. 461 9,719 0.00
Vanguard ESG Developed World All Cap Equity Index Fund (UK)
81

Holding
MarketValue
(£)
% ofTotal Net
Assets
Live Oak Bancshares Inc. 288 9,710 0.00Century Aluminum Co. 724 9,699 0.00RPT Realty 916 9,696 0.00Cerence Inc. 411 9,657 0.00Stratasys Ltd. 623 9,622 0.00Ardagh Metal Packaging SA 1,688 9,586 0.00C3.ai Inc. 706 9,543 0.00Invitae Corp. 2,248 9,508 0.00LendingTree Inc. 149 9,425 0.00Sylvamo Corp. 264 9,391 0.00Tivity Health Inc. 364 9,315 0.00Shoals Technologies Group Inc. 1,168 9,294 0.00Columbia Financial Inc. 614 9,263 0.00LivePerson Inc. 512 9,225 0.00TTEC Holdings Inc. 156 9,171 0.00Orion Engineered Carbons SA 761 9,153 0.00Pacific Biosciences of California Inc. 1,799 9,070 0.00Kaiser Aluminum Corp. 117 8,993 0.00MFA Financial Inc. 790 8,967 0.00Schneider National Inc. 475 8,940 0.00Neenah Inc. 315 8,884 0.00Riot Blockchain Inc. 1,099 8,867 0.00Turning Point Therapeutics Inc. 377 8,852 0.00Enanta Pharmaceuticals Inc. 172 8,827 0.00BrightSpire Capital Inc. 1,298 8,798 0.00Tootsie Roll Industries Inc. 315 8,796 0.00FibroGen Inc. 1,187 8,793 0.00LTC Properties Inc. 333 8,763 0.00Recursion Pharmaceuticals Inc. 1,768 8,745 0.00AMC Networks Inc. 336 8,724 0.00Weis Markets Inc. 137 8,713 0.00Liberty Latin America Ltd. Class A 1,182 8,699 0.00SunPower Corp. 661 8,692 0.00Stem Inc. 1,518 8,669 0.00Brightsphere Investment Group Inc. 542 8,647 0.00Veracyte Inc. 528 8,617 0.00CNA Financial Corp. 226 8,549 0.00Ranpak Holdings Corp. 712 8,546 0.00American Woodmark Corp. 229 8,538 0.00Magnite Inc. 1,112 8,538 0.00Thoughtworks Holding Inc. 578 8,517 0.00Avanos Medical Inc. 363 8,428 0.00Gates Industrial Corp. plc 828 8,409 0.00Enovix Corp. 1,166 8,386 0.00Alexander & Baldwin Inc. 496 8,375 0.00Palomar Holdings Inc. 193 8,358 0.00Shenandoah Telecommunications
Co. 521 8,358 0.00Duck Creek Technologies Inc. 657 8,336 0.00NeoGenomics Inc. 1,064 7,992 0.00Cimpress plc 199 7,992 0.00Employers Holdings Inc. 255 7,990 0.00CommScope Holding Co. Inc. 1,665 7,984 0.00Harsco Corp. 980 7,962 0.00Vir Biotechnology Inc. 486 7,881 0.00Cassava Sciences Inc. 470 7,828 0.00SpringWorks Therapeutics Inc. 227 7,762 0.00REVOLUTION Medicines Inc. 481 7,655 0.00Stitch Fix Inc. 1,007 7,620 0.00Stock Yards Bancorp Inc. 182 7,579 0.00JFrog Ltd. 453 7,527 0.00Kearny Financial Corp. 789 7,453 0.00Matson Inc. 108 7,400 0.00Astec Industries Inc. 237 7,381 0.00Veris Residential Inc. 578 7,371 0.00Copa Holdings SA Class A 122 7,330 0.00Fulgent Genetics Inc. 167 7,292 0.00ChemoCentryx Inc. 493 7,253 0.00Bridgebio Pharma Inc. 1,131 7,216 0.00ScanSource Inc. 263 7,156 0.00Phreesia Inc. 392 7,153 0.00Innoviva Inc. 525 7,130 0.00NBT Bancorp Inc. 254 7,119 0.00Laureate Education Inc. 787 7,096 0.00G-III Apparel Group Ltd. 335 7,055 0.00uniQure NV 592 7,049 0.00
Holding
MarketValue
(£)
% ofTotal Net
Assets
Avaya Holdings Corp. 946 6,962 0.00Redwood Trust Inc. 898 6,938 0.00Allegiant Travel Co. 56 6,922 0.00American Axle & Manufacturing
Holdings Inc. 1,313 6,913 0.008x8 Inc. 939 6,866 0.00Northwest Bancshares Inc. 677 6,837 0.00Natus Medical Inc. 256 6,784 0.00SFL Corp. Ltd. 856 6,757 0.00Apogee Enterprises Inc. 193 6,753 0.00Lions Gate Entertainment Corp.
Class A 626 6,721 0.00Provident Financial Services Inc. 377 6,642 0.00MakeMyTrip Ltd. 327 6,634 0.00National Beverage Corp. 188 6,586 0.001st Source Corp. 191 6,572 0.00La-Z-Boy Inc. 309 6,468 0.00Heartland Express Inc. 584 6,414 0.00H&E Equipment Services Inc. 223 6,295 0.00EW Scripps Co. 480 6,293 0.00Liberty Media Corp-Liberty Braves
Class A 299 6,254 0.00Sleep Number Corp. 192 6,204 0.002U Inc. 780 6,200 0.00eXp World Holdings Inc. 581 6,196 0.00Berkshire Hills Bancorp Inc. 313 6,168 0.00Marcus & Millichap Inc. 172 6,136 0.00TG Therapeutics Inc. 1,108 6,125 0.00USANA Health Sciences Inc. 100 6,100 0.00Immunovant Inc. 1,656 6,067 0.00Brookline Bancorp Inc. 515 5,931 0.00Tennant Co. 115 5,921 0.00CryoPort Inc. 324 5,812 0.00Office Properties Income Trust 338 5,810 0.00CureVac NV 425 5,789 0.00Adaptive Biotechnologies Corp. 878 5,762 0.00Summit Hotel Properties Inc. 733 5,762 0.00AdaptHealth Corp. 571 5,758 0.00SiriusPoint Ltd. 1,146 5,732 0.00Allegro MicroSystems Inc. 295 5,717 0.00Safehold Inc. 166 5,697 0.00fuboTV Inc. 1,887 5,696 0.00PROS Holdings Inc. 254 5,651 0.00NanoString Technologies Inc. 373 5,582 0.00BGC Partners Inc. 1,921 5,539 0.00ARMOUR Residential REIT Inc. 942 5,492 0.00Buckle Inc. 222 5,490 0.00Array Technologies Inc. 1,047 5,446 0.00NETGEAR Inc. 315 5,439 0.001Life Healthcare Inc. 960 5,391 0.00Scorpio Tankers Inc. 273 5,377 0.00CTS Corp. 190 5,350 0.00Scholastic Corp. 176 5,162 0.00Apartment Investment and
Management Co. 1,028 5,158 0.00REGENXBIO Inc. 233 5,156 0.00TrueBlue Inc. 252 5,138 0.00Global-e Online Ltd. 286 5,135 0.00Varex Imaging Corp. 322 5,086 0.00Steelcase Inc. 535 4,998 0.00Sinclair Broadcast Group Inc. 282 4,995 0.00Orion Office REIT Inc. 467 4,995 0.00S&T Bancorp Inc. 222 4,990 0.00Lemonade Inc. 299 4,965 0.00Saul Centers Inc. 117 4,818 0.00Calavo Growers Inc. 167 4,814 0.00BigCommerce Holdings Inc. 338 4,811 0.00Coeur Mining Inc. 1,653 4,766 0.00Big Lots Inc. 193 4,758 0.00Nektar Therapeutics 1,411 4,619 0.00EchoStar Corp. 247 4,594 0.00Consensus Cloud Solutions Inc. 109 4,563 0.00Reata Pharmaceuticals Inc. 222 4,475 0.00Fresh Del Monte Produce Inc. 209 4,330 0.00Bandwidth Inc. 244 4,293 0.00Getty Realty Corp. 200 4,287 0.00
Vanguard ESG Developed World All Cap Equity Index Fund (UK)
82

Holding
MarketValue
(£)
% ofTotal Net
Assets
Axsome Therapeutics Inc. 166 4,198 0.00Liberty Media Corp-Liberty Braves
Class C 210 4,197 0.00Universal Health Realty Income Trust 105 4,197 0.00IMAX Corp. 329 4,146 0.00Zimvie Inc. 218 3,905 0.00Guess? Inc. 215 3,851 0.00Children's Place Inc. 104 3,836 0.00SkyWest Inc. 164 3,806 0.00Desktop Metal Inc. 1,337 3,727 0.00Amyris Inc. 1,276 3,486 0.00Vivint Smart Home Inc. 804 3,349 0.00Yext Inc. 722 3,318 0.00American Well Corp. 1,319 3,278 0.00FARO Technologies Inc. 114 3,113 0.00MicroVision Inc. 1,209 3,101 0.00Atara Biotherapeutics Inc. 592 2,999 0.00Sorrento Therapeutics Inc. 2,418 2,927 0.00Aaron's Co. Inc. 175 2,863 0.00WW International Inc. 366 2,851 0.00Myovant Sciences Ltd. 378 2,803 0.00TFS Financial Corp. 225 2,686 0.00Endo International plc 1,625 2,576 0.00Allogene Therapeutics Inc. 356 2,368 0.00Alector Inc. 305 2,332 0.00Cognyte Software Ltd. 432 2,326 0.00
Holding
MarketValue
(£)
% ofTotal Net
Assets
Inogen Inc. 106 2,134 0.00GrowGeneration Corp. 452 2,131 0.00Heron Therapeutics Inc. 586 2,114 0.00Forrester Research Inc. 46 2,037 0.00Accolade Inc. 413 1,826 0.002seventy bio Inc. 160 1,715 0.00Rocket Pharmaceuticals Inc. 202 1,654 0.00Selectquote Inc. 1,005 1,641 0.00SolarWinds Corp. 166 1,634 0.00Loyalty Ventures Inc. 154 1,568 0.00Community Trust Bancorp Inc. 47 1,488 0.00Alexander's Inc. 7 1,384 0.00Berkeley Lights Inc. 334 1,322 0.00N-able Inc. 166 1,322 0.00Kodiak Sciences Inc. 270 1,292 0.00United States Cellular Corp. 45 1,031 0.00Vroom Inc. 766 946 0.00Theravance Biopharma Inc. 122 938 0.00Taro Pharmaceutical Industries Ltd. 25 782 0.00Precigen Inc. 216 229 0.00Yandex NV Class A1 3,452 — 0.00
321,493,910 67.03
Total Equities 469,073,755 97.80
Number ofContracts
Long/(Short)
NotionalAmount
(£)
UnrealisedGain/(Loss)
(£)
% ofTotal Net
Assets
Financial Derivative Instruments (0.11%) (31 October 2021: (0.01%))
Futures Contracts (0.08%) (31 October 2021: 0.01%)
Topix Index June 2022 67 783,837 5,163 0.00STOXX Europe 600 Index June 2022 122 2,284,993 (8,214) (0.00)S&P 500 E Mini Index June 2022 505 8,301,021 (385,844) (0.08)
(388,895) (0.08)
CurrencyBuy
Amount Currency(Sell)
Amount CounterpartySettlement
Date
UnrealisedGain/(Loss)
(£)
% ofTotal Net
Assets
Forward Currency Exchange Contracts (0.03%) (31 October 2021: (0.02%))
USD 1,089,143 JPY (125,599,000) JP Morgan Chase Bank 15/6/22 94,373 0.02USD 2,295,821 EUR (2,071,575) JP Morgan Chase Bank 15/6/22 84,678 0.02USD 1,915,121 EUR (1,737,120) Barclays Bank 15/6/22 63,010 0.01USD 957,536 JPY (113,880,000) JP Morgan Chase Bank 15/6/22 61,685 0.01USD 2,339,407 EUR (2,142,915) JP Morgan Chase Bank 15/6/22 59,339 0.01USD 1,840,094 EUR (1,682,250) JP Morgan Chase Bank 15/6/22 49,443 0.01USD 2,160,302 EUR (1,998,480) Barclays Bank 15/6/22 38,274 0.01USD 982,786 EUR (892,000) JP Morgan Chase Bank 15/6/22 31,864 0.01USD 728,966 JPY (89,309,000) Barclays Bank 15/6/22 30,877 0.01USD 763,446 JPY (94,447,500) JP Morgan Chase Bank 15/6/22 26,711 0.00USD 435,361 JPY (53,001,000) JP Morgan Chase Bank 15/6/22 20,516 0.00USD 418,604 GBP (320,000) Barclays Bank 15/6/22 13,405 0.00USD 802,253 JPY (103,207,500) Barclays Bank 15/6/22 3,699 0.00EUR 349,120 USD (367,904) JP Morgan Chase Bank 15/6/22 868 0.00JPY 7,612,000 USD (59,609) JP Morgan Chase Bank 15/6/22 (623) (0.00)JPY 13,398,000 USD (104,408) JP Morgan Chase Bank 15/6/22 (689) (0.00)JPY 9,362,500 USD (73,730) JP Morgan Chase Bank 15/6/22 (1,095) (0.00)JPY 24,388,000 USD (190,308) JP Morgan Chase Bank 15/6/22 (1,459) (0.00)EUR 198,045 USD (211,352) Barclays Bank 15/6/22 (1,619) (0.00)JPY 20,894,500 USD (163,870) JP Morgan Chase Bank 15/6/22 (1,906) (0.00)JPY 11,361,000 USD (90,379) JP Morgan Chase Bank 15/6/22 (2,054) (0.00)EUR 179,240 USD (192,302) JP Morgan Chase Bank 15/6/22 (2,276) (0.00)JPY 3,672,000 USD (31,826) JP Morgan Chase Bank 15/6/22 (2,746) (0.00)EUR 66,885 USD (74,239) JP Morgan Chase Bank 15/6/22 (2,824) (0.00)JPY 16,753,500 USD (133,473) JP Morgan Chase Bank 15/6/22 (3,184) (0.00)EUR 202,590 USD (218,807) JP Morgan Chase Bank 15/6/22 (3,731) (0.00)EUR 114,114 USD (126,156) JP Morgan Chase Bank 15/6/22 (4,417) (0.00)JPY 22,776,000 USD (181,758) JP Morgan Chase Bank 15/6/22 (4,572) (0.00)JPY 7,254,000 USD (62,140) JP Morgan Chase Bank 15/6/22 (4,843) (0.00)EUR 227,400 USD (247,108) JP Morgan Chase Bank 15/6/22 (5,386) (0.00)
Vanguard ESG Developed World All Cap Equity Index Fund (UK)
83

CurrencyBuy
Amount Currency(Sell)
Amount CounterpartySettlement
Date
UnrealisedGain/(Loss)
(£)
% ofTotal Net
Assets
EUR 225,500 USD (245,153) JP Morgan Chase Bank 15/6/22 (5,428) (0.00)EUR 210,300 USD (229,565) JP Morgan Chase Bank 15/6/22 (5,809) (0.00)EUR 188,235 USD (207,136) JP Morgan Chase Bank 15/6/22 (6,519) (0.00)JPY 32,121,500 USD (257,041) Barclays Bank 15/6/22 (7,009) (0.00)JPY 18,482,779 USD (151,726) JP Morgan Chase Bank 15/6/22 (7,079) (0.00)JPY 23,556,000 USD (191,055) Barclays Bank 15/6/22 (7,176) (0.00)JPY 12,519,500 USD (106,314) JP Morgan Chase Bank 15/6/22 (7,615) (0.00)JPY 23,358,000 USD (190,459) Barclays Bank 15/6/22 (7,920) (0.00)JPY 15,040,000 USD (126,434) JP Morgan Chase Bank 15/6/22 (8,125) (0.00)EUR 232,760 USD (256,433) JP Morgan Chase Bank 15/6/22 (8,301) (0.00)EUR 316,190 USD (344,632) Barclays Bank 15/6/22 (8,317) (0.00)JPY 10,974,000 USD (95,348) JP Morgan Chase Bank 15/6/22 (8,394) (0.00)JPY 11,157,000 USD (97,426) JP Morgan Chase Bank 15/6/22 (8,922) (0.00)JPY 23,532,000 USD (193,216) Barclays Bank 15/6/22 (9,045) (0.00)JPY 16,096,500 USD (136,490) JP Morgan Chase Bank 15/6/22 (9,632) (0.00)EUR 278,395 USD (306,541) JP Morgan Chase Bank 15/6/22 (9,795) (0.00)EUR 405,810 USD (441,868) JP Morgan Chase Bank 15/6/22 (10,320) (0.00)JPY 25,584,000 USD (211,161) JP Morgan Chase Bank 15/6/22 (10,706) (0.00)EUR 265,380 USD (294,102) JP Morgan Chase Bank 15/6/22 (10,844) (0.00)EUR 320,774 USD (354,165) JP Morgan Chase Bank 15/6/22 (12,051) (0.00)JPY 43,392,016 USD (351,276) JP Morgan Chase Bank 15/6/22 (12,691) (0.00)JPY 22,050,000 USD (186,485) JP Morgan Chase Bank 15/6/22 (12,806) (0.00)JPY 22,560,000 USD (190,838) Barclays Bank 15/6/22 (13,134) (0.00)EUR 362,865 USD (400,263) JP Morgan Chase Bank 15/6/22 (13,333) (0.00)GBP 320,000 USD (418,607) JP Morgan Chase Bank 15/6/22 (13,407) (0.00)EUR 331,440 USD (367,345) JP Morgan Chase Bank 15/6/22 (13,570) (0.00)JPY 19,074,000 USD (165,059) JP Morgan Chase Bank 15/6/22 (14,059) (0.00)EUR 446,200 USD (490,926) Barclays Bank 15/6/22 (15,392) (0.00)JPY 40,655,803 USD (336,570) Barclays Bank 15/6/22 (17,820) (0.00)EUR 598,948 USD (655,684) JP Morgan Chase Bank 15/6/22 (18,032) (0.01)EUR 363,600 USD (407,063) Barclays Bank 15/6/22 (18,131) (0.01)EUR 471,870 USD (522,149) Barclays Bank 15/6/22 (18,651) (0.01)EUR 508,645 USD (561,275) Barclays Bank 15/6/22 (18,855) (0.01)EUR 418,380 USD (466,215) Barclays Bank 15/6/22 (19,129) (0.01)EUR 474,600 USD (529,468) JP Morgan Chase Bank 15/6/22 (22,182) (0.01)EUR 635,850 USD (702,952) JP Morgan Chase Bank 15/6/22 (24,615) (0.01)EUR 895,785 USD (978,528) JP Morgan Chase Bank 15/6/22 (25,287) (0.01)JPY 34,780,000 USD (300,599) JP Morgan Chase Bank 15/6/22 (25,337) (0.01)JPY 39,448,500 USD (342,085) JP Morgan Chase Bank 15/6/22 (29,644) (0.01)EUR 961,102 USD (1,054,042) Barclays Bank 15/6/22 (30,448) (0.01)EUR 879,905 USD (975,226) JP Morgan Chase Bank 15/6/22 (36,025) (0.01)EUR 1,326,398 USD (1,452,937) Barclays Bank 15/6/22 (40,644) (0.01)JPY 58,535,236 USD (507,194) JP Morgan Chase Bank 15/6/22 (43,664) (0.01)
(130,545) (0.03)
Total Financial Derivative Instruments (519,440) (0.11)
MarketValue
(£)
% ofTotal Net
Assets
Portfolio of Investments 468,554,315 97.69
Net Other Assets 11,063,308 2.31
Net Assets Attributable to Shareholders 479,617,623 100.00
All holdings are listed on an official stock exchange or are traded on an eligible securities market, unless otherwise stated.1 Manually priced securities.
Vanguard ESG Developed World All Cap Equity Index Fund (UK)
84

As at As at
30 April 2022(£)
31 October 2021(£)
Assets:
Financial Assets 469,657,660 343,669,170Current Assets
Debtors 2,365,691 2,121,923Cash and Bank Balances 9,502,585 4,011,965
Total Assets 481,525,936 349,803,058
Liabilities:
Financial Liabilities 1,103,345 232,340Creditors
Distribution Payable 667,927 360,430Other Creditors 137,041 78,154
Total Liabilities 1,908,313 670,924
Net Assets Attributable to Shareholders 479,617,623 349,132,134
Statement of Total Return
Period Ended Period Ended
30 April 2022(£)
30 April 2022(£)
30 April 2021(£)
30 April 2021(£)
IncomeNet Capital Gains/(Losses) (34,947,804) 14,004,948Revenue 3,630,179 773,882
Expenses (374,574) (88,543)
Net Revenue Before Taxation 3,255,605 685,339Taxation (477,690) (103,498)
Net Revenue After Taxation 2,777,915 581,841
Total Return Before Distributions (32,169,889) 14,586,789
Distributions1 (2,777,915) (581,841)
Change in Net Assets Attributable to
Shareholders From Investment Activities (34,947,804) 14,004,948
1 Includes adjustments for equalisation.
Statement of Change in Net Assets Attributable to Shareholders
Period Ended Period Ended†
30 April 2022(£)
30 April 2022(£)
30 April 2021(£)
30 April 2021(£)
Opening Net Assets Attributable to Shareholders 349,132,134 56,704,070
Amounts Received on Issue of Shares 170,147,195 83,884,671Amounts Paid on Cancellation of Shares (6,775,564) (23,348,090)
163,371,631 60,536,581
Dilution Adjustment 32,940 39,913Change in Net Assets Attributable to
Shareholders From Investment Activities (34,947,804) 14,004,948Retained Distribution on Accumulation Shares 2,028,722 441,165
Closing Net Assets Attributable to Shareholders 479,617,623 131,726,677
† The Fund launched on 9 June 2020.
The interim financial statements for the Fund have been prepared on the same basis of the accounting policies as the annual financial statements for the year ended 31 October 2021.
Vanguard ESG Developed World All Cap Equity Index Fund (UK)
Balance Sheet
85
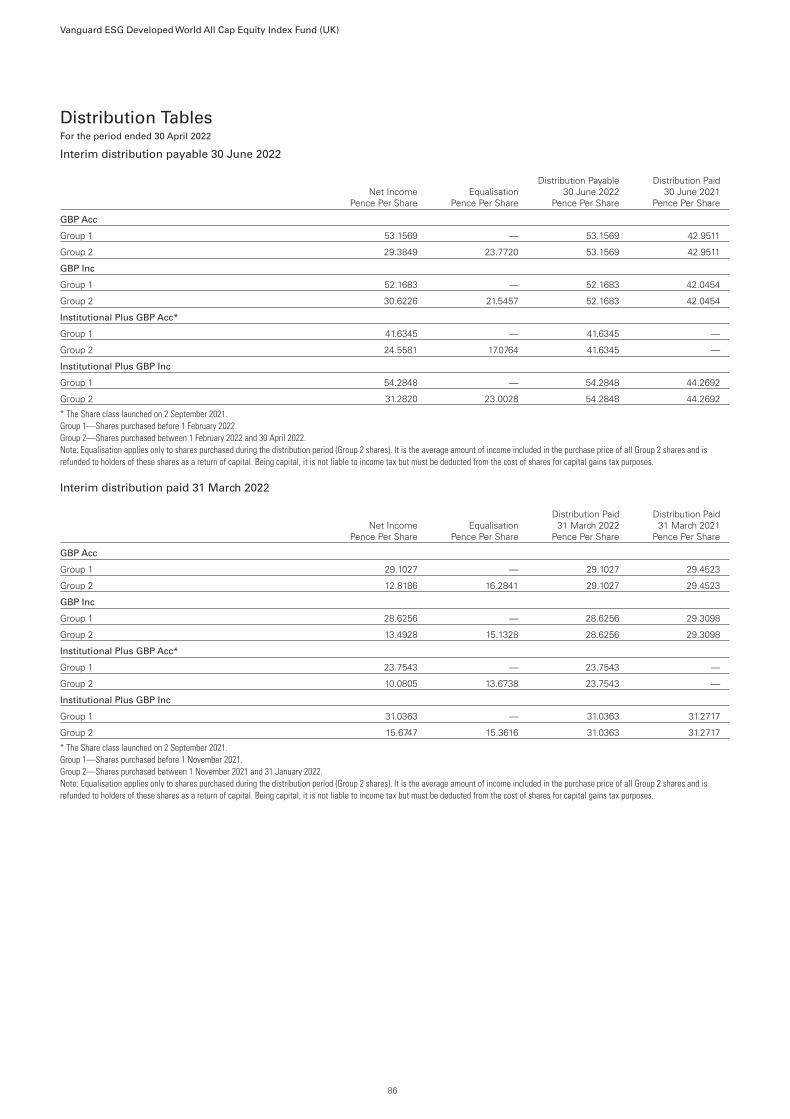
Interim distribution payable 30 June 2022
Net IncomePence Per Share
EqualisationPence Per Share
Distribution Payable30 June 2022
Pence Per Share
Distribution Paid30 June 2021
Pence Per Share
GBP Acc
Group 1 53.1569 — 53.1569 42.9511
Group 2 29.3849 23.7720 53.1569 42.9511
GBP Inc
Group 1 52.1683 — 52.1683 42.0454
Group 2 30.6226 21.5457 52.1683 42.0454
Institutional Plus GBP Acc*
Group 1 41.6345 — 41.6345 —
Group 2 24.5581 17.0764 41.6345 —
Institutional Plus GBP Inc
Group 1 54.2848 — 54.2848 44.2692
Group 2 31.2820 23.0028 54.2848 44.2692
* The Share class launched on 2 September 2021.Group 1—Shares purchased before 1 February 2022.Group 2—Shares purchased between 1 February 2022 and 30 April 2022.Note: Equalisation applies only to shares purchased during the distribution period (Group 2 shares). It is the average amount of income included in the purchase price of all Group 2 shares and isrefunded to holders of these shares as a return of capital. Being capital, it is not liable to income tax but must be deducted from the cost of shares for capital gains tax purposes.
Interim distribution paid 31 March 2022
Net IncomePence Per Share
EqualisationPence Per Share
Distribution Paid31 March 2022
Pence Per Share
Distribution Paid31 March 2021
Pence Per Share
GBP Acc
Group 1 29.1027 — 29.1027 29.4523
Group 2 12.8186 16.2841 29.1027 29.4523
GBP Inc
Group 1 28.6256 — 28.6256 29.3098
Group 2 13.4928 15.1328 28.6256 29.3098
Institutional Plus GBP Acc*
Group 1 23.7543 — 23.7543 —
Group 2 10.0805 13.6738 23.7543 —
Institutional Plus GBP Inc
Group 1 31.0363 — 31.0363 31.2717
Group 2 15.6747 15.3616 31.0363 31.2717
* The Share class launched on 2 September 2021.Group 1—Shares purchased before 1 November 2021.Group 2—Shares purchased between 1 November 2021 and 31 January 2022.Note: Equalisation applies only to shares purchased during the distribution period (Group 2 shares). It is the average amount of income included in the purchase price of all Group 2 shares and isrefunded to holders of these shares as a return of capital. Being capital, it is not liable to income tax but must be deducted from the cost of shares for capital gains tax purposes.
Vanguard ESG Developed World All Cap Equity Index Fund (UK)
Distribution TablesFor the period ended 30 April 2022
86

Investment Objective
Vanguard FTSE Developed Europe ex-U.K. Equity Index Fund (the “Fund”) seeks to track the performance of the FTSE Developed Europe ex-U.K. Index (the“Index”).
Investment Strategy
The Fund is a passive fund that seeks to achieve its investment objective by investing in a representative sample of the component shares of the Index.
Synthetic Risk and Reward Indicator
Lower risk
Typically lower rewards
Higher risk
Typically higher rewards
1 2 3 4 5 6 7
The Synthetic Risk and Reward Indicator (SRRI) measures the volatility of the Fund. The risk and reward category (which may range from 1 to 7) is calculatedusing historical data and may not be a reliable indicator of the Fund’s future risk profile. The risk and reward category may shift over time and is not a target orguarantee. The lowest category (i.e. category 1) does not mean “risk free”. The Fund appears in the higher range of the risk and reward indicator because thevalues of the Fund’s investments have experienced a higher rate of change in the past.
Performance SummaryThe Performance Summary does not form part of the Financial Statements.
• Volatility surged and global financial markets slumped during the six months ended 30 April 2022. When the period began, supply bottlenecks, rising oil pricesand the prospect of less accommodative monetary policy were already weighing on market sentiment.
• Then Russia’s invasion of Ukraine injected substantial uncertainty into the markets. Energy prices soared, helping to push consumer prices to multidecadehighs across much of the world. Some central banks, including those in the United States and the United Kingdom, raised short-term interest rates. TheEuropean Central Bank continued to reduce its bond purchases and was expected to raise rates later this year.
• While consumer sentiment flagged during the period, in many markets unemployment remained low, consumer balance sheets healthy and corporate profitsrobust.
• With central banks turning less accommodative and inflation looking set to remain elevated for some time, bond yields in many markets moved higher acrossthe maturity spectrum. The Bloomberg Global Aggregate Bond Index hedged to British pounds, a global bond proxy, returned about –7% for the six months.
• Stocks regained some ground in March but finished the six months with a negative return. The FTSE Global All Cap Index, a proxy for global stocks, returnedabout –4%. The United Kingdom and Asia-Pacific were bright spots, while Europe detracted the most.
• In this environment, the Fund’s benchmark Index returned –7.21% for the six months.
• Among the markets with larger weightings in the Fund’s Index, Switzerland, Denmark, Spain and France were among the better performers. In contrast, theNetherlands, Germany and Sweden hurt performance the most.
• By industry sector, telecommunications, energy, consumer staples and health care posted positive returns, while technology, consumer discretionary andindustrials were among the laggards, posting double-digit declines.
Vanguard FTSE Developed Europe ex-U.K. Equity Index FundManaged by Vanguard Global Advisers, LLC.
87
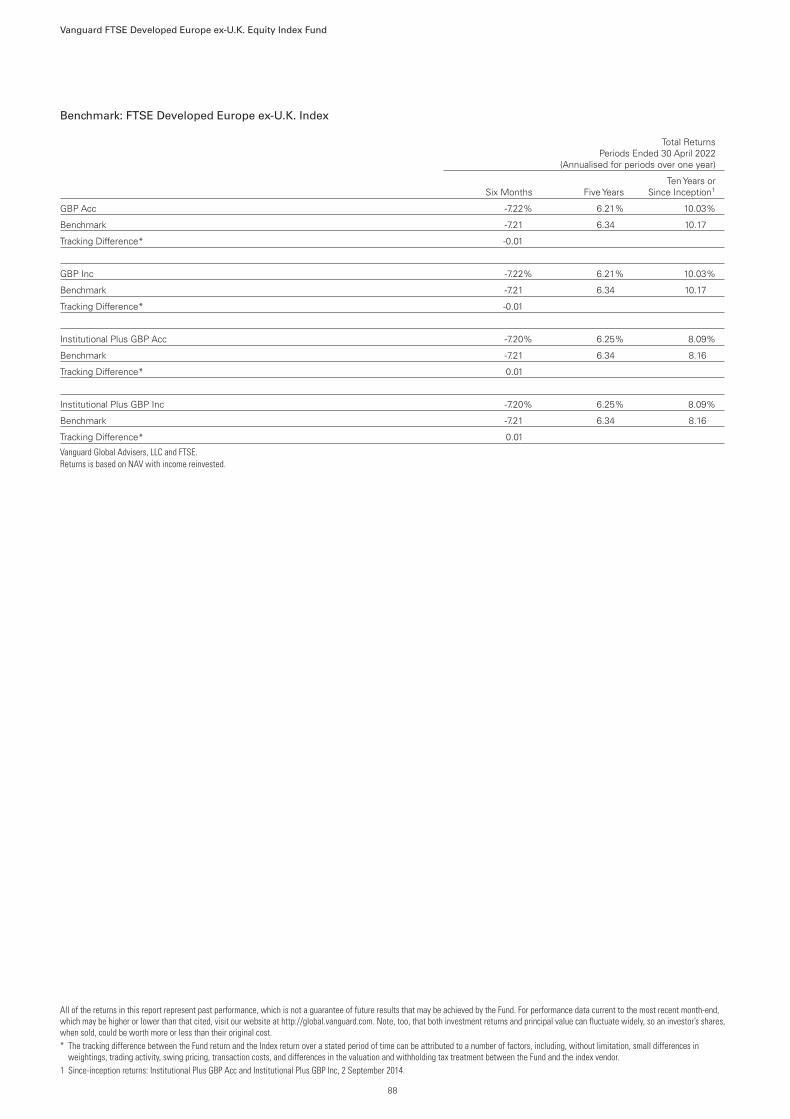
Benchmark: FTSE Developed Europe ex-U.K. Index
Total ReturnsPeriods Ended 30 April 2022
(Annualised for periods over one year)
Six Months Five YearsTen Years or
Since Inception1
GBP Acc -7.22% 6.21% 10.03%
Benchmark -7.21 6.34 10.17
Tracking Difference* -0.01
GBP Inc -7.22% 6.21% 10.03%
Benchmark -7.21 6.34 10.17
Tracking Difference* -0.01
Institutional Plus GBP Acc -7.20% 6.25% 8.09%
Benchmark -7.21 6.34 8.16
Tracking Difference* 0.01
Institutional Plus GBP Inc -7.20% 6.25% 8.09%
Benchmark -7.21 6.34 8.16
Tracking Difference* 0.01
Vanguard Global Advisers, LLC and FTSE.Returns is based on NAV with income reinvested.
All of the returns in this report represent past performance, which is not a guarantee of future results that may be achieved by the Fund. For performance data current to the most recent month-end,which may be higher or lower than that cited, visit our website at http://global.vanguard.com. Note, too, that both investment returns and principal value can fluctuate widely, so an investor’s shares,when sold, could be worth more or less than their original cost.* The tracking difference between the Fund return and the Index return over a stated period of time can be attributed to a number of factors, including, without limitation, small differences in
weightings, trading activity, swing pricing, transaction costs, and differences in the valuation and withholding tax treatment between the Fund and the index vendor.1 Since-inception returns: Institutional Plus GBP Acc and Institutional Plus GBP Inc, 2 September 2014.
Vanguard FTSE Developed Europe ex-U.K. Equity Index Fund
88

Performance Comparative Table
GBP Acc
For the PeriodEnded
30 April 2022For the Year Ended
31 October 2021For the Year Ended
31 October 2020For the Year Ended
31 October 2019
Closing Net Asset Value £2,464,548,426 £2,528,853,739 £1,648,665,318 £1,608,144,487
Closing Number of Shares 7,788,014 7,419,745 6,438,544 6,005,813
Closing Net Asset Value Per Share1 £316.45 £340.83 £256.06 £267.76
Operating Charges2 0.12% 0.12% 0.12% 0.12%
GBP Inc
Closing Net Asset Value £422,719,417 £443,755,116 £291,990,097 £239,056,192
Closing Number of Shares 1,821,830 1,776,103 1,525,554 1,170,783
Closing Net Asset Value Per Share1 £232.03 £249.85 £191.40 £204.18
Operating Charges2 0.12% 0.12% 0.12% 0.12%
Institutional Plus GBP Acc
Closing Net Asset Value £34,279,991 £170,490,643 £103,664,506 £23,460,402
Closing Number of Shares 188,832 872,151 706,098 152,874
Closing Net Asset Value Per Share1 £181.54 £195.48 £146.81 £153.46
Operating Charges2 0.08% 0.08% 0.08% 0.09%
Institutional Plus GBP Inc
Closing Net Asset Value £174,877,919 £190,403,988 £132,484,823 £118,802,885
Closing Number of Shares 1,146,446 1,159,471 1,053,169 885,257
Closing Net Asset Value Per Share1 £152.54 £164.22 £125.80 £134.20
Operating Charges2 0.08% 0.08% 0.08% 0.09%
1 The net asset value per share shown may diverge from the net asset value per share used for dealing purposes as at 30 April 2022 because of any adjustments for trade date accounting, swingpricing and any adjustments in valuation to bid prices.
2 Operating charges include indirect costs incurred in the maintenance and running of the Fund, as disclosed in the detailed expenses within the Statement of Total Return.
Vanguard FTSE Developed Europe ex-U.K. Equity Index Fund
89

Summary of Significant ChangesFor the period ended 30 April 2022
Cost(£)
Largest Purchases
Roche Holding AG (Non-voting) 8,486,416
Nestle SA 8,085,904
Novartis AG 4,944,023
LVMH Moet Hennessy Louis Vuitton SE 4,652,797
ASML Holding NV 4,595,027
Total 30,764,167
Total Purchases for the Period 234,055,242
Proceeds(£)
Largest Sales
Nestle SA 8,872,240
ASML Holding NV 6,469,196
Roche Holding AG (Non-voting) 5,045,758
Novartis AG 4,436,901
LVMH Moet Hennessy Louis Vuitton SE 3,499,248
Total 28,323,343
Total Sales for the Period 189,517,669
Vanguard FTSE Developed Europe ex-U.K. Equity Index Fund
90

Portfolio StatementAs at 30 April 2022
Holding
MarketValue
(£)
% ofTotal Net
Assets
Austria 0.47% (31 October 2021: 0.45%)
Erste Group Bank AG 157,702 3,942,253 0.13OMV AG 72,376 3,006,274 0.10Verbund AG 33,716 2,920,467 0.09ams-OSRAM AG 128,870 1,249,065 0.04ANDRITZ AG 36,616 1,246,409 0.04voestalpine AG 58,470 1,236,051 0.04Raiffeisen Bank International AG 67,658 618,038 0.02Telekom Austria AG 66,430 381,366 0.01
14,599,923 0.47
Belgium 1.92% (31 October 2021: 2.00%)
Anheuser-Busch InBev SA/NV 442,277 20,685,834 0.67KBC Group NV 140,649 7,720,626 0.25UCB SA 61,787 5,654,514 0.18Groupe Bruxelles Lambert SA 52,376 4,005,286 0.13Ageas SA/NV 91,778 3,554,154 0.12Umicore SA 105,823 3,293,095 0.11Solvay SA 35,274 2,696,275 0.09Elia Group SA/NV 17,772 2,276,097 0.07Warehouses De Pauw CVA 71,635 2,223,155 0.07Sofina SA 7,850 1,948,435 0.06Ackermans & van Haaren NV 11,454 1,647,767 0.05D'ieteren SA 11,896 1,556,688 0.05Proximus SADP 73,014 1,018,938 0.03Colruyt SA 25,066 739,184 0.02Telenet Group Holding NV 22,548 538,340 0.02
59,558,388 1.92
Denmark 5.45% (31 October 2021: 5.19%)
Novo Nordisk A/S Class B 813,124 75,206,753 2.43DSV PANALPINA A/S 99,494 13,199,390 0.43Vestas Wind Systems A/S 516,865 10,695,511 0.34Orsted A/S 96,553 8,648,690 0.28Genmab A/S 30,338 8,617,678 0.28Coloplast A/S Class B 68,154 7,429,787 0.24AP Moeller - Maersk A/S Class B 2,743 6,431,297 0.21Novozymes A/S Class B 101,699 5,731,468 0.18Carlsberg AS Class B 49,309 5,072,109 0.16AP Moeller - Maersk A/S Class A 2,177 4,975,771 0.16Danske Bank A/S 337,635 4,180,369 0.13Pandora A/S 47,833 3,415,535 0.11Chr Hansen Holding A/S 52,253 3,276,910 0.11Tryg A/S 156,688 3,002,474 0.10GN Store Nord A/S 65,275 1,984,550 0.06Demant A/S 52,440 1,869,274 0.06Royal Unibrew A/S 24,805 1,730,112 0.06SimCorp A/S 19,750 1,118,433 0.04Ambu A/S Class B 85,361 908,861 0.03Rockwool A/S Class B 3,156 711,668 0.02H Lundbeck A/S 31,485 581,345 0.02
168,787,985 5.45
Finland 2.75% (31 October 2021: 2.75%)
Nordea Bank Abp 1,866,682 15,078,579 0.49Nokia Oyj (OMXH) 2,885,597 11,840,923 0.38Sampo Oyj Class A 258,703 10,175,672 0.33Kone Oyj Class B 201,101 7,823,401 0.25UPM-Kymmene Oyj 273,002 7,615,086 0.25Neste Oyj 213,167 7,432,569 0.24Stora Enso Oyj Class R 294,142 4,700,852 0.15Elisa Oyj 74,058 3,483,790 0.11Fortum Oyj 223,456 2,993,904 0.10Kesko Oyj Class B 136,777 2,796,766 0.09Metso Outotec Oyj 310,104 2,153,076 0.07Valmet Oyj 84,847 1,840,935 0.06Orion Oyj Class B 52,300 1,659,309 0.06Wartsila OYJ Abp 249,265 1,625,446 0.05Kojamo Oyj 99,003 1,586,403 0.05Huhtamaki Oyj 48,465 1,479,127 0.05Nokian Renkaat Oyj 67,305 727,321 0.02
85,013,159 2.75
Holding
MarketValue
(£)
% ofTotal Net
Assets
France 21.42% (31 October 2021: 21.09%)
LVMH Moet Hennessy LouisVuitton SE 127,752 66,815,609 2.16
TotalEnergies SE 1,216,915 48,517,803 1.57Sanofi 556,897 47,561,179 1.54Schneider Electric SE 271,028 31,498,570 1.02Airbus SE 284,914 25,386,322 0.82BNP Paribas SA 547,756 22,978,679 0.74AXA SA 984,703 21,165,697 0.68EssilorLuxottica SA 151,056 20,889,151 0.67Vinci SA 256,691 20,119,384 0.65L'Oreal SA (Prime De Fidelite
2020) 65,128 19,183,932 0.62Pernod Ricard SA 106,940 17,844,563 0.58Air Liquide SA (Prime De Fidelite) 125,354 17,470,349 0.56Kering SA 37,568 16,273,801 0.53Hermes International 15,849 15,875,906 0.51Safran SA 178,380 15,523,494 0.50Danone SA 307,405 14,956,448 0.48Capgemini SE 81,957 13,565,063 0.44Dassault Systemes SE 340,937 12,243,046 0.40L'Oreal SA 40,419 11,905,714 0.38Cie de Saint-Gobain 239,263 11,374,439 0.37Air Liquide SA (Prime De Fidelite
2024) 72,347 10,082,864 0.33Legrand SA 136,920 9,797,759 0.32Orange SA 980,054 9,364,587 0.30Cie Generale des Etablissements
Michelin SCA 89,659 9,011,399 0.29Teleperformance 29,750 8,607,360 0.28Societe Generale SA 390,315 7,635,020 0.25Veolia Environnement SA 318,970 7,510,473 0.24Publicis Groupe SA 117,137 5,694,226 0.18Credit Agricole SA 619,552 5,407,334 0.17Carrefour SA 317,610 5,392,314 0.17Thales SA 51,414 5,293,368 0.17Edenred 127,689 5,177,677 0.17Eurofins Scientific SE 62,128 4,653,480 0.15Engie SA (Prime De Fidelite 2021) 447,742 4,279,765 0.14Worldline SA 124,904 3,991,270 0.13Getlink SE 231,695 3,418,242 0.11Vivendi SE 367,727 3,401,001 0.11Bureau Veritas SA 146,822 3,400,054 0.11Sartorius Stedim Biotech 12,364 3,265,086 0.11L Oreal S.A. 10,976 3,233,062 0.10Air Liquide SA (Prime De Fidelite
2023) 21,984 3,063,868 0.10Arkema SA 32,940 3,035,402 0.10Eiffage SA 37,916 3,023,064 0.10Bouygues SA 108,232 3,001,649 0.10L'Oreal (Prime Fidelite 2024) 9,614 2,831,874 0.09Alstom SA 150,189 2,677,941 0.09Rexel SA 154,738 2,565,056 0.08Air Liquide (Prime Fidelite 2024) 18,089 2,521,030 0.08Accor SA 93,987 2,501,847 0.08Engie SA 258,356 2,469,509 0.08Gecina SA 26,302 2,389,296 0.08Remy Cointreau SA 12,620 2,019,005 0.07Bollore SE 508,284 1,918,151 0.06Renault SA 95,065 1,892,088 0.06Klepierre SA 96,352 1,859,541 0.06SCOR SE 80,533 1,834,361 0.06Valeo SA 124,042 1,828,969 0.06Ubisoft Entertainment SA 49,346 1,794,303 0.06BioMerieux 21,660 1,660,036 0.05SOITEC 11,274 1,646,143 0.05Aeroports de Paris 14,352 1,642,407 0.05Dassault Aviation SA 11,983 1,618,656 0.05Ipsen SA 17,558 1,460,092 0.05Covivio 25,431 1,458,888 0.05Amundi SA 29,568 1,440,345 0.05CNP Assurances 77,790 1,371,271 0.04
Vanguard FTSE Developed Europe ex-U.K. Equity Index Fund
91

Holding
MarketValue
(£)
% ofTotal Net
Assets
La Francaise des Jeux SAEM 44,220 1,329,412 0.04Wendel SE 14,010 1,128,971 0.04Faurecia SE (XPAR) 60,422 1,074,292 0.03Electricite de France SA 139,286 1,020,930 0.03Electricite de France SA (Prime De
Fidelite 2021) 135,399 992,440 0.03Atos SE 49,298 973,899 0.03Eurazeo SA 14,152 879,356 0.03Sodexo SA 14,066 856,199 0.03Sodexo SA (Prime De Fidelite 2019) 13,541 824,242 0.03ICADE 16,958 816,769 0.03SEB SA (Prime De Fidelite 2025) 8,146 787,442 0.03Engie SA (Prime De Fidelite 2023) 77,033 736,324 0.02Orpea SA 24,323 697,971 0.02Engie SA (Prime Fidelite 2024) 66,178 632,566 0.02JCDecaux SA 35,909 606,927 0.02Eurazeo SE 9,028 560,968 0.02Sodexo (Prime De Fidelite 2023) 8,287 504,431 0.02SEB SA 5,032 486,424 0.02Neoen SA 14,572 469,704 0.01ALD SA 39,716 432,538 0.01Somfy SA 3,862 416,037 0.01Cie Plastic Omnium SA 26,652 350,113 0.01Sodexo (Prime De Fidelite 2024) 5,044 307,029 0.01Electricite de France SA (Prime De
Fidelite 2023) 26,924 197,346 0.01Cie de L'Odet SE 195 181,091 0.01Electricite de France SA (Prime De
Fidelite 2024) 23,133 169,559 0.01Sodexo1 2,541 154,671 0.00SEB SA (Prime Fidelite 2024) 1,354 130,886 0.00SEB SA (Prime De Fidelite 2023) 1,059 102,369 0.00Eurazeo SE (Prime Fidelite 2024) 1,263 78,478 0.00Sodexo (Prime De Fidelite 2022) 885 53,870 0.00Faurecia SE (MTTA) 3 53 0.00
663,243,589 21.42
Germany 16.36% (31 October 2021: 17.68%)
SAP SE 567,981 46,695,227 1.51Allianz SE 210,347 38,233,959 1.24Siemens AG 385,075 38,205,512 1.23Bayer AG 503,516 26,746,743 0.86Deutsche Telekom AG 1,731,711 25,631,604 0.83Mercedes-Benz Group AG 430,565 24,427,381 0.79BASF SE 468,706 19,891,994 0.64Deutsche Post AG 500,879 17,250,778 0.56Infineon Technologies AG 667,113 15,386,825 0.50adidas AG 93,875 15,275,334 0.49Muenchener Rueckversicherungs-
Gesellschaft AG 71,751 13,762,749 0.44Deutsche Boerse AG 94,055 13,193,230 0.43Vonovia SE 397,961 12,827,598 0.41Volkswagen AG - Preference
Shares 94,007 11,787,292 0.38Bayerische Motoren Werke AG 164,003 10,834,405 0.35RWE AG 322,748 10,795,604 0.35Merck KGaA 66,206 9,870,905 0.32E.ON SE 1,108,497 9,285,444 0.30Deutsche Bank AG 1,046,833 8,480,795 0.27Symrise AG 66,671 6,394,171 0.21Siemens Healthineers AG 141,893 6,128,588 0.20Fresenius SE & Co. KGaA 208,843 5,977,073 0.19Porsche Automobil Holding SE -
Preference Shares 78,505 5,253,156 0.17Fresenius Medical Care AG & Co.
KGaA 103,917 5,211,251 0.17Brenntag SE 79,143 4,940,386 0.16Daimler Truck Holding AG 216,108 4,690,745 0.15Henkel AG & Co. KGaA -
Preference Shares 88,937 4,616,207 0.15MTU Aero Engines AG 27,381 4,448,731 0.14Beiersdorf AG 51,280 4,142,267 0.13Rheinmetall AG 22,151 4,028,171 0.13Hannover Rueck SE 30,860 3,876,750 0.13Sartorius AG - Preference Shares 12,636 3,830,839 0.12Zalando SE 111,869 3,537,907 0.11HeidelbergCement AG 74,253 3,459,112 0.11
Holding
MarketValue
(£)
% ofTotal Net
Assets
Covestro AG 92,891 3,234,158 0.10LEG Immobilien SE 37,653 3,113,990 0.10Continental AG 54,865 3,054,311 0.10Puma SE 50,584 3,025,246 0.10Volkswagen AG 16,212 2,850,984 0.09HelloFresh SE 83,220 2,850,373 0.09Commerzbank AG 528,289 2,802,700 0.09Delivery Hero SE 97,322 2,774,668 0.09Henkel AG & Co. KGaA 52,377 2,679,675 0.09GEA Group AG 84,412 2,648,188 0.09Evonik Industries AG 98,224 2,074,788 0.07Scout24 SE 38,862 1,984,293 0.06Knorr-Bremse AG 33,913 1,953,773 0.06Carl Zeiss Meditec AG 18,716 1,895,318 0.06Deutsche Lufthansa AG 302,357 1,825,135 0.06Nemetschek SE 27,848 1,798,087 0.06KION Group AG 39,938 1,790,399 0.06Bayerische Motoren Werke AG -
Preference Shares 30,031 1,784,890 0.06CTS Eventim AG & Co. KGaA 30,234 1,684,645 0.05Bechtle AG 42,484 1,586,753 0.05thyssenkrupp AG 251,954 1,567,255 0.05Evotec SE 79,823 1,560,084 0.05United Internet AG 54,027 1,401,659 0.05LANXESS AG 44,470 1,381,229 0.04Vantage Towers AG 46,964 1,279,082 0.04Wacker Chemie AG 7,722 983,757 0.03Uniper SE 45,662 948,329 0.03Talanx AG 27,564 926,643 0.03FUCHS PETROLUB SE -
Preference Shares 35,142 898,362 0.03Rational AG 1,727 851,479 0.03Telefonica Deutschland Holding AG 349,833 847,050 0.03Fraport AG Frankfurt Airport
Services Worldwide 18,471 799,352 0.03Sixt SE 7,357 770,178 0.03Deutsche Wohnen SE 25,327 583,093 0.02Hella GmbH & Co. KGaA 11,345 573,720 0.02Fielmann AG 12,943 526,466 0.02Varta AG 6,919 522,449 0.02HOCHTIEF AG 9,754 478,934 0.02METRO AG 66,013 465,634 0.02DWS Group GmbH & Co. KGaA 17,206 456,410 0.011&1 Drillisch AG 24,485 413,841 0.01FUCHS PETROLUB SE 19,082 406,775 0.01Sixt SE - Preference Shares 6,963 405,028 0.01Auto1 Group SE 45,930 386,793 0.01Traton SE 24,842 333,886 0.01Sartorius AG 1,141 305,843 0.01
506,604,438 16.36
Ireland 0.47% (31 October 2021: 0.48%)
Kerry Group plc Class A 78,823 6,984,001 0.23Kingspan Group plc 77,406 5,820,044 0.19Glanbia plc 97,349 933,638 0.03AIB Group plc 390,595 686,557 0.02
14,424,240 0.47
Italy 3.94% (31 October 2021: 5.19%)
Enel SpA 3,980,857 20,921,116 0.68Eni SpA 1,268,432 14,317,510 0.46Intesa Sanpaolo SpA 8,505,723 13,953,966 0.45Assicurazioni Generali SpA 664,805 10,155,979 0.33UniCredit SpA 1,097,349 8,209,116 0.27Snam SpA 1,140,435 5,037,409 0.16Atlantia SpA 252,794 4,872,385 0.16Terna Rete Elettrica Nazionale SpA 722,355 4,748,255 0.15Moncler SpA 110,388 4,680,233 0.15FinecoBank Banca Fineco SpA 314,594 3,523,113 0.12Prysmian SpA 133,601 3,520,241 0.11Nexi SpA 383,072 3,047,787 0.10Mediobanca Banca di Credito
Finanziario SpA 354,716 2,873,690 0.09Amplifon SpA 66,143 2,133,124 0.07Recordati Industria Chimica e
Farmaceutica SpA 49,745 1,932,282 0.06Poste Italiane SpA 234,710 1,851,541 0.06
Vanguard FTSE Developed Europe ex-U.K. Equity Index Fund
92

Holding
MarketValue
(£)
% ofTotal Net
Assets
Leonardo SpA 202,915 1,679,525 0.06Infrastrutture Wireless Italiane SpA 180,213 1,548,827 0.05Reply SpA 11,703 1,395,085 0.05Interpump Group SpA 41,329 1,350,314 0.04Italgas SpA 250,811 1,310,709 0.04Telecom Italia SpA 5,492,749 1,288,223 0.04Hera SpA 407,328 1,227,325 0.04DiaSorin SpA 11,481 1,213,052 0.04A2A SpA 751,934 1,036,656 0.03Pirelli & C SpA 253,115 1,009,691 0.03Banca Mediolanum SpA 121,243 711,190 0.02Telecom Italia SpA - Preference
Shares 3,103,638 692,266 0.02Buzzi Unicem SpA 45,847 684,905 0.02De' Longhi SpA 35,152 682,569 0.02UnipolSai Assicurazioni SpA 229,328 517,324 0.02
122,125,408 3.94
Luxembourg 0.49% (31 October 2021: 0.00%)
ArcelorMittal SA 300,703 7,134,939 0.23Tenaris SA 237,716 2,958,182 0.09Aroundtown SA 587,830 2,396,006 0.08RTL Group SA 19,736 826,770 0.03Allegro.eu SA 192,092 809,538 0.03InPost SA 106,124 523,233 0.02SUSE SA 18,562 486,111 0.01
15,134,779 0.49
Netherlands 10.19% (31 October 2021: 10.20%)
ASML Holding NV 195,973 90,666,262 2.93Adyen NV 15,063 20,639,487 0.67Prosus NV 451,645 17,764,739 0.57ING Groep NV 1,935,607 14,864,029 0.48Koninklijke Ahold Delhaize NV 499,155 11,835,286 0.38Koninklijke DSM NV 85,094 11,533,953 0.37Stellantis NV 1,036,068 11,348,307 0.37Ferrari NV 63,633 10,878,683 0.35Wolters Kluwer NV 131,320 10,707,473 0.35STMicroelectronics NV 324,068 9,776,848 0.32Heineken NV 121,908 9,612,758 0.31Koninklijke Philips NV 448,419 9,462,504 0.31Universal Music Group BV 382,534 7,192,157 0.23NN Group NV 160,236 6,349,976 0.21Akzo Nobel NV 87,883 6,165,592 0.20Argenx SE 26,114 6,036,369 0.19ASM International NV 24,477 5,990,669 0.19CNH Industrial NV 503,974 5,812,029 0.19Koninklijke KPN NV 1,669,881 4,625,521 0.15QIAGEN NV 113,646 4,225,425 0.14Aegon NV 911,994 3,822,017 0.12IMCD NV 29,327 3,780,729 0.12Heineken Holding NV 53,628 3,379,795 0.11EXOR NV 52,522 2,962,898 0.10Unibail-Rodamco-Westfield (XPAR) 50,777 2,915,042 0.09Euronext NV 41,663 2,695,018 0.09ASR Nederland NV 67,535 2,471,080 0.08Randstad NV 56,135 2,409,396 0.08Davide Campari-Milano NV 253,489 2,303,786 0.07Signify NV 64,166 2,199,378 0.07ABN AMRO Bank NV 212,465 2,150,678 0.07Just Eat Takeaway.com NV 92,163 2,045,967 0.07Aalberts NV 49,515 1,948,848 0.06BE Semiconductor Industries NV 36,759 1,822,915 0.06JDE Peet's NV 43,614 1,029,513 0.03Koninklijke Vopak NV 34,694 750,417 0.02Iveco Group NV 101,021 481,272 0.02Pepco Group NV 55,768 424,942 0.01CTP NV 35,741 404,938 0.01Unibail-Rodamco-Westfield (XAMS) 1,438 82,554 0.00
315,569,250 10.19
Norway 1.75% (31 October 2021: 1.51%)
Equinor ASA 492,146 13,626,182 0.44DNB Bank ASA 525,183 8,320,077 0.27Mowi ASA 227,153 5,214,757 0.17Norsk Hydro ASA 686,038 4,729,550 0.15Telenor ASA 325,316 3,728,533 0.12
Holding
MarketValue
(£)
% ofTotal Net
Assets
Yara International ASA 83,878 3,477,201 0.11Orkla ASA 386,357 2,544,264 0.08TOMRA Systems ASA 59,783 1,921,003 0.06Aker BP ASA 63,654 1,868,628 0.06Salmar ASA 27,310 1,819,398 0.06Gjensidige Forsikring ASA 84,354 1,466,573 0.05Nordic Semiconductor ASA 79,040 1,304,998 0.04Leroy Seafood Group ASA 132,110 1,010,001 0.03Adevinta ASA 137,908 874,741 0.03Aker ASA Class A 12,618 837,893 0.03Schibsted ASA Class B 49,727 778,353 0.03Schibsted ASA Class A 38,863 662,599 0.02
54,184,751 1.75
Poland 0.49% (31 October 2021: 0.62%)
Powszechna Kasa OszczednosciBank Polski SA 432,000 2,592,934 0.09
Polski Koncern Naftowy ORLEN SA 158,610 2,182,641 0.07KGHM Polska Miedz SA 69,728 1,848,883 0.06Powszechny Zaklad Ubezpieczen
SA 285,547 1,604,168 0.05Bank Polska Kasa Opieki SA 80,196 1,438,178 0.05Dino Polska SA 24,283 1,279,760 0.04Polskie Gornictwo Naftowe i
Gazownictwo SA 905,928 1,029,483 0.03LPP SA 582 1,001,649 0.03Santander Bank Polska SA 14,825 725,421 0.03CD Projekt SA 32,522 719,987 0.02Cyfrowy Polsat SA 138,860 615,439 0.02
15,038,543 0.49
Portugal 0.34% (31 October 2021: 0.37%)
EDP - Energias de Portugal SA 1,446,152 5,423,272 0.18Galp Energia SGPS SA 266,247 2,614,167 0.08Jeronimo Martins SGPS SA 140,795 2,353,539 0.08Banco Espirito Santo SA1 529,326 4 —
10,390,982 0.34
Spain 5.09% (31 October 2021: 4.78%)
Iberdrola SA 3,071,854 28,553,332 0.92Banco Santander SA 8,640,247 20,541,290 0.66Banco Bilbao Vizcaya Argentaria SA 3,407,962 14,546,909 0.47Cellnex Telecom SA 311,263 11,709,587 0.38Amadeus IT Group SA 218,002 11,116,455 0.36Telefonica SA 2,600,966 10,171,199 0.33Industria de Diseno Textil SA 538,258 9,133,883 0.30Repsol SA 665,192 8,022,250 0.26CaixaBank SA 2,256,832 5,879,820 0.19Ferrovial SA 243,260 5,050,079 0.16Aena SME SA 36,049 4,148,184 0.13Red Electrica Corp. SA 219,190 3,540,011 0.11Endesa SA 161,669 2,732,497 0.09EDP Renovaveis SA 123,681 2,364,005 0.08ACS Actividades de Construccion y
Servicios SA 111,607 2,316,962 0.08Grifols SA 169,491 2,289,473 0.07Enagas SA 127,633 2,216,492 0.07Acciona SA 11,607 1,837,343 0.06Naturgy Energy Group SA 72,983 1,770,216 0.06Bankinter SA 350,205 1,664,561 0.05Siemens Gamesa Renewable
Energy SA 116,440 1,506,017 0.05Merlin Properties Socimi SA 167,615 1,473,101 0.05Fluidra SA 58,549 1,288,139 0.04Inmobiliaria Colonial Socimi SA 179,879 1,209,582 0.04Grifols SA Class B - Preference
Shares 134,186 1,181,573 0.04Mapfre SA 513,425 756,382 0.02Corp ACCIONA Energias
Renovables SA 25,315 754,435 0.02
157,773,777 5.09
Sweden 7.32% (31 October 2021: 7.47%)
Investor AB Class B 919,321 14,985,347 0.48Atlas Copco AB Class A 322,584 12,423,644 0.40Hexagon AB 960,737 10,470,220 0.34
Vanguard FTSE Developed Europe ex-U.K. Equity Index Fund
93

Holding
MarketValue
(£)
% ofTotal Net
Assets
Telefonaktiebolaget LM EricssonClass B 1,543,591 10,436,862 0.34
Volvo AB Class B 774,055 10,413,502 0.34Assa Abloy AB Class B 469,607 10,000,312 0.32Sandvik AB 551,389 8,819,279 0.29Evolution Gaming Group AB 82,678 7,243,388 0.23Skandinaviska Enskilda Banken AB
Class A 738,395 7,021,623 0.23Essity AB Class B 312,024 6,906,962 0.22Swedbank AB Class A 514,082 6,855,777 0.22Atlas Copco AB Class B 194,386 6,489,066 0.21Svenska Handelsbanken AB
Class A 760,557 6,470,046 0.21Epiroc AB Class A 319,657 5,490,223 0.18Swedish Match AB 790,330 5,287,359 0.17Boliden AB 140,195 5,120,656 0.17Nibe Industrier AB 613,903 5,073,845 0.16Svenska Cellulosa AB SCA Class B 304,879 4,978,729 0.16Investor AB Class A 282,411 4,965,656 0.16Hennes & Mauritz AB Class B 448,937 4,760,623 0.15Telia Co. AB 1,317,154 4,580,459 0.15Alfa Laval AB 160,781 3,781,659 0.12EQT AB 144,870 3,503,407 0.11Lundin Energy AB 96,068 3,342,438 0.11Skanska AB Class B 185,235 2,979,292 0.10Indutrade AB 142,889 2,859,557 0.09Epiroc AB Class B 192,934 2,835,173 0.09Tele2 AB Class B 254,419 2,812,667 0.09Getinge AB Class B 115,267 2,794,368 0.09SKF AB Class B 195,414 2,690,688 0.09Industrivarden AB Class A 116,345 2,522,046 0.08Holmen AB Class B 49,247 2,408,663 0.08Castellum AB 140,426 2,346,858 0.08Trelleborg AB Class B 124,404 2,304,701 0.07Fastighets AB Balder Class B 51,216 2,152,583 0.07Lifco AB 116,208 2,062,050 0.07Kinnevik AB Class B 120,521 1,994,747 0.06Sagax AB Class B 88,555 1,914,368 0.06Industrivarden AB Class C 86,624 1,845,400 0.06Beijer Ref AB 125,036 1,711,021 0.06Husqvarna AB Class B 204,957 1,652,166 0.05Investment AB Latour Class B 73,937 1,651,114 0.05Swedish Orphan Biovitrum AB 89,987 1,594,479 0.05Securitas AB Class B 157,111 1,563,412 0.05Thule Group AB 52,796 1,549,436 0.05Electrolux AB 119,463 1,540,590 0.05L E Lundbergforetagen AB Class B 37,591 1,484,139 0.05Samhallsbyggnadsbolaget i Norden
AB 559,717 1,482,889 0.05Volvo AB Class A 103,962 1,438,535 0.05Sweco AB Class B 103,625 1,233,182 0.04Elekta AB Class B 185,121 1,050,720 0.03Sinch AB 279,243 1,047,575 0.03Vitrolife AB 33,091 716,762 0.02Svenska Handelsbanken AB 21,399 202,490 0.01Svenska Cellulosa AB SCA Class A 10,186 166,642 0.01Kinnevik AB Class A 8,812 151,948 0.01Sagax AB Class D 53,863 138,630 0.01Telefonaktiebolaget LM Ericsson
Class A 16,008 113,404 0.00Husqvarna AB Class A 10,800 88,068 0.00Skandinaviska Enskilda Banken AB 6,801 69,439 0.00Samhallsbyggnadsbolaget i Norden
AB Class D 26,216 57,675 0.00
226,648,559 7.32
Holding
MarketValue
(£)
% ofTotal Net
Assets
Switzerland 20.53% (31 October 2021: 18.93%)
Nestle SA 1,409,857 141,827,414 4.58Roche Holding AG (Non-voting) 360,138 104,200,958 3.37Novartis AG 1,074,900 74,233,296 2.40Zurich Insurance Group AG 76,083 27,085,676 0.87Cie Financiere Richemont SA 261,444 24,108,780 0.78UBS Group AG 1,629,025 21,739,458 0.70ABB Ltd. 839,941 19,849,751 0.64Sika AG 78,331 18,817,869 0.61Lonza Group AG 37,944 17,516,034 0.57Givaudan SA 4,724 14,686,571 0.47Alcon Inc. 235,368 13,206,683 0.43Holcim AG 280,921 10,799,287 0.35Partners Group Holding AG 11,485 9,605,050 0.31Swiss Re AG 147,818 9,479,067 0.31Geberit AG 17,919 8,011,547 0.26Sonova Holding AG 27,198 7,713,021 0.25Swiss Life Holding AG 15,913 7,279,830 0.24Credit Suisse Group AG 1,316,875 7,063,161 0.23SGS SA 3,007 6,054,706 0.20Swisscom AG 13,011 5,989,629 0.19Kuehne + Nagel International AG 25,644 5,632,367 0.18Chocoladefabriken Lindt &
Spruengli AG 559 4,882,516 0.16Straumann Holding AG 51,610 4,800,366 0.15Chocoladefabriken Lindt &
Spruengli AG Registered 51 4,641,834 0.15Roche Holding AG - Bearer Shares 13,608 4,267,567 0.14Julius Baer Group Ltd. 109,508 4,131,067 0.13Logitech International SA 74,929 3,854,962 0.12Siemens Energy AG 220,740 3,442,047 0.11Vifor Pharma AG 24,993 3,433,109 0.11Barry Callebaut AG 1,806 3,247,138 0.10VAT Group AG 13,234 3,243,725 0.10Schindler Holding AG (Non-voting) 20,613 3,116,993 0.10Baloise Holding AG 22,802 3,100,289 0.10Swatch Group AG - Bearer Shares 15,050 3,058,010 0.10Swiss Prime Site AG 38,089 2,904,140 0.09SIG Combibloc Group AG 170,614 2,797,884 0.09EMS-Chemie Holding AG 3,618 2,531,833 0.08Adecco Group AG 80,417 2,449,385 0.08Temenos AG 30,861 2,445,676 0.08PSP Swiss Property AG 22,024 2,166,314 0.07Belimo Holding AG 4,663 1,807,462 0.06Georg Fischer AG 42,160 1,799,131 0.06Helvetia Holding AG 17,777 1,786,894 0.06Clariant AG 117,184 1,568,975 0.05Tecan Group AG 6,479 1,528,034 0.05Schindler Holding AG 9,976 1,506,927 0.05Flughafen Zurich AG 9,670 1,280,818 0.04DKSH Holding AG 18,092 1,213,334 0.04Banque Cantonale Vaudoise 14,709 971,775 0.03BKW AG 9,252 879,755 0.03Swatch Group AG - Registered
Shares 21,340 827,006 0.03Emmi AG 977 757,405 0.02Vifor Pharma AG - Blue Chip
Shares 1,902 262,631 0.01
635,605,157 20.53
Total Equities 3,064,702,928 98.98
Vanguard FTSE Developed Europe ex-U.K. Equity Index Fund
94

Number ofContracts
Long/(Short)
NotionalAmount
(£)
UnrealisedGain/(Loss)
(£)
% ofTotal Net
Assets
Financial Derivative Instruments 0.00% (31 October 2021: 0.05%)
Futures Contracts 0.01% (31 October 2021: 0.05%)
Euro STOXX 50 Index June 2022 480 15,060,194 125,500 0.01STOXX Europe 600 Index June 2022 905 16,942,551 97,640 0.00Swiss Market Index June 2022 59 5,852,788 9,160 0.00
232,300 0.01
CurrencyBuy
Amount Currency(Sell)
Amount CounterpartySettlement
Date
UnrealisedGain/(Loss)
(£)
% ofTotal Net
Assets
Forward Currency Exchange Contracts (0.01%) (31 October 2021: 0.00%)
EUR 18,735,576 GBP (15,651,119) Goldman Sachs 15/6/22 120,666 0.00EUR 5,892,165 CHF (5,971,950) BNP Paribas 15/6/22 49,901 0.00EUR 2,561,672 CHF (2,602,226) JP Morgan Chase Bank 15/6/22 16,872 0.00CHF 2,318,391 EUR (2,246,827) BNP Paribas 15/6/22 14,797 0.00CHF 2,369,620 EUR (2,302,021) BNP Paribas 15/6/22 10,455 0.00EUR 922,383 CHF (937,638) State Street Bank 15/6/22 5,538 0.00CHF 2,019,728 EUR (1,966,478) State Street Bank 15/6/22 5,235 0.00CHF 1,468,866 EUR (1,432,801) BNP Paribas 15/6/22 1,566 0.00GBP 1,626,281 EUR (1,930,210) State Street Bank 15/6/22 1,412 0.00EUR 134,509 NOK (1,321,379) BNP Paribas 15/6/22 255 0.00EUR 247,582 CHF (253,911) State Street Bank 15/6/22 (351) (0.00)EUR 843,906 DKK (6,282,466) BNP Paribas 15/6/22 (510) (0.00)EUR 573,780 CHF (589,883) State Street Bank 15/6/22 (1,992) (0.00)CHF 2,744,568 EUR (2,685,043) BNP Paribas 15/6/22 (3,692) (0.00)CHF 619,059 EUR (609,855) BNP Paribas 15/6/22 (4,387) (0.00)EUR 627,239 USD (695,137) JP Morgan Chase Bank 15/6/22 (25,639) (0.00)EUR 8,520,573 CHF (8,787,148) JP Morgan Chase Bank 15/6/22 (52,155) (0.00)CHF 9,616,053 EUR (9,515,857) State Street Bank 15/6/22 (104,153) (0.00)GBP 14,184,378 EUR (17,037,228) State Street Bank 15/6/22 (157,722) (0.01)
(123,904) (0.01)
Total Financial Derivative Instruments 108,396 0.00
MarketValue
(£)
% ofTotal Net
Assets
Portfolio of Investments 3,064,811,324 98.98
Net Other Assets 31,614,429 1.02
Net Assets Attributable to Shareholders 3,096,425,753 100.00
All holdings are listed on an official stock exchange or are traded on an eligible securities market, unless otherwise stated.1 Manually priced securities.
Vanguard FTSE Developed Europe ex-U.K. Equity Index Fund
95

As at As at
30 April 2022(£)
31 October 2021(£)
Assets:
Financial Assets 3,065,161,925 3,292,502,161Current Assets
Debtors 16,830,783 12,034,428Cash and Bank Balances 24,650,700 50,112,739
Total Assets 3,106,643,408 3,354,649,328
Liabilities:
Financial Liabilities 350,601 176,280Creditors
Bank Overdrafts 2,895,389 151,785Distribution Payable — 12,771,738Other Creditors 6,971,665 8,046,039
Total Liabilities 10,217,655 21,145,842
Net Assets Attributable to Shareholders 3,096,425,753 3,333,503,486
Statement of Total Return
Period Ended Period Ended
30 April 2022(£)
30 April 2022(£)
30 April 2021(£)
30 April 2021(£)
IncomeNet Capital Gains/(Losses) (267,226,574) 511,860,516Revenue 44,560,800 37,278,324
Expenses (1,967,226) (1,609,013)
Net Revenue Before Taxation 42,593,574 35,669,311Taxation (6,897,801) (5,926,391)
Net Revenue After Taxation 35,695,773 29,742,920
Total Return Before Distributions (231,530,801) 541,603,436
Distributions1 173,210 613,163
Change in Net Assets Attributable to
Shareholders From Investment Activities (231,357,591) 542,216,598
1 Includes adjustments for equalisation.
Statement of Change in Net Assets Attributable to Shareholders
Period Ended Period Ended
30 April 2022(£)
30 April 2022(£)
30 April 2021(£)
30 April 2021(£)
Opening Net Assets Attributable to Shareholders 3,333,503,486 2,176,804,744
Amounts Received on Issue of Shares 276,661,847 332,811,993Amounts Paid on Cancellation of Shares (282,414,533) (86,017,453)
(5,752,686) 246,794,540
Dilution Adjustment 32,544 41,048Change in Net Assets Attributable to
Shareholders From Investment Activities (231,357,591) 542,216,598
Closing Net Assets Attributable to Shareholders 3,096,425,753 2,965,856,930
The interim financial statements for the Fund have been prepared on the same basis of the accounting policies as the annual financial statements for the year ended 31 October 2021.
Vanguard FTSE Developed Europe ex-U.K. Equity Index Fund
Balance Sheet
96

Investment Objective
Vanguard FTSE Developed World ex-U.K. Equity Index Fund (the “Fund”) seeks to track the performance of the FTSE Developed ex-U.K. Index (the “Index”).
Investment Strategy
The Fund is a passive fund that seeks to achieve its investment objective by investing in a representative sample of the component shares of the Index.
Synthetic Risk and Reward Indicator
Lower risk
Typically lower rewards
Higher risk
Typically higher rewards
1 2 3 4 5 6 7
The Synthetic Risk and Reward Indicator (SRRI) measures the volatility of the Fund. The risk and reward category (which may range from 1 to 7) is calculatedusing historical data and may not be a reliable indicator of the Fund’s future risk profile. The risk and reward category may shift over time and is not a target orguarantee. The lowest category (i.e. category 1) does not mean “risk free”. The Fund appears in the higher range of the risk and reward indicator because thevalues of the Fund’s investments have experienced a higher rate of change in the past.
Performance SummaryThe Performance Summary does not form part of the Financial Statements.
• Volatility surged and global financial markets slumped during the six months ended 30 April 2022. When the period began, supply bottlenecks, rising oil pricesand the prospect of less accommodative monetary policy were already weighing on market sentiment.
• Then Russia’s invasion of Ukraine injected substantial uncertainty into the markets. Energy prices soared, helping to push consumer prices to multidecadehighs across much of the world. Some central banks, including those in the United States and the United Kingdom, raised short-term interest rates. TheEuropean Central Bank continued to reduce its bond purchases and was expected to raise rates later this year.
• While consumer sentiment flagged during the period, in many markets unemployment remained low, consumer balance sheets healthy and corporate profitsrobust.
• With central banks turning less accommodative and inflation looking set to remain elevated for some time, bond yields in many markets moved higher acrossthe maturity spectrum. The Bloomberg Global Aggregate Bond Index hedged to British pounds, a global bond proxy, returned about –7% for the six months.
• Stocks regained some ground in March but finished the six months with a negative return. The FTSE Global All Cap Index, a proxy for global stocks, returnedabout –4%.
• In this environment, the Fund’s benchmark Index returned –3.55% for the six months.
• The US, by far the largest market in the Fund’s Index, performed a little better than the index as a whole. Among other countries with large weightings in theindex, Canada, Australia and Switzerland performed well, posting positive returns. In contrast, Germany, Sweden and the Netherlands were among thebiggest detractors.
• By industry sector, performances varied widely. Energy, consumer staples and utilities posted double-digit gains, while technology and consumerdiscretionary recorded double-digit declines.
Vanguard FTSE Developed World ex-U.K. Equity Index FundManaged by Vanguard Global Advisers, LLC.
97

Benchmark: FTSE Developed ex-U.K. Index
Total ReturnsPeriods Ended 30 April 2022
(Annualised for periods over one year)
Six Months Five YearsTen Years or
Since Inception1
GBP Acc -3.59% 11.12% 13.37%
Benchmark -3.55 11.26 13.56
Tracking Difference* -0.04
GBP Inc -3.59% 11.12% 13.37%
Benchmark -3.55 11.26 13.56
Tracking Difference* -0.04
Institutional Plus GBP Acc -3.56% 11.18% 12.79%
Benchmark -3.55 11.26 12.87
Tracking Difference* -0.01
Institutional Plus GBP Inc -3.56% 11.18% 12.79%
Benchmark -3.55 11.26 12.87
Tracking Difference* -0.01
Vanguard Global Advisers, LLC and FTSE.Returns is based on NAV with income reinvested.
All of the returns in this report represent past performance, which is not a guarantee of future results that may be achieved by the Fund. For performance data current to the most recent month-end,which may be higher or lower than that cited, visit our website at http://global.vanguard.com. Note, too, that both investment returns and principal value can fluctuate widely, so an investor’s shares,when sold, could be worth more or less than their original cost.* The tracking difference between the Fund return and the Index return over a stated period of time can be attributed to a number of factors, including, without limitation, small differences in
weightings, trading activity, transaction costs, swing pricing and differences in the valuation and withholding tax treatment between the Fund and the index vendor.1 Since-inception returns: Institutional Plus GBP Acc and Institutional Plus GBP Inc, 2 September 2014.
Vanguard FTSE Developed World ex-U.K. Equity Index Fund
98

Performance Comparative Table
GBP Acc
For the PeriodEnded
30 April 2022For the Year Ended
31 October 2021For the Year Ended
31 October 2020For the Year Ended
31 October 2019
Closing Net Asset Value £10,638,111,914 £10,536,991,376 £7,096,914,030 £5,669,235,871
Closing Number of Shares 20,768,832 19,833,620 17,624,558 14,924,871
Closing Net Asset Value Per Share1 £512.22 £531.27 £402.67 £379.85
Operating Charges2 0.14% 0.14% 0.14% 0.15%
GBP Inc
Closing Net Asset Value £895,161,561 £969,641,223 £782,078,658 £763,537,591
Closing Number of Shares 2,173,380 2,269,994 2,385,421 2,429,195
Closing Net Asset Value Per Share1 £411.88 £427.16 £327.86 £314.32
Operating Charges2 0.14% 0.14% 0.14% 0.15%
Institutional Plus GBP Acc
Closing Net Asset Value £19,191,589 £34,510,827 £73,043,852 £56,835,525
Closing Number of Shares 76,358 132,423 370,002 305,369
Closing Net Asset Value Per Share1 £251.34 £260.61 £197.41 £186.12
Operating Charges2 0.08% 0.08% 0.08% 0.10%
Institutional Plus GBP Inc
Closing Net Asset Value £49,322,393 £62,927,334 £99,123,472 £89,021,400
Closing Number of Shares 222,744 274,102 562,571 527,000
Closing Net Asset Value Per Share1 £221.43 £229.58 £176.20 £168.92
Operating Charges2 0.08% 0.08% 0.08% 0.10%
1 The net asset value per share shown may diverge from the net asset value per share used for dealing purposes as at 30 April 2022 because of any adjustments for trade date accounting, swingpricing and any adjustments in valuation to bid prices.
2 Operating charges include indirect costs incurred in the maintenance and running of the Fund, as disclosed in the detailed expenses within the Statement of Total Return.
Vanguard FTSE Developed World ex-U.K. Equity Index Fund
99

Summary of Significant ChangesFor the period ended 30 April 2022
Cost(£)
Largest Purchases
Apple Inc. 24,948,541
Microsoft Corp. 23,013,063
Alphabet Inc. Class A 16,026,284
BHP Group Ltd. 15,512,133
Tesla Inc. 14,120,807
Total 93,620,828
Total Purchases for the Period 689,931,114
Proceeds(£)
Largest Sales
Apple Inc. 8,921,492
Kansas City Southern 5,199,919
Meta Platforms Inc. 4,616,034
Alphabet Inc. Class A 3,076,093
Bank of America Corp. 2,662,937
Total 24,476,475
Total Sales for the Period 115,767,411
Vanguard FTSE Developed World ex-U.K. Equity Index Fund
100

Portfolio StatementAs at 30 April 2022
Holding
MarketValue
(£)
% ofTotal Net
Assets
Australia 2.60% (31 October 2021: 2.22%)
BHP Group Ltd. 1,380,011 37,501,894 0.32Commonwealth Bank of Australia 465,304 27,354,203 0.24CSL Ltd. 131,063 20,252,643 0.17National Australia Bank Ltd. 890,668 16,440,143 0.14Westpac Banking Corp. 966,484 13,047,341 0.11Australia & New Zealand Banking
Group Ltd. 770,840 11,907,120 0.10Macquarie Group Ltd. 95,780 11,192,540 0.10Wesfarmers Ltd. 309,202 8,637,109 0.07Woolworths Group Ltd. 333,659 7,271,140 0.06Rio Tinto Ltd. 103,628 6,614,106 0.06Transurban Group Stapled 811,842 6,589,609 0.06Goodman Group 486,449 6,577,978 0.06Fortescue Metals Group Ltd. 440,998 5,394,241 0.05Woodside Petroleum Ltd. 269,651 4,749,858 0.04Amcor plc 404,868 3,868,342 0.03Santos Ltd. 823,513 3,724,399 0.03Newcrest Mining Ltd. 243,828 3,709,811 0.03Aristocrat Leisure Ltd. 190,947 3,622,895 0.03South32 Ltd. 1,334,074 3,594,396 0.03Coles Group Ltd. 331,698 3,503,430 0.03James Hardie Industries plc 125,587 2,946,512 0.03QBE Insurance Group Ltd. 386,046 2,685,529 0.02Sonic Healthcare Ltd. 128,983 2,680,860 0.02Telstra Corp. Ltd. 1,171,022 2,664,588 0.02Brambles Ltd. 418,783 2,500,809 0.02Scentre Group 1,463,100 2,476,191 0.02Cochlear Ltd. 18,633 2,443,488 0.02ASX Ltd. 48,990 2,398,903 0.02APA Group Stapled 348,848 2,266,820 0.02Ramsay Health Care Ltd. 48,634 2,231,717 0.02Computershare Ltd. 155,260 2,226,044 0.02Suncorp Group Ltd. 343,521 2,216,650 0.02Xero Ltd. 36,576 1,990,602 0.02Dexus 293,182 1,851,998 0.02Tabcorp Holdings Ltd. 568,717 1,751,193 0.02Origin Energy Ltd. 443,883 1,713,530 0.02Insurance Australia Group Ltd. 633,249 1,616,553 0.01Northern Star Resources Ltd. 285,617 1,587,576 0.01BlueScope Steel Ltd. 131,489 1,527,979 0.01Mirvac Group 1,116,367 1,522,871 0.01SEEK Ltd. 94,166 1,508,943 0.01Endeavour Group Ltd. 332,925 1,462,336 0.01GPT Group 488,019 1,406,026 0.01Lendlease Corp. Ltd. Stapled 202,673 1,399,570 0.01Stockland 581,123 1,365,071 0.01IGO Ltd. 182,953 1,363,843 0.01OZ Minerals Ltd. 93,392 1,318,394 0.01Ampol Ltd. 68,605 1,314,090 0.01Medibank Private Ltd. 719,214 1,302,708 0.01Mineral Resources Ltd. 38,967 1,290,965 0.01Lynas Rare Earths Ltd. 244,450 1,266,048 0.01Washington H Soul Pattinson & Co.
Ltd. 78,109 1,227,767 0.01Incitec Pivot Ltd. 560,799 1,225,275 0.01Treasury Wine Estates Ltd. 188,298 1,195,852 0.01Orica Ltd. 128,343 1,195,752 0.01WiseTech Global Ltd. 43,935 1,115,850 0.01Evolution Mining Ltd. 476,820 1,093,071 0.01Pilbara Minerals Ltd. 674,984 1,085,052 0.01Allkem Ltd. 156,461 1,084,879 0.01Charter Hall Group 119,715 1,060,478 0.01REA Group Ltd. 14,443 1,057,212 0.01ALS Ltd. 141,207 1,042,252 0.01Aurizon Holdings Ltd. 421,480 956,666 0.01Vicinity Centres 883,612 935,281 0.01carsales.com Ltd. 77,242 930,825 0.01Atlas Arteria Ltd. Stapled 233,597 918,948 0.01Bendigo & Adelaide Bank Ltd. 150,793 908,159 0.01AGL Energy Ltd. 173,838 846,218 0.01JB Hi-Fi Ltd. 28,175 842,048 0.01
Holding
MarketValue
(£)
% ofTotal Net
Assets
Challenger Ltd. 193,463 796,107 0.01Cleanaway Waste Management
Ltd. 438,370 791,536 0.01Alumina Ltd. 748,849 765,086 0.01IDP Education Ltd. 50,041 759,951 0.01Reece Ltd. 75,982 750,920 0.01Crown Resorts Ltd. 102,060 745,220 0.01Bank of Queensland Ltd. 154,532 711,128 0.01Worley Ltd. 88,737 698,668 0.01Sims Ltd. 56,734 666,989 0.01Domino's Pizza Enterprises Ltd. 15,219 648,750 0.01NEXTDC Ltd. 102,254 647,663 0.01AMP Ltd. 961,833 628,812 0.01Altium Ltd. 33,630 622,653 0.01Ansell Ltd. 40,130 620,340 0.01Iluka Resources Ltd. 91,024 584,262 0.01Whitehaven Coal Ltd. 207,853 577,666 0.01Metcash Ltd. 212,445 575,998 0.01Qube Holdings Ltd. 331,522 551,694 0.01Qantas Airways Ltd. 173,396 548,643 0.00Shopping Centres Australasia
Property Group 309,823 538,383 0.00Flight Centre Travel Group Ltd. 41,217 526,559 0.00Downer EDI Ltd. 163,571 512,926 0.00Orora Ltd. 202,554 455,167 0.00Seven Group Holdings Ltd. 37,235 420,890 0.00CSR Ltd. 113,151 391,966 0.00Perpetual Ltd. 20,605 384,414 0.00Harvey Norman Holdings Ltd. 122,059 350,972 0.00Star Entertainment Group Ltd. 190,207 338,061 0.00Beach Energy Ltd. 358,848 329,052 0.00Nufarm Ltd. 89,329 324,108 0.00TPG Telecom Ltd. 95,870 319,080 0.00Magellan Financial Group Ltd. 34,760 317,754 0.00Pro Medicus Ltd. 9,812 263,421 0.00Insignia Financial Ltd. 129,761 254,132 0.00Deterra Royalties Ltd. 91,024 248,337 0.00Domain Holdings Australia Ltd. 123,983 247,027 0.00Boral Ltd. 111,889 226,097 0.00Adbri Ltd. 92,562 152,987 0.00Platinum Asset Management Ltd. 107,909 113,608 0.00Appen Ltd. 24,203 90,554 0.00
302,070,771 2.60
Austria 0.06% (31 October 2021: 0.07%)
Erste Group Bank AG 85,780 2,134,221 0.02OMV AG 38,574 1,594,685 0.01Verbund AG 17,864 1,540,072 0.01voestalpine AG 28,096 591,145 0.01ANDRITZ AG 16,008 542,341 0.01Raiffeisen Bank International AG 40,097 364,548 0.00Telekom Austria AG 24,588 140,491 0.00
6,907,503 0.06
Belgium 0.30% (31 October 2021: 0.30%)
Anheuser-Busch InBev SA/NV 231,119 10,758,716 0.09KBC Group NV 75,411 4,119,995 0.04Argenx SE 14,144 3,254,024 0.03UCB SA 31,593 2,877,632 0.02Groupe Bruxelles Lambert SA 27,984 2,129,890 0.02Ageas SA/NV 48,325 1,862,583 0.02Solvay SA 22,245 1,692,341 0.01Umicore SA 53,371 1,653,011 0.01Elia Group SA/NV 10,324 1,315,978 0.01Warehouses De Pauw CVA 38,889 1,201,205 0.01Sofina SA 3,936 972,338 0.01D'ieteren SA 5,940 773,630 0.01Ackermans & van Haaren NV 5,340 764,585 0.01Proximus SADP 52,356 727,201 0.01Colruyt SA 13,035 382,582 0.00Telenet Group Holding NV 13,600 323,172 0.00
34,808,883 0.30
Vanguard FTSE Developed World ex-U.K. Equity Index Fund
101

Holding
MarketValue
(£)
% ofTotal Net
Assets
Bermuda 0.00% (31 October 2021: 0.14%)
Canada 3.23% (31 October 2021: 2.87%)
Royal Bank of Canada 387,797 31,326,485 0.27Toronto-Dominion Bank 498,184 28,780,923 0.25Enbridge Inc. 551,933 19,283,003 0.17Bank of Nova Scotia 329,549 16,687,012 0.14Canadian Natural Resources Ltd. 319,502 15,819,862 0.14Bank of Montreal 181,203 15,367,205 0.13Canadian National Railway Co. 162,871 15,326,956 0.13Canadian Pacific Railway Ltd. 256,448 15,018,403 0.13Brookfield Asset Management Inc.
Class A 366,759 14,605,514 0.13Nutrien Ltd. 155,247 12,202,319 0.11Suncor Energy Inc. 390,182 11,212,374 0.10TC Energy Corp. 263,916 11,176,103 0.10Canadian Imperial Bank of
Commerce 117,969 10,439,782 0.09Shopify Inc. Class A (XTSE) 29,468 10,039,478 0.09Barrick Gold Corp. 484,209 8,642,534 0.07Manulife Financial Corp. 531,202 8,312,691 0.07Waste Connections Inc. 73,681 8,135,897 0.07Alimentation Couche-Tard Inc. 219,531 7,810,721 0.07Constellation Software Inc. 5,277 6,643,703 0.06Franco-Nevada Corp. 52,201 6,302,146 0.05Sun Life Financial Inc. 157,811 6,279,620 0.05Agnico Eagle Mines Ltd. 121,595 5,653,140 0.05Cenovus Energy Inc. 351,622 5,204,450 0.04National Bank of Canada 89,125 4,980,048 0.04Fortis Inc. 124,029 4,827,924 0.04Pembina Pipeline Corp. 157,470 4,761,610 0.04Intact Financial Corp. 39,379 4,399,542 0.04Rogers Communications Inc.
Class B 97,803 4,258,101 0.04Wheaton Precious Metals Corp. 118,214 4,227,315 0.04Teck Resources Ltd. Class B 122,453 3,866,071 0.03CGI Inc. 58,101 3,702,752 0.03BCE Inc. 85,126 3,619,702 0.03Restaurant Brands
International Inc. 79,379 3,618,722 0.03Power Corp. of Canada 151,961 3,577,909 0.03Magna International Inc. 73,854 3,556,478 0.03Thomson Reuters Corp. 44,120 3,521,147 0.03Dollarama Inc. 77,553 3,448,481 0.03Loblaw Cos. Ltd. 45,809 3,351,329 0.03Metro Inc. 69,653 3,058,131 0.03Shaw Communications Inc.
Class B 112,269 2,674,150 0.02Fairfax Financial Holdings Ltd. 5,966 2,621,245 0.02Imperial Oil Ltd. 61,901 2,484,770 0.02George Weston Ltd. 19,829 1,969,934 0.02Hydro One Ltd. 89,378 1,928,381 0.02Canadian Tire Corp. Ltd. Class A 15,224 1,676,963 0.01Great-West Lifeco Inc. 69,260 1,527,992 0.01TELUS Corp. Foreign 64,958 1,301,109 0.01Bausch Health Cos. Inc. 82,808 1,256,627 0.01TELUS Corp. 57,808 1,156,454 0.01Saputo Inc. 58,338 997,270 0.01Canadian Utilities Ltd. Class A 31,390 755,312 0.01IGM Financial Inc. 26,293 665,275 0.01Shopify Inc. Class A (XNYS) 1,481 503,740 0.00
374,564,805 3.23
Cayman Islands 0.00% (31 October 2021: 0.05%)
Curacao 0.00% (31 October 2021: 0.07%)
Denmark 0.77% (31 October 2021: 0.77%)
Novo Nordisk A/S Class B 435,451 40,087,665 0.35DSV PANALPINA A/S 54,264 7,165,396 0.06Vestas Wind Systems A/S 268,638 5,533,033 0.05Orsted A/S 52,171 4,651,415 0.04Genmab A/S 16,424 4,643,588 0.04Coloplast A/S Class B 36,380 3,947,473 0.03AP Moeller - Maersk A/S Class B 1,483 3,460,870 0.03Novozymes A/S Class B 51,964 2,914,897 0.02AP Moeller - Maersk A/S Class A 1,167 2,654,876 0.02Carlsberg AS Class B 25,886 2,650,322 0.02Danske Bank A/S 175,590 2,163,906 0.02
Holding
MarketValue
(£)
% ofTotal Net
Assets
Pandora A/S 25,943 1,843,838 0.02Chr Hansen Holding A/S 28,432 1,774,730 0.02Tryg A/S 77,283 1,474,005 0.01Demant A/S 30,073 1,066,986 0.01GN Store Nord A/S 31,472 952,381 0.01Royal Unibrew A/S 12,166 844,606 0.01SimCorp A/S 10,897 614,216 0.01Ambu A/S Class B 45,289 479,957 0.00Rockwool A/S Class B 1,694 380,211 0.00H Lundbeck A/S 11,499 211,330 0.00
89,515,701 0.77
Finland 0.39% (31 October 2021: 0.41%)
Nordea Bank Abp 995,252 8,001,461 0.07Nokia Oyj (OMXH) 1,567,768 6,402,915 0.05Sampo Oyj Class A 135,551 5,306,528 0.05Kone Oyj Class B 108,223 4,190,319 0.04UPM-Kymmene Oyj 144,099 4,000,516 0.03Neste Oyj 109,151 3,787,850 0.03Stora Enso Oyj Class R 156,428 2,488,171 0.02Elisa Oyj 42,194 1,975,499 0.02Fortum Oyj 115,154 1,535,575 0.01Kesko Oyj Class B 68,840 1,400,974 0.01Metso Outotec Oyj 164,209 1,134,737 0.01Orion Oyj Class B 35,158 1,110,187 0.01Valmet Oyj 45,771 988,413 0.01Wartsila Oyj Abp 135,816 881,471 0.01Huhtamaki Oyj 26,645 809,355 0.01Kojamo Oyj 45,083 718,992 0.01Nokian Renkaat Oyj 38,001 408,714 0.00
45,141,677 0.39
France 3.09% (31 October 2021: 3.12%)
LVMH Moet Hennessy LouisVuitton SE 67,765 35,274,575 0.30
TotalEnergies SE 649,662 25,779,498 0.22Sanofi 298,148 25,342,867 0.22Schneider Electric SE 145,852 16,870,781 0.15Airbus SE 150,315 13,330,132 0.12BNP Paribas SA 296,916 12,397,029 0.11AXA SA 524,624 11,223,326 0.10EssilorLuxottica SA 81,494 11,216,428 0.10Vinci SA 138,226 10,783,007 0.09L'Oreal SA (Prime De Fidelite
2020) 34,696 10,171,744 0.09Pernod Ricard SA 58,516 9,718,215 0.08Air Liquide SA (Prime De Fidelite
2021) 67,159 9,330,334 0.08Kering SA 20,217 8,716,332 0.08Hermes International 8,440 8,414,440 0.07Safran SA 95,112 8,238,056 0.07Danone SA 162,645 7,875,976 0.07Capgemini SE 43,611 7,184,192 0.06L'Oreal SA 23,932 7,016,087 0.06Dassault Systemes SE 180,164 6,439,164 0.06Cie de Saint-Gobain 128,767 6,092,635 0.05Air Liquide SA (Prime De Fidelite
2024) 43,530 6,038,070 0.05Legrand SA 72,923 5,193,624 0.05STMicroelectronics NV 171,135 5,138,634 0.04Orange SA 504,848 4,801,151 0.04Cie Generale des Etablissements
Michelin SCA 47,644 4,765,985 0.04Teleperformance 16,511 4,754,474 0.04Societe Generale SA 219,032 4,264,309 0.04Veolia Environnement SA 162,289 3,803,230 0.03Publicis Groupe SA 68,190 3,299,190 0.03Credit Agricole SA 352,772 3,064,402 0.03Edenred 71,494 2,885,341 0.03Thales SA 27,759 2,844,465 0.02Carrefour SA 164,250 2,775,444 0.02Eurofins Scientific SE 32,469 2,420,502 0.02Engie SA (Prime De Fidelite 2021) 239,733 2,280,689 0.02Worldline SA 65,279 2,076,129 0.02Sartorius Stedim Biotech 6,971 1,832,217 0.02Getlink SE 122,491 1,798,608 0.02Vivendi SE 193,312 1,779,452 0.02
Vanguard FTSE Developed World ex-U.K. Equity Index Fund
102

Holding
MarketValue
(£)
% ofTotal Net
Assets
L Oreal S.A. 5,953 1,745,227 0.02Bureau Veritas SA 72,026 1,660,084 0.01Arkema SA 17,732 1,626,284 0.01Air Liquide SA (Prime De Fidelite
2023) 11,572 1,607,687 0.01Bouygues SA 57,879 1,597,612 0.01Eiffage SA 19,012 1,508,686 0.01Rexel SA 84,581 1,395,464 0.01Euronext NV 21,590 1,389,984 0.01Alstom SA 78,131 1,386,540 0.01Engie SA 132,207 1,257,745 0.01Accor SA 46,615 1,234,994 0.01Gecina SA 13,018 1,176,987 0.01SCOR SE 48,083 1,090,055 0.01Aeroports de Paris 9,375 1,067,790 0.01Remy Cointreau SA 6,415 1,021,459 0.01Bollore SE 269,817 1,013,426 0.01Klepierre SA 52,499 1,008,422 0.01Renault SA 48,326 957,299 0.01Ubisoft Entertainment SA 24,668 892,738 0.01L'Oreal (Prime Fidelite 2024) 3,016 884,194 0.01Valeo SA 59,414 871,912 0.01SOITEC 5,933 862,204 0.01Covivio 14,203 810,932 0.01Amundi SA 16,496 799,778 0.01BioMerieux 10,384 792,082 0.01Dassault Aviation SA 5,550 746,153 0.01Air Liquide SA (Prime De Fidelite
2025) 5,269 732,017 0.01Ipsen SA 8,768 725,691 0.01CNP Assurances 39,079 685,629 0.01La Francaise des Jeux SAEM 21,660 648,105 0.01ICADE 12,421 595,425 0.01Faurecia SE (XPAR) 31,985 566,004 0.01Electricite de France SA (Prime De
Fidelite 2021) 73,402 535,603 0.00Wendel SE 6,603 529,581 0.00Electricite de France SA 69,706 508,516 0.00Atos SE 25,719 505,691 0.00SEB SA (Prime De Fidelite 2025) 4,469 430,714 0.00Sodexo SA 7,015 424,989 0.00Eurazeo SA 6,372 394,066 0.00Sodexo (Prime De Fidelite 2023) 5,830 353,296 0.00Engie SA (Prime De Fidelite 2023) 36,697 349,115 0.00Sodexo SA (Prime De Fidelite
2021) 5,649 342,328 0.00Orpea SA 11,774 336,272 0.00Engie SA (Prime Fidelite 2024)1 32,050 304,906 0.00JCDecaux SA 17,862 300,476 0.00Eurazeo SE 3,907 241,622 0.00ALD SA 20,732 224,722 0.00SEB SA 2,325 223,688 0.00Eurazeo SE (Prime Fidelite 2024) 2,742 169,574 0.00Neoen SA 5,087 163,197 0.00Cie Plastic Omnium SA 12,319 161,065 0.00Sodexo 2,086 126,411 0.00Sodexo (Prime De Fidelite 2024) 1,650 99,990 0.00SEB SA (Prime De Fidelite 2023) 955 92,041 0.00Electricite de France SA (Prime De
Fidelite 2023) 11,328 82,659 0.00Sodexo (Prime De Fidelite 2022) 1,151 69,750 0.00Faurecia SE (MTTA) 585 10,273 0.00SEB SA (Prime Fidelite 2024) 1 96 0.00
358,569,984 3.09
Germany 2.37% (31 October 2021: 2.62%)
SAP SE 301,775 24,692,671 0.21Allianz SE 112,869 20,418,966 0.18Siemens AG 205,893 20,331,452 0.18Bayer AG 267,040 14,118,224 0.12Deutsche Telekom AG 922,607 13,591,370 0.12Mercedes-Benz Group AG 232,615 13,134,756 0.11BASF SE 254,772 10,761,569 0.09Deutsche Post AG 264,324 9,060,634 0.08adidas AG 50,563 8,188,790 0.07Infineon Technologies AG 350,739 8,051,555 0.07
Holding
MarketValue
(£)
% ofTotal Net
Assets
Muenchener Rueckversicherungs-Gesellschaft AG 37,753 7,207,337 0.06
Deutsche Boerse AG 50,269 7,018,037 0.06Vonovia SE 215,154 6,902,404 0.06Volkswagen AG - Preference
Shares 47,934 5,981,962 0.05RWE AG 173,777 5,785,246 0.05Bayerische Motoren Werke AG 83,465 5,487,869 0.05Merck KGaA 35,081 5,205,683 0.05E.ON SE 597,323 4,979,933 0.04Deutsche Bank AG 572,835 4,618,860 0.04Symrise AG 35,456 3,384,411 0.03Fresenius SE & Co. KGaA 114,864 3,271,890 0.03Siemens Healthineers AG 73,198 3,146,624 0.03Porsche Automobil Holding SE -
Preference Shares 40,108 2,671,161 0.02Brenntag SE 42,990 2,670,926 0.02Fresenius Medical Care AG & Co.
KGaA 53,501 2,670,320 0.02MTU Aero Engines AG 16,025 2,591,379 0.02Henkel AG & Co. KGaA -
Preference Shares 46,171 2,385,164 0.02Daimler Truck Holding AG 110,352 2,383,951 0.02Beiersdorf AG 28,891 2,322,730 0.02QIAGEN NV 57,601 2,131,534 0.02Rheinmetall AG 11,569 2,093,903 0.02HeidelbergCement AG 43,676 2,025,068 0.02Hannover Rueck SE 15,876 1,984,993 0.02Sartorius AG - Preference Shares 6,543 1,974,274 0.02Zalando SE 57,715 1,816,651 0.02Siemens Energy AG 112,083 1,739,489 0.02Volkswagen AG 9,642 1,687,607 0.01Henkel AG & Co. KGaA 32,819 1,671,141 0.01Covestro AG 46,694 1,618,061 0.01Puma SE 26,083 1,552,570 0.01Continental AG 27,856 1,543,415 0.01LEG Immobilien SE 18,666 1,536,438 0.01HelloFresh SE 42,027 1,432,677 0.01Commerzbank AG 267,388 1,411,865 0.01Delivery Hero SE 49,718 1,410,781 0.01GEA Group AG 42,382 1,323,342 0.01Aroundtown SA 299,018 1,213,053 0.01Bayerische Motoren Werke AG -
Preference Shares 20,483 1,211,661 0.01Scout24 SE 22,322 1,134,384 0.01Bechtle AG 29,026 1,078,990 0.01Evonik Industries AG 50,583 1,063,425 0.01Knorr-Bremse AG 17,286 991,171 0.01Carl Zeiss Meditec AG 9,500 957,500 0.01KION Group AG 21,222 946,882 0.01Deutsche Lufthansa AG 153,082 919,698 0.01Nemetschek SE 14,044 902,514 0.01CTS Eventim AG & Co. KGaA 15,374 852,601 0.01Evotec SE 42,934 835,156 0.01thyssenkrupp AG 128,062 792,839 0.01United Internet AG 30,270 781,610 0.01Vantage Towers AG 28,636 776,232 0.01Sixt SE 6,652 693,089 0.01LANXESS AG 22,132 684,172 0.01Fraport AG Frankfurt Airport
Services Worldwide 14,413 620,795 0.01Uniper SE 27,616 570,835 0.01Wacker Chemie AG 4,420 560,437 0.01Talanx AG 16,444 550,204 0.01FUCHS PETROLUB SE -
Preference Shares 16,653 423,705 0.00Telefonica Deutschland Holding AG 160,778 387,455 0.00RTL Group SA 8,888 370,575 0.00Rational AG 706 346,444 0.001&1 Drillisch AG 18,385 309,273 0.00Hella GmbH & Co. KGaA 6,086 306,319 0.00SUSE SA 11,317 294,977 0.00Varta AG 3,568 268,146 0.00Deutsche Wohnen SE 11,465 262,709 0.00Fielmann AG 6,245 252,822 0.00METRO AG 33,898 237,977 0.00
Vanguard FTSE Developed World ex-U.K. Equity Index Fund
103

Holding
MarketValue
(£)
% ofTotal Net
Assets
FUCHS PETROLUB SE 10,190 216,197 0.00DWS Group GmbH & Co. KGaA 7,205 190,220 0.00HOCHTIEF AG 3,679 179,791 0.00Traton SE 12,143 162,437 0.00Auto1 Group SE 18,729 156,979 0.00Sartorius AG 543 144,863 0.00
274,637,820 2.37
Hong Kong 0.95% (31 October 2021: 0.93%)
AIA Group Ltd. 3,319,961 26,203,533 0.23Hong Kong Exchanges & Clearing
Ltd. 350,000 12,002,014 0.10Link REIT 600,210 4,149,318 0.04CK Hutchison Holdings Ltd. 707,843 3,966,454 0.04Techtronic Industries Co. Ltd. 342,533 3,696,257 0.03CLP Holdings Ltd. 460,086 3,572,950 0.03Sun Hung Kai Properties Ltd. 374,044 3,453,439 0.03Galaxy Entertainment Group Ltd. 618,295 2,858,976 0.03CK Asset Holdings Ltd. 524,778 2,844,745 0.03Hang Seng Bank Ltd. 194,470 2,753,932 0.02BOC Hong Kong Holdings Ltd. 940,706 2,735,930 0.02Hong Kong & China Gas Co. Ltd. 2,889,404 2,548,911 0.02Jardine Matheson Holdings Ltd. 53,702 2,272,122 0.02BeiGene Ltd. 189,600 2,011,319 0.02Power Assets Holdings Ltd. 364,936 1,957,889 0.02Wharf Real Estate Investment Co.
Ltd. 466,648 1,759,846 0.02Lenovo Group Ltd. 2,198,000 1,711,391 0.02MTR Corp. Ltd. 372,533 1,582,657 0.01Henderson Land Development Co.
Ltd. 405,524 1,311,150 0.01ESR Cayman Ltd. 531,561 1,292,365 0.01Hongkong Land Holdings Ltd. 325,149 1,214,614 0.01Sands China Ltd. 675,942 1,210,415 0.01New World Development Co. Ltd. 356,817 1,090,281 0.01WH Group Ltd. 1,815,108 1,004,212 0.01Sino Land Co. Ltd. 933,489 989,318 0.01Xinyi Glass Holdings Ltd. 546,209 979,210 0.01Budweiser Brewing Co. APAC Ltd. 483,500 970,843 0.01Hang Lung Properties Ltd. 612,984 934,642 0.01Want Want China Holdings Ltd. 1,288,149 923,204 0.01Wharf Holdings Ltd. 391,648 916,417 0.01SITC International Holdings Co.
Ltd. 311,000 836,629 0.01CK Infrastructure Holdings Ltd. 151,009 809,400 0.01Tingyi Cayman Islands Holding
Corp. 549,209 801,720 0.01Orient Overseas International Ltd. 33,000 737,663 0.01Samsonite International SA 398,303 706,776 0.01ASM Pacific Technology Ltd. 85,812 696,890 0.01PRADA SpA 127,309 632,613 0.01Swire Pacific Ltd. Class A 134,278 612,037 0.01Chow Tai Fook Jewellery Group
Ltd. 405,935 546,420 0.01Swire Properties Ltd. 281,358 542,103 0.01PCCW Ltd. 1,002,073 454,709 0.00VTech Holdings Ltd. 75,769 428,808 0.00L'Occitane International SA 158,067 401,953 0.00Bank of East Asia Ltd. 308,810 365,525 0.00Hysan Development Co. Ltd. 154,119 362,188 0.00Hang Lung Group Ltd. 229,000 358,000 0.00AAC Technologies Holdings Inc. 189,027 354,611 0.00Kerry Properties Ltd. 161,853 349,145 0.00NWS Holdings Ltd. 480,828 348,509 0.00BOC Aviation Ltd. 51,900 326,916 0.00Minth Group Ltd. 150,000 285,965 0.00Vitasoy International Holdings Ltd. 190,000 274,271 0.00HUTCHMED China Ltd. 102,000 264,556 0.00NagaCorp Ltd. 364,000 260,136 0.00Man Wah Holdings Ltd. 340,800 258,432 0.00Kerry Logistics Network Ltd. 131,189 241,314 0.00Yue Yuen Industrial Holdings Ltd. 186,869 218,533 0.00JS Global Lifestyle Co. Ltd. 207,500 199,056 0.00Microport Scientific Corp. 109,000 174,385 0.00Lee & Man Paper Manufacturing
Ltd. 425,000 162,651 0.00SJM Holdings Ltd. 473,126 160,897 0.00
Holding
MarketValue
(£)
% ofTotal Net
Assets
Uni-President China Holdings Ltd. 227,792 160,019 0.00Wynn Macau Ltd. 311,145 154,769 0.00Vinda International Holdings Ltd. 80,000 153,652 0.00Cathay Pacific Airways Ltd. 191,251 152,794 0.00Huabao International Holdings Ltd. 334,000 146,473 0.00Champion REIT 402,379 140,514 0.00United Energy Group Ltd. 1,468,000 137,101 0.00Shangri-La Asia Ltd. 225,126 136,207 0.00First Pacific Co. Ltd. 415,959 133,856 0.00Johnson Electric Holdings Ltd. 142,486 129,601 0.00Dairy Farm International Holdings
Ltd. 56,200 121,755 0.00Swire Pacific Ltd. Class B 160,000 120,193 0.00MMG Ltd. 348,000 118,698 0.00Melco International Development
Ltd. 143,289 91,493 0.00Towngas Smart Energy Co. Ltd. 209,123 82,793 0.00Cafe de Coral Holdings Ltd. 48,114 60,467 0.00Nexteer Automotive Group Ltd. 130,000 58,990 0.00MGM China Holdings Ltd. 128,192 58,820 0.00Haitong International Securities
Group Ltd. 437,977 55,132 0.00Dah Sing Financial Holdings Ltd. 22,112 51,515 0.00Shui On Land Ltd. 428,930 48,332 0.00Shun Tak Holdings Ltd. 295,603 48,013 0.00Guotai Junan International
Holdings Ltd. 545,124 47,037 0.00China Travel International
Investment Hong Kong Ltd. 314,133 45,282 0.00Hutchison Telecommunications
Hong Kong Holdings Ltd. 312,174 41,514 0.00Dah Sing Banking Group Ltd. 49,387 33,239 0.00Lifestyle International Holdings Ltd. 84,899 32,836 0.00FIH Mobile Ltd. 277,537 27,329 0.00FIT Hon Teng Ltd. 146,000 14,969 0.00Untrade.Brightoil¹ 186,047 3,777 0.00
110,698,335 0.95
Ireland 0.07% (31 October 2021: 1.57%)
Kerry Group plc Class A 43,812 3,863,586 0.03Kingspan Group plc 42,448 3,176,545 0.03Glanbia plc 44,375 423,576 0.01AIB Group plc 188,135 329,128 0.00
7,792,835 0.07
Israel 0.23% (31 October 2021: 0.19%)
Bank Leumi Le-Israel BM 424,905 3,576,224 0.03Bank Hapoalim BM 385,538 2,865,355 0.03Nice Ltd. 16,473 2,684,169 0.02Teva Pharmaceutical Industries Ltd. 251,383 1,785,013 0.02ICL Group Ltd. 198,908 1,743,809 0.02Israel Discount Bank Ltd. 312,912 1,482,024 0.01Elbit Systems Ltd. 6,760 1,170,463 0.01Mizrahi Tefahot Bank Ltd. 37,644 1,117,121 0.01Tower Semiconductor Ltd. 25,164 966,296 0.01Bezeq The Israeli
Telecommunication Corp. Ltd. 548,423 696,882 0.01Israel Corp Ltd. 1,323 604,497 0.01Mivne Real Estate KD Ltd. 200,956 603,062 0.01Azrieli Group Ltd. 7,932 546,028 0.01Enlight Renewable Energy Ltd. 302,872 523,470 0.01Nova Ltd. 6,266 483,170 0.01First International Bank Of Israel
Ltd. 12,227 411,810 0.01Alony Hetz Properties &
Investments Ltd. 30,876 404,044 0.00Electra Ltd. 595 324,637 0.00Kenon Holdings Ltd. 6,904 317,609 0.00AFI Properties Ltd. 6,430 310,364 0.00Melisron Ltd. 4,731 308,084 0.00Big Shopping Centers Ltd. 2,557 307,975 0.00Airport City Ltd. 16,952 303,052 0.00Amot Investments Ltd. 49,430 300,917 0.00Shikun & Binui Ltd. 63,353 300,205 0.00Camtek Ltd. 12,516 293,112 0.00Ashtrom Group Ltd. 12,358 276,863 0.00Fox Wizel Ltd. 2,338 275,802 0.00
Vanguard FTSE Developed World ex-U.K. Equity Index Fund
104

Holding
MarketValue
(£)
% ofTotal Net
Assets
Paz Oil Co. Ltd. 1,950 240,443 0.00Shapir Engineering and Industry
Ltd. 31,066 232,959 0.00Maytronics Ltd. 14,846 211,225 0.00Harel Insurance Investments &
Financial Services Ltd. 17,870 175,449 0.00Strauss Group Ltd. 8,231 174,849 0.00Energix-Renewable Energies Ltd. 63,596 173,417 0.00Phoenix Holdings Ltd. 16,932 170,478 0.00Gav-Yam Lands Corp. Ltd. 17,530 154,602 0.00Sapiens International Corp. NV 8,064 150,850 0.00OPC Energy Ltd. 14,440 127,108 0.00Shufersal Ltd. 17,095 114,949 0.00Gazit-Globe Ltd. 11,981 90,043 0.00
26,998,429 0.23
Italy 0.72% (31 October 2021: 0.77%)
Enel SpA 2,099,500 10,981,718 0.09Eni SpA 677,951 7,616,312 0.07Intesa Sanpaolo SpA 4,649,348 7,591,446 0.07Stellantis NV 562,164 6,128,469 0.05Ferrari NV 34,442 5,860,416 0.05Assicurazioni Generali SpA 372,714 5,666,949 0.05UniCredit SpA 579,172 4,312,264 0.04CNH Industrial NV 266,756 3,061,822 0.03Terna Rete Elettrica Nazionale SpA 388,053 2,538,753 0.02Snam SpA 568,654 2,499,947 0.02Atlantia SpA 128,576 2,466,499 0.02Moncler SpA 56,850 2,398,956 0.02Prysmian SpA 81,108 2,127,025 0.02FinecoBank Banca Fineco SpA 175,730 1,958,701 0.02Nexi SpA 211,080 1,671,465 0.01EXOR NV 26,726 1,500,567 0.01Tenaris SA 118,727 1,470,490 0.01Mediobanca Banca di Credito
Finanziario SpA 176,856 1,426,018 0.01Davide Campari-Milano NV 126,761 1,146,607 0.01Amplifon SpA 34,603 1,110,688 0.01Poste Italiane SpA 128,461 1,008,601 0.01Recordati Industria Chimica e
Farmaceutica SpA 24,936 964,038 0.01Infrastrutture Wireless Italiane SpA 98,274 840,623 0.01Leonardo SpA 88,785 731,405 0.01DiaSorin SpA 6,487 682,166 0.01Reply SpA 5,647 669,989 0.01Telecom Italia SpA 2,690,811 628,103 0.01Interpump Group SpA 19,263 626,397 0.01Italgas SpA 112,392 584,576 0.01Hera SpA 184,630 553,686 0.00A2A SpA 366,399 502,754 0.00Pirelli & C SpA 116,358 461,969 0.00Buzzi Unicem SpA 26,796 398,415 0.00Banca Mediolanum SpA 64,919 379,007 0.00Telecom Italia SpA - Preference
Shares 1,569,350 348,391 0.00De' Longhi SpA 15,464 298,858 0.00UnipolSai Assicurazioni SpA 128,052 287,500 0.00Iveco Group NV 53,351 252,969 0.00
83,754,559 0.72
Japan 7.01% (31 October 2021: 7.32%)
Toyota Motor Corp. 3,337,100 45,852,061 0.40Sony Corp. 338,665 23,360,132 0.20Keyence Corp. 49,600 16,112,265 0.14Mitsubishi UFJ Financial Group Inc. 3,367,808 15,611,003 0.14Tokyo Electron Ltd. 40,679 13,869,546 0.12KDDI Corp. 454,027 12,099,931 0.11Shin-Etsu Chemical Co. Ltd. 107,222 11,851,838 0.10Recruit Holdings Co. Ltd. 392,885 11,634,674 0.10SoftBank Group Corp. 359,224 11,627,218 0.10Daiichi Sankyo Co. Ltd. 529,093 10,597,299 0.09Nintendo Co. Ltd. 28,342 10,436,850 0.09Honda Motor Co. Ltd. 463,421 9,734,929 0.08Takeda Pharmaceutical Co. Ltd. 416,864 9,643,634 0.08Hitachi Ltd. 257,769 9,615,865 0.08ITOCHU Corp. 367,728 8,886,727 0.08Daikin Industries Ltd. 71,372 8,795,207 0.08
Holding
MarketValue
(£)
% ofTotal Net
Assets
Mitsubishi Corp. 322,796 8,695,862 0.08Mitsui & Co. Ltd. 438,203 8,485,902 0.07Sumitomo Mitsui Financial
Group Inc. 350,159 8,421,244 0.07Nippon Telegraph & Telephone
Corp. 328,818 7,776,602 0.07Hoya Corp. 96,835 7,727,147 0.07Tokio Marine Holdings Inc. 176,221 7,593,218 0.07Seven & i Holdings Co. Ltd. 210,920 7,413,069 0.06Murata Manufacturing Co. Ltd. 154,125 7,380,179 0.06SoftBank Corp. 753,407 7,007,784 0.06Mizuho Financial Group Inc. 695,680 6,740,279 0.06Nidec Corp. 125,938 6,611,133 0.06FANUC Corp. 52,119 6,446,681 0.06Astellas Pharma Inc. 526,317 6,383,908 0.06SMC Corp. 16,200 6,278,318 0.05Oriental Land Co. Ltd. 50,097 6,088,783 0.05Fujitsu Ltd. 52,285 6,004,351 0.05Denso Corp. 122,603 5,995,886 0.05Fast Retailing Co. Ltd. 14,234 5,253,875 0.05Central Japan Railway Co. 50,441 5,085,570 0.04ORIX Corp. 337,153 4,919,584 0.04Canon Inc. 266,608 4,908,057 0.04Dai-ichi Life Holdings Inc. 286,329 4,576,683 0.04Komatsu Ltd. 249,697 4,482,376 0.04Bridgestone Corp. 152,799 4,477,935 0.04Mitsubishi Electric Corp. 532,330 4,472,009 0.04Chugai Pharmaceutical Co. Ltd. 185,646 4,454,472 0.04Panasonic Holdings Corp. 614,155 4,379,738 0.04Japan Tobacco Inc. 320,796 4,379,170 0.04East Japan Railway Co. 104,092 4,363,653 0.04Terumo Corp. 181,512 4,344,121 0.04Mitsui Fudosan Co. Ltd. 250,890 4,233,873 0.04FUJIFILM Holdings Corp. 93,704 4,130,950 0.04Olympus Corp. 290,292 4,119,809 0.04Kubota Corp. 300,025 4,090,093 0.04Kao Corp. 126,465 4,066,157 0.04Shiseido Co. Ltd. 102,140 3,849,182 0.03Mitsubishi Estate Co. Ltd. 326,787 3,782,920 0.03Marubeni Corp. 430,411 3,763,984 0.03Toshiba Corp. 111,972 3,717,195 0.03Sumitomo Corp. 291,073 3,688,010 0.03Japan Post Holdings Co. Ltd. 635,856 3,553,324 0.03Daiwa House Industry Co. Ltd. 182,507 3,525,314 0.03Kyocera Corp. 81,642 3,439,588 0.03Asahi Group Holdings Ltd. 114,818 3,432,625 0.03Shionogi & Co. Ltd. 76,519 3,418,508 0.03Suzuki Motor Corp. 134,418 3,224,459 0.03M3 Inc. 122,812 3,171,799 0.03Advantest Corp. 56,195 3,102,317 0.03Aeon Co. Ltd. 201,940 3,063,935 0.03Shimano Inc. 21,239 3,040,995 0.03Bandai Namco Holdings Inc. 55,802 3,039,111 0.03Unicharm Corp. 108,352 3,013,503 0.03Secom Co. Ltd. 53,276 3,002,744 0.03Otsuka Holdings Co. Ltd. 110,758 2,970,112 0.03Sompo Holdings Inc. 91,328 2,966,736 0.03MS&AD Insurance Group
Holdings Inc. 122,898 2,932,247 0.03Nippon Steel Corp. 227,740 2,893,256 0.03Sysmex Corp. 52,268 2,766,309 0.02Nomura Holdings Inc. 878,498 2,699,827 0.02NTT Data Corp. 179,055 2,644,062 0.02Ajinomoto Co. Inc. 126,377 2,629,121 0.02Nippon Yusen KK 45,074 2,618,605 0.02Omron Corp. 54,906 2,606,186 0.02TDK Corp. 99,282 2,471,938 0.02Eisai Co. Ltd. 70,014 2,437,494 0.02Sumitomo Mitsui Trust
Holdings Inc. 95,005 2,353,768 0.02Kirin Holdings Co. Ltd. 200,601 2,339,443 0.02Sekisui House Ltd. 168,357 2,336,528 0.02Sumitomo Metal Mining Co. Ltd. 66,124 2,300,440 0.02Ono Pharmaceutical Co. Ltd. 111,100 2,275,785 0.02Renesas Electronics Corp. 263,499 2,272,735 0.02Z Holdings Corp. 714,856 2,259,762 0.02
Vanguard FTSE Developed World ex-U.K. Equity Index Fund
105

Holding
MarketValue
(£)
% ofTotal Net
Assets
Inpex Corp. 234,477 2,205,483 0.02Resona Holdings Inc. 630,383 2,188,827 0.02ENEOS Holdings Inc. 777,699 2,178,726 0.02Kikkoman Corp. 48,744 2,175,554 0.02Toyota Industries Corp. 45,383 2,170,626 0.02Mitsubishi Heavy Industries Ltd. 79,486 2,166,210 0.02Lasertec Corp. 19,700 2,143,639 0.02Sumitomo Realty & Development
Co. Ltd. 100,902 2,129,539 0.02Obic Co. Ltd. 17,926 2,121,418 0.02Asahi Kasei Corp. 321,032 2,110,772 0.02NEC Corp. 67,928 2,100,530 0.02Nitto Denko Corp. 37,705 2,021,285 0.02Yaskawa Electric Corp. 69,505 1,901,464 0.02West Japan Railway Co. 63,851 1,901,446 0.02Subaru Corp. 157,757 1,898,950 0.02Nexon Co. Ltd. 103,302 1,886,790 0.02Nippon Paint Holdings Co. Ltd. 293,746 1,874,483 0.02Shimadzu Corp. 70,550 1,856,320 0.02Toyota Tsusho Corp. 63,690 1,836,353 0.02Osaka Gas Co. Ltd. 127,172 1,832,573 0.02Nitori Holdings Co. Ltd. 22,288 1,828,529 0.02MINEBEA MITSUMI Inc. 116,191 1,799,338 0.02Mitsui OSK Lines Ltd. 95,418 1,797,931 0.02Nissan Chemical Corp. 41,068 1,742,067 0.02Tokyo Gas Co. Ltd. 113,440 1,734,419 0.02Mitsubishi Chemical Holdings
Corp. 355,809 1,733,955 0.02Sumitomo Electric Industries Ltd. 196,696 1,689,289 0.02Yakult Honsha Co. Ltd. 40,732 1,680,236 0.02Japan Exchange Group Inc. 139,511 1,673,744 0.02Nippon Building Fund Inc. 401 1,659,096 0.02Nissan Motor Co. Ltd. 513,621 1,632,155 0.01SG Holdings Co. Ltd. 115,900 1,630,240 0.01AGC Inc. 54,161 1,623,205 0.01MISUMI Group Inc. 80,286 1,611,518 0.01Dentsu Group Inc. 55,414 1,601,141 0.01Daiwa Securities Group Inc. 400,952 1,567,448 0.01MEIJI Holdings Co. Ltd. 39,188 1,556,316 0.01Kansai Electric Power Co. Inc. 221,784 1,551,617 0.01Chubu Electric Power Co. Inc. 189,237 1,524,016 0.01T&D Holdings Inc. 147,575 1,515,100 0.01Yamaha Motor Co. Ltd. 91,488 1,509,027 0.01Disco Corp. 7,628 1,500,627 0.01Makita Corp. 62,604 1,487,523 0.01Toray Industries Inc. 388,811 1,479,351 0.01Nomura Research Institute Ltd. 64,500 1,471,112 0.01SBI Holdings Inc. 79,452 1,420,891 0.01Idemitsu Kosan Co. Ltd. 66,052 1,382,659 0.01JFE Holdings Inc. 141,127 1,381,228 0.01Daito Trust Construction Co. Ltd. 17,764 1,364,003 0.01Japan Real Estate Investment
Corp. 353 1,362,845 0.01Nippon Prologis REIT Inc. 610 1,348,158 0.01Dai Nippon Printing Co. Ltd. 79,559 1,329,874 0.01Yamato Holdings Co. Ltd. 86,277 1,294,717 0.01Pan Pacific International Holdings
Corp. 103,376 1,276,132 0.01Sumitomo Chemical Co. Ltd. 376,849 1,271,897 0.01Trend Micro Inc. 28,445 1,267,816 0.01Isuzu Motors Ltd. 133,732 1,246,369 0.01Yamaha Corp. 40,422 1,241,268 0.01Konami Holdings Corp. 24,980 1,233,162 0.01Hankyu Hanshin Holdings Inc. 58,400 1,231,457 0.01Tokyu Corp. 125,574 1,226,693 0.01Rohm Co. Ltd. 21,681 1,219,586 0.01Fuji Electric Co. Ltd. 34,528 1,218,416 0.01Hamamatsu Photonics KK 33,853 1,217,489 0.01Tokyo Electric Power Co.
Holdings Inc. 442,135 1,214,995 0.01Daifuku Co. Ltd. 24,400 1,206,030 0.01Nomura Real Estate Master
Fund Inc. 1,202 1,204,493 0.01GLP J-Reit 1,115 1,202,996 0.01Obayashi Corp. 216,278 1,188,672 0.01
Holding
MarketValue
(£)
% ofTotal Net
Assets
Japan Retail Fund InvestmentCorp. 1,839 1,166,739 0.01
Aisin Corp. 49,683 1,151,493 0.01Rakuten Group Inc. 201,873 1,139,287 0.01Taiyo Yuden Co. Ltd. 35,378 1,124,439 0.01Daiwa House REIT Investment
Corp. 563 1,086,801 0.01Nissin Foods Holdings Co. Ltd. 19,221 1,068,210 0.01Kyowa Kirin Co. Ltd. 63,377 1,064,448 0.01TIS Inc. 58,200 1,049,057 0.01JSR Corp. 47,558 1,037,920 0.01Matsumotokiyoshi Holdings Co.
Ltd. 39,118 1,034,087 0.01Taisei Corp. 47,675 1,033,147 0.01Kajima Corp. 115,547 1,027,873 0.01Ebara Corp. 27,802 1,027,218 0.01Lixil Corp. 72,700 1,020,805 0.01TOTO Ltd. 37,760 1,017,920 0.01Kintetsu Group Holdings Co. Ltd. 44,271 1,013,813 0.01Tobu Railway Co. Ltd. 55,963 1,005,295 0.01BayCurrent Consulting Inc. 3,800 1,004,533 0.01Suntory Beverage & Food Ltd. 31,586 994,207 0.01Hirose Electric Co. Ltd. 9,623 983,818 0.01Ricoh Co. Ltd. 165,368 965,800 0.01Capcom Co. Ltd. 45,568 959,473 0.01Toho Co. Ltd. 31,615 937,784 0.01TOPPAN Inc. 70,621 934,304 0.01Odakyu Electric Railway Co. Ltd. 77,049 934,084 0.01MonotaRO Co. Ltd. 66,548 923,785 0.01Mazda Motor Corp. 161,257 919,981 0.01Mitsui Chemicals Inc. 50,289 919,446 0.01Oji Holdings Corp. 242,623 917,317 0.01NIPPON EXPRESS HOLDINGS Inc. 19,509 915,107 0.01Sega Sammy Holdings Inc. 63,817 905,491 0.01Kawasaki Kisen Kaisha Ltd. 21,200 892,768 0.01Koito Manufacturing Co. Ltd. 30,076 883,812 0.01Sekisui Chemical Co. Ltd. 81,576 882,146 0.01Kobayashi Pharmaceutical Co. Ltd. 16,100 878,923 0.01Keio Corp. 28,379 870,582 0.01Nisshin Seifun Group Inc. 80,635 861,560 0.01Nippon Shinyaku Co. Ltd. 15,724 851,630 0.01Azbil Corp. 34,870 851,049 0.01Hitachi Metals Ltd. 67,766 844,457 0.01Marui Group Co. Ltd. 61,142 842,728 0.01CyberAgent Inc. 98,712 840,489 0.01Japan Post Bank Co. Ltd. 137,108 826,883 0.01Brother Industries Ltd. 59,412 826,553 0.01Chiba Bank Ltd. 179,829 825,833 0.01Hulic Co. Ltd. 122,010 821,338 0.01SUMCO Corp. 70,271 818,216 0.01Showa Denko KK 51,825 803,838 0.01NGK Insulators Ltd. 74,624 803,298 0.01Kobe Bussan Co. Ltd. 40,700 799,424 0.01Ibiden Co. Ltd. 26,012 789,174 0.01Kyushu Railway Co. 49,701 780,366 0.01Concordia Financial Group Ltd. 268,112 776,335 0.01Keisei Electric Railway Co. Ltd. 38,923 763,324 0.01Hoshizaki Corp. 14,941 756,866 0.01Asahi Intecc Co. Ltd. 48,156 750,778 0.01Persol Holdings Co. Ltd. 46,838 746,067 0.01Seiko Epson Corp. 66,488 742,695 0.01Kurita Water Industries Ltd. 26,879 737,814 0.01Tosoh Corp. 65,760 724,860 0.01United Urban Investment Corp. 829 722,675 0.01Yokogawa Electric Corp. 55,989 716,631 0.01Haseko Corp. 79,586 695,742 0.01Shinko Electric Industries Co. Ltd. 19,200 672,803 0.01Kose Corp. 8,147 672,645 0.01Orix JREIT Inc. 624 671,712 0.01Sojitz Corp. 54,617 665,829 0.01Advance Residence Investment
Corp. 304 665,328 0.01GMO Payment Gateway Inc. 9,747 663,332 0.01Tokyu Fudosan Holdings Corp. 159,334 663,146 0.01Nikon Corp. 71,926 650,003 0.01Kansai Paint Co. Ltd. 58,663 648,074 0.01
Vanguard FTSE Developed World ex-U.K. Equity Index Fund
106

Holding
MarketValue
(£)
% ofTotal Net
Assets
Otsuka Corp. 24,646 646,216 0.01NH Foods Ltd. 25,532 644,333 0.01Japan Post Insurance Co. Ltd. 49,784 643,637 0.01Square Enix Holdings Co. Ltd. 20,044 641,999 0.01Nagoya Railroad Co. Ltd. 49,743 639,743 0.01Hakuhodo DY Holdings Inc. 67,461 638,269 0.01USS Co. Ltd. 48,011 636,949 0.01Kawasaki Heavy Industries Ltd. 44,957 636,784 0.01Japan Logistics Fund Inc. 325 634,365 0.01ANA Holdings Inc. 41,997 633,327 0.01IHI Corp. 34,814 633,302 0.01Nihon M&A Center Holdings Inc. 63,600 630,672 0.01SCREEN Holdings Co. Ltd. 9,340 617,833 0.01Tohoku Electric Power Co. Inc. 139,032 615,403 0.01Nabtesco Corp. 33,574 613,429 0.01Shizuoka Bank Ltd. 118,572 612,313 0.01Keikyu Corp. 73,683 593,404 0.01Bank of Kyoto Ltd. 16,942 589,513 0.01Santen Pharmaceutical Co. Ltd. 89,490 583,717 0.01Tokyo Century Corp. 23,710 583,047 0.01Kyushu Electric Power Co. Inc. 116,155 580,551 0.01Cosmo Energy Holdings Co. Ltd. 29,351 577,411 0.01Konica Minolta Inc. 203,915 567,884 0.01SCSK Corp. 44,052 560,323 0.01Japan Airlines Co. Ltd. 42,211 557,926 0.01Mitsubishi HC Capital Inc. 154,880 556,058 0.01AEON REIT Investment Corp. 604 554,010 0.01Fukuoka Financial Group Inc. 37,898 552,874 0.01NGK Spark Plug Co. Ltd. 44,876 550,112 0.01NOF Corp. 18,300 548,451 0.01Food & Life Cos Ltd. 28,700 546,960 0.01Nomura Real Estate Holdings Inc. 28,226 546,603 0.01Toyo Suisan Kaisha Ltd. 22,114 543,800 0.01Open House Group Co. Ltd. 17,500 540,075 0.01Sekisui House Reit Inc. 1,149 536,841 0.01Tokyo Tatemono Co. Ltd. 47,766 535,325 0.01Rohto Pharmaceutical Co. Ltd. 25,163 534,469 0.01Zensho Holdings Co. Ltd. 28,200 531,364 0.01THK Co. Ltd. 33,343 531,315 0.01Sumitomo Heavy Industries Ltd. 31,485 530,935 0.01Hikari Tsushin Inc. 5,659 530,196 0.01Industrial & Infrastructure Fund
Investment Corp. 462 529,704 0.01Shimizu Corp. 125,739 527,189 0.01Skylark Holdings Co. Ltd. 55,596 527,036 0.01Japan Prime Realty Investment
Corp. 214 518,349 0.01Lion Corp. 62,492 514,419 0.01Japan Steel Works Ltd. 22,700 513,554 0.01Itochu Techno-Solutions Corp. 27,330 512,450 0.01Denka Co. Ltd. 23,983 512,354 0.01Isetan Mitsukoshi Holdings Ltd. 85,735 507,571 0.01Asics Corp. 39,930 507,156 0.01Koei Tecmo Holdings Co. Ltd. 20,826 507,006 0.01Mitsubishi Gas Chemical Co. Inc. 43,283 505,040 0.01Air Water Inc. 47,610 503,430 0.01Kakaku.com Inc. 29,843 502,512 0.01Kuraray Co. Ltd. 78,334 500,836 0.01Dowa Holdings Co. Ltd. 14,583 495,774 0.01Tokyo Ohka Kogyo Co. Ltd. 11,300 495,313 0.00OKUMA Corp. 17,216 493,737 0.00Alfresa Holdings Corp. 45,172 491,258 0.00TechnoPro Holdings Inc. 24,000 488,373 0.00Mitsui High-Tec Inc. 6,900 482,305 0.00Mitsui Fudosan Logistics Park Inc. 140 479,397 0.00Nippon Accommodations Fund Inc. 122 478,512 0.00Yamada Holdings Co. Ltd. 199,860 474,270 0.00Electric Power Development Co.
Ltd. 43,102 473,250 0.00Aozora Bank Ltd. 29,296 468,447 0.00Mebuki Financial Group Inc. 292,900 468,171 0.00Keihan Holdings Co. Ltd. 27,348 467,561 0.00Nippon Sanso Holdings Corp. 32,496 466,276 0.00Amada Co. Ltd. 74,942 465,788 0.00COMSYS Holdings Corp. 27,963 465,183 0.00Ryohin Keikaku Co. Ltd. 64,670 463,966 0.00
Holding
MarketValue
(£)
% ofTotal Net
Assets
JGC Holdings Corp. 51,212 463,753 0.00Stanley Electric Co. Ltd. 33,762 463,685 0.00Medipal Holdings Corp. 35,230 460,889 0.00Nankai Electric Railway Co. Ltd. 32,217 460,094 0.00NSK Ltd. 103,697 457,086 0.00Shinsei Bank Ltd. 32,690 456,800 0.00Rinnai Corp. 8,769 447,985 0.00Activia Properties Inc. 176 446,863 0.00LaSalle Logiport REIT 410 442,357 0.00Hisamitsu Pharmaceutical Co. Inc. 20,071 440,503 0.00Japan Airport Terminal Co. Ltd. 13,232 438,456 0.00Miura Co. Ltd. 26,100 437,881 0.00Iida Group Holdings Co. Ltd. 33,870 432,061 0.00Kenedix Office Investment Corp. 103 430,584 0.00Mori Hills REIT Investment Corp. 470 426,478 0.00Kyowa Exeo Corp. 32,000 426,109 0.00Ito En Ltd. 12,986 425,515 0.00ZOZO Inc. 25,025 423,230 0.00Hitachi Construction Machinery Co.
Ltd. 23,476 422,145 0.00Welcia Holdings Co. Ltd. 25,492 419,688 0.00UBE Corp. 33,755 417,936 0.00Japan Hotel REIT Investment Corp. 1,030 417,920 0.00Amano Corp. 27,100 417,173 0.00Casio Computer Co. Ltd. 50,034 416,789 0.00Katitas Co. Ltd. 22,200 415,578 0.00Shimamura Co. Ltd. 5,847 414,452 0.00NET One Systems Co. Ltd. 21,700 414,222 0.00Kadokawa Corp. 20,400 409,473 0.00SHO-BOND Holdings Co. Ltd. 12,000 404,272 0.00Nippon Electric Glass Co. Ltd. 24,899 401,353 0.00Toho Gas Co. Ltd. 21,328 399,254 0.00Sankyu Inc. 16,300 395,819 0.00SHIFT Inc. 2,600 395,604 0.00Nifco Inc. 23,396 392,516 0.00Hitachi Transport System Ltd. 7,485 392,512 0.00Zeon Corp. 46,278 392,330 0.00Sumitomo Forestry Co. Ltd. 31,759 390,099 0.00Anritsu Corp. 38,700 389,706 0.00Jeol Ltd. 10,600 387,735 0.00Sohgo Security Services Co. Ltd. 17,402 387,275 0.00Seibu Holdings Inc. 48,495 385,783 0.00Chugoku Electric Power Co. Inc. 73,498 384,518 0.00Suzuken Co. Ltd. 16,302 383,841 0.00Tokai Carbon Co. Ltd. 58,000 382,952 0.00Pigeon Corp. 27,650 376,684 0.00Ulvac Inc. 11,800 373,595 0.00Takara Holdings Inc. 55,483 373,496 0.00Hirogin Holdings Inc. 93,783 368,991 0.00Money Forward Inc. 13,400 368,234 0.00Oracle Corp. Japan 7,164 368,192 0.00Iwatani Corp. 11,400 363,734 0.00Taiheiyo Cement Corp. 27,999 361,471 0.00Sharp Corp. 53,446 361,098 0.00Cosmos Pharmaceutical Corp. 4,866 361,070 0.00Tsuruha Holdings Inc. 8,823 360,161 0.00Nichirei Corp. 24,510 359,372 0.00Nishi-Nippon Railroad Co. Ltd. 22,407 358,842 0.00Sanwa Holdings Corp. 49,067 357,756 0.00Mitsui Mining & Smelting Co. Ltd. 17,700 357,455 0.00Kagome Co. Ltd. 17,806 354,669 0.00Kamigumi Co. Ltd. 26,116 354,662 0.00Mitsubishi Materials Corp. 28,113 351,191 0.00Horiba Ltd. 9,000 350,787 0.00As One Corp. 8,200 348,845 0.00Kewpie Corp. 25,660 345,314 0.00Kinden Corp. 36,882 342,603 0.00Credit Saison Co. Ltd. 37,937 340,975 0.00Lawson Inc. 11,638 340,205 0.00Sugi Holdings Co. Ltd. 9,910 338,735 0.00Teijin Ltd. 39,775 338,666 0.00BIPROGY Inc. 16,700 337,773 0.00Nihon Kohden Corp. 17,443 336,715 0.00Coca-Cola Bottlers Japan
Holdings Inc. 37,439 335,808 0.00Daicel Corp. 68,876 334,932 0.00
Vanguard FTSE Developed World ex-U.K. Equity Index Fund
107

Holding
MarketValue
(£)
% ofTotal Net
Assets
DMG Mori Co. Ltd. 32,794 330,838 0.00Internet Initiative Japan Inc. 13,000 328,072 0.00Ushio Inc. 31,309 327,405 0.00Justsystems Corp. 9,400 327,082 0.00Ezaki Glico Co. Ltd. 14,315 326,936 0.00Relo Group Inc. 28,300 325,342 0.00Taisho Pharmaceutical Holdings
Co. Ltd. 10,216 319,677 0.00J Front Retailing Co. Ltd. 52,961 316,471 0.00INFRONEER Holdings Inc. 53,787 313,471 0.00Goldwin Inc. 7,800 313,127 0.00TS Tech Co. Ltd. 37,444 313,064 0.00Takashimaya Co. Ltd. 43,165 312,866 0.00GMO internet Inc. 19,100 307,995 0.00Sundrug Co. Ltd. 16,590 307,500 0.00Penta-Ocean Construction Co. Ltd. 77,800 304,193 0.00Mitsubishi Motors Corp. 151,868 303,432 0.00Sumitomo Rubber Industries Ltd. 43,676 302,070 0.00Kobe Steel Ltd. 87,076 301,383 0.00JTEKT Corp. 54,091 301,277 0.00Kaneka Corp. 13,958 298,617 0.00Zenkoku Hosho Co. Ltd. 10,634 298,108 0.00PeptiDream Inc. 23,000 296,368 0.00Fancl Corp. 19,200 294,971 0.00Toyota Boshoku Corp. 22,992 293,862 0.00DIC Corp. 19,300 293,423 0.00Chugoku Bank Ltd. 49,434 290,229 0.00Alps Alpine Co. Ltd. 40,891 289,596 0.00House Foods Group Inc. 15,287 285,229 0.00Kokuyo Co. Ltd. 27,300 283,972 0.00DeNA Co. Ltd. 24,399 282,445 0.00PALTAC Corp. 9,700 282,360 0.00Toyoda Gosei Co. Ltd. 24,073 281,187 0.00Aica Kogyo Co. Ltd. 15,100 278,398 0.00K's Holdings Corp. 35,100 277,930 0.00Yamazaki Baking Co. Ltd. 27,829 274,761 0.00Morinaga & Co. Ltd. 11,000 273,203 0.00Toda Corp. 59,630 273,107 0.00Tsumura & Co. 13,908 272,324 0.00Hino Motors Ltd. 65,605 271,434 0.00Morinaga Milk Industry Co. Ltd. 8,400 270,597 0.00Park24 Co. Ltd. 23,641 269,747 0.00GS Yuasa Corp. 19,263 268,110 0.00H.U. Group Holdings Inc. 14,957 266,934 0.00Nippon Shokubai Co. Ltd. 8,275 266,061 0.00Toyo Seikan Group Holdings Ltd. 30,719 265,902 0.00Yokohama Rubber Co. Ltd. 24,717 263,942 0.00Rengo Co. Ltd. 55,781 263,709 0.00Calbee Inc. 18,468 263,630 0.00Seino Holdings Co. Ltd. 40,149 261,880 0.00Nagase & Co. Ltd. 22,815 261,304 0.00Bic Camera Inc. 38,793 260,905 0.00Sumitomo Pharma Co. Ltd. 36,679 260,442 0.00SMS Co. Ltd. 13,700 260,250 0.00Mitsubishi Logistics Corp. 13,877 255,935 0.00Canon Marketing Japan Inc. 14,480 251,388 0.00Matsui Securities Co. Ltd. 50,500 249,609 0.00Pola Orbis Holdings Inc. 26,752 247,352 0.00Descente Ltd. 15,900 246,814 0.00Daido Steel Co. Ltd. 10,745 244,411 0.00Toyo Tire Corp. 26,198 239,653 0.00Hachijuni Bank Ltd. 90,577 237,214 0.00Ship Healthcare Holdings Inc. 17,600 235,442 0.00Rakus Co. Ltd. 23,700 234,869 0.00Daiichikosho Co. Ltd. 10,600 231,012 0.00FP Corp. 12,708 229,453 0.00Mabuchi Motor Co. Ltd. 10,684 228,573 0.00Nippon Kayaku Co. Ltd. 32,659 227,280 0.00Daiwa Office Investment Corp. 50 225,928 0.00Benesse Holdings Inc. 16,116 225,497 0.00Benefit One Inc. 18,400 225,104 0.00Sawai Group Holdings Co. Ltd. 8,382 223,640 0.00Menicon Co. Ltd. 12,800 219,153 0.00Aeon Mall Co. Ltd. 22,628 218,681 0.00Kotobuki Spirits Co. Ltd. 5,200 218,661 0.00Izumi Co. Ltd. 12,646 217,760 0.00
Holding
MarketValue
(£)
% ofTotal Net
Assets
JCR Pharmaceuticals Co. Ltd. 14,400 214,589 0.00Sapporo Holdings Ltd. 12,800 212,386 0.00Maruichi Steel Tube Ltd. 12,451 212,259 0.00Furukawa Electric Co. Ltd. 16,146 210,333 0.00Kaken Pharmaceutical Co. Ltd. 8,616 208,166 0.00Itoham Yonekyu Holdings Inc. 51,800 207,948 0.00Information Services International-
Dentsu Ltd. 9,000 206,101 0.00Yamaguchi Financial Group Inc. 46,689 204,365 0.00Ain Holdings Inc. 5,700 204,294 0.00Iyo Bank Ltd. 52,792 204,141 0.00Kyudenko Corp. 11,200 202,087 0.00OBIC Business Consultants Co.
Ltd. 6,917 199,436 0.00Yamato Kogyo Co. Ltd. 7,647 196,978 0.00Sankyo Co. Ltd. 8,484 194,806 0.00Sotetsu Holdings Inc. 14,178 194,633 0.00Seven Bank Ltd. 124,141 184,690 0.00Takara Bio Inc. 14,200 182,713 0.00NOK Corp. 26,424 179,991 0.00Acom Co. Ltd. 87,276 179,206 0.00Kyushu Financial Group Inc. 73,379 179,091 0.00Yaoko Co. Ltd. 4,200 176,353 0.00ABC-Mart Inc. 5,333 175,403 0.00Maruwa Unyu Kikan Co. Ltd. 17,900 166,936 0.00AEON Financial Service Co. Ltd. 22,562 165,335 0.00NEC Networks & System
Integration Corp. 14,500 164,644 0.00Fuyo General Lease Co. Ltd. 3,600 155,586 0.00Resorttrust Inc. 11,451 154,381 0.00TBS Holdings Inc. 14,539 152,484 0.00Sumitomo Bakelite Co. Ltd. 5,800 152,432 0.00NS Solutions Corp. 6,268 149,896 0.00Shochiku Co. Ltd. 1,787 145,893 0.00Daio Paper Corp. 15,300 145,604 0.00NHK Spring Co. Ltd. 28,035 144,947 0.00Sansan Inc. 18,400 141,510 0.00Ariake Japan Co. Ltd. 4,300 137,198 0.00Fujitsu General Ltd. 9,500 135,086 0.00Nipro Corp. 21,226 133,623 0.00Heiwa Corp. 11,031 132,307 0.00OSG Corp. 12,751 127,774 0.00Toshiba TEC Corp. 4,700 127,568 0.00Fukuyama Transporting Co. Ltd. 5,693 127,221 0.00Fuji Kyuko Co. Ltd. 5,000 126,489 0.00Shikoku Electric Power Co. Inc. 26,279 120,197 0.00Lintec Corp. 7,748 115,270 0.00Mani Inc. 11,600 106,328 0.00GungHo Online Entertainment Inc. 6,360 103,926 0.00RENOVA Inc. 10,300 102,390 0.00Kusuri no Aoki Holdings Co. Ltd. 2,800 99,150 0.00Japan Aviation Electronics Industry
Ltd. 8,731 97,475 0.00Kandenko Co. Ltd. 18,517 93,574 0.00Fuji Oil Holdings Inc. 8,100 91,625 0.00Noevir Holdings Co. Ltd. 2,000 62,584 0.00Orient Corp. 68,039 51,867 0.00ASKUL Corp. 4,200 41,028 0.00
813,592,853 7.01
Jersey 0.00% (31 October 2021: 0.11%)
Liberia 0.00% (31 October 2021: 0.03%)
Luxembourg 0.00% (31 October 2021: 0.07%)
Malta 0.00% (31 October 2021: 0.00%)
AZ BGP Holdings1 6,442 — 0.00
— 0.00
Netherlands 1.22% (31 October 2021: 1.64%)
ASML Holding NV 104,290 48,021,780 0.41Adyen NV 8,014 10,929,062 0.09Prosus NV 244,475 9,570,667 0.08ING Groep NV 1,038,140 7,934,534 0.07Koninklijke Ahold Delhaize NV 272,411 6,428,566 0.06Koninklijke DSM NV 45,571 6,147,717 0.05Wolters Kluwer NV 70,183 5,695,530 0.05Heineken NV 64,914 5,094,485 0.04
Vanguard FTSE Developed World ex-U.K. Equity Index Fund
108

Holding
MarketValue
(£)
% ofTotal Net
Assets
Koninklijke Philips NV 240,358 5,048,086 0.04Universal Music Group BV 214,773 4,018,972 0.04ArcelorMittal SA 163,412 3,859,069 0.03Akzo Nobel NV 49,342 3,445,346 0.03NN Group NV 84,169 3,319,787 0.03ASM International NV 12,446 3,031,748 0.03Koninklijke KPN NV 872,421 2,405,179 0.02IMCD NV 15,757 2,021,751 0.02Aegon NV 469,704 1,959,165 0.02Unibail-Rodamco-Westfield (XAMS) 29,747 1,699,680 0.02Heineken Holding NV 26,897 1,687,130 0.02ASR Nederland NV 38,382 1,397,757 0.01Randstad NV 29,362 1,254,314 0.01ABN AMRO Bank NV 121,692 1,226,016 0.01Signify NV 32,433 1,106,441 0.01Aalberts NV 28,151 1,102,760 0.01Just Eat Takeaway.com NV 46,410 1,025,415 0.01BE Semiconductor Industries NV 18,191 897,854 0.01JDE Peet's NV 21,289 500,158 0.00Koninklijke Vopak NV 18,899 406,849 0.00InPost SA 59,865 293,766 0.00CTP NV 15,578 175,663 0.00
141,705,247 1.22
New Zealand 0.09% (31 October 2021: 0.10%)
Fisher & Paykel Healthcare Corp.Ltd. 168,902 1,875,557 0.02
Auckland International Airport Ltd. 323,543 1,309,649 0.01Spark New Zealand Ltd. 451,077 1,147,300 0.01Mainfreight Ltd. 21,515 889,244 0.01Meridian Energy Ltd. 326,713 800,583 0.01Contact Energy Ltd. 189,560 798,667 0.01Mercury NZ Ltd. 254,418 797,043 0.01EBOS Group Ltd. 33,395 731,996 0.01Fletcher Building Ltd. 213,052 680,668 0.00Infratil Ltd. 115,929 501,025 0.00Ryman Healthcare Ltd. 95,120 450,923 0.00a2 Milk Co. Ltd. 176,893 441,692 0.00SKYCITY Entertainment Group Ltd. 154,205 226,401 0.00Kiwi Property Group Ltd. 294,551 161,409 0.00Air New Zealand Ltd. 238,848 108,042 0.00Air New Zealand Ltd. Rights
02/05/20221 79,616 29,223 0.00
10,949,422 0.09
Norway 0.25% (31 October 2021: 0.22%)
Equinor ASA 264,813 7,268,418 0.06DNB Bank ASA 285,413 4,482,402 0.04Mowi ASA 133,213 3,031,675 0.03Norsk Hydro ASA 365,603 2,498,629 0.02Telenor ASA 169,564 1,926,578 0.02Yara International ASA 41,634 1,711,001 0.02Orkla ASA 241,244 1,574,890 0.01Salmar ASA 15,595 1,029,940 0.01TOMRA Systems ASA 32,255 1,027,467 0.01Aker BP ASA 33,447 973,362 0.01Gjensidige Forsikring ASA 42,411 730,966 0.01Nordic Semiconductor ASA 41,280 675,652 0.01Aker ASA Class A 7,716 507,938 0.00Schibsted ASA Class B 32,352 502,002 0.00Leroy Seafood Group ASA 59,999 454,727 0.00Adevinta ASA 60,463 380,190 0.00Schibsted ASA Class A 13,776 232,840 0.00
29,008,677 0.25
Panama 0.00% (31 October 2021: 0.03%)
Poland 0.07% (31 October 2021: 0.09%)
Powszechna Kasa OszczednosciBank Polski SA 209,849 1,235,423 0.01
Powszechny Zaklad UbezpieczenSA 184,894 1,018,817 0.01
Polski Koncern Naftowy ORLEN SA 74,313 1,003,038 0.01KGHM Polska Miedz SA 33,740 877,502 0.01Bank Polska Kasa Opieki SA 45,898 807,337 0.01Polskie Gornictwo Naftowe i
Gazownictwo SA 501,614 559,108 0.01Dino Polska SA 10,731 554,712 0.01
Holding
MarketValue
(£)
% ofTotal Net
Assets
LPP SA 317 535,122 0.00Santander Bank Polska SA 9,426 452,401 0.00Allegro.eu SA 108,481 448,418 0.00Cyfrowy Polsat SA 78,226 340,064 0.00CD Projekt SA 14,599 317,009 0.00Pepco Group NV 36,756 274,710 0.00
8,423,661 0.07
Portugal 0.06% (31 October 2021: 0.05%)
EDP - Energias de Portugal SA 782,784 2,921,699 0.03Galp Energia SGPS SA 142,954 1,396,983 0.01Jeronimo Martins SGPS SA 72,196 1,201,139 0.01EDP Renovaveis SA 61,209 1,164,412 0.01Banco Espirito Santo SA1 211,191 2 0.00
6,684,235 0.06
Singapore 0.41% (31 October 2021: 0.35%)
DBS Group Holdings Ltd. 484,492 9,479,017 0.08Oversea-Chinese Banking Corp.
Ltd. 951,099 6,791,523 0.06United Overseas Bank Ltd. 342,021 5,916,298 0.05Singapore Telecommunications
Ltd. (Singtel 10) 1,336,001 2,134,556 0.02CapitaLand Integrated Commercial
Trust 1,372,479 1,844,516 0.02Capitaland Investment Ltd. 667,543 1,628,697 0.01Ascendas Real Estate Investment
Trust 883,423 1,457,322 0.01Keppel Corp. Ltd. 351,395 1,392,429 0.01Wilmar International Ltd. 520,803 1,333,759 0.01Singapore Exchange Ltd. 194,406 1,097,775 0.01Singapore Telecommunications
Ltd. (Singtel) 663,526 1,060,129 0.01Singapore Airlines Ltd. 316,399 1,003,734 0.01Mapletree Logistics Trust 908,073 932,313 0.01Mapletree Commercial Trust 841,801 907,971 0.01Singapore Technologies
Engineering Ltd. 347,812 822,525 0.01Genting Singapore Ltd. 1,699,025 793,790 0.01Suntec Real Estate Investment
Trust 647,088 686,755 0.01Mapletree Industrial Trust 450,661 678,440 0.01Jardine Cycle & Carriage Ltd. 40,438 674,075 0.01UOL Group Ltd. 151,036 635,081 0.01Venture Corp. Ltd. 61,802 611,347 0.01Frasers Logistics & Commercial
Trust 643,900 538,526 0.01City Developments Ltd. 109,026 537,043 0.01Golden Agri-Resources Ltd. 2,692,275 504,688 0.00Mapletree North Asia Commercial
Trust 716,700 491,932 0.00Hutchison Port Holdings Trust 2,499,657 467,876 0.00SATS Ltd. 162,200 425,680 0.00Keppel REIT 586,800 412,925 0.00Ascott Residence Trust 616,200 408,733 0.00Sembcorp Industries Ltd. 235,219 400,235 0.00NetLink NBN Trust 692,200 399,257 0.00ComfortDelGro Corp. Ltd. 462,372 392,039 0.00Keppel DC REIT 326,042 389,282 0.00Sembcorp Marine Ltd. 4,508,905 280,878 0.00Olam Group Ltd. 182,300 177,703 0.00Singapore Post Ltd. 337,783 139,304 0.00SIA Engineering Co. Ltd. 43,233 66,830 0.00StarHub Ltd. 80,314 58,369 0.00Wing Tai Holdings Ltd. 37,278 37,628 0.00
48,010,980 0.41
South Korea 1.65% (31 October 2021: 1.62%)
Samsung Electronics Co. Ltd. 1,294,223 55,317,485 0.48SK Hynix Inc. 139,382 9,899,611 0.09Samsung Electronics Co. Ltd. -
Preference Shares 210,962 7,933,272 0.07NAVER Corp. 37,505 6,802,188 0.06Samsung SDI Co. Ltd. 13,814 5,352,468 0.05Kakao Corp. 78,447 4,467,310 0.04Hyundai Motor Co. 37,720 4,437,200 0.04Kia Corp. 75,346 3,999,255 0.04
Vanguard FTSE Developed World ex-U.K. Equity Index Fund
109
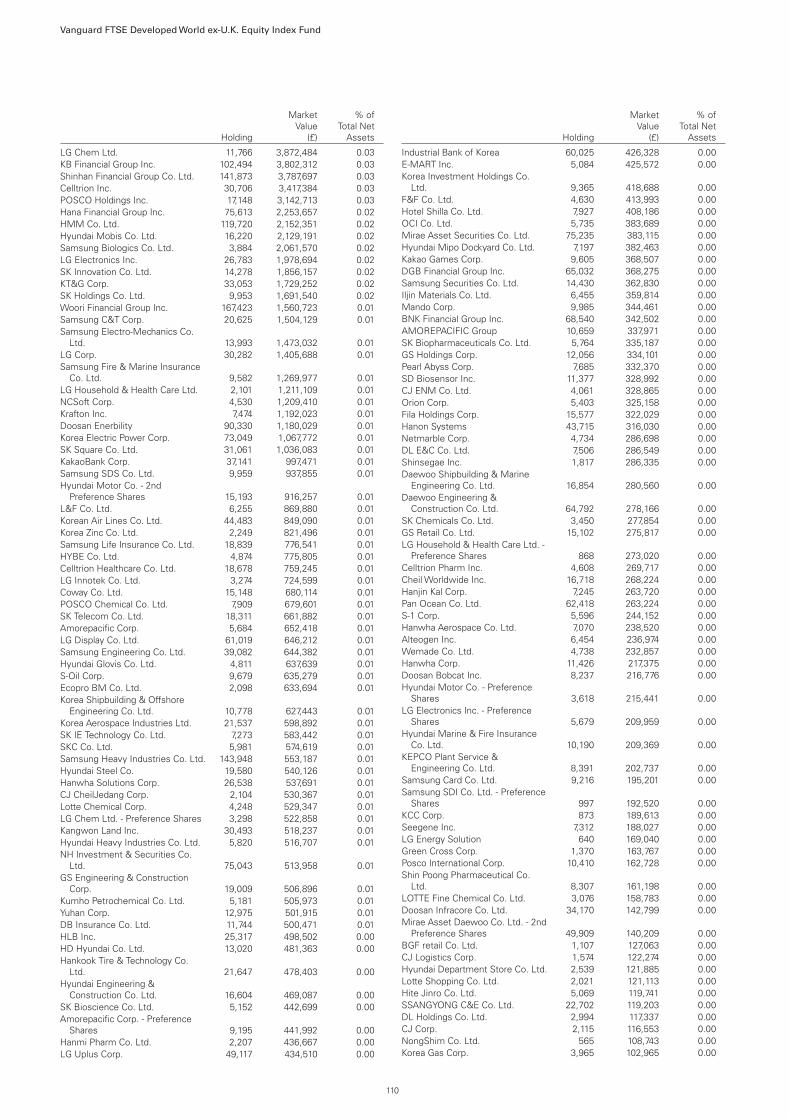
Holding
MarketValue
(£)
% ofTotal Net
Assets
LG Chem Ltd. 11,766 3,872,484 0.03KB Financial Group Inc. 102,494 3,802,312 0.03Shinhan Financial Group Co. Ltd. 141,873 3,787,697 0.03Celltrion Inc. 30,706 3,417,384 0.03POSCO Holdings Inc. 17,148 3,142,713 0.03Hana Financial Group Inc. 75,613 2,253,657 0.02HMM Co. Ltd. 119,720 2,152,351 0.02Hyundai Mobis Co. Ltd. 16,220 2,129,191 0.02Samsung Biologics Co. Ltd. 3,884 2,061,570 0.02LG Electronics Inc. 26,783 1,978,694 0.02SK Innovation Co. Ltd. 14,278 1,856,157 0.02KT&G Corp. 33,053 1,729,252 0.02SK Holdings Co. Ltd. 9,953 1,691,540 0.02Woori Financial Group Inc. 167,423 1,560,723 0.01Samsung C&T Corp. 20,625 1,504,129 0.01Samsung Electro-Mechanics Co.
Ltd. 13,993 1,473,032 0.01LG Corp. 30,282 1,405,688 0.01Samsung Fire & Marine Insurance
Co. Ltd. 9,582 1,269,977 0.01LG Household & Health Care Ltd. 2,101 1,211,109 0.01NCSoft Corp. 4,530 1,209,410 0.01Krafton Inc. 7,474 1,192,023 0.01Doosan Enerbility 90,330 1,180,029 0.01Korea Electric Power Corp. 73,049 1,067,772 0.01SK Square Co. Ltd. 31,061 1,036,083 0.01KakaoBank Corp. 37,141 997,471 0.01Samsung SDS Co. Ltd. 9,959 937,855 0.01Hyundai Motor Co. - 2nd
Preference Shares 15,193 916,257 0.01L&F Co. Ltd. 6,255 869,880 0.01Korean Air Lines Co. Ltd. 44,483 849,090 0.01Korea Zinc Co. Ltd. 2,249 821,496 0.01Samsung Life Insurance Co. Ltd. 18,839 776,541 0.01HYBE Co. Ltd. 4,874 775,805 0.01Celltrion Healthcare Co. Ltd. 18,678 759,245 0.01LG Innotek Co. Ltd. 3,274 724,599 0.01Coway Co. Ltd. 15,148 680,114 0.01POSCO Chemical Co. Ltd. 7,909 679,601 0.01SK Telecom Co. Ltd. 18,311 661,882 0.01Amorepacific Corp. 5,684 652,418 0.01LG Display Co. Ltd. 61,019 646,212 0.01Samsung Engineering Co. Ltd. 39,082 644,382 0.01Hyundai Glovis Co. Ltd. 4,811 637,639 0.01S-Oil Corp. 9,679 635,279 0.01Ecopro BM Co. Ltd. 2,098 633,694 0.01Korea Shipbuilding & Offshore
Engineering Co. Ltd. 10,778 627,443 0.01Korea Aerospace Industries Ltd. 21,537 598,892 0.01SK IE Technology Co. Ltd. 7,273 583,442 0.01SKC Co. Ltd. 5,981 574,619 0.01Samsung Heavy Industries Co. Ltd. 143,948 553,187 0.01Hyundai Steel Co. 19,580 540,126 0.01Hanwha Solutions Corp. 26,538 537,691 0.01CJ CheilJedang Corp. 2,104 530,367 0.01Lotte Chemical Corp. 4,248 529,347 0.01LG Chem Ltd. - Preference Shares 3,298 522,858 0.01Kangwon Land Inc. 30,493 518,237 0.01Hyundai Heavy Industries Co. Ltd. 5,820 516,707 0.01NH Investment & Securities Co.
Ltd. 75,043 513,958 0.01GS Engineering & Construction
Corp. 19,009 506,896 0.01Kumho Petrochemical Co. Ltd. 5,181 505,973 0.01Yuhan Corp. 12,975 501,915 0.01DB Insurance Co. Ltd. 11,744 500,471 0.01HLB Inc. 25,317 498,502 0.00HD Hyundai Co. Ltd. 13,020 481,363 0.00Hankook Tire & Technology Co.
Ltd. 21,647 478,403 0.00Hyundai Engineering &
Construction Co. Ltd. 16,604 469,087 0.00SK Bioscience Co. Ltd. 5,152 442,699 0.00Amorepacific Corp. - Preference
Shares 9,195 441,992 0.00Hanmi Pharm Co. Ltd. 2,207 436,667 0.00LG Uplus Corp. 49,117 434,510 0.00
Holding
MarketValue
(£)
% ofTotal Net
Assets
Industrial Bank of Korea 60,025 426,328 0.00E-MART Inc. 5,084 425,572 0.00Korea Investment Holdings Co.
Ltd. 9,365 418,688 0.00F&F Co. Ltd. 4,630 413,993 0.00Hotel Shilla Co. Ltd. 7,927 408,186 0.00OCI Co. Ltd. 5,735 383,689 0.00Mirae Asset Securities Co. Ltd. 75,235 383,115 0.00Hyundai Mipo Dockyard Co. Ltd. 7,197 382,463 0.00Kakao Games Corp. 9,605 368,507 0.00DGB Financial Group Inc. 65,032 368,275 0.00Samsung Securities Co. Ltd. 14,430 362,830 0.00Iljin Materials Co. Ltd. 6,455 359,814 0.00Mando Corp. 9,985 344,461 0.00BNK Financial Group Inc. 68,540 342,502 0.00AMOREPACIFIC Group 10,659 337,971 0.00SK Biopharmaceuticals Co. Ltd. 5,764 335,187 0.00GS Holdings Corp. 12,056 334,101 0.00Pearl Abyss Corp. 7,685 332,370 0.00SD Biosensor Inc. 11,377 328,992 0.00CJ ENM Co. Ltd. 4,061 328,865 0.00Orion Corp. 5,403 325,158 0.00Fila Holdings Corp. 15,577 322,029 0.00Hanon Systems 43,715 316,030 0.00Netmarble Corp. 4,734 286,698 0.00DL E&C Co. Ltd. 7,506 286,549 0.00Shinsegae Inc. 1,817 286,335 0.00Daewoo Shipbuilding & Marine
Engineering Co. Ltd. 16,854 280,560 0.00Daewoo Engineering &
Construction Co. Ltd. 64,792 278,166 0.00SK Chemicals Co. Ltd. 3,450 277,854 0.00GS Retail Co. Ltd. 15,102 275,817 0.00LG Household & Health Care Ltd. -
Preference Shares 868 273,020 0.00Celltrion Pharm Inc. 4,608 269,717 0.00Cheil Worldwide Inc. 16,718 268,224 0.00Hanjin Kal Corp. 7,245 263,720 0.00Pan Ocean Co. Ltd. 62,418 263,224 0.00S-1 Corp. 5,596 244,152 0.00Hanwha Aerospace Co. Ltd. 7,070 238,520 0.00Alteogen Inc. 6,454 236,974 0.00Wemade Co. Ltd. 4,738 232,857 0.00Hanwha Corp. 11,426 217,375 0.00Doosan Bobcat Inc. 8,237 216,776 0.00Hyundai Motor Co. - Preference
Shares 3,618 215,441 0.00LG Electronics Inc. - Preference
Shares 5,679 209,959 0.00Hyundai Marine & Fire Insurance
Co. Ltd. 10,190 209,369 0.00KEPCO Plant Service &
Engineering Co. Ltd. 8,391 202,737 0.00Samsung Card Co. Ltd. 9,216 195,201 0.00Samsung SDI Co. Ltd. - Preference
Shares 997 192,520 0.00KCC Corp. 873 189,613 0.00Seegene Inc. 7,312 188,027 0.00LG Energy Solution 640 169,040 0.00Green Cross Corp. 1,370 163,767 0.00Posco International Corp. 10,410 162,728 0.00Shin Poong Pharmaceutical Co.
Ltd. 8,307 161,198 0.00LOTTE Fine Chemical Co. Ltd. 3,076 158,783 0.00Doosan Infracore Co. Ltd. 34,170 142,799 0.00Mirae Asset Daewoo Co. Ltd. - 2nd
Preference Shares 49,909 140,209 0.00BGF retail Co. Ltd. 1,107 127,063 0.00CJ Logistics Corp. 1,574 122,274 0.00Hyundai Department Store Co. Ltd. 2,539 121,885 0.00Lotte Shopping Co. Ltd. 2,021 121,113 0.00Hite Jinro Co. Ltd. 5,069 119,741 0.00SSANGYONG C&E Co. Ltd. 22,702 119,203 0.00DL Holdings Co. Ltd. 2,994 117,337 0.00CJ Corp. 2,115 116,553 0.00NongShim Co. Ltd. 565 108,743 0.00Korea Gas Corp. 3,965 102,965 0.00
Vanguard FTSE Developed World ex-U.K. Equity Index Fund
110

Holding
MarketValue
(£)
% ofTotal Net
Assets
Hyundai Wia Corp. 2,453 101,735 0.00Lotte Corp. 4,646 100,762 0.00LS Corp. 2,654 97,111 0.00Paradise Co. Ltd. 8,151 86,063 0.00Dongsuh Cos. Inc. 4,971 84,326 0.00Helixmith Co. Ltd. 6,059 80,881 0.00HDC Hyundai Development Co-
Engineering & Construction 8,527 80,841 0.00Hanwha Life Insurance Co. Ltd. 43,207 80,418 0.00Doosan Solus Co. Ltd. 1,708 78,419 0.00Medytox Inc. 885 76,719 0.00NHN Corp. 3,172 70,806 0.00SK Networks Co. Ltd. 22,255 68,378 0.00Hanmi Science Co. Ltd. 2,110 68,375 0.00Ottogi Corp. 229 68,181 0.00Lotte Chilsung Beverage Co. Ltd. 590 68,095 0.00Hanssem Co. Ltd. 1,178 58,642 0.00SillaJen Inc.1 8,598 17,448 0.00Hyundai Engineering &
Construction Co. Ltd. -Preference Shares 282 13,377 0.00
Solus Advanced Materials Co. Ltd.1 252 3,676 0.00
191,566,763 1.65
Spain 0.72% (31 October 2021: 0.71%)
Iberdrola SA 1,652,695 15,289,562 0.13Banco Santander SA 4,608,368 10,904,224 0.09Banco Bilbao Vizcaya Argentaria SA 1,796,944 7,634,079 0.07Cellnex Telecom SA 168,852 6,322,174 0.05Amadeus IT Group SA 113,368 5,753,637 0.05Telefonica SA 1,378,135 5,363,834 0.05Industria de Diseno Textil SA 296,636 5,009,968 0.04Repsol SA 349,913 4,200,059 0.04CaixaBank SA 1,190,400 3,086,767 0.03Ferrovial SA 125,779 2,598,853 0.02Aena SME SA 20,512 2,349,194 0.02Red Electrica Corp. SA 107,633 1,730,117 0.01Endesa SA 89,583 1,506,970 0.01ACS Actividades de Construccion y
Servicios SA 62,379 1,288,878 0.01Acciona SA 6,660 1,049,278 0.01Merlin Properties Socimi SA 118,102 1,033,054 0.01Grifols SA Class B - Preference
Shares 116,530 1,021,262 0.01Enagas SA 58,858 1,017,313 0.01Naturgy Energy Group SA 41,461 1,000,899 0.01Bankinter SA 192,131 908,910 0.01Grifols SA 67,192 903,343 0.01Siemens Gamesa Renewable
Energy SA 57,108 735,141 0.01Inmobiliaria Colonial Socimi SA 97,793 654,498 0.01Corp ACCIONA Energias
Renovables SA 20,507 608,264 0.01Fluidra SA 25,523 558,883 0.00Mapfre SA 250,275 366,968 0.00
82,896,129 0.72
Sweden 0.99% (31 October 2021: 1.11%)
Investor AB Class B 458,492 7,155,805 0.06Atlas Copco AB Class A 189,895 7,002,398 0.06Volvo AB Class B 416,221 5,361,374 0.05Hexagon AB 507,678 5,297,449 0.05Assa Abloy AB Class B 254,570 5,190,549 0.05Telefonaktiebolaget LM Ericsson
Class B 793,381 5,136,256 0.04Sandvik AB 281,758 4,314,976 0.04Evolution Gaming Group AB 42,166 3,537,051 0.03Swedbank AB Class A 275,855 3,522,348 0.03Essity AB Class B 165,196 3,501,271 0.03Skandinaviska Enskilda Banken AB
Class A 366,753 3,339,255 0.03Svenska Handelsbanken AB
Class A 393,775 3,207,383 0.03Investor AB Class A 186,458 3,139,086 0.03Swedish Match AB 446,229 2,858,349 0.02Atlas Copco AB Class B 86,067 2,750,939 0.02Svenska Cellulosa AB SCA Class B 172,830 2,702,323 0.02
Holding
MarketValue
(£)
% ofTotal Net
Assets
Telia Co. AB 786,957 2,620,298 0.02Epiroc AB Class A 158,446 2,605,639 0.02Nibe Industrier AB 313,880 2,483,866 0.02Boliden AB 69,734 2,438,736 0.02Hennes & Mauritz AB Class B 228,121 2,316,172 0.02Alfa Laval AB 86,001 1,936,771 0.02EQT AB 72,349 1,675,220 0.01Epiroc AB Class B 112,985 1,589,713 0.01Lundin Energy AB 47,414 1,579,495 0.01Indutrade AB 76,891 1,473,339 0.01Skanska AB Class B 94,433 1,454,256 0.01Tele2 AB Class B 135,548 1,434,792 0.01Getinge AB Class B 61,808 1,434,665 0.01Industrivarden AB Class A 63,729 1,322,725 0.01SKF AB Class B 95,861 1,263,795 0.01Holmen AB Class B 26,054 1,220,107 0.01Castellum AB 71,613 1,145,931 0.01Fastighets AB Balder Class B 27,134 1,091,931 0.01Sagax AB Class B 52,485 1,086,363 0.01Lifco AB 63,925 1,086,078 0.01L E Lundbergforetagen AB Class B 27,485 1,038,995 0.01Trelleborg AB Class B 57,533 1,020,527 0.01Kinnevik AB Class B 59,272 939,294 0.01Thule Group AB 32,202 904,863 0.01Securitas AB Class B 86,533 824,472 0.01Electrolux AB 66,067 815,766 0.01Samhallsbyggnadsbolaget i Norden
AB 320,358 812,649 0.01Industrivarden AB Class C 38,960 794,691 0.01Investment AB Latour Class B 37,034 791,850 0.01Swedish Orphan Biovitrum AB 44,824 760,461 0.01Beijer Ref AB 55,714 729,981 0.01Husqvarna AB Class B 93,368 720,636 0.01Sweco AB Class B 57,826 658,890 0.01Volvo AB Class A 45,985 609,241 0.01Elekta AB Class B 93,112 506,016 0.00Sinch AB 131,960 473,993 0.00Vitrolife AB 18,257 378,636 0.00Telefonaktiebolaget LM Ericsson
Class A 33,486 227,133 0.00Husqvarna AB Class A 25,952 202,625 0.00Skandinaviska Enskilda Banken AB 13,802 134,927 0.00Kinnevik AB Class A 6,919 114,233 0.00Svenska Handelsbanken AB 4,427 40,109 0.00
114,776,692 0.99
Switzerland 2.99% (31 October 2021: 3.06%)
Nestle SA 750,385 77,584,521 0.67Roche Holding AG (Non-voting) 190,138 56,542,825 0.49Novartis AG 573,175 40,684,009 0.35Zurich Insurance Group AG 40,424 14,790,987 0.13Cie Financiere Richemont SA 139,964 13,265,350 0.11UBS Group AG 867,983 11,905,236 0.10ABB Ltd. 451,555 10,967,882 0.09Sika AG 41,931 10,353,276 0.09Lonza Group AG 20,131 9,551,330 0.08Givaudan SA 2,496 7,975,555 0.07Alcon Inc. 122,386 7,058,036 0.06Holcim AG 153,513 6,065,434 0.05Partners Group Holding AG 6,258 5,379,105 0.05Swiss Re AG 78,905 5,200,542 0.05Geberit AG 9,350 4,296,552 0.04Sonova Holding AG 14,315 4,172,388 0.04Swiss Life Holding AG 8,227 3,868,268 0.03Credit Suisse Group AG 685,810 3,780,630 0.03Swisscom AG 7,237 3,424,156 0.03SGS SA 1,591 3,292,575 0.03Kuehne + Nagel International AG 13,367 3,017,484 0.03Chocoladefabriken Lindt &
Spruengli AG 324 2,908,591 0.03Roche Holding AG - Bearer Shares 8,619 2,778,106 0.02Straumann Holding AG 26,540 2,537,156 0.02Chocoladefabriken Lindt &
Spruengli AG Registered 25 2,338,650 0.02Julius Baer Group Ltd. 57,187 2,217,275 0.02Vifor Pharma AG 15,493 2,187,311 0.02
Vanguard FTSE Developed World ex-U.K. Equity Index Fund
111

Holding
MarketValue
(£)
% ofTotal Net
Assets
Logitech International SA 39,771 2,103,015 0.02VAT Group AG 6,846 1,724,629 0.02Baloise Holding AG 12,305 1,719,557 0.01Swiss Prime Site AG 21,513 1,685,873 0.01Barry Callebaut AG 907 1,676,085 0.01SIG Combibloc Group AG 98,424 1,658,906 0.01Schindler Holding AG (Non-voting) 10,302 1,601,113 0.01EMS-Chemie Holding AG 2,019 1,452,140 0.01Temenos AG 16,362 1,332,696 0.01Swatch Group AG - Bearer Shares 6,137 1,281,635 0.01Adecco Group AG 39,649 1,241,215 0.01PSP Swiss Property AG 11,039 1,115,991 0.01Helvetia Holding AG 10,650 1,100,261 0.01Georg Fischer AG 23,820 1,044,744 0.01Belimo Holding AG 2,484 989,603 0.01Clariant AG 62,141 855,129 0.01Schindler Holding AG 5,325 826,725 0.01Tecan Group AG 3,297 799,190 0.01Swatch Group AG - Registered
Shares 19,607 780,964 0.01ams-OSRAM AG 61,457 612,224 0.01Flughafen Zurich AG 4,480 609,881 0.01DKSH Holding AG 8,442 581,896 0.01Emmi AG 686 546,593 0.00BKW AG 5,532 540,648 0.00Banque Cantonale Vaudoise 6,040 410,134 0.00Vifor Pharma AG - Blue Chip
Shares 1,539 218,414 0.00
346,652,491 2.99
United Kingdom 0.00% (31 October 2021: 0.07%)
United States 68.31% (31 October 2021: 65.30%)
Apple Inc. 4,204,840 528,024,473 4.55Microsoft Corp. 2,052,853 453,851,140 3.91Amazon.com Inc. 118,285 234,178,739 2.02Tesla Inc. 226,806 157,197,882 1.36Alphabet Inc. Class A 83,548 151,831,690 1.31Alphabet Inc. Class C 73,706 134,985,526 1.16UnitedHealth Group Inc. 256,263 103,697,161 0.89Johnson & Johnson 717,588 103,171,439 0.89Meta Platforms Inc. 628,559 100,374,136 0.87NVIDIA Corp. 651,107 96,180,200 0.83Berkshire Hathaway Inc. 354,068 90,768,830 0.78Procter & Gamble Co. 654,621 83,747,646 0.72Exxon Mobil Corp. 1,155,551 78,371,259 0.68Visa Inc. 451,202 76,526,406 0.66JPMorgan Chase & Co. 801,316 76,193,591 0.66Mastercard Inc. 234,847 67,971,850 0.59Home Depot Inc. 283,923 67,944,739 0.59Chevron Corp. 527,642 65,842,795 0.57Pfizer Inc. 1,524,662 59,602,049 0.51AbbVie Inc. 481,242 56,273,278 0.49Bank of America Corp. 1,932,259 54,881,976 0.47Coca-Cola Co. 1,056,624 54,392,332 0.47Eli Lilly & Co. 231,295 53,819,582 0.46PepsiCo Inc. 374,687 51,244,501 0.44Costco Wholesale Corp. 120,309 50,937,970 0.44Merck & Co. Inc. 691,498 48,859,223 0.42Broadcom Inc. 108,954 48,110,694 0.41Thermo Fisher Scientific Inc. 107,084 47,178,345 0.41Walmart Inc. 383,497 46,734,377 0.40Cisco Systems Inc. 1,152,769 44,981,381 0.39Walt Disney Co. 497,009 44,194,389 0.38Abbott Laboratories 473,886 42,817,682 0.37Verizon Communications Inc. 1,138,962 42,002,321 0.36Accenture plc 173,672 41,565,062 0.36McDonald's Corp. 203,939 40,485,647 0.35Adobe Inc. 128,021 40,375,283 0.35Comcast Corp. 1,227,283 38,866,385 0.34Intel Corp. 1,104,525 38,348,243 0.33Berkshire Hathaway Inc. Class A 98 37,849,602 0.33Wells Fargo & Co. 1,055,778 36,681,013 0.32Salesforce Inc. 257,547 36,103,742 0.31Bristol-Myers Squibb Co. 589,116 35,318,788 0.30Linde plc 140,960 35,000,277 0.30Danaher Corp. 172,604 34,531,780 0.30
Holding
MarketValue
(£)
% ofTotal Net
Assets
QUALCOMM Inc. 308,005 34,266,918 0.30Texas Instruments Inc. 251,978 34,169,042 0.29Philip Morris International Inc. 425,417 33,891,028 0.29NIKE Inc. 338,768 33,639,334 0.29Union Pacific Corp. 174,872 32,637,185 0.28Raytheon Technologies Corp. 404,809 30,611,347 0.26Medtronic plc 368,039 30,592,218 0.26Advanced Micro Devices Inc. 446,745 30,430,595 0.26NextEra Energy Inc. 535,940 30,312,289 0.26AT&T Inc. 1,953,350 29,343,021 0.25Honeywell International Inc. 186,444 28,746,962 0.25Lowe's Cos. Inc. 182,156 28,673,414 0.25S&P Global Inc. 94,276 28,276,778 0.24United Parcel Service Inc. 196,063 28,106,253 0.24Amgen Inc. 151,006 28,039,833 0.24ConocoPhillips 360,170 27,390,692 0.24CVS Health Corp. 355,260 27,201,215 0.23Anthem Inc. 67,183 26,850,176 0.23Prologis Inc. 201,656 25,745,459 0.22International Business Machines
Corp. 244,231 25,738,101 0.22Oracle Corp. 438,197 25,621,684 0.22Caterpillar Inc. 148,367 24,876,719 0.21Intuit Inc. 71,740 23,924,177 0.21Target Corp. 130,063 23,687,925 0.20American Tower Corp. 122,362 23,490,958 0.20American Express Co. 167,049 23,248,472 0.20Morgan Stanley 357,617 22,943,874 0.20Deere & Co. 75,651 22,727,826 0.20Lockheed Martin Corp. 66,073 22,724,258 0.20PayPal Holdings Inc. 319,311 22,350,487 0.19Altria Group Inc. 495,634 21,949,212 0.19Goldman Sachs Group Inc. 89,405 21,754,849 0.19Charles Schwab Corp. 410,610 21,699,689 0.19Applied Materials Inc. 240,727 21,154,437 0.18Citigroup Inc. 539,708 20,715,663 0.18ServiceNow Inc. 54,058 20,590,253 0.18Automatic Data Processing Inc. 115,184 20,016,592 0.17Booking Holdings Inc. 11,261 19,825,000 0.17BlackRock Inc. 38,906 19,359,715 0.17Chubb Ltd. 117,311 19,283,657 0.17Mondelez International Inc. 369,504 18,974,043 0.16Starbucks Corp. 316,738 18,827,674 0.16Duke Energy Corp. 211,420 18,553,758 0.16Intuitive Surgical Inc. 96,899 18,463,668 0.16Stryker Corp. 95,134 18,274,357 0.16Zoetis Inc. 129,277 18,243,956 0.16Netflix Inc. 118,338 17,941,558 0.153M Co. 154,652 17,768,649 0.15General Electric Co. 297,412 17,659,939 0.15Cigna Corp. 89,228 17,539,280 0.15Marsh & McLennan Cos. Inc. 136,021 17,518,586 0.15Boeing Co. 147,487 17,486,980 0.15Crown Castle International Corp. 118,054 17,415,189 0.15Analog Devices Inc. 141,634 17,412,343 0.15CME Group Inc. 98,393 17,204,463 0.15Southern Co. 288,151 16,843,800 0.15Micron Technology Inc. 304,944 16,559,993 0.14CSX Corp. 602,724 16,485,489 0.14Gilead Sciences Inc. 341,784 16,140,472 0.14T-Mobile US Inc. 161,381 15,828,312 0.14TJX Cos. Inc. 323,097 15,762,390 0.14PNC Financial Services Group Inc. 116,982 15,481,122 0.13Blackstone Inc. 189,506 15,332,544 0.13Becton Dickinson and Co. 77,473 15,237,891 0.13Vertex Pharmaceuticals Inc. 69,120 15,041,231 0.13Waste Management Inc. 114,735 15,027,490 0.13EOG Resources Inc. 159,677 14,840,860 0.13Regeneron Pharmaceuticals Inc. 27,794 14,591,455 0.13Sherwin-Williams Co. 65,595 14,348,344 0.12Dominion Energy Inc. 220,355 14,330,527 0.12Lam Research Corp. 38,628 14,330,042 0.12Edwards Lifesciences Corp. 169,823 14,304,080 0.12US Bancorp 363,739 14,065,726 0.12Equinix Inc. 24,512 14,039,092 0.12Intercontinental Exchange Inc. 151,679 13,991,187 0.12
Vanguard FTSE Developed World ex-U.K. Equity Index Fund
112

Holding
MarketValue
(£)
% ofTotal Net
Assets
Colgate-Palmolive Co. 227,677 13,972,524 0.12Northrop Grumman Corp. 39,618 13,863,610 0.12Truist Financial Corp. 357,717 13,787,269 0.12Aon plc 59,932 13,728,263 0.12Illinois Tool Works Inc. 85,687 13,456,708 0.12Progressive Corp. 156,735 13,405,174 0.12Norfolk Southern Corp. 64,853 13,306,868 0.11Estee Lauder Cos. Inc. 63,069 13,258,800 0.11Fidelity National Information
Services Inc. 167,110 13,199,753 0.11Boston Scientific Corp. 388,577 13,023,745 0.11Freeport-McMoRan Inc. 403,390 13,019,000 0.11Fiserv Inc. 164,988 12,857,362 0.11Newmont Corp. 221,031 12,825,249 0.11Activision Blizzard Inc. 212,151 12,776,367 0.11General Dynamics Corp. 67,799 12,771,910 0.11Eaton Corp. plc 109,355 12,625,248 0.11Humana Inc. 35,139 12,438,164 0.11Public Storage 41,370 12,231,740 0.11Dollar General Corp. 64,603 12,223,879 0.11Ford Motor Co. 1,074,198 12,106,645 0.10Schlumberger NV 380,644 11,821,029 0.10Marathon Petroleum Corp. 169,248 11,765,797 0.10Emerson Electric Co. 163,525 11,749,568 0.10Palo Alto Networks Inc. 26,155 11,685,685 0.10HCA Healthcare Inc. 67,406 11,519,414 0.10Sempra Energy 87,903 11,297,507 0.10Moody's Corp. 44,564 11,233,459 0.10Charter Communications Inc. 32,860 11,195,426 0.10Uber Technologies Inc. 445,680 11,171,280 0.10General Motors Co. 369,858 11,167,909 0.10Air Products and Chemicals Inc. 59,627 11,123,718 0.10Capital One Financial Corp. 111,203 11,038,807 0.10Pioneer Natural Resources Co. 59,038 10,924,493 0.09American Electric Power Co. Inc. 137,134 10,824,351 0.09Archer-Daniels-Midland Co. 151,536 10,821,753 0.09Roper Technologies Inc. 28,850 10,782,840 0.09Dow Inc. 201,239 10,655,804 0.09KLA Corp. 41,727 10,600,746 0.09FedEx Corp. 66,877 10,587,388 0.09American International Group Inc. 224,832 10,472,456 0.09Marriott International Inc. 73,926 10,453,266 0.09Marvell Technology Inc. 225,737 10,437,297 0.09Centene Corp. 160,071 10,269,783 0.09McKesson Corp. 41,215 10,152,245 0.09Occidental Petroleum Corp. 231,233 10,146,252 0.09Kimberly-Clark Corp. 91,294 10,095,053 0.09MetLife Inc. 192,099 10,047,897 0.09Exelon Corp. 268,662 10,010,356 0.09Moderna Inc. 93,391 9,995,175 0.09MercadoLibre Inc. 12,845 9,961,085 0.09L3Harris Technologies Inc. 53,413 9,871,296 0.09Valero Energy Corp. 110,464 9,804,940 0.08NXP Semiconductors NV 71,337 9,710,463 0.08Sysco Corp. 140,932 9,602,005 0.08General Mills Inc. 168,952 9,520,787 0.08Synopsys Inc. 41,298 9,433,570 0.08Cognizant Technology Solutions
Corp. 145,162 9,352,567 0.08Ecolab Inc. 69,013 9,308,367 0.08Illumina Inc. 39,237 9,269,990 0.08Johnson Controls International plc 193,821 9,262,647 0.08Hilton Worldwide Holdings Inc. 74,471 9,212,334 0.08Corteva Inc. 199,921 9,184,737 0.08Autodesk Inc. 60,454 9,114,561 0.08IQVIA Holdings Inc. 52,455 9,108,072 0.08Cadence Design Systems Inc. 75,433 9,062,770 0.08Nucor Corp. 73,440 9,061,397 0.08TE Connectivity Ltd. 90,299 8,974,515 0.08Chipotle Mexican Grill Inc. 7,724 8,955,037 0.08Digital Realty Trust Inc. 76,963 8,948,668 0.08Amphenol Corp. 157,037 8,946,914 0.08Williams Cos. Inc. 325,428 8,888,029 0.08AutoZone Inc. 5,682 8,849,840 0.08Prudential Financial Inc. 102,231 8,839,659 0.08Phillips 66 127,462 8,796,955 0.08
Holding
MarketValue
(£)
% ofTotal Net
Assets
Travelers Cos. Inc. 64,500 8,781,345 0.08Lululemon Athletica Inc. 30,903 8,727,416 0.08O'Reilly Automotive Inc. 18,053 8,721,514 0.08Paychex Inc. 86,149 8,695,864 0.08Warner Bros Discovery Inc. 600,213 8,676,910 0.07Welltower Inc. 119,799 8,665,027 0.07Global Payments Inc. 79,093 8,628,724 0.07Devon Energy Corp. 184,833 8,560,759 0.07HP Inc. 292,938 8,551,312 0.07Realty Income Corp. 154,745 8,550,103 0.07Block Inc. 107,613 8,541,322 0.07Dexcom Inc. 26,115 8,498,863 0.07Kroger Co. 197,377 8,483,040 0.07Crowdstrike Holdings Inc. 53,341 8,444,485 0.07Workday Inc. 51,248 8,434,792 0.07Xcel Energy Inc. 144,375 8,424,458 0.07Twitter Inc. 214,566 8,374,137 0.07Simon Property Group Inc. 88,808 8,346,745 0.07Fortinet Inc. 36,041 8,296,459 0.07SBA Communications Corp. 29,937 8,276,485 0.07Constellation Brands Inc. 42,092 8,250,765 0.07IDEXX Laboratories Inc. 23,350 8,006,135 0.07Dollar Tree Inc. 61,444 7,951,256 0.07Microchip Technology Inc. 151,688 7,874,965 0.07Agilent Technologies Inc. 81,898 7,780,795 0.07Aflac Inc. 169,502 7,734,579 0.07Baxter International Inc. 136,053 7,700,455 0.07Motorola Solutions Inc. 45,086 7,682,392 0.07Parker-Hannifin Corp. 35,535 7,659,480 0.07Kinder Morgan Inc. 529,730 7,657,980 0.07Cintas Corp. 24,172 7,648,398 0.07Ross Stores Inc. 96,065 7,633,166 0.07Allstate Corp. 75,726 7,632,911 0.07Public Service Enterprise
Group Inc. 137,528 7,632,773 0.07Yum! Brands Inc. 81,376 7,585,367 0.07Arthur J Gallagher & Co. 55,676 7,480,225 0.06Hershey Co. 40,813 7,339,835 0.06Snowflake Inc. 53,546 7,313,471 0.06MSCI Inc. 21,729 7,292,321 0.06DuPont de Nemours Inc. 138,524 7,276,506 0.06Verisk Analytics Inc. 44,673 7,260,471 0.06Discover Financial Services 80,422 7,204,347 0.06Trane Technologies plc 64,417 7,173,859 0.06Electronic Arts Inc. 76,027 7,148,533 0.06Consolidated Edison Inc. 96,546 7,131,558 0.06Carrier Global Corp. 232,401 7,085,867 0.06Fastenal Co. 160,346 7,063,905 0.06eBay Inc. 169,392 7,006,389 0.06Cheniere Energy Inc. 64,665 7,001,122 0.06Monster Beverage Corp. 100,577 6,863,746 0.06Atlassian Corp. plc Class A 38,312 6,860,453 0.06AvalonBay Communities Inc. 37,629 6,813,678 0.06Weyerhaeuser Co. 207,052 6,797,833 0.06International Flavors &
Fragrances Inc. 70,211 6,785,102 0.06WEC Energy Group Inc. 84,777 6,755,822 0.06TransDigm Group Inc. 14,109 6,684,325 0.06Halliburton Co. 235,590 6,682,083 0.06Biogen Inc. 39,953 6,601,231 0.06Otis Worldwide Corp. 113,508 6,586,263 0.06Walgreens Boots Alliance Inc. 194,894 6,581,841 0.06Bank of New York Mellon Corp. 196,329 6,578,699 0.06Datadog Inc. 68,202 6,560,535 0.06Ameriprise Financial Inc. 30,862 6,524,649 0.06Kraft Heinz Co. 190,982 6,484,714 0.06Equity Residential 99,710 6,474,992 0.06PPG Industries Inc. 63,512 6,472,605 0.06M&T Bank Corp. 48,580 6,447,923 0.06Alexandria Real Estate Equities Inc. 44,260 6,421,663 0.06Aptiv plc 75,770 6,420,682 0.06Eversource Energy 91,575 6,375,601 0.06Rockwell Automation Inc. 31,408 6,321,873 0.05AMETEK Inc. 62,811 6,315,116 0.05Mettler-Toledo International Inc. 6,185 6,292,144 0.05KKR & Co. Inc. 154,381 6,271,148 0.05
Vanguard FTSE Developed World ex-U.K. Equity Index Fund
113

Holding
MarketValue
(£)
% ofTotal Net
Assets
Hess Corp. 75,676 6,202,355 0.05RESMED INC-CDI 38,911 6,196,624 0.05Arista Networks Inc. 66,767 6,146,496 0.05PACCAR Inc. 92,762 6,136,105 0.05American Water Works Co. Inc. 49,849 6,118,063 0.05Old Dominion Freight Line Inc. 27,311 6,089,773 0.05CBRE Group Inc. 91,914 6,081,475 0.05LyondellBasell Industries NV 71,654 6,051,350 0.05Republic Services Inc. 56,431 6,035,035 0.05ONEOK Inc. 119,473 6,026,460 0.05T Rowe Price Group Inc. 61,125 5,989,809 0.05Tyson Foods Inc. 80,046 5,942,081 0.05SVB Financial Group 15,203 5,904,767 0.05Willis Towers Watson plc 34,412 5,888,821 0.05Cerner Corp. 78,495 5,855,080 0.05Cummins Inc. 38,262 5,762,306 0.05Corning Inc. 205,378 5,758,106 0.05Edison International 104,291 5,718,350 0.05Keurig Dr Pepper Inc. 191,146 5,694,032 0.05First Republic Bank 47,683 5,667,647 0.05Zimmer Biomet Holdings Inc. 58,446 5,620,216 0.05Veeva Systems Inc. 38,754 5,616,935 0.05Keysight Technologies Inc. 50,255 5,616,308 0.05DTE Energy Co. 53,508 5,585,201 0.05Trade Desk Inc. 117,402 5,514,291 0.05Ball Corp. 85,108 5,501,004 0.05Equifax Inc. 33,751 5,493,171 0.05ANSYS Inc. 24,967 5,482,396 0.05Fifth Third Bancorp 182,420 5,454,435 0.05PG&E Corp. 539,932 5,440,172 0.05CoStar Group Inc. 107,079 5,426,015 0.05Expedia Group Inc. 38,706 5,388,316 0.05State Street Corp. 100,881 5,380,317 0.05McCormick & Co. Inc. 66,642 5,341,442 0.05Extra Space Storage Inc. 34,553 5,229,045 0.05Entergy Corp. 55,004 5,207,305 0.04Invitation Homes Inc. 163,911 5,197,366 0.04Copart Inc. 57,003 5,160,006 0.04DR Horton Inc. 92,801 5,149,695 0.04West Pharmaceutical Services Inc. 20,519 5,149,114 0.04FirstEnergy Corp. 149,182 5,148,588 0.04VMware Inc. 59,473 5,120,691 0.04Ameren Corp. 68,996 5,107,515 0.04Coterra Energy Inc. 222,004 5,087,257 0.04Hartford Financial Services
Group Inc. 91,235 5,081,689 0.04Tractor Supply Co. 31,602 5,070,916 0.04Vulcan Materials Co. 36,826 5,053,270 0.04Align Technology Inc. 21,900 5,052,260 0.04Baker Hughes Co. 203,973 5,037,992 0.04Church & Dwight Co. Inc. 64,556 5,016,392 0.04WW Grainger Inc. 12,592 5,015,033 0.04Laboratory Corp. of America
Holdings 26,201 5,012,934 0.04Gartner Inc. 21,608 5,002,624 0.04MongoDB Inc. 17,700 4,998,291 0.04Diamondback Energy Inc. 49,573 4,984,147 0.04United Rentals Inc. 19,650 4,953,895 0.04Albemarle Corp. 32,118 4,927,060 0.04Cloudflare Inc. 71,484 4,905,092 0.04Mid-America Apartment
Communities Inc. 31,188 4,883,758 0.04Zoom Video Communications Inc. 60,923 4,831,136 0.04Horizon Therapeutics plc 61,389 4,818,704 0.04Ventas Inc. 108,600 4,804,174 0.04AmerisourceBergen Corp. 39,408 4,747,790 0.04ON Semiconductor Corp. 114,244 4,738,098 0.04Essex Property Trust Inc. 18,046 4,732,778 0.04Match Group Inc. 75,019 4,728,794 0.04Ulta Beauty Inc. 14,956 4,724,688 0.04Northern Trust Corp. 57,509 4,722,561 0.04CDW Corp. 36,343 4,721,259 0.04Enphase Energy Inc. 36,724 4,721,028 0.04Best Buy Co. Inc. 65,843 4,715,206 0.04PPL Corp. 208,659 4,705,004 0.04Martin Marietta Materials Inc. 16,557 4,666,025 0.04
Holding
MarketValue
(£)
% ofTotal Net
Assets
Duke Realty Corp. 102,511 4,471,943 0.04Regions Financial Corp. 270,940 4,471,425 0.04Sun Communities Inc. 31,576 4,412,590 0.04Zebra Technologies Corp. 14,935 4,396,395 0.04Hewlett Packard Enterprise Co. 357,720 4,393,500 0.04Teledyne Technologies Inc. 12,670 4,355,026 0.04CMS Energy Corp. 79,589 4,354,413 0.04CF Industries Holdings Inc. 55,834 4,301,284 0.04Dover Corp. 39,831 4,226,430 0.04Citizens Financial Group Inc. 134,050 4,206,744 0.04FleetCor Technologies Inc. 21,142 4,202,128 0.04Stanley Black & Decker Inc. 43,665 4,178,344 0.04Synchrony Financial 141,145 4,135,979 0.04PerkinElmer Inc. 35,281 4,125,528 0.04Waters Corp. 17,075 4,123,702 0.04Splunk Inc. 42,316 4,111,273 0.04STERIS plc 23,051 4,110,805 0.04Constellation Energy Corp. 86,454 4,077,211 0.04Cincinnati Financial Corp. 41,728 4,075,084 0.04Skyworks Solutions Inc. 45,148 4,073,926 0.04Genuine Parts Co. 39,269 4,067,960 0.04Markel Corp. 3,771 4,066,430 0.04CenterPoint Energy Inc. 166,437 4,057,853 0.04Hologic Inc. 70,738 4,056,657 0.04Avantor Inc. 159,537 4,051,005 0.04International Paper Co. 109,954 4,050,474 0.03Twilio Inc. 45,249 4,030,060 0.03Boston Properties Inc. 43,004 4,029,118 0.03Huntington Bancshares Inc. 383,809 4,016,923 0.03VICI Properties Inc. 168,723 4,006,077 0.03Yum China Holdings Inc. 120,258 4,002,851 0.03Healthpeak Properties Inc. 151,517 3,960,801 0.03Fortive Corp. 86,211 3,949,018 0.03Monolithic Power Systems Inc. 12,508 3,907,714 0.03VeriSign Inc. 27,347 3,891,963 0.03Cooper Cos. Inc. 13,524 3,888,942 0.03Nasdaq Inc. 30,815 3,863,961 0.03Jacobs Engineering Group Inc. 34,916 3,853,134 0.03Akamai Technologies Inc. 42,895 3,837,486 0.03Lennar Corp. Class A 62,913 3,833,407 0.03KeyCorp 248,899 3,828,146 0.03Principal Financial Group Inc. 70,512 3,826,910 0.03ViacomCBS Inc. Class B 164,686 3,818,404 0.03VF Corp. 91,901 3,806,332 0.03HubSpot Inc. 12,570 3,799,031 0.03ICON plc 20,975 3,779,006 0.03Raymond James Financial Inc. 48,447 3,761,152 0.03Arch Capital Group Ltd. 103,373 3,760,289 0.03Seagen Inc. 35,893 3,745,106 0.03Clorox Co. 32,707 3,737,532 0.03Trimble Inc. 69,487 3,690,474 0.03TransUnion 52,831 3,683,230 0.03NetApp Inc. 62,933 3,671,215 0.03Teradyne Inc. 43,636 3,665,005 0.03Palantir Technologies Inc. 441,216 3,654,834 0.03Kellogg Co. 66,983 3,654,586 0.03Broadridge Financial Solutions Inc. 31,667 3,636,343 0.03Expeditors International of
Washington Inc. 46,024 3,632,430 0.03Ingersoll Rand Inc. 103,658 3,627,822 0.03Western Digital Corp. 85,705 3,622,067 0.03UDR Inc. 85,561 3,620,751 0.03Garmin Ltd. 41,379 3,616,829 0.03Darden Restaurants Inc. 34,029 3,570,400 0.03Zscaler Inc. 22,106 3,569,708 0.03Royal Caribbean Cruises Ltd. 57,612 3,567,766 0.03Cardinal Health Inc. 76,833 3,553,716 0.03FMC Corp. 33,638 3,551,614 0.03Conagra Brands Inc. 126,996 3,535,251 0.03Bunge Ltd. 38,957 3,510,627 0.03Evergy Inc. 64,912 3,509,020 0.03MGM Resorts International 106,903 3,497,868 0.03Avery Dennison Corp. 24,123 3,471,174 0.03Steel Dynamics Inc. 50,799 3,469,139 0.03Bill.com Holdings Inc. 25,389 3,453,145 0.03
Vanguard FTSE Developed World ex-U.K. Equity Index Fund
114

Holding
MarketValue
(£)
% ofTotal Net
Assets
Westinghouse Air BrakeTechnologies Corp. 48,187 3,448,122 0.03
Seagate Technology Holdings plc 52,695 3,443,326 0.03FactSet Research Systems Inc. 10,673 3,430,065 0.03Omnicom Group Inc. 56,488 3,427,072 0.03Quest Diagnostics Inc. 32,145 3,427,006 0.03DocuSign Inc. 52,821 3,407,805 0.03Celanese Corp. 29,014 3,396,635 0.03Bio-Techne Corp. 11,168 3,377,529 0.03Insulet Corp. 17,646 3,359,695 0.03WP Carey Inc. 51,953 3,341,873 0.03Atmos Energy Corp. 36,914 3,335,930 0.03Textron Inc. 60,396 3,329,355 0.03Alnylam Pharmaceuticals Inc. 31,242 3,320,036 0.03Tyler Technologies Inc. 10,516 3,306,068 0.03Okta Inc. 34,615 3,289,181 0.03Hormel Foods Corp. 78,658 3,282,270 0.03BioMarin Pharmaceutical Inc. 50,651 3,281,521 0.03Pool Corp. 10,157 3,278,230 0.03Catalent Inc. 45,373 3,272,781 0.03SS&C Technologies Holdings Inc. 63,209 3,254,846 0.03Zendesk Inc. 33,395 3,249,328 0.03Iron Mountain Inc. 75,322 3,223,456 0.03Packaging Corp. of America 25,052 3,212,960 0.03Liberty Broadband Corp. Class C 35,998 3,203,548 0.03Xylem Inc. 49,502 3,175,539 0.03Incyte Corp. 53,178 3,175,007 0.03Signature Bank 16,420 3,168,254 0.03Alliant Energy Corp. 66,548 3,117,233 0.03Brown & Brown Inc. 62,824 3,102,418 0.03CarMax Inc. 45,247 3,091,787 0.03IDEX Corp. 20,413 3,086,906 0.03Carnival 223,985 3,084,587 0.03Ally Financial Inc. 96,744 3,078,392 0.03Kimco Realty Corp. 151,681 3,063,822 0.03J M Smucker Co. 28,016 3,055,762 0.03Leidos Holdings Inc. 36,722 3,026,383 0.03Take-Two Interactive Software Inc. 31,788 3,025,112 0.03JB Hunt Transport Services Inc. 22,217 3,023,138 0.03Live Nation Entertainment Inc. 36,179 3,022,551 0.03Jack Henry & Associates Inc. 19,929 3,009,428 0.03Paycom Software Inc. 13,384 3,002,257 0.03Caesars Entertainment Inc. 56,720 2,994,345 0.03Generac Holdings Inc. 17,083 2,989,489 0.03W R Berkley Corp. 56,313 2,982,726 0.03EPAM Systems Inc. 14,101 2,974,181 0.03Teleflex Inc. 13,079 2,972,489 0.03Host Hotels & Resorts Inc. 183,375 2,970,805 0.03CH Robinson Worldwide Inc. 34,885 2,949,177 0.03Royalty Pharma plc 86,419 2,930,879 0.03Spotify Technology SA 36,153 2,929,385 0.03SolarEdge Technologies Inc. 14,691 2,927,550 0.03Loews Corp. 58,354 2,921,649 0.03Dell Technologies Inc. 76,780 2,876,114 0.02NVR Inc. 823 2,868,889 0.02Eastman Chemical Co. 35,077 2,863,712 0.02NortonLifeLock Inc. 143,350 2,859,006 0.02Equity LifeStyle Properties Inc. 46,361 2,854,034 0.02Burlington Stores Inc. 17,544 2,844,488 0.02Masco Corp. 67,518 2,833,550 0.02LKQ Corp. 71,334 2,820,973 0.02Brown-Forman Corp. Class B 52,427 2,816,567 0.02GoDaddy Inc. 43,641 2,808,943 0.02Advance Auto Parts Inc. 17,583 2,794,512 0.02PTC Inc. 30,625 2,787,105 0.02Westrock Co. 70,545 2,783,028 0.02AES Corp. 170,924 2,778,620 0.02Interpublic Group of Cos. Inc. 106,824 2,776,316 0.02Citrix Systems Inc. 34,751 2,771,221 0.02Check Point Software Technologies
Ltd. 27,305 2,744,852 0.02Howmet Aerospace Inc. 101,028 2,744,774 0.02Domino's Pizza Inc. 10,086 2,715,145 0.02Viatris Inc. 324,005 2,665,846 0.02Qorvo Inc. 29,310 2,656,225 0.02Bath & Body Works Inc. 62,989 2,652,009 0.02
Holding
MarketValue
(£)
% ofTotal Net
Assets
ABIOMED Inc. 11,454 2,612,569 0.02Fox Corp. Class A 90,876 2,594,181 0.02Charles River Laboratories
International Inc. 13,335 2,562,167 0.02Vistra Corp. 128,118 2,553,175 0.02Henry Schein Inc. 39,499 2,551,153 0.02Pinterest Inc. 155,158 2,535,914 0.02Alleghany Corp. 3,771 2,512,557 0.02Etsy Inc. 33,712 2,502,286 0.02Las Vegas Sands Corp. 88,256 2,491,974 0.02Snap-on Inc. 14,643 2,478,637 0.02DoorDash Inc. 38,124 2,472,972 0.02Everest Re Group Ltd. 11,225 2,461,184 0.02Bio-Rad Laboratories Inc. 6,018 2,456,186 0.02Regency Centers Corp. 44,713 2,451,646 0.02Cboe Global Markets Inc. 27,257 2,442,816 0.02Roku Inc. 32,339 2,390,586 0.02Amdocs Ltd. 37,570 2,383,771 0.02Fidelity National Financial Inc. 74,974 2,377,908 0.02Comerica Inc. 36,354 2,370,899 0.02Lincoln National Corp. 49,479 2,370,498 0.02Elanco Animal Health Inc. 117,633 2,370,461 0.02Whirlpool Corp. 16,311 2,356,032 0.02NiSource Inc. 101,177 2,347,499 0.02Robert Half International Inc. 29,830 2,337,217 0.02Equitable Holdings Inc. 101,299 2,326,931 0.02PulteGroup Inc. 69,818 2,322,817 0.02HEICO Corp. 20,598 2,317,048 0.02Hasbro Inc. 33,014 2,315,318 0.02Lumen Technologies Inc. 287,110 2,298,251 0.02Lamb Weston Holdings Inc. 42,803 2,253,165 0.02Unity Software Inc. 42,396 2,243,559 0.02Plug Power Inc. 131,135 2,193,416 0.02F5 Inc. 16,440 2,191,999 0.02Lyft Inc. 84,429 2,191,589 0.02MarketAxess Holdings Inc. 10,429 2,189,715 0.02Allegion plc 23,955 2,179,703 0.02Juniper Networks Inc. 86,220 2,164,598 0.02Coca-Cola Europacific Partners plc 54,022 2,149,261 0.02Fortune Brands Home &
Security Inc. 37,403 2,122,332 0.02Vail Resorts Inc. 10,433 2,109,368 0.02Assurant Inc. 14,555 2,108,416 0.02Fair Isaac Corp. 7,064 2,106,877 0.02Credicorp Ltd. 18,512 2,048,926 0.02Jazz Pharmaceuticals plc 16,020 2,044,511 0.02Globe Life Inc. 25,994 2,030,864 0.02Zillow Group Inc. Class C 63,886 2,025,727 0.02Molson Coors Beverage Co. 46,662 2,011,427 0.02Campbell Soup Co. 53,433 2,009,642 0.02Nielsen Holdings plc 93,815 2,001,834 0.02Pentair plc 49,021 1,981,533 0.02Exact Sciences Corp. 44,986 1,972,503 0.02Annaly Capital Management Inc. 376,609 1,925,789 0.02Zions Bancorp NA 42,606 1,917,354 0.02Federal Realty Investment Trust 20,213 1,884,614 0.02Huntington Ingalls Industries Inc. 11,084 1,877,525 0.02BorgWarner Inc. 63,485 1,861,315 0.02Aramark 63,911 1,846,317 0.02NRG Energy Inc. 64,542 1,845,011 0.02Newell Brands Inc. 99,596 1,836,437 0.02DENTSPLY SIRONA Inc. 56,915 1,812,394 0.02Universal Health Services Inc. 18,301 1,785,786 0.02Liberty Media Corp-Liberty
SiriusXM Class C 52,730 1,758,926 0.02Block Inc. CDI 21,396 1,757,272 0.02Organon & Co. 66,474 1,711,751 0.01Mohawk Industries Inc. 15,217 1,707,624 0.01Lucid Group Inc. 118,560 1,707,339 0.01Lear Corp. 16,711 1,703,842 0.01Arrow Electronics Inc. 18,103 1,700,715 0.01Pinnacle West Capital Corp. 29,872 1,694,292 0.01Coupang LLC 164,672 1,688,035 0.01Clarivate plc 133,951 1,671,853 0.01Flex Ltd. 127,278 1,670,681 0.01Franklin Resources Inc. 84,988 1,664,559 0.01
Vanguard FTSE Developed World ex-U.K. Equity Index Fund
115
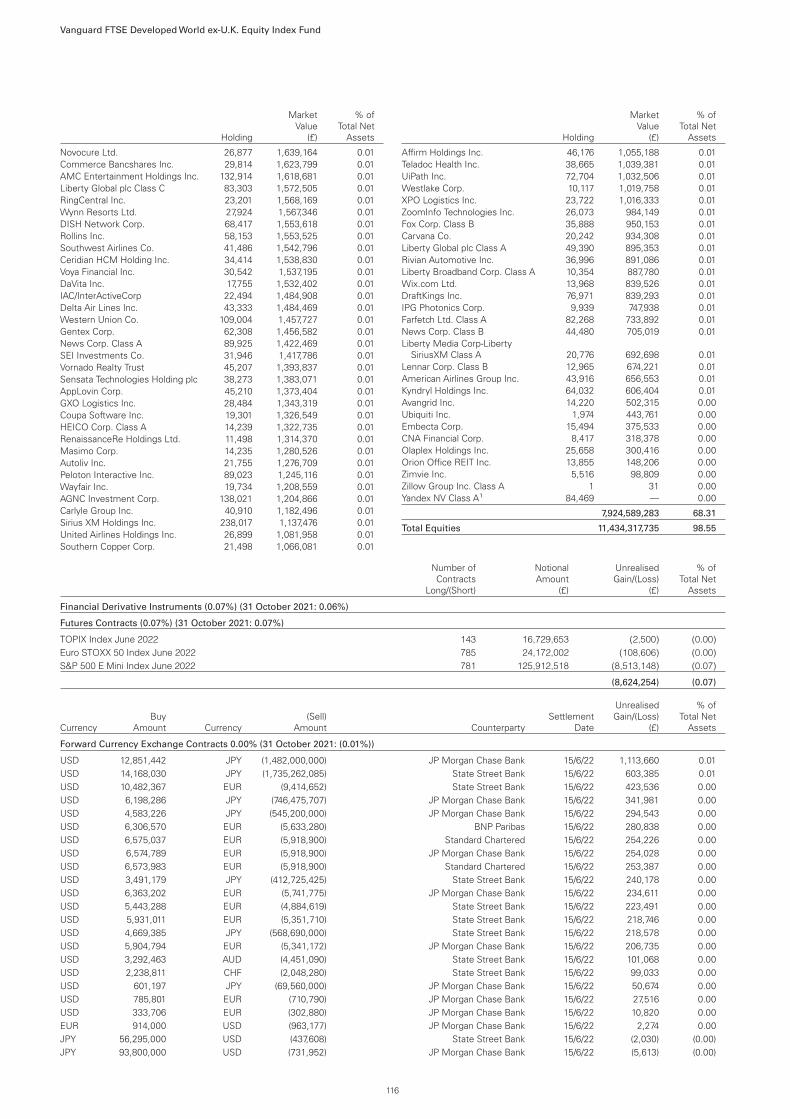
Holding
MarketValue
(£)
% ofTotal Net
Assets
Novocure Ltd. 26,877 1,639,164 0.01Commerce Bancshares Inc. 29,814 1,623,799 0.01AMC Entertainment Holdings Inc. 132,914 1,618,681 0.01Liberty Global plc Class C 83,303 1,572,505 0.01RingCentral Inc. 23,201 1,568,169 0.01Wynn Resorts Ltd. 27,924 1,567,346 0.01DISH Network Corp. 68,417 1,553,618 0.01Rollins Inc. 58,153 1,553,525 0.01Southwest Airlines Co. 41,486 1,542,796 0.01Ceridian HCM Holding Inc. 34,414 1,538,830 0.01Voya Financial Inc. 30,542 1,537,195 0.01DaVita Inc. 17,755 1,532,402 0.01IAC/InterActiveCorp 22,494 1,484,908 0.01Delta Air Lines Inc. 43,333 1,484,469 0.01Western Union Co. 109,004 1,457,727 0.01Gentex Corp. 62,308 1,456,582 0.01News Corp. Class A 89,925 1,422,469 0.01SEI Investments Co. 31,946 1,417,786 0.01Vornado Realty Trust 45,207 1,393,837 0.01Sensata Technologies Holding plc 38,273 1,383,071 0.01AppLovin Corp. 45,210 1,373,404 0.01GXO Logistics Inc. 28,484 1,343,319 0.01Coupa Software Inc. 19,301 1,326,549 0.01HEICO Corp. Class A 14,239 1,322,735 0.01RenaissanceRe Holdings Ltd. 11,498 1,314,370 0.01Masimo Corp. 14,235 1,280,526 0.01Autoliv Inc. 21,755 1,276,709 0.01Peloton Interactive Inc. 89,023 1,245,116 0.01Wayfair Inc. 19,734 1,208,559 0.01AGNC Investment Corp. 138,021 1,204,866 0.01Carlyle Group Inc. 40,910 1,182,496 0.01Sirius XM Holdings Inc. 238,017 1,137,476 0.01United Airlines Holdings Inc. 26,899 1,081,958 0.01Southern Copper Corp. 21,498 1,066,081 0.01
Holding
MarketValue
(£)
% ofTotal Net
Assets
Affirm Holdings Inc. 46,176 1,055,188 0.01Teladoc Health Inc. 38,665 1,039,381 0.01UiPath Inc. 72,704 1,032,506 0.01Westlake Corp. 10,117 1,019,758 0.01XPO Logistics Inc. 23,722 1,016,333 0.01ZoomInfo Technologies Inc. 26,073 984,149 0.01Fox Corp. Class B 35,888 950,153 0.01Carvana Co. 20,242 934,308 0.01Liberty Global plc Class A 49,390 895,353 0.01Rivian Automotive Inc. 36,996 891,086 0.01Liberty Broadband Corp. Class A 10,354 887,780 0.01Wix.com Ltd. 13,968 839,526 0.01DraftKings Inc. 76,971 839,293 0.01IPG Photonics Corp. 9,939 747,938 0.01Farfetch Ltd. Class A 82,268 733,892 0.01News Corp. Class B 44,480 705,019 0.01Liberty Media Corp-Liberty
SiriusXM Class A 20,776 692,698 0.01Lennar Corp. Class B 12,965 674,221 0.01American Airlines Group Inc. 43,916 656,553 0.01Kyndryl Holdings Inc. 64,032 606,404 0.01Avangrid Inc. 14,220 502,315 0.00Ubiquiti Inc. 1,974 443,761 0.00Embecta Corp. 15,494 375,533 0.00CNA Financial Corp. 8,417 318,378 0.00Olaplex Holdings Inc. 25,658 300,416 0.00Orion Office REIT Inc. 13,855 148,206 0.00Zimvie Inc. 5,516 98,809 0.00Zillow Group Inc. Class A 1 31 0.00Yandex NV Class A1 84,469 — 0.00
7,924,589,283 68.31
Total Equities 11,434,317,735 98.55
Number ofContracts
Long/(Short)
NotionalAmount
(£)
UnrealisedGain/(Loss)
(£)
% ofTotal Net
Assets
Financial Derivative Instruments (0.07%) (31 October 2021: 0.06%)
Futures Contracts (0.07%) (31 October 2021: 0.07%)
TOPIX Index June 2022 143 16,729,653 (2,500) (0.00)Euro STOXX 50 Index June 2022 785 24,172,002 (108,606) (0.00)S&P 500 E Mini Index June 2022 781 125,912,518 (8,513,148) (0.07)
(8,624,254) (0.07)
CurrencyBuy
Amount Currency(Sell)
Amount CounterpartySettlement
Date
UnrealisedGain/(Loss)
(£)
% ofTotal Net
Assets
Forward Currency Exchange Contracts 0.00% (31 October 2021: (0.01%))
USD 12,851,442 JPY (1,482,000,000) JP Morgan Chase Bank 15/6/22 1,113,660 0.01USD 14,168,030 JPY (1,735,262,085) State Street Bank 15/6/22 603,385 0.01USD 10,482,367 EUR (9,414,652) State Street Bank 15/6/22 423,536 0.00USD 6,198,286 JPY (746,475,707) JP Morgan Chase Bank 15/6/22 341,981 0.00USD 4,583,226 JPY (545,200,000) JP Morgan Chase Bank 15/6/22 294,543 0.00USD 6,306,570 EUR (5,633,280) BNP Paribas 15/6/22 280,838 0.00USD 6,575,037 EUR (5,918,900) Standard Chartered 15/6/22 254,226 0.00USD 6,574,789 EUR (5,918,900) JP Morgan Chase Bank 15/6/22 254,028 0.00USD 6,573,983 EUR (5,918,900) Standard Chartered 15/6/22 253,387 0.00USD 3,491,179 JPY (412,725,425) State Street Bank 15/6/22 240,178 0.00USD 6,363,202 EUR (5,741,775) JP Morgan Chase Bank 15/6/22 234,611 0.00USD 5,443,288 EUR (4,884,619) State Street Bank 15/6/22 223,491 0.00USD 5,931,011 EUR (5,351,710) State Street Bank 15/6/22 218,746 0.00USD 4,669,385 JPY (568,690,000) State Street Bank 15/6/22 218,578 0.00USD 5,904,794 EUR (5,341,172) JP Morgan Chase Bank 15/6/22 206,735 0.00USD 3,292,463 AUD (4,451,090) State Street Bank 15/6/22 101,068 0.00USD 2,238,811 CHF (2,048,280) State Street Bank 15/6/22 99,033 0.00USD 601,197 JPY (69,560,000) JP Morgan Chase Bank 15/6/22 50,674 0.00USD 785,801 EUR (710,790) JP Morgan Chase Bank 15/6/22 27,516 0.00USD 333,706 EUR (302,880) JP Morgan Chase Bank 15/6/22 10,820 0.00EUR 914,000 USD (963,177) JP Morgan Chase Bank 15/6/22 2,274 0.00JPY 56,295,000 USD (437,608) State Street Bank 15/6/22 (2,030) (0.00)JPY 93,800,000 USD (731,952) JP Morgan Chase Bank 15/6/22 (5,613) (0.00)
Vanguard FTSE Developed World ex-U.K. Equity Index Fund
116

CurrencyBuy
Amount Currency(Sell)
Amount CounterpartySettlement
Date
UnrealisedGain/(Loss)
(£)
% ofTotal Net
Assets
EUR 737,000 USD (786,494) State Street Bank 15/6/22 (6,004) (0.00)JPY 93,625,000 USD (737,285) State Street Bank 15/6/22 (10,938) (0.00)EUR 360,800 USD (397,496) JP Morgan Chase Bank 15/6/22 (12,868) (0.00)EUR 679,860 USD (734,929) State Street Bank 15/6/22 (13,036) (0.00)JPY 58,890,000 USD (477,640) State Street Bank 15/6/22 (17,941) (0.00)EUR 598,080 USD (655,580) State Street Bank 15/6/22 (18,680) (0.00)JPY 94,900,000 USD (757,325) JP Morgan Chase Bank 15/6/22 (19,050) (0.00)JPY 58,890,000 USD (483,743) State Street Bank 15/6/22 (22,802) (0.00)JPY 132,545,000 USD (1,054,421) JP Morgan Chase Bank 15/6/22 (23,963) (0.00)EUR 1,310,750 USD (1,415,674) JP Morgan Chase Bank 15/6/22 (24,139) (0.00)EUR 1,056,160 USD (1,153,718) JP Morgan Chase Bank 15/6/22 (29,815) (0.00)JPY 53,655,000 USD (455,623) State Street Bank 15/6/22 (32,628) (0.00)JPY 399,630,000 USD (3,129,473) JP Morgan Chase Bank 15/6/22 (32,697) (0.00)JPY 78,720,000 USD (649,734) State Street Bank 15/6/22 (32,950) (0.00)EUR 984,360 USD (1,083,033) State Street Bank 15/6/22 (33,959) (0.00)EUR 733,970 USD (818,795) BNP Paribas 15/6/22 (34,282) (0.00)JPY 170,055,000 USD (1,360,778) BNP Paribas 15/6/22 (37,082) (0.00)EUR 1,021,090 USD (1,131,706) JP Morgan Chase Bank 15/6/22 (41,805) (0.00)USD 1,309,957 GBP (1,000,000) Standard Chartered 15/6/22 (43,340) (0.00)EUR 1,689,300 USD (1,841,258) State Street Bank 15/6/22 (44,436) (0.00)JPY 55,785,000 USD (487,130) JP Morgan Chase Bank 15/6/22 (44,612) (0.00)JPY 260,610,000 USD (2,076,228) State Street Bank 15/6/22 (49,525) (0.00)EUR 4,183,590 USD (4,488,511) State Street Bank 15/6/22 (53,174) (0.00)EUR 2,627,800 USD (2,856,855) State Street Bank 15/6/22 (63,289) (0.00)JPY 104,040,000 USD (900,312) State Street Bank 15/6/22 (76,676) (0.00)JPY 311,440,000 USD (2,539,446) State Street Bank 15/6/22 (105,592) (0.00)EUR 4,538,220 USD (4,954,348) JP Morgan Chase Bank 15/6/22 (125,667) (0.00)EUR 3,249,550 USD (3,595,793) State Street Bank 15/6/22 (128,435) (0.00)JPY 785,383,975 USD (6,324,011) JP Morgan Chase Bank 15/6/22 (202,626) (0.00)EUR 8,940,649 USD (9,745,477) State Street Bank 15/6/22 (235,646) (0.00)JPY 442,250,000 USD (3,835,011) JP Morgan Chase Bank 15/6/22 (332,298) (0.00)EUR 20,126,871 USD (21,991,961) JP Morgan Chase Bank 15/6/22 (572,922) (0.00)EUR 20,948,375 USD (22,890,757) JP Morgan Chase Bank 15/6/22 (597,234) (0.00)JPY 2,822,635,595 USD (24,466,195) State Street Bank 15/6/22 (2,112,473) (0.02)
213,081 0.00
Total Financial Derivative Instruments (8,411,173) (0.07)
MarketValue
(£)
% ofTotal Net
Assets
Portfolio of Investments 11,425,906,562 98.48
Net Other Assets 175,880,895 1.52
Net Assets Attributable to Shareholders 11,601,787,457 100.00
All holdings are listed on an official stock exchange or are traded on an eligible securities market, unless otherwise stated.1 Manually priced securities.
Vanguard FTSE Developed World ex-U.K. Equity Index Fund
117

As at As at
30 April 2022(£)
31 October 2021(£)
Assets:
Financial Assets 11,439,771,043 11,377,941,183Current Assets
Debtors 32,858,158 22,269,808Cash and Bank Balances 146,565,584 223,578,296
Total Assets 11,619,194,785 11,623,789,287
Liabilities:
Financial Liabilities 13,864,481 1,839,274Creditors
Bank Overdrafts 1,633,175 250,289Distribution Payable — 13,345,341Other Creditors 1,909,672 4,283,623
Total Liabilities 17,407,328 19,718,527
Net Assets Attributable to Shareholders 11,601,787,457 11,604,070,760
Statement of Total Return
Period Ended Period Ended
30 April 2022(£)
30 April 2022(£)
30 April 2021(£)
30 April 2021(£)
IncomeNet Capital Gains/(Losses) (505,081,106) 1,630,632,278Revenue 108,756,671 87,860,734
Expenses (8,153,491) (6,487,450)
Net Revenue Before Taxation 100,603,180 81,373,284Taxation (14,127,836) (12,042,041)
Net Revenue After Taxation 86,475,344 69,331,243
Total Return Before Distributions (418,605,762) 1,699,963,521
Distributions1 1,319,420 1,920,593
Change in Net Assets Attributable to
Shareholders From Investment Activities (417,286,342) 1,701,884,114
1 Includes adjustments for equalisation.
Statement of Change in Net Assets Attributable to Shareholders
Period Ended Period Ended
30 April 2022(£)
30 April 2022(£)
30 April 2021(£)
30 April 2021(£)
Opening Net Assets Attributable to Shareholders 11,604,070,760 8,051,160,012
Amounts Received on Issue of Shares 872,671,280 709,701,717Amounts Paid on Cancellation of Shares (457,688,080) (136,570,899)
414,983,200 573,130,818
Dilution Adjustment 19,839 —Change in Net Assets Attributable to
Shareholders From Investment Activities (417,286,342) 1,701,884,114
Closing Net Assets Attributable to Shareholders 11,601,787,457 10,326,174,944
The interim financial statements for the Fund have been prepared on the same basis of the accounting policies as the annual financial statements for the year ended 31 October 2021.
Vanguard FTSE Developed World ex-U.K. Equity Index Fund
Balance Sheet
118
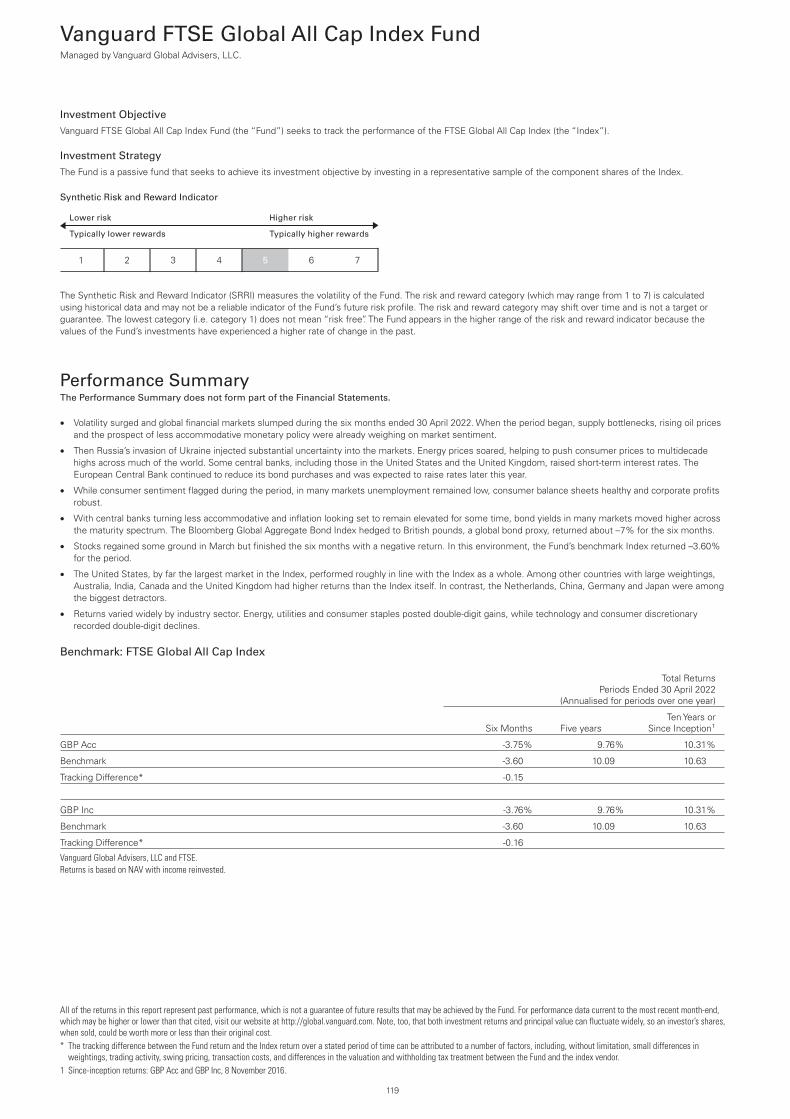
Investment Objective
Vanguard FTSE Global All Cap Index Fund (the “Fund”) seeks to track the performance of the FTSE Global All Cap Index (the “Index”).
Investment Strategy
The Fund is a passive fund that seeks to achieve its investment objective by investing in a representative sample of the component shares of the Index.
Synthetic Risk and Reward Indicator
Lower risk
Typically lower rewards
Higher risk
Typically higher rewards
1 2 3 4 5 6 7
The Synthetic Risk and Reward Indicator (SRRI) measures the volatility of the Fund. The risk and reward category (which may range from 1 to 7) is calculatedusing historical data and may not be a reliable indicator of the Fund’s future risk profile. The risk and reward category may shift over time and is not a target orguarantee. The lowest category (i.e. category 1) does not mean “risk free”. The Fund appears in the higher range of the risk and reward indicator because thevalues of the Fund’s investments have experienced a higher rate of change in the past.
Performance SummaryThe Performance Summary does not form part of the Financial Statements.
• Volatility surged and global financial markets slumped during the six months ended 30 April 2022. When the period began, supply bottlenecks, rising oil pricesand the prospect of less accommodative monetary policy were already weighing on market sentiment.
• Then Russia’s invasion of Ukraine injected substantial uncertainty into the markets. Energy prices soared, helping to push consumer prices to multidecadehighs across much of the world. Some central banks, including those in the United States and the United Kingdom, raised short-term interest rates. TheEuropean Central Bank continued to reduce its bond purchases and was expected to raise rates later this year.
• While consumer sentiment flagged during the period, in many markets unemployment remained low, consumer balance sheets healthy and corporate profitsrobust.
• With central banks turning less accommodative and inflation looking set to remain elevated for some time, bond yields in many markets moved higher acrossthe maturity spectrum. The Bloomberg Global Aggregate Bond Index hedged to British pounds, a global bond proxy, returned about –7% for the six months.
• Stocks regained some ground in March but finished the six months with a negative return. In this environment, the Fund’s benchmark Index returned –3.60%for the period.
• The United States, by far the largest market in the Index, performed roughly in line with the Index as a whole. Among other countries with large weightings,Australia, India, Canada and the United Kingdom had higher returns than the Index itself. In contrast, the Netherlands, China, Germany and Japan were amongthe biggest detractors.
• Returns varied widely by industry sector. Energy, utilities and consumer staples posted double-digit gains, while technology and consumer discretionaryrecorded double-digit declines.
Benchmark: FTSE Global All Cap Index
Total ReturnsPeriods Ended 30 April 2022
(Annualised for periods over one year)
Six Months Five yearsTen Years or
Since Inception1
GBP Acc -3.75% 9.76% 10.31%
Benchmark -3.60 10.09 10.63
Tracking Difference* -0.15
GBP Inc -3.76% 9.76% 10.31%
Benchmark -3.60 10.09 10.63
Tracking Difference* -0.16
Vanguard Global Advisers, LLC and FTSE.Returns is based on NAV with income reinvested.
All of the returns in this report represent past performance, which is not a guarantee of future results that may be achieved by the Fund. For performance data current to the most recent month-end,which may be higher or lower than that cited, visit our website at http://global.vanguard.com. Note, too, that both investment returns and principal value can fluctuate widely, so an investor’s shares,when sold, could be worth more or less than their original cost.* The tracking difference between the Fund return and the Index return over a stated period of time can be attributed to a number of factors, including, without limitation, small differences in
weightings, trading activity, swing pricing, transaction costs, and differences in the valuation and withholding tax treatment between the Fund and the index vendor.1 Since-inception returns: GBP Acc and GBP Inc, 8 November 2016.
Vanguard FTSE Global All Cap Index FundManaged by Vanguard Global Advisers, LLC.
119

Performance Comparative Table
GBP Acc
For the PeriodEnded
30 April 2022For the Year Ended
31 October 2021For the Year Ended
31 October 2020For the Year Ended
31 October 2019
Closing Net Asset Value £1,682,972,619 £1,357,429,269 £484,462,903 £238,437,636
Closing Number of Shares 9,820,078 7,639,855 3,539,028 1,816,945
Closing Net Asset Value Per Share1 £171.38 £177.68 £136.89 £131.23
Operating Charges2 0.23% 0.23% 0.23% 0.24%
GBP Inc
Closing Net Asset Value £129,995,467 £113,451,104 £50,560,287 £20,679,935
Closing Number of Shares 825,797 695,235 396,878 166,614
Closing Net Asset Value Per Share1 £157.42 £163.18 £127.40 £124.12
Operating Charges2 0.23% 0.23% 0.23% 0.24%
1 The net asset value per share shown may diverge from the net asset value per share used for dealing purposes as at 30 April 2022 because of any adjustments for trade date accounting, swingpricing and any adjustments in valuation to bid prices.
2 Operating charges include indirect costs incurred in the maintenance and running of the Fund, as disclosed in the detailed expenses within the Statement of Total Return.
Vanguard FTSE Global All Cap Index Fund
120
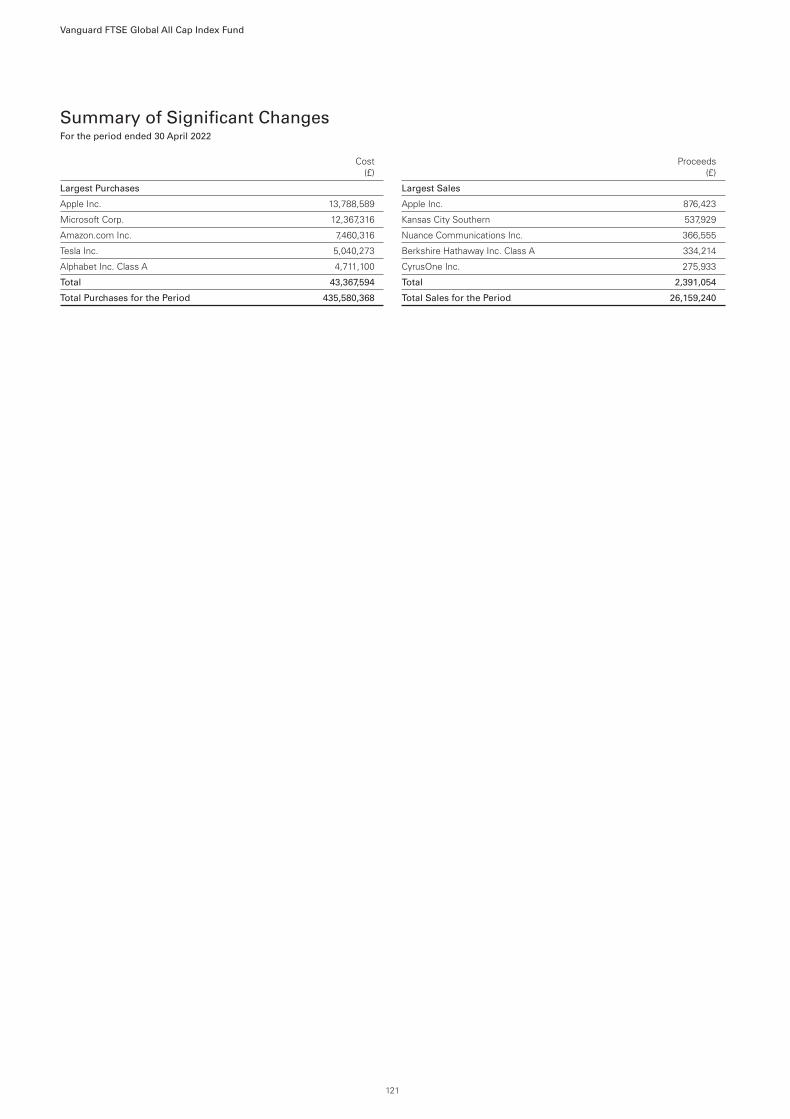
Summary of Significant ChangesFor the period ended 30 April 2022
Cost(£)
Largest Purchases
Apple Inc. 13,788,589
Microsoft Corp. 12,367,316
Amazon.com Inc. 7,460,316
Tesla Inc. 5,040,273
Alphabet Inc. Class A 4,711,100
Total 43,367,594
Total Purchases for the Period 435,580,368
Proceeds(£)
Largest Sales
Apple Inc. 876,423
Kansas City Southern 537,929
Nuance Communications Inc. 366,555
Berkshire Hathaway Inc. Class A 334,214
CyrusOne Inc. 275,933
Total 2,391,054
Total Sales for the Period 26,159,240
Vanguard FTSE Global All Cap Index Fund
121

Portfolio StatementAs at 30 April 2022
Holding
MarketValue
(£)
% ofTotal Net
Assets
Australia 2.22% (31 October 2021: 1.90%)
BHP Group Ltd. 165,659 4,501,795 0.25Commonwealth Bank of
Australia 55,725 3,275,951 0.18CSL Ltd. 15,484 2,392,681 0.13National Australia Bank Ltd. 104,011 1,919,858 0.11Westpac Banking Corp. 115,613 1,560,752 0.09Australia & New Zealand
Banking Group Ltd. 92,330 1,426,216 0.08Macquarie Group Ltd. 11,096 1,296,643 0.07Wesfarmers Ltd. 36,657 1,023,960 0.06Woolworths Group Ltd. 41,475 903,829 0.05Goodman Group 65,469 885,301 0.05Rio Tinto Ltd. 12,605 804,520 0.05Transurban Group Stapled 97,440 790,907 0.04Fortescue Metals Group Ltd. 52,306 639,801 0.04Woodside Petroleum Ltd. 32,298 568,924 0.03Aristocrat Leisure Ltd. 28,898 548,291 0.03Santos Ltd. 102,251 462,438 0.03South32 Ltd. 168,877 455,005 0.03Coles Group Ltd. 40,019 422,685 0.02Amcor plc 40,666 388,546 0.02Newcrest Mining Ltd. 24,494 372,673 0.02Sonic Healthcare Ltd. 16,466 342,239 0.02Ramsay Health Care Ltd. 7,126 326,998 0.02Telstra Corp. Ltd. 142,883 325,121 0.02James Hardie Industries plc 13,601 319,106 0.02QBE Insurance Group Ltd. 45,638 317,481 0.02ASX Ltd. 6,314 309,179 0.02Cochlear Ltd. 2,332 305,813 0.02Scentre Group 165,860 280,706 0.02Computershare Ltd. 19,138 274,392 0.02Brambles Ltd. 44,388 265,068 0.02Xero Ltd. 4,767 259,438 0.02Suncorp Group Ltd. 39,705 256,206 0.02Dexus 39,939 252,290 0.02APA Group Stapled 38,008 246,977 0.01Stockland 93,549 219,749 0.01Insurance Australia Group Ltd. 85,592 218,499 0.01GPT Group 72,042 207,559 0.01Medibank Private Ltd. 111,733 202,381 0.01BlueScope Steel Ltd. 17,366 201,803 0.01Northern Star Resources Ltd. 36,261 201,553 0.01Atlas Arteria Ltd. Stapled 50,959 200,468 0.01Origin Energy Ltd. 50,428 194,668 0.01Tabcorp Holdings Ltd. 59,094 181,962 0.01Treasury Wine Estates Ltd. 28,570 181,444 0.01Ampol Ltd. 9,094 174,190 0.01Endeavour Group Ltd. 39,584 173,868 0.01JB Hi-Fi Ltd. 5,759 172,116 0.01IGO Ltd. 22,729 169,436 0.01Mineral Resources Ltd. 4,948 163,926 0.01Lendlease Corp. Ltd. Stapled 23,424 161,756 0.01Bendigo & Adelaide Bank Ltd. 25,426 153,129 0.01OZ Minerals Ltd. 10,794 152,376 0.01Washington H Soul Pattinson &
Co. Ltd. 9,627 151,323 0.01Lynas Rare Earths Ltd. 29,109 150,760 0.01SEEK Ltd. 9,260 148,385 0.01Mirvac Group 108,512 148,025 0.01REA Group Ltd. 1,994 145,959 0.01WiseTech Global Ltd. 5,681 144,285 0.01Aurizon Holdings Ltd. 62,618 142,129 0.01Evolution Mining Ltd. 59,125 135,539 0.01IDP Education Ltd. 8,743 132,776 0.01Pilbara Minerals Ltd. 82,112 131,997 0.01Incitec Pivot Ltd. 59,941 130,963 0.01Allkem Ltd. 18,421 127,729 0.01Orica Ltd. 13,350 124,380 0.01Vicinity Centres 117,083 123,929 0.01AMP Ltd. 186,424 121,877 0.01National Storage REIT 80,744 119,286 0.01
Holding
MarketValue
(£)
% ofTotal Net
Assets
Challenger Ltd. 28,579 117,604 0.01Charter Hall Group 13,215 117,063 0.01Premier Investments Ltd. 7,865 112,987 0.01carsales.com Ltd. 8,819 106,276 0.01Qantas Airways Ltd. 33,305 105,381 0.01Elders Ltd. 12,583 101,636 0.01AGL Energy Ltd. 20,823 101,363 0.01Shopping Centres Australasia
Property Group 57,919 100,646 0.01Technology One Ltd. 16,831 99,841 0.01ALS Ltd. 13,488 99,555 0.01Steadfast Group Ltd. 31,947 93,127 0.01GrainCorp Ltd. Class A 15,901 92,704 0.01Amcor plc 9,774 92,329 0.01Qube Holdings Ltd. 52,912 88,052 0.01Worley Ltd. 11,154 87,821 0.01Credit Corp. Group Ltd. 5,514 85,924 0.01Newcrest Mining Ltd. (CAD) 5,555 83,433 0.01Reliance Worldwide Corp. Ltd. 35,906 80,482 0.01Bank of Queensland Ltd. 16,254 74,798 0.01Healius Ltd. 29,274 74,730 0.01Iluka Resources Ltd. 11,333 72,744 0.01Nine Entertainment Co.
Holdings Ltd. 47,409 71,918 0.01nib holdings Ltd. 17,822 71,018 0.01Nufarm Ltd. 19,477 70,667 0.00Reece Ltd. 7,100 70,168 0.00NEXTDC Ltd. 11,019 69,793 0.00Breville Group Ltd. 5,059 68,954 0.00Sims Ltd. 5,812 68,328 0.00Crown Resorts Ltd. 9,241 67,476 0.00Sandfire Resources Ltd. 20,903 67,322 0.00AUB Group Ltd. 5,110 67,191 0.00Metcash Ltd. 24,618 66,746 0.00Uniti Group Ltd. 23,870 66,745 0.00Domino's Pizza Enterprises Ltd. 1,551 66,116 0.00Alumina Ltd. 64,236 65,629 0.00Whitehaven Coal Ltd. 23,251 64,619 0.00HomeCo Daily Needs REIT 79,991 64,294 0.00Charter Hall Long Wale REIT 20,814 63,148 0.00Altium Ltd. 3,371 62,413 0.00GUD Holdings Ltd. 8,523 61,895 0.00Perseus Mining Ltd. 53,720 60,054 0.00Centuria Capital Group 37,984 59,770 0.00Seven Group Holdings Ltd. 5,250 59,344 0.00Western Areas Ltd. 26,419 57,423 0.00InvoCare Ltd. 8,263 57,201 0.00Bapcor Ltd. 14,823 56,970 0.00Cleanaway Waste Management
Ltd. 30,967 55,915 0.00Calix Ltd. 11,158 54,947 0.00Firefinch Ltd. 83,972 52,997 0.00Genworth Mortgage Insurance
Australia Ltd. 30,972 52,243 0.00Eagers Automotive Ltd. 6,769 51,227 0.00Orora Ltd. 22,365 50,257 0.00Champion Iron Ltd. 12,081 49,987 0.00Ansell Ltd. 3,221 49,791 0.00AVZ Minerals Ltd. 88,184 49,416 0.00Lake Resources NL 43,366 48,356 0.00Harvey Norman Holdings Ltd. 16,536 47,548 0.00Johns Lyng Group Ltd. 9,358 47,195 0.00Downer EDI Ltd. 14,467 45,366 0.00Flight Centre Travel Group Ltd. 3,515 44,905 0.00Coronado Global Resources Inc. 34,228 44,754 0.00Core Exploration Ltd. 56,300 44,455 0.00Silver Lake Resources Ltd. 42,017 44,236 0.00Insignia Financial Ltd. 22,319 43,711 0.00Jervois Global Ltd. 86,980 43,571 0.00Lifestyle Communities Ltd. 5,062 43,408 0.00Brickworks Ltd. 3,159 42,413 0.00IRESS Ltd. 6,783 42,156 0.00
Vanguard FTSE Global All Cap Index Fund
122

Holding
MarketValue
(£)
% ofTotal Net
Assets
Super Retail Group Ltd. 6,952 41,711 0.00Star Entertainment Group Ltd. 22,978 40,840 0.00De Grey Mining Ltd. 60,128 40,671 0.00Chalice Mining Ltd. 10,320 40,540 0.00Beach Energy Ltd. 41,567 38,116 0.00Novonix Ltd. 11,752 34,790 0.00Capricorn Metals Ltd. 14,580 34,249 0.00Link Administration Holdings
Ltd. 11,669 33,355 0.00Rural Funds Group 19,415 33,188 0.00Liontown Resources Ltd. 39,388 32,662 0.00Paladin Energy Ltd. 67,297 31,045 0.00Magellan Financial Group Ltd. 3,375 30,852 0.00Pendal Group Ltd. 9,912 29,623 0.00Pro Medicus Ltd. 1,094 29,370 0.00HUB24 Ltd. 2,059 27,971 0.00CSR Ltd. 7,957 27,564 0.00EVENT Hospitality and
Entertainment Ltd. 3,323 27,461 0.00Nickel Mines Ltd. 36,446 27,025 0.00ARB Corp. Ltd. 1,177 26,709 0.00ioneer Ltd. 71,161 26,584 0.00Costa Group Holdings Ltd. 13,569 25,422 0.00Cedar Woods Properties Ltd. 9,610 25,294 0.00Deterra Royalties Ltd. 9,208 25,122 0.00Corporate Travel Management
Ltd. 1,665 24,579 0.00Webjet Ltd. 7,062 23,984 0.00Viva Energy Group Ltd. 13,930 21,999 0.00Boral Ltd. 10,075 20,359 0.00Arena REIT 7,033 19,267 0.00Temple & Webster Group Ltd. 5,512 18,252 0.00Australian Ethical Investment
Ltd. 5,227 17,160 0.00Australian Strategic Materials
Ltd. 4,614 16,689 0.00Imugene Ltd. 136,865 16,656 0.00TPG Telecom Ltd. 4,625 15,393 0.00Koppar Resources Ltd. 3,177 15,052 0.00Ingenia Communities Group 5,338 14,171 0.00Cromwell Property Group 28,052 13,576 0.00Perpetual Ltd. 716 13,358 0.00BWP Trust 5,609 13,207 0.00West African Resources Ltd. 17,146 12,956 0.00Waypoint REIT 8,084 12,263 0.00Life360 Inc. 5,317 12,038 0.00PolyNovo Ltd. 22,253 11,966 0.00Centuria Industrial REIT 5,232 11,816 0.00Abacus Property Group 5,444 10,138 0.00Codan Ltd. 2,394 9,689 0.00Centuria Office REIT 7,483 9,276 0.00Megaport Ltd. 1,741 8,544 0.00Bellevue Gold Ltd. 15,551 8,362 0.00Bega Cheese Ltd. 2,770 7,887 0.00Growthpoint Properties Australia
Ltd. 3,043 7,596 0.00Charter Hall Retail REIT 2,914 7,373 0.00Regis Resources Ltd. 6,156 7,283 0.00Adbri Ltd. 4,311 7,125 0.00Clinuvel Pharmaceuticals Ltd. 732 6,853 0.00Gold Road Resources Ltd. 6,815 5,998 0.00Zip Co. Ltd. 9,651 5,954 0.00St Barbara Ltd. 7,636 5,749 0.00United Malt Group Ltd. 2,412 5,652 0.00Ramelius Resources Ltd. 6,124 5,217 0.00Nanosonics Ltd. 2,171 4,879 0.00Blackmores Ltd. 118 4,817 0.00Charter Hall Social Infrastructure
REIT 2,046 4,667 0.00Redbubble Ltd. 7,079 4,488 0.00Jumbo Interactive Ltd. 423 4,197 0.00Austal Ltd. 3,676 4,182 0.00Netwealth Group Ltd. 548 4,060 0.00Monadelphous Group Ltd. 673 4,019 0.00Platinum Asset Management
Ltd. 3,704 3,900 0.00
Holding
MarketValue
(£)
% ofTotal Net
Assets
PointsBet Holdings Ltd. 2,301 3,868 0.00Appen Ltd. 1,021 3,820 0.00Bravura Solutions Ltd. 3,348 3,591 0.00IPH Ltd. 829 3,538 0.00Mount Gibson Iron Ltd. 8,681 3,366 0.00Opthea Ltd. 5,842 3,356 0.00Resolute Mining Ltd. 16,312 3,232 0.00Mesoblast Ltd. 5,233 3,169 0.00Tyro Payments Ltd. 4,435 3,138 0.00Electro Optic Systems Holdings
Ltd. 2,323 2,893 0.00Kogan.com Ltd. 1,251 2,769 0.00Service Stream Ltd. 5,445 2,697 0.00Omni Bridgeway Ltd. 1,307 2,501 0.00EML Payments Ltd. 2,604 2,358 0.00Kelsian Group Ltd. 520 2,328 0.00SmartGroup Corp. Ltd. 438 2,209 0.00NRW Holdings Ltd. 1,685 1,846 0.00Eclipx Group Ltd. 1,084 1,706 0.00New Hope Corp. Ltd. 822 1,628 0.00Seven West Media Ltd. 3,435 1,332 0.00Collins Foods Ltd. 228 1,329 0.00G8 Education Ltd. 2,079 1,271 0.00Perenti Global Ltd. 2,627 1,056 0.00oOh!media Ltd. 1,192 1,053 0.00Select Harvests Ltd. 262 971 0.00Nearmap Ltd. 1,341 926 0.00Australian Agricultural Co. Ltd. 961 925 0.00Tassal Group Ltd. 424 902 0.00Minerals 260 Ltd. 3,297 877 0.00Inghams Group Ltd. 444 777 0.00Falcon Metals Ltd. 3,401 655 0.00Humm Group Ltd. 1,410 654 0.00Mayne Pharma Group Ltd. 4,069 645 0.00Syrah Resources Ltd. 565 628 0.00Emeco Holdings Ltd. 1,086 516 0.00GWA Group Ltd. 378 488 0.00Domain Holdings Australia Ltd. 242 482 0.00BWX Ltd. 454 479 0.00Pact Group Holdings Ltd. 271 348 0.00Sigma Healthcare Ltd. 1,222 339 0.00Southern Cross Media Group
Ltd. 292 281 0.00Myer Holdings Ltd. 892 245 0.00Estia Health Ltd. 171 224 0.00SpeedCast International Ltd.1 267 — 0.00
40,178,793 2.22
Austria 0.08% (31 October 2021: 0.08%)
Erste Group Bank AG 9,092 226,211 0.01OMV AG 5,069 209,557 0.01Verbund AG 2,138 184,319 0.01BAWAG Group AG 2,606 100,114 0.01EVN AG 4,355 89,288 0.01ANDRITZ AG 2,499 84,665 0.01voestalpine AG 3,744 78,774 0.01Telekom Austria AG 12,856 73,457 0.01Wienerberger AG 2,752 62,296 0.00AT&S Austria Technologie &
Systemtechnik AG 1,286 53,381 0.00Vienna Insurance Group AG
Wiener Versicherung Gruppe 2,019 39,952 0.00IMMOFINANZ AG 1,913 36,874 0.00Mayr Melnhof Karton AG 249 35,066 0.00S IMMO AG 1,791 34,237 0.00Raiffeisen Bank International AG 3,765 34,230 0.00Lenzing AG 411 30,183 0.00CA Immobilien Anlagen AG 917 20,766 0.00Schoeller-Bleckmann Oilfield
Equipment AG 354 16,211 0.00Oesterreichische Post AG 478 12,331 0.00UNIQA Insurance Group AG 1,318 8,062 0.00Agrana Beteiligungs AG 361 5,126 0.00Palfinger AG 93 1,883 0.00DO & CO AG 18 1,269 0.00
Vanguard FTSE Global All Cap Index Fund
123

Holding
MarketValue
(£)
% ofTotal Net
Assets
Strabag SE 27 850 0.00Flughafen Wien AG 31 697 0.00
1,439,799 0.08
Bahrain 0.00% (31 October 2021: 0.01%)
Belgium 0.28% (31 October 2021: 0.28%)
Anheuser-Busch InBev SA/NV 28,795 1,340,423 0.07KBC Group NV 8,943 488,591 0.03Argenx SE 1,703 391,799 0.02UCB SA 4,191 381,735 0.02Groupe Bruxelles Lambert SA 3,531 268,748 0.02Ageas SA/NV 6,573 253,342 0.02Umicore SA 7,400 229,193 0.01Solvay SA 2,319 176,423 0.01Elia Group SA/NV 1,206 153,726 0.01Warehouses De Pauw CVA 4,340 134,054 0.01Aedifica SA 1,290 122,593 0.01Cofinimmo SA 982 105,783 0.01Sofina SA 421 104,003 0.01D'ieteren SA 762 99,243 0.01Ackermans & van Haaren NV 649 92,924 0.01Euronav NV 8,157 76,148 0.01Gimv NV 1,500 68,565 0.00Colruyt SA 2,276 66,801 0.00Melexis NV 894 62,312 0.00Montea NV 632 60,433 0.00Proximus SADP 4,154 57,697 0.00Barco NV 2,790 50,638 0.00VGP NV 233 48,358 0.00Telenet Group Holding NV 2,023 48,072 0.00AGFA-Gevaert NV 10,265 33,121 0.00Shurgard Self Storage SA 682 31,576 0.00Bekaert SA 759 22,666 0.00KBC Ancora 694 22,591 0.00Xior Student Housing NV 454 19,379 0.00Cie d'Entreprises CFE 172 18,066 0.00Befimmo SA 358 14,274 0.00Tessenderlo Group SA 324 9,107 0.00Fagron 603 9,014 0.00bpost SA 1,333 6,491 0.00Ontex Group NV 1,000 5,541 0.00Retail Estates NV 87 5,300 0.00Orange Belgium SA 96 1,486 0.00Kinepolis Group NV 27 1,200 0.00Econocom Group SA/NV 88 259 0.00
5,081,675 0.28
Brazil 0.65% (31 October 2021: 0.48%)
Vale SA 132,743 1,778,236 0.10Petroleo Brasileiro SA 157,165 845,292 0.05Petroleo Brasileiro SA -
Preference Shares 142,807 695,489 0.04Banco Bradesco SA - Preference
Shares 184,195 532,367 0.03Itau Unibanco Holding SA -
Preference Shares 133,550 512,721 0.03B3 SA - Brasil Bolsa Balcao 193,600 413,824 0.02Ambev SA 165,600 386,733 0.02JBS SA 46,508 283,125 0.02WEG SA 49,820 241,108 0.01Hapvida Participacoes e
Investimentos SA 161,774 228,188 0.01Gerdau SA - Preference Shares 45,900 206,486 0.01Itausa SA - Preference Shares 135,364 200,298 0.01Suzano SA 23,641 188,634 0.01Itau Unibanco Holding SA 57,200 184,733 0.01Localiza Rent a Car SA 18,838 160,400 0.01Equatorial Energia SA 37,614 155,115 0.01Banco BTG Pactual SA 38,760 143,944 0.01Banco do Brasil SA 25,923 138,506 0.01Lojas Renner SA 35,358 135,006 0.01Telefonica Brasil SA 15,000 128,082 0.01Banco Bradesco SA 48,802 116,952 0.01Centrais Eletricas Brasileiras SA 17,873 116,365 0.01Petro Rio SA 26,395 113,349 0.01Raia Drogasil SA 32,400 109,068 0.01
Holding
MarketValue
(£)
% ofTotal Net
Assets
Kinea Rendimentos Imobiliarios 6,480 106,286 0.01Rumo SA 39,993 105,297 0.01Hypera SA 17,400 104,722 0.01BB Seguridade Participacoes SA 25,400 103,847 0.01TOTVS SA 20,166 103,693 0.01Klabin SA 30,600 102,074 0.01Vibra Energia SA 29,910 101,552 0.01Natura & Co. Holding SA 33,326 99,643 0.01Magazine Luiza SA 126,344 99,165 0.01Cia de Saneamento Basico do
Estado de Sao Paulo 13,600 97,404 0.01Arezzo Industria e Comercio SA 6,600 94,889 0.01Kinea Renda Imobiliaria 4,205 92,588 0.01Cosan SA ADR 6,473 87,492 0.01Transmissora Alianca de Energia
Eletrica SA 11,800 83,468 0.01Cia Energetica de Minas Gerais 26,331 81,100 0.01Americanas SA 21,009 81,096 0.013R Petroleum Oleo E Gas SA 10,800 80,268 0.01Rede D'Or Sao Luiz SA 13,335 78,777 0.01TIM SA 35,400 76,750 0.00Cia Siderurgica Nacional SA 21,700 73,503 0.00Sendas Distribuidora SA 29,500 72,499 0.00Centrais Eletricas Brasileiras SA
Class B - Preference Shares 10,800 69,742 0.00Cia de Locacao das Americas 17,902 67,807 0.00Energisa SA 8,535 65,356 0.00Cia Paranaense de Energia 61,500 64,492 0.00Sul America SA 15,026 64,188 0.00GPS Participacoes e
Empreendimentos SA 26,100 62,842 0.00Raizen SA Preference Shares 55,395 61,387 0.00BRF SA 28,022 61,205 0.00FII Iridium 3,440 59,035 0.00Cia Energetica de Minas Gerais -
Preference Shares 24,929 58,819 0.00CCR SA 28,100 56,087 0.00Auren Energia SA 23,470 55,339 0.00Cosan SA 16,112 54,419 0.00Marfrig Global Foods SA 16,673 50,281 0.00Eneva SA 21,500 47,409 0.00Embraer SA 19,700 44,992 0.00Bradespar SA - Preference
Shares 9,374 44,160 0.00Ultrapar Participacoes SA 20,400 42,884 0.00Banco Santander Brasil SA 7,200 36,767 0.00Atacadao SA 10,808 35,757 0.00Multiplan Empreendimentos
Imobiliarios SA 8,915 35,316 0.00BR Malls Participacoes SA 22,301 34,039 0.00LOG Commercial Properties e
Participacoes SA 8,227 31,664 0.00CSHG Logistica FI Imobiliario 1,113 29,361 0.00Usinas Siderurgicas de Minas
Gerais SA Usiminas 16,200 27,358 0.00Braskem SA Class A -
Preference Shares 4,100 26,516 0.00Via S/A 55,248 26,302 0.00Kinea Indice de Precos 1,597 26,294 0.00Usinas Siderurgicas de Minas
Gerais SA Usiminas Class A -Preference Shares 14,100 25,649 0.00
SLC Agricola SA 2,860 24,338 0.00Cia Paranaense de Energia -
Preference Shares 20,000 23,933 0.00Azul SA - Preference Shares 6,700 23,653 0.00Banco Inter SA - Preference
Shares 27,592 23,210 0.00Cogna Educacao 58,847 23,189 0.00Metalurgica Gerdau SA -
Preference Shares 12,200 22,291 0.00Unipar Carbocloro SA
Preference Shares 1,430 22,082 0.00Sao Martinho SA 2,500 18,661 0.00Iguatemi SA 41,940 17,808 0.00Infracommerce CXAAS SA 14,500 16,768 0.00
Vanguard FTSE Global All Cap Index Fund
124

Holding
MarketValue
(£)
% ofTotal Net
Assets
Pet Center Comercio eParticipacoes SA 6,800 16,646 0.00
Iguatemi SA - Units 4,830 16,306 0.00Santos Brasil Participacoes SA 14,172 16,138 0.00GRUPO DE MODA SOMA SA 7,638 14,828 0.00Grupo SBF SA 3,700 14,360 0.00YDUQS Participacoes SA 5,400 14,001 0.00CVC Brasil Operadora e Agencia
de Viagens SA 6,370 13,575 0.00Engie Brasil Energia SA 1,950 13,138 0.00Cia de Transmissao de Energia
Eletrica Paulista - PreferenceShares 2,900 11,735 0.00
Locaweb Servicos de InternetSA 9,316 10,743 0.00
Minerva SA 5,000 10,551 0.00Ser Educacional SA 6,900 10,354 0.00EDP - Energias do Brasil SA 2,900 9,879 0.00Anima Holding SA 10,775 9,618 0.00Gol Linhas Aereas Inteligentes
SA - Preference Shares 3,563 8,716 0.00Cia de Saneamento do Parana 2,600 8,267 0.00CPFL Energia SA 1,400 8,138 0.00Banco Pan SA - Preference
Shares 5,300 7,970 0.00Lojas Quero Quero S/A 5,400 7,469 0.00Alpargatas SA - Preference
Shares 2,200 6,935 0.00Cia Brasileira de Distribuicao 2,100 6,867 0.00Porto Seguro SA 2,000 6,546 0.00M Dias Branco SA 1,700 6,466 0.00Light SA 4,500 6,456 0.00Neoenergia SA 2,100 6,340 0.00Qualicorp Consultoria e
Corretora de Seguros SA 2,900 6,190 0.00Movida Participacoes SA 2,100 6,127 0.00Dexco SA 2,860 5,893 0.00Fleury SA 2,500 5,798 0.00Cyrela Brazil Realty SA
Empreendimentos eParticipacoes 2,400 5,462 0.00
Meliuz SA 17,634 5,332 0.00Odontoprev SA 2,860 4,664 0.00MPM Corporeos SA 6,800 4,572 0.00IRB Brasil Resseguros S/A 9,762 4,349 0.00Cielo SA 7,340 4,002 0.00Omega Energia SA 2,317 3,980 0.00Bradespar SA 900 3,894 0.00MRV Engenharia e Participacoes
SA 2,300 3,818 0.00Aliansce Sonae Shopping
Centers sa 1,000 3,392 0.00Cia de Saneamento de Minas
Gerais-COPASA 1,500 3,296 0.00AES Brasil Energia SA 1,802 3,197 0.00Alupar Investimento SA 700 2,948 0.00Guararapes Confeccoes SA 1,400 2,076 0.00Ez Tec Empreendimentos e
Participacoes SA 800 2,015 0.00Direcional Engenharia SA 593 1,097 0.00Enauta Participacoes SA 300 996 0.00BK Brasil Operacao e Assessoria
a Restaurantes SA 965 976 0.00Getnet Adquirencia e Servicos
para Meios de Pagamento SA 1,800 964 0.00Grendene SA 600 909 0.00Even Construtora e
Incorporadora SA 800 688 0.00Randon SA Implementos e
Participacoes - PreferenceShares 400 686 0.00
Iochpe Maxion SA 300 643 0.00Banco do Estado do Rio Grande
do Sul SA Class B -Preference Shares 300 509 0.00
EcoRodovias Infraestrutura eLogistica SA 400 445 0.00
Holding
MarketValue
(£)
% ofTotal Net
Assets
Marcopolo SA - PreferenceShares 1,023 439 0.00
Construtora Tenda SA 400 374 0.00CSHG Logistica Fi Imobiliario
Rights 02/05/20221 200 113 0.00Gol Linhas Aereas Inteligentes
SA 608 1 0.00
11,873,421 0.65
Canada 3.15% (31 October 2021: 2.90%)
Royal Bank of Canada 44,410 3,587,468 0.20Toronto-Dominion Bank 58,095 3,356,245 0.19Enbridge Inc. 64,331 2,247,546 0.12Bank of Nova Scotia 38,204 1,934,494 0.11Canadian Natural Resources Ltd. 38,661 1,914,266 0.11Canadian National Railway Co. 19,015 1,789,404 0.10Bank of Montreal 21,034 1,783,821 0.10Canadian Pacific Railway Ltd. 29,993 1,756,485 0.10Brookfield Asset
Management Inc. Class A 43,488 1,731,831 0.10Nutrien Ltd. 18,535 1,456,840 0.08Suncor Energy Inc. 47,089 1,353,162 0.07TC Energy Corp. 31,513 1,334,487 0.07Canadian Imperial Bank of
Commerce 14,170 1,253,988 0.07Barrick Gold Corp. 58,686 1,047,473 0.06Manulife Financial Corp. 63,135 987,989 0.05Shopify Inc. Class A (XTSE) 2,860 974,376 0.05Waste Connections Inc. 8,652 955,359 0.05Alimentation Couche-Tard Inc. 26,230 933,240 0.05Constellation Software Inc. 677 852,338 0.05Franco-Nevada Corp. 6,504 785,218 0.04Sun Life Financial Inc. 18,733 745,424 0.04Agnico Eagle Mines Ltd. 15,178 705,649 0.04Cenovus Energy Inc. 45,662 675,855 0.04National Bank of Canada 10,556 589,839 0.03Fortis Inc. 14,583 567,654 0.03Teck Resources Ltd. Class B 17,009 537,006 0.03Intact Financial Corp. 4,553 508,675 0.03Pembina Pipeline Corp. 16,511 499,263 0.03Wheaton Precious Metals Corp. 13,906 497,277 0.03CGI Inc. 7,719 491,929 0.03Magna International Inc. 10,068 484,830 0.03Dollarama Inc. 10,382 461,647 0.03Rogers Communications Inc.
Class B 10,574 460,366 0.03First Quantum Minerals Ltd. 19,657 448,734 0.03Restaurant Brands
International Inc. 9,496 432,903 0.02Thomson Reuters Corp. 4,985 397,845 0.02Power Corp. of Canada 16,800 395,555 0.02Loblaw Cos. Ltd. 5,379 393,521 0.02Tourmaline Oil Corp. 9,224 380,033 0.02BCE Inc. 8,325 353,993 0.02WSP Global Inc. 3,599 335,454 0.02Metro Inc. 7,637 335,304 0.02Fairfax Financial Holdings Ltd. 757 332,598 0.02Algonquin Power & Utilities
Corp. 26,555 306,991 0.02Emera Inc. 7,736 298,671 0.02Shaw Communications Inc.
Class B 12,452 296,596 0.02Shopify Inc. Class A (XNYS) 824 280,271 0.02Open Text Corp. 8,735 279,809 0.02Cameco Corp. 12,580 259,661 0.01Canadian Tire Corp. Ltd. Class A 2,303 253,681 0.01ARC Resources Ltd. 22,281 247,028 0.01Imperial Oil Ltd. 6,112 245,342 0.01George Weston Ltd. 2,281 226,608 0.01CAE Inc. 11,909 226,514 0.01TELUS Corp. 11,191 223,877 0.01West Fraser Timber Co. Ltd. 3,102 217,814 0.01Gildan Activewear Inc. 7,612 205,979 0.01Ritchie Bros Auctioneers Inc. 4,617 202,883 0.01Hydro One Ltd. 8,953 193,166 0.01AltaGas Ltd. 10,026 183,013 0.01Keyera Corp. 9,082 180,271 0.01
Vanguard FTSE Global All Cap Index Fund
125

Holding
MarketValue
(£)
% ofTotal Net
Assets
Great-West Lifeco Inc. 8,081 178,280 0.01CCL Industries Inc. Class B 5,045 176,070 0.01Toromont Industries Ltd. 2,417 169,835 0.01iA Financial Corp. Inc. 3,962 165,804 0.01Finning International Inc. 7,378 165,576 0.01Quebecor Inc. Class B 8,719 163,774 0.01TFI International Inc. 2,531 162,893 0.01Canadiaartment Properties REIT 5,100 159,713 0.01Northland Power Inc. 6,626 159,519 0.01Descartes Systems Group Inc. 3,191 158,179 0.01Kinross Gold Corp. 38,868 156,965 0.01Parkland Corp. 6,738 152,641 0.01TMX Group Ltd. 1,861 151,156 0.01RioCan Real Estate Investment
Trust 9,662 144,395 0.01Lundin Mining Corp. 19,713 143,247 0.01Onex Corp. 2,920 140,141 0.01Yamana Gold Inc. 31,561 139,061 0.01Saputo Inc. 8,081 138,142 0.01Canadian Utilities Ltd. Class A 5,704 137,251 0.01Bausch Health Cos. Inc. 8,887 134,862 0.01Colliers International Group Inc. 1,512 133,118 0.01SSR Mining Inc. 7,501 131,640 0.01FirstService Corp. 1,316 130,821 0.01Pan American Silver Corp. 6,503 128,310 0.01BlackBerry Ltd. 27,308 125,087 0.01Granite Real Estate Investment
Trust 2,096 124,094 0.01Empire Co. Ltd. Class A 4,545 119,815 0.01Capital Power Corp. 4,506 118,028 0.01TransAlta Corp. 13,194 112,897 0.01PrairieSky Royalty Ltd. 10,178 111,511 0.01Dream Industrial Real Estate
Investment Trust 11,918 111,040 0.01Stantec Inc. 3,013 110,298 0.01B2Gold Corp. 32,186 108,919 0.01Choice Properties Real Estate
Investment Trust 11,539 108,731 0.01Chartwell Retirement
Residences 14,179 107,364 0.01Premium Brands Holdings Corp. 1,644 107,271 0.01SNC-Lavalin Group Inc. 6,003 106,622 0.01Ivanhoe Mines Ltd. Class A 16,448 105,068 0.01Allied Properties Real Estate
Investment Trust 3,953 102,508 0.01Atco Ltd. Class I 3,584 102,120 0.01Brookfield Infrastructure Corp.
Class A (CAD) 1,819 102,026 0.01Brookfield Renewable Corp.
Class A 3,550 101,481 0.01Alamos Gold Inc. Class A 16,111 99,904 0.01MEG Energy Corp. 8,310 99,797 0.01Canadian Western Bank 4,925 99,384 0.01Nuvei Corp. 2,170 96,897 0.01Tricon Residential Inc. 8,317 96,149 0.01Gibson Energy Inc. 6,214 94,570 0.01H&R Real Estate Investment
Trust 11,694 92,993 0.01Linamar Corp. 2,837 89,764 0.01Summit Industrial Income REIT 6,949 88,086 0.01Boyd Group Services Inc. 856 84,822 0.01Kinaxis Inc. 928 82,043 0.00First Majestic Silver Corp. 9,874 81,227 0.00Crescent Point Energy Corp. 14,298 79,216 0.00Element Fleet Management
Corp. 11,085 78,686 0.00GFL Environmental Inc. (CAD) 3,258 77,339 0.00TransAlta Renewables Inc. 6,969 77,308 0.00Aritzia Inc. 2,713 77,116 0.00Turquoise Hill Resources Ltd. 3,467 75,451 0.00Innergex Renewable Energy Inc. 7,007 74,891 0.00Vermilion Energy Inc. 4,727 73,648 0.00Osisko Gold Royalties Ltd. (CAD) 7,454 72,979 0.00Whitecap Resources Inc. 11,013 72,135 0.00Methanex Corp. 1,789 71,567 0.00Air Canada 4,996 70,055 0.00Boralex Inc. Class A 2,922 69,909 0.00
Holding
MarketValue
(£)
% ofTotal Net
Assets
Artis Real Estate InvestmentTrust 8,556 69,638 0.00
Lithium Americas Corp. 3,439 69,226 0.00First Capital Real Estate
Investment Trust 6,415 68,364 0.00Primo Water Corp. 5,937 68,117 0.00SmartCentres Real Estate
Investment Trust 3,415 66,593 0.00BRP Inc. 1,027 66,564 0.00Centerra Gold Inc. 8,974 66,273 0.00Paramount Resources Ltd. 3,383 65,126 0.00Stella-Jones Inc. 2,918 64,376 0.00Russel Metals Inc. 2,954 62,906 0.00ATS Automation Tooling
Systems Inc. 2,668 62,136 0.00Enerplus Corp. 6,187 60,459 0.00OceanaGold Corp. 30,291 60,220 0.00Ballard Power Systems Inc. 9,060 59,851 0.00Cargojet Inc. 636 59,217 0.00IAMGOLD Corp. 25,454 57,425 0.00Novagold Resources Inc. 11,239 55,964 0.00IGM Financial Inc. 2,166 54,805 0.00Lightspeed Commerce Inc. 3,074 54,790 0.00Cascades Inc. 6,840 53,753 0.00Boardwalk Real Estate
Investment Trust 1,501 52,665 0.00Parex Resources Inc. 3,377 52,446 0.00CI Financial Corp. 4,566 47,521 0.00ECN Capital Corp. 12,728 46,007 0.00Maple Leaf Foods Inc. 2,585 45,430 0.00Canopy Growth Corp. 9,767 44,921 0.00Stelco Holdings Inc. 1,486 43,323 0.00Equinox Gold Corp. 7,418 41,977 0.00Bombardier Inc. Class B 50,956 40,013 0.00Laurentian Bank of Canada 1,418 34,465 0.00Eldorado Gold Corp. 3,787 29,289 0.00Enghouse Systems Ltd. 1,212 27,252 0.00Canada Goose Holdings Inc. 1,519 26,431 0.00Primaris Real Estate Investment
Trust 2,923 25,157 0.00Canfor Corp. 1,573 23,890 0.00Superior Plus Corp. 2,801 19,708 0.00Hudbay Minerals Inc. 3,593 18,317 0.00Celestica Inc. 2,028 18,174 0.00TELUS Corp. Foreign 860 17,226 0.00North West Co. Inc. 746 16,621 0.00Transcontinental Inc. Class A 1,327 13,257 0.00Aurora Cannabis Inc. 4,680 11,317 0.00Brookfield Infrastructure Corp.
Class A (USD) 200 11,298 0.00Dye & Durham Ltd. 827 10,875 0.00Winpak Ltd. 385 10,130 0.00Home Capital Group Inc. 501 9,991 0.00Mullen Group Ltd. 1,187 9,092 0.00Dream Office Real Estate
Investment Trust 540 8,750 0.00Martinrea International Inc. 1,784 8,516 0.00Osisko Gold Royalties Ltd. (USD) 834 8,164 0.00Torex Gold Resources Inc. 850 7,575 0.00NFI Group Inc. 840 6,135 0.00Cronos Group Inc. 2,466 5,917 0.00GFL Environmental Inc. (USD) 164 3,932 0.00Cogeco Communications Inc. 45 2,956 0.00First National Financial Corp. 107 2,422 0.00Westshore Terminals
Investment Corp. 63 1,346 0.00Aecon Group Inc. 82 765 0.00Barrick Gold Corp. (XLON)1 30 540 0.00
57,127,382 3.15
Cayman Islands 0.00% (31 October 2021: 0.00%)
Chile 0.06% (31 October 2021: 0.05%)
Sociedad Quimica y Minera deChile SA Class B - PreferenceShares 4,109 241,321 0.01
Banco Santander Chile 3,161,104 121,014 0.01Banco de Chile 1,411,824 112,062 0.01
Vanguard FTSE Global All Cap Index Fund
126

Holding
MarketValue
(£)
% ofTotal Net
Assets
Empresas Copec SA 17,365 101,660 0.01Enel Americas SA 1,195,770 99,703 0.01Cia Sud Americana de Vapores
SA 813,718 73,242 0.01Cencosud SA 56,484 71,884 0.00Sociedad Quimica y Minera de
Chile SA Class A 944 51,122 0.00Falabella SA 20,475 45,672 0.00Empresas CMPC SA 35,040 41,583 0.00CAP SA 3,467 33,835 0.00Embotelladora Andina SA
Class B - Preference Shares 15,602 22,434 0.00Itau CorpBanca Chile SA 13,498,089 21,813 0.00Banco de Credito e Inversiones
SA 770 18,942 0.00Enel Chile SA 807,044 16,857 0.00Empresa Nacional de
Telecomunicaciones SA 2,315 6,728 0.00Colbun SA 104,691 5,780 0.00Cia Cervecerias Unidas SA 880 4,669 0.00Plaza SA 5,855 4,319 0.00Cencosud Shopping SA 4,505 3,639 0.00Engie Energia Chile SA 8,622 3,100 0.00Parque Arauco SA 4,447 2,948 0.00Aguas Andinas SA Class A 18,166 2,544 0.00Inversiones La Construccion SA 503 1,620 0.00Inversiones Aguas
Metropolitanas SA 3,672 1,149 0.00Vina Concha y Toro SA 707 825 0.00SONDA SA 1,422 386 0.00Salfacorp SA 562 138 0.00
1,110,989 0.06
China 3.26% (31 October 2021: 3.62%)
Tencent Holdings Ltd. 199,760 7,649,035 0.42Alibaba Group Holding Ltd. 471,132 4,883,090 0.27Meituan 127,154 2,215,000 0.12JD.com Inc. Class A 52,584 1,416,710 0.08China Construction Bank Corp.
Class H 2,426,000 1,374,205 0.08Industrial & Commercial Bank of
China Ltd. Class H 2,129,000 1,022,265 0.06Baidu Inc. Class A 73,898 979,721 0.06China Shenhua Energy Co. Ltd. 181,500 946,114 0.05NetEase Inc. 53,574 836,444 0.05Bank of China Ltd. Class H 2,395,000 753,692 0.04Xiaomi Corp. Class B 579,200 716,147 0.04China Merchants Bank Co. Ltd.
Class H 144,000 699,473 0.04Wuxi Biologics Cayman Inc. 110,747 673,981 0.04BYD Co. Ltd. Class H 26,000 621,835 0.04Kweichow Moutai Co. Ltd.
Class A 2,716 600,447 0.03NIO Inc. ADR 44,272 587,825 0.03China Mengniu Dairy Co. Ltd. 113,009 488,708 0.03ANTA Sports Products Ltd. 49,000 456,631 0.03Li Ning Co. Ltd. 70,306 446,066 0.03Pinduoduo Inc. ADR 12,525 429,571 0.03Geely Automobile Holdings Ltd. 316,300 398,793 0.02Trip.com Group Ltd. ADR 19,932 375,302 0.02China Construction Bank Corp.
Class A 503,500 369,559 0.02Contemporary Amperex
Technology Co. Ltd. Class A 7,100 351,438 0.02Kuaishou Technology 51,500 348,967 0.02XPeng Inc. ADR 17,544 344,172 0.02China Overseas Land &
Investment Ltd. 132,000 327,627 0.02ENN Energy Holdings Ltd. 29,300 314,688 0.02Ping An Insurance Group Co. of
China Ltd. Class A 57,959 312,292 0.02Industrial & Commercial Bank of
China Ltd. Class A 538,800 311,423 0.02China Resources Beer Holdings
Co. Ltd. 66,000 311,212 0.02PetroChina Co. Ltd. Class H 806,000 310,918 0.02Nongfu Spring Co. Ltd. 71,000 302,355 0.02
Holding
MarketValue
(£)
% ofTotal Net
Assets
China Resources Land Ltd. 84,000 300,583 0.02Sunny Optical Technology Group
Co. Ltd. 25,200 298,025 0.02CSPC Pharmaceutical Group
Ltd. 354,320 290,985 0.02Agricultural Bank of China Ltd.
Class H 967,000 289,585 0.02Anhui Conch Cement Co. Ltd.
Class H 62,000 269,378 0.02China Petroleum & Chemical
Corp. Class H 658,000 259,838 0.02Li Auto Inc. ADR 14,405 257,236 0.02Shenzhou International Group
Holdings Ltd. 22,806 251,886 0.02Postal Savings Bank of China
Co. Ltd. Class H 406,673 247,286 0.02Haier Smart Home Co. Ltd.
Class H 86,200 247,202 0.02China Life Insurance Co. Ltd.
Class H 201,000 234,650 0.01Longfor Group Holdings Ltd. 58,500 231,308 0.01Country Garden Services
Holdings Co. Ltd. 67,264 230,795 0.01China Shenhua Energy Co. Ltd.
Class H 85,500 219,590 0.01China Yangtze Power Co. Ltd.
Class A 78,200 214,838 0.01China Merchants Bank Co. Ltd.
Class A 42,937 207,313 0.01BYD Co. Ltd. Class A 7,000 205,684 0.01Kanzhun Ltd. ADR 10,858 203,236 0.01CITIC Securities Co. Ltd. Class H 111,555 197,045 0.01Bilibili Inc. Class Z 9,223 190,623 0.01China Everbright Bank Co. Ltd.
Class A 484,100 186,733 0.01Zijin Mining Group Co. Ltd.
Class H 156,000 184,650 0.01China Pacific Insurance Group
Co. Ltd. Class H 103,400 184,320 0.01CITIC Ltd. 217,000 179,753 0.01Wuliangye Yibin Co. Ltd. Class A 9,097 178,343 0.01Huazhu Group Ltd. ADR 7,222 173,777 0.01ZhongAn Online P&C Insurance
Co. Ltd. Class H 62,032 173,486 0.01Xinyi Solar Holdings Ltd. 140,400 168,466 0.01Foshan Haitian Flavouring &
Food Co. Ltd. Class A 16,988 167,456 0.01China State Construction
Engineering Corp. Ltd. Class A 219,300 166,530 0.01LONGi Green Energy
Technology Co. Ltd. Class A 19,760 162,357 0.01China Vanke Co. Ltd. Class H 83,900 158,587 0.01PICC Property & Casualty Co.
Ltd. Class H 189,000 154,449 0.01COSCO SHIPPING Holdings Co.
Ltd. Class H 120,900 152,677 0.01Muyuan Foodstuff Co. Ltd.
Class A 24,043 151,817 0.01Country Garden Holdings Co.
Ltd. 271,000 150,206 0.01China Longyuan Power Group
Corp. Ltd. Class H 96,000 150,078 0.01Bank of Communications Co.
Ltd. Class H 269,000 149,371 0.01Industrial Bank Co. Ltd. Class A 59,900 148,265 0.01China Tower Corp. Ltd. Class H 1,603,385 148,117 0.01Bank Of Ningbo Co. Ltd. Class A 33,540 147,219 0.01Hengan International Group Co.
Ltd. 39,000 147,079 0.01Inner Mongolia Yili Industrial
Group Co. Ltd. Class A 31,600 146,958 0.01SF Holding Co. Ltd. Class A 23,500 145,746 0.01Kingdee International Software
Group Co. Ltd. 82,000 135,684 0.01DiDi Global Inc. ADR 90,548 135,588 0.01Sino Biopharmaceutical Ltd. 309,000 129,863 0.01Zhongsheng Group Holdings
Ltd. 24,000 127,299 0.01
Vanguard FTSE Global All Cap Index Fund
127

Holding
MarketValue
(£)
% ofTotal Net
Assets
CRRC Corp. Ltd. Class H 429,000 127,165 0.01Pop Mart International Group
Ltd. 34,400 126,064 0.01Haitong Securities Co. Ltd.
Class H 222,800 124,395 0.01Anhui Gujing Distillery Co. Ltd.
Class B 11,500 121,831 0.01China Merchants Shekou
Industrial Zone Holdings Co.Ltd. Class A 62,800 118,994 0.01
WuXi AppTec Co. Ltd. Class A 9,502 118,609 0.01C&D International Investment
Group Ltd. 61,000 118,398 0.01CSC Financial Co. Ltd. Class H 158,000 116,605 0.01China National Building Material
Co. Ltd. Class H 108,550 116,144 0.01Huatai Securities Co. Ltd.
Class H 104,800 115,111 0.01China Petroleum & Chemical
Corp. Class A 213,600 112,095 0.01Beijing-Shanghai High Speed
Railway Co. Ltd. Class A 198,700 110,042 0.01China Three Gorges Renewables
Group Co. Ltd. 154,900 109,011 0.01Yanzhou Coal Mining Co. Ltd.
Class H 48,000 108,904 0.01Full Truck Alliance Co. Ltd. ADR 22,595 108,521 0.01Shenzhen Mindray Bio-Medical
Electronics Co. Ltd. Class A 2,833 107,051 0.01JD Health International Inc. 20,879 107,035 0.01Daqin Railway Co. Ltd. Class A 131,700 106,061 0.01Fosun International Ltd. 125,500 105,997 0.01Luzhou Laojiao Co. Ltd. Class A 4,100 104,473 0.01Zijin Mining Group Co. Ltd.
Class A 77,700 103,913 0.01China Galaxy Securities Co. Ltd.
Class H 233,500 101,688 0.01China Gas Holdings Ltd. 103,641 101,212 0.01Tianjin Zhonghuan
Semiconductor Co. Ltd.Class A 21,400 100,945 0.01
China Shenhua Energy Co. Ltd.Class A 26,800 99,714 0.01
China Conch Venture HoldingsLtd. 48,000 99,403 0.01
Citic Pacific Special Steel GroupCo. Ltd. Class A 45,390 99,013 0.01
Zhuzhou CRRC Times ElectricCo. Ltd. Class H 31,100 98,975 0.01
New China Life Insurance Co.Ltd. Class H 48,413 98,292 0.01
Vipshop Holdings Ltd. Class AADR 15,807 96,567 0.01
CGN Power Co. Ltd. Class H 430,000 96,469 0.01Kunlun Energy Co. Ltd. 144,000 96,333 0.01JD Logistics Inc. 57,143 95,249 0.01Innovent Biologics Inc. 37,301 95,232 0.01China Overseas Property
Holdings Ltd. 100,000 94,916 0.01WuXi AppTec Co. Ltd. Class H 8,500 93,967 0.01Dali Foods Group Co. Ltd. 230,000 93,860 0.01China Resources Mixc Lifestyle
Services Ltd. 24,200 93,107 0.01Bank of China Ltd. Class A 237,300 92,682 0.01GDS Holdings Ltd. Class A 26,614 91,047 0.01China Resources Gas Group Ltd. 30,000 90,754 0.01Smoore International Holdings
Ltd. 53,000 90,711 0.01Lufax Holding Ltd. ADR 20,148 89,065 0.01Wanhua Chemical Group Co.
Ltd. Class A 9,400 88,487 0.01Greentown China Holdings Ltd. 62,500 88,190 0.01Gigadevice Semiconductor
Beijing Inc. Class A 5,792 87,412 0.01East Money Information Co. Ltd.
Class A 30,643 84,407 0.01Satellite Chemical Co. Ltd.
Class A 19,300 84,085 0.01
Holding
MarketValue
(£)
% ofTotal Net
Assets
Tencent Music EntertainmentGroup ADR 24,254 82,102 0.01
Guangdong Investment Ltd. 80,000 81,861 0.01Fuyao Glass Industry Group Co.
Ltd. Class H 24,800 81,820 0.01ZTO Express Cayman Inc. (HKD) 3,668 81,620 0.01China International Capital Corp.
Ltd. Class H 50,400 81,247 0.01China Resources Cement
Holdings Ltd. 122,000 80,872 0.01COSCO SHIPPING Energy
Transportation Co. Ltd.Class A 84,000 80,039 0.01
China Tourism Group Duty FreeCorp. Ltd. Class A 3,599 79,200 0.01
KE Holdings Inc. ADR 6,925 78,103 0.01China Resources Power
Holdings Co. Ltd. 50,000 75,933 0.01China Merchants Port Holdings
Co. Ltd. 54,000 75,539 0.01China CITIC Bank Corp. Ltd.
Class A 123,800 75,148 0.01Yuexiu Property Co. Ltd. 89,200 74,433 0.01China Energy Engineering Corp
Ltd. 255,100 74,340 0.01Shanxi Xinghuacun Fen Wine
Factory Co. Ltd. Class A 2,240 73,668 0.01Hangzhou Silan Microelectronics
Co. Ltd. 14,500 73,640 0.01Poly Developments and
Holdings Group Co. Ltd.Class A 32,900 72,046 0.01
Haidilao International HoldingLtd. 45,000 71,446 0.01
Agricultural Bank of China Ltd.Class A 192,000 71,042 0.01
China Life Insurance Co. Ltd.Class A 23,000 70,780 0.01
Tongwei Co. Ltd. Class A 14,200 70,571 0.01China Merchants Securities Co.
Ltd. Class A 45,660 70,450 0.01Ping An Bank Co. Ltd. Class A 37,500 69,423 0.01GF Securities Co. Ltd. Class H 68,800 69,143 0.01Kingboard Holdings Ltd. 19,000 68,761 0.01Great Wall Motor Co. Ltd.
Class A 22,900 68,728 0.01China Power International
Development Ltd. 175,339 68,350 0.01Guangzhou Automobile Group
Co. Ltd. Class H 97,600 66,977 0.01Ganfeng Lithium Co. Ltd.
Class A 5,000 66,905 0.01Tsingtao Brewery Co. Ltd.
Class A 6,400 66,786 0.01Beijing Enterprises Holdings Ltd. 24,500 66,281 0.01Aier Eye Hospital Group Co. Ltd.
Class A 15,256 66,263 0.0151job Inc. ADR 1,365 66,103 0.01China Cinda Asset Management
Co. Ltd. Class H 493,000 66,062 0.01Bank of Communications Co.
Ltd. Class A 104,300 64,068 0.01Dongfeng Motor Group Co. Ltd.
Class H 108,000 63,150 0.01Far East Horizon Ltd. 97,000 63,118 0.01Sinopharm Group Co. Ltd.
Class H 34,300 62,953 0.00China Hongqiao Group Ltd. 61,500 62,306 0.00Shanghai Pharmaceuticals
Holding Co. Ltd. Class H 48,100 62,207 0.00Xinte Energy Co. Ltd. Class H 34,400 60,762 0.00Great Wall Motor Co. Ltd.
Class H 53,000 60,689 0.00Huaneng Power
International Inc. Class H 150,000 60,604 0.00Luxshare Precision Industry Co.
Ltd. Class A 16,084 60,057 0.00
Vanguard FTSE Global All Cap Index Fund
128

Holding
MarketValue
(£)
% ofTotal Net
Assets
China Resources Double CranePharmaceutical Co. Ltd.Class A 16,400 59,710 0.00
Haichang Ocean Park HoldingsLtd. 109,000 58,645 0.00
China Railway Group Ltd.Class A 68,300 58,472 0.00
Weichai Power Co. Ltd. Class A 42,900 58,047 0.00Chongqing Changan Automobile
Co. Ltd. Class B 154,740 57,964 0.00Nari Technology Co. Ltd. Class A 14,800 57,267 0.00China Everbright Environment
Group Ltd. 120,592 56,924 0.00Shanghai Junshi
Biosciences Co. Ltd. Class H 9,800 55,810 0.00Shanghai Fosun Pharmaceutical
Group Co. Ltd. Class A 10,700 55,609 0.00Beijing Enterprises Water Group
Ltd. 214,000 55,396 0.00Sinopec Shanghai Petrochemical
Co. Ltd. Class H 370,000 55,214 0.00Aluminum Corp. of China Ltd.
Class A 94,400 54,334 0.00China State Construction
International Holdings Ltd. 52,250 54,102 0.00China Southern Airlines Co. Ltd.
Class H 120,000 53,843 0.00Kingsoft Corp. Ltd. 22,000 53,823 0.00China Traditional Chinese
Medicine Holdings Co. Ltd. 136,000 53,015 0.00Linklogis Inc. Class B 69,000 52,814 0.00Datang International Power
Generation Co. Ltd. Class H 406,000 52,343 0.00Flat Glass Group Co. Ltd.
Class H 18,000 51,711 0.00Alibaba Health Information
Technology Ltd. 112,000 51,618 0.00Luye Pharma Group Ltd. 204,500 51,276 0.00Jiangsu Yanghe Brewery Joint-
Stock Co. Ltd. Class A 2,664 51,238 0.00Genscript Biotech Corp. 22,000 50,696 0.00Imeik Technology Development
Co. Ltd. 800 50,037 0.00China National Nuclear Power
Co. Ltd. Class A 57,600 49,660 0.00People's Insurance Co. Group of
China Ltd. Class H 194,000 49,431 0.00China Jinmao Holdings Group
Ltd. 186,000 49,092 0.00Zhejiang Expressway Co. Ltd.
Class H 74,000 48,753 0.00Jiangsu Hengrui Medicine Co.
Ltd. Class A 13,500 48,123 0.00Trina Solar Co. Ltd. Class A 7,769 47,723 0.00China Dili Group 250,000 47,458 0.00China Eastern Airlines Corp. Ltd.
Class A 81,900 46,645 0.00Yunnan Energy New Material
Co. Ltd. Class A 1,900 46,618 0.00China Feihe Ltd. 61,000 46,443 0.00ZTE Corp. Class A 15,900 46,393 0.00Shanghai RAAS Blood Products
Co. Ltd. Class A 70,900 46,209 0.00Shanghai Pudong Development
Bank Co. Ltd. Class A 47,600 46,161 0.00China Minsheng Banking Corp.
Ltd. Class A 103,400 46,136 0.00China Oilfield Services Ltd.
Class A 30,200 45,574 0.00Guangzhou Baiyunshan
Pharmaceutical Holdings Co.Ltd. Class H 22,000 45,560 0.00
Sunac China Holdings Ltd.1 97,667 45,409 0.00TravelSky Technology Ltd.
Class H 37,000 44,697 0.00Shandong Weigao Group
Medical Polymer Co. Ltd.Class H 52,000 44,500 0.00
Holding
MarketValue
(£)
% ofTotal Net
Assets
JOYY Inc. ADR 1,381 43,558 0.00JA Solar Technology Co. Ltd. 4,400 43,324 0.00Jiangxi Copper Co. Ltd. Class H 34,000 43,143 0.00Guosen Securities Co. Ltd.
Class A 36,300 42,577 0.00Zai Lab Ltd. ADR 1,341 42,361 0.00Yantai Changyu Pioneer Wine
Co. Ltd. Class A 13,200 42,298 0.00Shaanxi Coal Industry Co. Ltd.
Class A 20,100 41,804 0.00China Coal Energy Co. Ltd.
Class A 36,700 41,715 0.00Guoyuan Securities Co. Ltd.
Class A 56,800 41,484 0.00New Horizon Health Ltd. 24,000 41,272 0.00TBEA Co. Ltd. 17,600 41,244 0.00Tongcheng-Elong Holdings Ltd. 28,800 41,223 0.00Huatai Securities Co. Ltd.
Class A 25,400 40,972 0.00Guotai Junan Securities Co. Ltd.
Class H 39,600 40,843 0.00CITIC Securities Co. Ltd. Class A 17,015 40,511 0.00NAURA Technology Group Co.
Ltd. Class A 1,400 40,460 0.00China Minsheng Banking Corp.
Ltd. Class H 133,200 40,295 0.00Shenzhen International Holdings
Ltd. 47,000 40,173 0.00GRG Banking Equipment Co.
Ltd. Class A 38,800 40,114 0.00Grand Pharmaceutical Group
Ltd. 81,460 40,024 0.00SAIC Motor Corp. Ltd. Class A 20,700 39,898 0.00Daqo New Energy Corp. ADR 1,205 39,821 0.00Huaxi Securities Co. Ltd. Class A 47,100 39,753 0.00Jinke Smart Services Group Co.
Ltd. 15,100 39,701 0.00Yankuang Energy Group Co. Ltd.
Class A 9,400 39,464 0.00Central China Securities Co. Ltd.
Class A 82,000 39,265 0.00Chinasoft International Ltd. 60,000 39,225 0.00Yangzijiang Shipbuilding
Holdings Ltd. 74,700 39,209 0.00Hua Hong Semiconductor Ltd. 12,394 39,192 0.00Tsingtao Brewery Co. Ltd.
Class H 6,000 39,164 0.00Nine Dragons Paper Holdings
Ltd. 55,000 38,915 0.00Foxconn Industrial Internet Co.
Ltd. Class A 33,800 38,909 0.00China Medical System Holdings
Ltd. 34,000 38,864 0.00FinVolution Group ADR 12,845 38,571 0.00Shanghai Lingang Holdings Corp
Ltd. Class A 25,000 38,513 0.00China Datang Corp Renewable
Power Co. Ltd. 125,000 38,195 0.00China CITIC Bank Corp. Ltd.
Class H 93,000 37,763 0.00Jiangsu Jiangyin Rural
Commercial Bank Co. Ltd.Class A 78,200 37,540 0.00
China Northern Rare EarthGroup High-Tech Co. Ltd.Class A 9,700 37,146 0.00
Shanghai Lujiazui Finance &Trade Zone Development Co.Ltd. Class B 50,880 37,000 0.00
Bosideng International HoldingsLtd. 92,000 36,890 0.00
Wingtech Technology Co. Ltd.Class A 4,600 36,583 0.00
Shandong Gold Mining Co. Ltd.Class A 15,666 36,295 0.00
JinkoSolar Holding Co. Ltd. ADR 885 36,112 0.00Orient Securities Co. Ltd.
Class H 74,000 35,983 0.00
Vanguard FTSE Global All Cap Index Fund
129

Holding
MarketValue
(£)
% ofTotal Net
Assets
Golden Solar New EnergyTechnology Holdings Ltd. 46,000 35,910 0.00
Bank of Beijing Co. Ltd. Class A 64,600 35,698 0.00Alibaba Pictures Group Ltd. 520,000 35,367 0.00Huaxia Bank Co. Ltd. Class A 53,400 35,191 0.00Angang Steel Co. Ltd. Class A 83,500 35,036 0.00RLX Technology Inc. ADR 21,393 34,249 0.00Weimob Inc. 70,000 34,038 0.00Maanshan Iron & Steel Co. Ltd. 108,000 33,987 0.00SG Micro Corp. 1,000 33,857 0.00Northeast Securities Co. Ltd. 42,500 33,712 0.00Livzon Pharmaceutical
Group Inc. Class A 8,300 33,411 0.00CIFI Holdings Group Co. Ltd. 86,100 33,388 0.00Zhangzhou Pientzehuang
Pharmaceutical Co. Ltd.Class A 900 33,317 0.00
China Lesso Group HoldingsLtd. 33,000 33,265 0.00
China Conch EnvironmentProtection Holdings Ltd. 48,000 32,744 0.00
360 DigiTech Inc. ADR 2,846 32,688 0.00Fuyao Glass Industry Group Co.
Ltd. Class A 7,600 32,670 0.00Evergrande Property Services
Group Ltd.1 139,000 32,454 0.00BOE Technology Group Co. Ltd.
Class B 84,500 31,996 0.00Chongqing Zhifei Biological
Products Co. Ltd. Class A 2,800 31,992 0.00Shanxi Securities Co. Ltd.
Class A 52,800 31,986 0.00Dongyue Group Ltd. 33,000 31,590 0.00Bank of Nanjing Co. Ltd. Class A 22,400 31,393 0.00China Literature Ltd. 9,200 31,380 0.00Inner Mongolia BaoTou Steel
Union Co. Ltd. 137,600 31,280 0.00China Taiping Insurance
Holdings Co. Ltd. 34,000 31,236 0.00Ganfeng Lithium Co. Ltd.
Class H 3,200 31,104 0.00Will Semiconductor Co. Ltd.
Class A 1,700 30,931 0.00COSCO SHIPPING Ports Ltd. 54,000 30,698 0.00Sinopec Oilfield Service Corp.
Class H 530,000 30,667 0.00Anhui Expressway Co. Ltd.
Class A 35,100 30,644 0.00Shanghai Baosight Software Co.
Ltd. Class B 10,426 30,618 0.00Western Securities Co. Ltd.
Class A 40,200 30,332 0.00Xtep International Holdings Ltd. 25,500 30,028 0.00360 Security Technology Inc.
Class A 30,200 29,871 0.00China Molybdenum Co. Ltd.
Class A 52,600 29,766 0.00Shenzhen Transsion Holdings
Co. Ltd. Class A 2,908 29,748 0.00Haitian International Holdings
Ltd. 15,000 29,632 0.00China Railway Group Ltd.
Class H 53,000 29,591 0.00Weibo Corp. ADR 1,606 29,587 0.00Skyworth Group Ltd. 69,792 29,544 0.00Shaanxi International Trust Co.
Ltd. Class A 83,000 29,406 0.00Zheshang Securities Co. Ltd.
Class A 26,300 29,289 0.00Advanced Micro-Fabrication
Equipment Inc China 2,303 29,240 0.00Hansoh Pharmaceutical Group
Co. Ltd. 22,000 29,078 0.00Everbright Securities Co. Ltd.
Class A 21,000 28,872 0.00Jiangsu Expressway Co. Ltd.
Class A 29,100 28,678 0.00
Holding
MarketValue
(£)
% ofTotal Net
Assets
Jiumaojiu International HoldingsLtd. 16,000 28,554 0.00
Joinn Laboratories China Co.Ltd. 4,800 28,432 0.00
Montage Technology Co. Ltd. 4,018 28,204 0.00Hygeia Healthcare Holdings Co.
Ltd. 7,154 28,069 0.00Lao Feng Xiang Co. Ltd. Class A 5,800 27,359 0.00Shenzhen Zhongjin Lingnan
Nonfemet Co. Ltd. Class A 53,900 27,243 0.00Eve Energy Co. Ltd. Class A 3,410 27,160 0.00China Suntien Green Energy
Corp. Ltd. Class H 60,000 27,104 0.00Huafa Industrial Co. Ltd. Zhuhai
Class A 29,300 26,997 0.00Lao Feng Xiang Co. Ltd. Class B 10,500 26,846 0.00COSCO SHIPPING Holdings Co.
Ltd. Class A 15,340 26,766 0.00Hangzhou Tigermed Consulting
Co. Ltd. Class H 3,400 26,697 0.00Topsports International Holdings
Ltd. 43,000 26,409 0.00China Meidong Auto Holdings
Ltd. 10,000 26,394 0.00Differ Group Holding Co. Ltd. 126,000 26,221 0.00Shenzhen Inovance Technology
Co. Ltd. Class A 3,750 26,159 0.00Sunflower Pharmaceutical Group
Co. Ltd. Class A 11,500 25,865 0.00Shanghai Putailai New Energy
Technology Co. Ltd. Class A 1,800 25,842 0.00Shandong Chenming Paper
Holdings Ltd. Class A 40,000 25,538 0.00Xinjiang Goldwind Science &
Technology Co. Ltd. Class A 18,700 25,506 0.00Haier Smart Home Co. Ltd.
Class A 8,100 25,368 0.00TAL Education Group Class A
ADR 9,154 24,644 0.00Zhejiang NHU Co. Ltd. Class A 7,560 24,472 0.00Seazen Holdings Co. Ltd. 7,300 24,469 0.00Tianjin Capital Environmental
Protection Group Co. Ltd.Class A 30,400 24,372 0.00
SDIC Power Holdings Co. Ltd. 20,700 24,229 0.00AECC Aviation Power Co. Ltd.
Class A 5,300 24,212 0.00Kingboard Laminates Holdings
Ltd. 19,500 24,111 0.00Guangzhou R&F Properties Co.
Ltd. Class H 80,400 23,996 0.00China New Higher Education
Group Ltd. 84,000 23,791 0.00BYD Electronic International Co.
Ltd. 14,500 23,640 0.00Yangzijiang Financial Holding
Ltd. 74,700 23,482 0.00Gotion High-tech Co. Ltd. 7,200 23,324 0.00NetDragon Websoft Holdings
Ltd. 14,500 23,316 0.00Shanghai Jinqiao Export
Processing ZoneDevelopment Co. Ltd. Class A 12,400 23,121 0.00
Sany Heavy Industry Co. Ltd.Class A 11,400 22,745 0.00
Baoshan Iron and Steel Co. Ltd.Class A 29,100 22,731 0.00
China CSSC Holdings Ltd. 12,000 22,709 0.00Weifu High-Technology Group
Co. Ltd. Class B 13,900 22,704 0.00Yihai International Holding Ltd. 10,000 22,638 0.00Yonyou Network Technology Co.
Ltd. Class A 9,700 22,438 0.00Autohome Inc. ADR 969 22,413 0.00New Oriental Education &
Technology Group Inc. ADR 2,230 22,220 0.00CRRC Corp. Ltd. Class A 35,800 21,818 0.00Yadea Group Holdings Ltd. 18,000 21,817 0.00
Vanguard FTSE Global All Cap Index Fund
130

Holding
MarketValue
(£)
% ofTotal Net
Assets
Vatti Corp Ltd. 35,700 21,800 0.00Hengli Petrochemical Co. Ltd.
Class A 8,600 21,776 0.00Shenwan Hongyuan Group Co.
Ltd. Class H 129,600 21,708 0.00Hangzhou Tigermed Consulting
Co. Ltd. Class A 2,000 21,654 0.003SBio Inc. 38,500 21,652 0.00Air China Ltd. Class H 40,000 21,643 0.00Iflytek Co. Ltd. Class A 4,800 21,469 0.00Huangshan Tourism
Development Co. Ltd. Class B 36,900 21,338 0.00Anhui Gujing Distillery Co. Ltd.
Class A 900 21,276 0.00China Oriental Group Co. Ltd. 102,000 21,227 0.00Pharmaron Beijing Co. Ltd.
Class A 1,400 21,195 0.00Hexing Electrical Co. Ltd.
Class A 15,200 20,935 0.00AviChina Industry & Technology
Co. Ltd. Class H 48,000 20,904 0.00Henan Shuanghui Investment &
Development Co. Ltd. Class A 5,800 20,865 0.00Tong Ren Tang Technologies Co.
Ltd. Class H 34,000 20,847 0.00Greentown Service Group Co.
Ltd. 26,000 20,798 0.00Canadian Solar Inc. 944 20,669 0.00Sungrow Power Supply Co. Ltd.
Class A 2,700 20,634 0.00CGN New Energy Holdings Co.
Ltd. 58,000 20,431 0.00Shanghai Bailian Group Co. Ltd.
Class B 32,800 20,378 0.00Dongfang Electric Corp. Ltd.
Class H 23,400 20,357 0.00Hopson Development Holdings
Ltd. 13,200 20,287 0.00Metallurgical Corp. of China Ltd.
Class H 98,000 20,195 0.00InnoCare Pharma Ltd. 18,000 20,100 0.00COSCO SHIPPING
Development Co. Ltd. Class H 127,000 19,983 0.00Orient Group Inc. Class A 61,900 19,910 0.00Chongqing Brewery Co. Ltd. 1,300 19,720 0.00iQIYI Inc. ADR 6,935 19,609 0.00Yunnan Baiyao Group Co. Ltd.
Class A 2,100 19,367 0.00Sinotrans Ltd. Class H 79,000 19,247 0.00Ming Yuan Cloud Group Holdings
Ltd. 18,000 19,077 0.00Shanxi Taigang Stainless Steel
Co. Ltd. Class A 25,800 18,562 0.00Yidu Tech Inc. 21,900 18,474 0.00Hisense Home Appliances
Group Co. Ltd. Class A 12,900 18,391 0.00Zhejiang Jingsheng Mechanical
& Electrical Co. Ltd. 3,000 18,330 0.00Guangzhou Tinci Materials
Technology Co. Ltd. 2,000 18,119 0.00Weichai Power Co. Ltd. Class H 16,000 17,996 0.00Bank of Hangzhou Co. Ltd.
Class A 9,700 17,910 0.00Lens Technology Co. Ltd.
Class A 14,500 17,814 0.00Jiangsu Eastern Shenghong Co.
Ltd. 12,000 17,775 0.00Chengxin Lithium Group Co. Ltd. 3,300 17,713 0.00Huadian Power International
Corp. Ltd. Class H 64,000 17,672 0.00Chongqing Zaisheng Technology
Corp Ltd. 26,040 17,633 0.00Jilin Aodong Pharmaceutical
Group Co. Ltd. Class A 10,000 17,545 0.00Shanghai Industrial Holdings Ltd. 15,000 17,542 0.00Yuexiu Real Estate Investment
Trust 54,800 17,412 0.00Jinxin Fertility Group Ltd. 34,000 17,292 0.00
Holding
MarketValue
(£)
% ofTotal Net
Assets
Xinyi Energy Holdings Ltd. 40,000 17,257 0.00China United Network
Communications Ltd. Class A 40,100 17,068 0.00Qingdao Port International Co.
Ltd. Class A 26,000 16,883 0.00Walvax Biotechnology Co. Ltd.
Class A 2,600 16,801 0.00Shanghai International Airport
Co. Ltd. Class A 2,800 16,722 0.00PAX Global Technology Ltd. 24,000 16,616 0.00Seazen Group Ltd. 48,777 16,588 0.00Zhejiang Runtu Co. Ltd. Class A 17,600 16,579 0.00Yunnan Aluminium Co. Ltd.
Class A 13,000 16,505 0.00Huadong Medicine Co. Ltd. 4,000 16,489 0.00Wuxi Shangji Automation Co.
Ltd. 1,100 16,306 0.00Zoomlion Heavy Industry
Science and Technology Co.Ltd. Class A 22,900 16,033 0.00
Kintor Pharmaceutical Ltd. 7,000 16,024 0.00Guangxi Liugong Machinery Co.
Ltd. Class A 21,500 15,911 0.00Hangzhou Steam Turbine Co.
Ltd. Class B 11,600 15,838 0.00Power Construction Corp of
China Ltd. 16,900 15,837 0.00Shandong Chenming Paper
Holdings Ltd. Class B 55,100 15,829 0.00China Molybdenum Co. Ltd.
Class H 39,000 15,717 0.00Sihuan Pharmaceutical Holdings
Group Ltd. 122,000 15,605 0.00Topchoice Medical Corp. 1,000 15,519 0.00Unigroup Guoxin
Microelectronics Co. Ltd.Class A 700 15,489 0.00
Shanghai Fosun PharmaceuticalGroup Co. Ltd. Class H 4,500 15,463 0.00
COFCO Joycome Foods Ltd. 47,000 15,411 0.00Shandong Hualu Hengsheng
Chemical Co. Ltd. Class A 4,200 15,337 0.00Pharmaron Beijing Co. Ltd.
Class H 1,500 15,197 0.00Sany Heavy Equipment
International Holdings Co. Ltd. 20,000 15,166 0.00Akeso Inc. 10,000 15,166 0.00Yihai Kerry Arawana Holdings
Co. Ltd. 2,600 15,091 0.00Ping An Healthcare and
Technology Co. Ltd. 7,520 15,039 0.00Canaan Inc. ADR 4,972 15,009 0.00Everbright Securities Co. Ltd.
Class H 30,200 14,930 0.00Zhejiang Huayou Cobalt Co. Ltd.
Class A 1,500 14,929 0.00GoerTek Inc. Class A 3,500 14,834 0.00Shenzhen Expressway Co. Ltd.
Class H 18,000 14,782 0.00Vnet Group Inc. ADR 3,074 14,617 0.00Tongdao Liepin Group 10,000 14,598 0.00China National Accord
Medicines Corp. Ltd. Class A 4,200 14,560 0.00China International Marine
Containers Group Co. Ltd.Class A 9,600 14,510 0.00
Hoshine Silicon Industry Co. Ltd. 1,500 14,407 0.00Ecovacs Robotics Co. Ltd. 1,100 14,376 0.00Lomon Billions Group Co. Ltd. 6,500 14,375 0.00Blue Moon Group Holdings Ltd. 23,000 14,336 0.00Shanghai Electric Group Co. Ltd.
Class H 74,000 14,273 0.00Jiangsu Zhongtian Technology
Co. Ltd. Class A 7,200 14,226 0.00Zhuguang Holdings Group Co.
Ltd. 98,000 14,226 0.00Guangdong Haid Group Co. Ltd.
Class A 1,900 14,166 0.00
Vanguard FTSE Global All Cap Index Fund
131
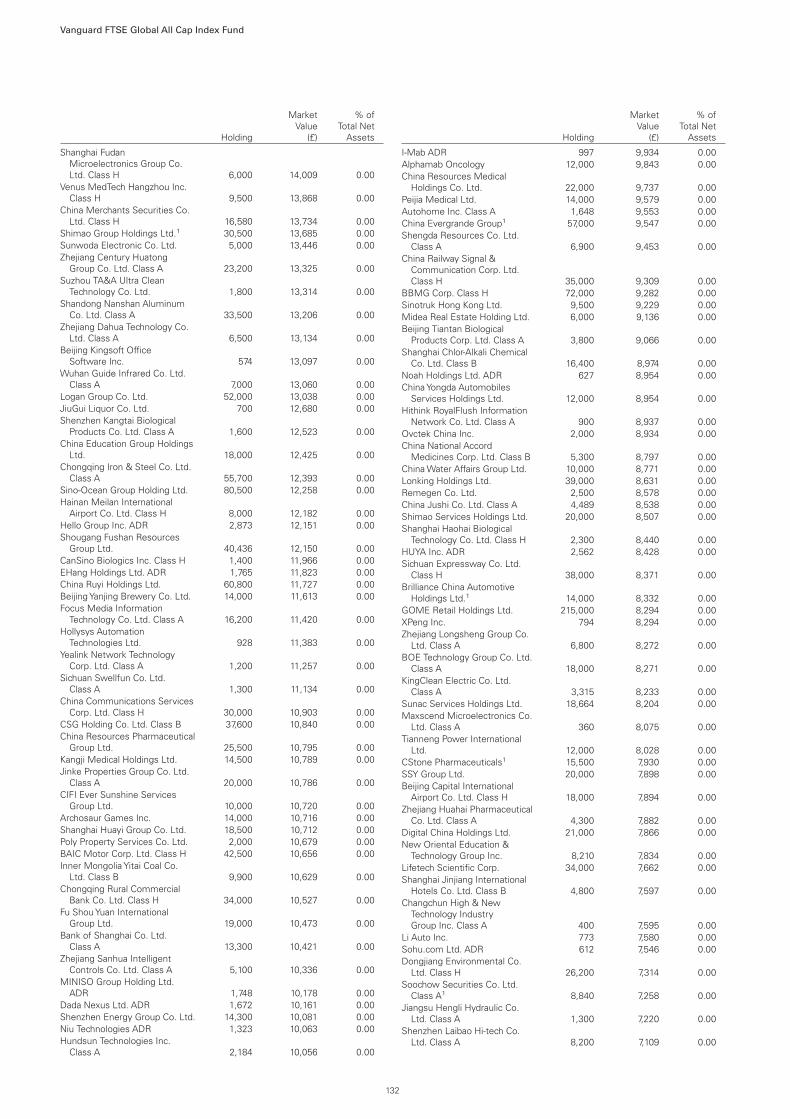
Holding
MarketValue
(£)
% ofTotal Net
Assets
Shanghai FudanMicroelectronics Group Co.Ltd. Class H 6,000 14,009 0.00
Venus MedTech Hangzhou Inc.Class H 9,500 13,868 0.00
China Merchants Securities Co.Ltd. Class H 16,580 13,734 0.00
Shimao Group Holdings Ltd.1 30,500 13,685 0.00Sunwoda Electronic Co. Ltd. 5,000 13,446 0.00Zhejiang Century Huatong
Group Co. Ltd. Class A 23,200 13,325 0.00Suzhou TA&A Ultra Clean
Technology Co. Ltd. 1,800 13,314 0.00Shandong Nanshan Aluminum
Co. Ltd. Class A 33,500 13,206 0.00Zhejiang Dahua Technology Co.
Ltd. Class A 6,500 13,134 0.00Beijing Kingsoft Office
Software Inc. 574 13,097 0.00Wuhan Guide Infrared Co. Ltd.
Class A 7,000 13,060 0.00Logan Group Co. Ltd. 52,000 13,038 0.00JiuGui Liquor Co. Ltd. 700 12,680 0.00Shenzhen Kangtai Biological
Products Co. Ltd. Class A 1,600 12,523 0.00China Education Group Holdings
Ltd. 18,000 12,425 0.00Chongqing Iron & Steel Co. Ltd.
Class A 55,700 12,393 0.00Sino-Ocean Group Holding Ltd. 80,500 12,258 0.00Hainan Meilan International
Airport Co. Ltd. Class H 8,000 12,182 0.00Hello Group Inc. ADR 2,873 12,151 0.00Shougang Fushan Resources
Group Ltd. 40,436 12,150 0.00CanSino Biologics Inc. Class H 1,400 11,966 0.00EHang Holdings Ltd. ADR 1,765 11,823 0.00China Ruyi Holdings Ltd. 60,800 11,727 0.00Beijing Yanjing Brewery Co. Ltd. 14,000 11,613 0.00Focus Media Information
Technology Co. Ltd. Class A 16,200 11,420 0.00Hollysys Automation
Technologies Ltd. 928 11,383 0.00Yealink Network Technology
Corp. Ltd. Class A 1,200 11,257 0.00Sichuan Swellfun Co. Ltd.
Class A 1,300 11,134 0.00China Communications Services
Corp. Ltd. Class H 30,000 10,903 0.00CSG Holding Co. Ltd. Class B 37,600 10,840 0.00China Resources Pharmaceutical
Group Ltd. 25,500 10,795 0.00Kangji Medical Holdings Ltd. 14,500 10,789 0.00Jinke Properties Group Co. Ltd.
Class A 20,000 10,786 0.00CIFI Ever Sunshine Services
Group Ltd. 10,000 10,720 0.00Archosaur Games Inc. 14,000 10,716 0.00Shanghai Huayi Group Co. Ltd. 18,500 10,712 0.00Poly Property Services Co. Ltd. 2,000 10,679 0.00BAIC Motor Corp. Ltd. Class H 42,500 10,656 0.00Inner Mongolia Yitai Coal Co.
Ltd. Class B 9,900 10,629 0.00Chongqing Rural Commercial
Bank Co. Ltd. Class H 34,000 10,527 0.00Fu Shou Yuan International
Group Ltd. 19,000 10,473 0.00Bank of Shanghai Co. Ltd.
Class A 13,300 10,421 0.00Zhejiang Sanhua Intelligent
Controls Co. Ltd. Class A 5,100 10,336 0.00MINISO Group Holding Ltd.
ADR 1,748 10,178 0.00Dada Nexus Ltd. ADR 1,672 10,161 0.00Shenzhen Energy Group Co. Ltd. 14,300 10,081 0.00Niu Technologies ADR 1,323 10,063 0.00Hundsun Technologies Inc.
Class A 2,184 10,056 0.00
Holding
MarketValue
(£)
% ofTotal Net
Assets
I-Mab ADR 997 9,934 0.00Alphamab Oncology 12,000 9,843 0.00China Resources Medical
Holdings Co. Ltd. 22,000 9,737 0.00Peijia Medical Ltd. 14,000 9,579 0.00Autohome Inc. Class A 1,648 9,553 0.00China Evergrande Group1 57,000 9,547 0.00Shengda Resources Co. Ltd.
Class A 6,900 9,453 0.00China Railway Signal &
Communication Corp. Ltd.Class H 35,000 9,309 0.00
BBMG Corp. Class H 72,000 9,282 0.00Sinotruk Hong Kong Ltd. 9,500 9,229 0.00Midea Real Estate Holding Ltd. 6,000 9,136 0.00Beijing Tiantan Biological
Products Corp. Ltd. Class A 3,800 9,066 0.00Shanghai Chlor-Alkali Chemical
Co. Ltd. Class B 16,400 8,974 0.00Noah Holdings Ltd. ADR 627 8,954 0.00China Yongda Automobiles
Services Holdings Ltd. 12,000 8,954 0.00Hithink RoyalFlush Information
Network Co. Ltd. Class A 900 8,937 0.00Ovctek China Inc. 2,000 8,934 0.00China National Accord
Medicines Corp. Ltd. Class B 5,300 8,797 0.00China Water Affairs Group Ltd. 10,000 8,771 0.00Lonking Holdings Ltd. 39,000 8,631 0.00Remegen Co. Ltd. 2,500 8,578 0.00China Jushi Co. Ltd. Class A 4,489 8,538 0.00Shimao Services Holdings Ltd. 20,000 8,507 0.00Shanghai Haohai Biological
Technology Co. Ltd. Class H 2,300 8,440 0.00HUYA Inc. ADR 2,562 8,428 0.00Sichuan Expressway Co. Ltd.
Class H 38,000 8,371 0.00Brilliance China Automotive
Holdings Ltd.1 14,000 8,332 0.00GOME Retail Holdings Ltd. 215,000 8,294 0.00XPeng Inc. 794 8,294 0.00Zhejiang Longsheng Group Co.
Ltd. Class A 6,800 8,272 0.00BOE Technology Group Co. Ltd.
Class A 18,000 8,271 0.00KingClean Electric Co. Ltd.
Class A 3,315 8,233 0.00Sunac Services Holdings Ltd. 18,664 8,204 0.00Maxscend Microelectronics Co.
Ltd. Class A 360 8,075 0.00Tianneng Power International
Ltd. 12,000 8,028 0.00CStone Pharmaceuticals1 15,500 7,930 0.00SSY Group Ltd. 20,000 7,898 0.00Beijing Capital International
Airport Co. Ltd. Class H 18,000 7,894 0.00Zhejiang Huahai Pharmaceutical
Co. Ltd. Class A 4,300 7,882 0.00Digital China Holdings Ltd. 21,000 7,866 0.00New Oriental Education &
Technology Group Inc. 8,210 7,834 0.00Lifetech Scientific Corp. 34,000 7,662 0.00Shanghai Jinjiang International
Hotels Co. Ltd. Class B 4,800 7,597 0.00Changchun High & New
Technology IndustryGroup Inc. Class A 400 7,595 0.00
Li Auto Inc. 773 7,580 0.00Sohu.com Ltd. ADR 612 7,546 0.00Dongjiang Environmental Co.
Ltd. Class H 26,200 7,314 0.00Soochow Securities Co. Ltd.
Class A1 8,840 7,258 0.00Jiangsu Hengli Hydraulic Co.
Ltd. Class A 1,300 7,220 0.00Shenzhen Laibao Hi-tech Co.
Ltd. Class A 8,200 7,109 0.00
Vanguard FTSE Global All Cap Index Fund
132

Holding
MarketValue
(£)
% ofTotal Net
Assets
Inner Mongolia JunzhengEnergy & Chemical IndustryGroup Co. Ltd. Class A 13,400 7,065 0.00
Metallurgical Corp. of China Ltd.Class A 16,700 7,048 0.00
Agile Group Holdings Ltd. 18,000 6,907 0.00Tongling Nonferrous Metals
Group Co. Ltd. Class A 16,360 6,904 0.00Huayu Automotive Systems Co.
Ltd. Class A 2,900 6,873 0.00XD Inc. 3,200 6,838 0.00TCL Technology Group Corp.
Class A 13,500 6,807 0.00Shenzhen Sunway
Communication Co. Ltd.Class A 3,700 6,563 0.00
Legend Holdings Corp. Class H 6,900 6,535 0.00Zhaojin Mining Industry Co. Ltd.
Class H 8,500 6,454 0.00Suning.com Co. Ltd. Class A 16,500 6,444 0.00XCMG Construction Machinery
Co. Ltd. Class A 10,700 6,404 0.00Jiangsu Expressway Co. Ltd.
Class H 8,000 6,270 0.00Fire Rock Holdings Ltd.1 110,000 6,253 0.00LexinFintech Holdings Ltd.
Class A ADR 3,065 6,250 0.00China Reinsurance Group Corp.
Class H 88,000 6,164 0.00China Everbright Ltd. 8,000 6,131 0.00Zhenro Properties Group Ltd. 99,000 6,130 0.00China Overseas Grand Oceans
Group Ltd. 13,000 6,084 0.00Mango Excellent Media Co. Ltd.
Class A 1,400 6,059 0.00DouYu International Holdings
Ltd. ADR 4,268 6,051 0.00Kingsoft Cloud Holdings Ltd.
ADR 2,108 6,044 0.00Central China Securities Co. Ltd.
Class H 47,000 6,012 0.00Jiangsu Nhwa Pharmaceutical
Co. Ltd. 4,000 5,993 0.00Gemdale Properties &
Investment Corp. Ltd. 70,000 5,898 0.00Yeahka Ltd. 2,800 5,898 0.00Gemdale Corp. Class A 3,400 5,867 0.00China Resources Sanjiu Medical
& Pharmaceutical Co. Ltd.Class A 1,300 5,796 0.00
SPIC Dongfang New EnergyCorp. Class A 10,900 5,733 0.00
CanSino Biologics Inc. Class A 308 5,661 0.00Zhou Hei Ya International
Holdings Co. Ltd. 13,500 5,564 0.00Shanghai Haixin Group Co.
Class B 22,000 5,257 0.00Henan Yuguang Gold & Lead Co.
Ltd. Class A 9,200 5,229 0.00Sun Art Retail Group Ltd. 21,000 5,223 0.00KWG Group Holdings Ltd. 18,000 5,208 0.00China SCE Group Holdings Ltd. 36,000 5,189 0.00Youdao Inc. ADR 873 4,972 0.00Shanghai Mechanical and
Electrical Industry Co. Ltd.Class B 5,600 4,960 0.00
Genetron Holdings Ltd. ADR 3,618 4,957 0.00A-Living Services Co. Ltd.
Class H 3,750 4,766 0.00Shoucheng Holdings Ltd. 42,000 4,519 0.00Shenzhen Yan Tian Port Holding
Co. Ltd. Class A 7,800 4,471 0.00Tiangong International Co. Ltd. 16,000 4,239 0.00China Galaxy Securities Co. Ltd.
Class A 3,700 4,152 0.00Gaotu Techedu Inc. ADR 3,255 4,148 0.00
Holding
MarketValue
(£)
% ofTotal Net
Assets
Shanghai Jinqiao ExportProcessing ZoneDevelopment Co. Ltd. Class B 5,400 4,133 0.00
Yuexiu Transport InfrastructureLtd. 8,000 4,077 0.00
China Shineway PharmaceuticalGroup Ltd. 6,000 3,874 0.00
Times China Holdings Ltd. 13,000 3,682 0.00Cathay Media And Education
Group Inc. 28,000 3,638 0.00Industrial Securities Co. Ltd.
Class A 4,500 3,537 0.00OneConnect Financial
Technology Co. Ltd. ADR 3,213 3,532 0.00Dongxing Securities Co. Ltd.
Class A 3,500 3,479 0.00ZTO Express Cayman Inc.
(USD)1 154 3,427 0.00Hualan Biological
Engineering Inc. Class A 1,690 3,411 0.00Lingyi iTech Guangdong Co.
Class A 6,500 3,364 0.00Lepu Medical Technology Beijing
Co. Ltd. Class A 1,600 3,301 0.00Shengyi Technology Co. Ltd.
Class A 1,600 3,225 0.00Shenzhen Investment Ltd. 18,000 3,088 0.00DHC Software Co. Ltd. Class A 4,300 3,026 0.00SOHO China Ltd. 20,500 2,997 0.00Inspur Electronic Information
Industry Co. Ltd. Class A 1,000 2,981 0.00New Hope Liuhe Co. Ltd.
Class A 1,700 2,884 0.00Da An Gene Co. Ltd. of Sun Yat-
Sen University Class A 1,286 2,796 0.00Viva Biotech Holdings 11,000 2,780 0.00KWG Living Group Holdings Ltd. 9,000 2,723 0.00Health & Happiness H&H
International Holdings Ltd. 3,000 2,650 0.00Ascentage Pharma Group
International 1,900 2,596 0.00China Yuhua Education Corp.
Ltd. 18,000 2,522 0.00Yonghui Superstores Co. Ltd.
Class A 4,700 2,518 0.00Winning Health Technology
Group Co. Ltd. Class A 2,600 2,499 0.00China East Education Holdings
Ltd. 6,000 2,467 0.00YiChang HEC ChangJiang
Pharmaceutical Co. Ltd.Class H 4,800 2,461 0.00
Southwest Securities Co. Ltd.Class A 5,100 2,300 0.00
Sinopec Engineering Group Co.Ltd. Class H 5,500 2,267 0.00
China BlueChemical Ltd. Class H 8,000 2,193 0.00Hope Education Group Co. Ltd. 44,000 2,166 0.00Beijing Chunlizhengda Medical
Instruments Co. Ltd. Class H 2,250 2,124 0.00Zhongyu Energy Holdings Ltd. 3,000 2,089 0.00Comba Telecom Systems
Holdings Ltd. 14,000 1,890 0.00AK Medical Holdings Ltd. 4,000 1,738 0.00COSCO SHIPPING Energy
Transportation Co. Ltd.Class H 4,000 1,681 0.00
Jinmao Property Services Co.Ltd. 2,809 1,668 0.00
Beijing Thunisoft Corp. Ltd.Class A 2,000 1,654 0.00
China Aoyuan Group Ltd.1 13,000 1,557 0.00Guangdong Electric Power
Development Co. Ltd. Class B 7,100 1,463 0.00Yatsen Holding Ltd. ADR 2,398 1,188 0.00Kaisa Group Holdings Ltd.1 13,722 1,170 0.00Yantai Changyu Pioneer Wine
Co. Ltd. Class B 1,000 1,139 0.00
Vanguard FTSE Global All Cap Index Fund
133

Holding
MarketValue
(£)
% ofTotal Net
Assets
Sinopec Kantons Holdings Ltd. 4,000 1,084 0.00Times Neighborhood Holdings
Ltd. 5,000 1,066 0.00Yanlord Land Group Ltd. 1,500 1,056 0.00Tian Lun Gas Holdings Ltd. 2,000 940 0.00China Everbright Bank Co. Ltd.
Class H 3,000 871 0.00Beijing Jingneng Clean Energy
Co. Ltd. Class H 4,000 816 0.00Fufeng Group Ltd. 2,000 802 0.00Poly Property Group Co. Ltd. 4,000 796 0.00Genertec Universal Medical
Group Co. Ltd. 1,500 772 0.00China Harmony Auto Holding
Ltd. 2,000 741 0.00Meitu Inc. 7,500 716 0.00Koolearn Technology Holding
Ltd. 2,000 709 0.00Yuzhou Group Holdings Co. Ltd. 12,642 693 0.00INESA Intelligent Tech Inc.
Class B 1,700 654 0.00Q Technology Group Co. Ltd. 1,000 566 0.00Yangtze Optical Fibre and Cable
Joint Stock Ltd. Co. Class H 500 522 0.00Jiayuan International Group Ltd. 4,000 479 0.00China Zhongwang Holdings
Ltd.1 2,800 478 0.00Berry Genomics Co. Ltd. Class A 300 471 0.00China High Speed Transmission
Equipment Group Co. Ltd. 1,000 442 0.00Greatview Aseptic Packaging
Co. Ltd. 2,000 426 0.00Eastern Communications Co.
Ltd. Class B 1,300 425 0.00Greenland Hong Kong Holdings
Ltd. 2,000 331 0.00Beijing Enterprises Clean Energy
Group Ltd. 40,000 300 0.00Shanghai Industrial Urban
Development Group Ltd. 4,000 276 0.00Guangshen Railway Co. Ltd.
Class H 2,000 266 0.00Ronshine China Holdings Ltd. 1,000 237 0.00Red Star Macalline Group Corp.
Ltd. Class H 712 234 0.00Skyfame Realty Holdings Ltd. 6,000 52 0.00Orient Securities Co. Ltd. Rights
02/05/20221 20,719 — 0.00
59,081,855 3.26
Colombia 0.02% (31 October 2021: 0.02%)
Bancolombia SA 15,279 118,760 0.01Ecopetrol SA 138,753 89,041 0.01Interconexion Electrica SA ESP 11,977 52,183 0.00Bancolombia SA - Preference
Shares 6,432 49,453 0.00Grupo Aval Acciones y Valores
SA - Preference Shares 204,193 34,711 0.00Grupo de Inversiones
Suramericana SA 4,132 33,176 0.00Banco Davivienda SA -
Preference Shares 2,483 16,506 0.00BAC Holding International Corp. 204,193 11,750 0.00Cementos Argos SA 7,497 9,014 0.00
414,594 0.02
Czech Republic 0.02% (31 October 2021: 0.01%)
CEZ AS 4,821 164,315 0.01Komercni Banka AS 3,258 86,231 0.01Moneta Money Bank AS 19,556 58,639 0.00Philip Morris CR AS 6 3,586 0.00
312,771 0.02
Denmark 0.64% (31 October 2021: 0.65%)
Novo Nordisk A/S Class B 51,829 4,771,383 0.26DSV PANALPINA A/S 6,325 835,197 0.05Vestas Wind Systems A/S 32,878 677,175 0.04Orsted A/S 6,128 546,355 0.03
Holding
MarketValue
(£)
% ofTotal Net
Assets
Genmab A/S 1,842 520,792 0.03Coloplast A/S Class B 4,281 464,517 0.03AP Moeller - Maersk A/S Class A 193 439,067 0.03Novozymes A/S Class B 6,232 349,581 0.02Carlsberg AS Class B 3,280 335,821 0.02AP Moeller - Maersk A/S Class B 127 296,379 0.02Chr Hansen Holding A/S 4,067 253,863 0.01Danske Bank A/S 19,411 239,214 0.01Pandora A/S 3,349 238,022 0.01Tryg A/S 9,368 178,674 0.01GN Store Nord A/S 4,551 137,719 0.01Demant A/S 3,405 120,809 0.01Royal Unibrew A/S 1,731 120,172 0.01Jyske Bank A/S 2,231 99,719 0.01ALK-Abello A/S 5,340 93,465 0.01Ringkjoebing Landbobank A/S 945 93,188 0.01SimCorp A/S 1,302 73,388 0.01Topdanmark A/S 1,484 66,515 0.00Sydbank AS 2,349 64,848 0.00Chemometec A/S 698 63,548 0.00ISS A/S 4,425 58,681 0.00NKT A/S 1,191 45,633 0.00Drilling Co. of 1972 A/S 1,121 44,648 0.00Ambu A/S Class B 4,126 43,726 0.00Alm Brand A/S 30,135 41,699 0.00Spar Nord Bank A/S 3,833 39,010 0.00FLSmidth & Co. A/S 1,738 38,488 0.00Rockwool A/S Class B 160 35,911 0.00D/S Norden A/S 1,132 33,680 0.00Netcompany Group A/S 704 31,507 0.00H Lundbeck A/S 1,674 30,765 0.00NeuroSearch A/S 618 26,946 0.00Bavarian Nordic A/S 1,486 22,820 0.00Schouw & Co. A/S 361 21,979 0.00Scandinavian Tobacco Group A/S 1,078 18,034 0.00Dfds A/S 558 17,396 0.00Zealand Pharma A/S 380 3,445 0.00Nilfisk Holding A/S 150 3,362 0.00
11,637,141 0.64
Egypt 0.01% (31 October 2021: 0.01%)
Commercial International BankEgypt SAE 53,340 99,951 0.01
Eastern Co. SAE 61,559 28,931 0.00Egypt Kuwait Holding Co. SAE
(USD) 17,931 18,153 0.00Egyptian Financial Group-
Hermes Holding Co. 17,780 13,005 0.00Egypt Kuwait Holding Co. SAE
(EGP) 13,810 12,945 0.00Talaat Moustafa Group 1,572 586 0.00ElSewedy Electric Co. 890 295 0.00
173,866 0.01
Finland 0.33% (31 October 2021: 0.36%)
Nordea Bank Abp 119,940 964,274 0.05Nokia Oyj (OMXH) 189,356 773,348 0.04Sampo Oyj Class A 16,365 640,654 0.04Neste Oyj 14,009 486,152 0.03UPM-Kymmene Oyj 17,234 478,455 0.03Kone Oyj Class B 12,328 477,332 0.03Stora Enso Oyj Class R 17,678 281,189 0.02Elisa Oyj 4,348 203,571 0.01Fortum Oyj 12,879 171,741 0.01Kesko Oyj Class B 8,324 169,403 0.01Metso Outotec Oyj 23,987 165,758 0.01Metsa Board Oyj 13,796 118,241 0.01Valmet Oyj 5,372 116,007 0.01Kojamo Oyj 6,813 108,655 0.01Wartsila Oyj Abp 15,692 101,844 0.01Huhtamaki Oyj 3,025 91,886 0.01Orion Oyj Class B 2,843 89,774 0.00Cargotec Oyj Class B 2,117 58,737 0.00TietoEVRY Oyj 2,784 56,049 0.00Nokian Renkaat Oyj 4,291 46,151 0.00Terveystalo Oyj 4,886 43,929 0.00Revenio Group Oyj 1,066 41,257 0.00
Vanguard FTSE Global All Cap Index Fund
134
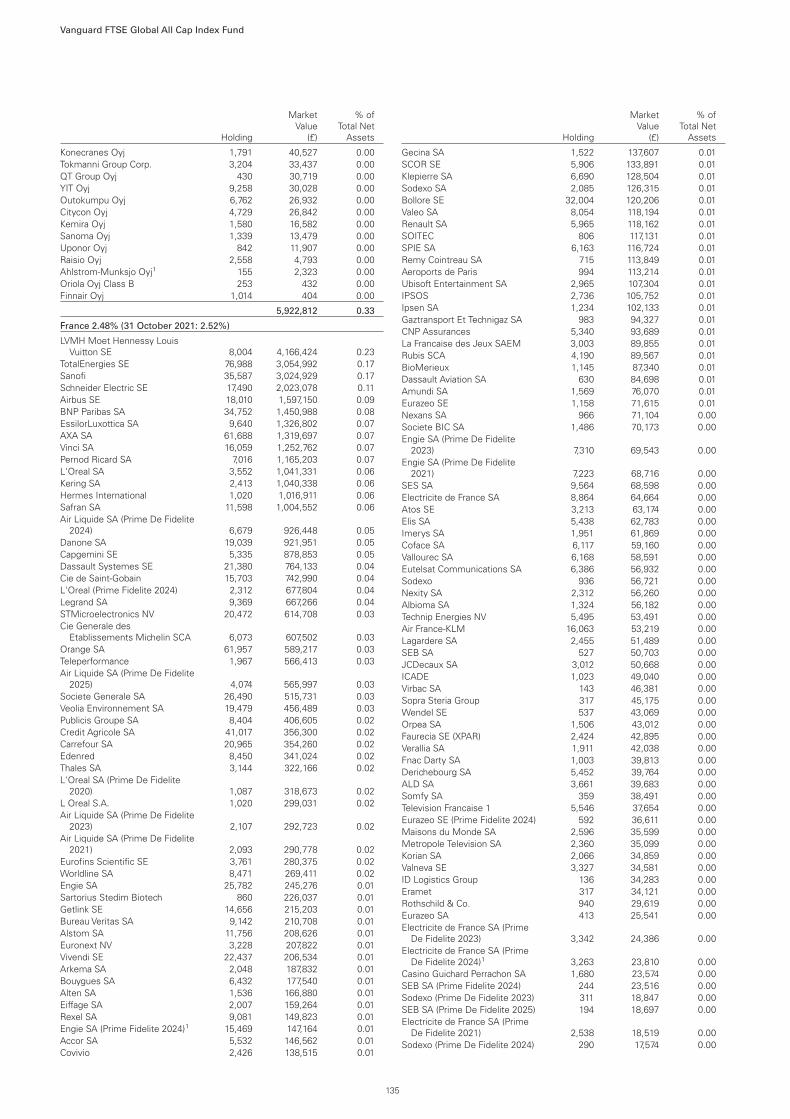
Holding
MarketValue
(£)
% ofTotal Net
Assets
Konecranes Oyj 1,791 40,527 0.00Tokmanni Group Corp. 3,204 33,437 0.00QT Group Oyj 430 30,719 0.00YIT Oyj 9,258 30,028 0.00Outokumpu Oyj 6,762 26,932 0.00Citycon Oyj 4,729 26,842 0.00Kemira Oyj 1,580 16,582 0.00Sanoma Oyj 1,339 13,479 0.00Uponor Oyj 842 11,907 0.00Raisio Oyj 2,558 4,793 0.00Ahlstrom-Munksjo Oyj1 155 2,323 0.00Oriola Oyj Class B 253 432 0.00Finnair Oyj 1,014 404 0.00
5,922,812 0.33
France 2.48% (31 October 2021: 2.52%)
LVMH Moet Hennessy LouisVuitton SE 8,004 4,166,424 0.23
TotalEnergies SE 76,988 3,054,992 0.17Sanofi 35,587 3,024,929 0.17Schneider Electric SE 17,490 2,023,078 0.11Airbus SE 18,010 1,597,150 0.09BNP Paribas SA 34,752 1,450,988 0.08EssilorLuxottica SA 9,640 1,326,802 0.07AXA SA 61,688 1,319,697 0.07Vinci SA 16,059 1,252,762 0.07Pernod Ricard SA 7,016 1,165,203 0.07L'Oreal SA 3,552 1,041,331 0.06Kering SA 2,413 1,040,338 0.06Hermes International 1,020 1,016,911 0.06Safran SA 11,598 1,004,552 0.06Air Liquide SA (Prime De Fidelite
2024) 6,679 926,448 0.05Danone SA 19,039 921,951 0.05Capgemini SE 5,335 878,853 0.05Dassault Systemes SE 21,380 764,133 0.04Cie de Saint-Gobain 15,703 742,990 0.04L'Oreal (Prime Fidelite 2024) 2,312 677,804 0.04Legrand SA 9,369 667,266 0.04STMicroelectronics NV 20,472 614,708 0.03Cie Generale des
Etablissements Michelin SCA 6,073 607,502 0.03Orange SA 61,957 589,217 0.03Teleperformance 1,967 566,413 0.03Air Liquide SA (Prime De Fidelite
2025) 4,074 565,997 0.03Societe Generale SA 26,490 515,731 0.03Veolia Environnement SA 19,479 456,489 0.03Publicis Groupe SA 8,404 406,605 0.02Credit Agricole SA 41,017 356,300 0.02Carrefour SA 20,965 354,260 0.02Edenred 8,450 341,024 0.02Thales SA 3,144 322,166 0.02L'Oreal SA (Prime De Fidelite
2020) 1,087 318,673 0.02L Oreal S.A. 1,020 299,031 0.02Air Liquide SA (Prime De Fidelite
2023) 2,107 292,723 0.02Air Liquide SA (Prime De Fidelite
2021) 2,093 290,778 0.02Eurofins Scientific SE 3,761 280,375 0.02Worldline SA 8,471 269,411 0.02Engie SA 25,782 245,276 0.01Sartorius Stedim Biotech 860 226,037 0.01Getlink SE 14,656 215,203 0.01Bureau Veritas SA 9,142 210,708 0.01Alstom SA 11,756 208,626 0.01Euronext NV 3,228 207,822 0.01Vivendi SE 22,437 206,534 0.01Arkema SA 2,048 187,832 0.01Bouygues SA 6,432 177,540 0.01Alten SA 1,536 166,880 0.01Eiffage SA 2,007 159,264 0.01Rexel SA 9,081 149,823 0.01Engie SA (Prime Fidelite 2024)1 15,469 147,164 0.01Accor SA 5,532 146,562 0.01Covivio 2,426 138,515 0.01
Holding
MarketValue
(£)
% ofTotal Net
Assets
Gecina SA 1,522 137,607 0.01SCOR SE 5,906 133,891 0.01Klepierre SA 6,690 128,504 0.01Sodexo SA 2,085 126,315 0.01Bollore SE 32,004 120,206 0.01Valeo SA 8,054 118,194 0.01Renault SA 5,965 118,162 0.01SOITEC 806 117,131 0.01SPIE SA 6,163 116,724 0.01Remy Cointreau SA 715 113,849 0.01Aeroports de Paris 994 113,214 0.01Ubisoft Entertainment SA 2,965 107,304 0.01IPSOS 2,736 105,752 0.01Ipsen SA 1,234 102,133 0.01Gaztransport Et Technigaz SA 983 94,327 0.01CNP Assurances 5,340 93,689 0.01La Francaise des Jeux SAEM 3,003 89,855 0.01Rubis SCA 4,190 89,567 0.01BioMerieux 1,145 87,340 0.01Dassault Aviation SA 630 84,698 0.01Amundi SA 1,569 76,070 0.01Eurazeo SE 1,158 71,615 0.01Nexans SA 966 71,104 0.00Societe BIC SA 1,486 70,173 0.00Engie SA (Prime De Fidelite
2023) 7,310 69,543 0.00Engie SA (Prime De Fidelite
2021) 7,223 68,716 0.00SES SA 9,564 68,598 0.00Electricite de France SA 8,864 64,664 0.00Atos SE 3,213 63,174 0.00Elis SA 5,438 62,783 0.00Imerys SA 1,951 61,869 0.00Coface SA 6,117 59,160 0.00Vallourec SA 6,168 58,591 0.00Eutelsat Communications SA 6,386 56,932 0.00Sodexo 936 56,721 0.00Nexity SA 2,312 56,260 0.00Albioma SA 1,324 56,182 0.00Technip Energies NV 5,495 53,491 0.00Air France-KLM 16,063 53,219 0.00Lagardere SA 2,455 51,489 0.00SEB SA 527 50,703 0.00JCDecaux SA 3,012 50,668 0.00ICADE 1,023 49,040 0.00Virbac SA 143 46,381 0.00Sopra Steria Group 317 45,175 0.00Wendel SE 537 43,069 0.00Orpea SA 1,506 43,012 0.00Faurecia SE (XPAR) 2,424 42,895 0.00Verallia SA 1,911 42,038 0.00Fnac Darty SA 1,003 39,813 0.00Derichebourg SA 5,452 39,764 0.00ALD SA 3,661 39,683 0.00Somfy SA 359 38,491 0.00Television Francaise 1 5,546 37,654 0.00Eurazeo SE (Prime Fidelite 2024) 592 36,611 0.00Maisons du Monde SA 2,596 35,599 0.00Metropole Television SA 2,360 35,099 0.00Korian SA 2,066 34,859 0.00Valneva SE 3,327 34,581 0.00ID Logistics Group 136 34,283 0.00Eramet 317 34,121 0.00Rothschild & Co. 940 29,619 0.00Eurazeo SA 413 25,541 0.00Electricite de France SA (Prime
De Fidelite 2023) 3,342 24,386 0.00Electricite de France SA (Prime
De Fidelite 2024)1 3,263 23,810 0.00Casino Guichard Perrachon SA 1,680 23,574 0.00SEB SA (Prime Fidelite 2024) 244 23,516 0.00Sodexo (Prime De Fidelite 2023) 311 18,847 0.00SEB SA (Prime De Fidelite 2025) 194 18,697 0.00Electricite de France SA (Prime
De Fidelite 2021) 2,538 18,519 0.00Sodexo (Prime De Fidelite 2024) 290 17,574 0.00
Vanguard FTSE Global All Cap Index Fund
135

Holding
MarketValue
(£)
% ofTotal Net
Assets
Solutions 30 SE 3,721 17,384 0.00Peugeot Invest 161 14,421 0.00Interparfums SA 292 12,906 0.00Neoen SA 382 12,255 0.00Cie Plastic Omnium SA 928 12,133 0.00Trigano SA 112 11,651 0.00Faurecia SE (MTTA) 655 11,503 0.00CGG SA 6,635 6,172 0.00Carmila SA 471 5,849 0.00Albioma (Prime De Fidelite
2023) 132 5,607 0.00SEB SA (Prime De Fidelite 2023) 42 4,048 0.00Mercialys SA 523 4,047 0.00Quadient SA 235 3,505 0.00Sodexo SA (Prime De Fidelite
2021) 40 2,424 0.00Sodexo (Prime De Fidelite 2022) 35 2,121 0.00Elior Group SA 569 1,404 0.00Albioma (Prime De Fidelite) 33 1,402 0.00Tarkett SA 84 919 0.00Boiron SA 24 838 0.00Jacquet Metals SACA 39 675 0.00Mersen SA 25 664 0.00Vicat SA 21 508 0.00Vilmorin & Cie SA 12 454 0.00Beneteau SA 41 413 0.00Bonduelle SCA 23 306 0.00LISI SA 16 289 0.00Guerbet 9 188 0.00LISI 8 144 0.00
44,966,459 2.48
Germany 1.95% (31 October 2021: 2.19%)
SAP SE 35,802 2,929,490 0.16Siemens AG 24,382 2,407,665 0.13Allianz SE 13,012 2,353,982 0.13Bayer AG 32,483 1,717,354 0.10Deutsche Telekom AG 111,052 1,635,961 0.09Mercedes-Benz Group AG 27,608 1,558,904 0.09BASF SE 30,409 1,284,476 0.07Deutsche Post AG 32,591 1,117,171 0.06Infineon Technologies AG 43,288 993,718 0.06adidas AG 6,134 993,415 0.06Muenchener
Rueckversicherungs-Gesellschaft AG 4,563 871,112 0.05
Deutsche Boerse AG 5,850 816,716 0.05Vonovia SE 25,408 815,120 0.05RWE AG 20,895 695,620 0.04Merck KGaA 4,409 654,253 0.04Volkswagen AG - Preference
Shares 5,227 652,308 0.04E.ON SE 71,150 593,184 0.03Deutsche Bank AG 69,249 558,366 0.03Bayerische Motoren Werke AG 6,754 444,079 0.03Symrise AG 4,262 406,824 0.02Fresenius SE & Co. KGaA 13,614 387,793 0.02Siemens Healthineers AG 8,724 375,026 0.02Bayerische Motoren Werke AG -
Preference Shares 5,967 352,975 0.02Fresenius Medical Care AG &
Co. KGaA 6,865 342,643 0.02Brenntag SE 5,400 335,497 0.02Porsche Automobil Holding SE -
Preference Shares 4,975 331,331 0.02Daimler Truck Holding AG 14,382 310,697 0.02Henkel AG & Co. KGaA 5,758 293,197 0.02MTU Aero Engines AG 1,807 292,207 0.02QIAGEN NV 7,697 284,829 0.02Volkswagen AG 1,623 284,068 0.02Beiersdorf AG 3,153 253,490 0.02Rheinmetall AG 1,384 250,494 0.02Hannover Rueck SE 1,960 245,061 0.01Sartorius AG - Preference Shares 754 227,511 0.01Continental AG 3,955 219,134 0.01Zalando SE 6,901 217,218 0.01Siemens Energy AG 13,764 213,612 0.01
Holding
MarketValue
(£)
% ofTotal Net
Assets
Commerzbank AG 40,378 213,204 0.01Henkel AG & Co. KGaA -
Preference Shares 4,115 212,578 0.01Puma SE 3,516 209,287 0.01LEG Immobilien SE 2,533 208,497 0.01HelloFresh SE 6,080 207,264 0.01Aroundtown SA 50,670 205,557 0.01HeidelbergCement AG 4,313 199,975 0.01Covestro AG 5,358 185,668 0.01K+S AG 6,308 170,831 0.01Delivery Hero SE 5,822 165,203 0.01Knorr-Bremse AG 2,750 157,684 0.01GEA Group AG 5,013 156,527 0.01Deutsche Lufthansa AG 24,318 146,100 0.01Carl Zeiss Meditec AG 1,423 143,423 0.01Scout24 SE 2,572 130,707 0.01CTS Eventim AG & Co. KGaA 2,327 129,049 0.01Evotec SE 6,421 124,902 0.01KION Group AG 2,703 120,602 0.01Evonik Industries AG 5,591 117,542 0.01Nemetschek SE 1,783 114,581 0.01Freenet AG 4,979 110,240 0.01United Internet AG 3,904 100,806 0.01Aurubis AG 1,088 99,786 0.01thyssenkrupp AG 15,843 98,085 0.01Bechtle AG 2,625 97,580 0.01Sixt SE 933 97,212 0.01LANXESS AG 3,019 93,327 0.01Encavis AG 4,757 84,140 0.01Vantage Towers AG 2,967 80,426 0.01Takkt AG 5,690 73,438 0.01Wacker Chemie AG 535 67,836 0.01Aareal Bank AG 2,319 63,406 0.00Befesa SA 1,265 62,926 0.00Sartorius AG 224 59,759 0.00Grand City Properties SA 4,209 59,487 0.00Uniper SE 2,811 58,105 0.00HUGO BOSS AG 1,277 57,814 0.00HOCHTIEF AG 1,182 57,764 0.00AIXTRON SE 2,739 56,870 0.00Stabilus SE 1,436 54,539 0.00Nordex SE 4,681 54,515 0.00SUSE SA 2,078 54,163 0.00Jenoptik AG 2,321 52,384 0.00Telefonica Deutschland Holding
AG 21,554 51,942 0.00Jungheinrich AG - Preference
Shares 2,632 51,839 0.00TAG Immobilien AG 3,133 50,308 0.00Kloeckner & Co. SE 4,677 48,731 0.00Stroeer SE & Co. KGaA 1,004 48,340 0.00Gerresheimer AG 849 47,547 0.00Siltronic AG 622 46,750 0.00FUCHS PETROLUB SE 2,160 45,828 0.00Rational AG 92 45,146 0.00ProSiebenSat.1 Media SE 4,845 44,660 0.00Talanx AG 1,333 44,601 0.00Norma Group SE 2,244 44,197 0.00Hella GmbH & Co. KGaA 872 43,889 0.00Adesso SE 260 40,854 0.00Software AG 1,564 38,899 0.00CANCOM SE 988 38,304 0.00Fielmann AG 924 37,407 0.00TeamViewer AG 3,838 37,119 0.00Hensoldt AG 1,615 35,893 0.00Salzgitter AG 1,076 35,821 0.00Nagarro SE 315 35,732 0.00GFT Technologies SE 1,113 35,585 0.00flatexDEGIRO AG 2,403 33,134 0.00Fraport AG Frankfurt Airport
Services Worldwide 727 31,313 0.00Instone Real Estate Group SE 2,508 30,894 0.00Pfeiffer Vacuum Technology AG 216 30,854 0.00Duerr AG 1,366 28,419 0.00Deutsche Pfandbriefbank AG 2,683 27,076 0.00METRO AG 3,853 27,050 0.00
Vanguard FTSE Global All Cap Index Fund
136
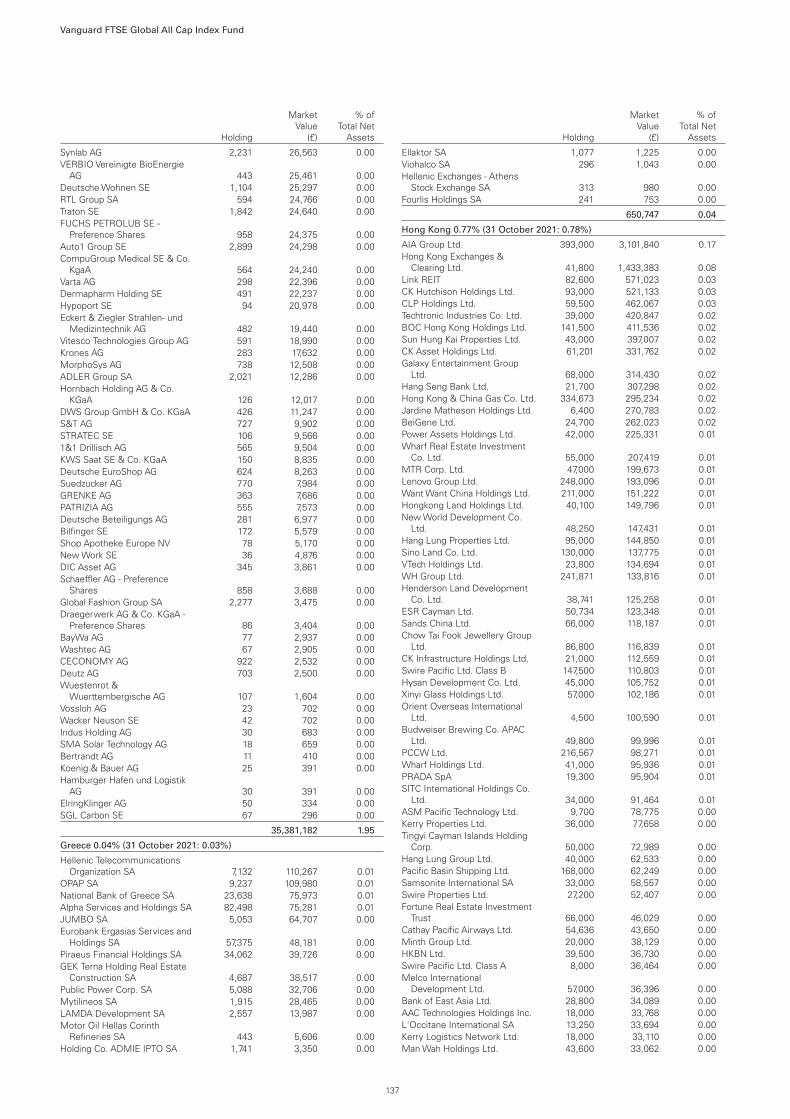
Holding
MarketValue
(£)
% ofTotal Net
Assets
Synlab AG 2,231 26,563 0.00VERBIO Vereinigte BioEnergie
AG 443 25,461 0.00Deutsche Wohnen SE 1,104 25,297 0.00RTL Group SA 594 24,766 0.00Traton SE 1,842 24,640 0.00FUCHS PETROLUB SE -
Preference Shares 958 24,375 0.00Auto1 Group SE 2,899 24,298 0.00CompuGroup Medical SE & Co.
KgaA 564 24,240 0.00Varta AG 298 22,396 0.00Dermapharm Holding SE 491 22,237 0.00Hypoport SE 94 20,978 0.00Eckert & Ziegler Strahlen- und
Medizintechnik AG 482 19,440 0.00Vitesco Technologies Group AG 591 18,990 0.00Krones AG 283 17,632 0.00MorphoSys AG 738 12,508 0.00ADLER Group SA 2,021 12,286 0.00Hornbach Holding AG & Co.
KGaA 126 12,017 0.00DWS Group GmbH & Co. KGaA 426 11,247 0.00S&T AG 727 9,902 0.00STRATEC SE 106 9,566 0.001&1 Drillisch AG 565 9,504 0.00KWS Saat SE & Co. KGaA 150 8,835 0.00Deutsche EuroShop AG 624 8,263 0.00Suedzucker AG 770 7,984 0.00GRENKE AG 363 7,686 0.00PATRIZIA AG 555 7,573 0.00Deutsche Beteiligungs AG 281 6,977 0.00Bilfinger SE 172 5,579 0.00Shop Apotheke Europe NV 78 5,170 0.00New Work SE 36 4,876 0.00DIC Asset AG 345 3,861 0.00Schaeffler AG - Preference
Shares 858 3,688 0.00Global Fashion Group SA 2,277 3,475 0.00Draegerwerk AG & Co. KGaA -
Preference Shares 86 3,404 0.00BayWa AG 77 2,937 0.00Washtec AG 67 2,905 0.00CECONOMY AG 922 2,532 0.00Deutz AG 703 2,500 0.00Wuestenrot &
Wuerttembergische AG 107 1,604 0.00Vossloh AG 23 702 0.00Wacker Neuson SE 42 702 0.00Indus Holding AG 30 683 0.00SMA Solar Technology AG 18 659 0.00Bertrandt AG 11 410 0.00Koenig & Bauer AG 25 391 0.00Hamburger Hafen und Logistik
AG 30 391 0.00ElringKlinger AG 50 334 0.00SGL Carbon SE 67 296 0.00
35,381,182 1.95
Greece 0.04% (31 October 2021: 0.03%)
Hellenic TelecommunicationsOrganization SA 7,132 110,267 0.01
OPAP SA 9,237 109,980 0.01National Bank of Greece SA 23,638 75,973 0.01Alpha Services and Holdings SA 82,498 75,281 0.01JUMBO SA 5,053 64,707 0.00Eurobank Ergasias Services and
Holdings SA 57,375 48,181 0.00Piraeus Financial Holdings SA 34,062 39,726 0.00GEK Terna Holding Real Estate
Construction SA 4,687 38,517 0.00Public Power Corp. SA 5,088 32,706 0.00Mytilineos SA 1,915 28,465 0.00LAMDA Development SA 2,557 13,987 0.00Motor Oil Hellas Corinth
Refineries SA 443 5,606 0.00Holding Co. ADMIE IPTO SA 1,741 3,350 0.00
Holding
MarketValue
(£)
% ofTotal Net
Assets
Ellaktor SA 1,077 1,225 0.00Viohalco SA 296 1,043 0.00Hellenic Exchanges - Athens
Stock Exchange SA 313 980 0.00Fourlis Holdings SA 241 753 0.00
650,747 0.04
Hong Kong 0.77% (31 October 2021: 0.78%)
AIA Group Ltd. 393,000 3,101,840 0.17Hong Kong Exchanges &
Clearing Ltd. 41,800 1,433,383 0.08Link REIT 82,600 571,023 0.03CK Hutchison Holdings Ltd. 93,000 521,133 0.03CLP Holdings Ltd. 59,500 462,067 0.03Techtronic Industries Co. Ltd. 39,000 420,847 0.02BOC Hong Kong Holdings Ltd. 141,500 411,536 0.02Sun Hung Kai Properties Ltd. 43,000 397,007 0.02CK Asset Holdings Ltd. 61,201 331,762 0.02Galaxy Entertainment Group
Ltd. 68,000 314,430 0.02Hang Seng Bank Ltd. 21,700 307,298 0.02Hong Kong & China Gas Co. Ltd. 334,673 295,234 0.02Jardine Matheson Holdings Ltd. 6,400 270,783 0.02BeiGene Ltd. 24,700 262,023 0.02Power Assets Holdings Ltd. 42,000 225,331 0.01Wharf Real Estate Investment
Co. Ltd. 55,000 207,419 0.01MTR Corp. Ltd. 47,000 199,673 0.01Lenovo Group Ltd. 248,000 193,096 0.01Want Want China Holdings Ltd. 211,000 151,222 0.01Hongkong Land Holdings Ltd. 40,100 149,796 0.01New World Development Co.
Ltd. 48,250 147,431 0.01Hang Lung Properties Ltd. 95,000 144,850 0.01Sino Land Co. Ltd. 130,000 137,775 0.01VTech Holdings Ltd. 23,800 134,694 0.01WH Group Ltd. 241,871 133,816 0.01Henderson Land Development
Co. Ltd. 38,741 125,258 0.01ESR Cayman Ltd. 50,734 123,348 0.01Sands China Ltd. 66,000 118,187 0.01Chow Tai Fook Jewellery Group
Ltd. 86,800 116,839 0.01CK Infrastructure Holdings Ltd. 21,000 112,559 0.01Swire Pacific Ltd. Class B 147,500 110,803 0.01Hysan Development Co. Ltd. 45,000 105,752 0.01Xinyi Glass Holdings Ltd. 57,000 102,186 0.01Orient Overseas International
Ltd. 4,500 100,590 0.01Budweiser Brewing Co. APAC
Ltd. 49,800 99,996 0.01PCCW Ltd. 216,567 98,271 0.01Wharf Holdings Ltd. 41,000 95,936 0.01PRADA SpA 19,300 95,904 0.01SITC International Holdings Co.
Ltd. 34,000 91,464 0.01ASM Pacific Technology Ltd. 9,700 78,775 0.00Kerry Properties Ltd. 36,000 77,658 0.00Tingyi Cayman Islands Holding
Corp. 50,000 72,989 0.00Hang Lung Group Ltd. 40,000 62,533 0.00Pacific Basin Shipping Ltd. 168,000 62,249 0.00Samsonite International SA 33,000 58,557 0.00Swire Properties Ltd. 27,200 52,407 0.00Fortune Real Estate Investment
Trust 66,000 46,029 0.00Cathay Pacific Airways Ltd. 54,636 43,650 0.00Minth Group Ltd. 20,000 38,129 0.00HKBN Ltd. 39,500 36,730 0.00Swire Pacific Ltd. Class A 8,000 36,464 0.00Melco International
Development Ltd. 57,000 36,396 0.00Bank of East Asia Ltd. 28,800 34,089 0.00AAC Technologies Holdings Inc. 18,000 33,768 0.00L'Occitane International SA 13,250 33,694 0.00Kerry Logistics Network Ltd. 18,000 33,110 0.00Man Wah Holdings Ltd. 43,600 33,062 0.00
Vanguard FTSE Global All Cap Index Fund
137
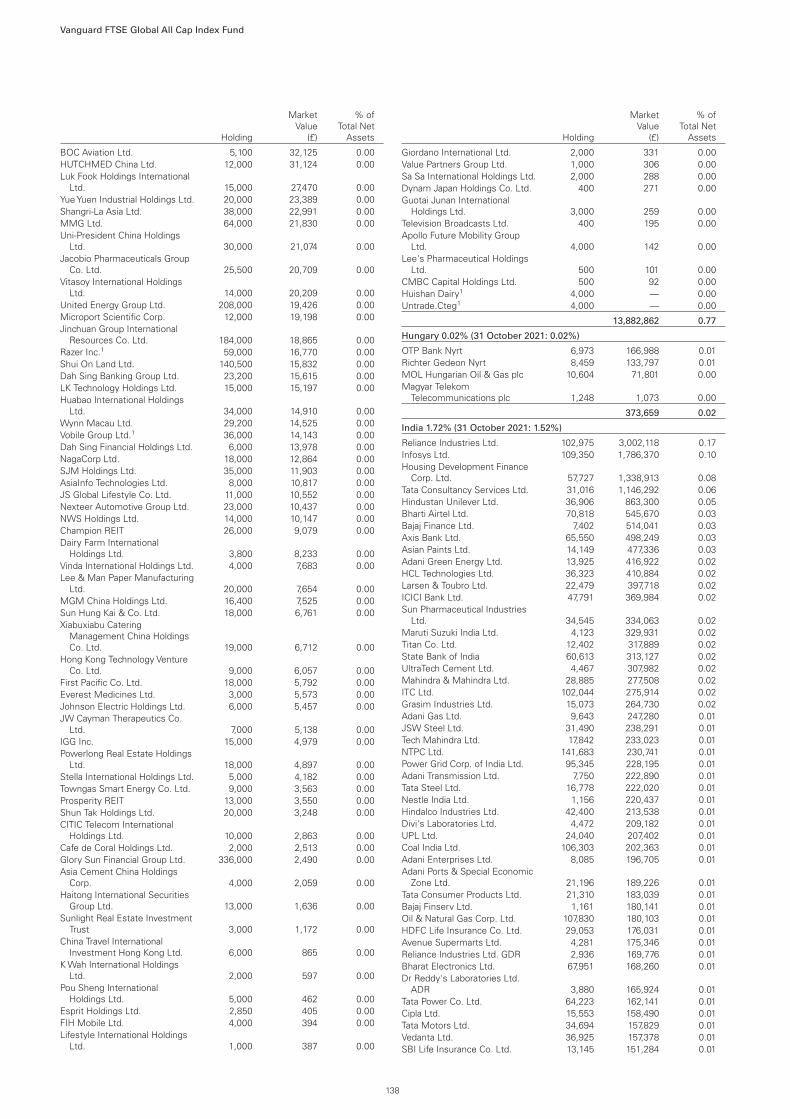
Holding
MarketValue
(£)
% ofTotal Net
Assets
BOC Aviation Ltd. 5,100 32,125 0.00HUTCHMED China Ltd. 12,000 31,124 0.00Luk Fook Holdings International
Ltd. 15,000 27,470 0.00Yue Yuen Industrial Holdings Ltd. 20,000 23,389 0.00Shangri-La Asia Ltd. 38,000 22,991 0.00MMG Ltd. 64,000 21,830 0.00Uni-President China Holdings
Ltd. 30,000 21,074 0.00Jacobio Pharmaceuticals Group
Co. Ltd. 25,500 20,709 0.00Vitasoy International Holdings
Ltd. 14,000 20,209 0.00United Energy Group Ltd. 208,000 19,426 0.00Microport Scientific Corp. 12,000 19,198 0.00Jinchuan Group International
Resources Co. Ltd. 184,000 18,865 0.00Razer Inc.1 59,000 16,770 0.00Shui On Land Ltd. 140,500 15,832 0.00Dah Sing Banking Group Ltd. 23,200 15,615 0.00LK Technology Holdings Ltd. 15,000 15,197 0.00Huabao International Holdings
Ltd. 34,000 14,910 0.00Wynn Macau Ltd. 29,200 14,525 0.00Vobile Group Ltd.1 36,000 14,143 0.00Dah Sing Financial Holdings Ltd. 6,000 13,978 0.00NagaCorp Ltd. 18,000 12,864 0.00SJM Holdings Ltd. 35,000 11,903 0.00AsiaInfo Technologies Ltd. 8,000 10,817 0.00JS Global Lifestyle Co. Ltd. 11,000 10,552 0.00Nexteer Automotive Group Ltd. 23,000 10,437 0.00NWS Holdings Ltd. 14,000 10,147 0.00Champion REIT 26,000 9,079 0.00Dairy Farm International
Holdings Ltd. 3,800 8,233 0.00Vinda International Holdings Ltd. 4,000 7,683 0.00Lee & Man Paper Manufacturing
Ltd. 20,000 7,654 0.00MGM China Holdings Ltd. 16,400 7,525 0.00Sun Hung Kai & Co. Ltd. 18,000 6,761 0.00Xiabuxiabu Catering
Management China HoldingsCo. Ltd. 19,000 6,712 0.00
Hong Kong Technology VentureCo. Ltd. 9,000 6,057 0.00
First Pacific Co. Ltd. 18,000 5,792 0.00Everest Medicines Ltd. 3,000 5,573 0.00Johnson Electric Holdings Ltd. 6,000 5,457 0.00JW Cayman Therapeutics Co.
Ltd. 7,000 5,138 0.00IGG Inc. 15,000 4,979 0.00Powerlong Real Estate Holdings
Ltd. 18,000 4,897 0.00Stella International Holdings Ltd. 5,000 4,182 0.00Towngas Smart Energy Co. Ltd. 9,000 3,563 0.00Prosperity REIT 13,000 3,550 0.00Shun Tak Holdings Ltd. 20,000 3,248 0.00CITIC Telecom International
Holdings Ltd. 10,000 2,863 0.00Cafe de Coral Holdings Ltd. 2,000 2,513 0.00Glory Sun Financial Group Ltd. 336,000 2,490 0.00Asia Cement China Holdings
Corp. 4,000 2,059 0.00Haitong International Securities
Group Ltd. 13,000 1,636 0.00Sunlight Real Estate Investment
Trust 3,000 1,172 0.00China Travel International
Investment Hong Kong Ltd. 6,000 865 0.00K Wah International Holdings
Ltd. 2,000 597 0.00Pou Sheng International
Holdings Ltd. 5,000 462 0.00Esprit Holdings Ltd. 2,850 405 0.00FIH Mobile Ltd. 4,000 394 0.00Lifestyle International Holdings
Ltd. 1,000 387 0.00
Holding
MarketValue
(£)
% ofTotal Net
Assets
Giordano International Ltd. 2,000 331 0.00Value Partners Group Ltd. 1,000 306 0.00Sa Sa International Holdings Ltd. 2,000 288 0.00Dynam Japan Holdings Co. Ltd. 400 271 0.00Guotai Junan International
Holdings Ltd. 3,000 259 0.00Television Broadcasts Ltd. 400 195 0.00Apollo Future Mobility Group
Ltd. 4,000 142 0.00Lee's Pharmaceutical Holdings
Ltd. 500 101 0.00CMBC Capital Holdings Ltd. 500 92 0.00Huishan Dairy1 4,000 — 0.00Untrade.Cteg1 4,000 — 0.00
13,882,862 0.77
Hungary 0.02% (31 October 2021: 0.02%)
OTP Bank Nyrt 6,973 166,988 0.01Richter Gedeon Nyrt 8,459 133,797 0.01MOL Hungarian Oil & Gas plc 10,604 71,801 0.00Magyar Telekom
Telecommunications plc 1,248 1,073 0.00
373,659 0.02
India 1.72% (31 October 2021: 1.52%)
Reliance Industries Ltd. 102,975 3,002,118 0.17Infosys Ltd. 109,350 1,786,370 0.10Housing Development Finance
Corp. Ltd. 57,727 1,338,913 0.08Tata Consultancy Services Ltd. 31,016 1,146,292 0.06Hindustan Unilever Ltd. 36,906 863,300 0.05Bharti Airtel Ltd. 70,818 545,670 0.03Bajaj Finance Ltd. 7,402 514,041 0.03Axis Bank Ltd. 65,550 498,249 0.03Asian Paints Ltd. 14,149 477,336 0.03Adani Green Energy Ltd. 13,925 416,922 0.02HCL Technologies Ltd. 36,323 410,884 0.02Larsen & Toubro Ltd. 22,479 397,718 0.02ICICI Bank Ltd. 47,791 369,984 0.02Sun Pharmaceutical Industries
Ltd. 34,545 334,063 0.02Maruti Suzuki India Ltd. 4,123 329,931 0.02Titan Co. Ltd. 12,402 317,889 0.02State Bank of India 60,613 313,127 0.02UltraTech Cement Ltd. 4,467 307,982 0.02Mahindra & Mahindra Ltd. 28,885 277,508 0.02ITC Ltd. 102,044 275,914 0.02Grasim Industries Ltd. 15,073 264,730 0.02Adani Gas Ltd. 9,643 247,280 0.01JSW Steel Ltd. 31,490 238,291 0.01Tech Mahindra Ltd. 17,842 233,023 0.01NTPC Ltd. 141,683 230,741 0.01Power Grid Corp. of India Ltd. 95,345 228,195 0.01Adani Transmission Ltd. 7,750 222,890 0.01Tata Steel Ltd. 16,778 222,020 0.01Nestle India Ltd. 1,156 220,437 0.01Hindalco Industries Ltd. 42,400 213,538 0.01Divi's Laboratories Ltd. 4,472 209,182 0.01UPL Ltd. 24,040 207,402 0.01Coal India Ltd. 106,303 202,363 0.01Adani Enterprises Ltd. 8,085 196,705 0.01Adani Ports & Special Economic
Zone Ltd. 21,196 189,226 0.01Tata Consumer Products Ltd. 21,310 183,039 0.01Bajaj Finserv Ltd. 1,161 180,141 0.01Oil & Natural Gas Corp. Ltd. 107,830 180,103 0.01HDFC Life Insurance Co. Ltd. 29,053 176,031 0.01Avenue Supermarts Ltd. 4,281 175,346 0.01Reliance Industries Ltd. GDR 2,936 169,776 0.01Bharat Electronics Ltd. 67,951 168,260 0.01Dr Reddy's Laboratories Ltd.
ADR 3,880 165,924 0.01Tata Power Co. Ltd. 64,223 162,141 0.01Cipla Ltd. 15,553 158,490 0.01Tata Motors Ltd. 34,694 157,829 0.01Vedanta Ltd. 36,925 157,378 0.01SBI Life Insurance Co. Ltd. 13,145 151,284 0.01
Vanguard FTSE Global All Cap Index Fund
138

Holding
MarketValue
(£)
% ofTotal Net
Assets
Apollo Hospitals Enterprise Ltd. 3,143 145,305 0.01Bharat Petroleum Corp. Ltd. 38,297 144,711 0.01Infosys Ltd. ADR 8,953 141,765 0.01Wipro Ltd. 26,320 139,301 0.01SRF Ltd. 5,295 139,032 0.01ICICI Lombard General
Insurance Co. Ltd. 10,183 135,917 0.01Bajaj Auto Ltd. 3,485 135,524 0.01Ambuja Cements Ltd. 34,774 134,714 0.01Indian Oil Corp. Ltd. 96,800 127,236 0.01Hero MotoCorp Ltd. 4,808 125,188 0.01Federal Bank Ltd. 124,051 124,344 0.01Bandhan Bank Ltd. 35,238 122,449 0.01Pfizer Ltd. 2,667 122,132 0.01Cholamandalam Investment and
Finance Co. Ltd. 15,707 121,321 0.01Page Industries Ltd. 248 117,600 0.01Britannia Industries Ltd. 3,324 113,878 0.01Info Edge India Ltd. 2,348 113,765 0.01Tata Motors Ltd. Class A 50,003 113,085 0.01Pidilite Industries Ltd. 4,420 111,555 0.01Shriram Transport Finance Co.
Ltd. 8,822 110,338 0.01Emami Ltd. 21,569 110,291 0.01SBI Cards & Payment Services
Ltd. 12,590 108,487 0.01Dabur India Ltd. 18,509 107,469 0.01Tata Steel Ltd. GDR 8,150 105,486 0.01Havells India Ltd. 7,374 100,652 0.01Mphasis Ltd. 3,335 98,305 0.01LIC Housing Finance Ltd. 24,781 97,809 0.01Laurus Labs Ltd. 15,883 96,160 0.01Shree Cement Ltd. 355 95,545 0.01Eicher Motors Ltd. 3,482 95,487 0.01Indus Towers Ltd. 42,336 92,503 0.01Ashok Leyland Ltd. 68,943 91,159 0.01Bharat Forge Ltd. 12,353 90,433 0.01Yes Bank Ltd. 635,970 90,121 0.01Navin Fluorine International Ltd. 2,153 88,043 0.01Tata Communications Ltd. 7,669 87,419 0.01United Spirits Ltd. 9,712 87,255 0.01Voltas Ltd. 6,637 87,072 0.01Astral Ltd. 3,863 86,740 0.01Supreme Industries Ltd. 4,265 86,390 0.01Tube Investments of India Ltd. 4,409 85,448 0.01Atul Ltd. 907 84,214 0.01Jindal Steel & Power Ltd. 14,847 83,615 0.01Larsen & Toubro Infotech Ltd. 1,649 82,955 0.01Marico Ltd. 14,959 81,214 0.01Piramal Enterprises Ltd. 3,540 79,748 0.01Muthoot Finance Ltd. 5,898 77,555 0.01Persistent Systems Ltd. 1,714 77,151 0.01Adani Power Ltd. 26,078 77,114 0.01Bajaj Holdings & Investment Ltd. 1,418 76,889 0.01Embassy Office Parks REIT 18,914 75,972 0.01Petronet LNG Ltd. 35,619 75,563 0.01Cummins India Ltd. 6,840 73,404 0.01HDFC Asset Management Co.
Ltd. 3,431 72,823 0.01Deepak Nitrite Ltd. 3,001 72,660 0.01Bata India Ltd. 3,571 72,593 0.01PI Industries Ltd. 2,449 72,500 0.01InterGlobe Aviation Ltd. 3,726 72,366 0.01Godrej Consumer Products Ltd. 8,812 71,939 0.01Trent Ltd. 5,576 71,247 0.01Power Finance Corp. Ltd. 57,517 70,568 0.01Aurobindo Pharma Ltd. 10,661 69,788 0.01GAIL India Ltd. 41,426 68,695 0.01Varun Beverages Ltd. 6,058 68,108 0.00Aarti Industries Ltd. 7,351 67,793 0.00Tata Elxsi Ltd. 836 67,412 0.00Indian Railway Catering &
Tourism Corp Ltd. 8,610 67,011 0.00Wipro Ltd. ADR 12,886 66,098 0.00Crompton Greaves Consumer
Electricals Ltd. 16,313 65,295 0.00
Holding
MarketValue
(£)
% ofTotal Net
Assets
Cholamandalam FinancialHoldings Ltd. 9,772 65,200 0.00
MRF Ltd. 86 65,145 0.00Ipca Laboratories Ltd. 6,172 65,020 0.00Jubilant Foodworks Ltd. 11,405 64,741 0.00Berger Paints India Ltd. 8,608 64,255 0.00Angel One Ltd. 3,105 63,346 0.00Container Corp. Of India Ltd. 9,316 63,128 0.00ICICI Prudential Life Insurance
Co. Ltd. 11,441 62,436 0.00Bank of Baroda 52,781 61,980 0.00Torrent Pharmaceuticals Ltd. 2,097 61,726 0.00Lupin Ltd. 7,898 61,325 0.00Dr Lal PathLabs Ltd. 2,249 61,091 0.00GMR Infrastructure Ltd. 153,171 59,929 0.00Sona Blw Precision Forgings
Ltd. 8,954 59,248 0.00Mindtree Ltd. 1,596 59,119 0.00DLF Ltd. 15,250 58,792 0.00Balkrishna Industries Ltd. 2,604 57,945 0.00Zee Entertainment Enterprises
Ltd. 22,399 57,798 0.00Siemens Ltd. 2,400 56,966 0.00REC Ltd. 42,646 56,388 0.00Hindustan Petroleum Corp. Ltd. 19,926 56,255 0.00Colgate-Palmolive India Ltd. 3,257 56,199 0.00TVS Motor Co. Ltd. 8,131 55,704 0.00ACC Ltd. 2,243 54,466 0.00JK Cement Ltd. 1,954 53,852 0.00Tata Chemicals Ltd. 5,460 53,335 0.00ABB India Ltd. 2,438 53,270 0.00Canara Bank 22,238 53,015 0.00Thermax Ltd. Foreign 2,341 51,687 0.00Schaeffler India Ltd. 2,154 51,463 0.00Honeywell Automation India Ltd. 123 51,264 0.00Motherson Sumi Systems Ltd. 35,519 50,832 0.00L&T Technology Services Ltd. 1,174 49,915 0.00AU Small Finance Bank Ltd. 3,435 49,712 0.00Indian Energy Exchange Ltd. 22,014 49,201 0.00Max Healthcare Institute Ltd. 11,376 48,675 0.00Cyient Ltd. Foreign 5,266 48,620 0.00L&T Finance Holdings Ltd. 53,258 48,500 0.00Indraprastha Gas Ltd. 12,992 47,772 0.00Linde India Ltd. 1,267 47,394 0.00Max Financial Services Ltd. 5,944 46,698 0.00SKF India Ltd. 1,291 44,862 0.00KPIT Technologies Ltd. 7,718 44,624 0.00Gujarat Fluorochemicals Ltd. 1,507 43,982 0.00Godrej Properties Ltd. 2,661 43,453 0.00Rajesh Exports Ltd. 6,644 43,388 0.00Bosch Ltd. 287 43,361 0.00Gillette India Ltd. 779 42,979 0.00Mahindra & Mahindra Ltd. GDR 4,513 42,776 0.00Biocon Ltd. 10,919 41,993 0.00CG Power & Industrial Solutions
Ltd. 20,320 41,869 0.00Dalmia Bharat Ltd. 2,629 41,500 0.00Minda Industries Ltd. 4,278 40,786 0.00Apollo Tyres Ltd. 18,693 39,889 0.00Chambal Fertilisers and
Chemicals Ltd. 8,375 39,836 0.00Axis Bank Ltd. GDR 1,053 39,671 0.00Indian Hotels Co. Ltd. 14,675 39,144 0.00Aditya Birla Fashion and Retail
Ltd. 13,123 39,038 0.00Carborundum Universal Ltd. 4,851 38,692 0.00JSW Energy Ltd. 11,663 38,523 0.00Fortis Healthcare Ltd. 13,706 38,130 0.00Dixon Technologies India Ltd. 820 37,414 0.00Gujarat Narmada Valley
Fertilizers & Chemicals Ltd. 4,230 36,584 0.00Tanla Platforms Ltd. 2,466 36,538 0.00Hatsun Agro Product Ltd. 3,291 36,125 0.00NMDC Ltd. 21,334 35,666 0.00National Aluminium Co. Ltd. 32,412 35,460 0.00Oil India Ltd. 14,856 35,308 0.00
Vanguard FTSE Global All Cap Index Fund
139

Holding
MarketValue
(£)
% ofTotal Net
Assets
Brightcom Group Ltd. 37,778 33,065 0.00Gujarat State Petronet Ltd. 12,110 33,003 0.00APL Apollo Tubes Ltd. 3,080 32,787 0.00Tata Teleservices Maharashtra
Ltd. 22,207 32,348 0.00Larsen & Toubro Ltd. GDR 1,825 32,052 0.00RBL Bank Ltd. 25,575 32,004 0.00Trident Ltd. 57,980 31,596 0.00Central Depository Services
India Ltd. 2,145 30,843 0.00Torrent Power Ltd. 5,516 30,611 0.00Grindwell Norton Ltd. 1,689 30,094 0.00Steel Authority of India Ltd. 29,850 30,091 0.00UTI Asset Management Co. Ltd. 3,604 30,085 0.00BSE Ltd. 3,192 30,050 0.00Oberoi Realty Ltd. 3,011 29,961 0.00Mahindra & Mahindra Financial
Services Ltd. 15,447 29,510 0.00Suzlon Energy Ltd. 269,557 28,367 0.00Zomato Ltd. 37,742 28,275 0.00Bharat Heavy Electricals Ltd. 51,085 27,998 0.00EIH Ltd. 16,622 27,685 0.00State Bank of India GDR 537 27,588 0.00TTK Prestige Ltd. 3,120 27,507 0.00Vardhman Textiles Ltd. 5,945 27,193 0.00HFCL Ltd. 35,142 27,151 0.00Phoenix Mills Ltd. 2,399 26,629 0.00IIFL Finance Ltd. 7,226 26,544 0.00Amara Raja Batteries Ltd. 4,400 25,720 0.00Balrampur Chini Mills Ltd. 4,896 22,660 0.00Zensar Technologies Ltd. 6,615 22,325 0.00IndiaMart InterMesh Ltd. 423 21,795 0.00Birlasoft Ltd. 5,032 21,696 0.00Balaji Amines Ltd. 624 20,929 0.00Redington India Ltd. 12,938 20,585 0.00Ramco Cements Ltd. 2,466 20,453 0.00IDFC First Bank Ltd. 49,723 20,413 0.00Kajaria Ceramics Ltd. 1,894 20,327 0.00Blue Star Ltd. 1,660 19,631 0.00Sun TV Network Ltd. 3,867 19,451 0.00Happiest Minds Technologies
Ltd. 1,853 19,346 0.00Intellect Design Arena Ltd. 2,288 18,907 0.00Sonata Software Ltd. 2,414 18,739 0.00Sundram Fasteners Ltd. 2,205 18,483 0.00Can Fin Homes Ltd. 2,975 18,360 0.00IDFC Ltd. 30,830 18,278 0.00Century Textiles & Industries
Ltd. 2,100 18,238 0.00Hindustan Zinc Ltd. 5,389 18,097 0.00NHPC Ltd. 48,065 16,602 0.00Alkem Laboratories Ltd. 473 16,066 0.00Quess Corp Ltd. 2,154 16,058 0.00United Breweries Ltd. 960 15,864 0.00PVR Ltd. 834 15,806 0.00Computer Age Management
Services Ltd. 614 15,776 0.00Gujarat Gas Ltd. 3,096 15,539 0.00Indiabulls Housing Finance Ltd. 9,617 15,381 0.00Alok Industries Ltd. 56,249 15,062 0.00Coforge Ltd. 337 14,720 0.00Amber Enterprises India Ltd. 383 14,630 0.00Graphite India Ltd. 2,568 14,074 0.00Natco Pharma Ltd. 1,710 13,939 0.00Firstsource Solutions Ltd. 10,449 13,598 0.00Oracle Financial Services
Software Ltd. 359 13,370 0.00Kansai Nerolac Paints Ltd. 2,725 13,315 0.00Relaxo Footwears Ltd. 1,173 13,249 0.00EID Parry India Ltd. 2,371 13,192 0.00CESC Ltd. 14,260 12,667 0.00Glenmark Pharmaceuticals Ltd. 2,715 12,419 0.00Metropolis Healthcare Ltd. 477 11,981 0.00Escorts Ltd. 705 11,974 0.00Syngene International Ltd. 1,811 11,812 0.00Zydus Lifesciences Ltd. 3,221 11,783 0.00
Holding
MarketValue
(£)
% ofTotal Net
Assets
Vaibhav Global Ltd. 2,380 11,705 0.00Coromandel International Ltd. 1,238 11,533 0.00Vodafone Idea Ltd. 114,480 11,332 0.00Karnataka Bank Ltd. 16,929 11,086 0.00GlaxoSmithKline
Pharmaceuticals Ltd. 657 10,741 0.00Castrol India Ltd. 9,121 10,264 0.00KEC International Ltd. 2,397 9,918 0.00AIA Engineering Ltd. 460 9,250 0.00Manappuram Finance Ltd. 7,695 9,237 0.00Procter & Gamble Health Ltd. 197 9,175 0.00Suven Pharmaceuticals Ltd. 1,417 8,822 0.00PNB Housing Finance Ltd. 2,254 8,805 0.00Aegis Logistics Ltd. 3,617 8,344 0.00Aditya Birla Capital Ltd. 5,589 7,009 0.00Bayer CropScience Ltd. 143 6,916 0.00Rallis India Ltd. 2,820 6,896 0.00Jubilant Pharmova Ltd. 1,402 6,853 0.00Sanofi India Ltd. 94 6,822 0.00Infibeam Avenues Ltd. 36,040 6,816 0.00Equitas Holdings Ltd. 5,764 6,678 0.00Dr Reddy's Laboratories Ltd. 137 5,900 0.00Aavas Financiers Ltd. 243 5,778 0.00eClerx Services Ltd. 229 5,750 0.00Nippon Life India Asset
Management Ltd. 1,676 5,536 0.00Whirlpool of India Ltd. 306 5,187 0.00City Union Bank Ltd. 3,554 5,081 0.00Granules India Ltd. 1,453 4,254 0.00Strides Pharma Science Ltd. 1,091 3,716 0.00Radico Khaitan Ltd. 393 3,686 0.00India Cements Ltd. 1,678 3,619 0.00Prestige Estates Projects Ltd. 686 3,395 0.00Just Dial Ltd. 376 3,366 0.00IRB Infrastructure Developers
Ltd. 1,093 2,690 0.00Sobha Ltd. 373 2,507 0.00DCB Bank Ltd. 2,806 2,327 0.00PTC India Ltd. 2,373 2,287 0.00GAIL India Ltd. GDR 220 2,147 0.00Dhani Services Ltd. 3,728 2,136 0.00Welspun Corp. Ltd. 984 2,093 0.00Alembic Pharmaceuticals Ltd. 252 2,051 0.00Jindal Saw Ltd. 1,702 1,631 0.00NCC Ltd. 1,901 1,347 0.00Punjab National Bank 3,559 1,298 0.00Sun Pharma Advanced Research
Co. Ltd. 410 1,128 0.00NBCC India Ltd. 2,766 1,092 0.00Wockhardt Ltd. 369 1,056 0.00KRBL Ltd. 415 1,029 0.00Indiabulls Real Estate Ltd. 1,104 1,026 0.00Sterlite Technologies Ltd. 467 943 0.00Kaveri Seed Co. Ltd. 137 766 0.00Edelweiss Financial Services
Ltd. 900 564 0.00Future Retail Ltd. 2,197 522 0.00HEG Ltd. 36 462 0.00Engineers India Ltd. 554 371 0.00Care Ratings Ltd. 69 331 0.00
31,162,319 1.72
Indonesia 0.21% (31 October 2021: 0.16%)
Bank Central Asia Tbk PT 1,565,470 698,832 0.04Bank Rakyat Indonesia Persero
Tbk PT 2,135,434 570,199 0.03Telkom Indonesia Persero Tbk
PT 1,529,300 388,185 0.02Bank Mandiri Persero Tbk PT 565,800 278,221 0.02Astra International Tbk PT 655,800 272,935 0.02Elang Mahkota Teknologi Tbk PT 1,072,200 176,138 0.01Bank Negara Indonesia Persero
Tbk PT 271,000 137,354 0.01Sarana Menara Nusantara Tbk
PT 2,387,000 132,457 0.01Bukit Asam Tbk PT 428,400 89,677 0.01Adaro Energy Indonesia Tbk PT 478,100 87,472 0.01
Vanguard FTSE Global All Cap Index Fund
140

Holding
MarketValue
(£)
% ofTotal Net
Assets
United Tractors Tbk PT 45,000 74,728 0.01Kalbe Farma Tbk PT 810,200 73,003 0.01Aneka Tambang Tbk 429,600 61,368 0.01Ciputra Development Tbk PT 1,035,900 60,614 0.00Indocement Tunggal Prakarsa
Tbk PT 105,000 60,429 0.00Indofood Sukses Makmur Tbk
PT 158,500 54,862 0.00Vale Indonesia Tbk 135,700 54,426 0.00Unilever Indonesia Tbk PT 254,195 54,328 0.00Gudang Garam Tbk PT 30,600 51,614 0.00Charoen Pokphand Indonesia
Tbk PT 181,600 51,384 0.00Semen Indonesia Persero Tbk
PT 113,800 40,015 0.00Tower Bersama Infrastructure
Tbk PT 228,400 37,772 0.00Indah Kiat Pulp & Paper Corp.
Tbk PT 83,400 34,595 0.00Barito Pacific Tbk PT 740,000 34,559 0.00Matahari Department Store Tbk
PT 106,700 34,002 0.00Jasa Marga Persero Tbk PT 148,469 32,792 0.00Bank Yudha Bhakti Tbk PT 309,100 28,361 0.00Smartfren Telecom Tbk PT 3,863,800 17,406 0.00Surya Citra Media Tbk PT 1,188,500 16,455 0.00Mitra Keluarga Karyasehat Tbk
PT 112,400 15,624 0.00Pakuwon Jati Tbk PT 444,900 13,689 0.00Indofood CBP Sukses Makmur
Tbk PT 27,748 11,625 0.00XL Axiata Tbk PT 48,000 8,386 0.00Perusahaan Gas Negara Tbk PT 91,600 7,297 0.00Bank BTPN Syariah Tbk PT 28,100 5,326 0.00Japfa Comfeed Indonesia Tbk
PT 61,800 4,923 0.00Ace Hardware Indonesia Tbk PT 85,000 4,857 0.00Hanjaya Mandala Sampoerna
Tbk PT 86,353 4,578 0.00Bank Pembangunan Daerah
Jawa Barat Dan Banten TbkPT 48,122 3,887 0.00
Summarecon Agung Tbk PT 82,389 3,191 0.00Lippo Karawaci Tbk PT 447,847 3,051 0.00Pabrik Kertas Tjiwi Kimia Tbk PT 7,800 2,828 0.00Bank Danamon Indonesia Tbk
PT 10,000 1,346 0.00Astra Agro Lestari Tbk PT 1,400 962 0.00Indo Tambangraya Megah Tbk
PT 500 780 0.00AKR Corporindo Tbk PT 11,500 673 0.00Medco Energi Internasional Tbk
PT 17,183 515 0.00Bumi Serpong Damai Tbk PT 8,900 472 0.00Bank Tabungan Negara Persero
Tbk PT 4,500 455 0.00Media Nusantara Citra Tbk PT 8,100 447 0.00Waskita Karya Persero Tbk PT 15,013 437 0.00Trada Alam Minera Tbk PT1 125,200 344 0.00
3,799,876 0.21
Ireland 0.06% (31 October 2021: 0.07%)
Kerry Group plc Class A 5,219 460,240 0.03Kingspan Group plc 4,640 347,229 0.02Bank of Ireland Group plc 27,045 131,759 0.01Glanbia plc 4,576 43,680 0.00Dalata Hotel Group plc 10,335 37,776 0.00AIB Group plc 18,706 32,725 0.00Hibernia REIT plc 9,957 13,570 0.00
1,066,979 0.06
Isle Of Man 0.00% (31 October 2021: 0.02%)
Israel 0.21% (31 October 2021: 0.17%)
Bank Leumi Le-Israel BM 46,380 390,358 0.02Nice Ltd. 2,241 365,156 0.02Bank Hapoalim BM 45,379 337,261 0.02Israel Discount Bank Ltd. 49,429 234,107 0.01
Holding
MarketValue
(£)
% ofTotal Net
Assets
Teva Pharmaceutical IndustriesLtd. 31,419 223,099 0.01
ICL Group Ltd. 23,104 202,551 0.01Elbit Systems Ltd. 812 140,594 0.01Mizrahi Tefahot Bank Ltd. 4,283 127,102 0.01Tower Semiconductor Ltd. 3,099 119,001 0.01Shikun & Binui Ltd. 24,018 113,812 0.01One Software Technologies Ltd. 6,715 88,753 0.01Bezeq The Israeli
Telecommunication Corp. Ltd. 69,486 88,296 0.01Mivne Real Estate KD Ltd. 25,422 76,291 0.01Nova Ltd. 981 75,645 0.01Enlight Renewable Energy Ltd. 40,352 69,743 0.01Harel Insurance Investments &
Financial Services Ltd. 6,756 66,331 0.01Azrieli Group Ltd. 897 61,748 0.01Alony Hetz Properties &
Investments Ltd. 4,439 58,089 0.01First International Bank Of Israel
Ltd. 1,477 49,746 0.00Paz Oil Co. Ltd. 399 49,198 0.00Strauss Group Ltd. 2,165 45,991 0.00Israel Corp Ltd. 99 45,234 0.00Phoenix Holdings Ltd. 4,432 44,623 0.00Ashtrom Group Ltd. 1,971 44,157 0.00Fox Wizel Ltd. 373 44,001 0.00Perion Network Ltd. 2,401 41,961 0.00Clal Insurance Enterprises
Holdings Ltd. 2,356 41,798 0.00Melisron Ltd. 613 39,919 0.00Summit Real Estate Holdings
Ltd. 1,902 35,698 0.00Kenon Holdings Ltd. 775 35,653 0.00OPC Energy Ltd. 3,950 34,767 0.00Mega OR Holdings Ltd. 1,116 33,996 0.00Camtek Ltd. 1,275 29,859 0.00Shufersal Ltd. 4,372 29,398 0.00Isracard Ltd. 6,037 24,233 0.00Airport City Ltd. 959 17,144 0.00Big Shopping Centers Ltd. 138 16,621 0.00Gav-Yam Lands Corp. Ltd. 1,864 16,441 0.00Danel Adir Yeoshua Ltd. 121 15,295 0.00Formula Systems 1985 Ltd. 189 14,686 0.00Amot Investments Ltd. 1,990 12,115 0.00AFI Properties Ltd. 244 11,777 0.00Reit 1 Ltd. 2,241 11,677 0.00Sapiens International Corp. NV 600 11,224 0.00Electra Ltd. 20 10,912 0.00Shapir Engineering and Industry
Ltd. 1,333 9,996 0.00Rami Levy Chain Stores
Hashikma Marketing2006 Ltd. 161 9,736 0.00
Maytronics Ltd. 670 9,533 0.00Hilan Ltd. 202 9,399 0.00Delek Group Ltd. 70 9,119 0.00AudioCodes Ltd. 471 8,814 0.00Matrix IT Ltd. 375 7,571 0.00Gazit-Globe Ltd. 913 6,862 0.00Fattal Holdings 1998 Ltd. 57 6,530 0.00Energix-Renewable Energies
Ltd. 2,221 6,056 0.00Compugen Ltd. 3,059 5,563 0.00IDI Insurance Co. Ltd. 69 1,821 0.00Partner Communications Co.
Ltd. 232 1,461 0.00Allot Ltd. 264 1,237 0.00Oil Refineries Ltd. 3,283 1,169 0.00Cellcom Israel Ltd. 194 901 0.00
3,741,829 0.21
Italy 0.62% (31 October 2021: 0.67%)
Enel SpA 252,694 1,321,750 0.07Intesa Sanpaolo SpA 560,277 914,819 0.05Eni SpA 79,485 892,959 0.05Stellantis NV 64,207 699,957 0.04Ferrari NV 3,958 673,466 0.04
Vanguard FTSE Global All Cap Index Fund
141

Holding
MarketValue
(£)
% ofTotal Net
Assets
Assicurazioni Generali SpA 42,256 642,484 0.04UniCredit SpA 67,135 499,858 0.03CNH Industrial NV 32,744 375,835 0.02Snam SpA 73,352 322,474 0.02Atlantia SpA 15,806 303,210 0.02Terna Rete Elettrica Nazionale
SpA 43,435 284,164 0.02Moncler SpA 6,424 271,080 0.02Prysmian SpA 9,586 251,389 0.01Mediobanca Banca di Credito
Finanziario SpA 27,458 221,398 0.01FinecoBank Banca Fineco SpA 19,053 212,366 0.01Nexi SpA 25,562 202,416 0.01Tenaris SA 16,257 201,351 0.01EXOR NV 3,181 178,602 0.01Davide Campari-Milano NV 18,899 170,950 0.01Leonardo SpA 16,751 137,994 0.01Recordati Industria Chimica e
Farmaceutica SpA 3,289 127,154 0.01Banco BPM SpA 47,617 121,153 0.01Amplifon SpA 3,631 116,548 0.01Poste Italiane SpA 13,556 106,434 0.01Hera SpA 33,314 99,905 0.01DiaSorin SpA 848 89,175 0.01Reply SpA 746 88,509 0.01Infrastrutture Wireless Italiane
SpA 9,616 82,254 0.01Unipol Gruppo SpA 18,457 81,080 0.01A2A SpA 58,028 79,623 0.01ERG SpA 2,803 77,488 0.01Italgas SpA 14,564 75,751 0.01Interpump Group SpA 2,227 72,418 0.00Azimut Holding SpA 3,888 66,580 0.00Pirelli & C SpA 16,691 66,267 0.00Brunello Cucinelli SpA 1,486 61,033 0.00Banca Generali SpA 2,183 58,055 0.00Telecom Italia SpA 242,984 56,719 0.00Telecom Italia SpA - Preference
Shares 246,964 54,825 0.00Banca Popolare di Sondrio SCPA 15,909 50,904 0.00Technogym SpA 8,041 48,782 0.00Falck Renewables SpA 6,244 46,249 0.00Autogrill SpA 7,601 45,066 0.00Banca Mediolanum SpA 7,538 44,008 0.00Buzzi Unicem SpA 2,715 40,368 0.00Sesa SpA 339 39,281 0.00Salvatore Ferragamo SpA 2,682 37,545 0.00ACEA SpA 2,708 37,135 0.00Iren SpA 17,335 36,153 0.00BPER Banca 26,177 35,171 0.00SOL SpA 2,515 34,953 0.00De' Longhi SpA 1,734 33,511 0.00UnipolSai Assicurazioni SpA 12,636 28,370 0.00Banca Farmafactoring SpA 5,438 27,256 0.00Brembo SpA 3,372 27,101 0.00Iveco Group NV 5,081 24,092 0.00Danieli & C Officine Meccaniche
SpA - Preference Shares 1,821 22,829 0.00Gruppo MutuiOnline SpA 914 22,564 0.00Italmobiliare SpA 594 15,023 0.00Anima Holding SpA 3,266 12,810 0.00GVS SpA 1,729 11,579 0.00Carel Industries SpA 543 10,540 0.00Danieli & C Officine Meccaniche
SpA 606 10,362 0.00Saipem SpA 8,660 7,873 0.00Tamburi Investment Partners
SpA 1,016 7,427 0.00Enav SpA 1,970 7,244 0.00Societa Cattolica di Assicurazioni
SC 1,314 6,823 0.00doValue SpA 971 6,593 0.00MARR SpA 504 6,564 0.00Tod's SpA 201 6,394 0.00Saras SpA 7,847 5,852 0.00Zignago Vetro SpA 498 4,888 0.00
Holding
MarketValue
(£)
% ofTotal Net
Assets
MFE-MediaForEurope NVClass B 5,086 3,731 0.00
Credito Emiliano SpA 731 3,581 0.00RAI Way SpA 545 2,578 0.00MFE-MediaForEurope NV
Class A 5,086 2,489 0.00Piaggio & C. SpA 1,069 2,134 0.00Immobiliare Grande
Distribuzione SIIQ SpA 160 608 0.00Banca IFIS SpA 40 587 0.00Banca Monte dei Paschi di Siena
SpA 837 567 0.00Maire Tecnimont SpA 196 464 0.00Webuild SpA (MTAA) 318 434 0.00Juventus Football Club SpA 1,508 393 0.00Datalogic SpA 46 359 0.00Fincantieri SpA 527 257 0.00Biesse SpA 18 226 0.00Webuild SpA - Warrants
02/08/20301 28 12 0.00
11,179,223 0.62
Japan 5.89% (31 October 2021: 6.11%)
Toyota Motor Corp. 395,890 5,439,565 0.30Sony Corp. 40,700 2,807,368 0.16Keyence Corp. 6,000 1,949,064 0.11Mitsubishi UFJ Financial
Group Inc. 394,400 1,828,186 0.10Tokyo Electron Ltd. 4,918 1,676,797 0.09KDDI Corp. 53,743 1,432,264 0.08SoftBank Group Corp. 44,000 1,424,174 0.08Shin-Etsu Chemical Co. Ltd. 12,829 1,418,060 0.08Recruit Holdings Co. Ltd. 47,680 1,411,968 0.08Daiichi Sankyo Co. Ltd. 63,400 1,269,850 0.07Nintendo Co. Ltd. 3,400 1,252,039 0.07Honda Motor Co. Ltd. 55,700 1,170,071 0.07Takeda Pharmaceutical Co. Ltd. 49,900 1,154,375 0.06Hitachi Ltd. 30,400 1,134,048 0.06ITOCHU Corp. 44,100 1,065,746 0.06Daikin Industries Ltd. 8,500 1,047,459 0.06Mitsubishi Corp. 38,400 1,034,465 0.06Sumitomo Mitsui Financial
Group Inc. 42,500 1,022,115 0.06Mitsui & Co. Ltd. 50,700 981,817 0.06Hoya Corp. 11,700 933,625 0.05Murata Manufacturing Co. Ltd. 19,200 919,380 0.05Nippon Telegraph & Telephone
Corp. 38,100 901,072 0.05Tokio Marine Holdings Inc. 20,800 896,255 0.05Seven & i Holdings Co. Ltd. 25,400 892,717 0.05Nidec Corp. 15,800 829,423 0.05SoftBank Corp. 86,281 802,539 0.05Mizuho Financial Group Inc. 82,621 800,495 0.05FANUC Corp. 6,400 791,626 0.04Astellas Pharma Inc. 62,300 755,661 0.04Oriental Land Co. Ltd. 6,100 741,393 0.04SMC Corp. 1,900 736,346 0.04Denso Corp. 14,300 699,340 0.04Fujitsu Ltd. 6,000 689,033 0.04Fast Retailing Co. Ltd. 1,700 627,483 0.04ORIX Corp. 41,600 607,008 0.03Central Japan Railway Co. 5,800 584,768 0.03Canon Inc. 31,700 583,574 0.03Shiseido Co. Ltd. 15,000 565,280 0.03Mitsubishi Electric Corp. 66,999 562,847 0.03Komatsu Ltd. 31,100 558,284 0.03FUJIFILM Holdings Corp. 12,500 551,064 0.03Dai-ichi Life Holdings Inc. 34,200 546,653 0.03Terumo Corp. 22,700 543,278 0.03Bridgestone Corp. 18,300 536,301 0.03Mitsui Fudosan Co. Ltd. 31,700 534,951 0.03Chugai Pharmaceutical Co. Ltd. 21,500 515,881 0.03Japan Tobacco Inc. 37,634 513,740 0.03Panasonic Holdings Corp. 71,800 512,029 0.03Toshiba Corp. 15,300 507,922 0.03Olympus Corp. 35,600 505,233 0.03Kubota Corp. 36,200 493,497 0.03
Vanguard FTSE Global All Cap Index Fund
142

Holding
MarketValue
(£)
% ofTotal Net
Assets
East Japan Railway Co. 11,400 477,901 0.03Sumitomo Corp. 37,400 473,873 0.03Kao Corp. 14,500 466,210 0.03Marubeni Corp. 51,000 446,000 0.03Mitsubishi Estate Co. Ltd. 37,600 435,261 0.03Daiwa House Industry Co. Ltd. 22,500 434,611 0.03Shionogi & Co. Ltd. 9,600 428,883 0.02Kyocera Corp. 10,000 421,301 0.02Japan Post Holdings Co. Ltd. 74,030 413,698 0.02Shimano Inc. 2,800 400,903 0.02MS&AD Insurance Group
Holdings Inc. 16,700 398,449 0.02Nippon Steel Corp. 31,271 397,273 0.02Asahi Group Holdings Ltd. 12,769 381,745 0.02Suzuki Motor Corp. 15,700 376,616 0.02Sompo Holdings Inc. 11,300 367,074 0.02Secom Co. Ltd. 6,500 366,353 0.02Nippon Yusen KK 6,200 360,193 0.02M3 Inc. 13,900 358,988 0.02Otsuka Holdings Co. Ltd. 12,934 346,841 0.02Unicharm Corp. 12,400 344,871 0.02Aeon Co. Ltd. 22,500 341,381 0.02Bandai Namco Holdings Inc. 6,100 332,221 0.02Advantest Corp. 6,000 331,238 0.02Shimadzu Corp. 12,200 321,008 0.02Renesas Electronics Corp. 36,677 316,347 0.02Sysmex Corp. 5,900 312,260 0.02ENEOS Holdings Inc. 110,850 310,547 0.02Ajinomoto Co. Inc. 14,800 307,896 0.02Lasertec Corp. 2,800 304,680 0.02Kirin Holdings Co. Ltd. 25,500 297,385 0.02Inpex Corp. 31,400 295,347 0.02TDK Corp. 11,800 293,798 0.02Sumitomo Mitsui Trust
Holdings Inc. 11,800 292,347 0.02NTT Data Corp. 19,700 290,905 0.02Ono Pharmaceutical Co. Ltd. 14,152 289,891 0.02Eisai Co. Ltd. 8,300 288,959 0.02Nomura Holdings Inc. 93,048 285,958 0.02Resona Holdings Inc. 79,140 274,791 0.02Omron Corp. 5,700 270,558 0.02SG Holdings Co. Ltd. 18,700 263,033 0.02Nippon Building Fund Inc. 63 260,656 0.02Obic Co. Ltd. 2,200 260,355 0.02Nissan Chemical Corp. 6,100 258,756 0.02Mitsubishi Heavy Industries Ltd. 9,400 256,176 0.02Sumitomo Realty &
Development Co. Ltd. 12,100 255,371 0.02NEC Corp. 8,200 253,568 0.02Z Holdings Corp. 80,200 253,524 0.02Nitto Denko Corp. 4,700 251,957 0.02Asahi Kasei Corp. 38,300 251,821 0.02Sumitomo Metal Mining Co.
Ltd. 7,200 250,486 0.02Sekisui House Ltd. 18,000 249,811 0.02Kikkoman Corp. 5,500 245,477 0.01Dentsu Group Inc. 8,400 242,711 0.01West Japan Railway Co. 8,049 239,695 0.01Nexon Co. Ltd. 12,700 231,963 0.01Nissan Motor Co. Ltd. 72,800 231,340 0.01Subaru Corp. 18,900 227,503 0.01Nippon Paint Holdings Co. Ltd. 35,396 225,873 0.01Toyota Industries Corp. 4,700 224,796 0.01Yaskawa Electric Corp. 8,100 221,594 0.01Nomura Research Institute Ltd. 9,700 221,237 0.01Sumitomo Electric Industries
Ltd. 25,600 219,861 0.01Tokyo Gas Co. Ltd. 14,300 218,637 0.01Daiwa Securities Group Inc. 54,900 214,621 0.01Nitori Holdings Co. Ltd. 2,500 205,102 0.01Toyota Tsusho Corp. 7,100 204,712 0.01Suntory Beverage & Food Ltd. 6,500 204,595 0.01JFE Holdings Inc. 20,800 203,572 0.01Nippon Prologis REIT Inc. 91 201,119 0.01MEIJI Holdings Co. Ltd. 5,000 198,570 0.01Idemitsu Kosan Co. Ltd. 9,469 198,214 0.01
Holding
MarketValue
(£)
% ofTotal Net
Assets
Mitsui OSK Lines Ltd. 10,500 197,848 0.01Japan Exchange Group Inc. 16,300 195,555 0.01Mitsubishi Chemical Holdings
Corp. 39,500 192,494 0.01Taiyo Yuden Co. Ltd. 6,000 190,701 0.01Makita Corp. 7,900 187,711 0.01MISUMI Group Inc. 9,300 186,672 0.01Kobayashi Pharmaceutical Co.
Ltd. 3,400 185,611 0.01Japan Retail Fund Investment
Corp. 292 185,257 0.01MINEBEA MITSUMI Inc. 11,900 184,284 0.01Sumitomo Chemical Co. Ltd. 54,500 183,942 0.01SBI Holdings Inc. 10,200 182,413 0.01Toray Industries Inc. 47,400 180,348 0.01Disco Corp. 900 177,054 0.01Osaka Gas Co. Ltd. 12,200 175,804 0.01Odakyu Electric Railway Co. Ltd. 14,500 175,787 0.01AGC Inc. 5,800 173,826 0.01Daifuku Co. Ltd. 3,500 172,996 0.01Ebara Corp. 4,600 169,959 0.01Yamato Holdings Co. Ltd. 11,200 168,073 0.01T&D Holdings Inc. 16,200 166,320 0.01Tokyu Corp. 17,000 166,068 0.01Nikon Corp. 18,300 165,379 0.01Chubu Electric Power Co. Inc. 20,500 165,096 0.01Yamaha Motor Co. Ltd. 9,900 163,293 0.01Isuzu Motors Ltd. 17,400 162,166 0.01TOPPAN Inc. 12,200 161,404 0.01Yakult Honsha Co. Ltd. 3,911 161,333 0.01Daito Trust Construction Co. Ltd. 2,100 161,248 0.01TIS Inc. 8,900 160,423 0.01Yokogawa Electric Corp. 12,500 159,994 0.01Fuji Electric Co. Ltd. 4,517 159,395 0.01Tokyu Fudosan Holdings Corp. 38,200 158,988 0.01Japan Real Estate Investment
Corp. 41 158,291 0.01Kansai Electric Power Co. Inc. 22,500 157,412 0.01Yamaha Corp. 5,100 156,609 0.01Mitsubishi Gas Chemical Co.
Inc. 13,000 151,688 0.01Kakaku.com Inc. 9,000 151,547 0.01Trend Micro Inc. 3,400 151,541 0.01SUMCO Corp. 13,000 151,368 0.01GLP J-Reit 139 149,970 0.01NGK Insulators Ltd. 13,700 147,475 0.01Keio Corp. 4,800 147,250 0.01JSR Corp. 6,600 144,040 0.01Hamamatsu Photonics KK 4,000 143,856 0.01Kyowa Kirin Co. Ltd. 8,500 142,762 0.01Dai Nippon Printing Co. Ltd. 8,500 142,082 0.01Pan Pacific International
Holdings Corp. 11,500 141,962 0.01Nomura Real Estate Master
Fund Inc. 139 139,288 0.01NSD Co. Ltd. 9,800 138,991 0.01Tokyo Electric Power Co.
Holdings Inc. 49,300 135,477 0.01TOTO Ltd. 5,000 134,788 0.01Konami Holdings Corp. 2,700 133,288 0.01ANA Holdings Inc. 8,825 133,084 0.01Lixil Corp. 9,400 131,988 0.01Mitsui Chemicals Inc. 7,200 131,639 0.01Nippon Kayaku Co. Ltd. 18,900 131,529 0.01Rakuten Group Inc. 23,200 130,931 0.01Hankyu Hanshin Holdings Inc. 6,200 130,737 0.01Brother Industries Ltd. 9,300 129,384 0.01Daiwa House REIT Investment
Corp. 67 129,335 0.01Capcom Co. Ltd. 6,100 128,441 0.01Industrial & Infrastructure Fund
Investment Corp. 111 127,266 0.01Tosoh Corp. 11,300 124,558 0.01Kajima Corp. 14,000 124,540 0.01Ito En Ltd. 3,800 124,515 0.01Rohm Co. Ltd. 2,200 123,753 0.01
Vanguard FTSE Global All Cap Index Fund
143

Holding
MarketValue
(£)
% ofTotal Net
Assets
Mitsui Fudosan LogisticsPark Inc. 36 123,274 0.01
Rinnai Corp. 2,400 122,610 0.01Sojitz Corp. 9,959 121,409 0.01Japan Airport Terminal Co. Ltd. 3,600 119,290 0.01Toho Co. Ltd. 4,000 118,650 0.01Keisei Electric Railway Co. Ltd. 5,900 115,706 0.01Mazda Motor Corp. 20,200 115,242 0.01MonotaRO Co. Ltd. 8,300 115,216 0.01TKC Corp. 5,500 114,962 0.01Kawasaki Heavy Industries Ltd. 8,100 114,731 0.01Kawasaki Kisen Kaisha Ltd. 2,700 113,702 0.01Aisin Corp. 4,900 113,566 0.01NSK Ltd. 25,700 113,283 0.01Concordia Financial Group Ltd. 39,100 113,216 0.01Kobe Bussan Co. Ltd. 5,700 111,959 0.01Koito Manufacturing Co. Ltd. 3,800 111,667 0.01Matsumotokiyoshi Holdings Co.
Ltd. 4,210 111,292 0.01Oji Holdings Corp. 29,400 111,156 0.01Nissin Foods Holdings Co. Ltd. 2,000 111,150 0.01Kintetsu Group Holdings Co.
Ltd. 4,800 109,921 0.01Taisei Corp. 5,000 108,353 0.01Nippon Shinyaku Co. Ltd. 2,000 108,322 0.01Sekisui Chemical Co. Ltd. 9,900 107,057 0.01Kurita Water Industries Ltd. 3,900 107,053 0.01NET One Systems Co. Ltd. 5,600 106,896 0.01Obayashi Corp. 19,400 106,623 0.01BayCurrent Consulting Inc. 400 105,740 0.01Kyushu Railway Co. 6,700 105,198 0.01Azbil Corp. 4,300 104,947 0.01Bank of Kyoto Ltd. 3,000 104,388 0.01Showa Denko KK 6,714 104,138 0.01Nippon Electric Glass Co. Ltd. 6,400 103,163 0.01Hirose Electric Co. Ltd. 1,005 102,747 0.01Activia Properties Inc. 40 101,560 0.01Hoshizaki Corp. 2,000 101,314 0.01NH Foods Ltd. 4,000 100,945 0.01Chiba Bank Ltd. 21,700 99,653 0.01Sangetsu Corp. 10,400 99,548 0.01Kose Corp. 1,200 99,076 0.01Tobu Railway Co. Ltd. 5,500 98,800 0.01Ibiden Co. Ltd. 3,200 97,084 0.01Shizuoka Bank Ltd. 18,700 96,568 0.01Hitachi Construction Machinery
Co. Ltd. 5,300 95,305 0.01Ricoh Co. Ltd. 16,100 94,029 0.01Ain Holdings Inc. 2,600 93,187 0.01CyberAgent Inc. 10,900 92,809 0.01Nagoya Railroad Co. Ltd. 7,200 92,599 0.01Stanley Electric Co. Ltd. 6,700 92,017 0.01NGK Spark Plug Co. Ltd. 7,500 91,939 0.01TechnoPro Holdings Inc. 4,500 91,570 0.01Shinko Electric Industries Co.
Ltd. 2,600 91,109 0.01Hakuhodo DY Holdings Inc. 9,600 90,828 0.01Santen Pharmaceutical Co. Ltd. 13,700 89,361 0.01NIPPON EXPRESS
HOLDINGS Inc. 1,900 89,123 0.01Asahi Intecc Co. Ltd. 5,700 88,866 0.01Zensho Holdings Co. Ltd. 4,700 88,561 0.01NS Solutions Corp. 3,700 88,484 0.01Sega Sammy Holdings Inc. 6,200 87,971 0.01Advance Residence Investment
Corp. 39 85,355 0.01Nagase & Co. Ltd. 7,400 84,753 0.01Seiko Epson Corp. 7,500 83,778 0.01Square Enix Holdings Co. Ltd. 2,600 83,277 0.01Kinden Corp. 8,900 82,674 0.01Kyushu Electric Power Co. Inc. 16,500 82,468 0.01Persol Holdings Co. Ltd. 5,100 81,236 0.01Toyo Suisan Kaisha Ltd. 3,300 81,150 0.01United Urban Investment Corp. 93 81,072 0.01Japan Post Insurance Co. Ltd. 6,260 80,933 0.01Okinawa Electric Power Co. Inc. 10,156 80,355 0.01
Holding
MarketValue
(£)
% ofTotal Net
Assets
Aozora Bank Ltd. 5,000 79,951 0.01SCREEN Holdings Co. Ltd. 1,200 79,379 0.01Tsumura & Co. 4,000 78,322 0.01USS Co. Ltd. 5,900 78,274 0.01Fujitec Co. Ltd. 4,500 77,821 0.01Nihon M&A Center Holdings Inc. 7,800 77,347 0.01Ulvac Inc. 2,400 75,985 0.01Sumitomo Warehouse Co. Ltd. 5,600 75,154 0.01Japan Prime Realty Investment
Corp. 31 75,088 0.01THK Co. Ltd. 4,700 74,894 0.01GMO Payment Gateway Inc. 1,100 74,860 0.01Tohoku Electric Power Co. Inc. 16,900 74,805 0.01Dowa Holdings Co. Ltd. 2,200 74,793 0.01Chugoku Bank Ltd. 12,700 74,562 0.01Nippon Accommodations
Fund Inc. 19 74,522 0.01Fukuoka Financial Group Inc. 5,100 74,401 0.01Food & Life Cos Ltd. 3,900 74,326 0.01Yamada Holdings Co. Ltd. 31,300 74,275 0.01Nisshin Seifun Group Inc. 6,900 73,724 0.01Otsuka Corp. 2,800 73,416 0.01Kamigumi Co. Ltd. 5,400 73,333 0.01Japan Post Bank Co. Ltd. 12,000 72,371 0.01Trusco Nakayama Corp. 5,800 72,312 0.01Hitachi Metals Ltd. 5,800 72,276 0.01Isetan Mitsukoshi Holdings Ltd. 12,100 71,635 0.01Orix JREIT Inc. 66 71,046 0.01Kaken Pharmaceutical Co. Ltd. 2,900 70,065 0.01Pigeon Corp. 5,100 69,479 0.01Nabtesco Corp. 3,800 69,430 0.01Hulic Co. Ltd. 10,216 68,771 0.01Aica Kogyo Co. Ltd. 3,700 68,217 0.01Hitachi Transport System Ltd. 1,300 68,172 0.01Japan Steel Works Ltd. 3,000 67,871 0.01Amada Co. Ltd. 10,900 67,747 0.01Relia Inc. 10,300 67,627 0.01Iida Group Holdings Co. Ltd. 5,300 67,609 0.01Sumitomo Forestry Co. Ltd. 5,500 67,557 0.00Marui Group Co. Ltd. 4,900 67,537 0.00Welcia Holdings Co. Ltd. 4,100 67,500 0.00Koei Tecmo Holdings Co. Ltd. 2,756 67,094 0.00Fuji Corp. 4,900 65,700 0.00DIC Corp. 4,300 65,374 0.00Mirai Corp. 208 64,703 0.00Lawson Inc. 2,200 64,311 0.00Kadokawa Corp. 3,200 64,231 0.00Yoshinoya Holdings Co. Ltd. 4,400 63,838 0.00Tokyo Seimitsu Co. Ltd. 2,300 63,699 0.00IHI Corp. 3,500 63,669 0.00Shimizu Corp. 15,100 63,310 0.00COMSYS Holdings Corp. 3,800 63,215 0.00Hachijuni Bank Ltd. 24,100 63,116 0.00Internet Initiative Japan Inc. 2,500 63,091 0.00Daiseki Co. Ltd. 2,179 62,692 0.00Open House Group Co. Ltd. 2,000 61,723 0.00Ezaki Glico Co. Ltd. 2,700 61,664 0.00Frontier Real Estate Investment
Corp. 20 61,600 0.00Cosmo Energy Holdings Co. Ltd. 3,099 60,965 0.00SHIFT Inc. 400 60,862 0.00JGC Holdings Corp. 6,700 60,672 0.00AEON REIT Investment Corp. 66 60,538 0.00EDION Corp. 8,400 60,368 0.00Nippon Sanso Holdings Corp. 4,200 60,265 0.00Calbee Inc. 4,200 59,955 0.00Iyo Bank Ltd. 15,500 59,937 0.00Rohto Pharmaceutical Co. Ltd. 2,800 59,473 0.00Taisho Pharmaceutical Holdings
Co. Ltd. 1,900 59,454 0.00Kansai Paint Co. Ltd. 5,300 58,551 0.00Toyo Corp/Chuo-ku 9,100 58,294 0.00Kuraray Co. Ltd. 9,100 58,182 0.00Nippon Shokubai Co. Ltd. 1,800 57,874 0.00Money Forward Inc. 2,100 57,708 0.00Lion Corp. 7,000 57,622 0.00
Vanguard FTSE Global All Cap Index Fund
144
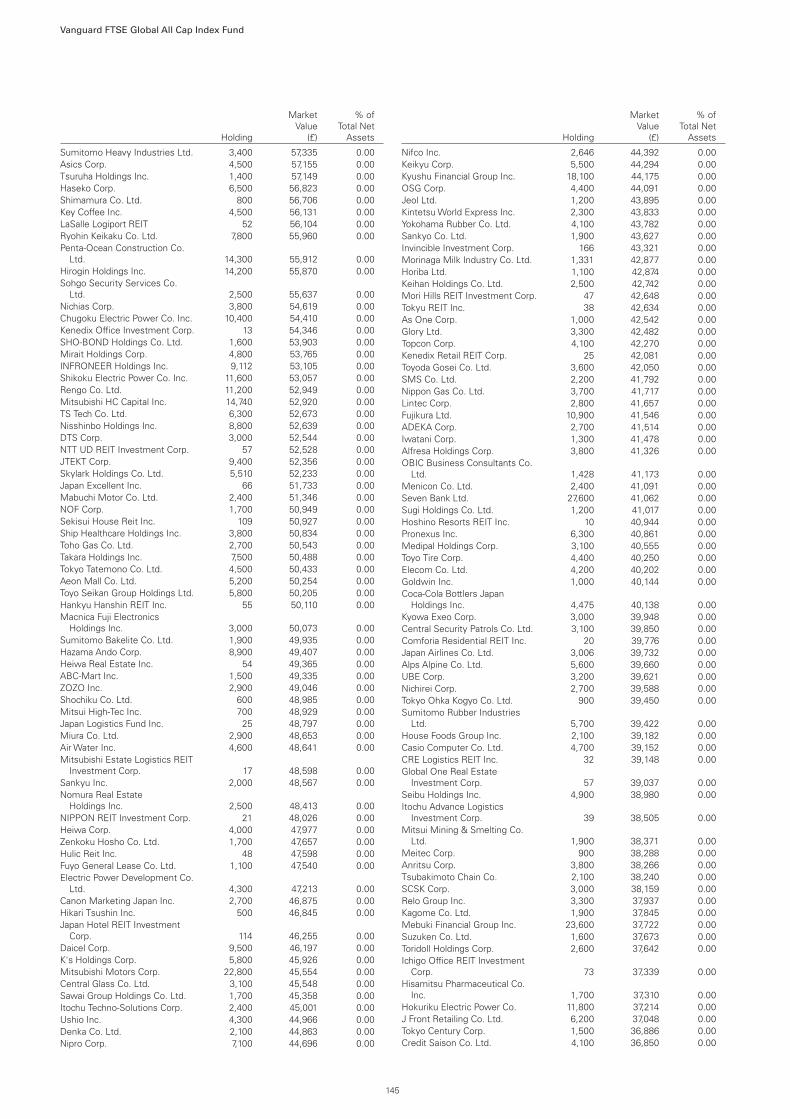
Holding
MarketValue
(£)
% ofTotal Net
Assets
Sumitomo Heavy Industries Ltd. 3,400 57,335 0.00Asics Corp. 4,500 57,155 0.00Tsuruha Holdings Inc. 1,400 57,149 0.00Haseko Corp. 6,500 56,823 0.00Shimamura Co. Ltd. 800 56,706 0.00Key Coffee Inc. 4,500 56,131 0.00LaSalle Logiport REIT 52 56,104 0.00Ryohin Keikaku Co. Ltd. 7,800 55,960 0.00Penta-Ocean Construction Co.
Ltd. 14,300 55,912 0.00Hirogin Holdings Inc. 14,200 55,870 0.00Sohgo Security Services Co.
Ltd. 2,500 55,637 0.00Nichias Corp. 3,800 54,619 0.00Chugoku Electric Power Co. Inc. 10,400 54,410 0.00Kenedix Office Investment Corp. 13 54,346 0.00SHO-BOND Holdings Co. Ltd. 1,600 53,903 0.00Mirait Holdings Corp. 4,800 53,765 0.00INFRONEER Holdings Inc. 9,112 53,105 0.00Shikoku Electric Power Co. Inc. 11,600 53,057 0.00Rengo Co. Ltd. 11,200 52,949 0.00Mitsubishi HC Capital Inc. 14,740 52,920 0.00TS Tech Co. Ltd. 6,300 52,673 0.00Nisshinbo Holdings Inc. 8,800 52,639 0.00DTS Corp. 3,000 52,544 0.00NTT UD REIT Investment Corp. 57 52,528 0.00JTEKT Corp. 9,400 52,356 0.00Skylark Holdings Co. Ltd. 5,510 52,233 0.00Japan Excellent Inc. 66 51,733 0.00Mabuchi Motor Co. Ltd. 2,400 51,346 0.00NOF Corp. 1,700 50,949 0.00Sekisui House Reit Inc. 109 50,927 0.00Ship Healthcare Holdings Inc. 3,800 50,834 0.00Toho Gas Co. Ltd. 2,700 50,543 0.00Takara Holdings Inc. 7,500 50,488 0.00Tokyo Tatemono Co. Ltd. 4,500 50,433 0.00Aeon Mall Co. Ltd. 5,200 50,254 0.00Toyo Seikan Group Holdings Ltd. 5,800 50,205 0.00Hankyu Hanshin REIT Inc. 55 50,110 0.00Macnica Fuji Electronics
Holdings Inc. 3,000 50,073 0.00Sumitomo Bakelite Co. Ltd. 1,900 49,935 0.00Hazama Ando Corp. 8,900 49,407 0.00Heiwa Real Estate Inc. 54 49,365 0.00ABC-Mart Inc. 1,500 49,335 0.00ZOZO Inc. 2,900 49,046 0.00Shochiku Co. Ltd. 600 48,985 0.00Mitsui High-Tec Inc. 700 48,929 0.00Japan Logistics Fund Inc. 25 48,797 0.00Miura Co. Ltd. 2,900 48,653 0.00Air Water Inc. 4,600 48,641 0.00Mitsubishi Estate Logistics REIT
Investment Corp. 17 48,598 0.00Sankyu Inc. 2,000 48,567 0.00Nomura Real Estate
Holdings Inc. 2,500 48,413 0.00NIPPON REIT Investment Corp. 21 48,026 0.00Heiwa Corp. 4,000 47,977 0.00Zenkoku Hosho Co. Ltd. 1,700 47,657 0.00Hulic Reit Inc. 48 47,598 0.00Fuyo General Lease Co. Ltd. 1,100 47,540 0.00Electric Power Development Co.
Ltd. 4,300 47,213 0.00Canon Marketing Japan Inc. 2,700 46,875 0.00Hikari Tsushin Inc. 500 46,845 0.00Japan Hotel REIT Investment
Corp. 114 46,255 0.00Daicel Corp. 9,500 46,197 0.00K's Holdings Corp. 5,800 45,926 0.00Mitsubishi Motors Corp. 22,800 45,554 0.00Central Glass Co. Ltd. 3,100 45,548 0.00Sawai Group Holdings Co. Ltd. 1,700 45,358 0.00Itochu Techno-Solutions Corp. 2,400 45,001 0.00Ushio Inc. 4,300 44,966 0.00Denka Co. Ltd. 2,100 44,863 0.00Nipro Corp. 7,100 44,696 0.00
Holding
MarketValue
(£)
% ofTotal Net
Assets
Nifco Inc. 2,646 44,392 0.00Keikyu Corp. 5,500 44,294 0.00Kyushu Financial Group Inc. 18,100 44,175 0.00OSG Corp. 4,400 44,091 0.00Jeol Ltd. 1,200 43,895 0.00Kintetsu World Express Inc. 2,300 43,833 0.00Yokohama Rubber Co. Ltd. 4,100 43,782 0.00Sankyo Co. Ltd. 1,900 43,627 0.00Invincible Investment Corp. 166 43,321 0.00Morinaga Milk Industry Co. Ltd. 1,331 42,877 0.00Horiba Ltd. 1,100 42,874 0.00Keihan Holdings Co. Ltd. 2,500 42,742 0.00Mori Hills REIT Investment Corp. 47 42,648 0.00Tokyu REIT Inc. 38 42,634 0.00As One Corp. 1,000 42,542 0.00Glory Ltd. 3,300 42,482 0.00Topcon Corp. 4,100 42,270 0.00Kenedix Retail REIT Corp. 25 42,081 0.00Toyoda Gosei Co. Ltd. 3,600 42,050 0.00SMS Co. Ltd. 2,200 41,792 0.00Nippon Gas Co. Ltd. 3,700 41,717 0.00Lintec Corp. 2,800 41,657 0.00Fujikura Ltd. 10,900 41,546 0.00ADEKA Corp. 2,700 41,514 0.00Iwatani Corp. 1,300 41,478 0.00Alfresa Holdings Corp. 3,800 41,326 0.00OBIC Business Consultants Co.
Ltd. 1,428 41,173 0.00Menicon Co. Ltd. 2,400 41,091 0.00Seven Bank Ltd. 27,600 41,062 0.00Sugi Holdings Co. Ltd. 1,200 41,017 0.00Hoshino Resorts REIT Inc. 10 40,944 0.00Pronexus Inc. 6,300 40,861 0.00Medipal Holdings Corp. 3,100 40,555 0.00Toyo Tire Corp. 4,400 40,250 0.00Elecom Co. Ltd. 4,200 40,202 0.00Goldwin Inc. 1,000 40,144 0.00Coca-Cola Bottlers Japan
Holdings Inc. 4,475 40,138 0.00Kyowa Exeo Corp. 3,000 39,948 0.00Central Security Patrols Co. Ltd. 3,100 39,850 0.00Comforia Residential REIT Inc. 20 39,776 0.00Japan Airlines Co. Ltd. 3,006 39,732 0.00Alps Alpine Co. Ltd. 5,600 39,660 0.00UBE Corp. 3,200 39,621 0.00Nichirei Corp. 2,700 39,588 0.00Tokyo Ohka Kogyo Co. Ltd. 900 39,450 0.00Sumitomo Rubber Industries
Ltd. 5,700 39,422 0.00House Foods Group Inc. 2,100 39,182 0.00Casio Computer Co. Ltd. 4,700 39,152 0.00CRE Logistics REIT Inc. 32 39,148 0.00Global One Real Estate
Investment Corp. 57 39,037 0.00Seibu Holdings Inc. 4,900 38,980 0.00Itochu Advance Logistics
Investment Corp. 39 38,505 0.00Mitsui Mining & Smelting Co.
Ltd. 1,900 38,371 0.00Meitec Corp. 900 38,288 0.00Anritsu Corp. 3,800 38,266 0.00Tsubakimoto Chain Co. 2,100 38,240 0.00SCSK Corp. 3,000 38,159 0.00Relo Group Inc. 3,300 37,937 0.00Kagome Co. Ltd. 1,900 37,845 0.00Mebuki Financial Group Inc. 23,600 37,722 0.00Suzuken Co. Ltd. 1,600 37,673 0.00Toridoll Holdings Corp. 2,600 37,642 0.00Ichigo Office REIT Investment
Corp. 73 37,339 0.00Hisamitsu Pharmaceutical Co.
Inc. 1,700 37,310 0.00Hokuriku Electric Power Co. 11,800 37,214 0.00J Front Retailing Co. Ltd. 6,200 37,048 0.00Tokyo Century Corp. 1,500 36,886 0.00Credit Saison Co. Ltd. 4,100 36,850 0.00
Vanguard FTSE Global All Cap Index Fund
145

Holding
MarketValue
(£)
% ofTotal Net
Assets
Maruha Nichiro Corp. 2,500 36,809 0.00Nihon Kohden Corp. 1,900 36,677 0.00Mori Trust Sogo Reit Inc. 42 36,510 0.00Star Asia Investment Corp. 100 36,456 0.00Zeon Corp. 4,300 36,454 0.00Kureha Corp. 600 36,001 0.00CTS Co. Ltd. 6,800 35,994 0.00Oracle Corp. Japan 700 35,976 0.00Daiwa Securities Living
Investments Corp. 51 35,931 0.00Shinsei Bank Ltd. 2,569 35,898 0.00Teijin Ltd. 4,200 35,761 0.00Nankai Electric Railway Co. Ltd. 2,500 35,703 0.00Yamazaki Baking Co. Ltd. 3,600 35,543 0.00Asahi Holdings Inc. 2,800 35,529 0.00Rorze Corp. 500 35,226 0.00Hokkaido Gas Co. Ltd. 3,800 35,042 0.00Sanwa Holdings Corp. 4,800 34,998 0.00Mitsubishi Materials Corp. 2,800 34,978 0.00Jaccs Co. Ltd. 1,700 34,489 0.00Mani Inc. 3,700 33,915 0.00Nagawa Co. Ltd. 600 33,861 0.00Resorttrust Inc. 2,500 33,705 0.00Dexerials Corp. 1,900 33,675 0.00Nishi-Nippon Railroad Co. Ltd. 2,100 33,631 0.00Taiheiyo Cement Corp. 2,600 33,566 0.00Shoei Foods Corp. 1,400 33,566 0.00Ringer Hut Co. Ltd. 2,400 33,065 0.00Seiren Co. Ltd. 2,600 32,911 0.00Hokkan Holdings Ltd. 4,200 32,120 0.00Okamura Corp. 4,300 31,643 0.00Daiwa Office Investment Corp. 7 31,630 0.00Nippon Parking Development
Co. Ltd. 33,400 31,621 0.00Daio Paper Corp. 3,300 31,405 0.00Justsystems Corp. 900 31,316 0.00Autobacs Seven Co. Ltd. 3,700 31,140 0.00Kewpie Corp. 2,300 30,952 0.00Kenedix Residential Next
Investment Corp. 24 30,896 0.00Juroku Financial Group Inc. 2,300 30,740 0.00Tokai Carbon Co. Ltd. 4,600 30,372 0.00BeNext-Yumeshin Group Co. 3,300 30,370 0.00H.U. Group Holdings Inc. 1,700 30,339 0.00BIPROGY Inc. 1,500 30,339 0.00GungHo Online
Entertainment Inc. 1,840 30,067 0.00Okumura Corp. 1,600 30,050 0.00Sumitomo Pharma Co. Ltd. 4,200 29,822 0.00Fuji Soft Inc. 700 29,779 0.00Cosmos Pharmaceutical Corp. 400 29,681 0.00Park24 Co. Ltd. 2,600 29,666 0.00SOSiLA Logistics REIT Inc. 30 29,048 0.00Sinko Industries Ltd. 2,900 29,024 0.00KH Neochem Co. Ltd. 1,900 28,804 0.00Sundrug Co. Ltd. 1,536 28,470 0.00Sharp Corp. 4,200 28,377 0.00Kyokuyo Co. Ltd. 1,400 28,015 0.00Tokai Rika Co. Ltd. 3,300 27,713 0.00Heiwado Co. Ltd. 2,300 27,587 0.00Meidensha Corp. 1,900 27,508 0.00Sotetsu Holdings Inc. 2,000 27,456 0.00Nojima Corp. 1,700 27,277 0.00Tenma Corp. 2,000 27,197 0.00ZERIA Pharmaceutical Co. Ltd. 2,200 26,860 0.00Nippon Paper Industries Co. Ltd. 4,200 26,595 0.00Infomart Corp. 6,500 26,134 0.00Airport Facilities Co. Ltd. 7,900 26,129 0.00Fancl Corp. 1,700 26,117 0.00Starts Corp Inc. 1,700 25,166 0.00Kumagai Gumi Co. Ltd. 1,500 25,027 0.00Rakus Co. Ltd. 2,500 24,775 0.00PeptiDream Inc. 1,900 24,483 0.00Hino Motors Ltd. 5,900 24,411 0.00Raiznext Corp. 3,700 24,384 0.00GMO internet Inc. 1,500 24,188 0.00
Holding
MarketValue
(£)
% ofTotal Net
Assets
Plenus Co. Ltd. 2,000 23,386 0.00PALTAC Corp. 800 23,287 0.00Toyota Boshoku Corp. 1,800 23,006 0.00Fukuoka REIT Corp. 23 22,906 0.00Konica Minolta Inc. 8,200 22,836 0.00Kaneka Corp. 1,053 22,528 0.00Japan Securities Finance Co.
Ltd. 3,900 22,466 0.00Seino Holdings Co. Ltd. 3,400 22,177 0.00Mitsubishi Logistics Corp. 1,200 22,132 0.00Takashimaya Co. Ltd. 3,000 21,744 0.00Fuji Oil Holdings Inc. 1,900 21,492 0.00Kobe Steel Ltd. 6,200 21,459 0.00ESPEC Corp. 2,000 21,320 0.00Hokkaido Electric Power Co. Inc. 7,200 21,291 0.00Hakuto Co. Ltd. 1,500 21,154 0.00Nishimatsu Construction Co.
Ltd. 900 21,108 0.00Ichiyoshi Securities Co. Ltd. 6,000 21,025 0.00Furukawa Co. Ltd. 2,700 20,997 0.00JCR Pharmaceuticals Co. Ltd. 1,400 20,863 0.00Furukawa Electric Co. Ltd. 1,600 20,843 0.00Tokuyama Corp. 1,957 20,826 0.00Acom Co. Ltd. 10,100 20,739 0.00Kohnan Shoji Co. Ltd. 900 20,665 0.00Hitachi Zosen Corp. 4,700 20,313 0.00Kisoji Co. Ltd. 1,600 20,273 0.00Tokyo Electron Device Ltd. 600 20,140 0.00St Marc Holdings Co. Ltd. 2,200 20,085 0.00Fujimori Kogyo Co. Ltd. 900 19,808 0.00Inabata & Co. Ltd. 1,500 19,596 0.00Benefit One Inc. 1,600 19,574 0.00Arcland Service Holdings Co.
Ltd. 1,400 19,339 0.00Toda Corp. 4,200 19,236 0.00Maruwa Co. Ltd. 200 18,763 0.00Amano Corp. 1,200 18,473 0.00Yamato Kogyo Co. Ltd. 700 18,031 0.00Pola Orbis Holdings Inc. 1,948 18,011 0.00Toagosei Co. Ltd. 2,700 17,727 0.00Nippon Suisan Kaisha Ltd. 5,000 17,613 0.00BRONCO BILLY Co. Ltd. 1,200 17,182 0.00DMG Mori Co. Ltd. 1,700 17,150 0.00Yaoko Co. Ltd. 400 16,795 0.00Mars Group Holdings Corp. 1,600 16,643 0.00Yamaguchi Financial Group Inc. 3,800 16,633 0.00Oki Electric Industry Co. Ltd. 3,200 16,623 0.00Monex Group Inc. 4,500 16,516 0.00Kandenko Co. Ltd. 3,200 16,171 0.00Central Sports Co. Ltd. 1,100 16,149 0.00Sakata Seed Corp. 600 16,119 0.00Pilot Corp. 500 16,107 0.00Tanseisha Co. Ltd. 3,300 16,088 0.00Shinwa Co. Ltd. 1,300 15,872 0.00Keihanshin Building Co. Ltd. 1,900 15,734 0.00Inaba Denki Sangyo Co. Ltd. 1,000 15,720 0.00Daiwabo Holdings Co. Ltd. 1,500 15,566 0.00Morinaga & Co. Ltd. 626 15,548 0.00Toho Zinc Co. Ltd. 900 15,481 0.00NS United Kaiun Kaisha Ltd. 700 15,449 0.00Toa Corp. 3,600 15,448 0.00Sansan Inc. 2,000 15,382 0.00Maruichi Steel Tube Ltd. 900 15,343 0.00GS Yuasa Corp. 1,100 15,310 0.00Mixi Inc. 1,100 15,168 0.00Citizen Watch Co. Ltd. 5,000 15,154 0.00NOK Corp. 2,200 14,986 0.00Katitas Co. Ltd. 800 14,976 0.00RENOVA Inc. 1,500 14,911 0.00Kanematsu Corp. 1,800 14,861 0.00Sanken Electric Co. Ltd. 500 14,831 0.00Fujiya Co. Ltd. 1,000 14,754 0.00FP Corp. 800 14,445 0.00Gunma Bank Ltd. 6,300 14,408 0.00Outsourcing Inc. 1,800 14,330 0.00Studio Alice Co. Ltd. 1,000 14,029 0.00
Vanguard FTSE Global All Cap Index Fund
146

Holding
MarketValue
(£)
% ofTotal Net
Assets
Descente Ltd. 900 13,971 0.00Wacom Co. Ltd. 2,400 13,928 0.00Pacific Metals Co. Ltd. 600 13,427 0.00Musashino Bank Ltd. 1,200 13,095 0.00Daiichikosho Co. Ltd. 600 13,076 0.00Fujita Kanko Inc. 900 13,036 0.00Nippon Steel Trading Corp. 400 13,033 0.00Chudenko Corp. 1,000 12,836 0.00Bic Camera Inc. 1,900 12,779 0.00DeNA Co. Ltd. 1,100 12,734 0.00Pasona Group Inc. 1,000 12,732 0.00Hokuetsu Corp. 3,100 12,673 0.00Kyudenko Corp. 700 12,630 0.00Kotobuki Spirits Co. Ltd. 300 12,615 0.00Benesse Holdings Inc. 900 12,593 0.00Noevir Holdings Co. Ltd. 400 12,517 0.00Takasago Thermal Engineering
Co. Ltd. 1,200 12,504 0.00Heiwa Real Estate Co. Ltd. 500 12,495 0.00AEON Financial Service Co. Ltd. 1,700 12,458 0.00Daishi Hokuetsu Financial
Group Inc. 800 12,379 0.00San-In Godo Bank Ltd. 3,100 12,292 0.00Asahi Co. Ltd. 1,500 12,255 0.00Roland DG Corp. 600 11,970 0.00Nissin Electric Co. Ltd. 1,400 11,946 0.00Raito Kogyo Co. Ltd. 1,000 11,914 0.00NHK Spring Co. Ltd. 2,300 11,891 0.00Taikisha Ltd. 600 11,785 0.00Sanrio Co. Ltd. 700 11,774 0.00Hanwa Co. Ltd. 600 11,711 0.00Toho Holdings Co. Ltd. 900 11,674 0.00Sapporo Holdings Ltd. 700 11,615 0.00Hokkoku Financial Holdings Inc. 500 11,465 0.00Showa Sangyo Co. Ltd. 700 11,288 0.00TOKAI Holdings Corp. 2,100 11,283 0.00Sumitomo Osaka Cement Co.
Ltd. 500 11,081 0.00Bank of the Ryukyus Ltd. 2,200 10,955 0.00H2O Retailing Corp. 2,100 10,922 0.0077 Bank Ltd. 1,100 10,915 0.00Hokuhoku Financial Group Inc. 2,000 10,795 0.00Digital Garage Inc. 400 10,611 0.00Toei Co. Ltd. 100 10,537 0.00Japan Elevator Service Holdings
Co. Ltd. 1,000 10,537 0.00Nippon Soda Co. Ltd. 500 10,513 0.00Fujimi Inc. 300 10,476 0.00Shinko Shoji Co. Ltd. 1,800 10,446 0.00Izumi Co. Ltd. 600 10,332 0.00NEC Networks & System
Integration Corp. 900 10,219 0.00Towa Pharmaceutical Co. Ltd. 600 10,170 0.00Komeri Co. Ltd. 600 10,096 0.00Nishi-Nippon Financial
Holdings Inc. 2,100 10,083 0.00Valor Holdings Co. Ltd. 800 10,038 0.00Milbon Co. Ltd. 300 9,996 0.00Fujitsu General Ltd. 700 9,954 0.00Sinanen Holdings Co. Ltd. 500 9,929 0.00Sanki Engineering Co. Ltd. 1,100 9,914 0.00Kitz Corp. 2,400 9,753 0.00Nikkon Holdings Co. Ltd. 800 9,674 0.00Takara Standard Co. Ltd. 1,200 9,590 0.00Pharma Foods International Co.
Ltd. 900 9,561 0.00Kokuyo Co. Ltd. 900 9,362 0.00Nippn Corp. 900 9,334 0.00Mizuho Leasing Co. Ltd. 500 9,237 0.00Awa Bank Ltd. 700 9,231 0.00DCM Holdings Co. Ltd. 1,400 9,175 0.00Information Services
International-Dentsu Ltd. 400 9,160 0.00Doutor Nichires Holdings Co.
Ltd. 1,000 9,160 0.00Toyobo Co. Ltd. 1,400 9,158 0.00Keiyo Bank Ltd. 3,000 9,148 0.00
Holding
MarketValue
(£)
% ofTotal Net
Assets
Daido Steel Co. Ltd. 400 9,099 0.00Wacoal Holdings Corp. 800 9,094 0.00Shiga Bank Ltd. 600 9,033 0.00Shoei Co. Ltd. 300 8,890 0.00Nanto Bank Ltd. 700 8,732 0.00JAFCO Group Co. Ltd. 900 8,687 0.00Senko Group Holdings Co. Ltd. 1,600 8,666 0.00Nakayama Steel Works Ltd. 3,300 8,663 0.00Totetsu Kogyo Co. Ltd. 600 8,624 0.00OKUMA Corp. 300 8,604 0.00Nihon Parkerizing Co. Ltd. 1,500 8,484 0.00Kato Sangyo Co. Ltd. 400 8,275 0.00Tokyo Steel Manufacturing Co.
Ltd. 1,000 8,250 0.00BML Inc. 400 8,213 0.00Akita Bank Ltd. 800 8,208 0.00Chugoku Marine Paints Ltd. 1,400 8,176 0.00Fuji Co. Ltd. 600 8,170 0.00Toshiba TEC Corp. 300 8,143 0.00NTN Corp. 6,389 8,130 0.00Kumiai Chemical Industry Co.
Ltd. 1,500 8,097 0.00Takuma Co. Ltd. 900 8,056 0.00Hiday Hidaka Corp. 700 7,991 0.00Nippon Light Metal Holdings Co.
Ltd. 780 7,974 0.00Hyakugo Bank Ltd. 3,700 7,802 0.00Kameda Seika Co. Ltd. 300 7,755 0.00Gecoss Corp. 1,600 7,712 0.00Joyful Honda Co. Ltd. 800 7,662 0.00Taiyo Holdings Co. Ltd. 400 7,635 0.00Wowow Inc. 800 7,579 0.00San-A Co. Ltd. 300 7,469 0.00Right On Co. Ltd. 1,700 7,410 0.00Noritz Corp. 800 7,402 0.00Japan Lifeline Co. Ltd. 1,100 7,331 0.00MCJ Co. Ltd. 1,400 7,307 0.00Shinmaywa Industries Ltd. 1,300 7,289 0.00Japan Material Co. Ltd. 600 7,267 0.00UT Group Co. Ltd. 400 7,249 0.00Ryoden Corp. 700 7,230 0.00Colowide Co. Ltd. 700 7,161 0.00Mandom Corp. 900 7,160 0.00Chukyo Bank Ltd. 700 7,088 0.00Kusuri no Aoki Holdings Co. Ltd. 200 7,082 0.00Fuso Chemical Co. Ltd. 300 7,082 0.00Systena Corp. 2,800 7,058 0.00Ministop Co. Ltd. 800 6,871 0.00Seiko Holdings Corp. 500 6,839 0.00Duskin Co. Ltd. 400 6,812 0.00Mochida Pharmaceutical Co.
Ltd. 300 6,796 0.00Tadano Ltd. 1,200 6,787 0.00Belc Co. Ltd. 200 6,738 0.00Fukuyama Transporting Co. Ltd. 300 6,704 0.00Solasto Corp. 1,200 6,617 0.00Matsuya Co. Ltd. 1,500 6,547 0.00Canon Electronics Inc. 700 6,408 0.00Ariake Japan Co. Ltd. 200 6,381 0.00Fuji Seal International Inc. 600 6,370 0.00Yokowo Co. Ltd. 400 6,290 0.00Shizuoka Gas Co. Ltd. 1,100 6,282 0.00Kintetsu Department Store Co.
Ltd. 400 6,280 0.00Ricoh Leasing Co. Ltd. 300 6,271 0.00CKD Corp. 600 6,263 0.00Eizo Corp. 300 6,243 0.00T Hasegawa Co. Ltd. 400 6,231 0.00DyDo Group Holdings Inc. 200 6,148 0.00Morita Holdings Corp. 800 6,099 0.00JCU Corp. 300 6,095 0.00Tomy Co. Ltd. 800 6,074 0.00Tri Chemical Laboratories Inc. 400 6,069 0.00Create Restaurants
Holdings Inc. 1,200 5,983 0.00Megmilk Snow Brand Co. Ltd. 500 5,945 0.00
Vanguard FTSE Global All Cap Index Fund
147

Holding
MarketValue
(£)
% ofTotal Net
Assets
Maruzen Showa Unyu Co. Ltd. 300 5,856 0.00Ogaki Kyoritsu Bank Ltd. 500 5,853 0.00Nippon Seiki Co. Ltd. 1,000 5,779 0.00Shibaura Machine Co. Ltd. 300 5,727 0.00Argo Graphics Inc. 300 5,644 0.00Maruwa Unyu Kikan Co. Ltd. 600 5,596 0.00Japan Aviation Electronics
Industry Ltd. 500 5,582 0.00Life Corp. 300 5,465 0.00TOMONY Holdings Inc. 2,700 5,461 0.00Sakai Moving Service Co. Ltd. 200 5,453 0.00Atom Corp. 1,200 5,444 0.00Sekisui Jushi Corp. 500 5,435 0.00Round One Corp. 600 5,356 0.00Paramount Bed Holdings Co.
Ltd. 400 5,329 0.00eGuarantee Inc. 400 5,317 0.00METAWATER Co. Ltd. 400 5,280 0.00Kiyo Bank Ltd. 600 5,267 0.00Prima Meat Packers Ltd. 400 5,233 0.00Saibu Gas Holdings Co. Ltd. 400 5,218 0.00Comture Corp. 300 5,218 0.00Kyokuto Securities Co. Ltd. 1,200 5,112 0.00Fuji Kyuko Co. Ltd. 200 5,060 0.00Ryoyo Electro Corp. 400 5,021 0.00Strike Co. Ltd. 200 4,869 0.00Orient Corp. 6,300 4,803 0.00Nitto Boseki Co. Ltd. 300 4,655 0.00KYORIN Holdings Inc. 400 4,645 0.00Daihen Corp. 200 4,574 0.00Digital Arts Inc. 100 4,506 0.00Change Inc. 400 4,483 0.00Nippon Signal Company Ltd. 800 4,431 0.00Itoham Yonekyu Holdings Inc. 1,100 4,416 0.00Arata Corp. 200 4,402 0.00Giken Ltd. 200 4,377 0.00CHIMNEY Co. Ltd. 600 4,242 0.00Zojirushi Corp. 500 4,214 0.00TBS Holdings Inc. 400 4,195 0.00Axial Retailing Inc. 200 4,162 0.00Yamazen Corp. 700 4,127 0.00Infocom Corp. 300 4,102 0.00Hogy Medical Co. Ltd. 200 3,990 0.00ASKUL Corp. 400 3,907 0.00Max Co. Ltd. 400 3,903 0.00Dai-Dan Co. Ltd. 300 3,903 0.00Teikoku Sen-I Co. Ltd. 400 3,898 0.00Takara Bio Inc. 300 3,860 0.00Shimizu Bank Ltd. 400 3,819 0.00en-japan Inc. 200 3,769 0.00Chubu Shiryo Co. Ltd. 600 3,766 0.00Marvelous Inc. 800 3,753 0.00Ohsho Food Service Corp. 100 3,744 0.00Create SD Holdings Co. Ltd. 200 3,653 0.00Aiful Corp. 1,600 3,649 0.00Nisshin Oillio Group Ltd. 200 3,606 0.00Kojima Co. Ltd. 900 3,513 0.00Yokogawa Bridge Holdings Corp. 300 3,506 0.00Prestige International Inc. 900 3,453 0.00GMO GlobalSign Holdings KK 100 3,412 0.00Earth Corp. 100 3,363 0.00Raksul Inc. 200 3,357 0.00Kappa Create Co. Ltd. 400 3,290 0.00Kurabo Industries Ltd. 300 3,285 0.00Tocalo Co. Ltd. 400 3,207 0.00Eiken Chemical Co. Ltd. 300 3,174 0.00Japan Petroleum Exploration Co.
Ltd. 200 3,146 0.00Mitsuuroko Group Holdings Co.
Ltd. 500 3,098 0.00Nippon Densetsu Kogyo Co. Ltd. 300 2,979 0.00Kyoritsu Maintenance Co. Ltd. 100 2,914 0.00Nichi-iko Pharmaceutical Co. Ltd. 600 2,866 0.00Mitsubishi Logisnext Co. Ltd. 600 2,825 0.00Okinawa Financial Group Inc. 200 2,732 0.00Honeys Holdings Co. Ltd. 400 2,624 0.00
Holding
MarketValue
(£)
% ofTotal Net
Assets
JINS Holdings Inc. 100 2,622 0.00IR Japan Holdings Ltd. 100 2,557 0.00Noritake Co. Ltd. 100 2,530 0.00Matsui Securities Co. Ltd. 500 2,471 0.00Makino Milling Machine Co. Ltd. 100 2,447 0.00Nissan Shatai Co. Ltd. 700 2,427 0.00Cybozu Inc. 300 2,403 0.00Toyo Ink SC Holdings Co. Ltd. 200 2,375 0.00Nagaileben Co. Ltd. 200 2,367 0.00Okamoto Industries Inc. 100 2,345 0.00Gunze Ltd. 100 2,308 0.00Nachi-Fujikoshi Corp. 100 2,308 0.00Nomura Co. Ltd. 400 2,193 0.00United Arrows Ltd. 200 2,153 0.00Optim Corp. 400 2,137 0.00Tokai Corp/Gifu 200 2,115 0.00Leopalace21 Corp. 1,700 2,038 0.00Teikoku Electric Manufacturing
Co. Ltd. 200 2,030 0.00Suruga Bank Ltd. 800 2,002 0.00Transcosmos Inc. 100 1,884 0.00Iriso Electronics Co. Ltd. 100 1,878 0.00Pacific Industrial Co. Ltd. 300 1,857 0.00S Foods Inc. 100 1,854 0.00MedPeer Inc. 100 1,854 0.00MOS Food Services Inc. 100 1,830 0.00KYB Corp. 100 1,810 0.00Aeon Delight Co. Ltd. 100 1,704 0.00Toa Oil Co. Ltd. 100 1,661 0.00euglena Co. Ltd. 300 1,588 0.00Kissei Pharmaceutical Co. Ltd. 100 1,576 0.00Sumitomo Mitsui Construction
Co. Ltd. 600 1,553 0.00FULLCAST Holdings Co. Ltd. 100 1,533 0.00Anicom Holdings Inc. 400 1,517 0.00Nippon Coke & Engineering Co.
Ltd. 1,800 1,505 0.00Modec Inc. 200 1,499 0.00Nikkiso Co. Ltd. 300 1,492 0.00Taiko Pharmaceutical Co. Ltd. 400 1,478 0.00Saizeriya Co. Ltd. 100 1,469 0.00Takeuchi Manufacturing Co. Ltd. 100 1,461 0.00Nichiha Corp. 100 1,445 0.00Shibuya Corp. 100 1,440 0.00Idec Corp. 100 1,418 0.00HIS Co. Ltd. 100 1,362 0.00Funai Soken Holdings Inc. 100 1,338 0.00Adastria Co. Ltd. 100 1,312 0.00Nextage Co. Ltd. 100 1,231 0.00eRex Co. Ltd. 100 1,221 0.00Kanamoto Co. Ltd. 100 1,194 0.00San-Ai Obbli Co. Ltd. 200 1,167 0.00ASAHI YUKIZAI Corp. 100 1,161 0.00Zenrin Co. Ltd. 200 1,161 0.00Shima Seiki Manufacturing Ltd. 100 1,137 0.00Maezawa Kyuso Industries Co.
Ltd. 200 1,125 0.00Tokyo Kiraboshi Financial
Group Inc. 100 1,079 0.00Optex Group Co. Ltd. 100 1,056 0.00Ai Holdings Corp. 100 1,051 0.00Exedy Corp. 100 953 0.00Koshidaka Holdings Co. Ltd. 200 953 0.00Koa Corp. 100 944 0.00Curves Holdings Co. Ltd. 200 939 0.00ST Corp. 100 925 0.00Komatsu Matere Co. Ltd. 100 923 0.00Alconix Corp. 100 866 0.00San ju San Financial Group Inc. 100 865 0.00Kenko Mayonnaise Co. Ltd. 100 852 0.00Nissha Co. Ltd. 100 847 0.00Kyokuto Kaihatsu Kogyo Co. Ltd. 100 804 0.00FCC Co. Ltd. 100 798 0.00Mitsubishi Pencil Co. Ltd. 100 771 0.00Kourakuen Holdings Corp. 100 769 0.00Hosiden Corp. 100 765 0.00
Vanguard FTSE Global All Cap Index Fund
148

Holding
MarketValue
(£)
% ofTotal Net
Assets
YA-MAN Ltd. 100 763 0.00Nippon Sheet Glass Co. Ltd. 300 725 0.00Maxell Ltd. 100 714 0.00Tokai Tokyo Financial
Holdings Inc. 300 712 0.00Fuji Media Holdings Inc. 100 688 0.00Sagami Holdings Corp. 100 687 0.00Topre Corp. 100 679 0.00Rheon Automatic Machinery Co.
Ltd. 100 676 0.00Tamura Corp. 200 676 0.00Tosei Corp. 100 671 0.00United Super Markets
Holdings Inc. 100 670 0.00Ryobi Ltd. 100 660 0.00Nippon Yakin Kogyo Co. Ltd. 40 625 0.00Nippon Thompson Co. Ltd. 200 621 0.00Sakata INX Corp. 100 603 0.00Tsubaki Nakashima Co. Ltd. 100 576 0.00Ichigo Inc. 300 535 0.00Chiyoda Corp. 200 532 0.00Seikagaku Corp. 100 517 0.00Unipres Corp. 100 459 0.00North Pacific Bank Ltd. 300 454 0.00Broadleaf Co. Ltd. 200 454 0.00Senshu Ikeda Holdings Inc. 400 435 0.00Takamiya Co. Ltd. 200 434 0.00Futaba Corp. 100 407 0.00Aoyama Trading Co. Ltd. 100 405 0.00Nippon Denko Co. Ltd. 200 389 0.00Tokyu Construction Co. Ltd. 100 370 0.00Aruhi Corp. 60 368 0.00COOKPAD Inc. 200 334 0.00Daikyonishikawa Corp. 100 309 0.00Onward Holdings Co. Ltd. 200 296 0.00KLab Inc. 100 273 0.00FAN Communications Inc. 100 265 0.00Gurunavi Inc. 100 261 0.00Futaba Industrial Co. Ltd. 100 242 0.00Ichikoh Industries Ltd. 100 231 0.00Mitsui E&S Holdings Co. Ltd. 100 216 0.00Yamashin-Filter Corp. 100 213 0.00Tokyo Base Co. Ltd. 100 202 0.00Japan Display Inc. 300 124 0.00Robot Home Inc. 100 123 0.00Kitanotatsujin Corp. 100 106 0.00Istyle Inc. 100 97 0.00
106,702,437 5.89
Jersey 0.00% (31 October 2021: 0.00%)
Kuwait 0.10% (31 October 2021: 0.07%)
National Bank of Kuwait SAKP 234,706 641,746 0.04Kuwait Finance House KSCP 152,164 389,557 0.02Ahli United Bank BSC 206,615 168,622 0.01Agility Public Warehousing Co.
KSC 34,250 111,274 0.01Mobile Telecommunications Co.
KSCP 62,246 110,175 0.01Boubyan Bank KSCP 25,715 65,566 0.01Gulf Bank KSCP 68,008 60,275 0.00National Industries Group
Holding SAK 70,440 57,670 0.00Mabanee Co. KPSC 22,822 49,470 0.00Boubyan Petrochemicals Co.
KSCP 18,495 48,840 0.00Qurain Petrochemical Industries
Co. 45,142 43,881 0.00Humansoft Holding Co. KSC 4,991 43,327 0.00Boursa Kuwait Securities Co.
KPSC 4,779 32,916 0.00Warba Bank KSCP 21,633 15,575 0.00Kuwait Projects Co. Holding
KSCP 19,021 9,690 0.00Burgan Bank SAK 11,086 8,500 0.00Alimtiaz Investment Group KSC 5,691 1,805 0.00
Holding
MarketValue
(£)
% ofTotal Net
Assets
Kuwait International Bank KSCP 2,285 1,437 0.00Integrated Holding Co. KCSC 1,141 1,299 0.00
1,861,625 0.10
Malaysia 0.20% (31 October 2021: 0.19%)
Public Bank Bhd. 483,900 415,215 0.02Malayan Banking Bhd. 223,500 370,468 0.02CIMB Group Holdings Bhd. 223,800 212,916 0.01Tenaga Nasional Bhd. 119,508 197,219 0.01Petronas Chemicals Group Bhd. 84,900 158,435 0.01Malaysia Airports Holdings Bhd. 112,200 140,819 0.01Press Metal Aluminium Holdings
Bhd. 103,100 112,799 0.01IHH Healthcare Bhd. 92,700 112,105 0.01IOI Corp. Bhd. 130,200 111,005 0.01PPB Group Bhd. 34,900 109,569 0.01Sime Darby Plantation Bhd. 101,200 96,834 0.01MISC Bhd. 64,654 92,383 0.01DiGi.Com Bhd. 118,700 82,741 0.01Kuala Lumpur Kepong Bhd. 15,000 80,738 0.01Alliance Bank Malaysia Bhd. 117,000 80,272 0.01Dialog Group Bhd. 164,900 75,423 0.01Axiata Group Bhd. 113,400 72,822 0.01Nestle Malaysia Bhd. 2,800 68,235 0.01IJM Corp. Bhd. 200,200 67,028 0.00AMMB Holdings Bhd. 97,100 65,553 0.00Sime Darby Bhd. 150,700 64,517 0.00Top Glove Corp. Bhd. 193,800 59,567 0.00Gamuda Bhd. 83,300 56,541 0.00Hong Leong Bank Bhd. 14,600 56,041 0.00Genting Bhd. 63,900 54,012 0.00Genting Malaysia Bhd. 93,100 51,951 0.00QL Resources Bhd. 54,190 50,662 0.00Maxis Bhd. 67,800 47,136 0.00Petronas Gas Bhd. 14,900 46,288 0.00RHB Bank Bhd. 40,100 45,633 0.00Hartalega Holdings Bhd. 54,600 43,953 0.00Mega First Corp. BHD 59,200 40,941 0.00PanPages Bhd 67,700 31,461 0.00My EG Services Bhd. 152,700 26,121 0.00Inari Amertron Bhd. 49,600 25,772 0.00MR DIY Group M Bhd 35,600 22,666 0.00TIME dotCom Bhd. 24,000 19,540 0.00Scientex BHD 27,300 19,030 0.00Petronas Dagangan Bhd. 4,300 17,103 0.00D&O Green Technologies Bhd 20,500 14,740 0.00Hong Leong Financial Group
Bhd. 3,400 12,068 0.00Frontken Corp. Bhd. 22,800 11,596 0.00VS Industry Bhd. 62,800 11,490 0.00Carlsberg Brewery Malaysia
Bhd. 2,700 10,927 0.00Telekom Malaysia Bhd. 11,100 10,113 0.00Genting Plantations Bhd. 5,600 9,323 0.00Supermax Corp. Bhd. 45,870 9,315 0.00Westports Holdings Bhd. 12,200 8,794 0.00Bursa Malaysia Bhd. 6,900 8,660 0.00Fraser & Neave Holdings Bhd. 2,000 8,416 0.00KPJ Healthcare Bhd. 46,700 8,074 0.00Pentamaster Corp. Bhd. 12,900 8,001 0.00Sunway Real Estate Investment
Trust 28,500 7,561 0.00YTL Corp. Bhd. 63,330 7,357 0.00Sunway Bhd. 18,000 5,994 0.00Kossan Rubber Industries 17,000 5,661 0.00Yinson Holdings Bhd. 12,600 5,625 0.00Axis Real Estate Investment
Trust 13,100 4,554 0.00British American Tobacco
Malaysia Bhd. 1,900 4,484 0.00Padini Holdings Bhd. 1,600 984 0.00Sports Toto Bhd. 2,020 713 0.00Malaysia Building Society Bhd. 4,400 511 0.00Bumi Armada Bhd. 6,200 482 0.00Lotte Chemical Titan Holding
Bhd. 1,200 481 0.00SP Setia Group Bhd. 2,100 449 0.00
Vanguard FTSE Global All Cap Index Fund
149

Holding
MarketValue
(£)
% ofTotal Net
Assets
Astro Malaysia Holdings Bhd. 2,200 398 0.00Sapura Energy Bhd. 47,400 303 0.00Cahya Mata Sarawak Bhd. 1,100 215 0.00Velesto Energy Bhd. 4,944 108 0.00Velesto Energy Bhd. - Warrants
18/10/2024 952 6 0.00
3,678,917 0.20
Mexico 0.25% (31 October 2021: 0.23%)
America Movil SAB de CV 1,028,400 796,699 0.04Grupo Financiero Banorte SAB
de CV Class O 100,310 525,374 0.03Wal-Mart de Mexico SAB de CV 172,200 483,880 0.03Grupo Mexico SAB de CV
Class B 120,600 447,845 0.03Fomento Economico Mexicano
SAB de CV 57,203 340,746 0.02Grupo Bimbo SAB de CV
Class A 78,900 193,440 0.01Cemex SAB de CV 425,024 148,792 0.01Grupo Aeroportuario del Pacifico
SAB de CV Class B 11,300 138,425 0.01Grupo Aeroportuario del Sureste
SAB de CV Class B 6,975 121,140 0.01Arca Continental SAB de CV 23,200 116,231 0.01Operadora de Sites Mexicanos
SA de CV 103,100 100,191 0.01Grupo Elektra SAB DE CV 2,035 96,020 0.01Grupo Televisa SAB 61,600 90,611 0.01Grupo Comercial Chedraui SA de
CV 44,900 90,105 0.01Fibra Uno Administracion SA de
CV 97,200 84,595 0.01Alsea SAB de CV 45,200 78,712 0.00Grupo Financiero Inbursa SAB
de CV Class O 56,800 76,257 0.00Coca-Cola Femsa SAB de CV 16,970 73,204 0.00Promotora y Operadora de
Infraestructura SAB de CV 10,185 59,024 0.00Alfa SAB de CV Class A 108,200 57,683 0.00Gruma SAB de CV Class B 5,125 48,444 0.00Orbia Advance Corp. SAB de CV 23,625 45,225 0.00GCC SAB de CV 7,900 41,346 0.00Grupo Aeroportuario del Centro
Norte SAB de CV 7,389 41,013 0.00Concentradora Fibra Danhos SA
de CV 42,100 37,347 0.00Corp. Inmobiliaria Vesta SAB de
CV 24,600 36,253 0.00Regional SAB de CV 6,600 31,603 0.00Controladora Vuela Cia de
Aviacion SAB de CV 23,400 29,781 0.00Banco del Bajio SA 14,300 27,916 0.00La Comer SAB de CV 16,645 24,296 0.00Becle SAB de CV 9,200 18,236 0.00Prologis Property Mexico SA de
CV 8,369 17,866 0.00Grupo Carso SAB de CV
Class A1 6,400 16,760 0.00Industrias Penoles SAB de CV 1,730 15,072 0.00Qualitas Controladora SAB de
CV 2,500 10,707 0.00El Puerto de Liverpool SAB de
CV 2,400 9,603 0.00Kimberly-Clark de Mexico SAB
de CV Class A 7,800 8,645 0.00PLA Administradora Industrial S
de RL de CV 7,900 8,328 0.00Genomma Lab Internacional
SAB de CV Class B 9,400 7,847 0.00Bolsa Mexicana de Valores SAB
de CV 4,800 7,484 0.00Macquarie Mexico Real Estate
Management SA de CV 7,100 6,221 0.00Nemak SAB de CV 33,715 5,763 0.00Megacable Holdings SAB de CV 1,900 4,301 0.00Gentera SAB de CV 4,600 2,820 0.00Alpek SAB de CV 1,400 1,497 0.00
Holding
MarketValue
(£)
% ofTotal Net
Assets
Industrias Bachoco SAB de CVClass B 300 903 0.00
Axtel SAB de CV 5,600 476 0.00
4,624,727 0.25
Netherlands 0.98% (31 October 2021: 1.22%)
ASML Holding NV 12,497 5,754,417 0.32Adyen NV 961 1,310,560 0.07Prosus NV 28,566 1,118,297 0.06ING Groep NV 124,629 952,543 0.05Koninklijke Ahold Delhaize NV 31,368 740,246 0.04Koninklijke DSM NV 5,424 731,720 0.04Wolters Kluwer NV 8,315 674,784 0.04Heineken NV 7,957 624,470 0.04Koninklijke Philips NV 29,151 612,240 0.03Universal Music Group BV 26,225 490,739 0.03ArcelorMittal SA 19,961 471,391 0.03NN Group NV 10,115 398,955 0.02ASM International NV 1,637 398,760 0.02Akzo Nobel NV 5,269 367,912 0.02IMCD NV 2,315 297,033 0.02Koninklijke KPN NV 105,354 290,451 0.02Heineken Holding NV 3,647 228,760 0.01Aegon NV 51,691 215,607 0.01Unibail-Rodamco-Westfield
(XAMS) 3,139 179,356 0.01Signify NV 4,343 148,160 0.01Randstad NV 3,287 140,417 0.01ASR Nederland NV 3,807 138,639 0.01Aalberts NV 3,225 126,333 0.01ABN AMRO Bank NV 11,557 116,434 0.01BE Semiconductor Industries NV 2,345 115,742 0.01OCI NV 3,602 109,927 0.01Boskalis Westminster 3,210 89,279 0.01Just Eat Takeaway.com NV 3,708 81,927 0.01SBM Offshore NV 5,970 69,226 0.01Arcadis NV 2,021 67,791 0.00Intertrust NV 3,498 57,550 0.00Galapagos NV (XAMS) 1,205 56,681 0.00Basic-Fit NV 1,663 55,978 0.00JDE Peet's NV 2,271 53,354 0.00TKH Group NV 1,274 50,121 0.00Fugro NV 5,028 49,557 0.00APERAM SA 1,584 49,286 0.00Koninklijke Vopak NV 2,183 46,995 0.00Accell Group NV 945 45,459 0.00PostNL NV 15,749 41,394 0.00Alfen Beheer BV 549 39,672 0.00Corbion NV 1,382 38,367 0.00Just Eat Takeaway.com NV ADR 7,354 31,572 0.00CTP NV 2,274 25,642 0.00AMG Advanced Metallurgical
Group NV 728 22,964 0.00InPost SA 4,037 19,810 0.00Unibail-Rodamco-Westfield
(XPAR) 255 14,570 0.00Eurocommercial Properties NV 651 12,636 0.00NSI NV 340 10,628 0.00Flow Traders 241 6,257 0.00Koninklijke BAM Groep NV 2,056 4,571 0.00Sligro Food Group NV 199 3,737 0.00Vastned Retail NV 142 2,888 0.00TomTom NV 213 1,485 0.00Wereldhave NV 59 772 0.00ForFarmers NV 131 323 0.00
17,804,385 0.98
New Zealand 0.10% (31 October 2021: 0.10%)
Spark New Zealand Ltd. 75,048 190,882 0.01Fisher & Paykel Healthcare Corp.
Ltd. 17,089 189,763 0.01Auckland International Airport
Ltd. 30,003 121,447 0.01Skellerup Holdings Ltd. 36,136 106,856 0.01Contact Energy Ltd. 25,341 106,768 0.01EBOS Group Ltd. 4,859 106,506 0.01Mainfreight Ltd. 2,223 91,880 0.01
Vanguard FTSE Global All Cap Index Fund
150

Holding
MarketValue
(£)
% ofTotal Net
Assets
Freightways Ltd. 13,792 86,273 0.01Meridian Energy Ltd. 31,674 77,614 0.01Fletcher Building Ltd. 24,075 76,916 0.01a2 Milk Co. Ltd. 29,686 74,124 0.00Summerset Group Holdings Ltd. 12,129 73,425 0.00Z Energy Ltd.1 36,760 71,644 0.00Mercury NZ Ltd. 21,525 67,434 0.00Kiwi Property Group Ltd. 110,873 60,757 0.00Chorus Ltd. 14,386 54,662 0.00Infratil Ltd. 11,784 50,928 0.00Ryman Healthcare Ltd. 9,669 45,837 0.00Arvida Group Ltd. 42,720 35,777 0.00SKYCITY Entertainment Group
Ltd. 20,181 29,629 0.00Genesis Energy Ltd. 13,488 19,942 0.00Goodman Property Trust 15,994 18,604 0.00Precinct Properties New Zealand
Ltd. 9,913 7,789 0.00Pushpay Holdings Ltd. 10,948 7,414 0.00Vector Ltd. 3,274 7,346 0.00KMD Brands Ltd. 4,375 3,099 0.00Vital Healthcare Property Trust1 1,587 2,560 0.00Argosy Property Ltd. 2,980 2,010 0.00Air New Zealand Ltd. 3,853 1,743 0.00Air New Zealand Ltd. Rights
02/05/20221 3,853 1,414 0.00Synlait Milk Ltd. 446 761 0.00SKY Network Television Ltd. 546 737 0.00Tourism Holdings Ltd. 7 11 0.00
1,792,552 0.10
Norway 0.24% (31 October 2021: 0.24%)
Equinor ASA 30,805 845,516 0.05DNB Bank ASA 33,972 533,529 0.03Mowi ASA 15,351 349,360 0.02Yara International ASA 7,327 301,112 0.02Norsk Hydro ASA 40,841 279,118 0.02Telenor ASA 19,468 221,194 0.01Salmar ASA 2,362 155,993 0.01Orkla ASA 22,301 145,585 0.01Kongsberg Gruppen ASA 3,307 114,729 0.01Aker BP ASA 3,749 109,102 0.01TOMRA Systems ASA 3,312 105,502 0.01Storebrand ASA 11,718 82,188 0.01Nordic Semiconductor ASA 4,931 80,708 0.01Bakkafrost P/F 1,352 74,900 0.01Gjensidige Forsikring ASA 4,130 71,182 0.01Borregaard ASA 4,488 69,064 0.00Subsea 7 SA 10,323 68,820 0.00SpareBank 1 SMN 5,626 63,393 0.00TGS ASA 5,058 63,393 0.00Scatec ASA 5,654 55,757 0.00Adevinta ASA 8,635 54,297 0.00Entra ASA 3,502 46,586 0.00Leroy Seafood Group ASA 6,108 46,292 0.00Aker ASA Class A 669 44,040 0.00Atea ASA 4,347 41,921 0.00Schibsted ASA Class B 2,683 41,632 0.00NEL ASA 35,226 40,942 0.00Crayon Group Holding ASA 3,258 38,772 0.00Veidekke ASA 3,558 36,989 0.00Bonheur ASA 1,246 36,857 0.00Schibsted ASA Class A 2,150 36,339 0.00Aker Carbon Capture ASA 21,411 35,456 0.00MPC Container Ships AS 12,831 31,044 0.00SpareBank 1 SR-Bank ASA 2,811 28,838 0.00Austevoll Seafood ASA 1,416 18,134 0.00BW Offshore Ltd. 7,525 17,499 0.00Kahoot! ASA 8,219 16,281 0.00Grieg Seafood ASA 804 9,664 0.00DNO ASA 4,168 5,153 0.00BW LPG Ltd. 879 4,490 0.00Elkem ASA 916 3,089 0.00Stolt-Nielsen Ltd. 79 1,143 0.00Wallenius Wilhelmsen ASA 142 718 0.00
4,426,321 0.24
Holding
MarketValue
(£)
% ofTotal Net
Assets
Pakistan 0.01% (31 October 2021: 0.01%)
Fauji Fertilizer Co. Ltd. 76,807 39,719 0.01MCB Bank Ltd. 35,173 22,775 0.00Bank Alfalah Ltd. 87,750 13,207 0.00Lucky Cement Ltd. 4,745 11,506 0.00Nishat Mills Ltd. 15,200 5,358 0.00Engro Fertilizers Ltd. 13,000 5,282 0.00Hub Power Co. Ltd. 12,957 3,801 0.00Engro Corp. Ltd. 770 918 0.00Pakistan Oilfields Ltd. 360 584 0.00Habib Bank Ltd. 1,100 511 0.00Pakistan State Oil Co. Ltd. 685 499 0.00Oil & Gas Development Co. Ltd. 1,100 399 0.00Pakistan Petroleum Ltd. 1,242 392 0.00United Bank Ltd. 600 353 0.00DG Khan Cement Co. Ltd. 1,000 287 0.00
105,591 0.01
Philippines 0.08% (31 October 2021: 0.09%)
SM Prime Holdings Inc. 313,800 167,568 0.01Ayala Land Inc. 292,250 142,907 0.01BDO Unibank Inc. 66,955 132,800 0.01Ayala Corp. 9,725 109,278 0.01International Container Terminal
Services Inc. 32,150 105,461 0.01PLDT Inc. 3,530 100,498 0.01JG Summit Holdings Inc. 109,187 92,789 0.01Universal Robina Corp. 58,570 91,595 0.01Bank of the Philippine Islands 54,975 79,598 0.00Manila Electric Co. 12,750 67,890 0.00Metropolitan Bank & Trust Co. 58,853 45,884 0.00Jollibee Foods Corp. 12,640 41,463 0.00Monde Nissin Corp. 203,600 40,258 0.00Globe Telecom Inc. 1,070 37,058 0.00Wilcon Depot Inc. 85,900 36,434 0.00Converge Information and
Communications TechnologySolutions Inc. 63,500 27,515 0.00
Security Bank Corp. 16,130 25,348 0.00San Miguel Food and
Beverage Inc. 26,140 24,188 0.00AC Energy Corp. 218,600 24,080 0.00Metro Pacific Investments Corp. 186,300 10,801 0.00GT Capital Holdings Inc. 1,303 10,020 0.00Aboitiz Power Corp. 20,200 9,878 0.00Alliance Global Group Inc. 53,900 9,654 0.00Megaworld Corp. 192,000 8,349 0.00San Miguel Corp. 5,110 8,280 0.00Robinsons Retail Holdings Inc. 8,990 7,338 0.00DMCI Holdings Inc. 58,000 7,256 0.00Century Pacific Food Inc. 20,700 6,932 0.00Puregold Price Club Inc. 12,500 6,198 0.00Robinsons Land Corp. 21,137 6,166 0.00LT Group Inc. 35,500 4,615 0.00Semirara Mining & Power Corp. 1,840 769 0.00Bloomberry Resorts Corp. 5,900 545 0.00D&L Industries Inc. 5,100 543 0.00Manila Water Co. Inc. 1,900 530 0.00Cebu Air Inc. 740 498 0.00First Gen Corp. 938 333 0.00
1,491,317 0.08
Poland 0.07% (31 October 2021: 0.09%)
Powszechna Kasa OszczednosciBank Polski SA 33,429 196,803 0.01
Polski Koncern Naftowy ORLENSA 11,652 157,273 0.01
Grupa Lotos SA 8,422 104,908 0.01KGHM Polska Miedz SA 3,953 102,809 0.01Bank Polska Kasa Opieki SA 4,941 86,911 0.01Dino Polska SA 1,676 86,637 0.01Powszechny Zaklad Ubezpieczen
SA 15,164 83,558 0.01LPP SA 29 48,954 0.00Orange Polska SA 40,413 48,599 0.00Polskie Gornictwo Naftowe i
Gazownictwo SA 38,716 43,154 0.00
Vanguard FTSE Global All Cap Index Fund
151

Holding
MarketValue
(£)
% ofTotal Net
Assets
Asseco Poland SA 3,017 41,724 0.00Allegro.eu SA 9,910 40,964 0.00Santander Bank Polska SA 762 36,572 0.00PGE Polska Grupa Energetyczna
SA 20,461 36,020 0.00Jastrzebska Spolka Weglowa SA 2,769 33,607 0.00CD Projekt SA 1,514 32,876 0.00Pepco Group NV 3,208 23,976 0.00Cyfrowy Polsat SA 5,398 23,466 0.00KRUK SA 491 22,473 0.00Warsaw Stock Exchange 1,617 11,174 0.00Tauron Polska Energia SA 13,832 8,292 0.00mBank SA 138 7,381 0.00CCC SA 368 3,428 0.00Alior Bank SA 349 2,268 0.00Bank Millennium SA 1,954 1,764 0.00Enea SA 378 646 0.00AmRest Holdings SE 190 587 0.00Bank Handlowy w Warszawie
SA 46 490 0.00Grupa Azoty SA 62 445 0.00Ciech SA 63 441 0.00
1,288,200 0.07
Portugal 0.06% (31 October 2021: 0.05%)
EDP - Energias de Portugal SA 88,276 329,485 0.02Jeronimo Martins SGPS SA 12,122 201,676 0.01Galp Energia SGPS SA 16,662 162,825 0.01EDP Renovaveis SA 7,840 149,145 0.01Navigator Co. SA 16,717 55,035 0.01REN - Redes Energeticas
Nacionais SGPS SA 18,252 44,322 0.00Banco Comercial Portugues SA 268,426 33,336 0.00NOS SGPS SA 4,165 14,076 0.00Sonae SGPS SA 13,124 11,303 0.00Altri SGPS SA 235 1,250 0.00CTT-Correios de Portugal SA 219 791 0.00Corticeira Amorim SGPS SA 76 630 0.00Greenvolt-Energias Renovaveis
SA 4 24 0.00
1,003,898 0.06
Qatar 0.11% (31 October 2021: 0.08%)
Qatar National Bank QPSC 141,644 718,719 0.04Qatar Islamic Bank SAQ 43,573 233,388 0.01Industries Qatar QSC 50,042 204,887 0.01Masraf Al Rayan QSC 169,456 199,765 0.01Commercial Bank PSQC 72,706 120,741 0.01Mesaieed Petrochemical Holding
Co. 190,871 108,122 0.01Qatar Fuel QSC 18,796 75,353 0.01Qatar Gas Transport Co. Ltd. 86,050 64,365 0.01Ooredoo QPSC 37,222 60,853 0.00Qatar International Islamic Bank
QSC 23,186 58,571 0.00Barwa Real Estate Co. 72,899 54,066 0.00Qatar Electricity & Water Co.
QSC 13,320 49,816 0.00Qatar Insurance Co. SAQ 83,479 44,714 0.00Qatar Aluminum Manufacturing
Co. 82,957 43,454 0.00Doha Bank QPSC 20,485 11,608 0.00United Development Co. QSC 31,507 9,992 0.00Al Meera Consumer Goods Co.
QSC 1,550 6,394 0.00Vodafone Qatar QSC 6,075 2,167 0.00Ezdan Holding Group QSC 6,160 1,777 0.00
2,068,752 0.11
Romania 0.01% (31 October 2021: 0.01%)
OMV Petrom SA 964,958 78,660 0.01Banca Transilvania SA 125,236 50,619 0.00
129,279 0.01
Russian Federation 0.21% (31 October 2021: 0.35%)
Gazprom PJSC (RUB)1 309,910 837,850 0.05LUKOIL PJSC (RUB)1 10,463 552,797 0.03
Holding
MarketValue
(£)
% ofTotal Net
Assets
Sberbank of Russia PJSC (RUB)1 292,700 424,266 0.02Novatek PJSC (RUB)1 30,023 363,095 0.02MMC Norilsk Nickel PJSC1 1,096 265,616 0.02Tatneft PJSC1 45,686 198,423 0.01Magnit PJSC1 2,739 143,525 0.01Rosneft Oil Co. PJSC (RUB)1 26,076 119,939 0.01Surgutneftegas PJSC -
Preference Shares1 264,900 99,024 0.01PhosAgro PJSC1 1,158 92,449 0.01Severstal PAO1 6,191 76,127 0.01Transneft PJSC - Preference
Shares1 57 72,435 0.01Novolipetsk Steel PJSC1 39,660 70,890 0.00Alrosa PJSC1 69,300 62,535 0.00United Co. RUSAL International
PJSC1 81,770 62,164 0.00Mobile TeleSystems PJSC1 19,050 44,786 0.00Magnitogorsk Iron & Steel
Works PJSC1 85,210 42,935 0.00RusHydro PJSC1 4,729,000 42,594 0.00Tatneft PJSC - Preference
Shares1 10,586 42,441 0.00Moscow Exchange MICEX-RTS
PJSC1 38,240 40,764 0.00VTB Bank PJSC1 151,710,000 34,135 0.00Surgutneftegas PJSC1 122,900 32,791 0.00Polyus PJSC1 180 27,723 0.00Credit Bank of Moscow PJSC1 407,100 25,496 0.00Inter RAO UES PJSC1 839,160 25,315 0.00Aeroflot PJSC1 71,031 24,843 0.00Federal Grid Co. Unified Energy
System PJSC1 13,010,000 14,558 0.00Sovcomflot PJSC1 27,850 14,009 0.00Detsky Mir PJSC1 9,650 8,361 0.00Sistema PJSFC1 47,400 6,830 0.00Rostelecom PJSC1 6,380 4,306 0.00Mechel PJSC1 1,988 2,974 0.00M.Video PJSC1 880 2,247 0.00ROSSETI PJSC1 166,000 1,209 0.00Unipro PJSC1 42,000 679 0.00Bashneft PJSC - Preference
Shares1 35 255 0.00Rosneft Oil Co. PJSC GDR1 12,692 — 0.00Mobile TeleSystems PJSC ADR1 1,800 — 0.00Gazprom PJSC ADR1 4,140 — 0.00Surgutneftegas PJSC ADR1 2,860 — 0.00Sberbank of Russia PJSC (USD)1 1,950 — 0.00LUKOIL PJSC ADR (XLON)1 141 — 0.00MMC Norilsk Nickel PJSC ADR1 2,320 — 0.00RusHydro PJSC ADR1 1,758 — 0.00Sberbank of Russia PJSC ADR1 2,464 — 0.00Tatneft PJSC ADR1 238 — 0.00Rostelecom PJSC ADR1 330 — 0.00LUKOIL PJSC ADR (OOTC)1 105 — 0.00Gazprom PJSC (USD)1 2,280 — 0.00LUKOIL PJSC (USD)1 151 — 0.00Severstal PAO GDR1 189 — 0.00Rosneft Oil Co. PJSC (USD)1 950 — 0.00Novatek PJSC (USD)1 300 — 0.00Polyus PJSC GDR1 1,163 — 0.00
3,880,386 0.21
Saudi Arabia 0.54% (31 October 2021: 0.37%)
Al Rajhi Bank 40,219 1,508,277 0.08Saudi National Bank 70,228 1,172,174 0.07Saudi Basic Industries Corp. 29,647 819,692 0.05Saudi Arabian Oil Co. 83,512 795,372 0.04Saudi Telecom Co. 22,321 547,937 0.03Riyad Bank 49,807 431,529 0.02Saudi Arabian Mining Co. 12,738 372,743 0.02Alinma Bank 33,952 298,847 0.02Saudi British Bank 30,067 286,360 0.02SABIC Agri-Nutrients Co. 7,120 245,844 0.01Banque Saudi Fransi 18,821 216,621 0.01Bank AlBilad 17,488 192,366 0.01Arab National Bank 22,535 168,445 0.01Saudi Electricity Co. 27,424 157,528 0.01
Vanguard FTSE Global All Cap Index Fund
152

Holding
MarketValue
(£)
% ofTotal Net
Assets
Sahara InternationalPetrochemical Co. 12,575 152,744 0.01
Saudi Industrial InvestmentGroup 20,758 145,465 0.01
Yanbu National PetrochemicalCo. 10,391 134,600 0.01
ACWA Power Co. 4,365 131,067 0.01Etihad Etisalat Co. 13,481 123,670 0.01Bank Al-Jazira 17,427 117,127 0.01Almarai Co. JSC 10,443 115,094 0.01Dr Sulaiman Al Habib Medical
Services Group Co. 2,632 111,783 0.01Saudi Kayan Petrochemical Co. 22,894 91,690 0.01Saudi Investment Bank 18,363 89,687 0.01Advanced Petrochemical Co. 6,190 88,201 0.01Nahdi Medical Co. 2,361 83,728 0.01Dallah Healthcare Co. 2,910 74,277 0.01Mouwasat Medical Services Co. 1,454 74,226 0.01National Industrialization Co. 16,813 73,619 0.00Jarir Marketing Co. 1,769 72,050 0.00Dar Al Arkan Real Estate
Development Co. 30,339 69,580 0.00Bupa Arabia for Cooperative
Insurance Co. 1,679 59,257 0.00Savola Group 7,252 54,978 0.00BinDawood Holding Co. 2,291 49,818 0.00Rabigh Refining & Petrochemical
Co. 7,917 48,335 0.00Saudi Research & Media Group 795 44,636 0.00Arabian Centres Co. Ltd. 9,332 43,835 0.00Mobile Telecommunications Co.
Saudi Arabia 14,175 41,901 0.00Southern Province Cement Co. 2,939 41,628 0.00Bawan Co. 5,261 40,219 0.00Co for Cooperative Insurance 2,343 34,331 0.00Seera Group Holding 7,094 33,111 0.00Saudi Cement Co. 2,590 31,790 0.00Saudi Airlines Catering Co. 1,494 30,012 0.00Abdullah Al Othaim Markets Co. 1,261 29,938 0.00Saudi Ground Services Co. 3,800 27,678 0.00Arabian Internet &
Communications Services Co. 532 27,362 0.00Astra Industrial Group 2,225 23,530 0.00Jadwa REIT Saudi Fund 4,451 13,289 0.00Qassim Cement Co. 715 12,207 0.00United Electronics Co. 447 12,207 0.00Yamama Cement Co. 1,635 12,100 0.00Aldrees Petroleum and Transport
Services Co. 685 11,477 0.00Emaar Economic City 4,927 11,467 0.00National Medical Care Co. 670 11,211 0.00Arriyadh Development Co. 1,567 10,166 0.00National Agriculture
Development Co. 1,419 9,673 0.00Hail Cement Co. 2,875 8,791 0.00Saudi Pharmaceutical Industries
& Medical Appliances Corp. 1,099 8,402 0.00Northern Region Cement Co. 2,692 7,774 0.00Tabuk Cement Co. 1,998 7,561 0.00Abdul Mohsen Al-Hokair Tourism
and Development Co. 2,033 6,683 0.00Yanbu Cement Co. 723 6,464 0.00Saudia Dairy & Foodstuff Co. 156 5,804 0.00
9,779,978 0.54
Singapore 0.36% (31 October 2021: 0.30%)
DBS Group Holdings Ltd. 57,700 1,128,892 0.06Oversea-Chinese Banking Corp.
Ltd. 109,300 780,480 0.04United Overseas Bank Ltd. 43,500 752,465 0.04Singapore Telecommunications
Ltd. (Singtel) 203,000 324,337 0.02CapitaLand Integrated
Commercial Trust 178,564 239,978 0.01Wilmar International Ltd. 88,160 225,775 0.01Mapletree Logistics Trust 209,658 215,255 0.01Keppel Corp. Ltd. 49,800 197,336 0.01
Holding
MarketValue
(£)
% ofTotal Net
Assets
Singapore Exchange Ltd. 34,200 193,121 0.01Capitaland Investment Ltd. 77,600 189,331 0.01Ascendas Real Estate
Investment Trust 104,371 172,174 0.01Singapore Airlines Ltd. 44,920 142,503 0.01Mapletree Commercial Trust 127,078 137,067 0.01Singapore Technologies
Engineering Ltd. 57,500 135,979 0.01Mapletree Industrial Trust 87,917 132,353 0.01Frasers Logistics & Commercial
Trust 148,405 124,119 0.01Haw Par Corp Ltd. 16,900 113,855 0.01ComfortDelGro Corp. Ltd. 106,700 90,470 0.01Genting Singapore Ltd. 190,900 89,189 0.01Mapletree North Asia
Commercial Trust 128,100 87,926 0.01NetLink NBN Trust 132,300 76,310 0.01Venture Corp. Ltd. 7,100 70,233 0.01Singapore Telecommunications
Ltd. (Singtel 10) 40,472 64,663 0.01City Developments Ltd. 13,100 64,528 0.01Keppel REIT 91,000 64,036 0.00Keppel DC REIT 53,584 63,977 0.00ESR-REIT 281,695 63,367 0.00Golden Agri-Resources Ltd. 331,100 62,067 0.00Hutchison Port Holdings Trust 280,700 52,540 0.00Suntec Real Estate Investment
Trust 46,600 49,457 0.00CDL Hospitality Trusts Stapled 54,500 42,123 0.00UOL Group Ltd. 8,200 34,480 0.00Parkway Life Real Estate
Investment Trust 11,400 31,825 0.00Cromwell European Real Estate
Investment Trust 16,340 31,579 0.00Sembcorp Industries Ltd. 16,300 27,735 0.00Sembcorp Marine Ltd. 337,372 21,016 0.00Frasers Centrepoint Trust 14,357 20,289 0.00Jardine Cycle & Carriage Ltd. 1,200 20,003 0.00SATS Ltd. 7,400 19,421 0.00Keppel Infrastructure Trust 51,460 16,473 0.00Ascott Residence Trust 22,800 15,124 0.00AEM Holdings Ltd. 4,100 11,375 0.00Raffles Medical Group Ltd. 15,500 10,728 0.00CapitaLand China Trust 13,507 9,115 0.00Manulife US Real Estate
Investment Trust 15,508 7,720 0.00Sabana Industrial Real Estate
Investment Trust 29,500 7,572 0.00Keppel Pacific Oak US REIT 12,300 7,103 0.00OUE Commercial Real Estate
Investment Trust 21,200 5,075 0.00Singapore Post Ltd. 12,200 5,031 0.00AIMS APAC REIT 5,500 4,505 0.00First Resources Ltd. 3,100 3,809 0.00Ascendas India Trust 5,100 3,706 0.00Olam Group Ltd. 3,400 3,314 0.00Starhill Global REIT 5,900 2,025 0.00StarHub Ltd. 1,200 872 0.00SIA Engineering Co. Ltd. 500 773 0.00Asian Pay Television Trust 9,000 685 0.00New Noble1 93 — 0.00Noble Group Ltd.1 930 — 0.00
6,467,259 0.36
South Africa 0.43% (31 October 2021: 0.38%)
FirstRand Ltd. 171,359 591,036 0.03Naspers Ltd. Class N 6,918 560,117 0.03MTN Group Ltd. 58,845 499,895 0.03Sasol Ltd. 18,492 365,513 0.02Standard Bank Group Ltd. 42,437 359,032 0.02Gold Fields Ltd. 29,585 324,272 0.02Capitec Bank Holdings Ltd. 2,524 282,579 0.02Impala Platinum Holdings Ltd. 26,008 270,082 0.02AngloGold Ashanti Ltd. 14,646 242,754 0.01Sibanye Stillwater Ltd. 84,326 236,875 0.01Absa Group Ltd. 25,317 219,087 0.01Nedbank Group Ltd. 16,443 183,481 0.01
Vanguard FTSE Global All Cap Index Fund
153

Holding
MarketValue
(£)
% ofTotal Net
Assets
Shoprite Holdings Ltd. 15,153 174,764 0.01Sanlam Ltd. 52,376 173,634 0.01Anglo American Platinum Ltd. 1,860 164,358 0.01Bid Corp. Ltd. 9,641 160,438 0.01Vodacom Group Ltd. 20,269 155,131 0.01Remgro Ltd. 21,286 152,656 0.01Growthpoint Properties Ltd. 207,286 147,395 0.01Bidvest Group Ltd. 11,869 130,302 0.01Woolworths Holdings Ltd. 42,888 128,271 0.01Clicks Group Ltd. 7,845 122,795 0.01Discovery Ltd. 15,820 121,303 0.01Equites Property Fund Ltd. 112,919 121,123 0.01Aspen Pharmacare Holdings Ltd. 12,573 107,721 0.01Mr Price Group Ltd. 9,670 104,734 0.01Northam Platinum Holdings Ltd. 10,705 101,841 0.01Foschini Group Ltd. 14,472 101,245 0.01MultiChoice Group 15,183 98,863 0.01Reinet Investments SCA 4,796 77,522 0.01AVI Ltd. 21,509 74,284 0.01Life Healthcare Group Holdings
Ltd. 68,511 74,248 0.01Exxaro Resources Ltd. 5,985 68,267 0.00NEPI Rockcastle plc 13,819 66,745 0.00Harmony Gold Mining Co. Ltd. 19,600 64,849 0.00Transaction Capital Ltd. 22,025 56,024 0.00Kumba Iron Ore Ltd. 1,939 51,509 0.00Sappi Ltd. 16,802 49,338 0.00Tiger Brands Ltd. 6,145 47,966 0.00Old Mutual Ltd. (XJSE) 73,894 47,037 0.00Pepkor Holdings Ltd. 43,494 46,917 0.00Barloworld Ltd. 8,059 46,534 0.00SPAR Group Ltd. 5,421 45,173 0.00Distell Group Holdings Ltd. 4,827 42,080 0.00Rand Merchant Investment
Holdings Ltd. 29,168 39,660 0.00Royal Bafokeng Platinum Ltd. 4,942 39,322 0.00African Rainbow Minerals Ltd. 2,868 37,471 0.00Redefine Properties Ltd. 169,839 37,376 0.00Momentum Metropolitan
Holdings 44,164 37,209 0.00Netcare Ltd. 48,256 37,060 0.00Thungela Resources Ltd. 2,667 36,532 0.00PSG Group Ltd. 7,454 35,650 0.00Adcock Ingram Holdings Ltd. 13,047 35,276 0.00Old Mutual Ltd. (XLON) 50,863 32,501 0.00Truworths International Ltd. 11,025 31,219 0.00Fortress REIT Ltd. Class B 180,873 29,876 0.00Coronation Fund Managers Ltd. 12,099 25,438 0.00Steinhoff International Holdings
NV 180,396 23,802 0.00Investec Ltd. 4,202 20,363 0.00Santam Ltd. 855 12,578 0.00Pick n Pay Stores Ltd. 3,853 11,169 0.00Vukile Property Fund Ltd. 16,018 10,841 0.00AECI Ltd. 2,040 10,461 0.00Motus Holdings Ltd. 1,621 9,277 0.00Dis-Chem Pharmacies Ltd. 4,633 8,971 0.00Resilient REIT Ltd. 2,527 7,376 0.00JSE Ltd. 1,273 7,115 0.00Emira Property Fund Ltd. 11,847 6,312 0.00Fortress REIT Ltd. Class A 7,729 4,838 0.00KAP Industrial Holdings Ltd. 15,500 3,965 0.00DRDGOLD Ltd. 5,627 3,681 0.00Telkom SA SOC Ltd. 1,033 2,459 0.00Hyprop Investments Ltd. 1,067 1,944 0.00Sun International Ltd. 1,279 1,800 0.00Ninety One Ltd. 453 1,155 0.00Omnia Holdings Ltd. 248 1,038 0.00Cashbuild Ltd. 67 955 0.00Astral Foods Ltd. 123 945 0.00Advtech Ltd. 949 851 0.00MAS P.L.C. 769 813 0.00Reunert Ltd. 259 574 0.00Super Group Ltd. 424 574 0.00Attacq Ltd. 1,692 562 0.00DataTec Ltd. 265 520 0.00
Holding
MarketValue
(£)
% ofTotal Net
Assets
Brait plc 1,705 350 0.00Famous Brands Ltd. 106 336 0.00SA Corporate Real Estate Ltd. 2,846 317 0.00Tsogo Sun Gaming Ltd. 527 297 0.00Massmart Holdings Ltd. 140 295 0.00
7,870,914 0.43
South Korea 1.45% (31 October 2021: 1.43%)
Samsung Electronics Co. Ltd. 152,316 6,510,268 0.36SK Hynix Inc. 17,699 1,257,072 0.07Samsung Electronics Co. Ltd. -
Preference Shares 30,127 1,132,932 0.06NAVER Corp. 5,013 909,195 0.05Samsung SDI Co. Ltd. 1,561 604,836 0.03LG Chem Ltd. 1,611 530,220 0.03Kakao Corp. 8,944 509,333 0.03Hyundai Motor Co. 4,108 483,245 0.03KB Financial Group Inc. 12,381 459,309 0.03POSCO Holdings Inc. 2,494 457,075 0.03Kia Corp. 7,954 422,187 0.02Shinhan Financial Group Co. Ltd. 15,535 414,750 0.02Celltrion Inc. 3,649 406,111 0.02SK Holdings Co. Ltd. 1,641 278,892 0.02SK Innovation Co. Ltd. 2,089 271,572 0.02Hana Financial Group Inc. 9,052 269,796 0.02Samsung Biologics Co. Ltd. 471 250,000 0.02HMM Co. Ltd. 13,811 248,297 0.02Hyundai Mobis Co. Ltd. 1,854 243,374 0.01Samsung C&T Corp. 3,042 221,845 0.01KT&G Corp. 4,149 217,065 0.01Hanmi Pharm Co. Ltd. 1,088 215,267 0.01Korean Air Lines Co. Ltd. 9,844 187,902 0.01Woori Financial Group Inc. 19,997 186,413 0.01Korea Electric Power Corp. 12,450 181,984 0.01Samsung Electro-Mechanics Co.
Ltd. 1,699 178,852 0.01LG Household & Health Care
Ltd. - Preference Shares 538 169,222 0.01LG Electronics Inc. 2,250 166,227 0.01LG Corp. 3,447 160,009 0.01POSCO Chemical Co. Ltd. 1,773 152,350 0.01HYBE Co. Ltd. 906 144,210 0.01SK Square Co. Ltd. 4,165 138,929 0.01Samsung SDS Co. Ltd. 1,455 137,020 0.01Krafton Inc. 852 135,885 0.01Amorepacific Corp. 1,171 134,409 0.01Yuhan Corp. 3,455 133,651 0.01LG Display Co. Ltd. 12,478 132,146 0.01Doosan Enerbility 10,003 130,675 0.01NCSoft Corp. 489 130,552 0.01ESR Kendall Square REIT Co.
Ltd. 27,557 127,570 0.01GS Engineering & Construction
Corp. 4,609 122,904 0.01Korea Zinc Co. Ltd. 334 122,001 0.01Lotte Chemical Corp. 962 119,876 0.01KakaoBank Corp. 4,459 119,752 0.01GS Holdings Corp. 4,097 113,538 0.01Kumho Petrochemical Co. Ltd. 1,162 113,480 0.01Hyundai Motor Co. - Preference
Shares 1,887 112,365 0.01S-Oil Corp. 1,684 110,529 0.01Celltrion Healthcare Co. Ltd. 2,718 110,484 0.01LG Electronics Inc. - Preference
Shares 2,915 107,771 0.01Samsung Fire & Marine
Insurance Co. Ltd. 776 102,849 0.01Samsung Life Insurance Co. Ltd. 2,470 101,813 0.01Ecopro BM Co. Ltd. 328 99,071 0.01Hyundai Motor Co. - 2nd
Preference Shares 1,627 98,121 0.01LG Innotek Co. Ltd. 439 97,159 0.01Samsung Engineering Co. Ltd. 5,163 85,127 0.01LEENO Industrial Inc. 742 83,286 0.01L&F Co. Ltd. 594 82,607 0.01DB Insurance Co. Ltd. 1,848 78,753 0.01Industrial Bank of Korea 11,079 78,689 0.01
Vanguard FTSE Global All Cap Index Fund
154

Holding
MarketValue
(£)
% ofTotal Net
Assets
Hotel Shilla Co. Ltd. 1,489 76,673 0.01LG Uplus Corp. 8,450 74,752 0.01Korea Aerospace Industries Ltd. 2,675 74,385 0.01SKC Co. Ltd. 771 74,073 0.01LG Chem Ltd. - Preference
Shares 465 73,720 0.01Hyundai Heavy Industries Co.
Ltd. 814 72,268 0.01Korea Investment Holdings Co.
Ltd. 1,615 72,203 0.01Coway Co. Ltd. 1,599 71,792 0.01Korea Shipbuilding & Offshore
Engineering Co. Ltd. 1,202 69,975 0.01CJ CheilJedang Corp. 275 69,321 0.01BNK Financial Group Inc. 13,700 68,461 0.01Meritz Fire & Marine Insurance
Co. Ltd. 2,433 68,350 0.01LG Household & Health Care
Ltd. 117 67,444 0.01Hyundai Marine & Fire Insurance
Co. Ltd. 3,210 65,954 0.01F&F Co. Ltd. 735 65,720 0.01Mirae Asset Securities Co. Ltd. 12,827 65,318 0.00Samsung Heavy Industries Co.
Ltd. 16,764 64,423 0.00Hanwha Solutions Corp. 3,168 64,187 0.00Dong-A ST Co. Ltd. 1,355 60,149 0.00Cheil Worldwide Inc. 3,697 59,315 0.00Lotte Shopping Co. Ltd. 987 59,148 0.00Kangwon Land Inc. 3,421 58,141 0.00Hyundai Glovis Co. Ltd. 432 57,256 0.00SD Biosensor Inc. 1,966 56,851 0.00E-MART Inc. 670 56,084 0.00Hyundai Steel Co. 1,981 54,647 0.00Samsung Fire & Marine
Insurance Co. Ltd. -Preference Shares 528 54,410 0.00
Samsung Securities Co. Ltd. 2,092 52,602 0.00Netmarble Corp. 851 51,538 0.00SK Telecom Co. Ltd. 1,403 50,714 0.00DL E&C Co. Ltd. 1,322 50,469 0.00SK IE Technology Co. Ltd. 619 49,656 0.00Orion Corp. 807 48,566 0.00Hankook Tire & Technology Co.
Ltd. 2,153 47,582 0.00HD Hyundai Co. Ltd. 1,259 46,547 0.00HLB Inc. 2,331 45,898 0.00Hyundai Engineering &
Construction Co. Ltd. 1,620 45,767 0.00Hanwha Aerospace Co. Ltd. 1,349 45,511 0.00SK Bioscience Co. Ltd. 529 45,456 0.00Pearl Abyss Corp. 1,026 44,374 0.00CJ ENM Co. Ltd. 547 44,297 0.00Green Cross Holdings Corp. 3,023 42,367 0.00Hanon Systems 5,738 41,482 0.00SK Chemicals Co. Ltd. 496 39,946 0.00Dongjin Semichem Co. Ltd. 1,605 38,728 0.00LX Semicon Co. Ltd. 449 37,841 0.00Chunbo Co. Ltd. 212 37,576 0.00Foosung Co. Ltd. 3,098 37,426 0.00Samsung SDI Co. Ltd. -
Preference Shares 189 36,496 0.00Wysiwyg Studios Co. Ltd. 1,696 35,815 0.00SM Entertainment Co. Ltd. 817 35,283 0.00Chabiotech Co. Ltd. 2,939 35,039 0.00Kolon Industries Inc. 884 34,869 0.00Ecopro Co. Ltd. 622 33,922 0.00Posco International Corp. 2,116 33,077 0.00Fila Holdings Corp. 1,575 32,561 0.00DB HiTek Co. Ltd. 718 30,825 0.00Kakao Games Corp. 794 30,463 0.00CosmoAM&T Co. Ltd. 842 29,902 0.00Dawonsys Co. Ltd. 1,596 29,807 0.00DGB Financial Group Inc. 5,263 29,804 0.00Kyobo Securities Co. Ltd. 6,008 29,756 0.00Alteogen Inc. 809 29,704 0.00
Holding
MarketValue
(£)
% ofTotal Net
Assets
Hyosung Advanced MaterialsCorp. 97 29,372 0.00
Iljin Materials Co. Ltd. 520 28,986 0.00Meritz Financial Group Inc. 1,183 28,358 0.00WONIK IPS Co. Ltd. 1,101 27,963 0.00KCC Corp. 127 27,584 0.00CS Wind Corp. 725 27,448 0.00Daeduck Co. Ltd. 5,359 26,678 0.00Hyundai Elevator Co. Ltd. 1,165 26,301 0.00Huons Co. Ltd. 941 25,630 0.00KMW Co. Ltd. 1,201 25,095 0.00Mando Corp. 724 24,976 0.00Hansol Chemical Co. Ltd. 160 24,960 0.00Hite Jinro Co. Ltd. 1,053 24,874 0.00Pan Ocean Co. Ltd. 5,726 24,147 0.00Green Cross LabCell Corp. 565 23,898 0.00Hyundai Mipo Dockyard Co. Ltd. 441 23,436 0.00JB Financial Group Co. Ltd. 4,099 23,239 0.00Hana Tour Service Inc. 445 23,225 0.00KEPCO Engineering &
Construction Co. Inc. 497 23,165 0.00SK Biopharmaceuticals Co. Ltd. 394 22,912 0.00OCI Co. Ltd. 336 22,479 0.00Advanced Process Systems
Corp. 1,404 21,591 0.00JYP Entertainment Corp. 565 21,247 0.00Hyundai Department Store Co.
Ltd. 435 20,882 0.00Insun ENT Co. Ltd. 2,952 20,873 0.00Korean Reinsurance Co. 3,378 20,822 0.00ST Pharm Co. Ltd. 334 20,757 0.00Cuckoo Holdings Co. Ltd. 1,750 20,753 0.00Seegene Inc. 796 20,469 0.00Hyosung TNC Co. Ltd. 78 20,429 0.00Celltrion Pharm Inc. 347 20,311 0.00Samsung Card Co. Ltd. 957 20,270 0.00AfreecaTV Co. Ltd. 290 20,229 0.00Daewoo Engineering &
Construction Co. Ltd. 4,703 20,191 0.00NKMax Co. Ltd. 1,510 20,157 0.00Dongkuk Steel Mill Co. Ltd. 1,656 19,795 0.00Naturecell Co. Ltd. 1,798 19,555 0.00Daishin Securities Co. Ltd. -
Preference Shares 2,018 19,516 0.00Shinsegae Inc. 122 19,226 0.00GeneOne Life Science Inc. 2,656 18,780 0.00Hanwha Corp. 985 18,739 0.00SOLUM Co. Ltd. 1,191 18,731 0.00LS Electric Co. Ltd. 617 18,722 0.00Hyundai Bioscience Co. Ltd. 1,024 18,507 0.00GS Retail Co. Ltd. 1,012 18,483 0.00Sam Young Electronics Co. Ltd. 2,666 18,174 0.00SK Networks Co. Ltd. 5,913 18,167 0.00Samchully Co. Ltd. 250 17,836 0.00LG Energy Solution 67 17,696 0.00Wemade Co. Ltd. 348 17,103 0.00Hanwha Systems Co. Ltd. 1,673 16,604 0.00LOTTE Fine Chemical Co. Ltd. 315 16,260 0.00Meritz Securities Co. Ltd. 3,909 16,237 0.00Hugel Inc. 203 16,130 0.00Vidente Co. Ltd. 1,742 15,852 0.00Dongsuh Cos. Inc. 934 15,844 0.00Helixmith Co. Ltd. 1,181 15,765 0.00Hyundai Wia Corp. 380 15,760 0.00Youngone Corp. 517 15,721 0.00Shin Poong Pharmaceutical Co.
Ltd. 802 15,563 0.00Oscotec Inc. 897 15,472 0.00Hanwha Investment &
Securities Co. Ltd. 4,978 15,184 0.00Poongsan Corp. 740 15,017 0.00SSANGYONG C&E Co. Ltd. 2,830 14,860 0.00Taihan Electric Wire Co. Ltd. 12,903 14,769 0.00LG HelloVision Co. Ltd. 3,451 14,116 0.00IS Dongseo Co. Ltd. 403 13,673 0.00DB Financial Investment Co.
Ltd. 3,300 13,603 0.00
Vanguard FTSE Global All Cap Index Fund
155

Holding
MarketValue
(£)
% ofTotal Net
Assets
Com2uSCorp 216 13,109 0.00Ecopro HN Co. Ltd. 413 13,095 0.00Com2uS Holdings Corp. 239 12,959 0.00Eubiologics Co. Ltd. 1,054 12,766 0.00NongShim Co. Ltd. 66 12,703 0.00Sebang Global Battery Co. Ltd. 255 12,274 0.00Daol Investment & Securities
Co. Ltd. 4,025 12,035 0.00KEPCO Plant Service &
Engineering Co. Ltd. 498 12,032 0.00NH Investment & Securities Co.
Ltd. 1,719 11,773 0.00Korea Real Estate Investment &
Trust Co. Ltd. 8,296 11,627 0.00Kumho Tire Co. Inc. 4,254 11,614 0.00Hanjin Kal Corp. 301 10,956 0.00BGF Co. Ltd. 3,008 10,835 0.00Hyundai Rotem Co. Ltd. 861 10,374 0.00Ottogi Corp. 34 10,123 0.00KISCO Corp. 1,622 9,319 0.00Daishin Securities Co. Ltd. 831 9,275 0.00Daewoo Shipbuilding & Marine
Engineering Co. Ltd. 553 9,205 0.00KT Skylife Co. Ltd. 1,552 9,025 0.00Sam Chun Dang Pharm Co. Ltd. 314 9,010 0.00Modetour Network Inc. 615 8,853 0.00Cellivery Therapeutics Inc. 386 8,665 0.00Vaxcell-Bio Therapeutics Co. Ltd. 298 8,504 0.00KIWOOM Securities Co. Ltd. 141 8,494 0.00Green Cross Corp. 71 8,487 0.00Sindoh Co. Ltd. 391 8,133 0.00AMOREPACIFIC Group 241 7,642 0.00Mirae Asset Daewoo Co. Ltd. -
2nd Preference Shares 2,710 7,613 0.00SK Telecom Co. Ltd. ADR 376 7,493 0.00Chong Kun Dang Pharmaceutical
Corp. 116 7,275 0.00Amicogen Inc. 360 7,271 0.00S-1 Corp. 166 7,243 0.00HLB Global Co. Ltd. 1,431 7,214 0.00Douzone Bizon Co. Ltd. 277 7,167 0.00Daewoong Co. Ltd. 373 7,096 0.00Doosan Fuel Cell Co. Ltd. 319 7,040 0.00Huons Global Co. Ltd. 387 6,970 0.00NICE Information Service Co.
Ltd. 598 6,959 0.00Hanwha Life Insurance Co. Ltd. 3,729 6,941 0.00Samyang Holdings Corp. 124 6,833 0.00Koh Young Technology Inc. 550 6,732 0.00Hanall Biopharma Co. Ltd. 571 6,681 0.00Kwang Dong Pharmaceutical Co.
Ltd. 1,437 6,643 0.00Doosan Infracore Co. Ltd. 1,554 6,494 0.00Genexine Inc. 252 6,464 0.00HLB Life Science Co. Ltd. 980 6,463 0.00CJ CheilJedang Corp. -
Preference Shares 57 6,434 0.00CJ Corp. 116 6,393 0.00Soulbrain Co. Ltd. 40 6,238 0.00CJ Logistics Corp. 79 6,137 0.00Zinus Inc. 144 5,899 0.00Yuanta Securities Korea Co. Ltd. 2,568 5,830 0.00LegoChem Biosciences Inc. 204 5,556 0.00Posco ICT Co. Ltd. 1,397 5,475 0.00CMG Pharmaceutical Co. Ltd. 2,444 5,037 0.00Amorepacific Corp. - Preference
Shares 101 4,855 0.00DL Holdings Co. Ltd. 120 4,703 0.00KCC Glass Corp. 119 4,694 0.00Lotte Corp. 212 4,598 0.00Enzychem Lifesciences Corp. 316 4,489 0.00Webzen Inc. 317 4,473 0.00Yungjin Pharmaceutical Co. Ltd. 1,373 4,314 0.00Medytox Inc. 49 4,248 0.00LX Holdings Co. Ltd. 658 4,160 0.00SK Securities Co. Ltd. 7,568 4,151 0.00
Holding
MarketValue
(£)
% ofTotal Net
Assets
Bukwang Pharmaceutical Co.Ltd. 540 4,058 0.00
Hanssem Co. Ltd. 80 3,982 0.00MedPacto Inc. 191 3,882 0.00Binex Co. Ltd. 390 3,846 0.00TY Holdings Co. Ltd. 218 3,511 0.00Pharmicell Co. Ltd. 477 3,448 0.00BGF retail Co. Ltd. 30 3,443 0.00Eugene Investment & Securities
Co. Ltd. 1,574 3,279 0.00CrystalGenomics Inc. 996 3,228 0.00ABLBio Inc. 191 3,064 0.00Ilyang Pharmaceutical Co. Ltd. 193 3,041 0.00Ace Technologies Corp. 445 2,935 0.00GemVax & Kael Co. Ltd. 304 2,844 0.00Komipharm International Co.
Ltd. 480 2,721 0.00SFA Engineering Corp. 107 2,701 0.00Korea Gas Corp. 98 2,545 0.00Asiana Airlines Inc. 173 2,216 0.00Doosan Bobcat Inc. 81 2,132 0.00HDC Hyundai Development Co-
Engineering & Construction 210 1,991 0.00Hankook Shell Oil Co. Ltd. 12 1,929 0.00LOTTE Himart Co. Ltd. 110 1,643 0.00Hanjin Transportation Co. Ltd. 70 1,458 0.00Mezzion Pharma Co. Ltd. 114 1,457 0.00SK Discovery Co. Ltd. 55 1,442 0.00LS Corp. 36 1,317 0.00CJ CGV Co. Ltd. 75 1,313 0.00Hyundai Engineering &
Construction Co. Ltd. -Preference Shares 27 1,281 0.00
Lotte Chilsung Beverage Co.Ltd. 10 1,154 0.00
Samsung Pharmaceutical Co.Ltd. 452 1,137 0.00
Hanwha Corp. - 3rd PreferenceShares 105 1,059 0.00
Doosan Solus Co. Ltd. 23 1,056 0.00Shinsegae International Inc. 50 1,007 0.00Eo Technics Co. Ltd. 14 993 0.00Korea Petrochemical Ind Co. Ltd. 10 961 0.00NHN Corp. 42 938 0.00Cosmax Inc. 17 926 0.00TK Corp. 131 901 0.00Soulbrain Holdings Co. Ltd. 49 881 0.00Ahnlab Inc. 13 857 0.00Hyosung Corp. 16 846 0.00BH Co. Ltd. 48 826 0.00Daewoong Pharmaceutical Co.
Ltd. 7 810 0.00Hanil Cement Co. Ltd. 60 784 0.00Innocean Worldwide Inc. 25 774 0.00Ananti Inc. 135 747 0.00PI Advanced Materials Co. Ltd. 24 730 0.00Doosan Co. Ltd. 12 683 0.00Daou Technology Inc. 49 645 0.00Taekwang Industrial Co. Ltd. 1 642 0.00TES Co. Ltd. 35 620 0.00Hanmi Science Co. Ltd. 19 616 0.00Paradise Co. Ltd. 57 602 0.00Peptron Inc. 99 595 0.00Kolmar Korea Co. Ltd. 19 566 0.00HYUNDAI Corp. 46 540 0.00Hyundai Home Shopping
Network Corp. 14 535 0.00Hyundai Greenfood Co. Ltd. 91 527 0.00iNtRON Biotechnology Inc. 46 525 0.00Hyundai Construction
Equipment Co. Ltd. 20 472 0.00Inscobee Inc. 262 463 0.00Hyosung Chemical Corp. 3 432 0.00SillaJen Inc.1 204 414 0.00Hyosung Heavy Industries Corp. 11 389 0.00Seoul Semiconductor Co. Ltd. 44 378 0.00CUROCOM Co. Ltd. 501 364 0.00
Vanguard FTSE Global All Cap Index Fund
156

Holding
MarketValue
(£)
% ofTotal Net
Assets
Cafe24 Corp. 30 361 0.00STCUBE 104 357 0.00Medipost Co. Ltd. 22 319 0.00KH FEELUX Co. Ltd. 195 279 0.00Hanil Holdings Co. Ltd. 26 221 0.00Toptec Co. Ltd. 37 201 0.00HDC Holdings Co. Ltd. 40 183 0.00Orion Holdings Corp. 18 168 0.00Lotte Confectionery Co. Ltd. 2 158 0.00HLB Therapeutics Co. Ltd. 23 123 0.00Telcon RF Pharmaceutical Inc. 89 115 0.00Hyundai Electric & Energy
System Co. Ltd. 6 83 0.00Solus Advanced Materials Co.
Ltd.1 3 44 0.00STCUBE Inc. 37 12 0.00APAM Corp.1 40 3 0.00
26,300,567 1.45
Spain 0.60% (31 October 2021: 0.61%)
Iberdrola SA 196,743 1,820,127 0.10Banco Santander SA 550,140 1,301,730 0.07Banco Bilbao Vizcaya Argentaria
SA 216,114 918,132 0.05Cellnex Telecom SA 19,987 748,355 0.04Amadeus IT Group SA 13,567 688,550 0.04Telefonica SA 160,497 624,670 0.03Industria de Diseno Textil SA 34,833 588,304 0.03Repsol SA 45,066 540,934 0.03CaixaBank SA 141,642 367,285 0.02Ferrovial SA 15,152 313,071 0.02Aena SME SA 2,664 305,102 0.02Red Electrica Corp. SA 15,867 255,050 0.01Endesa SA 12,658 212,934 0.01ACS Actividades de
Construccion y Servicios SA 9,763 201,724 0.01Acciona SA 963 151,720 0.01Enagas SA 7,134 123,305 0.01Inmobiliaria Colonial Socimi SA 17,753 118,815 0.01Banco de Sabadell SA 184,272 115,198 0.01Naturgy Energy Group SA 4,761 114,934 0.01Bankinter SA 24,240 114,672 0.01Grifols SA Class B - Preference
Shares 12,697 111,276 0.01Fluidra SA 4,928 107,910 0.01Acerinox SA 10,690 90,587 0.01Corp. Financiera Alba SA 1,836 86,701 0.01Grifols SA 6,410 86,177 0.01Siemens Gamesa Renewable
Energy SA 6,380 82,129 0.01Merlin Properties Socimi SA 8,898 77,832 0.00Viscofan SA 1,498 66,145 0.00Ebro Foods SA 4,113 58,752 0.00Unicaja Banco SA 72,962 55,207 0.00Corp ACCIONA Energias
Renovables SA 1,748 51,848 0.00Cia de Distribucion Integral
Logista Holdings SA 2,799 41,088 0.00Mapfre SA 22,302 32,700 0.00CIE Automotive SA 1,493 26,320 0.00Indra Sistemas SA 3,193 26,186 0.00Grupo Catalana Occidente SA 1,125 25,996 0.00Solaria Energia y Medio
Ambiente SA 1,348 24,137 0.00Laboratorios Farmaceuticos Rovi
SA 395 21,640 0.00Faes Farma SA 6,083 20,215 0.00Linea Directa Aseguradora SA
Cia de Seguros y Reaseguros 14,701 16,911 0.00Sacyr SA 7,250 15,717 0.00Applus Services SA 2,084 12,993 0.00Almirall SA 999 10,426 0.00Pharma Mar SA 140 8,585 0.00Gestamp Automocion SA 3,148 8,248 0.00Neinor Homes SA 891 7,996 0.00Global Dominion Access SA 2,251 7,433 0.00
Holding
MarketValue
(£)
% ofTotal Net
Assets
Construcciones y Auxiliar deFerrocarriles SA 254 6,232 0.00
Prosegur Cia de Seguridad SA 3,466 5,758 0.00Mediaset Espana Comunicacion
SA 1,103 3,952 0.00Prosegur Cash SA 6,438 3,808 0.00Lar Espana Real Estate Socimi
SA 852 3,533 0.00Aedas Homes SA 153 2,828 0.00Tecnicas Reunidas SA 282 1,872 0.00Melia Hotels International SA 157 1,049 0.00Ence Energia y Celulosa SA 260 784 0.00Atresmedia Corp. de Medios de
Comunicacion SA 102 313 0.00NH Hotel Group SA 61 182 0.00
10,836,078 0.60
Sweden 0.93% (31 October 2021: 1.08%)
Atlas Copco AB Class A 20,884 770,100 0.04Investor AB Class A 38,436 647,083 0.04Hexagon AB 59,236 618,108 0.04Assa Abloy AB Class B 30,192 615,599 0.04Telefonaktiebolaget LM Ericsson
Class B 90,863 588,236 0.03Sandvik AB 34,799 532,928 0.03Investor AB Class B 34,057 531,537 0.03Volvo AB Class B 38,370 494,247 0.03Evolution Gaming Group AB 5,360 449,618 0.03Essity AB Class B 20,322 430,718 0.02Swedbank AB Class A 32,090 409,752 0.02Skandinaviska Enskilda Banken
AB Class A 44,559 405,706 0.02Atlas Copco AB Class B 12,176 389,179 0.02Epiroc AB Class A 22,351 367,561 0.02Svenska Handelsbanken AB
Class A 43,112 351,157 0.02Swedish Match AB 48,972 313,693 0.02Nibe Industrier AB 38,120 301,660 0.02Hennes & Mauritz AB Class B 29,516 299,684 0.02Boliden AB 8,442 295,233 0.02Telia Co. AB 83,261 277,231 0.02Svenska Cellulosa AB SCA
Class B 16,084 251,485 0.02Alfa Laval AB 10,541 237,387 0.01Volvo AB Class A 17,195 227,811 0.01EQT AB 8,995 208,277 0.01Indutrade AB 10,326 197,861 0.01Lundin Energy AB 5,883 195,979 0.01Tele2 AB Class B 17,922 189,707 0.01Skanska AB Class B 12,170 187,416 0.01Getinge AB Class B 7,815 181,399 0.01Castellum AB 10,284 164,562 0.01SKF AB Class B 11,774 155,224 0.01Epiroc AB Class B 10,411 146,484 0.01Fastighets AB Balder Class B 3,601 144,912 0.01Holmen AB Class B 3,040 142,363 0.01Industrivarden AB Class C 6,955 141,865 0.01Trelleborg AB Class B 7,557 134,047 0.01Avanza Bank Holding AB 6,110 125,126 0.01Industrivarden AB Class A 5,610 116,438 0.01Lifco AB 6,734 114,410 0.01Investment AB Latour Class B 5,272 112,724 0.01Nordic Entertainment Group AB 4,089 109,379 0.01Swedish Orphan Biovitrum AB 6,393 108,460 0.01Kinnevik AB Class B 6,731 106,667 0.01Securitas AB Class B 10,752 102,443 0.01Beijer Ref AB 7,796 102,146 0.01Sagax AB Class B 4,839 100,160 0.01Husqvarna AB Class B 12,457 96,146 0.01AAK AB 6,809 94,724 0.01Saab AB Class B 2,632 89,841 0.01Thule Group AB 3,101 87,137 0.01SSAB AB Class B 17,917 85,479 0.01Electrolux AB 6,858 84,680 0.01AddLife AB Class B 4,530 81,054 0.01Nordnet AB publ 5,616 78,698 0.01AddNode Group AB 2,262 76,255 0.01
Vanguard FTSE Global All Cap Index Fund
157

Holding
MarketValue
(£)
% ofTotal Net
Assets
Sweco AB Class B 6,609 75,305 0.01Samhallsbyggnadsbolaget i
Norden AB Class D 35,415 74,600 0.01AddTech AB Class B 5,170 73,836 0.01Fabege AB 7,181 70,668 0.01Bufab AB 2,516 66,504 0.00Axfood AB 2,771 65,694 0.00Wihlborgs Fastigheter AB 4,602 64,676 0.00BillerudKorsnas AB 5,127 63,860 0.00Hexatronic Group AB 1,790 61,493 0.00Elekta AB Class B 11,310 61,464 0.00Telefonaktiebolaget LM Ericsson
Class A 9,038 61,304 0.00Cibus Nordic Real Estate AB 3,275 60,836 0.00Dometic Group AB 8,772 60,741 0.00Sinch AB 16,770 60,237 0.00SSAB AB Class A 11,505 59,324 0.00Loomis AB 2,877 57,467 0.00Beijer Alma AB 3,339 56,213 0.00Bravida Holding AB 6,701 55,426 0.00Peab AB Class B 7,171 55,347 0.00L E Lundbergforetagen AB
Class B 1,418 53,604 0.00Sdiptech AB Class B 1,908 53,474 0.00AFRY AB 3,896 51,965 0.00Modern Times Group MTG AB
Class B 6,099 51,835 0.00Catena AB 1,219 51,008 0.00Nyfosa AB 5,704 50,844 0.00Arjo AB Class B 8,400 50,589 0.00Vitec Software Group AB
Class B 1,244 50,243 0.00HMS Networks AB 1,524 50,075 0.00Hexpol AB 7,099 49,307 0.00Electrolux Professional AB
Class B 10,773 48,890 0.00Ratos AB Class B 11,505 47,290 0.00Svenska Cellulosa AB SCA
Class A 2,884 45,176 0.00Samhallsbyggnadsbolaget i
Norden AB 17,745 45,014 0.00Sectra AB 4,365 44,305 0.00JM AB 2,379 43,960 0.00Skandinaviska Enskilda Banken
AB 4,496 43,952 0.00Nolato AB Class B 7,403 41,333 0.00Svenska Handelsbanken AB 4,354 39,448 0.00MIPS AB 673 38,939 0.00Mycronic AB 2,724 38,393 0.00Atrium Ljungberg AB Class B 2,858 37,609 0.00Vitrolife AB 1,810 37,538 0.00Stillfront Group AB 22,046 36,183 0.00Instalco AB 7,205 35,581 0.00Granges AB 5,347 35,268 0.00Bure Equity AB 1,833 35,212 0.00Pandox AB 3,008 33,858 0.00Medicover AB Class B 2,425 32,384 0.00Intrum AB 1,640 31,852 0.00Biotage AB 1,902 31,681 0.00Lindab International AB 1,643 30,974 0.00Wallenstam AB Class B 3,366 29,976 0.00Kinnevik AB Class A 1,801 29,735 0.00NP3 Fastigheter AB 1,264 28,322 0.00Corem Property Group AB 16,349 27,790 0.00Troax Group AB 1,367 24,515 0.00Concentric AB 1,514 23,814 0.00INVISIO AB 1,598 22,848 0.00Platzer Fastigheter Holding AB 2,755 22,541 0.00NCC AB Class A 1,941 20,680 0.00Cint Group AB 2,862 19,075 0.00Sagax AB Class D 6,238 15,372 0.00BHG Group AB 2,626 14,608 0.00Hufvudstaden AB Class A 1,303 13,554 0.00VNV Global AB 3,735 12,606 0.00Bilia AB Class A 1,012 11,243 0.00Boozt AB 1,333 11,232 0.00NCC AB Class B 1,114 11,099 0.00
Holding
MarketValue
(£)
% ofTotal Net
Assets
Dios Fastigheter AB 1,494 10,766 0.00Munters Group AB 2,195 10,622 0.00Betsson AB 1,936 9,602 0.00Corem Property Group AB -
Preference Shares 373 9,328 0.00Cloetta AB Class B 3,409 6,904 0.00BICO Group AB 607 4,916 0.00Bonava AB Class B 1,083 4,253 0.00SAS AB 42,417 3,558 0.00Hansa Biopharma AB 460 2,045 0.00SkiStar AB 102 1,594 0.00Investment AB Oresund 139 1,332 0.00Nobia AB 313 990 0.00Scandic Hotels Group AB 189 589 0.00Attendo AB 141 306 0.00Solid Forsakring AB 58 224 0.00
16,846,594 0.93
Switzerland 2.40% (31 October 2021: 2.32%)
Nestle SA 89,420 9,245,398 0.51Roche Holding AG (Non-voting) 21,339 6,345,745 0.35Novartis AG 68,364 4,852,482 0.27Zurich Insurance Group AG 4,761 1,742,032 0.10Cie Financiere Richemont SA 16,652 1,578,225 0.09UBS Group AG 102,950 1,412,060 0.08ABB Ltd. 54,626 1,326,818 0.07Sika AG 5,100 1,259,252 0.07Lonza Group AG 2,398 1,137,752 0.06Givaudan SA 298 952,210 0.05Alcon Inc. 15,101 870,879 0.05Roche Holding AG - Bearer
Shares 2,490 802,585 0.05Holcim AG 18,718 739,565 0.04Partners Group Holding AG 753 647,246 0.04Swiss Re AG 9,101 599,837 0.03Geberit AG 1,158 532,129 0.03Sonova Holding AG 1,764 514,153 0.03Chocoladefabriken Lindt &
Spruengli AG 57 511,697 0.03Swiss Life Holding AG 1,000 470,192 0.03Credit Suisse Group AG 84,140 463,834 0.03Swisscom AG 802 379,463 0.02SGS SA 181 374,580 0.02Kuehne + Nagel International AG 1,586 358,026 0.02Straumann Holding AG 3,660 349,887 0.02Julius Baer Group Ltd. 6,627 256,944 0.02VAT Group AG 979 246,628 0.01Logitech International SA 4,495 237,687 0.01Swiss Prime Site AG 2,833 222,009 0.01Helvetia Holding AG 2,010 207,655 0.01Vifor Pharma AG 1,391 196,382 0.01Georg Fischer AG 4,300 188,598 0.01Barry Callebaut AG 99 182,946 0.01Schindler Holding AG 1,177 182,733 0.01Baloise Holding AG 1,246 174,122 0.01SIG Combibloc Group AG 10,235 172,508 0.01Belimo Holding AG 402 160,153 0.01Swatch Group AG - Registered
Shares 4,002 159,403 0.01Adecco Group AG 5,060 158,404 0.01PSP Swiss Property AG 1,504 152,047 0.01Temenos AG 1,849 150,602 0.01Schindler Holding AG (Non-
voting) 966 150,133 0.01EMS-Chemie Holding AG 208 149,601 0.01Swatch Group AG - Bearer
Shares 655 136,788 0.01Flughafen Zurich AG 780 106,185 0.01Tecan Group AG 423 102,535 0.01Bucher Industries AG 342 99,627 0.01Chocoladefabriken Lindt &
Spruengli AG Registered 1 93,546 0.01Galenica AG 1,486 87,795 0.01ams-OSRAM AG 8,666 86,329 0.01DKSH Holding AG 1,192 82,163 0.01Clariant AG 5,875 80,847 0.01Allreal Holding AG 506 76,565 0.01
Vanguard FTSE Global All Cap Index Fund
158

Holding
MarketValue
(£)
% ofTotal Net
Assets
Daetwyler Holding AG 291 75,218 0.01Mobimo Holding AG 324 74,310 0.01BKW AG 743 72,614 0.00Siegfried Holding AG 118 68,748 0.00Sensirion Holding AG 692 66,778 0.00SFS Group AG 637 63,980 0.00Forbo Holding AG 54 63,454 0.00Stadler Rail AG 2,137 62,252 0.00St Galler Kantonalbank AG 145 56,041 0.00Comet Holding AG 317 55,536 0.00Bachem Holding AG Class B 156 54,814 0.00Vontobel Holding AG 894 52,526 0.00Huber + Suhner AG 724 50,974 0.00ALSO Holding AG 275 50,322 0.00Dufry AG 1,514 48,961 0.00Interroll Holding AG 20 48,742 0.00Emmi AG 61 48,604 0.00Swissquote Group Holding SA 364 48,119 0.00Inficon Holding AG 63 46,268 0.00Cembra Money Bank AG 776 45,179 0.00Banque Cantonale Vaudoise 619 42,032 0.00Softwareone Holding AG 3,734 40,752 0.00Dottikon Es Holding AG 169 40,633 0.00Kardex Holding AG 264 40,510 0.00Idorsia Ltd. 2,797 38,444 0.00Arbonia AG 2,563 36,595 0.00Landis+Gyr Group AG 797 35,839 0.00Intershop Holding AG 66 34,336 0.00Meyer Burger Technology AG 86,048 32,847 0.00dormakaba Holding AG 87 32,483 0.00Burckhardt Compression
Holding AG 77 31,434 0.00Bell Food Group AG 137 29,847 0.00Aryzta AG 35,707 26,751 0.00PolyPeptide Group AG 311 21,947 0.00Valiant Holding AG 233 18,699 0.00OC Oerlikon Corp. AG 3,120 17,921 0.00LEM Holding SA 9 16,617 0.00Sulzer AG 274 16,503 0.00u-blox Holding AG 245 16,385 0.00Zur Rose Group AG 163 16,131 0.00Schweiter Technologies AG 17 13,769 0.00Vifor Pharma AG - Blue Chip
Shares 89 12,631 0.00Conzzeta AG 16 10,661 0.00Ypsomed Holding AG 70 7,984 0.00Medacta Group SA 83 7,574 0.00Medmix AG 274 7,348 0.00VZ Holding AG 115 6,860 0.00Vetropack Holding AG 207 6,854 0.00Komax Holding AG 25 5,283 0.00Zehnder Group AG 52 3,273 0.00Implenia AG 156 2,810 0.00Bobst Group SA 21 1,429 0.00Rieter Holding AG 10 1,096 0.00COSMO Pharmaceuticals NV 22 997 0.00Mobimo Holding AG Rights
03/05/20221 324 901 0.00EFG International AG 137 833 0.00Valora Holding AG 6 787 0.00Basilea Pharmaceutica AG 28 751 0.00Ascom Holding AG 71 506 0.00Autoneum Holding AG 5 475 0.00
43,599,950 2.40
Taiwan 1.90% (31 October 2021: 1.80%)
Taiwan SemiconductorManufacturing Co. Ltd. 786,000 11,426,855 0.63
MediaTek Inc. 51,000 1,143,853 0.06Hon Hai Precision Industry Co.
Ltd. 387,600 1,063,094 0.06United Microelectronics Corp. 433,000 559,291 0.03CTBC Financial Holding Co. Ltd. 685,000 540,499 0.03Nan Ya Plastics Corp. 217,000 507,808 0.03Fubon Financial Holding Co. Ltd. 251,066 504,757 0.03Cathay Financial Holding Co.
Ltd. 274,547 463,680 0.03
Holding
MarketValue
(£)
% ofTotal Net
Assets
Delta Electronics Inc. 67,000 451,718 0.03Chunghwa Telecom Co. Ltd. 125,000 440,801 0.03E.Sun Financial Holding Co. Ltd. 476,893 435,572 0.03Uni-President Enterprises Corp. 235,000 433,721 0.03Formosa Plastics Corp. 151,000 428,438 0.03Mega Financial Holding Co. Ltd. 362,000 406,934 0.02China Steel Corp. 384,000 374,594 0.02First Financial Holding Co. Ltd. 442,500 332,414 0.02Evergreen Marine Corp. Taiwan
Ltd. 83,904 327,621 0.02ASE Technology Holding Co. Ltd. 124,078 320,199 0.02Yuanta Financial Holding Co. Ltd. 398,720 281,748 0.02China Development Financial
Holding Corp. 539,858 261,858 0.02Chailease Holding Co. Ltd. 39,045 249,528 0.02Taiwan Cooperative Financial
Holding Co. Ltd. 313,162 240,754 0.01Unimicron Technology Corp. 39,000 224,474 0.01Quanta Computer Inc. 95,000 215,124 0.01Formosa Chemicals & Fibre
Corp. 99,000 213,481 0.01Asustek Computer Inc. 22,000 212,233 0.01Advantech Co. Ltd. 20,608 205,765 0.01Novatek Microelectronics Corp. 19,000 204,599 0.01Taiwan Cement Corp. 161,970 200,895 0.01Taishin Financial Holding Co.
Ltd. 368,330 193,090 0.01Far EasTone
Telecommunications Co. Ltd. 86,000 192,188 0.01Yang Ming Marine Transport
Corp. 55,000 186,521 0.01Hua Nan Financial Holdings Co.
Ltd. 282,251 181,143 0.01Synnex Technology International
Corp. 83,000 173,596 0.01Hotai Motor Co. Ltd. 11,000 172,402 0.01Shin Kong Financial Holding Co.
Ltd. 643,006 170,801 0.01Lite-On Technology Corp. 97,000 170,375 0.01SinoPac Financial Holdings Co.
Ltd. 337,612 166,039 0.01Realtek Semiconductor Corp. 14,000 153,973 0.01Silergy Corp. 2,000 146,731 0.01Compal Electronics Inc. 239,000 143,698 0.01AU Optronics Corp. 307,000 142,274 0.01Yageo Corp. 12,978 141,681 0.01Taiwan Mobile Co. Ltd. 47,000 137,800 0.01Wiwynn Corp. 5,000 137,138 0.01Largan Precision Co. Ltd. 3,000 137,003 0.01Charoen Pokphand Enterprise 61,000 133,352 0.01President Chain Store Corp. 17,000 125,640 0.01United Integrated Services Co.
Ltd. 26,000 125,410 0.01Pegatron Corp. 66,000 125,200 0.01Compeq Manufacturing Co. Ltd. 100,000 123,897 0.01Radiant Opto-Electronics Corp. 44,000 121,870 0.01Innolux Corp. 326,000 120,246 0.01Accton Technology Corp. 19,000 119,114 0.01E Ink Holdings Inc. 25,000 117,547 0.01Asia Cement Corp. 90,000 116,858 0.01Catcher Technology Co. Ltd. 29,000 113,629 0.01Airtac International Group 5,139 112,760 0.01Wan Hai Lines Ltd. 27,700 109,283 0.01Ruentex Development Co. Ltd. 51,124 108,032 0.01Tatung Co. Ltd. 119,000 107,885 0.01Formosa Petrochemical Corp. 43,000 106,319 0.01Inventec Corp. 151,000 103,233 0.01Shanghai Commercial & Savings
Bank Ltd. 78,000 103,174 0.01Walsin Lihwa Corp. 85,000 102,901 0.01Tong Yang Industry Co. Ltd. 115,000 102,860 0.01Zhen Ding Technology Holding
Ltd. 36,000 102,631 0.01Teco Electric and Machinery Co.
Ltd. 114,000 96,113 0.01Elite Material Co. Ltd. 15,000 89,984 0.01Kenda Rubber Industrial Co. Ltd. 104,000 88,666 0.01
Vanguard FTSE Global All Cap Index Fund
159

Holding
MarketValue
(£)
% ofTotal Net
Assets
Pou Chen Corp. 105,000 87,816 0.01WPG Holdings Ltd. 59,840 87,804 0.01Nan Ya Printed Circuit Board
Corp. 8,000 87,336 0.01Acer Inc. 117,000 87,260 0.01Sino-American Silicon
Products Inc. 21,000 84,269 0.01Chang Hwa Commercial Bank
Ltd. 168,512 84,241 0.01Globalwafers Co. Ltd. 6,000 84,147 0.01Foxconn Technology Co. Ltd. 51,000 81,172 0.01Feng TAY Enterprise Co. Ltd. 15,440 79,898 0.01King's Town Bank Co. Ltd. 75,000 79,243 0.01Parade Technologies Ltd. 2,000 77,284 0.01Far Eastern New Century Corp. 95,000 77,142 0.01Feng Hsin Steel Co. Ltd. 33,000 74,014 0.01Giant Manufacturing Co. Ltd. 11,000 73,865 0.01Merida Industry Co. Ltd. 11,000 72,082 0.01ASPEED Technology Inc. 1,000 71,609 0.01eMemory Technology Inc. 2,000 69,447 0.01Chipbond Technology Corp. 37,000 67,088 0.01Tripod Technology Corp. 20,000 67,015 0.01Eclat Textile Co. Ltd. 5,000 65,799 0.01Eva Airways Corp. 67,388 64,827 0.00Win Semiconductors Corp. 12,000 63,394 0.00China Airlines Ltd. 84,000 63,216 0.00Vanguard International
Semiconductor Corp. 22,000 62,421 0.00Cheng Shin Rubber Industry Co.
Ltd. 69,000 62,369 0.00Micro-Star International Co. Ltd. 19,000 62,124 0.00Gigabyte Technology Co. Ltd. 21,000 61,570 0.00ITEQ Corp. 21,657 61,156 0.00Lien Hwa Industrial Holdings
Corp. 40,232 61,098 0.00Wistron Corp. 78,178 60,102 0.00Highwealth Construction Corp. 45,500 57,664 0.00Bizlink Holding Inc. 7,000 56,747 0.00Taiwan Business Bank 162,406 55,954 0.00King Yuan Electronics Co. Ltd. 51,000 55,746 0.00United Renewable Energy Co.
Ltd. 95,196 55,307 0.00Winbond Electronics Corp. 74,268 54,587 0.00Ruentex Industries Ltd. 17,080 53,308 0.00Taiwan Fertilizer Co. Ltd. 26,000 52,623 0.00Taiwan High Speed Rail Corp. 69,000 52,114 0.00Great Wall Enterprise Co. Ltd. 35,226 50,260 0.00Chroma ATE Inc. 11,000 49,491 0.00Capital Securities Corp. 115,000 48,789 0.00Alchip Technologies Ltd. 2,000 47,829 0.00TA Chen Stainless Pipe 39,650 47,572 0.00CTCI Corp. 37,000 46,492 0.00Elan Microelectronics Corp. 11,000 44,884 0.00HTC Corp. 34,000 43,733 0.00ENNOSTAR Inc. 27,500 43,621 0.00Tung Ho Steel Enterprise Corp. 25,460 43,412 0.00Oneness Biotech Co. Ltd. 8,000 42,047 0.00Phison Electronics Corp. 4,000 41,885 0.00Nuvoton Technology Corp. 10,000 39,453 0.00Macronix International Co. Ltd. 38,040 39,267 0.00Formosa Taffeta Co. Ltd. 53,000 38,812 0.00Voltronic Power Technology
Corp. 1,102 38,712 0.00Hiwin Technologies Corp. 6,494 38,694 0.00Supreme Electronics Co. Ltd. 30,959 38,650 0.00ASMedia Technology Inc. 1,000 38,372 0.00Powertech Technology Inc. 15,000 37,858 0.00Hannstar Board Corp. 36,000 37,502 0.00Wah Lee Industrial Corp. 13,240 37,209 0.00Sampo Corp. 44,000 36,799 0.00Standard Foods Corp. 27,040 36,753 0.00Taiflex Scientific Co. Ltd. 31,000 36,691 0.00China Petrochemical
Development Corp. 114,588 36,383 0.00Walsin Technology Corp. 10,937 36,204 0.00Qisda Corp. 42,000 35,807 0.00Faraday Technology Corp. 5,000 35,197 0.00
Holding
MarketValue
(£)
% ofTotal Net
Assets
Taichung Commercial Bank Co.Ltd. 86,574 34,857 0.00
Wisdom Marine Lines Co. Ltd. 14,000 34,843 0.00Nien Made Enterprise Co. Ltd. 4,000 33,886 0.00TA-I Technology Co. Ltd. 23,000 33,686 0.00Darfon Electronics Corp. 26,000 33,302 0.00Far Eastern International Bank 101,910 32,908 0.00SDI Corp. 9,000 32,102 0.00Nanya Technology Corp. 18,000 31,908 0.00Solar Applied Materials
Technology Corp. 23,266 30,806 0.00Holtek Semiconductor Inc. 12,000 30,351 0.00TYC Brother Industrial Co. Ltd. 57,000 30,035 0.00Namchow Holdings Co. Ltd. 23,000 29,677 0.00IBF Financial Holdings Co. Ltd. 68,081 29,527 0.00Chicony Electronics Co. Ltd. 13,010 28,969 0.00Sinbon Electronics Co. Ltd. 4,000 28,103 0.00Test Research Inc. 15,000 28,090 0.00Sitronix Technology Corp. 4,000 27,833 0.00momo.com Inc. 1,300 27,752 0.00Century Iron & Steel Industrial
Co. Ltd. 8,000 27,563 0.00Medigen Vaccine Biologics Corp. 4,000 27,076 0.00Nichidenbo Corp. 19,000 27,006 0.00CSBC Corp. Taiwan 47,547 26,981 0.00YFY Inc. 32,000 26,979 0.00Formosan Rubber Group Inc. 44,000 26,455 0.00Episil Technologies Inc. 9,137 25,925 0.00Taiwan Surface Mounting
Technology Corp. 9,000 25,658 0.00Taiwan Glass Industry Corp. 42,000 25,479 0.00China Motor Corp. 16,000 25,466 0.00Asia Vital Components Co. Ltd. 9,000 25,414 0.00Makalot Industrial Co. Ltd. 5,128 25,220 0.00Taiwan PCB Techvest Co. Ltd. 19,000 25,183 0.00Advanced Energy Solution
Holding Co. Ltd. 1,000 24,860 0.00Wafer Works Corp. 16,784 24,627 0.00Pan Jit International Inc. 11,900 24,471 0.00U-Ming Marine Transport Corp. 14,000 24,288 0.00HannStar Display Corp. 67,000 23,808 0.00Chung Hung Steel Corp. 23,000 23,711 0.00Simplo Technology Co. Ltd. 3,000 23,590 0.00Cheng Loong Corp. 26,000 23,501 0.00Kinsus Interconnect Technology
Corp. 5,000 23,172 0.00Syncmold Enterprise Corp. 12,000 22,764 0.00Gloria Material Technology Corp. 29,000 22,647 0.00Via Technologies Inc. 17,000 22,555 0.00Yieh Phui Enterprise Co. Ltd. 39,000 22,447 0.00Global Unichip Corp. 2,000 22,374 0.00BES Engineering Corp. 86,000 22,170 0.00Genesys Logic Inc. 4,000 21,564 0.00YungShin Global Holding Corp. 18,000 20,891 0.00Wistron NeWeb Corp. 10,000 20,726 0.00Elite Semiconductor
MicroelectronicsTechnology Inc. 6,000 20,267 0.00
Lotes Co. Ltd. 1,019 20,046 0.00TSRC Corp. 23,000 20,013 0.00Shinkong Synthetic Fibers Corp. 37,000 19,747 0.00Eternal Materials Co. Ltd. 19,247 19,738 0.00International Games System Co.
Ltd. 1,000 19,699 0.00Hong Pu Real Estate
Development Co. Ltd. 35,000 19,672 0.00WT Microelectronics Co. Ltd. 10,000 19,402 0.00Tong Hsing Electronic Industries
Ltd. 3,022 19,068 0.00Tainan Spinning Co. Ltd. 34,000 18,926 0.00USI Corp. 24,000 18,775 0.00AcBel Polytech Inc. 24,000 18,743 0.00ITE Technology Inc. 7,000 18,235 0.00Center Laboratories Inc. 10,577 18,063 0.00Nan Kang Rubber Tire Co. Ltd. 17,000 17,732 0.00Fusheng Precision Co. Ltd. 3,000 17,510 0.00TXC Corp. 7,000 17,213 0.00
Vanguard FTSE Global All Cap Index Fund
160

Holding
MarketValue
(£)
% ofTotal Net
Assets
RDC Semiconductor Co. Ltd. 2,000 17,159 0.00Longchen Paper & Packaging
Co. Ltd. 31,118 16,902 0.00Nantex Industry Co. Ltd. 11,000 16,289 0.00TTY Biopharm Co. Ltd. 8,000 16,127 0.00Gold Circuit Electronics Ltd. 7,000 15,700 0.00FocalTech Systems Co. Ltd. 5,000 15,673 0.00Depo Auto Parts Ind Co. Ltd. 10,000 15,565 0.00Fitipower Integrated
Technology Inc. 3,270 15,508 0.00RichWave Technology Corp. 2,800 15,322 0.00Sigurd Microelectronics Corp. 10,000 15,268 0.00ADATA Technology Co. Ltd. 8,000 15,262 0.00Dynapack International
Technology Corp. 7,000 15,189 0.00Mitac Holdings Corp. 19,399 14,547 0.00Cathay Real Estate
Development Co. Ltd. 28,000 13,922 0.00Hsin Kuang Steel Co. Ltd. 8,000 13,922 0.00Firich Enterprises Co. Ltd. 18,268 13,723 0.00Evergreen International Storage
& Transport Corp. 14,000 13,638 0.00AP Memory Technology Corp. 2,000 13,565 0.00Topkey Corp. 4,000 13,457 0.00Kinpo Electronics 35,000 13,430 0.00Altek Corp. 13,000 13,086 0.00Rich Development Co. Ltd. 53,000 13,076 0.00UPC Technology Corp. 29,000 12,969 0.00Ho Tung Chemical Corp. 47,000 12,891 0.00Federal Corp. 21,000 12,853 0.00Co-Tech Development Corp. 8,000 12,560 0.00Holy Stone Enterprise Co. Ltd. 4,000 12,268 0.00Wowprime Corp. 4,000 11,998 0.00Silicon Integrated Systems Corp. 19,677 11,884 0.00Far Eastern Department Stores
Ltd. 21,000 11,803 0.00Visual Photonics Epitaxy Co. Ltd. 5,000 11,714 0.00XinTec Inc. 3,000 11,147 0.00Kung Long Batteries Industrial
Co. Ltd. 3,000 11,106 0.00L&K Engineering Co. Ltd. 14,000 11,066 0.00Pegavision Corp. 1,000 11,066 0.00Genius Electronic Optical Co.
Ltd. 1,079 11,051 0.00Goldsun Building Materials Co.
Ltd. 13,692 10,822 0.00Pan-International Industrial Corp. 12,000 10,798 0.00King Slide Works Co. Ltd. 1,000 10,701 0.00Jentech Precision Industrial Co.
Ltd. 1,000 10,241 0.00FLEXium Interconnect Inc. 4,049 10,132 0.00Ability Enterprise Co. Ltd. 15,000 9,404 0.00FSP Technology Inc. 8,000 8,885 0.00ChipMOS Technologies Inc. 7,000 8,834 0.00Poya International Co. Ltd. 1,030 8,753 0.00Yulon Finance Corp. 1,391 8,683 0.00Microbio Co. Ltd. 5,491 8,576 0.00International CSRC Investment
Holdings Co. 13,501 8,500 0.00Li Peng Enterprise Co. Ltd. 38,000 8,420 0.00Taiwan Union Technology Corp. 4,000 8,334 0.00WUS Printed Circuit Co. Ltd. 10,430 8,089 0.00Andes Technology Corp. 1,000 8,026 0.00TaiDoc Technology Corp. 1,000 7,823 0.00St Shine Optical Co. Ltd. 1,000 7,242 0.00Shin Zu Shing Co. Ltd. 3,123 7,072 0.00Yulon Motor Co. Ltd. 6,357 6,803 0.00Universal Vision Biotechnology
Co. Ltd. 1,000 6,702 0.00Advanced Ceramic X Corp. 1,000 6,620 0.00TPK Holding Co. Ltd. 7,000 6,498 0.00YC INOX Co. Ltd. 7,386 6,407 0.00Gudeng Precision Industrial Co.
Ltd. 1,075 6,246 0.00Pixart Imaging Inc. 2,000 6,242 0.00Kindom Development Co. Ltd. 6,600 6,180 0.00TCI Co. Ltd. 1,320 6,082 0.00
Holding
MarketValue
(£)
% ofTotal Net
Assets
Sunny Friend EnvironmentalTechnology Co. Ltd. 1,000 6,080 0.00
Speed Tech Corp. 4,000 5,729 0.00Gigastorage Corp. 9,476 5,710 0.00Adimmune Corp. 5,000 5,486 0.00China Metal Products 6,000 5,342 0.00Huaku Development Co. Ltd. 2,000 4,972 0.00Cub Elecparts Inc. 1,070 3,976 0.00Grape King Bio Ltd. 1,000 3,864 0.00LandMark Optoelectronics Corp. 1,000 3,797 0.00OBI Pharma Inc. 1,184 3,567 0.00Coretronic Corp. 2,000 3,086 0.00China Steel Chemical Corp. 1,000 3,081 0.00Weltrend Semiconductor 1,599 2,999 0.00Egis Technology Inc. 1,000 2,986 0.00Taiwan Secom Co. Ltd. 1,000 2,945 0.00Clevo Co. 3,000 2,744 0.00KEE TAI Properties Co. Ltd. 8,000 2,648 0.00Gourmet Master Co. Ltd. 1,000 2,500 0.00General Interface Solution
Holding Ltd. 1,000 2,475 0.00China Electric Manufacturing
Corp. 4,860 2,410 0.00Tyntek Corp. 4,000 2,367 0.00Advanced International
Multitech Co. Ltd. 1,000 2,302 0.00Merry Electronics Co. Ltd. 1,037 2,292 0.00Shining Building Business Co.
Ltd. 8,080 2,194 0.00Hota Industrial Manufacturing
Co. Ltd. 1,073 2,186 0.00PChome Online Inc. 1,000 2,102 0.00Sonix Technology Co. Ltd. 1,000 2,046 0.00Transcend Information Inc. 1,000 1,919 0.00Asia Optical Co. Inc. 1,000 1,913 0.00Kuo Toong International Co. Ltd. 3,256 1,874 0.00Taiwan Paiho Ltd. 1,000 1,813 0.00Iron Force Industrial Co. Ltd. 1,000 1,794 0.00Sunplus Technology Co. Ltd. 2,000 1,789 0.00Ta Ya Electric Wire & Cable 2,230 1,705 0.00TaiMed Biologics Inc. 1,000 1,692 0.00Dynamic Electronics Co. Ltd. 2,904 1,679 0.00AGV Products Corp. 5,000 1,581 0.00Hung Sheng Construction Ltd. 2,304 1,569 0.00Primax Electronics Ltd. 1,000 1,508 0.00Radium Life Tech Co. Ltd. 5,100 1,385 0.00Ardentec Corp. 1,000 1,175 0.00Oriental Union Chemical Corp. 2,000 1,103 0.00Taiyen Biotech Co. Ltd. 1,000 930 0.00Tong-Tai Machine & Tool Co. Ltd. 2,000 803 0.00Grand Pacific Petrochemical 1,000 703 0.00Career Technology MFG. Co.
Ltd. 1,050 593 0.00Unitech Printed Circuit Board
Corp. 1,020 460 0.00Yulon Finance Corp. - Preference
Shares 291 402 0.00Darwin Precisions Corp. 1,000 286 0.00Ritek Corp. 1,177 284 0.00
34,435,323 1.90
Thailand 0.30% (31 October 2021: 0.24%)
PTT PCL Foreign1 438,400 382,318 0.02CP ALL PCL Foreign1 229,100 346,307 0.02Siam Cement PCL Foreign1 26,600 228,879 0.01SCB X PCL Foreign1 75,978 197,892 0.01PTT Exploration & Production
PCL Foreign1 55,600 194,596 0.01Airports of Thailand PCL
Foreign1 121,700 188,914 0.01Advanced Info Service PCL
Foreign1 37,100 185,496 0.01Bangkok Dusit Medical Services
PCL Foreign1 273,800 162,366 0.01Central Pattana PCL Foreign1 115,500 161,831 0.01Gulf Energy Development PCL
Foreign1 138,280 155,964 0.01
Vanguard FTSE Global All Cap Index Fund
161

Holding
MarketValue
(£)
% ofTotal Net
Assets
Kasikornbank PCL Foreign1 41,281 146,400 0.01Jasmine Telecom Systems PCL1 10,000 128,369 0.01Intouch Holdings PCL1 77,220 125,255 0.01TMBThanachart Bank PCL
Foreign1 3,372,919 101,970 0.01Esso Thailand PCL Foreign 464,000 100,891 0.01Delta Electronics Thailand PCL
Foreign1 11,600 97,923 0.01Minor International PCL Foreign1 117,816 95,895 0.01Energy Absolute PCL Foreign1 45,900 94,467 0.01Singer Thailand PCL Foreign1 70,600 93,995 0.01Thai Union Group PCL Foreign1 231,300 90,904 0.01Indorama Ventures PCL Foreign 83,800 87,696 0.01Siam Global House PCL Foreign1 166,480 84,400 0.01Charoen Pokphand Foods PCL
Foreign1 134,800 75,236 0.01PTT Global Chemical PCL
Foreign1 63,300 73,603 0.01Central Retail Corp. PCL
Foreign1 80,500 73,478 0.01BTS Group Holdings PCL
Foreign1 348,645 72,971 0.01Thanachart Capital PCL Foreign1 73,000 68,330 0.01SCG Packaging PCL1 52,900 67,969 0.01True Corp. PCL Foreign1 594,400 66,627 0.00Krung Thai Bank PCL Foreign1 176,500 61,979 0.00Tisco Financial Group PCL1 25,300 53,394 0.00JMT Network Services PCL1 26,300 53,058 0.00Home Product Center PCL
Foreign1 149,900 52,290 0.00Bangkok Expressway & Metro
PCL Foreign1 270,800 51,955 0.00Muangthai Capital PCL Foreign1 48,300 51,949 0.00Thonburi Healthcare Group PCL
Foreign1 32,400 46,339 0.00Electricity Generating PCL
Foreign1 11,600 44,915 0.00Digital Telecommunications
Infrastructure Fund Foreign1 132,152 43,333 0.00WHA Corp. PCL Foreign1 551,200 43,070 0.00Krungthai Card PCL Foreign1 31,600 42,255 0.00Thai Oil PCL Foreign1 32,000 42,046 0.00Land & Houses PCL Foreign1 190,300 42,042 0.00Kiatnakin Phatra Bank PCL
Foreign1 24,360 40,788 0.00Bumrungrad Hospital PCL
Foreign1 10,800 40,185 0.00Ngern Tid Lor PCL Foreign 44,907 38,379 0.00PTT Oil & Retail Business PCL1 64,500 37,349 0.00Srisawad Corp PCL Foreign1 29,781 37,052 0.00Banpu PCL Foreign1 129,333 36,694 0.00Ratch Group PCL Foreign1 34,700 35,506 0.00Bangkok Bank PCL Foreign1 11,600 35,204 0.00VGI PCL Foreign1 298,710 34,316 0.00TTW PCL Foreign1 134,600 34,119 0.00Global Power Synergy PCL
Foreign1 19,505 30,164 0.00Jasmine Broadband Internet
Infrastructure Fund Foreign1 116,917 29,636 0.00IRPC PCL Foreign1 341,200 27,613 0.00Central Plaza Hotel PCL Foreign1 25,300 26,329 0.00Quality Houses PCL Foreign1 505,300 26,087 0.00Major Cineplex Group PCL1 54,200 25,839 0.00Com7 PCL Foreign1 26,600 25,826 0.00Jay Mart PCL1 17,800 25,768 0.00Kasikornbank PCL NVDR 6,900 24,470 0.00KCE Electronics PCL Foreign1 15,700 22,454 0.00Supalai PCL Foreign1 43,950 22,383 0.00Siam Makro PCL Foreign1 20,152 17,574 0.00Bangkok Chain Hospital PCL
Foreign1 33,100 16,473 0.00Osotspa PCL Foreign1 20,100 16,243 0.00CK Power PCL Foreign1 122,300 15,501 0.00Asset World Corp. PCL Foreign1 135,400 15,240 0.00Bangkok Commercial Asset
Management PCL Foreign1 31,400 14,020 0.00Central Pattana PCL NVDR 9,893 13,861 0.00
Holding
MarketValue
(£)
% ofTotal Net
Assets
Hana Microelectronics PCLForeign1 12,500 13,008 0.00
Chularat Hospital PCL Foreign1 132,000 11,910 0.00Land & Houses PCL NVDR 53,000 11,709 0.00Jasmine International PCL
Foreign1 112,200 9,550 0.00Total Access Communication
PCL Foreign1 8,900 9,521 0.00Thoresen Thai Agencies PCL1 41,200 9,294 0.00Sri Trang Gloves Thailand PCL
Foreign1 16,400 9,230 0.00Sri Trang Agro-Industry PCL
Foreign1 14,200 8,256 0.00Bangchak Corp. PCL Foreign1 10,600 8,196 0.00CPN Retail Growth Leasehold
REIT 17,000 7,946 0.00Carabao Group PCL Foreign1 3,000 7,639 0.00Tisco Financial Group PCL NVDR 3,600 7,597 0.00Berli Jucker PCL Foreign1 9,400 7,487 0.00B Grimm Power PCL Foreign1 9,400 7,050 0.00CH Karnchang PCL Foreign1 14,900 6,757 0.00Bangkok Bank PCL NVDR 2,200 6,677 0.00Thailand Future Fund Foreign1 32,400 6,367 0.00Siam Cement PCL NVDR 700 6,023 0.00AEON Thana Sinsap Thailand
PCL Foreign1 1,100 4,912 0.00Sino-Thai Engineering &
Construction PCL1 15,800 4,777 0.00TQM Corp PCL Foreign1 4,000 4,605 0.00TOA Paint Thailand PCL Foreign1 4,800 3,209 0.00TPI Polene Power PCL Foreign1 39,100 1,364 0.00BTS Rail Mass Transit Growth
Infrastructure Fund1 12,900 1,290 0.00AP Thailand PCL Foreign1 4,100 1,116 0.00Siam City Cement PCL Foreign1 259 915 0.00Bangkok Life Assurance PCL
NVDR 800 814 0.00Origin Property PCL Class F1 3,000 767 0.00Star Petroleum Refining PCL1 2,000 498 0.00Bangkok Land PCL Foreign1 20,600 474 0.00TPI Polene Power PCL1 4,700 415 0.00Workpoint Entertainment PCL1 400 291 0.00TMBThanachart Bank PCL1 33,729 274 0.00Thai Airways International PCL
Foreign1 1,500 116 0.00
5,524,694 0.30
Turkey 0.06% (31 October 2021: 0.05%)
Eregli Demir ve Celik FabrikalariTAS 83,122 149,472 0.01
Haci Omer Sabanci Holding AS 79,780 85,718 0.01BIM Birlesik Magazalar AS 16,952 75,936 0.01Ford Otomotiv Sanayi AS 4,419 70,816 0.01Turkiye Petrol Rafinerileri AS 5,491 68,948 0.01Arcelik AS 15,370 55,500 0.01Oyak Cimento Fabrikalari AS 96,059 55,313 0.00Turkiye Sise ve Cam Fabrikalari
AS 54,839 53,276 0.00KOC Holding AS 22,228 47,884 0.00Turkiye Garanti Bankasi AS 59,090 47,458 0.00Turkcell Iletisim Hizmetleri AS 33,867 39,293 0.00Akbank T.A.S. 70,733 33,827 0.00Turkiye Is Bankasi AS 56,381 31,830 0.00Aselsan Elektronik Sanayi Ve
Ticaret AS 18,474 24,267 0.00TAV Havalimanlari Holding AS 10,000 22,979 0.00Kardemir Karabuk Demir Celik
Sanayi ve Ticaret AS Class A 32,708 22,148 0.00Turk Hava Yollari AO 8,517 18,841 0.00Tofas Turk Otomobil Fabrikasi AS 3,588 15,130 0.00Emlak Konut Gayrimenkul Yatirim
Ortakligi AS 77,225 11,013 0.00Petkim Petrokimya Holding AS 18,708 9,569 0.00Coca-Cola Icecek AS 1,268 8,403 0.00Yapi ve Kredi Bankasi AS 27,721 7,223 0.00Enka Insaat ve Sanayi AS 8,059 6,853 0.00Enerjisa Enerji AS 6,835 5,163 0.00
Vanguard FTSE Global All Cap Index Fund
162

Holding
MarketValue
(£)
% ofTotal Net
Assets
Bera Holding AS 8,834 4,916 0.00Tat Gida Sanayi AS 5,746 4,390 0.00Turk Telekomunikasyon AS 7,140 3,855 0.00Turkiye Vakiflar Bankasi TAO 16,188 3,854 0.00Turkiye Halk Bankasi AS 11,015 3,195 0.00Anadolu Efes Biracilik Ve Malt
Sanayii AS 1,862 2,955 0.00Koza Altin Isletmeleri AS 311 2,871 0.00Ulker Biskuvi Sanayi AS 2,244 2,010 0.00Kardemir Karabuk Demir Celik
Sanayi ve Ticaret AS Class D 2,262 1,837 0.00Konya Cimento Sanayii AS 26 1,259 0.00Logo Yazilim Sanayi Ve Ticaret
AS 436 1,052 0.00Ipek Dogal Enerji Kaynaklari
Arastirma Ve Uretim AS 643 712 0.00Sok Marketler Ticaret AS 854 596 0.00Cimsa Cimento Sanayi VE
Ticaret AS 283 506 0.00Tekfen Holding AS 467 492 0.00Akcansa Cimento AS 329 379 0.00Yatas Yatak ve Yorgan Sanayi ve
Ticaret AS 342 265 0.00
1,002,004 0.06
United Arab Emirates 0.17% (31 October 2021: 0.09%)
Emirates TelecommunicationsGroup Co. PJSC 116,165 879,138 0.05
First Abu Dhabi Bank PJSC 147,157 714,801 0.04Alpha Dhabi Holding PJSC 42,457 248,950 0.01Emaar Properties PJSC 154,589 212,867 0.01Abu Dhabi Commercial Bank
PJSC 92,922 204,321 0.01Aldar Properties PJSC 104,527 127,612 0.01Dubai Islamic Bank PJSC 81,703 114,276 0.01Abu Dhabi Islamic Bank PJSC 54,934 103,756 0.01Dubai Electricity & Water
Authority PJSC 120,295 73,823 0.01Abu Dhabi National Oil Co. for
Distribution PJSC 80,806 72,018 0.01Dubai Investments PJSC 107,455 58,254 0.00AL Seer Marine Supplies &
Equipment Co. LLC 20,326 57,740 0.00GFH Financial Group 176,392 46,283 0.00AL Yah Satellite Communications
Co. PJSC 60,568 34,937 0.00ADNOC Drilling Co. PJSC 37,291 29,030 0.00Dubai Financial Market PJSC 43,669 25,284 0.00Dana Gas PJSC 80,881 20,696 0.00Air Arabia PJSC 35,180 16,249 0.00Emaar Development PJSC 13,284 14,864 0.00Arabtec Holding PJSC1 802 92 0.00
3,054,991 0.17
United Kingdom 4.06% (31 October 2021: 3.88%)
AstraZeneca plc 50,654 5,413,900 0.30Shell plc 249,096 5,412,856 0.30HSBC Holdings plc 648,221 3,248,884 0.18Unilever plc 82,941 3,084,161 0.17Diageo plc 74,451 2,991,441 0.17GlaxoSmithKline plc 160,101 2,876,695 0.16British American Tobacco plc 74,390 2,493,181 0.14BP plc 628,197 2,459,705 0.14Glencore plc 430,465 2,140,487 0.12Rio Tinto plc 35,344 2,016,729 0.11RELX plc 60,791 1,454,121 0.08Anglo American plc 39,947 1,432,499 0.08National Grid plc 114,607 1,368,408 0.08Reckitt Benckiser Group plc 20,596 1,284,778 0.07Vodafone Group plc 900,947 1,095,011 0.06Lloyds Banking Group plc 2,285,710 1,048,684 0.06Compass Group plc 57,258 974,531 0.05London Stock Exchange Group
plc 11,855 938,205 0.05Prudential plc 91,741 926,584 0.05Experian plc 30,164 842,179 0.05CRH plc 26,039 837,675 0.05
Holding
MarketValue
(£)
% ofTotal Net
Assets
Barclays plc 547,102 810,696 0.05BAE Systems plc 102,516 758,618 0.04Ferguson plc 7,201 730,181 0.04Tesco plc 247,432 672,768 0.04SSE plc 34,262 640,014 0.04Ashtead Group plc 14,613 610,239 0.03Aviva plc 121,946 528,392 0.03Imperial Brands plc 31,218 519,936 0.03Segro plc 38,453 516,232 0.03Flutter Entertainment plc 6,042 491,094 0.03Legal & General Group plc 191,369 482,250 0.03Standard Chartered plc 83,632 461,314 0.033i Group plc 32,244 427,072 0.02WPP plc 42,363 425,748 0.02Smith & Nephew plc 32,382 421,776 0.02BT Group plc 219,130 388,517 0.02Croda International plc 4,601 359,062 0.02Natwest Group plc 164,181 357,915 0.02Rentokil Initial plc 62,865 345,632 0.02Halma plc 13,514 333,796 0.02Bunzl plc 10,525 326,485 0.02InterContinental Hotels Group
plc 6,070 313,940 0.02Smurfit Kappa Group plc 9,019 307,818 0.02Spirax-Sarco Engineering plc 2,273 276,170 0.02Informa plc 47,593 273,469 0.02Entain plc 17,912 271,904 0.02Next plc 4,492 270,688 0.02Severn Trent plc 8,424 265,019 0.02Intertek Group plc 5,271 263,866 0.02Sage Group plc 34,869 257,054 0.01Mondi plc 16,787 253,484 0.01United Utilities Group plc 20,527 236,266 0.01Persimmon plc 11,093 232,620 0.01DCC plc 3,715 225,723 0.01Rolls-Royce Holdings plc 267,825 223,045 0.01St James's Place plc 16,875 218,953 0.01Burberry Group plc 13,546 215,517 0.01Land Securities Group plc 27,321 205,618 0.01Admiral Group plc 7,745 195,484 0.01M&G plc 88,080 188,579 0.01Associated British Foods plc 11,568 185,782 0.01Meggitt plc 23,833 184,658 0.01Auto Trader Group plc 28,869 183,260 0.01Pearson plc 23,298 183,029 0.01Smiths Group plc 12,361 182,634 0.01Rightmove plc 28,767 177,838 0.01Whitbread plc 6,226 175,386 0.01Antofagasta plc 11,141 172,797 0.01Electrocomponents plc 16,066 169,496 0.01Barratt Developments plc 32,519 160,741 0.01Kingfisher plc 62,890 159,300 0.01Spectris plc 5,220 153,938 0.01Melrose Industries plc 128,976 152,321 0.01British Land Co. plc 28,925 149,774 0.01Johnson Matthey plc 6,599 146,762 0.01UNITE Group plc 12,723 144,406 0.01Standard Life Aberdeen plc 74,958 141,821 0.01Taylor Wimpey plc 109,792 139,271 0.01B&M European Value Retail SA 28,118 137,834 0.01Centrica plc 173,397 137,781 0.01Tritax Big Box REIT plc 56,426 137,567 0.01Ocado Group plc 14,322 132,249 0.01Greggs plc 5,619 132,047 0.01Phoenix Group Holdings plc 21,612 131,574 0.01HomeServe plc 13,377 131,496 0.01Dechra Pharmaceuticals plc 3,612 131,260 0.01ConvaTec Group plc 61,654 130,706 0.01Intermediate Capital Group plc 8,432 130,485 0.01J Sainsbury plc 55,722 129,999 0.01Howden Joinery Group plc 16,866 128,384 0.01DS Smith plc 37,762 124,954 0.01Weir Group plc 7,975 124,251 0.01Hikma Pharmaceuticals plc 6,474 121,938 0.01Vistry Group plc 13,894 116,154 0.01Future plc 5,137 113,836 0.01
Vanguard FTSE Global All Cap Index Fund
163

Holding
MarketValue
(£)
% ofTotal Net
Assets
Berkeley Group Holdings plc 2,788 113,750 0.01Beazley plc 26,193 113,049 0.01Coca-Cola HBC AG 6,886 112,621 0.01AVEVA Group plc 5,148 111,918 0.01Bellway plc 4,558 110,759 0.01Drax Group plc 13,554 109,449 0.01Endeavour Mining plc 5,549 108,649 0.01Softcat plc 7,634 108,097 0.01Royal Mail plc 30,584 105,362 0.01Hargreaves Lansdown plc 11,167 102,401 0.01Tate & Lyle plc 13,172 102,346 0.01JD Sports Fashion plc 75,160 100,226 0.01Harbour Energy plc 19,853 100,059 0.01Schroders plc 3,446 97,866 0.01Derwent London plc 3,222 97,176 0.01Investec plc 20,068 94,922 0.01Direct Line Insurance Group plc 37,087 94,090 0.01IMI plc 6,888 93,057 0.01IG Group Holdings plc 11,341 92,486 0.01Diploma plc 3,357 92,318 0.01Hiscox Ltd. 9,672 91,555 0.01Sirius Real Estate Ltd. 74,595 90,409 0.01Brewin Dolphin Holdings plc 17,568 90,124 0.01Safestore Holdings plc 7,144 90,014 0.01TUI AG 38,946 89,693 0.01LXI REIT plc 59,531 88,225 0.01Indivior plc 27,889 87,348 0.01Pennon Group plc 7,828 86,969 0.01ITV plc 116,205 86,340 0.01Avast plc 15,278 86,168 0.01Ultra Electronics Holdings plc 2,635 86,006 0.01Big Yellow Group plc 5,929 84,785 0.01QinetiQ Group plc 23,998 82,025 0.01Inchcape plc 11,438 81,725 0.01Marks & Spencer Group plc 59,073 81,344 0.01Rathbones Group plc 3,833 80,493 0.01Man Group plc 34,228 80,402 0.01Grafton Group plc 8,129 79,542 0.00Games Workshop Group plc 1,069 79,159 0.00SSP Group plc 32,422 76,937 0.00Chemring Group plc 21,683 76,107 0.00Travis Perkins plc 6,043 74,238 0.00Virgin Money UK plc 41,720 72,947 0.00easyJet plc 12,844 71,978 0.00Watches of Switzerland Group
plc 6,997 71,439 0.00Volution Group plc 17,304 71,119 0.00Clarkson plc 1,884 69,520 0.00Plus500 Ltd. 4,441 69,191 0.00LondonMetric Property plc 25,443 68,594 0.00Sanne Group plc 7,512 68,134 0.00Workspace Group plc 10,163 67,787 0.00Britvic plc 7,778 66,657 0.00Telecom Plus plc 4,029 66,479 0.00Close Brothers Group plc 5,972 66,229 0.00Rotork plc 22,337 65,403 0.00Carnival plc 5,054 65,020 0.00Molten Ventures plc 9,219 63,888 0.00Essentra plc 20,281 63,784 0.00Frasers Group plc 9,358 63,541 0.00Pagegroup plc 12,901 63,396 0.00Shaftesbury plc 10,568 63,249 0.00Savills plc 5,834 63,182 0.00OSB Group plc 11,225 62,972 0.00Great Portland Estates plc 8,936 61,167 0.00Quilter plc 45,812 60,380 0.00John Wood Group plc 26,840 59,934 0.00Cranswick plc 1,878 59,608 0.00Hill & Smith Holdings plc 4,196 58,073 0.00Capital & Counties Properties
plc 35,048 57,934 0.00Primary Health Properties plc 39,677 57,413 0.00Serco Group plc 37,101 56,431 0.00Playtech plc 10,532 55,188 0.00Coats Group plc 76,852 54,565 0.00JTC plc 6,982 54,529 0.00
Holding
MarketValue
(£)
% ofTotal Net
Assets
Hays plc 43,583 53,651 0.00Wise plc Class A 13,364 52,774 0.00Centamin plc 55,851 51,126 0.00FDM Group Holdings plc 4,906 49,943 0.00Paragon Banking Group plc 10,059 49,893 0.00WH Smith plc 3,412 49,645 0.00Ascential plc 15,457 49,184 0.00Energean plc 4,138 48,994 0.00Mediclinic International plc 13,160 48,876 0.00Moneysupermarket.com Group
plc 27,735 48,481 0.00Biffa plc 13,628 47,534 0.00Airtel Africa plc 32,339 47,409 0.00Premier Foods plc 42,326 46,897 0.00Victrex plc 2,543 46,486 0.00Darktrace plc 10,581 45,943 0.00Computacenter plc 1,688 45,137 0.00Redde Northgate plc 11,200 44,408 0.00Bridgepoint Group plc 14,443 44,224 0.00Grainger plc 14,854 44,057 0.00Ninety One plc 16,453 43,732 0.00IntegraFin Holdings plc 11,798 42,496 0.00Renishaw plc 987 41,948 0.00Genus plc 1,660 41,766 0.00International Consolidated
Airlines Group SA 29,008 41,743 0.00Balfour Beatty plc 16,743 40,652 0.00Helios Towers plc 35,965 40,317 0.00Just Group plc 47,401 40,291 0.00Countryside Partnerships plc 15,843 39,829 0.00Deliveroo plc 34,927 38,699 0.00Assura plc 58,192 38,349 0.00Domino's Pizza Group plc 10,987 38,191 0.00Vivo Energy plc 25,835 37,357 0.00S4 Capital plc 12,164 37,076 0.00IWG plc 15,147 36,959 0.00Wizz Air Holdings plc 1,135 36,036 0.00Marshalls plc 5,791 35,470 0.00Euromoney Institutional Investor
plc 3,549 35,242 0.00Genuit Group plc 7,735 34,924 0.00Spirent Communications plc 15,026 34,740 0.00Hammerson plc 119,971 34,660 0.00Morgan Sindall Group plc 1,607 34,631 0.00Pets at Home Group plc 10,977 33,963 0.00Petershill Partners plc 13,200 33,660 0.00Spire Healthcare Group plc 14,997 32,319 0.00AJ Bell plc 12,860 32,073 0.00Synthomer plc 10,515 32,071 0.00Currys plc 33,787 31,506 0.00C&C Group plc 14,900 31,141 0.00Liontrust Asset Management plc 2,599 30,356 0.00National Express Group plc 11,820 29,385 0.00IP Group plc 35,064 29,243 0.00Fresnillo plc 3,729 28,907 0.00Dr. Martens plc 13,565 28,893 0.00Ashmore Group plc 12,454 27,748 0.00Hilton Food Group plc 2,268 27,624 0.00TP ICAP Group plc 20,740 27,335 0.00THG plc 25,061 26,978 0.00Dunelm Group plc 2,730 26,781 0.00Micro Focus International plc 6,874 26,052 0.00Network International Holdings
plc 9,708 25,299 0.00Bytes Technology Group plc 5,360 23,959 0.00Trustpilot AS 22,807 23,765 0.00Oxford Instruments plc 968 22,554 0.00Trainline plc 7,302 20,708 0.00Firstgroup plc 17,848 20,079 0.00XP Power Ltd. 615 19,803 0.00Tullow Oil plc 34,496 19,421 0.00Bodycote plc 3,031 18,898 0.00Oxford Biomedica plc 3,217 18,337 0.00Lancashire Holdings Ltd. 4,215 17,880 0.00Redrow plc 3,385 17,805 0.00Halfords Group plc 7,038 15,920 0.00
Vanguard FTSE Global All Cap Index Fund
164

Holding
MarketValue
(£)
% ofTotal Net
Assets
Ferrexpo plc 9,538 15,719 0.00Mitie Group plc 27,578 14,947 0.00Capricorn Energy plc 6,999 14,432 0.00RHI Magnesita NV 539 12,925 0.00Ibstock plc 6,793 12,866 0.00Jupiter Fund Management plc 6,678 11,900 0.00888 Holdings plc 6,090 11,601 0.00Morgan Advanced Materials plc 4,070 11,477 0.00Moonpig Group plc 5,821 11,252 0.00Aston Martin Lagonda Global
Holdings plc 1,218 10,394 0.00Restaurant Group plc 16,708 10,376 0.00Kainos Group plc 804 9,793 0.00Greencore Group plc 8,236 9,438 0.00AG Barr plc 1,554 9,013 0.00NCC Group plc 4,834 8,827 0.00Vesuvius plc 2,700 8,732 0.00Wickes Group plc 4,471 8,602 0.00Provident Financial plc 3,341 8,580 0.00Auction Technology Group plc 974 8,542 0.00PureTech Health plc 4,781 8,252 0.00Babcock International Group plc 2,619 8,025 0.00Picton Property Income Ltd. 7,240 7,356 0.00Keller Group plc 798 6,751 0.00TI Fluid Systems plc 4,104 6,665 0.00Elementis plc 5,251 6,401 0.00Mitchells & Butlers plc 2,708 6,174 0.00Crest Nicholson Holdings plc 2,158 5,460 0.00Marston's plc 7,124 5,347 0.00J D Wetherspoon plc 723 5,314 0.00Hochschild Mining plc 3,796 4,475 0.00AO World plc 5,234 3,978 0.00Senior plc 3,042 3,894 0.00Avon Protection plc 318 3,374 0.00Cineworld Group plc 10,841 3,338 0.00Stagecoach Group plc 2,748 2,888 0.00Capita plc 11,390 2,731 0.00BMO Commercial Property Trust
Ltd. 2,090 2,466 0.00Petrofac Ltd. 1,415 1,909 0.00TBC Bank Group plc 152 1,909 0.00SIG plc 3,667 1,511 0.00Bank of Georgia Group plc 117 1,437 0.00UK Commercial Property REIT
Ltd. 1,522 1,345 0.00PZ Cussons plc 393 804 0.00Devro plc 359 745 0.00Alfa Financial Software Holdings
plc 179 326 0.00Funding Circle Holdings plc 359 262 0.00Intu Properties plc1 2,617 — 0.00Evraz plc1 19,798 — 0.00NMC Health plc1 1,048 — 0.00
73,622,123 4.06
United States 58.46% (31 October 2021: 59.21%)
Apple Inc. 503,840 63,269,911 3.49Microsoft Corp. 245,829 54,348,642 3.00Amazon.com Inc. 14,196 28,105,012 1.55Tesla Inc. 27,224 18,868,792 1.04Alphabet Inc. Class A 9,858 17,914,933 0.99Alphabet Inc. Class C 8,991 16,466,161 0.91UnitedHealth Group Inc. 30,418 12,308,684 0.68Johnson & Johnson 85,440 12,284,163 0.68Meta Platforms Inc. 75,567 12,067,240 0.67NVIDIA Corp. 78,348 11,573,407 0.64Berkshire Hathaway Inc. 41,736 10,699,436 0.59Procter & Gamble Co. 77,617 9,929,778 0.55Exxon Mobil Corp. 138,157 9,370,022 0.52Visa Inc. 53,970 9,153,617 0.51JPMorgan Chase & Co. 94,912 9,024,762 0.50Mastercard Inc. 28,125 8,140,229 0.45Home Depot Inc. 34,007 8,138,111 0.45Chevron Corp. 62,983 7,859,452 0.43Pfizer Inc. 182,424 7,131,314 0.39AbbVie Inc. 58,130 6,797,340 0.38
Holding
MarketValue
(£)
% ofTotal Net
Assets
Bank of America Corp. 229,539 6,519,599 0.36Eli Lilly & Co. 27,639 6,431,265 0.36Coca-Cola Co. 124,217 6,394,377 0.35Costco Wholesale Corp. 14,301 6,054,941 0.33PepsiCo Inc. 44,149 6,038,089 0.33Merck & Co. Inc. 82,352 5,818,751 0.32Broadcom Inc. 13,123 5,794,708 0.32Thermo Fisher Scientific Inc. 12,677 5,585,147 0.31Walmart Inc. 45,502 5,545,044 0.31Cisco Systems Inc. 137,225 5,354,559 0.30Walt Disney Co. 59,527 5,293,183 0.29Abbott Laboratories 55,948 5,055,148 0.28Verizon Communications Inc. 135,851 5,009,875 0.28Accenture plc 20,610 4,932,608 0.27Adobe Inc. 15,443 4,870,416 0.27McDonald's Corp. 23,983 4,761,067 0.26Berkshire Hathaway Inc. Class A 12 4,634,645 0.26Comcast Corp. 145,663 4,612,949 0.25Intel Corp. 131,192 4,554,884 0.25Wells Fargo & Co. 126,232 4,385,693 0.24Salesforce Inc. 30,975 4,342,172 0.24Bristol-Myers Squibb Co. 70,505 4,226,928 0.23Linde plc 16,716 4,150,572 0.23Danaher Corp. 20,586 4,118,510 0.23QUALCOMM Inc. 36,965 4,112,520 0.23Philip Morris International Inc. 50,765 4,044,216 0.22Texas Instruments Inc. 29,758 4,035,282 0.22NIKE Inc. 40,191 3,990,927 0.22Union Pacific Corp. 20,473 3,820,972 0.21Raytheon Technologies Corp. 48,502 3,667,684 0.20Advanced Micro Devices Inc. 53,749 3,661,180 0.20NextEra Energy Inc. 63,824 3,609,829 0.20Medtronic plc 43,381 3,605,925 0.20AT&T Inc. 233,107 3,501,709 0.19Amgen Inc. 18,597 3,453,219 0.19Lowe's Cos. Inc. 21,896 3,446,678 0.19Honeywell International Inc. 22,134 3,412,742 0.19S&P Global Inc. 11,205 3,360,784 0.19United Parcel Service Inc. 23,415 3,356,614 0.19ConocoPhillips 43,160 3,282,290 0.18CVS Health Corp. 42,379 3,244,836 0.18Anthem Inc. 7,917 3,164,087 0.18Oracle Corp. 52,358 3,061,409 0.17International Business Machines
Corp. 28,868 3,042,233 0.17Prologis Inc. 23,705 3,026,422 0.17Caterpillar Inc. 17,519 2,937,414 0.16Intuit Inc. 8,720 2,907,985 0.16Target Corp. 15,635 2,847,549 0.16American Tower Corp. 14,573 2,797,713 0.15American Express Co. 20,027 2,787,189 0.15Morgan Stanley 42,862 2,749,926 0.15Lockheed Martin Corp. 7,973 2,742,126 0.15Deere & Co. 9,085 2,729,406 0.15PayPal Holdings Inc. 38,824 2,717,524 0.15Altria Group Inc. 59,243 2,623,583 0.15Charles Schwab Corp. 49,270 2,603,794 0.14Applied Materials Inc. 29,153 2,561,887 0.14Goldman Sachs Group Inc. 10,507 2,556,660 0.14ServiceNow Inc. 6,644 2,530,646 0.14Citigroup Inc. 63,864 2,451,298 0.14Booking Holdings Inc. 1,335 2,350,269 0.13Automatic Data Processing Inc. 13,470 2,340,807 0.13BlackRock Inc. 4,605 2,291,459 0.13Starbucks Corp. 37,976 2,257,385 0.13Mondelez International Inc. 43,499 2,233,675 0.12Intuitive Surgical Inc. 11,684 2,226,334 0.12Zoetis Inc. 15,678 2,212,526 0.12Chubb Ltd. 13,334 2,191,851 0.12Stryker Corp. 11,359 2,181,958 0.12Netflix Inc. 14,310 2,169,579 0.12General Electric Co. 35,503 2,108,122 0.123M Co. 18,272 2,099,351 0.12Analog Devices Inc. 17,073 2,098,938 0.12Duke Energy Corp. 23,723 2,081,879 0.12Cigna Corp. 10,503 2,064,543 0.11
Vanguard FTSE Global All Cap Index Fund
165

Holding
MarketValue
(£)
% ofTotal Net
Assets
Boeing Co. 17,387 2,061,511 0.11Marsh & McLennan Cos. Inc. 15,960 2,055,540 0.11Crown Castle International Corp. 13,898 2,050,217 0.11CME Group Inc. 11,572 2,023,417 0.11Southern Co. 33,976 1,986,059 0.11Micron Technology Inc. 36,190 1,965,299 0.11Gilead Sciences Inc. 41,187 1,945,023 0.11CSX Corp. 70,610 1,931,299 0.11TJX Cos. Inc. 39,526 1,928,289 0.11T-Mobile US Inc. 19,230 1,886,086 0.10Blackstone Inc. 22,996 1,860,559 0.10PNC Financial Services
Group Inc. 13,748 1,819,378 0.10Vertex Pharmaceuticals Inc. 8,274 1,800,508 0.10Becton Dickinson and Co. 9,152 1,800,075 0.10Regeneron Pharmaceuticals Inc. 3,426 1,798,601 0.10EOG Resources Inc. 19,256 1,789,710 0.10Waste Management Inc. 13,218 1,731,236 0.10Northrop Grumman Corp. 4,834 1,691,572 0.09Sherwin-Williams Co. 7,709 1,686,278 0.09Lam Research Corp. 4,530 1,680,519 0.09Edwards Lifesciences Corp. 19,921 1,677,933 0.09Colgate-Palmolive Co. 27,336 1,677,609 0.09US Bancorp 43,367 1,676,995 0.09Equinix Inc. 2,920 1,672,411 0.09Dominion Energy Inc. 25,703 1,671,564 0.09Truist Financial Corp. 43,283 1,668,230 0.09Intercontinental Exchange Inc. 17,705 1,633,146 0.09Aon plc 7,036 1,611,694 0.09Progressive Corp. 18,738 1,602,617 0.09Estee Lauder Cos. Inc. 7,570 1,591,418 0.09Norfolk Southern Corp. 7,737 1,587,517 0.09Fidelity National Information
Services Inc. 20,031 1,582,217 0.09Freeport-McMoRan Inc. 48,419 1,562,674 0.09Boston Scientific Corp. 46,587 1,561,434 0.09Illinois Tool Works Inc. 9,846 1,546,264 0.09Fiserv Inc. 19,559 1,524,215 0.08Activision Blizzard Inc. 25,126 1,513,163 0.08Newmont Corp. 25,925 1,504,289 0.08Eaton Corp. plc 12,956 1,495,795 0.08Humana Inc. 4,192 1,483,844 0.08General Dynamics Corp. 7,831 1,475,196 0.08Dollar General Corp. 7,638 1,445,227 0.08Public Storage 4,852 1,434,576 0.08Ford Motor Co. 126,035 1,420,465 0.08Schlumberger NV 45,588 1,415,751 0.08Palo Alto Networks Inc. 3,132 1,399,333 0.08Marathon Petroleum Corp. 19,907 1,383,896 0.08General Motors Co. 45,693 1,379,706 0.08HCA Healthcare Inc. 7,999 1,366,997 0.08Emerson Electric Co. 18,992 1,364,610 0.08Charter Communications Inc. 3,964 1,350,538 0.08Air Products and Chemicals Inc. 7,203 1,343,756 0.07Moody's Corp. 5,268 1,327,930 0.07Capital One Financial Corp. 13,205 1,310,823 0.07Archer-Daniels-Midland Co. 18,303 1,307,086 0.07Uber Technologies Inc. 51,889 1,300,634 0.07Pioneer Natural Resources Co. 7,003 1,295,847 0.07American Electric Power Co. Inc. 16,354 1,290,865 0.07Dow Inc. 24,153 1,278,925 0.07FedEx Corp. 8,015 1,268,865 0.07KLA Corp. 4,979 1,264,915 0.07Marvell Technology Inc. 27,226 1,258,836 0.07Roper Technologies Inc. 3,343 1,249,464 0.07Sempra Energy 9,695 1,246,025 0.07American International
Group Inc. 26,601 1,239,049 0.07Kimberly-Clark Corp. 11,168 1,234,928 0.07Marriott International Inc. 8,649 1,222,984 0.07Synopsys Inc. 5,255 1,200,383 0.07Occidental Petroleum Corp. 27,321 1,198,816 0.07Hilton Worldwide Holdings Inc. 9,576 1,184,586 0.07Valero Energy Corp. 13,322 1,182,479 0.07Centene Corp. 18,405 1,180,822 0.07Exelon Corp. 31,608 1,177,715 0.07
Holding
MarketValue
(£)
% ofTotal Net
Assets
MercadoLibre Inc. 1,516 1,175,633 0.07Moderna Inc. 10,924 1,169,141 0.06McKesson Corp. 4,745 1,168,808 0.06NXP Semiconductors NV 8,585 1,168,599 0.06L3Harris Technologies Inc. 6,319 1,167,819 0.06MetLife Inc. 22,310 1,166,943 0.06IQVIA Holdings Inc. 6,663 1,156,936 0.06Illumina Inc. 4,778 1,128,833 0.06Sysco Corp. 16,513 1,125,067 0.06Cadence Design Systems Inc. 9,353 1,123,700 0.06Ecolab Inc. 8,185 1,103,980 0.06Nucor Corp. 8,884 1,096,153 0.06General Mills Inc. 19,423 1,094,525 0.06Chipotle Mexican Grill Inc. 941 1,090,975 0.06Corteva Inc. 23,655 1,086,754 0.06Lululemon Athletica Inc. 3,846 1,086,161 0.06TE Connectivity Ltd. 10,915 1,084,805 0.06Cognizant Technology Solutions
Corp. 16,757 1,079,628 0.06Johnson Controls International
plc 22,445 1,072,640 0.06Autodesk Inc. 7,110 1,071,964 0.06Williams Cos. Inc. 39,066 1,066,963 0.06Prudential Financial Inc. 12,325 1,065,712 0.06Travelers Cos. Inc. 7,818 1,064,381 0.06Block Inc. 13,237 1,050,630 0.06AutoZone Inc. 674 1,049,770 0.06HP Inc. 35,844 1,046,342 0.06Digital Realty Trust Inc. 8,959 1,041,684 0.06Phillips 66 15,088 1,041,318 0.06Workday Inc. 6,299 1,036,738 0.06Paychex Inc. 10,234 1,033,018 0.06Crowdstrike Holdings Inc. 6,486 1,026,807 0.06O'Reilly Automotive Inc. 2,120 1,024,185 0.06Devon Energy Corp. 22,092 1,023,217 0.06Dexcom Inc. 3,142 1,022,532 0.06Amphenol Corp. 17,935 1,021,816 0.06Simon Property Group Inc. 10,802 1,015,241 0.06Xcel Energy Inc. 17,365 1,013,269 0.06Kroger Co. 23,541 1,011,766 0.06Welltower Inc. 13,985 1,011,531 0.06Warner Bros Discovery Inc. 69,833 1,009,533 0.06Constellation Brands Inc. 5,149 1,009,294 0.06Fortinet Inc. 4,358 1,003,190 0.06Twitter Inc. 25,479 994,401 0.06Global Payments Inc. 9,086 991,246 0.06Realty Income Corp. 17,520 968,030 0.05Microchip Technology Inc. 18,617 966,512 0.05SBA Communications Corp. 3,484 963,199 0.05Ross Stores Inc. 12,085 960,254 0.05Agilent Technologies Inc. 9,999 949,964 0.05Baxter International Inc. 16,702 945,315 0.05Motorola Solutions Inc. 5,545 944,836 0.05IDEXX Laboratories Inc. 2,747 941,878 0.05Aflac Inc. 20,556 937,995 0.05Dollar Tree Inc. 7,212 933,280 0.05Snowflake Inc. 6,820 931,496 0.05Allstate Corp. 9,211 928,436 0.05Yum! Brands Inc. 9,824 915,732 0.05Kinder Morgan Inc. 63,124 912,545 0.05Parker-Hannifin Corp. 4,188 902,713 0.05Cintas Corp. 2,825 893,874 0.05Public Service Enterprise
Group Inc. 16,104 893,768 0.05DuPont de Nemours Inc. 16,866 885,951 0.05MSCI Inc. 2,611 876,260 0.05Arthur J Gallagher & Co. 6,518 875,711 0.05Monster Beverage Corp. 12,805 873,860 0.05Electronic Arts Inc. 9,207 865,700 0.05Atlassian Corp. plc Class A 4,758 852,006 0.05Carrier Global Corp. 27,818 848,166 0.05Discover Financial Services 9,460 847,444 0.05eBay Inc. 20,461 846,308 0.05Consolidated Edison Inc. 11,382 840,754 0.05Biogen Inc. 5,050 834,386 0.05Hershey Co. 4,623 831,403 0.05
Vanguard FTSE Global All Cap Index Fund
166

Holding
MarketValue
(£)
% ofTotal Net
Assets
Trane Technologies plc 7,464 831,235 0.05Cheniere Energy Inc. 7,664 829,763 0.05Fastenal Co. 18,735 825,354 0.05Verisk Analytics Inc. 5,068 823,676 0.05WEC Energy Group Inc. 10,332 823,350 0.05Otis Worldwide Corp. 13,901 806,601 0.05Weyerhaeuser Co. 24,481 803,749 0.04AvalonBay Communities Inc. 4,424 801,077 0.04Walgreens Boots Alliance Inc. 23,633 798,119 0.04M&T Bank Corp. 5,956 790,528 0.04Datadog Inc. 8,199 788,684 0.04Aptiv plc 9,306 788,582 0.04International Flavors &
Fragrances Inc. 8,147 787,316 0.04TransDigm Group Inc. 1,654 783,604 0.04Halliburton Co. 27,587 782,455 0.04Bank of New York Mellon Corp. 23,345 782,257 0.04Ameriprise Financial Inc. 3,697 781,596 0.04Alexandria Real Estate
Equities Inc. 5,308 770,135 0.04PPG Industries Inc. 7,529 767,292 0.04KKR & Co. Inc. 18,878 766,848 0.04Eversource Energy 10,983 764,654 0.04Equity Residential 11,758 763,544 0.04ONEOK Inc. 15,108 762,078 0.04RESMED INC-CDI 4,781 761,380 0.04Hess Corp. 9,259 758,861 0.04Arista Networks Inc. 8,219 756,632 0.04Old Dominion Freight Line Inc. 3,375 752,553 0.04T Rowe Price Group Inc. 7,582 742,981 0.04Kraft Heinz Co. 21,865 742,417 0.04Mettler-Toledo International Inc. 729 741,629 0.04Rockwell Automation Inc. 3,676 739,914 0.04SVB Financial Group 1,905 739,892 0.04AMETEK Inc. 7,331 737,070 0.04CBRE Group Inc. 11,040 730,460 0.04Veeva Systems Inc. 4,982 722,082 0.04PACCAR Inc. 10,908 721,552 0.04LyondellBasell Industries NV 8,528 720,210 0.04Keysight Technologies Inc. 6,438 719,486 0.04Cerner Corp. 9,585 714,962 0.04American Water Works Co. Inc. 5,778 709,145 0.04Corning Inc. 25,215 706,943 0.04First Republic Bank 5,928 704,608 0.04Tyson Foods Inc. 9,491 704,549 0.04Expedia Group Inc. 4,996 695,500 0.04Republic Services Inc. 6,496 694,717 0.04PG&E Corp. 68,364 688,813 0.04Willis Towers Watson plc 4,012 686,561 0.04Cummins Inc. 4,522 681,019 0.04Ball Corp. 10,530 680,613 0.04Fifth Third Bancorp 22,714 679,158 0.04ANSYS Inc. 3,078 675,885 0.04Edison International 12,122 664,658 0.04Trade Desk Inc. 14,126 663,488 0.04Keurig Dr Pepper Inc. 22,190 661,016 0.04McCormick & Co. Inc. 8,154 653,554 0.04State Street Corp. 12,180 649,600 0.04Extra Space Storage Inc. 4,290 649,223 0.04Equifax Inc. 3,987 648,907 0.04Church & Dwight Co. Inc. 8,247 640,842 0.04Zimmer Biomet Holdings Inc. 6,657 640,143 0.04DR Horton Inc. 11,535 640,098 0.04CoStar Group Inc. 12,624 639,696 0.04Copart Inc. 7,048 637,997 0.04Coterra Energy Inc. 27,473 629,548 0.04Match Group Inc. 9,892 623,538 0.03DTE Energy Co. 5,923 618,247 0.03United Rentals Inc. 2,452 618,165 0.03Entergy Corp. 6,454 611,009 0.03Mosaic Co. 12,274 610,522 0.03Cloudflare Inc. 8,889 609,946 0.03Align Technology Inc. 2,643 609,732 0.03MongoDB Inc. 2,151 607,419 0.03VMware Inc. 7,050 607,013 0.03
Holding
MarketValue
(£)
% ofTotal Net
Assets
West PharmaceuticalServices Inc. 2,418 606,782 0.03
Ameren Corp. 8,155 603,684 0.03Baker Hughes Co. 24,348 601,379 0.03Hartford Financial Services
Group Inc. 10,692 595,533 0.03Albemarle Corp. 3,878 594,904 0.03Mid-America Apartment
Communities Inc. 3,789 593,323 0.03Martin Marietta Materials Inc. 2,104 592,941 0.03ON Semiconductor Corp. 14,190 588,509 0.03Ulta Beauty Inc. 1,857 586,637 0.03WW Grainger Inc. 1,462 582,273 0.03Invitation Homes Inc. 18,353 581,945 0.03Ventas Inc. 13,141 581,323 0.03FirstEnergy Corp. 16,839 581,150 0.03Vulcan Materials Co. 4,234 580,990 0.03Zoom Video
Communications Inc. 7,305 579,279 0.03Best Buy Co. Inc. 8,088 579,205 0.03Gartner Inc. 2,490 576,478 0.03Tractor Supply Co. 3,584 575,095 0.03Laboratory Corp. of America
Holdings 2,977 569,578 0.03Diamondback Energy Inc. 5,646 567,658 0.03AmerisourceBergen Corp. 4,697 565,884 0.03Northern Trust Corp. 6,808 559,064 0.03Essex Property Trust Inc. 2,116 554,946 0.03Citizens Financial Group Inc. 17,521 549,842 0.03CF Industries Holdings Inc. 7,087 545,961 0.03Zebra Technologies Corp. 1,853 545,465 0.03Enphase Energy Inc. 4,234 544,299 0.03CDW Corp. 4,178 542,757 0.03Regions Financial Corp. 32,840 541,971 0.03Horizon Therapeutics plc 6,847 537,452 0.03Hewlett Packard Enterprise Co. 43,707 536,807 0.03PPL Corp. 23,660 533,504 0.03FleetCor Technologies Inc. 2,663 529,291 0.03PerkinElmer Inc. 4,490 525,031 0.03Huntington Bancshares Inc. 49,965 522,931 0.03Duke Realty Corp. 11,971 522,223 0.03Avantor Inc. 20,255 514,320 0.03Yum China Holdings Inc. 15,369 511,565 0.03Splunk Inc. 5,261 511,140 0.03Skyworks Solutions Inc. 5,661 510,820 0.03Stanley Black & Decker Inc. 5,338 510,798 0.03Dover Corp. 4,758 504,867 0.03Clorox Co. 4,401 502,916 0.03Teledyne Technologies Inc. 1,458 501,155 0.03CMS Energy Corp. 9,090 497,325 0.03Apollo Global Management Inc. 12,491 495,262 0.03Fortive Corp. 10,774 493,518 0.03Raymond James Financial Inc. 6,282 487,699 0.03Cincinnati Financial Corp. 4,971 485,459 0.03Twilio Inc. 5,441 484,598 0.03Marathon Oil Corp. 24,337 483,057 0.03Synchrony Financial 16,450 482,035 0.03ICON plc 2,666 480,326 0.03Markel Corp. 445 479,863 0.03Waters Corp. 1,982 478,663 0.03Sun Communities Inc. 3,423 478,347 0.03Constellation Energy Corp. 10,129 477,688 0.03MGM Resorts International 14,590 477,385 0.03Palantir Technologies Inc. 57,336 474,946 0.03Royal Caribbean Cruises Ltd. 7,622 472,011 0.03TransUnion 6,763 471,497 0.03International Paper Co. 12,760 470,052 0.03HubSpot Inc. 1,549 468,154 0.03Teradyne Inc. 5,555 466,567 0.03Nasdaq Inc. 3,718 466,208 0.03Molina Healthcare Inc. 1,866 465,868 0.03Cooper Cos. Inc. 1,619 465,557 0.03Western Digital Corp. 10,974 463,783 0.03STERIS plc 2,599 463,493 0.03Ingersoll Rand Inc. 13,170 460,924 0.03Hologic Inc. 7,998 458,666 0.03
Vanguard FTSE Global All Cap Index Fund
167

Holding
MarketValue
(£)
% ofTotal Net
Assets
Monolithic Power Systems Inc. 1,468 458,628 0.03Zscaler Inc. 2,826 456,346 0.03VF Corp. 10,971 454,394 0.03Boston Properties Inc. 4,848 454,217 0.03Omnicom Group Inc. 7,485 454,108 0.03FMC Corp. 4,298 453,797 0.03Celanese Corp. 3,868 452,822 0.03BioMarin Pharmaceutical Inc. 6,988 452,731 0.03Catalent Inc. 6,257 451,321 0.03CenterPoint Energy Inc. 18,511 451,311 0.03Garmin Ltd. 5,144 449,623 0.03Jacobs Engineering Group Inc. 4,058 447,818 0.03Akamai Technologies Inc. 4,999 447,222 0.03KeyCorp 29,075 447,183 0.03Genuine Parts Co. 4,307 446,171 0.03Kellogg Co. 8,161 445,263 0.03Conagra Brands Inc. 15,945 443,869 0.02VICI Properties Inc. 18,563 440,751 0.02Principal Financial Group Inc. 8,108 440,047 0.02Healthpeak Properties Inc. 16,823 439,769 0.02Steel Dynamics Inc. 6,422 438,568 0.02NVR Inc. 125 435,737 0.02Broadridge Financial
Solutions Inc. 3,779 433,945 0.02Seagen Inc. 4,156 433,641 0.02Alnylam Pharmaceuticals Inc. 4,045 429,856 0.02VeriSign Inc. 3,010 428,376 0.02DocuSign Inc. 6,625 427,419 0.02Darden Restaurants Inc. 4,059 425,880 0.02ViacomCBS Inc. Class B 18,301 424,326 0.02Arch Capital Group Ltd. 11,603 422,070 0.02Signature Bank 2,184 421,405 0.02NetApp Inc. 7,213 420,772 0.02Avery Dennison Corp. 2,922 420,461 0.02LPL Financial Holdings Inc. 2,803 419,099 0.02Expeditors International of
Washington Inc. 5,293 417,748 0.02Seagate Technology Holdings plc 6,392 417,682 0.02Quest Diagnostics Inc. 3,913 417,168 0.02Entegris Inc. 4,696 416,637 0.02Quanta Services Inc. 4,505 415,874 0.02FactSet Research Systems Inc. 1,294 415,863 0.02Okta Inc. 4,317 410,209 0.02Bill.com Holdings Inc. 3,005 408,709 0.02Insulet Corp. 2,135 406,492 0.02Trimble Inc. 7,646 406,081 0.02Ally Financial Inc. 12,737 405,291 0.02Paycom Software Inc. 1,806 405,116 0.02Westinghouse Air Brake
Technologies Corp. 5,653 404,512 0.02Hubbell Inc. 2,597 404,019 0.02Cardinal Health Inc. 8,725 403,553 0.02Evergy Inc. 7,455 403,003 0.02Royalty Pharma plc 11,872 402,636 0.02Lennar Corp. Class A 6,504 396,301 0.02Zendesk Inc. 4,061 395,135 0.02Interpublic Group of Cos. Inc. 15,179 394,497 0.02Spotify Technology SA 4,859 393,712 0.02AES Corp. 24,183 393,130 0.02UDR Inc. 9,263 391,990 0.02Pool Corp. 1,206 389,243 0.02Generac Holdings Inc. 2,206 386,045 0.02Leidos Holdings Inc. 4,682 385,859 0.02Packaging Corp. of America 3,005 385,396 0.02Targa Resources Corp. 6,586 385,193 0.02Tyler Technologies Inc. 1,217 382,606 0.02EPAM Systems Inc. 1,813 382,398 0.02Camden Property Trust 3,054 381,634 0.02Carnival 27,533 379,168 0.02Bunge Ltd. 4,201 378,575 0.02Iron Mountain Inc. 8,835 378,100 0.02LKQ Corp. 9,547 377,545 0.02NortonLifeLock Inc. 18,811 375,171 0.02Textron Inc. 6,797 374,687 0.02Bio-Techne Corp. 1,238 374,407 0.02Atmos Energy Corp. 4,126 372,868 0.02
Holding
MarketValue
(£)
% ofTotal Net
Assets
J M Smucker Co. 3,360 366,482 0.02IDEX Corp. 2,420 365,959 0.02Crown Holdings Inc. 4,166 365,367 0.02APA Corp. 11,121 362,462 0.02Kimco Realty Corp. 17,865 360,857 0.02SS&C Technologies
Holdings Inc. 6,991 359,990 0.02Xylem Inc. 5,611 359,944 0.02Hormel Foods Corp. 8,620 359,699 0.02Live Nation Entertainment Inc. 4,305 359,658 0.02Alliant Energy Corp. 7,667 359,137 0.02Take-Two Interactive
Software Inc. 3,771 358,868 0.02Host Hotels & Resorts Inc. 22,076 357,647 0.02Qorvo Inc. 3,929 356,066 0.02PTC Inc. 3,906 355,475 0.02Teleflex Inc. 1,563 355,226 0.02JB Hunt Transport Services Inc. 2,596 353,246 0.02Liberty Broadband Corp. Class C 3,967 353,033 0.02Brown & Brown Inc. 7,116 351,407 0.02Eastman Chemical Co. 4,303 351,300 0.02Viatris Inc. 42,669 351,072 0.02Incyte Corp. 5,871 350,530 0.02Hasbro Inc. 4,998 350,517 0.02Caesars Entertainment Inc. 6,613 349,111 0.02GoDaddy Inc. 5,421 348,921 0.02CarMax Inc. 5,100 348,490 0.02Rexford Industrial Realty Inc. 5,603 348,319 0.02Cognex Corp. 6,421 345,880 0.02Loews Corp. 6,872 344,065 0.02Burlington Stores Inc. 2,113 342,590 0.02Equity LifeStyle Properties Inc. 5,544 341,295 0.02WP Carey Inc. 5,262 338,478 0.02Darling Ingredients Inc. 5,779 337,994 0.02CH Robinson Worldwide Inc. 3,986 336,976 0.02W R Berkley Corp. 6,334 335,492 0.02Jack Henry & Associates Inc. 2,212 334,029 0.02Reliance Steel & Aluminum Co. 2,111 333,355 0.02Carlisle Cos. Inc. 1,600 330,271 0.02SolarEdge Technologies Inc. 1,641 327,010 0.02Domino's Pizza Inc. 1,212 326,270 0.02Five Below Inc. 2,585 323,459 0.02DoorDash Inc. 4,963 321,933 0.02Cboe Global Markets Inc. 3,590 321,742 0.02Check Point Software
Technologies Ltd. 3,193 320,978 0.02Etsy Inc. 4,323 320,876 0.02Westrock Co. 8,070 318,365 0.02Equitable Holdings Inc. 13,846 318,055 0.02Robert Half International Inc. 4,041 316,617 0.02Masco Corp. 7,514 315,342 0.02Nordson Corp. 1,837 315,311 0.02ABIOMED Inc. 1,377 314,083 0.02Cleveland-Cliffs Inc. 15,445 313,575 0.02Bio-Rad Laboratories Inc. 766 312,635 0.02Alcoa Corp. 5,773 311,618 0.02Citrix Systems Inc. 3,907 311,564 0.02Dell Technologies Inc. 8,314 311,435 0.02Pinterest Inc. 19,037 311,142 0.02Wolfspeed Inc. 4,238 310,280 0.02Howmet Aerospace Inc. 11,406 309,883 0.02Fidelity National Financial Inc. 9,673 306,793 0.02EQT Corp. 9,686 306,742 0.02Service Corp. International 5,834 304,920 0.02Advance Auto Parts Inc. 1,895 301,177 0.02Roku Inc. 4,065 300,496 0.02Bath & Body Works Inc. 7,134 300,361 0.02RPM International Inc. 4,532 299,173 0.02Antero Resources Corp. 10,674 299,008 0.02First Horizon Corp. 16,724 298,248 0.02Brown-Forman Corp. Class B 5,551 298,220 0.02Booz Allen Hamilton Holding
Corp. 4,580 297,636 0.02Unity Software Inc. 5,546 293,489 0.02Charles River Laboratories
International Inc. 1,520 292,050 0.02
Vanguard FTSE Global All Cap Index Fund
168

Holding
MarketValue
(£)
% ofTotal Net
Assets
Everest Re Group Ltd. 1,331 291,834 0.02Vistra Corp. 14,619 291,332 0.02Graco Inc. 5,872 290,069 0.02Medical Properties Trust Inc. 19,595 287,019 0.02Builders FirstSource Inc. 5,841 286,444 0.02Jones Lang LaSalle Inc. 1,643 286,435 0.02Las Vegas Sands Corp. 10,034 283,317 0.02Plug Power Inc. 16,904 282,743 0.02Regency Centers Corp. 5,106 279,966 0.02Avis Budget Group Inc. 1,307 278,597 0.02Lumen Technologies Inc. 34,543 276,509 0.02Black Knight Inc. 5,263 275,789 0.02NiSource Inc. 11,871 275,430 0.02American Homes 4 Rent 8,712 274,856 0.02Elanco Animal Health Inc. 13,579 273,635 0.02Alleghany Corp. 410 273,176 0.02Liberty Media Corp-Liberty
Formula One Class C 5,481 272,107 0.02Pentair plc 6,711 271,273 0.02Aspen Technology Inc. 2,128 268,750 0.02Middleby Corp. 2,191 268,522 0.02Comerica Inc. 4,110 268,042 0.02Henry Schein Inc. 4,150 268,039 0.02Webster Financial Corp. 6,724 267,835 0.02Lincoln National Corp. 5,581 267,381 0.02Juniper Networks Inc. 10,612 266,420 0.02CubeSmart 6,942 262,585 0.01Sealed Air Corp. 5,112 261,280 0.01Fox Corp. Class A 9,146 261,085 0.01Sensata Technologies Holding
plc 7,207 260,439 0.01East West Bancorp Inc. 4,564 259,081 0.01F5 Inc. 1,943 259,067 0.01Snap-on Inc. 1,523 257,800 0.01Credicorp Ltd. 2,326 257,444 0.01Fortune Brands Home &
Security Inc. 4,534 257,270 0.01Essential Utilities Inc. 7,202 256,817 0.01Owens Corning 3,518 254,792 0.01PulteGroup Inc. 7,595 252,683 0.01Life Storage Inc. 2,391 252,545 0.01Annaly Capital Management Inc. 49,005 250,587 0.01Vail Resorts Inc. 1,239 250,504 0.01Zions Bancorp NA 5,563 250,346 0.01Ovintiv Inc. 6,133 249,814 0.01Assurant Inc. 1,724 249,736 0.01Exact Sciences Corp. 5,673 248,744 0.01Williams-Sonoma Inc. 2,388 248,158 0.01Allegion plc 2,721 247,588 0.01Whirlpool Corp. 1,708 246,711 0.01Coca-Cola Europacific Partners
plc 6,176 245,712 0.01DENTSPLY SIRONA Inc. 7,711 245,548 0.01MarketAxess Holdings Inc. 1,166 244,818 0.01Lyft Inc. 9,427 244,704 0.01Anaplan Inc. 4,697 243,099 0.01Aramark 8,395 242,522 0.01HEICO Corp. 2,150 241,851 0.01Liberty Global plc Class C 12,803 241,681 0.01Fair Isaac Corp. 804 239,797 0.01Wyndham Hotels & Resorts Inc. 3,410 238,985 0.01Jazz Pharmaceuticals plc 1,872 238,909 0.01Ciena Corp. 5,430 238,565 0.01Campbell Soup Co. 6,339 238,413 0.01Molson Coors Beverage Co. 5,526 238,205 0.01AECOM 4,224 237,392 0.01Syneos Health Inc. 4,075 237,229 0.01First Citizens BancShares Inc. 465 236,804 0.01Amdocs Ltd. 3,689 234,063 0.01Globe Life Inc. 2,990 233,603 0.01American Campus
Communities Inc. 4,536 233,538 0.01Lamb Weston Holdings Inc. 4,435 233,460 0.01Huntington Ingalls
Industries Inc. 1,372 232,404 0.01Lamar Advertising Co. 2,640 232,143 0.01
Holding
MarketValue
(£)
% ofTotal Net
Assets
Nielsen Holdings plc 10,873 232,009 0.01Novocure Ltd. 3,761 229,374 0.01Churchill Downs Inc. 1,415 228,699 0.01Knight-Swift Transportation
Holdings Inc. 5,971 227,711 0.01Ares Management Corp. 4,307 227,271 0.01Gaming and Leisure
Properties Inc. 6,421 226,921 0.01United States Steel Corp. 9,344 226,920 0.01Watsco Inc. 1,065 226,301 0.01Universal Health Services Inc. 2,310 225,407 0.01American Financial Group Inc. 2,045 225,398 0.01Huntsman Corp. 8,353 225,275 0.01US Foods Holding Corp. 7,480 224,132 0.01Southwest Airlines Co. 5,986 222,609 0.01Floor & Decor Holdings Inc. 3,487 221,524 0.01Tapestry Inc. 8,443 221,313 0.01Popular Inc. 3,558 221,018 0.01Repligen Corp. 1,764 220,925 0.01BorgWarner Inc. 7,501 219,922 0.01Curtiss-Wright Corp. 1,928 219,658 0.01BJ's Wholesale Club
Holdings Inc. 4,282 219,437 0.01Globant SA 1,272 218,828 0.01Olin Corp. 4,739 216,661 0.01Texas Pacific Land Corp. 199 216,305 0.01Toro Co. 3,387 216,169 0.01Performance Food Group Co. 5,487 215,241 0.01NRG Energy Inc. 7,508 214,625 0.01Federal Realty Investment Trust 2,298 214,260 0.01GameStop Corp. 2,146 213,967 0.01Southwestern Energy Co. 35,790 213,514 0.01Hyatt Hotels Corp. 2,822 213,442 0.01Planet Fitness Inc. 3,348 213,413 0.01PDC Energy Inc. 3,837 213,228 0.01AGCO Corp. 2,095 212,587 0.01Delta Air Lines Inc. 6,190 212,052 0.01Royal Gold Inc. 2,040 211,978 0.01Berry Global Group Inc. 4,714 211,576 0.01SiteOne Landscape Supply Inc. 1,879 211,067 0.01Kohl's Corp. 4,571 210,874 0.01Neurocrine Biosciences Inc. 2,936 210,513 0.01Newell Brands Inc. 11,416 210,498 0.01Mattel Inc. 10,831 209,632 0.01United Therapeutics Corp. 1,481 209,510 0.01Brixmor Property Group Inc. 10,337 209,128 0.01Regal Rexnord Corp. 2,056 208,728 0.01Lattice Semiconductor Corp. 5,449 208,498 0.01Kilroy Realty Corp. 3,718 207,266 0.01AptarGroup Inc. 2,258 206,538 0.01Lithia Motors Inc. 915 206,176 0.01Mohawk Industries Inc. 1,833 205,696 0.01Organon & Co. 7,940 204,460 0.01Cullen/Frost Bankers Inc. 1,941 204,443 0.01Arrow Electronics Inc. 2,176 204,428 0.01First American Financial Corp. 4,399 204,305 0.01Zynga Inc. 30,930 203,736 0.01Bentley Systems Inc. 6,004 202,763 0.01Manhattan Associates Inc. 1,949 202,506 0.01Clarivate plc 16,205 202,256 0.01MSA Safety Inc. 2,100 201,570 0.01Lear Corp. 1,971 200,962 0.01Chesapeake Energy Corp. 3,057 199,709 0.01Jabil Inc. 4,331 199,147 0.01Tetra Tech Inc. 1,793 198,565 0.01Lucid Group Inc. 13,777 198,397 0.01Coupang LLC 19,316 198,006 0.01Autoliv Inc. 3,372 197,888 0.01Tenet Healthcare Corp. 3,419 197,460 0.01Guidewire Software Inc. 2,843 196,870 0.01Vontier Corp. 9,629 196,338 0.01AMC Entertainment
Holdings Inc. 16,117 196,279 0.01First Solar Inc. 3,347 194,795 0.01Masimo Corp. 2,161 194,395 0.01Deckers Outdoor Corp. 917 194,195 0.01
Vanguard FTSE Global All Cap Index Fund
169

Holding
MarketValue
(£)
% ofTotal Net
Assets
DaVita Inc. 2,241 193,417 0.01XP Inc. Class A 9,836 192,724 0.01Coupa Software Inc. 2,801 192,511 0.01Advanced Drainage
Systems Inc. 2,355 192,114 0.01Pinnacle West Capital Corp. 3,382 191,822 0.01Paylocity Holding Corp. 1,266 191,296 0.01Chemed Corp. 488 190,644 0.01Flex Ltd. 14,482 190,094 0.01Agree Realty Corp. 3,504 189,503 0.01Encompass Health Corp. 3,451 189,331 0.01Pure Storage Inc. 8,111 189,289 0.01Bright Horizons Family
Solutions Inc. 2,072 188,485 0.01Western Alliance Bancorp 3,108 188,114 0.01IDACORP Inc. 2,244 187,992 0.01SouthState Corp. 3,045 187,890 0.01Chart Industries Inc. 1,399 187,804 0.01Trex Co. Inc. 4,055 187,780 0.01Genpact Ltd. 5,828 187,072 0.01Exelixis Inc. 10,461 186,140 0.01LHC Group Inc. 1,400 184,960 0.01Polaris Inc. 2,433 183,885 0.01Reinsurance Group of
America Inc. 2,148 183,611 0.01Range Resources Corp. 7,701 183,585 0.01Avnet Inc. 5,279 183,535 0.01Rayonier Inc. 5,302 182,477 0.01Block Inc. CDI 2,217 182,084 0.01Casey's General Stores Inc. 1,135 181,980 0.01Change Healthcare Inc. 9,688 181,799 0.01AerCap Holdings NV 4,865 180,999 0.01Gentex Corp. 7,741 180,962 0.01Apartment Income REIT Corp. 4,615 180,887 0.01Lennox International Inc. 1,065 180,825 0.01Voya Financial Inc. 3,590 180,687 0.01Valvoline Inc. 7,508 180,658 0.01Rollins Inc. 6,745 180,189 0.01WEX Inc. 1,357 179,679 0.01Louisiana-Pacific Corp. 3,492 179,481 0.01Tradeweb Markets Inc. 3,148 178,499 0.01Independence Realty Trust Inc. 8,182 177,586 0.01DISH Network Corp. 7,803 177,191 0.01Graphic Packaging Holding Co. 10,196 177,039 0.01PVH Corp. 3,049 176,820 0.01Americold Realty Trust 8,396 176,413 0.01Dynatrace Inc. 5,773 176,386 0.01RenaissanceRe Holdings Ltd. 1,542 176,271 0.01New Residential Investment
Corp. 21,294 176,220 0.01A O Smith Corp. 3,786 176,077 0.01OGE Energy Corp. 5,705 175,717 0.01Norwegian Cruise Line Holdings
Ltd. 10,990 175,332 0.01Wynn Resorts Ltd. 3,119 175,066 0.01EastGroup Properties Inc. 1,171 174,899 0.01KBR Inc. 4,458 174,876 0.01National Fuel Gas Co. 3,104 173,384 0.01AppLovin Corp. 5,703 173,248 0.01Franklin Resources Inc. 8,837 173,080 0.01Old Republic International Corp. 9,846 172,530 0.01Macy's Inc. 8,963 172,478 0.01SEI Investments Co. 3,863 171,443 0.01Chemours Co. 6,505 171,290 0.01First Industrial Realty Trust Inc. 3,705 171,188 0.01Axon Enterprise Inc. 1,915 171,031 0.01Power Integrations Inc. 2,675 170,450 0.01Invesco Ltd. 11,635 170,331 0.01Liberty Media Corp-Liberty
SiriusXM Class A 5,088 169,640 0.01ICU Medical Inc. 994 169,293 0.01Envista Holdings Corp. 5,352 168,894 0.01Lumentum Holdings Inc. 2,609 168,738 0.01WillScot Mobile Mini Holdings
Corp. 6,033 168,664 0.01FTI Consulting Inc. 1,342 168,576 0.01
Holding
MarketValue
(£)
% ofTotal Net
Assets
Lincoln Electric Holdings Inc. 1,571 168,449 0.01Commerce Bancshares Inc. 3,091 168,349 0.01Five9 Inc. 1,919 168,316 0.01DXC Technology Co. 7,354 168,225 0.01NOV Inc. 11,627 167,992 0.01Terminix Global Holdings Inc. 4,591 167,879 0.01Dropbox Inc. 9,678 167,659 0.01New York Times Co. 5,489 167,490 0.01RH 626 167,427 0.01MKS Instruments Inc. 1,839 166,923 0.01UGI Corp. 6,107 166,842 0.01Guardant Health Inc. 3,383 165,903 0.01Carlyle Group Inc. 5,737 165,827 0.01RingCentral Inc. 2,450 165,597 0.01Box Inc. 6,786 165,502 0.01Wayfair Inc. 2,698 165,232 0.01Capri Holdings Ltd. 4,336 164,599 0.01Ceridian HCM Holding Inc. 3,679 164,507 0.01Woodward Inc. 1,866 164,187 0.01Penn National Gaming Inc. 5,638 164,178 0.01Vornado Realty Trust 5,311 163,750 0.01Synaptics Inc. 1,382 163,440 0.01Cable One Inc. 176 163,309 0.01Sarepta Therapeutics Inc. 2,830 163,060 0.01Synovus Financial Corp. 4,927 163,017 0.01Spirit Realty Capital Inc. 4,702 162,725 0.01Western Union Co. 12,076 161,494 0.01Ingredion Inc. 2,381 161,445 0.01EMCOR Group Inc. 1,901 161,225 0.01World Wrestling
Entertainment Inc. 3,460 160,943 0.01Concentrix Corp. 1,283 160,919 0.01nVent Electric plc 5,975 160,761 0.01CACI International Inc. 759 160,312 0.01Coherent Inc. 751 160,082 0.01CDK Global Inc. 3,692 160,001 0.01Science Applications
International Corp. 2,412 159,955 0.01Terreno Realty Corp. 2,761 159,942 0.01Simpson Manufacturing Co. Inc. 1,936 159,845 0.01Marriott Vacations Worldwide
Corp. 1,340 159,508 0.01Alkermes plc 6,910 158,784 0.01IAA Inc. 5,418 158,246 0.01Healthcare Trust of America Inc. 6,520 158,183 0.01Stifel Financial Corp. 3,205 158,042 0.01Zillow Group Inc. Class A 5,131 157,996 0.01ITT Inc. 2,822 157,789 0.01Smartsheet Inc. 4,076 157,099 0.01Dick's Sporting Goods Inc. 2,044 157,089 0.01Nexstar Media Group Inc. 1,245 157,006 0.01Clean Harbors Inc. 1,880 157,003 0.01Robinhood Markets Inc. Class A 20,090 156,816 0.01IAC/InterActiveCorp 2,374 156,716 0.01Omega Healthcare
Investors Inc. 7,689 156,046 0.01Oshkosh Corp. 2,118 155,944 0.01Douglas Emmett Inc. 6,603 154,885 0.01Jefferies Financial Group Inc. 6,321 154,866 0.01HEICO Corp. Class A 1,665 154,671 0.01Donaldson Co. Inc. 3,952 154,334 0.01CyberArk Software Ltd. 1,226 153,448 0.01News Corp. Class A 9,684 153,185 0.01Texas Roadhouse Inc. 2,334 152,997 0.01Exponent Inc. 2,003 152,614 0.01HealthEquity Inc. 3,036 150,627 0.01Acuity Brands Inc. 1,095 150,431 0.01Brunswick Corp. 2,480 149,373 0.01Avalara Inc. 2,464 149,292 0.01Tandem Diabetes Care Inc. 1,943 149,157 0.01Matador Resources Co. 3,832 149,007 0.01Saia Inc. 908 148,954 0.01Globus Medical Inc. 2,815 148,452 0.01Option Care Health Inc. 6,225 148,150 0.01Axalta Coating Systems Ltd. 7,331 148,138 0.01Cirrus Logic Inc. 2,454 148,080 0.01
Vanguard FTSE Global All Cap Index Fund
170

Holding
MarketValue
(£)
% ofTotal Net
Assets
Universal Display Corp. 1,453 147,834 0.01Janus Henderson Group plc 6,088 147,751 0.01Harley-Davidson Inc. 5,068 147,378 0.01Murphy Oil Corp. 4,864 147,257 0.01Asbury Automotive Group Inc. 1,004 146,917 0.01Iridium Communications Inc. 5,153 146,607 0.01Murphy USA Inc. 787 146,462 0.01Hanover Insurance Group Inc. 1,246 145,709 0.01TEGNA Inc. 8,288 145,626 0.01OneMain Holdings Inc. 3,974 145,349 0.01Acadia Healthcare Co. Inc. 2,689 145,341 0.01WESCO International Inc. 1,480 145,218 0.01Euronet Worldwide Inc. 1,500 145,137 0.01National Instruments Corp. 5,030 144,750 0.01Peloton Interactive Inc. 10,348 144,732 0.01Evercore Inc. 1,712 144,173 0.01Avient Corp. 3,675 144,131 0.01Skechers USA Inc. 4,719 144,032 0.01II-VI Inc. 2,954 143,971 0.01Fox Corp. Class B 5,423 143,577 0.01Yelp Inc. 5,536 143,570 0.01Carter's Inc. 2,136 143,319 0.01Unum Group 5,871 142,765 0.01Elastic NV 2,352 142,656 0.01Starwood Property Trust Inc. 7,800 142,146 0.01ZoomInfo Technologies Inc. 3,749 141,509 0.01Stericycle Inc. 3,540 141,487 0.01Bruker Corp. 3,082 141,102 0.01Landstar System Inc. 1,143 140,838 0.01Healthcare Realty Trust Inc. 6,531 140,816 0.01Qualys Inc. 1,296 140,604 0.01Southern Copper Corp. 2,829 140,289 0.01Hawaiian Electric Industries Inc. 4,273 139,915 0.01National Retail Properties Inc. 4,007 139,886 0.01American Airlines Group Inc. 9,351 139,799 0.01Lennar Corp. Class B 2,683 139,524 0.01Glacier Bancorp Inc. 3,826 139,510 0.01Pinnacle Financial Partners Inc. 2,258 139,437 0.01Sonoco Products Co. 2,822 139,201 0.01Rapid7 Inc. 1,828 139,076 0.01UFP Industries Inc. 2,256 139,008 0.01CMC Materials Inc. 976 138,988 0.01Prosperity Bancshares Inc. 2,668 138,936 0.01Ashland Global Holdings Inc. 1,661 138,833 0.01Interactive Brokers Group Inc. 2,926 138,784 0.01Penumbra Inc. 1,009 138,680 0.01Leggett & Platt Inc. 4,879 138,462 0.01HF Sinclair Corp. 4,565 138,241 0.01MDU Resources Group Inc. 6,731 138,158 0.01Ryman Hospitality
Properties Inc. 1,854 138,042 0.01National Storage Affiliates Trust 3,060 137,950 0.01Nutanix Inc. 6,910 137,705 0.01Procore Technologies Inc. 3,112 137,518 0.01AGNC Investment Corp. 15,722 137,247 0.01Ultragenyx Pharmaceutical Inc. 2,437 137,155 0.01Shockwave Medical Inc. 1,137 136,857 0.01Univar Solutions Inc. 5,893 136,682 0.01STORE Capital Corp. 5,998 135,821 0.01STAG Industrial Inc. 4,569 135,778 0.01Antero Midstream Corp. 16,591 135,582 0.01Essent Group Ltd. 4,190 135,195 0.01Meritage Homes Corp. 2,054 135,101 0.01Sailpoint Technologies
Holdings Inc. 2,644 134,464 0.01Silicon Laboratories Inc. 1,252 134,354 0.01United Bankshares Inc. 5,070 134,352 0.01TopBuild Corp. 931 134,315 0.01SM Energy Co. 4,747 134,300 0.01Morningstar Inc. 663 133,725 0.01UMB Financial Corp. 1,862 133,684 0.01Toll Brothers Inc. 3,618 133,654 0.01Affirm Holdings Inc. 5,847 133,612 0.01Post Holdings Inc. 2,249 133,292 0.01ASGN Inc. 1,473 133,080 0.01EPR Properties 3,166 132,541 0.01
Holding
MarketValue
(£)
% ofTotal Net
Assets
GXO Logistics Inc. 2,800 132,049 0.01Black Hills Corp. 2,263 132,013 0.01Southwest Gas Holdings Inc. 1,878 131,961 0.01Boyd Gaming Corp. 2,730 131,792 0.01Dolby Laboratories Inc. 2,131 131,475 0.01Mandiant Inc. 7,468 130,801 0.01Azenta Inc. 2,189 130,782 0.01First Financial Bankshares Inc. 4,105 130,686 0.01Light & Wonder Inc.1 2,924 130,561 0.01Inspire Medical Systems Inc. 795 130,309 0.01Hexcel Corp. 3,006 130,176 0.01News Corp. Class B 8,204 130,035 0.01Eagle Materials Inc. 1,323 129,950 0.01Ziff Davis Inc. 1,848 129,912 0.01ManpowerGroup Inc. 1,804 129,635 0.01Teladoc Health Inc. 4,815 129,435 0.01Integra LifeSciences Holdings
Corp. 2,636 128,346 0.01Carvana Co. 2,780 128,316 0.01Rogers Corp. 592 128,208 0.01Casella Waste Systems Inc. 1,957 128,051 0.01Primerica Inc. 1,240 127,990 0.01Biohaven Pharmaceutical
Holding Co. Ltd. 1,802 127,869 0.01BWX Technologies Inc. 3,086 127,717 0.01Selective Insurance Group Inc. 1,944 127,463 0.01Liberty Broadband Corp. Class A 1,480 126,899 0.01Mimecast Ltd. 1,997 126,739 0.01HB Fuller Co. 2,384 126,691 0.01Insmed Inc. 7,230 126,575 0.01DT Midstream Inc. 2,946 126,123 0.01Bank OZK 4,122 126,073 0.01AMERCO 296 126,048 0.01Brady Corp. 3,524 125,438 0.01Affiliated Managers Group Inc. 1,248 124,889 0.01Flowers Foods Inc. 5,898 124,631 0.01PacWest Bancorp 4,755 124,565 0.01Ralph Lauren Corp. 1,497 124,422 0.01Radian Group Inc. 7,293 124,251 0.01Valmont Industries Inc. 627 124,091 0.01Element Solutions Inc. 7,525 123,529 0.01XPO Logistics Inc. 2,881 123,432 0.01AutoNation Inc. 1,337 123,338 0.01LivaNova plc 2,017 122,996 0.01Assured Guaranty Ltd. 2,794 122,731 0.01Helen of Troy Ltd. 716 122,213 0.01Ensign Group Inc. 1,909 122,142 0.01Kinsale Capital Group Inc. 691 122,013 0.01Axis Capital Holdings Ltd. 2,670 121,984 0.01Crane Co. 1,590 121,919 0.01Varonis Systems Inc. 3,537 121,675 0.01RBC Bearings Inc. 907 121,576 0.01Halozyme Therapeutics Inc. 3,824 121,527 0.01UiPath Inc. 8,538 121,252 0.01Maximus Inc. 2,086 121,123 0.01Steven Madden Ltd. 3,703 121,103 0.01ONE Gas Inc. 1,793 120,576 0.01Summit Materials Inc. 5,428 120,060 0.01ChampionX Corp. 7,142 120,029 0.01Tenable Holdings Inc. 2,728 119,941 0.01ExlService Holdings Inc. 1,106 119,938 0.01Victoria's Secret & Co. 3,195 119,860 0.01Hudson Pacific Properties Inc. 6,457 119,728 0.01Hancock Whitney Corp. 3,214 119,728 0.01Envestnet Inc. 1,878 119,262 0.01Portland General Electric Co. 3,162 119,227 0.01Commercial Metals Co. 3,641 118,902 0.01Teradata Corp. 3,606 118,793 0.01Walker & Dunlop Inc. 1,246 118,725 0.01PTC Therapeutics Inc. 4,209 118,543 0.01RLJ Lodging Trust 10,598 118,346 0.01Ionis Pharmaceuticals Inc. 4,041 118,317 0.01TD SYNNEX Corp. 1,482 118,229 0.01American Equity Investment Life
Holding Co. 3,930 118,072 0.01DiamondRock Hospitality Co. 13,936 117,882 0.01
Vanguard FTSE Global All Cap Index Fund
171

Holding
MarketValue
(£)
% ofTotal Net
Assets
Vonage Holdings Corp. 7,365 117,148 0.01AMN Healthcare Services Inc. 1,504 117,086 0.01Amedisys Inc. 1,149 116,822 0.01Atkore Inc. 1,520 116,503 0.01Air Lease Corp. 3,631 116,348 0.01Park Hotels & Resorts Inc. 7,403 116,160 0.01JBG SMITH Properties 5,528 116,064 0.01Grocery Outlet Holding Corp. 4,326 115,980 0.01Omnicell Inc. 1,332 115,939 0.01ABM Industries Inc. 3,012 115,874 0.01Premier Inc. 4,019 115,848 0.01Cytokinetics Inc. 3,629 115,301 0.01MasTec Inc. 2,010 115,285 0.01Boot Barn Holdings Inc. 1,610 115,271 0.01Kirby Corp. 2,222 115,250 0.01Enovis Corp. 2,227 115,066 0.01H&R Block Inc. 5,532 114,826 0.01Triton International Ltd. 2,354 114,634 0.01NCR Corp. 4,099 114,400 0.01Magnolia Oil & Gas Corp. 6,177 114,192 0.01Tempur Sealy International Inc. 5,268 113,752 0.01First Hawaiian Inc. 6,048 113,638 0.01NuVasive Inc. 2,766 113,240 0.01Houlihan Lokey Inc. 1,706 113,135 0.01Littelfuse Inc. 619 113,027 0.01Albertsons Cos. Inc. 4,536 112,975 0.01Sunrun Inc. 7,004 111,461 0.01Apple Hospitality REIT Inc. 7,859 110,671 0.01MSC Industrial Direct Co. Inc. 1,675 110,506 0.01Highwoods Properties Inc. 3,388 110,262 0.01Arbor Realty Trust Inc. 8,075 109,982 0.01Kadant Inc. 747 109,810 0.01New Jersey Resources Corp. 3,186 109,448 0.01Sanderson Farms Inc. 724 109,151 0.01New York Community
Bancorp Inc. 14,809 108,989 0.01Zurn Water Solutions Corp. 4,380 108,950 0.01Sirius XM Holdings Inc. 22,774 108,836 0.01Spirit AeroSystems Holdings Inc. 3,251 108,833 0.01Arconic Corp. 5,429 108,796 0.01RLI Corp. 1,184 108,338 0.01CNX Resources Corp. 6,584 107,767 0.01Perrigo Co. plc 3,942 107,726 0.01National Vision Holdings Inc. 3,585 107,507 0.01Physicians Realty Trust 7,859 107,290 0.01Westlake Corp. 1,063 107,147 0.01Onto Innovation Inc. 1,880 106,481 0.01Insperity Inc. 1,258 106,261 0.01Universal Corp. 2,308 106,236 0.01American States Water Co. 1,695 106,196 0.01Iovance Biotherapeutics Inc. 8,800 106,189 0.01Evoqua Water Technologies
Corp. 3,190 105,876 0.01SeaWorld Entertainment Inc. 1,970 105,820 0.01Chegg Inc. 5,365 105,762 0.01Umpqua Holdings Corp. 8,017 105,552 0.01Alight Inc. 15,407 105,290 0.01Insight Enterprises Inc. 1,329 105,092 0.01Cousins Properties Inc. 3,655 104,424 0.01Old National Bancorp 8,650 104,379 0.01Quidel Corp. 1,302 104,347 0.01Travel + Leisure Co. 2,355 104,066 0.01Cheesecake Factory Inc. 3,529 103,748 0.01Inari Medical Inc. 1,615 103,730 0.01SL Green Realty Corp. 1,878 103,705 0.01Denali Therapeutics Inc. 5,457 103,446 0.01ServisFirst Bancshares Inc. 1,604 102,679 0.01MFA Financial Inc. 9,039 102,593 0.01YETI Holdings Inc. 2,632 102,450 0.01Vertiv Holdings Co. 10,272 102,434 0.01Wintrust Financial Corp. 1,467 102,030 0.01Rivian Automotive Inc. 4,226 101,787 0.01Hanesbrands Inc. 9,612 101,517 0.01Freshpet Inc. 1,366 101,490 0.01Cabot Corp. 1,935 101,443 0.01Certara Inc. 6,925 101,214 0.01
Holding
MarketValue
(£)
% ofTotal Net
Assets
First BanCorp (Puerto Rico) 9,300 100,889 0.01Cadence Bank 5,050 100,678 0.01Mueller Industries Inc. 2,329 100,450 0.01Valley National Bancorp 10,530 100,393 0.01SLM Corp. 7,532 100,367 0.01PennyMac Mortgage Investment
Trust 8,209 100,299 0.01PagerDuty Inc. 4,410 100,283 0.01Novanta Inc. 980 100,279 0.01Switch Inc. 4,205 100,109 0.01TriNet Group Inc. 1,416 100,039 0.01Alarm.com Holdings Inc. 2,055 99,992 0.01Home BancShares Inc. 5,786 99,590 0.01MP Materials Corp. 3,283 99,549 0.01TechnipFMC plc 18,085 99,392 0.01Flowserve Corp. 3,812 99,346 0.01Credit Acceptance Corp. 240 97,715 0.01Liberty Media Corp-Liberty
SiriusXM Class C 2,926 97,603 0.01Valaris Ltd. 2,414 97,502 0.01Livent Corp. 5,715 97,367 0.01QuantumScape Corp. 8,130 96,809 0.01LXP Industrial Trust 9,671 96,671 0.01Kornit Digital Ltd. 1,827 96,596 0.01PS Business Parks Inc. 646 96,331 0.01Spectrum Brands Holdings Inc. 1,421 96,295 0.01Kite Realty Group Trust 5,414 96,119 0.01Six Flags Entertainment Corp. 3,152 96,104 0.01Frontier Communications
Parent Inc. 4,571 96,044 0.01Hain Celestial Group Inc. 3,583 95,661 0.01MGE Energy Inc. 1,539 95,306 0.01Hilton Grand Vacations Inc. 2,555 95,301 0.01Century Communities Inc. 2,264 95,086 0.01NorthWestern Corp. 2,102 94,912 0.01Diodes Inc. 1,631 94,872 0.01Brink's Co. 2,016 94,690 0.01Franklin Electric Co. Inc. 1,700 94,688 0.01Patterson-UTI Energy Inc. 7,229 94,659 0.01Scotts Miracle-Gro Co. 1,143 94,645 0.01API Group Corp. 6,400 94,560 0.01Helmerich & Payne Inc. 2,579 94,532 0.01Spire Inc. 1,626 94,232 0.01Ryder System Inc. 1,690 94,104 0.01Beacon Roofing Supply Inc. 1,979 93,977 0.01PNM Resources Inc. 2,525 93,921 0.01Select Medical Holdings Corp. 5,215 93,791 0.01Fluor Corp. 4,761 93,779 0.01Ormat Technologies Inc. 1,515 93,760 0.01Intra-Cellular Therapies Inc. 2,325 93,648 0.01Medpace Holdings Inc. 880 93,621 0.01MGIC Investment Corp. 8,999 93,610 0.01Allison Transmission
Holdings Inc. 3,138 93,578 0.01Wendy's Co. 5,942 93,520 0.01Coursera Inc. 6,244 93,498 0.01Cinemark Holdings Inc. 7,394 93,463 0.01GATX Corp. 1,130 93,091 0.01PotlatchDeltic Corp. 2,108 92,950 0.01R1 RCM Inc. 5,170 92,693 0.01Hostess Brands Inc. 5,125 92,621 0.01Blackstone Mortgage Trust Inc. 3,867 92,525 0.01Eastern Bankshares Inc. 6,065 92,460 0.01Apellis Pharmaceuticals Inc. 2,665 92,336 0.01Watts Water Technologies Inc. 909 92,268 0.01Aerojet Rocketdyne
Holdings Inc. 2,878 91,784 0.01Continental Resources Inc. 2,072 91,660 0.01agilon health Inc. 6,475 91,645 0.01Sanmina Corp. 2,814 91,626 0.01Pacira BioSciences Inc. 1,541 91,527 0.01Wix.com Ltd. 1,520 91,357 0.01iRhythm Technologies Inc. 928 91,189 0.01Workiva Inc. 1,185 91,147 0.01Sprout Social Inc. 1,860 90,726 0.01Silvergate Capital Corp. 972 90,643 0.01
Vanguard FTSE Global All Cap Index Fund
172

Holding
MarketValue
(£)
% ofTotal Net
Assets
SPS Commerce Inc. 950 90,520 0.01Sunstone Hotel Investors Inc. 9,279 90,462 0.01Broadstone Net Lease Inc. 5,486 90,363 0.01DraftKings Inc. 8,280 90,285 0.01Howard Hughes Corp. 1,127 90,088 0.01Cargurus Inc. 3,446 89,725 0.0110X Genomics Inc. 2,356 89,661 0.01Progyny Inc. 2,921 89,456 0.01Crocs Inc. 1,681 88,997 0.01Altair Engineering Inc. 2,059 88,920 0.01John Bean Technologies Corp. 945 88,734 0.01Dave & Buster's
Entertainment Inc. 2,449 88,714 0.01CRISPR Therapeutics AG 2,243 88,648 0.01Maravai
LifeSciences Holdings Inc. 3,620 88,575 0.01Veris Residential Inc. 6,936 88,447 0.01Upstart Holdings Inc. 1,481 88,412 0.01ACADIA Pharmaceuticals Inc. 6,006 88,212 0.01Armstrong World Industries Inc. 1,305 87,998 0.01Signet Jewelers Ltd. 1,571 87,941 0.01Federal Signal Corp. 3,239 87,870 0.01Graham Holdings Co. 186 87,858 0.01Equitrans Midstream Corp. 13,926 87,183 0.01Nordstrom Inc. 4,249 86,977 0.01Four Corners Property Trust Inc. 3,975 86,909 0.01Golar LNG Ltd. 4,881 86,734 0.01Applied Industrial
Technologies Inc. 1,038 86,504 0.01Owens & Minor Inc. 3,057 86,390 0.01Choice Hotels International Inc. 772 86,368 0.01Balchem Corp. 881 86,240 0.01Alteryx Inc. 1,683 86,033 0.01Boise Cascade Co. 1,428 85,964 0.01Eagle Bancorp Inc. 2,145 85,851 0.01Arrowhead Pharmaceuticals Inc. 2,621 85,822 0.01Blackline Inc. 1,608 85,798 0.01Thor Industries Inc. 1,409 85,774 0.01Flywire Corp. 3,519 85,515 0.01Perficient Inc. 1,077 85,276 0.01Equity Commonwealth 4,086 85,267 0.01Bread Financial Holdings Inc. 1,951 85,173 0.01Taylor Morrison Home Corp. 4,076 84,994 0.01Blackbaud Inc. 1,838 84,910 0.01Mr Cooper Group Inc. 2,368 84,818 0.01South Jersey Industries Inc. 3,108 84,687 0.01Focus Financial Partners Inc. 2,688 84,462 0.01GrafTech International Ltd. 11,659 84,227 0.01Adient plc 3,100 84,222 0.01White Mountains Insurance
Group Ltd. 101 84,130 0.01Boston Beer Co. Inc. 282 84,052 0.01Otter Tail Corp. 1,824 84,030 0.01MicroStrategy Inc. 298 83,950 0.01California Water Service Group 2,031 83,893 0.01Progress Software Corp. 2,191 83,731 0.01Skyline Champion Corp. 2,060 83,663 0.01Rambus Inc. 4,217 83,635 0.01Grand Canyon Education Inc. 1,092 83,472 0.01Hamilton Lane Inc. 1,529 83,410 0.01Esab Corp. 2,228 83,406 0.01Badger Meter Inc. 1,293 83,182 0.01Northwest Natural Holding Co. 2,183 83,182 0.01United Natural Foods Inc. 2,430 83,013 0.01Civitas Resources Inc. 1,777 82,955 0.01TechTarget Inc. 1,536 82,360 0.01New Relic Inc. 1,624 81,788 0.01Sabre Corp. 9,730 81,141 0.00Sempra Energy (XMEX)1 742 81,084 0.00Columbia Sportswear Co. 1,238 81,034 0.00Innospec Inc. 1,066 80,924 0.00Brighthouse Financial Inc. 1,977 80,875 0.00Innovative Industrial
Properties Inc. 702 80,846 0.00MaxLinear Inc. 2,117 80,751 0.00Wingstop Inc. 1,105 80,716 0.00
Holding
MarketValue
(£)
% ofTotal Net
Assets
Westamerica BanCorp 1,721 80,615 0.00Viavi Solutions Inc. 7,057 80,547 0.00DigitalBridge Group Inc. 14,527 80,532 0.00International Bancshares Corp. 2,540 80,438 0.00Pegasystems Inc. 1,317 80,258 0.00Bloom Energy Corp. 5,413 80,063 0.00Kyndryl Holdings Inc. 8,420 79,740 0.00Enstar Group Ltd. 425 79,712 0.00CSG Systems International Inc. 1,628 79,708 0.00Dlocal Ltd. 4,418 79,703 0.00CONMED Corp. 752 79,632 0.00Sensient Technologies Corp. 1,181 79,580 0.00Under Armour Inc. Class C 7,030 79,455 0.00Goodyear Tire & Rubber Co. 7,488 79,383 0.00Silgan Holdings Inc. 2,239 79,127 0.00Welbilt Inc. 4,195 78,888 0.00MACOM Technology Solutions
Holdings Inc. 1,944 78,813 0.00Redwood Trust Inc. 10,188 78,713 0.00TripAdvisor Inc. 3,841 78,533 0.00Apogee Enterprises Inc. 2,240 78,378 0.00Dun & Bradstreet Holdings Inc. 6,234 78,353 0.00Hecla Mining Co. 18,845 78,052 0.00Farfetch Ltd. Class A 8,737 77,941 0.00Renewable Energy Group Inc. 1,603 77,935 0.00FNB Corp. 8,470 77,718 0.00Timken Co. 1,688 77,563 0.00ACI Worldwide Inc. 3,520 77,437 0.00SiTime Corp. 576 77,305 0.00EnerSys 1,482 77,246 0.00Mueller Water Products Inc. 8,061 77,175 0.00Allscripts Healthcare
Solutions Inc. 4,688 77,144 0.00Avangrid Inc. 2,183 77,113 0.00Blueprint Medicines Corp. 1,658 77,043 0.00Outfront Media Inc. 3,776 76,964 0.00Macerich Co. 7,703 76,938 0.00Meritor Inc. 2,684 76,768 0.00Fabrinet 982 76,730 0.00Ovintiv Inc. (XTSE) 1,873 76,492 0.00Glaukos Corp. 2,020 76,215 0.00Centerspace 1,035 76,131 0.00Q2 Holdings Inc. 1,848 76,069 0.00Leslie's Inc. 4,876 76,043 0.00Kratos Defense & Security
Solutions Inc. 6,293 75,987 0.00CNO Financial Group Inc. 3,948 75,878 0.00Employers Holdings Inc. 2,421 75,860 0.00United Airlines Holdings Inc. 1,885 75,820 0.00Verint Systems Inc. 1,745 75,818 0.00Lindsay Corp. 704 75,727 0.00Banner Corp. 1,771 75,650 0.00Plexus Corp. 1,172 75,613 0.00Associated Banc-Corp 4,760 75,599 0.00Intellia Therapeutics Inc. 1,933 75,472 0.00Gap Inc. 7,617 75,412 0.00Neogen Corp. 3,587 75,368 0.00John Wiley & Sons Inc. Class A 1,857 75,315 0.00Methode Electronics Inc. 2,120 75,192 0.00Essential Properties Realty
Trust Inc. 3,929 75,106 0.00Twist Bioscience Corp. 3,264 75,055 0.00Avista Corp. 2,314 74,756 0.00Sprouts Farmers Market Inc. 3,148 74,720 0.00Haemonetics Corp. 1,849 74,682 0.00Fox Factory Holding Corp. 1,141 74,404 0.00Papa John's International Inc. 1,025 74,334 0.00Kemper Corp. 2,014 74,031 0.00AAR Corp. 1,976 73,941 0.00Viasat Inc. 2,516 73,686 0.00Coty Inc. 11,390 73,575 0.00FormFactor Inc. 2,425 73,513 0.00Texas Capital Bancshares Inc. 1,794 73,389 0.00Renasant Corp. 3,101 73,382 0.00Atlas Air Worldwide
Holdings Inc. 1,336 73,360 0.00
Vanguard FTSE Global All Cap Index Fund
173

Holding
MarketValue
(£)
% ofTotal Net
Assets
Mister Car Wash Inc. 6,385 73,233 0.00Pacific Premier Bancorp Inc. 2,933 73,144 0.00Terex Corp. 2,697 73,101 0.00Enerpac Tool Group Corp. 4,547 72,687 0.00CommVault Systems Inc. 1,495 72,636 0.00BOK Financial Corp. 1,098 72,527 0.00Novavax Inc. 2,018 72,442 0.00Nomad Foods Ltd. 4,878 71,723 0.00Evolent Health Inc. 3,260 71,536 0.00Independent Bank Corp.
(Massachusetts) 1,166 71,492 0.00Allegheny Technologies Inc. 3,299 71,419 0.00Kennedy-Wilson Holdings Inc. 3,965 71,184 0.00Opendoor Technologies Inc. 12,776 71,029 0.00Griffon Corp. 4,766 71,025 0.00Cogent Communications
Holdings Inc. 1,523 70,964 0.00Ollie's Bargain Outlet
Holdings Inc. 1,850 70,802 0.00BankUnited Inc. 2,366 70,726 0.00Fate Therapeutics Inc. 3,097 70,426 0.00E2open Parent Holdings Inc. 11,438 70,332 0.00Oak Street Health Inc. 4,887 70,298 0.00WD-40 Co. 479 70,105 0.00Stepan Co. 862 70,086 0.00TTEC Holdings Inc. 1,186 69,724 0.00DoubleVerify Holdings Inc. 4,015 69,587 0.00Hannon Armstrong Sustainable
Infrastructure Capital Inc. 2,182 69,518 0.00Madison Square Garden Sports
Corp. 538 69,466 0.00Encore Wire Corp. 775 69,346 0.00Ambarella Inc. 1,059 69,208 0.00Mercury Systems Inc. 1,558 69,182 0.00CCC Intelligent Solutions
Holdings Inc. 9,413 69,126 0.00Axos Financial Inc. 2,285 68,923 0.00Semtech Corp. 1,449 68,763 0.00WeWork Inc. 12,319 68,684 0.00Minerals Technologies Inc. 1,354 68,622 0.00Pebblebrook Hotel Trust 3,521 68,513 0.00IPG Photonics Corp. 907 68,254 0.00Community Bank System Inc. 1,330 68,211 0.00ChargePoint Holdings Inc. 6,606 68,086 0.00United Community Banks Inc. 2,838 68,085 0.00New Fortress Energy Inc. 2,203 68,082 0.00Trustmark Corp. 3,068 68,080 0.00Washington Federal Inc. 2,805 67,986 0.00Arcosa Inc. 1,591 67,885 0.00Under Armour Inc. Class A 5,537 67,785 0.00Celsius Holdings Inc. 1,636 67,759 0.00Natera Inc. 2,420 67,694 0.00Cohen & Steers Inc. 1,091 67,493 0.00Virtu Financial Inc. 2,931 67,398 0.00Knowles Corp. 4,550 67,226 0.00AtriCure Inc. 1,625 67,213 0.00Hillenbrand Inc. 2,060 66,878 0.00NetScout Systems Inc. 2,722 66,776 0.00Transocean Ltd. 22,391 66,700 0.00Delek US Holdings Inc. 3,460 66,665 0.00Simply Good Foods Co. 2,010 66,632 0.00STAAR Surgical Co. 1,465 66,628 0.00Hub Group Inc. 1,243 66,462 0.00Sabra Health Care REIT Inc. 7,138 66,348 0.00Urban Edge Properties 4,452 66,275 0.00Kaiser Aluminum Corp. 859 66,024 0.00National Health Investors Inc. 1,604 65,795 0.00Bank of NT Butterfield & Son
Ltd. 2,580 65,718 0.00Sonos Inc. 3,609 65,569 0.00First Financial Bancorp 4,025 65,561 0.00Alexander & Baldwin Inc. 3,876 65,449 0.00Apartment Investment and
Management Co. 13,001 65,238 0.00Ortho Clinical
Diagnostics Holdings plc 4,654 65,167 0.00ArcBest Corp. 1,129 65,033 0.00
Holding
MarketValue
(£)
% ofTotal Net
Assets
Lancaster Colony Corp. 526 64,989 0.00ALLETE Inc. 1,375 64,966 0.00Vishay Intertechnology Inc. 4,358 64,632 0.00PriceSmart Inc. 1,020 64,539 0.00Resideo Technologies Inc. 3,605 64,520 0.00SJW Group 1,371 64,428 0.00Cal-Maine Foods Inc. 1,505 64,407 0.00SITE Centers Corp. 5,073 64,246 0.00Sandy Spring Bancorp Inc. 2,048 64,025 0.00Merit Medical Systems Inc. 1,296 64,021 0.00Washington REIT 3,335 63,991 0.00Penske Automotive Group Inc. 764 63,791 0.00Korn Ferry 1,303 63,764 0.00EVERTEC Inc. 2,032 63,719 0.00Herc Holdings Inc. 624 63,623 0.00Albany International Corp. 1,022 63,607 0.00Corcept Therapeutics Inc. 3,712 63,596 0.00Kennametal Inc. 3,083 63,158 0.00Piedmont Lithium Inc. 1,208 62,935 0.00Dorman Products Inc. 801 62,881 0.00Compass Minerals
International Inc. 1,334 62,753 0.00DigitalOcean Holdings Inc. 1,995 62,639 0.00Pagseguro Digital Ltd. Class A 5,345 62,582 0.00Columbia Banking System Inc. 2,799 62,512 0.00Standex International Corp. 832 62,378 0.00GCP Applied Technologies Inc. 2,495 62,340 0.00Zillow Group Inc. Class C 1,965 62,307 0.00InterDigital Inc. 1,372 62,114 0.00Jack in the Box Inc. 940 61,918 0.00Gates Industrial Corp. plc 6,089 61,836 0.00CoreCivic Inc. 6,234 61,769 0.00Kosmos Energy Ltd. 11,464 61,726 0.00Triumph Bancorp Inc. 1,115 61,669 0.00LCI Industries 793 61,463 0.00Olaplex Holdings Inc. 5,225 61,177 0.00Inmode Ltd. 3,054 60,910 0.00Gentherm Inc. 1,134 60,895 0.00Visteon Corp. 730 60,877 0.00Acadia Realty Trust 3,644 60,719 0.00Tronox Holdings plc 4,424 60,572 0.00Uniti Group Inc. 6,135 60,495 0.00Driven Brands Holdings Inc. 2,725 60,490 0.00Core & Main Inc. 3,191 60,490 0.00Luminar Technologies Inc. 6,098 60,081 0.00Prestige Consumer
Healthcare Inc. 1,378 59,982 0.00Apollo Commercial Real Estate
Finance Inc. 6,254 59,975 0.00Kymera Therapeutics Inc. 2,398 59,917 0.00CBIZ Inc. 1,796 59,910 0.00Cavco Industries Inc. 319 59,867 0.00Atlantic Union Bankshares Corp. 2,226 59,839 0.00Lazard Ltd. 2,279 59,485 0.00Forward Air Corp. 770 59,466 0.00Dycom Industries Inc. 879 59,433 0.00Surgery Partners Inc. 1,458 59,400 0.00Brookline Bancorp Inc. 5,139 59,188 0.00SpringWorks Therapeutics Inc. 1,722 58,881 0.00Hilltop Holdings Inc. 2,890 58,652 0.00Arvinas Inc. 1,338 58,465 0.00AZEK Co. Inc. 3,455 58,450 0.00Independent Bank Group Inc. 1,082 58,431 0.00Piper Sandler Cos. 639 58,403 0.00Kulicke & Soffa Industries Inc. 1,573 58,146 0.00PRA Group Inc. 1,732 57,982 0.00Werner Enterprises Inc. 1,835 57,922 0.00Digital Turbine Inc. 2,296 57,843 0.00FirstCash Holdings Inc. 909 57,755 0.00PBF Energy Inc. 2,492 57,660 0.00Amicus Therapeutics Inc. 10,202 57,531 0.00Zentalis Pharmaceuticals Inc. 2,718 57,434 0.00Foot Locker Inc. 2,453 57,344 0.00Tri Pointe Homes Inc. 3,480 57,293 0.00Herbalife Nutrition Ltd. 2,706 57,288 0.00Coca-Cola Consolidated Inc. 163 57,267 0.00
Vanguard FTSE Global All Cap Index Fund
174

Holding
MarketValue
(£)
% ofTotal Net
Assets
Belden Inc. 1,392 57,254 0.00Horace Mann Educators Corp. 1,798 57,012 0.00Liberty Media Corp-Liberty
Formula One Class A 1,245 56,960 0.00Trupanion Inc. 1,121 56,912 0.00nCino Inc. 1,905 56,869 0.00ProAssurance Corp. 2,901 56,749 0.00Beyond Meat Inc. 1,928 56,588 0.00Paysafe Ltd. 25,535 56,134 0.00Granite Construction Inc. 2,377 56,041 0.00Amkor Technology Inc. 3,738 56,003 0.00Simmons First National Corp. 2,944 55,972 0.00Xerox Holdings Corp. 4,033 55,893 0.00CVB Financial Corp. 3,043 55,770 0.00Altra Industrial Motion Corp. 1,789 55,572 0.00Verra Mobility Corp. 4,977 55,538 0.00CareTrust REIT Inc. 4,293 55,428 0.00Upwork Inc. 3,311 55,302 0.00Advanced Energy Industries Inc. 905 55,165 0.00Academy Sports &
Outdoors Inc. 1,851 55,095 0.00SFL Corp. Ltd. 6,907 54,519 0.00Mirati Therapeutics Inc. 1,105 54,409 0.00First Commonwealth Financial
Corp. 5,065 54,382 0.00Materion Corp. 798 54,160 0.00Jackson Financial Inc. 1,604 54,054 0.00USANA Health Sciences Inc. 886 54,042 0.00Cushman & Wakefield plc 3,783 53,905 0.00Patrick Industries Inc. 1,084 53,798 0.00Corporate Office Properties
Trust 2,523 53,635 0.00Ingevity Corp. 1,119 53,405 0.00Telephone and Data
Systems Inc. 3,645 53,187 0.00Monday.com Ltd. 515 53,075 0.00Cracker Barrel Old Country
Store Inc. 600 53,042 0.00Group 1 Automotive Inc. 382 52,981 0.00Stem Inc. 9,228 52,700 0.00Towne Bank 2,398 52,659 0.00Central Garden & Pet Co.
Class A 1,596 52,590 0.00Comfort Systems USA Inc. 780 52,441 0.00Newmark Group Inc. 5,432 52,438 0.00MEDNAX Inc. 3,556 52,427 0.00Bank of Hawaii Corp. 879 52,047 0.00American Eagle Outfitters Inc. 4,308 51,813 0.00Clearway Energy Inc. Class C 2,129 51,805 0.00Navient Corp. 4,093 51,802 0.00Dillard's Inc. 214 51,687 0.00Bottomline Technologies DE Inc. 1,146 51,682 0.00WSFS Financial Corp. 1,618 51,588 0.00SoFi Technologies Inc. 10,544 51,397 0.00Aurinia Pharmaceuticals Inc. 6,277 51,396 0.00Primoris Services Corp. 2,772 51,135 0.00Avanos Medical Inc. 2,201 51,102 0.00Ardagh Metal Packaging SA 8,974 50,963 0.00Barnes Group Inc. 1,905 50,952 0.00Tivity Health Inc. 1,984 50,773 0.00Emergent BioSolutions Inc. 1,968 50,740 0.00Patterson Cos. Inc. 2,070 50,715 0.00Trinity Industries Inc. 2,288 50,553 0.00Gray Television Inc. 3,428 50,539 0.00Atlantica Sustainable
Infrastructure plc 2,056 50,536 0.00McGrath RentCorp 759 50,461 0.00Schneider National Inc. 2,681 50,460 0.00Federated Hermes Inc. 2,219 50,319 0.00J & J Snack Foods Corp. 421 50,064 0.00Cathay General Bancorp 1,563 49,909 0.00Argo Group International
Holdings Ltd. 1,462 49,805 0.00Ameris Bancorp 1,499 49,788 0.00Artisan Partners Asset
Management Inc. 1,944 49,765 0.00Greif Inc. Class A 1,028 49,652 0.00
Holding
MarketValue
(£)
% ofTotal Net
Assets
Callaway Golf Co. 2,841 49,602 0.00Playtika Holding Corp. 3,534 49,484 0.00H&E Equipment Services Inc. 1,750 49,399 0.00WesBanco Inc. 1,925 49,386 0.00Trinseo plc 1,303 49,224 0.00Altice USA Inc. 6,658 49,159 0.00UniFirst Corp. 358 49,073 0.00Nevro Corp. 999 49,007 0.00Cerevel Therapeutics
Holdings Inc. 2,099 48,952 0.00Maxar Technologies Inc. 1,902 48,826 0.00Quaker Chemical Corp. 375 48,599 0.00Red Rock Resorts Inc. 1,388 48,599 0.00NewMarket Corp. 188 48,509 0.00Worthington Industries Inc. 1,281 48,506 0.00Liberty Global plc Class A 2,674 48,475 0.00TriMas Corp. 2,060 48,403 0.00Ubiquiti Inc. 215 48,333 0.00Strategic Education Inc. 940 48,306 0.00KB Home 1,865 48,218 0.00JetBlue Airways Corp. 5,495 48,188 0.00JELD-WEN Holding Inc. 2,880 47,599 0.00Xperi Holding Corp. 3,816 47,415 0.00Rent-A-Center Inc. 2,452 47,107 0.00Edgewell Personal Care Co. 1,552 47,098 0.00Momentive Global Inc. 3,730 46,970 0.00Figs Inc. 3,764 46,919 0.00Republic Bancorp Inc. 1,414 46,863 0.00Axonics Inc. 1,133 46,764 0.001st Source Corp. 1,358 46,727 0.00Gibraltar Industries Inc. 1,552 46,702 0.00MillerKnoll Inc. 1,848 46,689 0.00Kearny Financial Corp. 4,932 46,590 0.00Frontdoor Inc. 1,887 46,457 0.00Piedmont Office Realty
Trust Inc. 3,608 46,325 0.00Moelis & Co. 1,312 46,210 0.00Fulton Financial Corp. 3,817 46,120 0.00Nelnet Inc. 703 45,915 0.00AAON Inc. 1,181 45,829 0.00Callon Petroleum Co. 1,113 45,469 0.00TTM Technologies Inc. 4,077 45,300 0.00Hope Bancorp Inc. 3,961 45,052 0.00Helios Technologies Inc. 841 44,974 0.00Core Laboratories NV 2,165 44,869 0.00LTC Properties Inc. 1,705 44,869 0.00Vicor Corp. 930 44,830 0.00Bloomin' Brands Inc. 2,553 44,716 0.00Ameresco Inc. 1,106 44,407 0.00ESCO Technologies Inc. 893 44,376 0.00Thoughtworks Holding Inc. 3,011 44,368 0.00Karuna Therapeutics Inc. 500 44,365 0.00Archrock Inc. 6,392 44,344 0.00Rush Enterprises Inc. Class A 1,093 44,295 0.00Arcus Biosciences Inc. 2,292 44,252 0.00Fastly Inc. 3,477 44,061 0.00Moog Inc. 690 43,961 0.00First Merchants Corp. 1,408 43,939 0.00MDC Holdings Inc. 1,493 43,916 0.00Shake Shack Inc. 953 43,843 0.00Beam Therapeutics Inc. 1,460 43,655 0.00Global Net Lease Inc. 3,896 43,506 0.00Chimera Investment Corp. 5,440 43,416 0.00Riot Blockchain Inc. 5,357 43,223 0.00Tilray Brands Inc. 10,883 43,168 0.00Medifast Inc. 304 43,081 0.00Safehold Inc. 1,253 43,004 0.00Appfolio Inc. 520 42,934 0.00Greenbrier Cos. Inc. 1,260 42,873 0.00Integer Holdings Corp. 711 42,564 0.00Beauty Health Co. 4,065 42,415 0.00Embecta Corp. 1,747 42,343 0.00Lions Gate Entertainment Corp.
Class A 3,943 42,335 0.00PennyMac Financial
Services Inc. 1,093 42,275 0.00
Vanguard FTSE Global All Cap Index Fund
175

Holding
MarketValue
(£)
% ofTotal Net
Assets
Mercury General Corp. 1,051 42,266 0.00AeroVironment Inc. 660 42,223 0.00Calix Inc. 1,324 42,077 0.00Two Harbors Investment Corp. 10,911 41,802 0.00Flagstar Bancorp Inc. 1,481 41,652 0.00Weis Markets Inc. 654 41,594 0.00CNA Financial Corp. 1,098 41,532 0.00IonQ Inc. 6,611 41,388 0.00Shift4 Payments Inc. 984 41,069 0.00Sally Beauty Holdings Inc. 3,385 40,766 0.00Enanta Pharmaceuticals Inc. 791 40,593 0.00Allegro MicroSystems Inc. 2,092 40,540 0.00SPX Corp. 1,214 40,505 0.00Dana Inc. 3,428 40,410 0.00ODP Corp. 1,176 40,305 0.00Vector Group Ltd. 3,973 40,252 0.00Energizer Holdings Inc. 1,645 39,674 0.00Alignment Healthcare Inc. 5,152 39,394 0.00Stock Yards Bancorp Inc. 933 38,851 0.00Kontoor Brands Inc. 1,222 38,660 0.00Asana Inc. 1,799 38,359 0.00Paramount Group Inc. 5,068 38,348 0.00ManTech International Corp. 598 38,257 0.00Sage Therapeutics Inc. 1,520 38,148 0.00Lions Gate Entertainment Corp.
Class B 3,815 38,104 0.00KAR Auction Services Inc. 3,253 37,932 0.00StoneCo Ltd. Class A 4,998 37,460 0.00Cannae Holdings Inc. 2,084 37,182 0.00Getty Realty Corp. 1,732 37,123 0.00Sotera Health Co. 2,276 36,963 0.00Nu Skin Enterprises Inc. 1,090 36,958 0.00St Joe Co. 863 36,582 0.00Qurate Retail Inc. 10,883 36,493 0.00Bumble Inc. 1,903 36,362 0.00Service Properties Trust 5,626 36,342 0.00International Game Technology
plc 2,088 36,272 0.00Xenia Hotels & Resorts Inc. 2,357 36,233 0.00Enovix Corp. 5,002 35,976 0.00Ranpak Holdings Corp. 2,993 35,926 0.00Capitol Federal Financial Inc. 4,669 35,775 0.00Itron Inc. 940 35,728 0.00Heartland Financial USA Inc. 1,024 35,699 0.00Constellium SE 2,679 35,613 0.00EW Scripps Co. 2,716 35,608 0.00Live Oak Bancshares Inc. 1,047 35,300 0.00Open Lending Corp. 3,249 35,272 0.00Brandywine Realty Trust 3,791 35,208 0.00Fisker Inc. 4,370 35,016 0.00Inter Parfums Inc. 537 34,953 0.00Relay Therapeutics Inc. 1,834 34,796 0.00LGI Homes Inc. 466 34,782 0.00LiveRamp Holdings Inc. 1,395 34,778 0.00O-I Glass Inc. 3,212 34,486 0.00S&T Bancorp Inc. 1,522 34,210 0.00American Woodmark Corp. 917 34,189 0.00Carpenter Technology Corp. 1,120 34,024 0.00Winnebago Industries Inc. 804 34,017 0.00Installed Building Products Inc. 528 33,842 0.00Genworth Financial Inc. 11,494 33,782 0.00American National Group Inc. 223 33,490 0.00TuSimple Holdings Inc. 4,062 33,486 0.00Masonite International Corp. 539 33,259 0.00Everbridge Inc. 964 33,093 0.00Monro Inc. 910 33,044 0.00Global Blood Therapeutics Inc. 1,350 33,011 0.00Deluxe Corp. 1,526 32,902 0.00NMI Holdings Inc. 2,242 32,840 0.00ZIM Integrated Shipping
Services Ltd. 739 32,768 0.00Xencor Inc. 1,633 32,517 0.00B&G Foods Inc. 1,508 32,298 0.00Fiverr International Ltd. 760 32,234 0.00Invitae Corp. 7,571 32,021 0.00EnPro Industries Inc. 431 31,950 0.00
Holding
MarketValue
(£)
% ofTotal Net
Assets
PROG Holdings Inc. 1,514 31,896 0.00Tanger Factory Outlet
Centers Inc. 2,479 31,829 0.00Appian Corp. 831 31,638 0.00Realogy Holdings Corp. 3,616 31,624 0.00Matthews International Corp. 1,331 31,592 0.00TreeHouse Foods Inc. 1,252 31,382 0.00Encore Capital Group Inc. 679 31,249 0.00Vista Outdoor Inc. 1,109 31,110 0.00BioCryst Pharmaceuticals Inc. 4,204 31,107 0.00Bed Bath & Beyond Inc. 2,851 30,928 0.00Sylvamo Corp. 869 30,912 0.00Wolverine World Wide Inc. 1,951 30,784 0.00Myriad Genetics Inc. 1,881 30,713 0.00Spirit Airlines Inc. 1,616 30,389 0.00Pacific Biosciences of
California Inc. 6,016 30,332 0.00Oxford Industries Inc. 420 29,970 0.00Madison Square Garden
Entertainment Corp. 514 29,968 0.00Overstock.com Inc. 1,117 29,858 0.00Vimeo Inc. 3,651 29,603 0.00Marathon Digital Holdings Inc. 2,351 29,212 0.00World Fuel Services Corp. 1,496 28,788 0.00Oceaneering International Inc. 3,167 28,555 0.00Shutterstock Inc. 471 28,429 0.00Abercrombie & Fitch Co. 1,032 28,424 0.00iHeartMedia Inc. 2,213 28,149 0.00Urban Outfitters Inc. 1,464 27,717 0.00Virgin Galactic Holdings Inc. 4,611 27,471 0.00REGENXBIO Inc. 1,232 27,260 0.00Brinker International Inc. 940 27,178 0.00Supernus Pharmaceuticals Inc. 1,216 27,042 0.00Jamf Holding Corp. 1,101 26,975 0.00Kaman Corp. 866 26,908 0.00Sunnova Energy
International Inc. 1,953 26,880 0.00Atara Biotherapeutics Inc. 5,195 26,316 0.00Green Dot Corp. 1,235 26,038 0.00FuelCell Energy Inc. 7,986 26,016 0.00Stratasys Ltd. 1,683 25,992 0.003D Systems Corp. 2,850 25,697 0.00Astec Industries Inc. 823 25,631 0.00Century Aluminum Co. 1,888 25,294 0.00Matson Inc. 366 25,079 0.00La-Z-Boy Inc. 1,195 25,014 0.00Nikola Corp. 4,367 25,009 0.00ADT Inc. 4,574 24,919 0.00OPKO Health Inc. 11,580 24,903 0.00Healthcare Services Group Inc. 1,822 24,801 0.00Plantronics Inc. 780 24,795 0.00Covetrus Inc. 2,253 24,746 0.00Magnite Inc. 3,207 24,624 0.00Brookdale Senior Living Inc. 4,924 24,198 0.00Multiplan Corp. 6,841 24,138 0.00TG Therapeutics Inc. 4,325 23,907 0.00JFrog Ltd. 1,422 23,626 0.00Palomar Holdings Inc. 545 23,601 0.00Adtalem Global Education Inc. 1,009 23,547 0.00GEO Group Inc. 4,541 23,510 0.00Desktop Metal Inc. 8,414 23,456 0.00Vir Biotechnology Inc. 1,444 23,417 0.00Ligand Pharmaceuticals Inc. 316 23,372 0.00LivePerson Inc. 1,294 23,314 0.00Petco Health & Wellness Co.
Inc. 1,509 23,149 0.00US Ecology Inc. 604 23,087 0.00Reynolds Consumer
Products Inc. 979 23,066 0.00Fulgent Genetics Inc. 527 23,011 0.00Ironwood Pharmaceuticals Inc. 2,403 22,968 0.00Community Trust Bancorp Inc. 718 22,738 0.00NBT Bancorp Inc. 808 22,647 0.00Liberty Latin America Ltd.
Class C 3,071 22,601 0.00
Vanguard FTSE Global All Cap Index Fund
176

Holding
MarketValue
(£)
% ofTotal Net
Assets
Retail Opportunity InvestmentsCorp. 1,515 22,469 0.00
NeoGenomics Inc. 2,989 22,450 0.00Phreesia Inc. 1,230 22,445 0.00Agios Pharmaceuticals Inc. 1,281 22,416 0.00FARO Technologies Inc. 814 22,225 0.00Veracyte Inc. 1,353 22,081 0.00CareDx Inc. 900 21,821 0.00Vivint Smart Home Inc. 5,142 21,420 0.00Parsons Corp. 723 21,272 0.00iRobot Corp. 524 21,144 0.00Shenandoah
Telecommunications Co. 1,308 20,982 0.00Shoals Technologies Group Inc. 2,607 20,744 0.00Global-e Online Ltd. 1,151 20,664 0.00Buckle Inc. 828 20,477 0.00Cardlytics Inc. 749 20,278 0.00Editas Medicine Inc. 1,916 20,221 0.00Duck Creek Technologies Inc. 1,564 19,844 0.00CorVel Corp. 161 19,841 0.00Schrodinger Inc. 999 19,678 0.00SunPower Corp. 1,490 19,594 0.00CommScope Holding Co. Inc. 4,084 19,582 0.00G-III Apparel Group Ltd. 919 19,354 0.00Redfin Corp. 2,152 19,112 0.00HNI Corp. 671 19,021 0.00Clearway Energy Inc. Class A 834 18,879 0.00CryoPort Inc. 1,046 18,762 0.00Turning Point Therapeutics Inc. 791 18,573 0.00Heartland Express Inc. 1,680 18,453 0.00BGC Partners Inc. 6,398 18,447 0.00Empire State Realty Trust Inc. 2,676 18,394 0.00Liberty Media Corp-Liberty
Braves Class C 916 18,305 0.00Axsome Therapeutics Inc. 718 18,157 0.00MakeMyTrip Ltd. 889 18,035 0.00NOW Inc. 2,055 17,841 0.00Alaska Air Group Inc. 408 17,682 0.00Cerence Inc. 750 17,622 0.00Coeur Mining Inc. 6,090 17,559 0.00Pilgrim's Pride Corp. 771 17,404 0.00American Assets Trust Inc. 593 17,315 0.00AdaptHealth Corp. 1,685 16,991 0.00Nektar Therapeutics 5,174 16,938 0.00Bridgebio Pharma Inc. 2,600 16,588 0.00CureVac NV 1,211 16,494 0.00Cassava Sciences Inc. 989 16,472 0.00Virtus Investment Partners Inc. 116 16,276 0.00Array Technologies Inc. 3,095 16,097 0.00eXp World Holdings Inc. 1,494 15,934 0.008x8 Inc. 2,172 15,881 0.00Adaptive Biotechnologies Corp. 2,409 15,811 0.00REVOLUTION Medicines Inc. 986 15,691 0.00Safety Insurance Group Inc. 229 15,661 0.00Children's Place Inc. 420 15,492 0.00Summit Hotel Properties Inc. 1,952 15,345 0.00BigCommerce Holdings Inc. 1,078 15,344 0.00TrueBlue Inc. 740 15,089 0.00Orion Office REIT Inc. 1,397 14,944 0.00Proto Labs Inc. 436 14,790 0.00Atlas Corp. Marshall Islands 1,491 14,678 0.00Northwest Bancshares Inc. 1,437 14,513 0.00ChemoCentryx Inc. 981 14,432 0.00Lemonade Inc. 865 14,365 0.00Ebix Inc. 603 14,313 0.00LendingTree Inc. 223 14,106 0.00iStar Inc. 1,051 14,097 0.00SiriusPoint Ltd. 2,793 13,971 0.00City Holding Co. 226 13,898 0.00ContextLogic Inc. 10,305 13,871 0.00uniQure NV 1,160 13,813 0.00Allegiant Travel Co. 111 13,720 0.00BancFirst Corp. 209 13,609 0.00Liberty Media Corp-Liberty
Braves Class A 644 13,470 0.00Sleep Number Corp. 416 13,443 0.00
Holding
MarketValue
(£)
% ofTotal Net
Assets
Berkshire Hills Bancorp Inc. 679 13,380 0.00Brightsphere Investment
Group Inc. 838 13,369 0.001Life Healthcare Inc. 2,353 13,213 0.00FibroGen Inc. 1,773 13,133 0.00NanoString Technologies Inc. 876 13,110 0.00Bandwidth Inc. 744 13,090 0.00AMC Networks Inc. 499 12,957 0.00Avaya Holdings Corp. 1,758 12,938 0.00C3.ai Inc. 948 12,814 0.00Dine Brands Global Inc. 224 12,787 0.00Skillz Inc. 7,753 12,659 0.00Big Lots Inc. 512 12,622 0.00Consensus Cloud Solutions Inc. 299 12,517 0.00WW International Inc. 1,562 12,168 0.00Tennant Co. 236 12,151 0.00Amyris Inc. 4,383 11,974 0.00Sturm Ruger & Co. Inc. 218 11,833 0.002U Inc. 1,488 11,828 0.00Ladder Capital Corp. 1,306 11,827 0.00Sinclair Broadcast Group Inc. 666 11,798 0.00AZZ Inc. 317 11,513 0.00Acushnet Holdings Corp. 353 11,463 0.00Benchmark Electronics Inc. 601 11,355 0.00PROS Holdings Inc. 510 11,346 0.00Laureate Education Inc. 1,252 11,288 0.00National Beverage Corp. 320 11,210 0.00American Well Corp. 4,470 11,108 0.00Zimvie Inc. 606 10,855 0.00Sorrento Therapeutics Inc. 8,799 10,653 0.00Stitch Fix Inc. 1,399 10,586 0.00MicroVision Inc. 4,112 10,546 0.00EchoStar Corp. 567 10,545 0.00Inovio Pharmaceuticals Inc. 4,811 10,538 0.00OSI Systems Inc. 167 10,521 0.00Huron Consulting Group Inc. 252 10,373 0.00Natus Medical Inc. 387 10,255 0.00Scholastic Corp. 347 10,176 0.00Endo International plc 6,344 10,055 0.00Reata Pharmaceuticals Inc. 494 9,959 0.00NextGen Healthcare Inc. 646 9,694 0.00IMAX Corp. 765 9,639 0.00Douglas Elliman Inc. 1,986 9,586 0.00fuboTV Inc. 3,169 9,566 0.00Cimpress plc 229 9,196 0.00CTS Corp. 318 8,954 0.00Myovant Sciences Ltd. 1,187 8,802 0.00American Axle & Manufacturing
Holdings Inc. 1,657 8,724 0.00Harsco Corp. 1,068 8,677 0.00Heron Therapeutics Inc. 2,395 8,641 0.00Allogene Therapeutics Inc. 1,276 8,486 0.00Marcus & Millichap Inc. 234 8,348 0.00CVR Energy Inc. 412 8,224 0.00Office Properties Income Trust 476 8,182 0.00ScanSource Inc. 297 8,081 0.00Loyalty Ventures Inc. 780 7,940 0.00Provident Financial Services Inc. 450 7,928 0.00Liberty Latin America Ltd.
Class A 1,071 7,882 0.00Universal Health Realty Income
Trust 192 7,674 0.00NETGEAR Inc. 433 7,477 0.00Alector Inc. 972 7,432 0.00GrowGeneration Corp. 1,520 7,167 0.00Scorpio Tankers Inc. 361 7,111 0.00Orion Engineered Carbons SA 583 7,012 0.00Steelcase Inc. 746 6,970 0.00Yext Inc. 1,486 6,829 0.00Rocket Pharmaceuticals Inc. 819 6,706 0.00Madrigal Pharmaceuticals Inc. 119 6,634 0.00Aaron's Co. Inc. 387 6,331 0.00Innoviva Inc. 466 6,328 0.00Selectquote Inc. 3,793 6,193 0.00Columbia Financial Inc. 408 6,155 0.00
Vanguard FTSE Global All Cap Index Fund
177

Holding
MarketValue
(£)
% ofTotal Net
Assets
Schweitzer-MauduitInternational Inc. 293 5,876 0.00
Frontline Ltd. 869 5,862 0.00Neenah Inc. 204 5,754 0.002seventy bio Inc. 517 5,543 0.00TFS Financial Corp. 456 5,444 0.00ACCO Brands Corp. 919 5,358 0.00Accolade Inc. 1,193 5,274 0.00BrightSpire Capital Inc. 744 5,043 0.00Calavo Growers Inc. 173 4,987 0.00Guess? Inc. 257 4,604 0.00Fresh Del Monte Produce Inc. 214 4,433 0.00Cognyte Software Ltd. 820 4,415 0.00ARMOUR Residential REIT Inc. 694 4,046 0.00Varex Imaging Corp. 245 3,870 0.00Inogen Inc. 190 3,826 0.00Precigen Inc. 3,486 3,693 0.00Blucora Inc. 222 3,579 0.00Theravance Biopharma Inc. 429 3,297 0.00Forrester Research Inc. 70 3,099 0.00Kodiak Sciences Inc. 629 3,011 0.00Vroom Inc. 2,371 2,927 0.00
Holding
MarketValue
(£)
% ofTotal Net
Assets
Berkeley Lights Inc. 736 2,914 0.00SkyWest Inc. 117 2,716 0.00Diversified Healthcare Trust 1,509 2,704 0.00SolarWinds Corp. 273 2,688 0.00WisdomTree Investments Inc. 534 2,480 0.00Taro Pharmaceutical Industries
Ltd. 77 2,407 0.00N-able Inc. 273 2,174 0.00Tootsie Roll Industries Inc. 43 1,201 0.00Washington Trust Bancorp Inc. 28 1,047 0.00Saul Centers Inc. 21 865 0.00RPT Realty 80 847 0.00United States Cellular Corp. 35 802 0.00Copa Holdings SA Class A 13 781 0.00Alexander's Inc. 3 593 0.00StoneCo Ltd. 59 427 0.00Media General Inc. CVR1 82 3 0.00Yandex NV Class A1 9,272 — 0.00
1,059,929,986 58.46
Total Equities 1,790,689,081 98.77
Number ofContracts
Long/(Short)
NotionalAmount
(£)
UnrealisedGain/(Loss)
(£)
% ofTotal Net
Assets
Financial Derivative Instruments (0.05%) (31 October 2021: (0.01%))
Futures Contracts (0.03%) (31 October 2021: 0.00%)
TOPIX Index June 2022 13 1,286,896 5,010 0.00STOXX Europe 600 Index June 2022 244 4,064,291 (6,162) (0.00)MSCI Emerging Markets Index June 2022 89 3,326,745 (35,413) (0.00)E-Mini Russell 2000 Index June 2022 29 1,927,271 (87,274) (0.00)S&P 500 E Mini Index June 2022 83 11,999,496 (509,113) (0.03)
(632,952) (0.03)
CurrencyBuy
Amount Currency(Sell)
Amount CounterpartySettlement
Date
UnrealisedGain/(Loss)
(£)
% ofTotal Net
Assets
Forward Currency Exchange Contracts (0.02%) (31 October 2021: (0.01%))
USD 11,178,113 EUR (10,086,465) JP Morgan Chase Bank 15/6/22 412,137 0.02USD 8,174,968 EUR (7,342,280) State Street Bank 15/6/22 330,307 0.02USD 3,593,373 JPY (427,451,500) JP Morgan Chase Bank 15/6/22 230,930 0.01USD 8,096,339 EUR (7,401,900) State Street Bank 15/6/22 217,492 0.01USD 2,969,652 JPY (363,715,000) State Street Bank 15/6/22 126,471 0.00USD 8,461,277 EUR (7,886,560) JP Morgan Chase Bank 15/6/22 100,163 0.00USD 2,804,495 JPY (346,950,000) JP Morgan Chase Bank 15/6/22 98,122 0.00USD 1,062,096 JPY (130,000,000) State Street Bank 30/6/22 45,217 0.00USD 2,980,451 JPY (380,600,000) JP Morgan Chase Bank 15/6/22 31,140 0.00JPY 37,220,000 USD (284,452) BNP Paribas 15/6/22 2,542 0.00EUR 636,115 USD (670,209) State Street Bank 15/6/22 1,687 0.00EUR 610,960 USD (643,832) JP Morgan Chase Bank 15/6/22 1,520 0.00KWD 14,219 USD (46,554) State Street Bank 5/5/22 (125) (0.00)JPY 18,760,000 USD (146,391) JP Morgan Chase Bank 15/6/22 (1,123) (0.00)JPY 56,295,000 USD (437,592) Barclays Bank 15/6/22 (2,018) (0.00)JPY 38,550,000 USD (300,506) JP Morgan Chase Bank 15/6/22 (2,058) (0.00)EUR 528,120 USD (563,586) BNP Paribas 15/6/22 (4,302) (0.00)EUR 181,920 USD (197,686) JP Morgan Chase Bank 15/6/22 (4,309) (0.00)JPY 37,450,000 USD (294,914) State Street Bank 15/6/22 (4,375) (0.00)JPY 37,870,000 USD (301,266) State Street Bank 15/6/22 (6,849) (0.00)JPY 37,230,000 USD (296,621) BNP Paribas 15/6/22 (7,088) (0.00)JPY 13,160,000 USD (110,630) JP Morgan Chase Bank 15/6/22 (7,110) (0.00)JPY 37,790,000 USD (302,395) BNP Paribas 15/6/22 (8,240) (0.00)JPY 23,502,000 USD (193,050) JP Morgan Chase Bank 15/6/22 (9,097) (0.00)EUR 495,220 USD (534,861) State Street Bank 15/6/22 (9,120) (0.00)JPY 37,820,000 USD (304,537) State Street Bank 15/6/22 (9,762) (0.00)JPY 13,872,000 USD (120,043) JP Morgan Chase Bank 15/6/22 (10,225) (0.00)JPY 17,885,000 USD (151,649) State Street Bank 15/6/22 (10,697) (0.00)EUR 265,380 USD (294,102) JP Morgan Chase Bank 15/6/22 (10,843) (0.00)JPY 17,885,000 USD (151,874) State Street Bank 15/6/22 (10,876) (0.00)EUR 436,905 USD (476,964) State Street Bank 15/6/22 (12,096) (0.00)EUR 503,990 USD (550,162) State Street Bank 15/6/22 (13,923) (0.00)
Vanguard FTSE Global All Cap Index Fund
178

CurrencyBuy
Amount Currency(Sell)
Amount CounterpartySettlement
Date
UnrealisedGain/(Loss)
(£)
% ofTotal Net
Assets
EUR 776,560 USD (838,491) JP Morgan Chase Bank 15/6/22 (14,117) (0.00)EUR 352,155 USD (390,304) JP Morgan Chase Bank 15/6/22 (14,418) (0.00)JPY 21,762,000 USD (186,418) State Street Bank 15/6/22 (14,525) (0.00)JPY 75,920,000 USD (605,860) JP Morgan Chase Bank 15/6/22 (15,240) (0.00)JPY 27,105,000 USD (229,227) State Street Bank 15/6/22 (15,734) (0.00)EUR 449,715 USD (495,182) JP Morgan Chase Bank 15/6/22 (15,823) (0.00)JPY 36,062,000 USD (299,437) JP Morgan Chase Bank 15/6/22 (16,521) (0.00)EUR 465,520 USD (512,866) JP Morgan Chase Bank 15/6/22 (16,603) (0.00)JPY 22,308,000 USD (193,454) State Street Bank 15/6/22 (16,769) (0.00)EUR 501,960 USD (552,362) JP Morgan Chase Bank 15/6/22 (17,385) (0.00)JPY 24,346,000 USD (210,421) State Street Bank 15/6/22 (17,738) (0.00)JPY 58,740,000 USD (477,272) BNP Paribas 15/6/22 (18,572) (0.00)JPY 45,264,000 USD (373,597) State Street Bank 15/6/22 (18,946) (0.00)JPY 62,816,000 USD (509,483) State Street Bank 15/6/22 (19,137) (0.00)JPY 58,395,000 USD (476,146) State Street Bank 15/6/22 (19,798) (0.00)JPY 45,183,500 USD (374,049) State Street Bank 15/6/22 (19,802) (0.00)JPY 27,435,000 USD (238,370) JP Morgan Chase Bank 15/6/22 (20,984) (0.00)EUR 551,070 USD (609,280) State Street Bank 15/6/22 (21,377) (0.00)JPY 58,830,000 USD (483,049) BNP Paribas 15/6/22 (22,619) (0.00)JPY 41,756,000 USD (351,151) JP Morgan Chase Bank 15/6/22 (22,661) (0.00)EUR 529,320 USD (587,963) State Street Bank 15/6/22 (22,708) (0.00)EUR 896,000 USD (976,657) State Street Bank 15/6/22 (23,616) (0.00)JPY 31,603,000 USD (273,897) State Street Bank 15/6/22 (23,625) (0.00)EUR 946,890 USD (1,031,057) BNP Paribas 15/6/22 (24,104) (0.00)EUR 661,695 USD (729,891) JP Morgan Chase Bank 15/6/22 (24,314) (0.00)EUR 925,985 USD (1,009,259) BNP Paribas 15/6/22 (24,340) (0.00)EUR 1,059,850 USD (1,152,216) BNP Paribas 15/6/22 (25,512) (0.00)JPY 77,660,000 USD (633,872) State Street Bank 15/6/22 (26,841) (0.00)EUR 758,200 USD (835,368) JP Morgan Chase Bank 15/6/22 (27,085) (0.00)JPY 97,575,000 USD (789,904) State Street Bank 15/6/22 (28,534) (0.00)EUR 691,145 USD (767,181) State Street Bank 15/6/22 (29,224) (0.00)EUR 1,024,600 USD (1,123,106) State Street Bank 15/6/22 (32,001) (0.00)JPY 56,400,000 USD (477,079) State Street Bank 15/6/22 (32,821) (0.00)EUR 849,870 USD (939,552) JP Morgan Chase Bank 15/6/22 (32,895) (0.00)EUR 936,390 USD (1,033,864) JP Morgan Chase Bank 15/6/22 (35,178) (0.00)EUR 1,116,465 USD (1,224,421) BNP Paribas 15/6/22 (35,362) (0.00)EUR 1,316,890 USD (1,438,531) JP Morgan Chase Bank 15/6/22 (37,175) (0.00)JPY 49,023,000 USD (428,083) JP Morgan Chase Bank 15/6/22 (39,205) (0.00)EUR 980,100 USD (1,086,143) State Street Bank 15/6/22 (40,022) (0.00)EUR 1,102,500 USD (1,216,596) State Street Bank 15/6/22 (40,885) (0.00)EUR 904,000 USD (1,008,475) BNP Paribas 15/6/22 (42,223) (0.00)EUR 1,227,050 USD (1,350,070) JP Morgan Chase Bank 15/6/22 (42,347) (0.01)EUR 1,213,380 USD (1,342,667) State Street Bank 15/6/22 (47,958) (0.01)EUR 1,443,840 USD (1,591,802) State Street Bank 15/6/22 (52,382) (0.01)EUR 1,956,930 USD (2,142,334) State Street Bank 15/6/22 (58,940) (0.01)EUR 1,272,600 USD (1,424,696) State Street Bank 15/6/22 (63,439) (0.01)EUR 7,579,596 USD (8,276,806) JP Morgan Chase Bank 15/6/22 (211,642) (0.01)JPY 326,907,974 USD (2,833,591) State Street Bank 15/6/22 (244,659) (0.02)
(274,314) (0.02)
Total Financial Derivative Instruments (907,266) (0.05)
MarketValue
(£)
% ofTotal Net
Assets
Portfolio of Investments 1,789,781,815 98.72
Net Other Assets 23,186,271 1.28
Net Assets Attributable to Shareholders 1,812,968,086 100.00
All holdings are listed on an official stock exchange or are traded on an eligible securities market, unless otherwise stated.1 Manually priced securities.
Vanguard FTSE Global All Cap Index Fund
179

As at As at
30 April 2022(£)
31 October 2021(£)
Assets:
Financial Assets 1,792,291,819 1,458,258,553Current Assets
Debtors 9,287,776 7,027,029Cash and Bank Balances 20,536,797 32,084,032
Total Assets 1,822,116,392 1,497,369,614
Liabilities:
Financial Liabilities 2,510,004 373,236Creditors
Bank Overdrafts 5,017,813 29Distribution Payable — 1,520,437Other Creditors 1,620,489 24,595,539
Total Liabilities 9,148,306 26,489,241
Net Assets Attributable to Shareholders 1,812,968,086 1,470,880,373
Statement of Total Return
Period Ended Period Ended
30 April 2022(£)
30 April 2022(£)
30 April 2021(£)
30 April 2021(£)
IncomeNet Capital Gains/(Losses) (75,882,250) 124,582,588Revenue 15,907,020 7,063,646
Expenses (1,875,909) (863,668)
Net Revenue Before Taxation 14,031,111 6,199,978Taxation (1,860,642) (871,237)
Net Revenue After Taxation 12,170,469 5,328,741
Total Return Before Distributions (63,711,781) 129,911,329
Distributions1 1,343,670 1,309,848
Change in Net Assets Attributable to
Shareholders From Investment Activities (62,368,111) 131,221,177
1 Includes adjustments for equalisation.
Statement of Change in Net Assets Attributable to Shareholders
Period Ended Period Ended
30 April 2022(£)
30 April 2022(£)
30 April 2021(£)
30 April 2021(£)
Opening Net Assets Attributable to Shareholders 1,470,880,373 535,023,190
Amounts Received on Issue of Shares 406,827,931 368,025,116Amounts Paid on Cancellation of Shares (2,420,313) (1,597,567)
404,407,618 366,427,549
Dilution Adjustment 48,206 143,209Change in Net Assets Attributable to
Shareholders From Investment Activities (62,368,111) 131,221,177
Closing Net Assets Attributable to Shareholders 1,812,968,086 1,032,815,125
The interim financial statements for the Fund have been prepared on the same basis of the accounting policies as the annual financial statements for the year ended 31 October 2021.
Vanguard FTSE Global All Cap Index Fund
Balance Sheet
180

Investment Objective
Vanguard FTSE U.K. Equity Income Index Fund (the “Fund”) seeks to track the performance of the FTSE U.K. Equity Income Index (the “Index”).
Investment Strategy
The Fund is a passive fund that seeks to achieve its investment objective by investing in a representative sample of the component shares of the Index.
Synthetic Risk and Reward Indicator
Lower risk
Typically lower rewards
Higher risk
Typically higher rewards
1 2 3 4 5 6 7
The Synthetic Risk and Reward Indicator (SRRI) measures the volatility of the Fund. The risk and reward category (which may range from 1 to 7) is calculatedusing historical data and may not be a reliable indicator of the Fund’s future risk profile. The risk and reward category may shift over time and is not a target orguarantee. The lowest category (i.e. category 1) does not mean “risk free”. The Fund appears in the higher range of the risk and reward indicator because thevalues of the Fund’s investments have experienced a higher rate of change in the past.
Performance SummaryThe Performance Summary does not form part of the Financial Statements.
• Volatility surged and global financial markets slumped during the six months ended 30 April 2022. When the period began, supply bottlenecks, rising oil pricesand the prospect of less accommodative monetary policy were already weighing on market sentiment.
• Then Russia’s invasion of Ukraine injected substantial uncertainty into the markets. Energy prices soared, helping to push consumer prices to multidecadehighs across much of the world. Some central banks, including those in the United States and the United Kingdom, raised short-term interest rates. TheEuropean Central Bank continued to reduce its bond purchases and was expected to raise rates later this year.
• While consumer sentiment flagged during the period, in many markets unemployment remained low, consumer balance sheets healthy and corporate profitsrobust.
• In the UK, the Bank of England raised its bank rate three times in an effort to combat surging inflation. Energy prices fuelled part of that rise, but so did othercommodity prices and supply chain disruptions, along with wage increases that were supported by a strong jobs market.
• With central banks turning less accommodative and inflation looking set to remain elevated for some time, bond yields in many markets moved higher acrossthe maturity spectrum. The Bloomberg Global Aggregate Bond Index hedged to British pounds, a global bond proxy, returned about –7% for the six months.
• Stocks regained some ground in March but finished the six months with a negative return. The FTSE Global All Cap Index, a proxy for global stocks, returnedabout –4%. The United Kingdom and Asia-Pacific were bright spots, while Europe detracted the most.
• In this environment, the Fund’s benchmark Index returned 11.20% for the six months.
• Returns for the Fund’s Index by industry sector varied widely. Basic materials, energy and health care were among those posting double-digit gains, whileconsumer discretionary, financials and technology finished in the red.
• Compared with the broad UK stock market, which returned roughly 3% according to the FTSE All-Share Index, the Fund’s Index benefited from greaterexposure to industry sectors that performed strongly, including basic materials and utilities, and from having fewer holdings in sectors like industrials andhealth care.
Vanguard FTSE U.K. Equity Income Index FundManaged by Vanguard Global Advisers, LLC.
181

Benchmark: FTSE U.K. Equity Income Index
Total ReturnsPeriods Ended 30 April 2022
(Annualised for periods over one year)
Six Months Five YearsTen Years or
Since Inception1
GBP Acc 11.12% 4.16% 6.62%
Benchmark 11.20 4.33 6.84
Tracking Difference* -0.08
GBP Inc 11.12% 4.14% 6.61%
Benchmark 11.20 4.33 6.84
Tracking Difference* -0.08
Institutional Plus GBP Acc 11.13% 4.22% 4.35%
Benchmark 11.20 4.33 4.46
Tracking Difference* -0.07
Institutional Plus GBP Inc 11.13% 4.19% 4.33%
Benchmark 11.20 4.33 4.46
Tracking Difference* -0.07
Vanguard Global Advisers, LLC and FTSE.Returns is based on NAV with income reinvested.
All of the returns in this report represent past performance, which is not a guarantee of future results that may be achieved by the Fund. For performance data current to the most recent month-end,which may be higher or lower than that cited, visit our website at http://global.vanguard.com. Note, too, that both investment returns and principal value can fluctuate widely, so an investor’s shares,when sold, could be worth more or less than their original cost.* The tracking difference between the Fund return and the Index return over a stated period of time can be attributed to a number of factors, including, without limitation, small differences in
weightings, trading activity, swing pricing, transaction costs, and differences in the valuation and withholding tax treatment between the Fund and the index vendor.1 Since-inception returns: Institutional Plus GBP Acc and Institutional Plus GBP Inc, 2 September 2014.
Vanguard FTSE U.K. Equity Income Index Fund
182

Performance Comparative Table
GBP Acc
For the PeriodEnded
30 April 2022For the Year Ended
31 October 2021For the Year Ended
31 October 2020For the Year Ended
31 October 2019
Closing Net Asset Value £583,701,569 £353,686,421 £288,485,117 £380,611,094
Closing Number of Shares 1,933,466 1,301,682 1,463,007 1,454,069
Closing Net Asset Value Per Share1 £301.89 £271.71 £197.19 £261.76
Operating Charges2 0.14% 0.14% 0.14% 0.22%
GBP Inc
Closing Net Asset Value £303,927,727 £269,700,648 £266,654,406 £322,981,906
Closing Number of Shares 1,865,108 1,791,583 2,308,796 2,004,431
Closing Net Asset Value Per Share1 £162.95 £150.54 £115.50 £161.13
Operating Charges2 0.14% 0.14% 0.14% 0.22%
Institutional Plus GBP Acc
Closing Net Asset Value £88,279,466 £1,781,583 £793,698 £348,758
Closing Number of Shares 640,474 14,362 8,820 2,920
Closing Net Asset Value Per Share1 £137.83 £124.05 £89.99 £119.44
Operating Charges2 0.12% 0.12% 0.12% 0.12%
Institutional Plus GBP Inc
Closing Net Asset Value £258,003,543 £287,305,237 £412,042,039 £421,706,972
Closing Number of Shares 2,744,545 3,308,656 6,186,182 4,538,884
Closing Net Asset Value Per Share1 £94.01 £86.83 £66.61 £92.91
Operating Charges2 0.12% 0.12% 0.12% 0.12%
1 The net asset value per share shown may diverge from the net asset value per share used for dealing purposes as at 30 April 2022 because of any adjustments for trade date accounting, swingpricing and any adjustments in valuation to bid prices.
2 Operating charges include indirect costs incurred in the maintenance and running of the Fund, as disclosed in the detailed expenses within the Statement of Total Return.
Vanguard FTSE U.K. Equity Income Index Fund
183

Summary of Significant ChangesFor the period ended 30 April 2022
Cost(£)
Largest Purchases
Unilever plc 22,678,887
BT Group plc 18,869,670
GlaxoSmithKline plc 16,896,221
BP plc 16,583,040
British American Tobacco plc 16,252,303
Total 91,280,121
Total Purchases for the Period 423,635,049
Proceeds(£)
Largest Sales
BHP Group plc 50,384,750
Glencore plc 24,110,725
Shell plc 18,034,761
HSBC Holdings plc 12,931,962
BP plc 12,700,549
Total 118,162,747
Total Sales for the Period 187,072,735
Vanguard FTSE U.K. Equity Income Index Fund
184

Portfolio StatementAs at 30 April 2022
Holding
MarketValue
(£)
% ofTotal Net
Assets
Basic Materials 15.22% (31 October 2021: 20.37%)
Rio Tinto plc 1,015,572 57,948,538 4.70Glencore plc 11,214,189 55,762,555 4.52Anglo American plc 1,477,831 52,995,020 4.29Antofagasta plc 514,612 7,981,632 0.65Johnson Matthey plc 277,237 6,165,751 0.50Fresnillo plc 274,215 2,125,715 0.17Synthomer plc 543,590 1,657,949 0.13Centamin plc 1,608,481 1,472,404 0.12RHI Magnesita NV 41,902 1,004,810 0.08Ferrexpo plc 426,239 702,442 0.06Evraz plc1 494,536 — 0.00
187,816,816 15.22
Consumer Discretionary 6.69% (31 October 2021: 6.27%)
WPP plc 1,646,907 16,551,415 1.34Persimmon plc 471,922 9,896,204 0.80Kingfisher plc 3,060,298 7,751,735 0.63Barratt Developments plc 1,504,462 7,436,556 0.60Taylor Wimpey plc 5,379,023 6,823,291 0.55B&M European Value Retail SA 1,384,901 6,788,785 0.55Berkeley Group Holdings plc 154,923 6,320,858 0.51Bellway plc 183,544 4,460,119 0.36ITV plc 5,538,934 4,115,428 0.33Vistry Group plc 326,877 2,732,692 0.22Domino's Pizza Group plc 672,473 2,337,516 0.19Redrow plc 337,912 1,777,417 0.15Dunelm Group plc 167,976 1,647,845 0.14Currys plc 1,499,108 1,397,918 0.11Crest Nicholson Holdings plc 370,405 937,125 0.08Vivo Energy plc 582,173 841,822 0.07888 Holdings plc 391,946 746,657 0.06
82,563,383 6.69
Consumer Staples 15.06% (31 October 2021: 14.80%)
Unilever plc 1,659,834 61,720,927 5.00British American Tobacco plc 1,801,448 60,375,530 4.89Tesco plc 11,223,234 30,515,973 2.47Imperial Brands plc 1,400,782 23,330,024 1.89J Sainsbury plc 2,550,099 5,949,381 0.48Britvic plc 395,843 3,392,375 0.28PZ Cussons plc 278,068 568,649 0.05
185,852,859 15.06
Energy 10.39% (31 October 2021: 11.44%)
Shell plc 2,855,394 62,047,712 5.03BP plc 15,363,402 60,155,400 4.88Harbour Energy plc 696,813 3,511,937 0.28Diversified Gas & Oil plc 1,213,175 1,467,942 0.12Capricorn Energy plc 480,643 991,086 0.08
128,174,077 10.39
Financials 24.98% (31 October 2021: 26.56%)
HSBC Holdings plc 10,778,661 54,022,649 4.38Lloyds Banking Group plc 89,940,212 41,264,569 3.34Barclays plc 21,253,548 31,493,507 2.55Aviva plc 4,740,140 20,539,027 1.66Legal & General Group plc 7,524,664 18,962,153 1.54Standard Chartered plc 3,201,281 17,658,266 1.433i Group plc 1,209,175 16,015,523 1.30Natwest Group plc 6,517,732 14,208,656 1.15St James's Place plc 674,544 8,752,208 0.71Admiral Group plc 281,890 7,114,904 0.58M&G plc 3,300,206 7,065,741 0.57Phoenix Group Holdings plc 931,279 5,669,626 0.46Intermediate Capital Group plc 353,035 5,463,217 0.44Standard Life Aberdeen plc 2,727,985 5,161,348 0.42Hargreaves Lansdown plc 480,182 4,403,269 0.36Direct Line Insurance Group plc 1,691,301 4,290,831 0.35
Holding
MarketValue
(£)
% ofTotal Net
Assets
IG Group Holdings plc 507,198 4,136,200 0.33HomeServe plc 410,401 4,034,242 0.33Schroders plc 141,709 4,024,536 0.33Man Group plc 1,703,657 4,001,890 0.32Investec plc 842,499 3,985,020 0.32Virgin Money UK plc 1,575,611 2,754,956 0.22OSB Group plc 478,963 2,686,982 0.22Quilter plc 2,034,515 2,681,491 0.22Close Brothers Group plc 190,445 2,112,035 0.17Plus500 Ltd. 123,654 1,926,529 0.16Brewin Dolphin Holdings plc 368,328 1,889,523 0.15Rathbones Group plc 76,765 1,612,065 0.13Paragon Banking Group plc 310,431 1,539,738 0.12TP ICAP Group plc 1,002,275 1,320,998 0.11Lancashire Holdings Ltd. 308,868 1,310,218 0.11Ashmore Group plc 578,689 1,289,319 0.10Ninety One plc 416,533 1,107,145 0.09Jupiter Fund Management plc 552,831 985,145 0.08Petershill Partners plc 369,837 943,084 0.08Liontrust Asset Management plc 75,158 877,845 0.07TBC Bank Group plc 44,539 559,410 0.05CMC Markets plc 142,140 411,495 0.03
308,275,360 24.98
Health Care 5.31% (31 October 2021: 4.99%)
GlaxoSmithKline plc 3,645,070 65,494,618 5.31
65,494,618 5.31
Industrials 5.58% (31 October 2021: 3.59%)
BAE Systems plc 4,722,225 34,944,465 2.83Mondi plc 720,285 10,876,303 0.88DS Smith plc 1,896,561 6,275,720 0.51Royal Mail plc 1,335,687 4,601,442 0.37Hays plc 2,303,391 2,835,474 0.23Balfour Beatty plc 943,906 2,291,804 0.19Redde Northgate plc 364,651 1,445,841 0.12Morgan Sindall Group plc 60,013 1,293,280 0.11FDM Group Holdings plc 127,022 1,293,084 0.10Ibstock plc 578,665 1,095,992 0.09Vesuvius plc 317,873 1,028,001 0.08Tyman plc 294,881 813,872 0.07
68,795,278 5.58
Technology 0.26% (31 October 2021: 0.28%)
Micro Focus International plc 490,512 1,859,041 0.15Moneysupermarket.com Group
plc 771,403 1,348,412 0.11
3,207,453 0.26
Telecommunications 5.75% (31 October 2021: 3.88%)
Vodafone Group plc 40,178,946 48,833,491 3.96BT Group plc 10,322,856 18,302,424 1.48Airtel Africa plc 1,484,180 2,175,808 0.18Telecom Plus plc 97,404 1,607,166 0.13
70,918,889 5.75
Utilities 10.41% (31 October 2021: 8.55%)
National Grid plc 4,927,030 58,828,738 4.77SSE plc 1,584,708 29,602,345 2.40Severn Trent plc 372,145 11,707,682 0.95United Utilities Group plc 1,014,039 11,671,589 0.94Centrica plc 8,737,796 6,943,053 0.56Drax Group plc 591,651 4,777,582 0.39Pennon Group plc 397,664 4,418,047 0.36ContourGlobal plc 262,559 501,487 0.04
128,450,523 10.41
Total Equities 1,229,549,256 99.65
Vanguard FTSE U.K. Equity Income Index Fund
185

Number ofContracts
Long/(Short)
NotionalAmount
(£)
UnrealisedGain/(Loss)
(£)
% ofTotal Net
Assets
Financial Derivative Instruments (0.01%) (31 October 2021: 0.00%)
Futures Contracts (0.01%) (31 October 2021: 0.00%)
FTSE 100 Index June 2022 256 19,219,200 (63,125) (0.01)
(63,125) (0.01)
CurrencyBuy
Amount Currency(Sell)
Amount CounterpartySettlement
Date
UnrealisedGain/(Loss)
(£)
% ofTotal Net
Assets
Forward Currency Exchange Contracts (0.00%) (31 October 2021: (0.00%))
USD 1,698,644 GBP (1,285,525) State Street Bank 15/06/22 67,392 0.01USD 827,221 GBP (631,980) State Street Bank 15/06/22 26,876 0.00USD 688,687 GBP (527,318) State Street Bank 15/06/22 21,200 0.00GBP 460,230 EUR (550,997) State Street Bank 15/06/22 (3,604) (0.00)GBP 954,334 USD (1,245,000) BNP Paribas 23/05/22 (37,320) (0.00)GBP 2,681,070 USD (3,512,086) Standard Chartered 15/06/22 (116,198) (0.01)
(41,654) (0.00)
Total Financial Derivative Instruments (104,779) (0.01)
Market Value(£)
% ofTotal Net
Assets
Portfolio of Investments 1,229,444,477 99.64
Net Other Assets 4,467,828 0.36
Net Assets Attributable to Shareholders 1,233,912,305 100.00
All holdings are ordinary shares or stock units on an official stock exchange listing unless otherwise stated.1 Manually priced securities.
Vanguard FTSE U.K. Equity Income Index Fund
186

As at As at
30 April 2022(£)
31 October 2021(£)
Assets:
Financial Assets 1,229,664,724 919,204,641Current Assets
Debtors 13,649,351 10,477,361Cash and Bank Balances 6,011,076 927,644
Total Assets 1,249,325,151 930,609,646
Liabilities:
Financial Liabilities 220,247 24,330Creditors
Bank Overdrafts — 113,188Distribution Payable 14,957,208 17,086,521Other Creditors 235,391 911,718
Total Liabilities 15,412,846 18,135,757
Net Assets Attributable to Shareholders 1,233,912,305 912,473,889
Statement of Total Return
Period Ended Period Ended
30 April 2022(£)
30 April 2022(£)
30 April 2021(£)
30 April 2021(£)
IncomeNet Capital Gains/(Losses) 74,655,817 253,660,666Revenue 26,933,573 27,074,113
Expenses (657,666) (668,582)
Net Revenue Before Taxation 26,275,907 26,405,531Taxation (124,418) (155,094)
Net Revenue After Taxation 26,151,489 26,250,437
Total Return Before Distributions 100,807,306 279,911,103
Distributions1 (26,808,506) (26,908,071)
Change in Net Assets Attributable to
Shareholders From Investment Activities 73,998,800 253,003,032
1 Includes adjustments for equalisation.
Statement of Change in Net Assets Attributable to Shareholders
Period Ended Period Ended
30 April 2022(£)
30 April 2022(£)
30 April 2021(£)
30 April 2021(£)
Opening Net Assets Attributable to Shareholders 912,473,889 967,975,260
Amounts Received on Issue of Shares 328,387,691 60,904,434Amounts Paid on Cancellation of Shares (99,848,737) (311,335,992)
228,538,954 (250,431,558)
Dilution Adjustment 1,477,718 247,701Change in Net Assets Attributable to
Shareholders From Investment Activities 73,998,800 253,003,032Retained Distribution on Accumulation Shares 17,422,944 9,233,044
Closing Net Assets Attributable to Shareholders 1,233,912,305 980,027,479
The interim financial statements for the Fund have been prepared on the same basis of the accounting policies as the annual financial statements for the year ended 31 October 2021.
Vanguard FTSE U.K. Equity Income Index Fund
Balance Sheet
187

Interim distribution payable 30 June 2022
Net IncomePence Per Share
EqualisationPence Per Share
Distribution Payable30 June 2022
Pence Per Share
Distribution Paid30 June 2021
Pence Per Share
GBP Acc
Group 1 782.7450 — 782.7450 654.9649
Group 2 243.5733 539.1717 782.7450 654.9649
GBP Inc
Group 1 433.7517 — 433.7517 383.7366
Group 2 204.0887 229.6630 433.7517 383.7366
Institutional Plus GBP Acc
Group 1 357.3659 — 357.3659 298.7510
Group 2 6.4174 350.9485 357.3659 298.7510
Institutional Plus GBP Inc
Group 1 250.2152 — 250.2152 221.3187
Group 2 172.7010 77.5142 250.2152 221.3187
Group 1—Shares purchased before 1 November 2021.Group 2—Shares purchased between 1 November 2021 and 30 April 2022.Note: Equalisation applies only to shares purchased during the distribution period (Group 2 shares). It is the average amount of income included in the purchase price of all Group 2 shares and isrefunded to holders of these shares as a return of capital. Being capital, it is not liable to income tax but must be deducted from the cost of shares for capital gains tax purposes.
Vanguard FTSE U.K. Equity Income Index Fund
Distribution TablesFor the period ended 30 April 2022
188

Investment Objective
Vanguard Global Emerging Markets Fund (the “Fund”) seeks to provide an increase in the value of investments over the long term (more than 5 years).
Investment Strategy
The Fund is an active fund that seeks to achieve its investment objective by investing primarily in shares of companies located in emerging markets around theworld. The Fund typically invests in a diverse range of companies of various sizes representing different economic sectors and industry groups, chosen mainly onthe basis of an investment approach that focuses on analysing individual shares rather than stock markets.
Synthetic Risk and Reward Indicator
Lower risk
Typically lower rewards
Higher risk
Typically higher rewards
1 2 3 4 5 6 7
The Synthetic Risk and Reward Indicator (SRRI) measures the volatility of the Fund. The risk and reward category (which may range from 1 to 7) is calculatedusing historical data and may not be a reliable indicator of the Fund’s future risk profile. The risk and reward category may shift over time and is not a target orguarantee. The lowest category (i.e. category 1) does not mean “risk free”. The Fund appears in the higher range of the risk and reward indicator because thevalues of the Fund’s investments have experienced a higher rate of change in the past.
Performance SummaryThe Performance Summary does not form part of the Financial Statements.
• Volatility surged and global financial markets slumped during the six months ended 30 April 2022. When the period began, supply bottlenecks, rising oil pricesand the prospect of less accommodative monetary policy were already weighing on market sentiment.
• Then Russia’s invasion of Ukraine injected substantial uncertainty into the markets. Energy prices soared, helping to push consumer prices to multidecadehighs across much of the world. Some central banks, including those in the United States and the United Kingdom, raised short-term interest rates. TheEuropean Central Bank continued to reduce its bond purchases and was expected to raise rates later this year.
• While consumer sentiment flagged during the period, in many markets unemployment remained low, consumer balance sheets healthy and corporate profitsrobust.
• With central banks turning less accommodative and inflation looking set to remain elevated for some time, bond yields in many markets moved higher acrossthe maturity spectrum. The Bloomberg Global Aggregate Bond Index hedged to British pounds, a global bond proxy, returned about –7% for the six months.
• Stocks regained some ground in March but finished the six months with a negative return. The FTSE Global All Cap Index, a proxy for global stocks, returnedabout –4%. The United Kingdom and Asia-Pacific were bright spots, while Europe detracted the most.
• The Fund is actively managed; it does not seek to track a benchmark. The performance information in the table below shows how the Fund’s returns comparewith those of a market index with similar investment characteristics. For the period under review, the Fund underperformed the index, which returned –4.04%for the six months.
• At the market level, the Fund’s positions in Russian, Indian and Taiwanese companies were among the largest detractors from relative performance. However,its above-benchmark allocation to Brazil and its underweight to China added value.
• At the industry sector level, security selection in financials and basic materials accounted for most of the Fund’s relative underperformance. Energy, on theother hand, was a bright spot.
Benchmark: FTSE Emerging Index
Total ReturnsPeriods Ended 30 April 2022
(Annualised for periods over one year)
Six Months Five yearsTen Years or
Since Inception1
GBP Acc -6.38% 6.65% 12.57%
Benchmark -4.04 5.50 10.96
GBP Inc -6.38% 6.63% 12.56%
Benchmark -4.04 5.50 10.96
Vanguard Global Advisers, LLC and FTSE.Returns is based on NAV with income reinvested.
All of the returns in this report represent past performance, which is not a guarantee of future results that may be achieved by the Fund. For performance data current to the most recent month-end,which may be higher or lower than that cited, visit our website at http://global.vanguard.com. Note, too, that both investment returns and principal value can fluctuate widely, so an investor’s shares,when sold, could be worth more or less than their original cost.1 Since-inception returns: GBP Acc and GBP Inc, 25 May 2016.
Vanguard Global Emerging Markets FundSub-managed by Baillie Gifford Overseas Limited, Oaktree Capital Management, L.P., and Pzena Investment Management, LLC.
189

Performance Comparative Table
GBP Acc
For the PeriodEnded
30 April 2022For the Year Ended
31 October 2021For the Year Ended
31 October 2020For the Year Ended
31 October 2019
Closing Net Asset Value £260,181,793 £265,923,479 £160,490,305 £77,723,677
Closing Number of Shares 1,292,636 1,237,163 891,727 441,742
Closing Net Asset Value Per Share1 £201.28 £214.95 £179.98 £175.95
Operating Charges2 0.78% 0.78% 0.78% 0.79%
GBP Inc
Closing Net Asset Value £31,535,611 £42,645,368 £12,578,255 £6,548,437
Closing Number of Shares 170,928 216,545 75,083 39,412
Closing Net Asset Value Per Share1 £184.50 £196.94 £167.52 £166.15
Operating Charges2 0.78% 0.78% 0.78% 0.79%
1 The net asset value per share shown may diverge from the net asset value per share used for dealing purposes as at 30 April 2022 because of any adjustments for trade date accounting, swingpricing and any adjustments in valuation to bid prices.
2 Operating charges include indirect costs incurred in the maintenance and running of the Fund, as disclosed in the detailed expenses within the Statement of Total Return.
Vanguard Global Emerging Markets Fund
190

Summary of Significant ChangesFor the period ended 30 April 2022
Cost(£)
Largest Purchases
Alibaba Group Holding Ltd. 6,977,062
Tencent Holdings Ltd. 6,058,719
Sberbank of Russia ADR 2,276,356
Credicorp Ltd. 1,860,582
Samsung Electronics Co. Ltd. 1,856,968
Total 19,029,687
Total Purchases for the Period 62,397,289
Proceeds(£)
Largest Sales
Taiwan Semiconductor Manufacturing Co. Ltd. 3,083,512
Alibaba Group Holding Ltd. 2,068,004
China Construction Bank Corp. 2,043,007
Hon Hai Precision Industry Co. Ltd. 1,586,119
Tencent Holdings Ltd. 1,496,831
Total 10,277,473
Total Sales for the Period 53,584,122
Vanguard Global Emerging Markets Fund
191

Portfolio StatementAs at 30 April 2022
Holding
MarketValue
(£)
% ofTotal Net
Assets
Bermuda 0.00% (31 October 2021: 0.24%)
Brazil 11.44% (31 October 2021: 8.40%)
Petroleo Brasileiro SA ADR 761,132 8,220,585 2.82Vale SA ADR 382,590 5,146,907 1.76Cia Energetica de Minas Gerais -
Preference Shares 1,412,130 3,331,883 1.14Ambev SA 1,267,300 2,959,585 1.02Raizen SA Preference Shares 2,444,303 2,708,689 0.93Banco Bradesco SA ADR 856,148 2,448,084 0.84Itau Unibanco Holding SA ADR 558,499 2,121,895 0.73Itau Unibanco Holding SA -
Preference Shares 474,500 1,821,686 0.63B3 SA - Brasil Bolsa Balcao 780,700 1,668,760 0.57Petroleo Brasileiro SA ADR -
Preference Shares 120,482 1,175,550 0.40Azul SA ADR 96,247 1,024,948 0.35Light SA 508,400 729,382 0.25
33,357,954 11.44
Canada 1.60% (31 October 2021: 1.04%)
First Quantum Minerals Ltd. 134,238 3,064,415 1.05Lundin Mining Corp. 218,479 1,587,609 0.55Valeura Energy Inc. 30,200 9,128 0.00
4,661,152 1.60
Cayman Islands 0.00% (31 October 2021: 1.60%)
Chile 0.25% (31 October 2021: 0.00%)
Sociedad Quimica y Minera deChile 12,193 716,332 0.25
716,332 0.25
China 23.48% (31 October 2021: 22.12%)
Alibaba Group Holding Ltd. 969,436 10,047,808 3.44Tencent Holdings Ltd. 244,245 9,352,416 3.21Trip.com Group Ltd. ADR 182,068 3,428,184 1.17China Merchants Bank Co. Ltd.
Class H 667,367 3,241,702 1.11China Overseas Land &
Investment Ltd. 1,002,000 2,486,984 0.85Zijin Mining Group Co. Ltd.
Class H 2,052,254 2,429,161 0.83China Shenhua Energy Co. Ltd. 457,500 2,384,833 0.82Aluminum Corp of China Ltd 5,501,493 2,088,713 0.72Meituan 119,500 2,081,669 0.71Anhui Conch Cement Co. Ltd.
Class H 427,939 1,859,311 0.64Ping An Bank Co. Ltd. Class A 988,068 1,829,184 0.63China Construction Bank Corp.
Class H 3,105,000 1,758,824 0.60Geely Automobile Holdings Ltd. 1,275,904 1,608,666 0.55Shanghai International Airport Co.
Ltd. 266,640 1,592,428 0.55Baoshan Iron and Steel Co. Ltd.
Class A 1,943,044 1,517,786 0.52Baidu Inc. ADR 14,116 1,395,072 0.48JD.com Inc. Class A 51,377 1,384,191 0.47Contemporary Amperex
Technology Co. Ltd. Class A 27,009 1,336,899 0.46WuXi AppTec Co. Ltd. Class H 112,691 1,245,786 0.43Ganfeng Lithium Co. Ltd. Class H 114,363 1,111,606 0.38Brilliance China Automotive
Holdings Ltd.1 1,818,000 1,081,986 0.37Nine Dragons Paper Holdings Ltd. 1,428,386 1,010,659 0.35Haier Smart Home Co. Ltd.
Class H 349,200 1,001,427 0.34Air China Ltd. Class H 1,766,188 955,631 0.33Muyuan Foodstuff Co. Ltd.
Class A 146,197 923,147 0.32Dongfeng Motor Group Co. Ltd.
Class H 1,568,000 916,843 0.31Weichai Power Co. Ltd. Class H 738,340 830,467 0.28Suofeiya Home Collection Co.
Ltd. Class A 323,836 798,432 0.27
Holding
MarketValue
(£)
% ofTotal Net
Assets
Baidu Inc. Class A 58,350 773,589 0.26Pharmaron Beijing Co. Ltd.
Class H 71,367 723,027 0.25Lufax Holding Ltd. ADR 151,079 667,852 0.23Shenzhou International Group
Holdings Ltd. 59,600 658,266 0.23Li Ning Co. Ltd. 101,500 643,980 0.22Midea Group Co. Ltd. Class A 89,200 615,772 0.21Riyue Heavy Industry Co. Ltd. 259,480 511,745 0.18Kuaishou Technology 58,700 397,755 0.14Zai Lab Ltd. ADR 10,553 333,359 0.11Anker Innovations Technology 47,900 328,582 0.11Tencent Music Entertainment
Group ADR 78,257 264,908 0.09China Youran Dairy Group Ltd 737,693 238,887 0.08Grand Baoxin Auto Group Ltd. 3,681,000 201,785 0.07KE Holdings Inc. ADR 15,663 176,653 0.06Dada Nexus Ltd. ADR 22,773 138,397 0.05Burning Rock Biotech Ltd. ADR 30,097 132,086 0.05
68,506,458 23.48
Czech Republic 0.71% (31 October 2021: 0.82%)
CEZ AS 61,073 2,081,563 0.71
2,081,563 0.71
Greece 0.54% (31 October 2021: 0.51%)
Alpha Services and Holdings SA 1,711,201 1,561,514 0.54
1,561,514 0.54
Hong Kong 5.89% (31 October 2021: 5.36%)
Galaxy Entertainment Group Ltd. 1,111,545 5,139,748 1.76Pacific Basin Shipping Ltd. 9,195,308 3,407,110 1.17Orient Overseas International Ltd. 101,363 2,265,809 0.78Yue Yuen Industrial Holdings Ltd. 1,632,000 1,908,531 0.65Lenovo Group Ltd. 1,854,000 1,443,548 0.49VTech Holdings Ltd. 189,500 1,072,459 0.37Cathay Pacific Airways Ltd. 1,267,802 1,012,867 0.35Minth Group Ltd. 276,000 526,176 0.18BeiGene Ltd. 39,403 417,996 0.14
17,194,244 5.89
Hungary 1.19% (31 October 2021: 1.24%)
OTP Bank Nyrt 144,669 3,464,509 1.19
3,464,509 1.19
India 10.00% (31 October 2021: 10.06%)
Reliance Industries Ltd. GDR(XLON) 85,027 4,916,732 1.69
Reliance Industries Ltd. 143,873 4,194,451 1.44ICICI Bank Ltd. ADR 242,628 3,679,518 1.26State Bank of India GDR (XLON) 47,369 2,433,532 0.83Larsen & Toubro Ltd. GDR 136,061 2,389,600 0.82Housing Development Finance
Corp. Ltd. 100,475 2,330,405 0.80UltraTech Cement Ltd. 27,504 1,896,292 0.65Tata Consultancy Services Ltd. 50,765 1,876,177 0.64Tech Mahindra Ltd. 119,847 1,565,245 0.54HDFC Life Insurance Co. Ltd. 194,995 1,181,466 0.41Axis Bank Ltd. GDR 30,387 1,144,806 0.39Piramal Enterprises Ltd. 39,382 887,180 0.30ICICI Lombard General Insurance
Co. Ltd. 34,744 463,743 0.16Glenmark Life Sciences Ltd 40,065 198,314 0.07
29,157,461 10.00
Indonesia 3.11% (31 October 2021: 2.16%)
Bank Rakyat Indonesia PerseroTbk PT 20,279,382 5,414,960 1.86
Bank Mandiri Persero Tbk PT 5,421,500 2,665,920 0.91Semen Indonesia Persero Tbk PT 2,827,500 994,231 0.34
9,075,111 3.11
Japan 0.00% (31 October 2021: 0.33%)
Jersey 0.00% (31 October 2021: 0.32%)
Vanguard Global Emerging Markets Fund
192

Holding
MarketValue
(£)
% ofTotal Net
Assets
Mexico 2.11% (31 October 2021: 1.75%)
Grupo Financiero Banorte SAB deCV Class O 623,994 3,268,172 1.12
Cemex SAB de CV ADR 575,172 2,015,735 0.69Wal-Mart de Mexico SAB de CV 315,066 885,332 0.30
6,169,239 2.11
Poland 0.31% (31 October 2021: 0.36%)
KGHM Polska Miedz SA 20,480 532,639 0.19Allegro.eu SA 86,331 356,858 0.12
889,497 0.31
Romania 0.34% (31 October 2021: 0.34%)
Banca Transilvania SA 2,464,246 996,016 0.34
996,016 0.34
Russian Federation 0.00% (31 October 2021: 6.06%)
Sberbank of Russia ADR1 501,065 1 0.00Novatek1 3,963 — 0.00Magnit PJSC GDR (XLON)1 38,501 — 0.00MMC Norilsk Nickel PJSC ADR1 127,905 — 0.00LUKOIL PJSC ADR (XLON)1 42,127 — 0.00Moscow Exchange MICEX-RTS
PJSC1 325,990 — 0.00
1 0.00
Singapore 0.87% (31 October 2021: 0.71%)
Wilmar International Ltd. 996,446 2,551,864 0.87
2,551,864 0.87
South Africa 2.58% (31 October 2021: 1.84%)
AngloGold Ashanti Ltd. ADR 164,116 2,669,253 0.91Sasol Ltd. 134,154 2,651,690 0.91Impala Platinum Holdings Ltd. 84,407 876,532 0.30Reunert Ltd. 309,338 686,057 0.24FirstRand Ltd. 188,760 651,054 0.22
7,534,586 2.58
South Korea 9.77% (31 October 2021: 8.24%)
Samsung Electronics Co. Ltd. 182,245 7,789,488 2.67SK Hynix Inc. 43,182 3,067,003 1.05LG Chem Ltd. 7,347 2,418,081 0.83Hyundai Motor Co. 18,267 2,148,842 0.74POSCO Holdings Inc. 9,409 1,724,387 0.59Hankook Tire & Technology Co.
Ltd. 75,674 1,672,410 0.57Samsung Electronics Co. Ltd. -
Preference Shares 42,095 1,582,992 0.54Samsung SDI Co. Ltd. 4,070 1,576,990 0.54DB Insurance Co. Ltd. 36,100 1,538,402 0.53Shinhan Financial Group Co. Ltd. 42,950 1,146,671 0.39Hana Financial Group Inc. 35,858 1,068,753 0.37Korea Shipbuilding & Offshore
Engineering Co. Ltd. 17,665 1,028,371 0.35KB Financial Group Inc. 18,500 686,311 0.24Doosan Bobcat Inc. 21,303 560,638 0.19NAVER Corp. 2,727 494,589 0.17
28,503,928 9.77
Holding
MarketValue
(£)
% ofTotal Net
Assets
Taiwan 10.56% (31 October 2021: 11.67%)
Taiwan SemiconductorManufacturing Co. Ltd. 1,115,306 16,214,300 5.56
Hon Hai Precision Industry Co.Ltd. 1,439,440 3,948,040 1.35
MediaTek Inc. 147,781 3,314,504 1.14Lite-On Technology Corp. 1,291,399 2,268,275 0.78Compal Electronics Inc. 2,212,000 1,329,956 0.46Elite Material Co. Ltd. 221,000 1,325,767 0.45Yageo Corp. 118,418 1,292,769 0.44United Integrated Services Co.
Ltd. 232,000 1,119,046 0.38
30,812,657 10.56
Thailand 2.15% (31 October 2021: 1.98%)
SCB X PCL Foreign1 1,049,600 2,807,011 0.96Charoen Pokphand Foods PCL
Foreign1 2,927,000 1,633,641 0.56Bangkok Bank PCL Foreign1 406,800 1,234,565 0.43Bangkok Bank PCL NVDR 193,800 588,148 0.20
6,263,365 2.15
Turkey 0.88% (31 October 2021: 1.19%)
Akbank T.A.S. 2,784,870 1,331,836 0.46Tofas Turk Otomobil Fabrikasi AS 292,469 1,233,275 0.42
2,565,111 0.88
United Arab Emirates 0.82% (31 October 2021: 0.86%)
Abu Dhabi Commercial BankPJSC 1,092,883 2,403,078 0.82
2,403,078 0.82
United Kingdom 1.54% (31 October 2021: 1.64%)
Standard Chartered plc 411,112 2,267,694 0.78Fresnillo plc 144,758 1,122,164 0.38Antofagasta plc 58,284 903,985 0.31Polymetal International plc 78,134 193,772 0.07
4,487,615 1.54
United States 4.27% (31 October 2021: 3.40%)
Freeport-McMoRan Inc. 71,958 2,322,371 0.80Flex Ltd. 157,173 2,063,090 0.71Credicorp Ltd. 17,064 1,888,660 0.65Cognizant Technology Solutions
Corp. 27,062 1,743,563 0.60MercadoLibre Inc. 2,086 1,617,658 0.55Copa Holdings SA Class A 14,792 888,698 0.30Coupang LLC 74,942 768,222 0.26Afya Ltd. 48,556 582,440 0.20Sea Ltd. ADR 7,502 494,516 0.17StoneCo Ltd. Class A 10,779 80,789 0.03Ozon Holdings plc ADR1 24,931 — 0.00
12,450,007 4.27
Total Equities 275,403,262 94.41
Number ofContracts
Long/(Short)
NotionalAmount
(£)
UnrealisedGain/(Loss)
(£)
% ofTotal Net
Assets
Financial Derivative Instruments 0.04% (31 October 2021: 0.01%)
Futures Contracts (0.17%) (31 October 2021: (0.01%))
MSCI Emerging Markets Index June 2022 240 10,106,566 (493,508) (0.17)
(493,508) (0.17)
CurrencyBuy
Amount Currency(Sell)
Amount CounterpartySettlement
Date
UnrealisedGain/(Loss)
(£)
% ofTotal Net
Assets
Forward Currency Exchange Contracts 0.21% (31 October 2021: 0.02%)
USD 18,401,902 GBP (13,896,317) State Street Bank 15/6/22 760,225 0.26USD 6,471,433 GBP (4,916,744) State Street Bank 15/6/22 237,551 0.08USD 1,388,491 GBP (1,061,495) State Street Bank 15/6/22 44,395 0.02GBP 3,610,251 USD (4,490,682) BNP Paribas 15/6/22 33,562 0.01
Vanguard Global Emerging Markets Fund
193

CurrencyBuy
Amount Currency(Sell)
Amount CounterpartySettlement
Date
UnrealisedGain/(Loss)
(£)
% ofTotal Net
Assets
USD 661,501 GBP (501,518) JP Morgan Chase Bank 15/6/22 25,347 0.01USD 598,006 GBP (452,774) State Street Bank 15/6/22 23,519 0.01USD 550,773 GBP (420,867) State Street Bank 15/6/22 17,807 0.01USD 440,853 GBP (338,053) State Street Bank 15/6/22 13,072 0.00USD 343,388 GBP (260,527) State Street Bank 15/6/22 12,970 0.00USD 357,916 GBP (274,052) Barclays Bank 15/6/22 11,018 0.00USD 396,086 GBP (304,543) State Street Bank 15/6/22 10,927 0.00USD 339,306 GBP (260,231) JP Morgan Chase Bank 15/6/22 10,016 0.00USD 258,424 GBP (197,086) State Street Bank 15/6/22 8,741 0.00USD 100,853 GBP (76,689) JP Morgan Chase Bank 15/6/22 3,637 0.00USD 7,487 GBP (5,702) JP Morgan Chase Bank 15/6/22 261 0.00GBP 16,647 USD (21,806) State Street Bank 15/6/22 (721) (0.00)GBP 498,687 USD (398,825) BNP Paribas 15/6/22 (1,637) (0.00)GBP 70,381 USD (92,359) State Street Bank 15/6/22 (3,180) (0.00)GBP 115,225 USD (150,988) JP Morgan Chase Bank 15/6/22 (5,032) (0.00)GBP 594,237 USD (778,677) BNP Paribas 15/6/22 (25,955) (0.01)GBP 662,552 USD (870,080) State Street Bank 15/6/22 (30,440) (0.01)GBP 744,575 USD (980,101) State Street Bank 15/6/22 (36,045) (0.01)GBP 1,288,908 USD (1,694,869) Standard Chartered 15/6/22 (61,002) (0.02)GBP 8,621,615 USD (11,354,642) State Street Bank 15/6/22 (422,003) (0.14)
627,033 0.21
Total Financial Derivative Instruments 133,525 0.04
MarketValue
(£)
% ofTotal Net
Assets
Portfolio of Investments 275,536,787 94.45
Net Other Assets 16,180,617 5.55
Net Assets Attributable to Shareholders 291,717,404 100.00
All holdings are listed on an official stock exchange or are traded on an eligible securities market, unless otherwise stated.1 Manually priced securities.
Vanguard Global Emerging Markets Fund
194

As at As at
30 April 2022(£)
31 October 2021(£)
Assets:
Financial Assets 276,616,310 290,992,902Current Assets
Debtors 12,567,226 1,002,708Cash and Bank Balances 17,075,708 24,042,977
Total Assets 306,259,244 316,038,587
Liabilities:
Financial Liabilities 1,079,523 177,924Creditors
Bank Overdrafts — 253,941Distribution Payable — 691,800Other Creditors 13,462,317 6,346,075
Total Liabilities 14,541,840 7,469,740
Net Assets Attributable to Shareholders 291,717,404 308,568,847
Statement of Total Return
Period Ended Period Ended
30 April 2022(£)
30 April 2022(£)
30 April 2021(£)
30 April 2021(£)
IncomeNet Capital Gains/(Losses) (24,757,699) 41,873,424Revenue 5,545,998 1,982,490
Expenses (1,218,309) (866,681)
Net Revenue Before Taxation 4,327,689 1,115,809Taxation (454,627) (236,911)
Net Revenue After Taxation 3,873,062 878,898
Total Return Before Distributions (20,884,637) 42,752,322
Distributions1 (156,854) 112,872
Change in Net Assets Attributable to
Shareholders From Investment Activities (21,041,491) 42,865,194
1 Includes adjustments for equalisation.
Statement of Change in Net Assets Attributable to Shareholders
Period Ended Period Ended
30 April 2022(£)
30 April 2022(£)
30 April 2021(£)
30 April 2021(£)
Opening Net Assets Attributable to Shareholders 308,568,847 173,068,560
Amounts Received on Issue of Shares 35,120,524 78,529,341Amounts Paid on Cancellation of Shares (31,034,413) (23,963,872)
4,086,111 54,565,469
Dilution Adjustment 103,937 131,546Change in Net Assets Attributable to
Shareholders From Investment Activities (21,041,491) 42,865,194
Closing Net Assets Attributable to Shareholders 291,717,404 270,630,769
The interim financial statements for the Fund have been prepared on the same basis of the accounting policies as the annual financial statements for the year ended 31 October 2021.
Vanguard Global Emerging Markets Fund
Balance Sheet
195

Investment Objective
Vanguard Global Equity Fund (the “Fund”) seeks to provide an increase in the value of investments over the long term (more than 5 years).
Investment Strategy
The Fund is an active fund that seeks to achieve its investment objective by investing primarily in shares of global companies. The Fund typically invests in adiverse range of large, midsize and small companies that are chosen mainly through an investment approach that focuses on analysing individual shares ratherthan stock markets.
Synthetic Risk and Reward Indicator
Lower risk
Typically lower rewards
Higher risk
Typically higher rewards
1 2 3 4 5 6 7
The Synthetic Risk and Reward Indicator (SRRI) measures the volatility of the Fund. The risk and reward category (which may range from 1 to 7) is calculatedusing historical data and may not be a reliable indicator of the Fund’s future risk profile. The risk and reward category may shift over time and is not a target orguarantee. The lowest category (i.e. category 1) does not mean “risk free”. The Fund appears in the higher range of the risk and reward indicator because thevalues of the Fund’s investments have experienced a higher rate of change in the past.
Performance SummaryThe Performance Summary does not form part of the Financial Statements.
• Volatility surged and global financial markets slumped during the six months ended 30 April 2022. When the period began, supply bottlenecks, rising oil pricesand the prospect of less accommodative monetary policy were already weighing on market sentiment.
• Then Russia’s invasion of Ukraine injected substantial uncertainty into the markets. Energy prices soared, helping to push consumer prices to multidecadehighs across much of the world. Some central banks, including those in the United States and the United Kingdom, raised short-term interest rates. TheEuropean Central Bank continued to reduce its bond purchases and was expected to raise rates later this year.
• While consumer sentiment flagged during the period, in many markets unemployment remained low, consumer balance sheets healthy and corporate profitsrobust.
• With central banks turning less accommodative and inflation looking set to remain elevated for some time, bond yields in many markets moved higher acrossthe maturity spectrum. The Bloomberg Global Aggregate Bond Index hedged to British pounds, a global bond proxy, returned about –7% for the six months.
• Stocks regained some ground in March but finished the six months with a negative return. The FTSE Global All Cap Index, a proxy for global stocks, returnedabout –4%. The United Kingdom and Asia-Pacific were bright spots, while Europe detracted the most.
• The Fund is actively managed; it does not seek to track a benchmark. The performance information in the table below shows how the Fund’s returns comparewith those of a market index with similar investment characteristics. For the period under review, the Fund significantly underperformed the index, whichreturned –3.20% for the six months.
• At the market level, selection among US, Canadian and Taiwanese companies was the largest drag on the Fund’s relative performance. The Fund’s positioningadded value in Japan, the United Kingdom and Germany.
• At the industry sector level, selection in technology, consumer discretionary and health care detracted the most from relative performance. The Fund’spositioning in basic materials was a bright spot.
Benchmark: FTSE All World Index
Total ReturnsPeriods Ended 30 April 2022
(Annualised for periods over one year)
Six Months Five yearsTen Years or
Since Inception1
GBP Acc -10.09% 9.91% 13.83%
Benchmark -3.20 10.32 13.81
GBP Inc -10.09% 9.91% 13.83%
Benchmark -3.20 10.32 13.81
Vanguard Global Advisers, LLC and FTSE.Returns is based on NAV with income reinvested.
All of the returns in this report represent past performance, which is not a guarantee of future results that may be achieved by the Fund. For performance data current to the most recent month-end,which may be higher or lower than that cited, visit our website at http://global.vanguard.com. Note, too, that both investment returns and principal value can fluctuate widely, so an investor’s shares,when sold, could be worth more or less than their original cost.1 Since-inception returns: GBP Acc and GBP Inc, 25 May 2016.
Vanguard Global Equity FundSub-managed by Baillie Gifford Overseas Limited and Wellington Management Company LLP.
196

Performance Comparative Table
GBP Acc
For the PeriodEnded
30 April 2022For the Year Ended
31 October 2021For the Year Ended
31 October 2020For the Year Ended
31 October 2019
Closing Net Asset Value £303,522,609 £319,348,567 £113,625,205 £41,926,793
Closing Number of Shares 1,409,275 1,333,276 617,668 255,612
Closing Net Asset Value Per Share1 £215.38 £239.52 £183.96 £164.03
Operating Charges2 0.48% 0.48% 0.48% 0.55%
GBP Inc
Closing Net Asset Value £18,712,164 £18,794,501 £6,588,320 £2,584,375
Closing Number of Shares 91,444 82,590 37,428 16,323
Closing Net Asset Value Per Share1 £204.63 £227.56 £176.03 £158.33
Operating Charges2 0.48% 0.48% 0.48% 0.56%
1 The net asset value per share shown may diverge from the net asset value per share used for dealing purposes as at 30 April 2022 because of any adjustments for trade date accounting, swingpricing and any adjustments in valuation to bid prices.
2 Operating charges include indirect costs incurred in the maintenance and running of the Fund, as disclosed in the detailed expenses within the Statement of Total Return.
Vanguard Global Equity Fund
197

Summary of Significant ChangesFor the period ended 30 April 2022
Cost(£)
Largest Purchases
Unilever plc 2,649,040
Meta Platforms Inc. 2,090,282
CRH plc 2,079,385
Charter Communications Inc. 1,823,336
Cellnex Telecom SA 1,821,328
Total 10,463,371
Total Purchases for the Period 81,691,557
Proceeds(£)
Largest Sales
Cisco Systems Inc. 2,160,612
Broadcom Inc. 2,034,705
Regeneron Pharmaceuticals Inc. 2,014,140
American Tower Corp. 1,761,698
Tyson Foods Inc. Class A 1,527,904
Total 9,499,059
Total Sales for the Period 53,969,438
Vanguard Global Equity Fund
198

Portfolio StatementAs at 30 April 2022
Holding
MarketValue
(£)
% ofTotal Net
Assets
Australia 1.02% (31 October 2021: 0.10%)
BHP Group Ltd. 120,162 3,273,213 1.02
3,273,213 1.02
Brazil 0.44% (31 October 2021: 0.14%)
B3 SA - Brasil Bolsa Balcao 666,421 1,424,487 0.44
1,424,487 0.44
Canada 1.93% (31 October 2021: 2.15%)
Canadian Natural Resources Ltd. 60,897 3,001,437 0.93Royal Bank of Canada 26,995 2,180,673 0.68Shopify Inc. Class A (XNYS) 3,004 1,021,767 0.32
6,203,877 1.93
China 3.80% (31 October 2021: 4.76%)
China Shenhua Energy Co. Ltd. 427,570 2,228,815 0.69Trip.com Group Ltd. 101,907 1,935,549 0.60Midea Group Co. Ltd. Class A 248,142 1,712,993 0.53Alibaba Group Holding Ltd. 143,372 1,485,992 0.46Meituan 57,500 1,001,640 0.31Guangzhou Automobile Group Co.
Ltd. Class H 1,296,787 889,901 0.28Alibaba Group Holding Ltd. ADR 10,477 810,955 0.25CSC Financial Co. Ltd. Class H 1,032,500 761,993 0.24Li Auto Inc. ADR 42,111 751,994 0.23Brilliance China Automotive
Holdings Ltd.1 580,000 345,188 0.11Tencent Music Entertainment
Group ADR 65,384 221,332 0.07KE Holdings Inc. ADR 6,055 68,291 0.02Midea Group Co. Ltd. Class A
(XSHE) 5,400 37,278 0.01
12,251,921 3.80
Denmark 0.69% (31 October 2021: 0.72%)
Genmab A/S 7,885 2,229,341 0.69
2,229,341 0.69
France 3.20% (31 October 2021: 3.08%)
Airbus SE 36,689 3,253,629 1.01Pernod Ricard SA 17,229 2,861,356 0.89Sanofi 18,951 1,610,853 0.50Engie SA 137,849 1,311,420 0.41Nexity SA 37,496 912,428 0.28Ubisoft Entertainment SA 9,720 351,768 0.11
10,301,454 3.20
Germany 1.16% (31 October 2021: 1.29%)
United Internet AG 63,592 1,642,026 0.51Deutsche Boerse AG 7,870 1,098,728 0.34adidas AG 6,261 1,013,983 0.31
3,754,737 1.16
Hong Kong 1.82% (31 October 2021: 1.53%)
AIA Group Ltd. 314,400 2,481,472 0.77Sands China Ltd. 1,277,013 2,286,759 0.71CK Asset Holdings Ltd. 201,186 1,090,600 0.34
5,858,831 1.82
India 2.53% (31 October 2021: 2.16%)
Reliance Industries Ltd. GDR(XLON) 102,431 5,923,127 1.84
Housing Development FinanceCorp. Ltd. 66,908 1,551,856 0.48
Reliance Industries Ltd. GDR 11,987 693,155 0.21
8,168,138 2.53
Ireland 1.46% (31 October 2021: 1.62%)
Bank of Ireland Group plc 372,889 1,816,656 0.56Ryanair Holdings plc ADR 23,118 1,608,224 0.50Ryanair Holdings plc 105,254 1,289,470 0.40
4,714,350 1.46
Holding
MarketValue
(£)
% ofTotal Net
Assets
Italy 0.47% (31 October 2021: 0.74%)
Banca Generali SpA 56,641 1,506,328 0.47
1,506,328 0.47
Japan 7.43% (31 October 2021: 6.27%)
Olympus Corp. 161,800 2,296,257 0.71T&D Holdings Inc. 209,470 2,150,554 0.67Daiichi Sankyo Co. Ltd. 95,400 1,910,784 0.59SoftBank Corp. 197,430 1,836,387 0.57Asahi Group Holdings Ltd. 54,590 1,632,035 0.51Ono Pharmaceutical Co. Ltd. 75,820 1,553,105 0.48Matsumotokiyoshi Holdings Co.
Ltd. 51,680 1,366,165 0.42Nabtesco Corp. 73,100 1,335,606 0.41SMC Corp. 3,200 1,240,162 0.39Makita Corp. 50,300 1,195,170 0.37Sysmex Corp. 22,300 1,180,238 0.37Astellas Pharma Inc. 96,830 1,174,489 0.36Z Holdings Corp. 364,600 1,152,553 0.36Denso Corp. 19,200 938,974 0.29CyberAgent Inc. 95,300 811,437 0.25PALTAC Corp. 24,145 702,845 0.22JTOWER Inc 18,010 684,249 0.21Yokogawa Bridge Holdings Corp. 38,870 454,264 0.14Hoshizaki Corp. 6,700 339,402 0.11
23,954,676 7.43
Netherlands 1.61% (31 October 2021: 2.21%)
Prosus NV 82,114 3,214,585 1.00Adyen NV 736 1,003,717 0.31ING Groep NV 125,627 960,171 0.30
5,178,473 1.61
Norway 0.40% (31 October 2021: 0.73%)
Schibsted ASA Class A 44,625 754,246 0.23Adevinta ASA 78,324 492,499 0.15Schibsted ASA Class B 3,802 58,995 0.02
1,305,740 0.40
Russian Federation 0.00% (31 October 2021: 0.39%)
Sberbank of Russia ADR1 47,872 — 0.00VK Co. Ltd. GDR1 5,629 — 0.00Sberbank of Russia PJSC ADR1 88,400 — 0.00
— 0.00
South Africa 0.02% (31 October 2021: 0.41%)
Naspers Ltd. Class N 692 56,028 0.02
56,028 0.02
South Korea 1.38% (31 October 2021: 1.45%)
Samsung Electronics Co. Ltd. 51,920 2,219,157 0.69LG Chem Ltd. 3,684 1,212,496 0.37Kangwon Land Inc. 60,076 1,021,008 0.32
4,452,661 1.38
Spain 1.97% (31 October 2021: 1.09%)
Iberdrola SA 318,647 2,947,896 0.92Cellnex Telecom SA 45,717 1,711,741 0.53Almirall SA 160,313 1,673,036 0.52
6,332,673 1.97
Sweden 1.16% (31 October 2021: 1.10%)
Atlas Copco AB Class B 42,698 1,364,746 0.43Sandvik AB 79,743 1,221,222 0.38Epiroc AB Class B 80,795 1,136,796 0.35
3,722,764 1.16
Switzerland 0.46% (31 October 2021: 0.38%)
Cie Financiere Richemont SA 15,610 1,479,467 0.46
1,479,467 0.46
Vanguard Global Equity Fund
199

Holding
MarketValue
(£)
% ofTotal Net
Assets
Taiwan 1.18% (31 October 2021: 1.19%)
Taiwan SemiconductorManufacturing Co. Ltd. 217,000 3,154,742 0.98
Globalwafers Co. Ltd. 46,505 652,212 0.20
3,806,954 1.18
United Kingdom 7.09% (31 October 2021: 5.90%)
CRH plc 139,761 4,496,111 1.40Rio Tinto plc 59,940 3,420,176 1.06Unilever plc 70,317 2,614,738 0.81Prudential plc 238,149 2,405,305 0.75Compass Group plc 135,785 2,311,061 0.72Standard Chartered plc 322,083 1,776,610 0.55AstraZeneca plc 15,458 1,652,151 0.51Mondi plc 99,130 1,496,863 0.46Rentokil Initial plc 209,479 1,151,716 0.36Direct Line Insurance Group plc 353,387 896,543 0.28Wizz Air Holdings plc 19,650 623,887 0.19
22,845,161 7.09
United States 53.68% (31 October 2021: 53.86%)
Anthem Inc. 13,654 5,456,921 1.69Microsoft Corp. 19,329 4,273,316 1.33Moody's Corp. 16,812 4,237,880 1.32Martin Marietta Materials Inc. 14,127 3,981,213 1.24Alphabet Inc. Class C 2,151 3,939,352 1.22T-Mobile US Inc. 36,754 3,604,847 1.12Meta Platforms Inc. 20,806 3,322,495 1.03Arthur J Gallagher & Co. 24,401 3,278,342 1.02VICI Properties Inc. 134,364 3,190,274 0.99Charles Schwab Corp. 58,757 3,105,157 0.96Service Corp. International 55,539 2,902,801 0.90Centene Corp. 45,017 2,888,186 0.90Reliance Steel & Aluminum Co. 18,142 2,864,859 0.89Mastercard Inc. 9,612 2,782,005 0.86Amazon.com Inc. 1,392 2,755,859 0.86VMware Inc. 31,063 2,674,559 0.83Fidelity National Information
Services Inc. 33,381 2,636,712 0.82Cognizant Technology Solutions
Corp. 40,758 2,625,976 0.81Electronic Arts Inc. 27,818 2,615,622 0.81MetLife Inc. 47,301 2,474,118 0.77F5 Inc. 18,105 2,413,999 0.75Keurig Dr Pepper Inc. 77,016 2,294,223 0.71Chubb Ltd. 13,636 2,241,494 0.70Micron Technology Inc. 41,082 2,230,959 0.69Tesla Inc. 3,209 2,224,139 0.69Albemarle Corp. 14,194 2,177,430 0.68Leidos Holdings Inc. 26,419 2,177,278 0.68Westinghouse Air Brake
Technologies Corp. 30,340 2,171,043 0.67CBRE Group Inc. 32,262 2,134,610 0.66Exelon Corp. 55,385 2,063,647 0.64Seagen Inc. 19,651 2,050,402 0.64Thermo Fisher Scientific Inc. 4,606 2,029,280 0.63FMC Corp. 19,064 2,012,842 0.62Estee Lauder Cos. Inc. 9,206 1,935,349 0.60CVS Health Corp. 25,210 1,930,256 0.60GoDaddy Inc. 29,902 1,924,635 0.60Equinix Inc. 3,238 1,854,544 0.58Booking Holdings Inc. 1,052 1,852,047 0.57Trade Desk Inc. 39,217 1,841,995 0.57Avantor Inc. 72,503 1,841,015 0.57FleetCor Technologies Inc. 8,773 1,743,698 0.54Royalty Pharma plc 51,365 1,742,031 0.54Teradyne Inc. 20,581 1,728,606 0.54S&P Global Inc. 5,721 1,715,935 0.53
Holding
MarketValue
(£)
% ofTotal Net
Assets
PPG Industries Inc. 16,341 1,665,336 0.52Americold Realty Trust 78,552 1,650,498 0.51Cable One Inc. 1,736 1,610,822 0.50Boston Scientific Corp. 47,366 1,587,543 0.49Raymond James Financial Inc. 19,600 1,521,634 0.47Schlumberger NV 48,471 1,505,283 0.47Alnylam Pharmaceuticals Inc. 14,140 1,502,635 0.47Lumentum Holdings Inc. 23,174 1,498,788 0.47Illumina Inc. 6,337 1,497,156 0.46Broadridge Financial Solutions Inc. 12,549 1,441,010 0.45Moderna Inc. 13,227 1,415,620 0.44DENTSPLY SIRONA Inc. 44,413 1,414,282 0.44Globe Life Inc. 17,956 1,402,870 0.44Dollar Tree Inc. 10,686 1,382,838 0.43Salesforce Inc. 9,471 1,327,674 0.41Markel Corp. 1,223 1,318,813 0.41Charter Communications Inc. 3,795 1,292,959 0.40Genpact Ltd. 39,560 1,269,827 0.39Sea Ltd. ADR 18,917 1,246,969 0.39Philip Morris International Inc. 15,625 1,244,772 0.39Airbnb Inc. 10,198 1,244,391 0.39Coupang LLC 120,771 1,238,010 0.38Becton Dickinson and Co. 6,200 1,219,456 0.38Alphabet Inc. Class A 647 1,175,792 0.36Raytheon Technologies Corp. 15,342 1,160,150 0.36Apollo Global Management Inc. 28,238 1,119,623 0.35Qorvo Inc. 11,992 1,086,777 0.34Cloudflare Inc. 15,485 1,062,550 0.33Datadog Inc. 10,752 1,034,264 0.32SiteOne Landscape Supply Inc. 9,035 1,014,899 0.31Biogen Inc. 6,097 1,007,376 0.31Adobe Inc. 3,091 974,840 0.30CoStar Group Inc. 18,714 948,295 0.29Baker Hughes Co. 35,000 864,476 0.27ABIOMED Inc. 3,712 846,679 0.26DoorDash Inc. 12,836 832,627 0.26Howard Hughes Corp. 9,789 782,496 0.24Ascendis Pharma A/S ADR 10,628 772,953 0.24KLA Corp. 2,986 758,593 0.24Broadcom Inc. 1,688 745,368 0.23NXP Semiconductors NV 5,428 738,865 0.23Analog Devices Inc. 5,958 732,471 0.23Twilio Inc. 8,189 729,346 0.23Novocure Ltd. 11,698 713,433 0.22Snowflake Inc. 4,881 666,661 0.21Axon Enterprise Inc. 6,864 613,031 0.19General Motors Co. 19,647 593,244 0.18Farfetch Ltd. Class A 60,880 543,095 0.17Certara Inc. 36,485 533,253 0.17Wayfair Inc. 6,953 425,819 0.13Netflix Inc. 2,713 411,326 0.13Oscar Health Inc. 68,222 399,388 0.12STAAR Surgical Co. 8,169 371,525 0.12Exact Sciences Corp. 8,360 366,561 0.11Chewy Inc. 15,819 366,023 0.11IAC/InterActiveCorp 5,442 359,246 0.11Chegg Inc. 16,617 327,575 0.10Spotify Technology SA 3,545 287,242 0.09Lennar Corp. Class A 4,600 280,287 0.09Teladoc Health Inc. 10,080 270,968 0.08Carvana Co. 4,985 230,092 0.07Peloton Interactive Inc. 14,108 197,321 0.06Vimeo Inc. 21,610 175,221 0.05
172,960,888 53.68
Total Equities 305,782,162 94.90
Number ofContracts
Long/(Short)
NotionalAmount
(£)
UnrealisedGain/(Loss)
(£)
% ofTotal Net
Assets
Financial Derivative Instruments 0.03% (31 October 2021: 0.14%)
Futures Contracts (0.14%) (31 October 2021: 0.12%)
FTSE 100 Index June 2022 15 1,126,950 35,746 0.01Topix Index June 2022 81 947,623 22,770 0.01
Vanguard Global Equity Fund
200

Euro STOXX 50 Index June 2022 37 1,161,512 4,345 0.00MSCI Emerging Markets Index June 2022 49 2,063,424 (46,188) (0.01)S&P 500 E Mini Index June 2022 556 9,139,342 (472,566) (0.15)
(455,893) (0.14)
CurrencyBuy
Amount Currency(Sell)
Amount CounterpartySettlement
Date
UnrealisedGain/(Loss)
(£)
% ofTotal Net
Assets
Forward Currency Exchange Contracts 0.17% (31 October 2021: 0.02%)
USD 11,952,066 GBP (9,025,681) JP Morgan Chase Bank 15/6/22 493,767 0.15USD 1,275,510 GBP (973,388) State Street Bank 15/6/22 42,515 0.01USD 1,032,894 GBP (787,733) State Street Bank 15/6/22 34,935 0.01USD 944,351 GBP (718,086) Barclays Bank 15/6/22 34,060 0.01USD 746,746 GBP (571,773) State Street Bank 15/6/22 22,987 0.01USD 529,539 GBP (401,760) State Street Bank 15/6/22 20,002 0.01USD 536,539 GBP (408,703) State Street Bank 15/6/22 18,634 0.01USD 596,085 GBP (456,289) JP Morgan Chase Bank 15/6/22 18,474 0.01USD 444,162 GBP (336,140) State Street Bank 15/6/22 17,622 0.01USD 458,125 GBP (347,328) State Street Bank 15/6/22 17,554 0.01USD 580,558 GBP (446,969) State Street Bank 15/6/22 15,427 0.00USD 429,149 GBP (327,861) State Street Bank 15/6/22 13,943 0.00USD 474,380 GBP (363,938) BNP Paribas 15/6/22 13,891 0.00USD 267,850 GBP (200,911) State Street Bank 15/6/22 12,423 0.00EUR 1,435,561 GBP (1,199,029) Goldman Sachs 15/6/22 9,439 0.00USD 251,556 GBP (191,695) State Street Bank 15/6/22 8,662 0.00USD 290,278 GBP (222,590) JP Morgan Chase Bank 15/6/22 8,607 0.00USD 223,556 GBP (171,888) State Street Bank 15/6/22 6,168 0.00USD 557,519 GBP (441,783) State Street Bank 15/6/22 2,263 0.00GBP 29,663 JPY (4,482,878) State Street Bank 15/6/22 2,070 0.00GBP 12,706 JPY (1,920,049) State Street Bank 15/6/22 887 0.00GBP 11,821 JPY (1,805,069) State Street Bank 15/6/22 710 0.00GBP 10,694 JPY (1,624,800) State Street Bank 15/6/22 692 0.00EUR 36,902 GBP (30,612) State Street Bank 15/6/22 453 0.00EUR 87,764 GBP (73,796) State Street Bank 15/6/22 85 0.00EUR 5,809 GBP (4,836) State Street Bank 15/6/22 54 0.00EUR 3,379 GBP (2,848) State Street Bank 15/6/22 (4) (0.00)GBP 7,587 EUR (9,020) State Street Bank 15/6/22 (5) (0.00)GBP 2,093 EUR (2,517) State Street Bank 15/6/22 (26) (0.00)EUR 54,223 GBP (45,685) State Street Bank 15/6/22 (40) (0.00)EUR 53,324 GBP (44,935) State Street Bank 15/6/22 (46) (0.00)EUR 22,619 GBP (19,107) State Street Bank 15/6/22 (66) (0.00)EUR 80,926 GBP (68,225) JP Morgan Chase Bank 15/6/22 (101) (0.00)GBP 126,913 EUR (151,147) State Street Bank 15/6/22 (324) (0.00)GBP 33,434 EUR (40,133) State Street Bank 15/6/22 (350) (0.00)JPY 1,336,643 GBP (8,703) State Street Bank 15/6/22 (475) (0.00)JPY 14,793,144 GBP (91,589) State Street Bank 15/6/22 (533) (0.00)EUR 114,125 GBP (96,708) Barclays Bank 15/6/22 (637) (0.00)JPY 3,112,118 GBP (20,106) State Street Bank 15/6/22 (950) (0.00)JPY 3,354,169 GBP (21,805) State Street Bank 15/6/22 (1,159) (0.00)JPY 2,926,988 GBP (19,278) State Street Bank 15/6/22 (1,261) (0.00)JPY 3,677,992 GBP (24,308) State Street Bank 15/6/22 (1,669) (0.00)GBP 272,467 JPY (44,587,208) BNP Paribas 15/6/22 (1,980) (0.00)GBP 231,191 EUR (277,179) State Street Bank 15/6/22 (2,141) (0.00)JPY 8,482,680 GBP (54,563) Barclays Bank 15/6/22 (2,350) (0.00)GBP 60,087 USD (78,598) State Street Bank 15/6/22 (2,513) (0.00)JPY 37,242,955 GBP (231,838) State Street Bank 15/6/22 (2,597) (0.00)JPY 8,423,943 GBP (54,692) State Street Bank 15/6/22 (2,840) (0.00)GBP 64,773 USD (85,048) JP Morgan Chase Bank 15/6/22 (2,965) (0.00)GBP 249,060 USD (316,612) JP Morgan Chase Bank 15/6/22 (3,112) (0.00)USD 493,202 GBP (396,506) BNP Paribas 15/6/22 (3,686) (0.00)GBP 105,010 USD (137,556) Standard Chartered 15/6/22 (4,550) (0.00)GBP 89,523 USD (118,158) State Street Bank 15/6/22 (4,586) (0.00)GBP 114,425 USD (150,465) State Street Bank 15/6/22 (5,416) (0.00)GBP 135,314 USD (177,312) State Street Bank 15/6/22 (5,910) (0.00)GBP 412,119 USD (541,206) State Street Bank 15/6/22 (18,934) (0.01)JPY 113,854,224 GBP (752,464) Standard Chartered 15/6/22 (51,660) (0.02)GBP 3,605,260 USD (4,699,759) State Street Bank 15/6/22 (137,952) (0.04)
555,486 0.17
Total Financial Derivative Instruments 99,593 0.03
Vanguard Global Equity Fund
201

MarketValue
(£)
% ofTotal Net
Assets
Portfolio of Investments 305,881,755 94.93
Net Other Assets 16,353,018 5.07
Net Assets Attributable to Shareholders 322,234,773 100.00
All holdings are listed on an official stock exchange or are traded on an eligible securities market, unless otherwise stated.1 Manually priced securities.
Vanguard Global Equity Fund
202
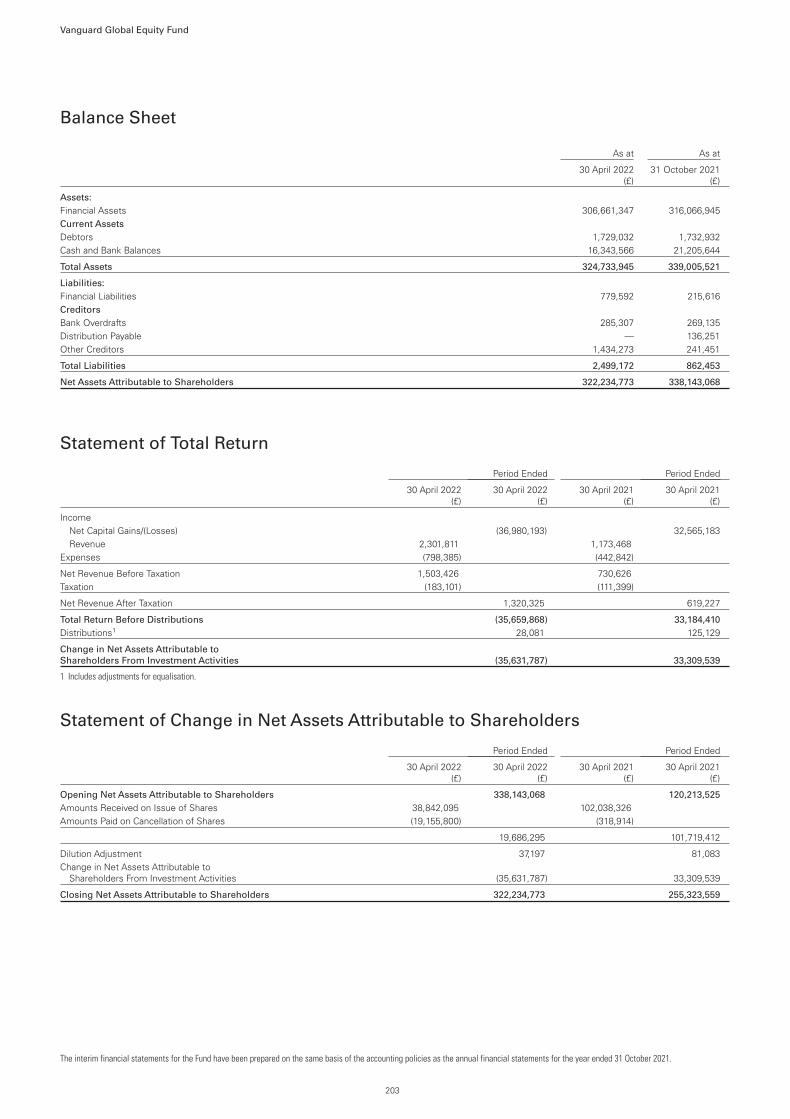
As at As at
30 April 2022(£)
31 October 2021(£)
Assets:
Financial Assets 306,661,347 316,066,945Current Assets
Debtors 1,729,032 1,732,932Cash and Bank Balances 16,343,566 21,205,644
Total Assets 324,733,945 339,005,521
Liabilities:
Financial Liabilities 779,592 215,616Creditors
Bank Overdrafts 285,307 269,135Distribution Payable — 136,251Other Creditors 1,434,273 241,451
Total Liabilities 2,499,172 862,453
Net Assets Attributable to Shareholders 322,234,773 338,143,068
Statement of Total Return
Period Ended Period Ended
30 April 2022(£)
30 April 2022(£)
30 April 2021(£)
30 April 2021(£)
IncomeNet Capital Gains/(Losses) (36,980,193) 32,565,183Revenue 2,301,811 1,173,468
Expenses (798,385) (442,842)
Net Revenue Before Taxation 1,503,426 730,626Taxation (183,101) (111,399)
Net Revenue After Taxation 1,320,325 619,227
Total Return Before Distributions (35,659,868) 33,184,410
Distributions1 28,081 125,129
Change in Net Assets Attributable to
Shareholders From Investment Activities (35,631,787) 33,309,539
1 Includes adjustments for equalisation.
Statement of Change in Net Assets Attributable to Shareholders
Period Ended Period Ended
30 April 2022(£)
30 April 2022(£)
30 April 2021(£)
30 April 2021(£)
Opening Net Assets Attributable to Shareholders 338,143,068 120,213,525
Amounts Received on Issue of Shares 38,842,095 102,038,326Amounts Paid on Cancellation of Shares (19,155,800) (318,914)
19,686,295 101,719,412
Dilution Adjustment 37,197 81,083Change in Net Assets Attributable to
Shareholders From Investment Activities (35,631,787) 33,309,539
Closing Net Assets Attributable to Shareholders 322,234,773 255,323,559
The interim financial statements for the Fund have been prepared on the same basis of the accounting policies as the annual financial statements for the year ended 31 October 2021.
Vanguard Global Equity Fund
Balance Sheet
203

Investment Objective
Vanguard Global Equity Income Fund (the “Fund”) seeks to provide an annual level of income (gross of fees) greater than that of the FTSE Developed Index (the“Index”) together with an increase in the value of investments over the long term (more than 5 years).
Investment Strategy
The Fund is an active fund and seeks to achieve its investment objective by investing primarily in shares of companies that tend to pay out a larger amount ofmoney as income (gross of fees) than an equivalent investment in the Index would pay out. The Fund generally invests in a diverse range of large and midsizecompanies representing different economic sectors and industry groups, chosen mainly on the basis of an investment approach that focuses on analysingindividual shares rather than stock markets.
Synthetic Risk and Reward Indicator
Lower risk
Typically lower rewards
Higher risk
Typically higher rewards
1 2 3 4 5 6 7
The Synthetic Risk and Reward Indicator (SRRI) measures the volatility of the Fund. The risk and reward category (which may range from 1 to 7) is calculatedusing historical data and may not be a reliable indicator of the Fund’s future risk profile. The risk and reward category may shift over time and is not a target orguarantee. The lowest category (i.e. category 1) does not mean “risk free”. The Fund appears in the higher range of the risk and reward indicator because thevalues of the Fund’s investments have experienced a higher rate of change in the past.
Performance SummaryThe Performance Summary does not form part of the Financial Statements.
• Volatility surged and global financial markets slumped during the six months ended 30 April 2022. When the period began, supply bottlenecks, rising oil pricesand the prospect of less accommodative monetary policy were already weighing on market sentiment.
• Then Russia’s invasion of Ukraine injected substantial uncertainty into the markets. Energy prices soared, helping to push consumer prices to multidecadehighs across much of the world. Some central banks, including those in the United States and the United Kingdom, raised short-term interest rates. TheEuropean Central Bank continued to reduce its bond purchases and was expected to raise rates later this year.
• While consumer sentiment flagged during the period, in many markets unemployment remained low, consumer balance sheets healthy and corporate profitsrobust.
• With central banks turning less accommodative and inflation looking set to remain elevated for some time, bond yields in many markets moved higher acrossthe maturity spectrum. The Bloomberg Global Aggregate Bond Index hedged to British pounds, a global bond proxy, returned about –7% for the six months.
• Stocks regained some ground in March but finished the six months with a negative return. The FTSE Global All Cap Index, a proxy for global stocks, returnedabout –4%. The United Kingdom and Asia-Pacific were bright spots, while Europe detracted the most.
• The Fund is actively managed; it does not seek to track a benchmark. The performance information in the table below shows how the Fund’s returns comparewith those of a market index with similar investment characteristics. For the period under review, the Fund significantly outperformed the index, whichreturned –3.11% for the six months.
• At the market level, selection among US companies accounted for the bulk of the Fund’s outperformance. Selection in the United Kingdom, Japan and theNetherlands also added value. A small out-of-benchmark allocation to China and an underweight to Canada detracted slightly from relative performance.
• At the industry sector level, the Fund’s strong relative performance was driven largely by underweights to technology and consumer discretionary as well assecurity selection in industrials and health care.
Benchmark: FTSE Developed Index
Total ReturnsPeriods Ended 30 April 2022
(Annualised for periods over one year)
Six Months Five YearsTen Years or
Since Inception1
A GBP Accumulation Shares 9.30% 8.01% 11.48%
Benchmark -3.11 10.91 14.20
A GBP Income Shares 9.30% 8.00% 11.48%
Benchmark -3.11 10.91 14.20
Vanguard Global Advisers, LLC and FTSE.Returns is based on NAV with income reinvested.
All of the returns in this report represent past performance, which is not a guarantee of future results that may be achieved by the Fund. For performance data current to the most recent month-end,which may be higher or lower than that cited, visit our website at http://global.vanguard.com. Note, too, that both investment returns and principal value can fluctuate widely, so an investor’s shares,when sold, could be worth more or less than their original cost.1 Since-inception returns: GBP Acc and GBP Inc, 25 May 2016.
Vanguard Global Equity Income FundSub-managed by Wellington Management Company LLP and Vanguard Quantitative Equity Group.
204

Performance Comparative Table
GBP Acc
For the PeriodEnded
30 April 2022For the Year Ended
31 October 2021For the Year Ended
31 October 2020For the Year Ended
31 October 2019
Closing Net Asset Value £97,895,826 £66,173,801 £29,436,068 £24,683,594
Closing Number of Shares 514,332 380,050 221,428 167,296
Closing Net Asset Value Per Share1 £190.34 £174.12 £132.94 £147.54
Operating Charges2 0.48% 0.48% 0.48% 0.55%
GBP Inc
Closing Net Asset Value £26,319,952 £18,316,751 £10,499,877 £7,807,293
Closing Number of Shares 165,018 123,627 90,010 58,551
Closing Net Asset Value Per Share1 £159.50 £148.16 £116.65 £133.34
Operating Charges2 0.48% 0.48% 0.48% 0.55%
1 The net asset value per share shown may diverge from the net asset value per share used for dealing purposes as at 30 April 2022 because of any adjustments for trade date accounting, swingpricing and any adjustments in valuation to bid prices.
2 Operating charges include indirect costs incurred in the maintenance and running of the Fund, as disclosed in the detailed expenses within the Statement of Total Return.
Vanguard Global Equity Income Fund
205

Summary of Significant ChangesFor the period ended 30 April 2022
Cost(£)
Largest Purchases
Ares Management Corp. Class A 1,212,156
Exelon Corp. 1,100,279
Pfizer Inc. 1,077,905
Lockheed Martin Corp. 1,029,200
Iberdrola SA 908,721
Total 5,328,261
Total Purchases for the Period 43,059,766
Proceeds(£)
Largest Sales
Nexity SA 682,130
Fortescue Metals Group Ltd. 532,003
Volkswagen AG - Preference Shares 524,156
Lockheed Martin Corp. 498,166
Constellation Energy Corp. 466,917
Total 2,703,372
Total Sales for the Period 13,926,600
Vanguard Global Equity Income Fund
206

Portfolio StatementAs at 30 April 2022
Holding
MarketValue
(£)
% ofTotal Net
Assets
Australia 0.96% (31 October 2021: 0.71%)
BHP Group Ltd. 26,085 708,862 0.57JB Hi-Fi Ltd. 16,146 482,545 0.39
1,191,407 0.96
Austria 0.43% (31 October 2021: 0.40%)
OMV AG 12,749 527,055 0.43
527,055 0.43
Canada 7.09% (31 October 2021: 6.82%)
Bank of Nova Scotia 47,582 2,409,358 1.94Royal Bank of Canada 22,987 1,856,904 1.49TC Energy Corp. 37,712 1,596,998 1.29Enbridge Inc. 37,650 1,315,386 1.06Toronto-Dominion Bank 10,909 630,231 0.51Suncor Energy Inc. 20,684 594,381 0.48Hydro One Ltd. 18,565 400,550 0.32
8,803,808 7.09
Cayman Islands 0.00% (31 October 2021: 0.46%)
China 0.83% (31 October 2021: 1.07%)
ENN Energy Holdings Ltd. 95,988 1,030,930 0.83
1,030,930 0.83
Denmark 0.45% (31 October 2021: 0.72%)
AP Moeller - Maersk A/S Class B 239 557,753 0.45
557,753 0.45
Finland 0.13% (31 October 2021: 0.00%)
Fortum Oyj 12,290 163,887 0.13
163,887 0.13
France 7.10% (31 October 2021: 8.22%)
AXA SA 99,885 2,136,848 1.72TotalEnergies SE 44,736 1,775,187 1.43Bureau Veritas SA 64,847 1,494,620 1.20Vinci SA 16,171 1,261,499 1.02Engie SA 53,887 512,652 0.41Carrefour SA 30,060 507,944 0.41Cie de Saint-Gobain 10,574 500,311 0.40Sanofi 5,105 433,930 0.35Societe Generale SA 6,177 120,259 0.10Nexity SA 3,098 75,387 0.06
8,818,637 7.10
Germany 0.91% (31 October 2021: 1.77%)
Wacker Chemie AG 3,466 439,474 0.35Bayerische Motoren Werke AG -
Preference Shares 6,822 403,552 0.33Mercedes-Benz Group AG 5,142 290,346 0.23
1,133,372 0.91
Greece 1.04% (31 October 2021: 0.96%)
Hellenic TelecommunicationsOrganization SA 83,692 1,293,948 1.04
1,293,948 1.04
Hong Kong 1.57% (31 October 2021: 1.67%)
AIA Group Ltd. 122,400 966,069 0.78Sands China Ltd. 317,800 569,088 0.46Lenovo Group Ltd. 524,000 407,993 0.33
1,943,150 1.57
Ireland 0.00% (31 October 2021: 0.88%)
Italy 0.20% (31 October 2021: 0.36%)
Poste Italiane SpA 31,309 245,820 0.20
245,820 0.20
Japan 7.53% (31 October 2021: 7.32%)
Tokio Marine Holdings Inc. 42,600 1,835,599 1.48Mitsubishi UFJ Financial Group Inc. 281,600 1,305,317 1.05KDDI Corp. 48,300 1,287,207 1.04Isuzu Motors Ltd. 85,700 798,716 0.64SCREEN Holdings Co. Ltd. 7,500 496,119 0.40
Holding
MarketValue
(£)
% ofTotal Net
Assets
SBI Holdings Inc. 27,600 493,588 0.40Takeda Pharmaceutical Co. Ltd. 20,300 469,615 0.38Marubeni Corp. 51,800 452,996 0.36Mitsui & Co. Ltd. 20,400 395,051 0.32Mizuho Financial Group Inc. 36,310 351,799 0.28Mitsubishi Corp. 12,900 347,516 0.28Nippon Electric Glass Co. Ltd. 21,200 341,728 0.27Daiwa House Industry Co. Ltd. 12,300 237,587 0.19NIPPON EXPRESS HOLDINGS Inc. 4,000 187,628 0.15Nippon Telegraph & Telephone Corp. 7,700 182,106 0.15SUMCO Corp. 14,500 168,834 0.14
9,351,406 7.53
Jersey 0.00% (31 October 2021: 0.30%)
Netherlands 1.54% (31 October 2021: 1.82%)
Koninklijke KPN NV 453,094 1,249,136 1.01ASR Nederland NV 12,748 464,243 0.37Randstad NV 4,712 201,292 0.16
1,914,671 1.54
Norway 1.54% (31 October 2021: 1.59%)
DNB Bank ASA 88,847 1,395,339 1.12Equinor ASA 18,756 514,803 0.42
1,910,142 1.54
Poland 0.16% (31 October 2021: 0.00%)
Cyfrowy Polsat SA 45,511 197,845 0.16
197,845 0.16
South Korea 1.39% (31 October 2021: 1.43%)
BNK Financial Group Inc. 93,704 468,250 0.38Kia Corp. 8,477 449,947 0.36Hana Financial Group Inc. 13,115 390,894 0.31DGB Financial Group Inc. 40,252 227,946 0.18Samsung Electronics Co. Ltd. 4,525 193,407 0.16
1,730,444 1.39
Spain 2.35% (31 October 2021: 1.31%)
Industria de Diseno Textil SA 67,447 1,139,131 0.92Iberdrola SA 108,771 1,006,272 0.81Telefonica SA 111,766 435,004 0.35Mapfre SA 233,382 342,198 0.27
2,922,605 2.35
Sweden 0.19% (31 October 2021: 0.73%)
Samhallsbyggnadsbolaget i NordenAB 94,089 238,675 0.19
238,675 0.19
Switzerland 5.08% (31 October 2021: 5.90%)
Novartis AG 29,945 2,125,499 1.71UBS Group AG 154,790 2,123,096 1.71Nestle SA 12,630 1,305,853 1.05Roche Holding AG (Non-voting) 1,556 462,720 0.37Cie Financiere Richemont SA 3,120 295,704 0.24
6,312,872 5.08
Taiwan 1.03% (31 October 2021: 1.19%)
Taiwan SemiconductorManufacturing Co. Ltd. 88,000 1,279,342 1.03
1,279,342 1.03
United Kingdom 9.26% (31 October 2021: 8.33%)
AstraZeneca plc 21,582 2,306,684 1.86Rio Tinto plc 38,807 2,214,328 1.78National Grid plc 151,577 1,809,829 1.46BAE Systems plc 213,863 1,582,586 1.27Standard Chartered plc 199,498 1,100,431 0.89Imperial Brands plc 31,022 516,671 0.423i Group plc 38,376 508,290 0.41WPP plc 49,575 498,229 0.40Glencore plc 87,411 434,651 0.35
Vanguard Global Equity Income Fund
207

Holding
MarketValue
(£)
% ofTotal Net
Assets
Natwest Group plc 133,710 291,488 0.23Sage Group plc 32,733 241,308 0.19
11,504,495 9.26
United States 43.08% (31 October 2021: 40.92%)
Pfizer Inc. 78,481 3,067,977 2.47Philip Morris International Inc. 35,535 2,830,911 2.28Merck & Co. Inc. 39,315 2,777,883 2.24Johnson & Johnson 17,181 2,470,204 1.99Anthem Inc. 5,326 2,128,575 1.71Bank of America Corp. 74,931 2,128,266 1.71Lockheed Martin Corp. 5,882 2,022,976 1.63Exelon Corp. 53,747 2,002,615 1.61Progressive Corp. 21,031 1,798,732 1.45Cisco Systems Inc. 43,129 1,682,906 1.35FMC Corp. 15,160 1,600,644 1.29Verizon Communications Inc. 42,482 1,566,639 1.26Duke Energy Corp. 17,732 1,556,122 1.25Texas Instruments Inc. 10,317 1,399,019 1.13Microsoft Corp. 5,752 1,271,670 1.02Comcast Corp. 38,769 1,227,761 0.99Exxon Mobil Corp. 16,744 1,135,604 0.91Ares Management Corp. 20,615 1,087,808 0.88Edison International 19,821 1,086,800 0.88Chubb Ltd. 6,541 1,075,214 0.87Kellogg Co. 18,731 1,021,962 0.82TJX Cos. Inc. 20,395 994,977 0.80Medtronic plc 11,333 942,024 0.76Procter & Gamble Co. 7,069 904,358 0.73Medical Properties Trust Inc. 55,700 815,868 0.66Home Depot Inc. 2,967 710,024 0.57Altria Group Inc. 15,071 667,421 0.54
Holding
MarketValue
(£)
% ofTotal Net
Assets
JPMorgan Chase & Co. 6,780 644,680 0.52EOG Resources Inc. 6,632 616,398 0.50CVS Health Corp. 7,852 601,205 0.48American Electric Power Co. Inc. 7,187 567,289 0.46Emerson Electric Co. 7,800 560,444 0.45Archer-Daniels-Midland Co. 7,844 560,169 0.45Colgate-Palmolive Co. 8,729 535,698 0.43McDonald's Corp. 2,685 533,022 0.43Tyson Foods Inc. 7,140 530,026 0.43Nucor Corp. 3,952 487,618 0.39Everest Re Group Ltd. 2,207 483,905 0.39NiSource Inc. 20,530 476,335 0.38Fidelity National Financial Inc. 14,629 463,980 0.37Gilead Sciences Inc. 9,811 463,316 0.37AbbVie Inc. 3,948 461,653 0.37Citigroup Inc. 11,795 452,729 0.36QUALCOMM Inc. 4,005 445,574 0.36Genuine Parts Co. 4,203 435,398 0.35HP Inc. 14,741 430,312 0.35Caterpillar Inc. 2,056 344,730 0.28Credicorp Ltd. 2,984 330,272 0.27Carlyle Group Inc. 10,043 290,291 0.23Kinder Morgan Inc. 18,746 270,999 0.22Ally Financial Inc. 7,191 228,817 0.18Chevron Corp. 1,627 203,028 0.16Steel Dynamics Inc. 1,759 120,125 0.10
53,512,973 43.08
Total Equities 116,585,237 93.86
Number ofContracts
Long/(Short)
NotionalAmount
(£)
UnrealisedGain/(Loss)
(£)
% ofTotal Net
Assets
Financial Derivative Instruments (0.04%) (31 October 2021: 0.13%)
Futures Contracts (0.25%) (31 October 2021: 0.13%)
Topix Index June 2022 45 526,458 (15) (0.00)STOXX Europe 600 Index June 2022 77 1,442,168 (18,857) (0.02)S&P 500 E Mini Index June 2022 295 4,849,111 (290,557) (0.23)
(309,429) (0.25)
CurrencyBuy
Amount Currency(Sell)
Amount CounterpartySettlement
Date
UnrealisedGain/(Loss)
(£)
% ofTotal Net
Assets
Forward Currency Exchange Contracts 0.21% (31 October 2021: (0.00%))
USD 4,911,774 GBP (3,709,158) JP Morgan Chase Bank 15/6/22 202,917 0.16USD 1,238,873 GBP (950,446) BNP Paribas 15/6/22 36,277 0.03USD 1,158,033 GBP (888,152) BNP Paribas 15/6/22 34,185 0.03USD 793,642 GBP (608,473) State Street Bank 15/6/22 23,638 0.02USD 455,825 GBP (341,909) State Street Bank 15/6/22 21,141 0.02USD 591,563 GBP (451,153) State Street Bank 15/6/22 20,008 0.02USD 656,701 GBP (503,399) BNP Paribas 15/6/22 19,643 0.02USD 593,204 GBP (455,324) State Street Bank 15/6/22 17,145 0.01USD 437,149 GBP (331,425) State Street Bank 15/6/22 16,750 0.01USD 507,082 GBP (387,621) State Street Bank 15/6/22 16,254 0.01USD 396,930 GBP (301,572) State Street Bank 15/6/22 14,570 0.01USD 413,825 GBP (316,219) State Street Bank 15/6/22 13,379 0.01USD 339,094 GBP (256,742) State Street Bank 15/6/22 13,336 0.01USD 452,942 GBP (347,459) State Street Bank 15/6/22 13,295 0.01USD 341,989 GBP (259,111) State Street Bank 15/6/22 13,273 0.01USD 422,499 GBP (324,851) State Street Bank 15/6/22 11,656 0.01USD 312,146 GBP (237,356) Barclays Bank 15/6/22 11,258 0.01USD 307,002 GBP (233,856) State Street Bank 15/6/22 10,662 0.01USD 285,150 GBP (216,850) State Street Bank 15/6/22 10,263 0.01USD 281,286 GBP (214,195) State Street Bank 15/6/22 9,841 0.01EUR 1,450,053 GBP (1,211,133) Goldman Sachs 15/6/22 9,535 0.01USD 529,080 GBP (412,041) BNP Paribas 15/6/22 9,355 0.01USD 299,900 GBP (229,567) JP Morgan Chase Bank 15/6/22 9,295 0.01USD 241,773 GBP (183,579) BNP Paribas 15/6/22 8,986 0.01USD 191,791 GBP (144,701) State Street Bank 15/6/22 8,055 0.01
Vanguard Global Equity Income Fund
208

CurrencyBuy
Amount Currency(Sell)
Amount CounterpartySettlement
Date
UnrealisedGain/(Loss)
(£)
% ofTotal Net
Assets
USD 196,796 GBP (149,505) JP Morgan Chase Bank 15/6/22 7,238 0.01USD 195,263 GBP (149,511) State Street Bank 15/6/22 6,011 0.00USD 179,742 GBP (137,168) State Street Bank 15/6/22 5,990 0.00USD 171,018 GBP (130,322) State Street Bank 15/6/22 5,889 0.00GBP 88,979 JPY (13,666,252) State Street Bank 15/6/22 4,860 0.00EUR 327,989 GBP (271,591) State Street Bank 15/6/22 4,513 0.00USD 94,907 GBP (71,825) State Street Bank 15/6/22 3,765 0.00USD 94,461 GBP (72,215) State Street Bank 15/6/22 3,020 0.00GBP 226,918 JPY (36,467,216) State Street Bank 15/6/22 2,453 0.00USD 54,362 GBP (41,051) JP Morgan Chase Bank 15/6/22 2,246 0.00GBP 153,473 JPY (24,594,675) State Street Bank 15/6/22 2,086 0.00EUR 357,664 GBP (299,066) State Street Bank 15/6/22 2,018 0.00JPY 22,661,790 GBP (137,578) JP Morgan Chase Bank 15/6/22 1,912 0.00GBP 37,200 JPY (5,757,883) State Street Bank 15/6/22 1,758 0.00GBP 473,263 EUR (560,439) State Street Bank 15/6/22 1,480 0.00EUR 159,491 GBP (132,784) State Street Bank 15/6/22 1,476 0.00EUR 186,882 GBP (155,876) State Street Bank 15/6/22 1,443 0.00EUR 169,678 GBP (141,624) JP Morgan Chase Bank 15/6/22 1,212 0.00EUR 296,574 GBP (248,463) BNP Paribas 15/6/22 1,196 0.00JPY 48,042,681 GBP (294,932) State Street Bank 15/6/22 784 0.00EUR 202,960 GBP (170,098) State Street Bank 15/6/22 755 0.00GBP 156,383 EUR (184,929) BNP Paribas 15/6/22 708 0.00EUR 129,423 GBP (108,265) State Street Bank 15/6/22 685 0.00EUR 86,090 GBP (71,917) State Street Bank 15/6/22 555 0.00GBP 152,445 EUR (180,466) State Street Bank 15/6/22 527 0.00EUR 35,913 GBP (29,918) State Street Bank 15/6/22 313 0.00GBP 117,305 EUR (138,994) JP Morgan Chase Bank 15/6/22 299 0.00EUR 20,056 GBP (16,637) State Street Bank 15/6/22 246 0.00EUR 77,435 GBP (65,022) JP Morgan Chase Bank 15/6/22 164 0.00EUR 201,639 GBP (169,578) State Street Bank 15/6/22 164 0.00EUR 14,625 GBP (12,215) Goldman Sachs 15/6/22 96 0.00GBP 93,205 EUR (110,605) State Street Bank 15/6/22 96 0.00EUR 89,574 GBP (75,318) State Street Bank 15/6/22 86 0.00EUR 19,453 GBP (16,364) State Street Bank 15/6/22 12 0.00EUR 52,926 GBP (44,557) JP Morgan Chase Bank 15/6/22 (4) (0.00)EUR 29,325 GBP (24,723) JP Morgan Chase Bank 15/6/22 (37) (0.00)EUR 65,748 GBP (55,396) State Street Bank 15/6/22 (48) (0.00)EUR 63,319 GBP (53,375) State Street Bank 15/6/22 (73) (0.00)GBP 18,618 EUR (22,395) State Street Bank 15/6/22 (234) (0.00)JPY 4,438,175 GBP (27,628) State Street Bank 15/6/22 (310) (0.00)JPY 11,252,444 GBP (69,609) State Street Bank 15/6/22 (347) (0.00)EUR 84,672 GBP (71,750) Barclays Bank 15/6/22 (472) (0.00)JPY 1,075,583 GBP (7,117) State Street Bank 15/6/22 (497) (0.00)JPY 1,474,166 GBP (9,709) State Street Bank 15/6/22 (635) (0.00)JPY 1,949,968 GBP (12,660) State Street Bank 15/6/22 (657) (0.00)JPY 1,988,537 GBP (13,022) State Street Bank 15/6/22 (782) (0.00)JPY 3,287,736 GBP (21,148) Barclays Bank 15/6/22 (911) (0.00)JPY 2,164,267 GBP (14,322) State Street Bank 15/6/22 (1,000) (0.00)EUR 122,413 GBP (104,053) State Street Bank 15/6/22 (1,004) (0.00)JPY 3,233,710 GBP (21,283) State Street Bank 15/6/22 (1,378) (0.00)GBP 37,095 USD (48,706) JP Morgan Chase Bank 15/6/22 (1,698) (0.00)GBP 344,879 EUR (411,710) JP Morgan Chase Bank 15/6/22 (1,702) (0.00)JPY 18,047,581 GBP (113,167) BNP Paribas 15/6/22 (2,080) (0.00)GBP 453,022 USD (571,702) State Street Bank 15/6/22 (2,320) (0.00)JPY 7,606,432 GBP (49,449) State Street Bank 15/6/22 (2,629) (0.00)USD 444,820 GBP (357,610) BNP Paribas 15/6/22 (3,324) (0.00)GBP 218,334 JPY (36,481,576) State Street Bank 15/6/22 (6,220) (0.00)GBP 871,819 EUR (1,047,559) State Street Bank 15/6/22 (10,026) (0.01)GBP 887,701 USD (1,128,473) JP Morgan Chase Bank 15/6/22 (11,093) (0.01)GBP 333,360 USD (436,347) State Street Bank 15/6/22 (14,177) (0.01)GBP 639,785 USD (834,340) JP Morgan Chase Bank 15/6/22 (24,740) (0.02)JPY 70,030,935 GBP (462,835) Standard Chartered 15/6/22 (31,776) (0.03)GBP 1,335,870 USD (1,760,742) State Street Bank 15/6/22 (66,506) (0.05)GBP 2,022,648 USD (2,650,439) State Street Bank 15/6/22 (88,345) (0.07)GBP 2,904,278 USD (3,772,300) State Street Bank 15/6/22 (100,241) (0.08)
265,507 0.21
Total Financial Derivative Instruments (43,922) (0.04)
Vanguard Global Equity Income Fund
209

MarketValue
(£)
% ofTotal Net
Assets
Portfolio of Investments 116,541,315 93.82
Net Other Assets 7,674,463 6.18
Net Assets Attributable to Shareholders 124,215,778 100.00
All holdings are listed on an official stock exchange or are traded on an eligible securities market, unless otherwise stated.
Vanguard Global Equity Income Fund
210

As at As at
30 April 2022(£)
31 October 2021(£)
Assets:
Financial Assets 117,226,010 80,326,789Current Assets
Debtors 1,292,674 1,597,503Cash and Bank Balances 6,848,566 3,667,455
Total Assets 125,367,250 85,591,747
Liabilities:
Financial Liabilities 684,695 56,158Creditors
Bank Overdrafts 111,917 62,096Distribution Payable 273,543 135,436Other Creditors 81,317 847,505
Total Liabilities 1,151,472 1,101,195
Net Assets Attributable to Shareholders 124,215,778 84,490,552
Statement of Total Return
Period Ended Period Ended
30 April 2022(£)
30 April 2022(£)
30 April 2021(£)
30 April 2021(£)
IncomeNet Capital Gains/(Losses) 7,173,024 9,890,329Revenue 1,844,509 928,918
Expenses (238,185) (125,363)
Net Revenue Before Taxation 1,606,324 803,555Taxation (212,420) (117,971)
Net Revenue After Taxation 1,393,904 685,584
Total Return Before Distributions 8,566,928 10,575,913
Distributions1 (1,629,365) (809,469)
Change in Net Assets Attributable to
Shareholders From Investment Activities 6,937,563 9,766,444
1 Includes adjustments for equalisation.
Statement of Change in Net Assets Attributable to Shareholders
Period Ended Period Ended
30 April 2022(£)
30 April 2022(£)
30 April 2021(£)
30 April 2021(£)
Opening Net Assets Attributable to Shareholders 84,490,552 39,935,945
Amounts Received on Issue of Shares 34,500,209 16,174,927Amounts Paid on Cancellation of Shares (3,133,540) (2,736,332)
31,366,669 13,438,595
Dilution Adjustment 27,575 12,634Change in Net Assets Attributable to
Shareholders From Investment Activities 6,937,563 9,766,444Retained Distribution on Accumulation Shares 1,393,419 640,087
Closing Net Assets Attributable to Shareholders 124,215,778 63,793,705
The interim financial statements for the Fund have been prepared on the same basis of the accounting policies as the annual financial statements for the year ended 31 October 2021.
Vanguard Global Equity Income Fund
Balance Sheet
211

Interim distribution payable 30 June 2022
Net IncomePence Per Share
EqualisationPence Per Share
Distribution Payable30 June 2022
Pence Per Share
Distribution Paid30 June 2021
Pence Per Share
GBP Acc
Group 1 196.2115 — 196.2115 145.3518
Group 2 109.6670 86.5445 196.2115 145.3518
GBP Inc
Group 1 166.1417 — 166.1417 124.6986
Group 2 84.3560 81.7857 166.1417 124.6986
Group 1—Shares purchased before 1 February 2022.Group 2—Shares purchased between 1 February 2022 and 30 April 2022.Note: Equalisation applies only to shares purchased during the distribution period (Group 2 shares). It is the average amount of income included in the purchase price of all Group 2 shares and isrefunded to holders of these shares as a return of capital. Being capital, it is not liable to income tax but must be deducted from the cost of shares for capital gains tax purposes.
Interim distribution paid 31 March 2022
Net IncomePence Per Share
EqualisationPence Per Share
Distribution Paid31 March 2022
Pence Per Share
Distribution Paid31 March 2021
Pence Per Share
GBP Acc
Group 1 92.3619 — 92.3619 86.5888
Group 2 41.8790 50.4829 92.3619 86.5888
GBP Inc
Group 1 78.6051 — 78.6051 75.9687
Group 2 34.9024 43.7027 78.6051 75.9687
Group 1—Shares purchased before 1 November 2021.Group 2—Shares purchased between 1 November 2021 and 31 January 2022.Note: Equalisation applies only to shares purchased during the distribution period (Group 2 shares). It is the average amount of income included in the purchase price of all Group 2 shares and isrefunded to holders of these shares as a return of capital. Being capital, it is not liable to income tax but must be deducted from the cost of shares for capital gains tax purposes.
Vanguard Global Equity Income Fund
Distribution TablesFor the period ended 30 April 2022
212

Investment Objective
The Vanguard Global Sustainable Equity Fund (the “Fund”) seeks to provide an increase in the value of investments over the long-term (more than 5 years),through a combination of capital growth and income. The Fund aims to achieve this whilst selecting investments which meet certain sustainability criteria.
Investment Strategy
The Fund seeks to achieve its investment objective by investing almost exclusively (at least 90% of the Fund's assets), in equity securities issued by large andmid-size companies located throughout the world, selected in accordance with the Sustainability Policy described in the Prospectus.
Synthetic Risk and Reward Indicator
Lower risk
Typically lower rewards
Higher risk
Typically higher rewards
1 2 3 4 5 6 7
The Synthetic Risk and Reward Indicator (SRRI) measures the volatility of the Fund. The risk and reward category (which may range from 1 to 7) is calculatedusing historical data and may not be a reliable indicator of the Fund’s future risk profile. The risk and reward category may shift over time and is not a target orguarantee. The lowest category (i.e. category 1) does not mean “risk free”. The Fund appears in the higher range of the risk and reward indicator because thevalues of the Fund’s investments have experienced a higher rate of change in the past.
Performance SummaryThe Performance Summary does not form part of the Financial Statements.
• Volatility surged and global financial markets slumped during the six months ended 30 April 2022. When the period began, supply bottlenecks, rising oil pricesand the prospect of less accommodative monetary policy were already weighing on market sentiment.
• Then Russia’s invasion of Ukraine injected substantial uncertainty into the markets. Energy prices soared, helping to push consumer prices to multidecadehighs across much of the world. Some central banks, including those in the United States and the United Kingdom, raised short-term interest rates. TheEuropean Central Bank continued to reduce its bond purchases and was expected to raise rates later this year.
• While consumer sentiment flagged during the period, in many markets unemployment remained low, consumer balance sheets healthy and corporate profitsrobust.
• With central banks turning less accommodative and inflation looking set to remain elevated for some time, bond yields in many markets moved higher acrossthe maturity spectrum. The Bloomberg Global Aggregate Bond Index hedged to British pounds, a global bond proxy, returned about –7% for the six months.
• Stocks regained some ground in March but finished the six months with a negative return. The FTSE All World Index, the Fund’s benchmark and a proxy forglobal stocks, returned about –3%. The United Kingdom and Asia-Pacific were bright spots, while Europe detracted the most.
• The Fund is actively managed; it does not seek to track a benchmark. The performance information in the table below shows how the Fund’s returns comparewith those of a market index with similar investment characteristics. From its inception on 8 December 2021 through 30 April 2022, the Fund held upsignificantly better than the index, which returned –7.18% for that period.
• The United States, by far the largest market in the Fund’s index, drove much of the Fund’s outperformance. The UK, Brazil, Switzerland and Singapore werealso bright spots. In contrast, France, the Netherlands, Australia and Spain were among those that dampened the Fund’s relative performance.
• Among industry sectors, security selection in energy, basic materials and industrials detracted from relative performance. In contrast, an underweight totechnology and security selection in financials and health care added value.
Benchmark: FTSE All-World Index
Total ReturnsPeriods Ended 30 April 2022
(Annualised for periods over one year)
Ten Years orSince Inception1
GBP Acc -3.83%
Benchmark -7.18
GBP Inc -3.83%
Benchmark -7.18
Sources: Vanguard Global Advisers, LLC, FTSE and Bloomberg.Returns is based on NAV with income reinvested.
All of the returns in this report represent past performance, which is not a guarantee of future results that may be achieved by the Fund. For performance data current to the most recent month-end,which may be higher or lower than that cited, visit our website at http://global.vanguard.com. Note, too, that both investment returns and principal value can fluctuate widely, so an investor’s shares,when sold, could be worth more or less than their original cost.1 Since-inception returns: GBP Acc and GBP Inc, 8 December 2021.
Vanguard Global Sustainable Equity FundSub-managed by Wellington Management Company LLP.
213

Performance Comparative Table
GBP Acc†
For the PeriodEnded
30 April 2022
Closing Net Asset Value £25,381,031
Closing Number of Shares 263,975
Closing Net Asset Value Per Share1 £96.15
Operating Charges2 0.48%
GBP Inc†
Closing Net Asset Value £8,504,016
Closing Number of Shares 88,447
Closing Net Asset Value Per Share1 £96.15
Operating Charges2 0.48%
† The Fund launched on 8 December 2021.1 The net asset value per share shown may diverge from the net asset value per share used for dealing purposes as at 30 April 2022 because of any adjustments for trade date accounting, swing
pricing and any adjustments in valuation to bid prices.2 Operating charges include indirect costs incurred in the maintenance and running of the Fund, as disclosed in the detailed expenses within the Statement of Total Return.
Vanguard Global Sustainable Equity Fund
214
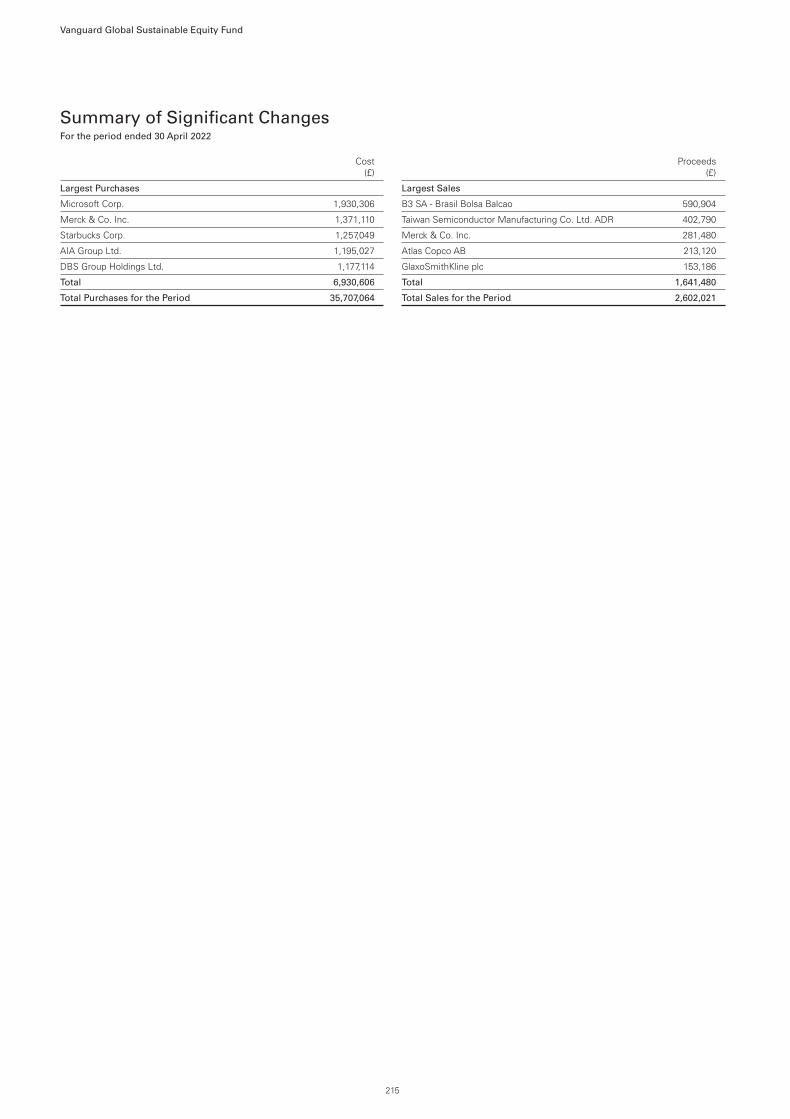
Summary of Significant ChangesFor the period ended 30 April 2022
Cost(£)
Largest Purchases
Microsoft Corp. 1,930,306
Merck & Co. Inc. 1,371,110
Starbucks Corp. 1,257,049
AIA Group Ltd. 1,195,027
DBS Group Holdings Ltd. 1,177,114
Total 6,930,606
Total Purchases for the Period 35,707,064
Proceeds(£)
Largest Sales
B3 SA - Brasil Bolsa Balcao 590,904
Taiwan Semiconductor Manufacturing Co. Ltd. ADR 402,790
Merck & Co. Inc. 281,480
Atlas Copco AB 213,120
GlaxoSmithKline plc 153,186
Total 1,641,480
Total Sales for the Period 2,602,021
Vanguard Global Sustainable Equity Fund
215

Portfolio StatementAs at 30 April 2022
Holding
MarketValue
(£)
% ofTotal Net
Assets
Canada 4.72%
Bank of Nova Scotia 19,116 967,956 2.86BCE Inc. 14,842 631,107 1.86
1,599,063 4.72
Denmark 1.60%
Vestas Wind Systems A/S 26,260 540,867 1.60
540,867 1.60
France 4.44%
Cie Generale des EtablissementsMichelin SCA 9,366 936,911 2.76
Schneider Electric SE 4,909 567,827 1.68
1,504,738 4.44
Hong Kong 3.56%
AIA Group Ltd. 152,800 1,206,008 3.56
1,206,008 3.56
Japan 5.15%
Mitsubishi UFJ Financial Group Inc. 237,100 1,099,044 3.24Recruit Holdings Co. Ltd. 21,800 645,573 1.91
1,744,617 5.15
Netherlands 5.40%
ING Groep NV 102,765 785,436 2.32Koninklijke DSM NV 4,155 560,527 1.65Wolters Kluwer NV 5,957 483,426 1.43
1,829,389 5.40
Singapore 3.42%
DBS Group Holdings Ltd. 59,200 1,158,240 3.42
1,158,240 3.42
Spain 5.14%
Iberdrola SA 97,675 903,620 2.67Industria de Diseno Textil SA 49,597 837,657 2.47
1,741,277 5.14
Switzerland 3.69%
Novartis AG 17,600 1,249,249 3.69
1,249,249 3.69
Taiwan 2.29%
Taiwan SemiconductorManufacturing Co. Ltd. 53,500 777,782 2.29
777,782 2.29
United Kingdom 10.92%
Compass Group plc 61,127 1,040,382 3.07GlaxoSmithKline plc 56,341 1,012,335 2.99Diageo plc 20,714 832,288 2.45National Grid plc 68,333 815,896 2.41
3,700,901 10.92
United States 45.83%
Microsoft Corp. 7,909 1,748,546 5.16Merck & Co. Inc. 19,209 1,357,252 4.01Visa Inc. 6,822 1,157,050 3.41Starbucks Corp. 17,623 1,047,554 3.09Texas Instruments Inc. 7,458 1,011,329 2.98Cisco Systems Inc. 25,232 984,560 2.91Northern Trust Corp. 11,628 954,875 2.82Colgate-Palmolive Co. 15,162 930,491 2.75Home Depot Inc. 3,794 907,930 2.68Deere & Co. 2,943 884,165 2.61Progressive Corp. 9,452 808,407 2.39Ecolab Inc. 5,401 728,479 2.15Prologis Inc. 5,599 714,825 2.11Automatic Data Processing Inc. 3,712 645,069 1.90Baxter International Inc. 11,276 638,210 1.88
Holding
MarketValue
(£)
% ofTotal Net
Assets
Accenture plc 2,584 618,431 1.82Trane Technologies plc 3,535 393,679 1.16
15,530,852 45.83
Total Equities 32,582,983 96.16
MarketValue
(£)
% ofTotal Net
Assets
Portfolio of Investments 32,582,983 96.16
Net Other Assets 1,302,064 3.84
Net Assets Attributable to Shareholders 33,885,047 100.00
All holdings are listed on an official stock exchange or are traded on an eligible securitiesmarket, unless otherwise stated.
Vanguard Global Sustainable Equity Fund
216

As at
30 April 2022(£)
Assets:
Financial Assets 32,582,983Current Assets
Debtors 634,835Cash and Bank Balances 836,348
Total Assets 34,054,166
Liabilities:
Creditors
Other Creditors 169,119
Total Liabilities 169,119
Net Assets Attributable to Shareholders 33,885,047
Statement of Total Return
Period Ended†
30 April 2022(£)
30 April 2022(£)
IncomeNet Capital Gains/(Losses) (488,304)Revenue 216,599
Expenses (35,912)
Net Revenue Before Taxation 180,687Taxation (28,932)
Net Revenue After Taxation 151,755
Total Return Before Distributions (336,549)
Distributions1 85,116
Change in Net Assets Attributable to
Shareholders From Investment Activities (251,433)
† The Fund launched on 8 December 2021.1 Includes adjustments for equalisation.
Statement of Change in Net Assets Attributable to Shareholders
Period Ended†
30 April 2022(£)
30 April 2022(£)
Amounts Received on Issue of Shares 34,223,413Amounts Paid on Cancellation of Shares (107,288)
34,116,125
Dilution Adjustment 20,355Change in Net Assets Attributable to
Shareholders From Investment Activities (251,433)
Closing Net Assets Attributable to Shareholders 33,885,047
† The Fund launched on 8 December 2021.
The interim financial statements for the Fund have been prepared on the same basis of the accounting policies as the annual financial statements for the year ended 31 October 2021.
Vanguard Global Sustainable Equity Fund
Balance Sheet
217

Investment Objective
Vanguard U.S. Equity Index Fund (the “Fund”) seeks to track the performance of the S&P Total Market Index (the “Index”).
Investment Strategy
The Fund is a passive fund that seeks to achieve its investment objective by investing in a representative sample of the component shares of the Index.
Synthetic Risk and Reward Indicator
Lower risk
Typically lower rewards
Higher risk
Typically higher rewards
1 2 3 4 5 6 7
The Synthetic Risk and Reward Indicator (SRRI) measures the volatility of the Fund. The risk and reward category (which may range from 1 to 7) is calculatedusing historical data and may not be a reliable indicator of the Fund’s future risk profile. The risk and reward category may shift over time and is not a target orguarantee. The lowest category (i.e. category 1) does not mean “risk free”. The Fund appears in the higher range of the risk and reward indicator because thevalues of the Fund’s investments have experienced a higher rate of change in the past.
Performance SummaryThe Performance Summary does not form part of the Financial Statements.
• Volatility surged and global financial markets slumped during the six months ended 30 April 2022. When the period began, supply bottlenecks, rising oil pricesand the prospect of less accommodative monetary policy were already weighing on market sentiment.
• Then Russia’s invasion of Ukraine injected substantial uncertainty into the markets. Energy prices soared, helping to push consumer prices to multidecadehighs across much of the world. Some central banks, including those in the United States and the United Kingdom, raised short-term interest rates. TheEuropean Central Bank continued to reduce its bond purchases and was expected to raise rates later this year.
• While consumer sentiment flagged during the period, in many markets unemployment remained low, consumer balance sheets healthy and corporate profitsrobust.
• With central banks turning less accommodative and inflation looking set to remain elevated for some time, bond yields in many markets moved higher acrossthe maturity spectrum. The Bloomberg Global Aggregate Bond Index hedged to British pounds, a global bond proxy, returned about –7% for the six months.
• Stocks regained some ground in March but finished the six months with a negative return. The FTSE Developed Index, the Fund’s equity benchmark and aproxy for global stocks, returned about –3%. The United Kingdom and Asia-Pacific were bright spots, while Europe detracted the most.
• The Fund is actively managed; it does not seek to track a benchmark. The performance information in the table below shows how the Fund’s returns comparewith those of a composite index with similar investment characteristics. From its inception on 8 December 2021 through 30 April 2022, the Fund held upsignificantly better than the index, which returned –8.81%. The Fund’s stock and bond portfolios both lagged their benchmarks.
• The United States, by far the largest market in the Fund’s equity index, drove much of the Fund’s outperformance. Japan, Switzerland and Spain were alsobright spots. In contrast, underweights in Australia and Canada and security selection in Austria and South Korea dampened the Fund’s relative performance.
• Among equity industry sectors, an underweight allocation to technology and security selection in technology, health care and industrials added the mostvalue. Security selection in basic materials, energy and consumer staples detracted.
• In the fixed income component, outperformance was driven by positioning. An underweight to credit spread duration and an overweight to Treasuriesboosted relative performance, while selection within energy and technology was a headwind.
Vanguard U.S. Equity Index FundManaged by Vanguard Global Advisers, LLC.
218

Benchmark: S&P Total Market Index
Total ReturnsPeriods Ended 30 April 2022
(Annualised for periods over one year)
Six Months Five YearsTen Years or
Since Inception1
GBP Acc -4.02% 13.21% 15.71%
Benchmark -3.99 13.30 15.83
Tracking Difference* -0.03
GBP Inc -4.02% 13.21% 15.71%
Benchmark -3.99 13.30 15.83
Tracking Difference* -0.03
Institutional Plus GBP Acc -4.00% 13.25% 15.10%
Benchmark -3.99 13.30 15.14
Tracking Difference* -0.01
Institutional Plus GBP Inc -4.00% 13.25% 15.10%
Benchmark -3.99 13.30 15.14
Tracking Difference* -0.01
Vanguard Global Advisers, LLC and Standard & Poor's.Returns is based on NAV with income reinvested.
All of the returns in this report represent past performance, which is not a guarantee of future results that may be achieved by the Fund. For performance data current to the most recent month-end,which may be higher or lower than that cited, visit our website at http://global.vanguard.com. Note, too, that both investment returns and principal value can fluctuate widely, so an investor’s shares,when sold, could be worth more or less than their original cost.* The tracking difference between the Fund return and the Index return over a stated period of time can be attributed to a number of factors, including, without limitation, small differences in
weightings, trading activity, swing pricing, transaction costs, and differences in the valuation and withholding tax treatment between the Fund and the index vendor.1 Since-inception returns: Institutional Plus GBP Acc and Institutional Plus GBP Inc, 2 September 2014.
Vanguard U.S. Equity Index Fund
219

Performance Comparative Table
GBP Acc
For the PeriodEnded
30 April 2022For the Year Ended
31 October 2021For the Year Ended
31 October 2020For the Year Ended
31 October 2019
Closing Net Asset Value £8,924,771,346 £9,129,578,408 £5,962,246,470 £4,775,577,542
Closing Number of Shares 12,395,679 12,171,017 10,766,950 9,460,074
Closing Net Asset Value Per Share1 £719.99 £750.11 £553.75 £504.81
Operating Charges2 0.10% 0.10% 0.10% 0.10%
GBP Inc
Closing Net Asset Value £1,235,318,442 £1,349,311,590 £970,144,501 £821,248,380
Closing Number of Shares 2,039,799 2,138,674 2,063,343 1,889,717
Closing Net Asset Value Per Share1 £605.61 £630.91 £470.18 £434.59
Operating Charges2 0.10% 0.10% 0.10% 0.10%
Institutional Plus GBP Acc
Closing Net Asset Value £1,150,573,102 £1,242,446,718 £739,893,568 £769,020,825
Closing Number of Shares 3,919,497 4,063,221 3,279,158 3,739,925
Closing Net Asset Value Per Share1 £293.55 £305.78 £225.64 £205.62
Operating Charges2 0.06% 0.06% 0.06% 0.06%
Institutional Plus GBP Inc
Closing Net Asset Value £959,337,661 £968,261,695 £567,077,509 £441,213,699
Closing Number of Shares 3,621,384 3,509,253 2,757,903 2,321,468
Closing Net Asset Value Per Share1 £264.91 £275.92 £205.62 £190.06
Operating Charges2 0.06% 0.06% 0.06% 0.06%
1 The net asset value per share shown may diverge from the net asset value per share used for dealing purposes as at 30 April 2022 because of any adjustments for trade date accounting, swingpricing and any adjustments in valuation to bid prices.
2 Operating charges include indirect costs incurred in the maintenance and running of the Fund, as disclosed in the detailed expenses within the Statement of Total Return.
Vanguard U.S. Equity Index Fund
220

Summary of Significant ChangesFor the period ended 30 April 2022
Cost(£)
Largest Purchases
Apple Inc. 28,660,659
Microsoft Corp. 25,017,086
Amazon.com Inc. 17,163,014
Tesla Inc. 15,388,253
Alphabet Inc. Class A 11,917,418
Total 98,146,430
Total Purchases for the Period 598,617,305
Proceeds(£)
Largest Sales
Apple Inc. 28,103,264
Microsoft Corp. 18,888,371
Amazon.com Inc. 11,131,727
Alphabet Inc. Class A 10,223,708
Meta Platforms Inc. 9,964,776
Total 78,311,846
Total Sales for the Period 481,253,884
Vanguard U.S. Equity Index Fund
221

Portfolio StatementAs at 30 April 2022
Holding
MarketValue
(£)
% ofTotal Net
Assets
Equities 99.42% (31 October 2021: 99.72%)
Communication Services 7.88% (31 October 2021: 0.00%)
Alphabet Inc. Class A 111,131 201,958,247 1.65Alphabet Inc. Class C 102,196 187,162,250 1.53Meta Platforms Inc. 851,507 135,976,542 1.11Walt Disney Co. 671,503 59,710,518 0.49Verizon Communications Inc. 1,546,665 57,037,477 0.47Comcast Corp. 1,668,360 52,834,694 0.43AT&T Inc. 2,633,723 39,563,513 0.32Netflix Inc. 163,750 24,826,600 0.20T-Mobile US Inc. 216,712 21,255,198 0.17Activision Blizzard Inc. 287,138 17,292,308 0.14Charter Communications Inc. 43,907 14,959,147 0.12Warner Bros Discovery Inc. 813,782 11,764,345 0.10Twitter Inc. 294,405 11,490,113 0.09Electronic Arts Inc. 103,909 9,770,172 0.08Snap Inc. 398,902 9,042,409 0.07Match Group Inc. 104,506 6,587,495 0.05ViacomCBS Inc. Class B 217,126 5,034,277 0.04Omnicom Group Inc. 77,084 4,676,611 0.04Liberty Broadband Corp. Class C 51,951 4,623,243 0.04ZoomInfo Technologies Inc. 111,517 4,209,309 0.04Live Nation Entertainment Inc. 49,746 4,155,998 0.03Take-Two Interactive Software Inc. 42,592 4,053,277 0.03Interpublic Group of Cos. Inc. 144,575 3,757,451 0.03Pinterest Inc. 209,161 3,418,544 0.03Fox Corp. Class A 119,078 3,399,246 0.03Liberty Media Corp-Liberty
Formula One Class C 68,125 3,382,102 0.03Roku Inc. 43,312 3,201,740 0.03Lumen Technologies Inc. 340,295 2,723,985 0.02Zynga Inc. 390,882 2,574,745 0.02Liberty Global plc Class C 132,222 2,495,946 0.02AMC Entertainment Holdings Inc. 189,432 2,306,980 0.02News Corp. Class A 144,606 2,287,434 0.02DISH Network Corp. 92,090 2,091,186 0.02IAC/InterActiveCorp 30,981 2,045,164 0.02Nexstar Media Group Inc. 15,062 1,899,455 0.02New York Times Co. 61,755 1,884,375 0.02Liberty Media Corp-Liberty
SiriusXM Class C 53,616 1,788,480 0.02Cable One Inc. 1,829 1,697,116 0.01Frontier Communications
Parent Inc. 76,613 1,609,757 0.01Sirius XM Holdings Inc. 335,879 1,605,156 0.01Vonage Holdings Corp. 92,119 1,465,245 0.01TEGNA Inc. 81,095 1,424,894 0.01Iridium Communications Inc. 48,871 1,390,419 0.01Fox Corp. Class B 50,941 1,348,688 0.01Ziff Davis Inc. 17,632 1,239,506 0.01Liberty Media Corp-Liberty
SiriusXM Class A 34,107 1,137,171 0.01Warner Music Group Corp. 42,447 1,006,489 0.01Liberty Global plc Class A 55,388 1,004,086 0.01Cargurus Inc. 32,135 836,713 0.01Madison Square Garden Sports
Corp. 6,198 800,285 0.01World Wrestling Entertainment Inc. 16,638 773,922 0.01TripAdvisor Inc. 36,276 741,700 0.01Liberty Broadband Corp. Class A 8,578 735,501 0.01Cogent Communications
Holdings Inc. 15,453 720,032 0.01Liberty Media Corp-Liberty
Formula One Class A 15,645 715,769 0.01News Corp. Class B 45,004 713,325 0.01Lions Gate Entertainment Corp.
Class B 67,448 673,674 0.01Yelp Inc. 25,427 659,421 0.01Altice USA Inc. 83,100 613,570 0.01Madison Square Garden
Entertainment Corp. 9,150 533,476 0.01TechTarget Inc. 9,915 531,643 0.01
Holding
MarketValue
(£)
% ofTotal Net
Assets
Telephone and Data Systems Inc. 35,988 525,129 0.01iHeartMedia Inc. 40,898 520,224 0.01Playtika Holding Corp. 36,878 516,380 0.01Cinemark Holdings Inc. 39,627 500,900 0.01Bumble Inc. 25,981 496,443 0.01Liberty Latin America Ltd. Class A 63,450 466,968 0.00John Wiley & Sons Inc. Class A 11,402 462,437 0.00Gray Television Inc. 31,314 461,666 0.00Vimeo Inc. 56,279 456,328 0.00Clear Channel Outdoor
Holdings Inc. 179,564 350,404 0.00Gogo Inc. 23,826 349,182 0.00Cardlytics Inc. 12,189 329,991 0.00Radius Global Infrastructure Inc. 33,320 329,352 0.00Scholastic Corp. 11,143 326,790 0.00Sinclair Broadcast Group Inc. 18,268 323,600 0.00Magnite Inc. 41,416 318,001 0.00WideOpenWest Inc. 19,065 304,007 0.00Anterix Inc. 7,131 293,248 0.00Shenandoah Telecommunications
Co. 17,812 285,730 0.00EW Scripps Co. 20,793 272,603 0.00AMC Networks Inc. 10,417 270,485 0.00EchoStar Corp. 14,060 261,490 0.00John Wiley & Sons Inc. Class B 6,415 259,001 0.00ViacomCBS Inc. Class A 9,792 246,067 0.00Liberty Media Corp-Liberty Braves
Class C 12,012 240,049 0.00Eventbrite Inc. 27,539 231,191 0.00Globalstar Inc. 249,368 228,413 0.00Cars.com Inc. 23,364 206,936 0.00PubMatic Inc. 10,165 182,492 0.00Stagwell Inc. 31,794 171,695 0.00Gannett Co. Inc. 53,178 169,848 0.00Leafly Holdings Inc. 18,452 166,222 0.00System1 Inc. 16,027 163,015 0.00fuboTV Inc. 51,632 155,862 0.00Skillz Inc. 93,414 152,528 0.00Advantage Solutions Inc. 38,101 152,343 0.00Playstudios Inc. 32,232 147,874 0.00Bandwidth Inc. 8,396 147,724 0.00AdTheorent Holding Co. Inc. 21,197 146,041 0.00QuinStreet Inc. 18,643 140,769 0.00IDT Corp. 6,353 133,891 0.00Consolidated Communications
Holdings Inc. 27,868 132,292 0.00Thryv Holdings Inc. 6,382 131,300 0.00Marcus Corp. 9,973 124,950 0.00ATN International Inc. 3,867 121,477 0.00United States Cellular Corp. 5,229 119,823 0.00Liberty Latin America Ltd. Class C 15,426 113,529 0.00Boston Omaha Corp. 6,818 113,009 0.00Liberty Media Corp-Liberty Braves
Class A 5,138 107,466 0.00TrueCar Inc. 35,332 100,466 0.00Sciplay Corp. 9,283 98,782 0.00Angi Inc. 27,528 96,474 0.00Innovid Corp. 22,130 95,888 0.00MediaAlpha Inc. 8,135 95,313 0.00EverQuote Inc. 8,285 91,462 0.00Nextdoor Holdings Inc. 23,608 84,616 0.00Audacy Inc. 41,100 82,822 0.00Entravision Communications Corp. 19,982 82,283 0.00Ooma Inc. 8,026 82,018 0.00AST SpaceMobile Inc. 13,454 80,692 0.00BuzzFeed Inc. 20,045 80,148 0.00Reservoir Media Inc. 10,727 79,288 0.00Loyalty Ventures Inc. 7,264 73,942 0.00DHI Group Inc. 16,618 73,328 0.00ZipRecruiter Inc. 3,972 71,183 0.00Daily Journal Corp. 322 65,913 0.00Cumulus Media Inc. 5,217 56,845 0.00
Vanguard U.S. Equity Index Fund
222

Holding
MarketValue
(£)
% ofTotal Net
Assets
KORE Group Holdings Inc. 11,192 47,959 0.00Wejo Group Ltd. 20,916 46,980 0.00Integral AD Science Inc. 4,812 45,265 0.00Spok Holdings Inc. 8,165 44,678 0.00National CineMedia Inc. 21,550 37,762 0.00comScore Inc. 22,447 35,937 0.00Urban One Inc. Class A 5,257 33,707 0.00Saga Communications Inc. 1,764 31,824 0.00Lee Enterprises Inc. 1,617 30,846 0.00Liberty TripAdvisor Holdings Inc. 25,425 30,174 0.00Cinedigm Corp. 50,271 27,528 0.00NerdWallet Inc. 3,485 27,342 0.00Emerald Holding Inc. 11,917 25,533 0.00IZEA Worldwide Inc. 26,409 23,769 0.00Outbrain Inc. 2,898 20,774 0.00Hemisphere Media Group Inc. 6,171 19,071 0.00Townsquare Media Inc. 2,200 18,942 0.00Chicken Soup For The Soul
Entertainment Inc. 2,723 18,717 0.00Zedge Inc. 3,956 16,227 0.00Gray Television Inc. Class A 1,251 15,604 0.00Marchex Inc. 11,241 15,489 0.00CuriosityStream Inc. 9,620 15,478 0.00Fluent Inc. 13,100 13,982 0.00Gaia Inc. 3,635 13,810 0.00Travelzoo 2,369 13,020 0.00LiveOne Inc. 23,754 12,886 0.00Reading International Inc. Class A 3,645 11,381 0.00Digital Media Solutions Inc. 5,130 11,359 0.00Lions Gate Entertainment Corp.
Class A 1,014 10,887 0.00Super League Gaming Inc. 9,833 10,808 0.00Urban One Inc. Class D 2,012 9,615 0.00Dolphin Entertainment Inc. 2,582 7,815 0.00Ballantyne Strong Inc. 3,252 7,771 0.00IHS Holding Ltd. 805 6,726 0.00NII Holdings Inc.1 28,180 5,836 0.00NextPlay Technologies Inc. 15,140 4,802 0.00NextPlat Corp. 2,648 4,429 0.00DallasNews Corp. 795 4,129 0.00Creatd Inc. 6,300 4,116 0.00Kubient Inc. 4,800 3,976 0.00Cuentas Inc. 4,701 3,632 0.00Professional Diversity Network Inc. 4,481 3,088 0.00Creative Realities Inc. 3,848 2,000 0.00Mediaco Holding Inc. 806 1,605 0.00Reading International Inc. Class C 89 1,379 0.00Grom Social Enterprises Inc. 1,967 1,255 0.00Troika Media Group Inc. 3,125 1,170 0.00Motorsport Games Inc. 1,584 1,161 0.00Media General Inc. CVR1 19,573 606 0.00ZAGG Inc.1 7,608 545 0.00Esc Srax, Inc.1 6,885 384 0.00
966,340,541 7.88
Consumer Discretionary 11.38% (31 October 2021: 16.24%)
Amazon.com Inc. 161,382 319,501,486 2.60Tesla Inc. 308,728 213,977,530 1.74Home Depot Inc. 385,019 92,137,712 0.75McDonald's Corp. 275,338 54,659,663 0.45NIKE Inc. 470,650 46,735,089 0.38Lowe's Cos. Inc. 248,361 39,094,830 0.32Target Corp. 176,626 32,168,283 0.26Booking Holdings Inc. 15,143 26,659,265 0.22Starbucks Corp. 424,055 25,206,856 0.21TJX Cos. Inc. 439,977 21,464,418 0.18Ford Motor Co. 1,450,661 16,349,536 0.13General Motors Co. 536,215 16,191,079 0.13Dollar General Corp. 85,372 16,153,693 0.13Airbnb Inc. 127,952 15,613,091 0.13Marriott International Inc. 100,855 14,261,074 0.12Hilton Worldwide Holdings Inc. 102,785 12,714,878 0.10Lululemon Athletica Inc. 43,426 12,264,077 0.10Chipotle Mexican Grill Inc. 10,370 12,022,751 0.10O'Reilly Automotive Inc. 24,817 11,989,244 0.10AutoZone Inc. 7,595 11,829,380 0.10
Holding
MarketValue
(£)
% ofTotal Net
Assets
Dollar Tree Inc. 82,748 10,708,133 0.09Ross Stores Inc. 130,450 10,365,341 0.09Yum! Brands Inc. 106,356 9,913,848 0.08eBay Inc. 231,052 9,556,769 0.08Aptiv plc 99,948 8,469,504 0.07Expedia Group Inc. 55,424 7,715,652 0.06Tractor Supply Co. 41,974 6,735,227 0.06DR Horton Inc. 119,564 6,634,822 0.06Ulta Beauty Inc. 19,908 6,289,054 0.05Best Buy Co. Inc. 80,002 5,729,172 0.05Genuine Parts Co. 52,623 5,451,329 0.05Lennar Corp. Class A 88,163 5,371,936 0.04Royal Caribbean Cruises Ltd. 82,763 5,125,305 0.04Darden Restaurants Inc. 47,584 4,992,622 0.04VF Corp. 118,766 4,919,019 0.04Garmin Ltd. 56,129 4,906,088 0.04Pool Corp. 14,736 4,756,128 0.04MGM Resorts International 140,505 4,597,326 0.04NVR Inc. 1,204 4,197,014 0.04Caesars Entertainment Inc. 78,696 4,154,495 0.03Carnival 297,450 4,096,303 0.03CarMax Inc. 59,693 4,078,901 0.03Bath & Body Works Inc. 95,167 4,006,790 0.03Burlington Stores Inc. 24,550 3,980,403 0.03LKQ Corp. 98,571 3,898,086 0.03DoorDash Inc. 59,675 3,870,912 0.03Advance Auto Parts Inc. 23,143 3,678,177 0.03Domino's Pizza Inc. 13,443 3,618,847 0.03Las Vegas Sands Corp. 127,093 3,588,566 0.03Etsy Inc. 46,680 3,464,840 0.03Hasbro Inc. 47,614 3,339,236 0.03Service Corp. International 60,710 3,173,069 0.03Whirlpool Corp. 21,720 3,137,332 0.03PulteGroup Inc. 92,052 3,062,533 0.03Vail Resorts Inc. 14,879 3,008,270 0.03Lucid Group Inc. 207,327 2,985,639 0.03Williams-Sonoma Inc. 26,822 2,787,307 0.02Aramark 94,849 2,740,081 0.02Five Below Inc. 20,671 2,586,549 0.02BorgWarner Inc. 88,143 2,584,263 0.02Newell Brands Inc. 139,535 2,572,866 0.02Tapestry Inc. 97,491 2,555,497 0.02Norwegian Cruise Line Holdings
Ltd. 157,577 2,513,951 0.02Lithia Motors Inc. 11,128 2,507,455 0.02Mattel Inc. 128,604 2,489,108 0.02Floor & Decor Holdings Inc. 38,881 2,470,049 0.02Kohl's Corp. 51,995 2,398,685 0.02Wyndham Hotels & Resorts Inc. 34,204 2,397,139 0.02Mohawk Industries Inc. 20,326 2,280,947 0.02GameStop Corp. 22,807 2,273,977 0.02Lear Corp. 22,011 2,244,227 0.02Wynn Resorts Ltd. 38,960 2,186,786 0.02Deckers Outdoor Corp. 10,137 2,146,734 0.02Macy's Inc. 110,842 2,132,968 0.02Capri Holdings Ltd. 54,552 2,070,846 0.02Gentex Corp. 87,670 2,049,473 0.02Churchill Downs Inc. 12,662 2,046,493 0.02Bright Horizons Family
Solutions Inc. 22,413 2,038,859 0.02Planet Fitness Inc. 30,679 1,955,587 0.02Marriott Vacations Worldwide Corp. 15,727 1,872,082 0.02Penn National Gaming Inc. 61,420 1,788,542 0.02Dick's Sporting Goods Inc. 23,183 1,781,702 0.02Wayfair Inc. 28,818 1,764,886 0.02TopBuild Corp. 12,217 1,762,536 0.02Brunswick Corp. 28,422 1,711,884 0.02RH 6,373 1,704,491 0.01Autoliv Inc. 28,885 1,695,138 0.01Carvana Co. 36,649 1,691,604 0.01Texas Roadhouse Inc. 25,428 1,666,845 0.01Harley-Davidson Inc. 57,132 1,661,400 0.01Murphy USA Inc. 8,673 1,614,054 0.01Terminix Global Holdings Inc. 44,016 1,609,537 0.01Polaris Inc. 21,023 1,588,906 0.01Light & Wonder Inc.1 35,488 1,584,593 0.01
Vanguard U.S. Equity Index Fund
223

Holding
MarketValue
(£)
% ofTotal Net
Assets
Peloton Interactive Inc. 111,442 1,558,678 0.01Toll Brothers Inc. 41,816 1,544,743 0.01Tempur Sealy International Inc. 70,535 1,523,061 0.01Skechers USA Inc. 49,838 1,521,140 0.01PVH Corp. 26,211 1,520,049 0.01Helen of Troy Ltd. 8,816 1,504,793 0.01Boyd Gaming Corp. 30,476 1,471,246 0.01Rivian Automotive Inc. 59,843 1,441,379 0.01Ralph Lauren Corp. 17,019 1,414,521 0.01Hyatt Hotels Corp. 18,495 1,398,872 0.01Leggett & Platt Inc. 49,182 1,395,742 0.01Travel + Leisure Co. 31,297 1,383,000 0.01Choice Hotels International Inc. 12,212 1,366,226 0.01Hanesbrands Inc. 128,539 1,357,568 0.01AutoNation Inc. 14,683 1,354,507 0.01DraftKings Inc. 122,412 1,334,783 0.01YETI Holdings Inc. 32,681 1,272,098 0.01H&R Block Inc. 60,771 1,261,403 0.01Asbury Automotive Group Inc. 8,446 1,235,921 0.01Thor Industries Inc. 20,297 1,235,602 0.01Hilton Grand Vacations Inc. 32,686 1,219,183 0.01Crocs Inc. 21,979 1,163,635 0.01QuantumScape Corp. 94,406 1,124,149 0.01Grand Canyon Education Inc. 14,479 1,106,769 0.01Signet Jewelers Ltd. 19,532 1,093,356 0.01Goodyear Tire & Rubber Co. 103,078 1,092,766 0.01Carter's Inc. 15,558 1,043,891 0.01Wendy's Co. 65,110 1,024,749 0.01SeaWorld Entertainment Inc. 18,908 1,015,655 0.01Fox Factory Holding Corp. 15,428 1,006,045 0.01Victoria's Secret & Co. 26,629 998,985 0.01Chegg Inc. 50,580 997,096 0.01Under Armour Inc. Class A 79,369 971,645 0.01Adient plc 35,125 954,292 0.01Academy Sports & Outdoors Inc. 32,058 954,207 0.01Taylor Morrison Home Corp. 44,559 929,155 0.01Penske Automotive Group Inc. 11,029 920,884 0.01National Vision Holdings Inc. 30,516 915,115 0.01Steven Madden Ltd. 27,722 906,623 0.01Meritage Homes Corp. 13,547 891,048 0.01Papa John's International Inc. 11,998 870,105 0.01Group 1 Automotive Inc. 6,259 868,084 0.01Six Flags Entertainment Corp. 28,444 867,253 0.01Sonos Inc. 47,578 864,400 0.01Ollie's Bargain Outlet Holdings Inc. 22,494 860,881 0.01Visteon Corp. 10,264 855,946 0.01Luminar Technologies Inc. 86,743 854,648 0.01Nordstrom Inc. 41,320 845,817 0.01Columbia Sportswear Co. 12,603 824,941 0.01KB Home 31,420 812,340 0.01Dorman Products Inc. 10,332 811,088 0.01Lennar Corp. Class B 15,407 801,213 0.01Wingstop Inc. 10,872 794,162 0.01Skyline Champion Corp. 19,385 787,288 0.01Gap Inc. 78,902 781,164 0.01Leslie's Inc. 49,824 777,024 0.01Boot Barn Holdings Inc. 10,747 769,452 0.01Frontdoor Inc. 31,103 765,745 0.01Under Armour Inc. Class C 67,569 763,683 0.01Chewy Inc. 32,947 762,334 0.01Foot Locker Inc. 32,570 761,393 0.01Cracker Barrel Old Country
Store Inc. 8,599 760,177 0.01Callaway Golf Co. 43,292 755,842 0.01LCI Industries 9,309 721,512 0.01Graham Holdings Co. 1,467 692,942 0.01American Eagle Outfitters Inc. 56,642 681,238 0.01Red Rock Resorts Inc. 19,200 672,267 0.01Shake Shack Inc. 14,474 665,884 0.01Gentherm Inc. 12,304 660,721 0.01Tri Pointe Homes Inc. 40,104 660,254 0.01MDC Holdings Inc. 21,948 645,591 0.01Dana Inc. 52,841 622,896 0.01Abercrombie & Fitch Co. 21,993 605,749 0.01Cavco Industries Inc. 3,130 587,408 0.01LGI Homes Inc. 7,739 577,635 0.01
Holding
MarketValue
(£)
% ofTotal Net
Assets
Vista Outdoor Inc. 20,582 577,378 0.01ODP Corp. 16,569 567,872 0.01Kontoor Brands Inc. 17,293 547,095 0.01Installed Building Products Inc. 8,458 542,107 0.01Laureate Education Inc. 59,995 540,934 0.01Levi Strauss & Co. 37,526 540,697 0.01Jack in the Box Inc. 7,985 525,973 0.01Dave & Buster's
Entertainment Inc. 14,490 524,894 0.01Winnebago Industries Inc. 12,393 524,346 0.01Cheesecake Factory Inc. 17,696 520,238 0.01Shutterstock Inc. 8,521 514,314 0.01Bloomin' Brands Inc. 29,354 514,133 0.01Sally Beauty Holdings Inc. 40,792 491,258 0.01Brinker International Inc. 16,761 484,607 0.01Stride Inc. 15,470 484,369 0.00Revolve Group Inc. 14,390 484,366 0.00Wolverine World Wide Inc. 30,398 479,637 0.00Everi Holdings Inc. 33,943 468,524 0.00Coursera Inc. 30,351 454,479 0.00Monro Inc. 12,478 453,104 0.00Century Communities Inc. 10,759 451,869 0.00Urban Outfitters Inc. 23,793 450,465 0.00Petco Health & Wellness Co. Inc. 29,019 445,166 0.00Strategic Education Inc. 8,470 435,272 0.00Qurate Retail Inc. 129,603 434,590 0.00Rent-A-Center Inc. 22,445 431,201 0.00Acushnet Holdings Corp. 13,180 427,995 0.00Adtalem Global Education Inc. 18,125 422,989 0.00Overstock.com Inc. 15,524 414,962 0.00Fisker Inc. 51,612 413,554 0.00Oxford Industries Inc. 5,770 411,736 0.00iRobot Corp. 10,116 408,185 0.00Patrick Industries Inc. 8,207 407,310 0.00Bed Bath & Beyond Inc. 37,228 403,859 0.00Dillard's Inc. 1,602 386,930 0.00Playa Hotels & Resorts NV 51,144 384,140 0.00M/I Homes Inc. 10,666 375,667 0.00Tenneco Inc. 27,301 372,711 0.00Dine Brands Global Inc. 6,194 353,583 0.00Sturm Ruger & Co. Inc. 6,494 352,502 0.00Dutch Bros Inc. 9,147 348,395 0.00GoPro Inc. 49,090 348,380 0.00G-III Apparel Group Ltd. 16,199 341,140 0.00La-Z-Boy Inc. 15,993 334,764 0.00Camping World Holdings Inc. 15,401 315,012 0.00Franchise Group Inc. 10,175 301,887 0.00Malibu Boats Inc. 7,502 299,602 0.00Monarch Casino & Resort Inc. 5,349 298,189 0.00Big Lots Inc. 11,670 287,683 0.00ADT Inc. 52,192 284,343 0.00Sleep Number Corp. 8,539 275,928 0.00Green Brick Partners Inc. 17,591 275,599 0.00Golden Entertainment Inc. 7,151 272,712 0.00Sonic Automotive Inc. 7,969 270,457 0.00Caleres Inc. 14,737 269,151 0.00Genesco Inc. 5,379 265,801 0.00Solid Power Inc. 41,049 265,159 0.00Duolingo Inc. 3,858 264,759 0.00Tupperware Brands Corp. 18,817 263,633 0.00Buckle Inc. 10,621 262,670 0.00MarineMax Inc. 8,029 261,942 0.00Guess? Inc. 14,491 259,580 0.00Designer Brands Inc. 22,750 250,603 0.00Bally's Corp. 10,396 247,169 0.00Perdoceo Education Corp. 27,644 245,944 0.00Standard Motor Products Inc. 6,902 234,574 0.00Denny's Corp. 22,807 232,884 0.00Stitch Fix Inc. 30,347 229,627 0.00Zumiez Inc. 7,811 227,891 0.00American Axle & Manufacturing
Holdings Inc. 42,290 222,650 0.00Vacasa Inc. 38,178 221,375 0.00Ruth's Hospitality Group Inc. 12,973 216,268 0.002U Inc. 27,172 215,991 0.00XPEL Inc. 6,073 209,544 0.00
Vanguard U.S. Equity Index Fund
224

Holding
MarketValue
(£)
% ofTotal Net
Assets
Boxed Inc. 22,451 204,393 0.00Aaron's Co. Inc. 12,359 202,193 0.00Canoo Inc. 51,678 197,574 0.00Chico's FAS Inc. 45,941 193,571 0.00Hibbett Inc. 5,603 192,657 0.00Winmark Corp. 1,193 191,288 0.00Accel Entertainment Inc. 19,925 187,427 0.00Smith & Wesson Brands Inc. 17,126 187,288 0.00Carriage Services Inc. 5,490 187,285 0.00EVgo Inc. 25,660 185,169 0.00Children's Place Inc. 5,018 185,092 0.00Movado Group Inc. 6,402 183,417 0.00Clarus Corp. 10,160 180,784 0.00BJ's Restaurants Inc. 8,162 180,598 0.00Mister Car Wash Inc. 14,976 171,768 0.00PowerSchool Holdings Inc. 14,117 170,011 0.00Arko Corp. 22,782 167,848 0.00OneSpaWorld Holdings Ltd. 20,736 165,822 0.00Johnson Outdoors Inc. 2,701 164,534 0.00Lovesac Co. 4,636 161,844 0.00ContextLogic Inc. 117,891 158,690 0.00Stoneridge Inc. 10,087 158,435 0.00WW International Inc. 20,254 157,773 0.00Life Time Group Holdings Inc. 13,170 149,900 0.00RCI Hospitality Holdings Inc. 3,005 147,940 0.00Shoe Carnival Inc. 6,133 147,475 0.00Ethan Allen Interiors Inc. 7,688 145,310 0.00Bowlero Corp. 16,743 145,226 0.00Quotient Technology Inc. 33,297 140,826 0.00Chuy's Holdings Inc. 7,081 140,605 0.00America's Car-Mart Inc. 2,165 139,419 0.00TravelCenters of America Inc. 4,473 135,383 0.00MasterCraft Boat Holdings Inc. 7,012 134,487 0.00Lindblad Expeditions Holdings Inc. 10,922 133,187 0.00Rover Group Inc. 26,219 131,982 0.00Funko Inc. 9,985 129,554 0.00Faraday Future Intelligent
Electric Inc. 62,852 129,158 0.00Workhorse Group Inc. 53,932 128,440 0.00Fossil Group Inc. 16,288 128,176 0.00Beazer Homes USA Inc. 10,430 125,359 0.00Poshmark Inc. 14,221 125,050 0.00RealReal Inc. 29,006 124,757 0.00PetMed Express Inc. 7,136 124,475 0.00OneWater Marine Inc. 4,757 124,087 0.00Latham Group Inc. 12,936 123,642 0.00Groupon Inc. 7,948 123,446 0.00Sonder Holdings Inc. 34,688 122,672 0.00Modine Manufacturing Co. 19,425 122,073 0.00Universal Technical Institute Inc. 14,565 120,186 0.00Portillo's Inc. 7,235 119,978 0.00Cricut Inc. 12,892 119,319 0.00Universal Electronics Inc. 5,078 119,316 0.00Bluegreen Vacations Holding Corp. 5,700 118,949 0.00Sportsman's Warehouse
Holdings Inc. 15,307 117,043 0.00Haverty Furniture Cos. Inc. 5,878 116,436 0.00Sweetgreen Inc. 5,366 115,398 0.00European Wax Center Inc. 5,196 113,108 0.00LL Flooring Holdings Inc. 10,175 111,921 0.00Liquidity Services Inc. 9,465 108,710 0.00Holley Inc. 12,801 107,159 0.00Krispy Kreme Inc. 9,987 105,717 0.00Garrett Motion Inc. 19,497 103,580 0.00ThredUp Inc. 19,714 103,163 0.00American Public Education Inc. 6,583 101,721 0.00Party City Holdco Inc. 41,442 101,666 0.00Rush Street Interactive Inc. 19,512 98,687 0.00Dream Finders Homes Inc. 7,174 98,682 0.00AMMO Inc. 28,631 92,358 0.00Century Casinos Inc. 10,858 90,548 0.00GrowGeneration Corp. 18,570 87,562 0.00Vuzix Corp. 21,057 86,542 0.001-800-Flowers.com Inc. 10,368 84,150 0.00Conn's Inc. 6,757 84,119 0.00Big 5 Sporting Goods Corp. 7,263 83,824 0.00
Holding
MarketValue
(£)
% ofTotal Net
Assets
Vinco Ventures Inc. 41,730 82,762 0.00Porch Group Inc. 27,855 82,090 0.00Build-A-Bear Workshop Inc. 5,291 79,649 0.00Full House Resorts Inc. 10,972 79,002 0.00Aterian Inc. 18,877 76,981 0.00Motorcar Parts of America Inc. 6,318 76,541 0.00Citi Trends Inc. 3,432 76,458 0.00CarParts.com Inc. 15,730 75,173 0.00Volta Inc. 44,437 73,973 0.00Express Inc. 27,084 73,777 0.00Vizio Holding Corp. 12,827 73,764 0.00Container Store Group Inc. 11,956 72,850 0.00Lordstown Motors Corp. 41,578 72,194 0.00Cato Corp. 6,488 70,125 0.00Xometry Inc. 2,664 69,661 0.00Purple Innovation Inc. 20,654 67,777 0.00Xponential Fitness Inc. 4,095 67,712 0.00Inspired Entertainment Inc. 9,138 67,543 0.00Membership Collective Group Inc. 11,284 67,317 0.00Rocky Brands Inc. 2,175 66,731 0.00Nerdy Inc. 22,498 66,661 0.00Unifi Inc. 5,701 66,568 0.00Warby Parker Inc. 3,512 65,149 0.00Vivint Smart Home Inc. 15,558 64,809 0.00BARK Inc. 26,342 64,413 0.00Legacy Housing Corp. 4,584 63,639 0.00Golden Nugget Online Gaming Inc. 15,883 63,127 0.00PLBY Group Inc. 8,491 59,785 0.00Vivid Seats Inc. 7,468 58,649 0.00Hovnanian Enterprises Inc. 1,590 58,357 0.00Red Robin Gourmet Burgers Inc. 5,541 58,212 0.00Vroom Inc. 46,122 56,941 0.00PlayAGS Inc. 10,811 56,918 0.00ONE Group Hospitality Inc. 7,619 56,437 0.00Noodles & Co. 12,670 56,008 0.00Hooker Furnishings Corp. 4,170 55,999 0.00Lincoln Educational Services Corp. 9,848 55,927 0.00Tilly's Inc. 7,911 55,512 0.00Genius Brands International Inc. 97,633 55,213 0.00Kura Sushi USA Inc. 1,360 54,357 0.00Tile Shop Holdings Inc. 11,284 53,746 0.00RumbleON Inc. 3,314 52,871 0.00Target Hospitality Corp. 10,559 52,648 0.00El Pollo Loco Holdings Inc. 6,096 51,710 0.00F45 Training Holdings Inc. 7,266 50,929 0.00Lands' End Inc. 4,528 50,564 0.00Snap One Holdings Corp. 5,308 50,268 0.00Bassett Furniture Industries Inc. 3,782 49,854 0.00Destination XL Group Inc. 12,651 49,778 0.00American Outdoor Brands Inc. 4,706 47,191 0.00Marine Products Corp. 5,025 46,628 0.00Delta Apparel Inc. 2,038 46,587 0.00Duluth Holdings Inc. 4,625 45,090 0.00Flexsteel Industries Inc. 2,608 45,056 0.00Superior Group of Cos. Inc. 3,517 44,512 0.00Strattec Security Corp. 1,603 44,419 0.00Lifetime Brands Inc. 4,421 44,298 0.00Vera Bradley Inc. 8,824 43,154 0.00Nathan's Famous Inc. 1,123 42,308 0.00Beachbody Co. Inc. 32,477 42,164 0.00XL Fleet Corp. 37,575 41,900 0.00Udemy Inc. 4,789 41,577 0.001847 Goedeker Inc. 41,153 41,300 0.00BBQ Holdings Inc. 3,440 38,770 0.00Traeger Inc. 8,058 38,445 0.00VOXX International Corp. 6,270 37,705 0.00GAN Ltd. 12,661 37,514 0.00Weyco Group Inc. 1,895 37,145 0.00Lakeland Industries Inc. 2,869 36,768 0.00Weber Inc. 5,246 36,561 0.00Potbelly Corp. 7,175 36,404 0.00First Watch Restaurant Group Inc. 3,501 36,139 0.00XpresSpa Group Inc. 47,668 35,689 0.00Lazydays Holdings Inc. 2,251 34,836 0.00JOANN Inc. 4,107 33,988 0.00Biglari Holdings Inc. Class A 62 33,581 0.00
Vanguard U.S. Equity Index Fund
225

Holding
MarketValue
(£)
% ofTotal Net
Assets
Fiesta Restaurant Group Inc. 6,198 33,471 0.00Barnes & Noble Education Inc. 13,190 31,938 0.00Escalade Inc. 3,035 31,716 0.00Rent the Runway Inc. 6,306 31,693 0.00Kirkland's Inc. 5,244 30,198 0.00Landsea Homes Corp. 4,523 29,973 0.00Arcimoto Inc. 11,132 29,703 0.00Arhaus Inc. 5,192 29,568 0.00Nautilus Inc. 12,069 28,935 0.00JAKKS Pacific Inc. 2,695 28,850 0.00Horizon Global Corp. 9,562 28,027 0.00Drive Shack Inc. 27,947 27,379 0.00Superior Industries
International Inc. 10,513 26,963 0.00Allbirds Inc. 6,637 26,749 0.00Lottery.com Inc. 13,748 25,733 0.00Hamilton Beach Brands Holding
Co. 3,447 25,616 0.00Biglari Holdings Inc. Class B 229 24,914 0.00Brilliant Earth Group Inc. 3,930 23,821 0.00Culp Inc. 4,437 22,795 0.00Shift Technologies Inc. 20,527 21,909 0.00Cooper-Standard Holdings Inc. 5,949 21,891 0.00Torrid Holdings Inc. 4,399 20,567 0.00Live Ventures Inc. 601 17,606 0.00Solo Brands Inc. 3,704 17,583 0.00iMedia Brands Inc. 5,969 17,163 0.00CarLotz Inc. 23,613 16,551 0.00Carrols Restaurant Group Inc. 12,960 16,413 0.00StoneMor Inc. 8,180 15,441 0.00Electric Last Mile Solutions Inc. 21,629 15,332 0.00Enjoy Technology Inc. 17,998 14,909 0.00Hall of Fame Resort &
Entertainment Co. 22,031 14,575 0.00J Jill Inc. 1,045 13,317 0.00BurgerFi International Inc. 3,807 11,371 0.00Remark Holdings Inc. 23,757 10,788 0.001stdibs.com Inc. 1,771 10,664 0.00AMCON Distributing Co. 81 10,570 0.00Koss Corp. 2,040 10,513 0.00Charles & Colvard Ltd. 9,552 10,499 0.00Regis Corp. 8,567 9,144 0.00AYRO Inc. 10,971 9,000 0.00Worksport Ltd. 4,701 8,837 0.00Crown Crafts Inc. 1,700 8,327 0.00Educational Development Corp. 1,600 8,220 0.00Tuesday Morning Corp. 12,091 8,202 0.00Waitr Holdings Inc. 36,081 7,610 0.00Sypris Solutions Inc. 4,300 7,158 0.00Ark Restaurants Corp. 500 7,045 0.00LMP Automotive Holdings Inc. 2,143 6,401 0.00Vince Holding Corp. 881 6,056 0.00Zovio Inc. 10,167 5,831 0.00Luby's Inc. 3,387 5,719 0.00Nephros Inc. 1,684 5,312 0.00Aspen Group Inc. 7,554 5,186 0.00Kaival Brands Innovations
Group Inc. 5,927 5,004 0.00Dixie Group Inc. 2,288 4,939 0.00Amesite Inc. 7,796 4,000 0.00Lulu's Fashion Lounge
Holdings Inc. 491 3,770 0.00TRxADE HEALTH Inc. 2,381 3,224 0.00PARTS iD Inc. 2,036 3,114 0.00Good Times Restaurants Inc. 1,100 2,918 0.00Toughbuilt Industries Inc. 304 2,620 0.00Mullen Automotive Inc. 2,345 2,484 0.00Esports Entertainment Group Inc. 5,504 2,367 0.00FAT Brands Inc. Class B 383 2,267 0.00FAT Brands Inc. Class A 458 2,123 0.00Rave Restaurant Group Inc. 2,500 1,972 0.00Muscle Maker Inc. 6,036 1,947 0.00Greenlane Holdings Inc. 6,632 1,799 0.00aka Brands Holding Corp. 596 1,685 0.00Unique Fabricating Inc. 1,400 1,561 0.00
Holding
MarketValue
(£)
% ofTotal Net
Assets
iPower Inc. 1,511 1,516 0.00Esports Technologies Inc. 435 1,265 0.00
1,395,847,761 11.38
Consumer Staples 6.22% (31 October 2021: 4.38%)
Procter & Gamble Co. 883,707 113,055,312 0.92Coca-Cola Co. 1,432,661 73,749,767 0.60PepsiCo Inc. 509,873 69,733,370 0.57Costco Wholesale Corp. 163,463 69,209,065 0.56Walmart Inc. 521,482 63,549,744 0.52Philip Morris International Inc. 571,606 45,537,238 0.37Altria Group Inc. 672,194 29,768,193 0.24Mondelez International Inc. 511,731 26,277,404 0.21Colgate-Palmolive Co. 310,395 19,048,923 0.16Estee Lauder Cos. Inc. 85,926 18,063,956 0.15Archer-Daniels-Midland Co. 206,367 14,737,440 0.12Kimberly-Clark Corp. 123,764 13,685,501 0.11Sysco Corp. 187,472 12,772,876 0.10General Mills Inc. 222,702 12,549,708 0.10Constellation Brands Inc. 60,676 11,893,553 0.10Kroger Co. 247,197 10,624,248 0.09Hershey Co. 53,426 9,608,164 0.08Monster Beverage Corp. 139,024 9,487,511 0.08Walgreens Boots Alliance Inc. 264,372 8,928,209 0.07Kraft Heinz Co. 261,664 8,884,692 0.07Keurig Dr Pepper Inc. 271,917 8,100,112 0.07Tyson Foods Inc. 108,284 8,038,282 0.07McCormick & Co. Inc. 91,721 7,351,557 0.06Church & Dwight Co. Inc. 89,905 6,986,163 0.06Clorox Co. 45,514 5,201,028 0.04Kellogg Co. 94,276 5,143,690 0.04Conagra Brands Inc. 176,128 4,902,963 0.04Bunge Ltd. 51,779 4,666,088 0.04Hormel Foods Corp. 104,651 4,366,916 0.04J M Smucker Co. 39,611 4,320,452 0.04Brown-Forman Corp. Class B 71,734 3,853,808 0.03Darling Ingredients Inc. 59,555 3,483,171 0.03Molson Coors Beverage Co. 70,035 3,018,950 0.03Lamb Weston Holdings Inc. 53,921 2,838,421 0.02Campbell Soup Co. 74,499 2,801,944 0.02BJ's Wholesale Club Holdings Inc. 50,412 2,583,438 0.02US Foods Holding Corp. 82,514 2,472,461 0.02Performance Food Group Co. 56,986 2,235,411 0.02Casey's General Stores Inc. 13,795 2,211,814 0.02Ingredion Inc. 24,753 1,678,393 0.01Flowers Foods Inc. 72,643 1,535,020 0.01Post Holdings Inc. 21,653 1,283,313 0.01Freshpet Inc. 16,205 1,203,984 0.01Sanderson Farms Inc. 7,856 1,184,375 0.01Spectrum Brands Holdings Inc. 15,726 1,065,685 0.01Simply Good Foods Co. 31,001 1,027,687 0.01Boston Beer Co. Inc. 3,436 1,024,122 0.01Sprouts Farmers Market Inc. 41,328 980,943 0.01Albertsons Cos. Inc. 37,554 935,335 0.01Lancaster Colony Corp. 7,415 916,140 0.01Hain Celestial Group Inc. 34,276 915,118 0.01Hostess Brands Inc. 49,955 902,810 0.01Grocery Outlet Holding Corp. 32,215 863,685 0.01Coty Inc. 129,233 834,790 0.01Brown-Forman Corp. Class A 16,051 798,011 0.01Herbalife Nutrition Ltd. 35,744 756,730 0.01United Natural Foods Inc. 21,769 743,665 0.01WD-40 Co. 5,051 739,244 0.01BellRing Brands Inc. 41,044 700,249 0.01J & J Snack Foods Corp. 5,525 657,015 0.01Beyond Meat Inc. 22,002 645,777 0.01Nu Skin Enterprises Inc. 18,467 626,157 0.01Coca-Cola Consolidated Inc. 1,724 605,700 0.01Edgewell Personal Care Co. 19,840 602,074 0.01Medifast Inc. 4,230 599,443 0.01Cal-Maine Foods Inc. 13,722 587,242 0.01Celsius Holdings Inc. 13,811 572,020 0.01Energizer Holdings Inc. 23,394 564,213 0.01PriceSmart Inc. 8,602 544,279 0.00Central Garden & Pet Co. 15,292 533,240 0.00TreeHouse Foods Inc. 20,582 515,902 0.00
Vanguard U.S. Equity Index Fund
226

Holding
MarketValue
(£)
% ofTotal Net
Assets
B&G Foods Inc. 23,735 508,350 0.00Vector Group Ltd. 47,514 481,384 0.00Andersons Inc. 11,616 464,732 0.00Reynolds Consumer Products Inc. 19,195 452,240 0.00Universal Corp. 9,417 433,459 0.00Inter Parfums Inc. 6,579 428,224 0.00Weis Markets Inc. 6,732 428,156 0.00Pilgrim's Pride Corp. 17,988 406,037 0.00Ingles Markets Inc. 5,085 376,909 0.00Beauty Health Co. 34,605 361,072 0.00SpartanNash Co. 13,146 358,622 0.00MGP Ingredients Inc. 4,852 353,147 0.00elf Beauty Inc. 17,853 345,826 0.00Chefs' Warehouse Inc. 11,649 339,588 0.00Seaboard Corp. 95 316,138 0.00Olaplex Holdings Inc. 25,896 303,203 0.00National Beverage Corp. 8,270 289,697 0.00USANA Health Sciences Inc. 4,350 265,331 0.00Fresh Del Monte Produce Inc. 12,731 263,746 0.00Utz Brands Inc. 22,827 256,724 0.00John B Sanfilippo & Son Inc. 3,394 209,776 0.00Tootsie Roll Industries Inc. 7,055 197,012 0.00Veru Inc. 20,963 195,855 0.00Duckhorn Portfolio Inc. 12,059 186,336 0.00Calavo Growers Inc. 6,368 183,559 0.00Benson Hill Inc. 47,070 135,718 0.00Turning Point Brands Inc. 5,416 135,713 0.00Mission Produce Inc. 12,378 125,210 0.00Sovos Brands Inc. 9,324 112,140 0.00Tattooed Chef Inc. 17,593 111,962 0.00BRC Inc. 9,175 109,106 0.00Seneca Foods Corp. 2,437 105,302 0.00Rite Aid Corp. 19,379 98,168 0.00Local Bounti Corp. 16,501 92,001 0.0022nd Century Group Inc. 59,779 90,942 0.00Central Garden & Pet Co. Class A 2,648 87,254 0.00Landec Corp. 10,765 85,400 0.00Vintage Wine Estates Inc. 9,388 77,018 0.00AppHarvest Inc. 23,158 75,810 0.00Whole Earth Brands Inc. 13,560 74,415 0.00Natural Grocers by Vitamin
Cottage Inc. 4,451 72,464 0.00Vital Farms Inc. 7,697 70,563 0.00HF Foods Group Inc. 13,218 61,063 0.00Nature's Sunshine Products Inc. 3,824 50,408 0.00Oil-Dri Corp. of America 2,499 49,662 0.00Limoneira Co. 4,673 44,441 0.00Alico Inc. 1,400 44,113 0.00Village Super Market Inc. 2,308 42,391 0.00Vita Coco Co. Inc. 4,506 38,869 0.00Honest Co. Inc. 9,485 29,917 0.00Farmer Bros Co. 5,625 28,002 0.00Alkaline Water Co. Inc. 36,263 22,240 0.00Blue Apron Holdings Inc. 6,588 15,794 0.00NewAge Inc. 43,434 13,658 0.00Better Choice Co. Inc. 8,001 13,255 0.00RiceBran Technologies 32,454 13,183 0.00Mannatech Inc. 500 12,971 0.00LifeMD Inc. 7,082 12,579 0.00Zevia PBC 4,584 12,560 0.00Revlon Inc. 2,570 12,548 0.00Natural Health Trends Corp. 2,230 12,256 0.00Zivo Bioscience Inc. 4,691 11,882 0.00Splash Beverage Group Inc. 6,074 10,837 0.00S&W Seed Co. 9,474 10,338 0.00MedAvail Holdings Inc. 7,383 9,585 0.00Lifevantage Corp. 3,029 9,409 0.00United-Guardian Inc. 500 8,407 0.00Jupiter Wellness Inc. 9,792 8,267 0.00Reed's Inc. 42,154 8,058 0.00Natural Alternatives
International Inc. 900 6,853 0.00Summer Infant Inc. 631 5,926 0.00Eastside Distilling Inc. 7,267 5,209 0.00Arcadia Biosciences Inc. 6,760 5,115 0.00Nuzee Inc. 4,091 4,953 0.00
Holding
MarketValue
(£)
% ofTotal Net
Assets
Thorne HealthTech Inc. 776 4,104 0.00Laird Superfood Inc. 1,414 3,367 0.00Real Good Food Co. Inc. 398 2,203 0.00Willamette Valley Vineyards Inc. 220 1,609 0.00Guardion Health Sciences Inc. 10,166 1,508 0.00
763,595,753 6.22
Energy 4.18% (31 October 2021: 3.04%)
Exxon Mobil Corp. 1,560,733 105,851,330 0.86Chevron Corp. 710,618 88,675,797 0.72ConocoPhillips 481,568 36,622,930 0.30EOG Resources Inc. 215,664 20,044,460 0.16Schlumberger NV 517,471 16,070,238 0.13Pioneer Natural Resources Co. 83,616 15,472,448 0.13Marathon Petroleum Corp. 214,487 14,910,725 0.12Occidental Petroleum Corp. 327,109 14,353,186 0.12Valero Energy Corp. 150,736 13,379,539 0.11Williams Cos. Inc. 447,820 12,230,777 0.10Phillips 66 172,575 11,910,487 0.10Devon Energy Corp. 231,893 10,740,399 0.09Kinder Morgan Inc. 718,357 10,384,845 0.09Cheniere Energy Inc. 86,927 9,411,375 0.08Halliburton Co. 331,156 9,392,640 0.08Hess Corp. 101,427 8,312,890 0.07ONEOK Inc. 164,221 8,283,640 0.07Baker Hughes Co. 335,320 8,282,173 0.07Coterra Energy Inc. 299,161 6,855,322 0.06Diamondback Energy Inc. 62,608 6,294,706 0.05Marathon Oil Corp. 285,949 5,675,703 0.05Targa Resources Corp. 84,229 4,926,270 0.04APA Corp. 133,439 4,349,121 0.04Ovintiv Inc. 96,291 3,922,198 0.03EQT Corp. 111,004 3,515,346 0.03Antero Resources Corp. 104,804 2,935,846 0.02Chesapeake Energy Corp. 38,582 2,520,505 0.02Southwestern Energy Co. 419,822 2,504,552 0.02Texas Pacific Land Corp. 2,292 2,491,314 0.02Range Resources Corp. 92,303 2,200,420 0.02NOV Inc. 144,461 2,087,233 0.02PDC Energy Inc. 35,739 1,986,068 0.02HF Sinclair Corp. 54,814 1,659,918 0.01Murphy Oil Corp. 53,699 1,625,725 0.01Matador Resources Co. 40,329 1,568,189 0.01DT Midstream Inc. 35,341 1,513,005 0.01Helmerich & Payne Inc. 40,009 1,466,518 0.01CNX Resources Corp. 77,244 1,264,328 0.01SM Energy Co. 44,664 1,263,612 0.01ChampionX Corp. 73,859 1,241,278 0.01Civitas Resources Inc. 26,497 1,236,948 0.01Patterson-UTI Energy Inc. 79,507 1,041,095 0.01Magnolia Oil & Gas Corp. 54,268 1,003,233 0.01Antero Midstream Corp. 120,771 986,945 0.01Valaris Ltd. 24,223 978,373 0.01California Resources Corp. 30,327 969,835 0.01Continental Resources Inc. 21,631 956,898 0.01Denbury Inc. 18,372 936,233 0.01Equitrans Midstream Corp. 148,136 927,398 0.01Kosmos Energy Ltd. 167,382 901,236 0.01Renewable Energy Group Inc. 18,250 887,279 0.01Cactus Inc. 21,590 858,441 0.01TechnipFMC plc 154,276 847,872 0.01Whiting Petroleum Corp. 14,384 837,949 0.01PBF Energy Inc. 34,696 802,802 0.01Arch Resources Inc. 5,482 724,383 0.01Callon Petroleum Co. 17,276 705,763 0.01Oasis Petroleum Inc. 6,672 704,984 0.01Enviva Inc. 10,365 693,807 0.01Transocean Ltd. 224,382 668,410 0.01Peabody Energy Corp. 35,140 633,387 0.01Weatherford International plc 24,236 621,005 0.01Tellurian Inc. 147,929 586,767 0.01Noble Corp. 22,526 572,524 0.01Liberty Energy Inc. 41,362 530,408 0.01Delek US Holdings Inc. 26,780 515,976 0.01NexTier Oilfield Solutions Inc. 56,812 498,208 0.00Northern Oil and Gas Inc. 24,564 488,541 0.00
Vanguard U.S. Equity Index Fund
227

Holding
MarketValue
(£)
% ofTotal Net
Assets
New Fortress Energy Inc. 15,387 475,520 0.00Comstock Resources Inc. 33,998 460,889 0.00World Fuel Services Corp. 23,425 450,775 0.00Green Plains Inc. 19,544 436,023 0.00CONSOL Energy Inc. 11,450 433,103 0.00Centennial Resource
Development Inc. 68,082 419,717 0.00US Silica Holdings Inc. 26,853 396,966 0.00Nabors Industries Ltd. 2,921 358,733 0.00Core Laboratories NV 17,259 357,689 0.00Brigham Minerals Inc. 18,107 357,380 0.00Gulfport Energy Corp. 4,750 354,727 0.00ProPetro Holding Corp. 30,381 342,164 0.00Archrock Inc. 49,237 341,580 0.00Uranium Energy Corp. 99,462 336,689 0.00Dril-Quip Inc. 14,629 336,391 0.00Oceaneering International Inc. 36,972 333,351 0.00Laredo Petroleum Inc. 5,439 308,491 0.00Clean Energy Fuels Corp. 59,848 278,862 0.00Archaea Energy Inc. 15,148 265,557 0.00International Seaways Inc. 15,701 264,247 0.00Tidewater Inc. 15,412 245,266 0.00Talos Energy Inc. 16,811 243,160 0.00Gevo Inc. 71,371 210,901 0.00Par Pacific Holdings Inc. 17,697 206,782 0.00Berry Corp. 23,641 206,376 0.00CVR Energy Inc. 10,327 206,129 0.00RPC Inc. 24,929 205,508 0.00Ranger Oil Corp. 7,994 202,540 0.00Bristow Group Inc. 8,159 193,723 0.00Select Energy Services Inc. 27,927 172,389 0.00Helix Energy Solutions Group Inc. 49,644 162,119 0.00SandRidge Energy Inc. 10,584 156,547 0.00TETRA Technologies Inc. 49,807 145,196 0.00W&T Offshore Inc. 37,259 140,667 0.00Alto Ingredients Inc. 30,532 140,075 0.00Kinetik Holdings Inc. 2,469 139,625 0.00Earthstone Energy Inc. 12,146 130,409 0.00Oil States International Inc. 24,009 129,081 0.00REX American Resources Corp. 1,857 125,634 0.00VAALCO Energy Inc. 23,358 121,302 0.00Vertex Energy Inc. 15,960 120,892 0.00Expro Group Holdings NV 9,807 119,199 0.00Crescent Energy Inc. 9,526 119,198 0.00DMC Global Inc. 7,171 114,005 0.00Dorian LPG Ltd. 9,304 109,084 0.00SilverBow Resources Inc. 3,654 106,317 0.00Newpark Resources Inc. 35,221 98,187 0.00Solaris Oilfield Infrastructure Inc. 10,820 96,953 0.00Centrus Energy Corp. 4,121 91,151 0.00Ring Energy Inc. 24,147 85,587 0.00Aemetis Inc. 10,425 75,645 0.00Amplify Energy Corp. 13,255 70,313 0.00Evolution Petroleum Corp. 13,937 70,046 0.00Falcon Minerals Corp. 12,520 67,810 0.00Epsilon Energy Ltd. 11,494 67,472 0.00NACCO Industries Inc. 1,705 62,197 0.00Camber Energy Inc. 94,090 58,762 0.00SEACOR Marine Holdings Inc. 10,096 57,094 0.00Exterran Corp. 10,155 54,758 0.00NextDecade Corp. 11,681 51,916 0.00PHX Minerals Inc. 13,961 38,920 0.00Overseas Shipholding Group Inc. 21,198 34,950 0.00Natural Gas Services Group Inc. 3,612 34,753 0.00Excelerate Energy Inc. 1,577 33,839 0.00American Resources Corp. 20,347 29,009 0.00Riley Exploration Permian Inc. 1,416 26,030 0.00Nabors Industries Ltd. - Warrants
11/06/2026 953 23,834 0.00Geospace Technologies Corp. 5,026 22,858 0.00Nine Energy Service Inc. 10,720 22,627 0.00Adams Resources & Energy Inc. 603 18,088 0.00Hallador Energy Co. 4,900 16,587 0.00Forum Energy Technologies Inc. 994 16,491 0.00Houston American Energy Corp. 5,609 15,904 0.00Ecoark Holdings Inc. 9,225 15,577 0.00
Holding
MarketValue
(£)
% ofTotal Net
Assets
Ranger Energy Services Inc. 1,988 15,533 0.00Smart Sand Inc. 4,400 15,035 0.00KLX Energy Services Holdings Inc. 3,586 14,024 0.00Enservco Corp. 6,563 13,644 0.00PrimeEnergy Resources Corp. 200 12,008 0.00Lightbridge Corp. 2,164 11,945 0.00Westwater Resources Inc. 10,550 10,840 0.00Battalion Oil Corp. 731 10,742 0.00Independence Contract Drilling Inc. 2,546 8,314 0.00Profire Energy Inc. 7,082 7,559 0.00ENGlobal Corp. 6,863 6,942 0.00Gulf Island Fabrication Inc. 2,323 6,790 0.00Mammoth Energy Services Inc. 2,882 4,958 0.00US Well Services Inc. 7,464 4,875 0.00PEDEVCO Corp. 4,239 3,950 0.00Superior Drilling Products Inc. 4,144 3,238 0.00MIND Technology Inc. 2,737 2,224 0.00Harvest Natural Resources Inc.1 1,786 — 0.00
513,304,713 4.18
Financials 11.51% (31 October 2021: 11.56%)
Berkshire Hathaway Inc. 674,987 173,039,587 1.41JPMorgan Chase & Co. 1,089,548 103,600,296 0.85Bank of America Corp. 2,620,221 74,422,169 0.61Wells Fargo & Co. 1,432,809 49,780,244 0.41S&P Global Inc. 130,533 39,151,562 0.32Morgan Stanley 522,702 33,535,343 0.27American Express Co. 226,816 31,566,339 0.26Goldman Sachs Group Inc. 125,081 30,435,863 0.25Charles Schwab Corp. 554,375 29,297,301 0.24Citigroup Inc. 731,296 28,069,403 0.23BlackRock Inc. 52,560 26,153,976 0.21Chubb Ltd. 158,698 26,086,879 0.21Marsh & McLennan Cos. Inc. 185,749 23,923,216 0.20CME Group Inc. 132,460 23,161,233 0.19Blackstone Inc. 259,845 21,023,529 0.17PNC Financial Services Group Inc. 154,925 20,502,410 0.17US Bancorp 497,979 19,256,764 0.16Intercontinental Exchange Inc. 207,164 19,109,240 0.16Truist Financial Corp. 492,339 18,975,923 0.16Progressive Corp. 215,340 18,417,521 0.15Aon plc 79,253 18,154,009 0.15Capital One Financial Corp. 152,606 15,148,766 0.12Moody's Corp. 59,626 15,030,208 0.12American International Group Inc. 306,238 14,264,268 0.12MetLife Inc. 258,197 13,505,208 0.11Travelers Cos. Inc. 89,249 12,150,795 0.10Prudential Financial Inc. 139,486 12,061,005 0.10Allstate Corp. 103,551 10,437,572 0.09Arthur J Gallagher & Co. 76,835 10,322,996 0.09MSCI Inc. 30,135 10,113,401 0.08Aflac Inc. 221,462 10,105,577 0.08Discover Financial Services 106,519 9,542,163 0.08Bank of New York Mellon Corp. 273,938 9,179,264 0.08KKR & Co. Inc. 216,271 8,785,197 0.07M&T Bank Corp. 65,787 8,731,772 0.07Ameriprise Financial Inc. 41,120 8,693,330 0.07SVB Financial Group 21,694 8,425,838 0.07T Rowe Price Group Inc. 84,575 8,287,739 0.07First Republic Bank 66,141 7,861,582 0.07Willis Towers Watson plc 45,125 7,722,104 0.06Fifth Third Bancorp 250,851 7,500,551 0.06State Street Corp. 134,568 7,176,956 0.06Hartford Financial Services
Group Inc. 123,944 6,903,544 0.06Northern Trust Corp. 76,527 6,284,293 0.05Regions Financial Corp. 350,797 5,789,335 0.05Citizens Financial Group Inc. 181,888 5,707,992 0.05Synchrony Financial 192,649 5,645,203 0.05Huntington Bancshares Inc. 532,226 5,570,248 0.05Nasdaq Inc. 43,156 5,411,426 0.05Apollo Global Management Inc. 136,463 5,410,693 0.05Markel Corp. 5,017 5,410,045 0.05Cincinnati Financial Corp. 55,146 5,385,462 0.04Raymond James Financial Inc. 68,636 5,328,512 0.04KeyCorp 340,627 5,238,952 0.04
Vanguard U.S. Equity Index Fund
228

Holding
MarketValue
(£)
% ofTotal Net
Assets
Arch Capital Group Ltd. 142,494 5,183,351 0.04Principal Financial Group Inc. 90,677 4,921,328 0.04FactSet Research Systems Inc. 13,888 4,463,294 0.04Signature Bank 23,118 4,460,639 0.04LPL Financial Holdings Inc. 29,600 4,425,734 0.04Brown & Brown Inc. 86,328 4,263,109 0.04W R Berkley Corp. 76,659 4,060,391 0.03Ally Financial Inc. 124,135 3,949,973 0.03Loews Corp. 73,603 3,685,131 0.03First Horizon Corp. 198,220 3,534,961 0.03Cboe Global Markets Inc. 39,170 3,510,479 0.03Alleghany Corp. 5,038 3,356,739 0.03Fidelity National Financial Inc. 105,426 3,343,736 0.03Ares Management Corp. 61,778 3,259,889 0.03Equitable Holdings Inc. 137,926 3,168,287 0.03Everest Re Group Ltd. 14,421 3,161,936 0.03Comerica Inc. 48,041 3,133,090 0.03Assurant Inc. 20,829 3,017,259 0.03East West Bancorp Inc. 52,121 2,958,711 0.03MarketAxess Holdings Inc. 13,929 2,924,589 0.02Lincoln National Corp. 60,862 2,915,848 0.02Annaly Capital Management Inc. 532,309 2,721,961 0.02American Financial Group Inc. 24,227 2,670,275 0.02Globe Life Inc. 34,135 2,666,906 0.02Webster Financial Corp. 65,590 2,612,628 0.02Zions Bancorp NA 56,146 2,526,681 0.02First Citizens BancShares Inc. 4,885 2,487,711 0.02Western Alliance Bancorp 39,003 2,360,682 0.02Commerce Bancshares Inc. 40,680 2,215,609 0.02Cullen/Frost Bankers Inc. 20,824 2,193,361 0.02Tradeweb Markets Inc. 38,518 2,184,066 0.02Reinsurance Group of America Inc. 24,783 2,118,447 0.02Voya Financial Inc. 40,980 2,062,545 0.02Starwood Property Trust Inc. 111,681 2,035,253 0.02Franklin Resources Inc. 103,303 2,023,273 0.02Stifel Financial Corp. 38,505 1,898,720 0.02First American Financial Corp. 40,647 1,887,794 0.02RenaissanceRe Holdings Ltd. 16,277 1,860,672 0.02Invesco Ltd. 126,352 1,849,740 0.02Unum Group 75,400 1,833,501 0.02Old Republic International Corp. 104,133 1,824,711 0.02Popular Inc. 29,199 1,813,802 0.02Synovus Financial Corp. 54,692 1,809,562 0.02Jefferies Financial Group Inc. 72,583 1,778,297 0.02Prosperity Bancshares Inc. 33,958 1,768,358 0.02Morningstar Inc. 8,684 1,751,532 0.02SouthState Corp. 28,334 1,748,334 0.02SEI Investments Co. 39,086 1,734,664 0.02Pinnacle Financial Partners Inc. 27,987 1,728,260 0.02AGNC Investment Corp. 194,090 1,694,325 0.01Wintrust Financial Corp. 21,962 1,527,456 0.01Hanover Insurance Group Inc. 13,042 1,525,150 0.01Interactive Brokers Group Inc. 32,050 1,520,172 0.01Janus Henderson Group plc 62,556 1,518,184 0.01Primerica Inc. 14,620 1,509,044 0.01Valley National Bancorp 156,854 1,495,453 0.01Affiliated Managers Group Inc. 14,903 1,491,368 0.01First Financial Bankshares Inc. 46,633 1,484,604 0.01Carlyle Group Inc. 51,140 1,478,192 0.01Blackstone Mortgage Trust Inc. 61,612 1,474,172 0.01OneMain Holdings Inc. 39,969 1,461,868 0.01Selective Insurance Group Inc. 22,095 1,448,713 0.01Glacier Bancorp Inc. 39,568 1,442,789 0.01Cadence Bank 72,255 1,440,495 0.01New Residential Investment Corp. 168,910 1,397,829 0.01Kinsale Capital Group Inc. 7,844 1,385,054 0.01SLM Corp. 102,831 1,370,260 0.01RLI Corp. 14,729 1,347,723 0.01Bank OZK 43,928 1,343,556 0.01Old National Bancorp 109,957 1,326,840 0.01United Bankshares Inc. 50,034 1,325,870 0.01Axis Capital Holdings Ltd. 28,697 1,311,079 0.01Essent Group Ltd. 40,230 1,298,062 0.01New York Community Bancorp Inc. 169,875 1,250,214 0.01MGIC Investment Corp. 119,716 1,245,313 0.01Houlihan Lokey Inc. 18,582 1,232,287 0.01
Holding
MarketValue
(£)
% ofTotal Net
Assets
Credit Acceptance Corp. 3,010 1,225,504 0.01Brighthouse Financial Inc. 29,605 1,211,081 0.01Evercore Inc. 14,354 1,208,799 0.01FNB Corp. 131,137 1,203,264 0.01Erie Indemnity Co. 9,362 1,195,174 0.01Hancock Whitney Corp. 31,584 1,176,569 0.01Blue Owl Capital Inc. 123,374 1,172,323 0.01PacWest Bancorp 44,481 1,165,256 0.01SoFi Technologies Inc. 238,171 1,160,976 0.01Assured Guaranty Ltd. 26,184 1,150,177 0.01ServisFirst Bancshares Inc. 17,965 1,150,017 0.01Jackson Financial Inc. 33,944 1,143,903 0.01Radian Group Inc. 66,734 1,136,949 0.01UMB Financial Corp. 15,705 1,127,557 0.01Lazard Ltd. 42,111 1,099,145 0.01Upstart Holdings Inc. 18,078 1,079,208 0.01Independent Bank Corp.
(Massachusetts) 17,474 1,071,404 0.01Umpqua Holdings Corp. 79,284 1,043,858 0.01Silvergate Capital Corp. 11,050 1,030,453 0.01Walker & Dunlop Inc. 10,797 1,028,789 0.01Hannon Armstrong Sustainable
Infrastructure Capital Inc. 31,687 1,009,541 0.01Community Bank System Inc. 19,360 992,903 0.01Mr Cooper Group Inc. 27,589 988,193 0.01Coinbase Global Inc. 10,816 970,984 0.01BankUnited Inc. 32,169 961,610 0.01Home BancShares Inc. 55,029 947,173 0.01CVB Financial Corp. 51,323 940,615 0.01Eastern Bankshares Inc. 61,616 939,331 0.01FirstCash Holdings Inc. 14,674 932,333 0.01White Mountains Insurance Group
Ltd. 1,097 913,764 0.01United Community Banks Inc. 37,950 910,437 0.01American Equity Investment Life
Holding Co. 30,212 907,683 0.01Cathay General Bancorp 28,369 905,864 0.01Simmons First National Corp. 46,415 882,458 0.01First Hawaiian Inc. 46,135 866,845 0.01Enstar Group Ltd. 4,603 863,332 0.01Bank of Hawaii Corp. 14,547 861,349 0.01CNO Financial Group Inc. 44,738 859,839 0.01Associated Banc-Corp 54,000 857,634 0.01Pacific Premier Bancorp Inc. 34,104 850,494 0.01Kemper Corp. 22,317 820,334 0.01First BanCorp (Puerto Rico) 74,458 807,740 0.01Federated Hermes Inc. 35,609 807,477 0.01Ameris Bancorp 24,248 805,369 0.01Fulton Financial Corp. 65,294 788,936 0.01Moelis & Co. 22,235 783,139 0.01WSFS Financial Corp. 23,900 762,020 0.01First Interstate BancSystem Inc. 29,156 754,735 0.01Arbor Realty Trust Inc. 55,413 754,729 0.01Texas Capital Bancshares Inc. 18,370 751,480 0.01Atlantic Union Bankshares Corp. 27,740 745,699 0.01Independent Bank Group Inc. 13,737 741,830 0.01Navient Corp. 57,517 727,953 0.01BOK Financial Corp. 10,972 724,737 0.01Virtu Financial Inc. 31,504 724,429 0.01American National Group Inc. 4,746 712,750 0.01Hamilton Lane Inc. 12,975 707,811 0.01Chimera Investment Corp. 87,225 696,132 0.01Focus Financial Partners Inc. 20,888 656,337 0.01Artisan Partners Asset
Management Inc. 25,186 644,745 0.01Ryan Specialty Group Holdings Inc. 21,655 638,007 0.01Columbia Banking System Inc. 28,453 635,461 0.01Trupanion Inc. 12,514 635,318 0.01First Merchants Corp. 20,005 624,290 0.01WesBanco Inc. 23,678 607,462 0.01Cohen & Steers Inc. 9,752 603,295 0.01Axos Financial Inc. 19,966 602,240 0.01International Bancshares Corp. 18,941 599,836 0.01Washington Federal Inc. 24,607 596,408 0.01First Financial Bancorp 34,280 558,364 0.01Seacoast Banking Corp. of Florida 21,609 558,340 0.01
Vanguard U.S. Equity Index Fund
229

Holding
MarketValue
(£)
% ofTotal Net
Assets
Genworth Financial Inc. 187,839 552,071 0.01Towne Bank 25,108 551,356 0.01Flagstar Bancorp Inc. 19,434 546,566 0.01Sandy Spring Bancorp Inc. 17,391 543,685 0.01Cannae Holdings Inc. 30,384 542,096 0.01PRA Group Inc. 16,094 538,774 0.01Heartland Financial USA Inc. 15,332 534,513 0.01Banner Corp. 12,377 528,696 0.01Lakeland Financial Corp. 9,070 525,995 0.01Trustmark Corp. 23,056 511,621 0.01Provident Financial Services Inc. 28,846 508,222 0.01Park National Corp. 5,412 507,060 0.01Horace Mann Educators Corp. 15,943 505,528 0.01Hope Bancorp Inc. 44,057 501,102 0.01Enterprise Financial Services Corp. 14,201 499,608 0.01Nelnet Inc. 7,618 497,551 0.01Two Harbors Investment Corp. 128,638 492,830 0.01Veritex Holdings Inc. 18,316 479,236 0.00Triumph Bancorp Inc. 8,560 473,442 0.00NBT Bancorp Inc. 16,825 471,582 0.00Piper Sandler Cos. 5,158 471,430 0.00Renasant Corp. 19,799 468,521 0.00PennyMac Financial Services Inc. 12,003 464,250 0.00PJT Partners Inc. 8,731 458,699 0.00NMI Holdings Inc. 31,278 458,146 0.00Apollo Commercial Real Estate
Finance Inc. 47,224 452,869 0.00Northwest Bancshares Inc. 44,689 451,339 0.00LendingClub Corp. 36,886 448,038 0.00Eagle Bancorp Inc. 11,190 447,867 0.00Hilltop Holdings Inc. 21,999 446,463 0.00Westamerica BanCorp 9,439 442,140 0.00PROG Holdings Inc. 20,904 440,391 0.00PennyMac Mortgage Investment
Trust 35,469 433,369 0.00BancFirst Corp. 6,632 431,833 0.00Encore Capital Group Inc. 9,325 429,150 0.00Argo Group International Holdings
Ltd. 12,546 427,393 0.00MFA Financial Inc. 37,111 421,212 0.00Green Dot Corp. 19,804 417,532 0.00Stewart Information Services Corp. 9,809 403,141 0.00Ladder Capital Corp. 44,406 402,147 0.00Open Lending Corp. 36,889 400,475 0.00First Foundation Inc. 22,500 398,028 0.00Live Oak Bancshares Inc. 11,794 397,642 0.00Meta Financial Group Inc. 11,344 393,945 0.00Palomar Holdings Inc. 9,084 393,387 0.00CNA Financial Corp. 10,336 390,965 0.00Enova International Inc. 13,028 387,882 0.00ProAssurance Corp. 19,770 386,739 0.00Safety Insurance Group Inc. 5,591 382,352 0.00FB Financial Corp. 12,362 379,771 0.00OFG Bancorp 17,920 379,381 0.00Mercury General Corp. 9,354 376,171 0.00Stock Yards Bancorp Inc. 8,949 372,643 0.00Virtus Investment Partners Inc. 2,651 371,963 0.00Bancorp Inc. 20,550 370,571 0.00First Bancorp (North Carolina) 12,338 368,125 0.00Customers Bancorp Inc. 10,884 364,707 0.00Tompkins Financial Corp. 6,248 364,230 0.00City Holding Co. 5,914 363,696 0.00StepStone Group Inc. 17,733 361,863 0.00Southside Bancshares Inc. 11,556 360,256 0.00BRP Group Inc. 19,518 359,112 0.00First Commonwealth Financial
Corp. 33,380 358,393 0.00S&T Bancorp Inc. 15,800 355,138 0.00Berkshire Hills Bancorp Inc. 17,969 354,084 0.00Rocket Cos. Inc. 49,427 348,016 0.00First Busey Corp. 19,417 347,201 0.00StoneX Group Inc. 6,383 344,900 0.00Brookline Bancorp Inc. 29,816 343,400 0.00Capitol Federal Financial Inc. 44,783 343,140 0.00New York Mortgage Trust Inc. 133,583 342,602 0.00Goosehead Insurance Inc. 7,379 337,183 0.00
Holding
MarketValue
(£)
% ofTotal Net
Assets
BGC Partners Inc. 115,433 332,829 0.001st Source Corp. 9,246 318,142 0.00Redwood Trust Inc. 40,934 316,256 0.00Dime Community Bancshares Inc. 12,547 314,100 0.00OceanFirst Financial Corp. 21,093 314,001 0.00National Bank Holdings Corp. 10,788 313,715 0.00Employers Holdings Inc. 9,922 310,897 0.00Ready Capital Corp. 26,700 310,064 0.00PGT Innovations Inc. 21,603 305,591 0.00ConnectOne Bancorp Inc. 13,717 304,494 0.00Lakeland Bancorp Inc. 24,953 298,720 0.00Federal Agricultural Mortgage
Corp. 3,598 293,027 0.00Nicolet Bankshares Inc. 4,512 292,462 0.00QCR Holdings Inc. 6,683 288,239 0.00Broadmark Realty Capital Inc. 46,240 287,642 0.00Heritage Financial Corp. 14,850 285,763 0.00TriCo Bancshares 9,525 284,574 0.00Preferred Bank 5,316 283,393 0.00German American Bancorp Inc. 10,038 280,152 0.00Premier Financial Corp. 13,129 277,011 0.00Blucora Inc. 17,098 275,638 0.00Banc of California Inc. 19,106 274,073 0.00LendingTree Inc. 4,284 270,996 0.00James River Group Holdings Ltd. 13,925 262,861 0.00AMERISAFE Inc. 7,052 260,343 0.00TPG Inc. 12,777 257,881 0.00Washington Trust Bancorp Inc. 6,894 257,749 0.00Metropolitan Bank Holding Corp. 3,602 255,511 0.00Ellington Financial Inc. 19,239 248,092 0.00HomeStreet Inc. 7,670 247,541 0.00KKR Real Estate Finance Trust Inc. 16,354 247,492 0.00Donnelley Financial Solutions Inc. 10,580 246,656 0.00Univest Financial Corp. 12,293 246,349 0.00Kearny Financial Corp. 25,281 238,815 0.00BrightSpire Capital Inc. 35,088 237,833 0.00TriState Capital Holdings Inc. 9,776 235,231 0.00Origin Bancorp Inc. 7,698 230,357 0.00Columbia Financial Inc. 15,080 227,491 0.00Lemonade Inc. 13,469 223,679 0.00World Acceptance Corp. 1,484 223,055 0.00Victory Capital Holdings Inc. 9,999 214,714 0.00Horizon Bancorp Inc. 15,350 213,592 0.00Allegiance Bancshares Inc. 6,545 212,745 0.00TFS Financial Corp. 17,460 208,463 0.00United Fire Group Inc. 8,941 208,303 0.00B Riley Financial Inc. 5,771 207,214 0.00Brightsphere Investment
Group Inc. 12,955 206,681 0.00Amerant Bancorp Inc. 9,722 205,436 0.00HarborOne Bancorp Inc. 18,829 200,813 0.00Hippo Holdings Inc. 135,216 200,320 0.00Community Trust Bancorp Inc. 6,272 198,626 0.00Hanmi Financial Corp. 10,779 198,323 0.00ARMOUR Residential REIT Inc. 33,882 197,544 0.00TrustCo Bank Corp. NY 7,952 197,042 0.00Northfield Bancorp Inc. 18,763 195,625 0.00WisdomTree Investments Inc. 41,943 194,765 0.00A-Mark Precious Metals Inc. 3,043 191,015 0.00TPG RE Finance Trust Inc. 22,753 191,013 0.00Central Pacific Financial Corp. 9,923 190,793 0.00First Bancshares Inc. 7,432 190,254 0.00Peoples Bancorp Inc. 8,695 189,898 0.00Ares Commercial Real Estate Corp. 15,794 189,704 0.00Heritage Commerce Corp. 21,094 188,342 0.00Merchants Bancorp 9,987 187,092 0.00Camden National Corp. 5,250 186,708 0.00Cowen Inc. 10,234 186,013 0.00Flushing Financial Corp. 10,835 185,459 0.00CrossFirst Bankshares Inc. 18,042 183,941 0.00First Community Bankshares Inc. 8,249 174,967 0.00Franklin BSP Realty Trust Inc. 16,249 171,614 0.00Great Southern Bancorp Inc. 3,778 170,469 0.00Arrow Financial Corp. 6,784 169,019 0.00Invesco Mortgage Capital Inc. 118,000 163,536 0.00Dynex Capital Inc. 12,598 162,856 0.00
Vanguard U.S. Equity Index Fund
230

Holding
MarketValue
(£)
% ofTotal Net
Assets
MBIA Inc. 16,648 159,651 0.00Cambridge Bancorp 2,439 158,423 0.00First Mid Bancshares Inc. 5,514 157,976 0.00Mercantile Bank Corp. 6,297 157,287 0.00HCI Group Inc. 3,037 155,249 0.00Byline Bancorp Inc. 8,293 154,961 0.00Old Second Bancorp Inc. 14,127 154,941 0.00Equity Bancshares Inc. 6,307 153,166 0.00SiriusPoint Ltd. 29,980 149,960 0.00Midland States Bancorp Inc. 7,136 149,825 0.00First Financial Corp. 4,393 148,953 0.00Granite Point Mortgage Trust Inc. 19,073 147,814 0.00Bridge Investment Group
Holdings Inc. 9,812 146,770 0.00Nexpoint Real Estate Finance Inc. 7,861 146,576 0.00Diamond Hill Investment
Group Inc. 1,068 143,225 0.00Hingham Institution For Savings
The 556 143,072 0.00Farmers National Banc Corp. 11,631 141,647 0.00Peapack-Gladstone Financial Corp. 5,679 140,132 0.00MVB Financial Corp. 4,229 134,937 0.00PCSB Financial Corp. 9,194 134,084 0.00MidWestOne Financial Group Inc. 5,641 133,892 0.00Business First Bancshares Inc. 7,600 133,840 0.00CBTX Inc. 5,873 133,318 0.00Republic Bancorp Inc. 3,984 132,038 0.00Carter Bankshares Inc. 10,115 131,805 0.00Orchid Island Capital Inc. 59,197 131,077 0.00Coastal Financial Corp. 4,008 131,014 0.00Bank of Marin Bancorp 5,229 130,152 0.00West BanCorp Inc. 6,388 127,200 0.00National Western Life Group Inc. 802 126,940 0.00Financial Institutions Inc. 5,647 125,219 0.00Bank First Corp. 2,225 125,011 0.00CNB Financial Corp. 6,257 123,844 0.00Alerus Financial Corp. 6,082 123,287 0.00AssetMark Financial Holdings Inc. 8,050 123,235 0.00Regional Management Corp. 3,571 122,446 0.00HomeTrust Bancshares Inc. 5,635 121,273 0.00Independent Bank Corp. (Michigan) 7,693 120,956 0.00Farmers & Merchants Bancorp Inc. 3,768 114,405 0.00RBB Bancorp 6,415 109,293 0.00Bar Harbor Bankshares 5,251 109,202 0.00Ambac Financial Group Inc. 17,591 108,026 0.00SmartFinancial Inc. 5,470 106,786 0.00First of Long Island Corp. 7,907 105,679 0.00Citizens & Northern Corp. 5,603 104,429 0.00Blue Foundry Bancorp 10,364 104,177 0.00EZCORP Inc. 18,532 103,325 0.00American National Bankshares Inc. 3,726 103,099 0.00Shore Bancshares Inc. 6,427 103,047 0.00Capstar Financial Holdings Inc. 6,425 103,015 0.00South Plains Financial Inc. 5,368 102,571 0.00Metrocity Bankshares Inc. 6,204 100,707 0.00First Internet Bancorp 3,283 100,647 0.00Waterstone Financial Inc. 7,814 99,954 0.00Mid Penn Bancorp Inc. 4,839 99,555 0.00Universal Insurance Holdings Inc. 9,811 98,149 0.00Bridgewater Bancshares Inc. 7,432 94,831 0.00Capital City Bank Group Inc. 4,642 94,356 0.00Summit Financial Group Inc. 4,305 93,438 0.00Great Ajax Corp. 12,589 93,352 0.00BayCom Corp. 5,184 93,110 0.00Peoples Financial Services Corp. 2,337 91,228 0.00Oppenheimer Holdings Inc. 3,504 90,119 0.00UWM Holdings Corp. 30,359 89,711 0.00Civista Bancshares Inc. 5,323 88,229 0.00Southern Missouri Bancorp Inc. 2,631 88,161 0.00Northeast Bank 2,936 87,156 0.00Ponce Financial Group Inc. 10,521 87,067 0.00Home Bancorp Inc. 2,800 85,483 0.00Sierra Bancorp 4,931 85,423 0.00ACNB Corp. 3,110 84,667 0.00Hagerty Inc. 11,210 84,466 0.00Southern First Bancshares Inc. 2,300 83,720 0.00
Holding
MarketValue
(£)
% ofTotal Net
Assets
Oscar Health Inc. 14,001 81,965 0.00First Bancorp Inc. 3,508 78,654 0.00BCB Bancorp Inc. 5,181 77,457 0.00PCB Bancorp 4,551 77,028 0.00Professional Holding Corp. 4,354 76,884 0.00Enterprise Bancorp Inc. 2,834 76,431 0.00Perella Weinberg Partners 12,392 75,902 0.00Selectquote Inc. 45,891 74,932 0.00Tiptree Inc. 8,096 74,802 0.00Macatawa Bank Corp. 10,720 74,797 0.00Western New England
Bancorp Inc. 11,032 74,689 0.00Investors Title Co. 506 74,560 0.00Provident Bancorp Inc. 5,901 74,544 0.00Orrstown Financial Services Inc. 3,943 74,023 0.00GCM Grosvenor Inc. 11,240 73,859 0.00Amalgamated Financial Corp. 5,259 73,680 0.00First Northwest Bancorp 4,449 73,034 0.00Guaranty Bancshares Inc. 2,664 72,992 0.00National Bankshares Inc. 2,668 72,804 0.00Timberland Bancorp Inc. 3,447 71,411 0.00First Business Financial
Services Inc. 2,578 70,923 0.00Primis Financial Corp. 6,520 70,886 0.00Greene County Bancorp Inc. 1,707 70,700 0.00Manning & Napier Inc. 6,921 70,340 0.00Northrim BanCorp Inc. 2,201 70,246 0.00Oportun Financial Corp. 7,587 69,918 0.00First Western Financial Inc. 2,689 69,693 0.00Donegal Group Inc. Class A 6,429 69,283 0.00First Bank 6,043 68,444 0.00Red River Bancshares Inc. 1,582 68,358 0.00FS Bancorp Inc. 2,916 68,261 0.00Capital Bancorp Inc. 3,746 66,834 0.00P10 Inc. 6,899 66,325 0.00Blue Ridge Bankshares Inc. 5,559 64,512 0.00Bankwell Financial Group Inc. 2,336 63,075 0.00Curo Group Holdings Corp. 6,753 63,039 0.00Atlanticus Holdings Corp. 1,833 62,837 0.00C&F Financial Corp. 1,536 62,700 0.00Sculptor Capital Management Inc. 7,507 62,543 0.00Parke Bancorp Inc. 3,183 60,668 0.00Chicago Atlantic Real Estate
Finance Inc. 4,320 60,594 0.00Luther Burbank Corp. 5,700 60,110 0.00Community Financial Corp. 1,850 59,825 0.00Norwood Financial Corp. 2,739 59,470 0.00Ames National Corp. 3,213 59,449 0.00Penns Woods Bancorp Inc. 3,196 59,440 0.00Northeast Community Bancorp Inc. 6,631 58,995 0.00Sunlight Financial Holdings Inc. 17,375 57,571 0.00Bank of Princeton 2,429 57,402 0.00Central Valley Community Bancorp 3,700 56,878 0.00Evans Bancorp Inc. 1,902 56,219 0.00Territorial Bancorp Inc. 3,123 56,017 0.00Franklin Financial Services Corp. 2,180 55,043 0.00Moneylion Inc. 33,385 54,777 0.00eHealth Inc. 8,442 54,061 0.00Meridian Corp. 2,143 52,914 0.00AFC Gamma Inc. 4,147 52,849 0.00Ocwen Financial Corp. 3,164 52,595 0.00Velocity Financial Inc. 6,150 52,413 0.00Esquire Financial Holdings Inc. 1,835 52,251 0.00FVCBankcorp Inc. 3,151 51,550 0.00Codorus Valley Bancorp Inc. 2,721 51,147 0.00Fidelity D&D Bancorp Inc. 1,724 50,985 0.00LCNB Corp. 3,973 50,473 0.00Unity Bancorp Inc. 2,204 50,452 0.00Chemung Financial Corp. 1,356 50,287 0.00Richmond Mutual BanCorp Inc. 3,846 49,442 0.00Prudential Bancorp Inc. 4,003 49,260 0.00Investar Holding Corp. 3,141 48,985 0.00Hawthorn Bancshares Inc. 2,373 48,878 0.00ChoiceOne Financial Services Inc. 2,525 48,791 0.00First Financial Northwest Inc. 3,588 47,468 0.00Colony Bankcorp Inc. 3,484 47,452 0.00
Vanguard U.S. Equity Index Fund
231

Holding
MarketValue
(£)
% ofTotal Net
Assets
Republic First Bancorp Inc. 14,189 47,353 0.00Root Inc. 29,637 45,559 0.00MainStreet Bancshares Inc. 2,272 45,241 0.00HBT Financial Inc. 3,212 43,952 0.00Summit State Bank 3,417 43,138 0.00Greenlight Capital Re Ltd. 7,867 43,110 0.00First Savings Financial Group Inc. 2,187 42,782 0.00Landmark Bancorp Inc. 2,135 42,717 0.00Middlefield Banc Corp. 2,090 42,699 0.00Seven Hills Realty Trust 4,753 42,590 0.00California BanCorp 2,446 42,101 0.00Crawford & Co. Class A 6,755 41,859 0.00SB Financial Group Inc. 2,829 41,686 0.00AG Mortgage Investment Trust Inc. 6,894 41,567 0.00Eagle Bancorp Montana Inc. 2,600 41,418 0.00Cherry Hill Mortgage Investment
Corp. 7,888 41,152 0.00SWK Holdings Corp. 2,635 40,926 0.00CB Financial Services Inc. 2,237 40,802 0.00Greenhill & Co. Inc. 4,232 40,786 0.00Security National Financial Corp. 5,137 40,220 0.00BankFinancial Corp. 4,930 40,053 0.00First United Corp. 2,250 39,642 0.00William Penn Bancorp 4,082 39,503 0.00First Community Corp. 2,484 38,581 0.00OP Bancorp 3,743 38,309 0.00Consumer Portfolio Services Inc. 4,223 38,042 0.00Partners Bancorp 5,319 37,705 0.00Citizens Community Bancorp Inc. 3,615 37,662 0.00Ohio Valley Banc Corp. 1,568 37,467 0.00Salisbury Bancorp Inc. 891 37,336 0.00Five Star Bancorp 1,882 37,220 0.00First Guaranty Bancshares Inc. 2,053 37,201 0.00Citizens Inc. 15,618 37,195 0.00First Capital Inc. 1,270 36,416 0.00Plumas Bancorp 1,309 36,127 0.00Sachem Capital Corp. 9,398 35,930 0.00Maiden Holdings Ltd. 20,309 35,749 0.00Sterling Bancorp Inc. 6,539 35,573 0.00Medallion Financial Corp. 5,749 35,488 0.00Riverview Bancorp Inc. 6,300 35,125 0.00Peoples Bancorp of North
Carolina Inc. 1,610 34,111 0.00ACRES Commercial Realty Corp. 3,767 34,055 0.00GAMCO Investors Inc. 2,126 33,765 0.00Westwood Holdings Group Inc. 2,622 33,644 0.00FNCB Bancorp Inc. 4,719 33,264 0.00MarketWise Inc. 11,082 33,189 0.00Donegal Group Inc. Class B 3,159 32,911 0.00Silvercrest Asset Management
Group Inc. 2,000 32,863 0.00Virginia National Bankshares Corp. 1,236 32,793 0.00Bakkt Holdings Inc. 10,659 32,176 0.00Heritage Insurance Holdings Inc. 9,403 31,830 0.00Provident Financial Holdings Inc. 2,605 31,331 0.00First National Corp. 1,871 30,550 0.00Trean Insurance Group Inc. 7,594 30,364 0.00Western Asset Mortgage Capital
Corp. 26,294 29,949 0.00Ellington Residential Mortgage
REIT 4,314 29,860 0.00Pzena Investment
Management Inc. 5,931 29,714 0.00Associated Capital Group Inc. 940 29,656 0.00HMN Financial Inc. 1,546 29,553 0.00ESSA Bancorp Inc. 2,165 29,315 0.00Old Point Financial Corp. 1,440 29,006 0.00Arlington Asset Investment Corp. 11,769 28,591 0.00Bank of the James Financial
Group Inc. 2,381 27,707 0.00Katapult Holdings Inc. 19,554 27,411 0.00Finward Bancorp 864 26,495 0.00NI Holdings Inc. 2,094 26,436 0.00Value Line Inc. 504 26,282 0.00Oak Valley Bancorp 1,897 26,139 0.00Bank of South Carolina Corp. 1,882 25,948 0.00
Holding
MarketValue
(£)
% ofTotal Net
Assets
Third Coast Bancshares Inc. 1,418 25,604 0.00Sound Financial Bancorp Inc. 835 25,113 0.00Safeguard Scientifics Inc. 7,356 24,139 0.00Citizens Holding Co. 1,651 23,999 0.00Randolph Bancorp Inc. 1,140 23,917 0.00CF Bankshares Inc. 1,418 23,436 0.00IF Bancorp Inc. 1,230 23,268 0.00Limestone Bancorp Inc. 1,398 23,250 0.00Auburn National BanCorp Inc. 964 23,227 0.00Kingsway Financial Services Inc. 5,170 23,142 0.00FFBW Inc. 2,469 23,127 0.00Pioneer Bancorp Inc. 2,725 22,486 0.00Malvern Bancorp Inc. 1,756 22,113 0.00US Global Investors Inc. 5,224 21,761 0.00Union Bankshares Inc. 919 21,747 0.00Elevate Credit Inc. 9,216 21,654 0.00Emclaire Financial Corp. 776 21,386 0.00Lument Finance Trust Inc. 9,384 19,508 0.00MetroMile Inc. 24,984 19,400 0.00Angel Oak Mortgage Inc. 1,451 18,630 0.00AmeriServ Financial Inc. 5,895 18,500 0.00United Security Bancshares 2,833 17,962 0.00Community West Bancshares 1,606 17,717 0.00Manhattan Bridge Capital Inc. 3,795 17,169 0.00Finance Of America Cos. Inc. 8,693 15,717 0.00Nicholas Financial Inc. 1,900 15,133 0.00United Bancshares Inc. 569 15,019 0.00Guild Holdings Co. 2,177 14,929 0.00Crawford & Co. Class B 2,570 14,923 0.00Midwest Holding Inc. 1,632 14,559 0.00United Bancorp Inc. 1,107 14,346 0.00Home Federal Bancorp Inc. of
Louisiana 800 12,903 0.00GoHealth Inc. 19,703 11,690 0.00United Insurance Holdings Corp. 5,923 10,803 0.00OppFi Inc. 4,253 9,959 0.00Kingstone Cos. Inc. 2,920 9,791 0.00Pathfinder Bancorp Inc. 595 9,384 0.00Hallmark Financial Services Inc. 3,500 9,255 0.00Bank7 Corp. 500 9,120 0.00Heritage Global Inc. 10,769 9,092 0.00loanDepot Inc. 3,560 8,648 0.00Broadway Financial Corp. 7,441 8,475 0.00Ashford Inc. 776 7,911 0.00First US Bancshares Inc. 800 7,264 0.00Reliance Global Group Inc. 3,219 7,076 0.00Hennessy Advisors Inc. 750 5,824 0.00Elmira Savings Bank 315 5,781 0.00Catalyst Bancorp Inc. 475 5,100 0.00FlexShopper Inc. 5,096 4,546 0.00Bogota Financial Corp. 506 4,333 0.00LM Funding America Inc. 2,255 4,131 0.00Affinity Bancshares Inc. 275 3,224 0.00Mid-Southern Bancorp Inc. 265 2,923 0.00USCB Financial Holdings Inc. 269 2,907 0.00Cohen & Co. Inc. 239 2,722 0.00TC Bancshares Inc. 222 2,343 0.00Income Opportunity Realty
Investors Inc. 210 1,935 0.00Finwise Bancorp 158 1,923 0.00Cincinnati Bancorp Inc. 126 1,470 0.00Conifer Holdings Inc. 606 1,057 0.00Rhinebeck Bancorp Inc. 105 824 0.00WVS Financial Corp. 6 72 0.00Patriot National Inc.1 2,200 — 0.00
1,412,734,037 11.51
Health Care 13.77% (31 October 2021: 12.64%)
UnitedHealth Group Inc. 347,273 140,524,478 1.15Johnson & Johnson 970,764 139,571,897 1.14Pfizer Inc. 2,070,233 80,929,497 0.66AbbVie Inc. 651,748 76,211,130 0.62Eli Lilly & Co. 292,830 68,138,041 0.56Merck & Co. Inc. 931,531 65,819,252 0.54Thermo Fisher Scientific Inc. 145,266 64,000,313 0.52Abbott Laboratories 651,891 58,901,216 0.48
Vanguard U.S. Equity Index Fund
232

Holding
MarketValue
(£)
% ofTotal Net
Assets
Bristol-Myers Squibb Co. 803,543 48,174,154 0.39Danaher Corp. 234,640 46,942,926 0.38Medtronic plc 495,721 41,205,429 0.34Amgen Inc. 207,654 38,558,623 0.32CVS Health Corp. 483,866 37,048,199 0.30Anthem Inc. 89,505 35,771,326 0.29Intuitive Surgical Inc. 131,956 25,143,622 0.21Zoetis Inc. 174,535 24,630,900 0.20Stryker Corp. 123,797 23,780,252 0.20Cigna Corp. 119,334 23,457,127 0.19Gilead Sciences Inc. 462,155 21,824,895 0.18Becton Dickinson and Co. 105,114 20,674,502 0.17Regeneron Pharmaceuticals Inc. 39,313 20,638,766 0.17Vertex Pharmaceuticals Inc. 93,845 20,421,648 0.17Edwards Lifesciences Corp. 230,292 19,397,345 0.16Boston Scientific Corp. 525,330 17,607,228 0.15Humana Inc. 47,396 16,776,778 0.14HCA Healthcare Inc. 88,300 15,090,114 0.12Moderna Inc. 130,111 13,925,134 0.12Centene Corp. 215,295 13,812,826 0.11Illumina Inc. 57,688 13,629,156 0.11McKesson Corp. 55,325 13,627,878 0.11IQVIA Holdings Inc. 70,479 12,237,685 0.10Dexcom Inc. 35,774 11,642,287 0.10IDEXX Laboratories Inc. 31,286 10,727,193 0.09Agilent Technologies Inc. 111,174 10,562,189 0.09Baxter International Inc. 184,374 10,435,372 0.09Biogen Inc. 54,065 8,932,885 0.07Mettler-Toledo International Inc. 8,493 8,640,126 0.07RESMED INC-CDI 53,883 8,580,933 0.07Cerner Corp. 107,630 8,028,311 0.07Veeva Systems Inc. 51,152 7,413,879 0.06Zimmer Biomet Holdings Inc. 77,077 7,411,789 0.06West Pharmaceutical Services Inc. 27,278 6,845,243 0.06AmerisourceBergen Corp. 55,396 6,673,990 0.06Laboratory Corp. of America
Holdings 34,614 6,622,560 0.06STERIS plc 36,956 6,590,557 0.06Horizon Therapeutics plc 83,678 6,568,270 0.06Align Technology Inc. 27,076 6,246,347 0.05Avantor Inc. 224,263 5,694,545 0.05Waters Corp. 22,525 5,439,906 0.05PerkinElmer Inc. 46,393 5,424,893 0.05Molina Healthcare Inc. 21,432 5,350,742 0.05Hologic Inc. 92,949 5,330,406 0.04Cooper Cos. Inc. 18,187 5,229,828 0.04Seagen Inc. 49,334 5,147,551 0.04Insulet Corp. 25,358 4,828,015 0.04Catalent Inc. 66,525 4,798,487 0.04Cardinal Health Inc. 102,185 4,726,308 0.04Quest Diagnostics Inc. 44,281 4,720,835 0.04Alnylam Pharmaceuticals Inc. 44,210 4,698,124 0.04Royalty Pharma plc 131,644 4,464,674 0.04BioMarin Pharmaceutical Inc. 67,659 4,383,417 0.04Bio-Techne Corp. 14,478 4,378,569 0.04Incyte Corp. 69,383 4,142,530 0.04Teleflex Inc. 17,233 3,916,576 0.03ABIOMED Inc. 16,769 3,824,879 0.03Viatris Inc. 445,203 3,663,038 0.03Charles River Laboratories
International Inc. 18,586 3,571,086 0.03Elanco Animal Health Inc. 174,264 3,511,650 0.03Henry Schein Inc. 50,879 3,286,162 0.03Bio-Rad Laboratories Inc. 7,993 3,262,263 0.03Jazz Pharmaceuticals plc 22,683 2,894,859 0.03Exact Sciences Corp. 65,418 2,868,386 0.02Universal Health Services Inc. 26,936 2,628,377 0.02DENTSPLY SIRONA Inc. 80,732 2,570,819 0.02Neurocrine Biosciences Inc. 34,799 2,495,105 0.02Organon & Co. 93,261 2,401,534 0.02Repligen Corp. 19,063 2,387,467 0.02United Therapeutics Corp. 16,463 2,328,946 0.02Tenet Healthcare Corp. 39,429 2,277,177 0.02Syneos Health Inc. 38,227 2,225,416 0.02Chemed Corp. 5,613 2,192,802 0.02Exelixis Inc. 117,697 2,094,265 0.02
Holding
MarketValue
(£)
% ofTotal Net
Assets
Encompass Health Corp. 36,895 2,024,155 0.02Novocure Ltd. 33,077 2,017,288 0.02DaVita Inc. 23,077 1,991,734 0.02Envista Holdings Corp. 59,122 1,865,721 0.02Sarepta Therapeutics Inc. 32,332 1,862,920 0.02Guardant Health Inc. 37,639 1,845,824 0.02Acadia Healthcare Co. Inc. 33,512 1,811,329 0.02Tandem Diabetes Care Inc. 23,453 1,800,397 0.02Penumbra Inc. 13,094 1,799,681 0.02Change Healthcare Inc. 92,391 1,733,756 0.02Bruker Corp. 37,486 1,716,204 0.02Masimo Corp. 18,794 1,690,636 0.02Azenta Inc. 27,907 1,667,306 0.02Inspire Medical Systems Inc. 10,047 1,646,811 0.01Biohaven Pharmaceutical Holding
Co. Ltd. 23,195 1,645,911 0.01Halozyme Therapeutics Inc. 51,400 1,633,500 0.01Teladoc Health Inc. 58,629 1,576,048 0.01Shockwave Medical Inc. 12,931 1,556,457 0.01Ionis Pharmaceuticals Inc. 52,991 1,551,532 0.01LHC Group Inc. 11,714 1,547,591 0.01Globus Medical Inc. 28,985 1,528,551 0.01HealthEquity Inc. 30,793 1,527,754 0.01Ultragenyx Pharmaceutical Inc. 25,126 1,414,100 0.01Omnicell Inc. 16,038 1,395,963 0.01Alkermes plc 59,848 1,375,240 0.01AMN Healthcare Services Inc. 17,390 1,353,801 0.01Perrigo Co. plc 49,042 1,340,207 0.01Integra LifeSciences Holdings
Corp. 26,850 1,307,320 0.01Lantheus Holdings Inc. 24,725 1,306,456 0.01Premier Inc. 44,799 1,291,338 0.0110X Genomics Inc. 33,885 1,289,546 0.01Intra-Cellular Therapies Inc. 31,542 1,270,472 0.01ICU Medical Inc. 7,393 1,259,135 0.01Arrowhead Pharmaceuticals Inc. 38,368 1,256,318 0.01Ensign Group Inc. 19,374 1,239,596 0.01Amedisys Inc. 12,127 1,232,983 0.01Option Care Health Inc. 51,083 1,215,738 0.01LivaNova plc 19,753 1,204,531 0.01CONMED Corp. 10,739 1,137,196 0.01Apellis Pharmaceuticals Inc. 32,721 1,133,702 0.01Medpace Holdings Inc. 10,583 1,125,902 0.01Blueprint Medicines Corp. 23,973 1,113,966 0.01Quidel Corp. 13,843 1,109,424 0.01Doximity Inc. 34,787 1,104,428 0.01iRhythm Technologies Inc. 10,831 1,064,293 0.01CRISPR Therapeutics AG 25,857 1,021,922 0.01Novavax Inc. 27,710 994,734 0.01Intellia Therapeutics Inc. 25,411 992,152 0.01Cytokinetics Inc. 31,015 985,414 0.01Maravai LifeSciences Holdings Inc. 40,159 982,624 0.01Natera Inc. 34,953 977,737 0.01Pacira BioSciences Inc. 16,300 968,133 0.01Merit Medical Systems Inc. 18,883 932,794 0.01Mirati Therapeutics Inc. 18,281 900,144 0.01R1 RCM Inc. 49,430 886,236 0.01Insmed Inc. 50,601 885,870 0.01Enovis Corp. 16,575 856,408 0.01Neogen Corp. 39,901 838,381 0.01Prestige Consumer Healthcare Inc. 18,219 793,045 0.01STAAR Surgical Co. 17,414 791,986 0.01Progyny Inc. 25,730 787,987 0.01Patterson Cos. Inc. 32,071 785,745 0.01Owens & Minor Inc. 27,582 779,457 0.01NuVasive Inc. 18,938 775,319 0.01Haemonetics Corp. 18,611 751,703 0.01Inari Medical Inc. 11,696 751,227 0.01PTC Therapeutics Inc. 26,487 745,982 0.01Allscripts Healthcare Solutions Inc. 44,608 734,051 0.01Oak Street Health Inc. 50,808 730,858 0.01Karuna Therapeutics Inc. 8,073 716,314 0.01Integer Holdings Corp. 11,955 715,681 0.01Axonics Inc. 17,199 709,878 0.01Select Medical Holdings Corp. 38,696 695,942 0.01AtriCure Inc. 16,775 693,847 0.01
Vanguard U.S. Equity Index Fund
233

Holding
MarketValue
(£)
% ofTotal Net
Assets
Arvinas Inc. 15,829 691,660 0.01Fate Therapeutics Inc. 29,731 676,081 0.01Glaukos Corp. 17,224 649,861 0.01Denali Therapeutics Inc. 34,157 647,500 0.01Evolent Health Inc. 29,376 644,610 0.01Nevro Corp. 12,954 635,473 0.01ACADIA Pharmaceuticals Inc. 42,996 631,498 0.01Iovance Biotherapeutics Inc. 49,689 599,592 0.01Corcept Therapeutics Inc. 34,415 589,619 0.01Sotera Health Co. 36,280 589,207 0.01Ortho Clinical Diagnostics Holdings
plc 41,372 579,307 0.01Ironwood Pharmaceuticals Inc. 60,574 578,963 0.01Certara Inc. 37,997 555,352 0.01Relay Therapeutics Inc. 29,085 551,815 0.01Global Blood Therapeutics Inc. 21,611 528,441 0.01Surgery Partners Inc. 12,968 528,326 0.01Twist Bioscience Corp. 22,477 516,854 0.01Amicus Therapeutics Inc. 91,309 514,908 0.01Embecta Corp. 21,022 509,517 0.01Beam Therapeutics Inc. 16,869 504,390 0.01BioCryst Pharmaceuticals Inc. 66,445 491,656 0.01Myriad Genetics Inc. 29,852 487,428 0.01Sage Therapeutics Inc. 19,099 479,338 0.01Cerevel Therapeutics Holdings Inc. 20,156 470,066 0.01MEDNAX Inc. 31,763 468,286 0.01CareDx Inc. 19,023 461,219 0.01Ligand Pharmaceuticals Inc. 6,152 455,017 0.01Emergent BioSolutions Inc. 17,282 445,574 0.01Supernus Pharmaceuticals Inc. 19,686 437,780 0.01Veracyte Inc. 26,397 430,804 0.01Vir Biotechnology Inc. 26,517 430,017 0.01IVERIC bio Inc. 38,601 426,133 0.01Tivity Health Inc. 16,537 423,205 0.01Covetrus Inc. 38,524 423,135 0.01Xencor Inc. 21,197 422,083 0.00CorVel Corp. 3,424 421,952 0.00Turning Point Therapeutics Inc. 17,823 418,496 0.00Outset Medical Inc. 14,885 411,990 0.00Avanos Medical Inc. 17,730 411,652 0.00Pacific Biosciences of
California Inc. 81,033 408,553 0.00Celldex Therapeutics Inc. 16,787 408,477 0.00US Physical Therapy Inc. 4,802 396,896 0.00Apollo Medical Holdings Inc. 13,596 395,047 0.00CryoPort Inc. 21,636 388,086 0.00Agios Pharmaceuticals Inc. 22,030 385,503 0.00Addus HomeCare Corp. 5,706 381,354 0.00Travere Therapeutics Inc. 19,015 381,057 0.00Vericel Corp. 16,775 380,661 0.00Krystal Biotech Inc. 7,721 372,736 0.00ModivCare Inc. 4,465 370,109 0.00Amphastar Pharmaceuticals Inc. 13,028 367,648 0.00AdaptHealth Corp. 34,877 351,687 0.001Life Healthcare Inc. 62,072 348,552 0.00REVOLUTION Medicines Inc. 21,879 348,182 0.00Silk Road Medical Inc. 12,440 347,488 0.00NeoGenomics Inc. 45,666 342,995 0.00EQRx Inc. 82,952 342,247 0.00Enanta Pharmaceuticals Inc. 6,539 335,570 0.00Brookdale Senior Living Inc. 68,066 334,502 0.00Heska Corp. 3,824 334,307 0.00Schrodinger Inc. 16,858 332,057 0.00Phreesia Inc. 18,107 330,411 0.00SpringWorks Therapeutics Inc. 9,594 328,053 0.00OPKO Health Inc. 151,962 326,800 0.00Innoviva Inc. 24,029 326,320 0.00Invitae Corp. 76,953 325,464 0.00Revance Therapeutics Inc. 24,760 322,639 0.00Arcus Biosciences Inc. 16,680 322,041 0.00Mesa Laboratories Inc. 1,887 320,392 0.00Meridian Bioscience Inc. 15,656 319,105 0.00Fulgent Genetics Inc. 7,302 318,833 0.00Kymera Therapeutics Inc. 12,751 318,597 0.00Natus Medical Inc. 11,928 316,085 0.00NextGen Healthcare Inc. 20,671 310,188 0.00
Holding
MarketValue
(£)
% ofTotal Net
Assets
HarmonyBiosciences Holdings Inc. 8,622 309,444 0.00
Multiplan Corp. 86,936 306,751 0.00Antares Pharma Inc. 69,127 306,130 0.00Dynavax Technologies Corp. 42,166 296,891 0.00Axsome Therapeutics Inc. 11,738 296,839 0.00Prothena Corp. plc 12,627 293,373 0.00REGENXBIO Inc. 13,157 291,120 0.00Zentalis Pharmaceuticals Inc. 13,709 289,685 0.00Cano Health Inc. 67,824 285,774 0.00Intersect ENT Inc. 12,844 280,000 0.00National HealthCare Corp. 5,160 279,844 0.00ImmunoGen Inc. 71,603 275,462 0.00Community Health Systems Inc. 45,149 275,461 0.00GoodRx Holdings Inc. 25,273 272,356 0.00SomaLogic Inc. 53,973 271,262 0.00Cutera Inc. 6,283 271,187 0.00AngioDynamics Inc. 15,931 267,103 0.00Kura Oncology Inc. 23,309 266,229 0.00Health Catalyst Inc. 20,071 265,535 0.00TG Therapeutics Inc. 47,604 263,139 0.00Editas Medicine Inc. 24,803 261,760 0.00Atrion Corp. 525 261,350 0.00ChemoCentryx Inc. 17,646 259,595 0.00Adaptive Biotechnologies Corp. 39,158 256,999 0.00Vaxcyte Inc. 13,209 254,711 0.00Bridgebio Pharma Inc. 39,470 251,816 0.00RadNet Inc. 16,187 251,282 0.00LeMaitre Vascular Inc. 7,214 248,281 0.00NanoString Technologies Inc. 16,331 244,412 0.00agilon health Inc. 17,068 241,576 0.00Avid Bioservices Inc. 22,461 240,800 0.00Madrigal Pharmaceuticals Inc. 4,319 240,770 0.00Pulmonx Corp. 12,480 239,560 0.00Syndax Pharmaceuticals Inc. 17,854 238,764 0.00Artivion Inc. 14,527 234,769 0.00Varex Imaging Corp. 14,747 232,921 0.00Morphic Holding Inc. 9,626 232,389 0.00FibroGen Inc. 31,166 230,859 0.00MannKind Corp. 91,213 228,123 0.00Cassava Sciences Inc. 13,686 227,936 0.0023andMe Holding Co. 94,778 224,961 0.00Nektar Therapeutics 68,550 224,405 0.00Cerus Corp. 60,167 222,361 0.00Sharecare Inc. 101,902 221,579 0.00Cardiovascular Systems Inc. 14,886 221,482 0.00Alphatec Holdings Inc. 25,469 220,102 0.00Crinetics Pharmaceuticals Inc. 13,459 217,724 0.00Clover Health Investments Corp. 100,882 215,343 0.00Chinook Therapeutics Inc. 17,389 209,416 0.00Quanterix Corp. 11,815 208,915 0.00Relmada Therapeutics Inc. 10,452 208,624 0.00Catalyst Pharmaceuticals Inc. 33,927 205,913 0.00Keros Therapeutics Inc. 4,822 203,595 0.00Codexis Inc. 21,130 202,464 0.00Simulations Plus Inc. 5,341 198,198 0.00Reata Pharmaceuticals Inc. 9,752 196,593 0.00Cross Country Healthcare Inc. 13,074 194,626 0.00American Well Corp. 77,712 193,119 0.00Hanger Inc. 14,611 191,206 0.00Definitive Healthcare Corp. 10,000 188,371 0.00Anavex Life Sciences Corp. 27,262 186,524 0.00OrthoPediatrics Corp. 5,129 184,162 0.00Assembly Biosciences Inc. 131,541 183,351 0.00Hyperfine Inc. 66,245 180,980 0.00Sana Biotechnology Inc. 29,875 179,654 0.00Orthofix Medical Inc. 7,232 178,625 0.00Albireo Pharma Inc. 6,968 176,600 0.00Avidity Biosciences Inc. 15,488 176,036 0.00Privia Health Group Inc. 9,935 173,773 0.00Point Biopharma Global Inc. 25,786 173,755 0.00Allogene Therapeutics Inc. 25,922 172,400 0.00Collegium Pharmaceutical Inc. 13,459 172,271 0.00Arcutis Biotherapeutics Inc. 10,570 169,894 0.00Inovio Pharmaceuticals Inc. 77,028 168,719 0.00Atara Biotherapeutics Inc. 32,888 166,601 0.00
Vanguard U.S. Equity Index Fund
234

Holding
MarketValue
(£)
% ofTotal Net
Assets
Vanda Pharmaceuticals Inc. 21,004 165,957 0.00Senseonics Holdings Inc. 149,381 165,384 0.00Coherus Biosciences Inc. 22,909 164,952 0.00TransMedics Group Inc. 9,755 162,855 0.00Eagle Pharmaceuticals Inc. 4,645 162,825 0.00Alector Inc. 21,198 162,087 0.00Figs Inc. 12,984 161,847 0.00DocGo Inc. 28,632 159,637 0.00uniQure NV 13,363 159,121 0.00Aclaris Therapeutics Inc. 16,182 158,791 0.00iTeos Therapeutics Inc. 7,458 158,546 0.00Agiliti Inc. 10,046 157,711 0.00UFP Technologies Inc. 2,850 155,518 0.00Replimune Group Inc. 11,582 154,796 0.00Castle Biosciences Inc. 8,507 151,507 0.00GreenLight Biosciences Holdings
PBC 23,218 150,348 0.00Nuvation Bio Inc. 40,361 149,485 0.00Surmodics Inc. 4,844 149,082 0.00SI-BONE Inc. 9,342 148,594 0.00Hims & Hers Health Inc. 44,264 148,428 0.00HealthStream Inc. 9,753 148,140 0.00Inogen Inc. 7,341 147,814 0.00Nkarta Inc. 10,070 147,501 0.00PetIQ Inc. 9,032 143,159 0.00National Research Corp. 5,238 142,767 0.00Theravance Biopharma Inc. 18,251 140,280 0.00AnaptysBio Inc. 7,526 139,970 0.00Tango Therapeutics Inc. 23,824 139,282 0.00Sangamo Therapeutics Inc. 41,859 138,696 0.00OptimizeRx Corp. 6,144 137,512 0.00Zimvie Inc. 7,663 137,269 0.00Endo International plc 86,556 137,193 0.00Agenus Inc. 92,273 135,966 0.00Rocket Pharmaceuticals Inc. 16,392 134,217 0.00NGM Biopharmaceuticals Inc. 13,509 134,068 0.00Computer Programs and
Systems Inc. 5,260 133,521 0.00ViewRay Inc. 62,703 132,847 0.00Humacyte Inc. 23,554 132,263 0.00Sorrento Therapeutics Inc. 108,823 131,749 0.00Bionano Genomics Inc. 101,428 131,683 0.00CareMax Inc. 24,899 130,692 0.00Intercept Pharmaceuticals Inc. 10,355 129,571 0.00Joint Corp. 5,302 128,886 0.00Heron Therapeutics Inc. 35,503 128,099 0.00Karyopharm Therapeutics Inc. 26,342 127,986 0.00Deciphera Pharmaceuticals Inc. 15,858 127,824 0.00Nurix Therapeutics Inc. 14,461 127,621 0.00Butterfly Network Inc. 47,869 126,964 0.00Vaxart Inc. 45,465 126,744 0.00CTI BioPharma Corp. 31,159 126,572 0.00ARCA biopharma Inc. 68,423 126,437 0.00Ocugen Inc. 72,413 126,312 0.00Kezar Life Sciences Inc. 13,311 125,954 0.00Pennant Group Inc. 9,638 125,820 0.00Amneal Pharmaceuticals Inc. 40,294 123,241 0.00Arcturus Therapeutics
Holdings Inc. 7,882 121,667 0.00Protagonist Therapeutics Inc. 16,641 120,748 0.00OraSure Technologies Inc. 24,594 120,081 0.00Geron Corp. 105,300 118,258 0.00Pear Therapeutics Inc. 28,704 117,285 0.00MacroGenics Inc. 20,106 114,663 0.00Evolus Inc. 12,753 113,665 0.00Myovant Sciences Ltd. 15,126 112,165 0.00Organogenesis Holdings Inc. 21,595 110,942 0.00Phibro Animal Health Corp. 7,736 110,849 0.00Rigel Pharmaceuticals Inc. 58,096 109,205 0.00BioLife Solutions Inc. 10,820 109,019 0.00Athira Pharma Inc. 13,258 108,662 0.00ADMA Biologics Inc. 74,373 107,813 0.00PMV Pharmaceuticals Inc. 9,130 105,299 0.00CinCor Pharma Inc. 5,544 104,521 0.00Cara Therapeutics Inc. 14,813 102,883 0.00Roivant Sciences Ltd. 34,747 101,570 0.00
Holding
MarketValue
(£)
% ofTotal Net
Assets
ANI Pharmaceuticals Inc. 4,287 100,696 0.00Pardes Biosciences Inc. 16,944 99,734 0.00Quantum-Si Inc. 28,374 98,535 0.00Aerie Pharmaceuticals Inc. 17,322 98,096 0.00Utah Medical Products Inc. 1,433 96,275 0.00Aadi Bioscience Inc. 8,217 95,554 0.00Inhibrx Inc. 7,483 94,469 0.004D Molecular Therapeutics Inc. 9,956 94,445 0.00Mirum Pharmaceuticals Inc. 4,980 94,285 0.00Tactile Systems Technology Inc. 6,949 92,985 0.00Gossamer Bio Inc. 16,755 92,216 0.00Esperion Therapeutics Inc. 20,402 92,138 0.00Accolade Inc. 20,694 91,479 0.00Viridian Therapeutics Inc. 8,327 90,864 0.00Signify Health Inc. 8,270 90,769 0.00MiMedx Group Inc. 28,789 90,575 0.00Radius Health Inc. 16,509 90,073 0.00Atea Pharmaceuticals Inc. 19,207 89,801 0.002seventy bio Inc. 8,355 89,572 0.00C4 Therapeutics Inc. 13,118 89,438 0.00VBI Vaccines Inc. 87,744 87,360 0.00Viking Therapeutics Inc. 45,677 86,952 0.00Chimerix Inc. 24,731 86,869 0.00SIGA Technologies Inc. 15,856 86,763 0.00Anika Therapeutics Inc. 5,046 86,532 0.00Seres Therapeutics Inc. 22,936 86,410 0.00EyePoint Pharmaceuticals Inc. 9,537 85,457 0.00Axogen Inc. 14,710 84,710 0.00Prometheus Biosciences Inc. 4,036 84,545 0.00Ideaya Biosciences Inc. 11,030 84,339 0.00SeaSpine Holdings Corp. 11,155 82,274 0.00RAPT Therapeutics Inc. 6,825 82,248 0.00IGM Biosciences Inc. 6,127 81,693 0.00Stoke Therapeutics Inc. 7,087 81,623 0.00Praxis Precision Medicines Inc. 12,549 80,961 0.00Ocular Therapeutix Inc. 28,530 80,897 0.00Y-mAbs Therapeutics Inc. 11,999 80,184 0.00LifeStance Health Group Inc. 14,828 79,720 0.00Alignment Healthcare Inc. 10,381 79,377 0.00Adicet Bio Inc. 6,740 79,184 0.00Generation Bio Co. 15,616 78,857 0.00PROCEPT BioRobotics Corp. 2,778 78,572 0.00Sutro Biopharma Inc. 16,385 78,434 0.00Sema4 Holdings Corp. 45,525 77,597 0.00DICE Therapeutics Inc. 4,782 77,281 0.00Tricida Inc. 10,480 76,795 0.00Liquidia Corp. 17,720 76,638 0.00Fulcrum Therapeutics Inc. 9,958 76,301 0.00Owlet Inc. 25,389 75,833 0.00Akero Therapeutics Inc. 9,037 75,506 0.00ALX Oncology Holdings Inc. 7,385 75,173 0.00Seer Inc. 12,889 74,737 0.00Bioventus Inc. 7,569 72,525 0.00Bluebird Bio Inc. 25,065 72,470 0.00Xeris Biopharma Holdings Inc. 37,415 72,416 0.00Zomedica Corp. 370,508 71,741 0.00Semler Scientific Inc. 1,876 68,316 0.00Verastem Inc. 60,265 68,161 0.00Provention Bio Inc. 18,967 67,529 0.00Accuray Inc. 31,864 67,510 0.00Treace Medical Concepts Inc. 4,322 67,472 0.00ImmunityBio Inc. 23,145 67,103 0.00VistaGen Therapeutics Inc. 66,558 66,797 0.00Rhythm Pharmaceuticals Inc. 13,280 66,321 0.00KalVista Pharmaceuticals Inc. 6,528 66,190 0.00Clovis Oncology Inc. 41,965 66,181 0.00Cullinan Oncology Inc. 8,461 66,111 0.00Science 37 Holdings Inc. 21,194 66,004 0.00Immunovant Inc. 17,930 65,693 0.00iRadimed Corp. 2,503 65,590 0.00Kiniksa Pharmaceuticals Ltd. 8,654 64,310 0.00Bioxcel Therapeutics Inc. 6,115 63,999 0.00Foghorn Therapeutics Inc. 6,854 63,108 0.00IntriCon Corp. 3,292 62,903 0.00DermTech Inc. 9,207 62,847 0.00Eiger BioPharmaceuticals Inc. 11,453 62,396 0.00
Vanguard U.S. Equity Index Fund
235

Holding
MarketValue
(£)
% ofTotal Net
Assets
Vera Therapeutics Inc. 3,895 62,047 0.00Mersana Therapeutics Inc. 22,325 61,703 0.00Nautilus Biotechnology Inc. 16,607 61,640 0.00Forma Therapeutics Holdings Inc. 10,205 61,449 0.00Marinus Pharmaceuticals Inc. 11,529 60,790 0.00Omeros Corp. 21,805 59,918 0.00Verve Therapeutics Inc. 5,024 59,784 0.00XOMA Corp. 3,881 59,444 0.00Cogent Biosciences Inc. 11,473 58,576 0.00Inotiv Inc. 5,145 58,355 0.00Kodiak Sciences Inc. 12,133 58,080 0.00SmileDirectClub Inc. 39,064 57,250 0.00Dyne Therapeutics Inc. 9,005 57,093 0.00Apollo Endosurgery Inc. 13,139 56,721 0.00Standard BioTools Inc. 26,735 56,430 0.00Berkeley Lights Inc. 14,220 56,291 0.00Voyager Therapeutics Inc. 9,487 55,312 0.00Jounce Therapeutics Inc. 12,997 54,969 0.00Arbutus Biopharma Corp. 29,306 54,387 0.00Personalis Inc. 12,116 54,042 0.00Scholar Rock Holding Corp. 9,536 53,471 0.00Vicarious Surgical Inc. 13,372 52,295 0.00Kronos Bio Inc. 13,557 51,075 0.00Harvard Bioscience Inc. 12,212 50,968 0.00Ovid therapeutics Inc. 23,339 50,563 0.00Optinose Inc. 25,935 49,577 0.00G1 Therapeutics Inc. 11,888 48,575 0.00Pieris Pharmaceuticals Inc. 21,888 48,466 0.00Satsuma Pharmaceuticals Inc. 15,889 48,091 0.00Paragon 28 Inc. 3,364 48,042 0.00Arcellx Inc. 5,465 47,141 0.00Avita Medical Inc. 9,734 47,139 0.00Phathom Pharmaceuticals Inc. 4,571 46,820 0.00Imago Biosciences Inc. 3,508 45,628 0.00Recursion Pharmaceuticals Inc. 9,168 45,347 0.00Gritstone bio Inc. 21,632 44,625 0.00Lineage Cell Therapeutics Inc. 45,645 43,991 0.00Altimmune Inc. 12,095 43,544 0.00Design Therapeutics Inc. 4,593 43,387 0.00AVEO Pharmaceuticals Inc. 10,737 43,187 0.00Aldeyra Therapeutics Inc. 17,687 43,108 0.00Actinium Pharmaceuticals Inc. 8,893 42,216 0.00Cytek Biosciences Inc. 5,584 42,030 0.00Ventyx Biosciences Inc. 3,631 41,877 0.00Harrow Health Inc. 7,732 41,693 0.00Kinnate Biopharma Inc. 6,960 41,411 0.00Sensus Healthcare Inc. 7,314 41,070 0.00RxSight Inc. 4,191 40,725 0.00Zynex Inc. 7,983 40,249 0.00CorMedix Inc. 14,727 40,117 0.00Spectrum Pharmaceuticals Inc. 62,014 39,890 0.00aTyr Pharma Inc. 12,077 39,824 0.00Spero Therapeutics Inc. 10,162 39,337 0.00PDS Biotechnology Corp. 8,939 39,230 0.00Outlook Therapeutics Inc. 31,746 39,193 0.00Savara Inc. 40,941 38,153 0.00ClearPoint Neuro Inc. 5,579 38,082 0.00Allakos Inc. 12,648 37,979 0.00KemPharm Inc. 10,707 37,865 0.00Aura Biosciences Inc. 2,799 37,788 0.00ContraFect Corp. 12,598 37,227 0.00Matinas BioPharma Holdings Inc. 66,942 36,806 0.00InfuSystem Holdings Inc. 5,833 36,796 0.00Atossa Therapeutics Inc. 46,349 36,621 0.00Caribou Biosciences Inc. 6,211 36,509 0.00CEL-SCI Corp. 16,080 36,374 0.00Stereotaxis Inc. 18,263 36,221 0.00Erasca Inc. 6,244 36,206 0.00Immunic Inc. 6,720 36,183 0.00Instil Bio Inc. 6,398 35,978 0.00Citius Pharmaceuticals Inc. 44,698 35,958 0.00Gelesis Holdings Inc. 8,827 35,786 0.00Allovir Inc. 9,841 35,586 0.00Cymabay Therapeutics Inc. 19,616 35,467 0.00Electromed Inc. 3,550 35,062 0.00Talkspace Inc. 32,634 34,830 0.00
Holding
MarketValue
(£)
% ofTotal Net
Assets
Cue Biopharma Inc. 11,089 34,799 0.00Pliant Therapeutics Inc. 7,429 34,615 0.00La Jolla Pharmaceutical Co. 10,720 34,581 0.00Precigen Inc. 32,450 34,376 0.00Beyond Air Inc. 7,218 34,207 0.00Lexicon Pharmaceuticals Inc. 23,662 34,112 0.00Lyell Immunopharma Inc. 8,139 33,191 0.00Aveanna Healthcare Holdings Inc. 14,312 33,172 0.00Icosavax Inc. 5,746 33,089 0.00Amylyx Pharmaceuticals Inc. 4,608 33,069 0.00MediciNova Inc. 15,599 32,801 0.00Augmedix Inc. 15,765 32,522 0.00FONAR Corp. 2,310 32,474 0.00Athersys Inc. 82,455 32,181 0.00Apyx Medical Corp. 10,619 31,887 0.00Enzo Biochem Inc. 15,690 31,617 0.00Alaunos Therapeutics Inc. 75,165 31,563 0.00CytomX Therapeutics Inc. 22,810 31,067 0.00Oncology Institute Inc. 4,916 30,776 0.00Co-Diagnostics Inc. 8,727 30,584 0.00Asensus Surgical Inc. 85,474 30,370 0.00VolitionRX Ltd. 13,718 30,266 0.00Tarsus Pharmaceuticals Inc. 2,075 30,162 0.00Theseus Pharmaceuticals Inc. 4,626 29,882 0.00Biora Therapeutics Inc. 45,126 29,850 0.00Monte Rosa Therapeutics Inc. 3,454 29,849 0.00Otonomy Inc. 17,291 29,748 0.00ORIC Pharmaceuticals Inc. 11,168 29,443 0.00Alpine Immune Sciences Inc. 4,027 29,413 0.00Shattuck Labs Inc. 9,562 29,246 0.00Sonida Senior Living Inc.1 1,274 29,245 0.00Achieve Life Sciences Inc. 5,292 28,915 0.00Janux Therapeutics Inc. 3,691 28,899 0.00Repro-Med Systems Inc. 13,922 28,831 0.00Century Therapeutics Inc. 3,009 28,688 0.00ChromaDex Corp. 18,919 28,480 0.00ATI Physical Therapy Inc. 21,163 28,318 0.00Edgewise Therapeutics Inc. 4,415 28,062 0.009 Meters Biopharma Inc. 84,665 28,053 0.00Tenaya Therapeutics Inc. 3,834 28,003 0.00Oncocyte Corp. 30,816 27,981 0.00Durect Corp. 77,776 27,939 0.00XBiotech Inc. 4,467 27,538 0.00Anixa Biosciences Inc. 10,729 27,517 0.00MyMD Pharmaceuticals Inc. 9,282 27,207 0.00PAVmed Inc. 27,080 27,177 0.00Puma Biotechnology Inc. 14,443 27,149 0.00Precision BioSciences Inc. 17,136 27,025 0.00Inmune Bio Inc. 4,539 27,006 0.00Paratek Pharmaceuticals Inc. 15,267 26,874 0.00Conformis Inc. 64,289 26,801 0.00Fortress Biotech Inc. 30,545 26,762 0.00Adverum Biotechnologies Inc. 31,677 26,744 0.00Enochian Biosciences Inc. 4,328 26,406 0.00Vapotherm Inc. 7,461 26,385 0.00Humanigen Inc. 17,311 25,784 0.00AirSculpt Technologies Inc. 3,081 25,546 0.00Eton Pharmaceuticals Inc. 8,991 25,423 0.00Aerovate Therapeutics Inc. 2,502 25,130 0.00Poseida Therapeutics Inc. 10,153 24,988 0.00Rallybio Corp. 3,153 24,938 0.00Tyra Biosciences Inc. 4,209 24,909 0.00Innovage Holding Corp. 6,652 24,319 0.00Orgenesis Inc. 10,344 24,222 0.00Sientra Inc. 21,229 24,010 0.00Homology Medicines Inc. 18,065 23,885 0.00Eargo Inc. 7,918 23,839 0.00Taysha Gene Therapies Inc. 8,176 23,834 0.00ProPhase Labs Inc. 4,057 23,783 0.00TFF Pharmaceuticals Inc. 5,910 23,678 0.00Opiant Pharmaceuticals Inc. 1,501 23,504 0.00WaVe Life Sciences Ltd. 15,127 23,254 0.00CytoSorbents Corp. 13,865 23,191 0.00Tabula Rasa HealthCare Inc. 8,529 22,826 0.00scPharmaceuticals Inc. 5,783 22,800 0.00P3 Health Partners Inc. 4,697 22,709 0.00
Vanguard U.S. Equity Index Fund
236

Holding
MarketValue
(£)
% ofTotal Net
Assets
TherapeuticsMD Inc. 141,229 22,666 0.00Curis Inc. 30,802 22,640 0.00Clearside Biomedical Inc. 18,571 22,631 0.00Assertio Holdings Inc. 13,386 22,390 0.00Galectin Therapeutics Inc. 18,065 22,302 0.00SAB Biotherapeutics Inc. 11,335 22,300 0.00Applied Molecular Transport Inc. 6,521 22,230 0.00Societal CDMO Inc. 21,036 22,117 0.00iCAD Inc. 7,749 21,972 0.00Palatin Technologies Inc. 74,515 21,871 0.00Sesen Bio Inc. 72,405 21,863 0.00Synlogic Inc. 16,164 21,501 0.00Miromatrix Medical Inc. 7,704 21,477 0.00Nuvalent Inc. 2,607 21,305 0.00DarioHealth Corp. 5,383 21,266 0.00Capricor Therapeutics Inc. 8,495 21,246 0.00Rubius Therapeutics Inc. 16,095 21,152 0.00Merrimack Pharmaceuticals Inc. 4,707 21,145 0.00NightHawk Biosciences Inc. 11,119 21,078 0.00AquaBounty Technologies Inc. 19,728 21,056 0.00Sight Sciences Inc. 3,789 21,005 0.00Akoya Biosciences Inc. 2,766 20,731 0.00PLx Pharma Inc. 8,598 20,682 0.00UpHealth Inc. 33,255 20,663 0.00Olema Pharmaceuticals Inc. 10,152 20,619 0.00Molecular Templates Inc. 15,167 20,537 0.00Verrica Pharmaceuticals Inc. 3,922 20,492 0.00Checkpoint Therapeutics Inc. 20,323 20,234 0.00Concert Pharmaceuticals Inc. 8,238 20,144 0.00Exagen Inc. 4,141 20,120 0.00Oyster Point Pharma Inc. 3,926 19,951 0.00Lipocine Inc. 28,747 19,923 0.00Infinity Pharmaceuticals Inc. 32,129 19,897 0.00Akebia Therapeutics Inc. 59,997 19,841 0.00Evelo Biosciences Inc. 10,159 19,824 0.00Biotricity Inc. 17,086 19,733 0.00Passage Bio Inc. 12,752 19,704 0.00T2 Biosystems Inc. 65,533 19,579 0.00Hepion Pharmaceuticals Inc. 26,843 19,563 0.00Selecta Biosciences Inc. 32,340 19,422 0.00Leap Therapeutics Inc. 18,603 19,114 0.00Talaris Therapeutics Inc. 3,397 19,102 0.00BrainStorm Cell Therapeutics Inc. 8,057 19,060 0.00Celcuity Inc. 3,663 18,993 0.00Forian Inc. 6,988 18,757 0.00Ardelyx Inc. 28,680 18,734 0.00Day One Biopharmaceuticals Inc. 2,750 18,684 0.00Silverback Therapeutics Inc. 7,564 18,677 0.00Trevi Therapeutics Inc. 8,836 18,580 0.00TCR2 Therapeutics Inc. 10,852 18,411 0.00LENSAR Inc. 3,178 18,099 0.00Zynerba Pharmaceuticals Inc. 16,163 18,023 0.00Aeglea BioTherapeutics Inc. 15,712 18,021 0.00Cortexyme Inc. 6,161 17,960 0.00Adamis Pharmaceuticals Corp. 57,415 17,949 0.00Invacare Corp. 13,572 17,945 0.00iBio Inc. 76,050 17,724 0.00Retractable Technologies Inc. 5,813 17,640 0.00Sanara Medtech Inc. 905 17,588 0.00Mustang Bio Inc. 29,629 17,574 0.00Seelos Therapeutics Inc. 35,242 17,552 0.00Akouos Inc. 7,851 17,509 0.00SQZ Biotechnologies Co. 5,892 17,270 0.00Genprex Inc. 13,634 17,266 0.00Annexon Inc. 8,360 16,980 0.00Prelude Therapeutics Inc. 4,636 16,949 0.00Rani Therapeutics Holdings Inc. 1,797 16,746 0.00NextCure Inc. 5,046 16,679 0.00Vor BioPharma Inc. 3,659 16,670 0.00Neuronetics Inc. 8,534 16,585 0.00Epizyme Inc. 32,125 16,514 0.00Rapid Micro Biosystems Inc. 3,576 16,491 0.00Predictive Oncology Inc. 28,505 16,147 0.00Astria Therapeutics Inc. 3,490 16,123 0.00Spring Bank Pharmaceuticals Inc. 7,100 16,061 0.00Clene Inc. 7,769 16,027 0.00
Holding
MarketValue
(£)
% ofTotal Net
Assets
NeuroPace Inc. 2,507 15,994 0.00eFFECTOR Therapeutics Inc. 6,359 15,954 0.00Renovacor Inc. 5,543 15,894 0.00BioAtla Inc. 5,728 15,877 0.00Tela Bio Inc. 2,257 15,874 0.00Absci Corp. 3,373 15,824 0.00Entrada Therapeutics Inc. 3,299 15,713 0.00SCYNEXIS Inc. 7,488 15,686 0.00Trevena Inc. 65,918 15,567 0.00Adagio Therapeutics Inc. 6,845 15,538 0.00PhaseBio Pharmaceuticals Inc. 16,146 15,432 0.00Dare Bioscience Inc. 17,137 15,287 0.00Surface Oncology Inc. 8,943 15,101 0.00Eyenovia Inc. 7,924 15,084 0.00Quotient Ltd. 32,807 15,072 0.00Cardiff Oncology Inc. 13,841 14,773 0.00Harpoon Therapeutics Inc. 8,274 14,762 0.00Magenta Therapeutics Inc. 13,043 14,648 0.00Sharps Compliance Corp. 4,244 14,603 0.00CASI Pharmaceuticals Inc. 42,792 14,468 0.00Checkmate Pharmaceuticals Inc. 1,746 14,421 0.00Codiak Biosciences Inc. 6,119 14,378 0.00Atreca Inc. 9,205 14,370 0.00Annovis Bio Inc. 1,931 14,365 0.00Armata Pharmaceuticals Inc. 3,964 14,239 0.00Larimar Therapeutics Inc. 5,026 14,211 0.00MEI Pharma Inc. 36,036 14,156 0.00Tonix Pharmaceuticals Holding
Corp. 121,680 14,140 0.00DiaMedica Therapeutics Inc. 7,780 14,005 0.00Gemini Therapeutics Inc. 11,653 13,922 0.00180 Life Sciences Corp. 8,320 13,916 0.00Novan Inc. 6,006 13,825 0.00Syros Pharmaceuticals Inc. 20,707 13,785 0.00Delcath Systems Inc. 2,881 13,768 0.00SELLAS Life Sciences Group Inc. 6,343 13,641 0.00Microbot Medical Inc. 2,966 13,631 0.00Viracta Therapeutics Inc. 6,686 13,526 0.00Neoleukin Therapeutics Inc. 13,892 13,499 0.00Impel Pharmaceuticals Inc. 2,645 13,336 0.00Streamline Health Solutions Inc. 11,087 13,246 0.00Surrozen Inc. 6,464 13,232 0.00Corbus Pharmaceuticals
Holdings Inc. 48,273 12,880 0.00Graphite Bio Inc. 4,028 12,833 0.00Tracon Pharmaceuticals Inc. 7,958 12,740 0.00Dyadic International Inc. 7,385 12,647 0.00NeuBase Therapeutics Inc. 13,930 12,538 0.00Champions Oncology Inc. 2,093 12,353 0.00Pro-Dex Inc. 1,024 12,259 0.00GT Biopharma Inc. 7,168 12,104 0.00Alpha Teknova Inc. 1,353 12,102 0.00Vincerx Pharma Inc. 5,956 12,050 0.00Ampio Pharmaceuticals Inc. 65,364 11,974 0.00IRIDEX Corp. 3,963 11,868 0.00Eledon Pharmaceuticals Inc. 5,037 11,835 0.00Nemaura Medical Inc. 4,179 11,816 0.00Second Sight Medical
Products Inc. 10,054 11,772 0.00Greenwich Lifesciences Inc. 1,251 11,748 0.00Cyclerion Therapeutics Inc. 20,011 11,683 0.00Milestone Scientific Inc. 14,867 11,605 0.00Ikena Oncology Inc. 3,732 11,504 0.00Moleculin Biotech Inc. 9,309 11,493 0.00IsoRay Inc. 45,950 11,437 0.00Oragenics Inc. 43,979 11,409 0.00Oncternal Therapeutics Inc. 16,686 11,402 0.00Axcella Health Inc. 8,427 11,343 0.00Convey Health Solutions
Holdings Inc. 2,785 11,291 0.00Equillium Inc. 5,826 11,230 0.00Black Diamond Therapeutics Inc. 5,808 11,195 0.00Aspira Women's Health Inc. 22,205 11,142 0.00Pyxis Oncology Inc. 5,732 11,140 0.00Frequency Therapeutics Inc. 10,755 11,051 0.00Lantern Pharma Inc. 2,355 10,992 0.00
Vanguard U.S. Equity Index Fund
237

Holding
MarketValue
(£)
% ofTotal Net
Assets
AIM ImmunoTech Inc. 13,208 10,836 0.00Aquestive Therapeutics Inc. 9,770 10,817 0.00Ocuphire Pharma Inc. 5,793 10,612 0.00NRX Pharmaceuticals Inc. 8,661 10,555 0.00Werewolf Therapeutics Inc. 2,989 10,547 0.00Biomerica Inc. 3,431 10,521 0.00Solid Biosciences Inc. 23,471 10,469 0.00Singular Genomics Systems Inc. 3,204 10,412 0.00Lumos Pharma Inc. 1,531 10,377 0.00Immunome Inc. 3,437 10,293 0.00Avalo Therapeutics Inc. 30,717 10,031 0.00Applied Genetic Technologies
Corp. 13,969 10,014 0.00Accelerate Diagnostics Inc. 13,046 9,884 0.00Cidara Therapeutics Inc. 17,862 9,832 0.00UNITY Biotechnology Inc. 13,565 9,832 0.00Vaccinex Inc. 9,555 9,818 0.00Applied Therapeutics Inc. 6,237 9,786 0.00Athenex Inc. 25,435 9,763 0.00Synaptogenix Inc. 2,328 9,735 0.00Cocrystal Pharma Inc. 26,510 9,713 0.00enVVeno Medical Corp. 2,724 9,655 0.00Avrobio Inc. 13,074 9,643 0.00X4 Pharmaceuticals Inc. 9,446 9,630 0.00Tyme Technologies Inc. 38,963 9,620 0.00Pulse Biosciences Inc.1 4,771 9,462 0.00AcelRx Pharmaceuticals Inc. 48,635 9,448 0.00Rain Therapeutics Inc. 2,983 9,433 0.00Aileron Therapeutics Inc. 27,291 9,412 0.00NantHealth Inc. 16,717 9,398 0.00CareCloud Inc. 2,995 9,303 0.00Entasis Therapeutics Holdings Inc. 6,238 9,291 0.00Kala Pharmaceuticals Inc. 17,938 9,280 0.00ImmuCell Corp. 1,228 9,263 0.00Vyant Bio Inc. 12,580 9,124 0.00Vivos Therapeutics Inc. 6,846 9,106 0.00Longeveron Inc. 1,141 9,070 0.00Cellectar Biosciences Inc. 21,799 9,029 0.00Kewaunee Scientific Corp. 800 9,016 0.00Hookipa Pharma Inc. 7,495 8,955 0.00OpGen Inc. 21,707 8,949 0.00ElectroCore Inc. 26,574 8,930 0.00Precipio Inc. 10,590 8,857 0.00Synthetic Biologics Inc. 45,644 8,580 0.00Brooklyn ImmunoTherapeutics Inc. 10,352 8,575 0.00Aptinyx Inc. 12,290 8,565 0.00Bellicum Pharmaceuticals Inc. 6,948 8,467 0.00Rockwell Medical Inc. 33,171 8,402 0.00Evofem Biosciences Inc. 61,173 8,381 0.00Biomea Fusion Inc. 3,496 8,381 0.00AgeX Therapeutics Inc. 12,961 8,372 0.00Eloxx Pharmaceuticals Inc. 31,720 8,337 0.00Panbela Therapeutics Inc. 6,098 8,306 0.00Xilio Therapeutics Inc. 2,944 8,277 0.00Inozyme Pharma Inc. 2,635 8,248 0.00Omega Therapeutics Inc. 3,040 8,233 0.00Qualigen Therapeutics Inc. 18,379 8,202 0.00BioSig Technologies Inc. 12,820 8,170 0.00Corvus Pharmaceuticals Inc. 7,846 8,124 0.00cbdMD Inc. 16,137 8,097 0.00Hillevax Inc. 548 8,084 0.00Navidea Biopharmaceuticals Inc. 10,155 8,074 0.00AlerisLife Inc. 4,799 8,065 0.00GlycoMimetics Inc. 14,312 8,057 0.00Acutus Medical Inc. 7,864 8,017 0.00Edesa Biotech Inc. 4,622 7,952 0.00Immuneering Corp. 1,967 7,771 0.00Aziyo Biologics Inc. 1,483 7,725 0.00Organovo Holdings Inc. 3,401 7,693 0.00Protara Therapeutics Inc. 2,659 7,624 0.00NanoVibronix Inc. 14,000 7,471 0.00RVL Pharmaceuticals plc 6,964 7,433 0.00Surgalign Holdings Inc. 48,933 7,405 0.00Ekso Bionics Holdings Inc. 4,081 7,379 0.00Adial Pharmaceuticals Inc. 6,600 7,360 0.00Strata Skin Sciences Inc. 7,376 7,344 0.00
Holding
MarketValue
(£)
% ofTotal Net
Assets
Lucira Health Inc. 3,237 7,296 0.00Onconova Therapeutics Inc. 6,546 7,195 0.00Yield10 Bioscience Inc. 2,957 7,183 0.00Acumen Pharmaceuticals Inc. 2,331 7,148 0.00Abeona Therapeutics Inc. 43,365 7,133 0.00AIkido Pharma Inc. 27,361 7,083 0.00AN2 Therapeutics Inc. 611 7,057 0.00Great Elm Group Inc. 6,122 6,827 0.00Better Therapeutics Inc. 9,188 6,806 0.00Cyclo Therapeutics Inc. 3,238 6,783 0.00Inhibikase Therapeutics Inc. 8,089 6,765 0.00Biolase Inc.1 1,815 6,650 0.00Biocept Inc. 5,341 6,636 0.00Evoke Pharma Inc. 17,825 6,602 0.00Virios Therapeutics Inc. 2,113 6,597 0.00Rezolute Inc. 2,367 6,561 0.00Plus Therapeutics Inc. 12,238 6,531 0.00Soligenix Inc. 15,724 6,513 0.00Clever Leaves Holdings Inc. 5,939 6,433 0.00Finch Therapeutics Group Inc. 3,270 6,433 0.00Marker Therapeutics Inc. 25,126 6,424 0.00Minerva Neurosciences Inc. 15,990 6,393 0.00Reneo Pharmaceuticals Inc. 3,443 6,362 0.00Processa Pharmaceuticals Inc. 2,955 6,355 0.00Caladrius Biosciences Inc. 15,503 6,353 0.00Aethlon Medical Inc. 7,490 6,324 0.00Tempest Therapeutics Inc. 2,186 6,268 0.00Aligos Therapeutics Inc. 6,695 6,239 0.00OncoSec Medical Inc. 9,268 6,220 0.00Aridis Pharmaceuticals Inc. 6,317 6,189 0.00BioVie Inc. 2,107 6,159 0.00VYNE Therapeutics Inc. 18,072 6,046 0.00Lannett Co. Inc. 12,133 6,001 0.00Aptevo Therapeutics Inc. 1,712 5,768 0.00Aytu BioPharma Inc. 11,288 5,754 0.00Motus GI Holdings Inc. 26,709 5,561 0.00Avalon GloboCare Corp. 13,173 5,561 0.00NeuroMetrix Inc. 2,349 5,557 0.00Jaguar Health Inc. 15,327 5,518 0.00Phio Pharmaceuticals Corp. 8,316 5,498 0.00CVRx Inc. 1,109 5,494 0.0089bio Inc. 3,165 5,445 0.00Aprea Therapeutics Inc. 4,582 5,255 0.00vTv Therapeutics Inc. 9,484 5,143 0.00Sigilon Therapeutics Inc. 6,265 5,140 0.00Cabaletta Bio Inc. 4,672 5,098 0.00Myomo Inc. 2,152 5,074 0.00Celsion Corp. 2,211 5,072 0.00Galera Therapeutics Inc. 3,771 5,016 0.00Regulus Therapeutics Inc. 31,475 5,014 0.00Bolt Biotherapeutics Inc. 4,011 4,984 0.00Psychemedics Corp. 1,000 4,930 0.00BioCardia Inc. 4,027 4,875 0.00Candel Therapeutics Inc. 1,686 4,727 0.00Sio Gene Therapies Inc. 20,935 4,669 0.00Salarius Pharmaceuticals Inc. 28,926 4,633 0.00Oncorus Inc. 4,962 4,624 0.00Talis Biomedical Corp. 5,560 4,606 0.00SiNtx Technologies Inc. 11,513 4,585 0.00Idera Pharmaceuticals Inc. 13,687 4,579 0.00PolarityTE Inc. 32,520 4,546 0.00Biodesix Inc. 3,548 4,522 0.00Applied DNA Sciences Inc. 3,524 4,463 0.00Forte Biosciences Inc. 4,835 4,429 0.00Diffusion Pharmaceuticals Inc. 897 4,394 0.00Cohbar Inc. 21,753 4,392 0.00Venus Concept Inc. 6,605 4,335 0.00Decibel Therapeutics Inc. 2,718 4,330 0.00Benitec Biopharma Inc. 3,598 4,299 0.00SCWorx Corp. 5,862 4,296 0.00Chembio Diagnostics Inc. 9,657 4,294 0.00Senestech Inc. 7,927 4,230 0.00NanoViricides Inc. 3,712 4,228 0.00Monopar Therapeutics Inc. 2,417 4,216 0.00Eliem Therapeutics Inc. 1,628 4,085 0.00Genocea Biosciences Inc. 18,166 4,077 0.00
Vanguard U.S. Equity Index Fund
238

Holding
MarketValue
(£)
% ofTotal Net
Assets
Calithera Biosciences Inc. 21,037 4,021 0.00Avinger Inc. 1,980 3,974 0.00Sensei Biotherapeutics Inc. 3,260 3,973 0.00Terns Pharmaceuticals Inc. 3,081 3,902 0.00Graybug Vision Inc. 4,608 3,890 0.00PharmaCyte Biotech Inc. 2,105 3,856 0.00NexImmune Inc. 2,276 3,807 0.00Longboard Pharmaceuticals Inc. 1,001 3,803 0.00Ensysce Biosciences Inc. 4,359 3,784 0.00Pulmatrix Inc. 938 3,743 0.00Codex DNA Inc. 1,262 3,719 0.00Bellerophon Therapeutics Inc. 3,642 3,684 0.00Tenax Therapeutics Inc. 6,722 3,656 0.00Allena Pharmaceuticals Inc. 28,570 3,652 0.00Palisade Bio Inc. 5,779 3,590 0.00Timber Pharmaceuticals Inc. 18,073 3,573 0.00Catalyst Biosciences Inc. 9,292 3,481 0.00Sonnet BioTherapeutics
Holdings Inc. 14,619 3,470 0.00Aravive Inc. 3,152 3,439 0.00Windtree Therapeutics Inc. 5,907 3,412 0.00ENDRA Life Sciences Inc. 16,239 3,408 0.00Alimera Sciences Inc. 793 3,379 0.00Cyclacel Pharmaceuticals Inc. 2,303 3,357 0.00LogicMark Inc. 2,345 3,325 0.00Imac Holdings Inc. 5,247 3,322 0.00IMARA Inc. 3,099 3,283 0.00Spruce Biosciences Inc. 2,351 3,277 0.00Exicure Inc. 28,866 3,219 0.00INVO BioScience Inc. 2,729 3,195 0.00Cumberland Pharmaceuticals Inc. 1,700 3,182 0.00HTG Molecular Diagnostics Inc. 4,495 3,169 0.00Jasper Therapeutics Inc. 1,324 3,122 0.00Ontrak Inc. 3,264 3,094 0.00Reviva Pharmaceuticals
Holdings Inc. 1,856 3,045 0.00Soleno Therapeutics Inc. 19,350 3,021 0.00Kintara Therapeutics Inc. 13,543 3,020 0.00Kiora Pharmaceuticals Inc. 7,244 3,006 0.00Protagenic Therapeutics Inc. 4,678 2,984 0.00Cue Health Inc. 556 2,958 0.00Acorda Therapeutics Inc. 2,782 2,947 0.00Acer Therapeutics Inc. 1,785 2,915 0.00Cyteir Therapeutics Inc. 1,598 2,851 0.00ReShape Lifesciences Inc. 4,256 2,851 0.00ThermoGenesis Holdings Inc. 7,231 2,809 0.00Statera Biopharma Inc. 10,433 2,780 0.00InVivo Therapeutics Holdings Corp. 711 2,764 0.00Lixte Biotechnology Holdings Inc. 2,825 2,655 0.00Vaxxinity Inc. 470 2,587 0.00Elevation Oncology Inc. 1,063 2,523 0.00Allied Healthcare Products Inc. 1,251 2,521 0.00GBS Inc. 5,066 2,431 0.00Calyxt Inc. 6,636 2,323 0.00Histogen Inc. 15,627 2,315 0.00Vigil Neuroscience Inc. 860 2,315 0.00NeuroBo Pharmaceuticals Inc. 4,639 2,269 0.00LogicBio Therapeutics Inc. 6,551 2,226 0.00Lexaria Bioscience Corp. 958 2,114 0.00SunLink Health Systems Inc. 2,213 2,062 0.00NeuroOne Medical Technologies
Corp. 3,303 2,011 0.00Regional Health Properties Inc. 787 2,006 0.00Yumanity Therapeutics Inc. 2,316 1,974 0.00Contra Strongbridge Bi1 13,619 1,965 0.00Aditxt Inc. 7,754 1,946 0.00First Wave BioPharma Inc. 3,860 1,906 0.00Zosano Pharma Corp. 1,265 1,894 0.00Avenue Therapeutics Inc. 6,539 1,875 0.00Helius Medical Technologies Inc. 806 1,862 0.00Angion Biomedica Corp. 1,857 1,849 0.00Metacrine Inc. 5,111 1,742 0.00Artelo Biosciences Inc. 5,724 1,714 0.00Landos Biopharma Inc. 2,206 1,678 0.00IsoPlexis Corp. 945 1,626 0.00GeoVax Labs Inc. 2,542 1,600 0.00
Holding
MarketValue
(£)
% ofTotal Net
Assets
TScan Therapeutics Inc. 939 1,593 0.00Hoth Therapeutics Inc. 3,851 1,590 0.00Contra Aduro Biotech Inc. CVR1 3,082 1,473 0.00Kiromic BioPharma Inc. 3,075 1,468 0.00CNS Pharmaceuticals Inc. 5,437 1,443 0.00IN8bio Inc. 831 1,423 0.00Scopus Biopharma Inc. 3,560 1,333 0.00Lucid Diagnostics Inc. 795 1,323 0.00Vallon Pharmaceuticals Inc. 1,318 1,302 0.00Baudax Bio Inc. 1,061 1,268 0.00Sonendo Inc. 585 1,263 0.00Agile Therapeutics Inc. 694 1,249 0.00RA Medical Systems Inc. 4,733 1,244 0.00Enveric Biosciences Inc. 5,550 1,189 0.00Minerva Surgical Inc. 621 1,187 0.00Titan Pharmaceuticals Inc. 2,122 1,138 0.00Cognition Therapeutics Inc. 489 1,052 0.00Tobira Therapeutics Inc. CVR1 288 1,039 0.00Issuer Not Found 4,771 874 0.00Adamas Pharmaceuticals Inc.1 12,815 612 0.00Adamas Pharmaceuticals Inc.1 12,815 612 0.00Ocera Therapeutics Inc. CVR1 1,775 382 0.00Alexza Pharmaceuticals Inc. CVR1 10,947 305 0.00Aevi Genomic Medicine Inc. CVR1 5,800 155 0.00Contra Miragen Therape1 4,227 67 0.00Cvr F Star1 819 47 0.00Cvr F Star Therapeutic1 819 47 0.00Rexahn Corp.1 47 5 0.00NeuroBo Pharmaceuticals Inc.
CVR1 184 1 0.00PDL BioPharma Inc.1 63,700 1 0.00Ambit Biosciences Corp. CVR1 1,897 — 0.00Progenics Pharmaceuticals Inc.
CVR1 23,896 — 0.00Contra Aerpio Pharmace1 10,242 — 0.00
1,689,368,767 13.77
Industrials 8.76% (31 October 2021: 12.96%)
Union Pacific Corp. 234,753 43,813,058 0.36Raytheon Technologies Corp. 550,318 41,614,626 0.34Honeywell International Inc. 252,919 38,996,443 0.32United Parcel Service Inc. 268,990 38,560,569 0.31Caterpillar Inc. 199,467 33,444,664 0.27Deere & Co. 103,434 31,074,671 0.25Lockheed Martin Corp. 89,346 30,728,461 0.253M Co. 210,787 24,218,247 0.20General Electric Co. 405,580 24,082,814 0.20Boeing Co. 202,165 23,969,945 0.20CSX Corp. 817,663 22,364,422 0.18Northrop Grumman Corp. 54,046 18,912,431 0.15Waste Management Inc. 141,801 18,572,476 0.15Norfolk Southern Corp. 88,393 18,136,925 0.15Eaton Corp. plc 147,057 16,978,017 0.14Illinois Tool Works Inc. 105,288 16,534,945 0.14General Dynamics Corp. 85,022 16,016,362 0.13Emerson Electric Co. 219,611 15,779,449 0.13Uber Technologies Inc. 615,786 15,435,106 0.13FedEx Corp. 90,012 14,249,921 0.12L3Harris Technologies Inc. 72,410 13,382,145 0.11Johnson Controls International plc 260,167 12,433,303 0.10Cintas Corp. 32,556 10,301,226 0.08Parker-Hannifin Corp. 47,460 10,229,883 0.08Carrier Global Corp. 316,785 9,658,721 0.08Verisk Analytics Inc. 59,419 9,657,061 0.08Trane Technologies plc 86,415 9,623,687 0.08Fastenal Co. 212,173 9,347,099 0.08TransDigm Group Inc. 19,478 9,227,959 0.08Otis Worldwide Corp. 156,766 9,096,294 0.07Rockwell Automation Inc. 42,867 8,628,366 0.07AMETEK Inc. 85,319 8,578,106 0.07PACCAR Inc. 128,182 8,479,100 0.07Republic Services Inc. 76,871 8,220,999 0.07Southwest Airlines Co. 219,193 8,151,426 0.07Delta Air Lines Inc. 235,346 8,062,307 0.07Cummins Inc. 52,541 7,912,742 0.07Old Dominion Freight Line Inc. 34,386 7,667,348 0.06
Vanguard U.S. Equity Index Fund
239

Holding
MarketValue
(£)
% ofTotal Net
Assets
CoStar Group Inc. 145,926 7,394,510 0.06Equifax Inc. 44,877 7,303,992 0.06Copart Inc. 78,761 7,129,576 0.06United Rentals Inc. 26,660 6,721,162 0.06WW Grainger Inc. 15,948 6,351,632 0.05Fortive Corp. 132,323 6,061,244 0.05Stanley Black & Decker Inc. 59,987 5,740,211 0.05Dover Corp. 53,119 5,636,407 0.05Jacobs Engineering Group Inc. 47,864 5,282,002 0.04Ingersoll Rand Inc. 150,597 5,270,592 0.04Expeditors International of
Washington Inc. 62,440 4,928,058 0.04TransUnion 70,582 4,920,780 0.04Westinghouse Air Brake
Technologies Corp. 68,743 4,919,050 0.04Quanta Services Inc. 52,411 4,838,257 0.04United Airlines Holdings Inc. 119,501 4,806,688 0.04Textron Inc. 81,427 4,488,698 0.04Xylem Inc. 66,752 4,282,121 0.04IDEX Corp. 28,160 4,258,427 0.04Leidos Holdings Inc. 51,612 4,253,517 0.04JB Hunt Transport Services Inc. 30,944 4,210,649 0.04Generac Holdings Inc. 23,306 4,078,501 0.03CH Robinson Worldwide Inc. 47,763 4,037,883 0.03Carlisle Cos. Inc. 19,286 3,981,009 0.03Howmet Aerospace Inc. 140,793 3,825,127 0.03Masco Corp. 88,121 3,698,202 0.03American Airlines Group Inc. 240,684 3,598,277 0.03Builders FirstSource Inc. 70,687 3,466,504 0.03Nordson Corp. 20,009 3,434,438 0.03Snap-on Inc. 19,718 3,337,688 0.03Plug Power Inc. 191,480 3,202,770 0.03Robert Half International Inc. 40,786 3,195,633 0.03Booz Allen Hamilton Holding Corp. 49,163 3,194,908 0.03Avis Budget Group Inc. 14,767 3,147,704 0.03Hubbell Inc. 20,001 3,111,584 0.03Graco Inc. 62,969 3,110,582 0.03Allegion plc 33,035 3,005,907 0.03AECOM 53,033 2,980,491 0.02Lyft Inc. 111,303 2,889,178 0.02Nielsen Holdings plc 132,725 2,832,099 0.02Fortune Brands Home &
Security Inc. 49,893 2,831,044 0.02Owens Corning 37,093 2,686,471 0.02Watsco Inc. 12,220 2,596,615 0.02Regal Rexnord Corp. 24,996 2,537,625 0.02Middleby Corp. 20,417 2,502,240 0.02Toro Co. 39,080 2,494,208 0.02Huntington Ingalls Industries Inc. 14,652 2,481,911 0.02Pentair plc 60,829 2,458,837 0.02HEICO Corp. Class A 25,919 2,407,751 0.02Lincoln Electric Holdings Inc. 21,924 2,350,782 0.02Knight-Swift Transportation
Holdings Inc. 61,097 2,330,006 0.02AGCO Corp. 22,663 2,299,693 0.02WillScot Mobile Mini Holdings
Corp. 81,924 2,290,347 0.02Axon Enterprise Inc. 25,550 2,281,896 0.02A O Smith Corp. 48,813 2,270,163 0.02Rollins Inc. 82,964 2,216,337 0.02Tetra Tech Inc. 19,934 2,207,584 0.02Sensata Technologies Holding plc 58,390 2,110,038 0.02Lennox International Inc. 12,391 2,103,854 0.02Woodward Inc. 23,246 2,045,388 0.02KBR Inc. 51,420 2,017,072 0.02Alaska Air Group Inc. 46,262 2,004,870 0.02Trex Co. Inc. 42,394 1,963,191 0.02HEICO Corp. 17,106 1,924,237 0.02Clarivate plc 148,255 1,850,382 0.02SiteOne Landscape Supply Inc. 16,436 1,846,251 0.02CACI International Inc. 8,606 1,817,712 0.02Oshkosh Corp. 24,592 1,810,660 0.02Donaldson Co. Inc. 45,723 1,785,581 0.02ITT Inc. 31,922 1,784,885 0.02Acuity Brands Inc. 12,885 1,770,134 0.02Chart Industries Inc. 13,042 1,750,775 0.01
Holding
MarketValue
(£)
% ofTotal Net
Assets
Landstar System Inc. 14,077 1,734,537 0.01ASGN Inc. 19,046 1,720,738 0.01Advanced Drainage Systems Inc. 21,061 1,718,094 0.01GXO Logistics Inc. 36,418 1,717,490 0.01EMCOR Group Inc. 19,733 1,673,571 0.01nVent Electric plc 61,859 1,664,354 0.01Curtiss-Wright Corp. 14,578 1,660,881 0.01Saia Inc. 9,719 1,594,364 0.01WESCO International Inc. 16,231 1,592,589 0.01FTI Consulting Inc. 12,524 1,573,205 0.01XPO Logistics Inc. 36,693 1,572,055 0.01AMERCO 3,643 1,551,328 0.01Valmont Industries Inc. 7,783 1,540,358 0.01MDU Resources Group Inc. 74,863 1,536,614 0.01Clean Harbors Inc. 18,257 1,524,688 0.01Evoqua Water Technologies Corp. 44,510 1,477,285 0.01Exponent Inc. 19,340 1,473,567 0.01IAA Inc. 50,175 1,465,485 0.01Univar Solutions Inc. 62,793 1,456,417 0.01ManpowerGroup Inc. 20,141 1,447,328 0.01Crane Co. 18,581 1,424,765 0.01RBC Bearings Inc. 10,581 1,418,300 0.01UFP Industries Inc. 22,913 1,411,827 0.01Science Applications International
Corp. 21,213 1,406,765 0.01BWX Technologies Inc. 33,988 1,406,623 0.01Stericycle Inc. 33,852 1,353,001 0.01Hexcel Corp. 30,603 1,325,276 0.01MSA Safety Inc. 13,760 1,320,762 0.01Spirit AeroSystems Holdings Inc. 39,308 1,315,902 0.01Simpson Manufacturing Co. Inc. 15,878 1,310,962 0.01Atkore Inc. 16,963 1,300,158 0.01Flowserve Corp. 48,439 1,262,384 0.01MasTec Inc. 21,960 1,259,529 0.01Air Lease Corp. 39,144 1,254,291 0.01Sunrun Inc. 76,158 1,211,976 0.01Casella Waste Systems Inc. 18,507 1,210,951 0.01Triton International Ltd. 24,350 1,185,789 0.01Applied Industrial Technologies Inc. 14,206 1,183,889 0.01Armstrong World Industries Inc. 17,277 1,165,010 0.01Kirby Corp. 22,376 1,160,593 0.01Timken Co. 25,015 1,149,434 0.01Zurn Water Solutions Corp. 46,173 1,148,532 0.01Allison Transmission Holdings Inc. 38,343 1,143,418 0.01MSC Industrial Direct Co. Inc. 17,161 1,132,174 0.01Vertiv Holdings Co. 112,971 1,126,560 0.01API Group Corp. 75,601 1,117,003 0.01GATX Corp. 13,375 1,101,852 0.01John Bean Technologies Corp. 11,676 1,096,362 0.01Insperity Inc. 12,957 1,094,456 0.01Ryder System Inc. 19,581 1,090,328 0.01Matson Inc. 15,242 1,044,419 0.01JetBlue Airways Corp. 116,459 1,021,277 0.01Watts Water Technologies Inc. 10,051 1,020,230 0.01Fluor Corp. 51,459 1,013,604 0.01TriNet Group Inc. 13,922 983,577 0.01Korn Ferry 19,947 976,139 0.01Beacon Roofing Supply Inc. 20,473 972,202 0.01ABM Industries Inc. 24,746 951,996 0.01Resideo Technologies Inc. 52,363 937,153 0.01Herc Holdings Inc. 9,164 934,355 0.01Mercury Systems Inc. 20,937 929,699 0.01Welbilt Inc. 48,412 910,400 0.01Mueller Industries Inc. 21,092 909,702 0.01Comfort Systems USA Inc. 13,093 880,270 0.01Hillenbrand Inc. 26,911 873,669 0.01Boise Cascade Co. 14,509 873,429 0.01Aerojet Rocketdyne Holdings Inc. 27,270 869,686 0.01Brink's Co. 18,054 847,984 0.01EnerSys 16,092 838,757 0.01Bloom Energy Corp. 54,537 806,652 0.01Franklin Electric Co. Inc. 14,371 800,449 0.01UniFirst Corp. 5,576 764,340 0.01Forward Air Corp. 9,843 760,157 0.01Dycom Industries Inc. 11,226 759,040 0.01Arcosa Inc. 17,547 748,700 0.01
Vanguard U.S. Equity Index Fund
240

Holding
MarketValue
(£)
% ofTotal Net
Assets
Altra Industrial Motion Corp. 24,053 747,166 0.01Spirit Airlines Inc. 39,685 746,286 0.01Albany International Corp. 11,831 736,339 0.01Meritor Inc. 25,705 735,218 0.01Upwork Inc. 44,009 735,060 0.01MillerKnoll Inc. 29,065 734,322 0.01Werner Enterprises Inc. 22,239 701,976 0.01AZEK Co. Inc. 40,908 692,063 0.01Dun & Bradstreet Holdings Inc. 55,008 691,379 0.01Terex Corp. 25,477 690,547 0.01Allegiant Travel Co. 5,540 684,789 0.01Maxar Technologies Inc. 26,274 674,481 0.01Moog Inc. 10,475 667,379 0.01Trinity Industries Inc. 30,116 665,406 0.01Rush Enterprises Inc. Class A 16,403 664,743 0.01Hub Group Inc. 12,364 661,087 0.01CBIZ Inc. 19,665 655,970 0.01Encore Wire Corp. 7,315 654,533 0.01ChargePoint Holdings Inc. 63,169 651,060 0.01ManTech International Corp. 10,136 648,445 0.01Brady Corp. 18,054 642,639 0.01Helios Technologies Inc. 11,885 635,570 0.01Kadant Inc. 4,294 631,223 0.01Alight Inc. 91,824 627,519 0.01Kennametal Inc. 30,374 622,237 0.01Esab Corp. 16,575 620,490 0.01GMS Inc. 15,882 606,438 0.01Federal Signal Corp. 22,037 597,833 0.01AAON Inc. 15,199 589,801 0.01McGrath RentCorp 8,662 575,880 0.01Veritiv Corp. 5,130 574,985 0.01EnPro Industries Inc. 7,577 561,681 0.01JELD-WEN Holding Inc. 33,860 559,613 0.01SPX Corp. 16,615 554,362 0.01Mueller Water Products Inc. 57,802 553,389 0.01Kratos Defense & Security
Solutions Inc. 45,487 549,249 0.01ArcBest Corp. 9,332 537,547 0.01AeroVironment Inc. 8,372 535,594 0.01KAR Auction Services Inc. 45,853 534,677 0.01Atlas Air Worldwide Holdings Inc. 9,733 534,443 0.01Masonite International Corp. 8,613 531,461 0.01GrafTech International Ltd. 72,684 525,084 0.00Air Transport Services Group Inc. 21,017 523,960 0.00CSW Industrials Inc. 5,922 496,731 0.00ESCO Technologies Inc. 9,571 475,615 0.00ICF International Inc. 6,014 472,450 0.00Barnes Group Inc. 17,487 467,713 0.00HNI Corp. 16,420 465,462 0.00Ameresco Inc. 11,364 456,280 0.00AAR Corp. 12,117 453,410 0.00Driven Brands Holdings Inc. 19,825 440,082 0.00Nikola Corp. 76,684 439,154 0.00FuelCell Energy Inc. 134,606 438,501 0.00CoreCivic Inc. 44,170 437,654 0.00Lindsay Corp. 4,066 437,366 0.00Triumph Group Inc. 24,216 434,943 0.00US Ecology Inc. 11,365 434,413 0.00SkyWest Inc. 18,232 423,162 0.00Core & Main Inc. 21,755 412,400 0.00NV5 Global Inc. 4,281 407,914 0.00Granite Construction Inc. 17,251 406,714 0.00Joby Aviation Inc. 96,574 402,295 0.00Kforce Inc. 7,219 402,033 0.00Greenbrier Cos. Inc. 11,698 398,039 0.00Cornerstone Building Brands Inc. 20,364 394,628 0.00MYR Group Inc. 6,147 387,229 0.00Virgin Galactic Holdings Inc. 64,573 384,712 0.00Vicor Corp. 7,976 384,474 0.00Healthcare Services Group Inc. 27,746 377,681 0.00Primoris Services Corp. 20,262 373,770 0.00Alamo Group Inc. 3,675 370,105 0.00ACV Auctions Inc. 34,060 361,896 0.00Enerpac Tool Group Corp. 22,627 361,707 0.00Gibraltar Industries Inc. 11,912 358,451 0.00
Holding
MarketValue
(£)
% ofTotal Net
Assets
Montrose EnvironmentalGroup Inc. 9,877 356,689 0.00
Gates Industrial Corp. plc 34,997 355,405 0.00Hillman Solutions Corp. 38,392 355,328 0.00NOW Inc. 39,575 343,582 0.00Proto Labs Inc. 10,103 342,721 0.00H&E Equipment Services Inc. 12,077 340,907 0.00Standex International Corp. 4,534 339,932 0.00Proterra Inc. 68,418 337,867 0.00Microvast Holdings Inc. 85,701 337,206 0.00Deluxe Corp. 15,545 335,168 0.00Tennant Co. 6,492 334,243 0.00Huron Consulting Group Inc. 8,031 330,579 0.00Apogee Enterprises Inc. 9,388 328,486 0.00Hertz Global Holdings Inc. 20,368 325,271 0.00AZZ Inc. 8,930 324,339 0.00Aurora Innovation Inc. 94,206 318,897 0.00Construction Partners Inc. 15,223 312,947 0.00Steelcase Inc. 33,463 312,641 0.00Kaman Corp. 10,001 310,744 0.00Parsons Corp. 10,523 309,613 0.00Rocket Lab USA Inc. 52,042 305,495 0.00Shoals Technologies Group Inc. 38,211 304,044 0.00Columbus McKinnon Corp. 10,378 293,031 0.00Marten Transport Ltd. 21,024 290,870 0.00Matthews International Corp. 12,193 289,408 0.00Griffon Corp. 19,320 287,915 0.00Stem Inc. 49,616 283,350 0.00Cimpress plc 7,035 282,521 0.00Sun Country Airlines Holdings Inc. 12,713 278,461 0.00Great Lakes Dredge & Dock Corp. 25,136 275,885 0.00Planet Labs PBC 66,996 268,411 0.00Hawaiian Holdings Inc. 19,151 258,397 0.00TrueBlue Inc. 12,619 257,305 0.00Astec Industries Inc. 8,213 255,777 0.00Genco Shipping & Trading Ltd. 14,436 253,305 0.00Pitney Bowes Inc. 60,015 251,915 0.00Enovix Corp. 34,847 250,632 0.00Schneider National Inc. 13,268 249,719 0.00GEO Group Inc. 47,614 246,508 0.00Eagle Bulk Shipping Inc. 4,944 245,093 0.00Shyft Group Inc. 12,050 244,743 0.00Harsco Corp. 29,336 238,333 0.00MRC Global Inc. 24,507 233,651 0.00Insteel Industries Inc. 6,805 229,598 0.00BrightView Holdings Inc. 22,258 223,910 0.00American Woodmark Corp. 5,984 223,107 0.00Array Technologies Inc. 42,600 221,567 0.00ACCO Brands Corp. 36,532 212,994 0.00Kelly Services Inc. 13,808 212,042 0.00First Advantage Corp. 15,359 212,004 0.00Viad Corp. 8,144 211,724 0.00Titan International Inc. 19,054 210,497 0.00Energy Recovery Inc. 14,221 209,775 0.00Interface Inc. 20,648 208,700 0.00Wabash National Corp. 18,327 208,450 0.00Quanex Building Products Corp. 13,435 205,565 0.00Gorman-Rupp Co. 7,954 201,653 0.00Douglas Dynamics Inc. 8,048 198,203 0.00Blink Charging Co. 12,984 197,113 0.00Hayward Holdings Inc. 14,886 188,639 0.00Sterling Construction Co. Inc. 10,332 188,041 0.00Luxfer Holdings plc 14,638 187,945 0.00SES AI Corp. 36,839 187,202 0.00BlueLinx Holdings Inc. 3,522 186,774 0.00Desktop Metal Inc. 66,318 184,877 0.00SP Plus Corp. 8,154 184,837 0.00Heartland Express Inc. 16,680 183,208 0.00Heidrick & Struggles
International Inc. 7,072 180,025 0.00Resources Connection Inc. 12,758 174,374 0.00Forrester Research Inc. 3,805 168,475 0.00CRA International Inc. 2,535 166,294 0.00Franklin Covey Co. 5,005 159,538 0.00Argan Inc. 5,446 159,324 0.00Transcat Inc. 2,738 159,199 0.00
Vanguard U.S. Equity Index Fund
241

Holding
MarketValue
(£)
% ofTotal Net
Assets
Global Industrial Co. 6,353 155,852 0.00Wheels Up Experience Inc. 63,188 153,000 0.00Archer Aviation Inc. 41,369 151,900 0.00Janus International Group Inc. 19,830 149,258 0.00Ducommun Inc. 3,638 147,867 0.00Barrett Business Services Inc. 2,552 145,965 0.00Tecnoglass Inc. 8,195 145,428 0.00Daseke Inc. 21,312 142,419 0.00VSE Corp. 4,091 141,157 0.00Thermon Group Holdings Inc. 11,689 139,281 0.00Titan Machinery Inc. 6,976 131,019 0.00DXP Enterprises Inc. 6,847 128,814 0.00Manitowoc Co. Inc. 12,174 128,382 0.00Heritage-Crystal Clean Inc. 5,631 122,218 0.00National Presto Industries Inc. 2,127 120,505 0.00HireRight Holdings Corp. 8,702 119,492 0.00Blade Air Mobility Inc. 17,306 118,681 0.00Ennis Inc. 8,578 117,789 0.00TPI Composites Inc. 12,906 117,598 0.00Vectrus Inc. 4,097 117,477 0.00Heliogen Inc. 38,362 117,332 0.00Sterling Check Corp. 5,638 116,532 0.00Babcock & Wilcox Enterprises Inc. 19,153 114,262 0.00Blue Bird Corp. 8,945 114,066 0.00ESS Tech Inc. 25,509 112,967 0.00Astra Space Inc. 43,730 111,110 0.00REV Group Inc. 11,672 110,817 0.00CIRCOR International Inc. 7,045 110,543 0.00Tutor Perini Corp. 14,909 109,843 0.00Park Aerospace Corp. 11,525 107,401 0.00Skillsoft Corp. 25,079 106,468 0.00Hyzon Motors Inc. 33,408 105,373 0.00Aris Water Solution Inc. 7,776 104,671 0.00TuSimple Holdings Inc. 12,095 99,708 0.00Hyliion Holdings Corp. 38,911 99,176 0.00Lawson Products Inc. 3,245 98,190 0.00Hydrofarm Holdings Group Inc. 12,694 96,557 0.00Alta Equipment Group Inc. 10,751 95,993 0.00Vidler Water Resouces Inc. 7,610 95,405 0.00Allied Motion Technologies Inc. 4,915 95,286 0.00Omega Flex Inc. 1,072 93,769 0.00Fluence Energy Inc. 12,547 91,642 0.00Frontier Group Holdings Inc. 10,771 90,938 0.00Custom Truck One Source Inc. 17,241 90,222 0.00Infrastructure and Energy
Alternatives Inc. 11,946 88,965 0.00Miller Industries Inc. 4,016 85,822 0.00Hyster-Yale Materials Handling Inc. 3,423 83,919 0.00Willdan Group Inc. 3,895 83,391 0.00Bird Global Inc. 56,542 80,613 0.00Red Violet Inc. 3,766 78,560 0.00Huttig Building Products Inc. 9,128 77,648 0.00Sarcos Technology and Robotics
Corp. 20,515 76,635 0.00Radiant Logistics Inc. 16,485 75,761 0.00Kimball International Inc. 12,195 74,501 0.00Rush Enterprises Inc. Class B 1,927 74,133 0.00Northwest Pipe Co. 3,454 73,344 0.00Legalzoom.com Inc. 6,391 72,945 0.00Commercial Vehicle Group Inc. 12,658 72,389 0.00Hudson Technologies Inc. 13,501 72,048 0.00IES Holdings Inc. 3,082 71,189 0.00AerSale Corp. 5,980 68,921 0.00Astronics Corp. 8,466 65,341 0.00Markforged Holding Corp. 23,927 64,606 0.00Quad/Graphics Inc. 11,885 63,898 0.00Atlas Technical Consultants Inc. 6,572 63,338 0.00Matrix Service Co. 11,591 62,871 0.00Acacia Research Corp. 16,671 62,143 0.00Covenant Logistics Group Inc. 3,570 58,348 0.00LSI Industries Inc. 10,120 57,310 0.00Velo3D Inc. 20,149 56,331 0.00PAM Transportation Services Inc. 2,282 54,892 0.00Cadre Holdings Inc. 2,588 52,440 0.00Xos Inc. 20,896 49,931 0.00Spire Global Inc. 38,129 49,806 0.00
Holding
MarketValue
(£)
% ofTotal Net
Assets
Concrete Pumping Holdings Inc. 10,891 48,231 0.00Yellow Corp. 12,395 44,229 0.00DLH Holdings Corp. 3,637 43,105 0.00Powell Industries Inc. 2,786 42,827 0.00Preformed Line Products Co. 900 42,652 0.00USA Truck Inc. 3,250 42,194 0.00Hurco Cos. Inc. 1,827 40,746 0.00CECO Environmental Corp. 10,752 40,679 0.00INNOVATE Corp. 16,816 40,449 0.00Beam Global 3,226 39,647 0.00Momentus Inc. 17,481 38,707 0.00Eastern Co. 2,110 38,704 0.00Lightning eMotors Inc. 11,141 37,891 0.00NN Inc. 15,523 37,463 0.00Mistras Group Inc. 8,090 36,600 0.00Pangaea Logistics Solutions Ltd. 9,562 36,405 0.00American Superconductor Corp. 8,544 36,272 0.00L B Foster Co. 2,962 33,501 0.00Bowman Consulting Group Ltd. 2,545 33,467 0.00Twin Disc Inc. 2,984 32,538 0.00Mesa Air Group Inc. 11,597 31,406 0.00BGSF Inc. 3,232 31,355 0.00Universal Logistics Holdings Inc. 1,944 31,169 0.00Karat Packaging Inc. 2,136 30,658 0.00Redwire Corp. 6,353 30,260 0.00KULR Technology Group Inc. 23,814 29,969 0.00Nuvve Holding Corp. 5,134 29,074 0.00HireQuest Inc. 2,186 28,938 0.00GEE Group Inc. 56,726 28,496 0.00Performant Financial Corp. 15,528 28,075 0.00Romeo Power Inc. 32,522 27,976 0.00Fathom Digital Manufacturing C 5,080 27,393 0.00Park-Ohio Holdings Corp. 3,479 26,546 0.00BlackSky Technology Inc. 20,600 25,596 0.00Gencor Industries Inc. 3,205 25,477 0.00Byrna Technologies Inc. 5,418 25,461 0.00Mayville Engineering Co. Inc. 3,834 25,285 0.00Berkshire Grey Inc. 12,771 24,515 0.00Quest Resource Holding Corp. 5,500 23,700 0.00RCM Technologies Inc. 1,700 23,669 0.00ARC Document Solutions Inc. 7,794 23,404 0.00Acme United Corp. 900 23,369 0.00Eos Energy Enterprises Inc. 13,823 23,231 0.00VirTra Inc. 5,232 22,753 0.00Ultralife Corp. 5,621 21,490 0.00US Xpress Enterprises Inc. 8,095 21,342 0.00Energous Corp. 26,298 21,156 0.00Orion Group Holdings Inc. 9,975 21,054 0.00Mastech Digital Inc. 1,439 20,757 0.00FreightCar America Inc. 5,024 20,488 0.00Orion Energy Systems Inc. 9,636 20,416 0.00Aqua Metals Inc. 26,696 19,987 0.00Orbital Energy Group Inc. 20,953 19,860 0.00Manitex International Inc. 3,270 19,795 0.00Willis Lease Finance Corp. 800 19,607 0.00Advent Technologies Holdings Inc. 12,177 18,816 0.00Odyssey Marine Exploration Inc. 3,786 17,731 0.00Graham Corp. 2,995 17,199 0.00EVI Industries Inc. 1,440 16,252 0.00FTC Solar Inc. 7,292 16,146 0.00AgEagle Aerial Systems Inc. 24,948 16,101 0.00Agrify Corp. 6,386 14,649 0.00Ocean Power Technologies Inc. 17,483 14,621 0.00View Inc. 11,848 14,344 0.00Urban-Gro Inc. 2,461 14,054 0.00Hudson Global Inc. 507 13,209 0.00Capstone Green Energy Corp. 5,627 12,997 0.00Ideal Power Inc. 2,138 12,976 0.00Team Inc. 11,281 12,849 0.00Sunworks Inc. 9,323 12,847 0.00Alpha Pro Tech Ltd. 3,961 12,809 0.00Armstrong Flooring Inc. 9,768 12,604 0.00Limbach Holdings Inc. 2,521 12,550 0.00Hill International Inc. 12,890 12,526 0.00Innovative Solutions and
Support Inc. 2,000 11,708 0.00
Vanguard U.S. Equity Index Fund
242

Holding
MarketValue
(£)
% ofTotal Net
Assets
Astrotech Corp. 27,344 11,608 0.00Williams Industrial Services
Group Inc. 7,235 9,624 0.00India Globalization Capital Inc. 16,321 9,505 0.00Charah Solutions Inc. 3,087 9,393 0.00Perma-Fix Environmental
Services Inc. 2,079 9,157 0.00BitNile Holdings Inc. 27,273 8,828 0.00CPI Aerostructures Inc. 4,362 8,616 0.00Broadwind Inc. 5,691 8,114 0.00HyreCar Inc. 6,461 7,977 0.00Air T Inc. 600 7,885 0.00NL Industries Inc. 1,356 7,355 0.00LiqTech International Inc. 5,704 6,406 0.00LS Starrett Co. 1,100 5,783 0.00Flux Power Holdings Inc. 3,135 5,718 0.00iSun Inc. 2,053 5,085 0.00SG Blocks Inc. 3,380 5,034 0.00Taylor Devices Inc. 700 5,029 0.00Perma-Pipe International
Holdings Inc. 540 5,024 0.00Gaucho Group Holdings Inc. 3,431 4,810 0.00Art's-Way Manufacturing Co. Inc. 2,042 4,554 0.00Fuel Tech Inc. 4,417 4,433 0.00DSS Inc. 11,876 3,907 0.00Energy Focus Inc. 4,000 3,536 0.00Mega Matrix Corp. 3,010 3,452 0.00Polar Power Inc. 1,658 3,328 0.00FTE Networks Inc.1 2,549 3,045 0.00ShiftPixy Inc. 10,649 2,978 0.00Espey Mfg. & Electronics Corp. 278 2,892 0.00Renovare Environmental Inc. 10,225 2,850 0.00Staffing 360 Solutions Inc. 5,380 2,743 0.00TOMI Environmental Solutions Inc. 4,432 2,715 0.00Patriot Transportation Holding Inc. 360 2,248 0.00JanOne Inc. 796 1,522 0.00SIFCO Industries Inc. 300 956 0.00Applied UV Inc. 739 618 0.00Air T Funding 31 580 0.00
1,074,360,266 8.76
Information Technology 26.23% (31 October 2021: 28.26%)
Apple Inc. 5,717,330 717,956,013 5.85Microsoft Corp. 2,764,548 611,194,889 4.98NVIDIA Corp. 921,949 136,188,428 1.11Visa Inc. 611,573 103,726,233 0.85Mastercard Inc. 318,280 92,119,893 0.75Broadcom Inc. 152,244 67,226,210 0.55Cisco Systems Inc. 1,555,384 60,691,535 0.50Accenture plc 233,010 55,766,474 0.46Adobe Inc. 173,947 54,859,433 0.45Intel Corp. 1,501,614 52,134,862 0.43Salesforce Inc. 363,210 50,915,911 0.42QUALCOMM Inc. 415,562 46,233,110 0.38Texas Instruments Inc. 340,480 46,170,203 0.38Advanced Micro Devices Inc. 602,767 41,058,229 0.34International Business Machines
Corp. 330,553 34,835,081 0.28Intuit Inc. 104,435 34,827,453 0.28Oracle Corp. 580,951 33,968,610 0.28PayPal Holdings Inc. 429,760 30,081,473 0.25Applied Materials Inc. 327,586 28,787,371 0.24ServiceNow Inc. 73,762 28,095,346 0.23Automatic Data Processing Inc. 154,835 26,907,115 0.22Analog Devices Inc. 193,817 23,827,669 0.19Micron Technology Inc. 412,987 22,427,271 0.18Lam Research Corp. 51,500 19,105,239 0.16Fidelity National Information
Services Inc. 224,621 17,742,455 0.15Fiserv Inc. 219,091 17,073,558 0.14Palo Alto Networks Inc. 36,372 16,250,497 0.13Block Inc. 184,928 14,677,870 0.12Roper Technologies Inc. 38,938 14,553,283 0.12Marvell Technology Inc. 311,324 14,394,543 0.12KLA Corp. 55,712 14,153,636 0.12NXP Semiconductors NV 98,178 13,364,087 0.11Synopsys Inc. 56,618 12,933,069 0.11
Holding
MarketValue
(£)
% ofTotal Net
Assets
Amphenol Corp. 220,831 12,581,468 0.10Cognizant Technology Solutions
Corp. 193,431 12,462,465 0.10Cadence Design Systems Inc. 102,279 12,288,137 0.10Autodesk Inc. 81,148 12,234,565 0.10Crowdstrike Holdings Inc. 76,720 12,145,646 0.10Paychex Inc. 118,305 11,941,684 0.10TE Connectivity Ltd. 119,965 11,922,919 0.10Snowflake Inc. 87,020 11,885,449 0.10Workday Inc. 71,170 11,713,709 0.10HP Inc. 401,053 11,707,355 0.10Fortinet Inc. 50,062 11,524,023 0.09Global Payments Inc. 105,181 11,474,818 0.09Microchip Technology Inc. 205,297 10,658,105 0.09Motorola Solutions Inc. 62,387 10,630,381 0.09Datadog Inc. 94,879 9,126,667 0.08Corning Inc. 277,409 7,777,612 0.06Arista Networks Inc. 82,938 7,635,180 0.06Keysight Technologies Inc. 67,717 7,567,795 0.06Trade Desk Inc. 160,988 7,561,495 0.06ANSYS Inc. 32,241 7,079,663 0.06Cloudflare Inc. 102,563 7,037,672 0.06Gartner Inc. 30,236 7,000,154 0.06MongoDB Inc. 24,633 6,956,097 0.06ON Semiconductor Corp. 158,435 6,570,853 0.05CDW Corp. 50,120 6,511,006 0.05VMware Inc. 74,424 6,407,989 0.05Zoom Video Communications Inc. 80,606 6,391,979 0.05Enphase Energy Inc. 49,420 6,353,153 0.05FleetCor Technologies Inc. 29,956 5,953,976 0.05Teledyne Technologies Inc. 17,223 5,920,017 0.05Hewlett Packard Enterprise Co. 476,406 5,851,196 0.05Zebra Technologies Corp. 19,668 5,789,642 0.05Splunk Inc. 58,811 5,713,869 0.05Twilio Inc. 62,010 5,522,863 0.05Skyworks Solutions Inc. 60,654 5,473,109 0.05Akamai Technologies Inc. 59,949 5,363,176 0.04Okta Inc. 54,637 5,191,709 0.04VeriSign Inc. 35,628 5,070,496 0.04Teradyne Inc. 60,033 5,042,196 0.04HubSpot Inc. 16,522 4,993,445 0.04Monolithic Power Systems Inc. 15,953 4,983,992 0.04Broadridge Financial Solutions Inc. 43,048 4,943,231 0.04Trimble Inc. 92,519 4,913,711 0.04Western Digital Corp. 115,671 4,888,491 0.04Palantir Technologies Inc. 589,347 4,881,884 0.04Seagate Technology Holdings plc 74,452 4,865,025 0.04NetApp Inc. 82,091 4,788,803 0.04Zscaler Inc. 29,594 4,778,880 0.04Tyler Technologies Inc. 15,066 4,736,517 0.04DocuSign Inc. 72,813 4,697,610 0.04Bill.com Holdings Inc. 34,080 4,635,203 0.04Entegris Inc. 49,808 4,419,044 0.04EPAM Systems Inc. 20,946 4,417,927 0.04Zendesk Inc. 44,840 4,362,924 0.04NortonLifeLock Inc. 213,954 4,267,149 0.04SS&C Technologies Holdings Inc. 81,708 4,207,423 0.03Jack Henry & Associates Inc. 27,138 4,098,041 0.03Dell Technologies Inc. 106,979 4,007,343 0.03Paycom Software Inc. 17,734 3,978,036 0.03GoDaddy Inc. 61,593 3,964,419 0.03SolarEdge Technologies Inc. 19,305 3,847,005 0.03Qorvo Inc. 40,407 3,661,892 0.03Citrix Systems Inc. 45,839 3,655,435 0.03Cognex Corp. 65,513 3,528,986 0.03PTC Inc. 38,717 3,523,538 0.03Wolfspeed Inc. 46,080 3,373,693 0.03Unity Software Inc. 60,864 3,220,870 0.03Aspen Technology Inc. 24,610 3,108,052 0.03Juniper Networks Inc. 119,741 3,006,160 0.03F5 Inc. 22,481 2,997,465 0.03Black Knight Inc. 57,140 2,994,216 0.03Fair Isaac Corp. 9,748 2,907,395 0.02Anaplan Inc. 54,522 2,821,854 0.02Ciena Corp. 57,336 2,519,038 0.02Jabil Inc. 52,687 2,422,635 0.02
Vanguard U.S. Equity Index Fund
243

Holding
MarketValue
(£)
% ofTotal Net
Assets
Manhattan Associates Inc. 23,270 2,417,818 0.02Arrow Electronics Inc. 25,709 2,415,273 0.02Pure Storage Inc. 99,889 2,331,140 0.02Bentley Systems Inc. 68,065 2,298,650 0.02Ceridian HCM Holding Inc. 50,140 2,242,022 0.02Dynatrace Inc. 72,514 2,215,560 0.02Paylocity Holding Corp. 14,642 2,212,451 0.02Five9 Inc. 25,092 2,200,820 0.02WEX Inc. 16,422 2,174,426 0.02Guidewire Software Inc. 30,655 2,122,775 0.02First Solar Inc. 36,452 2,121,502 0.02DXC Technology Co. 90,460 2,069,303 0.02RingCentral Inc. 30,276 2,046,372 0.02Genpact Ltd. 63,718 2,045,268 0.02Western Union Co. 148,216 1,982,115 0.02Concentrix Corp. 15,783 1,979,568 0.02Avalara Inc. 32,101 1,944,980 0.02Lattice Semiconductor Corp. 50,794 1,943,562 0.02Coherent Inc. 9,036 1,926,096 0.02II-VI Inc. 39,069 1,904,127 0.02Coupa Software Inc. 27,648 1,900,235 0.02CDK Global Inc. 43,700 1,893,840 0.02Euronet Worldwide Inc. 19,502 1,886,979 0.02MKS Instruments Inc. 20,438 1,855,128 0.02Dropbox Inc. 103,899 1,799,922 0.02Smartsheet Inc. 46,616 1,796,692 0.02Sailpoint Technologies
Holdings Inc. 34,155 1,736,994 0.01Lumentum Holdings Inc. 26,517 1,714,997 0.01Synaptics Inc. 14,449 1,708,790 0.01Littelfuse Inc. 9,057 1,653,776 0.01Elastic NV 27,070 1,641,879 0.01Universal Display Corp. 16,014 1,629,333 0.01Rapid7 Inc. 21,141 1,608,433 0.01Nutanix Inc. 79,105 1,576,429 0.01Mandiant Inc. 88,197 1,544,764 0.01Silicon Laboratories Inc. 14,141 1,517,496 0.01Rogers Corp. 6,911 1,496,694 0.01Dolby Laboratories Inc. 24,254 1,496,387 0.01CMC Materials Inc. 10,491 1,493,974 0.01Tenable Holdings Inc. 33,964 1,493,279 0.01Mimecast Ltd. 22,823 1,448,455 0.01Power Integrations Inc. 22,185 1,413,619 0.01UiPath Inc. 99,479 1,412,752 0.01National Instruments Corp. 48,493 1,395,501 0.01Affirm Holdings Inc. 60,358 1,379,267 0.01Varonis Systems Inc. 40,069 1,378,398 0.01NCR Corp. 48,668 1,358,284 0.01Novanta Inc. 13,152 1,345,788 0.01Box Inc. 55,114 1,344,158 0.01SentinelOne Inc. 50,736 1,343,665 0.01Qualys Inc. 12,309 1,335,411 0.01ExlService Holdings Inc. 12,118 1,314,110 0.01Teradata Corp. 39,816 1,311,660 0.01Maximus Inc. 22,563 1,310,109 0.01Envestnet Inc. 20,329 1,290,984 0.01Workiva Inc. 16,596 1,276,523 0.01Vontier Corp. 62,517 1,274,739 0.01Cirrus Logic Inc. 21,112 1,273,950 0.01Avnet Inc. 36,380 1,264,824 0.01SPS Commerce Inc. 13,258 1,263,285 0.01TD SYNNEX Corp. 15,080 1,203,036 0.01Switch Inc. 48,960 1,165,602 0.01Alteryx Inc. 22,053 1,127,328 0.01Semtech Corp. 23,679 1,123,691 0.01New Relic Inc. 22,052 1,110,591 0.01Fabrinet 13,642 1,065,933 0.01Blackline Inc. 19,562 1,043,774 0.01Verint Systems Inc. 23,743 1,031,605 0.01Onto Innovation Inc. 18,085 1,024,312 0.01Insight Enterprises Inc. 12,687 1,003,238 0.01IPG Photonics Corp. 13,226 995,294 0.01Viavi Solutions Inc. 87,171 994,950 0.01MaxLinear Inc. 25,933 989,192 0.01Sabre Corp. 118,378 987,190 0.01MicroStrategy Inc. 3,498 985,430 0.01
Holding
MarketValue
(£)
% ofTotal Net
Assets
Perficient Inc. 12,075 956,093 0.01ACI Worldwide Inc. 43,451 955,887 0.01Diodes Inc. 16,290 947,557 0.01Pegasystems Inc. 15,028 915,804 0.01FormFactor Inc. 29,019 879,699 0.01Ambarella Inc. 13,442 878,467 0.01Q2 Holdings Inc. 21,052 866,561 0.01Alarm.com Holdings Inc. 17,360 844,701 0.01Advanced Energy Industries Inc. 13,815 842,104 0.01Kulicke & Soffa Industries Inc. 22,775 841,885 0.01Shift4 Payments Inc. 19,855 828,675 0.01Sprout Social Inc. 16,673 813,265 0.01Digital Turbine Inc. 32,281 813,260 0.01CommVault Systems Inc. 16,709 811,827 0.01Altair Engineering Inc. 18,571 802,006 0.01Rambus Inc. 40,417 801,579 0.01Viasat Inc. 27,266 798,543 0.01Bread Financial Holdings Inc. 18,191 794,144 0.01Blackbaud Inc. 17,110 790,426 0.01Sanmina Corp. 23,591 768,140 0.01SiTime Corp. 5,507 739,091 0.01Vishay Intertechnology Inc. 48,998 726,676 0.01MACOM Technology Solutions
Holdings Inc. 17,758 719,938 0.01EVERTEC Inc. 22,141 694,298 0.01Badger Meter Inc. 10,611 682,636 0.01Belden Inc. 16,528 679,813 0.01NetScout Systems Inc. 27,017 662,782 0.01Plexus Corp. 10,221 659,419 0.01Asana Inc. 30,548 651,350 0.01Xerox Holdings Corp. 46,927 650,362 0.01Bottomline Technologies DE Inc. 14,171 639,077 0.01PagerDuty Inc. 27,903 634,512 0.01Itron Inc. 16,670 633,606 0.01Calix Inc. 19,933 633,474 0.01Marqeta Inc. 84,596 626,637 0.01nCino Inc. 20,989 626,577 0.01LiveRamp Holdings Inc. 25,005 623,382 0.01Kyndryl Holdings Inc. 65,186 617,333 0.01Progress Software Corp. 15,793 603,543 0.01CSG Systems International Inc. 12,170 595,850 0.01Momentive Global Inc. 47,004 591,902 0.01Appfolio Inc. 7,118 587,695 0.01Confluent Inc. 22,370 555,374 0.01Appian Corp. 14,437 549,652 0.01Amkor Technology Inc. 36,393 545,243 0.01Super Micro Computer Inc. 15,816 529,971 0.01Axcelis Technologies Inc. 12,077 523,192 0.00Ubiquiti Inc. 2,316 520,643 0.00Qualtrics International Inc. 34,890 515,221 0.00Verra Mobility Corp. 46,148 514,961 0.00Everbridge Inc. 14,865 510,300 0.00Knowles Corp. 34,516 509,973 0.00Methode Electronics Inc. 14,369 509,639 0.00InterDigital Inc. 11,247 509,183 0.00Fastly Inc. 39,583 501,605 0.00Jamf Holding Corp. 20,267 496,545 0.00Plantronics Inc. 15,457 491,349 0.00Marathon Digital Holdings Inc. 38,507 478,462 0.00Xperi Holding Corp. 37,862 470,448 0.00Infinera Corp. 75,893 464,244 0.00LivePerson Inc. 25,605 461,318 0.00Ping Identity Holding Corp. 21,355 444,279 0.00ePlus Inc. 9,674 435,195 0.00TTM Technologies Inc. 38,981 433,122 0.003D Systems Corp. 46,777 421,757 0.00AppLovin Corp. 13,713 416,578 0.00Zuora Inc. 42,660 413,178 0.00Core Scientific Inc. 87,204 410,494 0.00E2open Parent Holdings Inc. 65,406 402,178 0.00Ultra Clean Holdings Inc. 16,187 401,613 0.00Toast Inc. 26,756 396,385 0.00TTEC Holdings Inc. 6,701 393,947 0.00SunPower Corp. 29,900 393,189 0.00Allegro MicroSystems Inc. 19,702 381,800 0.00OSI Systems Inc. 6,014 378,899 0.00
Vanguard U.S. Equity Index Fund
244

Holding
MarketValue
(£)
% ofTotal Net
Assets
Cohu Inc. 17,706 374,287 0.00Extreme Networks Inc. 46,728 357,299 0.00Duck Creek Technologies Inc. 28,134 356,969 0.00CommScope Holding Co. Inc. 74,156 355,571 0.00Veeco Instruments Inc. 18,879 344,799 0.00Domo Inc. 10,412 343,418 0.00Cerence Inc. 14,591 342,839 0.00C3.ai Inc. 25,351 342,657 0.00Avid Technology Inc. 13,447 339,522 0.00CTS Corp. 12,057 339,478 0.00Lightwave Logic Inc. 36,470 329,987 0.00PROS Holdings Inc. 14,764 328,441 0.00Embark Technology Inc. 73,792 321,499 0.00BigCommerce Holdings Inc. 22,079 314,258 0.00Riot Blockchain Inc. 38,872 313,638 0.00Matterport Inc. 68,263 312,634 0.008x8 Inc. 42,545 311,082 0.00Evo Payments Inc. 17,008 305,074 0.00KnowBe4 Inc. 16,009 303,476 0.00SMART Global Holdings Inc. 16,658 300,786 0.00Repay Holdings Corp. 27,082 288,184 0.00MoneyGram International Inc. 35,240 284,053 0.00Datto Holding Corp. 10,028 277,078 0.00Impinj Inc. 7,030 276,272 0.00Unisys Corp. 24,231 274,058 0.00Alpha & Omega Semiconductor
Ltd. 8,010 273,763 0.00Photronics Inc. 22,626 269,962 0.00Conduent Inc. 58,886 264,061 0.00IonQ Inc. 41,251 258,250 0.00Model N Inc. 12,397 254,852 0.00PAR Technology Corp. 9,505 250,287 0.00Sumo Logic Inc. 33,431 249,767 0.00ScanSource Inc. 9,134 248,520 0.00Ichor Holdings Ltd. 10,694 247,951 0.00Consensus Cloud Solutions Inc. 5,840 244,484 0.00Harmonic Inc. 36,661 242,071 0.00Sprinklr Inc. 22,282 241,721 0.00Benchmark Electronics Inc. 12,789 241,621 0.00A10 Networks Inc. 21,190 241,014 0.00ADTRAN Inc. 17,018 235,310 0.00Mirion Technologies Inc. 37,449 235,044 0.00CEVA Inc. 8,029 231,757 0.00Avaya Holdings Corp. 31,341 230,658 0.00NeoPhotonics Corp. 18,917 228,270 0.00TaskUS Inc. 9,904 227,110 0.00Payoneer Global Inc. 67,859 225,386 0.00Paycor HCM Inc. 11,386 223,004 0.00HashiCorp Inc. 5,912 221,694 0.00Ebix Inc. 9,150 217,180 0.00PDF Solutions Inc. 11,572 214,388 0.00International Money Express Inc. 13,095 207,246 0.00Thoughtworks Holding Inc. 13,961 205,718 0.00Clearfield Inc. 4,397 203,127 0.00Yext Inc. 43,795 201,272 0.00Dave Inc. 62,217 200,204 0.00Agilysys Inc. 6,850 200,180 0.00Hackett Group Inc. 10,558 197,537 0.00Digi International Inc. 13,126 197,491 0.00DigitalOcean Holdings Inc. 6,278 197,116 0.00Arlo Technologies Inc. 31,899 196,653 0.00NETGEAR Inc. 11,112 191,882 0.00N-able Inc. 23,908 190,426 0.00Grid Dynamics Holdings Inc. 16,803 186,298 0.00Freshworks Inc. 12,851 185,779 0.00Olo Inc. 21,293 181,130 0.00nLight Inc. 16,709 175,009 0.00FARO Technologies Inc. 6,394 174,581 0.00PC Connection Inc. 4,429 174,549 0.00Informatica Inc. 11,171 173,059 0.00Rackspace Technology Inc. 21,716 170,891 0.00Gitlab Inc. 4,468 170,677 0.00Cvent Holding Corp. 30,219 168,485 0.00BTRS Holdings Inc. 31,234 167,178 0.00I3 Verticals Inc. 7,475 163,372 0.00AEye Inc. 40,127 162,681 0.00
Holding
MarketValue
(£)
% ofTotal Net
Assets
American Software Inc. 11,722 159,561 0.00Squarespace Inc. 10,015 159,219 0.00Clearwater Analytics Holdings Inc. 11,325 158,216 0.00ACM Research Inc. 13,149 157,830 0.00Tucows Inc. 3,422 156,477 0.00SolarWinds Corp. 15,622 153,794 0.00MicroVision Inc. 59,945 153,742 0.00Samsara Inc. 15,342 150,915 0.00CCC Intelligent Solutions
Holdings Inc. 20,305 149,113 0.00Corsair Gaming Inc. 12,011 144,649 0.00Navitas Semiconductor Corp. 26,447 144,084 0.00Limelight Networks Inc. 49,774 141,135 0.00Braze Inc. 4,313 138,030 0.00Napco Security Technologies Inc. 9,910 137,895 0.00OneSpan Inc. 12,160 136,661 0.00Cass Information Systems Inc. 4,395 135,473 0.00Mitek Systems Inc. 15,070 133,595 0.00Paya Holdings Inc. 32,772 133,385 0.00ChannelAdvisor Corp. 11,443 132,157 0.00AvePoint Inc. 33,804 131,662 0.00Ribbon Communications Inc. 47,009 128,802 0.00Cyxtera Technologies Inc. 13,415 128,433 0.00SmartRent Inc. 33,032 127,603 0.00Kimball Electronics Inc. 8,851 125,698 0.00Clear Secure Inc. 5,045 122,076 0.00indie Semiconductor Inc. 21,959 120,683 0.00Telos Corp. 18,527 114,954 0.00Upland Software Inc. 9,665 114,702 0.00Amplitude Inc. 8,051 111,964 0.00CS Disco Inc. 4,547 111,076 0.00Vertex Inc. 9,696 109,664 0.00Vishay Precision Group Inc. 4,169 103,503 0.00Digimarc Corp. 4,922 101,419 0.00Comtech Telecommunications
Corp. 9,103 98,534 0.00Cantaloupe Inc. 22,268 96,663 0.00Rockley Photonics Holdings Ltd. 41,255 94,964 0.00GTY Technology Holdings Inc. 19,494 94,093 0.00Eastman Kodak Co. 22,775 93,785 0.00Aeva Technologies Inc. 35,536 92,555 0.00Diebold Nixdorf Inc. 28,239 92,218 0.00908 Devices Inc. 6,473 91,514 0.00Flywire Corp. 3,739 90,862 0.00CyberOptics Corp. 2,689 90,297 0.00Veritone Inc. 10,418 89,700 0.00Latch Inc. 33,634 88,137 0.00Focus Universal Inc. 7,695 87,400 0.00Benefitfocus Inc. 10,203 86,549 0.00Identiv Inc. 8,642 83,701 0.00Meta Materials Inc. 85,902 82,105 0.00Cleanspark Inc. 15,802 81,685 0.00WM Technology Inc. 17,528 80,834 0.00ForgeRock Inc. 4,858 78,780 0.00Cerberus Cyber Sentinel Corp. 23,640 77,764 0.00SEMrush Holdings Inc. 10,002 77,435 0.00Brightcove Inc. 13,676 76,577 0.00Aviat Networks Inc. 3,218 76,509 0.00Credo Technology Group Holding
Ltd. 8,358 73,361 0.00Intapp Inc. 3,653 72,245 0.00Turtle Beach Corp. 5,367 71,090 0.00Information Services Group Inc. 13,988 69,856 0.00AXT Inc. 14,855 69,808 0.00Ouster Inc. 26,289 69,308 0.00Zeta Group Holdings Ltd. 7,799 67,274 0.00Paymentus Holdings Inc. 5,091 67,191 0.00eGain Corp. 8,133 66,981 0.00Inseego Corp. 28,632 64,995 0.00Enfusion Inc. 6,396 64,953 0.00NVE Corp. 1,732 63,900 0.00Atomera Inc. 7,671 63,849 0.00PFSweb Inc. 7,032 63,571 0.00Rimini Street Inc. 13,795 63,399 0.00EverCommerce Inc. 6,301 62,081 0.00ShotSpotter Inc. 2,819 61,409 0.00
Vanguard U.S. Equity Index Fund
245

Holding
MarketValue
(£)
% ofTotal Net
Assets
AvidXchange Holdings Inc. 9,036 58,873 0.00Akoustis Technologies Inc. 16,572 58,606 0.00DZS Inc. 5,981 57,547 0.00Cepton Inc. 23,157 56,071 0.00Ondas Holdings Inc. 8,734 56,001 0.00MeridianLink Inc. 4,340 55,758 0.00CalAmp Corp. 12,335 53,643 0.00Casa Systems Inc. 13,295 51,676 0.00Phunware Inc. 32,142 51,458 0.00Cambium Networks Corp. 4,208 51,180 0.00Velodyne Lidar Inc. 33,492 50,151 0.00Exela Technologies Inc. 182,993 47,967 0.00Bel Fuse Inc. 3,647 47,349 0.00CoreCard Corp. 2,524 45,836 0.00Aehr Test Systems 7,276 44,508 0.00Intevac Inc. 10,960 43,997 0.00Couchbase Inc. 3,224 43,526 0.00Luna Innovations Inc. 9,823 43,188 0.00Meta Materials Inc. Class A 42,673 42,826 0.00Innodata Inc. 7,285 41,430 0.00Lantronix Inc. 9,750 40,615 0.00Cipher Mining Inc. 16,850 40,397 0.00Terawulf Inc. 12,989 39,314 0.00Expensify Inc. 3,239 38,672 0.00Synchronoss Technologies Inc. 37,077 37,210 0.00AstroNova Inc. 3,540 36,937 0.00Computer Task Group Inc. 4,811 36,327 0.00Kopin Corp. 28,419 36,217 0.00Everspin Technologies Inc. 6,490 35,823 0.00Alpine 4 Holdings Inc. 57,432 35,228 0.00Evolv Technologies Holdings Inc. 20,273 35,201 0.00AgileThought Inc. 9,119 33,992 0.00Daktronics Inc. 12,472 33,279 0.00KVH Industries Inc. 5,156 32,690 0.00Smith Micro Software Inc. 13,192 32,258 0.00NextNav Inc. 6,419 31,852 0.00Immersion Corp. 8,402 31,185 0.00Amtech Systems Inc. 4,282 31,002 0.00Iteris Inc. 14,982 30,668 0.00ON24 Inc. 2,975 29,999 0.00BM Technologies Inc. 5,073 29,901 0.00Quantum Corp. 19,948 29,711 0.00EMCORE Corp. 10,775 29,437 0.00Soluna Holdings Inc. 4,182 28,080 0.00Genasys Inc. 11,357 28,042 0.00Digital Ally Inc. 31,532 27,878 0.00IronNet Inc. 13,150 27,861 0.00Asure Software Inc. 5,741 27,390 0.00Rekor Systems Inc. 11,524 27,261 0.00ServiceSource International Inc. 31,161 26,309 0.00inTEST Corp. 4,224 26,141 0.00Pixelworks Inc. 15,589 26,075 0.00Airspan Networks Holdings Inc. 13,318 25,989 0.00Wayside Technology Group Inc. 948 25,446 0.00SecureWorks Corp. 2,874 25,249 0.00VirnetX Holding Corp. 22,461 25,046 0.00SRAX Inc. 7,849 25,007 0.00Viant Technology Inc. 5,047 23,637 0.00Blend Labs Inc. 6,862 23,447 0.00Research Solutions Inc. 15,257 23,089 0.00Powerfleet Inc. 10,875 22,434 0.00Richardson Electronics Ltd. 2,298 21,873 0.00Ipsidy Inc. 8,882 21,577 0.00GSI Technology Inc. 7,500 21,565 0.00Airgain Inc. 3,201 21,416 0.00Steel Connect Inc. 21,014 21,257 0.00One Stop Systems Inc. 5,710 21,194 0.00QuickLogic Corp. 5,244 20,884 0.00Arteris Inc. 2,214 20,491 0.00GreenBox POS 6,928 19,865 0.00Backblaze Inc. 2,596 19,374 0.00Wrap Technologies Inc. 9,023 18,829 0.00eMagin Corp. 25,844 18,007 0.00Applied Optoelectronics Inc. 8,649 17,636 0.00Boxlight Corp. 22,264 17,203 0.00Frequency Electronics Inc. 2,781 17,145 0.00
Holding
MarketValue
(£)
% ofTotal Net
Assets
Greenidge GenerationHoldings Inc. 3,432 17,112 0.00
Issuer Direct Corp. 909 16,392 0.00TransAct Technologies Inc. 3,144 16,052 0.00Research Frontiers Inc. 11,108 16,014 0.00LiveVox Holdings Inc. 5,779 14,775 0.00MICT Inc. 39,422 14,098 0.00Red Cat Holdings Inc. 8,604 13,912 0.00ClearSign Technologies Corp. 13,500 13,871 0.00Movano Inc. 6,809 13,613 0.00Data I/O Corp. 5,124 13,468 0.00StarTek Inc. 4,471 13,354 0.00CPS Technologies Corp. 4,710 13,093 0.00SkyWater Technology Inc. 2,619 12,766 0.00PCTEL Inc. 3,726 12,583 0.00CPI Card Group Inc. 1,362 12,204 0.00Verb Technology Co. Inc. 24,066 12,026 0.00Paysign Inc. 7,969 11,742 0.00American Virtual Cloud
Technologies Inc. 23,600 11,261 0.00Neonode Inc. 2,702 10,890 0.00Intellicheck Inc. 6,422 10,742 0.00Marin Software Inc. 5,825 10,532 0.00Franklin Wireless Corp. 3,855 10,470 0.00Vislink Technologies Inc. 16,067 10,046 0.00Stronghold Digital Mining Inc. 3,225 9,967 0.00Usio Inc. 4,402 9,852 0.00SeaChange International Inc. 11,558 9,850 0.00Priority Technology Holdings Inc. 2,601 9,840 0.00Inuvo Inc. 30,876 9,837 0.00Quantum Computing Inc. 8,013 9,637 0.00NetSol Technologies Inc. 3,013 9,071 0.00Inpixon 50,898 9,008 0.00Park City Group Inc. 2,300 8,830 0.00RF Industries Ltd. 1,675 8,672 0.00ALJ Regional Holdings Inc. 4,510 8,549 0.00AudioEye Inc. 2,482 8,066 0.00Intrusion Inc. 4,844 8,025 0.00WiSA Technologies Inc. 8,294 7,333 0.00Network-1 Technologies Inc. 3,800 7,325 0.00Auddia Inc. 4,404 6,875 0.00Key Tronic Corp. 1,585 6,779 0.00Coda Octopus Group Inc. 1,450 6,502 0.00Kaltura Inc. 5,196 6,373 0.00Wireless Telecom Group Inc. 5,100 6,256 0.00Qumu Corp. 6,171 6,242 0.00EngageSmart Inc. 360 5,987 0.00BSQUARE Corp. 5,479 5,979 0.00LightPath Technologies Inc. 4,600 5,679 0.00Duos Technologies Group Inc. 2,042 5,627 0.00AmpliTech Group Inc. 2,395 4,922 0.00Akerna Corp. 8,612 4,664 0.00ComSovereign Holding Corp. 17,032 4,531 0.00RealNetworks Inc. 10,844 4,319 0.00Peraso Inc. 2,624 3,783 0.00Minim Inc. 7,320 3,682 0.00Bridgeline Digital Inc. 3,131 3,616 0.00VerifyMe Inc. 1,515 3,584 0.00WidePoint Corp. 1,220 3,197 0.00Socket Mobile Inc. 1,017 3,038 0.00Oblong Inc. 7,706 2,897 0.00Alfi Inc. 2,489 2,855 0.00UserTesting Inc. 453 2,829 0.00GSE Systems Inc. 1,500 1,864 0.00CSP Inc. 300 1,639 0.00Blonder Tongue Laboratories Inc. 4,348 1,555 0.00Kaspien Holdings Inc. 308 1,496 0.00Sonim Technologies Inc. 2,702 1,255 0.00Weave Communications Inc. 327 1,235 0.00Remitly Global Inc. 45 397 0.00Terawulf Inc.1 192 — 0.00
3,218,312,544 26.23
Materials 3.02% (31 October 2021: 1.93%)
Linde plc 188,948 46,915,666 0.38Sherwin-Williams Co. 88,951 19,457,268 0.16
Vanguard U.S. Equity Index Fund
246

Holding
MarketValue
(£)
% ofTotal Net
Assets
Freeport-McMoRan Inc. 541,514 17,476,810 0.14Newmont Corp. 294,113 17,065,807 0.14Air Products and Chemicals Inc. 81,723 15,245,839 0.13Dow Inc. 271,643 14,383,765 0.12Nucor Corp. 100,596 12,412,041 0.10Ecolab Inc. 91,997 12,408,414 0.10Corteva Inc. 268,016 12,313,146 0.10DuPont de Nemours Inc. 189,615 9,960,257 0.08International Flavors &
Fragrances Inc. 93,910 9,075,344 0.07PPG Industries Inc. 87,601 8,927,552 0.07LyondellBasell Industries NV 96,991 8,191,119 0.07Ball Corp. 119,469 7,721,947 0.06Mosaic Co. 136,721 6,800,655 0.06Vulcan Materials Co. 48,884 6,707,870 0.06Albemarle Corp. 43,197 6,626,633 0.05Martin Marietta Materials Inc. 22,934 6,463,165 0.05CF Industries Holdings Inc. 79,149 6,097,401 0.05Amcor plc 562,311 5,311,832 0.04International Paper Co. 142,380 5,244,979 0.04FMC Corp. 46,525 4,912,267 0.04Steel Dynamics Inc. 69,598 4,752,950 0.04Celanese Corp. 39,919 4,673,271 0.04Packaging Corp. of America 34,989 4,487,396 0.04Avery Dennison Corp. 30,606 4,404,044 0.04Crown Holdings Inc. 46,943 4,116,998 0.03Eastman Chemical Co. 48,122 3,928,716 0.03Westrock Co. 96,848 3,820,692 0.03Reliance Steel & Aluminum Co. 23,182 3,660,741 0.03Alcoa Corp. 67,756 3,657,365 0.03Cleveland-Cliffs Inc. 175,939 3,572,029 0.03RPM International Inc. 47,592 3,141,715 0.03Sealed Air Corp. 54,490 2,785,043 0.02Royal Gold Inc. 24,245 2,519,316 0.02Olin Corp. 52,779 2,412,993 0.02United States Steel Corp. 96,304 2,338,755 0.02Berry Global Group Inc. 49,884 2,238,918 0.02AptarGroup Inc. 24,217 2,215,117 0.02Huntsman Corp. 76,331 2,058,595 0.02Graphic Packaging Holding Co. 103,857 1,803,330 0.02Sonoco Products Co. 36,103 1,780,850 0.02Louisiana-Pacific Corp. 32,752 1,683,381 0.01Ashland Global Holdings Inc. 19,776 1,652,961 0.01Axalta Coating Systems Ltd. 79,589 1,608,261 0.01Valvoline Inc. 66,186 1,592,575 0.01Chemours Co. 59,156 1,557,703 0.01Commercial Metals Co. 44,986 1,469,076 0.01Eagle Materials Inc. 14,874 1,460,980 0.01Avient Corp. 33,422 1,310,791 0.01Element Solutions Inc. 79,272 1,301,310 0.01Westlake Corp. 12,259 1,235,664 0.01Scotts Miracle-Gro Co. 14,856 1,230,131 0.01Balchem Corp. 11,871 1,162,043 0.01Cabot Corp. 21,035 1,102,766 0.01Silgan Holdings Inc. 30,400 1,074,351 0.01Sensient Technologies Corp. 15,187 1,023,353 0.01Allegheny Technologies Inc. 47,192 1,021,647 0.01Livent Corp. 59,738 1,017,758 0.01HB Fuller Co. 19,121 1,016,131 0.01Ginkgo Bioworks Holdings Inc. 429,957 989,706 0.01Summit Materials Inc. 43,894 970,877 0.01MP Materials Corp. 27,816 843,452 0.01Hecla Mining Co. 200,155 828,997 0.01Arconic Corp. 39,596 793,496 0.01Alpha Metallurgical Resources Inc. 6,411 790,307 0.01Innospec Inc. 9,137 693,626 0.01Ingevity Corp. 14,438 689,068 0.01NewMarket Corp. 2,487 641,707 0.01Quaker Chemical Corp. 4,878 632,178 0.01Stepan Co. 7,770 631,749 0.01O-I Glass Inc. 57,867 621,304 0.01Minerals Technologies Inc. 11,995 607,918 0.01Compass Minerals
International Inc. 12,418 584,155 0.01Tronox Holdings plc 41,236 564,593 0.01Trinseo plc 14,134 533,951 0.01
Holding
MarketValue
(£)
% ofTotal Net
Assets
Carpenter Technology Corp. 17,538 532,775 0.01Warrior Met Coal Inc. 19,005 516,942 0.01Materion Corp. 7,521 510,445 0.00GCP Applied Technologies Inc. 19,525 487,853 0.00Greif Inc. Class A 9,756 471,210 0.00Sylvamo Corp. 13,060 464,563 0.00Worthington Industries Inc. 12,226 462,942 0.00Kaiser Aluminum Corp. 5,785 444,645 0.00TriMas Corp. 15,954 374,865 0.00AdvanSix Inc. 10,317 365,512 0.00Schnitzer Steel Industries Inc. 9,284 337,418 0.00Piedmont Lithium Inc. 5,934 309,154 0.00Coeur Mining Inc. 93,660 270,051 0.00Orion Engineered Carbons SA 21,574 259,472 0.00Century Aluminum Co. 19,114 256,071 0.00TimkenSteel Corp. 15,393 253,423 0.00Myers Industries Inc. 13,677 238,789 0.00Intrepid Potash Inc. 3,816 232,577 0.00Hawkins Inc. 7,675 227,652 0.00Schweitzer-Mauduit
International Inc. 11,086 222,338 0.00Origin Materials Inc. 41,129 212,279 0.00LSB Industries Inc. 11,584 197,265 0.00Resolute Forest Products Inc. 17,669 196,181 0.00SunCoke Energy Inc. 29,153 193,192 0.00Mercer International Inc. 14,847 188,854 0.00Amyris Inc. 67,919 185,553 0.00Chase Corp. 2,694 180,973 0.00Ranpak Holdings Corp. 14,855 178,307 0.00Clearwater Paper Corp. 6,430 169,776 0.00PureCycle Technologies Inc. 26,934 167,332 0.00Neenah Inc. 5,924 167,080 0.00Ryerson Holding Corp. 5,637 165,092 0.00Aspen Aerogels Inc. 9,182 157,824 0.00Glatfelter Corp. 17,534 153,484 0.00Ecovyst Inc. 19,040 152,259 0.00American Vanguard Corp. 8,933 152,192 0.00Koppers Holdings Inc. 7,607 146,929 0.00Haynes International Inc. 4,379 136,305 0.00Pactiv Evergreen Inc. 14,920 117,055 0.00Greif Inc. 2,378 110,405 0.00Diversey Holdings Ltd. 16,455 101,312 0.00Danimer Scientific Inc. 31,634 98,518 0.00Kronos Worldwide Inc. 7,727 93,549 0.00Rayonier Advanced Materials Inc. 22,106 90,326 0.00Olympic Steel Inc. 3,198 87,420 0.00McEwen Mining Inc. 157,126 83,876 0.00Tredegar Corp. 9,082 82,827 0.00United States Lime & Minerals Inc. 873 75,785 0.00FutureFuel Corp. 9,088 68,839 0.00Gold Resource Corp. 38,220 55,709 0.00Loop Industries Inc. 9,620 49,345 0.00Trecora Resources 6,429 48,493 0.00Marrone Bio Innovations Inc. 49,946 45,749 0.00Advanced Emissions Solutions Inc. 8,881 42,654 0.00Ramaco Resources Inc. 3,357 42,407 0.00Gatos Silver Inc. 15,633 41,962 0.00Northern Technologies
International Corp. 3,622 32,340 0.00Core Molding Technologies Inc. 3,693 29,238 0.00Synalloy Corp. 1,842 23,841 0.00Friedman Industries Inc. 2,432 17,569 0.00Hycroft Mining Holding Corp. 15,074 16,809 0.00Flotek Industries Inc. 15,792 16,352 0.00Universal Stainless & Alloy
Products Inc. 2,260 15,229 0.00Smith-Midland Corp. 1,069 14,023 0.00Comstock Mining Inc. 14,349 13,486 0.00Golden Minerals Co. 37,739 12,769 0.00Ampco-Pittsburgh Corp. 2,431 10,650 0.00US Gold Corp. 2,199 9,826 0.00AgroFresh Solutions Inc. 6,386 9,359 0.00United States Antimony Corp. 27,505 8,675 0.00
Vanguard U.S. Equity Index Fund
247

Holding
MarketValue
(£)
% ofTotal Net
Assets
Zymergen Inc. 5,841 7,816 0.00Crown ElectroKinetics Corp. 2,690 2,335 0.00
370,942,699 3.02
Real Estate 3.71% (31 October 2021: 3.46%)
Prologis Inc. 272,704 34,816,170 0.28American Tower Corp. 167,929 32,238,873 0.26Crown Castle International Corp. 159,450 23,521,879 0.19Equinix Inc. 33,210 19,020,816 0.16Public Storage 56,194 16,614,706 0.14Digital Realty Trust Inc. 104,675 12,170,807 0.10Welltower Inc. 160,291 11,593,802 0.09Realty Income Corp. 208,097 11,497,954 0.09Simon Property Group Inc. 121,223 11,393,315 0.09SBA Communications Corp. 40,147 11,099,177 0.09AvalonBay Communities Inc. 51,541 9,332,795 0.08Weyerhaeuser Co. 276,062 9,063,536 0.07CBRE Group Inc. 123,641 8,180,687 0.07Equity Residential 125,596 8,155,983 0.07Alexandria Real Estate Equities Inc. 53,612 7,778,540 0.06Extra Space Storage Inc. 49,391 7,474,540 0.06VICI Properties Inc. 310,866 7,381,052 0.06Invitation Homes Inc. 220,681 6,997,456 0.06Mid-America Apartment
Communities Inc. 42,507 6,656,210 0.05Ventas Inc. 147,342 6,518,017 0.05Essex Property Trust Inc. 24,036 6,303,727 0.05Duke Realty Corp. 140,076 6,110,680 0.05Sun Communities Inc. 42,998 6,008,758 0.05Healthpeak Properties Inc. 198,136 5,179,466 0.04Boston Properties Inc. 52,208 4,891,457 0.04Camden Property Trust 37,417 4,675,707 0.04UDR Inc. 109,703 4,642,387 0.04Kimco Realty Corp. 226,363 4,572,332 0.04Iron Mountain Inc. 106,731 4,567,625 0.04WP Carey Inc. 69,752 4,486,793 0.04Host Hotels & Resorts Inc. 262,557 4,253,609 0.03Equity LifeStyle Properties Inc. 63,684 3,920,457 0.03Rexford Industrial Realty Inc. 59,060 3,671,550 0.03American Homes 4 Rent 108,245 3,415,040 0.03Jones Lang LaSalle Inc. 18,689 3,258,181 0.03Medical Properties Trust Inc. 219,102 3,209,306 0.03Life Storage Inc. 30,174 3,187,074 0.03Regency Centers Corp. 56,863 3,117,839 0.03Gaming and Leisure Properties Inc. 87,070 3,077,096 0.03CubeSmart 80,076 3,028,919 0.03Lamar Advertising Co. 32,066 2,819,661 0.02American Campus
Communities Inc. 51,300 2,641,203 0.02Federal Realty Investment Trust 26,123 2,435,649 0.02Apartment Income REIT Corp. 57,745 2,263,345 0.02National Retail Properties Inc. 64,672 2,257,724 0.02EastGroup Properties Inc. 14,916 2,227,835 0.02First Industrial Realty Trust Inc. 48,135 2,224,062 0.02Brixmor Property Group Inc. 109,501 2,215,312 0.02Kilroy Realty Corp. 38,827 2,164,477 0.02Americold Realty Trust 98,934 2,078,755 0.02STORE Capital Corp. 91,201 2,065,188 0.02Healthcare Trust of America Inc. 81,410 1,975,107 0.02STAG Industrial Inc. 64,723 1,923,388 0.02Rayonier Inc. 54,821 1,886,750 0.02Vornado Realty Trust 59,294 1,828,172 0.02Independence Realty Trust Inc. 83,081 1,803,231 0.02Omega Healthcare Investors Inc. 88,600 1,798,110 0.01Zillow Group Inc. Class C 52,543 1,666,058 0.01Spirit Realty Capital Inc. 47,118 1,630,646 0.01Terreno Realty Corp. 27,555 1,596,236 0.01Cousins Properties Inc. 54,463 1,556,023 0.01Douglas Emmett Inc. 64,468 1,512,212 0.01Ryman Hospitality Properties Inc. 20,101 1,496,647 0.01Agree Realty Corp. 27,410 1,482,388 0.01Kite Realty Group Trust 81,957 1,455,054 0.01Park Hotels & Resorts Inc. 86,237 1,353,141 0.01SL Green Realty Corp. 24,502 1,353,025 0.01National Storage Affiliates Trust 29,935 1,349,518 0.01Highwoods Properties Inc. 39,320 1,279,661 0.01
Holding
MarketValue
(£)
% ofTotal Net
Assets
Howard Hughes Corp. 15,352 1,227,181 0.01PotlatchDeltic Corp. 26,658 1,175,457 0.01Healthcare Realty Trust Inc. 54,509 1,175,275 0.01Innovative Industrial Properties Inc. 10,097 1,162,823 0.01EPR Properties 27,581 1,154,645 0.01PS Business Parks Inc. 7,635 1,138,530 0.01Phillips Edison & Co. Inc. 41,392 1,116,314 0.01Physicians Realty Trust 81,210 1,108,673 0.01Apple Hospitality REIT Inc. 76,782 1,081,247 0.01Outfront Media Inc. 52,813 1,076,451 0.01DigitalBridge Group Inc. 192,769 1,068,635 0.01Hudson Pacific Properties Inc. 55,973 1,037,874 0.01LXP Industrial Trust 102,743 1,027,020 0.01Broadstone Net Lease Inc. 58,801 968,542 0.01Equity Commonwealth 45,087 940,883 0.01Pebblebrook Hotel Trust 48,265 939,158 0.01Uniti Group Inc. 88,252 870,218 0.01JBG SMITH Properties 41,265 866,384 0.01Corporate Office Properties Trust 40,664 864,454 0.01Essential Properties Realty
Trust Inc. 44,565 851,899 0.01SITE Centers Corp. 65,081 824,203 0.01Opendoor Technologies Inc. 145,202 807,256 0.01Kennedy-Wilson Holdings Inc. 44,629 801,224 0.01Sabra Health Care REIT Inc. 84,672 787,034 0.01Sunstone Hotel Investors Inc. 80,213 782,004 0.01Cushman & Wakefield plc 54,524 776,929 0.01Macerich Co. 77,454 773,614 0.01Zillow Group Inc. Class A 22,541 694,094 0.01National Health Investors Inc. 16,610 681,334 0.01Retail Opportunity Investments
Corp. 45,448 674,027 0.01RLJ Lodging Trust 59,731 667,008 0.01Four Corners Property Trust Inc. 29,818 651,934 0.01Xenia Hotels & Resorts Inc. 42,217 648,975 0.01DiamondRock Hospitality Co. 76,130 643,967 0.01NexPoint Residential Trust Inc. 8,857 628,702 0.01Urban Edge Properties 41,386 616,092 0.01Washington REIT 32,013 614,251 0.01Brandywine Realty Trust 63,065 585,693 0.01InvenTrust Properties Corp. 24,189 585,506 0.01Piedmont Office Realty Trust Inc. 45,105 579,126 0.01Newmark Group Inc. 59,645 575,784 0.01American Assets Trust Inc. 19,469 568,485 0.00Acadia Realty Trust 33,645 560,616 0.00St Joe Co. 12,269 520,076 0.00Tanger Factory Outlet Centers Inc. 37,453 480,878 0.00Easterly Government
Properties Inc. 31,455 477,274 0.00Paramount Group Inc. 60,773 459,851 0.00Alexander & Baldwin Inc. 27,213 459,510 0.00CareTrust REIT Inc. 35,218 454,706 0.00WeWork Inc. 77,963 434,680 0.00Global Net Lease Inc. 38,737 432,571 0.00Veris Residential Inc. 32,927 419,881 0.00Centerspace 5,522 406,178 0.00Preferred Apartment
Communities Inc. 20,235 401,154 0.00Service Properties Trust 60,886 393,298 0.00Realogy Holdings Corp. 42,697 373,407 0.00LTC Properties Inc. 13,814 363,532 0.00Empire State Realty Trust Inc. 51,789 355,985 0.00iStar Inc. 25,950 348,067 0.00Marcus & Millichap Inc. 9,700 346,048 0.00Gladstone Land Corp. 11,744 340,206 0.00Redfin Corp. 38,040 337,830 0.00Getty Realty Corp. 14,787 316,940 0.00Summit Hotel Properties Inc. 40,097 315,219 0.00Industrial Logistics Properties Trust 24,153 310,690 0.00RPT Realty 29,289 310,036 0.00Office Properties Income Trust 17,876 307,259 0.00UMH Properties Inc. 16,202 303,263 0.00Necessity Retail REIT Inc. 47,313 281,504 0.00Apartment Investment and
Management Co. 55,343 277,707 0.00Community Healthcare Trust Inc. 9,315 273,180 0.00
Vanguard U.S. Equity Index Fund
248

Holding
MarketValue
(£)
% ofTotal Net
Assets
eXp World Holdings Inc. 24,339 259,577 0.00NETSTREIT Corp. 14,970 257,548 0.00Global Medical REIT Inc. 21,660 254,641 0.00Plymouth Industrial REIT Inc. 12,774 245,407 0.00Armada Hoffler Properties Inc. 22,529 243,144 0.00Bluerock Residential Growth
REIT Inc. 10,238 216,992 0.00Saul Centers Inc. 5,168 212,812 0.00Orion Office REIT Inc. 19,864 212,484 0.00Gladstone Commercial Corp. 12,579 210,802 0.00Chatham Lodging Trust 16,967 194,063 0.00Postal Realty Trust Inc. 14,438 193,312 0.00Safehold Inc. 5,477 187,976 0.00City Office REIT Inc. 15,275 180,429 0.00Universal Health Realty Income
Trust 4,510 180,256 0.00Whitestone REIT 18,201 176,139 0.00Diversified Healthcare Trust 85,453 153,141 0.00Alexander's Inc. 755 149,262 0.00Urstadt Biddle Properties Inc.
Class A 10,686 147,672 0.00Indus Realty Trust Inc. 2,546 144,263 0.00Franklin Street Properties Corp. 34,004 139,753 0.00One Liberty Properties Inc. 5,649 128,998 0.00Tejon Ranch Co. 8,602 125,313 0.00RE/MAX Holdings Inc. 6,538 122,115 0.00RMR Group Inc. 5,445 117,964 0.00CTO Realty Growth Inc. 2,276 115,604 0.00FRP Holdings Inc. 2,578 115,194 0.00Douglas Elliman Inc. 23,757 114,669 0.00Braemar Hotels & Resorts Inc. 23,571 113,772 0.00CatchMark Timber Trust Inc. 17,166 112,116 0.00Hersha Hospitality Trust 14,192 110,891 0.00Farmland Partners Inc. 9,286 108,799 0.00Offerpad Solutions Inc. 26,739 106,913 0.00Seritage Growth Properties 12,950 102,218 0.00Stratus Properties Inc. 2,790 92,978 0.00Cedar Realty Trust Inc. 4,057 91,803 0.00Doma Holdings Inc. 61,974 90,826 0.00Forestar Group Inc. 6,693 87,054 0.00BRT Apartments Corp. 3,932 68,555 0.00Ashford Hospitality Trust Inc. 10,381 58,292 0.00Alpine Income Property Trust Inc. 2,944 43,779 0.00New York City REIT Inc. 4,323 42,042 0.00Creative Media & Community Trust
Corp. 6,514 36,059 0.00Global Self Storage Inc. 7,254 34,782 0.00Transcontinental Realty
Investors Inc. 1,026 32,435 0.00Sotherly Hotels Inc. 19,985 31,040 0.00Clipper Realty Inc. 4,300 30,585 0.00Altisource Portfolio Solutions SA 3,286 28,031 0.00Power REIT 857 17,993 0.00CorEnergy Infrastructure Trust Inc. 8,316 16,360 0.00Fathom Holdings Inc. 1,866 11,013 0.00Maui Land & Pineapple Co. Inc. 1,155 10,395 0.00InterGroup Corp. 250 10,384 0.00Trinity Place Holdings Inc. 9,747 10,170 0.00Pennsylvania REIT 21,840 9,338 0.00Urstadt Biddle Properties Inc. 698 9,173 0.00Wheeler REIT Inc. 3,496 5,987 0.00Rafael Holdings Inc. 3,369 5,769 0.00AMREP Corp. 453 4,507 0.00InnSuites Hospitality Trust 1,348 2,598 0.00Spirit MTA REIT1 10,922 2,328 0.00Alset EHome International Inc. 5,442 1,777 0.00Altisource Asset Management
Corp. 183 1,326 0.00
454,644,965 3.71
Telecommunications 0.00% (31 October 2021: 2.72%)
Utilities 2.76% (31 October 2021: 2.53%)
NextEra Energy Inc. 723,619 40,927,247 0.33Duke Energy Corp. 283,364 24,867,407 0.20Southern Co. 390,349 22,817,760 0.19
Holding
MarketValue
(£)
% ofTotal Net
Assets
Dominion Energy Inc. 298,812 19,432,885 0.16Sempra Energy 117,758 15,134,545 0.12American Electric Power Co. Inc. 185,391 14,633,404 0.12Exelon Corp. 360,633 13,437,199 0.11Xcel Energy Inc. 198,670 11,592,638 0.09Public Service Enterprise
Group Inc. 186,751 10,364,638 0.08Consolidated Edison Inc. 130,418 9,633,579 0.08WEC Energy Group Inc. 116,583 9,290,421 0.08Eversource Energy 126,590 8,813,402 0.07American Water Works Co. Inc. 66,896 8,210,274 0.07Edison International 140,279 7,691,598 0.06DTE Energy Co. 71,548 7,468,228 0.06FirstEnergy Corp. 210,041 7,248,962 0.06Ameren Corp. 95,116 7,041,080 0.06Entergy Corp. 74,089 7,014,109 0.06PPL Corp. 276,652 6,238,163 0.05CMS Energy Corp. 106,416 5,822,151 0.05CenterPoint Energy Inc. 232,874 5,677,634 0.05Constellation Energy Corp. 120,240 5,670,575 0.05PG&E Corp. 556,379 5,605,887 0.05Evergy Inc. 84,608 4,573,749 0.04Atmos Energy Corp. 49,659 4,487,700 0.04Alliant Energy Corp. 92,532 4,334,372 0.03AES Corp. 244,283 3,971,178 0.03Vistra Corp. 176,516 3,517,665 0.03NiSource Inc. 144,529 3,353,347 0.03Essential Utilities Inc. 84,245 3,004,099 0.02NRG Energy Inc. 89,837 2,568,099 0.02Pinnacle West Capital Corp. 41,362 2,345,987 0.02OGE Energy Corp. 73,627 2,267,746 0.02UGI Corp. 76,881 2,100,372 0.02National Fuel Gas Co. 33,501 1,871,305 0.01Southwest Gas Holdings Inc. 24,217 1,701,651 0.01IDACORP Inc. 18,556 1,554,535 0.01Black Hills Corp. 23,350 1,362,129 0.01ONE Gas Inc. 19,901 1,338,304 0.01Hawaiian Electric Industries Inc. 39,838 1,304,452 0.01Portland General Electric Co. 32,773 1,235,741 0.01New Jersey Resources Corp. 35,124 1,206,609 0.01PNM Resources Inc. 31,344 1,165,881 0.01Spire Inc. 19,285 1,117,623 0.01South Jersey Industries Inc. 40,737 1,110,006 0.01Ormat Technologies Inc. 17,137 1,060,569 0.01ALLETE Inc. 21,246 1,003,833 0.01Avangrid Inc. 25,841 912,822 0.01NorthWestern Corp. 19,641 886,856 0.01Clearway Energy Inc. Class C 35,787 870,802 0.01Avista Corp. 26,333 850,710 0.01MGE Energy Inc. 13,549 839,055 0.01American States Water Co. 13,152 824,003 0.01California Water Service Group 18,986 784,240 0.01Otter Tail Corp. 15,524 715,179 0.01Chesapeake Utilities Corp. 6,695 666,620 0.00Northwest Natural Holding Co. 13,089 498,747 0.00SJW Group 10,355 486,615 0.00Sunnova Energy International Inc. 33,888 466,415 0.00Middlesex Water Co. 6,453 455,796 0.00Unitil Corp. 5,403 219,563 0.00Montauk Renewables Inc. 23,853 215,446 0.00York Water Co. 4,941 151,988 0.00Clearway Energy Inc. Class A 6,655 150,645 0.00Artesian Resources Corp. 3,598 133,259 0.00Consolidated Water Co. Ltd. 14,786 127,191 0.00Altus Power Inc. 24,600 112,664 0.00Pure Cycle Corp. 8,401 69,992 0.00Global Water Resources Inc. 5,267 59,655 0.00RGC Resources Inc. 3,461 56,539 0.00Genie Energy Ltd. 7,571 38,895 0.00Via Renewables Inc. 5,625 31,989 0.00Cadiz Inc. 12,978 20,467 0.00
338,836,891 2.76
Total Equities 12,198,288,937 99.42
Vanguard U.S. Equity Index Fund
249
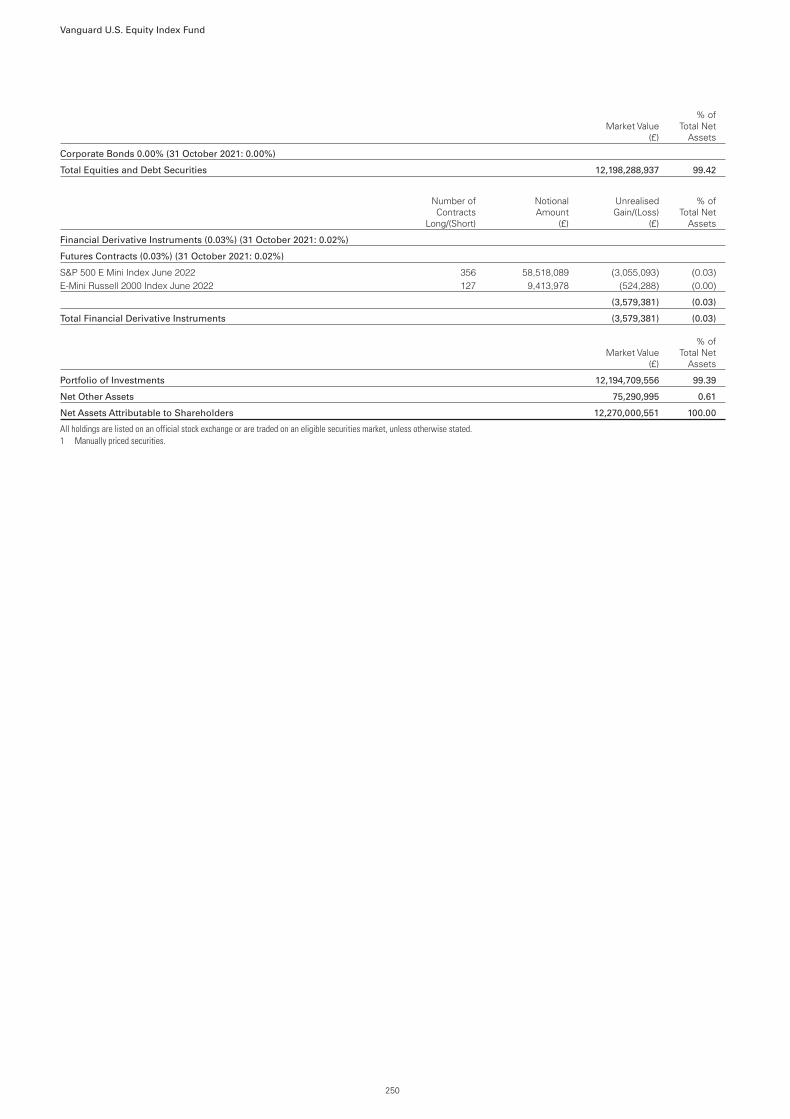
Market Value(£)
% ofTotal Net
Assets
Corporate Bonds 0.00% (31 October 2021: 0.00%)
Total Equities and Debt Securities 12,198,288,937 99.42
Number ofContracts
Long/(Short)
NotionalAmount
(£)
UnrealisedGain/(Loss)
(£)
% ofTotal Net
Assets
Financial Derivative Instruments (0.03%) (31 October 2021: 0.02%)
Futures Contracts (0.03%) (31 October 2021: 0.02%)
S&P 500 E Mini Index June 2022 356 58,518,089 (3,055,093) (0.03)E-Mini Russell 2000 Index June 2022 127 9,413,978 (524,288) (0.00)
(3,579,381) (0.03)
Total Financial Derivative Instruments (3,579,381) (0.03)
Market Value(£)
% ofTotal Net
Assets
Portfolio of Investments 12,194,709,556 99.39
Net Other Assets 75,290,995 0.61
Net Assets Attributable to Shareholders 12,270,000,551 100.00
All holdings are listed on an official stock exchange or are traded on an eligible securities market, unless otherwise stated.1 Manually priced securities.
Vanguard U.S. Equity Index Fund
250

As at As at
30 April 2022(£)
31 October 2021(£)
Assets:
Financial Assets 12,198,288,937 12,656,544,415Current Assets
Debtors 14,793,712 31,840,237Cash and Bank Balances 66,761,448 51,301,113
Total Assets 12,279,844,097 12,739,685,765
Liabilities:
Financial Liabilities 3,579,381 —Creditors
Distribution Payable — 22,883,234Other Creditors 6,264,165 27,204,120
Total Liabilities 9,843,546 50,087,354
Net Assets Attributable to Shareholders 12,270,000,551 12,689,598,411
Statement of Total Return
Period Ended Period Ended
30 April 2022(£)
30 April 2022(£)
30 April 2021(£)
30 April 2021(£)
IncomeNet Capital Gains/(Losses) (574,998,865) 1,888,812,313Revenue 87,146,765 72,166,905
Expenses (5,851,753) (4,591,488)
Net Revenue Before Taxation 81,295,012 67,575,417Taxation (11,661,428) (9,715,222)
Net Revenue After Taxation 69,633,584 57,860,195
Total Return Before Distributions (505,365,281) 1,946,672,508
Distributions1 451,098 3,185,659
Change in Net Assets Attributable to
Shareholders From Investment Activities (504,914,183) 1,949,858,167
1 Includes adjustments for equalisation.
Statement of Change in Net Assets Attributable to Shareholders
Period Ended Period Ended
30 April 2022(£)
30 April 2022(£)
30 April 2021(£)
30 April 2021(£)
Opening Net Assets Attributable to Shareholders 12,689,598,411 8,239,362,048
Amounts Received on Issue of Shares 798,667,931 1,342,228,697Amounts Paid on Cancellation of Shares (713,351,608) (188,214,240)
85,316,323 1,154,014,457
Change in Net Assets Attributable toShareholders From Investment Activities (504,914,183) 1,949,858,167
Closing Net Assets Attributable to Shareholders 12,270,000,551 11,343,234,672
The interim financial statements for the Fund have been prepared on the same basis of the accounting policies as the annual financial statements for the year ended 31 October 2021.
Vanguard U.S. Equity Index Fund
Balance Sheet
251

Investment Objective
Vanguard U.K. Inflation-Linked Gilt Index Fund (the “Fund”) seeks to track the performance of the Bloomberg U.K. Government Inflation-Linked Float AdjustedBond Index1 (the "Index).
Investment Strategy
The Fund is a passive fund that seeks to achieve its investment objective by investing in a representative sample of the component bonds of the Index.
Synthetic Risk and Reward Indicator
Lower risk
Typically lower rewards
Higher risk
Typically higher rewards
1 2 3 4 5 6 7
The Synthetic Risk and Reward Indicator (SRRI) measures the volatility of the Fund. The risk and reward category (which may range from 1 to 7) is calculatedusing historical data and may not be a reliable indicator of the Fund’s future risk profile. The risk and reward category may shift over time and is not a target orguarantee. The lowest category (i.e. category 1) does not mean “risk free”. The Fund appears in the higher range of the risk and reward indicator because thevalues of the Fund’s investments have experienced a higher rate of change in the past.
Performance SummaryThe Performance Summary does not form part of the Financial Statements.
• Volatility surged and global financial markets slumped during the six months ended 30 April 2022. When the period began, supply bottlenecks, rising oil pricesand the prospect of less accommodative monetary policy were already weighing on market sentiment.
• Then Russia’s invasion of Ukraine injected substantial uncertainty into the markets. Energy prices soared, helping to push consumer prices to multidecadehighs across much of the world. Some central banks, including those in the United States and the United Kingdom, raised short-term interest rates. TheEuropean Central Bank continued to reduce its bond purchases and was expected to raise rates later this year.
• While consumer sentiment flagged during the period, in many markets unemployment remained low, consumer balance sheets healthy and corporate profitsrobust.
• In the UK, the Bank of England raised its bank rate three times in an effort to combat surging inflation. Energy prices fuelled part of that rise, but so did othercommodity prices and supply chain disruptions, along with wage increases that were supported by a strong jobs market.
• Stocks regained some ground in March but finished the six months with a negative return. The FTSE Global All Cap Index, a proxy for global stocks, returnedabout –4%. The United Kingdom and Asia-Pacific were bright spots, while Europe detracted the most.
• With central banks turning less accommodative and inflation looking set to remain elevated for some time, bond yields in many markets moved higher acrossthe maturity spectrum. The Bloomberg Global Aggregate Bond Index hedged to British pounds, a global bond proxy, returned about –7% for the six months.
• In this environment, the Fund’s benchmark Index returned –11.85% for the six months.
• Inflation-linked gilts underperformed their nominal counterparts, which returned roughly –10%. Although inflation-linked bonds performed well very early in theperiod, the Bank of England’s pivot to a more hawkish monetary stance contributed to yields rising and prices falling.
Vanguard U.K. Inflation-Linked Gilt Index FundManaged by Vanguard Global Advisers, LLC.
252

Benchmark: Bloomberg U.K. Government Inflation-Linked Float Adjusted Bond Index1
Total ReturnsPeriods Ended 30 April 2022
(Annualised for periods over one year)
Six Months Five YearsTen Years or
Since Inception1
GBP Acc -11.90% 1.02% 5.23%
Benchmark -11.85 1.19 5.34
Tracking Difference* -0.05
GBP Inc -11.90% 1.02% 5.23%
Benchmark -11.85 1.19 5.34
Tracking Difference* -0.05
Institutional Plus GBP Acc -11.87% 1.09% 5.14%
Benchmark -11.85 1.19 5.21
Tracking Difference* -0.02
Institutional Plus GBP Inc -11.87% 1.10% 5.14%
Benchmark -11.85 1.19 5.21
Tracking Difference* -0.02
Sources: Vanguard Global Advisers, LLC and Bloomberg.Returns is based on NAV with income reinvested.
All of the returns in this report represent past performance, which is not a guarantee of future results that may be achieved by the Fund. For performance data current to the most recent month-end,which may be higher or lower than that cited, visit our website at http://global.vanguard.com. Note, too, that both investment returns and principal value can fluctuate widely, so an investor’s shares,when sold, could be worth more or less than their original cost.* The tracking difference between the Fund return and the Index return over a stated period of time can be attributed to a number of factors, including, without limitation, small differences in
weightings, trading activity, swing pricing, transaction costs, and differences in the valuation and withholding tax treatment between the Fund and the index vendor.1 Since-inception returns: Institutional Plus GBP Acc and Institutional Plus GBP Inc, 2 September 2014.
Vanguard U.K. Inflation-Linked Gilt Index Fund
253

Performance Comparative Table
GBP Acc
For the PeriodEnded
30 April 2022For the Year Ended
31 October 2021For the Year Ended
31 October 2020For the Year Ended
31 October 2019
Closing Net Asset Value £2,107,393,302 £2,216,998,472 £1,693,763,242 £1,463,982,715
Closing Number of Shares 10,368,576 9,547,334 7,665,360 7,064,697
Closing Net Asset Value Per Share1 £203.25 £232.21 £220.96 £207.23
Operating Charges2 0.12% 0.12% 0.12% 0.15%
GBP Inc
Closing Net Asset Value £137,231,212 £155,305,015 £158,340,486 £160,263,992
Closing Number of Shares 678,165 671,755 719,730 776,787
Closing Net Asset Value Per Share1 £202.36 £231.19 £220.00 £206.32
Operating Charges2 0.12% 0.12% 0.12% 0.15%
Institutional Plus GBP Acc
Closing Net Asset Value £78,860,975 £72,323,910 £77,100,196 £89,796,084
Closing Number of Shares 537,210 431,362 483,558 600,650
Closing Net Asset Value Per Share1 £146.80 £167.66 £159.44 £149.50
Operating Charges2 0.06% 0.06% 0.06% 0.06%
Institutional Plus GBP Inc
Closing Net Asset Value £16,682,402 £19,370,011 £23,377,417 £25,053,544
Closing Number of Shares 113,605 115,490 146,563 167,588
Closing Net Asset Value Per Share1 £146.85 £167.72 £159.50 £149.49
Operating Charges2 0.06% 0.06% 0.06% 0.06%
1 The net asset value per share shown may diverge from the net asset value per share used for dealing purposes as at 30 April 2022 because of any adjustments for trade date accounting, swingpricing and any adjustments in valuation to bid prices.
2 Operating charges include indirect costs incurred in the maintenance and running of the Fund, as disclosed in the detailed expenses within the Statement of Total Return.
Vanguard U.K. Inflation-Linked Gilt Index Fund
254

Summary of Significant ChangesFor the period ended 30 April 2022
Cost(£)
Largest Purchases
United Kingdom Gilt 0.125% 22/03/2073 28,064,756
United Kingdom Gilt 0.125% 22/03/2068 20,956,057
United Kingdom Gilt 1.250% 22/11/2027 18,958,173
United Kingdom Gilt 0.125% 10/08/2048 16,956,328
United Kingdom Gilt 0.750% 22/11/2047 16,682,743
Total 101,618,057
Total Purchases for the Period 385,180,977
Proceeds(£)
Largest Sales
United Kingdom Gilt 1.875% 22/11/2022 69,378,948
United Kingdom Gilt 0.125% 10/08/2048 10,168,171
United Kingdom Gilt 0.125% 22/03/2068 9,943,329
United Kingdom Gilt 1.25% 22/11/2027 9,807,855
United Kingdom Gilt 0.75% 22/03/2034 7,037,644
Total 106,335,947
Total Sales for the Period 181,315,253
Vanguard U.K. Inflation-Linked Gilt Index Fund
255

Portfolio StatementAs at 30 April 2022
CouponMaturity
Date Holding
MarketValue
(£)
% ofTotal Net
Assets
Government Bonds 99.83% (31 October 2021: 99.77%)
United Kingdom Gilt 1.250% 22/11/55 £32,275,533 117,994,302 5.04United Kingdom Gilt 1.125% 22/11/37 £41,817,392 104,704,357 4.47United Kingdom Gilt 0.375% 22/03/62 £39,123,362 104,387,086 4.46United Kingdom Gilt 0.125% 22/03/68 £38,227,668 101,239,778 4.33United Kingdom Gilt 0.750% 22/11/47 £37,404,281 101,022,488 4.32United Kingdom Gilt 0.625% 22/03/40 £43,679,768 99,047,025 4.23United Kingdom Gilt 1.250% 22/11/32 £46,149,116 98,287,871 4.20United Kingdom Gilt 0.500% 22/03/50 £37,589,996 97,490,907 4.17United Kingdom Gilt 0.125% 22/03/44 £48,970,223 96,072,329 4.11United Kingdom Gilt 1.250% 22/11/27 £45,175,515 93,781,542 4.01United Kingdom Gilt 0.625% 22/11/42 £38,628,140 93,396,845 3.99United Kingdom Gilt 0.750% 22/03/34 £44,581,301 86,591,712 3.70United Kingdom Gilt 2.000% 26/01/35 £29,225,081 85,143,766 3.64United Kingdom Gilt 0.250% 22/03/52 £38,195,971 84,666,063 3.62United Kingdom Gilt 0.125% 22/03/29 £49,444,472 81,093,768 3.47United Kingdom Gilt 2.500% 17/07/24 £20,566,594 76,885,744 3.29United Kingdom Gilt 0.125% 10/08/28 £55,387,000 76,589,764 3.27United Kingdom Gilt 0.125% 22/03/46 £40,367,844 76,063,085 3.25United Kingdom Gilt 0.125% 22/03/58 £33,846,000 74,179,244 3.17United Kingdom Gilt 0.125% 22/11/36 £40,909,751 69,303,049 2.96United Kingdom Gilt 0.125% 22/03/24 £46,239,500 67,034,416 2.86United Kingdom Gilt 0.125% 10/08/48 £36,541,000 66,521,127 2.84United Kingdom Gilt 0.125% 10/08/41 £39,309,000 65,512,875 2.80United Kingdom Gilt 0.125% 22/11/65 £25,591,517 61,585,636 2.63United Kingdom Gilt 0.125% 22/03/26 £42,316,000 59,883,054 2.56United Kingdom Gilt 4.125% 22/07/30 £14,598,037 55,363,493 2.37United Kingdom Gilt 0.125% 22/11/56 £22,044,076 45,733,302 1.95United Kingdom Gilt 0.125% 10/08/31 £19,500,000 27,261,938 1.16United Kingdom Gilt 0.125% 22/03/51 £14,231,000 24,924,925 1.06United Kingdom Gilt 0.125% 22/03/39 £14,900,000 22,642,635 0.97United Kingdom Gilt 0.125% 22/03/73 £9,047,507 21,875,026 0.93
2,336,279,152 99.83
Portfolio of Investments 2,336,279,152 99.83
Net Other Assets 3,888,739 0.17
Net Assets Attributable to Shareholders 2,340,167,891 100.00
Vanguard U.K. Inflation-Linked Gilt Index Fund
256

As at As at
30 April 2022(£)
31 October 2021(£)
Assets:
Financial Assets 2,336,279,152 2,458,270,803Current Assets
Debtors 14,933,592 3,807,434Cash and Bank Balances 2,632,818 3,703,490
Total Assets 2,353,845,562 2,465,781,727
Liabilities:
Creditors
Other Creditors 13,677,671 1,784,319
Total Liabilities 13,677,671 1,784,319
Net Assets Attributable to Shareholders 2,340,167,891 2,463,997,408
Statement of Total Return
Period Ended Period Ended
30 April 2022(£)
30 April 2022(£)
30 April 2021(£)
30 April 2021(£)
IncomeNet Capital Gains/(Losses) (414,843,929) (121,214,382)Revenue 94,002,300 18,802,081
Expenses (1,447,261) (1,182,511)
Net Revenue Before Taxation 92,555,039 17,619,570Taxation — —
Net Revenue After Taxation 92,555,039 17,619,570
Total Return Before Distributions (322,288,890) 103,594,812
Distributions — —
Change in Net Assets Attributable to
Shareholders From Investment Activities (322,288,890) 103,594,812
Statement of Change in Net Assets Attributable to Shareholders
Period Ended Period Ended
30 April 2022(£)
30 April 2022(£)
30 April 2021(£)
30 April 2021(£)
Opening Net Assets Attributable to Shareholders 2,463,997,408 1,952,581,341
Amounts Received on Issue of Shares 307,392,422 373,172,981Amounts Paid on Cancellation of Shares (108,933,049) (117,720,168)
198,459,373 255,452,813
Dilution Adjustment — 21,832Change in Net Assets Attributable to
Shareholders From Investment Activities (322,288,890) 103,594,812
Closing Net Assets Attributable to Shareholders 2,340,167,891 2,104,461,174
The interim financial statements for the Fund have been prepared on the same basis of the accounting policies as the annual financial statements for the year ended 31 October 2021.
Vanguard U.K. Inflation-Linked Gilt Index Fund
Balance Sheet
257

Investment Objective
Vanguard U.K. Long Duration Gilt Index Fund (the “Fund”) seeks to track the performance of the Bloomberg U.K. Government 15+ Years Float Adjusted BondIndex (the “Index”).
Investment Strategy
The Fund is a passive fund that seeks to achieve its investment objective by investing in a representative sample of the component bonds of the Index.
Synthetic Risk and Reward Indicator
Lower risk
Typically lower rewards
Higher risk
Typically higher rewards
1 2 3 4 5 6 7
The Synthetic Risk and Reward Indicator (SRRI) measures the volatility of the Fund. The risk and reward category (which may range from 1 to 7) is calculatedusing historical data and may not be a reliable indicator of the Fund’s future risk profile. The risk and reward category may shift over time and is not a target orguarantee. The lowest category (i.e. category 1) does not mean “risk free”. The Fund appears in the higher range of the risk and reward indicator because thevalues of the Fund’s investments have experienced a higher rate of change in the past.
Performance SummaryThe Performance Summary does not form part of the Financial Statements.
• Volatility surged and global financial markets slumped during the six months ended 30 April 2022. When the period began, supply bottlenecks, rising oil pricesand the prospect of less accommodative monetary policy were already weighing on market sentiment.
• Then Russia’s invasion of Ukraine injected substantial uncertainty into the markets. Energy prices soared, helping to push consumer prices to multidecadehighs across much of the world. Some central banks, including those in the United States and the United Kingdom, raised short-term interest rates. TheEuropean Central Bank continued to reduce its bond purchases and was expected to raise rates later this year.
• While consumer sentiment flagged during the period, in many markets unemployment remained low, consumer balance sheets healthy and corporate profitsrobust.
• In the UK, the Bank of England raised its bank rate three times in an effort to combat surging inflation. Energy prices fuelled part of that rise, but so did othercommodity prices and supply chain disruptions, along with wage increases that were supported by a strong jobs market.
• Stocks regained some ground in March but finished the six months with a negative return. The FTSE Global All Cap Index, a proxy for global stocks, returnedabout –4%. The United Kingdom and Asia-Pacific were bright spots, while Europe detracted the most.
• With central banks turning less accommodative and inflation looking set to remain elevated for some time, bond yields in many markets moved higher acrossthe maturity spectrum. The Bloomberg Global Aggregate Bond Index hedged to British pounds, a global bond proxy, returned about –7% for the six months.
• With bond yields declining sharply, the Fund’s benchmark Index returned –16.71% for the six months.
• Gilts as a whole returned roughly –10%, slightly underperforming the broad UK investment-grade bond market. Gilts maturing in more than 25 years returnedabout –20%, while the average for gilts maturing in 0 years or less was closer to –3%.
Vanguard U.K. Long Duration Gilt Index FundManaged by Vanguard Global Advisers, LLC.
258

Benchmark: Bloomberg U.K. Government 15+Years Float Adjusted Bond Index
Total ReturnsPeriods Ended 30 April 2022
(Annualised for periods over one year)
Six Months Five YearsTen Years or
Since Inception1
GBP Acc -16.75% -0.16% 4.11%
Benchmark -16.71 -0.07 4.47
Tracking Difference* -0.04
GBP Inc -16.74% -0.15% 4.10%
Benchmark -16.71 -0.07 4.47
Tracking Difference* -0.03
Institutional Plus GBP Acc -16.73% -0.11% 3.82%
Benchmark -16.71 -0.07 4.04
Tracking Difference* -0.02
Institutional Plus GBP Inc -16.73% -0.11% 3.82%
Benchmark -16.71 -0.07 4.04
Tracking Difference* -0.02
Sources: Vanguard Global Advisers, LLC, and Bloomberg.Returns is based on NAV with income reinvested.
All of the returns in this report represent past performance, which is not a guarantee of future results that may be achieved by the Fund. For performance data current to the most recent month-end,which may be higher or lower than that cited, visit our website at http://global.vanguard.com. Note, too, that both investment returns and principal value can fluctuate widely, so an investor’s shares,when sold, could be worth more or less than their original cost.* The tracking difference between the Fund return and the Index return over a stated period of time can be attributed to a number of factors, including, without limitation, small differences in
weightings, trading activity, swing pricing, transaction costs, and differences in the valuation and withholding tax treatment between the Fund and the index vendor.1 Since-inception returns: Institutional Plus GBP Acc and Institutional Plus GBP Inc, 2 September 2014.
Vanguard U.K. Long Duration Gilt Index Fund
259

Performance Comparative Table
GBP Acc
For the PeriodEnded
30 April 2022For the Year Ended
31 October 2021For the Year Ended
31 October 2020For the Year Ended
31 October 2019
Closing Net Asset Value £258,078,594 £421,525,694 £420,839,639 £359,551,206
Closing Number of Shares 1,361,484 1,849,087 1,752,119 1,609,612
Closing Net Asset Value Per Share1 £189.56 £227.96 £240.19 £223.38
Operating Charges2 0.12% 0.12% 0.12% 0.15%
GBP Inc
Closing Net Asset Value £74,215,473 £107,378,108 £152,676,562 £101,131,621
Closing Number of Shares 484,086 578,713 772,376 543,737
Closing Net Asset Value Per Share1 £153.31 £185.55 £197.67 £185.99
Operating Charges2 0.12% 0.12% 0.12% 0.15%
Institutional Plus GBP Acc
Closing Net Asset Value £1,899,502 £2,095,114 £2,389,999 £1,966,885
Closing Number of Shares 14,222 13,047 14,131 12,510
Closing Net Asset Value Per Share1 £133.56 £160.59 £169.13 £157.23
Operating Charges2 0.08% 0.08% 0.08% 0.10%
Institutional Plus GBP Inc
Closing Net Asset Value £4,778,889 £5,784,555 £5,542,292 £6,060,191
Closing Number of Shares 40,511 40,511 36,434 42,340
Closing Net Asset Value Per Share1 £117.96 £142.79 £152.12 £143.13
Operating Charges2 0.08% 0.08% 0.08% 0.10%
1 The net asset value per share shown may diverge from the net asset value per share used for dealing purposes as at 30 April 2022 because of any adjustments for trade date accounting, swingpricing and any adjustments in valuation to bid prices.
2 Operating charges include indirect costs incurred in the maintenance and running of the Fund, as disclosed in the detailed expenses within the Statement of Total Return.
Vanguard U.K. Long Duration Gilt Index Fund
260

Summary of Significant ChangesFor the period ended 30 April 2022
Cost(£)
Largest Purchases
United Kingdom Gilt 1.250% 31/07/2051 3,694,920
United Kingdom Gilt 1.125% 22/10/2073 3,340,140
United Kingdom Gilt 1.625% 22/10/2071 2,996,714
United Kingdom Gilt 1.125% 31/01/2039 2,916,487
United Kingdom Gilt 1.750% 07/09/2037 1,968,796
Total 14,917,057
Total Purchases for the Period 28,667,210
Proceeds(£)
Largest Sales
United Kingdom Gilt 1.250% 22/10/2041 8,568,713
United Kingdom Gilt 4.250% 07/12/2055 7,925,721
United Kingdom Gilt 1.750% 07/09/2037 7,619,771
United Kingdom Gilt 3.250% 22/01/2044 7,200,207
United Kingdom Gilt 4.500% 07/12/2042 7,189,990
Total 38,504,402
Total Sales for the Period 139,276,522
Vanguard U.K. Long Duration Gilt Index Fund
261
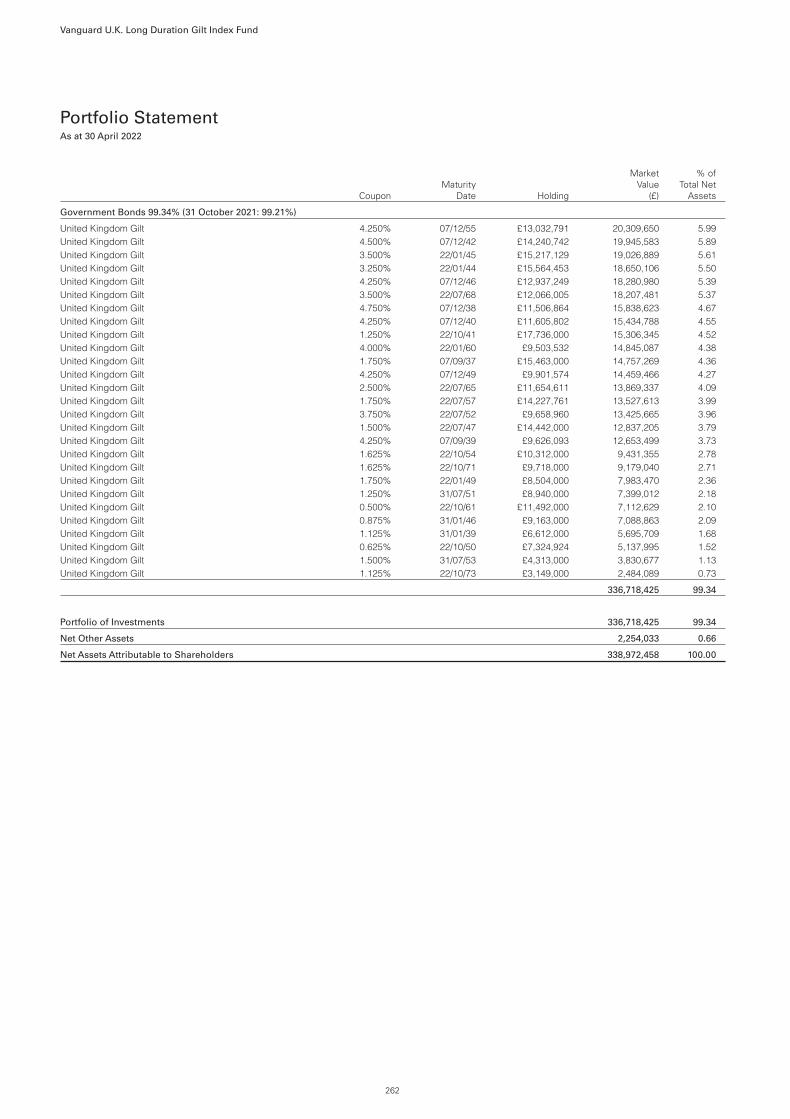
Portfolio StatementAs at 30 April 2022
CouponMaturity
Date Holding
MarketValue
(£)
% ofTotal Net
Assets
Government Bonds 99.34% (31 October 2021: 99.21%)
United Kingdom Gilt 4.250% 07/12/55 £13,032,791 20,309,650 5.99United Kingdom Gilt 4.500% 07/12/42 £14,240,742 19,945,583 5.89United Kingdom Gilt 3.500% 22/01/45 £15,217,129 19,026,889 5.61United Kingdom Gilt 3.250% 22/01/44 £15,564,453 18,650,106 5.50United Kingdom Gilt 4.250% 07/12/46 £12,937,249 18,280,980 5.39United Kingdom Gilt 3.500% 22/07/68 £12,066,005 18,207,481 5.37United Kingdom Gilt 4.750% 07/12/38 £11,506,864 15,838,623 4.67United Kingdom Gilt 4.250% 07/12/40 £11,605,802 15,434,788 4.55United Kingdom Gilt 1.250% 22/10/41 £17,736,000 15,306,345 4.52United Kingdom Gilt 4.000% 22/01/60 £9,503,532 14,845,087 4.38United Kingdom Gilt 1.750% 07/09/37 £15,463,000 14,757,269 4.36United Kingdom Gilt 4.250% 07/12/49 £9,901,574 14,459,466 4.27United Kingdom Gilt 2.500% 22/07/65 £11,654,611 13,869,337 4.09United Kingdom Gilt 1.750% 22/07/57 £14,227,761 13,527,613 3.99United Kingdom Gilt 3.750% 22/07/52 £9,658,960 13,425,665 3.96United Kingdom Gilt 1.500% 22/07/47 £14,442,000 12,837,205 3.79United Kingdom Gilt 4.250% 07/09/39 £9,626,093 12,653,499 3.73United Kingdom Gilt 1.625% 22/10/54 £10,312,000 9,431,355 2.78United Kingdom Gilt 1.625% 22/10/71 £9,718,000 9,179,040 2.71United Kingdom Gilt 1.750% 22/01/49 £8,504,000 7,983,470 2.36United Kingdom Gilt 1.250% 31/07/51 £8,940,000 7,399,012 2.18United Kingdom Gilt 0.500% 22/10/61 £11,492,000 7,112,629 2.10United Kingdom Gilt 0.875% 31/01/46 £9,163,000 7,088,863 2.09United Kingdom Gilt 1.125% 31/01/39 £6,612,000 5,695,709 1.68United Kingdom Gilt 0.625% 22/10/50 £7,324,924 5,137,995 1.52United Kingdom Gilt 1.500% 31/07/53 £4,313,000 3,830,677 1.13United Kingdom Gilt 1.125% 22/10/73 £3,149,000 2,484,089 0.73
336,718,425 99.34
Portfolio of Investments 336,718,425 99.34
Net Other Assets 2,254,033 0.66
Net Assets Attributable to Shareholders 338,972,458 100.00
Vanguard U.K. Long Duration Gilt Index Fund
262

As at As at
30 April 2022(£)
31 October 2021(£)
Assets:
Financial Assets 336,718,425 532,549,444Current Assets
Debtors 2,315,143 9,935,787Cash and Bank Balances 966,575 1,539,635
Total Assets 340,000,143 544,024,866
Liabilities:
Creditors
Distribution Payable 268,661 315,364Other Creditors 759,024 6,926,031
Total Liabilities 1,027,685 7,241,395
Net Assets Attributable to Shareholders 338,972,458 536,783,471
Statement of Total Return
Period Ended Period Ended
30 April 2022(£)
30 April 2022(£)
30 April 2021(£)
30 April 2021(£)
IncomeNet Capital Gains/(Losses) (83,476,392) (60,127,780)Revenue 3,066,279 3,424,687
Expenses (276,921) (331,858)
Net Revenue Before Taxation 2,789,358 3,092,829Taxation — —
Net Revenue After Taxation 2,789,358 3,092,829
Total Return Before Distributions (80,687,034) (57,034,951)
Distributions1 (2,789,358) (3,092,830)
Change in Net Assets Attributable to
Shareholders From Investment Activities (83,476,392) (60,127,781)
1 Includes adjustments for equalisation.
Statement of Change in Net Assets Attributable to Shareholders
Period Ended Period Ended
30 April 2022(£)
30 April 2022(£)
30 April 2021(£)
30 April 2021(£)
Opening Net Assets Attributable to Shareholders 536,783,471 581,448,492
Amounts Received on Issue of Shares 19,969,079 67,925,536Amounts Paid on Cancellation of Shares (136,419,553) (69,793,910)
(116,450,474) (1,868,374)
Dilution Adjustment 61,725 23,035Change in Net Assets Attributable to
Shareholders From Investment Activities (83,476,392) (60,127,781)Retained Distribution on Accumulation Shares 2,054,128 2,361,061
Closing Net Assets Attributable to Shareholders 338,972,458 521,836,433
The interim financial statements for the Fund have been prepared on the same basis of the accounting policies as the annual financial statements for the year ended 31 October 2021.
Vanguard U.K. Long Duration Gilt Index Fund
Balance Sheet
263

Interim distribution payable 30 June 2022
Net IncomePence Per Share
EqualisationPence Per Share
Distribution Payable30 June 2022
Pence Per Share
Distribution Paid30 June 2021
Pence Per Share
GBP Acc
Group 1 64.3760 — 64.3760 63.7016
Group 2 31.1751 33.2009 64.3760 63.7016
GBP Inc
Group 1 52.0451 — 52.0451 52.2913
Group 2 22.1761 29.8690 52.0451 52.2913
Institutional Plus GBP Acc
Group 1 46.6617 — 46.6617 46.4129
Group 2 30.4317 16.2300 46.6617 46.4129
Institutional Plus GBP Inc
Group 1 41.2705 — 41.2705 41.6349
Group 2 41.2705 — 41.2705 41.6349
Group 1—Shares purchased before 1 February 2022.Group 2—Shares purchased between 1 February 2022 and 30 April 2022.Note: Equalisation applies only to shares purchased during the distribution period (Group 2 shares). It is the average amount of income included in the purchase price of all Group 2 shares and isrefunded to holders of these shares as a return of capital. Being capital, it is not liable to income tax but must be deducted from the cost of shares for capital gains tax purposes.
Interim distribution paid 31 March 2022
Net IncomePence Per Share
EqualisationPence Per Share
Distribution Paid31 March 2022
Pence Per Share
Distribution Paid31 March 2021
Pence Per Share
GBP Acc
Group 1 64.7698 — 64.7698 63.3212
Group 2 39.5927 25.1771 64.7698 63.3212
GBP Inc
Group 1 52.8416 — 52.8416 52.1179
Group 2 27.9144 24.9272 52.8416 52.1179
Institutional Plus GBP Acc
Group 1 47.2877 — 47.2877 46.2530
Group 2 22.0932 25.1945 47.2877 46.2530
Institutional Plus GBP Inc
Group 1 42.1454 — 42.1454 41.6028
Group 2 42.1454 — 42.1454 41.6028
Group 1—Shares purchased before 1 November 2021.Group 2—Shares purchased between 1 November 2021 and 31 January 2022.Note: Equalisation applies only to shares purchased during the distribution period (Group 2 shares). It is the average amount of income included in the purchase price of all Group 2 shares and isrefunded to holders of these shares as a return of capital. Being capital, it is not liable to income tax but must be deducted from the cost of shares for capital gains tax purposes.
Vanguard U.K. Long Duration Gilt Index Fund
Distribution TablesFor the period ended 30 April 2022
264

Reports and Financial Statements
Each year, annual and interim reports will be prepared. They will describe investment activity during the period and provide managementcommentary.
Recipients of this document should not treat the contents as advice relating to legal, taxation or investment matters and should consult theirown professional advisers concerning the acquisition, holding or disposing of investments in the Funds.
Past performance is not necessarily indicative of future performance, and the value of the shares and income from them may fall as well asrise. On redemption of shares, investors may receive back an amount less than the original amount of their investment. The assets of theFunds will be in a variety of currencies, and therefore movements in the value of currencies may affect the value of an investor’s holdings andthe income from the holdings may fluctuate in value in money terms.
Prospectus
The Fund Prospectus, an important document describing each Fund in detail, is available from the ACD, which is responsible for themanagement and administration of the Funds.
The ACD for Vanguard Investments Funds ICVC is Vanguard Investments UK, Limited, located at 4th Floor, The Walbrook Building,25 Walbrook, London EC4N 8AF.
Types of Shares Available
Generally, the Funds offer two classes of shares, GBP and Institutional Plus GBP, and Accumulation and Income Shares, except for VanguardActive U.K. Equity Fund, Vanguard FTSE Global All Cap Index Fund, Vanguard Global Emerging Markets Fund, Vanguard Global Equity Fund,Vanguard Global Equity Income Fund, Vanguard Global Sustainable Equity Fund, Vanguard SustainableLife 40-50% Equity Fund, VanguardSustainableLife 60-70% Equity Fund and Vanguard SustainableLife 80-90% Equity Fund which offer only GBP Accumulation and IncomeShares. Vanguard ESG Developed World All Cap Equity Index Fund (UK) offers two classes of shares, GBP Accumulation and Income andInstitutional Plus GBP Income.
Switching
Investors may sell their shares and transfer the proceeds into any of the other Funds by calling our dealing desk on 0800 408 2065.
Distributions
Vanguard ESG Developed World All Cap Equity Index Fund (UK), Vanguard U.K. Inflation-Linked Gilt Index Fund, Vanguard U.K. Long DurationGilt Index Fund and Vanguard Global Equity Income Fund allocate revenue to shareholders quarterly, on 31 January, 30 April, 31 July and31 October. Vanguard FTSE U.K. Equity Income Index Fund allocates revenue to shareholders twice a year, on 30 April and 31 October.Vanguard Active U.K. Equity Fund, Vanguard FTSE Developed Europe ex-U.K. Equity Index Fund, Vanguard FTSE Developed World ex-U.K.Equity Index Fund, Vanguard FTSE Global All Cap Index Fund, Vanguard U.S. Equity Index Fund, Vanguard SustainableLife Equity Fund,Vanguard SustainableLife 40-50% Equity Fund, Vanguard SustainableLife 60-70% Equity Fund, Vanguard SustainableLife 80-90% Equity Fund,Vanguard Global Emerging Markets Fund and Vanguard Global Equity Fund allocate revenue annually, on 31 October. If the ex-dividend datedoes not fall on a business day, the effective date will be the first business day following the fiscal year-end.
Publication of Prices
The most recent share prices are published daily on https://global.vanguard.com.
Cross Holdings
On 30 April 2022 there were no shares in any sub-fund held by other sub-funds of Vanguard Investments Funds ICVC.
Assessment of Value
Under rules laid out in COLL 6.6.20R of the Financial Conduct Authority's Handbook, the ACD is required to inform investors annuallywhether its funds are providing value to investors and then publish an annual statement summarising the outcome of this process. Details ofthe statement are available at https://www.vanguard.co.uk/adviser/adv/about-vanguard/assessment-of-value.
Issued by Vanguard Investments UK, Limited4th Floor, The Walbrook Building25 Walbrook, London, EC4N 8AF
Vanguard Investments Funds ICVC
Further Information
265

Securities Financing Transactions RegulationSecurities Financing Transactions Regulation (“SFTR”) introduces reporting requirements for securities financing transactions (“SFTs”) andtotal return swaps.
An SFT is defined as per Article 3(11) of the SFTR as:
• a repurchase/reverse repurchase agreement;
• securities or commodities lending and securities or commodities borrowing;
• a buy-sell back transaction or sell-buy back transaction; or
• a margin lending transaction.
As at 30 April 2022, Vanguard Investments Funds ICVC had a securities-lending programme as a type of SFT under the scope of the SFTR.
Global Data
The amounts of securities on loan as at 30 April 2022 are as follows:
Fund Amount (£)Proportion
of NAV (%)
% ofLendable
AssetsVanguard Active U.K. Equity Fund 555,792 1.39 1.51Vanguard ESG Developed World All Cap Equity Index Fund (UK) 2,043,960 0.43 0.46Vanguard FTSE Developed Europe ex-U.K. Equity Index Fund 102,813,154 3.32 3.65Vanguard FTSE Developed World ex-U.K. Equity Index Fund 87,113,947 0.75 0.81Vanguard FTSE Global All Cap Index Fund 8,685,933 0.48 0.57Vanguard FTSE U.K. Equity Income Index Fund 217,864 0.02 0.02Vanguard Global Emerging Markets Fund 2,043,715 0.70 1.57Vanguard Global Equity Fund 853,654 0.26 0.30Vanguard Global Equity Income Fund 1,246,210 1.00 1.14Vanguard U.S. Equity Index Fund 25,659,220 0.21 0.22
Data on Re-Use of Collateral
Vanguard Investments Funds ICVC did not re-use any collateral received during the period ended 30 April 2022.
Concentration Data
The split of issuers of collateral securities received by Fund across all SFTs as at 30 April 2022 is as follows:
Fund Counterparty Collateral Amount (£)
Vanguard Active U.K. Equity Fund US Government 269,754
Vanguard Active U.K. Equity Fund NL Government 79,091
Vanguard Active U.K. Equity Fund FR Government 77,855
Vanguard Active U.K. Equity Fund UK Government 77,504
Vanguard Active U.K. Equity Fund DE Government 29,039
Vanguard ESG Developed World All Cap Equity Index Fund (UK) US Government 661,939
Vanguard ESG Developed World All Cap Equity Index Fund (UK) FR Government 627,071
Vanguard ESG Developed World All Cap Equity Index Fund (UK) UK Government 345,440
Vanguard ESG Developed World All Cap Equity Index Fund (UK) NL Government 344,601
Vanguard ESG Developed World All Cap Equity Index Fund (UK) DE Government 179,393
Vanguard FTSE Developed Europe ex-U.K. Equity Index Fund US Government 37,214,513
Vanguard FTSE Developed Europe ex-U.K. Equity Index Fund FR Government 35,310,991
Vanguard FTSE Developed Europe ex-U.K. Equity Index Fund UK Government 25,880,386
Vanguard FTSE Developed Europe ex-U.K. Equity Index Fund NL Government 7,395,248
Vanguard FTSE Developed Europe ex-U.K. Equity Index Fund DE Government 5,295,880
Vanguard FTSE Developed World ex-U.K. Equity Index Fund FR Government 32,081,391
Vanguard FTSE Developed World ex-U.K. Equity Index Fund US Government 27,596,323
Vanguard FTSE Developed World ex-U.K. Equity Index Fund UK Government 16,064,019
Vanguard FTSE Developed World ex-U.K. Equity Index Fund NL Government 10,967,258
Vanguard FTSE Developed World ex-U.K. Equity Index Fund DE Government 6,837,449
Additional Information From the Directors (Unaudited)
266

Fund Counterparty Collateral Amount (£)
Vanguard FTSE Global All Cap Index Fund FR Government 3,520,330
Vanguard FTSE Global All Cap Index Fund US Government 3,309,136
Vanguard FTSE Global All Cap Index Fund UK Government 1,363,508
Vanguard FTSE Global All Cap Index Fund NL Government 884,858
Vanguard FTSE Global All Cap Index Fund DE Government 445,668
Vanguard FTSE U.K. Equity Income Index Fund FR Government 168,998
Vanguard FTSE U.K. Equity Income Index Fund UK Government 63,607
Vanguard FTSE U.K. Equity Income Index Fund NL Government 62,593
Vanguard FTSE U.K. Equity Income Index Fund US Government 2,642
Vanguard Global Emerging Markets Fund FR Government 1,379,109
Vanguard Global Emerging Markets Fund NL Government 374,985
Vanguard Global Emerging Markets Fund UK Government 355,302
Vanguard Global Emerging Markets Fund US Government 252,318
Vanguard Global Emerging Markets Fund DE Government 95,562
Vanguard Global Equity Fund US Government 362,314
Vanguard Global Equity Fund FR Government 282,323
Vanguard Global Equity Fund UK Government 166,259
Vanguard Global Equity Fund DE Government 63,401
Vanguard Global Equity Fund NL Government 31,241
Vanguard Global Equity Income Fund FR Government 1,092,428
Vanguard Global Equity Income Fund US Government 153,363
Vanguard Global Equity Income Fund UK Government 70,670
Vanguard U.S. Equity Index Fund US Government 15,487,001
Vanguard U.S. Equity Index Fund FR Government 4,677,027
Vanguard U.S. Equity Index Fund NL Government 3,171,390
Vanguard U.S. Equity Index Fund UK Government 2,824,305
Vanguard U.S. Equity Index Fund DE Government 1,068,576
The split of counterparties of the securities-lending programme as at 30 April 2022 is as follows:
Fund CounterpartySecurities onLoan Amount
Vanguard Active U.K. Equity Fund Merrill Lynch 326,292
Vanguard Active U.K. Equity Fund UBS 229,500
Vanguard ESG Developed World All Cap Equity Index Fund (UK) Merrill Lynch 1,091,037
Vanguard ESG Developed World All Cap Equity Index Fund (UK) Citigroup 703,281
Vanguard ESG Developed World All Cap Equity Index Fund (UK) HSBC 232,978
Vanguard ESG Developed World All Cap Equity Index Fund (UK) Credit Suisse Group 16,665
Vanguard FTSE Developed Europe ex-U.K. Equity Index Fund UBS 31,072,477
Vanguard FTSE Developed Europe ex-U.K. Equity Index Fund Citigroup 25,654,850
Vanguard FTSE Developed Europe ex-U.K. Equity Index Fund Merrill Lynch 19,873,045
Vanguard FTSE Developed Europe ex-U.K. Equity Index Fund Morgan Stanley 14,451,136
Vanguard FTSE Developed Europe ex-U.K. Equity Index Fund Credit Suisse Group 9,130,490
Vanguard FTSE Developed Europe ex-U.K. Equity Index Fund HSBC 2,417,879
Vanguard FTSE Developed Europe ex-U.K. Equity Index Fund JP Morgan 213,277
Vanguard FTSE Developed World ex-U.K. Equity Index Fund Citigroup 32,881,684
Vanguard FTSE Developed World ex-U.K. Equity Index Fund Merrill Lynch 30,845,928
Vanguard FTSE Developed World ex-U.K. Equity Index Fund UBS 8,029,685
Vanguard FTSE Developed World ex-U.K. Equity Index Fund Morgan Stanley 5,656,377
Vanguard FTSE Developed World ex-U.K. Equity Index Fund Credit Suisse Group 4,847,072
Vanguard FTSE Developed World ex-U.K. Equity Index Fund HSBC 3,830,437
Vanguard FTSE Developed World ex-U.K. Equity Index Fund JP Morgan 1,022,764
Additional Information From the Directors(continued)
267

Fund CounterpartySecurities onLoan Amount
Vanguard FTSE Global All Cap Index Fund Merrill Lynch 2,316,738
Vanguard FTSE Global All Cap Index Fund Citigroup 2,243,672
Vanguard FTSE Global All Cap Index Fund UBS 2,142,468
Vanguard FTSE Global All Cap Index Fund Morgan Stanley 1,387,758
Vanguard FTSE Global All Cap Index Fund JP Morgan 364,760
Vanguard FTSE Global All Cap Index Fund Credit Suisse Group 230,537
Vanguard FTSE U.K. Equity Income Index Fund JP Morgan 217,864
Vanguard Global Emerging Markets Fund JP Morgan 965,150
Vanguard Global Emerging Markets Fund Citigroup 633,052
Vanguard Global Emerging Markets Fund Morgan Stanley 232,649
Vanguard Global Emerging Markets Fund Merrill Lynch 212,864
Vanguard Global Equity Fund Citigroup 550,725
Vanguard Global Equity Fund UBS 302,929
Vanguard Global Equity Income Fund Morgan Stanley 1,036,947
Vanguard Global Equity Income Fund UBS 209,263
Vanguard U.S. Equity Index Fund Merrill Lynch 11,977,717
Vanguard U.S. Equity Index Fund Citigroup 8,105,813
Vanguard U.S. Equity Index Fund UBS 5,575,690
Safekeeping of Collateral Received
All securities-lending collateral received is held by JPM—Securities Collateral Management as at 30 April 2022.
Aggregate Transaction Data
The aggregate transaction data for collateral positions received in respect of the securities-lending programme by Fund as at 30 April 2022 areas follows:
FundType of
CollateralCollateral
Amount (£)Moody's
RatingMaturity Tenor of
CollateralCurrency of
Collateral
Country ofCounterparty
EstablishmentSettlement
and Clearing
Vanguard Active U.K. EquityFund Bond 71,683 Aaa > 1 year EUR United Kingdom Tri Party
Vanguard Active U.K. EquityFund Bond 40,410 Aa2 > 1 year EUR United Kingdom Tri Party
Vanguard Active U.K. EquityFund Bond 64,524 Aa3 > 1 year GBP United Kingdom Tri Party
Vanguard Active U.K. EquityFund Bond 38,816 Not avail. > 1 year EUR United Kingdom Tri Party
Vanguard Active U.K. EquityFund Bond 12,005 Not avail. > 1 year GBP United Kingdom Tri Party
Vanguard Active U.K. EquityFund Bond 976 Not avail. 3 to 12 months GBP United Kingdom Tri Party
Vanguard Active U.K. EquityFund Bond 448 Not avail. 3 to 12 months EUR United Kingdom Tri Party
Vanguard Active U.K. EquityFund Bond 34,628 Not rated > 1 year EUR United Kingdom Tri Party
Vanguard Active U.K. EquityFund Treasury Bills 5,908 Not avail. 3 to 12 months USD United Kingdom Tri Party
Vanguard Active U.K. EquityFund Treasury Bills 1,111 Not avail. 1 to 3 months USD United Kingdom Tri Party
Vanguard Active U.K. EquityFund Treasury Bonds 76,876 Aaa > 1 year USD United Kingdom Tri Party
Vanguard Active U.K. EquityFund Treasury Notes 164,465 Aaa > 1 year USD United Kingdom Tri Party
Vanguard Active U.K. EquityFund Treasury Notes 17,305 Aaa 3 to 12 months USD United Kingdom Tri Party
Additional Information From the Directors(continued)
268

FundType of
CollateralCollateral
Amount (£)Moody's
RatingMaturity Tenor of
CollateralCurrency of
Collateral
Country ofCounterparty
EstablishmentSettlement
and Clearing
Vanguard Active U.K. EquityFund Treasury Notes 4,088 Not avail. > 1 year USD United Kingdom Tri Party
Vanguard ESG Developed WorldAll Cap Equity Index Fund (UK) Bond 287,922 Aaa > 1 year EUR United Kingdom Tri Party
Vanguard ESG Developed WorldAll Cap Equity Index Fund (UK) Bond 5 Aaa 3 to 12 months EUR United Kingdom Tri Party
Vanguard ESG Developed WorldAll Cap Equity Index Fund (UK) Bond 416,520 Aa2 > 1 year EUR United Kingdom Tri Party
Vanguard ESG Developed WorldAll Cap Equity Index Fund (UK) Bond 2,363 Aa2 3 to 12 months EUR United Kingdom Tri Party
Vanguard ESG Developed WorldAll Cap Equity Index Fund (UK) Bond 2,020 Aa2 1 week to 1 month EUR United Kingdom Tri Party
Vanguard ESG Developed WorldAll Cap Equity Index Fund (UK) Bond 345,440 Aa3 > 1 year GBP United Kingdom Tri Party
Vanguard ESG Developed WorldAll Cap Equity Index Fund (UK) Bond 282,068 Not avail. > 1 year EUR United Kingdom Tri Party
Vanguard ESG Developed WorldAll Cap Equity Index Fund (UK) Bond 24,017 Not avail. 3 to 12 months EUR United Kingdom Tri Party
Vanguard ESG Developed WorldAll Cap Equity Index Fund (UK) Bond 981 Not avail. 1 to 3 months EUR United Kingdom Tri Party
Vanguard ESG Developed WorldAll Cap Equity Index Fund (UK) Bond 135,169 Not rated > 1 year GBP United Kingdom Tri Party
Vanguard ESG Developed WorldAll Cap Equity Index Fund (UK) Treasury Bonds 205,469 Aaa > 1 year USD United Kingdom Tri Party
Vanguard ESG Developed WorldAll Cap Equity Index Fund (UK) Treasury Bonds 1,311 Not avail. > 1 year USD United Kingdom Tri Party
Vanguard ESG Developed WorldAll Cap Equity Index Fund (UK) Treasury Notes 410,064 Aaa > 1 year USD United Kingdom Tri Party
Vanguard ESG Developed WorldAll Cap Equity Index Fund (UK) Treasury Notes 30,993 Aaa 3 to 12 months USD United Kingdom Tri Party
Vanguard ESG Developed WorldAll Cap Equity Index Fund (UK) Treasury Notes 14,102 Not avail. > 1 year USD United Kingdom Tri Party
Vanguard FTSE DevelopedEurope ex-U.K. Equity IndexFund Bond 6,747,934 Aaa > 1 year EUR United Kingdom Tri Party
Vanguard FTSE DevelopedEurope ex-U.K. Equity IndexFund Bond 187 Aaa 3 to 12 months EUR United Kingdom Tri Party
Vanguard FTSE DevelopedEurope ex-U.K. Equity IndexFund Bond 25,578,717 Aa2 > 1 year EUR United Kingdom Tri Party
Vanguard FTSE DevelopedEurope ex-U.K. Equity IndexFund Bond 3,906,642 Aa2 3 to 12 months EUR United Kingdom Tri Party
Vanguard FTSE DevelopedEurope ex-U.K. Equity IndexFund Bond 79,274 Aa2 1 week to 1 month EUR United Kingdom Tri Party
Vanguard FTSE DevelopedEurope ex-U.K. Equity IndexFund Bond 24,122,899 Aa3 > 1 year GBP United Kingdom Tri Party
Vanguard FTSE DevelopedEurope ex-U.K. Equity IndexFund Bond 8,191,501 Not avail. > 1 year EUR United Kingdom Tri Party
Vanguard FTSE DevelopedEurope ex-U.K. Equity IndexFund Bond 1,625,339 Not avail. > 1 year GBP United Kingdom Tri Party
Vanguard FTSE DevelopedEurope ex-U.K. Equity IndexFund Bond 917,130 Not avail. 3 to 12 months EUR United Kingdom Tri Party
Additional Information From the Directors(continued)
269

FundType of
CollateralCollateral
Amount (£)Moody's
RatingMaturity Tenor of
CollateralCurrency of
Collateral
Country ofCounterparty
EstablishmentSettlement
and Clearing
Vanguard FTSE DevelopedEurope ex-U.K. Equity IndexFund Bond 132,148 Not avail. 3 to 12 months GBP United Kingdom Tri Party
Vanguard FTSE DevelopedEurope ex-U.K. Equity IndexFund Bond 38,496 Not avail. 1 to 3 months GBP United Kingdom Tri Party
Vanguard FTSE DevelopedEurope ex-U.K. Equity IndexFund Bond 2,542,238 Not rated > 1 year EUR United Kingdom Tri Party
Vanguard FTSE DevelopedEurope ex-U.K. Equity IndexFund Treasury Bills 150,451 Not avail. 3 to 12 months USD United Kingdom Tri Party
Vanguard FTSE DevelopedEurope ex-U.K. Equity IndexFund Treasury Bills 799,918 Not avail. 1 to 3 months USD United Kingdom Tri Party
Vanguard FTSE DevelopedEurope ex-U.K. Equity IndexFund Treasury Bonds 8,041,898 Aaa > 1 year USD United Kingdom Tri Party
Vanguard FTSE DevelopedEurope ex-U.K. Equity IndexFund Treasury Bonds 51,446 Not avail. > 1 year USD United Kingdom Tri Party
Vanguard FTSE DevelopedEurope ex-U.K. Equity IndexFund Treasury Notes 24,243,141 Aaa > 1 year USD United Kingdom Tri Party
Vanguard FTSE DevelopedEurope ex-U.K. Equity IndexFund Treasury Notes 3,559,616 Aaa > 1 year USD United Kingdom Tri Party
Vanguard FTSE DevelopedEurope ex-U.K. Equity IndexFund Treasury Notes 368,043 Not avail. 3 to 12 months USD United Kingdom Tri Party
Vanguard FTSE DevelopedWorld ex-U.K. Equity Index Fund Bond 9,403,153 Aaa > 1 year EUR United Kingdom Tri Party
Vanguard FTSE DevelopedWorld ex-U.K. Equity Index Fund Bond 229 Aaa 3 to 12 months EUR United Kingdom Tri Party
Vanguard FTSE DevelopedWorld ex-U.K. Equity Index Fund Bond 22,699,944 Aa2 > 1 year EUR United Kingdom Tri Party
Vanguard FTSE DevelopedWorld ex-U.K. Equity Index Fund Bond 1,606,458 Aa2 3 to 12 months EUR United Kingdom Tri Party
Vanguard FTSE DevelopedWorld ex-U.K. Equity Index Fund Bond 97,118 Aa2 1 week to 1 month EUR United Kingdom Tri Party
Vanguard FTSE DevelopedWorld ex-U.K. Equity Index Fund Bond 15,609,853 Aa3 > 1 year GBP United Kingdom Tri Party
Vanguard FTSE DevelopedWorld ex-U.K. Equity Index Fund Bond 10,963,129 Not avail. > 1 year EUR United Kingdom Tri Party
Vanguard FTSE DevelopedWorld ex-U.K. Equity Index Fund Bond 420,017 Not avail. > 1 year GBP United Kingdom Tri Party
Vanguard FTSE DevelopedWorld ex-U.K. Equity Index Fund Bond 1,128,305 Not avail. 3 to 12 months EUR United Kingdom Tri Party
Vanguard FTSE DevelopedWorld ex-U.K. Equity Index Fund Bond 34,149 Not avail. 3 to 12 months GBP United Kingdom Tri Party
Vanguard FTSE DevelopedWorld ex-U.K. Equity Index Fund Bond 47,162 Not avail. 1 to 3 months EUR United Kingdom Tri Party
Vanguard FTSE DevelopedWorld ex-U.K. Equity Index Fund Bond 3,940,600 Not rated > 1 year EUR United Kingdom Tri Party
Vanguard FTSE DevelopedWorld ex-U.K. Equity Index Fund Tresury Bills 38,879 Not avail. 3 to 12 months USD United Kingdom Tri Party
Vanguard FTSE DevelopedWorld ex-U.K. Equity Index Fund Tresury Bills 206,713 Not avail. 1 to 3 months USD United Kingdom Tri Party
Vanguard FTSE DevelopedWorld ex-U.K. Equity Index Fund Treasury Bonds 6,769,657 Aaa > 1 year USD United Kingdom Tri Party
Additional Information From the Directors(continued)
270
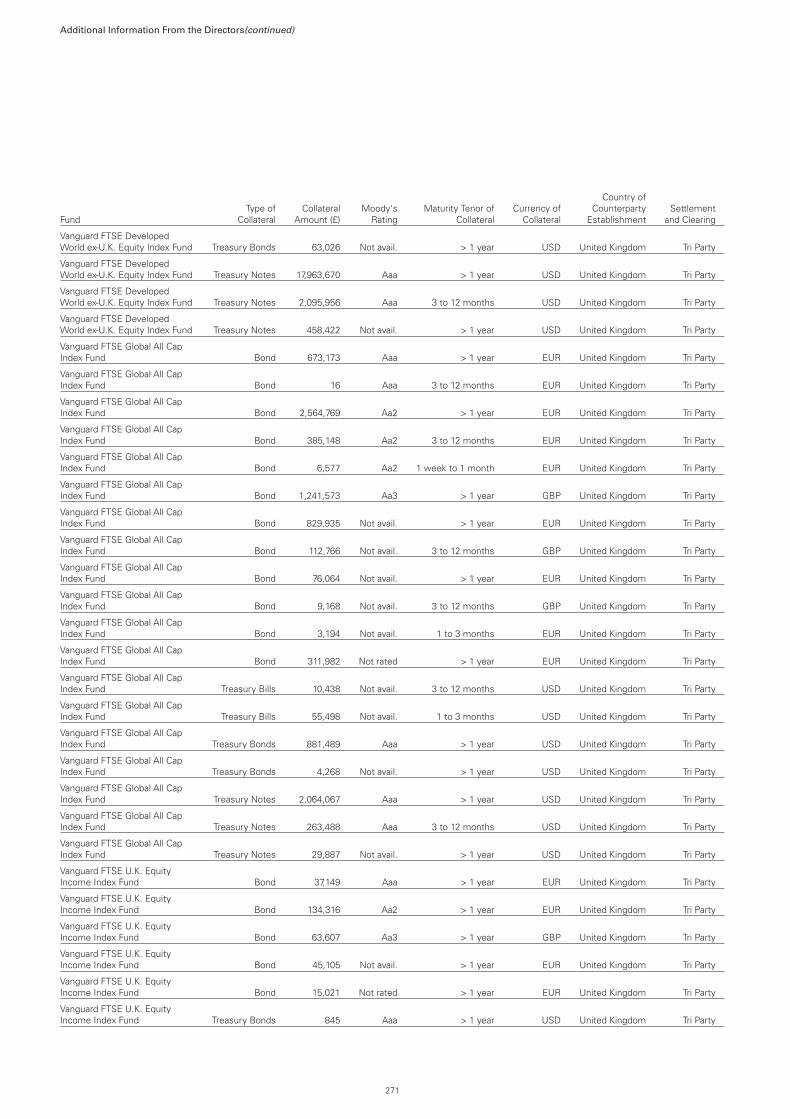
FundType of
CollateralCollateral
Amount (£)Moody's
RatingMaturity Tenor of
CollateralCurrency of
Collateral
Country ofCounterparty
EstablishmentSettlement
and Clearing
Vanguard FTSE DevelopedWorld ex-U.K. Equity Index Fund Treasury Bonds 63,026 Not avail. > 1 year USD United Kingdom Tri Party
Vanguard FTSE DevelopedWorld ex-U.K. Equity Index Fund Treasury Notes 17,963,670 Aaa > 1 year USD United Kingdom Tri Party
Vanguard FTSE DevelopedWorld ex-U.K. Equity Index Fund Treasury Notes 2,095,956 Aaa 3 to 12 months USD United Kingdom Tri Party
Vanguard FTSE DevelopedWorld ex-U.K. Equity Index Fund Treasury Notes 458,422 Not avail. > 1 year USD United Kingdom Tri Party
Vanguard FTSE Global All CapIndex Fund Bond 673,173 Aaa > 1 year EUR United Kingdom Tri Party
Vanguard FTSE Global All CapIndex Fund Bond 16 Aaa 3 to 12 months EUR United Kingdom Tri Party
Vanguard FTSE Global All CapIndex Fund Bond 2,564,769 Aa2 > 1 year EUR United Kingdom Tri Party
Vanguard FTSE Global All CapIndex Fund Bond 385,148 Aa2 3 to 12 months EUR United Kingdom Tri Party
Vanguard FTSE Global All CapIndex Fund Bond 6,577 Aa2 1 week to 1 month EUR United Kingdom Tri Party
Vanguard FTSE Global All CapIndex Fund Bond 1,241,573 Aa3 > 1 year GBP United Kingdom Tri Party
Vanguard FTSE Global All CapIndex Fund Bond 829,935 Not avail. > 1 year EUR United Kingdom Tri Party
Vanguard FTSE Global All CapIndex Fund Bond 112,766 Not avail. 3 to 12 months GBP United Kingdom Tri Party
Vanguard FTSE Global All CapIndex Fund Bond 76,064 Not avail. > 1 year EUR United Kingdom Tri Party
Vanguard FTSE Global All CapIndex Fund Bond 9,168 Not avail. 3 to 12 months GBP United Kingdom Tri Party
Vanguard FTSE Global All CapIndex Fund Bond 3,194 Not avail. 1 to 3 months EUR United Kingdom Tri Party
Vanguard FTSE Global All CapIndex Fund Bond 311,982 Not rated > 1 year EUR United Kingdom Tri Party
Vanguard FTSE Global All CapIndex Fund Treasury Bills 10,438 Not avail. 3 to 12 months USD United Kingdom Tri Party
Vanguard FTSE Global All CapIndex Fund Treasury Bills 55,498 Not avail. 1 to 3 months USD United Kingdom Tri Party
Vanguard FTSE Global All CapIndex Fund Treasury Bonds 881,489 Aaa > 1 year USD United Kingdom Tri Party
Vanguard FTSE Global All CapIndex Fund Treasury Bonds 4,268 Not avail. > 1 year USD United Kingdom Tri Party
Vanguard FTSE Global All CapIndex Fund Treasury Notes 2,064,067 Aaa > 1 year USD United Kingdom Tri Party
Vanguard FTSE Global All CapIndex Fund Treasury Notes 263,488 Aaa 3 to 12 months USD United Kingdom Tri Party
Vanguard FTSE Global All CapIndex Fund Treasury Notes 29,887 Not avail. > 1 year USD United Kingdom Tri Party
Vanguard FTSE U.K. EquityIncome Index Fund Bond 37,149 Aaa > 1 year EUR United Kingdom Tri Party
Vanguard FTSE U.K. EquityIncome Index Fund Bond 134,316 Aa2 > 1 year EUR United Kingdom Tri Party
Vanguard FTSE U.K. EquityIncome Index Fund Bond 63,607 Aa3 > 1 year GBP United Kingdom Tri Party
Vanguard FTSE U.K. EquityIncome Index Fund Bond 45,105 Not avail. > 1 year EUR United Kingdom Tri Party
Vanguard FTSE U.K. EquityIncome Index Fund Bond 15,021 Not rated > 1 year EUR United Kingdom Tri Party
Vanguard FTSE U.K. EquityIncome Index Fund Treasury Bonds 845 Aaa > 1 year USD United Kingdom Tri Party
Additional Information From the Directors(continued)
271

FundType of
CollateralCollateral
Amount (£)Moody's
RatingMaturity Tenor of
CollateralCurrency of
Collateral
Country ofCounterparty
EstablishmentSettlement
and Clearing
Vanguard FTSE U.K. EquityIncome Index Fund Treasury Notes 1,797 Aaa > 1 year USD United Kingdom Tri Party
Vanguard Global EmergingMarkets Fund Bond 254,596 Aaa > 1 year EUR United Kingdom Tri Party
Vanguard Global EmergingMarkets Fund Bond 4 Aaa 3 to 12 months EUR United Kingdom Tri Party
Vanguard Global EmergingMarkets Fund Bond 1,062,500 Aa2 > 1 year EUR United Kingdom Tri Party
Vanguard Global EmergingMarkets Fund Bond 63,527 Aa2 3 to 12 months EUR United Kingdom Tri Party
Vanguard Global EmergingMarkets Fund Bond 1,818 Aa2 1 week to 1 month EUR United Kingdom Tri Party
Vanguard Global EmergingMarkets Fund Bond 355,302 Aa3 > 1 year GBP United Kingdom Tri Party
Vanguard Global EmergingMarkets Fund Bond 352,054
NotAvail. > 1 year EUR United Kingdom Tri Party
Vanguard Global EmergingMarkets Fund Bond 20,632
NotAvail. 3 to 12 months EUR United Kingdom Tri Party
Vanguard Global EmergingMarkets Fund Bond 883
NotAvail. 1 to 3 months EUR United Kingdom Tri Party
Vanguard Global EmergingMarkets Fund Bond 93,641 Not rated > 1 year EUR United Kingdom Tri Party
Vanguard Global EmergingMarkets Fund Treasury Bonds 33,900 Aaa > 1 year USD United Kingdom Tri Party
Vanguard Global EmergingMarkets Fund Treasury Bonds 1,180
NotAvail. > 1 year USD United Kingdom Tri Party
Vanguard Global EmergingMarkets Fund Treasury Notes 185,101 Aaa > 1 year USD United Kingdom Tri Party
Vanguard Global EmergingMarkets Fund Treasury Notes 27,899 Aaa 3 to 12 months USD United Kingdom Tri Party
Vanguard Global EmergingMarkets Fund Treasury Notes 4,239
NotAvail. > 1 year USD United Kingdom Tri Party
Vanguard Global Equity Fund Bond 29,603 Aaa > 1 year EUR United Kingdom Tri Party
Vanguard Global Equity Fund Bond 4 Aaa 3 to 12 months EUR United Kingdom Tri Party
Vanguard Global Equity Fund Bond 219,410 Aa2 > 1 year EUR United Kingdom Tri Party
Vanguard Global Equity Fund Bond 1,851 Aa2 3 to 12 months EUR United Kingdom Tri Party
Vanguard Global Equity Fund Bond 1,581 Aa2 1 week to 1 month EUR United Kingdom Tri Party
Vanguard Global Equity Fund Bond 149,125 Aa3 > 1 year GBP United Kingdom Tri Party
Vanguard Global Equity Fund Bond 106,061Not
Avail. > 1 year EUR United Kingdom Tri Party
Vanguard Global Equity Fund Bond 15,846Not
Avail. 3 to 12 months GBP United Kingdom Tri Party
Vanguard Global Equity Fund Bond 17,644Not
Avail. > 1 year EUR United Kingdom Tri Party
Vanguard Global Equity Fund Bond 1,288Not
Avail. 3 to 12 months GBP United Kingdom Tri Party
Vanguard Global Equity Fund Bond 768Not
Avail. 1 to 3 months EUR United Kingdom Tri Party
Vanguard Global Equity Fund Bond 43 Not rated > 1 year EUR United Kingdom Tri Party
Vanguard Global Equity Fund Treasury Bills 1,467Not
Avail. 3 to 12 months USD United Kingdom Tri Party
Vanguard Global Equity Fund Treasury Bills 7,798Not
Avail. 1 to 3 months USD United Kingdom Tri Party
Vanguard Global Equity Fund Treasury Bonds 51,429 Aaa > 1 year USD United Kingdom Tri Party
Vanguard Global Equity Fund Treasury Bonds 1,026Not
Avail. > 1 year USD United Kingdom Tri Party
Vanguard Global Equity Fund Treasury Notes 252,067 Aaa > 1 year USD United Kingdom Tri Party
Additional Information From the Directors(continued)
272

FundType of
CollateralCollateral
Amount (£)Moody's
RatingMaturity Tenor of
CollateralCurrency of
Collateral
Country ofCounterparty
EstablishmentSettlement
and Clearing
Vanguard Global Equity Fund Treasury Notes 1,414 Aaa 3 to 12 months USD United Kingdom Tri Party
Vanguard Global Equity Fund Treasury Notes 47,112Not
Avail. > 1 year USD United Kingdom Tri Party
Vanguard Global Equity IncomeFund Bond 818,762 Aa2 > 1 year EUR United Kingdom Tri Party
Vanguard Global Equity IncomeFund Bond 273,666 Aa2 3 to 12 months EUR United Kingdom Tri Party
Vanguard Global Equity IncomeFund Bond 58,834 Aa3 > 1 year GBP United Kingdom Tri Party
Vanguard Global Equity IncomeFund Bond 10,946
NotAvail. > 1 year GBP United Kingdom Tri Party
Vanguard Global Equity IncomeFund Bond 890
NotAvail. 3 to 12 months GBP United Kingdom Tri Party
Vanguard Global Equity IncomeFund Treasury Bills 1,013
NotAvail. 3 to 12 months USD United Kingdom Tri Party
Vanguard Global Equity IncomeFund Treasury Bills 5,387
NotAvail. 1 to 3 months USD United Kingdom Tri Party
Vanguard Global Equity IncomeFund Treasury Bonds 35,314 Aaa > 1 year USD United Kingdom Tri Party
Vanguard Global Equity IncomeFund Treasury Notes 95,640 Aaa > 1 year USD United Kingdom Tri Party
Vanguard Global Equity IncomeFund Treasury Notes 15,779 Aaa 3 to 12 months USD United Kingdom Tri Party
Vanguard Global Equity IncomeFund Treasury Notes 230
NotAvail. > 1 year USD United Kingdom Tri Party
Vanguard U.S. Equity IndexFund Bond 1,227,014 Aaa > 1 year EUR United Kingdom Tri Party
Vanguard U.S. Equity IndexFund Bond 55 Aaa 3 to 12 months EUR United Kingdom Tri Party
Vanguard U.S. Equity IndexFund Bond 3,366,071 Aa2 > 1 year EUR United Kingdom Tri Party
Vanguard U.S. Equity IndexFund Bond 27,240 Aa2 3 to 12 months EUR United Kingdom Tri Party
Vanguard U.S. Equity IndexFund Bond 23,276 Aa2 1 week to 1 month EUR United Kingdom Tri Party
Vanguard U.S. Equity IndexFund Bond 2,508,939 Aa3 > 1 year GBP United Kingdom Tri Party
Vanguard U.S. Equity IndexFund Bond 2,705,439
NotAvail. > 1 year EUR United Kingdom Tri Party
Vanguard U.S. Equity IndexFund Bond 291,653
NotAvail. 3 to 12 months GBP United Kingdom Tri Party
Vanguard U.S. Equity IndexFund Bond 259,694
NotAvail. > 1 year EUR United Kingdom Tri Party
Vanguard U.S. Equity IndexFund Bond 23,713
NotAvail. 3 to 12 months GBP United Kingdom Tri Party
Vanguard U.S. Equity IndexFund Bond 11,303
NotAvail. 1 to 3 months EUR United Kingdom Tri Party
Vanguard U.S. Equity IndexFund Bond 1,296,901
NotRated > 1 year EUR United Kingdom Tri Party
Vanguard U.S. Equity IndexFund Treasury Bills 143,539
NotAvail. 3 to 12 months USD United Kingdom Tri Party
Vanguard U.S. Equity IndexFund Treasury Bills 26,997
NotAvail. 1 to 3 months USD United Kingdom Tri Party
Vanguard U.S. Equity IndexFund Treasury Bonds 5,970,821 Aaa > 1 year USD United Kingdom Tri Party
Vanguard U.S. Equity IndexFund Treasury Bonds 15,105
NotAvail. > 1 year USD United Kingdom Tri Party
Vanguard U.S. Equity IndexFund Treasury Notes 8,530,851 Aaa > 1 year USD United Kingdom Tri Party
Additional Information From the Directors(continued)
273

FundType of
CollateralCollateral
Amount (£)Moody's
RatingMaturity Tenor of
CollateralCurrency of
Collateral
Country ofCounterparty
EstablishmentSettlement
and Clearing
Vanguard U.S. Equity IndexFund Treasury Notes 22,037 Aaa 3 to 12 months USD United Kingdom Tri Party
Vanguard U.S. Equity IndexFund Treasury Notes 777,651
NotAvail. > 1 year USD United Kingdom Tri Party
Return/Costs
The securities-lending agent appointed is JPMorgan Chase Bank, N.A. (London Branch). All securities-lending revenue, with the exception ofa minimal lending agent fee, is received directly into the Funds.
The current securities-lending income split between the relevant Fund and the securities-lending agent for the period ended 30 April 2022 is asfollows:
Fund Returns Amount (£)%of Overall
Returns
Vanguard Active U.K. Equity Fund To Fund: 4,579 90
To Lending Agent: 508 10
Vanguard ESG Developed World All Cap Equity Index Fund (UK) To Fund: 8,437 90
To Lending Agent: 936 10
Vanguard FTSE Developed Europe ex-U.K. Equity Index Fund To Fund: 278,833 90
To Lending Agent: 30,979 10
Vanguard FTSE Developed World ex-U.K. Equity Index Fund To Fund: 377,988 90
To Lending Agent: 41,991 10
Vanguard FTSE Global All Cap Index Fund To Fund: 51,543 90
To Lending Agent: 5,717 10
Vanguard FTSE U.K. Equity Income Index Fund To Fund: 4,347 90
To Lending Agent: 483 10
Vanguard Global Emerging Markets Fund To Fund: 43,656 90
To Lending Agent: 4,850 10
Vanguard Global Equity Fund To Fund: 11,517 90
To Lending Agent: 1,279 10
Vanguard Global Equity Income Fund To Fund: 5,218 90
To Lending Agent: 579 10
Vanguard U.S. Equity Index Fund To Fund: 524,191 90
To Lending Agent: 58,219 10
Additional Information From the Directors(continued)
274

Vanguard U.S. Equity Index Fund is not sponsored, endorsed, sold or promoted by Standard & Poor’s and its affiliates (“S&P”). S&P makesno representation, condition or warranty, express or implied, to the owners of the fund or any member of the public regarding the advisabilityof investing in securities generally or in the fund particularly or the ability of the S&P Total Market Index to track the performance of certainfinancial markets and/or sections thereof and/or of groups of assets or asset classes. S&P’s only relationship to The Vanguard Group, Inc., isthe licensing of certain trademarks and trade names and of the S&P Total Market Index which is determined, composed and calculated byS&P without regard to The Vanguard Group, Inc., or the fund. S&P has no obligation to take the needs of The Vanguard Group, Inc., or theowners of the fund into consideration in determining, composing or calculating the S&P Total Market Index. S&P is not responsible for andhas not participated in the determination of the prices and amount of the fund or the timing of the issuance or sale of the fund or in thedetermination or calculation of the equation by which the fund shares are to be converted into cash. S&P has no obligation or liability inconnection with the administration, marketing, or trading of the fund.
S&P does not guarantee the accuracy and/or the completeness of the S&P Total Market Index or any data included therein and S&P shallhave no liability for any errors, omissions, or interruptions therein. S&P makes no warranty, condition or representation, express or implied, asto results to be obtained by The Vanguard Group, Inc., owners of the fund, or any other person or entity from the use of the S&P TotalMarket Index or any data included therein. S&P makes no express or implied warranties, representations or conditions, and expresslydisclaims all warranties or conditions of merchantability or fitness for a particular purpose or use and any other express or implied warranty orcondition with respect to the S&P Total Market Index or any data included therein. Without limiting any of the foregoing, in no event shallS&P have any liability for any special, punitive, indirect, or consequential damages (including lost profits) resulting from the use of the S&PTotal Market Index or any data included therein, even if notified of the possibility of such damages.
Vanguard FTSE Developed Europe ex-U.K. Equity Index Fund, Vanguard FTSE Developed World ex-U.K. Equity Index Fund, and Vanguard FTSEU.K. Equity Income Index Fund (the “Products”) are not in any way sponsored, endorsed, sold or promoted by FTSE International Limited(“FTSE”) or any of the London Stock Exchange Group companies (“LSEG”) (together the “Licensor Parties”), and none of the LicensorParties makes any claim, prediction, warranty or representation whatsoever, expressly or impliedly, either as to (i) the results to be obtainedfrom the use of the FTSE Developed Europe ex-UK Equity Index, FTSE UK Equity Income Index, and the FTSE Developed ex-UK Equity Index(the “Indices” and each an “Index”, upon which the Products are based), (ii) the figure at which the Index is said to stand at any particulartime on any particular day or otherwise, or (iii) the suitability of the Indices for the purpose to which they are being put in connection with theProducts. None of the Licensor Parties has provided or will provide any financial or investment advice or recommendation in relation to theIndex to Vanguard or to its clients. The Index is calculated by FTSE or its agent. None of the Licensor Parties shall be (a) liable (whether innegligence or otherwise) to any person for any error in the Index or (b) under any obligation to advise any person of any error therein.
All rights in the Index vest in FTSE. “FTSE®” is a trademark of LSEG and is used by FTSE under licence.
Bloomberg® is a trademark and service mark of Bloomberg Finance L.P. (collectively with its affiliates, “Bloomberg”). Barclays® is atrademark and service mark of Barclays Bank Plc (collectively with its affiliates, “Barclays”), used under license. Bloomberg or Bloomberg’slicensors, including Barclays, own all proprietary rights in the Bloomberg Indices. Neither Bloomberg nor Barclays is affiliated with Vanguard,and neither Bloomberg nor Barclays approves, endorses, reviews, or recommends Vanguard U.K. Inflation-Linked Gilt Index Fund or VanguardU.K. Long Duration Gilt Index Fund. Neither Bloomberg nor Barclays guarantees the timeliness, accurateness, or completeness of any data orinformation relating to the Bloomberg U.K. Government Inflation-Linked Float Adjusted Bond Index or the Bloomberg U.K. Government 15+Years Float Adjusted Bond Index. Neither Bloomberg nor Barclays shall be liable in any way to Vanguard, investors in Vanguard U.K. Inflation-Linked Gilt Index Fund or Vanguard U.K. Long Duration Gilt Index Fund, or to other third parties in respect of the use or accuracy of theBloomberg U.K. Government Inflation-Linked Float Adjusted Bond Index or the Bloomberg U.K. Government 15+ Years Float Adjusted BondIndex or any data included therein.
© 2022 Barclays. Used with Permission.
Source: Barclays Global Family of Indices. Copyright 2022, Barclays. All rights reserved.

Company’s Head Office and Registered Office
4th Floor, The Walbrook Building25 WalbrookLondonEC4N 8AFUnited Kingdom
Authorised Corporate Director (the "ACD")
Vanguard Investments UK, Limited4th Floor, The Walbrook Building25 WalbrookLondonEC4N 8AFUnited Kingdom
Directors of the ACD1,2
John BendlRobyn Laidlaw3
Paul Jakubowski3Maureen ErasmusDaniel Waters
Administrator and Registrar
SS&C Financial Services International Limited andSS&C Financial Services Europe LimitedSS&C HouseSt. Nicholas LaneBasildonEssex SS15 5FSUnited Kingdom
Investment Adviser
Vanguard Global Advisers, LLCP.O. Box 2600Valley Forge, PA 19482USA
The Depositary
State Street Trustees LimitedQuartermile 310 Nightingale WayEdinburghEH3 9EGUnited Kingdom
Independent Auditors
PricewaterhouseCoopers LLPAtria OneLevel 4144 Morrison StreetEdinburghEH3 8EXUnited Kingdom
1 With effect from 17 November 2021, Katie Smith resigned as a director of Vanguard Investments UK, Limited.2 With effect from 30 April 2022, Kathleen Bock and Sean Hagerty resigned as directors of Vanguard Investments UK, Limited.3 Robyn Laidlaw and Paul Jakubowski were appointed as directors on 30 April 2022.
Directory
Client Services
0800 408 2065
Monday to Friday09.00–17.00
This report is intended for the Funds’ shareholders. It may not be dis-tributed to prospective investors unless it is preceded or accompaniedby the current Fund Prospectus.
All comparative mutual fund data are from Lipper, a Thomson ReutersCompany, or Morningstar, Inc., unless otherwise noted.
Vanguard Investments UK, Limited, only gives information on productsand services and does not give investment advice based on individualcircumstances. The Key Investor Information Document (“KIID”) andthe Prospectus for these Funds are available in local languages fromVanguard Investments UK, Limited, via our website vanguard.co.uk.
Issued by Vanguard Investments UK, Limited, which is authorised andregulated in the UK by the Financial Conduct Authority.
Vanguard Investments UK, Limited4th Floor, The Walbrook Building25 WalbrookLondonEC4N 8AFUnited Kingdom
Connect with Vanguard® > vanguard.co.uk
© 2022 Vanguard Investments UK, Limited.All rights reserved.