ubs investment funds icvc
TRANSCRIPT
ab
UBS Investment Funds ICVCInterim report & accounts
Period ended 30 June 20 1
Contents
Introduction and Authorised Corporate Director's Report 2
Statement of the Authorised Corporate Director's responsibilities 3
UBS Corporate Bond UK Plus Fund 5
UBS Global Emerging Markets Equity Fund 23
UBS Global Optimal Fund 35
UBS Global Strategic Bond Fund 47
UBS S&P 500 Index Fund 65
UBS Sterling Corporate Bond Indexed Fund 87
UBS UK Equity Income Fund 113
UBS US Equity Fund 125
Details of the Company and other information 137
1
Introduction and Authorised Corporate Director's Report
During the period the following took place;
•
•
•
Since the period end the following has happened;•
UBS Asset Management Funds Ltd31 August 2021
In accordance with the requirements of the Collective Investment Schemes sourcebook as issued and amended by the Financial Conduct Authority, we hereby certify the investment report and financials statements on behalf of the Directors of the Company.
We are pleased to present the report and accounts for the UBS Investment Funds ICVC ("the Company") covering the six month period ended 30 June 2021.
We believe that our existing range of UK sub-funds across our four active ICVCs offers different investment objectives and a variety of risk profiles to suit investors' requirements. We have sub-funds aiming to achieve various objectives including: capital growth, income; outperformance of a benchmark and to achieve returns consistent with a benchmark.
In the following pages we will provide more information with regard to the global economy and the global markets together with individual sub-fund performance and outlook.
COVID-19
On 1 March 2021 we reduced the Annual Management Charge on the J share class of the UBS Global Emerging Markets Equity Fund from 1.25% to 0.75%.
On 1 April 2021 we reduced the Annual Management Charge on the R share classes of the UBS Global Strategic Bond Fund from 0.31% to 0.00%. This will be effective until 31 December 2021, after which it will revert back to original amount.
On 1 May 2021 we reduced the Annual Management Charge on C share classes of UBS Corporate Bond UK Plus Fund to 0.40%, UBS Sterling Corporate Bond Indexed Fund to 0.11% and UBS Global Strategic Bond Fund to 0.45%.
We hope you will find the report and accounts useful. If you have any queries or comments please contact your financial adviser or alternatively contact us directly. Our Customer Service Desk will be happy to assist you on 0800 358 3012, or you can find additional information on our website at www.ubs.com/retailfunds.
No other events took place between the end of the reporting period and the date of the approval of these financial statements that would require disclosure in or adjustments to the amounts recognized in these financial statements.
In addition, there is no indication that the going concern assumption of the sub-funds, other than UBS Corporate Bond UK Plus Fund mentioned above, is inappropriate.
In light of the material economic disruption caused by COVID-19, corporate balance sheets are coming under immense pressure with revenues and earnings forecasts considerably lower. Companies around the globe are under pressure to continue to provide support to employees and supply chains, particularly those that have benefitted from direct financial assistance from governments. Furthermore there is an expectation that executives exercise a degree of prudence given the unprecedented nature and duration of the COVID-19-induced economic crisis. Against this backdrop, it is likely that many companies have, or could in future, reduce or defer paying dividends to shareholders, in turn, potentially reducing the income received from Fund equity holdings.
The World Health Organization declared the COVID-19 outbreak to be a pandemic on 11 March 2020. This did cause concern about the impact on the world economy and the Board and the Investment Manager continue to observe the efforts of governments to contain the spread of the virus in order to monitor and manage the economic impact on the portfolios and the sub-funds.
As per a mailing to investors on 6 July 2021 the ACD has decided to close the UBS Corporate Bond UK Plus Fund on 13 September 2021.
2
•
•
•
•
The ACD is also required to manage the Company in accordance with the Prospectus and the Regulations, maintain proper accounting records and take reasonable steps for the prevention and detection of fraud and other irregularities or errors.
Statement of the Authorised Corporate Director's ("ACD") responsibilities
The ACD is required by the Collective Investment Schemes Sourcebook ("COLL") and the Open Ended Investment Company ("OEIC") Regulations to prepare financial statements which give a true and fair view of the financial position of the Company at the end of each accounting period, the net revenue or expenses, the net gains or losses of the property of the Company and the movement in shareholders’ funds for the year then ended. In preparing these financial statements, the ACD is required to:
select suitable accounting policies and then apply them on a consistent basis;
make judgements and estimates that are prudent and reasonable;
comply with the Prospectus and applicable accounting standards subject to any material departures which are required to be disclosed and explained in the financial statements; and
prepare the financial statements on the basis that the Company will continue in operation unless it is inappropriate to presume this.
3

4
UBS Corporate Bond UK Plus Fund
5
UBS Corporate Bond UK Plus FundManager's report
Investment objective
Investment policy
Investment strategy
Benchmark information
Market environment
Sub-fund performanceThe sub-fund posted a negative return of -2.03%* for the period compared to the Markit iBoxx GBP Non-Gilt Index benchmark negative return of -2.47%.
Both spread and active currency management contributed to active performance while duration management was marginally negative. An underweight position in the UK was a contributor but the corresponding overweight to the US and Euro area detracted from performance. Within spread management our underweight to government related sectors in favour of higher yielding corporate bonds contributed to the results. Within active currency management the fund’s underweight Swedish Krona and New Zealand dollar was the main contributor to active returns.
* Source: Lipper-Hindsight: Performance is based on NAV mid prices with income reinvested net of basic rate tax and in sterling terms to 30 June 2021, based on C income gross shares.
The sub-fund may use derivatives to invest in these assets including forward and future contracts, swaps, options, repurchase agreements and structured credit for investment purposes or efficient portfolio management. Use of derivatives may occasionally be significant.
The other funds that the sub-fund may invest in include funds managed by the Investment Manager or its affiliates.
The sub-fund is actively managed in reference to the benchmark and may hold some or all of the benchmark constituents. The sub-fund strategy includes taking active views on exchange rates.
The sub-fund’s target benchmark has been chosen because it broadly represents the Sterling denominated investment grade corporate bond market, and therefore aligns with the sub-fund’s principal asset class.
Bond yields rose sharply at the beginning of the year as optimism grew over a rebound in global economic growth despite number of economies still largely in various forms of lockdown. After starting the year at 0.91%, US 10- Year Treasury yields reached 1.74% at the end of March before ending the period at 1.47%. The increase was driven both by rising inflation expectations and higher real rates on the back of larger-than-expected US fiscal stimulus. Over the period, several developed market government bond yields followed the same path. Risk assets outperformed government bonds, as credit spreads continued to grind tighter supported by central bank purchasing programmes and an improving economic backdrop.
In addition the sub-fund may invest in other bonds, equities, warrants, money market instruments, deposits, currency, cash and near cash and other funds.
The sub-fund aims to generate income and grow the value of your investment; and outperform the Markit iBoxx GBP Non-Gilt Index after charges over the medium to long term (3 to 5 years).
The sub-fund invests at least 80% in corporate, supranational and government backed bonds which are rated triple BBB minus or above and denominated in Sterling or hedged back to Sterling.
The sub-fund may also invest in government bonds, bonds issued by local authorities, agencies, fixed rate, variable rate, inflation-linked, index-linked, non-sterling bonds and high yield bonds (including emerging market debt); secured and unsecured debt securities (including floating rate notes).
6
Outlook
Notice of sub-fund closure
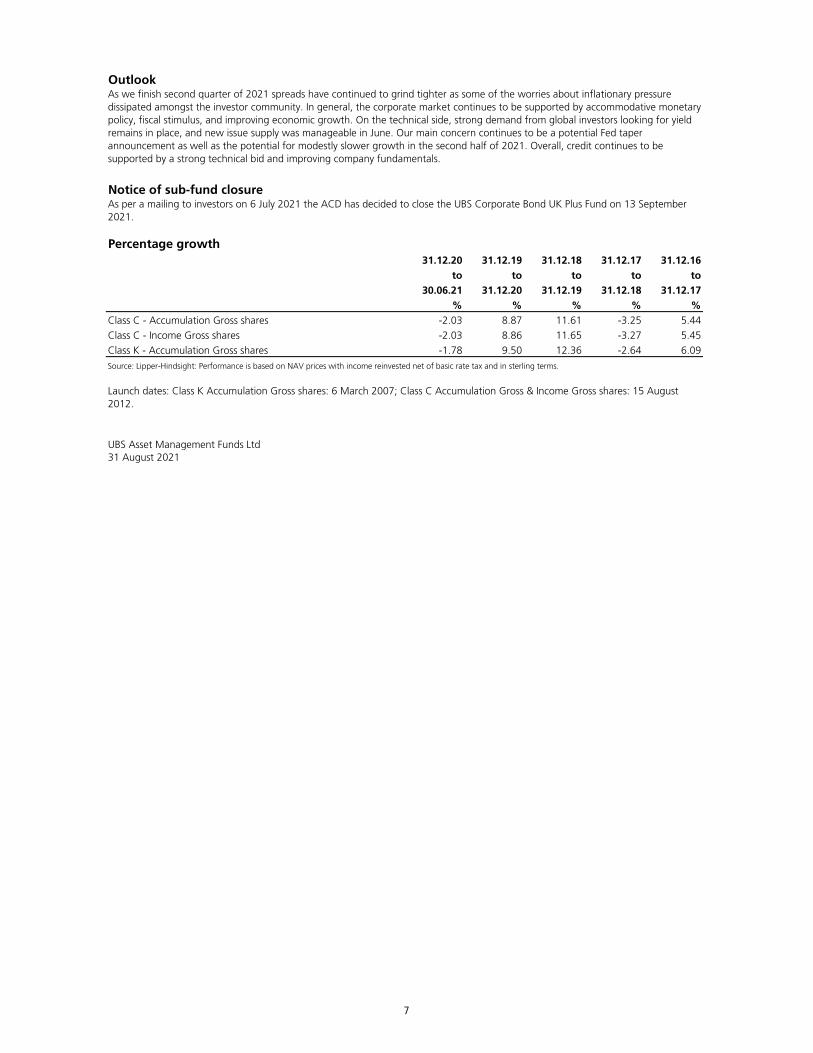
Percentage growth31.12.20 31.12.19 31.12.18 31.12.17 31.12.16
to to to to to30.06.21 31.12.20 31.12.19 31.12.18 31.12.17
% % % % %Class C - Accumulation Gross shares -2.03 8.87 11.61 -3.25 5.44Class C - Income Gross shares -2.03 8.86 11.65 -3.27 5.45Class K - Accumulation Gross shares -1.78 9.50 12.36 -2.64 6.09Source: Lipper-Hindsight: Performance is based on NAV prices with income reinvested net of basic rate tax and in sterling terms.
UBS Asset Management Funds Ltd31 August 2021
Launch dates: Class K Accumulation Gross shares: 6 March 2007; Class C Accumulation Gross & Income Gross shares: 15 August 2012.
As we finish second quarter of 2021 spreads have continued to grind tighter as some of the worries about inflationary pressure dissipated amongst the investor community. In general, the corporate market continues to be supported by accommodative monetary policy, fiscal stimulus, and improving economic growth. On the technical side, strong demand from global investors looking for yield remains in place, and new issue supply was manageable in June. Our main concern continues to be a potential Fed taper announcement as well as the potential for modestly slower growth in the second half of 2021. Overall, credit continues to be supported by a strong technical bid and improving company fundamentals.
As per a mailing to investors on 6 July 2021 the ACD has decided to close the UBS Corporate Bond UK Plus Fund on 13 September 2021.
7
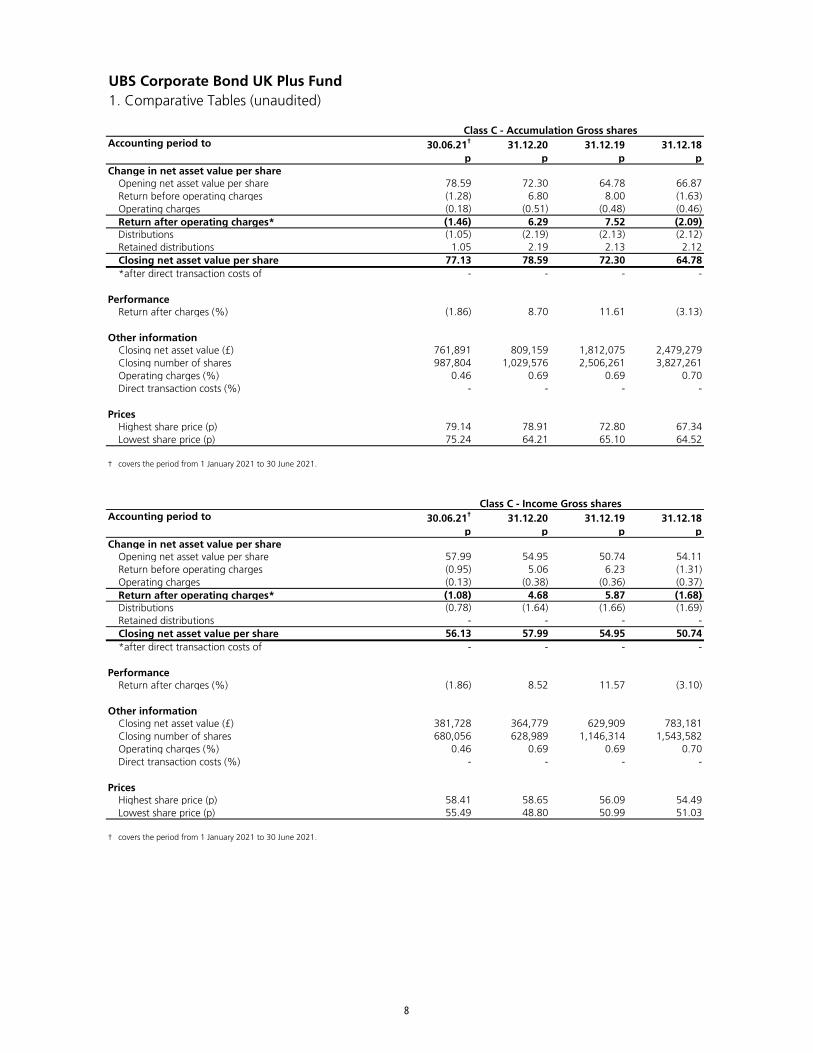
UBS Corporate Bond UK Plus Fund1. Comparative Tables (unaudited)
Accounting period to 30.06.21† 31.12.20 31.12.19 31.12.18p p p p
Change in net asset value per shareOpening net asset value per share 78.59 72.30 64.78 66.87Return before operating charges (1.28) 6.80 8.00 (1.63)Operating charges (0.18) (0.51) (0.48) (0.46)Return after operating charges* (1.46) 6.29 7.52 (2.09)Distributions (1.05) (2.19) (2.13) (2.12)Retained distributions 1.05 2.19 2.13 2.12Closing net asset value per share 77.13 78.59 72.30 64.78*after direct transaction costs of - - - -
PerformanceReturn after charges (%) (1.86) 8.70 11.61 (3.13)
Other informationClosing net asset value (£) 761,891 809,159 1,812,075 2,479,279Closing number of shares 987,804 1,029,576 2,506,261 3,827,261Operating charges (%) 0.46 0.69 0.69 0.70Direct transaction costs (%) - - - -
PricesHighest share price (p) 79.14 78.91 72.80 67.34Lowest share price (p) 75.24 64.21 65.10 64.52
† covers the period from 1 January 2021 to 30 June 2021.
Accounting period to 30.06.21† 31.12.20 31.12.19 31.12.18p p p p
Change in net asset value per shareOpening net asset value per share 57.99 54.95 50.74 54.11Return before operating charges (0.95) 5.06 6.23 (1.31)Operating charges (0.13) (0.38) (0.36) (0.37)Return after operating charges* (1.08) 4.68 5.87 (1.68)Distributions (0.78) (1.64) (1.66) (1.69)Retained distributions - - - -Closing net asset value per share 56.13 57.99 54.95 50.74*after direct transaction costs of - - - -
PerformanceReturn after charges (%) (1.86) 8.52 11.57 (3.10)
Other informationClosing net asset value (£) 381,728 364,779 629,909 783,181Closing number of shares 680,056 628,989 1,146,314 1,543,582Operating charges (%) 0.46 0.69 0.69 0.70Direct transaction costs (%) - - - -
PricesHighest share price (p) 58.41 58.65 56.09 54.49Lowest share price (p) 55.49 48.80 50.99 51.03
† covers the period from 1 January 2021 to 30 June 2021.
Class C - Accumulation Gross shares
Class C - Income Gross shares
8
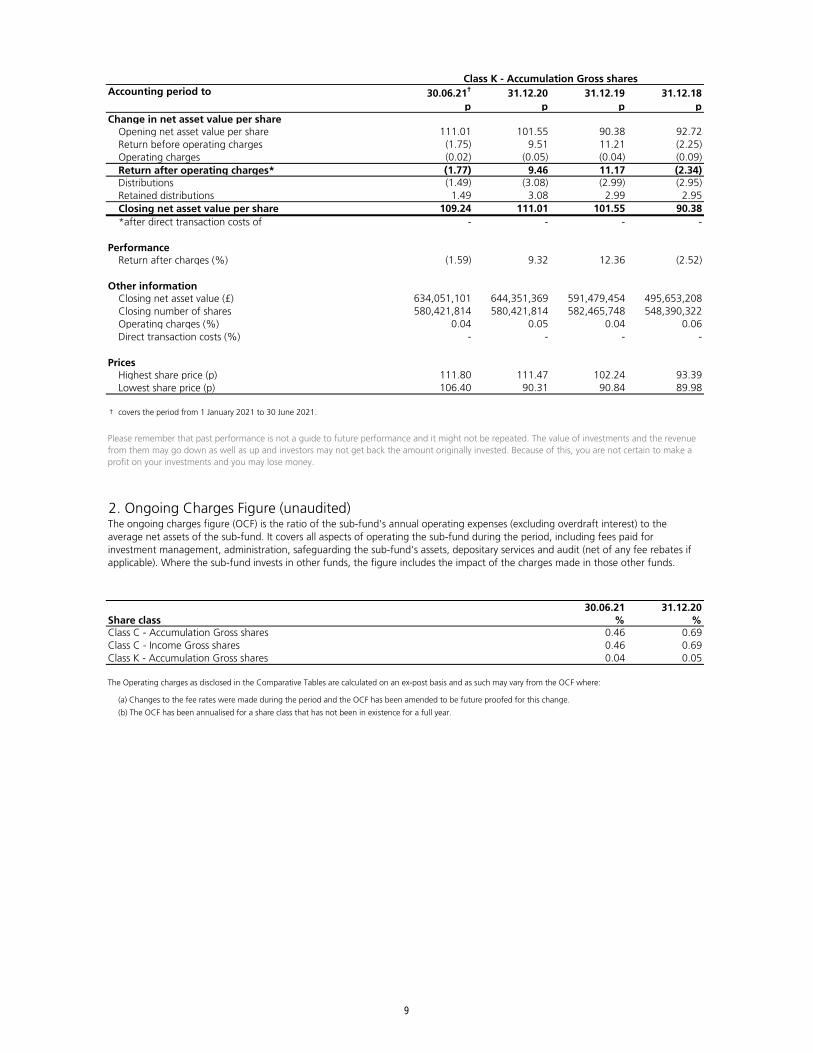
Accounting period to 30.06.21† 31.12.20 31.12.19 31.12.18p p p p
Change in net asset value per shareOpening net asset value per share 111.01 101.55 90.38 92.72Return before operating charges (1.75) 9.51 11.21 (2.25)Operating charges (0.02) (0.05) (0.04) (0.09)Return after operating charges* (1.77) 9.46 11.17 (2.34)Distributions (1.49) (3.08) (2.99) (2.95)Retained distributions 1.49 3.08 2.99 2.95Closing net asset value per share 109.24 111.01 101.55 90.38*after direct transaction costs of - - - -
PerformanceReturn after charges (%) (1.59) 9.32 12.36 (2.52)
Other informationClosing net asset value (£) 634,051,101 644,351,369 591,479,454 495,653,208Closing number of shares 580,421,814 580,421,814 582,465,748 548,390,322Operating charges (%) 0.04 0.05 0.04 0.06Direct transaction costs (%) - - - -
PricesHighest share price (p) 111.80 111.47 102.24 93.39Lowest share price (p) 106.40 90.31 90.84 89.98
† covers the period from 1 January 2021 to 30 June 2021.
2. Ongoing Charges Figure (unaudited)
30.06.21 31.12.20Share class % %Class C - Accumulation Gross shares 0.46 0.69 Class C - Income Gross shares 0.46 0.69 Class K - Accumulation Gross shares 0.04 0.05
(a) Changes to the fee rates were made during the period and the OCF has been amended to be future proofed for this change.
(b) The OCF has been annualised for a share class that has not been in existence for a full year.
Please remember that past performance is not a guide to future performance and it might not be repeated. The value of investments and the revenue from them may go down as well as up and investors may not get back the amount originally invested. Because of this, you are not certain to make a profit on your investments and you may lose money.
The ongoing charges figure (OCF) is the ratio of the sub-fund's annual operating expenses (excluding overdraft interest) to the average net assets of the sub-fund. It covers all aspects of operating the sub-fund during the period, including fees paid for investment management, administration, safeguarding the sub-fund's assets, depositary services and audit (net of any fee rebates if applicable). Where the sub-fund invests in other funds, the figure includes the impact of the charges made in those other funds.
The Operating charges as disclosed in the Comparative Tables are calculated on an ex-post basis and as such may vary from the OCF where:
Class K - Accumulation Gross shares
9
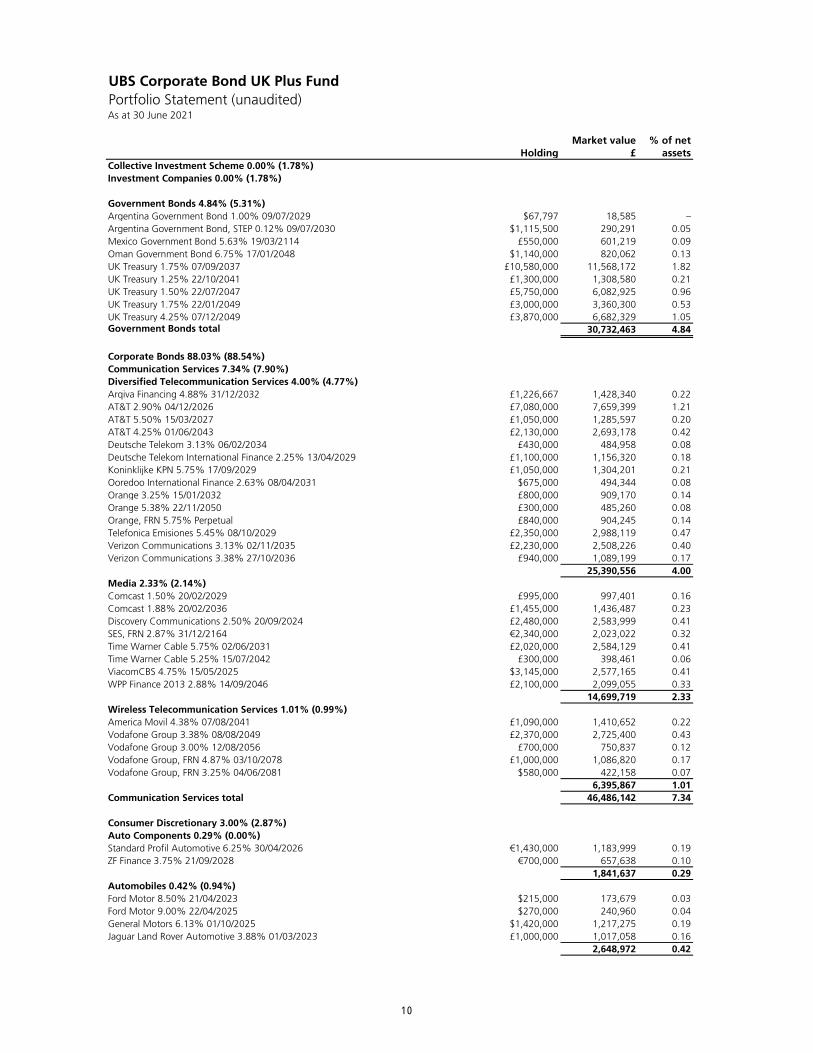
UBS Corporate Bond UK Plus FundPortfolio Statement (unaudited)As at 30 June 2021
Market value % of netHolding £ assets
Collective Investment Scheme 0.00% (1.78%)Investment Companies 0.00% (1.78%)
Government Bonds 4.84% (5.31%)Argentina Government Bond 1.00% 09/07/2029 $67,797 18,585 –Argentina Government Bond, STEP 0.12% 09/07/2030 $1,115,500 290,291 0.05Mexico Government Bond 5.63% 19/03/2114 £550,000 601,219 0.09Oman Government Bond 6.75% 17/01/2048 $1,140,000 820,062 0.13UK Treasury 1.75% 07/09/2037 £10,580,000 11,568,172 1.82UK Treasury 1.25% 22/10/2041 £1,300,000 1,308,580 0.21UK Treasury 1.50% 22/07/2047 £5,750,000 6,082,925 0.96UK Treasury 1.75% 22/01/2049 £3,000,000 3,360,300 0.53UK Treasury 4.25% 07/12/2049 £3,870,000 6,682,329 1.05Government Bonds total 30,732,463 4.84
Corporate Bonds 88.03% (88.54%)Communication Services 7.34% (7.90%)Diversified Telecommunication Services 4.00% (4.77%)Arqiva Financing 4.88% 31/12/2032 £1,226,667 1,428,340 0.22AT&T 2.90% 04/12/2026 £7,080,000 7,659,399 1.21AT&T 5.50% 15/03/2027 £1,050,000 1,285,597 0.20AT&T 4.25% 01/06/2043 £2,130,000 2,693,178 0.42Deutsche Telekom 3.13% 06/02/2034 £430,000 484,958 0.08Deutsche Telekom International Finance 2.25% 13/04/2029 £1,100,000 1,156,320 0.18Koninklijke KPN 5.75% 17/09/2029 £1,050,000 1,304,201 0.21Ooredoo International Finance 2.63% 08/04/2031 $675,000 494,344 0.08Orange 3.25% 15/01/2032 £800,000 909,170 0.14Orange 5.38% 22/11/2050 £300,000 485,260 0.08Orange, FRN 5.75% Perpetual £840,000 904,245 0.14Telefonica Emisiones 5.45% 08/10/2029 £2,350,000 2,988,119 0.47Verizon Communications 3.13% 02/11/2035 £2,230,000 2,508,226 0.40Verizon Communications 3.38% 27/10/2036 £940,000 1,089,199 0.17
25,390,556 4.00Media 2.33% (2.14%)Comcast 1.50% 20/02/2029 £995,000 997,401 0.16Comcast 1.88% 20/02/2036 £1,455,000 1,436,487 0.23Discovery Communications 2.50% 20/09/2024 £2,480,000 2,583,999 0.41SES, FRN 2.87% 31/12/2164 €2,340,000 2,023,022 0.32Time Warner Cable 5.75% 02/06/2031 £2,020,000 2,584,129 0.41Time Warner Cable 5.25% 15/07/2042 £300,000 398,461 0.06ViacomCBS 4.75% 15/05/2025 $3,145,000 2,577,165 0.41WPP Finance 2013 2.88% 14/09/2046 £2,100,000 2,099,055 0.33
14,699,719 2.33Wireless Telecommunication Services 1.01% (0.99%)America Movil 4.38% 07/08/2041 £1,090,000 1,410,652 0.22Vodafone Group 3.38% 08/08/2049 £2,370,000 2,725,400 0.43Vodafone Group 3.00% 12/08/2056 £700,000 750,837 0.12Vodafone Group, FRN 4.87% 03/10/2078 £1,000,000 1,086,820 0.17Vodafone Group, FRN 3.25% 04/06/2081 $580,000 422,158 0.07
6,395,867 1.01Communication Services total 46,486,142 7.34
Consumer Discretionary 3.00% (2.87%)Auto Components 0.29% (0.00%)Standard Profil Automotive 6.25% 30/04/2026 €1,430,000 1,183,999 0.19ZF Finance 3.75% 21/09/2028 €700,000 657,638 0.10
1,841,637 0.29Automobiles 0.42% (0.94%)Ford Motor 8.50% 21/04/2023 $215,000 173,679 0.03Ford Motor 9.00% 22/04/2025 $270,000 240,960 0.04General Motors 6.13% 01/10/2025 $1,420,000 1,217,275 0.19Jaguar Land Rover Automotive 3.88% 01/03/2023 £1,000,000 1,017,058 0.16
2,648,972 0.42
10
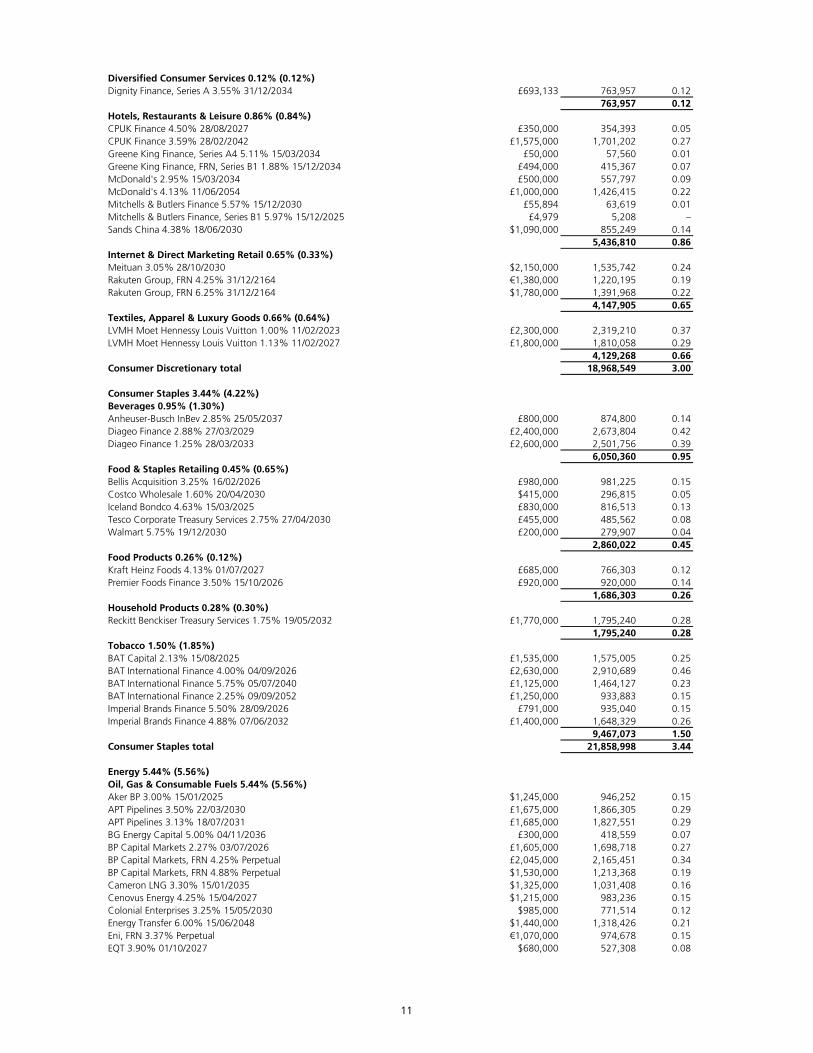
Diversified Consumer Services 0.12% (0.12%)Dignity Finance, Series A 3.55% 31/12/2034 £693,133 763,957 0.12
763,957 0.12Hotels, Restaurants & Leisure 0.86% (0.84%)CPUK Finance 4.50% 28/08/2027 £350,000 354,393 0.05CPUK Finance 3.59% 28/02/2042 £1,575,000 1,701,202 0.27Greene King Finance, Series A4 5.11% 15/03/2034 £50,000 57,560 0.01Greene King Finance, FRN, Series B1 1.88% 15/12/2034 £494,000 415,367 0.07McDonald's 2.95% 15/03/2034 £500,000 557,797 0.09McDonald's 4.13% 11/06/2054 £1,000,000 1,426,415 0.22Mitchells & Butlers Finance 5.57% 15/12/2030 £55,894 63,619 0.01Mitchells & Butlers Finance, Series B1 5.97% 15/12/2025 £4,979 5,208 –Sands China 4.38% 18/06/2030 $1,090,000 855,249 0.14
5,436,810 0.86Internet & Direct Marketing Retail 0.65% (0.33%)Meituan 3.05% 28/10/2030 $2,150,000 1,535,742 0.24Rakuten Group, FRN 4.25% 31/12/2164 €1,380,000 1,220,195 0.19Rakuten Group, FRN 6.25% 31/12/2164 $1,780,000 1,391,968 0.22
4,147,905 0.65Textiles, Apparel & Luxury Goods 0.66% (0.64%)LVMH Moet Hennessy Louis Vuitton 1.00% 11/02/2023 £2,300,000 2,319,210 0.37LVMH Moet Hennessy Louis Vuitton 1.13% 11/02/2027 £1,800,000 1,810,058 0.29
4,129,268 0.66Consumer Discretionary total 18,968,549 3.00
Consumer Staples 3.44% (4.22%)Beverages 0.95% (1.30%)Anheuser-Busch InBev 2.85% 25/05/2037 £800,000 874,800 0.14Diageo Finance 2.88% 27/03/2029 £2,400,000 2,673,804 0.42Diageo Finance 1.25% 28/03/2033 £2,600,000 2,501,756 0.39
6,050,360 0.95Food & Staples Retailing 0.45% (0.65%)Bellis Acquisition 3.25% 16/02/2026 £980,000 981,225 0.15Costco Wholesale 1.60% 20/04/2030 $415,000 296,815 0.05Iceland Bondco 4.63% 15/03/2025 £830,000 816,513 0.13Tesco Corporate Treasury Services 2.75% 27/04/2030 £455,000 485,562 0.08Walmart 5.75% 19/12/2030 £200,000 279,907 0.04
2,860,022 0.45Food Products 0.26% (0.12%)Kraft Heinz Foods 4.13% 01/07/2027 £685,000 766,303 0.12Premier Foods Finance 3.50% 15/10/2026 £920,000 920,000 0.14
1,686,303 0.26Household Products 0.28% (0.30%)Reckitt Benckiser Treasury Services 1.75% 19/05/2032 £1,770,000 1,795,240 0.28
1,795,240 0.28Tobacco 1.50% (1.85%)BAT Capital 2.13% 15/08/2025 £1,535,000 1,575,005 0.25BAT International Finance 4.00% 04/09/2026 £2,630,000 2,910,689 0.46BAT International Finance 5.75% 05/07/2040 £1,125,000 1,464,127 0.23BAT International Finance 2.25% 09/09/2052 £1,250,000 933,883 0.15Imperial Brands Finance 5.50% 28/09/2026 £791,000 935,040 0.15Imperial Brands Finance 4.88% 07/06/2032 £1,400,000 1,648,329 0.26
9,467,073 1.50Consumer Staples total 21,858,998 3.44
Energy 5.44% (5.56%)Oil, Gas & Consumable Fuels 5.44% (5.56%)Aker BP 3.00% 15/01/2025 $1,245,000 946,252 0.15APT Pipelines 3.50% 22/03/2030 £1,675,000 1,866,305 0.29APT Pipelines 3.13% 18/07/2031 £1,685,000 1,827,551 0.29BG Energy Capital 5.00% 04/11/2036 £300,000 418,559 0.07BP Capital Markets 2.27% 03/07/2026 £1,605,000 1,698,718 0.27BP Capital Markets, FRN 4.25% Perpetual £2,045,000 2,165,451 0.34BP Capital Markets, FRN 4.88% Perpetual $1,530,000 1,213,368 0.19Cameron LNG 3.30% 15/01/2035 $1,325,000 1,031,408 0.16Cenovus Energy 4.25% 15/04/2027 $1,215,000 983,236 0.15Colonial Enterprises 3.25% 15/05/2030 $985,000 771,514 0.12Energy Transfer 6.00% 15/06/2048 $1,440,000 1,318,426 0.21Eni, FRN 3.37% Perpetual €1,070,000 974,678 0.15EQT 3.90% 01/10/2027 $680,000 527,308 0.08
11
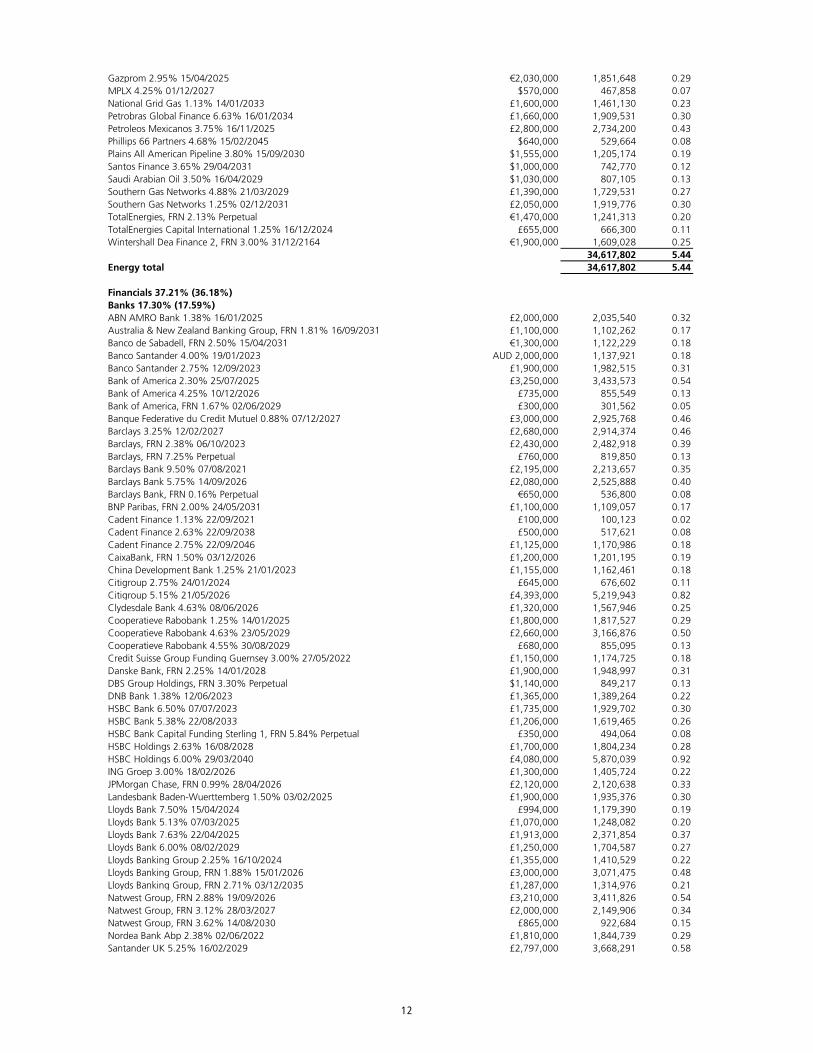
Gazprom 2.95% 15/04/2025 €2,030,000 1,851,648 0.29MPLX 4.25% 01/12/2027 $570,000 467,858 0.07National Grid Gas 1.13% 14/01/2033 £1,600,000 1,461,130 0.23Petrobras Global Finance 6.63% 16/01/2034 £1,660,000 1,909,531 0.30Petroleos Mexicanos 3.75% 16/11/2025 £2,800,000 2,734,200 0.43Phillips 66 Partners 4.68% 15/02/2045 $640,000 529,664 0.08Plains All American Pipeline 3.80% 15/09/2030 $1,555,000 1,205,174 0.19Santos Finance 3.65% 29/04/2031 $1,000,000 742,770 0.12Saudi Arabian Oil 3.50% 16/04/2029 $1,030,000 807,105 0.13Southern Gas Networks 4.88% 21/03/2029 £1,390,000 1,729,531 0.27Southern Gas Networks 1.25% 02/12/2031 £2,050,000 1,919,776 0.30TotalEnergies, FRN 2.13% Perpetual €1,470,000 1,241,313 0.20TotalEnergies Capital International 1.25% 16/12/2024 £655,000 666,300 0.11Wintershall Dea Finance 2, FRN 3.00% 31/12/2164 €1,900,000 1,609,028 0.25
34,617,802 5.44Energy total 34,617,802 5.44
Financials 37.21% (36.18%)Banks 17.30% (17.59%)ABN AMRO Bank 1.38% 16/01/2025 £2,000,000 2,035,540 0.32Australia & New Zealand Banking Group, FRN 1.81% 16/09/2031 £1,100,000 1,102,262 0.17Banco de Sabadell, FRN 2.50% 15/04/2031 €1,300,000 1,122,229 0.18Banco Santander 4.00% 19/01/2023 AUD 2,000,000 1,137,921 0.18Banco Santander 2.75% 12/09/2023 £1,900,000 1,982,515 0.31Bank of America 2.30% 25/07/2025 £3,250,000 3,433,573 0.54Bank of America 4.25% 10/12/2026 £735,000 855,549 0.13Bank of America, FRN 1.67% 02/06/2029 £300,000 301,562 0.05Banque Federative du Credit Mutuel 0.88% 07/12/2027 £3,000,000 2,925,768 0.46Barclays 3.25% 12/02/2027 £2,680,000 2,914,374 0.46Barclays, FRN 2.38% 06/10/2023 £2,430,000 2,482,918 0.39Barclays, FRN 7.25% Perpetual £760,000 819,850 0.13Barclays Bank 9.50% 07/08/2021 £2,195,000 2,213,657 0.35Barclays Bank 5.75% 14/09/2026 £2,080,000 2,525,888 0.40Barclays Bank, FRN 0.16% Perpetual €650,000 536,800 0.08BNP Paribas, FRN 2.00% 24/05/2031 £1,100,000 1,109,057 0.17Cadent Finance 1.13% 22/09/2021 £100,000 100,123 0.02Cadent Finance 2.63% 22/09/2038 £500,000 517,621 0.08Cadent Finance 2.75% 22/09/2046 £1,125,000 1,170,986 0.18CaixaBank, FRN 1.50% 03/12/2026 £1,200,000 1,201,195 0.19China Development Bank 1.25% 21/01/2023 £1,155,000 1,162,461 0.18Citigroup 2.75% 24/01/2024 £645,000 676,602 0.11Citigroup 5.15% 21/05/2026 £4,393,000 5,219,943 0.82Clydesdale Bank 4.63% 08/06/2026 £1,320,000 1,567,946 0.25Cooperatieve Rabobank 1.25% 14/01/2025 £1,800,000 1,817,527 0.29Cooperatieve Rabobank 4.63% 23/05/2029 £2,660,000 3,166,876 0.50Cooperatieve Rabobank 4.55% 30/08/2029 £680,000 855,095 0.13Credit Suisse Group Funding Guernsey 3.00% 27/05/2022 £1,150,000 1,174,725 0.18Danske Bank, FRN 2.25% 14/01/2028 £1,900,000 1,948,997 0.31DBS Group Holdings, FRN 3.30% Perpetual $1,140,000 849,217 0.13DNB Bank 1.38% 12/06/2023 £1,365,000 1,389,264 0.22HSBC Bank 6.50% 07/07/2023 £1,735,000 1,929,702 0.30HSBC Bank 5.38% 22/08/2033 £1,206,000 1,619,465 0.26HSBC Bank Capital Funding Sterling 1, FRN 5.84% Perpetual £350,000 494,064 0.08HSBC Holdings 2.63% 16/08/2028 £1,700,000 1,804,234 0.28HSBC Holdings 6.00% 29/03/2040 £4,080,000 5,870,039 0.92ING Groep 3.00% 18/02/2026 £1,300,000 1,405,724 0.22JPMorgan Chase, FRN 0.99% 28/04/2026 £2,120,000 2,120,638 0.33Landesbank Baden-Wuerttemberg 1.50% 03/02/2025 £1,900,000 1,935,376 0.30Lloyds Bank 7.50% 15/04/2024 £994,000 1,179,390 0.19Lloyds Bank 5.13% 07/03/2025 £1,070,000 1,248,082 0.20Lloyds Bank 7.63% 22/04/2025 £1,913,000 2,371,854 0.37Lloyds Bank 6.00% 08/02/2029 £1,250,000 1,704,587 0.27Lloyds Banking Group 2.25% 16/10/2024 £1,355,000 1,410,529 0.22Lloyds Banking Group, FRN 1.88% 15/01/2026 £3,000,000 3,071,475 0.48Lloyds Banking Group, FRN 2.71% 03/12/2035 £1,287,000 1,314,976 0.21Natwest Group, FRN 2.88% 19/09/2026 £3,210,000 3,411,826 0.54Natwest Group, FRN 3.12% 28/03/2027 £2,000,000 2,149,906 0.34Natwest Group, FRN 3.62% 14/08/2030 £865,000 922,684 0.15Nordea Bank Abp 2.38% 02/06/2022 £1,810,000 1,844,739 0.29Santander UK 5.25% 16/02/2029 £2,797,000 3,668,291 0.58
12
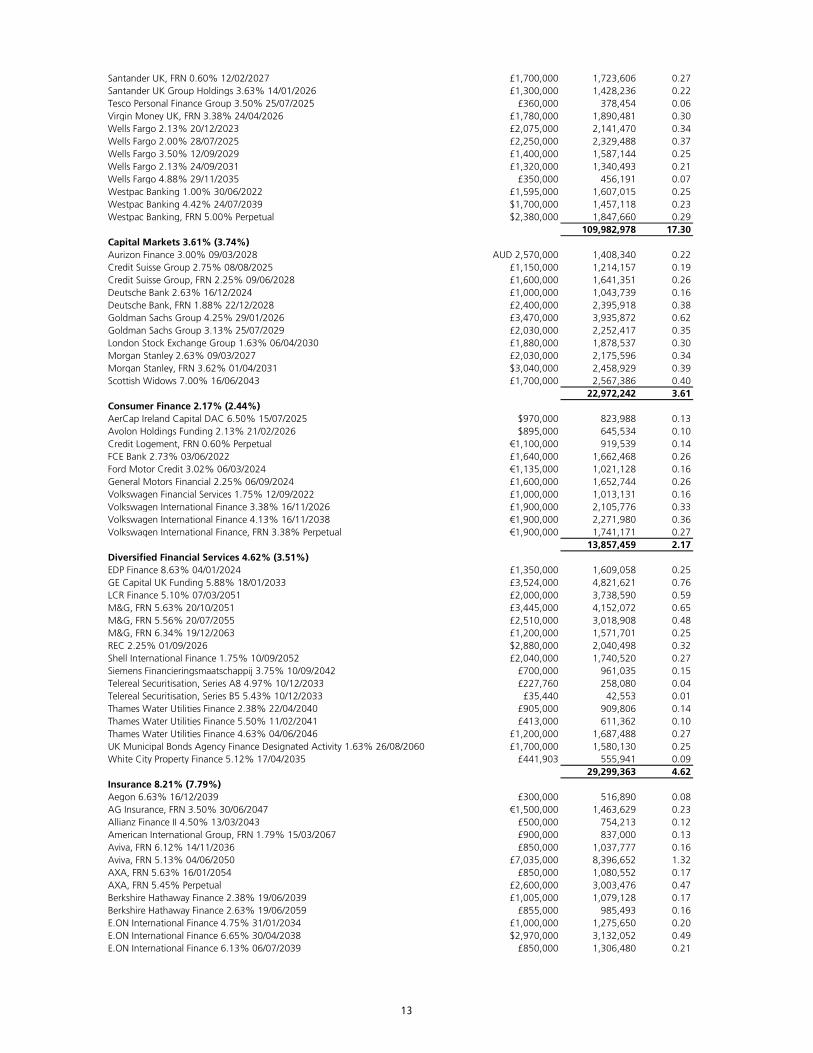
Santander UK, FRN 0.60% 12/02/2027 £1,700,000 1,723,606 0.27Santander UK Group Holdings 3.63% 14/01/2026 £1,300,000 1,428,236 0.22Tesco Personal Finance Group 3.50% 25/07/2025 £360,000 378,454 0.06Virgin Money UK, FRN 3.38% 24/04/2026 £1,780,000 1,890,481 0.30Wells Fargo 2.13% 20/12/2023 £2,075,000 2,141,470 0.34Wells Fargo 2.00% 28/07/2025 £2,250,000 2,329,488 0.37Wells Fargo 3.50% 12/09/2029 £1,400,000 1,587,144 0.25Wells Fargo 2.13% 24/09/2031 £1,320,000 1,340,493 0.21Wells Fargo 4.88% 29/11/2035 £350,000 456,191 0.07Westpac Banking 1.00% 30/06/2022 £1,595,000 1,607,015 0.25Westpac Banking 4.42% 24/07/2039 $1,700,000 1,457,118 0.23Westpac Banking, FRN 5.00% Perpetual $2,380,000 1,847,660 0.29
109,982,978 17.30Capital Markets 3.61% (3.74%)Aurizon Finance 3.00% 09/03/2028 AUD 2,570,000 1,408,340 0.22Credit Suisse Group 2.75% 08/08/2025 £1,150,000 1,214,157 0.19Credit Suisse Group, FRN 2.25% 09/06/2028 £1,600,000 1,641,351 0.26Deutsche Bank 2.63% 16/12/2024 £1,000,000 1,043,739 0.16Deutsche Bank, FRN 1.88% 22/12/2028 £2,400,000 2,395,918 0.38Goldman Sachs Group 4.25% 29/01/2026 £3,470,000 3,935,872 0.62Goldman Sachs Group 3.13% 25/07/2029 £2,030,000 2,252,417 0.35London Stock Exchange Group 1.63% 06/04/2030 £1,880,000 1,878,537 0.30Morgan Stanley 2.63% 09/03/2027 £2,030,000 2,175,596 0.34Morgan Stanley, FRN 3.62% 01/04/2031 $3,040,000 2,458,929 0.39Scottish Widows 7.00% 16/06/2043 £1,700,000 2,567,386 0.40
22,972,242 3.61Consumer Finance 2.17% (2.44%)AerCap Ireland Capital DAC 6.50% 15/07/2025 $970,000 823,988 0.13Avolon Holdings Funding 2.13% 21/02/2026 $895,000 645,534 0.10Credit Logement, FRN 0.60% Perpetual €1,100,000 919,539 0.14FCE Bank 2.73% 03/06/2022 £1,640,000 1,662,468 0.26Ford Motor Credit 3.02% 06/03/2024 €1,135,000 1,021,128 0.16General Motors Financial 2.25% 06/09/2024 £1,600,000 1,652,744 0.26Volkswagen Financial Services 1.75% 12/09/2022 £1,000,000 1,013,131 0.16Volkswagen International Finance 3.38% 16/11/2026 £1,900,000 2,105,776 0.33Volkswagen International Finance 4.13% 16/11/2038 €1,900,000 2,271,980 0.36Volkswagen International Finance, FRN 3.38% Perpetual €1,900,000 1,741,171 0.27
13,857,459 2.17Diversified Financial Services 4.62% (3.51%)EDP Finance 8.63% 04/01/2024 £1,350,000 1,609,058 0.25GE Capital UK Funding 5.88% 18/01/2033 £3,524,000 4,821,621 0.76LCR Finance 5.10% 07/03/2051 £2,000,000 3,738,590 0.59M&G, FRN 5.63% 20/10/2051 £3,445,000 4,152,072 0.65M&G, FRN 5.56% 20/07/2055 £2,510,000 3,018,908 0.48M&G, FRN 6.34% 19/12/2063 £1,200,000 1,571,701 0.25REC 2.25% 01/09/2026 $2,880,000 2,040,498 0.32Shell International Finance 1.75% 10/09/2052 £2,040,000 1,740,520 0.27Siemens Financieringsmaatschappij 3.75% 10/09/2042 £700,000 961,035 0.15Telereal Securitisation, Series A8 4.97% 10/12/2033 £227,760 258,080 0.04Telereal Securitisation, Series B5 5.43% 10/12/2033 £35,440 42,553 0.01Thames Water Utilities Finance 2.38% 22/04/2040 £905,000 909,806 0.14Thames Water Utilities Finance 5.50% 11/02/2041 £413,000 611,362 0.10Thames Water Utilities Finance 4.63% 04/06/2046 £1,200,000 1,687,488 0.27UK Municipal Bonds Agency Finance Designated Activity 1.63% 26/08/2060 £1,700,000 1,580,130 0.25White City Property Finance 5.12% 17/04/2035 £441,903 555,941 0.09
29,299,363 4.62Insurance 8.21% (7.79%)Aegon 6.63% 16/12/2039 £300,000 516,890 0.08AG Insurance, FRN 3.50% 30/06/2047 €1,500,000 1,463,629 0.23Allianz Finance II 4.50% 13/03/2043 £500,000 754,213 0.12American International Group, FRN 1.79% 15/03/2067 £900,000 837,000 0.13Aviva, FRN 6.12% 14/11/2036 £850,000 1,037,777 0.16Aviva, FRN 5.13% 04/06/2050 £7,035,000 8,396,652 1.32AXA, FRN 5.63% 16/01/2054 £850,000 1,080,552 0.17AXA, FRN 5.45% Perpetual £2,600,000 3,003,476 0.47Berkshire Hathaway Finance 2.38% 19/06/2039 £1,005,000 1,079,128 0.17Berkshire Hathaway Finance 2.63% 19/06/2059 £855,000 985,493 0.16E.ON International Finance 4.75% 31/01/2034 £1,000,000 1,275,650 0.20E.ON International Finance 6.65% 30/04/2038 $2,970,000 3,132,052 0.49E.ON International Finance 6.13% 06/07/2039 £850,000 1,306,480 0.21
13
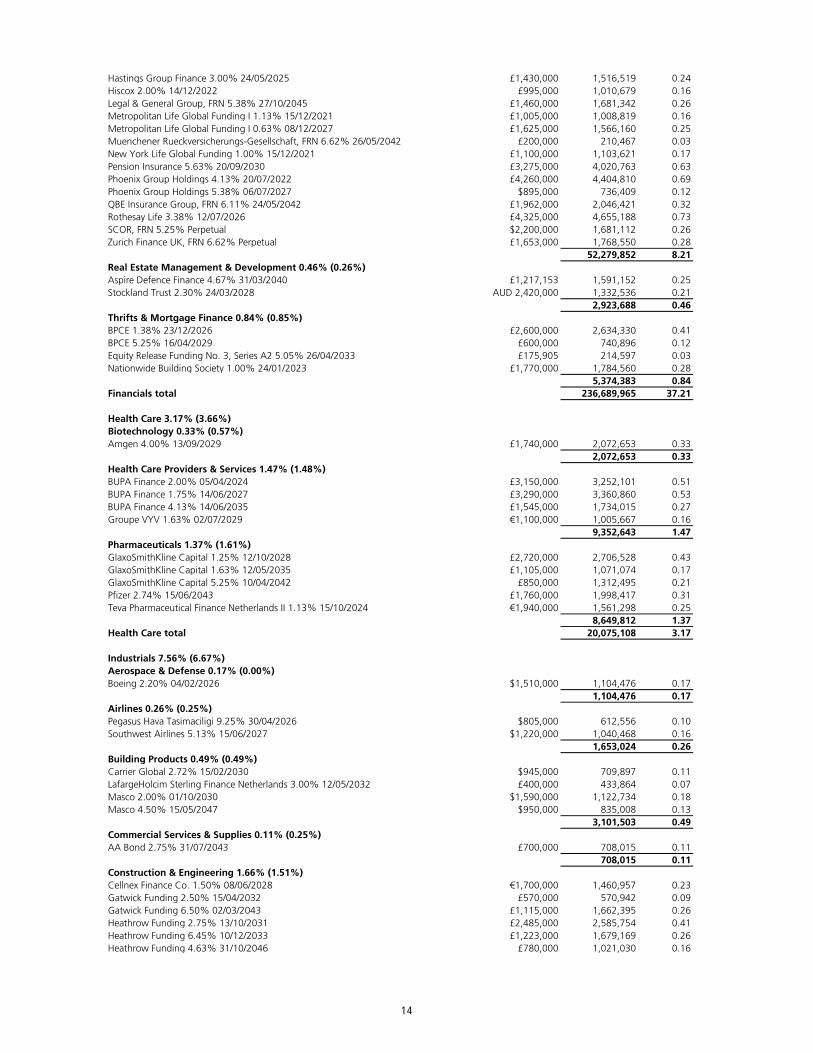
Hastings Group Finance 3.00% 24/05/2025 £1,430,000 1,516,519 0.24Hiscox 2.00% 14/12/2022 £995,000 1,010,679 0.16Legal & General Group, FRN 5.38% 27/10/2045 £1,460,000 1,681,342 0.26Metropolitan Life Global Funding I 1.13% 15/12/2021 £1,005,000 1,008,819 0.16Metropolitan Life Global Funding I 0.63% 08/12/2027 £1,625,000 1,566,160 0.25Muenchener Rueckversicherungs-Gesellschaft, FRN 6.62% 26/05/2042 £200,000 210,467 0.03New York Life Global Funding 1.00% 15/12/2021 £1,100,000 1,103,621 0.17Pension Insurance 5.63% 20/09/2030 £3,275,000 4,020,763 0.63Phoenix Group Holdings 4.13% 20/07/2022 £4,260,000 4,404,810 0.69Phoenix Group Holdings 5.38% 06/07/2027 $895,000 736,409 0.12QBE Insurance Group, FRN 6.11% 24/05/2042 £1,962,000 2,046,421 0.32Rothesay Life 3.38% 12/07/2026 £4,325,000 4,655,188 0.73SCOR, FRN 5.25% Perpetual $2,200,000 1,681,112 0.26Zurich Finance UK, FRN 6.62% Perpetual £1,653,000 1,768,550 0.28
52,279,852 8.21Real Estate Management & Development 0.46% (0.26%)Aspire Defence Finance 4.67% 31/03/2040 £1,217,153 1,591,152 0.25Stockland Trust 2.30% 24/03/2028 AUD 2,420,000 1,332,536 0.21
2,923,688 0.46Thrifts & Mortgage Finance 0.84% (0.85%)BPCE 1.38% 23/12/2026 £2,600,000 2,634,330 0.41BPCE 5.25% 16/04/2029 £600,000 740,896 0.12Equity Release Funding No. 3, Series A2 5.05% 26/04/2033 £175,905 214,597 0.03Nationwide Building Society 1.00% 24/01/2023 £1,770,000 1,784,560 0.28
5,374,383 0.84Financials total 236,689,965 37.21
Health Care 3.17% (3.66%)Biotechnology 0.33% (0.57%)Amgen 4.00% 13/09/2029 £1,740,000 2,072,653 0.33
2,072,653 0.33Health Care Providers & Services 1.47% (1.48%)BUPA Finance 2.00% 05/04/2024 £3,150,000 3,252,101 0.51BUPA Finance 1.75% 14/06/2027 £3,290,000 3,360,860 0.53BUPA Finance 4.13% 14/06/2035 £1,545,000 1,734,015 0.27Groupe VYV 1.63% 02/07/2029 €1,100,000 1,005,667 0.16
9,352,643 1.47Pharmaceuticals 1.37% (1.61%)GlaxoSmithKline Capital 1.25% 12/10/2028 £2,720,000 2,706,528 0.43GlaxoSmithKline Capital 1.63% 12/05/2035 £1,105,000 1,071,074 0.17GlaxoSmithKline Capital 5.25% 10/04/2042 £850,000 1,312,495 0.21Pfizer 2.74% 15/06/2043 £1,760,000 1,998,417 0.31Teva Pharmaceutical Finance Netherlands II 1.13% 15/10/2024 €1,940,000 1,561,298 0.25
8,649,812 1.37Health Care total 20,075,108 3.17
Industrials 7.56% (6.67%)Aerospace & Defense 0.17% (0.00%)Boeing 2.20% 04/02/2026 $1,510,000 1,104,476 0.17
1,104,476 0.17Airlines 0.26% (0.25%)Pegasus Hava Tasimaciligi 9.25% 30/04/2026 $805,000 612,556 0.10Southwest Airlines 5.13% 15/06/2027 $1,220,000 1,040,468 0.16
1,653,024 0.26Building Products 0.49% (0.49%)Carrier Global 2.72% 15/02/2030 $945,000 709,897 0.11LafargeHolcim Sterling Finance Netherlands 3.00% 12/05/2032 £400,000 433,864 0.07Masco 2.00% 01/10/2030 $1,590,000 1,122,734 0.18Masco 4.50% 15/05/2047 $950,000 835,008 0.13
3,101,503 0.49Commercial Services & Supplies 0.11% (0.25%)AA Bond 2.75% 31/07/2043 £700,000 708,015 0.11
708,015 0.11Construction & Engineering 1.66% (1.51%)Cellnex Finance Co. 1.50% 08/06/2028 €1,700,000 1,460,957 0.23Gatwick Funding 2.50% 15/04/2032 £570,000 570,942 0.09Gatwick Funding 6.50% 02/03/2043 £1,115,000 1,662,395 0.26Heathrow Funding 2.75% 13/10/2031 £2,485,000 2,585,754 0.41Heathrow Funding 6.45% 10/12/2033 £1,223,000 1,679,169 0.26Heathrow Funding 4.63% 31/10/2046 £780,000 1,021,030 0.16
14
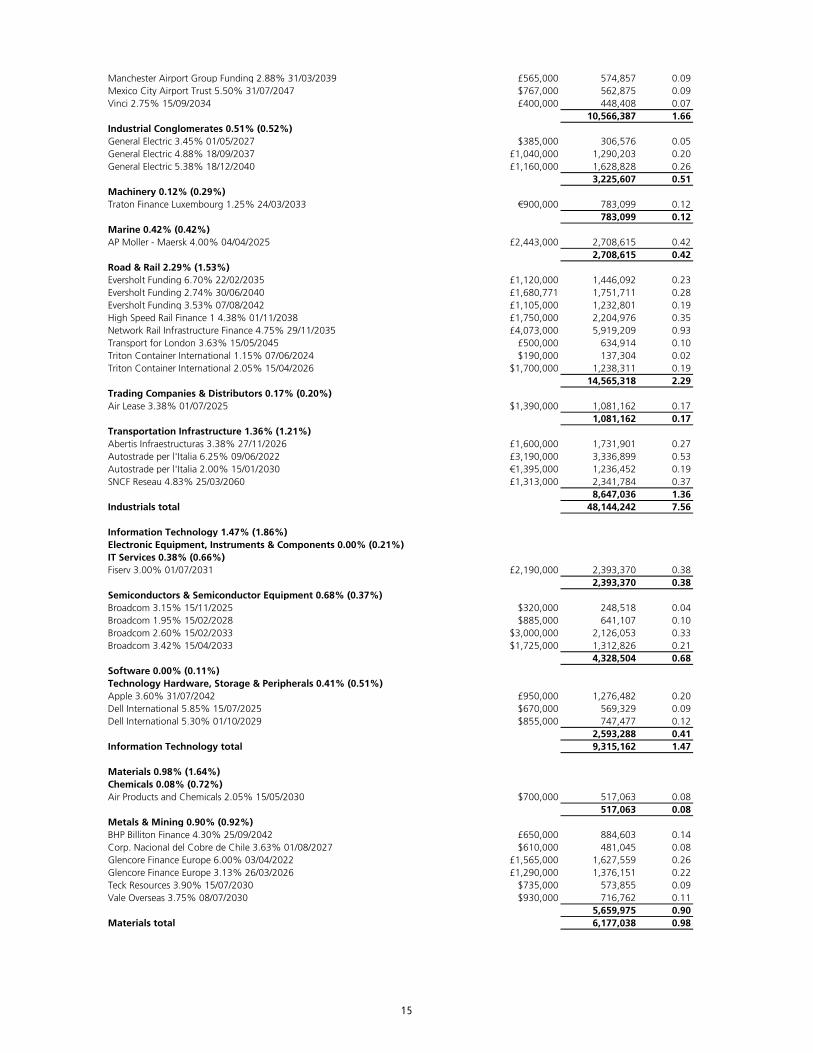
Manchester Airport Group Funding 2.88% 31/03/2039 £565,000 574,857 0.09Mexico City Airport Trust 5.50% 31/07/2047 $767,000 562,875 0.09Vinci 2.75% 15/09/2034 £400,000 448,408 0.07
10,566,387 1.66Industrial Conglomerates 0.51% (0.52%)General Electric 3.45% 01/05/2027 $385,000 306,576 0.05General Electric 4.88% 18/09/2037 £1,040,000 1,290,203 0.20General Electric 5.38% 18/12/2040 £1,160,000 1,628,828 0.26
3,225,607 0.51Machinery 0.12% (0.29%)Traton Finance Luxembourg 1.25% 24/03/2033 €900,000 783,099 0.12
783,099 0.12Marine 0.42% (0.42%)AP Moller - Maersk 4.00% 04/04/2025 £2,443,000 2,708,615 0.42
2,708,615 0.42Road & Rail 2.29% (1.53%)Eversholt Funding 6.70% 22/02/2035 £1,120,000 1,446,092 0.23Eversholt Funding 2.74% 30/06/2040 £1,680,771 1,751,711 0.28Eversholt Funding 3.53% 07/08/2042 £1,105,000 1,232,801 0.19High Speed Rail Finance 1 4.38% 01/11/2038 £1,750,000 2,204,976 0.35Network Rail Infrastructure Finance 4.75% 29/11/2035 £4,073,000 5,919,209 0.93Transport for London 3.63% 15/05/2045 £500,000 634,914 0.10Triton Container International 1.15% 07/06/2024 $190,000 137,304 0.02Triton Container International 2.05% 15/04/2026 $1,700,000 1,238,311 0.19
14,565,318 2.29Trading Companies & Distributors 0.17% (0.20%)Air Lease 3.38% 01/07/2025 $1,390,000 1,081,162 0.17
1,081,162 0.17Transportation Infrastructure 1.36% (1.21%)Abertis Infraestructuras 3.38% 27/11/2026 £1,600,000 1,731,901 0.27Autostrade per l'Italia 6.25% 09/06/2022 £3,190,000 3,336,899 0.53Autostrade per l'Italia 2.00% 15/01/2030 €1,395,000 1,236,452 0.19SNCF Reseau 4.83% 25/03/2060 £1,313,000 2,341,784 0.37
8,647,036 1.36Industrials total 48,144,242 7.56
Information Technology 1.47% (1.86%)Electronic Equipment, Instruments & Components 0.00% (0.21%)IT Services 0.38% (0.66%)Fiserv 3.00% 01/07/2031 £2,190,000 2,393,370 0.38
2,393,370 0.38Semiconductors & Semiconductor Equipment 0.68% (0.37%)Broadcom 3.15% 15/11/2025 $320,000 248,518 0.04Broadcom 1.95% 15/02/2028 $885,000 641,107 0.10Broadcom 2.60% 15/02/2033 $3,000,000 2,126,053 0.33Broadcom 3.42% 15/04/2033 $1,725,000 1,312,826 0.21
4,328,504 0.68Software 0.00% (0.11%)Technology Hardware, Storage & Peripherals 0.41% (0.51%)Apple 3.60% 31/07/2042 £950,000 1,276,482 0.20Dell International 5.85% 15/07/2025 $670,000 569,329 0.09Dell International 5.30% 01/10/2029 $855,000 747,477 0.12
2,593,288 0.41Information Technology total 9,315,162 1.47
Materials 0.98% (1.64%)Chemicals 0.08% (0.72%)Air Products and Chemicals 2.05% 15/05/2030 $700,000 517,063 0.08
517,063 0.08Metals & Mining 0.90% (0.92%)BHP Billiton Finance 4.30% 25/09/2042 £650,000 884,603 0.14Corp. Nacional del Cobre de Chile 3.63% 01/08/2027 $610,000 481,045 0.08Glencore Finance Europe 6.00% 03/04/2022 £1,565,000 1,627,559 0.26Glencore Finance Europe 3.13% 26/03/2026 £1,290,000 1,376,151 0.22Teck Resources 3.90% 15/07/2030 $735,000 573,855 0.09Vale Overseas 3.75% 08/07/2030 $930,000 716,762 0.11
5,659,975 0.90Materials total 6,177,038 0.98
15
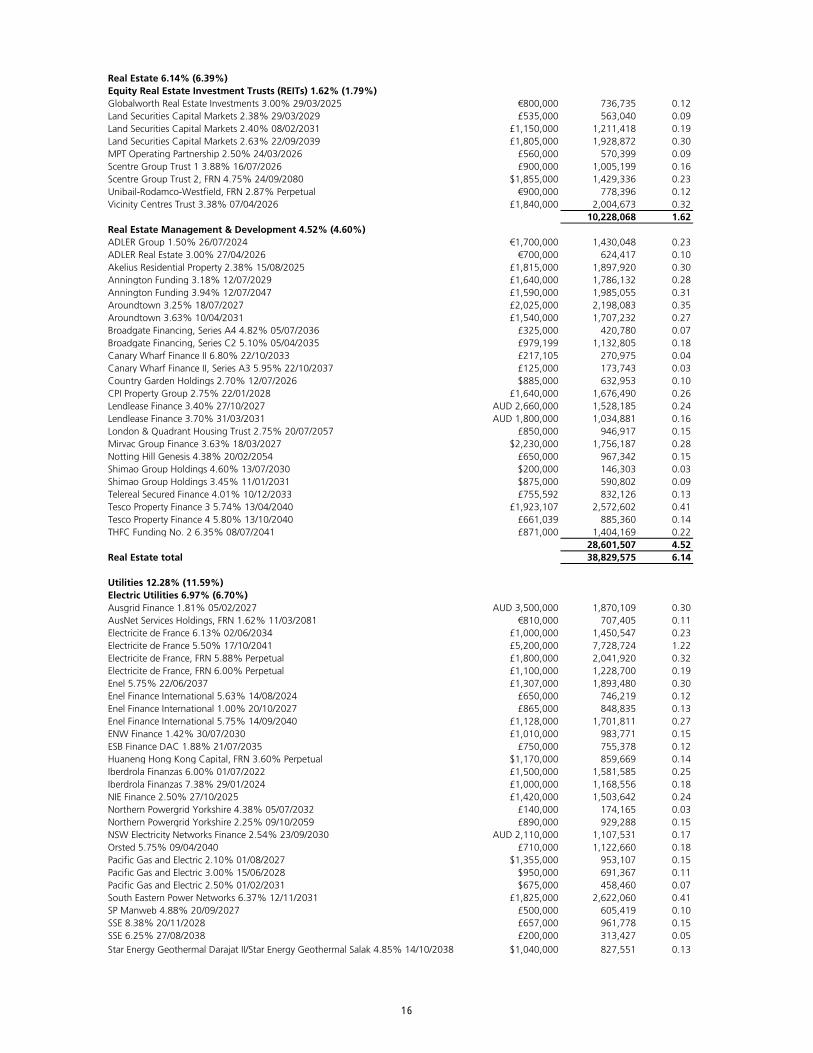
Real Estate 6.14% (6.39%)Equity Real Estate Investment Trusts (REITs) 1.62% (1.79%)Globalworth Real Estate Investments 3.00% 29/03/2025 €800,000 736,735 0.12Land Securities Capital Markets 2.38% 29/03/2029 £535,000 563,040 0.09Land Securities Capital Markets 2.40% 08/02/2031 £1,150,000 1,211,418 0.19Land Securities Capital Markets 2.63% 22/09/2039 £1,805,000 1,928,872 0.30MPT Operating Partnership 2.50% 24/03/2026 £560,000 570,399 0.09Scentre Group Trust 1 3.88% 16/07/2026 £900,000 1,005,199 0.16Scentre Group Trust 2, FRN 4.75% 24/09/2080 $1,855,000 1,429,336 0.23Unibail-Rodamco-Westfield, FRN 2.87% Perpetual €900,000 778,396 0.12Vicinity Centres Trust 3.38% 07/04/2026 £1,840,000 2,004,673 0.32
10,228,068 1.62Real Estate Management & Development 4.52% (4.60%)ADLER Group 1.50% 26/07/2024 €1,700,000 1,430,048 0.23ADLER Real Estate 3.00% 27/04/2026 €700,000 624,417 0.10Akelius Residential Property 2.38% 15/08/2025 £1,815,000 1,897,920 0.30Annington Funding 3.18% 12/07/2029 £1,640,000 1,786,132 0.28Annington Funding 3.94% 12/07/2047 £1,590,000 1,985,055 0.31Aroundtown 3.25% 18/07/2027 £2,025,000 2,198,083 0.35Aroundtown 3.63% 10/04/2031 £1,540,000 1,707,232 0.27Broadgate Financing, Series A4 4.82% 05/07/2036 £325,000 420,780 0.07Broadgate Financing, Series C2 5.10% 05/04/2035 £979,199 1,132,805 0.18Canary Wharf Finance II 6.80% 22/10/2033 £217,105 270,975 0.04Canary Wharf Finance II, Series A3 5.95% 22/10/2037 £125,000 173,743 0.03Country Garden Holdings 2.70% 12/07/2026 $885,000 632,953 0.10CPI Property Group 2.75% 22/01/2028 £1,640,000 1,676,490 0.26Lendlease Finance 3.40% 27/10/2027 AUD 2,660,000 1,528,185 0.24Lendlease Finance 3.70% 31/03/2031 AUD 1,800,000 1,034,881 0.16London & Quadrant Housing Trust 2.75% 20/07/2057 £850,000 946,917 0.15Mirvac Group Finance 3.63% 18/03/2027 $2,230,000 1,756,187 0.28Notting Hill Genesis 4.38% 20/02/2054 £650,000 967,342 0.15Shimao Group Holdings 4.60% 13/07/2030 $200,000 146,303 0.03Shimao Group Holdings 3.45% 11/01/2031 $875,000 590,802 0.09Telereal Secured Finance 4.01% 10/12/2033 £755,592 832,126 0.13Tesco Property Finance 3 5.74% 13/04/2040 £1,923,107 2,572,602 0.41Tesco Property Finance 4 5.80% 13/10/2040 £661,039 885,360 0.14THFC Funding No. 2 6.35% 08/07/2041 £871,000 1,404,169 0.22
28,601,507 4.52Real Estate total 38,829,575 6.14
Utilities 12.28% (11.59%)Electric Utilities 6.97% (6.70%)Ausgrid Finance 1.81% 05/02/2027 AUD 3,500,000 1,870,109 0.30AusNet Services Holdings, FRN 1.62% 11/03/2081 €810,000 707,405 0.11Electricite de France 6.13% 02/06/2034 £1,000,000 1,450,547 0.23Electricite de France 5.50% 17/10/2041 £5,200,000 7,728,724 1.22Electricite de France, FRN 5.88% Perpetual £1,800,000 2,041,920 0.32Electricite de France, FRN 6.00% Perpetual £1,100,000 1,228,700 0.19Enel 5.75% 22/06/2037 £1,307,000 1,893,480 0.30Enel Finance International 5.63% 14/08/2024 £650,000 746,219 0.12Enel Finance International 1.00% 20/10/2027 £865,000 848,835 0.13Enel Finance International 5.75% 14/09/2040 £1,128,000 1,701,811 0.27ENW Finance 1.42% 30/07/2030 £1,010,000 983,771 0.15ESB Finance DAC 1.88% 21/07/2035 £750,000 755,378 0.12Huaneng Hong Kong Capital, FRN 3.60% Perpetual $1,170,000 859,669 0.14Iberdrola Finanzas 6.00% 01/07/2022 £1,500,000 1,581,585 0.25Iberdrola Finanzas 7.38% 29/01/2024 £1,000,000 1,168,556 0.18NIE Finance 2.50% 27/10/2025 £1,420,000 1,503,642 0.24Northern Powergrid Yorkshire 4.38% 05/07/2032 £140,000 174,165 0.03Northern Powergrid Yorkshire 2.25% 09/10/2059 £890,000 929,288 0.15NSW Electricity Networks Finance 2.54% 23/09/2030 AUD 2,110,000 1,107,531 0.17Orsted 5.75% 09/04/2040 £710,000 1,122,660 0.18Pacific Gas and Electric 2.10% 01/08/2027 $1,355,000 953,107 0.15Pacific Gas and Electric 3.00% 15/06/2028 $950,000 691,367 0.11Pacific Gas and Electric 2.50% 01/02/2031 $675,000 458,460 0.07South Eastern Power Networks 6.37% 12/11/2031 £1,825,000 2,622,060 0.41SP Manweb 4.88% 20/09/2027 £500,000 605,419 0.10SSE 8.38% 20/11/2028 £657,000 961,778 0.15SSE 6.25% 27/08/2038 £200,000 313,427 0.05Star Energy Geothermal Darajat II/Star Energy Geothermal Salak 4.85% 14/10/2038 $1,040,000 827,551 0.13
16
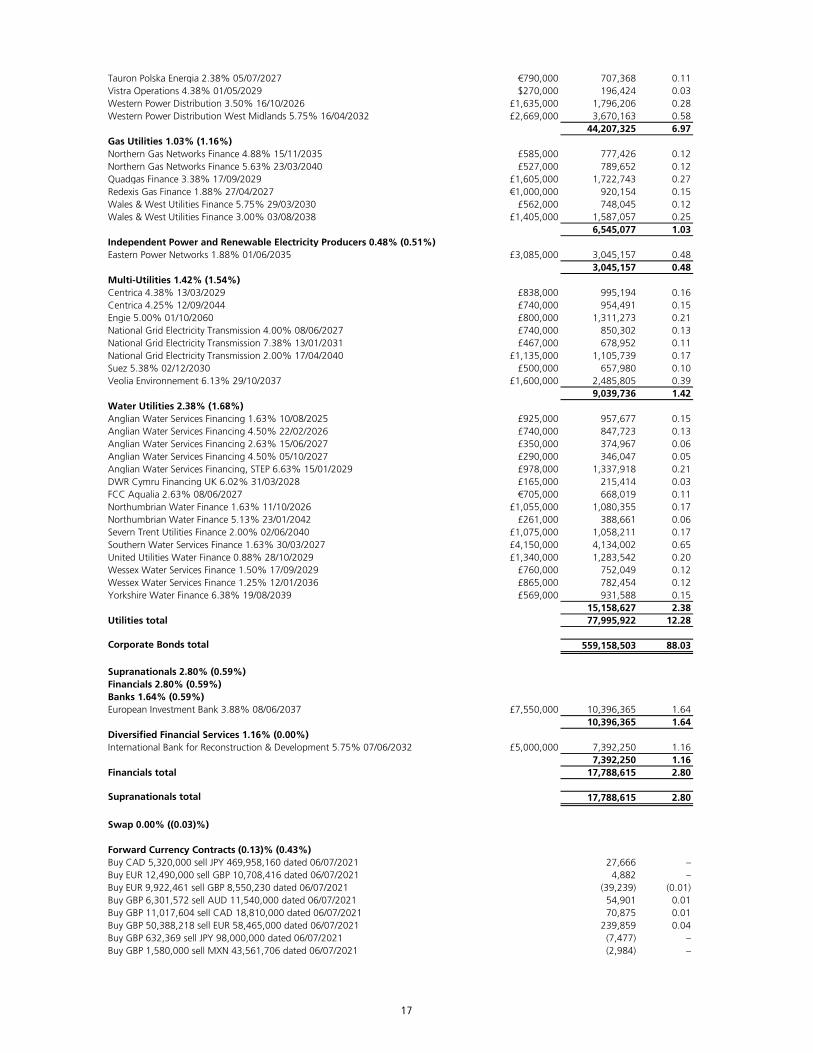
Tauron Polska Energia 2.38% 05/07/2027 €790,000 707,368 0.11Vistra Operations 4.38% 01/05/2029 $270,000 196,424 0.03Western Power Distribution 3.50% 16/10/2026 £1,635,000 1,796,206 0.28Western Power Distribution West Midlands 5.75% 16/04/2032 £2,669,000 3,670,163 0.58
44,207,325 6.97Gas Utilities 1.03% (1.16%)Northern Gas Networks Finance 4.88% 15/11/2035 £585,000 777,426 0.12Northern Gas Networks Finance 5.63% 23/03/2040 £527,000 789,652 0.12Quadgas Finance 3.38% 17/09/2029 £1,605,000 1,722,743 0.27Redexis Gas Finance 1.88% 27/04/2027 €1,000,000 920,154 0.15Wales & West Utilities Finance 5.75% 29/03/2030 £562,000 748,045 0.12Wales & West Utilities Finance 3.00% 03/08/2038 £1,405,000 1,587,057 0.25
6,545,077 1.03Independent Power and Renewable Electricity Producers 0.48% (0.51%)Eastern Power Networks 1.88% 01/06/2035 £3,085,000 3,045,157 0.48
3,045,157 0.48Multi-Utilities 1.42% (1.54%)Centrica 4.38% 13/03/2029 £838,000 995,194 0.16Centrica 4.25% 12/09/2044 £740,000 954,491 0.15Engie 5.00% 01/10/2060 £800,000 1,311,273 0.21National Grid Electricity Transmission 4.00% 08/06/2027 £740,000 850,302 0.13National Grid Electricity Transmission 7.38% 13/01/2031 £467,000 678,952 0.11National Grid Electricity Transmission 2.00% 17/04/2040 £1,135,000 1,105,739 0.17Suez 5.38% 02/12/2030 £500,000 657,980 0.10Veolia Environnement 6.13% 29/10/2037 £1,600,000 2,485,805 0.39
9,039,736 1.42Water Utilities 2.38% (1.68%)Anglian Water Services Financing 1.63% 10/08/2025 £925,000 957,677 0.15Anglian Water Services Financing 4.50% 22/02/2026 £740,000 847,723 0.13Anglian Water Services Financing 2.63% 15/06/2027 £350,000 374,967 0.06Anglian Water Services Financing 4.50% 05/10/2027 £290,000 346,047 0.05Anglian Water Services Financing, STEP 6.63% 15/01/2029 £978,000 1,337,918 0.21DWR Cymru Financing UK 6.02% 31/03/2028 £165,000 215,414 0.03FCC Aqualia 2.63% 08/06/2027 €705,000 668,019 0.11Northumbrian Water Finance 1.63% 11/10/2026 £1,055,000 1,080,355 0.17Northumbrian Water Finance 5.13% 23/01/2042 £261,000 388,661 0.06Severn Trent Utilities Finance 2.00% 02/06/2040 £1,075,000 1,058,211 0.17Southern Water Services Finance 1.63% 30/03/2027 £4,150,000 4,134,002 0.65United Utilities Water Finance 0.88% 28/10/2029 £1,340,000 1,283,542 0.20Wessex Water Services Finance 1.50% 17/09/2029 £760,000 752,049 0.12Wessex Water Services Finance 1.25% 12/01/2036 £865,000 782,454 0.12Yorkshire Water Finance 6.38% 19/08/2039 £569,000 931,588 0.15
15,158,627 2.38Utilities total 77,995,922 12.28
Corporate Bonds total 559,158,503 88.03
Supranationals 2.80% (0.59%)Financials 2.80% (0.59%)Banks 1.64% (0.59%)European Investment Bank 3.88% 08/06/2037 £7,550,000 10,396,365 1.64
10,396,365 1.64Diversified Financial Services 1.16% (0.00%)International Bank for Reconstruction & Development 5.75% 07/06/2032 £5,000,000 7,392,250 1.16
7,392,250 1.16Financials total 17,788,615 2.80
Supranationals total 17,788,615 2.80
Swap 0.00% ((0.03)%)
Forward Currency Contracts (0.13)% (0.43%)Buy CAD 5,320,000 sell JPY 469,958,160 dated 06/07/2021 27,666 –Buy EUR 12,490,000 sell GBP 10,708,416 dated 06/07/2021 4,882 –Buy EUR 9,922,461 sell GBP 8,550,230 dated 06/07/2021 (39,239) (0.01)Buy GBP 6,301,572 sell AUD 11,540,000 dated 06/07/2021 54,901 0.01Buy GBP 11,017,604 sell CAD 18,810,000 dated 06/07/2021 70,875 0.01Buy GBP 50,388,218 sell EUR 58,465,000 dated 06/07/2021 239,859 0.04Buy GBP 632,369 sell JPY 98,000,000 dated 06/07/2021 (7,477) –Buy GBP 1,580,000 sell MXN 43,561,706 dated 06/07/2021 (2,984) –
17
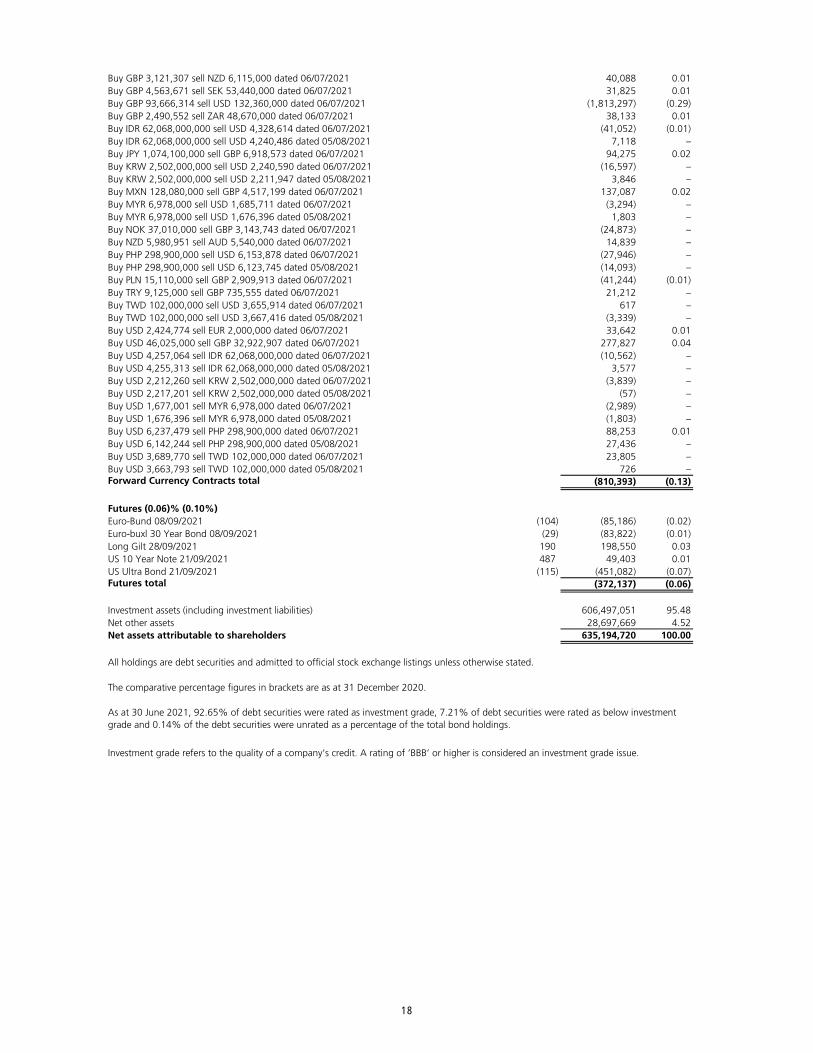
Buy GBP 3,121,307 sell NZD 6,115,000 dated 06/07/2021 40,088 0.01Buy GBP 4,563,671 sell SEK 53,440,000 dated 06/07/2021 31,825 0.01Buy GBP 93,666,314 sell USD 132,360,000 dated 06/07/2021 (1,813,297) (0.29)Buy GBP 2,490,552 sell ZAR 48,670,000 dated 06/07/2021 38,133 0.01Buy IDR 62,068,000,000 sell USD 4,328,614 dated 06/07/2021 (41,052) (0.01)Buy IDR 62,068,000,000 sell USD 4,240,486 dated 05/08/2021 7,118 –Buy JPY 1,074,100,000 sell GBP 6,918,573 dated 06/07/2021 94,275 0.02Buy KRW 2,502,000,000 sell USD 2,240,590 dated 06/07/2021 (16,597) –Buy KRW 2,502,000,000 sell USD 2,211,947 dated 05/08/2021 3,846 –Buy MXN 128,080,000 sell GBP 4,517,199 dated 06/07/2021 137,087 0.02Buy MYR 6,978,000 sell USD 1,685,711 dated 06/07/2021 (3,294) –Buy MYR 6,978,000 sell USD 1,676,396 dated 05/08/2021 1,803 –Buy NOK 37,010,000 sell GBP 3,143,743 dated 06/07/2021 (24,873) –Buy NZD 5,980,951 sell AUD 5,540,000 dated 06/07/2021 14,839 –Buy PHP 298,900,000 sell USD 6,153,878 dated 06/07/2021 (27,946) –Buy PHP 298,900,000 sell USD 6,123,745 dated 05/08/2021 (14,093) –Buy PLN 15,110,000 sell GBP 2,909,913 dated 06/07/2021 (41,244) (0.01)Buy TRY 9,125,000 sell GBP 735,555 dated 06/07/2021 21,212 –Buy TWD 102,000,000 sell USD 3,655,914 dated 06/07/2021 617 –Buy TWD 102,000,000 sell USD 3,667,416 dated 05/08/2021 (3,339) –Buy USD 2,424,774 sell EUR 2,000,000 dated 06/07/2021 33,642 0.01Buy USD 46,025,000 sell GBP 32,922,907 dated 06/07/2021 277,827 0.04Buy USD 4,257,064 sell IDR 62,068,000,000 dated 06/07/2021 (10,562) –Buy USD 4,255,313 sell IDR 62,068,000,000 dated 05/08/2021 3,577 –Buy USD 2,212,260 sell KRW 2,502,000,000 dated 06/07/2021 (3,839) –Buy USD 2,217,201 sell KRW 2,502,000,000 dated 05/08/2021 (57) –Buy USD 1,677,001 sell MYR 6,978,000 dated 06/07/2021 (2,989) –Buy USD 1,676,396 sell MYR 6,978,000 dated 05/08/2021 (1,803) –Buy USD 6,237,479 sell PHP 298,900,000 dated 06/07/2021 88,253 0.01Buy USD 6,142,244 sell PHP 298,900,000 dated 05/08/2021 27,436 –Buy USD 3,689,770 sell TWD 102,000,000 dated 06/07/2021 23,805 –Buy USD 3,663,793 sell TWD 102,000,000 dated 05/08/2021 726 –Forward Currency Contracts total (810,393) (0.13)
Futures (0.06)% (0.10%)Euro-Bund 08/09/2021 (104) (85,186) (0.02)Euro-buxl 30 Year Bond 08/09/2021 (29) (83,822) (0.01)Long Gilt 28/09/2021 190 198,550 0.03US 10 Year Note 21/09/2021 487 49,403 0.01US Ultra Bond 21/09/2021 (115) (451,082) (0.07)Futures total (372,137) (0.06)
Investment assets (including investment liabilities) 606,497,051 95.48Net other assets 28,697,669 4.52Net assets attributable to shareholders 635,194,720 100.00
All holdings are debt securities and admitted to official stock exchange listings unless otherwise stated.
The comparative percentage figures in brackets are as at 31 December 2020.
Investment grade refers to the quality of a company’s credit. A rating of ‘BBB’ or higher is considered an investment grade issue.
As at 30 June 2021, 92.65% of debt securities were rated as investment grade, 7.21% of debt securities were rated as below investment grade and 0.14% of the debt securities were unrated as a percentage of the total bond holdings.
18
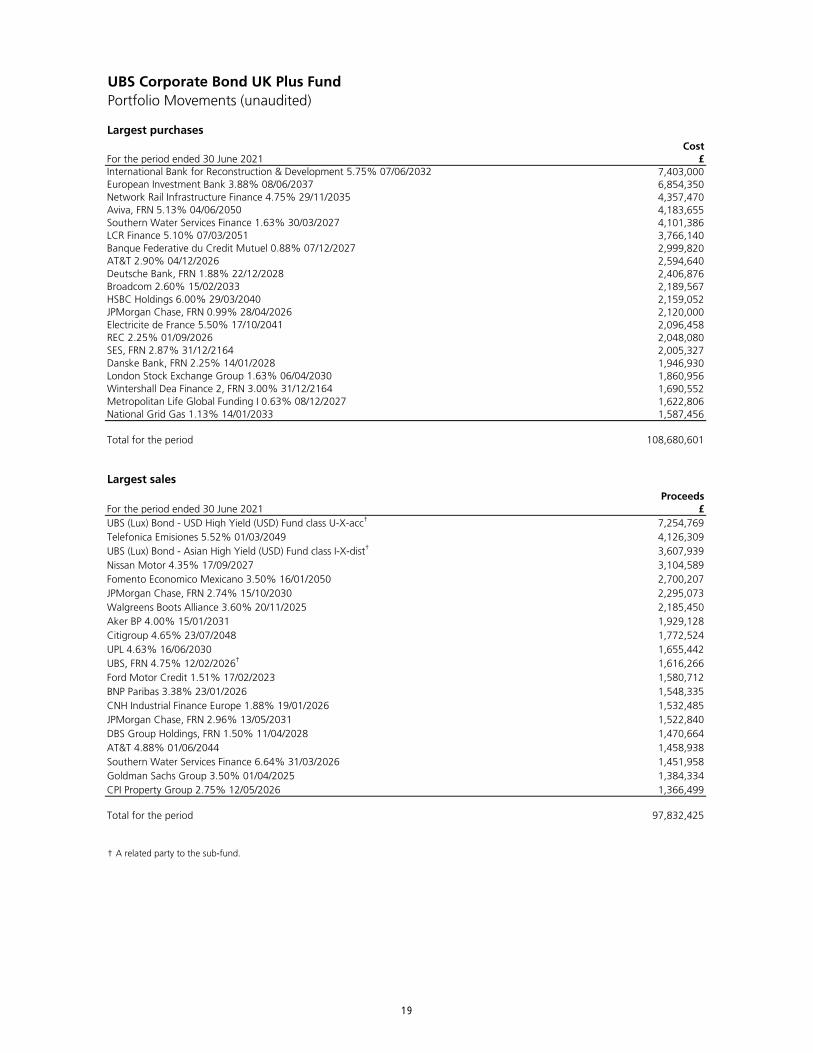
UBS Corporate Bond UK Plus FundPortfolio Movements (unaudited)
Largest purchasesCost
For the period ended 30 June 2021 £7,403,0006,854,3504,357,4704,183,6554,101,3863,766,1402,999,8202,594,6402,406,8762,189,5672,159,0522,120,0002,096,4582,048,0802,005,3271,946,9301,860,9561,690,5521,622,8061,587,456
Total for the period 108,680,601
Largest salesProceeds
For the period ended 30 June 2021 £UBS (Lux) Bond - USD High Yield (USD) Fund class U-X-acc† 7,254,769Telefonica Emisiones 5.52% 01/03/2049 4,126,309UBS (Lux) Bond - Asian High Yield (USD) Fund class I-X-dist† 3,607,939Nissan Motor 4.35% 17/09/2027 3,104,589Fomento Economico Mexicano 3.50% 16/01/2050 2,700,207JPMorgan Chase, FRN 2.74% 15/10/2030 2,295,073Walgreens Boots Alliance 3.60% 20/11/2025 2,185,450Aker BP 4.00% 15/01/2031 1,929,128Citigroup 4.65% 23/07/2048 1,772,524UPL 4.63% 16/06/2030 1,655,442UBS, FRN 4.75% 12/02/2026† 1,616,266Ford Motor Credit 1.51% 17/02/2023 1,580,712BNP Paribas 3.38% 23/01/2026 1,548,335CNH Industrial Finance Europe 1.88% 19/01/2026 1,532,485JPMorgan Chase, FRN 2.96% 13/05/2031 1,522,840DBS Group Holdings, FRN 1.50% 11/04/2028 1,470,664AT&T 4.88% 01/06/2044 1,458,938Southern Water Services Finance 6.64% 31/03/2026 1,451,958Goldman Sachs Group 3.50% 01/04/2025 1,384,334CPI Property Group 2.75% 12/05/2026 1,366,499
Total for the period 97,832,425
† A related party to the sub-fund.
Metropolitan Life Global Funding I 0.63% 08/12/2027National Grid Gas 1.13% 14/01/2033
Wintershall Dea Finance 2, FRN 3.00% 31/12/2164
Banque Federative du Credit Mutuel 0.88% 07/12/2027AT&T 2.90% 04/12/2026Deutsche Bank, FRN 1.88% 22/12/2028Broadcom 2.60% 15/02/2033HSBC Holdings 6.00% 29/03/2040JPMorgan Chase, FRN 0.99% 28/04/2026Electricite de France 5.50% 17/10/2041REC 2.25% 01/09/2026SES, FRN 2.87% 31/12/2164Danske Bank, FRN 2.25% 14/01/2028London Stock Exchange Group 1.63% 06/04/2030
LCR Finance 5.10% 07/03/2051
International Bank for Reconstruction & Development 5.75% 07/06/2032European Investment Bank 3.88% 08/06/2037Network Rail Infrastructure Finance 4.75% 29/11/2035Aviva, FRN 5.13% 04/06/2050Southern Water Services Finance 1.63% 30/03/2027
19

UBS Corporate Bond UK Plus FundFinancial Statements (unaudited)
Statement of Total ReturnFor the period ended 30 June 2021
£ £ £ £Income Net capital (losses)/gains (18,808,137) 7,452,583 Revenue 8,652,907 8,853,539Expenses (164,940) (142,173)Net revenue before taxation 8,487,967 8,711,366Taxation (2,455) -Net revenue after taxation 8,485,512 8,711,366Total return before distributions (10,322,625) 16,163,949Distributions (8,663,855) (8,801,880)Change in net assets attributable to shareholders from investment activities (18,986,480) 7,362,069
Statement of Change in Net Assets Attributable to ShareholdersFor the period ended 30 June 2021
£ £ £ £645,525,307 593,921,438
Amounts receivable on issue of shares 109,801 65,475Amounts payable on cancellation of shares (112,401) (3,450,147)
(2,600) (3,384,672)Dilution adjustment 5 9,678
(18,986,480) 7,362,0698,658,488 8,779,161
635,194,720 606,687,674
shareholders from investment activities (see above)Retained distribution on accumulation sharesClosing net assets attributable to shareholders
As the comparatives are for the previous interim period, the net assets at the end of that period will not agree to the net assets at the start of the current period. The published net asset value as at 31 December 2020 was £645,525,307.
Change in net assets attributable to
30.06.21 30.06.20
30.06.21 30.06.20
Opening net assets attributable to shareholders
20
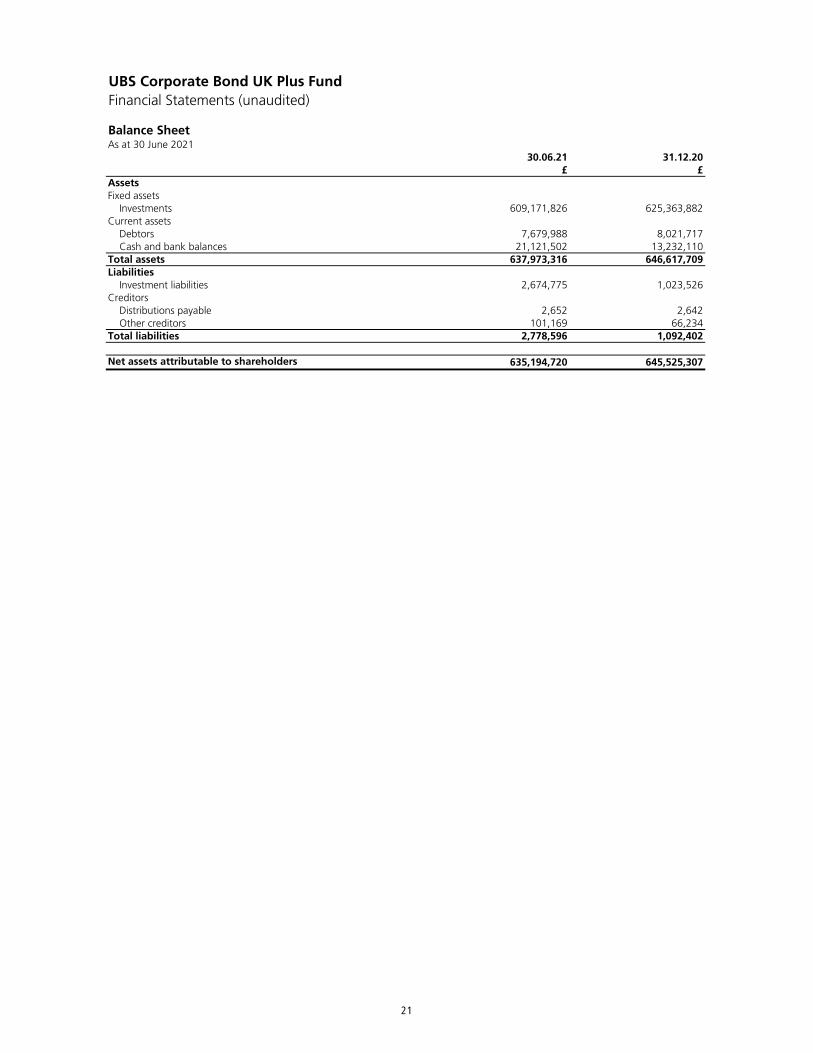
UBS Corporate Bond UK Plus FundFinancial Statements (unaudited)
Balance SheetAs at 30 June 2021
30.06.21 31.12.20£ £
AssetsFixed assets Investments 609,171,826 625,363,882Current assets Debtors 7,679,988 8,021,717 Cash and bank balances 21,121,502 13,232,110Total assets 637,973,316 646,617,709Liabilities Investment liabilities 2,674,775 1,023,526Creditors Distributions payable 2,652 2,642 Other creditors 101,169 66,234Total liabilities 2,778,596 1,092,402
Net assets attributable to shareholders 635,194,720 645,525,307
21

UBS Corporate Bond UK Plus FundNotes to the Financial Statements (unaudited)
Accounting policiesThe interim financial statements have been prepared in accordance with the Statement of Recommended Practice (SORP) for Authorised Funds issued by the Investment Association (IA) in May 2014 (SORP 2014).
The accounting policies applied are consistent with those of the financial statements for the year ended 31 December 2020 and are described in those annual financial statements.
22
UBS Global Emerging Markets Equity Fund
23
UBS Global Emerging Markets Equity FundManager's report
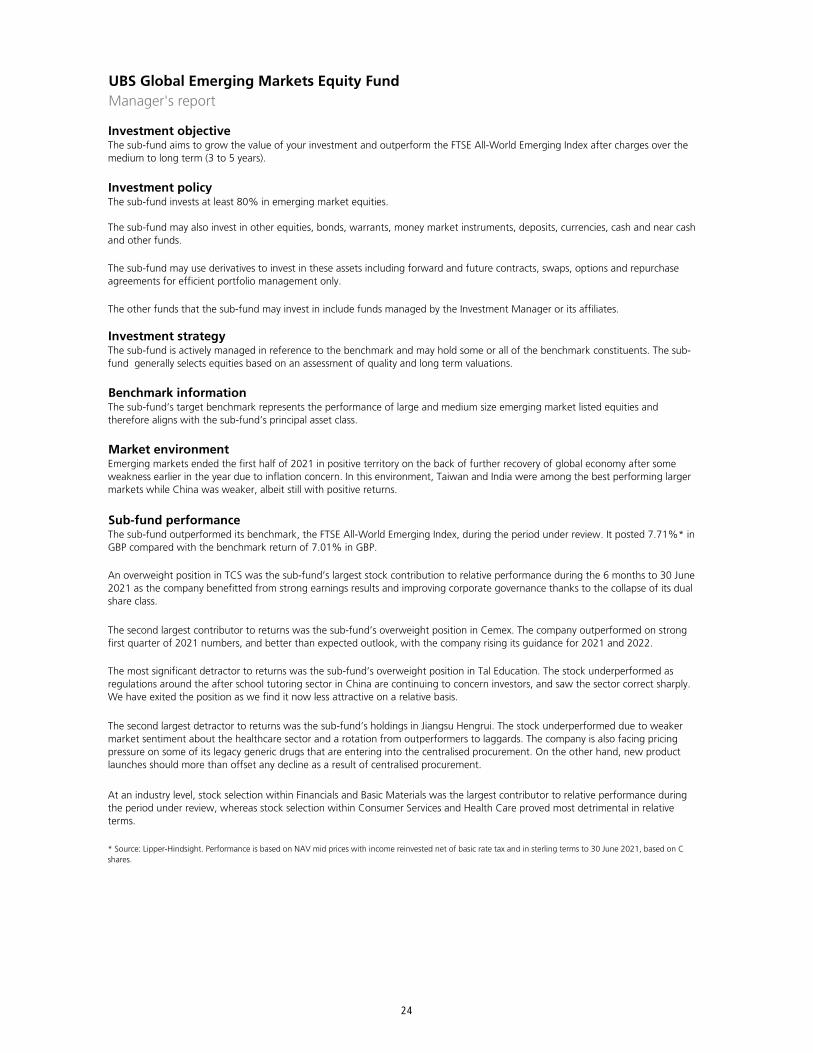
Investment objective
Investment policy
Investment strategy
Benchmark information
Market environment
Sub-fund performance
* Source: Lipper-Hindsight. Performance is based on NAV mid prices with income reinvested net of basic rate tax and in sterling terms to 30 June 2021, based on C shares.
The sub-fund is actively managed in reference to the benchmark and may hold some or all of the benchmark constituents. The sub-fund generally selects equities based on an assessment of quality and long term valuations.
The sub-fund’s target benchmark represents the performance of large and medium size emerging market listed equities and therefore aligns with the sub-fund’s principal asset class.
Emerging markets ended the first half of 2021 in positive territory on the back of further recovery of global economy after some weakness earlier in the year due to inflation concern. In this environment, Taiwan and India were among the best performing larger markets while China was weaker, albeit still with positive returns.
The sub-fund outperformed its benchmark, the FTSE All-World Emerging Index, during the period under review. It posted 7.71%* in GBP compared with the benchmark return of 7.01% in GBP.
An overweight position in TCS was the sub-fund’s largest stock contribution to relative performance during the 6 months to 30 June 2021 as the company benefitted from strong earnings results and improving corporate governance thanks to the collapse of its dual share class.
The second largest contributor to returns was the sub-fund’s overweight position in Cemex. The company outperformed on strong first quarter of 2021 numbers, and better than expected outlook, with the company rising its guidance for 2021 and 2022.
The most significant detractor to returns was the sub-fund’s overweight position in Tal Education. The stock underperformed as regulations around the after school tutoring sector in China are continuing to concern investors, and saw the sector correct sharply. We have exited the position as we find it now less attractive on a relative basis.
The second largest detractor to returns was the sub-fund’s holdings in Jiangsu Hengrui. The stock underperformed due to weaker market sentiment about the healthcare sector and a rotation from outperformers to laggards. The company is also facing pricing pressure on some of its legacy generic drugs that are entering into the centralised procurement. On the other hand, new product launches should more than offset any decline as a result of centralised procurement.
At an industry level, stock selection within Financials and Basic Materials was the largest contributor to relative performance during the period under review, whereas stock selection within Consumer Services and Health Care proved most detrimental in relative terms.
The other funds that the sub-fund may invest in include funds managed by the Investment Manager or its affiliates.
The sub-fund aims to grow the value of your investment and outperform the FTSE All-World Emerging Index after charges over the medium to long term (3 to 5 years).
The sub-fund invests at least 80% in emerging market equities.
The sub-fund may also invest in other equities, bonds, warrants, money market instruments, deposits, currencies, cash and near cash and other funds.
The sub-fund may use derivatives to invest in these assets including forward and future contracts, swaps, options and repurchase agreements for efficient portfolio management only.
24
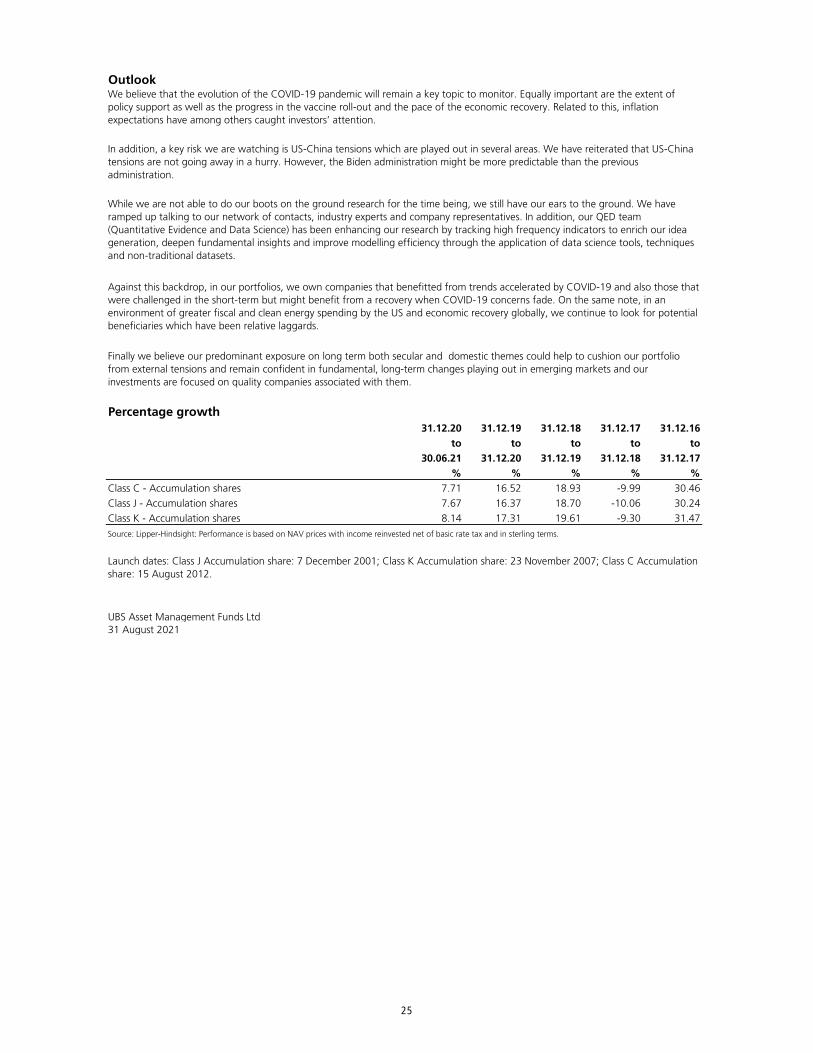
Outlook
Percentage growth31.12.20 31.12.19 31.12.18 31.12.17 31.12.16
to to to to to30.06.21 31.12.20 31.12.19 31.12.18 31.12.17
% % % % %Class C - Accumulation shares 7.71 16.52 18.93 -9.99 30.46Class J - Accumulation shares 7.67 16.37 18.70 -10.06 30.24Class K - Accumulation shares 8.14 17.31 19.61 -9.30 31.47Source: Lipper-Hindsight: Performance is based on NAV prices with income reinvested net of basic rate tax and in sterling terms.
UBS Asset Management Funds Ltd31 August 2021
Launch dates: Class J Accumulation share: 7 December 2001; Class K Accumulation share: 23 November 2007; Class C Accumulation share: 15 August 2012.
We believe that the evolution of the COVID-19 pandemic will remain a key topic to monitor. Equally important are the extent of policy support as well as the progress in the vaccine roll-out and the pace of the economic recovery. Related to this, inflation expectations have among others caught investors’ attention.
In addition, a key risk we are watching is US-China tensions which are played out in several areas. We have reiterated that US-China tensions are not going away in a hurry. However, the Biden administration might be more predictable than the previous administration.
While we are not able to do our boots on the ground research for the time being, we still have our ears to the ground. We have ramped up talking to our network of contacts, industry experts and company representatives. In addition, our QED team (Quantitative Evidence and Data Science) has been enhancing our research by tracking high frequency indicators to enrich our idea generation, deepen fundamental insights and improve modelling efficiency through the application of data science tools, techniques and non-traditional datasets.
Against this backdrop, in our portfolios, we own companies that benefitted from trends accelerated by COVID-19 and also those that were challenged in the short-term but might benefit from a recovery when COVID-19 concerns fade. On the same note, in an environment of greater fiscal and clean energy spending by the US and economic recovery globally, we continue to look for potential beneficiaries which have been relative laggards.
Finally we believe our predominant exposure on long term both secular and domestic themes could help to cushion our portfolio from external tensions and remain confident in fundamental, long-term changes playing out in emerging markets and our investments are focused on quality companies associated with them.
25
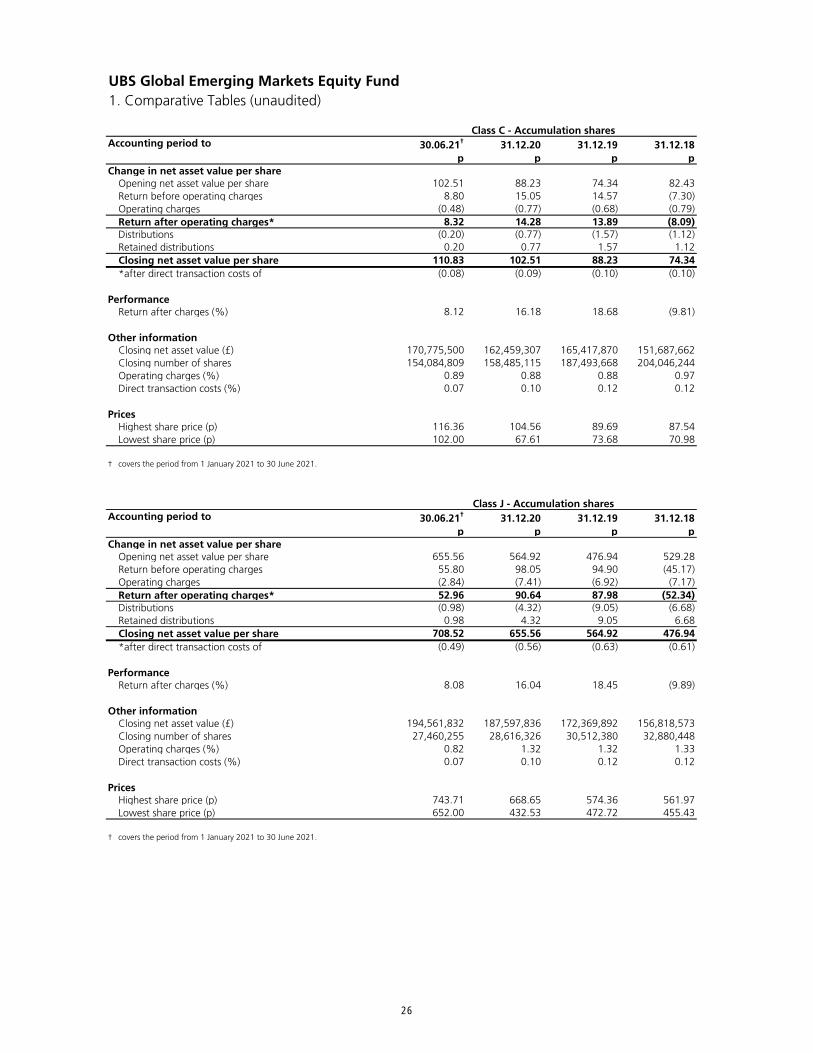
UBS Global Emerging Markets Equity Fund1. Comparative Tables (unaudited)
Accounting period to 30.06.21† 31.12.20 31.12.19 31.12.18p p p p
Change in net asset value per shareOpening net asset value per share 102.51 88.23 74.34 82.43Return before operating charges 8.80 15.05 14.57 (7.30)Operating charges (0.48) (0.77) (0.68) (0.79)Return after operating charges* 8.32 14.28 13.89 (8.09)Distributions (0.20) (0.77) (1.57) (1.12)Retained distributions 0.20 0.77 1.57 1.12Closing net asset value per share 110.83 102.51 88.23 74.34*after direct transaction costs of (0.08) (0.09) (0.10) (0.10)
PerformanceReturn after charges (%) 8.12 16.18 18.68 (9.81)
Other informationClosing net asset value (£) 170,775,500 162,459,307 165,417,870 151,687,662Closing number of shares 154,084,809 158,485,115 187,493,668 204,046,244Operating charges (%) 0.89 0.88 0.88 0.97Direct transaction costs (%) 0.07 0.10 0.12 0.12
PricesHighest share price (p) 116.36 104.56 89.69 87.54Lowest share price (p) 102.00 67.61 73.68 70.98
† covers the period from 1 January 2021 to 30 June 2021.
Accounting period to 30.06.21† 31.12.20 31.12.19 31.12.18p p p p
Change in net asset value per shareOpening net asset value per share 655.56 564.92 476.94 529.28Return before operating charges 55.80 98.05 94.90 (45.17)Operating charges (2.84) (7.41) (6.92) (7.17)Return after operating charges* 52.96 90.64 87.98 (52.34)Distributions (0.98) (4.32) (9.05) (6.68)Retained distributions 0.98 4.32 9.05 6.68Closing net asset value per share 708.52 655.56 564.92 476.94*after direct transaction costs of (0.49) (0.56) (0.63) (0.61)
PerformanceReturn after charges (%) 8.08 16.04 18.45 (9.89)
Other informationClosing net asset value (£) 194,561,832 187,597,836 172,369,892 156,818,573Closing number of shares 27,460,255 28,616,326 30,512,380 32,880,448Operating charges (%) 0.82 1.32 1.32 1.33Direct transaction costs (%) 0.07 0.10 0.12 0.12
PricesHighest share price (p) 743.71 668.65 574.36 561.97Lowest share price (p) 652.00 432.53 472.72 455.43
† covers the period from 1 January 2021 to 30 June 2021.
Class C - Accumulation shares
Class J - Accumulation shares
26
Accounting period to 30.06.21† 31.12.20 31.12.19 31.12.18p p p p
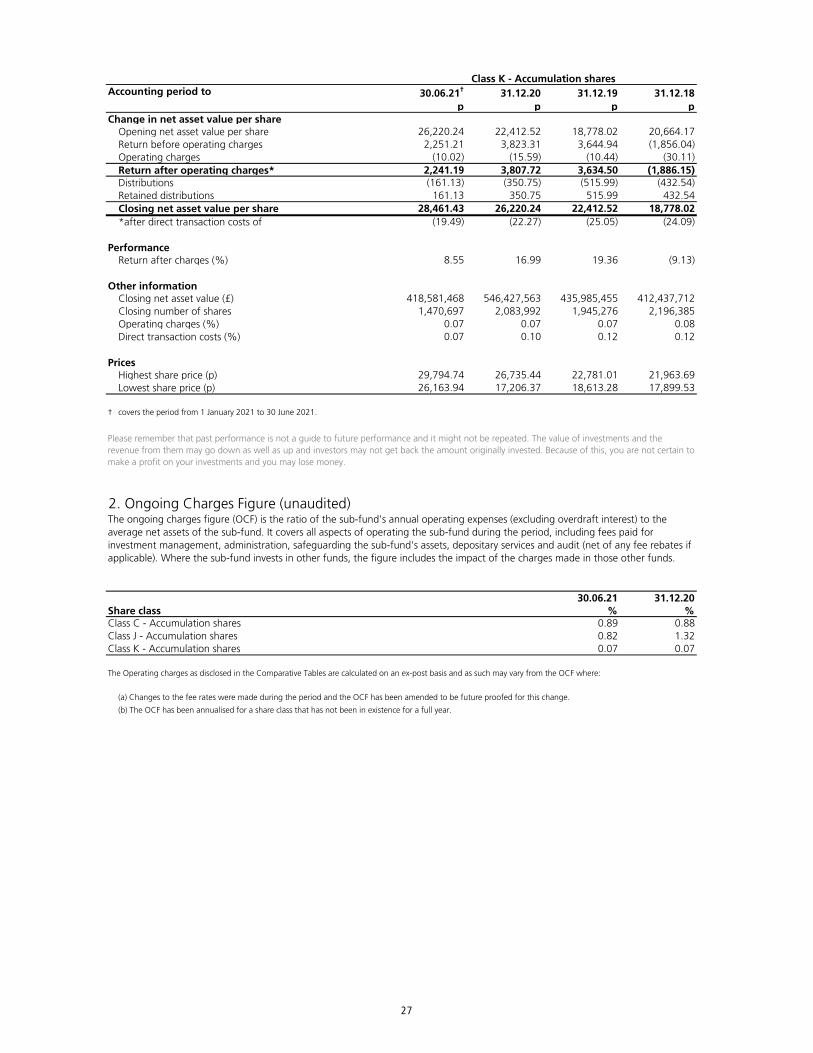
Change in net asset value per shareOpening net asset value per share 26,220.24 22,412.52 18,778.02 20,664.17Return before operating charges 2,251.21 3,823.31 3,644.94 (1,856.04)Operating charges (10.02) (15.59) (10.44) (30.11)Return after operating charges* 2,241.19 3,807.72 3,634.50 (1,886.15)Distributions (161.13) (350.75) (515.99) (432.54)Retained distributions 161.13 350.75 515.99 432.54Closing net asset value per share 28,461.43 26,220.24 22,412.52 18,778.02*after direct transaction costs of (19.49) (22.27) (25.05) (24.09)
PerformanceReturn after charges (%) 8.55 16.99 19.36 (9.13)
Other informationClosing net asset value (£) 418,581,468 546,427,563 435,985,455 412,437,712Closing number of shares 1,470,697 2,083,992 1,945,276 2,196,385Operating charges (%) 0.07 0.07 0.07 0.08Direct transaction costs (%) 0.07 0.10 0.12 0.12
PricesHighest share price (p) 29,794.74 26,735.44 22,781.01 21,963.69Lowest share price (p) 26,163.94 17,206.37 18,613.28 17,899.53
† covers the period from 1 January 2021 to 30 June 2021.
2. Ongoing Charges Figure (unaudited)
30.06.21 31.12.20Share class % %Class C - Accumulation shares 0.89 0.88Class J - Accumulation shares 0.82 1.32Class K - Accumulation shares 0.07 0.07
(a) Changes to the fee rates were made during the period and the OCF has been amended to be future proofed for this change.
(b) The OCF has been annualised for a share class that has not been in existence for a full year.
Please remember that past performance is not a guide to future performance and it might not be repeated. The value of investments and the revenue from them may go down as well as up and investors may not get back the amount originally invested. Because of this, you are not certain to make a profit on your investments and you may lose money.
The ongoing charges figure (OCF) is the ratio of the sub-fund's annual operating expenses (excluding overdraft interest) to the average net assets of the sub-fund. It covers all aspects of operating the sub-fund during the period, including fees paid for investment management, administration, safeguarding the sub-fund's assets, depositary services and audit (net of any fee rebates if applicable). Where the sub-fund invests in other funds, the figure includes the impact of the charges made in those other funds.
The Operating charges as disclosed in the Comparative Tables are calculated on an ex-post basis and as such may vary from the OCF where:
Class K - Accumulation shares
27
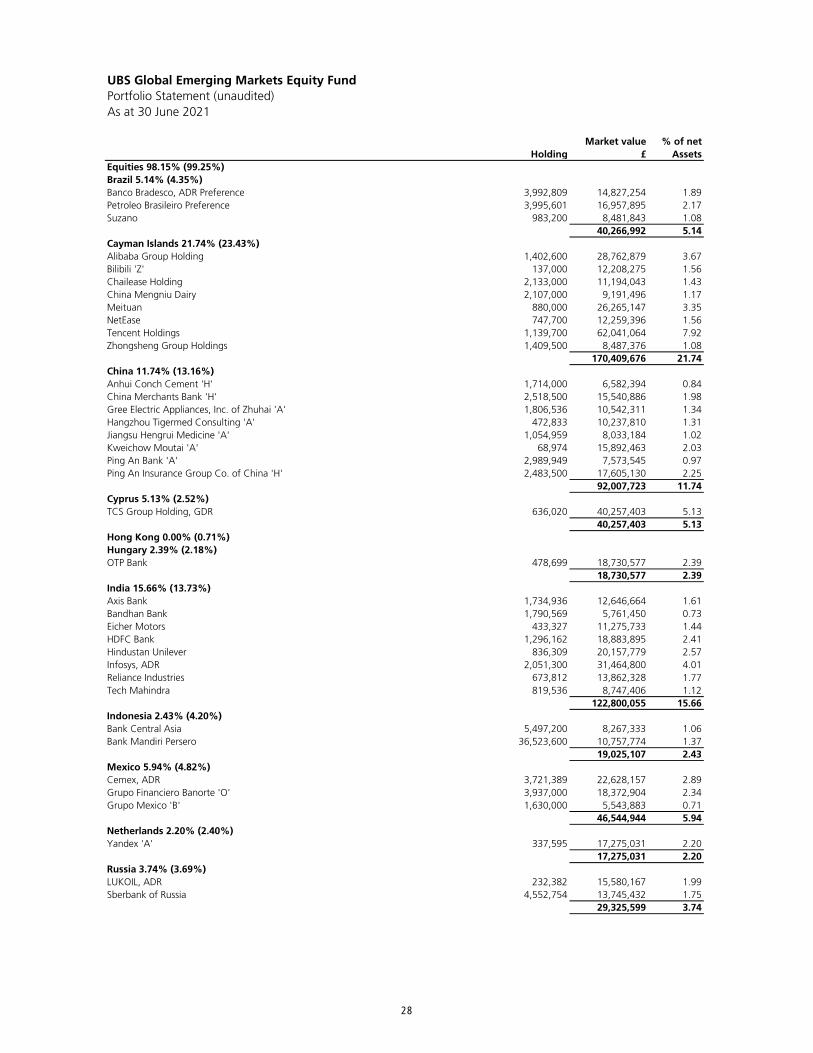
UBS Global Emerging Markets Equity FundPortfolio Statement (unaudited)As at 30 June 2021
HoldingMarket value
£% of net
AssetsEquities 98.15% (99.25%)Brazil 5.14% (4.35%)Banco Bradesco, ADR Preference 3,992,809 14,827,254 1.89Petroleo Brasileiro Preference 3,995,601 16,957,895 2.17Suzano 983,200 8,481,843 1.08
40,266,992 5.14Cayman Islands 21.74% (23.43%)Alibaba Group Holding 1,402,600 28,762,879 3.67Bilibili 'Z' 137,000 12,208,275 1.56Chailease Holding 2,133,000 11,194,043 1.43China Mengniu Dairy 2,107,000 9,191,496 1.17Meituan 880,000 26,265,147 3.35NetEase 747,700 12,259,396 1.56Tencent Holdings 1,139,700 62,041,064 7.92Zhongsheng Group Holdings 1,409,500 8,487,376 1.08
170,409,676 21.74China 11.74% (13.16%)Anhui Conch Cement 'H' 1,714,000 6,582,394 0.84China Merchants Bank 'H' 2,518,500 15,540,886 1.98Gree Electric Appliances, Inc. of Zhuhai 'A' 1,806,536 10,542,311 1.34Hangzhou Tigermed Consulting 'A' 472,833 10,237,810 1.31Jiangsu Hengrui Medicine 'A' 1,054,959 8,033,184 1.02Kweichow Moutai 'A' 68,974 15,892,463 2.03Ping An Bank 'A' 2,989,949 7,573,545 0.97Ping An Insurance Group Co. of China 'H' 2,483,500 17,605,130 2.25
92,007,723 11.74Cyprus 5.13% (2.52%)TCS Group Holding, GDR 636,020 40,257,403 5.13
40,257,403 5.13Hong Kong 0.00% (0.71%)Hungary 2.39% (2.18%)OTP Bank 478,699 18,730,577 2.39
18,730,577 2.39India 15.66% (13.73%)Axis Bank 1,734,936 12,646,664 1.61Bandhan Bank 1,790,569 5,761,450 0.73Eicher Motors 433,327 11,275,733 1.44HDFC Bank 1,296,162 18,883,895 2.41Hindustan Unilever 836,309 20,157,779 2.57Infosys, ADR 2,051,300 31,464,800 4.01Reliance Industries 673,812 13,862,328 1.77Tech Mahindra 819,536 8,747,406 1.12
122,800,055 15.66Indonesia 2.43% (4.20%)Bank Central Asia 5,497,200 8,267,333 1.06Bank Mandiri Persero 36,523,600 10,757,774 1.37
19,025,107 2.43Mexico 5.94% (4.82%)Cemex, ADR 3,721,389 22,628,157 2.89Grupo Financiero Banorte 'O' 3,937,000 18,372,904 2.34Grupo Mexico 'B' 1,630,000 5,543,883 0.71
46,544,944 5.94Netherlands 2.20% (2.40%)Yandex 'A' 337,595 17,275,031 2.20
17,275,031 2.20Russia 3.74% (3.69%)LUKOIL, ADR 232,382 15,580,167 1.99Sberbank of Russia 4,552,754 13,745,432 1.75
29,325,599 3.74
28
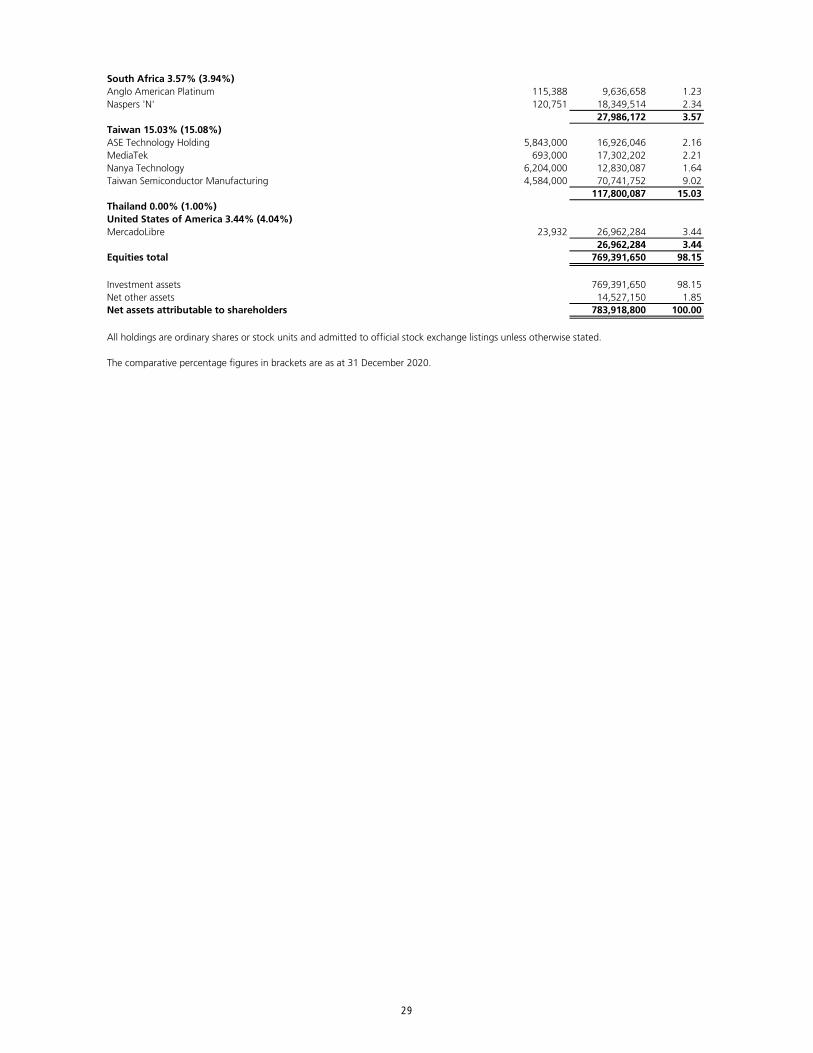
South Africa 3.57% (3.94%)Anglo American Platinum 115,388 9,636,658 1.23Naspers 'N' 120,751 18,349,514 2.34
27,986,172 3.57Taiwan 15.03% (15.08%)ASE Technology Holding 5,843,000 16,926,046 2.16MediaTek 693,000 17,302,202 2.21Nanya Technology 6,204,000 12,830,087 1.64Taiwan Semiconductor Manufacturing 4,584,000 70,741,752 9.02
117,800,087 15.03Thailand 0.00% (1.00%)United States of America 3.44% (4.04%)MercadoLibre 23,932 26,962,284 3.44
26,962,284 3.44Equities total 769,391,650 98.15
Investment assets 769,391,650 98.15Net other assets 14,527,150 1.85Net assets attributable to shareholders 783,918,800 100.00
All holdings are ordinary shares or stock units and admitted to official stock exchange listings unless otherwise stated.
The comparative percentage figures in brackets are as at 31 December 2020.
29
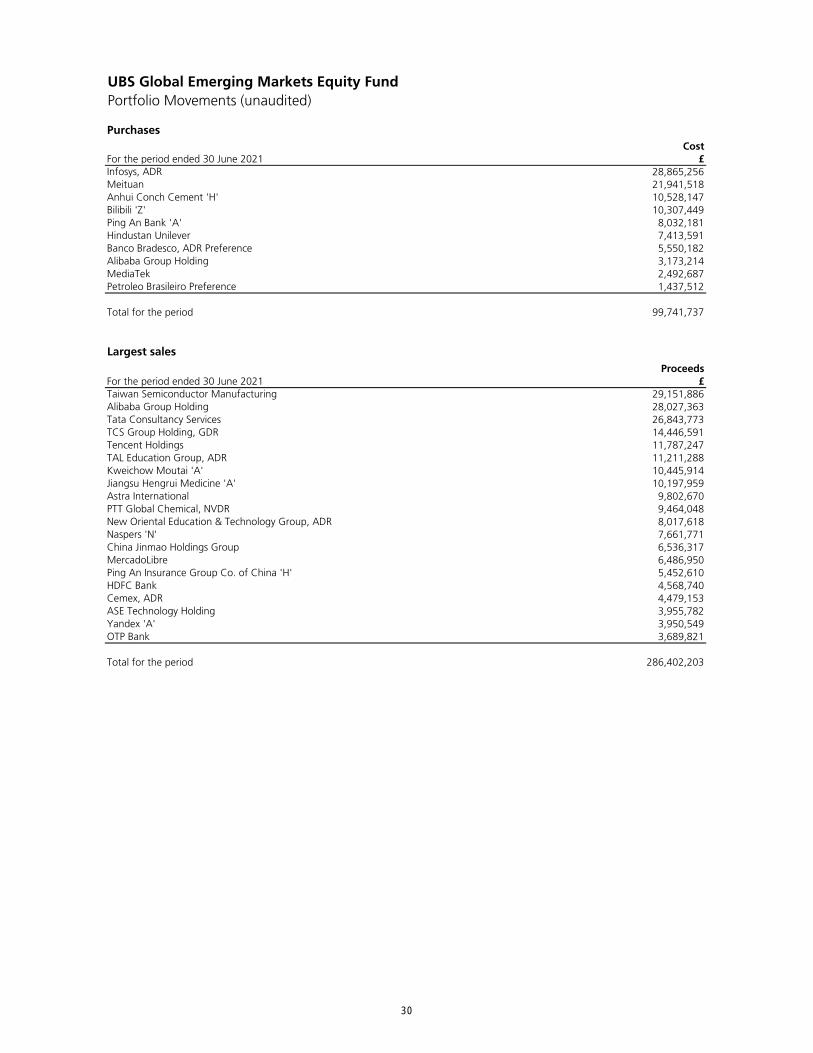
UBS Global Emerging Markets Equity FundPortfolio Movements (unaudited)
PurchasesCost
For the period ended 30 June 2021 £28,865,25621,941,51810,528,14710,307,4498,032,1817,413,5915,550,1823,173,2142,492,6871,437,512
Total for the period 99,741,737
Largest salesProceeds
For the period ended 30 June 2021 £29,151,88628,027,36326,843,77314,446,59111,787,24711,211,28810,445,91410,197,9599,802,6709,464,0488,017,6187,661,7716,536,3176,486,9505,452,6104,568,7404,479,1533,955,7823,950,5493,689,821
Total for the period 286,402,203
Cemex, ADR ASE Technology Holding Yandex 'A' OTP Bank
New Oriental Education & Technology Group, ADRNaspers 'N' China Jinmao Holdings GroupMercadoLibre Ping An Insurance Group Co. of China 'H' HDFC Bank
PTT Global Chemical, NVDR
Taiwan Semiconductor Manufacturing Alibaba Group Holding Tata Consultancy ServicesTCS Group Holding, GDR Tencent Holdings TAL Education Group, ADRKweichow Moutai 'A' Jiangsu Hengrui Medicine 'A' Astra International
Banco Bradesco, ADR PreferenceAlibaba Group Holding MediaTek Petroleo Brasileiro Preference
Hindustan Unilever
Infosys, ADR Meituan Anhui Conch Cement 'H' Bilibili 'Z' Ping An Bank 'A'
30
UBS Global Emerging Markets Equity FundFinancial Statements (unaudited)
Statement of Total ReturnFor the period ended 30 June 2021
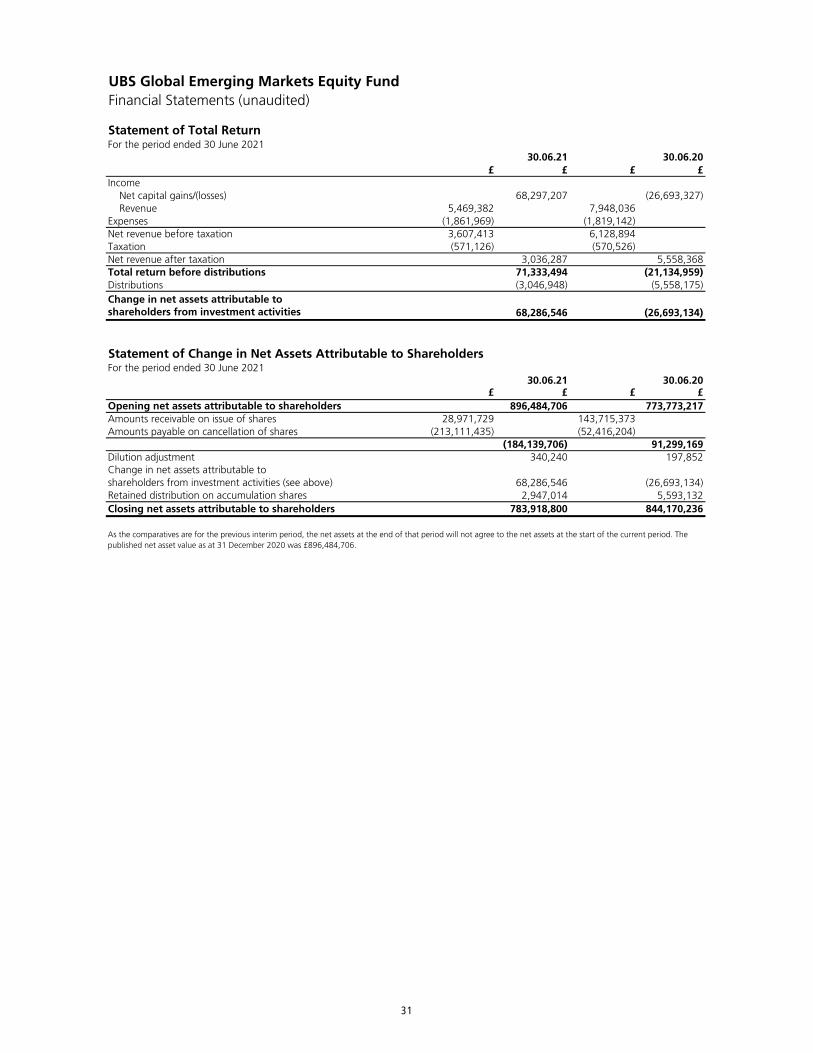
£ £ £ £Income Net capital gains/(losses) 68,297,207 (26,693,327) Revenue 5,469,382 7,948,036Expenses (1,861,969) (1,819,142)Net revenue before taxation 3,607,413 6,128,894Taxation (571,126) (570,526)Net revenue after taxation 3,036,287 5,558,368Total return before distributions 71,333,494 (21,134,959)Distributions (3,046,948) (5,558,175)Change in net assets attributable to shareholders from investment activities 68,286,546 (26,693,134)
Statement of Change in Net Assets Attributable to ShareholdersFor the period ended 30 June 2021
£ £ £ £896,484,706 773,773,217
Amounts receivable on issue of shares 28,971,729 143,715,373Amounts payable on cancellation of shares (213,111,435) (52,416,204)
(184,139,706) 91,299,169Dilution adjustment 340,240 197,852
68,286,546 (26,693,134)2,947,014 5,593,132
783,918,800 844,170,236
shareholders from investment activities (see above)Retained distribution on accumulation sharesClosing net assets attributable to shareholders
As the comparatives are for the previous interim period, the net assets at the end of that period will not agree to the net assets at the start of the current period. The published net asset value as at 31 December 2020 was £896,484,706.
Change in net assets attributable to
30.06.21 30.06.20
30.06.21 30.06.20
Opening net assets attributable to shareholders
31
UBS Global Emerging Markets Equity FundFinancial Statements (unaudited)
Balance SheetAs at 30 June 2021
30.06.21 31.12.20£ £
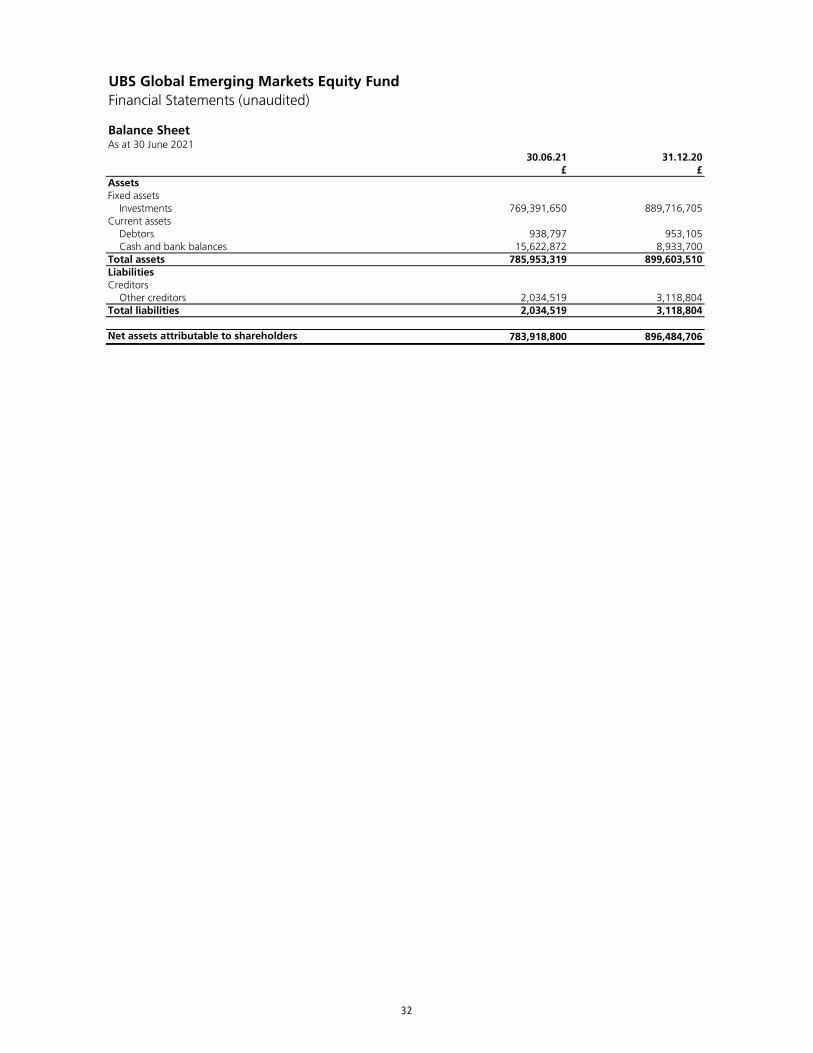
AssetsFixed assets Investments 769,391,650 889,716,705Current assets Debtors 938,797 953,105 Cash and bank balances 15,622,872 8,933,700Total assets 785,953,319 899,603,510LiabilitiesCreditors Other creditors 2,034,519 3,118,804Total liabilities 2,034,519 3,118,804
Net assets attributable to shareholders 783,918,800 896,484,706
32

UBS Global Emerging Markets Equity FundNotes to the Financial Statements (unaudited)
Accounting policiesThe interim financial statements have been prepared in accordance with the Statement of Recommended Practice (SORP) for Authorised Funds issued by the Investment Association (IA) in May 2014 (SORP 2014).
The accounting policies applied are consistent with those of the financial statements for the year ended 31 December 2020 and are described in those annual financial statements.
33

34

UBS Global Optimal Fund
35
UBS Global Optimal FundManager's report
Investment objective
Investment policy
Investment strategy
Benchmark information
Market environment
Sub-fund performance
The last six months saw value stocks outperform growth on the back of faster vaccine rollouts, strong fiscal stimulus and economic and corporate earnings growth. This backdrop also lifted the reflation trade, with beneficiaries such as energy and financials outperforming growth sectors that were more vulnerable to higher yields like information technology. With that said, the portfolio very nicely benefitted from this market trend and outperformed its benchmark. On a sector level, the biggest contributor was Materials, Industrials and Energy. The biggest gainers on a stock basis were BT, Hess, and Cemex.
* Source: Lipper-Hindsight. Performance is based on NAV mid prices with income reinvested net of basic rate tax and in sterling terms to 30 June 2021, based on C shares.
The sub-fund ended up 10.06%* for the period compared to MSCI ACWI Index benchmark return of 11.38%.
The sub-fund aims to grow the value of your investment and outperform the MSCI ACWI Index after charges over the medium to long term (3 to 5 years).
The sub-fund invests at least 70% in global equities.
The sub-fund may also invest in other equities, bonds, warrants, money market instruments, deposits, currencies, cash and near cash and other funds.
The sub-fund may use derivatives to invest in these assets including forward and future contracts, swaps, options and repurchase agreements for efficient portfolio management only.
The other funds that the sub-fund may invest in include funds managed by the Investment Manager or its affiliates.
The sub-fund is actively managed in reference to the benchmark and may hold some or all of the benchmark constituents. The sub-fund's strategy selects equities believed to be undervalued by the market.
The sub-fund’s target benchmark represents the performance of global equities and therefore aligns with the sub-fund’s principal asset class.
The first half of the year delivered faster-than-expected vaccine rollouts, bigger-than-expected US fiscal stimulus, higher-than expected inflation, and strong economic and corporate earnings growth. This backdrop drove further gains for equities, as well as higher 10-year US Treasury yields. The S&P 500 closed out the first half of the year on a winning streak, with five consecutive record closing highs for a total return of 15% year-to-date. Global equities also reached all-time highs and are now nearly 90% above their pandemic low. Meanwhile, volatility has been unusually low, with only one daily move in the MSCI All Country World index of greater than 1% in June, and the VIX index falling to its lowest levels since prior to the onset of COVID-19. With the post-pandemic recovery taking hold, prices of various goods and services are rising. In the US, the consumer price index rose by 4.2% year on year in April and 5% in May, and the Citi US inflation surprise index is at its highest level since its inception in 1998. But the inflation worry looks set to fade further. We expect the May data to represent a peak in US inflation, as the boosts from base effects and higher energy prices are ebbing. Finally, disruptions related to the pandemic and reopening should also moderate as supply chains and demand patterns normalize.
36
Outlook
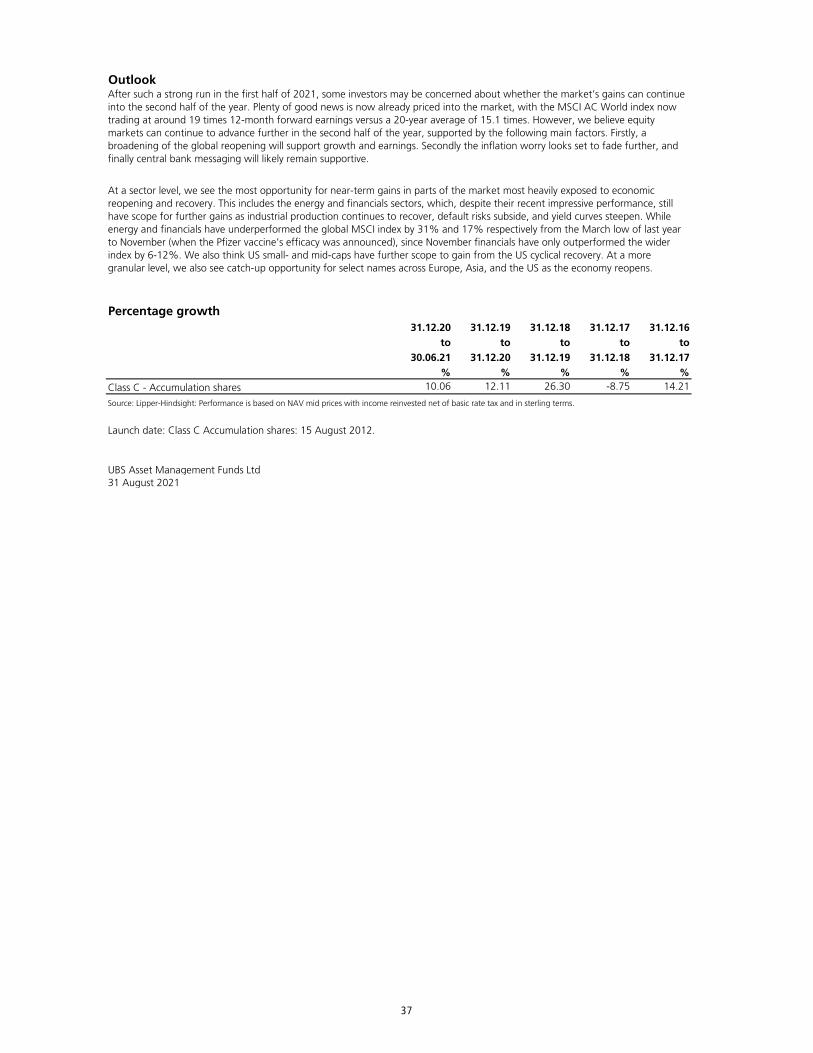
Percentage growth31.12.20 31.12.19 31.12.18 31.12.17 31.12.16
to to to to to30.06.21 31.12.20 31.12.19 31.12.18 31.12.17
% % % % %Class C - Accumulation shares 10.06 12.11 26.30 -8.75 14.21
Source: Lipper-Hindsight: Performance is based on NAV mid prices with income reinvested net of basic rate tax and in sterling terms.
UBS Asset Management Funds Ltd31 August 2021
After such a strong run in the first half of 2021, some investors may be concerned about whether the market’s gains can continue into the second half of the year. Plenty of good news is now already priced into the market, with the MSCI AC World index now trading at around 19 times 12-month forward earnings versus a 20-year average of 15.1 times. However, we believe equity markets can continue to advance further in the second half of the year, supported by the following main factors. Firstly, a broadening of the global reopening will support growth and earnings. Secondly the inflation worry looks set to fade further, and finally central bank messaging will likely remain supportive.
At a sector level, we see the most opportunity for near-term gains in parts of the market most heavily exposed to economic reopening and recovery. This includes the energy and financials sectors, which, despite their recent impressive performance, still have scope for further gains as industrial production continues to recover, default risks subside, and yield curves steepen. While energy and financials have underperformed the global MSCI index by 31% and 17% respectively from the March low of last year to November (when the Pfizer vaccine’s efficacy was announced), since November financials have only outperformed the wider index by 6-12%. We also think US small- and mid-caps have further scope to gain from the US cyclical recovery. At a more granular level, we also see catch-up opportunity for select names across Europe, Asia, and the US as the economy reopens.
Launch date: Class C Accumulation shares: 15 August 2012.
37
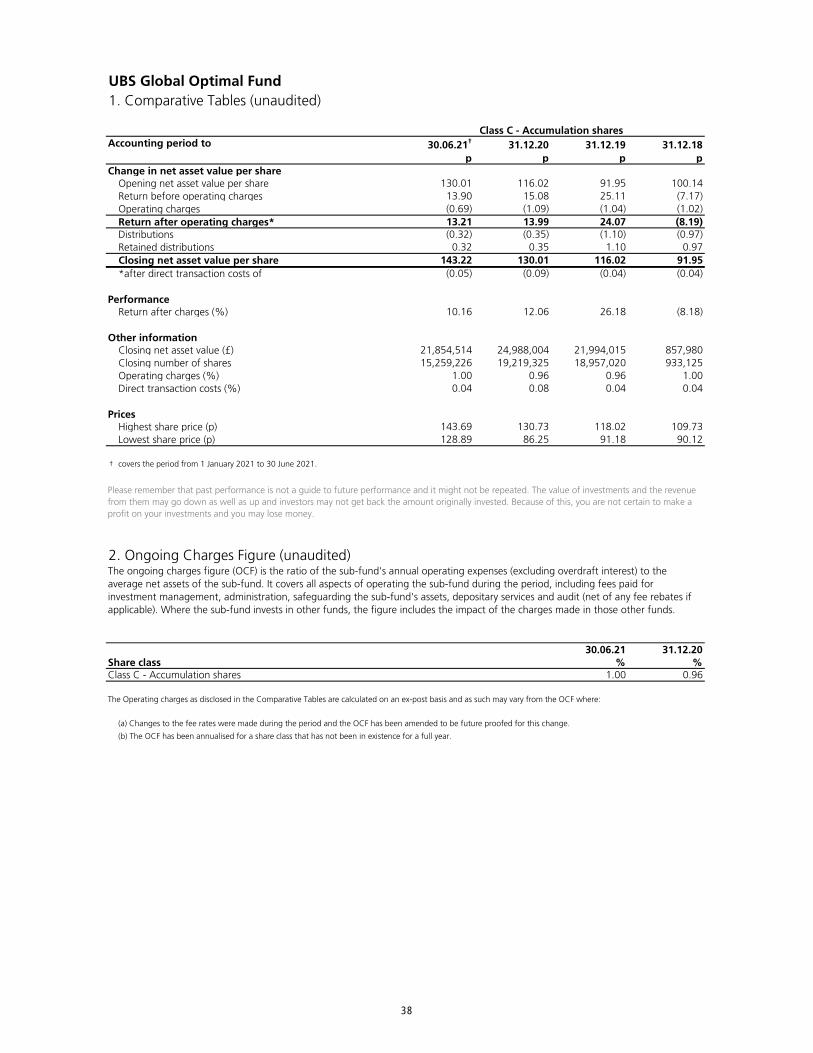
UBS Global Optimal Fund1. Comparative Tables (unaudited)
Accounting period to 30.06.21† 31.12.20 31.12.19 31.12.18p p p p
Change in net asset value per shareOpening net asset value per share 130.01 116.02 91.95 100.14Return before operating charges 13.90 15.08 25.11 (7.17)Operating charges (0.69) (1.09) (1.04) (1.02)Return after operating charges* 13.21 13.99 24.07 (8.19)Distributions (0.32) (0.35) (1.10) (0.97)Retained distributions 0.32 0.35 1.10 0.97Closing net asset value per share 143.22 130.01 116.02 91.95*after direct transaction costs of (0.05) (0.09) (0.04) (0.04)
PerformanceReturn after charges (%) 10.16 12.06 26.18 (8.18)
Other informationClosing net asset value (£) 21,854,514 24,988,004 21,994,015 857,980Closing number of shares 15,259,226 19,219,325 18,957,020 933,125Operating charges (%) 1.00 0.96 0.96 1.00Direct transaction costs (%) 0.04 0.08 0.04 0.04
PricesHighest share price (p) 143.69 130.73 118.02 109.73Lowest share price (p) 128.89 86.25 91.18 90.12
† covers the period from 1 January 2021 to 30 June 2021.
2. Ongoing Charges Figure (unaudited)
30.06.21 31.12.20Share class % %Class C - Accumulation shares 1.00 0.96
(a) Changes to the fee rates were made during the period and the OCF has been amended to be future proofed for this change.
(b) The OCF has been annualised for a share class that has not been in existence for a full year.
Please remember that past performance is not a guide to future performance and it might not be repeated. The value of investments and the revenue from them may go down as well as up and investors may not get back the amount originally invested. Because of this, you are not certain to make a profit on your investments and you may lose money.
The ongoing charges figure (OCF) is the ratio of the sub-fund's annual operating expenses (excluding overdraft interest) to the average net assets of the sub-fund. It covers all aspects of operating the sub-fund during the period, including fees paid for investment management, administration, safeguarding the sub-fund's assets, depositary services and audit (net of any fee rebates if applicable). Where the sub-fund invests in other funds, the figure includes the impact of the charges made in those other funds.
The Operating charges as disclosed in the Comparative Tables are calculated on an ex-post basis and as such may vary from the OCF where:
Class C - Accumulation shares
38
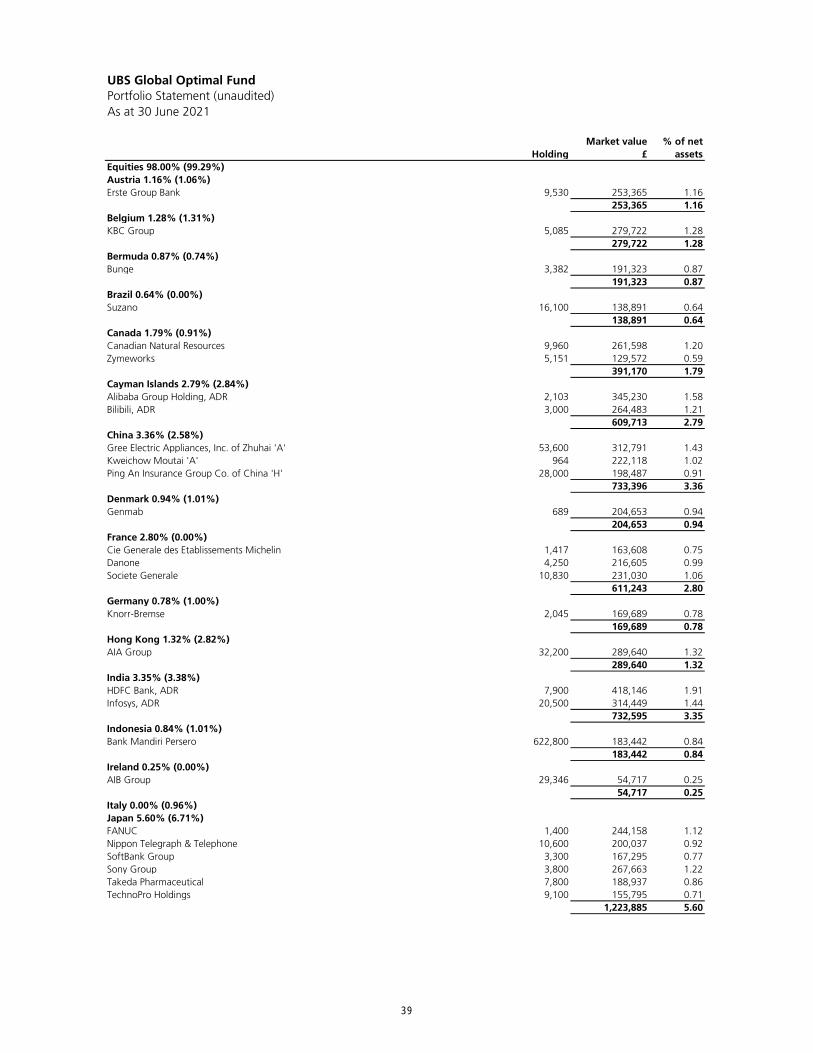
UBS Global Optimal FundPortfolio Statement (unaudited)As at 30 June 2021
HoldingMarket value
£% of net
assetsEquities 98.00% (99.29%)Austria 1.16% (1.06%)Erste Group Bank 9,530 253,365 1.16
253,365 1.16Belgium 1.28% (1.31%)KBC Group 5,085 279,722 1.28
279,722 1.28Bermuda 0.87% (0.74%)Bunge 3,382 191,323 0.87
191,323 0.87Brazil 0.64% (0.00%)Suzano 16,100 138,891 0.64
138,891 0.64Canada 1.79% (0.91%)Canadian Natural Resources 9,960 261,598 1.20Zymeworks 5,151 129,572 0.59
391,170 1.79Cayman Islands 2.79% (2.84%)Alibaba Group Holding, ADR 2,103 345,230 1.58Bilibili, ADR 3,000 264,483 1.21
609,713 2.79China 3.36% (2.58%)Gree Electric Appliances, Inc. of Zhuhai 'A' 53,600 312,791 1.43Kweichow Moutai 'A' 964 222,118 1.02Ping An Insurance Group Co. of China 'H' 28,000 198,487 0.91
733,396 3.36Denmark 0.94% (1.01%)Genmab 689 204,653 0.94
204,653 0.94France 2.80% (0.00%)Cie Generale des Etablissements Michelin 1,417 163,608 0.75Danone 4,250 216,605 0.99Societe Generale 10,830 231,030 1.06
611,243 2.80Germany 0.78% (1.00%)Knorr-Bremse 2,045 169,689 0.78
169,689 0.78Hong Kong 1.32% (2.82%)AIA Group 32,200 289,640 1.32
289,640 1.32India 3.35% (3.38%)HDFC Bank, ADR 7,900 418,146 1.91Infosys, ADR 20,500 314,449 1.44
732,595 3.35Indonesia 0.84% (1.01%)Bank Mandiri Persero 622,800 183,442 0.84
183,442 0.84Ireland 0.25% (0.00%)AIB Group 29,346 54,717 0.25
54,717 0.25Italy 0.00% (0.96%)Japan 5.60% (6.71%)FANUC 1,400 244,158 1.12Nippon Telegraph & Telephone 10,600 200,037 0.92SoftBank Group 3,300 167,295 0.77Sony Group 3,800 267,663 1.22Takeda Pharmaceutical 7,800 188,937 0.86TechnoPro Holdings 9,100 155,795 0.71
1,223,885 5.60
39
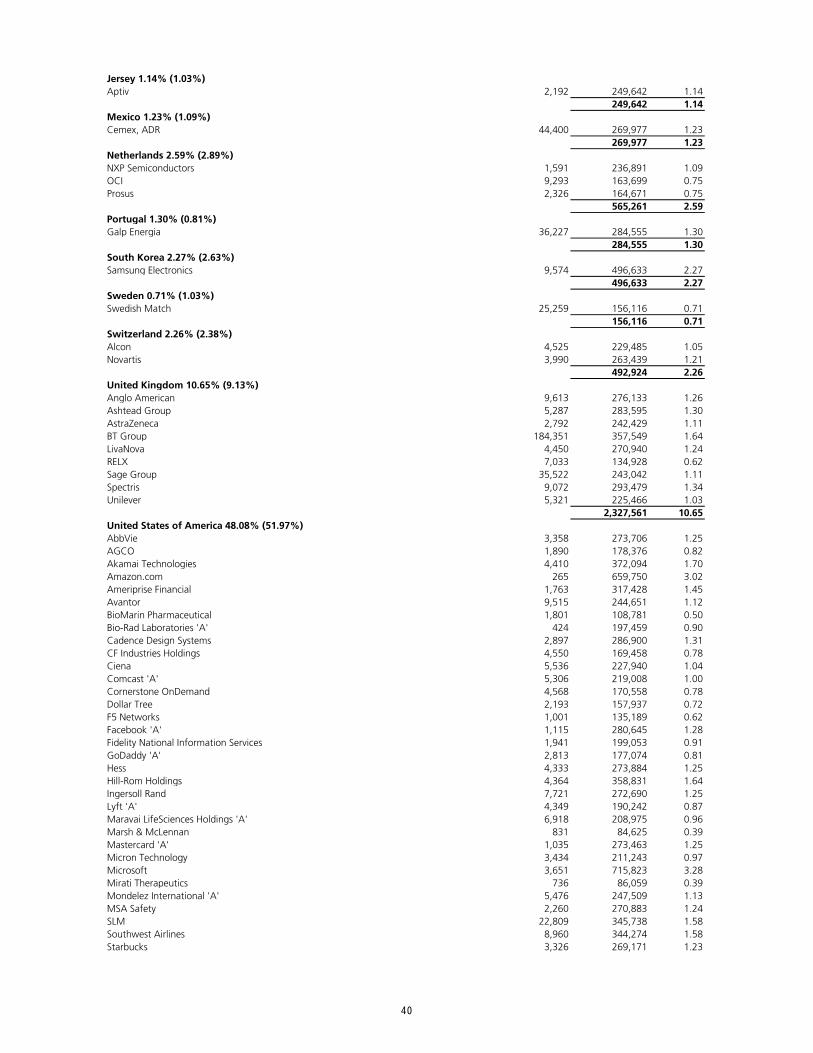
Jersey 1.14% (1.03%)Aptiv 2,192 249,642 1.14
249,642 1.14Mexico 1.23% (1.09%)Cemex, ADR 44,400 269,977 1.23
269,977 1.23Netherlands 2.59% (2.89%)NXP Semiconductors 1,591 236,891 1.09OCI 9,293 163,699 0.75Prosus 2,326 164,671 0.75
565,261 2.59Portugal 1.30% (0.81%)Galp Energia 36,227 284,555 1.30
284,555 1.30South Korea 2.27% (2.63%)Samsung Electronics 9,574 496,633 2.27
496,633 2.27Sweden 0.71% (1.03%)Swedish Match 25,259 156,116 0.71
156,116 0.71Switzerland 2.26% (2.38%)Alcon 4,525 229,485 1.05Novartis 3,990 263,439 1.21
492,924 2.26United Kingdom 10.65% (9.13%)Anglo American 9,613 276,133 1.26Ashtead Group 5,287 283,595 1.30AstraZeneca 2,792 242,429 1.11BT Group 184,351 357,549 1.64LivaNova 4,450 270,940 1.24RELX 7,033 134,928 0.62Sage Group 35,522 243,042 1.11Spectris 9,072 293,479 1.34Unilever 5,321 225,466 1.03
2,327,561 10.65United States of America 48.08% (51.97%)AbbVie 3,358 273,706 1.25AGCO 1,890 178,376 0.82Akamai Technologies 4,410 372,094 1.70Amazon.com 265 659,750 3.02Ameriprise Financial 1,763 317,428 1.45Avantor 9,515 244,651 1.12BioMarin Pharmaceutical 1,801 108,781 0.50Bio-Rad Laboratories 'A' 424 197,459 0.90Cadence Design Systems 2,897 286,900 1.31CF Industries Holdings 4,550 169,458 0.78Ciena 5,536 227,940 1.04Comcast 'A' 5,306 219,008 1.00Cornerstone OnDemand 4,568 170,558 0.78Dollar Tree 2,193 157,937 0.72F5 Networks 1,001 135,189 0.62Facebook 'A' 1,115 280,645 1.28Fidelity National Information Services 1,941 199,053 0.91GoDaddy 'A' 2,813 177,074 0.81Hess 4,333 273,884 1.25Hill-Rom Holdings 4,364 358,831 1.64Ingersoll Rand 7,721 272,690 1.25Lyft 'A' 4,349 190,242 0.87Maravai LifeSciences Holdings 'A' 6,918 208,975 0.96Marsh & McLennan 831 84,625 0.39Mastercard 'A' 1,035 273,463 1.25Micron Technology 3,434 211,243 0.97Microsoft 3,651 715,823 3.28Mirati Therapeutics 736 86,059 0.39Mondelez International 'A' 5,476 247,509 1.13MSA Safety 2,260 270,883 1.24SLM 22,809 345,738 1.58Southwest Airlines 8,960 344,274 1.58Starbucks 3,326 269,171 1.23
40
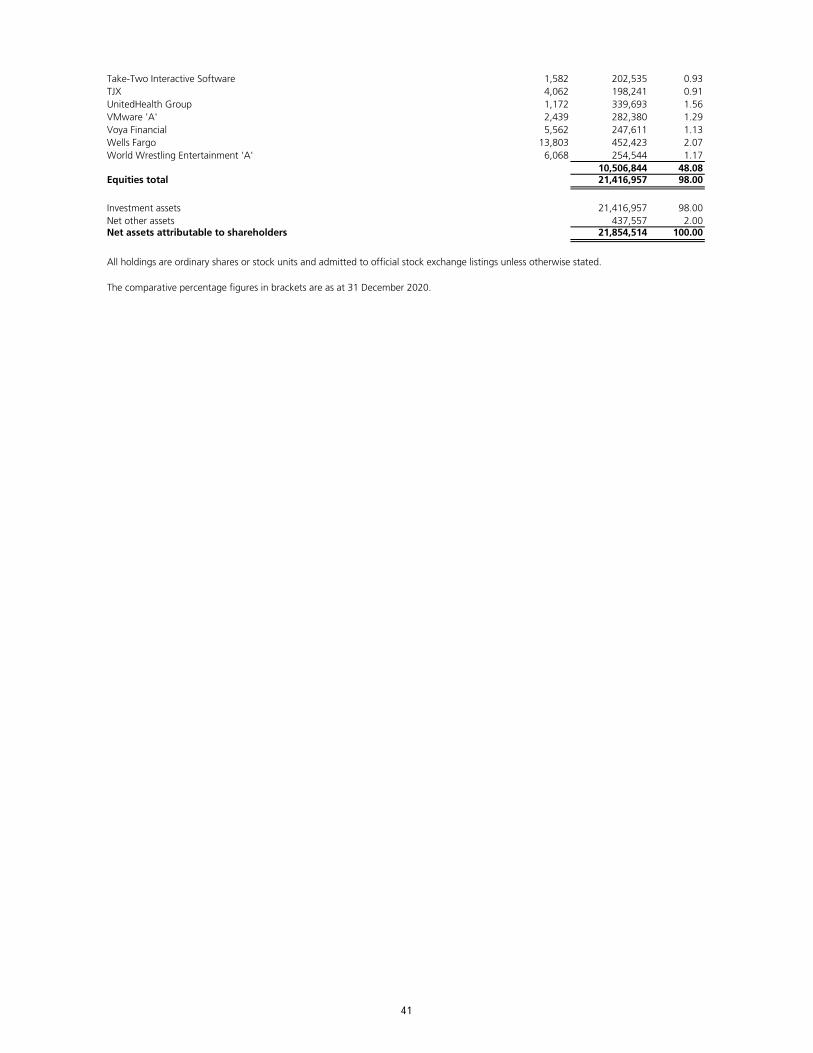
Take-Two Interactive Software 1,582 202,535 0.93TJX 4,062 198,241 0.91UnitedHealth Group 1,172 339,693 1.56VMware 'A' 2,439 282,380 1.29Voya Financial 5,562 247,611 1.13Wells Fargo 13,803 452,423 2.07World Wrestling Entertainment 'A' 6,068 254,544 1.17
10,506,844 48.08Equities total 21,416,957 98.00
Investment assets 21,416,957 98.00Net other assets 437,557 2.00Net assets attributable to shareholders 21,854,514 100.00
The comparative percentage figures in brackets are as at 31 December 2020.
All holdings are ordinary shares or stock units and admitted to official stock exchange listings unless otherwise stated.
41
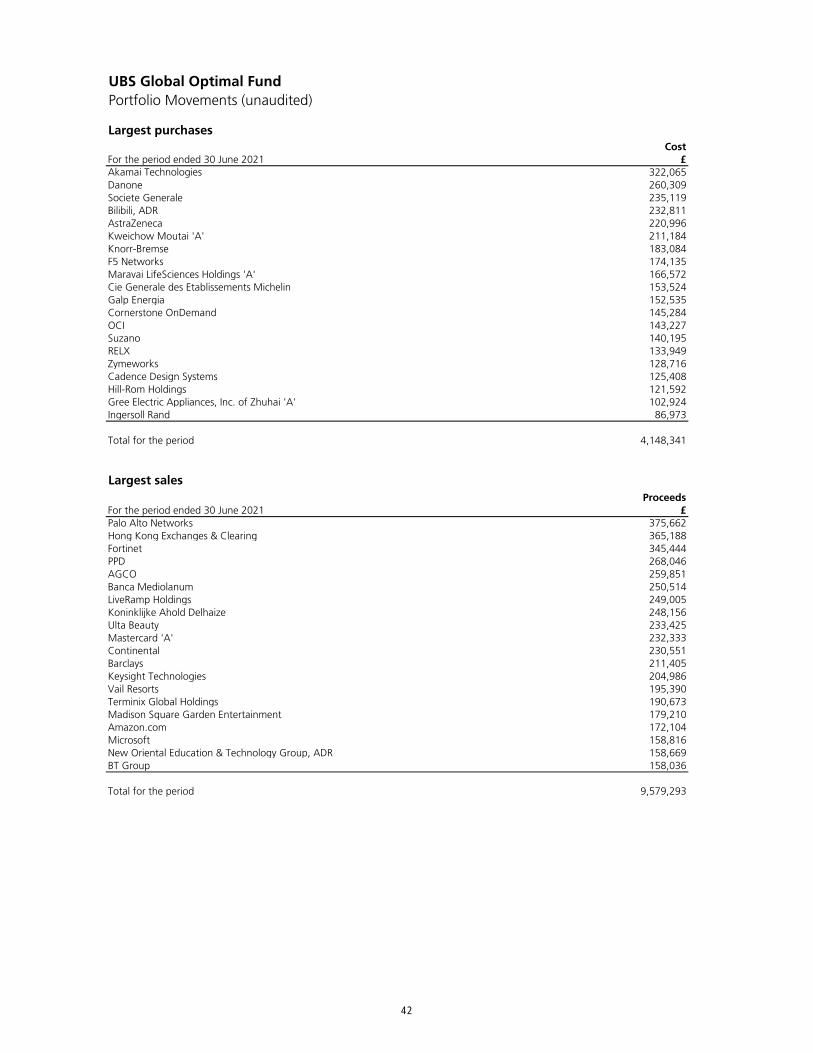
UBS Global Optimal FundPortfolio Movements (unaudited)
Largest purchasesCost
For the period ended 30 June 2021 £Akamai Technologies 322,065Danone 260,309Societe Generale 235,119Bilibili, ADR 232,811AstraZeneca 220,996Kweichow Moutai 'A' 211,184Knorr-Bremse 183,084F5 Networks 174,135Maravai LifeSciences Holdings 'A' 166,572Cie Generale des Etablissements Michelin 153,524Galp Energia 152,535Cornerstone OnDemand 145,284OCI 143,227Suzano 140,195RELX 133,949Zymeworks 128,716Cadence Design Systems 125,408Hill-Rom Holdings 121,592Gree Electric Appliances, Inc. of Zhuhai 'A' 102,924Ingersoll Rand 86,973
Total for the period 4,148,341
Largest salesProceeds
For the period ended 30 June 2021 £Palo Alto Networks 375,662Hong Kong Exchanges & Clearing 365,188Fortinet 345,444PPD 268,046AGCO 259,851Banca Mediolanum 250,514LiveRamp Holdings 249,005Koninklijke Ahold Delhaize 248,156Ulta Beauty 233,425Mastercard 'A' 232,333Continental 230,551Barclays 211,405Keysight Technologies 204,986Vail Resorts 195,390Terminix Global Holdings 190,673Madison Square Garden Entertainment 179,210Amazon.com 172,104Microsoft 158,816New Oriental Education & Technology Group, ADR 158,669BT Group 158,036
Total for the period 9,579,293
42

UBS Global Optimal FundFinancial Statements (unaudited)
Statement of Total ReturnFor the period ended 30 June 2021
£ £ £ £Income Net capital gains/(losses) 2,044,120 (611,284) Revenue 176,832 169,077Expenses (107,355) (92,793)Net revenue before taxation 69,477 76,284Taxation (21,897) (15,233)Net revenue after taxation 47,580 61,051Total return before distributions 2,091,700 (550,233)Distributions (48,815) (62,315)Change in net assets attributable to shareholders from investment activities 2,042,885 (612,548)
Statement of Change in Net Assets Attributable to ShareholdersFor the period ended 30 June 2021
£ £ £ £24,988,004 21,994,015
Amounts receivable on issue of shares 762,638 842,282Amounts payable on cancellation of shares (5,991,037) (1,744,126)
(5,228,399) (901,844)Dilution adjustment 3,194 -
2,042,885 (612,548)48,830 61,606
21,854,514 20,541,229
shareholders from investment activities (see above)Retained distribution on accumulation sharesClosing net assets attributable to shareholders
As the comparatives are for the previous interim period, the net assets at the end of that period will not agree to the net assets at the start of the current period. The published net asset value as at 31 December 2020 was £24,988,004.
Change in net assets attributable to
30.06.21 30.06.20
30.06.21 30.06.20
Opening net assets attributable to shareholders
43

UBS Global Optimal FundFinancial Statements (unaudited)
Balance SheetAs at 30 June 2021
30.06.21 31.12.20£ £
AssetsFixed assets Investments 21,416,957 24,811,743Current assets Debtors 98,732 230,796 Cash and bank balances 478,220 75,541Total assets 21,993,909 25,118,080LiabilitiesCreditors Other creditors 139,395 130,076Total liabilities 139,395 130,076
Net assets attributable to shareholders 21,854,514 24,988,004
44

UBS Global Optimal FundNotes to the Financial Statements (unaudited)
Accounting policiesThe interim financial statements have been prepared in accordance with the Statement of Recommended Practice (SORP) for Authorised Funds issued by the Investment Association (IA) in May 2014 (SORP 2014).
The accounting policies applied are consistent with those of the financial statements for the year ended 31 December 2020 and are described in those annual financial statements.
45

46
UBS Global Strategic Bond
47
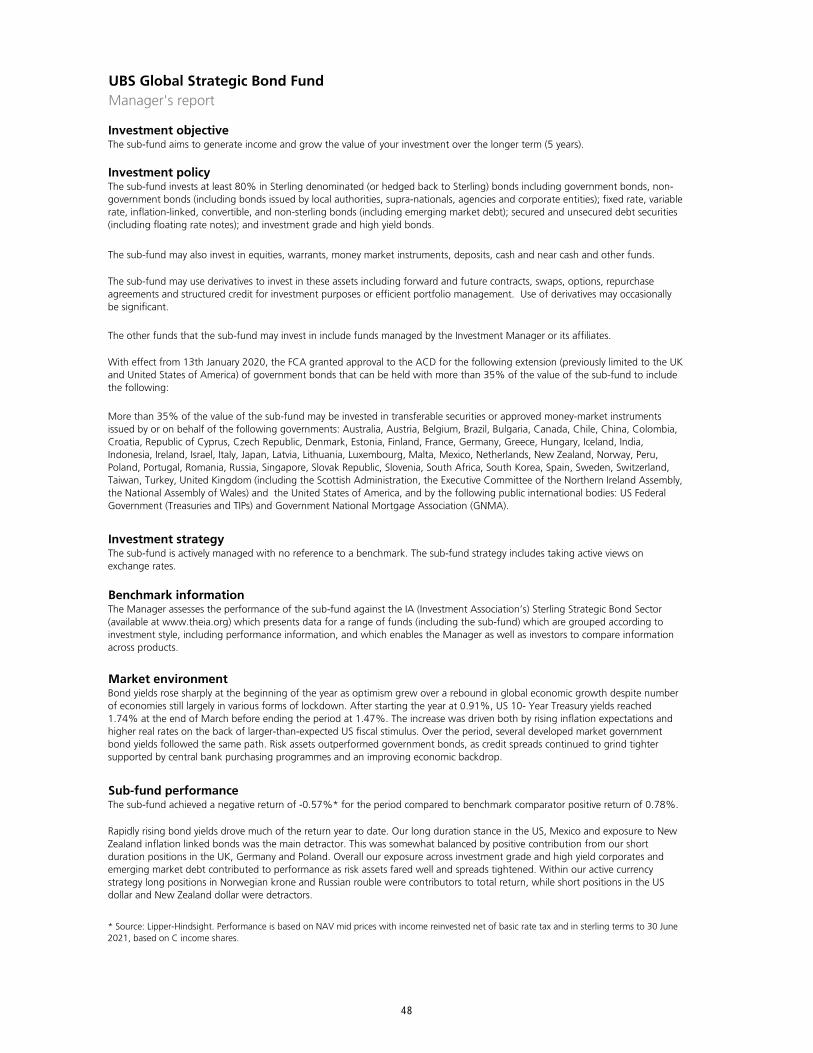
UBS Global Strategic Bond FundManager's report
Investment objective
Investment policy
Investment strategy
Benchmark information
Market environment
Sub-fund performanceThe sub-fund achieved a negative return of -0.57%* for the period compared to benchmark comparator positive return of 0.78%.
Rapidly rising bond yields drove much of the return year to date. Our long duration stance in the US, Mexico and exposure to New Zealand inflation linked bonds was the main detractor. This was somewhat balanced by positive contribution from our short duration positions in the UK, Germany and Poland. Overall our exposure across investment grade and high yield corporates and emerging market debt contributed to performance as risk assets fared well and spreads tightened. Within our active currency strategy long positions in Norwegian krone and Russian rouble were contributors to total return, while short positions in the US dollar and New Zealand dollar were detractors.
* Source: Lipper-Hindsight. Performance is based on NAV mid prices with income reinvested net of basic rate tax and in sterling terms to 30 June 2021, based on C income shares.
The sub-fund aims to generate income and grow the value of your investment over the longer term (5 years).
The sub-fund invests at least 80% in Sterling denominated (or hedged back to Sterling) bonds including government bonds, non-government bonds (including bonds issued by local authorities, supra-nationals, agencies and corporate entities); fixed rate, variable rate, inflation-linked, convertible, and non-sterling bonds (including emerging market debt); secured and unsecured debt securities (including floating rate notes); and investment grade and high yield bonds.
The sub-fund may also invest in equities, warrants, money market instruments, deposits, cash and near cash and other funds.
The sub-fund may use derivatives to invest in these assets including forward and future contracts, swaps, options, repurchase agreements and structured credit for investment purposes or efficient portfolio management. Use of derivatives may occasionally be significant.
The other funds that the sub-fund may invest in include funds managed by the Investment Manager or its affiliates.
With effect from 13th January 2020, the FCA granted approval to the ACD for the following extension (previously limited to the UK and United States of America) of government bonds that can be held with more than 35% of the value of the sub-fund to include the following:
More than 35% of the value of the sub-fund may be invested in transferable securities or approved money-market instruments issued by or on behalf of the following governments: Australia, Austria, Belgium, Brazil, Bulgaria, Canada, Chile, China, Colombia, Croatia, Republic of Cyprus, Czech Republic, Denmark, Estonia, Finland, France, Germany, Greece, Hungary, Iceland, India, Indonesia, Ireland, Israel, Italy, Japan, Latvia, Lithuania, Luxembourg, Malta, Mexico, Netherlands, New Zealand, Norway, Peru, Poland, Portugal, Romania, Russia, Singapore, Slovak Republic, Slovenia, South Africa, South Korea, Spain, Sweden, Switzerland, Taiwan, Turkey, United Kingdom (including the Scottish Administration, the Executive Committee of the Northern Ireland Assembly, the National Assembly of Wales) and the United States of America, and by the following public international bodies: US Federal Government (Treasuries and TIPs) and Government National Mortgage Association (GNMA).
The sub-fund is actively managed with no reference to a benchmark. The sub-fund strategy includes taking active views on exchange rates.
The Manager assesses the performance of the sub-fund against the IA (Investment Association’s) Sterling Strategic Bond Sector (available at www.theia.org) which presents data for a range of funds (including the sub-fund) which are grouped according to investment style, including performance information, and which enables the Manager as well as investors to compare information across products.
Bond yields rose sharply at the beginning of the year as optimism grew over a rebound in global economic growth despite number of economies still largely in various forms of lockdown. After starting the year at 0.91%, US 10- Year Treasury yields reached 1.74% at the end of March before ending the period at 1.47%. The increase was driven both by rising inflation expectations and higher real rates on the back of larger-than-expected US fiscal stimulus. Over the period, several developed market government bond yields followed the same path. Risk assets outperformed government bonds, as credit spreads continued to grind tighter supported by central bank purchasing programmes and an improving economic backdrop.
48
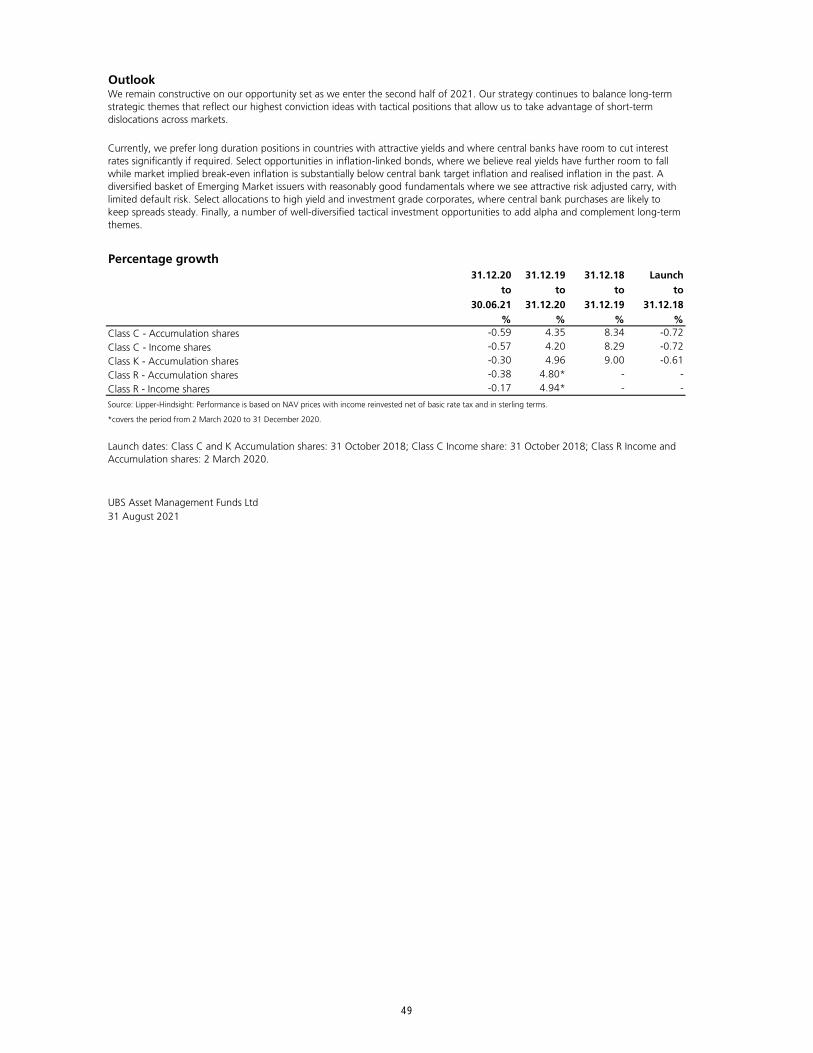
Outlook
Percentage growth31.12.20 31.12.19 31.12.18 Launch
to to to to30.06.21 31.12.20 31.12.19 31.12.18
% % % %Class C - Accumulation shares -0.59 4.35 8.34 -0.72
Class C - Income shares -0.57 4.20 8.29 -0.72
Class K - Accumulation shares -0.30 4.96 9.00 -0.61
Class R - Accumulation shares -0.38 4.80* - -
Class R - Income shares -0.17 4.94* - -
Source: Lipper-Hindsight: Performance is based on NAV prices with income reinvested net of basic rate tax and in sterling terms.
*covers the period from 2 March 2020 to 31 December 2020.
UBS Asset Management Funds Ltd31 August 2021
Launch dates: Class C and K Accumulation shares: 31 October 2018; Class C Income share: 31 October 2018; Class R Income and Accumulation shares: 2 March 2020.
We remain constructive on our opportunity set as we enter the second half of 2021. Our strategy continues to balance long-term strategic themes that reflect our highest conviction ideas with tactical positions that allow us to take advantage of short-term dislocations across markets.
Currently, we prefer long duration positions in countries with attractive yields and where central banks have room to cut interest rates significantly if required. Select opportunities in inflation-linked bonds, where we believe real yields have further room to fall while market implied break-even inflation is substantially below central bank target inflation and realised inflation in the past. A diversified basket of Emerging Market issuers with reasonably good fundamentals where we see attractive risk adjusted carry, with limited default risk. Select allocations to high yield and investment grade corporates, where central bank purchases are likely to keep spreads steady. Finally, a number of well-diversified tactical investment opportunities to add alpha and complement long-term themes.
49
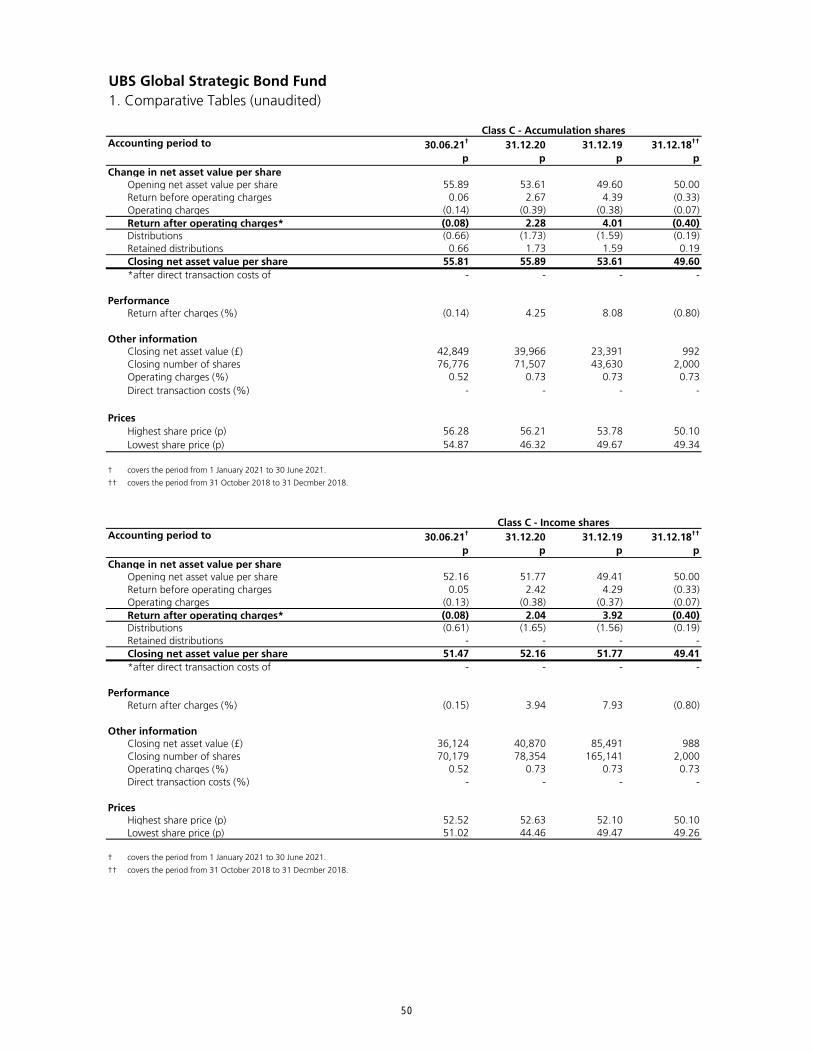
UBS Global Strategic Bond Fund1. Comparative Tables (unaudited)
Accounting period to 30.06.21† 31.12.20 31.12.19 31.12.18††
p p p pChange in net asset value per share
Opening net asset value per share 55.89 53.61 49.60 50.00Return before operating charges 0.06 2.67 4.39 (0.33)Operating charges (0.14) (0.39) (0.38) (0.07)Return after operating charges* (0.08) 2.28 4.01 (0.40)Distributions (0.66) (1.73) (1.59) (0.19)Retained distributions 0.66 1.73 1.59 0.19Closing net asset value per share 55.81 55.89 53.61 49.60*after direct transaction costs of - - - -
PerformanceReturn after charges (%) (0.14) 4.25 8.08 (0.80)
Other informationClosing net asset value (£) 42,849 39,966 23,391 992Closing number of shares 76,776 71,507 43,630 2,000Operating charges (%) 0.52 0.73 0.73 0.73Direct transaction costs (%) - - - -
PricesHighest share price (p) 56.28 56.21 53.78 50.10Lowest share price (p) 54.87 46.32 49.67 49.34
†
††
Accounting period to 30.06.21† 31.12.20 31.12.19 31.12.18††
p p p pChange in net asset value per share
Opening net asset value per share 52.16 51.77 49.41 50.00Return before operating charges 0.05 2.42 4.29 (0.33)Operating charges (0.13) (0.38) (0.37) (0.07)Return after operating charges* (0.08) 2.04 3.92 (0.40)Distributions (0.61) (1.65) (1.56) (0.19)Retained distributions - - - -Closing net asset value per share 51.47 52.16 51.77 49.41*after direct transaction costs of - - - -
PerformanceReturn after charges (%) (0.15) 3.94 7.93 (0.80)
Other informationClosing net asset value (£) 36,124 40,870 85,491 988Closing number of shares 70,179 78,354 165,141 2,000Operating charges (%) 0.52 0.73 0.73 0.73Direct transaction costs (%) - - - -
PricesHighest share price (p) 52.52 52.63 52.10 50.10Lowest share price (p) 51.02 44.46 49.47 49.26
†
††
Class C - Accumulation shares
covers the period from 1 January 2021 to 30 June 2021.
covers the period from 31 October 2018 to 31 Decmber 2018.
Class C - Income shares
covers the period from 1 January 2021 to 30 June 2021.
covers the period from 31 October 2018 to 31 Decmber 2018.
50
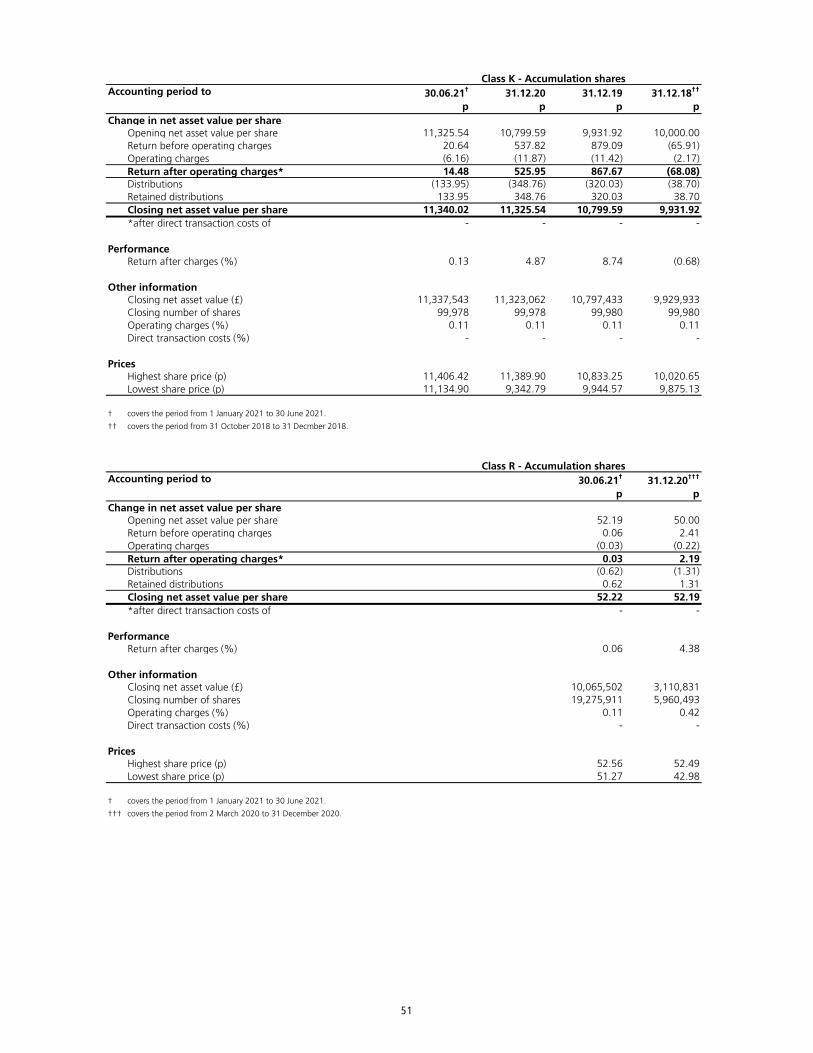
Accounting period to 30.06.21† 31.12.20 31.12.19 31.12.18††
p p p pChange in net asset value per share
Opening net asset value per share 11,325.54 10,799.59 9,931.92 10,000.00Return before operating charges 20.64 537.82 879.09 (65.91)Operating charges (6.16) (11.87) (11.42) (2.17)Return after operating charges* 14.48 525.95 867.67 (68.08)Distributions (133.95) (348.76) (320.03) (38.70)Retained distributions 133.95 348.76 320.03 38.70Closing net asset value per share 11,340.02 11,325.54 10,799.59 9,931.92*after direct transaction costs of - - - -
PerformanceReturn after charges (%) 0.13 4.87 8.74 (0.68)
Other informationClosing net asset value (£) 11,337,543 11,323,062 10,797,433 9,929,933Closing number of shares 99,978 99,978 99,980 99,980Operating charges (%) 0.11 0.11 0.11 0.11Direct transaction costs (%) - - - -
PricesHighest share price (p) 11,406.42 11,389.90 10,833.25 10,020.65Lowest share price (p) 11,134.90 9,342.79 9,944.57 9,875.13
†
††
Accounting period to 30.06.21† 31.12.20†††
p pChange in net asset value per share
Opening net asset value per share 52.19 50.00Return before operating charges 0.06 2.41Operating charges (0.03) (0.22)Return after operating charges* 0.03 2.19Distributions (0.62) (1.31)Retained distributions 0.62 1.31Closing net asset value per share 52.22 52.19*after direct transaction costs of - -
PerformanceReturn after charges (%) 0.06 4.38
Other informationClosing net asset value (£) 10,065,502 3,110,831Closing number of shares 19,275,911 5,960,493Operating charges (%) 0.11 0.42Direct transaction costs (%) - -
PricesHighest share price (p) 52.56 52.49Lowest share price (p) 51.27 42.98
† covers the period from 1 January 2021 to 30 June 2021.
††† covers the period from 2 March 2020 to 31 December 2020.
Class K - Accumulation shares
covers the period from 1 January 2021 to 30 June 2021.
covers the period from 31 October 2018 to 31 Decmber 2018.
Class R - Accumulation shares
51
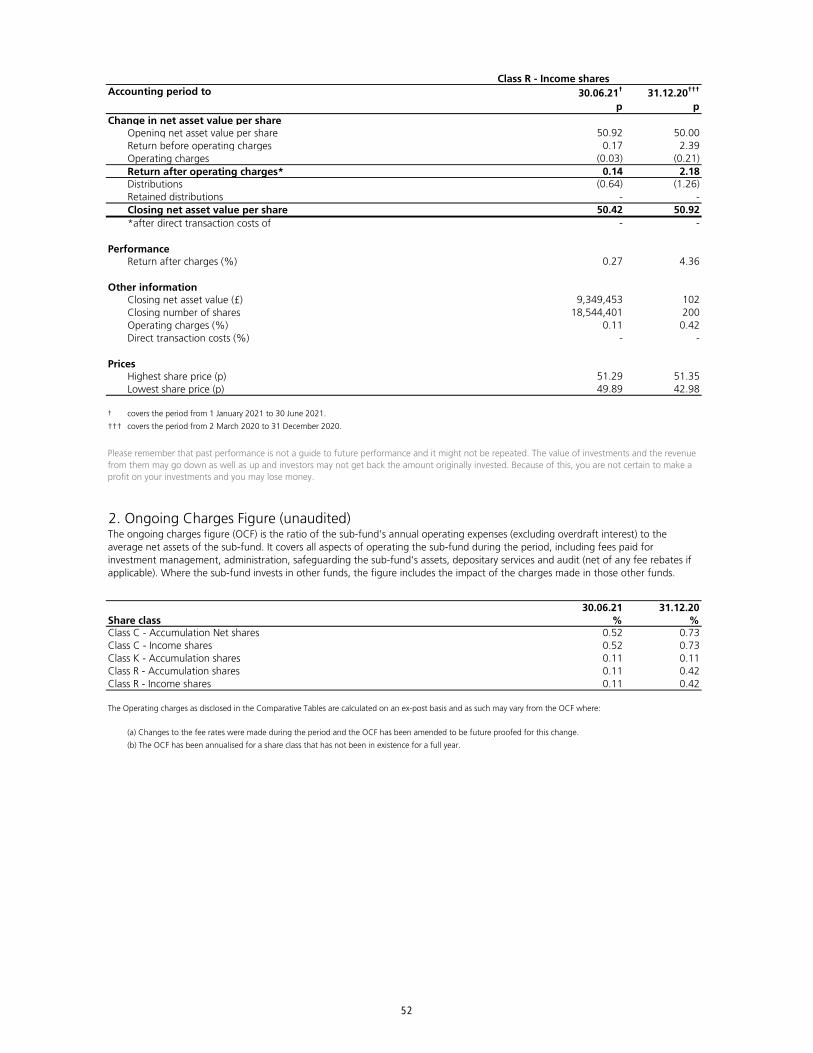
Accounting period to 30.06.21† 31.12.20†††
p pChange in net asset value per share
Opening net asset value per share 50.92 50.00Return before operating charges 0.17 2.39Operating charges (0.03) (0.21)Return after operating charges* 0.14 2.18Distributions (0.64) (1.26)Retained distributions - -Closing net asset value per share 50.42 50.92*after direct transaction costs of - -
PerformanceReturn after charges (%) 0.27 4.36
Other informationClosing net asset value (£) 9,349,453 102Closing number of shares 18,544,401 200Operating charges (%) 0.11 0.42Direct transaction costs (%) - -
PricesHighest share price (p) 51.29 51.35Lowest share price (p) 49.89 42.98
† covers the period from 1 January 2021 to 30 June 2021.
†††
2. Ongoing Charges Figure (unaudited)
30.06.21 31.12.20Share class % %Class C - Accumulation Net shares 0.52 0.73Class C - Income shares 0.52 0.73Class K - Accumulation shares 0.11 0.11Class R - Accumulation shares 0.11 0.42Class R - Income shares 0.11 0.42
Please remember that past performance is not a guide to future performance and it might not be repeated. The value of investments and the revenue from them may go down as well as up and investors may not get back the amount originally invested. Because of this, you are not certain to make a profit on your investments and you may lose money.
The ongoing charges figure (OCF) is the ratio of the sub-fund's annual operating expenses (excluding overdraft interest) to the average net assets of the sub-fund. It covers all aspects of operating the sub-fund during the period, including fees paid for investment management, administration, safeguarding the sub-fund's assets, depositary services and audit (net of any fee rebates if applicable). Where the sub-fund invests in other funds, the figure includes the impact of the charges made in those other funds.
The Operating charges as disclosed in the Comparative Tables are calculated on an ex-post basis and as such may vary from the OCF where:
(a) Changes to the fee rates were made during the period and the OCF has been amended to be future proofed for this change.
(b) The OCF has been annualised for a share class that has not been in existence for a full year.
covers the period from 2 March 2020 to 31 December 2020.
Class R - Income shares
52
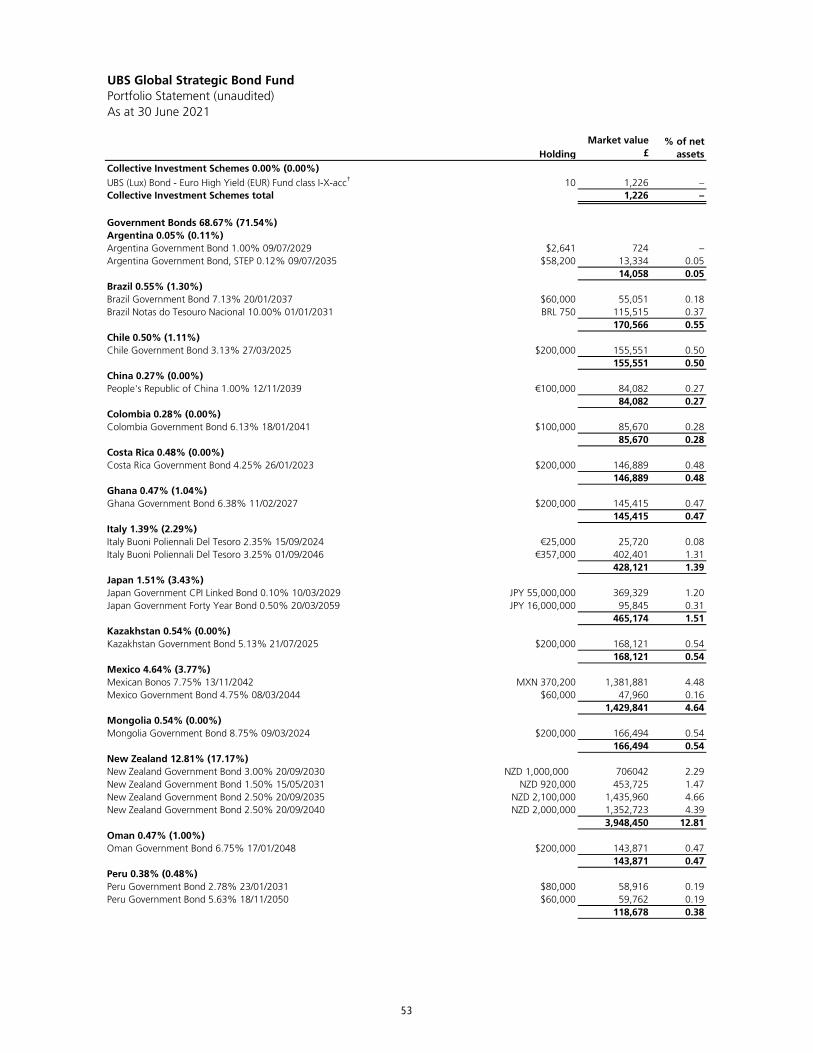
UBS Global Strategic Bond FundPortfolio Statement (unaudited)As at 30 June 2021
HoldingMarket value
£% of net
assetsCollective Investment Schemes 0.00% (0.00%)UBS (Lux) Bond - Euro High Yield (EUR) Fund class I-X-acc† 10 1,226 –Collective Investment Schemes total 1,226 –
Government Bonds 68.67% (71.54%)Argentina 0.05% (0.11%)Argentina Government Bond 1.00% 09/07/2029 $2,641 724 –Argentina Government Bond, STEP 0.12% 09/07/2035 $58,200 13,334 0.05
14,058 0.05Brazil 0.55% (1.30%)Brazil Government Bond 7.13% 20/01/2037 $60,000 55,051 0.18Brazil Notas do Tesouro Nacional 10.00% 01/01/2031 BRL 750 115,515 0.37
170,566 0.55Chile 0.50% (1.11%)Chile Government Bond 3.13% 27/03/2025 $200,000 155,551 0.50
155,551 0.50China 0.27% (0.00%)People's Republic of China 1.00% 12/11/2039 €100,000 84,082 0.27
84,082 0.27Colombia 0.28% (0.00%)Colombia Government Bond 6.13% 18/01/2041 $100,000 85,670 0.28
85,670 0.28Costa Rica 0.48% (0.00%)Costa Rica Government Bond 4.25% 26/01/2023 $200,000 146,889 0.48
146,889 0.48Ghana 0.47% (1.04%)Ghana Government Bond 6.38% 11/02/2027 $200,000 145,415 0.47
145,415 0.47Italy 1.39% (2.29%)Italy Buoni Poliennali Del Tesoro 2.35% 15/09/2024 €25,000 25,720 0.08Italy Buoni Poliennali Del Tesoro 3.25% 01/09/2046 €357,000 402,401 1.31
428,121 1.39Japan 1.51% (3.43%)Japan Government CPI Linked Bond 0.10% 10/03/2029 JPY 55,000,000 369,329 1.20Japan Government Forty Year Bond 0.50% 20/03/2059 JPY 16,000,000 95,845 0.31
465,174 1.51Kazakhstan 0.54% (0.00%)Kazakhstan Government Bond 5.13% 21/07/2025 $200,000 168,121 0.54
168,121 0.54Mexico 4.64% (3.77%)Mexican Bonos 7.75% 13/11/2042 MXN 370,200 1,381,881 4.48Mexico Government Bond 4.75% 08/03/2044 $60,000 47,960 0.16
1,429,841 4.64Mongolia 0.54% (0.00%)Mongolia Government Bond 8.75% 09/03/2024 $200,000 166,494 0.54
166,494 0.54New Zealand 12.81% (17.17%)New Zealand Government Bond 3.00% 20/09/2030 NZD 1,000,000 706042 2.29New Zealand Government Bond 1.50% 15/05/2031 NZD 920,000 453,725 1.47New Zealand Government Bond 2.50% 20/09/2035 NZD 2,100,000 1,435,960 4.66New Zealand Government Bond 2.50% 20/09/2040 NZD 2,000,000 1,352,723 4.39
3,948,450 12.81Oman 0.47% (1.00%)Oman Government Bond 6.75% 17/01/2048 $200,000 143,871 0.47
143,871 0.47Peru 0.38% (0.48%)Peru Government Bond 2.78% 23/01/2031 $80,000 58,916 0.19Peru Government Bond 5.63% 18/11/2050 $60,000 59,762 0.19
118,678 0.38
53
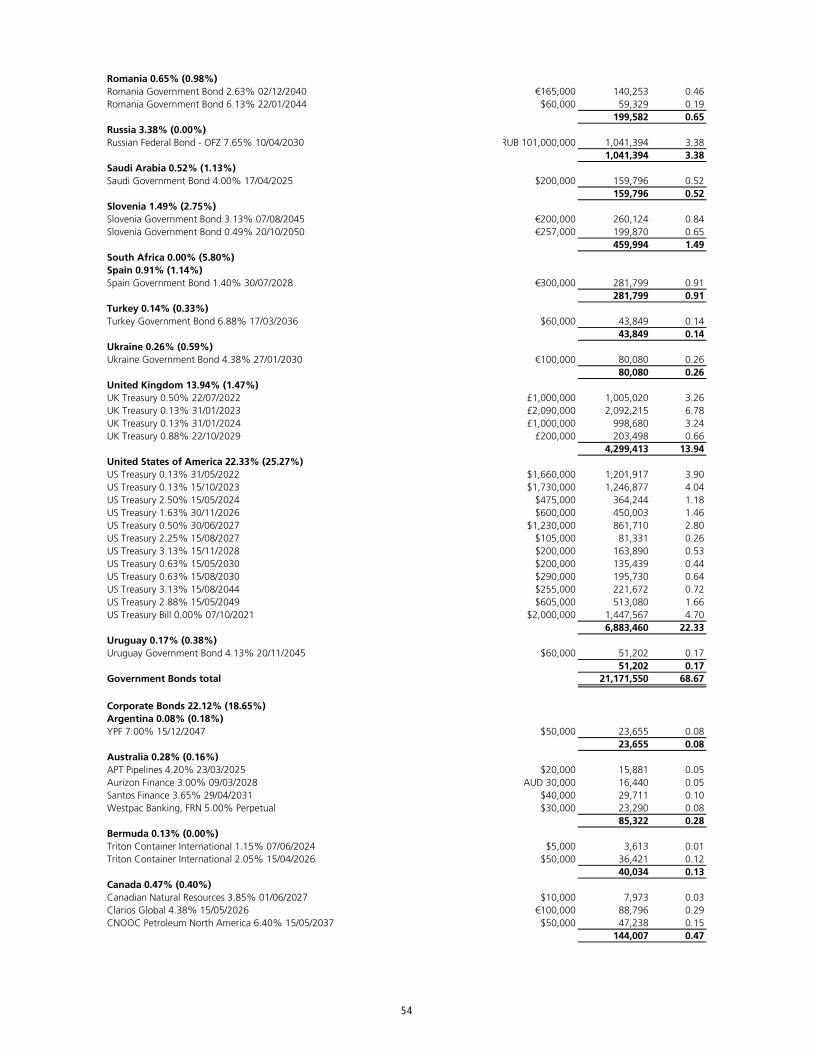
Romania 0.65% (0.98%)Romania Government Bond 2.63% 02/12/2040 €165,000 140,253 0.46Romania Government Bond 6.13% 22/01/2044 $60,000 59,329 0.19
199,582 0.65Russia 3.38% (0.00%)Russian Federal Bond - OFZ 7.65% 10/04/2030 RUB 101,000,000 1,041,394 3.38
1,041,394 3.38Saudi Arabia 0.52% (1.13%)Saudi Government Bond 4.00% 17/04/2025 $200,000 159,796 0.52
159,796 0.52Slovenia 1.49% (2.75%)Slovenia Government Bond 3.13% 07/08/2045 €200,000 260,124 0.84Slovenia Government Bond 0.49% 20/10/2050 €257,000 199,870 0.65
459,994 1.49South Africa 0.00% (5.80%)Spain 0.91% (1.14%)Spain Government Bond 1.40% 30/07/2028 €300,000 281,799 0.91
281,799 0.91Turkey 0.14% (0.33%)Turkey Government Bond 6.88% 17/03/2036 $60,000 43,849 0.14
43,849 0.14Ukraine 0.26% (0.59%)Ukraine Government Bond 4.38% 27/01/2030 €100,000 80,080 0.26
80,080 0.26United Kingdom 13.94% (1.47%)UK Treasury 0.50% 22/07/2022 £1,000,000 1,005,020 3.26UK Treasury 0.13% 31/01/2023 £2,090,000 2,092,215 6.78UK Treasury 0.13% 31/01/2024 £1,000,000 998,680 3.24UK Treasury 0.88% 22/10/2029 £200,000 203,498 0.66
4,299,413 13.94United States of America 22.33% (25.27%)US Treasury 0.13% 31/05/2022 $1,660,000 1,201,917 3.90US Treasury 0.13% 15/10/2023 $1,730,000 1,246,877 4.04US Treasury 2.50% 15/05/2024 $475,000 364,244 1.18US Treasury 1.63% 30/11/2026 $600,000 450,003 1.46US Treasury 0.50% 30/06/2027 $1,230,000 861,710 2.80US Treasury 2.25% 15/08/2027 $105,000 81,331 0.26US Treasury 3.13% 15/11/2028 $200,000 163,890 0.53US Treasury 0.63% 15/05/2030 $200,000 135,439 0.44US Treasury 0.63% 15/08/2030 $290,000 195,730 0.64US Treasury 3.13% 15/08/2044 $255,000 221,672 0.72US Treasury 2.88% 15/05/2049 $605,000 513,080 1.66US Treasury Bill 0.00% 07/10/2021 $2,000,000 1,447,567 4.70
6,883,460 22.33Uruguay 0.17% (0.38%)Uruguay Government Bond 4.13% 20/11/2045 $60,000 51,202 0.17
51,202 0.17Government Bonds total 21,171,550 68.67
Corporate Bonds 22.12% (18.65%)Argentina 0.08% (0.18%)YPF 7.00% 15/12/2047 $50,000 23,655 0.08
23,655 0.08Australia 0.28% (0.16%)APT Pipelines 4.20% 23/03/2025 $20,000 15,881 0.05Aurizon Finance 3.00% 09/03/2028 AUD 30,000 16,440 0.05Santos Finance 3.65% 29/04/2031 $40,000 29,711 0.10Westpac Banking, FRN 5.00% Perpetual $30,000 23,290 0.08
85,322 0.28Bermuda 0.13% (0.00%)Triton Container International 1.15% 07/06/2024 $5,000 3,613 0.01Triton Container International 2.05% 15/04/2026 $50,000 36,421 0.12
40,034 0.13Canada 0.47% (0.40%)Canadian Natural Resources 3.85% 01/06/2027 $10,000 7,973 0.03Clarios Global 4.38% 15/05/2026 €100,000 88,796 0.29CNOOC Petroleum North America 6.40% 15/05/2037 $50,000 47,238 0.15
144,007 0.47
54
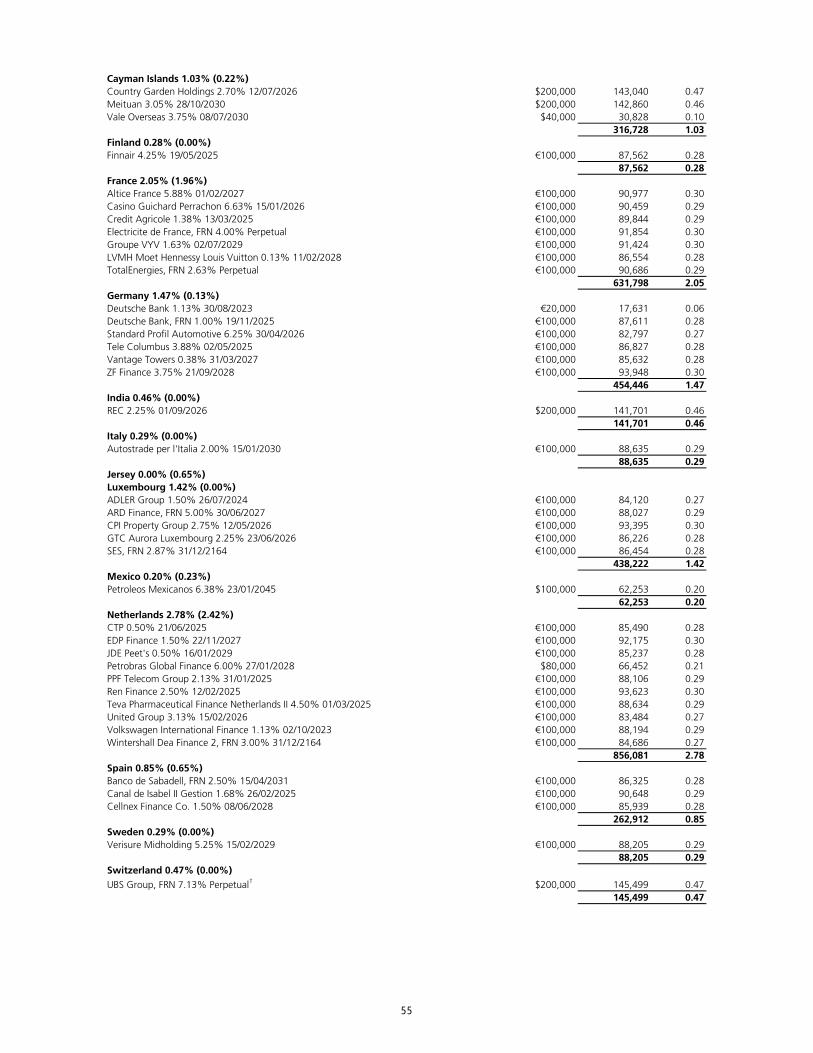
Cayman Islands 1.03% (0.22%)Country Garden Holdings 2.70% 12/07/2026 $200,000 143,040 0.47Meituan 3.05% 28/10/2030 $200,000 142,860 0.46Vale Overseas 3.75% 08/07/2030 $40,000 30,828 0.10
316,728 1.03Finland 0.28% (0.00%)Finnair 4.25% 19/05/2025 €100,000 87,562 0.28
87,562 0.28France 2.05% (1.96%)Altice France 5.88% 01/02/2027 €100,000 90,977 0.30Casino Guichard Perrachon 6.63% 15/01/2026 €100,000 90,459 0.29Credit Agricole 1.38% 13/03/2025 €100,000 89,844 0.29Electricite de France, FRN 4.00% Perpetual €100,000 91,854 0.30Groupe VYV 1.63% 02/07/2029 €100,000 91,424 0.30LVMH Moet Hennessy Louis Vuitton 0.13% 11/02/2028 €100,000 86,554 0.28TotalEnergies, FRN 2.63% Perpetual €100,000 90,686 0.29
631,798 2.05Germany 1.47% (0.13%)Deutsche Bank 1.13% 30/08/2023 €20,000 17,631 0.06Deutsche Bank, FRN 1.00% 19/11/2025 €100,000 87,611 0.28Standard Profil Automotive 6.25% 30/04/2026 €100,000 82,797 0.27Tele Columbus 3.88% 02/05/2025 €100,000 86,827 0.28Vantage Towers 0.38% 31/03/2027 €100,000 85,632 0.28ZF Finance 3.75% 21/09/2028 €100,000 93,948 0.30
454,446 1.47India 0.46% (0.00%)REC 2.25% 01/09/2026 $200,000 141,701 0.46
141,701 0.46Italy 0.29% (0.00%)Autostrade per l'Italia 2.00% 15/01/2030 €100,000 88,635 0.29
88,635 0.29Jersey 0.00% (0.65%)Luxembourg 1.42% (0.00%)ADLER Group 1.50% 26/07/2024 €100,000 84,120 0.27ARD Finance, FRN 5.00% 30/06/2027 €100,000 88,027 0.29CPI Property Group 2.75% 12/05/2026 €100,000 93,395 0.30GTC Aurora Luxembourg 2.25% 23/06/2026 €100,000 86,226 0.28SES, FRN 2.87% 31/12/2164 €100,000 86,454 0.28
438,222 1.42Mexico 0.20% (0.23%)Petroleos Mexicanos 6.38% 23/01/2045 $100,000 62,253 0.20
62,253 0.20Netherlands 2.78% (2.42%)CTP 0.50% 21/06/2025 €100,000 85,490 0.28EDP Finance 1.50% 22/11/2027 €100,000 92,175 0.30JDE Peet's 0.50% 16/01/2029 €100,000 85,237 0.28Petrobras Global Finance 6.00% 27/01/2028 $80,000 66,452 0.21PPF Telecom Group 2.13% 31/01/2025 €100,000 88,106 0.29Ren Finance 2.50% 12/02/2025 €100,000 93,623 0.30Teva Pharmaceutical Finance Netherlands II 4.50% 01/03/2025 €100,000 88,634 0.29United Group 3.13% 15/02/2026 €100,000 83,484 0.27Volkswagen International Finance 1.13% 02/10/2023 €100,000 88,194 0.29Wintershall Dea Finance 2, FRN 3.00% 31/12/2164 €100,000 84,686 0.27
856,081 2.78Spain 0.85% (0.65%)Banco de Sabadell, FRN 2.50% 15/04/2031 €100,000 86,325 0.28Canal de Isabel II Gestion 1.68% 26/02/2025 €100,000 90,648 0.29Cellnex Finance Co. 1.50% 08/06/2028 €100,000 85,939 0.28
262,912 0.85Sweden 0.29% (0.00%)Verisure Midholding 5.25% 15/02/2029 €100,000 88,205 0.29
88,205 0.29Switzerland 0.47% (0.00%)UBS Group, FRN 7.13% Perpetual† $200,000 145,499 0.47
145,499 0.47
55
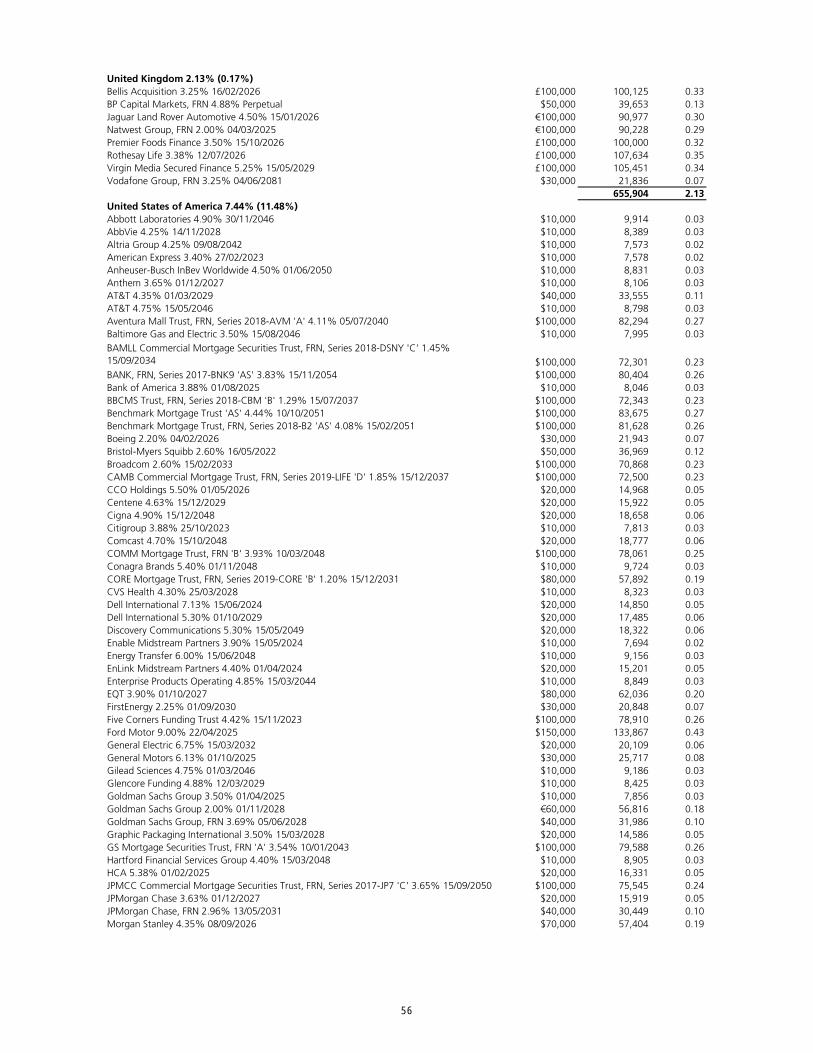
United Kingdom 2.13% (0.17%)Bellis Acquisition 3.25% 16/02/2026 £100,000 100,125 0.33BP Capital Markets, FRN 4.88% Perpetual $50,000 39,653 0.13Jaguar Land Rover Automotive 4.50% 15/01/2026 €100,000 90,977 0.30Natwest Group, FRN 2.00% 04/03/2025 €100,000 90,228 0.29Premier Foods Finance 3.50% 15/10/2026 £100,000 100,000 0.32Rothesay Life 3.38% 12/07/2026 £100,000 107,634 0.35Virgin Media Secured Finance 5.25% 15/05/2029 £100,000 105,451 0.34Vodafone Group, FRN 3.25% 04/06/2081 $30,000 21,836 0.07
655,904 2.13United States of America 7.44% (11.48%)Abbott Laboratories 4.90% 30/11/2046 $10,000 9,914 0.03AbbVie 4.25% 14/11/2028 $10,000 8,389 0.03Altria Group 4.25% 09/08/2042 $10,000 7,573 0.02American Express 3.40% 27/02/2023 $10,000 7,578 0.02Anheuser-Busch InBev Worldwide 4.50% 01/06/2050 $10,000 8,831 0.03Anthem 3.65% 01/12/2027 $10,000 8,106 0.03AT&T 4.35% 01/03/2029 $40,000 33,555 0.11AT&T 4.75% 15/05/2046 $10,000 8,798 0.03Aventura Mall Trust, FRN, Series 2018-AVM 'A' 4.11% 05/07/2040 $100,000 82,294 0.27Baltimore Gas and Electric 3.50% 15/08/2046 $10,000 7,995 0.03BAMLL Commercial Mortgage Securities Trust, FRN, Series 2018-DSNY 'C' 1.45% 15/09/2034 $100,000 72,301 0.23BANK, FRN, Series 2017-BNK9 'AS' 3.83% 15/11/2054 $100,000 80,404 0.26Bank of America 3.88% 01/08/2025 $10,000 8,046 0.03BBCMS Trust, FRN, Series 2018-CBM 'B' 1.29% 15/07/2037 $100,000 72,343 0.23Benchmark Mortgage Trust 'AS' 4.44% 10/10/2051 $100,000 83,675 0.27Benchmark Mortgage Trust, FRN, Series 2018-B2 'AS' 4.08% 15/02/2051 $100,000 81,628 0.26Boeing 2.20% 04/02/2026 $30,000 21,943 0.07Bristol-Myers Squibb 2.60% 16/05/2022 $50,000 36,969 0.12Broadcom 2.60% 15/02/2033 $100,000 70,868 0.23CAMB Commercial Mortgage Trust, FRN, Series 2019-LIFE 'D' 1.85% 15/12/2037 $100,000 72,500 0.23CCO Holdings 5.50% 01/05/2026 $20,000 14,968 0.05Centene 4.63% 15/12/2029 $20,000 15,922 0.05Cigna 4.90% 15/12/2048 $20,000 18,658 0.06Citigroup 3.88% 25/10/2023 $10,000 7,813 0.03Comcast 4.70% 15/10/2048 $20,000 18,777 0.06COMM Mortgage Trust, FRN 'B' 3.93% 10/03/2048 $100,000 78,061 0.25Conagra Brands 5.40% 01/11/2048 $10,000 9,724 0.03CORE Mortgage Trust, FRN, Series 2019-CORE 'B' 1.20% 15/12/2031 $80,000 57,892 0.19CVS Health 4.30% 25/03/2028 $10,000 8,323 0.03Dell International 7.13% 15/06/2024 $20,000 14,850 0.05Dell International 5.30% 01/10/2029 $20,000 17,485 0.06Discovery Communications 5.30% 15/05/2049 $20,000 18,322 0.06Enable Midstream Partners 3.90% 15/05/2024 $10,000 7,694 0.02Energy Transfer 6.00% 15/06/2048 $10,000 9,156 0.03EnLink Midstream Partners 4.40% 01/04/2024 $20,000 15,201 0.05Enterprise Products Operating 4.85% 15/03/2044 $10,000 8,849 0.03EQT 3.90% 01/10/2027 $80,000 62,036 0.20FirstEnergy 2.25% 01/09/2030 $30,000 20,848 0.07Five Corners Funding Trust 4.42% 15/11/2023 $100,000 78,910 0.26Ford Motor 9.00% 22/04/2025 $150,000 133,867 0.43General Electric 6.75% 15/03/2032 $20,000 20,109 0.06General Motors 6.13% 01/10/2025 $30,000 25,717 0.08Gilead Sciences 4.75% 01/03/2046 $10,000 9,186 0.03Glencore Funding 4.88% 12/03/2029 $10,000 8,425 0.03Goldman Sachs Group 3.50% 01/04/2025 $10,000 7,856 0.03Goldman Sachs Group 2.00% 01/11/2028 €60,000 56,816 0.18Goldman Sachs Group, FRN 3.69% 05/06/2028 $40,000 31,986 0.10Graphic Packaging International 3.50% 15/03/2028 $20,000 14,586 0.05GS Mortgage Securities Trust, FRN 'A' 3.54% 10/01/2043 $100,000 79,588 0.26Hartford Financial Services Group 4.40% 15/03/2048 $10,000 8,905 0.03HCA 5.38% 01/02/2025 $20,000 16,331 0.05JPMCC Commercial Mortgage Securities Trust, FRN, Series 2017-JP7 'C' 3.65% 15/09/2050 $100,000 75,545 0.24JPMorgan Chase 3.63% 01/12/2027 $20,000 15,919 0.05JPMorgan Chase, FRN 2.96% 13/05/2031 $40,000 30,449 0.10Morgan Stanley 4.35% 08/09/2026 $70,000 57,404 0.19
56
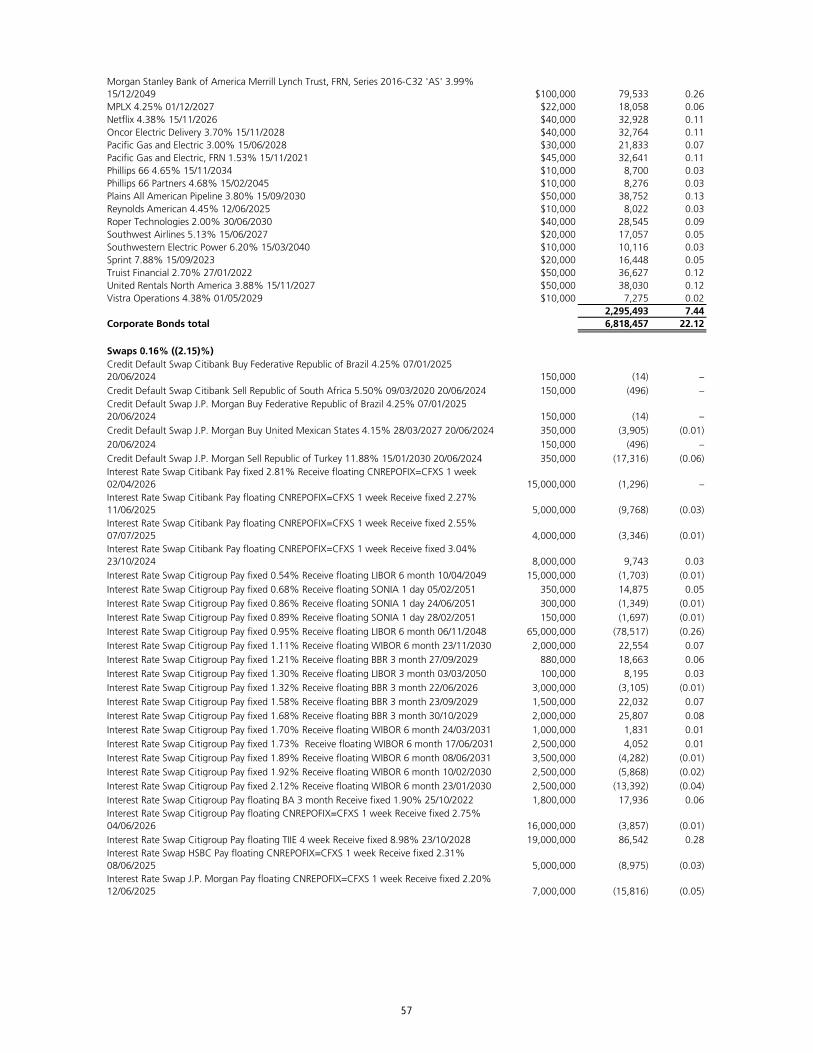
Morgan Stanley Bank of America Merrill Lynch Trust, FRN, Series 2016-C32 'AS' 3.99% 15/12/2049 $100,000 79,533 0.26MPLX 4.25% 01/12/2027 $22,000 18,058 0.06Netflix 4.38% 15/11/2026 $40,000 32,928 0.11Oncor Electric Delivery 3.70% 15/11/2028 $40,000 32,764 0.11Pacific Gas and Electric 3.00% 15/06/2028 $30,000 21,833 0.07Pacific Gas and Electric, FRN 1.53% 15/11/2021 $45,000 32,641 0.11Phillips 66 4.65% 15/11/2034 $10,000 8,700 0.03Phillips 66 Partners 4.68% 15/02/2045 $10,000 8,276 0.03Plains All American Pipeline 3.80% 15/09/2030 $50,000 38,752 0.13Reynolds American 4.45% 12/06/2025 $10,000 8,022 0.03Roper Technologies 2.00% 30/06/2030 $40,000 28,545 0.09Southwest Airlines 5.13% 15/06/2027 $20,000 17,057 0.05Southwestern Electric Power 6.20% 15/03/2040 $10,000 10,116 0.03Sprint 7.88% 15/09/2023 $20,000 16,448 0.05Truist Financial 2.70% 27/01/2022 $50,000 36,627 0.12United Rentals North America 3.88% 15/11/2027 $50,000 38,030 0.12Vistra Operations 4.38% 01/05/2029 $10,000 7,275 0.02
2,295,493 7.44Corporate Bonds total 6,818,457 22.12
Swaps 0.16% ((2.15)%)Credit Default Swap Citibank Buy Federative Republic of Brazil 4.25% 07/01/2025 20/06/2024 150,000 (14) –Credit Default Swap Citibank Sell Republic of South Africa 5.50% 09/03/2020 20/06/2024 150,000 (496) –Credit Default Swap J.P. Morgan Buy Federative Republic of Brazil 4.25% 07/01/2025 20/06/2024 150,000 (14) –Credit Default Swap J.P. Morgan Buy United Mexican States 4.15% 28/03/2027 20/06/2024 350,000 (3,905) (0.01) p g p 20/06/2024 150,000 (496) –Credit Default Swap J.P. Morgan Sell Republic of Turkey 11.88% 15/01/2030 20/06/2024 350,000 (17,316) (0.06)Interest Rate Swap Citibank Pay fixed 2.81% Receive floating CNREPOFIX=CFXS 1 week 02/04/2026 15,000,000 (1,296) –Interest Rate Swap Citibank Pay floating CNREPOFIX=CFXS 1 week Receive fixed 2.27% 11/06/2025 5,000,000 (9,768) (0.03)Interest Rate Swap Citibank Pay floating CNREPOFIX=CFXS 1 week Receive fixed 2.55% 07/07/2025 4,000,000 (3,346) (0.01)Interest Rate Swap Citibank Pay floating CNREPOFIX=CFXS 1 week Receive fixed 3.04% 23/10/2024 8,000,000 9,743 0.03Interest Rate Swap Citigroup Pay fixed 0.54% Receive floating LIBOR 6 month 10/04/2049 15,000,000 (1,703) (0.01)Interest Rate Swap Citigroup Pay fixed 0.68% Receive floating SONIA 1 day 05/02/2051 350,000 14,875 0.05Interest Rate Swap Citigroup Pay fixed 0.86% Receive floating SONIA 1 day 24/06/2051 300,000 (1,349) (0.01)Interest Rate Swap Citigroup Pay fixed 0.89% Receive floating SONIA 1 day 28/02/2051 150,000 (1,697) (0.01)Interest Rate Swap Citigroup Pay fixed 0.95% Receive floating LIBOR 6 month 06/11/2048 65,000,000 (78,517) (0.26)Interest Rate Swap Citigroup Pay fixed 1.11% Receive floating WIBOR 6 month 23/11/2030 2,000,000 22,554 0.07Interest Rate Swap Citigroup Pay fixed 1.21% Receive floating BBR 3 month 27/09/2029 880,000 18,663 0.06Interest Rate Swap Citigroup Pay fixed 1.30% Receive floating LIBOR 3 month 03/03/2050 100,000 8,195 0.03Interest Rate Swap Citigroup Pay fixed 1.32% Receive floating BBR 3 month 22/06/2026 3,000,000 (3,105) (0.01)Interest Rate Swap Citigroup Pay fixed 1.58% Receive floating BBR 3 month 23/09/2029 1,500,000 22,032 0.07Interest Rate Swap Citigroup Pay fixed 1.68% Receive floating BBR 3 month 30/10/2029 2,000,000 25,807 0.08Interest Rate Swap Citigroup Pay fixed 1.70% Receive floating WIBOR 6 month 24/03/2031 1,000,000 1,831 0.01Interest Rate Swap Citigroup Pay fixed 1.73% Receive floating WIBOR 6 month 17/06/2031 2,500,000 4,052 0.01Interest Rate Swap Citigroup Pay fixed 1.89% Receive floating WIBOR 6 month 08/06/2031 3,500,000 (4,282) (0.01)Interest Rate Swap Citigroup Pay fixed 1.92% Receive floating WIBOR 6 month 10/02/2030 2,500,000 (5,868) (0.02)Interest Rate Swap Citigroup Pay fixed 2.12% Receive floating WIBOR 6 month 23/01/2030 2,500,000 (13,392) (0.04)Interest Rate Swap Citigroup Pay floating BA 3 month Receive fixed 1.90% 25/10/2022 1,800,000 17,936 0.06Interest Rate Swap Citigroup Pay floating CNREPOFIX=CFXS 1 week Receive fixed 2.75% 04/06/2026 16,000,000 (3,857) (0.01)Interest Rate Swap Citigroup Pay floating TIIE 4 week Receive fixed 8.98% 23/10/2028 19,000,000 86,542 0.28Interest Rate Swap HSBC Pay floating CNREPOFIX=CFXS 1 week Receive fixed 2.31% 08/06/2025 5,000,000 (8,975) (0.03)Interest Rate Swap J.P. Morgan Pay floating CNREPOFIX=CFXS 1 week Receive fixed 2.20% 12/06/2025 7,000,000 (15,816) (0.05)
57
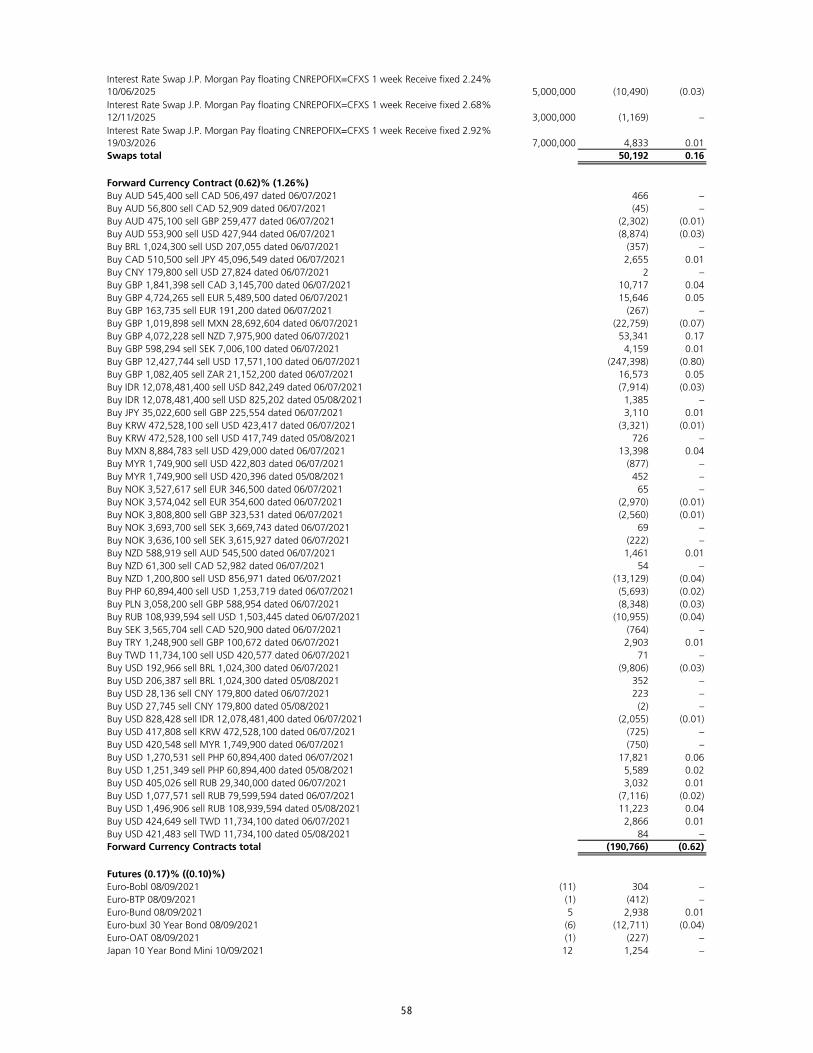
Interest Rate Swap J.P. Morgan Pay floating CNREPOFIX=CFXS 1 week Receive fixed 2.24% 10/06/2025 5,000,000 (10,490) (0.03)Interest Rate Swap J.P. Morgan Pay floating CNREPOFIX=CFXS 1 week Receive fixed 2.68% 12/11/2025 3,000,000 (1,169) –Interest Rate Swap J.P. Morgan Pay floating CNREPOFIX=CFXS 1 week Receive fixed 2.92% 19/03/2026 7,000,000 4,833 0.01Swaps total 50,192 0.16
Forward Currency Contract (0.62)% (1.26%)Buy AUD 545,400 sell CAD 506,497 dated 06/07/2021 466 –Buy AUD 56,800 sell CAD 52,909 dated 06/07/2021 (45) –Buy AUD 475,100 sell GBP 259,477 dated 06/07/2021 (2,302) (0.01)Buy AUD 553,900 sell USD 427,944 dated 06/07/2021 (8,874) (0.03)Buy BRL 1,024,300 sell USD 207,055 dated 06/07/2021 (357) –Buy CAD 510,500 sell JPY 45,096,549 dated 06/07/2021 2,655 0.01Buy CNY 179,800 sell USD 27,824 dated 06/07/2021 2 –Buy GBP 1,841,398 sell CAD 3,145,700 dated 06/07/2021 10,717 0.04Buy GBP 4,724,265 sell EUR 5,489,500 dated 06/07/2021 15,646 0.05Buy GBP 163,735 sell EUR 191,200 dated 06/07/2021 (267) –Buy GBP 1,019,898 sell MXN 28,692,604 dated 06/07/2021 (22,759) (0.07)Buy GBP 4,072,228 sell NZD 7,975,900 dated 06/07/2021 53,341 0.17Buy GBP 598,294 sell SEK 7,006,100 dated 06/07/2021 4,159 0.01Buy GBP 12,427,744 sell USD 17,571,100 dated 06/07/2021 (247,398) (0.80)Buy GBP 1,082,405 sell ZAR 21,152,200 dated 06/07/2021 16,573 0.05Buy IDR 12,078,481,400 sell USD 842,249 dated 06/07/2021 (7,914) (0.03)Buy IDR 12,078,481,400 sell USD 825,202 dated 05/08/2021 1,385 –Buy JPY 35,022,600 sell GBP 225,554 dated 06/07/2021 3,110 0.01Buy KRW 472,528,100 sell USD 423,417 dated 06/07/2021 (3,321) (0.01)Buy KRW 472,528,100 sell USD 417,749 dated 05/08/2021 726 –Buy MXN 8,884,783 sell USD 429,000 dated 06/07/2021 13,398 0.04Buy MYR 1,749,900 sell USD 422,803 dated 06/07/2021 (877) –Buy MYR 1,749,900 sell USD 420,396 dated 05/08/2021 452 –Buy NOK 3,527,617 sell EUR 346,500 dated 06/07/2021 65 –Buy NOK 3,574,042 sell EUR 354,600 dated 06/07/2021 (2,970) (0.01)Buy NOK 3,808,800 sell GBP 323,531 dated 06/07/2021 (2,560) (0.01)Buy NOK 3,693,700 sell SEK 3,669,743 dated 06/07/2021 69 –Buy NOK 3,636,100 sell SEK 3,615,927 dated 06/07/2021 (222) –Buy NZD 588,919 sell AUD 545,500 dated 06/07/2021 1,461 0.01Buy NZD 61,300 sell CAD 52,982 dated 06/07/2021 54 –Buy NZD 1,200,800 sell USD 856,971 dated 06/07/2021 (13,129) (0.04)Buy PHP 60,894,400 sell USD 1,253,719 dated 06/07/2021 (5,693) (0.02)Buy PLN 3,058,200 sell GBP 588,954 dated 06/07/2021 (8,348) (0.03)Buy RUB 108,939,594 sell USD 1,503,445 dated 06/07/2021 (10,955) (0.04)Buy SEK 3,565,704 sell CAD 520,900 dated 06/07/2021 (764) –Buy TRY 1,248,900 sell GBP 100,672 dated 06/07/2021 2,903 0.01Buy TWD 11,734,100 sell USD 420,577 dated 06/07/2021 71 –Buy USD 192,966 sell BRL 1,024,300 dated 06/07/2021 (9,806) (0.03)Buy USD 206,387 sell BRL 1,024,300 dated 05/08/2021 352 –Buy USD 28,136 sell CNY 179,800 dated 06/07/2021 223 –Buy USD 27,745 sell CNY 179,800 dated 05/08/2021 (2) –Buy USD 828,428 sell IDR 12,078,481,400 dated 06/07/2021 (2,055) (0.01)Buy USD 417,808 sell KRW 472,528,100 dated 06/07/2021 (725) –Buy USD 420,548 sell MYR 1,749,900 dated 06/07/2021 (750) –Buy USD 1,270,531 sell PHP 60,894,400 dated 06/07/2021 17,821 0.06Buy USD 1,251,349 sell PHP 60,894,400 dated 05/08/2021 5,589 0.02Buy USD 405,026 sell RUB 29,340,000 dated 06/07/2021 3,032 0.01Buy USD 1,077,571 sell RUB 79,599,594 dated 06/07/2021 (7,116) (0.02)Buy USD 1,496,906 sell RUB 108,939,594 dated 05/08/2021 11,223 0.04Buy USD 424,649 sell TWD 11,734,100 dated 06/07/2021 2,866 0.01Buy USD 421,483 sell TWD 11,734,100 dated 05/08/2021 84 –Forward Currency Contracts total (190,766) (0.62)
Futures (0.17)% ((0.10)%)Euro-Bobl 08/09/2021 (11) 304 –Euro-BTP 08/09/2021 (1) (412) –Euro-Bund 08/09/2021 5 2,938 0.01Euro-buxl 30 Year Bond 08/09/2021 (6) (12,711) (0.04)Euro-OAT 08/09/2021 (1) (227) –Japan 10 Year Bond Mini 10/09/2021 12 1,254 –
58
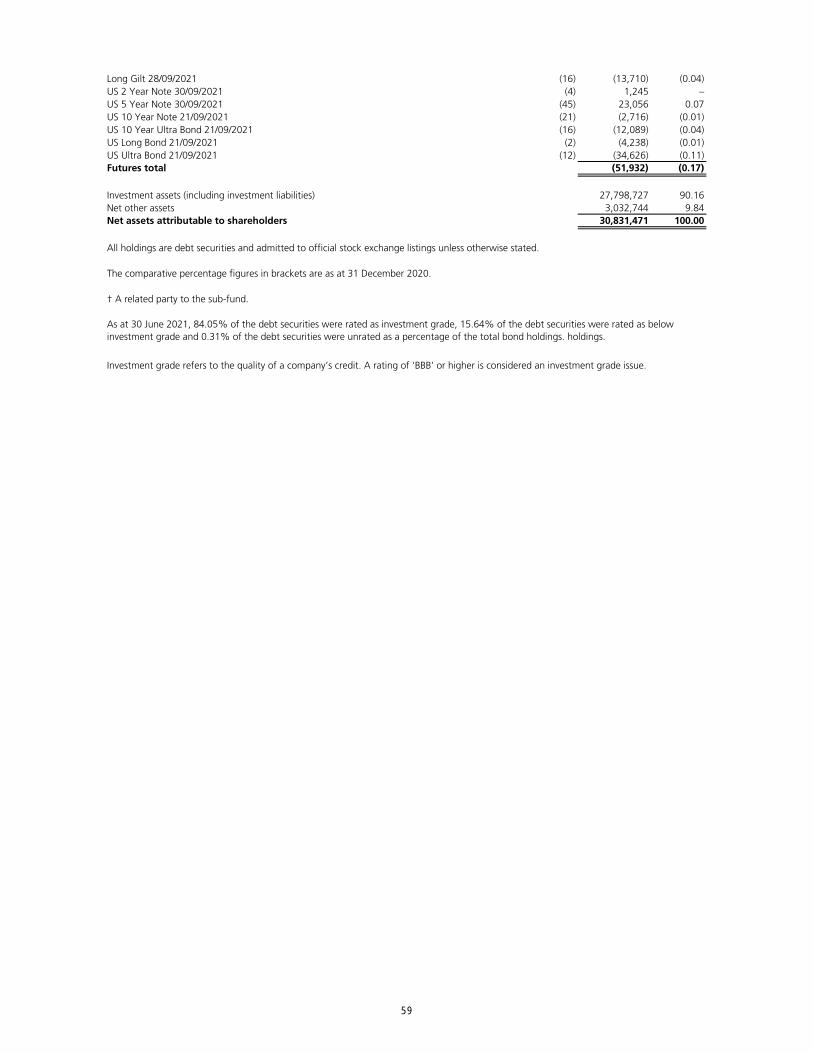
Long Gilt 28/09/2021 (16) (13,710) (0.04)US 2 Year Note 30/09/2021 (4) 1,245 –US 5 Year Note 30/09/2021 (45) 23,056 0.07US 10 Year Note 21/09/2021 (21) (2,716) (0.01)US 10 Year Ultra Bond 21/09/2021 (16) (12,089) (0.04)US Long Bond 21/09/2021 (2) (4,238) (0.01)US Ultra Bond 21/09/2021 (12) (34,626) (0.11)Futures total (51,932) (0.17)
Investment assets (including investment liabilities) 27,798,727 90.16Net other assets 3,032,744 9.84Net assets attributable to shareholders 30,831,471 100.00
All holdings are debt securities and admitted to official stock exchange listings unless otherwise stated.
The comparative percentage figures in brackets are as at 31 December 2020.
† A related party to the sub-fund.
Investment grade refers to the quality of a company’s credit. A rating of ‘BBB’ or higher is considered an investment grade issue.
As at 30 June 2021, 84.05% of the debt securities were rated as investment grade, 15.64% of the debt securities were rated as below investment grade and 0.31% of the debt securities were unrated as a percentage of the total bond holdings. holdings.
59
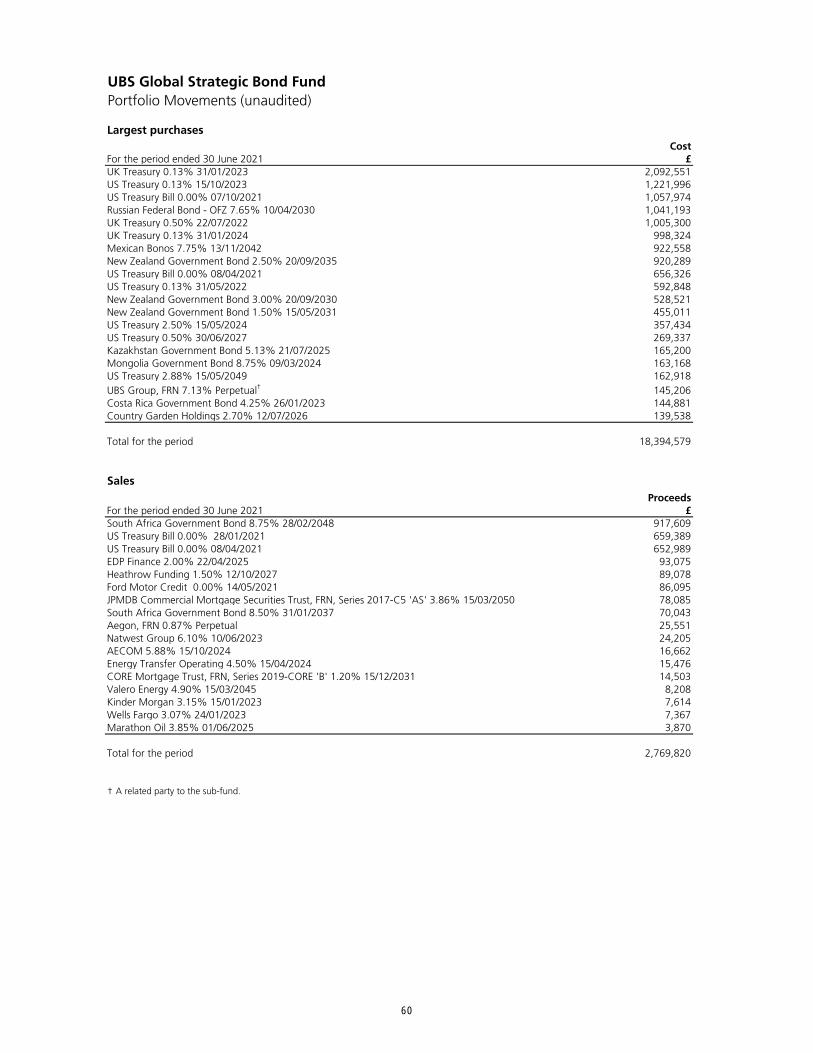
UBS Global Strategic Bond FundPortfolio Movements (unaudited)
Largest purchasesCost
For the period ended 30 June 2021 £UK Treasury 0.13% 31/01/2023 2,092,551US Treasury 0.13% 15/10/2023 1,221,996US Treasury Bill 0.00% 07/10/2021 1,057,974Russian Federal Bond - OFZ 7.65% 10/04/2030 1,041,193UK Treasury 0.50% 22/07/2022 1,005,300UK Treasury 0.13% 31/01/2024 998,324Mexican Bonos 7.75% 13/11/2042 922,558New Zealand Government Bond 2.50% 20/09/2035 920,289US Treasury Bill 0.00% 08/04/2021 656,326US Treasury 0.13% 31/05/2022 592,848New Zealand Government Bond 3.00% 20/09/2030 528,521New Zealand Government Bond 1.50% 15/05/2031 455,011US Treasury 2.50% 15/05/2024 357,434US Treasury 0.50% 30/06/2027 269,337Kazakhstan Government Bond 5.13% 21/07/2025 165,200Mongolia Government Bond 8.75% 09/03/2024 163,168US Treasury 2.88% 15/05/2049 162,918UBS Group, FRN 7.13% Perpetual† 145,206Costa Rica Government Bond 4.25% 26/01/2023 144,881Country Garden Holdings 2.70% 12/07/2026 139,538
Total for the period 18,394,579
SalesProceeds
For the period ended 30 June 2021 £South Africa Government Bond 8.75% 28/02/2048 917,609US Treasury Bill 0.00% 28/01/2021 659,389US Treasury Bill 0.00% 08/04/2021 652,989EDP Finance 2.00% 22/04/2025 93,075Heathrow Funding 1.50% 12/10/2027 89,078Ford Motor Credit 0.00% 14/05/2021 86,095JPMDB Commercial Mortgage Securities Trust, FRN, Series 2017-C5 'AS' 3.86% 15/03/2050 78,085South Africa Government Bond 8.50% 31/01/2037 70,043Aegon, FRN 0.87% Perpetual 25,551Natwest Group 6.10% 10/06/2023 24,205AECOM 5.88% 15/10/2024 16,662Energy Transfer Operating 4.50% 15/04/2024 15,476CORE Mortgage Trust, FRN, Series 2019-CORE 'B' 1.20% 15/12/2031 14,503Valero Energy 4.90% 15/03/2045 8,208Kinder Morgan 3.15% 15/01/2023 7,614Wells Fargo 3.07% 24/01/2023 7,367Marathon Oil 3.85% 01/06/2025 3,870
Total for the period 2,769,820
† A related party to the sub-fund.
60
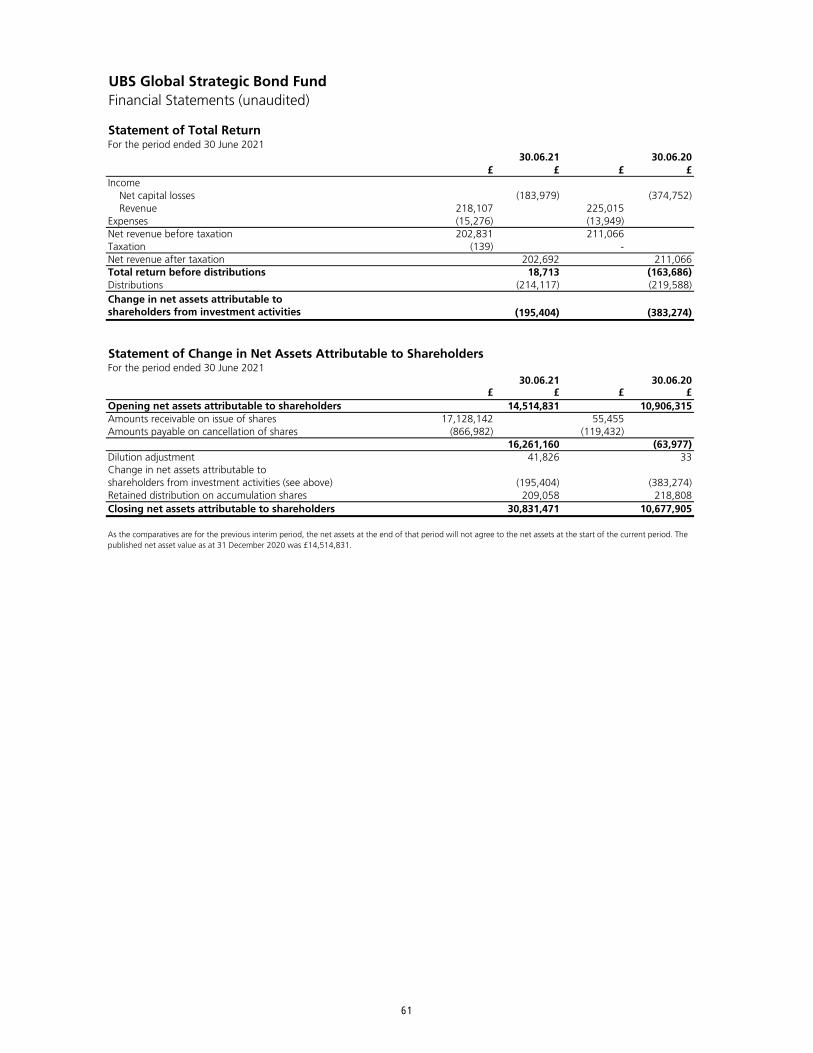
UBS Global Strategic Bond FundFinancial Statements (unaudited)
Statement of Total ReturnFor the period ended 30 June 2021
£ £ £ £Income Net capital losses (183,979) (374,752) Revenue 218,107 225,015Expenses (15,276) (13,949)Net revenue before taxation 202,831 211,066Taxation (139) -Net revenue after taxation 202,692 211,066Total return before distributions 18,713 (163,686)Distributions (214,117) (219,588)Change in net assets attributable to shareholders from investment activities (195,404) (383,274)
Statement of Change in Net Assets Attributable to ShareholdersFor the period ended 30 June 2021
£ £ £ £14,514,831 10,906,315
Amounts receivable on issue of shares 17,128,142 55,455Amounts payable on cancellation of shares (866,982) (119,432)
16,261,160 (63,977)Dilution adjustment 41,826 33
(195,404) (383,274)209,058 218,808
30,831,471 10,677,905
shareholders from investment activities (see above)Retained distribution on accumulation sharesClosing net assets attributable to shareholders
As the comparatives are for the previous interim period, the net assets at the end of that period will not agree to the net assets at the start of the current period. The published net asset value as at 31 December 2020 was £14,514,831.
Change in net assets attributable to
30.06.21 30.06.20
30.06.21 30.06.20
Opening net assets attributable to shareholders
61
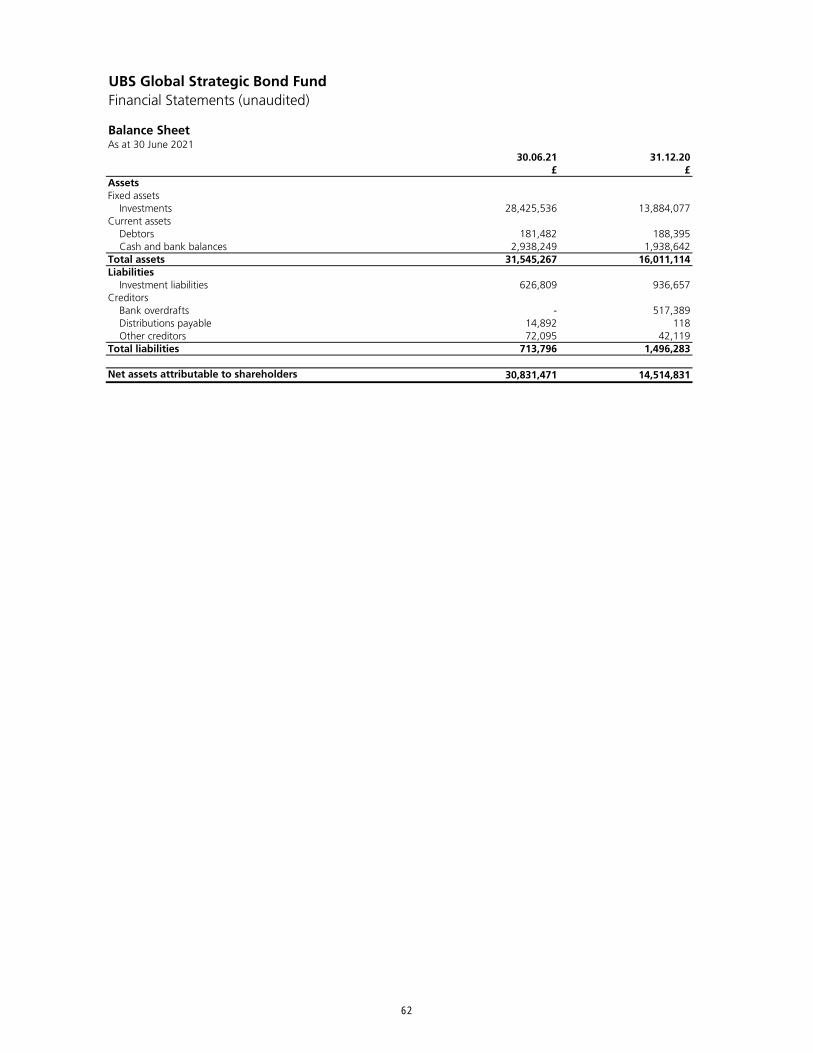
UBS Global Strategic Bond FundFinancial Statements (unaudited)
Balance SheetAs at 30 June 2021
30.06.21 31.12.20£ £
AssetsFixed assets Investments 28,425,536 13,884,077Current assets Debtors 181,482 188,395 Cash and bank balances 2,938,249 1,938,642Total assets 31,545,267 16,011,114Liabilities Investment liabilities 626,809 936,657Creditors Bank overdrafts - 517,389 Distributions payable 14,892 118 Other creditors 72,095 42,119Total liabilities 713,796 1,496,283
Net assets attributable to shareholders 30,831,471 14,514,831
62

UBS Global Strategic Bond FundNotes to the Financial Statements (unaudited)
Accounting policiesThe interim financial statements have been prepared in accordance with the Statement of Recommended Practice (SORP) for Authorised Funds issued by the Investment Association (IA) in May 2014 (SORP 2014).
The accounting policies applied are consistent with those of the financial statements for the year ended 31 December 2020 and are described in those annual financial statements.
63

64
UBS S&P 500 Index Fund
65
UBS S&P 500 Index FundManager's report
Investment objective
Investment policy
Benchmark information
Market environment
Sub-fund performance
† Tracking error has been calculated as the month end standard deviation of price returns on an ex post basis using the unswung prices of the J Accumulation share class versus the index values over the accounting year.
* Performance is based on NAV mid prices with income reinvested net of basic rate tax and in sterling terms to 30 June 2021, based on C Accumulation shares.
The sub-fund uses the Index as a target benchmark. The Index has been chosen because it meets the objective of the sub-fund.
The sub-fund aims to have an anticipated tracking error of up to 0.5% per annum. The anticipated tracking error is a target and is not guaranteed.
The first months of the reporting period came with faster-than-expected vaccine rollouts and bigger-than-expected US fiscal stimulus. President Joe Biden's proposed USD1.9 trillion stimulus package was eventually passed in its entirety in early March. The backdrop of vaccination-led reopening's, plus substantial monetary and fiscal stimulus, drove expectations for a faster economic recovery and further gains for US equities. This upward trend continued through the second quarter with US stocks delivering a return of 8.4% in the quarter, leaving returns year-to-date at 15.0%. The improved growth outlook and signs of reemerging inflation pushed 10-year US Treasury yields sharply higher. The combination of higher growth and higher yields prompted a shift into more cyclical sectors of the equity market and a rotation out of growth into value stocks.
The sub-fund returned 13.86%* over the period compared to its S&P 500 Index benchmark that returned 13.79%.
The most significant changes to the index were the addition of Enphase Energy Inc and the weight increase of International Flavors & Fragrances Inc. following the exchange offer by DuPont. Other notable changes were the additions of Trimble Inc, Monolithic Power Systems and Charles River Laboratories International Inc. At the quarterly index review in March, 4 stocks were added and 4 were deleted. The two-way turnover was 0.96%. The last quarterly index review took place in June with no stocks added to or deleted from the index and a two-way turnover of 0.44% due to stock reweighting.
The sub-fund will physically replicate the risk exposures of the benchmark on an optimised basis by investing predominantly in the components of the reference index, consistent with an anticipated tracking error of 0.5% per annum. This is a target and is not guaranteed.
The annualised tracking error as at 30 June 2021 is 0.33%†.
Tracking error indicates the consistency of a product’s excess returns over the period. Excess return shows the extent to which the sub-fund has over-or under-performed against the benchmark.
Factors which are likely to affect the ability of the sub-fund to track the performance of the Reference Index include, but are not limited to, the sub-fund’s expenses as stated in the Prospectus, transaction costs (from Reference Index turnover), portfolio weightings not being exactly the same as the Reference Index, small amounts of cash not being invested in stock and Efficient Portfolio Management.
The sub-fund may use derivatives for efficient portfolio management only.
The sub-fund seeks to track the return of the S&P 500 Index (the "Index') before the deduction of charges.
The sub-fund employs a passive investment strategy, investing all, or substantially all, of its assets in the shares of companies that make up the Index.
To the extent that the sub-fund is not fully invested in the equities of the Index, it may be invested in shares of companies which in the ACD's opinion are reasonably expected to become part of the Index. The sub-fund may also invest in warrants, money market instruments, deposits, cash and near cash and other funds.
The other funds that the sub-fund may invest in include funds managed by the Investment Manager or its affiliates.
66
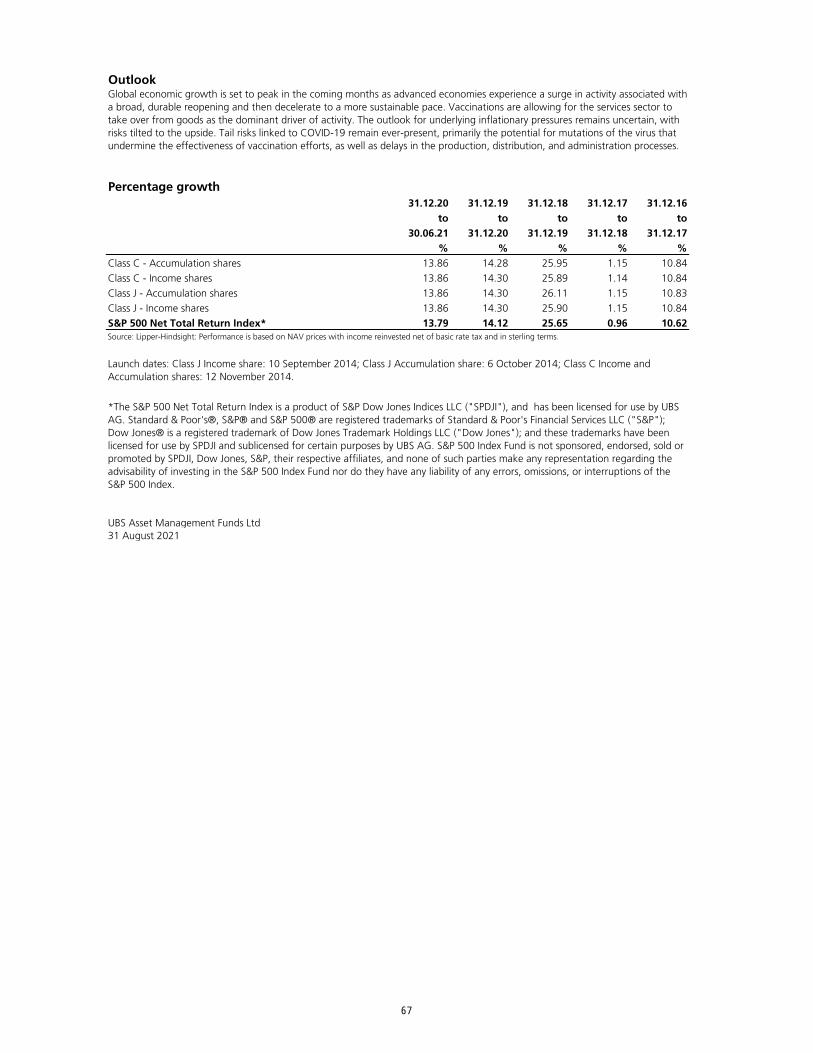
Outlook
Percentage growth31.12.20 31.12.19 31.12.18 31.12.17 31.12.16
to to to to to30.06.21 31.12.20 31.12.19 31.12.18 31.12.17
% % % % %Class C - Accumulation shares 13.86 14.28 25.95 1.15 10.84Class C - Income shares 13.86 14.30 25.89 1.14 10.84Class J - Accumulation shares 13.86 14.30 26.11 1.15 10.83Class J - Income shares 13.86 14.30 25.90 1.15 10.84S&P 500 Net Total Return Index* 13.79 14.12 25.65 0.96 10.62Source: Lipper-Hindsight: Performance is based on NAV prices with income reinvested net of basic rate tax and in sterling terms.
UBS Asset Management Funds Ltd31 August 2021
Global economic growth is set to peak in the coming months as advanced economies experience a surge in activity associated with a broad, durable reopening and then decelerate to a more sustainable pace. Vaccinations are allowing for the services sector to take over from goods as the dominant driver of activity. The outlook for underlying inflationary pressures remains uncertain, with risks tilted to the upside. Tail risks linked to COVID-19 remain ever-present, primarily the potential for mutations of the virus that undermine the effectiveness of vaccination efforts, as well as delays in the production, distribution, and administration processes.
Launch dates: Class J Income share: 10 September 2014; Class J Accumulation share: 6 October 2014; Class C Income and Accumulation shares: 12 November 2014.
*The S&P 500 Net Total Return Index is a product of S&P Dow Jones Indices LLC ("SPDJI"), and has been licensed for use by UBS AG. Standard & Poor's®, S&P® and S&P 500® are registered trademarks of Standard & Poor's Financial Services LLC ("S&P"); Dow Jones® is a registered trademark of Dow Jones Trademark Holdings LLC ("Dow Jones"); and these trademarks have been licensed for use by SPDJI and sublicensed for certain purposes by UBS AG. S&P 500 Index Fund is not sponsored, endorsed, sold or promoted by SPDJI, Dow Jones, S&P, their respective affiliates, and none of such parties make any representation regarding the advisability of investing in the S&P 500 Index Fund nor do they have any liability of any errors, omissions, or interruptions of the S&P 500 Index.
67
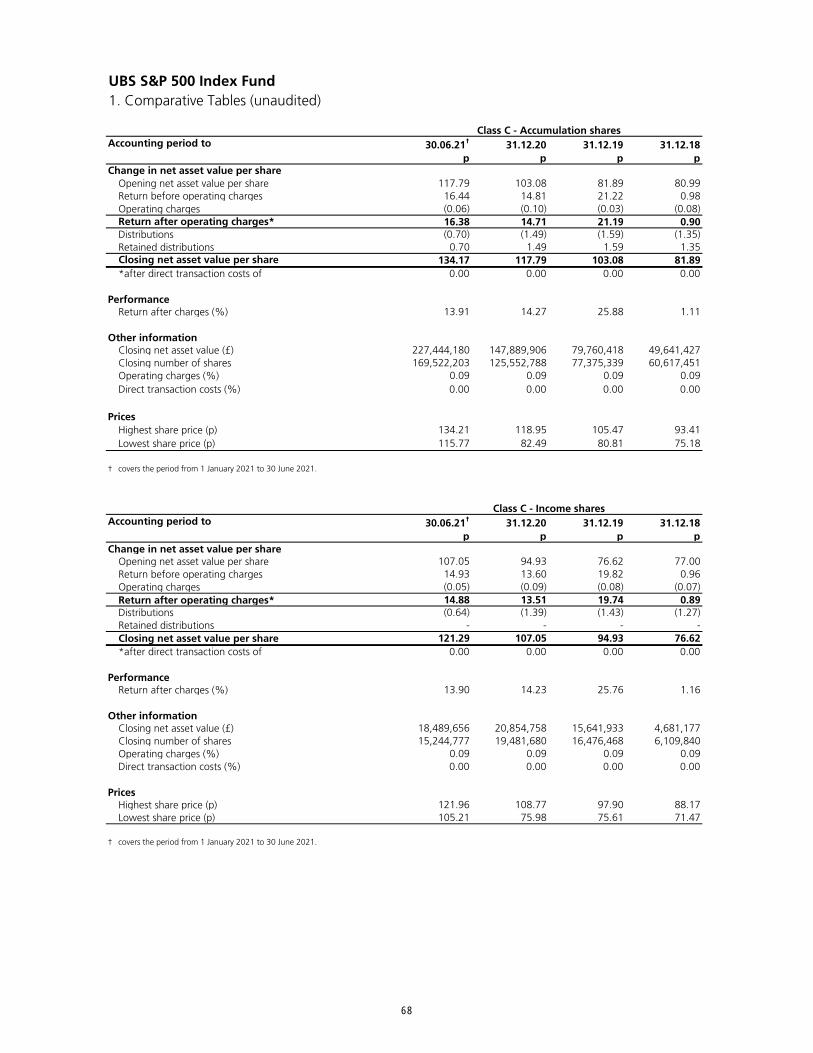
UBS S&P 500 Index Fund1. Comparative Tables (unaudited)
Accounting period to 30.06.21† 31.12.20 31.12.19 31.12.18p p p p
Change in net asset value per shareOpening net asset value per share 117.79 103.08 81.89 80.99Return before operating charges 16.44 14.81 21.22 0.98Operating charges (0.06) (0.10) (0.03) (0.08)Return after operating charges* 16.38 14.71 21.19 0.90Distributions (0.70) (1.49) (1.59) (1.35)Retained distributions 0.70 1.49 1.59 1.35Closing net asset value per share 134.17 117.79 103.08 81.89*after direct transaction costs of 0.00 0.00 0.00 0.00
PerformanceReturn after charges (%) 13.91 14.27 25.88 1.11
Other informationClosing net asset value (£) 227,444,180 147,889,906 79,760,418 49,641,427Closing number of shares 169,522,203 125,552,788 77,375,339 60,617,451Operating charges (%) 0.09 0.09 0.09 0.09Direct transaction costs (%) 0.00 0.00 0.00 0.00
PricesHighest share price (p) 134.21 118.95 105.47 93.41Lowest share price (p) 115.77 82.49 80.81 75.18
† covers the period from 1 January 2021 to 30 June 2021.
Accounting period to 30.06.21† 31.12.20 31.12.19 31.12.18p p p p
Change in net asset value per shareOpening net asset value per share 107.05 94.93 76.62 77.00Return before operating charges 14.93 13.60 19.82 0.96Operating charges (0.05) (0.09) (0.08) (0.07)Return after operating charges* 14.88 13.51 19.74 0.89Distributions (0.64) (1.39) (1.43) (1.27)Retained distributions - - - -Closing net asset value per share 121.29 107.05 94.93 76.62*after direct transaction costs of 0.00 0.00 0.00 0.00
PerformanceReturn after charges (%) 13.90 14.23 25.76 1.16
Other informationClosing net asset value (£) 18,489,656 20,854,758 15,641,933 4,681,177Closing number of shares 15,244,777 19,481,680 16,476,468 6,109,840Operating charges (%) 0.09 0.09 0.09 0.09Direct transaction costs (%) 0.00 0.00 0.00 0.00
PricesHighest share price (p) 121.96 108.77 97.90 88.17Lowest share price (p) 105.21 75.98 75.61 71.47
† covers the period from 1 January 2021 to 30 June 2021.
Class C - Accumulation shares
Class C - Income shares
68
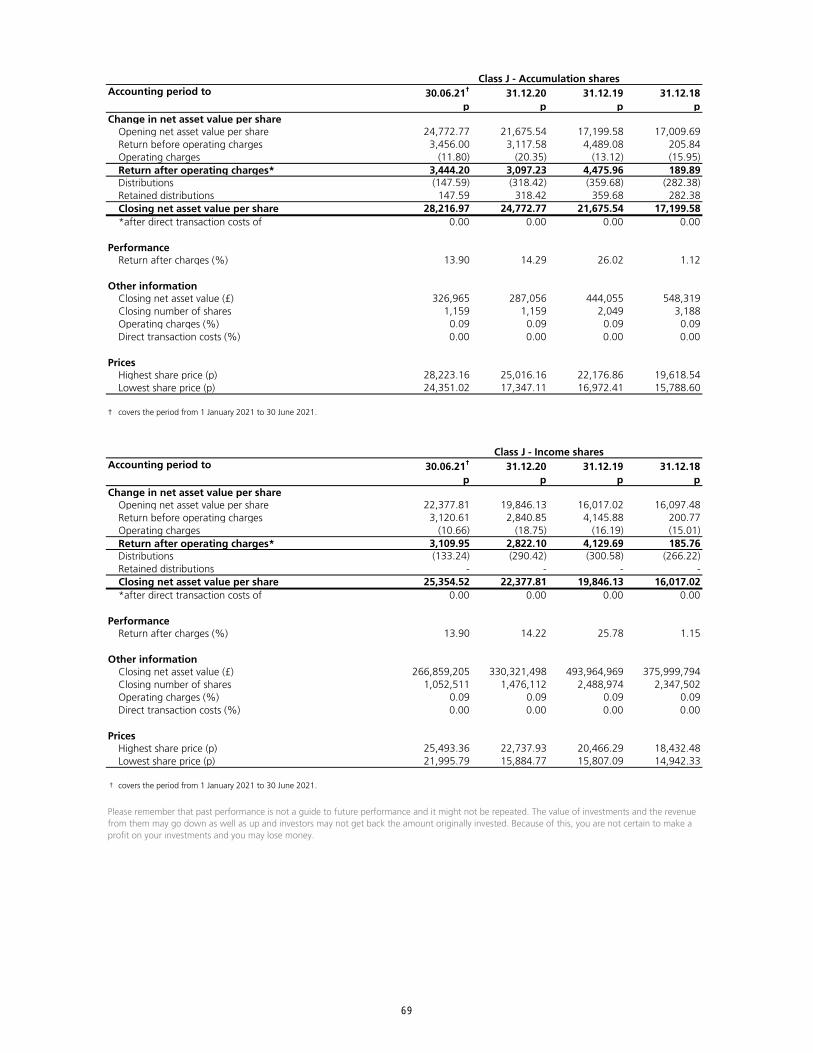
Accounting period to 30.06.21† 31.12.20 31.12.19 31.12.18p p p p
Change in net asset value per shareOpening net asset value per share 24,772.77 21,675.54 17,199.58 17,009.69Return before operating charges 3,456.00 3,117.58 4,489.08 205.84Operating charges (11.80) (20.35) (13.12) (15.95)Return after operating charges* 3,444.20 3,097.23 4,475.96 189.89Distributions (147.59) (318.42) (359.68) (282.38)Retained distributions 147.59 318.42 359.68 282.38Closing net asset value per share 28,216.97 24,772.77 21,675.54 17,199.58*after direct transaction costs of 0.00 0.00 0.00 0.00
PerformanceReturn after charges (%) 13.90 14.29 26.02 1.12
Other informationClosing net asset value (£) 326,965 287,056 444,055 548,319Closing number of shares 1,159 1,159 2,049 3,188Operating charges (%) 0.09 0.09 0.09 0.09Direct transaction costs (%) 0.00 0.00 0.00 0.00
PricesHighest share price (p) 28,223.16 25,016.16 22,176.86 19,618.54Lowest share price (p) 24,351.02 17,347.11 16,972.41 15,788.60
† covers the period from 1 January 2021 to 30 June 2021.
Accounting period to 30.06.21† 31.12.20 31.12.19 31.12.18p p p p
Change in net asset value per shareOpening net asset value per share 22,377.81 19,846.13 16,017.02 16,097.48Return before operating charges 3,120.61 2,840.85 4,145.88 200.77Operating charges (10.66) (18.75) (16.19) (15.01)Return after operating charges* 3,109.95 2,822.10 4,129.69 185.76Distributions (133.24) (290.42) (300.58) (266.22)Retained distributions - - - -Closing net asset value per share 25,354.52 22,377.81 19,846.13 16,017.02*after direct transaction costs of 0.00 0.00 0.00 0.00
PerformanceReturn after charges (%) 13.90 14.22 25.78 1.15
Other informationClosing net asset value (£) 266,859,205 330,321,498 493,964,969 375,999,794Closing number of shares 1,052,511 1,476,112 2,488,974 2,347,502Operating charges (%) 0.09 0.09 0.09 0.09Direct transaction costs (%) 0.00 0.00 0.00 0.00
PricesHighest share price (p) 25,493.36 22,737.93 20,466.29 18,432.48Lowest share price (p) 21,995.79 15,884.77 15,807.09 14,942.33
† covers the period from 1 January 2021 to 30 June 2021.
Please remember that past performance is not a guide to future performance and it might not be repeated. The value of investments and the revenue from them may go down as well as up and investors may not get back the amount originally invested. Because of this, you are not certain to make a profit on your investments and you may lose money.
Class J - Accumulation shares
Class J - Income shares
69
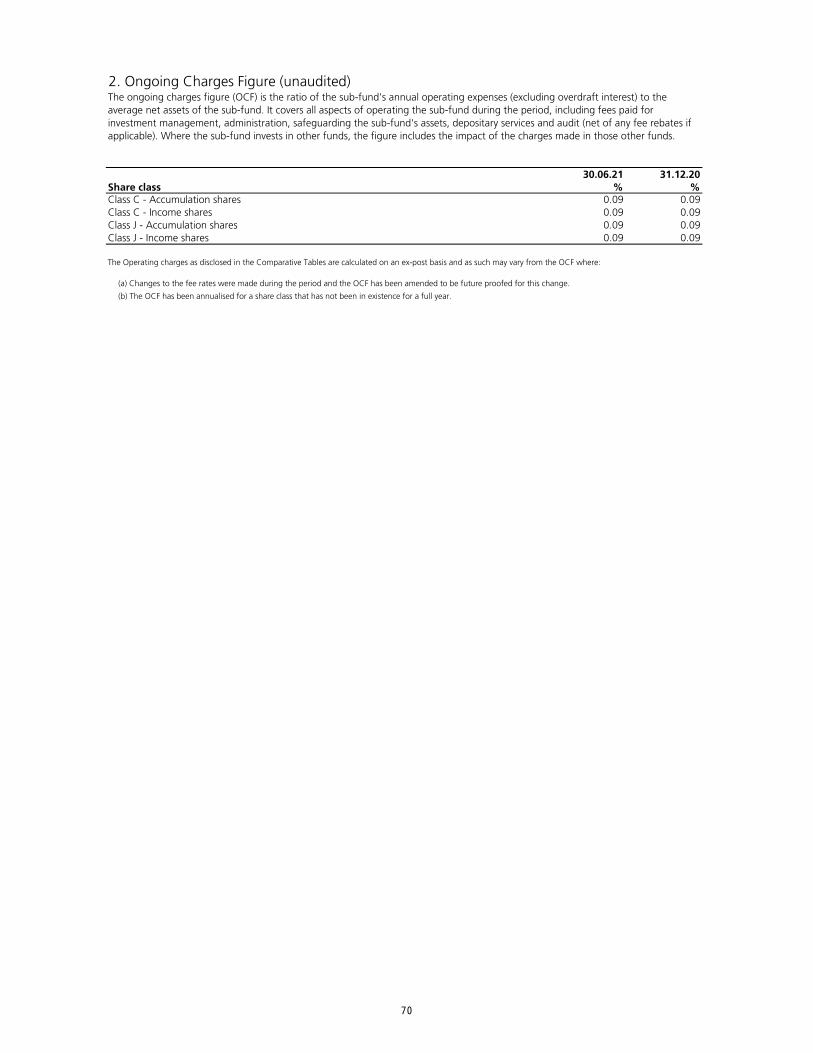
2. Ongoing Charges Figure (unaudited)
30.06.21 31.12.20Share class % %Class C - Accumulation shares 0.09 0.09Class C - Income shares 0.09 0.09Class J - Accumulation shares 0.09 0.09Class J - Income shares 0.09 0.09
(a) Changes to the fee rates were made during the period and the OCF has been amended to be future proofed for this change.
(b) The OCF has been annualised for a share class that has not been in existence for a full year.
The ongoing charges figure (OCF) is the ratio of the sub-fund's annual operating expenses (excluding overdraft interest) to the average net assets of the sub-fund. It covers all aspects of operating the sub-fund during the period, including fees paid for investment management, administration, safeguarding the sub-fund's assets, depositary services and audit (net of any fee rebates if applicable). Where the sub-fund invests in other funds, the figure includes the impact of the charges made in those other funds.
The Operating charges as disclosed in the Comparative Tables are calculated on an ex-post basis and as such may vary from the OCF where:
70
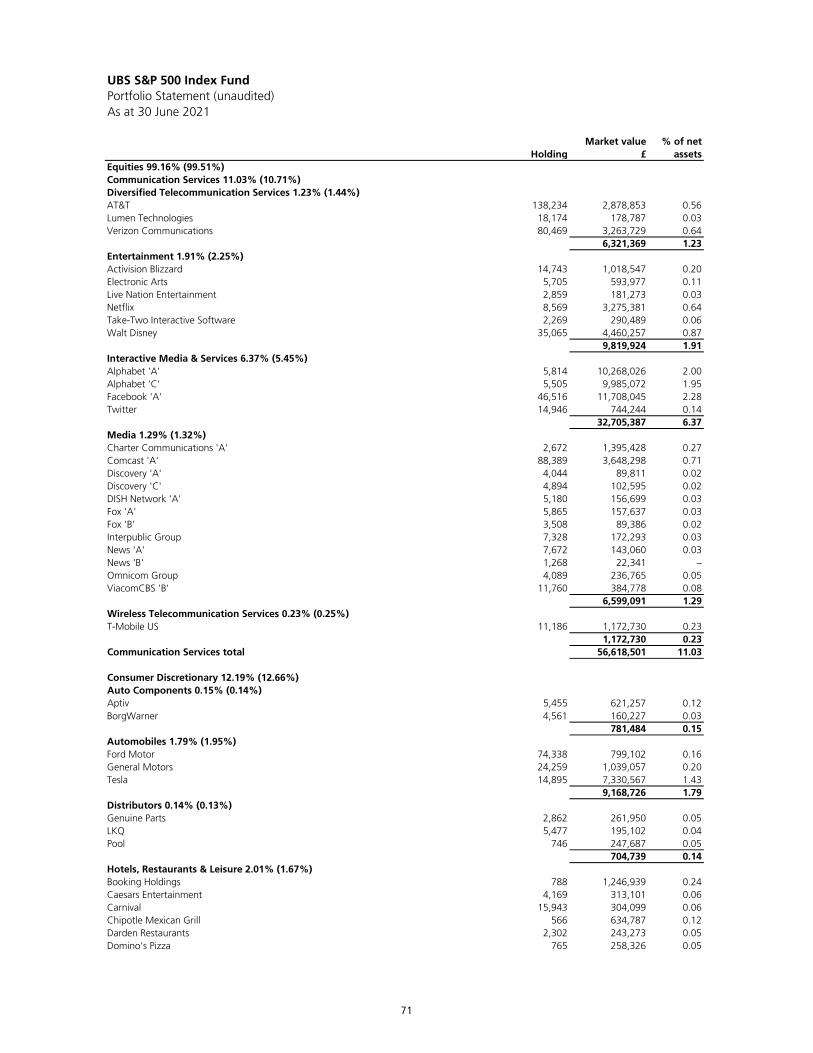
UBS S&P 500 Index FundPortfolio Statement (unaudited)As at 30 June 2021
HoldingMarket value
£% of net
assetsEquities 99.16% (99.51%)Communication Services 11.03% (10.71%)Diversified Telecommunication Services 1.23% (1.44%)AT&T 138,234 2,878,853 0.56Lumen Technologies 18,174 178,787 0.03Verizon Communications 80,469 3,263,729 0.64
6,321,369 1.23Entertainment 1.91% (2.25%)Activision Blizzard 14,743 1,018,547 0.20Electronic Arts 5,705 593,977 0.11Live Nation Entertainment 2,859 181,273 0.03Netflix 8,569 3,275,381 0.64Take-Two Interactive Software 2,269 290,489 0.06Walt Disney 35,065 4,460,257 0.87
9,819,924 1.91Interactive Media & Services 6.37% (5.45%)Alphabet 'A' 5,814 10,268,026 2.00Alphabet 'C' 5,505 9,985,072 1.95Facebook 'A' 46,516 11,708,045 2.28Twitter 14,946 744,244 0.14
32,705,387 6.37Media 1.29% (1.32%)Charter Communications 'A' 2,672 1,395,428 0.27Comcast 'A' 88,389 3,648,298 0.71Discovery 'A' 4,044 89,811 0.02Discovery 'C' 4,894 102,595 0.02DISH Network 'A' 5,180 156,699 0.03Fox 'A' 5,865 157,637 0.03Fox 'B' 3,508 89,386 0.02Interpublic Group 7,328 172,293 0.03News 'A' 7,672 143,060 0.03News 'B' 1,268 22,341 –Omnicom Group 4,089 236,765 0.05ViacomCBS 'B' 11,760 384,778 0.08
6,599,091 1.29Wireless Telecommunication Services 0.23% (0.25%)T-Mobile US 11,186 1,172,730 0.23
1,172,730 0.23Communication Services total 56,618,501 11.03
Consumer Discretionary 12.19% (12.66%)Auto Components 0.15% (0.14%)Aptiv 5,455 621,257 0.12BorgWarner 4,561 160,227 0.03
781,484 0.15Automobiles 1.79% (1.95%)Ford Motor 74,338 799,102 0.16General Motors 24,259 1,039,057 0.20Tesla 14,895 7,330,567 1.43
9,168,726 1.79Distributors 0.14% (0.13%)Genuine Parts 2,862 261,950 0.05LKQ 5,477 195,102 0.04Pool 746 247,687 0.05
704,739 0.14Hotels, Restaurants & Leisure 2.01% (1.67%)Booking Holdings 788 1,246,939 0.24Caesars Entertainment 4,169 313,101 0.06Carnival 15,943 304,099 0.06Chipotle Mexican Grill 566 634,787 0.12Darden Restaurants 2,302 243,273 0.05Domino's Pizza 765 258,326 0.05
71
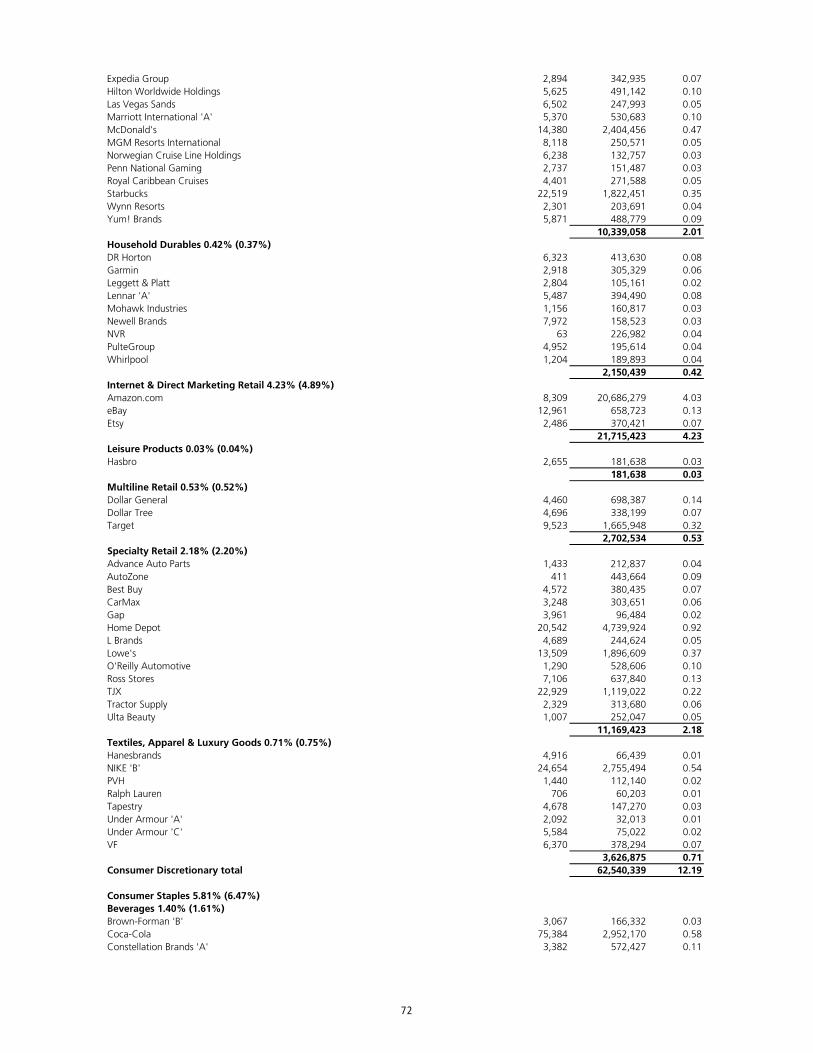
Expedia Group 2,894 342,935 0.07Hilton Worldwide Holdings 5,625 491,142 0.10Las Vegas Sands 6,502 247,993 0.05Marriott International 'A' 5,370 530,683 0.10McDonald's 14,380 2,404,456 0.47MGM Resorts International 8,118 250,571 0.05Norwegian Cruise Line Holdings 6,238 132,757 0.03Penn National Gaming 2,737 151,487 0.03Royal Caribbean Cruises 4,401 271,588 0.05Starbucks 22,519 1,822,451 0.35Wynn Resorts 2,301 203,691 0.04Yum! Brands 5,871 488,779 0.09
10,339,058 2.01Household Durables 0.42% (0.37%)DR Horton 6,323 413,630 0.08Garmin 2,918 305,329 0.06Leggett & Platt 2,804 105,161 0.02Lennar 'A' 5,487 394,490 0.08Mohawk Industries 1,156 160,817 0.03Newell Brands 7,972 158,523 0.03NVR 63 226,982 0.04PulteGroup 4,952 195,614 0.04Whirlpool 1,204 189,893 0.04
2,150,439 0.42Internet & Direct Marketing Retail 4.23% (4.89%)Amazon.com 8,309 20,686,279 4.03eBay 12,961 658,723 0.13Etsy 2,486 370,421 0.07
21,715,423 4.23Leisure Products 0.03% (0.04%)Hasbro 2,655 181,638 0.03
181,638 0.03Multiline Retail 0.53% (0.52%)Dollar General 4,460 698,387 0.14Dollar Tree 4,696 338,199 0.07Target 9,523 1,665,948 0.32
2,702,534 0.53Specialty Retail 2.18% (2.20%)Advance Auto Parts 1,433 212,837 0.04AutoZone 411 443,664 0.09Best Buy 4,572 380,435 0.07CarMax 3,248 303,651 0.06Gap 3,961 96,484 0.02Home Depot 20,542 4,739,924 0.92L Brands 4,689 244,624 0.05Lowe's 13,509 1,896,609 0.37O'Reilly Automotive 1,290 528,606 0.10Ross Stores 7,106 637,840 0.13TJX 22,929 1,119,022 0.22Tractor Supply 2,329 313,680 0.06Ulta Beauty 1,007 252,047 0.05
11,169,423 2.18Textiles, Apparel & Luxury Goods 0.71% (0.75%)Hanesbrands 4,916 66,439 0.01NIKE 'B' 24,654 2,755,494 0.54PVH 1,440 112,140 0.02Ralph Lauren 706 60,203 0.01Tapestry 4,678 147,270 0.03Under Armour 'A' 2,092 32,013 0.01Under Armour 'C' 5,584 75,022 0.02VF 6,370 378,294 0.07
3,626,875 0.71Consumer Discretionary total 62,540,339 12.19
Consumer Staples 5.81% (6.47%)Beverages 1.40% (1.61%)Brown-Forman 'B' 3,067 166,332 0.03Coca-Cola 75,384 2,952,170 0.58Constellation Brands 'A' 3,382 572,427 0.11
72
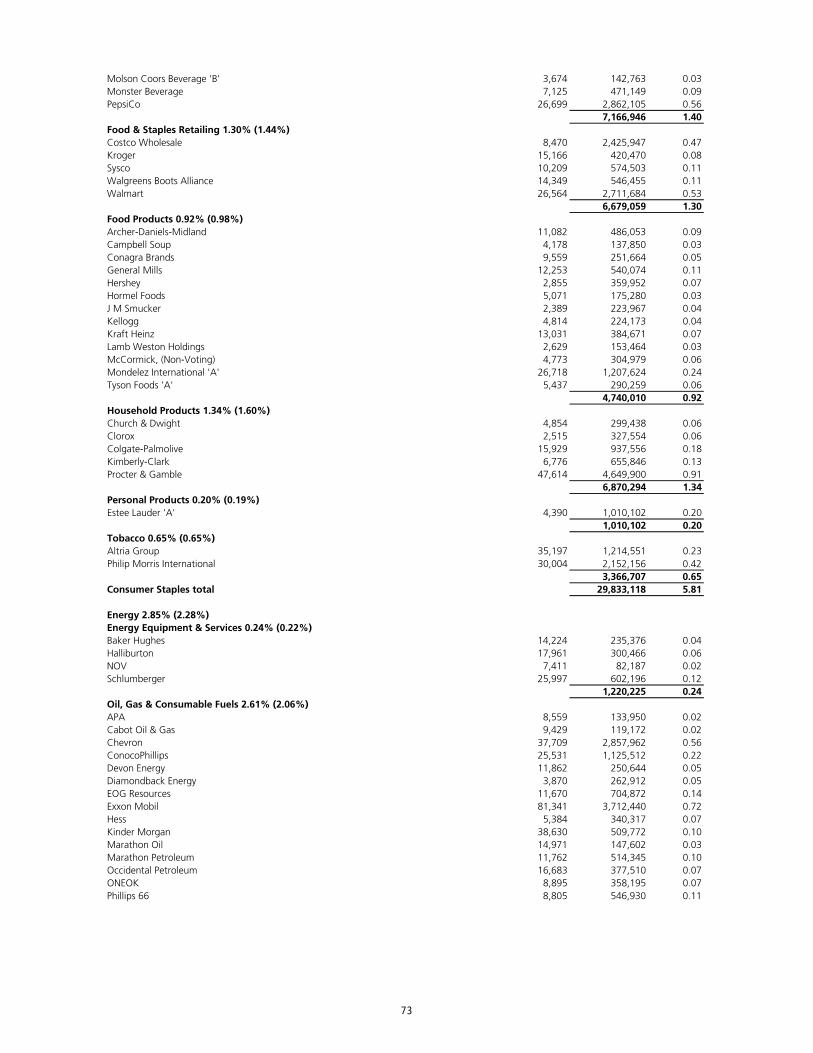
Molson Coors Beverage 'B' 3,674 142,763 0.03Monster Beverage 7,125 471,149 0.09PepsiCo 26,699 2,862,105 0.56
7,166,946 1.40Food & Staples Retailing 1.30% (1.44%)Costco Wholesale 8,470 2,425,947 0.47Kroger 15,166 420,470 0.08Sysco 10,209 574,503 0.11Walgreens Boots Alliance 14,349 546,455 0.11Walmart 26,564 2,711,684 0.53
6,679,059 1.30Food Products 0.92% (0.98%)Archer-Daniels-Midland 11,082 486,053 0.09Campbell Soup 4,178 137,850 0.03Conagra Brands 9,559 251,664 0.05General Mills 12,253 540,074 0.11Hershey 2,855 359,952 0.07Hormel Foods 5,071 175,280 0.03J M Smucker 2,389 223,967 0.04Kellogg 4,814 224,173 0.04Kraft Heinz 13,031 384,671 0.07Lamb Weston Holdings 2,629 153,464 0.03McCormick, (Non-Voting) 4,773 304,979 0.06Mondelez International 'A' 26,718 1,207,624 0.24Tyson Foods 'A' 5,437 290,259 0.06
4,740,010 0.92Household Products 1.34% (1.60%)Church & Dwight 4,854 299,438 0.06Clorox 2,515 327,554 0.06Colgate-Palmolive 15,929 937,556 0.18Kimberly-Clark 6,776 655,846 0.13Procter & Gamble 47,614 4,649,900 0.91
6,870,294 1.34Personal Products 0.20% (0.19%)Estee Lauder 'A' 4,390 1,010,102 0.20
1,010,102 0.20Tobacco 0.65% (0.65%)Altria Group 35,197 1,214,551 0.23Philip Morris International 30,004 2,152,156 0.42
3,366,707 0.65Consumer Staples total 29,833,118 5.81
Energy 2.85% (2.28%)Energy Equipment & Services 0.24% (0.22%)Baker Hughes 14,224 235,376 0.04Halliburton 17,961 300,466 0.06NOV 7,411 82,187 0.02Schlumberger 25,997 602,196 0.12
1,220,225 0.24Oil, Gas & Consumable Fuels 2.61% (2.06%)APA 8,559 133,950 0.02Cabot Oil & Gas 9,429 119,172 0.02Chevron 37,709 2,857,962 0.56ConocoPhillips 25,531 1,125,512 0.22Devon Energy 11,862 250,644 0.05Diamondback Energy 3,870 262,912 0.05EOG Resources 11,670 704,872 0.14Exxon Mobil 81,341 3,712,440 0.72Hess 5,384 340,317 0.07Kinder Morgan 38,630 509,772 0.10Marathon Oil 14,971 147,602 0.03Marathon Petroleum 11,762 514,345 0.10Occidental Petroleum 16,683 377,510 0.07ONEOK 8,895 358,195 0.07Phillips 66 8,805 546,930 0.11
73
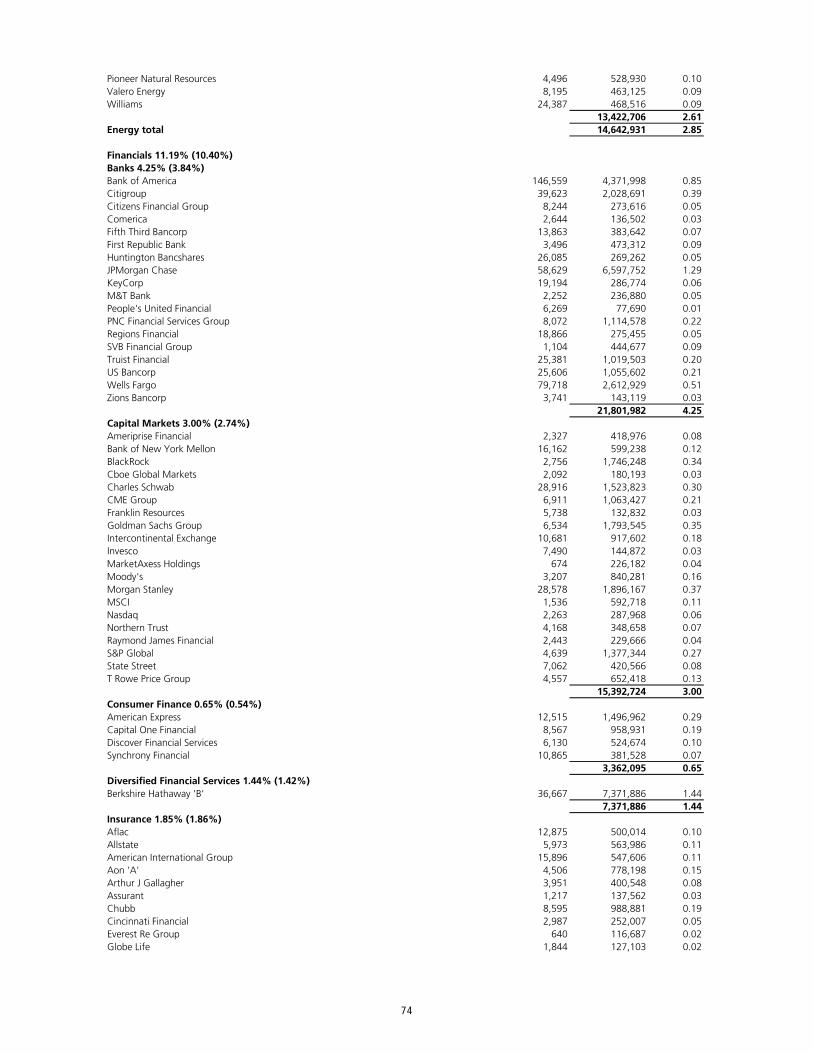
Pioneer Natural Resources 4,496 528,930 0.10Valero Energy 8,195 463,125 0.09Williams 24,387 468,516 0.09
13,422,706 2.61Energy total 14,642,931 2.85
Financials 11.19% (10.40%)Banks 4.25% (3.84%)Bank of America 146,559 4,371,998 0.85Citigroup 39,623 2,028,691 0.39Citizens Financial Group 8,244 273,616 0.05Comerica 2,644 136,502 0.03Fifth Third Bancorp 13,863 383,642 0.07First Republic Bank 3,496 473,312 0.09Huntington Bancshares 26,085 269,262 0.05JPMorgan Chase 58,629 6,597,752 1.29KeyCorp 19,194 286,774 0.06M&T Bank 2,252 236,880 0.05People's United Financial 6,269 77,690 0.01PNC Financial Services Group 8,072 1,114,578 0.22Regions Financial 18,866 275,455 0.05SVB Financial Group 1,104 444,677 0.09Truist Financial 25,381 1,019,503 0.20US Bancorp 25,606 1,055,602 0.21Wells Fargo 79,718 2,612,929 0.51Zions Bancorp 3,741 143,119 0.03
21,801,982 4.25Capital Markets 3.00% (2.74%)Ameriprise Financial 2,327 418,976 0.08Bank of New York Mellon 16,162 599,238 0.12BlackRock 2,756 1,746,248 0.34Cboe Global Markets 2,092 180,193 0.03Charles Schwab 28,916 1,523,823 0.30CME Group 6,911 1,063,427 0.21Franklin Resources 5,738 132,832 0.03Goldman Sachs Group 6,534 1,793,545 0.35Intercontinental Exchange 10,681 917,602 0.18Invesco 7,490 144,872 0.03MarketAxess Holdings 674 226,182 0.04Moody's 3,207 840,281 0.16Morgan Stanley 28,578 1,896,167 0.37MSCI 1,536 592,718 0.11Nasdaq 2,263 287,968 0.06Northern Trust 4,168 348,658 0.07Raymond James Financial 2,443 229,666 0.04S&P Global 4,639 1,377,344 0.27State Street 7,062 420,566 0.08T Rowe Price Group 4,557 652,418 0.13
15,392,724 3.00Consumer Finance 0.65% (0.54%)American Express 12,515 1,496,962 0.29Capital One Financial 8,567 958,931 0.19Discover Financial Services 6,130 524,674 0.10Synchrony Financial 10,865 381,528 0.07
3,362,095 0.65Diversified Financial Services 1.44% (1.42%)Berkshire Hathaway 'B' 36,667 7,371,886 1.44
7,371,886 1.44Insurance 1.85% (1.86%)Aflac 12,875 500,014 0.10Allstate 5,973 563,986 0.11American International Group 15,896 547,606 0.11Aon 'A' 4,506 778,198 0.15Arthur J Gallagher 3,951 400,548 0.08Assurant 1,217 137,562 0.03Chubb 8,595 988,881 0.19Cincinnati Financial 2,987 252,007 0.05Everest Re Group 640 116,687 0.02Globe Life 1,844 127,103 0.02
74
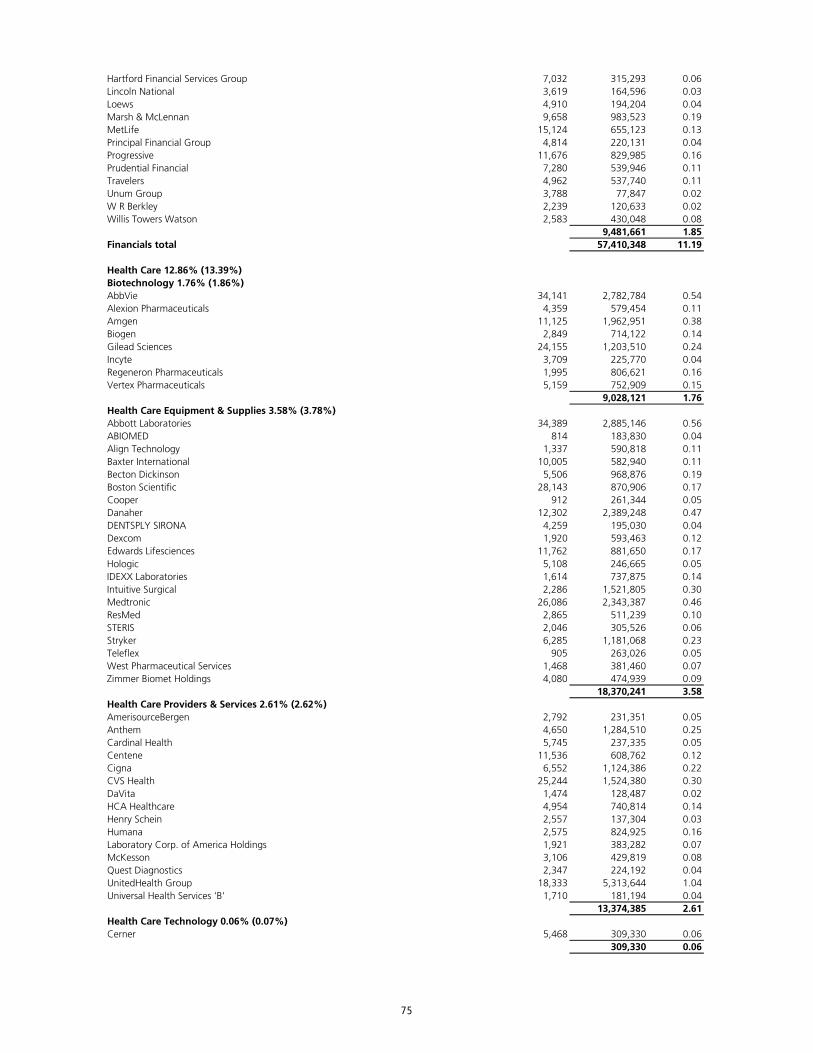
Hartford Financial Services Group 7,032 315,293 0.06Lincoln National 3,619 164,596 0.03Loews 4,910 194,204 0.04Marsh & McLennan 9,658 983,523 0.19MetLife 15,124 655,123 0.13Principal Financial Group 4,814 220,131 0.04Progressive 11,676 829,985 0.16Prudential Financial 7,280 539,946 0.11Travelers 4,962 537,740 0.11Unum Group 3,788 77,847 0.02W R Berkley 2,239 120,633 0.02Willis Towers Watson 2,583 430,048 0.08
9,481,661 1.85Financials total 57,410,348 11.19
Health Care 12.86% (13.39%)Biotechnology 1.76% (1.86%)AbbVie 34,141 2,782,784 0.54Alexion Pharmaceuticals 4,359 579,454 0.11Amgen 11,125 1,962,951 0.38Biogen 2,849 714,122 0.14Gilead Sciences 24,155 1,203,510 0.24Incyte 3,709 225,770 0.04Regeneron Pharmaceuticals 1,995 806,621 0.16Vertex Pharmaceuticals 5,159 752,909 0.15
9,028,121 1.76Health Care Equipment & Supplies 3.58% (3.78%)Abbott Laboratories 34,389 2,885,146 0.56ABIOMED 814 183,830 0.04Align Technology 1,337 590,818 0.11Baxter International 10,005 582,940 0.11Becton Dickinson 5,506 968,876 0.19Boston Scientific 28,143 870,906 0.17Cooper 912 261,344 0.05Danaher 12,302 2,389,248 0.47DENTSPLY SIRONA 4,259 195,030 0.04Dexcom 1,920 593,463 0.12Edwards Lifesciences 11,762 881,650 0.17Hologic 5,108 246,665 0.05IDEXX Laboratories 1,614 737,875 0.14Intuitive Surgical 2,286 1,521,805 0.30Medtronic 26,086 2,343,387 0.46ResMed 2,865 511,239 0.10STERIS 2,046 305,526 0.06Stryker 6,285 1,181,068 0.23Teleflex 905 263,026 0.05West Pharmaceutical Services 1,468 381,460 0.07Zimmer Biomet Holdings 4,080 474,939 0.09
18,370,241 3.58Health Care Providers & Services 2.61% (2.62%)AmerisourceBergen 2,792 231,351 0.05Anthem 4,650 1,284,510 0.25Cardinal Health 5,745 237,335 0.05Centene 11,536 608,762 0.12Cigna 6,552 1,124,386 0.22CVS Health 25,244 1,524,380 0.30DaVita 1,474 128,487 0.02HCA Healthcare 4,954 740,814 0.14Henry Schein 2,557 137,304 0.03Humana 2,575 824,925 0.16Laboratory Corp. of America Holdings 1,921 383,282 0.07McKesson 3,106 429,819 0.08Quest Diagnostics 2,347 224,192 0.04UnitedHealth Group 18,333 5,313,644 1.04Universal Health Services 'B' 1,710 181,194 0.04
13,374,385 2.61Health Care Technology 0.06% (0.07%)Cerner 5,468 309,330 0.06
309,330 0.06
75
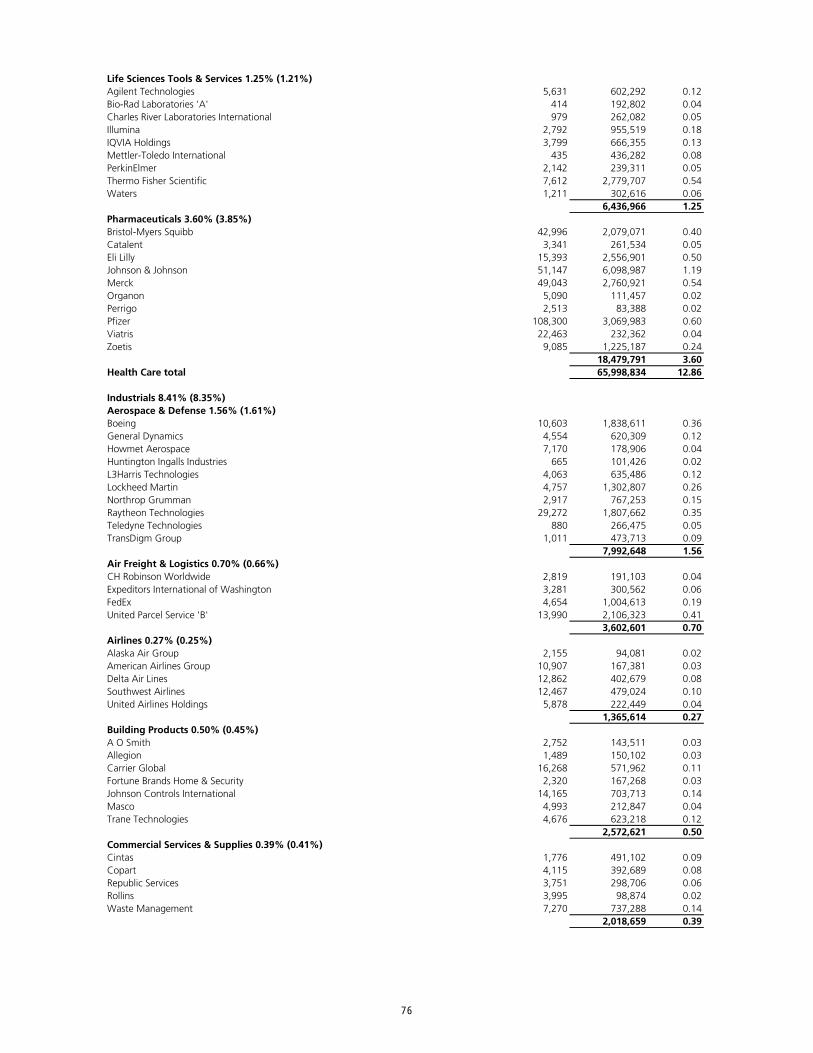
Life Sciences Tools & Services 1.25% (1.21%)Agilent Technologies 5,631 602,292 0.12Bio-Rad Laboratories 'A' 414 192,802 0.04Charles River Laboratories International 979 262,082 0.05Illumina 2,792 955,519 0.18IQVIA Holdings 3,799 666,355 0.13Mettler-Toledo International 435 436,282 0.08PerkinElmer 2,142 239,311 0.05Thermo Fisher Scientific 7,612 2,779,707 0.54Waters 1,211 302,616 0.06
6,436,966 1.25Pharmaceuticals 3.60% (3.85%)Bristol-Myers Squibb 42,996 2,079,071 0.40Catalent 3,341 261,534 0.05Eli Lilly 15,393 2,556,901 0.50Johnson & Johnson 51,147 6,098,987 1.19Merck 49,043 2,760,921 0.54Organon 5,090 111,457 0.02Perrigo 2,513 83,388 0.02Pfizer 108,300 3,069,983 0.60Viatris 22,463 232,362 0.04Zoetis 9,085 1,225,187 0.24
18,479,791 3.60Health Care total 65,998,834 12.86
Industrials 8.41% (8.35%)Aerospace & Defense 1.56% (1.61%)Boeing 10,603 1,838,611 0.36General Dynamics 4,554 620,309 0.12Howmet Aerospace 7,170 178,906 0.04Huntington Ingalls Industries 665 101,426 0.02L3Harris Technologies 4,063 635,486 0.12Lockheed Martin 4,757 1,302,807 0.26Northrop Grumman 2,917 767,253 0.15Raytheon Technologies 29,272 1,807,662 0.35Teledyne Technologies 880 266,475 0.05TransDigm Group 1,011 473,713 0.09
7,992,648 1.56Air Freight & Logistics 0.70% (0.66%)CH Robinson Worldwide 2,819 191,103 0.04Expeditors International of Washington 3,281 300,562 0.06FedEx 4,654 1,004,613 0.19United Parcel Service 'B' 13,990 2,106,323 0.41
3,602,601 0.70Airlines 0.27% (0.25%)Alaska Air Group 2,155 94,081 0.02American Airlines Group 10,907 167,381 0.03Delta Air Lines 12,862 402,679 0.08Southwest Airlines 12,467 479,024 0.10United Airlines Holdings 5,878 222,449 0.04
1,365,614 0.27Building Products 0.50% (0.45%)A O Smith 2,752 143,511 0.03Allegion 1,489 150,102 0.03Carrier Global 16,268 571,962 0.11Fortune Brands Home & Security 2,320 167,268 0.03Johnson Controls International 14,165 703,713 0.14Masco 4,993 212,847 0.04Trane Technologies 4,676 623,218 0.12
2,572,621 0.50Commercial Services & Supplies 0.39% (0.41%)Cintas 1,776 491,102 0.09Copart 4,115 392,689 0.08Republic Services 3,751 298,706 0.06Rollins 3,995 98,874 0.02Waste Management 7,270 737,288 0.14
2,018,659 0.39
76
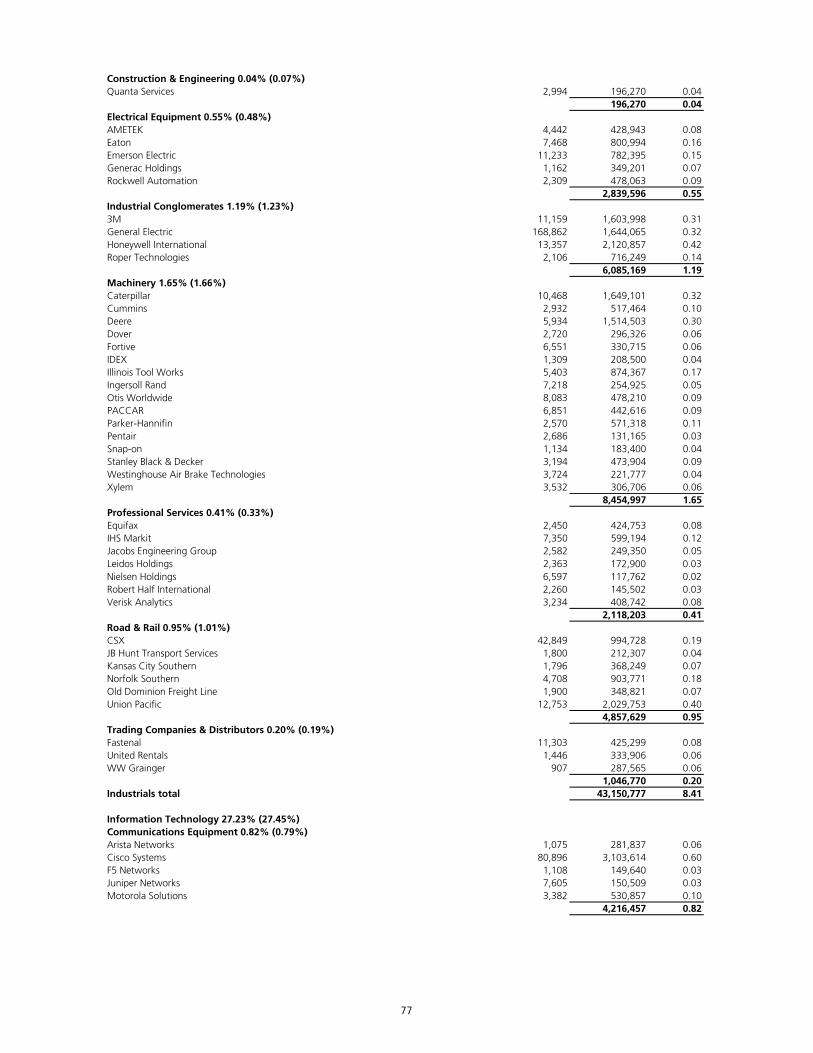
Construction & Engineering 0.04% (0.07%)Quanta Services 2,994 196,270 0.04
196,270 0.04Electrical Equipment 0.55% (0.48%)AMETEK 4,442 428,943 0.08Eaton 7,468 800,994 0.16Emerson Electric 11,233 782,395 0.15Generac Holdings 1,162 349,201 0.07Rockwell Automation 2,309 478,063 0.09
2,839,596 0.55Industrial Conglomerates 1.19% (1.23%)3M 11,159 1,603,998 0.31General Electric 168,862 1,644,065 0.32Honeywell International 13,357 2,120,857 0.42Roper Technologies 2,106 716,249 0.14
6,085,169 1.19Machinery 1.65% (1.66%)Caterpillar 10,468 1,649,101 0.32Cummins 2,932 517,464 0.10Deere 5,934 1,514,503 0.30Dover 2,720 296,326 0.06Fortive 6,551 330,715 0.06IDEX 1,309 208,500 0.04Illinois Tool Works 5,403 874,367 0.17Ingersoll Rand 7,218 254,925 0.05Otis Worldwide 8,083 478,210 0.09PACCAR 6,851 442,616 0.09Parker-Hannifin 2,570 571,318 0.11Pentair 2,686 131,165 0.03Snap-on 1,134 183,400 0.04Stanley Black & Decker 3,194 473,904 0.09Westinghouse Air Brake Technologies 3,724 221,777 0.04Xylem 3,532 306,706 0.06
8,454,997 1.65Professional Services 0.41% (0.33%)Equifax 2,450 424,753 0.08IHS Markit 7,350 599,194 0.12Jacobs Engineering Group 2,582 249,350 0.05Leidos Holdings 2,363 172,900 0.03Nielsen Holdings 6,597 117,762 0.02Robert Half International 2,260 145,502 0.03Verisk Analytics 3,234 408,742 0.08
2,118,203 0.41Road & Rail 0.95% (1.01%)CSX 42,849 994,728 0.19JB Hunt Transport Services 1,800 212,307 0.04Kansas City Southern 1,796 368,249 0.07Norfolk Southern 4,708 903,771 0.18Old Dominion Freight Line 1,900 348,821 0.07Union Pacific 12,753 2,029,753 0.40
4,857,629 0.95Trading Companies & Distributors 0.20% (0.19%)Fastenal 11,303 425,299 0.08United Rentals 1,446 333,906 0.06WW Grainger 907 287,565 0.06
1,046,770 0.20Industrials total 43,150,777 8.41
Information Technology 27.23% (27.45%)Communications Equipment 0.82% (0.79%)Arista Networks 1,075 281,837 0.06Cisco Systems 80,896 3,103,614 0.60F5 Networks 1,108 149,640 0.03Juniper Networks 7,605 150,509 0.03Motorola Solutions 3,382 530,857 0.10
4,216,457 0.82
77
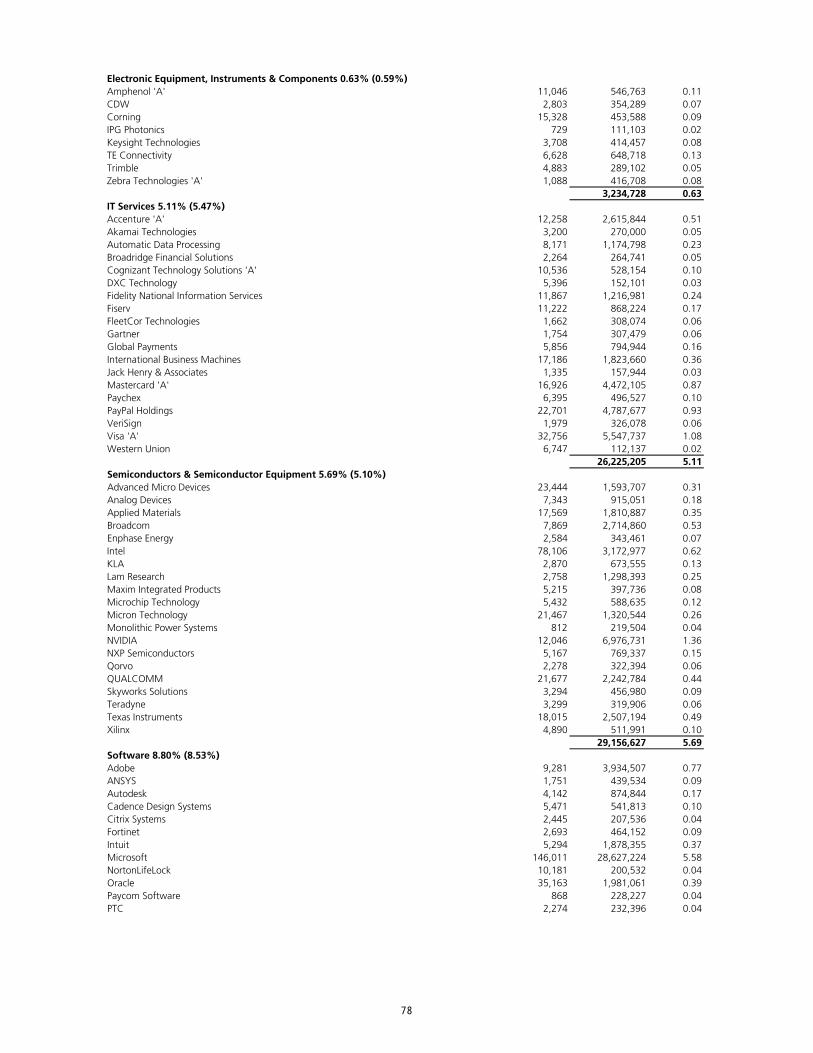
Electronic Equipment, Instruments & Components 0.63% (0.59%)Amphenol 'A' 11,046 546,763 0.11CDW 2,803 354,289 0.07Corning 15,328 453,588 0.09IPG Photonics 729 111,103 0.02Keysight Technologies 3,708 414,457 0.08TE Connectivity 6,628 648,718 0.13Trimble 4,883 289,102 0.05Zebra Technologies 'A' 1,088 416,708 0.08
3,234,728 0.63IT Services 5.11% (5.47%)Accenture 'A' 12,258 2,615,844 0.51Akamai Technologies 3,200 270,000 0.05Automatic Data Processing 8,171 1,174,798 0.23Broadridge Financial Solutions 2,264 264,741 0.05Cognizant Technology Solutions 'A' 10,536 528,154 0.10DXC Technology 5,396 152,101 0.03Fidelity National Information Services 11,867 1,216,981 0.24Fiserv 11,222 868,224 0.17FleetCor Technologies 1,662 308,074 0.06Gartner 1,754 307,479 0.06Global Payments 5,856 794,944 0.16International Business Machines 17,186 1,823,660 0.36Jack Henry & Associates 1,335 157,944 0.03Mastercard 'A' 16,926 4,472,105 0.87Paychex 6,395 496,527 0.10PayPal Holdings 22,701 4,787,677 0.93VeriSign 1,979 326,078 0.06Visa 'A' 32,756 5,547,737 1.08Western Union 6,747 112,137 0.02
26,225,205 5.11Semiconductors & Semiconductor Equipment 5.69% (5.10%)Advanced Micro Devices 23,444 1,593,707 0.31Analog Devices 7,343 915,051 0.18Applied Materials 17,569 1,810,887 0.35Broadcom 7,869 2,714,860 0.53Enphase Energy 2,584 343,461 0.07Intel 78,106 3,172,977 0.62KLA 2,870 673,555 0.13Lam Research 2,758 1,298,393 0.25Maxim Integrated Products 5,215 397,736 0.08Microchip Technology 5,432 588,635 0.12Micron Technology 21,467 1,320,544 0.26Monolithic Power Systems 812 219,504 0.04NVIDIA 12,046 6,976,731 1.36NXP Semiconductors 5,167 769,337 0.15Qorvo 2,278 322,394 0.06QUALCOMM 21,677 2,242,784 0.44Skyworks Solutions 3,294 456,980 0.09Teradyne 3,299 319,906 0.06Texas Instruments 18,015 2,507,194 0.49Xilinx 4,890 511,991 0.10
29,156,627 5.69Software 8.80% (8.53%)Adobe 9,281 3,934,507 0.77ANSYS 1,751 439,534 0.09Autodesk 4,142 874,844 0.17Cadence Design Systems 5,471 541,813 0.10Citrix Systems 2,445 207,536 0.04Fortinet 2,693 464,152 0.09Intuit 5,294 1,878,355 0.37Microsoft 146,011 28,627,224 5.58NortonLifeLock 10,181 200,532 0.04Oracle 35,163 1,981,061 0.39Paycom Software 868 228,227 0.04PTC 2,274 232,396 0.04
78
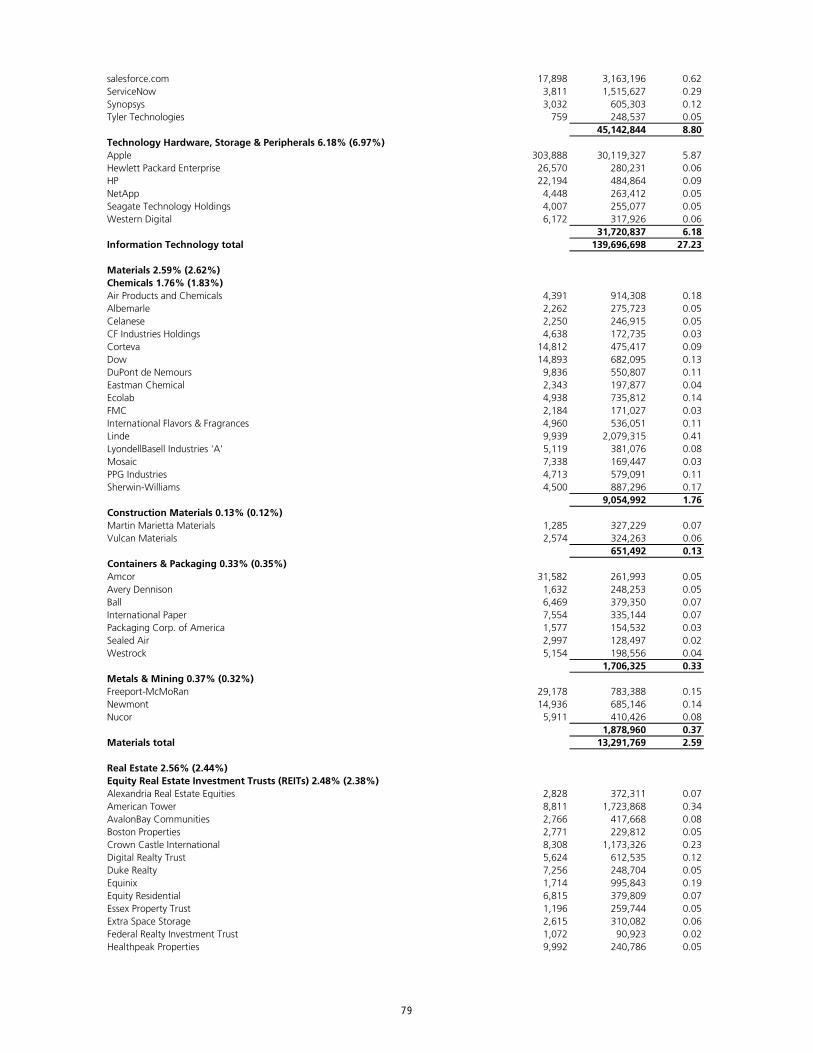
salesforce.com 17,898 3,163,196 0.62ServiceNow 3,811 1,515,627 0.29Synopsys 3,032 605,303 0.12Tyler Technologies 759 248,537 0.05
45,142,844 8.80Technology Hardware, Storage & Peripherals 6.18% (6.97%)Apple 303,888 30,119,327 5.87Hewlett Packard Enterprise 26,570 280,231 0.06HP 22,194 484,864 0.09NetApp 4,448 263,412 0.05Seagate Technology Holdings 4,007 255,077 0.05Western Digital 6,172 317,926 0.06
31,720,837 6.18Information Technology total 139,696,698 27.23
Materials 2.59% (2.62%)Chemicals 1.76% (1.83%)Air Products and Chemicals 4,391 914,308 0.18Albemarle 2,262 275,723 0.05Celanese 2,250 246,915 0.05CF Industries Holdings 4,638 172,735 0.03Corteva 14,812 475,417 0.09Dow 14,893 682,095 0.13DuPont de Nemours 9,836 550,807 0.11Eastman Chemical 2,343 197,877 0.04Ecolab 4,938 735,812 0.14FMC 2,184 171,027 0.03International Flavors & Fragrances 4,960 536,051 0.11Linde 9,939 2,079,315 0.41LyondellBasell Industries 'A' 5,119 381,076 0.08Mosaic 7,338 169,447 0.03PPG Industries 4,713 579,091 0.11Sherwin-Williams 4,500 887,296 0.17
9,054,992 1.76Construction Materials 0.13% (0.12%)Martin Marietta Materials 1,285 327,229 0.07Vulcan Materials 2,574 324,263 0.06
651,492 0.13Containers & Packaging 0.33% (0.35%)Amcor 31,582 261,993 0.05Avery Dennison 1,632 248,253 0.05Ball 6,469 379,350 0.07International Paper 7,554 335,144 0.07Packaging Corp. of America 1,577 154,532 0.03Sealed Air 2,997 128,497 0.02Westrock 5,154 198,556 0.04
1,706,325 0.33Metals & Mining 0.37% (0.32%)Freeport-McMoRan 29,178 783,388 0.15Newmont 14,936 685,146 0.14Nucor 5,911 410,426 0.08
1,878,960 0.37Materials total 13,291,769 2.59
Real Estate 2.56% (2.44%)Equity Real Estate Investment Trusts (REITs) 2.48% (2.38%)Alexandria Real Estate Equities 2,828 372,311 0.07American Tower 8,811 1,723,868 0.34AvalonBay Communities 2,766 417,668 0.08Boston Properties 2,771 229,812 0.05Crown Castle International 8,308 1,173,326 0.23Digital Realty Trust 5,624 612,535 0.12Duke Realty 7,256 248,704 0.05Equinix 1,714 995,843 0.19Equity Residential 6,815 379,809 0.07Essex Property Trust 1,196 259,744 0.05Extra Space Storage 2,615 310,082 0.06Federal Realty Investment Trust 1,072 90,923 0.02Healthpeak Properties 9,992 240,786 0.05
79
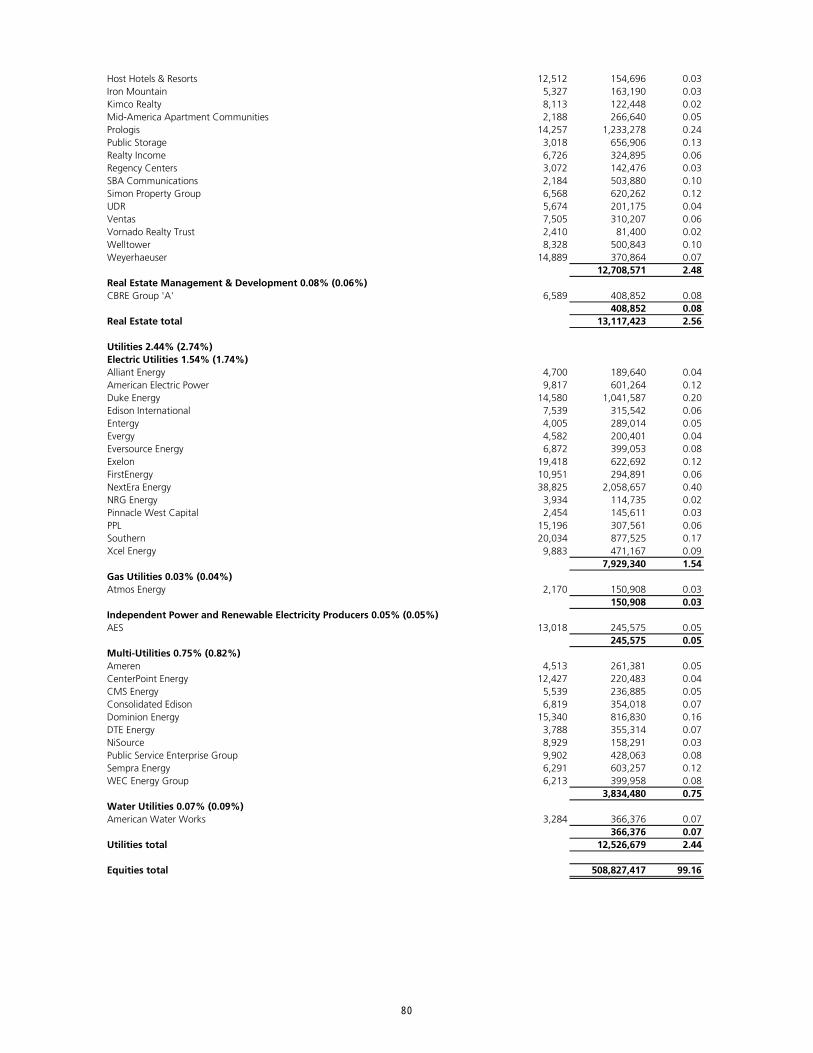
Host Hotels & Resorts 12,512 154,696 0.03Iron Mountain 5,327 163,190 0.03Kimco Realty 8,113 122,448 0.02Mid-America Apartment Communities 2,188 266,640 0.05Prologis 14,257 1,233,278 0.24Public Storage 3,018 656,906 0.13Realty Income 6,726 324,895 0.06Regency Centers 3,072 142,476 0.03SBA Communications 2,184 503,880 0.10Simon Property Group 6,568 620,262 0.12UDR 5,674 201,175 0.04Ventas 7,505 310,207 0.06Vornado Realty Trust 2,410 81,400 0.02Welltower 8,328 500,843 0.10Weyerhaeuser 14,889 370,864 0.07
12,708,571 2.48Real Estate Management & Development 0.08% (0.06%)CBRE Group 'A' 6,589 408,852 0.08
408,852 0.08Real Estate total 13,117,423 2.56
Utilities 2.44% (2.74%)Electric Utilities 1.54% (1.74%)Alliant Energy 4,700 189,640 0.04American Electric Power 9,817 601,264 0.12Duke Energy 14,580 1,041,587 0.20Edison International 7,539 315,542 0.06Entergy 4,005 289,014 0.05Evergy 4,582 200,401 0.04Eversource Energy 6,872 399,053 0.08Exelon 19,418 622,692 0.12FirstEnergy 10,951 294,891 0.06NextEra Energy 38,825 2,058,657 0.40NRG Energy 3,934 114,735 0.02Pinnacle West Capital 2,454 145,611 0.03PPL 15,196 307,561 0.06Southern 20,034 877,525 0.17Xcel Energy 9,883 471,167 0.09
7,929,340 1.54Gas Utilities 0.03% (0.04%)Atmos Energy 2,170 150,908 0.03
150,908 0.03Independent Power and Renewable Electricity Producers 0.05% (0.05%)AES 13,018 245,575 0.05
245,575 0.05Multi-Utilities 0.75% (0.82%)Ameren 4,513 261,381 0.05CenterPoint Energy 12,427 220,483 0.04CMS Energy 5,539 236,885 0.05Consolidated Edison 6,819 354,018 0.07Dominion Energy 15,340 816,830 0.16DTE Energy 3,788 355,314 0.07NiSource 8,929 158,291 0.03Public Service Enterprise Group 9,902 428,063 0.08Sempra Energy 6,291 603,257 0.12WEC Energy Group 6,213 399,958 0.08
3,834,480 0.75Water Utilities 0.07% (0.09%)American Water Works 3,284 366,376 0.07
366,376 0.07Utilities total 12,526,679 2.44
Equities total 508,827,417 99.16
80
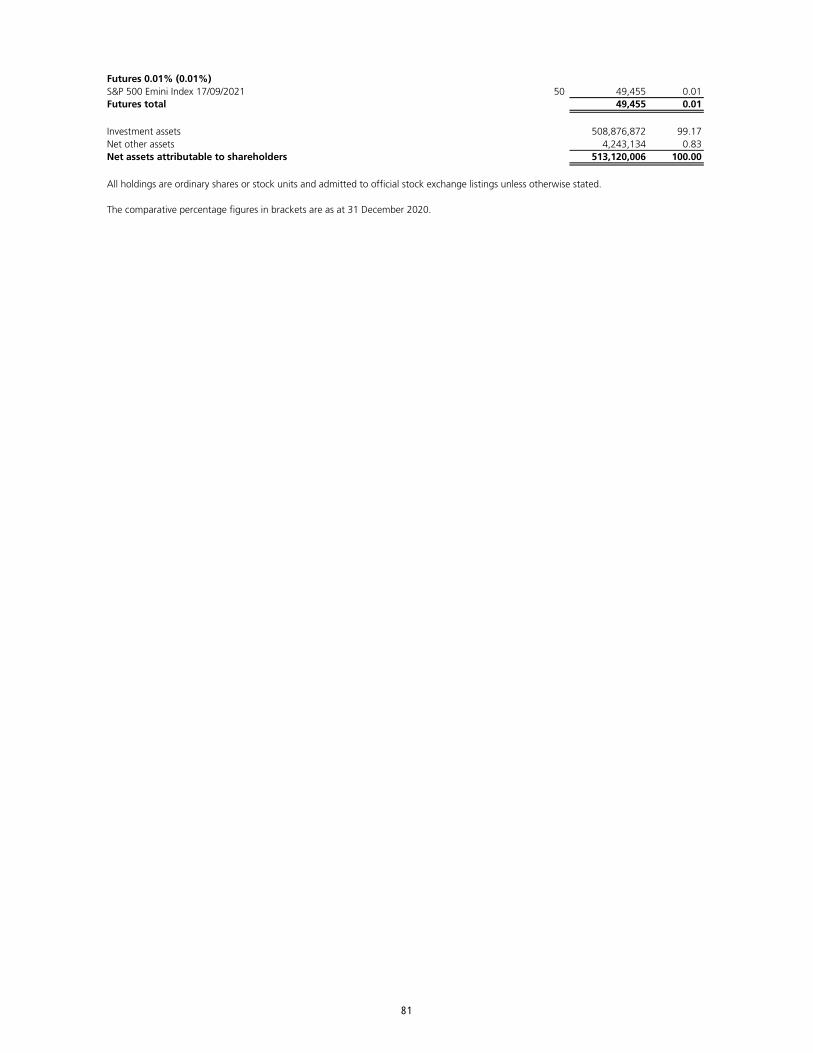
Futures 0.01% (0.01%)S&P 500 Emini Index 17/09/2021 50 49,455 0.01Futures total 49,455 0.01
Investment assets 508,876,872 99.17Net other assets 4,243,134 0.83Net assets attributable to shareholders 513,120,006 100.00
All holdings are ordinary shares or stock units and admitted to official stock exchange listings unless otherwise stated.
The comparative percentage figures in brackets are as at 31 December 2020.
81
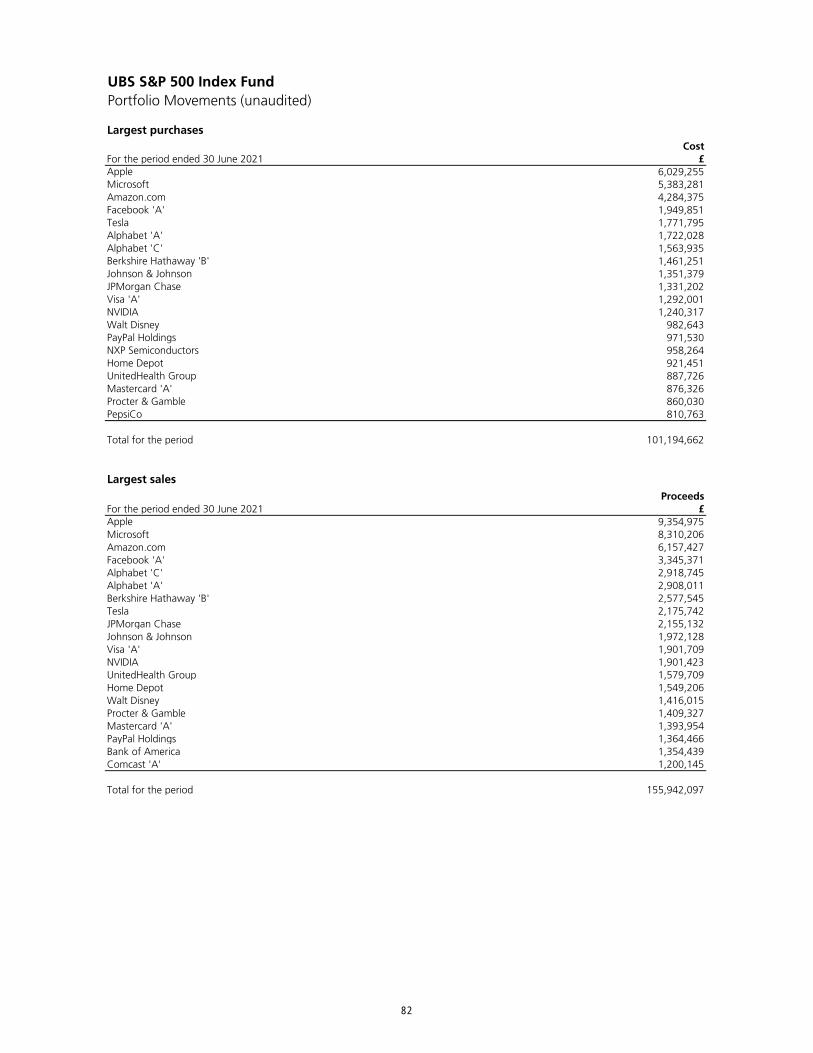
UBS S&P 500 Index FundPortfolio Movements (unaudited)
Largest purchasesCost
For the period ended 30 June 2021 £6,029,2555,383,2814,284,3751,949,8511,771,7951,722,0281,563,9351,461,2511,351,3791,331,2021,292,0011,240,317
982,643971,530958,264921,451887,726876,326860,030810,763
Total for the period 101,194,662
Largest salesProceeds
For the period ended 30 June 2021 £9,354,975
Microsoft 8,310,206Amazon.com 6,157,427Facebook 'A' 3,345,371Alphabet 'C' 2,918,745Alphabet 'A' 2,908,011Berkshire Hathaway 'B' 2,577,545Tesla 2,175,742JPMorgan Chase 2,155,132Johnson & Johnson 1,972,128Visa 'A' 1,901,709NVIDIA 1,901,423UnitedHealth Group 1,579,709Home Depot 1,549,206Walt Disney 1,416,015Procter & Gamble 1,409,327Mastercard 'A' 1,393,954PayPal Holdings 1,364,466Bank of America 1,354,439Comcast 'A' 1,200,145
Total for the period 155,942,097
Procter & Gamble PepsiCo
Apple
Walt Disney PayPal Holdings NXP Semiconductors Home Depot UnitedHealth Group Mastercard 'A'
NVIDIA
Apple Microsoft Amazon.com Facebook 'A' Tesla Alphabet 'A' Alphabet 'C' Berkshire Hathaway 'B' Johnson & Johnson JPMorgan Chase Visa 'A'
82

UBS S&P 500 Index FundFinancial Statements (unaudited)
Statement of Total ReturnFor the period ended 30 June 2021
£ £ £ £Income Net capital gains 67,180,150 18,333,155 Revenue 3,934,733 5,125,166Expenses (256,136) (272,014)Net revenue before taxation 3,678,597 4,853,152Taxation (561,685) (767,049)Net revenue after taxation 3,116,912 4,086,103Total return before distributions 70,297,062 22,419,258Distributions (3,111,419) (4,087,176)Change in net assets attributable to shareholders from investment activities 67,185,643 18,332,082
Statement of Change in Net Assets Attributable to ShareholdersFor the period ended 30 June 2021
£ £ £ £499,353,218 589,811,375
Amounts receivable on issue of shares 170,765,533 121,986,882Amounts payable on cancellation of shares (225,399,457) (174,639,549)
(54,633,924) (52,652,667)Dilution adjustment 26,703 19,255
67,185,643 18,332,0821,188,366 795,646
513,120,006 556,305,691
shareholders from investment activities (see above)Retained distribution on accumulation sharesClosing net assets attributable to shareholders
As the comparatives are for the previous interim period, the net assets at the end of that period will not agree to the net assets at the start of the current period. The published net asset value as at 31 December 2020 was £499,353,218.
Change in net assets attributable to
30.06.21 30.06.20
30.06.21 30.06.20
Opening net assets attributable to shareholders
83
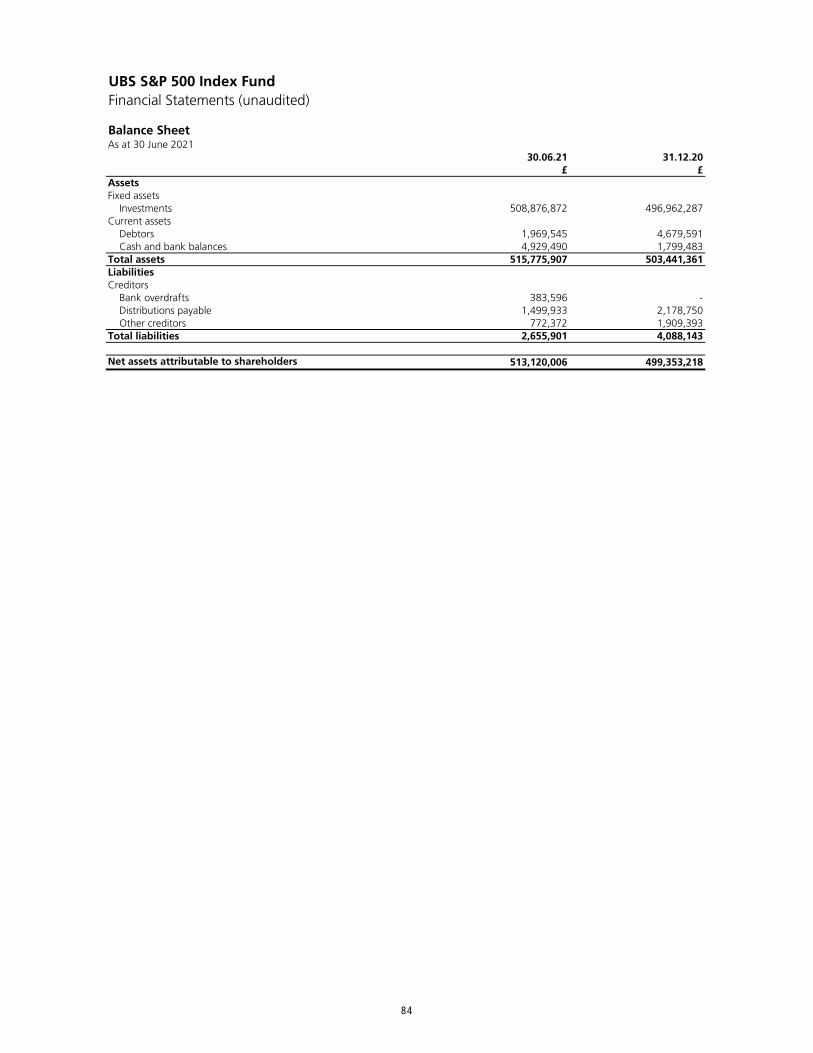
UBS S&P 500 Index FundFinancial Statements (unaudited)
Balance SheetAs at 30 June 2021
30.06.21 31.12.20£ £
AssetsFixed assets Investments 508,876,872 496,962,287Current assets Debtors 1,969,545 4,679,591 Cash and bank balances 4,929,490 1,799,483Total assets 515,775,907 503,441,361LiabilitiesCreditors Bank overdrafts 383,596 - Distributions payable 1,499,933 2,178,750 Other creditors 772,372 1,909,393Total liabilities 2,655,901 4,088,143
Net assets attributable to shareholders 513,120,006 499,353,218
84

UBS S&P 500 Index FundNotes to the Financial Statements (unaudited)
Accounting policiesThe interim financial statements have been prepared in accordance with the Statement of Recommended Practice (SORP) for Authorised Funds issued by the Investment Association (IA) in May 2014 (SORP 2014).
The accounting policies applied are consistent with those of the financial statements for the year ended 31 December 2020 and are described in those annual financial statements.
85

86
UBS Sterling Corporate Bond Indexed Fund
87
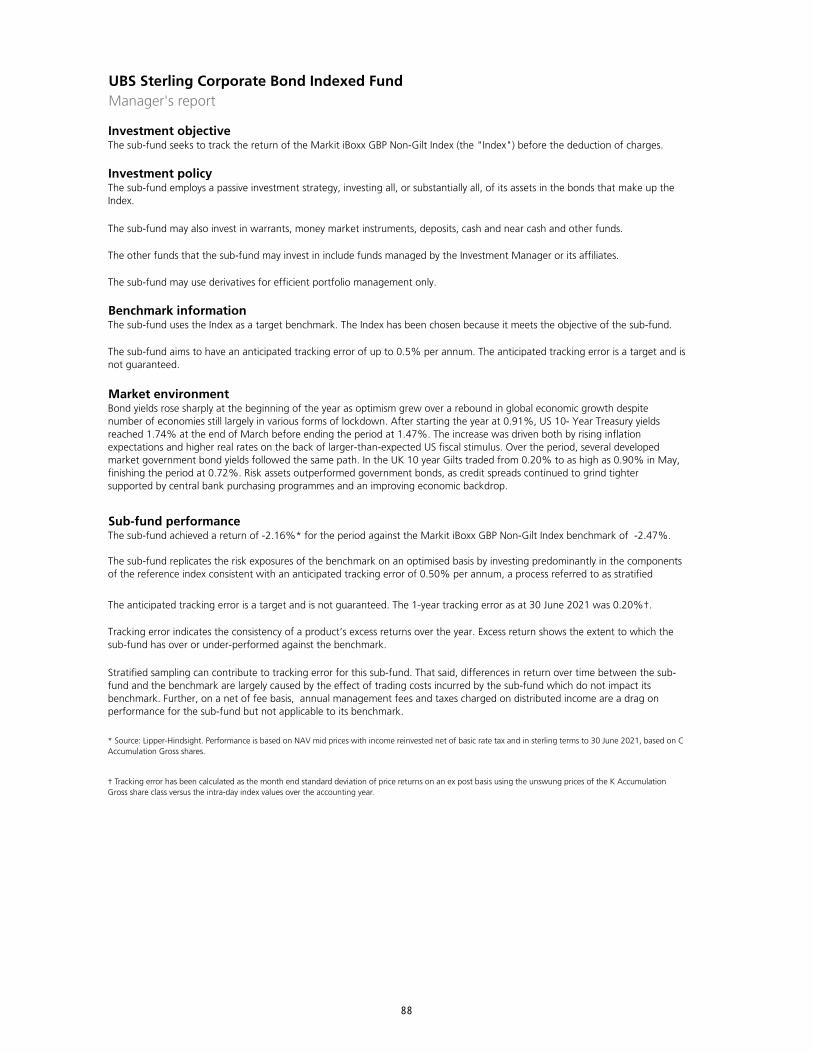
UBS Sterling Corporate Bond Indexed FundManager's report
Investment objective
Investment policy
Benchmark information
Market environment
Sub-fund performance
Tracking error indicates the consistency of a product’s excess returns over the year. Excess return shows the extent to which the sub-fund has over or under-performed against the benchmark.
Stratified sampling can contribute to tracking error for this sub-fund. That said, differences in return over time between the sub-fund and the benchmark are largely caused by the effect of trading costs incurred by the sub-fund which do not impact its benchmark. Further, on a net of fee basis, annual management fees and taxes charged on distributed income are a drag on performance for the sub-fund but not applicable to its benchmark.
* Source: Lipper-Hindsight. Performance is based on NAV mid prices with income reinvested net of basic rate tax and in sterling terms to 30 June 2021, based on C Accumulation Gross shares.
† Tracking error has been calculated as the month end standard deviation of price returns on an ex post basis using the unswung prices of the K Accumulation Gross share class versus the intra-day index values over the accounting year.
The anticipated tracking error is a target and is not guaranteed. The 1-year tracking error as at 30 June 2021 was 0.20%†.
The sub-fund seeks to track the return of the Markit iBoxx GBP Non-Gilt Index (the "Index") before the deduction of charges.
The sub-fund employs a passive investment strategy, investing all, or substantially all, of its assets in the bonds that make up the Index.
The sub-fund may also invest in warrants, money market instruments, deposits, cash and near cash and other funds.
The other funds that the sub-fund may invest in include funds managed by the Investment Manager or its affiliates.
The sub-fund may use derivatives for efficient portfolio management only.
The sub-fund uses the Index as a target benchmark. The Index has been chosen because it meets the objective of the sub-fund.
The sub-fund aims to have an anticipated tracking error of up to 0.5% per annum. The anticipated tracking error is a target and is not guaranteed.
Bond yields rose sharply at the beginning of the year as optimism grew over a rebound in global economic growth despite number of economies still largely in various forms of lockdown. After starting the year at 0.91%, US 10- Year Treasury yields reached 1.74% at the end of March before ending the period at 1.47%. The increase was driven both by rising inflation expectations and higher real rates on the back of larger-than-expected US fiscal stimulus. Over the period, several developed market government bond yields followed the same path. In the UK 10 year Gilts traded from 0.20% to as high as 0.90% in May, finishing the period at 0.72%. Risk assets outperformed government bonds, as credit spreads continued to grind tighter supported by central bank purchasing programmes and an improving economic backdrop.
The sub-fund achieved a return of -2.16%* for the period against the Markit iBoxx GBP Non-Gilt Index benchmark of -2.47%.
The sub-fund replicates the risk exposures of the benchmark on an optimised basis by investing predominantly in the components of the reference index consistent with an anticipated tracking error of 0.50% per annum, a process referred to as stratified
li
88
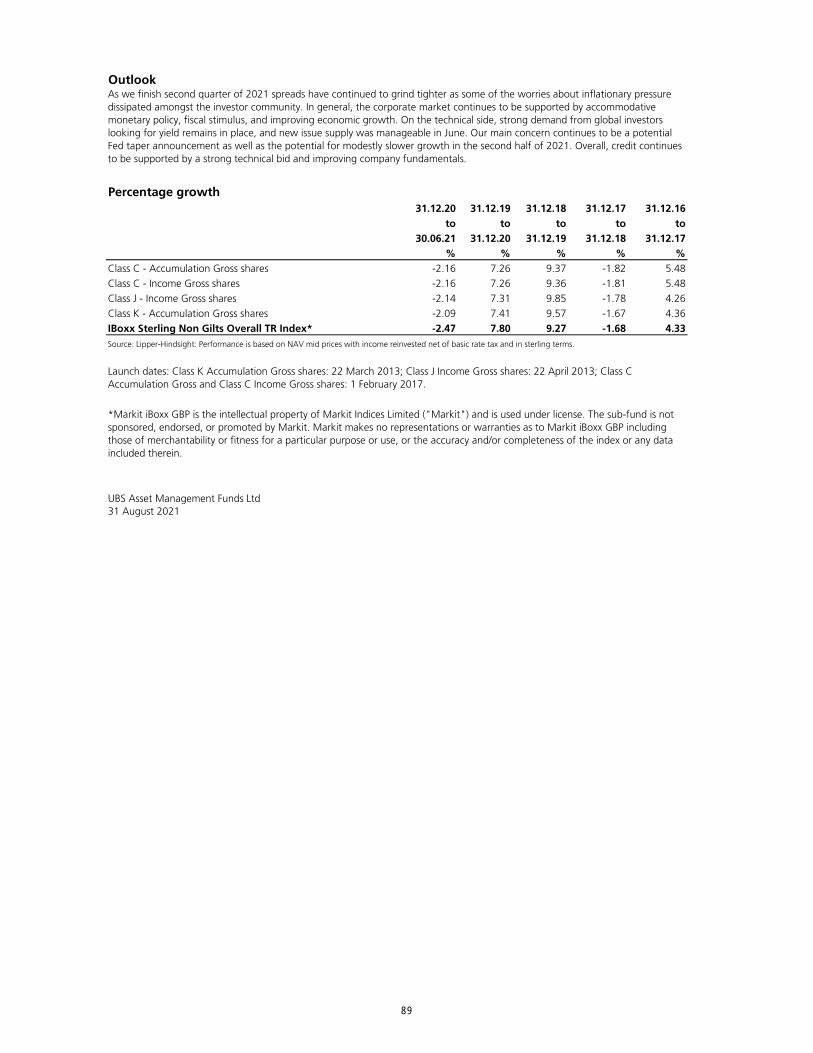
Outlook
Percentage growth31.12.20 31.12.19 31.12.18 31.12.17 31.12.16
to to to to to30.06.21 31.12.20 31.12.19 31.12.18 31.12.17
% % % % %Class C - Accumulation Gross shares -2.16 7.26 9.37 -1.82 5.48Class C - Income Gross shares -2.16 7.26 9.36 -1.81 5.48Class J - Income Gross shares -2.14 7.31 9.85 -1.78 4.26Class K - Accumulation Gross shares -2.09 7.41 9.57 -1.67 4.36IBoxx Sterling Non Gilts Overall TR Index* -2.47 7.80 9.27 -1.68 4.33Source: Lipper-Hindsight: Performance is based on NAV mid prices with income reinvested net of basic rate tax and in sterling terms.
UBS Asset Management Funds Ltd31 August 2021
*Markit iBoxx GBP is the intellectual property of Markit Indices Limited ("Markit") and is used under license. The sub-fund is not sponsored, endorsed, or promoted by Markit. Markit makes no representations or warranties as to Markit iBoxx GBP including those of merchantability or fitness for a particular purpose or use, or the accuracy and/or completeness of the index or any data included therein.
Launch dates: Class K Accumulation Gross shares: 22 March 2013; Class J Income Gross shares: 22 April 2013; Class C Accumulation Gross and Class C Income Gross shares: 1 February 2017.
As we finish second quarter of 2021 spreads have continued to grind tighter as some of the worries about inflationary pressure dissipated amongst the investor community. In general, the corporate market continues to be supported by accommodative monetary policy, fiscal stimulus, and improving economic growth. On the technical side, strong demand from global investors looking for yield remains in place, and new issue supply was manageable in June. Our main concern continues to be a potential Fed taper announcement as well as the potential for modestly slower growth in the second half of 2021. Overall, credit continues to be supported by a strong technical bid and improving company fundamentals.
89
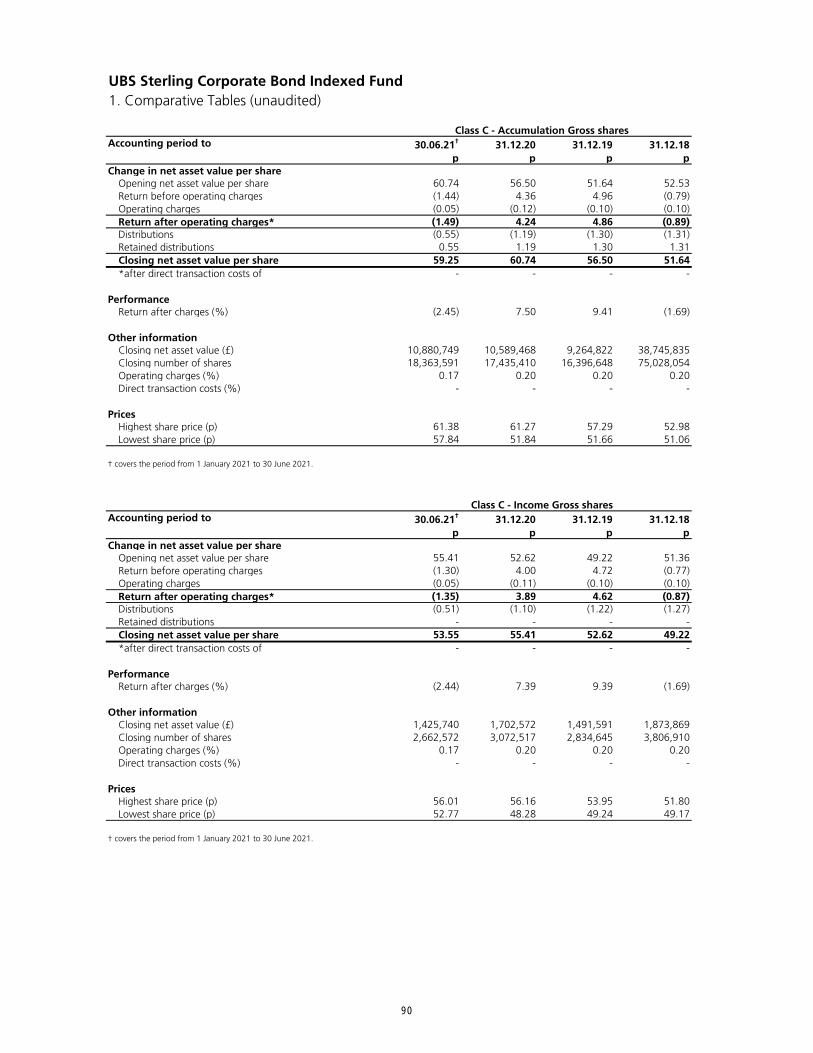
UBS Sterling Corporate Bond Indexed Fund1. Comparative Tables (unaudited)
Accounting period to 30.06.21† 31.12.20 31.12.19 31.12.18p p p p
Change in net asset value per shareOpening net asset value per share 60.74 56.50 51.64 52.53Return before operating charges (1.44) 4.36 4.96 (0.79)Operating charges (0.05) (0.12) (0.10) (0.10)Return after operating charges* (1.49) 4.24 4.86 (0.89)Distributions (0.55) (1.19) (1.30) (1.31)Retained distributions 0.55 1.19 1.30 1.31Closing net asset value per share 59.25 60.74 56.50 51.64*after direct transaction costs of - - - -
PerformanceReturn after charges (%) (2.45) 7.50 9.41 (1.69)
Other informationClosing net asset value (£) 10,880,749 10,589,468 9,264,822 38,745,835Closing number of shares 18,363,591 17,435,410 16,396,648 75,028,054Operating charges (%) 0.17 0.20 0.20 0.20Direct transaction costs (%) - - - -
PricesHighest share price (p) 61.38 61.27 57.29 52.98Lowest share price (p) 57.84 51.84 51.66 51.06
Accounting period to 30.06.21† 31.12.20 31.12.19 31.12.18p p p p
Change in net asset value per shareOpening net asset value per share 55.41 52.62 49.22 51.36Return before operating charges (1.30) 4.00 4.72 (0.77)Operating charges (0.05) (0.11) (0.10) (0.10)Return after operating charges* (1.35) 3.89 4.62 (0.87)Distributions (0.51) (1.10) (1.22) (1.27)Retained distributions - - - -Closing net asset value per share 53.55 55.41 52.62 49.22*after direct transaction costs of - - - -
PerformanceReturn after charges (%) (2.44) 7.39 9.39 (1.69)
Other informationClosing net asset value (£) 1,425,740 1,702,572 1,491,591 1,873,869Closing number of shares 2,662,572 3,072,517 2,834,645 3,806,910Operating charges (%) 0.17 0.20 0.20 0.20Direct transaction costs (%) - - - -
PricesHighest share price (p) 56.01 56.16 53.95 51.80Lowest share price (p) 52.77 48.28 49.24 49.17
† covers the period from 1 January 2021 to 30 June 2021.
Class C - Accumulation Gross shares
† covers the period from 1 January 2021 to 30 June 2021.
Class C - Income Gross shares
90
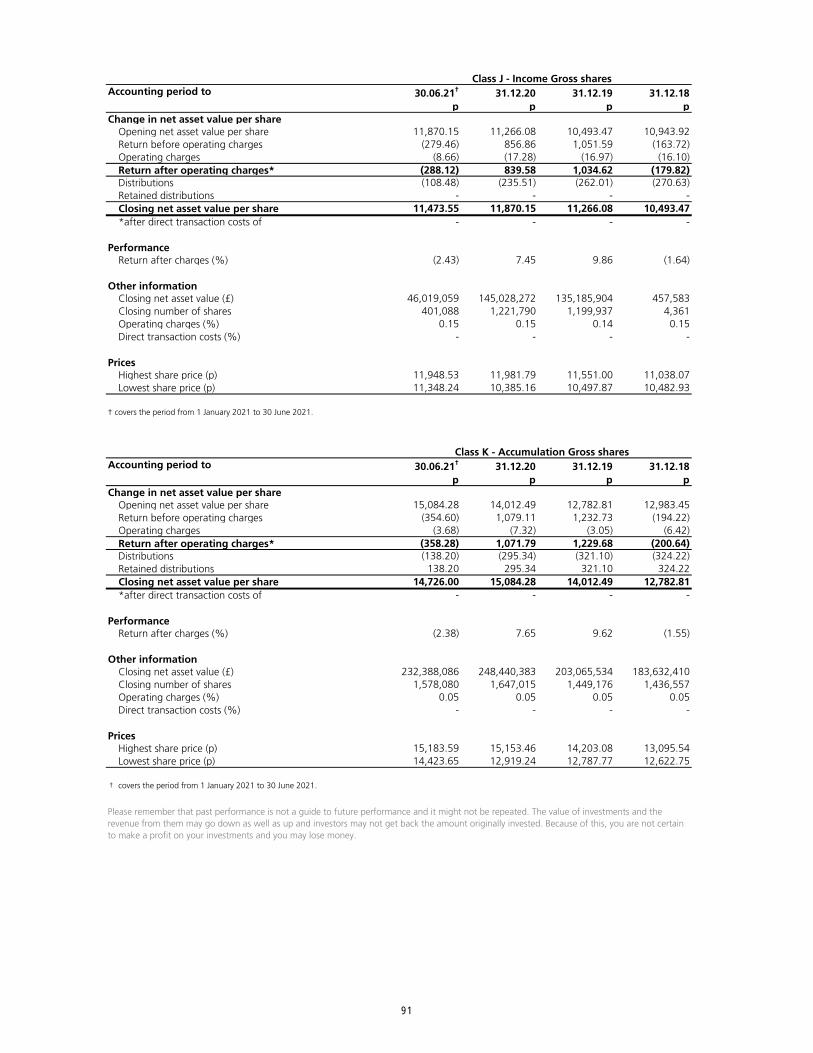
Accounting period to 30.06.21† 31.12.20 31.12.19 31.12.18p p p p
Change in net asset value per shareOpening net asset value per share 11,870.15 11,266.08 10,493.47 10,943.92Return before operating charges (279.46) 856.86 1,051.59 (163.72)Operating charges (8.66) (17.28) (16.97) (16.10)Return after operating charges* (288.12) 839.58 1,034.62 (179.82)Distributions (108.48) (235.51) (262.01) (270.63)Retained distributions - - - -Closing net asset value per share 11,473.55 11,870.15 11,266.08 10,493.47*after direct transaction costs of - - - -
PerformanceReturn after charges (%) (2.43) 7.45 9.86 (1.64)
Other informationClosing net asset value (£) 46,019,059 145,028,272 135,185,904 457,583Closing number of shares 401,088 1,221,790 1,199,937 4,361Operating charges (%) 0.15 0.15 0.14 0.15Direct transaction costs (%) - - - -
PricesHighest share price (p) 11,948.53 11,981.79 11,551.00 11,038.07Lowest share price (p) 11,348.24 10,385.16 10,497.87 10,482.93
† covers the period from 1 January 2021 to 30 June 2021.
Accounting period to 30.06.21† 31.12.20 31.12.19 31.12.18p p p p
Change in net asset value per shareOpening net asset value per share 15,084.28 14,012.49 12,782.81 12,983.45Return before operating charges (354.60) 1,079.11 1,232.73 (194.22)Operating charges (3.68) (7.32) (3.05) (6.42)Return after operating charges* (358.28) 1,071.79 1,229.68 (200.64)Distributions (138.20) (295.34) (321.10) (324.22)Retained distributions 138.20 295.34 321.10 324.22Closing net asset value per share 14,726.00 15,084.28 14,012.49 12,782.81*after direct transaction costs of - - - -
PerformanceReturn after charges (%) (2.38) 7.65 9.62 (1.55)
Other informationClosing net asset value (£) 232,388,086 248,440,383 203,065,534 183,632,410Closing number of shares 1,578,080 1,647,015 1,449,176 1,436,557Operating charges (%) 0.05 0.05 0.05 0.05Direct transaction costs (%) - - - -
PricesHighest share price (p) 15,183.59 15,153.46 14,203.08 13,095.54Lowest share price (p) 14,423.65 12,919.24 12,787.77 12,622.75
† covers the period from 1 January 2021 to 30 June 2021.
Please remember that past performance is not a guide to future performance and it might not be repeated. The value of investments and the revenue from them may go down as well as up and investors may not get back the amount originally invested. Because of this, you are not certain to make a profit on your investments and you may lose money.
Class J - Income Gross shares
Class K - Accumulation Gross shares
91
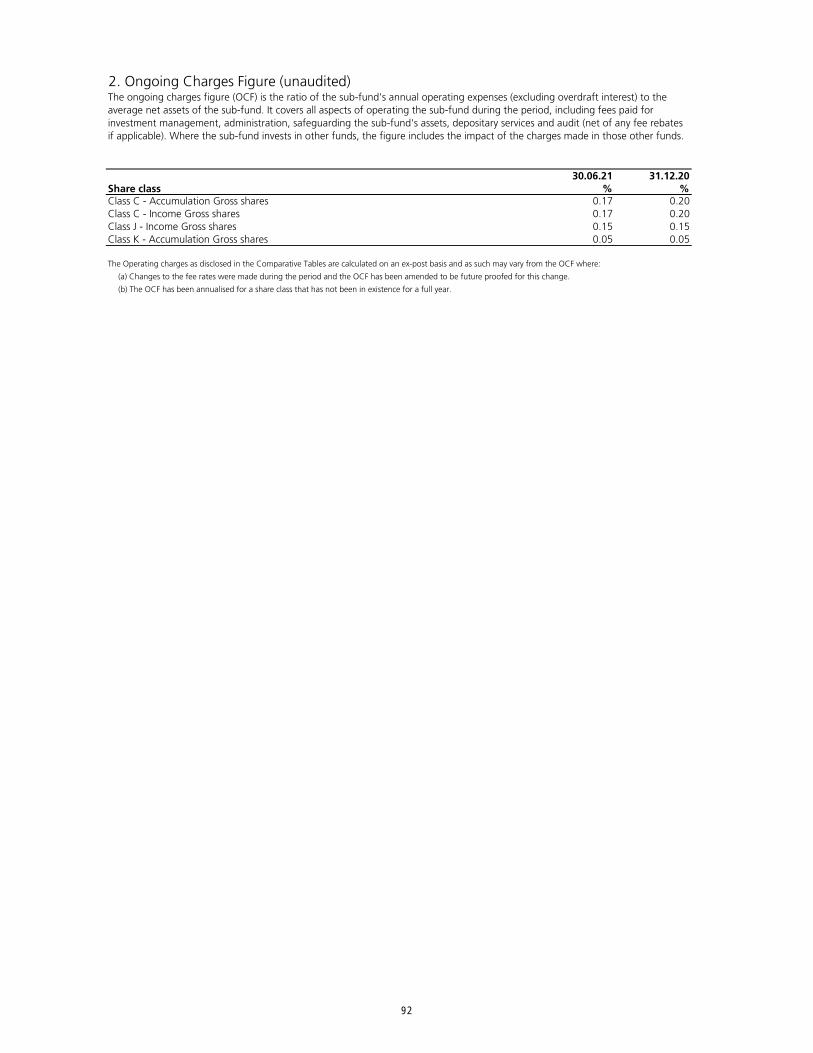
2. Ongoing Charges Figure (unaudited)
30.06.21 31.12.20Share class % %Class C - Accumulation Gross shares 0.17 0.20Class C - Income Gross shares 0.17 0.20Class J - Income Gross shares 0.15 0.15Class K - Accumulation Gross shares 0.05 0.05
The Operating charges as disclosed in the Comparative Tables are calculated on an ex-post basis and as such may vary from the OCF where:
(a) Changes to the fee rates were made during the period and the OCF has been amended to be future proofed for this change.
(b) The OCF has been annualised for a share class that has not been in existence for a full year.
The ongoing charges figure (OCF) is the ratio of the sub-fund's annual operating expenses (excluding overdraft interest) to the average net assets of the sub-fund. It covers all aspects of operating the sub-fund during the period, including fees paid for investment management, administration, safeguarding the sub-fund's assets, depositary services and audit (net of any fee rebates if applicable). Where the sub-fund invests in other funds, the figure includes the impact of the charges made in those other funds.
92
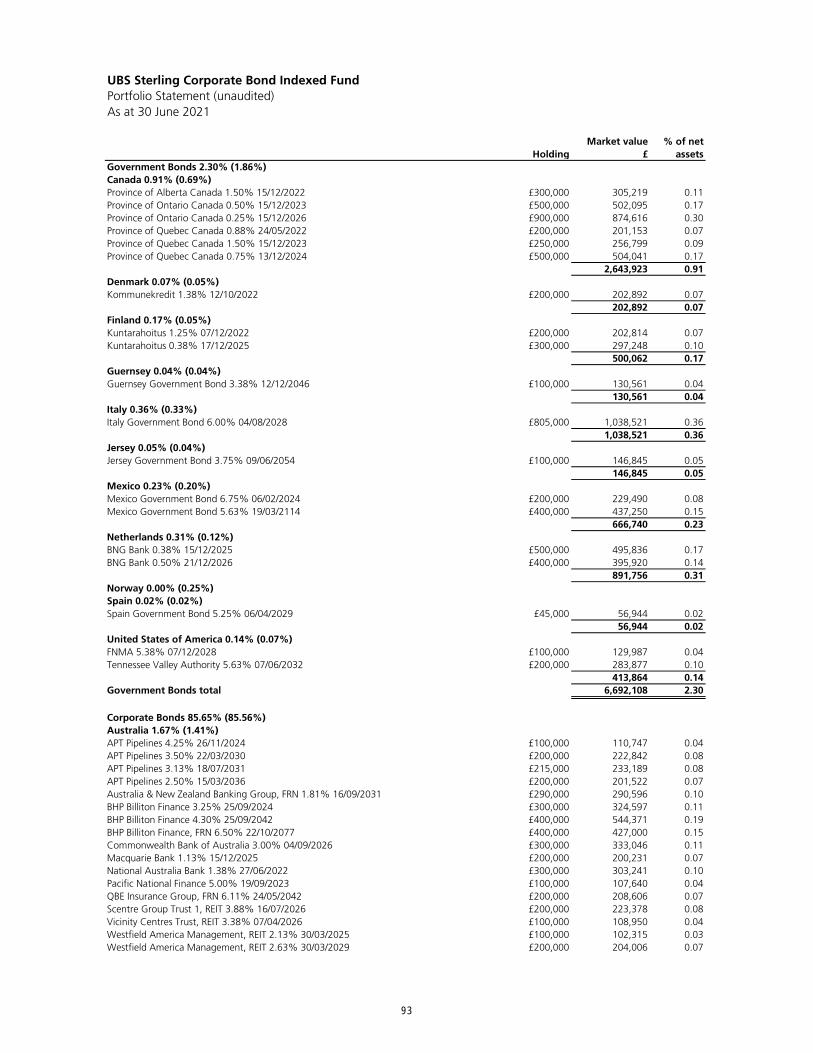
UBS Sterling Corporate Bond Indexed FundPortfolio Statement (unaudited)As at 30 June 2021
HoldingMarket value
£% of net
assetsGovernment Bonds 2.30% (1.86%)Canada 0.91% (0.69%)Province of Alberta Canada 1.50% 15/12/2022 £300,000 305,219 0.11Province of Ontario Canada 0.50% 15/12/2023 £500,000 502,095 0.17Province of Ontario Canada 0.25% 15/12/2026 £900,000 874,616 0.30Province of Quebec Canada 0.88% 24/05/2022 £200,000 201,153 0.07Province of Quebec Canada 1.50% 15/12/2023 £250,000 256,799 0.09Province of Quebec Canada 0.75% 13/12/2024 £500,000 504,041 0.17
2,643,923 0.91Denmark 0.07% (0.05%)Kommunekredit 1.38% 12/10/2022 £200,000 202,892 0.07
202,892 0.07Finland 0.17% (0.05%)Kuntarahoitus 1.25% 07/12/2022 £200,000 202,814 0.07Kuntarahoitus 0.38% 17/12/2025 £300,000 297,248 0.10
500,062 0.17Guernsey 0.04% (0.04%)Guernsey Government Bond 3.38% 12/12/2046 £100,000 130,561 0.04
130,561 0.04Italy 0.36% (0.33%)Italy Government Bond 6.00% 04/08/2028 £805,000 1,038,521 0.36
1,038,521 0.36Jersey 0.05% (0.04%)Jersey Government Bond 3.75% 09/06/2054 £100,000 146,845 0.05
146,845 0.05Mexico 0.23% (0.20%)Mexico Government Bond 6.75% 06/02/2024 £200,000 229,490 0.08Mexico Government Bond 5.63% 19/03/2114 £400,000 437,250 0.15
666,740 0.23Netherlands 0.31% (0.12%)BNG Bank 0.38% 15/12/2025 £500,000 495,836 0.17BNG Bank 0.50% 21/12/2026 £400,000 395,920 0.14
891,756 0.31Norway 0.00% (0.25%)Spain 0.02% (0.02%)Spain Government Bond 5.25% 06/04/2029 £45,000 56,944 0.02
56,944 0.02United States of America 0.14% (0.07%)FNMA 5.38% 07/12/2028 £100,000 129,987 0.04Tennessee Valley Authority 5.63% 07/06/2032 £200,000 283,877 0.10
413,864 0.14Government Bonds total 6,692,108 2.30
Corporate Bonds 85.65% (85.56%)Australia 1.67% (1.41%)APT Pipelines 4.25% 26/11/2024 £100,000 110,747 0.04APT Pipelines 3.50% 22/03/2030 £200,000 222,842 0.08APT Pipelines 3.13% 18/07/2031 £215,000 233,189 0.08APT Pipelines 2.50% 15/03/2036 £200,000 201,522 0.07Australia & New Zealand Banking Group, FRN 1.81% 16/09/2031 £290,000 290,596 0.10BHP Billiton Finance 3.25% 25/09/2024 £300,000 324,597 0.11BHP Billiton Finance 4.30% 25/09/2042 £400,000 544,371 0.19BHP Billiton Finance, FRN 6.50% 22/10/2077 £400,000 427,000 0.15Commonwealth Bank of Australia 3.00% 04/09/2026 £300,000 333,046 0.11Macquarie Bank 1.13% 15/12/2025 £200,000 200,231 0.07National Australia Bank 1.38% 27/06/2022 £300,000 303,241 0.10Pacific National Finance 5.00% 19/09/2023 £100,000 107,640 0.04QBE Insurance Group, FRN 6.11% 24/05/2042 £200,000 208,606 0.07Scentre Group Trust 1, REIT 3.88% 16/07/2026 £200,000 223,378 0.08Vicinity Centres Trust, REIT 3.38% 07/04/2026 £100,000 108,950 0.04Westfield America Management, REIT 2.13% 30/03/2025 £100,000 102,315 0.03Westfield America Management, REIT 2.63% 30/03/2029 £200,000 204,006 0.07
93
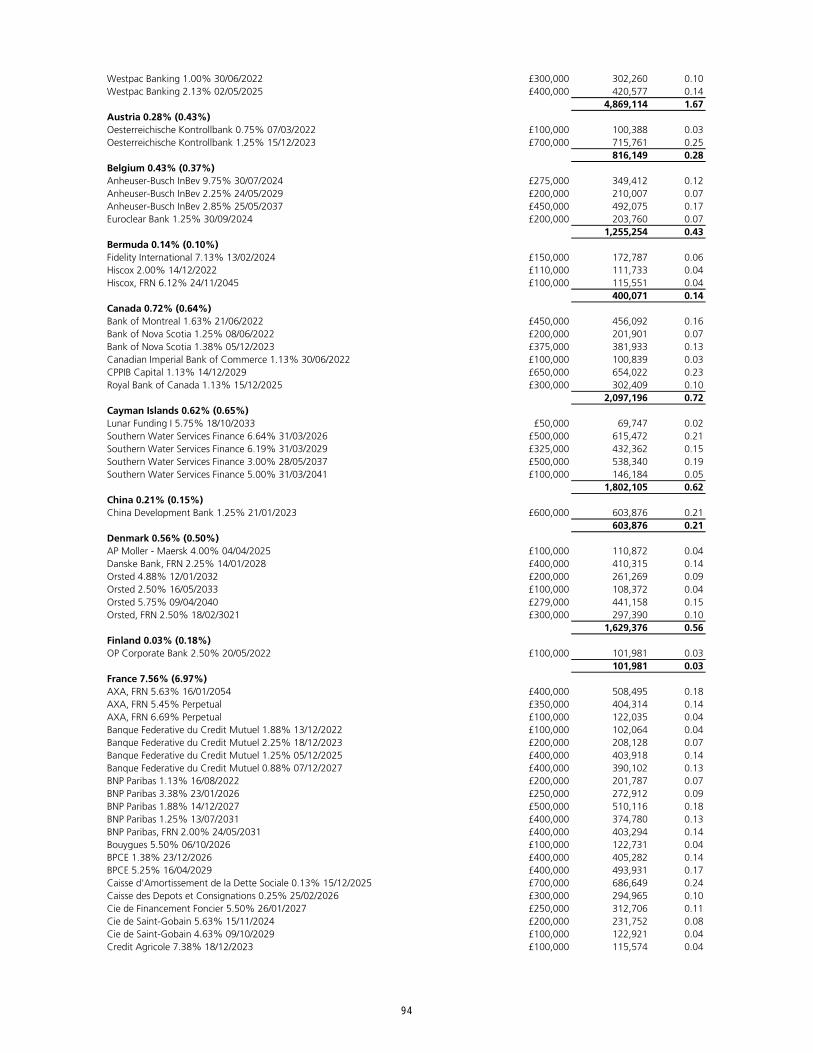
Westpac Banking 1.00% 30/06/2022 £300,000 302,260 0.10Westpac Banking 2.13% 02/05/2025 £400,000 420,577 0.14
4,869,114 1.67Austria 0.28% (0.43%)Oesterreichische Kontrollbank 0.75% 07/03/2022 £100,000 100,388 0.03Oesterreichische Kontrollbank 1.25% 15/12/2023 £700,000 715,761 0.25
816,149 0.28Belgium 0.43% (0.37%)Anheuser-Busch InBev 9.75% 30/07/2024 £275,000 349,412 0.12Anheuser-Busch InBev 2.25% 24/05/2029 £200,000 210,007 0.07Anheuser-Busch InBev 2.85% 25/05/2037 £450,000 492,075 0.17Euroclear Bank 1.25% 30/09/2024 £200,000 203,760 0.07
1,255,254 0.43Bermuda 0.14% (0.10%)Fidelity International 7.13% 13/02/2024 £150,000 172,787 0.06Hiscox 2.00% 14/12/2022 £110,000 111,733 0.04Hiscox, FRN 6.12% 24/11/2045 £100,000 115,551 0.04
400,071 0.14Canada 0.72% (0.64%)Bank of Montreal 1.63% 21/06/2022 £450,000 456,092 0.16Bank of Nova Scotia 1.25% 08/06/2022 £200,000 201,901 0.07Bank of Nova Scotia 1.38% 05/12/2023 £375,000 381,933 0.13Canadian Imperial Bank of Commerce 1.13% 30/06/2022 £100,000 100,839 0.03CPPIB Capital 1.13% 14/12/2029 £650,000 654,022 0.23Royal Bank of Canada 1.13% 15/12/2025 £300,000 302,409 0.10
2,097,196 0.72Cayman Islands 0.62% (0.65%)Lunar Funding I 5.75% 18/10/2033 £50,000 69,747 0.02Southern Water Services Finance 6.64% 31/03/2026 £500,000 615,472 0.21Southern Water Services Finance 6.19% 31/03/2029 £325,000 432,362 0.15Southern Water Services Finance 3.00% 28/05/2037 £500,000 538,340 0.19Southern Water Services Finance 5.00% 31/03/2041 £100,000 146,184 0.05
1,802,105 0.62China 0.21% (0.15%)China Development Bank 1.25% 21/01/2023 £600,000 603,876 0.21
603,876 0.21Denmark 0.56% (0.50%)AP Moller - Maersk 4.00% 04/04/2025 £100,000 110,872 0.04Danske Bank, FRN 2.25% 14/01/2028 £400,000 410,315 0.14Orsted 4.88% 12/01/2032 £200,000 261,269 0.09Orsted 2.50% 16/05/2033 £100,000 108,372 0.04Orsted 5.75% 09/04/2040 £279,000 441,158 0.15Orsted, FRN 2.50% 18/02/3021 £300,000 297,390 0.10
1,629,376 0.56Finland 0.03% (0.18%)OP Corporate Bank 2.50% 20/05/2022 £100,000 101,981 0.03
101,981 0.03France 7.56% (6.97%)AXA, FRN 5.63% 16/01/2054 £400,000 508,495 0.18AXA, FRN 5.45% Perpetual £350,000 404,314 0.14AXA, FRN 6.69% Perpetual £100,000 122,035 0.04Banque Federative du Credit Mutuel 1.88% 13/12/2022 £100,000 102,064 0.04Banque Federative du Credit Mutuel 2.25% 18/12/2023 £200,000 208,128 0.07Banque Federative du Credit Mutuel 1.25% 05/12/2025 £400,000 403,918 0.14Banque Federative du Credit Mutuel 0.88% 07/12/2027 £400,000 390,102 0.13BNP Paribas 1.13% 16/08/2022 £200,000 201,787 0.07BNP Paribas 3.38% 23/01/2026 £250,000 272,912 0.09BNP Paribas 1.88% 14/12/2027 £500,000 510,116 0.18BNP Paribas 1.25% 13/07/2031 £400,000 374,780 0.13BNP Paribas, FRN 2.00% 24/05/2031 £400,000 403,294 0.14Bouygues 5.50% 06/10/2026 £100,000 122,731 0.04BPCE 1.38% 23/12/2026 £400,000 405,282 0.14BPCE 5.25% 16/04/2029 £400,000 493,931 0.17Caisse d'Amortissement de la Dette Sociale 0.13% 15/12/2025 £700,000 686,649 0.24Caisse des Depots et Consignations 0.25% 25/02/2026 £300,000 294,965 0.10Cie de Financement Foncier 5.50% 26/01/2027 £250,000 312,706 0.11Cie de Saint-Gobain 5.63% 15/11/2024 £200,000 231,752 0.08Cie de Saint-Gobain 4.63% 09/10/2029 £100,000 122,921 0.04Credit Agricole 7.38% 18/12/2023 £100,000 115,574 0.04
94
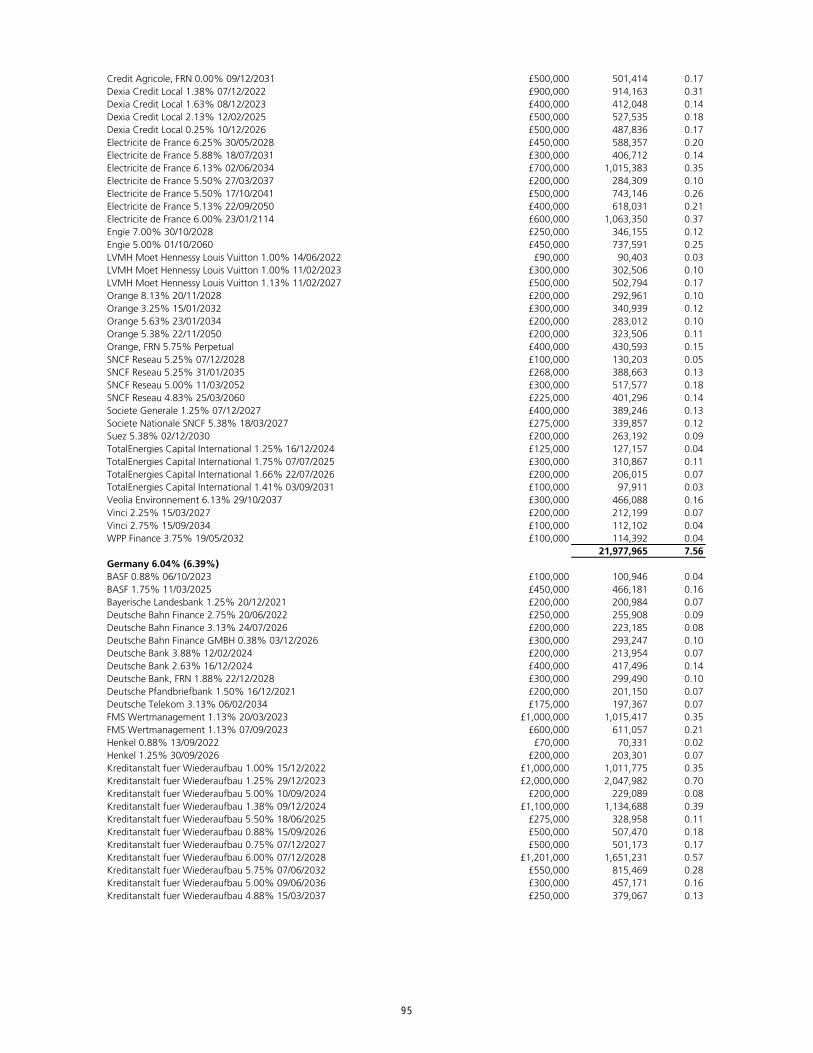
Credit Agricole, FRN 0.00% 09/12/2031 £500,000 501,414 0.17Dexia Credit Local 1.38% 07/12/2022 £900,000 914,163 0.31Dexia Credit Local 1.63% 08/12/2023 £400,000 412,048 0.14Dexia Credit Local 2.13% 12/02/2025 £500,000 527,535 0.18Dexia Credit Local 0.25% 10/12/2026 £500,000 487,836 0.17Electricite de France 6.25% 30/05/2028 £450,000 588,357 0.20Electricite de France 5.88% 18/07/2031 £300,000 406,712 0.14Electricite de France 6.13% 02/06/2034 £700,000 1,015,383 0.35Electricite de France 5.50% 27/03/2037 £200,000 284,309 0.10Electricite de France 5.50% 17/10/2041 £500,000 743,146 0.26Electricite de France 5.13% 22/09/2050 £400,000 618,031 0.21Electricite de France 6.00% 23/01/2114 £600,000 1,063,350 0.37Engie 7.00% 30/10/2028 £250,000 346,155 0.12Engie 5.00% 01/10/2060 £450,000 737,591 0.25LVMH Moet Hennessy Louis Vuitton 1.00% 14/06/2022 £90,000 90,403 0.03LVMH Moet Hennessy Louis Vuitton 1.00% 11/02/2023 £300,000 302,506 0.10LVMH Moet Hennessy Louis Vuitton 1.13% 11/02/2027 £500,000 502,794 0.17Orange 8.13% 20/11/2028 £200,000 292,961 0.10Orange 3.25% 15/01/2032 £300,000 340,939 0.12Orange 5.63% 23/01/2034 £200,000 283,012 0.10Orange 5.38% 22/11/2050 £200,000 323,506 0.11Orange, FRN 5.75% Perpetual £400,000 430,593 0.15SNCF Reseau 5.25% 07/12/2028 £100,000 130,203 0.05SNCF Reseau 5.25% 31/01/2035 £268,000 388,663 0.13SNCF Reseau 5.00% 11/03/2052 £300,000 517,577 0.18SNCF Reseau 4.83% 25/03/2060 £225,000 401,296 0.14Societe Generale 1.25% 07/12/2027 £400,000 389,246 0.13Societe Nationale SNCF 5.38% 18/03/2027 £275,000 339,857 0.12Suez 5.38% 02/12/2030 £200,000 263,192 0.09TotalEnergies Capital International 1.25% 16/12/2024 £125,000 127,157 0.04TotalEnergies Capital International 1.75% 07/07/2025 £300,000 310,867 0.11TotalEnergies Capital International 1.66% 22/07/2026 £200,000 206,015 0.07TotalEnergies Capital International 1.41% 03/09/2031 £100,000 97,911 0.03Veolia Environnement 6.13% 29/10/2037 £300,000 466,088 0.16Vinci 2.25% 15/03/2027 £200,000 212,199 0.07Vinci 2.75% 15/09/2034 £100,000 112,102 0.04WPP Finance 3.75% 19/05/2032 £100,000 114,392 0.04
21,977,965 7.56Germany 6.04% (6.39%)BASF 0.88% 06/10/2023 £100,000 100,946 0.04BASF 1.75% 11/03/2025 £450,000 466,181 0.16Bayerische Landesbank 1.25% 20/12/2021 £200,000 200,984 0.07Deutsche Bahn Finance 2.75% 20/06/2022 £250,000 255,908 0.09Deutsche Bahn Finance 3.13% 24/07/2026 £200,000 223,185 0.08Deutsche Bahn Finance GMBH 0.38% 03/12/2026 £300,000 293,247 0.10Deutsche Bank 3.88% 12/02/2024 £200,000 213,954 0.07Deutsche Bank 2.63% 16/12/2024 £400,000 417,496 0.14Deutsche Bank, FRN 1.88% 22/12/2028 £300,000 299,490 0.10Deutsche Pfandbriefbank 1.50% 16/12/2021 £200,000 201,150 0.07Deutsche Telekom 3.13% 06/02/2034 £175,000 197,367 0.07FMS Wertmanagement 1.13% 20/03/2023 £1,000,000 1,015,417 0.35FMS Wertmanagement 1.13% 07/09/2023 £600,000 611,057 0.21Henkel 0.88% 13/09/2022 £70,000 70,331 0.02Henkel 1.25% 30/09/2026 £200,000 203,301 0.07Kreditanstalt fuer Wiederaufbau 1.00% 15/12/2022 £1,000,000 1,011,775 0.35Kreditanstalt fuer Wiederaufbau 1.25% 29/12/2023 £2,000,000 2,047,982 0.70Kreditanstalt fuer Wiederaufbau 5.00% 10/09/2024 £200,000 229,089 0.08Kreditanstalt fuer Wiederaufbau 1.38% 09/12/2024 £1,100,000 1,134,688 0.39Kreditanstalt fuer Wiederaufbau 5.50% 18/06/2025 £275,000 328,958 0.11Kreditanstalt fuer Wiederaufbau 0.88% 15/09/2026 £500,000 507,470 0.18Kreditanstalt fuer Wiederaufbau 0.75% 07/12/2027 £500,000 501,173 0.17Kreditanstalt fuer Wiederaufbau 6.00% 07/12/2028 £1,201,000 1,651,231 0.57Kreditanstalt fuer Wiederaufbau 5.75% 07/06/2032 £550,000 815,469 0.28Kreditanstalt fuer Wiederaufbau 5.00% 09/06/2036 £300,000 457,171 0.16Kreditanstalt fuer Wiederaufbau 4.88% 15/03/2037 £250,000 379,067 0.13
95
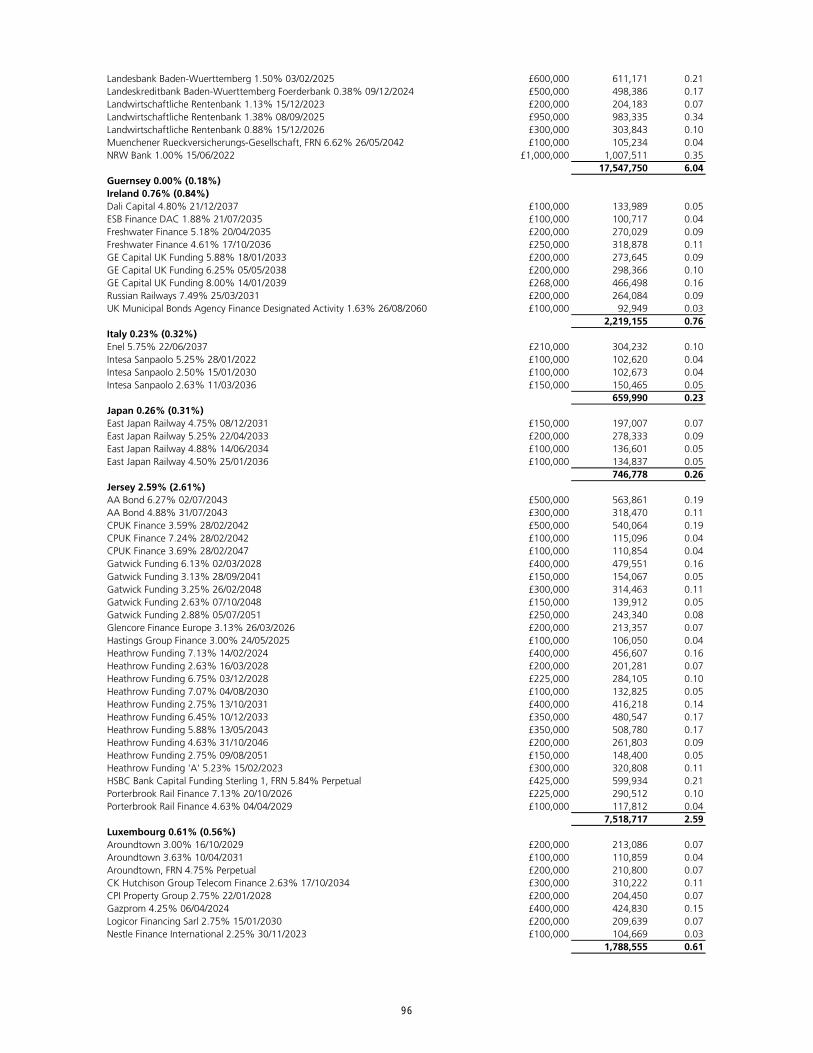
Landesbank Baden-Wuerttemberg 1.50% 03/02/2025 £600,000 611,171 0.21Landeskreditbank Baden-Wuerttemberg Foerderbank 0.38% 09/12/2024 £500,000 498,386 0.17Landwirtschaftliche Rentenbank 1.13% 15/12/2023 £200,000 204,183 0.07Landwirtschaftliche Rentenbank 1.38% 08/09/2025 £950,000 983,335 0.34Landwirtschaftliche Rentenbank 0.88% 15/12/2026 £300,000 303,843 0.10Muenchener Rueckversicherungs-Gesellschaft, FRN 6.62% 26/05/2042 £100,000 105,234 0.04NRW Bank 1.00% 15/06/2022 £1,000,000 1,007,511 0.35
17,547,750 6.04Guernsey 0.00% (0.18%)Ireland 0.76% (0.84%)Dali Capital 4.80% 21/12/2037 £100,000 133,989 0.05ESB Finance DAC 1.88% 21/07/2035 £100,000 100,717 0.04Freshwater Finance 5.18% 20/04/2035 £200,000 270,029 0.09Freshwater Finance 4.61% 17/10/2036 £250,000 318,878 0.11GE Capital UK Funding 5.88% 18/01/2033 £200,000 273,645 0.09GE Capital UK Funding 6.25% 05/05/2038 £200,000 298,366 0.10GE Capital UK Funding 8.00% 14/01/2039 £268,000 466,498 0.16Russian Railways 7.49% 25/03/2031 £200,000 264,084 0.09UK Municipal Bonds Agency Finance Designated Activity 1.63% 26/08/2060 £100,000 92,949 0.03
2,219,155 0.76Italy 0.23% (0.32%)Enel 5.75% 22/06/2037 £210,000 304,232 0.10Intesa Sanpaolo 5.25% 28/01/2022 £100,000 102,620 0.04Intesa Sanpaolo 2.50% 15/01/2030 £100,000 102,673 0.04Intesa Sanpaolo 2.63% 11/03/2036 £150,000 150,465 0.05
659,990 0.23Japan 0.26% (0.31%)East Japan Railway 4.75% 08/12/2031 £150,000 197,007 0.07East Japan Railway 5.25% 22/04/2033 £200,000 278,333 0.09East Japan Railway 4.88% 14/06/2034 £100,000 136,601 0.05East Japan Railway 4.50% 25/01/2036 £100,000 134,837 0.05
746,778 0.26Jersey 2.59% (2.61%)AA Bond 6.27% 02/07/2043 £500,000 563,861 0.19AA Bond 4.88% 31/07/2043 £300,000 318,470 0.11CPUK Finance 3.59% 28/02/2042 £500,000 540,064 0.19CPUK Finance 7.24% 28/02/2042 £100,000 115,096 0.04CPUK Finance 3.69% 28/02/2047 £100,000 110,854 0.04Gatwick Funding 6.13% 02/03/2028 £400,000 479,551 0.16Gatwick Funding 3.13% 28/09/2041 £150,000 154,067 0.05Gatwick Funding 3.25% 26/02/2048 £300,000 314,463 0.11Gatwick Funding 2.63% 07/10/2048 £150,000 139,912 0.05Gatwick Funding 2.88% 05/07/2051 £250,000 243,340 0.08Glencore Finance Europe 3.13% 26/03/2026 £200,000 213,357 0.07Hastings Group Finance 3.00% 24/05/2025 £100,000 106,050 0.04Heathrow Funding 7.13% 14/02/2024 £400,000 456,607 0.16Heathrow Funding 2.63% 16/03/2028 £200,000 201,281 0.07Heathrow Funding 6.75% 03/12/2028 £225,000 284,105 0.10Heathrow Funding 7.07% 04/08/2030 £100,000 132,825 0.05Heathrow Funding 2.75% 13/10/2031 £400,000 416,218 0.14Heathrow Funding 6.45% 10/12/2033 £350,000 480,547 0.17Heathrow Funding 5.88% 13/05/2043 £350,000 508,780 0.17Heathrow Funding 4.63% 31/10/2046 £200,000 261,803 0.09Heathrow Funding 2.75% 09/08/2051 £150,000 148,400 0.05Heathrow Funding 'A' 5.23% 15/02/2023 £300,000 320,808 0.11HSBC Bank Capital Funding Sterling 1, FRN 5.84% Perpetual £425,000 599,934 0.21Porterbrook Rail Finance 7.13% 20/10/2026 £225,000 290,512 0.10Porterbrook Rail Finance 4.63% 04/04/2029 £100,000 117,812 0.04
7,518,717 2.59Luxembourg 0.61% (0.56%)Aroundtown 3.00% 16/10/2029 £200,000 213,086 0.07Aroundtown 3.63% 10/04/2031 £100,000 110,859 0.04Aroundtown, FRN 4.75% Perpetual £200,000 210,800 0.07CK Hutchison Group Telecom Finance 2.63% 17/10/2034 £300,000 310,222 0.11CPI Property Group 2.75% 22/01/2028 £200,000 204,450 0.07Gazprom 4.25% 06/04/2024 £400,000 424,830 0.15Logicor Financing Sarl 2.75% 15/01/2030 £200,000 209,639 0.07Nestle Finance International 2.25% 30/11/2023 £100,000 104,669 0.03
1,788,555 0.61
96
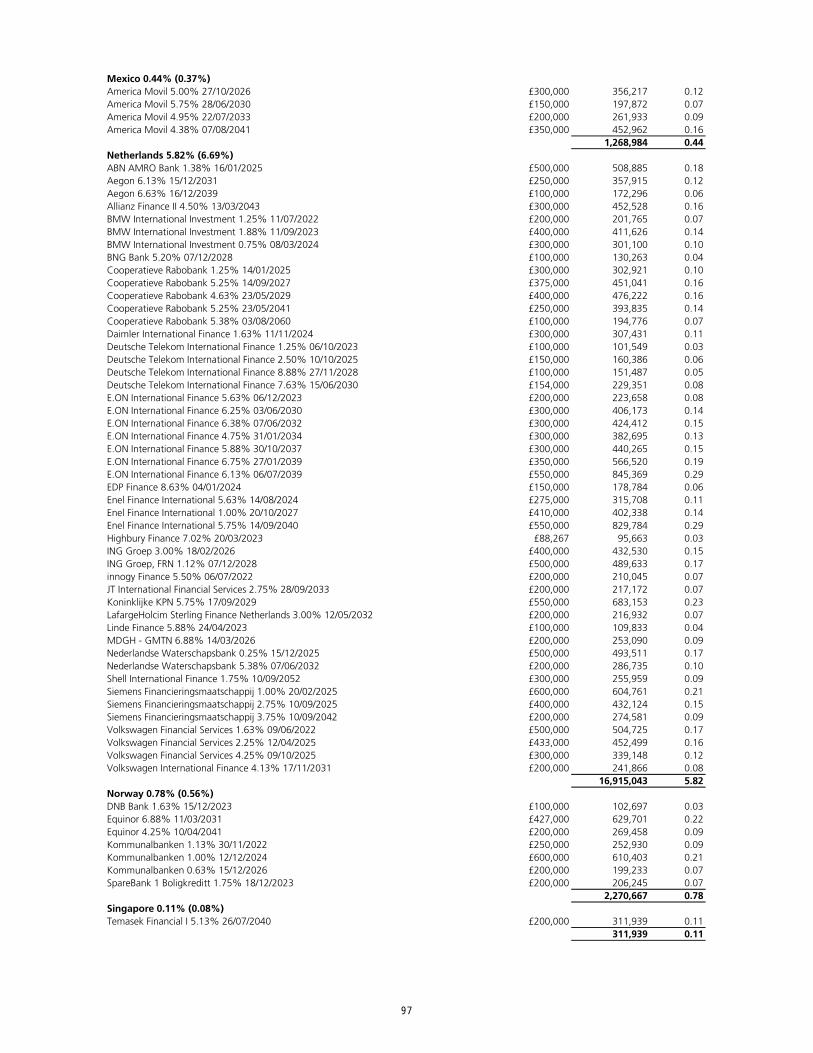
Mexico 0.44% (0.37%)America Movil 5.00% 27/10/2026 £300,000 356,217 0.12America Movil 5.75% 28/06/2030 £150,000 197,872 0.07America Movil 4.95% 22/07/2033 £200,000 261,933 0.09America Movil 4.38% 07/08/2041 £350,000 452,962 0.16
1,268,984 0.44Netherlands 5.82% (6.69%)ABN AMRO Bank 1.38% 16/01/2025 £500,000 508,885 0.18Aegon 6.13% 15/12/2031 £250,000 357,915 0.12Aegon 6.63% 16/12/2039 £100,000 172,296 0.06Allianz Finance II 4.50% 13/03/2043 £300,000 452,528 0.16BMW International Investment 1.25% 11/07/2022 £200,000 201,765 0.07BMW International Investment 1.88% 11/09/2023 £400,000 411,626 0.14BMW International Investment 0.75% 08/03/2024 £300,000 301,100 0.10BNG Bank 5.20% 07/12/2028 £100,000 130,263 0.04Cooperatieve Rabobank 1.25% 14/01/2025 £300,000 302,921 0.10Cooperatieve Rabobank 5.25% 14/09/2027 £375,000 451,041 0.16Cooperatieve Rabobank 4.63% 23/05/2029 £400,000 476,222 0.16Cooperatieve Rabobank 5.25% 23/05/2041 £250,000 393,835 0.14Cooperatieve Rabobank 5.38% 03/08/2060 £100,000 194,776 0.07Daimler International Finance 1.63% 11/11/2024 £300,000 307,431 0.11Deutsche Telekom International Finance 1.25% 06/10/2023 £100,000 101,549 0.03Deutsche Telekom International Finance 2.50% 10/10/2025 £150,000 160,386 0.06Deutsche Telekom International Finance 8.88% 27/11/2028 £100,000 151,487 0.05Deutsche Telekom International Finance 7.63% 15/06/2030 £154,000 229,351 0.08E.ON International Finance 5.63% 06/12/2023 £200,000 223,658 0.08E.ON International Finance 6.25% 03/06/2030 £300,000 406,173 0.14E.ON International Finance 6.38% 07/06/2032 £300,000 424,412 0.15E.ON International Finance 4.75% 31/01/2034 £300,000 382,695 0.13E.ON International Finance 5.88% 30/10/2037 £300,000 440,265 0.15E.ON International Finance 6.75% 27/01/2039 £350,000 566,520 0.19E.ON International Finance 6.13% 06/07/2039 £550,000 845,369 0.29EDP Finance 8.63% 04/01/2024 £150,000 178,784 0.06Enel Finance International 5.63% 14/08/2024 £275,000 315,708 0.11Enel Finance International 1.00% 20/10/2027 £410,000 402,338 0.14Enel Finance International 5.75% 14/09/2040 £550,000 829,784 0.29Highbury Finance 7.02% 20/03/2023 £88,267 95,663 0.03ING Groep 3.00% 18/02/2026 £400,000 432,530 0.15ING Groep, FRN 1.12% 07/12/2028 £500,000 489,633 0.17innogy Finance 5.50% 06/07/2022 £200,000 210,045 0.07JT International Financial Services 2.75% 28/09/2033 £200,000 217,172 0.07Koninklijke KPN 5.75% 17/09/2029 £550,000 683,153 0.23LafargeHolcim Sterling Finance Netherlands 3.00% 12/05/2032 £200,000 216,932 0.07Linde Finance 5.88% 24/04/2023 £100,000 109,833 0.04MDGH - GMTN 6.88% 14/03/2026 £200,000 253,090 0.09Nederlandse Waterschapsbank 0.25% 15/12/2025 £500,000 493,511 0.17Nederlandse Waterschapsbank 5.38% 07/06/2032 £200,000 286,735 0.10Shell International Finance 1.75% 10/09/2052 £300,000 255,959 0.09Siemens Financieringsmaatschappij 1.00% 20/02/2025 £600,000 604,761 0.21Siemens Financieringsmaatschappij 2.75% 10/09/2025 £400,000 432,124 0.15Siemens Financieringsmaatschappij 3.75% 10/09/2042 £200,000 274,581 0.09Volkswagen Financial Services 1.63% 09/06/2022 £500,000 504,725 0.17Volkswagen Financial Services 2.25% 12/04/2025 £433,000 452,499 0.16Volkswagen Financial Services 4.25% 09/10/2025 £300,000 339,148 0.12Volkswagen International Finance 4.13% 17/11/2031 £200,000 241,866 0.08
16,915,043 5.82Norway 0.78% (0.56%)DNB Bank 1.63% 15/12/2023 £100,000 102,697 0.03Equinor 6.88% 11/03/2031 £427,000 629,701 0.22Equinor 4.25% 10/04/2041 £200,000 269,458 0.09Kommunalbanken 1.13% 30/11/2022 £250,000 252,930 0.09Kommunalbanken 1.00% 12/12/2024 £600,000 610,403 0.21Kommunalbanken 0.63% 15/12/2026 £200,000 199,233 0.07SpareBank 1 Boligkreditt 1.75% 18/12/2023 £200,000 206,245 0.07
2,270,667 0.78Singapore 0.11% (0.08%)Temasek Financial I 5.13% 26/07/2040 £200,000 311,939 0.11
311,939 0.11
97
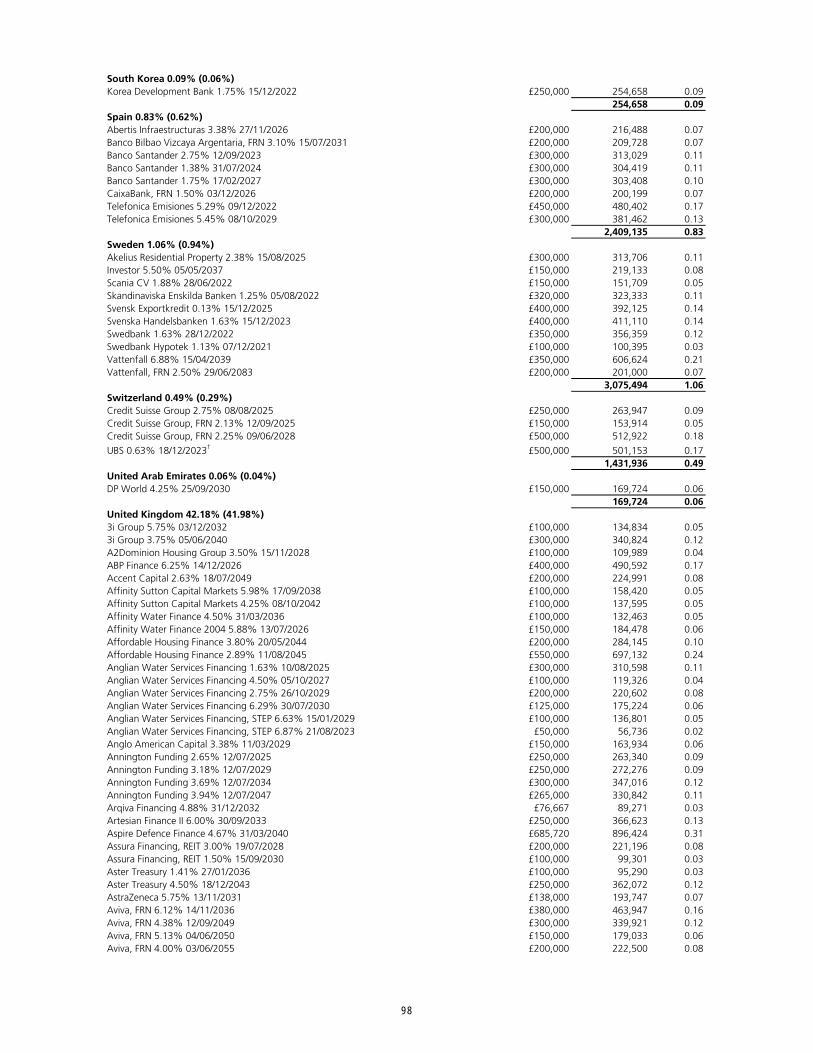
South Korea 0.09% (0.06%)Korea Development Bank 1.75% 15/12/2022 £250,000 254,658 0.09
254,658 0.09Spain 0.83% (0.62%)Abertis Infraestructuras 3.38% 27/11/2026 £200,000 216,488 0.07Banco Bilbao Vizcaya Argentaria, FRN 3.10% 15/07/2031 £200,000 209,728 0.07Banco Santander 2.75% 12/09/2023 £300,000 313,029 0.11Banco Santander 1.38% 31/07/2024 £300,000 304,419 0.11Banco Santander 1.75% 17/02/2027 £300,000 303,408 0.10CaixaBank, FRN 1.50% 03/12/2026 £200,000 200,199 0.07Telefonica Emisiones 5.29% 09/12/2022 £450,000 480,402 0.17Telefonica Emisiones 5.45% 08/10/2029 £300,000 381,462 0.13
2,409,135 0.83Sweden 1.06% (0.94%)Akelius Residential Property 2.38% 15/08/2025 £300,000 313,706 0.11Investor 5.50% 05/05/2037 £150,000 219,133 0.08Scania CV 1.88% 28/06/2022 £150,000 151,709 0.05Skandinaviska Enskilda Banken 1.25% 05/08/2022 £320,000 323,333 0.11Svensk Exportkredit 0.13% 15/12/2025 £400,000 392,125 0.14Svenska Handelsbanken 1.63% 15/12/2023 £400,000 411,110 0.14Swedbank 1.63% 28/12/2022 £350,000 356,359 0.12Swedbank Hypotek 1.13% 07/12/2021 £100,000 100,395 0.03Vattenfall 6.88% 15/04/2039 £350,000 606,624 0.21Vattenfall, FRN 2.50% 29/06/2083 £200,000 201,000 0.07
3,075,494 1.06Switzerland 0.49% (0.29%)Credit Suisse Group 2.75% 08/08/2025 £250,000 263,947 0.09Credit Suisse Group, FRN 2.13% 12/09/2025 £150,000 153,914 0.05Credit Suisse Group, FRN 2.25% 09/06/2028 £500,000 512,922 0.18
UBS 0.63% 18/12/2023† £500,000 501,153 0.17 1,431,936 0.49
United Arab Emirates 0.06% (0.04%)DP World 4.25% 25/09/2030 £150,000 169,724 0.06
169,724 0.06United Kingdom 42.18% (41.98%)3i Group 5.75% 03/12/2032 £100,000 134,834 0.053i Group 3.75% 05/06/2040 £300,000 340,824 0.12A2Dominion Housing Group 3.50% 15/11/2028 £100,000 109,989 0.04ABP Finance 6.25% 14/12/2026 £400,000 490,592 0.17Accent Capital 2.63% 18/07/2049 £200,000 224,991 0.08Affinity Sutton Capital Markets 5.98% 17/09/2038 £100,000 158,420 0.05Affinity Sutton Capital Markets 4.25% 08/10/2042 £100,000 137,595 0.05Affinity Water Finance 4.50% 31/03/2036 £100,000 132,463 0.05Affinity Water Finance 2004 5.88% 13/07/2026 £150,000 184,478 0.06Affordable Housing Finance 3.80% 20/05/2044 £200,000 284,145 0.10Affordable Housing Finance 2.89% 11/08/2045 £550,000 697,132 0.24Anglian Water Services Financing 1.63% 10/08/2025 £300,000 310,598 0.11Anglian Water Services Financing 4.50% 05/10/2027 £100,000 119,326 0.04Anglian Water Services Financing 2.75% 26/10/2029 £200,000 220,602 0.08Anglian Water Services Financing 6.29% 30/07/2030 £125,000 175,224 0.06Anglian Water Services Financing, STEP 6.63% 15/01/2029 £100,000 136,801 0.05Anglian Water Services Financing, STEP 6.87% 21/08/2023 £50,000 56,736 0.02Anglo American Capital 3.38% 11/03/2029 £150,000 163,934 0.06Annington Funding 2.65% 12/07/2025 £250,000 263,340 0.09Annington Funding 3.18% 12/07/2029 £250,000 272,276 0.09Annington Funding 3.69% 12/07/2034 £300,000 347,016 0.12Annington Funding 3.94% 12/07/2047 £265,000 330,842 0.11Arqiva Financing 4.88% 31/12/2032 £76,667 89,271 0.03Artesian Finance II 6.00% 30/09/2033 £250,000 366,623 0.13Aspire Defence Finance 4.67% 31/03/2040 £685,720 896,424 0.31Assura Financing, REIT 3.00% 19/07/2028 £200,000 221,196 0.08Assura Financing, REIT 1.50% 15/09/2030 £100,000 99,301 0.03Aster Treasury 1.41% 27/01/2036 £100,000 95,290 0.03Aster Treasury 4.50% 18/12/2043 £250,000 362,072 0.12AstraZeneca 5.75% 13/11/2031 £138,000 193,747 0.07Aviva, FRN 6.12% 14/11/2036 £380,000 463,947 0.16Aviva, FRN 4.38% 12/09/2049 £300,000 339,921 0.12Aviva, FRN 5.13% 04/06/2050 £150,000 179,033 0.06Aviva, FRN 4.00% 03/06/2055 £200,000 222,500 0.08
98
Aviva, FRN 6.12% Perpetual £120,000 127,470 0.04BAE Systems 4.13% 08/06/2022 £220,000 227,279 0.08Barclays 3.13% 17/01/2024 £900,000 948,822 0.33Barclays 3.00% 08/05/2026 £250,000 268,324 0.09Barclays 3.25% 12/02/2027 £450,000 489,354 0.17Barclays 3.25% 17/01/2033 £500,000 555,223 0.19Barclays, FRN 2.38% 06/10/2023 £200,000 204,355 0.07Barclays, FRN 1.70% 03/11/2026 £200,000 202,925 0.07Barclays Bank 5.75% 14/09/2026 £260,000 315,736 0.11BAT International Finance 7.25% 12/03/2024 £400,000 464,392 0.16BAT International Finance 4.00% 04/09/2026 £400,000 442,690 0.15BAT International Finance 2.25% 26/06/2028 £200,000 200,475 0.07BAT International Finance 5.75% 05/07/2040 £150,000 195,217 0.07BAT International Finance 2.25% 09/09/2052 £275,000 205,454 0.07BAT International Finance 4.00% 23/11/2055 £200,000 205,108 0.07BG Energy Capital 5.13% 01/12/2025 £350,000 414,520 0.14BG Energy Capital 5.00% 04/11/2036 £300,000 418,559 0.14Blend Funding 3.46% 21/09/2049 £100,000 124,231 0.04Blend Funding 2.92% 05/04/2056 £300,000 343,106 0.12BP Capital Markets 2.27% 03/07/2026 £100,000 105,839 0.04BP Capital Markets, FRN 4.25% Perpetual £500,000 529,450 0.18BPHA Finance 4.82% 11/04/2044 £150,000 219,000 0.08British Land, REIT 2.38% 14/09/2029 £100,000 102,290 0.03British Telecommunications 5.75% 07/12/2028 £400,000 507,148 0.17British Telecommunications 3.13% 21/11/2031 £300,000 322,964 0.11British Telecommunications 6.38% 23/06/2037 £100,000 148,006 0.05British Telecommunications 3.63% 21/11/2047 £150,000 170,733 0.06Broadgate Financing 4.82% 05/07/2036 £100,000 129,471 0.04Broadgate Financing 5.00% 05/10/2033 £100,000 114,895 0.04Broadgate Financing 5.10% 05/04/2035 £226,667 262,223 0.09Bromford Housing Group 3.13% 03/05/2048 £150,000 183,323 0.06Bunzl Finance 2.25% 11/06/2025 £200,000 209,460 0.07Bunzl Finance 1.50% 30/10/2030 £300,000 292,939 0.10BUPA Finance 5.00% 25/04/2023 £200,000 214,525 0.07BUPA Finance 5.00% 08/12/2026 £100,000 116,766 0.04BUPA Finance 1.75% 14/06/2027 £200,000 204,308 0.07BUPA Finance 4.13% 14/06/2035 £300,000 336,702 0.12Burberry Group 1.13% 21/09/2025 £200,000 199,205 0.07Cadent Finance 1.13% 22/09/2021 £166,000 166,204 0.06Cadent Finance 2.13% 22/09/2028 £100,000 103,689 0.04Cadent Finance 2.63% 22/09/2038 £250,000 258,811 0.09Cadent Finance 3.13% 21/03/2040 £300,000 330,672 0.11Cadent Finance 2.75% 22/09/2046 £400,000 416,350 0.14Canary Wharf Finance II, Series A1 6.46% 22/10/2033 £99,637 121,628 0.04Canary Wharf Finance II, Series A3 5.95% 22/10/2037 £250,000 347,485 0.12Canary Wharf Group Investment Holdings 3.38% 23/04/2028 £200,000 201,631 0.07Cardiff University 3.00% 07/12/2055 £200,000 249,395 0.09Catalyst Housing 3.13% 31/10/2047 £200,000 236,779 0.08Centrica 6.38% 10/03/2022 £500,000 519,843 0.18Centrica 4.38% 13/03/2029 £175,000 207,827 0.07Centrica 7.00% 19/09/2033 £400,000 610,384 0.21Centrica 4.25% 12/09/2044 £200,000 257,971 0.09Chancellor Masters & Scholars of The University of Cambridge 2.35% 27/06/2078 £200,000 272,571 0.09Channel Link Enterprises Finance 3.85% 30/06/2050 £150,000 167,818 0.06Circle Anglia Social Housing 5.20% 02/03/2044 £150,000 233,050 0.08Citizen Treasury 3.25% 20/10/2048 £150,000 183,861 0.06Clarion Funding 2.63% 18/01/2029 £200,000 217,411 0.07Clarion Funding 1.25% 13/11/2032 £400,000 383,897 0.13Clarion Funding 3.13% 19/04/2048 £200,000 241,076 0.08Close Brothers Finance 2.75% 19/10/2026 £150,000 161,776 0.06Close Brothers Finance 1.63% 03/12/2030 £200,000 197,031 0.07Close Brothers Group 2.75% 26/04/2023 £100,000 103,440 0.04Clydesdale Bank 4.63% 08/06/2026 £300,000 356,351 0.12Community Finance Co. 1 5.02% 31/07/2034 £350,000 463,536 0.16Compass Group 2.00% 05/09/2025 £200,000 209,181 0.07Connect Plus M25 Issuer 2.61% 31/03/2039 £280,389 310,209 0.11Coventry Building Society 5.88% 28/09/2022 £100,000 106,415 0.04Coventry Building Society 1.88% 24/10/2023 £200,000 205,330 0.07Coventry Building Society 1.00% 21/09/2025 £600,000 599,831 0.21
99
Crh Finance UK 4.13% 02/12/2029 £100,000 119,405 0.04CTRL Section 1 Finance, Series A1 5.23% 02/05/2035 £145,114 196,160 0.07Derby Healthcare 5.56% 30/06/2041 £221,510 304,636 0.10Diageo Finance 1.75% 12/10/2026 £250,000 259,914 0.09Diageo Finance 2.88% 27/03/2029 £200,000 222,817 0.08Diageo Finance 1.25% 28/03/2033 £135,000 129,899 0.04Direct Line Insurance Group 4.00% 05/06/2032 £300,000 337,112 0.12DWR Cymru Financing UK 6.02% 31/03/2028 £150,000 195,831 0.07DWR Cymru Financing UK 1.38% 31/03/2033 £160,000 156,828 0.05DWR Cymru Financing UK 2.38% 31/03/2034 £100,000 102,541 0.04DWR Cymru Financing UK 2.50% 31/03/2036 £183,000 200,725 0.07DWR Cymru Financing UK 4.47% 31/03/2057 £50,000 81,540 0.03Eastern Power Networks 5.75% 08/03/2024 £560,000 634,583 0.22Eastern Power Networks 1.88% 01/06/2035 £300,000 296,125 0.10Eastern Power Networks 6.25% 12/11/2036 £100,000 156,602 0.05Electricity North West 8.88% 25/03/2026 £200,000 270,859 0.09ENW Finance 6.13% 21/07/2021 £100,000 100,299 0.03ENW Finance 1.42% 30/07/2030 £200,000 194,806 0.07Equity Release Funding No. 2, Series 2 5.88% 26/05/2032 £38,462 45,777 0.02Equity Release Funding No. 3, Series A2 5.05% 26/04/2033 £49,135 59,943 0.02Eversholt Funding 2.74% 30/06/2040 £292,308 304,645 0.10Eversholt Funding 3.53% 07/08/2042 £200,000 223,131 0.08Exchequer Partnership No. 2 5.40% 13/07/2036 £19,400 25,740 0.01Experian Finance 3.25% 07/04/2032 £400,000 454,477 0.16Firstgroup 5.25% 29/11/2022 £100,000 106,388 0.04Folio Residential Finance NO 1 1.25% 31/10/2037 £200,000 200,620 0.07GB Social Housing 5.19% 12/02/2040 £200,000 273,712 0.09Genfinance II 6.06% 21/12/2039 £100,000 159,025 0.05GlaxoSmithKline Capital 3.38% 20/12/2027 £100,000 113,765 0.04GlaxoSmithKline Capital 1.25% 12/10/2028 £700,000 696,533 0.24GlaxoSmithKline Capital 5.25% 19/12/2033 £492,000 691,014 0.24GlaxoSmithKline Capital 1.63% 12/05/2035 £400,000 387,719 0.13GlaxoSmithKline Capital 6.38% 09/03/2039 £250,000 413,820 0.14GlaxoSmithKline Capital 5.25% 10/04/2042 £350,000 540,439 0.19GlaxoSmithKline Capital 4.25% 18/12/2045 £350,000 497,493 0.17Go-Ahead Group 2.50% 06/07/2024 £100,000 102,794 0.04Grainger 3.38% 24/04/2028 £100,000 108,063 0.04Grainger 3.00% 03/07/2030 £200,000 210,921 0.07Great Rolling Stock 6.50% 05/04/2031 £281,750 359,034 0.12Greene King Finance 5.32% 15/09/2031 £124,750 143,353 0.05Greene King Finance 4.06% 15/03/2035 £116,375 126,857 0.04Greene King Finance 5.11% 15/03/2034 £75,000 86,340 0.03Guinness Partnership 4.00% 24/10/2044 £100,000 137,959 0.05Guinness Partnership 2.00% 22/04/2055 £200,000 200,219 0.07Gwynt y Mor OFTO 2.78% 17/02/2034 £78,360 82,405 0.03Hammerson, REIT 3.50% 27/10/2025 £250,000 262,668 0.09Hammerson, REIT 6.00% 23/02/2026 £125,000 144,049 0.05Hammerson, REIT 7.25% 21/04/2028 £100,000 125,713 0.04High Speed Rail Finance 1 4.38% 01/11/2038 £300,000 377,996 0.13Home Group 3.13% 27/03/2043 £100,000 115,362 0.04Housing & Care 21 3.29% 08/11/2049 £100,000 116,537 0.04HSBC Bank 6.50% 07/07/2023 £150,000 166,833 0.06HSBC Bank 5.38% 22/08/2033 £325,000 436,423 0.15HSBC Bank 6.25% 30/01/2041 £200,000 315,083 0.11HSBC Bank 4.75% 24/03/2046 £300,000 417,122 0.14HSBC Bank, FRN 5.37% 04/11/2030 £50,000 58,490 0.02HSBC Holdings 6.50% 20/05/2024 £300,000 347,499 0.12HSBC Holdings 2.63% 16/08/2028 £385,000 408,606 0.14HSBC Holdings 6.75% 11/09/2028 £200,000 261,191 0.09HSBC Holdings 7.00% 07/04/2038 £350,000 539,681 0.19HSBC Holdings 6.00% 29/03/2040 £300,000 431,620 0.15HSBC Holdings, FRN 2.26% 13/11/2026 £500,000 518,854 0.18HSBC Holdings, FRN 1.75% 24/07/2027 £600,000 606,443 0.21HSBC Holdings, FRN 3.00% 22/07/2028 £500,000 538,805 0.19Hutchison Whampoa Finance UK 5.63% 24/11/2026 £150,000 184,672 0.06Hyde Housing Association 5.13% 23/07/2040 £50,000 72,800 0.02Hyde Housing Association 1.75% 18/08/2055 £200,000 179,847 0.06Imperial Brands Finance 8.13% 15/03/2024 £300,000 353,732 0.12Imperial Brands Finance 5.50% 28/09/2026 £150,000 177,315 0.06
100
Imperial Brands Finance 4.88% 07/06/2032 £200,000 235,476 0.08Incommunities Treasury 3.25% 21/03/2049 £100,000 123,635 0.04Informa 3.13% 05/07/2026 £150,000 159,678 0.05InterContinental Hotels Group 3.75% 14/08/2025 £100,000 108,601 0.04InterContinental Hotels Group 3.38% 08/10/2028 £500,000 540,052 0.19Investec 4.50% 05/05/2022 £100,000 102,977 0.04Investec Bank, FRN 4.25% 24/07/2028 £250,000 262,635 0.09Just Group, FRN 7.00% 15/04/2031 £500,000 580,881 0.20Juturna European Loan Conduit No. 16 5.06% 10/08/2033 £346,175 427,488 0.15Karbon Homes 3.38% 15/11/2047 £200,000 255,197 0.09Land Securities Capital Markets, REIT 2.38% 29/03/2029 £145,000 152,600 0.05Land Securities Capital Markets, REIT 2.63% 22/09/2039 £179,000 191,284 0.07Land Securities Capital Markets, REIT 2.75% 22/09/2059 £300,000 336,544 0.12LCR Finance 4.50% 07/12/2028 £345,000 434,440 0.15LCR Finance 4.50% 07/12/2038 £180,000 267,795 0.09LCR Finance 5.10% 07/03/2051 £510,000 953,340 0.33Leeds Building Society, FRN 1.50% 16/03/2027 £200,000 199,880 0.07Legal & General Finance 5.88% 11/12/2031 £25,000 35,220 0.01Legal & General Finance 5.88% 05/04/2033 £100,000 143,950 0.05Legal & General Group, FRN 5.38% 27/10/2045 £200,000 230,321 0.08Legal & General Group, FRN 3.75% 26/11/2049 £400,000 435,153 0.15Legal & General Group, FRN 4.50% 01/11/2050 £200,000 229,920 0.08Legal & General Group, FRN 5.50% 27/06/2064 £300,000 381,834 0.13Liberty Living Finance 2.63% 28/11/2024 £100,000 104,799 0.04Liberty Living Finance 3.38% 28/11/2029 £200,000 219,660 0.08Libra Longhurst Group Treasury 5.13% 02/08/2038 £200,000 284,603 0.10Liverpool Victoria Friendly Society, FRN 6.50% 22/05/2043 £100,000 108,482 0.04LiveWest Treasury 2.25% 10/10/2043 £200,000 209,507 0.07Lloyds Bank 7.50% 15/04/2024 £225,000 266,965 0.09Lloyds Bank 5.13% 07/03/2025 £750,000 874,824 0.30Lloyds Bank 7.63% 22/04/2025 £525,000 650,927 0.22Lloyds Bank 4.88% 30/03/2027 £200,000 245,599 0.08Lloyds Bank 6.00% 08/02/2029 £700,000 954,569 0.33Lloyds Bank 6.50% 17/09/2040 £400,000 683,224 0.23Lloyds Bank Corporate Markets 1.75% 11/07/2024 £300,000 307,858 0.11Lloyds Banking Group 2.25% 16/10/2024 £480,000 499,671 0.17Lloyds Banking Group, FRN 1.88% 15/01/2026 £400,000 409,530 0.14Lloyds Banking Group, FRN 2.71% 03/12/2035 £635,000 648,803 0.22Logicor UK 1.88% 17/11/2031 £500,000 519,999 0.18London & Quadrant Housing Trust 2.63% 05/05/2026 £100,000 107,254 0.04London & Quadrant Housing Trust 2.25% 20/07/2029 £300,000 316,568 0.11London & Quadrant Housing Trust 4.63% 05/12/2033 £100,000 131,598 0.04London & Quadrant Housing Trust 2.00% 20/10/2038 £300,000 297,733 0.10London & Quadrant Housing Trust 3.75% 27/10/2049 £150,000 197,985 0.07London & Quadrant Housing Trust 3.13% 28/02/2053 £150,000 179,623 0.06London & Quadrant Housing Trust 2.75% 20/07/2057 £165,000 183,813 0.06London Power Networks 6.13% 07/06/2027 £50,000 63,683 0.02London Power Networks 2.63% 01/03/2029 £250,000 269,505 0.09London Stock Exchange Group 1.63% 06/04/2030 £200,000 199,844 0.07Longstone Finance 4.90% 19/04/2036 £200,000 231,123 0.08M&G, FRN 5.63% 20/10/2051 £100,000 120,525 0.04M&G, FRN 5.56% 20/07/2055 £340,000 408,936 0.14M&G, FRN 6.34% 19/12/2063 £350,000 458,413 0.16M&G, FRN 6.25% 20/10/2068 £200,000 263,268 0.09Manchester Airport Group Funding 4.13% 02/04/2024 £250,000 270,269 0.09Manchester Airport Group Funding 2.88% 30/09/2044 £400,000 400,999 0.14Martlet Homes 3.00% 09/05/2052 £220,000 259,486 0.09Meadowhall Finance 4.99% 12/07/2037 £191,596 221,362 0.08Meadowhall Finance 'B' 4.99% 12/07/2037 £132,107 150,271 0.05Merseylink Issuer 3.84% 31/03/2043 £100,000 133,317 0.05Metropolitan Funding 4.13% 05/04/2048 £100,000 127,254 0.04Mitchells & Butlers Finance 5.57% 15/12/2030 £16,836 19,162 0.01Morhomes 3.40% 19/02/2040 £300,000 336,933 0.12Motability Operations Group 4.38% 08/02/2027 £200,000 236,269 0.08Motability Operations Group 1.75% 03/07/2029 £300,000 309,355 0.11Motability Operations Group 3.63% 10/03/2036 £300,000 368,911 0.13Motability Operations Group 2.38% 03/07/2039 £250,000 267,477 0.09Motability Operations Group 1.50% 20/01/2041 £200,000 185,270 0.06National Express Group 2.50% 11/11/2023 £200,000 207,578 0.07
101
National Express Group 2.38% 20/11/2028 £100,000 103,094 0.04National Grid Electricity Transmission 5.88% 02/02/2024 £125,000 140,664 0.05National Grid Electricity Transmission 4.00% 08/06/2027 £100,000 114,906 0.04National Grid Electricity Transmission 2.00% 16/09/2038 £300,000 295,619 0.10National Grid Gas 1.13% 14/01/2033 £230,000 210,037 0.07National Grid Gas 1.63% 14/01/2043 £300,000 264,268 0.09National Westminster Bank 5.13% 13/01/2024 £325,000 363,106 0.12Nationwide Building Society 5.63% 28/01/2026 £500,000 611,897 0.21Nationwide Building Society 3.00% 06/05/2026 £600,000 659,953 0.23Nats En Route 1.75% 30/09/2033 £300,000 303,707 0.10Natwest Group, FRN 2.88% 19/09/2026 £250,000 265,719 0.09Natwest Group, FRN 3.12% 28/03/2027 £450,000 483,729 0.17Natwest Group, FRN 3.62% 14/08/2030 £600,000 640,012 0.22Natwest Group, FRN 2.10% 28/11/2031 £400,000 401,841 0.14Network Rail Infrastructure Finance 3.00% 07/09/2023 £850,000 900,501 0.31Network Rail Infrastructure Finance 4.38% 09/12/2030 £450,000 587,382 0.20Network Rail Infrastructure Finance 4.75% 29/11/2035 £510,000 741,173 0.25NewRiver REIT 3.50% 07/03/2028 £100,000 104,282 0.04Next Group 3.00% 26/08/2025 £200,000 214,122 0.07Next Group 3.63% 18/05/2028 £200,000 220,179 0.08NIE Finance 2.50% 27/10/2025 £500,000 529,452 0.18NIE Finance 6.38% 02/06/2026 £100,000 125,140 0.04Northern Gas Networks Finance 4.88% 30/06/2027 £100,000 120,626 0.04Northern Gas Networks Finance 4.88% 15/11/2035 £100,000 132,893 0.05Northern Gas Networks Finance 5.63% 23/03/2040 £100,000 149,839 0.05Northern Powergrid Holdings 7.25% 15/12/2022 £80,000 87,612 0.03Northern Powergrid Yorkshire 5.13% 04/05/2035 £63,000 85,451 0.03Northern Powergrid Yorkshire 2.25% 09/10/2059 £320,000 334,126 0.11Northumbrian Water Finance 6.88% 06/02/2023 £250,000 274,485 0.09Northumbrian Water Finance 1.63% 11/10/2026 £100,000 102,403 0.03Northumbrian Water Finance 2.38% 05/10/2027 £400,000 423,038 0.15Northumbrian Water Finance 5.13% 23/01/2042 £200,000 297,824 0.10Notting Hill Genesis 2.88% 31/01/2029 £200,000 217,497 0.07Notting Hill Genesis 3.75% 20/12/2032 £300,000 359,051 0.12Notting Hill Genesis 2.00% 03/06/2036 £200,000 199,800 0.07Notting Hill Genesis 3.25% 12/10/2048 £200,000 240,052 0.08Notting Hill Genesis 4.38% 20/02/2054 £225,000 334,849 0.11Optivo Finance 3.28% 22/03/2048 £200,000 239,418 0.08Orbit Capital 2.00% 24/11/2038 £150,000 148,010 0.05Orbit Capital 3.50% 24/03/2045 £156,000 192,190 0.07Orbit Capital 3.38% 14/06/2048 £200,000 244,850 0.08Paradigm Homes Charitable Housing Association 2.25% 20/05/2051 £150,000 155,188 0.05Paragon Treasury 2.00% 07/05/2036 £150,000 151,870 0.05Paragon Treasury 3.63% 21/01/2047 £161,000 201,374 0.07Peabody Capital No. 2 3.25% 14/09/2048 £500,000 605,602 0.21Pearson Funding 3.75% 04/06/2030 £200,000 222,755 0.08Penarian Housing Finance 3.21% 07/06/2052 £100,000 114,250 0.04Pension Insurance 6.50% 03/07/2024 £300,000 343,884 0.12Pension Insurance 8.00% 23/11/2026 £150,000 195,921 0.07Pension Insurance 5.63% 20/09/2030 £150,000 184,157 0.06Pension Insurance 4.63% 07/05/2031 £400,000 458,322 0.16Phoenix Group Holdings 4.13% 20/07/2022 £100,000 103,399 0.04Phoenix Group Holdings 6.63% 18/12/2025 £300,000 362,215 0.12Phoenix Group Holdings 5.87% 13/06/2029 £300,000 367,669 0.13Phoenix Group Holdings 5.63% 28/04/2031 £300,000 366,295 0.13Places for People Homes 3.63% 22/11/2028 £200,000 228,872 0.08Platform HG Financing 1.63% 10/08/2055 £200,000 181,001 0.06Principality Building Society 2.38% 23/11/2023 £100,000 103,034 0.04Prs Finance 1.75% 24/11/2026 £192,417 202,651 0.07Prs Finance 2.00% 23/01/2029 £400,000 427,257 0.15Prudential 5.88% 11/05/2029 £350,000 470,461 0.16Quadgas Finance 3.38% 17/09/2029 £250,000 268,340 0.09RAC Bond 4.57% 06/05/2046 £250,000 260,305 0.09RAC Bond 4.87% 06/05/2046 £250,000 273,480 0.09Reckitt Benckiser Treasury Services 1.75% 19/05/2032 £320,000 324,563 0.11RHP Finance 3.25% 05/02/2048 £107,000 126,925 0.04Rio Tinto Finance 4.00% 11/12/2029 £300,000 360,655 0.12Riverside Finance 3.88% 05/12/2044 £100,000 132,973 0.05RL Finance Bonds NO 4, FRN 4.87% 07/10/2049 £250,000 284,915 0.10
102
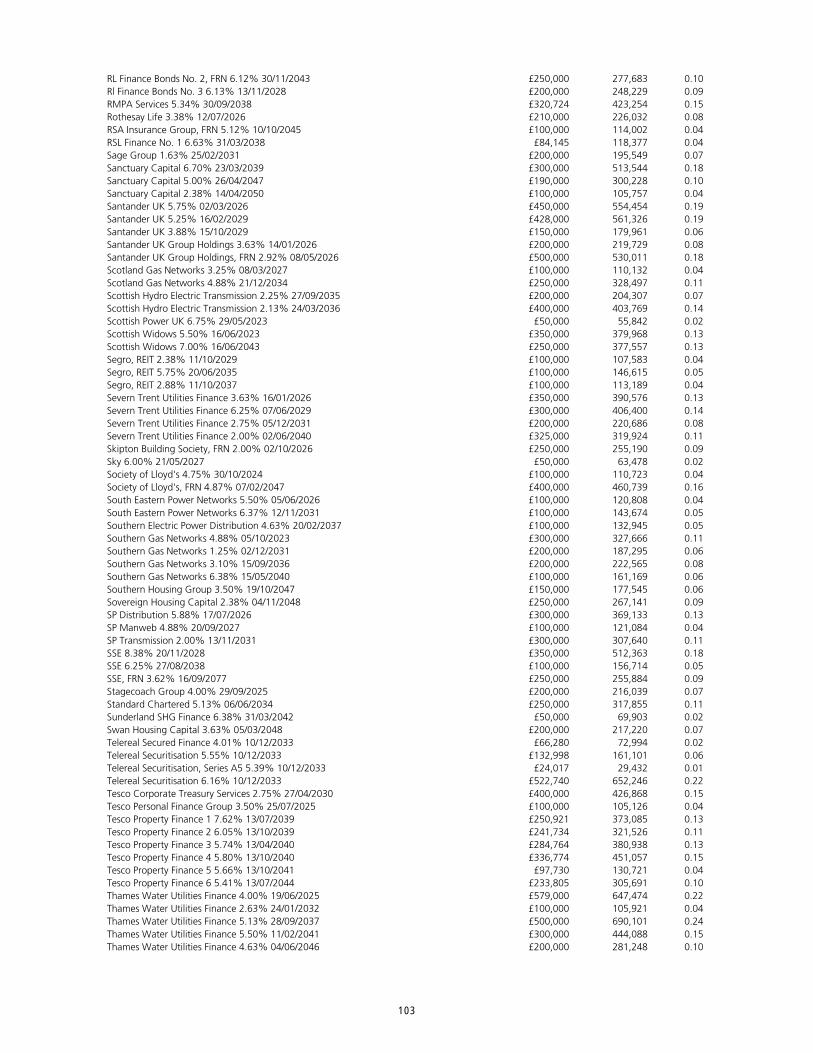
RL Finance Bonds No. 2, FRN 6.12% 30/11/2043 £250,000 277,683 0.10Rl Finance Bonds No. 3 6.13% 13/11/2028 £200,000 248,229 0.09RMPA Services 5.34% 30/09/2038 £320,724 423,254 0.15Rothesay Life 3.38% 12/07/2026 £210,000 226,032 0.08RSA Insurance Group, FRN 5.12% 10/10/2045 £100,000 114,002 0.04RSL Finance No. 1 6.63% 31/03/2038 £84,145 118,377 0.04Sage Group 1.63% 25/02/2031 £200,000 195,549 0.07Sanctuary Capital 6.70% 23/03/2039 £300,000 513,544 0.18Sanctuary Capital 5.00% 26/04/2047 £190,000 300,228 0.10Sanctuary Capital 2.38% 14/04/2050 £100,000 105,757 0.04Santander UK 5.75% 02/03/2026 £450,000 554,454 0.19Santander UK 5.25% 16/02/2029 £428,000 561,326 0.19Santander UK 3.88% 15/10/2029 £150,000 179,961 0.06Santander UK Group Holdings 3.63% 14/01/2026 £200,000 219,729 0.08Santander UK Group Holdings, FRN 2.92% 08/05/2026 £500,000 530,011 0.18Scotland Gas Networks 3.25% 08/03/2027 £100,000 110,132 0.04Scotland Gas Networks 4.88% 21/12/2034 £250,000 328,497 0.11Scottish Hydro Electric Transmission 2.25% 27/09/2035 £200,000 204,307 0.07Scottish Hydro Electric Transmission 2.13% 24/03/2036 £400,000 403,769 0.14Scottish Power UK 6.75% 29/05/2023 £50,000 55,842 0.02Scottish Widows 5.50% 16/06/2023 £350,000 379,968 0.13Scottish Widows 7.00% 16/06/2043 £250,000 377,557 0.13Segro, REIT 2.38% 11/10/2029 £100,000 107,583 0.04Segro, REIT 5.75% 20/06/2035 £100,000 146,615 0.05Segro, REIT 2.88% 11/10/2037 £100,000 113,189 0.04Severn Trent Utilities Finance 3.63% 16/01/2026 £350,000 390,576 0.13Severn Trent Utilities Finance 6.25% 07/06/2029 £300,000 406,400 0.14Severn Trent Utilities Finance 2.75% 05/12/2031 £200,000 220,686 0.08Severn Trent Utilities Finance 2.00% 02/06/2040 £325,000 319,924 0.11Skipton Building Society, FRN 2.00% 02/10/2026 £250,000 255,190 0.09Sky 6.00% 21/05/2027 £50,000 63,478 0.02Society of Lloyd's 4.75% 30/10/2024 £100,000 110,723 0.04Society of Lloyd's, FRN 4.87% 07/02/2047 £400,000 460,739 0.16South Eastern Power Networks 5.50% 05/06/2026 £100,000 120,808 0.04South Eastern Power Networks 6.37% 12/11/2031 £100,000 143,674 0.05Southern Electric Power Distribution 4.63% 20/02/2037 £100,000 132,945 0.05Southern Gas Networks 4.88% 05/10/2023 £300,000 327,666 0.11Southern Gas Networks 1.25% 02/12/2031 £200,000 187,295 0.06Southern Gas Networks 3.10% 15/09/2036 £200,000 222,565 0.08Southern Gas Networks 6.38% 15/05/2040 £100,000 161,169 0.06Southern Housing Group 3.50% 19/10/2047 £150,000 177,545 0.06Sovereign Housing Capital 2.38% 04/11/2048 £250,000 267,141 0.09SP Distribution 5.88% 17/07/2026 £300,000 369,133 0.13SP Manweb 4.88% 20/09/2027 £100,000 121,084 0.04SP Transmission 2.00% 13/11/2031 £300,000 307,640 0.11SSE 8.38% 20/11/2028 £350,000 512,363 0.18SSE 6.25% 27/08/2038 £100,000 156,714 0.05SSE, FRN 3.62% 16/09/2077 £250,000 255,884 0.09Stagecoach Group 4.00% 29/09/2025 £200,000 216,039 0.07Standard Chartered 5.13% 06/06/2034 £250,000 317,855 0.11Sunderland SHG Finance 6.38% 31/03/2042 £50,000 69,903 0.02Swan Housing Capital 3.63% 05/03/2048 £200,000 217,220 0.07Telereal Secured Finance 4.01% 10/12/2033 £66,280 72,994 0.02Telereal Securitisation 5.55% 10/12/2033 £132,998 161,101 0.06Telereal Securitisation, Series A5 5.39% 10/12/2033 £24,017 29,432 0.01Telereal Securitisation 6.16% 10/12/2033 £522,740 652,246 0.22Tesco Corporate Treasury Services 2.75% 27/04/2030 £400,000 426,868 0.15Tesco Personal Finance Group 3.50% 25/07/2025 £100,000 105,126 0.04Tesco Property Finance 1 7.62% 13/07/2039 £250,921 373,085 0.13Tesco Property Finance 2 6.05% 13/10/2039 £241,734 321,526 0.11Tesco Property Finance 3 5.74% 13/04/2040 £284,764 380,938 0.13Tesco Property Finance 4 5.80% 13/10/2040 £336,774 451,057 0.15Tesco Property Finance 5 5.66% 13/10/2041 £97,730 130,721 0.04Tesco Property Finance 6 5.41% 13/07/2044 £233,805 305,691 0.10Thames Water Utilities Finance 4.00% 19/06/2025 £579,000 647,474 0.22Thames Water Utilities Finance 2.63% 24/01/2032 £100,000 105,921 0.04Thames Water Utilities Finance 5.13% 28/09/2037 £500,000 690,101 0.24Thames Water Utilities Finance 5.50% 11/02/2041 £300,000 444,088 0.15Thames Water Utilities Finance 4.63% 04/06/2046 £200,000 281,248 0.10
103
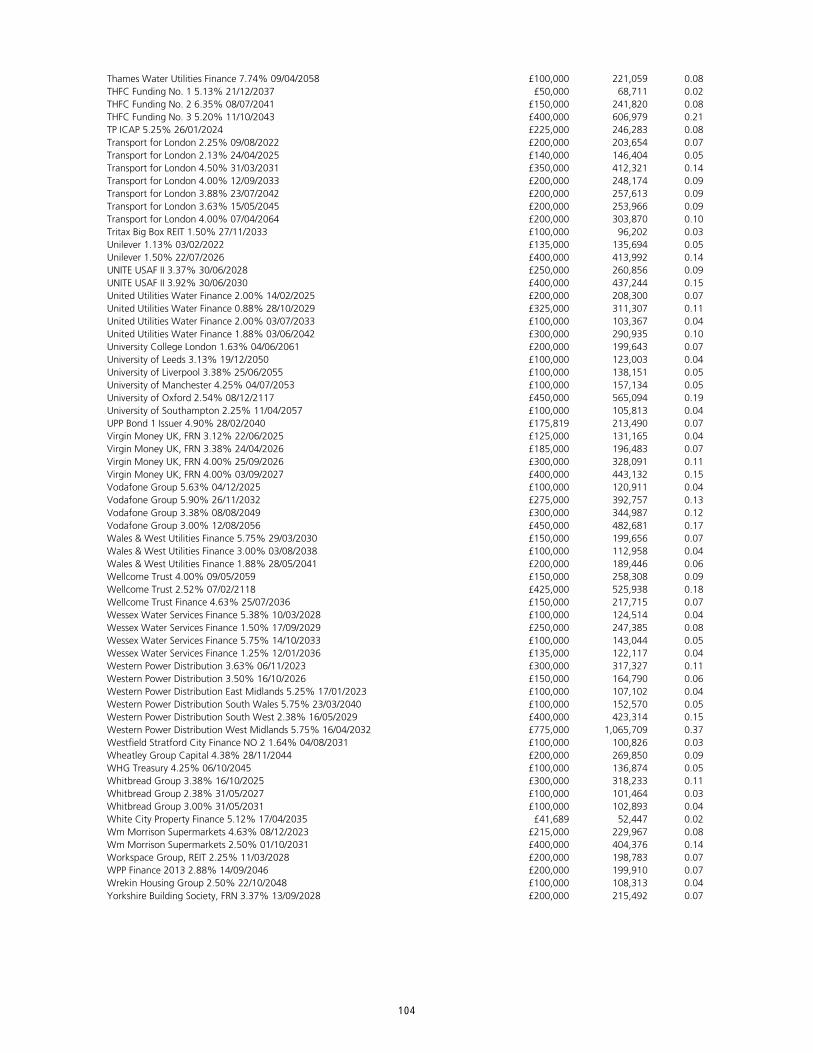
Thames Water Utilities Finance 7.74% 09/04/2058 £100,000 221,059 0.08THFC Funding No. 1 5.13% 21/12/2037 £50,000 68,711 0.02THFC Funding No. 2 6.35% 08/07/2041 £150,000 241,820 0.08THFC Funding No. 3 5.20% 11/10/2043 £400,000 606,979 0.21TP ICAP 5.25% 26/01/2024 £225,000 246,283 0.08Transport for London 2.25% 09/08/2022 £200,000 203,654 0.07Transport for London 2.13% 24/04/2025 £140,000 146,404 0.05Transport for London 4.50% 31/03/2031 £350,000 412,321 0.14Transport for London 4.00% 12/09/2033 £200,000 248,174 0.09Transport for London 3.88% 23/07/2042 £200,000 257,613 0.09Transport for London 3.63% 15/05/2045 £200,000 253,966 0.09Transport for London 4.00% 07/04/2064 £200,000 303,870 0.10Tritax Big Box REIT 1.50% 27/11/2033 £100,000 96,202 0.03Unilever 1.13% 03/02/2022 £135,000 135,694 0.05Unilever 1.50% 22/07/2026 £400,000 413,992 0.14UNITE USAF II 3.37% 30/06/2028 £250,000 260,856 0.09UNITE USAF II 3.92% 30/06/2030 £400,000 437,244 0.15United Utilities Water Finance 2.00% 14/02/2025 £200,000 208,300 0.07United Utilities Water Finance 0.88% 28/10/2029 £325,000 311,307 0.11United Utilities Water Finance 2.00% 03/07/2033 £100,000 103,367 0.04United Utilities Water Finance 1.88% 03/06/2042 £300,000 290,935 0.10University College London 1.63% 04/06/2061 £200,000 199,643 0.07University of Leeds 3.13% 19/12/2050 £100,000 123,003 0.04University of Liverpool 3.38% 25/06/2055 £100,000 138,151 0.05University of Manchester 4.25% 04/07/2053 £100,000 157,134 0.05University of Oxford 2.54% 08/12/2117 £450,000 565,094 0.19University of Southampton 2.25% 11/04/2057 £100,000 105,813 0.04UPP Bond 1 Issuer 4.90% 28/02/2040 £175,819 213,490 0.07Virgin Money UK, FRN 3.12% 22/06/2025 £125,000 131,165 0.04Virgin Money UK, FRN 3.38% 24/04/2026 £185,000 196,483 0.07Virgin Money UK, FRN 4.00% 25/09/2026 £300,000 328,091 0.11Virgin Money UK, FRN 4.00% 03/09/2027 £400,000 443,132 0.15Vodafone Group 5.63% 04/12/2025 £100,000 120,911 0.04Vodafone Group 5.90% 26/11/2032 £275,000 392,757 0.13Vodafone Group 3.38% 08/08/2049 £300,000 344,987 0.12Vodafone Group 3.00% 12/08/2056 £450,000 482,681 0.17Wales & West Utilities Finance 5.75% 29/03/2030 £150,000 199,656 0.07Wales & West Utilities Finance 3.00% 03/08/2038 £100,000 112,958 0.04Wales & West Utilities Finance 1.88% 28/05/2041 £200,000 189,446 0.06Wellcome Trust 4.00% 09/05/2059 £150,000 258,308 0.09Wellcome Trust 2.52% 07/02/2118 £425,000 525,938 0.18Wellcome Trust Finance 4.63% 25/07/2036 £150,000 217,715 0.07Wessex Water Services Finance 5.38% 10/03/2028 £100,000 124,514 0.04Wessex Water Services Finance 1.50% 17/09/2029 £250,000 247,385 0.08Wessex Water Services Finance 5.75% 14/10/2033 £100,000 143,044 0.05Wessex Water Services Finance 1.25% 12/01/2036 £135,000 122,117 0.04Western Power Distribution 3.63% 06/11/2023 £300,000 317,327 0.11Western Power Distribution 3.50% 16/10/2026 £150,000 164,790 0.06Western Power Distribution East Midlands 5.25% 17/01/2023 £100,000 107,102 0.04Western Power Distribution South Wales 5.75% 23/03/2040 £100,000 152,570 0.05Western Power Distribution South West 2.38% 16/05/2029 £400,000 423,314 0.15Western Power Distribution West Midlands 5.75% 16/04/2032 £775,000 1,065,709 0.37Westfield Stratford City Finance NO 2 1.64% 04/08/2031 £100,000 100,826 0.03Wheatley Group Capital 4.38% 28/11/2044 £200,000 269,850 0.09WHG Treasury 4.25% 06/10/2045 £100,000 136,874 0.05Whitbread Group 3.38% 16/10/2025 £300,000 318,233 0.11Whitbread Group 2.38% 31/05/2027 £100,000 101,464 0.03Whitbread Group 3.00% 31/05/2031 £100,000 102,893 0.04White City Property Finance 5.12% 17/04/2035 £41,689 52,447 0.02Wm Morrison Supermarkets 4.63% 08/12/2023 £215,000 229,967 0.08Wm Morrison Supermarkets 2.50% 01/10/2031 £400,000 404,376 0.14Workspace Group, REIT 2.25% 11/03/2028 £200,000 198,783 0.07WPP Finance 2013 2.88% 14/09/2046 £200,000 199,910 0.07Wrekin Housing Group 2.50% 22/10/2048 £100,000 108,313 0.04Yorkshire Building Society, FRN 3.37% 13/09/2028 £200,000 215,492 0.07
104
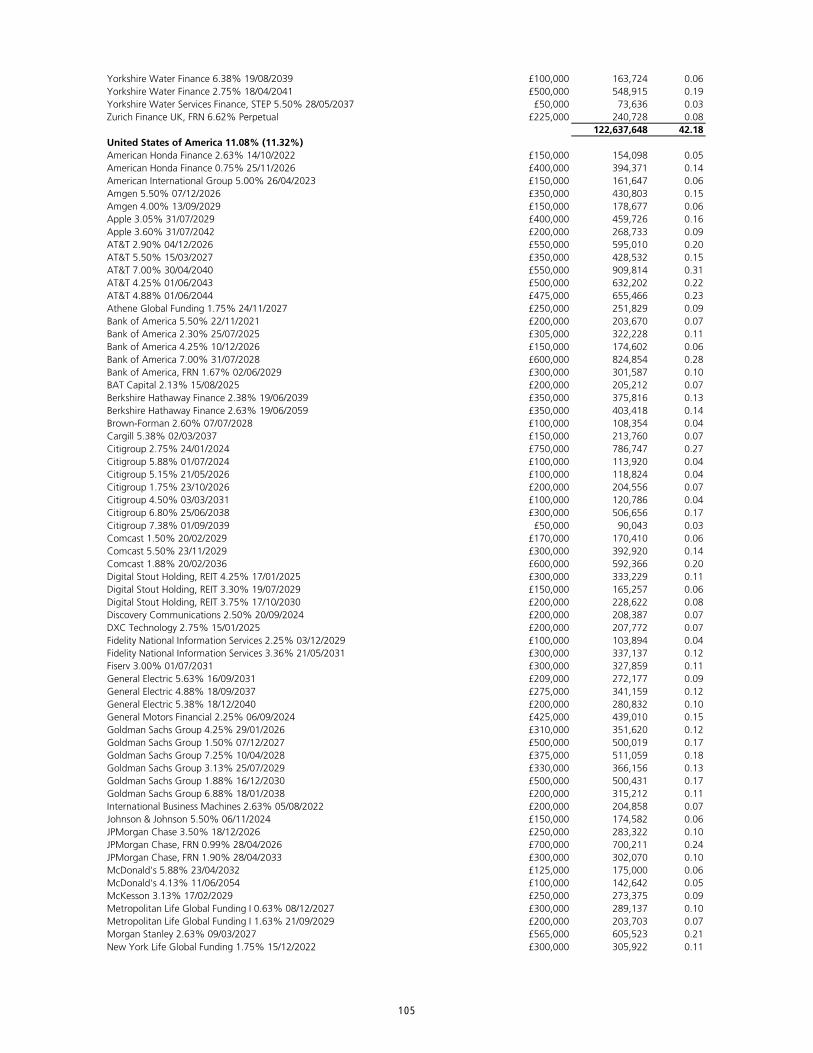
Yorkshire Water Finance 6.38% 19/08/2039 £100,000 163,724 0.06Yorkshire Water Finance 2.75% 18/04/2041 £500,000 548,915 0.19Yorkshire Water Services Finance, STEP 5.50% 28/05/2037 £50,000 73,636 0.03Zurich Finance UK, FRN 6.62% Perpetual £225,000 240,728 0.08
122,637,648 42.18United States of America 11.08% (11.32%)American Honda Finance 2.63% 14/10/2022 £150,000 154,098 0.05American Honda Finance 0.75% 25/11/2026 £400,000 394,371 0.14American International Group 5.00% 26/04/2023 £150,000 161,647 0.06Amgen 5.50% 07/12/2026 £350,000 430,803 0.15Amgen 4.00% 13/09/2029 £150,000 178,677 0.06Apple 3.05% 31/07/2029 £400,000 459,726 0.16Apple 3.60% 31/07/2042 £200,000 268,733 0.09AT&T 2.90% 04/12/2026 £550,000 595,010 0.20AT&T 5.50% 15/03/2027 £350,000 428,532 0.15AT&T 7.00% 30/04/2040 £550,000 909,814 0.31AT&T 4.25% 01/06/2043 £500,000 632,202 0.22AT&T 4.88% 01/06/2044 £475,000 655,466 0.23Athene Global Funding 1.75% 24/11/2027 £250,000 251,829 0.09Bank of America 5.50% 22/11/2021 £200,000 203,670 0.07Bank of America 2.30% 25/07/2025 £305,000 322,228 0.11Bank of America 4.25% 10/12/2026 £150,000 174,602 0.06Bank of America 7.00% 31/07/2028 £600,000 824,854 0.28Bank of America, FRN 1.67% 02/06/2029 £300,000 301,587 0.10BAT Capital 2.13% 15/08/2025 £200,000 205,212 0.07Berkshire Hathaway Finance 2.38% 19/06/2039 £350,000 375,816 0.13Berkshire Hathaway Finance 2.63% 19/06/2059 £350,000 403,418 0.14Brown-Forman 2.60% 07/07/2028 £100,000 108,354 0.04Cargill 5.38% 02/03/2037 £150,000 213,760 0.07Citigroup 2.75% 24/01/2024 £750,000 786,747 0.27Citigroup 5.88% 01/07/2024 £100,000 113,920 0.04Citigroup 5.15% 21/05/2026 £100,000 118,824 0.04Citigroup 1.75% 23/10/2026 £200,000 204,556 0.07Citigroup 4.50% 03/03/2031 £100,000 120,786 0.04Citigroup 6.80% 25/06/2038 £300,000 506,656 0.17Citigroup 7.38% 01/09/2039 £50,000 90,043 0.03Comcast 1.50% 20/02/2029 £170,000 170,410 0.06Comcast 5.50% 23/11/2029 £300,000 392,920 0.14Comcast 1.88% 20/02/2036 £600,000 592,366 0.20Digital Stout Holding, REIT 4.25% 17/01/2025 £300,000 333,229 0.11Digital Stout Holding, REIT 3.30% 19/07/2029 £150,000 165,257 0.06Digital Stout Holding, REIT 3.75% 17/10/2030 £200,000 228,622 0.08Discovery Communications 2.50% 20/09/2024 £200,000 208,387 0.07DXC Technology 2.75% 15/01/2025 £200,000 207,772 0.07Fidelity National Information Services 2.25% 03/12/2029 £100,000 103,894 0.04Fidelity National Information Services 3.36% 21/05/2031 £300,000 337,137 0.12Fiserv 3.00% 01/07/2031 £300,000 327,859 0.11General Electric 5.63% 16/09/2031 £209,000 272,177 0.09General Electric 4.88% 18/09/2037 £275,000 341,159 0.12General Electric 5.38% 18/12/2040 £200,000 280,832 0.10General Motors Financial 2.25% 06/09/2024 £425,000 439,010 0.15Goldman Sachs Group 4.25% 29/01/2026 £310,000 351,620 0.12Goldman Sachs Group 1.50% 07/12/2027 £500,000 500,019 0.17Goldman Sachs Group 7.25% 10/04/2028 £375,000 511,059 0.18Goldman Sachs Group 3.13% 25/07/2029 £330,000 366,156 0.13Goldman Sachs Group 1.88% 16/12/2030 £500,000 500,431 0.17Goldman Sachs Group 6.88% 18/01/2038 £200,000 315,212 0.11International Business Machines 2.63% 05/08/2022 £200,000 204,858 0.07Johnson & Johnson 5.50% 06/11/2024 £150,000 174,582 0.06JPMorgan Chase 3.50% 18/12/2026 £250,000 283,322 0.10JPMorgan Chase, FRN 0.99% 28/04/2026 £700,000 700,211 0.24JPMorgan Chase, FRN 1.90% 28/04/2033 £300,000 302,070 0.10McDonald's 5.88% 23/04/2032 £125,000 175,000 0.06McDonald's 4.13% 11/06/2054 £100,000 142,642 0.05McKesson 3.13% 17/02/2029 £250,000 273,375 0.09Metropolitan Life Global Funding I 0.63% 08/12/2027 £300,000 289,137 0.10Metropolitan Life Global Funding I 1.63% 21/09/2029 £200,000 203,703 0.07Morgan Stanley 2.63% 09/03/2027 £565,000 605,523 0.21New York Life Global Funding 1.75% 15/12/2022 £300,000 305,922 0.11
105
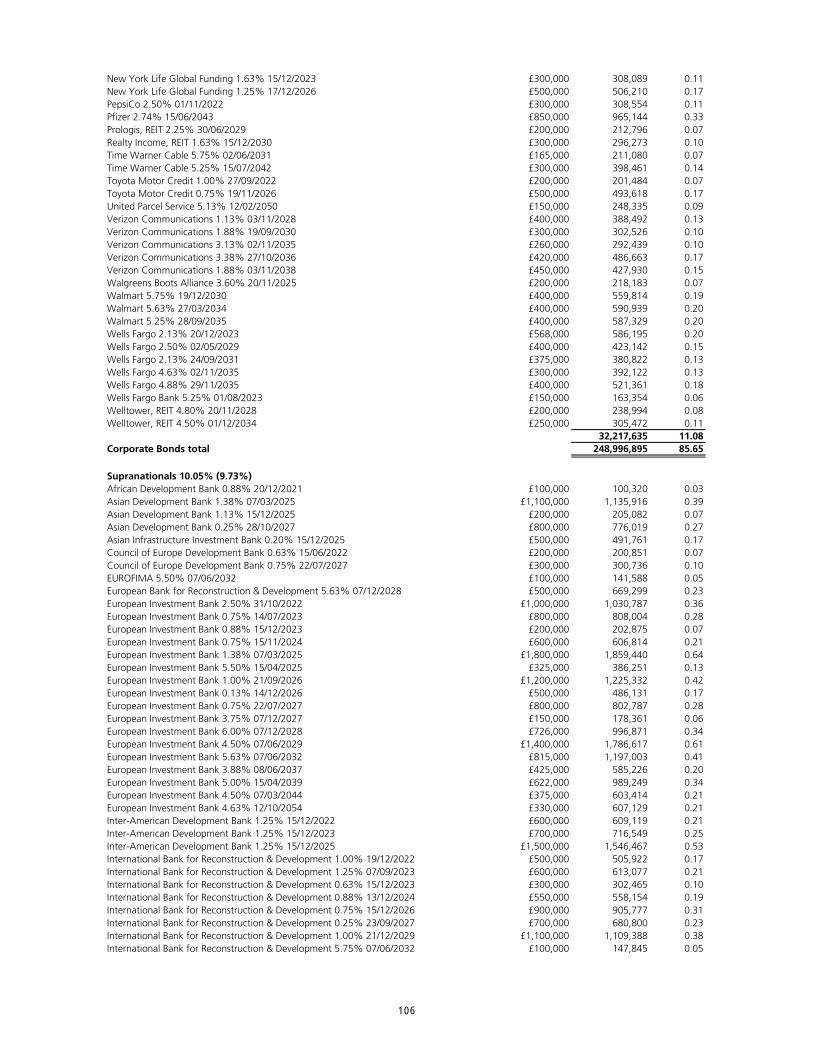
New York Life Global Funding 1.63% 15/12/2023 £300,000 308,089 0.11New York Life Global Funding 1.25% 17/12/2026 £500,000 506,210 0.17PepsiCo 2.50% 01/11/2022 £300,000 308,554 0.11Pfizer 2.74% 15/06/2043 £850,000 965,144 0.33Prologis, REIT 2.25% 30/06/2029 £200,000 212,796 0.07Realty Income, REIT 1.63% 15/12/2030 £300,000 296,273 0.10Time Warner Cable 5.75% 02/06/2031 £165,000 211,080 0.07Time Warner Cable 5.25% 15/07/2042 £300,000 398,461 0.14Toyota Motor Credit 1.00% 27/09/2022 £200,000 201,484 0.07Toyota Motor Credit 0.75% 19/11/2026 £500,000 493,618 0.17United Parcel Service 5.13% 12/02/2050 £150,000 248,335 0.09Verizon Communications 1.13% 03/11/2028 £400,000 388,492 0.13Verizon Communications 1.88% 19/09/2030 £300,000 302,526 0.10Verizon Communications 3.13% 02/11/2035 £260,000 292,439 0.10Verizon Communications 3.38% 27/10/2036 £420,000 486,663 0.17Verizon Communications 1.88% 03/11/2038 £450,000 427,930 0.15Walgreens Boots Alliance 3.60% 20/11/2025 £200,000 218,183 0.07Walmart 5.75% 19/12/2030 £400,000 559,814 0.19Walmart 5.63% 27/03/2034 £400,000 590,939 0.20Walmart 5.25% 28/09/2035 £400,000 587,329 0.20Wells Fargo 2.13% 20/12/2023 £568,000 586,195 0.20Wells Fargo 2.50% 02/05/2029 £400,000 423,142 0.15Wells Fargo 2.13% 24/09/2031 £375,000 380,822 0.13Wells Fargo 4.63% 02/11/2035 £300,000 392,122 0.13Wells Fargo 4.88% 29/11/2035 £400,000 521,361 0.18Wells Fargo Bank 5.25% 01/08/2023 £150,000 163,354 0.06Welltower, REIT 4.80% 20/11/2028 £200,000 238,994 0.08Welltower, REIT 4.50% 01/12/2034 £250,000 305,472 0.11
32,217,635 11.08Corporate Bonds total 248,996,895 85.65
Supranationals 10.05% (9.73%)African Development Bank 0.88% 20/12/2021 £100,000 100,320 0.03Asian Development Bank 1.38% 07/03/2025 £1,100,000 1,135,916 0.39Asian Development Bank 1.13% 15/12/2025 £200,000 205,082 0.07Asian Development Bank 0.25% 28/10/2027 £800,000 776,019 0.27Asian Infrastructure Investment Bank 0.20% 15/12/2025 £500,000 491,761 0.17Council of Europe Development Bank 0.63% 15/06/2022 £200,000 200,851 0.07Council of Europe Development Bank 0.75% 22/07/2027 £300,000 300,736 0.10EUROFIMA 5.50% 07/06/2032 £100,000 141,588 0.05European Bank for Reconstruction & Development 5.63% 07/12/2028 £500,000 669,299 0.23European Investment Bank 2.50% 31/10/2022 £1,000,000 1,030,787 0.36European Investment Bank 0.75% 14/07/2023 £800,000 808,004 0.28European Investment Bank 0.88% 15/12/2023 £200,000 202,875 0.07European Investment Bank 0.75% 15/11/2024 £600,000 606,814 0.21European Investment Bank 1.38% 07/03/2025 £1,800,000 1,859,440 0.64European Investment Bank 5.50% 15/04/2025 £325,000 386,251 0.13European Investment Bank 1.00% 21/09/2026 £1,200,000 1,225,332 0.42European Investment Bank 0.13% 14/12/2026 £500,000 486,131 0.17European Investment Bank 0.75% 22/07/2027 £800,000 802,787 0.28European Investment Bank 3.75% 07/12/2027 £150,000 178,361 0.06European Investment Bank 6.00% 07/12/2028 £726,000 996,871 0.34European Investment Bank 4.50% 07/06/2029 £1,400,000 1,786,617 0.61European Investment Bank 5.63% 07/06/2032 £815,000 1,197,003 0.41European Investment Bank 3.88% 08/06/2037 £425,000 585,226 0.20European Investment Bank 5.00% 15/04/2039 £622,000 989,249 0.34European Investment Bank 4.50% 07/03/2044 £375,000 603,414 0.21European Investment Bank 4.63% 12/10/2054 £330,000 607,129 0.21Inter-American Development Bank 1.25% 15/12/2022 £600,000 609,119 0.21Inter-American Development Bank 1.25% 15/12/2023 £700,000 716,549 0.25Inter-American Development Bank 1.25% 15/12/2025 £1,500,000 1,546,467 0.53International Bank for Reconstruction & Development 1.00% 19/12/2022 £500,000 505,922 0.17International Bank for Reconstruction & Development 1.25% 07/09/2023 £600,000 613,077 0.21International Bank for Reconstruction & Development 0.63% 15/12/2023 £300,000 302,465 0.10International Bank for Reconstruction & Development 0.88% 13/12/2024 £550,000 558,154 0.19International Bank for Reconstruction & Development 0.75% 15/12/2026 £900,000 905,777 0.31International Bank for Reconstruction & Development 0.25% 23/09/2027 £700,000 680,800 0.23International Bank for Reconstruction & Development 1.00% 21/12/2029 £1,100,000 1,109,388 0.38International Bank for Reconstruction & Development 5.75% 07/06/2032 £100,000 147,845 0.05
106
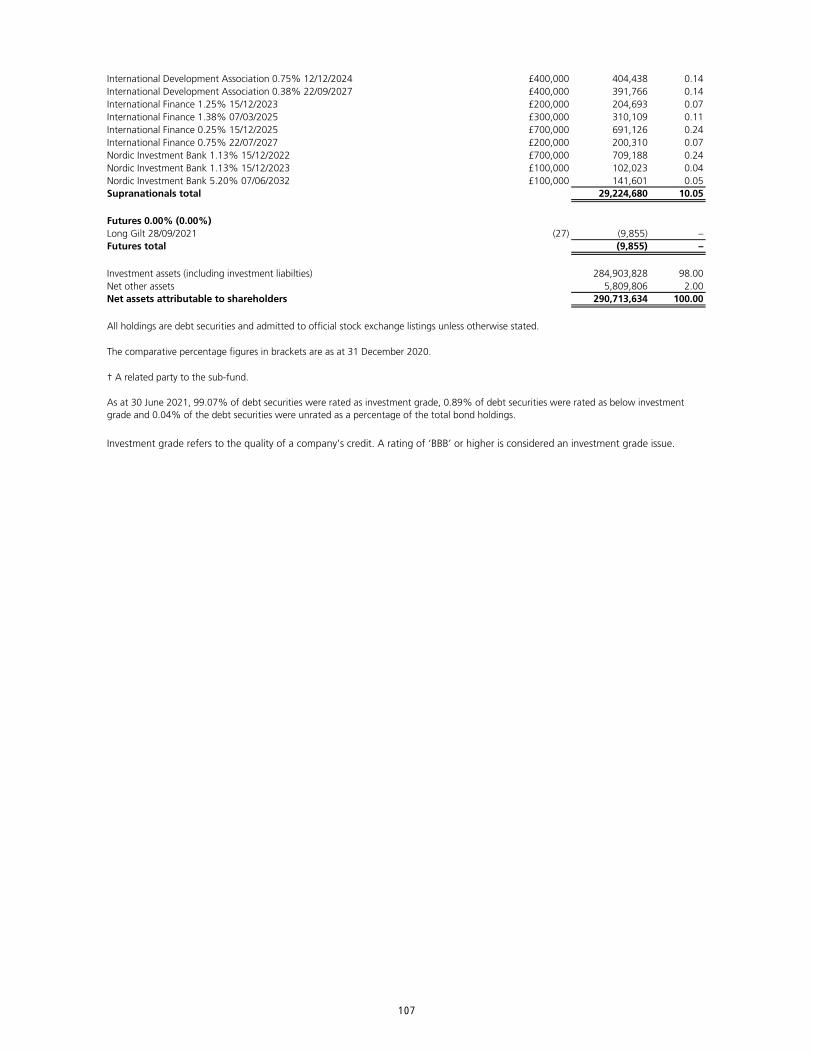
International Development Association 0.75% 12/12/2024 £400,000 404,438 0.14International Development Association 0.38% 22/09/2027 £400,000 391,766 0.14International Finance 1.25% 15/12/2023 £200,000 204,693 0.07International Finance 1.38% 07/03/2025 £300,000 310,109 0.11International Finance 0.25% 15/12/2025 £700,000 691,126 0.24International Finance 0.75% 22/07/2027 £200,000 200,310 0.07Nordic Investment Bank 1.13% 15/12/2022 £700,000 709,188 0.24Nordic Investment Bank 1.13% 15/12/2023 £100,000 102,023 0.04Nordic Investment Bank 5.20% 07/06/2032 £100,000 141,601 0.05Supranationals total 29,224,680 10.05
Futures 0.00% (0.00%)Long Gilt 28/09/2021 (27) (9,855) –Futures total (9,855) –
Investment assets (including investment liabilties) 284,903,828 98.00Net other assets 5,809,806 2.00Net assets attributable to shareholders 290,713,634 100.00
All holdings are debt securities and admitted to official stock exchange listings unless otherwise stated.
The comparative percentage figures in brackets are as at 31 December 2020.
† A related party to the sub-fund.
Investment grade refers to the quality of a company’s credit. A rating of ‘BBB’ or higher is considered an investment grade issue.
As at 30 June 2021, 99.07% of debt securities were rated as investment grade, 0.89% of debt securities were rated as below investment grade and 0.04% of the debt securities were unrated as a percentage of the total bond holdings.
107
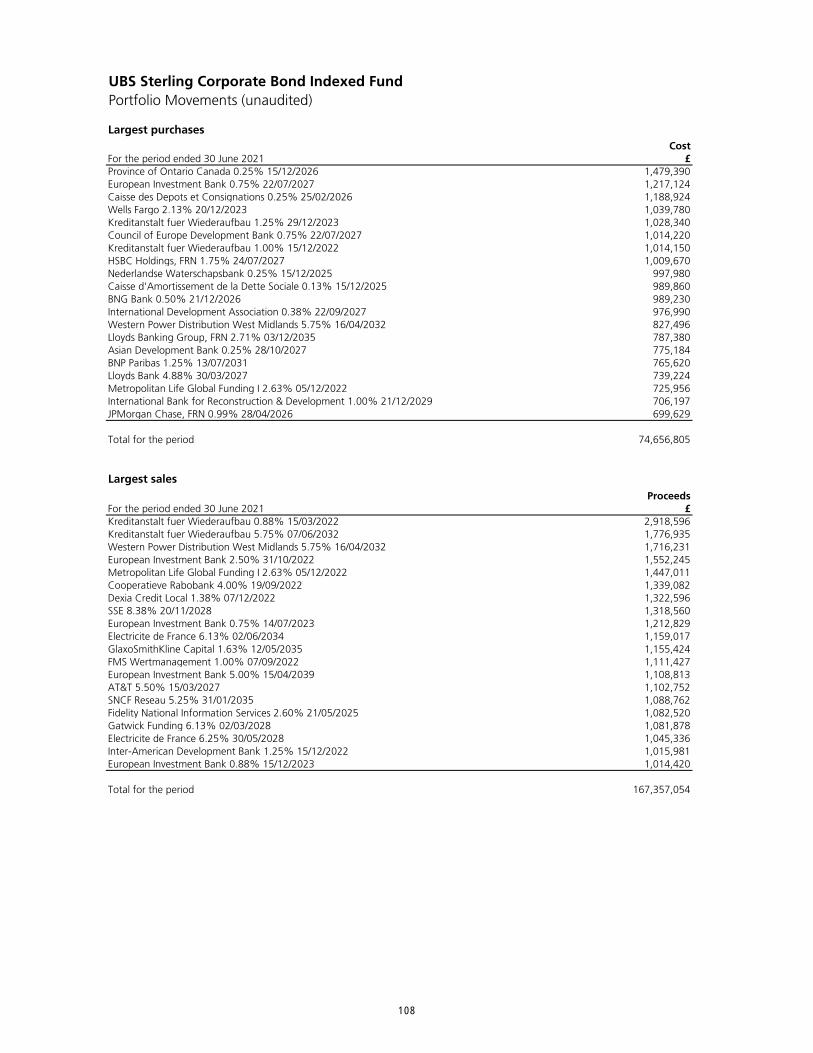
UBS Sterling Corporate Bond Indexed FundPortfolio Movements (unaudited)
Largest purchasesCost
For the period ended 30 June 2021 £Province of Ontario Canada 0.25% 15/12/2026 1,479,390European Investment Bank 0.75% 22/07/2027 1,217,124Caisse des Depots et Consignations 0.25% 25/02/2026 1,188,924Wells Fargo 2.13% 20/12/2023 1,039,780Kreditanstalt fuer Wiederaufbau 1.25% 29/12/2023 1,028,340Council of Europe Development Bank 0.75% 22/07/2027 1,014,220Kreditanstalt fuer Wiederaufbau 1.00% 15/12/2022 1,014,150HSBC Holdings, FRN 1.75% 24/07/2027 1,009,670Nederlandse Waterschapsbank 0.25% 15/12/2025 997,980Caisse d'Amortissement de la Dette Sociale 0.13% 15/12/2025 989,860BNG Bank 0.50% 21/12/2026 989,230International Development Association 0.38% 22/09/2027 976,990Western Power Distribution West Midlands 5.75% 16/04/2032 827,496Lloyds Banking Group, FRN 2.71% 03/12/2035 787,380Asian Development Bank 0.25% 28/10/2027 775,184BNP Paribas 1.25% 13/07/2031 765,620Lloyds Bank 4.88% 30/03/2027 739,224Metropolitan Life Global Funding I 2.63% 05/12/2022 725,956International Bank for Reconstruction & Development 1.00% 21/12/2029 706,197JPMorgan Chase, FRN 0.99% 28/04/2026 699,629
Total for the period 74,656,805
Largest salesProceeds
For the period ended 30 June 2021 £Kreditanstalt fuer Wiederaufbau 0.88% 15/03/2022 2,918,596Kreditanstalt fuer Wiederaufbau 5.75% 07/06/2032 1,776,935Western Power Distribution West Midlands 5.75% 16/04/2032 1,716,231European Investment Bank 2.50% 31/10/2022 1,552,245Metropolitan Life Global Funding I 2.63% 05/12/2022 1,447,011Cooperatieve Rabobank 4.00% 19/09/2022 1,339,082Dexia Credit Local 1.38% 07/12/2022 1,322,596SSE 8.38% 20/11/2028 1,318,560European Investment Bank 0.75% 14/07/2023 1,212,829Electricite de France 6.13% 02/06/2034 1,159,017GlaxoSmithKline Capital 1.63% 12/05/2035 1,155,424FMS Wertmanagement 1.00% 07/09/2022 1,111,427European Investment Bank 5.00% 15/04/2039 1,108,813AT&T 5.50% 15/03/2027 1,102,752SNCF Reseau 5.25% 31/01/2035 1,088,762Fidelity National Information Services 2.60% 21/05/2025 1,082,520Gatwick Funding 6.13% 02/03/2028 1,081,878Electricite de France 6.25% 30/05/2028 1,045,336Inter-American Development Bank 1.25% 15/12/2022 1,015,981European Investment Bank 0.88% 15/12/2023 1,014,420
Total for the period 167,357,054
108
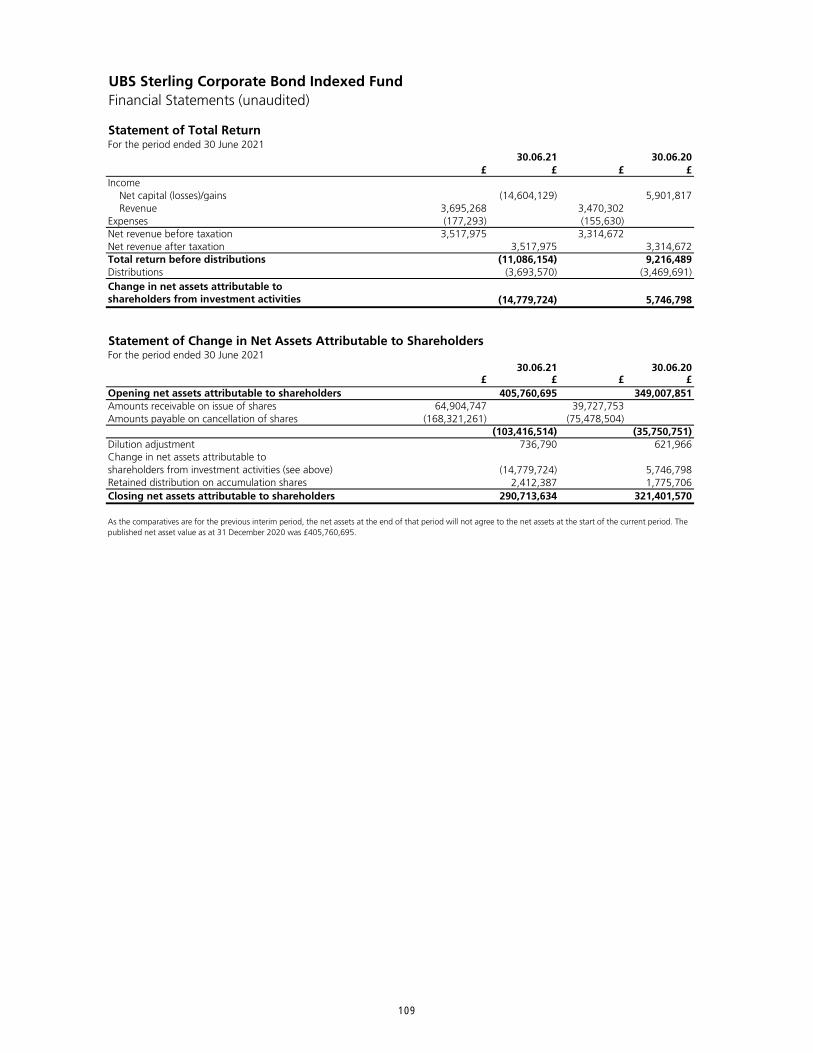
UBS Sterling Corporate Bond Indexed FundFinancial Statements (unaudited)
Statement of Total ReturnFor the period ended 30 June 2021
£ £ £ £Income Net capital (losses)/gains (14,604,129) 5,901,817 Revenue 3,695,268 3,470,302Expenses (177,293) (155,630)Net revenue before taxation 3,517,975 3,314,672Net revenue after taxation 3,517,975 3,314,672Total return before distributions (11,086,154) 9,216,489Distributions (3,693,570) (3,469,691)Change in net assets attributable to shareholders from investment activities (14,779,724) 5,746,798
Statement of Change in Net Assets Attributable to ShareholdersFor the period ended 30 June 2021
£ £ £ £405,760,695 349,007,851
Amounts receivable on issue of shares 64,904,747 39,727,753Amounts payable on cancellation of shares (168,321,261) (75,478,504)
(103,416,514) (35,750,751)Dilution adjustment 736,790 621,966
(14,779,724) 5,746,7982,412,387 1,775,706
290,713,634 321,401,570
shareholders from investment activities (see above)Retained distribution on accumulation sharesClosing net assets attributable to shareholders
As the comparatives are for the previous interim period, the net assets at the end of that period will not agree to the net assets at the start of the current period. The published net asset value as at 31 December 2020 was £405,760,695.
Change in net assets attributable to
30.06.21 30.06.20
30.06.21 30.06.20
Opening net assets attributable to shareholders
109
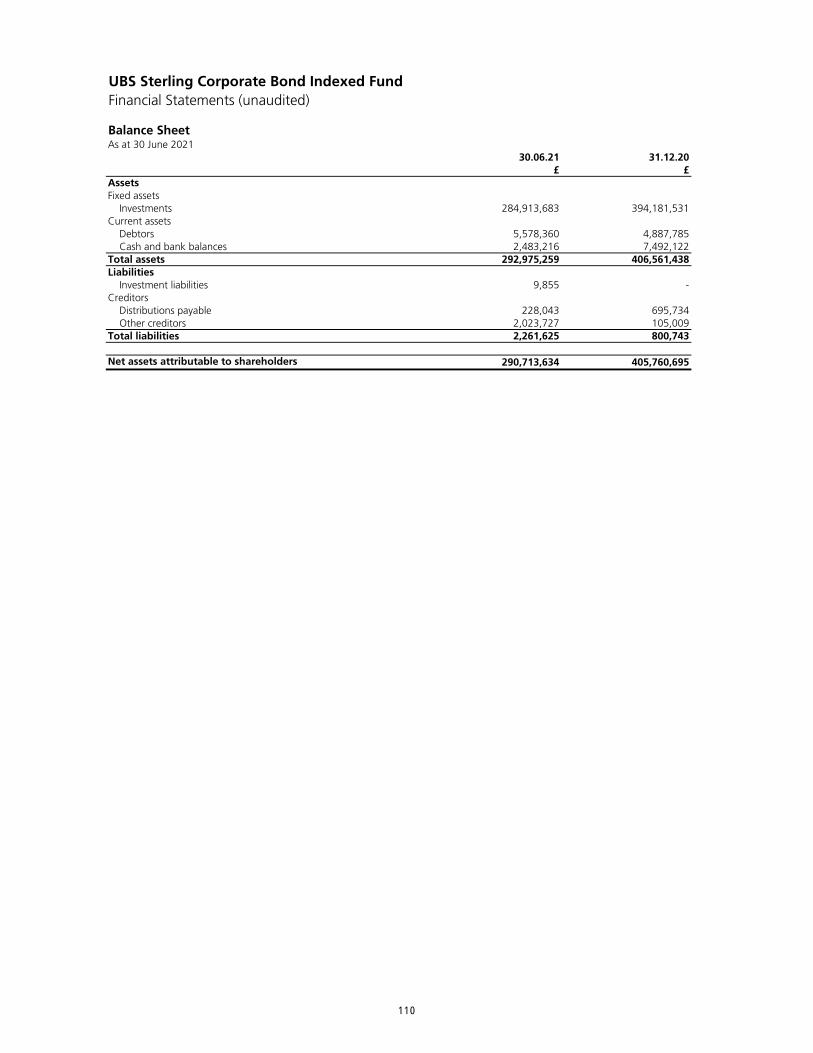
UBS Sterling Corporate Bond Indexed FundFinancial Statements (unaudited)
Balance SheetAs at 30 June 2021
30.06.21 31.12.20£ £
AssetsFixed assets Investments 284,913,683 394,181,531Current assets Debtors 5,578,360 4,887,785 Cash and bank balances 2,483,216 7,492,122Total assets 292,975,259 406,561,438Liabilities Investment liabilities 9,855 -Creditors Distributions payable 228,043 695,734 Other creditors 2,023,727 105,009Total liabilities 2,261,625 800,743
Net assets attributable to shareholders 290,713,634 405,760,695
110

UBS Sterling Corporate Bond Indexed FundNotes to the Financial Statements (unaudited)
Accounting policiesThe interim financial statements have been prepared in accordance with the Statement of Recommended Practice (SORP) for Authorised Funds issued by the Investment Association (IA) in May 2014 (SORP 2014).
The accounting policies applied are consistent with those of the financial statements for the year ended 31 December 2020 and are described in those annual financial statements.
111

112
UBS UK Equity Income Fund
113
UBS UK Equity Income FundManager's report
Investment objective
Investment policy
Investment strategy
Benchmark information
Market environment
Sub-fund performance
Within the portfolio, the largest positive contributors year-to-date were from the strategy’s holdings in Glencore, BT and Man Group. Conversely, the main detractors were not holding Ashtead Group and Diageo as well as our holding in Melrose Industries.
* Source: Lipper-Hindsight. Performance is based on NAV mid prices with income reinvested net of basic rate tax and in sterling terms to 30 June 2021, based on C income shares.
The underperformance in the portfolio in 2020 reflected extreme market conditions. We used this period to buy companies at substantial discounts to Fair Value, which has enabled us to recover strongly so far in 2021. Following the strong rally in cyclicals witnessed in the first quarter, we have gradually trimmed our position in stocks that traded above our assessment of the fair value. We also selectively topped up stocks that had been left behind in the market rebound and where we still see fundamental upside.
The sub-fund aims to generate income and grow the value of your investment; and outperform the FTSE All-Share Index after charges over the medium to long term (3 to 5 years).
At least 70% of the sub-fund will be invested in shares of UK companies.
The sub-fund may also invest in other equities, bonds, warrants, money market instruments, deposits, currencies, cash and near cash and other funds.
The sub-fund may use derivatives to invest in these assets including forward and future contracts, swaps, options and repurchase agreements for efficient portfolio management only.
The other funds that the sub-fund may invest in include funds managed by the Investment Manager or its affiliates.
The sub-fund is actively managed in reference to the benchmark and may hold some or all of the benchmark constituents. The sub-fund strategy is to invest in equities believed to be undervalued by the market.
The sub-fund’s target benchmark represents the performance of UK listed equities and therefore aligns with the sub-fund’s principal asset class.
Over the first quarter, the combination of higher growth and higher yields prompted a shift into more cyclical sectors of the equity market and a rotation out of growth into value stocks throughout February and March. Sectors that lost the most from the pandemic, such as energy and financials, saw the strongest bounce-back. In the second quarter, markets were largely driven by lowly valued and economically sensitive sectors during April and May, continuing a trend that has been since November 2020. The market, however, struggled in June amid a rise in COVID-19 infections and falling inflation expectations.
The sub-fund out performed the FTSE All-Share Index benchmark for the period. The sub-fund returned 15.68%* compared to benchmark return of 11.09% in Sterling terms. The yield of the sub-fund (C income class) at the period end was 2.59% compared to FTSE All share yield of 2.80%.
The performance of Value stocks was supported by the rotation out of growth stocks into value and cyclical, prompted by rising yields. The sub-fund gained value from overweighting cyclical sectors such as Financials (biggest overweight sector), Communication Services and Materials. In comparison, underweighting Real Estate detracted from returns over the quarter.
114
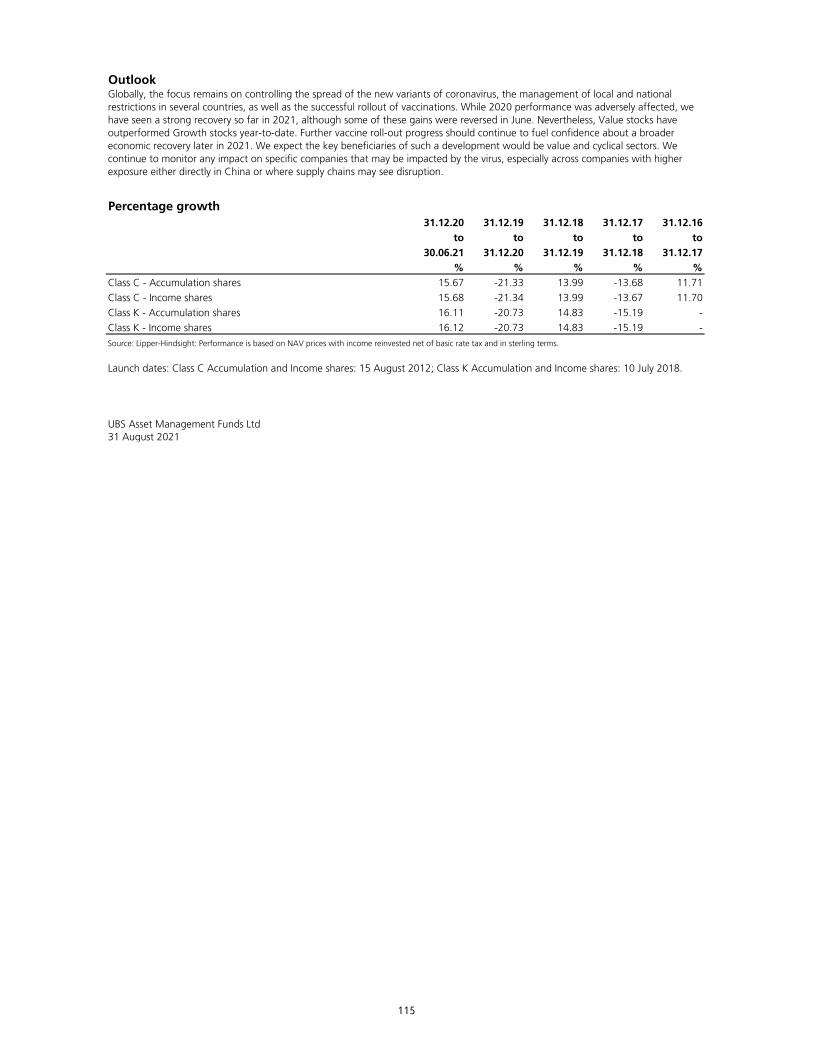
Outlook
Percentage growth31.12.20 31.12.19 31.12.18 31.12.17 31.12.16
to to to to to30.06.21 31.12.20 31.12.19 31.12.18 31.12.17
% % % % %Class C - Accumulation shares 15.67 -21.33 13.99 -13.68 11.71Class C - Income shares 15.68 -21.34 13.99 -13.67 11.70Class K - Accumulation shares 16.11 -20.73 14.83 -15.19 -Class K - Income shares 16.12 -20.73 14.83 -15.19 -Source: Lipper-Hindsight: Performance is based on NAV prices with income reinvested net of basic rate tax and in sterling terms.
UBS Asset Management Funds Ltd31 August 2021
Globally, the focus remains on controlling the spread of the new variants of coronavirus, the management of local and national restrictions in several countries, as well as the successful rollout of vaccinations. While 2020 performance was adversely affected, we have seen a strong recovery so far in 2021, although some of these gains were reversed in June. Nevertheless, Value stocks have outperformed Growth stocks year-to-date. Further vaccine roll-out progress should continue to fuel confidence about a broader economic recovery later in 2021. We expect the key beneficiaries of such a development would be value and cyclical sectors. We continue to monitor any impact on specific companies that may be impacted by the virus, especially across companies with higher exposure either directly in China or where supply chains may see disruption.
Launch dates: Class C Accumulation and Income shares: 15 August 2012; Class K Accumulation and Income shares: 10 July 2018.
115
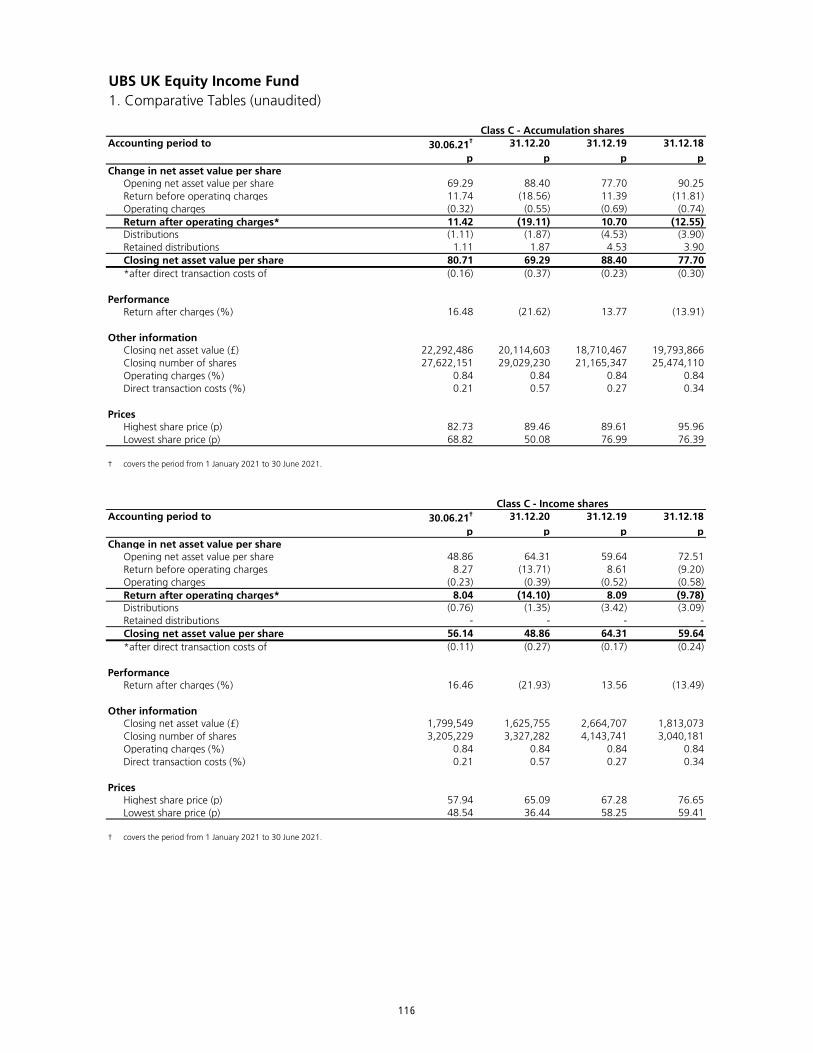
UBS UK Equity Income Fund1. Comparative Tables (unaudited)
Accounting period to 30.06.21† 31.12.20 31.12.19 31.12.18p p p p
Change in net asset value per shareOpening net asset value per share 69.29 88.40 77.70 90.25Return before operating charges 11.74 (18.56) 11.39 (11.81)Operating charges (0.32) (0.55) (0.69) (0.74)Return after operating charges* 11.42 (19.11) 10.70 (12.55)Distributions (1.11) (1.87) (4.53) (3.90)Retained distributions 1.11 1.87 4.53 3.90Closing net asset value per share 80.71 69.29 88.40 77.70*after direct transaction costs of (0.16) (0.37) (0.23) (0.30)
PerformanceReturn after charges (%) 16.48 (21.62) 13.77 (13.91)
Other informationClosing net asset value (£) 22,292,486 20,114,603 18,710,467 19,793,866Closing number of shares 27,622,151 29,029,230 21,165,347 25,474,110Operating charges (%) 0.84 0.84 0.84 0.84Direct transaction costs (%) 0.21 0.57 0.27 0.34
PricesHighest share price (p) 82.73 89.46 89.61 95.96Lowest share price (p) 68.82 50.08 76.99 76.39
† covers the period from 1 January 2021 to 30 June 2021.
Accounting period to 30.06.21† 31.12.20 31.12.19 31.12.18p p p p
Change in net asset value per shareOpening net asset value per share 48.86 64.31 59.64 72.51Return before operating charges 8.27 (13.71) 8.61 (9.20)Operating charges (0.23) (0.39) (0.52) (0.58)Return after operating charges* 8.04 (14.10) 8.09 (9.78)Distributions (0.76) (1.35) (3.42) (3.09)Retained distributions - - - -Closing net asset value per share 56.14 48.86 64.31 59.64*after direct transaction costs of (0.11) (0.27) (0.17) (0.24)
PerformanceReturn after charges (%) 16.46 (21.93) 13.56 (13.49)
Other informationClosing net asset value (£) 1,799,549 1,625,755 2,664,707 1,813,073Closing number of shares 3,205,229 3,327,282 4,143,741 3,040,181Operating charges (%) 0.84 0.84 0.84 0.84Direct transaction costs (%) 0.21 0.57 0.27 0.34
PricesHighest share price (p) 57.94 65.09 67.28 76.65Lowest share price (p) 48.54 36.44 58.25 59.41
† covers the period from 1 January 2021 to 30 June 2021.
Class C - Accumulation shares
Class C - Income shares
116
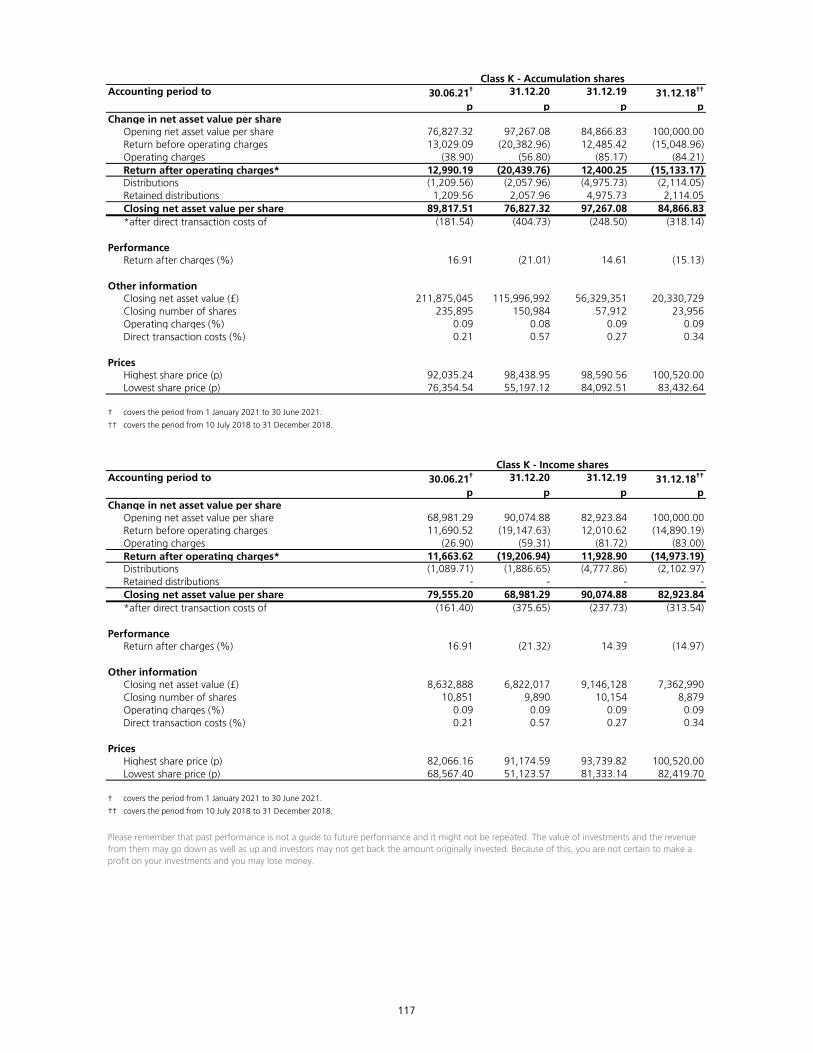
Accounting period to 30.06.21† 31.12.20 31.12.19 31.12.18††
p p p pChange in net asset value per share
Opening net asset value per share 76,827.32 97,267.08 84,866.83 100,000.00Return before operating charges 13,029.09 (20,382.96) 12,485.42 (15,048.96)Operating charges (38.90) (56.80) (85.17) (84.21)Return after operating charges* 12,990.19 (20,439.76) 12,400.25 (15,133.17)Distributions (1,209.56) (2,057.96) (4,975.73) (2,114.05)Retained distributions 1,209.56 2,057.96 4,975.73 2,114.05Closing net asset value per share 89,817.51 76,827.32 97,267.08 84,866.83*after direct transaction costs of (181.54) (404.73) (248.50) (318.14)
PerformanceReturn after charges (%) 16.91 (21.01) 14.61 (15.13)
Other informationClosing net asset value (£) 211,875,045 115,996,992 56,329,351 20,330,729Closing number of shares 235,895 150,984 57,912 23,956Operating charges (%) 0.09 0.08 0.09 0.09Direct transaction costs (%) 0.21 0.57 0.27 0.34
PricesHighest share price (p) 92,035.24 98,438.95 98,590.56 100,520.00Lowest share price (p) 76,354.54 55,197.12 84,092.51 83,432.64
† covers the period from 1 January 2021 to 30 June 2021.
†† covers the period from 10 July 2018 to 31 December 2018.
Accounting period to 30.06.21† 31.12.20 31.12.19 31.12.18††
p p p pChange in net asset value per share
Opening net asset value per share 68,981.29 90,074.88 82,923.84 100,000.00Return before operating charges 11,690.52 (19,147.63) 12,010.62 (14,890.19)Operating charges (26.90) (59.31) (81.72) (83.00)Return after operating charges* 11,663.62 (19,206.94) 11,928.90 (14,973.19)Distributions (1,089.71) (1,886.65) (4,777.86) (2,102.97)Retained distributions - - - -Closing net asset value per share 79,555.20 68,981.29 90,074.88 82,923.84*after direct transaction costs of (161.40) (375.65) (237.73) (313.54)
PerformanceReturn after charges (%) 16.91 (21.32) 14.39 (14.97)
Other informationClosing net asset value (£) 8,632,888 6,822,017 9,146,128 7,362,990Closing number of shares 10,851 9,890 10,154 8,879Operating charges (%) 0.09 0.09 0.09 0.09Direct transaction costs (%) 0.21 0.57 0.27 0.34
PricesHighest share price (p) 82,066.16 91,174.59 93,739.82 100,520.00Lowest share price (p) 68,567.40 51,123.57 81,333.14 82,419.70
† covers the period from 1 January 2021 to 30 June 2021.
†† covers the period from 10 July 2018 to 31 December 2018.
Please remember that past performance is not a guide to future performance and it might not be repeated. The value of investments and the revenue from them may go down as well as up and investors may not get back the amount originally invested. Because of this, you are not certain to make a profit on your investments and you may lose money.
Class K - Accumulation shares
Class K - Income shares
117
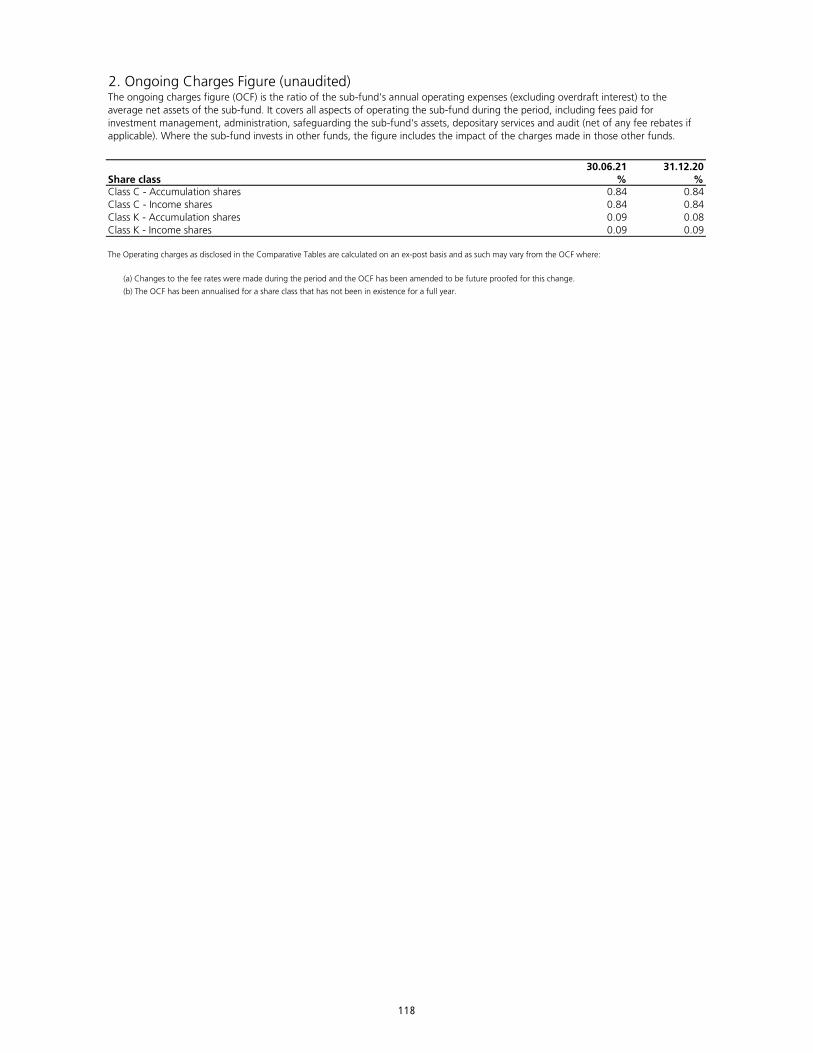
2. Ongoing Charges Figure (unaudited)
30.06.21 31.12.20Share class % %Class C - Accumulation shares 0.84 0.84Class C - Income shares 0.84 0.84Class K - Accumulation shares 0.09 0.08Class K - Income shares 0.09 0.09
(a) Changes to the fee rates were made during the period and the OCF has been amended to be future proofed for this change.
(b) The OCF has been annualised for a share class that has not been in existence for a full year.
The ongoing charges figure (OCF) is the ratio of the sub-fund's annual operating expenses (excluding overdraft interest) to the average net assets of the sub-fund. It covers all aspects of operating the sub-fund during the period, including fees paid for investment management, administration, safeguarding the sub-fund's assets, depositary services and audit (net of any fee rebates if applicable). Where the sub-fund invests in other funds, the figure includes the impact of the charges made in those other funds.
The Operating charges as disclosed in the Comparative Tables are calculated on an ex-post basis and as such may vary from the OCF where:
118
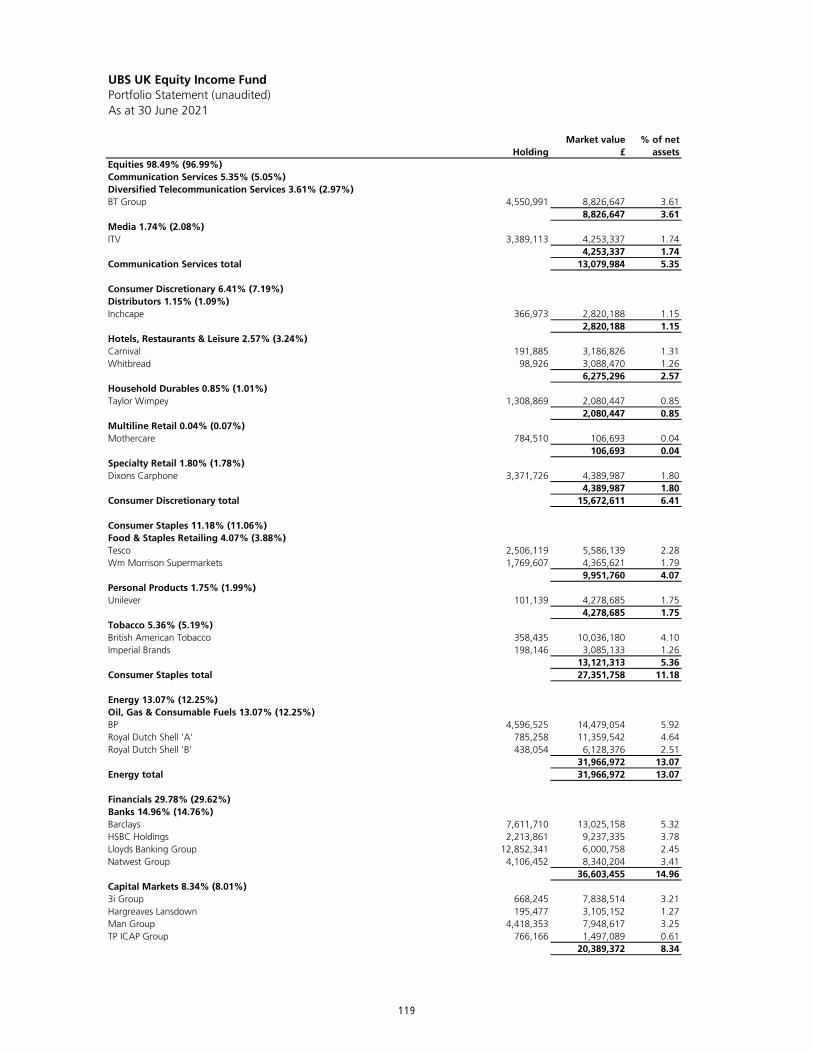
UBS UK Equity Income FundPortfolio Statement (unaudited)As at 30 June 2021
HoldingMarket value
£% of net
assetsEquities 98.49% (96.99%)Communication Services 5.35% (5.05%)Diversified Telecommunication Services 3.61% (2.97%)BT Group 4,550,991 8,826,647 3.61
8,826,647 3.61Media 1.74% (2.08%)ITV 3,389,113 4,253,337 1.74
4,253,337 1.74Communication Services total 13,079,984 5.35
Consumer Discretionary 6.41% (7.19%)Distributors 1.15% (1.09%)Inchcape 366,973 2,820,188 1.15
2,820,188 1.15Hotels, Restaurants & Leisure 2.57% (3.24%)Carnival 191,885 3,186,826 1.31Whitbread 98,926 3,088,470 1.26
6,275,296 2.57Household Durables 0.85% (1.01%)Taylor Wimpey 1,308,869 2,080,447 0.85
2,080,447 0.85Multiline Retail 0.04% (0.07%)Mothercare 784,510 106,693 0.04
106,693 0.04Specialty Retail 1.80% (1.78%)Dixons Carphone 3,371,726 4,389,987 1.80
4,389,987 1.80Consumer Discretionary total 15,672,611 6.41
Consumer Staples 11.18% (11.06%)Food & Staples Retailing 4.07% (3.88%)Tesco 2,506,119 5,586,139 2.28Wm Morrison Supermarkets 1,769,607 4,365,621 1.79
9,951,760 4.07Personal Products 1.75% (1.99%)Unilever 101,139 4,278,685 1.75
4,278,685 1.75Tobacco 5.36% (5.19%)British American Tobacco 358,435 10,036,180 4.10Imperial Brands 198,146 3,085,133 1.26
13,121,313 5.36Consumer Staples total 27,351,758 11.18
Energy 13.07% (12.25%)Oil, Gas & Consumable Fuels 13.07% (12.25%)BP 4,596,525 14,479,054 5.92Royal Dutch Shell 'A' 785,258 11,359,542 4.64Royal Dutch Shell 'B' 438,054 6,128,376 2.51
31,966,972 13.07Energy total 31,966,972 13.07
Financials 29.78% (29.62%)Banks 14.96% (14.76%)Barclays 7,611,710 13,025,158 5.32HSBC Holdings 2,213,861 9,237,335 3.78Lloyds Banking Group 12,852,341 6,000,758 2.45Natwest Group 4,106,452 8,340,204 3.41
36,603,455 14.96Capital Markets 8.34% (8.01%)3i Group 668,245 7,838,514 3.21Hargreaves Lansdown 195,477 3,105,152 1.27Man Group 4,418,353 7,948,617 3.25TP ICAP Group 766,166 1,497,089 0.61
20,389,372 8.34
119
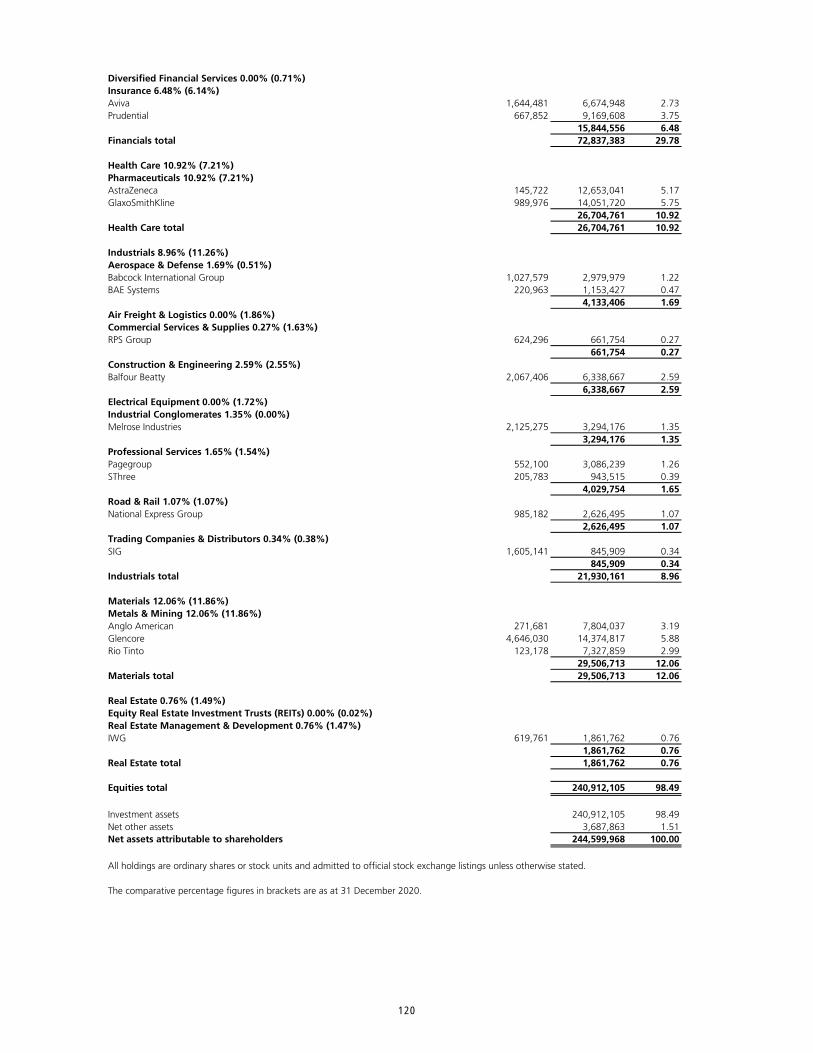
Diversified Financial Services 0.00% (0.71%)Insurance 6.48% (6.14%)Aviva 1,644,481 6,674,948 2.73Prudential 667,852 9,169,608 3.75
15,844,556 6.48Financials total 72,837,383 29.78
Health Care 10.92% (7.21%)Pharmaceuticals 10.92% (7.21%)AstraZeneca 145,722 12,653,041 5.17GlaxoSmithKline 989,976 14,051,720 5.75
26,704,761 10.92Health Care total 26,704,761 10.92
Industrials 8.96% (11.26%)Aerospace & Defense 1.69% (0.51%)Babcock International Group 1,027,579 2,979,979 1.22BAE Systems 220,963 1,153,427 0.47
4,133,406 1.69Air Freight & Logistics 0.00% (1.86%)Commercial Services & Supplies 0.27% (1.63%)RPS Group 624,296 661,754 0.27
661,754 0.27Construction & Engineering 2.59% (2.55%)Balfour Beatty 2,067,406 6,338,667 2.59
6,338,667 2.59Electrical Equipment 0.00% (1.72%)Industrial Conglomerates 1.35% (0.00%)Melrose Industries 2,125,275 3,294,176 1.35
3,294,176 1.35Professional Services 1.65% (1.54%)Pagegroup 552,100 3,086,239 1.26SThree 205,783 943,515 0.39
4,029,754 1.65Road & Rail 1.07% (1.07%)National Express Group 985,182 2,626,495 1.07
2,626,495 1.07Trading Companies & Distributors 0.34% (0.38%)SIG 1,605,141 845,909 0.34
845,909 0.34Industrials total 21,930,161 8.96
Materials 12.06% (11.86%)Metals & Mining 12.06% (11.86%)Anglo American 271,681 7,804,037 3.19Glencore 4,646,030 14,374,817 5.88Rio Tinto 123,178 7,327,859 2.99
29,506,713 12.06Materials total 29,506,713 12.06
Real Estate 0.76% (1.49%)Equity Real Estate Investment Trusts (REITs) 0.00% (0.02%)Real Estate Management & Development 0.76% (1.47%)IWG 619,761 1,861,762 0.76
1,861,762 0.76Real Estate total 1,861,762 0.76
Equities total 240,912,105 98.49
Investment assets 240,912,105 98.49Net other assets 3,687,863 1.51Net assets attributable to shareholders 244,599,968 100.00
All holdings are ordinary shares or stock units and admitted to official stock exchange listings unless otherwise stated.
The comparative percentage figures in brackets are as at 31 December 2020.
120
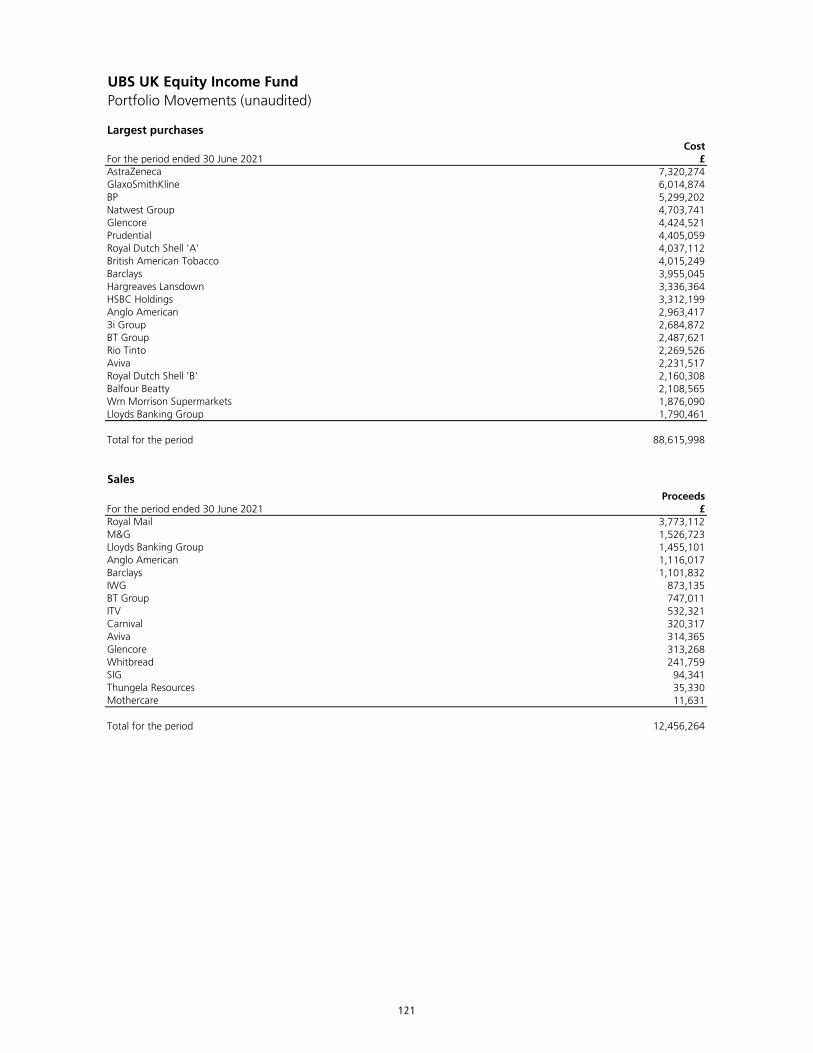
UBS UK Equity Income FundPortfolio Movements (unaudited)
Largest purchasesCost
For the period ended 30 June 2021 £7,320,2746,014,8745,299,2024,703,7414,424,5214,405,0594,037,1124,015,2493,955,0453,336,3643,312,1992,963,4172,684,8722,487,6212,269,5262,231,5172,160,3082,108,5651,876,0901,790,461
Total for the period 88,615,998
SalesProceeds
For the period ended 30 June 2021 £3,773,1121,526,7231,455,1011,116,0171,101,832
873,135747,011532,321320,317314,365313,268241,75994,34135,33011,631
Total for the period 12,456,264
Glencore Whitbread SIG Thungela ResourcesMothercare
Aviva
Wm Morrison Supermarkets Lloyds Banking Group
Royal Mail M&G Lloyds Banking Group Anglo American Barclays IWG BT Group ITV Carnival
Balfour Beatty
Royal Dutch Shell 'A' British American Tobacco Barclays Hargreaves Lansdown HSBC Holdings Anglo American 3i Group BT Group Rio Tinto Aviva Royal Dutch Shell 'B'
Prudential
AstraZeneca GlaxoSmithKline BP Natwest Group Glencore
121
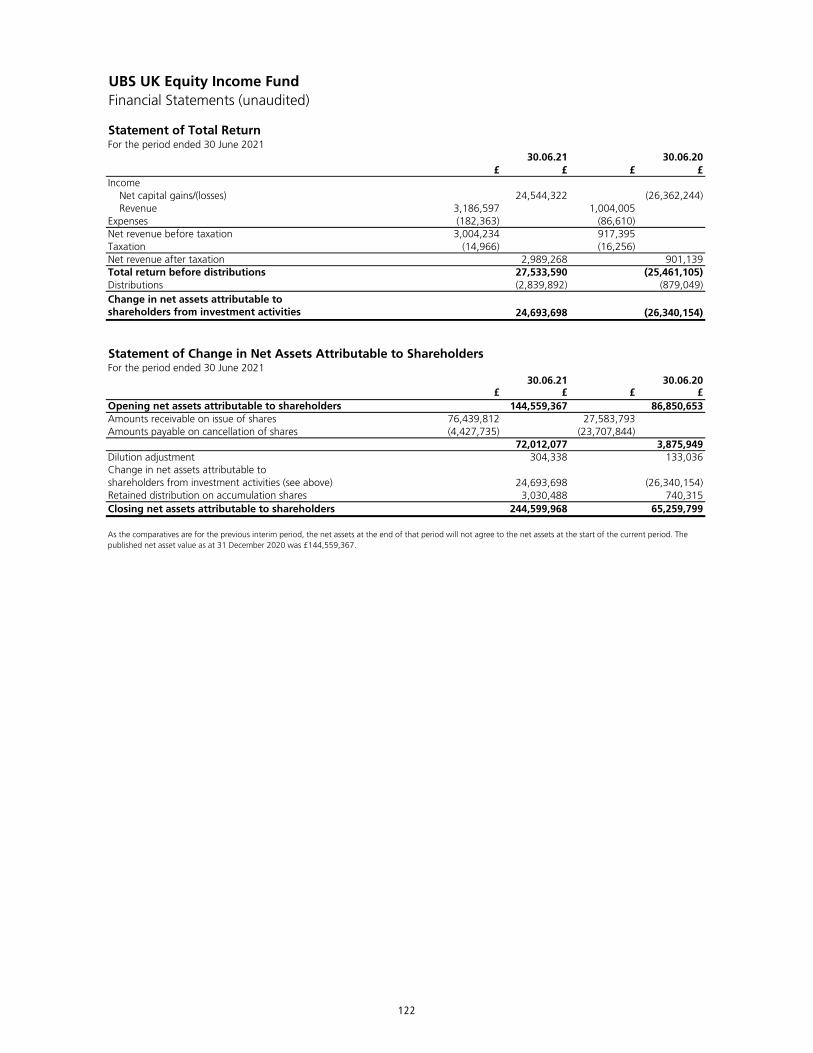
UBS UK Equity Income FundFinancial Statements (unaudited)
Statement of Total ReturnFor the period ended 30 June 2021
£ £ £ £Income Net capital gains/(losses) 24,544,322 (26,362,244) Revenue 3,186,597 1,004,005Expenses (182,363) (86,610)Net revenue before taxation 3,004,234 917,395Taxation (14,966) (16,256)Net revenue after taxation 2,989,268 901,139Total return before distributions 27,533,590 (25,461,105)Distributions (2,839,892) (879,049)Change in net assets attributable to shareholders from investment activities 24,693,698 (26,340,154)
Statement of Change in Net Assets Attributable to ShareholdersFor the period ended 30 June 2021
£ £ £ £144,559,367 86,850,653
Amounts receivable on issue of shares 76,439,812 27,583,793Amounts payable on cancellation of shares (4,427,735) (23,707,844)
72,012,077 3,875,949Dilution adjustment 304,338 133,036
24,693,698 (26,340,154)3,030,488 740,315
244,599,968 65,259,799
shareholders from investment activities (see above)Retained distribution on accumulation sharesClosing net assets attributable to shareholders
As the comparatives are for the previous interim period, the net assets at the end of that period will not agree to the net assets at the start of the current period. The published net asset value as at 31 December 2020 was £144,559,367.
Change in net assets attributable to
30.06.21 30.06.20
30.06.21 30.06.20
Opening net assets attributable to shareholders
122
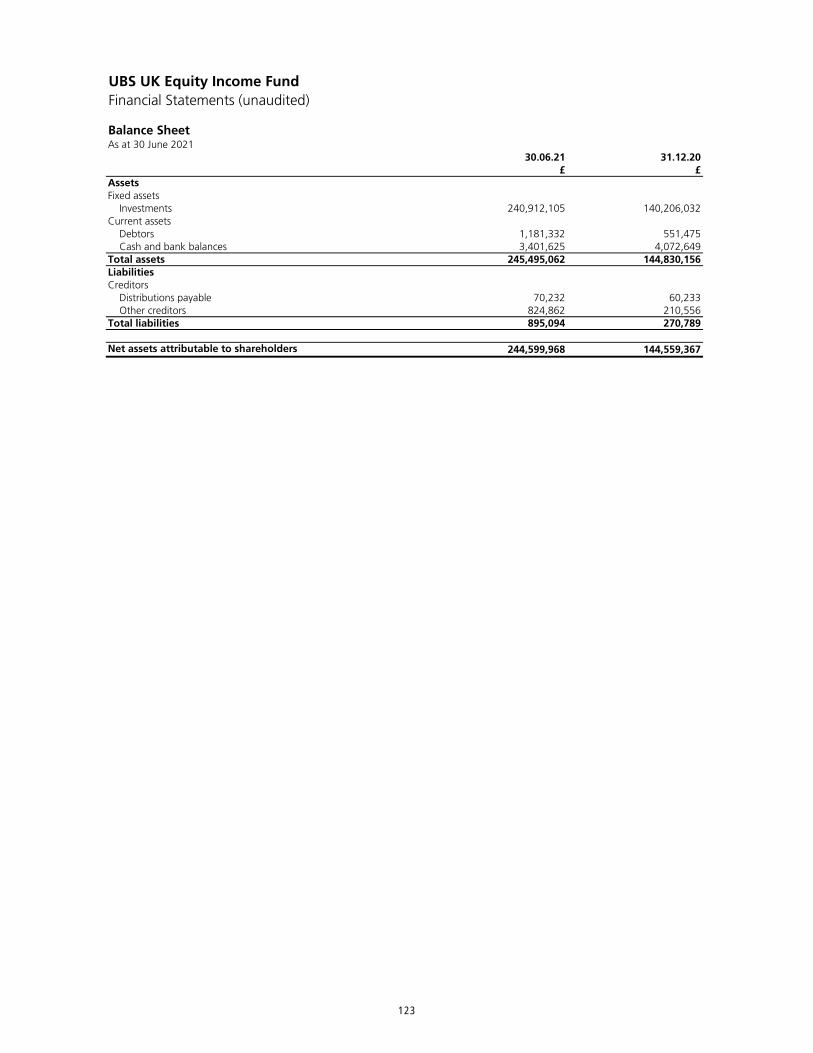
UBS UK Equity Income FundFinancial Statements (unaudited)
Balance SheetAs at 30 June 2021
30.06.21 31.12.20£ £
AssetsFixed assets Investments 240,912,105 140,206,032Current assets Debtors 1,181,332 551,475 Cash and bank balances 3,401,625 4,072,649Total assets 245,495,062 144,830,156LiabilitiesCreditors Distributions payable 70,232 60,233 Other creditors 824,862 210,556Total liabilities 895,094 270,789
Net assets attributable to shareholders 244,599,968 144,559,367
123

UBS UK Equity Income FundNotes to the Financial Statements (unaudited)
Accounting policiesThe interim financial statements have been prepared in accordance with the Statement of Recommended Practice (SORP) for Authorised Funds issued by the Investment Association (IA) in May 2014 (SORP 2014).
The accounting policies applied are consistent with those of the financial statements for the year ended 31 December 2020 and are described in those annual financial statements.
124
UBS US Equity Fund
125
UBS US Equity FundManager's report
Investment objective
Investment policy
Investment strategy
Benchmark information
Market environment
Sub-fund performance
* Source: Lipper-Hindsight. Performance is based on NAV mid prices with income reinvested net of basic rate tax and in sterling terms to 30 June 2021, based on C shares.
The other funds that the sub-fund may invest in include funds managed by the Investment Manager or its affiliates.
The sub-fund is actively managed in reference to the Benchmark and may hold some or all of the benchmark constituents. The sub-fund strategy is flexible and will change depending on the view of the market.
The sub-fund's target benchmark represents the performance of large US listed equites and therefore aligns with the sub-fund's principal asset class.
Performance of the sub-fund may also be assessed by comparison with the S&P 500 Index which also represents the performance of large US listed equites and therefore aligns with both the target benchmark and the sub-fund's principal asset class.
The first half of the year delivered faster-than-expected vaccine rollouts, bigger-than-expected US fiscal stimulus, higher-than expected inflation, and strong economic and corporate earnings growth. This backdrop drove further gains for equities, as well as higher 10-year US Treasury yields. The S&P 500 closed out the first half of the year on a winning streak, with five consecutive record closing highs for a total return of 15% year-to-date. Global equities also reached all-time highs and are now nearly 90% above their pandemic low. Meanwhile, volatility has been unusually low, with only one daily move in the MSCI All Country World index of greater than 1% in June, and the VIX index falling to its lowest levels since prior to the onset of COVID-19. With the post-pandemic recovery taking hold, prices of various goods and services are rising. In the US, the consumer price index rose by 4.2% year on year in April and 5% in May, and the Citi US inflation surprise index is at its highest level since its inception in 1998. But the inflation worry looks set to fade further. We expect the May data to represent a peak in US inflation, as the boosts from base effects and higher energy prices are ebbing. Finally, disruptions related to the pandemic and reopening should also moderate as supply chains and demand patterns normalize.
The sub-fund returned positive performance of 15.27%* for the period compared to the Russell 1000 index benchmark return of 13.75%
The portfolio weathered well the first half of 2021, leading the benchmark by more than 1.00% by end of June. The portfolio saw improved risk management over time which helped build a more balanced but highly active portfolio where stock specific risks are maximized. On back of this, we are pleased to see the performance is back on track and largely recovered previous losses. The relative performances are positive on both one year and two years basis now. Our intrinsic value methodology is anchored on a detailed fundamental analysis of cash flow forecasts as the key driver of alpha. This approach tends to have a stronger weighting towards value than growth. With that said, the portfolio very nicely benefitted from the market trend in the first half where value stocks outperformed growth in general.
The sub-fund may use derivatives to invest in these assets including forward and future contracts, swaps, options and repurchase agreements for efficient portfolio management only.
The sub-fund aims to grow the value of your investment and outperform the Russell 1000 Index after charges over the medium to long term (3 to 5 years).
The sub-fund invests at least 80% in US equities.
The sub-fund may also invest in other equities, bonds, warrants, money market instruments, deposits, currencies, cash and near cash and other funds.
126
Outlook
Percentage growth31.12.20 31.12.19 31.12.18 31.12.17 31.12.16
to to to to to30.06.21 31.12.20 31.12.19 31.12.18 31.12.17
% % % % %Class C - Accumulation shares 15.27 14.15 33.10 -9.60 11.11Source: Lipper-Hindsight: Performance is based on NAV prices with income reinvested net of basic rate tax and in sterling terms.
UBS Asset Management Funds Ltd31 August 2021
The economic outlook for the second half of the year looks bright, particularly for those countries which are advanced in their vaccine rollouts. With more countries step-up efforts to vaccinate populations, economic recovery should broaden out. We believe equities should continue to go well in the current environment with modestly rising inflation. From a sector perspective, we continue to overweight more economically sensitive sectors such as Financials and Consumer stocks as we believe these areas stand to further benefit from economic recovery.
Our process has been in place for 40 years, and our portfolio managers have invested through many short term dislocations, and it is crucial during such periods to stick to our disciplined process and take advantage of panic selling to invest in companies at cheap levels. Valuation spreads remain wide versus history, providing excellent opportunities going forward and it is likely that activity levels in the portfolio will continue to be high as we take advantage of the increased level of volatility in the market.
Launch date: Class C Accumulation shares: 15 August 2012.
127
UBS US Equity Fund1. Comparative Tables (unaudited)
Accounting period to 30.06.21† 31.12.20 31.12.19 31.12.18p p p p
Change in net asset value per shareOpening net asset value per share 166.82 145.47 109.34 119.65Return before operating charges 25.83 22.57 37.26 (9.25)Operating charges (0.76) (1.22) (1.13) (1.06)Return after operating charges* 25.07 21.35 36.13 (10.31)Distributions (0.30) (0.50) (0.55) (0.38)Retained distributions 0.30 0.50 0.55 0.38Closing net asset value per share 191.89 166.82 145.47 109.34*after direct transaction costs of (0.02) (0.04) (0.03) (0.02)
PerformanceReturn after charges (%) 15.03 14.68 33.04 (8.62)
Other informationClosing net asset value (£) 198,440,837 199,921,640 203,979,535 73,022,400Closing number of shares 103,415,342 119,842,365 140,223,901 66,784,915Operating charges (%) 0.85 0.84 0.84 0.86Direct transaction costs (%) 0.01 0.03 0.02 0.02
PricesHighest share price (p) 191.36 168.57 148.90 134.84Lowest share price (p) 164.25 103.00 108.23 105.74
† covers the period from 1 January 2021 to 30 June 2021.
2. Ongoing Charges Figure (unaudited)
30.06.21 31.12.20Share class % %Class C - Accumulation shares 0.85 0.84
(a) Changes to the fee rates were made during the period and the OCF has been amended to be future proofed for this change.
(b) The OCF has been annualised for a share class that has not been in existence for a full year.
Please remember that past performance is not a guide to future performance and it might not be repeated. The value of investments and the revenue from them may go down as well as up and investors may not get back the amount originally invested. Because of this, you are not certain to make a profit on your investments and you may lose money.
The ongoing charges figure (OCF) is the ratio of the sub-fund's annual operating expenses (excluding overdraft interest) to the average net assets of the sub-fund. It covers all aspects of operating the sub-fund during the period, including fees paid for investment management, administration, safeguarding the sub-fund's assets, depositary services and audit (net of any fee rebates if applicable). Where the sub-fund invests in other funds, the figure includes the impact of the charges made in those other funds.
The Operating charges as disclosed in the Comparative Tables are calculated on an ex-post basis and as such may vary from the OCF where:
Class C - Accumulation shares
128
UBS US Equity FundPortfolio StatementAs at 30 June 2020
Market Value % of netHolding £ assets
Equities 99.33% (99.16%)Communication Services 7.40% (7.80%)Entertainment 3.27% (3.85%)Electronic Arts 17,648 1,837,426 0.93Madison Square Garden Entertainment 14,065 854,723 0.43Take-Two Interactive Software 8,655 1,108,055 0.56World Wrestling Entertainment 'A' 64,106 2,689,162 1.35
6,489,366 3.27Interactive Media & Services 3.17% (2.90%)Facebook 'A' 24,983 6,288,204 3.17
6,288,204 3.17Media 0.96% (1.05%)Comcast 'A' 46,226 1,908,000 0.96
1,908,000 0.96Communication Services total 14,685,570 7.40
Consumer Discretionary 12.17% (16.39%)Auto Components 2.07% (2.13%)Aptiv 36,053 4,105,989 2.07
4,105,989 2.07Automobiles 0.98% (0.00%)Ford Motor 180,977 1,945,426 0.98
1,945,426 0.98Distributors 0.80% (1.12%)LKQ 44,668 1,591,163 0.80
1,591,163 0.80Diversified Consumer Services 0.00% (1.79%)Hotels, Restaurants & Leisure 2.86% (3.31%)Starbucks 45,832 3,709,159 1.87Vail Resorts 8,559 1,960,122 0.99
5,669,281 2.86Internet & Direct Marketing Retail 4.46% (6.02%)Amazon.com 3,557 8,855,590 4.46
8,855,590 4.46Multiline Retail 1.00% (1.25%)Dollar Tree 27,379 1,971,796 1.00
1,971,796 1.00Specialty Retail 0.00% (0.77%)Consumer Discretionary total 24,139,245 12.17
Consumer Staples 4.90% (5.27%)Food & Staples Retailing 1.57% (1.74%)Costco Wholesale 10,868 3,112,774 1.57
3,112,774 1.57Food Products 2.35% (2.55%)Mondelez International 'A' 103,006 4,655,757 2.35
4,655,757 2.35Tobacco 0.98% (0.98%)Philip Morris International 27,255 1,954,973 0.98
1,954,973 0.98Consumer Staples total 9,723,504 4.90
Energy 3.66% (2.48%)Oil, Gas & Consumable Fuels 3.66% (2.48%)Hess 48,759 3,082,005 1.55Williams 217,335 4,175,374 2.11
7,257,379 3.66Energy total 7,257,379 3.66
129
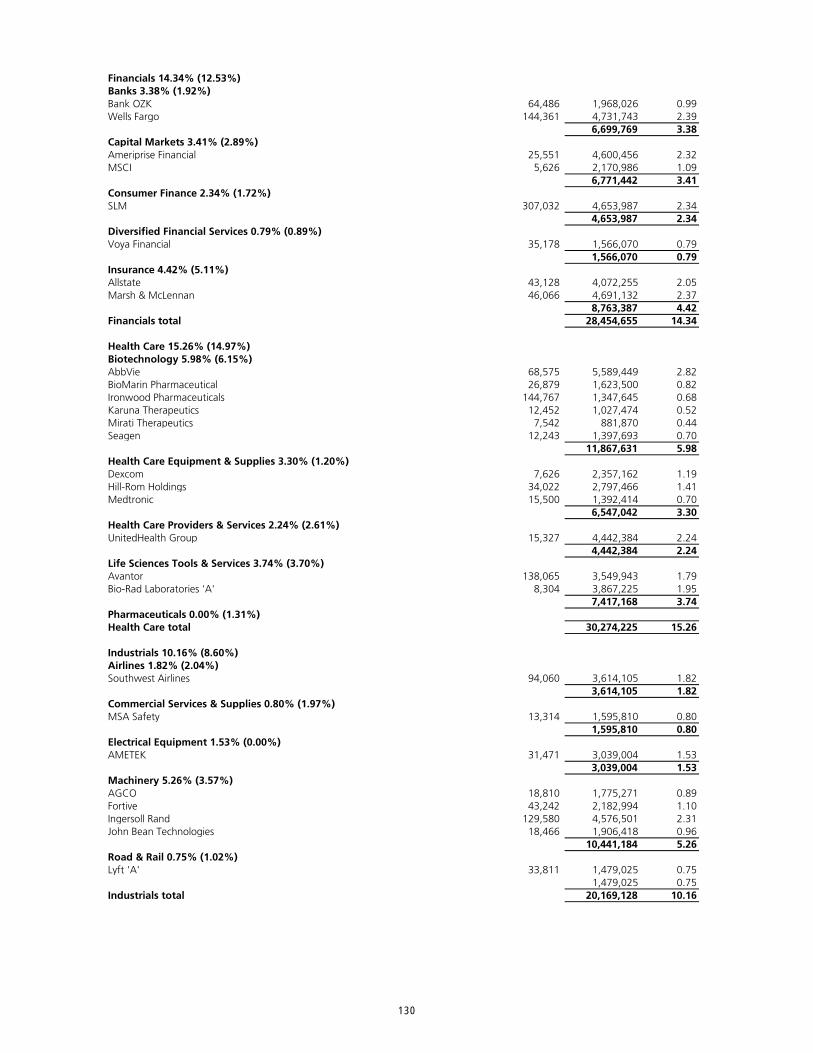
Financials 14.34% (12.53%)Banks 3.38% (1.92%)Bank OZK 64,486 1,968,026 0.99Wells Fargo 144,361 4,731,743 2.39
6,699,769 3.38Capital Markets 3.41% (2.89%)Ameriprise Financial 25,551 4,600,456 2.32MSCI 5,626 2,170,986 1.09
6,771,442 3.41Consumer Finance 2.34% (1.72%)SLM 307,032 4,653,987 2.34
4,653,987 2.34Diversified Financial Services 0.79% (0.89%)Voya Financial 35,178 1,566,070 0.79
1,566,070 0.79Insurance 4.42% (5.11%)Allstate 43,128 4,072,255 2.05Marsh & McLennan 46,066 4,691,132 2.37
8,763,387 4.42Financials total 28,454,655 14.34
Health Care 15.26% (14.97%)Biotechnology 5.98% (6.15%)AbbVie 68,575 5,589,449 2.82BioMarin Pharmaceutical 26,879 1,623,500 0.82Ironwood Pharmaceuticals 144,767 1,347,645 0.68Karuna Therapeutics 12,452 1,027,474 0.52Mirati Therapeutics 7,542 881,870 0.44Seagen 12,243 1,397,693 0.70
11,867,631 5.98Health Care Equipment & Supplies 3.30% (1.20%)Dexcom 7,626 2,357,162 1.19Hill-Rom Holdings 34,022 2,797,466 1.41Medtronic 15,500 1,392,414 0.70
6,547,042 3.30Health Care Providers & Services 2.24% (2.61%)UnitedHealth Group 15,327 4,442,384 2.24
4,442,384 2.24Life Sciences Tools & Services 3.74% (3.70%)Avantor 138,065 3,549,943 1.79Bio-Rad Laboratories 'A' 8,304 3,867,225 1.95
7,417,168 3.74Pharmaceuticals 0.00% (1.31%)Health Care total 30,274,225 15.26
Industrials 10.16% (8.60%)Airlines 1.82% (2.04%)Southwest Airlines 94,060 3,614,105 1.82
3,614,105 1.82Commercial Services & Supplies 0.80% (1.97%)MSA Safety 13,314 1,595,810 0.80
1,595,810 0.80Electrical Equipment 1.53% (0.00%)AMETEK 31,471 3,039,004 1.53
3,039,004 1.53Machinery 5.26% (3.57%)AGCO 18,810 1,775,271 0.89Fortive 43,242 2,182,994 1.10Ingersoll Rand 129,580 4,576,501 2.31John Bean Technologies 18,466 1,906,418 0.96
10,441,184 5.26Road & Rail 0.75% (1.02%)Lyft 'A' 33,811 1,479,025 0.75
1,479,025 0.75Industrials total 20,169,128 10.16
130
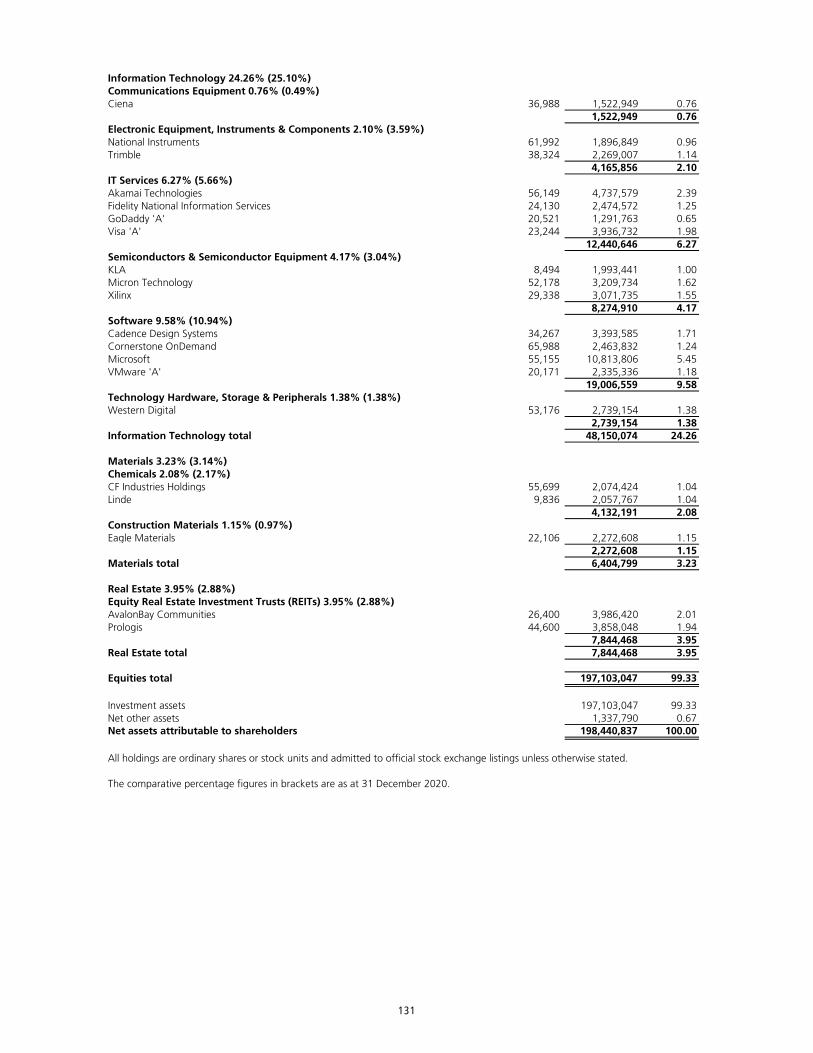
Information Technology 24.26% (25.10%)Communications Equipment 0.76% (0.49%)Ciena 36,988 1,522,949 0.76
1,522,949 0.76Electronic Equipment, Instruments & Components 2.10% (3.59%)National Instruments 61,992 1,896,849 0.96Trimble 38,324 2,269,007 1.14
4,165,856 2.10IT Services 6.27% (5.66%)Akamai Technologies 56,149 4,737,579 2.39Fidelity National Information Services 24,130 2,474,572 1.25GoDaddy 'A' 20,521 1,291,763 0.65Visa 'A' 23,244 3,936,732 1.98
12,440,646 6.27Semiconductors & Semiconductor Equipment 4.17% (3.04%)KLA 8,494 1,993,441 1.00Micron Technology 52,178 3,209,734 1.62Xilinx 29,338 3,071,735 1.55
8,274,910 4.17Software 9.58% (10.94%)Cadence Design Systems 34,267 3,393,585 1.71Cornerstone OnDemand 65,988 2,463,832 1.24Microsoft 55,155 10,813,806 5.45VMware 'A' 20,171 2,335,336 1.18
19,006,559 9.58Technology Hardware, Storage & Peripherals 1.38% (1.38%)Western Digital 53,176 2,739,154 1.38
2,739,154 1.38Information Technology total 48,150,074 24.26
Materials 3.23% (3.14%)Chemicals 2.08% (2.17%)CF Industries Holdings 55,699 2,074,424 1.04Linde 9,836 2,057,767 1.04
4,132,191 2.08Construction Materials 1.15% (0.97%)Eagle Materials 22,106 2,272,608 1.15
2,272,608 1.15Materials total 6,404,799 3.23
Real Estate 3.95% (2.88%)Equity Real Estate Investment Trusts (REITs) 3.95% (2.88%)AvalonBay Communities 26,400 3,986,420 2.01Prologis 44,600 3,858,048 1.94
7,844,468 3.95Real Estate total 7,844,468 3.95
Equities total 197,103,047 99.33
Investment assets 197,103,047 99.33Net other assets 1,337,790 0.67Net assets attributable to shareholders 198,440,837 100.00
All holdings are ordinary shares or stock units and admitted to official stock exchange listings unless otherwise stated.
The comparative percentage figures in brackets are as at 31 December 2020.
131
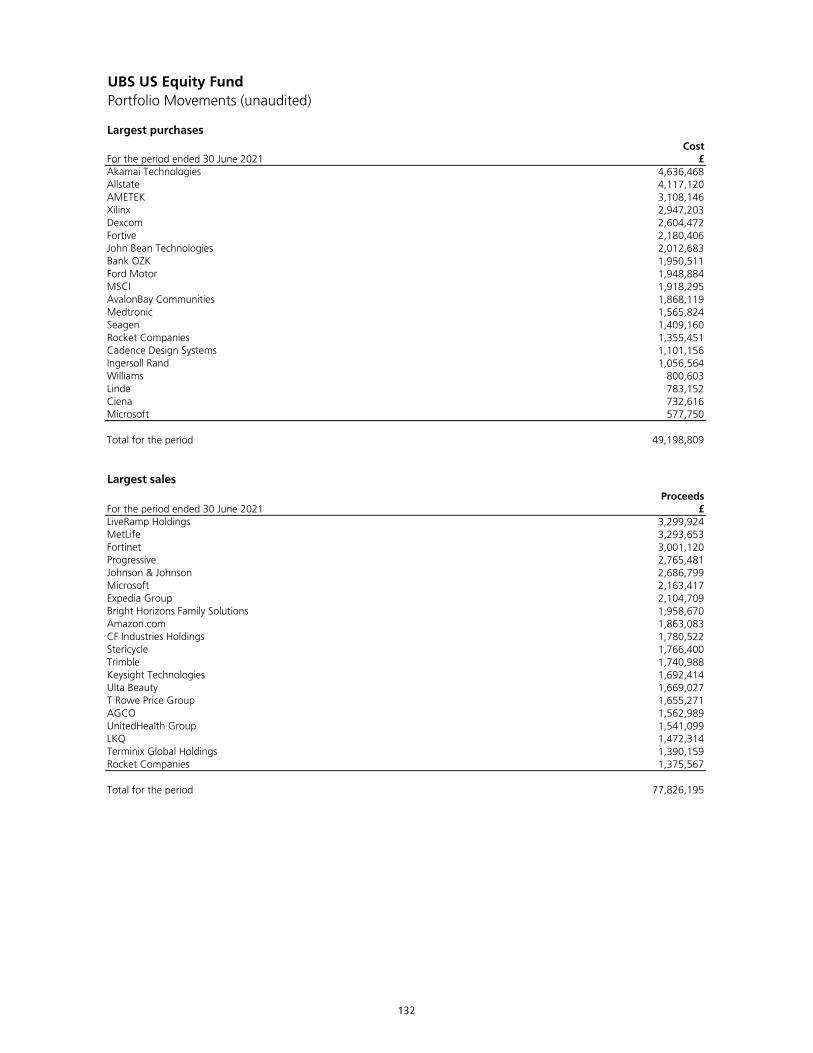
UBS US Equity FundPortfolio Movements (unaudited)
Largest purchasesCost
For the period ended 30 June 2021 £4,636,4684,117,1203,108,1462,947,2032,604,4722,180,4062,012,6831,950,5111,948,8841,918,2951,868,1191,565,8241,409,1601,355,4511,101,1561,056,564
800,603783,152732,616577,750
Total for the period 49,198,809
Largest salesProceeds
For the period ended 30 June 2021 £3,299,9243,293,6533,001,1202,765,4812,686,7992,163,4172,104,7091,958,6701,863,0831,780,5221,766,4001,740,9881,692,4141,669,0271,655,2711,562,9891,541,0991,472,3141,390,1591,375,567
Total for the period 77,826,195
UnitedHealth Group LKQ Terminix Global HoldingsRocket Companies
StericycleTrimble Keysight Technologies Ulta Beauty T Rowe Price Group AGCO
CF Industries Holdings
Ciena Microsoft
LiveRamp Holdings MetLife Fortinet Progressive Johnson & Johnson Microsoft Expedia Group Bright Horizons Family Solutions Amazon.com
Linde
John Bean Technologies Bank OZK Ford Motor MSCI AvalonBay CommunitiesMedtronic Seagen Rocket CompaniesCadence Design Systems Ingersoll Rand Williams
Fortive
Akamai Technologies Allstate AMETEK Xilinx Dexcom
132
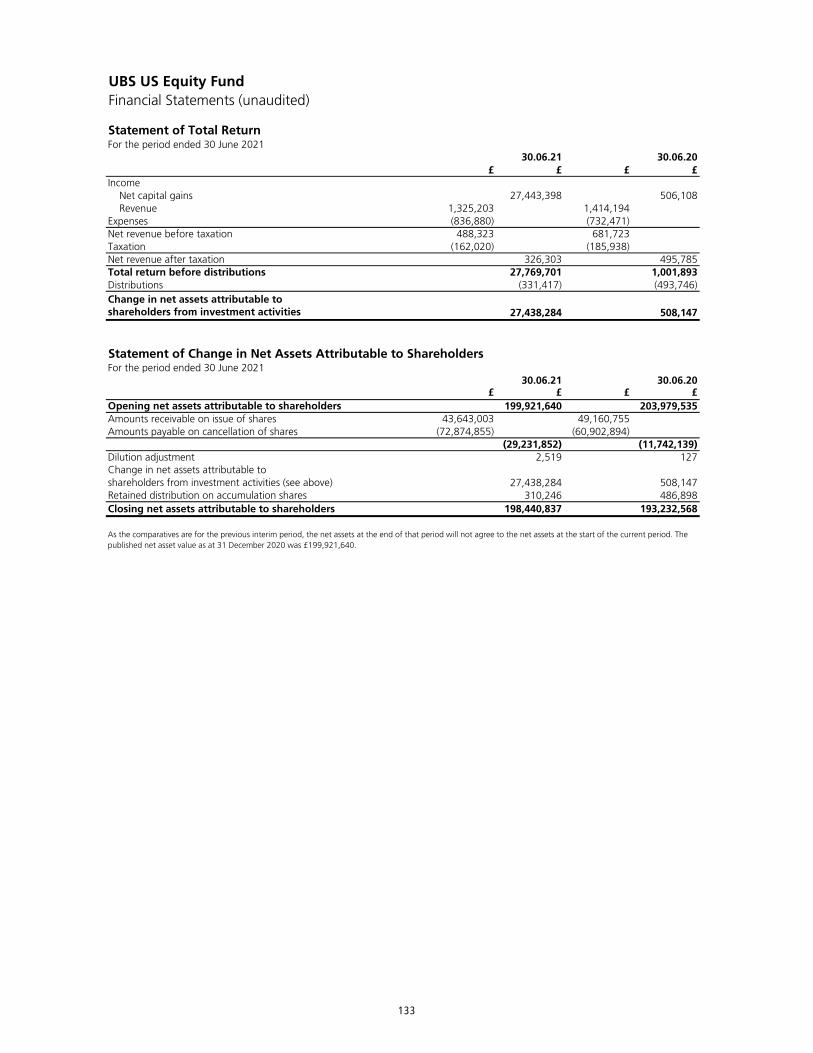
UBS US Equity FundFinancial Statements (unaudited)
Statement of Total ReturnFor the period ended 30 June 2021
£ £ £ £Income Net capital gains 27,443,398 506,108 Revenue 1,325,203 1,414,194Expenses (836,880) (732,471)Net revenue before taxation 488,323 681,723Taxation (162,020) (185,938)Net revenue after taxation 326,303 495,785Total return before distributions 27,769,701 1,001,893Distributions (331,417) (493,746)Change in net assets attributable to shareholders from investment activities 27,438,284 508,147
Statement of Change in Net Assets Attributable to ShareholdersFor the period ended 30 June 2021
£ £ £ £199,921,640 203,979,535
Amounts receivable on issue of shares 43,643,003 49,160,755Amounts payable on cancellation of shares (72,874,855) (60,902,894)
(29,231,852) (11,742,139)Dilution adjustment 2,519 127
27,438,284 508,147310,246 486,898
198,440,837 193,232,568
shareholders from investment activities (see above)Retained distribution on accumulation sharesClosing net assets attributable to shareholders
As the comparatives are for the previous interim period, the net assets at the end of that period will not agree to the net assets at the start of the current period. The published net asset value as at 31 December 2020 was £199,921,640.
Change in net assets attributable to
30.06.21 30.06.20
30.06.21 30.06.20
Opening net assets attributable to shareholders
133
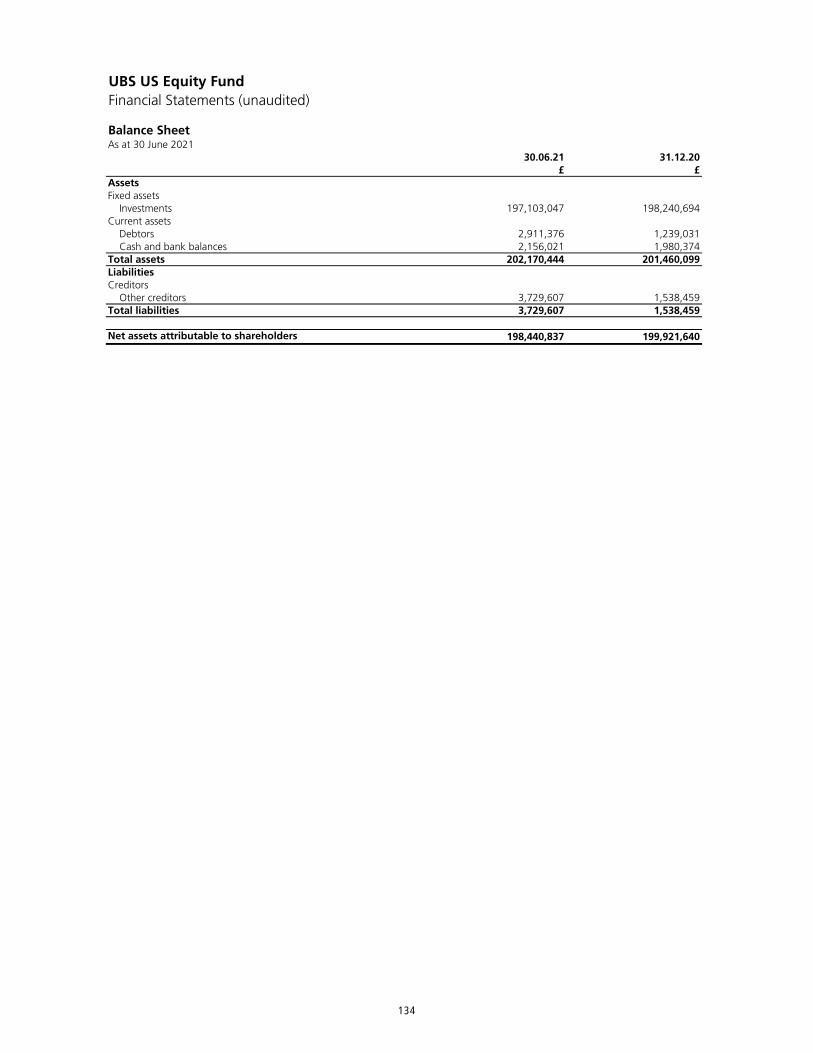
UBS US Equity FundFinancial Statements (unaudited)
Balance SheetAs at 30 June 2021
30.06.21 31.12.20£ £
AssetsFixed assets Investments 197,103,047 198,240,694Current assets Debtors 2,911,376 1,239,031 Cash and bank balances 2,156,021 1,980,374Total assets 202,170,444 201,460,099LiabilitiesCreditors Other creditors 3,729,607 1,538,459Total liabilities 3,729,607 1,538,459
Net assets attributable to shareholders 198,440,837 199,921,640
134

UBS US Equity FundNotes to the Financial Statements (unaudited)
Accounting policiesThe interim financial statements have been prepared in accordance with the Statement of Recommended Practice (SORP) for Authorised Funds issued by the Investment Association (IA) in May 2014 (SORP 2014).
The accounting policies applied are consistent with those of the financial statements for the year ended 31 December 2020 and are described in those annual financial statements.
135

136
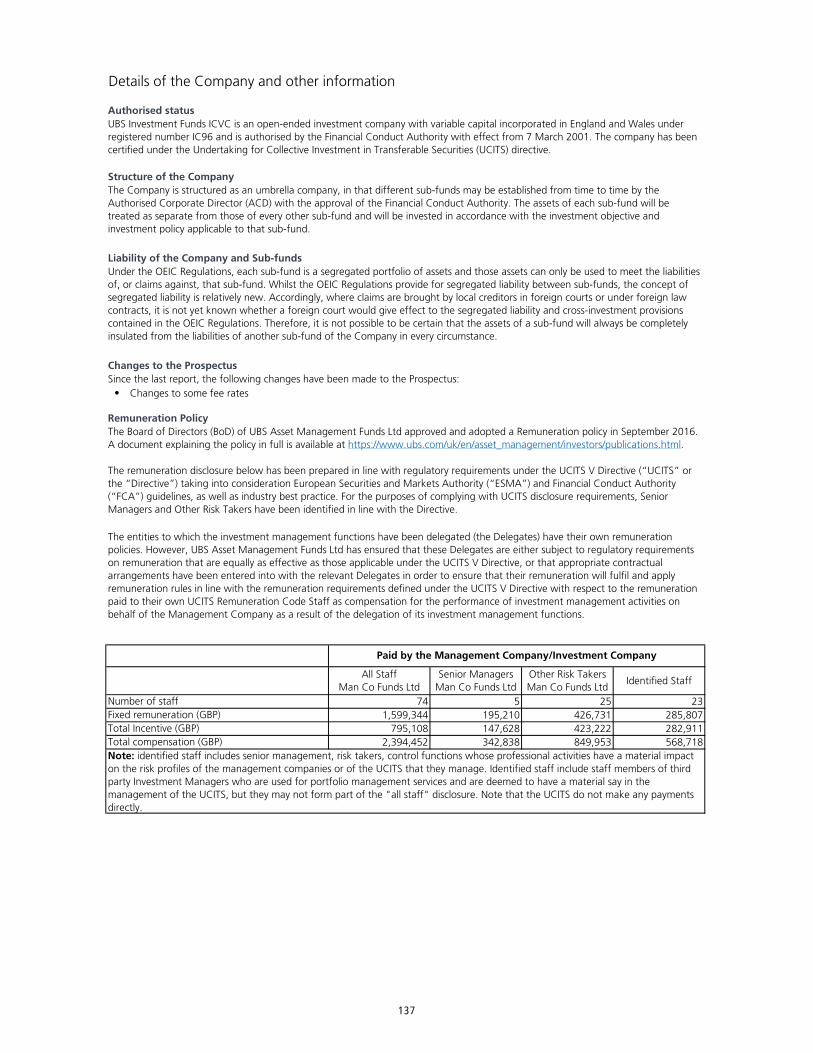
Details of the Company and other information
Authorised status
Structure of the Company
Liability of the Company and Sub-funds
Changes to the Prospectus
• Changes to some fee rates
Remuneration Policy
All Staff Man Co Funds Ltd
Senior Managers Man Co Funds Ltd
Other Risk Takers Man Co Funds Ltd
Identified Staff
74 5 25 231,599,344 195,210 426,731 285,807
795,108 147,628 423,222 282,9112,394,452 342,838 849,953 568,718Total compensation (GBP)
Note: identified staff includes senior management, risk takers, control functions whose professional activities have a material impact on the risk profiles of the management companies or of the UCITS that they manage. Identified staff include staff members of third party Investment Managers who are used for portfolio management services and are deemed to have a material say in the management of the UCITS, but they may not form part of the "all staff" disclosure. Note that the UCITS do not make any payments directly.
Total Incentive (GBP)
UBS Investment Funds ICVC is an open-ended investment company with variable capital incorporated in England and Wales under registered number IC96 and is authorised by the Financial Conduct Authority with effect from 7 March 2001. The company has been certified under the Undertaking for Collective Investment in Transferable Securities (UCITS) directive.
The Company is structured as an umbrella company, in that different sub-funds may be established from time to time by the Authorised Corporate Director (ACD) with the approval of the Financial Conduct Authority. The assets of each sub-fund will be treated as separate from those of every other sub-fund and will be invested in accordance with the investment objective and investment policy applicable to that sub-fund.
Under the OEIC Regulations, each sub-fund is a segregated portfolio of assets and those assets can only be used to meet the liabilities of, or claims against, that sub-fund. Whilst the OEIC Regulations provide for segregated liability between sub-funds, the concept of segregated liability is relatively new. Accordingly, where claims are brought by local creditors in foreign courts or under foreign law contracts, it is not yet known whether a foreign court would give effect to the segregated liability and cross-investment provisions contained in the OEIC Regulations. Therefore, it is not possible to be certain that the assets of a sub-fund will always be completely insulated from the liabilities of another sub-fund of the Company in every circumstance.
Since the last report, the following changes have been made to the Prospectus:
The Board of Directors (BoD) of UBS Asset Management Funds Ltd approved and adopted a Remuneration policy in September 2016. A document explaining the policy in full is available at https://www.ubs.com/uk/en/asset_management/investors/publications.html.
The remuneration disclosure below has been prepared in line with regulatory requirements under the UCITS V Directive (“UCITS” or the “Directive”) taking into consideration European Securities and Markets Authority (“ESMA”) and Financial Conduct Authority (“FCA”) guidelines, as well as industry best practice. For the purposes of complying with UCITS disclosure requirements, Senior Managers and Other Risk Takers have been identified in line with the Directive.
The entities to which the investment management functions have been delegated (the Delegates) have their own remuneration policies. However, UBS Asset Management Funds Ltd has ensured that these Delegates are either subject to regulatory requirements on remuneration that are equally as effective as those applicable under the UCITS V Directive, or that appropriate contractual arrangements have been entered into with the relevant Delegates in order to ensure that their remuneration will fulfil and apply remuneration rules in line with the remuneration requirements defined under the UCITS V Directive with respect to the remuneration paid to their own UCITS Remuneration Code Staff as compensation for the performance of investment management activities on behalf of the Management Company as a result of the delegation of its investment management functions.
Number of staffFixed remuneration (GBP)
Paid by the Management Company/Investment Company
137
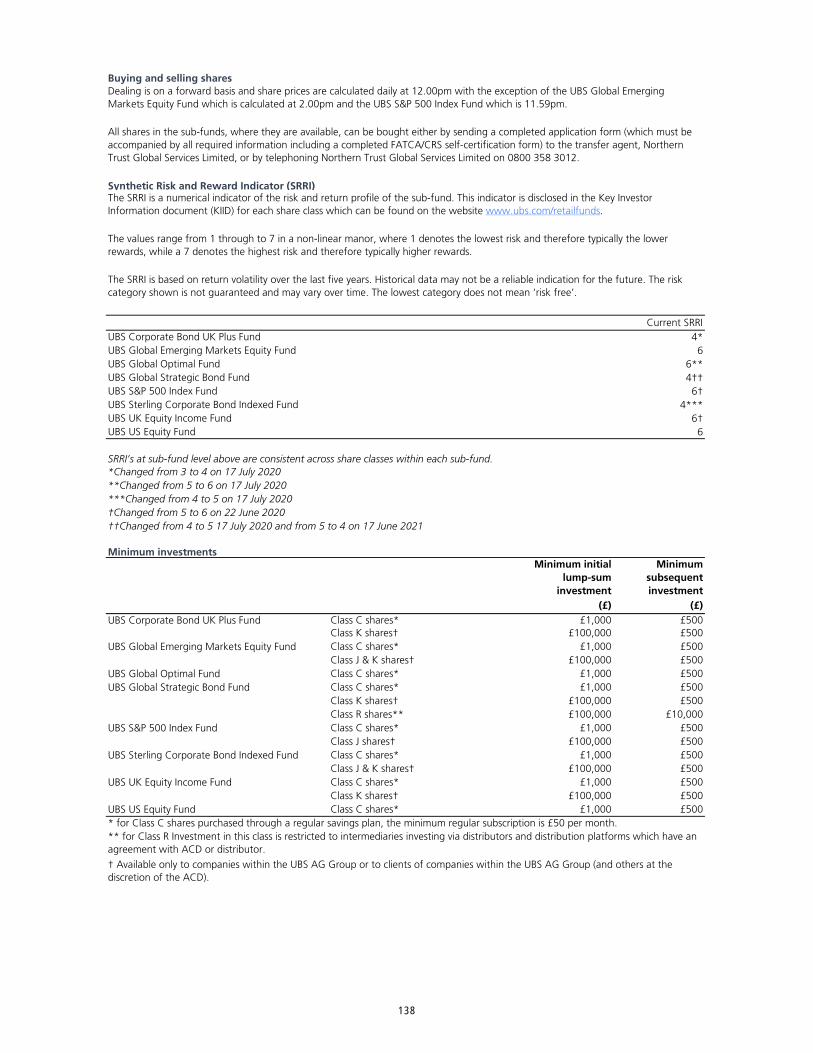
Buying and selling shares
Synthetic Risk and Reward Indicator (SRRI)
Current SRRIUBS Corporate Bond UK Plus Fund 4*UBS Global Emerging Markets Equity Fund 6UBS Global Optimal Fund 6**UBS Global Strategic Bond Fund 4††UBS S&P 500 Index Fund 6†UBS Sterling Corporate Bond Indexed Fund 4***UBS UK Equity Income Fund 6†UBS US Equity Fund 6
*Changed from 3 to 4 on 17 July 2020**Changed from 5 to 6 on 17 July 2020***Changed from 4 to 5 on 17 July 2020†Changed from 5 to 6 on 22 June 2020††Changed from 4 to 5 17 July 2020 and from 5 to 4 on 17 June 2021
Minimum investmentsMinimum initial
lump-sum investment
Minimum subsequent investment
(£) (£)UBS Corporate Bond UK Plus Fund Class C shares* £1,000 £500
Class K shares† £100,000 £500UBS Global Emerging Markets Equity Fund Class C shares* £1,000 £500
Class J & K shares† £100,000 £500UBS Global Optimal Fund Class C shares* £1,000 £500UBS Global Strategic Bond Fund Class C shares* £1,000 £500
Class K shares† £100,000 £500Class R shares** £100,000 £10,000
UBS S&P 500 Index Fund Class C shares* £1,000 £500Class J shares† £100,000 £500
UBS Sterling Corporate Bond Indexed Fund Class C shares* £1,000 £500Class J & K shares† £100,000 £500
UBS UK Equity Income Fund Class C shares* £1,000 £500Class K shares† £100,000 £500
UBS US Equity Fund Class C shares* £1,000 £500* for Class C shares purchased through a regular savings plan, the minimum regular subscription is £50 per month.
The SRRI is a numerical indicator of the risk and return profile of the sub-fund. This indicator is disclosed in the Key Investor Information document (KIID) for each share class which can be found on the website www.ubs.com/retailfunds.
The values range from 1 through to 7 in a non-linear manor, where 1 denotes the lowest risk and therefore typically the lower rewards, while a 7 denotes the highest risk and therefore typically higher rewards.
The SRRI is based on return volatility over the last five years. Historical data may not be a reliable indication for the future. The risk category shown is not guaranteed and may vary over time. The lowest category does not mean ‘risk free’.
SRRI’s at sub-fund level above are consistent across share classes within each sub-fund.
** for Class R Investment in this class is restricted to intermediaries investing via distributors and distribution platforms which have an agreement with ACD or distributor.
† Available only to companies within the UBS AG Group or to clients of companies within the UBS AG Group (and others at the discretion of the ACD).
All shares in the sub-funds, where they are available, can be bought either by sending a completed application form (which must be accompanied by all required information including a completed FATCA/CRS self-certification form) to the transfer agent, Northern Trust Global Services Limited, or by telephoning Northern Trust Global Services Limited on 0800 358 3012.
Dealing is on a forward basis and share prices are calculated daily at 12.00pm with the exception of the UBS Global Emerging Markets Equity Fund which is calculated at 2.00pm and the UBS S&P 500 Index Fund which is 11.59pm.
138
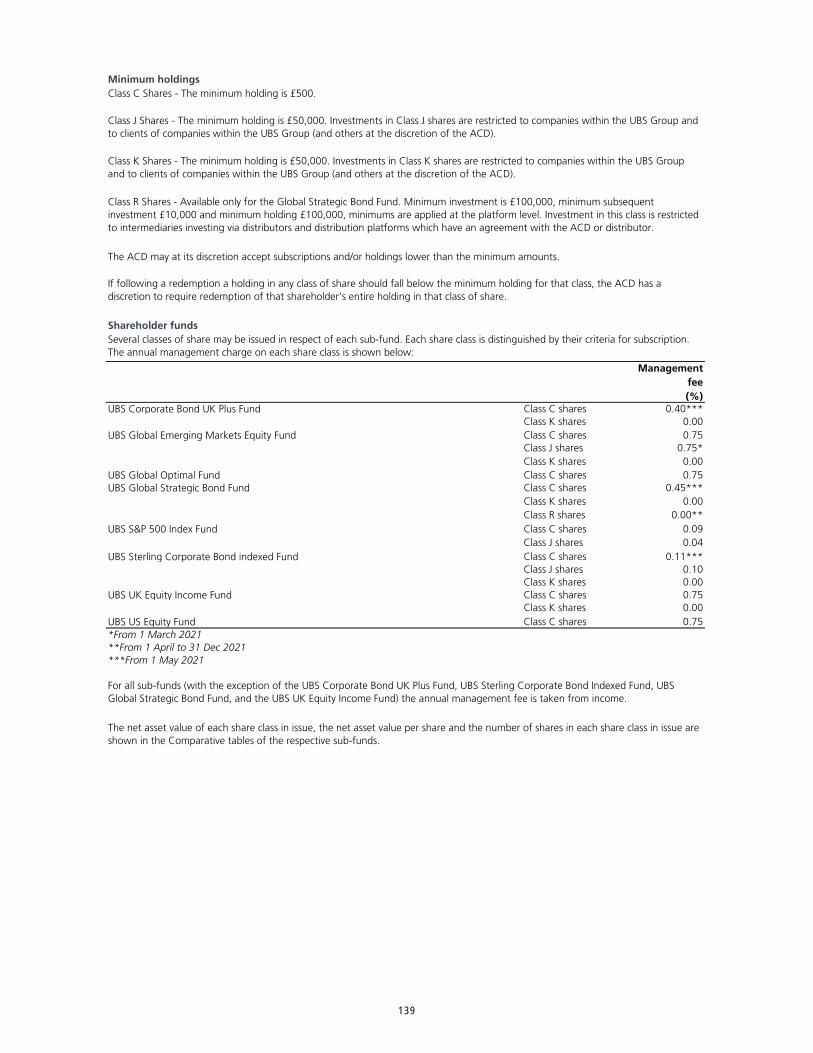
Minimum holdingsClass C Shares - The minimum holding is £500.
Shareholder funds
Managementfee(%)
UBS Corporate Bond UK Plus Fund Class C shares 0.40***Class K shares 0.00
UBS Global Emerging Markets Equity Fund Class C shares 0.75Class J shares 0.75*Class K shares 0.00
UBS Global Optimal Fund Class C shares 0.75UBS Global Strategic Bond Fund Class C shares 0.45***
Class K shares 0.00Class R shares 0.00**
UBS S&P 500 Index Fund Class C shares 0.09Class J shares 0.04
UBS Sterling Corporate Bond indexed Fund Class C shares 0.11***Class J shares 0.10Class K shares 0.00
UBS UK Equity Income Fund Class C shares 0.75Class K shares 0.00
UBS US Equity Fund Class C shares 0.75
If following a redemption a holding in any class of share should fall below the minimum holding for that class, the ACD has a discretion to require redemption of that shareholder’s entire holding in that class of share.
Several classes of share may be issued in respect of each sub-fund. Each share class is distinguished by their criteria for subscription. The annual management charge on each share class is shown below:
*From 1 March 2021**From 1 April to 31 Dec 2021***From 1 May 2021
For all sub-funds (with the exception of the UBS Corporate Bond UK Plus Fund, UBS Sterling Corporate Bond Indexed Fund, UBS Global Strategic Bond Fund, and the UBS UK Equity Income Fund) the annual management fee is taken from income.
The net asset value of each share class in issue, the net asset value per share and the number of shares in each share class in issue are shown in the Comparative tables of the respective sub-funds.
The ACD may at its discretion accept subscriptions and/or holdings lower than the minimum amounts.
Class J Shares - The minimum holding is £50,000. Investments in Class J shares are restricted to companies within the UBS Group and to clients of companies within the UBS Group (and others at the discretion of the ACD).
Class K Shares - The minimum holding is £50,000. Investments in Class K shares are restricted to companies within the UBS Group and to clients of companies within the UBS Group (and others at the discretion of the ACD).
Class R Shares - Available only for the Global Strategic Bond Fund. Minimum investment is £100,000, minimum subsequent investment £10,000 and minimum holding £100,000, minimums are applied at the platform level. Investment in this class is restricted to intermediaries investing via distributors and distribution platforms which have an agreement with the ACD or distributor.
139

Dealing chargesInitial charge
Redemption charge
Charges on switching
FCA Value Assessment
www.ubs.com/uk/en/asset-management/financial-advisors/products.html
www.ubs.com/uk/en/asset-management/private-investors/funds-prices.html
www.ubs.com/uk/en/asset-management/institutional-investors/funds-prices/application-forms-supplementary-documents.html
On the switching of shares between sub-funds or classes in the Company the Instrument of Incorporation authorises the Company to impose a charge on switching. At present no charge is levied on switches between any classes of shares. Switching into or between J or K Class Shares is restricted to companies within the UBS AG Group and to clients of companies within the UBS AG Group. Switching into Class R Shares is restricted to intermediaries investing via distributors and distribution platforms which have an agreement with the ACD or distributor. For details of charges in relation to switching into any other UBS collective investment scheme, please contact the ACD.
The Financial Conduct Authority (FCA) requires UK authorised fund managers (AFMs) to conduct an assessment of value at least annually for each share class of each UK authorised fund they manage, and publish a report of the result.
The UBS Asset Management Funds Ltd assessment is now available and can be viewed at below.
Financial Advisors
Private Investors
Institutional Investors
The ACD may make a charge on the redemption of shares in each class. At present no redemption charge is levied on any class of shares. The ACD may introduce a redemption charge on any class of shares or vary the rate or method of calculation of any redemption charge only in accordance with the FCA Rules and after the ACD has made available a revised version of the Prospectus showing the rate of charge and its commencement. Any redemption charge introduced will apply only to shares sold since its introduction but not to shares previously in issue.
The ACD may impose a charge on the purchase of shares in each class. At present no initial charge is levied on purchases of any class of shares.
140
Directors of UBS Asset Management Funds Ltd Investment ManagerE Byrne A Aziz UBS Asset Management (UK) LtdA Larkin 5 BroadgateJ Stannard (Non-Exec) P Davis (Non-Exec) London EC2M 2QS
Authorised and regulated by the Financial Conduct Authority
The Company and Head Office All telephone calls are recorded
UBS Investment Funds ICVC5 Broadgate CustodianLondon EC2M 2QS JP Morgan Chase Bank
125 London WallAuthorised Corporate Director London UBS Asset Management Funds Ltd EC27 5AH5 BroadgateLondon EC2M 2QS Fund AdministratorAuthorised and regulated by the Financial Conduct Authority JP Morgan
4/5 Lochside ViewTransfer Agent and Registrar for all Shares Edinburgh (where available) EH12 9DHNorthern Trust Global Services Limited
AuditorErnst & Young LLP
London E14 5NT 25 Churchill PlaceCanary Wharf
Depositary London E14 5EYNatWest Trustee and Depositary Services Limited250 Bishopsgate Legal AdviserLondon Eversheds Sutherland LLPEC2M 4AA One Wood StreetAuthorised and regulated by the Financial Conduct Authority London EC2V 7WS
50 Bank StreetCanary Wharf
141

ab
0800 358 3012 www.ubs.com/retailfunds