vam funds (lux)
TRANSCRIPT
VAM Funds (Lux)Société d’Investissement à Capital Variable
Unaudited Semi-Annual Report
As at June 30, 2021
R.C.S. Luxembourg B 107134
VAM Funds (Lux)
Table of Contents
Management and Organisation 3
Statement of Net Assets 6
Statement of Operations and Changes in Net Assets 8
Statistics 11
Statement of Investments
VAM Funds (Lux) – US Mid Cap Growth Fund 13
VAM Funds (Lux) – US Small Cap Growth Fund 16
VAM Funds (Lux) – US Micro Cap Growth Fund 20
VAM Funds (Lux) – US Large Cap Growth Fund 24
VAM Funds (Lux) – Emerging Markets Growth Fund 27
VAM Funds (Lux) – VAM Global Infrastructure Fund* 31
VAM Funds (Lux) – World Growth Fund 33
VAM Funds (Lux) – International Opportunities Fund 37
Notes to the Financial Statements 42
Shareholder Information 49
Appendix 49
* Please see Note 15Subscriptions can be accepted only on the basis of the valid Sales Prospectus (with annexes) and the Key Investor Information Document together with the most recentAnnual Report and, if the latter was published more than eight months ago, the most recent Semi-Annual Report.
2
Company:
VAM Funds (Lux)8-10, rue Genistre,L-1623 Luxembourg, Grand Duchy of Luxembourg
Board of Directors:
Mr Peter John de Putron (Chairman)Chairman of VAM Funds (Lux) and VAM Managed Funds (Lux)23 Marina Court, St Peter Port,Guernsey GY11WP, United Kingdom
The Hon. James CrippsDirectorElmbrook, Marsh,BuckinghamshireAylesbury HP17 8SP,United Kingdom
Mr Michael HuntDirector8-10, rue Genistre,L-1623 Luxembourg, Grand Duchy of Luxembourg
Mr Benoni DufourIndependent Director15, op der SankL-5713 Aspelt, Grand Duchy of Luxembourg
Mr Robert GordonDirector28 Eastern Point Bld01930 Gloucester, MA,United States of America
Management Company:
VAM Global Management Company SAJosy Welter House8-10, rue Genistre,L-1623 Luxembourg, Grand Duchy of Luxembourg
Board of Directors of the Management Company:
Mr Peter John de PutronChairman of VAM Funds (Lux) and VAM Managed Funds (Lux)23 Marina Court, St Peter Port,Guernsey GY11WP, United Kingdom
Mr Brendan ADAMSManager of VAM Global S.à r.l.Chesham,GB-HP5 3BG, United Kingdom
Mr Michael LANGEPartner, ME Business Solutions S.à r.l.L-1258 Luxembourg, Grand Duchy of Luxembourg
Mrs Julie KRENTZManager of VAM Global S.à r.l.L-1623 Luxembourg, Grand Duchy of Luxembourg
VAM Funds (Lux)
Management and Organisation
3
Conducting persons of the Management Company:
Mr Brendan ADAMSManager of VAM Global S.à r.l.Chesham,GB-HP5 3BG, United Kingdom
Mr Benoni DUFOURIndependent Director15, op der SankL-5713 Aspelt, Grand Duchy of Luxembourg
Mrs Julie KRENTZManager of VAM Global S.à r.l.L-1623 Luxembourg, Grand Duchy of Luxembourg
Mr Maciej MitkaManager of VAM Global S.à r.l.L-1623 Luxembourg, Grand Duchy of Luxembourg
Investment Manager:
Foresight Group LLPThe Shard, 32 Lond Bridge Street,London, SE1 9SG, United Kingdom
Driehaus Capital Management LLC25 East Erie StreetChicago, llinois 60611, United States of America
Administrative, Registrar and Transfer Agent:
RBC Investor Services Bank S.A.14, Porte de FranceL - 4360 Esch-sur-Alzette, Grand Duchy of Luxembourg
Domiciliary Agent:
VAM Global Management Company SAJosy Welter House8-10, rue Genistre,L-1623 Luxembourg, Grand Duchy of Luxembourg
Depositary and Principal Paying Agent:
RBC Investor Services Bank S.A.14, Porte de FranceL - 4360 Esch-sur-Alzette, Grand Duchy of Luxembourg
Facilities Agent in the United Kingdom:
Société Générale Securities Services Custody LondonSG House41 Tower HillLondon EC3N 4SG, United Kingdom
Representative Agent in South Africa:
Boutique Collective Investments (RF) (Pty) LimitedAcorn House, Unit AC13, Ground Floor,Old Oak Office Park,Cnr Old Oak Road & Durban Road,Bellville, ZA-7530 Western Cape, South Africa
Representative Agent in Switzerland:
RBC Investor Services Bank S.A.Zurich Branch,Bleicherweg 7,CH-8027 Zurich, Switzerland
Representative Agent in Sweden:
Skandinaviska Enskilda Banken ABKungstradgardsgatan,E-106 40 Stockholm, Sweden
VAM Funds (Lux)
Management and Organisation (continued)
4
Global Distributor:
VAM Marketing Limited,11th Floor, Tower 1,NeXTeracom Building,Ebene Cybercity, Mauritius
Independent Auditor:
Ernst & Young S.A.35E, avenue John F. KennedyL-1855 Luxembourg, Grand Duchy of Luxembourg
Legal Advisor in Luxembourg:
Elvinger Hoss Prussen2, Place Winston ChurchillL-1340 Luxembourg, Grand Duchy of Luxembourg
Registration Countries for Distribution:
Finland: only for VAM Funds (Lux) – World Growth FundSwitzerland: only for VAM Funds (Lux) – US Small Cap Growth Fund, VAM Funds (Lux) – US Micro Cap Growth Fund, VAM Funds (Lux) – USLarge Cap Growth Fund, VAM Funds (Lux) – Emerging Markets Growth Fund and VAM Funds (Lux) – World Growth FundSingapore, South Africa, Sweden, United Kingdom: all compartmentsUnited Arab Emirates: all compartments except VAM Funds (Lux) - VAM Global Infrastructure Fund
VAM Funds (Lux)
Management and Organisation (continued)
5
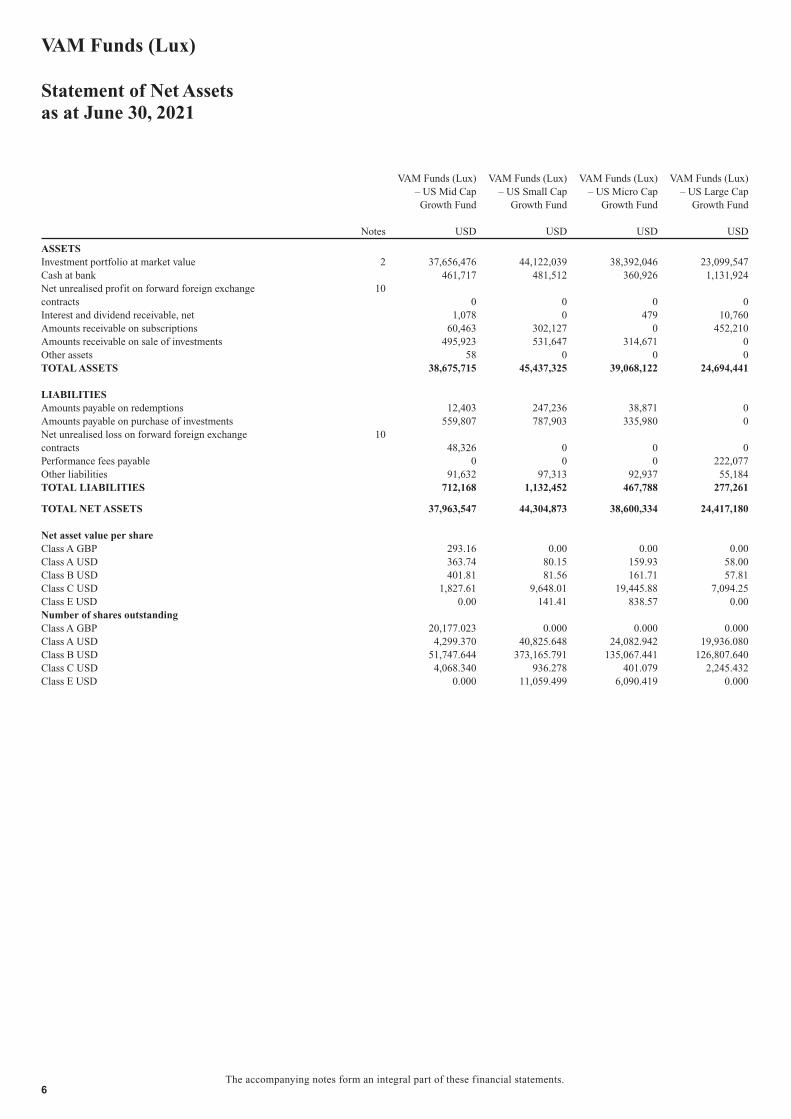
VAM Funds (Lux)– US Mid CapGrowth Fund
VAM Funds (Lux)– US Small Cap
Growth Fund
VAM Funds (Lux)– US Micro Cap
Growth Fund
VAM Funds (Lux)– US Large Cap
Growth Fund
Notes USD USD USD USD
ASSETSInvestment portfolio at market value 2 37,656,476 44,122,039 38,392,046 23,099,547Cash at bank 461,717 481,512 360,926 1,131,924Net unrealised profit on forward foreign exchangecontracts
100 0 0 0
Interest and dividend receivable, net 1,078 0 479 10,760Amounts receivable on subscriptions 60,463 302,127 0 452,210Amounts receivable on sale of investments 495,923 531,647 314,671 0Other assets 58 0 0 0TOTAL ASSETS 38,675,715 45,437,325 39,068,122 24,694,441
LIABILITIESAmounts payable on redemptions 12,403 247,236 38,871 0Amounts payable on purchase of investments 559,807 787,903 335,980 0Net unrealised loss on forward foreign exchangecontracts
1048,326 0 0 0
Performance fees payable 0 0 0 222,077Other liabilities 91,632 97,313 92,937 55,184TOTAL LIABILITIES 712,168 1,132,452 467,788 277,261
TOTAL NET ASSETS 37,963,547 44,304,873 38,600,334 24,417,180
Net asset value per shareClass A GBP 293.16 0.00 0.00 0.00Class A USD 363.74 80.15 159.93 58.00Class B USD 401.81 81.56 161.71 57.81Class C USD 1,827.61 9,648.01 19,445.88 7,094.25Class E USD 0.00 141.41 838.57 0.00Number of shares outstandingClass A GBP 20,177.023 0.000 0.000 0.000Class A USD 4,299.370 40,825.648 24,082.942 19,936.080Class B USD 51,747.644 373,165.791 135,067.441 126,807.640Class C USD 4,068.340 936.278 401.079 2,245.432Class E USD 0.000 11,059.499 6,090.419 0.000
VAM Funds (Lux)
Statement of Net Assetsas at June 30, 2021
The accompanying notes form an integral part of these financial statements.6
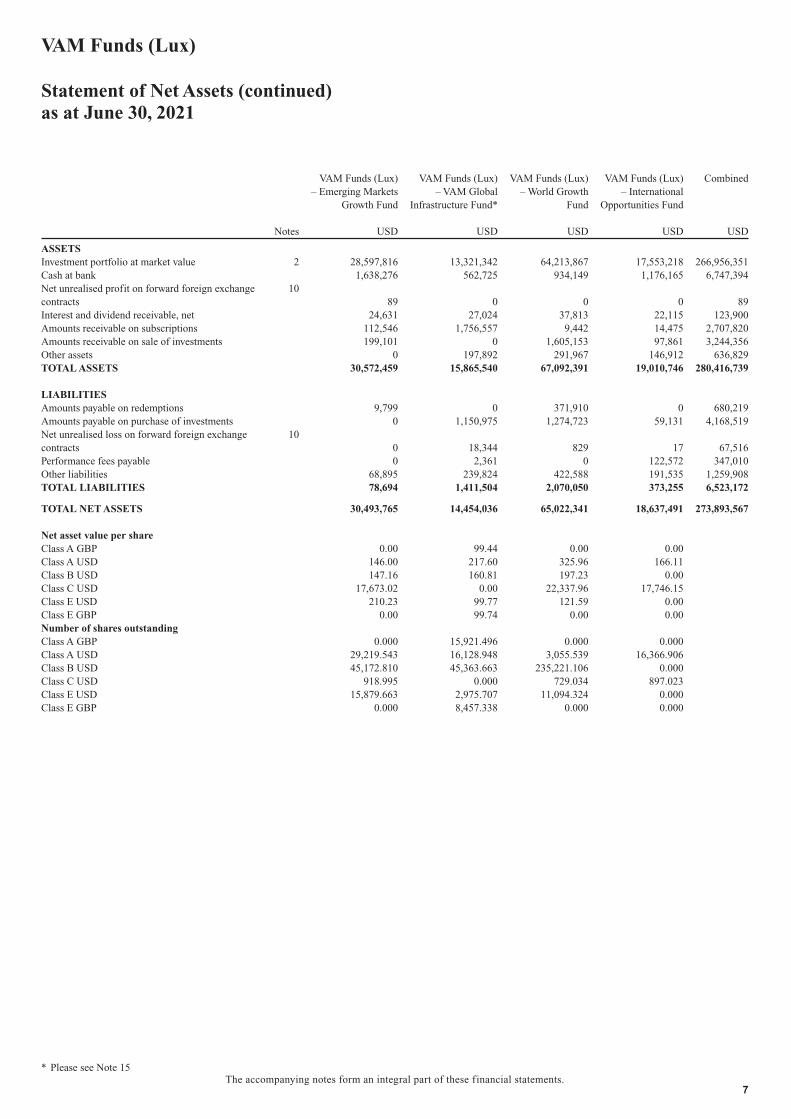
VAM Funds (Lux)– Emerging Markets
Growth Fund
VAM Funds (Lux)– VAM Global
Infrastructure Fund*
VAM Funds (Lux)– World Growth
Fund
VAM Funds (Lux)– International
Opportunities Fund
Combined
Notes USD USD USD USD USD
ASSETSInvestment portfolio at market value 2 28,597,816 13,321,342 64,213,867 17,553,218 266,956,351Cash at bank 1,638,276 562,725 934,149 1,176,165 6,747,394Net unrealised profit on forward foreign exchangecontracts
1089 0 0 0 89
Interest and dividend receivable, net 24,631 27,024 37,813 22,115 123,900Amounts receivable on subscriptions 112,546 1,756,557 9,442 14,475 2,707,820Amounts receivable on sale of investments 199,101 0 1,605,153 97,861 3,244,356Other assets 0 197,892 291,967 146,912 636,829TOTAL ASSETS 30,572,459 15,865,540 67,092,391 19,010,746 280,416,739
LIABILITIESAmounts payable on redemptions 9,799 0 371,910 0 680,219Amounts payable on purchase of investments 0 1,150,975 1,274,723 59,131 4,168,519Net unrealised loss on forward foreign exchangecontracts
100 18,344 829 17 67,516
Performance fees payable 0 2,361 0 122,572 347,010Other liabilities 68,895 239,824 422,588 191,535 1,259,908TOTAL LIABILITIES 78,694 1,411,504 2,070,050 373,255 6,523,172
TOTAL NET ASSETS 30,493,765 14,454,036 65,022,341 18,637,491 273,893,567
Net asset value per shareClass A GBP 0.00 99.44 0.00 0.00Class A USD 146.00 217.60 325.96 166.11Class B USD 147.16 160.81 197.23 0.00Class C USD 17,673.02 0.00 22,337.96 17,746.15Class E USD 210.23 99.77 121.59 0.00Class E GBP 0.00 99.74 0.00 0.00Number of shares outstandingClass A GBP 0.000 15,921.496 0.000 0.000Class A USD 29,219.543 16,128.948 3,055.539 16,366.906Class B USD 45,172.810 45,363.663 235,221.106 0.000Class C USD 918.995 0.000 729.034 897.023Class E USD 15,879.663 2,975.707 11,094.324 0.000Class E GBP 0.000 8,457.338 0.000 0.000
* Please see Note 15
VAM Funds (Lux)
Statement of Net Assets (continued)as at June 30, 2021
The accompanying notes form an integral part of these financial statements.7
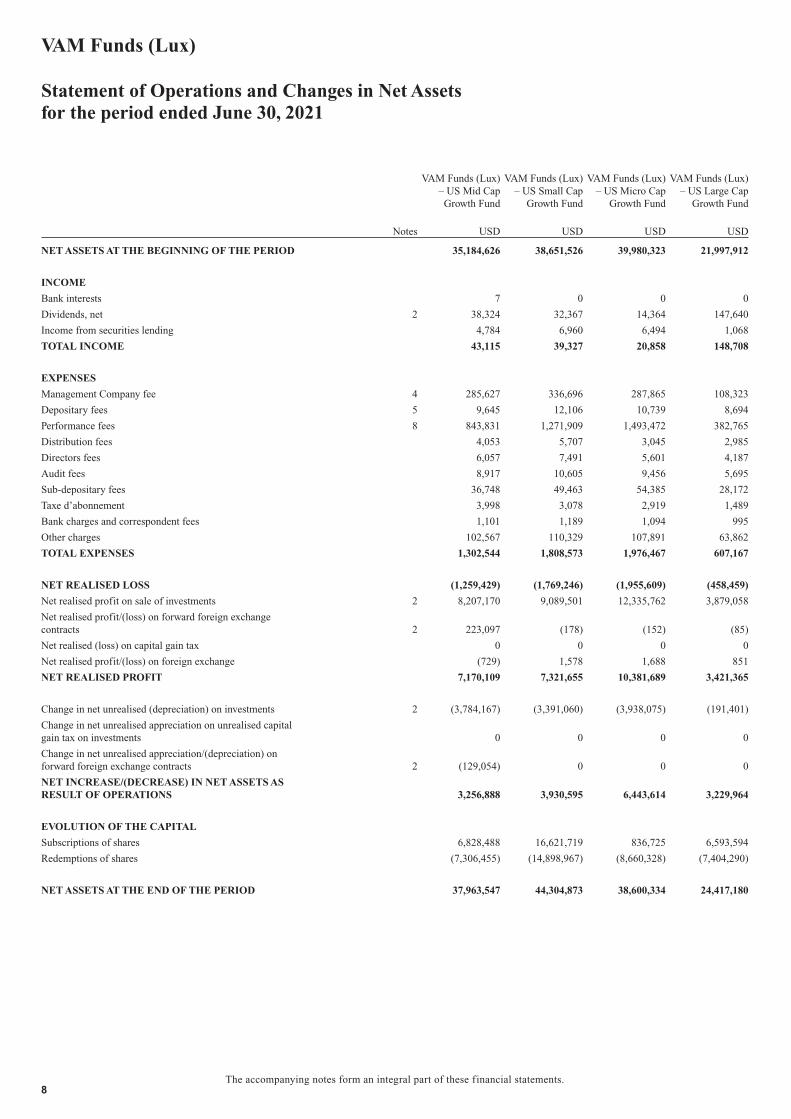
VAM Funds (Lux)– US Mid CapGrowth Fund
VAM Funds (Lux)– US Small Cap
Growth Fund
VAM Funds (Lux)– US Micro Cap
Growth Fund
VAM Funds (Lux)– US Large Cap
Growth Fund
Notes USD USD USD USD
NET ASSETS AT THE BEGINNING OF THE PERIOD 35,184,626 38,651,526 39,980,323 21,997,912
INCOME
Bank interests 7 0 0 0
Dividends, net 2 38,324 32,367 14,364 147,640
Income from securities lending 4,784 6,960 6,494 1,068
TOTAL INCOME 43,115 39,327 20,858 148,708
EXPENSES
Management Company fee 4 285,627 336,696 287,865 108,323
Depositary fees 5 9,645 12,106 10,739 8,694
Performance fees 8 843,831 1,271,909 1,493,472 382,765
Distribution fees 4,053 5,707 3,045 2,985
Directors fees 6,057 7,491 5,601 4,187
Audit fees 8,917 10,605 9,456 5,695
Sub-depositary fees 36,748 49,463 54,385 28,172
Taxe d’abonnement 3,998 3,078 2,919 1,489
Bank charges and correspondent fees 1,101 1,189 1,094 995
Other charges 102,567 110,329 107,891 63,862
TOTAL EXPENSES 1,302,544 1,808,573 1,976,467 607,167
NET REALISED LOSS (1,259,429) (1,769,246) (1,955,609) (458,459)
Net realised profit on sale of investments 2 8,207,170 9,089,501 12,335,762 3,879,058
Net realised profit/(loss) on forward foreign exchangecontracts 2 223,097 (178) (152) (85)
Net realised (loss) on capital gain tax 0 0 0 0
Net realised profit/(loss) on foreign exchange (729) 1,578 1,688 851
NET REALISED PROFIT 7,170,109 7,321,655 10,381,689 3,421,365
Change in net unrealised (depreciation) on investments 2 (3,784,167) (3,391,060) (3,938,075) (191,401)
Change in net unrealised appreciation on unrealised capitalgain tax on investments 0 0 0 0
Change in net unrealised appreciation/(depreciation) onforward foreign exchange contracts 2 (129,054) 0 0 0
NET INCREASE/(DECREASE) IN NET ASSETS ASRESULT OF OPERATIONS 3,256,888 3,930,595 6,443,614 3,229,964
EVOLUTION OF THE CAPITAL
Subscriptions of shares 6,828,488 16,621,719 836,725 6,593,594
Redemptions of shares (7,306,455) (14,898,967) (8,660,328) (7,404,290)
NET ASSETS AT THE END OF THE PERIOD 37,963,547 44,304,873 38,600,334 24,417,180
VAM Funds (Lux)
Statement of Operations and Changes in Net Assetsfor the period ended June 30, 2021
The accompanying notes form an integral part of these financial statements.8
VAM Funds (Lux)– Emerging Markets
Growth Fund
VAM Funds (Lux)– VAM Global
Infrastructure Fund*
VAM Funds (Lux)– World Growth
Fund
VAM Funds (Lux)– International
Opportunities Fund
Combined
Notes USD USD USD USD USD
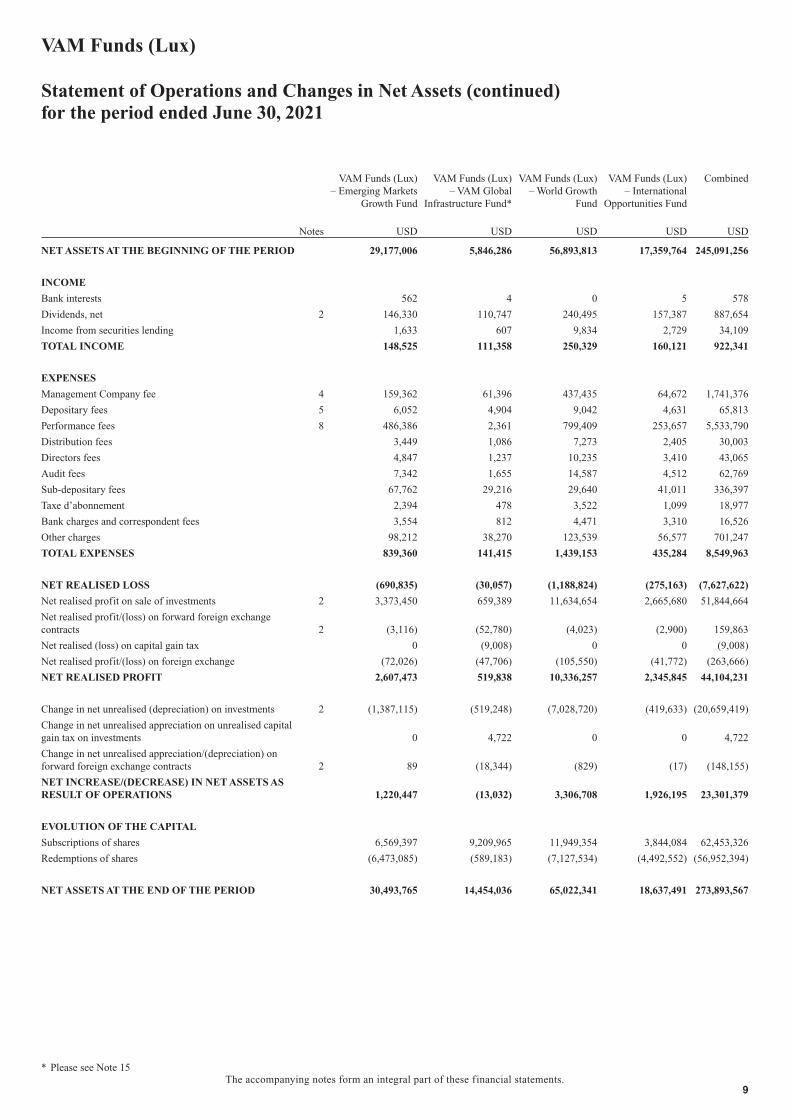
NET ASSETS AT THE BEGINNING OF THE PERIOD 29,177,006 5,846,286 56,893,813 17,359,764 245,091,256
INCOME
Bank interests 562 4 0 5 578
Dividends, net 2 146,330 110,747 240,495 157,387 887,654
Income from securities lending 1,633 607 9,834 2,729 34,109
TOTAL INCOME 148,525 111,358 250,329 160,121 922,341
EXPENSES
Management Company fee 4 159,362 61,396 437,435 64,672 1,741,376
Depositary fees 5 6,052 4,904 9,042 4,631 65,813
Performance fees 8 486,386 2,361 799,409 253,657 5,533,790
Distribution fees 3,449 1,086 7,273 2,405 30,003
Directors fees 4,847 1,237 10,235 3,410 43,065
Audit fees 7,342 1,655 14,587 4,512 62,769
Sub-depositary fees 67,762 29,216 29,640 41,011 336,397
Taxe d’abonnement 2,394 478 3,522 1,099 18,977
Bank charges and correspondent fees 3,554 812 4,471 3,310 16,526
Other charges 98,212 38,270 123,539 56,577 701,247
TOTAL EXPENSES 839,360 141,415 1,439,153 435,284 8,549,963
NET REALISED LOSS (690,835) (30,057) (1,188,824) (275,163) (7,627,622)
Net realised profit on sale of investments 2 3,373,450 659,389 11,634,654 2,665,680 51,844,664
Net realised profit/(loss) on forward foreign exchangecontracts 2 (3,116) (52,780) (4,023) (2,900) 159,863
Net realised (loss) on capital gain tax 0 (9,008) 0 0 (9,008)
Net realised profit/(loss) on foreign exchange (72,026) (47,706) (105,550) (41,772) (263,666)
NET REALISED PROFIT 2,607,473 519,838 10,336,257 2,345,845 44,104,231
Change in net unrealised (depreciation) on investments 2 (1,387,115) (519,248) (7,028,720) (419,633) (20,659,419)
Change in net unrealised appreciation on unrealised capitalgain tax on investments 0 4,722 0 0 4,722
Change in net unrealised appreciation/(depreciation) onforward foreign exchange contracts 2 89 (18,344) (829) (17) (148,155)
NET INCREASE/(DECREASE) IN NET ASSETS ASRESULT OF OPERATIONS 1,220,447 (13,032) 3,306,708 1,926,195 23,301,379
EVOLUTION OF THE CAPITAL
Subscriptions of shares 6,569,397 9,209,965 11,949,354 3,844,084 62,453,326
Redemptions of shares (6,473,085) (589,183) (7,127,534) (4,492,552) (56,952,394)
NET ASSETS AT THE END OF THE PERIOD 30,493,765 14,454,036 65,022,341 18,637,491 273,893,567
* Please see Note 15
VAM Funds (Lux)
Statement of Operations and Changes in Net Assets (continued)for the period ended June 30, 2021
The accompanying notes form an integral part of these financial statements.9
VAM Funds (Lux)– US Mid CapGrowth Fund
VAM Funds (Lux)– US Small Cap
Growth Fund
VAM Funds (Lux)– US Micro Cap
Growth Fund
VAM Funds (Lux)– US Large Cap
Growth Fund
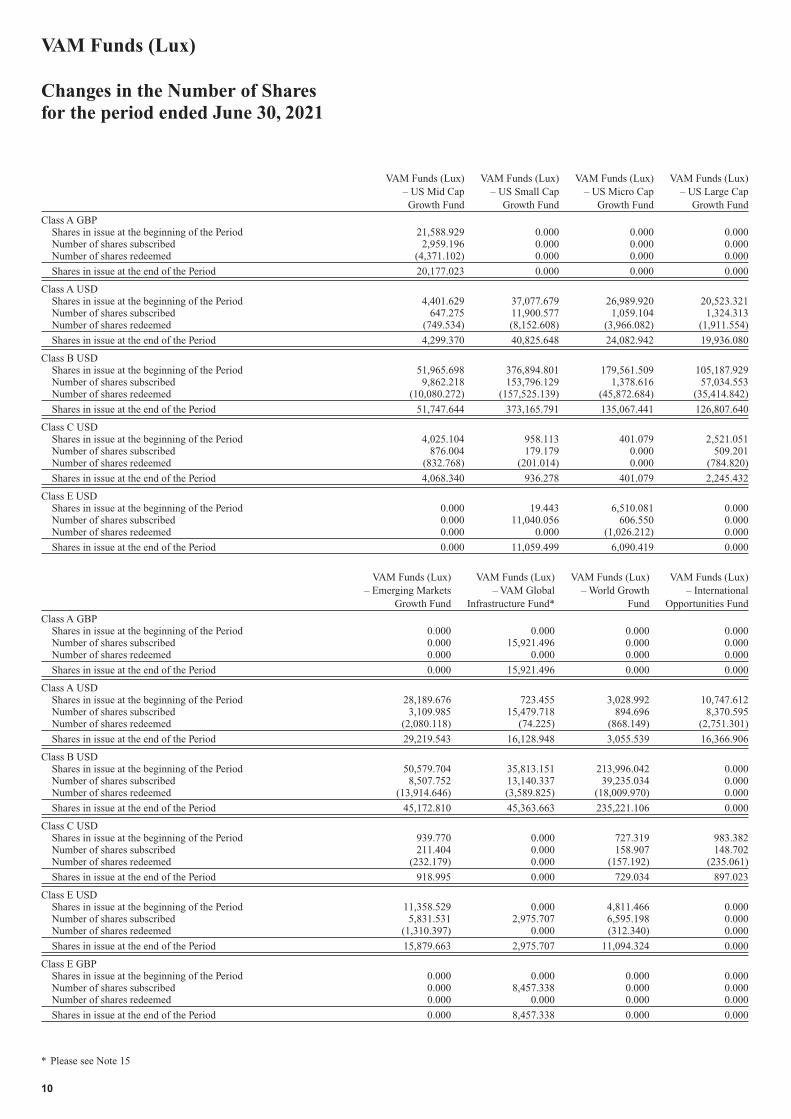
Class A GBPShares in issue at the beginning of the Period 21,588.929 0.000 0.000 0.000Number of shares subscribed 2,959.196 0.000 0.000 0.000Number of shares redeemed (4,371.102) 0.000 0.000 0.000
Shares in issue at the end of the Period 20,177.023 0.000 0.000 0.000
Class A USDShares in issue at the beginning of the Period 4,401.629 37,077.679 26,989.920 20,523.321Number of shares subscribed 647.275 11,900.577 1,059.104 1,324.313Number of shares redeemed (749.534) (8,152.608) (3,966.082) (1,911.554)
Shares in issue at the end of the Period 4,299.370 40,825.648 24,082.942 19,936.080
Class B USDShares in issue at the beginning of the Period 51,965.698 376,894.801 179,561.509 105,187.929Number of shares subscribed 9,862.218 153,796.129 1,378.616 57,034.553Number of shares redeemed (10,080.272) (157,525.139) (45,872.684) (35,414.842)
Shares in issue at the end of the Period 51,747.644 373,165.791 135,067.441 126,807.640
Class C USDShares in issue at the beginning of the Period 4,025.104 958.113 401.079 2,521.051Number of shares subscribed 876.004 179.179 0.000 509.201Number of shares redeemed (832.768) (201.014) 0.000 (784.820)
Shares in issue at the end of the Period 4,068.340 936.278 401.079 2,245.432
Class E USDShares in issue at the beginning of the Period 0.000 19.443 6,510.081 0.000Number of shares subscribed 0.000 11,040.056 606.550 0.000Number of shares redeemed 0.000 0.000 (1,026.212) 0.000
Shares in issue at the end of the Period 0.000 11,059.499 6,090.419 0.000
VAM Funds (Lux)– Emerging Markets
Growth Fund
VAM Funds (Lux)– VAM Global
Infrastructure Fund*
VAM Funds (Lux)– World Growth
Fund
VAM Funds (Lux)– International
Opportunities Fund
Class A GBPShares in issue at the beginning of the Period 0.000 0.000 0.000 0.000Number of shares subscribed 0.000 15,921.496 0.000 0.000Number of shares redeemed 0.000 0.000 0.000 0.000
Shares in issue at the end of the Period 0.000 15,921.496 0.000 0.000
Class A USDShares in issue at the beginning of the Period 28,189.676 723.455 3,028.992 10,747.612Number of shares subscribed 3,109.985 15,479.718 894.696 8,370.595Number of shares redeemed (2,080.118) (74.225) (868.149) (2,751.301)
Shares in issue at the end of the Period 29,219.543 16,128.948 3,055.539 16,366.906
Class B USDShares in issue at the beginning of the Period 50,579.704 35,813.151 213,996.042 0.000Number of shares subscribed 8,507.752 13,140.337 39,235.034 0.000Number of shares redeemed (13,914.646) (3,589.825) (18,009.970) 0.000
Shares in issue at the end of the Period 45,172.810 45,363.663 235,221.106 0.000
Class C USDShares in issue at the beginning of the Period 939.770 0.000 727.319 983.382Number of shares subscribed 211.404 0.000 158.907 148.702Number of shares redeemed (232.179) 0.000 (157.192) (235.061)
Shares in issue at the end of the Period 918.995 0.000 729.034 897.023
Class E USDShares in issue at the beginning of the Period 11,358.529 0.000 4,811.466 0.000Number of shares subscribed 5,831.531 2,975.707 6,595.198 0.000Number of shares redeemed (1,310.397) 0.000 (312.340) 0.000
Shares in issue at the end of the Period 15,879.663 2,975.707 11,094.324 0.000
Class E GBPShares in issue at the beginning of the Period 0.000 0.000 0.000 0.000Number of shares subscribed 0.000 8,457.338 0.000 0.000Number of shares redeemed 0.000 0.000 0.000 0.000
Shares in issue at the end of the Period 0.000 8,457.338 0.000 0.000
* Please see Note 15
VAM Funds (Lux)
Changes in the Number of Sharesfor the period ended June 30, 2021
10
VAM Funds (Lux)– US Mid CapGrowth Fund
VAM Funds (Lux)– US Small Cap
Growth Fund
VAM Funds (Lux)– US Micro Cap
Growth Fund
VAM Funds (Lux)– US Large Cap
Growth FundUSD USD USD USD
June 30, 2021
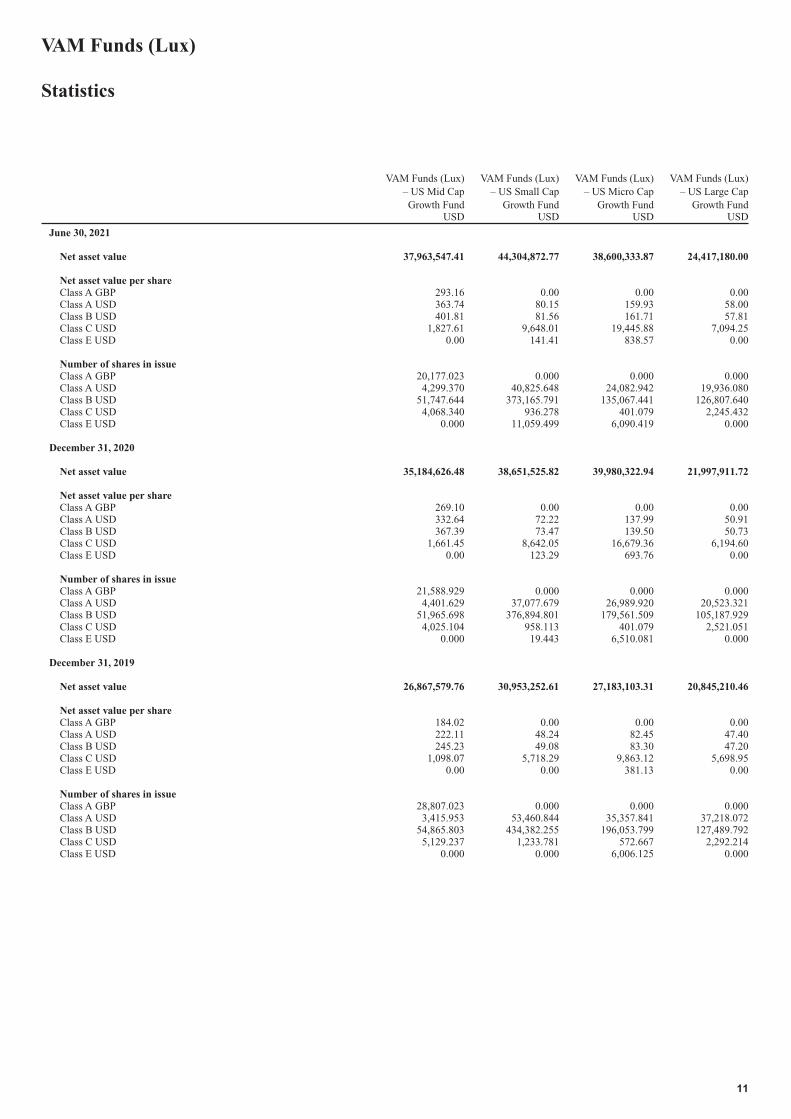
Net asset value 37,963,547.41 44,304,872.77 38,600,333.87 24,417,180.00
Net asset value per shareClass A GBP 293.16 0.00 0.00 0.00Class A USD 363.74 80.15 159.93 58.00Class B USD 401.81 81.56 161.71 57.81Class C USD 1,827.61 9,648.01 19,445.88 7,094.25Class E USD 0.00 141.41 838.57 0.00
Number of shares in issueClass A GBP 20,177.023 0.000 0.000 0.000Class A USD 4,299.370 40,825.648 24,082.942 19,936.080Class B USD 51,747.644 373,165.791 135,067.441 126,807.640Class C USD 4,068.340 936.278 401.079 2,245.432Class E USD 0.000 11,059.499 6,090.419 0.000
December 31, 2020
Net asset value 35,184,626.48 38,651,525.82 39,980,322.94 21,997,911.72
Net asset value per shareClass A GBP 269.10 0.00 0.00 0.00Class A USD 332.64 72.22 137.99 50.91Class B USD 367.39 73.47 139.50 50.73Class C USD 1,661.45 8,642.05 16,679.36 6,194.60Class E USD 0.00 123.29 693.76 0.00
Number of shares in issueClass A GBP 21,588.929 0.000 0.000 0.000Class A USD 4,401.629 37,077.679 26,989.920 20,523.321Class B USD 51,965.698 376,894.801 179,561.509 105,187.929Class C USD 4,025.104 958.113 401.079 2,521.051Class E USD 0.000 19.443 6,510.081 0.000
December 31, 2019
Net asset value 26,867,579.76 30,953,252.61 27,183,103.31 20,845,210.46
Net asset value per shareClass A GBP 184.02 0.00 0.00 0.00Class A USD 222.11 48.24 82.45 47.40Class B USD 245.23 49.08 83.30 47.20Class C USD 1,098.07 5,718.29 9,863.12 5,698.95Class E USD 0.00 0.00 381.13 0.00
Number of shares in issueClass A GBP 28,807.023 0.000 0.000 0.000Class A USD 3,415.953 53,460.844 35,357.841 37,218.072Class B USD 54,865.803 434,382.255 196,053.799 127,489.792Class C USD 5,129.237 1,233.781 572.667 2,292.214Class E USD 0.000 0.000 6,006.125 0.000
VAM Funds (Lux)
Statistics
11
VAM Funds (Lux)– Emerging Markets
Growth Fund
VAM Funds (Lux)– VAM Global
Infrastructure Fund*
VAM Funds (Lux)– World Growth
Fund
VAM Funds (Lux)– International
Opportunities FundUSD USD USD USD
June 30, 2021
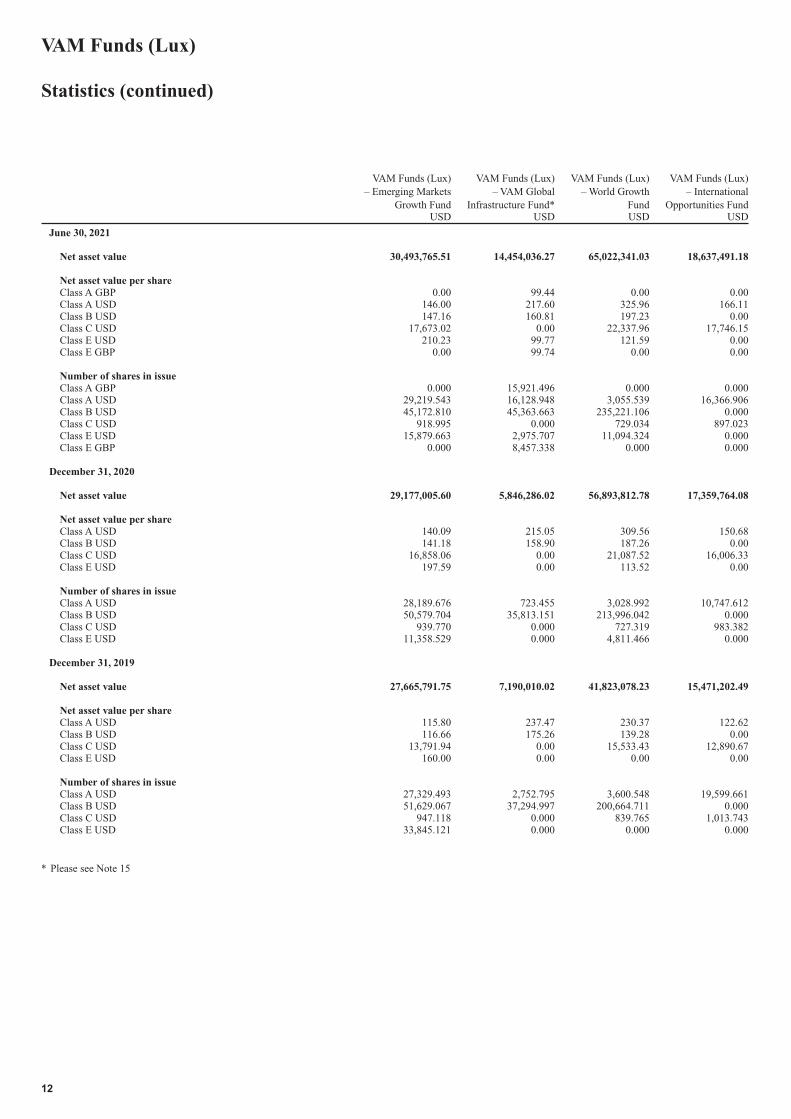
Net asset value 30,493,765.51 14,454,036.27 65,022,341.03 18,637,491.18
Net asset value per shareClass A GBP 0.00 99.44 0.00 0.00Class A USD 146.00 217.60 325.96 166.11Class B USD 147.16 160.81 197.23 0.00Class C USD 17,673.02 0.00 22,337.96 17,746.15Class E USD 210.23 99.77 121.59 0.00Class E GBP 0.00 99.74 0.00 0.00
Number of shares in issueClass A GBP 0.000 15,921.496 0.000 0.000Class A USD 29,219.543 16,128.948 3,055.539 16,366.906Class B USD 45,172.810 45,363.663 235,221.106 0.000Class C USD 918.995 0.000 729.034 897.023Class E USD 15,879.663 2,975.707 11,094.324 0.000Class E GBP 0.000 8,457.338 0.000 0.000
December 31, 2020
Net asset value 29,177,005.60 5,846,286.02 56,893,812.78 17,359,764.08
Net asset value per shareClass A USD 140.09 215.05 309.56 150.68Class B USD 141.18 158.90 187.26 0.00Class C USD 16,858.06 0.00 21,087.52 16,006.33Class E USD 197.59 0.00 113.52 0.00
Number of shares in issueClass A USD 28,189.676 723.455 3,028.992 10,747.612Class B USD 50,579.704 35,813.151 213,996.042 0.000Class C USD 939.770 0.000 727.319 983.382Class E USD 11,358.529 0.000 4,811.466 0.000
December 31, 2019
Net asset value 27,665,791.75 7,190,010.02 41,823,078.23 15,471,202.49
Net asset value per shareClass A USD 115.80 237.47 230.37 122.62Class B USD 116.66 175.26 139.28 0.00Class C USD 13,791.94 0.00 15,533.43 12,890.67Class E USD 160.00 0.00 0.00 0.00
Number of shares in issueClass A USD 27,329.493 2,752.795 3,600.548 19,599.661Class B USD 51,629.067 37,294.997 200,664.711 0.000Class C USD 947.118 0.000 839.765 1,013.743Class E USD 33,845.121 0.000 0.000 0.000
* Please see Note 15
VAM Funds (Lux)
Statistics (continued)
12
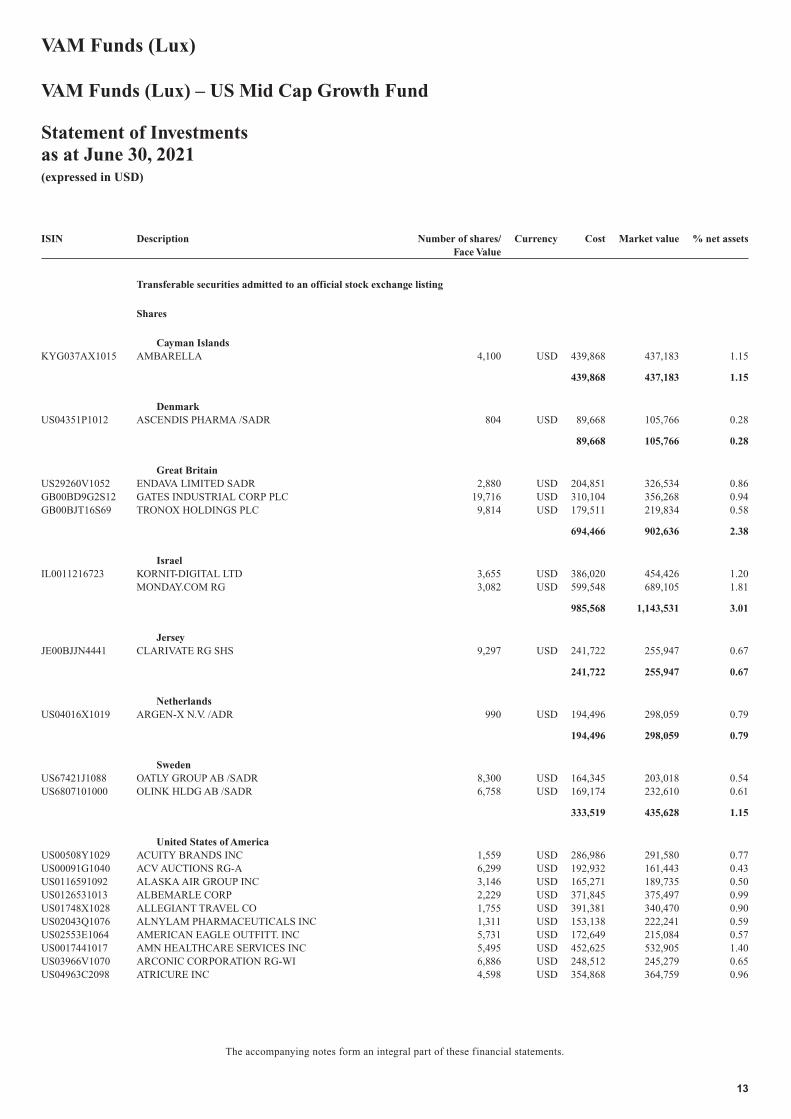
ISIN Description Number of shares/Face Value
Currency Cost Market value % net assets
Transferable securities admitted to an official stock exchange listing
Shares
Cayman IslandsKYG037AX1015 AMBARELLA 4,100 USD 439,868 437,183 1.15
439,868 437,183 1.15
DenmarkUS04351P1012 ASCENDIS PHARMA /SADR 804 USD 89,668 105,766 0.28
89,668 105,766 0.28
Great BritainUS29260V1052 ENDAVA LIMITED SADR 2,880 USD 204,851 326,534 0.86GB00BD9G2S12 GATES INDUSTRIAL CORP PLC 19,716 USD 310,104 356,268 0.94GB00BJT16S69 TRONOX HOLDINGS PLC 9,814 USD 179,511 219,834 0.58
694,466 902,636 2.38
IsraelIL0011216723 KORNIT-DIGITAL LTD 3,655 USD 386,020 454,426 1.20
MONDAY.COM RG 3,082 USD 599,548 689,105 1.81
985,568 1,143,531 3.01
JerseyJE00BJJN4441 CLARIVATE RG SHS 9,297 USD 241,722 255,947 0.67
241,722 255,947 0.67
NetherlandsUS04016X1019 ARGEN-X N.V. /ADR 990 USD 194,496 298,059 0.79
194,496 298,059 0.79
SwedenUS67421J1088 OATLY GROUP AB /SADR 8,300 USD 164,345 203,018 0.54US6807101000 OLINK HLDG AB /SADR 6,758 USD 169,174 232,610 0.61
333,519 435,628 1.15
United States of AmericaUS00508Y1029 ACUITY BRANDS INC 1,559 USD 286,986 291,580 0.77US00091G1040 ACV AUCTIONS RG-A 6,299 USD 192,932 161,443 0.43US0116591092 ALASKA AIR GROUP INC 3,146 USD 165,271 189,735 0.50US0126531013 ALBEMARLE CORP 2,229 USD 371,845 375,497 0.99US01748X1028 ALLEGIANT TRAVEL CO 1,755 USD 391,381 340,470 0.90US02043Q1076 ALNYLAM PHARMACEUTICALS INC 1,311 USD 153,138 222,241 0.59US02553E1064 AMERICAN EAGLE OUTFITT. INC 5,731 USD 172,649 215,084 0.57US0017441017 AMN HEALTHCARE SERVICES INC 5,495 USD 452,625 532,905 1.40US03966V1070 ARCONIC CORPORATION RG-WI 6,886 USD 248,512 245,279 0.65US04963C2098 ATRICURE INC 4,598 USD 354,868 364,759 0.96
VAM Funds (Lux)
VAM Funds (Lux) – US Mid Cap Growth Fund
Statement of Investmentsas at June 30, 2021(expressed in USD)
The accompanying notes form an integral part of these financial statements.
13
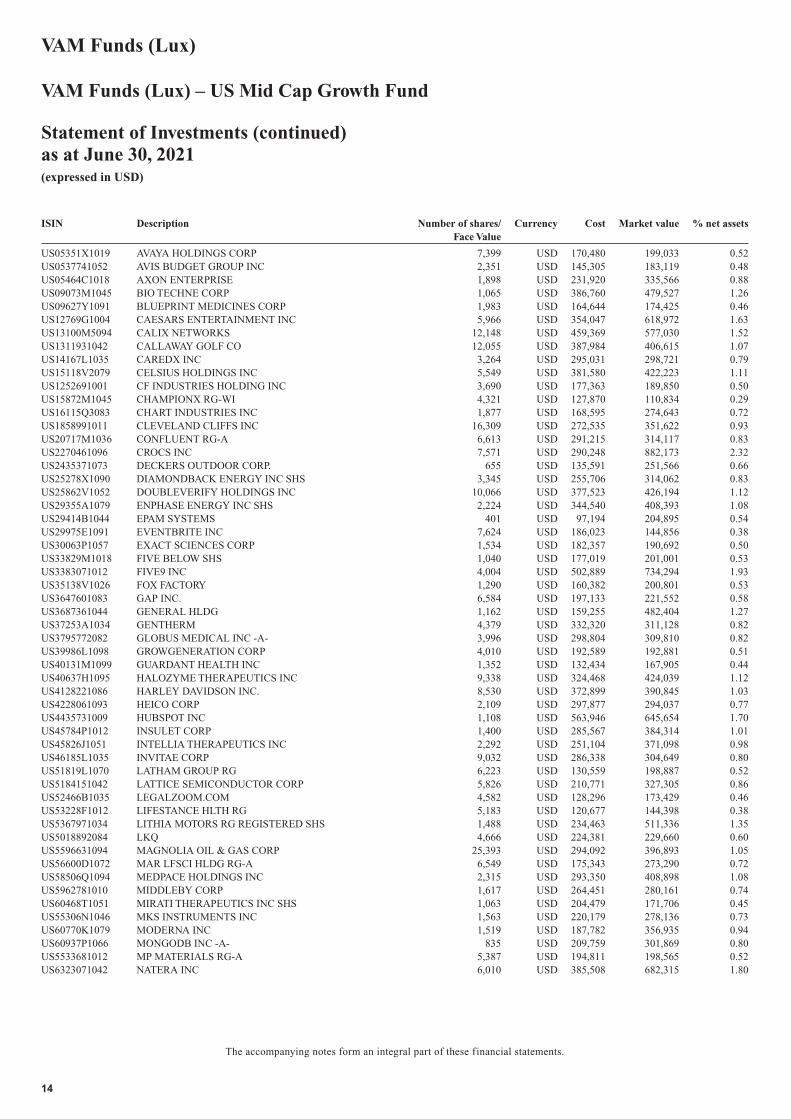
ISIN Description Number of shares/Face Value
Currency Cost Market value % net assets
US05351X1019 AVAYA HOLDINGS CORP 7,399 USD 170,480 199,033 0.52US0537741052 AVIS BUDGET GROUP INC 2,351 USD 145,305 183,119 0.48US05464C1018 AXON ENTERPRISE 1,898 USD 231,920 335,566 0.88US09073M1045 BIO TECHNE CORP 1,065 USD 386,760 479,527 1.26US09627Y1091 BLUEPRINT MEDICINES CORP 1,983 USD 164,644 174,425 0.46US12769G1004 CAESARS ENTERTAINMENT INC 5,966 USD 354,047 618,972 1.63US13100M5094 CALIX NETWORKS 12,148 USD 459,369 577,030 1.52US1311931042 CALLAWAY GOLF CO 12,055 USD 387,984 406,615 1.07US14167L1035 CAREDX INC 3,264 USD 295,031 298,721 0.79US15118V2079 CELSIUS HOLDINGS INC 5,549 USD 381,580 422,223 1.11US1252691001 CF INDUSTRIES HOLDING INC 3,690 USD 177,363 189,850 0.50US15872M1045 CHAMPIONX RG-WI 4,321 USD 127,870 110,834 0.29US16115Q3083 CHART INDUSTRIES INC 1,877 USD 168,595 274,643 0.72US1858991011 CLEVELAND CLIFFS INC 16,309 USD 272,535 351,622 0.93US20717M1036 CONFLUENT RG-A 6,613 USD 291,215 314,117 0.83US2270461096 CROCS INC 7,571 USD 290,248 882,173 2.32US2435371073 DECKERS OUTDOOR CORP. 655 USD 135,591 251,566 0.66US25278X1090 DIAMONDBACK ENERGY INC SHS 3,345 USD 255,706 314,062 0.83US25862V1052 DOUBLEVERIFY HOLDINGS INC 10,066 USD 377,523 426,194 1.12US29355A1079 ENPHASE ENERGY INC SHS 2,224 USD 344,540 408,393 1.08US29414B1044 EPAM SYSTEMS 401 USD 97,194 204,895 0.54US29975E1091 EVENTBRITE INC 7,624 USD 186,023 144,856 0.38US30063P1057 EXACT SCIENCES CORP 1,534 USD 182,357 190,692 0.50US33829M1018 FIVE BELOW SHS 1,040 USD 177,019 201,001 0.53US3383071012 FIVE9 INC 4,004 USD 502,889 734,294 1.93US35138V1026 FOX FACTORY 1,290 USD 160,382 200,801 0.53US3647601083 GAP INC. 6,584 USD 197,133 221,552 0.58US3687361044 GENERAL HLDG 1,162 USD 159,255 482,404 1.27US37253A1034 GENTHERM 4,379 USD 332,320 311,128 0.82US3795772082 GLOBUS MEDICAL INC -A- 3,996 USD 298,804 309,810 0.82US39986L1098 GROWGENERATION CORP 4,010 USD 192,589 192,881 0.51US40131M1099 GUARDANT HEALTH INC 1,352 USD 132,434 167,905 0.44US40637H1095 HALOZYME THERAPEUTICS INC 9,338 USD 324,468 424,039 1.12US4128221086 HARLEY DAVIDSON INC. 8,530 USD 372,899 390,845 1.03US4228061093 HEICO CORP 2,109 USD 297,877 294,037 0.77US4435731009 HUBSPOT INC 1,108 USD 563,946 645,654 1.70US45784P1012 INSULET CORP 1,400 USD 285,567 384,314 1.01US45826J1051 INTELLIA THERAPEUTICS INC 2,292 USD 251,104 371,098 0.98US46185L1035 INVITAE CORP 9,032 USD 286,338 304,649 0.80US51819L1070 LATHAM GROUP RG 6,223 USD 130,559 198,887 0.52US5184151042 LATTICE SEMICONDUCTOR CORP 5,826 USD 210,771 327,305 0.86US52466B1035 LEGALZOOM.COM 4,582 USD 128,296 173,429 0.46US53228F1012 LIFESTANCE HLTH RG 5,183 USD 120,677 144,398 0.38US5367971034 LITHIA MOTORS RG REGISTERED SHS 1,488 USD 234,463 511,336 1.35US5018892084 LKQ 4,666 USD 224,381 229,660 0.60US5596631094 MAGNOLIA OIL & GAS CORP 25,393 USD 294,092 396,893 1.05US56600D1072 MAR LFSCI HLDG RG-A 6,549 USD 175,343 273,290 0.72US58506Q1094 MEDPACE HOLDINGS INC 2,315 USD 293,350 408,898 1.08US5962781010 MIDDLEBY CORP 1,617 USD 264,451 280,161 0.74US60468T1051 MIRATI THERAPEUTICS INC SHS 1,063 USD 204,479 171,706 0.45US55306N1046 MKS INSTRUMENTS INC 1,563 USD 220,179 278,136 0.73US60770K1079 MODERNA INC 1,519 USD 187,782 356,935 0.94US60937P1066 MONGODB INC -A- 835 USD 209,759 301,869 0.80US5533681012 MP MATERIALS RG-A 5,387 USD 194,811 198,565 0.52US6323071042 NATERA INC 6,010 USD 385,508 682,315 1.80
VAM Funds (Lux)
VAM Funds (Lux) – US Mid Cap Growth Fund
Statement of Investments (continued)as at June 30, 2021(expressed in USD)
The accompanying notes form an integral part of these financial statements.
14
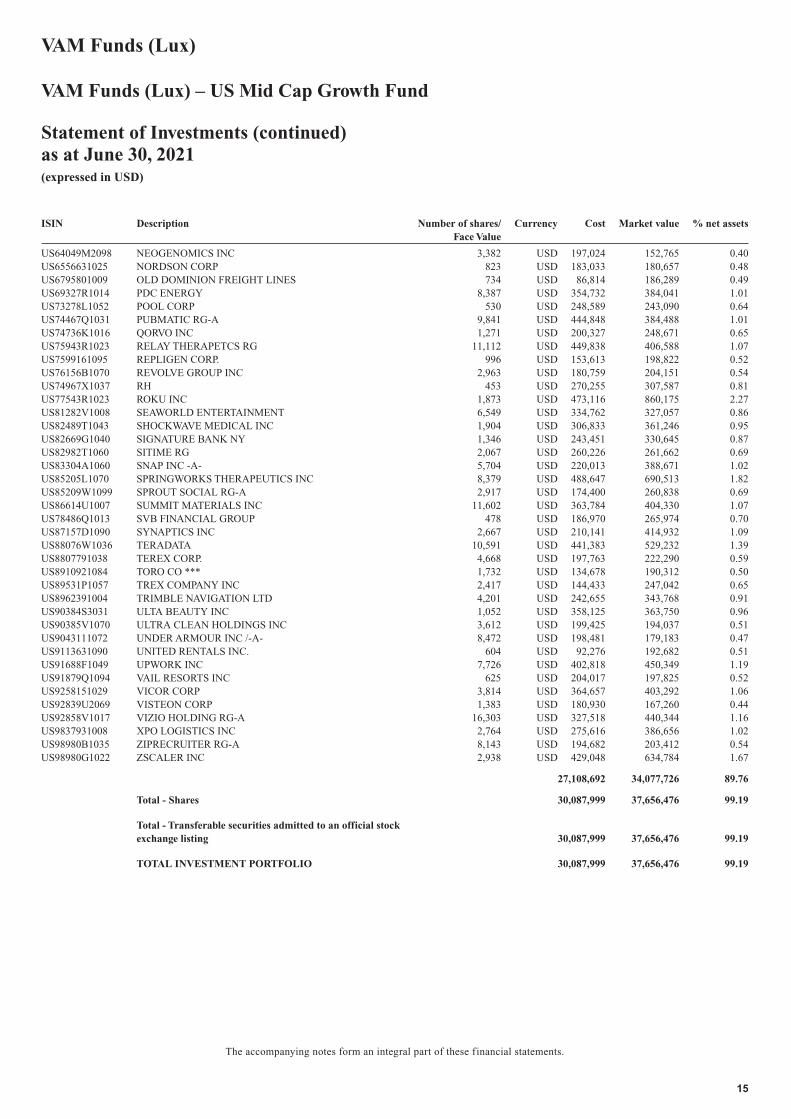
ISIN Description Number of shares/Face Value
Currency Cost Market value % net assets
US64049M2098 NEOGENOMICS INC 3,382 USD 197,024 152,765 0.40US6556631025 NORDSON CORP 823 USD 183,033 180,657 0.48US6795801009 OLD DOMINION FREIGHT LINES 734 USD 86,814 186,289 0.49US69327R1014 PDC ENERGY 8,387 USD 354,732 384,041 1.01US73278L1052 POOL CORP 530 USD 248,589 243,090 0.64US74467Q1031 PUBMATIC RG-A 9,841 USD 444,848 384,488 1.01US74736K1016 QORVO INC 1,271 USD 200,327 248,671 0.65US75943R1023 RELAY THERAPETCS RG 11,112 USD 449,838 406,588 1.07US7599161095 REPLIGEN CORP. 996 USD 153,613 198,822 0.52US76156B1070 REVOLVE GROUP INC 2,963 USD 180,759 204,151 0.54US74967X1037 RH 453 USD 270,255 307,587 0.81US77543R1023 ROKU INC 1,873 USD 473,116 860,175 2.27US81282V1008 SEAWORLD ENTERTAINMENT 6,549 USD 334,762 327,057 0.86US82489T1043 SHOCKWAVE MEDICAL INC 1,904 USD 306,833 361,246 0.95US82669G1040 SIGNATURE BANK NY 1,346 USD 243,451 330,645 0.87US82982T1060 SITIME RG 2,067 USD 260,226 261,662 0.69US83304A1060 SNAP INC -A- 5,704 USD 220,013 388,671 1.02US85205L1070 SPRINGWORKS THERAPEUTICS INC 8,379 USD 488,647 690,513 1.82US85209W1099 SPROUT SOCIAL RG-A 2,917 USD 174,400 260,838 0.69US86614U1007 SUMMIT MATERIALS INC 11,602 USD 363,784 404,330 1.07US78486Q1013 SVB FINANCIAL GROUP 478 USD 186,970 265,974 0.70US87157D1090 SYNAPTICS INC 2,667 USD 210,141 414,932 1.09US88076W1036 TERADATA 10,591 USD 441,383 529,232 1.39US8807791038 TEREX CORP. 4,668 USD 197,763 222,290 0.59US8910921084 TORO CO *** 1,732 USD 134,678 190,312 0.50US89531P1057 TREX COMPANY INC 2,417 USD 144,433 247,042 0.65US8962391004 TRIMBLE NAVIGATION LTD 4,201 USD 242,655 343,768 0.91US90384S3031 ULTA BEAUTY INC 1,052 USD 358,125 363,750 0.96US90385V1070 ULTRA CLEAN HOLDINGS INC 3,612 USD 199,425 194,037 0.51US9043111072 UNDER ARMOUR INC /-A- 8,472 USD 198,481 179,183 0.47US9113631090 UNITED RENTALS INC. 604 USD 92,276 192,682 0.51US91688F1049 UPWORK INC 7,726 USD 402,818 450,349 1.19US91879Q1094 VAIL RESORTS INC 625 USD 204,017 197,825 0.52US9258151029 VICOR CORP 3,814 USD 364,657 403,292 1.06US92839U2069 VISTEON CORP 1,383 USD 180,930 167,260 0.44US92858V1017 VIZIO HOLDING RG-A 16,303 USD 327,518 440,344 1.16US9837931008 XPO LOGISTICS INC 2,764 USD 275,616 386,656 1.02US98980B1035 ZIPRECRUITER RG-A 8,143 USD 194,682 203,412 0.54US98980G1022 ZSCALER INC 2,938 USD 429,048 634,784 1.67
27,108,692 34,077,726 89.76
Total - Shares 30,087,999 37,656,476 99.19
Total - Transferable securities admitted to an official stockexchange listing 30,087,999 37,656,476 99.19
TOTAL INVESTMENT PORTFOLIO 30,087,999 37,656,476 99.19
VAM Funds (Lux)
VAM Funds (Lux) – US Mid Cap Growth Fund
Statement of Investments (continued)as at June 30, 2021(expressed in USD)
The accompanying notes form an integral part of these financial statements.
15
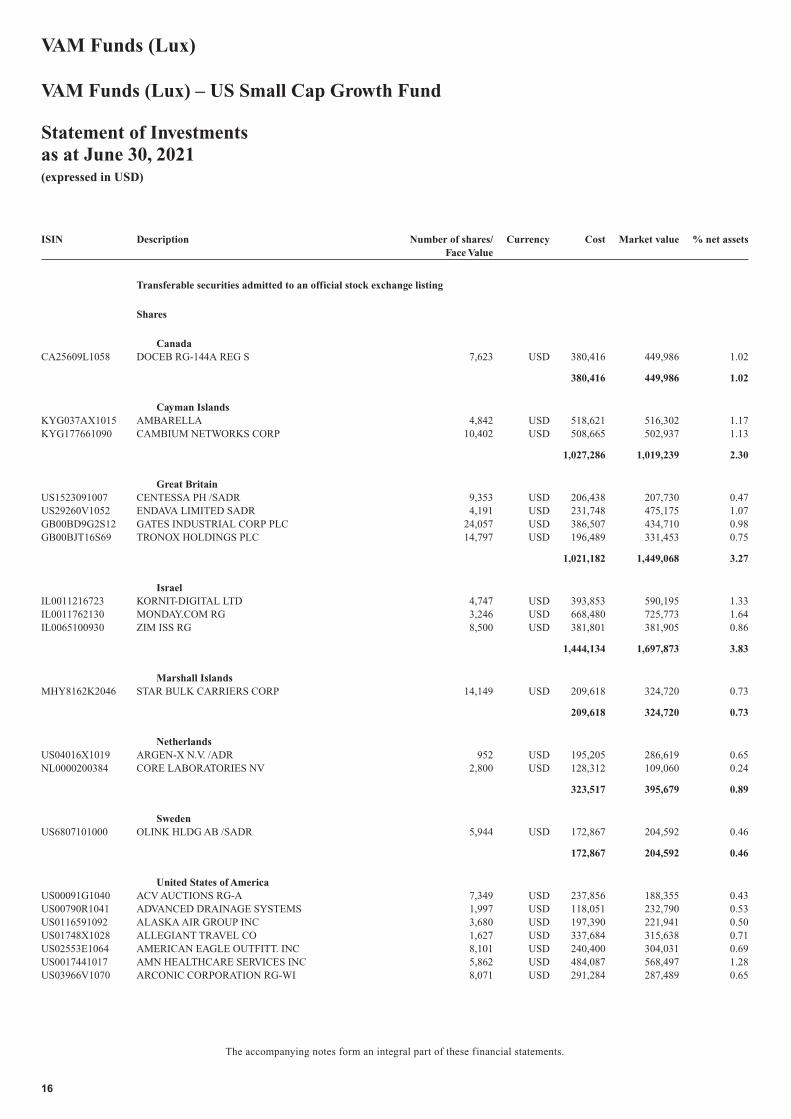
ISIN Description Number of shares/Face Value
Currency Cost Market value % net assets
Transferable securities admitted to an official stock exchange listing
Shares
CanadaCA25609L1058 DOCEB RG-144A REG S 7,623 USD 380,416 449,986 1.02
380,416 449,986 1.02
Cayman IslandsKYG037AX1015 AMBARELLA 4,842 USD 518,621 516,302 1.17KYG177661090 CAMBIUM NETWORKS CORP 10,402 USD 508,665 502,937 1.13
1,027,286 1,019,239 2.30
Great BritainUS1523091007 CENTESSA PH /SADR 9,353 USD 206,438 207,730 0.47US29260V1052 ENDAVA LIMITED SADR 4,191 USD 231,748 475,175 1.07GB00BD9G2S12 GATES INDUSTRIAL CORP PLC 24,057 USD 386,507 434,710 0.98GB00BJT16S69 TRONOX HOLDINGS PLC 14,797 USD 196,489 331,453 0.75
1,021,182 1,449,068 3.27
IsraelIL0011216723 KORNIT-DIGITAL LTD 4,747 USD 393,853 590,195 1.33IL0011762130 MONDAY.COM RG 3,246 USD 668,480 725,773 1.64IL0065100930 ZIM ISS RG 8,500 USD 381,801 381,905 0.86
1,444,134 1,697,873 3.83
Marshall IslandsMHY8162K2046 STAR BULK CARRIERS CORP 14,149 USD 209,618 324,720 0.73
209,618 324,720 0.73
NetherlandsUS04016X1019 ARGEN-X N.V. /ADR 952 USD 195,205 286,619 0.65NL0000200384 CORE LABORATORIES NV 2,800 USD 128,312 109,060 0.24
323,517 395,679 0.89
SwedenUS6807101000 OLINK HLDG AB /SADR 5,944 USD 172,867 204,592 0.46
172,867 204,592 0.46
United States of AmericaUS00091G1040 ACV AUCTIONS RG-A 7,349 USD 237,856 188,355 0.43US00790R1041 ADVANCED DRAINAGE SYSTEMS 1,997 USD 118,051 232,790 0.53US0116591092 ALASKA AIR GROUP INC 3,680 USD 197,390 221,941 0.50US01748X1028 ALLEGIANT TRAVEL CO 1,627 USD 337,684 315,638 0.71US02553E1064 AMERICAN EAGLE OUTFITT. INC 8,101 USD 240,400 304,031 0.69US0017441017 AMN HEALTHCARE SERVICES INC 5,862 USD 484,087 568,497 1.28US03966V1070 ARCONIC CORPORATION RG-WI 8,071 USD 291,284 287,489 0.65
VAM Funds (Lux)
VAM Funds (Lux) – US Small Cap Growth Fund
Statement of Investmentsas at June 30, 2021(expressed in USD)
The accompanying notes form an integral part of these financial statements.
16
ISIN Description Number of shares/Face Value
Currency Cost Market value % net assets
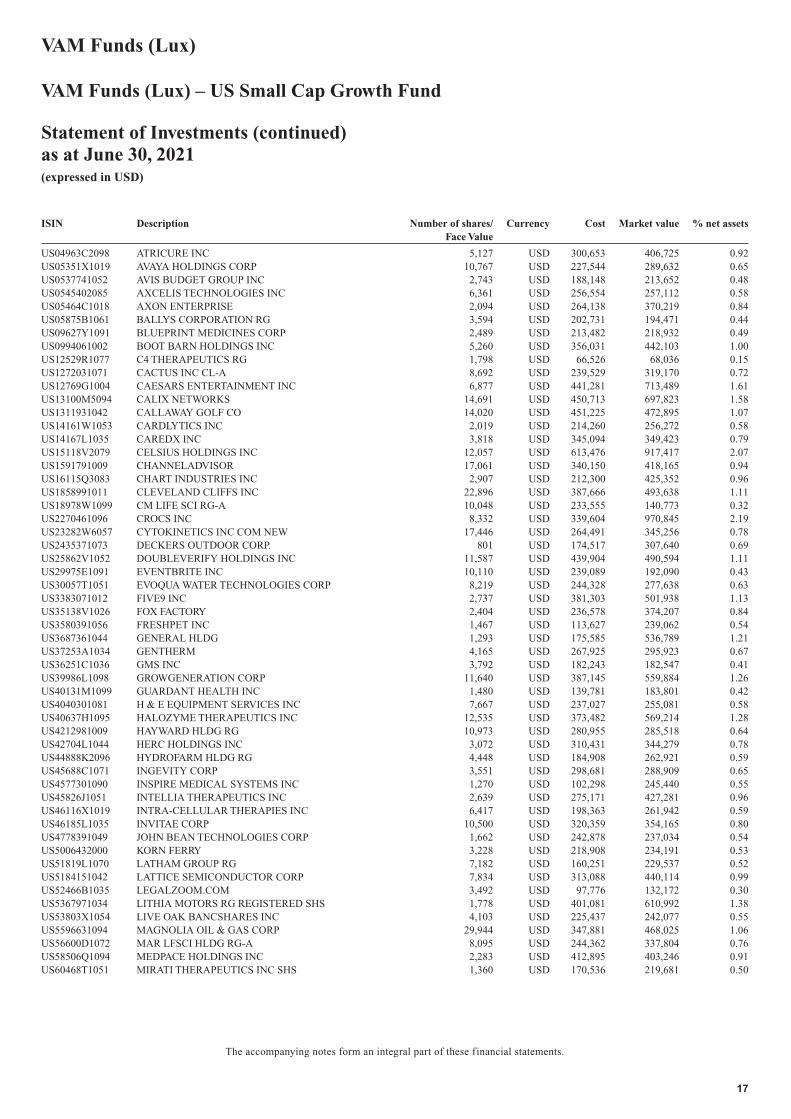
US04963C2098 ATRICURE INC 5,127 USD 300,653 406,725 0.92US05351X1019 AVAYA HOLDINGS CORP 10,767 USD 227,544 289,632 0.65US0537741052 AVIS BUDGET GROUP INC 2,743 USD 188,148 213,652 0.48US0545402085 AXCELIS TECHNOLOGIES INC 6,361 USD 256,554 257,112 0.58US05464C1018 AXON ENTERPRISE 2,094 USD 264,138 370,219 0.84US05875B1061 BALLYS CORPORATION RG 3,594 USD 202,731 194,471 0.44US09627Y1091 BLUEPRINT MEDICINES CORP 2,489 USD 213,482 218,932 0.49US0994061002 BOOT BARN HOLDINGS INC 5,260 USD 356,031 442,103 1.00US12529R1077 C4 THERAPEUTICS RG 1,798 USD 66,526 68,036 0.15US1272031071 CACTUS INC CL-A 8,692 USD 239,529 319,170 0.72US12769G1004 CAESARS ENTERTAINMENT INC 6,877 USD 441,281 713,489 1.61US13100M5094 CALIX NETWORKS 14,691 USD 450,713 697,823 1.58US1311931042 CALLAWAY GOLF CO 14,020 USD 451,225 472,895 1.07US14161W1053 CARDLYTICS INC 2,019 USD 214,260 256,272 0.58US14167L1035 CAREDX INC 3,818 USD 345,094 349,423 0.79US15118V2079 CELSIUS HOLDINGS INC 12,057 USD 613,476 917,417 2.07US1591791009 CHANNELADVISOR 17,061 USD 340,150 418,165 0.94US16115Q3083 CHART INDUSTRIES INC 2,907 USD 212,300 425,352 0.96US1858991011 CLEVELAND CLIFFS INC 22,896 USD 387,666 493,638 1.11US18978W1099 CM LIFE SCI RG-A 10,048 USD 233,555 140,773 0.32US2270461096 CROCS INC 8,332 USD 339,604 970,845 2.19US23282W6057 CYTOKINETICS INC COM NEW 17,446 USD 264,491 345,256 0.78US2435371073 DECKERS OUTDOOR CORP. 801 USD 174,517 307,640 0.69US25862V1052 DOUBLEVERIFY HOLDINGS INC 11,587 USD 439,904 490,594 1.11US29975E1091 EVENTBRITE INC 10,110 USD 239,089 192,090 0.43US30057T1051 EVOQUA WATER TECHNOLOGIES CORP 8,219 USD 244,328 277,638 0.63US3383071012 FIVE9 INC 2,737 USD 381,303 501,938 1.13US35138V1026 FOX FACTORY 2,404 USD 236,578 374,207 0.84US3580391056 FRESHPET INC 1,467 USD 113,627 239,062 0.54US3687361044 GENERAL HLDG 1,293 USD 175,585 536,789 1.21US37253A1034 GENTHERM 4,165 USD 267,925 295,923 0.67US36251C1036 GMS INC 3,792 USD 182,243 182,547 0.41US39986L1098 GROWGENERATION CORP 11,640 USD 387,145 559,884 1.26US40131M1099 GUARDANT HEALTH INC 1,480 USD 139,781 183,801 0.42US4040301081 H & E EQUIPMENT SERVICES INC 7,667 USD 237,027 255,081 0.58US40637H1095 HALOZYME THERAPEUTICS INC 12,535 USD 373,482 569,214 1.28US4212981009 HAYWARD HLDG RG 10,973 USD 280,955 285,518 0.64US42704L1044 HERC HOLDINGS INC 3,072 USD 310,431 344,279 0.78US44888K2096 HYDROFARM HLDG RG 4,448 USD 184,908 262,921 0.59US45688C1071 INGEVITY CORP 3,551 USD 298,681 288,909 0.65US4577301090 INSPIRE MEDICAL SYSTEMS INC 1,270 USD 102,298 245,440 0.55US45826J1051 INTELLIA THERAPEUTICS INC 2,639 USD 275,171 427,281 0.96US46116X1019 INTRA-CELLULAR THERAPIES INC 6,417 USD 198,363 261,942 0.59US46185L1035 INVITAE CORP 10,500 USD 320,359 354,165 0.80US4778391049 JOHN BEAN TECHNOLOGIES CORP 1,662 USD 242,878 237,034 0.54US5006432000 KORN FERRY 3,228 USD 218,908 234,191 0.53US51819L1070 LATHAM GROUP RG 7,182 USD 160,251 229,537 0.52US5184151042 LATTICE SEMICONDUCTOR CORP 7,834 USD 313,088 440,114 0.99US52466B1035 LEGALZOOM.COM 3,492 USD 97,776 132,172 0.30US5367971034 LITHIA MOTORS RG REGISTERED SHS 1,778 USD 401,081 610,992 1.38US53803X1054 LIVE OAK BANCSHARES INC 4,103 USD 225,437 242,077 0.55US5596631094 MAGNOLIA OIL & GAS CORP 29,944 USD 347,881 468,025 1.06US56600D1072 MAR LFSCI HLDG RG-A 8,095 USD 244,362 337,804 0.76US58506Q1094 MEDPACE HOLDINGS INC 2,283 USD 412,895 403,246 0.91US60468T1051 MIRATI THERAPEUTICS INC SHS 1,360 USD 170,536 219,681 0.50
VAM Funds (Lux)
VAM Funds (Lux) – US Small Cap Growth Fund
Statement of Investments (continued)as at June 30, 2021(expressed in USD)
The accompanying notes form an integral part of these financial statements.
17
ISIN Description Number of shares/Face Value
Currency Cost Market value % net assets
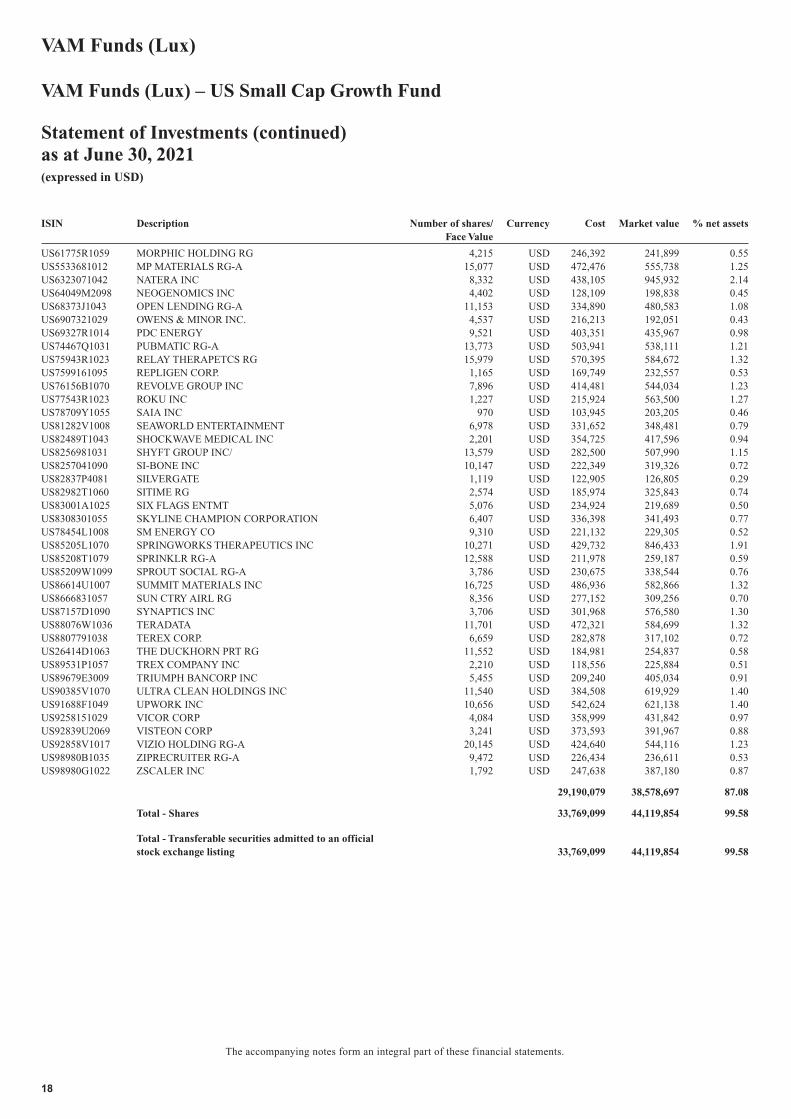
US61775R1059 MORPHIC HOLDING RG 4,215 USD 246,392 241,899 0.55US5533681012 MP MATERIALS RG-A 15,077 USD 472,476 555,738 1.25US6323071042 NATERA INC 8,332 USD 438,105 945,932 2.14US64049M2098 NEOGENOMICS INC 4,402 USD 128,109 198,838 0.45US68373J1043 OPEN LENDING RG-A 11,153 USD 334,890 480,583 1.08US6907321029 OWENS & MINOR INC. 4,537 USD 216,213 192,051 0.43US69327R1014 PDC ENERGY 9,521 USD 403,351 435,967 0.98US74467Q1031 PUBMATIC RG-A 13,773 USD 503,941 538,111 1.21US75943R1023 RELAY THERAPETCS RG 15,979 USD 570,395 584,672 1.32US7599161095 REPLIGEN CORP. 1,165 USD 169,749 232,557 0.53US76156B1070 REVOLVE GROUP INC 7,896 USD 414,481 544,034 1.23US77543R1023 ROKU INC 1,227 USD 215,924 563,500 1.27US78709Y1055 SAIA INC 970 USD 103,945 203,205 0.46US81282V1008 SEAWORLD ENTERTAINMENT 6,978 USD 331,652 348,481 0.79US82489T1043 SHOCKWAVE MEDICAL INC 2,201 USD 354,725 417,596 0.94US8256981031 SHYFT GROUP INC/ 13,579 USD 282,500 507,990 1.15US8257041090 SI-BONE INC 10,147 USD 222,349 319,326 0.72US82837P4081 SILVERGATE 1,119 USD 122,905 126,805 0.29US82982T1060 SITIME RG 2,574 USD 185,974 325,843 0.74US83001A1025 SIX FLAGS ENTMT 5,076 USD 234,924 219,689 0.50US8308301055 SKYLINE CHAMPION CORPORATION 6,407 USD 336,398 341,493 0.77US78454L1008 SM ENERGY CO 9,310 USD 221,132 229,305 0.52US85205L1070 SPRINGWORKS THERAPEUTICS INC 10,271 USD 429,732 846,433 1.91US85208T1079 SPRINKLR RG-A 12,588 USD 211,978 259,187 0.59US85209W1099 SPROUT SOCIAL RG-A 3,786 USD 230,675 338,544 0.76US86614U1007 SUMMIT MATERIALS INC 16,725 USD 486,936 582,866 1.32US8666831057 SUN CTRY AIRL RG 8,356 USD 277,152 309,256 0.70US87157D1090 SYNAPTICS INC 3,706 USD 301,968 576,580 1.30US88076W1036 TERADATA 11,701 USD 472,321 584,699 1.32US8807791038 TEREX CORP. 6,659 USD 282,878 317,102 0.72US26414D1063 THE DUCKHORN PRT RG 11,552 USD 184,981 254,837 0.58US89531P1057 TREX COMPANY INC 2,210 USD 118,556 225,884 0.51US89679E3009 TRIUMPH BANCORP INC 5,455 USD 209,240 405,034 0.91US90385V1070 ULTRA CLEAN HOLDINGS INC 11,540 USD 384,508 619,929 1.40US91688F1049 UPWORK INC 10,656 USD 542,624 621,138 1.40US9258151029 VICOR CORP 4,084 USD 358,999 431,842 0.97US92839U2069 VISTEON CORP 3,241 USD 373,593 391,967 0.88US92858V1017 VIZIO HOLDING RG-A 20,145 USD 424,640 544,116 1.23US98980B1035 ZIPRECRUITER RG-A 9,472 USD 226,434 236,611 0.53US98980G1022 ZSCALER INC 1,792 USD 247,638 387,180 0.87
29,190,079 38,578,697 87.08
Total - Shares 33,769,099 44,119,854 99.58
Total - Transferable securities admitted to an officialstock exchange listing 33,769,099 44,119,854 99.58
VAM Funds (Lux)
VAM Funds (Lux) – US Small Cap Growth Fund
Statement of Investments (continued)as at June 30, 2021(expressed in USD)
The accompanying notes form an integral part of these financial statements.
18
ISIN Description Number of shares/Face Value
Currency Cost Market value % net assets
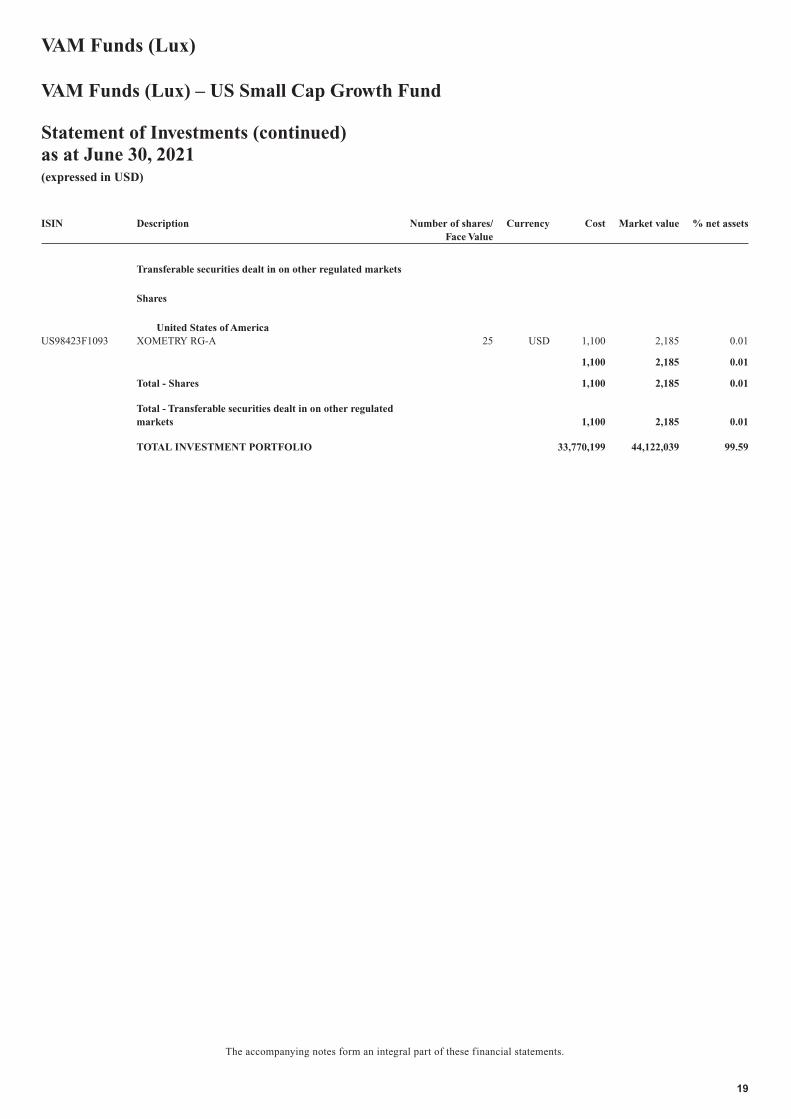
Transferable securities dealt in on other regulated markets
Shares
United States of AmericaUS98423F1093 XOMETRY RG-A 25 USD 1,100 2,185 0.01
1,100 2,185 0.01
Total - Shares 1,100 2,185 0.01
Total - Transferable securities dealt in on other regulatedmarkets 1,100 2,185 0.01
TOTAL INVESTMENT PORTFOLIO 33,770,199 44,122,039 99.59
VAM Funds (Lux)
VAM Funds (Lux) – US Small Cap Growth Fund
Statement of Investments (continued)as at June 30, 2021(expressed in USD)
The accompanying notes form an integral part of these financial statements.
19
ISIN Description Number of shares/Face Value
Currency Cost Market value % net assets
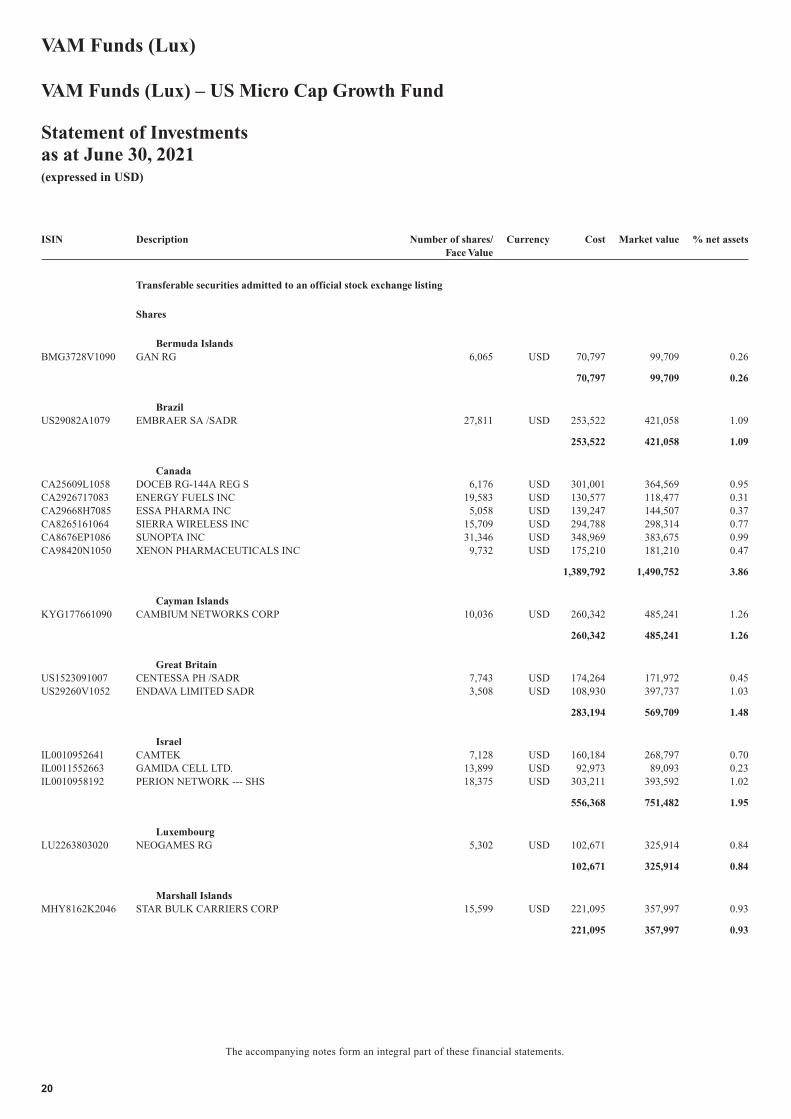
Transferable securities admitted to an official stock exchange listing
Shares
Bermuda IslandsBMG3728V1090 GAN RG 6,065 USD 70,797 99,709 0.26
70,797 99,709 0.26
BrazilUS29082A1079 EMBRAER SA /SADR 27,811 USD 253,522 421,058 1.09
253,522 421,058 1.09
CanadaCA25609L1058 DOCEB RG-144A REG S 6,176 USD 301,001 364,569 0.95CA2926717083 ENERGY FUELS INC 19,583 USD 130,577 118,477 0.31CA29668H7085 ESSA PHARMA INC 5,058 USD 139,247 144,507 0.37CA8265161064 SIERRA WIRELESS INC 15,709 USD 294,788 298,314 0.77CA8676EP1086 SUNOPTA INC 31,346 USD 348,969 383,675 0.99CA98420N1050 XENON PHARMACEUTICALS INC 9,732 USD 175,210 181,210 0.47
1,389,792 1,490,752 3.86
Cayman IslandsKYG177661090 CAMBIUM NETWORKS CORP 10,036 USD 260,342 485,241 1.26
260,342 485,241 1.26
Great BritainUS1523091007 CENTESSA PH /SADR 7,743 USD 174,264 171,972 0.45US29260V1052 ENDAVA LIMITED SADR 3,508 USD 108,930 397,737 1.03
283,194 569,709 1.48
IsraelIL0010952641 CAMTEK 7,128 USD 160,184 268,797 0.70IL0011552663 GAMIDA CELL LTD. 13,899 USD 92,973 89,093 0.23IL0010958192 PERION NETWORK --- SHS 18,375 USD 303,211 393,592 1.02
556,368 751,482 1.95
LuxembourgLU2263803020 NEOGAMES RG 5,302 USD 102,671 325,914 0.84
102,671 325,914 0.84
Marshall IslandsMHY8162K2046 STAR BULK CARRIERS CORP 15,599 USD 221,095 357,997 0.93
221,095 357,997 0.93
VAM Funds (Lux)
VAM Funds (Lux) – US Micro Cap Growth Fund
Statement of Investmentsas at June 30, 2021(expressed in USD)
The accompanying notes form an integral part of these financial statements.
20
ISIN Description Number of shares/Face Value
Currency Cost Market value % net assets
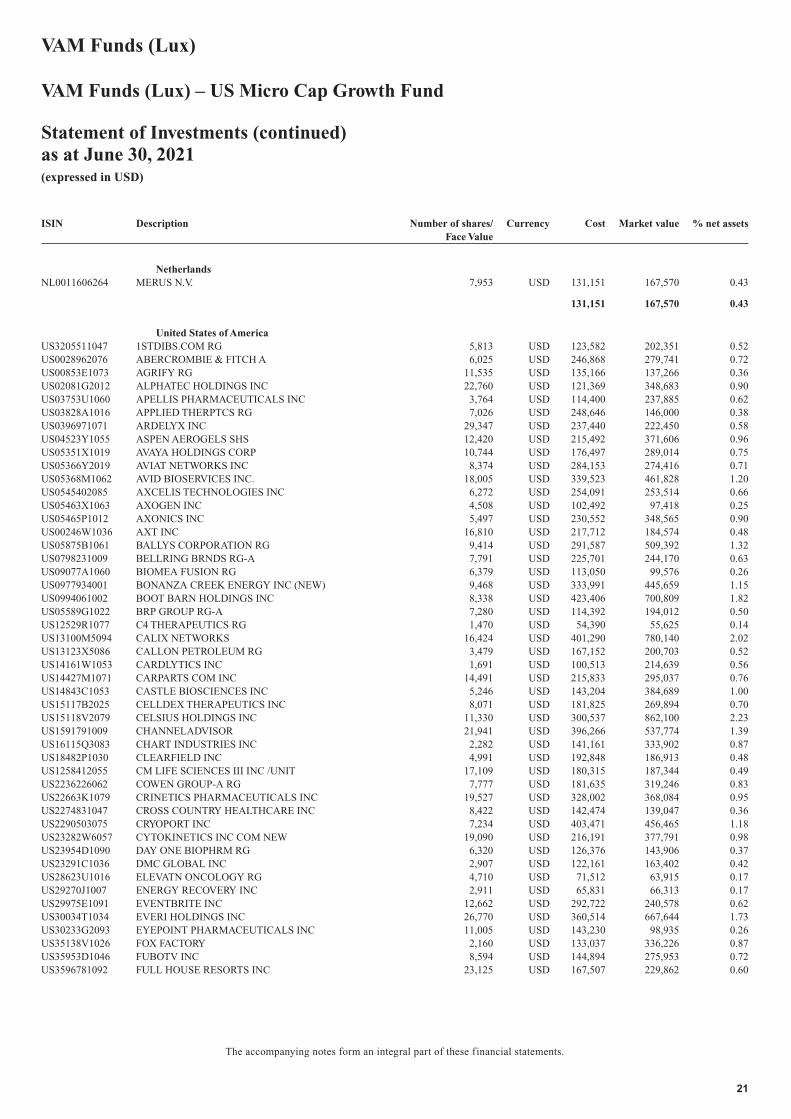
NetherlandsNL0011606264 MERUS N.V. 7,953 USD 131,151 167,570 0.43
131,151 167,570 0.43
United States of AmericaUS3205511047 1STDIBS.COM RG 5,813 USD 123,582 202,351 0.52US0028962076 ABERCROMBIE & FITCH A 6,025 USD 246,868 279,741 0.72US00853E1073 AGRIFY RG 11,535 USD 135,166 137,266 0.36US02081G2012 ALPHATEC HOLDINGS INC 22,760 USD 121,369 348,683 0.90US03753U1060 APELLIS PHARMACEUTICALS INC 3,764 USD 114,400 237,885 0.62US03828A1016 APPLIED THERPTCS RG 7,026 USD 248,646 146,000 0.38US0396971071 ARDELYX INC 29,347 USD 237,440 222,450 0.58US04523Y1055 ASPEN AEROGELS SHS 12,420 USD 215,492 371,606 0.96US05351X1019 AVAYA HOLDINGS CORP 10,744 USD 176,497 289,014 0.75US05366Y2019 AVIAT NETWORKS INC 8,374 USD 284,153 274,416 0.71US05368M1062 AVID BIOSERVICES INC. 18,005 USD 339,523 461,828 1.20US0545402085 AXCELIS TECHNOLOGIES INC 6,272 USD 254,091 253,514 0.66US05463X1063 AXOGEN INC 4,508 USD 102,492 97,418 0.25US05465P1012 AXONICS INC 5,497 USD 230,552 348,565 0.90US00246W1036 AXT INC 16,810 USD 217,712 184,574 0.48US05875B1061 BALLYS CORPORATION RG 9,414 USD 291,587 509,392 1.32US0798231009 BELLRING BRNDS RG-A 7,791 USD 225,701 244,170 0.63US09077A1060 BIOMEA FUSION RG 6,379 USD 113,050 99,576 0.26US0977934001 BONANZA CREEK ENERGY INC (NEW) 9,468 USD 333,991 445,659 1.15US0994061002 BOOT BARN HOLDINGS INC 8,338 USD 423,406 700,809 1.82US05589G1022 BRP GROUP RG-A 7,280 USD 114,392 194,012 0.50US12529R1077 C4 THERAPEUTICS RG 1,470 USD 54,390 55,625 0.14US13100M5094 CALIX NETWORKS 16,424 USD 401,290 780,140 2.02US13123X5086 CALLON PETROLEUM RG 3,479 USD 167,152 200,703 0.52US14161W1053 CARDLYTICS INC 1,691 USD 100,513 214,639 0.56US14427M1071 CARPARTS COM INC 14,491 USD 215,833 295,037 0.76US14843C1053 CASTLE BIOSCIENCES INC 5,246 USD 143,204 384,689 1.00US15117B2025 CELLDEX THERAPEUTICS INC 8,071 USD 181,825 269,894 0.70US15118V2079 CELSIUS HOLDINGS INC 11,330 USD 300,537 862,100 2.23US1591791009 CHANNELADVISOR 21,941 USD 396,266 537,774 1.39US16115Q3083 CHART INDUSTRIES INC 2,282 USD 141,161 333,902 0.87US18482P1030 CLEARFIELD INC 4,991 USD 192,848 186,913 0.48US1258412055 CM LIFE SCIENCES III INC /UNIT 17,109 USD 180,315 187,344 0.49US2236226062 COWEN GROUP-A RG 7,777 USD 181,635 319,246 0.83US22663K1079 CRINETICS PHARMACEUTICALS INC 19,527 USD 328,002 368,084 0.95US2274831047 CROSS COUNTRY HEALTHCARE INC 8,422 USD 142,474 139,047 0.36US2290503075 CRYOPORT INC 7,234 USD 403,471 456,465 1.18US23282W6057 CYTOKINETICS INC COM NEW 19,090 USD 216,191 377,791 0.98US23954D1090 DAY ONE BIOPHRM RG 6,320 USD 126,376 143,906 0.37US23291C1036 DMC GLOBAL INC 2,907 USD 122,161 163,402 0.42US28623U1016 ELEVATN ONCOLOGY RG 4,710 USD 71,512 63,915 0.17US29270J1007 ENERGY RECOVERY INC 2,911 USD 65,831 66,313 0.17US29975E1091 EVENTBRITE INC 12,662 USD 292,722 240,578 0.62US30034T1034 EVERI HOLDINGS INC 26,770 USD 360,514 667,644 1.73US30233G2093 EYEPOINT PHARMACEUTICALS INC 11,005 USD 143,230 98,935 0.26US35138V1026 FOX FACTORY 2,160 USD 133,037 336,226 0.87US35953D1046 FUBOTV INC 8,594 USD 144,894 275,953 0.72US3596781092 FULL HOUSE RESORTS INC 23,125 USD 167,507 229,862 0.60
VAM Funds (Lux)
VAM Funds (Lux) – US Micro Cap Growth Fund
Statement of Investments (continued)as at June 30, 2021(expressed in USD)
The accompanying notes form an integral part of these financial statements.
21
ISIN Description Number of shares/Face Value
Currency Cost Market value % net assets
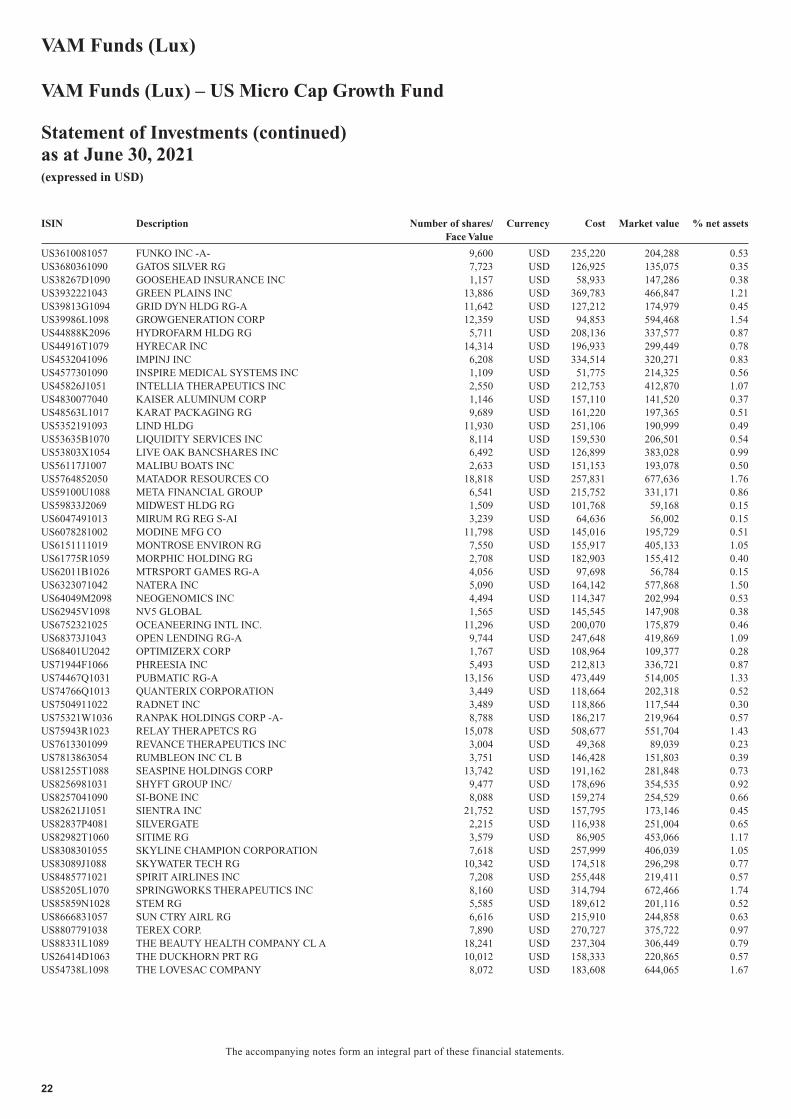
US3610081057 FUNKO INC -A- 9,600 USD 235,220 204,288 0.53US3680361090 GATOS SILVER RG 7,723 USD 126,925 135,075 0.35US38267D1090 GOOSEHEAD INSURANCE INC 1,157 USD 58,933 147,286 0.38US3932221043 GREEN PLAINS INC 13,886 USD 369,783 466,847 1.21US39813G1094 GRID DYN HLDG RG-A 11,642 USD 127,212 174,979 0.45US39986L1098 GROWGENERATION CORP 12,359 USD 94,853 594,468 1.54US44888K2096 HYDROFARM HLDG RG 5,711 USD 208,136 337,577 0.87US44916T1079 HYRECAR INC 14,314 USD 196,933 299,449 0.78US4532041096 IMPINJ INC 6,208 USD 334,514 320,271 0.83US4577301090 INSPIRE MEDICAL SYSTEMS INC 1,109 USD 51,775 214,325 0.56US45826J1051 INTELLIA THERAPEUTICS INC 2,550 USD 212,753 412,870 1.07US4830077040 KAISER ALUMINUM CORP 1,146 USD 157,110 141,520 0.37US48563L1017 KARAT PACKAGING RG 9,689 USD 161,220 197,365 0.51US5352191093 LIND HLDG 11,930 USD 251,106 190,999 0.49US53635B1070 LIQUIDITY SERVICES INC 8,114 USD 159,530 206,501 0.54US53803X1054 LIVE OAK BANCSHARES INC 6,492 USD 126,899 383,028 0.99US56117J1007 MALIBU BOATS INC 2,633 USD 151,153 193,078 0.50US5764852050 MATADOR RESOURCES CO 18,818 USD 257,831 677,636 1.76US59100U1088 META FINANCIAL GROUP 6,541 USD 215,752 331,171 0.86US59833J2069 MIDWEST HLDG RG 1,509 USD 101,768 59,168 0.15US6047491013 MIRUM RG REG S-AI 3,239 USD 64,636 56,002 0.15US6078281002 MODINE MFG CO 11,798 USD 145,016 195,729 0.51US6151111019 MONTROSE ENVIRON RG 7,550 USD 155,917 405,133 1.05US61775R1059 MORPHIC HOLDING RG 2,708 USD 182,903 155,412 0.40US62011B1026 MTRSPORT GAMES RG-A 4,056 USD 97,698 56,784 0.15US6323071042 NATERA INC 5,090 USD 164,142 577,868 1.50US64049M2098 NEOGENOMICS INC 4,494 USD 114,347 202,994 0.53US62945V1098 NV5 GLOBAL 1,565 USD 145,545 147,908 0.38US6752321025 OCEANEERING INTL INC. 11,296 USD 200,070 175,879 0.46US68373J1043 OPEN LENDING RG-A 9,744 USD 247,648 419,869 1.09US68401U2042 OPTIMIZERX CORP 1,767 USD 108,964 109,377 0.28US71944F1066 PHREESIA INC 5,493 USD 212,813 336,721 0.87US74467Q1031 PUBMATIC RG-A 13,156 USD 473,449 514,005 1.33US74766Q1013 QUANTERIX CORPORATION 3,449 USD 118,664 202,318 0.52US7504911022 RADNET INC 3,489 USD 118,866 117,544 0.30US75321W1036 RANPAK HOLDINGS CORP -A- 8,788 USD 186,217 219,964 0.57US75943R1023 RELAY THERAPETCS RG 15,078 USD 508,677 551,704 1.43US7613301099 REVANCE THERAPEUTICS INC 3,004 USD 49,368 89,039 0.23US7813863054 RUMBLEON INC CL B 3,751 USD 146,428 151,803 0.39US81255T1088 SEASPINE HOLDINGS CORP 13,742 USD 191,162 281,848 0.73US8256981031 SHYFT GROUP INC/ 9,477 USD 178,696 354,535 0.92US8257041090 SI-BONE INC 8,088 USD 159,274 254,529 0.66US82621J1051 SIENTRA INC 21,752 USD 157,795 173,146 0.45US82837P4081 SILVERGATE 2,215 USD 116,938 251,004 0.65US82982T1060 SITIME RG 3,579 USD 86,905 453,066 1.17US8308301055 SKYLINE CHAMPION CORPORATION 7,618 USD 257,999 406,039 1.05US83089J1088 SKYWATER TECH RG 10,342 USD 174,518 296,298 0.77US8485771021 SPIRIT AIRLINES INC 7,208 USD 255,448 219,411 0.57US85205L1070 SPRINGWORKS THERAPEUTICS INC 8,160 USD 314,794 672,466 1.74US85859N1028 STEM RG 5,585 USD 189,612 201,116 0.52US8666831057 SUN CTRY AIRL RG 6,616 USD 215,910 244,858 0.63US8807791038 TEREX CORP. 7,890 USD 270,727 375,722 0.97US88331L1089 THE BEAUTY HEALTH COMPANY CL A 18,241 USD 237,304 306,449 0.79US26414D1063 THE DUCKHORN PRT RG 10,012 USD 158,333 220,865 0.57US54738L1098 THE LOVESAC COMPANY 8,072 USD 183,608 644,065 1.67
VAM Funds (Lux)
VAM Funds (Lux) – US Micro Cap Growth Fund
Statement of Investments (continued)as at June 30, 2021(expressed in USD)
The accompanying notes form an integral part of these financial statements.
22
ISIN Description Number of shares/Face Value
Currency Cost Market value % net assets
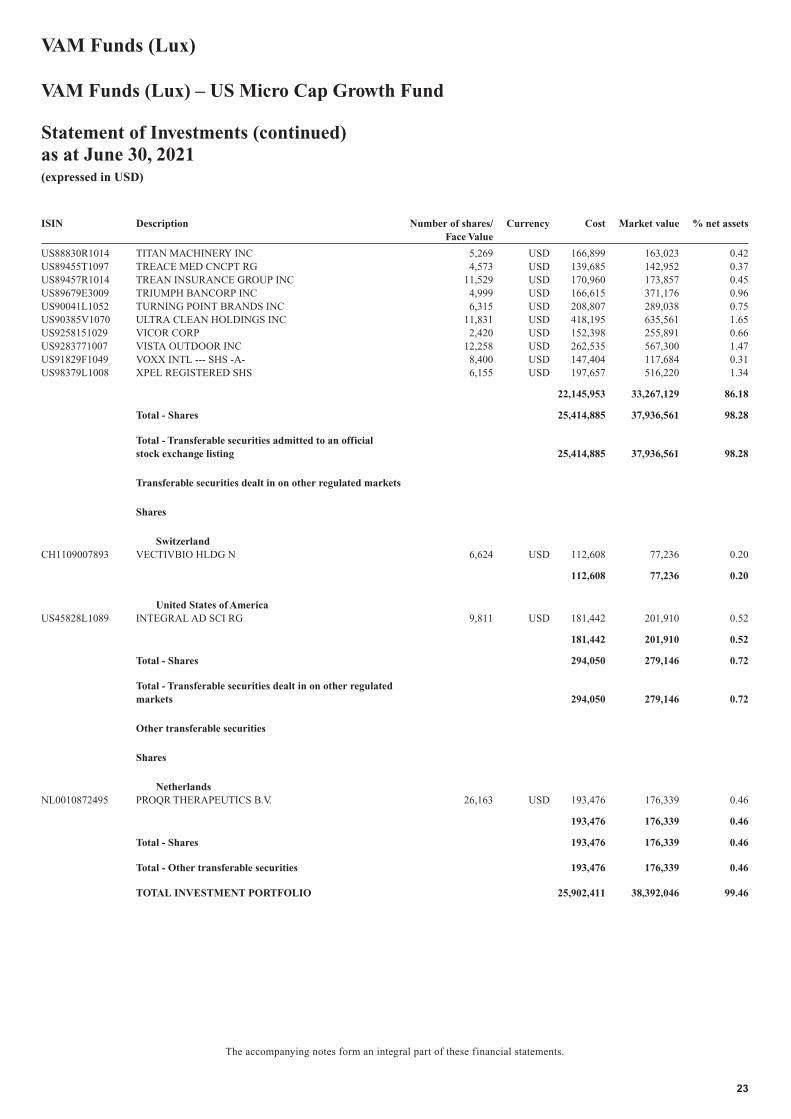
US88830R1014 TITAN MACHINERY INC 5,269 USD 166,899 163,023 0.42US89455T1097 TREACE MED CNCPT RG 4,573 USD 139,685 142,952 0.37US89457R1014 TREAN INSURANCE GROUP INC 11,529 USD 170,960 173,857 0.45US89679E3009 TRIUMPH BANCORP INC 4,999 USD 166,615 371,176 0.96US90041L1052 TURNING POINT BRANDS INC 6,315 USD 208,807 289,038 0.75US90385V1070 ULTRA CLEAN HOLDINGS INC 11,831 USD 418,195 635,561 1.65US9258151029 VICOR CORP 2,420 USD 152,398 255,891 0.66US9283771007 VISTA OUTDOOR INC 12,258 USD 262,535 567,300 1.47US91829F1049 VOXX INTL --- SHS -A- 8,400 USD 147,404 117,684 0.31US98379L1008 XPEL REGISTERED SHS 6,155 USD 197,657 516,220 1.34
22,145,953 33,267,129 86.18
Total - Shares 25,414,885 37,936,561 98.28
Total - Transferable securities admitted to an officialstock exchange listing 25,414,885 37,936,561 98.28
Transferable securities dealt in on other regulated markets
Shares
SwitzerlandCH1109007893 VECTIVBIO HLDG N 6,624 USD 112,608 77,236 0.20
112,608 77,236 0.20
United States of AmericaUS45828L1089 INTEGRAL AD SCI RG 9,811 USD 181,442 201,910 0.52
181,442 201,910 0.52
Total - Shares 294,050 279,146 0.72
Total - Transferable securities dealt in on other regulatedmarkets 294,050 279,146 0.72
Other transferable securities
Shares
NetherlandsNL0010872495 PROQR THERAPEUTICS B.V. 26,163 USD 193,476 176,339 0.46
193,476 176,339 0.46
Total - Shares 193,476 176,339 0.46
Total - Other transferable securities 193,476 176,339 0.46
TOTAL INVESTMENT PORTFOLIO 25,902,411 38,392,046 99.46
VAM Funds (Lux)
VAM Funds (Lux) – US Micro Cap Growth Fund
Statement of Investments (continued)as at June 30, 2021(expressed in USD)
The accompanying notes form an integral part of these financial statements.
23
ISIN Description Number of shares/Face Value
Currency Cost Market value % net assets
Transferable securities admitted to an official stock exchange listing
Shares
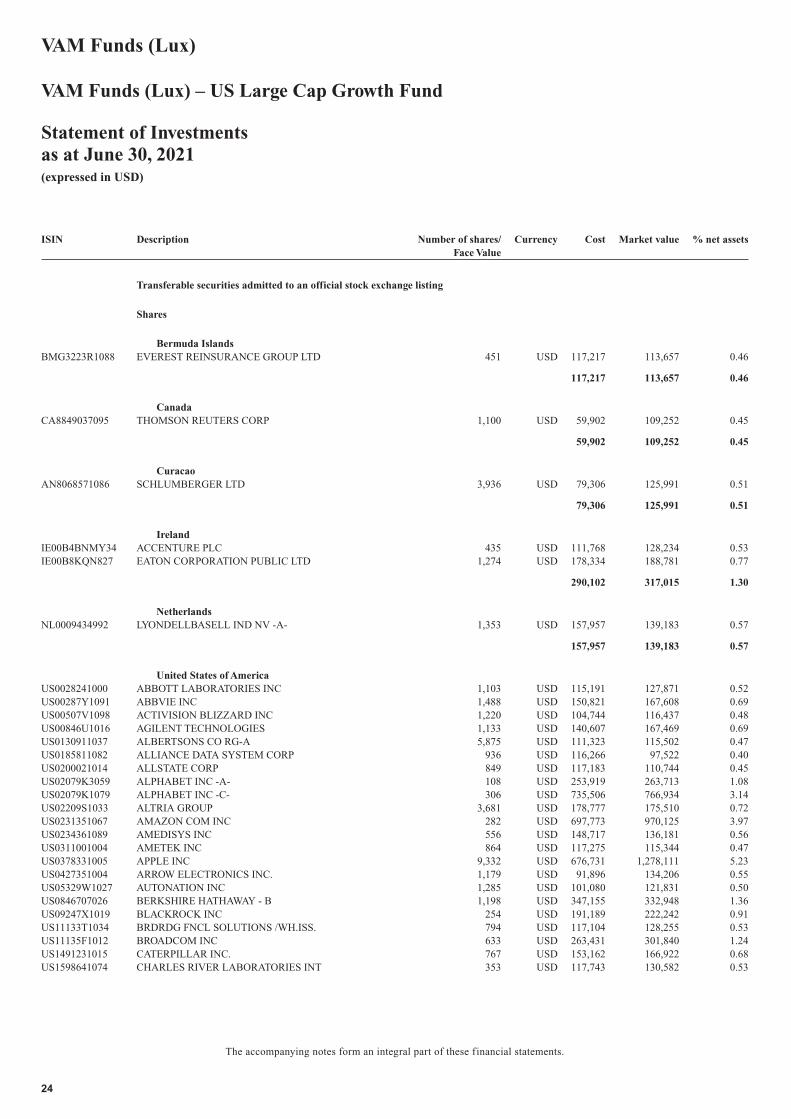
Bermuda IslandsBMG3223R1088 EVEREST REINSURANCE GROUP LTD 451 USD 117,217 113,657 0.46
117,217 113,657 0.46
CanadaCA8849037095 THOMSON REUTERS CORP 1,100 USD 59,902 109,252 0.45
59,902 109,252 0.45
CuracaoAN8068571086 SCHLUMBERGER LTD 3,936 USD 79,306 125,991 0.51
79,306 125,991 0.51
IrelandIE00B4BNMY34 ACCENTURE PLC 435 USD 111,768 128,234 0.53IE00B8KQN827 EATON CORPORATION PUBLIC LTD 1,274 USD 178,334 188,781 0.77
290,102 317,015 1.30
NetherlandsNL0009434992 LYONDELLBASELL IND NV -A- 1,353 USD 157,957 139,183 0.57
157,957 139,183 0.57
United States of AmericaUS0028241000 ABBOTT LABORATORIES INC 1,103 USD 115,191 127,871 0.52US00287Y1091 ABBVIE INC 1,488 USD 150,821 167,608 0.69US00507V1098 ACTIVISION BLIZZARD INC 1,220 USD 104,744 116,437 0.48US00846U1016 AGILENT TECHNOLOGIES 1,133 USD 140,607 167,469 0.69US0130911037 ALBERTSONS CO RG-A 5,875 USD 111,323 115,502 0.47US0185811082 ALLIANCE DATA SYSTEM CORP 936 USD 116,266 97,522 0.40US0200021014 ALLSTATE CORP 849 USD 117,183 110,744 0.45US02079K3059 ALPHABET INC -A- 108 USD 253,919 263,713 1.08US02079K1079 ALPHABET INC -C- 306 USD 735,506 766,934 3.14US02209S1033 ALTRIA GROUP 3,681 USD 178,777 175,510 0.72US0231351067 AMAZON COM INC 282 USD 697,773 970,125 3.97US0234361089 AMEDISYS INC 556 USD 148,717 136,181 0.56US0311001004 AMETEK INC 864 USD 117,275 115,344 0.47US0378331005 APPLE INC 9,332 USD 676,731 1,278,111 5.23US0427351004 ARROW ELECTRONICS INC. 1,179 USD 91,896 134,206 0.55US05329W1027 AUTONATION INC 1,285 USD 101,080 121,831 0.50US0846707026 BERKSHIRE HATHAWAY - B 1,198 USD 347,155 332,948 1.36US09247X1019 BLACKROCK INC 254 USD 191,189 222,242 0.91US11133T1034 BRDRDG FNCL SOLUTIONS /WH.ISS. 794 USD 117,104 128,255 0.53US11135F1012 BROADCOM INC 633 USD 263,431 301,840 1.24US1491231015 CATERPILLAR INC. 767 USD 153,162 166,922 0.68US1598641074 CHARLES RIVER LABORATORIES INT 353 USD 117,743 130,582 0.53
VAM Funds (Lux)
VAM Funds (Lux) – US Large Cap Growth Fund
Statement of Investmentsas at June 30, 2021(expressed in USD)
The accompanying notes form an integral part of these financial statements.
24
ISIN Description Number of shares/Face Value
Currency Cost Market value % net assets
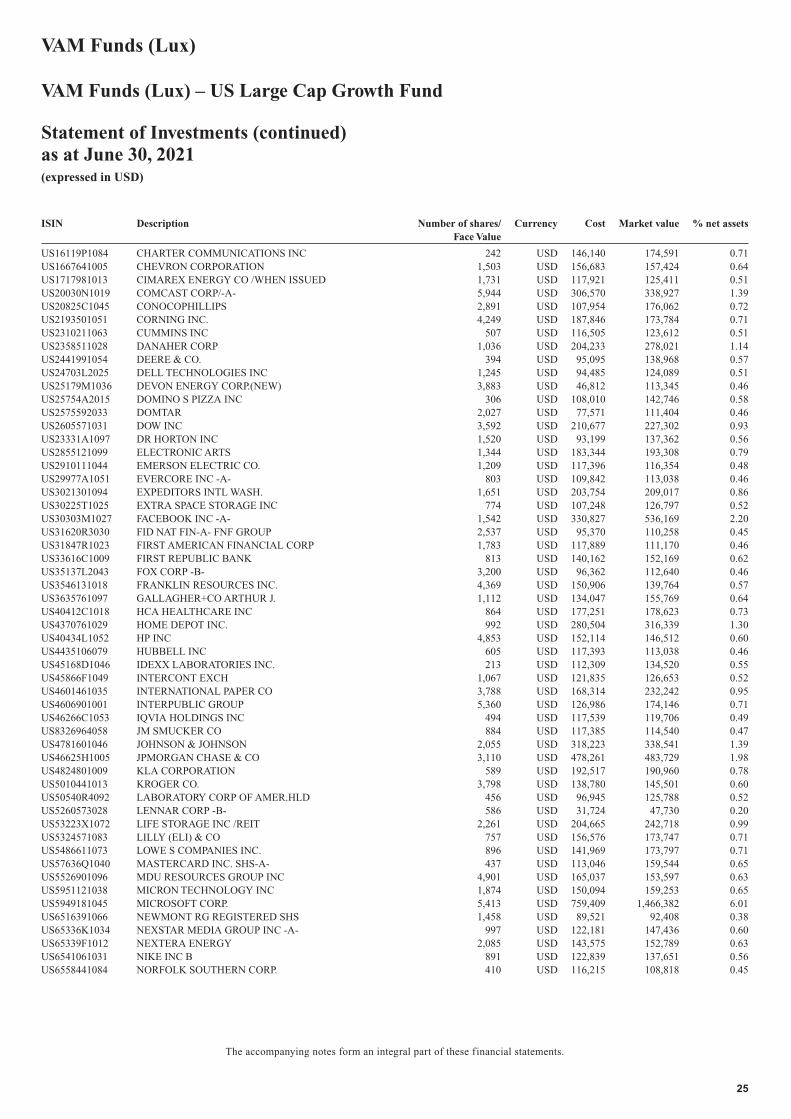
US16119P1084 CHARTER COMMUNICATIONS INC 242 USD 146,140 174,591 0.71US1667641005 CHEVRON CORPORATION 1,503 USD 156,683 157,424 0.64US1717981013 CIMAREX ENERGY CO /WHEN ISSUED 1,731 USD 117,921 125,411 0.51US20030N1019 COMCAST CORP/-A- 5,944 USD 306,570 338,927 1.39US20825C1045 CONOCOPHILLIPS 2,891 USD 107,954 176,062 0.72US2193501051 CORNING INC. 4,249 USD 187,846 173,784 0.71US2310211063 CUMMINS INC 507 USD 116,505 123,612 0.51US2358511028 DANAHER CORP 1,036 USD 204,233 278,021 1.14US2441991054 DEERE & CO. 394 USD 95,095 138,968 0.57US24703L2025 DELL TECHNOLOGIES INC 1,245 USD 94,485 124,089 0.51US25179M1036 DEVON ENERGY CORP.(NEW) 3,883 USD 46,812 113,345 0.46US25754A2015 DOMINO S PIZZA INC 306 USD 108,010 142,746 0.58US2575592033 DOMTAR 2,027 USD 77,571 111,404 0.46US2605571031 DOW INC 3,592 USD 210,677 227,302 0.93US23331A1097 DR HORTON INC 1,520 USD 93,199 137,362 0.56US2855121099 ELECTRONIC ARTS 1,344 USD 183,344 193,308 0.79US2910111044 EMERSON ELECTRIC CO. 1,209 USD 117,396 116,354 0.48US29977A1051 EVERCORE INC -A- 803 USD 109,842 113,038 0.46US3021301094 EXPEDITORS INTL WASH. 1,651 USD 203,754 209,017 0.86US30225T1025 EXTRA SPACE STORAGE INC 774 USD 107,248 126,797 0.52US30303M1027 FACEBOOK INC -A- 1,542 USD 330,827 536,169 2.20US31620R3030 FID NAT FIN-A- FNF GROUP 2,537 USD 95,370 110,258 0.45US31847R1023 FIRST AMERICAN FINANCIAL CORP 1,783 USD 117,889 111,170 0.46US33616C1009 FIRST REPUBLIC BANK 813 USD 140,162 152,169 0.62US35137L2043 FOX CORP -B- 3,200 USD 96,362 112,640 0.46US3546131018 FRANKLIN RESOURCES INC. 4,369 USD 150,906 139,764 0.57US3635761097 GALLAGHER+CO ARTHUR J. 1,112 USD 134,047 155,769 0.64US40412C1018 HCA HEALTHCARE INC 864 USD 177,251 178,623 0.73US4370761029 HOME DEPOT INC. 992 USD 280,504 316,339 1.30US40434L1052 HP INC 4,853 USD 152,114 146,512 0.60US4435106079 HUBBELL INC 605 USD 117,393 113,038 0.46US45168D1046 IDEXX LABORATORIES INC. 213 USD 112,309 134,520 0.55US45866F1049 INTERCONT EXCH 1,067 USD 121,835 126,653 0.52US4601461035 INTERNATIONAL PAPER CO 3,788 USD 168,314 232,242 0.95US4606901001 INTERPUBLIC GROUP 5,360 USD 126,986 174,146 0.71US46266C1053 IQVIA HOLDINGS INC 494 USD 117,539 119,706 0.49US8326964058 JM SMUCKER CO 884 USD 117,385 114,540 0.47US4781601046 JOHNSON & JOHNSON 2,055 USD 318,223 338,541 1.39US46625H1005 JPMORGAN CHASE & CO 3,110 USD 478,261 483,729 1.98US4824801009 KLA CORPORATION 589 USD 192,517 190,960 0.78US5010441013 KROGER CO. 3,798 USD 138,780 145,501 0.60US50540R4092 LABORATORY CORP OF AMER.HLD 456 USD 96,945 125,788 0.52US5260573028 LENNAR CORP -B- 586 USD 31,724 47,730 0.20US53223X1072 LIFE STORAGE INC /REIT 2,261 USD 204,665 242,718 0.99US5324571083 LILLY (ELI) & CO 757 USD 156,576 173,747 0.71US5486611073 LOWE S COMPANIES INC. 896 USD 141,969 173,797 0.71US57636Q1040 MASTERCARD INC. SHS-A- 437 USD 113,046 159,544 0.65US5526901096 MDU RESOURCES GROUP INC 4,901 USD 165,037 153,597 0.63US5951121038 MICRON TECHNOLOGY INC 1,874 USD 150,094 159,253 0.65US5949181045 MICROSOFT CORP. 5,413 USD 759,409 1,466,382 6.01US6516391066 NEWMONT RG REGISTERED SHS 1,458 USD 89,521 92,408 0.38US65336K1034 NEXSTAR MEDIA GROUP INC -A- 997 USD 122,181 147,436 0.60US65339F1012 NEXTERA ENERGY 2,085 USD 143,575 152,789 0.63US6541061031 NIKE INC B 891 USD 122,839 137,651 0.56US6558441084 NORFOLK SOUTHERN CORP. 410 USD 116,215 108,818 0.45
VAM Funds (Lux)
VAM Funds (Lux) – US Large Cap Growth Fund
Statement of Investments (continued)as at June 30, 2021(expressed in USD)
The accompanying notes form an integral part of these financial statements.
25
ISIN Description Number of shares/Face Value
Currency Cost Market value % net assets
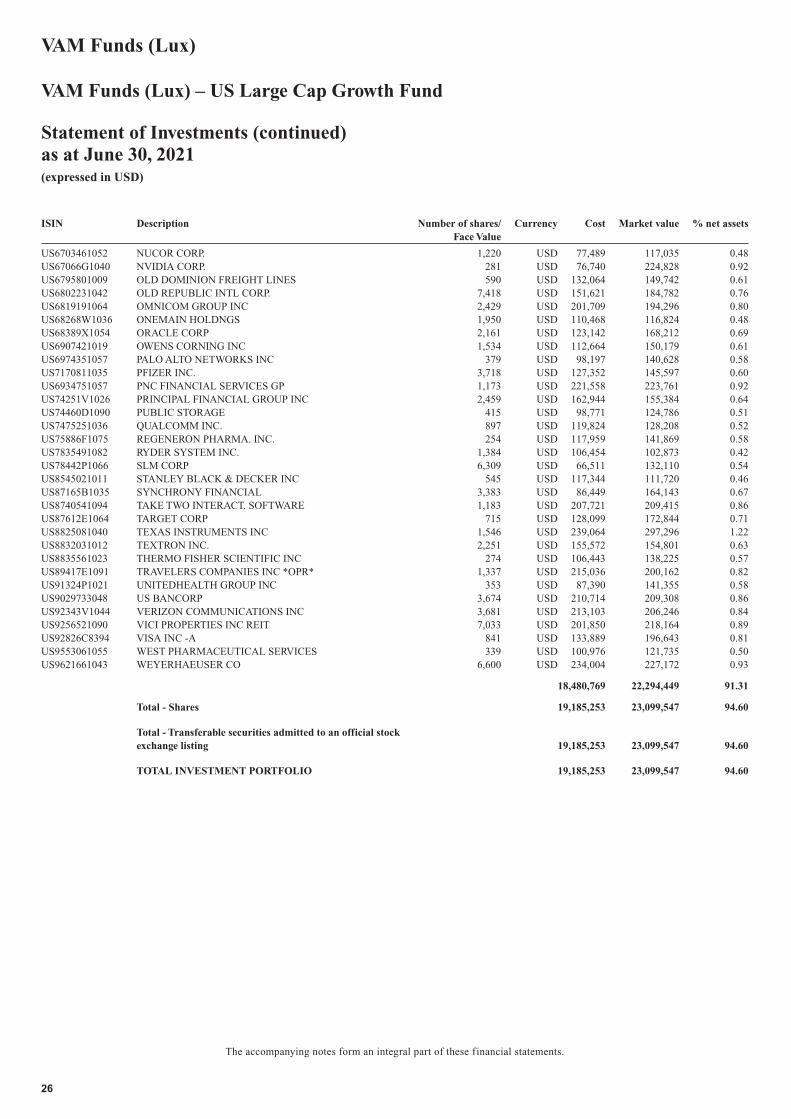
US6703461052 NUCOR CORP. 1,220 USD 77,489 117,035 0.48US67066G1040 NVIDIA CORP. 281 USD 76,740 224,828 0.92US6795801009 OLD DOMINION FREIGHT LINES 590 USD 132,064 149,742 0.61US6802231042 OLD REPUBLIC INTL CORP. 7,418 USD 151,621 184,782 0.76US6819191064 OMNICOM GROUP INC 2,429 USD 201,709 194,296 0.80US68268W1036 ONEMAIN HOLDNGS 1,950 USD 110,468 116,824 0.48US68389X1054 ORACLE CORP 2,161 USD 123,142 168,212 0.69US6907421019 OWENS CORNING INC 1,534 USD 112,664 150,179 0.61US6974351057 PALO ALTO NETWORKS INC 379 USD 98,197 140,628 0.58US7170811035 PFIZER INC. 3,718 USD 127,352 145,597 0.60US6934751057 PNC FINANCIAL SERVICES GP 1,173 USD 221,558 223,761 0.92US74251V1026 PRINCIPAL FINANCIAL GROUP INC 2,459 USD 162,944 155,384 0.64US74460D1090 PUBLIC STORAGE 415 USD 98,771 124,786 0.51US7475251036 QUALCOMM INC. 897 USD 119,824 128,208 0.52US75886F1075 REGENERON PHARMA. INC. 254 USD 117,959 141,869 0.58US7835491082 RYDER SYSTEM INC. 1,384 USD 106,454 102,873 0.42US78442P1066 SLM CORP 6,309 USD 66,511 132,110 0.54US8545021011 STANLEY BLACK & DECKER INC 545 USD 117,344 111,720 0.46US87165B1035 SYNCHRONY FINANCIAL 3,383 USD 86,449 164,143 0.67US8740541094 TAKE TWO INTERACT. SOFTWARE 1,183 USD 207,721 209,415 0.86US87612E1064 TARGET CORP 715 USD 128,099 172,844 0.71US8825081040 TEXAS INSTRUMENTS INC 1,546 USD 239,064 297,296 1.22US8832031012 TEXTRON INC. 2,251 USD 155,572 154,801 0.63US8835561023 THERMO FISHER SCIENTIFIC INC 274 USD 106,443 138,225 0.57US89417E1091 TRAVELERS COMPANIES INC *OPR* 1,337 USD 215,036 200,162 0.82US91324P1021 UNITEDHEALTH GROUP INC 353 USD 87,390 141,355 0.58US9029733048 US BANCORP 3,674 USD 210,714 209,308 0.86US92343V1044 VERIZON COMMUNICATIONS INC 3,681 USD 213,103 206,246 0.84US9256521090 VICI PROPERTIES INC REIT 7,033 USD 201,850 218,164 0.89US92826C8394 VISA INC -A 841 USD 133,889 196,643 0.81US9553061055 WEST PHARMACEUTICAL SERVICES 339 USD 100,976 121,735 0.50US9621661043 WEYERHAEUSER CO 6,600 USD 234,004 227,172 0.93
18,480,769 22,294,449 91.31
Total - Shares 19,185,253 23,099,547 94.60
Total - Transferable securities admitted to an official stockexchange listing 19,185,253 23,099,547 94.60
TOTAL INVESTMENT PORTFOLIO 19,185,253 23,099,547 94.60
VAM Funds (Lux)
VAM Funds (Lux) – US Large Cap Growth Fund
Statement of Investments (continued)as at June 30, 2021(expressed in USD)
The accompanying notes form an integral part of these financial statements.
26
ISIN Description Number of shares/Face Value
Currency Cost Market value % net assets
Transferable securities admitted to an official stock exchange listing
Shares
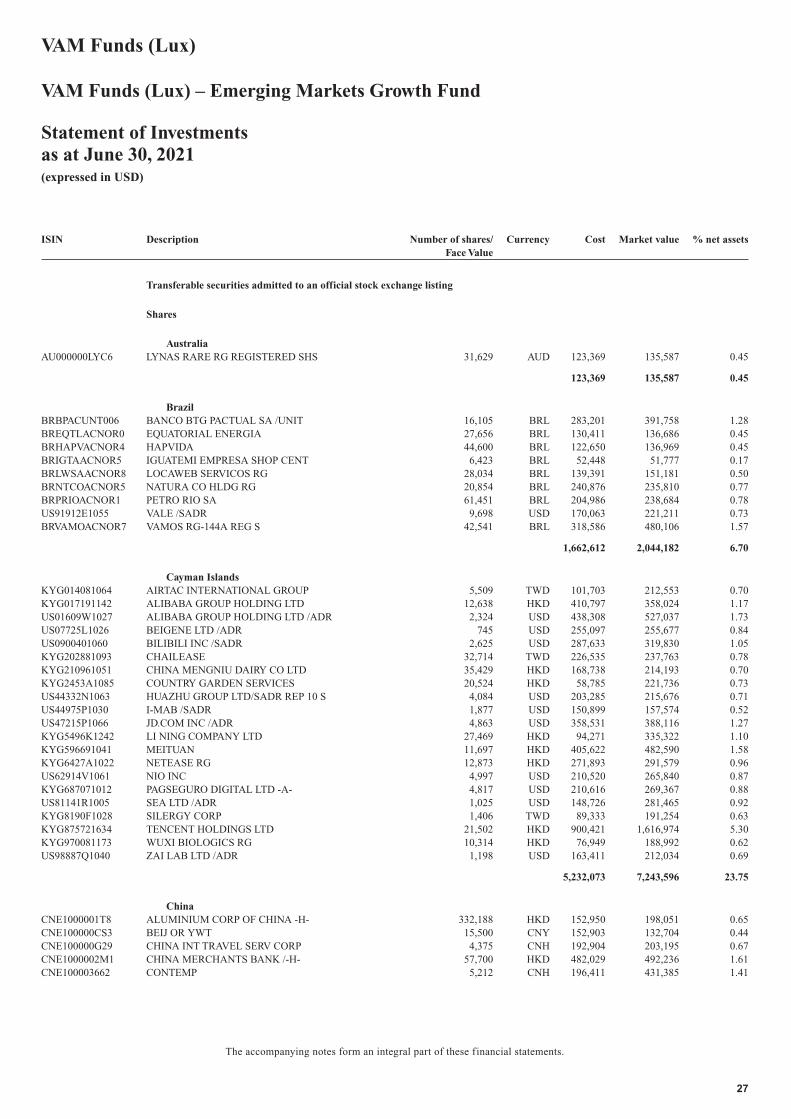
AustraliaAU000000LYC6 LYNAS RARE RG REGISTERED SHS 31,629 AUD 123,369 135,587 0.45
123,369 135,587 0.45
BrazilBRBPACUNT006 BANCO BTG PACTUAL SA /UNIT 16,105 BRL 283,201 391,758 1.28BREQTLACNOR0 EQUATORIAL ENERGIA 27,656 BRL 130,411 136,686 0.45BRHAPVACNOR4 HAPVIDA 44,600 BRL 122,650 136,969 0.45BRIGTAACNOR5 IGUATEMI EMPRESA SHOP CENT 6,423 BRL 52,448 51,777 0.17BRLWSAACNOR8 LOCAWEB SERVICOS RG 28,034 BRL 139,391 151,181 0.50BRNTCOACNOR5 NATURA CO HLDG RG 20,854 BRL 240,876 235,810 0.77BRPRIOACNOR1 PETRO RIO SA 61,451 BRL 204,986 238,684 0.78US91912E1055 VALE /SADR 9,698 USD 170,063 221,211 0.73BRVAMOACNOR7 VAMOS RG-144A REG S 42,541 BRL 318,586 480,106 1.57
1,662,612 2,044,182 6.70
Cayman IslandsKYG014081064 AIRTAC INTERNATIONAL GROUP 5,509 TWD 101,703 212,553 0.70KYG017191142 ALIBABA GROUP HOLDING LTD 12,638 HKD 410,797 358,024 1.17US01609W1027 ALIBABA GROUP HOLDING LTD /ADR 2,324 USD 438,308 527,037 1.73US07725L1026 BEIGENE LTD /ADR 745 USD 255,097 255,677 0.84US0900401060 BILIBILI INC /SADR 2,625 USD 287,633 319,830 1.05KYG202881093 CHAILEASE 32,714 TWD 226,535 237,763 0.78KYG210961051 CHINA MENGNIU DAIRY CO LTD 35,429 HKD 168,738 214,193 0.70KYG2453A1085 COUNTRY GARDEN SERVICES 20,524 HKD 58,785 221,736 0.73US44332N1063 HUAZHU GROUP LTD/SADR REP 10 S 4,084 USD 203,285 215,676 0.71US44975P1030 I-MAB /SADR 1,877 USD 150,899 157,574 0.52US47215P1066 JD.COM INC /ADR 4,863 USD 358,531 388,116 1.27KYG5496K1242 LI NING COMPANY LTD 27,469 HKD 94,271 335,322 1.10KYG596691041 MEITUAN 11,697 HKD 405,622 482,590 1.58KYG6427A1022 NETEASE RG 12,873 HKD 271,893 291,579 0.96US62914V1061 NIO INC 4,997 USD 210,520 265,840 0.87KYG687071012 PAGSEGURO DIGITAL LTD -A- 4,817 USD 210,616 269,367 0.88US81141R1005 SEA LTD /ADR 1,025 USD 148,726 281,465 0.92KYG8190F1028 SILERGY CORP 1,406 TWD 89,333 191,254 0.63KYG875721634 TENCENT HOLDINGS LTD 21,502 HKD 900,421 1,616,974 5.30KYG970081173 WUXI BIOLOGICS RG 10,314 HKD 76,949 188,992 0.62US98887Q1040 ZAI LAB LTD /ADR 1,198 USD 163,411 212,034 0.69
5,232,073 7,243,596 23.75
ChinaCNE1000001T8 ALUMINIUM CORP OF CHINA -H- 332,188 HKD 152,950 198,051 0.65CNE100000CS3 BEIJ OR YWT 15,500 CNY 152,903 132,704 0.44CNE100000G29 CHINA INT TRAVEL SERV CORP 4,375 CNH 192,904 203,195 0.67CNE1000002M1 CHINA MERCHANTS BANK /-H- 57,700 HKD 482,029 492,236 1.61CNE100003662 CONTEMP 5,212 CNH 196,411 431,385 1.41
VAM Funds (Lux)
VAM Funds (Lux) – Emerging Markets Growth Fund
Statement of Investmentsas at June 30, 2021(expressed in USD)
The accompanying notes form an integral part of these financial statements.
27
ISIN Description Number of shares/Face Value
Currency Cost Market value % net assets
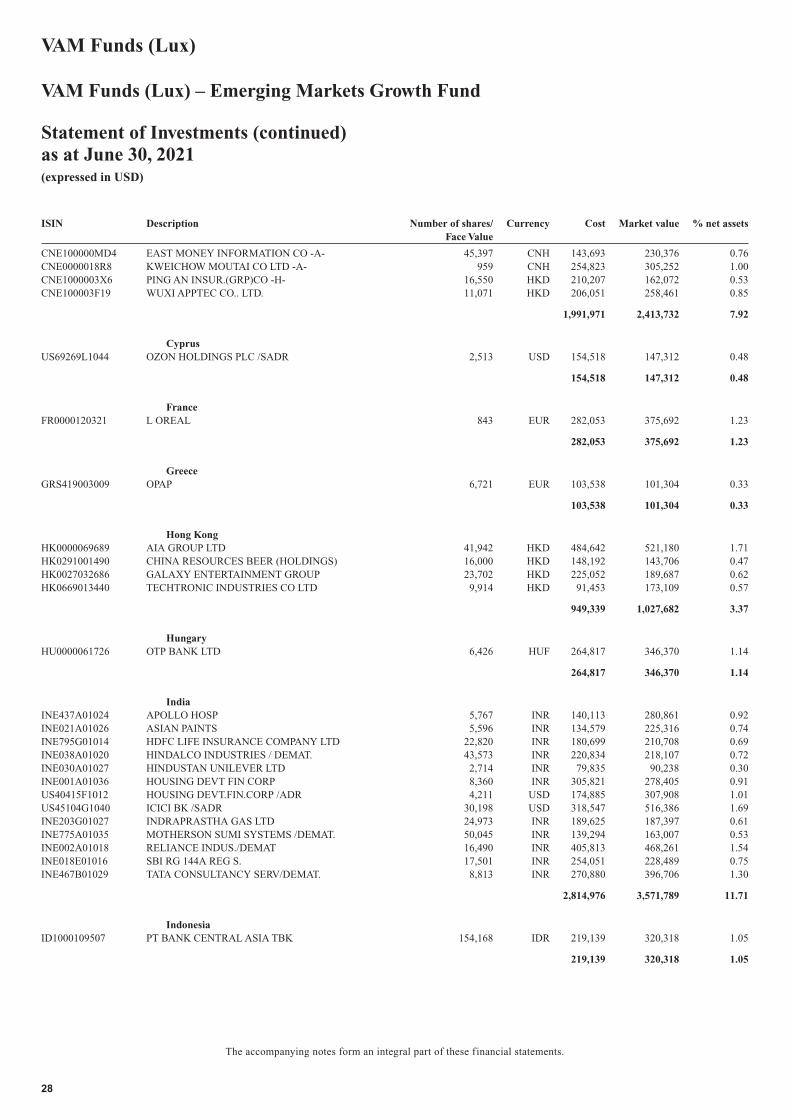
CNE100000MD4 EAST MONEY INFORMATION CO -A- 45,397 CNH 143,693 230,376 0.76CNE0000018R8 KWEICHOW MOUTAI CO LTD -A- 959 CNH 254,823 305,252 1.00CNE1000003X6 PING AN INSUR.(GRP)CO -H- 16,550 HKD 210,207 162,072 0.53CNE100003F19 WUXI APPTEC CO.. LTD. 11,071 HKD 206,051 258,461 0.85
1,991,971 2,413,732 7.92
CyprusUS69269L1044 OZON HOLDINGS PLC /SADR 2,513 USD 154,518 147,312 0.48
154,518 147,312 0.48
FranceFR0000120321 L OREAL 843 EUR 282,053 375,692 1.23
282,053 375,692 1.23
GreeceGRS419003009 OPAP 6,721 EUR 103,538 101,304 0.33
103,538 101,304 0.33
Hong KongHK0000069689 AIA GROUP LTD 41,942 HKD 484,642 521,180 1.71HK0291001490 CHINA RESOURCES BEER (HOLDINGS) 16,000 HKD 148,192 143,706 0.47HK0027032686 GALAXY ENTERTAINMENT GROUP 23,702 HKD 225,052 189,687 0.62HK0669013440 TECHTRONIC INDUSTRIES CO LTD 9,914 HKD 91,453 173,109 0.57
949,339 1,027,682 3.37
HungaryHU0000061726 OTP BANK LTD 6,426 HUF 264,817 346,370 1.14
264,817 346,370 1.14
IndiaINE437A01024 APOLLO HOSP 5,767 INR 140,113 280,861 0.92INE021A01026 ASIAN PAINTS 5,596 INR 134,579 225,316 0.74INE795G01014 HDFC LIFE INSURANCE COMPANY LTD 22,820 INR 180,699 210,708 0.69INE038A01020 HINDALCO INDUSTRIES / DEMAT. 43,573 INR 220,834 218,107 0.72INE030A01027 HINDUSTAN UNILEVER LTD 2,714 INR 79,835 90,238 0.30INE001A01036 HOUSING DEVT FIN CORP 8,360 INR 305,821 278,405 0.91US40415F1012 HOUSING DEVT.FIN.CORP /ADR 4,211 USD 174,885 307,908 1.01US45104G1040 ICICI BK /SADR 30,198 USD 318,547 516,386 1.69INE203G01027 INDRAPRASTHA GAS LTD 24,973 INR 189,625 187,397 0.61INE775A01035 MOTHERSON SUMI SYSTEMS /DEMAT. 50,045 INR 139,294 163,007 0.53INE002A01018 RELIANCE INDUS./DEMAT 16,490 INR 405,813 468,261 1.54INE018E01016 SBI RG 144A REG S. 17,501 INR 254,051 228,489 0.75INE467B01029 TATA CONSULTANCY SERV/DEMAT. 8,813 INR 270,880 396,706 1.30
2,814,976 3,571,789 11.71
IndonesiaID1000109507 PT BANK CENTRAL ASIA TBK 154,168 IDR 219,139 320,318 1.05
219,139 320,318 1.05
VAM Funds (Lux)
VAM Funds (Lux) – Emerging Markets Growth Fund
Statement of Investments (continued)as at June 30, 2021(expressed in USD)
The accompanying notes form an integral part of these financial statements.
28
ISIN Description Number of shares/Face Value
Currency Cost Market value % net assets
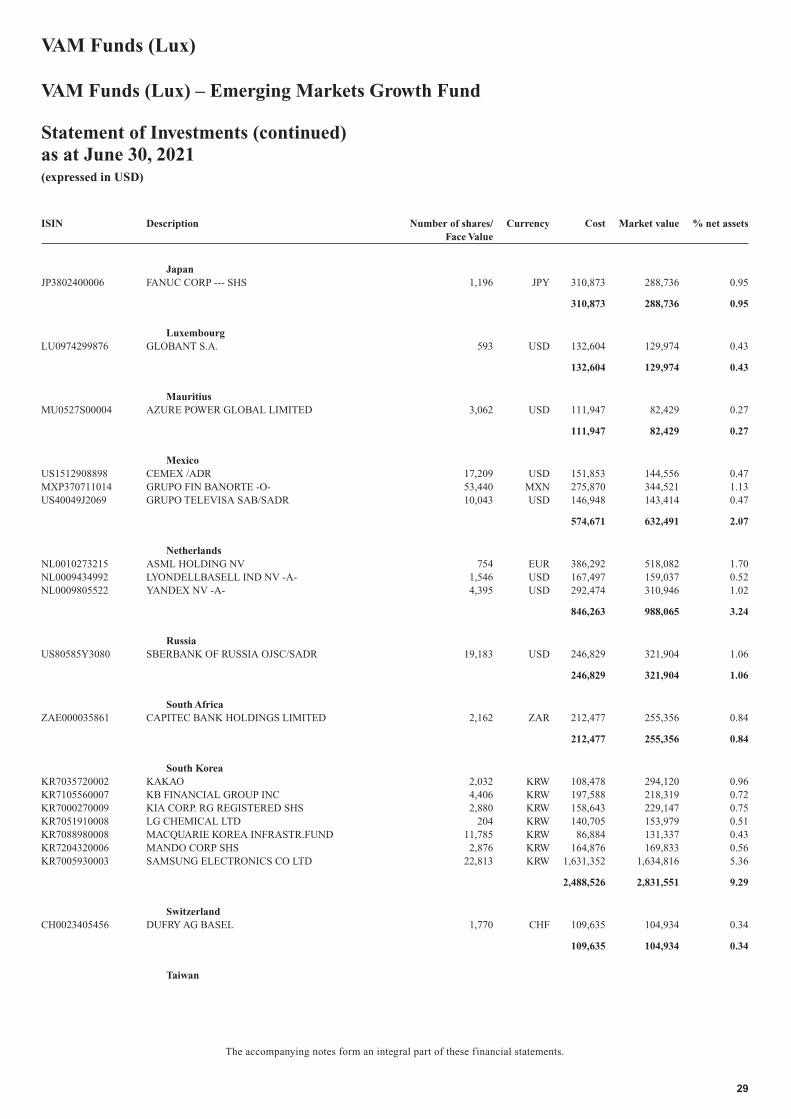
JapanJP3802400006 FANUC CORP --- SHS 1,196 JPY 310,873 288,736 0.95
310,873 288,736 0.95
LuxembourgLU0974299876 GLOBANT S.A. 593 USD 132,604 129,974 0.43
132,604 129,974 0.43
MauritiusMU0527S00004 AZURE POWER GLOBAL LIMITED 3,062 USD 111,947 82,429 0.27
111,947 82,429 0.27
MexicoUS1512908898 CEMEX /ADR 17,209 USD 151,853 144,556 0.47MXP370711014 GRUPO FIN BANORTE -O- 53,440 MXN 275,870 344,521 1.13US40049J2069 GRUPO TELEVISA SAB/SADR 10,043 USD 146,948 143,414 0.47
574,671 632,491 2.07
NetherlandsNL0010273215 ASML HOLDING NV 754 EUR 386,292 518,082 1.70NL0009434992 LYONDELLBASELL IND NV -A- 1,546 USD 167,497 159,037 0.52NL0009805522 YANDEX NV -A- 4,395 USD 292,474 310,946 1.02
846,263 988,065 3.24
RussiaUS80585Y3080 SBERBANK OF RUSSIA OJSC/SADR 19,183 USD 246,829 321,904 1.06
246,829 321,904 1.06
South AfricaZAE000035861 CAPITEC BANK HOLDINGS LIMITED 2,162 ZAR 212,477 255,356 0.84
212,477 255,356 0.84
South KoreaKR7035720002 KAKAO 2,032 KRW 108,478 294,120 0.96KR7105560007 KB FINANCIAL GROUP INC 4,406 KRW 197,588 218,319 0.72KR7000270009 KIA CORP. RG REGISTERED SHS 2,880 KRW 158,643 229,147 0.75KR7051910008 LG CHEMICAL LTD 204 KRW 140,705 153,979 0.51KR7088980008 MACQUARIE KOREA INFRASTR.FUND 11,785 KRW 86,884 131,337 0.43KR7204320006 MANDO CORP SHS 2,876 KRW 164,876 169,833 0.56KR7005930003 SAMSUNG ELECTRONICS CO LTD 22,813 KRW 1,631,352 1,634,816 5.36
2,488,526 2,831,551 9.29
SwitzerlandCH0023405456 DUFRY AG BASEL 1,770 CHF 109,635 104,934 0.34
109,635 104,934 0.34
Taiwan
VAM Funds (Lux)
VAM Funds (Lux) – Emerging Markets Growth Fund
Statement of Investments (continued)as at June 30, 2021(expressed in USD)
The accompanying notes form an integral part of these financial statements.
29
ISIN Description Number of shares/Face Value
Currency Cost Market value % net assets
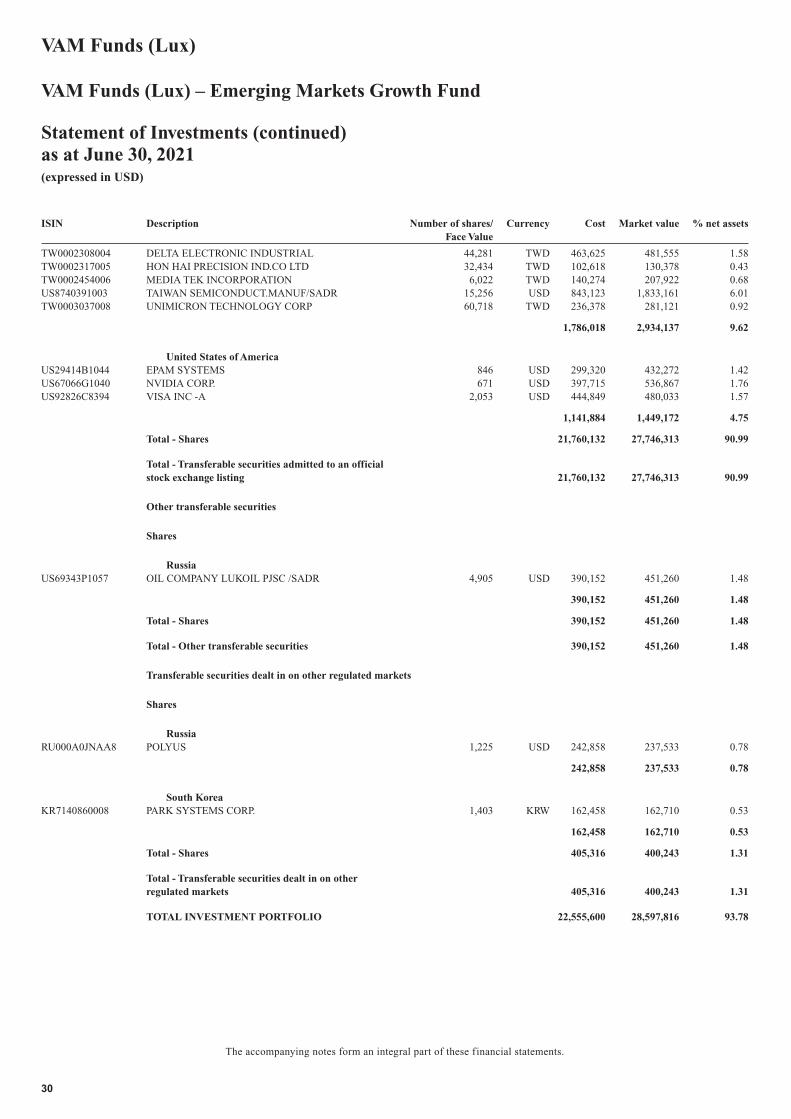
TW0002308004 DELTA ELECTRONIC INDUSTRIAL 44,281 TWD 463,625 481,555 1.58TW0002317005 HON HAI PRECISION IND.CO LTD 32,434 TWD 102,618 130,378 0.43TW0002454006 MEDIA TEK INCORPORATION 6,022 TWD 140,274 207,922 0.68US8740391003 TAIWAN SEMICONDUCT.MANUF/SADR 15,256 USD 843,123 1,833,161 6.01TW0003037008 UNIMICRON TECHNOLOGY CORP 60,718 TWD 236,378 281,121 0.92
1,786,018 2,934,137 9.62
United States of AmericaUS29414B1044 EPAM SYSTEMS 846 USD 299,320 432,272 1.42US67066G1040 NVIDIA CORP. 671 USD 397,715 536,867 1.76US92826C8394 VISA INC -A 2,053 USD 444,849 480,033 1.57
1,141,884 1,449,172 4.75
Total - Shares 21,760,132 27,746,313 90.99
Total - Transferable securities admitted to an officialstock exchange listing 21,760,132 27,746,313 90.99
Other transferable securities
Shares
RussiaUS69343P1057 OIL COMPANY LUKOIL PJSC /SADR 4,905 USD 390,152 451,260 1.48
390,152 451,260 1.48
Total - Shares 390,152 451,260 1.48
Total - Other transferable securities 390,152 451,260 1.48
Transferable securities dealt in on other regulated markets
Shares
RussiaRU000A0JNAA8 POLYUS 1,225 USD 242,858 237,533 0.78
242,858 237,533 0.78
South KoreaKR7140860008 PARK SYSTEMS CORP. 1,403 KRW 162,458 162,710 0.53
162,458 162,710 0.53
Total - Shares 405,316 400,243 1.31
Total - Transferable securities dealt in on otherregulated markets 405,316 400,243 1.31
TOTAL INVESTMENT PORTFOLIO 22,555,600 28,597,816 93.78
VAM Funds (Lux)
VAM Funds (Lux) – Emerging Markets Growth Fund
Statement of Investments (continued)as at June 30, 2021(expressed in USD)
The accompanying notes form an integral part of these financial statements.
30
ISIN Description Number of shares/Face Value
Currency Cost Market value % net assets
Transferable securities admitted to an official stock exchange listing
Rights
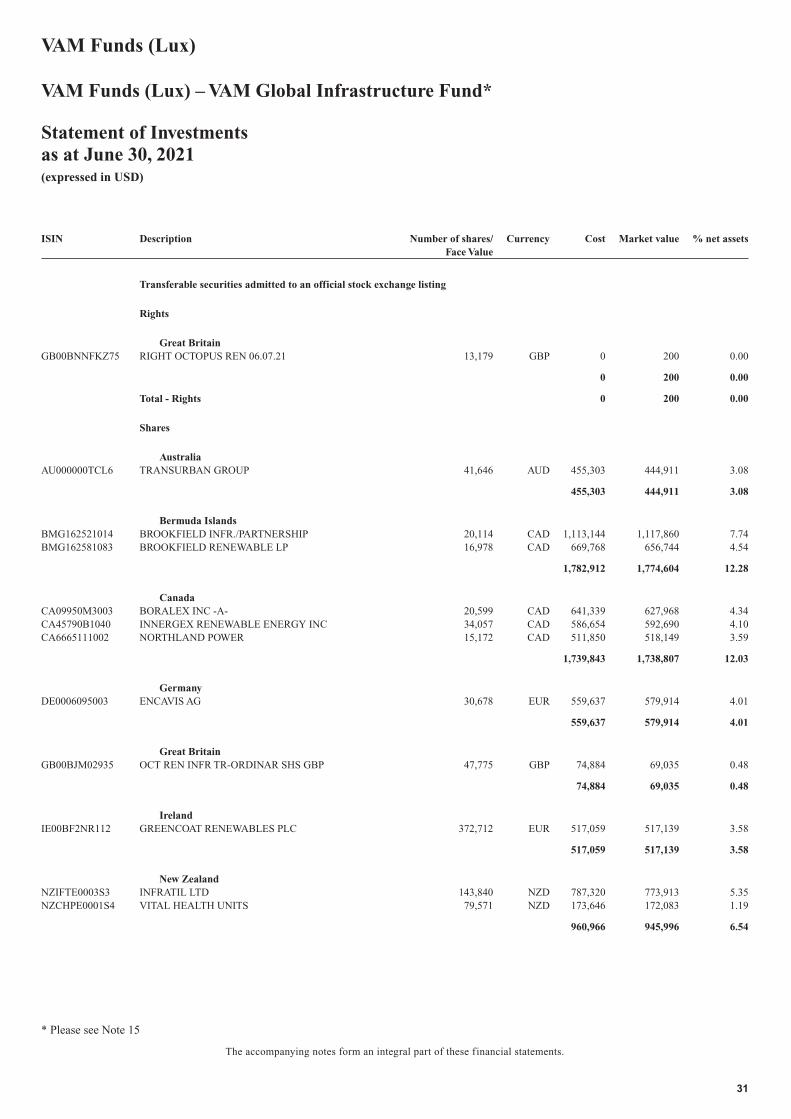
Great BritainGB00BNNFKZ75 RIGHT OCTOPUS REN 06.07.21 13,179 GBP 0 200 0.00
0 200 0.00
Total - Rights 0 200 0.00
Shares
AustraliaAU000000TCL6 TRANSURBAN GROUP 41,646 AUD 455,303 444,911 3.08
455,303 444,911 3.08
Bermuda IslandsBMG162521014 BROOKFIELD INFR./PARTNERSHIP 20,114 CAD 1,113,144 1,117,860 7.74BMG162581083 BROOKFIELD RENEWABLE LP 16,978 CAD 669,768 656,744 4.54
1,782,912 1,774,604 12.28
CanadaCA09950M3003 BORALEX INC -A- 20,599 CAD 641,339 627,968 4.34CA45790B1040 INNERGEX RENEWABLE ENERGY INC 34,057 CAD 586,654 592,690 4.10CA6665111002 NORTHLAND POWER 15,172 CAD 511,850 518,149 3.59
1,739,843 1,738,807 12.03
GermanyDE0006095003 ENCAVIS AG 30,678 EUR 559,637 579,914 4.01
559,637 579,914 4.01
Great BritainGB00BJM02935 OCT REN INFR TR-ORDINAR SHS GBP 47,775 GBP 74,884 69,035 0.48
74,884 69,035 0.48
IrelandIE00BF2NR112 GREENCOAT RENEWABLES PLC 372,712 EUR 517,059 517,139 3.58
517,059 517,139 3.58
New ZealandNZIFTE0003S3 INFRATIL LTD 143,840 NZD 787,320 773,913 5.35NZCHPE0001S4 VITAL HEALTH UNITS 79,571 NZD 173,646 172,083 1.19
960,966 945,996 6.54
VAM Funds (Lux)
VAM Funds (Lux) – VAM Global Infrastructure Fund*
Statement of Investmentsas at June 30, 2021(expressed in USD)
* Please see Note 15
The accompanying notes form an integral part of these financial statements.
31
ISIN Description Number of shares/Face Value
Currency Cost Market value % net assets
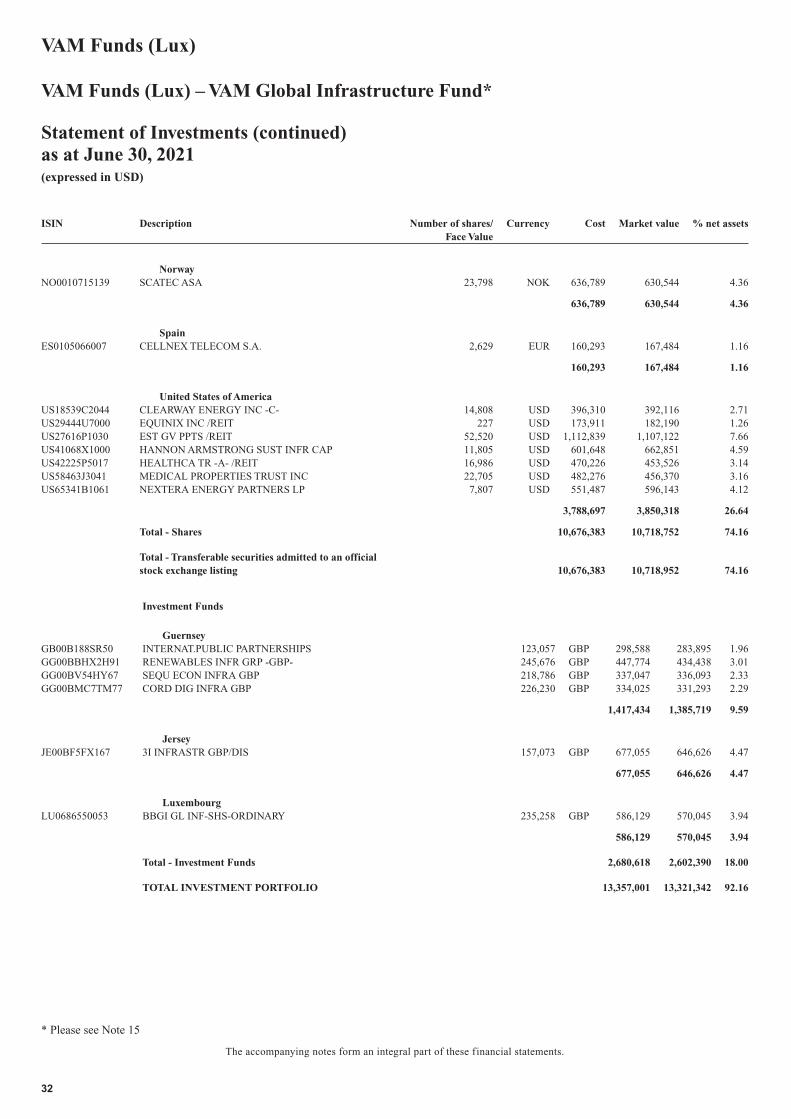
NorwayNO0010715139 SCATEC ASA 23,798 NOK 636,789 630,544 4.36
636,789 630,544 4.36
SpainES0105066007 CELLNEX TELECOM S.A. 2,629 EUR 160,293 167,484 1.16
160,293 167,484 1.16
United States of AmericaUS18539C2044 CLEARWAY ENERGY INC -C- 14,808 USD 396,310 392,116 2.71US29444U7000 EQUINIX INC /REIT 227 USD 173,911 182,190 1.26US27616P1030 EST GV PPTS /REIT 52,520 USD 1,112,839 1,107,122 7.66US41068X1000 HANNON ARMSTRONG SUST INFR CAP 11,805 USD 601,648 662,851 4.59US42225P5017 HEALTHCA TR -A- /REIT 16,986 USD 470,226 453,526 3.14US58463J3041 MEDICAL PROPERTIES TRUST INC 22,705 USD 482,276 456,370 3.16US65341B1061 NEXTERA ENERGY PARTNERS LP 7,807 USD 551,487 596,143 4.12
3,788,697 3,850,318 26.64
Total - Shares 10,676,383 10,718,752 74.16
Total - Transferable securities admitted to an officialstock exchange listing 10,676,383 10,718,952 74.16
Investment Funds
GuernseyGB00B188SR50 INTERNAT.PUBLIC PARTNERSHIPS 123,057 GBP 298,588 283,895 1.96GG00BBHX2H91 RENEWABLES INFR GRP -GBP- 245,676 GBP 447,774 434,438 3.01GG00BV54HY67 SEQU ECON INFRA GBP 218,786 GBP 337,047 336,093 2.33GG00BMC7TM77 CORD DIG INFRA GBP 226,230 GBP 334,025 331,293 2.29
1,417,434 1,385,719 9.59
JerseyJE00BF5FX167 3I INFRASTR GBP/DIS 157,073 GBP 677,055 646,626 4.47
677,055 646,626 4.47
LuxembourgLU0686550053 BBGI GL INF-SHS-ORDINARY 235,258 GBP 586,129 570,045 3.94
586,129 570,045 3.94
Total - Investment Funds 2,680,618 2,602,390 18.00
TOTAL INVESTMENT PORTFOLIO 13,357,001 13,321,342 92.16
VAM Funds (Lux)
VAM Funds (Lux) – VAM Global Infrastructure Fund*
Statement of Investments (continued)as at June 30, 2021(expressed in USD)
* Please see Note 15
The accompanying notes form an integral part of these financial statements.
32
ISIN Description Number of shares/Face Value
Currency Cost Market value % net assets
Transferable securities admitted to an official stock exchange listing
Shares
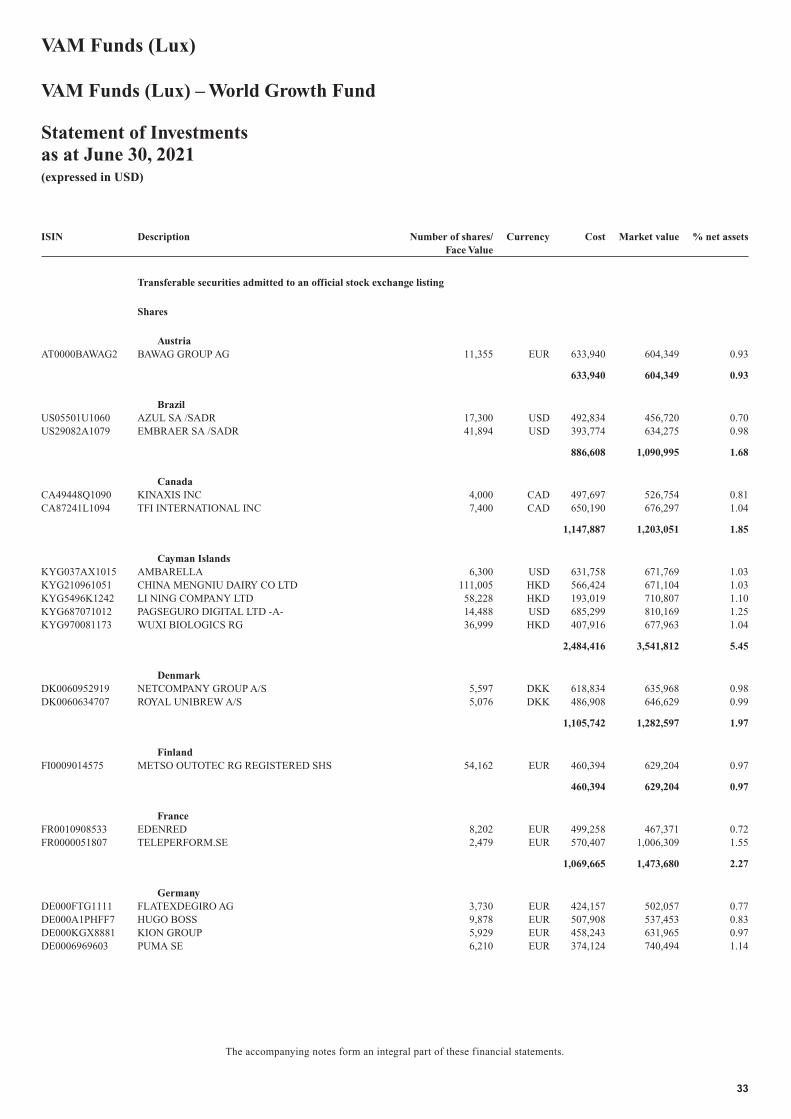
AustriaAT0000BAWAG2 BAWAG GROUP AG 11,355 EUR 633,940 604,349 0.93
633,940 604,349 0.93
BrazilUS05501U1060 AZUL SA /SADR 17,300 USD 492,834 456,720 0.70US29082A1079 EMBRAER SA /SADR 41,894 USD 393,774 634,275 0.98
886,608 1,090,995 1.68
CanadaCA49448Q1090 KINAXIS INC 4,000 CAD 497,697 526,754 0.81CA87241L1094 TFI INTERNATIONAL INC 7,400 CAD 650,190 676,297 1.04
1,147,887 1,203,051 1.85
Cayman IslandsKYG037AX1015 AMBARELLA 6,300 USD 631,758 671,769 1.03KYG210961051 CHINA MENGNIU DAIRY CO LTD 111,005 HKD 566,424 671,104 1.03KYG5496K1242 LI NING COMPANY LTD 58,228 HKD 193,019 710,807 1.10KYG687071012 PAGSEGURO DIGITAL LTD -A- 14,488 USD 685,299 810,169 1.25KYG970081173 WUXI BIOLOGICS RG 36,999 HKD 407,916 677,963 1.04
2,484,416 3,541,812 5.45
DenmarkDK0060952919 NETCOMPANY GROUP A/S 5,597 DKK 618,834 635,968 0.98DK0060634707 ROYAL UNIBREW A/S 5,076 DKK 486,908 646,629 0.99
1,105,742 1,282,597 1.97
FinlandFI0009014575 METSO OUTOTEC RG REGISTERED SHS 54,162 EUR 460,394 629,204 0.97
460,394 629,204 0.97
FranceFR0010908533 EDENRED 8,202 EUR 499,258 467,371 0.72FR0000051807 TELEPERFORM.SE 2,479 EUR 570,407 1,006,309 1.55
1,069,665 1,473,680 2.27
GermanyDE000FTG1111 FLATEXDEGIRO AG 3,730 EUR 424,157 502,057 0.77DE000A1PHFF7 HUGO BOSS 9,878 EUR 507,908 537,453 0.83DE000KGX8881 KION GROUP 5,929 EUR 458,243 631,965 0.97DE0006969603 PUMA SE 6,210 EUR 374,124 740,494 1.14
VAM Funds (Lux)
VAM Funds (Lux) – World Growth Fund
Statement of Investmentsas at June 30, 2021(expressed in USD)
The accompanying notes form an integral part of these financial statements.
33
ISIN Description Number of shares/Face Value
Currency Cost Market value % net assets
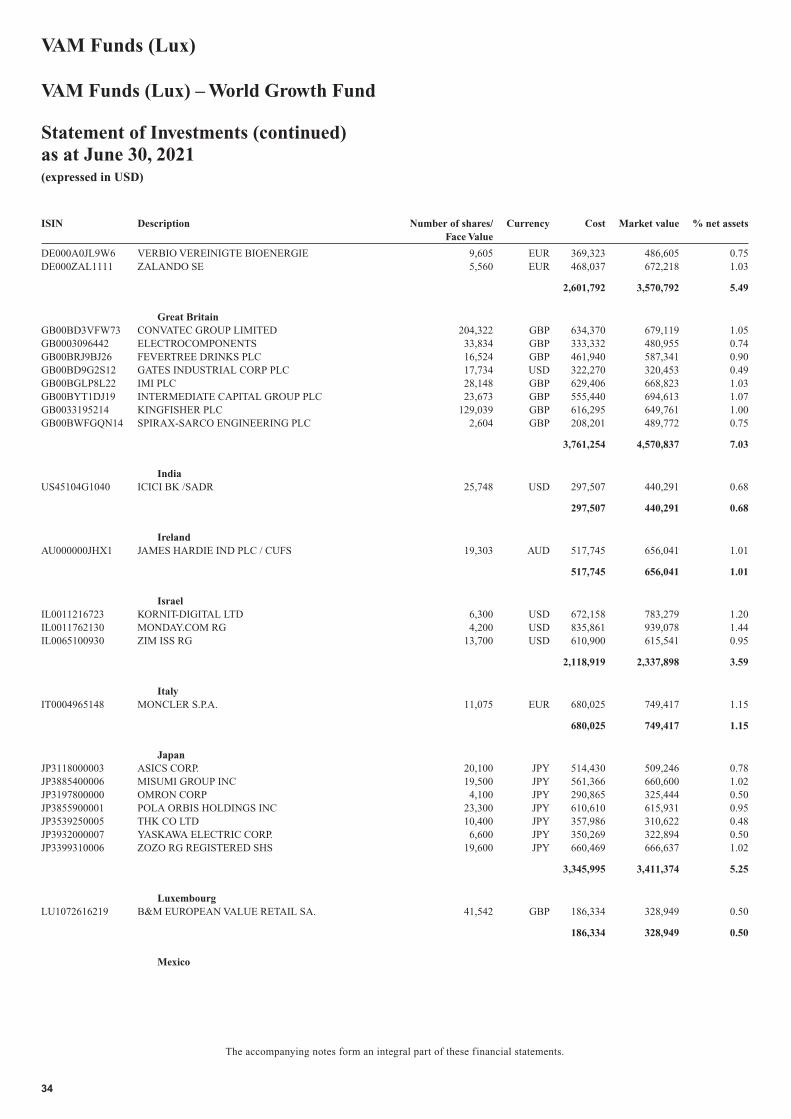
DE000A0JL9W6 VERBIO VEREINIGTE BIOENERGIE 9,605 EUR 369,323 486,605 0.75DE000ZAL1111 ZALANDO SE 5,560 EUR 468,037 672,218 1.03
2,601,792 3,570,792 5.49
Great BritainGB00BD3VFW73 CONVATEC GROUP LIMITED 204,322 GBP 634,370 679,119 1.05GB0003096442 ELECTROCOMPONENTS 33,834 GBP 333,332 480,955 0.74GB00BRJ9BJ26 FEVERTREE DRINKS PLC 16,524 GBP 461,940 587,341 0.90GB00BD9G2S12 GATES INDUSTRIAL CORP PLC 17,734 USD 322,270 320,453 0.49GB00BGLP8L22 IMI PLC 28,148 GBP 629,406 668,823 1.03GB00BYT1DJ19 INTERMEDIATE CAPITAL GROUP PLC 23,673 GBP 555,440 694,613 1.07GB0033195214 KINGFISHER PLC 129,039 GBP 616,295 649,761 1.00GB00BWFGQN14 SPIRAX-SARCO ENGINEERING PLC 2,604 GBP 208,201 489,772 0.75
3,761,254 4,570,837 7.03
IndiaUS45104G1040 ICICI BK /SADR 25,748 USD 297,507 440,291 0.68
297,507 440,291 0.68
IrelandAU000000JHX1 JAMES HARDIE IND PLC / CUFS 19,303 AUD 517,745 656,041 1.01
517,745 656,041 1.01
IsraelIL0011216723 KORNIT-DIGITAL LTD 6,300 USD 672,158 783,279 1.20IL0011762130 MONDAY.COM RG 4,200 USD 835,861 939,078 1.44IL0065100930 ZIM ISS RG 13,700 USD 610,900 615,541 0.95
2,118,919 2,337,898 3.59
ItalyIT0004965148 MONCLER S.P.A. 11,075 EUR 680,025 749,417 1.15
680,025 749,417 1.15
JapanJP3118000003 ASICS CORP. 20,100 JPY 514,430 509,246 0.78JP3885400006 MISUMI GROUP INC 19,500 JPY 561,366 660,600 1.02JP3197800000 OMRON CORP 4,100 JPY 290,865 325,444 0.50JP3855900001 POLA ORBIS HOLDINGS INC 23,300 JPY 610,610 615,931 0.95JP3539250005 THK CO LTD 10,400 JPY 357,986 310,622 0.48JP3932000007 YASKAWA ELECTRIC CORP. 6,600 JPY 350,269 322,894 0.50JP3399310006 ZOZO RG REGISTERED SHS 19,600 JPY 660,469 666,637 1.02
3,345,995 3,411,374 5.25
LuxembourgLU1072616219 B&M EUROPEAN VALUE RETAIL SA. 41,542 GBP 186,334 328,949 0.50
186,334 328,949 0.50
Mexico
VAM Funds (Lux)
VAM Funds (Lux) – World Growth Fund
Statement of Investments (continued)as at June 30, 2021(expressed in USD)
The accompanying notes form an integral part of these financial statements.
34
ISIN Description Number of shares/Face Value
Currency Cost Market value % net assets
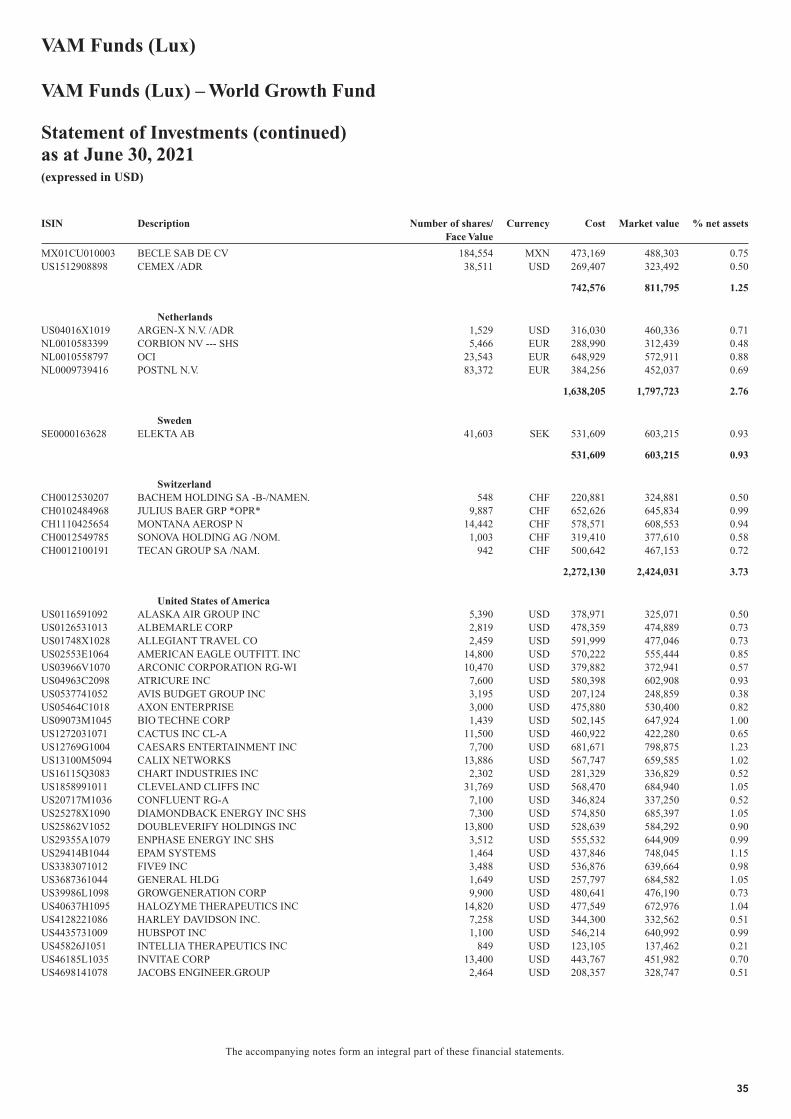
MX01CU010003 BECLE SAB DE CV 184,554 MXN 473,169 488,303 0.75US1512908898 CEMEX /ADR 38,511 USD 269,407 323,492 0.50
742,576 811,795 1.25
NetherlandsUS04016X1019 ARGEN-X N.V. /ADR 1,529 USD 316,030 460,336 0.71NL0010583399 CORBION NV --- SHS 5,466 EUR 288,990 312,439 0.48NL0010558797 OCI 23,543 EUR 648,929 572,911 0.88NL0009739416 POSTNL N.V. 83,372 EUR 384,256 452,037 0.69
1,638,205 1,797,723 2.76
SwedenSE0000163628 ELEKTA AB 41,603 SEK 531,609 603,215 0.93
531,609 603,215 0.93
SwitzerlandCH0012530207 BACHEM HOLDING SA -B-/NAMEN. 548 CHF 220,881 324,881 0.50CH0102484968 JULIUS BAER GRP *OPR* 9,887 CHF 652,626 645,834 0.99CH1110425654 MONTANA AEROSP N 14,442 CHF 578,571 608,553 0.94CH0012549785 SONOVA HOLDING AG /NOM. 1,003 CHF 319,410 377,610 0.58CH0012100191 TECAN GROUP SA /NAM. 942 CHF 500,642 467,153 0.72
2,272,130 2,424,031 3.73
United States of AmericaUS0116591092 ALASKA AIR GROUP INC 5,390 USD 378,971 325,071 0.50US0126531013 ALBEMARLE CORP 2,819 USD 478,359 474,889 0.73US01748X1028 ALLEGIANT TRAVEL CO 2,459 USD 591,999 477,046 0.73US02553E1064 AMERICAN EAGLE OUTFITT. INC 14,800 USD 570,222 555,444 0.85US03966V1070 ARCONIC CORPORATION RG-WI 10,470 USD 379,882 372,941 0.57US04963C2098 ATRICURE INC 7,600 USD 580,398 602,908 0.93US0537741052 AVIS BUDGET GROUP INC 3,195 USD 207,124 248,859 0.38US05464C1018 AXON ENTERPRISE 3,000 USD 475,880 530,400 0.82US09073M1045 BIO TECHNE CORP 1,439 USD 502,145 647,924 1.00US1272031071 CACTUS INC CL-A 11,500 USD 460,922 422,280 0.65US12769G1004 CAESARS ENTERTAINMENT INC 7,700 USD 681,671 798,875 1.23US13100M5094 CALIX NETWORKS 13,886 USD 567,747 659,585 1.02US16115Q3083 CHART INDUSTRIES INC 2,302 USD 281,329 336,829 0.52US1858991011 CLEVELAND CLIFFS INC 31,769 USD 568,470 684,940 1.05US20717M1036 CONFLUENT RG-A 7,100 USD 346,824 337,250 0.52US25278X1090 DIAMONDBACK ENERGY INC SHS 7,300 USD 574,850 685,397 1.05US25862V1052 DOUBLEVERIFY HOLDINGS INC 13,800 USD 528,639 584,292 0.90US29355A1079 ENPHASE ENERGY INC SHS 3,512 USD 555,532 644,909 0.99US29414B1044 EPAM SYSTEMS 1,464 USD 437,846 748,045 1.15US3383071012 FIVE9 INC 3,488 USD 536,876 639,664 0.98US3687361044 GENERAL HLDG 1,649 USD 257,797 684,582 1.05US39986L1098 GROWGENERATION CORP 9,900 USD 480,641 476,190 0.73US40637H1095 HALOZYME THERAPEUTICS INC 14,820 USD 477,549 672,976 1.04US4128221086 HARLEY DAVIDSON INC. 7,258 USD 344,300 332,562 0.51US4435731009 HUBSPOT INC 1,100 USD 546,214 640,992 0.99US45826J1051 INTELLIA THERAPEUTICS INC 849 USD 123,105 137,462 0.21US46185L1035 INVITAE CORP 13,400 USD 443,767 451,982 0.70US4698141078 JACOBS ENGINEER.GROUP 2,464 USD 208,357 328,747 0.51
VAM Funds (Lux)
VAM Funds (Lux) – World Growth Fund
Statement of Investments (continued)as at June 30, 2021(expressed in USD)
The accompanying notes form an integral part of these financial statements.
35
ISIN Description Number of shares/Face Value
Currency Cost Market value % net assets
US47233W1099 JEFFERIES FINANCIAL GROUP INC 12,500 USD 432,643 427,500 0.66US51819L1070 LATHAM GROUP RG 10,698 USD 219,058 341,908 0.53US5184151042 LATTICE SEMICONDUCTOR CORP 12,139 USD 477,529 681,969 1.05US5738741041 MARVELL TECH RG 12,500 USD 642,046 729,125 1.12US5962781010 MIDDLEBY CORP 1,947 USD 320,068 337,337 0.52US55306N1046 MKS INSTRUMENTS INC 1,900 USD 328,621 338,105 0.52US60937P1066 MONGODB INC -A- 889 USD 221,148 321,391 0.49US5533681012 MP MATERIALS RG-A 19,778 USD 594,070 729,017 1.12US6323071042 NATERA INC 7,191 USD 779,058 816,394 1.26US6556631025 NORDSON CORP 1,400 USD 308,608 307,314 0.47US69327R1014 PDC ENERGY 10,200 USD 502,962 467,058 0.72US74467Q1031 PUBMATIC RG-A 18,171 USD 700,101 709,941 1.09US74736K1016 QORVO INC 2,717 USD 435,435 531,581 0.82US75943R1023 RELAY THERAPETCS RG 18,198 USD 725,282 665,865 1.02US77543R1023 ROKU INC 2,185 USD 504,000 1,003,461 1.54US8308301055 SKYLINE CHAMPION CORPORATION 6,600 USD 339,638 351,780 0.54US85205L1070 SPRINGWORKS THERAPEUTICS INC 7,600 USD 641,315 626,316 0.96US85209W1099 SPROUT SOCIAL RG-A 3,581 USD 231,273 320,213 0.49US86614U1007 SUMMIT MATERIALS INC 19,039 USD 566,969 663,509 1.02US78486Q1013 SVB FINANCIAL GROUP 609 USD 338,357 338,866 0.52US87157D1090 SYNAPTICS INC 5,005 USD 394,419 778,678 1.20US88076W1036 TERADATA 15,220 USD 604,974 760,543 1.17US05478C1053 THE AZEK CO RG-A 7,564 USD 246,733 321,167 0.49US26414D1063 THE DUCKHORN PRT RG 22,500 USD 487,413 496,350 0.76US90384S3031 ULTA BEAUTY INC 2,400 USD 825,680 829,848 1.28US9113631090 UNITED RENTALS INC. 1,055 USD 218,051 336,556 0.52US91688F1049 UPWORK INC 9,100 USD 478,291 530,439 0.82US9258151029 VICOR CORP 6,700 USD 640,737 708,458 1.09US92858V1017 VIZIO HOLDING RG-A 25,800 USD 602,658 696,858 1.07US3848021040 WW GRAINGER INC 726 USD 294,973 317,988 0.49US9837931008 XPO LOGISTICS INC 4,550 USD 508,875 636,499 0.98US98980B1035 ZIPRECRUITER RG-A 17,000 USD 409,730 424,660 0.65US98980G1022 ZSCALER INC 2,944 USD 444,675 636,081 0.98
28,052,806 32,685,816 50.27
Total - Shares 54,535,549 64,213,867 98.76
Total - Transferable securities admitted to an officialstock exchange listing 54,535,549 64,213,867 98.76
TOTAL INVESTMENT PORTFOLIO 54,535,549 64,213,867 98.76
VAM Funds (Lux)
VAM Funds (Lux) – World Growth Fund
Statement of Investments (continued)as at June 30, 2021(expressed in USD)
The accompanying notes form an integral part of these financial statements.
36
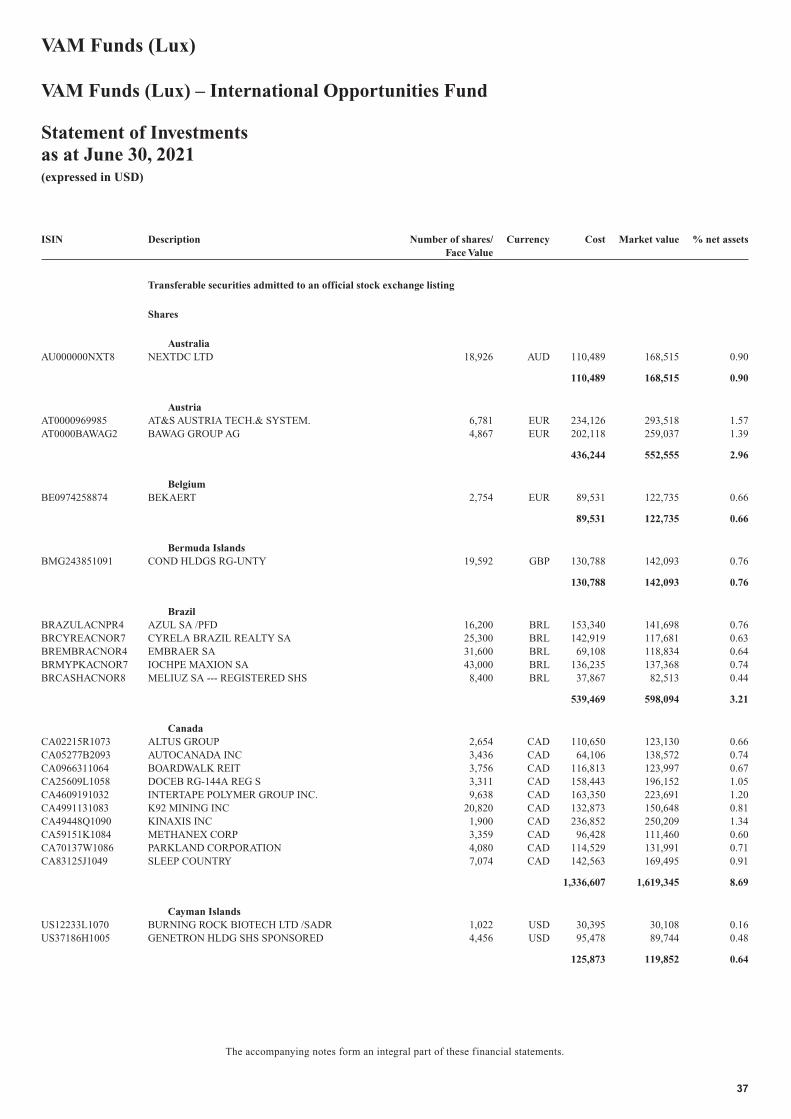
ISIN Description Number of shares/Face Value
Currency Cost Market value % net assets
Transferable securities admitted to an official stock exchange listing
Shares
AustraliaAU000000NXT8 NEXTDC LTD 18,926 AUD 110,489 168,515 0.90
110,489 168,515 0.90
AustriaAT0000969985 AT&S AUSTRIA TECH.& SYSTEM. 6,781 EUR 234,126 293,518 1.57AT0000BAWAG2 BAWAG GROUP AG 4,867 EUR 202,118 259,037 1.39
436,244 552,555 2.96
BelgiumBE0974258874 BEKAERT 2,754 EUR 89,531 122,735 0.66
89,531 122,735 0.66
Bermuda IslandsBMG243851091 COND HLDGS RG-UNTY 19,592 GBP 130,788 142,093 0.76
130,788 142,093 0.76
BrazilBRAZULACNPR4 AZUL SA /PFD 16,200 BRL 153,340 141,698 0.76BRCYREACNOR7 CYRELA BRAZIL REALTY SA 25,300 BRL 142,919 117,681 0.63BREMBRACNOR4 EMBRAER SA 31,600 BRL 69,108 118,834 0.64BRMYPKACNOR7 IOCHPE MAXION SA 43,000 BRL 136,235 137,368 0.74BRCASHACNOR8 MELIUZ SA --- REGISTERED SHS 8,400 BRL 37,867 82,513 0.44
539,469 598,094 3.21
CanadaCA02215R1073 ALTUS GROUP 2,654 CAD 110,650 123,130 0.66CA05277B2093 AUTOCANADA INC 3,436 CAD 64,106 138,572 0.74CA0966311064 BOARDWALK REIT 3,756 CAD 116,813 123,997 0.67CA25609L1058 DOCEB RG-144A REG S 3,311 CAD 158,443 196,152 1.05CA4609191032 INTERTAPE POLYMER GROUP INC. 9,638 CAD 163,350 223,691 1.20CA4991131083 K92 MINING INC 20,820 CAD 132,873 150,648 0.81CA49448Q1090 KINAXIS INC 1,900 CAD 236,852 250,209 1.34CA59151K1084 METHANEX CORP 3,359 CAD 96,428 111,460 0.60CA70137W1086 PARKLAND CORPORATION 4,080 CAD 114,529 131,991 0.71CA83125J1049 SLEEP COUNTRY 7,074 CAD 142,563 169,495 0.91
1,336,607 1,619,345 8.69
Cayman IslandsUS12233L1070 BURNING ROCK BIOTECH LTD /SADR 1,022 USD 30,395 30,108 0.16US37186H1005 GENETRON HLDG SHS SPONSORED 4,456 USD 95,478 89,744 0.48
125,873 119,852 0.64
VAM Funds (Lux)
VAM Funds (Lux) – International Opportunities Fund
Statement of Investmentsas at June 30, 2021(expressed in USD)
The accompanying notes form an integral part of these financial statements.
37
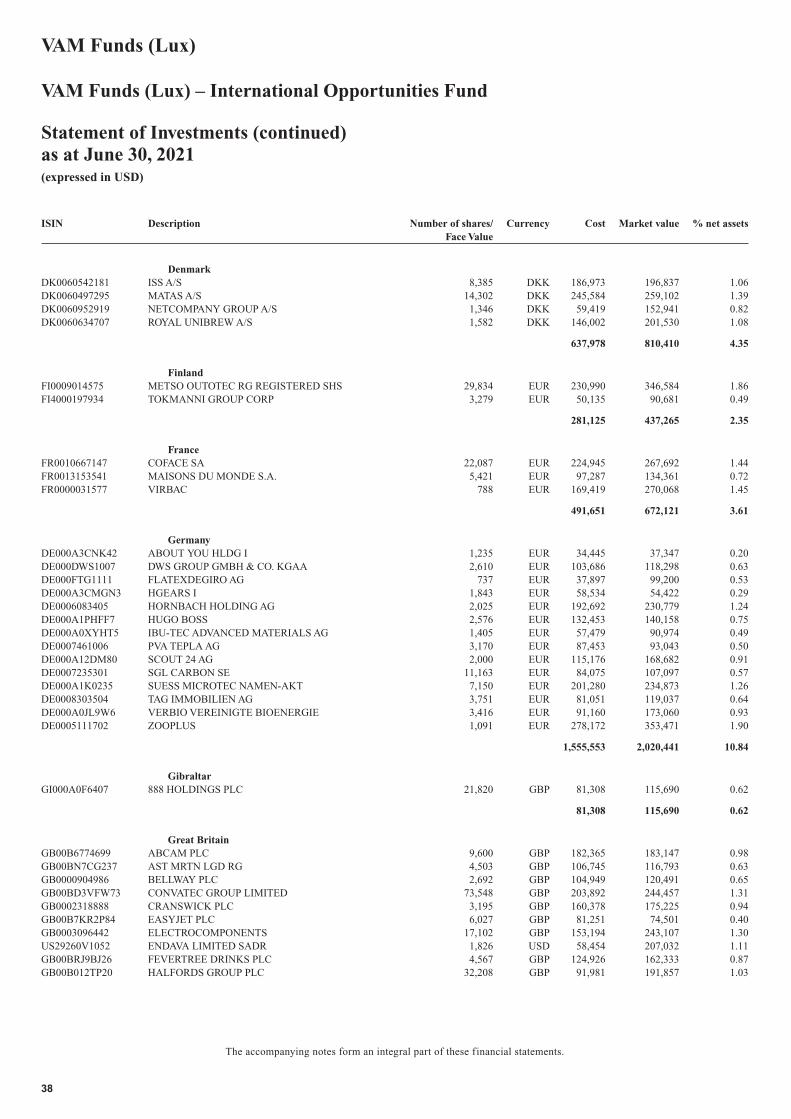
ISIN Description Number of shares/Face Value
Currency Cost Market value % net assets
DenmarkDK0060542181 ISS A/S 8,385 DKK 186,973 196,837 1.06DK0060497295 MATAS A/S 14,302 DKK 245,584 259,102 1.39DK0060952919 NETCOMPANY GROUP A/S 1,346 DKK 59,419 152,941 0.82DK0060634707 ROYAL UNIBREW A/S 1,582 DKK 146,002 201,530 1.08
637,978 810,410 4.35
FinlandFI0009014575 METSO OUTOTEC RG REGISTERED SHS 29,834 EUR 230,990 346,584 1.86FI4000197934 TOKMANNI GROUP CORP 3,279 EUR 50,135 90,681 0.49
281,125 437,265 2.35
FranceFR0010667147 COFACE SA 22,087 EUR 224,945 267,692 1.44FR0013153541 MAISONS DU MONDE S.A. 5,421 EUR 97,287 134,361 0.72FR0000031577 VIRBAC 788 EUR 169,419 270,068 1.45
491,651 672,121 3.61
GermanyDE000A3CNK42 ABOUT YOU HLDG I 1,235 EUR 34,445 37,347 0.20DE000DWS1007 DWS GROUP GMBH & CO. KGAA 2,610 EUR 103,686 118,298 0.63DE000FTG1111 FLATEXDEGIRO AG 737 EUR 37,897 99,200 0.53DE000A3CMGN3 HGEARS I 1,843 EUR 58,534 54,422 0.29DE0006083405 HORNBACH HOLDING AG 2,025 EUR 192,692 230,779 1.24DE000A1PHFF7 HUGO BOSS 2,576 EUR 132,453 140,158 0.75DE000A0XYHT5 IBU-TEC ADVANCED MATERIALS AG 1,405 EUR 57,479 90,974 0.49DE0007461006 PVA TEPLA AG 3,170 EUR 87,453 93,043 0.50DE000A12DM80 SCOUT 24 AG 2,000 EUR 115,176 168,682 0.91DE0007235301 SGL CARBON SE 11,163 EUR 84,075 107,097 0.57DE000A1K0235 SUESS MICROTEC NAMEN-AKT 7,150 EUR 201,280 234,873 1.26DE0008303504 TAG IMMOBILIEN AG 3,751 EUR 81,051 119,037 0.64DE000A0JL9W6 VERBIO VEREINIGTE BIOENERGIE 3,416 EUR 91,160 173,060 0.93DE0005111702 ZOOPLUS 1,091 EUR 278,172 353,471 1.90
1,555,553 2,020,441 10.84
GibraltarGI000A0F6407 888 HOLDINGS PLC 21,820 GBP 81,308 115,690 0.62
81,308 115,690 0.62
Great BritainGB00B6774699 ABCAM PLC 9,600 GBP 182,365 183,147 0.98GB00BN7CG237 AST MRTN LGD RG 4,503 GBP 106,745 116,793 0.63GB0000904986 BELLWAY PLC 2,692 GBP 104,949 120,491 0.65GB00BD3VFW73 CONVATEC GROUP LIMITED 73,548 GBP 203,892 244,457 1.31GB0002318888 CRANSWICK PLC 3,195 GBP 160,378 175,225 0.94GB00B7KR2P84 EASYJET PLC 6,027 GBP 81,251 74,501 0.40GB0003096442 ELECTROCOMPONENTS 17,102 GBP 153,194 243,107 1.30US29260V1052 ENDAVA LIMITED SADR 1,826 USD 58,454 207,032 1.11GB00BRJ9BJ26 FEVERTREE DRINKS PLC 4,567 GBP 124,926 162,333 0.87GB00B012TP20 HALFORDS GROUP PLC 32,208 GBP 91,981 191,857 1.03
VAM Funds (Lux)
VAM Funds (Lux) – International Opportunities Fund
Statement of Investments (continued)as at June 30, 2021(expressed in USD)
The accompanying notes form an integral part of these financial statements.
38
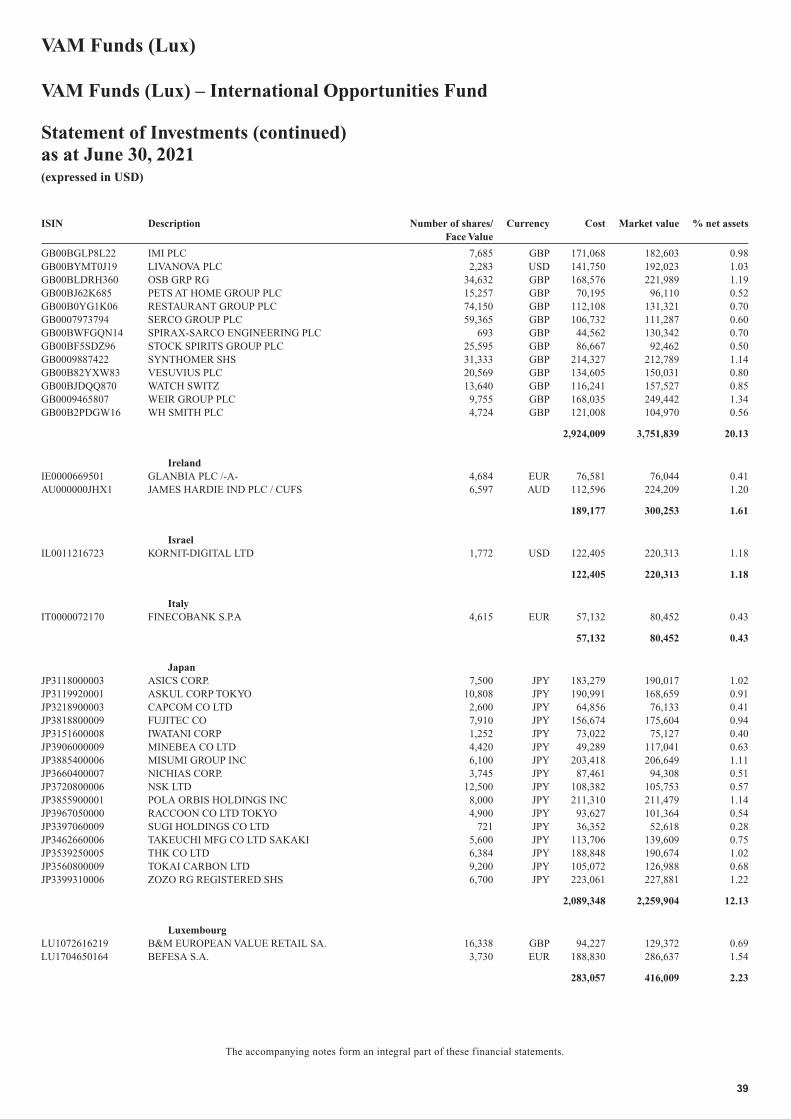
ISIN Description Number of shares/Face Value
Currency Cost Market value % net assets
GB00BGLP8L22 IMI PLC 7,685 GBP 171,068 182,603 0.98GB00BYMT0J19 LIVANOVA PLC 2,283 USD 141,750 192,023 1.03GB00BLDRH360 OSB GRP RG 34,632 GBP 168,576 221,989 1.19GB00BJ62K685 PETS AT HOME GROUP PLC 15,257 GBP 70,195 96,110 0.52GB00B0YG1K06 RESTAURANT GROUP PLC 74,150 GBP 112,108 131,321 0.70GB0007973794 SERCO GROUP PLC 59,365 GBP 106,732 111,287 0.60GB00BWFGQN14 SPIRAX-SARCO ENGINEERING PLC 693 GBP 44,562 130,342 0.70GB00BF5SDZ96 STOCK SPIRITS GROUP PLC 25,595 GBP 86,667 92,462 0.50GB0009887422 SYNTHOMER SHS 31,333 GBP 214,327 212,789 1.14GB00B82YXW83 VESUVIUS PLC 20,569 GBP 134,605 150,031 0.80GB00BJDQQ870 WATCH SWITZ 13,640 GBP 116,241 157,527 0.85GB0009465807 WEIR GROUP PLC 9,755 GBP 168,035 249,442 1.34GB00B2PDGW16 WH SMITH PLC 4,724 GBP 121,008 104,970 0.56
2,924,009 3,751,839 20.13
IrelandIE0000669501 GLANBIA PLC /-A- 4,684 EUR 76,581 76,044 0.41AU000000JHX1 JAMES HARDIE IND PLC / CUFS 6,597 AUD 112,596 224,209 1.20
189,177 300,253 1.61
IsraelIL0011216723 KORNIT-DIGITAL LTD 1,772 USD 122,405 220,313 1.18
122,405 220,313 1.18
ItalyIT0000072170 FINECOBANK S.P.A 4,615 EUR 57,132 80,452 0.43
57,132 80,452 0.43
JapanJP3118000003 ASICS CORP. 7,500 JPY 183,279 190,017 1.02JP3119920001 ASKUL CORP TOKYO 10,808 JPY 190,991 168,659 0.91JP3218900003 CAPCOM CO LTD 2,600 JPY 64,856 76,133 0.41JP3818800009 FUJITEC CO 7,910 JPY 156,674 175,604 0.94JP3151600008 IWATANI CORP 1,252 JPY 73,022 75,127 0.40JP3906000009 MINEBEA CO LTD 4,420 JPY 49,289 117,041 0.63JP3885400006 MISUMI GROUP INC 6,100 JPY 203,418 206,649 1.11JP3660400007 NICHIAS CORP. 3,745 JPY 87,461 94,308 0.51JP3720800006 NSK LTD 12,500 JPY 108,382 105,753 0.57JP3855900001 POLA ORBIS HOLDINGS INC 8,000 JPY 211,310 211,479 1.14JP3967050000 RACCOON CO LTD TOKYO 4,900 JPY 93,627 101,364 0.54JP3397060009 SUGI HOLDINGS CO LTD 721 JPY 36,352 52,618 0.28JP3462660006 TAKEUCHI MFG CO LTD SAKAKI 5,600 JPY 113,706 139,609 0.75JP3539250005 THK CO LTD 6,384 JPY 188,848 190,674 1.02JP3560800009 TOKAI CARBON LTD 9,200 JPY 105,072 126,988 0.68JP3399310006 ZOZO RG REGISTERED SHS 6,700 JPY 223,061 227,881 1.22
2,089,348 2,259,904 12.13
LuxembourgLU1072616219 B&M EUROPEAN VALUE RETAIL SA. 16,338 GBP 94,227 129,372 0.69LU1704650164 BEFESA S.A. 3,730 EUR 188,830 286,637 1.54
283,057 416,009 2.23
VAM Funds (Lux)
VAM Funds (Lux) – International Opportunities Fund
Statement of Investments (continued)as at June 30, 2021(expressed in USD)
The accompanying notes form an integral part of these financial statements.
39
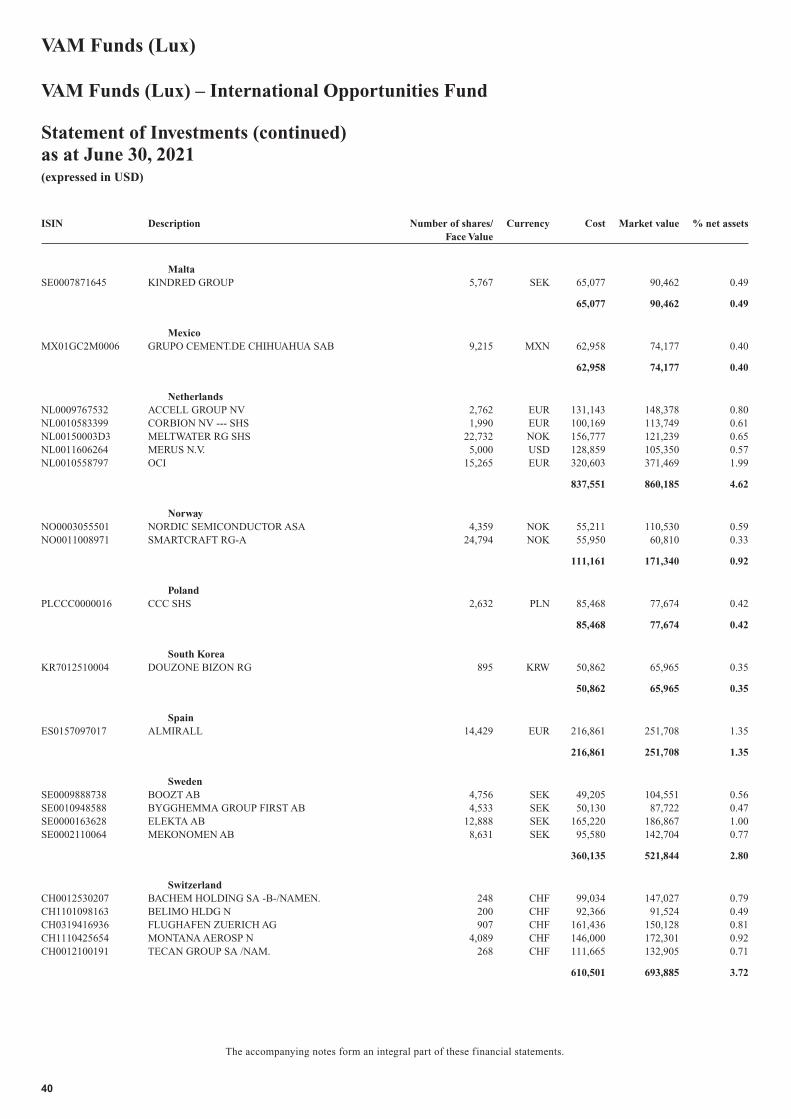
ISIN Description Number of shares/Face Value
Currency Cost Market value % net assets
MaltaSE0007871645 KINDRED GROUP 5,767 SEK 65,077 90,462 0.49
65,077 90,462 0.49
MexicoMX01GC2M0006 GRUPO CEMENT.DE CHIHUAHUA SAB 9,215 MXN 62,958 74,177 0.40
62,958 74,177 0.40
NetherlandsNL0009767532 ACCELL GROUP NV 2,762 EUR 131,143 148,378 0.80NL0010583399 CORBION NV --- SHS 1,990 EUR 100,169 113,749 0.61NL00150003D3 MELTWATER RG SHS 22,732 NOK 156,777 121,239 0.65NL0011606264 MERUS N.V. 5,000 USD 128,859 105,350 0.57NL0010558797 OCI 15,265 EUR 320,603 371,469 1.99
837,551 860,185 4.62
NorwayNO0003055501 NORDIC SEMICONDUCTOR ASA 4,359 NOK 55,211 110,530 0.59NO0011008971 SMARTCRAFT RG-A 24,794 NOK 55,950 60,810 0.33
111,161 171,340 0.92
PolandPLCCC0000016 CCC SHS 2,632 PLN 85,468 77,674 0.42
85,468 77,674 0.42
South KoreaKR7012510004 DOUZONE BIZON RG 895 KRW 50,862 65,965 0.35
50,862 65,965 0.35
SpainES0157097017 ALMIRALL 14,429 EUR 216,861 251,708 1.35
216,861 251,708 1.35
SwedenSE0009888738 BOOZT AB 4,756 SEK 49,205 104,551 0.56SE0010948588 BYGGHEMMA GROUP FIRST AB 4,533 SEK 50,130 87,722 0.47SE0000163628 ELEKTA AB 12,888 SEK 165,220 186,867 1.00SE0002110064 MEKONOMEN AB 8,631 SEK 95,580 142,704 0.77
360,135 521,844 2.80
SwitzerlandCH0012530207 BACHEM HOLDING SA -B-/NAMEN. 248 CHF 99,034 147,027 0.79CH1101098163 BELIMO HLDG N 200 CHF 92,366 91,524 0.49CH0319416936 FLUGHAFEN ZUERICH AG 907 CHF 161,436 150,128 0.81CH1110425654 MONTANA AEROSP N 4,089 CHF 146,000 172,301 0.92CH0012100191 TECAN GROUP SA /NAM. 268 CHF 111,665 132,905 0.71
610,501 693,885 3.72
VAM Funds (Lux)
VAM Funds (Lux) – International Opportunities Fund
Statement of Investments (continued)as at June 30, 2021(expressed in USD)
The accompanying notes form an integral part of these financial statements.
40
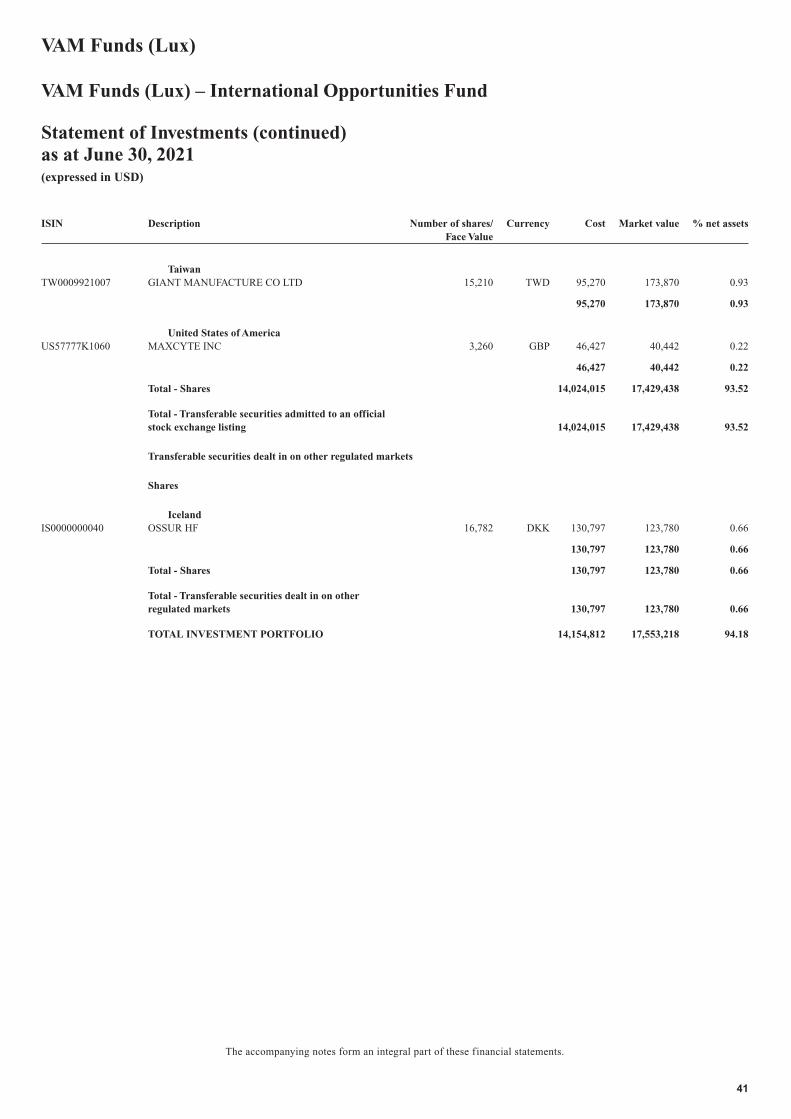
ISIN Description Number of shares/Face Value
Currency Cost Market value % net assets
TaiwanTW0009921007 GIANT MANUFACTURE CO LTD 15,210 TWD 95,270 173,870 0.93
95,270 173,870 0.93
United States of AmericaUS57777K1060 MAXCYTE INC 3,260 GBP 46,427 40,442 0.22
46,427 40,442 0.22
Total - Shares 14,024,015 17,429,438 93.52
Total - Transferable securities admitted to an officialstock exchange listing 14,024,015 17,429,438 93.52
Transferable securities dealt in on other regulated markets
Shares
IcelandIS0000000040 OSSUR HF 16,782 DKK 130,797 123,780 0.66
130,797 123,780 0.66
Total - Shares 130,797 123,780 0.66
Total - Transferable securities dealt in on otherregulated markets 130,797 123,780 0.66
TOTAL INVESTMENT PORTFOLIO 14,154,812 17,553,218 94.18
VAM Funds (Lux)
VAM Funds (Lux) – International Opportunities Fund
Statement of Investments (continued)as at June 30, 2021(expressed in USD)
The accompanying notes form an integral part of these financial statements.
41
NOTE 1 - GENERAL INFORMATION
VAM Funds (Lux) (the “Fund”) is an open-ended investment fund with multiple compartments (société d‘investissement à capital variable (“SICAV”)à compartiments multiples) governed by Luxembourg law, established in accordance with the provisions of Part I of the amended Law of December 17,2010 (the “Law of 2010”) relating to undertakings for collective investment.
The Fund was incorporated for an indefinite period on April 11, 2005. The purpose of the Fund is to offer investors access to a worldwide selection ofmarkets and a variety of investment techniques via a range of specialised products (“Compartments”) included under a single structural umbrella.
The Board of Directors has appointed VAM Global Management Company SA (hereafter the “Management Company”) as the Management Companyof the Fund to be responsible on a day-to-day basis, under the supervision of the Board of Directors, for providing administration, marketing andinvestment management and advisory services in respect of all Compartments.
The Management Company is a public limited company (“société anonyme”) incorporated on June 9, 2016. Its registered office is at Josy WelterHouse, 8-10, rue Genistre, L-1623 Luxembourg since August 1, 2019 and its share capital amounted to EUR 300,000 as at that date.
The Management Company has been set up with the main object of creating and administering UCITS as well as other types of Luxembourg funds. Itmay manage the portfolio of such investment funds and perform all the functions enumerated in Annex II of the 2010 Law. In addition, it may distributein Luxembourg and/or third countries the parts and shares of investment funds. It may delegate all or part only of its activities in accordance withLuxembourg law.
Each Compartment may issue the Classes of Shares listed below. Each Class of Shares are subject to a minimum initial subscription and holdingrequirements set forth in the Prospectus.
Class A Shares:
- for all Compartments shall be normally available in accordance with the provisions of the Prospectus and the Appendix to the
Prospectus.
Class B Shares:
- for all Compartments shall be reserved for investments made by investors qualifying as institutional investors within the
meaning of the Law of 2010.
Class C Shares:
- for all Compartments may only be subscribed by investment funds of the VAM Group.
Class E Shares:
- for all other Compartments (when applicable) shall be reserved for investments made by investors qualifying as institutional investors within themeaning of the Law of 2010.
NOTE 2 - SUMMARY OF SIGNIFICANT ACCOUNTING POLICIES
The financial statements of the Fund are prepared in accordance with Luxembourg regulations relating to undertakings for collective investments. Thecombined financial statements are expressed in USD.
a) Foreign currency translation
In each Compartment, investments as well as other assets and liabilities stated in foreign currencies are translated into the reference currency of theCompartment at the exchange rates prevailing as at the date of the report. The costs of investments are at historical exchange rates. Transactions inforeign currency during the year are translated at the rates prevailing at the date of transaction. Realised and unrealised exchange gains and losses, ifany, are recorded in the statement of operations of each Compartment.
b) Investments
The value of securities, which are traded on a stock exchange or traded on another regulated market providing reliable price quotations are valued at thelatest price available on the valuation day. In the event that any securities held in the portfolio are not listed on any stock exchange or not traded on anyother regulated market or if the price obtained as described above is not representative of the fair value of the securities, the value of such securities willbe based on the reasonably foreseeable sales price determined prudently and in good faith by the Board of Directors of the Fund.
The cost of investments sold is determined on the basis of the weighted average price method.
c) Forward foreign exchange contracts
Forward foreign exchange contracts are valued at forward market rates for the remaining period from valuation date to the maturity of the contract.
VAM Funds (Lux)
Notes to the Financial Statementsas at June 30, 2021
42
NOTE 2 - SUMMARY OF SIGNIFICANT ACCOUNTING POLICIES (continued)
d) Income recognition
Interest income is accounted for on an accrual basis.
Dividends are accrued on the date upon which the relevant security becomes ex-dividend. These are accounted for net of any applicable withholdingtaxes in the relevant country.
NOTE 3 - NET ASSET VALUE
a) Computation
The net asset value of a share type in each Compartment will be calculated by dividing the net assets of that Compartment attributable to that type ofshare by the total number of shares outstanding of that type of that Compartment. The net assets of a Compartment correspond to the differencebetween the total assets and the total liabilities of the Compartment.
b) Redemption of shares
Each Shareholder of any Class of a Compartment has the right to request at any time the redemption of her/his/its shares at an amount equal to the netasset value per share of the relevant Class of the Compartment as described in the preceding paragraph. For each Compartment the Fund maytemporarily suspend the calculation of the net asset value per share, the redemption and the conversion of shares under certain well definedcircumstances as disclosed in the Prospectus.
NOTE 4 - MANAGEMENT COMPANY FEE
The Management Company and the Fund have appointed the following investment manager for the Compartments shown below:Driehaus Capital Management LLC for• VAM Funds (Lux) – US Micro Cap Growth Fund• VAM Funds (Lux) – US Small Cap Growth Fund• VAM Funds (Lux) – US Micro Cap Growth Fund• VAM Funds (Lux) – US Large Cap Growth Fund• VAM Funds (Lux) – Emerging Markets Growth Fund• VAM Funds (Lux) – VAM Global Infrastructure*• VAM Funds (Lux) – World Growth Fund• VAM Funds (Lux) – International Opportunities Fund
* Please see Note 15
In relation to the Compartments, the Management Company was entitled to receive from the Fund fees, payable on a monthly basis at a total annualrate (expressed in percentage) per Share Class of the average net asset of the relevant Class, as detailed in the below table:
A B C** E
VAM Funds (Lux) – US Mid Cap Growth Fund 1.75% 1.75% 0.75% 1.00%
VAM Funds (Lux) – US Small Cap Growth Fund 1.75% 1.75% 0.75% 1.00%
VAM Funds (Lux) – US Micro Cap Growth Fund 1.75% 1.75% 0.75% 1.00%
VAM Funds (Lux) – US Large Cap Growth Fund 1.75% 1.75% 0.75% 1.00%
VAM Funds (Lux) – Emerging Markets Growth Fund 1.75% 1.75% 0.75% 1.00%
VAM Funds (Lux) – VAM Global Infrastructure* 1.75% 1.75% 0.75% 1.00%
VAM Funds (Lux) – World Growth Fund 1.75% 1.75% 0.75% 1.00%
VAM Funds (Lux) – International Opportunities Fund 1.75% 1.75% 0.75% 1.00%
* Please see Note 15
** Effective from 1 April 2020, the Management Company has reduced its Fee on the C classes to 0.55%.
The investment manager was remunerated by the Management Company out of the fees that it received from the Fund. Under the terms of theManagement Services Agreement dated September 1, 2016, as may be amended from time to time, the Management Company is entitled to receive aManagement Company Service fee in accordance to the following scale of fees, payable monthly in arrears:• up to USD 250 mln: 0.21%• from USD 250 mln to USD 500 mln: 0.17%• from USD 500 mln to USD 1 bln: 0.07%• above USD 1 bln 0.06%
subject to a minimum fee of EUR 18,000.- p.a. per Compartment.
VAM Funds (Lux)
Notes to the Financial Statementsas at June 30, 2021 (continued)
43
NOTE 4 - MANAGEMENT COMPANY FEE (continued)
VAM Global Management Company SA has waived the Management Company Service fee with effect from 1 August 2020 until a future date to bedetermined.
NOTE 5 - DEPOSITARY BANK FEE
RBC Investor Services Bank S.A. was entitled to receive the following fees:
UCITS V Supervisory Charges: 3 bps p.a.Minimum monthly fee: EUR 500 per compartmentDepositary cash flow monitoring & reconciliation: EUR 9,000 per compartment p.a.Minimum monthly safekeeping fee: EUR 600 per compartment
NOTE 6 - TAXES
In accordance with the Law of 2010, the Fund is not subject to any tax on income, capital gains tax or wealth tax. Moreover, no dividends distributedby the Fund, if any, are subject to withholding tax.
However, income collected by the Fund on securities in its portfolios may be subject to withholding tax which, in normal circumstances, cannot bereclaimed.
The Fund is only subject to the Luxembourg subscription tax (“taxe d’abonnement”) payable quarterly, at a rate of 0.05% per annum based on the netasset value of each Compartment at the end of the relevant quarter, calculated and paid quarterly. In respect of any Class of Shares which comprisesonly institutional investors (within the meaning of article 174 of the Law of 2010), the tax levied will be at the rate of 0.01% per annum.
However, no tax is levied on the asset value represented by shares held in other undertakings for collective investment falling under Luxembourg law.
NOTE 7 - SECURITIES LENDING
The Fund had entered into fully collateralized securities lending agreements through high quality financial institutions.
The transaction revenue amounts are included under the heading Income on Securities Lending in the Statement of Operations and Changes in NetAssets.
On June 30, 2021, the overall value of the collaterized securities amounted by the Compartments to:
Compartment Currency Market Value on Loan
VAM Funds (Lux) – US Mid Cap Growth Fund USD 8,165,103VAM Funds (Lux) – US Small Cap Growth Fund USD 10,358,880VAM Funds (Lux) – US Micro Cap Growth Fund USD 9,859,196VAM Funds (Lux) – US Large Cap Growth Fund USD 985,358VAM Funds (Lux) – Emerging Markets Growth Fund USD 855,905VAM Funds (Lux) – VAM Global Infrastructure Fund* USD 2,488,101VAM Funds (Lux) – World Growth Fund USD 12,665,365VAM Funds (Lux) – International Opportunities Fund USD 1,388,353
* Please see Note 15
NOTE 8 - PERFORMANCE FEES
As at June 30, 2021, all compartments were eligible for performance fees.
In addition to the Management Company Fee, a performance fee may be paid to the Management Company on a quarterly basis in relation to Class A,Class B and Class C Shares.
The Management Company is entitled to a performance fee calculated and due in relation of each Valuation Day for each share and fraction thereof inissue at the rate of 15% of the difference – if positive – between:
- the net asset value per share before deduction of the daily performance fee to be calculated, but after deduction of all other fees attributable to therespective Class of Shares, including but not limited to the Management Company Fee;
and
- the greater of (“High Water Mark”)
VAM Funds (Lux)
Notes to the Financial Statementsas at June 30, 2021 (continued)
44
NOTE 8 - PERFORMANCE FEES (continued)
i) the highest net asset value per share of the Class recorded on any preceding day during the same financial year of the Fund,
and
ii) the last net asset value per share of the Class recorded for the immediately preceding financial year of the Fund,
each of them increased on a pro rata temporis basis by a rate of 12% p.a. (the “hurdle rate”).
In relation to Classes of Shares launched during the financial year of the Fund, the initial High Water Mark shall be equal to the initial subscriptionprice of such Class of Shares. Performance of Classes of Shares in currencies other than the reference currency of the Compartment shall be measuredin the currency of such Classes of Shares.
The amounts so accumulated during each calendar quarter shall be paid to the Management Company after each calendar quarter end.
No performance fee is due in relation to Class E.
The performance fee is paid to VAM Global Management SA after each calendar quarter end.
NOTE 9 - EXCHANGE RATES
The exchange rates used as of June 30, 2021 are:
1 USD = 1.332001332 AUD
1 USD = 5.017838416 BRL
1 USD = 1.238299616 CAD
1 USD = 0.924350251 CHF
1 USD = 6.460866531 CNH
1 USD = 6.461450983 CNY
1 USD = 6.270536005 DKK
1 USD = 0.84324142 EUR
1 USD = 0.723877086 GBP
1 USD = 7.765844264 HKD
1 USD = 296.0033626 HUF
1 USD = 14499.05756 IDR
1 USD = 74.32733759 INR
1 USD = 110.9900087 JPY
1 USD = 1126.126126 KRW
1 USD = 19.91040319 MXN
1 USD = 8.605185485 NOK
1 USD = 1.431127013 NZD
1 USD = 3.807000312 PLN
1 USD = 8.552125203 SEK
1 USD = 27.86213814 TWD
1 USD = 14.27877888 ZAR
VAM Funds (Lux)
Notes to the Financial Statementsas at June 30, 2021 (continued)
45
NOTE 10 - FORWARD FOREIGN EXCHANGE CONTRACTS
As of June 30, 2021, the following forward foreign exchange contracts were open and were only invested in to hedge the Classes of shares denominatedin currencies other than the compartment base currency:
The forwards contracts were conducted with the following counterparty: RBC INVESTOR SERVICES BANK S.A
VAM Funds (Lux) – US Mid Cap Growth Fund
Maturity
Date Currency Purchase Currency Sales
Net unrealised
gain/(loss)
(in USD)
30/07/2021 GBP 5,894,258 USD 8,191,793 (48,463)
02/07/2021 GBP 8,936 USD 12,368 (22)
30/07/2021 USD 13,089 GBP 9,407 92
06/07/2021 USD 13,882 GBP 10,000 67
(48,326)
VAM Funds (Lux) – Emerging Markets Growth Fund
Maturity
Date Currency Purchase Currency Sales
Net unrealised
gain/(loss)
(in USD)
01/07/2021 JPY 18 USD 0 0
01/07/2021 USD 32,474 MXN 645,013 78
01/07/2021 USD 64,055 ZAR 914,569 11
89
VAM Funds (Lux) – VAM Global Infrastructure Fund*
Maturity
Date Currency Purchase Currency Sales
Net unrealised
gain/(loss)
(in USD)
01/07/2021 EUR 43,040 USD 51,112 (68)
30/07/2021 GBP 2,425,921 USD 3,371,173 (19,594)
01/07/2021 GBP 108,693 USD 150,798 (638)
06/07/2021 GBP 500 USD 691 0
01/07/2021 JPY 36 USD 0 0
01/07/2021 USD 6,883 JPY 762,165 15
06/07/2021 USD 117,944 GBP 85,000 518
01/07/2021 USD 241,685 GBP 174,000 1,305
02/07/2021 USD 17,386 GBP 12,500 118
(18,344)
*Please see Note 15
VAM Funds (Lux)
Notes to the Financial Statementsas at June 30, 2021 (continued)
46
NOTE 10 - FORWARD FOREIGN EXCHANGE CONTRACTS (continued)
VAM Funds (Lux) – World Growth Fund
Maturity
Date Currency Purchase Currency Sales
Net unrealised
gain/(loss)
(in USD)
01/07/2021 JPY 775 USD 7 0
01/07/2021 USD 301,847 GBP 218,695 (280)
02/07/2021 USD 308,211 HKD 2,397,760 (549)
(829)
VAM Funds (Lux) – International Opportunities Fund
Maturity
Date Currency Purchase Currency Sales
Net unrealised
gain/(loss)
(in USD)
01/07/2021 JPY 1,053 USD 9 0
01/07/2021 NOK 59,982 USD 6,993 (22)
01/07/2021 USD 2,112 JPY 233,866 5
(17)
NOTE 11 - RELATED PARTY TRANSACTION
All transactions with related parties were carried out on an arm’s length basis.
The following is a summary of transactions entered into during the year between the SICAV and the holding company of its Management Company,VAM Global Sárl, which is considered a related party. All such transactions were entered into in the ordinary course of business and on normalcommercial terms. As at 30 June 2021, two Investment transactions had occurred with VAM Global Sárl:
Share Class ISIN Type Date of NAV Number of Shares NAV per share Amount PaidVAM Funds (Lux) – VAM GlobalInfrastructure Fund* E GBP LU2346233203 Subscription 01 June 2021 1,759.741 £100.0000 £175,974.05VAM Funds (Lux) – VAM GlobalInfrastructure Fund* A GBP LU2346233039 Subscription 01 June 2021 5,279.222 £100.0000 £527,922.16
*Please see Note 15
NOTE 12 - RISK MANAGEMENT PROCESS
The Fund must employ a risk management process that enables it to monitor and measure at any time the risk of the positions in its portfolios and theircontribution to the overall risk profile of its portfolios, as included but not limited to the CSSF Circular 11/512. The global risk exposure relating tofinancial derivative instruments may be calculated through the “commitment approach” or through a Value-at-Risk (“VaR”) methodology. Generally,a Compartment that uses derivatives more extensively or as part of its investment objective will utilize the VaR methodology, and a Compartment thatuses derivatives less extensively will utilize the commitment approach.
For all Compartments the commitment approach is used to calculate the global risk exposure.
NOTE 13 - CORPORATE GOVERNANCE STATEMENT
The Board of Directors of the Fund confirms its adherence with the principles contained in the ALFI (Association Luxembourgeoise des Fondsd’Investissements) Code of Conduct for Luxembourg Investment Funds.
VAM Funds (Lux)
Notes to the Financial Statementsas at June 30, 2021 (continued)
47
NOTE 14 - SWING PRICING
Under certain circumstances (for example, large volumes of deals) investment and/or disinvestment costs may have an adverse effect on theShareholders’ interests in a Compartment. In order to prevent this effect, called �dilution�, the Board of Directors have the authority to allow for the NetAsset Value per Share to be adjusted by effective dealing and other costs and fiscal charges which would be payable on the effective acquisition ordisposal of assets in the relevant Compartment if the net capital activity exceeds, as a consequence of the sum of all subscriptions, redemptions orconversions in such a Compartment, such threshold percentage (the �Threshold�) as may be determined from time to time by the Board of Directors,of the Compartment’s total net assets on a given Valuation Day.
Swing pricing is applied on the capital activity at the level of a Compartment and does not address the specific circumstances of each individualinvestor transaction. The decision to swing is based on the overall net-flows into a Compartment, not per Class.
The swing pricing mechanism may apply to all Compartments.
The performance fees, described under sub-section “Performance Fees”, are calculated based on the unswung Net Asset Value.
If the net capital activity on a given Valuation Day leads to a net inflow of assets in excess of the Threshold in the relevant Compartment, the Directorsmay decide to adjust upwards the Net Asset Value used to process all subscriptions, redemptions or conversions in such a Compartment by the swingfactor that shall be determined from time to time by them. The maximum limit (in terms of percentage of Net Asset Value) for each case of net inflowin excess of the Threshold is currently 2%.
If the net capital activity on a given Valuation Day leads to a net outflow of assets in excess of the Threshold in the relevant Compartment, the Directorsmay decide to adjust downwards the Net Asset Value used to process all subscriptions, redemptions or conversions in such a Compartment by the swingfactor that shall be determined from time to time by them. The maximum limit (in terms of percentage of Net Asset Value) for each case of net outflowin excess of the Threshold is currently 2%.
No swing pricing was applied during the period.
NOTE 15 - EVENTS
Effective June 1, 2021, VAM Funds (Lux) - International Real Estate Equity was renamed VAM Funds (Lux) - VAM Global Infrastructure. TheInvestment Manager for the Fund was also changed, from Driehaus Capital Management LLC to Foresight Group LLP, also effective June 1, 2021.
VAM Funds (Lux)
Notes to the Financial Statementsas at June 30, 2021 (continued)
48
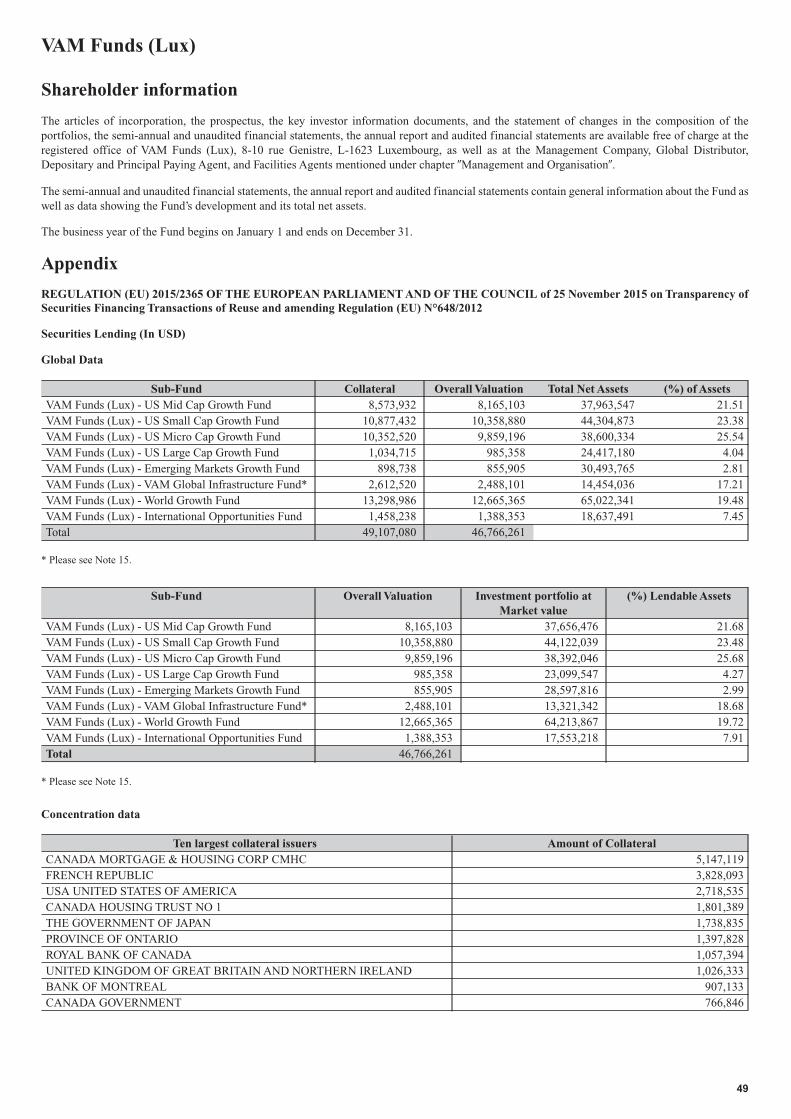
Shareholder information
The articles of incorporation, the prospectus, the key investor information documents, and the statement of changes in the composition of theportfolios, the semi-annual and unaudited financial statements, the annual report and audited financial statements are available free of charge at theregistered office of VAM Funds (Lux), 8-10 rue Genistre, L-1623 Luxembourg, as well as at the Management Company, Global Distributor,Depositary and Principal Paying Agent, and Facilities Agents mentioned under chapter �Management and Organisation�.
The semi-annual and unaudited financial statements, the annual report and audited financial statements contain general information about the Fund aswell as data showing the Fund’s development and its total net assets.
The business year of the Fund begins on January 1 and ends on December 31.
Appendix
REGULATION (EU) 2015/2365 OF THE EUROPEAN PARLIAMENT AND OF THE COUNCIL of 25 November 2015 on Transparency ofSecurities Financing Transactions of Reuse and amending Regulation (EU) N°648/2012
Securities Lending (In USD)
Global Data
Sub-Fund Collateral Overall Valuation Total Net Assets (%) of AssetsVAM Funds (Lux) - US Mid Cap Growth Fund 8,573,932 8,165,103 37,963,547 21.51VAM Funds (Lux) - US Small Cap Growth Fund 10,877,432 10,358,880 44,304,873 23.38VAM Funds (Lux) - US Micro Cap Growth Fund 10,352,520 9,859,196 38,600,334 25.54VAM Funds (Lux) - US Large Cap Growth Fund 1,034,715 985,358 24,417,180 4.04VAM Funds (Lux) - Emerging Markets Growth Fund 898,738 855,905 30,493,765 2.81VAM Funds (Lux) - VAM Global Infrastructure Fund* 2,612,520 2,488,101 14,454,036 17.21VAM Funds (Lux) - World Growth Fund 13,298,986 12,665,365 65,022,341 19.48VAM Funds (Lux) - International Opportunities Fund 1,458,238 1,388,353 18,637,491 7.45Total 49,107,080 46,766,261
* Please see Note 15.
Sub-Fund Overall Valuation Investment portfolio atMarket value
(%) Lendable Assets
VAM Funds (Lux) - US Mid Cap Growth Fund 8,165,103 37,656,476 21.68VAM Funds (Lux) - US Small Cap Growth Fund 10,358,880 44,122,039 23.48VAM Funds (Lux) - US Micro Cap Growth Fund 9,859,196 38,392,046 25.68VAM Funds (Lux) - US Large Cap Growth Fund 985,358 23,099,547 4.27VAM Funds (Lux) - Emerging Markets Growth Fund 855,905 28,597,816 2.99VAM Funds (Lux) - VAM Global Infrastructure Fund* 2,488,101 13,321,342 18.68VAM Funds (Lux) - World Growth Fund 12,665,365 64,213,867 19.72VAM Funds (Lux) - International Opportunities Fund 1,388,353 17,553,218 7.91Total 46,766,261
* Please see Note 15.
Concentration data
Ten largest collateral issuers Amount of CollateralCANADA MORTGAGE & HOUSING CORP CMHC 5,147,119FRENCH REPUBLIC 3,828,093USA UNITED STATES OF AMERICA 2,718,535CANADA HOUSING TRUST NO 1 1,801,389THE GOVERNMENT OF JAPAN 1,738,835PROVINCE OF ONTARIO 1,397,828ROYAL BANK OF CANADA 1,057,394UNITED KINGDOM OF GREAT BRITAIN AND NORTHERN IRELAND 1,026,333BANK OF MONTREAL 907,133CANADA GOVERNMENT 766,846
VAM Funds (Lux)
49
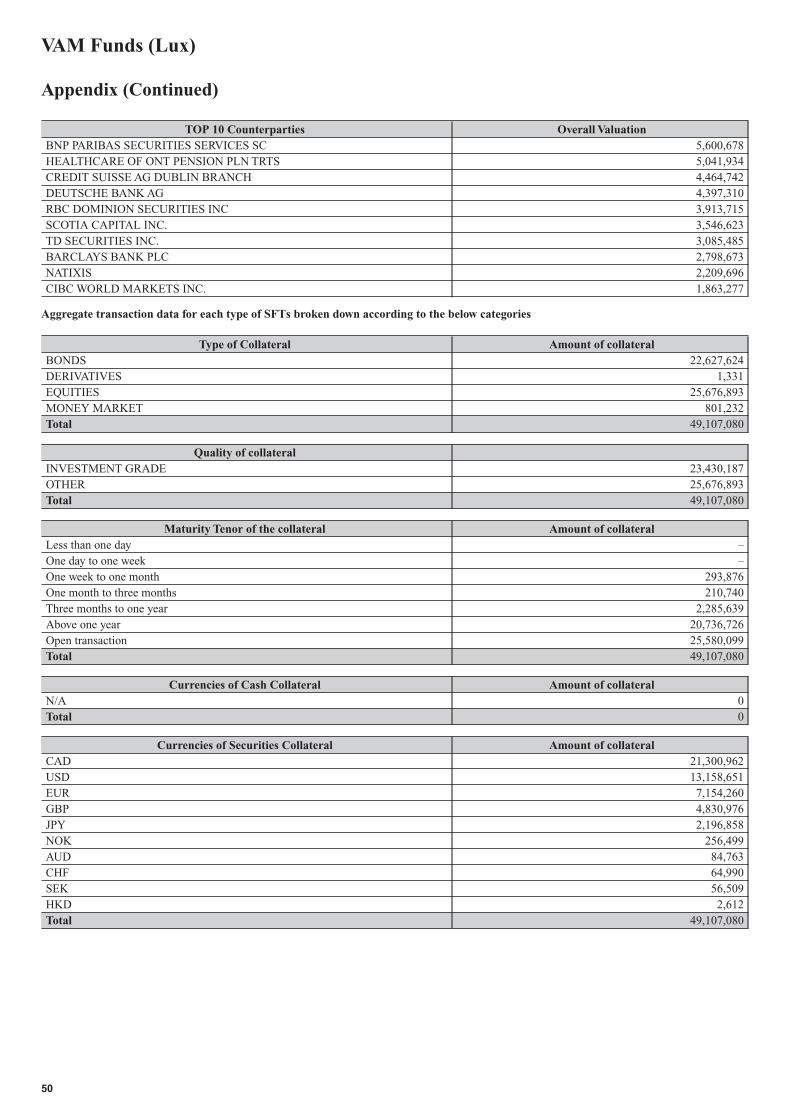
Appendix (Continued)
TOP 10 Counterparties Overall ValuationBNP PARIBAS SECURITIES SERVICES SC 5,600,678HEALTHCARE OF ONT PENSION PLN TRTS 5,041,934CREDIT SUISSE AG DUBLIN BRANCH 4,464,742DEUTSCHE BANK AG 4,397,310RBC DOMINION SECURITIES INC 3,913,715SCOTIA CAPITAL INC. 3,546,623TD SECURITIES INC. 3,085,485BARCLAYS BANK PLC 2,798,673NATIXIS 2,209,696CIBC WORLD MARKETS INC. 1,863,277
Aggregate transaction data for each type of SFTs broken down according to the below categories
Type of Collateral Amount of collateralBONDS 22,627,624DERIVATIVES 1,331EQUITIES 25,676,893MONEY MARKET 801,232Total 49,107,080
Quality of collateralINVESTMENT GRADE 23,430,187OTHER 25,676,893Total 49,107,080
Maturity Tenor of the collateral Amount of collateralLess than one day –One day to one week –One week to one month 293,876One month to three months 210,740Three months to one year 2,285,639Above one year 20,736,726Open transaction 25,580,099Total 49,107,080
Currencies of Cash Collateral Amount of collateralN/A 0Total 0
Currencies of Securities Collateral Amount of collateralCAD 21,300,962USD 13,158,651EUR 7,154,260GBP 4,830,976JPY 2,196,858NOK 256,499AUD 84,763CHF 64,990SEK 56,509HKD 2,612Total 49,107,080
VAM Funds (Lux)
50
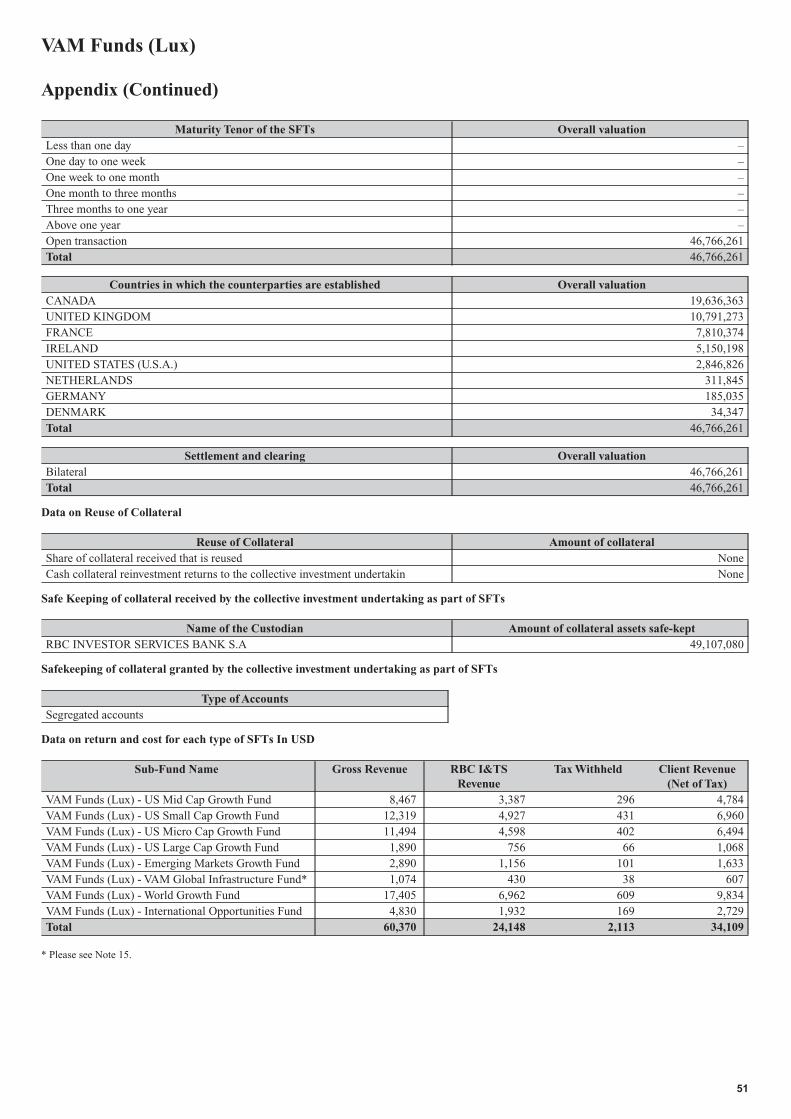
Appendix (Continued)
Maturity Tenor of the SFTs Overall valuationLess than one day –One day to one week –One week to one month –One month to three months –Three months to one year –Above one year –Open transaction 46,766,261Total 46,766,261
Countries in which the counterparties are established Overall valuationCANADA 19,636,363UNITED KINGDOM 10,791,273FRANCE 7,810,374IRELAND 5,150,198UNITED STATES (U.S.A.) 2,846,826NETHERLANDS 311,845GERMANY 185,035DENMARK 34,347Total 46,766,261
Settlement and clearing Overall valuationBilateral 46,766,261Total 46,766,261
Data on Reuse of Collateral
Reuse of Collateral Amount of collateralShare of collateral received that is reused NoneCash collateral reinvestment returns to the collective investment undertakin None
Safe Keeping of collateral received by the collective investment undertaking as part of SFTs
Name of the Custodian Amount of collateral assets safe-keptRBC INVESTOR SERVICES BANK S.A 49,107,080
Safekeeping of collateral granted by the collective investment undertaking as part of SFTs
Type of AccountsSegregated accounts
Data on return and cost for each type of SFTs In USD
Sub-Fund Name Gross Revenue RBC I&TSRevenue
Tax Withheld Client Revenue(Net of Tax)
VAM Funds (Lux) - US Mid Cap Growth Fund 8,467 3,387 296 4,784VAM Funds (Lux) - US Small Cap Growth Fund 12,319 4,927 431 6,960VAM Funds (Lux) - US Micro Cap Growth Fund 11,494 4,598 402 6,494VAM Funds (Lux) - US Large Cap Growth Fund 1,890 756 66 1,068VAM Funds (Lux) - Emerging Markets Growth Fund 2,890 1,156 101 1,633VAM Funds (Lux) - VAM Global Infrastructure Fund* 1,074 430 38 607VAM Funds (Lux) - World Growth Fund 17,405 6,962 609 9,834VAM Funds (Lux) - International Opportunities Fund 4,830 1,932 169 2,729Total 60,370 24,148 2,113 34,109
* Please see Note 15.
VAM Funds (Lux)
51