vanguard developed markets index fund annual report
TRANSCRIPT
Annual Report | December 31, 2020
Vanguard Developed Markets Index Fund

Contents
Please note: The opinions expressed in this report are just that—informed opinions. They should not be considered promisesor advice. Also, please keep in mind that the information and opinions cover the period through the date on the front of thisreport. Of course, the risks of investing in your fund are spelled out in the prospectus.
Your Fund’s Performance at a Glance. . . . . . . . . . . . . . . . . . 1
About Your Fund’s Expenses. . . . . . . . . . . . . . . . . . . . . . . . . 2
Performance Summary. . . . . . . . . . . . . . . . . . . . . . . . . . . . . .4
Financial Statements. . . . . . . . . . . . . . . . . . . . . . . . . . . . . . . 7

• Vanguard Developed Markets Index Fund’s returns for the 12 months ended
December 31, 2020, ranged from 10.11% for Investor Shares to 10.29% for ETF Shares.
The fund’s benchmark, the FTSE Developed All Cap ex US Index, returned 10.00%.
• The emergence of COVID-19 in early 2020 turned into a global health crisis, and
aggressive attempts to contain it resulted in a sharp downturn in economic activity.
Unemployment spiked, and sectors where social distancing isn’t possible were hit hard.
Stocks initially plummeted as infections surged, but they finished the year significantly
higher. The gain was thanks in part to rapid and robust monetary and fiscal action by
policymakers and the rollout of COVID-19 vaccines as the year drew to a close.
• The technology and industrial sectors contributed the most to results, while
financials detracted.
• Over the past decade, the fund recorded an average annual return of almost 6%,
in line with its benchmark index.
Your Fund’s Performance at a Glance
Market Barometer
Average Annual Total Returns
Periods Ended December 31, 2020
One Year Three Years Five Years
Stocks
Russell 1000 Index (Large-caps) 20.96% 14.82% 15.60%
Russell 2000 Index (Small-caps) 19.96 10.25 13.26
Russell 3000 Index (Broad U.S. market) 20.89 14.49 15.43
FTSE All-World ex US Index (International) 11.22 5.18 9.16
Bonds
Bloomberg Barclays U.S. Aggregate Bond Index
(Broad taxable market) 7.51% 5.34% 4.44%
Bloomberg Barclays Municipal Bond Index
(Broad tax-exempt market) 5.21 4.64 3.91
FTSE Three-Month U.S. Treasury Bill Index 0.58 1.56 1.16
CPI
Consumer Price Index 1.36% 1.85% 1.95%
1

About Your Fund’s Expenses
2
As a shareholder of the fund, you incur ongoing costs, which include costs for portfolio management, administrative services, and shareholder reports (like this one), among others. Operating expenses, which are deducted from a fund’s gross income, directly reduce the investment return of the fund.
A fund’s expenses are expressed as a percentage of its average net assets. This figure is known as the expense ratio. The following examples are intended to help you understand the ongoing costs (in dollars) of investing in your fund and to compare these costs with those of other mutual funds. The examples are based on an investment of $1,000 made at the beginning of the period shown and held for the entire period.
The accompanying table illustrates your fund’s costs in two ways:
• Based on actual fund return. This section helps you to estimate the actual expenses that you paid over the period. The ”Ending Account Value“ shown is derived from the fund‘s actual return, and the third column shows the dollar amount that would have been paid by an investor who started with $1,000 in the fund. You may use the information here, together with the amount you invested, to estimate the expenses that you paid over the period.
To do so, simply divide your account value by $1,000 (for example, an $8,600 account value divided by $1,000 = 8.6), then multiply the result by the number given for your fund under the heading ”Expenses Paid During Period.“
• Based on hypothetical 5% yearly return. This section is intended to help you compare your fund‘s costs with those of other mutual funds. It assumes that the fund had a yearly return of 5% before expenses, but that the expense ratio is unchanged. In this case—because the return used is not the fund’s actual return—the results do not apply to your investment. The example is useful in making comparisons because the Securities and Exchange Commission requires all mutual funds to calculate expenses based on a 5% return. You can assess your fund’s costs by comparing this hypothetical example with the hypothetical examples that appear in shareholder reports of other funds.
Note that the expenses shown in the table are meant to highlight and help you compare ongoing costs only and do not reflect transaction costs incurred by the fund for buying and sellingsecurities. Further, the expenses do not include any purchase, redemption, or account servicefees described in the fund prospectus. If such fees were applied to your account, your costswould be higher. Your fund does not carry a “sales load.”
The calculations assume no shares were bought or sold during the period. Your actual costs mayhave been higher or lower, depending on the amount of your investment and the timing of anypurchases or redemptions.
You can find more information about the fund’s expenses, including annual expense ratios, in theFinancial Statements section of this report. For additional information on operating expenses andother shareholder costs, please refer to your fund’s current prospectus.
3
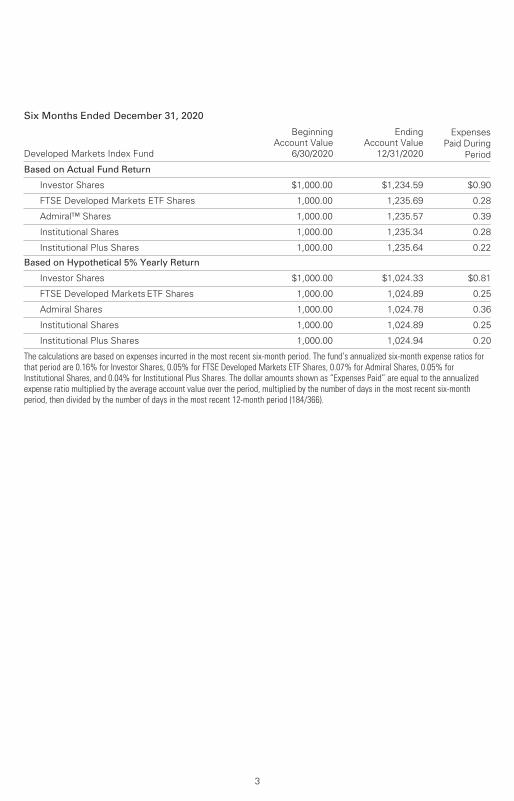
Six Months Ended December 31, 2020
Developed Markets Index Fund
BeginningAccount Value
6/30/2020
EndingAccount Value
12/31/2020
ExpensesPaid During
Period
Based on Actual Fund Return
Investor Shares $1,000.00 $1,234.59 $0.90
FTSE Developed Markets ETF Shares 1,000.00 1,235.69 0.28
Admiral™ Shares 1,000.00 1,235.57 0.39
Institutional Shares 1,000.00 1,235.34 0.28
Institutional Plus Shares 1,000.00 1,235.64 0.22
Based on Hypothetical 5% Yearly Return
Investor Shares $1,000.00 $1,024.33 $0.81
FTSE Developed Markets ETF Shares 1,000.00 1,024.89 0.25
Admiral Shares 1,000.00 1,024.78 0.36
Institutional Shares 1,000.00 1,024.89 0.25
Institutional Plus Shares 1,000.00 1,024.94 0.20
The calculations are based on expenses incurred in the most recent six-month period. The fund’s annualized six-month expense ratios forthat period are 0.16% for Investor Shares, 0.05% for FTSE Developed Markets ETF Shares, 0.07% for Admiral Shares, 0.05% forInstitutional Shares, and 0.04% for Institutional Plus Shares. The dollar amounts shown as “Expenses Paid” are equal to the annualizedexpense ratio multiplied by the average account value over the period, multiplied by the number of days in the most recent six-monthperiod, then divided by the number of days in the most recent 12-month period (184/366).

All of the returns in this report represent past performance, which is not a guarantee of future
results that may be achieved by the fund. (Current performance may be lower or higher than
the performance data cited. For performance data current to the most recent month-end, visit
our website at vanguard.com/performance.) Note, too, that both investment returns and
principal value can fluctuate widely, so an investor’s shares, when sold, could be worth more
or less than their original cost. The returns shown do not reflect taxes that a shareholder would pay on fund distributions or on the sale of fund shares.
Performance Summary
See Financial Highlights for dividend and capital gains information.
Developed Markets Index Fund
4
Cumulative Performance: December 31, 2010, Through December 31, 2020Initial Investment of $10,000
2020201920182017201620152014201320122011
$22,000
5,000
17,783
Average Annual Total ReturnsPeriods Ended December 31, 2020
OneYear
FiveYears
TenYears
Final Valueof a $10,000Investment
FTSE Developed Markets ETF SharesNet Asset Value 10.29% 8.34% 5.93% $17,783
FTSE Developed Markets ETF Shares Market Price 9.81 8.30 5.86 17,669
• • • • • • • • Spliced Developed ex US Index 10.00 8.18 5.92 17,779
________ FTSE Global All Cap ex US Index 11.24 9.07 5.22 16,638
Spliced Developed ex US Index: MSCI EAFE Index through May 28, 2013; FTSE Developed ex North America Index through December 20,2015; FTSE Developed All Cap ex US Transition Index through May 31, 2016; FTSE Developed All Cap ex US Index thereafter. Benchmarkreturns are adjusted for withholding taxes.
OneYear
FiveYears
SinceInception
(12/19/2013)
Final Valueof a $10,000Investment
Developed Markets Index Fund Investor Shares 10.11% 8.21% 5.33% $14,404
Spliced Developed ex US Index 10.00 8.18 5.43 14,504
FTSE Global All Cap ex US Index 11.24 9.07 5.61 14,678
"Since Inception" performance is calculated from the Investor Shares’ inception date for both the fund and its comparative standard(s).

Developed Markets Index Fund
5
Average Annual Total ReturnsPeriods Ended December 31, 2020
OneYear
FiveYears
TenYears
Final Valueof a $10,000Investment
Developed Markets Index Fund Admiral Shares 10.26% 8.31% 5.92% $17,773
Spliced Developed ex US Index 10.00 8.18 5.92 17,779
FTSE Global All Cap ex US Index 11.24 9.07 5.22 16,638
OneYear
FiveYears
TenYears
Final Valueof a $5,000,000
Investment
Developed Markets Index Fund InstitutionalShares 10.27% 8.34% 5.93% $8,898,778
Spliced Developed ex US Index 10.00 8.18 5.92 8,889,303
FTSE Global All Cap ex US Index 11.24 9.07 5.22 8,319,198
OneYear
FiveYears
SinceInception
(4/1/2014)
Final Valueof a $100,000,000
Investment
Developed Markets Index Fund InstitutionalPlus Shares 10.27% 8.35% 5.00% $139,044,784
Spliced Developed ex US Index 10.00 8.18 5.02 139,208,918
FTSE Global All Cap ex US Index 11.24 9.07 5.20 140,784,065
"Since Inception" performance is calculated from the Institutional Plus Shares’ inception date for both the fund and its comparative standard(s).
Cumulative Returns of ETF Shares: December 31, 2010, Through December 31, 2020
OneYear
FiveYears
TenYears
FTSE Developed Markets ETF Shares Market Price 9.81% 48.96% 76.69%
FTSE Developed Markets ETF Shares Net AssetValue 10.29 49.25 77.83
Spliced Developed ex US Index 10.00 48.14 77.79
For the ETF Shares, the market price is determined by the midpoint of the bid-offer spread as of the closing time of the New York Stock Exchange (generally 4 p.m., Eastern time). The net asset value is also determined as of the NYSE closing time. For more information about how the ETF Shares' market prices have compared with their net asset value, visit vanguard.com, select your ETF, and then select the Price and Performance tab. The ETF premium/discount analysis there shows the percentages of days on which the ETF Shares' market price was above or below the NAV.
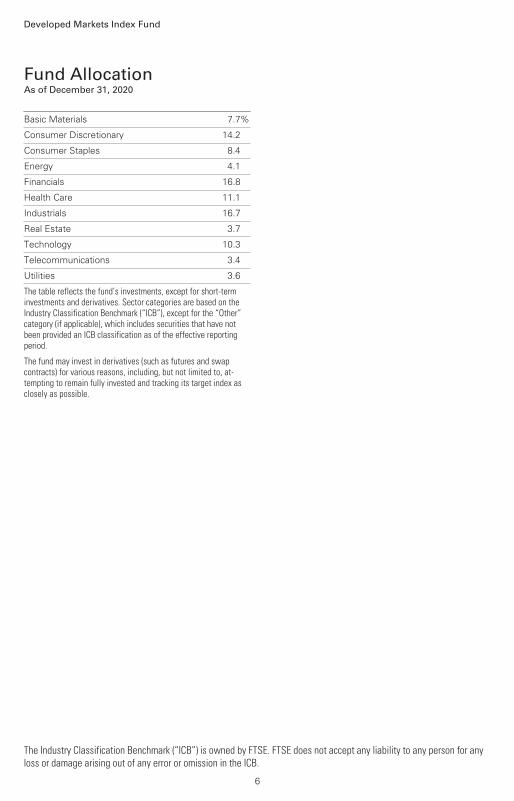
Fund AllocationAs of December 31, 2020
Developed Markets Index Fund
6
Basic Materials 7.7%
Consumer Discretionary 14.2
Consumer Staples 8.4
Energy 4.1
Financials 16.8
Health Care 11.1
Industrials 16.7
Real Estate 3.7
Technology 10.3
Telecommunications 3.4
Utilities 3.6
The table reflects the fund’s investments, except for short-terminvestments and derivatives. Sector categories are based on theIndustry Classification Benchmark (“ICB”), except for the “Other”category (if applicable), which includes securities that have notbeen provided an ICB classification as of the effective reportingperiod.
The fund may invest in derivatives (such as futures and swap contracts) for various reasons, including, but not limited to, at-tempting to remain fully invested and tracking its target index as closely as possible.
The Industry Classification Benchmark (“ICB”) is owned by FTSE. FTSE does not accept any liability to any person for any loss or damage arising out of any error or omission in the ICB.
Financial Statements
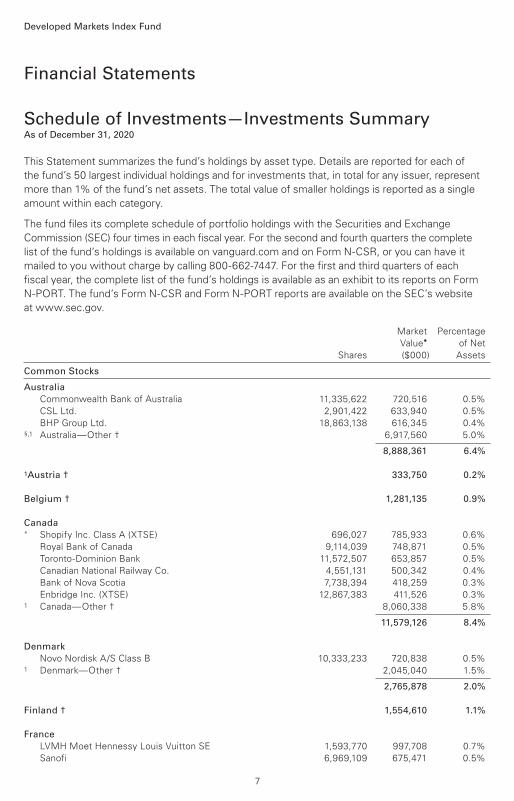
Schedule of Investments—Investments SummaryAs of December 31, 2020
Developed Markets Index Fund
Market Percentage
Value• of Net
Shares ($000) Assets
Common Stocks
Australia
Commonwealth Bank of Australia 11,335,622 720,516 0.5%
CSL Ltd. 2,901,422 633,940 0.5%
BHP Group Ltd. 18,863,138 616,345 0.4% §,1 Australia—Other † 6,917,560 5.0%
8,888,361 6.4%
1Austria † 333,750 0.2%
Belgium † 1,281,135 0.9%
Canada* Shopify Inc. Class A (XTSE) 696,027 785,933 0.6%
Royal Bank of Canada 9,114,039 748,871 0.5%
Toronto-Dominion Bank 11,572,507 653,857 0.5%
Canadian National Railway Co. 4,551,131 500,342 0.4%
Bank of Nova Scotia 7,738,394 418,259 0.3%
Enbridge Inc. (XTSE) 12,867,383 411,526 0.3% 1 Canada—Other † 8,060,338 5.8%
11,579,126 8.4%
Denmark
Novo Nordisk A/S Class B 10,333,233 720,838 0.5% 1 Denmark—Other † 2,045,040 1.5%
2,765,878 2.0%
Finland † 1,554,610 1.1%
France
LVMH Moet Hennessy Louis Vuitton SE 1,593,770 997,708 0.7%
Sanofi 6,969,109 675,471 0.5%
This Statement summarizes the fund’s holdings by asset type. Details are reported for each of
the fund’s 50 largest individual holdings and for investments that, in total for any issuer, represent
more than 1% of the fund’s net assets. The total value of smaller holdings is reported as a single
amount within each category.
The fund files its complete schedule of portfolio holdings with the Securities and Exchange
Commission (SEC) four times in each fiscal year. For the second and fourth quarters the complete
list of the fund’s holdings is available on vanguard.com and on Form N-CSR, or you can have it
mailed to you without charge by calling 800-662-7447. For the first and third quarters of each
fiscal year, the complete list of the fund’s holdings is available as an exhibit to its reports on Form
N-PORT. The fund’s Form N-CSR and Form N-PORT reports are available on the SEC’s website
at www.sec.gov.
7

Developed Markets Index Fund
TOTAL SE 15,519,696 669,869 0.5%
Schneider Electric SE 3,364,207 486,223 0.3% * Airbus SE 3,547,314 389,300 0.3% §,1 France—Other † 8,010,439 5.8%
11,229,010 8.1%
Germany
SAP SE 7,180,804 930,055 0.7%
Siemens AG 4,892,189 704,707 0.5%
Allianz SE 2,658,199 653,052 0.5%
BASF SE 5,856,342 462,904 0.3% * adidas AG 1,231,208 447,922 0.3% 1 Germany—Other † 7,207,051 5.2%
10,405,691 7.5%
Hong Kong
AIA Group Ltd. 77,418,877 943,436 0.7%
Hong Kong Exchanges & Clearing Ltd. 8,120,878 445,444 0.3% §,1 Hong Kong—Other † 2,485,366 1.8%
3,874,246 2.8%
§Ireland † 320,069 0.2%
Israel † 653,137 0.5%
Italy
Enel SPA 49,734,249 506,036 0.4% 1 Italy—Other † 2,351,417 1.7%
2,857,453 2.1%
Japan
Toyota Motor Corp. 15,735,270 1,214,293 0.9%
Sony Corp. 7,890,784 795,139 0.6%
SoftBank Group Corp. 9,303,966 722,314 0.5%
Keyence Corp. 1,152,374 648,230 0.5%
Shin-Etsu Chemical Co. Ltd. 2,541,924 446,148 0.3%
Nintendo Co. Ltd. 681,865 437,717 0.3%
Daiichi Sankyo Co. Ltd. 12,198,592 418,048 0.3%
Daikin Industries Ltd. 1,695,123 377,109 0.3%
Chugai Pharmaceutical Co. Ltd. 4,158,609 221,883 0.1%
Japan—Other † 25,496,393 18.4%
30,777,274 22.2%
Netherlands
ASML Holding NV 2,553,323 1,236,268 0.9% *,1 Adyen NV 171,276 397,969 0.3% 1 Netherlands—Other † 2,733,186 2.0%
4,367,423 3.2%
New Zealand † 525,034 0.4%
1Norway † 966,074 0.7%
1Poland † 387,139 0.3%
Portugal † 241,107 0.2%
Market Percentage
Value• of Net
Shares ($000) Assets
8

Developed Markets Index Fund
§Singapore † 1,384,973 1.0%
South Korea
Samsung Electronics Co. Ltd. 29,090,533 2,172,351 1.6%
Samsung Electronics Co. Ltd. Preference Shares 4,476,062 303,642 0.2% 1 Samsung Electronics Co. Ltd. GDR 69,460 126,333 0.1% §,1 South Korea—Other † 5,127,858 3.7%
7,730,184 5.6%
Spain* Iberdrola SA 37,981,510 545,809 0.4% 1 Spain—Other † 2,224,789 1.6%
2,770,598 2.0%
1Sweden † 4,310,724 3.1%
Switzerland
Nestle SA 17,828,756 2,107,561 1.5%
Roche Holding AG 4,454,928 1,551,645 1.1%
Novartis AG 13,751,476 1,294,811 0.9%
Zurich Insurance Group AG 953,618 401,875 0.3%
Roche Holding AG (Bearer) 170,436 59,641 0.1% 1 Switzerland—Other † 5,050,778 3.7%
10,466,311 7.6%
United Kingdom
AstraZeneca plc 8,401,800 837,773 0.6% * HSBC Holdings plc 130,397,669 673,537 0.5%
Diageo plc 14,678,097 580,795 0.4%
GlaxoSmithKline plc 31,541,225 577,141 0.4%
Unilever plc (XAMS) 9,376,176 567,741 0.4%
British American Tobacco plc 14,245,910 529,050 0.4%
Rio Tinto plc 6,947,518 522,962 0.4%
Royal Dutch Shell plc Class A 26,219,024 459,788 0.3%
BP plc 126,902,418 437,908 0.3%
Unilever plc (XLON) 6,891,693 413,321 0.3%
Royal Dutch Shell plc Class B 23,782,136 403,077 0.3% §,1 United Kingdom—Other † 11,216,949 8.1%
17,220,042 12.4%
Total Common Stocks (Cost $109,834,055) 136,889,349 98.9%
Market Percentage
Value• of Net
Shares ($000) Assets
9
Developed Markets Index Fund
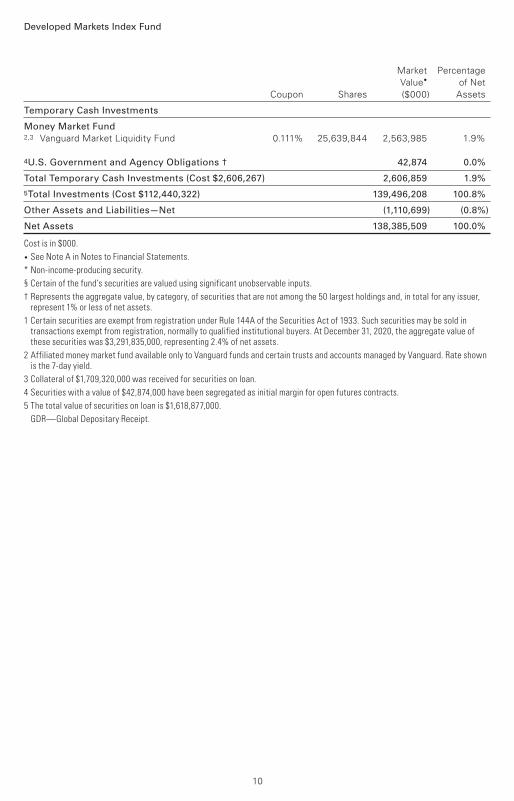
Temporary Cash Investments
Money Market Fund2,3 Vanguard Market Liquidity Fund 0.111% 25,639,844 2,563,985 1.9%
4U.S. Government and Agency Obligations † 42,874 0.0%
Total Temporary Cash Investments (Cost $2,606,267) 2,606,859 1.9%
5Total Investments (Cost $112,440,322) 139,496,208 100.8%
Other Assets and Liabilities—Net (1,110,699) (0.8%)
Net Assets 138,385,509 100.0%
Cost is in $000.
• See Note A in Notes to Financial Statements.
* Non-income-producing security.
§ Certain of the fund’s securities are valued using significant unobservable inputs.
† Represents the aggregate value, by category, of securities that are not among the 50 largest holdings and, in total for any issuer, represent 1% or less of net assets.
1 Certain securities are exempt from registration under Rule 144A of the Securities Act of 1933. Such securities may be sold in transactions exempt from registration, normally to qualified institutional buyers. At December 31, 2020, the aggregate value of these securities was $3,291,835,000, representing 2.4% of net assets.
2 Affiliated money market fund available only to Vanguard funds and certain trusts and accounts managed by Vanguard. Rate shown is the 7-day yield.
3 Collateral of $1,709,320,000 was received for securities on loan.
4 Securities with a value of $42,874,000 have been segregated as initial margin for open futures contracts.
5 The total value of securities on loan is $1,618,877,000.
GDR—Global Depositary Receipt.
Market Percentage
Value• of Net
Coupon Shares ($000) Assets
10
Developed Markets Index Fund
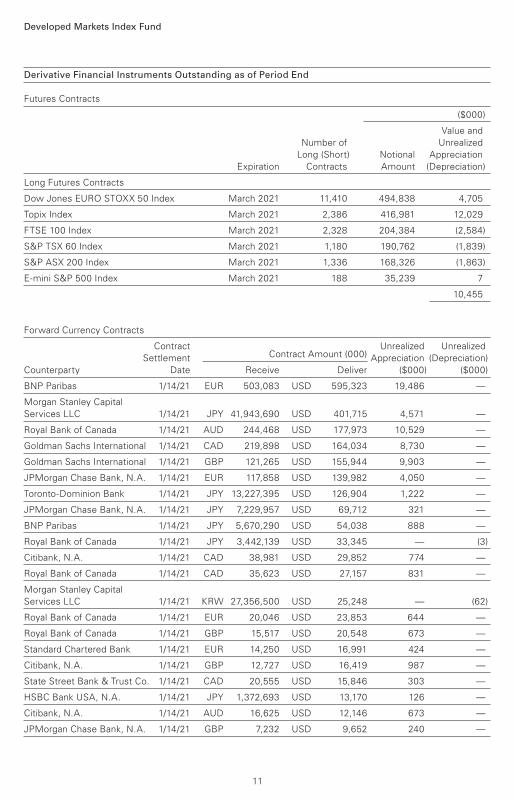
Derivative Financial Instruments Outstanding as of Period End
Futures Contracts
($000)
Value and
Number of Unrealized
Long (Short) Notional Appreciation
Expiration Contracts Amount (Depreciation)
Long Futures Contracts
Dow Jones EURO STOXX 50 Index March 2021 11,410 494,838 4,705
Topix Index March 2021 2,386 416,981 12,029
FTSE 100 Index March 2021 2,328 204,384 (2,584)
S&P TSX 60 Index March 2021 1,180 190,762 (1,839)
S&P ASX 200 Index March 2021 1,336 168,326 (1,863)
E-mini S&P 500 Index March 2021 188 35,239 7
10,455
Forward Currency Contracts
Contract Unrealized Unrealized
Settlement Contract Amount (000) Appreciation (Depreciation)
Counterparty Date Receive Deliver ($000) ($000)
BNP Paribas 1/14/21 EUR 503,083 USD 595,323 19,486 —
Morgan Stanley Capital
Services LLC 1/14/21 JPY 41,943,690 USD 401,715 4,571 —
Royal Bank of Canada 1/14/21 AUD 244,468 USD 177,973 10,529 —
Goldman Sachs International 1/14/21 CAD 219,898 USD 164,034 8,730 —
Goldman Sachs International 1/14/21 GBP 121,265 USD 155,944 9,903 —
JPMorgan Chase Bank, N.A. 1/14/21 EUR 117,858 USD 139,982 4,050 —
Toronto-Dominion Bank 1/14/21 JPY 13,227,395 USD 126,904 1,222 —
JPMorgan Chase Bank, N.A. 1/14/21 JPY 7,229,957 USD 69,712 321 —
BNP Paribas 1/14/21 JPY 5,670,290 USD 54,038 888 —
Royal Bank of Canada 1/14/21 JPY 3,442,139 USD 33,345 — (3)
Citibank, N.A. 1/14/21 CAD 38,981 USD 29,852 774 —
Royal Bank of Canada 1/14/21 CAD 35,623 USD 27,157 831 —
Morgan Stanley Capital
Services LLC 1/14/21 KRW 27,356,500 USD 25,248 — (62)
Royal Bank of Canada 1/14/21 EUR 20,046 USD 23,853 644 —
Royal Bank of Canada 1/14/21 GBP 15,517 USD 20,548 673 —
Standard Chartered Bank 1/14/21 EUR 14,250 USD 16,991 424 —
Citibank, N.A. 1/14/21 GBP 12,727 USD 16,419 987 —
State Street Bank & Trust Co. 1/14/21 CAD 20,555 USD 15,846 303 —
HSBC Bank USA, N.A. 1/14/21 JPY 1,372,693 USD 13,170 126 —
Citibank, N.A. 1/14/21 AUD 16,625 USD 12,146 673 —
JPMorgan Chase Bank, N.A. 1/14/21 GBP 7,232 USD 9,652 240 —
11

Developed Markets Index Fund
Forward Currency Contracts (continued)
Contract Unrealized Unrealized
Settlement Contract Amount (000) Appreciation (Depreciation)
Counterparty Date Receive Deliver ($000) ($000)
Morgan Stanley Capital
Services LLC 1/14/21 AUD 9,915 USD 7,101 544 —
Morgan Stanley Capital
Services LLC 1/14/21 EUR 5,022 USD 5,907 231 —
Bank of America, N.A. 1/14/21 AUD 7,555 USD 5,398 427 —
Morgan Stanley Capital
Services LLC 1/14/21 CAD 5,857 USD 4,459 143 —
BNP Paribas 1/14/21 GBP 1,876 USD 2,429 137 —
BNP Paribas 1/14/21 CAD 2,710 USD 2,065 64 —
BNP Paribas 1/14/21 AUD 2,468 USD 1,741 162 —
BNP Paribas 1/14/21 SGD 1,000 USD 733 23 —
BNP Paribas 1/14/21 USD 205,084 JPY 21,585,557 — (4,003)
Bank of America, N.A. 1/14/21 USD 151,455 CHF 139,865 — (6,601)
Toronto-Dominion Bank 1/14/21 USD 147,611 EUR 124,273 — (4,261)
Royal Bank of Canada 1/14/21 USD 69,827 EUR 56,959 219 —
JPMorgan Chase Bank, N.A. 1/14/21 USD 56,663 EUR 48,602 — (2,733)
Royal Bank of Canada 1/14/21 USD 46,749 JPY 4,879,417 — (515)
JPMorgan Chase Bank, N.A. 1/14/21 USD 36,039 JPY 3,800,000 — (770)
Royal Bank of Canada 1/14/21 USD 33,041 CAD 42,476 — (330)
Royal Bank of Canada 1/14/21 USD 23,681 AUD 32,453 — (1,343)
HSBC Bank USA, N.A. 1/14/21 USD 23,344 KRW 27,356,500 — (1,843)
UBS AG 1/14/21 USD 20,087 GBP 15,076 — (532)
HSBC Bank USA, N.A. 1/14/21 USD 19,657 EUR 16,749 — (812)
State Street Bank & Trust Co. 1/14/21 USD 19,287 JPY 2,023,495 — (314)
Toronto-Dominion Bank 1/14/21 USD 18,998 CAD 25,064 — (694)
Royal Bank of Canada 1/14/21 USD 14,957 GBP 11,076 — (191)
Citibank, N.A. 1/14/21 USD 12,716 DKK 81,202 — (617)
BNP Paribas 1/14/21 USD 12,188 EUR 10,417 — (543)
UBS AG 1/14/21 USD 11,197 JPY 1,172,049 — (155)
State Street Bank & Trust Co. 1/14/21 USD 10,402 AUD 14,270 — (601)
Royal Bank of Canada 1/14/21 USD 8,276 CHF 7,307 18 —
BNP Paribas 1/14/21 USD 5,143 GBP 4,004 — (333)
BNP Paribas 1/14/21 USD 4,449 CAD 5,949 — (225)
Bank of America, N.A. 1/14/21 USD 4,205 CAD 5,593 — (189)
BNP Paribas 1/14/21 USD 3,889 AUD 5,498 — (350)
BNP Paribas 4/14/21 USD 2,876 EUR 2,353 — (5)
BNP Paribas 4/14/21 USD 2,244 JPY 231,790 — (4)
Bank of America, N.A. 1/14/21 USD 1,821 HKD 14,121 — (1)
12
Developed Markets Index Fund
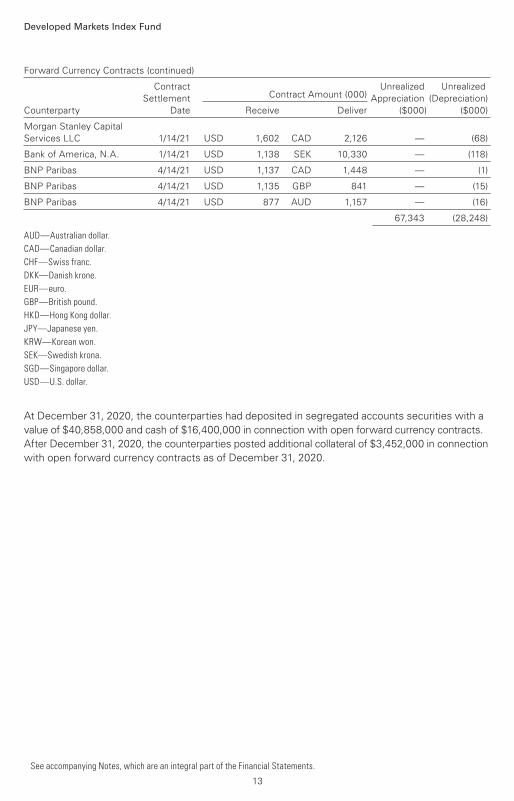
Forward Currency Contracts (continued)
Contract Unrealized Unrealized
Settlement Contract Amount (000) Appreciation (Depreciation)
Counterparty Date Receive Deliver ($000) ($000)
Morgan Stanley Capital
Services LLC 1/14/21 USD 1,602 CAD 2,126 — (68)
Bank of America, N.A. 1/14/21 USD 1,138 SEK 10,330 — (118)
BNP Paribas 4/14/21 USD 1,137 CAD 1,448 — (1)
BNP Paribas 4/14/21 USD 1,135 GBP 841 — (15)
BNP Paribas 4/14/21 USD 877 AUD 1,157 — (16)
67,343 (28,248)
AUD—Australian dollar.
CAD—Canadian dollar.
CHF—Swiss franc.
DKK—Danish krone.
EUR—euro.
GBP—British pound.
HKD—Hong Kong dollar.
JPY—Japanese yen.
KRW—Korean won.
SEK—Swedish krona.
SGD—Singapore dollar.
USD—U.S. dollar.
At December 31, 2020, the counterparties had deposited in segregated accounts securities with a
value of $40,858,000 and cash of $16,400,000 in connection with open forward currency contracts.
After December 31, 2020, the counterparties posted additional collateral of $3,452,000 in connection
with open forward currency contracts as of December 31, 2020.
See accompanying Notes, which are an integral part of the Financial Statements.
13
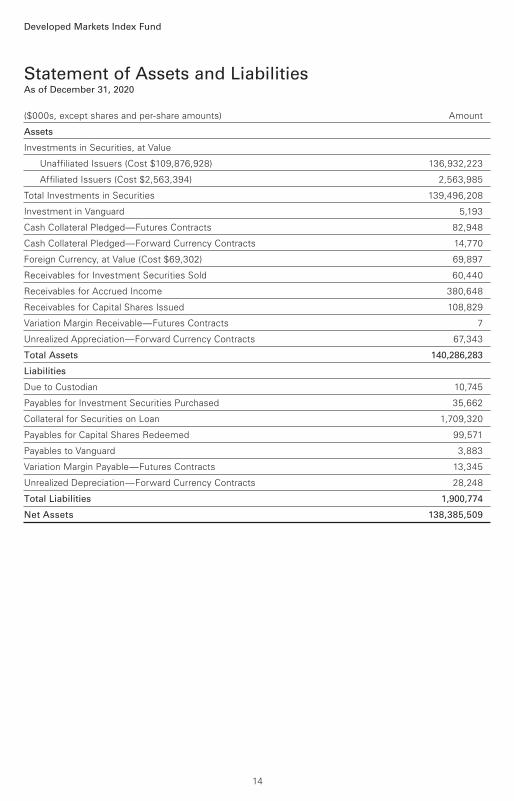
($000s, except shares and per-share amounts) Amount
Assets
Investments in Securities, at Value
Unaffiliated Issuers (Cost $109,876,928) 136,932,223
Affiliated Issuers (Cost $2,563,394) 2,563,985
Total Investments in Securities 139,496,208
Investment in Vanguard 5,193
Cash Collateral Pledged—Futures Contracts 82,948
Cash Collateral Pledged—Forward Currency Contracts 14,770
Foreign Currency, at Value (Cost $69,302) 69,897
Receivables for Investment Securities Sold 60,440
Receivables for Accrued Income 380,648
Receivables for Capital Shares Issued 108,829
Variation Margin Receivable—Futures Contracts 7
Unrealized Appreciation—Forward Currency Contracts 67,343
Total Assets 140,286,283
Liabilities
Due to Custodian 10,745
Payables for Investment Securities Purchased 35,662
Collateral for Securities on Loan 1,709,320
Payables for Capital Shares Redeemed 99,571
Payables to Vanguard 3,883
Variation Margin Payable—Futures Contracts 13,345
Unrealized Depreciation—Forward Currency Contracts 28,248
Total Liabilities 1,900,774
Net Assets 138,385,509
Statement of Assets and LiabilitiesAs of December 31, 2020
Developed Markets Index Fund
14

Statement of Assets and Liabilities (continued)
At December 31, 2020, net assets consisted of:
($000s, except shares and per-share amounts) Amount
Paid-in Capital 115,015,781
Total Distributable Earnings (Loss) 23,369,728
Net Assets 138,385,509
Investor Shares—Net Assets
Applicable to 4,172,141 outstanding $.001 par value shares of
beneficial interest (unlimited authorization) 49,193
Net Asset Value Per Share—Investor Shares $11.79
ETF Shares—Net Assets
Applicable to 1,849,090,687 outstanding $.001 par value shares of
beneficial interest (unlimited authorization) 87,578,426
Net Asset Value Per Share—ETF Shares $47.36
Admiral Shares—Net Assets
Applicable to 1,392,748,082 outstanding $.001 par value shares of
beneficial interest (unlimited authorization) 21,206,938
Net Asset Value Per Share—Admiral Shares $15.23
Institutional Shares—Net Assets
Applicable to 919,478,447 outstanding $.001 par value shares of
beneficial interest (unlimited authorization) 14,019,693
Net Asset Value Per Share—Institutional Shares $15.25
Institutional Plus Shares—Net Assets
Applicable to 651,690,000 outstanding $.001 par value shares of
beneficial interest (unlimited authorization) 15,531,259
Net Asset Value Per Share—Institutional Plus Shares $23.83
Developed Markets Index Fund
See accompanying Notes, which are an integral part of the Financial Statements.
15

Year Ended
December 31, 2020
($000)
Investment Income
Income
Dividends1 2,848,005
Interest2 4,976
Securities Lending—Net 57,990
Total Income 2,910,971
Expenses
The Vanguard Group—Note B
Investment Advisory Services 3,618
Management and Administrative—Investor Shares 66
Management and Administrative—ETF Shares 28,318
Management and Administrative—Admiral Shares 10,461
Management and Administrative—Institutional Shares 4,770
Management and Administrative—Institutional Plus Shares 4,268
Marketing and Distribution—Investor Shares 6
Marketing and Distribution—ETF Shares 2,372
Marketing and Distribution—Admiral Shares 1,059
Marketing and Distribution—Institutional Shares 363
Marketing and Distribution—Institutional Plus Shares 179
Custodian Fees 3,498
Auditing Fees 59
Shareholders’ Reports—Investor Shares —
Shareholders’ Reports—ETF Shares 1,749
Shareholders’ Reports—Admiral Shares 177
Shareholders’ Reports—Institutional Shares 60
Shareholders’ Reports—Institutional Plus Shares 47
Trustees’ Fees and Expenses 63
Total Expenses 61,133
Net Investment Income 2,849,838
Realized Net Gain (Loss)
Investment Securities Sold2,3 117,234
Futures Contracts 46,311
Swap Contracts 1,159
Forward Currency Contracts 32,463
Foreign Currencies 20,636
Realized Net Gain (Loss) 217,803
Statement of Operations
Developed Markets Index Fund
16
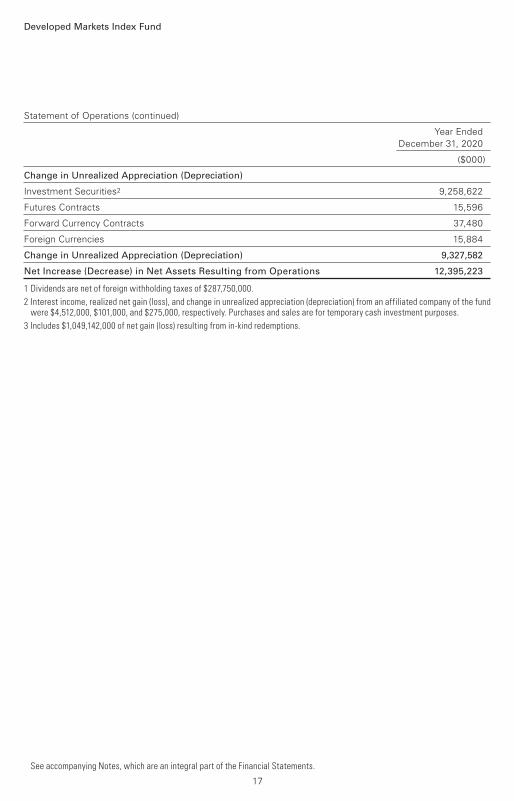
Statement of Operations (continued)
Year Ended
December 31, 2020
($000)
Developed Markets Index Fund
See accompanying Notes, which are an integral part of the Financial Statements.
Change in Unrealized Appreciation (Depreciation)
Investment Securities2 9,258,622
Futures Contracts 15,596
Forward Currency Contracts 37,480
Foreign Currencies 15,884
Change in Unrealized Appreciation (Depreciation) 9,327,582
Net Increase (Decrease) in Net Assets Resulting from Operations 12,395,223
1 Dividends are net of foreign withholding taxes of $287,750,000.
2 Interest income, realized net gain (loss), and change in unrealized appreciation (depreciation) from an affiliated company of the fund were $4,512,000, $101,000, and $275,000, respectively. Purchases and sales are for temporary cash investment purposes.
3 Includes $1,049,142,000 of net gain (loss) resulting from in-kind redemptions.
17
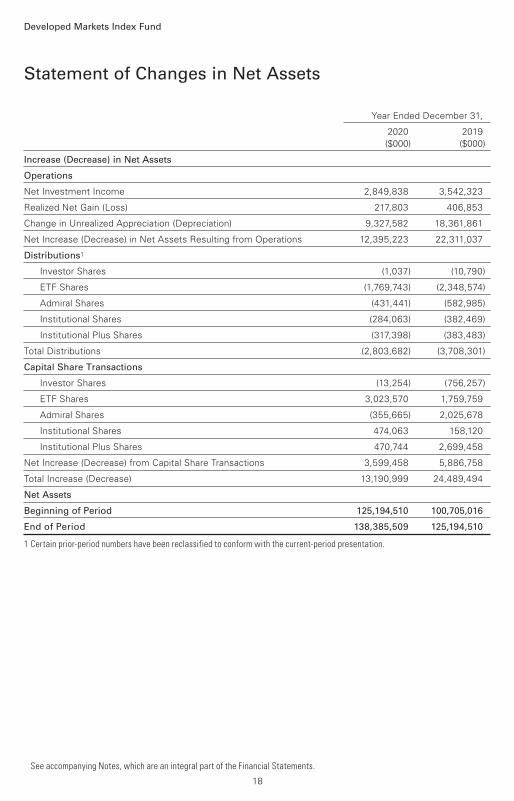
Statement of Changes in Net Assets
Developed Markets Index Fund
See accompanying Notes, which are an integral part of the Financial Statements.
Year Ended December 31,
2020 2019
($000) ($000)
Increase (Decrease) in Net Assets
Operations
Net Investment Income 2,849,838 3,542,323
Realized Net Gain (Loss) 217,803 406,853
Change in Unrealized Appreciation (Depreciation) 9,327,582 18,361,861
Net Increase (Decrease) in Net Assets Resulting from Operations 12,395,223 22,311,037
Distributions1
Investor Shares (1,037) (10,790)
ETF Shares (1,769,743) (2,348,574)
Admiral Shares (431,441) (582,985)
Institutional Shares (284,063) (382,469)
Institutional Plus Shares (317,398) (383,483)
Total Distributions (2,803,682) (3,708,301)
Capital Share Transactions
Investor Shares (13,254) (756,257)
ETF Shares 3,023,570 1,759,759
Admiral Shares (355,665) 2,025,678
Institutional Shares 474,063 158,120
Institutional Plus Shares 470,744 2,699,458
Net Increase (Decrease) from Capital Share Transactions 3,599,458 5,886,758
Total Increase (Decrease) 13,190,999 24,489,494
Net Assets
Beginning of Period 125,194,510 100,705,016
End of Period 138,385,509 125,194,510
1 Certain prior-period numbers have been reclassified to conform with the current-period presentation.
18
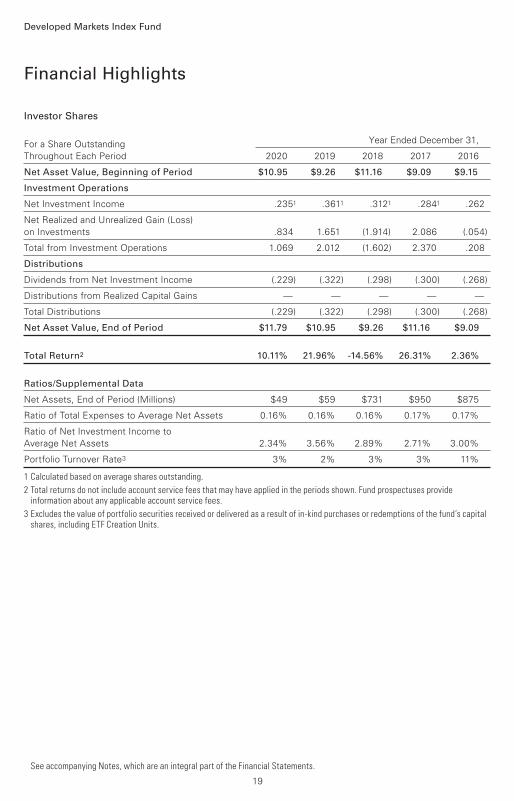
Investor Shares
For a Share Outstanding Year Ended December 31,
Throughout Each Period 2020 2019 2018 2017 2016
Net Asset Value, Beginning of Period $10.95 $9.26 $11.16 $9.09 $9.15
Investment Operations
Net Investment Income .2351 .3611 .3121 .2841 .262
Net Realized and Unrealized Gain (Loss)
on Investments .834 1.651 (1.914) 2.086 (.054)
Total from Investment Operations 1.069 2.012 (1.602) 2.370 .208
Distributions
Dividends from Net Investment Income (.229) (.322) (.298) (.300) (.268)
Distributions from Realized Capital Gains — — — — —
Total Distributions (.229) (.322) (.298) (.300) (.268)
Net Asset Value, End of Period $11.79 $10.95 $9.26 $11.16 $9.09
Total Return2 10.11% 21.96% -14.56% 26.31% 2.36%
Ratios/Supplemental Data
Net Assets, End of Period (Millions) $49 $59 $731 $950 $875
Ratio of Total Expenses to Average Net Assets 0.16% 0.16% 0.16% 0.17% 0.17%
Ratio of Net Investment Income to
Average Net Assets 2.34% 3.56% 2.89% 2.71% 3.00%
Portfolio Turnover Rate3 3% 2% 3% 3% 11%
1 Calculated based on average shares outstanding.
2 Total returns do not include account service fees that may have applied in the periods shown. Fund prospectuses provide information about any applicable account service fees.
3 Excludes the value of portfolio securities received or delivered as a result of in-kind purchases or redemptions of the fund’s capital shares, including ETF Creation Units.
Financial Highlights
See accompanying Notes, which are an integral part of the Financial Statements.
Developed Markets Index Fund
19

FTSE Developed Markets ETF Shares
For a Share Outstanding Year Ended December 31,
Throughout Each Period 2020 2019 2018 2017 2016
Net Asset Value, Beginning of Period $43.98 $37.20 $44.83 $36.51 $36.75
Investment Operations
Net Investment Income .9821 1.2891 1.2911 1.1661 1.090
Net Realized and Unrealized Gain (Loss)
on Investments 3.363 6.831 (7.677) 8.397 (.216)
Total from Investment Operations 4.345 8.120 (6.386) 9.563 .874
Distributions
Dividends from Net Investment Income (.965) (1.340) (1.244) (1.243) (1.114)
Distributions from Realized Capital Gains — — — — —
Total Distributions (.965) (1.340) (1.244) (1.243) (1.114)
Net Asset Value, End of Period $47.36 $43.98 $37.20 $44.83 $36.51
Total Return 10.29% 22.08% -14.47% 26.44% 2.51%
Ratios/Supplemental Data
Net Assets, End of Period (Millions) $87,578 $78,752 $65,139 $68,406 $40,243
Ratio of Total Expenses to Average Net Assets 0.05% 0.05% 0.05% 0.07% 0.07%
Ratio of Net Investment Income to
Average Net Assets 2.43% 3.13% 3.00% 2.81% 3.10%
Portfolio Turnover Rate2 3% 2% 3% 3% 11%
1 Calculated based on average shares outstanding.
2 Excludes the value of portfolio securities received or delivered as a result of in-kind purchases or redemptions of the fund’s capital shares, including ETF Creation Units.
Financial Highlights
See accompanying Notes, which are an integral part of the Financial Statements.
Developed Markets Index Fund
20
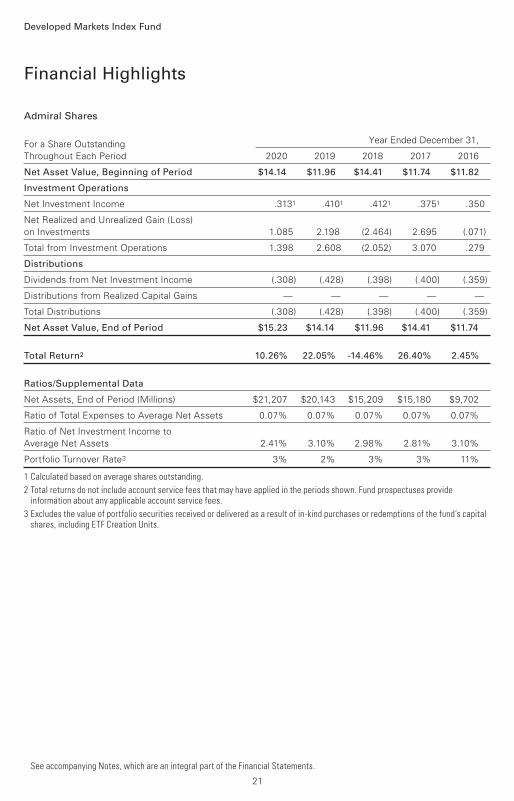
Admiral Shares
For a Share Outstanding Year Ended December 31,
Throughout Each Period 2020 2019 2018 2017 2016
Net Asset Value, Beginning of Period $14.14 $11.96 $14.41 $11.74 $11.82
Investment Operations
Net Investment Income .3131 .4101 .4121 .3751 .350
Net Realized and Unrealized Gain (Loss)
on Investments 1.085 2.198 (2.464) 2.695 (.071)
Total from Investment Operations 1.398 2.608 (2.052) 3.070 .279
Distributions
Dividends from Net Investment Income (.308) (.428) (.398) (.400) (.359)
Distributions from Realized Capital Gains — — — — —
Total Distributions (.308) (.428) (.398) (.400) (.359)
Net Asset Value, End of Period $15.23 $14.14 $11.96 $14.41 $11.74
Total Return2 10.26% 22.05% -14.46% 26.40% 2.45%
Ratios/Supplemental Data
Net Assets, End of Period (Millions) $21,207 $20,143 $15,209 $15,180 $9,702
Ratio of Total Expenses to Average Net Assets 0.07% 0.07% 0.07% 0.07% 0.07%
Ratio of Net Investment Income to
Average Net Assets 2.41% 3.10% 2.98% 2.81% 3.10%
Portfolio Turnover Rate3 3% 2% 3% 3% 11%
1 Calculated based on average shares outstanding.
2 Total returns do not include account service fees that may have applied in the periods shown. Fund prospectuses provide information about any applicable account service fees.
3 Excludes the value of portfolio securities received or delivered as a result of in-kind purchases or redemptions of the fund’s capital shares, including ETF Creation Units.
Financial Highlights
See accompanying Notes, which are an integral part of the Financial Statements.
Developed Markets Index Fund
21
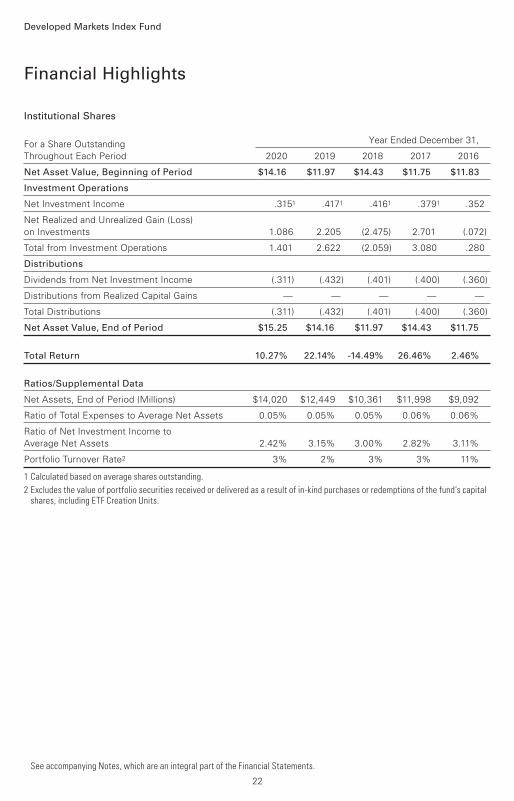
Institutional Shares
For a Share Outstanding Year Ended December 31,
Throughout Each Period 2020 2019 2018 2017 2016
Net Asset Value, Beginning of Period $14.16 $11.97 $14.43 $11.75 $11.83
Investment Operations
Net Investment Income .3151 .4171 .4161 .3791 .352
Net Realized and Unrealized Gain (Loss)
on Investments 1.086 2.205 (2.475) 2.701 (.072)
Total from Investment Operations 1.401 2.622 (2.059) 3.080 .280
Distributions
Dividends from Net Investment Income (.311) (.432) (.401) (.400) (.360)
Distributions from Realized Capital Gains — — — — —
Total Distributions (.311) (.432) (.401) (.400) (.360)
Net Asset Value, End of Period $15.25 $14.16 $11.97 $14.43 $11.75
Total Return 10.27% 22.14% -14.49% 26.46% 2.46%
Ratios/Supplemental Data
Net Assets, End of Period (Millions) $14,020 $12,449 $10,361 $11,998 $9,092
Ratio of Total Expenses to Average Net Assets 0.05% 0.05% 0.05% 0.06% 0.06%
Ratio of Net Investment Income to
Average Net Assets 2.42% 3.15% 3.00% 2.82% 3.11%
Portfolio Turnover Rate2 3% 2% 3% 3% 11%
1 Calculated based on average shares outstanding.
2 Excludes the value of portfolio securities received or delivered as a result of in-kind purchases or redemptions of the fund’s capital shares, including ETF Creation Units.
Financial Highlights
See accompanying Notes, which are an integral part of the Financial Statements.
Developed Markets Index Fund
22

Institutional Plus Shares
For a Share Outstanding Year Ended December 31,
Throughout Each Period 2020 2019 2018 2017 2016
Net Asset Value, Beginning of Period $22.13 $18.72 $22.56 $18.37 $18.49
Investment Operations
Net Investment Income .4951 .6471 .6431 .5971 .552
Net Realized and Unrealized Gain (Loss)
on Investments 1.693 3.439 (3.855) 4.223 (.107)
Total from Investment Operations 2.188 4.086 (3.212) 4.820 .445
Distributions
Dividends from Net Investment Income (0.488) (.676) (.628) (.630) (.565)
Distributions from Realized Capital Gains — — — — —
Total Distributions (0.488) (.676) (.628) (.630) (.565)
Net Asset Value, End of Period $23.83 $22.13 $18.72 $22.56 $18.37
Total Return 10.27% 22.07% -14.45% 26.49% 2.50%
Ratios/Supplemental Data
Net Assets, End of Period (Millions) $15,531 $13,790 $9,265 $10,102 $7,444
Ratio of Total Expenses to Average Net Assets 0.04% 0.04% 0.04% 0.05% 0.05%
Ratio of Net Investment Income to
Average Net Assets 2.43% 3.12% 3.01% 2.83% 3.12%
Portfolio Turnover Rate2 3% 2% 3% 3% 11%
1 Calculated based on average shares outstanding.
2 Excludes the value of portfolio securities received or delivered as a result of in-kind purchases or redemptions of the fund’s capital shares, including ETF Creation Units.
Financial Highlights
See accompanying Notes, which are an integral part of the Financial Statements.
Developed Markets Index Fund
23
Notes to Financial Statements
Developed Markets Index Fund
Vanguard Developed Markets Index Fund is registered under the Investment Company Act of 1940
as an open-end investment company, or mutual fund. The fund offers five classes of shares: Investor
Shares, ETF Shares, Admiral Shares, Institutional Shares, and Institutional Plus Shares. Each of the
share classes has different eligibility and minimum purchase requirements, and is designed for
different types of investors. ETF Shares, known as Vanguard FTSE Developed Markets ETF Shares,
are listed for trading on NYSE Arca; they can be purchased and sold through a broker.
The fund invests in securities of foreign issuers, which may subject it to investment risks not
normally associated with investing in securities of U.S. corporations. Market disruptions associated
with the COVID-19 pandemic have had a global impact, and uncertainty exists as to the long-term
implications. Such disruptions can adversely affect assets of the fund and thus fund performance.
A. The following significant accounting policies conform to generally accepted accounting
principles for U.S. investment companies. The fund consistently follows such policies in preparing
its financial statements.
1. Security Valuation: Securities are valued as of the close of trading on the New York Stock
Exchange (generally 4 p.m., Eastern time) on the valuation date. Equity securities are valued at
the latest quoted sales prices or official closing prices taken from the primary market in which
each security trades; such securities not traded on the valuation date are valued at the mean of the
latest quoted bid and asked prices. Securities for which market quotations are not readily available,
or whose values have been affected by events occurring before the fund’s pricing time but after
the close of the securities’ primary markets, are valued at their fair values calculated according to
procedures adopted by the board of trustees. These procedures include obtaining quotations from
an independent pricing service, monitoring news to identify significant market- or security-specific
events, and evaluating changes in the values of foreign market proxies (for example, ADRs, futures
contracts, or exchange-traded funds), between the time the foreign markets close and the fund’s
pricing time. When fair-value pricing is employed, the prices of securities used by a fund to calculate
its net asset value may differ from quoted or published prices for the same securities. Investments
in Vanguard Market Liquidity Fund are valued at that fund’s net asset value. Temporary cash
investments are valued using the latest bid prices or using valuations based on a matrix system
(which considers such factors as security prices, yields, maturities, and ratings), both as furnished
by independent pricing services.
2. Foreign Currency: Securities and other assets and liabilities denominated in foreign currencies
are translated into U.S. dollars using exchange rates obtained from an independent third party as
of the fund’s pricing time on the valuation date. Realized gains (losses) and unrealized appreciation
(depreciation) on investment securities include the effects of changes in exchange rates since the
securities were purchased, combined with the effects of changes in security prices. Fluctuations
in the value of other assets and liabilities resulting from changes in exchange rates are recorded as
unrealized foreign currency gains (losses) until the assets or liabilities are settled in cash, at which
time they are recorded as realized foreign currency gains (losses).
3. Futures Contracts: The fund uses index futures contracts to a limited extent, with the objectives
of maintaining full exposure to the stock market, maintaining liquidity, and minimizing transaction
costs. The fund may purchase futures contracts to immediately invest incoming cash in the market,
or sell futures in response to cash outflows, thereby simulating a fully invested position in the
underlying index while maintaining a cash balance for liquidity. The primary risks associated with
24

Developed Markets Index Fund
the use of futures contracts are imperfect correlation between changes in market values of stocks
held by the fund and the prices of futures contracts, and the possibility of an illiquid market.
Counterparty risk involving futures is mitigated because a regulated clearinghouse is the counterparty
instead of the clearing broker. To further mitigate counterparty risk, the fund trades futures contracts
on an exchange, monitors the financial strength of its clearing brokers and clearinghouse, and has
entered into clearing agreements with its clearing brokers. The clearinghouse imposes initial margin
requirements to secure the fund’s performance and requires daily settlement of variation margin
representing changes in the market value of each contract. Any securities pledged as initial margin
for open contracts are noted in the Schedule of Investments.
Futures contracts are valued at their quoted daily settlement prices. The notional amounts of the
contracts are not recorded in the Statement of Assets and Liabilities. Fluctuations in the value of
the contracts are recorded in the Statement of Assets and Liabilities as an asset (liability) and in the
Statement of Operations as unrealized appreciation (depreciation) until the contracts are closed,
when they are recorded as realized gains (losses) on futures contracts.
During the year ended December 31, 2020, the fund’s average investments in long and short
futures contracts represented 1% and 0% of net assets, respectively, based on the average of
the notional amounts at each quarter-end during the period.
4. Forward Currency Contracts: The fund enters into forward currency contracts to protect the value
of securities and related receivables and payables against changes in future foreign exchange rates.
The fund’s risks in using these contracts include movement in the values of the foreign currencies
relative to the U.S. dollar and the ability of the counterparties to fulfill their obligations under the
contracts. The fund mitigates its counterparty risk by entering into forward currency contracts only
with a diverse group of prequalified counterparties, monitoring their financial strength, entering into
master netting arrangements with its counterparties, and requiring its counterparties to transfer
collateral as security for their performance. In the absence of a default, the collateral pledged or
received by the fund cannot be repledged, resold, or rehypothecated. The master netting
arrangements provide that, in the event of a counterparty’s default (including bankruptcy), the fund
may terminate the forward currency contracts, determine the net amount owed by either party in
accordance with its master netting arrangements, and sell or retain any collateral held up to the net
amount owed to the fund under the master netting arrangements. The forward currency contracts
contain provisions whereby a counterparty may terminate open contracts if the fund’s net assets
decline below a certain level, triggering a payment by the fund if the fund is in a net liability position
at the time of the termination. The payment amount would be reduced by any collateral the fund
has pledged. Any securities pledged as collateral for open contracts are noted in the Schedule of
Investments. The value of collateral received or pledged is compared daily to the value of the forward
currency contracts exposure with each counterparty, and any difference, if in excess of a specified
minimum transfer amount, is adjusted and settled within two business days.
Forward currency contracts are valued at their quoted daily prices obtained from an independent
third party, adjusted for currency risk based on the expiration date of each contract. The notional
amounts of the contracts are not recorded in the Statement of Assets and Liabilities. Fluctuations in
the value of the contracts are recorded in the Statement of Assets and Liabilities as an asset (liability)
and in the Statement of Operations as unrealized appreciation (depreciation) until the contracts are
closed, when they are recorded as realized gains (losses) on forward currency contracts.
25
Developed Markets Index Fund
During the year ended December 31, 2020, the fund’s average investment in forward currency
contracts represented 4% of net assets, based on the average of notional amounts at each
quarter-end during the period.
5. Swap Contracts: The fund has entered into equity swap contracts to earn the total return on
selected reference stocks in the fund’s target index. Under the terms of the swaps, the fund receives
the total return on the referenced stock (i.e., receiving the increase or paying the decrease in value
of the selected reference stock and receiving the equivalent of any dividends in respect of the
selected referenced stock) over a specified period of time, applied to a notional amount that
represents the value of a designated number of shares of the selected reference stock at the
beginning of the equity swap contract. The fund also pays a floating rate that is based on short-
term interest rates, applied to the notional amount. At the same time, the fund generally invests an
amount approximating the notional amount of the swap in high-quality temporary cash investments.
A risk associated with all types of swaps is the possibility that a counterparty may default on its
obligation to pay net amounts due to the fund. The fund’s maximum amount subject to counterparty
risk is the unrealized appreciation on the swap contract. The fund mitigates its counterparty risk
by entering into swaps only with a diverse group of prequalified counterparties, monitoring their
financial strength, entering into master netting arrangements with its counterparties, and requiring
its counterparties to transfer collateral as security for their performance. In the absence of a default,
the collateral pledged or received by the fund cannot be repledged, resold, or rehypothecated. In
the event of a counterparty’s default (including bankruptcy), the fund may terminate any swap
contracts with that counterparty, determine the net amount owed by either party in accordance
with its master netting arrangements, and sell or retain any collateral held up to the net amount
owed to the fund under the master netting arrangements. The swap contracts contain provisions
whereby a counterparty may terminate open contracts if the fund’s net assets decline below a
certain level, triggering a payment by the fund if the fund is in a net liability position at the time of
the termination. The payment amount would be reduced by any collateral the fund has pledged.
Any securities pledged as collateral for open contracts are noted in the Schedule of Investments.
The value of collateral received or pledged is compared daily to the value of the swap contracts
exposure with each counterparty, and any difference, if in excess of a specified minimum transfer
amount, is adjusted and settled within two business days.
The notional amounts of swap contracts are not recorded in the Statement of Assets and Liabilities.
Swaps are valued daily based on market quotations received from independent pricing services or
recognized dealers and the change in value is recorded in the Statement of Assets and Liabilities
as an asset (liability) and in the Statement of Operations as unrealized appreciation (depreciation)
until periodic payments are made or the termination of the swap, at which time realized gain (loss)
is recorded.
During the year ended December 31, 2020, the fund’s average amounts of investments in total
return swaps represented less than 1% of net assets, based on the average of notional amounts at
each quarter-end during the period. The fund had no open swap contracts at December 31, 2020.
6. Federal Income Taxes: The fund intends to continue to qualify as a regulated investment company
and distribute all of its taxable income. The fund’s tax returns are open to examination by the
relevant tax authorities until expiration of the applicable statute of limitations, which is generally
26

Developed Markets Index Fund
three years after the filing of the tax return. Management has analyzed the fund’s tax positions
taken for all open federal and state income tax years, and has concluded that no provision for
income tax is required in the fund’s financial statements.
7. Distributions: Distributions to shareholders are recorded on the ex-dividend date. Distributions
are determined on a tax basis at the fiscal year-end and may differ from net investment income and
realized capital gains for financial reporting purposes.
8. Securities Lending: To earn additional income, the fund lends its securities to qualified institutional
borrowers. Security loans are subject to termination by the fund at any time, and are required to be
secured at all times by collateral in an amount at least equal to the market value of securities loaned.
Daily market fluctuations could cause the value of loaned securities to be more or less than the
value of the collateral received. When this occurs, the collateral is adjusted and settled before the
opening of the market on the next business day. The fund further mitigates its counterparty risk by
entering into securities lending transactions only with a diverse group of prequalified counterparties,
monitoring their financial strength, and entering into master securities lending agreements with its
counterparties. The master securities lending agreements provide that, in the event of a counter-
party’s default (including bankruptcy), the fund may terminate any loans with that borrower,
determine the net amount owed, and sell or retain the collateral up to the net amount owed to
the fund; however, such actions may be subject to legal proceedings. While collateral mitigates
counterparty risk, in the event of a default, the fund may experience delays and costs in recovering
the securities loaned. The fund invests cash collateral received in Vanguard Market Liquidity Fund,
and records a liability in the Statement of Assets and Liabilities for the return of the collateral, during
the period the securities are on loan. Collateral investments in Vanguard Market Liquidity Fund are
subject to market appreciation or depreciation. Securities lending income represents fees charged
to borrowers plus income earned on invested cash collateral, less expenses associated with the
loan. During the term of the loan, the fund is entitled to all distributions made on or in respect of the
loaned securities.
9. Credit Facilities and Interfund Lending Program: The fund and certain other funds managed by
The Vanguard Group (“Vanguard”) participate in a $4.3 billion committed credit facility provided by
a syndicate of lenders pursuant to a credit agreement and an uncommitted credit facility provided
by Vanguard. Both facilities may be renewed annually. Each fund is individually liable for its
borrowings, if any, under the credit facilities. Borrowings may be utilized for temporary or emergency
purposes, subject to the fund’s regulatory and contractual borrowing restrictions. With respect to
the committed credit facility, the participating funds are charged administrative fees and an annual
commitment fee of 0.10% of the undrawn committed amount of the facility; these fees are
allocated to the funds based on a method approved by the fund’s board of trustees and included in
Management and Administrative expenses on the fund’s Statement of Operations. Any borrowings
under either facility bear interest at a rate based upon the higher of the one-month London Interbank
Offered Rate (or an acceptable alternate rate, if necessary), federal funds effective rate, or overnight
bank funding rate plus an agreed-upon spread, except that borrowings under the uncommitted
credit facility may bear interest based upon an alternative rate agreed to by the fund and Vanguard.
In accordance with an exemptive order (the “Order”) from the SEC, the fund may participate in a
joint lending and borrowing program that allows registered open-end Vanguard funds to borrow
money from and lend money to each other for temporary or emergency purposes (the “Interfund
27
Developed Markets Index Fund
Lending Program”), subject to compliance with the terms and conditions of the Order, and to the
extent permitted by the fund’s investment objective and investment policies. Interfund loans and
borrowings normally extend overnight, but can have a maximum duration of seven days. Loans
may be called on one business day’s notice. The interest rate to be charged is governed by the
conditions of the Order and internal procedures adopted by the board of trustees. The board of
trustees is responsible for overseeing the Interfund Lending Program.
For the year ended December 31, 2020, the fund did not utilize the credit facilities or the Interfund
Lending Program.
10. Other: Dividend income is recorded on the ex-dividend date. Non-cash dividends included in
dividend income, if any, are recorded at the fair value of the securities received. Interest income
includes income distributions received from Vanguard Market Liquidity Fund and is accrued daily.
Premiums and discounts on debt securities are amortized and accreted, respectively, to interest
income over the lives of the respective securities, except for premiums on certain callable debt
securities that are amortized to the earliest call date. Security transactions are accounted for on the
date securities are bought or sold. Costs used to determine realized gains (losses) on the sale of
investment securities are those of the specific securities sold.
Taxes on foreign dividends and capital gains have been provided for in accordance with the fund’s
understanding of the applicable countries’ tax rules and rates. Foreign capital gains tax, if any, is
accrued daily based upon net unrealized gains. The fund has filed tax reclaims for previously withheld
taxes on dividends earned in certain European Union countries. These filings are subject to various
administrative and judicial proceedings within these countries. Such tax reclaims received during
the year, if any, are included in dividend income. No other amounts for additional tax reclaims are
reflected in the financial statements due to the uncertainty as to the ultimate resolution of
proceedings, the likelihood of receipt of these reclaims, and the potential timing of payment.
Each class of shares has equal rights as to assets and earnings, except that each class separately
bears certain class-specific expenses related to maintenance of shareholder accounts (included in
Management and Administrative expenses) and shareholder reporting. Marketing and distribution
expenses are allocated to each class of shares based on a method approved by the board of
trustees. Income, other non-class-specific expenses, and gains and losses on investments are
allocated to each class of shares based on its relative net assets.
B. In accordance with the terms of a Funds’ Service Agreement (the “FSA”) between Vanguard
and the fund, Vanguard furnishes to the fund investment advisory, corporate management,
administrative, marketing, and distribution services at Vanguard’s cost of operations (as defined
by the FSA). These costs of operations are allocated to the fund based on methods and guidelines
approved by the board of trustees and are generally settled twice a month.
Upon the request of Vanguard, the fund may invest up to 0.40% of its net assets as capital in
Vanguard. At December 31, 2020, the fund had contributed to Vanguard capital in the amount of
$5,193,000, representing less than 0.01% of the fund’s net assets and 2.08% of Vanguard’s capital
received pursuant to the FSA. The fund’s trustees and officers are also directors and employees,
respectively, of Vanguard.
28

Developed Markets Index Fund
C. Various inputs may be used to determine the value of the fund’s investments and derivatives.
These inputs are summarized in three broad levels for financial statement purposes. The inputs or
methodologies used to value securities are not necessarily an indication of the risk associated with
investing in those securities.
Level 1—Quoted prices in active markets for identical securities.
Level 2—Other significant observable inputs (including quoted prices for similar securities, interest
rates, prepayment speeds, credit risk, etc.).
Level 3—Significant unobservable inputs (including the fund’s own assumptions used to determine
the fair value of investments). Any investments and derivatives valued with significant unobservable
inputs are noted on the Schedule of Investments.
The following table summarizes the market value of the fund’s investments and derivatives as of
December 31, 2020, based on the inputs used to value them:
Level 1 Level 2 Level 3 Total
($000) ($000) ($000) ($000)
Investments
Assets
Common Stocks 11,562,052 125,310,539 16,758 136,889,349
Temporary Cash Investments 2,563,985 42,874 — 2,606,859
Total 14,126,037 125,353,413 16,758 139,496,208
Derivative Financial Instruments
Assets
Futures Contracts1 7 — — 7
Forward Currency Contracts — 67,343 — 67,343
Total 7 67,343 — 67,350
Liabilities
Futures Contracts1 13,345 — — 13,345
Forward Currency Contracts — 28,248 — 28,248
Total 13,345 28,248 — 41,593
1 Represents variation margin on the last day of the reporting period.
29

Developed Markets Index Fund
D. At December 31, 2020, the fair values of derivatives were reflected in the Statement of Assets
and Liabilities as follows:
Foreign
Equity Exchange
Contracts Contracts Total
Statement of Assets and Liabilities Caption ($000) ($000) ($000)
Variation Margin Receivable—Futures Contracts 7 — 7
Unrealized Appreciation—Forward Currency Contracts — 67,343 67,343
Total Assets 7 67,343 67,350
Variation Margin Payable—Futures Contracts 13,345 — 13,345
Unrealized Depreciation—Forward Currency Contracts — 28,248 28,248
Total Liabilities 13,345 28,248 41,593
Realized net gain (loss) and the change in unrealized appreciation (depreciation) on derivatives for
the year ended December 31, 2020, were:
Foreign
Equity Exchange
Contracts Contracts Total
Realized Net Gain (Loss) on Derivatives ($000) ($000) ($000)
Futures Contracts 46,311 — 46,311
Swap Contracts 1,159 — 1,159
Forward Currency Contracts — 32,463 32,463
Realized Net Gain (Loss) on Derivatives 47,470 32,463 79,933
Change in Unrealized Appreciation (Depreciation) on Derivatives
Futures Contracts 15,596 — 15,596
Forward Currency Contracts — 37,480 37,480
Change in Unrealized Appreciation (Depreciation) on Derivatives 15,596 37,480 53,076
E. Permanent differences between book-basis and tax-basis components of net assets are
reclassified among capital accounts in the financial statements to reflect their tax character.
These reclassifications have no effect on net assets or net asset value per share. As of period
end, permanent differences primarily attributable to the accounting for in-kind redemptions, foreign
currency transactions, passive foreign investment companies, swap agreements, and tax expense
on capital gains were reclassified between the following accounts:
Amount
($000)
Paid-in Capital 1,024,422
Total Distributable Earnings (Loss) (1,024,422)
30

Developed Markets Index Fund
Temporary differences between book-basis and tax-basis components of total distributable
earnings (loss) arise when certain items of income, gain, or loss are recognized in different periods
for financial statement and tax purposes; these differences will reverse at some time in the future.
The differences are primarily related to the deferral of losses from wash sales; the recognition of
unrealized gains or losses from certain derivative contracts; the recognition of unrealized gains from
passive foreign investment companies; and the classification of securities for tax purposes. As of
period end, the tax-basis components of total distributable earnings (loss) are detailed in the table
as follows:
Amount
($000)
Undistributed Ordinary Income 334,405
Undistributed Long-Term Gains —
Capital Loss Carryforwards (3,339,506)
Qualified Late-Year Losses —
Net Unrealized Gains (Losses) 26,374,829
The tax character of distributions paid was as follows:
Year Ended December 31,
2020 2019
Amount Amount
($000) ($000)
Ordinary Income* 2,803,682 3,708,301
Long-Term Capital Gains — —
Total 2,803,682 3,708,301
* Includes short-term capital gains, if any.
As of December 31, 2020, gross unrealized appreciation and depreciation for investments and
derivatives based on cost for U.S. federal income tax purposes were as follows:
Amount
($000)
Tax Cost 113,148,396
Gross Unrealized Appreciation 42,127,861
Gross Unrealized Depreciation (15,772,317)
Net Unrealized Appreciation (Depreciation) 26,355,544
F. During the year ended December 31, 2020, the fund purchased $10,186,907,000 of investment
securities and sold $6,685,995,000 of investment securities, other than temporary cash
investments. Purchases and sales include $4,220,206,000 and $2,772,561,000, respectively, in
connection with in-kind purchases and redemptions of the fund’s capital shares.
31

Developed Markets Index Fund
G. Capital share transactions for each class of shares were:
Year Ended December 31,
2020 2019
Amount Shares Amount Shares
($000) (000) ($000) (000)
Investor Shares
Issued 8,465 868 179,311 17,300
Issued in Lieu of Cash Distributions 1,037 103 9,838 970
Redeemed1 (22,756) (2,213) (945,406) (91,817)
Net Increase (Decrease)—Investor Shares (13,254) (1,242) (756,257) (73,547)
ETF Shares
Issued 5,546,171 128,480 3,191,112 75,900
Issued in Lieu of Cash Distributions — — — —
Redeemed (2,522,601) (70,000) (1,431,353) (36,500)
Net Increase (Decrease)—ETF Shares 3,023,570 58,480 1,759,759 39,400
Admiral Shares
Issued1 5,693,782 462,836 5,494,696 416,279
Issued in Lieu of Cash Distributions 338,012 25,835 468,526 34,970
Redeemed (6,387,459) (520,543) (3,937,544) (298,516)
Net Increase (Decrease)—Admiral Shares (355,665) (31,872) 2,025,678 152,733
Institutional Shares
Issued 3,233,752 253,662 3,150,458 238,396
Issued in Lieu of Cash Distributions 257,784 19,654 349,841 26,090
Redeemed (3,017,473) (233,104) (3,342,179) (250,436)
Net Increase (Decrease)—Institutional Shares 474,063 40,212 158,120 14,050
Institutional Plus Shares
Issued 2,646,526 131,406 4,049,971 192,199
Issued in Lieu of Cash Distributions 301,006 14,700 364,062 17,328
Redeemed (2,476,788) (117,555) (1,714,575) (81,383)
Net Increase (Decrease)—Institutional Plus Shares 470,744 28,551 2,699,458 128,144
1 In November 2018, the fund announced changes to the availability and minimum investment criteria of the Investor and Admiral share classes. As a result, all of the outstanding Investor Shares automatically converted to Admiral Shares beginning in April 2019, with the exception of those held by Vanguard funds and certain other institutional investors. Investor Shares—Redeemed and Admiral Shares—Issued include 64,858,000 and 50,199,000 shares, respectively, in the amount of $668,306,000 from the conversion during the year ended December 31, 2019.
H. Management has determined that no events or transactions occurred subsequent to
December 31, 2020, that would require recognition or disclosure in these financial statements.
32

To the Board of Trustees of Vanguard Tax-Managed Funds and Shareholders of Vanguard
Developed Markets Index Fund
Opinion on the Financial Statements
We have audited the accompanying statement of assets and liabilities, including the schedule of
investments—investments summary of Vanguard Developed Markets Index Fund (one of the funds
constituting Vanguard Tax-Managed Funds, referred to hereafter as the “Fund”) as of December 31,
2020, the related statement of operations for the year ended December 31, 2020, the statement of
changes in net assets for each of the two years in the period ended December 31, 2020, including
the related notes, and the financial highlights for each of the five years in the period ended
December 31, 2020 (collectively referred to as the “financial statements”). In our opinion, the
financial statements present fairly, in all material respects, the financial position of the Fund as of
December 31, 2020, the results of its operations for the year then ended, the changes in its net
assets for each of the two years in the period ended December 31, 2020 and the financial
highlights for each of the five years in the period ended December 31, 2020 in conformity with
accounting principles generally accepted in the United States of America.
Basis for Opinion
These financial statements are the responsibility of the Fund’s management. Our responsibility is
to express an opinion on the Fund’s financial statements based on our audits. We are a public
accounting firm registered with the Public Company Accounting Oversight Board (United States)
(PCAOB) and are required to be independent with respect to the Fund in accordance with the U.S.
federal securities laws and the applicable rules and regulations of the Securities and Exchange
Commission and the PCAOB.
We conducted our audits of these financial statements in accordance with the standards of
the PCAOB. Those standards require that we plan and perform the audit to obtain reasonable
assurance about whether the financial statements are free of material misstatement, whether
due to error or fraud.
Our audits included performing procedures to assess the risks of material misstatement of the
financial statements, whether due to error or fraud, and performing procedures that respond to
those risks. Such procedures included examining, on a test basis, evidence regarding the amounts
and disclosures in the financial statements. Our audits also included evaluating the accounting
principles used and significant estimates made by management, as well as evaluating the overall
presentation of the financial statements. Our procedures included confirmation of securities owned
as of December 31, 2020 by correspondence with the custodian and brokers and by agreement to
the underlying ownership records of the transfer agent; when replies were not received from
brokers, we performed other auditing procedures. We believe that our audits provide a reasonable
basis for our opinion.
/s/PricewaterhouseCoopers LLP
Philadelphia, Pennsylvania
February 16, 2021
We have served as the auditor of one or more investment companies in The Vanguard Group of
Funds since 1975.
Report of Independent Registered Public Accounting Firm
33

Special 2020 tax information (unaudited) for Vanguard Developed Markets Index Fund
This information for the fiscal year ended December 31, 2020 is included pursuant to provisions
of the Internal Revenue Code.
The fund distributed $2,249,113,000 of qualified dividend income to shareholders during the
fiscal year.
The fund designates to shareholders foreign source income of $3,134,826,000 and foreign taxes
paid of $277,661,000. Shareholders will receive more detailed information with their Form 1099-DIV
in January 2021 to determine the calendar-year amounts to be included on their 2020 tax returns.
34
London Stock Exchange Group companies include FTSE International Limited (“FTSE”), Frank Russell Company (“Russell”),
MTS Next Limited (“MTS”), and FTSE TMX Global Debt Capital Markets Inc. (“FTSE TMX”). All rights reserved. “FTSE®”,
“Russell®”, “MTS®”, “FTSE TMX®” and “FTSE Russell” and other service marks and trademarks related to the FTSE or
Russell indexes are trademarks of the London Stock Exchange Group companies and are used by FTSE, MTS, FTSE TMX
and Russell under license. All information is provided for information purposes only. Every effort is made to ensure that
all information given in this publication is accurate, but no responsibility or liability can be accepted by the London Stock
Exchange Group companies nor its licensors for any errors or for any loss from use of this publication. Neither the London
Stock Exchange Group companies nor any of their licensors make any claim, prediction, warranty or representation
whatsoever, expressly or impliedly, either as to the results to be obtained from the use of the Indices or the fitness
or suitability of the Indices for any particular purpose to which they might be put. The London Stock Exchange Group
companies do not provide investment advice and nothing in this document should be taken as constituting financial or
investment advice. The London Stock Exchange Group companies make no representation regarding the advisability of
investing in any asset. A decision to invest in any such asset should not be made in reliance on any information herein.
Indexes cannot be invested in directly. Inclusion of an asset in an index is not a recommendation to buy, sell or hold that
asset. The general information contained in this publication should not be acted upon without obtaining specific legal, tax,
and investment advice from a licensed professional. No part of this information may be reproduced, stored in a retrieval
system or transmitted in any form or by any means, electronic, mechanical, photocopying, recording or otherwise, without
prior written permission of the London Stock Exchange Group companies. Distribution of the London Stock Exchange Group
companies’ index values and the use of their indexes to create financial products require a license with FTSE, FTSE TMX,
MTS and/or Russell and/or its licensors.
35

This page intentionally left blank.

This page intentionally left blank.

This page intentionally left blank.

This page intentionally left blank.

This page intentionally left blank.

This page intentionally left blank.

This page intentionally left blank.
The People Who Govern Your Fund
The trustees of your mutual fund are there to see that the fund is operated and managed in your
best interests since, as a shareholder, you are a part owner of the fund. Your fund’s trustees also
serve on the board of directors of The Vanguard Group, Inc., which is owned by the Vanguard
funds and provides services to them.
A majority of Vanguard’s board members are independent, meaning that they have no affiliation
with Vanguard or the funds they oversee, apart from the sizable personal investments they have
made as private individuals. The independent board members have distinguished backgrounds
in business, academia, and public service. Each of the trustees and executive officers oversees
211 Vanguard funds.
Information for each trustee and executive officer of the fund appears below. That information,
as well as the Vanguard fund count, is as of the date on the cover of this fund report. The mailing
address of the trustees and officers is P.O. Box 876, Valley Forge, PA 19482. More information
about the trustees is in the Statement of Additional Information, which can be obtained, without
charge, by contacting Vanguard at 800-662-7447, or online at vanguard.com.
Interested Trustee1
Mortimer J. Buckley
Born in 1969. Trustee since January 2018. Principal
occupation(s) during the past five years and other
experience: chairman of the board (2019–present) of
Vanguard and of each of the investment companies
served by Vanguard; chief executive officer (2018–
present) of Vanguard; chief executive officer, president,
and trustee (2018–present) of each of the investment
companies served by Vanguard; president and
director (2017–present) of Vanguard; and president
(2018–present) of Vanguard Marketing Corporation.
Chief investment officer (2013–2017), managing
director (2002–2017), head of the Retail Investor
Group (2006–2012), and chief information officer
(2001–2006) of Vanguard. Chairman of the board
(2011–2017) and trustee (2009–2017) of the Children’s
Hospital of Philadelphia; and trustee (2018–present)
and vice chair (2019–present) of The Shipley School.
Independent Trustees
Emerson U. Fullwood
Born in 1948. Trustee since January 2008. Principal
occupation(s) during the past five years and other
experience: executive chief staff and marketing officer
for North America and corporate vice president (retired
2008) of Xerox Corporation (document management
products and services). Former president of the
Worldwide Channels Group, Latin America, and
Worldwide Customer Service and executive chief
staff officer of Developing Markets of Xerox. Executive
in residence and 2009–2010 Distinguished Minett
Professor at the Rochester Institute of Technology.
Director of SPX FLOW, Inc. (multi-industry manufac-
turing). Director of the University of Rochester Medical
Center, the Monroe Community College Foundation,
the United Way of Rochester, North Carolina A&T
University, and Roberts Wesleyan College. Trustee
of the University of Rochester.
Amy Gutmann
Born in 1949. Trustee since June 2006. Principal
occupation(s) during the past five years and other
experience: president (2004–present) of the University
of Pennsylvania. Christopher H. Browne Distinguished
Professor of Political Science, School of Arts and
Sciences, and professor of communication, Annenberg
School for Communication, with secondary faculty
appointments in the Department of Philosophy, School
of Arts and Sciences, and at the Graduate School of
Education, University of Pennsylvania.
F. Joseph Loughrey
Born in 1949. Trustee since October 2009. Principal
occupation(s) during the past five years and other
experience: president and chief operating officer
(retired 2009) and vice chairman of the board
(2008–2009) of Cummins Inc. (industrial machinery).
Chairman of the board of Hillenbrand, Inc. (specialized
consumer services) and the Lumina Foundation.
Director of the V Foundation. Member of the advisory
1 Mr. Buckley is considered an “interested person,” as defined in the Investment Company Act of 1940, because he is an officer of the Vanguard funds.

council for the College of Arts and Letters and
chair of the advisory board to the Kellogg Institute
for International Studies, both at the University of
Notre Dame.
Mark Loughridge
Born in 1953. Trustee since March 2012. Principal
occupation(s) during the past five years and other
experience: senior vice president and chief financial
officer (retired 2013) of IBM (information technology
services). Fiduciary member of IBM’s Retirement
Plan Committee (2004–2013), senior vice president
and general manager (2002–2004) of IBM Global
Financing, vice president and controller (1998–2002)
of IBM, and a variety of other prior management roles
at IBM. Member of the Council on Chicago Booth.
Scott C. Malpass
Born in 1962. Trustee since March 2012. Principal
occupation(s) during the past five years and other
experience: chief investment officer (retired June
2020) and vice president (retired June 2020) of the
University of Notre Dame. Assistant professor of
finance at the Mendoza College of Business, University
of Notre Dame, and member of the Notre Dame 403(b)
Investment Committee (retired June 2020). Member
of the board of Catholic Investment Services, Inc.
(investment advisors) and the board of superintendence
of the Institute for the Works of Religion.
Deanna Mulligan
Born in 1963. Trustee since January 2018. Principal
occupation(s) during the past five years and other
experience: board chair (2020–present), chief executive
officer (2011–2020), and president (2010–2019) of
The Guardian Life Insurance Company of America.
Chief operating officer (2010–2011) and executive
vice president (2008–2010) of the individual life and
disability division of Guardian Life. Member of the
board of the American Council of Life Insurers and the
board of the Economic Club of New York. Trustee of
the Partnership for New York City (business leadership),
Chief Executives for Corporate Purpose, NewYork-
Presbyterian Hospital, Catalyst, and the Bruce Museum
(arts and science). Member of the Advisory Council
for the Stanford Graduate School of Business.
André F. Perold
Born in 1952. Trustee since December 2004. Principal
occupation(s) during the past five years and other
experience: George Gund Professor of Finance and
Banking, Emeritus at the Harvard Business School
(retired 2011). Chief investment officer and co-
managing partner of HighVista Strategies (private
investment firm). Member of the board of advisors
and member of the investment committee of the
Museum of Fine Arts Boston. Member of the board
(2018–present) of RIT Capital Partners (investment
firm). Member of the investment committee of
Partners Health Care System.
Sarah Bloom Raskin
Born in 1961. Trustee since January 2018. Principal
occupation(s) during the past five years and other
experience: deputy secretary (2014–2017) of
the United States Department of the Treasury.
Governor (2010–2014) of the Federal Reserve
Board. Commissioner (2007–2010) of financial
regulation for the State of Maryland. Member of
the board of directors (2012–2014) of Neighborhood
Reinvestment Corporation. Director (2017–present)
of i(x) Investments, LLC; director (2017–present) of
Reserve Trust. Rubenstein Fellow (2017–present)
of Duke University; trustee (2017–present) of Amherst
College, and trustee (2019–present) of the Folger
Shakespeare Library.
Peter F. Volanakis
Born in 1955. Trustee since July 2009. Principal
occupation(s) during the past five years and other
experience: president and chief operating officer
(retired 2010) of Corning Incorporated (communications
equipment) and director of Corning Incorporated
(2000–2010) and Dow Corning (2001–2010).
Director (2012) of SPX Corporation (multi-industry
manufacturing). Overseer of the Amos Tuck School
of Business Administration, Dartmouth College
(2001–2013). Chairman of the board of trustees
of Colby-Sawyer College. Member of the board of
Hypertherm Inc. (industrial cutting systems, software,
and consumables).
Executive Officers
John Bendl
Born in 1970. Principal occupation(s) during the past
five years and other experience: principal of Vanguard.
Chief financial officer (2019–present) of each of the
investment companies served by Vanguard. Chief
accounting officer, treasurer, and controller of Vanguard
(2017–present). Partner (2003–2016) at KPMG (audit,
tax, and advisory services).
Christine M. Buchanan
Born in 1970. Principal occupation(s) during the past
five years and other experience: principal of Vanguard.
Treasurer (2017–present) of each of the investment
companies served by Vanguard. Partner (2005–2017)
at KPMG (audit, tax, and advisory services).
David Cermak
Born in 1960. Principal occupation(s) during the
past five years and other experience: principal of
Vanguard. Finance director (2019–present) of each
of the investment companies served by Vanguard.
Managing director and head (2017–present) of
Vanguard Investments Singapore. Managing director
and head (2017–2019) of Vanguard Investments Hong
Kong. Representative director and head (2014–2017)
of Vanguard Investments Japan.
John Galloway
Born in 1973. Principal occupation(s) during the
past five years and other experience: principal of
Vanguard. Investment stewardship officer (September
2020–present) of each of the investment companies
served by Vanguard. Head of Investor Advocacy
(February 2020–present) and head of Marketing
Strategy and Planning (2017–2020) at Vanguard.
Deputy assistant to the President of the United
States (2015).
Thomas J. Higgins
Born in 1957. Principal occupation(s) during the past
five years and other experience: principal of Vanguard.
Finance director (2019–present), chief financial officer
(2008–2019), and treasurer (1998–2008) of each of
the investment companies served by Vanguard.
Peter Mahoney
Born in 1974. Principal occupation(s) during the past
five years and other experience: principal of Vanguard.
Controller (2015–present) of each of the investment
companies served by Vanguard. Head of International
Fund Services (2008–2014) at Vanguard.
Anne E. Robinson
Born in 1970. Principal occupation(s) during the
past five years and other experience: general
counsel (2016–present) of Vanguard. Secretary
(2016–present) of Vanguard and of each of the
investment companies served by Vanguard.
Managing director (2016–present) of Vanguard.
Managing director and general counsel of Global
Cards and Consumer Services (2014–2016) at
Citigroup. Counsel (2003–2014) at American Express.
Michael Rollings
Born in 1963. Principal occupation(s) during the
past five years and other experience: finance
director (2017–present) and treasurer (2017) of each
of the investment companies served by Vanguard.
Managing director (2016–present) of Vanguard. Chief
financial officer (2016–present) of Vanguard. Director
(2016–present) of Vanguard Marketing Corporation.
Executive vice president and chief financial officer
(2006–2016) of MassMutual Financial Group.
John E. Schadl
Born in 1972. Principal occupation(s) during the past
five years and other experience: principal of Vanguard.
Chief compliance officer (2019–present) of Vanguard
and of each of the investment companies served by
Vanguard. Assistant vice president (2019–present)
of Vanguard Marketing Corporation.
Vanguard Senior Management Team
Joseph Brennan James M. Norris
Mortimer J. Buckley Thomas M. Rampulla
Gregory Davis Karin A. Risi
John James Anne E. Robinson
John T. Marcante Michael Rollings
Chris D. McIsaac Lauren Valente

Connect with Vanguard® > vanguard.com
Fund Information > 800-662-7447
Direct Investor Account Services > 800-662-2739
Institutional Investor Services > 800-523-1036
Text Telephone for PeopleWho Are Deaf or Hard of Hearing > 800-749-7273
This material may be used in conjunctionwith the offering of shares of any Vanguardfund only if preceded or accompanied bythe fund’s current prospectus.
All comparative mutual fund data are from Morningstar,Inc., unless otherwise noted.
You can obtain a free copy of Vanguard’s proxy votingguidelines by visiting vanguard.com/proxyreporting or bycalling Vanguard at 800-662-2739. The guidelines arealso available from the SEC’s website, www.sec.gov. Inaddition, you may obtain a free report on how your fundvoted the proxies for securities it owned during the 12months ended June 30. To get the report, visit eithervanguard.com/proxyreporting or www.sec.gov.
You can review information about your fund on theSEC’s website, and you can receive copies of thisinformation, for a fee, by sending a request via emailaddressed to [email protected].
Source for Bloomberg Barclays indexes: BloombergIndex Services Limited. Copyright 2021, Bloomberg. Allrights reserved.
© 2021 The Vanguard Group, Inc.All rights reserved.U.S. Patent Nos. 6,879,964; 7,337,138;7,720,749; 7,925,573; 8,090,646; 8,417,623; and 8,626,636.Vanguard Marketing Corporation, Distributor.
Q1270 022021
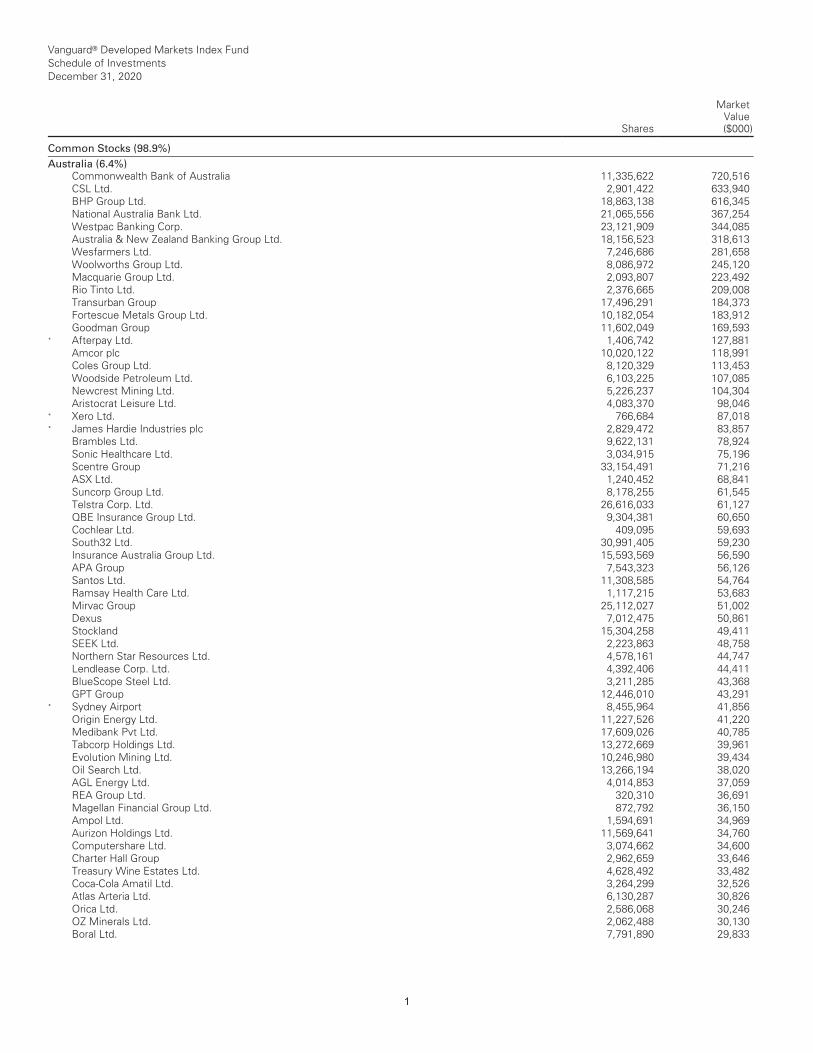
Vanguard® Developed Markets Index Fund Schedule of Investments December 31, 2020
Shares
MarketValue($000)
__________________________________________________________________________________________________________________________________________________________________________________________________________________________________________________________________________________________________________________________________________________________________________________________________________________________________________________________________________________________________________________________________________________________________________________________________________________________________________________________________________________________ __________________________________________________________________________________________________________________________________________________________________________________________________________________________________________________________________________________________________________________________________________________________________________________________________________________________________________________________________________________________________________________________________________________________________________________________________________________________________________________________________________________________
Common Stocks (98.9%) __________________________________________________________________________________________________________________________________________________________________________________________________________________________________________________________________________________________________________________________________________________________________________________________________________________________________________________________________________________________________________________________________________________________________________________________________________________________________________________________________________________________ __________________________________________________________________________________________________________________________________________________________________________________________________________________________________________________________________________________________________________________________________________________________________________________________________________________________________________________________________________________________________________________________________________________________________________________________________________________________________________________________________________________________
Australia (6.4%)Commonwealth Bank of Australia 11,335,622 720,516CSL Ltd. 2,901,422 633,940BHP Group Ltd. 18,863,138 616,345National Australia Bank Ltd. 21,065,556 367,254 Westpac Banking Corp. 23,121,909 344,085Australia & New Zealand Banking Group Ltd. 18,156,523 318,613 Wesfarmers Ltd. 7,246,686 281,658Woolworths Group Ltd. 8,086,972 245,120Macquarie Group Ltd. 2,093,807 223,492Rio Tinto Ltd. 2,376,665 209,008Transurban Group 17,496,291 184,373Fortescue Metals Group Ltd. 10,182,054 183,912 Goodman Group 11,602,049 169,593
* Afterpay Ltd. 1,406,742 127,881Amcor plc 10,020,122 118,991Coles Group Ltd. 8,120,329 113,453Woodside Petroleum Ltd. 6,103,225 107,085 Newcrest Mining Ltd. 5,226,237 104,304Aristocrat Leisure Ltd. 4,083,370 98,046
* Xero Ltd. 766,684 87,018* James Hardie Industries plc 2,829,472 83,857
Brambles Ltd. 9,622,131 78,924Sonic Healthcare Ltd. 3,034,915 75,196Scentre Group 33,154,491 71,216ASX Ltd. 1,240,452 68,841Suncorp Group Ltd. 8,178,255 61,545Telstra Corp. Ltd. 26,616,033 61,127QBE Insurance Group Ltd. 9,304,381 60,650 Cochlear Ltd. 409,095 59,693South32 Ltd. 30,991,405 59,230Insurance Australia Group Ltd. 15,593,569 56,590 APA Group 7,543,323 56,126Santos Ltd. 11,308,585 54,764Ramsay Health Care Ltd. 1,117,215 53,683 Mirvac Group 25,112,027 51,002Dexus 7,012,475 50,861Stockland 15,304,258 49,411SEEK Ltd. 2,223,863 48,758Northern Star Resources Ltd. 4,578,161 44,747 Lendlease Corp. Ltd. 4,392,406 44,411BlueScope Steel Ltd. 3,211,285 43,368GPT Group 12,446,010 43,291
* Sydney Airport 8,455,964 41,856Origin Energy Ltd. 11,227,526 41,220Medibank Pvt Ltd. 17,609,026 40,785Tabcorp Holdings Ltd. 13,272,669 39,961Evolution Mining Ltd. 10,246,980 39,434Oil Search Ltd. 13,266,194 38,020AGL Energy Ltd. 4,014,853 37,059REA Group Ltd. 320,310 36,691Magellan Financial Group Ltd. 872,792 36,150 Ampol Ltd. 1,594,691 34,969Aurizon Holdings Ltd. 11,569,641 34,760Computershare Ltd. 3,074,662 34,600Charter Hall Group 2,962,659 33,646Treasury Wine Estates Ltd. 4,628,492 33,482 Coca-Cola Amatil Ltd. 3,264,299 32,526Atlas Arteria Ltd. 6,130,287 30,826Orica Ltd. 2,586,068 30,246OZ Minerals Ltd. 2,062,488 30,130Boral Ltd. 7,791,890 29,833
1

Vanguard® Developed Markets Index Fund Schedule of Investments December 31, 2020
Shares
MarketValue($000)
__________________________________________________________________________________________________________________________________________________________________________________________________________________________________________________________________________________________________________________________________________________________________________________________________________________________________________________________________________________________________________________________________________________________________________________________________________________________________________________________________________________________ __________________________________________________________________________________________________________________________________________________________________________________________________________________________________________________________________________________________________________________________________________________________________________________________________________________________________________________________________________________________________________________________________________________________________________________________________________________________________________________________________________________________
Vicinity Centres 24,013,212 29,692 * NEXTDC Ltd. 2,889,069 27,262 JB Hi-Fi Ltd. 721,696 27,096 AMP Ltd. 22,055,119 26,504 Domino's Pizza Enterprises Ltd. 387,379 25,934 * Saracen Mineral Holdings Ltd. 7,010,704 25,724 Mineral Resources Ltd. 887,852 25,670 Bendigo & Adelaide Bank Ltd. 3,405,236 24,532 Alumina Ltd. 16,001,997 22,688 ALS Ltd. 3,067,395 22,643 Ansell Ltd. 820,488 21,933 * Incitec Pivot Ltd. 12,397,925 21,808 carsales.com Ltd. 1,389,955 21,469 Challenger Ltd. 4,276,872 21,252 Qube Holdings Ltd. 9,275,219 21,000 IGO Ltd. 4,003,853 19,733 Downer EDI Ltd. 4,458,502 18,320 Altium Ltd. 695,431 18,262 Worley Ltd. 2,049,638 18,104 * Lynas Rare Earths Ltd. 5,743,270 17,696 Breville Group Ltd. 891,774 17,552 * Qantas Airways Ltd. 4,680,242 17,550 ^ Bank of Queensland Ltd. 2,890,509 17,268 Metcash Ltd. 6,533,533 17,043 Nine Entertainment Co. Holdings Ltd. 9,346,227 16,732 Steadfast Group Ltd. 5,413,850 16,659 Crown Resorts Ltd. 2,232,874 16,618 AusNet Services 11,741,149 15,913 Reliance Worldwide Corp. Ltd. 5,061,526 15,849 Cleanaway Waste Management Ltd. 8,727,782 15,798 Beach Energy Ltd. 11,313,819 15,782 Star Entertainment Grp Ltd. 5,445,177 15,455 Seven Group Holdings Ltd. 841,450 15,195 Link Administration Holdings Ltd. 3,286,320 14,040 Harvey Norman Holdings Ltd. 3,808,772 13,764 ^ IDP Education Ltd. 886,376 13,586 Washington H Soul Pattinson & Co. Ltd. 580,484 13,503 nib holdings Ltd. 2,934,062 13,463 Iluka Resources Ltd. 2,662,306 13,369 Appen Ltd. 694,044 13,251 Shopping Centres Australasia Property Group 6,822,006 13,214 * TPG Telecom Ltd. 2,345,660 13,028 Bapcor Ltd. 2,163,444 13,010 Eagers Automotive Ltd. 1,238,113 12,692 WiseTech Global Ltd. 533,714 12,684 CSR Ltd. 3,107,970 12,589 Orora Ltd. 6,039,477 12,563 * Vocus Group Ltd. 3,794,409 11,793 * CIMIC Group Ltd. 611,683 11,506 *,^ Zip Co. Ltd. 2,745,741 11,295 * PolyNovo Ltd. 3,735,528 11,189 *,^ Flight Centre Travel Group Ltd. 911,113 11,180 IOOF Holdings Ltd. 4,056,685 11,000 Sims Ltd. 1,055,838 10,918 Healius Ltd. 3,689,623 10,586 Charter Hall Long Wale REIT 2,947,792 10,564 BWP Trust 3,081,608 10,501 Waypoint REIT 4,967,493 10,453 ARB Corp. Ltd. 426,453 10,145 * Deterra Royalties Ltd. 2,709,224 10,026 IRESS Ltd. 1,220,177 10,023 * Champion Iron Ltd. 2,683,520 9,862 Perpetual Ltd. 358,503 9,614 National Storage REIT 6,459,670 9,510
2

Vanguard® Developed Markets Index Fund Schedule of Investments December 31, 2020
Shares
MarketValue($000)
__________________________________________________________________________________________________________________________________________________________________________________________________________________________________________________________________________________________________________________________________________________________________________________________________________________________________________________________________________________________________________________________________________________________________________________________________________________________________________________________________________________________ __________________________________________________________________________________________________________________________________________________________________________________________________________________________________________________________________________________________________________________________________________________________________________________________________________________________________________________________________________________________________________________________________________________________________________________________________________________________________________________________________________________________
Premier Investments Ltd. 517,510 9,389 * Nanosonics Ltd. 1,500,626 9,284 *,^ Pilbara Minerals Ltd. 13,742,393 9,282 Corporate Travel Management Ltd. 672,754 9,142 * Megaport Ltd. 829,843 9,114 Charter Hall Retail REIT 3,176,754 8,971 Pendal Group Ltd. 1,779,715 8,963 Regis Resources Ltd. 2,965,607 8,558 Super Retail Group Ltd. 1,027,629 8,351 *,^ PointsBet Holdings Ltd. 907,818 8,347 1 Viva Energy Group Ltd. 5,621,768 8,319 Credit Corp. Group Ltd. 362,650 8,315 ^ Webjet Ltd. 2,103,114 8,237 St. Barbara Ltd. 4,496,960 8,180 InvoCare Ltd. 920,643 8,130 * Perseus Mining Ltd. 7,898,220 7,918 Costa Group Holdings Ltd. 2,436,196 7,670 Elders Ltd. 986,749 7,506 Adbri Ltd. 2,898,764 7,498 * Silver Lake Resources Ltd. 5,267,752 7,270 Ingenia Communities Group 1,890,242 7,156 Cromwell Property Group 10,423,361 7,001 Pro Medicus Ltd. 265,091 6,987 ^ Whitehaven Coal Ltd. 5,417,945 6,886 Nickel Mines Ltd. 7,965,895 6,809 Ramelius Resources Ltd. 5,167,297 6,727 Codan Ltd. 777,658 6,714 * Orocobre Ltd. 1,906,881 6,580 Centuria Industrial REIT 2,762,743 6,552 Bega Cheese Ltd. 1,659,555 6,542 * Nufarm Ltd. 2,033,063 6,429 Abacus Property Group 2,897,893 6,406 Netwealth Group Ltd. 517,159 6,380 Centuria Capital Group 3,092,950 6,260 Kogan.com Ltd. 418,113 6,134 * De Grey Mining Ltd. 7,773,172 6,118 * EML Payments Ltd. 1,888,472 6,068 ^ Technology One Ltd. 950,343 6,015 NRW Holdings Ltd. 2,652,690 5,965 Platinum Asset Management Ltd. 1,891,487 5,953 Lifestyle Communities Ltd. 602,371 5,941 Monadelphous Group Ltd. 560,290 5,804 Bingo Industries Ltd. 3,045,664 5,705 Aventus Group 2,634,284 5,571 United Malt Grp Ltd. 1,740,753 5,502 *,^ Blackmores Ltd. 94,483 5,500 AUB Group Ltd. 437,963 5,479 Brickworks Ltd. 368,131 5,467 *,^ Mesoblast Ltd. 3,162,015 5,459 * Gold Road Resources Ltd. 5,303,645 5,418 Charter Hall Social Infrastructure REIT 2,074,893 5,235 Collins Foods Ltd. 691,120 5,146 Domain Holdings Australia Ltd. 1,478,139 5,114 * Tyro Payments Ltd. 2,052,454 5,036 IPH Ltd. 1,014,097 5,022 GUD Holdings Ltd. 553,308 5,001 HUB24 Ltd. 303,257 5,000 Omni Bridgeway Ltd. 1,506,118 4,968 * Galaxy Resources Ltd. 2,854,997 4,928 G8 Education Ltd. 5,364,077 4,884 Perenti Global Ltd. 4,554,392 4,832 Growthpoint Properties Australia Ltd. 1,785,290 4,803 GrainCorp Ltd. Class A 1,444,191 4,667 Arena REIT 2,058,680 4,575
3
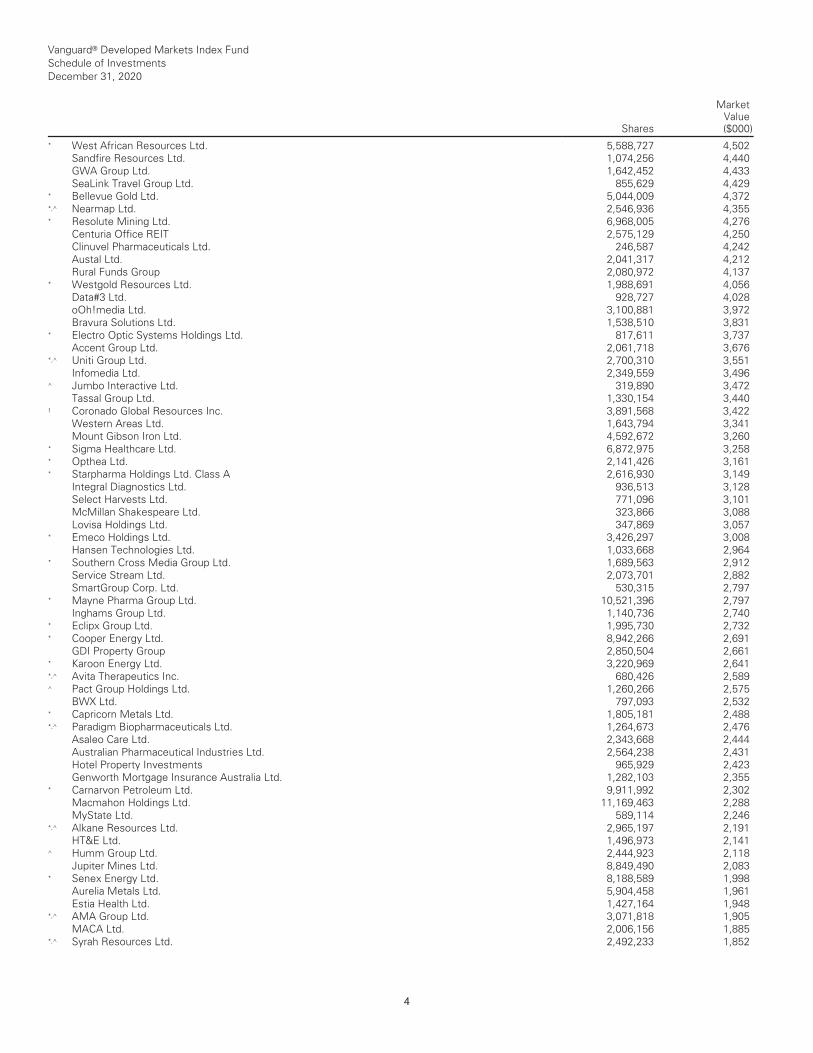
Vanguard® Developed Markets Index Fund Schedule of Investments December 31, 2020
Shares
MarketValue($000)
__________________________________________________________________________________________________________________________________________________________________________________________________________________________________________________________________________________________________________________________________________________________________________________________________________________________________________________________________________________________________________________________________________________________________________________________________________________________________________________________________________________________ __________________________________________________________________________________________________________________________________________________________________________________________________________________________________________________________________________________________________________________________________________________________________________________________________________________________________________________________________________________________________________________________________________________________________________________________________________________________________________________________________________________________
* West African Resources Ltd. 5,588,727 4,502 Sandfire Resources Ltd. 1,074,256 4,440 GWA Group Ltd. 1,642,452 4,433 SeaLink Travel Group Ltd. 855,629 4,429 * Bellevue Gold Ltd. 5,044,009 4,372 *,^ Nearmap Ltd. 2,546,936 4,355 * Resolute Mining Ltd. 6,968,005 4,276 Centuria Office REIT 2,575,129 4,250 Clinuvel Pharmaceuticals Ltd. 246,587 4,242 Austal Ltd. 2,041,317 4,212 Rural Funds Group 2,080,972 4,137 * Westgold Resources Ltd. 1,988,691 4,056 Data#3 Ltd. 928,727 4,028 oOh!media Ltd. 3,100,881 3,972 Bravura Solutions Ltd. 1,538,510 3,831 * Electro Optic Systems Holdings Ltd. 817,611 3,737 Accent Group Ltd. 2,061,718 3,676 *,^ Uniti Group Ltd. 2,700,310 3,551 Infomedia Ltd. 2,349,559 3,496 ^ Jumbo Interactive Ltd. 319,890 3,472 Tassal Group Ltd. 1,330,154 3,440 1 Coronado Global Resources Inc. 3,891,568 3,422 Western Areas Ltd. 1,643,794 3,341 Mount Gibson Iron Ltd. 4,592,672 3,260 * Sigma Healthcare Ltd. 6,872,975 3,258 * Opthea Ltd. 2,141,426 3,161 * Starpharma Holdings Ltd. Class A 2,616,930 3,149 Integral Diagnostics Ltd. 936,513 3,128 Select Harvests Ltd. 771,096 3,101 McMillan Shakespeare Ltd. 323,866 3,088 Lovisa Holdings Ltd. 347,869 3,057 * Emeco Holdings Ltd. 3,426,297 3,008 Hansen Technologies Ltd. 1,033,668 2,964 * Southern Cross Media Group Ltd. 1,689,563 2,912 Service Stream Ltd. 2,073,701 2,882 SmartGroup Corp. Ltd. 530,315 2,797 * Mayne Pharma Group Ltd. 10,521,396 2,797 Inghams Group Ltd. 1,140,736 2,740 * Eclipx Group Ltd. 1,995,730 2,732 * Cooper Energy Ltd. 8,942,266 2,691 GDI Property Group 2,850,504 2,661 * Karoon Energy Ltd. 3,220,969 2,641 *,^ Avita Therapeutics Inc. 680,426 2,589 ^ Pact Group Holdings Ltd. 1,260,266 2,575 BWX Ltd. 797,093 2,532 * Capricorn Metals Ltd. 1,805,181 2,488 *,^ Paradigm Biopharmaceuticals Ltd. 1,264,673 2,476 Asaleo Care Ltd. 2,343,668 2,444 Australian Pharmaceutical Industries Ltd. 2,564,238 2,431 Hotel Property Investments 965,929 2,423 Genworth Mortgage Insurance Australia Ltd. 1,282,103 2,355 * Carnarvon Petroleum Ltd. 9,911,992 2,302 Macmahon Holdings Ltd. 11,169,463 2,288 MyState Ltd. 589,114 2,246 *,^ Alkane Resources Ltd. 2,965,197 2,191 HT&E Ltd. 1,496,973 2,141 ^ Humm Group Ltd. 2,444,923 2,118 Jupiter Mines Ltd. 8,849,490 2,083 * Senex Energy Ltd. 8,188,589 1,998 Aurelia Metals Ltd. 5,904,458 1,961 Estia Health Ltd. 1,427,164 1,948 *,^ AMA Group Ltd. 3,071,818 1,905 MACA Ltd. 2,006,156 1,885 *,^ Syrah Resources Ltd. 2,492,233 1,852
4
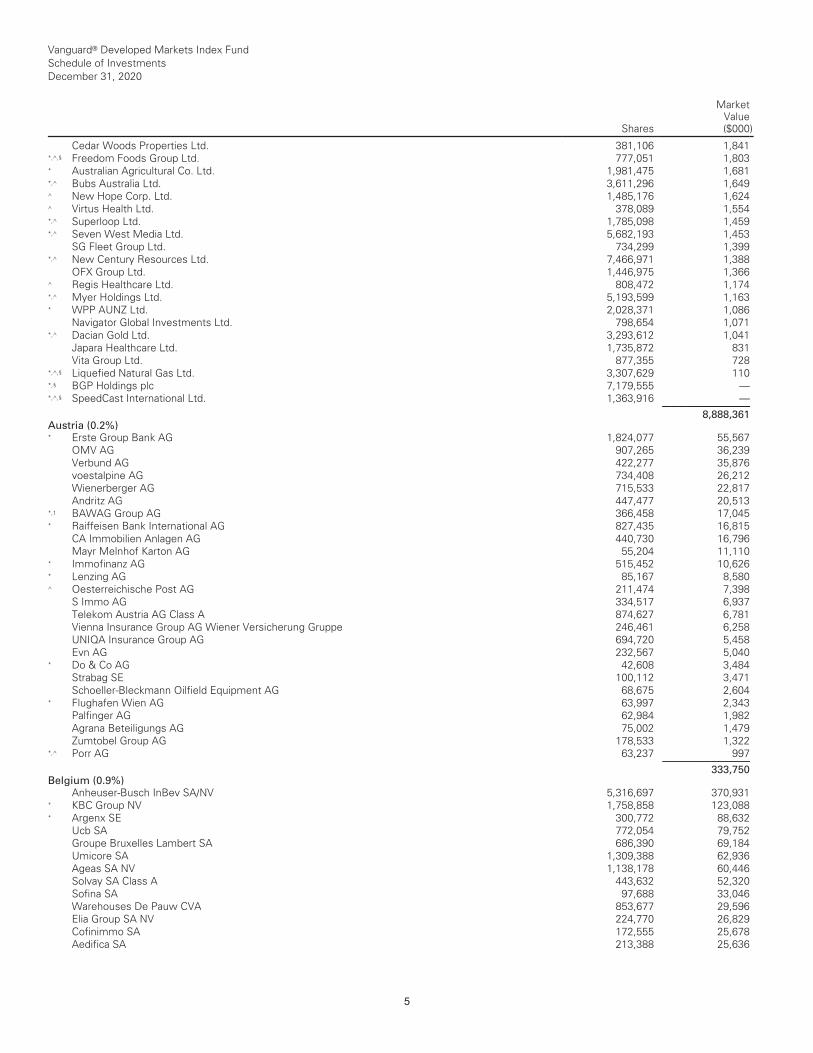
Vanguard® Developed Markets Index Fund Schedule of Investments December 31, 2020
Shares
MarketValue($000)
__________________________________________________________________________________________________________________________________________________________________________________________________________________________________________________________________________________________________________________________________________________________________________________________________________________________________________________________________________________________________________________________________________________________________________________________________________________________________________________________________________________________ __________________________________________________________________________________________________________________________________________________________________________________________________________________________________________________________________________________________________________________________________________________________________________________________________________________________________________________________________________________________________________________________________________________________________________________________________________________________________________________________________________________________
Cedar Woods Properties Ltd. 381,106 1,841 *,^,§ Freedom Foods Group Ltd. 777,051 1,803 * Australian Agricultural Co. Ltd. 1,981,475 1,681 *,^ Bubs Australia Ltd. 3,611,296 1,649 ^ New Hope Corp. Ltd. 1,485,176 1,624 ^ Virtus Health Ltd. 378,089 1,554 *,^ Superloop Ltd. 1,785,098 1,459 *,^ Seven West Media Ltd. 5,682,193 1,453 SG Fleet Group Ltd. 734,299 1,399 *,^ New Century Resources Ltd. 7,466,971 1,388 OFX Group Ltd. 1,446,975 1,366 ^ Regis Healthcare Ltd. 808,472 1,174 *,^ Myer Holdings Ltd. 5,193,599 1,163 * WPP AUNZ Ltd. 2,028,371 1,086 Navigator Global Investments Ltd. 798,654 1,071 *,^ Dacian Gold Ltd. 3,293,612 1,041 Japara Healthcare Ltd. 1,735,872 831 Vita Group Ltd. 877,355 728 *,^,§ Liquefied Natural Gas Ltd. 3,307,629 110 *,§ BGP Holdings plc 7,179,555 — *,^,§ SpeedCast International Ltd. 1,363,916 — ___________ 8,888,361 Austria (0.2%)
* Erste Group Bank AG 1,824,077 55,567 OMV AG 907,265 36,239 Verbund AG 422,277 35,876 voestalpine AG 734,408 26,212 Wienerberger AG 715,533 22,817 Andritz AG 447,477 20,513 *,1 BAWAG Group AG 366,458 17,045 * Raiffeisen Bank International AG 827,435 16,815 CA Immobilien Anlagen AG 440,730 16,796 Mayr Melnhof Karton AG 55,204 11,110 * Immofinanz AG 515,452 10,626 * Lenzing AG 85,167 8,580 ^ Oesterreichische Post AG 211,474 7,398 S Immo AG 334,517 6,937 Telekom Austria AG Class A 874,627 6,781 Vienna Insurance Group AG Wiener Versicherung Gruppe 246,461 6,258 UNIQA Insurance Group AG 694,720 5,458 Evn AG 232,567 5,040 * Do & Co AG 42,608 3,484 Strabag SE 100,112 3,471 Schoeller-Bleckmann Oilfield Equipment AG 68,675 2,604 * Flughafen Wien AG 63,997 2,343 Palfinger AG 62,984 1,982 Agrana Beteiligungs AG 75,002 1,479 Zumtobel Group AG 178,533 1,322 *,^ Porr AG 63,237 997 ___________ 333,750 Belgium (0.9%)
Anheuser-Busch InBev SA/NV 5,316,697 370,931 * KBC Group NV 1,758,858 123,088 * Argenx SE 300,772 88,632 Ucb SA 772,054 79,752 Groupe Bruxelles Lambert SA 686,390 69,184 Umicore SA 1,309,388 62,936 Ageas SA NV 1,138,178 60,446 Solvay SA Class A 443,632 52,320 Sofina SA 97,688 33,046 Warehouses De Pauw CVA 853,677 29,596 Elia Group SA NV 224,770 26,829 Cofinimmo SA 172,555 25,678 Aedifica SA 213,388 25,636
5

Vanguard® Developed Markets Index Fund Schedule of Investments December 31, 2020
Shares
MarketValue($000)
__________________________________________________________________________________________________________________________________________________________________________________________________________________________________________________________________________________________________________________________________________________________________________________________________________________________________________________________________________________________________________________________________________________________________________________________________________________________________________________________________________________________ __________________________________________________________________________________________________________________________________________________________________________________________________________________________________________________________________________________________________________________________________________________________________________________________________________________________________________________________________________________________________________________________________________________________________________________________________________________________________________________________________________________________
Ackermans & van Haaren NV 143,151 21,501 Etablissements Franz Colruyt NV 325,441 19,224 Proximus SADP 893,619 17,652 Telenet Group Holding NV 293,494 12,553 D'ieteren SA/NV 144,758 11,960 ^ Melexis NV 118,509 11,551 Euronav NV 1,313,908 10,631 * KBC Ancora 225,286 9,589 Barco NV 436,778 9,502 Montea CVA 82,746 9,378 Fagron 390,276 9,076 Bekaert SA 225,904 7,471 Gimv NV 121,432 7,418 VGP NV 48,573 7,279 Shurgard Self Storage SA 160,937 6,971 * bpost SA 646,805 6,686 * Ontex Group NV 494,068 6,642 * Tessenderlo Chemie NV (Voting Shares) 164,624 6,564 Befimmo SA 138,021 6,121 Xior Student Housing NV 101,507 6,107 * AGFA-Gevaert NV 1,059,366 5,058 Orange Belgium SA 179,469 4,784 Retail Estates NV 64,180 4,637 * Cie d'Entreprises CFE 44,425 4,561 *,^ Kinepolis Group NV 81,379 3,451 Econocom Group SA NV 851,731 2,566 *,^ Mithra Pharmaceuticals SA 101,051 2,427 Van de Velde NV 35,294 984 Wereldhave Belgium Comm VA 14,893 717 ___________ 1,281,135 Canada (8.4%)
* Shopify Inc. Class A (XTSE) 696,027 785,933 Royal Bank of Canada 9,114,039 748,871 Toronto-Dominion Bank 11,572,507 653,857 Canadian National Railway Co. 4,551,131 500,342 Bank of Nova Scotia 7,738,394 418,259 Enbridge Inc. (XTSE) 12,867,383 411,526 Brookfield Asset Management Inc. Class A 8,532,645 352,728 Bank of Montreal 4,095,234 311,365 Canadian Pacific Railway Ltd. 868,056 301,102 ^ TC Energy Corp. 6,019,474 244,723 ^ Canadian Imperial Bank of Commerce 2,848,966 243,334 Manulife Financial Corp. 12,405,821 220,749 Alimentation Couche-Tard Inc. Class B 5,338,327 181,928 Canadian Natural Resources Ltd. 7,401,670 177,875 Barrick Gold Corp. (XTSE) 7,742,035 176,384 Nutrien Ltd. 3,646,261 175,424 Sun Life Financial Inc. 3,747,339 166,627 Suncor Energy Inc. 9,774,385 163,943 Constellation Software Inc. 122,321 158,840 Franco-Nevada Corp. 1,197,299 150,121 Magna International Inc. 1,765,532 124,984 ^ National Bank of Canada 2,144,823 120,713 Wheaton Precious Metals Corp. 2,869,280 119,829 Fortis Inc. (XTSE) 2,885,100 117,861 * CGI Inc. 1,468,215 116,486 Waste Connections Inc. (XTSE) 1,116,335 114,466 Restaurant Brands International Inc. (XTSE) 1,852,564 113,273 Agnico Eagle Mines Ltd. 1,543,209 108,615 Intact Financial Corp. 912,699 108,070 Rogers Communications Inc. Class B 2,241,482 104,352 Thomson Reuters Corp. 1,075,812 88,049 Barrick Gold Corp. (XLON) 3,561,990 83,200 ^ Pembina Pipeline Corp. 3,512,853 83,068
6

Vanguard® Developed Markets Index Fund Schedule of Investments December 31, 2020
Shares
MarketValue($000)
__________________________________________________________________________________________________________________________________________________________________________________________________________________________________________________________________________________________________________________________________________________________________________________________________________________________________________________________________________________________________________________________________________________________________________________________________________________________________________________________________________________________ __________________________________________________________________________________________________________________________________________________________________________________________________________________________________________________________________________________________________________________________________________________________________________________________________________________________________________________________________________________________________________________________________________________________________________________________________________________________________________________________________________________________
BCE Inc. 1,928,102 82,447 ^ Power Corp. of Canada 3,486,291 80,057 Open Text Corp. 1,712,490 77,815 Dollarama Inc. 1,849,048 75,362 ^ Kirkland Lake Gold Ltd. 1,750,764 72,347 Metro Inc. 1,608,161 71,760 ^ WSP Global Inc. 717,839 68,006 Emera Inc. 1,588,505 67,514 First Quantum Minerals Ltd. 3,555,482 63,825 ^ Algonquin Power & Utilities Corp. 3,777,382 62,170 Fairfax Financial Holdings Ltd. 172,677 58,855 Kinross Gold Corp. 8,015,790 58,816 Waste Connections Inc. (XNYS) 570,366 58,502 TELUS Corp. 2,712,388 53,719 Teck Resources Ltd. Class B 2,957,969 53,680 Loblaw Cos. Ltd. 1,047,197 51,673 Shaw Communications Inc. Class B 2,930,276 51,428 Ritchie Bros Auctioneers Inc. 699,625 48,631 Canadian Tire Corp. Ltd. Class A 362,557 47,660 CAE Inc. 1,698,993 47,076 1 Hydro One Ltd. 2,012,529 45,297 Pan American Silver Corp. 1,313,412 45,297 CCL Industries Inc. Class B 953,814 43,303 Canadian Apartment Properties REIT 1,080,458 42,432 Saputo Inc. 1,493,463 41,804 * Bausch Health Cos. Inc. 1,983,823 41,160 Great-West Lifeco Inc. 1,723,551 41,095 Cenovus Energy Inc. 6,514,888 39,666 ^ Northland Power Inc. 1,104,281 39,620 B2Gold Corp. 6,553,652 36,710 Lundin Mining Corp. 4,067,510 36,109 *,^ Canopy Growth Corp. 1,458,669 35,891 Toromont Industries Ltd. 509,247 35,686 TMX Group Ltd. 357,099 35,668 Gildan Activewear Inc. 1,245,095 34,813 Yamana Gold Inc. 6,061,469 34,619 George Weston Ltd. 460,271 34,380 Cameco Corp. 2,527,983 33,861 *,^ Ballard Power Systems Inc. 1,443,722 33,776 FirstService Corp. 232,267 31,790 * Descartes Systems Group Inc. 536,847 31,399 Parkland Corp. 942,515 29,907 iA Financial Corp. Inc. 684,421 29,670 ^ Element Fleet Management Corp. 2,795,940 29,389 Empire Co. Ltd. 1,075,181 29,386 TFI International Inc. 564,647 29,069 Onex Corp. 504,217 28,940 Quebecor Inc. Class B 1,098,307 28,267 * SSR Mining Inc. 1,392,774 27,967 Imperial Oil Ltd. 1,436,253 27,260 ^ RioCan REIT 2,018,009 26,555 ^ AltaGas Ltd. 1,771,975 26,060 Inter Pipeline Ltd. 2,717,317 25,339 ^ Keyera Corp. 1,394,861 24,787 * Lightspeed POS Inc. (XTSE) 351,152 24,784 * Kinaxis Inc. 171,261 24,264 Boyd Group Services Inc. 135,869 23,436 Allied Properties REIT 776,097 23,065 Stantec Inc. 710,315 23,035 ^ GFL Environmental Inc. 778,632 22,700 Granite REIT 367,562 22,494 Finning International Inc. 1,034,849 21,975 Alamos Gold Inc. Class A 2,495,181 21,798 Tourmaline Oil Corp. 1,595,060 21,503
7

Vanguard® Developed Markets Index Fund Schedule of Investments December 31, 2020
Shares
MarketValue($000)
__________________________________________________________________________________________________________________________________________________________________________________________________________________________________________________________________________________________________________________________________________________________________________________________________________________________________________________________________________________________________________________________________________________________________________________________________________________________________________________________________________________________ __________________________________________________________________________________________________________________________________________________________________________________________________________________________________________________________________________________________________________________________________________________________________________________________________________________________________________________________________________________________________________________________________________________________________________________________________________________________________________________________________________________________
* BlackBerry Ltd. 3,194,479 21,181 ^ West Fraser Timber Co. Ltd. 322,038 20,690 * Air Canada 1,110,709 19,869 Boralex Inc. Class A 518,539 19,244 Canadian Utilities Ltd. Class A 785,224 19,179 * Ivanhoe Mines Ltd. 3,557,612 19,173 ^ SNC-Lavalin Group Inc. 1,122,241 19,158 H&R REIT 1,794,960 18,741 * Endeavour Mining Corp. 804,855 18,729 ^ Capital Power Corp. 670,536 18,427 Methanex Corp. 400,068 18,383 ^ Innergex Renewable Energy Inc. 822,187 17,679 Colliers International Group Inc. 193,351 17,207 *,^ First Majestic Silver Corp. 1,274,102 17,096 BRP Inc. 258,611 17,084 Premium Brands Holdings Corp. Class A 214,003 16,935 ^ Choice Properties REIT 1,636,115 16,722 Centerra Gold Inc. 1,381,489 15,997 Stella-Jones Inc. 432,026 15,708 Primo Water Corp. 990,407 15,530 ^ CI Financial Corp. 1,238,699 15,356 Linamar Corp. 288,277 15,269 ^ Gibson Energy Inc. 931,248 15,042 ^ SmartCentres REIT 825,849 14,974 * Eldorado Gold Corp. 1,105,243 14,648 * NovaGold Resources Inc. 1,508,751 14,603 ^ First Capital REIT 1,371,444 14,599 Brookfield Infrastructure Corp. Class A 201,061 14,562 IGM Financial Inc. 515,639 13,980 Atco Ltd. Class I 477,595 13,691 * Pretium Resources Inc. 1,190,595 13,647 ^ Osisko Gold Royalties Ltd. 1,075,737 13,632 TransAlta Corp. 1,772,487 13,465 * Equinox Gold Corp. 1,248,064 12,913 *,^ Aphria Inc. 1,846,893 12,768 Norbord Inc. 295,507 12,759 Enghouse Systems Ltd. 259,126 12,550 ^ Canadian Western Bank 544,759 12,248 ^ Chartwell Retirement Residences 1,389,211 12,212 * Great Canadian Gaming Corp. 354,208 12,099 * Parex Resources Inc. 863,261 11,882 ^ TransAlta Renewables Inc. 675,369 11,545 ^ PrairieSky Royalty Ltd. 1,442,160 11,432 * IAMGOLD Corp. 3,009,112 11,040 Maple Leaf Foods Inc. 481,194 10,668 Superior Plus Corp. 1,114,514 10,664 ^ ARC Resources Ltd. 2,226,991 10,497 *,^ Canada Goose Holdings Inc. 333,813 9,923 Hudbay Minerals Inc. 1,413,715 9,896 ^ Husky Energy Inc. 1,972,176 9,761 ^ Whitecap Resources Inc. 2,556,324 9,760 * Seven Generations Energy Ltd. Class A 1,767,894 9,180 * OceanaGold Corp. 4,474,100 8,647 * ATS Automation Tooling Systems Inc. 471,088 8,272 *,^ Cronos Group Inc. 1,176,438 8,170 * Torex Gold Resources Inc. 543,895 8,157 ^ Genworth MI Canada Inc. 236,183 8,055 Crescent Point Energy Corp. 3,385,462 7,899 * Turquoise Hill Resources Ltd. 633,377 7,877 North West Co. Inc. 307,953 7,848 *,^ Home Capital Group Inc. Class B 334,046 7,794 * Shopify Inc. Class A (XNYS) 6,666 7,546 Transcontinental Inc. Class A 459,678 7,407 ECN Capital Corp. 1,411,781 7,176
8
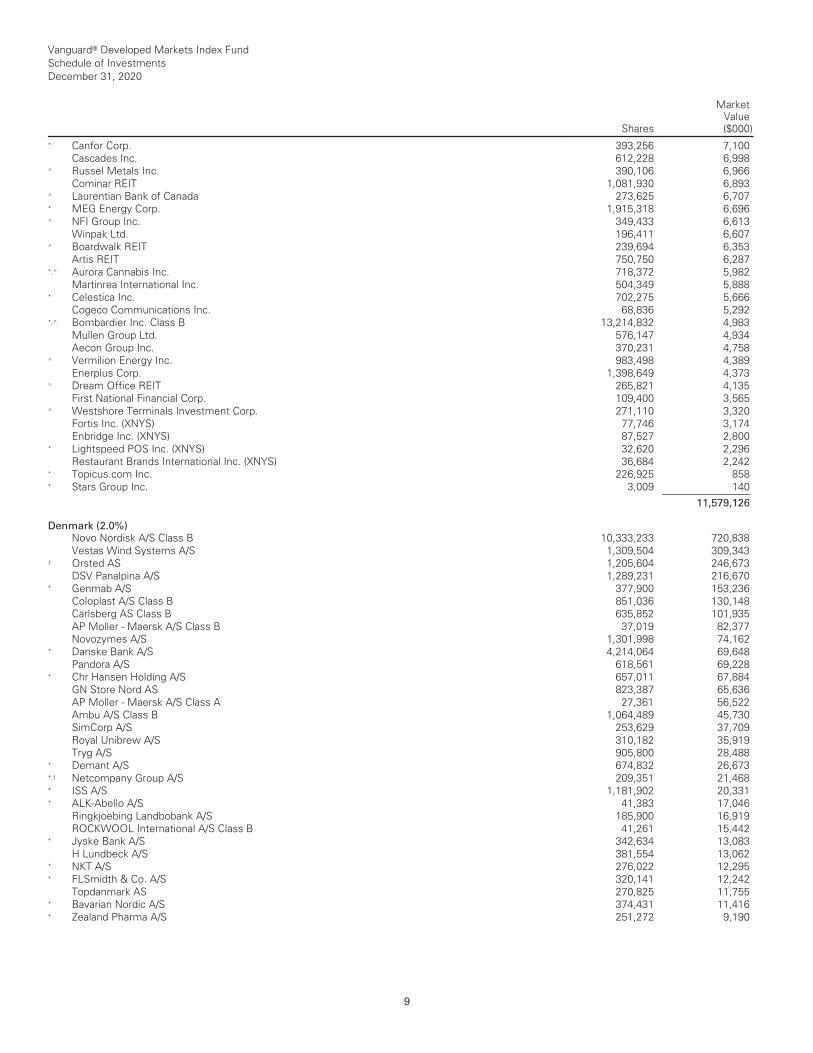
Vanguard® Developed Markets Index Fund Schedule of Investments December 31, 2020
Shares
MarketValue($000)
__________________________________________________________________________________________________________________________________________________________________________________________________________________________________________________________________________________________________________________________________________________________________________________________________________________________________________________________________________________________________________________________________________________________________________________________________________________________________________________________________________________________ __________________________________________________________________________________________________________________________________________________________________________________________________________________________________________________________________________________________________________________________________________________________________________________________________________________________________________________________________________________________________________________________________________________________________________________________________________________________________________________________________________________________
* Canfor Corp. 393,256 7,100 Cascades Inc. 612,228 6,998 ^ Russel Metals Inc. 390,106 6,966 Cominar REIT 1,081,930 6,893 ^ Laurentian Bank of Canada 273,625 6,707 * MEG Energy Corp. 1,915,318 6,696 ^ NFI Group Inc. 349,433 6,613 Winpak Ltd. 196,411 6,607 ^ Boardwalk REIT 239,694 6,353 Artis REIT 750,750 6,287 *,^ Aurora Cannabis Inc. 718,372 5,982 Martinrea International Inc. 504,349 5,888 * Celestica Inc. 702,275 5,666 Cogeco Communications Inc. 68,836 5,292 *,^ Bombardier Inc. Class B 13,214,832 4,983 Mullen Group Ltd. 576,147 4,934 Aecon Group Inc. 370,231 4,758 ^ Vermilion Energy Inc. 983,498 4,389 Enerplus Corp. 1,398,649 4,373 ^ Dream Office REIT 265,821 4,135 First National Financial Corp. 109,400 3,565 ^ Westshore Terminals Investment Corp. 271,110 3,320 Fortis Inc. (XNYS) 77,746 3,174 Enbridge Inc. (XNYS) 87,527 2,800 * Lightspeed POS Inc. (XNYS) 32,620 2,296 Restaurant Brands International Inc. (XNYS) 36,684 2,242 * Topicus.com Inc. 226,925 858 * Stars Group Inc. 3,009 140 ___________ 11,579,126 Denmark (2.0%)
Novo Nordisk A/S Class B 10,333,233 720,838 Vestas Wind Systems A/S 1,309,504 309,343 1 Orsted AS 1,205,604 246,673 DSV Panalpina A/S 1,289,231 216,670 * Genmab A/S 377,900 153,236 Coloplast A/S Class B 851,036 130,148 Carlsberg AS Class B 635,852 101,935 AP Moller - Maersk A/S Class B 37,019 82,377 Novozymes A/S 1,301,998 74,162 * Danske Bank A/S 4,214,064 69,648 Pandora A/S 618,561 69,228 * Chr Hansen Holding A/S 657,011 67,884 GN Store Nord AS 823,387 65,636 AP Moller - Maersk A/S Class A 27,361 56,522 Ambu A/S Class B 1,064,489 45,730 SimCorp A/S 253,629 37,709 Royal Unibrew A/S 310,182 35,919 Tryg A/S 905,800 28,488 * Demant A/S 674,832 26,673 *,1 Netcompany Group A/S 209,351 21,468 * ISS A/S 1,181,902 20,331 * ALK-Abello A/S 41,383 17,046 Ringkjoebing Landbobank A/S 185,900 16,919 ROCKWOOL International A/S Class B 41,261 15,442 * Jyske Bank A/S 342,634 13,083 H Lundbeck A/S 381,554 13,062 * NKT A/S 276,022 12,295 * FLSmidth & Co. A/S 320,141 12,242 Topdanmark AS 270,825 11,755 * Bavarian Nordic A/S 374,431 11,416 * Zealand Pharma A/S 251,272 9,190
9

Vanguard® Developed Markets Index Fund Schedule of Investments December 31, 2020
Shares
MarketValue($000)
__________________________________________________________________________________________________________________________________________________________________________________________________________________________________________________________________________________________________________________________________________________________________________________________________________________________________________________________________________________________________________________________________________________________________________________________________________________________________________________________________________________________ __________________________________________________________________________________________________________________________________________________________________________________________________________________________________________________________________________________________________________________________________________________________________________________________________________________________________________________________________________________________________________________________________________________________________________________________________________________________________________________________________________________________
* Dfds A/S 194,980 8,859 Schouw & Co. A/S 80,378 8,127 * Sydbank AS 365,922 8,107 1 Scandinavian Tobacco Group A/S 403,886 6,888 * Spar Nord Bank A/S 519,216 5,087 * Alm Brand A/S 393,748 4,742 * Drilling Co. of 1972 A/S 140,764 4,408 * Nilfisk Holding A/S 174,656 3,740 D/S Norden A/S 157,680 2,852 ___________ 2,765,878 Finland (1.1%)
Kone Oyj Class B 2,509,902 204,508 Neste Oyj 2,661,019 193,201 * Nordea Bank Abp 19,089,656 156,447 * Nokia Oyj (XHEL) 35,863,489 138,517 Sampo Oyj Class A 3,235,599 138,334 UPM-Kymmene Oyj 3,417,251 127,436 Stora Enso Oyj 3,668,673 70,247 Fortum Oyj 2,757,123 66,613 Elisa Oyj 916,529 50,244 Kesko Oyj Class B 1,719,585 44,136 Metso Outotec Oyj 3,871,881 38,904 Wartsila Oyj Abp 3,116,393 31,190 Huhtamaki Oyj 593,130 30,760 Nokian Renkaat Oyj 869,646 30,630 Orion Oyj Class B 657,210 30,189 * Kojamo Oyj 1,246,388 27,664 Valmet Oyj 854,617 24,571 * Nordea Bank Abp (XHEL) 2,601,894 21,252 Konecranes Oyj Class A 463,722 16,394 TietoEVRY Oyj (XHEL) 478,822 15,755 Cargotec Oyj Class B 309,810 12,873 Metsa Board Oyj 1,098,216 11,565 Neles Oyj 685,469 9,091 Kemira Oyj 563,469 8,931 Sanoma Oyj 470,396 7,891 Uponor Oyj 348,410 7,756 *,^ Outokumpu Oyj 1,945,503 7,669 YIT Oyj 1,023,272 6,176 Ahlstrom-Munksjo Oyj 239,563 5,298 ^ Citycon Oyj 493,828 4,813 TietoEVRY Oyj (XOSL) 125,869 4,180 *,^ Finnair Oyj 3,669,363 3,377 * F-Secure Oyj 643,077 3,018 Raisio Oyj 718,894 2,806 Oriola Oyj 814,256 1,892 * Nokia Oyj (XPAR) 73,124 282 ___________ 1,554,610 France (8.1%)
LVMH Moet Hennessy Louis Vuitton SE 1,593,770 997,708 Sanofi 6,969,109 675,471 TOTAL SE 15,519,696 669,869 Schneider Electric SE 3,364,207 486,223 * Airbus SE 3,547,314 389,300 * BNP Paribas SA 6,928,074 365,750 Kering SA 474,580 344,421 Vinci SA 3,005,992 299,427 Axa SA 12,308,341 295,185 EssilorLuxottica SA 1,886,613 294,001 * Safran SA 2,058,355 291,740 Pernod Ricard SA 1,327,622 254,967 Danone SA 3,835,445 252,397 L'Oreal SA Loyalty Shares 633,276 241,629 Hermes International 197,386 212,246
10

Vanguard® Developed Markets Index Fund Schedule of Investments December 31, 2020
Shares
MarketValue($000)
__________________________________________________________________________________________________________________________________________________________________________________________________________________________________________________________________________________________________________________________________________________________________________________________________________________________________________________________________________________________________________________________________________________________________________________________________________________________________________________________________________________________ __________________________________________________________________________________________________________________________________________________________________________________________________________________________________________________________________________________________________________________________________________________________________________________________________________________________________________________________________________________________________________________________________________________________________________________________________________________________________________________________________________________________
Air Liquide SA Loyalty Shares 1,259,450 206,484 L'Oreal SA 451,182 172,151 Dassault Systemes SE 842,367 170,850 Vivendi SA 4,995,453 161,127 Capgemini SE 1,008,333 156,850 Air Liquide SA 956,648 156,840 Legrand SA 1,706,086 152,622 STMicroelectronics NV 4,051,708 149,897 *,1 Worldline SA 1,524,095 148,064 Orange SA 12,236,550 145,677 Cie Generale des Etablissements Michelin SCA 1,122,292 144,504 * Cie de Saint-Gobain 3,056,068 140,557 L'Oreal Loyalty Shares 2021 358,283 136,705 Teleperformance 371,957 123,483 Air Liquide SA Loyalty Shares 2021 652,591 106,991 * Societe Generale SA 4,942,812 102,755 * Alstom SA 1,697,566 96,692 * Peugeot SA 3,479,704 95,295 * Credit Agricole SA 7,380,159 93,300 Edenred 1,576,958 89,558 Veolia Environnement SA 3,210,986 79,175 Publicis Groupe SA 1,417,556 70,455 * Engie 4,330,276 66,384 * Eurofins Scientific SE 775,391 65,402 Carrefour SA 3,706,325 63,469 Valeo SA 1,527,586 60,255 Thales SA 640,505 58,602 * Ubisoft Entertainment SA 604,120 58,219 Bouygues SA 1,356,592 55,794 * Atos SE 602,409 55,010 Sartorius Stedim Biotech 153,273 54,638 Gecina SA 333,493 51,859 * Renault SA 1,177,291 51,533 * Getlink SE 2,905,892 50,276 Arkema SA 426,956 48,853 * Bureau Veritas SA 1,812,064 48,373 * Engie SA (XPAR) 3,110,480 47,684 Suez SA 2,372,283 47,017 * Eiffage SA 481,073 46,502 1 Euronext NV 391,881 43,166 * Accor SA 1,168,363 42,389 * Orpea SA 312,547 40,985 BioMerieux 272,311 38,327 * Engie SA Loyalty Shares 2021 2,400,527 36,800 * Scor SE 1,001,561 32,487 * Rexel SA 1,934,704 30,536 *,1 Amundi SA 361,583 29,470 Covivio 318,958 29,268 Remy Cointreau SA 155,625 29,049 Rubis SCA 602,964 27,874 TechnipFMC plc 2,927,352 27,515 * Faurecia SE 528,760 27,092 Klepierre SA 1,193,199 26,912 * Soitec 134,761 26,134 Bollore SA 6,311,262 26,130 1 La Francaise des Jeux SAEM 555,833 25,477 * Aeroports de Paris 181,133 23,435 * Electricite de France SA Loyalty Shares 1,459,528 23,096 SES SA Class A 2,392,036 22,450 L'Oreal Loyalty Shares 55,941 21,345 Wendel SE 173,429 20,697 * Alten SA 181,680 20,601 Iliad SA 97,552 20,024 * Eurazeo SE 276,691 18,801
11
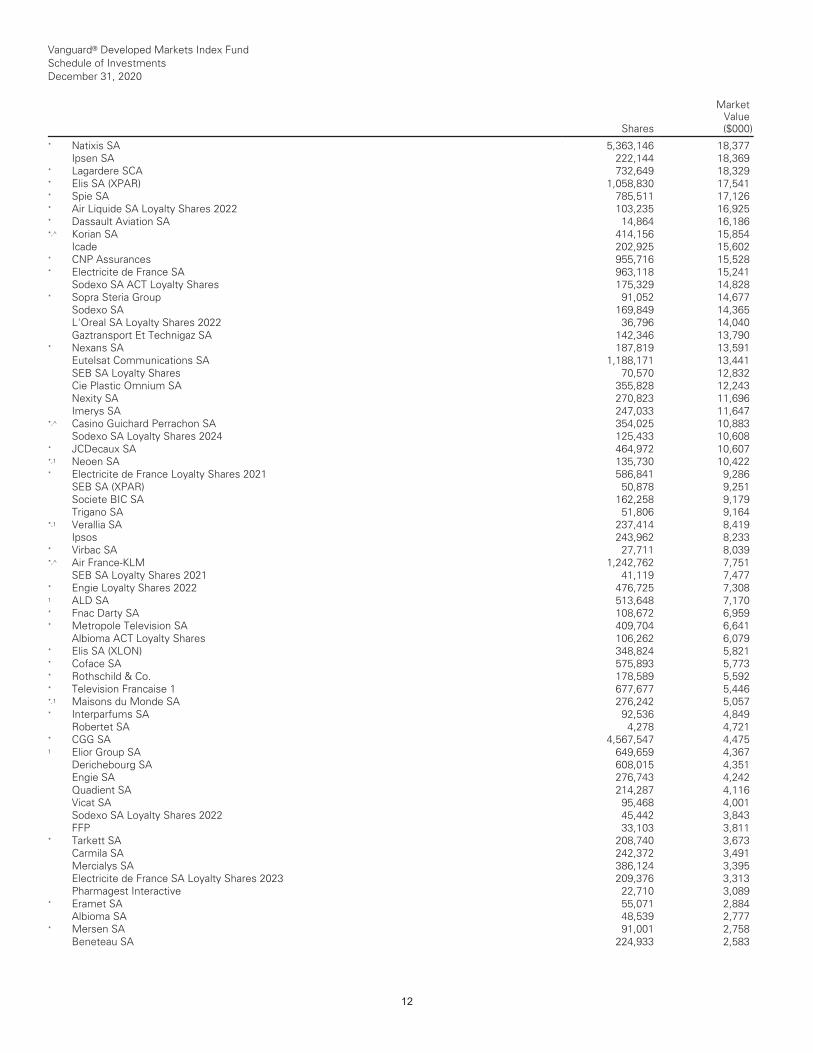
Vanguard® Developed Markets Index Fund Schedule of Investments December 31, 2020
Shares
MarketValue($000)
__________________________________________________________________________________________________________________________________________________________________________________________________________________________________________________________________________________________________________________________________________________________________________________________________________________________________________________________________________________________________________________________________________________________________________________________________________________________________________________________________________________________ __________________________________________________________________________________________________________________________________________________________________________________________________________________________________________________________________________________________________________________________________________________________________________________________________________________________________________________________________________________________________________________________________________________________________________________________________________________________________________________________________________________________
* Natixis SA 5,363,146 18,377 Ipsen SA 222,144 18,369 * Lagardere SCA 732,649 18,329 * Elis SA (XPAR) 1,058,830 17,541 * Spie SA 785,511 17,126 * Air Liquide SA Loyalty Shares 2022 103,235 16,925 * Dassault Aviation SA 14,864 16,186 *,^ Korian SA 414,156 15,854 Icade 202,925 15,602 * CNP Assurances 955,716 15,528 * Electricite de France SA 963,118 15,241 Sodexo SA ACT Loyalty Shares 175,329 14,828 * Sopra Steria Group 91,052 14,677 Sodexo SA 169,849 14,365 L'Oreal SA Loyalty Shares 2022 36,796 14,040 Gaztransport Et Technigaz SA 142,346 13,790 * Nexans SA 187,819 13,591 Eutelsat Communications SA 1,188,171 13,441 SEB SA Loyalty Shares 70,570 12,832 Cie Plastic Omnium SA 355,828 12,243 Nexity SA 270,823 11,696 Imerys SA 247,033 11,647 *,^ Casino Guichard Perrachon SA 354,025 10,883 Sodexo SA Loyalty Shares 2024 125,433 10,608 * JCDecaux SA 464,972 10,607 *,1 Neoen SA 135,730 10,422 * Electricite de France Loyalty Shares 2021 586,841 9,286 SEB SA (XPAR) 50,878 9,251 Societe BIC SA 162,258 9,179 Trigano SA 51,806 9,164 *,1 Verallia SA 237,414 8,419 Ipsos 243,962 8,233 * Virbac SA 27,711 8,039 *,^ Air France-KLM 1,242,762 7,751 SEB SA Loyalty Shares 2021 41,119 7,477 * Engie Loyalty Shares 2022 476,725 7,308 1 ALD SA 513,648 7,170 * Fnac Darty SA 108,672 6,959 * Metropole Television SA 409,704 6,641 Albioma ACT Loyalty Shares 106,262 6,079 * Elis SA (XLON) 348,824 5,821 * Coface SA 575,893 5,773 * Rothschild & Co. 178,589 5,592 * Television Francaise 1 677,677 5,446 *,1 Maisons du Monde SA 276,242 5,057 * Interparfums SA 92,536 4,849 Robertet SA 4,278 4,721 * CGG SA 4,567,547 4,475 1 Elior Group SA 649,659 4,367 Derichebourg SA 608,015 4,351 Engie SA 276,743 4,242 Quadient SA 214,287 4,116 Vicat SA 95,468 4,001 Sodexo SA Loyalty Shares 2022 45,442 3,843 FFP 33,103 3,811 * Tarkett SA 208,740 3,673 Carmila SA 242,372 3,491 Mercialys SA 386,124 3,395 Electricite de France SA Loyalty Shares 2023 209,376 3,313 Pharmagest Interactive 22,710 3,089 * Eramet SA 55,071 2,884 Albioma SA 48,539 2,777 * Mersen SA 91,001 2,758 Beneteau SA 224,933 2,583
12
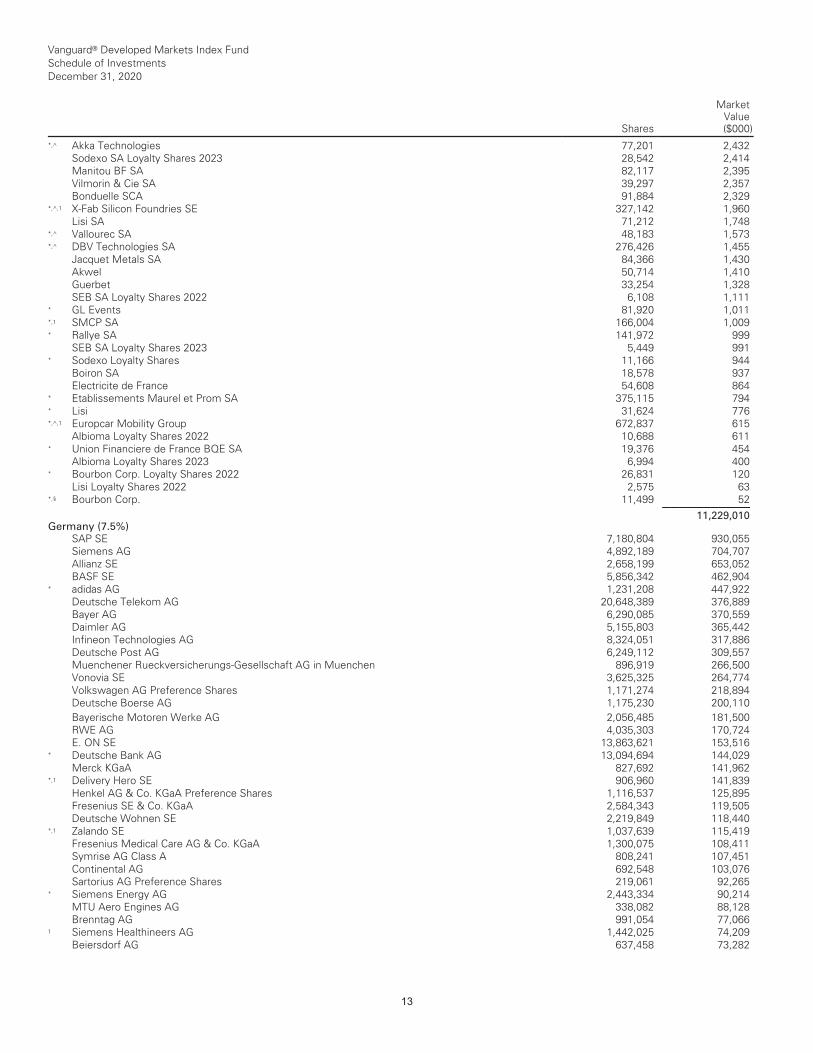
Vanguard® Developed Markets Index Fund Schedule of Investments December 31, 2020
Shares
MarketValue($000)
__________________________________________________________________________________________________________________________________________________________________________________________________________________________________________________________________________________________________________________________________________________________________________________________________________________________________________________________________________________________________________________________________________________________________________________________________________________________________________________________________________________________ __________________________________________________________________________________________________________________________________________________________________________________________________________________________________________________________________________________________________________________________________________________________________________________________________________________________________________________________________________________________________________________________________________________________________________________________________________________________________________________________________________________________
*,^ Akka Technologies 77,201 2,432 Sodexo SA Loyalty Shares 2023 28,542 2,414 Manitou BF SA 82,117 2,395 Vilmorin & Cie SA 39,297 2,357 Bonduelle SCA 91,884 2,329 *,^,1 X-Fab Silicon Foundries SE 327,142 1,960 Lisi SA 71,212 1,748 *,^ Vallourec SA 48,183 1,573 *,^ DBV Technologies SA 276,426 1,455 Jacquet Metals SA 84,366 1,430 Akwel 50,714 1,410 Guerbet 33,254 1,328 SEB SA Loyalty Shares 2022 6,108 1,111 * GL Events 81,920 1,011 *,1 SMCP SA 166,004 1,009 * Rallye SA 141,972 999 SEB SA Loyalty Shares 2023 5,449 991 * Sodexo Loyalty Shares 11,166 944 Boiron SA 18,578 937 Electricite de France 54,608 864 * Etablissements Maurel et Prom SA 375,115 794 * Lisi 31,624 776 *,^,1 Europcar Mobility Group 672,837 615 Albioma Loyalty Shares 2022 10,688 611 * Union Financiere de France BQE SA 19,376 454 Albioma Loyalty Shares 2023 6,994 400 * Bourbon Corp. Loyalty Shares 2022 26,831 120 Lisi Loyalty Shares 2022 2,575 63 *,§ Bourbon Corp. 11,499 52 ___________ 11,229,010 Germany (7.5%)
SAP SE 7,180,804 930,055 Siemens AG 4,892,189 704,707 Allianz SE 2,658,199 653,052 BASF SE 5,856,342 462,904 * adidas AG 1,231,208 447,922 Deutsche Telekom AG 20,648,389 376,889 Bayer AG 6,290,085 370,559 Daimler AG 5,155,803 365,442 Infineon Technologies AG 8,324,051 317,886 Deutsche Post AG 6,249,112 309,557 Muenchener Rueckversicherungs-Gesellschaft AG in Muenchen 896,919 266,500 Vonovia SE 3,625,325 264,774 Volkswagen AG Preference Shares 1,171,274 218,894 Deutsche Boerse AG 1,175,230 200,110 __________________________________________________________________________________________________________________________________________________________________________________________________________________________________________________________________________________________________________________________________________________________________________________________________________________________________________________________________________________________________________________________________________________________________________________________________________________________________________________________________________________________ __________________________________________________________________________________________________________________________________________________________________________________________________________________________________________________________________________________________________________________________________________________________________________________________________________________________________________________________________________________________________________________________________________________________________________________________________________________________________________________________________________________________
Bayerische Motoren Werke AG 2,056,485 181,500 RWE AG 4,035,303 170,724 E. ON SE 13,863,621 153,516 * Deutsche Bank AG 13,094,694 144,029 Merck KGaA 827,692 141,962 *,1 Delivery Hero SE 906,960 141,839 Henkel AG & Co. KGaA Preference Shares 1,116,537 125,895 Fresenius SE & Co. KGaA 2,584,343 119,505 Deutsche Wohnen SE 2,219,849 118,440 *,1 Zalando SE 1,037,639 115,419 Fresenius Medical Care AG & Co. KGaA 1,300,075 108,411 Symrise AG Class A 808,241 107,451 Continental AG 692,548 103,076 Sartorius AG Preference Shares 219,061 92,265 * Siemens Energy AG 2,443,334 90,214 MTU Aero Engines AG 338,082 88,128 Brenntag AG 991,054 77,066 1 Siemens Healthineers AG 1,442,025 74,209 Beiersdorf AG 637,458 73,282
13
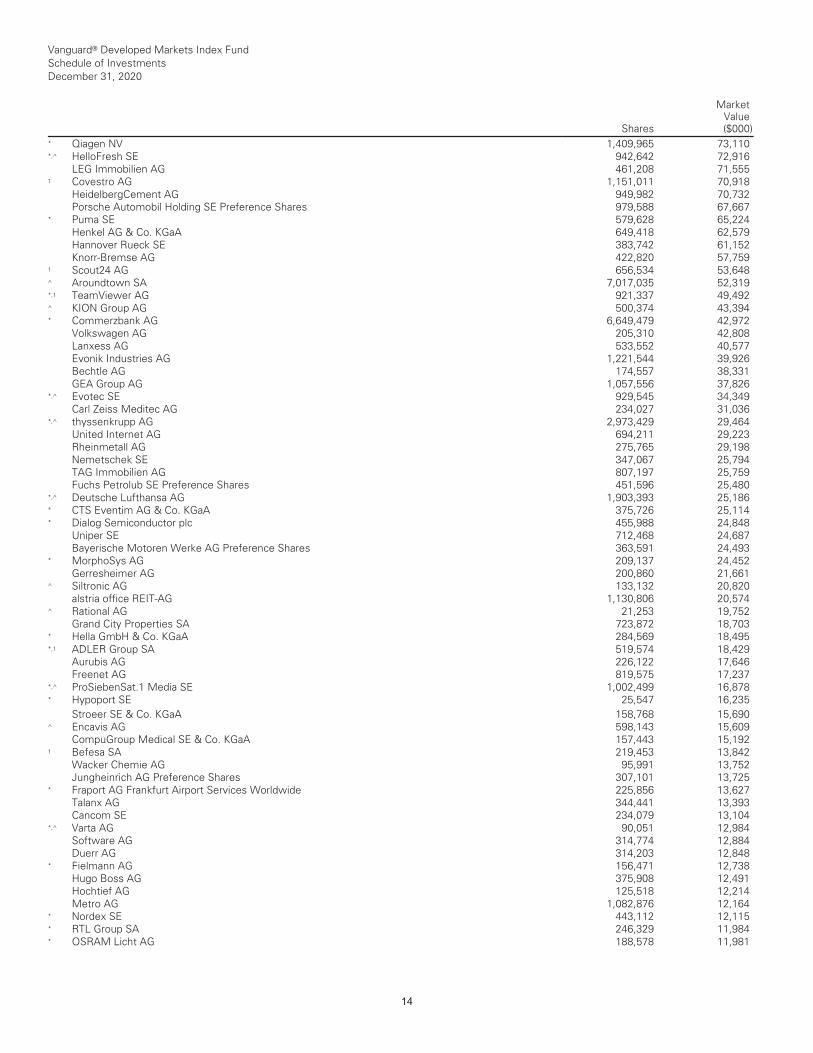
Vanguard® Developed Markets Index Fund Schedule of Investments December 31, 2020
Shares
MarketValue($000)
* Qiagen NV 1,409,965 73,110 *,^ HelloFresh SE 942,642 72,916 LEG Immobilien AG 461,208 71,555 1 Covestro AG 1,151,011 70,918 HeidelbergCement AG 949,982 70,732 Porsche Automobil Holding SE Preference Shares 979,588 67,667 * Puma SE 579,628 65,224 Henkel AG & Co. KGaA 649,418 62,579 Hannover Rueck SE 383,742 61,152 Knorr-Bremse AG 422,820 57,759 1 Scout24 AG 656,534 53,648 ^ Aroundtown SA 7,017,035 52,319 *,1 TeamViewer AG 921,337 49,492 ^ KION Group AG 500,374 43,394 * Commerzbank AG 6,649,479 42,972 Volkswagen AG 205,310 42,808 Lanxess AG 533,552 40,577 Evonik Industries AG 1,221,544 39,926 Bechtle AG 174,557 38,331 GEA Group AG 1,057,556 37,826 *,^ Evotec SE 929,545 34,349 Carl Zeiss Meditec AG 234,027 31,036 *,^ thyssenkrupp AG 2,973,429 29,464 United Internet AG 694,211 29,223 Rheinmetall AG 275,765 29,198 Nemetschek SE 347,067 25,794 TAG Immobilien AG 807,197 25,759 Fuchs Petrolub SE Preference Shares 451,596 25,480 *,^ Deutsche Lufthansa AG 1,903,393 25,186 * CTS Eventim AG & Co. KGaA 375,726 25,114 * Dialog Semiconductor plc 455,988 24,848 Uniper SE 712,468 24,687 Bayerische Motoren Werke AG Preference Shares 363,591 24,493 * MorphoSys AG 209,137 24,452 Gerresheimer AG 200,860 21,661 ^ Siltronic AG 133,132 20,820 alstria office REIT-AG 1,130,806 20,574 ^ Rational AG 21,253 19,752 Grand City Properties SA 723,872 18,703 * Hella GmbH & Co. KGaA 284,569 18,495 *,1 ADLER Group SA 519,574 18,429 Aurubis AG 226,122 17,646 Freenet AG 819,575 17,237 *,^ ProSiebenSat.1 Media SE 1,002,499 16,878 * Hypoport SE 25,547 16,235 __________________________________________________________________________________________________________________________________________________________________________________________________________________________________________________________________________________________________________________________________________________________________________________________________________________________________________________________________________________________________________________________________________________________________________________________________________________________________________________________________________________________ __________________________________________________________________________________________________________________________________________________________________________________________________________________________________________________________________________________________________________________________________________________________________________________________________________________________________________________________________________________________________________________________________________________________________________________________________________________________________________________________________________________________
Stroeer SE & Co. KGaA 158,768 15,690 ^ Encavis AG 598,143 15,609 CompuGroup Medical SE & Co. KGaA 157,443 15,192 1 Befesa SA 219,453 13,842 Wacker Chemie AG 95,991 13,752 Jungheinrich AG Preference Shares 307,101 13,725 * Fraport AG Frankfurt Airport Services Worldwide 225,856 13,627 Talanx AG 344,441 13,393 Cancom SE 234,079 13,104 *,^ Varta AG 90,051 12,984 Software AG 314,774 12,884 Duerr AG 314,203 12,848 * Fielmann AG 156,471 12,738 Hugo Boss AG 375,908 12,491 Hochtief AG 125,518 12,214 Metro AG 1,082,876 12,164 * Nordex SE 443,112 12,115 * RTL Group SA 246,329 11,984 * OSRAM Licht AG 188,578 11,981
14
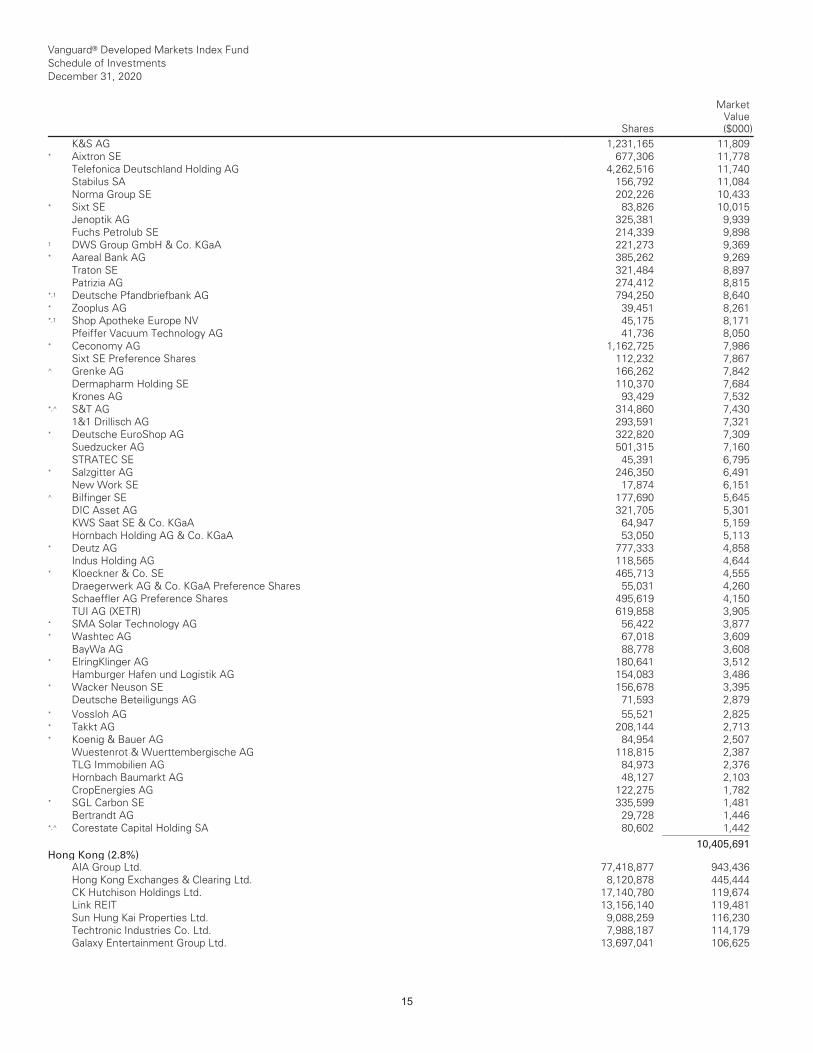
Vanguard® Developed Markets Index Fund Schedule of Investments December 31, 2020
Shares
MarketValue($000)
K&S AG 1,231,165 11,809 * Aixtron SE 677,306 11,778 Telefonica Deutschland Holding AG 4,262,516 11,740 Stabilus SA 156,792 11,084 Norma Group SE 202,226 10,433 * Sixt SE 83,826 10,015 Jenoptik AG 325,381 9,939 Fuchs Petrolub SE 214,339 9,898 1 DWS Group GmbH & Co. KGaA 221,273 9,369 * Aareal Bank AG 385,262 9,269 Traton SE 321,484 8,897 Patrizia AG 274,412 8,815 *,1 Deutsche Pfandbriefbank AG 794,250 8,640 * Zooplus AG 39,451 8,261 *,1 Shop Apotheke Europe NV 45,175 8,171 Pfeiffer Vacuum Technology AG 41,736 8,050 * Ceconomy AG 1,162,725 7,986 Sixt SE Preference Shares 112,232 7,867 ^ Grenke AG 166,262 7,842 Dermapharm Holding SE 110,370 7,684 Krones AG 93,429 7,532 *,^ S&T AG 314,860 7,430 1&1 Drillisch AG 293,591 7,321 * Deutsche EuroShop AG 322,820 7,309 Suedzucker AG 501,315 7,160 STRATEC SE 45,391 6,795 * Salzgitter AG 246,350 6,491 New Work SE 17,874 6,151 ^ Bilfinger SE 177,690 5,645 DIC Asset AG 321,705 5,301 KWS Saat SE & Co. KGaA 64,947 5,159 Hornbach Holding AG & Co. KGaA 53,050 5,113 * Deutz AG 777,333 4,858 Indus Holding AG 118,565 4,644 * Kloeckner & Co. SE 465,713 4,555 Draegerwerk AG & Co. KGaA Preference Shares 55,031 4,260 Schaeffler AG Preference Shares 495,619 4,150 TUI AG (XETR) 619,858 3,905 * SMA Solar Technology AG 56,422 3,877 * Washtec AG 67,018 3,609 BayWa AG 88,778 3,608 * ElringKlinger AG 180,641 3,512 Hamburger Hafen und Logistik AG 154,083 3,486 * Wacker Neuson SE 156,678 3,395 Deutsche Beteiligungs AG 71,593 2,879 __________________________________________________________________________________________________________________________________________________________________________________________________________________________________________________________________________________________________________________________________________________________________________________________________________________________________________________________________________________________________________________________________________________________________________________________________________________________________________________________________________________________ __________________________________________________________________________________________________________________________________________________________________________________________________________________________________________________________________________________________________________________________________________________________________________________________________________________________________________________________________________________________________________________________________________________________________________________________________________________________________________________________________________________________
* Vossloh AG 55,521 2,825 * Takkt AG 208,144 2,713 * Koenig & Bauer AG 84,954 2,507 Wuestenrot & Wuerttembergische AG 118,815 2,387 TLG Immobilien AG 84,973 2,376 Hornbach Baumarkt AG 48,127 2,103 CropEnergies AG 122,275 1,782 * SGL Carbon SE 335,599 1,481 Bertrandt AG 29,728 1,446 *,^ Corestate Capital Holding SA 80,602 1,442 ___________ 10,405,691 Hong Kong (2.8%)
AIA Group Ltd. 77,418,877 943,436 Hong Kong Exchanges & Clearing Ltd. 8,120,878 445,444 CK Hutchison Holdings Ltd. 17,140,780 119,674 Link REIT 13,156,140 119,481 Sun Hung Kai Properties Ltd. 9,088,259 116,230 Techtronic Industries Co. Ltd. 7,988,187 114,179 Galaxy Entertainment Group Ltd. 13,697,041 106,625
15

Vanguard® Developed Markets Index Fund Schedule of Investments December 31, 2020
Shares
MarketValue($000)
Hong Kong & China Gas Co. Ltd. 66,281,244 99,164 CLP Holdings Ltd. 10,506,621 97,151 Hang Seng Bank Ltd. 4,628,508 79,879 CK Asset Holdings Ltd. 15,195,633 77,755 Jardine Matheson Holdings Ltd. 1,339,569 74,933 BOC Hong Kong Holdings Ltd. 22,922,439 69,483 Sands China Ltd. 15,356,121 67,066 Wharf Real Estate Investment Co. Ltd. 10,482,423 54,478 MTR Corp. Ltd. 9,144,464 51,142 Power Assets Holdings Ltd. 8,731,106 47,284 1 WH Group Ltd. 53,720,238 45,047 Lenovo Group Ltd. 47,634,000 45,033 New World Development Co. Ltd. 9,095,453 42,316 *,1 ESR Cayman Ltd. 10,472,052 37,591 Xinyi Glass Holdings Ltd. 12,845,109 35,928 1 Budweiser Brewing Co. APAC Ltd. 10,814,775 35,725 Hang Lung Properties Ltd. 12,934,909 34,087 Henderson Land Development Co. Ltd. 8,301,045 32,247 Hongkong Land Holdings Ltd. 7,397,333 30,552 Jardine Strategic Holdings Ltd. 1,159,299 28,817 Sino Land Co. Ltd. 21,184,785 27,568 ASM Pacific Technology Ltd. 1,948,374 25,732 Want Want China Holdings Ltd. 34,368,109 24,848 AAC Technologies Holdings Inc. 4,357,713 24,154 Minth Group Ltd. 4,468,424 23,641 Wharf Holdings Ltd. 8,691,861 23,347 * Prada SPA 3,272,755 21,626 CK Infrastructure Holdings Ltd. 3,965,404 21,296 Man Wah Holdings Ltd. 9,393,515 20,376 Tingyi Cayman Islands Holding Corp. 11,911,728 20,375 Vitasoy International Holdings Ltd. 5,098,482 19,859 Swire Properties Ltd. 6,723,167 19,547 Swire Pacific Ltd. Class A 3,167,897 17,450 Bank of East Asia Ltd. 8,083,833 17,294 Microport Scientific Corp. 3,035,904 16,388 SITC International Holdings Co. Ltd. 7,490,863 16,178 PCCW Ltd. 26,624,682 16,033 * Wynn Macau Ltd. 9,364,805 15,756 *,1 Samsonite International SA 8,270,087 14,689 Hysan Development Co. Ltd. 3,908,455 14,316 Chow Tai Fook Jewellery Group Ltd. 11,116,973 13,978 Hang Lung Group Ltd. 5,611,455 13,949 SJM Holdings Ltd. 11,928,928 13,374 NagaCorp Ltd. 9,672,432 12,704 1 BOC Aviation Ltd. 1,325,107 11,469 __________________________________________________________________________________________________________________________________________________________________________________________________________________________________________________________________________________________________________________________________________________________________________________________________________________________________________________________________________________________________________________________________________________________________________________________________________________________________________________________________________________________ __________________________________________________________________________________________________________________________________________________________________________________________________________________________________________________________________________________________________________________________________________________________________________________________________________________________________________________________________________________________________________________________________________________________________________________________________________________________________________________________________________________________
Melco International Development Ltd. 5,004,639 9,747 Kerry Properties Ltd. 3,815,684 9,651 * United Energy Group Ltd. 48,205,171 9,521 Yue Yuen Industrial Holdings Ltd. 4,532,373 9,440 NWS Holdings Ltd. 9,091,035 8,447 Fortune REIT 8,667,044 8,254 MGM China Holdings Ltd. 4,750,183 8,169 Kerry Logistics Network Ltd. 3,715,362 8,154 Dairy Farm International Holdings Ltd. 1,940,631 8,100 VTech Holdings Ltd. 1,040,325 8,075 *,1 JS Global Lifestyle Co. Ltd. 4,107,000 7,950 HKBN Ltd. 4,987,252 7,725 Lee & Man Paper Manufacturing Ltd. 9,148,000 7,506 Uni-President China Holdings Ltd. 7,368,968 7,504 ^ Huabao International Holdings Ltd. 5,356,030 7,385 Champion REIT 12,558,568 7,338 L'Occitane International SA 2,914,414 7,277 *,1 Razer Inc. 23,216,723 7,136 1 Xiabuxiabu Catering Management China Holdings Co. Ltd. 3,080,509 7,040
16
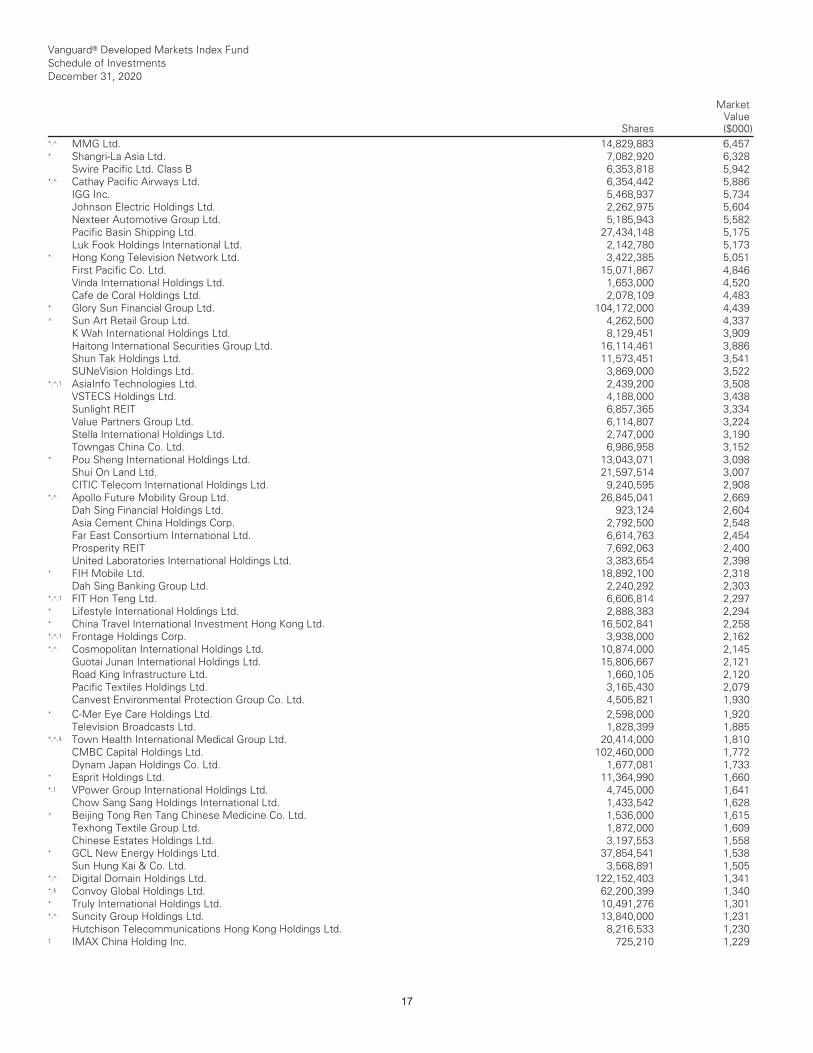
Vanguard® Developed Markets Index Fund Schedule of Investments December 31, 2020
Shares
MarketValue($000)
*,^ MMG Ltd. 14,829,883 6,457 * Shangri-La Asia Ltd. 7,082,920 6,328 Swire Pacific Ltd. Class B 6,353,818 5,942 *,^ Cathay Pacific Airways Ltd. 6,354,442 5,886 IGG Inc. 5,468,937 5,734 Johnson Electric Holdings Ltd. 2,262,975 5,604 Nexteer Automotive Group Ltd. 5,185,943 5,582 Pacific Basin Shipping Ltd. 27,434,148 5,175 Luk Fook Holdings International Ltd. 2,142,780 5,173 * Hong Kong Television Network Ltd. 3,422,385 5,051 First Pacific Co. Ltd. 15,071,867 4,846 Vinda International Holdings Ltd. 1,653,000 4,520 Cafe de Coral Holdings Ltd. 2,078,109 4,483 * Glory Sun Financial Group Ltd. 104,172,000 4,439 ^ Sun Art Retail Group Ltd. 4,262,500 4,337 K Wah International Holdings Ltd. 8,129,451 3,909 Haitong International Securities Group Ltd. 16,114,461 3,886 Shun Tak Holdings Ltd. 11,573,451 3,541 SUNeVision Holdings Ltd. 3,869,000 3,522 *,^,1 AsiaInfo Technologies Ltd. 2,439,200 3,508 VSTECS Holdings Ltd. 4,188,000 3,438 Sunlight REIT 6,857,365 3,334 Value Partners Group Ltd. 6,114,807 3,224 Stella International Holdings Ltd. 2,747,000 3,190 Towngas China Co. Ltd. 6,986,958 3,152 * Pou Sheng International Holdings Ltd. 13,043,071 3,098 Shui On Land Ltd. 21,597,514 3,007 CITIC Telecom International Holdings Ltd. 9,240,595 2,908 *,^ Apollo Future Mobility Group Ltd. 26,845,041 2,669 Dah Sing Financial Holdings Ltd. 923,124 2,604 Asia Cement China Holdings Corp. 2,792,500 2,548 Far East Consortium International Ltd. 6,614,763 2,454 Prosperity REIT 7,692,063 2,400 United Laboratories International Holdings Ltd. 3,383,654 2,398 * FIH Mobile Ltd. 18,892,100 2,318 Dah Sing Banking Group Ltd. 2,240,292 2,303 *,^,1 FIT Hon Teng Ltd. 6,606,814 2,297 * Lifestyle International Holdings Ltd. 2,888,383 2,294 * China Travel International Investment Hong Kong Ltd. 16,502,841 2,258 *,^,1 Frontage Holdings Corp. 3,938,000 2,162 *,^ Cosmopolitan International Holdings Ltd. 10,874,000 2,145 Guotai Junan International Holdings Ltd. 15,806,667 2,121 Road King Infrastructure Ltd. 1,660,105 2,120 Pacific Textiles Holdings Ltd. 3,165,430 2,079 Canvest Environmental Protection Group Co. Ltd. 4,505,821 1,930 __________________________________________________________________________________________________________________________________________________________________________________________________________________________________________________________________________________________________________________________________________________________________________________________________________________________________________________________________________________________________________________________________________________________________________________________________________________________________________________________________________________________ __________________________________________________________________________________________________________________________________________________________________________________________________________________________________________________________________________________________________________________________________________________________________________________________________________________________________________________________________________________________________________________________________________________________________________________________________________________________________________________________________________________________
* C-Mer Eye Care Holdings Ltd. 2,598,000 1,920 Television Broadcasts Ltd. 1,828,399 1,885 *,^,§ Town Health International Medical Group Ltd. 20,414,000 1,810 CMBC Capital Holdings Ltd. 102,460,000 1,772 Dynam Japan Holdings Co. Ltd. 1,677,081 1,733 * Esprit Holdings Ltd. 11,364,990 1,660 *,1 VPower Group International Holdings Ltd. 4,745,000 1,641 Chow Sang Sang Holdings International Ltd. 1,433,542 1,628 ^ Beijing Tong Ren Tang Chinese Medicine Co. Ltd. 1,536,000 1,615 Texhong Textile Group Ltd. 1,872,000 1,609 Chinese Estates Holdings Ltd. 3,197,553 1,558 * GCL New Energy Holdings Ltd. 37,854,541 1,538 Sun Hung Kai & Co. Ltd. 3,568,891 1,505 *,^ Digital Domain Holdings Ltd. 122,152,403 1,341 *,§ Convoy Global Holdings Ltd. 62,200,399 1,340 * Truly International Holdings Ltd. 10,491,276 1,301 *,^ Suncity Group Holdings Ltd. 13,840,000 1,231 Hutchison Telecommunications Hong Kong Holdings Ltd. 8,216,533 1,230 1 IMAX China Holding Inc. 725,210 1,229
17
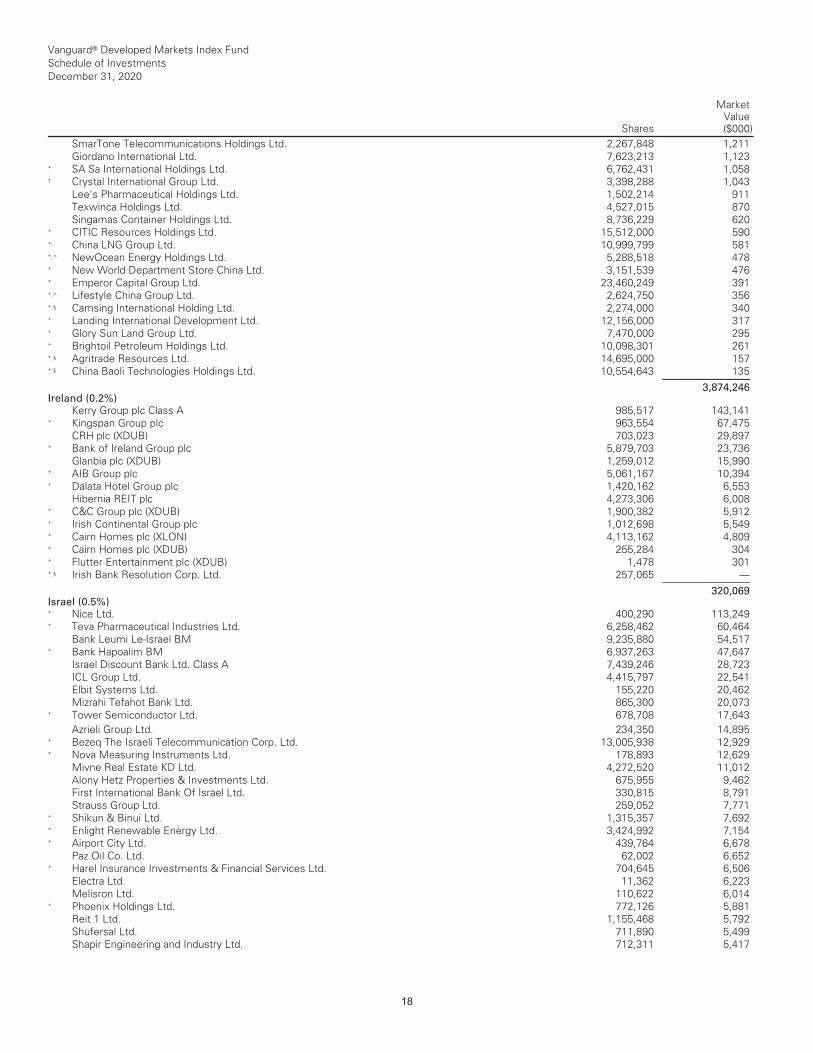
Vanguard® Developed Markets Index Fund Schedule of Investments December 31, 2020
Shares
MarketValue($000)
SmarTone Telecommunications Holdings Ltd. 2,267,848 1,211 Giordano International Ltd. 7,623,213 1,123 * SA Sa International Holdings Ltd. 6,762,431 1,058 1 Crystal International Group Ltd. 3,398,288 1,043 Lee's Pharmaceutical Holdings Ltd. 1,502,214 911 Texwinca Holdings Ltd. 4,527,015 870 Singamas Container Holdings Ltd. 8,736,229 620 * CITIC Resources Holdings Ltd. 15,512,000 590 * China LNG Group Ltd. 10,999,799 581 *,^ NewOcean Energy Holdings Ltd. 5,288,518 478 * New World Department Store China Ltd. 3,151,539 476 * Emperor Capital Group Ltd. 23,460,249 391 *,^ Lifestyle China Group Ltd. 2,624,750 356 *,§ Camsing International Holding Ltd. 2,274,000 340 * Landing International Development Ltd. 12,156,000 317 * Glory Sun Land Group Ltd. 7,470,000 295 * Brightoil Petroleum Holdings Ltd. 10,098,301 261 *,§ Agritrade Resources Ltd. 14,695,000 157 *,§ China Baoli Technologies Holdings Ltd. 10,554,643 135 ___________ 3,874,246 Ireland (0.2%)
Kerry Group plc Class A 985,517 143,141 * Kingspan Group plc 963,554 67,475 CRH plc (XDUB) 703,023 29,897 * Bank of Ireland Group plc 5,879,703 23,736 Glanbia plc (XDUB) 1,259,012 15,990 * AIB Group plc 5,061,167 10,394 * Dalata Hotel Group plc 1,420,162 6,553 Hibernia REIT plc 4,273,306 6,008 * C&C Group plc (XDUB) 1,900,382 5,912 * Irish Continental Group plc 1,012,698 5,549 * Cairn Homes plc (XLON) 4,113,162 4,809 * Cairn Homes plc (XDUB) 255,284 304 * Flutter Entertainment plc (XDUB) 1,478 301 *,§ Irish Bank Resolution Corp. Ltd. 257,065 — ___________ 320,069 Israel (0.5%)
* Nice Ltd. 400,290 113,249 * Teva Pharmaceutical Industries Ltd. 6,258,462 60,464 Bank Leumi Le-Israel BM 9,235,880 54,517 * Bank Hapoalim BM 6,937,263 47,647 Israel Discount Bank Ltd. Class A 7,439,246 28,723 ICL Group Ltd. 4,415,797 22,541 Elbit Systems Ltd. 155,220 20,462 Mizrahi Tefahot Bank Ltd. 865,300 20,073 * Tower Semiconductor Ltd. 678,708 17,643 __________________________________________________________________________________________________________________________________________________________________________________________________________________________________________________________________________________________________________________________________________________________________________________________________________________________________________________________________________________________________________________________________________________________________________________________________________________________________________________________________________________________ __________________________________________________________________________________________________________________________________________________________________________________________________________________________________________________________________________________________________________________________________________________________________________________________________________________________________________________________________________________________________________________________________________________________________________________________________________________________________________________________________________________________
Azrieli Group Ltd. 234,350 14,895 * Bezeq The Israeli Telecommunication Corp. Ltd. 13,005,938 12,929 * Nova Measuring Instruments Ltd. 178,893 12,629 Mivne Real Estate KD Ltd. 4,272,520 11,012 Alony Hetz Properties & Investments Ltd. 675,955 9,462 First International Bank Of Israel Ltd. 330,815 8,791 Strauss Group Ltd. 259,052 7,771 * Shikun & Binui Ltd. 1,315,357 7,692 * Enlight Renewable Energy Ltd. 3,424,992 7,154 * Airport City Ltd. 439,764 6,678 Paz Oil Co. Ltd. 62,002 6,652 * Harel Insurance Investments & Financial Services Ltd. 704,645 6,506 Electra Ltd. 11,362 6,223 Melisron Ltd. 110,622 6,014 * Phoenix Holdings Ltd. 772,126 5,881 Reit 1 Ltd. 1,155,468 5,792 Shufersal Ltd. 711,890 5,499 Shapir Engineering and Industry Ltd. 712,311 5,417
18

Vanguard® Developed Markets Index Fund Schedule of Investments December 31, 2020
Shares
MarketValue($000)
Sapiens International Corp. NV 172,031 5,323 Energix-Renewable Energies Ltd. 1,158,041 5,291 Amot Investments Ltd. 930,336 5,214 Gev-Yam Land Ltd. 608,087 4,962 * Clal Insurance Enterprises Holdings Ltd. 307,888 4,832 Danel Adir Yeoshua Ltd. 28,854 4,763 Matrix IT Ltd. 199,720 4,527 * Israel Corp. Ltd. 23,085 4,415 Formula Systems 1985 Ltd. 49,594 4,288 * AFI Properties Ltd. 102,711 4,206 Maytronics Ltd. 276,774 4,167 Hilan Ltd. 87,200 4,141 AudioCodes Ltd. 146,624 4,039 Isracard Ltd. 1,186,514 4,014 Mega Or Holdings Ltd. 125,223 3,824 * Partner Communications Co. Ltd. 663,307 3,660 * Fattal Holdings 1998 Ltd. 32,932 3,563 Rami Levy Chain Stores Hashikma Marketing 2006 Ltd. 49,231 3,449 FIBI Holdings Ltd. 111,664 3,390 Delek Automotive Systems Ltd. 329,995 3,101 * Big Shopping Centers Ltd. 27,638 3,078 Kenon Holdings Ltd. 103,829 3,059 Gazit-Globe Ltd. 432,693 2,831 * Menora Mivtachim Holdings Ltd. 148,621 2,791 Sella Capital Real Estate Ltd. 1,225,601 2,770 * Equital Ltd. 104,060 2,719 * Cellcom Israel Ltd. (Registered) 518,250 2,562 * Migdal Insurance & Financial Holdings Ltd. 2,121,717 2,457 * Allot Ltd. 209,892 2,219 * Oil Refineries Ltd. 9,323,608 2,114 Delta Galil Industries Ltd. 56,125 1,423 IDI Insurance Co. Ltd. 44,712 1,356 * Delek Group Ltd. 42,096 1,315 * Brack Capital Properties NV 14,031 1,301 * Kamada Ltd. 191,190 1,231 Gilat Satellite Networks Ltd. 174,451 1,139 * Naphtha Israel Petroleum Corp. Ltd. 201,360 966 * Teva Pharmaceutical Industries Ltd. ADR 33,295 321 ___________ 653,137 Italy (2.1%)
Enel SPA 49,734,249 506,036 * Intesa Sanpaolo SPA (Registered) 99,389,820 234,931 Ferrari NV 777,529 180,342 Eni SPA 15,860,254 165,577 Assicurazioni Generali SPA 8,087,883 141,607 * UniCredit SPA 13,685,240 128,223 __________________________________________________________________________________________________________________________________________________________________________________________________________________________________________________________________________________________________________________________________________________________________________________________________________________________________________________________________________________________________________________________________________________________________________________________________________________________________________________________________________________________ __________________________________________________________________________________________________________________________________________________________________________________________________________________________________________________________________________________________________________________________________________________________________________________________________________________________________________________________________________________________________________________________________________________________________________________________________________________________________________________________________________________________
* Fiat Chrysler Automobiles NV 7,053,638 127,432 * CNH Industrial NV 6,290,061 79,069 Snam SPA 13,989,872 79,010 * Moncler SPA 1,226,724 75,420 Terna Rete Elettrica Nazionale SPA 8,886,147 68,283 * FinecoBank Banca Fineco SPA 3,895,261 64,241 * Atlantia SPA 3,145,369 56,799 *,1 Nexi SPA 2,787,734 55,474 Prysmian SPA 1,528,783 54,414 Exor NV 664,589 53,983 * Mediobanca Banca di Credito Finanziario SPA 4,342,707 40,200 Davide Campari-Milano NV 3,194,726 36,619 Recordati Industria Chimica e Farmaceutica SPA 617,559 34,342 * Amplifon SPA 777,079 32,300 Telecom Italia SPA (Registered) 67,375,190 31,272 DiaSorin SPA 143,662 29,995 1 Poste Italiane SPA 2,912,132 29,788 Interpump Group SPA 511,864 25,339
19
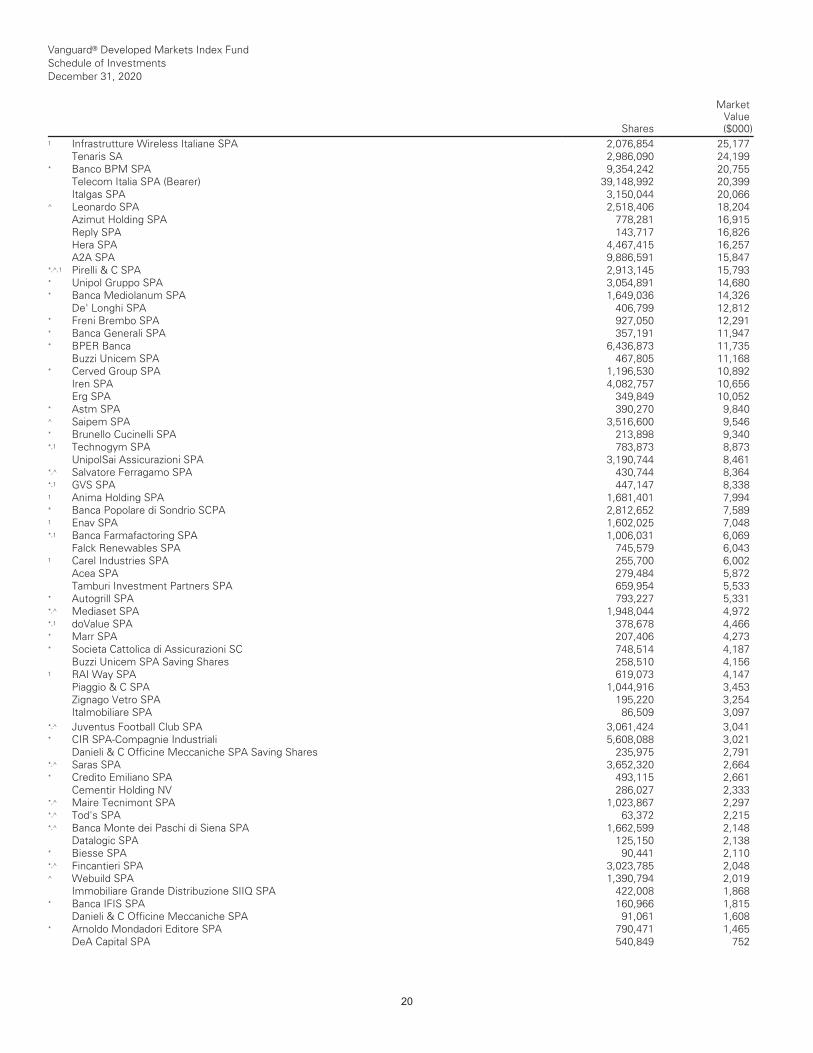
Vanguard® Developed Markets Index Fund Schedule of Investments December 31, 2020
Shares
MarketValue($000)
1 Infrastrutture Wireless Italiane SPA 2,076,854 25,177 Tenaris SA 2,986,090 24,199 * Banco BPM SPA 9,354,242 20,755 Telecom Italia SPA (Bearer) 39,148,992 20,399 Italgas SPA 3,150,044 20,066 ^ Leonardo SPA 2,518,406 18,204 Azimut Holding SPA 778,281 16,915 Reply SPA 143,717 16,826 Hera SPA 4,467,415 16,257 A2A SPA 9,886,591 15,847 *,^,1 Pirelli & C SPA 2,913,145 15,793 * Unipol Gruppo SPA 3,054,891 14,680 * Banca Mediolanum SPA 1,649,036 14,326 De' Longhi SPA 406,799 12,812 * Freni Brembo SPA 927,050 12,291 * Banca Generali SPA 357,191 11,947 * BPER Banca 6,436,873 11,735 Buzzi Unicem SPA 467,805 11,168 * Cerved Group SPA 1,196,530 10,892 Iren SPA 4,082,757 10,656 Erg SPA 349,849 10,052 * Astm SPA 390,270 9,840 ^ Saipem SPA 3,516,600 9,546 * Brunello Cucinelli SPA 213,898 9,340 *,1 Technogym SPA 783,873 8,873 UnipolSai Assicurazioni SPA 3,190,744 8,461 *,^ Salvatore Ferragamo SPA 430,744 8,364 *,1 GVS SPA 447,147 8,338 1 Anima Holding SPA 1,681,401 7,994 * Banca Popolare di Sondrio SCPA 2,812,652 7,589 1 Enav SPA 1,602,025 7,048 *,1 Banca Farmafactoring SPA 1,006,031 6,069 Falck Renewables SPA 745,579 6,043 1 Carel Industries SPA 255,700 6,002 Acea SPA 279,484 5,872 Tamburi Investment Partners SPA 659,954 5,533 * Autogrill SPA 793,227 5,331 *,^ Mediaset SPA 1,948,044 4,972 *,1 doValue SPA 378,678 4,466 * Marr SPA 207,406 4,273 * Societa Cattolica di Assicurazioni SC 748,514 4,187 Buzzi Unicem SPA Saving Shares 258,510 4,156 1 RAI Way SPA 619,073 4,147 Piaggio & C SPA 1,044,916 3,453 Zignago Vetro SPA 195,220 3,254 Italmobiliare SPA 86,509 3,097 __________________________________________________________________________________________________________________________________________________________________________________________________________________________________________________________________________________________________________________________________________________________________________________________________________________________________________________________________________________________________________________________________________________________________________________________________________________________________________________________________________________________ __________________________________________________________________________________________________________________________________________________________________________________________________________________________________________________________________________________________________________________________________________________________________________________________________________________________________________________________________________________________________________________________________________________________________________________________________________________________________________________________________________________________
*,^ Juventus Football Club SPA 3,061,424 3,041 * CIR SPA-Compagnie Industriali 5,608,088 3,021 Danieli & C Officine Meccaniche SPA Saving Shares 235,975 2,791 *,^ Saras SPA 3,652,320 2,664 * Credito Emiliano SPA 493,115 2,661 Cementir Holding NV 286,027 2,333 *,^ Maire Tecnimont SPA 1,023,867 2,297 *,^ Tod's SPA 63,372 2,215 *,^ Banca Monte dei Paschi di Siena SPA 1,662,599 2,148 Datalogic SPA 125,150 2,138 * Biesse SPA 90,441 2,110 *,^ Fincantieri SPA 3,023,785 2,048 ^ Webuild SPA 1,390,794 2,019 Immobiliare Grande Distribuzione SIIQ SPA 422,008 1,868 * Banca IFIS SPA 160,966 1,815 Danieli & C Officine Meccaniche SPA 91,061 1,608 * Arnoldo Mondadori Editore SPA 790,471 1,465 DeA Capital SPA 540,849 752
20
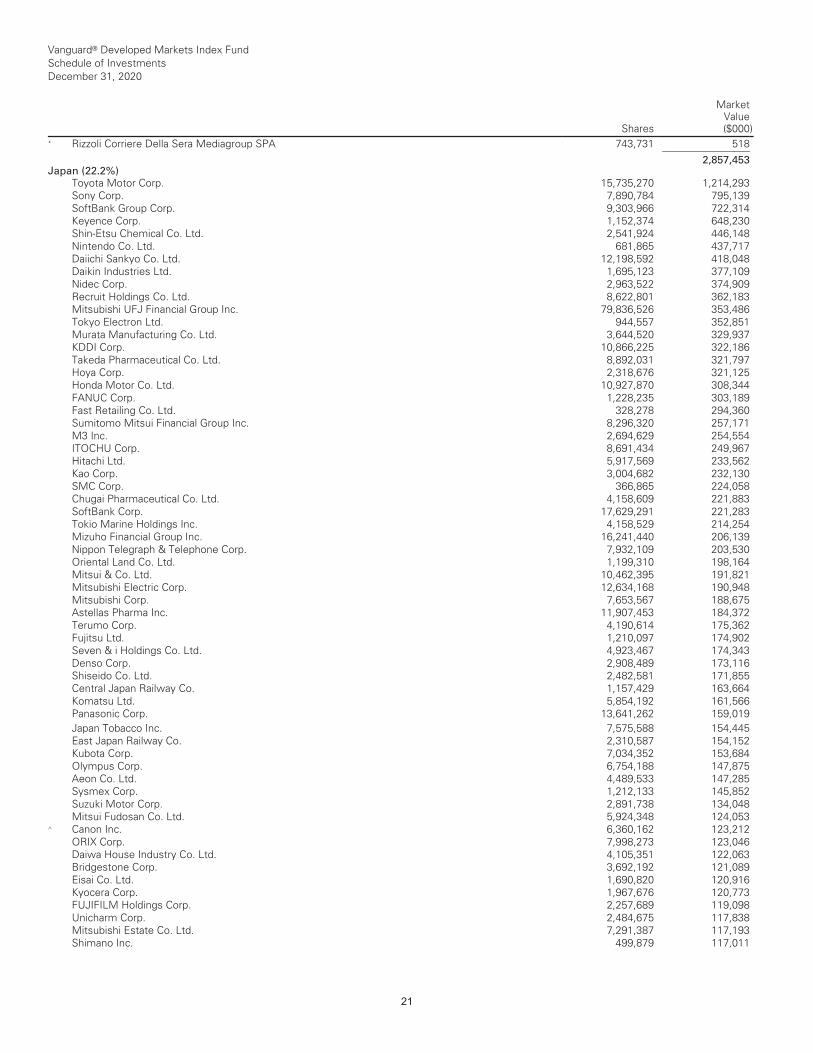
Vanguard® Developed Markets Index Fund Schedule of Investments December 31, 2020
Shares
MarketValue($000)
* Rizzoli Corriere Della Sera Mediagroup SPA 743,731 518 ___________ 2,857,453 Japan (22.2%)
Toyota Motor Corp. 15,735,270 1,214,293 Sony Corp. 7,890,784 795,139 SoftBank Group Corp. 9,303,966 722,314 Keyence Corp. 1,152,374 648,230 Shin-Etsu Chemical Co. Ltd. 2,541,924 446,148 Nintendo Co. Ltd. 681,865 437,717 Daiichi Sankyo Co. Ltd. 12,198,592 418,048 Daikin Industries Ltd. 1,695,123 377,109 Nidec Corp. 2,963,522 374,909 Recruit Holdings Co. Ltd. 8,622,801 362,183 Mitsubishi UFJ Financial Group Inc. 79,836,526 353,486 Tokyo Electron Ltd. 944,557 352,851 Murata Manufacturing Co. Ltd. 3,644,520 329,937 KDDI Corp. 10,866,225 322,186 Takeda Pharmaceutical Co. Ltd. 8,892,031 321,797 Hoya Corp. 2,318,676 321,125 Honda Motor Co. Ltd. 10,927,870 308,344 FANUC Corp. 1,228,235 303,189 Fast Retailing Co. Ltd. 328,278 294,360 Sumitomo Mitsui Financial Group Inc. 8,296,320 257,171 M3 Inc. 2,694,629 254,554 ITOCHU Corp. 8,691,434 249,967 Hitachi Ltd. 5,917,569 233,562 Kao Corp. 3,004,682 232,130 SMC Corp. 366,865 224,058 Chugai Pharmaceutical Co. Ltd. 4,158,609 221,883 SoftBank Corp. 17,629,291 221,283 Tokio Marine Holdings Inc. 4,158,529 214,254 Mizuho Financial Group Inc. 16,241,440 206,139 Nippon Telegraph & Telephone Corp. 7,932,109 203,530 Oriental Land Co. Ltd. 1,199,310 198,164 Mitsui & Co. Ltd. 10,462,395 191,821 Mitsubishi Electric Corp. 12,634,168 190,948 Mitsubishi Corp. 7,653,567 188,675 Astellas Pharma Inc. 11,907,453 184,372 Terumo Corp. 4,190,614 175,362 Fujitsu Ltd. 1,210,097 174,902 Seven & i Holdings Co. Ltd. 4,923,467 174,343 Denso Corp. 2,908,489 173,116 Shiseido Co. Ltd. 2,482,581 171,855 Central Japan Railway Co. 1,157,429 163,664 Komatsu Ltd. 5,854,192 161,566 Panasonic Corp. 13,641,262 159,019 __________________________________________________________________________________________________________________________________________________________________________________________________________________________________________________________________________________________________________________________________________________________________________________________________________________________________________________________________________________________________________________________________________________________________________________________________________________________________________________________________________________________ __________________________________________________________________________________________________________________________________________________________________________________________________________________________________________________________________________________________________________________________________________________________________________________________________________________________________________________________________________________________________________________________________________________________________________________________________________________________________________________________________________________________
Japan Tobacco Inc. 7,575,588 154,445 East Japan Railway Co. 2,310,587 154,152 Kubota Corp. 7,034,352 153,684 Olympus Corp. 6,754,188 147,875 Aeon Co. Ltd. 4,489,533 147,285 Sysmex Corp. 1,212,133 145,852 Suzuki Motor Corp. 2,891,738 134,048 Mitsui Fudosan Co. Ltd. 5,924,348 124,053 ^ Canon Inc. 6,360,162 123,212 ORIX Corp. 7,998,273 123,046 Daiwa House Industry Co. Ltd. 4,105,351 122,063 Bridgestone Corp. 3,692,192 121,089 Eisai Co. Ltd. 1,690,820 120,916 Kyocera Corp. 1,967,676 120,773 FUJIFILM Holdings Corp. 2,257,689 119,098 Unicharm Corp. 2,484,675 117,838 Mitsubishi Estate Co. Ltd. 7,291,387 117,193 Shimano Inc. 499,879 117,011
21

Vanguard® Developed Markets Index Fund Schedule of Investments December 31, 2020
Shares
MarketValue($000)
TDK Corp. 766,990 115,726 Kirin Holdings Co. Ltd. 4,897,404 115,642 Otsuka Holdings Co. Ltd. 2,679,362 114,801 Secom Co. Ltd. 1,239,984 114,391 Asahi Group Holdings Ltd. 2,685,110 110,579 Nippon Paint Holdings Co. Ltd. 986,912 108,444 Bandai Namco Holdings Inc. 1,246,970 107,989 Omron Corp. 1,187,195 105,982 Dai-ichi Life Holdings Inc. 6,797,730 102,411 Nomura Holdings Inc. 19,307,119 102,078 Z Holdings Corp. 16,639,198 100,688 Nitori Holdings Co. Ltd. 476,272 99,589 Shionogi & Co. Ltd. 1,786,928 97,694 Sumitomo Corp. 7,177,789 95,127 Advantest Corp. 1,254,387 93,956 MS&AD Insurance Group Holdings Inc. 3,062,981 93,191 NEC Corp. 1,679,728 90,218 Japan Exchange Group Inc. 3,425,670 87,532 Obic Co. Ltd. 427,755 85,969 Sompo Holdings Inc. 2,104,049 85,304 Nitto Denko Corp. 936,244 83,869 Ono Pharmaceutical Co. Ltd. 2,736,285 82,457 Yaskawa Electric Corp. 1,646,172 82,071 Toyota Industries Corp. 1,022,254 81,219 Kikkoman Corp. 1,165,999 81,150 Asahi Kasei Corp. 7,901,475 80,991 Nexon Co. Ltd. 2,604,821 80,372 Toshiba Corp. 2,823,578 79,084 Makita Corp. 1,557,494 78,119 Sumitomo Realty & Development Co. Ltd. 2,529,263 78,085 Subaru Corp. 3,891,492 77,865 Daifuku Co. Ltd. 616,496 76,289 Pan Pacific International Holdings Corp. 3,252,152 75,137 Sekisui House Ltd. 3,659,406 74,549 SG Holdings Co. Ltd. 2,704,748 73,748 Sumitomo Mitsui Trust Holdings Inc. 2,335,889 72,073 Ajinomoto Co. Inc. 3,121,045 70,722 ENEOS Holdings Inc. 19,161,205 68,821 Sumitomo Metal Mining Co. Ltd. 1,512,107 67,260 * Nippon Steel Corp. 5,213,790 67,243 * Nissan Motor Co. Ltd. 12,331,208 66,840 Shimadzu Corp. 1,715,112 66,666 Marubeni Corp. 9,996,031 66,598 Japan Post Holdings Co. Ltd. 8,497,057 66,185 Sumitomo Electric Industries Ltd. 4,808,815 63,721 Tokyo Gas Co. Ltd. 2,705,351 62,616 __________________________________________________________________________________________________________________________________________________________________________________________________________________________________________________________________________________________________________________________________________________________________________________________________________________________________________________________________________________________________________________________________________________________________________________________________________________________________________________________________________________________ __________________________________________________________________________________________________________________________________________________________________________________________________________________________________________________________________________________________________________________________________________________________________________________________________________________________________________________________________________________________________________________________________________________________________________________________________________________________________________________________________________________________
Odakyu Electric Railway Co. Ltd. 1,961,635 61,611 West Japan Railway Co. 1,156,670 60,563 MEIJI Holdings Co. Ltd. 856,370 60,271 Disco Corp. 177,188 59,718 Nomura Research Institute Ltd. 1,658,022 59,313 Yamaha Corp. 997,788 58,794 MISUMI Group Inc. 1,776,979 58,333 Toyota Tsusho Corp. 1,423,396 57,600 Toray Industries Inc. 9,679,747 57,415 Keio Corp. 734,524 56,988 Lasertec Corp. 484,598 56,879 Mitsubishi Heavy Industries Ltd. 1,827,694 55,975 Nihon M&A Center Inc. 834,288 55,792 TOTO Ltd. 921,246 55,448 NTT Data Corp. 4,020,881 55,039 Yamato Holdings Co. Ltd. 2,136,778 54,558 Nissan Chemical Corp. 861,597 54,026 Chubu Electric Power Co. Inc. 4,463,562 53,866
22

Vanguard® Developed Markets Index Fund Schedule of Investments December 31, 2020
Shares
MarketValue($000)
MINEBEA MITSUMI Inc. 2,613,796 52,001 Osaka Gas Co. Ltd. 2,520,482 51,664 Rohm Co. Ltd. 526,006 50,991 Kintetsu Group Holdings Co. Ltd. 1,146,334 50,238 Koito Manufacturing Co. Ltd. 730,311 49,702 Mitsubishi Chemical Holdings Corp. 8,135,227 49,286 Rakuten Inc. 5,061,228 48,703 Resona Holdings Inc. 13,823,079 48,391 * Renesas Electronics Corp. 4,567,315 47,806 Kobayashi Pharmaceutical Co. Ltd. 390,125 47,684 Hamamatsu Photonics KK 814,516 46,602 Hankyu Hanshin Holdings Inc. 1,395,716 46,424 Azbil Corp. 839,004 45,895 Kansai Electric Power Co. Inc. 4,644,690 43,930 Asahi Intecc Co. Ltd. 1,196,466 43,701 Taisei Corp. 1,263,999 43,606 Daiwa Securities Group Inc. 9,553,227 43,513 Kyowa Kirin Co. Ltd. 1,588,074 43,367 Yakult Honsha Co. Ltd. 850,533 42,894 Trend Micro Inc. 741,587 42,696 CyberAgent Inc. 613,074 42,293 Dentsu Group Inc. 1,401,197 41,702 Sekisui Chemical Co. Ltd. 2,197,065 41,659 T&D Holdings Inc. 3,487,663 41,255 AGC Inc. 1,176,848 41,153 Lion Corp. 1,609,410 38,988 Tokyu Corp. 3,130,684 38,899 Sumitomo Chemical Co. Ltd. 9,621,570 38,782 Kajima Corp. 2,886,724 38,725 Tobu Railway Co. Ltd. 1,296,630 38,661 Daito Trust Construction Co. Ltd. 413,371 38,631 Kansai Paint Co. Ltd. 1,234,489 38,054 MonotaRO Co. Ltd. 746,889 37,934 Nissin Foods Holdings Co. Ltd. 440,755 37,780 Toho Gas Co. Ltd. 567,645 37,607 Capcom Co. Ltd. 576,788 37,406 Obayashi Corp. 4,299,005 37,120 Taiyo Yuden Co. Ltd. 789,300 37,059 Santen Pharmaceutical Co. Ltd. 2,271,193 36,887 Yamaha Motor Co. Ltd. 1,782,209 36,377 Lixil Corp. 1,675,694 36,340 SBI Holdings Inc. 1,523,614 36,246 Miura Co. Ltd. 630,382 35,193 Otsuka Corp. 653,922 34,492 GMO Payment Gateway Inc. 252,575 33,942 Konami Holdings Corp. 596,747 33,577 __________________________________________________________________________________________________________________________________________________________________________________________________________________________________________________________________________________________________________________________________________________________________________________________________________________________________________________________________________________________________________________________________________________________________________________________________________________________________________________________________________________________ __________________________________________________________________________________________________________________________________________________________________________________________________________________________________________________________________________________________________________________________________________________________________________________________________________________________________________________________________________________________________________________________________________________________________________________________________________________________________________________________________________________________
Hikari Tsushin Inc. 141,726 33,254 Idemitsu Kosan Co. Ltd. 1,502,656 33,084 Aisin Seiki Co. Ltd. 1,102,691 33,069 Tsuruha Holdings Inc. 232,280 33,031 Nagoya Railroad Co. Ltd. 1,243,732 32,817 Mitsui Chemicals Inc. 1,116,666 32,802 Nabtesco Corp. 746,560 32,769 SUMCO Corp. 1,480,525 32,510 Hirose Electric Co. Ltd. 213,593 32,417 Oji Holdings Corp. 5,662,547 32,237 JSR Corp. 1,154,706 32,196 Ibiden Co. Ltd. 688,343 32,178 Dai Nippon Printing Co. Ltd. 1,758,121 31,624 * JFE Holdings Inc. 3,275,954 31,453 Inpex Corp. 5,832,257 31,449 Kose Corp. 183,690 31,389 Tokyo Century Corp. 395,325 31,373 Brother Industries Ltd. 1,507,889 31,128
23

Vanguard® Developed Markets Index Fund Schedule of Investments December 31, 2020
Shares
MarketValue($000)
Isuzu Motors Ltd. 3,257,191 31,007 TIS Inc. 1,509,924 30,953 Takeda Pharmaceutical Co. Ltd. ADR 1,700,083 30,942 Hoshizaki Corp. 336,431 30,893 Yokogawa Electric Corp. 1,542,681 30,769 Ryohin Keikaku Co. Ltd. 1,501,355 30,725 Nippon Express Co. Ltd. 452,112 30,412 Toho Co. Ltd. (XTKS) 719,814 30,361 Keihan Holdings Co. Ltd. 625,214 29,975 Keisei Electric Railway Co. Ltd. 883,764 29,915 Square Enix Holdings Co. Ltd. 493,079 29,896 Stanley Electric Co. Ltd. 922,900 29,772 Fuji Electric Co. Ltd. 799,232 28,849 Ricoh Co. Ltd. 4,329,385 28,470 Pigeon Corp. 689,677 28,465 Suntory Beverage & Food Ltd. 801,558 28,391 * PeptiDream Inc. 555,591 28,261 Toyo Suisan Kaisha Ltd. 575,518 28,009 NH Foods Ltd. 631,148 27,799 Tosoh Corp. 1,774,608 27,727 USS Co. Ltd. 1,348,653 27,271 Nippon Building Fund Inc. 4,699 27,253 Keikyu Corp. 1,587,396 27,233 Rinnai Corp. 233,811 27,179 Oracle Corp. Japan 207,235 27,014 Kurita Water Industries Ltd. 698,009 26,681 Hisamitsu Pharmaceutical Co. Inc. 448,318 26,648 Mitsubishi Gas Chemical Co. Inc. 1,145,280 26,336 * Tokyo Electric Power Co. Holdings Inc. 9,946,851 26,274 Nisshin Seifun Group Inc. 1,640,498 26,133 Seiko Epson Corp. 1,725,053 25,635 NGK Insulators Ltd. 1,658,036 25,620 Hulic Co. Ltd. 2,328,200 25,611 Toppan Printing Co. Ltd. 1,812,466 25,595 Shimizu Corp. 3,504,892 25,513 Kyushu Electric Power Co. Inc. 2,947,690 25,429 Casio Computer Co. Ltd. 1,368,373 25,042 Concordia Financial Group Ltd. 7,092,079 25,018 Sushiro Global Holdings Ltd. 648,296 24,870 Tohoku Electric Power Co. Inc. 3,002,880 24,783 Yamada Holdings Co. Ltd. 4,661,024 24,764 NSK Ltd. 2,808,902 24,445 Mazda Motor Corp. 3,645,718 24,404 Welcia Holdings Co. Ltd. 639,940 24,140 Nippon Yusen KK 1,032,088 24,079 Japan Post Insurance Co. Ltd. 1,172,698 24,045 __________________________________________________________________________________________________________________________________________________________________________________________________________________________________________________________________________________________________________________________________________________________________________________________________________________________________________________________________________________________________________________________________________________________________________________________________________________________________________________________________________________________ __________________________________________________________________________________________________________________________________________________________________________________________________________________________________________________________________________________________________________________________________________________________________________________________________________________________________________________________________________________________________________________________________________________________________________________________________________________________________________________________________________________________
Bank of Kyoto Ltd. 460,449 24,007 Japan Real Estate Investment Corp. 4,145 23,951 THK Co. Ltd. 728,681 23,566 Shizuoka Bank Ltd. 3,207,773 23,546 Kuraray Co. Ltd. 2,200,687 23,431 Marui Group Co. Ltd. 1,312,191 23,108 Ito En Ltd. 361,231 22,874 Koei Tecmo Holdings Co. Ltd. 373,917 22,827 Kakaku.com Inc. 831,995 22,774 Chugoku Electric Power Co. Inc. 1,921,804 22,553 Sohgo Security Services Co. Ltd. 431,209 22,369 COMSYS Holdings Corp. 717,559 22,312 Teijin Ltd. 1,178,552 22,178 Itochu Techno-Solutions Corp. 615,552 21,980 Amada Co. Ltd. 1,994,726 21,950 NOF Corp. 430,656 21,850 Kyushu Railway Co. 1,010,874 21,808 Denka Co. Ltd. 557,158 21,786
24
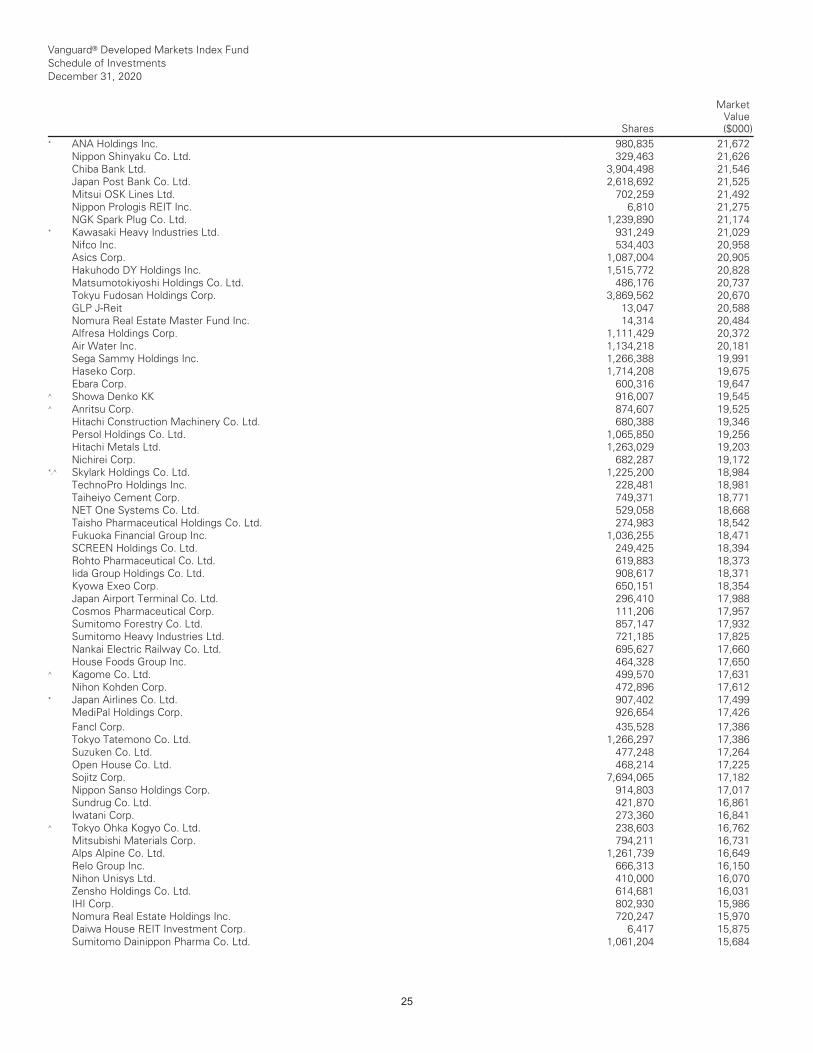
Vanguard® Developed Markets Index Fund Schedule of Investments December 31, 2020
Shares
MarketValue($000)
* ANA Holdings Inc. 980,835 21,672 Nippon Shinyaku Co. Ltd. 329,463 21,626 Chiba Bank Ltd. 3,904,498 21,546 Japan Post Bank Co. Ltd. 2,618,692 21,525 Mitsui OSK Lines Ltd. 702,259 21,492 Nippon Prologis REIT Inc. 6,810 21,275 NGK Spark Plug Co. Ltd. 1,239,890 21,174 * Kawasaki Heavy Industries Ltd. 931,249 21,029 Nifco Inc. 534,403 20,958 Asics Corp. 1,087,004 20,905 Hakuhodo DY Holdings Inc. 1,515,772 20,828 Matsumotokiyoshi Holdings Co. Ltd. 486,176 20,737 Tokyu Fudosan Holdings Corp. 3,869,562 20,670 GLP J-Reit 13,047 20,588 Nomura Real Estate Master Fund Inc. 14,314 20,484 Alfresa Holdings Corp. 1,111,429 20,372 Air Water Inc. 1,134,218 20,181 Sega Sammy Holdings Inc. 1,266,388 19,991 Haseko Corp. 1,714,208 19,675 Ebara Corp. 600,316 19,647 ^ Showa Denko KK 916,007 19,545 ^ Anritsu Corp. 874,607 19,525 Hitachi Construction Machinery Co. Ltd. 680,388 19,346 Persol Holdings Co. Ltd. 1,065,850 19,256 Hitachi Metals Ltd. 1,263,029 19,203 Nichirei Corp. 682,287 19,172 *,^ Skylark Holdings Co. Ltd. 1,225,200 18,984 TechnoPro Holdings Inc. 228,481 18,981 Taiheiyo Cement Corp. 749,371 18,771 NET One Systems Co. Ltd. 529,058 18,668 Taisho Pharmaceutical Holdings Co. Ltd. 274,983 18,542 Fukuoka Financial Group Inc. 1,036,255 18,471 SCREEN Holdings Co. Ltd. 249,425 18,394 Rohto Pharmaceutical Co. Ltd. 619,883 18,373 Iida Group Holdings Co. Ltd. 908,617 18,371 Kyowa Exeo Corp. 650,151 18,354 Japan Airport Terminal Co. Ltd. 296,410 17,988 Cosmos Pharmaceutical Corp. 111,206 17,957 Sumitomo Forestry Co. Ltd. 857,147 17,932 Sumitomo Heavy Industries Ltd. 721,185 17,825 Nankai Electric Railway Co. Ltd. 695,627 17,660 House Foods Group Inc. 464,328 17,650 ^ Kagome Co. Ltd. 499,570 17,631 Nihon Kohden Corp. 472,896 17,612 * Japan Airlines Co. Ltd. 907,402 17,499 MediPal Holdings Corp. 926,654 17,426 __________________________________________________________________________________________________________________________________________________________________________________________________________________________________________________________________________________________________________________________________________________________________________________________________________________________________________________________________________________________________________________________________________________________________________________________________________________________________________________________________________________________ __________________________________________________________________________________________________________________________________________________________________________________________________________________________________________________________________________________________________________________________________________________________________________________________________________________________________________________________________________________________________________________________________________________________________________________________________________________________________________________________________________________________
Fancl Corp. 435,528 17,386 Tokyo Tatemono Co. Ltd. 1,266,297 17,386 Suzuken Co. Ltd. 477,248 17,264 Open House Co. Ltd. 468,214 17,225 Sojitz Corp. 7,694,065 17,182 Nippon Sanso Holdings Corp. 914,803 17,017 Sundrug Co. Ltd. 421,870 16,861 Iwatani Corp. 273,360 16,841 ^ Tokyo Ohka Kogyo Co. Ltd. 238,603 16,762 Mitsubishi Materials Corp. 794,211 16,731 Alps Alpine Co. Ltd. 1,261,739 16,649 Relo Group Inc. 666,313 16,150 Nihon Unisys Ltd. 410,000 16,070 Zensho Holdings Co. Ltd. 614,681 16,031 IHI Corp. 802,930 15,986 Nomura Real Estate Holdings Inc. 720,247 15,970 Daiwa House REIT Investment Corp. 6,417 15,875 Sumitomo Dainippon Pharma Co. Ltd. 1,061,204 15,684
25
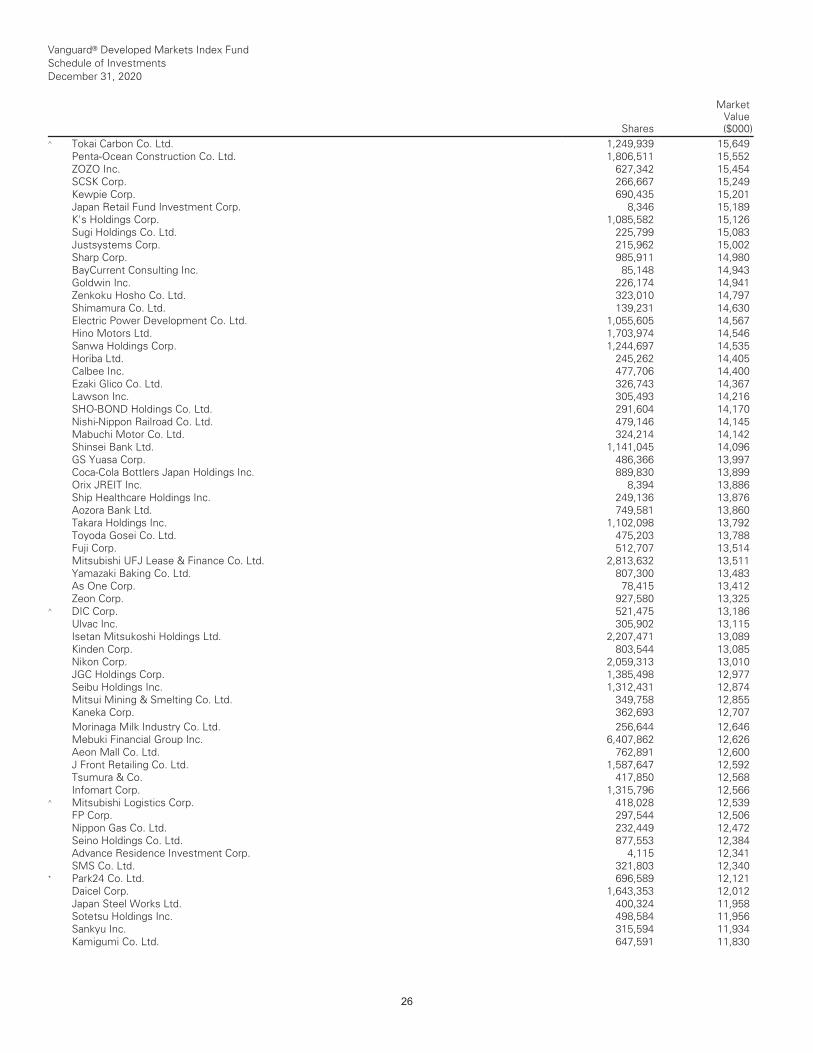
Vanguard® Developed Markets Index Fund Schedule of Investments December 31, 2020
Shares
MarketValue($000)
^ Tokai Carbon Co. Ltd. 1,249,939 15,649 Penta-Ocean Construction Co. Ltd. 1,806,511 15,552 ZOZO Inc. 627,342 15,454 SCSK Corp. 266,667 15,249 Kewpie Corp. 690,435 15,201 Japan Retail Fund Investment Corp. 8,346 15,189 K's Holdings Corp. 1,085,582 15,126 Sugi Holdings Co. Ltd. 225,799 15,083 Justsystems Corp. 215,962 15,002 Sharp Corp. 985,911 14,980 BayCurrent Consulting Inc. 85,148 14,943 Goldwin Inc. 226,174 14,941 Zenkoku Hosho Co. Ltd. 323,010 14,797 Shimamura Co. Ltd. 139,231 14,630 Electric Power Development Co. Ltd. 1,055,605 14,567 Hino Motors Ltd. 1,703,974 14,546 Sanwa Holdings Corp. 1,244,697 14,535 Horiba Ltd. 245,262 14,405 Calbee Inc. 477,706 14,400 Ezaki Glico Co. Ltd. 326,743 14,367 Lawson Inc. 305,493 14,216 SHO-BOND Holdings Co. Ltd. 291,604 14,170 Nishi-Nippon Railroad Co. Ltd. 479,146 14,145 Mabuchi Motor Co. Ltd. 324,214 14,142 Shinsei Bank Ltd. 1,141,045 14,096 GS Yuasa Corp. 486,366 13,997 Coca-Cola Bottlers Japan Holdings Inc. 889,830 13,899 Orix JREIT Inc. 8,394 13,886 Ship Healthcare Holdings Inc. 249,136 13,876 Aozora Bank Ltd. 749,581 13,860 Takara Holdings Inc. 1,102,098 13,792 Toyoda Gosei Co. Ltd. 475,203 13,788 Fuji Corp. 512,707 13,514 Mitsubishi UFJ Lease & Finance Co. Ltd. 2,813,632 13,511 Yamazaki Baking Co. Ltd. 807,300 13,483 As One Corp. 78,415 13,412 Zeon Corp. 927,580 13,325 ^ DIC Corp. 521,475 13,186 Ulvac Inc. 305,902 13,115 Isetan Mitsukoshi Holdings Ltd. 2,207,471 13,089 Kinden Corp. 803,544 13,085 Nikon Corp. 2,059,313 13,010 JGC Holdings Corp. 1,385,498 12,977 Seibu Holdings Inc. 1,312,431 12,874 Mitsui Mining & Smelting Co. Ltd. 349,758 12,855 Kaneka Corp. 362,693 12,707 __________________________________________________________________________________________________________________________________________________________________________________________________________________________________________________________________________________________________________________________________________________________________________________________________________________________________________________________________________________________________________________________________________________________________________________________________________________________________________________________________________________________ __________________________________________________________________________________________________________________________________________________________________________________________________________________________________________________________________________________________________________________________________________________________________________________________________________________________________________________________________________________________________________________________________________________________________________________________________________________________________________________________________________________________
Morinaga Milk Industry Co. Ltd. 256,644 12,646 Mebuki Financial Group Inc. 6,407,862 12,626 Aeon Mall Co. Ltd. 762,891 12,600 J Front Retailing Co. Ltd. 1,587,647 12,592 Tsumura & Co. 417,850 12,568 Infomart Corp. 1,315,796 12,566 ^ Mitsubishi Logistics Corp. 418,028 12,539 FP Corp. 297,544 12,506 Nippon Gas Co. Ltd. 232,449 12,472 Seino Holdings Co. Ltd. 877,553 12,384 Advance Residence Investment Corp. 4,115 12,341 SMS Co. Ltd. 321,803 12,340 * Park24 Co. Ltd. 696,589 12,121 Daicel Corp. 1,643,353 12,012 Japan Steel Works Ltd. 400,324 11,958 Sotetsu Holdings Inc. 498,584 11,956 Sankyu Inc. 315,594 11,934 Kamigumi Co. Ltd. 647,591 11,830
26
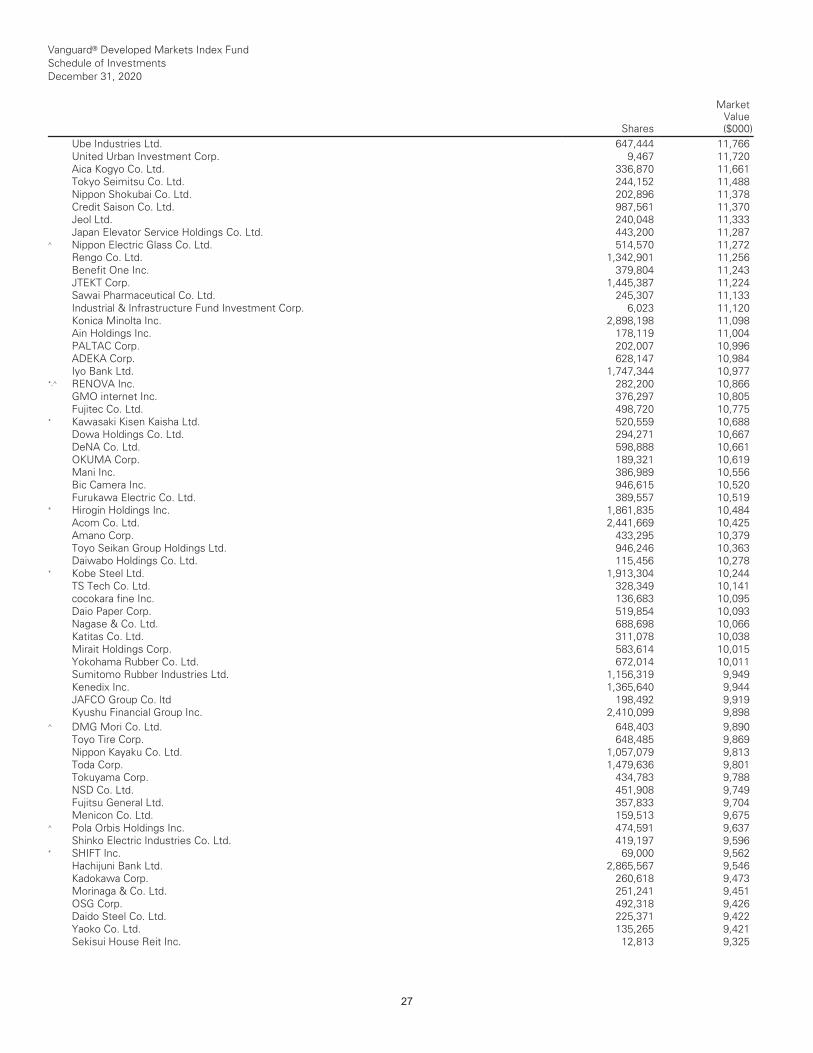
Vanguard® Developed Markets Index Fund Schedule of Investments December 31, 2020
Shares
MarketValue($000)
Ube Industries Ltd. 647,444 11,766 United Urban Investment Corp. 9,467 11,720 Aica Kogyo Co. Ltd. 336,870 11,661 Tokyo Seimitsu Co. Ltd. 244,152 11,488 Nippon Shokubai Co. Ltd. 202,896 11,378 Credit Saison Co. Ltd. 987,561 11,370 Jeol Ltd. 240,048 11,333 Japan Elevator Service Holdings Co. Ltd. 443,200 11,287 ^ Nippon Electric Glass Co. Ltd. 514,570 11,272 Rengo Co. Ltd. 1,342,901 11,256 Benefit One Inc. 379,804 11,243 JTEKT Corp. 1,445,387 11,224 Sawai Pharmaceutical Co. Ltd. 245,307 11,133 Industrial & Infrastructure Fund Investment Corp. 6,023 11,120 Konica Minolta Inc. 2,898,198 11,098 Ain Holdings Inc. 178,119 11,004 PALTAC Corp. 202,007 10,996 ADEKA Corp. 628,147 10,984 Iyo Bank Ltd. 1,747,344 10,977 *,^ RENOVA Inc. 282,200 10,866 GMO internet Inc. 376,297 10,805 Fujitec Co. Ltd. 498,720 10,775 * Kawasaki Kisen Kaisha Ltd. 520,559 10,688 Dowa Holdings Co. Ltd. 294,271 10,667 DeNA Co. Ltd. 598,888 10,661 OKUMA Corp. 189,321 10,619 Mani Inc. 386,989 10,556 Bic Camera Inc. 946,615 10,520 Furukawa Electric Co. Ltd. 389,557 10,519 * Hirogin Holdings Inc. 1,861,835 10,484 Acom Co. Ltd. 2,441,669 10,425 Amano Corp. 433,295 10,379 Toyo Seikan Group Holdings Ltd. 946,246 10,363 Daiwabo Holdings Co. Ltd. 115,456 10,278 * Kobe Steel Ltd. 1,913,304 10,244 TS Tech Co. Ltd. 328,349 10,141 cocokara fine Inc. 136,683 10,095 Daio Paper Corp. 519,854 10,093 Nagase & Co. Ltd. 688,698 10,066 Katitas Co. Ltd. 311,078 10,038 Mirait Holdings Corp. 583,614 10,015 Yokohama Rubber Co. Ltd. 672,014 10,011 Sumitomo Rubber Industries Ltd. 1,156,319 9,949 Kenedix Inc. 1,365,640 9,944 JAFCO Group Co. ltd 198,492 9,919 Kyushu Financial Group Inc. 2,410,099 9,898 __________________________________________________________________________________________________________________________________________________________________________________________________________________________________________________________________________________________________________________________________________________________________________________________________________________________________________________________________________________________________________________________________________________________________________________________________________________________________________________________________________________________ __________________________________________________________________________________________________________________________________________________________________________________________________________________________________________________________________________________________________________________________________________________________________________________________________________________________________________________________________________________________________________________________________________________________________________________________________________________________________________________________________________________________
^ DMG Mori Co. Ltd. 648,403 9,890 Toyo Tire Corp. 648,485 9,869 Nippon Kayaku Co. Ltd. 1,057,079 9,813 Toda Corp. 1,479,636 9,801 Tokuyama Corp. 434,783 9,788 NSD Co. Ltd. 451,908 9,749 Fujitsu General Ltd. 357,833 9,704 Menicon Co. Ltd. 159,513 9,675 ^ Pola Orbis Holdings Inc. 474,591 9,637 Shinko Electric Industries Co. Ltd. 419,197 9,596 * SHIFT Inc. 69,000 9,562 Hachijuni Bank Ltd. 2,865,567 9,546 Kadokawa Corp. 260,618 9,473 Morinaga & Co. Ltd. 251,241 9,451 OSG Corp. 492,318 9,426 Daido Steel Co. Ltd. 225,371 9,422 Yaoko Co. Ltd. 135,265 9,421 Sekisui House Reit Inc. 12,813 9,325
27

Vanguard® Developed Markets Index Fund Schedule of Investments December 31, 2020
Shares
MarketValue($000)
Activia Properties Inc. 2,203 9,310 ^ Japan Prime Realty Investment Corp. 2,806 9,307 Toagosei Co. Ltd. 782,421 9,197 Systena Corp. 434,640 9,126 ABC-Mart Inc. 164,082 9,123 Izumi Co. Ltd. 250,753 9,086 Ushio Inc. 696,578 9,074 H.U. Group Holdings Inc. 336,065 9,056 Nippo Corp. 328,734 9,007 IR Japan Holdings Ltd. 55,800 8,940 Daiichikosho Co. Ltd. 256,136 8,862 AEON Financial Service Co. Ltd. 737,928 8,850 Chugoku Bank Ltd. 1,093,775 8,778 Kusuri no Aoki Holdings Co. Ltd. 100,904 8,776 Benesse Holdings Inc. 447,549 8,744 Maruichi Steel Tube Ltd. 394,470 8,738 Shochiku Co. Ltd. 63,691 8,734 Nipro Corp. 741,666 8,734 Seven Bank Ltd. 4,103,596 8,675 Outsourcing Inc. 645,273 8,675 Nippon Accommodations Fund Inc. 1,536 8,634 Kobe Bussan Co. Ltd. 278,692 8,563 Fukuyama Transporting Co. Ltd. 202,969 8,555 Digital Garage Inc. 204,095 8,433 Hazama Ando Corp. 1,206,196 8,423 Nichias Corp. 352,451 8,394 LaSalle Logiport REIT 5,189 8,373 Takuma Co. Ltd. 467,448 8,355 * Mitsubishi Motors Corp. 3,963,820 8,340 JCR Pharmaceuticals Co. Ltd. 352,564 8,339 Yamaguchi Financial Group Inc. 1,472,701 8,314 Fuji Oil Holdings Inc. 289,532 8,281 Asahi Holdings Inc. 232,124 8,254 Ariake Japan Co. Ltd. 114,295 8,225 Gunma Bank Ltd. 2,656,640 8,205 Kenedix Office Investment Corp. 1,206 8,188 Kaken Pharmaceutical Co. Ltd. 211,104 8,158 Topcon Corp. 655,380 8,156 Inaba Denki Sangyo Co. Ltd. 332,416 8,148 Kureha Corp. 115,100 8,128 Mitsui Fudosan Logistics Park Inc. 1,599 8,110 Japan Logistics Fund Inc. 2,745 8,102 Meitec Corp. 155,534 8,088 CKD Corp. 376,389 8,068 Fuyo General Lease Co. Ltd. 121,191 8,028 Mizuho Leasing Co. Ltd. 265,054 7,992 __________________________________________________________________________________________________________________________________________________________________________________________________________________________________________________________________________________________________________________________________________________________________________________________________________________________________________________________________________________________________________________________________________________________________________________________________________________________________________________________________________________________ __________________________________________________________________________________________________________________________________________________________________________________________________________________________________________________________________________________________________________________________________________________________________________________________________________________________________________________________________________________________________________________________________________________________________________________________________________________________________________________________________________________________
Kyudenko Corp. 246,159 7,950 Takara Bio Inc. 293,612 7,890 Nitto Boseki Co. Ltd. 176,653 7,796 * Fujikura Ltd. 1,687,536 7,784 NOK Corp. 721,719 7,762 Hokuhoku Financial Group Inc. 815,316 7,757 Heiwa Real Estate Co. Ltd. 214,196 7,751 Wacom Co. Ltd. 918,430 7,704 ^ Sapporo Holdings Ltd. 397,824 7,687 Takashimaya Co. Ltd. 892,174 7,678 Sankyo Co. Ltd. 283,404 7,668 ^ Yoshinoya Holdings Co. Ltd. 407,126 7,528 Toyobo Co. Ltd. 559,308 7,487 Maeda Corp. 840,900 7,484 NEC Networks & System Integration Corp. 431,279 7,457 TOKAI Holdings Corp. 749,040 7,453 Cosmo Energy Holdings Co. Ltd. 416,299 7,418 Milbon Co. Ltd. 115,925 7,386
28
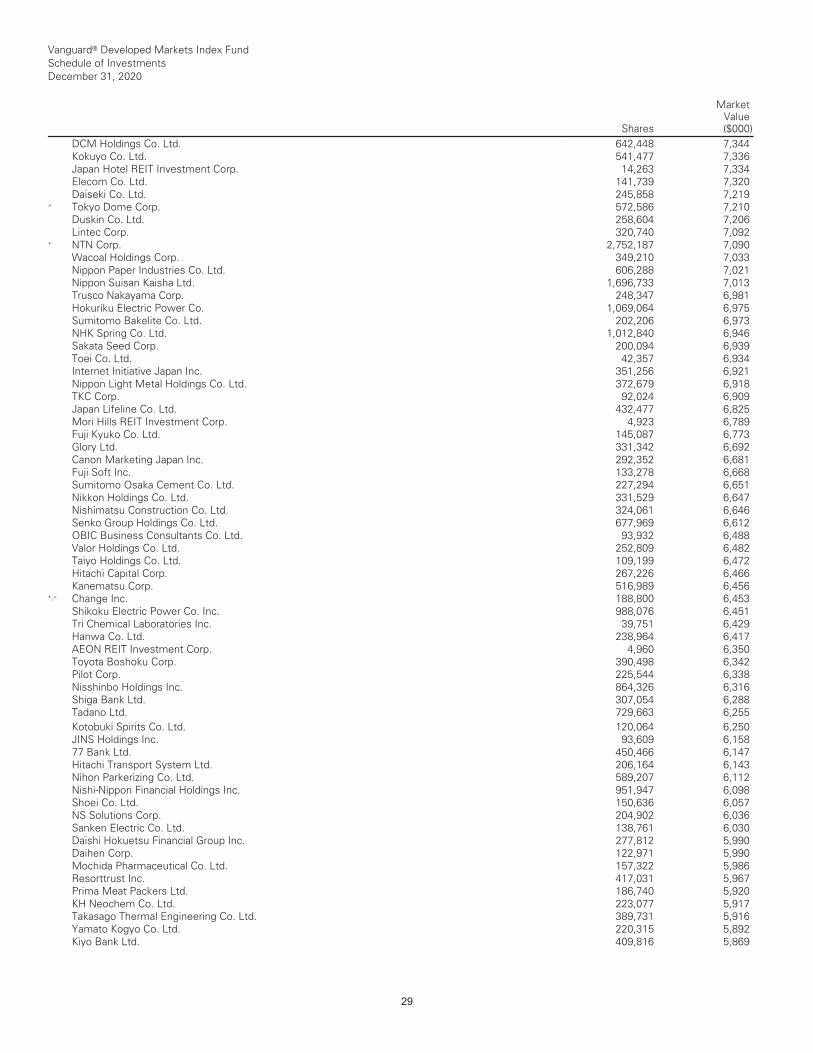
Vanguard® Developed Markets Index Fund Schedule of Investments December 31, 2020
Shares
MarketValue($000)
DCM Holdings Co. Ltd. 642,448 7,344 Kokuyo Co. Ltd. 541,477 7,336 Japan Hotel REIT Investment Corp. 14,263 7,334 Elecom Co. Ltd. 141,739 7,320 Daiseki Co. Ltd. 245,858 7,219 ^ Tokyo Dome Corp. 572,586 7,210 Duskin Co. Ltd. 258,604 7,206 Lintec Corp. 320,740 7,092 * NTN Corp. 2,752,187 7,090 Wacoal Holdings Corp. 349,210 7,033 Nippon Paper Industries Co. Ltd. 606,288 7,021 Nippon Suisan Kaisha Ltd. 1,696,733 7,013 Trusco Nakayama Corp. 248,347 6,981 Hokuriku Electric Power Co. 1,069,064 6,975 Sumitomo Bakelite Co. Ltd. 202,206 6,973 NHK Spring Co. Ltd. 1,012,840 6,946 Sakata Seed Corp. 200,094 6,939 Toei Co. Ltd. 42,357 6,934 Internet Initiative Japan Inc. 351,256 6,921 Nippon Light Metal Holdings Co. Ltd. 372,679 6,918 TKC Corp. 92,024 6,909 Japan Lifeline Co. Ltd. 432,477 6,825 Mori Hills REIT Investment Corp. 4,923 6,789 Fuji Kyuko Co. Ltd. 145,087 6,773 Glory Ltd. 331,342 6,692 Canon Marketing Japan Inc. 292,352 6,681 Fuji Soft Inc. 133,278 6,668 Sumitomo Osaka Cement Co. Ltd. 227,294 6,651 Nikkon Holdings Co. Ltd. 331,529 6,647 Nishimatsu Construction Co. Ltd. 324,061 6,646 Senko Group Holdings Co. Ltd. 677,969 6,612 OBIC Business Consultants Co. Ltd. 93,932 6,488 Valor Holdings Co. Ltd. 252,809 6,482 Taiyo Holdings Co. Ltd. 109,199 6,472 Hitachi Capital Corp. 267,226 6,466 Kanematsu Corp. 516,989 6,456 *,^ Change Inc. 188,800 6,453 Shikoku Electric Power Co. Inc. 988,076 6,451 Tri Chemical Laboratories Inc. 39,751 6,429 Hanwa Co. Ltd. 238,964 6,417 AEON REIT Investment Corp. 4,960 6,350 Toyota Boshoku Corp. 390,498 6,342 Pilot Corp. 225,544 6,338 Nisshinbo Holdings Inc. 864,326 6,316 Shiga Bank Ltd. 307,054 6,288 Tadano Ltd. 729,663 6,255 __________________________________________________________________________________________________________________________________________________________________________________________________________________________________________________________________________________________________________________________________________________________________________________________________________________________________________________________________________________________________________________________________________________________________________________________________________________________________________________________________________________________ __________________________________________________________________________________________________________________________________________________________________________________________________________________________________________________________________________________________________________________________________________________________________________________________________________________________________________________________________________________________________________________________________________________________________________________________________________________________________________________________________________________________
Kotobuki Spirits Co. Ltd. 120,064 6,250 JINS Holdings Inc. 93,609 6,158 77 Bank Ltd. 450,466 6,147 Hitachi Transport System Ltd. 206,164 6,143 Nihon Parkerizing Co. Ltd. 589,207 6,112 Nishi-Nippon Financial Holdings Inc. 951,947 6,098 Shoei Co. Ltd. 150,636 6,057 NS Solutions Corp. 204,902 6,036 Sanken Electric Co. Ltd. 138,761 6,030 Daishi Hokuetsu Financial Group Inc. 277,812 5,990 Daihen Corp. 122,971 5,990 Mochida Pharmaceutical Co. Ltd. 157,322 5,986 Resorttrust Inc. 417,031 5,967 Prima Meat Packers Ltd. 186,740 5,920 KH Neochem Co. Ltd. 223,077 5,917 Takasago Thermal Engineering Co. Ltd. 389,731 5,916 Yamato Kogyo Co. Ltd. 220,315 5,892 Kiyo Bank Ltd. 409,816 5,869
29

Vanguard® Developed Markets Index Fund Schedule of Investments December 31, 2020
Shares
MarketValue($000)
Paramount Bed Holdings Co. Ltd. 128,514 5,868 Toho Holdings Co. Ltd. 332,303 5,842 Macnica Fuji Electronics Holdings Inc. 296,898 5,840 en-japan Inc. 193,500 5,813 Maruwa Co. Ltd. 51,144 5,752 Okumura Corp. 231,180 5,721 Kyoritsu Maintenance Co. Ltd. 153,251 5,715 Hitachi Zosen Corp. 1,030,738 5,701 Digital Arts Inc. 61,624 5,682 ^ Colowide Co. Ltd. 356,835 5,653 Kansai Mirai Financial Group Inc. 1,165,153 5,647 Frontier Real Estate Investment Corp. 1,455 5,634 Megmilk Snow Brand Co. Ltd. 262,216 5,609 Comforia Residential REIT Inc. 1,946 5,607 Kandenko Co. Ltd. 661,668 5,605 Meidensha Corp. 248,529 5,604 Kumagai Gumi Co. Ltd. 221,698 5,590 Nojima Corp. 203,614 5,585 Iriso Electronics Co. Ltd. 128,877 5,578 Joyful Honda Co. Ltd. 389,085 5,577 Nichiha Corp. 176,714 5,572 Daiwa Securities Living Investments Corp. 5,982 5,553 EDION Corp. 545,623 5,548 Daiwa Office Investment Corp. 871 5,537 Kumiai Chemical Industry Co. Ltd. 612,799 5,524 Toshiba TEC Corp. 152,301 5,502 Hulic Reit Inc. 3,684 5,500 Central Glass Co. Ltd. 251,961 5,494 Kenedix Residential Next Investment Corp. 2,985 5,485 Itoham Yonekyu Holdings Inc. 837,088 5,464 * UT Group Co. Ltd. 175,300 5,457 Tsubakimoto Chain Co. 207,098 5,446 Sangetsu Corp. 361,220 5,436 Mitsui High-Tec Inc. 143,943 5,415 ^ Maruwa Unyu Kikan Co. Ltd. 249,864 5,333 Starts Corp. Inc. 191,440 5,326 Anicom Holdings Inc. 509,196 5,321 Kintetsu World Express Inc. 221,972 5,272 Tokai Rika Co. Ltd. 309,887 5,245 Awa Bank Ltd. 229,755 5,213 Create SD Holdings Co. Ltd. 138,337 5,193 DTS Corp. 251,734 5,192 Matsui Securities Co. Ltd. 659,250 5,178 JCU Corp. 133,781 5,161 Takeuchi Manufacturing Co. Ltd. 218,497 5,160 Earth Corp. 91,391 5,155 __________________________________________________________________________________________________________________________________________________________________________________________________________________________________________________________________________________________________________________________________________________________________________________________________________________________________________________________________________________________________________________________________________________________________________________________________________________________________________________________________________________________ __________________________________________________________________________________________________________________________________________________________________________________________________________________________________________________________________________________________________________________________________________________________________________________________________________________________________________________________________________________________________________________________________________________________________________________________________________________________________________________________________________________________
Ichibanya Co. Ltd. 103,172 5,155 Autobacs Seven Co. Ltd. 371,157 5,143 Raito Kogyo Co. Ltd. 291,744 5,133 Fuji Seal International Inc. 262,030 5,127 GungHo Online Entertainment Inc. 225,760 5,055 Tomy Co. Ltd. 572,497 5,053 Invincible Investment Corp. 15,585 5,017 Maruha Nichiro Corp. 231,984 4,995 Premier Investment Corp. 4,036 4,993 Arcs Co. Ltd. 221,419 4,989 Japan Material Co. Ltd. 362,290 4,979 Ogaki Kyoritsu Bank Ltd. 244,269 4,967 ^ NIPPON REIT Investment Corp. 1,380 4,965 Kohnan Shoji Co. Ltd. 158,494 4,938 Nichicon Corp. 387,675 4,912 Komeri Co. Ltd. 173,713 4,911 Japan Excellent Inc. 3,959 4,911 Sanrio Co. Ltd. 357,456 4,893
30

Vanguard® Developed Markets Index Fund Schedule of Investments December 31, 2020
Shares
MarketValue($000)
Zojirushi Corp. 273,177 4,888 Nippon Soda Co. Ltd. 163,622 4,867 Nippon Flour Mills Co. Ltd. 311,504 4,865 ASKUL Corp. 130,059 4,853 MCUBS MidCity Investment Corp 5,285 4,819 Taikisha Ltd. 183,418 4,818 Mitsubishi Logisnext Co. Ltd. 416,391 4,787 Citizen Watch Co. Ltd. 1,667,761 4,762 Funai Soken Holdings Inc. 194,432 4,758 San-A Co. Ltd. 112,483 4,757 Fujimi Inc. 124,942 4,745 Prestige International Inc. 535,328 4,737 Totetsu Kogyo Co. Ltd. 177,737 4,704 Nachi-Fujikoshi Corp. 112,985 4,696 Makino Milling Machine Co. Ltd. 129,140 4,674 Heiwa Corp. 338,479 4,670 Oki Electric Industry Co. Ltd. 524,953 4,642 Toyo Ink SC Holdings Co. Ltd. 242,033 4,635 Kato Sangyo Co. Ltd. 136,234 4,618 San-In Godo Bank Ltd. 966,303 4,616 Nippon Densetsu Kogyo Co. Ltd. 223,107 4,615 Atom Corp. 542,225 4,576 Okamura Corp. 510,909 4,575 MOS Food Services Inc. 161,540 4,569 Ai Holdings Corp. 224,885 4,533 Nagaileben Co. Ltd. 158,356 4,531 Information Services International-Dentsu Ltd. 149,130 4,518 Tocalo Co. Ltd. 328,616 4,515 KYORIN Holdings Inc. 239,839 4,514 Takara Standard Co. Ltd. 306,721 4,513 Showa Sangyo Co. Ltd. 152,284 4,492 Solasto Corp. 289,371 4,485 Japan Aviation Electronics Industry Ltd. 291,813 4,479 Saibu Gas Co. Ltd. 148,432 4,473 * Aiful Corp. 1,859,344 4,471 Fujimori Kogyo Co. Ltd. 96,330 4,457 * M&A Capital Partners Co. Ltd. 77,678 4,454 Tokyu REIT Inc. 2,805 4,451 Mitsubishi Estate Logistics REIT Investment Corp. 1,065 4,443 Strike Co. Ltd. 89,032 4,428 Fuso Chemical Co. Ltd. 122,637 4,422 Hogy Medical Co. Ltd. 135,875 4,422 ZERIA Pharmaceutical Co. Ltd. 239,771 4,421 Musashi Seimitsu Industry Co. Ltd. 277,812 4,419 Shibuya Corp. 128,351 4,407 * Grace Technology Inc. 65,673 4,406 __________________________________________________________________________________________________________________________________________________________________________________________________________________________________________________________________________________________________________________________________________________________________________________________________________________________________________________________________________________________________________________________________________________________________________________________________________________________________________________________________________________________ __________________________________________________________________________________________________________________________________________________________________________________________________________________________________________________________________________________________________________________________________________________________________________________________________________________________________________________________________________________________________________________________________________________________________________________________________________________________________________________________________________________________
Axial Retailing Inc. 90,137 4,390 Tsugami Corp. 289,384 4,383 Sumitomo Warehouse Co. Ltd. 339,012 4,343 Eizo Corp. 122,967 4,340 eGuarantee Inc. 198,800 4,333 Tokyotokeiba Co. Ltd. 95,243 4,323 MCJ Co. Ltd. 401,448 4,315 Morita Holdings Corp. 253,322 4,310 Nisshin Oillio Group Ltd. 145,639 4,286 Noevir Holdings Co. Ltd. 96,417 4,273 Life Corp. 123,501 4,265 eRex Co. Ltd. 210,992 4,254 Yamazen Corp. 424,223 4,251 Seiren Co. Ltd. 279,976 4,240 Topre Corp. 275,146 4,222 Nishimatsuya Chain Co. Ltd. 293,556 4,216 Kissei Pharmaceutical Co. Ltd. 193,470 4,201 Transcosmos Inc. 165,891 4,195
31

Vanguard® Developed Markets Index Fund Schedule of Investments December 31, 2020
Shares
MarketValue($000)
Infocom Corp. 127,575 4,191 Kenedix Retail REIT Corp. 1,712 4,178 Yokogawa Bridge Holdings Corp. 196,521 4,159 Hokkaido Electric Power Co. Inc. 1,138,820 4,152 * Descente Ltd. 239,437 4,139 ^ Keihanshin Building Co. Ltd. 227,749 4,112 Kameda Seika Co. Ltd. 86,796 4,075 Tokai Tokyo Financial Holdings Inc. 1,375,916 4,072 Heiwado Co. Ltd. 189,399 4,070 Mori Trust Sogo Reit Inc. 3,154 4,068 Invesco Office J-Reit Inc. 27,713 4,068 Orient Corp. 3,611,944 4,064 Monex Group Inc. 1,084,086 4,063 Juroku Bank Ltd. 222,868 4,059 Sumitomo Mitsui Construction Co. Ltd. 966,068 4,014 Nomura Co. Ltd. 483,380 3,999 Dexerials Corp. 305,258 3,997 Hirata Corp. 53,202 3,988 Eiken Chemical Co. Ltd. 199,891 3,985 Sanki Engineering Co. Ltd. 338,406 3,982 Suruga Bank Ltd. 1,194,419 3,922 Kanamoto Co. Ltd. 181,931 3,912 Ohsho Food Service Corp. 69,528 3,904 Comture Corp. 137,300 3,888 SKY Perfect JSAT Holdings Inc. 789,003 3,887 BML Inc. 124,881 3,881 United Super Markets Holdings Inc. 353,989 3,874 TBS Holdings Inc. 219,779 3,865 S Foods Inc. 117,776 3,845 Hyakugo Bank Ltd. 1,327,352 3,839 Rorze Corp. 59,010 3,825 Ichigo Inc. 1,266,709 3,816 FCC Co. Ltd. 219,560 3,801 Japan Wool Textile Co. Ltd. 392,337 3,798 ^ Cybozu Inc. 151,766 3,794 Hokkoku Bank Ltd. 149,252 3,791 Okinawa Electric Power Co. Inc. 279,787 3,763 Kura Sushi Inc. 61,725 3,750 San-Ai Oil Co. Ltd. 345,419 3,748 Mandom Corp. 227,101 3,741 Inabata & Co. Ltd. 267,033 3,737 Token Corp. 47,000 3,728 Optex Group Co. Ltd. 203,501 3,726 Arata Corp. 78,378 3,725 Yokowo Co. Ltd. 123,730 3,724 Daibiru Corp. 293,813 3,723 __________________________________________________________________________________________________________________________________________________________________________________________________________________________________________________________________________________________________________________________________________________________________________________________________________________________________________________________________________________________________________________________________________________________________________________________________________________________________________________________________________________________ __________________________________________________________________________________________________________________________________________________________________________________________________________________________________________________________________________________________________________________________________________________________________________________________________________________________________________________________________________________________________________________________________________________________________________________________________________________________________________________________________________________________
Aruhi Corp. 211,613 3,718 Toridoll Holdings Corp. 276,902 3,716 Mitsubishi Pencil Co. Ltd. 277,696 3,706 Okasan Securities Group Inc. 1,017,062 3,700 North Pacific Bank Ltd. 1,746,766 3,696 Giken Ltd. 88,532 3,663 Nikkiso Co. Ltd. 375,146 3,655 Sekisui Jushi Corp. 172,520 3,648 KOMEDA Holdings Co. Ltd. 201,616 3,647 Mitsuuroko Group Holdings Co. Ltd. 279,659 3,618 Daiho Corp. 102,388 3,615 Monogatari Corp. 29,587 3,605 H2O Retailing Corp. 531,851 3,605 Maeda Road Construction Co. Ltd. 214,126 3,592 Shizuoka Gas Co. Ltd. 357,806 3,588 Maeda Kosen Co. Ltd. 136,228 3,582 Bank of Okinawa Ltd. 134,751 3,580 Nissha Co. Ltd. 245,193 3,564
32
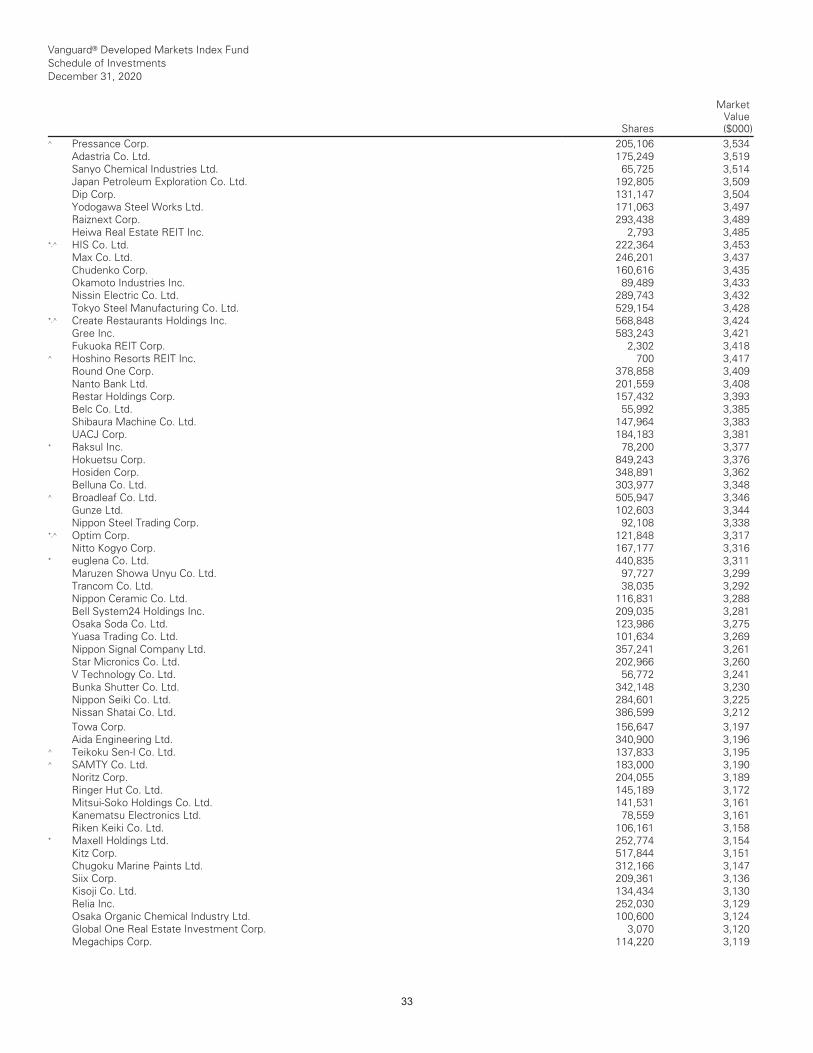
Vanguard® Developed Markets Index Fund Schedule of Investments December 31, 2020
Shares
MarketValue($000)
^ Pressance Corp. 205,106 3,534 Adastria Co. Ltd. 175,249 3,519 Sanyo Chemical Industries Ltd. 65,725 3,514 Japan Petroleum Exploration Co. Ltd. 192,805 3,509 Dip Corp. 131,147 3,504 Yodogawa Steel Works Ltd. 171,063 3,497 Raiznext Corp. 293,438 3,489 Heiwa Real Estate REIT Inc. 2,793 3,485 *,^ HIS Co. Ltd. 222,364 3,453 Max Co. Ltd. 246,201 3,437 Chudenko Corp. 160,616 3,435 Okamoto Industries Inc. 89,489 3,433 Nissin Electric Co. Ltd. 289,743 3,432 Tokyo Steel Manufacturing Co. Ltd. 529,154 3,428 *,^ Create Restaurants Holdings Inc. 568,848 3,424 Gree Inc. 583,243 3,421 Fukuoka REIT Corp. 2,302 3,418 ^ Hoshino Resorts REIT Inc. 700 3,417 Round One Corp. 378,858 3,409 Nanto Bank Ltd. 201,559 3,408 Restar Holdings Corp. 157,432 3,393 Belc Co. Ltd. 55,992 3,385 Shibaura Machine Co. Ltd. 147,964 3,383 UACJ Corp. 184,183 3,381 * Raksul Inc. 78,200 3,377 Hokuetsu Corp. 849,243 3,376 Hosiden Corp. 348,891 3,362 Belluna Co. Ltd. 303,977 3,348 ^ Broadleaf Co. Ltd. 505,947 3,346 Gunze Ltd. 102,603 3,344 Nippon Steel Trading Corp. 92,108 3,338 *,^ Optim Corp. 121,848 3,317 Nitto Kogyo Corp. 167,177 3,316 * euglena Co. Ltd. 440,835 3,311 Maruzen Showa Unyu Co. Ltd. 97,727 3,299 Trancom Co. Ltd. 38,035 3,292 Nippon Ceramic Co. Ltd. 116,831 3,288 Bell System24 Holdings Inc. 209,035 3,281 Osaka Soda Co. Ltd. 123,986 3,275 Yuasa Trading Co. Ltd. 101,634 3,269 Nippon Signal Company Ltd. 357,241 3,261 Star Micronics Co. Ltd. 202,966 3,260 V Technology Co. Ltd. 56,772 3,241 Bunka Shutter Co. Ltd. 342,148 3,230 Nippon Seiki Co. Ltd. 284,601 3,225 Nissan Shatai Co. Ltd. 386,599 3,212 __________________________________________________________________________________________________________________________________________________________________________________________________________________________________________________________________________________________________________________________________________________________________________________________________________________________________________________________________________________________________________________________________________________________________________________________________________________________________________________________________________________________ __________________________________________________________________________________________________________________________________________________________________________________________________________________________________________________________________________________________________________________________________________________________________________________________________________________________________________________________________________________________________________________________________________________________________________________________________________________________________________________________________________________________
Towa Corp. 156,647 3,197 Aida Engineering Ltd. 340,900 3,196 ^ Teikoku Sen-I Co. Ltd. 137,833 3,195 ^ SAMTY Co. Ltd. 183,000 3,190 Noritz Corp. 204,055 3,189 Ringer Hut Co. Ltd. 145,189 3,172 Mitsui-Soko Holdings Co. Ltd. 141,531 3,161 Kanematsu Electronics Ltd. 78,559 3,161 Riken Keiki Co. Ltd. 106,161 3,158 * Maxell Holdings Ltd. 252,774 3,154 Kitz Corp. 517,844 3,151 Chugoku Marine Paints Ltd. 312,166 3,147 Siix Corp. 209,361 3,136 Kisoji Co. Ltd. 134,434 3,130 Relia Inc. 252,030 3,129 Osaka Organic Chemical Industry Ltd. 100,600 3,124 Global One Real Estate Investment Corp. 3,070 3,120 Megachips Corp. 114,220 3,119
33

Vanguard® Developed Markets Index Fund Schedule of Investments December 31, 2020
Shares
MarketValue($000)
Sato Holdings Corp. 143,552 3,103 YA-MAN Ltd. 170,677 3,096 Fuji Media Holdings Inc. 289,587 3,091 Yellow Hat Ltd. 189,364 3,084 Shima Seiki Manufacturing Ltd. 181,717 3,083 METAWATER Co. Ltd. 136,696 3,078 Noritsu Koki Co. Ltd. 129,963 3,068 Keiyo Bank Ltd. 758,037 3,068 TechMatrix Corp. 147,000 3,058 Joshin Denki Co. Ltd. 115,487 3,052 Towa Pharmaceutical Co. Ltd. 163,585 3,036 Sakata INX Corp. 267,995 3,012 Shinmaywa Industries Ltd. 350,939 3,009 Fukushima Galilei Co. Ltd. 69,160 3,006 ValueCommerce Co. Ltd. 96,800 3,002 Nohmi Bosai Ltd. 137,477 3,001 Musashino Bank Ltd. 205,140 2,978 Pacific Industrial Co. Ltd. 285,238 2,972 Tsukishima Kikai Co. Ltd. 219,262 2,962 Elan Corp. 201,600 2,932 Aeon Delight Co. Ltd. 112,120 2,921 Argo Graphics Inc. 93,000 2,918 COLOPL Inc. 294,066 2,912 *,^ Royal Holdings Co. Ltd. 163,034 2,910 ^ Nextage Co. Ltd. 226,298 2,905 Curves Holdings Co. Ltd. 386,189 2,890 Nissei ASB Machine Co. Ltd. 50,486 2,886 Itochu Enex Co. Ltd. 292,653 2,884 Sanyo Denki Co. Ltd. 53,402 2,877 Saizeriya Co. Ltd. 155,050 2,869 Nichi-iko Pharmaceutical Co. Ltd. 303,179 2,868 * KYB Corp. 124,899 2,862 ^ GMO GlobalSign Holdings KK 33,330 2,858 Daikyonishikawa Corp. 352,441 2,850 Idec Corp. 161,127 2,848 Japan Securities Finance Co. Ltd. 543,695 2,842 ^ Tsubaki Nakashima Co. Ltd. 257,970 2,812 Media Do Co. Ltd. 39,011 2,806 Jaccs Co. Ltd. 158,021 2,802 Oiles Corp. 177,902 2,798 Hamakyorex Co. Ltd. 98,344 2,797 DyDo Group Holdings Inc. 53,798 2,795 *,^ Chiyoda Corp. 1,013,634 2,787 Sakai Moving Service Co. Ltd. 55,008 2,783 Hiday Hidaka Corp. 165,209 2,779 T Hasegawa Co. Ltd. 131,915 2,777 __________________________________________________________________________________________________________________________________________________________________________________________________________________________________________________________________________________________________________________________________________________________________________________________________________________________________________________________________________________________________________________________________________________________________________________________________________________________________________________________________________________________ __________________________________________________________________________________________________________________________________________________________________________________________________________________________________________________________________________________________________________________________________________________________________________________________________________________________________________________________________________________________________________________________________________________________________________________________________________________________________________________________________________________________
Aomori Bank Ltd. 118,514 2,763 Inageya Co. Ltd. 156,132 2,758 ^ Shoei Foods Corp. 78,978 2,749 Wakita & Co. Ltd. 268,194 2,744 Daito Pharmaceutical Co. Ltd. 75,622 2,730 Ichigo Office REIT Investment Corp. 3,773 2,725 TOMONY Holdings Inc. 897,327 2,718 Ryosan Co. Ltd. 150,027 2,716 Miroku Jyoho Service Co. Ltd. 133,534 2,711 Nitta Corp. 125,180 2,708 Arcland Sakamoto Co. Ltd. 162,985 2,706 Kaga Electronics Co. Ltd. 116,480 2,699 Nippon Road Co. Ltd. 36,104 2,696 ^ Medical Data Vision Co. Ltd. 97,708 2,689 Zenrin Co. Ltd. 219,030 2,683 *,^ Nippon Sheet Glass Co. Ltd. 580,805 2,682 Obara Group Inc. 70,117 2,676 Konishi Co. Ltd. 164,775 2,675
34
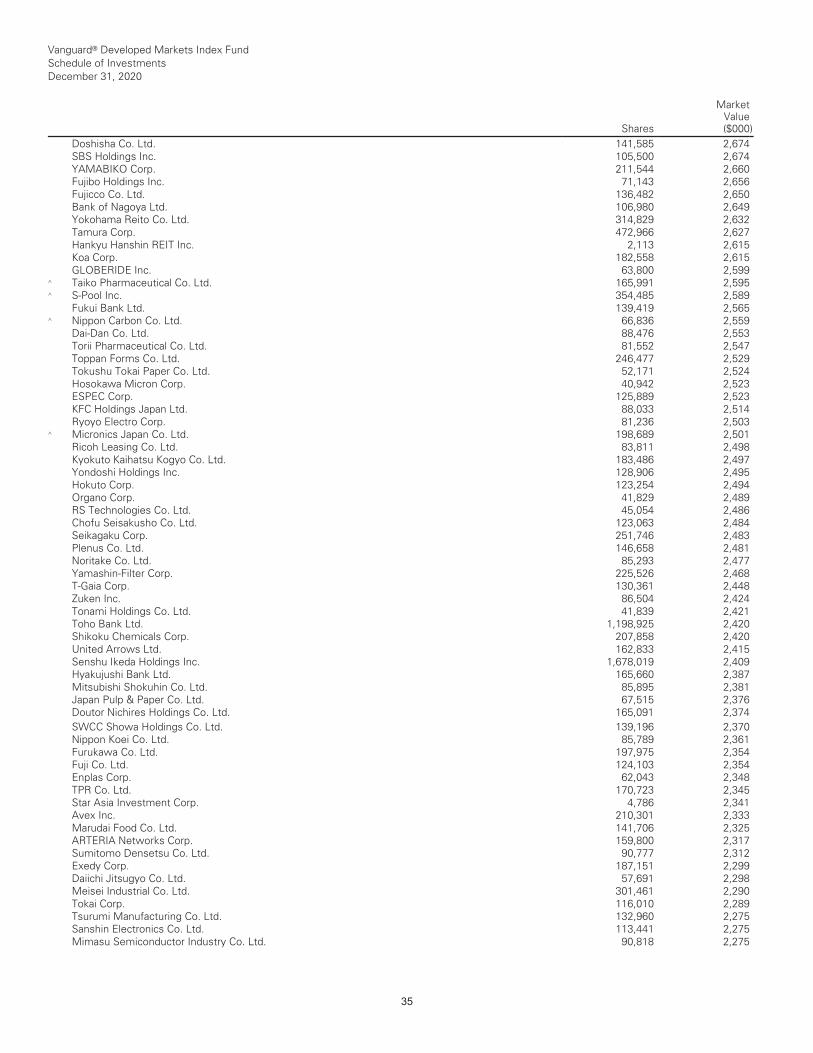
Vanguard® Developed Markets Index Fund Schedule of Investments December 31, 2020
Shares
MarketValue($000)
Doshisha Co. Ltd. 141,585 2,674 SBS Holdings Inc. 105,500 2,674 YAMABIKO Corp. 211,544 2,660 Fujibo Holdings Inc. 71,143 2,656 Fujicco Co. Ltd. 136,482 2,650 Bank of Nagoya Ltd. 106,980 2,649 Yokohama Reito Co. Ltd. 314,829 2,632 Tamura Corp. 472,966 2,627 Hankyu Hanshin REIT Inc. 2,113 2,615 Koa Corp. 182,558 2,615 GLOBERIDE Inc. 63,800 2,599 ^ Taiko Pharmaceutical Co. Ltd. 165,991 2,595 ^ S-Pool Inc. 354,485 2,589 Fukui Bank Ltd. 139,419 2,565 ^ Nippon Carbon Co. Ltd. 66,836 2,559 Dai-Dan Co. Ltd. 88,476 2,553 Torii Pharmaceutical Co. Ltd. 81,552 2,547 Toppan Forms Co. Ltd. 246,477 2,529 Tokushu Tokai Paper Co. Ltd. 52,171 2,524 Hosokawa Micron Corp. 40,942 2,523 ESPEC Corp. 125,889 2,523 KFC Holdings Japan Ltd. 88,033 2,514 Ryoyo Electro Corp. 81,236 2,503 ^ Micronics Japan Co. Ltd. 198,689 2,501 Ricoh Leasing Co. Ltd. 83,811 2,498 Kyokuto Kaihatsu Kogyo Co. Ltd. 183,486 2,497 Yondoshi Holdings Inc. 128,906 2,495 Hokuto Corp. 123,254 2,494 Organo Corp. 41,829 2,489 RS Technologies Co. Ltd. 45,054 2,486 Chofu Seisakusho Co. Ltd. 123,063 2,484 Seikagaku Corp. 251,746 2,483 Plenus Co. Ltd. 146,658 2,481 Noritake Co. Ltd. 85,293 2,477 Yamashin-Filter Corp. 225,526 2,468 T-Gaia Corp. 130,361 2,448 Zuken Inc. 86,504 2,424 Tonami Holdings Co. Ltd. 41,839 2,421 Toho Bank Ltd. 1,198,925 2,420 Shikoku Chemicals Corp. 207,858 2,420 United Arrows Ltd. 162,833 2,415 Senshu Ikeda Holdings Inc. 1,678,019 2,409 Hyakujushi Bank Ltd. 165,660 2,387 Mitsubishi Shokuhin Co. Ltd. 85,895 2,381 Japan Pulp & Paper Co. Ltd. 67,515 2,376 Doutor Nichires Holdings Co. Ltd. 165,091 2,374 __________________________________________________________________________________________________________________________________________________________________________________________________________________________________________________________________________________________________________________________________________________________________________________________________________________________________________________________________________________________________________________________________________________________________________________________________________________________________________________________________________________________ __________________________________________________________________________________________________________________________________________________________________________________________________________________________________________________________________________________________________________________________________________________________________________________________________________________________________________________________________________________________________________________________________________________________________________________________________________________________________________________________________________________________
SWCC Showa Holdings Co. Ltd. 139,196 2,370 Nippon Koei Co. Ltd. 85,789 2,361 Furukawa Co. Ltd. 197,975 2,354 Fuji Co. Ltd. 124,103 2,354 Enplas Corp. 62,043 2,348 TPR Co. Ltd. 170,723 2,345 Star Asia Investment Corp. 4,786 2,341 Avex Inc. 210,301 2,333 Marudai Food Co. Ltd. 141,706 2,325 ARTERIA Networks Corp. 159,800 2,317 Sumitomo Densetsu Co. Ltd. 90,777 2,312 Exedy Corp. 187,151 2,299 Daiichi Jitsugyo Co. Ltd. 57,691 2,298 Meisei Industrial Co. Ltd. 301,461 2,290 Tokai Corp. 116,010 2,289 Tsurumi Manufacturing Co. Ltd. 132,960 2,275 Sanshin Electronics Co. Ltd. 113,441 2,275 Mimasu Semiconductor Industry Co. Ltd. 90,818 2,275
35
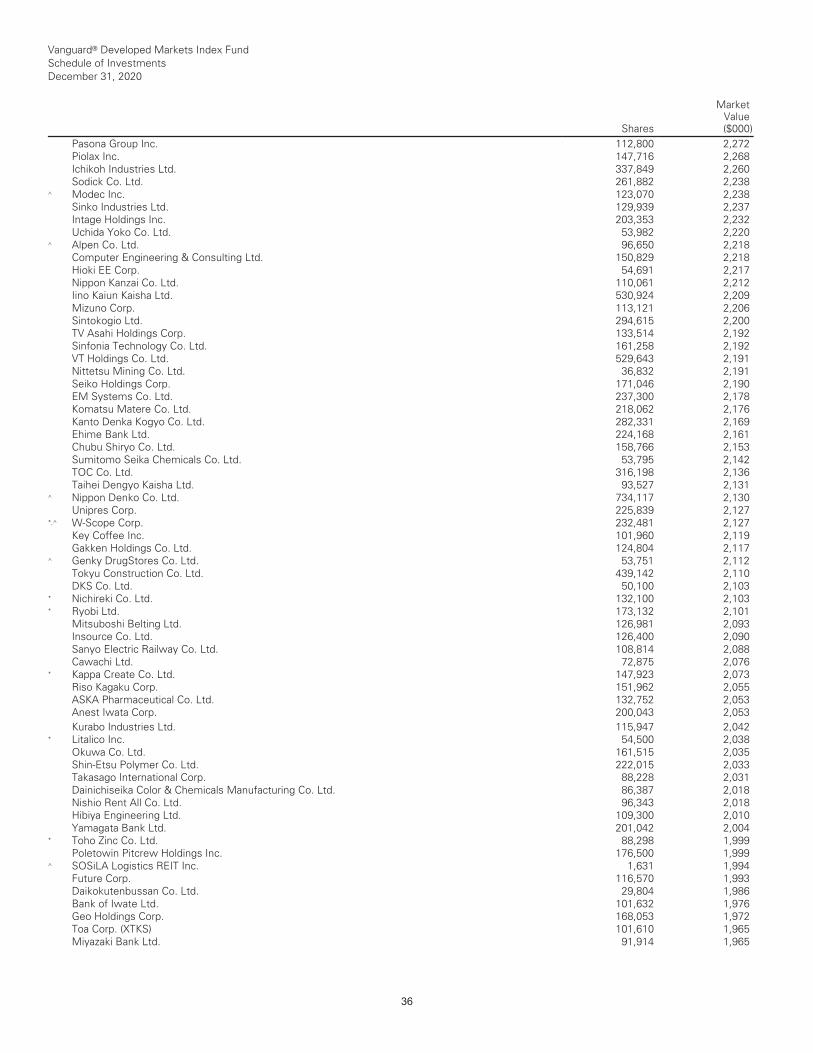
Vanguard® Developed Markets Index Fund Schedule of Investments December 31, 2020
Shares
MarketValue($000)
Pasona Group Inc. 112,800 2,272 Piolax Inc. 147,716 2,268 Ichikoh Industries Ltd. 337,849 2,260 Sodick Co. Ltd. 261,882 2,238 ^ Modec Inc. 123,070 2,238 Sinko Industries Ltd. 129,939 2,237 Intage Holdings Inc. 203,353 2,232 Uchida Yoko Co. Ltd. 53,982 2,220 ^ Alpen Co. Ltd. 96,650 2,218 Computer Engineering & Consulting Ltd. 150,829 2,218 Hioki EE Corp. 54,691 2,217 Nippon Kanzai Co. Ltd. 110,061 2,212 Iino Kaiun Kaisha Ltd. 530,924 2,209 Mizuno Corp. 113,121 2,206 Sintokogio Ltd. 294,615 2,200 TV Asahi Holdings Corp. 133,514 2,192 Sinfonia Technology Co. Ltd. 161,258 2,192 VT Holdings Co. Ltd. 529,643 2,191 Nittetsu Mining Co. Ltd. 36,832 2,191 Seiko Holdings Corp. 171,046 2,190 EM Systems Co. Ltd. 237,300 2,178 Komatsu Matere Co. Ltd. 218,062 2,176 Kanto Denka Kogyo Co. Ltd. 282,331 2,169 Ehime Bank Ltd. 224,168 2,161 Chubu Shiryo Co. Ltd. 158,766 2,153 Sumitomo Seika Chemicals Co. Ltd. 53,795 2,142 TOC Co. Ltd. 316,198 2,136 Taihei Dengyo Kaisha Ltd. 93,527 2,131 ^ Nippon Denko Co. Ltd. 734,117 2,130 Unipres Corp. 225,839 2,127 *,^ W-Scope Corp. 232,481 2,127 Key Coffee Inc. 101,960 2,119 Gakken Holdings Co. Ltd. 124,804 2,117 ^ Genky DrugStores Co. Ltd. 53,751 2,112 Tokyu Construction Co. Ltd. 439,142 2,110 DKS Co. Ltd. 50,100 2,103 * Nichireki Co. Ltd. 132,100 2,103 * Ryobi Ltd. 173,132 2,101 Mitsuboshi Belting Ltd. 126,981 2,093 Insource Co. Ltd. 126,400 2,090 Sanyo Electric Railway Co. Ltd. 108,814 2,088 Cawachi Ltd. 72,875 2,076 * Kappa Create Co. Ltd. 147,923 2,073 Riso Kagaku Corp. 151,962 2,055 ASKA Pharmaceutical Co. Ltd. 132,752 2,053 Anest Iwata Corp. 200,043 2,053 __________________________________________________________________________________________________________________________________________________________________________________________________________________________________________________________________________________________________________________________________________________________________________________________________________________________________________________________________________________________________________________________________________________________________________________________________________________________________________________________________________________________ __________________________________________________________________________________________________________________________________________________________________________________________________________________________________________________________________________________________________________________________________________________________________________________________________________________________________________________________________________________________________________________________________________________________________________________________________________________________________________________________________________________________
Kurabo Industries Ltd. 115,947 2,042 * Litalico Inc. 54,500 2,038 Okuwa Co. Ltd. 161,515 2,035 Shin-Etsu Polymer Co. Ltd. 222,015 2,033 Takasago International Corp. 88,228 2,031 Dainichiseika Color & Chemicals Manufacturing Co. Ltd. 86,387 2,018 Nishio Rent All Co. Ltd. 96,343 2,018 Hibiya Engineering Ltd. 109,300 2,010 Yamagata Bank Ltd. 201,042 2,004 * Toho Zinc Co. Ltd. 88,298 1,999 Poletowin Pitcrew Holdings Inc. 176,500 1,999 ^ SOSiLA Logistics REIT Inc. 1,631 1,994 Future Corp. 116,570 1,993 Daikokutenbussan Co. Ltd. 29,804 1,986 Bank of Iwate Ltd. 101,632 1,976 Geo Holdings Corp. 168,053 1,972 Toa Corp. (XTKS) 101,610 1,965 Miyazaki Bank Ltd. 91,914 1,965
36

Vanguard® Developed Markets Index Fund Schedule of Investments December 31, 2020
Shares
MarketValue($000)
* Nippon Chemi-Con Corp. 110,363 1,962 Starzen Co. Ltd. 47,766 1,960 Denyo Co. Ltd. 93,601 1,953 ^ Itochu Advance Logistics Investment Corp. 1,511 1,948 ^ Taki Chemical Co. Ltd. 30,700 1,942 Futaba Corp. 224,146 1,939 ^ Pack Corp. 70,453 1,931 SB Technology Corp. 57,000 1,930 Toyo Construction Co. Ltd. 453,042 1,929 J-Oil Mills Inc. 56,166 1,926 Komori Corp. 273,895 1,921 Tosei Corp. 167,300 1,920 JM Holdings Co. Ltd. 86,000 1,918 Weathernews Inc. 35,298 1,904 Okabe Co. Ltd. 253,614 1,904 Bank of the Ryukyus Ltd. 256,710 1,900 Tachi-S Co. Ltd. 166,746 1,899 EPS Holdings Inc. 200,443 1,898 Pacific Metals Co. Ltd. 87,521 1,896 Futaba Industrial Co. Ltd. 370,251 1,893 Stella Chemifa Corp. 58,511 1,884 FULLCAST Holdings Co. Ltd. 120,648 1,880 Keiyo Co. Ltd. 264,524 1,879 ^ Fujio Food Group Inc. 154,000 1,877 ^ Arcland Service Holdings Co. Ltd. 89,399 1,875 Aichi Steel Corp. 69,947 1,871 Yurtec Corp. 231,338 1,870 LEC Inc. 147,956 1,862 Sakai Chemical Industry Co. Ltd. 97,340 1,859 G-Tekt Corp. 126,680 1,848 DKK Co. Ltd. 70,966 1,844 * Sanyo Special Steel Co. Ltd. 147,898 1,840 CRE Logistics REIT Inc. 1,206 1,837 Ines Corp. 135,521 1,836 Union Tool Co. 61,015 1,832 Tachibana Eletech Co. Ltd. 112,500 1,829 Kyoei Steel Ltd. 131,658 1,828 Oita Bank Ltd. 92,424 1,825 Mirai Corp. 4,884 1,823 Takamatsu Construction Group Co. Ltd. 91,821 1,821 Alconix Corp. 128,406 1,820 Valqua Ltd. 91,328 1,820 Marvelous Inc. 211,097 1,812 I'll Inc. 118,800 1,805 Hoosiers Holdings 279,500 1,803 JAC Recruitment Co. Ltd. 97,548 1,793 __________________________________________________________________________________________________________________________________________________________________________________________________________________________________________________________________________________________________________________________________________________________________________________________________________________________________________________________________________________________________________________________________________________________________________________________________________________________________________________________________________________________ __________________________________________________________________________________________________________________________________________________________________________________________________________________________________________________________________________________________________________________________________________________________________________________________________________________________________________________________________________________________________________________________________________________________________________________________________________________________________________________________________________________________
Tenma Corp. 90,018 1,783 Rock Field Co. Ltd. 117,181 1,782 Hodogaya Chemical Co. Ltd. 36,115 1,781 Itochu-Shokuhin Co. Ltd. 33,190 1,771 Enigmo Inc. 147,700 1,770 *,^ Leopalace21 Corp. 1,495,441 1,769 San ju San Financial Group Inc. 144,753 1,769 Kintetsu Department Store Co. Ltd. 57,966 1,767 One REIT Inc. 695 1,767 Shin Nippon Air Technologies Co. Ltd. 81,200 1,767 Toyo Tanso Co. Ltd. 90,116 1,765 Konoike Transport Co. Ltd. 177,815 1,764 Tokyo Kiraboshi Financial Group Inc. 164,180 1,762 Nichiden Corp. 80,475 1,746 IDOM Inc. 327,281 1,740 Furuno Electric Co. Ltd. 147,635 1,739 Toenec Corp. 44,324 1,736 Halows Co. Ltd. 51,651 1,729
37
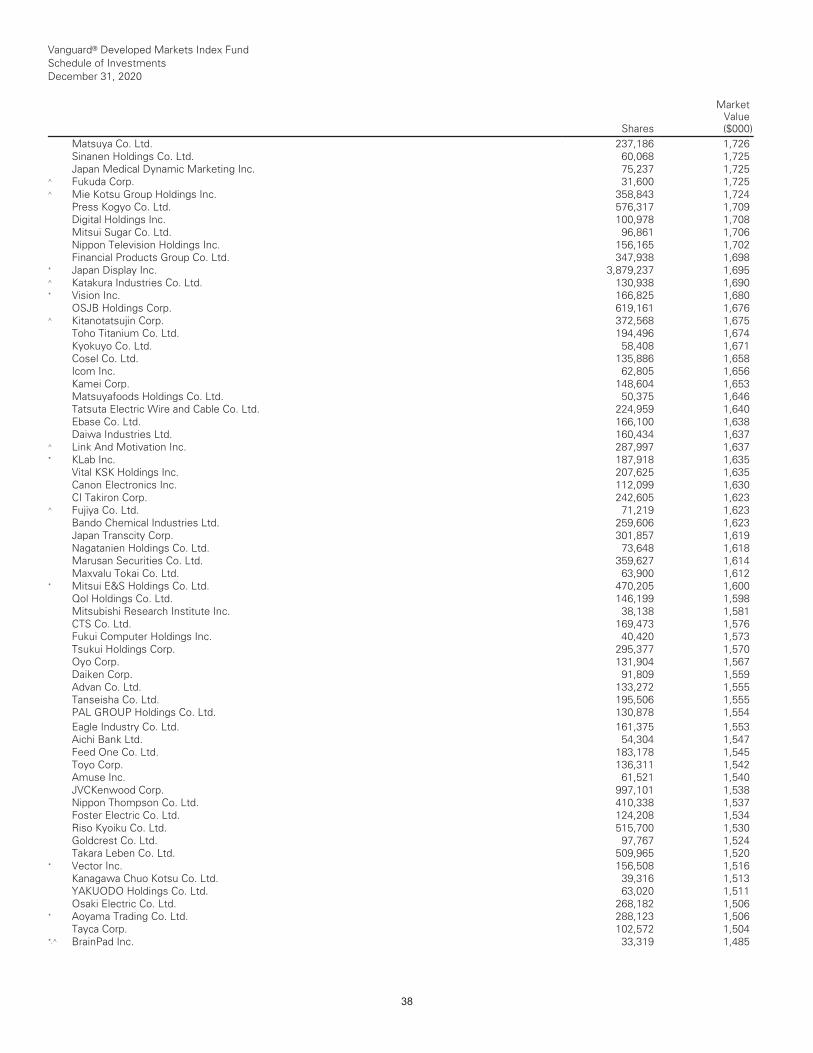
Vanguard® Developed Markets Index Fund Schedule of Investments December 31, 2020
Shares
MarketValue($000)
Matsuya Co. Ltd. 237,186 1,726 Sinanen Holdings Co. Ltd. 60,068 1,725 Japan Medical Dynamic Marketing Inc. 75,237 1,725 ^ Fukuda Corp. 31,600 1,725 ^ Mie Kotsu Group Holdings Inc. 358,843 1,724 Press Kogyo Co. Ltd. 576,317 1,709 Digital Holdings Inc. 100,978 1,708 Mitsui Sugar Co. Ltd. 96,861 1,706 Nippon Television Holdings Inc. 156,165 1,702 Financial Products Group Co. Ltd. 347,938 1,698 * Japan Display Inc. 3,879,237 1,695 ^ Katakura Industries Co. Ltd. 130,938 1,690 * Vision Inc. 166,825 1,680 OSJB Holdings Corp. 619,161 1,676 ^ Kitanotatsujin Corp. 372,568 1,675 Toho Titanium Co. Ltd. 194,496 1,674 Kyokuyo Co. Ltd. 58,408 1,671 Cosel Co. Ltd. 135,886 1,658 Icom Inc. 62,805 1,656 Kamei Corp. 148,604 1,653 Matsuyafoods Holdings Co. Ltd. 50,375 1,646 Tatsuta Electric Wire and Cable Co. Ltd. 224,959 1,640 Ebase Co. Ltd. 166,100 1,638 Daiwa Industries Ltd. 160,434 1,637 ^ Link And Motivation Inc. 287,997 1,637 * KLab Inc. 187,918 1,635 Vital KSK Holdings Inc. 207,625 1,635 Canon Electronics Inc. 112,099 1,630 CI Takiron Corp. 242,605 1,623 ^ Fujiya Co. Ltd. 71,219 1,623 Bando Chemical Industries Ltd. 259,606 1,623 Japan Transcity Corp. 301,857 1,619 Nagatanien Holdings Co. Ltd. 73,648 1,618 Marusan Securities Co. Ltd. 359,627 1,614 Maxvalu Tokai Co. Ltd. 63,900 1,612 * Mitsui E&S Holdings Co. Ltd. 470,205 1,600 Qol Holdings Co. Ltd. 146,199 1,598 Mitsubishi Research Institute Inc. 38,138 1,581 CTS Co. Ltd. 169,473 1,576 Fukui Computer Holdings Inc. 40,420 1,573 Tsukui Holdings Corp. 295,377 1,570 Oyo Corp. 131,904 1,567 Daiken Corp. 91,809 1,559 Advan Co. Ltd. 133,272 1,555 Tanseisha Co. Ltd. 195,506 1,555 PAL GROUP Holdings Co. Ltd. 130,878 1,554 __________________________________________________________________________________________________________________________________________________________________________________________________________________________________________________________________________________________________________________________________________________________________________________________________________________________________________________________________________________________________________________________________________________________________________________________________________________________________________________________________________________________ __________________________________________________________________________________________________________________________________________________________________________________________________________________________________________________________________________________________________________________________________________________________________________________________________________________________________________________________________________________________________________________________________________________________________________________________________________________________________________________________________________________________
Eagle Industry Co. Ltd. 161,375 1,553 Aichi Bank Ltd. 54,304 1,547 Feed One Co. Ltd. 183,178 1,545 Toyo Corp. 136,311 1,542 Amuse Inc. 61,521 1,540 JVCKenwood Corp. 997,101 1,538 Nippon Thompson Co. Ltd. 410,338 1,537 Foster Electric Co. Ltd. 124,208 1,534 Riso Kyoiku Co. Ltd. 515,700 1,530 Goldcrest Co. Ltd. 97,767 1,524 Takara Leben Co. Ltd. 509,965 1,520 * Vector Inc. 156,508 1,516 Kanagawa Chuo Kotsu Co. Ltd. 39,316 1,513 YAKUODO Holdings Co. Ltd. 63,020 1,511 Osaki Electric Co. Ltd. 268,182 1,506 * Aoyama Trading Co. Ltd. 288,123 1,506 Tayca Corp. 102,572 1,504 *,^ BrainPad Inc. 33,319 1,485
38

Vanguard® Developed Markets Index Fund Schedule of Investments December 31, 2020
Shares
MarketValue($000)
Rheon Automatic Machinery Co. Ltd. 120,861 1,479 Central Security Patrols Co. Ltd. 42,388 1,475 Macromill Inc. 226,171 1,471 Shikoku Bank Ltd. 222,890 1,470 Sun Frontier Fudousan Co. Ltd. 169,691 1,470 Kenko Mayonnaise Co. Ltd. 82,099 1,470 Tekken Corp. 82,587 1,466 CONEXIO Corp. 105,239 1,459 *,^ FDK Corp. 84,263 1,458 Nippon Yakin Kogyo Co. Ltd. 86,857 1,455 BeNEXT Group Inc. 117,050 1,452 Shinwa Co. Ltd. 69,629 1,447 Tosho Co. Ltd. 95,227 1,446 Shinko Shoji Co. Ltd. 198,182 1,441 Alpha Systems Inc. 42,323 1,435 ZIGExN Co. Ltd. 372,700 1,433 Yamanashi Chuo Bank Ltd. 191,338 1,429 Sparx Group Co. Ltd. 577,400 1,427 Onward Holdings Co. Ltd. 708,835 1,423 LIFULL Co. Ltd. 396,216 1,419 Moriroku Holdings Co. Ltd. 66,700 1,416 Proto Corp. 139,700 1,411 *,^ Sagami Holdings Corp. 121,561 1,411 Tamron Co. Ltd. 79,454 1,408 * Unitika Ltd. 367,900 1,408 Kamakura Shinsho Ltd. 126,600 1,405 Dai Nippon Toryo Co. Ltd. 150,009 1,399 Yonex Co. Ltd. 239,878 1,395 Koatsu Gas Kogyo Co. Ltd. 179,329 1,383 Daido Metal Co. Ltd. 278,997 1,382 Starts Proceed Investment Corp. 705 1,377 Kansai Super Market Ltd. 117,932 1,377 MTI Ltd. 172,309 1,374 Asahi Diamond Industrial Co. Ltd. 314,535 1,370 Ishihara Sangyo Kaisha Ltd. 225,768 1,368 Matsuda Sangyo Co. Ltd. 78,607 1,363 Akita Bank Ltd. 102,233 1,359 Sourcenext Corp. 500,000 1,359 Aichi Corp. 152,505 1,356 ST Corp. 71,324 1,353 ^ ES-Con Japan Ltd. 170,600 1,351 Happinet Corp. 88,793 1,350 Teikoku Electric Manufacturing Co. Ltd. 114,854 1,344 Chukyo Bank Ltd. 71,015 1,343 Shinnihon Corp. 166,590 1,340 * Iseki & Co. Ltd. 99,757 1,338 __________________________________________________________________________________________________________________________________________________________________________________________________________________________________________________________________________________________________________________________________________________________________________________________________________________________________________________________________________________________________________________________________________________________________________________________________________________________________________________________________________________________ __________________________________________________________________________________________________________________________________________________________________________________________________________________________________________________________________________________________________________________________________________________________________________________________________________________________________________________________________________________________________________________________________________________________________________________________________________________________________________________________________________________________
*,^ Roland DG Corp. 73,229 1,336 * Atrae Inc. 49,307 1,334 World Co. Ltd. 109,600 1,333 * Sumida Corp. 127,576 1,333 Kanaden Corp. 106,133 1,331 Nippon Parking Development Co. Ltd. 890,781 1,330 Akatsuki Inc. 32,841 1,319 Sumitomo Riko Co. Ltd. 223,579 1,318 Shibusawa Warehouse Co. Ltd. 58,691 1,313 Sankyo Tateyama Inc. 166,294 1,311 Shindengen Electric Manufacturing Co. Ltd. 52,478 1,306 ^ Rokko Butter Co. Ltd. 74,125 1,301 Kyodo Printing Co. Ltd. 46,176 1,295 Yahagi Construction Co. Ltd. 150,623 1,294 Riken Technos Corp. 295,700 1,294 ^ BRONCO BILLY Co. Ltd. 57,887 1,288 Nissin Sugar Co. Ltd. 71,800 1,285 Riken Vitamin Co. Ltd. 97,060 1,281
39
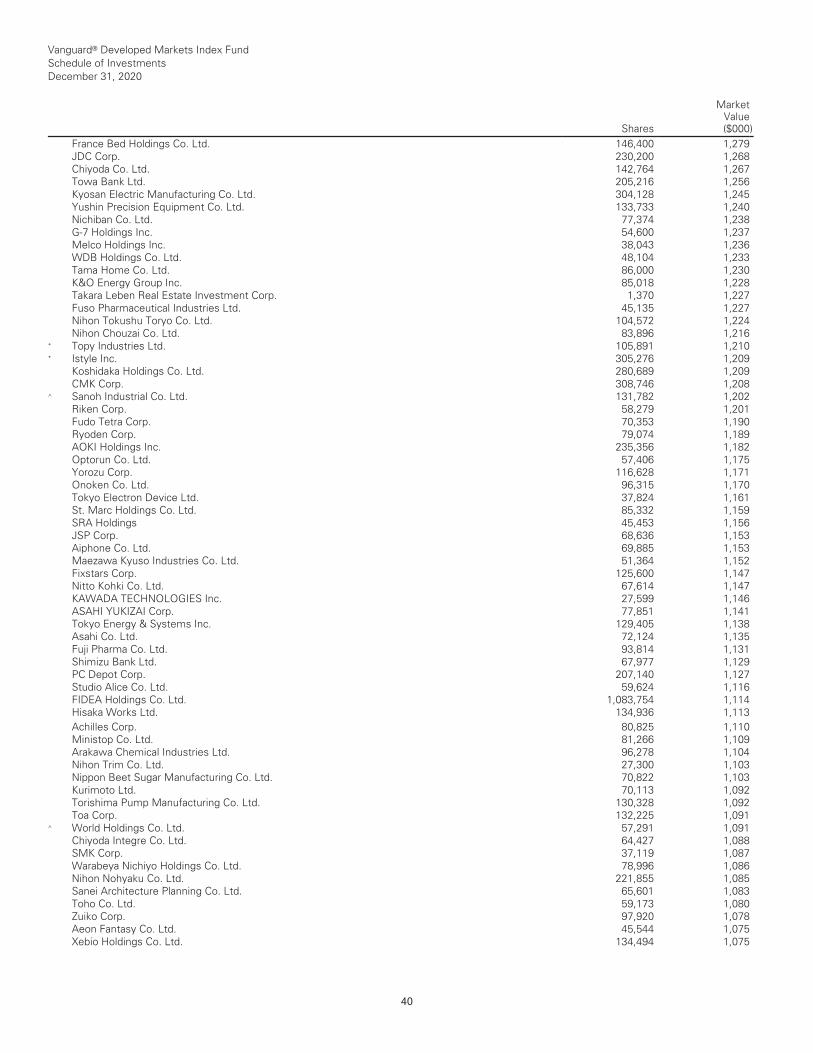
Vanguard® Developed Markets Index Fund Schedule of Investments December 31, 2020
Shares
MarketValue($000)
France Bed Holdings Co. Ltd. 146,400 1,279 JDC Corp. 230,200 1,268 Chiyoda Co. Ltd. 142,764 1,267 Towa Bank Ltd. 205,216 1,256 Kyosan Electric Manufacturing Co. Ltd. 304,128 1,245 Yushin Precision Equipment Co. Ltd. 133,733 1,240 Nichiban Co. Ltd. 77,374 1,238 G-7 Holdings Inc. 54,600 1,237 Melco Holdings Inc. 38,043 1,236 WDB Holdings Co. Ltd. 48,104 1,233 Tama Home Co. Ltd. 86,000 1,230 K&O Energy Group Inc. 85,018 1,228 Takara Leben Real Estate Investment Corp. 1,370 1,227 Fuso Pharmaceutical Industries Ltd. 45,135 1,227 Nihon Tokushu Toryo Co. Ltd. 104,572 1,224 Nihon Chouzai Co. Ltd. 83,896 1,216 * Topy Industries Ltd. 105,891 1,210 * Istyle Inc. 305,276 1,209 Koshidaka Holdings Co. Ltd. 280,689 1,209 CMK Corp. 308,746 1,208 ^ Sanoh Industrial Co. Ltd. 131,782 1,202 Riken Corp. 58,279 1,201 Fudo Tetra Corp. 70,353 1,190 Ryoden Corp. 79,074 1,189 AOKI Holdings Inc. 235,356 1,182 Optorun Co. Ltd. 57,406 1,175 Yorozu Corp. 116,628 1,171 Onoken Co. Ltd. 96,315 1,170 Tokyo Electron Device Ltd. 37,824 1,161 St. Marc Holdings Co. Ltd. 85,332 1,159 SRA Holdings 45,453 1,156 JSP Corp. 68,636 1,153 Aiphone Co. Ltd. 69,885 1,153 Maezawa Kyuso Industries Co. Ltd. 51,364 1,152 Fixstars Corp. 125,600 1,147 Nitto Kohki Co. Ltd. 67,614 1,147 KAWADA TECHNOLOGIES Inc. 27,599 1,146 ASAHI YUKIZAI Corp. 77,851 1,141 Tokyo Energy & Systems Inc. 129,405 1,138 Asahi Co. Ltd. 72,124 1,135 Fuji Pharma Co. Ltd. 93,814 1,131 Shimizu Bank Ltd. 67,977 1,129 PC Depot Corp. 207,140 1,127 Studio Alice Co. Ltd. 59,624 1,116 FIDEA Holdings Co. Ltd. 1,083,754 1,114 Hisaka Works Ltd. 134,936 1,113 __________________________________________________________________________________________________________________________________________________________________________________________________________________________________________________________________________________________________________________________________________________________________________________________________________________________________________________________________________________________________________________________________________________________________________________________________________________________________________________________________________________________ __________________________________________________________________________________________________________________________________________________________________________________________________________________________________________________________________________________________________________________________________________________________________________________________________________________________________________________________________________________________________________________________________________________________________________________________________________________________________________________________________________________________
Achilles Corp. 80,825 1,110 Ministop Co. Ltd. 81,266 1,109 Arakawa Chemical Industries Ltd. 96,278 1,104 Nihon Trim Co. Ltd. 27,300 1,103 Nippon Beet Sugar Manufacturing Co. Ltd. 70,822 1,103 Kurimoto Ltd. 70,113 1,092 Torishima Pump Manufacturing Co. Ltd. 130,328 1,092 Toa Corp. 132,225 1,091 ^ World Holdings Co. Ltd. 57,291 1,091 Chiyoda Integre Co. Ltd. 64,427 1,088 SMK Corp. 37,119 1,087 Warabeya Nichiyo Holdings Co. Ltd. 78,996 1,086 Nihon Nohyaku Co. Ltd. 221,855 1,085 Sanei Architecture Planning Co. Ltd. 65,601 1,083 Toho Co. Ltd. 59,173 1,080 Zuiko Corp. 97,920 1,078 Aeon Fantasy Co. Ltd. 45,544 1,075 Xebio Holdings Co. Ltd. 134,494 1,075
40

Vanguard® Developed Markets Index Fund Schedule of Investments December 31, 2020
Shares
MarketValue($000)
Taisei Lamick Co. Ltd. 36,117 1,074 Mori Trust Hotel Reit Inc. 958 1,070 Hochiki Corp. 86,424 1,069 ^ GCA Corp. 149,558 1,066 Godo Steel Ltd. 56,079 1,056 * Nippon Sharyo Ltd. 44,911 1,052 Hokkaido Gas Co. Ltd. 70,006 1,050 Wowow Inc. 38,033 1,045 Kojima Co. Ltd. 151,201 1,044 FAN Communications Inc. 256,471 1,043 *,^ Open Door Inc. 76,284 1,031 Samty Residential Investment Corp. 974 1,028 * RPA Holdings Inc. 164,847 1,025 Tochigi Bank Ltd. 609,057 1,017 Toyo Kanetsu KK 49,790 1,015 Honeys Holdings Co. Ltd. 99,406 1,011 Elematec Corp. 101,020 993 Takaoka Toko Co. Ltd. 62,022 993 Ohara Inc. 61,687 986 JP-Holdings Inc. 360,632 983 * OSAKA Titanium Technologies Co. Ltd. 118,003 981 * Mitsuba Corp. 221,871 979 Sankyo Seiko Co. Ltd. 208,137 968 Okura Industrial Co. Ltd. 52,159 966 J Trust Co. Ltd. 491,937 964 Tsutsumi Jewelry Co. Ltd. 46,523 964 ^ PIA Corp. 35,338 959 Bank of Saga Ltd. 75,153 959 Toa Oil Co. Ltd. 38,449 959 Neturen Co. Ltd. 208,665 955 Fujikura Kasei Co. Ltd. 179,478 955 Ichiyoshi Securities Co. Ltd. 209,794 949 Michinoku Bank Ltd. 97,413 947 Tomoku Co. Ltd. 57,094 946 Aisan Industry Co. Ltd. 202,476 942 Chori Co. Ltd. 61,953 941 I-PEX Inc. 48,835 937 ^ WATAMI Co. Ltd. 110,567 934 Kanamic Network Co. Ltd. 130,900 918 Tsukuba Bank Ltd. 509,982 915 Krosaki Harima Corp. 23,787 911 NS United Kaiun Kaisha Ltd. 67,215 909 * Juki Corp. 176,129 903 Hokkan Holdings Ltd. 66,103 898 Pronexus Inc. 87,917 895 TSI Holdings Co. Ltd. 447,405 894 __________________________________________________________________________________________________________________________________________________________________________________________________________________________________________________________________________________________________________________________________________________________________________________________________________________________________________________________________________________________________________________________________________________________________________________________________________________________________________________________________________________________ __________________________________________________________________________________________________________________________________________________________________________________________________________________________________________________________________________________________________________________________________________________________________________________________________________________________________________________________________________________________________________________________________________________________________________________________________________________________________________________________________________________________
Jimoto Holdings Inc. 111,715 893 Shimojima Co. Ltd. 63,984 893 Kyokuto Securities Co. Ltd. 132,842 889 Kita-Nippon Bank Ltd. 44,446 879 NEC Capital Solutions Ltd. 47,537 872 * Kourakuen Holdings Corp. 56,133 871 Tv Tokyo Holdings Corp. 38,913 869 Sekisui Kasei Co. Ltd. 168,360 866 Japan Best Rescue System Co. Ltd. 98,576 862 Hakuto Co. Ltd. 82,362 858 Gurunavi Inc. 167,564 851 * Heroz Inc. 32,700 844 CAC Holdings Corp. 60,680 838 * COOKPAD Inc. 274,525 829 Hito Communications Holdings Inc. 60,129 827 Shin Nippon Biomedical Laboratories Ltd. 124,229 814 Itoki Corp. 249,460 809 Corona Corp. Class A 89,691 809
41
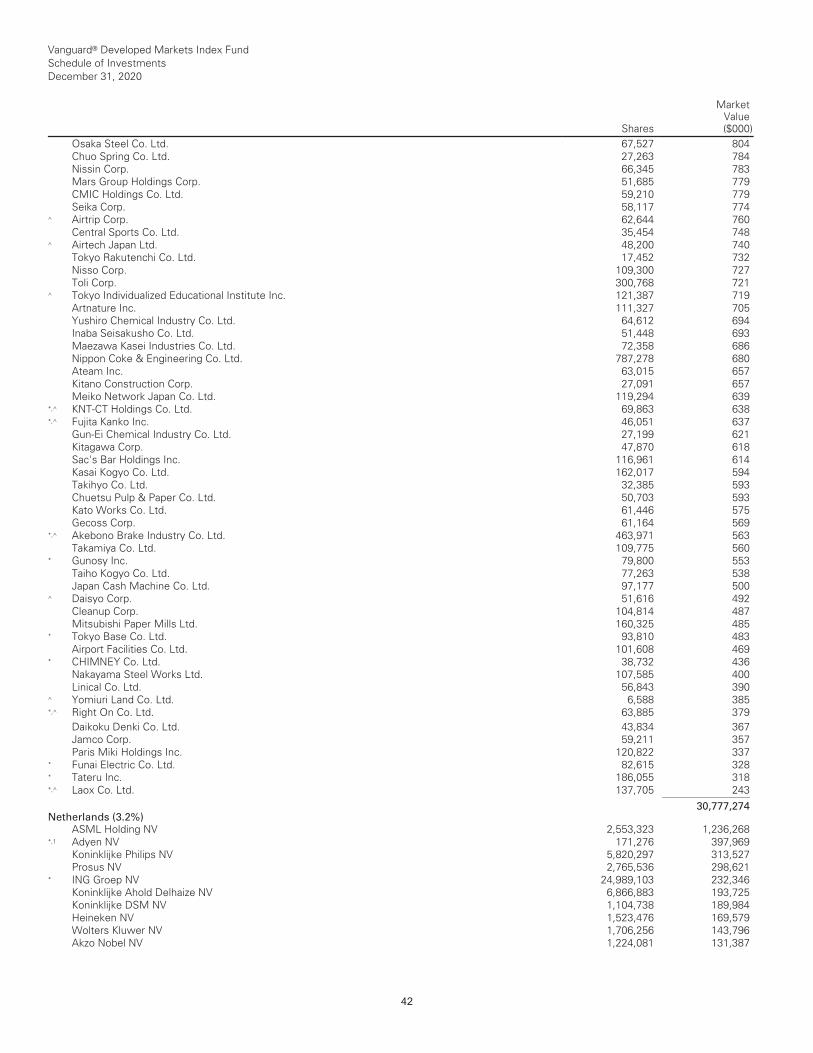
Vanguard® Developed Markets Index Fund Schedule of Investments December 31, 2020
Shares
MarketValue($000)
Osaka Steel Co. Ltd. 67,527 804 Chuo Spring Co. Ltd. 27,263 784 Nissin Corp. 66,345 783 Mars Group Holdings Corp. 51,685 779 CMIC Holdings Co. Ltd. 59,210 779 Seika Corp. 58,117 774 ^ Airtrip Corp. 62,644 760 Central Sports Co. Ltd. 35,454 748 ^ Airtech Japan Ltd. 48,200 740 Tokyo Rakutenchi Co. Ltd. 17,452 732 Nisso Corp. 109,300 727 Toli Corp. 300,768 721 ^ Tokyo Individualized Educational Institute Inc. 121,387 719 Artnature Inc. 111,327 705 Yushiro Chemical Industry Co. Ltd. 64,612 694 Inaba Seisakusho Co. Ltd. 51,448 693 Maezawa Kasei Industries Co. Ltd. 72,358 686 Nippon Coke & Engineering Co. Ltd. 787,278 680 Ateam Inc. 63,015 657 Kitano Construction Corp. 27,091 657 Meiko Network Japan Co. Ltd. 119,294 639 *,^ KNT-CT Holdings Co. Ltd. 69,863 638 *,^ Fujita Kanko Inc. 46,051 637 Gun-Ei Chemical Industry Co. Ltd. 27,199 621 Kitagawa Corp. 47,870 618 Sac's Bar Holdings Inc. 116,961 614 Kasai Kogyo Co. Ltd. 162,017 594 Takihyo Co. Ltd. 32,385 593 Chuetsu Pulp & Paper Co. Ltd. 50,703 593 Kato Works Co. Ltd. 61,446 575 Gecoss Corp. 61,164 569 *,^ Akebono Brake Industry Co. Ltd. 463,971 563 Takamiya Co. Ltd. 109,775 560 * Gunosy Inc. 79,800 553 Taiho Kogyo Co. Ltd. 77,263 538 Japan Cash Machine Co. Ltd. 97,177 500 ^ Daisyo Corp. 51,616 492 Cleanup Corp. 104,814 487 Mitsubishi Paper Mills Ltd. 160,325 485 * Tokyo Base Co. Ltd. 93,810 483 Airport Facilities Co. Ltd. 101,608 469 * CHIMNEY Co. Ltd. 38,732 436 Nakayama Steel Works Ltd. 107,585 400 Linical Co. Ltd. 56,843 390 ^ Yomiuri Land Co. Ltd. 6,588 385 *,^ Right On Co. Ltd. 63,885 379 __________________________________________________________________________________________________________________________________________________________________________________________________________________________________________________________________________________________________________________________________________________________________________________________________________________________________________________________________________________________________________________________________________________________________________________________________________________________________________________________________________________________ __________________________________________________________________________________________________________________________________________________________________________________________________________________________________________________________________________________________________________________________________________________________________________________________________________________________________________________________________________________________________________________________________________________________________________________________________________________________________________________________________________________________
Daikoku Denki Co. Ltd. 43,834 367 Jamco Corp. 59,211 357 Paris Miki Holdings Inc. 120,822 337 * Funai Electric Co. Ltd. 82,615 328 * Tateru Inc. 186,055 318 *,^ Laox Co. Ltd. 137,705 243 ___________ 30,777,274 Netherlands (3.2%)
ASML Holding NV 2,553,323 1,236,268 *,1 Adyen NV 171,276 397,969 Koninklijke Philips NV 5,820,297 313,527 Prosus NV 2,765,536 298,621 * ING Groep NV 24,989,103 232,346 Koninklijke Ahold Delhaize NV 6,866,883 193,725 Koninklijke DSM NV 1,104,738 189,984 Heineken NV 1,523,476 169,579 Wolters Kluwer NV 1,706,256 143,796 Akzo Nobel NV 1,224,081 131,387
42
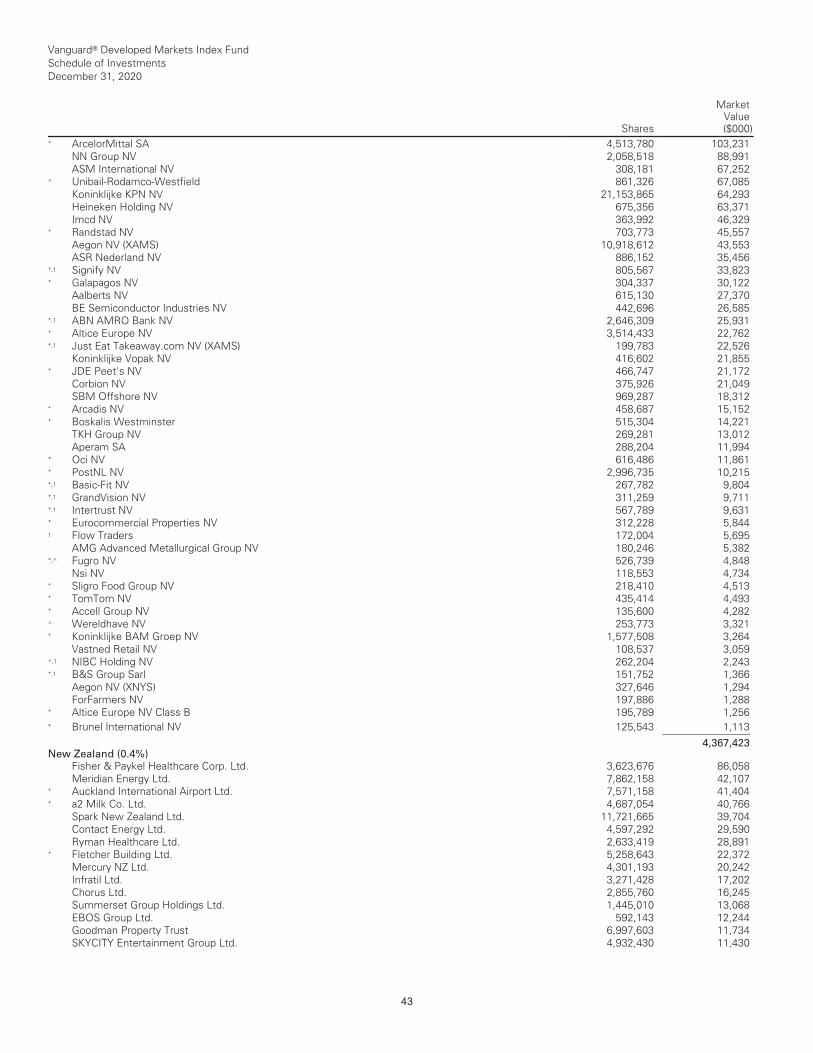
Vanguard® Developed Markets Index Fund Schedule of Investments December 31, 2020
Shares
MarketValue($000)
* ArcelorMittal SA 4,513,780 103,231 NN Group NV 2,058,518 88,991 ASM International NV 308,181 67,252 ^ Unibail-Rodamco-Westfield 861,326 67,085 Koninklijke KPN NV 21,153,865 64,293 Heineken Holding NV 675,356 63,371 Imcd NV 363,992 46,329 * Randstad NV 703,773 45,557 Aegon NV (XAMS) 10,918,612 43,553 ASR Nederland NV 886,152 35,456 *,1 Signify NV 805,567 33,823 * Galapagos NV 304,337 30,122 Aalberts NV 615,130 27,370 BE Semiconductor Industries NV 442,696 26,585 *,1 ABN AMRO Bank NV 2,646,309 25,931 * Altice Europe NV 3,514,433 22,762 *,1 Just Eat Takeaway.com NV (XAMS) 199,783 22,526 Koninklijke Vopak NV 416,602 21,855 * JDE Peet's NV 466,747 21,172 Corbion NV 375,926 21,049 SBM Offshore NV 969,287 18,312 * Arcadis NV 458,687 15,152 * Boskalis Westminster 515,304 14,221 TKH Group NV 269,281 13,012 Aperam SA 288,204 11,994 * Oci NV 616,486 11,861 * PostNL NV 2,996,735 10,215 *,1 Basic-Fit NV 267,782 9,804 *,1 GrandVision NV 311,259 9,711 *,1 Intertrust NV 567,789 9,631 * Eurocommercial Properties NV 312,228 5,844 1 Flow Traders 172,004 5,695 AMG Advanced Metallurgical Group NV 180,246 5,382 *,^ Fugro NV 526,739 4,848 Nsi NV 118,553 4,734 * Sligro Food Group NV 218,410 4,513 * TomTom NV 435,414 4,493 * Accell Group NV 135,600 4,282 ^ Wereldhave NV 253,773 3,321 * Koninklijke BAM Groep NV 1,577,508 3,264 Vastned Retail NV 108,537 3,059 ^,1 NIBC Holding NV 262,204 2,243 *,1 B&S Group Sarl 151,752 1,366 Aegon NV (XNYS) 327,646 1,294 ForFarmers NV 197,886 1,288 * Altice Europe NV Class B 195,789 1,256 __________________________________________________________________________________________________________________________________________________________________________________________________________________________________________________________________________________________________________________________________________________________________________________________________________________________________________________________________________________________________________________________________________________________________________________________________________________________________________________________________________________________ __________________________________________________________________________________________________________________________________________________________________________________________________________________________________________________________________________________________________________________________________________________________________________________________________________________________________________________________________________________________________________________________________________________________________________________________________________________________________________________________________________________________
* Brunel International NV 125,543 1,113 ___________ 4,367,423 New Zealand (0.4%)
Fisher & Paykel Healthcare Corp. Ltd. 3,623,676 86,058 Meridian Energy Ltd. 7,862,158 42,107 * Auckland International Airport Ltd. 7,571,158 41,404 * a2 Milk Co. Ltd. 4,687,054 40,766 Spark New Zealand Ltd. 11,721,665 39,704 Contact Energy Ltd. 4,597,292 29,590 Ryman Healthcare Ltd. 2,633,419 28,891 * Fletcher Building Ltd. 5,258,643 22,372 Mercury NZ Ltd. 4,301,193 20,242 Infratil Ltd. 3,271,428 17,202 Chorus Ltd. 2,855,760 16,245 Summerset Group Holdings Ltd. 1,445,010 13,068 EBOS Group Ltd. 592,143 12,244 Goodman Property Trust 6,997,603 11,734 SKYCITY Entertainment Group Ltd. 4,932,430 11,430
43

Vanguard® Developed Markets Index Fund Schedule of Investments December 31, 2020
Shares
MarketValue($000)
Kiwi Property Group Ltd. 9,911,801 8,721 Precinct Properties New Zealand Ltd. 6,820,950 8,648 Genesis Energy Ltd. 3,263,004 8,530 Freightways Ltd. 1,014,305 7,354 * Z Energy Ltd. 2,988,173 6,893 * Pushpay Holdings Ltd. 4,672,200 6,100 Argosy Property Ltd. 5,244,917 6,008 Vital Healthcare Property Trust 2,398,949 5,655 Vector Ltd. 1,627,873 4,984 Arvida Group Ltd. 3,449,298 4,453 * Air New Zealand Ltd. 3,199,869 4,159 * Kathmandu Holdings Ltd. 3,679,694 3,399 Heartland Group Holdings Ltd. 2,588,509 3,101 Scales Corp. Ltd. 708,096 2,541 Oceania Healthcare Ltd. 2,262,103 2,368 * Synlait Milk Ltd. 615,907 2,316 * Tourism Holdings Ltd. 941,344 1,765 * Restaurant Brands New Zealand Ltd. 196,945 1,636 * Vista Group International Ltd. 1,324,652 1,605 * SKY Network Television Ltd. 10,889,596 1,263 * New Zealand Refining Co. Ltd. 1,207,954 478 ___________ 525,034 Norway (0.7%)
* DNB ASA 6,561,272 128,572 Equinor ASA 6,156,183 103,895 Telenor ASA 4,002,806 67,947 Mowi ASA 2,722,291 60,781 Orkla ASA 4,877,228 49,516 Yara International ASA 1,100,043 45,636 Norsk Hydro ASA 8,538,652 39,740 TOMRA Systems ASA 746,892 36,744 1 Scatec ASA 732,121 29,156 * NEL ASA 8,521,387 28,834 * Adevinta ASA Class B 1,438,473 24,181 1 Entra ASA 1,065,364 24,163 Gjensidige Forsikring ASA 1,060,276 23,665 * Bakkafrost P/F 328,582 23,459 * Storebrand ASA 2,986,031 22,369 * Schibsted ASA Class B 600,128 22,277 * Schibsted ASA Class A 512,417 21,839 Salmar ASA 331,855 19,444 Aker BP ASA 690,597 17,426 * Nordic Semiconductor ASA 986,389 15,847 * Subsea 7 SA 1,501,357 15,426 * SpareBank 1 SR-Bank ASA 1,140,591 12,111 Leroy Seafood Group ASA 1,646,712 11,618 __________________________________________________________________________________________________________________________________________________________________________________________________________________________________________________________________________________________________________________________________________________________________________________________________________________________________________________________________________________________________________________________________________________________________________________________________________________________________________________________________________________________ __________________________________________________________________________________________________________________________________________________________________________________________________________________________________________________________________________________________________________________________________________________________________________________________________________________________________________________________________________________________________________________________________________________________________________________________________________________________________________________________________________________________
TGS NOPEC Geophysical Co. ASA 727,247 11,275 Borregaard ASA 634,007 10,496 Kongsberg Gruppen ASA 486,428 10,007 Aker ASA 152,909 9,985 SpareBank 1 SMN 831,523 9,464 Veidekke ASA 696,470 9,013 * Norwegian Finans Holding ASA 995,268 8,511 Atea ASA 526,421 7,458 Austevoll Seafood ASA 574,687 5,869 1 Elkem ASA 1,570,232 5,206 *,1 Sbanken ASA 529,682 4,257 Frontline Ltd. 575,875 3,650 * Bonheur ASA 127,942 3,614 * Grieg Seafood ASA 351,204 3,481 1 BW LPG Ltd. 503,327 3,471 BW Offshore Ltd. 579,556 2,552 * DNO ASA 3,102,533 2,477 Norway Royal Salmon ASA 94,160 2,352
44
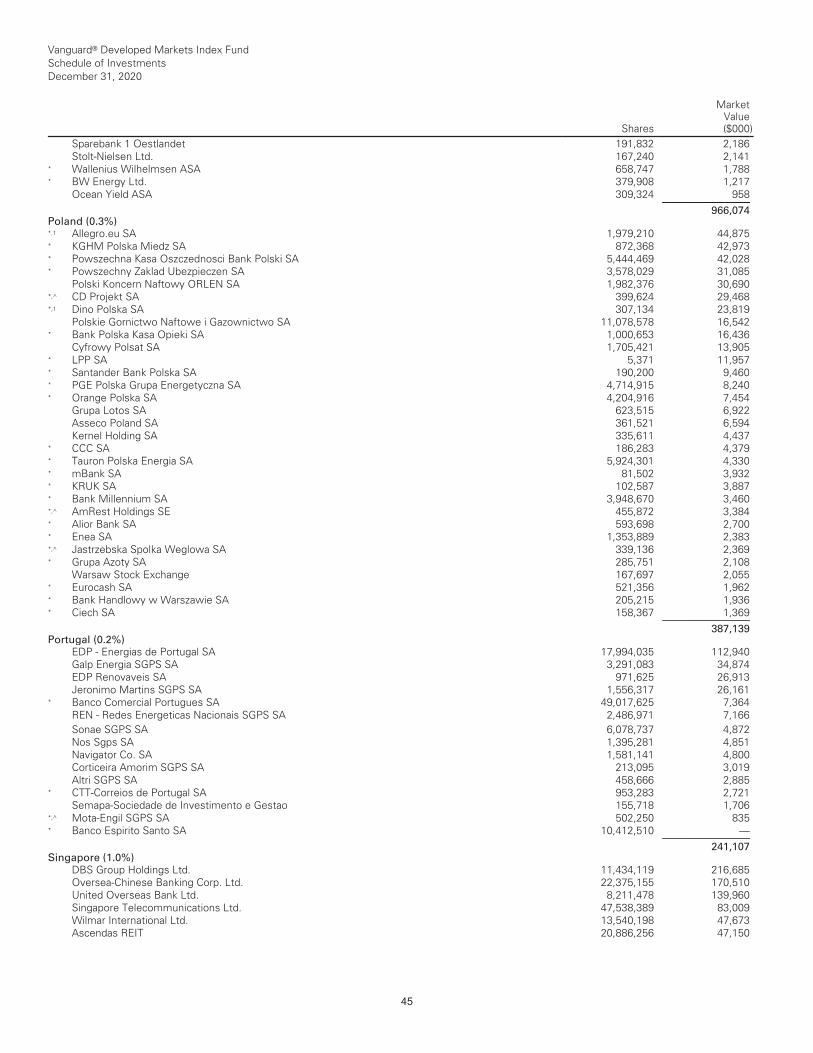
Vanguard® Developed Markets Index Fund Schedule of Investments December 31, 2020
Shares
MarketValue($000)
Sparebank 1 Oestlandet 191,832 2,186 Stolt-Nielsen Ltd. 167,240 2,141 * Wallenius Wilhelmsen ASA 658,747 1,788 * BW Energy Ltd. 379,908 1,217 Ocean Yield ASA 309,324 958 ___________ 966,074 Poland (0.3%)
*,1 Allegro.eu SA 1,979,210 44,875 * KGHM Polska Miedz SA 872,368 42,973 * Powszechna Kasa Oszczednosci Bank Polski SA 5,444,469 42,028 * Powszechny Zaklad Ubezpieczen SA 3,578,029 31,085 Polski Koncern Naftowy ORLEN SA 1,982,376 30,690 *,^ CD Projekt SA 399,624 29,468 *,1 Dino Polska SA 307,134 23,819 Polskie Gornictwo Naftowe i Gazownictwo SA 11,078,578 16,542 * Bank Polska Kasa Opieki SA 1,000,653 16,436 Cyfrowy Polsat SA 1,705,421 13,905 * LPP SA 5,371 11,957 * Santander Bank Polska SA 190,200 9,460 * PGE Polska Grupa Energetyczna SA 4,714,915 8,240 * Orange Polska SA 4,204,916 7,454 Grupa Lotos SA 623,515 6,922 Asseco Poland SA 361,521 6,594 Kernel Holding SA 335,611 4,437 * CCC SA 186,283 4,379 * Tauron Polska Energia SA 5,924,301 4,330 * mBank SA 81,502 3,932 * KRUK SA 102,587 3,887 * Bank Millennium SA 3,948,670 3,460 *,^ AmRest Holdings SE 455,872 3,384 * Alior Bank SA 593,698 2,700 * Enea SA 1,353,889 2,383 *,^ Jastrzebska Spolka Weglowa SA 339,136 2,369 * Grupa Azoty SA 285,751 2,108 Warsaw Stock Exchange 167,697 2,055 * Eurocash SA 521,356 1,962 * Bank Handlowy w Warszawie SA 205,215 1,936 * Ciech SA 158,367 1,369 ___________ 387,139 Portugal (0.2%)
EDP - Energias de Portugal SA 17,994,035 112,940 Galp Energia SGPS SA 3,291,083 34,874 EDP Renovaveis SA 971,625 26,913 Jeronimo Martins SGPS SA 1,556,317 26,161 * Banco Comercial Portugues SA 49,017,625 7,364 REN - Redes Energeticas Nacionais SGPS SA 2,486,971 7,166 __________________________________________________________________________________________________________________________________________________________________________________________________________________________________________________________________________________________________________________________________________________________________________________________________________________________________________________________________________________________________________________________________________________________________________________________________________________________________________________________________________________________ __________________________________________________________________________________________________________________________________________________________________________________________________________________________________________________________________________________________________________________________________________________________________________________________________________________________________________________________________________________________________________________________________________________________________________________________________________________________________________________________________________________________
Sonae SGPS SA 6,078,737 4,872 Nos Sgps SA 1,395,281 4,851 Navigator Co. SA 1,581,141 4,800 Corticeira Amorim SGPS SA 213,095 3,019 Altri SGPS SA 458,666 2,885 * CTT-Correios de Portugal SA 953,283 2,721 Semapa-Sociedade de Investimento e Gestao 155,718 1,706 *,^ Mota-Engil SGPS SA 502,250 835 * Banco Espirito Santo SA 10,412,510 — ___________ 241,107 Singapore (1.0%)
DBS Group Holdings Ltd. 11,434,119 216,685 Oversea-Chinese Banking Corp. Ltd. 22,375,155 170,510 United Overseas Bank Ltd. 8,211,478 139,960 Singapore Telecommunications Ltd. 47,538,389 83,009 Wilmar International Ltd. 13,540,198 47,673 Ascendas REIT 20,886,256 47,150
45
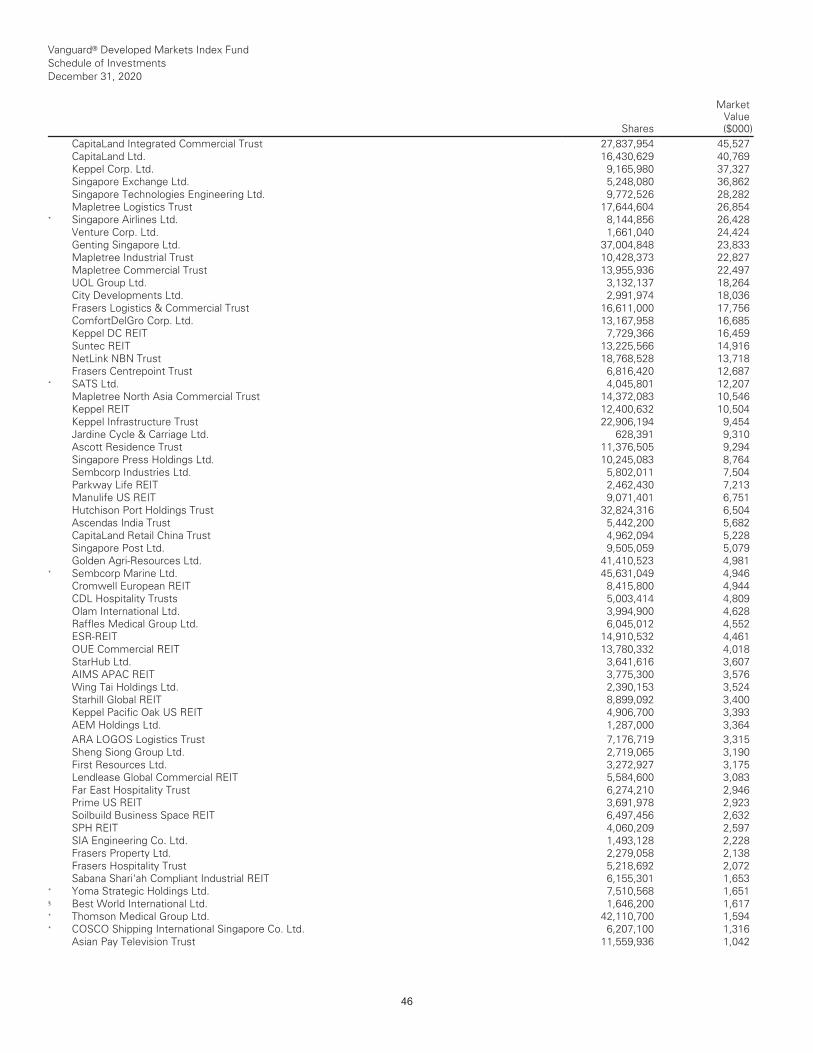
Vanguard® Developed Markets Index Fund Schedule of Investments December 31, 2020
Shares
MarketValue($000)
CapitaLand Integrated Commercial Trust 27,837,954 45,527 CapitaLand Ltd. 16,430,629 40,769 Keppel Corp. Ltd. 9,165,980 37,327 Singapore Exchange Ltd. 5,248,080 36,862 Singapore Technologies Engineering Ltd. 9,772,526 28,282 Mapletree Logistics Trust 17,644,604 26,854 * Singapore Airlines Ltd. 8,144,856 26,428 Venture Corp. Ltd. 1,661,040 24,424 Genting Singapore Ltd. 37,004,848 23,833 Mapletree Industrial Trust 10,428,373 22,827 Mapletree Commercial Trust 13,955,936 22,497 UOL Group Ltd. 3,132,137 18,264 City Developments Ltd. 2,991,974 18,036 Frasers Logistics & Commercial Trust 16,611,000 17,756 ComfortDelGro Corp. Ltd. 13,167,958 16,685 Keppel DC REIT 7,729,366 16,459 Suntec REIT 13,225,566 14,916 NetLink NBN Trust 18,768,528 13,718 Frasers Centrepoint Trust 6,816,420 12,687 * SATS Ltd. 4,045,801 12,207 Mapletree North Asia Commercial Trust 14,372,083 10,546 Keppel REIT 12,400,632 10,504 Keppel Infrastructure Trust 22,906,194 9,454 Jardine Cycle & Carriage Ltd. 628,391 9,310 Ascott Residence Trust 11,376,505 9,294 Singapore Press Holdings Ltd. 10,245,083 8,764 Sembcorp Industries Ltd. 5,802,011 7,504 Parkway Life REIT 2,462,430 7,213 Manulife US REIT 9,071,401 6,751 Hutchison Port Holdings Trust 32,824,316 6,504 Ascendas India Trust 5,442,200 5,682 CapitaLand Retail China Trust 4,962,094 5,228 Singapore Post Ltd. 9,505,059 5,079 Golden Agri-Resources Ltd. 41,410,523 4,981 * Sembcorp Marine Ltd. 45,631,049 4,946 Cromwell European REIT 8,415,800 4,944 CDL Hospitality Trusts 5,003,414 4,809 Olam International Ltd. 3,994,900 4,628 Raffles Medical Group Ltd. 6,045,012 4,552 ESR-REIT 14,910,532 4,461 OUE Commercial REIT 13,780,332 4,018 StarHub Ltd. 3,641,616 3,607 AIMS APAC REIT 3,775,300 3,576 Wing Tai Holdings Ltd. 2,390,153 3,524 Starhill Global REIT 8,899,092 3,400 Keppel Pacific Oak US REIT 4,906,700 3,393 AEM Holdings Ltd. 1,287,000 3,364 __________________________________________________________________________________________________________________________________________________________________________________________________________________________________________________________________________________________________________________________________________________________________________________________________________________________________________________________________________________________________________________________________________________________________________________________________________________________________________________________________________________________ __________________________________________________________________________________________________________________________________________________________________________________________________________________________________________________________________________________________________________________________________________________________________________________________________________________________________________________________________________________________________________________________________________________________________________________________________________________________________________________________________________________________
ARA LOGOS Logistics Trust 7,176,719 3,315 Sheng Siong Group Ltd. 2,719,065 3,190 First Resources Ltd. 3,272,927 3,175 Lendlease Global Commercial REIT 5,584,600 3,083 Far East Hospitality Trust 6,274,210 2,946 Prime US REIT 3,691,978 2,923 Soilbuild Business Space REIT 6,497,456 2,632 SPH REIT 4,060,209 2,597 SIA Engineering Co. Ltd. 1,493,128 2,228 Frasers Property Ltd. 2,279,058 2,138 Frasers Hospitality Trust 5,218,692 2,072 Sabana Shari'ah Compliant Industrial REIT 6,155,301 1,653 * Yoma Strategic Holdings Ltd. 7,510,568 1,651 § Best World International Ltd. 1,646,200 1,617 * Thomson Medical Group Ltd. 42,110,700 1,594 * COSCO Shipping International Singapore Co. Ltd. 6,207,100 1,316 Asian Pay Television Trust 11,559,936 1,042
46
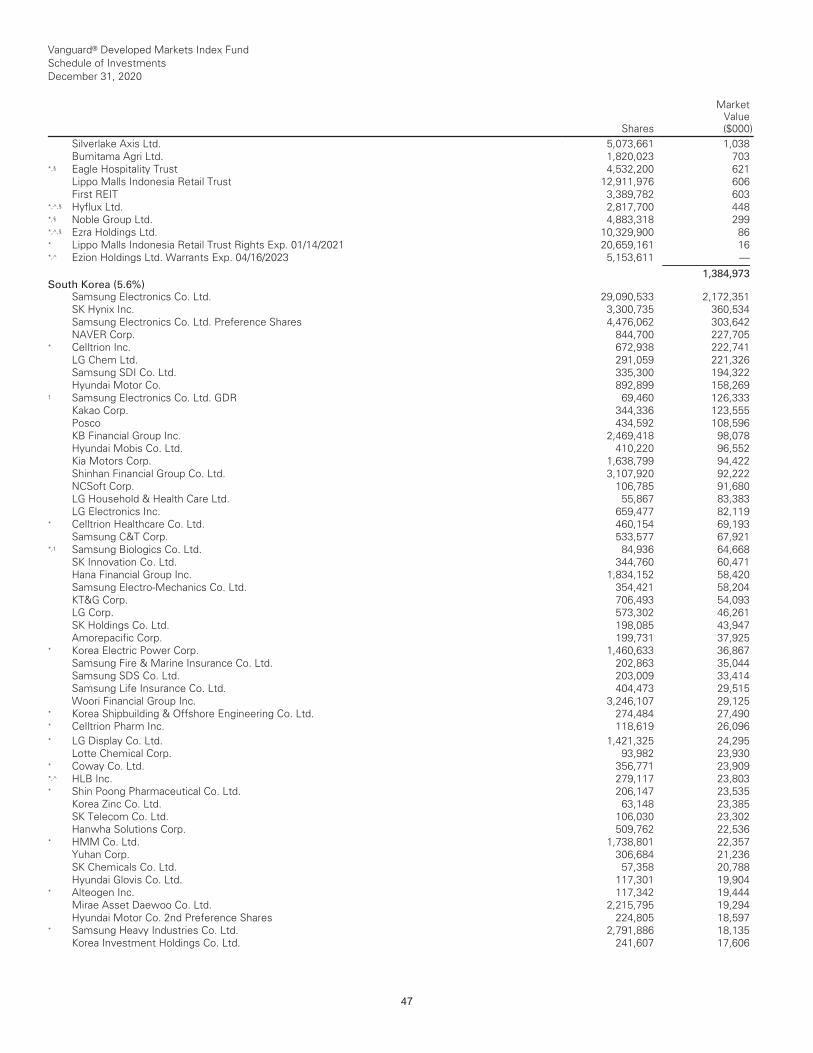
Vanguard® Developed Markets Index Fund Schedule of Investments December 31, 2020
Shares
MarketValue($000)
Silverlake Axis Ltd. 5,073,661 1,038 Bumitama Agri Ltd. 1,820,023 703 *,§ Eagle Hospitality Trust 4,532,200 621 Lippo Malls Indonesia Retail Trust 12,911,976 606 First REIT 3,389,782 603 *,^,§ Hyflux Ltd. 2,817,700 448 *,§ Noble Group Ltd. 4,883,318 299 *,^,§ Ezra Holdings Ltd. 10,329,900 86 * Lippo Malls Indonesia Retail Trust Rights Exp. 01/14/2021 20,659,161 16 *,^ Ezion Holdings Ltd. Warrants Exp. 04/16/2023 5,153,611 — ___________ 1,384,973 South Korea (5.6%)
Samsung Electronics Co. Ltd. 29,090,533 2,172,351 SK Hynix Inc. 3,300,735 360,534 Samsung Electronics Co. Ltd. Preference Shares 4,476,062 303,642 NAVER Corp. 844,700 227,705 * Celltrion Inc. 672,938 222,741 LG Chem Ltd. 291,059 221,326 Samsung SDI Co. Ltd. 335,300 194,322 Hyundai Motor Co. 892,899 158,269 1 Samsung Electronics Co. Ltd. GDR 69,460 126,333 Kakao Corp. 344,336 123,555 Posco 434,592 108,596 KB Financial Group Inc. 2,469,418 98,078 Hyundai Mobis Co. Ltd. 410,220 96,552 Kia Motors Corp. 1,638,799 94,422 Shinhan Financial Group Co. Ltd. 3,107,920 92,222 NCSoft Corp. 106,785 91,680 LG Household & Health Care Ltd. 55,867 83,383 LG Electronics Inc. 659,477 82,119 * Celltrion Healthcare Co. Ltd. 460,154 69,193 Samsung C&T Corp. 533,577 67,921 *,1 Samsung Biologics Co. Ltd. 84,936 64,668 SK Innovation Co. Ltd. 344,760 60,471 Hana Financial Group Inc. 1,834,152 58,420 Samsung Electro-Mechanics Co. Ltd. 354,421 58,204 KT&G Corp. 706,493 54,093 LG Corp. 573,302 46,261 SK Holdings Co. Ltd. 198,085 43,947 Amorepacific Corp. 199,731 37,925 * Korea Electric Power Corp. 1,460,633 36,867 Samsung Fire & Marine Insurance Co. Ltd. 202,863 35,044 Samsung SDS Co. Ltd. 203,009 33,414 Samsung Life Insurance Co. Ltd. 404,473 29,515 Woori Financial Group Inc. 3,246,107 29,125 * Korea Shipbuilding & Offshore Engineering Co. Ltd. 274,484 27,490 * Celltrion Pharm Inc. 118,619 26,096 __________________________________________________________________________________________________________________________________________________________________________________________________________________________________________________________________________________________________________________________________________________________________________________________________________________________________________________________________________________________________________________________________________________________________________________________________________________________________________________________________________________________ __________________________________________________________________________________________________________________________________________________________________________________________________________________________________________________________________________________________________________________________________________________________________________________________________________________________________________________________________________________________________________________________________________________________________________________________________________________________________________________________________________________________
* LG Display Co. Ltd. 1,421,325 24,295 Lotte Chemical Corp. 93,982 23,930 * Coway Co. Ltd. 356,771 23,909 *,^ HLB Inc. 279,117 23,803 * Shin Poong Pharmaceutical Co. Ltd. 206,147 23,535 Korea Zinc Co. Ltd. 63,148 23,385 SK Telecom Co. Ltd. 106,030 23,302 Hanwha Solutions Corp. 509,762 22,536 * HMM Co. Ltd. 1,738,801 22,357 Yuhan Corp. 306,684 21,236 SK Chemicals Co. Ltd. 57,358 20,788 Hyundai Glovis Co. Ltd. 117,301 19,904 * Alteogen Inc. 117,342 19,444 Mirae Asset Daewoo Co. Ltd. 2,215,795 19,294 Hyundai Motor Co. 2nd Preference Shares 224,805 18,597 * Samsung Heavy Industries Co. Ltd. 2,791,886 18,135 Korea Investment Holdings Co. Ltd. 241,607 17,606
47

Vanguard® Developed Markets Index Fund Schedule of Investments December 31, 2020
Shares
MarketValue($000)
CJ CheilJedang Corp. 50,013 17,566 Hyundai Steel Co. 477,298 17,444 E-MART Inc. 124,073 17,326 LG Chem Ltd. Preference Shares 48,992 17,247 Hankook Tire & Technology Co. Ltd. 474,111 17,225 * Doosan Heavy Industries & Construction Co. Ltd. 1,371,263 17,117 Hyundai Heavy Industries Holdings Co. Ltd. 64,574 16,884 S-Oil Corp. 260,212 16,590 Seegene Inc. 91,198 16,230 Hyundai Engineering & Construction Co. Ltd. 463,203 15,995 Hanmi Pharm Co. Ltd. 46,774 15,806 Orion Corp. 137,242 15,673 * SK Biopharmaceuticals Co. Ltd. 100,211 15,622 Hanon Systems 1,030,210 15,424 LG Innotek Co. Ltd. 89,696 15,108 Samsung Securities Co. Ltd. 402,156 15,004 Kumho Petrochemical Co. Ltd. 111,342 14,897 Hotel Shilla Co. Ltd. 196,257 14,889 LG Uplus Corp. 1,370,812 14,844 Kangwon Land Inc. 677,657 14,683 * Korean Air Lines Co. Ltd. 559,737 14,049 *,^ KMW Co. Ltd. 183,541 13,646 ^ SK Telecom Co. Ltd. ADR 554,580 13,576 * Genexine Inc. 115,790 13,292 Fila Holdings Corp. 327,261 13,198 *,1 Netmarble Corp. 108,828 13,193 Daelim Industrial Co. Ltd. 172,381 13,079 POSCO Chemical Co. Ltd. 136,019 13,060 GS Engineering & Construction Corp. 371,352 12,942 Green Cross Corp. 34,361 12,865 * Samsung Engineering Co. Ltd. 997,880 12,201 Industrial Bank of Korea 1,472,760 12,010 Hyundai Motor Co. Preference Shares 140,890 11,509 DB Insurance Co. Ltd. 285,104 11,490 Mando Corp. 209,754 11,379 GS Holdings Corp. 325,465 11,261 LG Electronics Inc. Preference Shares 187,500 11,038 Douzone Bizon Co. Ltd. 114,612 10,981 ^ Hanjin Kal Corp. 188,457 10,956 DB HiTek Co. Ltd. 227,263 10,676 SKC Co. Ltd. 120,023 10,407 * OCI Co. Ltd. 116,595 9,997 SK Materials Co. Ltd. 29,851 9,840 Shinsegae Inc. 44,291 9,783 Korea Aerospace Industries Ltd. 409,171 9,732 BNK Financial Group Inc. 1,857,101 9,729 Chong Kun Dang Pharmaceutical Corp. 46,462 9,697 __________________________________________________________________________________________________________________________________________________________________________________________________________________________________________________________________________________________________________________________________________________________________________________________________________________________________________________________________________________________________________________________________________________________________________________________________________________________________________________________________________________________ __________________________________________________________________________________________________________________________________________________________________________________________________________________________________________________________________________________________________________________________________________________________________________________________________________________________________________________________________________________________________________________________________________________________________________________________________________________________________________________________________________________________
S-1 Corp. 121,964 9,550 Hansol Chemical Co. Ltd. 52,466 9,513 *,^ Pearl Abyss Corp. 39,028 9,358 AMOREPACIFIC Group 183,558 9,288 * WONIK IPS Co. Ltd. 223,922 9,138 * Oscotec Inc. 149,570 9,051 LG Household & Health Care Ltd. Preference Shares 13,474 8,913 Com2uSCorp 60,102 8,830 * MedPacto Inc. 80,182 8,710 NH Investment & Securities Co. Ltd. 809,276 8,434 KIWOOM Securities Co. Ltd. 71,991 8,410 Ecopro BM Co. Ltd. 53,146 8,344 Cheil Worldwide Inc. 437,985 8,321 * Hanall Biopharma Co. Ltd. 234,741 8,124 Hyundai Marine & Fire Insurance Co. Ltd. 382,953 8,029 CJ ENM Co. Ltd. 61,140 7,874 * Daewoo Shipbuilding & Marine Engineering Co. Ltd. 306,091 7,742
48

Vanguard® Developed Markets Index Fund Schedule of Investments December 31, 2020
Shares
MarketValue($000)
* Doosan Fuel Cell Co. Ltd. 156,063 7,705 Koh Young Technology Inc. 76,567 7,408 LS Corp. 110,451 7,277 * CJ Logistics Corp. 47,068 7,179 L&F Co. Ltd. 108,140 7,136 HDC Hyundai Development Co-Engineering & Construction 296,288 7,129 LEENO Industrial Inc. 57,306 7,127 CJ Corp. 82,302 6,987 * Hugel Inc. 39,498 6,833 Lotte Shopping Co. Ltd. 71,523 6,764 Hanwha Corp. 258,948 6,763 Green Cross Holdings Corp. 175,396 6,712 * Soulbrain Co. Ltd. 26,662 6,698 * Cellivery Therapeutics Inc. 38,515 6,686 * LegoChem Biosciences Inc. 103,183 6,676 Meritz Securities Co. Ltd. 1,876,252 6,344 Bukwang Pharmaceutical Co. Ltd. 242,939 6,298 Dongjin Semichem Co. Ltd. 185,654 6,256 *,^ Doosan Infracore Co. Ltd. 856,146 6,255 Dongsuh Cos. Inc. 198,861 6,222 Hanmi Science Co. ltd 88,659 6,220 * HLB Life Science Co. Ltd. 247,522 6,211 Sam Chun Dang Pharm Co. Ltd. 81,762 6,197 Daewoong Co. Ltd. 133,405 6,192 ^ Hyundai Department Store Co. Ltd. 93,692 6,173 DGB Financial Group Inc. 980,555 6,144 JYP Entertainment Corp. 172,518 6,110 Hanssem Co. Ltd. 60,782 5,856 Samsung Card Co. Ltd. 193,333 5,786 * Hanwha Aerospace Co. Ltd. 219,695 5,774 Hyundai Mipo Dockyard Co. Ltd. 129,152 5,719 Eo Technics Co. Ltd. 52,856 5,705 *,^ Helixmith Co. Ltd. 185,602 5,653 Hite Jinro Co. Ltd. 192,380 5,649 LS Electric Co. Ltd. 96,560 5,621 LOTTE Fine Chemical Co. Ltd. 110,066 5,602 Youngone Corp. 191,574 5,600 NongShim Co. Ltd. 20,201 5,584 * Hyundai Bioscience Co. Ltd. 204,778 5,515 * Pan Ocean Co. Ltd. 1,188,041 5,498 KCC Corp. 29,905 5,445 Lotte Corp. 166,709 5,423 GS Retail Co. Ltd. 170,730 5,421 * ST Pharm Co. Ltd. 56,360 5,391 * Pharmicell Co. Ltd. 334,941 5,345 Ecopro Co. Ltd. 116,383 5,340 Hyundai Elevator Co. Ltd. 145,736 5,333 __________________________________________________________________________________________________________________________________________________________________________________________________________________________________________________________________________________________________________________________________________________________________________________________________________________________________________________________________________________________________________________________________________________________________________________________________________________________________________________________________________________________ __________________________________________________________________________________________________________________________________________________________________________________________________________________________________________________________________________________________________________________________________________________________________________________________________________________________________________________________________________________________________________________________________________________________________________________________________________________________________________________________________________________________
NHN KCP Corp. 82,991 5,238 GeneOne Life Science Inc. 260,695 5,185 * Daewoo Engineering & Construction Co. Ltd. 1,119,926 5,147 Ilyang Pharmaceutical Co. Ltd. 84,313 5,117 Iljin Materials Co. Ltd. 108,101 5,077 * Mezzion Pharma Co. Ltd. 31,220 5,061 Hyundai Wia Corp. 100,436 4,961 BGF retail Co. Ltd. 39,654 4,954 * Chabiotech Co. Ltd. 266,988 4,936 * GemVax & Kael Co. Ltd. 223,298 4,922 NICE Information Service Co. Ltd. 214,277 4,901 * Hyundai Rotem Co. Ltd. 306,941 4,871 Meritz Fire & Marine Insurance Co. Ltd. 360,726 4,854 * Ace Technologies Corp. 190,224 4,760 JB Financial Group Co. Ltd. 913,332 4,747 Zinus Inc. 49,502 4,701 Korea Gas Corp. 160,876 4,583
49
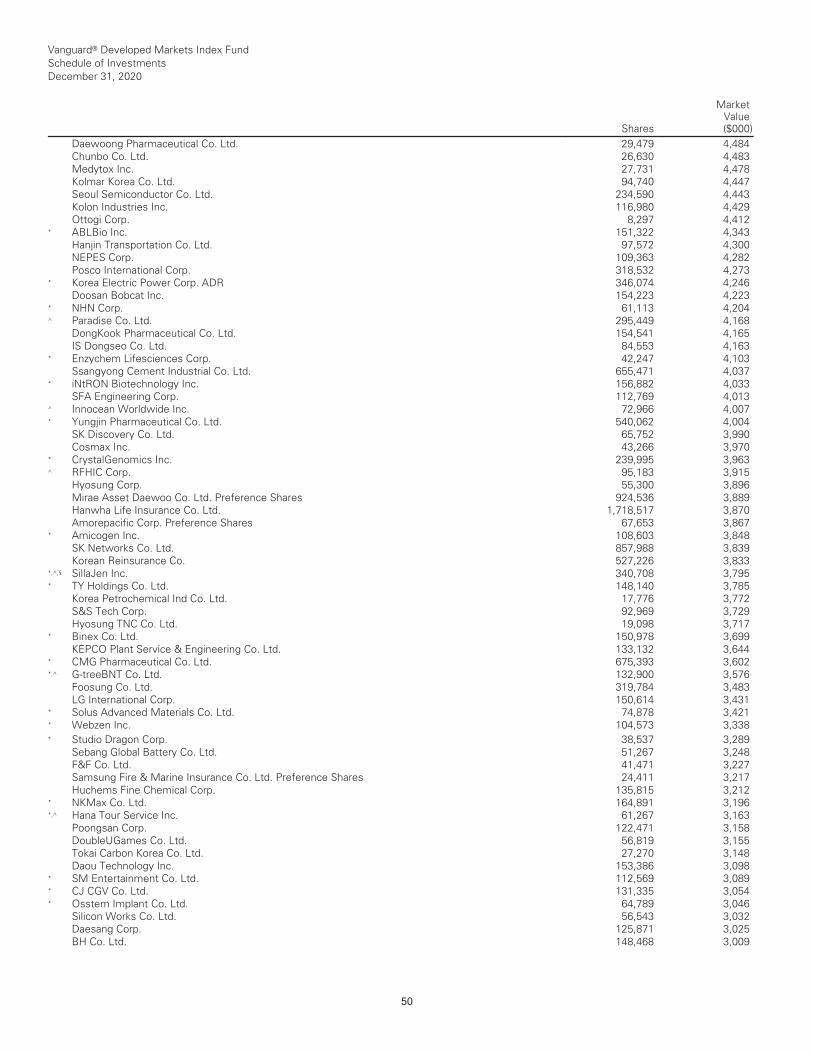
Vanguard® Developed Markets Index Fund Schedule of Investments December 31, 2020
Shares
MarketValue($000)
Daewoong Pharmaceutical Co. Ltd. 29,479 4,484 Chunbo Co. Ltd. 26,630 4,483 Medytox Inc. 27,731 4,478 Kolmar Korea Co. Ltd. 94,740 4,447 Seoul Semiconductor Co. Ltd. 234,590 4,443 Kolon Industries Inc. 116,980 4,429 Ottogi Corp. 8,297 4,412 * ABLBio Inc. 151,322 4,343 Hanjin Transportation Co. Ltd. 97,572 4,300 NEPES Corp. 109,363 4,282 Posco International Corp. 318,532 4,273 * Korea Electric Power Corp. ADR 346,074 4,246 Doosan Bobcat Inc. 154,223 4,223 * NHN Corp. 61,113 4,204 ^ Paradise Co. Ltd. 295,449 4,168 DongKook Pharmaceutical Co. Ltd. 154,541 4,165 IS Dongseo Co. Ltd. 84,553 4,163 * Enzychem Lifesciences Corp. 42,247 4,103 Ssangyong Cement Industrial Co. Ltd. 655,471 4,037 * iNtRON Biotechnology Inc. 156,882 4,033 SFA Engineering Corp. 112,769 4,013 ^ Innocean Worldwide Inc. 72,966 4,007 * Yungjin Pharmaceutical Co. Ltd. 540,062 4,004 SK Discovery Co. Ltd. 65,752 3,990 Cosmax Inc. 43,266 3,970 * CrystalGenomics Inc. 239,995 3,963 ^ RFHIC Corp. 95,183 3,915 Hyosung Corp. 55,300 3,896 Mirae Asset Daewoo Co. Ltd. Preference Shares 924,536 3,889 Hanwha Life Insurance Co. Ltd. 1,718,517 3,870 Amorepacific Corp. Preference Shares 67,653 3,867 * Amicogen Inc. 108,603 3,848 SK Networks Co. Ltd. 857,988 3,839 Korean Reinsurance Co. 527,226 3,833 *,^,§ SillaJen Inc. 340,708 3,795 * TY Holdings Co. Ltd. 148,140 3,785 Korea Petrochemical Ind Co. Ltd. 17,776 3,772 S&S Tech Corp. 92,969 3,729 Hyosung TNC Co. Ltd. 19,098 3,717 * Binex Co. Ltd. 150,978 3,699 KEPCO Plant Service & Engineering Co. Ltd. 133,132 3,644 * CMG Pharmaceutical Co. Ltd. 675,393 3,602 *,^ G-treeBNT Co. Ltd. 132,900 3,576 Foosung Co. Ltd. 319,784 3,483 LG International Corp. 150,614 3,431 * Solus Advanced Materials Co. Ltd. 74,878 3,421 * Webzen Inc. 104,573 3,338 __________________________________________________________________________________________________________________________________________________________________________________________________________________________________________________________________________________________________________________________________________________________________________________________________________________________________________________________________________________________________________________________________________________________________________________________________________________________________________________________________________________________ __________________________________________________________________________________________________________________________________________________________________________________________________________________________________________________________________________________________________________________________________________________________________________________________________________________________________________________________________________________________________________________________________________________________________________________________________________________________________________________________________________________________
* Studio Dragon Corp. 38,537 3,289 Sebang Global Battery Co. Ltd. 51,267 3,248 F&F Co. Ltd. 41,471 3,227 Samsung Fire & Marine Insurance Co. Ltd. Preference Shares 24,411 3,217 Huchems Fine Chemical Corp. 135,815 3,212 * NKMax Co. Ltd. 164,891 3,196 *,^ Hana Tour Service Inc. 61,267 3,163 Poongsan Corp. 122,471 3,158 DoubleUGames Co. Ltd. 56,819 3,155 Tokai Carbon Korea Co. Ltd. 27,270 3,148 Daou Technology Inc. 153,386 3,098 * SM Entertainment Co. Ltd. 112,569 3,089 * CJ CGV Co. Ltd. 131,335 3,054 * Osstem Implant Co. Ltd. 64,789 3,046 Silicon Works Co. Ltd. 56,543 3,032 Daesang Corp. 125,871 3,025 BH Co. Ltd. 148,468 3,009
50
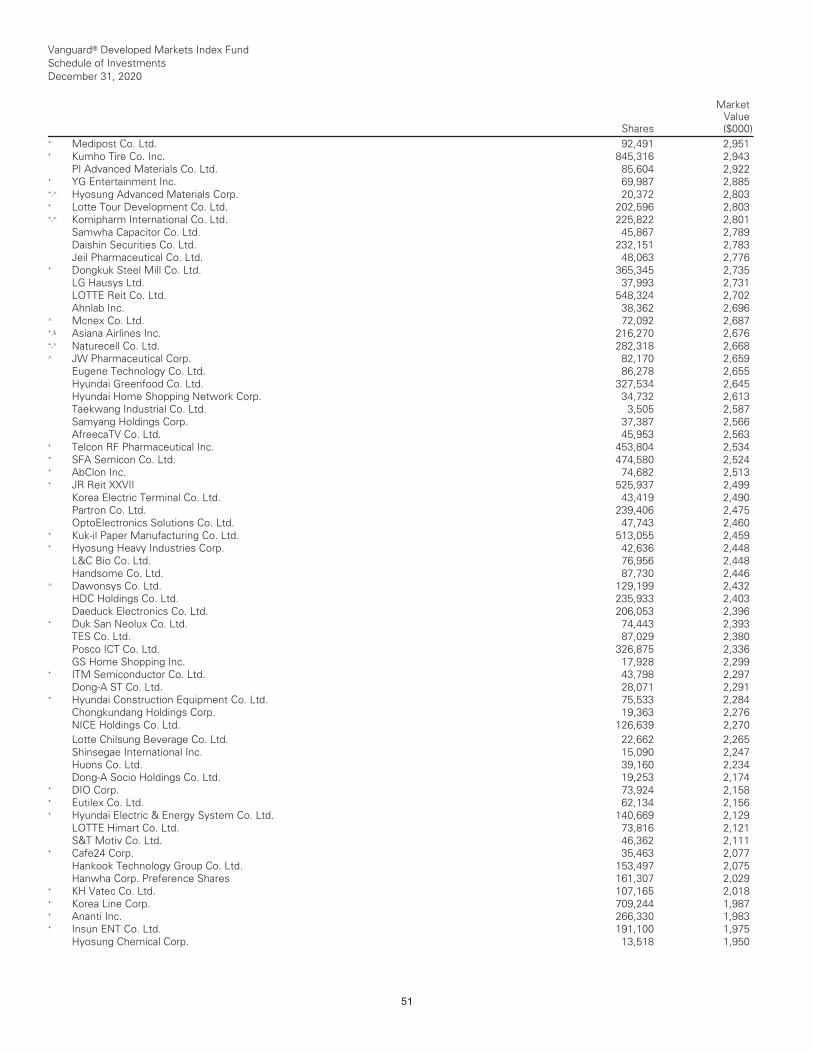
Vanguard® Developed Markets Index Fund Schedule of Investments December 31, 2020
Shares
MarketValue($000)
* Medipost Co. Ltd. 92,491 2,951 * Kumho Tire Co. Inc. 845,316 2,943 PI Advanced Materials Co. Ltd. 85,604 2,922 * YG Entertainment Inc. 69,987 2,885 *,^ Hyosung Advanced Materials Corp. 20,372 2,803 * Lotte Tour Development Co. Ltd. 202,596 2,803 *,^ Komipharm International Co. Ltd. 225,822 2,801 Samwha Capacitor Co. Ltd. 45,867 2,789 Daishin Securities Co. Ltd. 232,151 2,783 Jeil Pharmaceutical Co. Ltd. 48,063 2,776 * Dongkuk Steel Mill Co. Ltd. 365,345 2,735 LG Hausys Ltd. 37,993 2,731 LOTTE Reit Co. Ltd. 548,324 2,702 Ahnlab Inc. 38,362 2,696 ^ Mcnex Co. Ltd. 72,092 2,687 *,§ Asiana Airlines Inc. 216,270 2,676 *,^ Naturecell Co. Ltd. 282,318 2,668 ^ JW Pharmaceutical Corp. 82,170 2,659 Eugene Technology Co. Ltd. 86,278 2,655 Hyundai Greenfood Co. Ltd. 327,534 2,645 Hyundai Home Shopping Network Corp. 34,732 2,613 Taekwang Industrial Co. Ltd. 3,505 2,587 Samyang Holdings Corp. 37,387 2,566 AfreecaTV Co. Ltd. 45,953 2,563 * Telcon RF Pharmaceutical Inc. 453,804 2,534 * SFA Semicon Co. Ltd. 474,580 2,524 * AbClon Inc. 74,682 2,513 * JR Reit XXVII 525,937 2,499 Korea Electric Terminal Co. Ltd. 43,419 2,490 Partron Co. Ltd. 239,406 2,475 OptoElectronics Solutions Co. Ltd. 47,743 2,460 * Kuk-il Paper Manufacturing Co. Ltd. 513,055 2,459 * Hyosung Heavy Industries Corp. 42,636 2,448 L&C Bio Co. Ltd. 76,956 2,448 Handsome Co. Ltd. 87,730 2,446 ^ Dawonsys Co. Ltd. 129,199 2,432 HDC Holdings Co. Ltd. 235,933 2,403 Daeduck Electronics Co. Ltd. 206,053 2,396 * Duk San Neolux Co. Ltd. 74,443 2,393 TES Co. Ltd. 87,029 2,380 Posco ICT Co. Ltd. 326,875 2,336 GS Home Shopping Inc. 17,928 2,299 * ITM Semiconductor Co. Ltd. 43,798 2,297 Dong-A ST Co. Ltd. 28,071 2,291 * Hyundai Construction Equipment Co. Ltd. 75,533 2,284 Chongkundang Holdings Corp. 19,363 2,276 NICE Holdings Co. Ltd. 126,639 2,270 __________________________________________________________________________________________________________________________________________________________________________________________________________________________________________________________________________________________________________________________________________________________________________________________________________________________________________________________________________________________________________________________________________________________________________________________________________________________________________________________________________________________ __________________________________________________________________________________________________________________________________________________________________________________________________________________________________________________________________________________________________________________________________________________________________________________________________________________________________________________________________________________________________________________________________________________________________________________________________________________________________________________________________________________________
Lotte Chilsung Beverage Co. Ltd. 22,662 2,265 Shinsegae International Inc. 15,090 2,247 Huons Co. Ltd. 39,160 2,234 Dong-A Socio Holdings Co. Ltd. 19,253 2,174 * DIO Corp. 73,924 2,158 * Eutilex Co. Ltd. 62,134 2,156 * Hyundai Electric & Energy System Co. Ltd. 140,669 2,129 LOTTE Himart Co. Ltd. 73,816 2,121 S&T Motiv Co. Ltd. 46,362 2,111 * Cafe24 Corp. 35,463 2,077 Hankook Technology Group Co. Ltd. 153,497 2,075 Hanwha Corp. Preference Shares 161,307 2,029 * KH Vatec Co. Ltd. 107,165 2,018 * Korea Line Corp. 709,244 1,987 * Ananti Inc. 266,330 1,983 * Insun ENT Co. Ltd. 191,100 1,975 Hyosung Chemical Corp. 13,518 1,950
51
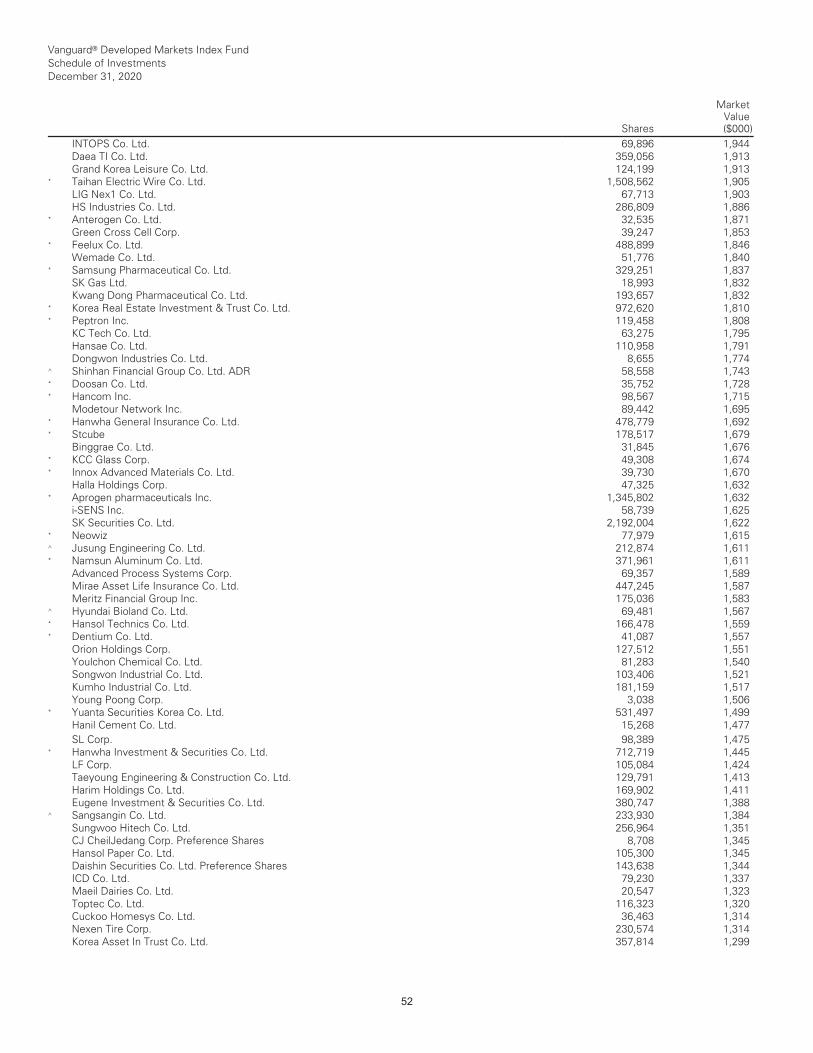
Vanguard® Developed Markets Index Fund Schedule of Investments December 31, 2020
Shares
MarketValue($000)
INTOPS Co. Ltd. 69,896 1,944 Daea TI Co. Ltd. 359,056 1,913 Grand Korea Leisure Co. Ltd. 124,199 1,913 * Taihan Electric Wire Co. Ltd. 1,508,562 1,905 LIG Nex1 Co. Ltd. 67,713 1,903 HS Industries Co. Ltd. 286,809 1,886 * Anterogen Co. Ltd. 32,535 1,871 Green Cross Cell Corp. 39,247 1,853 * Feelux Co. Ltd. 488,899 1,846 Wemade Co. Ltd. 51,776 1,840 * Samsung Pharmaceutical Co. Ltd. 329,251 1,837 SK Gas Ltd. 18,993 1,832 Kwang Dong Pharmaceutical Co. Ltd. 193,657 1,832 * Korea Real Estate Investment & Trust Co. Ltd. 972,620 1,810 * Peptron Inc. 119,458 1,808 KC Tech Co. Ltd. 63,275 1,795 Hansae Co. Ltd. 110,958 1,791 Dongwon Industries Co. Ltd. 8,655 1,774 ^ Shinhan Financial Group Co. Ltd. ADR 58,558 1,743 * Doosan Co. Ltd. 35,752 1,728 * Hancom Inc. 98,567 1,715 Modetour Network Inc. 89,442 1,695 * Hanwha General Insurance Co. Ltd. 478,779 1,692 * Stcube 178,517 1,679 Binggrae Co. Ltd. 31,845 1,676 * KCC Glass Corp. 49,308 1,674 * Innox Advanced Materials Co. Ltd. 39,730 1,670 Halla Holdings Corp. 47,325 1,632 * Aprogen pharmaceuticals Inc. 1,345,802 1,632 i-SENS Inc. 58,739 1,625 SK Securities Co. Ltd. 2,192,004 1,622 * Neowiz 77,979 1,615 ^ Jusung Engineering Co. Ltd. 212,874 1,611 * Namsun Aluminum Co. Ltd. 371,961 1,611 Advanced Process Systems Corp. 69,357 1,589 Mirae Asset Life Insurance Co. Ltd. 447,245 1,587 Meritz Financial Group Inc. 175,036 1,583 ^ Hyundai Bioland Co. Ltd. 69,481 1,567 * Hansol Technics Co. Ltd. 166,478 1,559 * Dentium Co. Ltd. 41,087 1,557 Orion Holdings Corp. 127,512 1,551 Youlchon Chemical Co. Ltd. 81,283 1,540 Songwon Industrial Co. Ltd. 103,406 1,521 Kumho Industrial Co. Ltd. 181,159 1,517 Young Poong Corp. 3,038 1,506 * Yuanta Securities Korea Co. Ltd. 531,497 1,499 Hanil Cement Co. Ltd. 15,268 1,477 __________________________________________________________________________________________________________________________________________________________________________________________________________________________________________________________________________________________________________________________________________________________________________________________________________________________________________________________________________________________________________________________________________________________________________________________________________________________________________________________________________________________ __________________________________________________________________________________________________________________________________________________________________________________________________________________________________________________________________________________________________________________________________________________________________________________________________________________________________________________________________________________________________________________________________________________________________________________________________________________________________________________________________________________________
SL Corp. 98,389 1,475 * Hanwha Investment & Securities Co. Ltd. 712,719 1,445 LF Corp. 105,084 1,424 Taeyoung Engineering & Construction Co. Ltd. 129,791 1,413 Harim Holdings Co. Ltd. 169,902 1,411 Eugene Investment & Securities Co. Ltd. 380,747 1,388 ^ Sangsangin Co. Ltd. 233,930 1,384 Sungwoo Hitech Co. Ltd. 256,964 1,351 CJ CheilJedang Corp. Preference Shares 8,708 1,345 Hansol Paper Co. Ltd. 105,300 1,345 Daishin Securities Co. Ltd. Preference Shares 143,638 1,344 ICD Co. Ltd. 79,230 1,337 Maeil Dairies Co. Ltd. 20,547 1,323 Toptec Co. Ltd. 116,323 1,320 Cuckoo Homesys Co. Ltd. 36,463 1,314 Nexen Tire Corp. 230,574 1,314 Korea Asset In Trust Co. Ltd. 357,814 1,299
52

Vanguard® Developed Markets Index Fund Schedule of Investments December 31, 2020
Shares
MarketValue($000)
* Dongsung Pharmaceutical Co. Ltd. 110,312 1,267 KEPCO Engineering & Construction Co. Inc. 76,726 1,264 Samyang Corp. 22,461 1,249 * Vidente Co. Ltd. 171,765 1,247 Tongyang Inc. 1,135,709 1,246 Soulbrain Holdings Co. Ltd. 29,927 1,246 *,^ Inscobee Inc. 628,890 1,224 Dongwon F&B Co. Ltd. 7,333 1,209 JW Holdings Corp. 221,572 1,192 * Wonik Holdings Co. Ltd. 202,877 1,186 * Interflex Co. Ltd. 72,908 1,168 * Lutronic Corp. 131,610 1,166 Vieworks Co. Ltd. 41,458 1,160 Youngone Holdings Co. Ltd. 33,272 1,157 GOLFZON Co. Ltd. 18,018 1,151 Seobu T&D 164,221 1,144 KC Co. Ltd. 44,827 1,144 InBody Co. Ltd. 70,586 1,128 *,^ CUROCOM Co. Ltd. 590,197 1,108 NS Shopping Co. Ltd. 97,273 1,084 Samchully Co. Ltd. 14,365 1,078 Kolmar Korea Holdings Co. Ltd. 42,246 1,011 Namhae Chemical Corp. 132,560 1,004 * Lock&Lock Co. Ltd. 106,002 993 iMarketKorea Inc. 122,050 983 * Gamevil Inc. 28,917 983 Hankook Shell Oil Co. Ltd. 4,121 981 Aekyung Industrial Co. Ltd. 43,393 980 Dae Han Flour Mills Co. Ltd. 6,231 953 KISCO Corp. 158,153 953 KTB Investment & Securities Co. Ltd. 322,563 948 Dae Hwa Pharmaceutical Co. Ltd. 65,917 938 SPC Samlip Co. Ltd. 13,957 926 Huons Global Co. Ltd. 33,762 911 * POSCO Chemical Co. Ltd. Rights Exp. 01/14/2021 32,407 908 Lotte Confectionery Co. Ltd. 9,366 881 Kolon Corp. 43,765 880 * Hansol Holdings Co. Ltd. 257,533 875 BGF Co. Ltd. 193,806 874 KT Skylife Co. Ltd. 103,629 842 KISWIRE Ltd. 61,779 837 * Able C&C Co. Ltd. 120,276 821 Hyundai Livart Furniture Co. Ltd. 53,890 793 Lotte Food Co. Ltd. 2,595 792 Namyang Dairy Products Co. Ltd. 3,014 791 E1 Corp. 19,205 790 Interpark Corp. 379,096 751 __________________________________________________________________________________________________________________________________________________________________________________________________________________________________________________________________________________________________________________________________________________________________________________________________________________________________________________________________________________________________________________________________________________________________________________________________________________________________________________________________________________________ __________________________________________________________________________________________________________________________________________________________________________________________________________________________________________________________________________________________________________________________________________________________________________________________________________________________________________________________________________________________________________________________________________________________________________________________________________________________________________________________________________________________
Seah Besteel Corp. 76,256 745 Sung Kwang Bend Co. Ltd. 107,988 729 ^ Kyobo Securities Co. Ltd. 103,347 728 DB Financial Investment Co. Ltd. 167,685 720 Woongjin Thinkbig Co. Ltd. 280,495 712 AK Holdings Inc. 30,661 711 Humedix Co. Ltd. 32,250 707 Hanil Holdings Co. Ltd. 70,305 706 TK Corp. 98,388 694 Cell Biotech Co. Ltd. 31,477 682 * Coreana Cosmetics Co. Ltd. 148,739 680 Cuckoo Holdings Co. Ltd. 7,240 666 Sam Young Electronics Co. Ltd. 66,608 626 Hyundai Corp. 42,262 622 * Byucksan Corp. 263,447 609 Tongyang Life Insurance Co. Ltd. 187,336 608 Daekyo Co. Ltd. 177,908 604
53
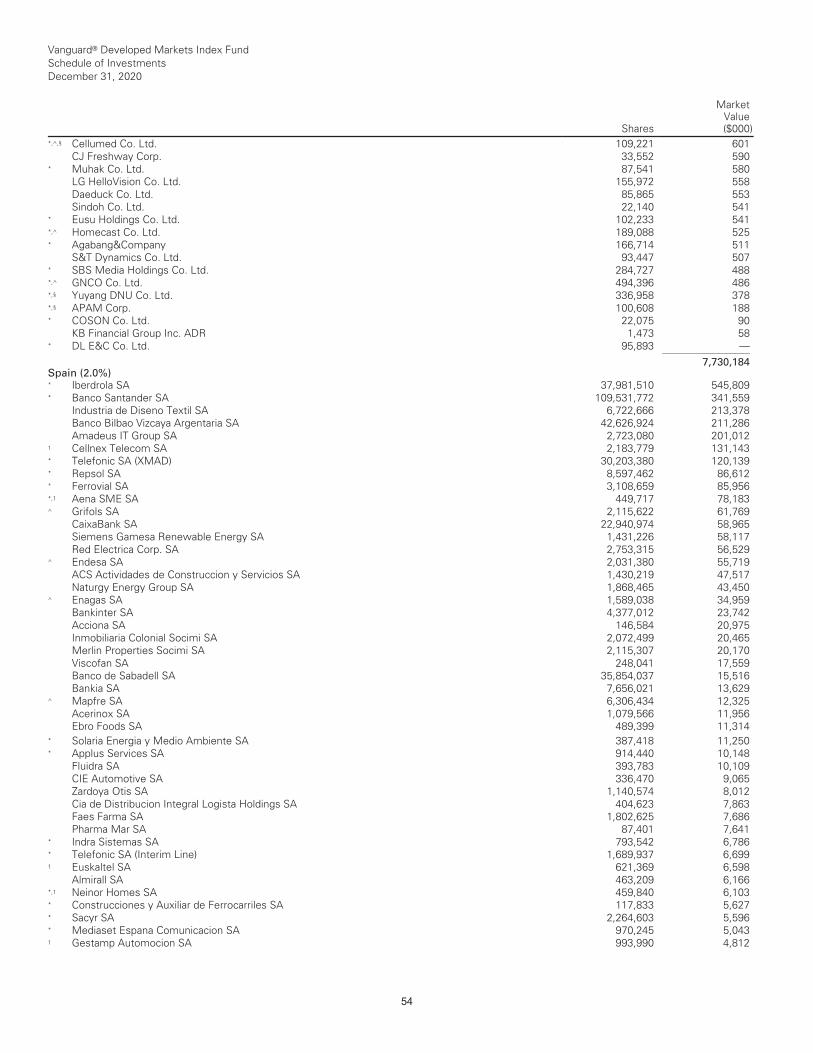
Vanguard® Developed Markets Index Fund Schedule of Investments December 31, 2020
Shares
MarketValue($000)
*,^,§ Cellumed Co. Ltd. 109,221 601 CJ Freshway Corp. 33,552 590 * Muhak Co. Ltd. 87,541 580 LG HelloVision Co. Ltd. 155,972 558 Daeduck Co. Ltd. 85,865 553 Sindoh Co. Ltd. 22,140 541 * Eusu Holdings Co. Ltd. 102,233 541 *,^ Homecast Co. Ltd. 189,088 525 * Agabang&Company 166,714 511 S&T Dynamics Co. Ltd. 93,447 507 * SBS Media Holdings Co. Ltd. 284,727 488 *,^ GNCO Co. Ltd. 494,396 486 *,§ Yuyang DNU Co. Ltd. 336,958 378 *,§ APAM Corp. 100,608 188 * COSON Co. Ltd. 22,075 90 KB Financial Group Inc. ADR 1,473 58 * DL E&C Co. Ltd. 95,893 — ___________ 7,730,184 Spain (2.0%)
* Iberdrola SA 37,981,510 545,809 * Banco Santander SA 109,531,772 341,559 Industria de Diseno Textil SA 6,722,666 213,378 Banco Bilbao Vizcaya Argentaria SA 42,626,924 211,286 Amadeus IT Group SA 2,723,080 201,012 1 Cellnex Telecom SA 2,183,779 131,143 * Telefonic SA (XMAD) 30,203,380 120,139 * Repsol SA 8,597,462 86,612 * Ferrovial SA 3,108,659 85,956 *,1 Aena SME SA 449,717 78,183 ^ Grifols SA 2,115,622 61,769 CaixaBank SA 22,940,974 58,965 Siemens Gamesa Renewable Energy SA 1,431,226 58,117 Red Electrica Corp. SA 2,753,315 56,529 ^ Endesa SA 2,031,380 55,719 ACS Actividades de Construccion y Servicios SA 1,430,219 47,517 Naturgy Energy Group SA 1,868,465 43,450 ^ Enagas SA 1,589,038 34,959 Bankinter SA 4,377,012 23,742 Acciona SA 146,584 20,975 Inmobiliaria Colonial Socimi SA 2,072,499 20,465 Merlin Properties Socimi SA 2,115,307 20,170 Viscofan SA 248,041 17,559 Banco de Sabadell SA 35,854,037 15,516 Bankia SA 7,656,021 13,629 ^ Mapfre SA 6,306,434 12,325 Acerinox SA 1,079,566 11,956 Ebro Foods SA 489,399 11,314 __________________________________________________________________________________________________________________________________________________________________________________________________________________________________________________________________________________________________________________________________________________________________________________________________________________________________________________________________________________________________________________________________________________________________________________________________________________________________________________________________________________________ __________________________________________________________________________________________________________________________________________________________________________________________________________________________________________________________________________________________________________________________________________________________________________________________________________________________________________________________________________________________________________________________________________________________________________________________________________________________________________________________________________________________
* Solaria Energia y Medio Ambiente SA 387,418 11,250 * Applus Services SA 914,440 10,148 Fluidra SA 393,783 10,109 CIE Automotive SA 336,470 9,065 Zardoya Otis SA 1,140,574 8,012 Cia de Distribucion Integral Logista Holdings SA 404,623 7,863 Faes Farma SA 1,802,625 7,686 Pharma Mar SA 87,401 7,641 * Indra Sistemas SA 793,542 6,786 * Telefonic SA (Interim Line) 1,689,937 6,699 1 Euskaltel SA 621,369 6,598 Almirall SA 463,209 6,166 *,1 Neinor Homes SA 459,840 6,103 * Construcciones y Auxiliar de Ferrocarriles SA 117,833 5,627 * Sacyr SA 2,264,603 5,596 * Mediaset Espana Comunicacion SA 970,245 5,043 1 Gestamp Automocion SA 993,990 4,812
54

Vanguard® Developed Markets Index Fund Schedule of Investments December 31, 2020
Shares
MarketValue($000)
* Melia Hotels International SA 645,070 4,493 Prosegur Cia de Seguridad SA 1,478,686 4,436 *,1 Unicaja Banco SA 4,963,928 4,362 *,1 Aedas Homes SA 133,618 3,425 1 Global Dominion Access SA 737,970 3,387 * Ence Energia y Celulosa SA 809,889 3,357 * Repsol SA Rights Exp. 01/08/2021 9,165,480 3,143 * Promotora de Informaciones SA 2,634,473 2,875 * Tecnicas Reunidas SA 192,590 2,554 * Liberbank SA 8,262,551 2,543 1 Prosegur Cash SA 2,467,802 2,406 Lar Espana Real Estate Socimi SA 398,686 2,277 *,1 Metrovacesa SA 288,532 2,120 * Atresmedia Corp. de Medios de Comunicacion SA 519,052 1,825 * Distribuidora Internacional de Alimentacion SA 10,091,867 1,411 *,^ NH Hotel Group SA 157,953 661 * Faes Farma SA (Interim Line) 85,839 366 ___________ 2,770,598 Sweden (3.1%)
Telefonaktiebolaget LM Ericsson Class B 19,177,154 228,121 * Volvo AB Class B 9,176,289 217,231 Investor AB Class B 2,908,003 211,654 Atlas Copco AB Class A 3,970,336 204,061 * Sandvik AB 6,891,986 169,981 Hexagon AB Class B 1,632,335 149,656 Assa Abloy AB Class B 5,871,151 145,088 Essity AB Class B 3,890,361 125,344 * Hennes & Mauritz AB Class B 5,614,935 117,869 * Swedbank AB Class A 6,421,931 112,643 Atlas Copco AB Class B 2,483,569 111,481 1 Evolution Gaming Group AB 999,647 100,499 * Svenska Handelsbanken AB Class A 9,449,303 95,249 * Skandinaviska Enskilda Banken AB Class A 9,111,345 93,824 * Kinnevik AB 1,529,106 76,817 Swedish Match AB 981,594 76,388 Epiroc AB Class A 4,011,900 72,915 Telia Co. AB 16,400,248 67,731 * Svenska Cellulosa AB SCA Class B 3,788,919 66,246 Nibe Industrier AB Class B 1,912,800 62,728 Boliden AB 1,748,650 62,038 SKF AB 2,378,758 61,894 Investor AB Class A 846,612 61,318 Skanska AB Class B 2,284,505 58,218 * Alfa Laval AB 2,004,429 55,355 Tele2 AB 3,409,971 45,107 * Industrivarden AB Class A 1,323,511 44,096 Castellum AB 1,720,931 43,868 __________________________________________________________________________________________________________________________________________________________________________________________________________________________________________________________________________________________________________________________________________________________________________________________________________________________________________________________________________________________________________________________________________________________________________________________________________________________________________________________________________________________ __________________________________________________________________________________________________________________________________________________________________________________________________________________________________________________________________________________________________________________________________________________________________________________________________________________________________________________________________________________________________________________________________________________________________________________________________________________________________________________________________________________________
*,1 Sinch AB 256,649 41,738 Epiroc AB Class B 2,414,249 40,757 * Indutrade AB 1,785,567 38,222 * Industrivarden AB Class C 1,073,150 34,687 * Trelleborg AB Class B 1,551,804 34,469 Electrolux AB Class B 1,469,684 34,195 Husqvarna AB 2,598,735 33,726 Getinge AB 1,425,628 33,362 Lundin Energy AB 1,205,869 32,682 EQT AB 1,285,898 32,641 * Fastighets AB Balder Class B 618,852 32,313 Securitas AB Class B 1,974,005 31,848 Elekta AB Class B 2,288,955 30,665 * Volvo AB Class A 1,270,126 30,270 Holmen AB 613,733 29,432 Lifco AB Class B 289,962 27,741 Fabege AB 1,684,650 26,616
55
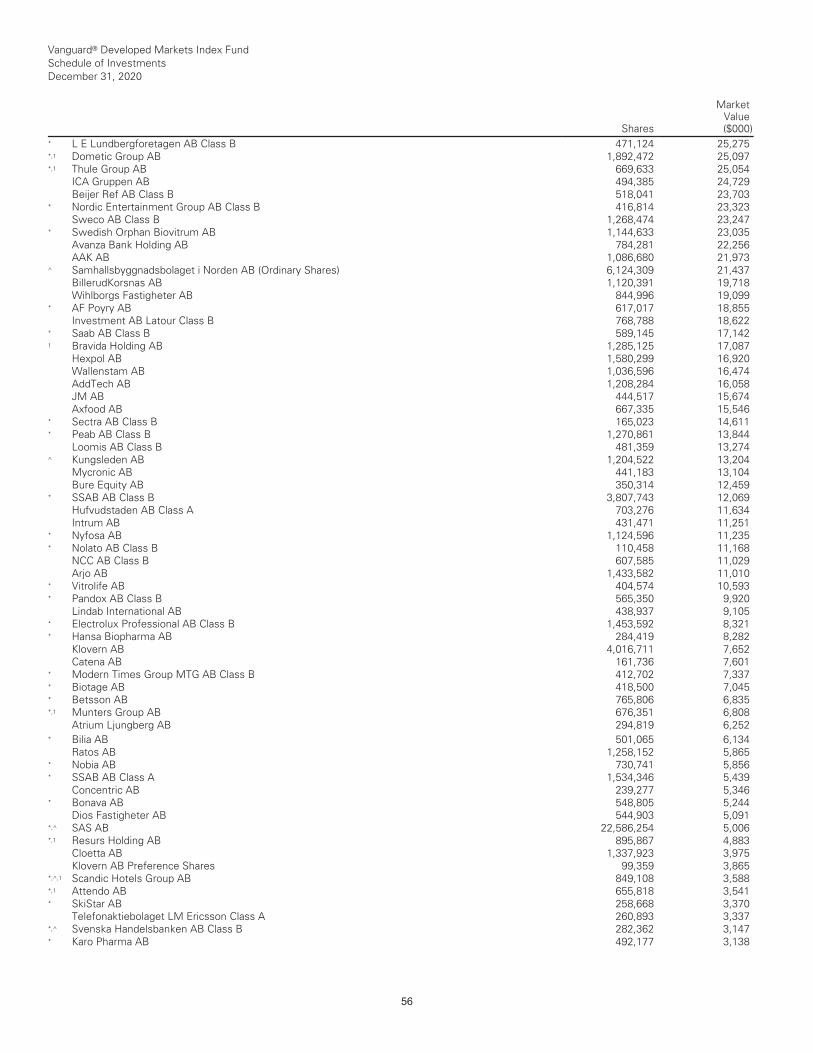
Vanguard® Developed Markets Index Fund Schedule of Investments December 31, 2020
Shares
MarketValue($000)
* L E Lundbergforetagen AB Class B 471,124 25,275 *,1 Dometic Group AB 1,892,472 25,097 *,1 Thule Group AB 669,633 25,054 ICA Gruppen AB 494,385 24,729 Beijer Ref AB Class B 518,041 23,703 * Nordic Entertainment Group AB Class B 416,814 23,323 Sweco AB Class B 1,268,474 23,247 * Swedish Orphan Biovitrum AB 1,144,633 23,035 Avanza Bank Holding AB 784,281 22,256 AAK AB 1,086,680 21,973 ^ Samhallsbyggnadsbolaget i Norden AB (Ordinary Shares) 6,124,309 21,437 BillerudKorsnas AB 1,120,391 19,718 Wihlborgs Fastigheter AB 844,996 19,099 * AF Poyry AB 617,017 18,855 Investment AB Latour Class B 768,788 18,622 * Saab AB Class B 589,145 17,142 1 Bravida Holding AB 1,285,125 17,087 Hexpol AB 1,580,299 16,920 Wallenstam AB 1,036,596 16,474 AddTech AB 1,208,284 16,058 JM AB 444,517 15,674 Axfood AB 667,335 15,546 * Sectra AB Class B 165,023 14,611 * Peab AB Class B 1,270,861 13,844 Loomis AB Class B 481,359 13,274 ^ Kungsleden AB 1,204,522 13,204 Mycronic AB 441,183 13,104 Bure Equity AB 350,314 12,459 * SSAB AB Class B 3,807,743 12,069 Hufvudstaden AB Class A 703,276 11,634 Intrum AB 431,471 11,251 * Nyfosa AB 1,124,596 11,235 * Nolato AB Class B 110,458 11,168 NCC AB Class B 607,585 11,029 Arjo AB 1,433,582 11,010 * Vitrolife AB 404,574 10,593 * Pandox AB Class B 565,350 9,920 Lindab International AB 438,937 9,105 * Electrolux Professional AB Class B 1,453,592 8,321 * Hansa Biopharma AB 284,419 8,282 Klovern AB 4,016,711 7,652 Catena AB 161,736 7,601 * Modern Times Group MTG AB Class B 412,702 7,337 * Biotage AB 418,500 7,045 * Betsson AB 765,806 6,835 *,1 Munters Group AB 676,351 6,808 Atrium Ljungberg AB 294,819 6,252 __________________________________________________________________________________________________________________________________________________________________________________________________________________________________________________________________________________________________________________________________________________________________________________________________________________________________________________________________________________________________________________________________________________________________________________________________________________________________________________________________________________________ __________________________________________________________________________________________________________________________________________________________________________________________________________________________________________________________________________________________________________________________________________________________________________________________________________________________________________________________________________________________________________________________________________________________________________________________________________________________________________________________________________________________
* Bilia AB 501,065 6,134 Ratos AB 1,258,152 5,865 * Nobia AB 730,741 5,856 * SSAB AB Class A 1,534,346 5,439 Concentric AB 239,277 5,346 * Bonava AB 548,805 5,244 Dios Fastigheter AB 544,903 5,091 *,^ SAS AB 22,586,254 5,006 *,1 Resurs Holding AB 895,867 4,883 Cloetta AB 1,337,923 3,975 Klovern AB Preference Shares 99,359 3,865 *,^,1 Scandic Hotels Group AB 849,108 3,588 *,1 Attendo AB 655,818 3,541 * SkiStar AB 258,668 3,370 Telefonaktiebolaget LM Ericsson Class A 260,893 3,337 *,^ Svenska Handelsbanken AB Class B 282,362 3,147 * Karo Pharma AB 492,177 3,138
56
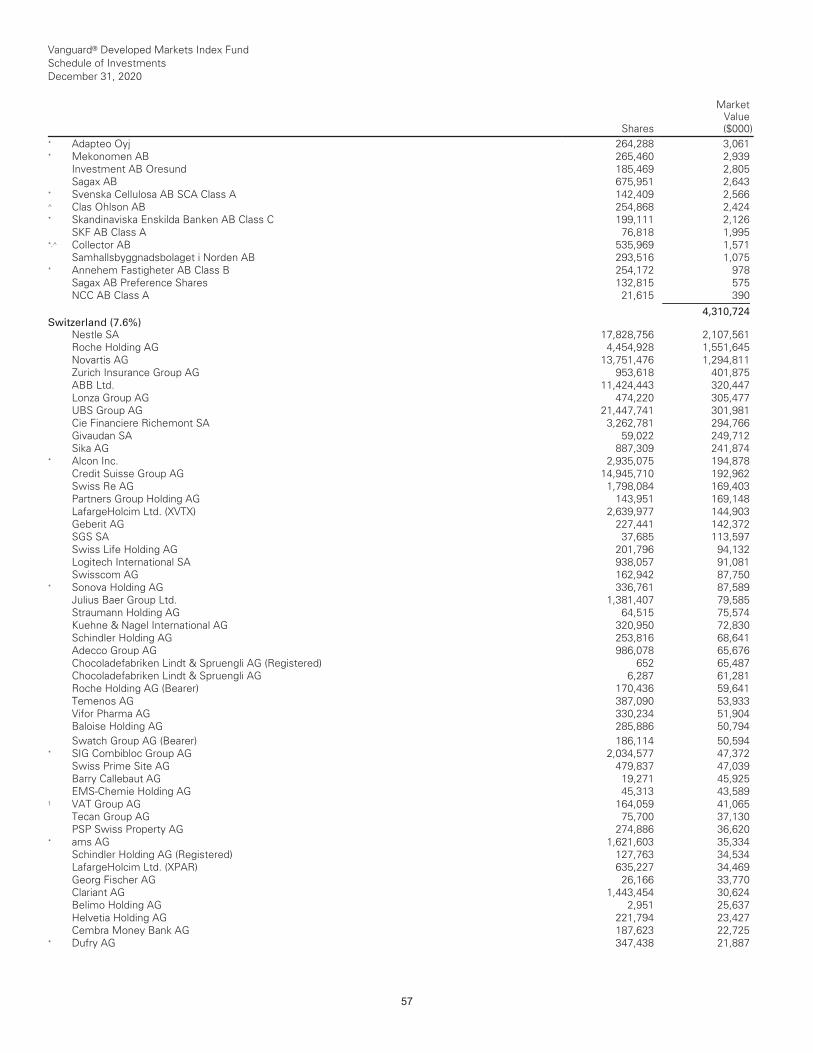
Vanguard® Developed Markets Index Fund Schedule of Investments December 31, 2020
Shares
MarketValue($000)
* Adapteo Oyj 264,288 3,061 * Mekonomen AB 265,460 2,939 Investment AB Oresund 185,469 2,805 Sagax AB 675,951 2,643 * Svenska Cellulosa AB SCA Class A 142,409 2,566 ^ Clas Ohlson AB 254,868 2,424 * Skandinaviska Enskilda Banken AB Class C 199,111 2,126 SKF AB Class A 76,818 1,995 *,^ Collector AB 535,969 1,571 Samhallsbyggnadsbolaget i Norden AB 293,516 1,075 * Annehem Fastigheter AB Class B 254,172 978 Sagax AB Preference Shares 132,815 575 NCC AB Class A 21,615 390 ___________ 4,310,724 Switzerland (7.6%)
Nestle SA 17,828,756 2,107,561 Roche Holding AG 4,454,928 1,551,645 Novartis AG 13,751,476 1,294,811 Zurich Insurance Group AG 953,618 401,875 ABB Ltd. 11,424,443 320,447 Lonza Group AG 474,220 305,477 UBS Group AG 21,447,741 301,981 Cie Financiere Richemont SA 3,262,781 294,766 Givaudan SA 59,022 249,712 Sika AG 887,309 241,874 * Alcon Inc. 2,935,075 194,878 Credit Suisse Group AG 14,945,710 192,962 Swiss Re AG 1,798,084 169,403 Partners Group Holding AG 143,951 169,148 LafargeHolcim Ltd. (XVTX) 2,639,977 144,903 Geberit AG 227,441 142,372 SGS SA 37,685 113,597 Swiss Life Holding AG 201,796 94,132 Logitech International SA 938,057 91,081 Swisscom AG 162,942 87,750 * Sonova Holding AG 336,761 87,589 Julius Baer Group Ltd. 1,381,407 79,585 Straumann Holding AG 64,515 75,574 Kuehne & Nagel International AG 320,950 72,830 Schindler Holding AG 253,816 68,641 Adecco Group AG 986,078 65,676 Chocoladefabriken Lindt & Spruengli AG (Registered) 652 65,487 Chocoladefabriken Lindt & Spruengli AG 6,287 61,281 Roche Holding AG (Bearer) 170,436 59,641 Temenos AG 387,090 53,933 Vifor Pharma AG 330,234 51,904 Baloise Holding AG 285,886 50,794 __________________________________________________________________________________________________________________________________________________________________________________________________________________________________________________________________________________________________________________________________________________________________________________________________________________________________________________________________________________________________________________________________________________________________________________________________________________________________________________________________________________________ __________________________________________________________________________________________________________________________________________________________________________________________________________________________________________________________________________________________________________________________________________________________________________________________________________________________________________________________________________________________________________________________________________________________________________________________________________________________________________________________________________________________
Swatch Group AG (Bearer) 186,114 50,594 * SIG Combibloc Group AG 2,034,577 47,372 Swiss Prime Site AG 479,837 47,039 Barry Callebaut AG 19,271 45,925 EMS-Chemie Holding AG 45,313 43,589 1 VAT Group AG 164,059 41,065 Tecan Group AG 75,700 37,130 PSP Swiss Property AG 274,886 36,620 * ams AG 1,621,603 35,334 Schindler Holding AG (Registered) 127,763 34,534 LafargeHolcim Ltd. (XPAR) 635,227 34,469 Georg Fischer AG 26,166 33,770 Clariant AG 1,443,454 30,624 Belimo Holding AG 2,951 25,637 Helvetia Holding AG 221,794 23,427 Cembra Money Bank AG 187,623 22,725 * Dufry AG 347,438 21,887
57
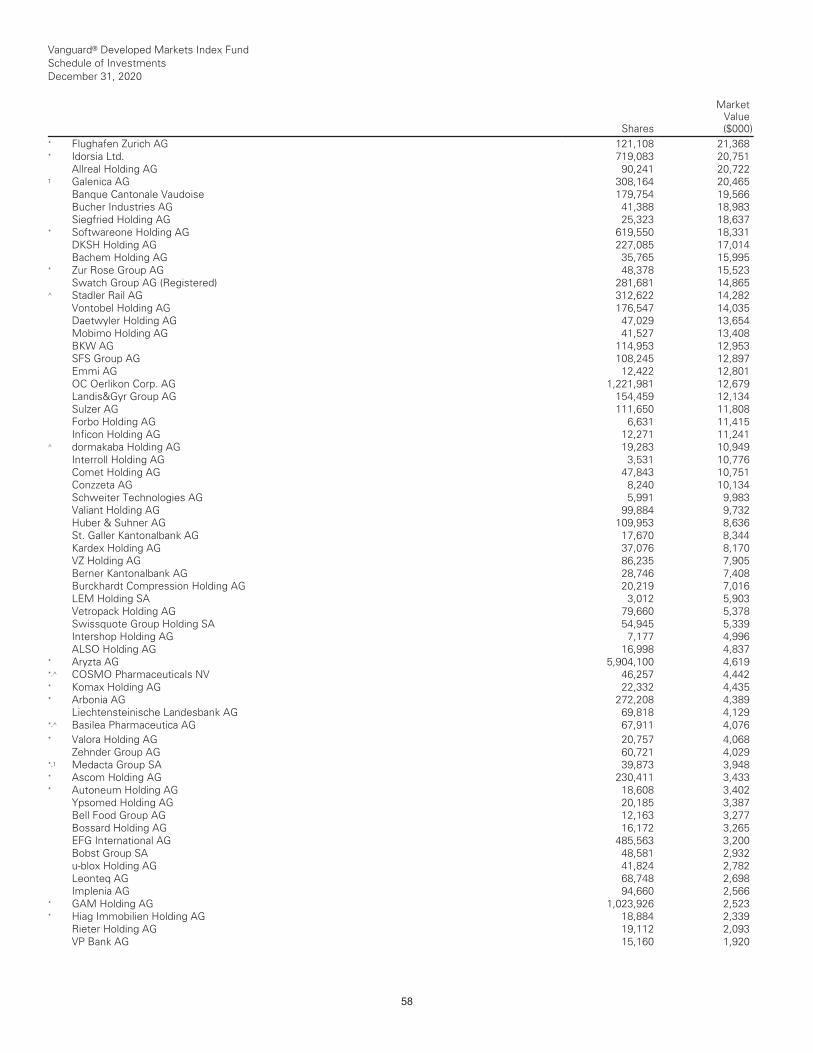
Vanguard® Developed Markets Index Fund Schedule of Investments December 31, 2020
Shares
MarketValue($000)
* Flughafen Zurich AG 121,108 21,368 * Idorsia Ltd. 719,083 20,751 Allreal Holding AG 90,241 20,722 1 Galenica AG 308,164 20,465 Banque Cantonale Vaudoise 179,754 19,566 Bucher Industries AG 41,388 18,983 Siegfried Holding AG 25,323 18,637 * Softwareone Holding AG 619,550 18,331 DKSH Holding AG 227,085 17,014 Bachem Holding AG 35,765 15,995 * Zur Rose Group AG 48,378 15,523 Swatch Group AG (Registered) 281,681 14,865 ^ Stadler Rail AG 312,622 14,282 Vontobel Holding AG 176,547 14,035 Daetwyler Holding AG 47,029 13,654 Mobimo Holding AG 41,527 13,408 BKW AG 114,953 12,953 SFS Group AG 108,245 12,897 Emmi AG 12,422 12,801 OC Oerlikon Corp. AG 1,221,981 12,679 Landis&Gyr Group AG 154,459 12,134 Sulzer AG 111,650 11,808 Forbo Holding AG 6,631 11,415 Inficon Holding AG 12,271 11,241 ^ dormakaba Holding AG 19,283 10,949 Interroll Holding AG 3,531 10,776 Comet Holding AG 47,843 10,751 Conzzeta AG 8,240 10,134 Schweiter Technologies AG 5,991 9,983 Valiant Holding AG 99,884 9,732 Huber & Suhner AG 109,953 8,636 St. Galler Kantonalbank AG 17,670 8,344 Kardex Holding AG 37,076 8,170 VZ Holding AG 86,235 7,905 Berner Kantonalbank AG 28,746 7,408 Burckhardt Compression Holding AG 20,219 7,016 LEM Holding SA 3,012 5,903 Vetropack Holding AG 79,660 5,378 Swissquote Group Holding SA 54,945 5,339 Intershop Holding AG 7,177 4,996 ALSO Holding AG 16,998 4,837 * Aryzta AG 5,904,100 4,619 *,^ COSMO Pharmaceuticals NV 46,257 4,442 * Komax Holding AG 22,332 4,435 * Arbonia AG 272,208 4,389 Liechtensteinische Landesbank AG 69,818 4,129 *,^ Basilea Pharmaceutica AG 67,911 4,076 __________________________________________________________________________________________________________________________________________________________________________________________________________________________________________________________________________________________________________________________________________________________________________________________________________________________________________________________________________________________________________________________________________________________________________________________________________________________________________________________________________________________ __________________________________________________________________________________________________________________________________________________________________________________________________________________________________________________________________________________________________________________________________________________________________________________________________________________________________________________________________________________________________________________________________________________________________________________________________________________________________________________________________________________________
* Valora Holding AG 20,757 4,068 Zehnder Group AG 60,721 4,029 *,1 Medacta Group SA 39,873 3,948 * Ascom Holding AG 230,411 3,433 * Autoneum Holding AG 18,608 3,402 Ypsomed Holding AG 20,185 3,387 Bell Food Group AG 12,163 3,277 Bossard Holding AG 16,172 3,265 EFG International AG 485,563 3,200 Bobst Group SA 48,581 2,932 u-blox Holding AG 41,824 2,782 Leonteq AG 68,748 2,698 Implenia AG 94,660 2,566 * GAM Holding AG 1,023,926 2,523 * Hiag Immobilien Holding AG 18,884 2,339 Rieter Holding AG 19,112 2,093 VP Bank AG 15,160 1,920
58

Vanguard® Developed Markets Index Fund Schedule of Investments December 31, 2020
Shares
MarketValue($000)
* APG SGA SA 6,792 1,511 BB Biotech AG 160 13 ___________ 10,466,311 United Kingdom (12.4%)
AstraZeneca plc 8,401,800 837,773 * HSBC Holdings plc 130,397,669 673,537 Diageo plc 14,678,097 580,795 GlaxoSmithKline plc 31,541,225 577,141 Unilever plc (XAMS) 9,376,176 567,741 British American Tobacco plc 14,245,910 529,050 Rio Tinto plc 6,947,518 522,962 Royal Dutch Shell plc Class A 26,219,024 459,788 BP plc 126,902,418 437,908 Unilever plc (XLON) 6,891,693 413,321 Royal Dutch Shell plc Class B 23,782,136 403,077 Reckitt Benckiser Group plc 4,035,694 360,203 BHP Group plc 13,305,690 351,329 Prudential plc 16,694,567 306,980 RELX plc 11,896,372 291,074 Vodafone Group plc 171,388,806 281,505 National Grid plc 22,448,503 265,284 Anglo American plc 7,868,476 259,835 London Stock Exchange Group plc 2,014,308 248,640 * Lloyds Banking Group plc 450,309,754 224,506 * Barclays plc 110,638,654 221,952 Experian plc 5,795,253 220,154 * Glencore plc 68,999,115 219,127 Compass Group plc 11,407,385 212,764 Tesco plc 61,879,800 195,279 CRH plc (XLON) 4,332,657 183,072 Ferguson plc 1,438,347 174,760 * Flutter Entertainment plc (XLON) 808,057 167,155 Legal & General Group plc 37,942,601 138,279 BAE Systems plc 20,579,730 137,242 SSE plc 6,662,710 136,474 Ashtead Group plc 2,861,907 134,799 Imperial Brands plc 6,031,871 126,516 Smith & Nephew plc 5,599,862 116,323 Aviva plc 25,082,176 111,567 * Standard Chartered plc 16,564,345 105,183 * BT Group plc 55,738,140 100,466 Segro plc 7,613,717 98,794 * Ocado Group plc 3,102,275 97,009 3i Group plc 6,099,717 96,479 * Rentokil Initial plc 11,891,210 82,908 WPP plc 7,585,812 82,200 Halma plc 2,420,919 81,077 __________________________________________________________________________________________________________________________________________________________________________________________________________________________________________________________________________________________________________________________________________________________________________________________________________________________________________________________________________________________________________________________________________________________________________________________________________________________________________________________________________________________ __________________________________________________________________________________________________________________________________________________________________________________________________________________________________________________________________________________________________________________________________________________________________________________________________________________________________________________________________________________________________________________________________________________________________________________________________________________________________________________________________________________________
Intertek Group plc 1,033,876 79,857 * Next plc 813,237 78,418 Croda International plc 863,171 77,625 Persimmon plc 2,027,701 76,531 * InterContinental Hotels Group plc 1,167,327 75,661 * Melrose Industries plc 30,749,188 74,917 Smurfit Kappa Group plc (XLON) 1,578,259 73,999 Mondi plc 3,106,542 72,792 Spirax-Sarco Engineering plc 471,177 72,733 * Rolls-Royce Holdings plc 47,721,790 72,224 Bunzl plc 2,157,032 72,019 * Informa plc 9,558,400 71,472 * Associated British Foods plc 2,221,323 68,583 * Natwest Group plc 29,031,683 66,366 * Burberry Group plc 2,564,125 62,616 *,1 Just Eat Takeaway.com NV (XLON) 553,975 62,321 RSA Insurance Group plc 6,600,601 61,180
59
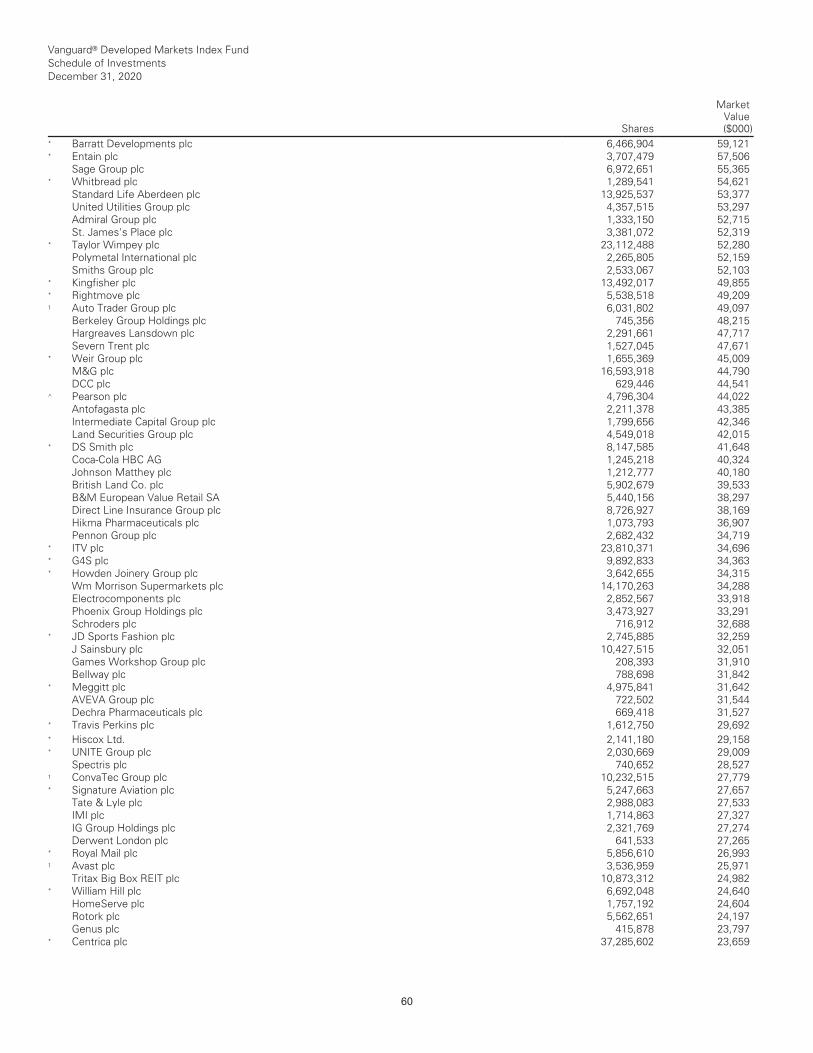
Vanguard® Developed Markets Index Fund Schedule of Investments December 31, 2020
Shares
MarketValue($000)
* Barratt Developments plc 6,466,904 59,121 * Entain plc 3,707,479 57,506 Sage Group plc 6,972,651 55,365 * Whitbread plc 1,289,541 54,621 Standard Life Aberdeen plc 13,925,537 53,377 United Utilities Group plc 4,357,515 53,297 Admiral Group plc 1,333,150 52,715 St. James's Place plc 3,381,072 52,319 * Taylor Wimpey plc 23,112,488 52,280 Polymetal International plc 2,265,805 52,159 Smiths Group plc 2,533,067 52,103 * Kingfisher plc 13,492,017 49,855 * Rightmove plc 5,538,518 49,209 1 Auto Trader Group plc 6,031,802 49,097 Berkeley Group Holdings plc 745,356 48,215 Hargreaves Lansdown plc 2,291,661 47,717 Severn Trent plc 1,527,045 47,671 * Weir Group plc 1,655,369 45,009 M&G plc 16,593,918 44,790 DCC plc 629,446 44,541 ^ Pearson plc 4,796,304 44,022 Antofagasta plc 2,211,378 43,385 Intermediate Capital Group plc 1,799,656 42,346 Land Securities Group plc 4,549,018 42,015 * DS Smith plc 8,147,585 41,648 Coca-Cola HBC AG 1,245,218 40,324 Johnson Matthey plc 1,212,777 40,180 British Land Co. plc 5,902,679 39,533 B&M European Value Retail SA 5,440,156 38,297 Direct Line Insurance Group plc 8,726,927 38,169 Hikma Pharmaceuticals plc 1,073,793 36,907 Pennon Group plc 2,682,432 34,719 * ITV plc 23,810,371 34,696 * G4S plc 9,892,833 34,363 * Howden Joinery Group plc 3,642,655 34,315 Wm Morrison Supermarkets plc 14,170,263 34,288 Electrocomponents plc 2,852,567 33,918 Phoenix Group Holdings plc 3,473,927 33,291 Schroders plc 716,912 32,688 * JD Sports Fashion plc 2,745,885 32,259 J Sainsbury plc 10,427,515 32,051 Games Workshop Group plc 208,393 31,910 Bellway plc 788,698 31,842 * Meggitt plc 4,975,841 31,642 AVEVA Group plc 722,502 31,544 Dechra Pharmaceuticals plc 669,418 31,527 * Travis Perkins plc 1,612,750 29,692 __________________________________________________________________________________________________________________________________________________________________________________________________________________________________________________________________________________________________________________________________________________________________________________________________________________________________________________________________________________________________________________________________________________________________________________________________________________________________________________________________________________________ __________________________________________________________________________________________________________________________________________________________________________________________________________________________________________________________________________________________________________________________________________________________________________________________________________________________________________________________________________________________________________________________________________________________________________________________________________________________________________________________________________________________
* Hiscox Ltd. 2,141,180 29,158 * UNITE Group plc 2,030,669 29,009 Spectris plc 740,652 28,527 1 ConvaTec Group plc 10,232,515 27,779 * Signature Aviation plc 5,247,663 27,657 Tate & Lyle plc 2,988,083 27,533 IMI plc 1,714,863 27,327 IG Group Holdings plc 2,321,769 27,274 Derwent London plc 641,533 27,265 * Royal Mail plc 5,856,610 26,993 1 Avast plc 3,536,959 25,971 Tritax Big Box REIT plc 10,873,312 24,982 * William Hill plc 6,692,048 24,640 HomeServe plc 1,757,192 24,604 Rotork plc 5,562,651 24,197 Genus plc 415,878 23,797 * Centrica plc 37,285,602 23,659
60
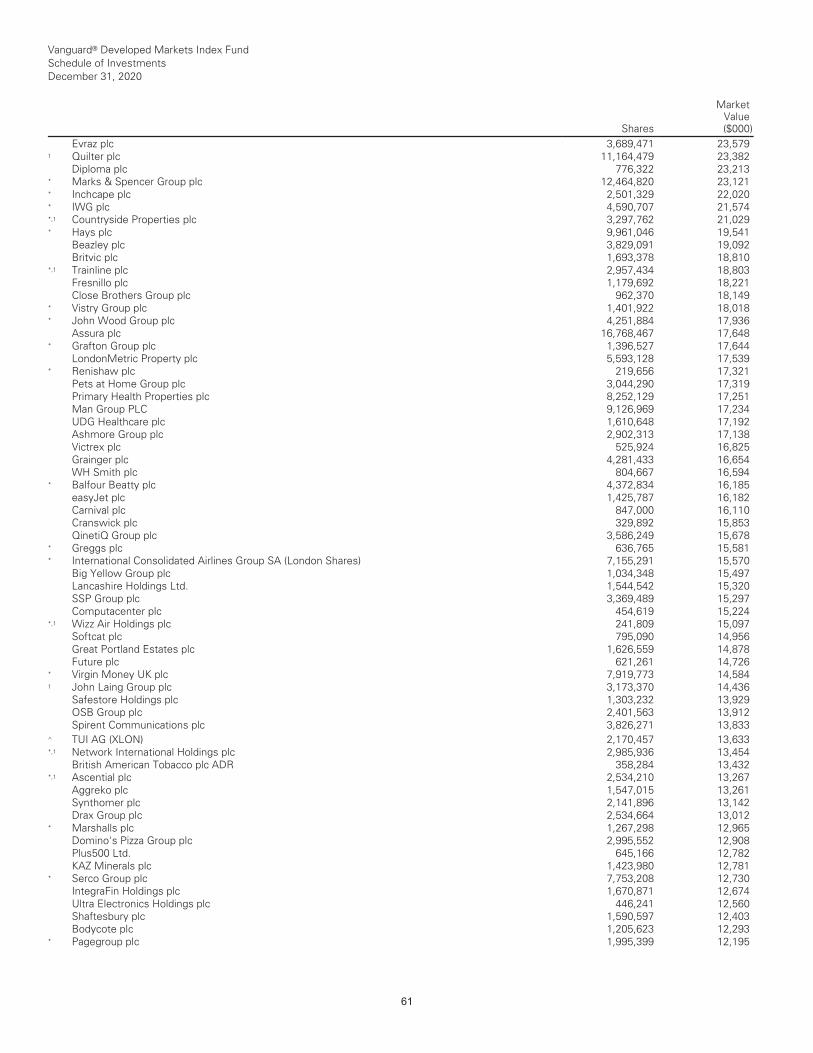
Vanguard® Developed Markets Index Fund Schedule of Investments December 31, 2020
Shares
MarketValue($000)
Evraz plc 3,689,471 23,579 1 Quilter plc 11,164,479 23,382 Diploma plc 776,322 23,213 * Marks & Spencer Group plc 12,464,820 23,121 * Inchcape plc 2,501,329 22,020 * IWG plc 4,590,707 21,574 *,1 Countryside Properties plc 3,297,762 21,029 * Hays plc 9,961,046 19,541 Beazley plc 3,829,091 19,092 Britvic plc 1,693,378 18,810 *,1 Trainline plc 2,957,434 18,803 Fresnillo plc 1,179,692 18,221 Close Brothers Group plc 962,370 18,149 * Vistry Group plc 1,401,922 18,018 * John Wood Group plc 4,251,884 17,936 Assura plc 16,768,467 17,648 * Grafton Group plc 1,396,527 17,644 LondonMetric Property plc 5,593,128 17,539 * Renishaw plc 219,656 17,321 Pets at Home Group plc 3,044,290 17,319 Primary Health Properties plc 8,252,129 17,251 Man Group PLC 9,126,969 17,234 UDG Healthcare plc 1,610,648 17,192 Ashmore Group plc 2,902,313 17,138 Victrex plc 525,924 16,825 Grainger plc 4,281,433 16,654 WH Smith plc 804,667 16,594 * Balfour Beatty plc 4,372,834 16,185 easyJet plc 1,425,787 16,182 Carnival plc 847,000 16,110 Cranswick plc 329,892 15,853 QinetiQ Group plc 3,586,249 15,678 * Greggs plc 636,765 15,581 * International Consolidated Airlines Group SA (London Shares) 7,155,291 15,570 Big Yellow Group plc 1,034,348 15,497 Lancashire Holdings Ltd. 1,544,542 15,320 SSP Group plc 3,369,489 15,297 Computacenter plc 454,619 15,224 *,1 Wizz Air Holdings plc 241,809 15,097 Softcat plc 795,090 14,956 Great Portland Estates plc 1,626,559 14,878 Future plc 621,261 14,726 * Virgin Money UK plc 7,919,773 14,584 1 John Laing Group plc 3,173,370 14,436 Safestore Holdings plc 1,303,232 13,929 OSB Group plc 2,401,563 13,912 Spirent Communications plc 3,826,271 13,833 __________________________________________________________________________________________________________________________________________________________________________________________________________________________________________________________________________________________________________________________________________________________________________________________________________________________________________________________________________________________________________________________________________________________________________________________________________________________________________________________________________________________ __________________________________________________________________________________________________________________________________________________________________________________________________________________________________________________________________________________________________________________________________________________________________________________________________________________________________________________________________________________________________________________________________________________________________________________________________________________________________________________________________________________________
^ TUI AG (XLON) 2,170,457 13,633 *,1 Network International Holdings plc 2,985,936 13,454 British American Tobacco plc ADR 358,284 13,432 *,1 Ascential plc 2,534,210 13,267 Aggreko plc 1,547,015 13,261 Synthomer plc 2,141,896 13,142 Drax Group plc 2,534,664 13,012 * Marshalls plc 1,267,298 12,965 Domino's Pizza Group plc 2,995,552 12,908 Plus500 Ltd. 645,166 12,782 KAZ Minerals plc 1,423,980 12,781 * Serco Group plc 7,753,208 12,730 IntegraFin Holdings plc 1,670,871 12,674 Ultra Electronics Holdings plc 446,241 12,560 Shaftesbury plc 1,590,597 12,403 Bodycote plc 1,205,623 12,293 * Pagegroup plc 1,995,399 12,195
61

Vanguard® Developed Markets Index Fund Schedule of Investments December 31, 2020
Shares
MarketValue($000)
Moneysupermarket.com Group plc 3,329,556 11,892 TP ICAP plc 3,626,846 11,793 Centamin plc 6,947,126 11,760 * Redrow plc 1,464,051 11,421 * Polypipe Group plc 1,381,516 11,280 * National Express Group plc 3,467,747 11,261 * Savills plc 851,720 11,114 AJ Bell plc 1,838,863 10,916 Investec plc 4,237,066 10,889 Jupiter Fund Management plc 2,788,864 10,781 Paragon Banking Group plc 1,605,225 10,759 * Playtech plc 1,934,473 10,627 * Cairn Energy plc 3,701,294 10,613 *,^,1 Aston Martin Lagonda Global Holdings plc 384,525 10,583 * Micro Focus International plc 1,818,343 10,462 * Dunelm Group plc 625,400 10,355 * Dixons Carphone plc 6,480,772 10,276 * AO World plc 1,811,666 10,218 Euromoney Institutional Investor plc 684,613 10,003 Vesuvius plc 1,350,714 9,880 Hill & Smith Holdings plc 508,885 9,813 * Mediclinic International plc 2,520,804 9,739 Capital & Counties Properties plc 4,722,001 9,386 * Oxford Instruments plc 341,839 9,330 Daily Mail & General Trust plc 902,240 9,155 ^ RHI Magnesita NV 188,827 9,050 Workspace Group plc 858,465 9,037 * Petropavlovsk plc 19,263,207 8,545 FDM Group Holdings plc 550,626 8,511 * Coats Group plc 9,166,727 8,446 ^ Hammerson plc 24,686,451 8,356 * Essentra plc 1,916,528 8,044 Telecom Plus plc 405,249 7,935 *,1 Watches of Switzerland Group plc 1,001,670 7,934 Sirius Real Estate Ltd. 6,149,934 7,878 Avon Rubber plc 182,135 7,870 * Firstgroup plc 7,722,004 7,852 * J D Wetherspoon plc 511,823 7,830 Gamesys Group plc 502,834 7,828 Brewin Dolphin Holdings plc 1,872,011 7,792 Rathbone Brothers plc 368,174 7,749 Morgan Advanced Materials plc 1,796,528 7,651 Sanne Group plc 879,786 7,412 * Frasers Group plc 1,190,910 7,334 Ferrexpo plc 1,844,541 7,109 *,1 Ibstock plc 2,507,432 7,074 Chemring Group plc 1,806,889 7,035 __________________________________________________________________________________________________________________________________________________________________________________________________________________________________________________________________________________________________________________________________________________________________________________________________________________________________________________________________________________________________________________________________________________________________________________________________________________________________________________________________________________________ __________________________________________________________________________________________________________________________________________________________________________________________________________________________________________________________________________________________________________________________________________________________________________________________________________________________________________________________________________________________________________________________________________________________________________________________________________________________________________________________________________________________
* Crest Nicholson Holdings plc 1,576,366 7,029 * Indivior plc 4,688,303 6,973 * Provident Financial plc 1,634,539 6,849 1 Airtel Africa plc 6,571,133 6,777 888 Holdings plc 1,695,704 6,637 * Vectura Group plc 3,829,153 6,513 Ninety One plc 2,054,447 6,509 * Just Group plc 6,638,676 6,394 * Energean plc 636,769 6,260 St. Modwen Properties plc 1,139,187 6,259 * Babcock International Group plc 1,612,665 6,162 Kainos Group plc 354,308 5,913 Clarkson plc 159,048 5,869 * Elementis plc 3,717,000 5,835 NCC Group plc 1,663,206 5,764 Redde Northgate plc 1,567,298 5,715 * Capita plc 10,594,568 5,677
62

Vanguard® Developed Markets Index Fund Schedule of Investments December 31, 2020
Shares
MarketValue($000)
*,^ Cineworld Group plc 6,435,039 5,663 * Bytes Technology Group plc 1,230,599 5,638 TalkTalk Telecom Group plc 4,218,524 5,631 *,1 McCarthy & Stone plc 3,423,292 5,623 *,1 TI Fluid Systems plc 1,456,145 4,882 * Mitchells & Butlers plc 1,392,673 4,591 Greencore Group plc 2,867,042 4,570 * Halfords Group plc 1,248,894 4,570 UK Commercial Property REIT Ltd. 4,740,635 4,488 Hochschild Mining plc 1,569,558 4,473 Keller Group plc 453,413 4,320 * Marston's plc 4,068,969 4,201 * Mitie Group plc 7,388,646 4,156 * Bank of Georgia Group plc 241,942 4,052 *,1 Spire Healthcare Group plc 1,815,196 3,883 * TBC Bank Group plc 223,083 3,806 * AG Barr plc 533,397 3,781 1 CMC Markets plc 701,726 3,773 PZ Cussons plc 1,191,777 3,747 * Go-Ahead Group plc 276,307 3,736 BMO Commercial Property Trust Ltd. 3,360,495 3,675 Picton Property Income Ltd. 3,544,845 3,640 *,^ Tullow Oil plc 8,811,685 3,556 GoCo Group plc 1,906,078 3,374 Helical plc 649,566 3,324 * Senior plc 2,657,083 3,244 *,1 Equiniti Group plc 2,107,845 3,184 * Petrofac Ltd. 1,673,428 3,153 *,^ Calisen plc 885,034 3,120 * Restaurant Group plc 3,530,839 3,111 Hunting plc 918,020 2,790 Stagecoach Group plc 2,611,043 2,632 Devro plc 1,088,275 2,282 Redefine International plc 1,669,839 2,176 Rank Group plc 1,100,289 2,098 * SIG plc 4,218,154 1,817 * Premier Oil plc 5,708,235 1,520 * Micro Focus International plc ADR 264,847 1,512 Smurfit Kappa Group plc (XDUB) 28,206 1,318 *,^,1 Funding Circle Holdings plc 887,565 1,087 *,1 Bakkavor Group plc 977,341 1,083 1 Alfa Financial Software Holdings plc 562,101 1,015 * C&C Group plc (XLON) 90,929 283 *,§,1 Finablr plc 1,120,022 169 *,^,§ Intu Properties plc 5,470,032 133 Glanbia plc (XLON) 771 10 *,§ Carillion plc 2,500,529 — __________________________________________________________________________________________________________________________________________________________________________________________________________________________________________________________________________________________________________________________________________________________________________________________________________________________________________________________________________________________________________________________________________________________________________________________________________________________________________________________________________________________ __________________________________________________________________________________________________________________________________________________________________________________________________________________________________________________________________________________________________________________________________________________________________________________________________________________________________________________________________________________________________________________________________________________________________________________________________________________________________________________________________________________________
*,§ NMC Health plc 510,606 — ___________ 17,220,042 __________________________________________________________________________________________________________________________________________________________________________________________________________________________________________________________________________________________________________________________________________________________________________________________________________________________________________________________________________________________________________________________________________________________________________________________________________________________________________________________________________________________ __________________________________________________________________________________________________________________________________________________________________________________________________________________________________________________________________________________________________________________________________________________________________________________________________________________________________________________________________________________________________________________________________________________________________________________________________________________________________________________________________________________________
Total Common Stocks (Cost $109,834,055) 136,889,349 __________________________________________________________________________________________________________________________________________________________________________________________________________________________________________________________________________________________________________________________________________________________________________________________________________________________________________________________________________________________________________________________________________________________________________________________________________________________________________________________________________________________ __________________________________________________________________________________________________________________________________________________________________________________________________________________________________________________________________________________________________________________________________________________________________________________________________________________________________________________________________________________________________________________________________________________________________________________________________________________________________________________________________________________________
Coupon __________________________________________________________________________________________________________________________________________________________________________________________________________________________________________________________________________________________________________________________________________________________________________________________________________________________________________________________________________________________________________________________________________________________________________________________________________________________________________________________________________________________ __________________________________________________________________________________________________________________________________________________________________________________________________________________________________________________________________________________________________________________________________________________________________________________________________________________________________________________________________________________________________________________________________________________________________________________________________________________________________________________________________________________________
Temporary Cash Investments (1.9%) __________________________________________________________________________________________________________________________________________________________________________________________________________________________________________________________________________________________________________________________________________________________________________________________________________________________________________________________________________________________________________________________________________________________________________________________________________________________________________________________________________________________ __________________________________________________________________________________________________________________________________________________________________________________________________________________________________________________________________________________________________________________________________________________________________________________________________________________________________________________________________________________________________________________________________________________________________________________________________________________________________________________________________________________________
Money Market Fund (1.9%)
2,3 Vanguard Market Liquidity Fund 0.111% 25,639,844 2,563,985
Maturity
Date
FaceAmount
($000) __________________________________________________________________________________________________________________________________________________________________________________________________________________________________________________________________________________________________________________________________________________________________________________________________________________________________________________________________________________________________________________________________________________________________________________________________________________________________________________________________________________________ __________________________________________________________________________________________________________________________________________________________________________________________________________________________________________________________________________________________________________________________________________________________________________________________________________________________________________________________________________________________________________________________________________________________________________________________________________________________________________________________________________________________
U.S. Government and Agency Obligations (0.0%)
4 United States Treasury Bill 0.095% 1/28/21 42,876 42,874
63
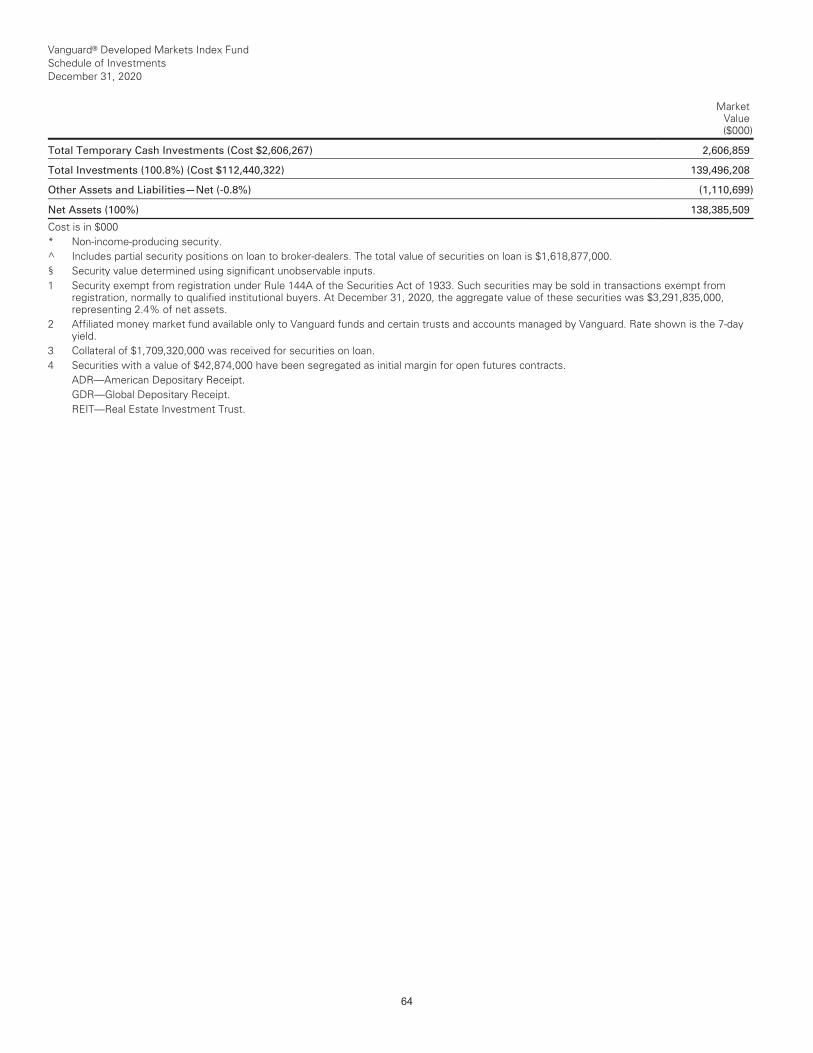
Vanguard® Developed Markets Index Fund Schedule of Investments December 31, 2020
__________________________________________________________________________________________________________________________________________________________________________________________________________________________________________________________________________________________________________________________________________________________________________________________________________________________________________________________________________________________________________________________________________________________________________________________________________________________________________________________________________________________ __________________________________________________________________________________________________________________________________________________________________________________________________________________________________________________________________________________________________________________________________________________________________________________________________________________________________________________________________________________________________________________________________________________________________________________________________________________________________________________________________________________________
MarketValue($000)
Total Temporary Cash Investments (Cost $2,606,267) 2,606,859 __________________________________________________________________________________________________________________________________________________________________________________________________________________________________________________________________________________________________________________________________________________________________________________________________________________________________________________________________________________________________________________________________________________________________________________________________________________________________________________________________________________________ __________________________________________________________________________________________________________________________________________________________________________________________________________________________________________________________________________________________________________________________________________________________________________________________________________________________________________________________________________________________________________________________________________________________________________________________________________________________________________________________________________________________
Total Investments (100.8%) (Cost $112,440,322) 139,496,208 __________________________________________________________________________________________________________________________________________________________________________________________________________________________________________________________________________________________________________________________________________________________________________________________________________________________________________________________________________________________________________________________________________________________________________________________________________________________________________________________________________________________ __________________________________________________________________________________________________________________________________________________________________________________________________________________________________________________________________________________________________________________________________________________________________________________________________________________________________________________________________________________________________________________________________________________________________________________________________________________________________________________________________________________________
Other Assets and Liabilities—Net (-0.8%) (1,110,699) __________________________________________________________________________________________________________________________________________________________________________________________________________________________________________________________________________________________________________________________________________________________________________________________________________________________________________________________________________________________________________________________________________________________________________________________________________________________________________________________________________________________ __________________________________________________________________________________________________________________________________________________________________________________________________________________________________________________________________________________________________________________________________________________________________________________________________________________________________________________________________________________________________________________________________________________________________________________________________________________________________________________________________________________________
Net Assets (100%) 138,385,509 __________________________________________________________________________________________________________________________________________________________________________________________________________________________________________________________________________________________________________________________________________________________________________________________________________________________________________________________________________________________________________________________________________________________________________________________________________________________________________________________________________________________ __________________________________________________________________________________________________________________________________________________________________________________________________________________________________________________________________________________________________________________________________________________________________________________________________________________________________________________________________________________________________________________________________________________________________________________________________________________________________________________________________________________________
Cost is in $000 * Non-income-producing security. ^ Includes partial security positions on loan to broker-dealers. The total value of securities on loan is $1,618,877,000. § Security value determined using significant unobservable inputs. 1 Security exempt from registration under Rule 144A of the Securities Act of 1933. Such securities may be sold in transactions exempt from
registration, normally to qualified institutional buyers. At December 31, 2020, the aggregate value of these securities was $3,291,835,000, representing 2.4% of net assets.
2 Affiliated money market fund available only to Vanguard funds and certain trusts and accounts managed by Vanguard. Rate shown is the 7-day yield.
3 Collateral of $1,709,320,000 was received for securities on loan. 4 Securities with a value of $42,874,000 have been segregated as initial margin for open futures contracts. ADR—American Depositary Receipt. GDR—Global Depositary Receipt. REIT—Real Estate Investment Trust.
64

This page intentionally left blank.

© 2021 The Vanguard Group, Inc. All rights reserved. Vanguard Marketing Corporation, Distributor. SNA1270 022021