tube investments buy - iifl capital
TRANSCRIPT
CMP Rs606
Target 12m Rs680 (12%)
Market cap (US$ m) 1,544
Enterprise value (US$ m) 1,580
Bloomberg TIINDIA IN
Sector Metals
1 October 2020
52Wk High/Low (Rs) 682/254
Shares o/s (m) 188
Daily volume (US$ m) 1
Dividend yield FY21ii (%) 0.7
Free float (%) 52.1
Shareholding pattern (%) Promoter 47.9 Pledged (as % of promoter share) 0.0
FII 18.2
DII 20.6
Price performance (%)
1M 3M 1Y
Tube Investments
(6.4) 36.4 57.8
Absolute (US$) (5.9) 39.6 52.7
Rel.to BSE Midcap
(6.7) 23.8 53.6
CAGR (%) 3 yrs 5 yrs
EPS 24.2 (12.5)
Stock movement
Anupam Gupta [email protected] 91 22 4646 4641
Urvil Bhatt, CFA [email protected] 91 22 4646 4648
www.iiflcap.com
www.iiflcap.com
0
200
400
600
800
0
1,000
2,000
3,000
Sep
-18
No
v-1
8Ja
n-1
9M
ar-1
9M
ay-1
9Ju
l-1
9Se
p-1
9N
ov-
19
Jan
-20
Mar
-20
May
-20
Jul-
20
Sep
-20
Vol('000, LHS) Price (Rs., RHS)
Leveraging manufacturing expertise
Tube Investments BUY BUY
1
Financial summary (Rs m)
Y/e 31 Mar, Consolidated FY19A FY20A FY21ii FY22ii FY23ii
Revenues (Rs m) 57,748 47,504 34,848 45,846 53,193
Ebitda margins (%) 9.4 12.2 11.7 13.3 13.9
Pre-exceptional PAT (Rs m) 2,478 3,352 1,896 3,350 4,271
Reported PAT (Rs m) 2,508 3,133 1,746 3,350 4,271
Pre-exceptional EPS (Rs) 13.2 17.8 10.1 17.8 22.7
Growth (%) 55.9 35.1 (43.5) 76.7 27.5
PER (x) 45.9 34.0 60.1 34.0 26.7
ROE (%) 18.0 20.9 10.7 17.2 19.0
Net debt/equity (x) 0.3 0.1 0.1 (0.1) (0.2)
EV/Ebitda (x) 21.9 20.1 28.5 18.6 14.9
Price/book (x) 7.7 6.6 6.2 5.5 4.7
OCF/Ebitda (x) 0.8 1.0 0.8 1.0 0.8
Source: Company, IIFL Research. Price as at close of business on 30 September 2020.
We initiate coverage on Tube Investments of India (TI) with
a BUY and TP of Rs680. TI is leveraging its manufacturing and
R&D expertise to maintain leadership as tier-2 auto
component supplier as well as to grow the non-auto, exports
and railways businesses. The ingrained focus on growth,
profitability, RoCE and cash generation is visible in the
company’s financials with ROE improving to 19% in FY20.
Recent announcement for acquisition of 58.6% stake in CG
Power will drive further diversification away from autos, as
capital support and mfg. expertise drive a turnaround.
Strong play on recovery in the domestic auto market: TI is a
leading tier-2 vendor for domestic auto OEMs. 55% of its
revenue/Ebit share is backed by strong quality & service levels, deep
integration in manufacturing with OEMs, well-spread manufacturing
facilities and importantly resilient customer relationships. As auto
volumes for 2Ws, PVs and tractors recover, TI is well placed to
benefit as the supplier to majority of the auto makers in India.
Non-auto segments also seeing healthy traction: TI’s intent to
lower exposure to auto cyclicality is playing out, as rise in exports’
share (15% in FY20) gains pace, with focus on product development
for global auto & industrial customers. The outlook is strong for rail
section supplies for coach building, despite near-term hiccups. The
large-diameter tubes segment, driven by import substitution, should
see healthy growth as demand revives in FY22-23.
Opening a new chapter with CG Power acquisition: TI will soon
complete the Rs8bn investment for 58.58% stake in CG Power. While
businesses are distinct, TI plans to leverage its manufacturing and
R&D capabilities and provide the much-needed capital for turning
around operations. If this ensues as planned, it will significantly lower
share of auto, and possibly open-up B2C segments around motors.
Fairly valued at CMP; upsides on stronger delivery: Adjusted for
value of CG Power, the stock trades at 26x FY22 PER which we believe
is fair. Faster than expected recovery in core businesses and quick
turnaround of CG Power will drive upsides and rerating.
Tube Investments of India – BUY
Company Snapshot
As part of the large and diversified Murugappa Group, Tube
Investment Holdings (TI) is a manufacturing company with a strong
established franchise across the auto and industrial sectors in India
and overseas. The company has been in business since 1959,
continuously building on its growing engineering prowess. It came
into its current form in FY17, post restructuring, wherein the
financial service business was segregated into TI Financial Holdings.
The company operates across three business segments (Engineering,
Metal Formed Products and Cycles) in the standalone entity and
holds 70% in Shanti Gears, which sells gears to industrial customers.
It is in the process of acquiring 58.58% stake (post warrant
conversion) in CG Power & Industrial Systems, which is a strong
player in motors, railway systems and transformers/switchgears.
Figure 1: Summary of Consolidated business segments
FY20 (Rs m) Engineering Metal formed Cycles Gears Consolidated
Net Sales 22,582 16,348 7,812 2,416 47,504
Share of total 44% 34% 16% 5%
PBIT 2,644 1,160 224 327 3,932
PBIT margin 11.7% 7.1% 2.9% 13.5% 8.2%
Share of total 58% 25% 5% 6%
Capital Employed 6,390 6,215 1,755 2,245 18,753
RoCE 41.4% 18.7% 12.7% 14.6% 20.4%
Source: Company, IIFL Research
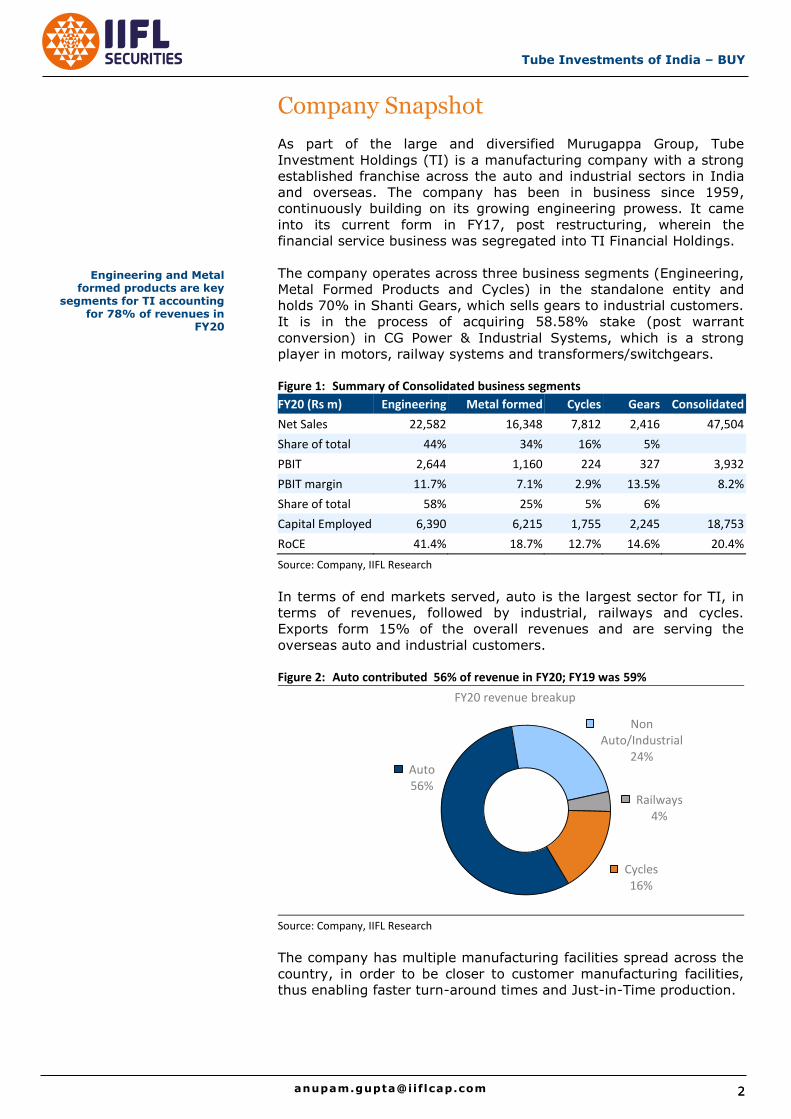
In terms of end markets served, auto is the largest sector for TI, in
terms of revenues, followed by industrial, railways and cycles.
Exports form 15% of the overall revenues and are serving the
overseas auto and industrial customers.
Figure 2: Auto contributed 56% of revenue in FY20; FY19 was 59%
Source: Company, IIFL Research
The company has multiple manufacturing facilities spread across the
country, in order to be closer to customer manufacturing facilities,
thus enabling faster turn-around times and Just-in-Time production.
Auto 56%
Non Auto/Industrial
24%
Railways 4%
Cycles 16%
FY20 revenue breakup
Engineering and Metal formed products are key
segments for TI accounting for 78% of revenues in
FY20

3
Tube Investments of India - BUY
Figure 3: Manufacturing presence
Source: Company, IIFL Research. TPI – Tube products of India (Engineering segment), TICI – TI Cycles of India, MFPD – Metal formed product division
Figure 4: Tube Investments of India – Major milestones
Year Major milestones
1949 TI Cycles of India established in collaboration with Tube Investments, UK
1959 Tube Products of India merged with TI Cycles of India to form Tube Investments of India
1960 TI Diamond Chains (TIDC) formed in collaboration with Diamond Chains USA
1965 TI Metal Forming was established as a division of Tube Investments
1969 TI Diamond Chains diversifies into industrial chains
1975 TIDC diversifies into heavy duty chains
1985 Diversification into engineering class chains and mfg. of bike chains
1990 Acquisition of Press Metal Corporation
1995 Setup of the fine blanking division for the auto sector
1996 Indigenously designed tube plant setup near Pune
1998 Sets-up new facility to make car door frames near Gurgaon
2001 Cycle manufacturing plant set up at Nashik, entry into financial services by purchasing 41.8% stake in Cholamandalam Investments and Finance
2004 TI Diamond Chains merged with TI India; metal forming division sets up mfg. facility in Gujarat for making door frames
2006 Hydro forming facility commissioned near Chennai to supply auto components
2010 Commissioned new plant at Sanand, Gujarat and Laksar, Uttarakhand
2017 Demerger of Tube Investment of India with the financial business into TI Financial Holdings
2019 New facility established at Rajpura, Punjab for high strength tubes and telescopic front fork products
2020 Made binding bid for acquisition of 58.58% stake in CG Power & Industrial Systems at Rs8bn
Source: Company, IIFL Research
Punjab (3) – Mohali & Rajpura Uttarakhand (2)
Haryana (1) - Bawal
Gujarat (1) –Sanand
Maharashtra (2) – Shirwal& Pune
Tamil Nadu (8)
Telengana (1) - Medak
TPI
TICI
MFPD
Tube Investments of India – BUY
Management structure
Post the restructuring in FY17 and following the appointment of
Vellayan Subbiah as the Managing Director a couple of years ago,
the company has adopted a differentiated management structure.
Each individual business has an independent operating CEO, apart
from the MD and Group CFO. And each business is separately
tracked on the key metrics of revenue growth, PBT margin, RoCE
and FCF/PAT. The company has created 18 business units within the
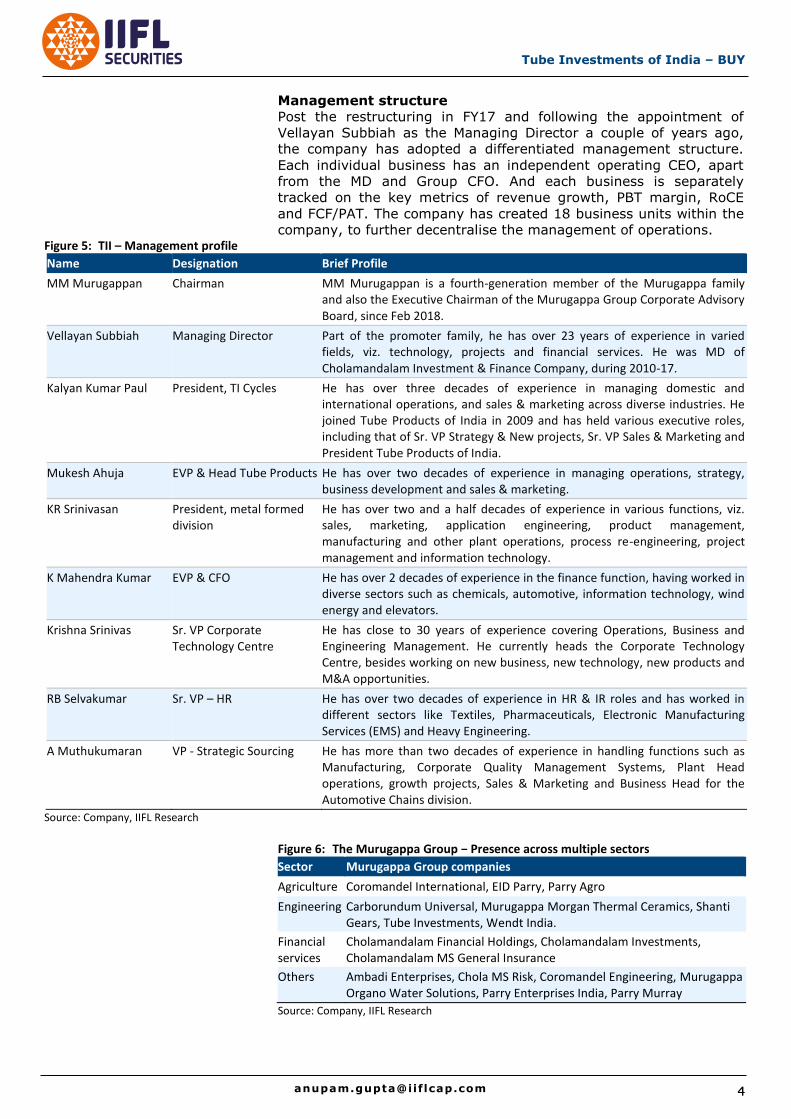
company, to further decentralise the management of operations. Figure 5: TII – Management profile
Name Designation Brief Profile
MM Murugappan Chairman MM Murugappan is a fourth-generation member of the Murugappa family and also the Executive Chairman of the Murugappa Group Corporate Advisory Board, since Feb 2018.
Vellayan Subbiah Managing Director Part of the promoter family, he has over 23 years of experience in varied fields, viz. technology, projects and financial services. He was MD of Cholamandalam Investment & Finance Company, during 2010-17.
Kalyan Kumar Paul President, TI Cycles He has over three decades of experience in managing domestic and international operations, and sales & marketing across diverse industries. He joined Tube Products of India in 2009 and has held various executive roles, including that of Sr. VP Strategy & New projects, Sr. VP Sales & Marketing and President Tube Products of India.
Mukesh Ahuja EVP & Head Tube Products He has over two decades of experience in managing operations, strategy, business development and sales & marketing.
KR Srinivasan President, metal formed division
He has over two and a half decades of experience in various functions, viz. sales, marketing, application engineering, product management, manufacturing and other plant operations, process re-engineering, project management and information technology.
K Mahendra Kumar EVP & CFO He has over 2 decades of experience in the finance function, having worked in diverse sectors such as chemicals, automotive, information technology, wind energy and elevators.
Krishna Srinivas Sr. VP Corporate Technology Centre
He has close to 30 years of experience covering Operations, Business and Engineering Management. He currently heads the Corporate Technology Centre, besides working on new business, new technology, new products and M&A opportunities.
RB Selvakumar Sr. VP – HR He has over two decades of experience in HR & IR roles and has worked in different sectors like Textiles, Pharmaceuticals, Electronic Manufacturing Services (EMS) and Heavy Engineering.
A Muthukumaran VP - Strategic Sourcing He has more than two decades of experience in handling functions such as Manufacturing, Corporate Quality Management Systems, Plant Head operations, growth projects, Sales & Marketing and Business Head for the Automotive Chains division.
Source: Company, IIFL Research
Figure 6: The Murugappa Group − Presence across multiple sectors
Sector Murugappa Group companies
Agriculture Coromandel International, EID Parry, Parry Agro
Engineering Carborundum Universal, Murugappa Morgan Thermal Ceramics, Shanti Gears, Tube Investments, Wendt India.
Financial services
Cholamandalam Financial Holdings, Cholamandalam Investments, Cholamandalam MS General Insurance
Others Ambadi Enterprises, Chola MS Risk, Coromandel Engineering, Murugappa Organo Water Solutions, Parry Enterprises India, Parry Murray
Source: Company, IIFL Research
5
Tube Investments of India - BUY
Figure 7: Murugappa Group – FY20 revenue and Ebitda contribution by companies
Source: Company, IIFL Research
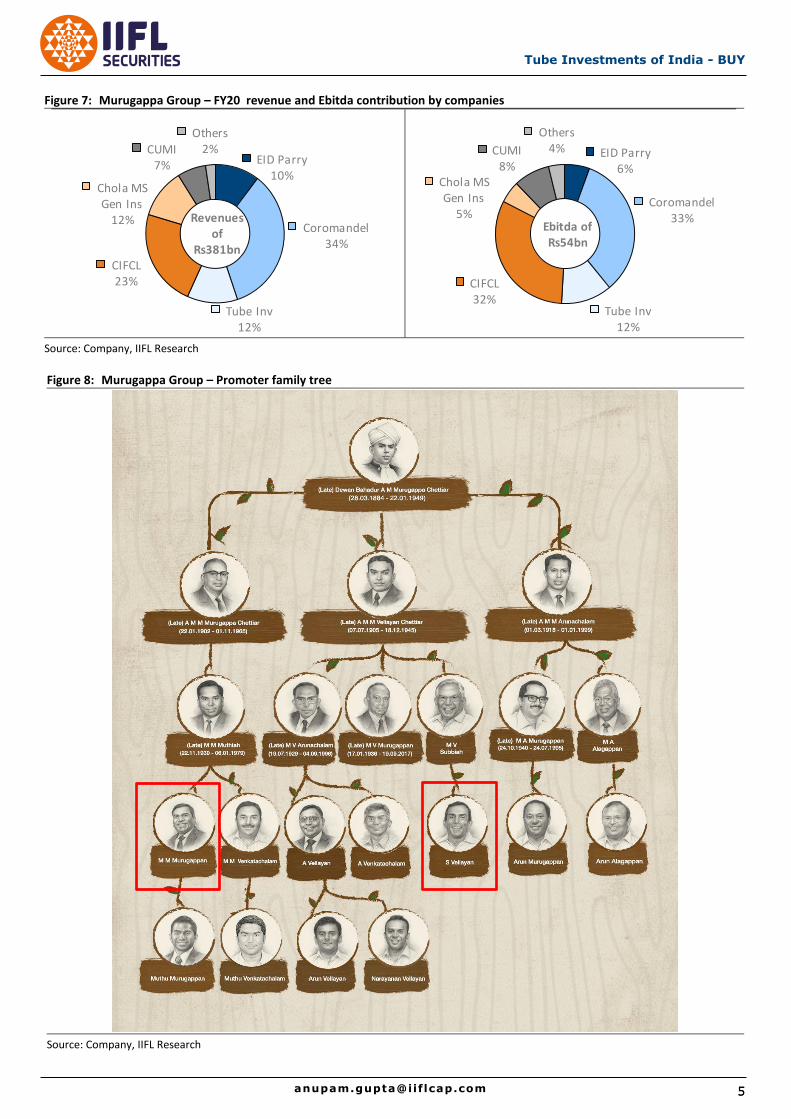
Figure 8: Murugappa Group – Promoter family tree
Source: Company, IIFL Research
EID Parry10%
Coromandel34%
Tube Inv12%
CIFCL23%
Chola MS Gen Ins
12%
CUMI7%
Others2%
Revenuesof
Rs381bn
EID Parry6%
Coromandel33%
Tube Inv12%
CIFCL32%
Chola MS Gen Ins
5%
CUMI8%
Others4%
Ebitda ofRs54bn
Tube Investments of India – BUY
Ingrained objectives driving improvement
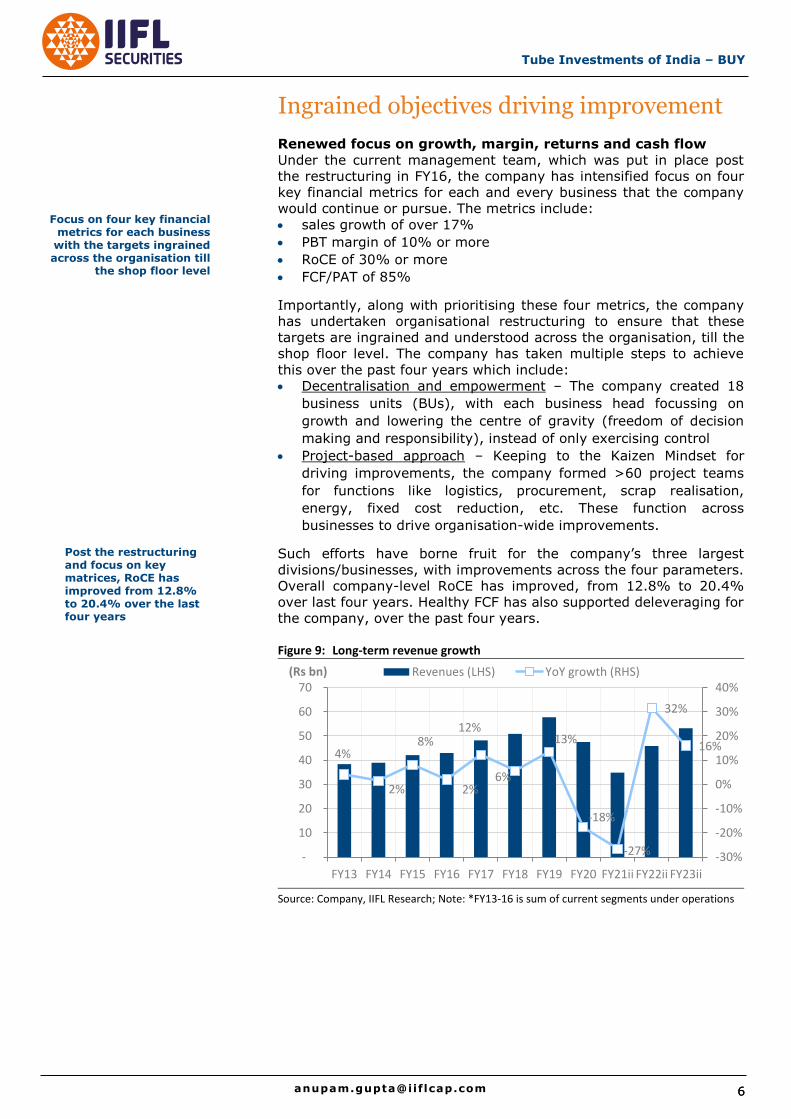
Renewed focus on growth, margin, returns and cash flow
Under the current management team, which was put in place post
the restructuring in FY16, the company has intensified focus on four
key financial metrics for each and every business that the company
would continue or pursue. The metrics include:
sales growth of over 17%
PBT margin of 10% or more
RoCE of 30% or more
FCF/PAT of 85%
Importantly, along with prioritising these four metrics, the company
has undertaken organisational restructuring to ensure that these
targets are ingrained and understood across the organisation, till the
shop floor level. The company has taken multiple steps to achieve
this over the past four years which include:
Decentralisation and empowerment – The company created 18
business units (BUs), with each business head focussing on
growth and lowering the centre of gravity (freedom of decision
making and responsibility), instead of only exercising control
Project-based approach – Keeping to the Kaizen Mindset for
driving improvements, the company formed >60 project teams
for functions like logistics, procurement, scrap realisation,
energy, fixed cost reduction, etc. These function across
businesses to drive organisation-wide improvements.
Such efforts have borne fruit for the company’s three largest
divisions/businesses, with improvements across the four parameters.
Overall company-level RoCE has improved, from 12.8% to 20.4%
over last four years. Healthy FCF has also supported deleveraging for
the company, over the past four years.
Figure 9: Long-term revenue growth
Source: Company, IIFL Research; Note: *FY13-16 is sum of current segments under operations
4%
2%
8%
2%
12%
6%
13%
-18%
-27%
32%
16%
-30%
-20%
-10%
0%
10%
20%
30%
40%
-
10
20
30
40
50
60
70
FY13 FY14 FY15 FY16 FY17 FY18 FY19 FY20 FY21ii FY22ii FY23ii
(Rs bn) Revenues (LHS) YoY growth (RHS)
Focus on four key financial metrics for each business
with the targets ingrained across the organisation till
the shop floor level
Post the restructuring and focus on key matrices, RoCE has improved from 12.8% to 20.4% over the last four years
7
Tube Investments of India - BUY
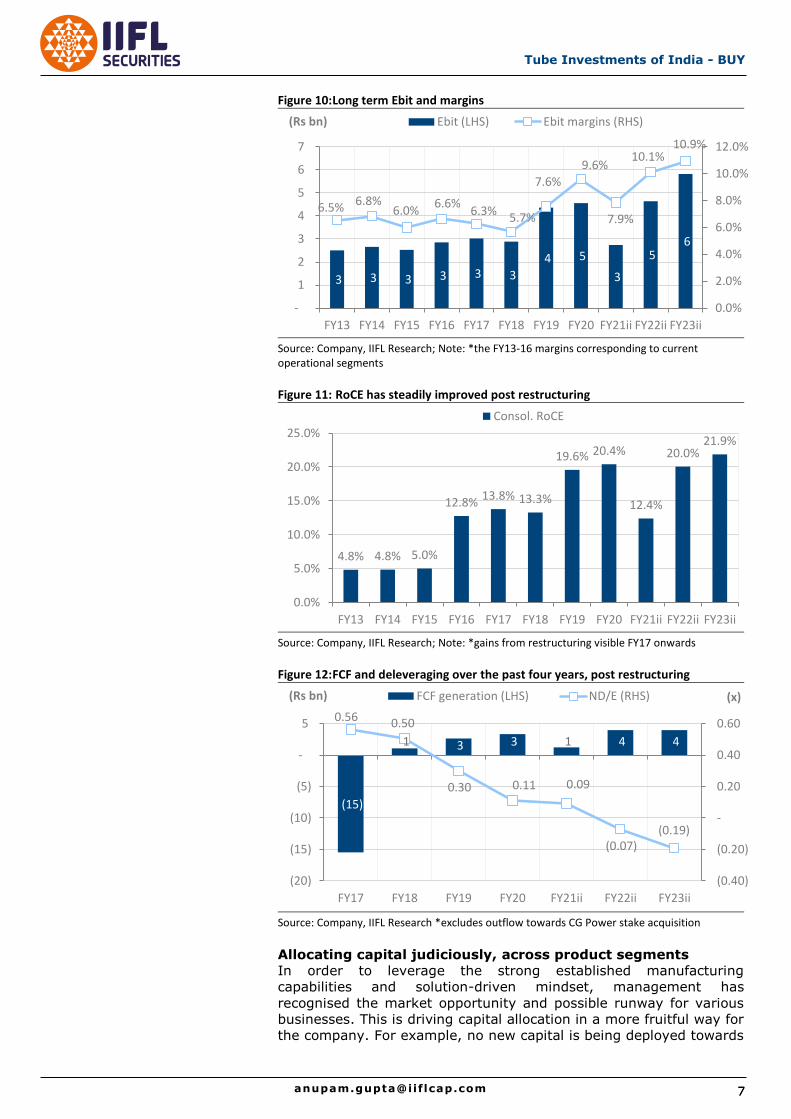
Figure 10: Long term Ebit and margins
Source: Company, IIFL Research; Note: *the FY13-16 margins corresponding to current operational segments
Figure 11: RoCE has steadily improved post restructuring
Source: Company, IIFL Research; Note: *gains from restructuring visible FY17 onwards
Figure 12: FCF and deleveraging over the past four years, post restructuring
Source: Company, IIFL Research *excludes outflow towards CG Power stake acquisition
Allocating capital judiciously, across product segments
In order to leverage the strong established manufacturing
capabilities and solution-driven mindset, management has
recognised the market opportunity and possible runway for various
businesses. This is driving capital allocation in a more fruitful way for
the company. For example, no new capital is being deployed towards
3 3 3 3 3 3
4 5
3
5 6
6.5% 6.8%
6.0% 6.6%
6.3% 5.7%
7.6%
9.6%
7.9%
10.1% 10.9%
0.0%
2.0%
4.0%
6.0%
8.0%
10.0%
12.0%
-
1
2
3
4
5
6
7
FY13 FY14 FY15 FY16 FY17 FY18 FY19 FY20 FY21ii FY22ii FY23ii
(Rs bn) Ebit (LHS) Ebit margins (RHS)
4.8% 4.8% 5.0%
12.8% 13.8% 13.3%
19.6% 20.4%
12.4%
20.0% 21.9%
0.0%
5.0%
10.0%
15.0%
20.0%
25.0%
FY13 FY14 FY15 FY16 FY17 FY18 FY19 FY20 FY21ii FY22ii FY23ii
Consol. RoCE
(15)
1 3 3 1 4 4
0.56 0.50
0.30 0.11 0.09
(0.07) (0.19)
(0.40)
(0.20)
-
0.20
0.40
0.60
(20)
(15)
(10)
(5)
-
5
FY17 FY18 FY19 FY20 FY21ii FY22ii FY23ii
(x) (Rs bn) FCF generation (LHS) ND/E (RHS)
Tube Investments of India – BUY
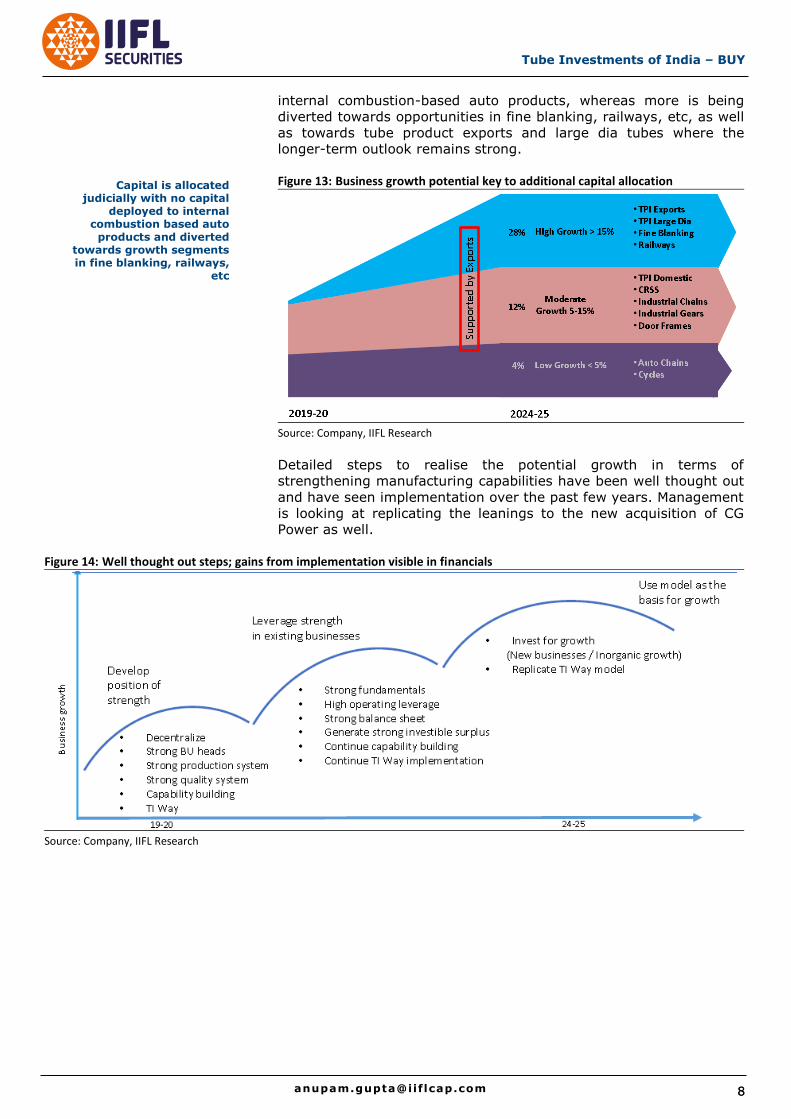
internal combustion-based auto products, whereas more is being
diverted towards opportunities in fine blanking, railways, etc, as well
as towards tube product exports and large dia tubes where the
longer-term outlook remains strong.
Figure 13: Business growth potential key to additional capital allocation
Source: Company, IIFL Research
Detailed steps to realise the potential growth in terms of
strengthening manufacturing capabilities have been well thought out
and have seen implementation over the past few years. Management
is looking at replicating the leanings to the new acquisition of CG
Power as well.
Figure 14: Well thought out steps; gains from implementation visible in financials
Source: Company, IIFL Research
Capital is allocated judicially with no capital
deployed to internal combustion based auto
products and diverted towards growth segments in fine blanking, railways,
etc
9
Tube Investments of India - BUY
Strengthening leadership in core operations
Direct play on domestic auto recovery
Strong product portfolio for most auto manufacturers
Over the past several years, TI has built up strong leadership
position in the auto component segment for most of the products it
manufactures and supplies through a combination of excellence in
various aspects, including:
An extensive product portfolio across tubes, tubular components,
CRSS, fine blank products, PV door frames.
Pan India manufacturing presence for closer integration with
customers.
Forming a strong, well-established and transparent relationship
with OEMs, from the product-development phase itself.
Well-developed supply chain and focussed, solution-based
investment in R&D.
Established infrastructure for handling new product development.
Strong financial metrics.
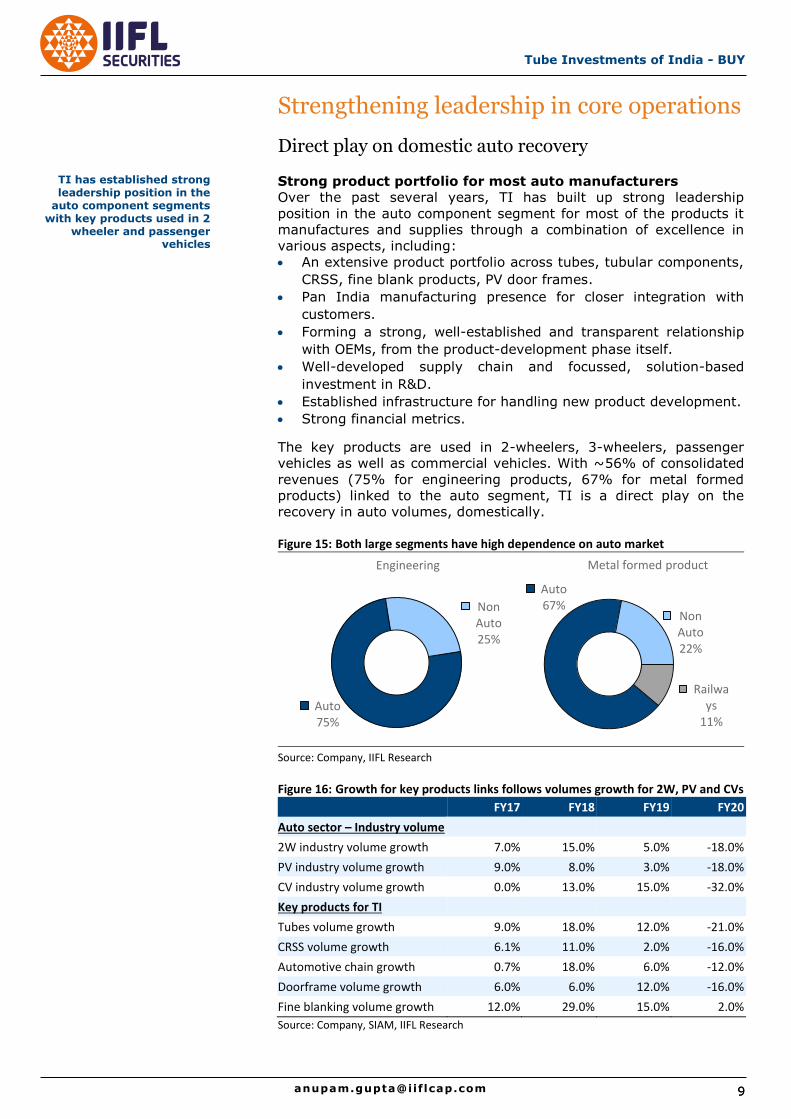
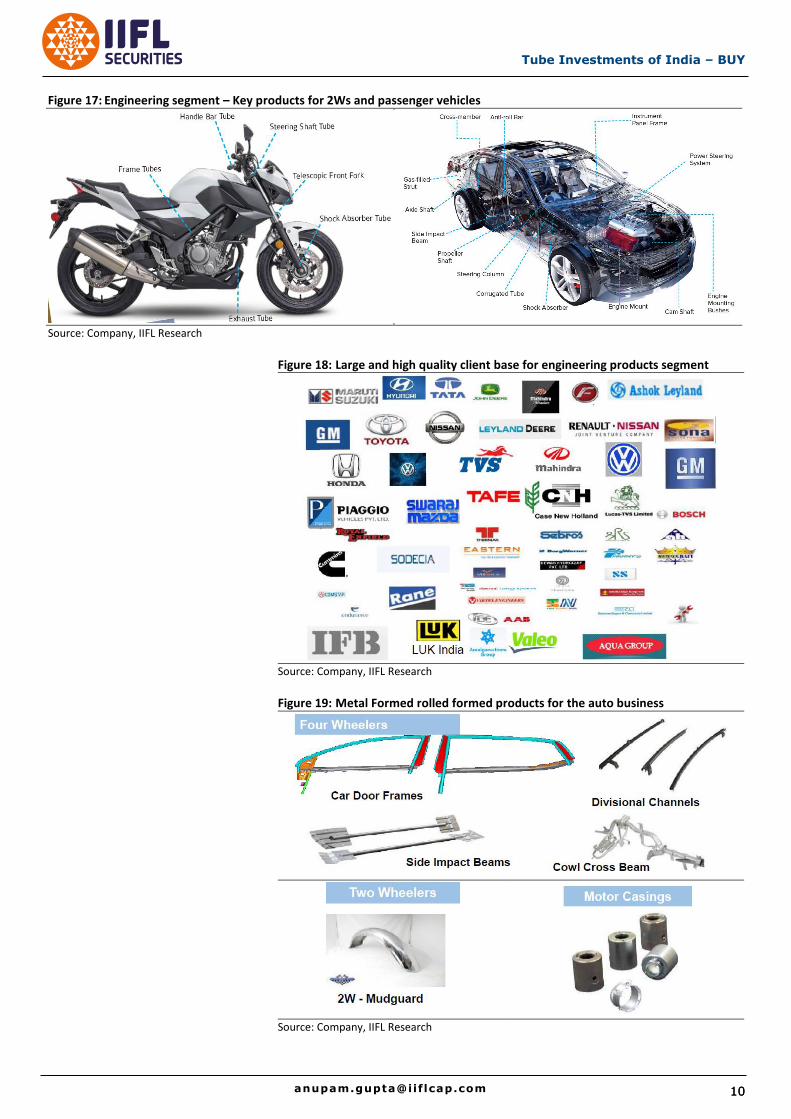
The key products are used in 2-wheelers, 3-wheelers, passenger
vehicles as well as commercial vehicles. With ~56% of consolidated
revenues (75% for engineering products, 67% for metal formed
products) linked to the auto segment, TI is a direct play on the
recovery in auto volumes, domestically.
Figure 15: Both large segments have high dependence on auto market
Source: Company, IIFL Research
Figure 16: Growth for key products links follows volumes growth for 2W, PV and CVs
FY17 FY18 FY19 FY20
Auto sector – Industry volume
2W industry volume growth 7.0% 15.0% 5.0% -18.0%
PV industry volume growth 9.0% 8.0% 3.0% -18.0%
CV industry volume growth 0.0% 13.0% 15.0% -32.0%
Key products for TI
Tubes volume growth 9.0% 18.0% 12.0% -21.0%
CRSS volume growth 6.1% 11.0% 2.0% -16.0%
Automotive chain growth 0.7% 18.0% 6.0% -12.0%
Doorframe volume growth 6.0% 6.0% 12.0% -16.0%
Fine blanking volume growth 12.0% 29.0% 15.0% 2.0%
Source: Company, SIAM, IIFL Research
Auto 75%
Non Auto 25%
Engineering
Auto 67%
Non Auto 22%
Railways
11%
Metal formed product
TI has established strong leadership position in the
auto component segments with key products used in 2
wheeler and passenger vehicles
Tube Investments of India – BUY
10 10 [email protected]
Figure 17: Engineering segment – Key products for 2Ws and passenger vehicles
Source: Company, IIFL Research
Figure 18: Large and high quality client base for engineering products segment
Source: Company, IIFL Research
Figure 19: Metal Formed rolled formed products for the auto business
Source: Company, IIFL Research
11
Tube Investments of India - BUY
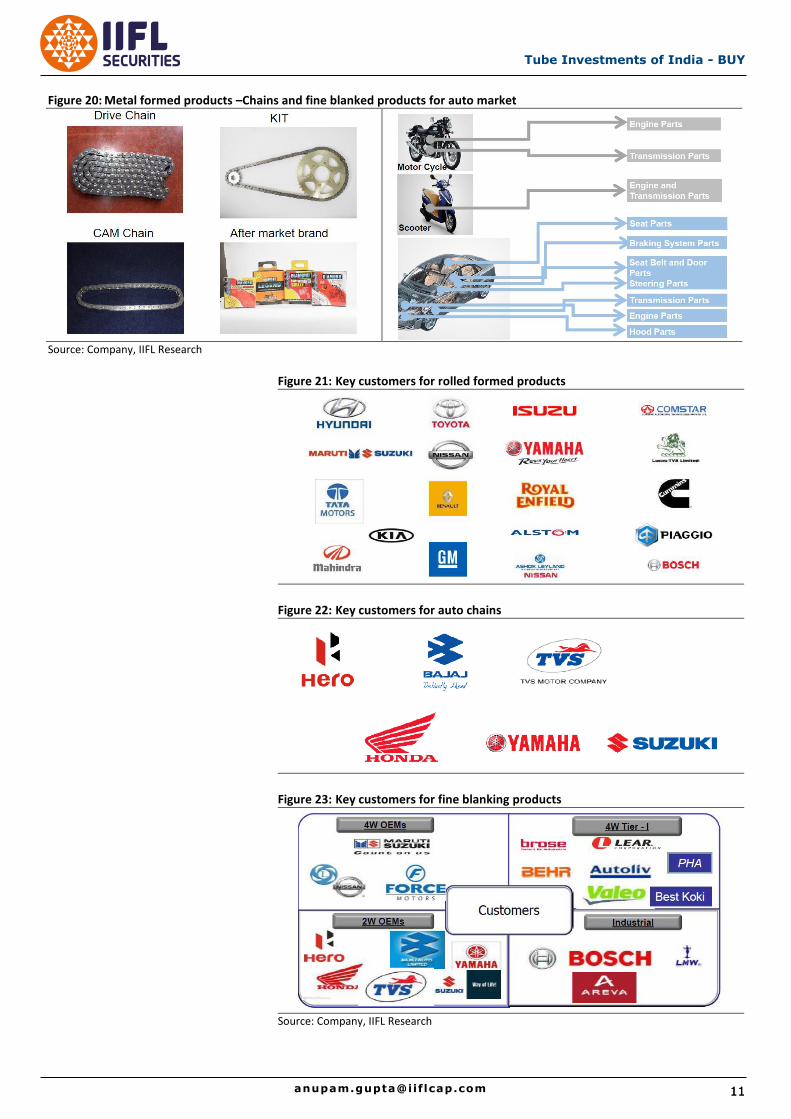
Figure 20: Metal formed products –Chains and fine blanked products for auto market
Source: Company, IIFL Research
Figure 21: Key customers for rolled formed products
Figure 22: Key customers for auto chains
Figure 23: Key customers for fine blanking products
Source: Company, IIFL Research
Tube Investments of India – BUY
12 12 [email protected]
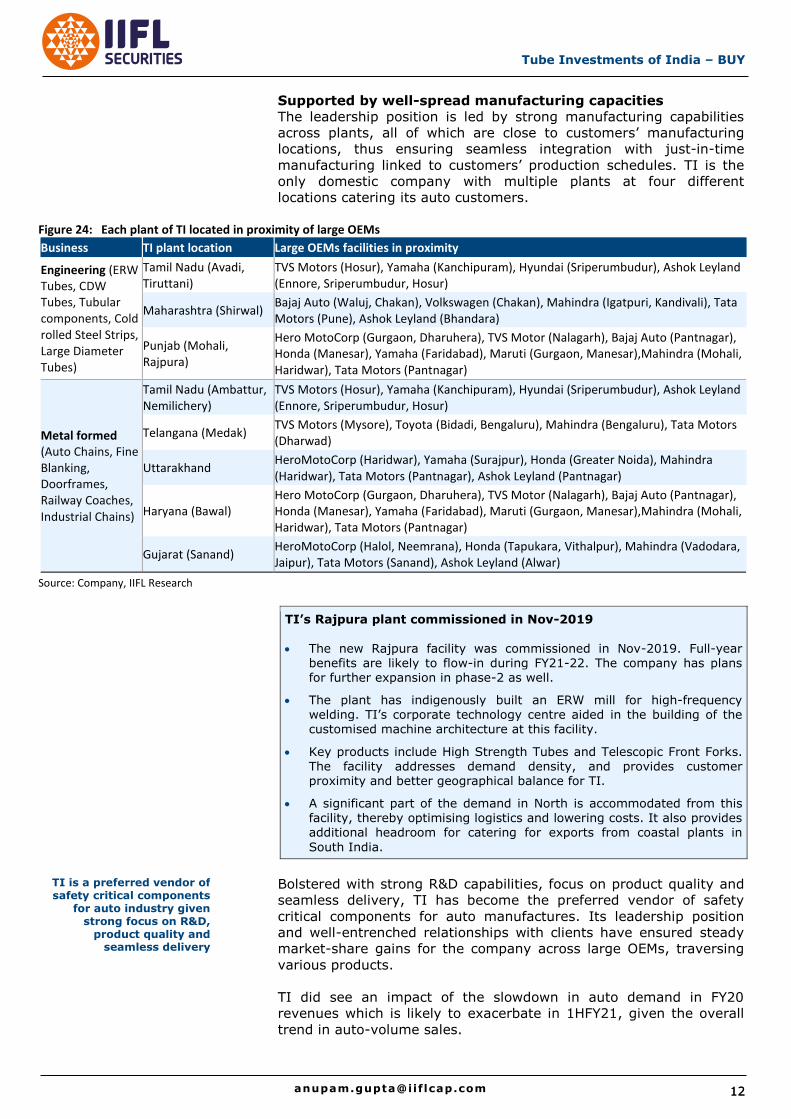
Supported by well-spread manufacturing capacities
The leadership position is led by strong manufacturing capabilities
across plants, all of which are close to customers’ manufacturing
locations, thus ensuring seamless integration with just-in-time
manufacturing linked to customers’ production schedules. TI is the
only domestic company with multiple plants at four different
locations catering its auto customers.
Figure 24: Each plant of TI located in proximity of large OEMs
Business TI plant location Large OEMs facilities in proximity
Engineering (ERW Tubes, CDW Tubes, Tubular components, Cold rolled Steel Strips, Large Diameter Tubes)
Tamil Nadu (Avadi, Tiruttani)
TVS Motors (Hosur), Yamaha (Kanchipuram), Hyundai (Sriperumbudur), Ashok Leyland (Ennore, Sriperumbudur, Hosur)
Maharashtra (Shirwal) Bajaj Auto (Waluj, Chakan), Volkswagen (Chakan), Mahindra (Igatpuri, Kandivali), Tata Motors (Pune), Ashok Leyland (Bhandara)
Punjab (Mohali, Rajpura)
Hero MotoCorp (Gurgaon, Dharuhera), TVS Motor (Nalagarh), Bajaj Auto (Pantnagar), Honda (Manesar), Yamaha (Faridabad), Maruti (Gurgaon, Manesar),Mahindra (Mohali, Haridwar), Tata Motors (Pantnagar)
Metal formed (Auto Chains, Fine Blanking, Doorframes, Railway Coaches, Industrial Chains)
Tamil Nadu (Ambattur, Nemilichery)
TVS Motors (Hosur), Yamaha (Kanchipuram), Hyundai (Sriperumbudur), Ashok Leyland (Ennore, Sriperumbudur, Hosur)
Telangana (Medak) TVS Motors (Mysore), Toyota (Bidadi, Bengaluru), Mahindra (Bengaluru), Tata Motors (Dharwad)
Uttarakhand HeroMotoCorp (Haridwar), Yamaha (Surajpur), Honda (Greater Noida), Mahindra (Haridwar), Tata Motors (Pantnagar), Ashok Leyland (Pantnagar)
Haryana (Bawal) Hero MotoCorp (Gurgaon, Dharuhera), TVS Motor (Nalagarh), Bajaj Auto (Pantnagar), Honda (Manesar), Yamaha (Faridabad), Maruti (Gurgaon, Manesar),Mahindra (Mohali, Haridwar), Tata Motors (Pantnagar)
Gujarat (Sanand) HeroMotoCorp (Halol, Neemrana), Honda (Tapukara, Vithalpur), Mahindra (Vadodara, Jaipur), Tata Motors (Sanand), Ashok Leyland (Alwar)
Source: Company, IIFL Research
TI’s Rajpura plant commissioned in Nov-2019
The new Rajpura facility was commissioned in Nov-2019. Full-year
benefits are likely to flow-in during FY21-22. The company has plans for further expansion in phase-2 as well.
The plant has indigenously built an ERW mill for high-frequency welding. TI’s corporate technology centre aided in the building of the customised machine architecture at this facility.
Key products include High Strength Tubes and Telescopic Front Forks.
The facility addresses demand density, and provides customer proximity and better geographical balance for TI.
A significant part of the demand in North is accommodated from this facility, thereby optimising logistics and lowering costs. It also provides additional headroom for catering for exports from coastal plants in
South India.
Bolstered with strong R&D capabilities, focus on product quality and
seamless delivery, TI has become the preferred vendor of safety
critical components for auto manufactures. Its leadership position
and well-entrenched relationships with clients have ensured steady
market-share gains for the company across large OEMs, traversing
various products.
TI did see an impact of the slowdown in auto demand in FY20
revenues which is likely to exacerbate in 1HFY21, given the overall
trend in auto-volume sales.
TI is a preferred vendor of safety critical components
for auto industry given strong focus on R&D,
product quality and seamless delivery
13
Tube Investments of India - BUY
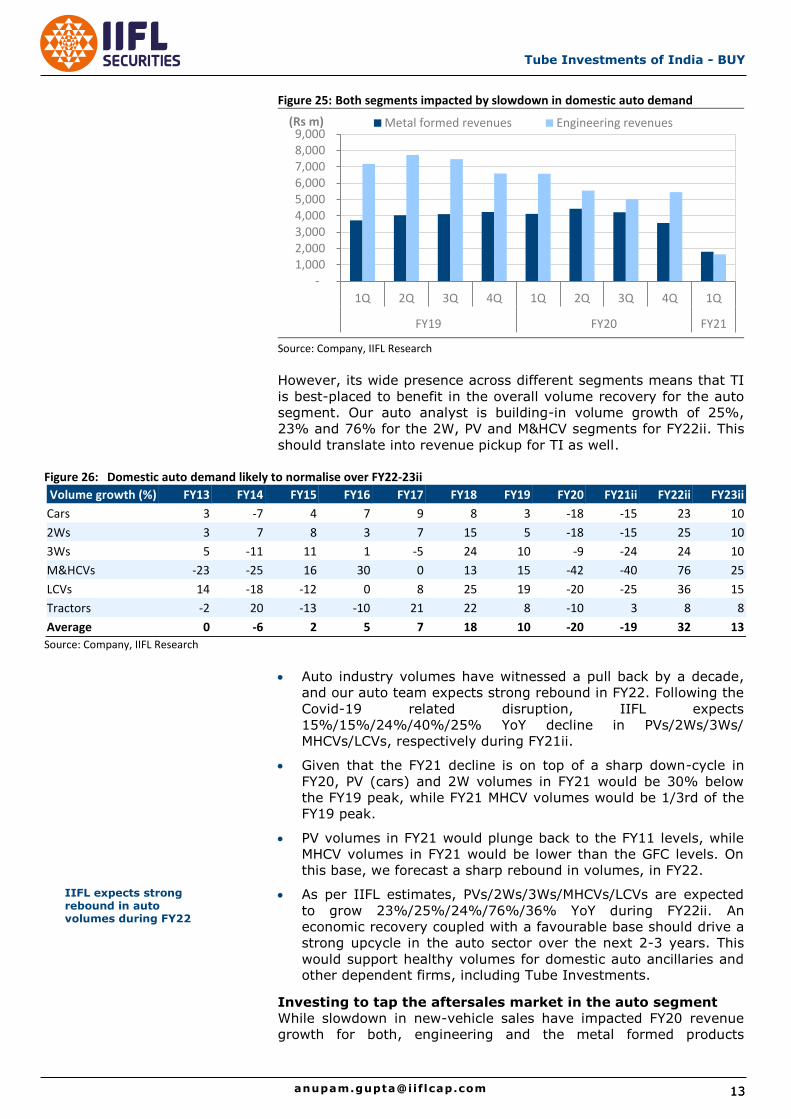
Figure 25: Both segments impacted by slowdown in domestic auto demand
Source: Company, IIFL Research
However, its wide presence across different segments means that TI
is best-placed to benefit in the overall volume recovery for the auto
segment. Our auto analyst is building-in volume growth of 25%,
23% and 76% for the 2W, PV and M&HCV segments for FY22ii. This
should translate into revenue pickup for TI as well.
Figure 26: Domestic auto demand likely to normalise over FY22-23ii
Volume growth (%) FY13 FY14 FY15 FY16 FY17 FY18 FY19 FY20 FY21ii FY22ii FY23ii
Cars 3 -7 4 7 9 8 3 -18 -15 23 10
2Ws 3 7 8 3 7 15 5 -18 -15 25 10
3Ws 5 -11 11 1 -5 24 10 -9 -24 24 10
M&HCVs -23 -25 16 30 0 13 15 -42 -40 76 25
LCVs 14 -18 -12 0 8 25 19 -20 -25 36 15
Tractors -2 20 -13 -10 21 22 8 -10 3 8 8
Average 0 -6 2 5 7 18 10 -20 -19 32 13
Source: Company, IIFL Research
Auto industry volumes have witnessed a pull back by a decade,
and our auto team expects strong rebound in FY22. Following the
Covid-19 related disruption, IIFL expects
15%/15%/24%/40%/25% YoY decline in PVs/2Ws/3Ws/
MHCVs/LCVs, respectively during FY21ii.
Given that the FY21 decline is on top of a sharp down-cycle in
FY20, PV (cars) and 2W volumes in FY21 would be 30% below
the FY19 peak, while FY21 MHCV volumes would be 1/3rd of the
FY19 peak.
PV volumes in FY21 would plunge back to the FY11 levels, while
MHCV volumes in FY21 would be lower than the GFC levels. On
this base, we forecast a sharp rebound in volumes, in FY22.
As per IIFL estimates, PVs/2Ws/3Ws/MHCVs/LCVs are expected
to grow 23%/25%/24%/76%/36% YoY during FY22ii. An
economic recovery coupled with a favourable base should drive a
strong upcycle in the auto sector over the next 2-3 years. This
would support healthy volumes for domestic auto ancillaries and other dependent firms, including Tube Investments.
Investing to tap the aftersales market in the auto segment
While slowdown in new-vehicle sales have impacted FY20 revenue
growth for both, engineering and the metal formed products
- 1,000 2,000 3,000 4,000 5,000 6,000 7,000 8,000 9,000
1Q 2Q 3Q 4Q 1Q 2Q 3Q 4Q 1Q
FY19 FY20 FY21
(Rs m) Metal formed revenues Engineering revenues
IIFL expects strong rebound in auto volumes during FY22
Tube Investments of India – BUY
14 14 [email protected]
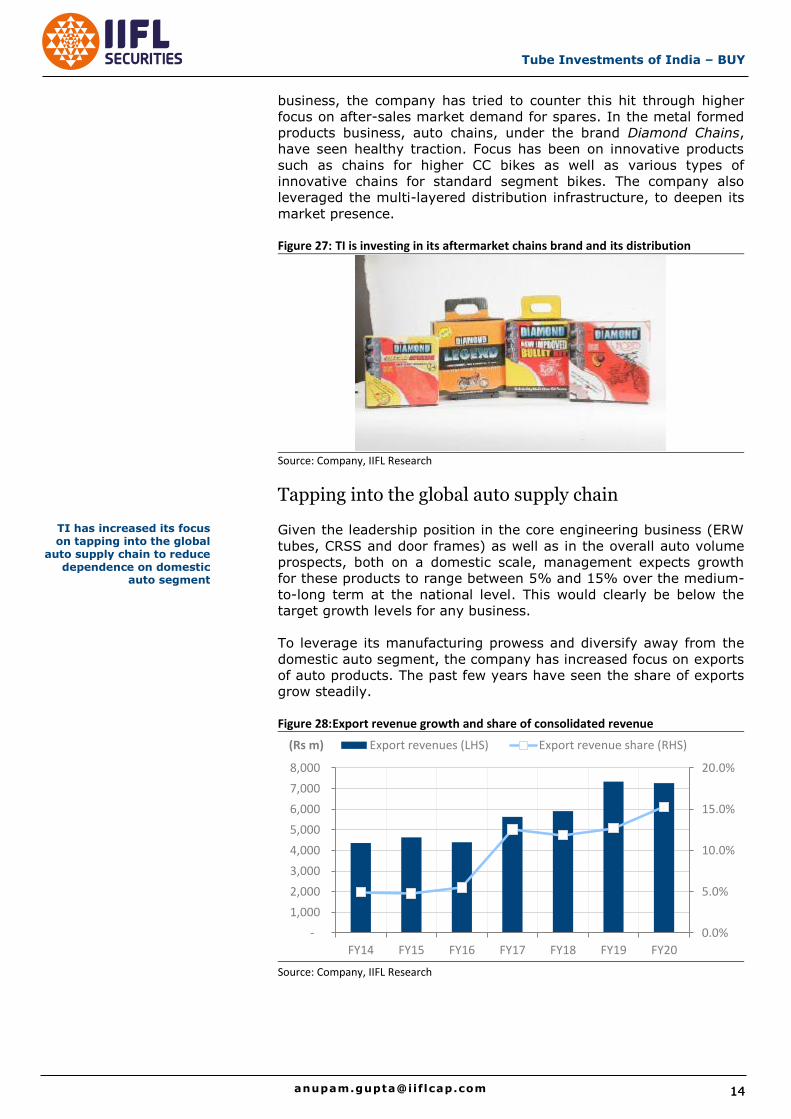
business, the company has tried to counter this hit through higher
focus on after-sales market demand for spares. In the metal formed
products business, auto chains, under the brand Diamond Chains,
have seen healthy traction. Focus has been on innovative products
such as chains for higher CC bikes as well as various types of
innovative chains for standard segment bikes. The company also
leveraged the multi-layered distribution infrastructure, to deepen its
market presence.
Figure 27: TI is investing in its aftermarket chains brand and its distribution
Source: Company, IIFL Research
Tapping into the global auto supply chain
Given the leadership position in the core engineering business (ERW
tubes, CRSS and door frames) as well as in the overall auto volume
prospects, both on a domestic scale, management expects growth
for these products to range between 5% and 15% over the medium-
to-long term at the national level. This would clearly be below the
target growth levels for any business.
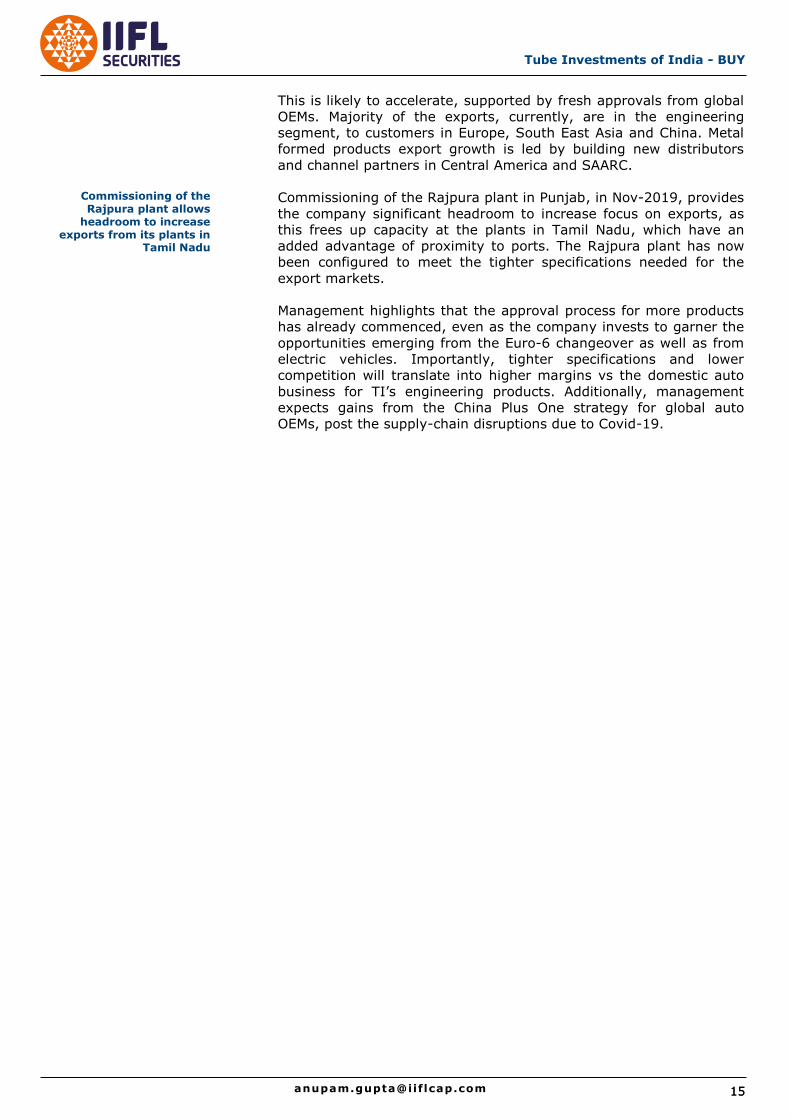
To leverage its manufacturing prowess and diversify away from the
domestic auto segment, the company has increased focus on exports
of auto products. The past few years have seen the share of exports
grow steadily.
Figure 28: Export revenue growth and share of consolidated revenue
Source: Company, IIFL Research
0.0%
5.0%
10.0%
15.0%
20.0%
-
1,000
2,000
3,000
4,000
5,000
6,000
7,000
8,000
FY14 FY15 FY16 FY17 FY18 FY19 FY20
(Rs m) Export revenues (LHS) Export revenue share (RHS)
TI has increased its focus on tapping into the global
auto supply chain to reduce dependence on domestic
auto segment
15
Tube Investments of India - BUY
This is likely to accelerate, supported by fresh approvals from global
OEMs. Majority of the exports, currently, are in the engineering
segment, to customers in Europe, South East Asia and China. Metal
formed products export growth is led by building new distributors
and channel partners in Central America and SAARC.
Commissioning of the Rajpura plant in Punjab, in Nov-2019, provides
the company significant headroom to increase focus on exports, as
this frees up capacity at the plants in Tamil Nadu, which have an
added advantage of proximity to ports. The Rajpura plant has now
been configured to meet the tighter specifications needed for the
export markets.
Management highlights that the approval process for more products
has already commenced, even as the company invests to garner the
opportunities emerging from the Euro-6 changeover as well as from
electric vehicles. Importantly, tighter specifications and lower
competition will translate into higher margins vs the domestic auto
business for TI’s engineering products. Additionally, management
expects gains from the China Plus One strategy for global auto
OEMs, post the supply-chain disruptions due to Covid-19.
Commissioning of the Rajpura plant allows
headroom to increase exports from its plants in
Tamil Nadu
Tube Investments of India – BUY
16 16 [email protected]
Healthy traction in non-auto business
Efforts on, to grow non-auto revenues for engineering and
metal formed product
Over the last four years, the company has seen steady growth in the
non-auto business, including railway coaches and large dia tubes for
off-road vehicle applications. This has been a conscious choice by the
management for diversifying revenue streams to reduce dependence
and, hence, the cyclicality from exposure to the auto sector.
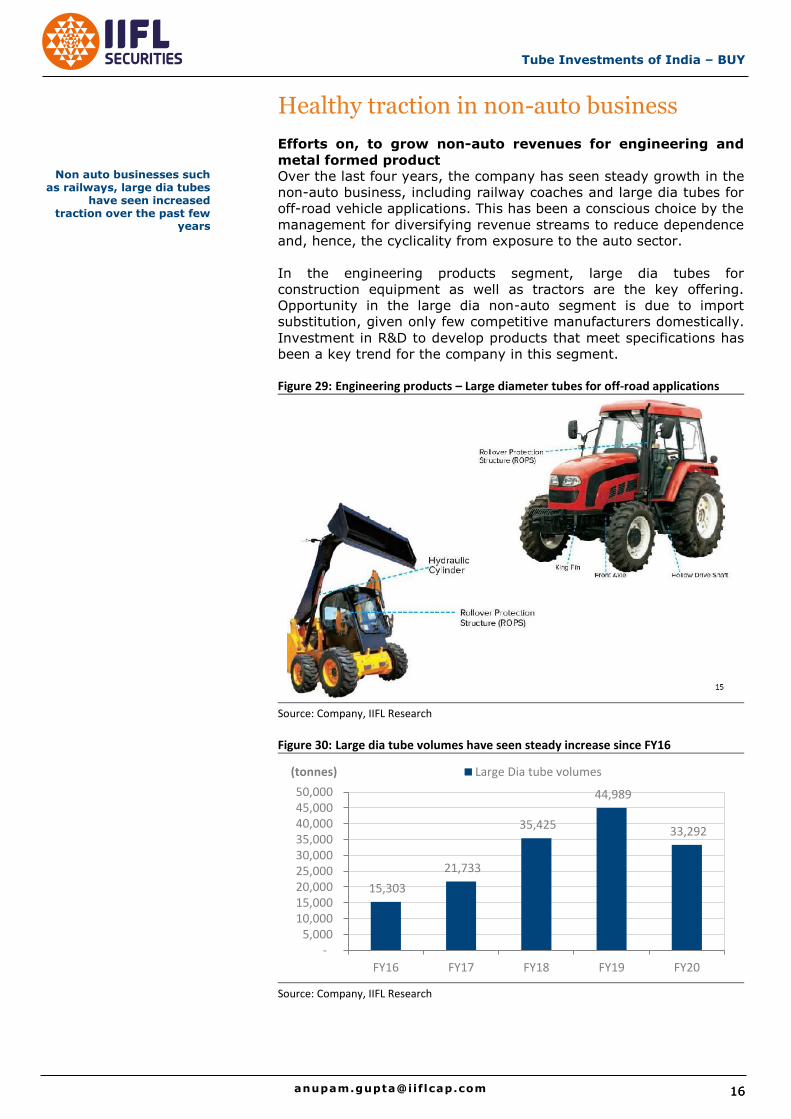
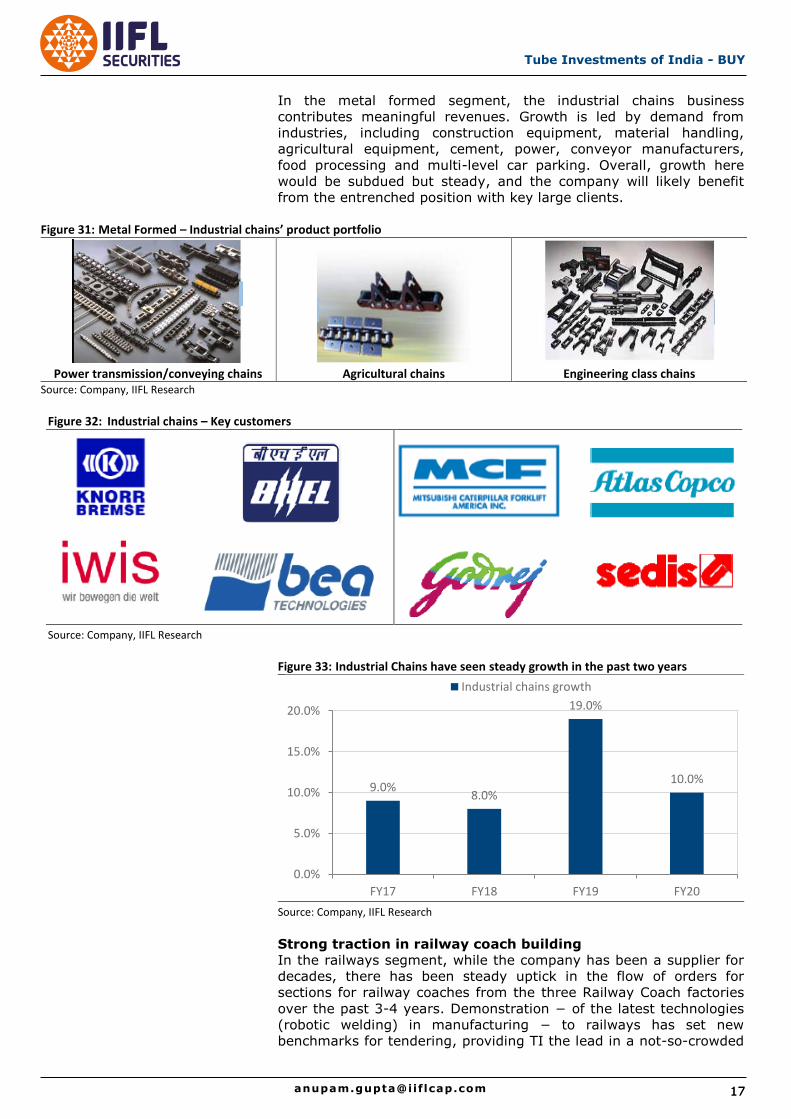
In the engineering products segment, large dia tubes for
construction equipment as well as tractors are the key offering.
Opportunity in the large dia non-auto segment is due to import
substitution, given only few competitive manufacturers domestically.
Investment in R&D to develop products that meet specifications has
been a key trend for the company in this segment.
Figure 29: Engineering products – Large diameter tubes for off-road applications
Source: Company, IIFL Research
Figure 30: Large dia tube volumes have seen steady increase since FY16
Source: Company, IIFL Research
15,303
21,733
35,425
44,989
33,292
- 5,000
10,000 15,000 20,000 25,000 30,000 35,000 40,000 45,000 50,000
FY16 FY17 FY18 FY19 FY20
(tonnes) Large Dia tube volumes
Non auto businesses such as railways, large dia tubes
have seen increased traction over the past few
years
17
Tube Investments of India - BUY
In the metal formed segment, the industrial chains business
contributes meaningful revenues. Growth is led by demand from
industries, including construction equipment, material handling,
agricultural equipment, cement, power, conveyor manufacturers,
food processing and multi-level car parking. Overall, growth here
would be subdued but steady, and the company will likely benefit
from the entrenched position with key large clients.
Figure 31: Metal Formed – Industrial chains’ product portfolio
Power transmission/conveying chains
Agricultural chains
Engineering class chains
Source: Company, IIFL Research
Figure 32: Industrial chains – Key customers
Source: Company, IIFL Research
Figure 33: Industrial Chains have seen steady growth in the past two years
Source: Company, IIFL Research
Strong traction in railway coach building
In the railways segment, while the company has been a supplier for
decades, there has been steady uptick in the flow of orders for
sections for railway coaches from the three Railway Coach factories
over the past 3-4 years. Demonstration − of the latest technologies
(robotic welding) in manufacturing − to railways has set new
benchmarks for tendering, providing TI the lead in a not-so-crowded
9.0% 8.0%
19.0%
10.0%
0.0%
5.0%
10.0%
15.0%
20.0%
FY17 FY18 FY19 FY20
Industrial chains growth
Tube Investments of India – BUY
18 18 [email protected]
market. Also, dedicated manufacturing plants in close proximity to
the Rail Coach factories have provided an advantage to the
company.
Figure 34: Railway factory locations and TI plants for railways
Railway factories TI plants catering for the Railways
Integral Coach Factory, Chennai (Tamil Nadu) TI Metal Forming, Kakkalur
Rail Coach Factory, Kapurthala (Punjab) TI Metal Forming - Uttarakhand
Modern Coach Factory, Raebareli (UP) TI Metal Forming Uttarakhand
Source: Company, IIFL Research
Figure 35: Metal formed products used in rail coaches
Source: Company, IIFL Research
FY20 witnessed 49% YoY revenue growth for the railways business,
supported by healthy coach build-out by the Indian Railways and TI’s
leadership position in the segment. While the near term is uncertain
due to stressed financials of railways, coach build-out plans remain
strong, as per various releases by the government.
Figure 36: Coach build-out plan announced by the Indian Railways (IR)
No. of coaches FY19* FY20* FY20R FY21* FY21R FY22*
LHB 4,238 4,034 5,784 4,079 6,631 4,099
Self-propelled 1,729 1,856 2,192 2,405 1,765 2,546
Others 91 50 50 50 279 50
Total 6,058 5,940 8,026 6,534 8,675 6,695
Source: IR; Note: *original plan announced in Jan-19; R - revised production plan for respective years, announced later
Additionally, increase in domestic sourcing of train-sets, as
announced for 44 Vande Bharat trains, will aid ordering for the TI
railway business.
TI’s railway business grew 49% YoY in FY20 on
healthy coach building by the Indian Railways

19
Tube Investments of India - BUY
Tender for 44 Vande Bharat trains
The Indian Railways has floated the revised Tender of semi high-
speed 44 Vande Bharat trains-sets. The Tender is for 3-phase
Propulsion, Control and other Equipment, along with bogies for the
trains-sets. The main features of the Tender are as under:
Train-sets shall be manufactured at ICF/Chennai,
RCF/Kapurthala and MCF/Raebareli
It shall be a local (indigenous) tender
A two-stage, reverse auction shall take place
The revised Tender is in line with Government of India’s preference
for the Make in India policy; the minimum local content percentage
has been revised to 75%. It is the first big tender under the revised
DPIIT norms of AtmaNirbhar Bharat and has at least 75% domestic
components. This tender is now a Domestic Tender, with only the
companies registered in India eligible to apply, and would have to
quote in Indian Rupees.
The company has also started supplying parts for metro train
manufacturing in both, India and overseas. This has been a
remunerative business with healthy return ratios, despite being a
B2G (business-to-government) business.
Cycles – Turnaround on track
TI manufactures and markets a wide range of bicycles and
accessories − from standard to premium − including performance
bicycles for the fitness and adventure space.
Figure 37: Cycles − Key brands for TI
Source: Company, IIFL Research
It was a pioneer in the retail format of experiential stores – Track &
Trail Urban, Track & trail Sport and BSA Hercules Rural outlets. It
currently has ~225 Track & Trail stores across India. Its overall
distribution network is spread across 8,500 dealers. It has an omni-
channel presence, with unified in-store and online experience.
Tube Investments of India – BUY
20 20 [email protected]
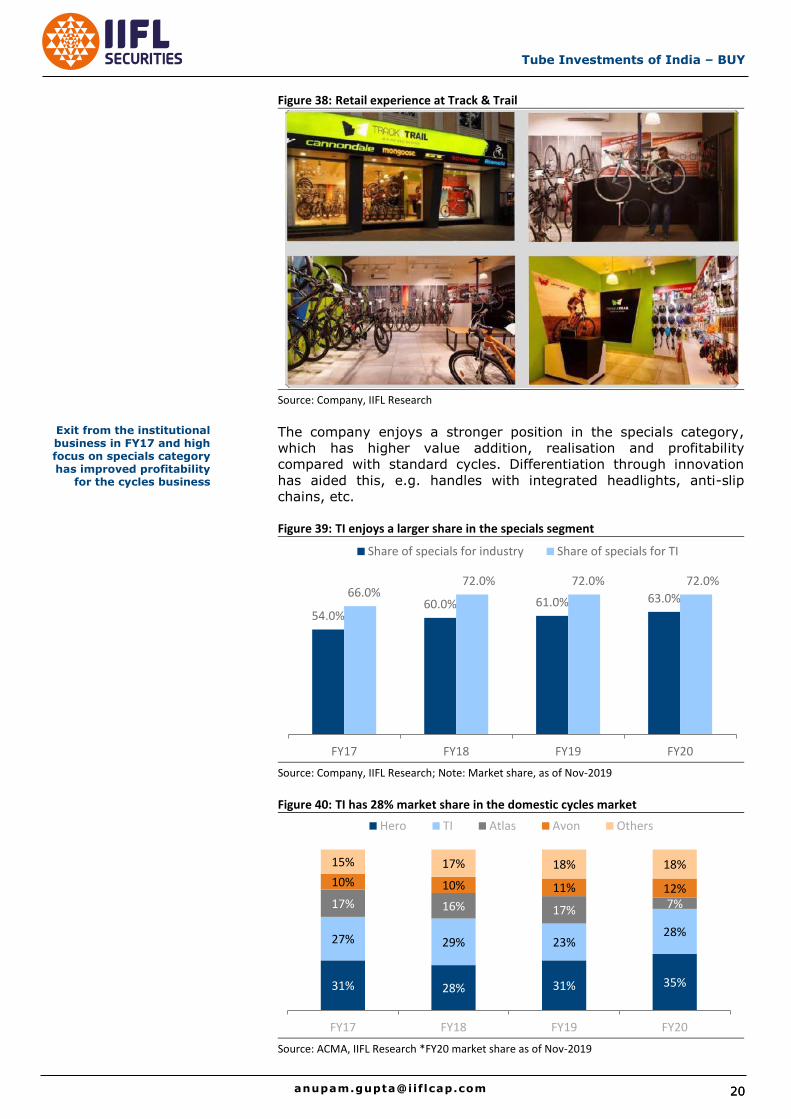
Figure 38: Retail experience at Track & Trail
Source: Company, IIFL Research
The company enjoys a stronger position in the specials category,
which has higher value addition, realisation and profitability
compared with standard cycles. Differentiation through innovation
has aided this, e.g. handles with integrated headlights, anti-slip
chains, etc.
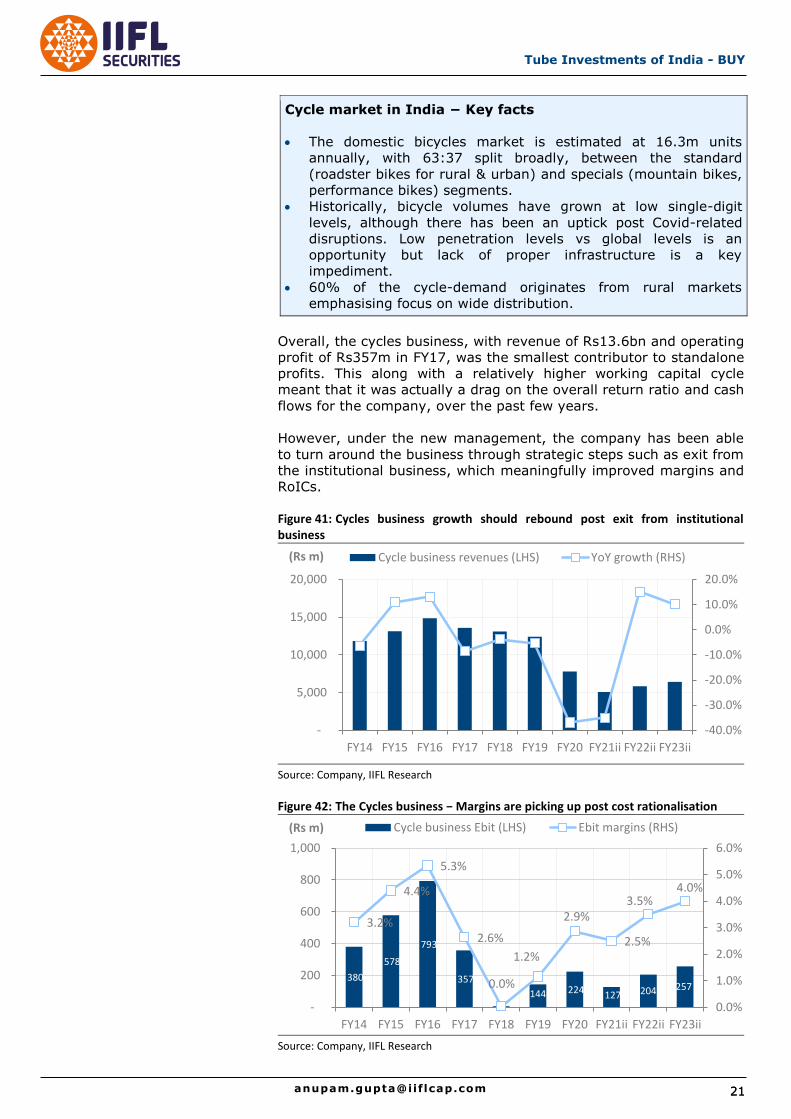
Figure 39: TI enjoys a larger share in the specials segment
Source: Company, IIFL Research; Note: Market share, as of Nov-2019
Figure 40: TI has 28% market share in the domestic cycles market
Source: ACMA, IIFL Research *FY20 market share as of Nov-2019
54.0% 60.0% 61.0% 63.0% 66.0%
72.0% 72.0% 72.0%
FY17 FY18 FY19 FY20
Share of specials for industry Share of specials for TI
31% 28% 31% 35%
27% 29% 23% 28%
17% 16% 17% 7%
10% 10% 11% 12%
15% 17% 18% 18%
FY17 FY18 FY19 FY20
Hero TI Atlas Avon Others
Exit from the institutional business in FY17 and high focus on specials category has improved profitability
for the cycles business
21
Tube Investments of India - BUY
Cycle market in India − Key facts
The domestic bicycles market is estimated at 16.3m units
annually, with 63:37 split broadly, between the standard
(roadster bikes for rural & urban) and specials (mountain bikes,
performance bikes) segments.
Historically, bicycle volumes have grown at low single-digit
levels, although there has been an uptick post Covid-related
disruptions. Low penetration levels vs global levels is an
opportunity but lack of proper infrastructure is a key
impediment.
60% of the cycle-demand originates from rural markets
emphasising focus on wide distribution.
Overall, the cycles business, with revenue of Rs13.6bn and operating
profit of Rs357m in FY17, was the smallest contributor to standalone
profits. This along with a relatively higher working capital cycle
meant that it was actually a drag on the overall return ratio and cash
flows for the company, over the past few years.
However, under the new management, the company has been able
to turn around the business through strategic steps such as exit from
the institutional business, which meaningfully improved margins and
RoICs.
Figure 41: Cycles business growth should rebound post exit from institutional business
Source: Company, IIFL Research
Figure 42: The Cycles business − Margins are picking up post cost rationalisation
Source: Company, IIFL Research
-40.0%
-30.0%
-20.0%
-10.0%
0.0%
10.0%
20.0%
-
5,000
10,000
15,000
20,000
FY14 FY15 FY16 FY17 FY18 FY19 FY20 FY21ii FY22ii FY23ii
(Rs m) Cycle business revenues (LHS) YoY growth (RHS)
380
578
793
357
6 144 224 127 204 257
3.2%
4.4%
5.3%
2.6%
0.0%
1.2%
2.9%
2.5%
3.5% 4.0%
0.0%
1.0%
2.0%
3.0%
4.0%
5.0%
6.0%
-
200
400
600
800
1,000
FY14 FY15 FY16 FY17 FY18 FY19 FY20 FY21ii FY22ii FY23ii
(Rs m) Cycle business Ebit (LHS) Ebit margins (RHS)
Tube Investments of India – BUY
22 22 [email protected]
Other significant steps and initiatives include:
Rationalising of the product portfolio towards
affordability/specialities. New product development through
innovation has benefited overall revenue growth over FY19-20.
Rationalisation of the cost structure to reduce breakeven
volumes, from ~0.18m cycles annually to ~0.145m cycles.
Streamlining and rationalising the distribution network through
optimised warehousing.
Consolidation of manufacturing footprint post commissioning of
the 250,000-unit capacity Rajpura plant, as the company was
able to close down the Nashik facility for bicycles.
Investments in marketing and distribution, with steady increase
in Track & trail stores. Leveraging rapid increase in internet
penetration through its omni-channel strategy.
However, given the state of the market, management admits that
these steps can only help the company cover some distance, in
terms of growth potential, segment margins and RoICs. Further
measures to meet overall company-level targets would involve
playing on the manufacturing strength to tap newer markets. This
will primarily be targeted towards generating volumes so as to sweat
the assets, including the new Rajpura plant.
Shanti Gears – A steady performer
TI has presence in the gears manufacturing business through its
70.47%-owned subsidiary Shanti Gears. Acquired in 2012 for
~Rs4.64bn, Shanti Gear ranks among the leading industrial-gear
manufacturers, with four factories and over 1,000 employees. The
company’s operations are fully integrated with an in-house R&D
team for design and engineering, in-house foundry, a fabrication and
forging unit, comprehensive heat treatment facilities and an
extensive tool room for manufacturing hobs and cutters.
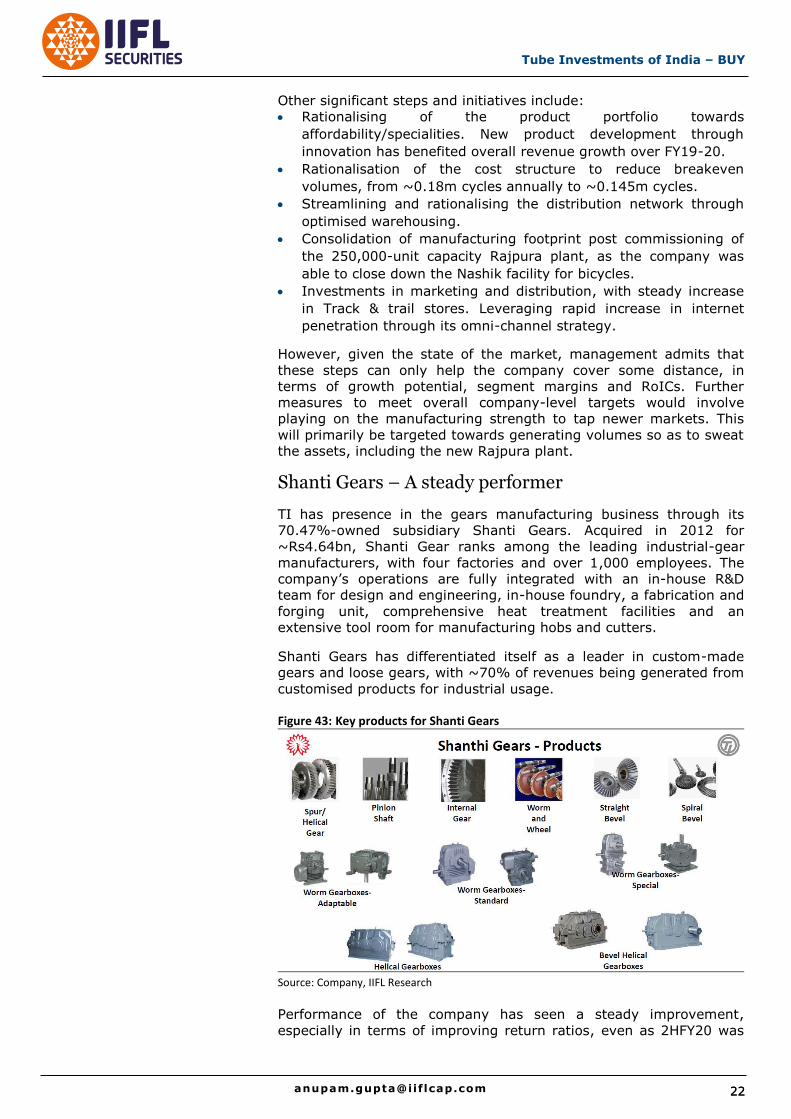
Shanti Gears has differentiated itself as a leader in custom-made
gears and loose gears, with ~70% of revenues being generated from
customised products for industrial usage.
Figure 43: Key products for Shanti Gears
Source: Company, IIFL Research
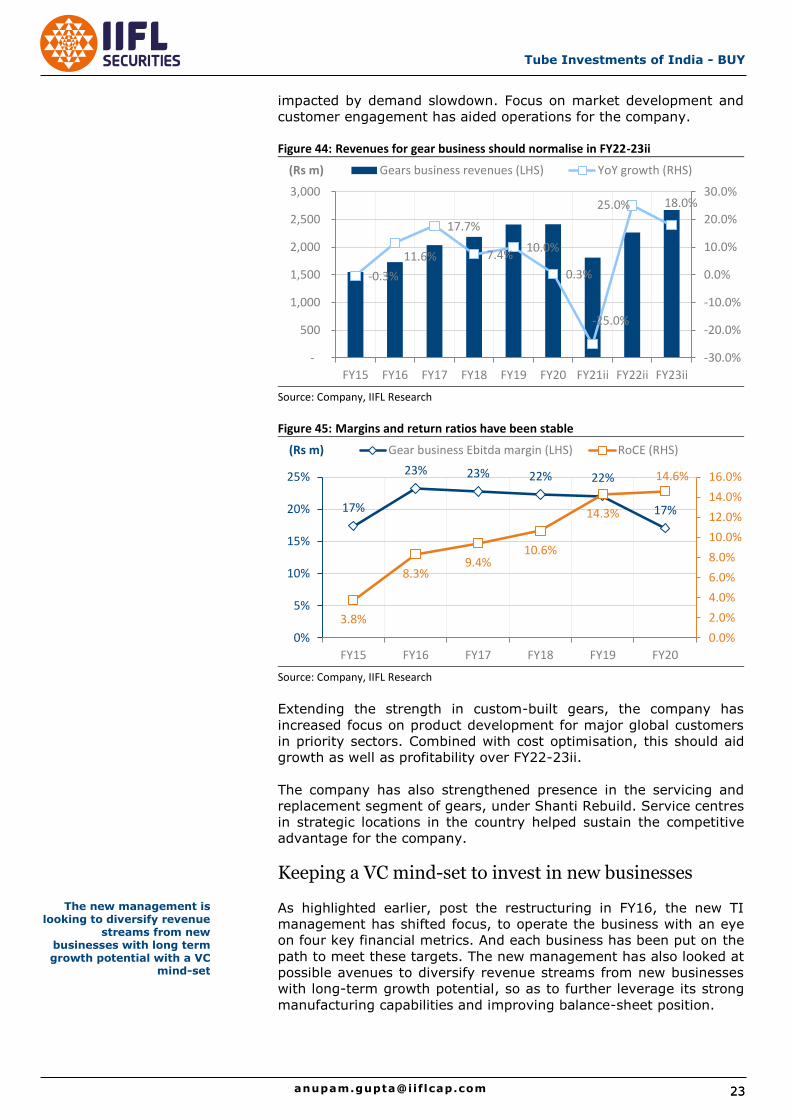
Performance of the company has seen a steady improvement,
especially in terms of improving return ratios, even as 2HFY20 was
23
Tube Investments of India - BUY
impacted by demand slowdown. Focus on market development and
customer engagement has aided operations for the company.
Figure 44: Revenues for gear business should normalise in FY22-23ii
Source: Company, IIFL Research
Figure 45: Margins and return ratios have been stable
Source: Company, IIFL Research
Extending the strength in custom-built gears, the company has
increased focus on product development for major global customers
in priority sectors. Combined with cost optimisation, this should aid
growth as well as profitability over FY22-23ii.
The company has also strengthened presence in the servicing and
replacement segment of gears, under Shanti Rebuild. Service centres
in strategic locations in the country helped sustain the competitive
advantage for the company.
Keeping a VC mind-set to invest in new businesses
As highlighted earlier, post the restructuring in FY16, the new TI
management has shifted focus, to operate the business with an eye
on four key financial metrics. And each business has been put on the
path to meet these targets. The new management has also looked at
possible avenues to diversify revenue streams from new businesses
with long-term growth potential, so as to further leverage its strong
manufacturing capabilities and improving balance-sheet position.
-0.3%
11.6%
17.7%
7.4% 10.0%
0.3%
-25.0%
25.0% 18.0%
-30.0%
-20.0%
-10.0%
0.0%
10.0%
20.0%
30.0%
-
500
1,000
1,500
2,000
2,500
3,000
FY15 FY16 FY17 FY18 FY19 FY20 FY21ii FY22ii FY23ii
(Rs m) Gears business revenues (LHS) YoY growth (RHS)
17%
23% 23% 22% 22%
17%
3.8%
8.3% 9.4%
10.6%
14.3%
14.6%
0.0%
2.0%
4.0%
6.0%
8.0%
10.0%
12.0%
14.0%
16.0%
0%
5%
10%
15%
20%
25%
FY15 FY16 FY17 FY18 FY19 FY20
(Rs m) Gear business Ebitda margin (LHS) RoCE (RHS)
The new management is looking to diversify revenue
streams from new businesses with long term growth potential with a VC
mind-set
Tube Investments of India – BUY
24 24 [email protected]
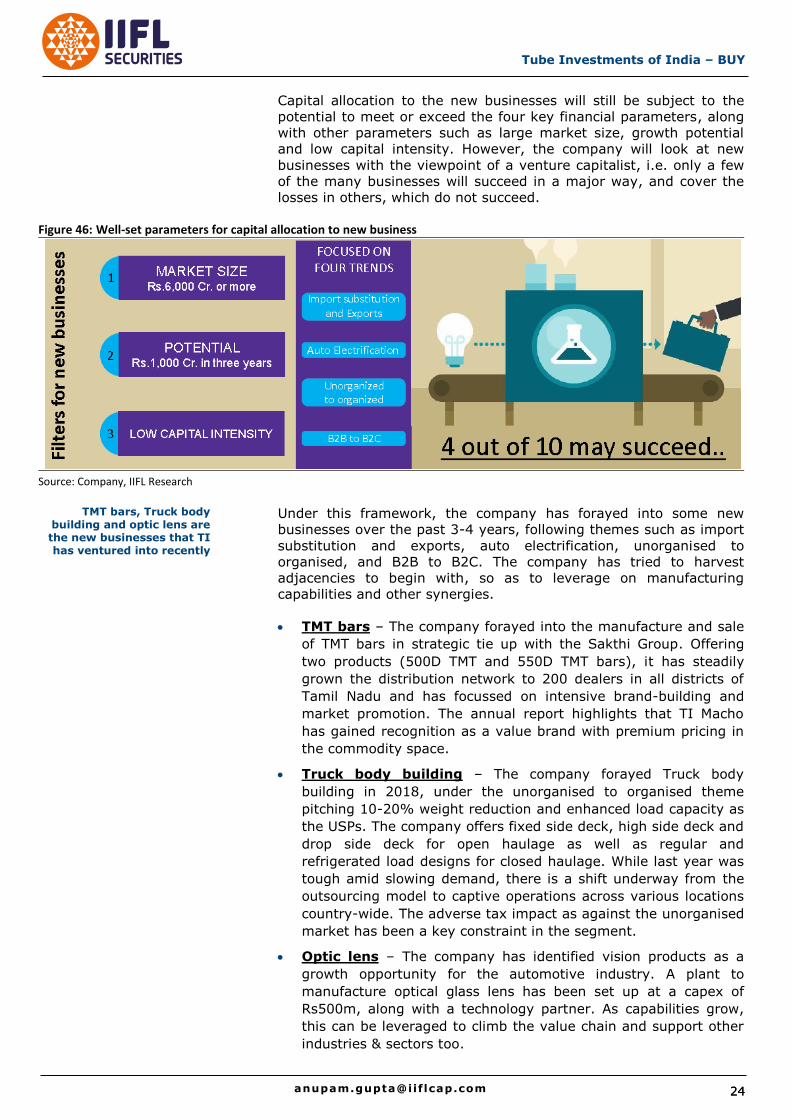
Capital allocation to the new businesses will still be subject to the
potential to meet or exceed the four key financial parameters, along
with other parameters such as large market size, growth potential
and low capital intensity. However, the company will look at new
businesses with the viewpoint of a venture capitalist, i.e. only a few
of the many businesses will succeed in a major way, and cover the
losses in others, which do not succeed.
Figure 46: Well-set parameters for capital allocation to new business
Source: Company, IIFL Research
Under this framework, the company has forayed into some new
businesses over the past 3-4 years, following themes such as import
substitution and exports, auto electrification, unorganised to
organised, and B2B to B2C. The company has tried to harvest
adjacencies to begin with, so as to leverage on manufacturing
capabilities and other synergies.
TMT bars – The company forayed into the manufacture and sale
of TMT bars in strategic tie up with the Sakthi Group. Offering
two products (500D TMT and 550D TMT bars), it has steadily
grown the distribution network to 200 dealers in all districts of
Tamil Nadu and has focussed on intensive brand-building and
market promotion. The annual report highlights that TI Macho
has gained recognition as a value brand with premium pricing in
the commodity space.
Truck body building – The company forayed Truck body
building in 2018, under the unorganised to organised theme
pitching 10-20% weight reduction and enhanced load capacity as
the USPs. The company offers fixed side deck, high side deck and
drop side deck for open haulage as well as regular and
refrigerated load designs for closed haulage. While last year was
tough amid slowing demand, there is a shift underway from the
outsourcing model to captive operations across various locations
country-wide. The adverse tax impact as against the unorganised
market has been a key constraint in the segment.
Optic lens – The company has identified vision products as a
growth opportunity for the automotive industry. A plant to
manufacture optical glass lens has been set up at a capex of
Rs500m, along with a technology partner. As capabilities grow,
this can be leveraged to climb the value chain and support other
industries & sectors too.
TMT bars, Truck body building and optic lens are the new businesses that TI has ventured into recently
25
Tube Investments of India - BUY
CG Power–Large step to diversify business
Tube Investments has taken a giant and bold step towards reducing
the share of exposure to the domestic auto industry and
strengthening its industrial manufacturing portfolio through the
acquisition of controlling stake in CG Power and Industrial Systems
(CG Power). TI management highlights reasonable valuation for a
leading industrial product manufacturer with strong possibility to
enhance revenue growth, improve profitability and drive capital
efficiency as the key rationale for the acquisition.
The company is currently awaiting CCI approval for closure of the
transaction by end-Oct/early-Nov 2020. TI will end-up owning a
domestic franchise (primarily) with market-leading positions in
motors and railway products, along with a strong product offering in
transformers/switchgears. It also inherits the CG Power brand and,
with non-compete on B2C products now over, will look to launch
other products around the motors portfolio.
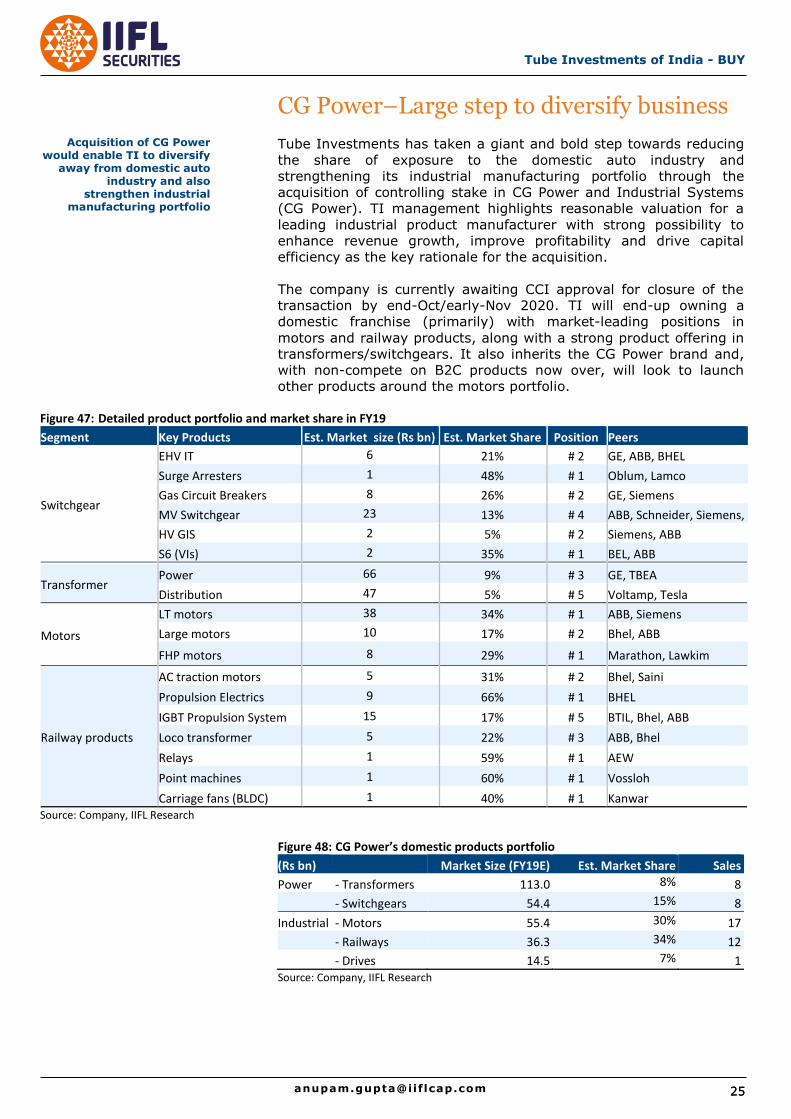
Figure 47: Detailed product portfolio and market share in FY19
Segment Key Products Est. Market size (Rs bn) Est. Market Share Position Peers
Switchgear
EHV IT 6 21% # 2 GE, ABB, BHEL
Surge Arresters 1 48% # 1 Oblum, Lamco
Gas Circuit Breakers 8 26% # 2 GE, Siemens
MV Switchgear 23 13% # 4 ABB, Schneider, Siemens,
HV GIS 2 5% # 2 Siemens, ABB
S6 (VIs) 2 35% # 1 BEL, ABB
Transformer
Power 66 9% # 3 GE, TBEA
Distribution 47 5% # 5 Voltamp, Tesla
Motors
LT motors 38 34% # 1 ABB, Siemens
Large motors 10 17% # 2 Bhel, ABB
FHP motors 8 29% # 1 Marathon, Lawkim
Railway products
AC traction motors 5 31% # 2 Bhel, Saini
Propulsion Electrics 9 66% # 1 BHEL
IGBT Propulsion System 15 17% # 5 BTIL, Bhel, ABB
Loco transformer 5 22% # 3 ABB, Bhel
Relays 1 59% # 1 AEW
Point machines 1 60% # 1 Vossloh
Carriage fans (BLDC) 1 40% # 1 Kanwar Source: Company, IIFL Research
Figure 48: CG Power’s domestic products portfolio
(Rs bn)
Market Size (FY19E) Est. Market Share Sales
Power - Transformers 113.0 8% 8 - Switchgears 54.4 15% 8
Industrial - Motors 55.4 30% 17 - Railways 36.3 34% 12 - Drives 14.5 7% 1 Source: Company, IIFL Research
Acquisition of CG Power would enable TI to diversify
away from domestic auto industry and also
strengthen industrial manufacturing portfolio
Tube Investments of India – BUY
26 26 [email protected]
Given that most of its international operations are under liquidation,
CG Power will be left with two main international operating entities −
QEI (USA) and Drives & Automation (Sweden) − with aggregate
revenue of ~EUR40m, as per Management.
Post completion of the transaction, CG Power will start off with fresh
equity infusion of Rs8bn from TI (Rs6.5bn upfront, for controlling
stake; Rs1.5bn in the form of warrants, of which 25% is upfront and
the balance 75% has to be infused within 18 months for controlling
stake of the 58.58% post-warrant conversion) and debt of Rs10bn
(of which Rs2bn carries coupon of 0.01% for two years, and Rs1.5bn
is against the CG House property in Worli, Mumbai).
Figure 49: Fund infusion and equity dilution proposed on acquisition
Particulars No of shares (m) Price (Rs) Value (Rs m)
Current equity shares 627
Fresh issuance (3QFY21) 643 8.56 5,500
Fresh issuance (3QFY21) 69 14.55 1,000
Warrants (18 months) 175 8.56 1,500
Total equity shares, post dilution 1,513 9.02 8,000
Total equity dilution 58.58%
Immediate fund infusion (3QFY21)
6,875
TI's shareholding, post dilution 58.58%
Source: Company, IIFL Research
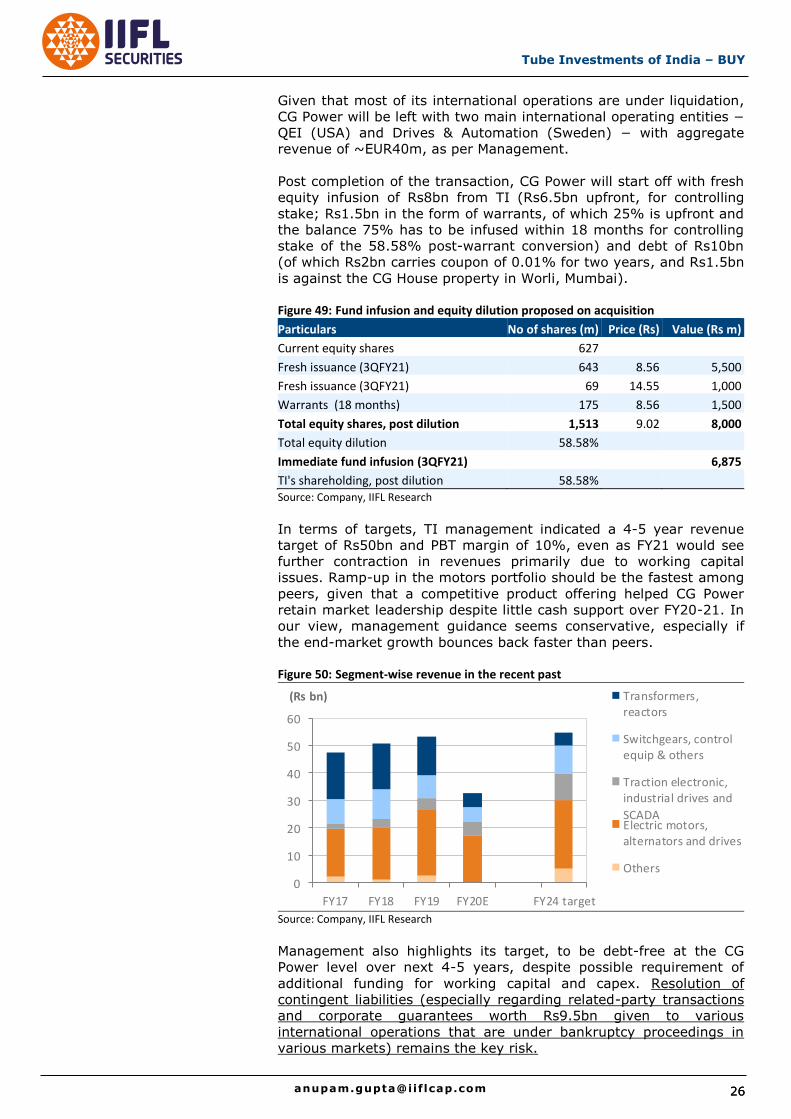
In terms of targets, TI management indicated a 4-5 year revenue
target of Rs50bn and PBT margin of 10%, even as FY21 would see
further contraction in revenues primarily due to working capital
issues. Ramp-up in the motors portfolio should be the fastest among
peers, given that a competitive product offering helped CG Power
retain market leadership despite little cash support over FY20-21. In
our view, management guidance seems conservative, especially if
the end-market growth bounces back faster than peers.
Figure 50: Segment-wise revenue in the recent past
Source: Company, IIFL Research
Management also highlights its target, to be debt-free at the CG
Power level over next 4-5 years, despite possible requirement of
additional funding for working capital and capex. Resolution of
contingent liabilities (especially regarding related-party transactions
and corporate guarantees worth Rs9.5bn given to various
international operations that are under bankruptcy proceedings in
various markets) remains the key risk.
0
10
20
30
40
50
60
FY17 FY18 FY19 FY20E FY24 target
(Rs bn) Transformers,reactors
Switchgears, controlequip & others
Traction electronic,industrial drives and
SCADAElectric motors,alternators and drives
Others
27
Tube Investments of India - BUY
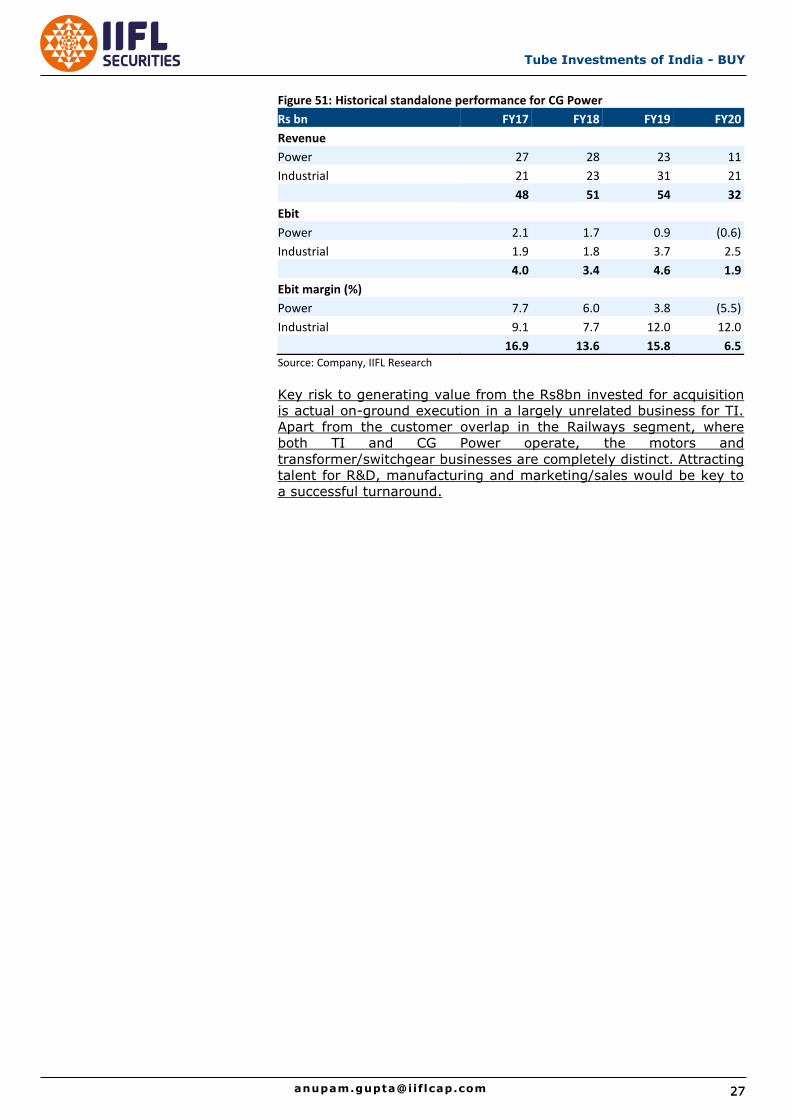
Figure 51: Historical standalone performance for CG Power
Rs bn FY17 FY18 FY19 FY20
Revenue
Power 27 28 23 11
Industrial 21 23 31 21
48 51 54 32
Ebit
Power 2.1 1.7 0.9 (0.6)
Industrial 1.9 1.8 3.7 2.5
4.0 3.4 4.6 1.9
Ebit margin (%)
Power 7.7 6.0 3.8 (5.5)
Industrial 9.1 7.7 12.0 12.0
16.9 13.6 15.8 6.5
Source: Company, IIFL Research
Key risk to generating value from the Rs8bn invested for acquisition
is actual on-ground execution in a largely unrelated business for TI.
Apart from the customer overlap in the Railways segment, where
both TI and CG Power operate, the motors and
transformer/switchgear businesses are completely distinct. Attracting
talent for R&D, manufacturing and marketing/sales would be key to
a successful turnaround.
Tube Investments of India – BUY
28 28 [email protected]
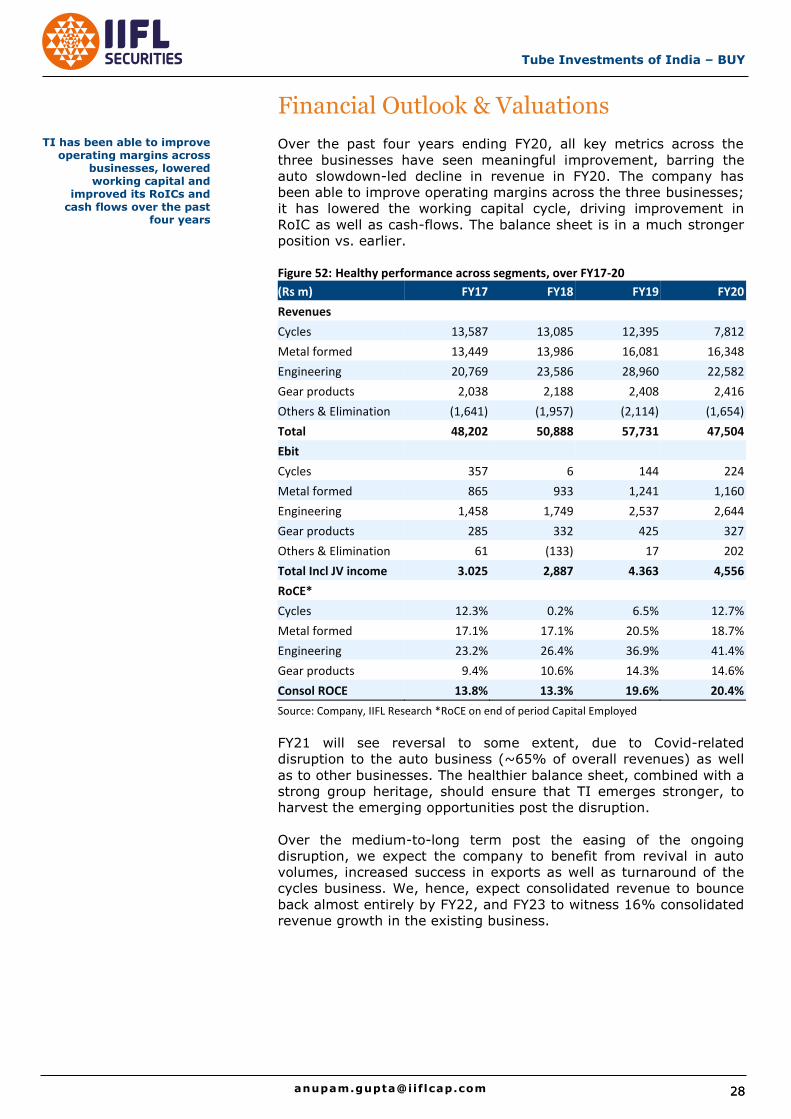
Financial Outlook & Valuations
Over the past four years ending FY20, all key metrics across the
three businesses have seen meaningful improvement, barring the
auto slowdown-led decline in revenue in FY20. The company has
been able to improve operating margins across the three businesses;
it has lowered the working capital cycle, driving improvement in
RoIC as well as cash-flows. The balance sheet is in a much stronger
position vs. earlier.
Figure 52: Healthy performance across segments, over FY17-20
(Rs m) FY17 FY18 FY19 FY20
Revenues
Cycles 13,587 13,085 12,395 7,812
Metal formed 13,449 13,986 16,081 16,348
Engineering 20,769 23,586 28,960 22,582
Gear products 2,038 2,188 2,408 2,416
Others & Elimination (1,641) (1,957) (2,114) (1,654)
Total 48,202 50,888 57,731 47,504
Ebit
Cycles 357 6 144 224
Metal formed 865 933 1,241 1,160
Engineering 1,458 1,749 2,537 2,644
Gear products 285 332 425 327
Others & Elimination 61 (133) 17 202
Total Incl JV income 3.025 2,887 4.363 4,556
RoCE*
Cycles 12.3% 0.2% 6.5% 12.7%
Metal formed 17.1% 17.1% 20.5% 18.7%
Engineering 23.2% 26.4% 36.9% 41.4%
Gear products 9.4% 10.6% 14.3% 14.6%
Consol ROCE 13.8% 13.3% 19.6% 20.4%
Source: Company, IIFL Research *RoCE on end of period Capital Employed
FY21 will see reversal to some extent, due to Covid-related
disruption to the auto business (~65% of overall revenues) as well
as to other businesses. The healthier balance sheet, combined with a
strong group heritage, should ensure that TI emerges stronger, to
harvest the emerging opportunities post the disruption.
Over the medium-to-long term post the easing of the ongoing
disruption, we expect the company to benefit from revival in auto
volumes, increased success in exports as well as turnaround of the
cycles business. We, hence, expect consolidated revenue to bounce
back almost entirely by FY22, and FY23 to witness 16% consolidated
revenue growth in the existing business.
TI has been able to improve operating margins across
businesses, lowered working capital and
improved its RoICs and cash flows over the past
four years
29
Tube Investments of India - BUY
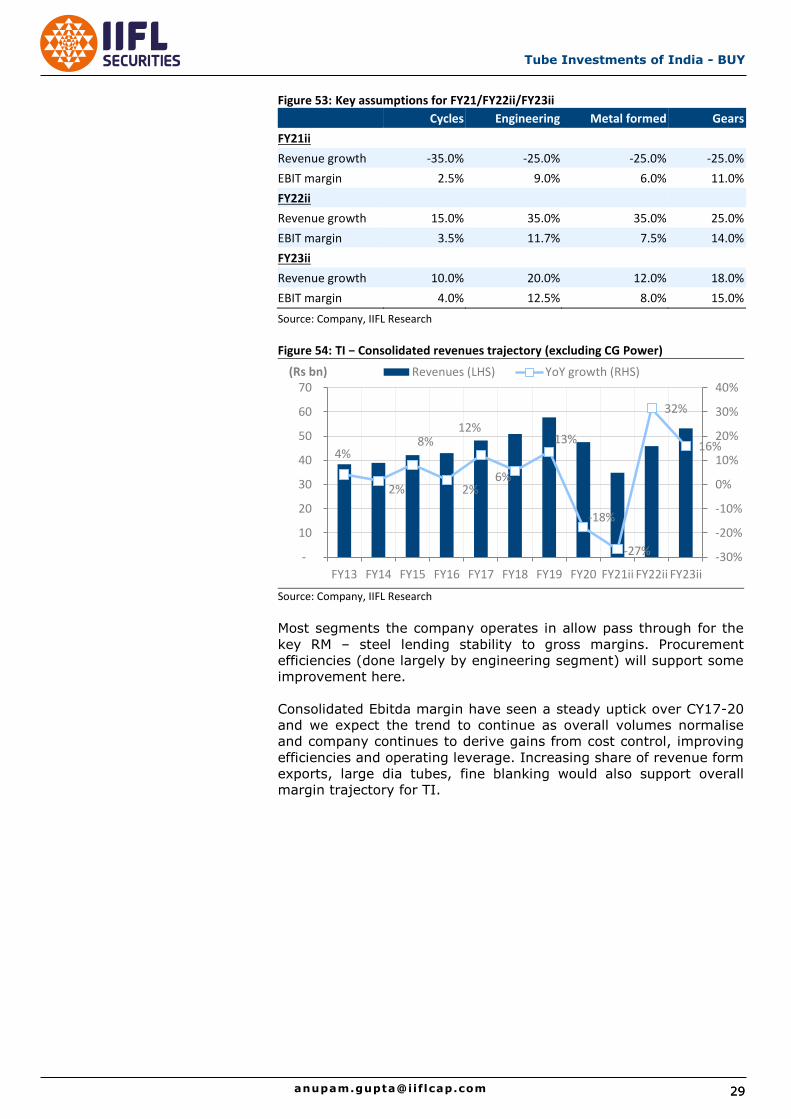
Figure 53: Key assumptions for FY21/FY22ii/FY23ii
Cycles Engineering Metal formed Gears
FY21ii
Revenue growth -35.0% -25.0% -25.0% -25.0%
EBIT margin 2.5% 9.0% 6.0% 11.0%
FY22ii
Revenue growth 15.0% 35.0% 35.0% 25.0%
EBIT margin 3.5% 11.7% 7.5% 14.0%
FY23ii
Revenue growth 10.0% 20.0% 12.0% 18.0%
EBIT margin 4.0% 12.5% 8.0% 15.0%
Source: Company, IIFL Research
Figure 54: TI − Consolidated revenues trajectory (excluding CG Power)
Source: Company, IIFL Research
Most segments the company operates in allow pass through for the
key RM – steel lending stability to gross margins. Procurement
efficiencies (done largely by engineering segment) will support some
improvement here.
Consolidated Ebitda margin have seen a steady uptick over CY17-20
and we expect the trend to continue as overall volumes normalise
and company continues to derive gains from cost control, improving
efficiencies and operating leverage. Increasing share of revenue form
exports, large dia tubes, fine blanking would also support overall
margin trajectory for TI.
4%
2%
8%
2%
12%
6%
13%
-18%
-27%
32%
16%
-30%
-20%
-10%
0%
10%
20%
30%
40%
-
10
20
30
40
50
60
70
FY13 FY14 FY15 FY16 FY17 FY18 FY19 FY20 FY21ii FY22ii FY23ii
(Rs bn) Revenues (LHS) YoY growth (RHS)
Tube Investments of India – BUY
30 30 [email protected]
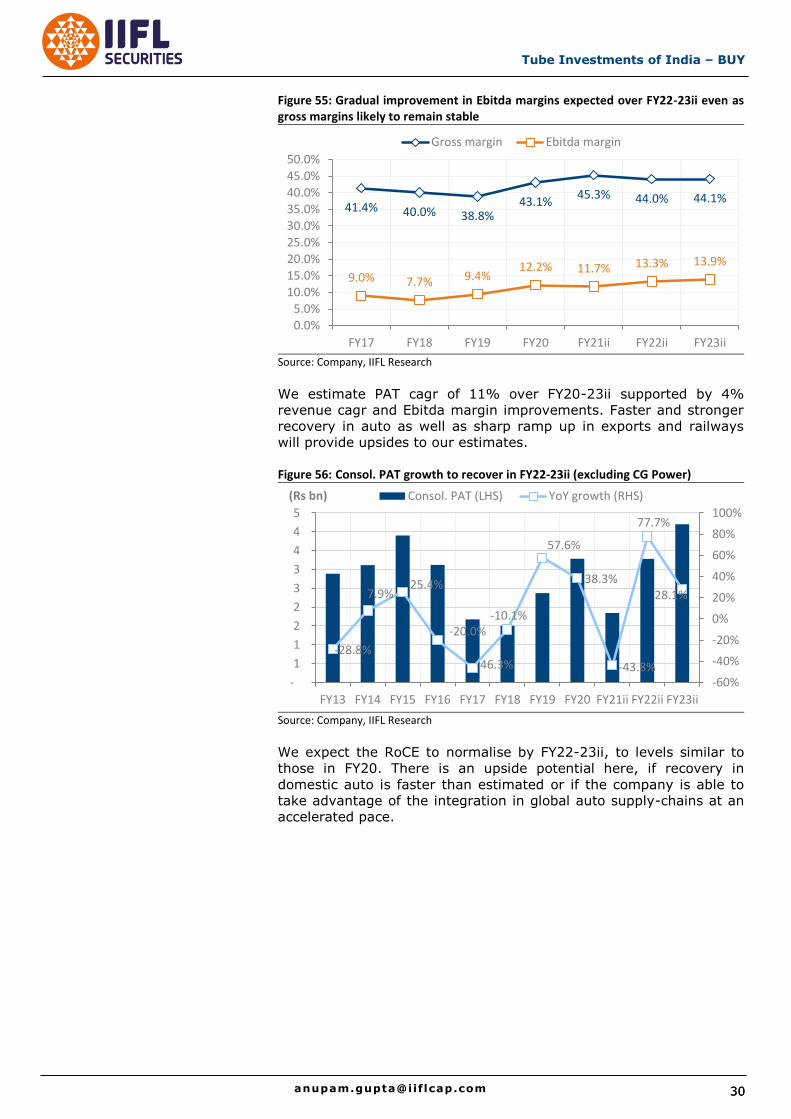
Figure 55: Gradual improvement in Ebitda margins expected over FY22-23ii even as gross margins likely to remain stable
Source: Company, IIFL Research
We estimate PAT cagr of 11% over FY20-23ii supported by 4%
revenue cagr and Ebitda margin improvements. Faster and stronger
recovery in auto as well as sharp ramp up in exports and railways
will provide upsides to our estimates.
Figure 56: Consol. PAT growth to recover in FY22-23ii (excluding CG Power)
Source: Company, IIFL Research
We expect the RoCE to normalise by FY22-23ii, to levels similar to
those in FY20. There is an upside potential here, if recovery in
domestic auto is faster than estimated or if the company is able to
take advantage of the integration in global auto supply-chains at an
accelerated pace.
41.4% 40.0% 38.8% 43.1%
45.3% 44.0% 44.1%
9.0% 7.7% 9.4% 12.2% 11.7% 13.3% 13.9%
0.0%
5.0%
10.0%
15.0%
20.0%
25.0%
30.0%
35.0%
40.0%
45.0%
50.0%
FY17 FY18 FY19 FY20 FY21ii FY22ii FY23ii
Gross margin Ebitda margin
-28.8%
7.9% 25.4%
-20.0%
-46.3%
-10.1%
57.6%
38.3%
-43.8%
77.7%
28.1%
-60%
-40%
-20%
0%
20%
40%
60%
80%
100%
-
1
1
2
2
3
3
4
4
5
FY13 FY14 FY15 FY16 FY17 FY18 FY19 FY20 FY21ii FY22ii FY23ii
(Rs bn) Consol. PAT (LHS) YoY growth (RHS)
31
Tube Investments of India - BUY
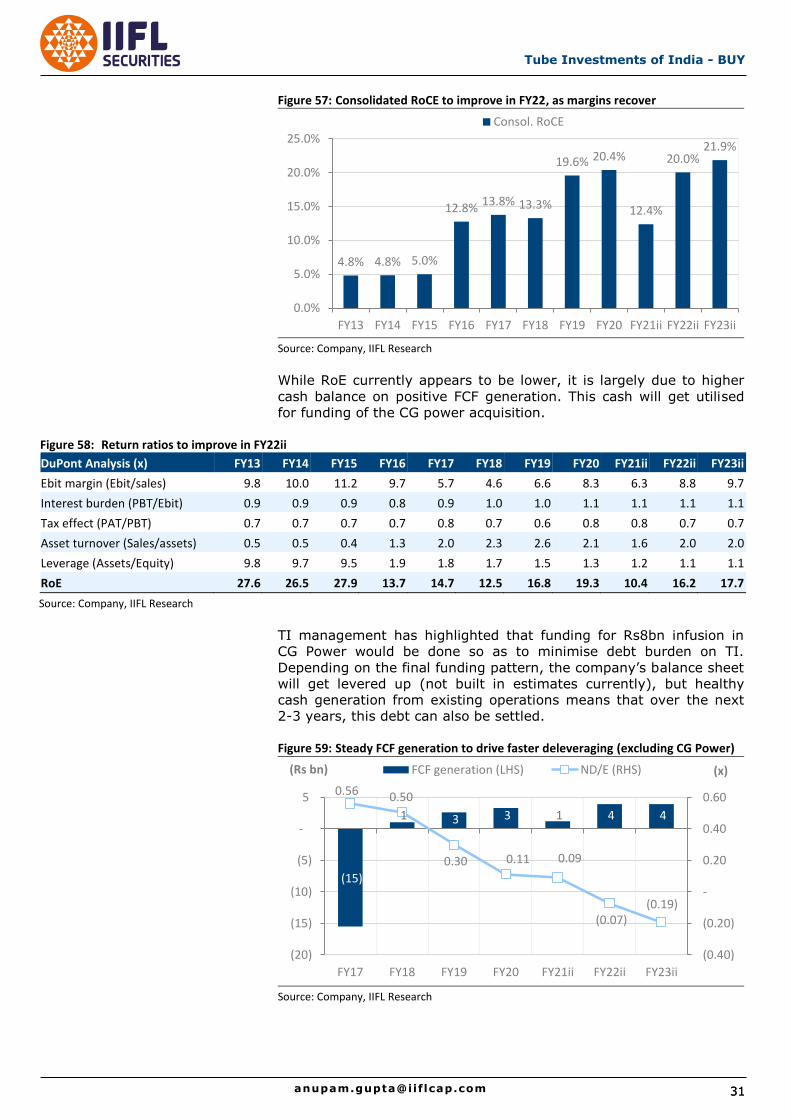
Figure 57: Consolidated RoCE to improve in FY22, as margins recover
Source: Company, IIFL Research
While RoE currently appears to be lower, it is largely due to higher
cash balance on positive FCF generation. This cash will get utilised
for funding of the CG power acquisition.
Figure 58: Return ratios to improve in FY22ii
DuPont Analysis (x) FY13 FY14 FY15 FY16 FY17 FY18 FY19 FY20 FY21ii FY22ii FY23ii
Ebit margin (Ebit/sales) 9.8 10.0 11.2 9.7 5.7 4.6 6.6 8.3 6.3 8.8 9.7
Interest burden (PBT/Ebit) 0.9 0.9 0.9 0.8 0.9 1.0 1.0 1.1 1.1 1.1 1.1
Tax effect (PAT/PBT) 0.7 0.7 0.7 0.7 0.8 0.7 0.6 0.8 0.8 0.7 0.7
Asset turnover (Sales/assets) 0.5 0.5 0.4 1.3 2.0 2.3 2.6 2.1 1.6 2.0 2.0
Leverage (Assets/Equity) 9.8 9.7 9.5 1.9 1.8 1.7 1.5 1.3 1.2 1.1 1.1
RoE 27.6 26.5 27.9 13.7 14.7 12.5 16.8 19.3 10.4 16.2 17.7
Source: Company, IIFL Research
TI management has highlighted that funding for Rs8bn infusion in
CG Power would be done so as to minimise debt burden on TI.
Depending on the final funding pattern, the company’s balance sheet
will get levered up (not built in estimates currently), but healthy
cash generation from existing operations means that over the next
2-3 years, this debt can also be settled.
Figure 59: Steady FCF generation to drive faster deleveraging (excluding CG Power)
Source: Company, IIFL Research
4.8% 4.8% 5.0%
12.8% 13.8% 13.3%
19.6% 20.4%
12.4%
20.0% 21.9%
0.0%
5.0%
10.0%
15.0%
20.0%
25.0%
FY13 FY14 FY15 FY16 FY17 FY18 FY19 FY20 FY21ii FY22ii FY23ii
Consol. RoCE
(15)
1 3 3 1 4 4
0.56 0.50
0.30 0.11 0.09
(0.07) (0.19)
(0.40)
(0.20)
-
0.20
0.40
0.60
(20)
(15)
(10)
(5)
-
5
FY17 FY18 FY19 FY20 FY21ii FY22ii FY23ii
(x) (Rs bn) FCF generation (LHS) ND/E (RHS)
Tube Investments of India – BUY
32 32 [email protected]
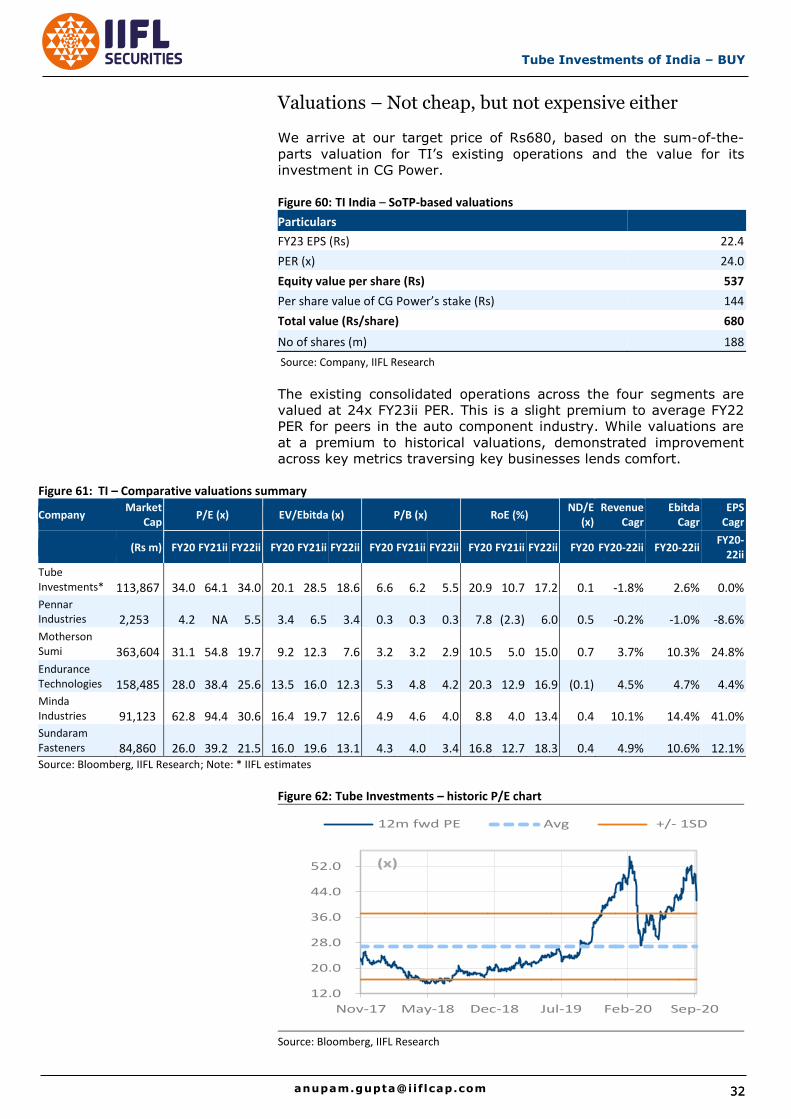
Valuations – Not cheap, but not expensive either
We arrive at our target price of Rs680, based on the sum-of-the-
parts valuation for TI’s existing operations and the value for its
investment in CG Power.
Figure 60: TI India – SoTP-based valuations
Particulars
FY23 EPS (Rs) 22.4
PER (x) 24.0
Equity value per share (Rs) 537
Per share value of CG Power’s stake (Rs) 144
Total value (Rs/share) 680
No of shares (m) 188
Source: Company, IIFL Research
The existing consolidated operations across the four segments are
valued at 24x FY23ii PER. This is a slight premium to average FY22
PER for peers in the auto component industry. While valuations are
at a premium to historical valuations, demonstrated improvement
across key metrics traversing key businesses lends comfort.
Figure 61: TI – Comparative valuations summary
Company Market
Cap P/E (x) EV/Ebitda (x) P/B (x) RoE (%)
ND/E (x)
Revenue Cagr
Ebitda Cagr
EPS Cagr
(Rs m) FY20 FY21ii FY22ii FY20 FY21ii FY22ii FY20 FY21ii FY22ii FY20 FY21ii FY22ii FY20 FY20-22ii FY20-22ii FY20-
22ii
Tube Investments*
113,867 34.0 64.1 34.0 20.1 28.5 18.6 6.6 6.2 5.5 20.9 10.7 17.2 0.1 -1.8% 2.6% 0.0%
Pennar Industries 2,253 4.2 NA 5.5 3.4 6.5 3.4 0.3 0.3 0.3 7.8 (2.3) 6.0 0.5 -0.2% -1.0% -8.6% Motherson Sumi
363,604 31.1 54.8 19.7 9.2 12.3 7.6 3.2 3.2 2.9 10.5 5.0 15.0 0.7 3.7% 10.3% 24.8%
Endurance Technologies
158,485 28.0 38.4 25.6 13.5 16.0 12.3 5.3 4.8 4.2 20.3 12.9 16.9 (0.1) 4.5% 4.7% 4.4%
Minda Industries 91,123 62.8 94.4 30.6 16.4 19.7 12.6 4.9 4.6 4.0 8.8 4.0 13.4 0.4 10.1% 14.4% 41.0% Sundaram Fasteners 84,860 26.0 39.2 21.5 16.0 19.6 13.1 4.3 4.0 3.4 16.8 12.7 18.3 0.4 4.9% 10.6% 12.1% Source: Bloomberg, IIFL Research; Note: * IIFL estimates
Figure 62: Tube Investments – historic P/E chart
Source: Bloomberg, IIFL Research
12.0
20.0
28.0
36.0
44.0
52.0
Nov-17 May-18 Dec-18 Jul-19 Feb-20 Sep-20
12m fwd PE Avg +/- 1SD
(x)
33
Tube Investments of India - BUY
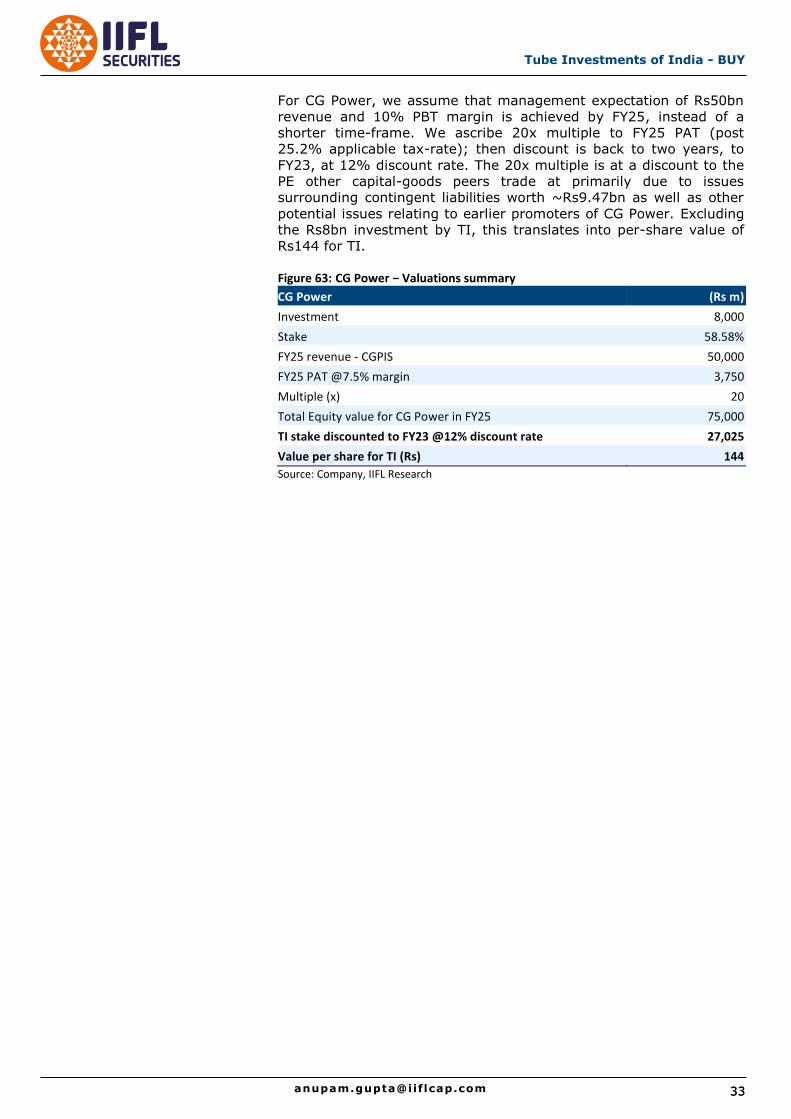
For CG Power, we assume that management expectation of Rs50bn
revenue and 10% PBT margin is achieved by FY25, instead of a
shorter time-frame. We ascribe 20x multiple to FY25 PAT (post
25.2% applicable tax-rate); then discount is back to two years, to
FY23, at 12% discount rate. The 20x multiple is at a discount to the
PE other capital-goods peers trade at primarily due to issues
surrounding contingent liabilities worth ~Rs9.47bn as well as other
potential issues relating to earlier promoters of CG Power. Excluding
the Rs8bn investment by TI, this translates into per-share value of
Rs144 for TI.
Figure 63: CG Power − Valuations summary
CG Power (Rs m)
Investment 8,000
Stake 58.58%
FY25 revenue - CGPIS 50,000
FY25 PAT @7.5% margin 3,750
Multiple (x) 20
Total Equity value for CG Power in FY25 75,000
TI stake discounted to FY23 @12% discount rate 27,025
Value per share for TI (Rs) 144
Source: Company, IIFL Research
Tube Investments of India – BUY
34 34 [email protected]
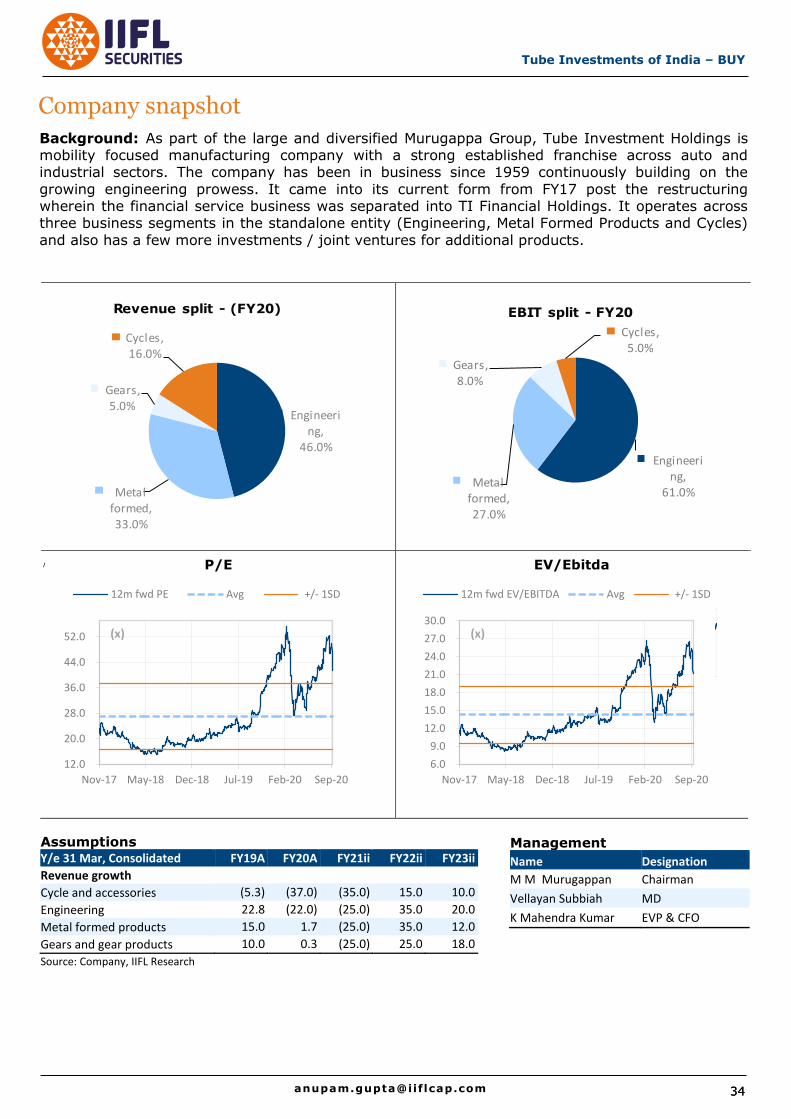
Company snapshot
P/E
EV/Ebitda
0100200300400500600700800
No
v-1
7
Jan
-18
Mar
-18
May
-18
Jul-
18
Sep
-18
No
v-1
8
Jan
-19
Mar
-19
May
-19
Jul-
19
Sep
-19
No
v-1
9
Jan
-20
Mar
-20
May
-20
Jul-
20
Sep
-20
Price TP/Reco changed date(Rs)
#N/A
Background: As part of the large and diversified Murugappa Group, Tube Investment Holdings is mobility focused manufacturing company with a strong established franchise across auto and industrial sectors. The company has been in business since 1959 continuously building on the
growing engineering prowess. It came into its current form from FY17 post the restructuring wherein the financial service business was separated into TI Financial Holdings. It operates across three business segments in the standalone entity (Engineering, Metal Formed Products and Cycles)
and also has a few more investments / joint ventures for additional products.
Assumptions Y/e 31 Mar, Consolidated FY19A FY20A FY21ii FY22ii FY23ii
Revenue growth
Cycle and accessories (5.3) (37.0) (35.0) 15.0 10.0
Engineering 22.8 (22.0) (25.0) 35.0 20.0
Metal formed products 15.0 1.7 (25.0) 35.0 12.0
Gears and gear products 10.0 0.3 (25.0) 25.0 18.0
Source: Company, IIFL Research
Engineering,
61.0%Metal
formed, 27.0%
Gears, 8.0%
Cycles, 5.0%
EBIT split - FY20
6.0
9.0
12.0
15.0
18.0
21.0
24.0
27.0
30.0
Nov-17 May-18 Dec-18 Jul-19 Feb-20 Sep-20
12m fwd EV/EBITDA Avg +/- 1SD
(x)
Engineering,
46.0%
Metal formed, 33.0%
Gears, 5.0%
Cycles, 16.0%
Revenue split - (FY20)
/
12.0
20.0
28.0
36.0
44.0
52.0
Nov-17 May-18 Dec-18 Jul-19 Feb-20 Sep-20
12m fwd PE Avg +/- 1SD
(x)
Management
Name Designation
M M Murugappan Chairman
Vellayan Subbiah MD
K Mahendra Kumar EVP & CFO
35
Tube Investments of India - BUY
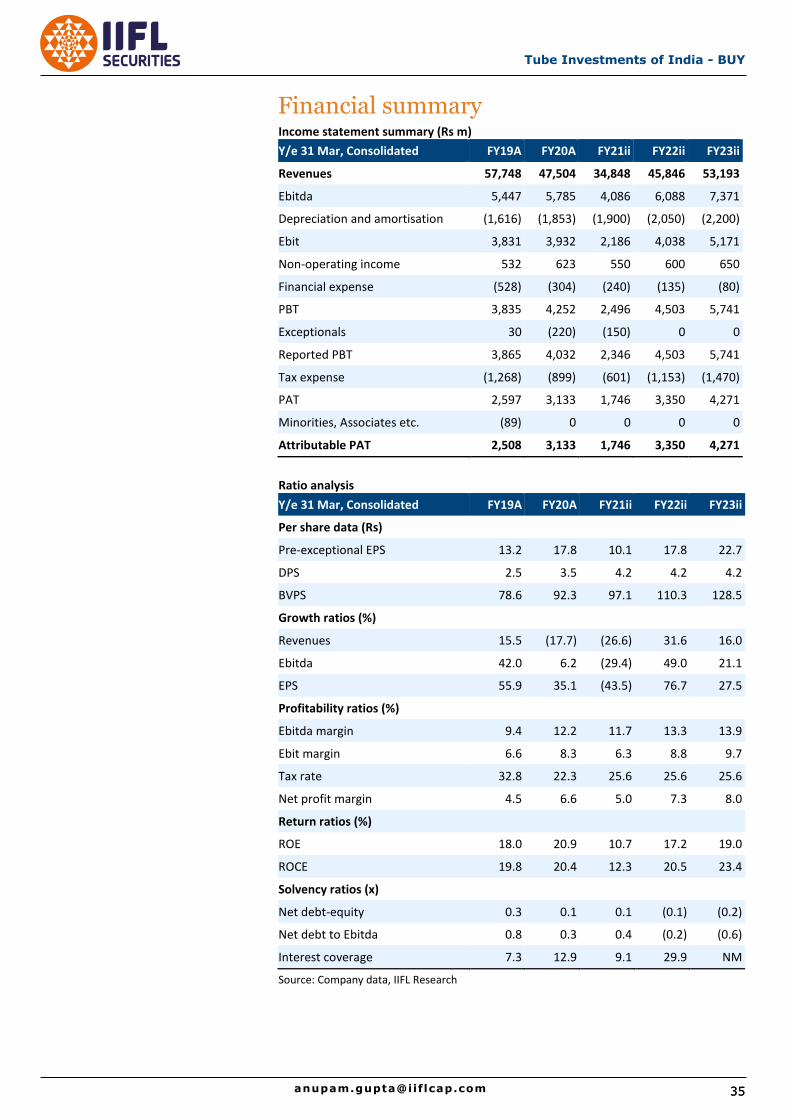
Income statement summary (Rs m)
Y/e 31 Mar, Consolidated FY19A FY20A FY21ii FY22ii FY23ii
Revenues 57,748 47,504 34,848 45,846 53,193
Ebitda 5,447 5,785 4,086 6,088 7,371
Depreciation and amortisation (1,616) (1,853) (1,900) (2,050) (2,200)
Ebit 3,831 3,932 2,186 4,038 5,171
Non-operating income 532 623 550 600 650
Financial expense (528) (304) (240) (135) (80)
PBT 3,835 4,252 2,496 4,503 5,741
Exceptionals 30 (220) (150) 0 0
Reported PBT 3,865 4,032 2,346 4,503 5,741
Tax expense (1,268) (899) (601) (1,153) (1,470)
PAT 2,597 3,133 1,746 3,350 4,271
Minorities, Associates etc. (89) 0 0 0 0
Attributable PAT 2,508 3,133 1,746 3,350 4,271
Ratio analysis
Y/e 31 Mar, Consolidated FY19A FY20A FY21ii FY22ii FY23ii
Per share data (Rs)
Pre-exceptional EPS 13.2 17.8 10.1 17.8 22.7
DPS 2.5 3.5 4.2 4.2 4.2
BVPS 78.6 92.3 97.1 110.3 128.5
Growth ratios (%)
Revenues 15.5 (17.7) (26.6) 31.6 16.0
Ebitda 42.0 6.2 (29.4) 49.0 21.1
EPS 55.9 35.1 (43.5) 76.7 27.5
Profitability ratios (%)
Ebitda margin 9.4 12.2 11.7 13.3 13.9
Ebit margin 6.6 8.3 6.3 8.8 9.7
Tax rate 32.8 22.3 25.6 25.6 25.6
Net profit margin 4.5 6.6 5.0 7.3 8.0
Return ratios (%)
ROE 18.0 20.9 10.7 17.2 19.0
ROCE 19.8 20.4 12.3 20.5 23.4
Solvency ratios (x)
Net debt-equity 0.3 0.1 0.1 (0.1) (0.2)
Net debt to Ebitda 0.8 0.3 0.4 (0.2) (0.6)
Interest coverage 7.3 12.9 9.1 29.9 NM
Source: Company data, IIFL Research
Financial summary
Tube Investments of India – BUY
36 36 [email protected]
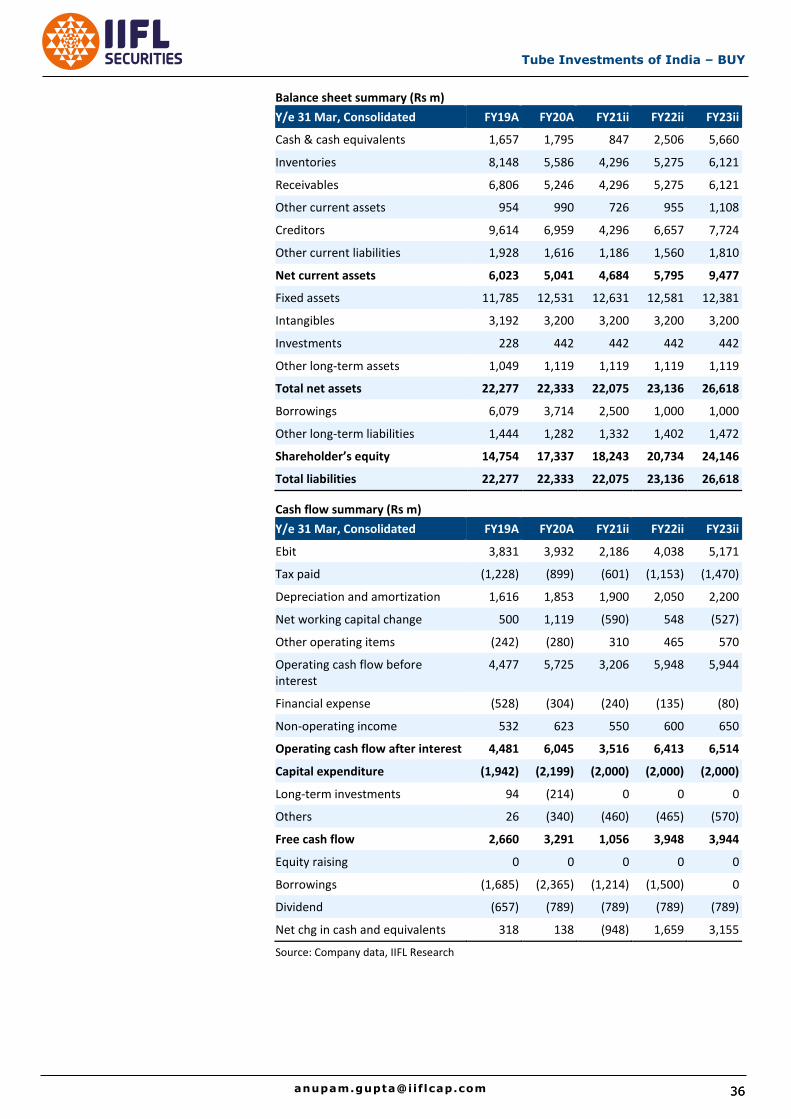
Balance sheet summary (Rs m)
Y/e 31 Mar, Consolidated FY19A FY20A FY21ii FY22ii FY23ii
Cash & cash equivalents 1,657 1,795 847 2,506 5,660
Inventories 8,148 5,586 4,296 5,275 6,121
Receivables 6,806 5,246 4,296 5,275 6,121
Other current assets 954 990 726 955 1,108
Creditors 9,614 6,959 4,296 6,657 7,724
Other current liabilities 1,928 1,616 1,186 1,560 1,810
Net current assets 6,023 5,041 4,684 5,795 9,477
Fixed assets 11,785 12,531 12,631 12,581 12,381
Intangibles 3,192 3,200 3,200 3,200 3,200
Investments 228 442 442 442 442
Other long-term assets 1,049 1,119 1,119 1,119 1,119
Total net assets 22,277 22,333 22,075 23,136 26,618
Borrowings 6,079 3,714 2,500 1,000 1,000
Other long-term liabilities 1,444 1,282 1,332 1,402 1,472
Shareholder’s equity 14,754 17,337 18,243 20,734 24,146
Total liabilities 22,277 22,333 22,075 23,136 26,618
Cash flow summary (Rs m)
Y/e 31 Mar, Consolidated FY19A FY20A FY21ii FY22ii FY23ii
Ebit 3,831 3,932 2,186 4,038 5,171
Tax paid (1,228) (899) (601) (1,153) (1,470)
Depreciation and amortization 1,616 1,853 1,900 2,050 2,200
Net working capital change 500 1,119 (590) 548 (527)
Other operating items (242) (280) 310 465 570
Operating cash flow before interest
4,477 5,725 3,206 5,948 5,944
Financial expense (528) (304) (240) (135) (80)
Non-operating income 532 623 550 600 650
Operating cash flow after interest 4,481 6,045 3,516 6,413 6,514
Capital expenditure (1,942) (2,199) (2,000) (2,000) (2,000)
Long-term investments 94 (214) 0 0 0
Others 26 (340) (460) (465) (570)
Free cash flow 2,660 3,291 1,056 3,948 3,944
Equity raising 0 0 0 0 0
Borrowings (1,685) (2,365) (1,214) (1,500) 0
Dividend (657) (789) (789) (789) (789)
Net chg in cash and equivalents 318 138 (948) 1,659 3,155
Source: Company data, IIFL Research
37
Tube Investments of India - BUY
Disclosure: Published in 2020, © IIFL Securities Limited (Formerly ‘India Infoline Limited’) 2020
India Infoline Group (hereinafter referred as IIFL) is engaged in diversified financial services business including equity broking, DP services, merchant
banking, portfolio management services, distribution of Mutual Fund, insurance products and other investment products and also loans and finance business. India Infoline Ltd (“hereinafter referred as IIL”) is a part of the IIFL and is a member of the National Stock Exchange of India Limited
(“NSE”) and the BSE Limited (“BSE”). IIL is also a Depository Participant registered with NSDL & CDSL, a SEBI registered merchant banker and a
SEBI registered portfolio manager. IIL is a large broking house catering to retail, HNI and institutional clients. It operates through its branches and
authorised persons and sub-brokers spread across the country and the clients are provided online trading through internet and offline trading through
branches and Customer Care.
a) This research report (“Report”) is for the personal information of the authorized recipient(s) and is not for public distribution and should not be reproduced or redistributed to any other person or in any form without IIL’s prior permission. The information provided in the Report is from
publicly available data, which we believe, are reliable. While reasonable endeavors have been made to present reliable data in the Report so far
as it relates to current and historical information, but IIL does not guarantee the accuracy or completeness of the data in the Report.
Accordingly, IIL or any of its connected persons including its directors or subsidiaries or associates or employees shall not be in any way
responsible for any loss or damage that may arise to any person from any inadvertent error in the information contained, views and opinions
expressed in this publication.
b) Past performance should not be taken as an indication or guarantee of future performance, and no representation or warranty, express or
implied, is made regarding future performance. Information, opinions and estimates contained in this report reflect a judgment of its original
date of publication by IIFL and are subject to change without notice. The price, value of and income from any of the securities or financial
instruments mentioned in this report can fall as well as rise. The value of securities and financial instruments is subject to exchange rate fluctuation that may have a positive or adverse effect on the price or income of such securities or financial instruments.
c) The Report also includes analysis and views of our research team. The Report is purely for information purposes and does not construe to be
investment recommendation/advice or an offer or solicitation of an offer to buy/sell any securities. The opinions expressed in the Report are our current opinions as of the date of the Report and may be subject to change from time to time without notice. IIL or any persons connected with
it do not accept any liability arising from the use of this document.
d) Investors should not solely rely on the information contained in this Report and must make investment decisions based on their own investment objectives, judgment, risk profile and financial position. The recipients of this Report may take professional advice before acting on this
information.
e) IIL has other business segments / divisions with independent research teams separated by 'Chinese walls' catering to different sets of customers having varying objectives, risk profiles, investment horizon, etc and therefore, may at times have, different and contrary views on
stocks, sectors and markets.
f) This report is not directed or intended for distribution to, or use by, any person or entity who is a citizen or resident of or located in any locality, state, country or other jurisdiction, where such distribution, publication, availability or use would be contrary to local law, regulation or which
would subject IIL and its affiliates to any registration or licensing requirement within such jurisdiction. The securities described herein may or
may not be eligible for sale in all jurisdictions or to certain category of investors. Persons in whose possession this Report may come are
required to inform themselves of and to observe such restrictions.
g) As IIL along with its associates, are engaged in various financial services business and so might have financial, business or other interests in other entities including the subject company(ies) mentioned in this Report. However, IIL encourages independence in preparation of research
report and strives to minimize conflict in preparation of research report. IIL and its associates did not receive any compensation or other
benefits from the subject company(ies) mentioned in the Report or from a third party in connection with preparation of the Report. Accordingly,
IIL and its associates do not have any material conflict of interest at the time of publication of this Report.
h) As IIL and its associates are engaged in various financial services business, it might have:-
(a) received any compensation (except in connection with the preparation of this Report) from the subject company in the past twelve months; (b) managed or co-managed public offering of securities for the subject company in the past twelve months; (c) received any compensation for
investment banking or merchant banking or brokerage services from the subject company in the past twelve months; (d) received any
compensation for products or services other than investment banking or merchant banking or brokerage services from the subject company in
the past twelve months; (e) engaged in market making activity for the subject company.
i) IIL and its associates collectively do not own (in their proprietary position) 1% or more of the equity securities of the subject company mentioned in the report as of the last day of the month preceding the publication of the research report.
j) The Research Analyst engaged in preparation of this Report or his/her relative:-
(a) does not have any financial interests in the subject company (ies) mentioned in this report; (b) does not own 1% or more of the equity securities of the subject company mentioned in the report as of the last day of the month preceding the publication of the research report; (c)
does not have any other material conflict of interest at the time of publication of the research report.
k) The Research Analyst engaged in preparation of this Report:-
(a) has not received any compensation from the subject company in the past twelve months; (b) has not managed or co-managed public
offering of securities for the subject company in the past twelve months; (c) has not received any compensation for investment banking or
merchant banking or brokerage services from the subject company in the past twelve months; (d) has not received any compensation for
products or services other than investment banking or merchant banking or brokerage services from the subject company in the past twelve months; (e) has not received any compensation or other benefits from the subject company or third party in connection with the research
report; (f) has not served as an officer, director or employee of the subject company; (g) is not engaged in market making activity for the
subject company.
L) IIFLCAP accepts responsibility for the contents of this research report, subject to the terms set out below, to the extent that it is delivered to a U.S. person other than a major U.S. institutional investor. The analyst whose name appears in this research report is not registered or qualified
as a research analyst with the Financial Industry Regulatory Authority (“FINRA”) and may not be an associated person of IIFLCAP and,
therefore, may not be subject to applicable restrictions under FINRA Rules on communications with a subject company, public appearances and
trading securities held by a research analyst account.
We submit that no material disciplinary action has been taken on IIL by any regulatory authority impacting Equity Research Analysis.
Tube Investments of India – BUY
38 38 [email protected]
This research report was prepared by IIFL Securities Limited (Formerly ‘India Infoline Limited’) Institutional Equities Research Desk (‘IIFL’), a
company to engage activities is not dealer United States and, therefore, is not subject to U.S. rules of reports independence of research report is
provided for distribution to U.S. institutional investors” in reliance on the exemption from registration provided by Rule 15a-6 of the U.S. Securities
Exchange recipient of wishing to effect any transaction to buy or sell securities or related financial instruments based on the information provided in
this report should do IIFL IIFLCAP’), broker dealer in the United States.
IIFLCAP accepts responsibility for the contents of this research report, a person whose name appears in this research report is not registered or
qualified as a research analyst with the Financial Industry FINRA”) and an person of IIFLCAP may not be subject to applicable restrictions under
FINRA Rules with held by analyst IIFL has other business units with independent research teams different views stocks and This report for the
personal information of the authorized recipient and is not for public distribution. This should not be reproduced or redistributed to any other person
or in any form. This report is for the general information of the investors, and should not be construed as an offer or solicitation of an offer to
buy/sell any securities.
We have exercised due diligence in checking the correctness and authenticity of the information contained herein, so far as it relates do not or
completeness. The opinions expressed are our current opinions as of the date appearing in the material and may be subject to from to time without
notice. or any persons connected it accept any liability arising from the use of this document. The recipients of this material should rely on their own
judgment professional advice on this information. IIFL or any of its connected persons including its directors or or not in way for any or damage that
may arise to any from any inadvertent error the information contained, views and opinions expressed in this publication.
IIFL and/or its affiliate companies may deal in the securities mentioned herein as a broker or for any transaction as a Maker, Investment Advisor, to
issuer persons. IIFL generally prohibits its analysts from having financial interest in the securities of any of the companies that the analysts cover. In
addition, company its employees from conducting Futures & Options transactions or holding any shares for a period of less than 30 days.
Past performance should not be taken as an indication or guarantee of performance, and no or warranty, express performance. estimates contained
in this report reflect a judgment of its original date of publication by IIFL and are subject to change of mentioned in this report can fall as well as
rise. The value of securities and financial instruments is subject to exchange rate may adverse on the price of such securities
or financial instruments.
Analyst Certification: (a) that the views expressed in the research report accurately reflect part of her compensation was, is, or will be directly or
indirectly related to the specific recommendation or views contained in the research report.
A graph of daily closing prices of securities is available at http://www.nseindia.com/ChartApp/install/charts/mainpage.jsp, www.bseindia.com and
http://economictimes.indiatimes.com/markets/stocks/stock-quotes. (Choose a company from the list on the browser and select the “three years”
period in the price chart).
Name, Qualification and Certification of Research Analyst: Anupam Gupta(PGDBM), Urvil Bhatt, CFA(Chartered Accountant)
IIFL Securities Limited (Formerly ‘India Infoline Limited’), CIN No.: L99999MH1996PLC132983, Corporate Office – IIFL Centre, Kamala City, Senapati Bapat Marg, Lower Parel, Mumbai – 400013 Tel: (91-22) 4249 9000 .Fax: (91-22) 40609049, Regd. Office – IIFL House, Sun
Infotech Park, Road No. 16V, Plot No. B-23, MIDC, Thane Industrial Area, Wagle Estate, Thane – 400604 Tel: (91-22) 25806650. Fax: (91-22)
25806654 E-mail: [email protected] Website: www.indiainfoline.com, Refer www.indiainfoline.com for detail of Associates.
Stock Broker SEBI Regn.: INZ000164132, PMS SEBI Regn. No. INP000002213, IA SEBI Regn. No. INA000000623, SEBI RA Regn.:- INH000000248
Key to our recommendation structure
BUY - Stock expected to give a return 10%+ more than average return on a debt instrument over a 1-year horizon.
SELL - Stock expected to give a return 10%+ below the average return on a debt instrument over a 1-year horizon.
Add - Stock expected to give a return 0-10% over the average return on a debt instrument over a 1-year horizon.
Reduce - Stock expected to give a return 0-10% below the average return on a debt instrument over a 1-year horizon.
Distribution of Ratings: Out of 229 stocks rated in the IIFL coverage universe, 106 have BUY ratings, 10 have SELL ratings, 85 have ADD ratings
and 27 have REDUCE ratings
Price Target: Unless otherwise stated in the text of this report, target prices in this report are based on either a discounted cash flow valuation or comparison of valuation ratios with companies seen by the analyst as comparable or a combination of the two methods. The result of this
fundamental valuation is adjusted to reflect the analyst’s views on the likely course of investor sentiment. Whichever valuation method is used there
is a significant risk that the target price will not be achieved within the expected timeframe. Risk factors include unforeseen changes in competitive
pressures or in the level of demand for the company’s products. Such demand variations may result from changes in technology, in the overall level
of economic activity or, in some cases, in fashion. Valuations may also be affected by changes in taxation, in exchange rates and, in certain
industries, in regulations. Investment in overseas markets and instruments such as ADRs can result in increased risk from factors such as exchange
rates, exchange controls, taxation, and political and social conditions. This discussion of valuation methods and risk factors is not comprehensive –
further information is available upon request.
www.iiflcap.com
IIFL - IndiaIIFL Securities Limited9th Floor, IIFL Centre, Kamala City, Senapati Bapat Marg, Lower Parel (W),Mumbai - 400013Tel +91-22-4646-4600Fax +91-22-4646-4700
IIFL - USAIIFL Inc.1120 Avenue of the Americas Suite 1505,New York,NY 10036 Tel +1-212-221-6800Fax +1-646-417-5800
IIFL - UKIIFL Wealth (UK) Limited 41 LothburyLondon EC2R 7HG, United KingdomTel +44 (0) 20 707 87208
Our previous KYC reports (click on thumbnail to download)