capital investments
TRANSCRIPT
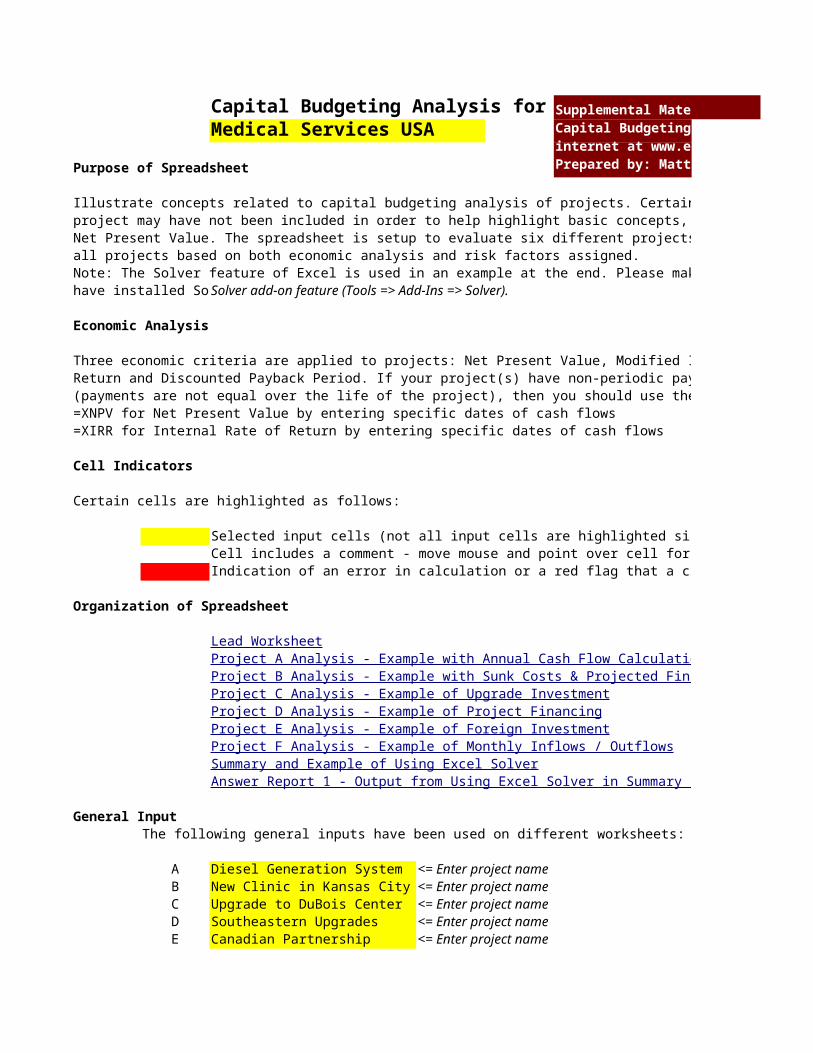
Capital Budgeting Analysis forMedical Services USA
Purpose of Spreadsheet
Illustrate concepts related to capital budgeting analysis of projects. Certain aspectsproject may have not been included in order to help highlight basic concepts, such asNet Present Value. The spreadsheet is setup to evaluate six different projects and sumall projects based on both economic analysis and risk factors assigned.Note: The Solver feature of Excel is used in an example at the end. Please make sure thave installed So Solver add-on feature (Tools => Add-Ins => Solver).
Economic Analysis
Three economic criteria are applied to projects: Net Present Value, Modified Internal Rate ofReturn and Discounted Payback Period. If your project(s) have non-periodic payments(payments are not equal over the life of the project), then you should use these Excel Functions:=XNPV for Net Present Value by entering specific dates of cash flows=XIRR for Internal Rate of Return by entering specific dates of cash flows
Cell Indicators
Certain cells are highlighted as follows:
Selected input cells (not all input cells are highlighted since each project is unique)Cell includes a comment - move mouse and point over cell for commentIndication of an error in calculation or a red flag that a criteria has not been met
Organization of Spreadsheet
General InputThe following general inputs have been used on different worksheets:
A Diesel Generation System <= Enter project nameB New Clinic in Kansas City <= Enter project nameC Upgrade to DuBois Center <= Enter project nameD Southeastern Upgrades <= Enter project nameE Canadian Partnership <= Enter project name
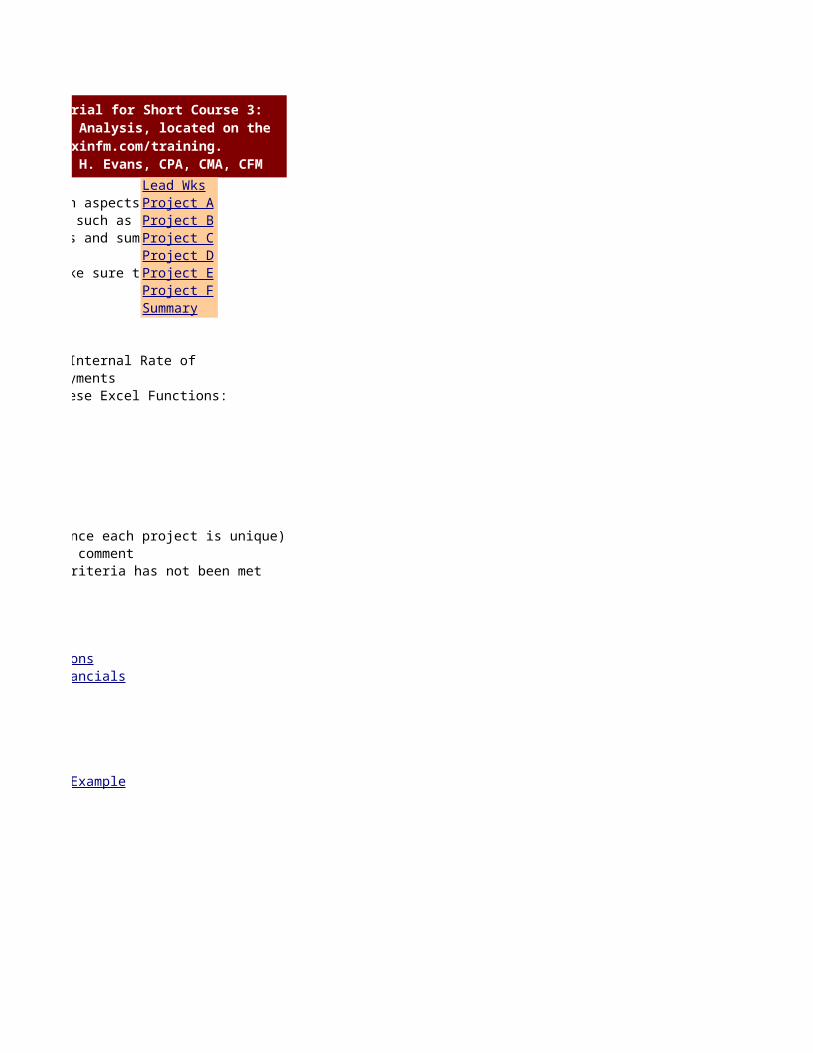
Supplemental Material for Short Course 3: Capital Budgeting Analysis, located on the internet at www.exinfm.com/training. Prepared by: Matt H. Evans, CPA, CMA, CFM
Lead WorksheetProject A Analysis - Example with Annual Cash Flow CalculationsProject B Analysis - Example with Sunk Costs & Projected FinancialsProject C Analysis - Example of Upgrade InvestmentProject D Analysis - Example of Project FinancingProject E Analysis - Example of Foreign InvestmentProject F Analysis - Example of Monthly Inflows / OutflowsSummary and Example of Using Excel SolverAnswer Report 1 - Output from Using Excel Solver in Summary Example
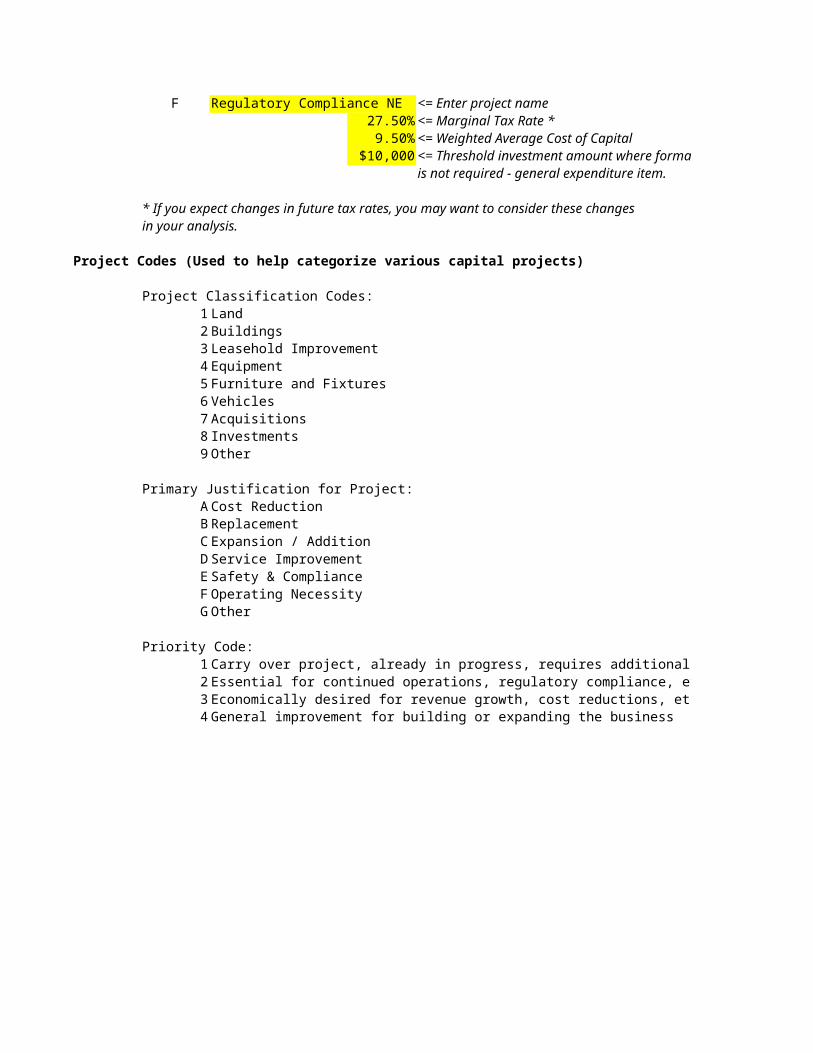
F Regulatory Compliance NE <= Enter project name 27.50% <= Marginal Tax Rate * 9.50% <= Weighted Average Cost of Capital
$10,000 <= Threshold investment amount where formal project analysisis not required - general expenditure item.
* If you expect changes in future tax rates, you may want to consider these changes in your analysis.
Project Codes (Used to help categorize various capital projects)
Project Classification Codes:1 Land2 Buildings3 Leasehold Improvement4 Equipment5 Furniture and Fixtures6 Vehicles7 Acquisitions8 Investments9 Other
Primary Justification for Project: A Cost Reduction
B ReplacementC Expansion / AdditionD Service ImprovementE Safety & ComplianceF Operating NecessityG Other
Priority Code:1 Carry over project, already in progress, requires additional funding2 Essential for continued operations, regulatory compliance, etc.3 Economically desired for revenue growth, cost reductions, etc.4 General improvement for building or expanding the business
Illustrate concepts related to capital budgeting analysis of projects. Certain aspectsproject may have not been included in order to help highlight basic concepts, such asNet Present Value. The spreadsheet is setup to evaluate six different projects and sum
Note: The Solver feature of Excel is used in an example at the end. Please make sure t
Three economic criteria are applied to projects: Net Present Value, Modified Internal Rate ofReturn and Discounted Payback Period. If your project(s) have non-periodic payments(payments are not equal over the life of the project), then you should use these Excel Functions:
Selected input cells (not all input cells are highlighted since each project is unique)Cell includes a comment - move mouse and point over cell for commentIndication of an error in calculation or a red flag that a criteria has not been met
Supplemental Material for Short Course 3: Capital Budgeting Analysis, located on the internet at www.exinfm.com/training. Prepared by: Matt H. Evans, CPA, CMA, CFM
Lead WksProject AProject BProject CProject DProject EProject FSummary
Project A Analysis - Example with Annual Cash Flow CalculationsProject B Analysis - Example with Sunk Costs & Projected Financials
Answer Report 1 - Output from Using Excel Solver in Summary Example

<= Threshold investment amount where formal project analysis
Carry over project, already in progress, requires additional fundingEssential for continued operations, regulatory compliance, etc.Economically desired for revenue growth, cost reductions, etc.
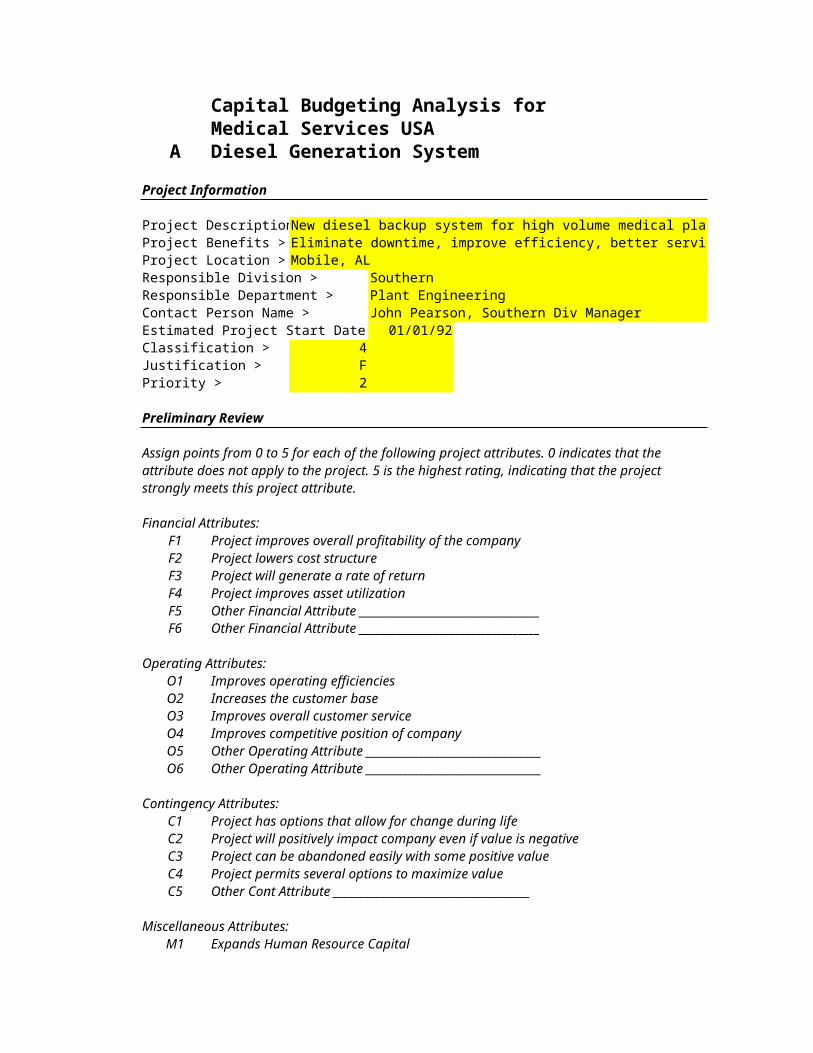
Capital Budgeting Analysis forMedical Services USA
A Diesel Generation SystemProject Information
Project DescriptionNew diesel backup system for high volume medical plantProject Benefits > Eliminate downtime, improve efficiency, better serviceProject Location > Mobile, ALResponsible Division > SouthernResponsible Department > Plant EngineeringContact Person Name > John Pearson, Southern Div ManagerEstimated Project Start Date 01/01/92Classification > 4 Justification > F Priority > 2
Preliminary Review
Assign points from 0 to 5 for each of the following project attributes. 0 indicates that the attribute does not apply to the project. 5 is the highest rating, indicating that the project strongly meets this project attribute.
Financial Attributes:F1 Project improves overall profitability of the companyF2 Project lowers cost structureF3 Project will generate a rate of returnF4 Project improves asset utilizationF5 Other Financial Attribute __________________________________F6 Other Financial Attribute __________________________________
Operating Attributes:O1 Improves operating efficienciesO2 Increases the customer baseO3 Improves overall customer serviceO4 Improves competitive position of companyO5 Other Operating Attribute _________________________________O6 Other Operating Attribute _________________________________
Contingency Attributes:C1 Project has options that allow for change during lifeC2 Project will positively impact company even if value is negativeC3 Project can be abandoned easily with some positive valueC4 Project permits several options to maximize valueC5 Other Cont Attribute _____________________________________
Miscellaneous Attributes:M1 Expands Human Resource Capital
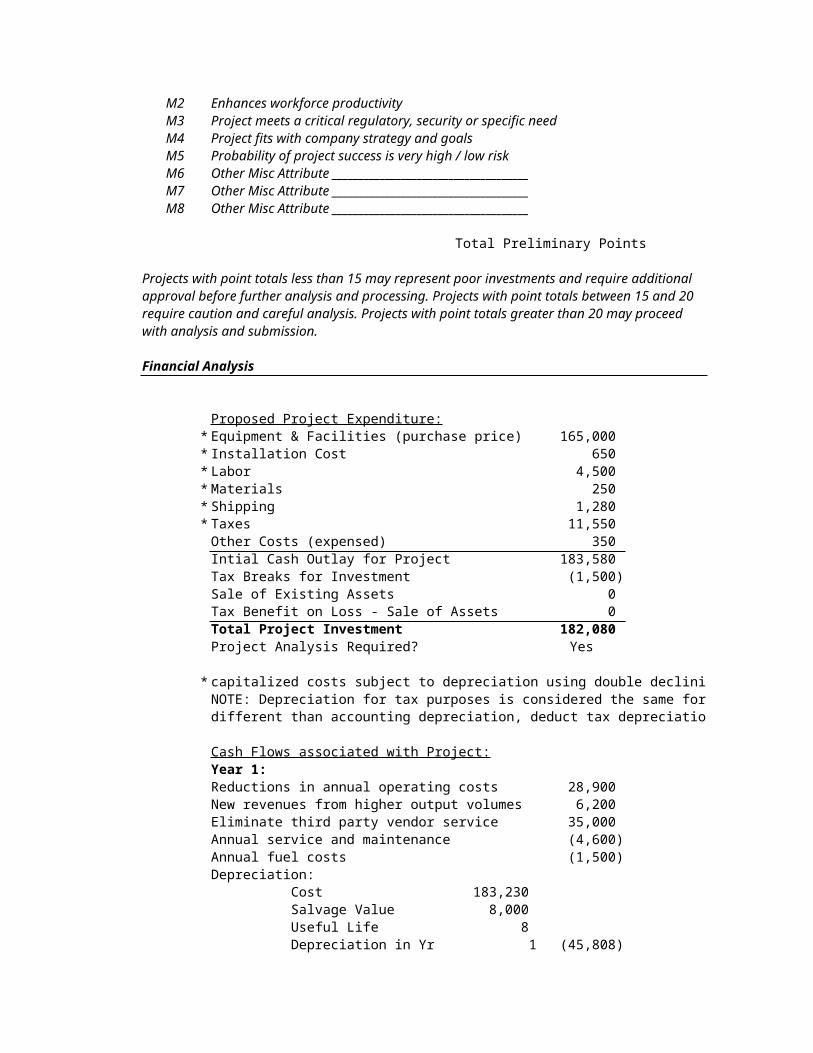
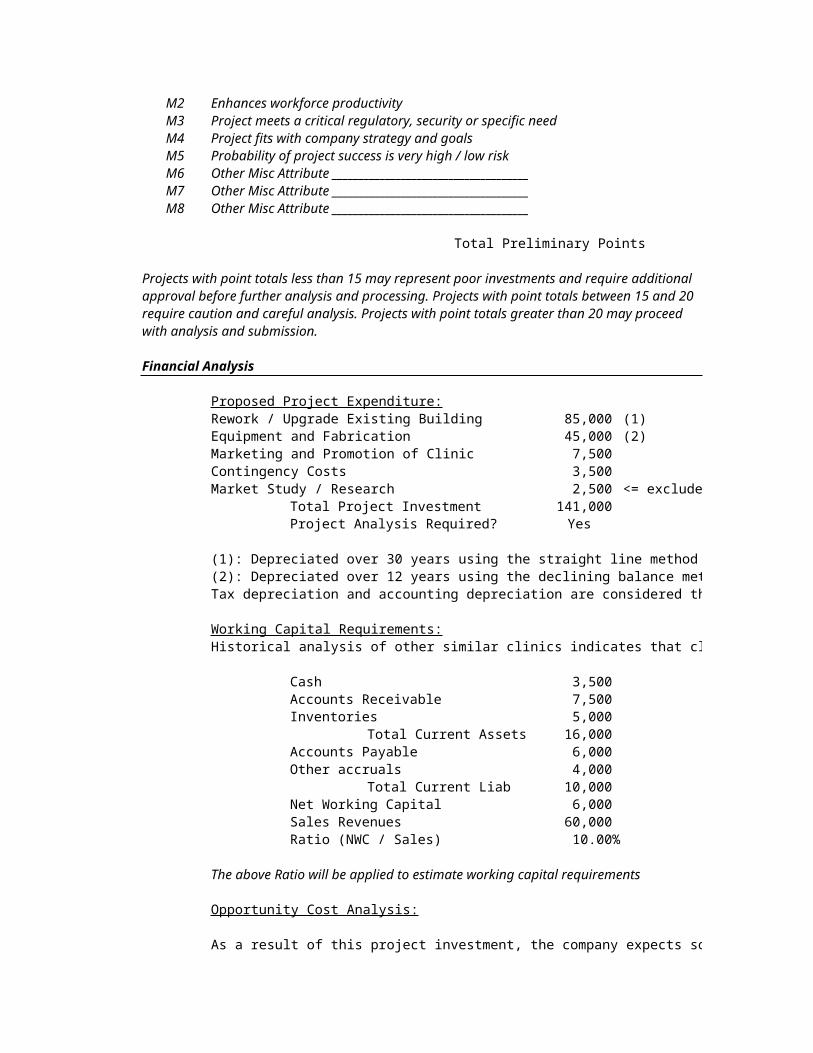
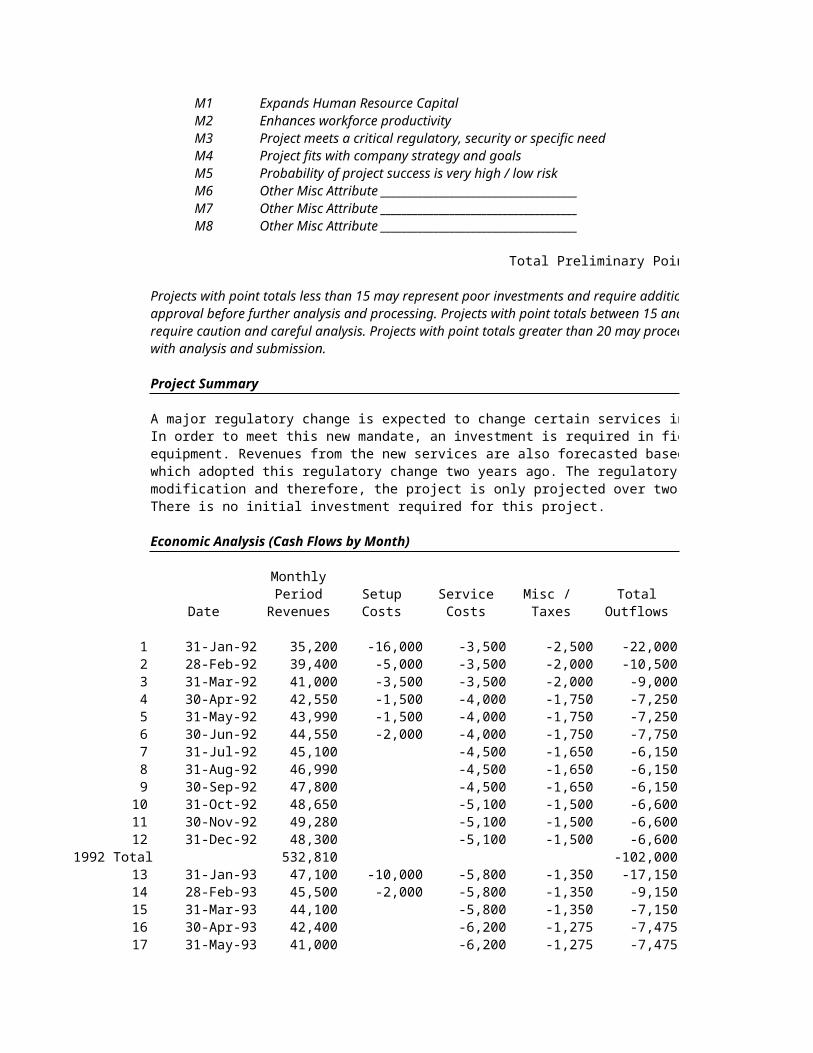
M2 Enhances workforce productivityM3 Project meets a critical regulatory, security or specific needM4 Project fits with company strategy and goalsM5 Probability of project success is very high / low riskM6 Other Misc Attribute _____________________________________M7 Other Misc Attribute _____________________________________M8 Other Misc Attribute _____________________________________
Total Preliminary Points
Projects with point totals less than 15 may represent poor investments and require additionalapproval before further analysis and processing. Projects with point totals between 15 and 20require caution and careful analysis. Projects with point totals greater than 20 may proceedwith analysis and submission.
Financial Analysis
Proposed Project Expenditure:* Equipment & Facilities (purchase price) 165,000 * Installation Cost 650 * Labor 4,500 * Materials 250 * Shipping 1,280 * Taxes 11,550 Other Costs (expensed) 350 Intial Cash Outlay for Project 183,580 Tax Breaks for Investment (1,500)Sale of Existing Assets 0 Tax Benefit on Loss - Sale of Assets 0 Total Project Investment 182,080 Project Analysis Required? Yes
* capitalized costs subject to depreciation using double declining method over 8 years with $ 8,000 salvage valueNOTE: Depreciation for tax purposes is considered the same for accounting purposes. If tax depreciation isdifferent than accounting depreciation, deduct tax depreciation in calculating taxes.
Cash Flows associated with Project:Year 1:Reductions in annual operating costs 28,900 New revenues from higher output volumes 6,200 Eliminate third party vendor service 35,000 Annual service and maintenance (4,600)Annual fuel costs (1,500)Depreciation:
Cost 183,230 Salvage Value 8,000 Useful Life 8 Depreciation in Yr 1 (45,808)
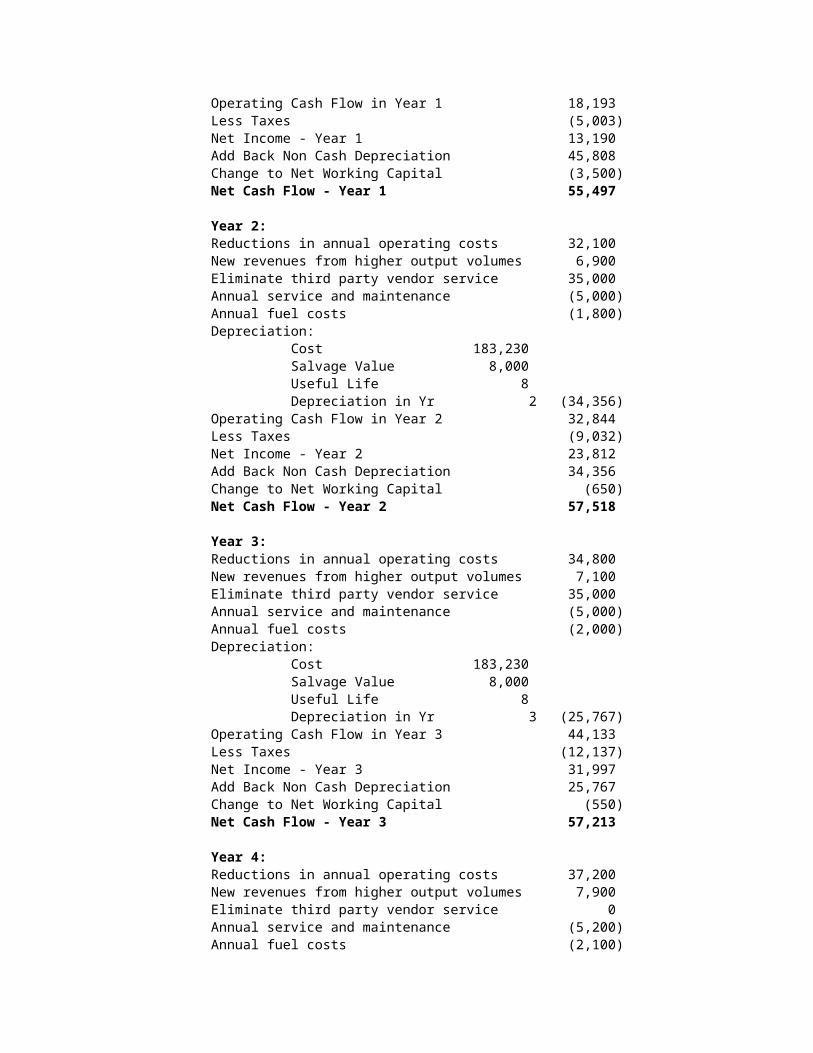
Operating Cash Flow in Year 1 18,193 Less Taxes (5,003)Net Income - Year 1 13,190 Add Back Non Cash Depreciation 45,808 Change to Net Working Capital (3,500)Net Cash Flow - Year 1 55,497
Year 2:Reductions in annual operating costs 32,100 New revenues from higher output volumes 6,900 Eliminate third party vendor service 35,000 Annual service and maintenance (5,000)Annual fuel costs (1,800)Depreciation:
Cost 183,230 Salvage Value 8,000 Useful Life 8 Depreciation in Yr 2 (34,356)
Operating Cash Flow in Year 2 32,844 Less Taxes (9,032)Net Income - Year 2 23,812 Add Back Non Cash Depreciation 34,356 Change to Net Working Capital (650)Net Cash Flow - Year 2 57,518
Year 3:Reductions in annual operating costs 34,800 New revenues from higher output volumes 7,100 Eliminate third party vendor service 35,000 Annual service and maintenance (5,000)Annual fuel costs (2,000)Depreciation:
Cost 183,230 Salvage Value 8,000 Useful Life 8 Depreciation in Yr 3 (25,767)
Operating Cash Flow in Year 3 44,133 Less Taxes (12,137)Net Income - Year 3 31,997 Add Back Non Cash Depreciation 25,767 Change to Net Working Capital (550)Net Cash Flow - Year 3 57,213
Year 4:Reductions in annual operating costs 37,200 New revenues from higher output volumes 7,900 Eliminate third party vendor service 0 Annual service and maintenance (5,200)Annual fuel costs (2,100)
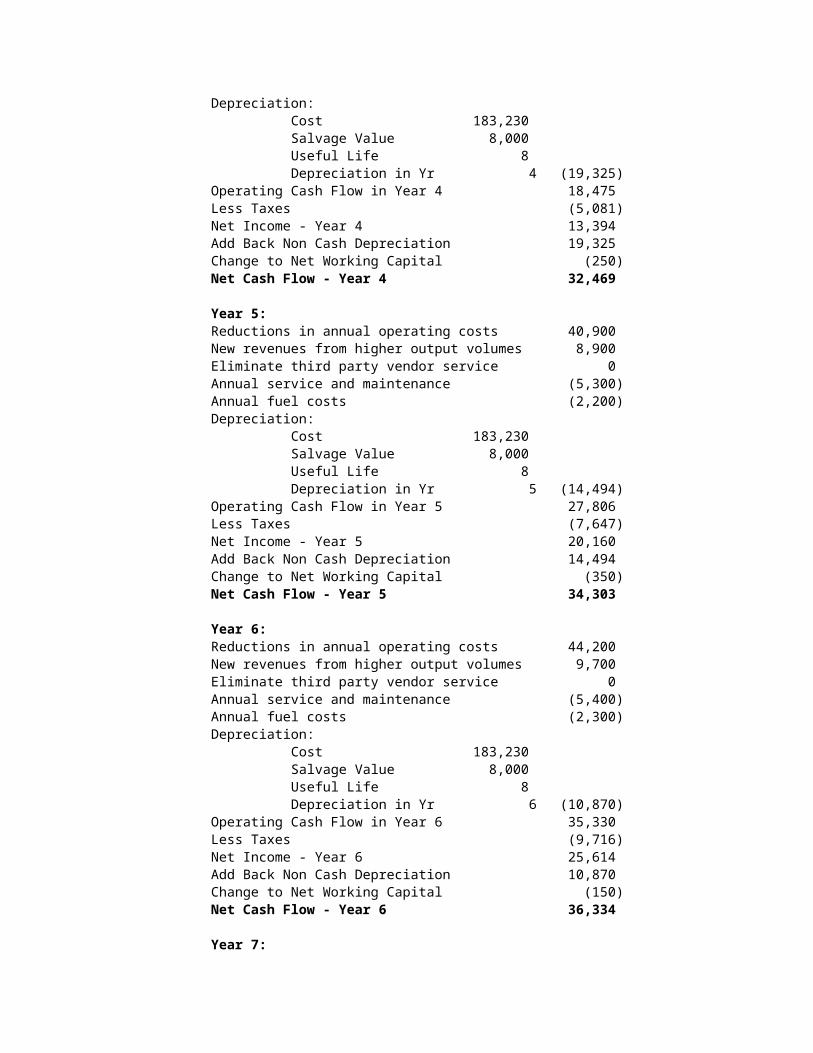
Depreciation:Cost 183,230 Salvage Value 8,000 Useful Life 8 Depreciation in Yr 4 (19,325)
Operating Cash Flow in Year 4 18,475 Less Taxes (5,081)Net Income - Year 4 13,394 Add Back Non Cash Depreciation 19,325 Change to Net Working Capital (250)Net Cash Flow - Year 4 32,469
Year 5:Reductions in annual operating costs 40,900 New revenues from higher output volumes 8,900 Eliminate third party vendor service 0 Annual service and maintenance (5,300)Annual fuel costs (2,200)Depreciation:
Cost 183,230 Salvage Value 8,000 Useful Life 8 Depreciation in Yr 5 (14,494)
Operating Cash Flow in Year 5 27,806 Less Taxes (7,647)Net Income - Year 5 20,160 Add Back Non Cash Depreciation 14,494 Change to Net Working Capital (350)Net Cash Flow - Year 5 34,303
Year 6:Reductions in annual operating costs 44,200 New revenues from higher output volumes 9,700 Eliminate third party vendor service 0 Annual service and maintenance (5,400)Annual fuel costs (2,300)Depreciation:
Cost 183,230 Salvage Value 8,000 Useful Life 8 Depreciation in Yr 6 (10,870)
Operating Cash Flow in Year 6 35,330 Less Taxes (9,716)Net Income - Year 6 25,614 Add Back Non Cash Depreciation 10,870 Change to Net Working Capital (150)Net Cash Flow - Year 6 36,334
Year 7:
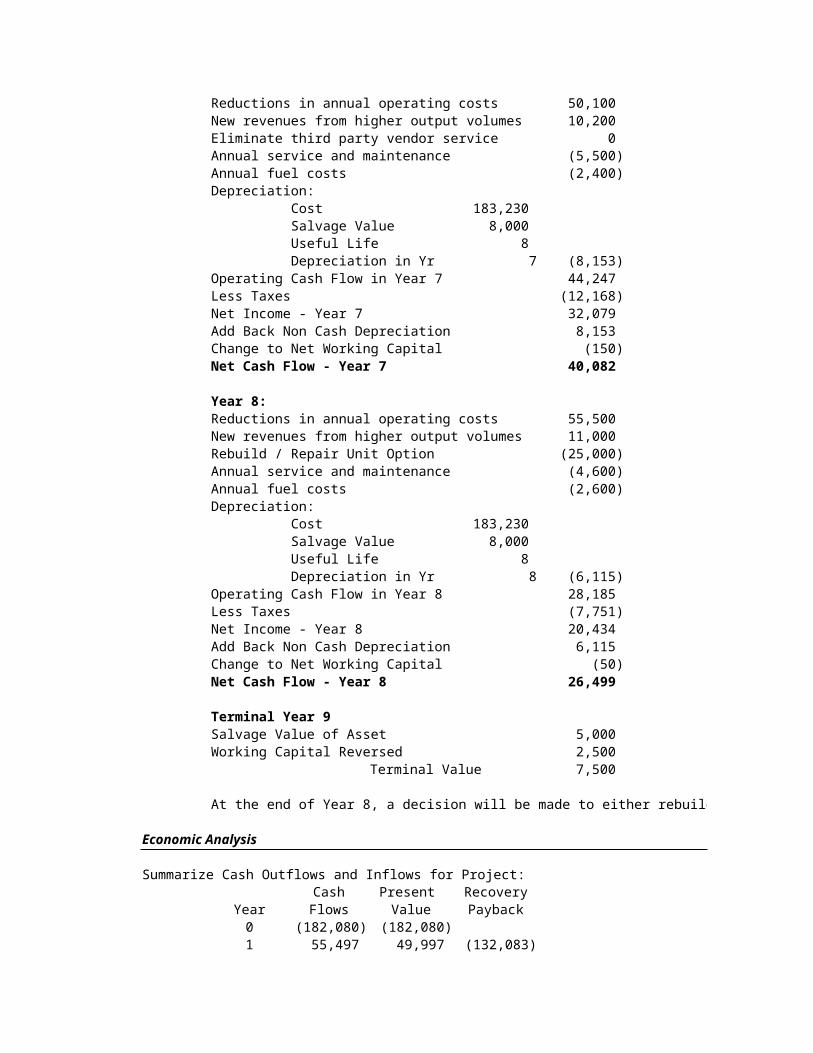
Reductions in annual operating costs 50,100 New revenues from higher output volumes 10,200 Eliminate third party vendor service 0 Annual service and maintenance (5,500)Annual fuel costs (2,400)Depreciation:
Cost 183,230 Salvage Value 8,000 Useful Life 8 Depreciation in Yr 7 (8,153)
Operating Cash Flow in Year 7 44,247 Less Taxes (12,168)Net Income - Year 7 32,079 Add Back Non Cash Depreciation 8,153 Change to Net Working Capital (150)Net Cash Flow - Year 7 40,082
Year 8:Reductions in annual operating costs 55,500 New revenues from higher output volumes 11,000 Rebuild / Repair Unit Option (25,000)Annual service and maintenance (4,600)Annual fuel costs (2,600)Depreciation:
Cost 183,230 Salvage Value 8,000 Useful Life 8 Depreciation in Yr 8 (6,115)
Operating Cash Flow in Year 8 28,185 Less Taxes (7,751)Net Income - Year 8 20,434 Add Back Non Cash Depreciation 6,115 Change to Net Working Capital (50)Net Cash Flow - Year 8 26,499
Terminal Year 9Salvage Value of Asset 5,000 Working Capital Reversed 2,500
Terminal Value 7,500
At the end of Year 8, a decision will be made to either rebuild the asset or outsource to third party.
Economic Analysis
Summarize Cash Outflows and Inflows for Project:Cash Present Recovery
Year Flows Value Payback0 (182,080) (182,080)1 55,497 49,997 (132,083)
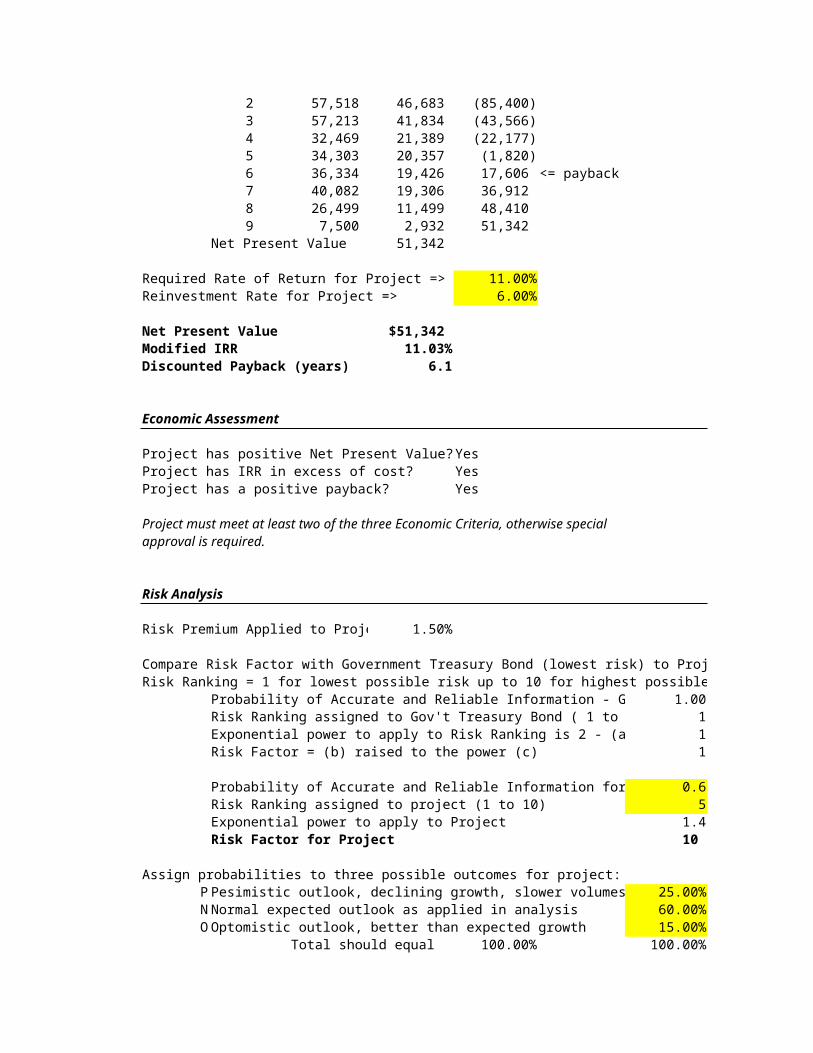
2 57,518 46,683 (85,400) 3 57,213 41,834 (43,566) 4 32,469 21,389 (22,177) 5 34,303 20,357 (1,820)6 36,334 19,426 17,606 <= payback7 40,082 19,306 36,912 8 26,499 11,499 48,410 9 7,500 2,932 51,342
Net Present Value 51,342
Required Rate of Return for Project => 11.00%Reinvestment Rate for Project => 6.00% Net Present Value $51,342 Modified IRR 11.03%Discounted Payback (years) 6.1
Economic Assessment
Project has positive Net Present Value?YesProject has IRR in excess of cost? YesProject has a positive payback? Yes
Project must meet at least two of the three Economic Criteria, otherwise specialapproval is required.
Risk Analysis
Risk Premium Applied to Proje 1.50%
Compare Risk Factor with Government Treasury Bond (lowest risk) to Project Risk Factor:Risk Ranking = 1 for lowest possible risk up to 10 for highest possible risk
Probability of Accurate and Reliable Information - G 1.00Risk Ranking assigned to Gov't Treasury Bond ( 1 to 1Exponential power to apply to Risk Ranking is 2 - (a 1Risk Factor = (b) raised to the power (c) 1
Probability of Accurate and Reliable Information for 0.6Risk Ranking assigned to project (1 to 10) 5Exponential power to apply to Project 1.4Risk Factor for Project 10
Assign probabilities to three possible outcomes for project:P Pesimistic outlook, declining growth, slower volumes 25.00%N Normal expected outlook as applied in analysis 60.00%O Optomistic outlook, better than expected growth 15.00%
Total should equal 100.00% 100.00%
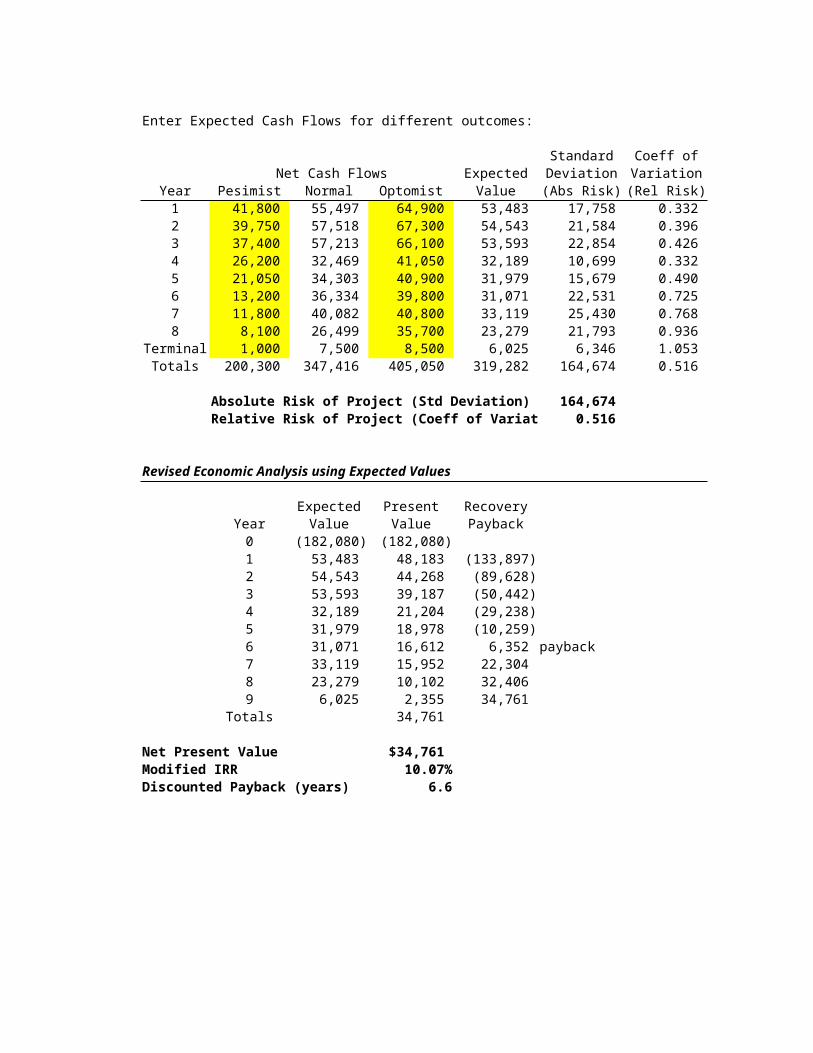
Enter Expected Cash Flows for different outcomes:
Standard Coeff ofNet Cash Flows Expected Deviation Variation
Year Pesimist Normal Optomist Value (Abs Risk) (Rel Risk)1 41,800 55,497 64,900 53,483 17,758 0.332 2 39,750 57,518 67,300 54,543 21,584 0.396 3 37,400 57,213 66,100 53,593 22,854 0.426 4 26,200 32,469 41,050 32,189 10,699 0.332 5 21,050 34,303 40,900 31,979 15,679 0.490 6 13,200 36,334 39,800 31,071 22,531 0.725 7 11,800 40,082 40,800 33,119 25,430 0.768 8 8,100 26,499 35,700 23,279 21,793 0.936
Terminal 1,000 7,500 8,500 6,025 6,346 1.053 Totals 200,300 347,416 405,050 319,282 164,674 0.516
Absolute Risk of Project (Std Deviation) 164,674 Relative Risk of Project (Coeff of Variat 0.516
Revised Economic Analysis using Expected Values
Expected Present RecoveryYear Value Value Payback0 (182,080) (182,080)1 53,483 48,183 (133,897)2 54,543 44,268 (89,628)3 53,593 39,187 (50,442)4 32,189 21,204 (29,238)5 31,979 18,978 (10,259)6 31,071 16,612 6,352 payback7 33,119 15,952 22,304 8 23,279 10,102 32,406 9 6,025 2,355 34,761
Totals 34,761
Net Present Value $34,761 Modified IRR 10.07%Discounted Payback (years) 6.6

New diesel backup system for high volume medical plantEliminate downtime, improve efficiency, better service
2 3 3 1 0 0
4 0 0 0 0 0
2 4 1 2 0
0

0 0 1 4 0 0 0
27
capitalized costs subject to depreciation using double declining method over 8 years with $ 8,000 salvage valueNOTE: Depreciation for tax purposes is considered the same for accounting purposes. If tax depreciation isdifferent than accounting depreciation, deduct tax depreciation in calculating taxes.

At the end of Year 8, a decision will be made to either rebuild the asset or outsource to third party.

Compare Risk Factor with Government Treasury Bond (lowest risk) to Project Risk Factor:Risk Ranking = 1 for lowest possible risk up to 10 for highest possible risk
(a)(b)(c)

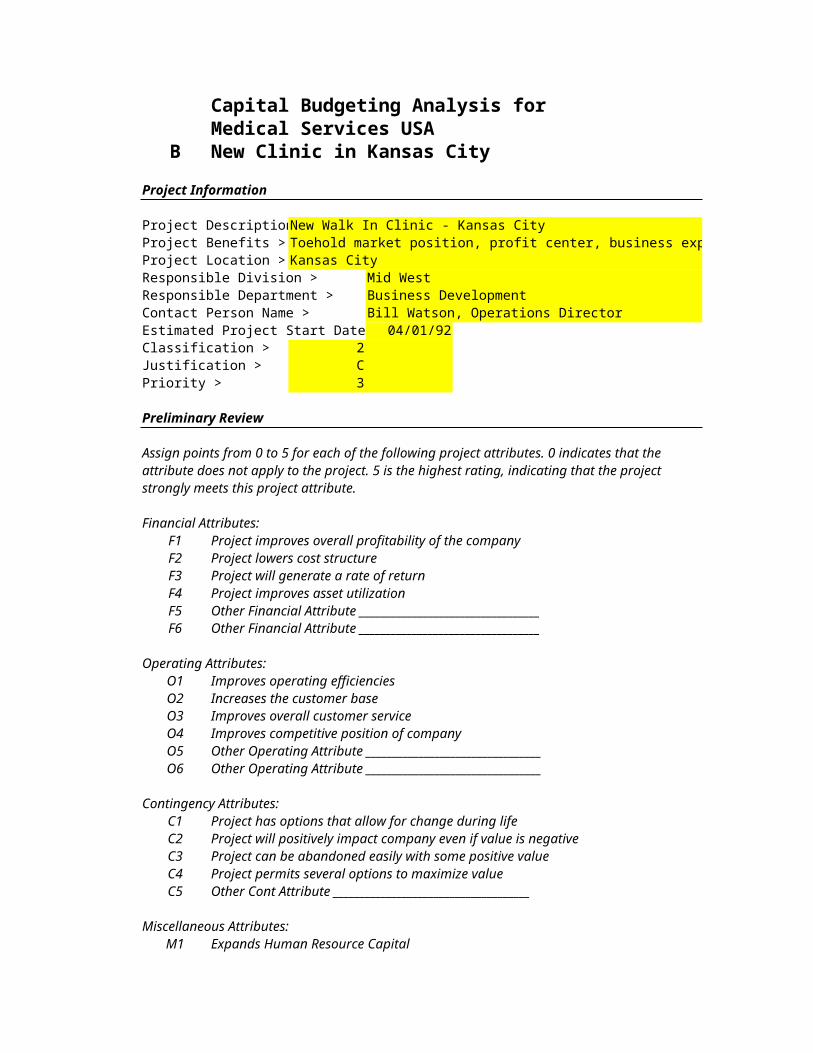
Capital Budgeting Analysis forMedical Services USA
B New Clinic in Kansas CityProject Information
Project DescriptionNew Walk In Clinic - Kansas CityProject Benefits > Toehold market position, profit center, business expansionProject Location > Kansas CityResponsible Division > Mid WestResponsible Department > Business DevelopmentContact Person Name > Bill Watson, Operations DirectorEstimated Project Start Date 04/01/92Classification > 2 Justification > CPriority > 3
Preliminary Review
Assign points from 0 to 5 for each of the following project attributes. 0 indicates that the attribute does not apply to the project. 5 is the highest rating, indicating that the project strongly meets this project attribute.
Financial Attributes:F1 Project improves overall profitability of the companyF2 Project lowers cost structureF3 Project will generate a rate of returnF4 Project improves asset utilizationF5 Other Financial Attribute __________________________________F6 Other Financial Attribute __________________________________
Operating Attributes:O1 Improves operating efficienciesO2 Increases the customer baseO3 Improves overall customer serviceO4 Improves competitive position of companyO5 Other Operating Attribute _________________________________O6 Other Operating Attribute _________________________________
Contingency Attributes:C1 Project has options that allow for change during lifeC2 Project will positively impact company even if value is negativeC3 Project can be abandoned easily with some positive valueC4 Project permits several options to maximize valueC5 Other Cont Attribute _____________________________________
Miscellaneous Attributes:M1 Expands Human Resource Capital
M2 Enhances workforce productivityM3 Project meets a critical regulatory, security or specific needM4 Project fits with company strategy and goalsM5 Probability of project success is very high / low riskM6 Other Misc Attribute _____________________________________M7 Other Misc Attribute _____________________________________M8 Other Misc Attribute _____________________________________
Total Preliminary Points
Projects with point totals less than 15 may represent poor investments and require additionalapproval before further analysis and processing. Projects with point totals between 15 and 20require caution and careful analysis. Projects with point totals greater than 20 may proceedwith analysis and submission.
Financial Analysis
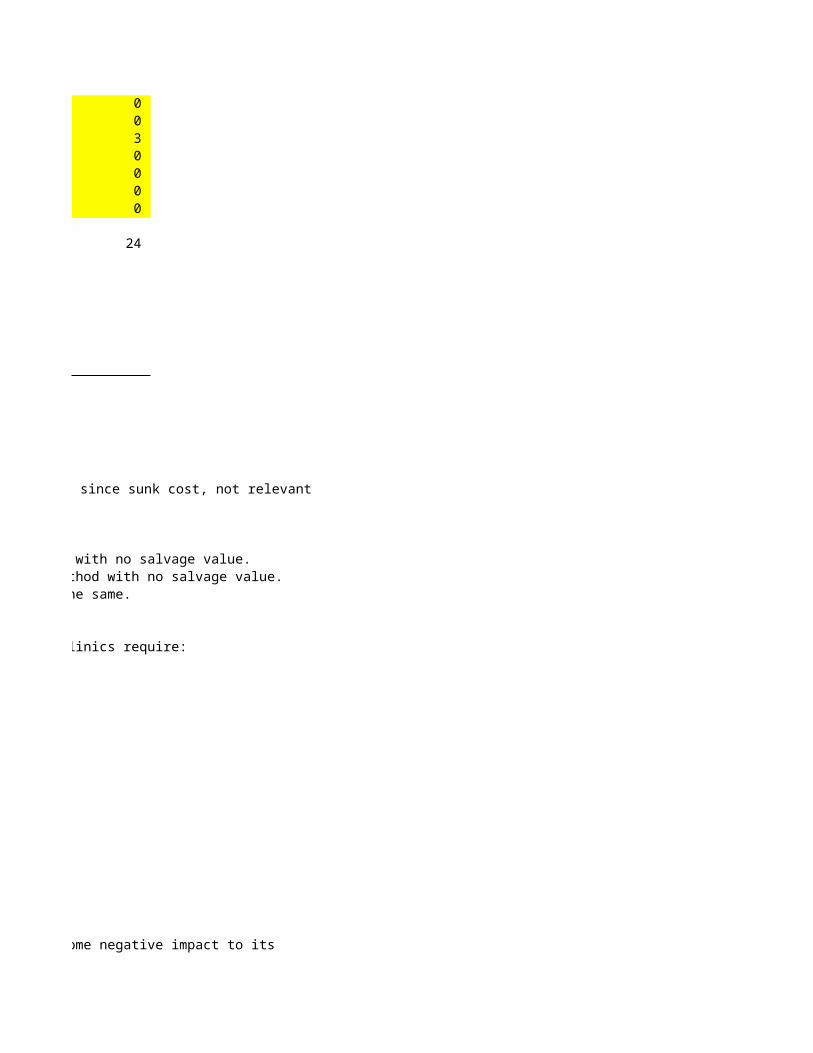
Proposed Project Expenditure: Rework / Upgrade Existing Building 85,000 (1)Equipment and Fabrication 45,000 (2)Marketing and Promotion of Clinic 7,500 Contingency Costs 3,500 Market Study / Research 2,500 <= exclude since sunk cost, not relevant
Total Project Investment 141,000 Project Analysis Required? Yes
(1): Depreciated over 30 years using the straight line method with no salvage value.(2): Depreciated over 12 years using the declining balance method with no salvage value.Tax depreciation and accounting depreciation are considered the same.
Working Capital Requirements:Historical analysis of other similar clinics indicates that clinics require:
Cash 3,500 Accounts Receivable 7,500 Inventories 5,000
Total Current Assets 16,000 Accounts Payable 6,000 Other accruals 4,000
Total Current Liab 10,000 Net Working Capital 6,000 Sales Revenues 60,000 Ratio (NWC / Sales) 10.00%
The above Ratio will be applied to estimate working capital requirements
Opportunity Cost Analysis:
As a result of this project investment, the company expects some negative impact to its
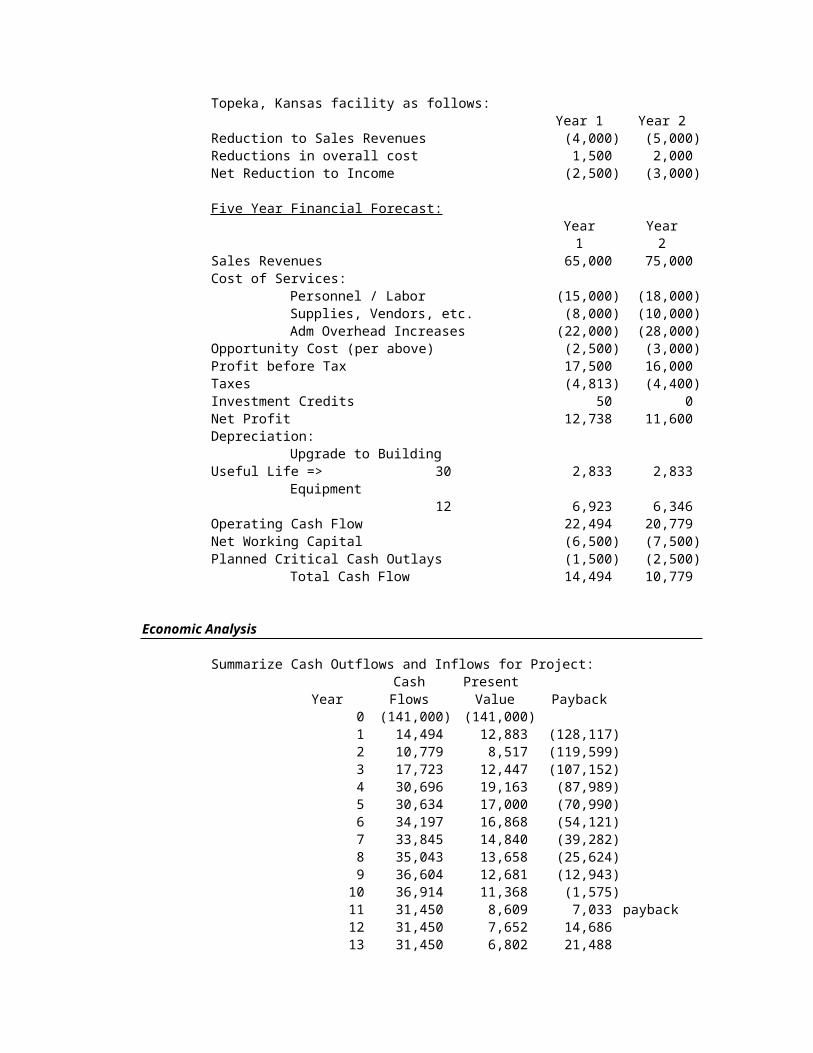
Topeka, Kansas facility as follows: Year 1 Year 2
Reduction to Sales Revenues (4,000) (5,000)Reductions in overall cost 1,500 2,000 Net Reduction to Income (2,500) (3,000)
Five Year Financial Forecast:Year Year1 2
Sales Revenues 65,000 75,000 Cost of Services:
Personnel / Labor (15,000) (18,000)Supplies, Vendors, etc. (8,000) (10,000)Adm Overhead Increases (22,000) (28,000)
Opportunity Cost (per above) (2,500) (3,000)Profit before Tax 17,500 16,000 Taxes (4,813) (4,400)Investment Credits 50 0 Net Profit 12,738 11,600 Depreciation:
Upgrade to BuildingUseful Life => 30 2,833 2,833
Equipment 12 6,923 6,346
Operating Cash Flow 22,494 20,779 Net Working Capital (6,500) (7,500)Planned Critical Cash Outlays (1,500) (2,500)
Total Cash Flow 14,494 10,779
Economic Analysis
Summarize Cash Outflows and Inflows for Project:
Cash Present Year Flows Value Payback
0 (141,000) (141,000)1 14,494 12,883 (128,117)2 10,779 8,517 (119,599)3 17,723 12,447 (107,152)4 30,696 19,163 (87,989)5 30,634 17,000 (70,990)6 34,197 16,868 (54,121)7 33,845 14,840 (39,282)8 35,043 13,658 (25,624)9 36,604 12,681 (12,943)10 36,914 11,368 (1,575)11 31,450 8,609 7,033 payback12 31,450 7,652 14,686 13 31,450 6,802 21,488
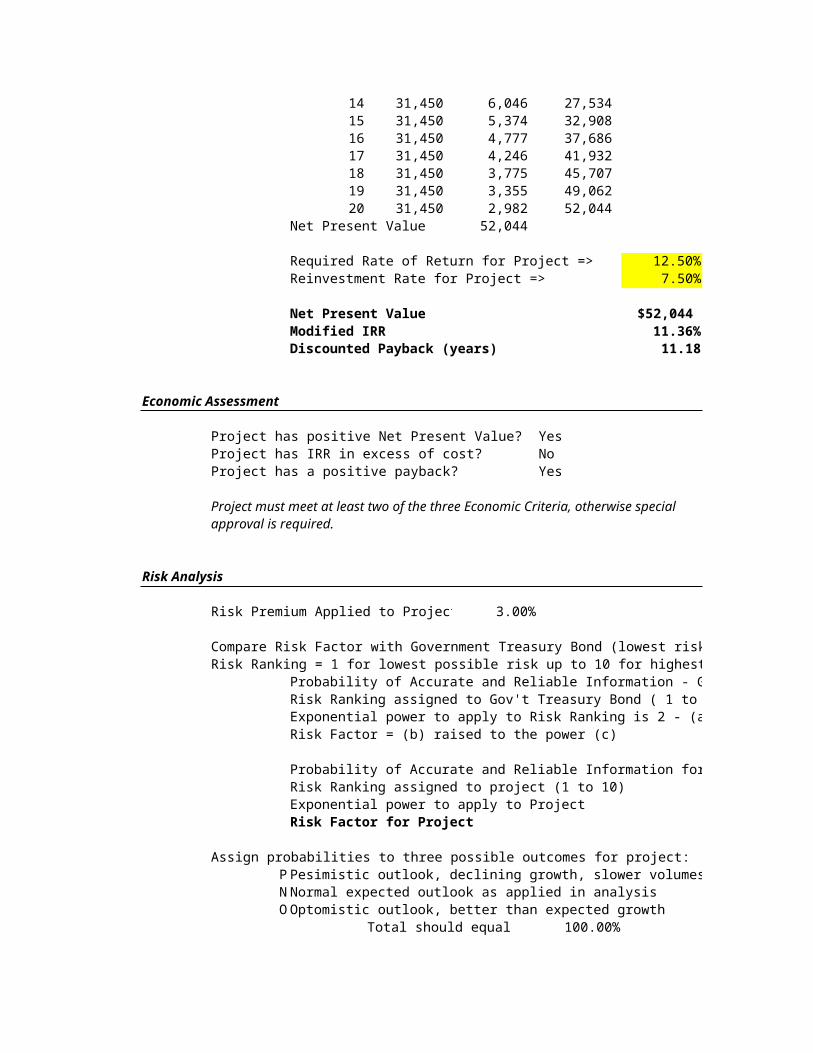
14 31,450 6,046 27,534 15 31,450 5,374 32,908 16 31,450 4,777 37,686 17 31,450 4,246 41,932 18 31,450 3,775 45,707 19 31,450 3,355 49,062 20 31,450 2,982 52,044
Net Present Value 52,044
Required Rate of Return for Project => 12.50%Reinvestment Rate for Project => 7.50%
Net Present Value $52,044 Modified IRR 11.36%Discounted Payback (years) 11.18
Economic Assessment
Project has positive Net Present Value? YesProject has IRR in excess of cost? NoProject has a positive payback? Yes
Project must meet at least two of the three Economic Criteria, otherwise specialapproval is required.
Risk Analysis
Risk Premium Applied to Project 3.00%
Compare Risk Factor with Government Treasury Bond (lowest risk) to Project Risk Factor:Risk Ranking = 1 for lowest possible risk up to 10 for highest possible risk
Probability of Accurate and Reliable Information - GRisk Ranking assigned to Gov't Treasury Bond ( 1 to Exponential power to apply to Risk Ranking is 2 - (aRisk Factor = (b) raised to the power (c)
Probability of Accurate and Reliable Information forRisk Ranking assigned to project (1 to 10)Exponential power to apply to ProjectRisk Factor for Project
Assign probabilities to three possible outcomes for project:P Pesimistic outlook, declining growth, slower volumesN Normal expected outlook as applied in analysisO Optomistic outlook, better than expected growth
Total should equal 100.00%
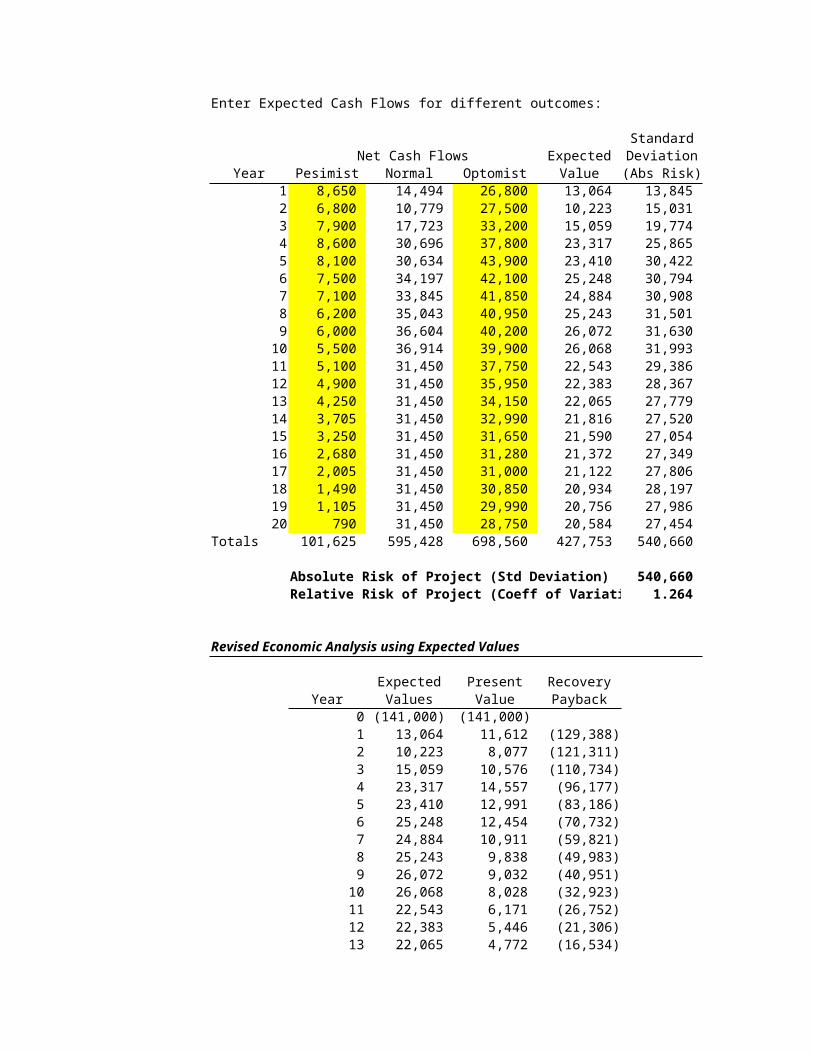
Enter Expected Cash Flows for different outcomes:
StandardNet Cash Flows Expected Deviation
Year Pesimist Normal Optomist Value (Abs Risk)1 8,650 14,494 26,800 13,064 13,845 2 6,800 10,779 27,500 10,223 15,031 3 7,900 17,723 33,200 15,059 19,774 4 8,600 30,696 37,800 23,317 25,865 5 8,100 30,634 43,900 23,410 30,422 6 7,500 34,197 42,100 25,248 30,794 7 7,100 33,845 41,850 24,884 30,908 8 6,200 35,043 40,950 25,243 31,501 9 6,000 36,604 40,200 26,072 31,630 10 5,500 36,914 39,900 26,068 31,993 11 5,100 31,450 37,750 22,543 29,386 12 4,900 31,450 35,950 22,383 28,367 13 4,250 31,450 34,150 22,065 27,779 14 3,705 31,450 32,990 21,816 27,520 15 3,250 31,450 31,650 21,590 27,054 16 2,680 31,450 31,280 21,372 27,349 17 2,005 31,450 31,000 21,122 27,806 18 1,490 31,450 30,850 20,934 28,197 19 1,105 31,450 29,990 20,756 27,986 20 790 31,450 28,750 20,584 27,454
Totals 101,625 595,428 698,560 427,753 540,660
Absolute Risk of Project (Std Deviation) 540,660 Relative Risk of Project (Coeff of Variati 1.264
Revised Economic Analysis using Expected Values
Expected Present RecoveryYear Values Value Payback
0 (141,000) (141,000)1 13,064 11,612 (129,388)2 10,223 8,077 (121,311)3 15,059 10,576 (110,734)4 23,317 14,557 (96,177)5 23,410 12,991 (83,186)6 25,248 12,454 (70,732)7 24,884 10,911 (59,821)8 25,243 9,838 (49,983)9 26,072 9,032 (40,951)10 26,068 8,028 (32,923)11 22,543 6,171 (26,752)12 22,383 5,446 (21,306)13 22,065 4,772 (16,534)
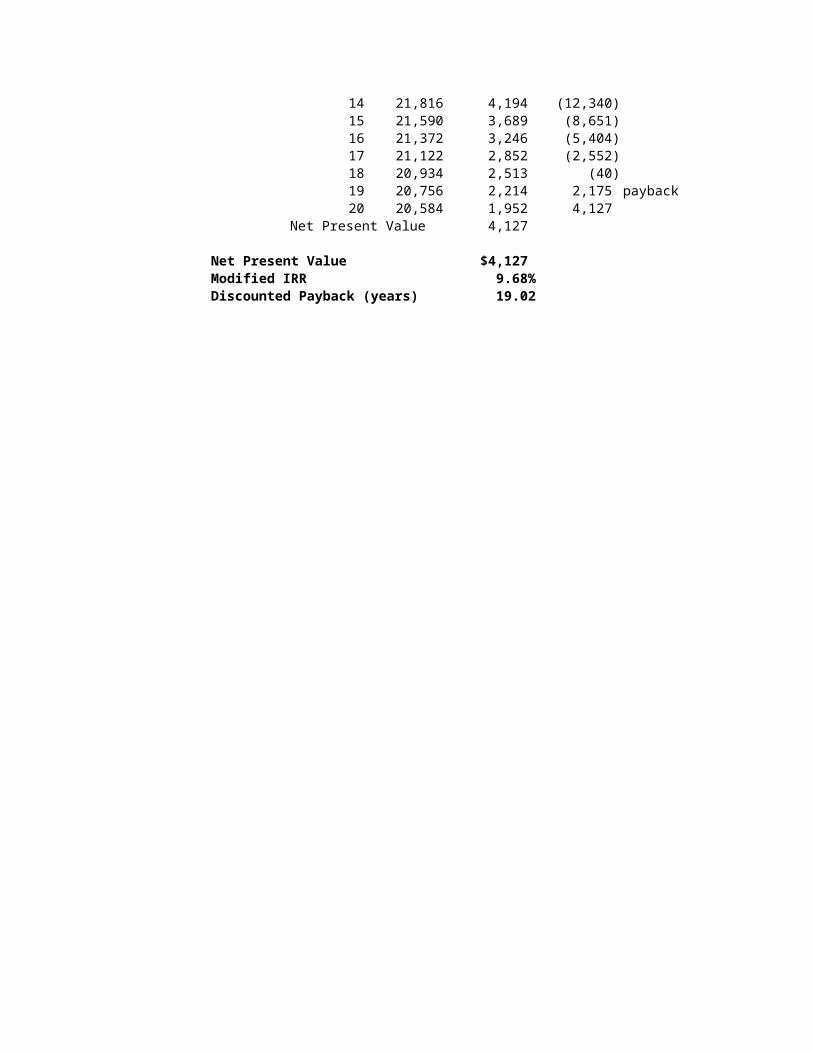
14 21,816 4,194 (12,340)15 21,590 3,689 (8,651)16 21,372 3,246 (5,404)17 21,122 2,852 (2,552) 18 20,934 2,513 (40)19 20,756 2,214 2,175 payback20 20,584 1,952 4,127
Net Present Value 4,127
Net Present Value $4,127 Modified IRR 9.68%Discounted Payback (years) 19.02
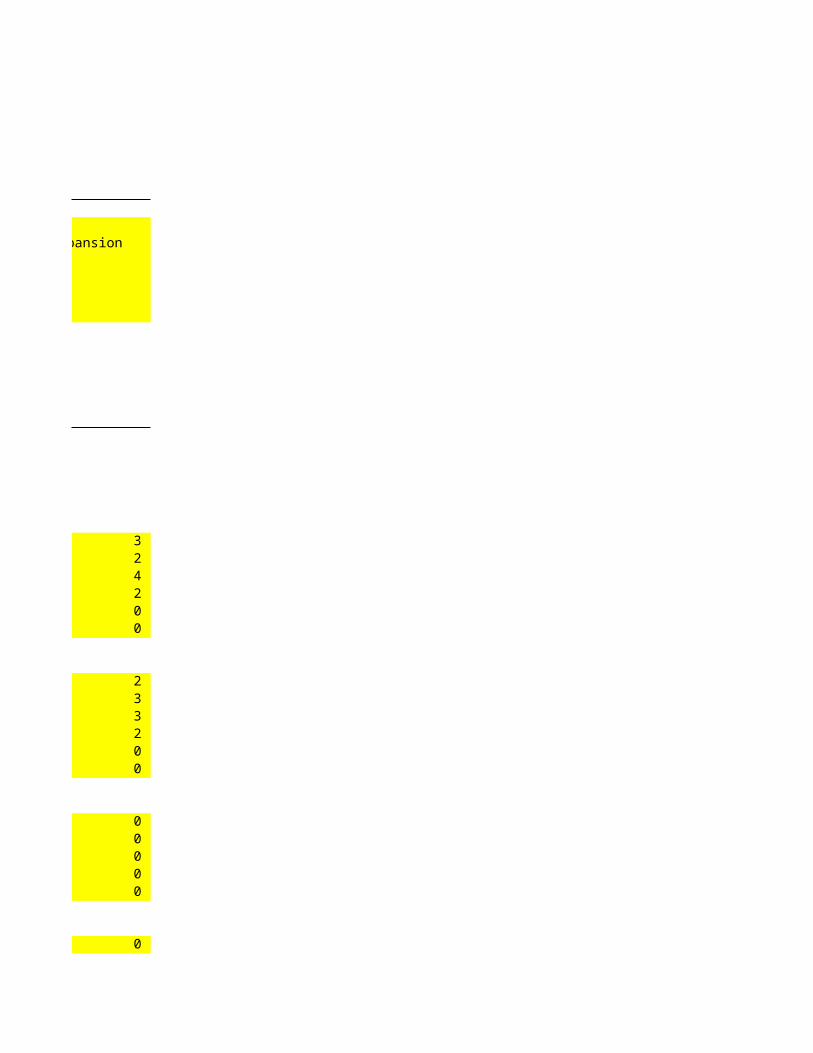
Toehold market position, profit center, business expansion
3 2 4 2 0 0
2 3 3 2 0 0
0 0 0 0 0
0
0 0 3 0 0 0 0
24
<= exclude since sunk cost, not relevant
(1): Depreciated over 30 years using the straight line method with no salvage value.(2): Depreciated over 12 years using the declining balance method with no salvage value.Tax depreciation and accounting depreciation are considered the same.
Historical analysis of other similar clinics indicates that clinics require:
As a result of this project investment, the company expects some negative impact to its
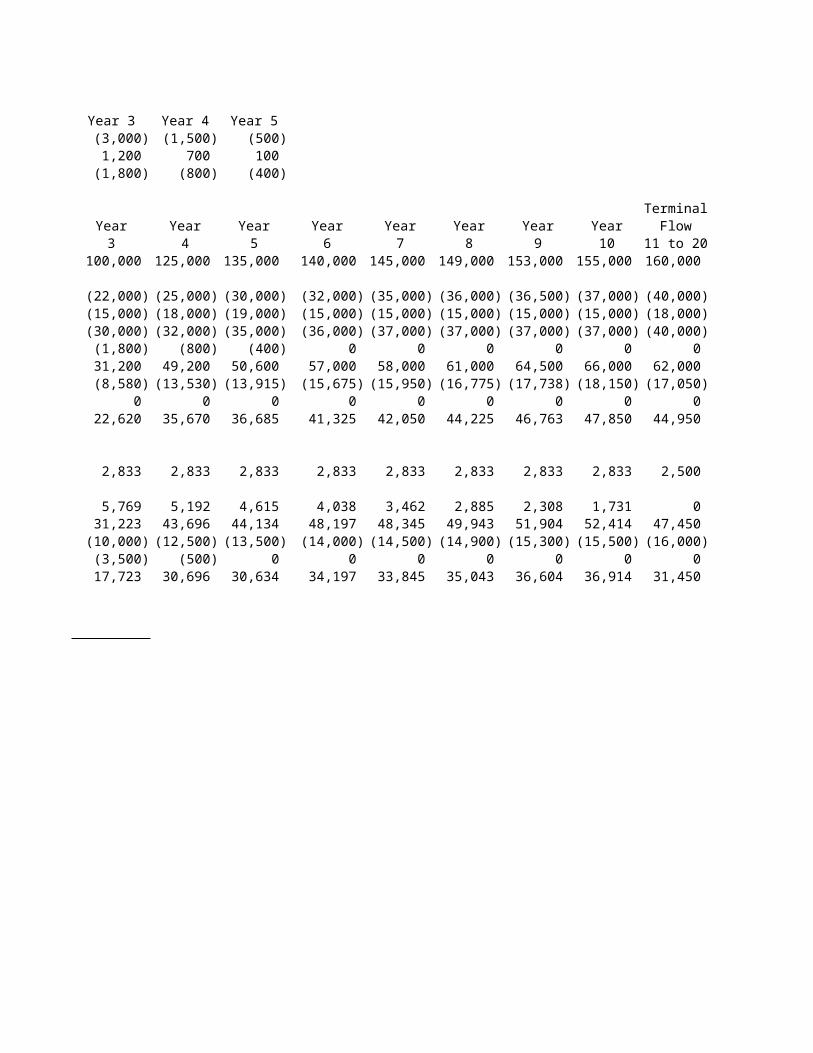
Year 3 Year 4 Year 5(3,000) (1,500) (500)1,200 700 100 (1,800) (800) (400)
TerminalYear Year Year Year Year Year Year Year Flow3 4 5 6 7 8 9 10 11 to 20
100,000 125,000 135,000 140,000 145,000 149,000 153,000 155,000 160,000
(22,000) (25,000) (30,000) (32,000) (35,000) (36,000) (36,500) (37,000) (40,000)(15,000) (18,000) (19,000) (15,000) (15,000) (15,000) (15,000) (15,000) (18,000)(30,000) (32,000) (35,000) (36,000) (37,000) (37,000) (37,000) (37,000) (40,000)(1,800) (800) (400) 0 0 0 0 0 0 31,200 49,200 50,600 57,000 58,000 61,000 64,500 66,000 62,000 (8,580) (13,530) (13,915) (15,675) (15,950) (16,775) (17,738) (18,150) (17,050)
0 0 0 0 0 0 0 0 0 22,620 35,670 36,685 41,325 42,050 44,225 46,763 47,850 44,950
2,833 2,833 2,833 2,833 2,833 2,833 2,833 2,833 2,500
5,769 5,192 4,615 4,038 3,462 2,885 2,308 1,731 0 31,223 43,696 44,134 48,197 48,345 49,943 51,904 52,414 47,450
(10,000) (12,500) (13,500) (14,000) (14,500) (14,900) (15,300) (15,500) (16,000)(3,500) (500) 0 0 0 0 0 0 0 17,723 30,696 30,634 34,197 33,845 35,043 36,604 36,914 31,450
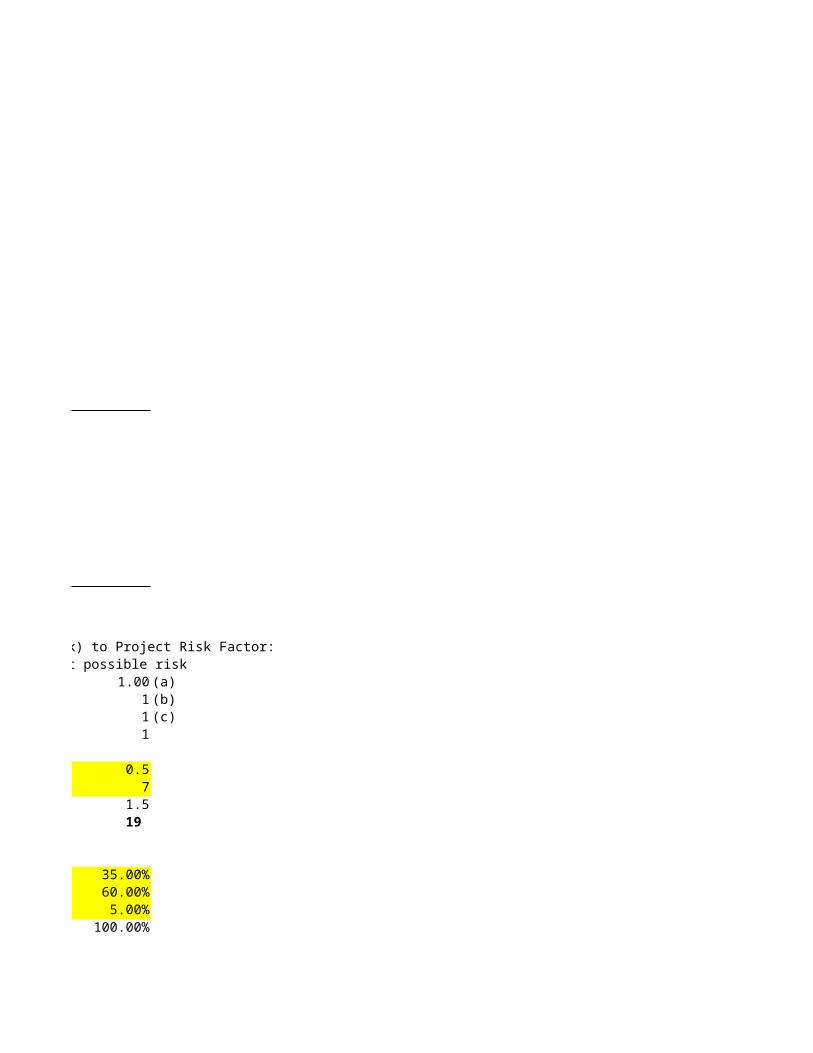
Compare Risk Factor with Government Treasury Bond (lowest risk) to Project Risk Factor:Risk Ranking = 1 for lowest possible risk up to 10 for highest possible risk
1.00 (a)1 (b)1 (c)1
0.57
1.5 19
35.00%60.00%5.00%
100.00%
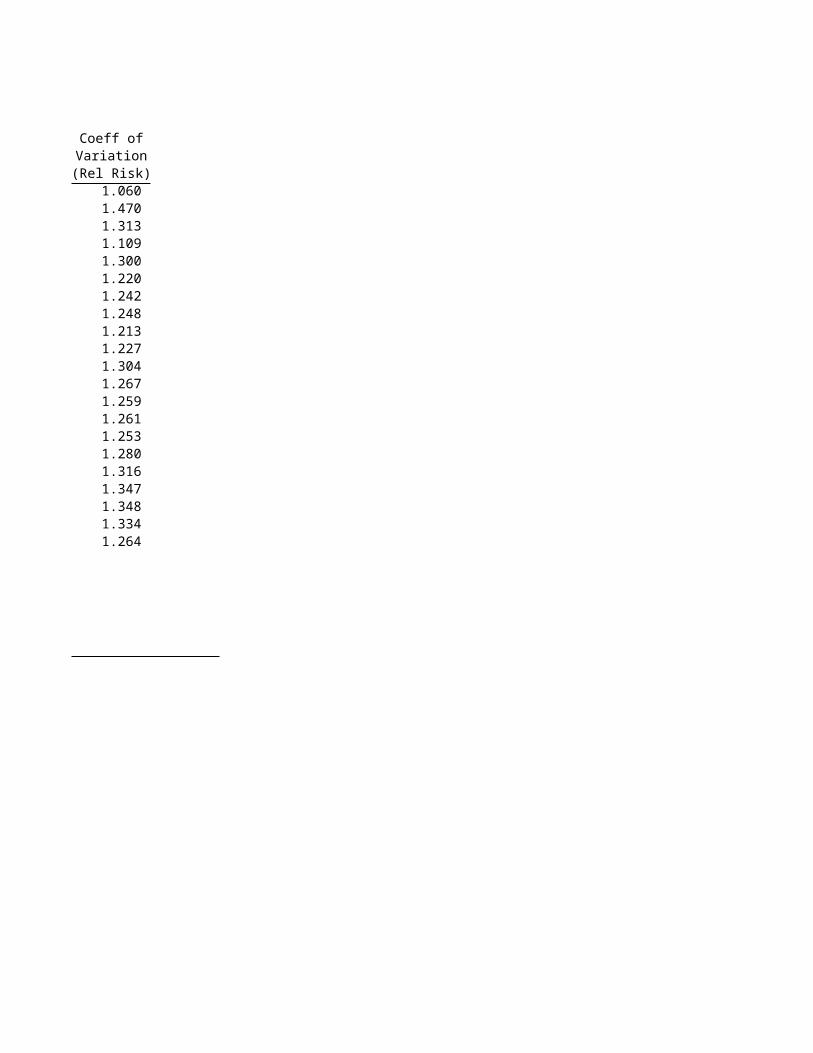
Coeff ofVariation(Rel Risk)
1.060 1.470 1.313 1.109 1.300 1.220 1.242 1.248 1.213 1.227 1.304 1.267 1.259 1.261 1.253 1.280 1.316 1.347 1.348 1.334 1.264
Capital Budgeting Analysis forMedical Services USA
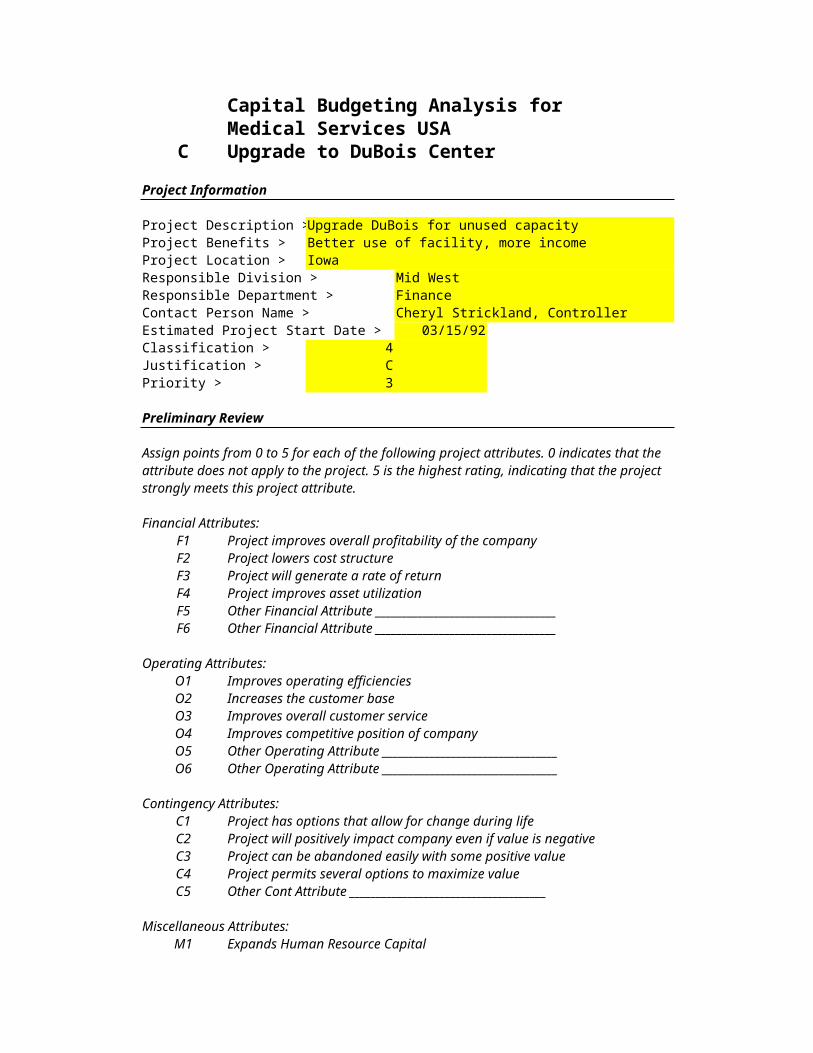
C Upgrade to DuBois CenterProject Information
Project Description >Upgrade DuBois for unused capacityProject Benefits > Better use of facility, more incomeProject Location > IowaResponsible Division > Mid WestResponsible Department > FinanceContact Person Name > Cheryl Strickland, ControllerEstimated Project Start Date > 03/15/92Classification > 4 Justification > CPriority > 3
Preliminary Review
Assign points from 0 to 5 for each of the following project attributes. 0 indicates that the attribute does not apply to the project. 5 is the highest rating, indicating that the project strongly meets this project attribute.
Financial Attributes:F1 Project improves overall profitability of the companyF2 Project lowers cost structureF3 Project will generate a rate of returnF4 Project improves asset utilizationF5 Other Financial Attribute __________________________________F6 Other Financial Attribute __________________________________
Operating Attributes:O1 Improves operating efficienciesO2 Increases the customer baseO3 Improves overall customer serviceO4 Improves competitive position of companyO5 Other Operating Attribute _________________________________O6 Other Operating Attribute _________________________________
Contingency Attributes:C1 Project has options that allow for change during lifeC2 Project will positively impact company even if value is negativeC3 Project can be abandoned easily with some positive valueC4 Project permits several options to maximize valueC5 Other Cont Attribute _____________________________________
Miscellaneous Attributes:M1 Expands Human Resource Capital
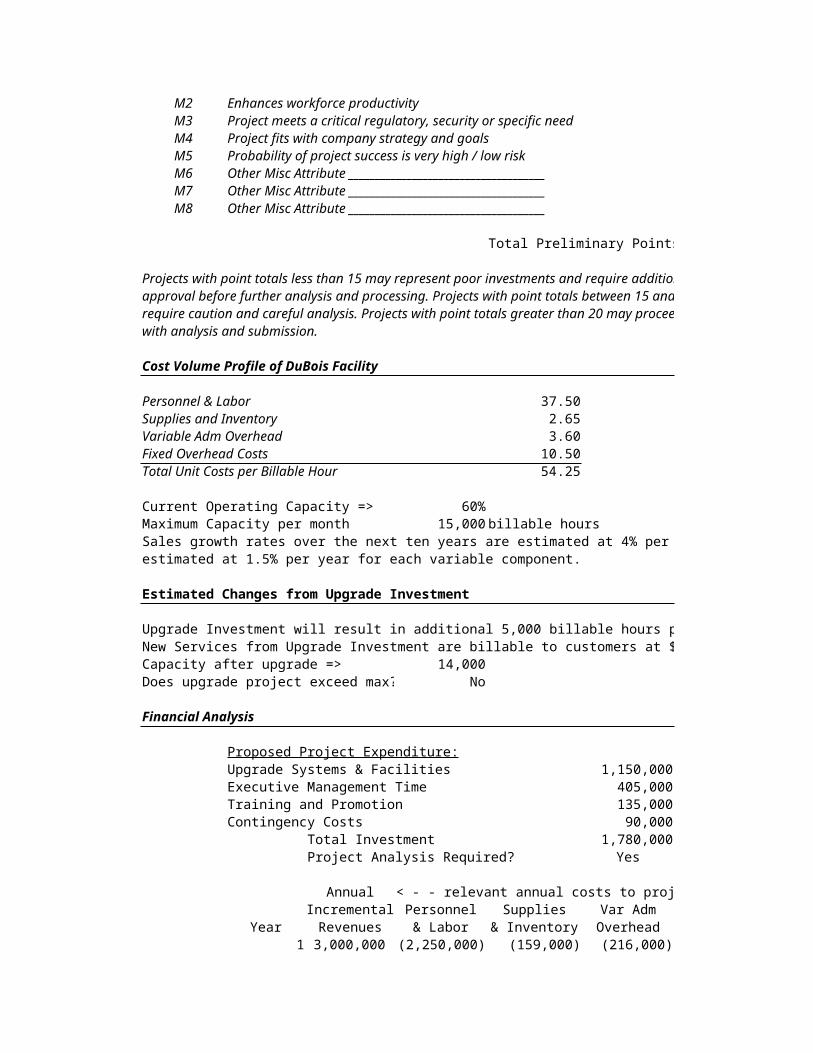
M2 Enhances workforce productivityM3 Project meets a critical regulatory, security or specific needM4 Project fits with company strategy and goalsM5 Probability of project success is very high / low riskM6 Other Misc Attribute _____________________________________M7 Other Misc Attribute _____________________________________M8 Other Misc Attribute _____________________________________
Total Preliminary Points
Projects with point totals less than 15 may represent poor investments and require additionalapproval before further analysis and processing. Projects with point totals between 15 and 20require caution and careful analysis. Projects with point totals greater than 20 may proceedwith analysis and submission.
Cost Volume Profile of DuBois Facility
Personnel & Labor 37.50Supplies and Inventory 2.65Variable Adm Overhead 3.60Fixed Overhead Costs 10.50Total Unit Costs per Billable Hour 54.25
Current Operating Capacity => 60%Maximum Capacity per month 15,000 billable hoursSales growth rates over the next ten years are estimated at 4% per year with increases to cestimated at 1.5% per year for each variable component.
Estimated Changes from Upgrade Investment
Upgrade Investment will result in additional 5,000 billable hours per monthNew Services from Upgrade Investment are billable to customers at $ 50.00 per hourCapacity after upgrade => 14,000Does upgrade project exceed max? No
Financial Analysis
Proposed Project Expenditure:Upgrade Systems & Facilities 1,150,000Executive Management Time 405,000Training and Promotion 135,000Contingency Costs 90,000
Total Investment 1,780,000Project Analysis Required? Yes
Annual < - - relevant annual costs to project - - >Incremental Personnel Supplies Var Adm
Year Revenues & Labor & Inventory Overhead1 3,000,000 (2,250,000) (159,000) (216,000)
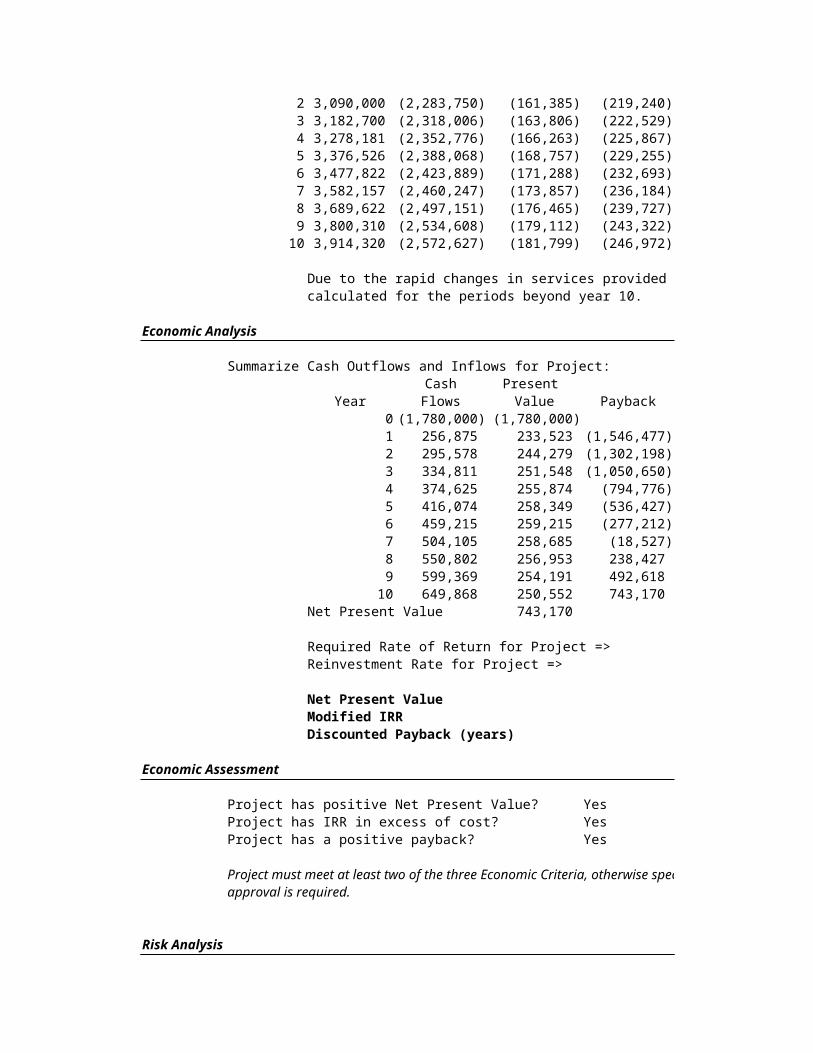
2 3,090,000 (2,283,750) (161,385) (219,240)3 3,182,700 (2,318,006) (163,806) (222,529)4 3,278,181 (2,352,776) (166,263) (225,867)5 3,376,526 (2,388,068) (168,757) (229,255)6 3,477,822 (2,423,889) (171,288) (232,693)7 3,582,157 (2,460,247) (173,857) (236,184)8 3,689,622 (2,497,151) (176,465) (239,727)9 3,800,310 (2,534,608) (179,112) (243,322)10 3,914,320 (2,572,627) (181,799) (246,972)
Due to the rapid changes in services provided by this upgrade investment project, no terminal value was calculated for the periods beyond year 10.
Economic Analysis
Summarize Cash Outflows and Inflows for Project:Cash Present
Year Flows Value Payback 0 (1,780,000) (1,780,000) 1 256,875 233,523 (1,546,477) 2 295,578 244,279 (1,302,198) 3 334,811 251,548 (1,050,650) 4 374,625 255,874 (794,776) 5 416,074 258,349 (536,427) 6 459,215 259,215 (277,212) 7 504,105 258,685 (18,527)
8 550,802 256,953 238,427 9 599,369 254,191 492,618
10 649,868 250,552 743,170 Net Present Value 743,170
Required Rate of Return for Project =>Reinvestment Rate for Project =>
Net Present Value Modified IRRDiscounted Payback (years)
Economic Assessment
Project has positive Net Present Value? YesProject has IRR in excess of cost? YesProject has a positive payback? Yes
Project must meet at least two of the three Economic Criteria, otherwise specialapproval is required.
Risk Analysis
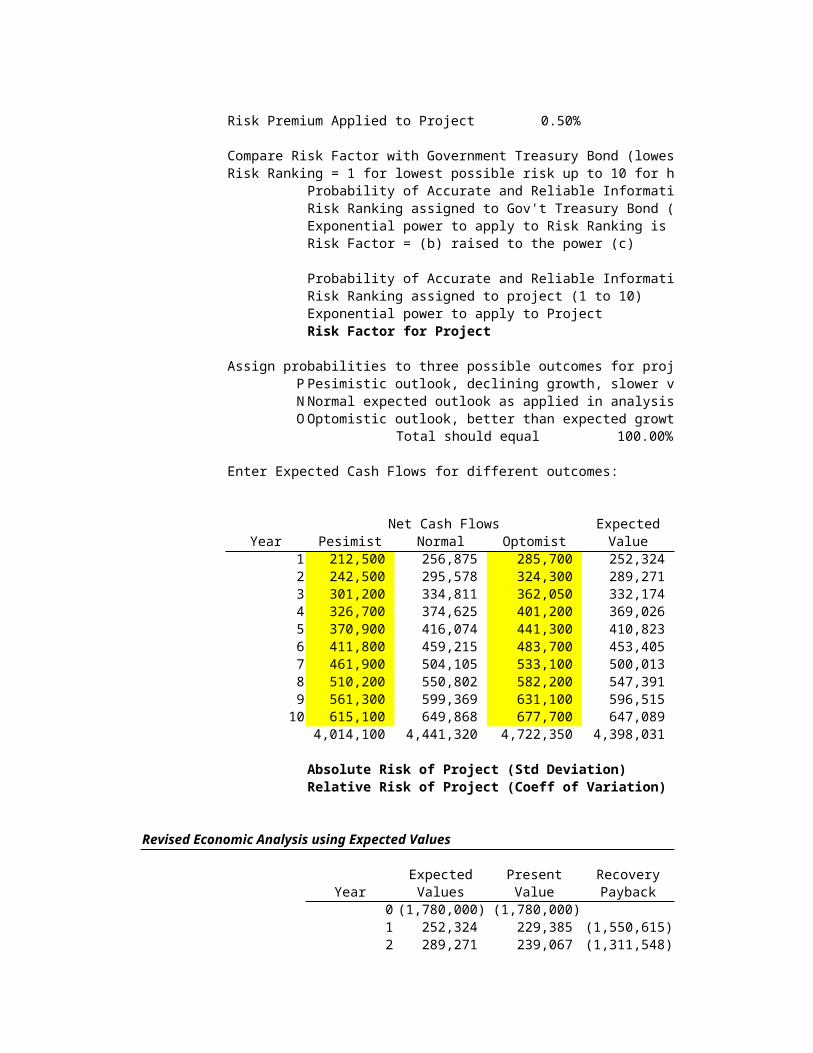
Risk Premium Applied to Project 0.50%
Compare Risk Factor with Government Treasury Bond (lowest risk) to Project Risk Factor:Risk Ranking = 1 for lowest possible risk up to 10 for highest possible risk
Probability of Accurate and Reliable Information - Gov't TRisk Ranking assigned to Gov't Treasury Bond ( 1 to 10)Exponential power to apply to Risk Ranking is 2 - (a)Risk Factor = (b) raised to the power (c)
Probability of Accurate and Reliable Information for ProjeRisk Ranking assigned to project (1 to 10)Exponential power to apply to ProjectRisk Factor for Project
Assign probabilities to three possible outcomes for project:P Pesimistic outlook, declining growth, slower volumes, etc.N Normal expected outlook as applied in analysisO Optomistic outlook, better than expected growth
Total should equal 100.00%
Enter Expected Cash Flows for different outcomes:
Net Cash Flows Expected
Year Pesimist Normal Optomist Value1 212,500 256,875 285,700 252,324 2 242,500 295,578 324,300 289,271 3 301,200 334,811 362,050 332,174 4 326,700 374,625 401,200 369,026 5 370,900 416,074 441,300 410,823 6 411,800 459,215 483,700 453,405 7 461,900 504,105 533,100 500,013 8 510,200 550,802 582,200 547,391 9 561,300 599,369 631,100 596,515 10 615,100 649,868 677,700 647,089
4,014,100 4,441,320 4,722,350 4,398,031
Absolute Risk of Project (Std Deviation)Relative Risk of Project (Coeff of Variation)
Revised Economic Analysis using Expected Values
Expected Present RecoveryYear Values Value Payback
0 (1,780,000) (1,780,000)1 252,324 229,385 (1,550,615)2 289,271 239,067 (1,311,548)
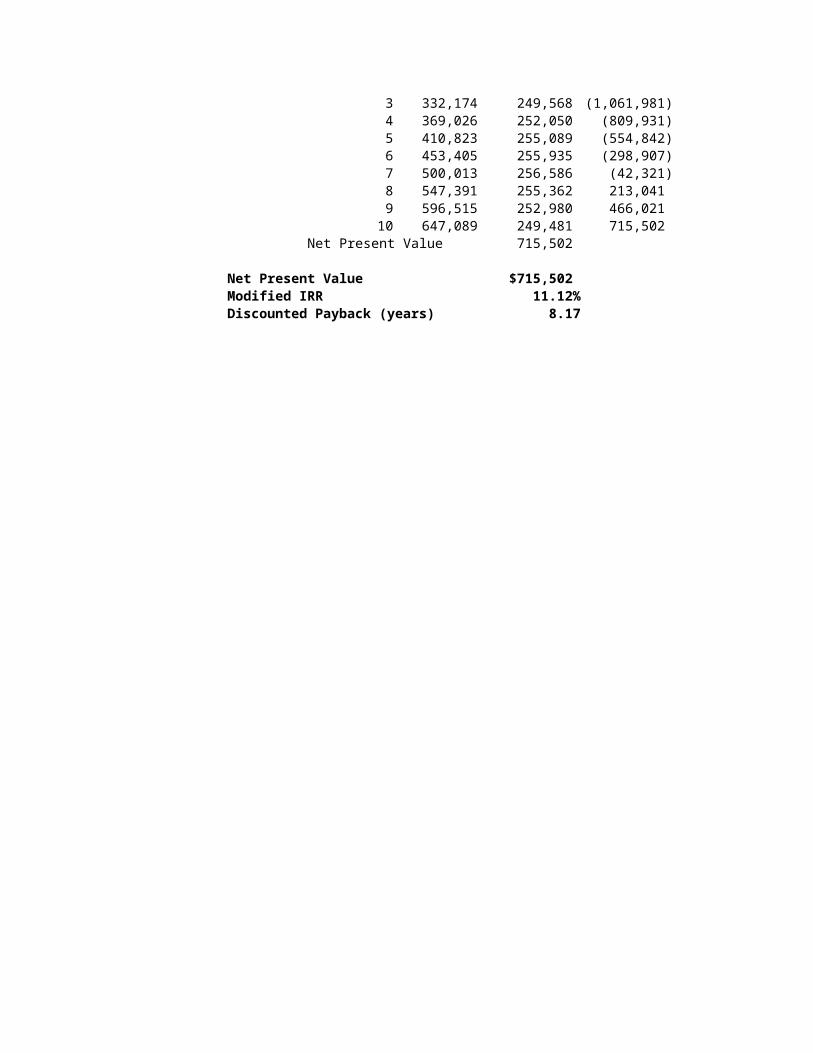
3 332,174 249,568 (1,061,981)4 369,026 252,050 (809,931)5 410,823 255,089 (554,842)6 453,405 255,935 (298,907)7 500,013 256,586 (42,321)8 547,391 255,362 213,041 9 596,515 252,980 466,021
10 647,089 249,481 715,502 Net Present Value 715,502
Net Present Value $715,502 Modified IRR 11.12%Discounted Payback (years) 8.17

3 3 4 4 0 0
4 3 3 2 0 0
0 0 0 0 0
0
0 0 2 3 0 0 0
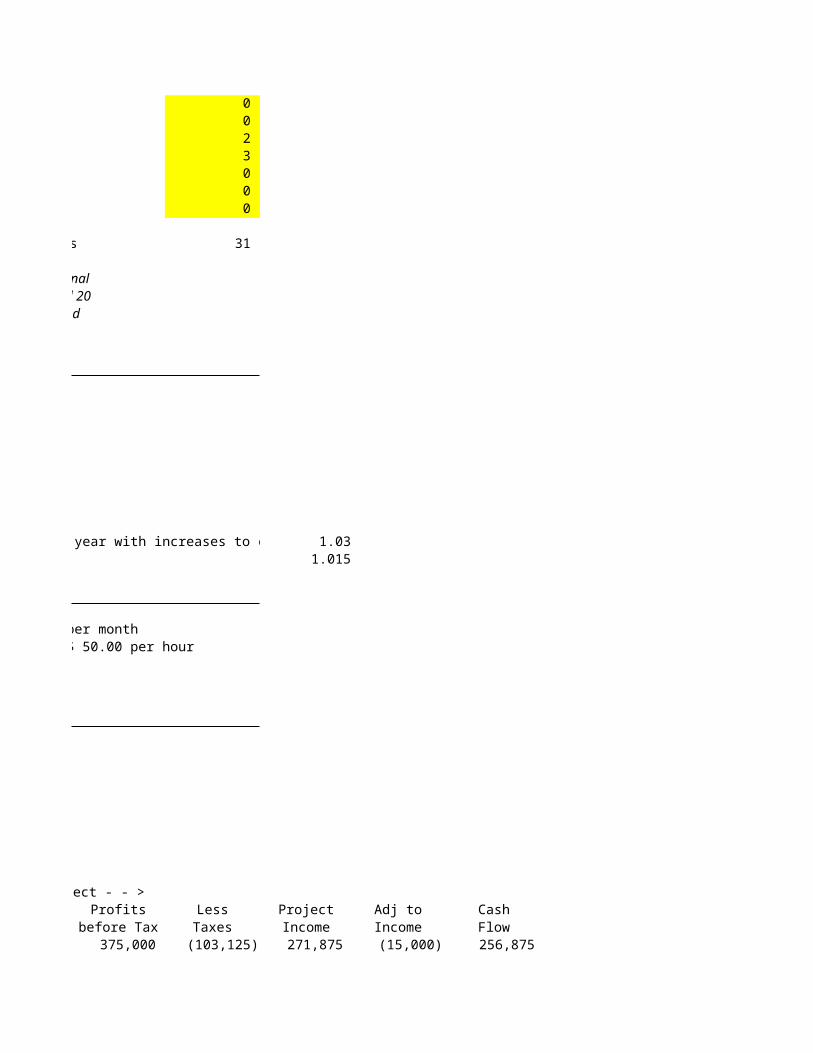
Total Preliminary Points 31
Projects with point totals less than 15 may represent poor investments and require additionalapproval before further analysis and processing. Projects with point totals between 15 and 20require caution and careful analysis. Projects with point totals greater than 20 may proceed
Sales growth rates over the next ten years are estimated at 4% per year with increases to c 1.031.015
Upgrade Investment will result in additional 5,000 billable hours per monthNew Services from Upgrade Investment are billable to customers at $ 50.00 per hour
< - - relevant annual costs to project - - >Profits Less Project Adj to Cash
before Tax Taxes Income Income Flow375,000 (103,125) 271,875 (15,000) 256,875
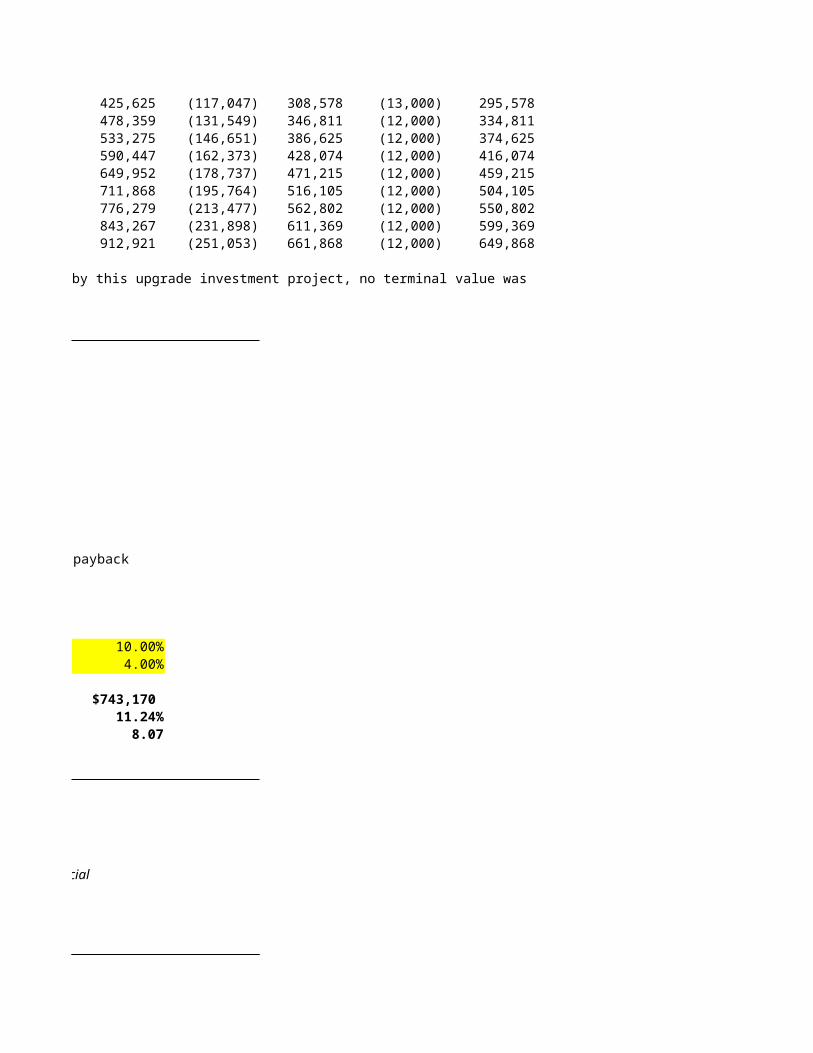
425,625 (117,047) 308,578 (13,000) 295,578 478,359 (131,549) 346,811 (12,000) 334,811 533,275 (146,651) 386,625 (12,000) 374,625 590,447 (162,373) 428,074 (12,000) 416,074 649,952 (178,737) 471,215 (12,000) 459,215 711,868 (195,764) 516,105 (12,000) 504,105 776,279 (213,477) 562,802 (12,000) 550,802 843,267 (231,898) 611,369 (12,000) 599,369 912,921 (251,053) 661,868 (12,000) 649,868
Due to the rapid changes in services provided by this upgrade investment project, no terminal value was
payback
10.00%4.00%
$743,170 11.24%8.07
Project must meet at least two of the three Economic Criteria, otherwise special
Compare Risk Factor with Government Treasury Bond (lowest risk) to Project Risk Factor:Risk Ranking = 1 for lowest possible risk up to 10 for highest possible risk
Probability of Accurate and Reliable Information - Gov't T 1.00 (a)Risk Ranking assigned to Gov't Treasury Bond ( 1 to 10) 1 (b)Exponential power to apply to Risk Ranking is 2 - (a) 1 (c)
1
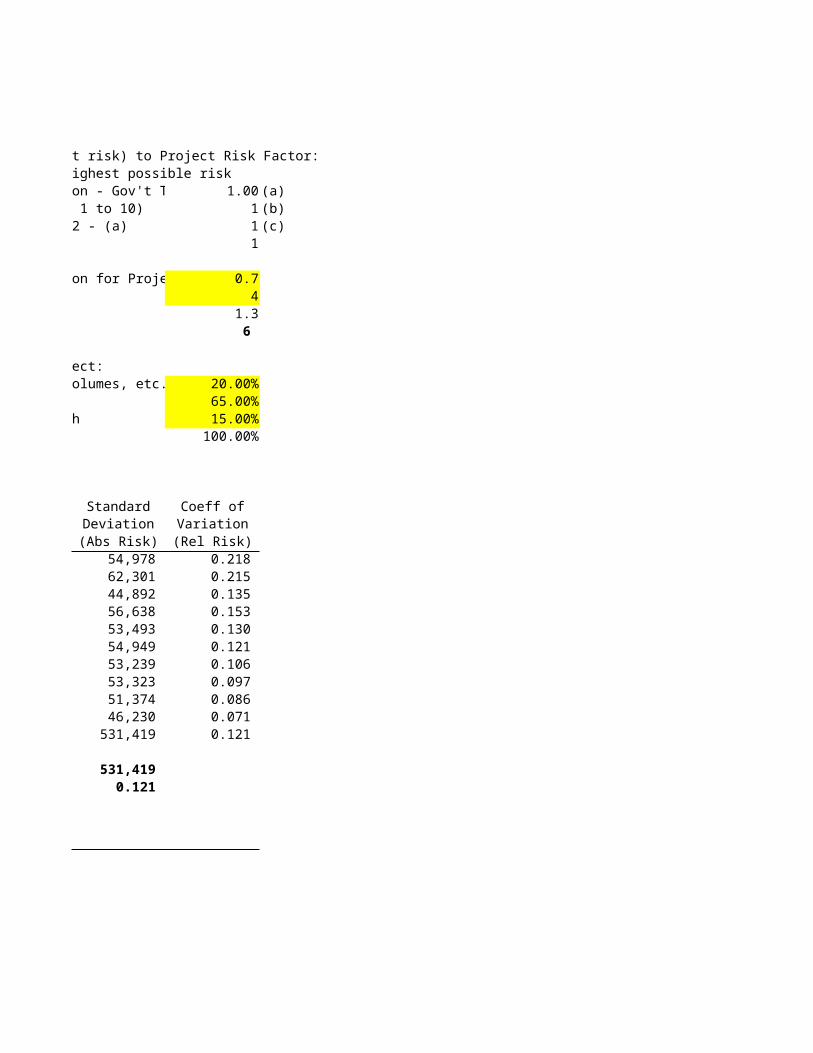
Probability of Accurate and Reliable Information for Proje 0.74
1.3 6
Assign probabilities to three possible outcomes for project:Pesimistic outlook, declining growth, slower volumes, etc. 20.00%Normal expected outlook as applied in analysis 65.00%Optomistic outlook, better than expected growth 15.00%
100.00%
Standard Coeff ofDeviation Variation(Abs Risk) (Rel Risk)
54,978 0.218 62,301 0.215 44,892 0.135 56,638 0.153 53,493 0.130 54,949 0.121 53,239 0.106 53,323 0.097 51,374 0.086 46,230 0.071 531,419 0.121
531,419 0.121

payback
Capital Budgeting Analysis forMedical Services USA
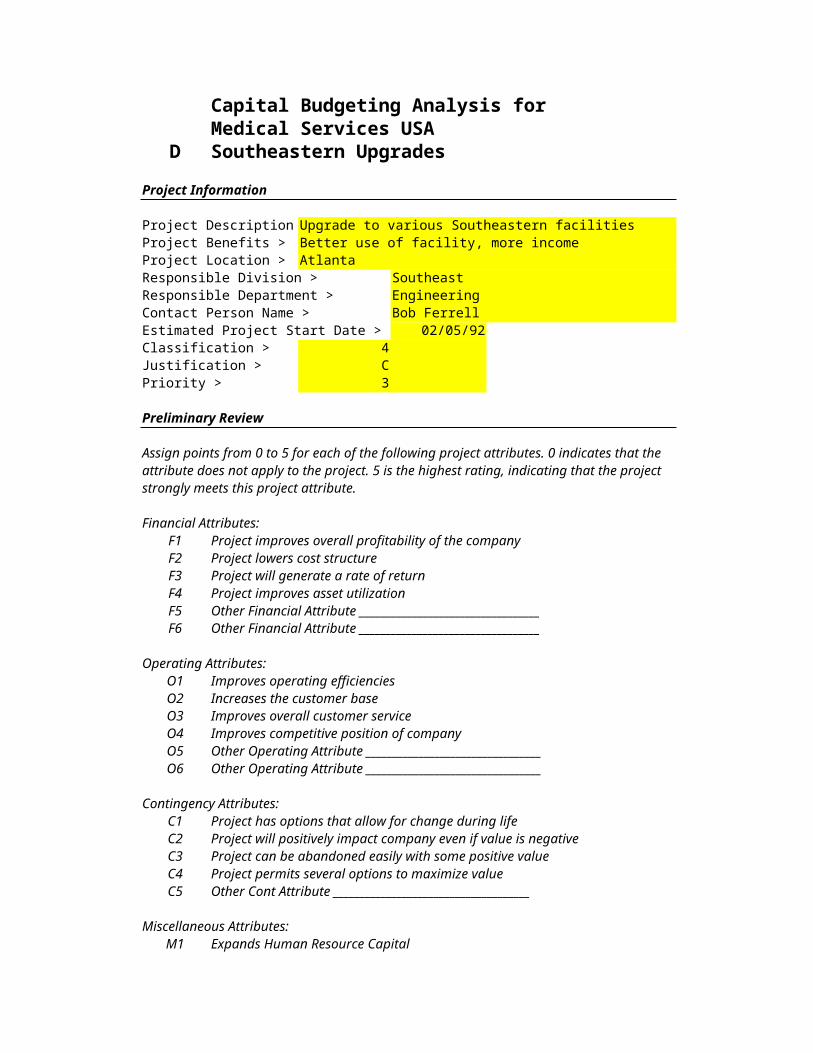
D Southeastern UpgradesProject Information
Project Description Upgrade to various Southeastern facilitiesProject Benefits > Better use of facility, more incomeProject Location > AtlantaResponsible Division > SoutheastResponsible Department > EngineeringContact Person Name > Bob FerrellEstimated Project Start Date > 02/05/92Classification > 4 Justification > CPriority > 3
Preliminary Review
Assign points from 0 to 5 for each of the following project attributes. 0 indicates that the attribute does not apply to the project. 5 is the highest rating, indicating that the project strongly meets this project attribute.
Financial Attributes:F1 Project improves overall profitability of the companyF2 Project lowers cost structureF3 Project will generate a rate of returnF4 Project improves asset utilizationF5 Other Financial Attribute __________________________________F6 Other Financial Attribute __________________________________
Operating Attributes:O1 Improves operating efficienciesO2 Increases the customer baseO3 Improves overall customer serviceO4 Improves competitive position of companyO5 Other Operating Attribute _________________________________O6 Other Operating Attribute _________________________________
Contingency Attributes:C1 Project has options that allow for change during lifeC2 Project will positively impact company even if value is negativeC3 Project can be abandoned easily with some positive valueC4 Project permits several options to maximize valueC5 Other Cont Attribute _____________________________________
Miscellaneous Attributes:M1 Expands Human Resource Capital
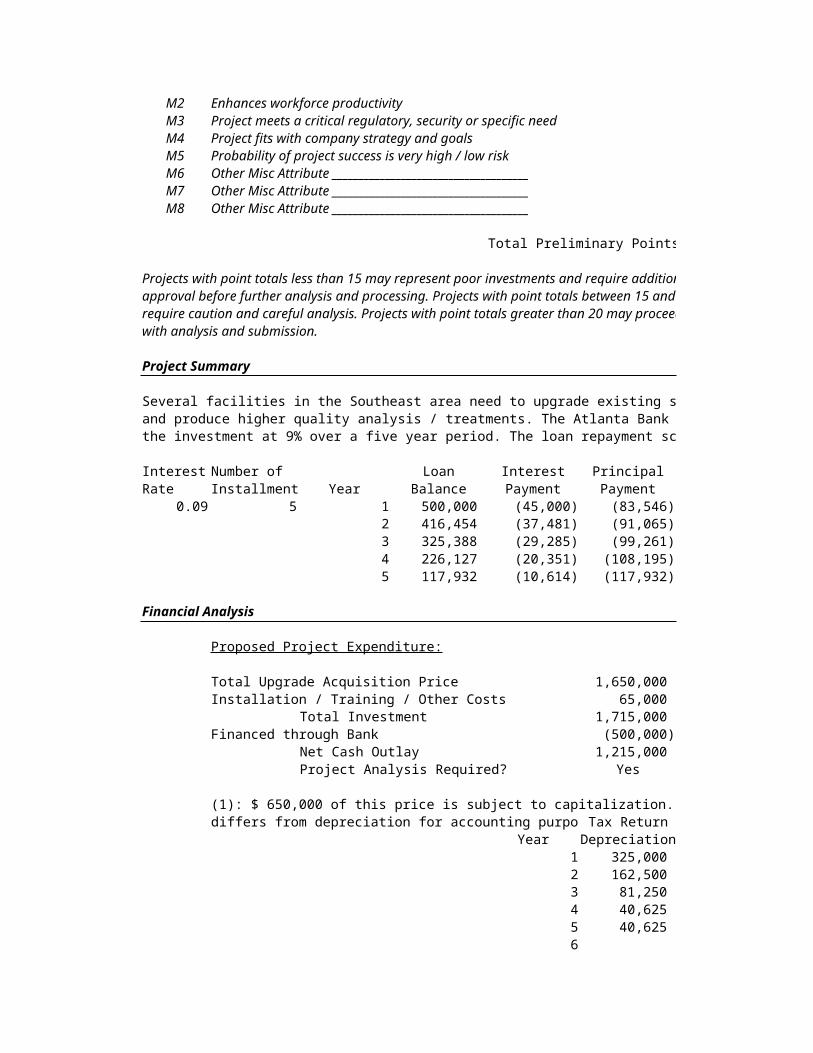
M2 Enhances workforce productivityM3 Project meets a critical regulatory, security or specific needM4 Project fits with company strategy and goalsM5 Probability of project success is very high / low riskM6 Other Misc Attribute _____________________________________M7 Other Misc Attribute _____________________________________M8 Other Misc Attribute _____________________________________
Total Preliminary Points
Projects with point totals less than 15 may represent poor investments and require additionalapproval before further analysis and processing. Projects with point totals between 15 and 20require caution and careful analysis. Projects with point totals greater than 20 may proceedwith analysis and submission.
Project Summary
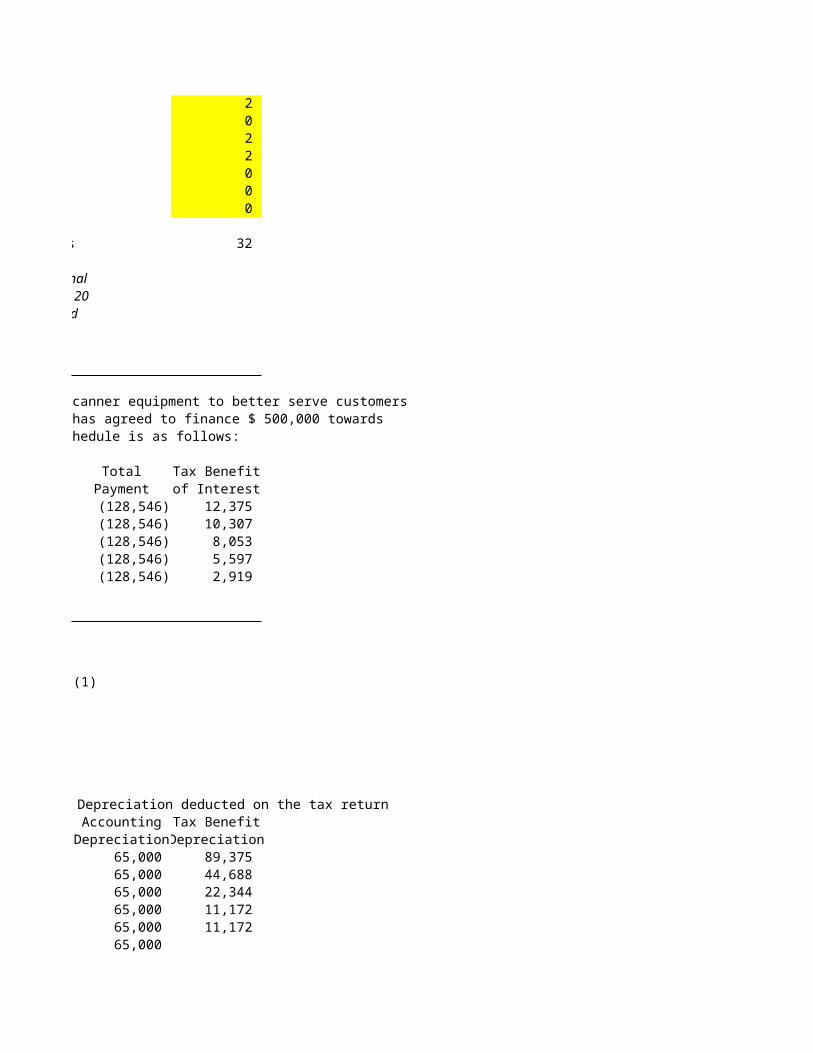
Several facilities in the Southeast area need to upgrade existing scanner equipment to better serve customersand produce higher quality analysis / treatments. The Atlanta Bank has agreed to finance $ 500,000 towardsthe investment at 9% over a five year period. The loan repayment schedule is as follows:
Interest Number of Loan Interest PrincipalRate Installment Year Balance Payment Payment
0.09 5 1 500,000 (45,000) (83,546)2 416,454 (37,481) (91,065)3 325,388 (29,285) (99,261)4 226,127 (20,351) (108,195)5 117,932 (10,614) (117,932)
Financial Analysis
Proposed Project Expenditure:
Total Upgrade Acquisition Price 1,650,000 Installation / Training / Other Costs 65,000
Total Investment 1,715,000 Financed through Bank (500,000)
Net Cash Outlay 1,215,000 Project Analysis Required? Yes
(1): $ 650,000 of this price is subject to capitalization. Depreciation deducted on the tax returndiffers from depreciation for accounting purposTax Return
Year Depreciation1 325,000 2 162,500 3 81,250 4 40,625 5 40,625 6
789
10Total 650,000
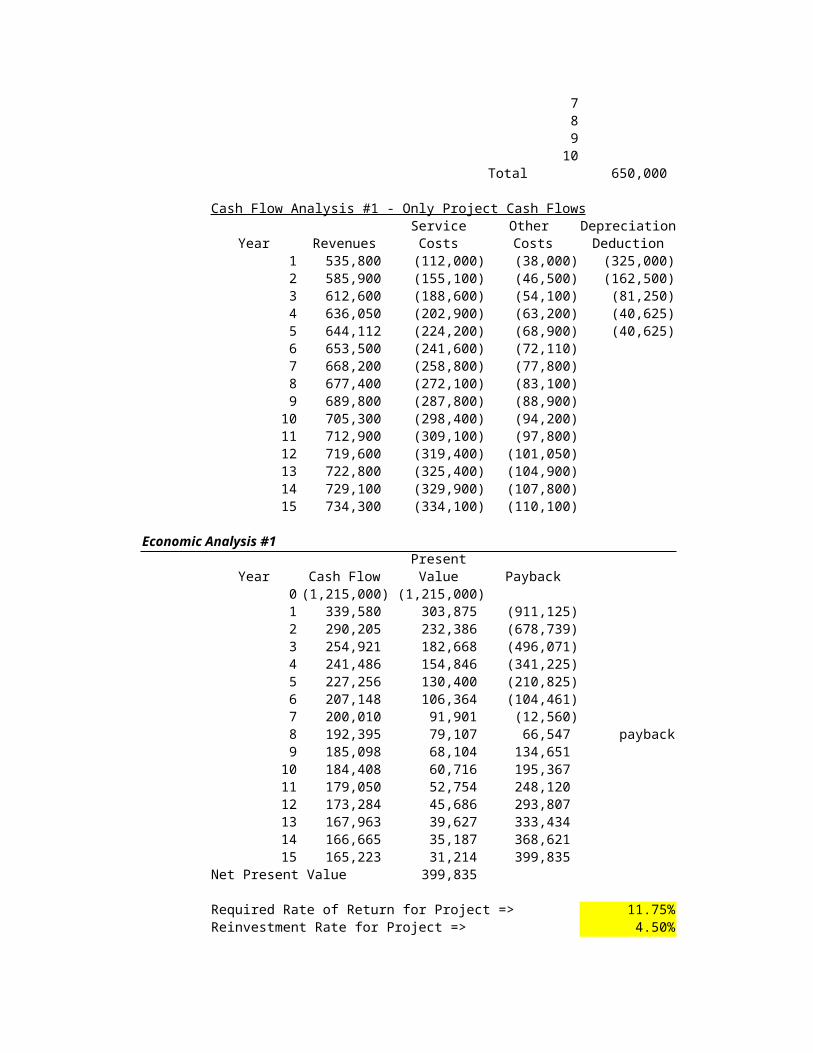
Cash Flow Analysis #1 - Only Project Cash FlowsService Other Depreciation
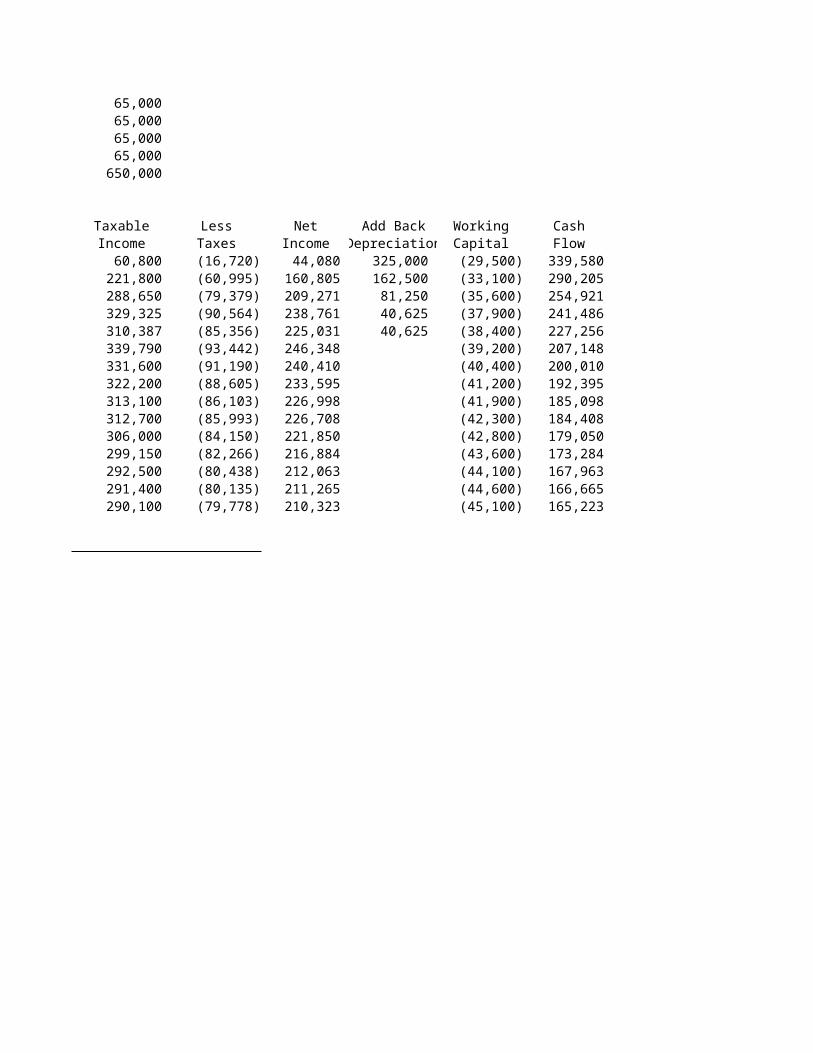
Year Revenues Costs Costs Deduction1 535,800 (112,000) (38,000) (325,000)2 585,900 (155,100) (46,500) (162,500)3 612,600 (188,600) (54,100) (81,250)4 636,050 (202,900) (63,200) (40,625)5 644,112 (224,200) (68,900) (40,625)6 653,500 (241,600) (72,110)7 668,200 (258,800) (77,800)8 677,400 (272,100) (83,100)9 689,800 (287,800) (88,900)
10 705,300 (298,400) (94,200)11 712,900 (309,100) (97,800)12 719,600 (319,400) (101,050)13 722,800 (325,400) (104,900)14 729,100 (329,900) (107,800)15 734,300 (334,100) (110,100)
Economic Analysis #1Present
Year Cash Flow Value Payback0 (1,215,000) (1,215,000)1 339,580 303,875 (911,125)2 290,205 232,386 (678,739)3 254,921 182,668 (496,071)4 241,486 154,846 (341,225)5 227,256 130,400 (210,825)6 207,148 106,364 (104,461)7 200,010 91,901 (12,560)8 192,395 79,107 66,547 payback9 185,098 68,104 134,651
10 184,408 60,716 195,367 11 179,050 52,754 248,120 12 173,284 45,686 293,807 13 167,963 39,627 333,434 14 166,665 35,187 368,621 15 165,223 31,214 399,835
Net Present Value 399,835
Required Rate of Return for Project => 11.75%Reinvestment Rate for Project => 4.50%
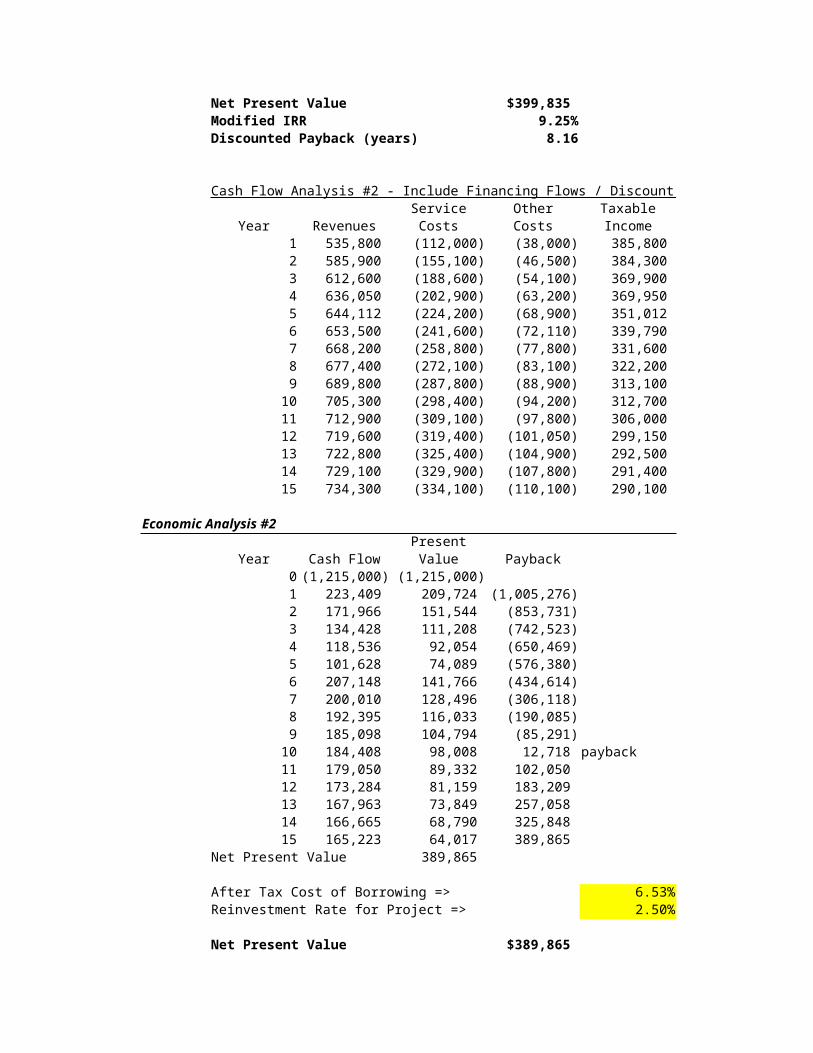
Net Present Value $399,835 Modified IRR 9.25%Discounted Payback (years) 8.16
Cash Flow Analysis #2 - Include Financing Flows / Discount Rate = Cost of Borrowing: Service Other Taxable
Year Revenues Costs Costs Income1 535,800 (112,000) (38,000) 385,800 2 585,900 (155,100) (46,500) 384,300 3 612,600 (188,600) (54,100) 369,900 4 636,050 (202,900) (63,200) 369,950 5 644,112 (224,200) (68,900) 351,012 6 653,500 (241,600) (72,110) 339,790 7 668,200 (258,800) (77,800) 331,600 8 677,400 (272,100) (83,100) 322,200 9 689,800 (287,800) (88,900) 313,100
10 705,300 (298,400) (94,200) 312,700 11 712,900 (309,100) (97,800) 306,000 12 719,600 (319,400) (101,050) 299,150 13 722,800 (325,400) (104,900) 292,500 14 729,100 (329,900) (107,800) 291,400 15 734,300 (334,100) (110,100) 290,100
Economic Analysis #2Present
Year Cash Flow Value Payback0 (1,215,000) (1,215,000)1 223,409 209,724 (1,005,276)2 171,966 151,544 (853,731)3 134,428 111,208 (742,523)4 118,536 92,054 (650,469)5 101,628 74,089 (576,380)6 207,148 141,766 (434,614)7 200,010 128,496 (306,118)8 192,395 116,033 (190,085)9 185,098 104,794 (85,291)
10 184,408 98,008 12,718 payback11 179,050 89,332 102,050 12 173,284 81,159 183,209 13 167,963 73,849 257,058 14 166,665 68,790 325,848 15 165,223 64,017 389,865
Net Present Value 389,865
After Tax Cost of Borrowing => 6.53%Reinvestment Rate for Project => 2.50% Net Present Value $389,865
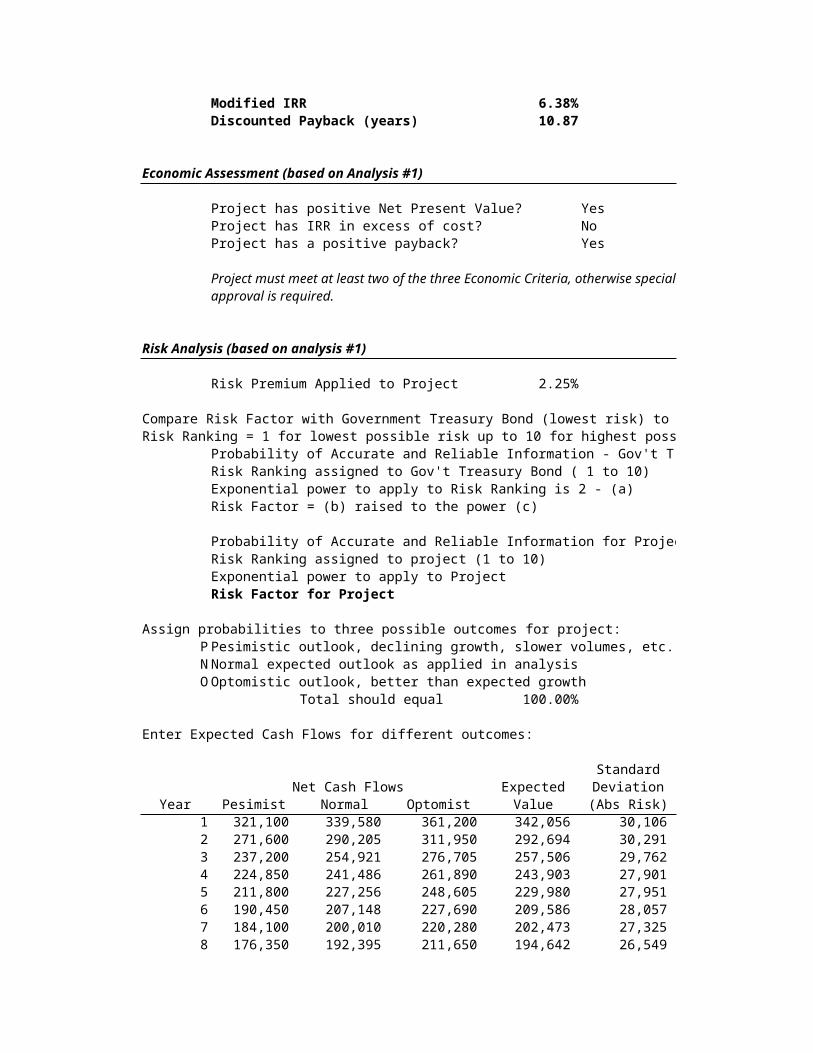
Modified IRR 6.38%Discounted Payback (years) 10.87
Economic Assessment (based on Analysis #1)
Project has positive Net Present Value? YesProject has IRR in excess of cost? NoProject has a positive payback? Yes
Project must meet at least two of the three Economic Criteria, otherwise specialapproval is required.
Risk Analysis (based on analysis #1)
Risk Premium Applied to Project 2.25%
Compare Risk Factor with Government Treasury Bond (lowest risk) to Project Risk Factor:Risk Ranking = 1 for lowest possible risk up to 10 for highest possible risk
Probability of Accurate and Reliable Information - Gov't T Risk Ranking assigned to Gov't Treasury Bond ( 1 to 10)Exponential power to apply to Risk Ranking is 2 - (a)Risk Factor = (b) raised to the power (c)
Probability of Accurate and Reliable Information for ProjecRisk Ranking assigned to project (1 to 10)Exponential power to apply to ProjectRisk Factor for Project
Assign probabilities to three possible outcomes for project:P Pesimistic outlook, declining growth, slower volumes, etc.N Normal expected outlook as applied in analysisO Optomistic outlook, better than expected growth
Total should equal 100.00%
Enter Expected Cash Flows for different outcomes:
StandardNet Cash Flows Expected Deviation
Year Pesimist Normal Optomist Value (Abs Risk)1 321,100 339,580 361,200 342,056 30,106 2 271,600 290,205 311,950 292,694 30,291 3 237,200 254,921 276,705 257,506 29,762 4 224,850 241,486 261,890 243,903 27,901 5 211,800 227,256 248,605 229,980 27,951 6 190,450 207,148 227,690 209,586 28,057 7 184,100 200,010 220,280 202,473 27,325 8 176,350 192,395 211,650 194,642 26,549
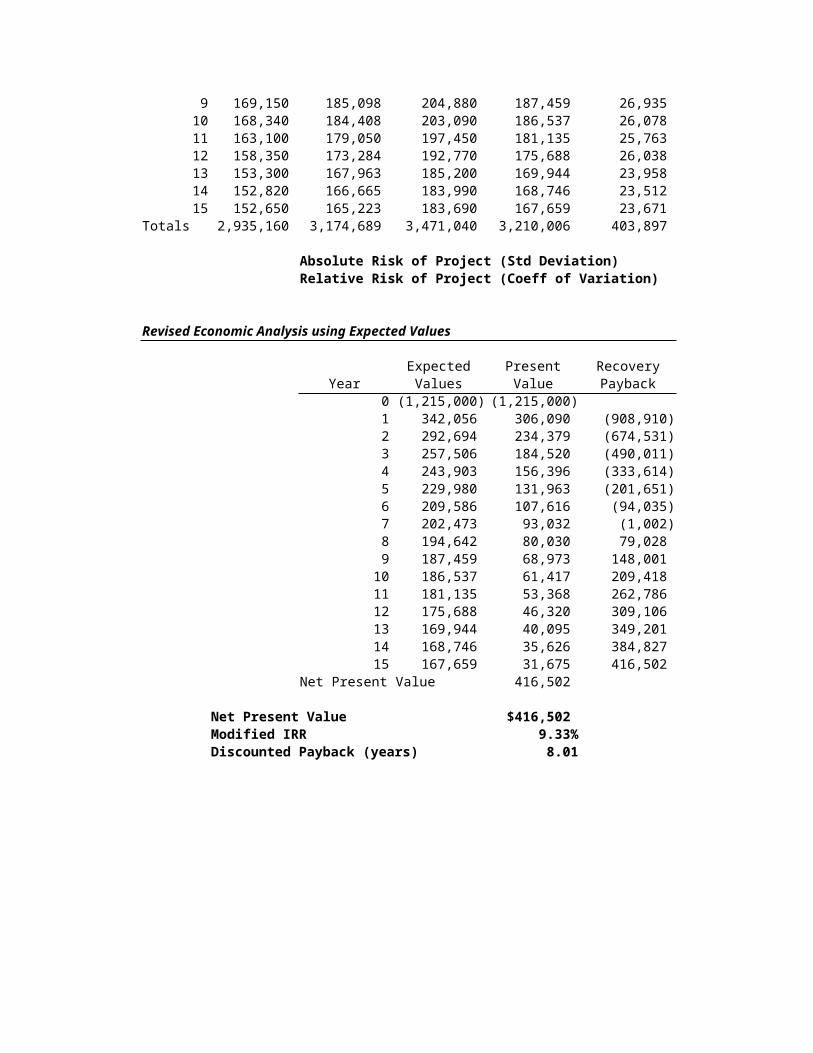
9 169,150 185,098 204,880 187,459 26,935 10 168,340 184,408 203,090 186,537 26,078 11 163,100 179,050 197,450 181,135 25,763 12 158,350 173,284 192,770 175,688 26,038 13 153,300 167,963 185,200 169,944 23,958 14 152,820 166,665 183,990 168,746 23,512 15 152,650 165,223 183,690 167,659 23,671
Totals 2,935,160 3,174,689 3,471,040 3,210,006 403,897 Absolute Risk of Project (Std Deviation)Relative Risk of Project (Coeff of Variation)
Revised Economic Analysis using Expected Values
Expected Present RecoveryYear Values Value Payback
0 (1,215,000) (1,215,000)1 342,056 306,090 (908,910)2 292,694 234,379 (674,531)3 257,506 184,520 (490,011)4 243,903 156,396 (333,614)5 229,980 131,963 (201,651)6 209,586 107,616 (94,035)7 202,473 93,032 (1,002)8 194,642 80,030 79,028 9 187,459 68,973 148,001
10 186,537 61,417 209,418 11 181,135 53,368 262,786 12 175,688 46,320 309,106 13 169,944 40,095 349,201 14 168,746 35,626 384,827 15 167,659 31,675 416,502
Net Present Value 416,502
Net Present Value $416,502 Modified IRR 9.33%Discounted Payback (years) 8.01

2 2 4 5 0 0
5 1 2 3 0 0
0 1 1 0 0
0
2 0 2 2 0 0 0
Total Preliminary Points 32
Projects with point totals less than 15 may represent poor investments and require additionalapproval before further analysis and processing. Projects with point totals between 15 and 20require caution and careful analysis. Projects with point totals greater than 20 may proceed
Several facilities in the Southeast area need to upgrade existing scanner equipment to better serve customersand produce higher quality analysis / treatments. The Atlanta Bank has agreed to finance $ 500,000 towardsthe investment at 9% over a five year period. The loan repayment schedule is as follows:
Total Tax BenefitPayment of Interest(128,546) 12,375 (128,546) 10,307 (128,546) 8,053 (128,546) 5,597 (128,546) 2,919
(1)
(1): $ 650,000 of this price is subject to capitalization. Depreciation deducted on the tax returnAccounting Tax Benefit
DepreciationDepreciation65,000 89,375 65,000 44,688 65,000 22,344 65,000 11,172 65,000 11,172 65,000
65,000 65,000 65,000 65,000 650,000
Taxable Less Net Add Back Working CashIncome Taxes Income Depreciation Capital Flow
60,800 (16,720) 44,080 325,000 (29,500) 339,580 221,800 (60,995) 160,805 162,500 (33,100) 290,205 288,650 (79,379) 209,271 81,250 (35,600) 254,921 329,325 (90,564) 238,761 40,625 (37,900) 241,486 310,387 (85,356) 225,031 40,625 (38,400) 227,256 339,790 (93,442) 246,348 (39,200) 207,148 331,600 (91,190) 240,410 (40,400) 200,010 322,200 (88,605) 233,595 (41,200) 192,395 313,100 (86,103) 226,998 (41,900) 185,098 312,700 (85,993) 226,708 (42,300) 184,408 306,000 (84,150) 221,850 (42,800) 179,050 299,150 (82,266) 216,884 (43,600) 173,284 292,500 (80,438) 212,063 (44,100) 167,963 291,400 (80,135) 211,265 (44,600) 166,665 290,100 (79,778) 210,323 (45,100) 165,223
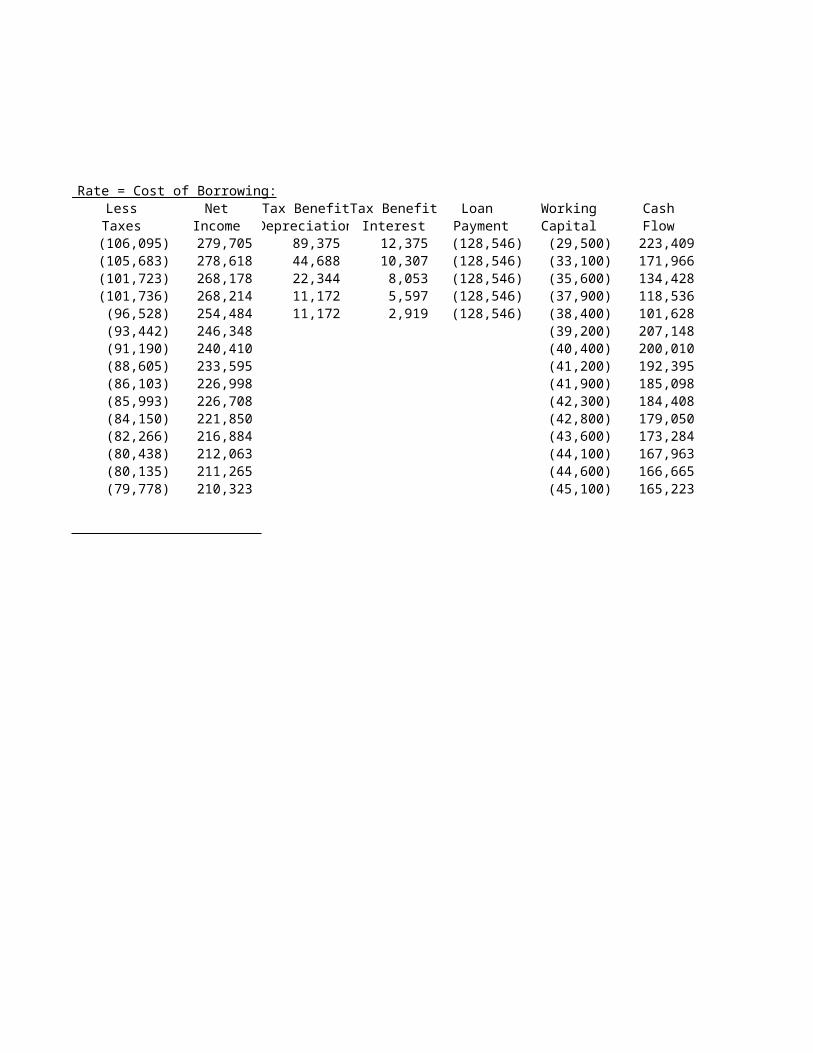
Cash Flow Analysis #2 - Include Financing Flows / Discount Rate = Cost of Borrowing: Less Net Tax BenefitTax Benefit Loan Working CashTaxes Income Depreciation Interest Payment Capital Flow(106,095) 279,705 89,375 12,375 (128,546) (29,500) 223,409 (105,683) 278,618 44,688 10,307 (128,546) (33,100) 171,966 (101,723) 268,178 22,344 8,053 (128,546) (35,600) 134,428 (101,736) 268,214 11,172 5,597 (128,546) (37,900) 118,536 (96,528) 254,484 11,172 2,919 (128,546) (38,400) 101,628 (93,442) 246,348 (39,200) 207,148 (91,190) 240,410 (40,400) 200,010 (88,605) 233,595 (41,200) 192,395 (86,103) 226,998 (41,900) 185,098 (85,993) 226,708 (42,300) 184,408 (84,150) 221,850 (42,800) 179,050 (82,266) 216,884 (43,600) 173,284 (80,438) 212,063 (44,100) 167,963 (80,135) 211,265 (44,600) 166,665 (79,778) 210,323 (45,100) 165,223
Project must meet at least two of the three Economic Criteria, otherwise special
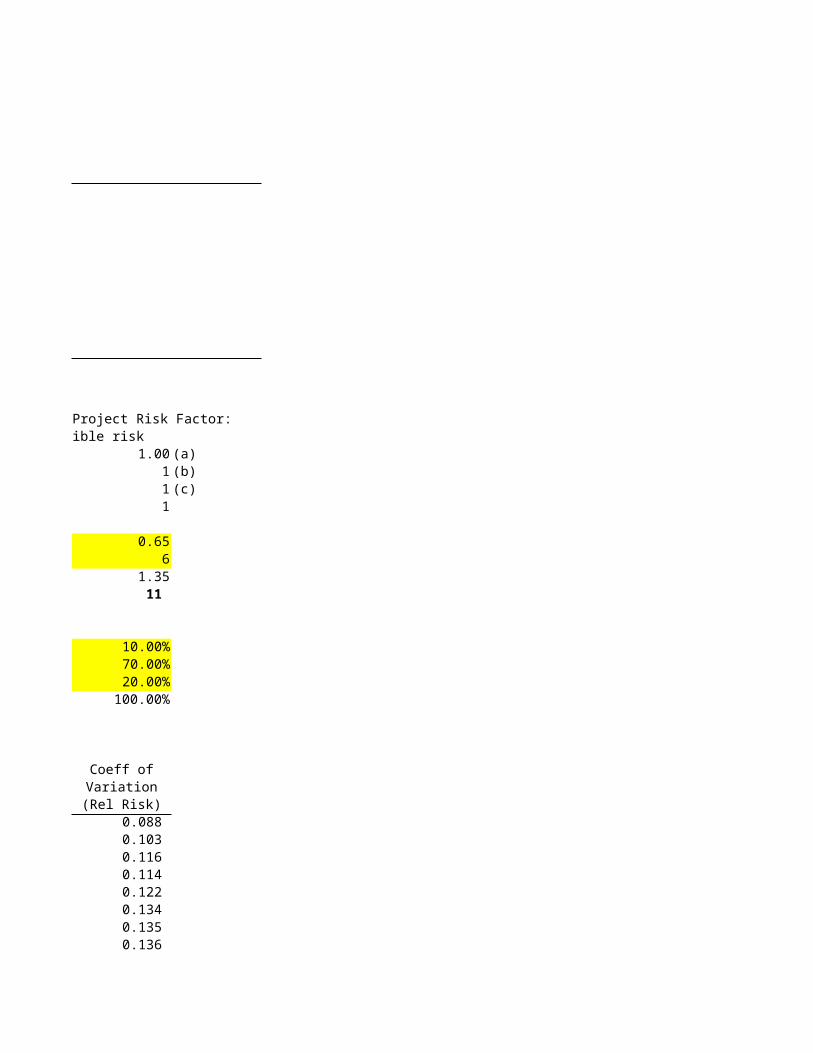
Compare Risk Factor with Government Treasury Bond (lowest risk) to Project Risk Factor:Risk Ranking = 1 for lowest possible risk up to 10 for highest possible risk
1.00 (a)1 (b)1 (c)1
0.656
1.35 11
10.00%70.00%20.00%
100.00%
Coeff ofVariation(Rel Risk)
0.088 0.103 0.116 0.114 0.122 0.134 0.135 0.136
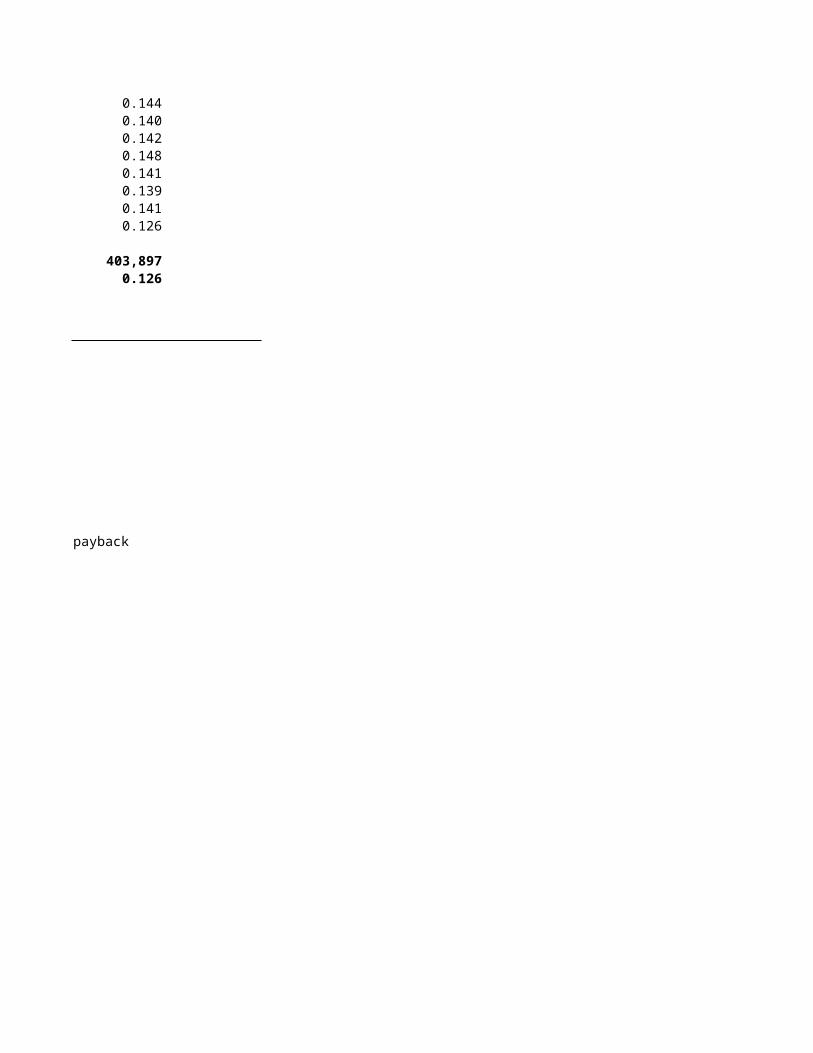
0.144 0.140 0.142 0.148 0.141 0.139 0.141 0.126
403,897 0.126
payback
Capital Budgeting Analysis forMedical Services USA
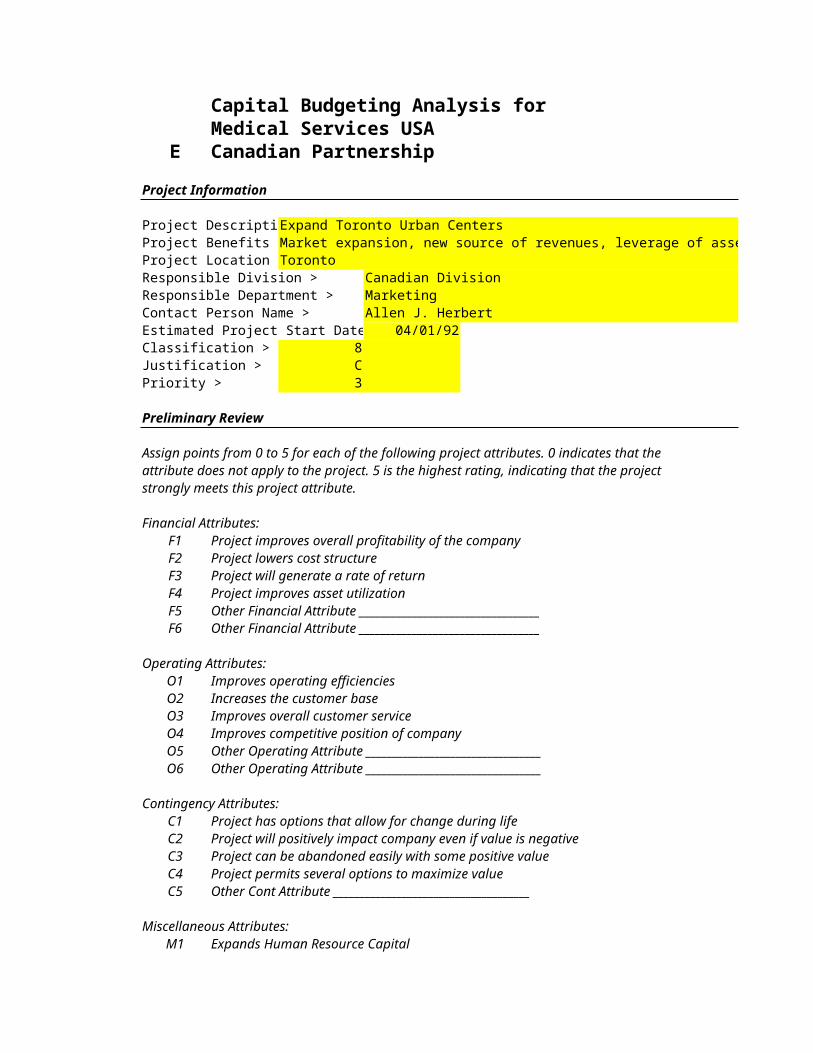
E Canadian PartnershipProject Information
Project DescriptiExpand Toronto Urban CentersProject Benefits Market expansion, new source of revenues, leverage of assetsProject Location TorontoResponsible Division > Canadian DivisionResponsible Department > MarketingContact Person Name > Allen J. HerbertEstimated Project Start Date 04/01/92Classification > 8 Justification > CPriority > 3
Preliminary Review
Assign points from 0 to 5 for each of the following project attributes. 0 indicates that the attribute does not apply to the project. 5 is the highest rating, indicating that the project strongly meets this project attribute.
Financial Attributes:F1 Project improves overall profitability of the companyF2 Project lowers cost structureF3 Project will generate a rate of returnF4 Project improves asset utilizationF5 Other Financial Attribute __________________________________F6 Other Financial Attribute __________________________________
Operating Attributes:O1 Improves operating efficienciesO2 Increases the customer baseO3 Improves overall customer serviceO4 Improves competitive position of companyO5 Other Operating Attribute _________________________________O6 Other Operating Attribute _________________________________
Contingency Attributes:C1 Project has options that allow for change during lifeC2 Project will positively impact company even if value is negativeC3 Project can be abandoned easily with some positive valueC4 Project permits several options to maximize valueC5 Other Cont Attribute _____________________________________
Miscellaneous Attributes:M1 Expands Human Resource Capital
M2 Enhances workforce productivityM3 Project meets a critical regulatory, security or specific needM4 Project fits with company strategy and goalsM5 Probability of project success is very high / low riskM6 Other Misc Attribute _____________________________________M7 Other Misc Attribute _____________________________________M8 Other Misc Attribute _____________________________________
Total Preliminary Points
Projects with point totals less than 15 may represent poor investments and require additionalapproval before further analysis and processing. Projects with point totals between 15 and 20require caution and careful analysis. Projects with point totals greater than 20 may proceedwith analysis and submission.
Project Summary
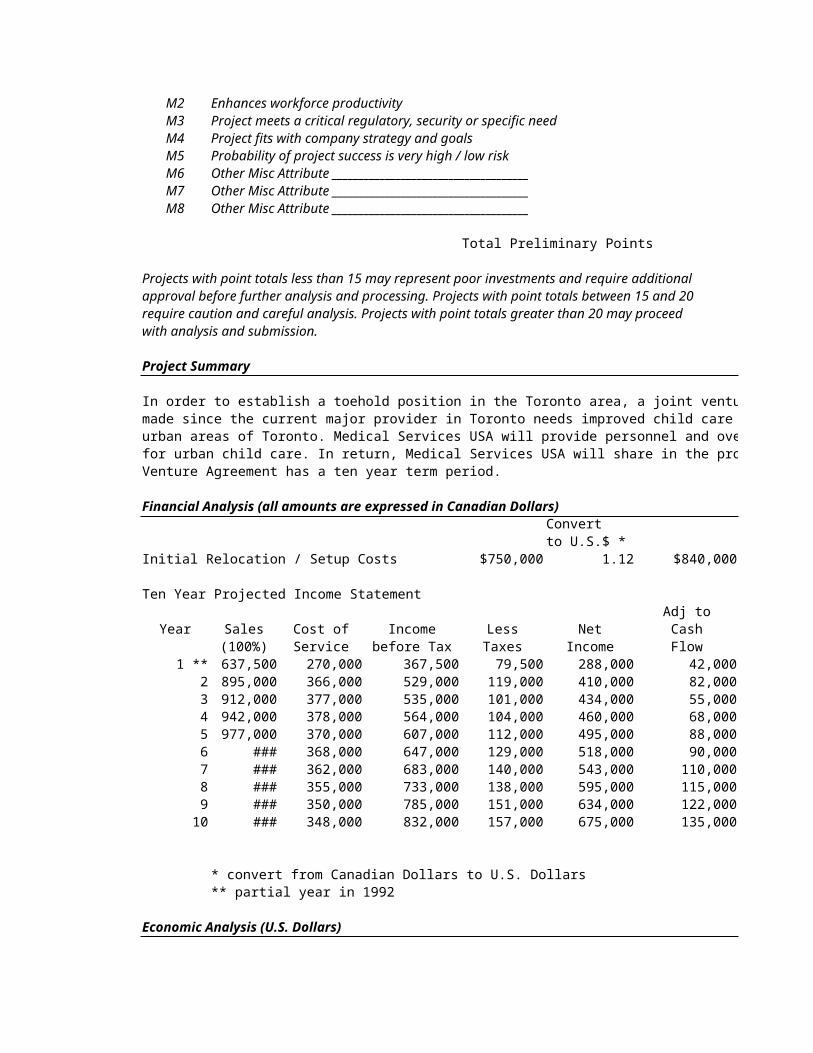
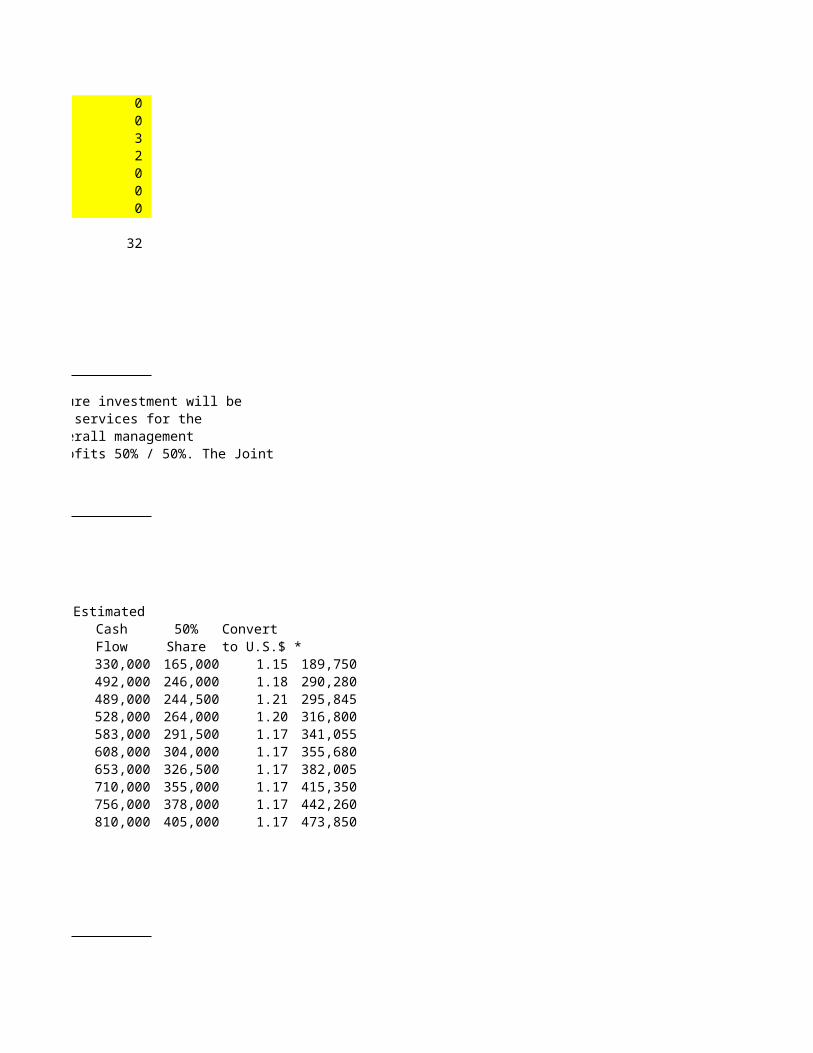
In order to establish a toehold position in the Toronto area, a joint venture investment will be made since the current major provider in Toronto needs improved child care services for theurban areas of Toronto. Medical Services USA will provide personnel and overall managementfor urban child care. In return, Medical Services USA will share in the profits 50% / 50%. The JointVenture Agreement has a ten year term period.
Financial Analysis (all amounts are expressed in Canadian Dollars)Convert to U.S.$ *
Initial Relocation / Setup Costs $750,000 1.12 $840,000 Ten Year Projected Income Statement Adj to
Year Sales Cost of Income Less Net Cash(100%) Service before Tax Taxes Income Flow
1 ** 637,500 270,000 367,500 79,500 288,000 42,0002 895,000 366,000 529,000 119,000 410,000 82,0003 912,000 377,000 535,000 101,000 434,000 55,0004 942,000 378,000 564,000 104,000 460,000 68,0005 977,000 370,000 607,000 112,000 495,000 88,0006 ### 368,000 647,000 129,000 518,000 90,0007 ### 362,000 683,000 140,000 543,000 110,0008 ### 355,000 733,000 138,000 595,000 115,0009 ### 350,000 785,000 151,000 634,000 122,00010 ### 348,000 832,000 157,000 675,000 135,000
* convert from Canadian Dollars to U.S. Dollars** partial year in 1992
Economic Analysis (U.S. Dollars)
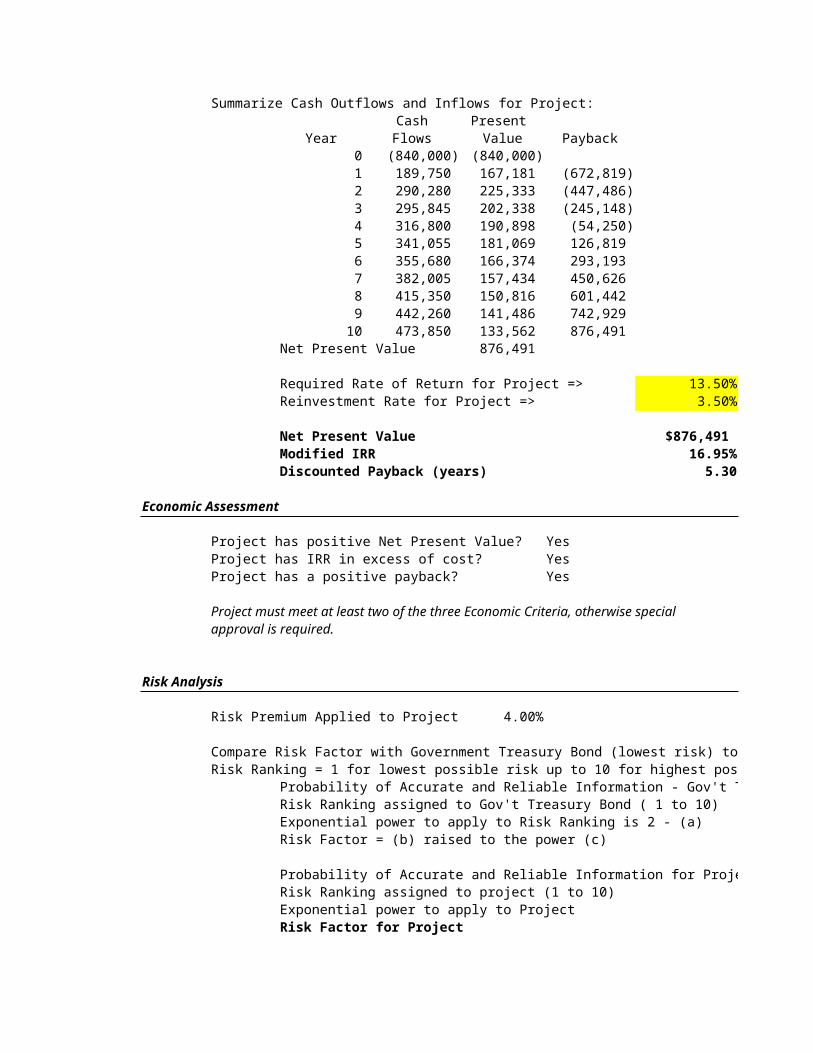
Summarize Cash Outflows and Inflows for Project:Cash Present
Year Flows Value Payback 0 (840,000) (840,000) 1 189,750 167,181 (672,819) 2 290,280 225,333 (447,486) 3 295,845 202,338 (245,148) 4 316,800 190,898 (54,250) 5 341,055 181,069 126,819 6 355,680 166,374 293,193 7 382,005 157,434 450,626
8 415,350 150,816 601,442 9 442,260 141,486 742,929
10 473,850 133,562 876,491 Net Present Value 876,491
Required Rate of Return for Project => 13.50%Reinvestment Rate for Project => 3.50%
Net Present Value $876,491 Modified IRR 16.95%Discounted Payback (years) 5.30
Economic Assessment
Project has positive Net Present Value? YesProject has IRR in excess of cost? YesProject has a positive payback? Yes
Project must meet at least two of the three Economic Criteria, otherwise specialapproval is required.
Risk Analysis
Risk Premium Applied to Project 4.00%
Compare Risk Factor with Government Treasury Bond (lowest risk) to Project Risk Factor:Risk Ranking = 1 for lowest possible risk up to 10 for highest possible risk
Probability of Accurate and Reliable Information - Gov't TRisk Ranking assigned to Gov't Treasury Bond ( 1 to 10)Exponential power to apply to Risk Ranking is 2 - (a)Risk Factor = (b) raised to the power (c)
Probability of Accurate and Reliable Information for ProjeRisk Ranking assigned to project (1 to 10)Exponential power to apply to ProjectRisk Factor for Project
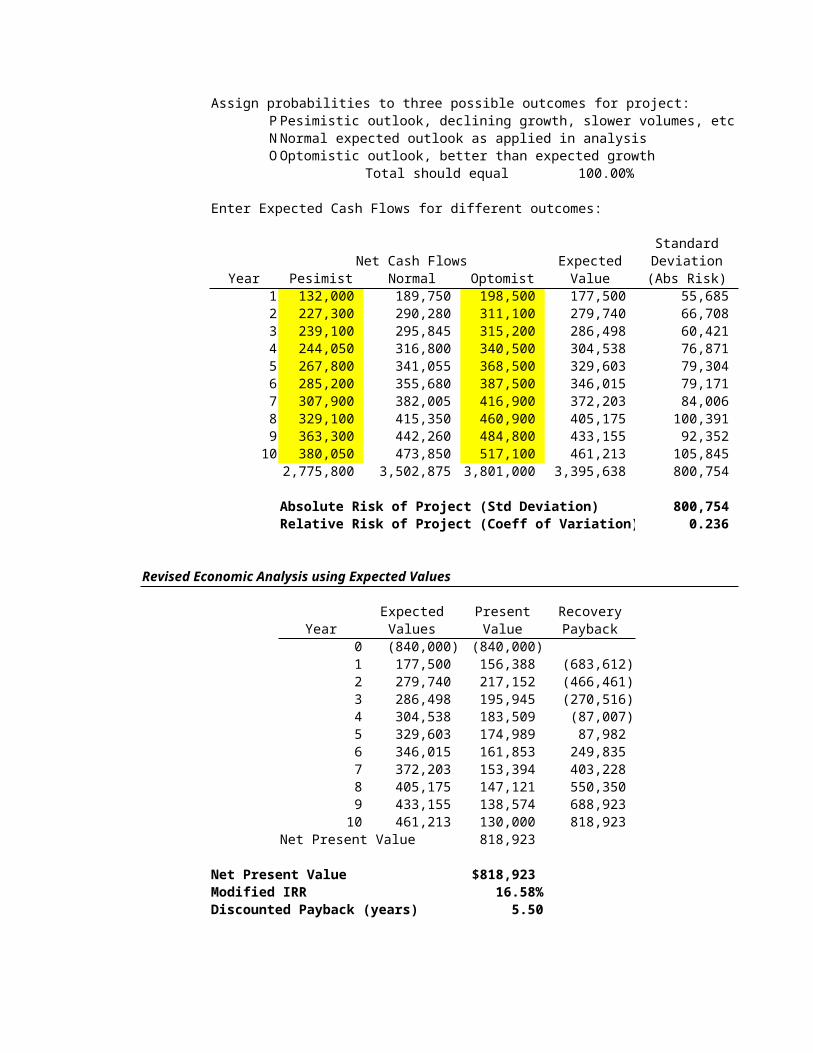
Assign probabilities to three possible outcomes for project:P Pesimistic outlook, declining growth, slower volumes, etc.N Normal expected outlook as applied in analysisO Optomistic outlook, better than expected growth
Total should equal 100.00%
Enter Expected Cash Flows for different outcomes:
StandardNet Cash Flows Expected Deviation
Year Pesimist Normal Optomist Value (Abs Risk)1 132,000 189,750 198,500 177,500 55,685 2 227,300 290,280 311,100 279,740 66,708 3 239,100 295,845 315,200 286,498 60,421 4 244,050 316,800 340,500 304,538 76,871 5 267,800 341,055 368,500 329,603 79,304 6 285,200 355,680 387,500 346,015 79,171 7 307,900 382,005 416,900 372,203 84,006 8 329,100 415,350 460,900 405,175 100,391 9 363,300 442,260 484,800 433,155 92,352 10 380,050 473,850 517,100 461,213 105,845
2,775,800 3,502,875 3,801,000 3,395,638 800,754
Absolute Risk of Project (Std Deviation) 800,754 Relative Risk of Project (Coeff of Variation) 0.236
Revised Economic Analysis using Expected Values
Expected Present RecoveryYear Values Value Payback
0 (840,000) (840,000)1 177,500 156,388 (683,612)2 279,740 217,152 (466,461)3 286,498 195,945 (270,516)4 304,538 183,509 (87,007)5 329,603 174,989 87,982 6 346,015 161,853 249,835 7 372,203 153,394 403,228 8 405,175 147,121 550,350 9 433,155 138,574 688,923
10 461,213 130,000 818,923 Net Present Value 818,923
Net Present Value $818,923 Modified IRR 16.58%Discounted Payback (years) 5.50

Market expansion, new source of revenues, leverage of assets
3 2 4 4 0 0
1 4 4 3 0 0
0 2 0 0 0
0
0 0 3 2 0 0 0
32
In order to establish a toehold position in the Toronto area, a joint venture investment will be made since the current major provider in Toronto needs improved child care services for theurban areas of Toronto. Medical Services USA will provide personnel and overall managementfor urban child care. In return, Medical Services USA will share in the profits 50% / 50%. The Joint
EstimatedCash 50% Convert Flow Share to U.S.$ *330,000 165,000 1.15 189,750492,000 246,000 1.18 290,280489,000 244,500 1.21 295,845528,000 264,000 1.20 316,800583,000 291,500 1.17 341,055608,000 304,000 1.17 355,680653,000 326,500 1.17 382,005710,000 355,000 1.17 415,350756,000 378,000 1.17 442,260810,000 405,000 1.17 473,850
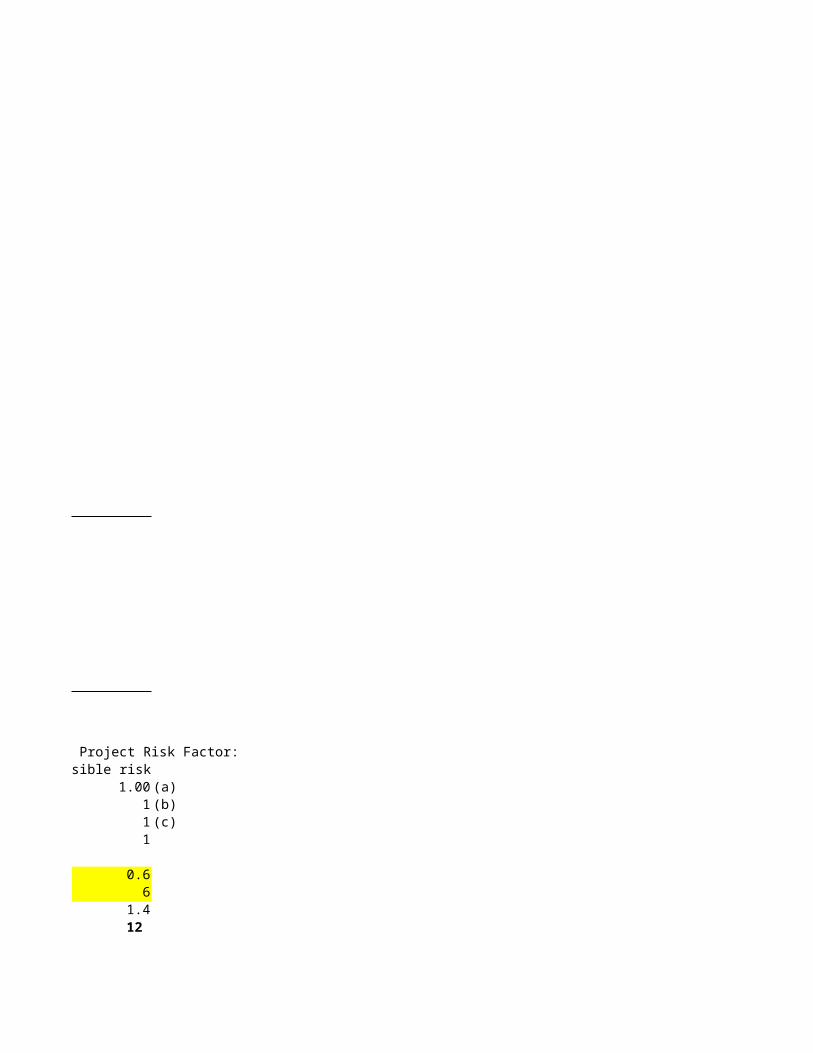
Compare Risk Factor with Government Treasury Bond (lowest risk) to Project Risk Factor:Risk Ranking = 1 for lowest possible risk up to 10 for highest possible risk
1.00 (a)1 (b)1 (c)1
0.66
1.4 12
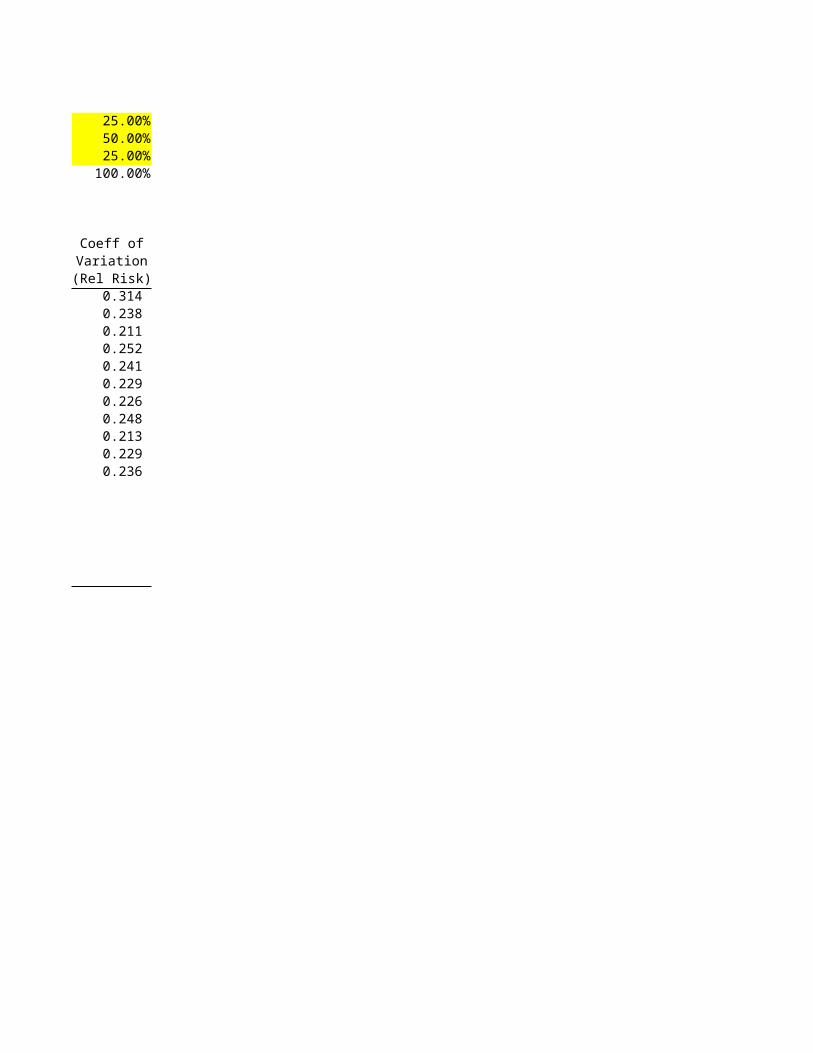
25.00%50.00%25.00%
100.00%
Coeff ofVariation(Rel Risk)
0.314 0.238 0.211 0.252 0.241 0.229 0.226 0.248 0.213 0.229 0.236
Capital Budgeting Analysis forMedical Services USA
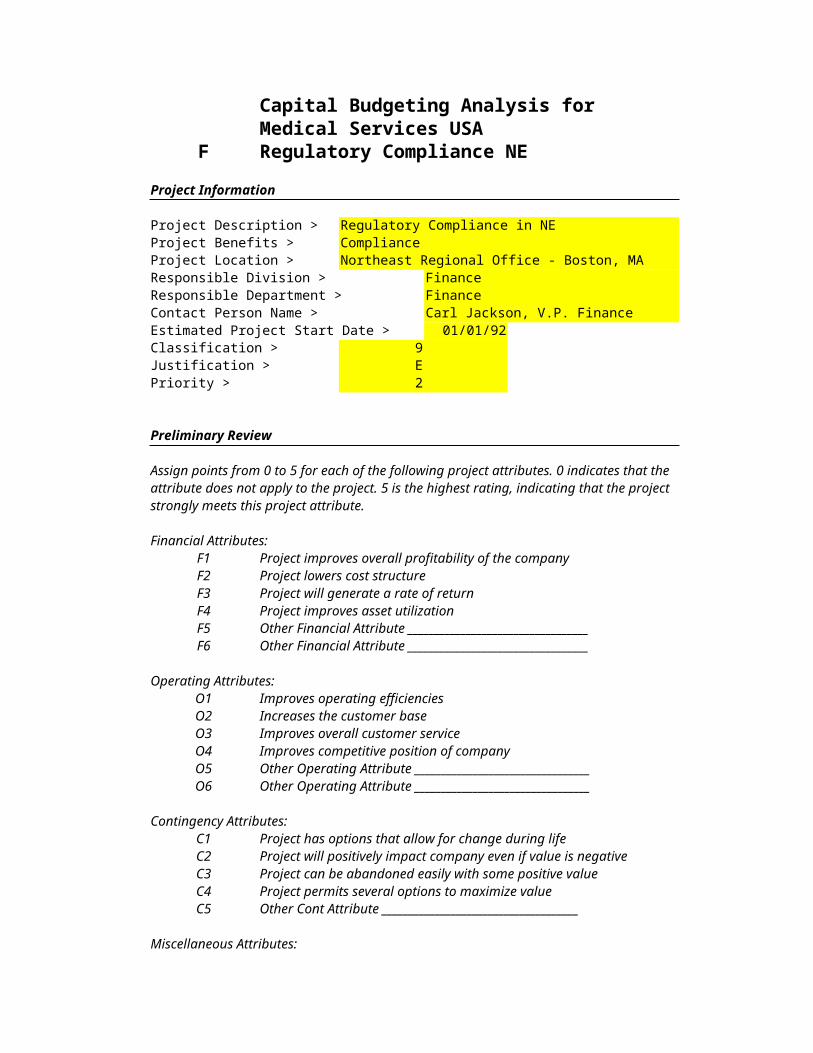
F Regulatory Compliance NEProject Information
Project Description > Regulatory Compliance in NEProject Benefits > ComplianceProject Location > Northeast Regional Office - Boston, MAResponsible Division > FinanceResponsible Department > FinanceContact Person Name > Carl Jackson, V.P. FinanceEstimated Project Start Date > 01/01/92Classification > 9 Justification > EPriority > 2
Preliminary Review
Assign points from 0 to 5 for each of the following project attributes. 0 indicates that the attribute does not apply to the project. 5 is the highest rating, indicating that the project strongly meets this project attribute.
Financial Attributes:F1 Project improves overall profitability of the companyF2 Project lowers cost structureF3 Project will generate a rate of returnF4 Project improves asset utilizationF5 Other Financial Attribute __________________________________F6 Other Financial Attribute __________________________________
Operating Attributes:O1 Improves operating efficienciesO2 Increases the customer baseO3 Improves overall customer serviceO4 Improves competitive position of companyO5 Other Operating Attribute _________________________________O6 Other Operating Attribute _________________________________
Contingency Attributes:C1 Project has options that allow for change during lifeC2 Project will positively impact company even if value is negativeC3 Project can be abandoned easily with some positive valueC4 Project permits several options to maximize valueC5 Other Cont Attribute _____________________________________
Miscellaneous Attributes:
M1 Expands Human Resource CapitalM2 Enhances workforce productivityM3 Project meets a critical regulatory, security or specific needM4 Project fits with company strategy and goalsM5 Probability of project success is very high / low riskM6 Other Misc Attribute _____________________________________M7 Other Misc Attribute _____________________________________M8 Other Misc Attribute _____________________________________
Total Preliminary Points
Projects with point totals less than 15 may represent poor investments and require additionalapproval before further analysis and processing. Projects with point totals between 15 and 20require caution and careful analysis. Projects with point totals greater than 20 may proceedwith analysis and submission.
Project Summary
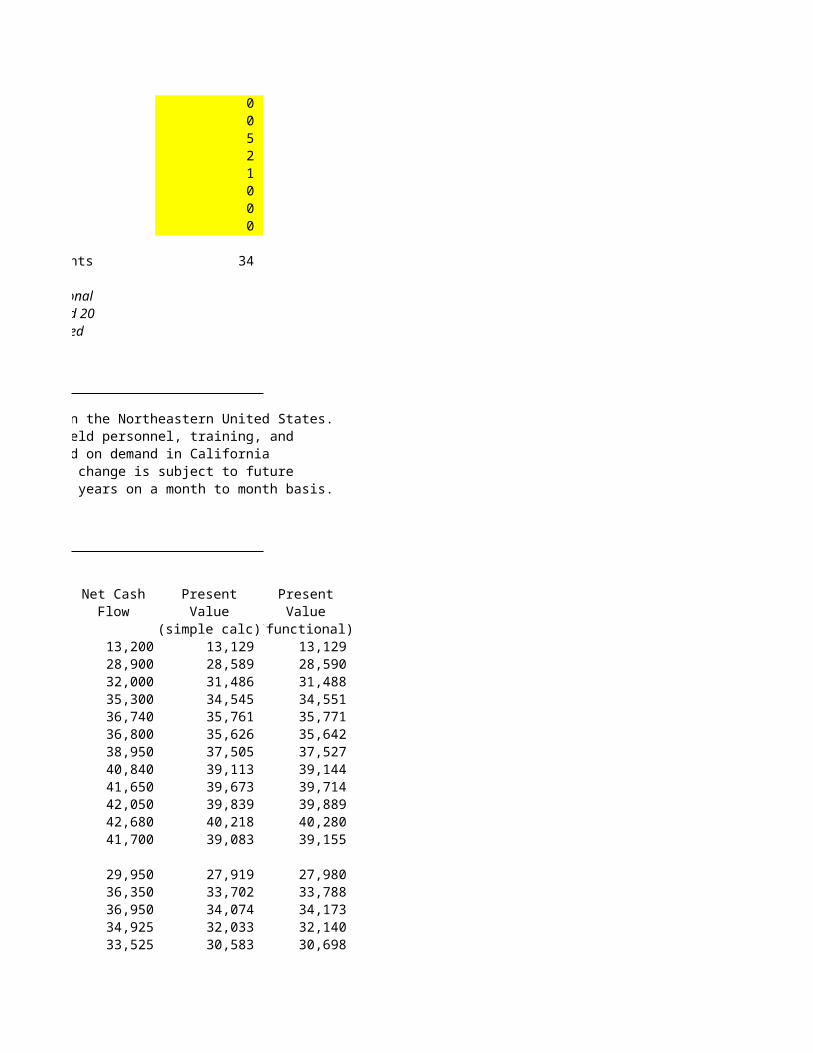
A major regulatory change is expected to change certain services in the Northeastern United States.In order to meet this new mandate, an investment is required in field personnel, training, andequipment. Revenues from the new services are also forecasted based on demand in Californiawhich adopted this regulatory change two years ago. The regulatory change is subject to futuremodification and therefore, the project is only projected over two years on a month to month basis.There is no initial investment required for this project.
Economic Analysis (Cash Flows by Month)
MonthlyPeriod Setup Service Misc / Total
Date Revenues Costs Costs Taxes Outflows 1 31-Jan-92 35,200 -16,000 -3,500 -2,500 -22,0002 28-Feb-92 39,400 -5,000 -3,500 -2,000 -10,5003 31-Mar-92 41,000 -3,500 -3,500 -2,000 -9,0004 30-Apr-92 42,550 -1,500 -4,000 -1,750 -7,2505 31-May-92 43,990 -1,500 -4,000 -1,750 -7,2506 30-Jun-92 44,550 -2,000 -4,000 -1,750 -7,7507 31-Jul-92 45,100 -4,500 -1,650 -6,1508 31-Aug-92 46,990 -4,500 -1,650 -6,1509 30-Sep-92 47,800 -4,500 -1,650 -6,150
10 31-Oct-92 48,650 -5,100 -1,500 -6,60011 30-Nov-92 49,280 -5,100 -1,500 -6,60012 31-Dec-92 48,300 -5,100 -1,500 -6,600
1992 Total 532,810 -102,00013 31-Jan-93 47,100 -10,000 -5,800 -1,350 -17,15014 28-Feb-93 45,500 -2,000 -5,800 -1,350 -9,15015 31-Mar-93 44,100 -5,800 -1,350 -7,15016 30-Apr-93 42,400 -6,200 -1,275 -7,47517 31-May-93 41,000 -6,200 -1,275 -7,475
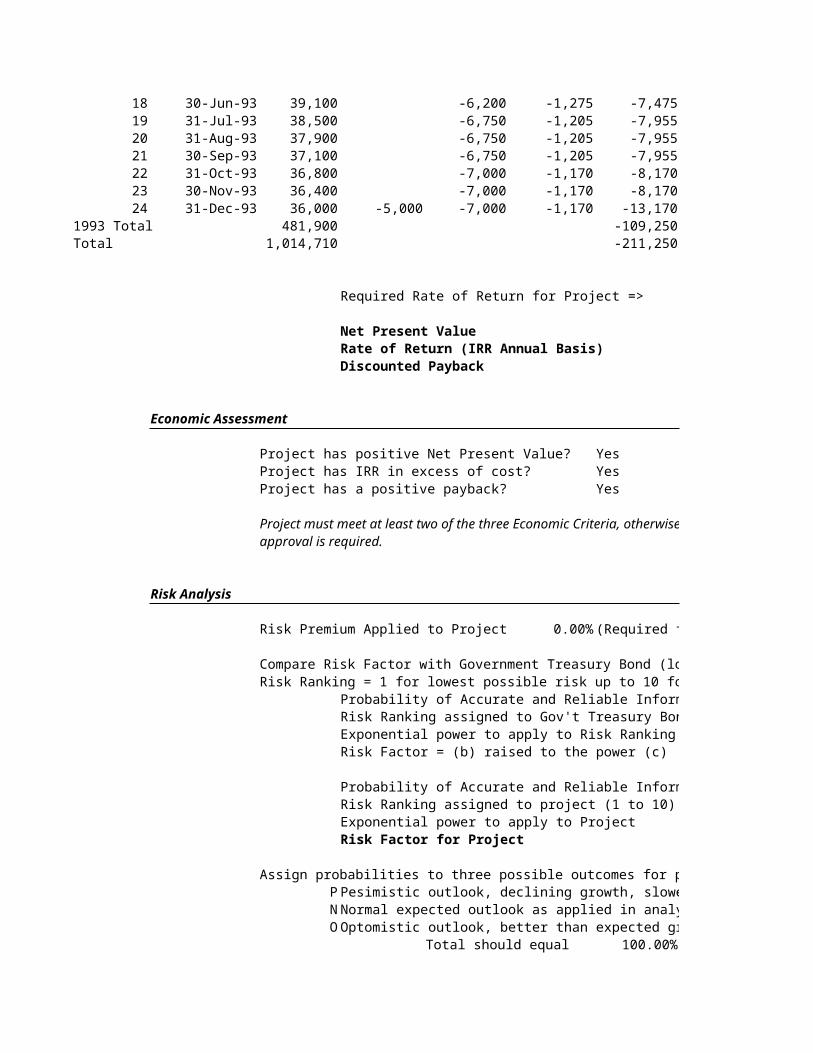
18 30-Jun-93 39,100 -6,200 -1,275 -7,47519 31-Jul-93 38,500 -6,750 -1,205 -7,95520 31-Aug-93 37,900 -6,750 -1,205 -7,95521 30-Sep-93 37,100 -6,750 -1,205 -7,95522 31-Oct-93 36,800 -7,000 -1,170 -8,17023 30-Nov-93 36,400 -7,000 -1,170 -8,17024 31-Dec-93 36,000 -5,000 -7,000 -1,170 -13,170
1993 Total 481,900 -109,250Total 1,014,710 -211,250
Required Rate of Return for Project =>
Net Present Value Rate of Return (IRR Annual Basis)Discounted Payback
Economic Assessment
Project has positive Net Present Value? YesProject has IRR in excess of cost? YesProject has a positive payback? Yes
Project must meet at least two of the three Economic Criteria, otherwise specialapproval is required.
Risk Analysis
Risk Premium Applied to Project 0.00% (Required for Compliance)
Compare Risk Factor with Government Treasury Bond (lowest risk) to Project Risk Factor:Risk Ranking = 1 for lowest possible risk up to 10 for highest possible risk
Probability of Accurate and Reliable Information - GoRisk Ranking assigned to Gov't Treasury Bond ( 1 to 1Exponential power to apply to Risk Ranking is 2 - (a)Risk Factor = (b) raised to the power (c)
Probability of Accurate and Reliable Information for Risk Ranking assigned to project (1 to 10)Exponential power to apply to ProjectRisk Factor for Project
Assign probabilities to three possible outcomes for project:P Pesimistic outlook, declining growth, slower volumes,N Normal expected outlook as applied in analysisO Optomistic outlook, better than expected growth
Total should equal 100.00%
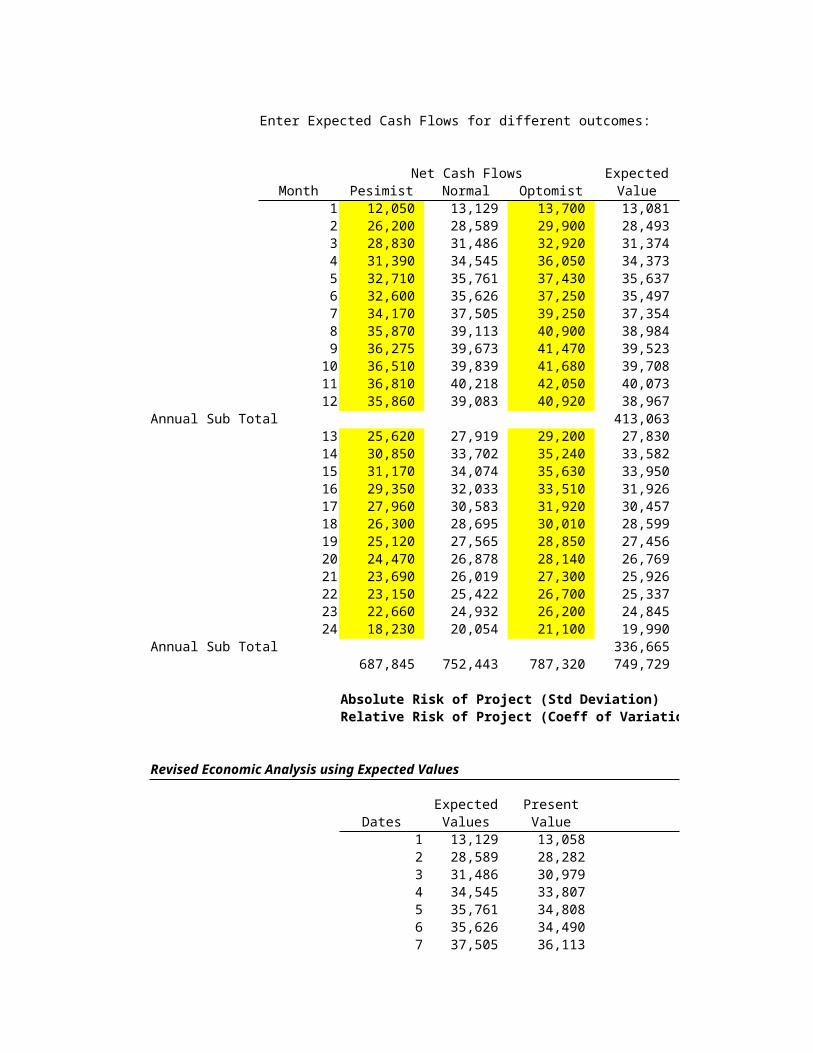
Enter Expected Cash Flows for different outcomes:
Net Cash Flows Expected
Month Pesimist Normal Optomist Value1 12,050 13,129 13,700 13,081 2 26,200 28,589 29,900 28,493 3 28,830 31,486 32,920 31,374 4 31,390 34,545 36,050 34,373 5 32,710 35,761 37,430 35,637 6 32,600 35,626 37,250 35,497 7 34,170 37,505 39,250 37,354 8 35,870 39,113 40,900 38,984 9 36,275 39,673 41,470 39,523 10 36,510 39,839 41,680 39,708 11 36,810 40,218 42,050 40,073 12 35,860 39,083 40,920 38,967
Annual Sub Total 413,063 13 25,620 27,919 29,200 27,830 14 30,850 33,702 35,240 33,582 15 31,170 34,074 35,630 33,950 16 29,350 32,033 33,510 31,926 17 27,960 30,583 31,920 30,457 18 26,300 28,695 30,010 28,599 19 25,120 27,565 28,850 27,456 20 24,470 26,878 28,140 26,769 21 23,690 26,019 27,300 25,926 22 23,150 25,422 26,700 25,337 23 22,660 24,932 26,200 24,845 24 18,230 20,054 21,100 19,990
Annual Sub Total 336,665 687,845 752,443 787,320 749,729
Absolute Risk of Project (Std Deviation)Relative Risk of Project (Coeff of Variatio
Revised Economic Analysis using Expected Values
Expected Present Dates Values Value
1 13,129 13,058 2 28,589 28,282 3 31,486 30,979 4 34,545 33,807 5 35,761 34,808 6 35,626 34,490 7 37,505 36,113
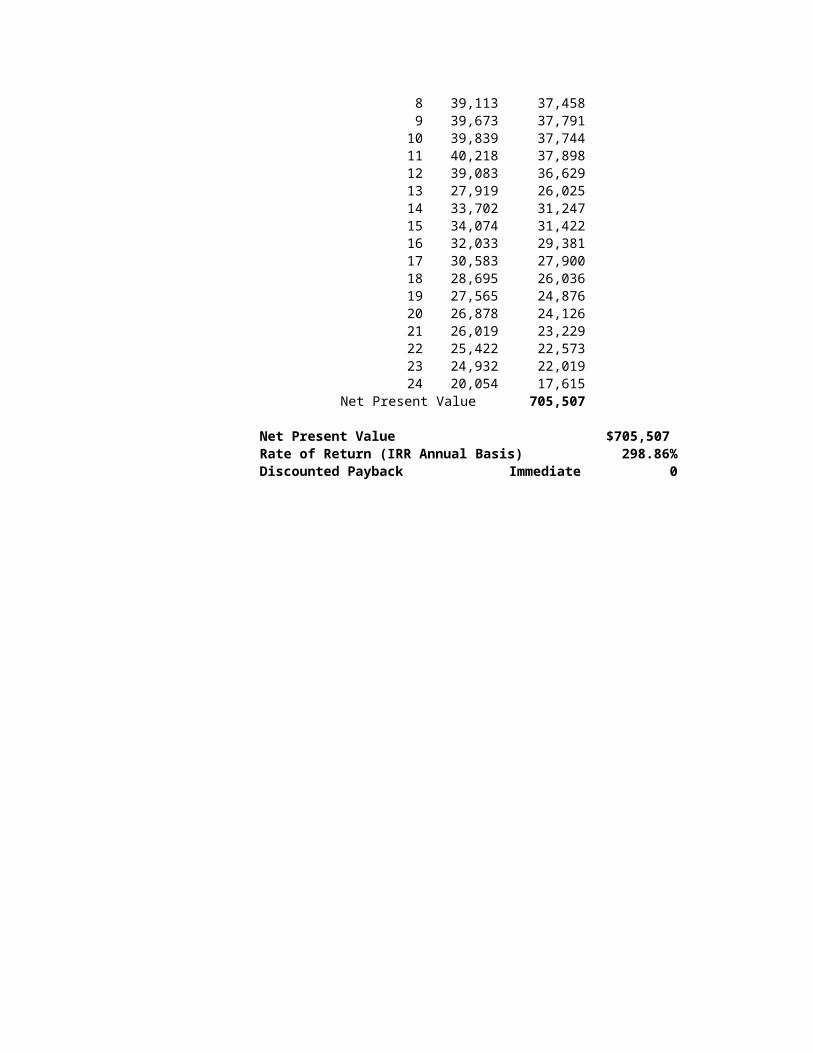
8 39,113 37,458 9 39,673 37,791
10 39,839 37,744 11 40,218 37,898 12 39,083 36,629 13 27,919 26,025 14 33,702 31,247 15 34,074 31,422 16 32,033 29,381 17 30,583 27,900 18 28,695 26,036 19 27,565 24,876 20 26,878 24,126 21 26,019 23,229 22 25,422 22,573 23 24,932 22,019 24 20,054 17,615
Net Present Value 705,507
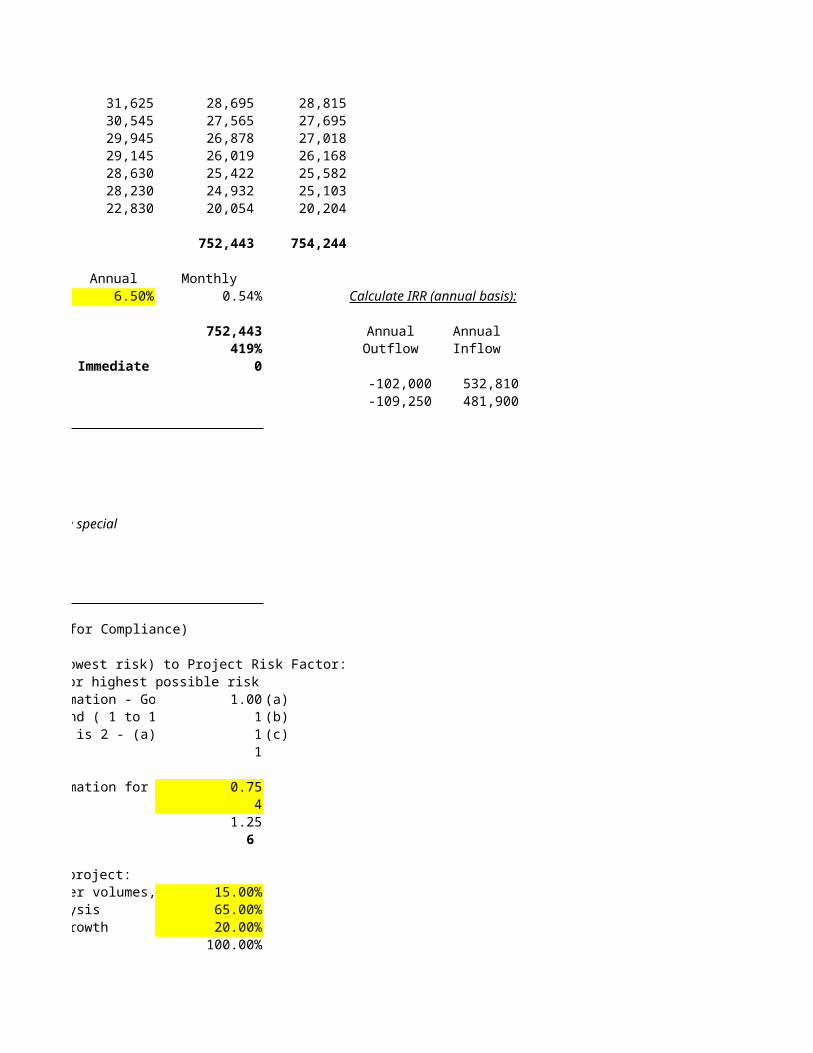
Net Present Value $705,507 Rate of Return (IRR Annual Basis) 298.86%Discounted Payback Immediate 0

2 3 4 3 0 0
2 3 3 2 0 0
3 1 0 0 0
0 0 5 2 1 0 0 0
Total Preliminary Points 34
Projects with point totals less than 15 may represent poor investments and require additionalapproval before further analysis and processing. Projects with point totals between 15 and 20require caution and careful analysis. Projects with point totals greater than 20 may proceed
A major regulatory change is expected to change certain services in the Northeastern United States.In order to meet this new mandate, an investment is required in field personnel, training, andequipment. Revenues from the new services are also forecasted based on demand in Californiawhich adopted this regulatory change two years ago. The regulatory change is subject to futuremodification and therefore, the project is only projected over two years on a month to month basis.
Net Cash Present PresentFlow Value Value
(simple calc)(functional)13,200 13,129 13,12928,900 28,589 28,59032,000 31,486 31,48835,300 34,545 34,55136,740 35,761 35,77136,800 35,626 35,64238,950 37,505 37,52740,840 39,113 39,14441,650 39,673 39,71442,050 39,839 39,88942,680 40,218 40,28041,700 39,083 39,155
29,950 27,919 27,98036,350 33,702 33,78836,950 34,074 34,17334,925 32,033 32,14033,525 30,583 30,698
31,625 28,695 28,81530,545 27,565 27,69529,945 26,878 27,01829,145 26,019 26,16828,630 25,422 25,58228,230 24,932 25,10322,830 20,054 20,204
752,443 754,244
Annual Monthly6.50% 0.54% Calculate IRR (annual basis):
752,443 Annual Annual419% Outflow Inflow
Immediate 0-102,000 532,810-109,250 481,900
Project must meet at least two of the three Economic Criteria, otherwise special
(Required for Compliance)
Compare Risk Factor with Government Treasury Bond (lowest risk) to Project Risk Factor:Risk Ranking = 1 for lowest possible risk up to 10 for highest possible risk
Probability of Accurate and Reliable Information - Go 1.00 (a)Risk Ranking assigned to Gov't Treasury Bond ( 1 to 1 1 (b)Exponential power to apply to Risk Ranking is 2 - (a) 1 (c)
1
Probability of Accurate and Reliable Information for 0.754
1.25 6
Assign probabilities to three possible outcomes for project:Pesimistic outlook, declining growth, slower volumes, 15.00%Normal expected outlook as applied in analysis 65.00%Optomistic outlook, better than expected growth 20.00%
100.00%
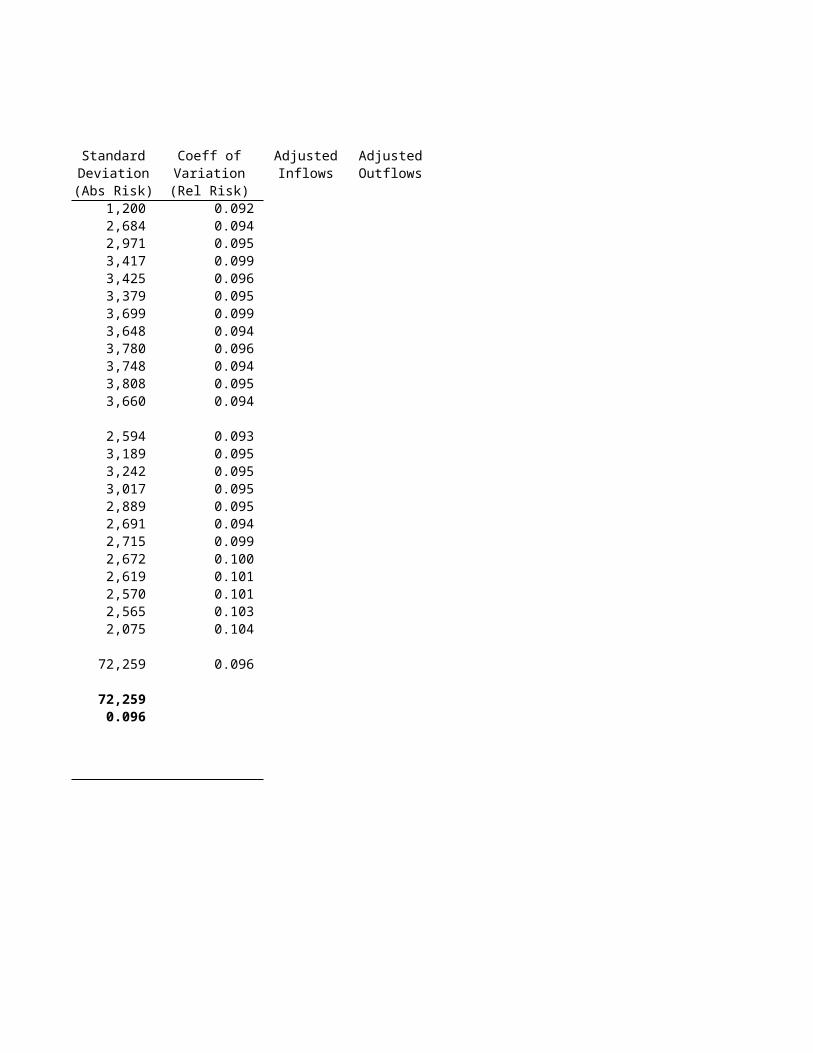
Standard Coeff of Adjusted AdjustedDeviation Variation Inflows Outflows(Abs Risk) (Rel Risk)
1,200 0.092 2,684 0.094 2,971 0.095 3,417 0.099 3,425 0.096 3,379 0.095 3,699 0.099 3,648 0.094 3,780 0.096 3,748 0.094 3,808 0.095 3,660 0.094
2,594 0.093 3,189 0.095 3,242 0.095 3,017 0.095 2,889 0.095 2,691 0.094 2,715 0.099 2,672 0.100 2,619 0.101 2,570 0.101 2,565 0.103 2,075 0.104
72,259 0.096
72,259 0.096
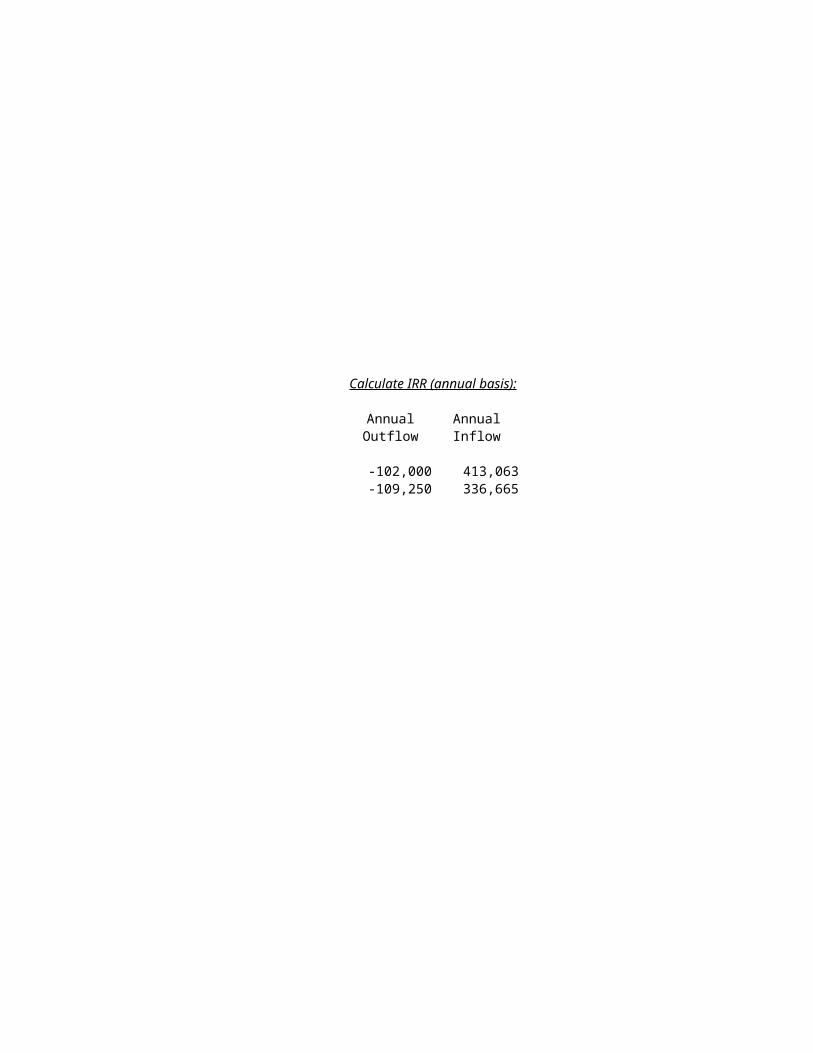
Calculate IRR (annual basis):
Annual AnnualOutflow Inflow
-102,000 413,063-109,250 336,665
Capital Budgeting Analysis forMedical Services USA
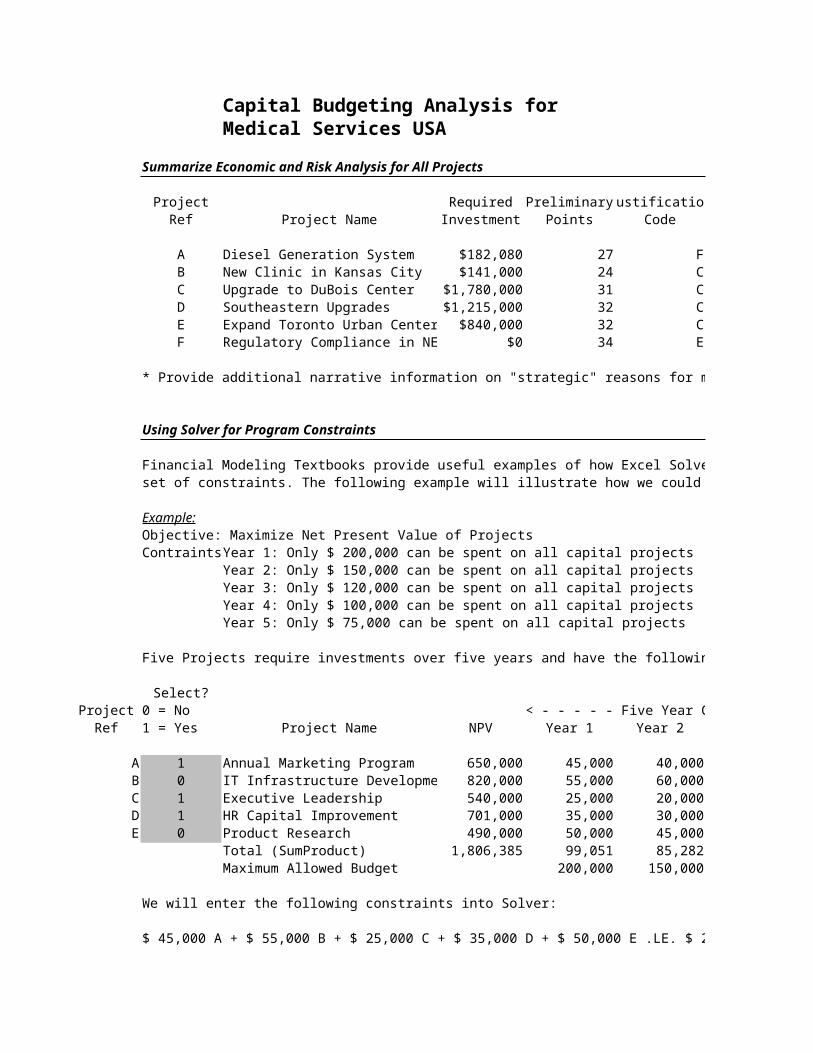
Summarize Economic and Risk Analysis for All Projects
Project Required PreliminaryJustificationRef Project Name Investment Points Code
A Diesel Generation System $182,080 27 FB New Clinic in Kansas City $141,000 24 CC Upgrade to DuBois Center $1,780,000 31 CD Southeastern Upgrades $1,215,000 32 CE Expand Toronto Urban Center $840,000 32 CF Regulatory Compliance in NE $0 34 E
* Provide additional narrative information on "strategic" reasons for making this investment since the return is less than the cost of investments (cost of capital).
Using Solver for Program Constraints
Financial Modeling Textbooks provide useful examples of how Excel Solver can be used to solve for capital budgeting program decisions given a set of constraints. The following example will illustrate how we could apply Solver for finding the right set of projects given a set of contraints:
Example:Objective: Maximize Net Present Value of Projects ContraintsYear 1: Only $ 200,000 can be spent on all capital projects Year 2: Only $ 150,000 can be spent on all capital projects
Year 3: Only $ 120,000 can be spent on all capital projectsYear 4: Only $ 100,000 can be spent on all capital projectsYear 5: Only $ 75,000 can be spent on all capital projects
Five Projects require investments over five years and have the following Net Present Values:
Select?Project 0 = No < - - - - - Five Year Capital Budgets for Each Project - - - - - >Ref 1 = Yes Project Name NPV Year 1 Year 2
A 1 Annual Marketing Program 650,000 45,000 40,000B 0 IT Infrastructure Developme 820,000 55,000 60,000C 1 Executive Leadership 540,000 25,000 20,000D 1 HR Capital Improvement 701,000 35,000 30,000E 0 Product Research 490,000 50,000 45,000 Total (SumProduct) 1,806,385 99,051 85,282
Maximum Allowed Budget 200,000 150,000
We will enter the following constraints into Solver:
$ 45,000 A + $ 55,000 B + $ 25,000 C + $ 35,000 D + $ 50,000 E .LE. $ 200,000
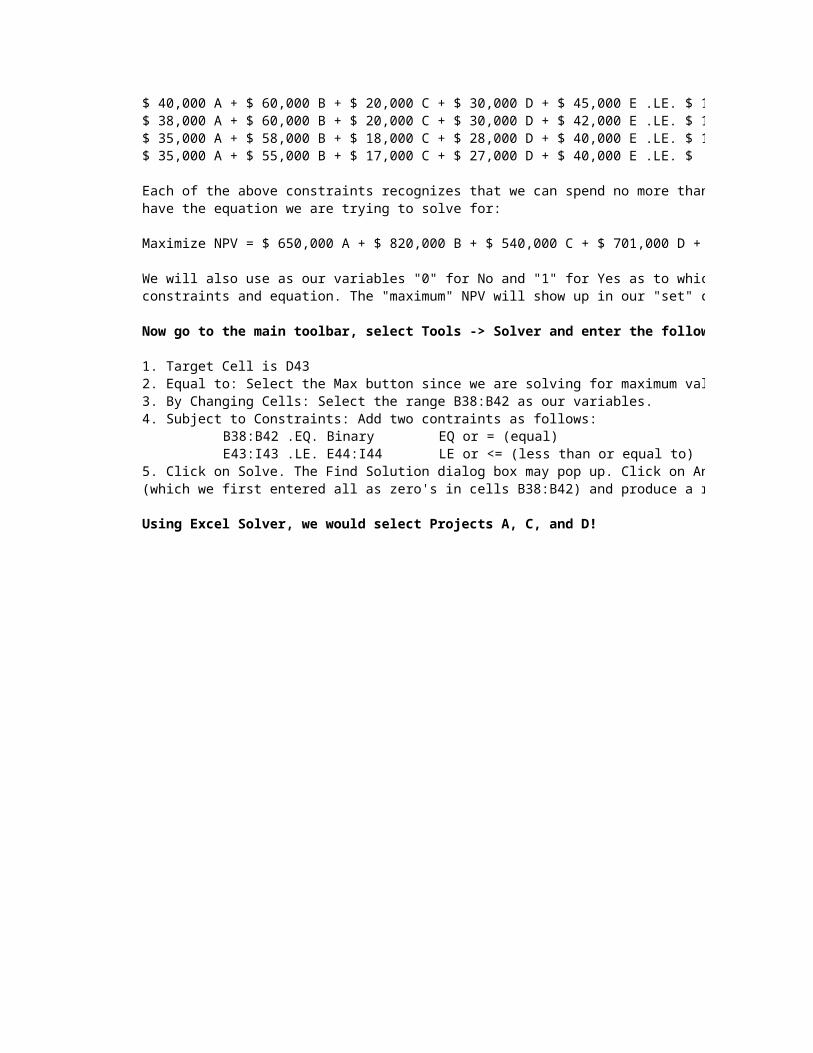
$ 40,000 A + $ 60,000 B + $ 20,000 C + $ 30,000 D + $ 45,000 E .LE. $ 150,000$ 38,000 A + $ 60,000 B + $ 20,000 C + $ 30,000 D + $ 42,000 E .LE. $ 120,000$ 35,000 A + $ 58,000 B + $ 18,000 C + $ 28,000 D + $ 40,000 E .LE. $ 100,000$ 35,000 A + $ 55,000 B + $ 17,000 C + $ 27,000 D + $ 40,000 E .LE. $ 75,000
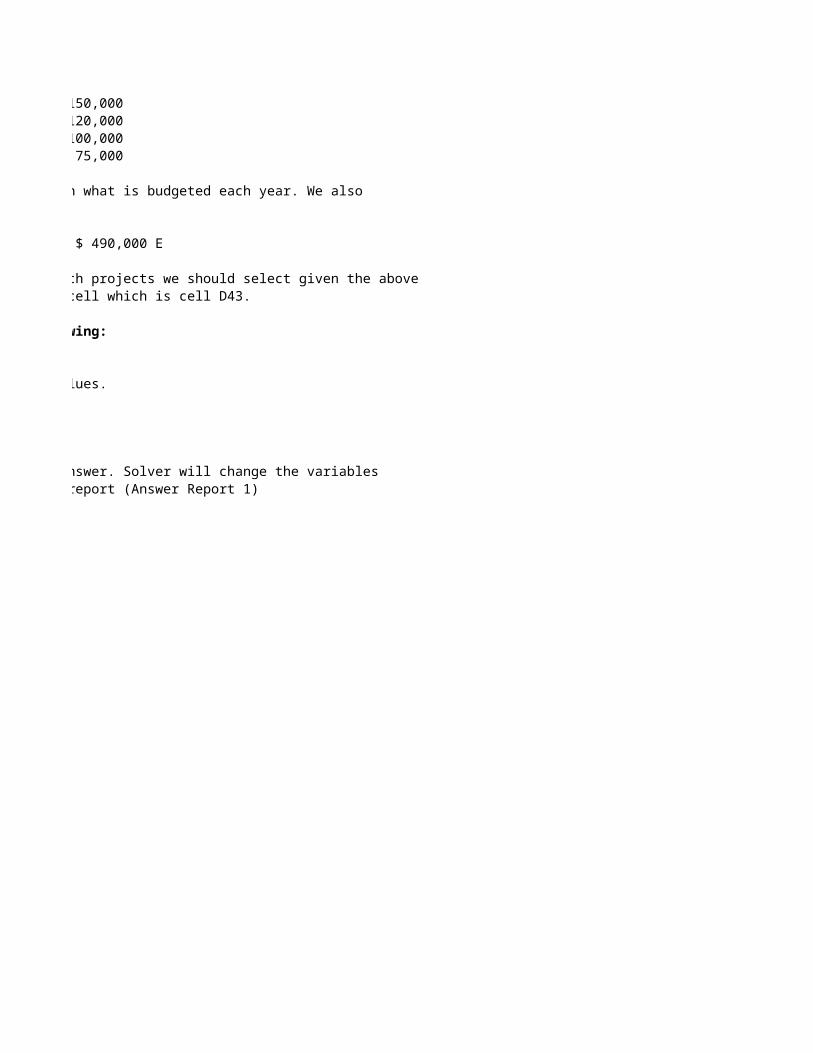
Each of the above constraints recognizes that we can spend no more than what is budgeted each year. We alsohave the equation we are trying to solve for: Maximize NPV = $ 650,000 A + $ 820,000 B + $ 540,000 C + $ 701,000 D + $ 490,000 E
We will also use as our variables "0" for No and "1" for Yes as to which projects we should select given the aboveconstraints and equation. The "maximum" NPV will show up in our "set" cell which is cell D43.
Now go to the main toolbar, select Tools -> Solver and enter the following:
1. Target Cell is D432. Equal to: Select the Max button since we are solving for maximum values.3. By Changing Cells: Select the range B38:B42 as our variables.4. Subject to Constraints: Add two contraints as follows:
B38:B42 .EQ. Binary EQ or = (equal)E43:I43 .LE. E44:I44 LE or <= (less than or equal to)
5. Click on Solve. The Find Solution dialog box may pop up. Click on Answer. Solver will change the variables(which we first entered all as zero's in cells B38:B42) and produce a report (Answer Report 1)
Using Excel Solver, we would select Projects A, C, and D!
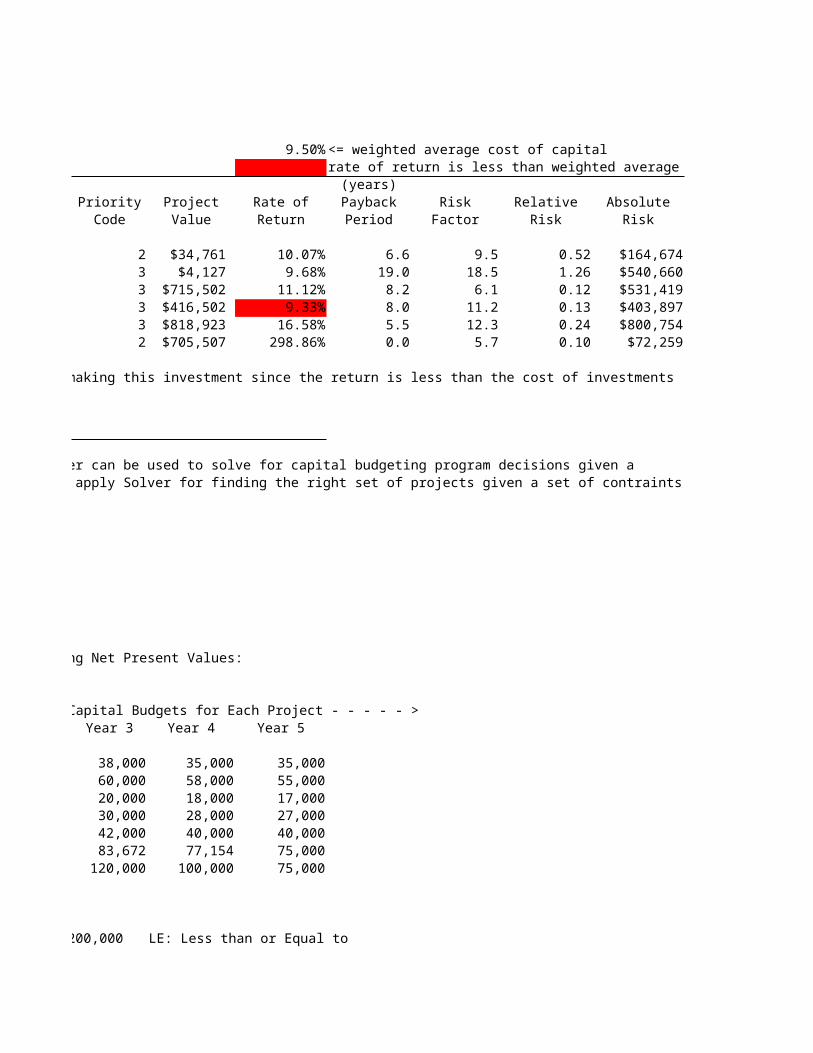
9.50% <= weighted average cost of capitalrate of return is less than weighted average cost of capital *(years)
Priority Project Rate of Payback Risk Relative AbsoluteCode Value Return Period Factor Risk Risk
2 $34,761 10.07% 6.6 9.5 0.52 $164,6743 $4,127 9.68% 19.0 18.5 1.26 $540,6603 $715,502 11.12% 8.2 6.1 0.12 $531,4193 $416,502 9.33% 8.0 11.2 0.13 $403,8973 $818,923 16.58% 5.5 12.3 0.24 $800,7542 $705,507 298.86% 0.0 5.7 0.10 $72,259
* Provide additional narrative information on "strategic" reasons for making this investment since the return is less than the cost of investments (cost of capital).
Financial Modeling Textbooks provide useful examples of how Excel Solver can be used to solve for capital budgeting program decisions given a set of constraints. The following example will illustrate how we could apply Solver for finding the right set of projects given a set of contraints:
Five Projects require investments over five years and have the following Net Present Values:
< - - - - - Five Year Capital Budgets for Each Project - - - - - >Year 3 Year 4 Year 5
38,000 35,000 35,00060,000 58,000 55,00020,000 18,000 17,00030,000 28,000 27,00042,000 40,000 40,00083,672 77,154 75,000
120,000 100,000 75,000
$ 45,000 A + $ 55,000 B + $ 25,000 C + $ 35,000 D + $ 50,000 E .LE. $ 200,000 LE: Less than or Equal to
$ 40,000 A + $ 60,000 B + $ 20,000 C + $ 30,000 D + $ 45,000 E .LE. $ 150,000$ 38,000 A + $ 60,000 B + $ 20,000 C + $ 30,000 D + $ 42,000 E .LE. $ 120,000$ 35,000 A + $ 58,000 B + $ 18,000 C + $ 28,000 D + $ 40,000 E .LE. $ 100,000$ 35,000 A + $ 55,000 B + $ 17,000 C + $ 27,000 D + $ 40,000 E .LE. $ 75,000
Each of the above constraints recognizes that we can spend no more than what is budgeted each year. We also
Maximize NPV = $ 650,000 A + $ 820,000 B + $ 540,000 C + $ 701,000 D + $ 490,000 E
We will also use as our variables "0" for No and "1" for Yes as to which projects we should select given the aboveconstraints and equation. The "maximum" NPV will show up in our "set" cell which is cell D43.
Now go to the main toolbar, select Tools -> Solver and enter the following:
2. Equal to: Select the Max button since we are solving for maximum values.
5. Click on Solve. The Find Solution dialog box may pop up. Click on Answer. Solver will change the variables(which we first entered all as zero's in cells B38:B42) and produce a report (Answer Report 1)

rate of return is less than weighted average cost of capital *
* Provide additional narrative information on "strategic" reasons for making this investment since the return is less than the cost of investments (cost of capital).
set of constraints. The following example will illustrate how we could apply Solver for finding the right set of projects given a set of contraints:
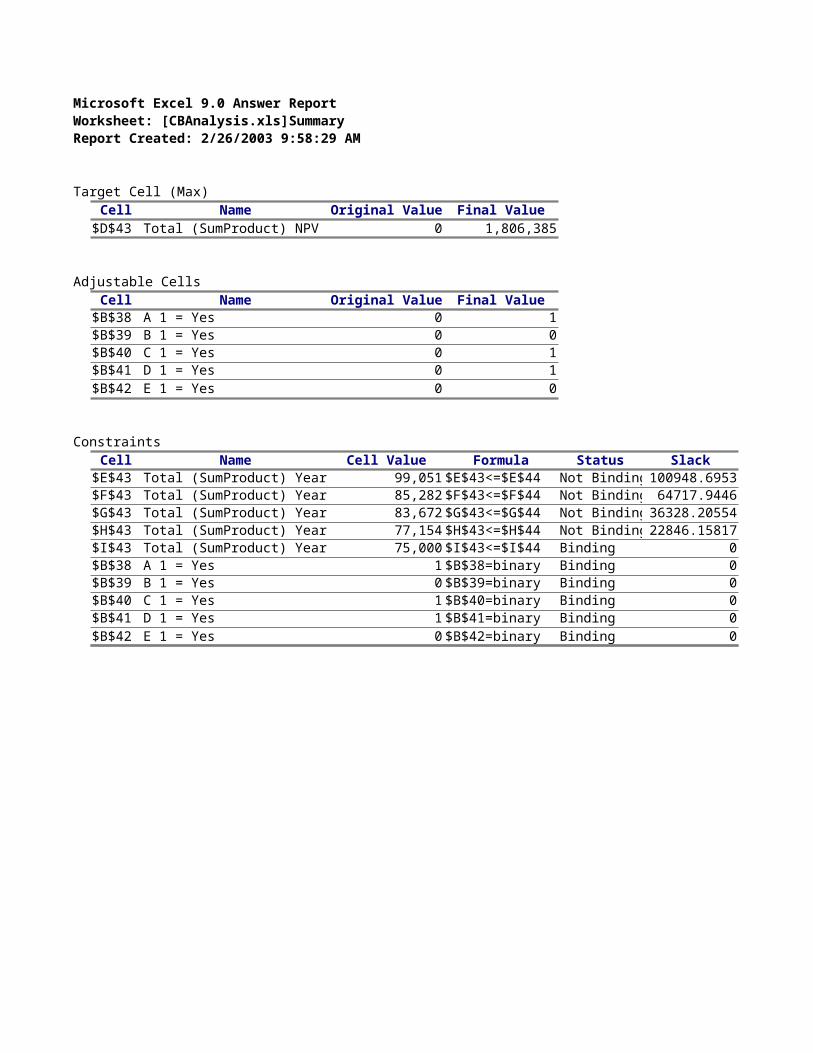
Microsoft Excel 9.0 Answer ReportWorksheet: [CBAnalysis.xls]SummaryReport Created: 2/26/2003 9:58:29 AM
Target Cell (Max)Cell Name Original Value Final Value
$D$43 Total (SumProduct) NPV 0 1,806,385
Adjustable CellsCell Name Original Value Final Value
$B$38 A 1 = Yes 0 1$B$39 B 1 = Yes 0 0$B$40 C 1 = Yes 0 1$B$41 D 1 = Yes 0 1$B$42 E 1 = Yes 0 0
ConstraintsCell Name Cell Value Formula Status Slack
$E$43 Total (SumProduct) Year 99,051 $E$43<=$E$44 Not Binding100948.6953$F$43 Total (SumProduct) Year 85,282 $F$43<=$F$44 Not Binding 64717.9446$G$43 Total (SumProduct) Year 83,672 $G$43<=$G$44 Not Binding36328.20554$H$43 Total (SumProduct) Year 77,154 $H$43<=$H$44 Not Binding22846.15817$I$43 Total (SumProduct) Year 75,000 $I$43<=$I$44 Binding 0$B$38 A 1 = Yes 1 $B$38=binary Binding 0$B$39 B 1 = Yes 0 $B$39=binary Binding 0$B$40 C 1 = Yes 1 $B$40=binary Binding 0$B$41 D 1 = Yes 1 $B$41=binary Binding 0$B$42 E 1 = Yes 0 $B$42=binary Binding 0