valuing public investments to support bicycling
TRANSCRIPT
© Swiss Society of Economics and Statistics 2014, Vol 150 (4) 297–329
a Institute of Social and Preventive Medicine, Physical Activity and Health Unit, University of Zurich, Seilergraben 49, 8001 Zurich, Switzerland, thomas goetschi@uzh ch
b Faculty of Business and Economics, University of Basel, Peter Merian-Weg 6, 4002 Basel, Switzerland, b hintermann@unibas ch
Valuing Public Investments to Support Bicycling
Thomas Götschia and Beat Hintermannb
JEL-Classification: H43, H76; Q51; R41, R42 Keywords: Cost-benefit analysis, health impact assessment, bicycle, valuation, internal cost, health benefit, VSL
1. Introduction
Transport and urban planning branches of many local, regional and some-times federal governments in industrialized countries have offices responsible for designing and carrying out bicycle-friendly policies, usually in coordination with other planning activities such as road construction or public transportation The role of government to design and finance bicycle policies can be justified by the public-good character of bicycle infrastructures and their substantial fixed costs, but also by societal benefits associated with bicycling compared to other modes of transportation, such as a reduction in mortality and morbidity due to increased physical activity, reduction of congestion, and reduction in air pollution (Woodcock et al , 2009) Public interventions to increase the level of bicycling have often been successful (Pucher, Dill and Handy, 2010)
In principle, there is nothing different about valuing bicycle-related investment, relative to investments in other types of transportation modes, and therefore standard cost-benefit principles based on consumer surplus should be employed There are two empirical problems with this: First, computing the consumer sur-plus associated with bicycling requires knowledge about the generalized costs of bicycling, which are difficult to estimate because of the lack of a readily observ-able monetary cost component (abstracting from the fixed cost of the bicycle pur-chase) And second, it requires knowledge about the degree of internalization of personal health benefits, which constitute a major part of the benefits associated with bicycling It is not clear that people fully internalize these benefits: The link
298 Götschi / Hintermann
Swiss Journal of Economics and Statistics, 2014, Vol. 150 (4)
between regular physical exercise and longevity may not be obvious because the benefits usually accrue many years in the future, and even if people are aware of cycling being healthy, translating this accurately into a quantitative sense for the long-term health benefits associated with bicycling, not to mention their mone-tary value, is extremely challenging Last but not least, commitment issues could yet prevent people from choosing their optimal level of exercise (Bernheim and Rangel, 2007) The share of personal health benefits not considered by cyclists should then be treated like an external benefit, because they are not traded off against internal costs
Most existing studies about the value of bicycle investment abstract from internal costs altogether and equate the benefits associated with an increase in bicycling with the resulting gross benefits to marginal riders, mostly in the form of health benefits, and report high benefit-cost ratios (Cavill et al , 2009; Gotschi, 2011; Krizek et al , 2007; Wang et al , 2005) While such a “gross benefits” approach overstates the consumer surplus associated with the increase in bicycling, it neglects the benefit to existing cyclists, such that the direction of the bias is not clear
Borjesson et al (2012), to our knowledge, provide the only published attempt at estimating the consumer surplus of bicycling in a survey of commuter cyclists in Stockholm They find that transportation time savings are valued higher for bicycling than for other modes, indicating that bicycling is associated with a direct disutility Their results further imply that cyclists consider health effects when choosing among several competing transport options However, these observations do not necessarily imply that internalization of health benefits is complete
In this paper we develop a valuation method based on consumer surplus that accounts for the internal (generalized) costs of bicycling and apply it to eight Swiss cities using data from the Swiss national travel survey By including mon-etary savings of bicycling relative to other modes of transportation in our gener-alized cost estimation, we can monetize these costs and compare them with the health benefits of bicycling, which we monetize independently using estimates for the reduction in mortality risk due to exercise and the Value of a Statistical Life (VSL) Our estimates suggest that Swiss bicyclists internalize around half of the health benefits when making transportation choices, although the results are sensitive to the VSL estimate employed (the higher the VSL, the lower the degree of internalization) We further find that due to the reduction in costs for existing riders, the total consumer surplus from bicycle spending turns out to be greater than the gross health benefits for new riders, a measure which has been used to value bicycle investments in the past
Valuing Public Investments to Support Bicycling 299
Swiss Journal of Economics and Statistics, 2014, Vol. 150 (4)
The relationship between changes in internal costs and the resulting level of cycling on the one hand, and the degree of internalization of health benefits on the other, allows us to conceptualize the interaction between “hard” and “soft” policy measures, which is a longstanding question in the promotion of bicycling “Hard” measures, such as investments in infrastructure, are aimed at reducing the internal costs (i e , the disutility) associated with bicycling, whereas “soft” measures, such as informational and educational campaigns highlighting ben-efits of bicycling enable people to realize – and hence internalize – benefits in their decision making Taking our results at face value, they suggest that there remains scope for soft bicycle measures in Swiss cities due to imperfect internali-zation of personal health benefits However, because of the complexity of assess-ing internal costs of bicycling and the inherent limitations of the available data, our results primarily serve illustrative purposes and need to be interpreted with caution For example, information about characteristics of chosen routes, longer or repeated assessments within subjects, more detailed information about atti-tudes and perceptions and various other types of data would likely improve the estimation of the internal cost function
2. The Costs and Benefits of Bicycling
In this section we briefly discuss the costs and benefits associated with bicy-cling identified by the literature We separate health benefits from other benefits because of their quantitative importance, and because the degree of their inter-nalization is the focus of our empirical analysis
2.1 Health Benefits
Bicycling is associated with a number of positive and negative health effects, and a literature has developed on the subject with the aim of defining, quantifying and sometimes monetizing various costs and benefits The most important effects identified in the literature in terms of magnitude are a ) decreased risk of mor-tality and various morbidities as a result of physical activity (Oja et al , 2011), b ) increased injury risk as a result of exposure to motorized traffic (de Geus et al , 2012), and c ) increased mortality and morbidity due to exposure to air pol-lutants (Int Panis et al , 2010) Most studies find that the first of these effects far outweighs the second two, leading to net health benefits of bicycling (de Hartog et al , 2010; de Nazelle et al , 2011; Holm, Glümer and Diderich-sen, 2012; Rabl and De Nazelle, 2012; Rojas-Rueda et al , 2011; Woodcock
300 Götschi / Hintermann
Swiss Journal of Economics and Statistics, 2014, Vol. 150 (4)
1 Experience from Dutch cities and Copenhagen suggests that there is no “law of nature” cap-ping bicycle mode share anywhere close to what is observed in most cities without a long his-tory of systematic bicycle investments
2 Whereas the mode choice describes the discrete decision between two or several competing transportation modes, the mode share is the proportion of all trips carried out by a particular mode and therefore also depends on trip distances In the literature reviewed here, the mode share is usually the dependent variable
3 Smith (1991) finds that psychological costs of bicycling are a significant predictor of bicycle mode choice, but does not provide an explicit link between mode choice determinants and psychological costs
et al , 2009) Benefits from physical activity are the focus of most valuation stud-ies, and they also feature prominently in our approach
2.2 Internal Costs and the Determinants of the Bicycle Mode Share
Abstracting from leisure trips that serve no purpose of transportation, getting from A to B conveys disutility to people in the form of money, time, effort, fear of accidents and other costs, the sum of which are usually referred to as general-ized costs In the context of bicycling, the generalized costs are almost exclusively nonmonetary and thus internal to cyclists The existence of internal costs follows readily from the fact that without an offsetting element, the presence of positive health benefits would make the bicycle the dominant transportation choice for all trips up to a certain distance 1 However, the bicycle mode share in Swiss cities is around 5%, with few cities reaching more than 10% (Federal Statistical Office, 2007, 2012), and similar or lower numbers apply to other countries (Pucher et al , 2010) Even though the presence of internal costs of bicycling may seem obvious, they are usually not considered when valuing the benefits of bicycle policies Natu-rally, bicycling also conveys utility gains for some trips (i e , negative internal costs), but the relatively low bicycle mode share implies that for many trips that could theoretically be carried out by bicycle, but are not, the internal costs are positive
The tradeoff between costs and benefits is implicit in the literature devoted to identifying the determinants of bicycle mode choice and/or mode share,2 most of which are non-monetary in nature Rietveld and Daniel (2004) use general-ized costs as a predictor variable, in which they include measures such as “costs of effort” or fear of accidents Similarly, Hunt and Abraham (2007) report that bicyclists choose routes that are least “onerous”,3 and Broach et al (2012) find that cyclists avoid high volumes of motorized traffic In the following, we sepa-rate the determinants that have been empirically identified to affect the propen-sity to bicycle into the following groups:
Valuing Public Investments to Support Bicycling 301
Swiss Journal of Economics and Statistics, 2014, Vol. 150 (4)
4 This study is based on GPS data of actual routes taken in Zurich, which are compared to constructed non-chosen alternative routes The main result is that the observed bicyclists are willing to make only slight detours in order to improve along another dimension (such as the presence of a bike trail or fewer stops), implying large time and effort costs of bicycling
a.) The general environmentGeneral factors that have been shown to influence the propensity to bicycle include weather (temperature and precipitation), topography, city size, cultural and neighborhood characteristics including land use (Pucher and Buehler, 2012; Saelens, Sallis and Frank, 2003; Wardman, Tight and Page, 2007) Determinants that may be more easily influenced by city planners are the prices of alternative modes of transportation including parking costs
b.) Route and destination characteristicsThe bicycle mode choice/share is influenced by the presence of bicycle lanes/paths; the lane width, the volume and speed of motorized traffic; competition for space between drivers and cyclists; the number of stops, traffic lights or other obstacles; the number of intersections and their characteristics, accident risk; and qualitative aspects about bicycle lanes such as continuity and connectivity or the presence of on-street parking (Berrigan, Pickle and Dill, 2010; Broach, Dill and Gliebe, 2012) Menghini et al (2010) conclude that trip length is the dominant factor for route choice, which is consistent with high time costs and/or costs of physical exertion 4 This category may also include trip end facilities such as locking stations or the presence of showers at work (Wardman, Tight and Page, 2007)
c.) Personal characteristicsIn terms of personal characteristics, the choice of bicycling is influenced by a person’s age, race, gender, education, car ownership, aversion to driving, and the perception of bicycle-friendliness of the traffic environment or environmental preferences (Bauman et al , 2012; Heinen and Handy, 2012; Li et al , 2012) Furthermore, the translation between external factors and route characteristics into (dis-) utility of bicycling may vary across people: For example, the physical effort associated with a significant elevation gain may deter older people more than younger ones, all else equal This means that even mode choice determi-nants that are the same for everybody (i e , hilliness) can have a person-specific influence on the propensity to bicycle
302 Götschi / Hintermann
Swiss Journal of Economics and Statistics, 2014, Vol. 150 (4)
5 Such a linear relationship between km of cycling and health benefits requires the assumption that cycling – more specifically cycling trips of different utility-is fairly evenly distributed with regards to overall activity levels of cyclists, which arguably may be the case for utilitarian urban cyclists This assumption, however, is unlikely to hold for occasional leisurely rides or long distance rides, and subjects which are either entirely inactive or extremely fit To include these extremes of the dose-response curve, a non-linear relationship reflecting lower benefits per additional km (within subject) would better reflect the nature of the effect (Woodcock et al , 2011) However, subject-specific health benefit assessment would be beyond the scope of this analysis
2.3 Externalities
A share of the benefits from improved personal health accrue to the population as a whole in the form of lower health care costs, which leads to lower tax rates in nationalized health care systems or reduced insurance payments in systems relying on private health insurance Better health may also increase the produc-tivity of workers, which may be captured only partially by a wage increase To the extent that bicycling substitutes for motorized traffic, it is also associated with a number of positive externalities, or more precisely, with the avoidance of negative externalities These external effects include a reduction in air pollution, noise and congestion, lower demand for parking spaces, less wear and tear on roads, and intangible effects such as “livability” (Dumbaugh, 2005; Ellison and Greaves, 2011; Litman, 2004; Thakuriah et al , 2012)
3. Consumer Surplus from Public Investments in Bicycling
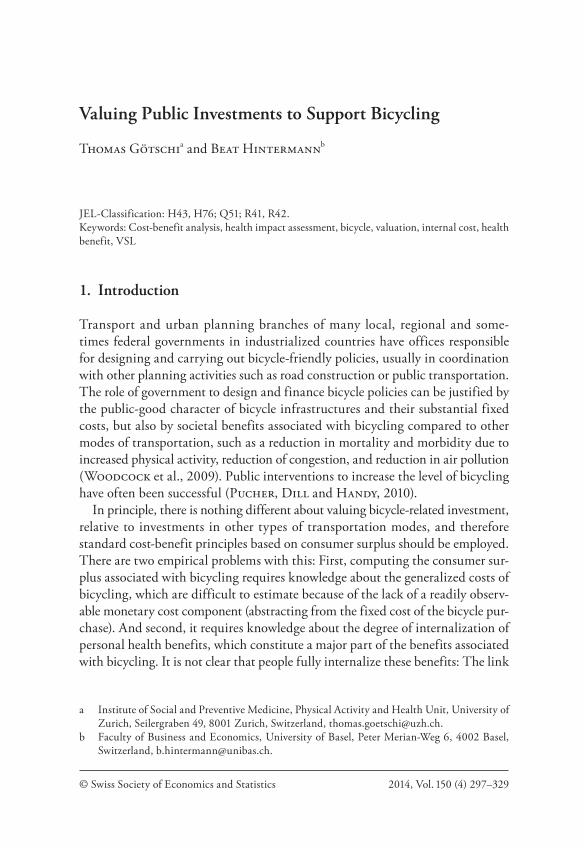
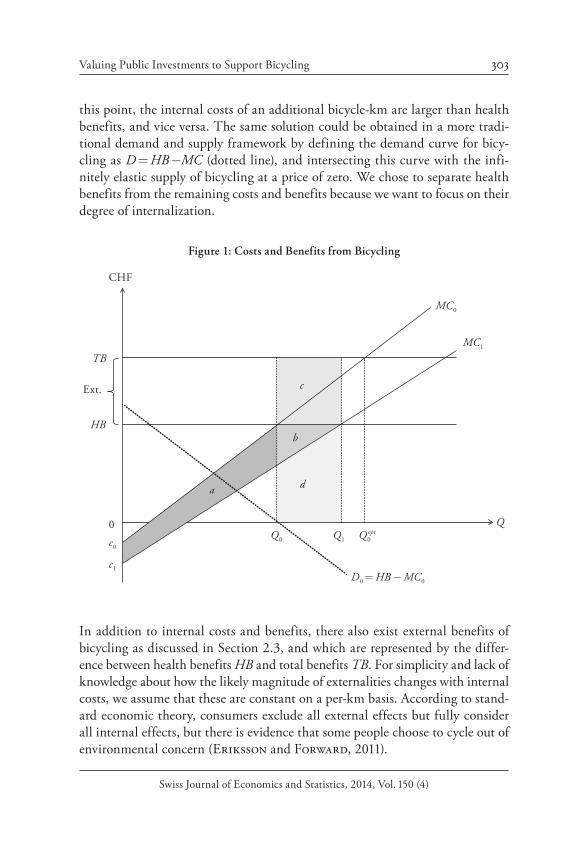
The social value of bicycle investment is shown in Figure 1 On the horizontal axis we measure cumulative bicycle-km Q that take place in a population and over a particular time period MC refers to the per-km net internal cost of bicycling, which we define to include all costs and benefits with the exception of health benefits We ordered bicycle trips by their internal costs, such that the MC curve is increasing by construction Bicycle-km on the left are associated with nega-tive costs (i e benefits), representing the bicycle trips with the highest utility As the overall level of bicycling increases, the internal costs increase because more trips take place during “bicycle-unfriendly” conditions (such as during inclement weather, over hilly terrain or in dense traffic), or are carried out by people with a stronger aversion to physical exercise or accident risk
Health benefits per bicycle-km are given by HB, which we assume to be con-stant across bicycle-km 5 The equilibrium level of bicycling is given by Q0; beyond
Valuing Public Investments to Support Bicycling 303
Swiss Journal of Economics and Statistics, 2014, Vol. 150 (4)
this point, the internal costs of an additional bicycle-km are larger than health benefits, and vice versa The same solution could be obtained in a more tradi-tional demand and supply framework by defining the demand curve for bicy-cling as D = HB -MC (dotted line), and intersecting this curve with the infi-nitely elastic supply of bicycling at a price of zero We chose to separate health benefits from the remaining costs and benefits because we want to focus on their degree of internalization
Figure 1: Costs and Benefits from Bicycling
MC0
HB
0Q0
TB
Q0opt
MC1
Q1c0
c1
Q
D0= HB -MC0
Ext.
CHF
d
b
c
a
In addition to internal costs and benefits, there also exist external benefits of bicycling as discussed in Section 2 3, and which are represented by the differ-ence between health benefits HB and total benefits TB For simplicity and lack of knowledge about how the likely magnitude of externalities changes with internal costs, we assume that these are constant on a per-km basis According to stand-ard economic theory, consumers exclude all external effects but fully consider all internal effects, but there is evidence that some people choose to cycle out of environmental concern (Eriksson and Forward, 2011)
304 Götschi / Hintermann
Swiss Journal of Economics and Statistics, 2014, Vol. 150 (4)
6 The “rule-and-a-half” is an approximation for surplus under the assumption of linear demand curves and constant costs across consumers (e g , the price of using public transportation) and abstracts from externalities It states that the benefit from a cost decrease from C0 to C1 that increases transport demand from Q0 to Q1 is given by the sum of inframarginal benefits Q0(C0 - C1), plus the benefits to new riders The latter cannot exceed C0 - C1 (otherwise, these trips would have taken place before the cost reduction), but they have to be positive (other-wise, they would not take place even after the cost reduction) The rule-and-a-half assumes that on average, the additional benefits are (C0 - C1)/2, such that total benefits are given by Q0(C0 - C1) + (Q1 - Q0)(C0 - C1)/2 = (Q0 + Q1)(C0 - C1)/2 (see e g Jara‐Díaz and Farah, 1988) If the shift from MC0 to MC1 is parallel, this corresponds to areas a + b
In principle, the socially optimal level of bicycling 0optQ could be achieved by
placing a Pigovian subsidy equal to marginal external benefits on every bicycle-km travelled However, assuming that a per-km subsidy of bicycling is not fea-sible due to asymmetric information and enforcement constraints, the govern-ment has to resort to other measures For example, it can carry out policies that increase the “bicycle-friendliness” of a city by reducing the internal costs of bicy-cling from MC0 to MC1, leading to an increase in the level of bicycling from Q0 to Q1 Examples include the expansion of bicycle infrastructure, driver educa-tion programs to raise awareness about sharing the street, rule changes such as a reduction in the speed limits for motorized traffic or subsidies for firms to install showers and locker rooms for their staff
The social value of investments that reduce MC0 to MC1 is the sum of net benefits associated with the increase in Q (area b), the benefit increase for infra-marginal bicycle-km (area a), and the corresponding external benefits (area c) This is a restatement of the so-called “rule-and-a-half”, (Jara‐Díaz and Farah, 1988) the only difference being that the cost decrease varies across inframar-ginal travelers 6
In contrast, the gross benefits associated with the increase in bicycling, which commonly have been used as an approximation of the value of bicycle investment, (e g Gotschi, 2011; Rutter et al , 2013; Woodcock et al , 2009) are given by internal gross benefits (area b + d) plus external benefits (area c) Whether this is an over- or an underestimate of the true net benefits depends on the relative magnitudes of areas a and d In our application to Swiss cyclists, we find that inframarginal benefits exceed internalized costs
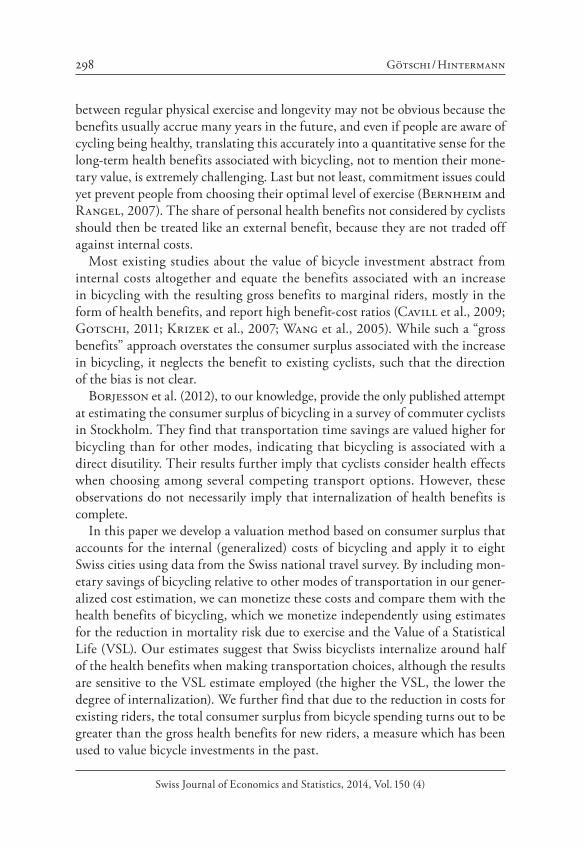
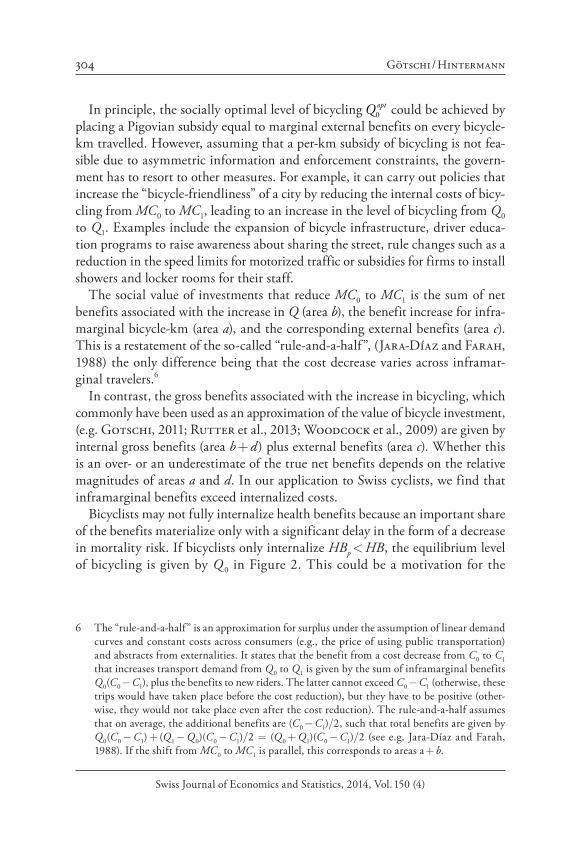
Bicyclists may not fully internalize health benefits because an important share of the benefits materialize only with a significant delay in the form of a decrease in mortality risk If bicyclists only internalize HBp < HB, the equilibrium level of bicycling is given by Q 0 in Figure 2 This could be a motivation for the
Valuing Public Investments to Support Bicycling 305
Swiss Journal of Economics and Statistics, 2014, Vol. 150 (4)
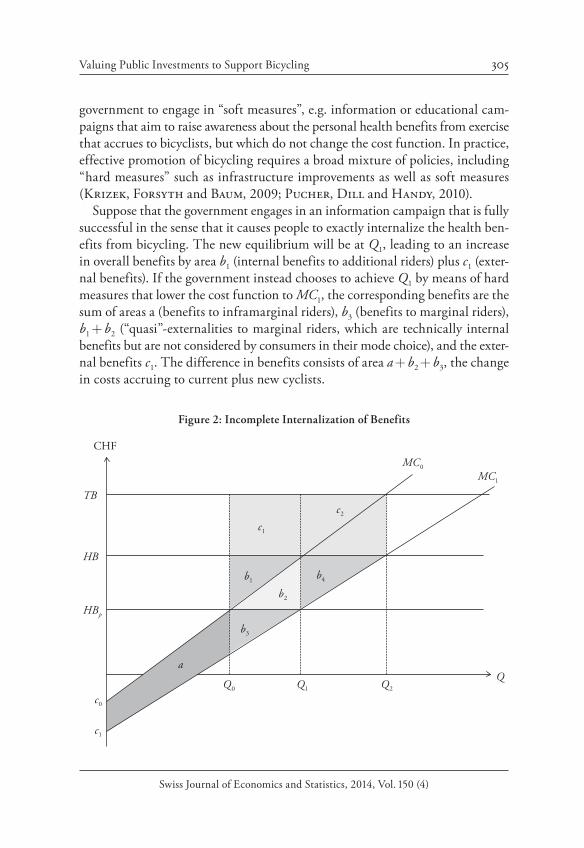
government to engage in “soft measures”, e g information or educational cam-paigns that aim to raise awareness about the personal health benefits from exercise that accrues to bicyclists, but which do not change the cost function In practice, effective promotion of bicycling requires a broad mixture of policies, including “hard measures” such as infrastructure improvements as well as soft measures (Krizek, Forsyth and Baum, 2009; Pucher, Dill and Handy, 2010)
Suppose that the government engages in an information campaign that is fully successful in the sense that it causes people to exactly internalize the health ben-efits from bicycling The new equilibrium will be at Q1, leading to an increase in overall benefits by area b1 (internal benefits to additional riders) plus c1 (exter-nal benefits) If the government instead chooses to achieve Q1 by means of hard measures that lower the cost function to MC1, the corresponding benefits are the sum of areas a (benefits to inframarginal riders), b3 (benefits to marginal riders), b1 + b2 (“quasi”-externalities to marginal riders, which are technically internal benefits but are not considered by consumers in their mode choice), and the exter-nal benefits c1 The difference in benefits consists of area a + b2 + b3, the change in costs accruing to current plus new cyclists
Figure 2: Incomplete Internalization of Benefits
TB
CHF
Q0 Q1
c0
c1
Q
HBp
MC0
MC1
b2
b1
c1
Q2
a
HB
b4
c2
b3
306 Götschi / Hintermann
Swiss Journal of Economics and Statistics, 2014, Vol. 150 (4)
If the government decides to invest both in infrastructure and an information campaign, it can achieve an equilibrium level of bicycling at Q2, with the cor-responding benefits given by the inframarginal benefits a, benefits to marginal riders (b1 + b2 + b3 + b4), plus external benefits (c1 + c2) More generally, any level of bicycling between Q0 and Q2 could be achieved by a mix of hard and soft policy instruments, with the corresponding benefits as discussed above Depend-ing on the relative monetary costs, the policy maker would then choose the opti-mal policy mix, characterized by the highest benefits/cost ratio
4. Data and Empirical Model
We now apply our valuation framework to data from eight Swiss cities, using an econometric specification that fits the situation depicted in Figures 1–2, and which allows us to estimate the benefits of public spending that leads to a given reduction in the internal cost function
4.1 Data
We use data from the Swiss national household travel survey (Federal Statistical Office, 2007, 2012), a large population-based survey conducted approximately every five years For methodological comparability we restrict our analysis to data from the surveys from 1994, 2000, 2005 and 2010 As part of the computer-assisted telephone interview (CATI), subjects are asked to provide information on one day of travel, tracking their mobility stage by stage A trip consists of one or more separate stages, which may be carried out by different means of transporta-tion Travel mode, distance, duration, trip purpose and additional variables are captured for each stage Whereas earlier surveys (1994 and 2000) captured start and endpoints of stages by address only, more recent surveys recorded geo-coordi-nates using mapping software to assist CATI Numerous additional variables are available at the levels of trip, travel day (e g weather), subject (e g public transport pass or car ownership), and household (e g number of vehicles available, includ-ing bikes) Not coded, however, are the actual routes chosen by the respondents
We used Mapquest’s address search feature and GIS software to identify direct routes between start and endpoints, which we overlaid with topographical data to derive elevation gains for each trip stage We obtained the number of fatal and severe accidents from annually published accident statistics
We compiled data for the 10 largest cities in Switzerland We included all trips that originated or ended within the limits of our sample cities Because Lausanne
Valuing Public Investments to Support Bicycling 307
Swiss Journal of Economics and Statistics, 2014, Vol. 150 (4)
and Lugano had very few observed bicycle trips, we limited our analysis to the cities of Basel, Bern, Biel, Geneva, Luzern, St Gallen, Winterthur and Zurich Because we want to focus on stages for which the bicycle provides a feasible choice over other means of transportation, we use stages with distances covering the central 98% of observed bicycle distances, which limits our sample to stages of 0 14–20 0 km for all modes Summary statistics of transportation mode choice in our sample are given in Table 1
Table 1: Transportation Choices at the Stage Level
Stages Stages (%) Km Km (%) Respondentsa
All modes 70,058 100 0% 142,831 100 0% 14,269
Walk 35,341 50 4% 27,636 19 3% 10,670
Public transport 16,487 23 5% 46,856 32 8% 5,883
Motor vehicle 12,197 17 4% 54,870 38 4% 4,716
Bicycle 4,678 6 7% 9,390 6 6% 1,644
Other 1,355 1 9% 4,080 2 9% 620
a The same person may carry out stages using several different transport modes
4.2 Econometric Specification
In order to estimate the relationship between internal costs and the quantity of bicycling on the population level, we have to overcome two problems: First, the internal cost of bicycling is unobserved, requiring the use of instrumental vari-ables Second, since bicycling is a choice, we have to control for self-selection, for which we use Heckman’s approach (Heckman, 1979)
Let bisq denote the distance travelled by bicycle (i e , the observed demand for
bicycling) by person i on stage s Although all trip stages are recorded for all respondents, we observe the demand for bicycling only for people who choose to use a bicycle The decision to use, or not use, a bicycle for a particular trip stage depends on a person’s preferences and characteristics specific to the route and the general environment as discussed in Section 2 2 We model the decision to use a bicycle using a linear function given by
is is isb Z ug* = + (1)
where Zis is a vector of mode choice variables, g is a vector of coefficients, b*is is
a latent variable, and uis is an error term Assuming that uis ∼ N(0,1) leads to the
308 Götschi / Hintermann
Swiss Journal of Economics and Statistics, 2014, Vol. 150 (4)
Probit model The sample rule is that we observe bisq only if b*
is > 0 Let bis be a dummy that takes the value of one if person i carries out stage s by bicycle, and zero otherwise Defining F(.) as the cumulative density function of the stand-ard normal distribution, the probability that person i chooses a bicycle for stage s is given by
Prob( 1) Prob( ) ( )is is is isb u Z Zg g= = < =F (2)
We specify the demand for bicycle-km as a linear function of the variables in Yis that determine the quantity of bicycling via internal costs, and additional vari-ables in Xis that influence the level of bicycling via different mechanisms:
bis is is isq X Yb d e= - × G+ (observed if bis = 1) (3)
Here, b and G are vectors of coefficients, YisG are the monetized internal net costs of bicycling (including all costs and benefits with the exception of health ben-efits), and d translates these costs into bicycle-km and therefore has the unit km/money Since both Yis and in Zis contain variables related to the internal costs of bicycling, there will be considerable overlap between these vectors
The error terms in (1) and (3) are jointly distributed according to a bivariate normal distribution:
( , ) biv. N [0, 0; 1, ; ]is is uu e ee s r∼ (4)
We estimate (2) and (3) jointly by full information maximum likelihood (FIML), allowing for clustering of the errors on the individual level such that they are independent between individuals, but not necessarily for different stages carried out by the same person Note that by clustering on the individual level we also allow for clustering on the trip level, as all stages that together comprise a trip are carried out by the same person
Estimating (3) individually leads to inconsistent estimates if rue ¹ 0, which is a natural assumption in the context of bicycling To provide some intuition, suppose that person i choses to use the bicycle for stage s, and that the observ-able mode choice determinants indicate that this person-stage combination is associated with high internal costs (e g , the trip covers a significant elevation gain and person i is a senior citizen) This translates to ˆ 0isZ g << in (1), which means that person i must have a large positive error in the mode choice decision for stage s in order for isb* to be positive We can therefore interpret uis as a measure
Valuing Public Investments to Support Bicycling 309
Swiss Journal of Economics and Statistics, 2014, Vol. 150 (4)
7 Both bicycle affinity and bicycle endurance can refer to characteristics of person i, of stage s, or a combination The person-level interpretation is consistent with our error clustering
8 Suppose that ˆ 0i sZ g¢ ¢ > for person i ¢ and stage s ¢ such that even moderately negative values of ui ¢s ¢ are consistent with 0.i sb*
¢ ¢ > Since we only observe ˆisZ g but not the error, it is possible
that ui ¢s ¢ exceeds uis even if ˆ ˆ.is i sZ Zg g¢ ¢<< However, the fact that both trips are carried out by bicycle means that [ | Z ; 1] [ | ; 1].is is is i s i s i sE u b E u Z b¢ ¢ ¢ ¢ ¢ ¢= > =
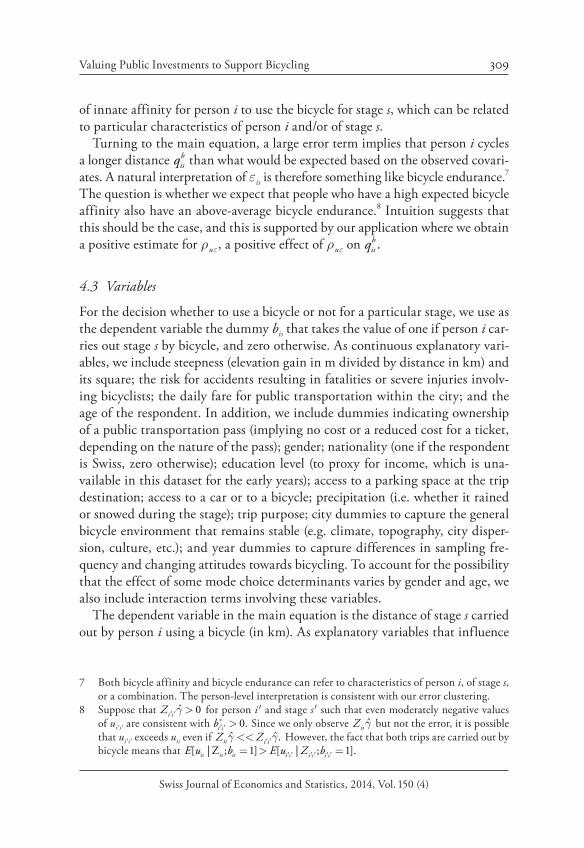
of innate affinity for person i to use the bicycle for stage s, which can be related to particular characteristics of person i and/or of stage s
Turning to the main equation, a large error term implies that person i cycles a longer distance b
isq than what would be expected based on the observed covari-ates A natural interpretation of eis is therefore something like bicycle endurance 7 The question is whether we expect that people who have a high expected bicycle affinity also have an above-average bicycle endurance 8 Intuition suggests that this should be the case, and this is supported by our application where we obtain a positive estimate for rue, a positive effect of rue on .b
isq
4.3 Variables
For the decision whether to use a bicycle or not for a particular stage, we use as the dependent variable the dummy bis that takes the value of one if person i car-ries out stage s by bicycle, and zero otherwise As continuous explanatory vari-ables, we include steepness (elevation gain in m divided by distance in km) and its square; the risk for accidents resulting in fatalities or severe injuries involv-ing bicyclists; the daily fare for public transportation within the city; and the age of the respondent In addition, we include dummies indicating ownership of a public transportation pass (implying no cost or a reduced cost for a ticket, depending on the nature of the pass); gender; nationality (one if the respondent is Swiss, zero otherwise); education level (to proxy for income, which is una-vailable in this dataset for the early years); access to a parking space at the trip destination; access to a car or to a bicycle; precipitation (i e whether it rained or snowed during the stage); trip purpose; city dummies to capture the general bicycle environment that remains stable (e g climate, topography, city disper-sion, culture, etc ); and year dummies to capture differences in sampling fre-quency and changing attitudes towards bicycling To account for the possibility that the effect of some mode choice determinants varies by gender and age, we also include interaction terms involving these variables
The dependent variable in the main equation is the distance of stage s carried out by person i using a bicycle (in km) As explanatory variables that influence
310 Götschi / Hintermann
Swiss Journal of Economics and Statistics, 2014, Vol. 150 (4)
9 These are known as “half-fare travelcards” (Halbtax in German and abonnement demi-tarif in French) and are held by a large share of the Swiss population As implied by their name, they convey the holder the right to purchase a fare at a 50% discount for long-distance travel For city travel, however, the discount is typically only 25%
the quantity of bicycling directly, which comprise the vector Xis in eq (3), we use a constant and year dummies, as well as the nonselection hazard (also known as the “inverse Mills ratio”; this term corrects for self-selection) As determinants that affect the demand for bicycling via the cost function YisG, we use a subset of the variables included in the selection equation (elevation gain, elevation gain squared, accident risk and age, plus dummies for gender, nationality, education level, precipitation and trip purpose) We also include city dummies, which we interpret as a proxy for a city’s general bicycling environment (e g , the extent and quality of the bicycle lane network, culture, hilliness, dispersion etc )
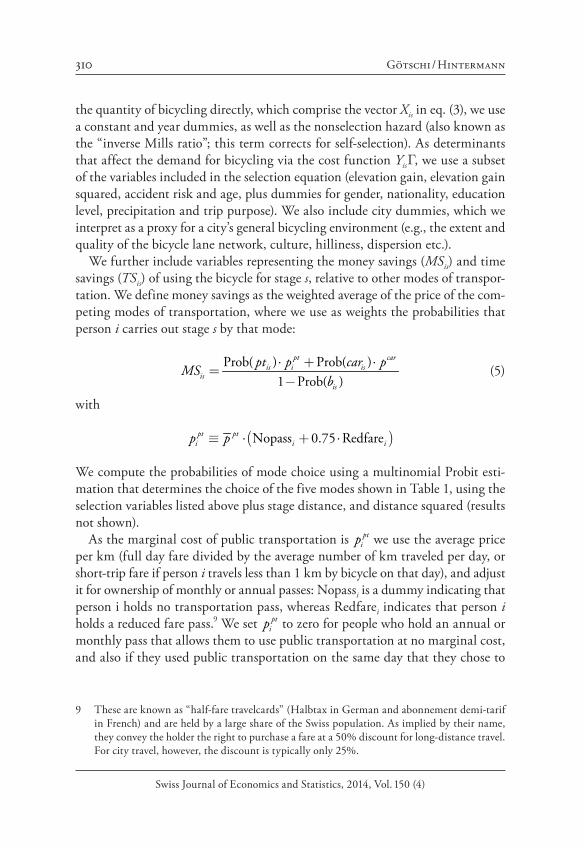
We further include variables representing the money savings (MSis) and time savings (TSis) of using the bicycle for stage s, relative to other modes of transpor-tation We define money savings as the weighted average of the price of the com-peting modes of transportation, where we use as weights the probabilities that person i carries out stage s by that mode:
Prob( ) Prob( )
1 Prob( )
pt caris i is
isis
pt p car pMS
b× + ×
=-
(5)
with
( )Nopass 0.75 Redfarept pti i ip pº × + ×
We compute the probabilities of mode choice using a multinomial Probit esti-mation that determines the choice of the five modes shown in Table 1, using the selection variables listed above plus stage distance, and distance squared (results not shown)
As the marginal cost of public transportation is ptip we use the average price
per km (full day fare divided by the average number of km traveled per day, or short-trip fare if person i travels less than 1 km by bicycle on that day), and adjust it for ownership of monthly or annual passes: Nopassi is a dummy indicating that person i holds no transportation pass, whereas Redfarei indicates that person i holds a reduced fare pass 9 We set pt
ip to zero for people who hold an annual or monthly pass that allows them to use public transportation at no marginal cost, and also if they used public transportation on the same day that they chose to
Valuing Public Investments to Support Bicycling 311
Swiss Journal of Economics and Statistics, 2014, Vol. 150 (4)
10 This reflects the assumption that if a person has used, or is intending to use, public transpor-tation during this day and thus had/has to buy a day fare in any case, there is no money cost to replacing stage s with public transportation
11 Touring Club Switzerland computes a cost of CHF 0 76/km, but some of these are fixed costs; www tcs ch, last accessed in December 2013
use the bicycle for stage s 10 We further assume a cost of CHF 0 50 per km for car travel11, and of zero for the modes “walk” and “other”
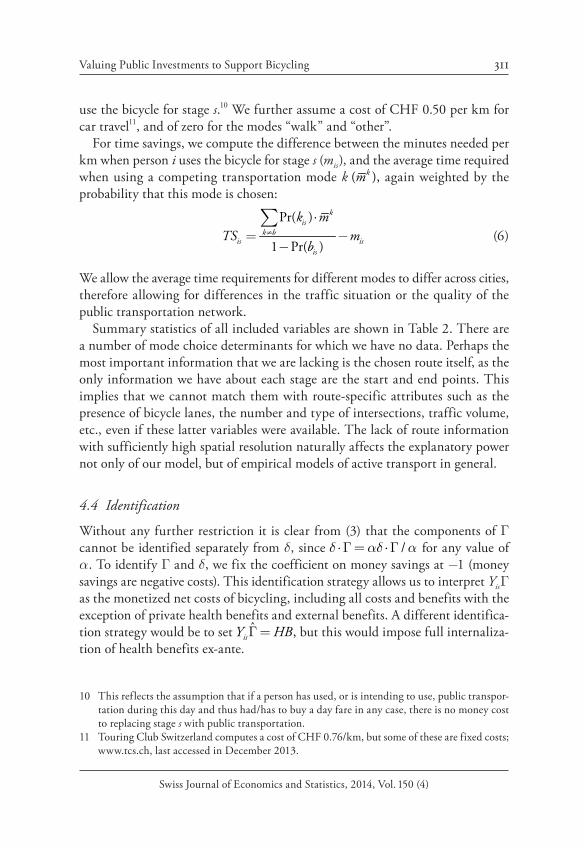
For time savings, we compute the difference between the minutes needed per km when person i uses the bicycle for stage s (mis ), and the average time required when using a competing transportation mode k ( ),km again weighted by the probability that this mode is chosen:
Pr( )
1 Pr( )
kis
k bis is
is
k mTS m
b¹
×= -
-
å (6)
We allow the average time requirements for different modes to differ across cities, therefore allowing for differences in the traffic situation or the quality of the public transportation network
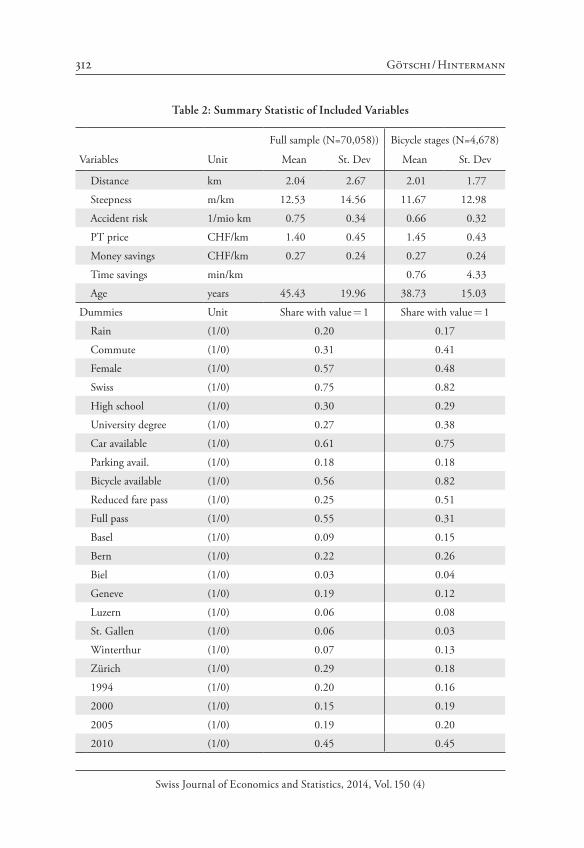
Summary statistics of all included variables are shown in Table 2 There are a number of mode choice determinants for which we have no data Perhaps the most important information that we are lacking is the chosen route itself, as the only information we have about each stage are the start and end points This implies that we cannot match them with route-specific attributes such as the presence of bicycle lanes, the number and type of intersections, traffic volume, etc , even if these latter variables were available The lack of route information with sufficiently high spatial resolution naturally affects the explanatory power not only of our model, but of empirical models of active transport in general
4.4 Identification
Without any further restriction it is clear from (3) that the components of G cannot be identified separately from d, since /d ad a×G= ×G for any value of a To identify G and d, we fix the coefficient on money savings at -1 (money savings are negative costs) This identification strategy allows us to interpret YisG as the monetized net costs of bicycling, including all costs and benefits with the exception of private health benefits and external benefits A different identifica-tion strategy would be to set ˆ ,isY HBG= but this would impose full internaliza-tion of health benefits ex-ante
312 Götschi / Hintermann
Swiss Journal of Economics and Statistics, 2014, Vol. 150 (4)
Table 2: Summary Statistic of Included Variables
Full sample (N=70,058)) Bicycle stages (N=4,678)
Variables Unit Mean St Dev Mean St Dev
Distance km 2 04 2 67 2 01 1 77
Steepness m/km 12 53 14 56 11 67 12 98
Accident risk 1/mio km 0 75 0 34 0 66 0 32
PT price CHF/km 1 40 0 45 1 45 0 43
Money savings CHF/km 0 27 0 24 0 27 0 24
Time savings min/km 0 76 4 33
Age years 45 43 19 96 38 73 15 03
Dummies Unit Share with value = 1 Share with value = 1
Rain (1/0) 0 20 0 17
Commute (1/0) 0 31 0 41
Female (1/0) 0 57 0 48
Swiss (1/0) 0 75 0 82
High school (1/0) 0 30 0 29
University degree (1/0) 0 27 0 38
Car available (1/0) 0 61 0 75
Parking avail (1/0) 0 18 0 18
Bicycle available (1/0) 0 56 0 82
Reduced fare pass (1/0) 0 25 0 51
Full pass (1/0) 0 55 0 31
Basel (1/0) 0 09 0 15
Bern (1/0) 0 22 0 26
Biel (1/0) 0 03 0 04
Geneve (1/0) 0 19 0 12
Luzern (1/0) 0 06 0 08
St Gallen (1/0) 0 06 0 03
Winterthur (1/0) 0 07 0 13
Zürich (1/0) 0 29 0 18
1994 (1/0) 0 20 0 16
2000 (1/0) 0 15 0 19
2005 (1/0) 0 19 0 20
2010 (1/0) 0 45 0 45
Valuing Public Investments to Support Bicycling 313
Swiss Journal of Economics and Statistics, 2014, Vol. 150 (4)
5. Results
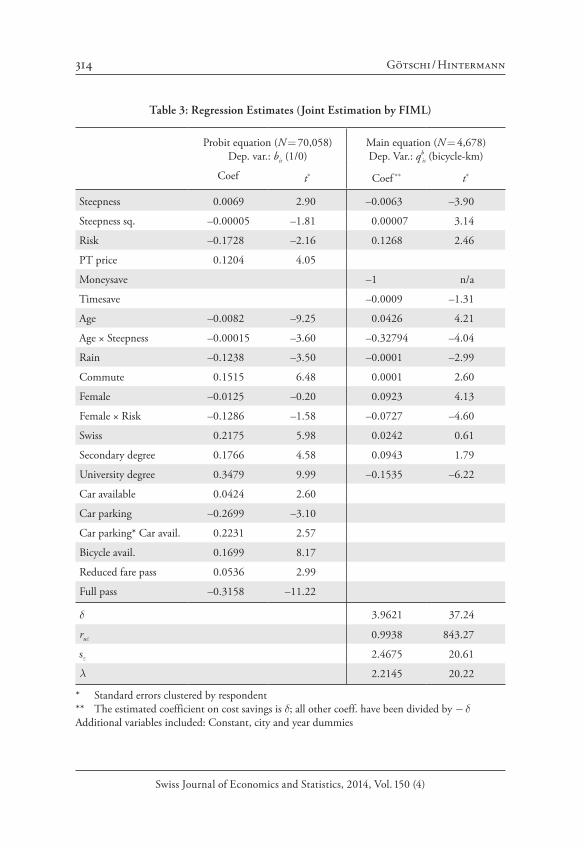
Estimates from jointly estimating (2) and (3) are presented in Table 3 The left side contains the parameters in g pertaining to the selection equation, and the right side the parameters in ˆ ,G which are computed by dividing the coefficient estimates from the main equation by the negative of the coefficient on cost sav-ings (which becomes our estimate for d ) Most of the mode share determinants have the expected sign and are statistically significant For example, an increase in accident risk, precipitation, or age of the respondent lowers the probability that this person chooses the bicycle (selection equation) and increases the inter-nal cost of bicycling (main equation), all else equal The results further suggest that people are more likely to choose the bicycle, and are willing to ride longer distances, if the observed stage is part of the daily commute (finding a good bicy-cle route can take some time, such that commuting trips may be associated with more attractive bicycle routes and thus with higher utility), or if the respondent is Swiss or has a higher education (cultural effects)
The total effect of steepness (elevation gain divided by distance) depends on the level of the variables at which it is evaluated At the sample means of steep-ness and age, an increase in steepness decreases the propensity to bicycle, as expected, but it also decreases the internal costs of bicycling However, the rela-tionship between steepness and bicycle demand is nonlinear, and costs increase as the stage becomes steeper, and as the age of the respondent increases Evalu-ated at age = 60 and the sample mean for steepness, the latter has a positive effect on internal costs
Lastly, the coefficient on time savings has the expected sign, but is not sig-nificant This could be explained by our lack of information about non-chosen alternatives, such that our time savings variable is a poor proxy for the actual time difference between competing modes for a particular stage Alternatively, within the range of the analyzed trip distances, the time differences between modes may not be substantial enough to be detected by our estimation
5.1 Computation of Net Benefits
We calculate the private health benefits from bicycling using the World Health Organization’s Health Economic Assessment Tool (HEAT) for cycling (Rutter et al , 2013; WHO, 2008) The tool has been developed in an expert consen-sus process and has been widely used It uses state of the art science to provide a fairly simple tool for economic valuation of health benefits from cycling pri-marily aimed at transport planners without in-depth economic or epidemiologic
314 Götschi / Hintermann
Swiss Journal of Economics and Statistics, 2014, Vol. 150 (4)
Table 3: Regression Estimates (Joint Estimation by FIML)
Probit equation (N = 70,058)Dep var : bis (1/0)
Main equation (N = 4,678)Dep Var : qb
is (bicycle-km)
Coef t* Coef ** t*
Steepness 0 0069 2 90 –0 0063 –3 90
Steepness sq –0 00005 –1 81 0 00007 3 14
Risk –0 1728 –2 16 0 1268 2 46
PT price 0 1204 4 05
Moneysave –1 n/a
Timesave –0 0009 –1 31
Age –0 0082 –9 25 0 0426 4 21
Age × Steepness –0 00015 –3 60 –0 32794 –4 04
Rain –0 1238 –3 50 –0 0001 –2 99
Commute 0 1515 6 48 0 0001 2 60
Female –0 0125 –0 20 0 0923 4 13
Female × Risk –0 1286 –1 58 –0 0727 –4 60
Swiss 0 2175 5 98 0 0242 0 61
Secondary degree 0 1766 4 58 0 0943 1 79
University degree 0 3479 9 99 –0 1535 –6 22
Car available 0 0424 2 60
Car parking –0 2699 –3 10
Car parking* Car avail 0 2231 2 57
Bicycle avail 0 1699 8 17
Reduced fare pass 0 0536 2 99
Full pass –0 3158 –11 22
d 3 9621 37 24
rue 0 9938 843 27
se 2 4675 20 61
l 2 2145 20 22
* Standard errors clustered by respondent** The estimated coefficient on cost savings is d; all other coeff have been divided by - dAdditional variables included: Constant, city and year dummies
Valuing Public Investments to Support Bicycling 315
Swiss Journal of Economics and Statistics, 2014, Vol. 150 (4)
12 Another issue is the transferability of VSL derived from labor market data involving US blue collar workers to cyclists in Switzerland, especially considering our finding that education is positively related to the propensity to choose the bicycle as a transport mode
knowledge The tool uses a relative risk estimate for all-cause mortality from a large cohort study (Andersen et al , 2000) to estimate avoided number of deaths from a certain level of observed cycling We then monetize the reduction in mor-tality using the value of a statistical life of $ 7 4 Mio (million, measured in 2006 dollars) used by the US Environmental Protection Agency, which is equivalent to CHF 9 33 Mio (2010 francs) This leads to an average estimate for the value of bicycling one kilometer of CHF 0 40 Note, however, that this estimate is directly proportional to the VSL, for which a range of estimates has been pro-posed in the literature For example, the default value VSL in HEAT based on a European report from 1990 is only CHF 3 19 Mio (Nellthorp et al , 2001), which would result in health benefits of CHF 0 15/km 12
We use daily bicycle-km as our dependent variable in the main equation, which requires multiplying the survey values by 365 to arrive at the annual demand for bicycling We work with annual rather than daily numbers because the compu-tation of health benefits presumes sustained long-term behavior As we are ulti-mately interested in the benefits to the population rather than the sample, we scale all distances by dividing by the fraction of the total population that was sampled in that year and city
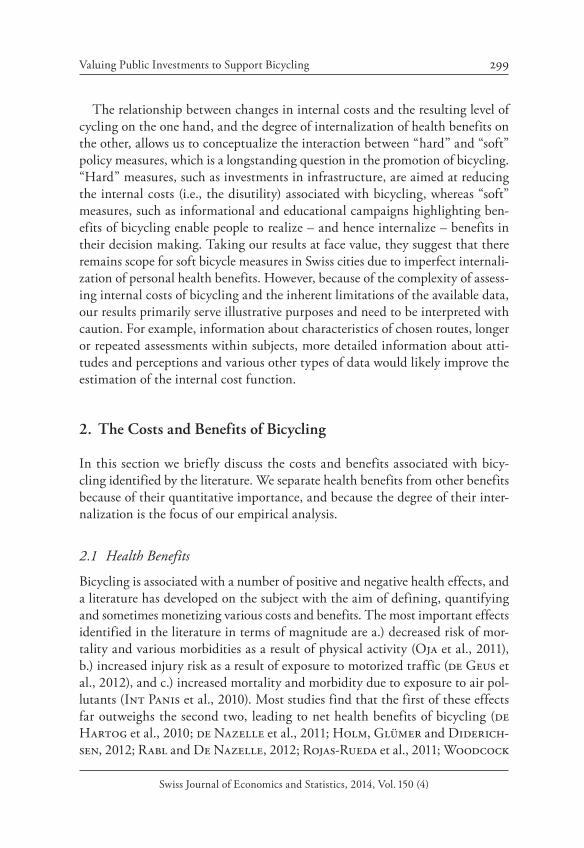
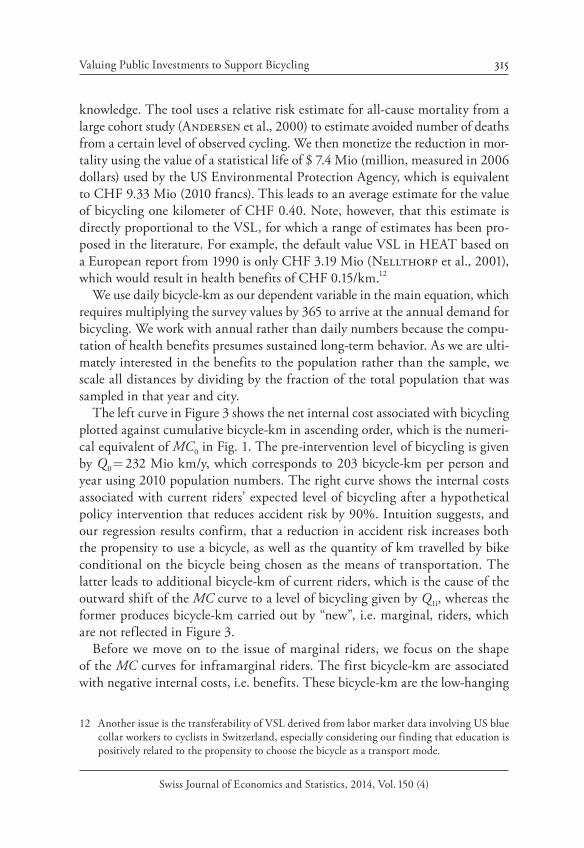
The left curve in Figure 3 shows the net internal cost associated with bicycling plotted against cumulative bicycle-km in ascending order, which is the numeri-cal equivalent of MC0 in Fig 1 The pre-intervention level of bicycling is given by Q0 = 232 Mio km/y, which corresponds to 203 bicycle-km per person and year using 2010 population numbers The right curve shows the internal costs associated with current riders’ expected level of bicycling after a hypothetical policy intervention that reduces accident risk by 90% Intuition suggests, and our regression results confirm, that a reduction in accident risk increases both the propensity to use a bicycle, as well as the quantity of km travelled by bike conditional on the bicycle being chosen as the means of transportation The latter leads to additional bicycle-km of current riders, which is the cause of the outward shift of the MC curve to a level of bicycling given by Q1i, whereas the former produces bicycle-km carried out by “new”, i e marginal, riders, which are not reflected in Figure 3
Before we move on to the issue of marginal riders, we focus on the shape of the MC curves for inframarginal riders The first bicycle-km are associated with negative internal costs, i e benefits These bicycle-km are the low-hanging
316 Götschi / Hintermann
Swiss Journal of Economics and Statistics, 2014, Vol. 150 (4)
fruit associated with mode choice characteristics that favor bicycling (e g nice weather, not much elevation gain, young riders, commuting, etc ) As we increase the total level of bicycling, more and more “onerous” bicycle-km are carried out such that we move up the MC curve Over a significant range, the relationship between internal costs and cumulative bicycle-km is approximately linear, but there is a sharp upwards trend in the beginning and at the very end These areas are determined by extreme combinations of explanatory variables For example, one cyclist in the sample is 99 years of age, and multiplying this number by the coefficients involving age yields a very high internal cost The same applies to other variables or their combination: The stages with the highest marginal costs are associated with higher age of the riders, greater steepness, worse weather, less time and money savings etc , all of which are measured with error such that the most extreme observations can be expected to over-state the true costs The positive error term from the Probit regression can only mitigate, but not remove this problem
We believe that it makes little sense to base our estimate of the internalized share of health benefits on these tail observations, because we are interested in the degree to which a representative person internalizes health benefits from an ex-ante perspective We therefore chose to adjust the last decile of the MC function
Figure 3: Generalized Cost Curves
Q0 Q1i
CH
F / k
m
0 100 200 300Million bicycle−km per year
1.0
0.5
0.0
–0.5
–1.0
–1.5
–2.0
–2.5
MC0 (pre-intervention)
MC1 (post-intervention)
Valuing Public Investments to Support Bicycling 317
Swiss Journal of Economics and Statistics, 2014, Vol. 150 (4)
13 The question of who would likely start to cycle is important when determining the health benefits associated with “new” bicycling However, since we lack information such as personal fitness, time gain relative to other modes of transportations etc , we cannot really address this question As noted above, the lack of relevant details pertaining to a person’s exercise level is the reason why we assume that health benefits are constant
by linearly extrapolating the slope between the 8th and 9th decile Although the same logic could be used to extrapolate for the first decile, the shape of the MC function at the lowest costs is of little empirical consequence because it is not used to identify the level of internalization of health benefits
A second reason for the adjustment is that some of the most extreme costs may not have been anticipated by the riders For example, riders may not know exactly how much elevation gain is associated with a stage, or they may not have expected rain When assessing the internal costs from an ex-post perspective based on the highest values, we would likely over-estimate people’s willingness to incur internal costs
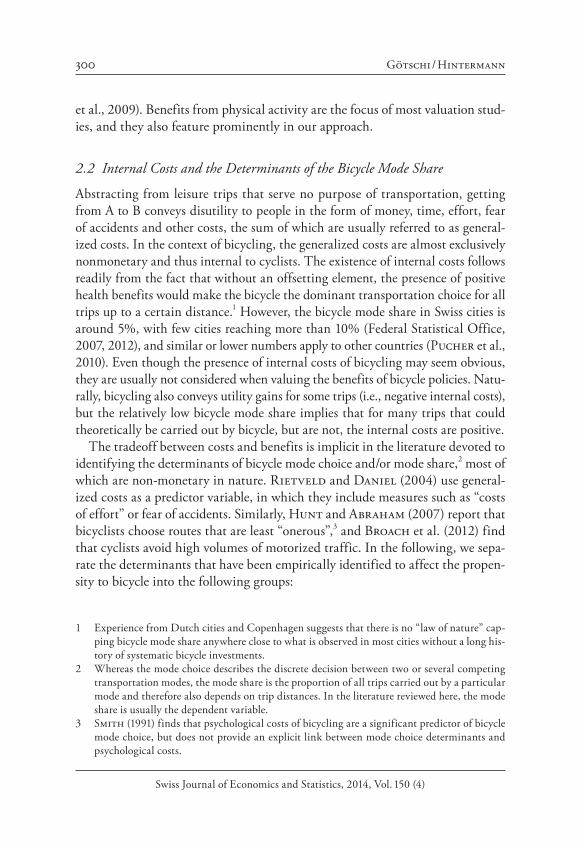
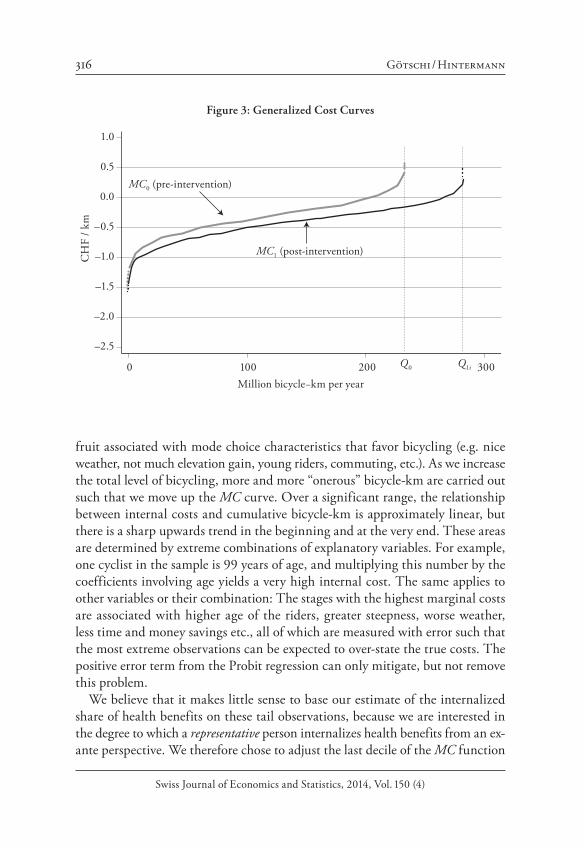
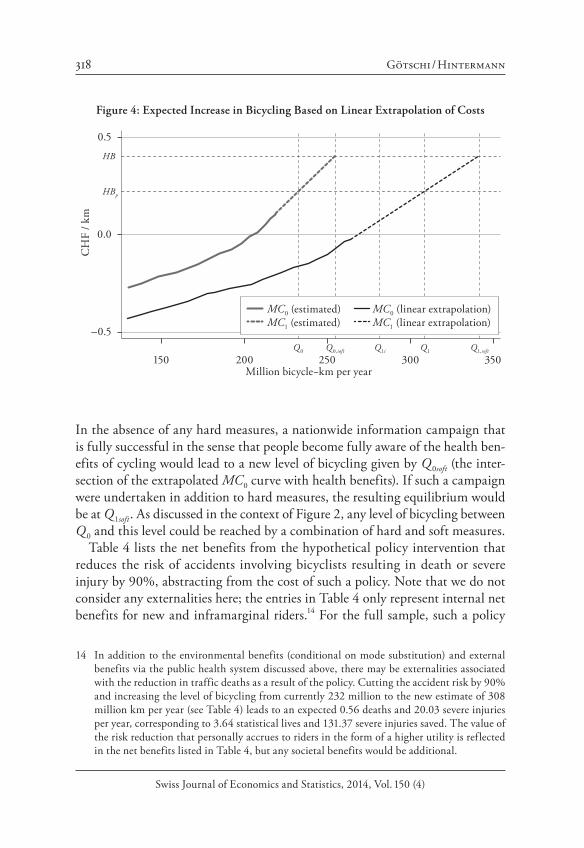
Figure 4 shows the region around Q 0 in more detail The straight part in MC0 replaces the last 10% of observed bicycle-km The intersection of this line with Q 0 gives us an adjusted estimate for internalized costs of 0 22 CHF/km, which is considerably lower than the unadjusted value and about half our estimate for gross health benefits HB of CHF 0 40
One way to identify the “new” riders would be to rely on the estimates from the Probit regression to compute the increase in the likelihood that a particular non-bicycle would switch to bicycling, and use some spline function to ensure that the internal cost estimates of the new trips continue where the MC1 func-tion ends at Q1i However, we believe that this would place undue weight on the distributional assumption for uij, and there may also be further problems asso-ciated with outliers and differences between ex ante- vs ex post assessments, requiring further extrapolations To avoid these issues, we determine the exten-sive margin of bicycling by simply extrapolating the internal cost curve beyond Q1i to the intersection with HBp, using the same slope as for the last two deciles 13
Conditional on our choice for the VSL, our results imply that bicyclists do not fully internalize health benefits, raising the scope for soft measures such as information campaigns with the aim to increase the awareness about positive health effects from bicycling Depending on their cost and effectiveness, such campaigns could be welfare-improving, and be used as substitutes or comple-ments for hard measures
318 Götschi / Hintermann
Swiss Journal of Economics and Statistics, 2014, Vol. 150 (4)
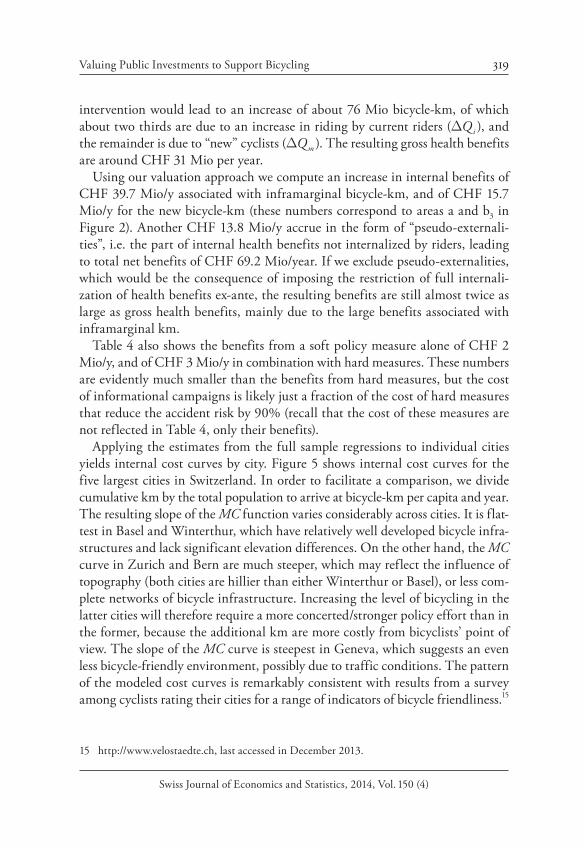
14 In addition to the environmental benefits (conditional on mode substitution) and external benefits via the public health system discussed above, there may be externalities associated with the reduction in traffic deaths as a result of the policy Cutting the accident risk by 90% and increasing the level of bicycling from currently 232 million to the new estimate of 308 million km per year (see Table 4) leads to an expected 0 56 deaths and 20 03 severe injuries per year, corresponding to 3 64 statistical lives and 131 37 severe injuries saved The value of the risk reduction that personally accrues to riders in the form of a higher utility is reflected in the net benefits listed in Table 4, but any societal benefits would be additional
In the absence of any hard measures, a nationwide information campaign that is fully successful in the sense that people become fully aware of the health ben-efits of cycling would lead to a new level of bicycling given by Q 0soft (the inter-section of the extrapolated MC0 curve with health benefits) If such a campaign were undertaken in addition to hard measures, the resulting equilibrium would be at Q 1soft As discussed in the context of Figure 2, any level of bicycling between Q 0 and this level could be reached by a combination of hard and soft measures
Table 4 lists the net benefits from the hypothetical policy intervention that reduces the risk of accidents involving bicyclists resulting in death or severe injury by 90%, abstracting from the cost of such a policy Note that we do not consider any externalities here; the entries in Table 4 only represent internal net benefits for new and inframarginal riders 14 For the full sample, such a policy
Figure 4: Expected Increase in Bicycling Based on Linear Extrapolation of Costs
CH
F / k
m
150 200 250 300 350Million bicycle−km per year
HB
HBp
0.5
0.0
–0.5Q0 Q0,soft Q1i Q1 Q1,soft
MC0 (estimated) MC0 (linear extrapolation)MC1 (estimated) MC1 (linear extrapolation)
Valuing Public Investments to Support Bicycling 319
Swiss Journal of Economics and Statistics, 2014, Vol. 150 (4)
15 http://www velostaedte ch, last accessed in December 2013
intervention would lead to an increase of about 76 Mio bicycle-km, of which about two thirds are due to an increase in riding by current riders (DQ i ), and the remainder is due to “new” cyclists (DQ m ) The resulting gross health benefits are around CHF 31 Mio per year
Using our valuation approach we compute an increase in internal benefits of CHF 39 7 Mio/y associated with inframarginal bicycle-km, and of CHF 15 7 Mio/y for the new bicycle-km (these numbers correspond to areas a and b3 in Figure 2) Another CHF 13 8 Mio/y accrue in the form of “pseudo-externali-ties”, i e the part of internal health benefits not internalized by riders, leading to total net benefits of CHF 69 2 Mio/year If we exclude pseudo-externalities, which would be the consequence of imposing the restriction of full internali-zation of health benefits ex-ante, the resulting benefits are still almost twice as large as gross health benefits, mainly due to the large benefits associated with inframarginal km
Table 4 also shows the benefits from a soft policy measure alone of CHF 2 Mio/y, and of CHF 3 Mio/y in combination with hard measures These numbers are evidently much smaller than the benefits from hard measures, but the cost of informational campaigns is likely just a fraction of the cost of hard measures that reduce the accident risk by 90% (recall that the cost of these measures are not reflected in Table 4, only their benefits)
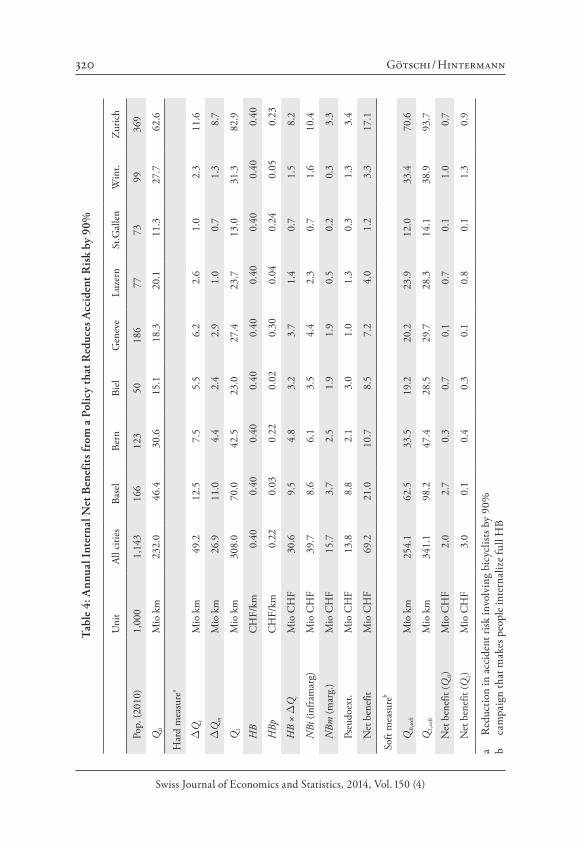
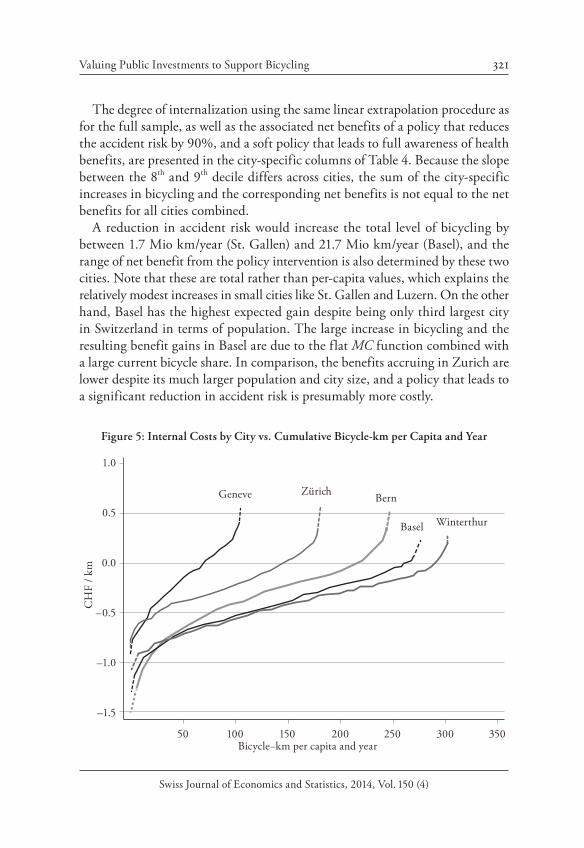
Applying the estimates from the full sample regressions to individual cities yields internal cost curves by city Figure 5 shows internal cost curves for the five largest cities in Switzerland In order to facilitate a comparison, we divide cumulative km by the total population to arrive at bicycle-km per capita and year The resulting slope of the MC function varies considerably across cities It is flat-test in Basel and Winterthur, which have relatively well developed bicycle infra-structures and lack significant elevation differences On the other hand, the MC curve in Zurich and Bern are much steeper, which may reflect the influence of topography (both cities are hillier than either Winterthur or Basel), or less com-plete networks of bicycle infrastructure Increasing the level of bicycling in the latter cities will therefore require a more concerted/stronger policy effort than in the former, because the additional km are more costly from bicyclists’ point of view The slope of the MC curve is steepest in Geneva, which suggests an even less bicycle-friendly environment, possibly due to traffic conditions The pattern of the modeled cost curves is remarkably consistent with results from a survey among cyclists rating their cities for a range of indicators of bicycle friendliness 15
320 Götschi / Hintermann
Swiss Journal of Economics and Statistics, 2014, Vol. 150 (4)
Tab
le 4
: Ann
ual I
nter
nal N
et B
enef
its
from
a P
olic
y th
at R
educ
es A
ccid
ent R
isk
by 9
0%
Uni
tAl
l citi
esBa
sel
Bern
Biel
Gen
eve
Luze
rnSt
Gal
len
Win
t Zu
rich
Pop
(201
0)1,
000
1,14
316
612
350
186
7773
9936
9
Q0
Mio
km
232
046
430
615
118
320
111
327
762
6
Har
d m
easu
rea
DQ
iM
io k
m49
212
57
55
56
22
61
02
311
6
DQ
mM
io k
m26
911
04
42
42
91
00
71
38
7
Q1
Mio
km
308
070
042
523
027
423
713
031
382
9
HB
CH
F/km
0 40
0 40
0 40
0 40
0 40
0 40
0 40
0 40
0 40
HBp
CH
F/km
0 22
0 03
0 22
0 02
0 30
0 04
0 24
0 05
0 23
HB
× D
QM
io C
HF
30 6
9 5
4 8
3 2
3 7
1 4
0 7
1 5
8 2
NBi
(inf
ram
arg)
Mio
CH
F39
78
66
13
54
42
30
71
610
4
NBm
(mar
g )
Mio
CH
F15
73
72
51
91
90
50
20
33
3
Pseu
doex
t M
io C
HF
13 8
8 8
2 1
3 0
1 0
1 3
0 3
1 3
3 4
Net
ben
efit
Mio
CH
F69
221
010
78
57
24
01
23
317
1
Soft
mea
sure
b
Q 0,
soft
Mio
km
254
162
533
519
220
223
912
033
470
6
Q1,
soft
Mio
km
341
198
247
428
529
728
314
138
993
7
Net
ben
efit
(Q 0)
Mio
CH
F2
02
70
30
70
10
70
11
00
7
Net
ben
efit
(Q1)
Mio
CH
F3
00
10
40
30
10
80
11
30
9
a R
educ
tion
in a
ccid
ent r
isk in
volv
ing
bicy
clist
s by
90%
b ca
mpa
ign
that
mak
es p
eopl
e in
tern
aliz
e fu
ll H
B
Valuing Public Investments to Support Bicycling 321
Swiss Journal of Economics and Statistics, 2014, Vol. 150 (4)
The degree of internalization using the same linear extrapolation procedure as for the full sample, as well as the associated net benefits of a policy that reduces the accident risk by 90%, and a soft policy that leads to full awareness of health benefits, are presented in the city-specific columns of Table 4 Because the slope between the 8th and 9th decile differs across cities, the sum of the city-specific increases in bicycling and the corresponding net benefits is not equal to the net benefits for all cities combined
A reduction in accident risk would increase the total level of bicycling by between 1 7 Mio km/year (St Gallen) and 21 7 Mio km/year (Basel), and the range of net benefit from the policy intervention is also determined by these two cities Note that these are total rather than per-capita values, which explains the relatively modest increases in small cities like St Gallen and Luzern On the other hand, Basel has the highest expected gain despite being only third largest city in Switzerland in terms of population The large increase in bicycling and the resulting benefit gains in Basel are due to the flat MC function combined with a large current bicycle share In comparison, the benefits accruing in Zurich are lower despite its much larger population and city size, and a policy that leads to a significant reduction in accident risk is presumably more costly
Figure 5: Internal Costs by City vs. Cumulative Bicycle-km per Capita and Year
Basel
BernGeneve
Winterthur
Zürich
CH
F / k
m
50 100 150 200 250 300 350Bicycle−km per capita and year
1.0
0.5
0.0
–0.5
–1.0
–1.5
322 Götschi / Hintermann
Swiss Journal of Economics and Statistics, 2014, Vol. 150 (4)
5.2 Sensitivity of the Results
Our results are sensitive to our model and parameter assumptions Whereas we were guided by the literature about bicycle mode choice determinants and the availability (or lack) of data for the selection of the variables in eqs (2) and (3), other modeling choices are more difficult to justify due to lack of information In the following, we discuss those to which our results are most sensitive
Our estimates of health benefits, and thus of the degree of internalization, directly depend on the choice of the VSL Using a value of CHF 9 33 mil-lion (2010 francs) that corresponds to the VSL employed by USEPA, we find that Swiss bicyclists internalize about half of the health benefits associated with bicycling, suggesting a large scope for soft measures If we were to use a VSL of CHF 5 21 million (2010 francs) instead, we would find that people exactly internalize health benefits On the other hand, including a value for reduction in morbidity risk, and of being healthy in general, would increase exercise-related benefits and thus lead to a decrease in the degree of internalization Note, finally, that the level of VSL and non-mortality-related benefits do not affect the ben-efits to inframarginal riders, which constitute the largest source of benefits in our application
The degree of internalization of health benefits further depends on the method by which we reduce the influence of outliers on our internal cost estimate Start-ing the linear extrapolation at a different cutoff will affect the level at which the MC function intersects with the benchmark quantity of bicycling For exam-ple, extrapolating the last 10% based on the slope between the 70th (rather than the 80th) and the 90th percentile lowers the internalized benefits from 0 22 to 0 20 CHF/km and increases net benefits to CHF 71 4 million (result for all cities combined), due to higher pseudoexternalities However, in the absence of more detailed information about actually chosen routes and their characteristics, we have no way of knowing the “best” cutoff point What seems clear, however, is that we do not want to base our estimate for the degree of internalization on the stages with the highest internal cost estimates, because they likely represent extreme preferences and/or biased expectations
Furthermore, the results are sensitive to the specification of equation (3) Using a log-linear specification (where we replace the dependent variable with its natural logarithm) changes the net benefits from reducing accident risk by 90 % from 69 2 to 39 5 million CHF per year, whereas the amount of inter-nalized health benefits is reduced from 0 22 to 0 14 CHF per km Specifica-tion tests are ambiguous as to which specification is more appropriate,16 but a visual inspection of predicted and actual bicycle-km provides support for the
Valuing Public Investments to Support Bicycling 323
Swiss Journal of Economics and Statistics, 2014, Vol. 150 (4)
16 According to the Wald statistic and the sum of squared residuals, the linear specification per-forms better; however, the average and the proportional absolute errors are smaller with the log-linear specification
linear specification As is generally the case when theory gives us no indication as to how the variables enter a model, the criteria according to which the “best” specification would have to be chosen are not clear, nor the universe of possible specifications that are tested
More advanced models of self-selection exist that relax the normality assump-tion embedded in Heckman’s model using semiparametric techniques (e g Newey, Powell and Walker, 1990), but it is not clear that the results based on a different modeling approach are necessarily more trustworthy than the FIML estimates reported here, given that they depend on further assumptions such as the choice of kernel, bandwidth, and type of matching Note that the paramet-ric assumptions of the Heckman model are especially important in small sam-ples (Puhani, 2000), whereas in larger samples, FIML performs usually well
Last, we stress that our estimates are static in nature, and that sustained bicy-cle-related spending in a city with a steep MC curve may lower the slope over time Indeed, we find that reducing the internal costs of bicycling by increasing road safety not only shifts the MC function downward, but also lowers its slope, such that it would be premature to conclude that bicycle investments should be concentrated in cities that currently have a relatively flat MC function If the effectiveness of bicycle measures, defined as the increase in bicycle-km per dollar of investment, is S-shaped due to network effects as is commonly assumed, then the value per dollar of investment may in fact be larger in cities with a currently steep MC function However, the dynamic effects and the effectiveness of bicy-cle investment at different mode shares are beyond the scope of this study and is left for future research
324 Götschi / Hintermann
Swiss Journal of Economics and Statistics, 2014, Vol. 150 (4)
6 Conclusions
Our framework for the valuation of bicycle investments adds an economic per-spective to a relatively young field of research, which to date has been studied pri-marily by health and transport scientists In particular, it expands the valuation beyond simple gross benefits calculations, as provided by WHO’s HEAT tool and others We explicitly consider internal costs to cyclists to reconcile the con-trast between large health benefits and rather low levels of cycling even for short trips Our framework can be interpreted as an application of standard valuation methods in the spirit of the “rule-of-a-half” to a situation that is nonstandard because the costs of bicycling are entirely nonmonetary in nature
In addition to the net benefits associated with an increase in bicycling in response to some policy intervention, our framework also allows us to compute inframarginal benefits, which are ignored when valuing the expansion of bicy-cling by means of gross health benefits alone The higher the level of cycling is, the more relevant inframarginal benefits become relative to the benefits accru-ing to marginal riders In our application, we find that the former outweigh the latter by an order of magnitude
By monetizing internal costs independently from health benefits related to mortality reductions, we obtain an indication for the degree to which bicyclists internalize health benefits, or more precisely, the sum of health benefits and exter-nal effects (for which we do not control as we have no source of variation across cities and time) This is an interesting question in its own right, but it also matters for valuing the benefits of bicycle-related spending, because the non-internalized part of health benefits are “quasi-external” and thus not offset by internal costs Incomplete internalization further indicates a potential for “soft measures”, e g in the form of educational campaigns that inform people about the benefits of cycling and lead them to internalize these
Our framework also serves as a rationale and guidance for future investments in data collection efforts While the travel survey data available to us are quite rich and considered state of the art, they lack psychological variables, such as personal attitudes, which limits their capability to predict bicycle behavior In addition, we identify a main gap in information relevant for internal costs at the level of road network characteristics, namely connectivity and route attributes such as objective and perceived safety and infrastructure types Besides general progress in research on determinants of cycling, richer data sets of sufficient spa-tial resolution are needed to advance towards an improved quantitative imple-mentation of our framework
Valuing Public Investments to Support Bicycling 325
Swiss Journal of Economics and Statistics, 2014, Vol. 150 (4)
References
Allen-Munley, C , J Daniel and S Dhar (2004), “Logistic Model for Rating Urban Bicycle Route Safety”, Pedestrians and Bicycles; Developing Countries, pp 107–115
Andersen, L B , P Schnohr, M Schroll and H O Hein (2000), “All-Cause Mortality Associated with Physical Activity during Leisure Time, Work, Sports, and Cycling to Work”, Archives of Internal Medicine, 160, pp 1621–1628
Bauman, A E , R S Reis, J F Sallis, J C Wells, R J Loos and B W Martin (2012), “Correlates of Physical Activity: Why Are Some People Phys-ically Active and Others Not?”, The Lancet, 380, pp 258–271
Bernheim, B Douglas and Antonio Rangel (2007), Behavioral Public Eco-nomics: Welfare and Policy Analysis with Nonstandard Decision-Makers, in: Diamond, P (Ed ), Behavioral Economics and its Applications, Princeton University Press, Princeton, p 112
Berrigan, D , L W Pickle and J Dill (2010), “Associations between Street Connectivity and Active Transportation”, Internationa Journal of Health Geo-graphics, 9, 20
Borjesson, Maria and Jonas Eliasson (2012), “The Value of Time and Exter-nal Benefits in Bicycle Appraisal”, Transportation Research: Part A: Policy and Practice, 46, pp 673–683
Broach, Joseph, Jennifer Dill and John Gliebe (2012), “Where Do Cyclists Ride? A Route Choice Model Developed with Revealed Preference GPS Data”, Transportation Research Part A: Policy and Practice.
Cavill, Nick, Sonja Kahlmeier, Harry Rutter, Francesca Racioppi and Pekka Oja (2009), “Economic Analyses of Transport Infrastructure and Poli-cies Including Health Effects Related to Cycling and Walking: A Systematic review”, Transport Policy, 15, pp 291–304
de Geus, Bas, Grégory Vandenbulcke, Luc Int Panis, Isabelle Thomas, Bart Degraeuwe, Elke Cumps, Joris Aertsens, Rudi Torfs and Romain Meeusen (2012), “A prospective cohort study on minor accidents involv-ing commuter cyclists in Belgium”, Accident Analysis & Prevention, 45, pp 683–693
de Hartog, Jeroen Johan, Hanna Boogaard, Hans Nijland and Gerard Hoek (2010), “Do The Health Benefits Of Cycling Outweigh The Risks?”, Environmental Health Perspectives, 118 (8), pp 1109–1116
de Nazelle, A , M J Nieuwenhuijsen, J M Anto, M Brauer, D Briggs, C Braun-Fahrlander, N Cavill, A R Cooper, H Desqueyroux,
326 Götschi / Hintermann
Swiss Journal of Economics and Statistics, 2014, Vol. 150 (4)
S Fruin, G Hoek, L I Panis, N Janssen, M Jerrett, M Joffe, Z J Andersen, E van Kempen, S Kingham, N Kubesch, K M Leyden, J D Marshall, J Matamala, G Mellios, M Mendez, H Nassif, D Ogilvie, R Peiro, K Perez, A Rabl, M Ragettli, D Rodriguez, D Rojas, P Ruiz, J F Sallis, J Terwoert, J F Toussaint, J Tuomisto, M Zuurbier and E Lebret (2011), “Improving Health Through Policies that Promote Active Travel: A Review of Evidence to Support Integrated Health Impact Assessment”, Environ Int., 37, pp 766–777
Dumbaugh, Eric (2005), “Safe Streets, Livable Streets”, Journal of the American Planning Association, 71, pp 283–300
Ellison, R B and S P Greaves (2011), “Travel Time Competitiveness of Cycling in Sydney”, Transportation Research Record: Journal of the Transpor-tation Research Board, 2247, pp 99–108
Eriksson, Louise and Sonja E Forward (2011), “Is the Intention to Travel in a Pro-environmental Manner and the Intention to Use the Car Determined by Different Factors?”, Transportation Research: Part D: Transport and Envi-ronment, 16, pp 372–376
Federal Statistical Office (2007), „Mobilität in der Schweiz: Ergebnisse des Mikrozensus 2005 zum Verkehrsverhalten“ BfS, ARE, Neuchâtel, pp 18, 41
Federal Statistical Office (2012), „Mobilität in der Schweiz: Ergebnisse des Mikrozensus Mobilität und Verkehr 2010“ BfS, ARE, Neuchâtel
Gotschi, T (2011), “Costs and Benefits of Bicycling Investments in Portland, Oregon”, Journal of Physical Activity and Health 8, pp S49–S58
Heckman, James J (1979), “Sample Selection Bias as a Specification Error”, Econometrica: Journal of the Econometric Society, pp 153–161
Heinen, Eva and Susan Handy (2012), “Similarities in Attitudes and Norms and the Effect on Bicycle Commuting: Evidence from the Bicycle Cities Davis and Delft”, International Journal of Sustainable Transportation, 6, pp 257–281
Holm, Astrid Ledgaard, Charlotte Glümer and Finn Diderichsen (2012), “Health Impact Assessment of Increased Cycling to Place of Work or Education in Copenhagen”, BMJ open 2
Hunt, J D and J E Abraham (2007), “Influences on Bicycle Use”, Transpor-tation, 34, pp 453–470
Int Panis, Luc, Bas de Geus, Grégory Vandenbulcke, Hanny Willems, Bart Degraeuwe, Nico Bleux, Vinit Mishra, Isabelle Thomas and Romain Meeusen (2010), “Exposure to Particulate Matter in Traffic: A Comparison of Cyclists and Car Passengers”, Atmospheric Environment, 44, pp 2263–2270
Valuing Public Investments to Support Bicycling 327
Swiss Journal of Economics and Statistics, 2014, Vol. 150 (4)
Jara‐Díaz, Sergio R and Marcelo Farah (1988), “Valuation of Users’ Benefits in Transport Systems”, Transport Reviews, 8, pp 197–218
Krizek, Kevin, Ann Forsyth and Laura Baum (2009), “Walking and Cycling International Literature Review”, Department of Transport – Walking and Cycling Branch, Melbourne, Australia
Krizek, Kevin, Gavin Poindexter, Gary Barnes and Paul Mogush (2007), “Analysing the Benefits and Costs of Bicycle Facilities via Online Guidelines”, Planning, Practice & Research, 22, pp 197–213
Li, Zhibin, Wei Wang, Pan Liu and David R Ragland (2012), “Physical Environments Influencing Bicyclists’ Perception of Comfort on Separated and On-Street Bicycle Facilities”, Transportation Research: Part D: Transport and Environment, 17, pp 256–261
Litman, Todd (2004), “Quantifying the Benefits of Nonmotorized Transporta-tion for Achieving Mobility Management Objectives”, Transportation Research Record, 1441, pp 134–140
Nellthorp, J , T Sansom, P Bickel, C Doll and G Lindberg (2001), “Val-uation Conventions for UNITE, UNITE (UNIfication of Accounts and Marginal Costs for Transport Efficiency)”, ITS, University of Leeds, Leeds
Newey, Whitney K, James L Powell and James R Walker (1990), “Sem-iparametric Estimation of Selection Models: Some Empirical Results”, The American Economic Review, pp 324–328
Oja, P , S Titze, A Bauman, B de Geus, P Krenn, B Reger-Nash and T Kohlberger (2011), “Health Benefits of Cycling: A Systematic Review”, Scandinavian Journal of Medicine & Science in Sports, 21 (4), pp 496–509
Pucher, J and R Buehler (2012), City Cycling, MIT Press, Cambridge, Massachusetts
Pucher, J , R Buehler, D R Bassett and A L Dannenberg (2010), “Walk-ing and Cycling to Health: A Comparative Analysis Of City, State, and Inter-national Data”, American Journal of Public Health, 100, pp 1986–1992
Pucher, J , J Dill and S Handy (2010), “Infrastructure, Programs, and Poli-cies to Increase Bicycling: An International Review”, Preventive Medicine, 50, pp S106-S125
Puhani, Patrick (2000), “The Heckman Correction for Sample Selection and its Critique”, Journal of Economic Surveys, 14, 53–68
Rabl, A and A De Nazelle (2012), “Benefits of Shift from Car to Active Transport”, Transport Policy, 19, pp 121–131
Rojas-Rueda, D , A de Nazelle, M Tainio and M J Nieuwenhuijsen (2011), “The Health Risks and Benefits of Cycling in Urban Environments
328 Götschi / Hintermann
Swiss Journal of Economics and Statistics, 2014, Vol. 150 (4)
Compared with Car Use: Health Impact Assessment Study”, BMJ: British Medical Journal, 343
Rutter, H , N Cavill, F Racioppi, Hywell Dinsdale, P Oja and S Kahl-meier (2013), “Economic Impact of Reduced Mortality Due to Increased Cycling”, American Journal of Preventive Medicine, 44, pp 89–92
Saelens, B E , J F Sallis and L D Frank (2003), “Environmental Correlates of Walking and Cycling: Findings from the Transportation, Urban Design, and Planning Literatures”, Annals of Behavioral Medicine, 25, pp 80–91
Smith, Bruce H (1991), “Anxiety as a Cost of Commuting to Work”, Journal of Urban Economics, 29, pp 260–266
Thakuriah, Piyushimita, Paul Metaxatos, Jane Lin and Elizabeth Jensen (2012), “An Examination of Factors Affecting Propensities to Use Bicycle and Pedestrian Facilities in Suburban Locations”, Transportation Research: Part D: Transport and Environment, 17, pp 341–348
Wang, Guijing, Caroline A Macera, Barbara Scudder-Soucie, Tom Schmid, Michael Pratt and David Buchner (2005), “A Cost-Benefit Analysis of Physical Activity Using Bike/Pedestrian Trails”, Health Promo-tion Practice, 6, pp 174–179
Wardman, Mark, Miles Tight and Matthew Page (2007), “Factors Influenc-ing the Propensity to Cycle to Work”, Transportation Research Part A: Policy and Practice, 41, pp 339–350
WHO (2008), “Health Economic Assessment Tool for Cycling”, World Health Organization Office for Europe
Woodcock, J , P Edwards, C Tonne, B G Armstrong, O Ashiru, D Banister, S Beevers, Z Chalabi, Z Chowdhury, A Cohen, O H Franco, A Haines, R Hickman, G Lindsay, I Mittal, D Mohan, G Tiwari, A Woodward and I Roberts (2009), “Public Health Benefits of Strategies to Reduce Greenhouse-Gas Emissions: Urban Land Transport”, The Lancet, 374, 1930–1943
Woodcock, J , O H Franco, N Orsini and I Roberts (2011), “Non-Vig-orous Physical Activity and All-Cause Mortality: Systematic Review and Meta-Analysis of Cohort Studies”, International Journal of Epidemiology, 40, pp 121–138
Valuing Public Investments to Support Bicycling 329
Swiss Journal of Economics and Statistics, 2014, Vol. 150 (4)
SUMMARY
We develop a framework for assessing the net benefits of investments to promote bicycling, which explicitly accounts for internal costs of bicycling We apply our model to eight Swiss cities using data from the Swiss national travel survey and find that increasing the level of bicycling by reducing internal costs leads to inframarginal benefits that exceed the net benefits from the additional bicy-cling We further find that Swiss cyclists only partially internalize health ben-efits, which affects the benefits from infrastructure investments but also implies that there is scope for “soft” measures that would inform users about health ben-efits of bicycling