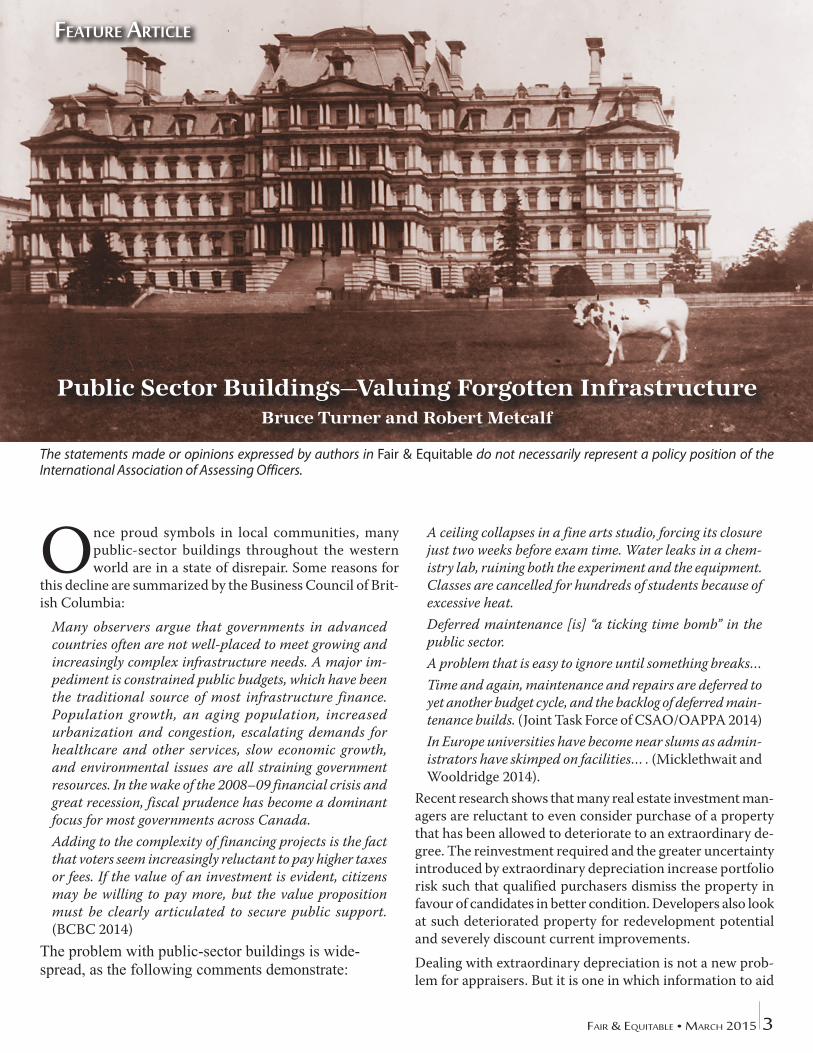
public sector buildings - valuing forgotten infrastructure
TRANSCRIPT
Fair & EquitablE • March 2015 3
The statements made or opinions expressed by authors in Fair & Equitable do not necessarily represent a policy position of the International Association of Assessing Officers.
Once proud symbols in local communities, many public-sector buildings throughout the western world are in a state of disrepair. Some reasons for
this decline are summarized by the Business Council of Brit-ish Columbia:
Many observers argue that governments in advanced countries often are not well-placed to meet growing and increasingly complex infrastructure needs. A major im-pediment is constrained public budgets, which have been the traditional source of most infrastructure finance. Population growth, an aging population, increased urbanization and congestion, escalating demands for healthcare and other services, slow economic growth, and environmental issues are all straining government resources. In the wake of the 2008–09 financial crisis and great recession, fiscal prudence has become a dominant focus for most governments across Canada. Adding to the complexity of financing projects is the fact that voters seem increasingly reluctant to pay higher taxes or fees. If the value of an investment is evident, citizens may be willing to pay more, but the value proposition must be clearly articulated to secure public support. (BCBC 2014)
The problem with public-sector buildings is wide-spread, as the following comments demonstrate:
A ceiling collapses in a fine arts studio, forcing its closure just two weeks before exam time. Water leaks in a chem-istry lab, ruining both the experiment and the equipment. Classes are cancelled for hundreds of students because of excessive heat. Deferred maintenance [is] “a ticking time bomb” in the public sector. A problem that is easy to ignore until something breaks… Time and again, maintenance and repairs are deferred to yet another budget cycle, and the backlog of deferred main-tenance builds. (Joint Task Force of CSAO/OAPPA 2014) In Europe universities have become near slums as admin-istrators have skimped on facilities… . (Micklethwait and Wooldridge 2014).
Recent research shows that many real estate investment man-agers are reluctant to even consider purchase of a property that has been allowed to deteriorate to an extraordinary de-gree. The reinvestment required and the greater uncertainty introduced by extraordinary depreciation increase portfolio risk such that qualified purchasers dismiss the property in favour of candidates in better condition. Developers also look at such deteriorated property for redevelopment potential and severely discount current improvements.
Dealing with extraordinary depreciation is not a new prob-lem for appraisers. But it is one in which information to aid
Feature article
Public Sector Buildings—Valuing Forgotten Infrastructure Bruce Turner and Robert Metcalf
4 Fair & EquitablE • March 2015
analysis hides in plain sight, lacking consistently applied methodology for appraisers to enhance their client’s or em-ployer’s decision making.
So how might appraisers use information such as condition reports and related metrics that are now commonly available to value extraordinarily deteriorated buildings?
This article explores the opportunity for reaching more sup-portable, evidence-based appraisal judgments versus the temptation of resorting to Ouija value conclusions—that is, ensuring that appraisal judgment is rooted in sound market analysis, while building upon proven valuation methodologies.
The idea for the article arose from a consulting assignment to review the assessments of government-owned buildings for which reactive maintenance strategies over many years had left high-profile buildings in a deteriorated state, thus diminishing service life and reducing asset values. This situ-ation, combined with the assessor’s constant challenge to allocate thin resources to address increasing performance requirements, often means that reduced asset values are not necessarily recognized in periodic property assessments for public-sector buildings. It also means that extraordinary de-ferred maintenance (EDM) and reduced building stewardship can actually be more costly to taxpayers over the long term.
Research Approach Research for the consulting assignment first required clarify-ing the problem, that is, understanding the context described above. Then extraordinary EDM had to be defined to describe and develop a methodology based on appraisal principles that facilitated the appraiser’s interpretation of market behaviour in consistently recognizing any loss in value.
Guiding appraisal principles and concepts had to be consid-ered carefully, and research was needed to validate the meth-odology against market behavior and to allow comparison to current practice. (The methodology described here builds on the foundation principles and concepts articulated in The Ap-praisal of Real Estate [Appraisal Institute of Canada 2010].)
The research comprised three concurrent phases:
1. Validating the proposed methodology with the experi-ence and practices of real estate investors and senior decision makers
2. Exploring the current practice of leading assessment agencies
3. Completing an extensive literature review (see the Bibliography for a list).
The research questions were as follows:
1. Does the proposed methodology for recognizing EDM reflect the behaviour of real estate market decision makers?
2. Can the appraiser rely on facilities condition assess-ment (FCA) reports and the facilities condition index (FCI) to aid appraisal judgment and achieve more accurate, equitable, and evidence-based valuation conclusions?
Based on our research findings, both questions are answered in the affirmative.
What Is Extraordinary Deferred Maintenance? It is unwise to pay too much, but it is worse to pay too little. When you pay too little, you sometimes lose everything because the thing you bought was incapable of doing the thing you bought it to do.” John Ruskin (1819–1900)
Based on the comprehensive research for this project, we developed the following definition for EDM:
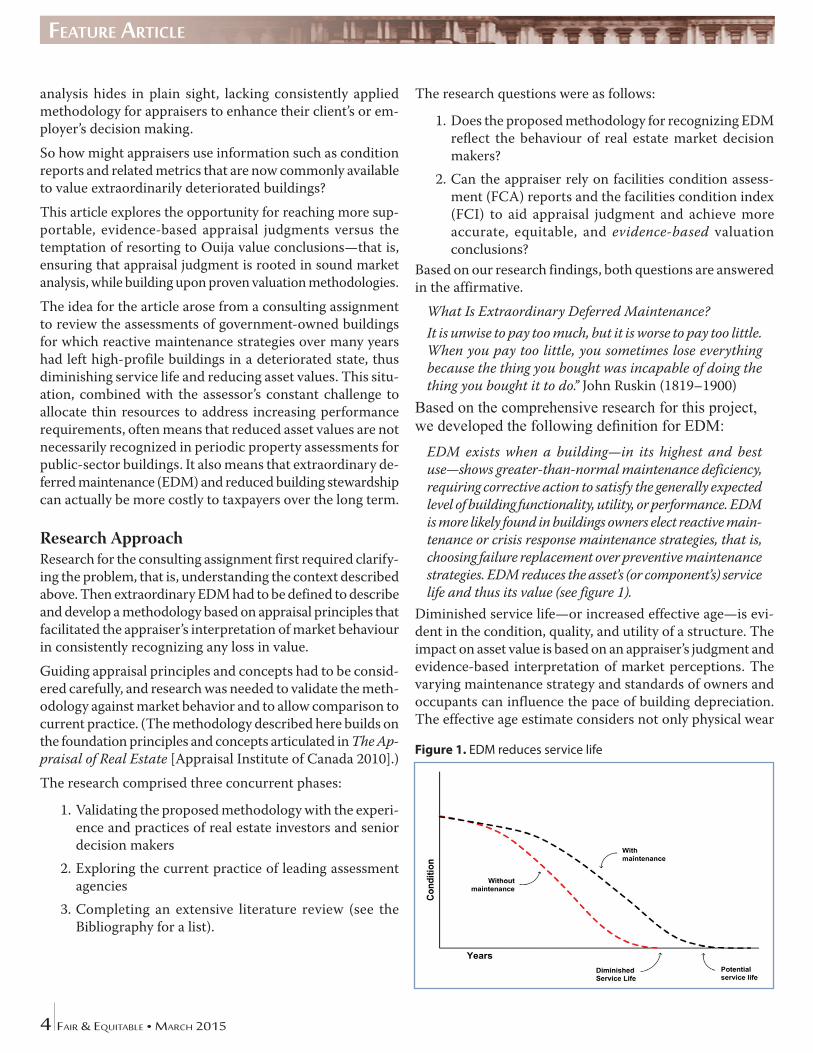
EDM exists when a building—in its highest and best use—shows greater-than-normal maintenance deficiency, requiring corrective action to satisfy the generally expected level of building functionality, utility, or performance. EDM is more likely found in buildings owners elect reactive main-tenance or crisis response maintenance strategies, that is, choosing failure replacement over preventive maintenance strategies. EDM reduces the asset’s (or component’s) service life and thus its value (see figure 1).
Diminished service life—or increased effective age—is evi-dent in the condition, quality, and utility of a structure. The impact on asset value is based on an appraiser’s judgment and evidence-based interpretation of market perceptions. The varying maintenance strategy and standards of owners and occupants can influence the pace of building depreciation. The effective age estimate considers not only physical wear
Feature article
Figure 1. EDM reduces service life
Fair & EquitablE • March 2015 5
and tear but also any loss in value for functional and external considerations (Appraisal Institute 2010, 19.3).
Premise for Measuring Impact of EDM on Asset ValueThe premise for measuring EDM is straightforward. The asset (i.e., the entire building or some component) is dete-riorated beyond its normally expected condition/utility—in comparison with typical market or expected asset perfor-mance level—to such an extent that a potential purchaser/investor would reduce the offer price, based on the principle of substitution.
The test for EDM involves comparing the observed condition of the subject property against the normally expected condi-tion (level of depreciation) that represents the standard of care for a similar asset in its comparable market set. (The observed condition of an asset reflects both its chronological age and the degree of replacement of its depreciable com-ponents.)
Before we discuss standard of care, it is useful to review facili-ties condition assessment (FCA) and introduce the Facilities Condition Index (FCI) (www.assetinsights.net).
The Facilities Condition Index Facilities Condition Assessment FCAs provide important information and have become commonplace in commercial real estate transactions and portfolio investment decisions. As part of disclosure during transactions or to expedite the sale of assets, vendors often provide qualified purchasers with comprehensive condition assessments.
Professionally prepared FCA reports provide a benchmark for the building’s relative performance and prioritize projects for maintenance, repair, or renewal. They provide defensible cost estimates that the decision maker can rely upon to make real estate acquisition, reinvestment, or disposition decisions.
The FCA report provides information about the current con-dition of building components (such as roofs or boilers) ex-pressed as statements about deferred maintenance, or catch-up costs. They may include information on keep-up costs, which are forecasts of future life cycle renewal requirements or, optionally, get-ahead costs, which identify opportunities for facility adaptation and improvement.
The methodology in this article focuses on catch-up costs.
Facilities Condition Index The FCI (an optional provision in a FCA report) is a key building performance indicator. It is used to objectively quantify and evaluate the current condition of a facility to
make benchmark comparisons of relative condition for that building with its comparable set (inclusive of private- and public-sector buildings).
The FCI is an industry standard method for comparing rela-tive asset conditions, expressed as a formula (U.S. Federal Real Property Council 2008):
FCI = total cost of existing requirementscurrent replacement value
FCI Condition Scale The lower the FCI, the better the condition of the building. Current industry benchmarks indicate the subjective ratings shown in table 1.
Table 1. Facilities Condition Index FCI (as a percentage of current replacement cost) Condition
0–5% Good5–10% Fair
10–30% Poor>30% Critical
www.assetinsights.net/Glossary/G_Facility_Condition_Index.html
Catch-up costs reflect deficient conditions that are typi-cally derived from FCA reports (www.assetinsights.net/Glossary/G_Catch-up_Costs.html), which are also referred to as building condition assessment (BCA) reports, that have been carried out by an experienced and qualified team of professionals (e.g., architects, engineers). The FCI provides a relative measure for comparing the condition assessments of many buildings and for determining the most important priorities to address in capital expenditures.
The identified catch-up costs provide the information base for determining any value adjustment for EDM.
The appraiser may also interpret the prioritized catch-up costs in the FCA report, reflecting how these may be typically considered by investors in market transactions.
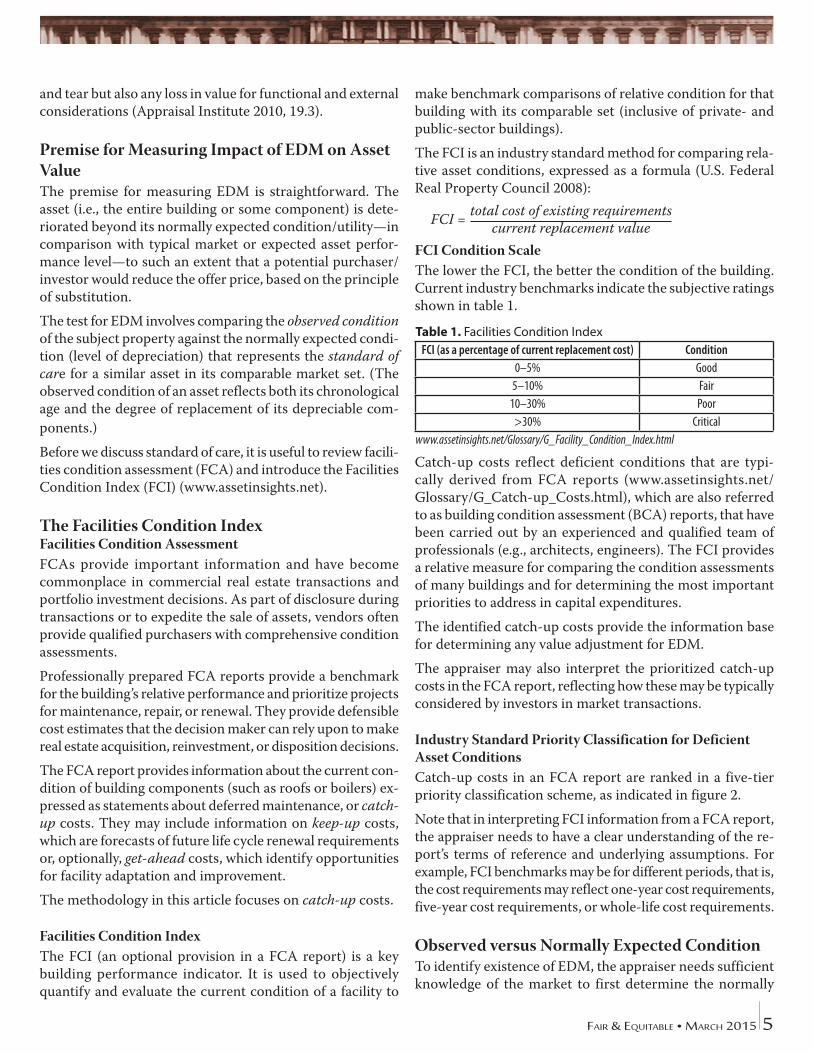
Industry Standard Priority Classification for Deficient Asset ConditionsCatch-up costs in an FCA report are ranked in a five-tier priority classification scheme, as indicated in figure 2.
Note that in interpreting FCI information from a FCA report, the appraiser needs to have a clear understanding of the re-port’s terms of reference and underlying assumptions. For example, FCI benchmarks may be for different periods, that is, the cost requirements may reflect one-year cost requirements, five-year cost requirements, or whole-life cost requirements.
Observed versus Normally Expected ConditionTo identify existence of EDM, the appraiser needs sufficient knowledge of the market to first determine the normally
6 Fair & EquitablE • March 2015
expected condition for the subject property’s comparable market set. This determination is facilitated through review of a professionally prepared FCA report.
The subject building’s observed condition can then be de-termined by applying appraisal judgment supplemented by information from the FCA report and confirmed through the appraiser’s physical inspection of the property.
Comparative FCIs assist in distinguishing the subject’s ob-served condition from the normally expected condition in the comparative market set. To do so, the owner’s mainte-nance strategy should be identified and compared with the standard of care typical for the property type and its market.
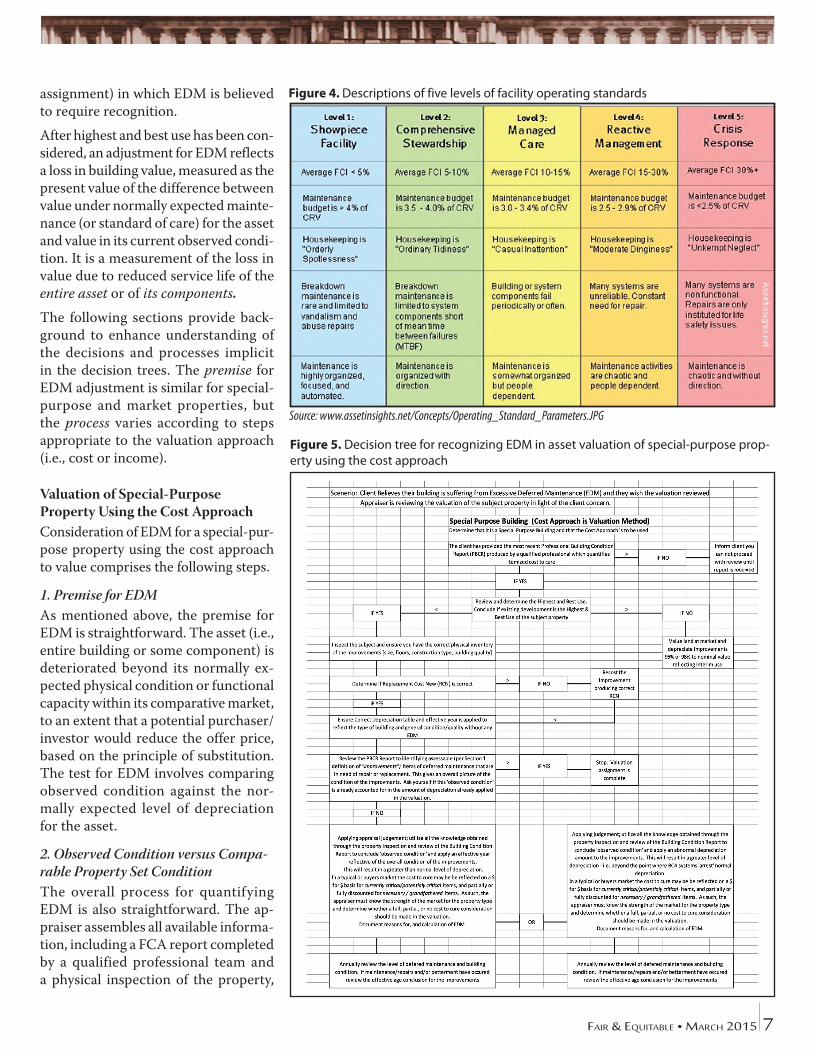
Standard of Care and Evidence of Maintenance StrategyFor various reasons, building owners may elect a mainte-nance strategy reflecting a standard of care ranging from showpiece facility to crisis response (www.assetinsights.net/Glossary/G_Managed_Care.htm).
In situations in which that maintenance strategy is reactive and funding levels are reduced, the normally expected stan-dard of care for the comparable property set (or market) is not met. In such circumstances, it is more likely to find that EDM affects the building’s service life and thus its value.
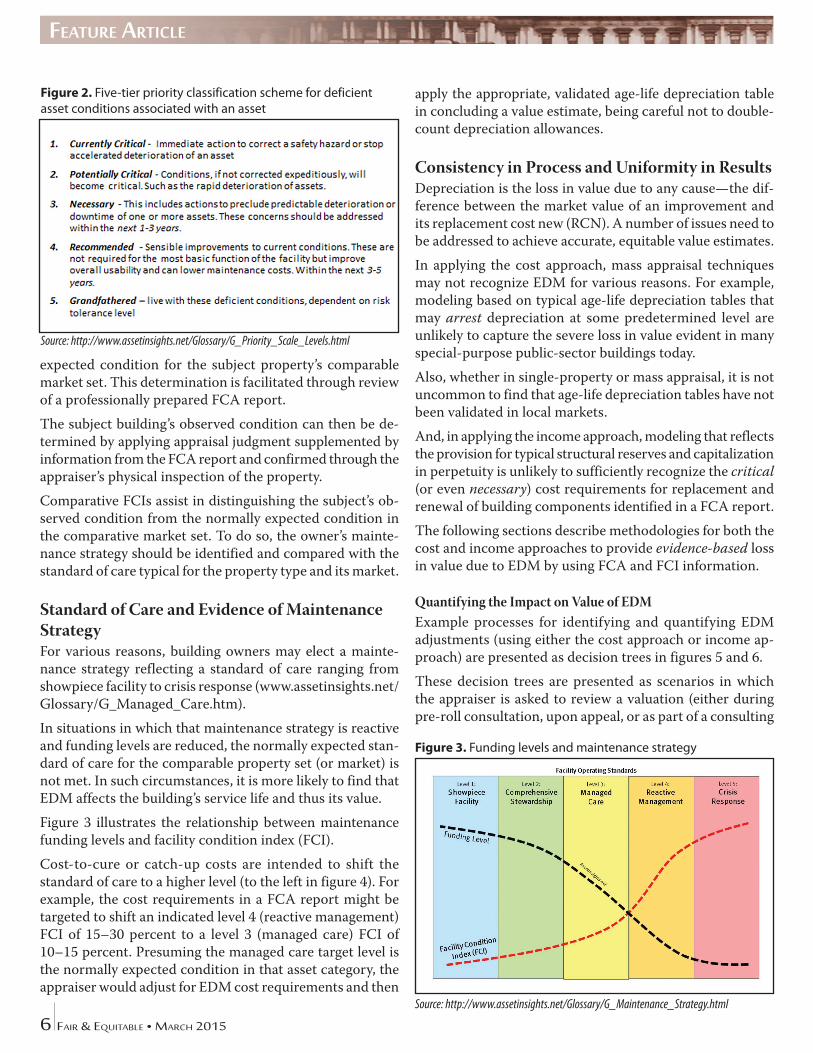
Figure 3 illustrates the relationship between maintenance funding levels and facility condition index (FCI).
Cost-to-cure or catch-up costs are intended to shift the standard of care to a higher level (to the left in figure 4). For example, the cost requirements in a FCA report might be targeted to shift an indicated level 4 (reactive management) FCI of 15–30 percent to a level 3 (managed care) FCI of 10–15 percent. Presuming the managed care target level is the normally expected condition in that asset category, the appraiser would adjust for EDM cost requirements and then
apply the appropriate, validated age-life depreciation table in concluding a value estimate, being careful not to double-count depreciation allowances.
Consistency in Process and Uniformity in ResultsDepreciation is the loss in value due to any cause—the dif-ference between the market value of an improvement and its replacement cost new (RCN). A number of issues need to be addressed to achieve accurate, equitable value estimates.
In applying the cost approach, mass appraisal techniques may not recognize EDM for various reasons. For example, modeling based on typical age-life depreciation tables that may arrest depreciation at some predetermined level are unlikely to capture the severe loss in value evident in many special-purpose public-sector buildings today.
Also, whether in single-property or mass appraisal, it is not uncommon to find that age-life depreciation tables have not been validated in local markets.
And, in applying the income approach, modeling that reflects the provision for typical structural reserves and capitalization in perpetuity is unlikely to sufficiently recognize the critical (or even necessary) cost requirements for replacement and renewal of building components identified in a FCA report.
The following sections describe methodologies for both the cost and income approaches to provide evidence-based loss in value due to EDM by using FCA and FCI information.
Quantifying the Impact on Value of EDMExample processes for identifying and quantifying EDM adjustments (using either the cost approach or income ap-proach) are presented as decision trees in figures 5 and 6.
These decision trees are presented as scenarios in which the appraiser is asked to review a valuation (either during pre-roll consultation, upon appeal, or as part of a consulting
Feature article
Figure 2. Five-tier priority classification scheme for deficient asset conditions associated with an asset
Source: http://www.assetinsights.net/Glossary/G_Priority_Scale_Levels.html
Figure 3. Funding levels and maintenance strategy
Source: http://www.assetinsights.net/Glossary/G_Maintenance_Strategy.html
Fair & EquitablE • March 2015 7
assignment) in which EDM is believed to require recognition.
After highest and best use has been con-sidered, an adjustment for EDM reflects a loss in building value, measured as the present value of the difference between value under normally expected mainte-nance (or standard of care) for the asset and value in its current observed condi-tion. It is a measurement of the loss in value due to reduced service life of the entire asset or of its components.
The following sections provide back-ground to enhance understanding of the decisions and processes implicit in the decision trees. The premise for EDM adjustment is similar for special-purpose and market properties, but the process varies according to steps appropriate to the valuation approach (i.e., cost or income).
Valuation of Special-Purpose Property Using the Cost ApproachConsideration of EDM for a special-pur-pose property using the cost approach to value comprises the following steps.
1. Premise for EDM As mentioned above, the premise for EDM is straightforward. The asset (i.e., entire building or some component) is deteriorated beyond its normally ex-pected physical condition or functional capacity within its comparative market, to an extent that a potential purchaser/investor would reduce the offer price, based on the principle of substitution. The test for EDM involves comparing observed condition against the nor-mally expected level of depreciation for the asset.
2. Observed Condition versus Compa-rable Property Set ConditionThe overall process for quantifying EDM is also straightforward. The ap-praiser assembles all available informa-tion, including a FCA report completed by a qualified professional team and a physical inspection of the property,
Figure 4. Descriptions of five levels of facility operating standards
Source: www.assetinsights.net/Concepts/Operating_Standard_Parameters.JPG
Figure 5. Decision tree for recognizing EDM in asset valuation of special-purpose prop-erty using the cost approach
8 Fair & EquitablE • March 2015
and determines an observed condition for the subject building. (The observed condition of an asset is indicative of its chronological age and the degree of replacement of its depreciable compo-nents. It is generally determined after a standard FCA report has been reviewed and a physical inspection of the prop-erty has been conducted, enabling the appraiser to interpret all information in terms of the market/comparable prop-erty set. For a definition of a standard FCA report, refer to www.assetinsights.net/Glossary/G_Standard_FCA.html.)
3. Highest and Best Use The appraiser then completes a high-est and best use analysis. If the current property use is not the highest and best use, the appraiser values the site at mar-ket and attributes a residual, nominal, or no value to the building.
4. Correctness of Current Replacement Cost New If the existing use is determined to be the highest and best, the appraiser con-tinues to determine whether the build-ing inventory is current and accurate and whether the RCN is correct; that
is, no adjustment should be made from the wrong starting point.
5. Estimate of Typical Replacement Cost New Less Depreciation The normal depreciation allowances for the asset category/type and condi-tion/quality are applied to determine pre-EDM replacement cost new less depreciation (RCNLD).
6. Evidence of Reactive Maintenance or Crisis Response Maintenance StrategiesIs there a failure replacement strategy for the subject versus preventive main-tenance strategy in the comparative property set? One test is to consider whether the indicated depreciation (typical RCNLD) is less than that in-dicated by the FCI in the FCA report.
7. Assessable ComponentsThe FCA report may include items such as furniture, fixtures, and equipment that are not assessable. Adjustments for EDM should reflect the items included within the definition of improvements, as set out in the relevant statute.
8. EDM Adjustments EDM adjustments should be deter-mined according to the industry stan-dard priority ranking for deficient con-ditions (see figure 2).
9. Current/Potential Critical (Rankings 1 and 2)Based on the assumption that observed condition (supported by FCI compari-son) indicates greater-than-normal deprecation (indicated by benchmark FCIs or appropriate age-life table), the FCA report should be used to identify and adjust for current and potential critical components replacement. Criti-cal items are identified as needing im-mediate replacement so that the adjust-ments are most likely dollar-for-dollar (i.e., not discounted).
Feature article
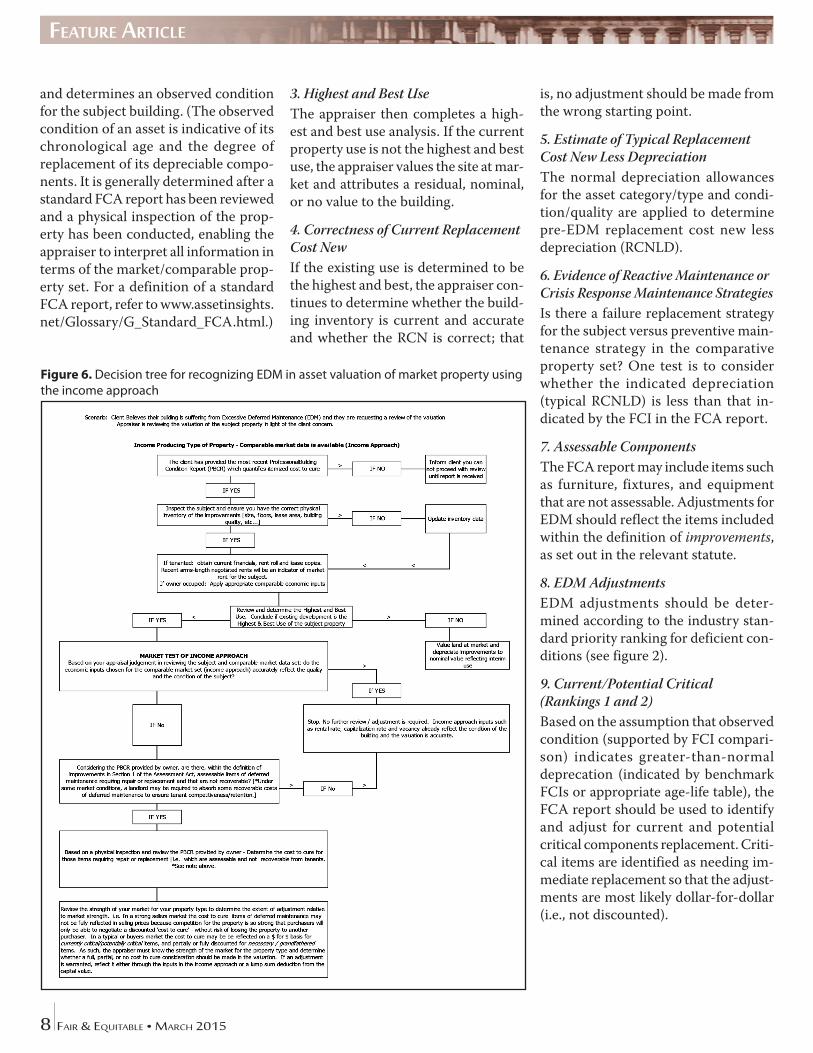
Figure 6. Decision tree for recognizing EDM in asset valuation of market property using the income approach
Fair & EquitablE • March 2015 9
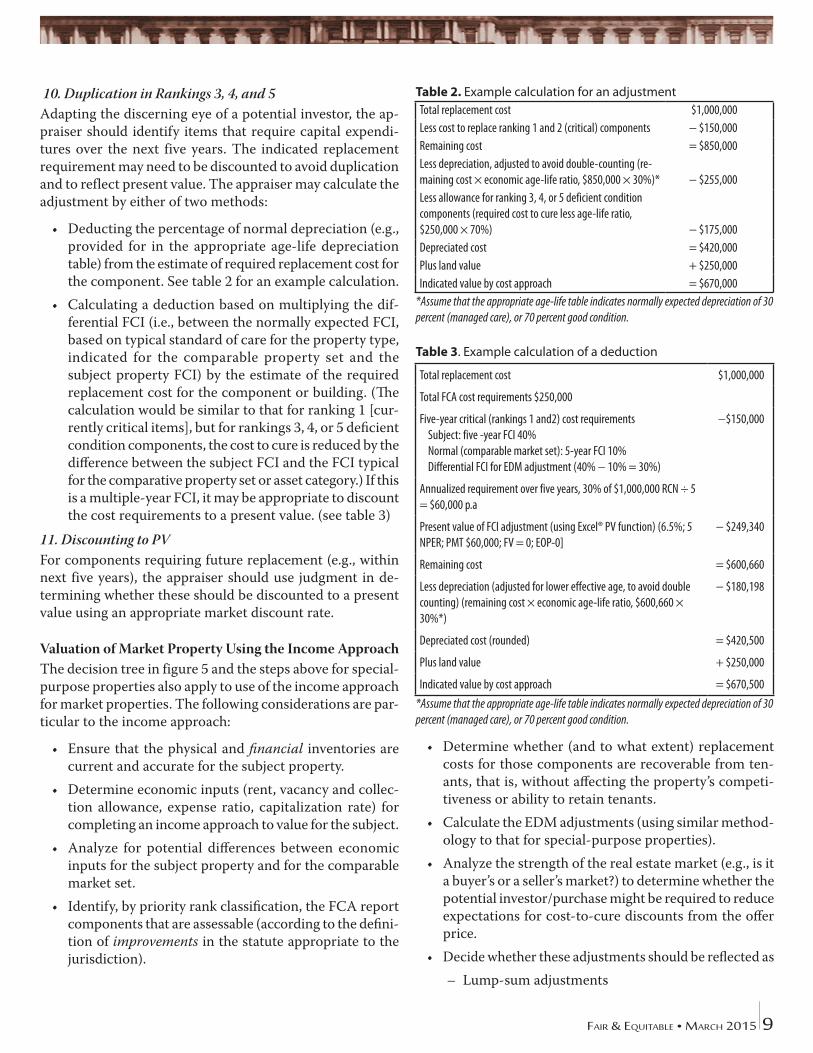
10. Duplication in Rankings 3, 4, and 5Adapting the discerning eye of a potential investor, the ap-praiser should identify items that require capital expendi-tures over the next five years. The indicated replacement requirement may need to be discounted to avoid duplication and to reflect present value. The appraiser may calculate the adjustment by either of two methods:
• Deducting the percentage of normal depreciation (e.g., provided for in the appropriate age-life depreciation table) from the estimate of required replacement cost for the component. See table 2 for an example calculation.
• Calculating a deduction based on multiplying the dif-ferential FCI (i.e., between the normally expected FCI, based on typical standard of care for the property type, indicated for the comparable property set and the subject property FCI) by the estimate of the required replacement cost for the component or building. (The calculation would be similar to that for ranking 1 [cur-rently critical items], but for rankings 3, 4, or 5 deficient condition components, the cost to cure is reduced by the difference between the subject FCI and the FCI typical for the comparative property set or asset category.) If this is a multiple-year FCI, it may be appropriate to discount the cost requirements to a present value. (see table 3)
11. Discounting to PVFor components requiring future replacement (e.g., within next five years), the appraiser should use judgment in de-termining whether these should be discounted to a present value using an appropriate market discount rate.
Valuation of Market Property Using the Income ApproachThe decision tree in figure 5 and the steps above for special-purpose properties also apply to use of the income approach for market properties. The following considerations are par-ticular to the income approach:
• Ensure that the physical and financial inventories are current and accurate for the subject property.
• Determine economic inputs (rent, vacancy and collec-tion allowance, expense ratio, capitalization rate) for completing an income approach to value for the subject.
• Analyze for potential differences between economic inputs for the subject property and for the comparable market set.
• Identify, by priority rank classification, the FCA report components that are assessable (according to the defini-tion of improvements in the statute appropriate to the jurisdiction).
• Determine whether (and to what extent) replacement costs for those components are recoverable from ten-ants, that is, without affecting the property’s competi-tiveness or ability to retain tenants.
• Calculate the EDM adjustments (using similar method-ology to that for special-purpose properties).
• Analyze the strength of the real estate market (e.g., is it a buyer’s or a seller’s market?) to determine whether the potential investor/purchase might be required to reduce expectations for cost-to-cure discounts from the offer price.
• Decide whether these adjustments should be reflected as– Lump-sum adjustments
Table 2. Example calculation for an adjustmentTotal replacement cost $1,000,000Less cost to replace ranking 1 and 2 (critical) components − $150,000Remaining cost = $850,000Less depreciation, adjusted to avoid double-counting (re-maining cost × economic age-life ratio, $850,000 × 30%)* − $255,000Less allowance for ranking 3, 4, or 5 deficient condition components (required cost to cure less age-life ratio, $250,000 × 70%) − $175,000Depreciated cost = $420,000Plus land value + $250,000Indicated value by cost approach = $670,000
*Assume that the appropriate age-life table indicates normally expected depreciation of 30 percent (managed care), or 70 percent good condition.
Table 3. Example calculation of a deduction
Total replacement cost $1,000,000
Total FCA cost requirements $250,000
Five-year critical (rankings 1 and2) cost requirements Subject: five -year FCI 40% Normal (comparable market set): 5-year FCI 10% Differential FCI for EDM adjustment (40% − 10% = 30%)
−$150,000
Annualized requirement over five years, 30% of $1,000,000 RCN ÷ 5 = $60,000 p.a
Present value of FCI adjustment (using Excel® PV function) (6.5%; 5 NPER; PMT $60,000; FV = 0; EOP-0]
− $249,340
Remaining cost = $600,660
Less depreciation (adjusted for lower effective age, to avoid double counting) (remaining cost × economic age-life ratio, $600,660 × 30%*)
− $180,198
Depreciated cost (rounded) = $420,500
Plus land value + $250,000
Indicated value by cost approach = $670,500
*Assume that the appropriate age-life table indicates normally expected depreciation of 30 percent (managed care), or 70 percent good condition.
10 Fair & EquitablE • March 2015
– Adjustments to valuation inputs, such as rental or oc-cupancy rates, operating expenses, occupancy cost ratio.
• Be careful not to duplicate the EDM adjustments by adjusting more than one input, unless warranted.
• Document the EDM adjustment so that future adjust-ments (e.g., when new capital expenditures reverse the effects of EDM) are readily made, and to facilitate explanation of adjustments to property owners, tenants, or taxing authorities.
ConclusionAs governments have grappled with challenges to finance infrastructure (including buildings) needs, real estate prac-titioners and their professional associations have developed concepts such as whole-life costing models and strategic as-set management techniques and come to rely on information and metrics such as found in condition assessment reports to aid their clients’ property decision making.
However, appraisers do not yet seem to have incorporated these concepts and related information from commercial real estate’s strategic asset management into their traditional appraisal techniques—either in single-property or mass ap-praisal valuations.
The research upon which this article is based showed that appraisal practices and valuation accuracy can be improved by recognizing EDM, as do real estate market investors and developers in their decisions. Appraisers can indeed rely on information from FCA assessment reports and metrics such as FCI (carefully interpreted) to bootstrap appraisal judgment in arriving at more evidence-based conclusions.
By adopting and refining the methodology described here, appraisers have the opportunity to incorporate concepts and related information from strategic asset management of com-mercial real estate into their traditional appraisal techniques in both single-property and mass appraisal.
The methodology developed for this research can be helpful in informing decision making for various purposes, whether to help ensure fair and equitable property tax (or payment-in-lieu of tax) burdens and in single-property appraisal, or to aid business case development to better achieve portfolio objectives and to support property life cycle decisions.
AcknowledgmentsThis report reflects the contribution of many profession-als. In particular, we acknowledge David Albrice of RDH Building Engineering and Asset Insights for their material. Asset Insights is an online laboratory for the development and testing of optimization strategies for maintenance and responsible stewardship of buildings.
Commercial Real Estate Practitioners SurveyedAnthem Properties, Bill Kennedy, Executive Vice President, Investments, Vancouver, British Columbia
BC Housing Commission, Darin McLennan, Director, Port-folio Planning, Asset Strategies; Ron Hansen, Senior Real Estate Advisor; Ahmed Omran, Manager, Portfolio Solutions. Vancouver, British Columbia.
Beedie Investment Group, Doug Nordan, Vice President, Asset Management, Vancouver, BC
Bentall Kennedy (Canada) LP, Brian Hagerman, Vice Presi-dent, Investment Management, Vancouver, BC
bc Investment Management Corporation (bcIMC), name held in confidence, Victoria, BC
Cadillac Fairview, Mark Griffiths, Associate Director, Invest-ments. Toronto, ON
First Capital Asset Management ULC. Clarence Cheng, Fi-nancial & Project Analyst. Calgary, AB
Infrastructure Ontario and Lands Corporation (Infrastruc-ture Ontario), Robert Prete, Manager, Valuation Services, Toronto, ON
Ontario Pension Board (OPB), Brian Whibbs, Managing Director Real Estate, Toronto ON
Oxford Properties Group, Eric Plesman, Senior Vice Presi-dent, Investments. Toronto, ON
Property Assessment Agencies SurveyedBC Assessment Authority. regional managers, via BCA proj-ect team members
Saskatchewan Assessment Management Agency. Irwin Blank, CEO
City of Calgary, Assessment Business Unit. Nelson Krpac, City Assessor
Municipal Property Assessment Corporation. Paul Campbell, Director, Centralized Properties, centralized team special-ists: John Watling, Malcolm Stadig and Tim Brown (special purpose properties: income and cost approach applications)
Glossary Asset Performance State—A building’s performance state, which changes during time in service, is reflected by two different indicators (www.assetinsights.net/Glossary/G_De-ficiency.html): the physical condition state, FCA, and the functionality state, FPE (functional performance evaluation).Betterment—Costs incurred to improve the service potential (and life) of a capital asset. Service potential is enhanced when
• there is an increase in service capacity;
Feature article
Fair & EquitablE • March 2015 11
• operating costs are lowered;• useful life is extended; and • quality (e.g., vacancy levels) is improved.
Deficient Conditions Five-Tier Priority Classification Scheme (www.assetinsights.net/Glossary/G_Deficiency.html)—
1. Currently Critical. Immediate action is required to cor-rect a safety hazard or stop accelerated deterioration of an asset.
2. Potentially Critical. Conditions, if not corrected expeditiously, will become critical, such as the rapid deterioration of assets.
3. Necessary. This includes actions to preclude predict-able deterioration or downtime of one or more assets. These concerns should be addressed within the next 1–3 years.
4. Recommended. There are sensible improvements to current conditions. They are not required for the most basic function of the facility but improve overall us-ability and can lower maintenance costs, within the next 3–5 years.
5. Grandfathered. These deficient conditions can be toler-ated, depending on risk tolerance level. For example, a multi-tenant building may have asbestos contamina-tion and the landlord addresses the asbestos contami-nation only upon tenant turnover.
Extraordinary Deferred Maintenance (EDM)—Exists where a building, in its highest and best use, shows greater-than-normal maintenance deficiency, requiring corrective action to satisfy the generally expected level of building functionality, utility, or performance.
• EDM is more likely found when owners elect reactive maintenance or crisis response maintenance strategies, that is, failure replacement versus preventive mainte-nance strategies.
• Reactive maintenance may be more common in owner-occupied institutional buildings where the owner does not keep buildings in competitive condition. If the condi-tion works for the owner’s current use, why spend more money.
• EDM reduces service life, that is, when a building’s quality and condition/age reduce its performance so that it is no longer as competitive for its design purpose without major renovations and upgrading to modern standard.
Effective Age—Effective age is the age indicated by the con-dition, quality, and utility of a structure and is based on an appraiser’s judgment and interpretation of market percep-tions. Maintenance standards of owners and occupants can
influence the pace of building depreciation. The effective age estimate considers not only physical wear and tear but also any loss in value for functional and external considerations (Appraisal Institute of Canada 2010, 19.3).
Facility Condition Index (FCI)—This is an industry stan-dard asset management tool which measures the “constructed asset’s condition at a specific point in time” (U.S. Federal Real Property Council 2008). It is a functional indicator resulting from an analysis of different but related operational indica-tors (such as building repair needs) to obtain an overview of a building’s condition as a numerical value (BC Housing. Facilities Condition Index, www.bchousing.org/resources/Partner_Resources/Major_Repairs/FCI.pdf).
Facility Operating Standards (Standard of Care)—Com-parison of the FCI and funding levels (figure 4) provides a basis for identifying the owner’s maintenance strategy. More importantly for the appraiser, it provides a basis for compar-ing the appraiser’s observed condition against the expected market/operating standard for the specific property type in estimating effective age, as a test for EDM.
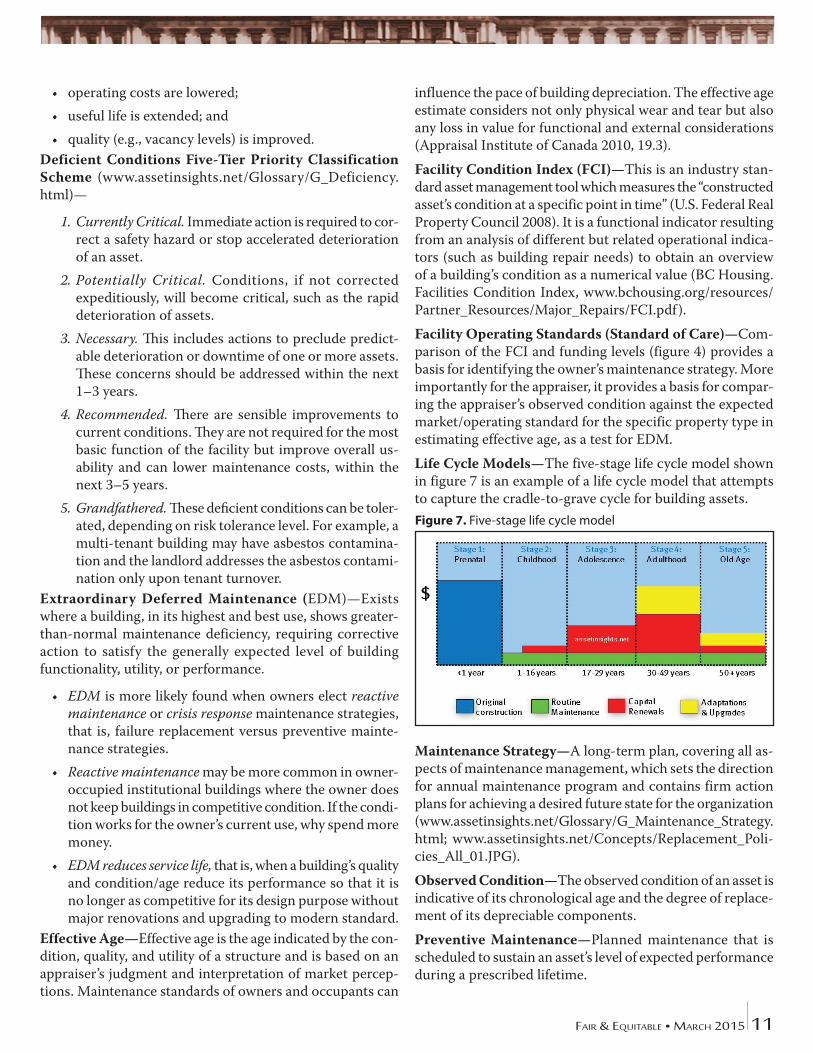
Life Cycle Models—The five-stage life cycle model shown in figure 7 is an example of a life cycle model that attempts to capture the cradle-to-grave cycle for building assets.
Maintenance Strategy—A long-term plan, covering all as-pects of maintenance management, which sets the direction for annual maintenance program and contains firm action plans for achieving a desired future state for the organization (www.assetinsights.net/Glossary/G_Maintenance_Strategy.html; www.assetinsights.net/Concepts/Replacement_Poli-cies_All_01.JPG).
Observed Condition—The observed condition of an asset is indicative of its chronological age and the degree of replace-ment of its depreciable components.
Preventive Maintenance—Planned maintenance that is scheduled to sustain an asset’s level of expected performance during a prescribed lifetime.
Figure 7. Five-stage life cycle model
12 Fair & EquitablE • March 2015
Reactive (Demand) Maintenance—Maintenance that is carried out either on the failure of an asset or when there is an emerging need. Sometimes associated with a strategy known as sweating the asset, or extracting the most possible life from the asset with the least maintenance cost.
Repairs and Maintenance—Any expenses incurred to keep the building competitive in the market in term of desirability and income-generating capacity or to maintain is functional utility in its designed use.
Service Life—The period of time over which an asset (and its components or assembly) provides adequate performance and function. Service life is a technical parameter that de-pends on design, construction quality, operations and main-tenance practices, use, and environmental factors (www.assetinsights.net/Glossary/G_Service_Life.html).
Standard FCA—An FCA that has the following basic scope definition, quality definition, and attributes. It does not include seismic assessment, green assessment, hazardous materials assessment, or functionality assessment. It does include an FCI but does not include a Facility Needs Index or a Functionality Index (www.assetinsights.net/Glossary/G_Standard_FCA.html).
ReferencesAppraisal Institute of Canada. 2010. Appraisal of real es-tate, 3rd ed. Vancouver, BC: University of British Columbia, Sauder School of Business.
Business Council of British Columbia, 2014, Infrastructure Policy & Financing, white paper, Vancouver, British Co-lumbia, October http://www.bcbc.com/publications/2014/building-bc-for-the-21st-century-a-white-paper-on-infra-structure-policy-and-financing (accessed February 9, 2015).
Joint Task Force of CSAO/OAPPA. 2004. Campus in Decline: A Report of the Joint Task Force of CSAO/OAPPA on the Need for Increased Facility Renewal Funding for Ontario Universi-ties. www.cou.on.ca/publications/reports/pdfs/campus-in-decline-november-2004 (accessed October 5, 2014).
Micklethwait, J. and Wooldridge, A. 2014. The fourth revolu-tion: The global race to reinvent the state. New York: Penguin Press HC.
Federal Real Property Council. 2008. 2008 Guidance for Real Property Inventory Reporting.Washington, DC: FRPC. http://www.gsa.gov/graphics/ogp/User_Guidance_2008_FINAL.pdf (accessed February 9, 2015)
BibliographyAlbrice, D., M. Branch, and T.-S. Lee. 2014. “Municipal Port-folio Stewardship with Limited Budgets: The Application of
Matrix Correlations as a Tool to Support Resource Allocation Decisions in the Public Good.” Presented at the Joint Confer-ence of the Institute of Engineering Technology (IET) and Institute of Asset Management (IAM), London, November 2014. www.assetinsights.net/Articles/IET_IAM_2014_Tool_to_Support_Municipal_Resource_Allocations.pdf.
Appraisal Institute of Canada. 2010a. “Market and market-ability analysis.” Chap. 9 in The appraisal of real estate, 3rd ed. Vancouver, BC: University of British Columbia, Sauder School of Business.
Appraisal Institute of Canada. 2010b. “Improvement analy-sis.” Chap. 11 in The appraisal of real estate, 3rd ed. Van-couver, BC: University of British Columbia, Sauder School of Business.
Appraisal Institute of Canada. 2010c. “Highest and best use analysis.” Chap. 12 in The appraisal of real estate, 3rd ed. Vancouver, BC: University of British Columbia, Sauder School of Business.
Appraisal Institute of Canada. 2010d. “Depreciation estimates.” Chap. 19 in The appraisal of real estate, 3rd ed. Vancouver, BC: University of British Columbia, Sauder School of Business.
Appraisal Institute of Canada. 2010e. “Income and expense analysis.” Chap. 21 in The appraisal of real estate, 3rd ed. Vancouver, BC: University of British Columbia, Sauder School of Business.
Assessor of Area 10–Burnaby/New Westminster & City of New Westminster v. Haggerty Equipment Co. Ltd. 1997. BC Supreme Court (SC 396). (http://www.courts.gov.bc.ca/jdb-txt/sc/97/08/s97-0806.txt accessed February 12, 2015)
Assessor of Area 10 – North Fraser v. Abolhassan Sherkat & PAAB. 2009. BC Court of Appeal (CA037652) Vancouver Registry (SC531).
Campbell, A.; and J. Whitehead. 2014. Making Trade-Offs in Corporate Portfolio Decisions. McKinsey & Company. Sep-tember. www.mckinsey.com/Insights/Corporate_Finance/Making_trade-offs_in_corporate_portfolio_decisions (ac-cessed September 13, 2014).
Commonwealth of Massachusetts, Massachusetts State and Community Colleges. 2003. Matching Facilities to Missions: Strategic Capital Program. Vol. 1: Report Summary. Prepared by Eva lkein & Associates, Ltd. with Entech Engineering Inc. and Symmes Maini McKee Associates. July. www.mass.edu/forinstitutions/fiscal/documents/evakleinv1.pdf.
Del Duca, S. 2013. Special Purpose Business Property Assess-ment Review & Recommendations, Report-back to Minister of Finance and Minister of Municipal Affairs and Housing. Ontario Ministry of Finance. www.fin.gov.on.ca/en/consulta-tions/par/spbp.pdf (accessed September 28, 2014.
Feature article
Fair & EquitablE • March 2015 13
Ellingham, I. and Fawcett, W. 2006. New generation whole life costing: property and construction decision-making un-der uncertainty, chap. 5–11, 14. New York: Taylor & Francis, New York.
Harp, K. 2013. “Due diligence checklists for commercial real estate transactions,” HARP - On This…A Commercial Real Estate and Business Thoughtboard, Nov. 26. www.harp-onthis.com/due-diligence-checklists-for-commercial-real-estate-transactions/ (accessed September 25, 2014).
Haynes, B.P., and N. Nunnington, 2010. Strategic alignment. Chap. 2 in Corporate real estate asset management: Strategy and implementation. Burlington, MA: EG Books, and Ox-ford, UK: Kidlington.
Hayes, B.P., and N. Nunnington, 2010. “Performance mea-surement and benchmarking.” Chap. 5 in Corporate real estate asset management: Strategy and implementation. Burlington, MA: EG Books, and Oxford, UK: Kidlington.
Hennessey, B., A. Knowlton, and S. Salimian, S. 2012. The due diligence process handbook for commercial real estate investments: How to avoid pitfalls and save time, money and headaches when buying commercial real estate investments. www.amazon.com/Diligence-Process-Handbook-Commer-cial-Investments/dp/0615719635/ref=sr_1_1?s=books&ie=UTF8&qid=1421182914&sr=1-1&keywords=The+Due+Diligence+Process+Handbook+for+Commercial+Real+Estate+Investments.
Jegher, W. 2009. Real Estate Capital Management Strat-egy: Deferred Capital Maintenance & The Facility Condi-tion Index. CoreNet Global: Canadian Chapter. October. www.canada.corenetglobal.org/Canadian/communityre-sources/blogsmain/blogviewer/?BlogKey=b37c5bbb-26ed-4797-aaed-d69e44d75dcb (accessed October 5, 2014).
Mueller, G. R. 2001. Predicting long-term trends & market cycles in commercial real estate. Working Paper #388, Oc-tober 24, Real Estate Department, Wharton University of Pennsylvania. www.realestate.wharton.upenn.edu/research/papers/full/388.pdf (accessed September 14, 2014):
Mueller, G.R. 2013. “Commercial Real Estate Market Cycles: How They Affect Your Local Market.” Slide Show. Franklin L. Burns School of Real Estate & Construction Management, University of Denver. www.slideshare.net/CCIM/commer-cial-realestatemarketcycleshowtheyaffectyourlocalmarket.
Pacific Newspaper Group Inc. v. Assessor of Area 14 – Sur-rey-White Rock. 2006. BC Court of Appeal – CA034277, Vancouver Registry (SC 500). www.bcassessment.ca/about/Stated%20Cases/SC500.pdf.
Quirk, R. 2006. The Facilities Condition Index as a measure of the conditions of public universities as perceived by the end users. Facilities Manager Journal September/October: 62–69. www.appa.org/files/FMArticles/FM091006_Fea-ture_FCI.pdf.
Rush, S.C., and S.L. Johnson. 1989. The decaying American campus: A ticking time bomb, APPA/NACUBO survey of capital renewal & deferred maintenance needs at U.S. colleges and universities. June. www.appa.org/Research/CRDM.cfm.
Task Force of the Council of Senior Administrative Officers and the Ontario Association of Physical Plant Administra-tors. 2010. Ontario Universities’ Facilities Condition Assess-ment Program As of February 2010. December. www.cou.on.ca/publications/reports/pdfs/fcap-report-dec-2010.
Vancouver Chinatown Merchants Association v. Assessor of Area #9 – Vancouver. 2002. BC Supreme Court 721.
Bruce Turner, MBA, AACI P. App, is president of Heuristic Consulting Asso-ciates. He concluded his career with BC Assessment as vice president responsible for assessment policy, valuation, and leg-islative services. For 12 years, Bruce has worked with the University of British Co-lumbia developing senior-level course materials. He is a member of the BC Property Assessment Appeal Board, the Appraisal Institute of Canada (AACI, P. App.), the Co-mox Valley Economic Development Society (director), the Financial Management Institute, the Institute of Internal Auditors, and the Real Estate Council of BC 2008–2014 (council member). In 2001, he received a Master of Busi-ness Administration from Royal Roads University.
Robert J. Metcalf is a professional appraiser and consultant with more than 40 years of experience. His experience in the past 20 years has included valuation opin-ions to Public Works and Government Services Canada, a framework for a land title, assessment, and taxation program for St. Petersburg, Russia, and assess-ment/valuation guides for Alberta Municipal Affairs. Bob’s career at BC Assessment included defense of high-profile investment properties, staff training in assessment/valuation techniques, and benchmarking initiatives pertaining to best practices among leading North America assessment organizations.