vinci partners investments ltd
TRANSCRIPT

UNITED STATES
SECURITIES AND EXCHANGE COMMISSIONWashington, D.C. 20549
FORM 6-K
REPORT OF FOREIGN PRIVATE ISSUER PURSUANT TO RULE 13a-16 OR 15d-16 UNDER THE SECURITIES EXCHANGE ACT
OF 1934
For the month of November 2021
Commission File Number: 001-39938
Vinci Partners Investments Ltd.(Exact name of registrant as specified in its charter)
Av. Bartolomeu Mitre, 336
Leblon – Rio de JaneiroBrazil 22431-002
+55 (21) 2159-6240 (Address of principal executive office)
Indicate by check mark whether the registrant files or will file annual reports under cover of Form 20-F or Form 40-F:
Form 20-F X Form 40-F
Indicate by check mark if the registrant is submitting the Form 6-K in paper as permitted by Regulation S-T Rule 101(b)(1):
Yes No X
Indicate by check mark if the registrant is submitting the Form 6-K in paper as permitted by Regulation S-T Rule 101(b)(7):
Yes No X

TABLE OF CONTENTS
EXHIBIT
99.1 Press release dated November 17, 2021 – Vinci Partners Reports Third Quarter 2021 Earnings Results99.2 Vinci Partners Third Quarter 2021 Earnings Presentation99.3 Vinci Partners Investments Ltd. Interim Financial Statements as of September 30, 2021

SIGNATURE
Pursuant to the requirements of the Securities Exchange Act of 1934, the registrant has duly caused this report to be signed on its behalf by the undersigned, thereunto duly authorized.
Vinci Partners Investments Ltd. By: /s/ Sergio Passos Ribeiro Name: Sergio Passos Ribeiro Title: Chief Financial OfficerDate: November 17, 2021
ABOUT VINCI PARTNERSVinci Partners is a leading alternative investmentplatform in Brazil, established in 2009. VinciPartners’ business segments include PrivateMarkets (Private Equity, Real Estate, Infrastructureand Credit), Liquid Strategies (Public Equities andHedge Funds), Investment products and Solutions,and Financial Advisory. As of September 30, 2021,the firm had R$58 billion of assets undermanagement. WEBCAST AND EARNINGS CONFERENCECALL Vinci Partners will host a conference call at 5:00pmEST on Wednesday, November 17, 2021, toannounce its third quarter 2021 results. To access the full detailed presentation and listento the conference call via public webcast, pleasevisit the Events & Presentations section of theCompany’s website athttps://ir.vincipartners.com/news-and-events/events-and-presentations. For those unable to listen to the live broadcast,there will be a webcast replay on the same sectionof the website. The conference call can also be accessed bydialing the following: +1 (833) 665-0595 (Domestic)+1 (661) 407-1609 (International) Conference ID: 8067767 INVESTOR [email protected] NY: +1 (646) 559-8040RJ: +55 (21) 2159-6240 USA MEDIA CONTACTJoele Frank, Wilkinson Brimmer Katcher Nick Lamplough / Kate Thompson / Katie Villany+1 (212) 355-4449 BRAZIL MEDIA CONTACT Danthi ComunicaçõesCarla Azevedo([email protected]) +55 (21) 3114-0779
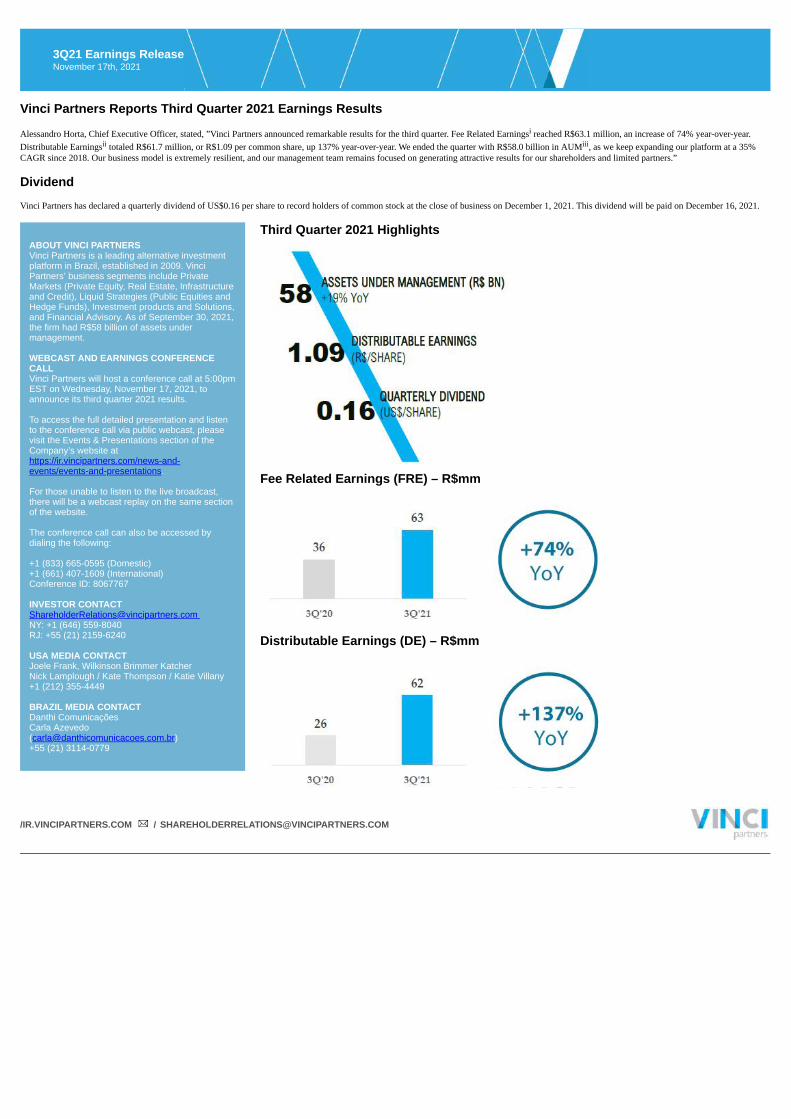
Third Quarter 2021 Highlights
Fee Related Earnings (FRE) – R$mm
Distributable Earnings (DE) – R$mm
3Q21 Earnings ReleaseNovember 17th, 2021
Vinci Partners Reports Third Quarter 2021 Earnings Results Alessandro Horta, Chief Executive Officer, stated, ”Vinci Partners announced remarkable results for the third quarter. Fee Related Earningsi reached R$63.1 million, an increase of 74% year-over-year.Distributable Earningsii totaled R$61.7 million, or R$1.09 per common share, up 137% year-over-year. We ended the quarter with R$58.0 billion in AUMiii, as we keep expanding our platform at a 35%CAGR since 2018. Our business model is extremely resilient, and our management team remains focused on generating attractive results for our shareholders and limited partners.” Dividend Vinci Partners has declared a quarterly dividend of US$0.16 per share to record holders of common stock at the close of business on December 1, 2021. This dividend will be paid on December 16, 2021.
/IR.VINCIPARTNERS.COM / [email protected]
3Q21 Earnings ReleaseNovember 17th, 2021
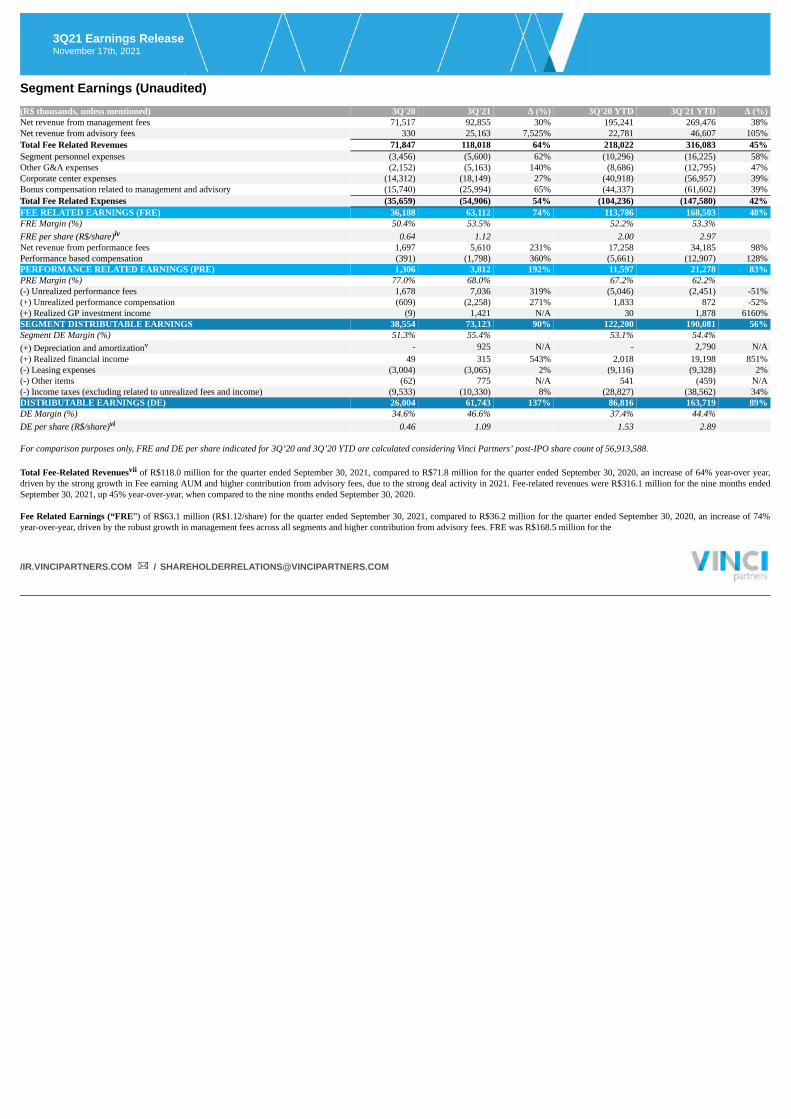
Segment Earnings (Unaudited) (R$ thousands, unless mentioned) 3Q'20 3Q'21 ∆ (%) 3Q'20 YTD 3Q'21 YTD ∆ (%)Net revenue from management fees 71,517 92,855 30% 195,241 269,476 38%Net revenue from advisory fees 330 25,163 7,525% 22,781 46,607 105%Total Fee Related Revenues 71,847 118,018 64% 218,022 316,083 45%Segment personnel expenses (3,456) (5,600) 62% (10,296) (16,225) 58%Other G&A expenses (2,152) (5,163) 140% (8,686) (12,795) 47%Corporate center expenses (14,312) (18,149) 27% (40,918) (56,957) 39%Bonus compensation related to management and advisory (15,740) (25,994) 65% (44,337) (61,602) 39%Total Fee Related Expenses (35,659) (54,906) 54% (104,236) (147,580) 42%FEE RELATED EARNINGS (FRE) 36,188 63,112 74% 113,786 168,503 48%FRE Margin (%) 50.4% 53.5% 52.2% 53.3% FRE per share (R$/share)iv 0.64 1.12 2.00 2.97 Net revenue from performance fees 1,697 5,610 231% 17,258 34,185 98%Performance based compensation (391) (1,798) 360% (5,661) (12,907) 128%PERFORMANCE RELATED EARNINGS (PRE) 1,306 3,812 192% 11,597 21,278 83%PRE Margin (%) 77.0% 68.0% 67.2% 62.2% (-) Unrealized performance fees 1,678 7,036 319% (5,046) (2,451) -51%(+) Unrealized performance compensation (609) (2,258) 271% 1,833 872 -52%(+) Realized GP investment income (9) 1,421 N/A 30 1,878 6160%SEGMENT DISTRIBUTABLE EARNINGS 38,554 73,123 90% 122,200 190,081 56%Segment DE Margin (%) 51.3% 55.4% 53.1% 54.4% (+) Depreciation and amortizationv - 925 N/A - 2,790 N/A(+) Realized financial income 49 315 543% 2,018 19,198 851%(-) Leasing expenses (3,004) (3,065) 2% (9,116) (9,328) 2%(-) Other items (62) 775 N/A 541 (459) N/A(-) Income taxes (excluding related to unrealized fees and income) (9,533) (10,330) 8% (28,827) (38,562) 34%DISTRIBUTABLE EARNINGS (DE) 26,004 61,743 137% 86,816 163,719 89%DE Margin (%) 34.6% 46.6% 37.4% 44.4% DE per share (R$/share)vi 0.46 1.09 1.53 2.89 For comparison purposes only, FRE and DE per share indicated for 3Q’20 and 3Q’20 YTD are calculated considering Vinci Partners’ post-IPO share count of 56,913,588. Total Fee-Related Revenuesvii of R$118.0 million for the quarter ended September 30, 2021, compared to R$71.8 million for the quarter ended September 30, 2020, an increase of 64% year-over year,driven by the strong growth in Fee earning AUM and higher contribution from advisory fees, due to the strong deal activity in 2021. Fee-related revenues were R$316.1 million for the nine months endedSeptember 30, 2021, up 45% year-over-year, when compared to the nine months ended September 30, 2020. Fee Related Earnings (“FRE”) of R$63.1 million (R$1.12/share) for the quarter ended September 30, 2021, compared to R$36.2 million for the quarter ended September 30, 2020, an increase of 74%year-over-year, driven by the robust growth in management fees across all segments and higher contribution from advisory fees. FRE was R$168.5 million for the
/IR.VINCIPARTNERS.COM / [email protected]

3Q21 Earnings ReleaseNovember 17th, 2021
nine months ended September 30, 2021, up 48% year-over-year, when compared to the nine months ended September 30, 2020. FRE Marginviii was 53.5% for the quarter ended September 30, 2021, compared to 50.4% for the quarter ended September 30, 2020, an increase of 3.1 percentage points year-over-year, showcasing theplatform´s operating leverage. Performance Related Earnings (“PRE”)ix of R$3.8 million for the quarter ended September 30, 2021, compared to R$1.3 million for the quarter ended September 30, 2020, an increase of 192% year-over-year, primarily due to a higher contribution from IP&S international exclusive mandates and our sovereign wealth mandate in Public Equities. PRE was R$21.3 million for the nine months endedSeptember 30, 2021, up 83% year-over-year, when compared to the nine months ended September 30, 2020. Segment Distributable Earningsx of R$73.1 million for the quarter ended September 30, 2021, compared to R$38.6 million for the quarter ended September 30, 2020, an increase of 90% year-over-year.Segment Distributable Earnings were R$190.1 million for the nine months ended September 30, 2021, up 56% year-over-year, when compared to the nine months ended September 30, 2020. Distributable Earnings (“DE”) of R$61.7 million (R$1.09/share) for the quarter ended September 30, 2021, compared to R$26.0 million for the quarter ended September 30, 2020, an increase of 137%year-over-year, driven by the notable growth in management fees, higher contribution from advisory fees and the realization of performance fees from international exclusive mandates in IP&S. DE was R$163.7 million for the nine months ended September 30, 2021, up 89% year-over-year, when compared to the nine months ended September 30, 2020. DE Marginxi was 46.6% for the quarter ended September 30, 2021, a 12.0 percentage point increase compared to 34.6% for the quarter ended September 30, 2020.
/IR.VINCIPARTNERS.COM / [email protected]
3Q21 Earnings ReleaseNovember 17th, 2021
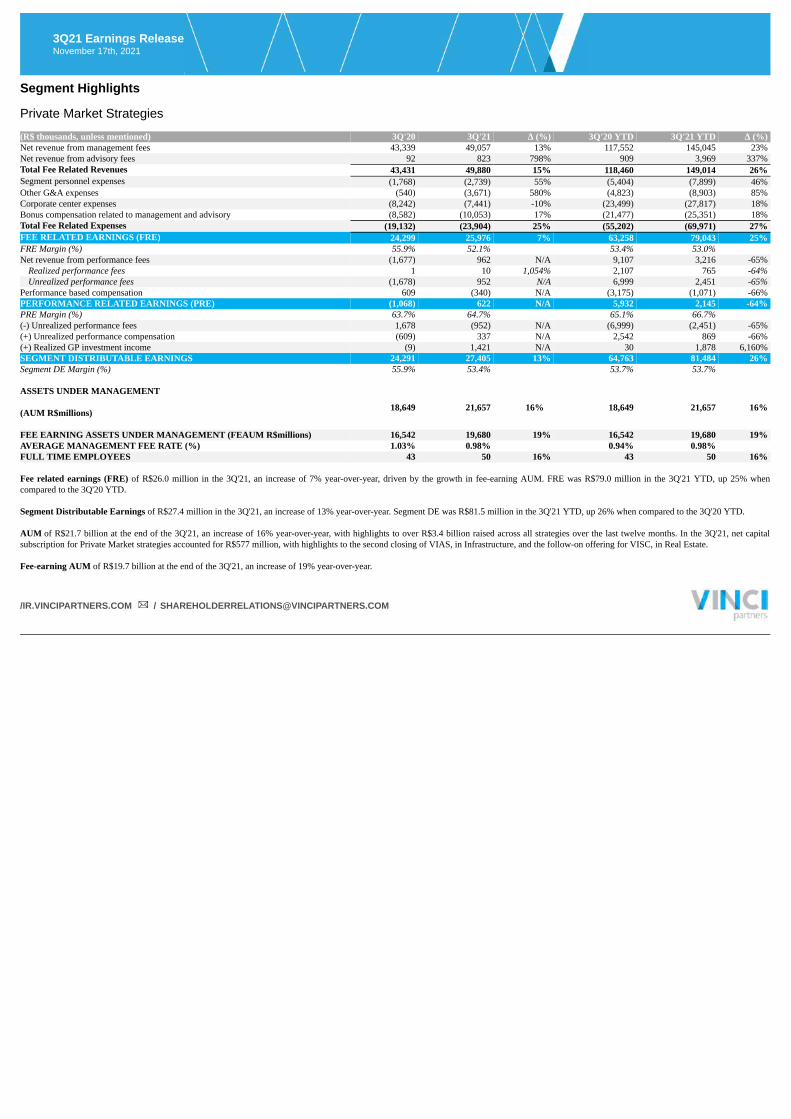
Segment Highlights Private Market Strategies (R$ thousands, unless mentioned) 3Q'20 3Q'21 ∆ (%) 3Q'20 YTD 3Q'21 YTD ∆ (%)Net revenue from management fees 43,339 49,057 13% 117,552 145,045 23%Net revenue from advisory fees 92 823 798% 909 3,969 337%Total Fee Related Revenues 43,431 49,880 15% 118,460 149,014 26%Segment personnel expenses (1,768) (2,739) 55% (5,404) (7,899) 46%Other G&A expenses (540) (3,671) 580% (4,823) (8,903) 85%Corporate center expenses (8,242) (7,441) -10% (23,499) (27,817) 18%Bonus compensation related to management and advisory (8,582) (10,053) 17% (21,477) (25,351) 18%Total Fee Related Expenses (19,132) (23,904) 25% (55,202) (69,971) 27%FEE RELATED EARNINGS (FRE) 24,299 25,976 7% 63,258 79,043 25%FRE Margin (%) 55.9% 52.1% 53.4% 53.0% Net revenue from performance fees (1,677) 962 N/A 9,107 3,216 -65%
Realized performance fees 1 10 1,054% 2,107 765 -64%Unrealized performance fees (1,678) 952 N/A 6,999 2,451 -65%
Performance based compensation 609 (340) N/A (3,175) (1,071) -66%PERFORMANCE RELATED EARNINGS (PRE) (1,068) 622 N/A 5,932 2,145 -64%PRE Margin (%) 63.7% 64.7% 65.1% 66.7% (-) Unrealized performance fees 1,678 (952) N/A (6,999) (2,451) -65%(+) Unrealized performance compensation (609) 337 N/A 2,542 869 -66%(+) Realized GP investment income (9) 1,421 N/A 30 1,878 6,160%SEGMENT DISTRIBUTABLE EARNINGS 24,291 27,405 13% 64,763 81,484 26%Segment DE Margin (%) 55.9% 53.4% 53.7% 53.7% ASSETS UNDER MANAGEMENT (AUM R$millions)
18,649 21,657 16% 18,649 21,657 16%
FEE EARNING ASSETS UNDER MANAGEMENT (FEAUM R$millions) 16,542 19,680 19% 16,542 19,680 19%AVERAGE MANAGEMENT FEE RATE (%) 1.03% 0.98% 0.94% 0.98% FULL TIME EMPLOYEES 43 50 16% 43 50 16% Fee related earnings (FRE) of R$26.0 million in the 3Q'21, an increase of 7% year-over-year, driven by the growth in fee-earning AUM. FRE was R$79.0 million in the 3Q'21 YTD, up 25% whencompared to the 3Q'20 YTD. Segment Distributable Earnings of R$27.4 million in the 3Q'21, an increase of 13% year-over-year. Segment DE was R$81.5 million in the 3Q'21 YTD, up 26% when compared to the 3Q'20 YTD. AUM of R$21.7 billion at the end of the 3Q'21, an increase of 16% year-over-year, with highlights to over R$3.4 billion raised across all strategies over the last twelve months. In the 3Q'21, net capitalsubscription for Private Market strategies accounted for R$577 million, with highlights to the second closing of VIAS, in Infrastructure, and the follow-on offering for VISC, in Real Estate. Fee-earning AUM of R$19.7 billion at the end of the 3Q'21, an increase of 19% year-over-year.
/IR.VINCIPARTNERS.COM / [email protected]
3Q21 Earnings ReleaseNovember 17th, 2021
Liquid Strategies (R$ thousands, unless mentioned) 3Q'20 3Q'21 ∆ (%) 3Q’20 YTD 3Q’21 YTD ∆ (%)Net revenue from management fees 15,766 23,273 48% 46,072 66,276 44%Net revenue from advisory fees - - N/A - - N/ATotal Fee Related Revenues 15,766 23,273 48% 46,072 66,276 44%Segment personnel expenses (604) (1,431) 137% (1,932) (4,111) 113%Other G&A expenses (1,264) (598) -53% (2,611) (1,903) -27%Corporate center expenses (2,992) (3,085) 3% (9,170) (11,774) 28%Bonus compensation related to management and advisory (3,244) (5,864) 81% (8,691) (13,176) 52%Total Fee Related Expenses (8,104) (10,978) 35% (22,403) (30,964) 38%FEE RELATED EARNINGS (FRE) 7,662 12,295 60% 23,669 35,312 49%FRE Margin (%) 48.6% 52.8% 51.4% 53.3% Net revenue from performance fees 2,709 1,689 -38% 5,187 10,149 96%
Realized performance fees 2,709 1,689 -38% 7,083 10,149 43%Unrealized performance fees - - N/A (1,896) - N/A
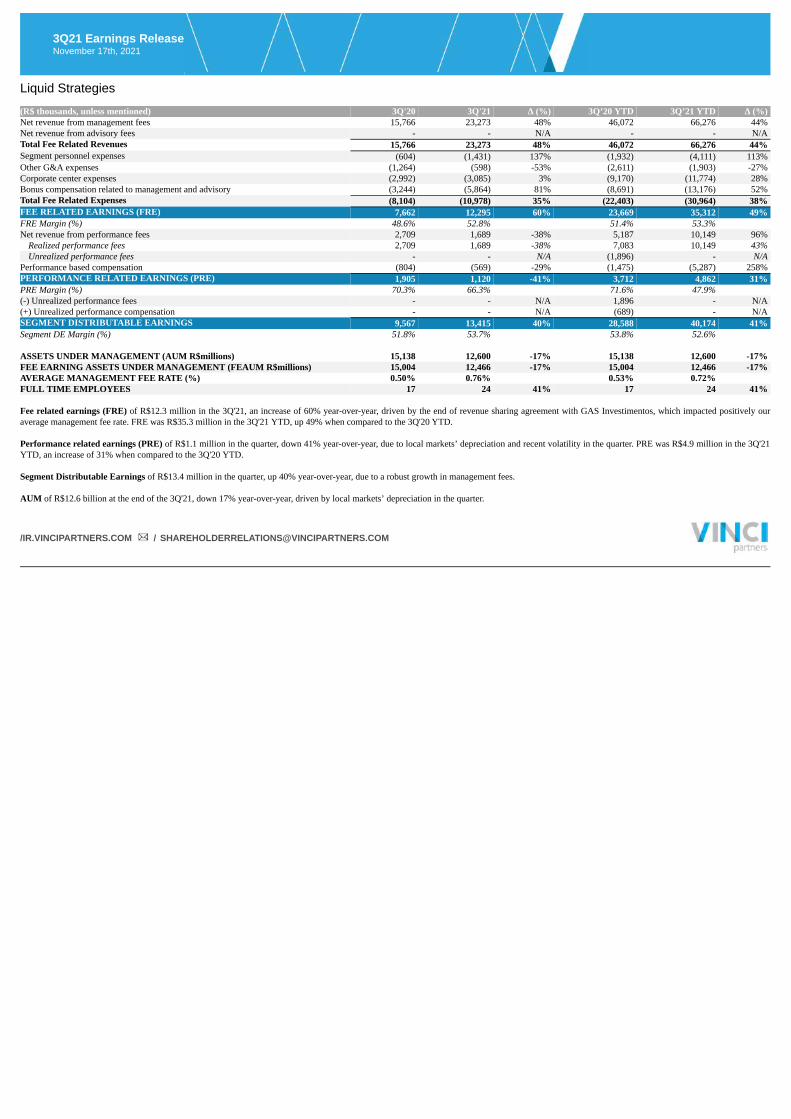
Performance based compensation (804) (569) -29% (1,475) (5,287) 258%PERFORMANCE RELATED EARNINGS (PRE) 1,905 1,120 -41% 3,712 4,862 31%PRE Margin (%) 70.3% 66.3% 71.6% 47.9% (-) Unrealized performance fees - - N/A 1,896 - N/A(+) Unrealized performance compensation - - N/A (689) - N/ASEGMENT DISTRIBUTABLE EARNINGS 9,567 13,415 40% 28,588 40,174 41%Segment DE Margin (%) 51.8% 53.7% 53.8% 52.6% ASSETS UNDER MANAGEMENT (AUM R$millions) 15,138 12,600 -17% 15,138 12,600 -17%FEE EARNING ASSETS UNDER MANAGEMENT (FEAUM R$millions) 15,004 12,466 -17% 15,004 12,466 -17%AVERAGE MANAGEMENT FEE RATE (%) 0.50% 0.76% 0.53% 0.72% FULL TIME EMPLOYEES 17 24 41% 17 24 41% Fee related earnings (FRE) of R$12.3 million in the 3Q'21, an increase of 60% year-over-year, driven by the end of revenue sharing agreement with GAS Investimentos, which impacted positively ouraverage management fee rate. FRE was R$35.3 million in the 3Q'21 YTD, up 49% when compared to the 3Q'20 YTD. Performance related earnings (PRE) of R$1.1 million in the quarter, down 41% year-over-year, due to local markets’ depreciation and recent volatility in the quarter. PRE was R$4.9 million in the 3Q'21YTD, an increase of 31% when compared to the 3Q'20 YTD. Segment Distributable Earnings of R$13.4 million in the quarter, up 40% year-over-year, due to a robust growth in management fees. AUM of R$12.6 billion at the end of the 3Q'21, down 17% year-over-year, driven by local markets’ depreciation in the quarter.
/IR.VINCIPARTNERS.COM / [email protected]
3Q21 Earnings ReleaseNovember 17th, 2021
Investment Products and Solutions (R$ thousands, unless mentioned) 3Q'20 3Q'21 ∆ (%) 3Q’20 YTD 3Q’21 YTD ∆ (%)Net revenue from management fees 12,422 20,525 65% 31,627 58,154 84%Net revenue from advisory fees 25 8 -68% 96 47 -51%Total Fee Related Revenues 12,447 20,533 65% 31,724 58,201 83%Segment personnel expenses (863) (1,032) 20% (2,323) (3,011) 30%Other G&A expenses (299) (491) 64% (1,078) (1,300) 21%Corporate center expenses (2,362) (3,993) 69% (6,206) (11,775) 90%Bonus compensation related to management and advisory (3,409) (5,377) 58% (8,105) (12,972) 60%Total Fee Related Expenses (6,934) (10,893) 57% (17,712) (29,059) 64%FEE RELATED EARNINGS (FRE) 5,513 9,640 75% 14,012 29,142 108%FRE Margin (%) 44.3% 47.0% 44.2% 50.1% Net revenue from performance fees 659 2,959 349% 2,958 20,822 604%
Realized performance fees 659 10,947 1,560% 3,015 20,822 591%Unrealized performance fees - (7,988) N/A (57) - N/A
Performance based compensation (196) (889) 354% (1,011) (6,549) 548%PERFORMANCE RELATED EARNINGS (PRE) 464 2,070 346% 1,947 14,273 633%PRE Margin (%) 70.3% 69.9% 65.8% 68.5% (-) Unrealized performance fees - 7,988 N/A 57 - N/A(+) Unrealized performance compensation - (2,596) N/A (21) 3 N/ASEGMENT DISTRIBUTABLE EARNINGS 5,977 17,102 186% 15,995 43,418 171%Segment DE Margin (%) 45.6% 54.3% 46.0% 54.9% ASSETS UNDER MANAGEMENT(AUM R$millions) 14,892 23,695 59% 14,892 23,695 59%
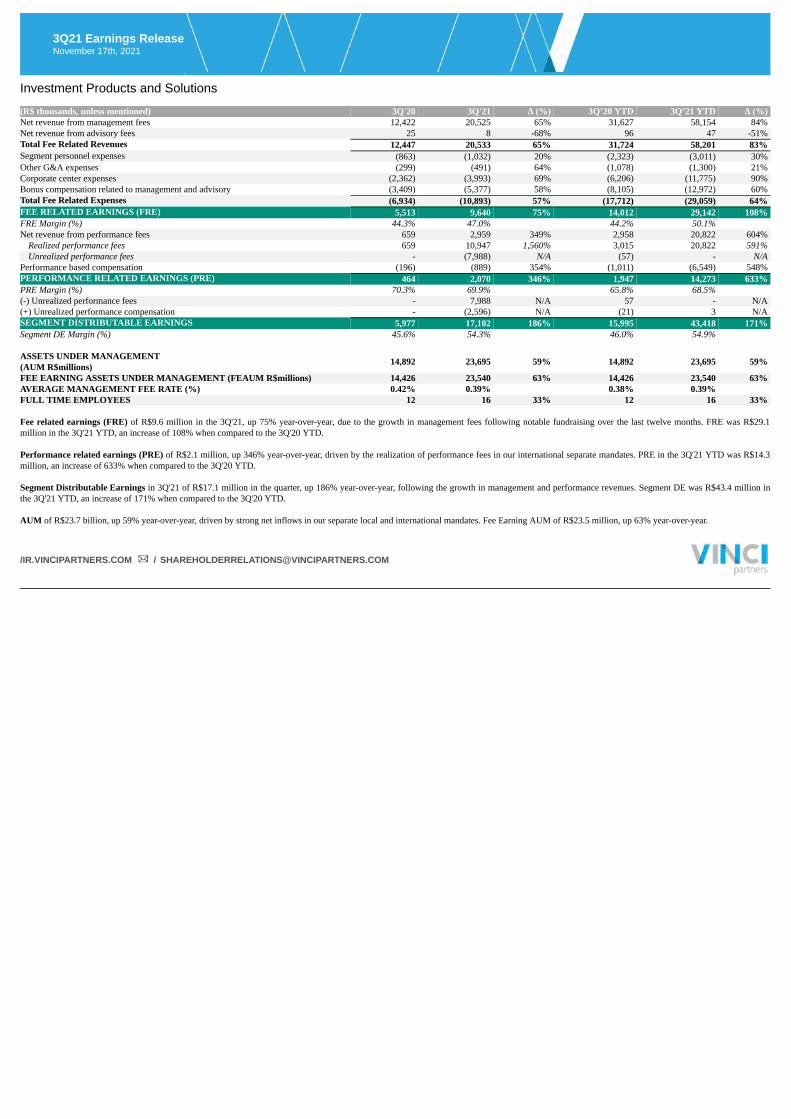
FEE EARNING ASSETS UNDER MANAGEMENT (FEAUM R$millions) 14,426 23,540 63% 14,426 23,540 63%AVERAGE MANAGEMENT FEE RATE (%) 0.42% 0.39% 0.38% 0.39% FULL TIME EMPLOYEES 12 16 33% 12 16 33% Fee related earnings (FRE) of R$9.6 million in the 3Q'21, up 75% year-over-year, due to the growth in management fees following notable fundraising over the last twelve months. FRE was R$29.1million in the 3Q'21 YTD, an increase of 108% when compared to the 3Q'20 YTD. Performance related earnings (PRE) of R$2.1 million, up 346% year-over-year, driven by the realization of performance fees in our international separate mandates. PRE in the 3Q'21 YTD was R$14.3million, an increase of 633% when compared to the 3Q'20 YTD. Segment Distributable Earnings in 3Q'21 of R$17.1 million in the quarter, up 186% year-over-year, following the growth in management and performance revenues. Segment DE was R$43.4 million inthe 3Q'21 YTD, an increase of 171% when compared to the 3Q'20 YTD. AUM of R$23.7 billion, up 59% year-over-year, driven by strong net inflows in our separate local and international mandates. Fee Earning AUM of R$23.5 million, up 63% year-over-year.
/IR.VINCIPARTNERS.COM / [email protected]

3Q21 Earnings ReleaseNovember 17th, 2021
Financial Advisory (R$ thousands, unless mentioned) 3Q'20 3Q'21 ∆ (%) 3Q’20 YTD 3Q’21 YTD ∆ (%)Net revenue from management fees - - N/A - - N/ANet revenue from advisory fees 210 24,332 11,487% 21,774 42,591 96%Total Fee Related Revenues 210 24,332 11,487% 21,774 42,591 96%Segment personnel expenses (221) (398) 80% (636) (1,204) 89%Other G&A expenses (49) (403) 725% (174) (710) 307%Corporate center expenses (716) (3,630) 407% (2,046) (5,569) 172%Bonus compensation related to management and advisory (505) (4,701) 830% (6,064) (10,102) 67%Total Fee Related Expenses (1,491) (9,132) 512% (8,921) (17,585) 97%FEE RELATED EARNINGS (FRE) (1,281) 15,200 N/A 12,853 25,006 95%FRE Margin (%) N/A 62.5% 59.0% 58.7% SEGMENT DISTRIBUTABLE EARNINGS (1,281) 15,200 N/A 12,853 25,006 95%Segment DE Margin (%) N/A 62.5% 59.0% 58.7% Fee related earnings (FRE) of R$15.2 million in the quarter, up R$16.5 million year-over-year. FRE was R$25.0 million in the 3Q'21 YTD, an increase of 95% when compared to the 3Q'21 YTD, aconsequence of the stronger deal activity in 2021. Segment Distributable Earnings in the 3Q'21 YTD were R$25.0 million, an increase of 95% year-over-year when compared to the 3Q'20 YTD.
/IR.VINCIPARTNERS.COM / [email protected]

3Q21 Earnings ReleaseNovember 17th, 2021
Income Statement (Unaudited) (R$ thousands, unless mentioned) 3Q'20 3Q'21 ∆ (%) 3Q'20 YTD 3Q'21 YTD ∆ (%)REVENUES Net revenue from management fees 71,517 92,855 30% 195,241 269,476 38%Net revenue from performance fees 1,697 5,610 231% 17,258 34,185 98%Realized performance fees 3,375 12,646 275% 12,212 31,734 160%Unrealized performance fees (1,678) (7,036) 319% 5,046 2,451 -51%Net revenue from advisory 330 25,163 7,525% 22,781 46,607 105%Total net revenues from services rendered 73,544 123,628 68% 235,280 350,268 49%EXPENSES Bonus related to management and advisory (15,740) (25,994) 65% (44,337) (61,602) 39%Performance based compensation (391) (1,798) 360% (5,661) (12,907) 128%Realized (1,000) (4,056) 306% (3,828) (12,035) 214%Unrealized 609 2,258 271% (1,833) (872) -52%Total compensation and benefitsxii (16,131) (27,792) 72% (49,998) (74,509) 49%Segment personnel expenses (3,456) (5,600) 62% (10,296) (16,225) 58%Other general and administrative expenses (2,152) (5,163) 140% (8,686) (12,795) 47%Corporate center expenses (14,312) (18,149) 27% (40,918) (56,957) 39%Total expenses (36,050) (56,704) 57% (109,897) (160,487) 46%Operating profit 37,494 66,924 78% 125,383 189,781 51%OTHER ITEMS GP Investment income 470 (290) N/A 2,886 (4,335) N/ARealized gain from GP investment income (9) 1,421 N/A 30 1,878 6,160%Unrealized gain from GP investment income 479 (1,711) N/A 2,856 (6,213) N/AFinancial income 491 (326) N/A 1,941 18,323 844%Realized gain from financial income 49 315 543% 2,018 19,198 851%Unrealized gain from financial income 442 (641) N/A (77) (875) 1,036%Leasing expenses (3,004) (3,065) 2% (9,116) (9,328) 2%Other items (62) 775 N/A 541 (459) N/AStock compensation plan - (1,014) N/A - (2,656) N/ATotal Other Items (2,105) (3,920) 86% (3,748) 1,545 N/AProfit before income taxes 35,389 63,004 78% 121,635 191,326 57%(-) Income taxes (9,653) (11,401) 18% (30,354) (39,304) 29%NET INCOME 25,736 51,603 101% 91,281 152,022 67% Total net revenues from services rendered of R$123.6 million for the quarter ended September 30, 2021, compared to R$73.5 million for the quarter ended September 30, 2020, an increase of 68% year-over-year. Net revenues for the nine months ended September 30, 2021 were R$350.3 million, up 49% year-over-year, when compared to the nine months ended September 30, 2020.
· Management fee revenues of R$92.9 million for the quarter ended September 30,2021, compared to R$71.5 million for the quarter ended September 30, 2021, an increase of 30% year-over-year.This increase was primarily driven by the growth in Fee earning AUM. Management fee revenues for the nine months ended September 30, 2021 were R$269.5 million, up 38% year-over-year,when compared to the nine months ended September 30, 2020.
/IR.VINCIPARTNERS.COM / [email protected]
3Q21 Earnings ReleaseNovember 17th, 2021
· Performance fee revenues of R$5.6 million for the quarter ended September 30, 2021, compared to R$1.7 million for the quarter ended September 30, 2020, an increase of 231% year-over-year,
due to higher contributions from the international exclusive mandates in IP&S and the sovereign wealth mandate in Public Equities. Performance fee revenues were R$34.2 million for the ninemonths ended September 30,2021, up 98% year-over-year, when compared to the nine months ended September 30, 2020.
· Advisory fee revenues of R$25.2 million for the quarter ended September 30, 2021, compared to R$0.3 million for the quarter ended September 30, 2020, an increase of 7,525% year-over-year.
Advisory revenues for the nine months ended September 30, 2021 were R$46.6 million, up 105% when compared to the nine months ended September 30, 2020, a consequence of the stronger dealactivity in 2021.
Total expenses for the quarter ended September 30, 2021 of R$56.7 million, compared to R$36.1 million for the quarter ended September 30, 2020, an increase of 57% year-over-year. Part of this increasewas driven by new recurring costs related to becoming a public company, such as changes in the company’s compensation structure, Board and support teams’ hirings and third-party services. Those factorsaccounted for R$2.9 million in additional expenses for the quarter. On a comparable basis, excluding costs related to being a public company, expenses were up 49% year-over-year. Additionally, 3Q'21expenses were impacted by R$2.2 million related to the company's new branding project, taking place throughout 2021.
· Bonus related to management and advisory feesxiii of R$26.0 million for the quarter ended September 30, 2021, compared to R$15.7 million for the quarter ended September 30,2020, an increaseof 65% year-over-year. Bonus related to management and advisory was R$61.6 million for the nine months ended September 30, 2021, up 39% year-over-year, when compared to the nine monthsended September 30, 2020.
· Performance based compensationxiv of R$1.8 million for the quarter ended September 30,2021, compared to R$0.4 million for the quarter ended September 30,2020, an increase of 360% year-
over-year, following the growth in performance fee revenues. Performance based compensation for the nine months ended September 30, 2021 was R$12.9 million, an increase of 128% year-over-year, when compared to the nine months ended September 30, 2020.
· Segment personnel expensesxv of R$5.6 million for the quarter ended September 30,2021 compared to R$3.5 million for the quarter ended September 30, 2020, an increase of 62% year-over-year.
This increase is primarily due to the change in Vinci Partners´ compensation structure after becoming a public company in 2021, which accounted for R$1.0 million in additional segment personnelexpenses for the quarter.
· Corporate center expensesxvi of R$18.1 million for the quarter ended September 30,2021 compared to R$14.3 million for the quarter ended September 30,2021, an increase of 27% year-over-year.
This increase was primarily due to (i) the previously mentioned change in the company´s compensation structure, (ii) new hirings after the company became public, such as our Board of directors,financial reporting and shareholder relations teams, and (iii) third-party expenses, such as Auditor and Nasdaq listing fees. These additional costs accounted for R$1.8 million in additionalcorporate center expenses for the quarter. Corporate center expenses for the quarter ended September 30, 2021 were also impacted by a R$2.2 million expense the company's new branding project,
/IR.VINCIPARTNERS.COM / [email protected]
3Q21 Earnings ReleaseNovember 17th, 2021
taking place throughout 2021. Corporate center expenses for the nine months ended September 30, 2021 were R$57.0 million, up 39% year-over-year, when compared to the nine months endedSeptember 30, 2020.
· Other general and administrative expensesxvii of R$5.2 million for the quarter ended September 30, 2021, compared to R$2.2 million for the quarter ended September 30, 2020, an increase of140% year-over-year. Other G&A expenses for the nine months ended September 30, 2021 were R$12.8 million, up 47% year-over-year, when compared to the nine months ended September 30,2020.
Operating Profit of R$66.9 million for the quarter ended September 30,2021, compared to R$37.5 million for the quarter ended September 30, 2020, an increase of 78% year-over-year. Operating profitfor the nine months ended September 30, 2021 was R$189.8 million, up 51% year-over-year, when compared to the nine months ended September 30, 2020. GP Investment incomexviii, which is a result of the company’s GP investments in its proprietary private market funds, was negative R$0.3 million for the quarter ended September 30, 2021, due to mark tomarket valuation of funds listed in the Brazilian stock exchange, compared to a positive R$0.5 million for the quarter ended September 30, 2020. GP Investment income for the nine months endedSeptember 30, 2021 was negative R$4.3 million compared to positive R$2.9 million for the nine months ended September 30, 2020. Financial Incomexix of negative R$0.3 million for the quarter ended September 30, 2021, compared to positive R$0.5 million for the quarter ended September 30, 2020. Our liquid funds' portfoliounderperformed the CDI quarterly return by 1.1 percentage point, due to the significant market volatility in the quarter. In addition, the portfolio’s exposure to fixed rate bonds (35% of all cash allocationsas of quarter end) suffered negative mark to market as interest rates begin their rising cycle in Brazil. Even with this impact, our liquid funds' portfolio outperformed the IMA-Bxx index by 1.7 percentagepoint in the third quarter. Financial income for the nine months ended September 30, 2021 was R$18.3 million, up 844% year-over-year, when compared to the nine months ended September 30, 2020, dueto gains from our liquid funds’ portfolio. We expect financial income to benefit from the recent increase in interest rates in the medium and long-term, as over 85% of our cash allocations are directedtowards fixed income products. Proceeds from the IPO will continue to be gradually shifted from cash allocation into Private Market funds’ GP commitments. Leasing Expensesxxi of R$3.1 million for the quarter ended September 30, 2021, compared to R$3.0 million for the quarter ended September 30, 2020, an increase of 2% year-over-year. Stock compensation plan expensesxxii of R$1.0 million for the quarter ended September 30,2021. Profit before income taxes of R$63.0 million for the quarter ended September 30, 2021, compared to R$35.4 million for the quarter ended September 30, 2020, an increase of 78% year-over-year. Profitbefore income taxes for the nine months ended September 30, 2021 was R$191.3 million, up 57% year-over-year, when compared to the nine months ended September 30, 2020. Income Taxesxxiii of R$11.4 million for the quarter ended September 30, 2021, which represented an effective tax rate for the quarter of 18%, compared to R$9.7 million for the quarter ended September30, 2020, which represented an effective tax rate of 23%.
/IR.VINCIPARTNERS.COM / [email protected]
3Q21 Earnings ReleaseNovember 17th, 2021
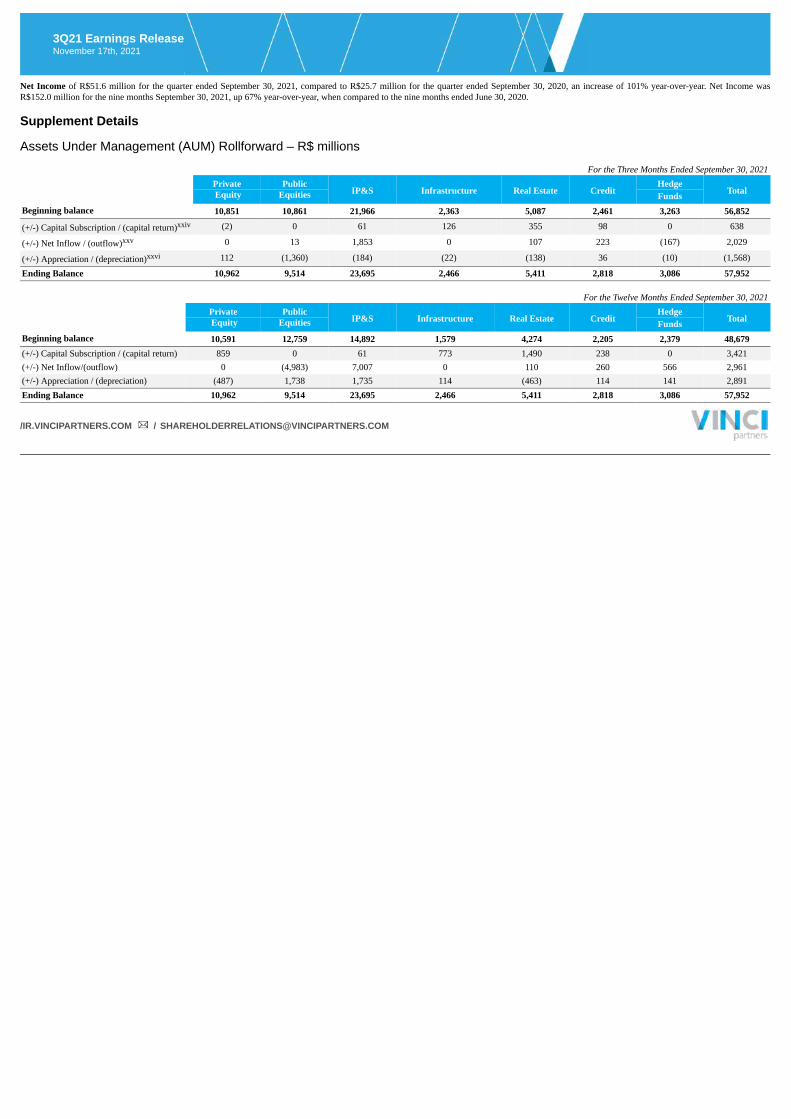
Net Income of R$51.6 million for the quarter ended September 30, 2021, compared to R$25.7 million for the quarter ended September 30, 2020, an increase of 101% year-over-year. Net Income wasR$152.0 million for the nine months September 30, 2021, up 67% year-over-year, when compared to the nine months ended June 30, 2020. Supplement Details Assets Under Management (AUM) Rollforward – R$ millions
For the Three Months Ended September 30, 2021
Private Public
IP&S Infrastructure Real Estate CreditHedge
Total Equity Equities FundsBeginning balance 10,851 10,861 21,966 2,363 5,087 2,461 3,263 56,852
(+/-) Capital Subscription / (capital return)xxiv (2) 0 61 126 355 98 0 638
(+/-) Net Inflow / (outflow)xxv 0 13 1,853 0 107 223 (167) 2,029
(+/-) Appreciation / (depreciation)xxvi 112 (1,360) (184) (22) (138) 36 (10) (1,568)
Ending Balance 10,962 9,514 23,695 2,466 5,411 2,818 3,086 57,952
For the Twelve Months Ended September 30, 2021
Private Public
IP&S Infrastructure Real Estate CreditHedge
Total Equity Equities FundsBeginning balance 10,591 12,759 14,892 1,579 4,274 2,205 2,379 48,679(+/-) Capital Subscription / (capital return) 859 0 61 773 1,490 238 0 3,421(+/-) Net Inflow/(outflow) 0 (4,983) 7,007 0 110 260 566 2,961(+/-) Appreciation / (depreciation) (487) 1,738 1,735 114 (463) 114 141 2,891Ending Balance 10,962 9,514 23,695 2,466 5,411 2,818 3,086 57,952
/IR.VINCIPARTNERS.COM / [email protected]
3Q21 Earnings ReleaseNovember 17th, 2021
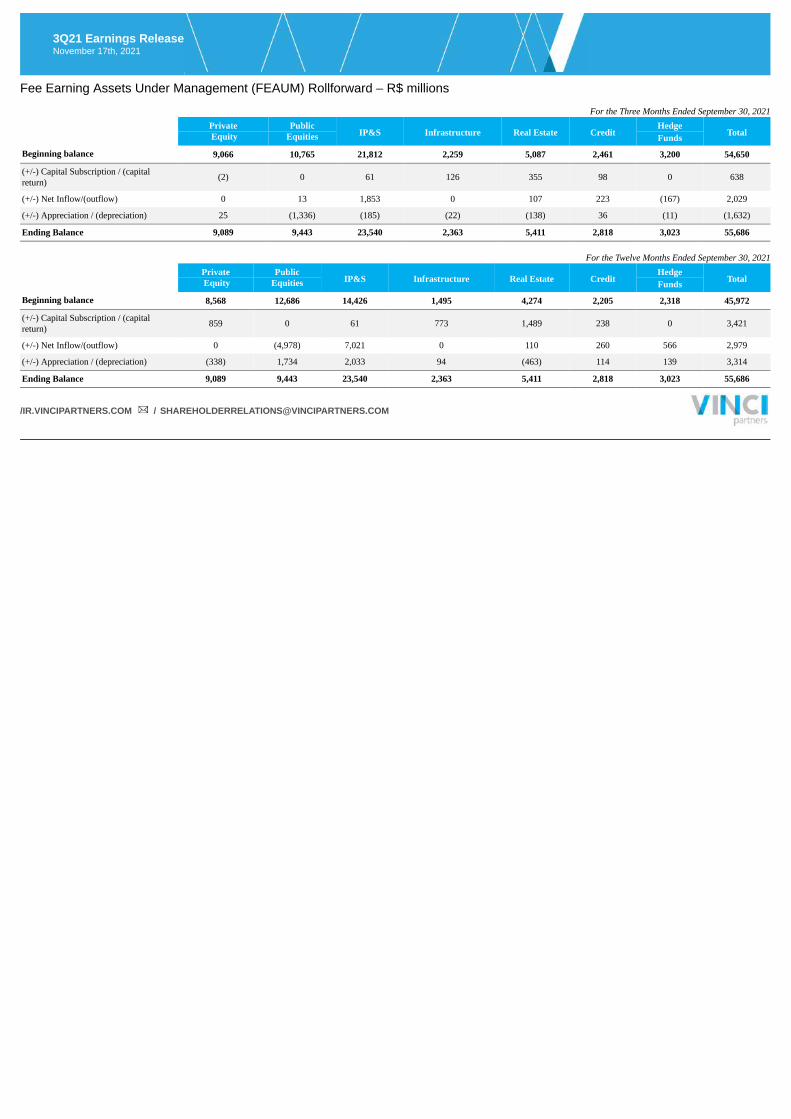
Fee Earning Assets Under Management (FEAUM) Rollforward – R$ millions
For the Three Months Ended September 30, 2021
Private Public
IP&S Infrastructure Real Estate CreditHedge
Total Equity Equities Funds
Beginning balance 9,066 10,765 21,812 2,259 5,087 2,461 3,200 54,650
(+/-) Capital Subscription / (capitalreturn) (2) 0 61 126 355 98 0 638
(+/-) Net Inflow/(outflow) 0 13 1,853 0 107 223 (167) 2,029
(+/-) Appreciation / (depreciation) 25 (1,336) (185) (22) (138) 36 (11) (1,632)
Ending Balance 9,089 9,443 23,540 2,363 5,411 2,818 3,023 55,686
For the Twelve Months Ended September 30, 2021
Private Public
IP&S Infrastructure Real Estate CreditHedge
Total Equity Equities Funds
Beginning balance 8,568 12,686 14,426 1,495 4,274 2,205 2,318 45,972
(+/-) Capital Subscription / (capitalreturn) 859 0 61 773 1,489 238 0 3,421
(+/-) Net Inflow/(outflow) 0 (4,978) 7,021 0 110 260 566 2,979
(+/-) Appreciation / (depreciation) (338) 1,734 2,033 94 (463) 114 139 3,314
Ending Balance 9,089 9,443 23,540 2,363 5,411 2,818 3,023 55,686
/IR.VINCIPARTNERS.COM / [email protected]
3Q21 Earnings ReleaseNovember 17th, 2021
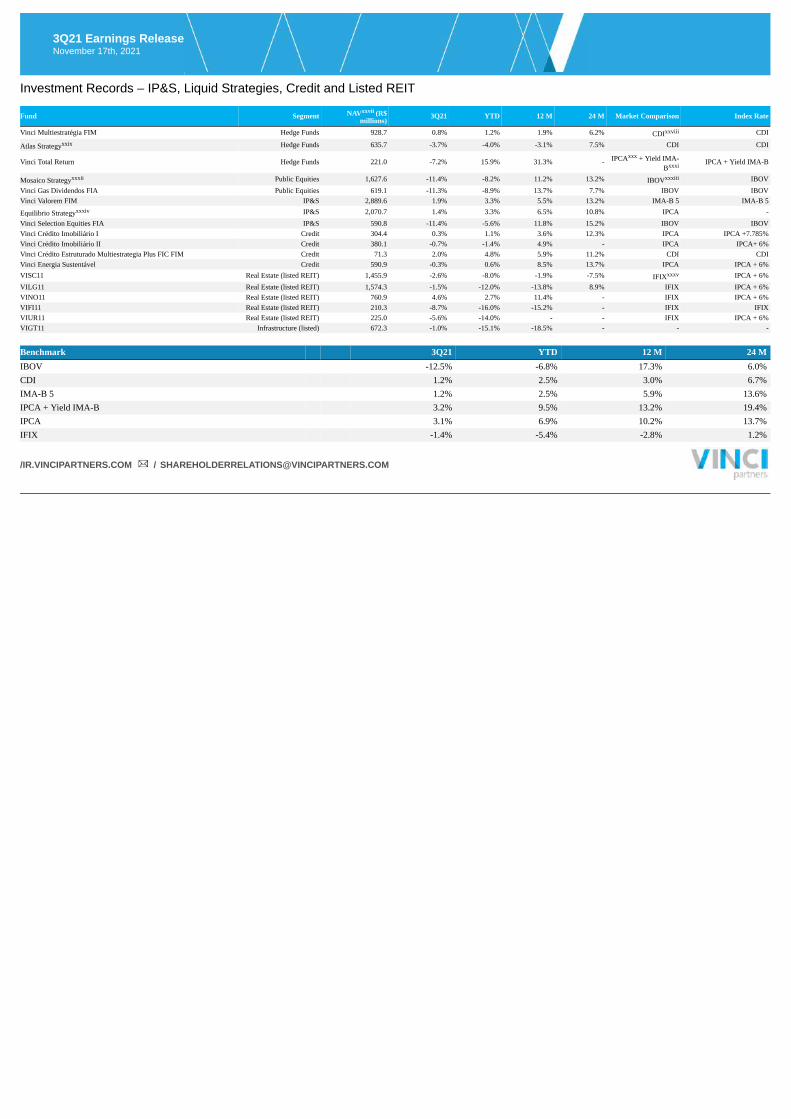
Investment Records – IP&S, Liquid Strategies, Credit and Listed REIT
Fund Segment NAVxxvii (R$millions)
3Q21 YTD 12 M 24 M Market Comparison Index Rate
Vinci Multiestratégia FIM Hedge Funds 928.7 0.8% 1.2% 1.9% 6.2% CDIxxviii CDI
Atlas Strategyxxix Hedge Funds 635.7 -3.7% -4.0% -3.1% 7.5% CDI CDI
Vinci Total Return Hedge Funds 221.0 -7.2% 15.9% 31.3% - IPCAxxx + Yield IMA-Bxxxi IPCA + Yield IMA-B
Mosaico Strategyxxxii Public Equities 1,627.6 -11.4% -8.2% 11.2% 13.2% IBOVxxxiii IBOVVinci Gas Dividendos FIA Public Equities 619.1 -11.3% -8.9% 13.7% 7.7% IBOV IBOVVinci Valorem FIM IP&S 2,889.6 1.9% 3.3% 5.5% 13.2% IMA-B 5 IMA-B 5
Equilibrio Strategyxxxiv IP&S 2,070.7 1.4% 3.3% 6.5% 10.8% IPCA -Vinci Selection Equities FIA IP&S 590.8 -11.4% -5.6% 11.8% 15.2% IBOV IBOVVinci Crédito Imobiliário I Credit 304.4 0.3% 1.1% 3.6% 12.3% IPCA IPCA +7.785%Vinci Crédito Imobiliário II Credit 380.1 -0.7% -1.4% 4.9% - IPCA IPCA+ 6%Vinci Crédito Estruturado Multiestrategia Plus FIC FIM Credit 71.3 2.0% 4.8% 5.9% 11.2% CDI CDIVinci Energia Sustentável Credit 590.9 -0.3% 0.6% 8.5% 13.7% IPCA IPCA + 6%VISC11 Real Estate (listed REIT) 1,455.9 -2.6% -8.0% -1.9% -7.5% IFIXxxxv IPCA + 6%VILG11 Real Estate (listed REIT) 1,574.3 -1.5% -12.0% -13.8% 8.9% IFIX IPCA + 6%VINO11 Real Estate (listed REIT) 760.9 4.6% 2.7% 11.4% - IFIX IPCA + 6%VIFI11 Real Estate (listed REIT) 210.3 -8.7% -16.0% -15.2% - IFIX IFIXVIUR11 Real Estate (listed REIT) 225.0 -5.6% -14.0% - - IFIX IPCA + 6%VIGT11 Infrastructure (listed) 672.3 -1.0% -15.1% -18.5% - - -
Benchmark 3Q21 YTD 12 M 24 MIBOV -12.5% -6.8% 17.3% 6.0%CDI 1.2% 2.5% 3.0% 6.7%IMA-B 5 1.2% 2.5% 5.9% 13.6%IPCA + Yield IMA-B 3.2% 9.5% 13.2% 19.4%IPCA 3.1% 6.9% 10.2% 13.7%IFIX -1.4% -5.4% -2.8% 1.2%
/IR.VINCIPARTNERS.COM / [email protected]

3Q21 Earnings ReleaseNovember 17th, 2021
Investment Records – Closed End Private Markets fundsxxxvi
Fund Segment Vintage yearCommitted
CapitalInvestedCapital Realized or Unrealized Total Value
GrossMOICxxxvii Gross MOIC
GrossIRRxxxviii Gross IRR
PartiallyRealized
(R$mm) (R$mm) (R$mm) (R$mm) (R$mm) (BRL) (USD) (BRL) (USD)Fund 1 Private Equity 2004 1,415 1,206 5,058 276.4 5,334 4.4x 4.1x 71.5% 77.2%
VCP II Private Equity 2011 2,200 1,805 1,959 2,596 4,555 2.5x 1.3x 14.5% 3.5%
VCP III Private Equity 2018 4,000 1,080 18.90 1,799 1,818 1.7x 1.5x 51.2% 36.1%
VCP Strategyxxxix Private Equity 7,615 4,091 7,035 4,672 11,707 2.9x 2.3x 64.9% 70.3%
NE Empreendedor Private Equity 2003 36 13 26 0 26 2.1x 2.6x 22.0% 30.5%
Nordeste III Private Equity 2017 240 134 65 132 197 1.5x 1.2x 21.3% 11.0%
VIR IV Private Equity 2020 1,000 61 0 62 62 1.0x 1.1x 5.6% 24.2%
VIR Strategy Private Equity 1,276 208 91 194 285 1.4x 1.4x 21.6% 28.4%
FIP Transmissão Infrastructure 2017 211 104 117 261 377 3.6x 2.8x 78.5% 59.7%
VIAS Infrastructure - 384 - - - - - - - -
VFDL Real Estate 2021 381 - - - - - - - -
Shareholder Dividends ($ in thousands) 1H21 3Q'21
Distributable Earnings (R$) 101,976 61,743
Distributable Earnings (US$)xl 19,397 11,377
DE per Common Share (US$)xli 0.34 0.20
Actual Dividend per Common Sharexlii 0.30 0.16
Record Date September 01, 2021 December 01, 2021
Payable Date September 16, 2021 December 16, 2021 Vinci Partners’ generated R$1.09 or US$0.20 of Distributable Earnings per common share for the third quarter of 2021. The company declared a quarterly dividend of US$0.16 per common share to record holders as of December 01, 2021; payable on December 16, 2021.
/IR.VINCIPARTNERS.COM / [email protected]
3Q21 Earnings ReleaseNovember 17th, 2021
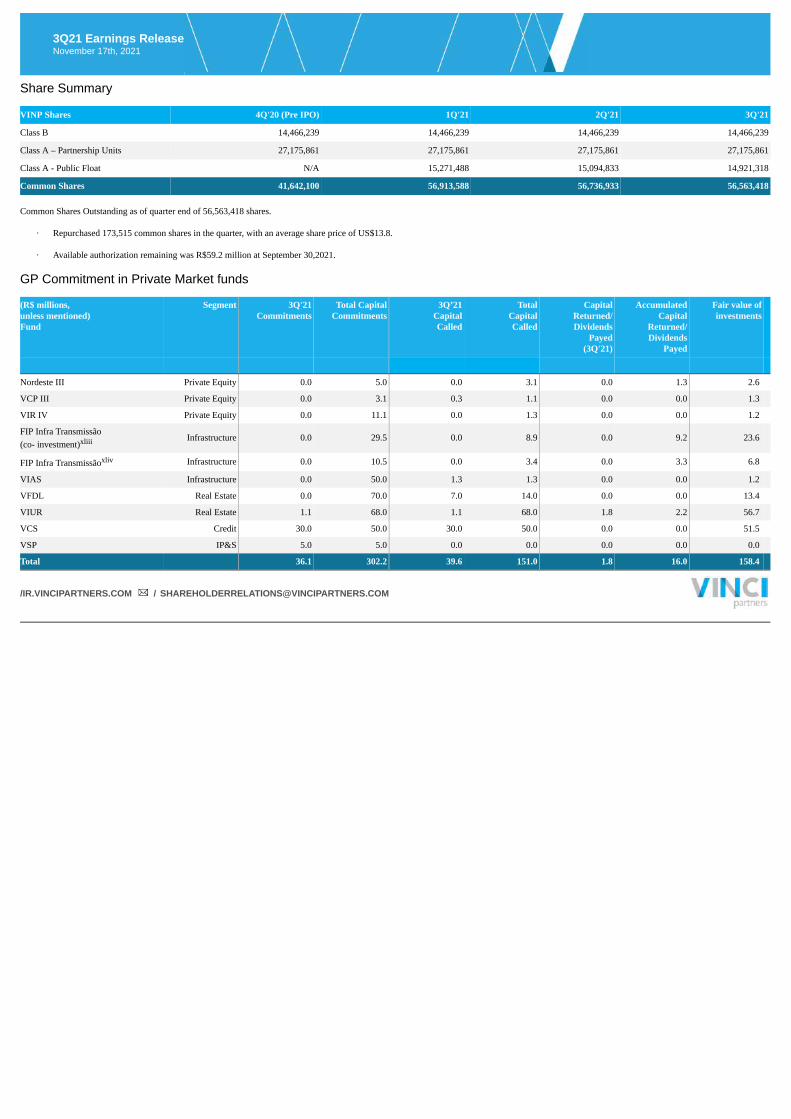
Share Summary VINP Shares 4Q'20 (Pre IPO) 1Q'21 2Q'21 3Q'21
Class B 14,466,239 14,466,239 14,466,239 14,466,239
Class A – Partnership Units 27,175,861 27,175,861 27,175,861 27,175,861
Class A - Public Float N/A 15,271,488 15,094,833 14,921,318
Common Shares 41,642,100 56,913,588 56,736,933 56,563,418 Common Shares Outstanding as of quarter end of 56,563,418 shares.
· Repurchased 173,515 common shares in the quarter, with an average share price of US$13.8.
· Available authorization remaining was R$59.2 million at September 30,2021. GP Commitment in Private Market funds (R$ millions,unless mentioned) Fund
Segment 3Q'21Commitments
Total CapitalCommitments
3Q’21CapitalCalled
TotalCapitalCalled
CapitalReturned/Dividends
Payed(3Q'21)
AccumulatedCapital
Returned/Dividends
Payed
Fair value ofinvestments
Nordeste III Private Equity 0.0 5.0 0.0 3.1 0.0 1.3 2.6
VCP III Private Equity 0.0 3.1 0.3 1.1 0.0 0.0 1.3
VIR IV Private Equity 0.0 11.1 0.0 1.3 0.0 0.0 1.2
FIP Infra Transmissão(co- investment)xliii
Infrastructure 0.0 29.5 0.0 8.9 0.0 9.2 23.6
FIP Infra Transmissãoxliv Infrastructure 0.0 10.5 0.0 3.4 0.0 3.3 6.8
VIAS Infrastructure 0.0 50.0 1.3 1.3 0.0 0.0 1.2
VFDL Real Estate 0.0 70.0 7.0 14.0 0.0 0.0 13.4
VIUR Real Estate 1.1 68.0 1.1 68.0 1.8 2.2 56.7
VCS Credit 30.0 50.0 30.0 50.0 0.0 0.0 51.5
VSP IP&S 5.0 5.0 0.0 0.0 0.0 0.0 0.0
Total 36.1 302.2 39.6 151.0 1.8 16.0 158.4
/IR.VINCIPARTNERS.COM / [email protected]
3Q21 Earnings ReleaseNovember 17th, 2021
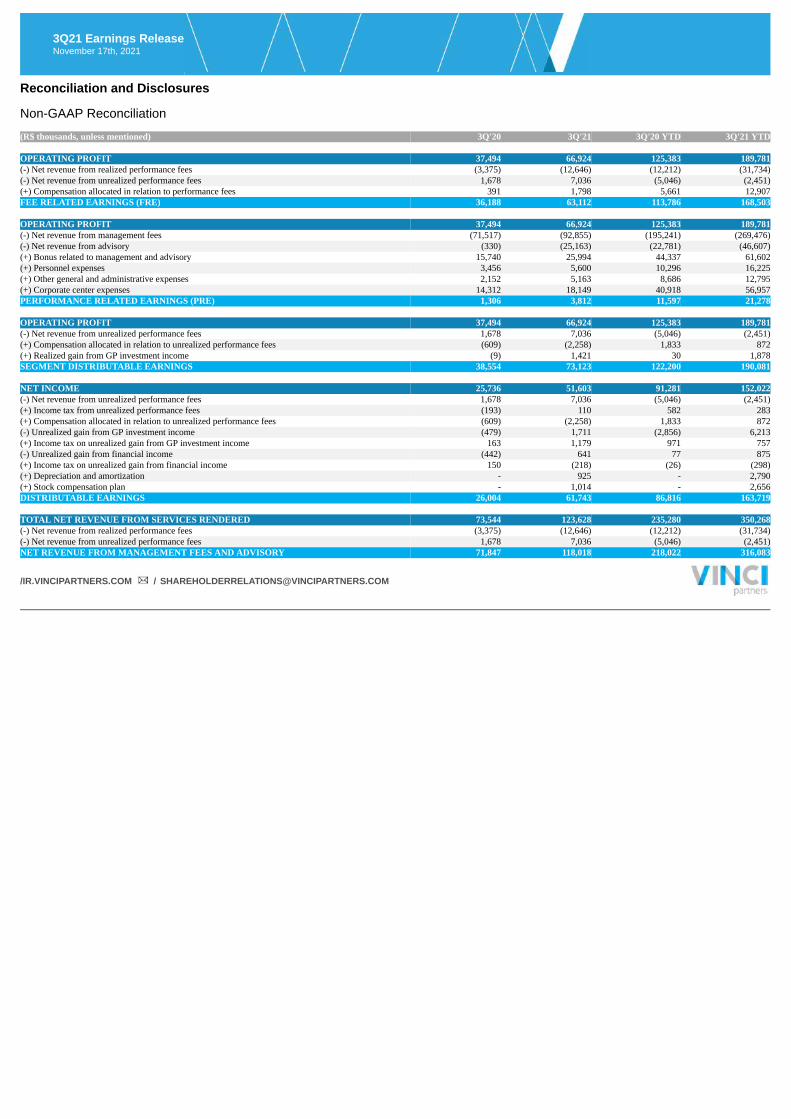
Reconciliation and Disclosures Non-GAAP Reconciliation (R$ thousands, unless mentioned) 3Q'20 3Q'21 3Q'20 YTD 3Q'21 YTD OPERATING PROFIT 37,494 66,924 125,383 189,781(-) Net revenue from realized performance fees (3,375) (12,646) (12,212) (31,734)(-) Net revenue from unrealized performance fees 1,678 7,036 (5,046) (2,451)(+) Compensation allocated in relation to performance fees 391 1,798 5,661 12,907FEE RELATED EARNINGS (FRE) 36,188 63,112 113,786 168,503 OPERATING PROFIT 37,494 66,924 125,383 189,781(-) Net revenue from management fees (71,517) (92,855) (195,241) (269,476)(-) Net revenue from advisory (330) (25,163) (22,781) (46,607)(+) Bonus related to management and advisory 15,740 25,994 44,337 61,602(+) Personnel expenses 3,456 5,600 10,296 16,225(+) Other general and administrative expenses 2,152 5,163 8,686 12,795(+) Corporate center expenses 14,312 18,149 40,918 56,957PERFORMANCE RELATED EARNINGS (PRE) 1,306 3,812 11,597 21,278 OPERATING PROFIT 37,494 66,924 125,383 189,781(-) Net revenue from unrealized performance fees 1,678 7,036 (5,046) (2,451)(+) Compensation allocated in relation to unrealized performance fees (609) (2,258) 1,833 872(+) Realized gain from GP investment income (9) 1,421 30 1,878SEGMENT DISTRIBUTABLE EARNINGS 38,554 73,123 122,200 190,081 NET INCOME 25,736 51,603 91,281 152,022(-) Net revenue from unrealized performance fees 1,678 7,036 (5,046) (2,451)(+) Income tax from unrealized performance fees (193) 110 582 283(+) Compensation allocated in relation to unrealized performance fees (609) (2,258) 1,833 872(-) Unrealized gain from GP investment income (479) 1,711 (2,856) 6,213(+) Income tax on unrealized gain from GP investment income 163 1,179 971 757(-) Unrealized gain from financial income (442) 641 77 875(+) Income tax on unrealized gain from financial income 150 (218) (26) (298)(+) Depreciation and amortization - 925 - 2,790(+) Stock compensation plan - 1,014 - 2,656DISTRIBUTABLE EARNINGS 26,004 61,743 86,816 163,719 TOTAL NET REVENUE FROM SERVICES RENDERED 73,544 123,628 235,280 350,268(-) Net revenue from realized performance fees (3,375) (12,646) (12,212) (31,734)(-) Net revenue from unrealized performance fees 1,678 7,036 (5,046) (2,451)NET REVENUE FROM MANAGEMENT FEES AND ADVISORY 71,847 118,018 218,022 316,083
/IR.VINCIPARTNERS.COM / [email protected]
3Q21 Earnings ReleaseNovember 17th, 2021
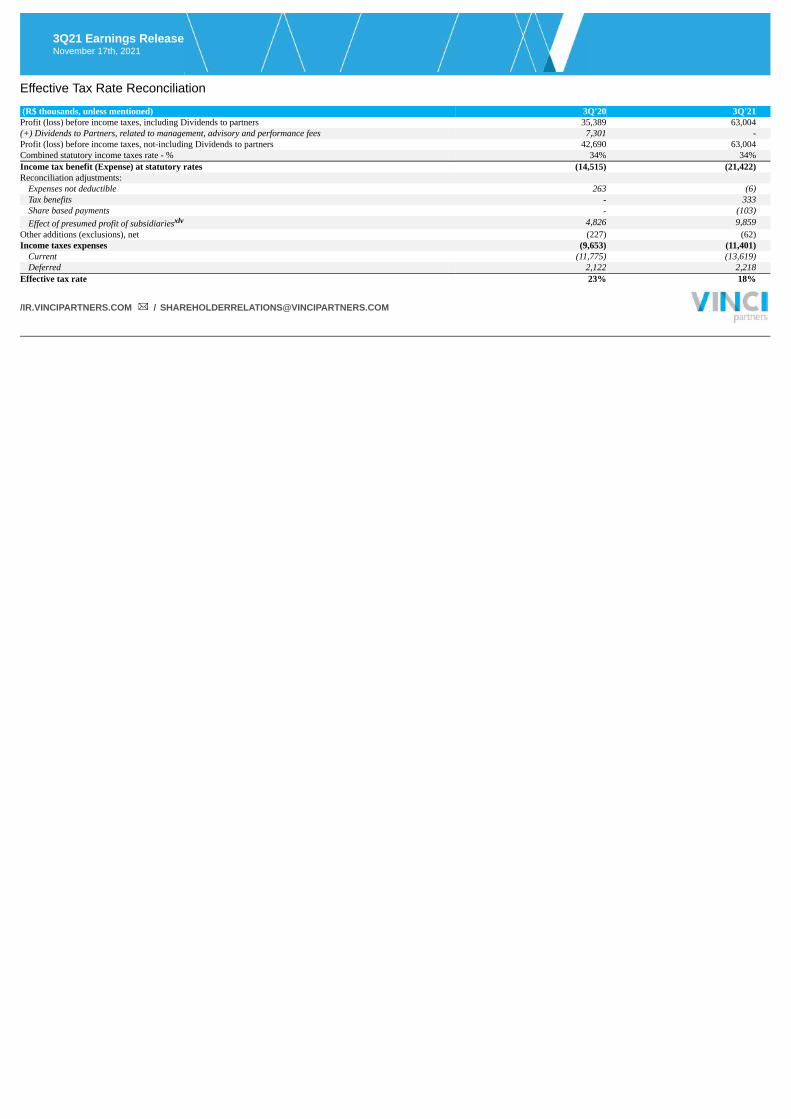
Effective Tax Rate Reconciliation (R$ thousands, unless mentioned) 3Q'20 3Q'21 Profit (loss) before income taxes, including Dividends to partners 35,389 63,004 (+) Dividends to Partners, related to management, advisory and performance fees 7,301 - Profit (loss) before income taxes, not-including Dividends to partners 42,690 63,004 Combined statutory income taxes rate - % 34% 34% Income tax benefit (Expense) at statutory rates (14,515) (21,422) Reconciliation adjustments:
Expenses not deductible 263 (6) Tax benefits - 333 Share based payments - (103) Effect of presumed profit of subsidiariesxlv 4,826 9,859
Other additions (exclusions), net (227) (62) Income taxes expenses (9,653) (11,401)
Current (11,775) (13,619) Deferred 2,122 2,218
Effective tax rate 23% 18%
/IR.VINCIPARTNERS.COM / [email protected]
3Q21 Earnings ReleaseNovember 17th, 2021
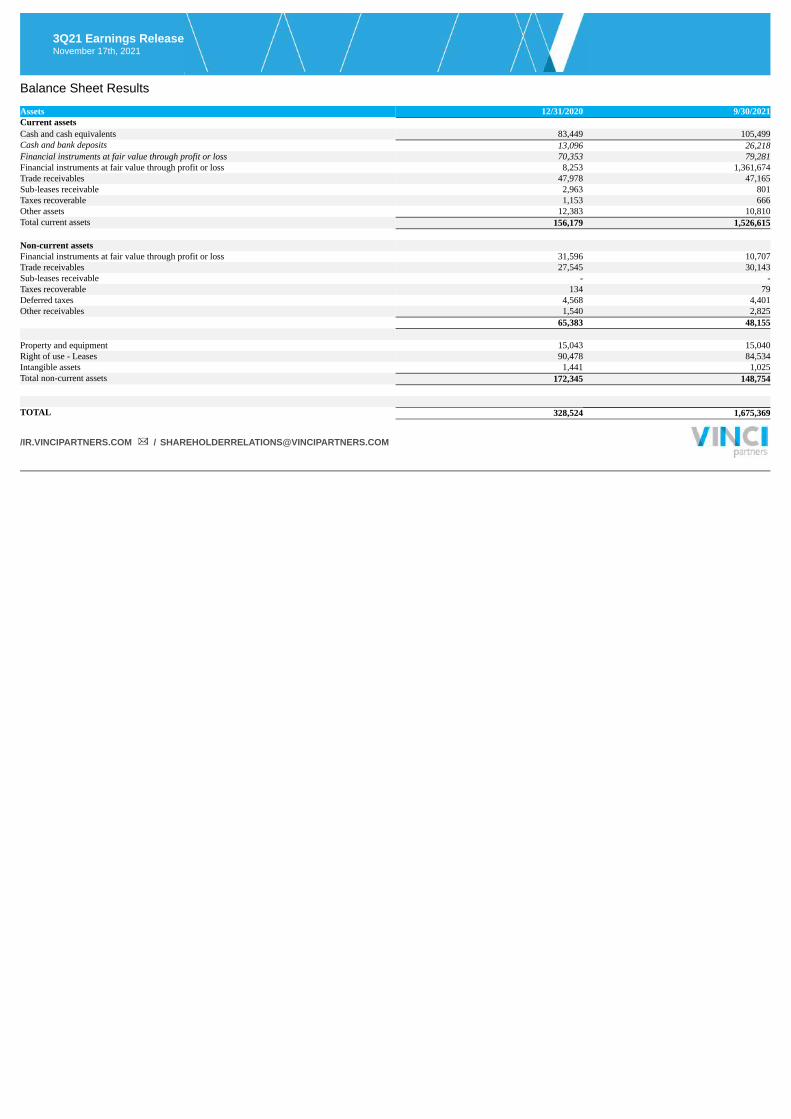
Balance Sheet Results Assets 12/31/2020 9/30/2021Current assets Cash and cash equivalents 83,449 105,499Cash and bank deposits 13,096 26,218Financial instruments at fair value through profit or loss 70,353 79,281Financial instruments at fair value through profit or loss 8,253 1,361,674Trade receivables 47,978 47,165Sub-leases receivable 2,963 801Taxes recoverable 1,153 666Other assets 12,383 10,810Total current assets 156,179 1,526,615 Non-current assets Financial instruments at fair value through profit or loss 31,596 10,707Trade receivables 27,545 30,143Sub-leases receivable - -Taxes recoverable 134 79Deferred taxes 4,568 4,401Other receivables 1,540 2,825 65,383 48,155 Property and equipment 15,043 15,040Right of use - Leases 90,478 84,534Intangible assets 1,441 1,025Total non-current assets 172,345 148,754 TOTAL 328,524 1,675,369
/IR.VINCIPARTNERS.COM / [email protected]
3Q21 Earnings ReleaseNovember 17th, 2021
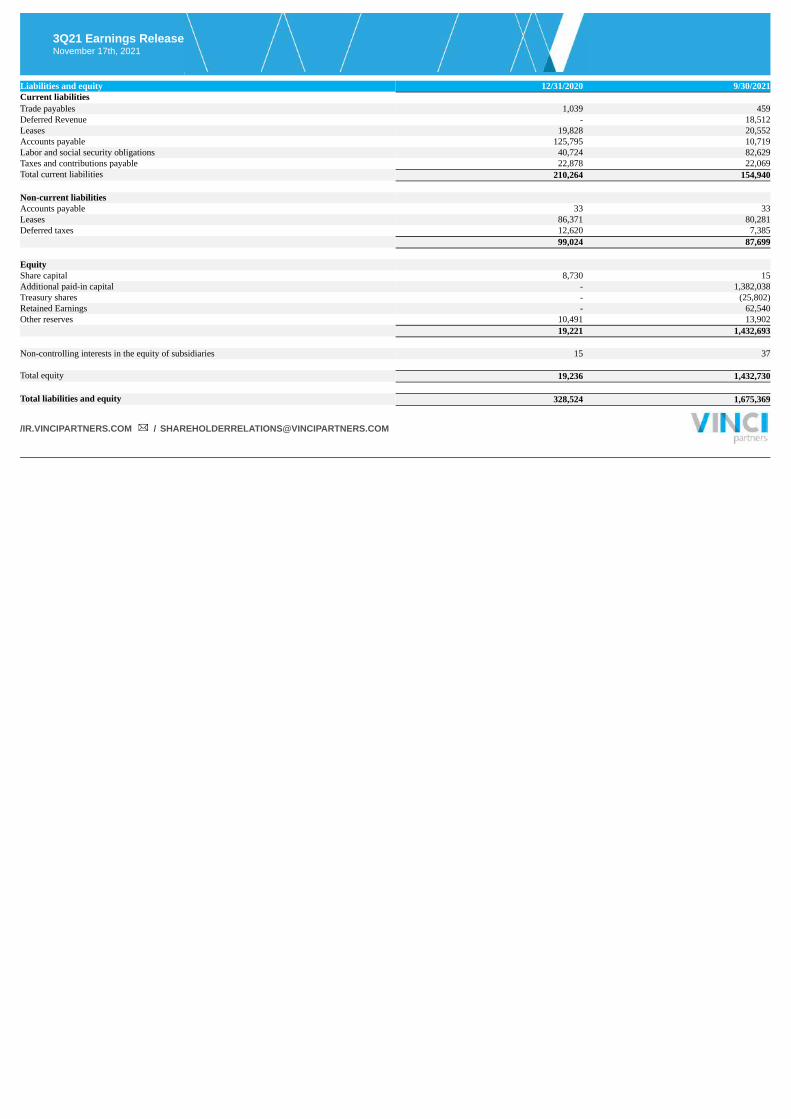
Liabilities and equity 12/31/2020 9/30/2021Current liabilities Trade payables 1,039 459Deferred Revenue - 18,512Leases 19,828 20,552Accounts payable 125,795 10,719Labor and social security obligations 40,724 82,629Taxes and contributions payable 22,878 22,069Total current liabilities 210,264 154,940 Non-current liabilities Accounts payable 33 33Leases 86,371 80,281Deferred taxes 12,620 7,385 99,024 87,699 Equity Share capital 8,730 15Additional paid-in capital - 1,382,038Treasury shares - (25,802)Retained Earnings - 62,540Other reserves 10,491 13,902 19,221 1,432,693 Non-controlling interests in the equity of subsidiaries 15 37 Total equity 19,236 1,432,730 Total liabilities and equity 328,524 1,675,369
/IR.VINCIPARTNERS.COM / [email protected]

3Q21 Earnings ReleaseNovember 17th, 2021
Subsequent Events BK Brasil (B3:BKBR3) announced on October 31, 2021 via Material Fact issued on BM&FBOVESPA, the termination of the agreement signed on July 9, 2021, as announced via Press Release by VinciPartners, for the acquisition of Vinci Capital Partners III's portfolio company Domino's Brasil. The termination agreement grants mutual release to both parties and does not result in penalties of any nature. Additionally, the agreement sets forth a right of first refusal for BK Brasil for the period oftwelve months for the acquisition of Domino's Brasil in case of any sale control of the company, and exclusivity rights to Domino's Brasil to commercialize pizza and/or focus on pizza delivery. Forward-Looking Statements This earnings release contains forward-looking statements that can be identified by the use of words such as “anticipate,” “believe,” “could,” “expect,” “should,” “plan,” “intend,” “estimate” and“potential,” among others. By their nature, forward-looking statements are necessarily subject to a high degree of uncertainty and involve known and unknown risks, uncertainties, assumptions and otherfactors because they relate to events and depend on circumstances that will occur in the future whether or not outside of our control. Such factors may cause actual results, performance or developments todiffer materially from those expressed or implied by such forward-looking statements and there can be no assurance that such forward-looking statements will prove to be correct. The forward-lookingstatements included herein speak only as at the date of this press release and we do not undertake any obligation to update these forward-looking statements. Past performance does not guarantee or predictfuture performance. Moreover, neither we nor our affiliates, officers, employees and agents undertake any obligation to review, update or confirm expectations or estimates or to release any revisions to anyforward-looking statements to reflect events that occur or circumstances that arise in relation to the content of this press release. Further information on these and other factors that could affect our financialresults is included in filings we have made and will make with the U.S. Securities and Exchange Commission from time to time.
i Fee related earnings, or FRE, is a metric to monitor the baseline performance of, and trends in, our business, in a manner that does not include performance fees or investment income. We calculate FRE asoperating profit less (a) net revenue from realized performance fees, less (b) net revenue from unrealized performance fees, plus (c) compensation allocated in relation to performance fees. ii Distributable Earnings is used as a reference point by our board of directors for determining the amount of earnings available to distribute to shareholders as dividends. Distributable Earnings is calculatedas profit for the year, less (a) net revenue from unrealized performance fees, plus (b) income taxes from unrealized performance fees, plus (c) compensation allocated in relation to unrealized performancefees, less (d) unrealized gain from GP investment income, less (e) unrealized gain from financial income, plus (f) income taxes on unrealized gain from GP investment income, plus (g) income taxes onunrealized gain from financial income.
/IR.VINCIPARTNERS.COM / [email protected]

3Q21 Earnings ReleaseNovember 17th, 2021
iii AUM” refers to assets under management. Our assets under management equal the sum of: (1) the fair market value of the investments held by funds plus the capital that we are entitled to call frominvestors in those funds pursuant to the terms of their capital commitments to those funds (plus the fair market value of co-investments arranged by us that were made or could be made by limited partnersof our corporate private equity funds and portfolio companies of such funds); (2) the net asset value of our public equity funds, hedge funds and closed-end mutual funds; and (3) the amount of capitalraised for our credit funds. AUM includes double counting related to funds from one segment that invest in funds from another segment. Those cases occur mainly due to (a) fund of funds of investmentproducts and solutions segment, and (b) investment funds in general that invest part of their cash in credit segment and hedge fund segment funds in order to maintain liquidity and provide for returns oncash. Such amounts are eliminated on consolidation. The bylaws of the relevant funds prohibit double-charging fees on AUM across segments. Therefore, while our AUM by segment may double-countfunds from one segment that invest in funds from another segment, the revenues for any given segment do not include revenue in respect of assets managed by another segment, which means there are nointercompany eliminations on revenues in our results of operations. iv FRE per share is calculated considering the number of outstanding shares at the end of the current quarter. Year to date values are calculated as the sum of the last three quarters v Depreciation and amortization is a non-cash expense that is being added back for our calculation of Distributable Earnings for the year ended December 31, 2020, and future periods. Our DistributableEarnings for the quarter and nine months ended September 30, 2020, would have been R$27.1 million and R$90.4 million, respectively, if we did add back depreciation and amortization to our calculationof Distributable Earnings. vi DE per share is calculated considering the number of outstanding shares at the end of the current quarter. Year to date values are calculated as the sum of the last three quarters vii Net revenue from Fund Management and Advisory is a performance measure that we use to assess our ability to generate profits from our fund management and advisory business without measuring forthe outcomes from funds above their respective benchmarks. We calculate Net Revenue from Fund Management and Advisory as net revenue from services rendered less (a) net revenue from realizedperformance fees and less (b) net revenue from unrealized performance fees. viii FRE Margin is calculated as FRE over total net management and advisory fees. ix “Performance Related Earnings”, or “PRE”, is a performance measure that we use to assess our ability to generate profits from revenue that relies on outcome from funds above their respectivebenchmarks. We calculate PRE as operating profit, less (a) net revenue from fund management and advisory, less (b) operating expenses, such as segment personnel, G&A, corporate center and bonusrelated to management and advisory.
x Segment Distributable Earnings is Vinci Partners’ segment profitability measure used to make operating decisions and assess performance across the company’s four segments (Private Markets, LiquidStrategies, Investment Products and Solutions and Financial Advisory). Segment Distributable Earnings is calculated as operating profit less (a) net revenue from unrealized performance fees, plus (b)compensation allocated in relation to unrealized performance fees, plus (c) realized gain from GP investment income. xi DE Margin is calculated as DE over the sum of management and advisory fee related revenues, realized performance revenue, realized GP investment income and realized financial income, net ofrevenue tax. xii “Total compensation and benefits” is the result of the profit sharing paid to our employees as (a) bonus compensation related to management advisory and (b) performance based compensation. Totalcompensation and benefits include Dividends to Partners, distributed by the company to its original partners before the public turned public in 2021. In accordance with the by-laws of Vinci Brazil,dividends have historically been distributed based on the resolution of the partners. Therefore, dividends could be distributed on a non-proportional basis among quotaholders, which are comprised by thepartners of Vinci Brazil. After the company’s IPO, Vinci Partners changed its compensation structure, from a dividend distribution policy to a profit-sharing scheme for our partners.
/IR.VINCIPARTNERS.COM / [email protected]
3Q21 Earnings ReleaseNovember 17th, 2021
xiii Bonus compensation related to management and advisory includes Dividends to Partners related to management and advisory, distributed by the company to its original partners before the companyturned public in 2021. xiv Performance based compensation includes Dividends to Partners related to performance fees, distributed by the company to its original partners before the company turned public in 2021. xv “Segment personnel expenses” are composed of the salary-part compensation paid to employees and partners of our funds’ management teams. xvi “Corporate center expenses” are composed by the salary-compensation paid to employees and partners of our support teams and other expenses, such as research, risk, legal & compliance, investorrelations, operations and ESG. xvii “Other general and administrative expenses” is made up of third-party expenses, depreciation and amortization, travel and representation, marketing expenses, administrative fees, non-operating taxes,third-party consultants’ fees, such as legal and accounting, and office consumables. xviii “GP investment income” is income from proprietary investments made by us in our own Private Markets’ funds, used as GP Commitments. xix “Financial income” is income generated through the investments made with our cash and cash equivalents in cash and bank deposits, certificate of deposits and proprietary investments in our LiquidFunds from our public equities and hedge funds’ segments and listed REITs from our real estate segment. xx IMAB is composed by government bonds indexed to IPCA. xxi “Leasing expenses” include costs from the company’s sub-leasing activities. xxii “Stock option compensation plan” is a benefit program in which the company concedes to an employee the option to buy stock in the company with stated fixed price. xxiii Income taxes is comprised of taxes on our corporate income tax and social contribution taxes. We are taxed on an actual taxable profit regime, while our subsidiaries are taxed based on deemed profit.Dividends to partners distributed by the company to its original partners before turned public in 2021 are not included in actual taxable regime. xxiv “Capital Subscription / (capital return)” represents the net capital commitments and capital returns from our Private Markets’ closed end and listed funds. xxv “Net Inflows / (outflows)” represent the net inflows and outflows from our liquid funds from our liquid strategies, IP&S and credit segments. xxvi “Appreciation / (depreciation)” represents the net capital appreciation/depreciation from our funds, which refers to the increase or decrease of the funds’ investment’s value. xxvii NAV is the net asset value of each fund. For listed vehicles, the NAV represents the Market valuation of the fund. xxviii CDI is an average of interbank overnight rates in Brazil (daily average for the period). xxix Atlas strategy comprises Atlas FIC FIM and Atlas Institucional FIC FIM.
/IR.VINCIPARTNERS.COM / [email protected]
3Q21 Earnings ReleaseNovember 17th, 2021
xxx IPCA is a broad consumer price index measured by the IBGE. xxxi IMAB is composed by government bonds indexed to IPCA. IMAB 5 also comprises government bonds indexed to IPCA but only the one´s with up to 5 Years duration. xxxii Mosaico strategy comprises Vinci Mosaico FIA, Vinci Mosaico Institucional FIA and Vinci Mosaico Advisory FIA. xxxiii IBOV is the Brazilian stock market most relevant index. xxxiv Equilibrio Strategy comprises IP&S Family of pension plans. xxxv IFIX is an index composed by listed REITs in the brazilian stock exchange. xxxvi Track record information is presented throughout this release on a pro forma basis and in local currency, excluding PIPE investments, a strategy that will be discontinued in VCP III. Past performanceof investments described herein is provided for illustrative purposes only and is not necessarily indicative of future investment results. xxxvii “MOIC” means multiple on invested capital, a ratio intended to represent how much value an investment has returned, and is calculated as realized value plus unrealized value, divided by the totalamount invested, gross of expenses and fees. xxxviii “IRR” means the internal rate of return, which is a discount rate that makes the net present value of all cash flows equal to zero in a discounted cash flow analysis. xxxix Total commitments for VCP III include R$1.3 billion in co-investments. xl US$ Distributable Earnings was calculated considering the exchange rate from USD to BRL of 5.4271 as of November 11, 2021, when dividends were approved by our Board of Directors. xli Per Share calculations are based on end of period Participating Common Shares. xlii Actual dividends per common share are calculated considering the share count as of the applicable record date. xliii The remaining capital committed in FIP Infra Transmissão co-investment will not be called by the fund, which is already in divestment period. xliv The remaining capital committed in FIP Infra Transmissão will not be called by the fund, which is already in divestment period. xlv Brazilian tax law establishes that companies that generate gross revenues of up to R$ 78,000 in the prior fiscal year may calculate income taxes as a percentage of gross revenue, using the presumedprofit income tax regime. The Entity's subsidiaries adopted this tax regime and the effect of the presumed profit of subsidiaries represents the difference between the taxation based on this method and theamount that would be due based on the statutory rate applied to the taxable profit of the subsidiaries.
/IR.VINCIPARTNERS.COM / [email protected]

Third Quarter 2021 Earnings Presentation November 17, 2021

Disclaimer This presentation contains forward - looking statements that can be identified by the use of words such as “anticipate,” “believe, ” “could,” “expect,” “should,” “plan,” “intend,” “estimate” and “potential,” among others. By their nature, forward - looking statements are necessarily subject to a hig h degree of uncertainty and involve known and unknown risks, uncertainties, assumptions and other factors because they relate to events and depend on circumstances tha t w ill occur in the future whether or not outside of our control. Such factors may cause actual results, performance or developments to differ materially from those ex pre ssed or implied by such forward - looking statements and there can be no assurance that such forward - looking statements will prove to be correct. Accordingly, you should not place undue reliance on forward - looking statements. The forward - looking statements included herein speak only as at the date of this presentation and we do not undertake any obligation to update these forward - looking statements. Past performance does not guarantee or predict future performance. Moreover, neither we nor our affi liates, officers, employees and agents undertake any obligation to review, update or confirm expectations or estimates or to release any revisions to any forward - looki ng statements to reflect events that occur or circumstances that arise in relation to the content of the presentation. Further information on these and other factors that cou ld affect our financial results is included in filings we have made and will make with the U.S. Securities and Exchange Commission (the “SEC”) from time to time, including in the section titled “Risk Factors” in our most recent form F - 1 and 424(b) prospectus and form 20 - F. These documents are available on the SEC Filings section of the inves tor relations section of our website at: https://ir.vincipartners.com/financials/sec - filings. We have prepared this presentation solely for informational purposes. The information in this presentation does not constitut e o r form part of, and should not be construed as, an offer or invitation to subscribe for, underwrite or otherwise acquire, any of our securities or securities of our subs idi aries or affiliates, not should it or any part of it form the basis of, or be relied on, in connection with any contract to purchase or subscribe for any of our securities or sec uri ties of any of our subsidiaries or affiliates, nor shall it or any part of it form the basis of, or be relied on, in connection w ith any contract or commitment whatsoever. This presentation also includes certain non - GAAP financial information. We believe that such information is meaningful and usefu l in understanding the activities andbusiness metrics of our operations. We also believe that these non - GAAP financial measures reflect an additional way of viewing aspects of our business that, when viewed with our International Financial Reporting Standards (“IFRS”) results, as issued by the International Accounting Standards Bo ard , provide a more complete understanding of factors and trends affecting our business. Further, investors regularly rely on non - GAAP financial measures to assess operati ng performance and such measures may highlight trends in our business that may not otherwise be apparent when relying on financial measures calculated in accordan ce with IFRS. We also believe that certain non - GAAP financial measures are frequently used by securities analysts, investors and other interested parties in the evaluation of public companies in our industry, many of which present these measures when reporting their results. The non - GAAP financial information is presented for informational purposes and to enhance understanding of the IFRS financial statements. The non - GAAP measures should be considered in addition to results prepared in accordance with IFRS, but not as a substitute for, or superior to, IFRS results. As other companies may determine or calculate this non - GAAP financial information differently, the us efulness of these measures for comparative purposes is limited. A reconciliation of such non - GAAP financial measures to the nearest GAAP measure is included in this presen tation. 2

Presenters Alessandro Horta Chief Executive Officer Bruno Zaremba Head of Private Equity & Investor Relations Sergio Passos Chief Operating Officer & Chief Financial Officer 3

Opening Remarks
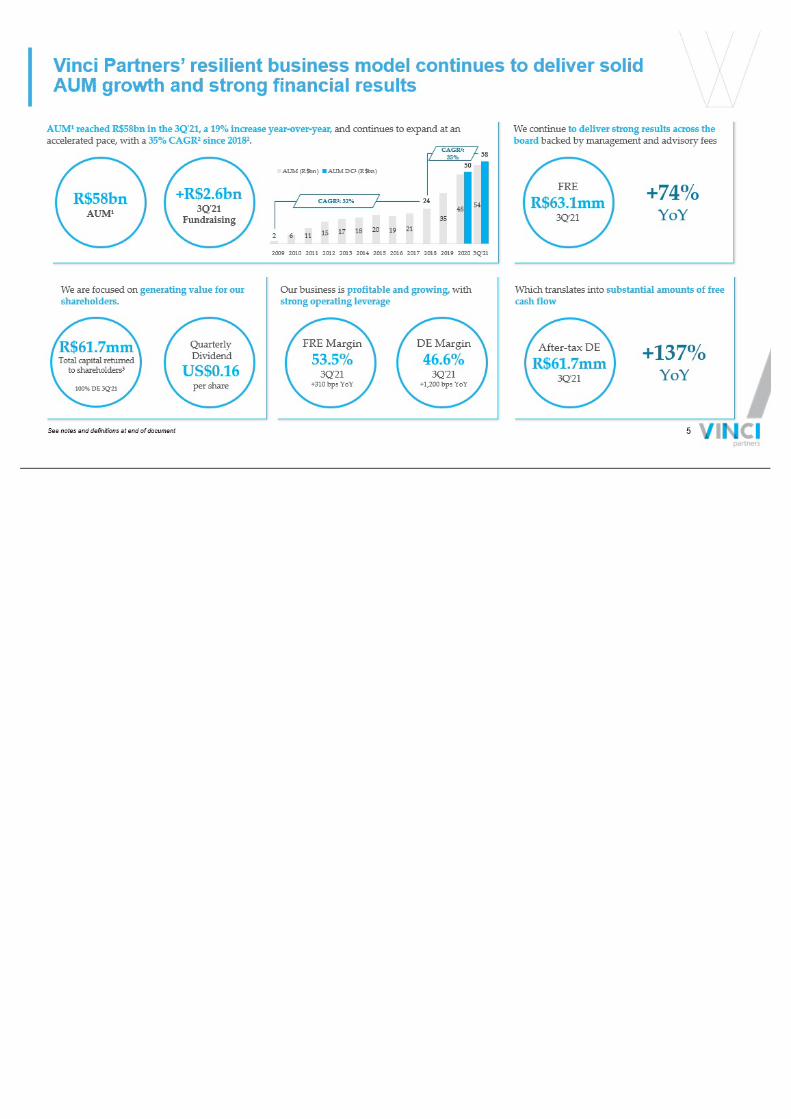
Vinci Partners’ resilient business model continues to deliver solid AUM growth and strong financial results We continue to deliver strong results across the board backed by management and advisory fees FRE R$63.1mm 3Q ' 21 +74% YoY Which translates into substantial amounts of free cash flow After - tax DE R$61.7mm 3Q ' 21 +137% YoY Our business is profitable and growing, with strong operating leverage FRE Margin 53.5% 3Q ' 21 +310 bps YoY DE Margin 46 .6% 3Q ' 21 +1,200 bps YoY We are focused on generating value for our shareholders. Quarterly Dividend US$0.16 per share R$61. 7 mm Total capital returned to shareholders³ 100% DE 3Q ' 21 AUM¹ reached R$58bn in the 3Q ' 21, a 19% increase year - over - year , and continues to expand at an accelerated pace, with a 35% CAGR² since 2018² . R$58bn AUM¹ 2 6 11 15 17 18 20 19 21 24 35 48 54 50 58 2009 2010 2011 2012 2013 2014 2015 2016 2017 2018 2019 2020 3Q'21 AUM (R$bn) AUM DC¹ (R$bn) CAGR²: 32% See notes and definitions at end of document CAGR²: 35% +R$ 2.6bn 3Q ' 21 Fundraising 5

Financial Highlights
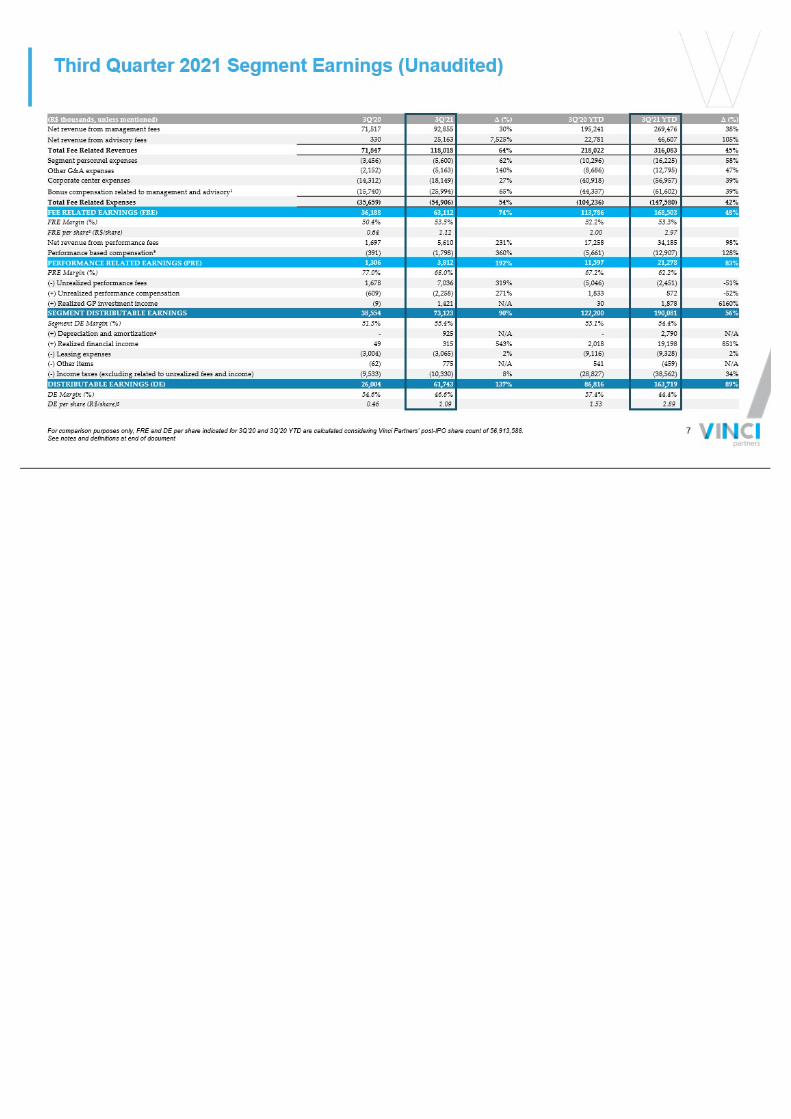
Third Quarter 2021 Segment Earnings (Unaudited) (R$ thousands, unless mentioned) 3Q'20 3Q'21 ∆ (%) 3Q'20 YTD 3Q'21 YTD ∆ (%) Net revenue from management fees 71,517 92,855 30% 195,241 269,476 38% Net revenue from advisory fees 330 25,163 7,525% 22,781 46,607 105% Total Fee Related Revenues 71,847 118,018 64% 218,022 316,083 45% Segment personnel expenses (3,456) (5,600) 62% (10,296) (16,225) 58% Other G&A expenses (2,152) (5,163) 140% (8,686) (12,795) 47% Corporate center expenses (14,312) (18,149) 27% (40,918) (56,957) 39% Bonus compensation related to management and advisory¹ (15,740) (25,994) 65% (44,337) (61,602) 39% Total Fee Related Expenses (35,659) (54,906) 54% (104,236) (147,580) 42% FEE RELATED EARNINGS (FRE) 36,188 63,112 74% 113,786 168,503 48% FRE Margin (%) 50.4% 53.5% 52.2% 53.3% FRE per share² (R$/share) 0.64 1.12 2.00 2.97 Net revenue from performance fees 1,697 5,610 231% 17,258 34,185 98% Performance based compensation³ (391) (1,798) 360% (5,661) (12,907) 128% PERFORMANCE RELATED EARNINGS (PRE) 1,306 3,812 192% 11,597 21,278 83% PRE Margin (%) 77.0% 68.0% 67.2% 62.2% ( - ) Unrealized performance fees 1,678 7,036 319% (5,046) (2,451) - 51% (+) Unrealized performance compensation (609) (2,258) 271% 1,833 872 - 52% (+) Realized GP investment income (9) 1,421 N/A 30 1,878 6160% SEGMENT DISTRIBUTABLE EARNINGS 38,554 73,123 90% 122,200 190,081 56% Segment DE Margin (%) 51.3% 55.4% 53.1% 54.4% (+) Depreciation and amortization 4 - 925 N/A - 2,790 N/A (+) Realized financial income 49 315 543% 2,018 19,198 851% ( - ) Leasing expenses (3,004) (3,065) 2% (9,116) (9,328) 2% ( - ) Other items (62) 775 N/A 541 (459) N/A ( - ) Income taxes (excluding related to unrealized fees and income) (9,533) (10,330) 8% (28,827) (38,562) 34% DISTRIBUTABLE EARNINGS (DE) 26,004 61,743 137% 86,816 163,719 89% DE Margin (%) 34.6% 46.6% 37.4% 44.4% DE per share (R$/share) 5 0.46 1.09 1.53 2.89 For comparison purposes only, FRE and DE per share indicated for 3Q’20 and 3Q’20 YTD are calculated considering Vinci Partner s’ post - IPO share count of 56,913,588. See notes and definitions at end of document 7
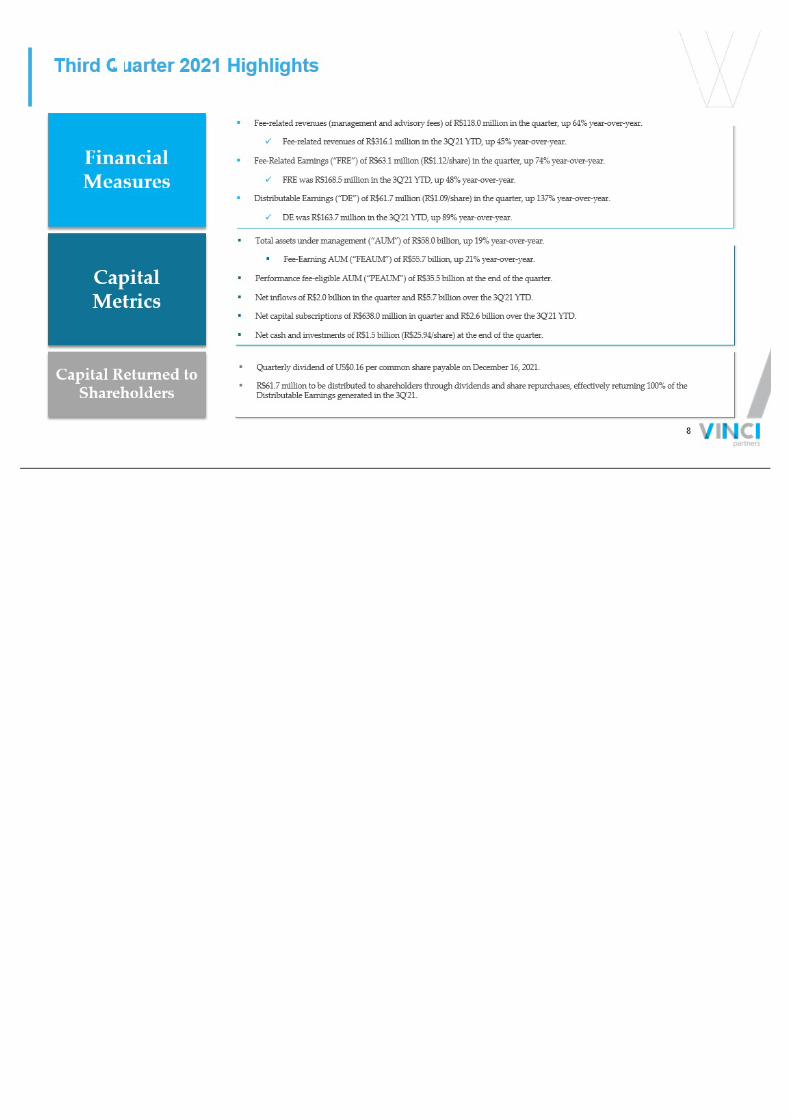
▪ Fee - related revenues (management and advisory fees) of R$118.0 million in the quarter, up 64 % year - over - year. x Fee - related revenues of R$ 316 .1 million in the 3Q'21 YTD, up 45 % year - over - year. ▪ Fee - Related Earnings (“FRE”) of R$ 63 .1 million (R$1.12/share) in the quarter, up 74 % year - over - year. x FRE was R$168.5 million in the 3Q'21 YTD, up 48 % year - over - year. ▪ Distributable Earnings (“DE”) of R$ 61 .7 million (R$1.09/share) in the quarter, up 137% year - over - year. x DE was R$163.7 million in the 3Q'21 YTD, up 89 % year - over - year. ▪ Total assets under management (“AUM”) of R$58.0 billion, up 19 % year - over - year. ▪ Fee - Earning AUM (“FEAUM”) of R$55.7 billion, up 21 % year - over - year. ▪ Performance fee - eligible AUM (“PEAUM”) of R$35.5 billion at the end of the quarter. ▪ Net inflows of R$2.0 billion in the quarter and R$5.7 billion over the 3Q ' 21 YTD. ▪ Net capital subscriptions of R$638.0 million in quarter and R$2.6 billion over the 3Q ' 21 YTD. ▪ Net cash and investments of R$1.5 billion (R$25.94/share) at the end of the quarter. Third Quarter 2021 Highlights Financial Measures Capital Metrics Capital Returned to Shareholders ▪ Quarterly dividend of US$0.16 per common share payable on December 16, 2021. ▪ R$61.7 million to be distributed to shareholders through dividends and share repurchases, effectively returning 100% of the Distributable Earnings generated in the 3Q ' 21. 8
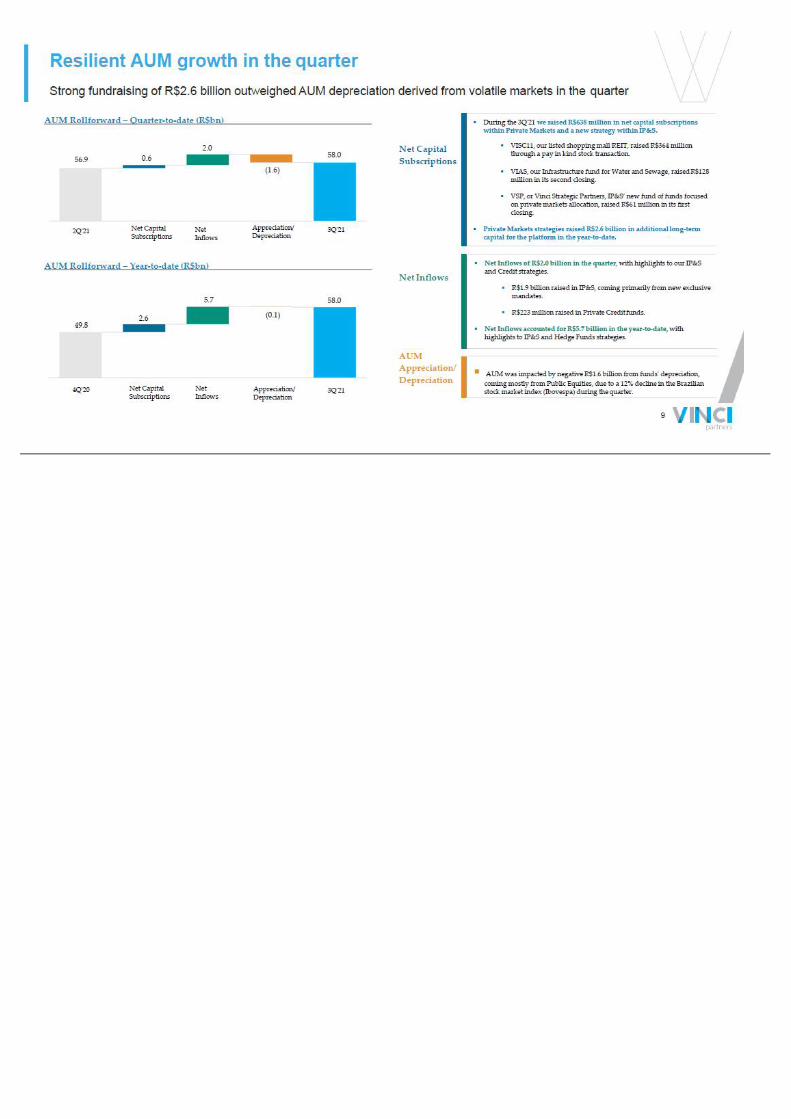
▪ Net Inflows of R$2.0 billion in the quarter , with highlights to our IP&S and Credit strategies. ▪ R$1.9 billion raised in IP&S, coming primarily from new exclusive mandates. ▪ R$223 million raised in Private Credit funds. ▪ Net Inflows accounted for R$5.7 billion in the year - to - date , with highlights to IP&S and Hedge Funds strategies. ▪ AUM was impacted by negative R$1.6 billion from funds' depreciation, coming mostly from Public Equities, due to a 13% decline in the Brazilian stock market index (Ibovespa) during the quarter. Strong fundraising of R$2.6 billion outweighed AUM depreciation derived from volatile markets in the quarter Resilient AUM growth in the quarter 2Q ' 21 3Q ' 21 Net Capital Subscriptions Net Inflows Appreciation/ Depreciation 56.9 0.6 2.0 (1.6) 58.0 AUM Rollforward – Quarter - to - date (R$bn) AUM Rollforward – Year - to - date (R$bn) 3Q ' 21 Net Capital Subscriptions Net Inflows Appreciation/ Depreciation 4Q ' 20 58.0 49.8 2.6 5.7 (0.1) Net Capital Subscriptions Net Inflows AUM Appreciation/ Depreciation ▪ During the 3Q'21 we raised R$638 million in net capital subscriptions within Private Markets and a new strategy within IP&S. ▪ VISC11, our listed shopping mall REIT, raised R$364 million through a pay in kind stock transaction. ▪ VIAS, our Infrastructure fund for Water and Sewage, raised R$128 million in its second closing. ▪ VSP, or Vinci Strategic Partners, IP&S’ new fund of funds focused on private markets allocation, raised R$61 million in its first closing. ▪ Private Markets strategies raised R$2.6 billion in additional long - term capital for the platform in the year - to - date. 9
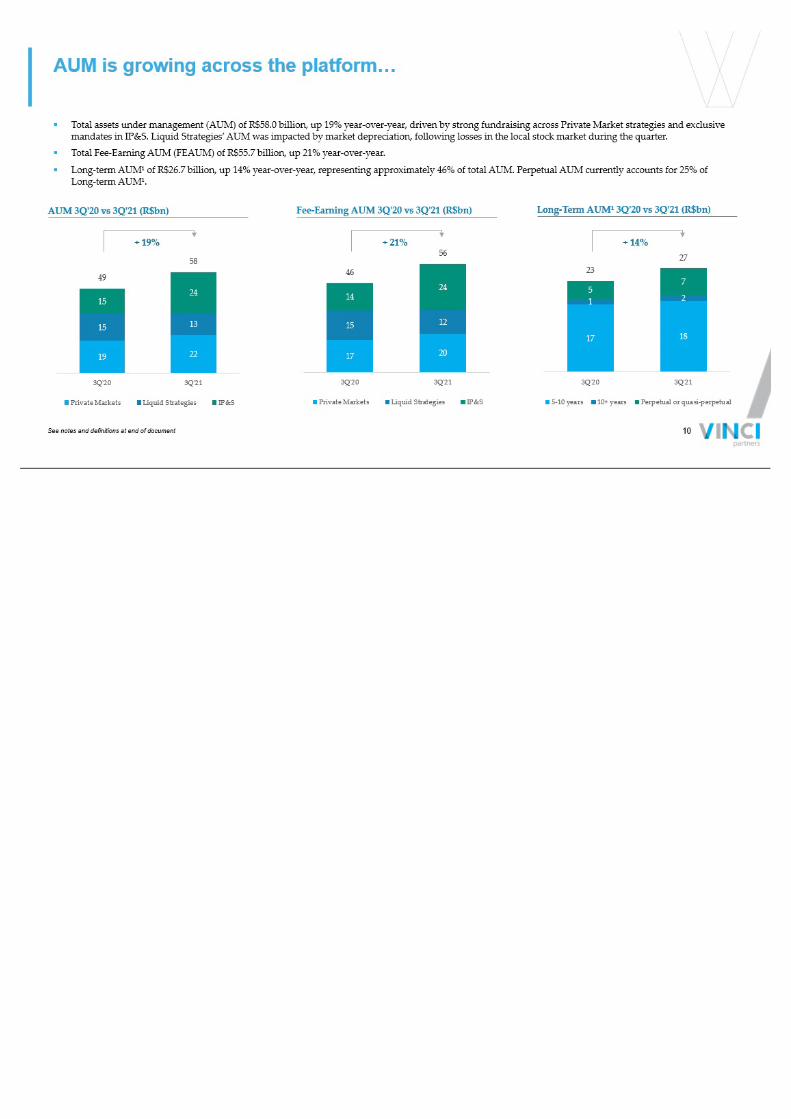
AUM is growing across the platform… ▪ Total assets under management (AUM) of R$58.0 billion, up 19% year - over - year, driven by strong fundraising across Private Market strategies and exclusive mandates in IP&S. Liquid Strategies’ AUM was impacted by market depreciation, following losses in the local stock market duri ng the quarter. ▪ Total Fee - Earning AUM (FEAUM) of R$55.7 billion, up 21% year - over - year. ▪ Long - term AUM¹ of R$26.7 billion, up 14% year - over - year, representing approximately 46% of total AUM. Perpetual AUM currently ac counts for 25% of Long - term AUM¹. AUM 3Q ' 20 vs 3Q ' 21 ( R$bn ) Fee - Earning AUM 3Q ' 20 vs 3Q ' 21 ( R$bn ) Long - Term AUM¹ 3Q ' 20 vs 3Q ' 21 ( R$bn ) 19 22 15 13 15 24 49 58 3Q'20 3Q'21 Private Markets Liquid Strategies IP&S 17 20 15 12 14 24 46 56 3Q'20 3Q'21 Private Markets Liquid Strategies IP&S 17 18 1 2 5 7 23 27 3Q'20 3Q'21 5-10 years 10+ years Perpetual or quasi-perpetual + 19% + 21% + 14% See notes and definitions at end of document 10

24% 10% 4% 6% 23% 16% 6% 12% Private Equity Real Estate Credit Infrastructure IP&S Public Equities Hedge Funds Advisory 19% 9% 5% 4% 41% 17% 5% AUM 3Q ' 21 Our AUM base favors alpha - driven strategies, while our revenue profile is management fee - centric … and is highly diversified across different strategies and clients 43 % of net revenues come from private market strategies ² 46 % of AUM is in long term products ¹ AUM diversified across five different distribution channels 36% 23% 22% 10% 9% Local Institucional HNWI Institutional Offshore Allocators & Distributors Public market vehicles AUM 3Q ' 21 Net Revenues 3Q'21 YTD See notes and definitions at end of document 11
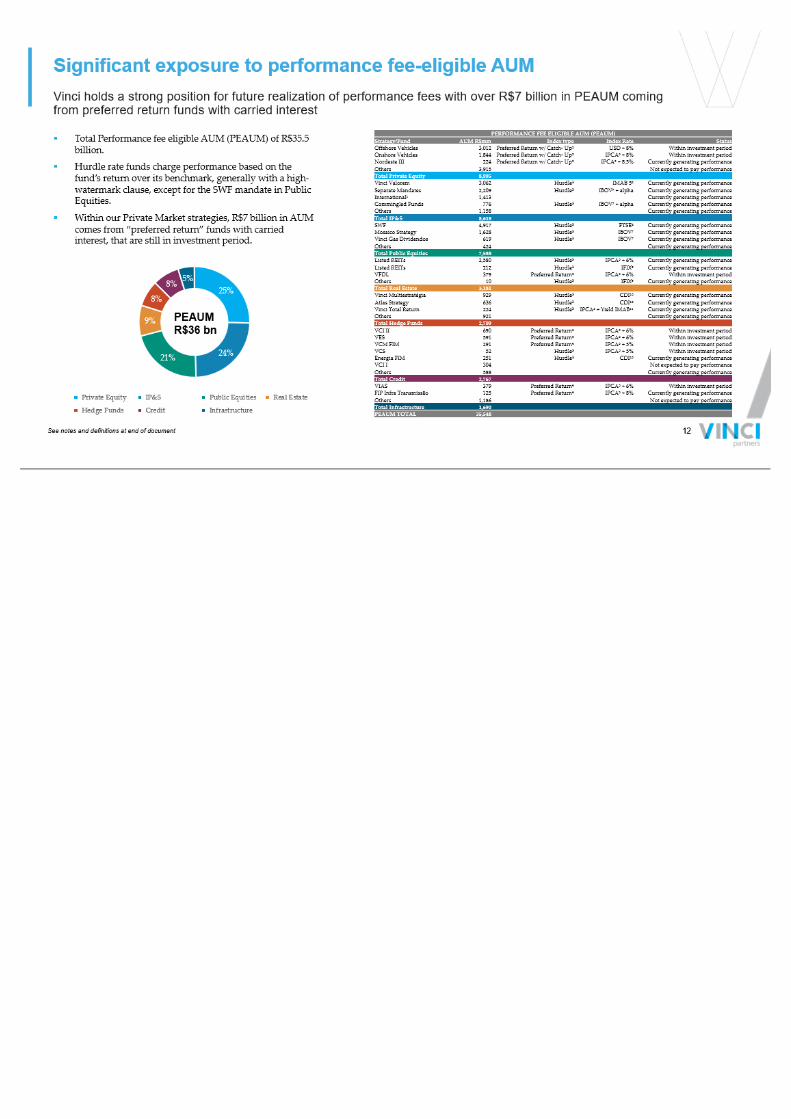
Vinci holds a strong position for future realization of performance fees with over R$7 billion in PEAUM coming from preferred return funds with carried interest Significant exposure to performance fee - eligible AUM PERFORMANCE FEE ELIGIBLE AUM (PEAUM) Strategy/Fund AUM R$mm Index type Index Rate Status Offshore Vehicles 3,012 Preferred Return w/ Catch - Up² USD + 8% Within investment period Onshore Vehicles 1,844 Preferred Return w/ Catch - Up² IPCA 5 + 8% Within investment period Nordeste III 224 Preferred Return w/ Catch - Up² IPCA 5 + 8.5% Currently generating performance Others 3,915 Not expected to pay performance Total Private Equity 8,995 Vinci Valorem 3,062 Hurdle³ IMAB 5 6 Currently generating performance Separate Mandates 2,209 Hurdle³ IBOV 7 + alpha Currently generating performance International¹ 1,413 Currently generating performance Commingled Funds 776 Hurdle³ IBOV 7 + alpha Currently generating performance Others 1,158 Currently generating performance Total IP&S 8,618 SWF 4,917 Hurdle³ FTSE 8 Currently generating performance Mosaico Strategy 1,628 Hurdle³ IBOV 7 Currently generating performance Vinci Gas Dividendos 619 Hurdle³ IBOV 7 Currently generating performance Others 424 Currently generating performance Total Public Equities 7,588 Listed REITs 2,580 Hurdle³ IPCA 5 + 6% Currently generating performance Listed REITs 212 Hurdle³ IFIX 9 Currently generating performance VFDL 379 Preferred Return 4 IPCA 5 + 6% Within investment period Others 10 Hurdle³ IFIX 9 Currently generating performance Total Real Estate 3,181 Vinci Multiestratégia 929 Hurdle³ CDI 10 Currently generating performance Atlas Strategy 636 Hurdle³ CDI 10 Currently generating performance Vinci Total Return 224 Hurdle³ IPCA 5 + Yield IMAB 11 Currently generating performance Others 921 Currently generating performance Total Hedge Funds 2,709 VCI II 690 Preferred Return 4 IPCA 5 + 6% Within investment period VES 591 Preferred Return 4 IPCA 5 + 6% Within investment period VCM FIM 291 Preferred Return 4 IPCA 5 + 5% Within investment period VCS 52 Hurdle³ IPCA 5 + 5% Within investment period Energia FIM 251 Hurdle³ CDI 10 Currently generating performance VCI I 304 Not expected to pay performance Others 588 Currently generating performance Total Credit 2,767 VIAS 379 Preferred Return 4 IPCA 5 + 6% Within investment period FIP Infra Transmissão 125 Preferred Return 4 IPCA 5 + 8% Currently generating performance Others 1,186 Not expected to pay performance Total Infrastructure 1,690 PEAUM TOTAL 35,548 ▪ Total Performance fee eligible AUM (PEAUM) ofR$35.5 billion. ▪ Hurdle rate funds charge performance based on the fund’s return over its benchmark, generally with a high - watermark clause, except for the SWF mandate in Public Equities. ▪ Within our Private Market strategies, R$7 billion in AUM comes from “preferred return” funds with carried interest, that are still in investment period. 25% 24% 21% 9% 8% 8% 5% Private Equity IP&S Public Equities Real Estate Hedge Funds Credit Infrastructure PEAUM R$36 bn See notes and definitions at end of document 12
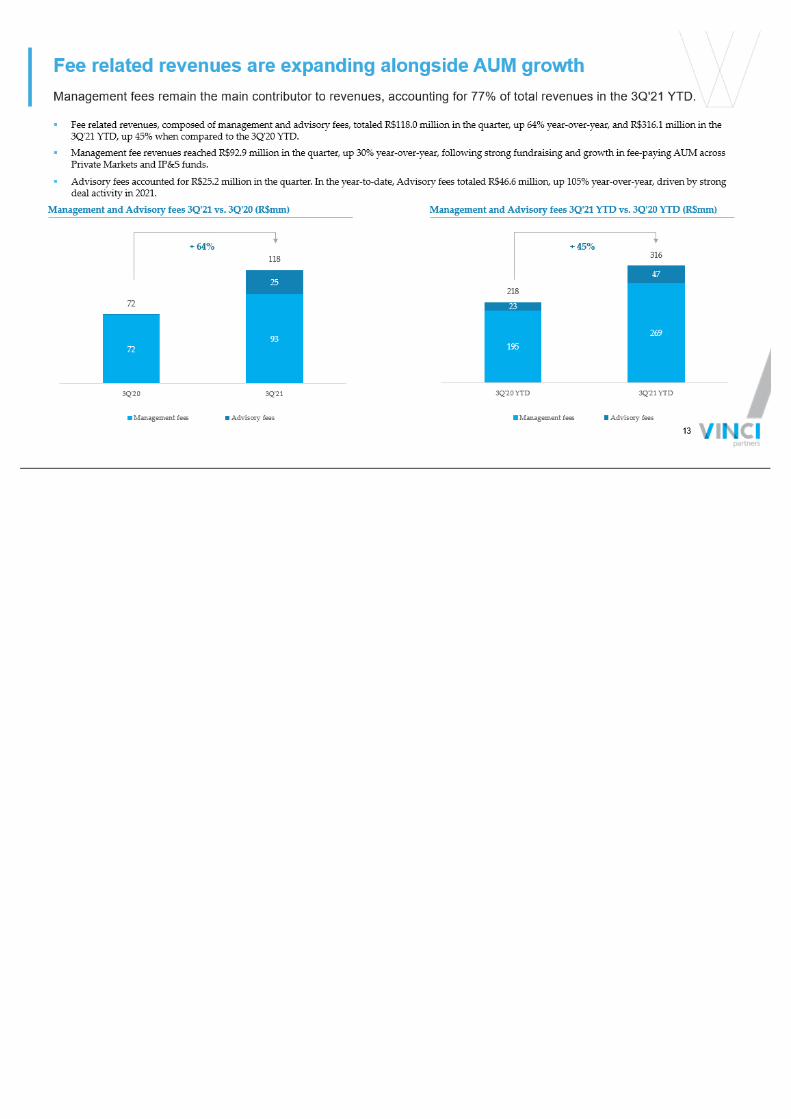
Management fees remain the main contributor to revenues, accounting for 77% of total revenues in the 3Q'21 YTD. Fee related revenues are expanding alongside AUM growth ▪ Fee related revenues, composed of management and advisory fees, totaled R$118.0 million in the quarter, up 64% year - over - year, a nd R$316.1 million in the 3Q'21 YTD, up 45% when compared to the 3Q'20 YTD. ▪ Management fee revenues reached R$92.9 million in the quarter, up 30% year - over - year, following strong fundraising and growth in fee - paying AUM across Private Markets and IP&S funds. ▪ Advisory fees accounted for R$25.2 million in the quarter. In the year - to - date, Advisory fees totaled R$46.6 million, up 105% ye ar - over - year, driven by strong deal activity in 2021. Management and Advisory fees 3Q ' 21 vs. 3Q ' 20 (R$mm) Management and Advisory fees 3Q ' 21 YTD vs. 3Q ' 20 YTD (R$mm) 72 93 25 72 118 3Q'20 3Q'21 Management fees Advisory fees + 64% 195 269 23 47 218 316 3Q'20 YTD 3Q'21 YTD Management fees Advisory fees + 45% 13
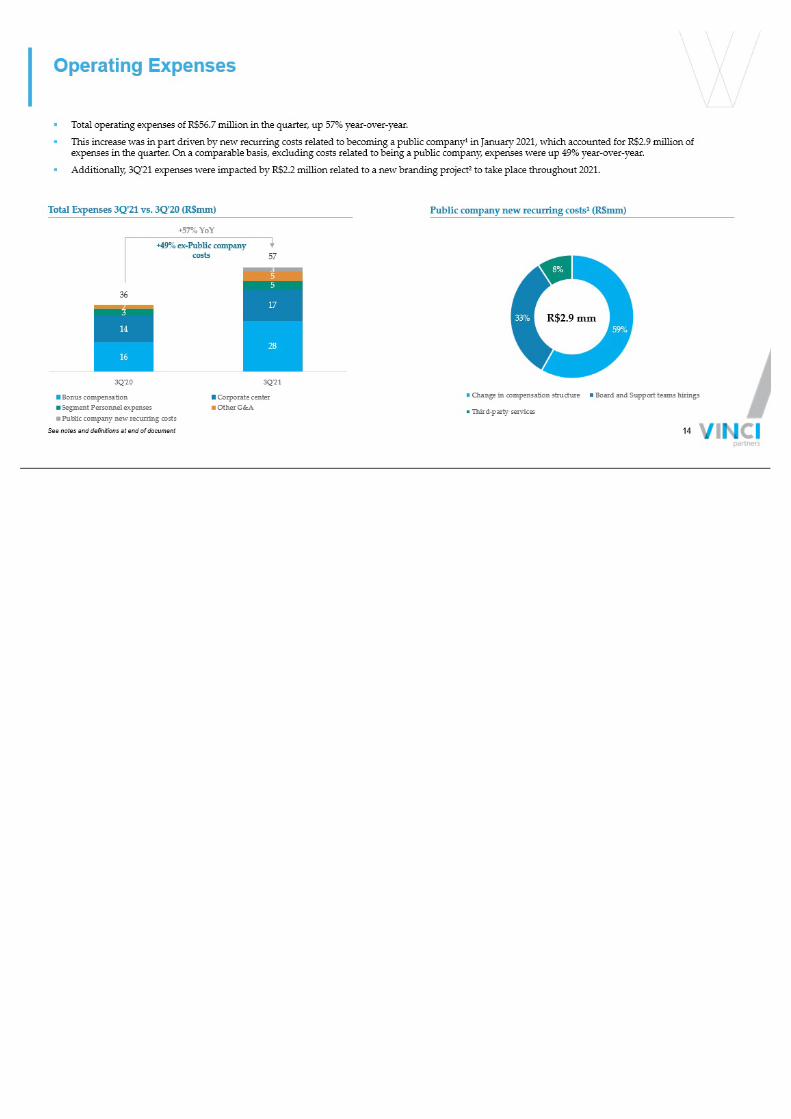
Operating Expenses ▪ Total operating expenses of R$56.7 million in the quarter, up 57% year - over - year. ▪ This increase was in part driven by new recurring costs related to becoming a public company¹ in January 2021, which accounte d f or R$2.9 million of expenses in the quarter. On a comparable basis, excluding costs related to being a public company, expenses were up 49% year - ove r - year. ▪ Additionally, 3Q'21 expenses were impacted by R$2.2 million related to a new branding project² to take place throughout 2021. Total Expenses 3Q ' 21 vs. 3Q ' 20 (R$mm) Public company new recurring costs¹ (R$mm) See notes and definitions at end of document 16 28 14 17 3 5 2 5 3 36 57 3Q'20 3Q'21 Bonus compensation Corporate center Segment Personnel expenses Other G&A Public company new recurring costs +49% ex - Public company costs +57% YoY 59% 33% 8% Change in compensation structure Board and Support teams hirings Third-party services R$2.9 mm 14
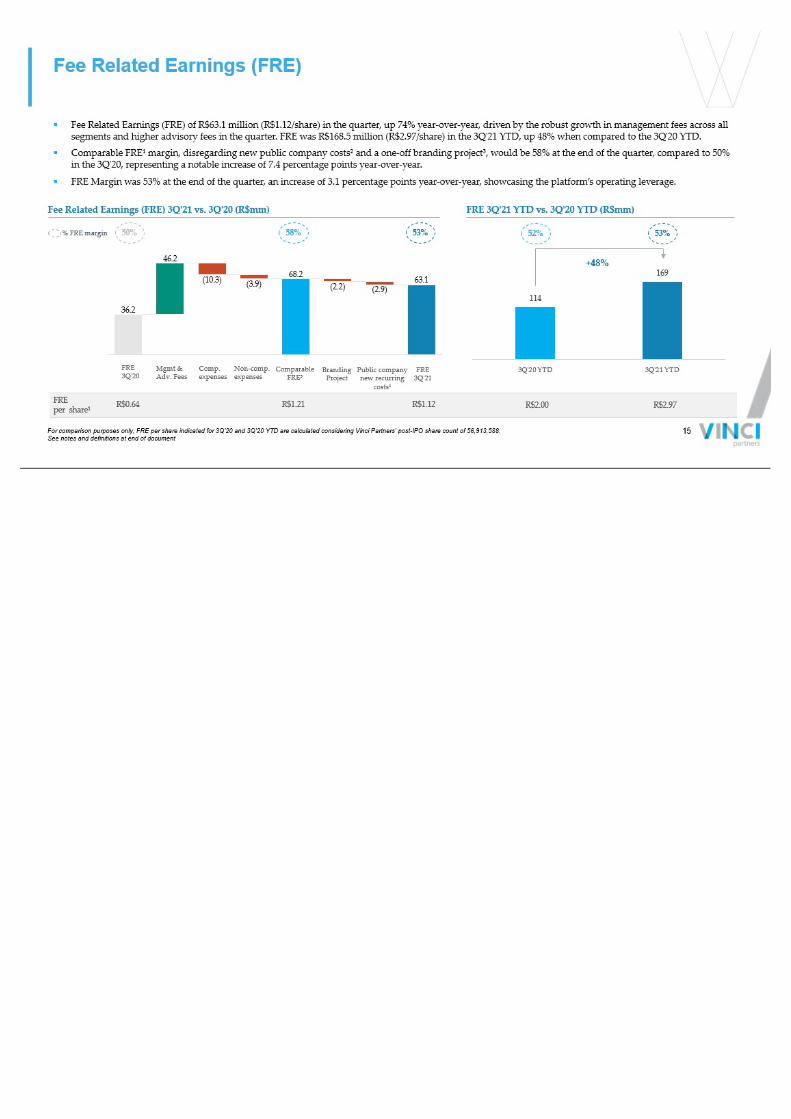
Fee Related Earnings (FRE) ▪ Fee Related Earnings (FRE) of R$63.1 million (R$1.12/share) in the quarter, up 74% year - over - year, driven by the robust growth i n management fees across all segments and higher advisory fees in the quarter. FRE was R$168.5 million (R$2.97/share) in the 3Q'21 YTD, up 48% when compar ed to the 3Q'20 YTD. ▪ Comparable FRE¹ margin, disregarding new public company costs² and a one - off branding project³, would be 58% at the end of the q uarter, compared to 50% in the 3Q'20, representing a notable increase of 7.4 percentage points year - over - year. ▪ FRE Margin was 53% at the end of the quarter, an increase of 3.1 percentage points year - over - year, showcasing the platform’s ope rating leverage. Fee Related Earnings (FRE) 3Q ' 21 vs. 3Q ' 20 (R$mm) FRE 3Q ' 21 YTD vs. 3Q ' 20 YTD (R$mm) FRE per share¹ R$0.64 R$1.21 R$2.00 R$2.97 R$1.12 50 % 58% 53% 52% 53% 114 169 3Q'20 YTD 3Q'21 YTD +48% For comparison purposes only, FRE per share indicated for 3Q’20 and 3Q’20 YTD are calculated considering Vinci Partners’ post - IP O share count of 56,913,588. See notes and definitions at end of document FRE 3Q'20 Mgmt & Adv. Fees Comp. expenses Non - comp. expenses Comparable FRE³ Branding Project Public company new recurring costs¹ FRE 3Q'21 % FRE margin 15
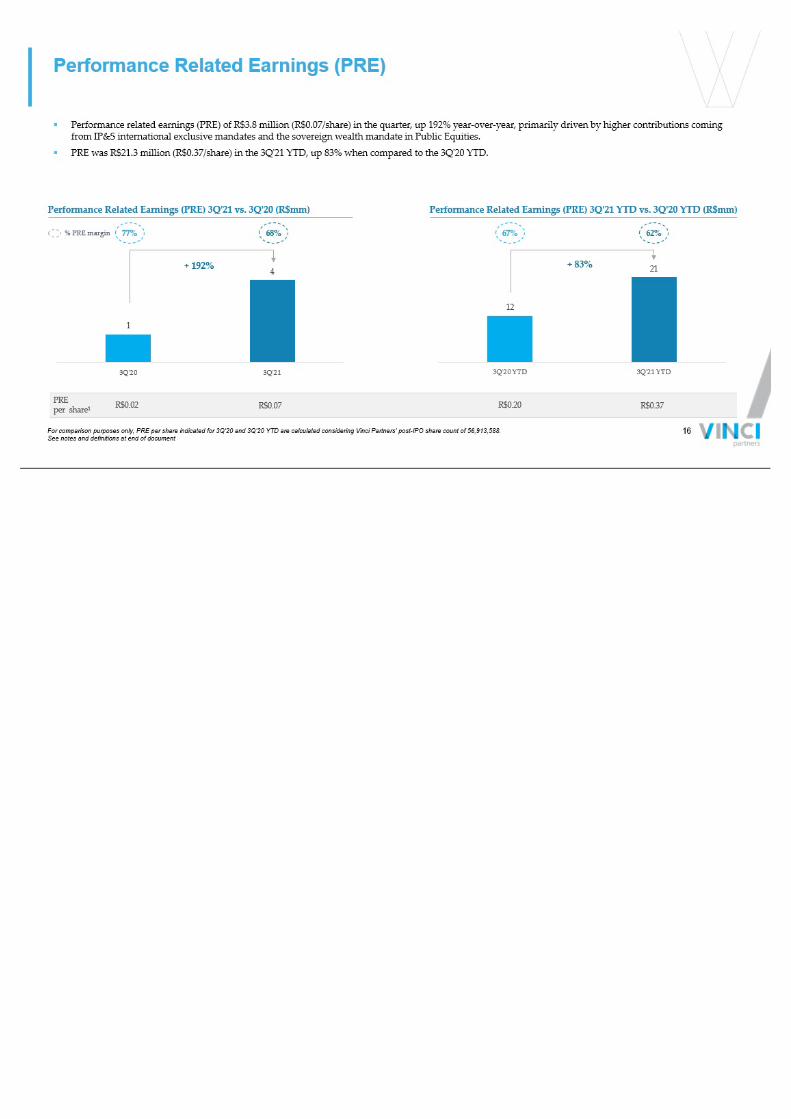
Performance Related Earnings (PRE) ▪ Performance related earnings (PRE) of R$3.8 million (R$0.07/share) in the quarter, up 192% year - over - year, primarily driven by h igher contributions coming from IP&S international exclusive mandates and the sovereign wealth mandate in Public Equities. ▪ PRE was R$21.3 million (R$0.37/share) in the 3Q'21 YTD, up 83% when compared to the 3Q'20 YTD. Performance Related Earnings (PRE) 3Q ' 21 vs. 3Q ' 20 (R$mm) Performance Related Earnings (PRE) 3Q ' 21 YTD vs. 3Q ' 20 YTD (R$mm) 1 4 3Q'20 3Q'21 + 192% % PRE margin 6 8% 77% 12 21 3Q'20 YTD 3Q'21 YTD + 83% 62 % 67 % PRE per share¹ R$0.02 R$0.07 R$0.20 R$0.37 For comparison purposes only, PRE per share indicated for 3Q’20 and 3Q’20 YTD are calculated considering Vinci Partners’ post - IP O share count of 56,913,588. See notes and definitions at end of document 16
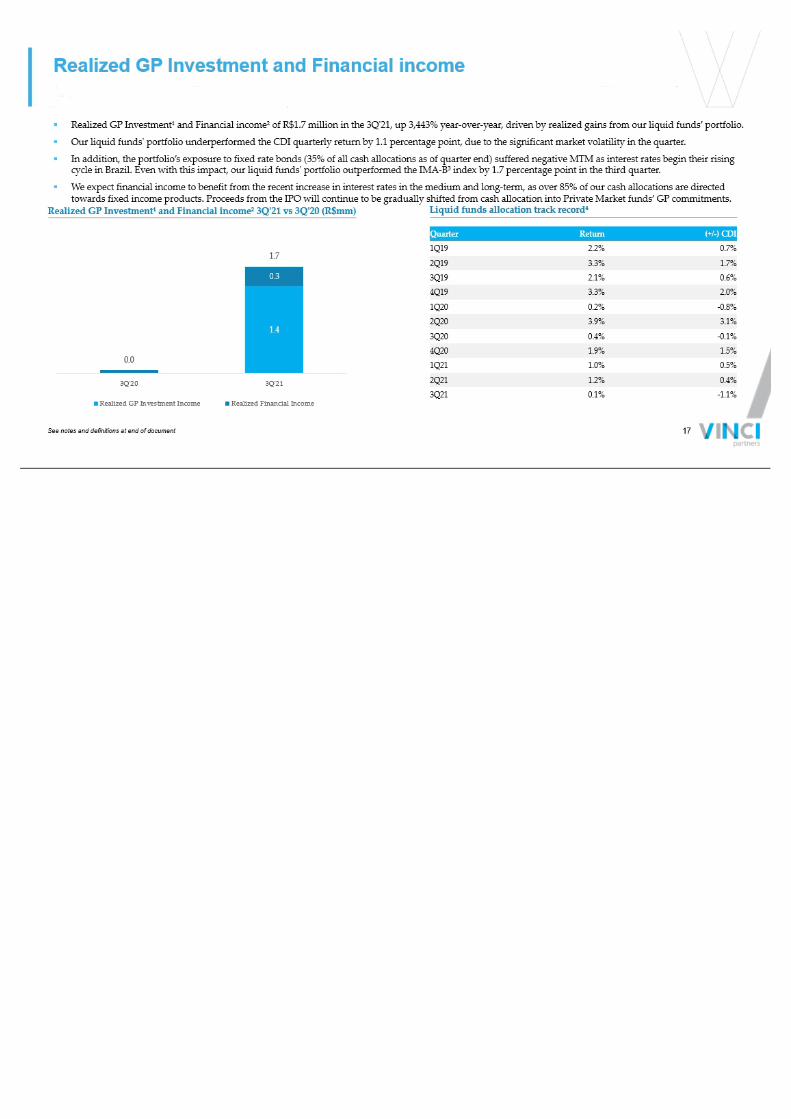
▪ Realized GP Investment¹ and Financial income² of R$1.7 million in the 3Q ' 21, up 3,443% year - over - year, driven by realized gains from our liquid funds’ portfolio. ▪ Our liquid funds' portfolio underperformed the CDI quarterly return by 1.1 percentage point, due to the significant market vo lat ility in the quarter. ▪ In addition, the portfolio’s exposure to fixed rate bonds (35% of all cash allocations as of quarter end) suffered negative M TM as interest rates begin their rising cycle in Brazil. Even with this impact, our liquid funds' portfolio outperformed the IMA - B³ index by 1.7 percentage point in the third quarter. ▪ We expect financial income to benefit from the recent increase in interest rates in the medium and long - term, as over 85% of our cash allocations are directed towards fixed income products. Proceeds from the IPO will continue to be gradually shifted from cash allocation into Private Mar ket funds’ GP commitments. Realized GP Investment¹ and Financial income² 3Q ' 21 vs 3Q ' 20 (R$mm) Realized GP Investment and Financial income 1.4 0.3 0.0 1.7 3Q'20 3Q'21 Realized GP Investment Income Realized Financial Income Liquid funds allocation track record 4 Quarter Return (+/ - ) CDI 1Q19 2.2% 0.7% 2Q19 3.3% 1.7% 3Q19 2.1% 0.6% 4Q19 3.3% 2.0% 1Q20 0.2% - 0.8% 2Q20 3.9% 3.1% 3Q20 0.4% - 0.1% 4Q20 1.9% 1.5% 1Q21 1.0% 0.5% 2Q21 1.2% 0.4% 3Q21 0.1% - 1.1% See notes and definitions at end of document 17
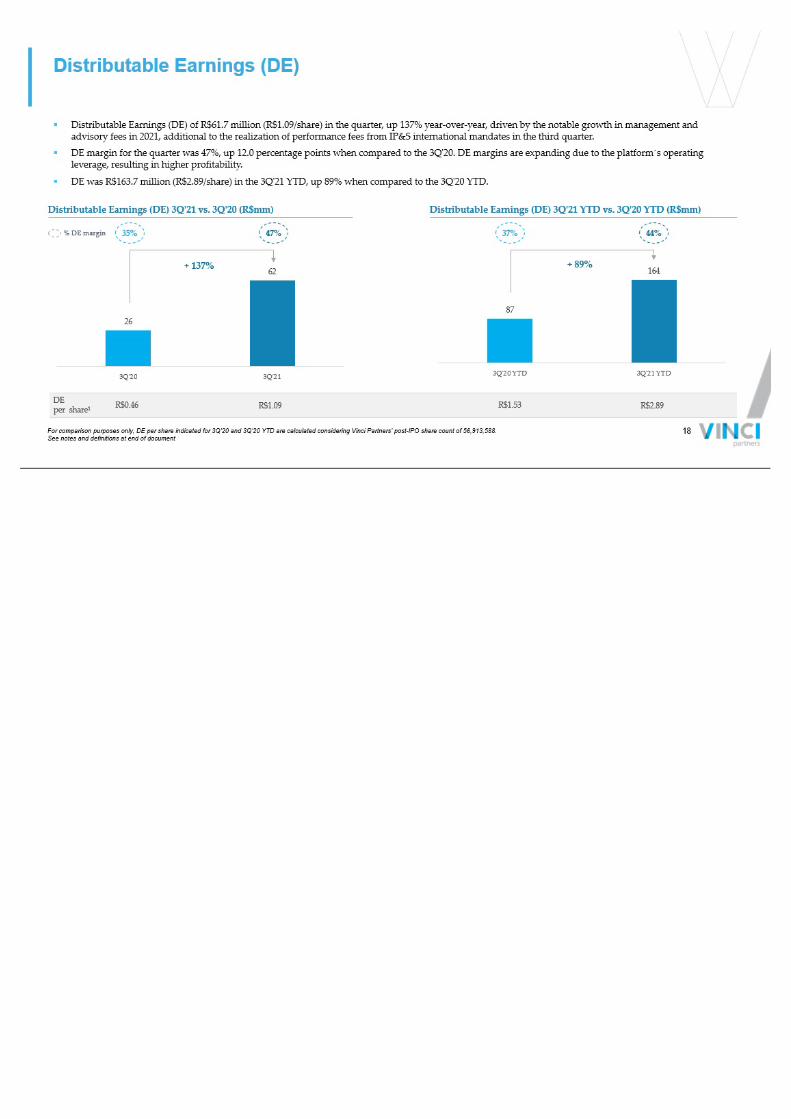
26 62 3Q'20 3Q'21 Distributable Earnings (DE) ▪ Distributable Earnings (DE) of R$61.7 million (R$1.09/share) in the quarter, up 137% year - over - year, driven by the notable growt h in management and advisory fees in 2021, additional to the realization of performance fees from IP&S international mandates in the third quarte r. ▪ DE margin for the quarter was 47%, up 12.0 percentage points when compared to the 3Q'20. DE margins are expanding due to the pla tform ´ s operating leverage, resulting in higher profitability. ▪ DE was R$163.7 million (R$2.89/share) in the 3Q'21 YTD, up 89% when compared to the 3Q'20 YTD. Distributable Earnings (DE) 3Q ' 21 vs. 3Q ' 20 (R$mm) Distributable Earnings (DE) 3Q ' 21 YTD vs. 3Q ' 20 YTD (R$mm) DE per share¹ + 137% % DE margin 47% 35 % R$0.46 R$1.09 87 164 3Q'20 YTD 3Q'21 YTD + 89% 44 % 37% R$1.53 R$2.89 For comparison purposes only, DE per share indicated for 3Q’20 and 3Q’20 YTD are calculated considering Vinci Partners’ post - IPO share count of 56,913,588. See notes and definitions at end of document 18
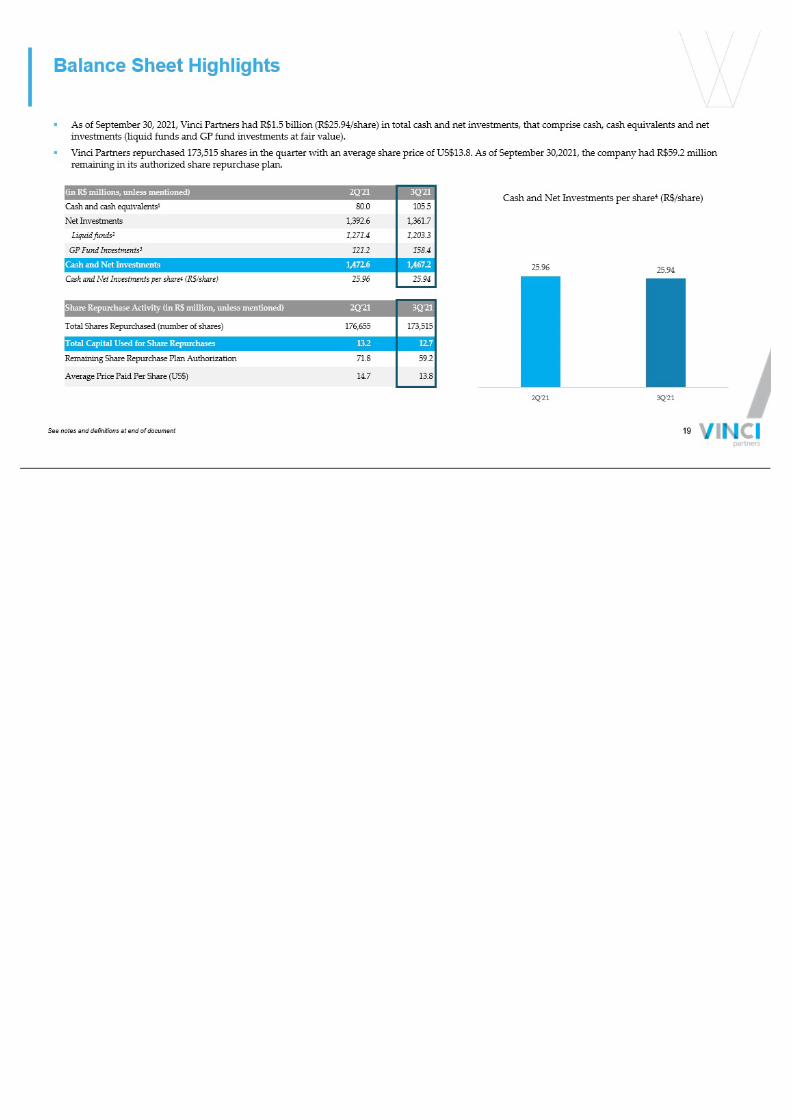
Balance Sheet Highlights ▪ As of September 30, 2021, Vinci Partners had R$1.5 billion (R$25.94/share) in total cash and net investments, that comprise c ash , cash equivalents and net investments (liquid funds and GP fund investments at fair value). ▪ Vinci Partners repurchased 173,515 shares in the quarter with an average share price of US$13.8. As of September 30,2021, the co mpany had R$59.2 million remaining in its authorized share repurchase plan. (in R$ millions, unless mentioned) 2Q'21 3Q'21 Cash and cash equivalents¹ 80.0 105.5 Net Investments 1,392.6 1,361.7 Liquid funds² 1,271.4 1,203.3 GP Fund Investments³ 121.2 158.4 Cash and Net Investments 1,472.6 1,467.2 Cash and Net Investments per share 4 (R$/share) 25.96 25.94 Share Repurchase Activity (in R$ million, unless mentioned) 2Q'21 3Q'21 Total Shares Repurchased (number of shares) 176,655 173,515 Total Capital Used for Share Repurchases 13.2 12.7 Remaining Share Repurchase Plan Authorization 71.8 59.2 Average Price Paid Per Share (US$) 14.7 13.8 25.96 25.94 2Q'21 3Q'21 Cash and Net Investments per share 4 (R$/share) See notes and definitions at end of document 19

Segment Highlights
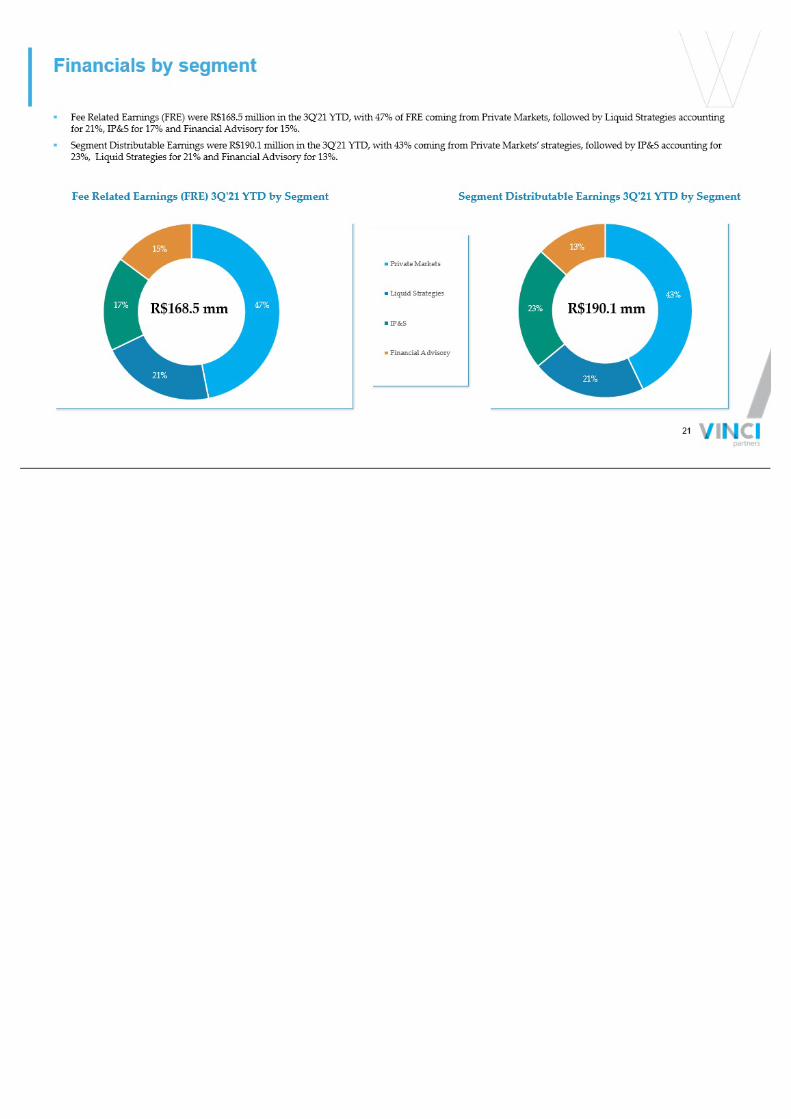
▪ Fee Related Earnings (FRE) were R$168.5 million in the 3Q'21 YTD, with 47% of FRE coming from Private Markets, followed by Li qui d Strategies accounting for 21%, IP&S for 17% and Financial Advisory for 15%. ▪ Segment Distributable Earnings were R$190.1 million in the 3Q'21 YTD, with 43% coming from Private Markets’ strategies, follo wed by IP&S accounting for 23%, Liquid Strategies for 21% and Financial Advisory for 13%. 43% 21% 23% 13% Private Markets Liquid Strategies IP&S Financial Advisory 47% 21% 17% 15% Segment Distributable Earnings 3Q ' 21 YTD by Segment Fee Related Earnings (FRE) 3Q ' 21 YTD by Segment R$168.5 mm R$190.1 mm Financials by segment 21
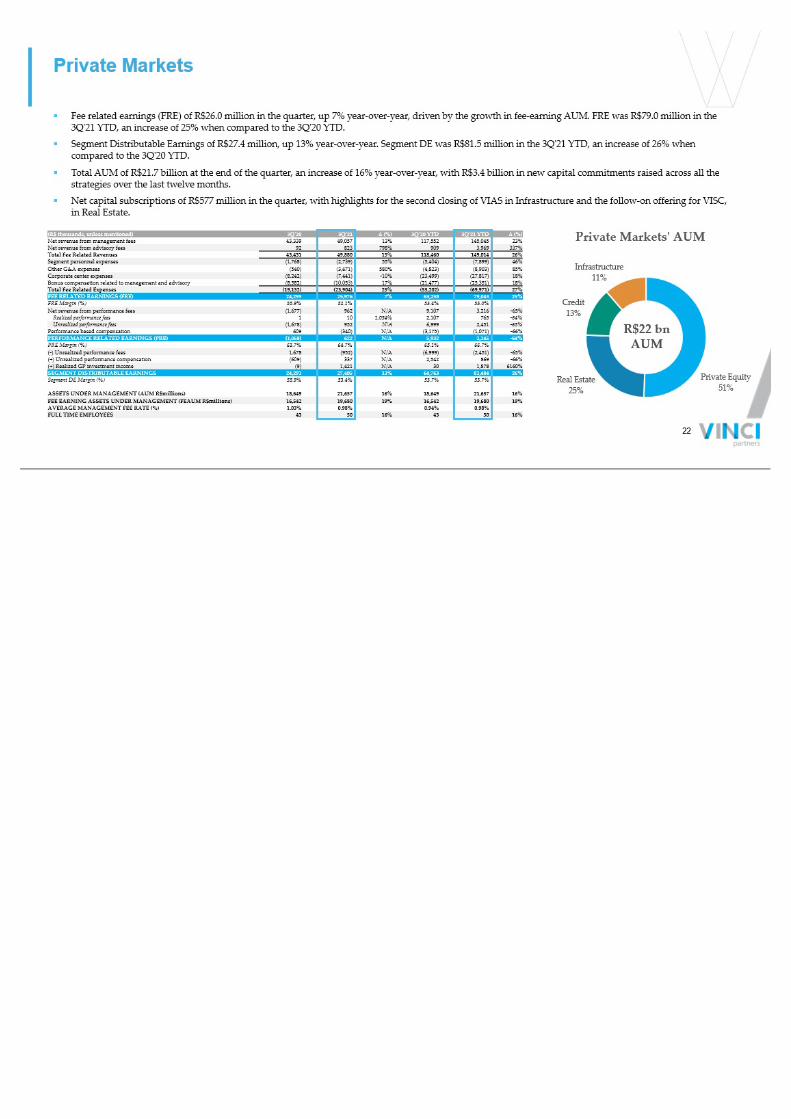
(R$ thousands, unless mentioned) 3Q'20 3Q'21 ∆ (%) 3Q'20 YTD 3Q'21 YTD ∆ (%) Net revenue from management fees 43,339 49,057 13% 117,552 145,045 23% Net revenue from advisory fees 92 823 798% 909 3,969 337% Total Fee Related Revenues 43,431 49,880 15% 118,460 149,014 26% Segment personnel expenses (1,768) (2,739) 55% (5,404) (7,899) 46% Other G&A expenses (540) (3,671) 580% (4,823) (8,903) 85% Corporate center expenses (8,242) (7,441) - 10% (23,499) (27,817) 18% Bonus compensation related to management and advisory (8,582) (10,053) 17% (21,477) (25,351) 18% Total Fee Related Expenses (19,132) (23,904) 25% (55,202) (69,971) 27% FEE RELATED EARNINGS (FRE) 24,299 25,976 7% 63,258 79,043 25% FRE Margin (%) 55.9% 52.1% 53.4% 53.0% Net revenue from performance fees (1,677) 962 N/A 9,107 3,216 - 65% Realized performance fees 1 10 1,054% 2,107 765 - 64% Unrealized performance fees (1,678) 952 N/A 6,999 2,451 - 65% Performance based compensation 609 (340) N/A (3,175) (1,071) - 66% PERFORMANCE RELATED EARNINGS (PRE) (1,068) 622 N/A 5,932 2,145 - 64% PRE Margin (%) 63.7% 64.7% 65.1% 66.7% ( - ) Unrealized performance fees 1,678 (952) N/A (6,999) (2,451) - 65% (+) Unrealized performance compensation (609) 337 N/A 2,542 869 - 66% (+) Realized GP investment income (9) 1,421 N/A 30 1,878 6160% SEGMENT DISTRIBUTABLE EARNINGS 24,291 27,405 13% 64,763 81,484 26% Segment DE Margin (%) 55.9% 53.4% 53.7% 53.7% ASSETS UNDER MANAGEMENT (AUM R$millions) 18,649 21,657 16% 18,649 21,657 16% FEE EARNING ASSETS UNDER MANAGEMENT (FEAUM R$millions) 16,542 19,680 19% 16,542 19,680 19% AVERAGE MANAGEMENT FEE RATE (%) 1.03% 0.98% 0.94% 0.98% FULL TIME EMPLOYEES 43 50 16% 43 50 16% Private Markets ▪ Fee related earnings (FRE) of R$26.0 million in the quarter, up 7% year - over - year, driven by the growth in fee - earning AUM. FRE was R$79.0 million in the 3Q'21 YTD, an increase of 25% when compared to the 3Q'20 YTD. ▪ Segment Distributable Earnings of R$27.4 million, up 13% year - over - year. Segment DE was R$81.5 million in the 3Q'21 YTD, an incr ease of 26% when compared to the 3Q'20 YTD. ▪ Total AUM of R$21.7 billion at the end of the quarter, an increase of 16% year - over - year, with R$3.4 billion in new capital comm itments raised across all the strategies over the last twelve months. ▪ Net capital subscriptions of R$577 million in the quarter, with highlights for the second closing of VIAS in Infrastructure a nd the follow - on offering for VISC, in Real Estate. PrivateEquity 51% Real Estate 25% Credit 13% Infrastructure 11% Private Markets' AUM R$22 bn AUM 22
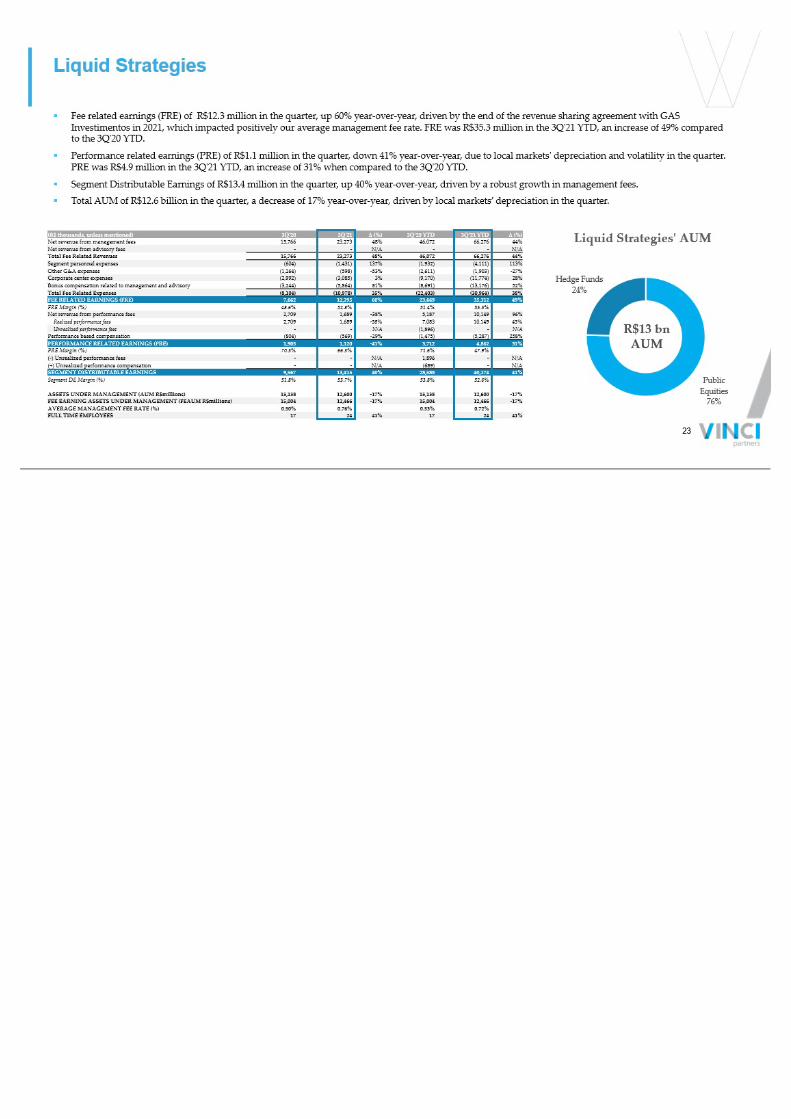
Public Equities 76% Hedge Funds 24% Liquid Strategies' AUM (R$ thousands, unless mentioned) 3Q'20 3Q'21 ∆ (%) 3Q’20 YTD 3Q’21 YTD ∆ (%) Net revenue from management fees 15,766 23,273 48% 46,072 66,276 44% Net revenue from advisory fees - - N/A - - N/A Total Fee Related Revenues 15,766 23,273 48% 46,072 66,276 44% Segment personnel expenses (604) (1,431) 137% (1,932) (4,111) 113% Other G&A expenses (1,264) (598) - 53% (2,611) (1,903) - 27% Corporate center expenses (2,992) (3,085) 3% (9,170) (11,774) 28% Bonus compensation related to management and advisory (3,244) (5,864) 81% (8,691) (13,176) 52% Total Fee Related Expenses (8,104) (10,978) 35% (22,403) (30,964) 38% FEE RELATED EARNINGS (FRE) 7,662 12,295 60% 23,669 35,312 49% FRE Margin (%) 48.6% 52.8% 51.4% 53.3% Net revenue from performance fees 2,709 1,689 - 38% 5,187 10,149 96% Realized performance fees 2,709 1,689 - 38% 7,083 10,149 43% Unrealized performance fees - - N/A (1,896) - N/A Performance based compensation (804) (569) - 29% (1,475) (5,287) 258% PERFORMANCE RELATED EARNINGS (PRE) 1,905 1,120 - 41% 3,712 4,862 31% PRE Margin (%) 70.3% 66.3% 71.6% 47.9% ( - ) Unrealized performance fees - - N/A 1,896 - N/A (+) Unrealized performance compensation - - N/A (689) - N/A SEGMENT DISTRIBUTABLE EARNINGS 9,567 13,415 40% 28,588 40,174 41% Segment DE Margin (%) 51.8% 53.7% 53.8% 52.6% ASSETS UNDER MANAGEMENT (AUM R$millions) 15,138 12,600 - 17% 15,138 12,600 - 17% FEE EARNING ASSETS UNDER MANAGEMENT (FEAUM R$millions) 15,004 12,466 - 17% 15,004 12,466 - 17% AVERAGE MANAGEMENT FEE RATE (%) 0.50% 0.76% 0.53% 0.72% FULL TIME EMPLOYEES 17 24 41% 17 24 41% Liquid Strategies R$13 bn AUM ▪ Fee related earnings (FRE) of R$12.3 million in the quarter, up 60% year - over - year, driven by the end of the revenue sharing ag reement with GAS Investimentos in 2021, which impacted positively our average management fee rate. FRE was R$35.3 million in the 3Q'21 YTD, an in crease of 49% compared to the 3Q'20 YTD. ▪ Performance related earnings (PRE) of R$1.1 million in the quarter, down 41% year - over - year, due to local markets' depreciation and volatility in the quarter. PRE was R$4.9 million in the 3Q'21 YTD, an increase of 31% when compared to the 3Q'20 YTD. ▪ Segment Distributable Earnings of R$13.4 million in the quarter, up 40% year - over - year, driven by a robust growth in management fees. ▪ Total AUM of R$12.6 billion in the quarter, a decrease of 17% year - over - year, driven by local markets’depreciation in the quart er. 23
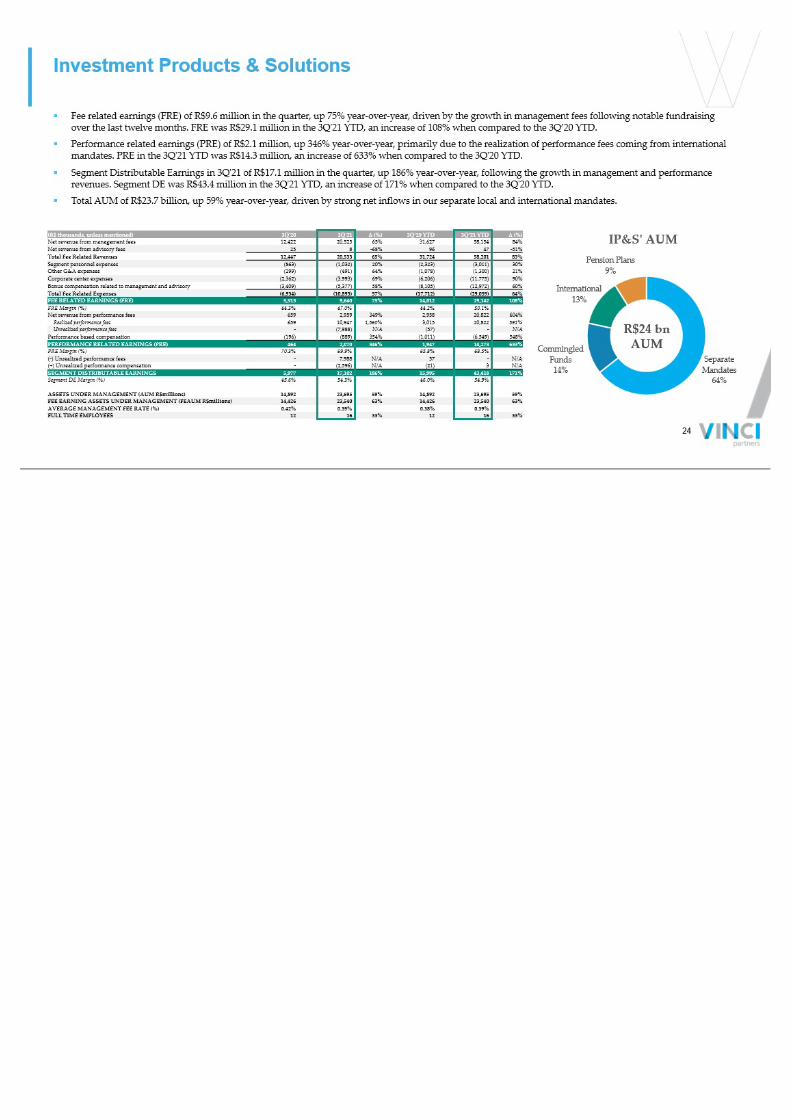
Separate Mandates 64% Commingled Funds 14% International 13% Pension Plans 9% IP&S' AUM (R$ thousands, unless mentioned) 3Q'20 3Q'21 ∆ (%) 3Q’20 YTD 3Q’21 YTD ∆ (%) Net revenue from management fees 12,422 20,525 65% 31,627 58,154 84% Net revenue from advisory fees 25 8 - 68% 96 47 - 51% Total Fee Related Revenues 12,447 20,533 65% 31,724 58,201 83% Segment personnel expenses (863) (1,032) 20% (2,323) (3,011) 30% Other G&A expenses (299) (491) 64% (1,078) (1,300) 21% Corporate center expenses (2,362) (3,993) 69% (6,206) (11,775) 90% Bonus compensation related to management and advisory (3,409) (5,377) 58% (8,105) (12,972) 60% Total Fee Related Expenses (6,934) (10,893) 57% (17,712) (29,059) 64% FEE RELATED EARNINGS (FRE) 5,513 9,640 75% 14,012 29,142 108% FRE Margin (%) 44.3% 47.0% 44.2% 50.1% Net revenue from performance fees 659 2,959 349% 2,958 20,822 604% Realized performance fees 659 10,947 1,560% 3,015 20,822 591% Unrealized performance fees - (7,988) N/A (57) - N/A Performance based compensation (196) (889) 354% (1,011) (6,549) 548% PERFORMANCE RELATED EARNINGS (PRE) 464 2,070 346% 1,947 14,273 633% PRE Margin (%) 70.3% 69.9% 65.8% 68.5% ( - ) Unrealized performance fees - 7,988 N/A 57 - N/A (+) Unrealized performance compensation - (2,596) N/A (21) 3 N/A SEGMENT DISTRIBUTABLE EARNINGS 5,977 17,102 186% 15,995 43,418 171% Segment DE Margin (%) 45.6% 54.3% 46.0% 54.9% ASSETS UNDER MANAGEMENT (AUM R$millions) 14,892 23,695 59% 14,892 23,695 59% FEE EARNING ASSETS UNDER MANAGEMENT (FEAUM R$millions) 14,426 23,540 63% 14,426 23,540 63% AVERAGE MANAGEMENT FEE RATE (%) 0.42% 0.39% 0.38% 0.39% FULL TIME EMPLOYEES 12 16 33% 12 16 33% Investment Products & Solutions ▪ Fee related earnings (FRE) of R$9.6 million in the quarter, up 75% year - over - year, driven by the growth in management fees follo wing notable fundraising over the last twelve months. FRE was R$29.1 million in the 3Q'21 YTD, an increase of 108% when compared to the 3Q’20 YTD. ▪ Performance related earnings (PRE) of R$2.1 million, up 346% year - over - year, primarily due to the realization of performance fee s coming from international mandates. PRE in the 3Q'21 YTD was R$14.3 million, an increase of 633% when compared to the 3Q'20 YTD. ▪ Segment Distributable Earnings in 3Q'21 of R$17.1 million in the quarter, up 186% year - over - year, following the growth in manage ment and performance revenues. Segment DE was R$43.4 million in the 3Q'21 YTD, an increase of171% when compared to the 3Q'20 YTD. ▪ Total AUM of R$23.7 billion, up 59% year - over - year, driven by strong net inflows in our separate local and international mandate s. R$24 bn AUM 24
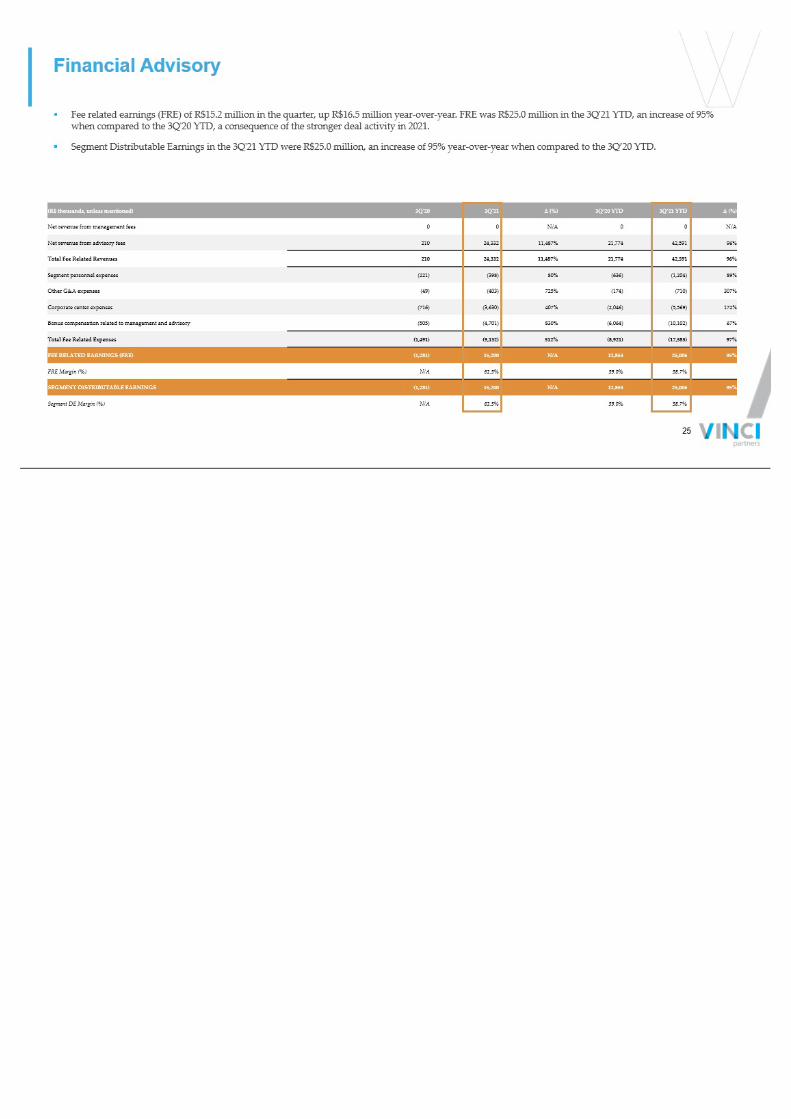
Financial Advisory ▪ Fee related earnings (FRE) of R$15.2 million in the quarter, up R$16.5 million year - over - year. FRE was R$25.0 million in the 3Q ' 21 YTD, an increase of 95% when compared to the 3Q'20 YTD, a consequence of the stronger deal activity in 2021. ▪ Segment Distributable Earnings in the 3Q'21 YTD were R$25.0 million, an increase of 95% year - over - year when compared to the 3Q’2 0 YTD. (R$ thousands, unless mentioned) 3Q'20 3Q'21 ∆ (%) 3Q’20 YTD 3Q’21 YTD ∆ (%) Net revenue from management fees 0 0 N/A 0 0 N/A Net revenue from advisory fees 210 24,332 11,487% 21,774 42,591 96% Total Fee Related Revenues 210 24,332 11,487% 21,774 42,591 96% Segment personnel expenses (221) (398) 80% (636) (1,204) 89% Other G&A expenses (49) (403) 725% (174) (710) 307% Corporate center expenses (716) (3,630) 407% (2,046) (5,569) 172% Bonus compensation related to management and advisory (505) (4,701) 830% (6,064) (10,102) 67% Total Fee Related Expenses (1,491) (9,132) 512% (8,921) (17,585) 97% FEE RELATED EARNINGS (FRE) (1,281) 15,200 N/A 12,853 25,006 95% FRE Margin (%) N/A 62.5% 59.0% 58.7% SEGMENT DISTRIBUTABLE EARNINGS (1,281) 15,200 N/A 12,853 25,006 95% Segment DE Margin (%) N/A 62.5% 59.0% 58.7% 25

Supplement Details
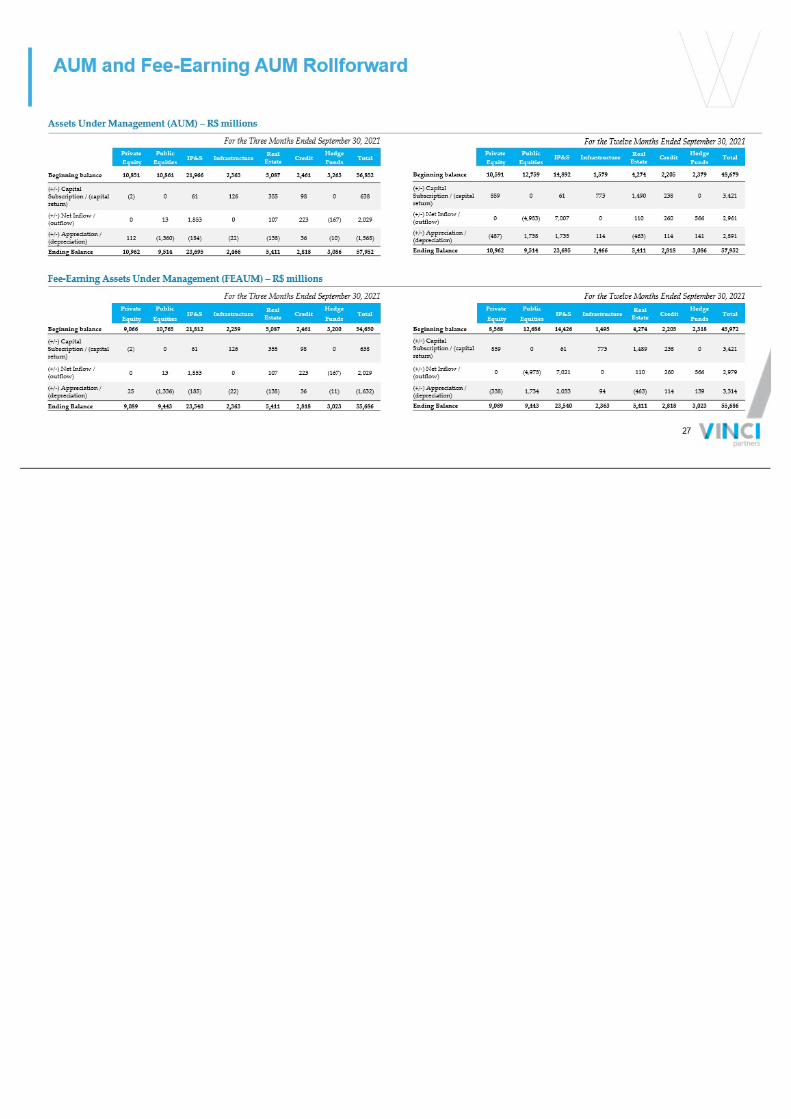
AUM and Fee - Earning AUM Rollforward Assets Under Management (AUM) – R$ millions Fee - Earning Assets Under Management (FEAUM) – R$ millions Private Public IP&S Infrastructure Real Estate Credit Hedge Total Equity Equities Funds Beginning balance 10,851 10,861 21,966 2,363 5,087 2,461 3,263 56,852 (+/ - ) Capital Subscription / (capital return) (2) 0 61 126 355 98 0 638 (+/ - ) Net Inflow / (outflow) 0 13 1,853 0 107 223 (167) 2,029 (+/ - ) Appreciation / (depreciation) 112 (1,360) (184) (22) (138) 36 (10) (1,568) Ending Balance 10,962 9,514 23,695 2,466 5,411 2,818 3,086 57,952 Private Public IP&S Infrastructure Real Estate Credit Hedge Total Equity Equities Funds Beginning balance 10,591 12,759 14,892 1,579 4,274 2,205 2,379 48,679 (+/ - ) Capital Subscription / (capital return) 859 0 61 773 1,490 238 0 3,421 (+/ - ) Net Inflow / (outflow) 0 (4,983) 7,007 0 110 260 566 2,961 (+/ - ) Appreciation / (depreciation) (487) 1,738 1,735 114 (463) 114 141 2,891 Ending Balance 10,962 9,514 23,695 2,466 5,411 2,818 3,086 57,952 Private Public IP&S Infrastructure Real Estate Credit Hedge Total Equity Equities Funds Beginning balance 9,066 10,765 21,812 2,259 5,087 2,461 3,200 54,650 (+/ - ) Capital Subscription / (capital return) (2) 0 61 126 355 98 0 638 (+/ - ) Net Inflow / (outflow) 0 13 1,853 0 107 223 (167) 2,029 (+/ - ) Appreciation / (depreciation) 25 (1,336) (185) (22) (138) 36 (11) (1,632) Ending Balance 9,089 9,443 23,540 2,363 5,411 2,818 3,023 55,686 Private Public IP&S Infrastructure Real Estate Credit Hedge Total Equity Equities Funds Beginning balance 8,568 12,686 14,426 1,495 4,274 2,205 2,318 45,972 (+/ - ) Capital Subscription / (capital return) 859 0 61 773 1,489 238 0 3,421 (+/ - ) Net Inflow / (outflow) 0 (4,978) 7,021 0 110 260 566 2,979 (+/ - ) Appreciation / (depreciation) (338) 1,734 2,033 94 (463) 114 139 3,314 Ending Balance 9,089 9,443 23,540 2,363 5,411 2,818 3,023 55,686 For the Three Months Ended September 30, 2021 For the Three Months Ended September 30, 2021 For the Twelve Months Ended September 30, 2021 For the Twelve Months Ended September 30, 2021 27
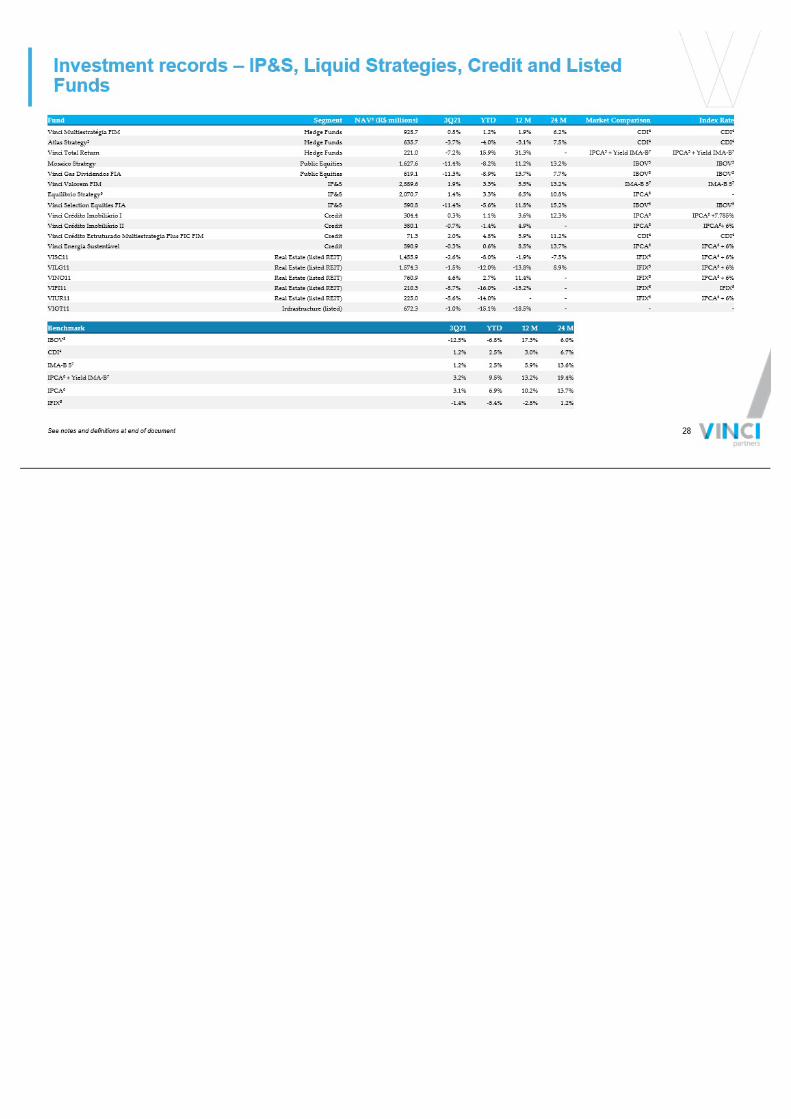
Investment records – IP&S, Liquid Strategies, Credit and Listed Funds Fund Segment NAV¹ (R$ millions) 3Q21 YTD 12 M 24 M Market Comparison Index Rate Vinci Multiestratégia FIM Hedge Funds 928.7 0.8% 1.2% 1.9% 6.2% CDI 4 CDI 4 Atlas Strategy² Hedge Funds 635.7 - 3.7% - 4.0% - 3.1% 7.5% CDI 4 CDI 4 Vinci Total Return Hedge Funds 221.0 - 7.2% 15.9% 31.3% - IPCA 5 + Yield IMA - B 7 IPCA 5 + Yield IMA - B 7 Mosaico Strategy Public Equities 1,627.6 - 11.4% - 8.2% 11.2% 13.2% IBOV 5 IBOV 5 Vinci Gas Dividendos FIA Public Equities 619.1 - 11.3% - 8.9% 13.7% 7.7% IBOV 5 IBOV 5 Vinci Valorem FIM IP&S 2,889.6 1.9% 3.3% 5.5% 13.2% IMA - B 5 7 IMA - B 5 7 Equilibrio Strategy³ IP&S 2,070.7 1.4% 3.3% 6.5% 10.8% IPCA 6 - Vinci Selection Equities FIA IP&S 590.8 - 11.4% - 5.6% 11.8% 15.2% IBOV 5 IBOV 5 Vinci Crédito Imobiliário I Credit 304.4 0.3% 1.1% 3.6% 12.3% IPCA 6 IPCA 6 +7.785% Vinci Crédito Imobiliário II Credit 380.1 - 0.7% - 1.4% 4.9% - IPCA 6 IPCA 6 + 6% Vinci Crédito Estruturado Multiestrategia Plus FIC FIM Credit 71.3 2.0% 4.8% 5.9% 11.2% CDI 4 CDI 4 Vinci Energia Sustentável Credit 590.9 - 0.3% 0.6% 8.5% 13.7% IPCA 6 IPCA 6 + 6% VISC11 Real Estate (listed REIT) 1,455.9 - 2.6% - 8.0% - 1.9% - 7.5% IFIX 8 IPCA 6 + 6% VILG11 Real Estate (listed REIT) 1,574.3 - 1.5% - 12.0% - 13.8% 8.9% IFIX 8 IPCA 6 + 6% VINO11 Real Estate (listed REIT) 760.9 4.6% 2.7% 11.4% - IFIX 8 IPCA 6 + 6% VIFI11 Real Estate (listed REIT) 210.3 - 8.7% - 16.0% - 15.2% - IFIX 8 IFIX 8 VIUR11 Real Estate (listed REIT) 225.0 - 5.6% - 14.0% - - IFIX 8 IPCA 6 + 6% VIGT11 Infrastructure (listed) 672.3 - 1.0% - 15.1% - 18.5% - - - Benchmark 3Q21 YTD 12 M 24 M IBOV 5 - 12.5% - 6.8% 17.3% 6.0% CDI 4 1.2% 2.5% 3.0% 6.7% IMA - B 5 7 1.2% 2.5% 5.9% 13.6% IPCA 6 + Yield IMA - B 7 3.2% 9.5% 13.2% 19.4% IPCA 6 3.1% 6.9% 10.2% 13.7% IFIX 8 - 1.4% - 5.4% - 2.8% 1.2% See notes and definitions at end of document 28
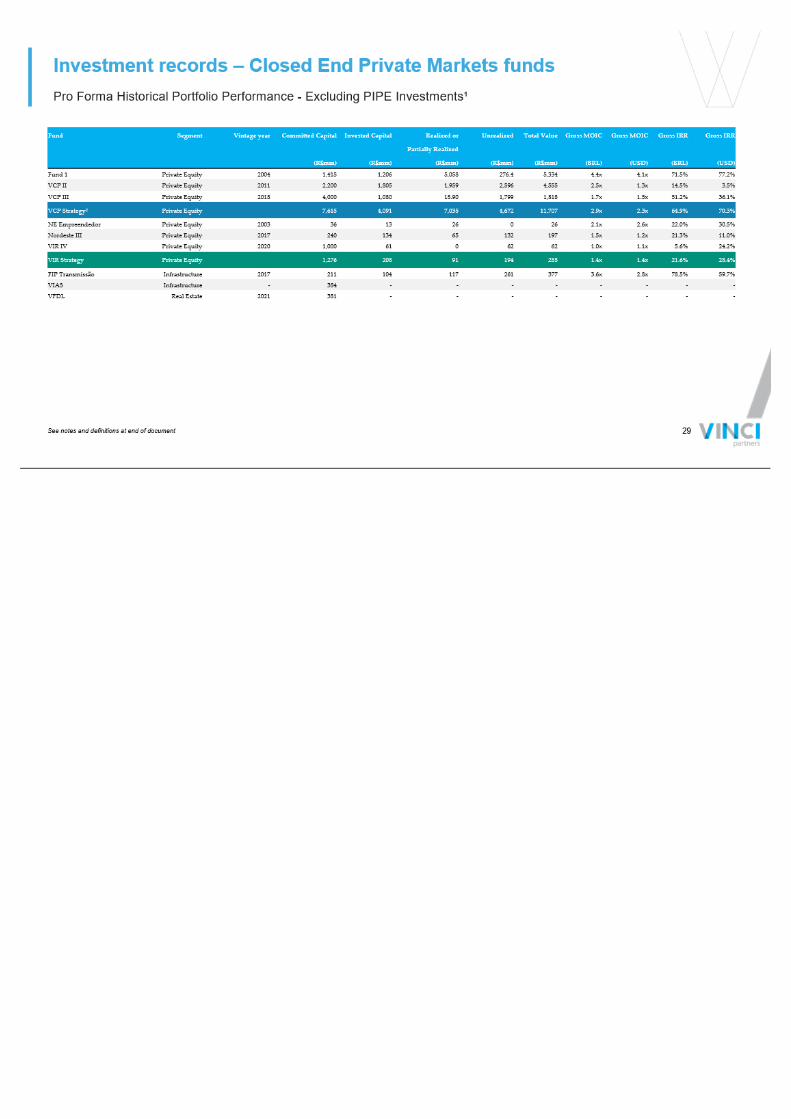
Pro Forma Historical Portfolio Performance - Excluding PIPE Investments¹ Investment records – Closed End Private Markets funds Fund Segment Vintage year Committed Capital Invested Capital Realized or Unrealized Total Value Gross MOIC Gross MOIC Gross IRR Gross IRR Partially Realized (R$mm) (R$mm) (R$mm) (R$mm) (R$mm) (BRL) (USD) (BRL) (USD) Fund 1 Private Equity 2004 1,415 1,206 5,058 276.4 5,334 4.4x 4.1x 71.5% 77.2% VCP II Private Equity 2011 2,200 1,805 1,959 2,596 4,555 2.5x 1.3x 14.5% 3.5% VCP III Private Equity 2018 4,000 1,080 18.90 1,799 1,818 1.7x 1.5x 51.2% 36.1% VCP Strategy² Private Equity 7,615 4,091 7,035 4,672 11,707 2.9x 2.3x 64.9% 70.3% NE Empreendedor Private Equity 2003 36 13 26 0 26 2.1x 2.6x 22.0% 30.5% Nordeste III Private Equity 2017 240 134 65 132 197 1.5x 1.2x 21.3% 11.0% VIR IV Private Equity 2020 1,000 61 0 62 62 1.0x 1.1x 5.6% 24.2% VIR Strategy Private Equity 1,276 208 91 194 285 1.4x 1.4x 21.6% 28.4% FIP Transmissão Infrastructure 2017 211 104 117 261 377 3.6x 2.8x 78.5% 59.7% VIAS Infrastructure - 384 - - - - - - - - VFDL Real Estate 2021 381 - - - - - - - - See notes and definitions at end of document 29
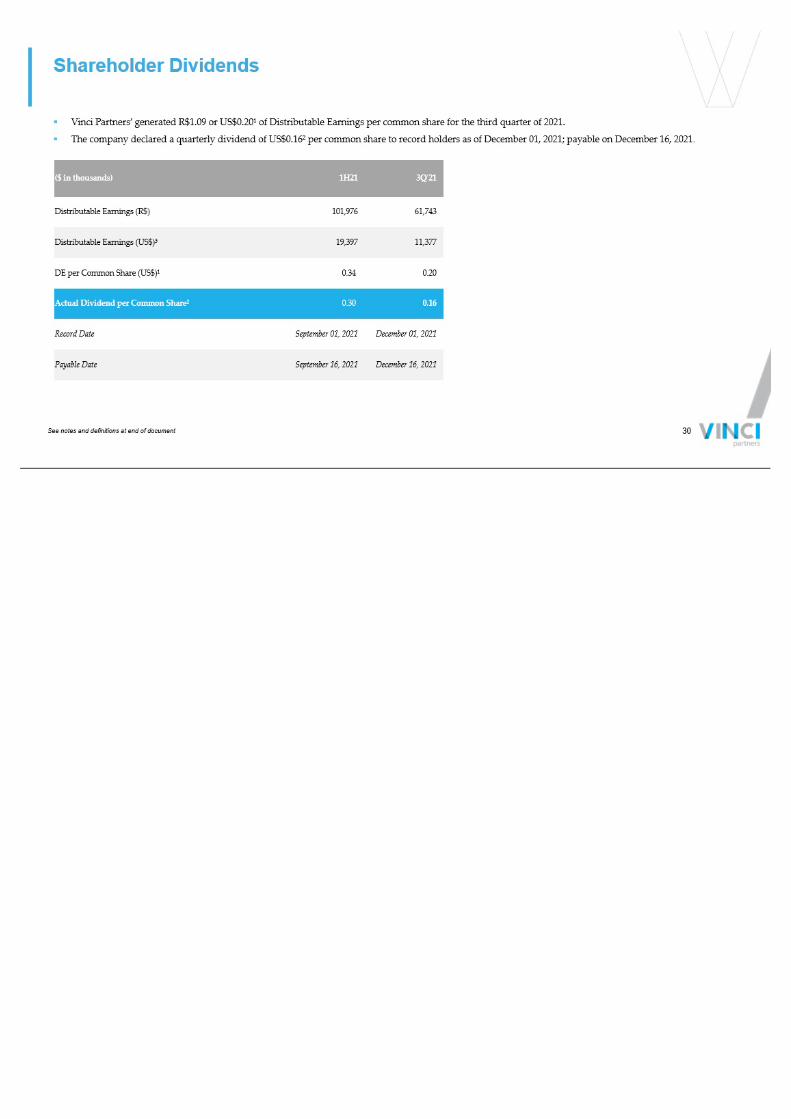
Shareholder Dividends ▪ Vinci Partners’ generated R$1.09 or US$0.20¹ of Distributable Earnings per common share for the third quarter of 2021. ▪ The company declared a quarterly dividend of US$0.16² per common share to record holders as of December 01, 2021; payable on Dec ember 16 , 2021 . ($ in thousands) 1H21 3Q ' 21 Distributable Earnings (R$) 101,976 61,743 Distributable Earnings (US$)³ 19,397 11,377 DE per Common Share (US$)¹ 0.34 0.20 Actual Dividend per Common Share² 0.30 0.16 Record Date September 01, 2021 December 01, 2021 Payable Date September 16, 2021 December 16, 2021 See notes and definitions at end of document 30

Share Summary VINP Shares 4Q ' 20 (Pre IPO) 1Q ' 21 2Q ' 21 3Q ' 21 Class B 14,466,239 14,466,239 14,466,239 14,466,239 Class A – Partnership Units 27,175,861 27,175,861 27,175,861 27,175,861 Class A - Public Float N/A 15,271,488 15,094,833 14,921,318 Common Shares 41,642,100 56,913,588 56,736,933 56,563,418 ▪ Common Shares Outstanding as of quarter end of 56,563,418 shares. x Repurchased 173,515 common shares in the quarter, with an average share price of US$13.8. x Available authorization remaining was R$59.2 million at September 30, 2021. 31
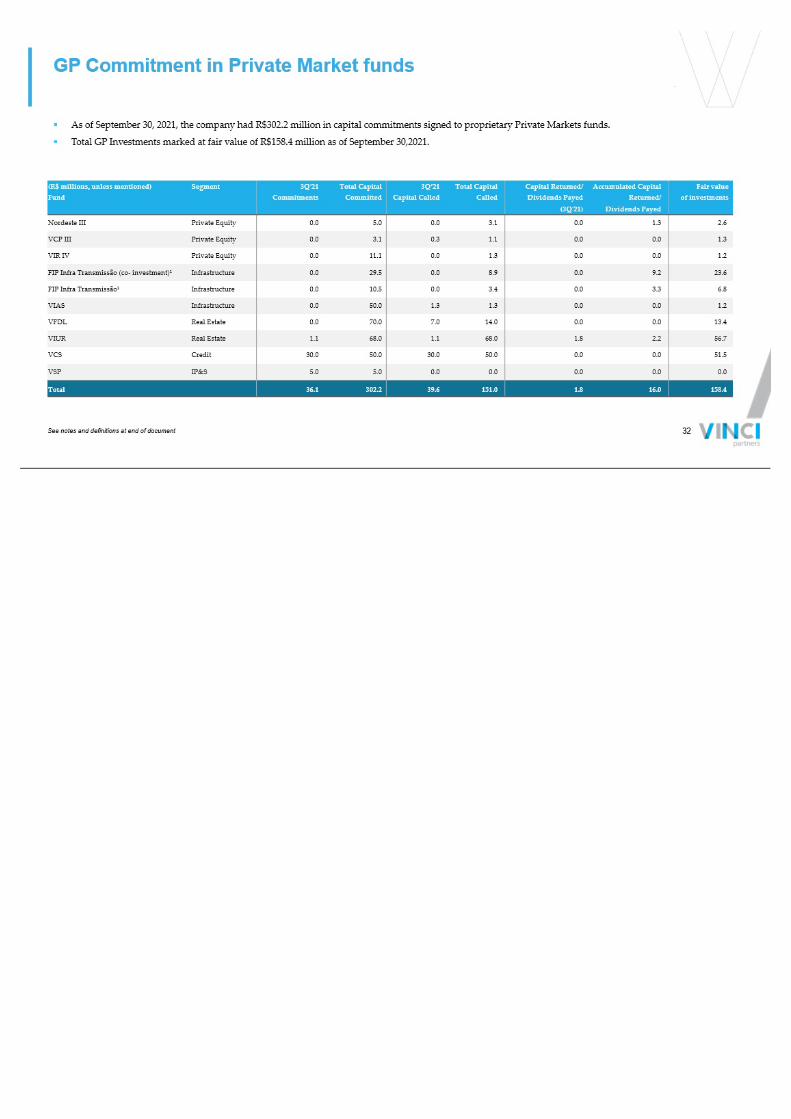
GP Commitment in Private Market funds (R$ millions, unless mentioned) Segment 3Q ' 21 Total Capital 3Q ’ 21 Total Capital Capital Returned/ Accumulated Capital Fair value Fund Commitments Committed Capital Called Called Dividends Payed Returned/ of investments (3Q ' 21) Dividends Payed Nordeste III Private Equity 0.0 5.0 0.0 3.1 0.0 1.3 2.6 VCP III Private Equity 0.0 3.1 0.3 1.1 0.0 0.0 1.3 VIR IV Private Equity 0.0 11.1 0.0 1.3 0.0 0.0 1.2 FIP Infra Transmissão ( co - investment)¹ Infrastructure 0.0 29.5 0.0 8.9 0.0 9.2 23.6 FIP Infra Transmissão¹ Infrastructure 0.0 10.5 0.0 3.4 0.0 3.3 6.8 VIAS Infrastructure 0.0 50.0 1.3 1.3 0.0 0.0 1.2 VFDL Real Estate 0.0 70.0 7.0 14.0 0.0 0.0 13.4 VIUR Real Estate 1.1 68.0 1.1 68.0 1.8 2.2 56.7 VCS Credit 30.0 50.0 30.0 50.0 0.0 0.0 51.5 VSP IP&S 5.0 5.0 0.0 0.0 0.0 0.0 0.0 Total 36.1 302.2 39.6 151.0 1.8 16.0 158.4 ▪ As of September 30, 2021, the company had R$302.2 million in capital commitments signed to proprietary Private Markets funds. ▪ Total GP Investments marked at fair value of R$158.4 million as of September 30,2021. 32 See notes and definitions at end of document

Reconciliations and Disclosures
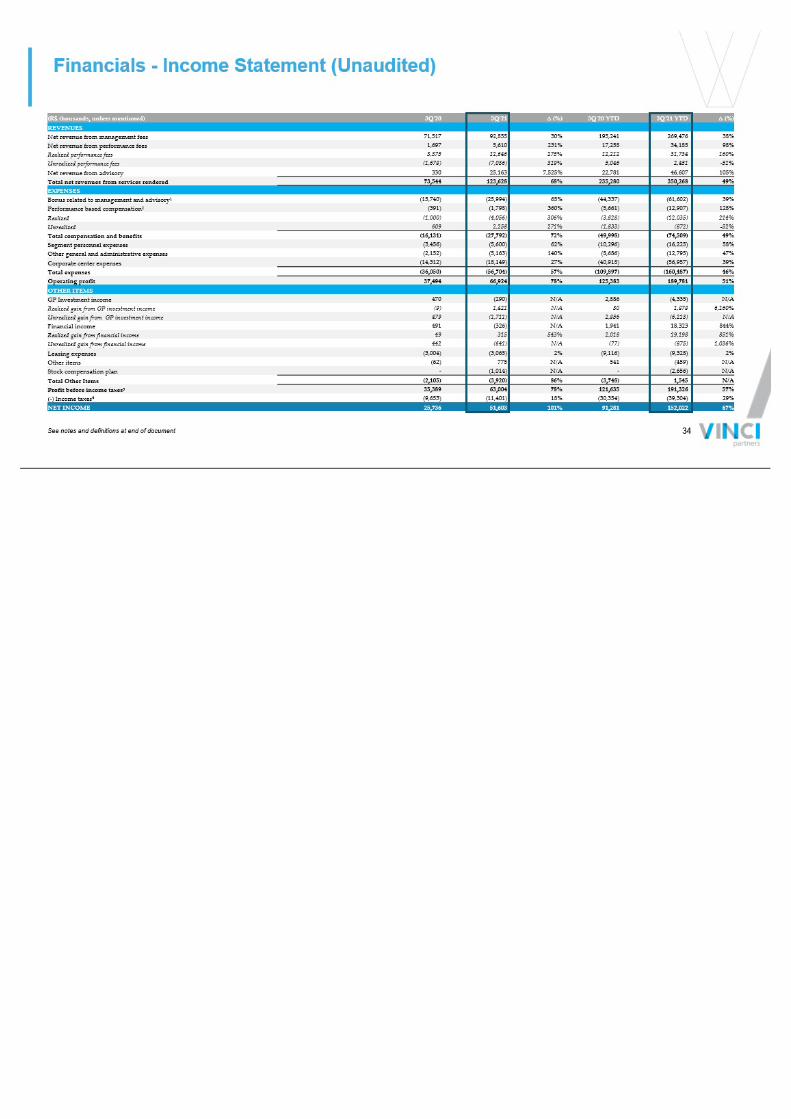
Financials - Income Statement (Unaudited) (R$ thousands, unless mentioned) 3Q'20 3Q'21 ∆ (%) 3Q'20 YTD 3Q'21 YTD ∆ (%) REVENUES Net revenue from management fees 71,517 92,855 30% 195,241 269,476 38% Net revenue from performance fees 1,697 5,610 231% 17,258 34,185 98% Realized performance fees 3,375 12,646 275% 12,212 31,734 160% Unrealized performance fees (1,678) (7,036) 319% 5,046 2,451 - 51% Net revenue from advisory 330 25,163 7,525% 22,781 46,607 105% Total net revenues from services rendered 73,544 123,628 68% 235,280 350,268 49% EXPENSES Bonus related to management and advisory¹ (15,740) (25,994) 65% (44,337) (61,602) 39% Performance based compensation² (391) (1,798) 360% (5,661) (12,907) 128% Realized (1,000) (4,056) 306% (3,828) (12,035) 214% Unrealized 609 2,258 271% (1,833) (872) - 52% Total compensation and benefits (16,131) (27,792) 72% (49,998) (74,509) 49% Segment personnel expenses (3,456) (5,600) 62% (10,296) (16,225) 58% Other general and administrative expenses (2,152) (5,163) 140% (8,686) (12,795) 47% Corporate center expenses (14,312) (18,149) 27% (40,918) (56,957) 39% Total expenses (36,050) (56,704) 57% (109,897) (160,487) 46% Operating profit 37,494 66,924 78% 125,383 189,781 51% OTHER ITEMS GP Investment income 470 (290) N/A 2,886 (4,335) N/A Realized gain from GP investment income (9) 1,421 N/A 30 1,878 6,160% Unrealized gain from GP investment income 479 (1,711) N/A 2,856 (6,213) N/A Financial income 491 (326) N/A 1,941 18,323 844% Realized gain from financial income 49 315 543% 2,018 19,198 851% Unrealized gain from financial income 442 (641) N/A (77) (875) 1,036% Leasing expenses (3,004) (3,065) 2% (9,116) (9,328) 2% Other items (62) 775 N/A 541 (459) N/A Stock compensation plan - (1,014) N/A - (2,656) N/A Total Other Items (2,105) (3,920) 86% (3,748) 1,545 N/A Profit before income taxes³ 35,389 63,004 78% 121,635 191,326 57% ( - ) Income taxes 4 (9,653) (11,401) 18% (30,354) (39,304) 29% NET INCOME 25,736 51,603 101% 91,281 152,022 67% See notes and definitions at end of document 34
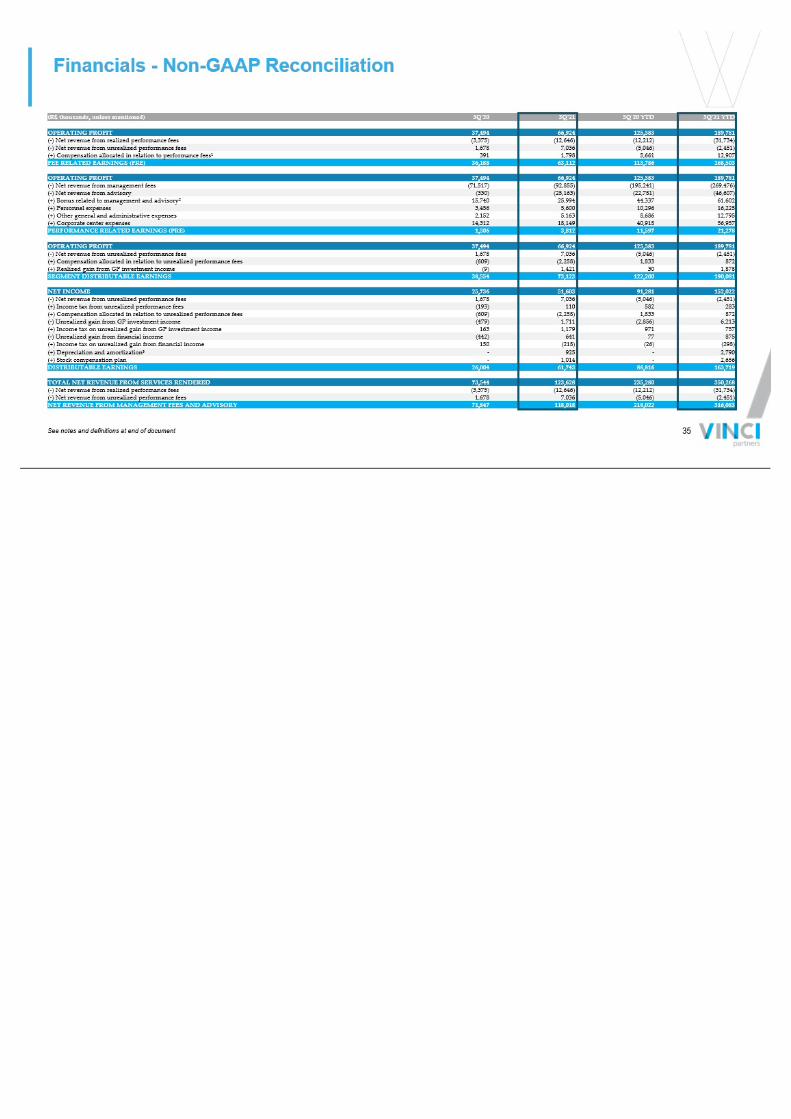
Financials - Non - GAAP Reconciliation (R$ thousands, unless mentioned) 3Q'20 3Q'21 3Q'20 YTD 3Q'21 YTD OPERATING PROFIT 37,494 66,924 125,383 189,781 ( - ) Net revenue from realized performance fees (3,375) (12,646) (12,212) (31,734) ( - ) Net revenue from unrealized performance fees 1,678 7,036 (5,046) (2,451) (+) Compensation allocated in relation to performance fees¹ 391 1,798 5,661 12,907 FEE RELATED EARNINGS (FRE) 36,188 63,112 113,786 168,503 OPERATING PROFIT 37,494 66,924 125,383 189,781 ( - ) Net revenue from management fees (71,517) (92,855) (195,241) (269,476) ( - ) Net revenue from advisory (330) (25,163) (22,781) (46,607) (+) Bonus related to management and advisory² 15,740 25,994 44,337 61,602 (+) Personnel expenses 3,456 5,600 10,296 16,225 (+) Other general and administrative expenses 2,152 5,163 8,686 12,795 (+) Corporate center expenses 14,312 18,149 40,918 56,957 PERFORMANCE RELATED EARNINGS (PRE) 1,306 3,812 11,597 21,278 OPERATING PROFIT 37,494 66,924 125,383 189,781 ( - ) Net revenue from unrealized performance fees 1,678 7,036 (5,046) (2,451) (+) Compensation allocated in relation to unrealized performance fees (609) (2,258) 1,833 872 (+) Realized gain from GP investment income (9) 1,421 30 1,878 SEGMENT DISTRIBUTABLE EARNINGS 38,554 73,123 122,200 190,081 NET INCOME 25,736 51,603 91,281 152,022 ( - ) Net revenue from unrealized performance fees 1,678 7,036 (5,046) (2,451) (+) Income tax from unrealized performance fees (193) 110 582 283 (+) Compensation allocated in relation to unrealized performance fees (609) (2,258) 1,833 872 ( - ) Unrealized gain from GP investment income (479) 1,711 (2,856) 6,213 (+) Income tax on unrealized gain from GP investment income 163 1,179 971 757 ( - ) Unrealized gain from financial income (442) 641 77 875 (+) Income tax on unrealized gain from financial income 150 (218) (26) (298) (+) Depreciation and amortization³ - 925 - 2,790 (+) Stock compensation plan - 1,014 - 2,656 DISTRIBUTABLE EARNINGS 26,004 61,743 86,816 163,719 TOTAL NET REVENUE FROM SERVICES RENDERED 73,544 123,628 235,280 350,268 ( - ) Net revenue from realized performance fees (3,375) (12,646) (12,212) (31,734) ( - ) Net revenue from unrealized performance fees 1,678 7,036 (5,046) (2,451) NET REVENUE FROM MANAGEMENT FEES AND ADVISORY 71,847 118,018 218,022 316,083 See notes and definitions at end of document 35
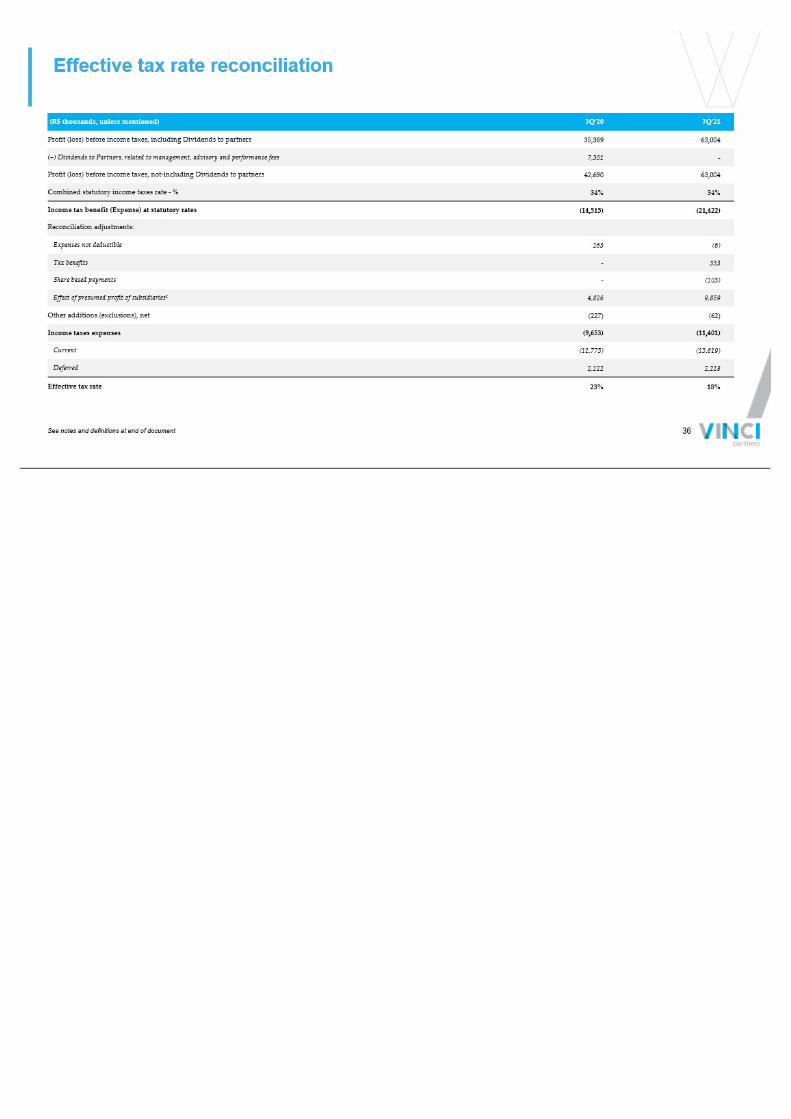
Effective tax rate reconciliation (R$ thousands, unless mentioned) 3Q'20 3Q'21 Profit (loss) before income taxes, including Dividends to partners 35,389 63,004 (+) Dividends to Partners, related to management, advisory and performance fees 7,301 - Profit (loss) before income taxes, not - including Dividends to partners 42,690 63,004 Combined statutory income taxes rate - % 34% 34% Income tax benefit (Expense) at statutory rates (14,515) (21,422) Reconciliation adjustments: Expenses not deductible 263 (6) Tax benefits - 333 Share based payments - (103) Effect of presumed profit of subsidiaries¹ 4,826 9,859 Other additions (exclusions), net (227) (62) Income taxes expenses (9,653) (11,401) Current (11,775) (13,619) Deferred 2,122 2,218 Effective tax rate 23% 18% See notes and definitions at end of document 36
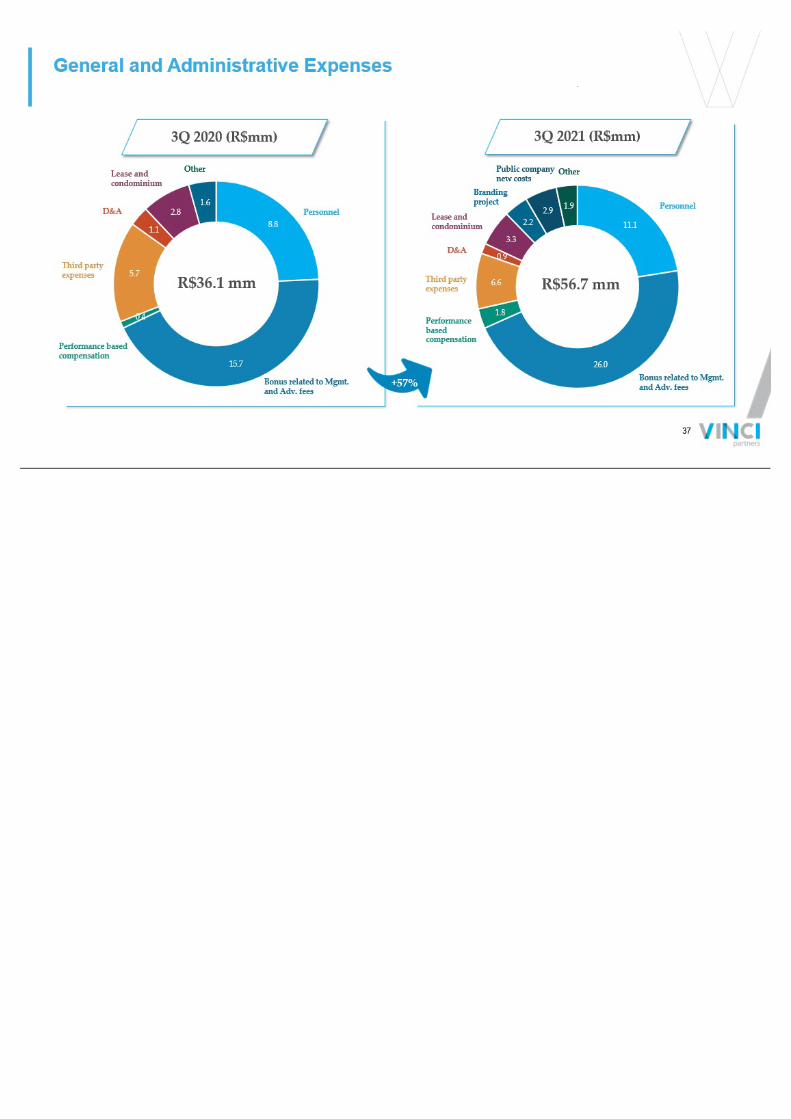
General and Administrative Expenses 3 Q 2020 (R$mm) 3 Q 2021 (R$mm) 8.8 15.7 0.4 5.7 1.1 2.8 1.6 Lease and condominium Other Personnel Bonus related to Mgmt. and Adv. fees Performance based compensation Third party expenses D&A R$36.1 mm 11.1 26.0 1.8 6.6 0.9 3.3 2.2 2.9 1.9 Personnel Bonus related to Mgmt. and Adv. fees Performance based compensation Third party expenses D&A Lease and condominium Branding project Public company new costs Other R$56.7 mm +57% 37
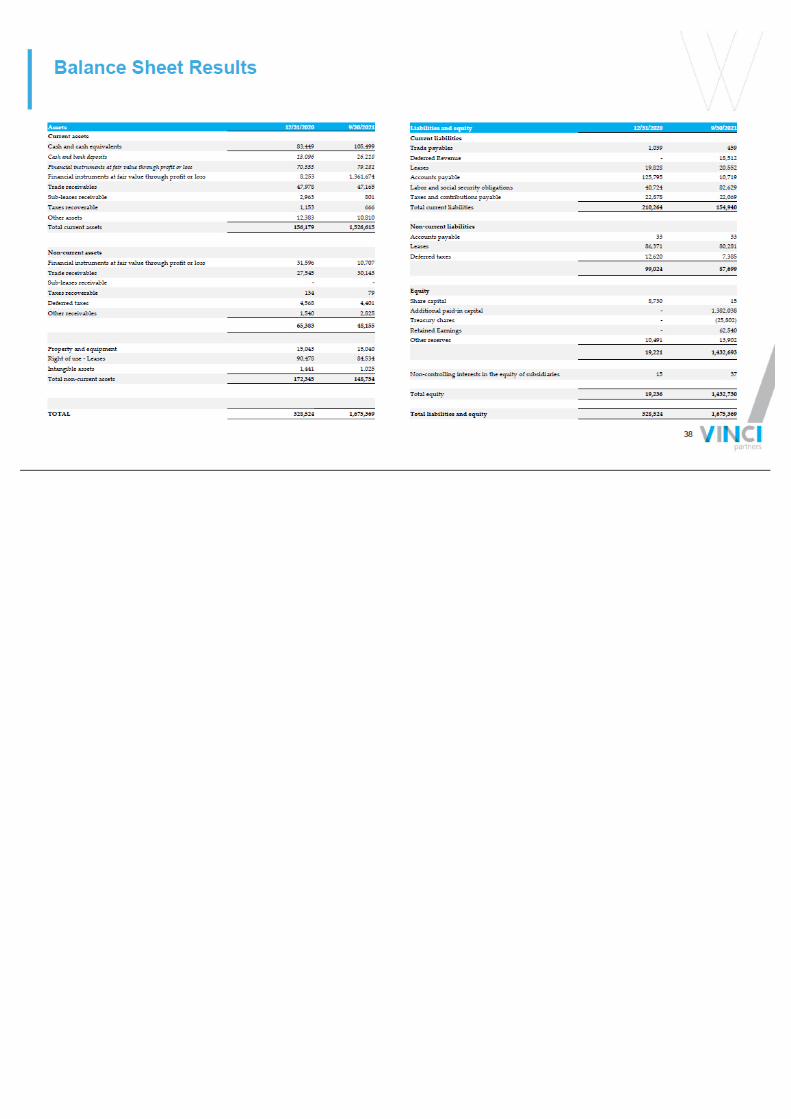
Balance Sheet Results Assets 12/31/2020 9/30/2021 Current assets Cash and cash equivalents 83,449 105,499 Cash and bank deposits 13,096 26,218 Financial instruments at fair value through profit or loss 70,353 79,281 Financial instruments at fair value through profit or loss 8,253 1,361,674 Trade receivables 47,978 47,165 Sub - leases receivable 2,963 801 Taxes recoverable 1,153 666 Other assets 12,383 10,810 Total current assets 156,179 1,526,615 Non - current assets Financial instruments at fair value through profit or loss 31,596 10,707 Trade receivables 27,545 30,143 Sub - leases receivable - - Taxes recoverable 134 79 Deferred taxes 4,568 4,401 Other receivables 1,540 2,825 65,383 48,155 Property and equipment 15,043 15,040 Right of use - Leases 90,478 84,534 Intangible assets 1,441 1,025 Total non - current assets 172,345 148,754 TOTAL 328,524 1,675,369 Liabilities and equity 12/31/2020 9/30/2021 Current liabilities Trade payables 1,039 459 Deferred Revenue - 18,512 Leases 19,828 20552 Accounts payable 125,795 10,719 Labor and social security obligations 40,724 82,629 Taxes and contributions payable 22,878 22,069 Total current liabilities 210,264 154,940 Non - current liabilities Accounts payable 33 33 Leases 86,371 80,281 Deferred taxes 12,620 7,385 99,024 87,699 Equity Share capital 8,730 15 Additional paid - in capital - 1,382,038 Treasury shares - - 25,802 Retained Earnings - 62,540 Other reserves 10,491 13,902 19,221 1,432,693 Non - controlling interests in the equity of subsidiaries 15 37 Total equity 19,236 1,432,730 Total liabilities and equity 328,524 1,675,369 38

Notes and Definitions ▪ Notes to page 5 (1) AUM is calculated as consolidated with double counting, due to funds from one segment investing in other segments and it ´ s eliminated on consolidation and excluding VIFI from Credit and Pension Products Co - managed with IP&S from Equities. (2) CAGR is calculated considering AUM without double counting. (3) Total capital returned to shareholders comprises distributions through dividends and share repurchases. ▪ Notes to page 7 (1) Bonus compensation related to management and advisory includes Dividends to Partners related to management and advisory, dis tributed by the company to its original partners before the company turned public in 2021. (2) FRE per share is calculated considering the number of outstanding shares at the end of the current quarter. Year to date val ues are calculated as the sum of the last three quarters. (3) Performance based compensation includes Dividends to Partners related to performance fees, distributed by the company to its original partners before the company turned public in 2021. (4) Depreciation and amortization is a non - cash expense that is being added back for our calculation of Distributable Earnings f or the year ended December 31, 2020, and future periods. Our Distributable Earnings for the quarter and nine months ended September 30, 2020, would have been R$27.1 million and R$90.4 mi lli on, respectively, if we did add back depreciation and amortization to our calculation of Distributable Earnings. (5) DE per share is calculated considering the number of outstanding shares at the end of the current quarter. Year to date v alu es are calculated as the sum of the last three quarters. ▪ Notes to page 10 (1) Long - term AUM includes funds with lockups for at least five years to quasi - perpetual capital commitments. ▪ Notes to page 11 (1) Long term products include funds with former lockups superior to five years. (2) Private markets strategies include Private Equity, Real Estate, Credit and Infrastructure. ▪ Notes to page 12 (1) International mandates have several different benchmarks across its vehicles. (2) The preferred return w/ catch - up rule applies to funds for which the vehicle must pay back its limited partners 100% of the invested capital corrected by the preferred return rate so it can charge performance fees. Once the preferred return rate is achieved, due to the catch - up clause, performance fees are charged over the absolute return of the fund instead of the excess return over the preferred rate. (3) Hurdle Rate is the minimum return the fund must achieve before it can charge performance fees. In most cases, funds with hur dle rate also are under a high - water mark clause . (4) Funds with preferredreturn must return 100% of invested capital corrected by the preferred return rate to its limited pa rtn ers in order to charge performance fees. 39
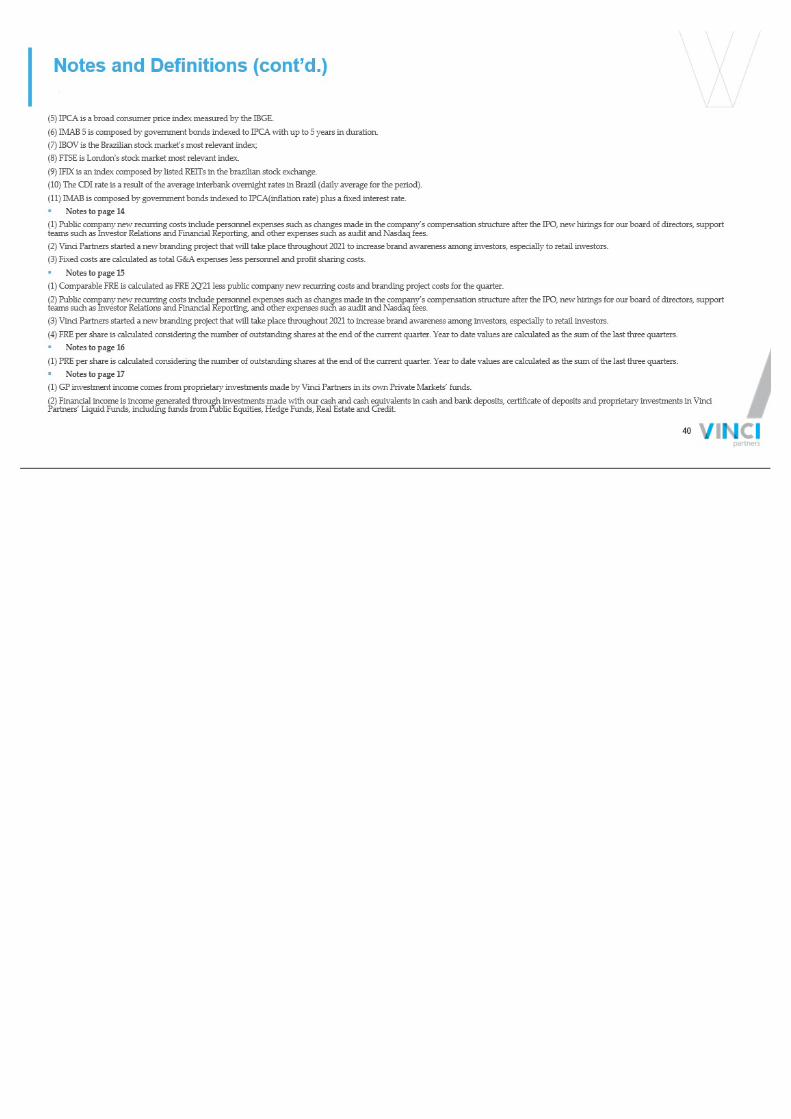
Notes and Definitions (cont’d.) (5) IPCA is a broad consumer price index measured by the IBGE. (6) IMAB 5 is composed by government bonds indexed to IPCA with up to 5 years in duration. (7) IBOV is the Brazilian stock market's most relevant index; (8) FTSE is London's stock market most relevant index. (9) IFIX is an index composed by listed REITs in the brazilian stock exchange. (10) The CDI rate is a result of the average interbank overnight rates in Brazil (daily average for the period). (11) IMAB is composed by government bonds indexed to IPCA(inflation rate) plus a fixed interest rate. ▪ Notes to page 14 (1) Public company new recurring costs include personnel expenses such as changes made in the company’s compensation structur e a fter the IPO, new hirings for our board of directors, support teams such as Investor Relations and Financial Reporting, and other expenses such as audit and Nasdaq fees. (2) Vinci Partners started a new branding project that will take place throughout 2021 to increase brand awareness among inve sto rs, especially to retail investors. (3) Fixed costs are calculated as total G&A expenses less personnel and profit sharing costs. ▪ Notes to page 15 (1) Comparable FRE is calculated as FRE 2Q'21 less public company new recurring costs and branding project costs for the quar ter . (2) Public company new recurring costs include personnel expenses such as changes made in the company’s compensation structur e a fter the IPO, new hirings for our board of directors, support teams such as Investor Relations and Financial Reporting, and other expenses such as audit and Nasdaq fees. (3) Vinci Partners started a new branding project that will take place throughout 2021 to increase brand awareness among inve sto rs, especially to retail investors. (4) FRE per share is calculated considering the number of outstanding shares at the end of the current quarter. Year to date val ues are calculated as the sum of the last three quarters. ▪ Notes to page 16 (1) PRE per share is calculated considering the number of outstanding shares at the end of the current quarter. Year to date val ues are calculated as the sum of the last three quarters. ▪ Notes to page 17 (1) GP investment income comes from proprietary investments made by Vinci Partners in its own Private Markets’ funds. (2) Financial income is income generated through investments made with our cash and cash equivalents in cash and bank deposit s, certificate of deposits and proprietary investments in Vinci Partners’ Liquid Funds, including funds from Public Equities, Hedge Funds, Real Estate and Credit. 40

Notes and Definitions (cont’d.) ▪ Notes to page 17 (1) GP investment income comes from proprietary investments made by Vinci Partners in its own Private Markets’ funds. (2) Financial income is income generated through investments made with our cash and cash equivalents in cash and bank deposit s, certificate of deposits and proprietary investments in Vinci Partners’ Liquid Funds, including funds from Public Equities, Hedge Funds, Real Estate and Credit. (3) IMAB is composed by government bonds indexed to IPCA(inflation rate) plus a fixed interest rate. (4) Back test result between January 2016 and March 2021. The result from the 2Q’21 onwards is the effective return of the ca sh allocation. ▪ Notes to page 18 (1) DE per share is calculated considering the number of outstanding shares at the end of the current quarter. Year to date v alu es are calculated as the sum of the last three quarters ▪ Notes to page 19 (1) Cash and cash equivalents include certificate of deposits and federal bonds. Certificate of deposits are issued by Banco Bra desco (credit rating AAA evaluated by Fitch Ratings) with interest rates variable from 99.5% to 101% of CDI (interbank deposit rate). The certificates are readily convertible to known amounts of cas h a nd which are subject to an insignificant risk of changes in value. (2) Liquid funds’ value are calculated as investment at fair value as of September 30, 2021, in liquid funds from Vinci Partn ers ’ public equities, hedge funds, credit segments and listed REITs. It also comprises the cash and certificate of deposits and federal bonds from Vinci Monalisa FIM. For more detail, see 3Q'21 Financia l S tatements filed within the SEC on November 17, 2021. (3) GP Fund Investments include Vinci Partners’ GP investments in private market funds, calculated at fair value as of Septem ber 30, 2021. For more detail, please see slide 32 and the Financial Statements filed within the SEC on November 17, 2021. (4) Cash and Net Investments per share were calculated considering the number of outstanding shares at the end of each quarte r. ▪ Notes to page 28 (1) NAV is the net asset value of each fund. For listed vehicles, the NAV represents the Market valuation of the fund. (2) Atlas strategy includes the funds Atlas FIC FIM and Atlas Institucional FIC FIM. (3) Equilibrio Strategy incudes the IP&S Family of pension plans. (4) CDI is an average of interbank overnight rates in Brazil(daily average for the period). (5) Brazil stock market most relevant index. (6) IPCA is a broad consumer price index measured by the IBGE. (7) IMAB is composed by government bonds indexed to IPCA. IMAB 5 also includes government bonds indexed to IPCA with up to 5 Yea rs in duration. (8)IFIX is an index composed by listed REITs in the brazilian stock Market. 41
Notes and Definitions (cont’d.) ▪ Notes to page 29 (1) Track record information is presented throughout this presentation on a pro forma basis and in local currency, excluding PIP E investments, a strategy that will be discontinued in VCP III. Past performance of investments described herein is provided for illustrative purposes only and is not necessarily indicative of VCP II or VCP III’s future investment results. (2) Total commitments for VCP III include R$1.3 billion in co - investments . ▪ Notes to page 32 (1) The remaining capital committed in FIP Infra Transmissão and FIP Infra Transmissão co - investment will not be called by the f und, which is already in divestment period. ▪ Notes to page 30 (1) US$ Distributable Earnings was calculated considering the exchange rate from USD to BRL of 5.4271, as of November 11, 202 1, when dividends were approved by our Board of Directors. (2) Per Share calculations are based on end of period Participating Common Shares. (3) Actual dividends per common share are calculated considering the share count as of the applicable record date. ▪ Notes to page 34 (1) Bonus compensation related to management and advisory includes Dividends to Partners related to management and advisory, dis tributed by the company to its original partners before the company turned public in 2021. (2) Performance based compensation includes Dividends to Partners related to performance fees, distributed by the company to its original partners before the company turned public in 2021. (3) Profit before income taxes includes Dividends to partners related to management, advisory and performance fees, distribut ed by the company to its original partners before the company turned public in 2021. (4) Income taxes are comprised of taxes calculated over our corporate income tax and social contribution taxes. We are taxed on an actual taxable profit regime, while our subsidiaries are taxed based on deemed profit. Dividends to partners distributed by the company to its original partners before turned public in 202 1 a re not included in actual taxable regime. ▪ Notes to page 35 (1) Performance based compensation includes Dividends to Partners related to performance fees, distributed by the company to its original partners before the company turned public in 2021. (2) Bonus compensation related to management and advisory includes Dividends to Partners related to management and advisory, dis tributed by the company to its original partners before the company turned public in 2021. (3) Depreciation and amortization is a non - cash expense that is being added back for our calculation of Distributable Earnings f or the year ended December 31, 2020, and future periods. 42

Notes and Definitions (cont’d.) ▪ Notes to page 36 (1) Brazilian tax law establishes that companies that generate gross revenues of up to R$ 78,000 in the prior fiscal year may ca lculate income taxes as a percentage of gross revenue, using the presumed profit income tax regime. The Entity's subsidiaries adopted this tax regime and the effect of the presumed profit of su bsidiaries represents the difference between the taxation based on this method and the amount that would be due based on the statutory rate applied to the taxable profit of the subsidiaries.
Notes and Definitions (cont’d.) ▪ “Fee related earnings”, or “FRE”, is a metric to monitor the baseline performance of, and trends in, our business, in a manne r t hat does not include performance fees or investment income. We calculate FRE as operating profit less (a) net revenue from realized performance fees, less (b) net revenue from unrealized p erf ormance fees, plus (c) compensation allocated in relation to performance fees. ▪ “FRE Margin” is calculated as FRE over total net management and advisory fees. ▪ “Distributable Earnings”, or “DE”, is used as a reference point by our board of directors for determining the amount of earni ngs available to distribute to shareholders as dividends. Distributable Earnings is calculated as profit for the year, less (a) net revenue from unrealized performance fees, plus (b) inc ome taxes from unrealized performance fees, plus (c) compensation allocated in relation to unrealized performance fees, less (d) unrealized gain from GP investment income, less (e) unrealized ga in from financial income, plus (f) income taxes on unrealized gain from GP investment income, plus (g) income taxes on unrealized gain from financial income. ▪ “DE Margin” is calculated as DE over the sum of management and advisory fee related revenues, realized performance revenue, r eal ized GP investment income and realized financial income, net of revenue tax. ▪ “Performance Related Earnings”, or “PRE”, is a performance measure that we use to assess our ability to generate profits from re venue that relies on outcome from funds above their respective benchmarks. We calculate PRE as operating profit, less (a) net revenue from fund management and advisory, less (b) operating exp enses, such as segment personnel, G&A, corporate center and bonus related to management and advisory.. ▪ “Segment Distributable Earnings” is Vinci Partners’ segment profitability measure used to make operating decisions and assess pe rformance across the company’s four segments (Private Markets, Liquid Strategies, Investment Products and Solutions and Financial Advisory). Segment Distributable Earnings is calc ula ted as operating profit less (a) net revenue from unrealized performance fees, plus (b) compensation allocated in relation to unrealized performance fees, plus (c) realized gain from GP inv estment income. ▪ “AUM” refers to assets under management. Our assets under management equal the sum of: (1) the fair market value of the inves tme nts held by funds plus the capital that we are entitled to call from investors in those funds pursuant to the terms of their capital commitments to those funds (plus the fair market va lue of co - investments arranged by us that were made or could be madeby limited partners of our corporate private equity funds and portfolio companies of such funds); (2) the net asset valu e o f our public equity funds, hedge funds and closed - end mutual funds; and (3) the amount of capital raised for our credit funds. AUM includes double counting related to funds from one segm ent that invest in funds from another segment. Those cases occur mainly due to (a) fund of funds of investment products and solutions segment, and (b) investment funds in general that inv est part of their cash in credit segment and hedge fund segment funds in order to maintain liquidity and provide for returns on cash. Such amounts are eliminated on consolidation. T he bylaws of the relevant funds prohibit double - charging fees on AUM across segments. Therefore, while our AUM by segment may double - count funds from one segment that invest in funds from anoth er segment, the revenues for any given segment do not include revenue in respect of assets managed by another segment, which means there are no intercompany eliminations on re ven ues in our results of operations. ▪ Net Cash and Investments include cash and cash equivalents and the fair value of investments in liquid funds and GP Fund Inve stm ents. Cash and cash equivalents include cash, certificate of deposits, which are issued by Banco Bradesco (credit rating AAA evaluated by Fitch Ratings) with interest rates from 99.5% to 10 1% of CDI. 43
Notes and Definitions (cont’d.) ▪ “Net revenue from Fund Management and Advisory” is a performance measure that we use to assess our ability to generate profit s f rom our fund management and advisory business without measuring for the outcomes from funds above their respective benchmarks. We calculate Net Revenue from Fund Management and Ad vis ory as net revenue from services rendered less (a) net revenue from realized performance fees and less (b) net revenue from unrealized performance fees. ▪ “Total compensation and benefits” is the result of the profit sharing paid to our employees as (a) bonus compensation related to management advisory and (b) performance based compensation. Total compensation and benefits include Dividends to Partners, distributed by the company to its original partn ers before the public turned public in 2021. In accordance with the by - laws of Vinci Brazil, dividends have historically been distributed based on the resolution of the partners. Therefore, di vidends could be distributed on a non - proportional basis among quotaholders, which are comprised by the partners of Vinci Brazil. After the company’s IPO, Vinci Partners changed its compen sat ion structure, from a dividend distribution policy to a profit - sharing scheme our partners. ▪ “Segment personnel expenses” are composed of the salary - part compensation paid to employees and partners of our funds’ managemen t teams. ▪ “Corporate center expenses” are composed by the salary - compensation paid to employees and other general and administrative expen ses related to our support teams, such as research, risk, legal & compliance, investor relations, operations and ESG. ▪ “Other general and administrative expenses” is made up of third - party expenses, depreciation and amortization, travel and repres entation, marketing expenses, administrative fees, non - operating taxes, third - party consultants’ fees, such as legal and accounting, and office consumables. ▪ “GP investment income” is income from proprietary investments made by us in our own Private Markets’ funds, used as GP Commit men ts. ▪ “Financial income” is income generated through the investments made with our cash and cash equivalents in cash and bank depos its , certificate of deposits and proprietary investments in our Liquid Funds from our public equities and hedge funds’ segments and listed REITs from our real estate segment. ▪ “Leasing expenses” include costs from the company’s sub - leasing activities. ▪ “Income taxes” is comprised of taxes on our corporate income tax and social contribution taxes. We are taxed on an actual tax abl e profit regime, while our subsidiaries are taxed based on deemed profit. Dividends topartners distributed by the company to its original partners before turned public in 2021 are not in cluded in actual taxable regime. ▪ “Capital Subscription / (capital return)” represents the net capital commitments and capital returns from our Private Markets ’ c losed end and listed funds. ▪ “Net Inflows / (outflows)” represent the net inflows and outflows from our liquid funds from our liquid strategies, IP&S and cre dit segments. ▪ “Appreciation / (depreciation)” represents the net capital appreciation/depreciation from our funds, which refers to the incr eas e or decrease of the funds’ investment’s value. ▪ “MOIC” means multiple on invested capital, a ratio intended to represent how much value an investment has returned, and is ca lcu lated as realized value plus unrealized value, divided by the total amount invested, gross of expenses and fees. ▪ “IRR” means the internal rate of return, which is a discount rate that makes the net present value of all cash flows equal to ze ro in a discounted cash flow analysis. 44

Funds/strategies’ descriptions ▪ Vinci Multiestratégia: The fund seeks to achieve long - term returns by investing in fixed income assets, through strategies that imply interest rates and currency risks. ▪ Vinci Atlas: The fund seeks to achieve long - term returns by investing across all strategies within fixed income, equities, curre ncy, derivatives, commodities and other investment funds with no obligation of any class concentration. ▪ Vinci Mosaico FIA: Public Equities’ long only flagship strategy. The strategy seeks to achieve long - term returns above Brazilian equities mar ket (Ibovespa) based on a fundamental analysis. ▪ Vinci Gas Dividendos : Public Equities’ dividends flagship strategy. The strategy seeks to achieve long - term returns by investing in companies with a consistent history of paying dividends in the Brazilian stock market. ▪ Vinci Total Return: The fund seeks to achieve medium and long - term returns by investing most of its capital in the Brazilian sto ck market, through bottom up and top - down strategies. ▪ Vinci Valorem: IP&S flagship commingled fund with exposure to fixed income assets, foreign exchange currency and derivatives. ▪ Equilibrio Strategy: IP&S family of pension plan funds. The strategy seeks to achieve long - term returns by investing across all strategies within fixed income, equities, currency, derivatives, commodities and other investment funds, respecting limitations in regulation. ▪ Vinci Selection Equities: The fund seeks to beat the Brazilian stock market index by investing in other funds that invest in Bra zilian public equities. ▪ Vinci Crédito Imobiliário I: The fund seeks to achieve long - term returns by investing in real estate mortgage - backed credit security bonds. ▪ Vinci Crédito Estruturado Multiestratégia PLUS FIC FIM: The fund seeks to achieve consistent returns by investing in private structured credit bonds. ▪ VISC11: Shopping malls listed REIT, focused on acquiring income - generating shopping malls in Brazil. ▪ VILG11: Industrial listed REIT focused on acquiring mature income - generating industrial properties in Brazil. ▪ VINO11: Listed REIT focused on acquiring mature income - generating boutique office real estate assets in Brazil. ▪ VIF11: Listed REIT that invests in other listed REITs and real estate mortgage - backed credit security bonds. ▪ VIUR11: perpetual capital listed REIT, focused on income generation to its quotaholders through the acquisition of urban comm erc ial properties in Brazil, such as street retail, grocery, healthcare, and educational focused real estate properties. 45
Rio de Janeiro 55 21 2159 6000 Av. Bartolomeu Mitre, 336 Leblon - 22431 - 002 São Paulo 55 11 3572 3700 Av. Brigadeiro Faria Lima, 2.277 14 o andar Jardim Paulistano - 01452 - 000 Recife 55 81 3204 6811 Av. República do Líbano, 251 - Sala 301 Torre A - Pina - 51110 - 160 Nova York 1 646 559 8000 780 Third Avenue, 25 th Floor - 10017


Exhibit 99.3
Vinci Partners Investments Ltd. Interim Financial Statements as of September 30, 2021 1
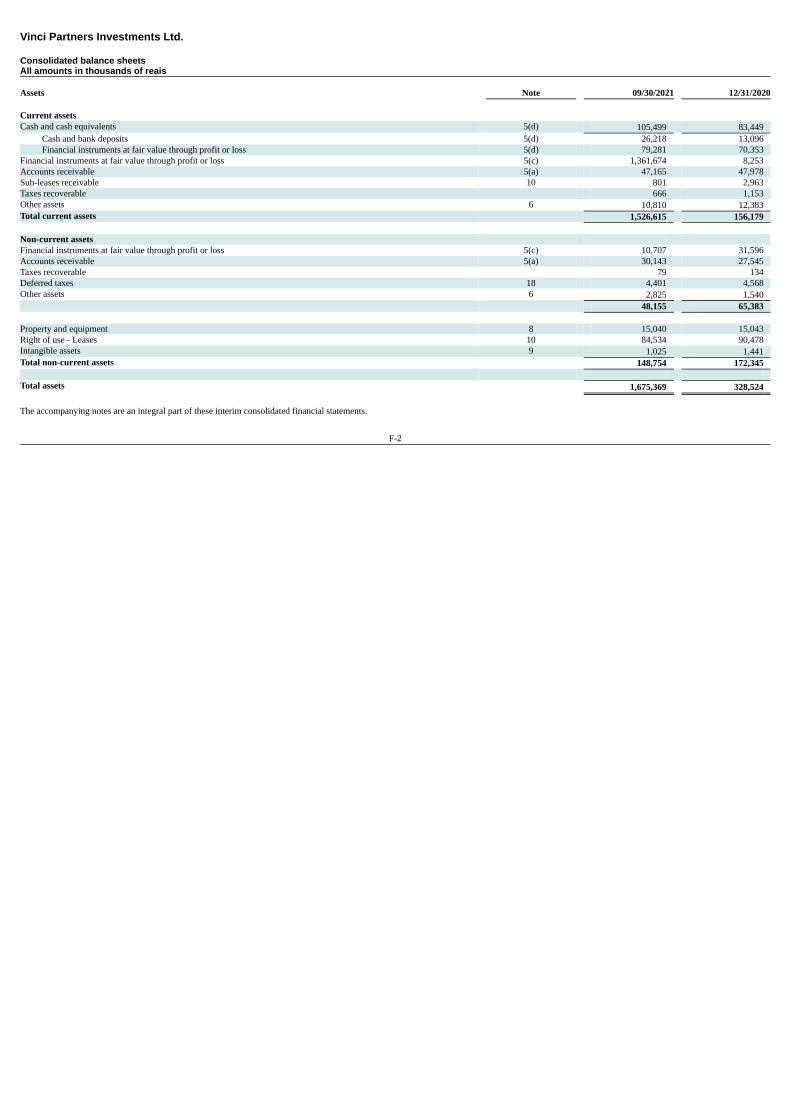
Vinci Partners Investments Ltd. Consolidated balance sheetsAll amounts in thousands of reais Assets Note 09/30/2021 12/31/2020 Current assets Cash and cash equivalents 5(d) 105,499 83,449
Cash and bank deposits 5(d) 26,218 13,096 Financial instruments at fair value through profit or loss 5(d) 79,281 70,353
Financial instruments at fair value through profit or loss 5(c) 1,361,674 8,253 Accounts receivable 5(a) 47,165 47,978 Sub-leases receivable 10 801 2,963 Taxes recoverable 666 1,153 Other assets 6 10,810 12,383 Total current assets 1,526,615 156,179 Non-current assets Financial instruments at fair value through profit or loss 5(c) 10,707 31,596 Accounts receivable 5(a) 30,143 27,545 Taxes recoverable 79 134 Deferred taxes 18 4,401 4,568 Other assets 6 2,825 1,540 48,155 65,383 Property and equipment 8 15,040 15,043 Right of use - Leases 10 84,534 90,478 Intangible assets 9 1,025 1,441 Total non-current assets 148,754 172,345 Total assets 1,675,369 328,524 The accompanying notes are an integral part of these interim consolidated financial statements.
F-2
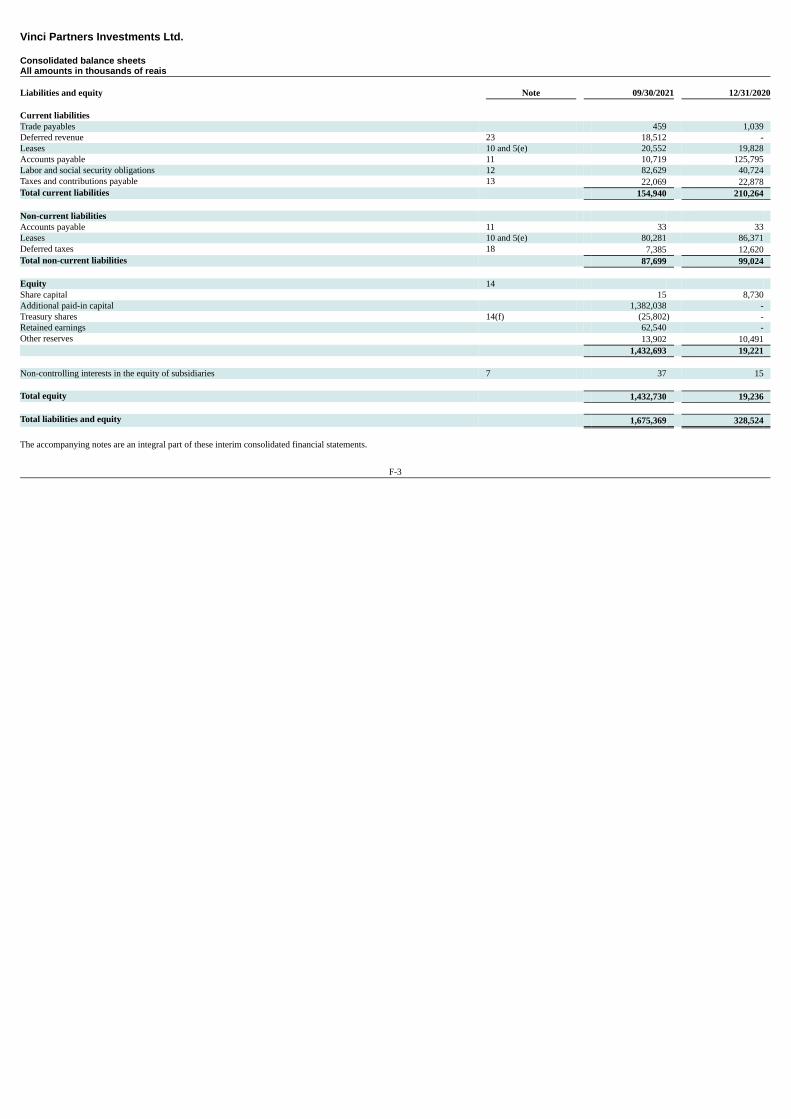
Vinci Partners Investments Ltd. Consolidated balance sheetsAll amounts in thousands of reais Liabilities and equity Note 09/30/2021 12/31/2020 Current liabilities Trade payables 459 1,039 Deferred revenue 23 18,512 - Leases 10 and 5(e) 20,552 19,828 Accounts payable 11 10,719 125,795 Labor and social security obligations 12 82,629 40,724 Taxes and contributions payable 13 22,069 22,878 Total current liabilities 154,940 210,264 Non-current liabilities Accounts payable 11 33 33 Leases 10 and 5(e) 80,281 86,371 Deferred taxes 18 7,385 12,620 Total non-current liabilities 87,699 99,024 Equity 14 Share capital 15 8,730 Additional paid-in capital 1,382,038 - Treasury shares 14(f) (25,802) - Retained earnings 62,540 - Other reserves 13,902 10,491 1,432,693 19,221 Non-controlling interests in the equity of subsidiaries 7 37 15 Total equity 1,432,730 19,236 Total liabilities and equity 1,675,369 328,524 The accompanying notes are an integral part of these interim consolidated financial statements.
F-3
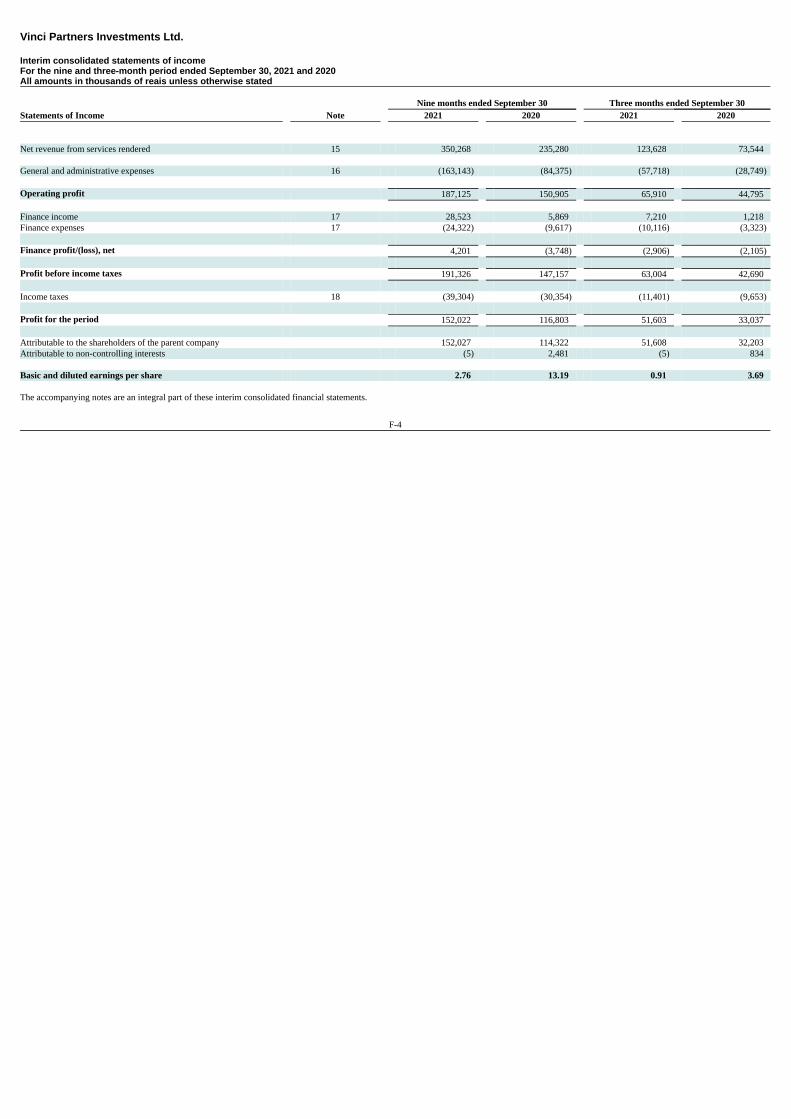
Vinci Partners Investments Ltd. Interim consolidated statements of incomeFor the nine and three-month period ended September 30, 2021 and 2020All amounts in thousands of reais unless otherwise stated Nine months ended September 30 Three months ended September 30Statements of Income Note 2021 2020 2021 2020 Net revenue from services rendered 15 350,268 235,280 123,628 73,544 General and administrative expenses 16 (163,143) (84,375) (57,718) (28,749) Operating profit 187,125 150,905 65,910 44,795 Finance income 17 28,523 5,869 7,210 1,218 Finance expenses 17 (24,322) (9,617) (10,116) (3,323) Finance profit/(loss), net 4,201 (3,748) (2,906) (2,105) Profit before income taxes 191,326 147,157 63,004 42,690 Income taxes 18 (39,304) (30,354) (11,401) (9,653) Profit for the period 152,022 116,803 51,603 33,037 Attributable to the shareholders of the parent company 152,027 114,322 51,608 32,203 Attributable to non-controlling interests (5) 2,481 (5) 834 Basic and diluted earnings per share 2.76 13.19 0.91 3.69 The accompanying notes are an integral part of these interim consolidated financial statements.
F-4
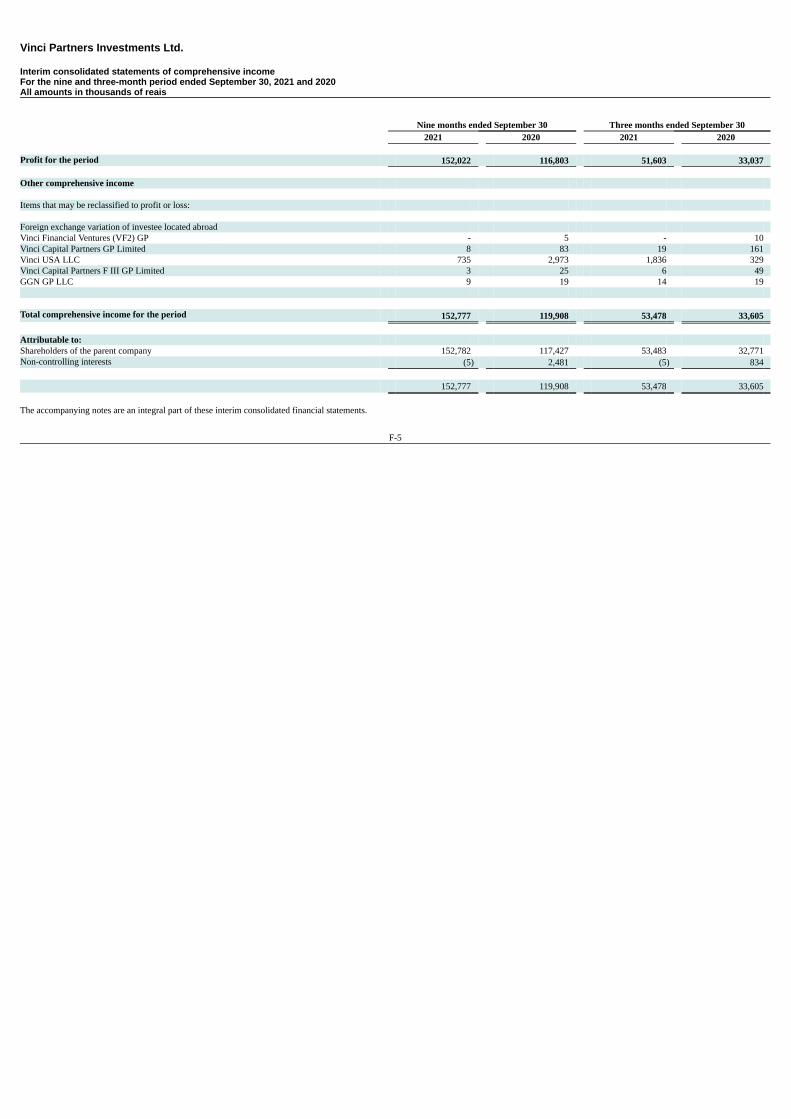
Vinci Partners Investments Ltd. Interim consolidated statements of comprehensive incomeFor the nine and three-month period ended September 30, 2021 and 2020All amounts in thousands of reais Nine months ended September 30 Three months ended September 30 2021 2020 2021 2020 Profit for the period 152,022 116,803 51,603 33,037 Other comprehensive income Items that may be reclassified to profit or loss: Foreign exchange variation of investee located abroad Vinci Financial Ventures (VF2) GP - 5 - 10 Vinci Capital Partners GP Limited 8 83 19 161 Vinci USA LLC 735 2,973 1,836 329 Vinci Capital Partners F III GP Limited 3 25 6 49 GGN GP LLC 9 19 14 19 Total comprehensive income for the period 152,777 119,908 53,478 33,605 Attributable to: Shareholders of the parent company 152,782 117,427 53,483 32,771 Non-controlling interests (5) 2,481 (5) 834 152,777 119,908 53,478 33,605 The accompanying notes are an integral part of these interim consolidated financial statements.
F-5

Vinci Partners Investments Ltd. Interim consolidated statements of changes in equityFor the nine months ended September 30, 2021 and 2020All amounts in thousands of reais Share Additional Retained Other Treasury Non-controlling Total capital paid-in capital earnings reserves shares Total interests equity At January 01, 2020 8,595 - 91,430 8,119 - 108,144 6,581 114,725 Profit for the period - - 114,322 - - 114,322 2,481 116,803 Other comprehensive income: Foreign exchange variationof investee located abroad - - - 3,105 - 3,105 - 3,105 Capital increase (deacrease) 135 - - - - 135 (900) (765)Acquisition of non-controllingquotas - - - - - - (657) (657)Allocation of profit: Dividends - - (92,882) - - (92,882) (3,390) (96,272) At September 30, 2020 8,730 - 112,870 11,224 - 132,824 4,115 136,939 At January 01, 2021 8,730 - - 10,491 - 19,221 15 19,236 Corporate reorganization (8,719) 8,719 - - - - - - Profit for the period - - 152,027 - - 152,027 (5) 152,022 Other comprehensive income: Foreign exchange variationof investee located abroad - - - 755 - 755 (2) 753 Capital increase 4 1,392,370 - - - 1,392,374 29 1,392,403 Share based payments - - - 2,656 - 2,656 - 2,656 Treasury shares bought - - - - (25,802) (25,802) - (25,802)Transaction costs from capitalincrease - (19,051) - - - (19,051) - (19,051)Allocation of profit: Dividends - - (89,487) - - (89,487) - (89,487) At September 30, 2021 15 1,382,038 62,540 13,902 (25,802) 1,432,693 37 1,432,730 The accompanying notes are an integral part of these interim consolidated financial statements.
F-6
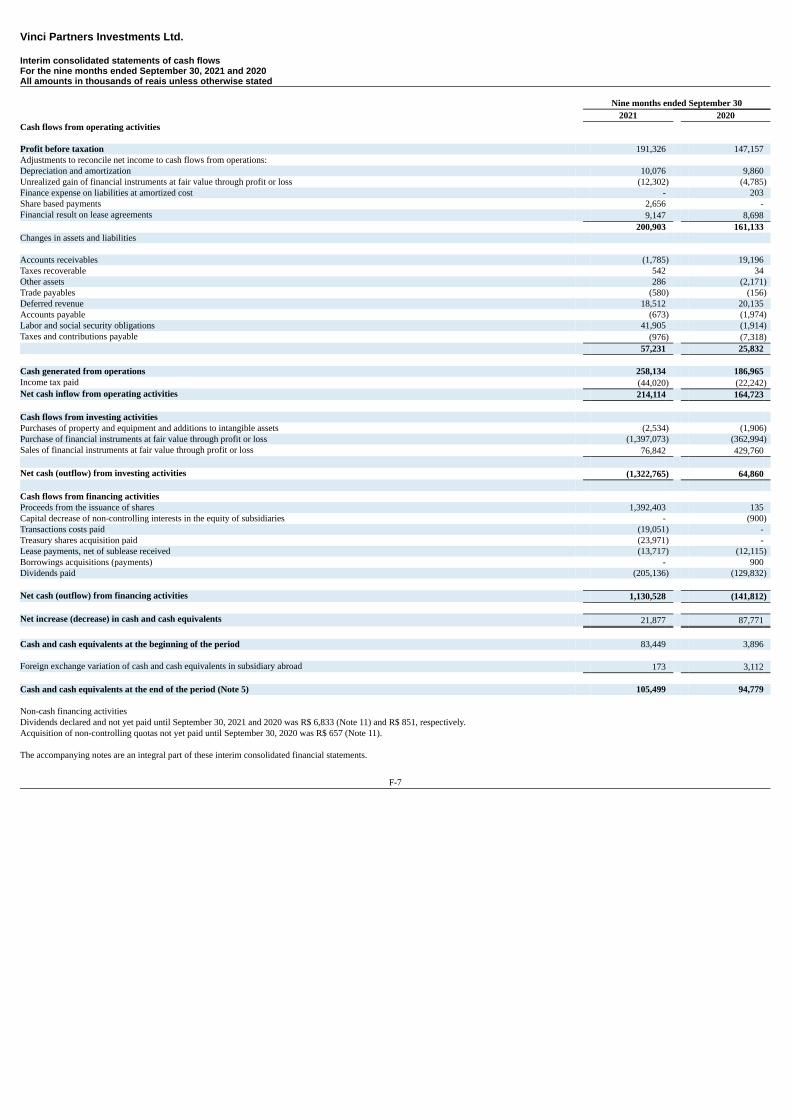
Vinci Partners Investments Ltd. Interim consolidated statements of cash flowsFor the nine months ended September 30, 2021 and 2020All amounts in thousands of reais unless otherwise stated
Nine months ended September 30 2021 2020Cash flows from operating activities Profit before taxation 191,326 147,157 Adjustments to reconcile net income to cash flows from operations: Depreciation and amortization 10,076 9,860 Unrealized gain of financial instruments at fair value through profit or loss (12,302) (4,785)Finance expense on liabilities at amortized cost - 203 Share based payments 2,656 - Financial result on lease agreements 9,147 8,698 200,903 161,133 Changes in assets and liabilities Accounts receivables (1,785) 19,196 Taxes recoverable 542 34 Other assets 286 (2,171)Trade payables (580) (156)Deferred revenue 18,512 20,135 Accounts payable (673) (1,974)Labor and social security obligations 41,905 (1,914)Taxes and contributions payable (976) (7,318) 57,231 25,832 Cash generated from operations 258,134 186,965 Income tax paid (44,020) (22,242)Net cash inflow from operating activities 214,114 164,723 Cash flows from investing activities Purchases of property and equipment and additions to intangible assets (2,534) (1,906)Purchase of financial instruments at fair value through profit or loss (1,397,073) (362,994)Sales of financial instruments at fair value through profit or loss 76,842 429,760 Net cash (outflow) from investing activities (1,322,765) 64,860 Cash flows from financing activities Proceeds from the issuance of shares 1,392,403 135 Capital decrease of non-controlling interests in the equity of subsidiaries - (900)Transactions costs paid (19,051) - Treasury shares acquisition paid (23,971) - Lease payments, net of sublease received (13,717) (12,115)Borrowings acquisitions (payments) - 900 Dividends paid (205,136) (129,832) Net cash (outflow) from financing activities 1,130,528 (141,812) Net increase (decrease) in cash and cash equivalents 21,877 87,771 Cash and cash equivalents at the beginning of the period 83,449 3,896 Foreign exchange variation of cash and cash equivalents in subsidiary abroad 173 3,112 Cash and cash equivalents at the end of the period (Note 5) 105,499 94,779 Non-cash financing activitiesDividends declared and not yet paid until September 30, 2021 and 2020 was R$ 6,833 (Note 11) and R$ 851, respectively.Acquisition of non-controlling quotas not yet paid until September 30, 2020 was R$ 657 (Note 11). The accompanying notes are an integral part of these interim consolidated financial statements.
F-7

Vinci Partners Investments Ltd. Notes to the interim consolidated financial statementsAll amounts in thousands of reais 1 Operations Vinci Partners Investments Ltd., an exempted company incorporated in the Cayman Islands (referred to herein as "Entity", "Group" or "Vinci"), started its activities in September 2009. Its objective is tohold investments in the capital of other companies as partner (shareholder). The investees are specialized in rendering alternative investment management, asset allocation and financial advisory services.The actual quotaholders of the Entity are disclosed in Note 14. The registered office of the Entity is at Harneys Fiduciary (Cayman) Limited, 4th Floor, Harbour Place, 103 South Church Street, P.O. Box 10240, Grand Cayman KY1-1002, Cayman Islands. Corporate reorganization Prior to the consummation of the initial public offering, on January 15, 2021 the individual partners of Vinci Partners Investimentos Ltda. (“Vinci Investimentos”) contributed the entirety of their quotas intothe Entity. In return for this contribution the Entity issued (1) new Class B common shares to Gilberto Sayão da Silva and (2) new Class A common shares to all other quotaholders of Vinci Investimentos in exchangefor the quotas of Vinci Investimentos contributed to the Entity, or the Contribution. Until the Contribution, the Entity did not commence operations and had only nominal assets and liabilities and nomaterial contingent liabilities or commitments. Initial Public Offering (IPO) On January 28, 2021 Vinci announced the price of its public offering of the Class A common shares being offered 13,873,474 Class A common shares. Prior to this offering, there has been no public marketfor our Class A common shares. The initial public offering price per Class A common share was US$18.00. The Class A common shares have been approved for listing on the Nasdaq Global Select Market, or Nasdaq, under the symbol "VINP." Vinci has two classes of common shares: Class A common sharesand our Class B common shares. Class B common shares carry rights that are identical to the Class A common shares, except that (1) holders of Class B common shares are entitled to 10 votes per share, whereas holders of our Class Acommon shares are entitled to one vote per share; (2) holders of Class B common shares have certain conversion rights; (3) holders of Class B common shares are entitled to preemptive rights in the eventthat additional Class A common shares are issued in order to maintain their proportional ownership interest; and (4) Class B common shares shall not be listed on any stock exchange and will not bepublicly traded. On February 1, 2021, Vinci announced the closing of its initial public offering. The net proceeds from the offering were US$ 232 million (R$ 1,266,926), after deducting underwriting discounts andcommissions. The Class A common shares began trading on the Nasdaq Global Select Market on January 28, 2021, under the ticker symbol "VINP." In connection with the offering, Vinci has granted the underwriters a 30-day option to purchase up to an additional 2,081,021 Class A common shares at the initial public offering price, less underwritingdiscounts and commissions. On February 8, 2021, Vinci received net proceeds of US$ 23 million (R$ 125,448) in respect of the additional 1,398,014 Class A common shares issued. Vinci Partners Ltd intends to use the net proceeds from the offering to (1) to fund investments in its own products alongside its investors; (2) to pursue opportunities for strategic transactions; and (3) forother general corporate purposes.
F-8
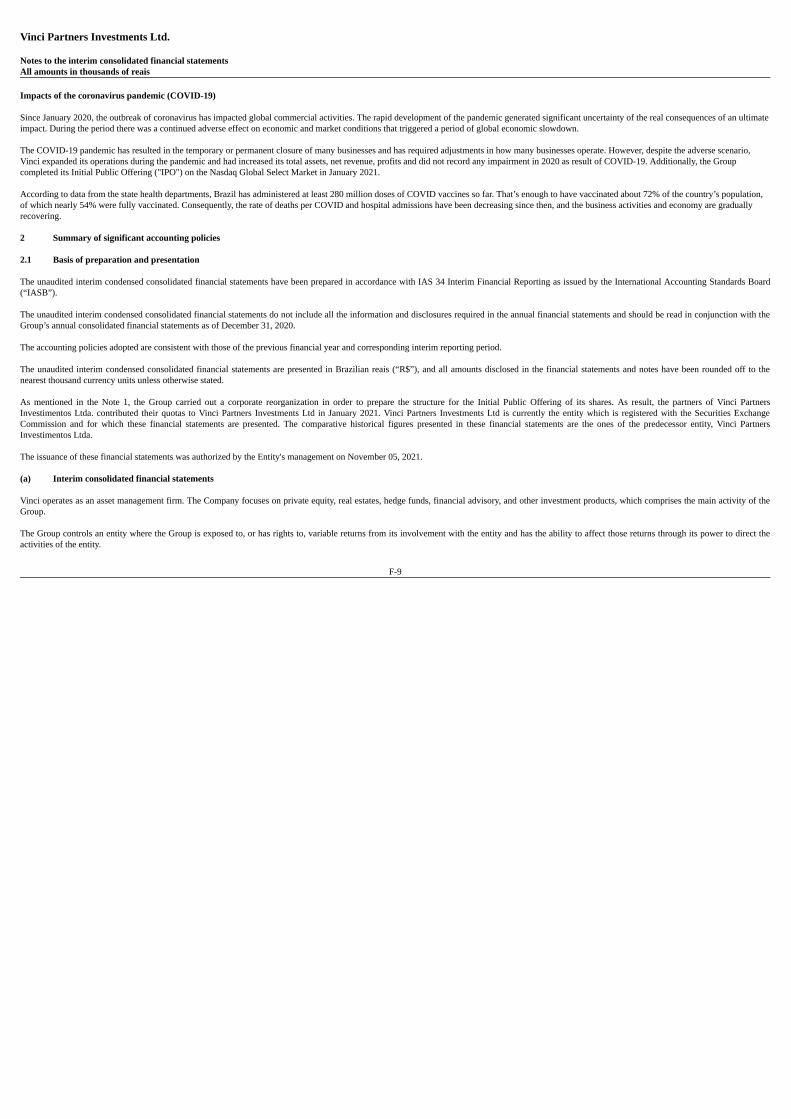
Vinci Partners Investments Ltd. Notes to the interim consolidated financial statementsAll amounts in thousands of reais Impacts of the coronavirus pandemic (COVID-19) Since January 2020, the outbreak of coronavirus has impacted global commercial activities. The rapid development of the pandemic generated significant uncertainty of the real consequences of an ultimateimpact. During the period there was a continued adverse effect on economic and market conditions that triggered a period of global economic slowdown. The COVID-19 pandemic has resulted in the temporary or permanent closure of many businesses and has required adjustments in how many businesses operate. However, despite the adverse scenario,Vinci expanded its operations during the pandemic and had increased its total assets, net revenue, profits and did not record any impairment in 2020 as result of COVID-19. Additionally, the Groupcompleted its Initial Public Offering ("IPO") on the Nasdaq Global Select Market in January 2021. According to data from the state health departments, Brazil has administered at least 280 million doses of COVID vaccines so far. That’s enough to have vaccinated about 72% of the country’s population,of which nearly 54% were fully vaccinated. Consequently, the rate of deaths per COVID and hospital admissions have been decreasing since then, and the business activities and economy are graduallyrecovering. 2 Summary of significant accounting policies 2.1 Basis of preparation and presentation The unaudited interim condensed consolidated financial statements have been prepared in accordance with IAS 34 Interim Financial Reporting as issued by the International Accounting Standards Board(“IASB”). The unaudited interim condensed consolidated financial statements do not include all the information and disclosures required in the annual financial statements and should be read in conjunction with theGroup’s annual consolidated financial statements as of December 31, 2020. The accounting policies adopted are consistent with those of the previous financial year and corresponding interim reporting period. The unaudited interim condensed consolidated financial statements are presented in Brazilian reais (“R$”), and all amounts disclosed in the financial statements and notes have been rounded off to thenearest thousand currency units unless otherwise stated. As mentioned in the Note 1, the Group carried out a corporate reorganization in order to prepare the structure for the Initial Public Offering of its shares. As result, the partners of Vinci PartnersInvestimentos Ltda. contributed their quotas to Vinci Partners Investments Ltd in January 2021. Vinci Partners Investments Ltd is currently the entity which is registered with the Securities ExchangeCommission and for which these financial statements are presented. The comparative historical figures presented in these financial statements are the ones of the predecessor entity, Vinci PartnersInvestimentos Ltda. The issuance of these financial statements was authorized by the Entity's management on November 05, 2021. (a) Interim consolidated financial statements Vinci operates as an asset management firm. The Company focuses on private equity, real estates, hedge funds, financial advisory, and other investment products, which comprises the main activity of theGroup. The Group controls an entity where the Group is exposed to, or has rights to, variable returns from its involvement with the entity and has the ability to affect those returns through its power to direct theactivities of the entity.
F-9
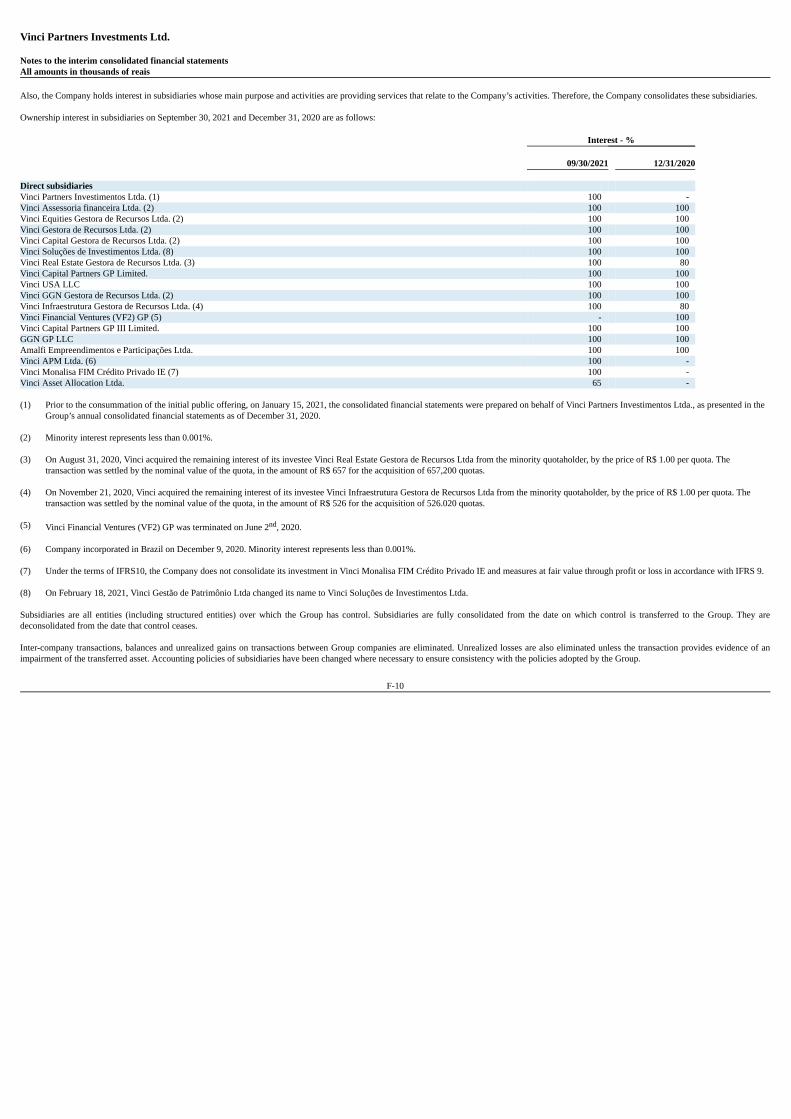
Vinci Partners Investments Ltd. Notes to the interim consolidated financial statementsAll amounts in thousands of reais Also, the Company holds interest in subsidiaries whose main purpose and activities are providing services that relate to the Company’s activities. Therefore, the Company consolidates these subsidiaries. Ownership interest in subsidiaries on September 30, 2021 and December 31, 2020 are as follows: Interest - % 09/30/2021 12/31/2020 Direct subsidiaries Vinci Partners Investimentos Ltda. (1) 100 - Vinci Assessoria financeira Ltda. (2) 100 100 Vinci Equities Gestora de Recursos Ltda. (2) 100 100 Vinci Gestora de Recursos Ltda. (2) 100 100 Vinci Capital Gestora de Recursos Ltda. (2) 100 100 Vinci Soluções de Investimentos Ltda. (8) 100 100 Vinci Real Estate Gestora de Recursos Ltda. (3) 100 80 Vinci Capital Partners GP Limited. 100 100 Vinci USA LLC 100 100 Vinci GGN Gestora de Recursos Ltda. (2) 100 100 Vinci Infraestrutura Gestora de Recursos Ltda. (4) 100 80 Vinci Financial Ventures (VF2) GP (5) - 100 Vinci Capital Partners GP III Limited. 100 100 GGN GP LLC 100 100 Amalfi Empreendimentos e Participações Ltda. 100 100 Vinci APM Ltda. (6) 100 - Vinci Monalisa FIM Crédito Privado IE (7) 100 - Vinci Asset Allocation Ltda. 65 - (1) Prior to the consummation of the initial public offering, on January 15, 2021, the consolidated financial statements were prepared on behalf of Vinci Partners Investimentos Ltda., as presented in the
Group’s annual consolidated financial statements as of December 31, 2020. (2) Minority interest represents less than 0.001%. (3) On August 31, 2020, Vinci acquired the remaining interest of its investee Vinci Real Estate Gestora de Recursos Ltda from the minority quotaholder, by the price of R$ 1.00 per quota. The
transaction was settled by the nominal value of the quota, in the amount of R$ 657 for the acquisition of 657,200 quotas. (4) On November 21, 2020, Vinci acquired the remaining interest of its investee Vinci Infraestrutura Gestora de Recursos Ltda from the minority quotaholder, by the price of R$ 1.00 per quota. The
transaction was settled by the nominal value of the quota, in the amount of R$ 526 for the acquisition of 526.020 quotas. (5) Vinci Financial Ventures (VF2) GP was terminated on June 2nd, 2020. (6) Company incorporated in Brazil on December 9, 2020. Minority interest represents less than 0.001%. (7) Under the terms of IFRS10, the Company does not consolidate its investment in Vinci Monalisa FIM Crédito Privado IE and measures at fair value through profit or loss in accordance with IFRS 9. (8) On February 18, 2021, Vinci Gestão de Patrimônio Ltda changed its name to Vinci Soluções de Investimentos Ltda. Subsidiaries are all entities (including structured entities) over which the Group has control. Subsidiaries are fully consolidated from the date on which control is transferred to the Group. They aredeconsolidated from the date that control ceases. Inter-company transactions, balances and unrealized gains on transactions between Group companies are eliminated. Unrealized losses are also eliminated unless the transaction provides evidence of animpairment of the transferred asset. Accounting policies of subsidiaries have been changed where necessary to ensure consistency with the policies adopted by the Group.
F-10

Vinci Partners Investments Ltd. Notes to the interim consolidated financial statementsAll amounts in thousands of reais Non-controlling interests in the results and equity of subsidiaries are shown separately in the consolidated statement of profit or loss, consolidated statement of comprehensive income, consolidatedstatement of changes in equity and consolidated balance sheet respectively. The Group treats transactions with non-controlling interests that do not result in a loss of control as transactions with equity owners of the Group. A change in ownership interest results in an adjustmentbetween the carrying amounts of the controlling and non-controlling interests to reflect their relative interests in the subsidiary. Any difference between the amount of the adjustment to non-controllinginterests and any consideration paid or received is recognized in another reserve within equity attributable to owners of Entity. When the Group ceases to consolidate an investment or account for it under equity method because of a loss of control, joint control or significant influence, any retained interest in the entity is remeasuredto its fair value, with the change in carrying amount recognized in profit or loss. This fair value becomes the initial carrying amount for the purposes of subsequently accounting for the retained interest asan associate, joint venture or financial asset. In addition, any amounts previously recognized in other comprehensive income in respect of that entity are accounted for as if the group had directly disposed ofthe related assets or liabilities. This may mean that amounts previously recognized in other comprehensive income are reclassified to profit or loss. 2.2 Segment reporting During January 2021, the members of the Board of Directors of Vinci Partners Investments Ltd were appointed. Under the supervision of the Board of Directors, The CEO is responsible for the decision-making process related to executive themes, resources allocation and strategic decisions of Vinci. Until December 31, 2020, the strategic decisions of Group comprise eight distinct business segments: (i) hedge funds; (ii) public equities; (iii) private equity; (iv) financial advisory services, (v) Investmentproducts and solutions; (vi) real estate; (vii) infrastructure and (viii) Credit (Note 20). Since 2021 the decision-making process and decision related to resources allocation changed and part of the segments were grouped in four different segments: (i) Private market strategies, (ii) Liquidstrategies, (iii) Investment products and solutions; and (iv) Financial advisory (Note 20). The change was motivated by the way how the CEO monitors and manages the business, as well as the way how the shareholders and investors evaluate Vinci, in a more consolidated view. 3 Accounting estimates and judgments The Entity makes estimates and assumptions concerning the future, based on historical experience and other factors, including expectations of future events. The resulting accounting estimates will, bydefinition, seldom equal the related actual results. The main estimations and assumptions made by the Entity comprises the provision for impairment of accounts receivable, provision for profit sharing, andthe revenue recognition of management fees for some funds abroad and the fair value measurement of financial assets. 4 Financial risk management The main risks related to the financial instruments are credit risk, market risk, and liquidity risk, as defined below: The management of such risks involves various levels in the Entity and comprehends anumber of policies and strategies. The Group's risk management focuses on the unpredictability of financial markets and seeks to mitigate potential adverse impacts on the Group's financial performance.
F-11
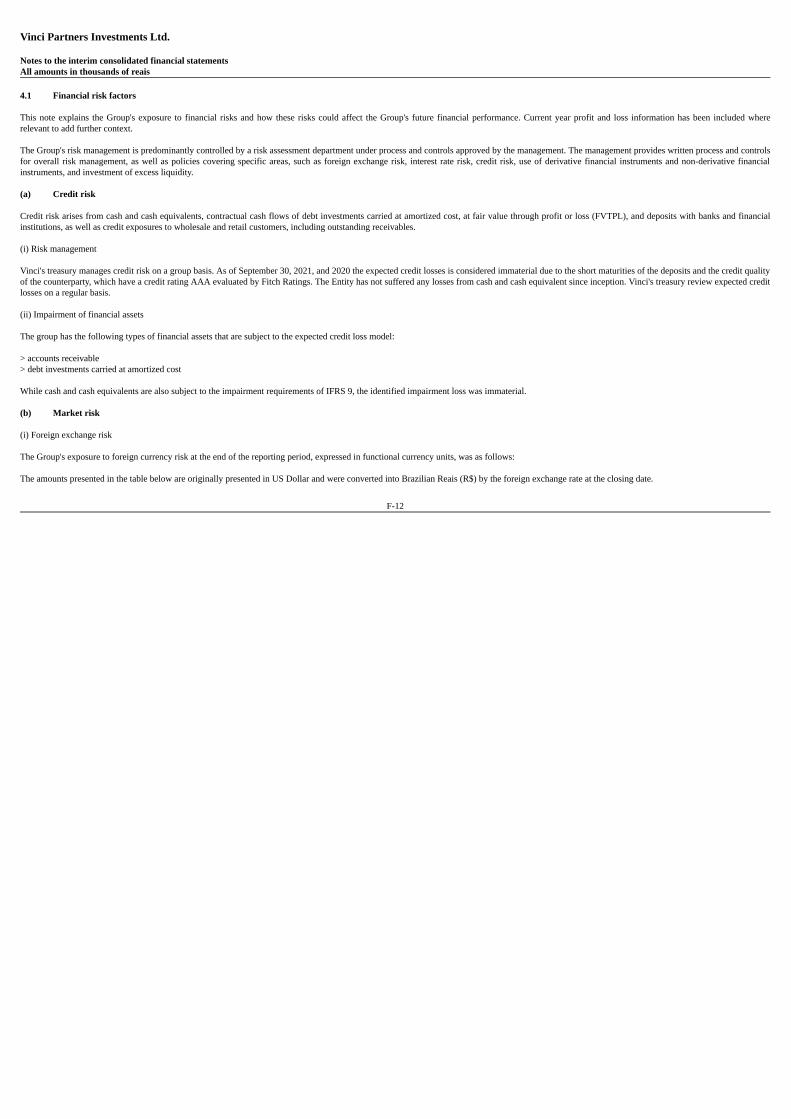
Vinci Partners Investments Ltd. Notes to the interim consolidated financial statementsAll amounts in thousands of reais 4.1 Financial risk factors This note explains the Group's exposure to financial risks and how these risks could affect the Group's future financial performance. Current year profit and loss information has been included whererelevant to add further context. The Group's risk management is predominantly controlled by a risk assessment department under process and controls approved by the management. The management provides written process and controlsfor overall risk management, as well as policies covering specific areas, such as foreign exchange risk, interest rate risk, credit risk, use of derivative financial instruments and non-derivative financialinstruments, and investment of excess liquidity. (a) Credit risk Credit risk arises from cash and cash equivalents, contractual cash flows of debt investments carried at amortized cost, at fair value through profit or loss (FVTPL), and deposits with banks and financialinstitutions, as well as credit exposures to wholesale and retail customers, including outstanding receivables. (i) Risk management Vinci's treasury manages credit risk on a group basis. As of September 30, 2021, and 2020 the expected credit losses is considered immaterial due to the short maturities of the deposits and the credit qualityof the counterparty, which have a credit rating AAA evaluated by Fitch Ratings. The Entity has not suffered any losses from cash and cash equivalent since inception. Vinci's treasury review expected creditlosses on a regular basis. (ii) Impairment of financial assets The group has the following types of financial assets that are subject to the expected credit loss model: > accounts receivable> debt investments carried at amortized cost While cash and cash equivalents are also subject to the impairment requirements of IFRS 9, the identified impairment loss was immaterial. (b) Market risk (i) Foreign exchange risk The Group's exposure to foreign currency risk at the end of the reporting period, expressed in functional currency units, was as follows: The amounts presented in the table below are originally presented in US Dollar and were converted into Brazilian Reais (R$) by the foreign exchange rate at the closing date.
F-12
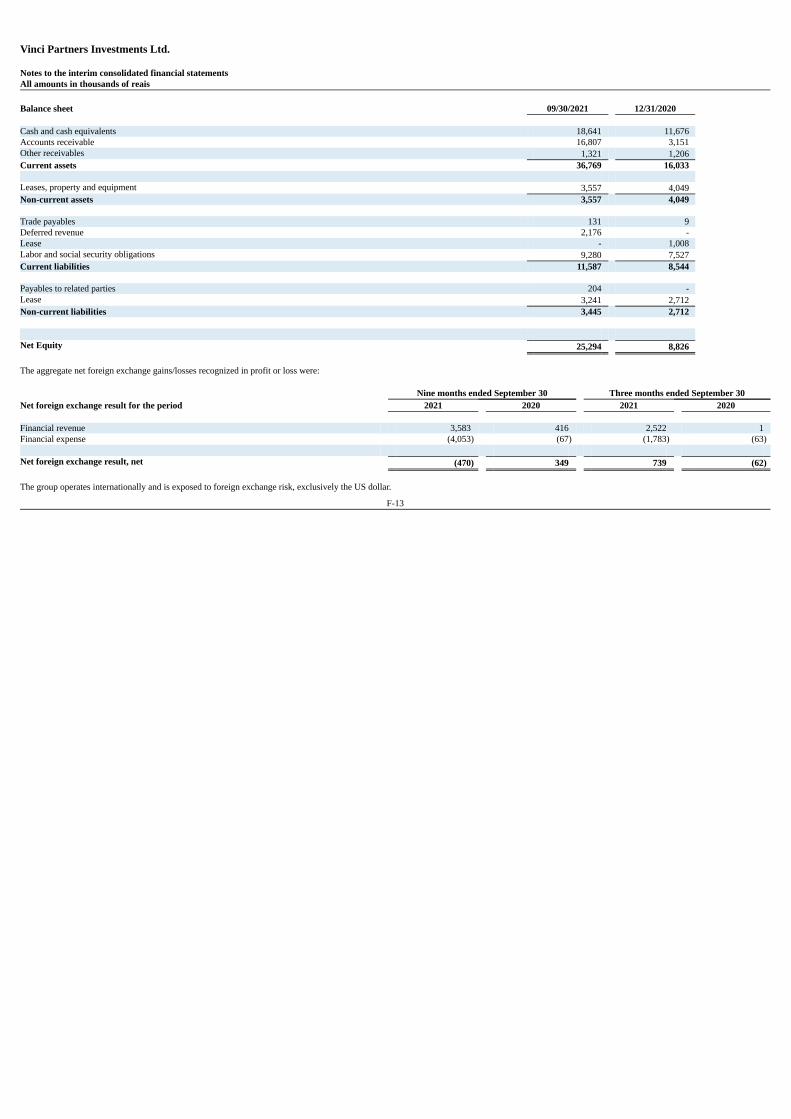
Vinci Partners Investments Ltd. Notes to the interim consolidated financial statementsAll amounts in thousands of reais Balance sheet 09/30/2021 12/31/2020 Cash and cash equivalents 18,641 11,676 Accounts receivable 16,807 3,151 Other receivables 1,321 1,206 Current assets 36,769 16,033 Leases, property and equipment 3,557 4,049 Non-current assets 3,557 4,049 Trade payables 131 9 Deferred revenue 2,176 - Lease - 1,008 Labor and social security obligations 9,280 7,527 Current liabilities 11,587 8,544 Payables to related parties 204 - Lease 3,241 2,712 Non-current liabilities 3,445 2,712 Net Equity 25,294 8,826 The aggregate net foreign exchange gains/losses recognized in profit or loss were: Nine months ended September 30 Three months ended September 30Net foreign exchange result for the period 2021 2020 2021 2020 Financial revenue 3,583 416 2,522 1 Financial expense (4,053) (67) (1,783) (63) Net foreign exchange result, net (470) 349 739 (62) The group operates internationally and is exposed to foreign exchange risk, exclusively the US dollar.
F-13
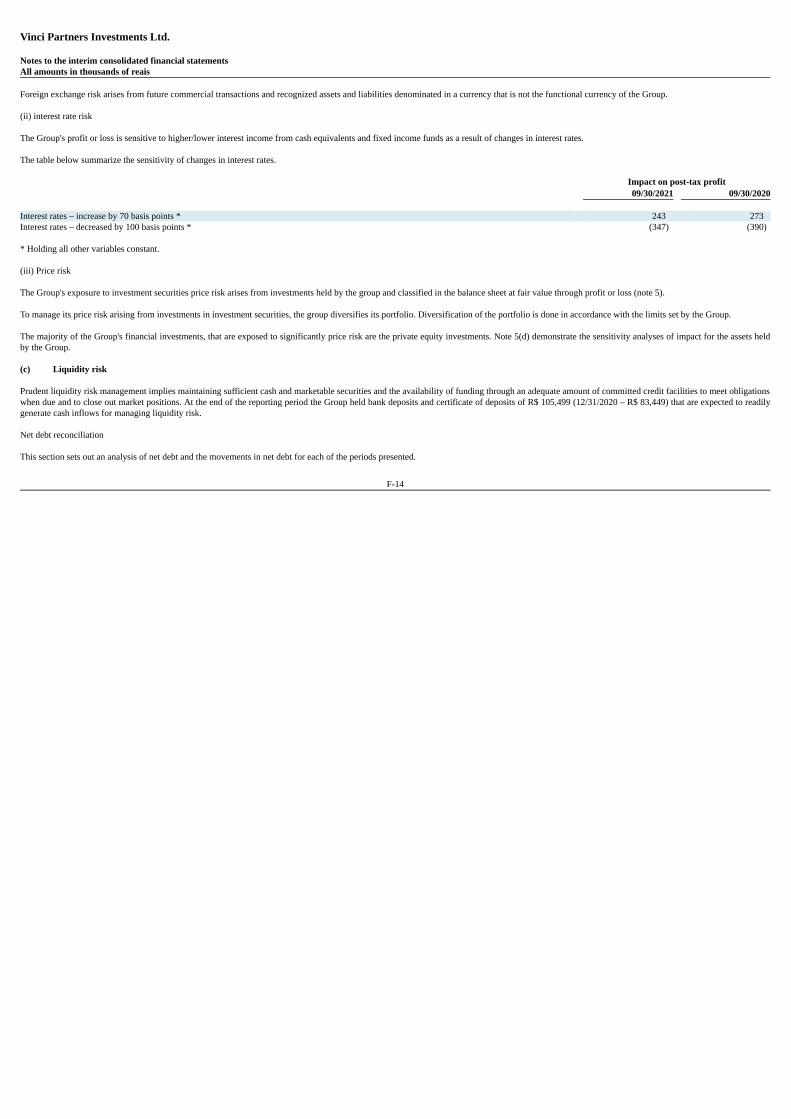
Vinci Partners Investments Ltd. Notes to the interim consolidated financial statementsAll amounts in thousands of reais Foreign exchange risk arises from future commercial transactions and recognized assets and liabilities denominated in a currency that is not the functional currency of the Group. (ii) interest rate risk The Group's profit or loss is sensitive to higher/lower interest income from cash equivalents and fixed income funds as a result of changes in interest rates. The table below summarize the sensitivity of changes in interest rates. Impact on post-tax profit 09/30/2021 09/30/2020 Interest rates – increase by 70 basis points * 243 273 Interest rates – decreased by 100 basis points * (347) (390) * Holding all other variables constant. (iii) Price risk The Group's exposure to investment securities price risk arises from investments held by the group and classified in the balance sheet at fair value through profit or loss (note 5). To manage its price risk arising from investments in investment securities, the group diversifies its portfolio. Diversification of the portfolio is done in accordance with the limits set by the Group. The majority of the Group's financial investments, that are exposed to significantly price risk are the private equity investments. Note 5(d) demonstrate the sensitivity analyses of impact for the assets heldby the Group. (c) Liquidity risk Prudent liquidity risk management implies maintaining sufficient cash and marketable securities and the availability of funding through an adequate amount of committed credit facilities to meet obligationswhen due and to close out market positions. At the end of the reporting period the Group held bank deposits and certificate of deposits of R$ 105,499 (12/31/2020 – R$ 83,449) that are expected to readilygenerate cash inflows for managing liquidity risk. Net debt reconciliation This section sets out an analysis of net debt and the movements in net debt for each of the periods presented.
F-14
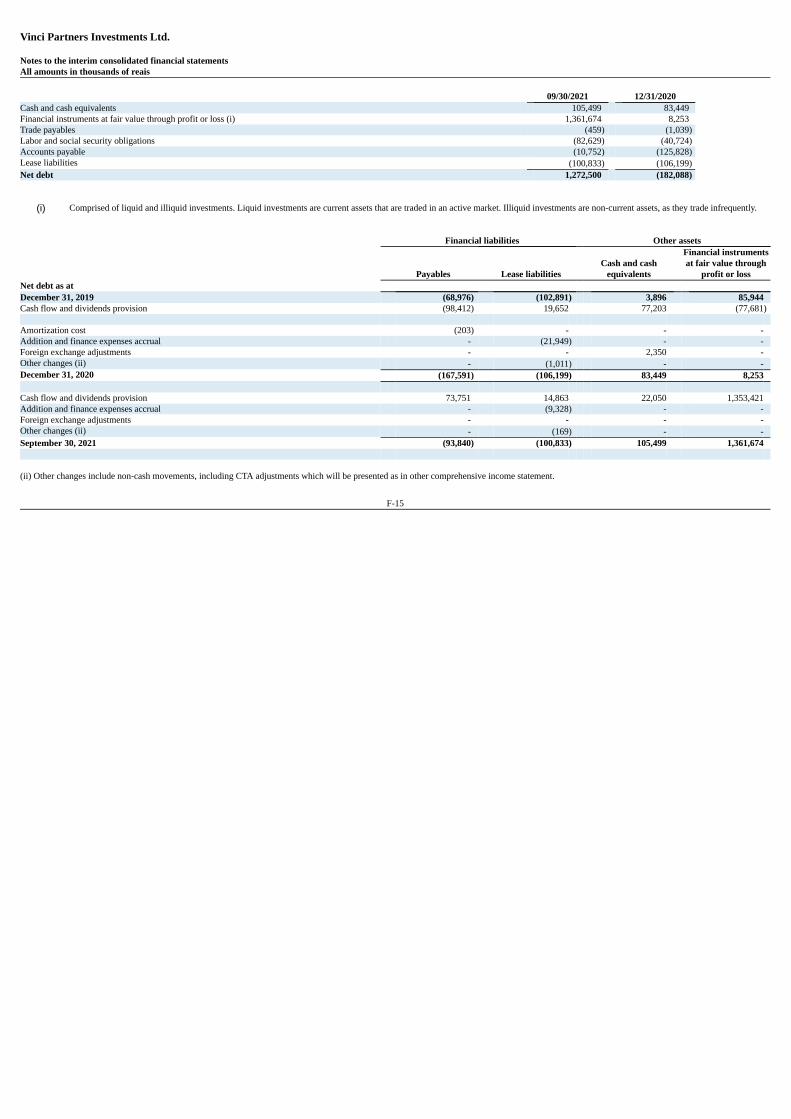
Vinci Partners Investments Ltd. Notes to the interim consolidated financial statementsAll amounts in thousands of reais 09/30/2021 12/31/2020Cash and cash equivalents 105,499 83,449 Financial instruments at fair value through profit or loss (i) 1,361,674 8,253 Trade payables (459) (1,039)Labor and social security obligations (82,629) (40,724)Accounts payable (10,752) (125,828)Lease liabilities (100,833) (106,199)Net debt 1,272,500 (182,088)
(i) Comprised of liquid and illiquid investments. Liquid investments are current assets that are traded in an active market. Illiquid investments are non-current assets, as they trade infrequently. Financial liabilities Other assets
Payables Lease liabilities Cash and cash
equivalents
Financial instrumentsat fair value through
profit or lossNet debt as at December 31, 2019 (68,976) (102,891) 3,896 85,944 Cash flow and dividends provision (98,412) 19,652 77,203 (77,681) Amortization cost (203) - - - Addition and finance expenses accrual - (21,949) - - Foreign exchange adjustments - - 2,350 - Other changes (ii) - (1,011) - - December 31, 2020 (167,591) (106,199) 83,449 8,253 Cash flow and dividends provision 73,751 14,863 22,050 1,353,421 Addition and finance expenses accrual - (9,328) - - Foreign exchange adjustments - - - - Other changes (ii) - (169) - - September 30, 2021 (93,840) (100,833) 105,499 1,361,674 (ii) Other changes include non-cash movements, including CTA adjustments which will be presented as in other comprehensive income statement.
F-15
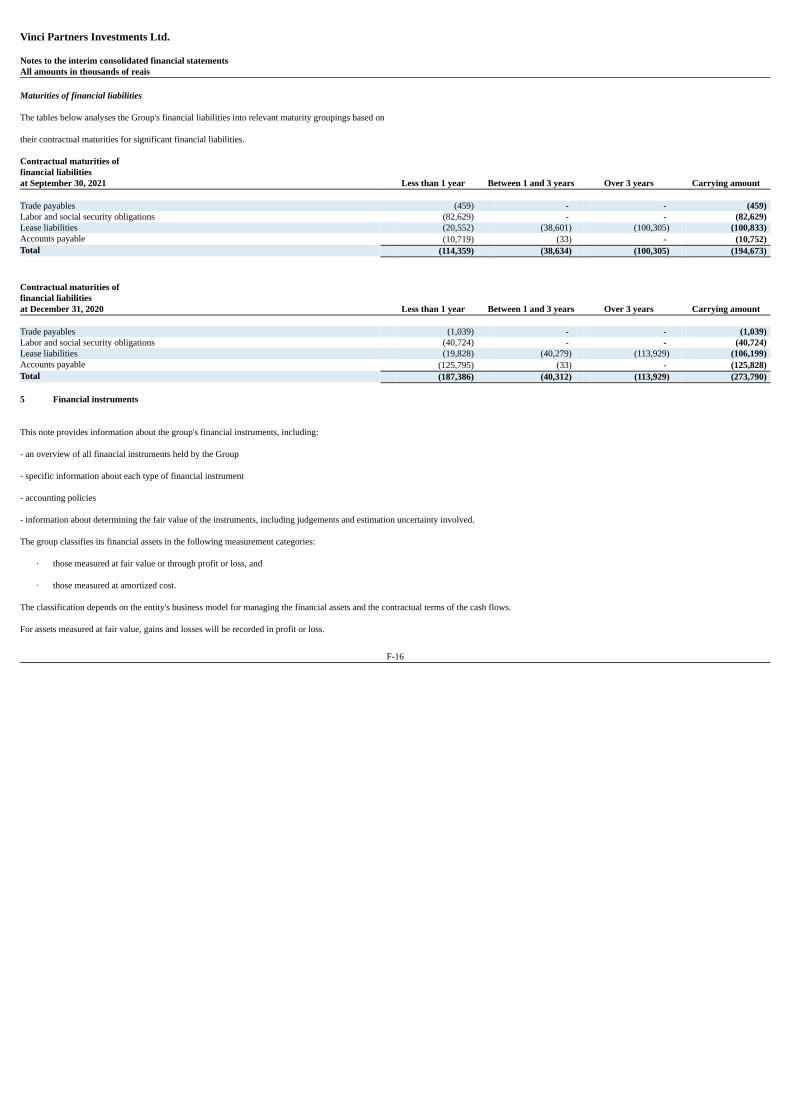
Vinci Partners Investments Ltd. Notes to the interim consolidated financial statementsAll amounts in thousands of reais Maturities of financial liabilities The tables below analyses the Group's financial liabilities into relevant maturity groupings based on their contractual maturities for significant financial liabilities. Contractual maturities offinancial liabilities at September 30, 2021 Less than 1 year Between 1 and 3 years Over 3 years Carrying amount Trade payables (459) - - (459)Labor and social security obligations (82,629) - - (82,629)Lease liabilities (20,552) (38,601) (100,305) (100,833)Accounts payable (10,719) (33) - (10,752)Total (114,359) (38,634) (100,305) (194,673) Contractual maturities offinancial liabilities at December 31, 2020 Less than 1 year Between 1 and 3 years Over 3 years Carrying amount Trade payables (1,039) - - (1,039)Labor and social security obligations (40,724) - - (40,724)Lease liabilities (19,828) (40,279) (113,929) (106,199)Accounts payable (125,795) (33) - (125,828)Total (187,386) (40,312) (113,929) (273,790) 5 Financial instruments This note provides information about the group's financial instruments, including: - an overview of all financial instruments held by the Group - specific information about each type of financial instrument - accounting policies - information about determining the fair value of the instruments, including judgements and estimation uncertainty involved. The group classifies its financial assets in the following measurement categories:
· those measured at fair value or through profit or loss, and
· those measured at amortized cost. The classification depends on the entity's business model for managing the financial assets and the contractual terms of the cash flows. For assets measured at fair value, gains and losses will be recorded in profit or loss.
F-16

Vinci Partners Investments Ltd. Notes to the interim consolidated financial statementsAll amounts in thousands of reais Recognition and derecognition Regular way purchases and sales of financial assets are recognized on trade date, being the date on which the group commits to purchase or sell the asset. Financial assets are derecognized when the rightsto receive cash flows from the financial assets have expired or have been transferred and the group has transferred substantially all the risks and rewards of ownership. Measurement At initial recognition, the group measures a financial asset at its fair value plus, in the case of a financial asset not at fair value through profit or loss (FVPL), transaction costs that are directly attributable tothe acquisition of the financial asset. Transaction costs of financial assets carried at FVPL are expensed in profit or loss. The Group holds the following financial instruments: Financial assets Section 09/30/2021 12/31/2020 Accounts receivable (a) 77,308 75,523 Other financial assets at amortized cost (b) 616 474 Cash and cash equivalents (d) 105,499 83,449 Financial assets at fair value through profit or loss (FVPL) (c) 1,372,381 39,849 1,555,804 199,295 Financial liabilities Liabilities at amortized cost (e) 93,840 167,591 Lease liabilities (e) 100,833 106,199 194,673 273,790 The Group's exposure to risks associated with the financial instruments is discussed in note 4. The maximum exposure to credit risk at the end of the reporting period is the carrying amount of each class offinancial assets mentioned above. a) Accounts receivable Current assets 09/30/2021 12/31/2020Accounts receivable from contracts with customers 47,314 48,127 Loss allowance (149) (149) Non-current assets Accounts receivable from contracts with customers 30,143 27,545 77,308 75,523
F-17
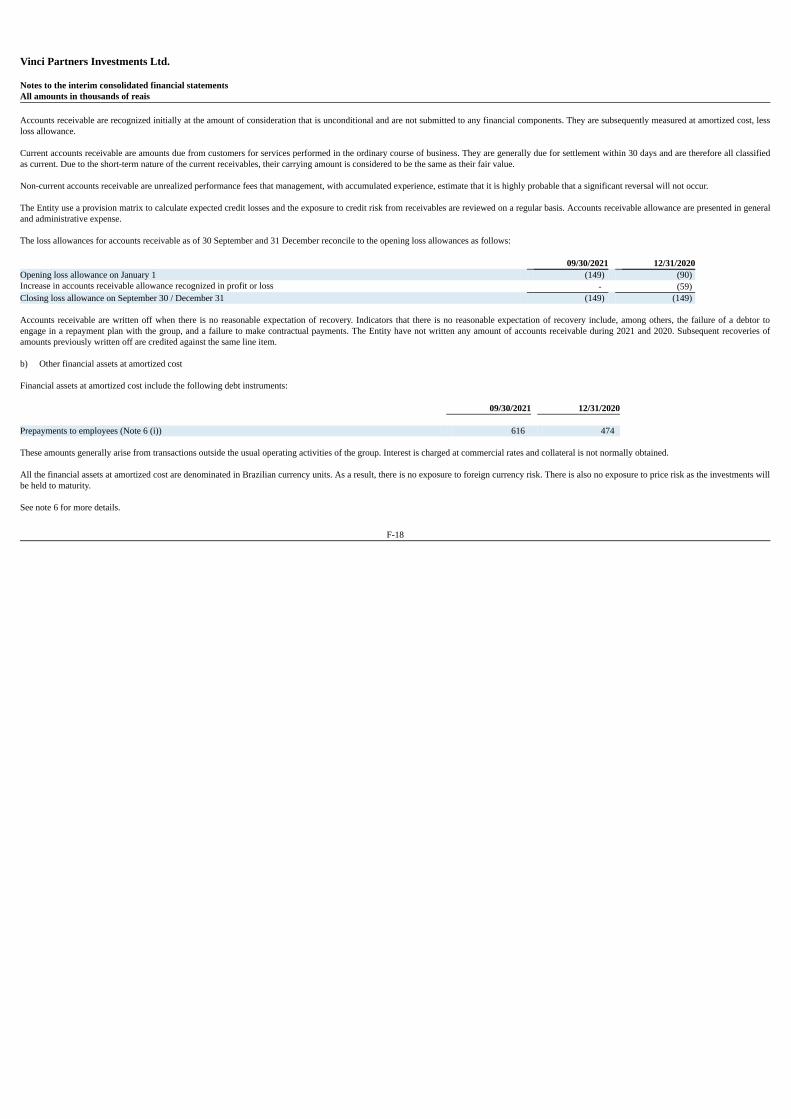
Vinci Partners Investments Ltd. Notes to the interim consolidated financial statementsAll amounts in thousands of reais Accounts receivable are recognized initially at the amount of consideration that is unconditional and are not submitted to any financial components. They are subsequently measured at amortized cost, lessloss allowance. Current accounts receivable are amounts due from customers for services performed in the ordinary course of business. They are generally due for settlement within 30 days and are therefore all classifiedas current. Due to the short-term nature of the current receivables, their carrying amount is considered to be the same as their fair value. Non-current accounts receivable are unrealized performance fees that management, with accumulated experience, estimate that it is highly probable that a significant reversal will not occur. The Entity use a provision matrix to calculate expected credit losses and the exposure to credit risk from receivables are reviewed on a regular basis. Accounts receivable allowance are presented in generaland administrative expense. The loss allowances for accounts receivable as of 30 September and 31 December reconcile to the opening loss allowances as follows: 09/30/2021 12/31/2020Opening loss allowance on January 1 (149) (90)Increase in accounts receivable allowance recognized in profit or loss - (59)Closing loss allowance on September 30 / December 31 (149) (149) Accounts receivable are written off when there is no reasonable expectation of recovery. Indicators that there is no reasonable expectation of recovery include, among others, the failure of a debtor toengage in a repayment plan with the group, and a failure to make contractual payments. The Entity have not written any amount of accounts receivable during 2021 and 2020. Subsequent recoveries ofamounts previously written off are credited against the same line item. b) Other financial assets at amortized cost Financial assets at amortized cost include the following debt instruments: 09/30/2021 12/31/2020 Prepayments to employees (Note 6 (i)) 616 474 These amounts generally arise from transactions outside the usual operating activities of the group. Interest is charged at commercial rates and collateral is not normally obtained. All the financial assets at amortized cost are denominated in Brazilian currency units. As a result, there is no exposure to foreign currency risk. There is also no exposure to price risk as the investments willbe held to maturity. See note 6 for more details.
F-18
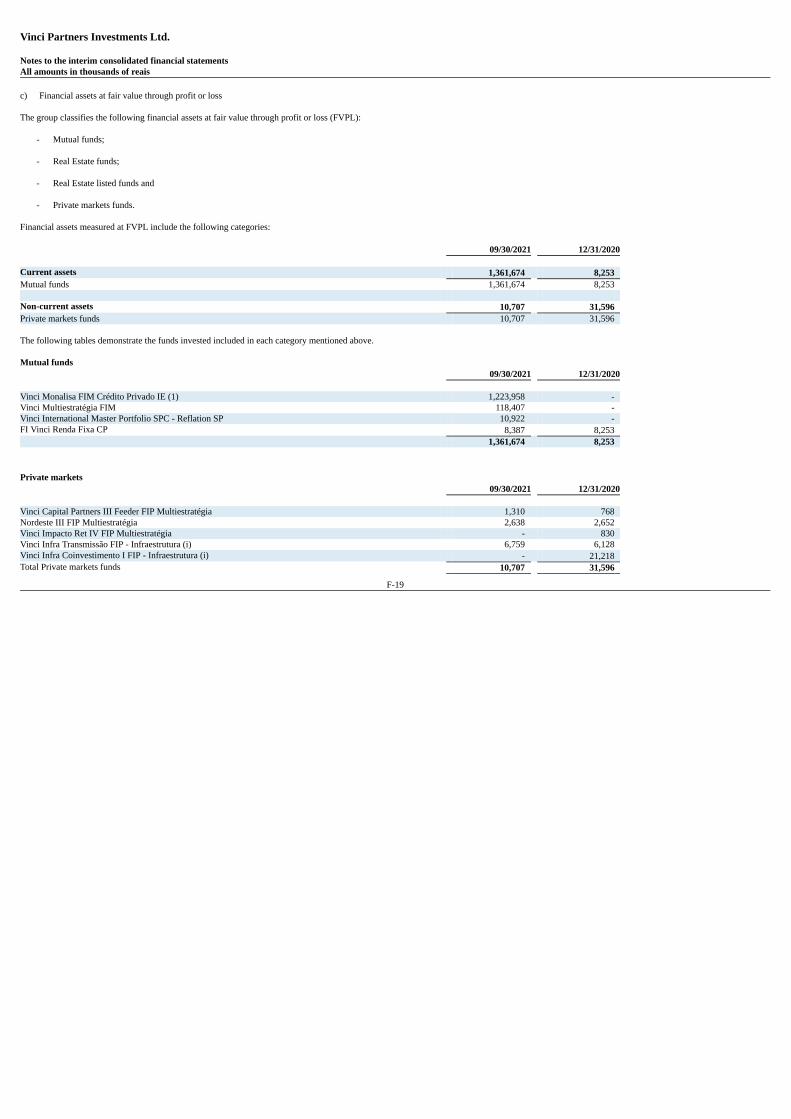
Vinci Partners Investments Ltd. Notes to the interim consolidated financial statementsAll amounts in thousands of reais c) Financial assets at fair value through profit or loss The group classifies the following financial assets at fair value through profit or loss (FVPL):
- Mutual funds;
- Real Estate funds;
- Real Estate listed funds and
- Private markets funds. Financial assets measured at FVPL include the following categories: 09/30/2021 12/31/2020 Current assets 1,361,674 8,253 Mutual funds 1,361,674 8,253 Non-current assets 10,707 31,596 Private markets funds 10,707 31,596 The following tables demonstrate the funds invested included in each category mentioned above. Mutual funds 09/30/2021 12/31/2020 Vinci Monalisa FIM Crédito Privado IE (1) 1,223,958 - Vinci Multiestratégia FIM 118,407 - Vinci International Master Portfolio SPC - Reflation SP 10,922 - FI Vinci Renda Fixa CP 8,387 8,253 1,361,674 8,253 Private markets 09/30/2021 12/31/2020 Vinci Capital Partners III Feeder FIP Multiestratégia 1,310 768 Nordeste III FIP Multiestratégia 2,638 2,652 Vinci Impacto Ret IV FIP Multiestratégia - 830 Vinci Infra Transmissão FIP - Infraestrutura (i) 6,759 6,128 Vinci Infra Coinvestimento I FIP - Infraestrutura (i) - 21,218 Total Private markets funds 10,707 31,596
F-19
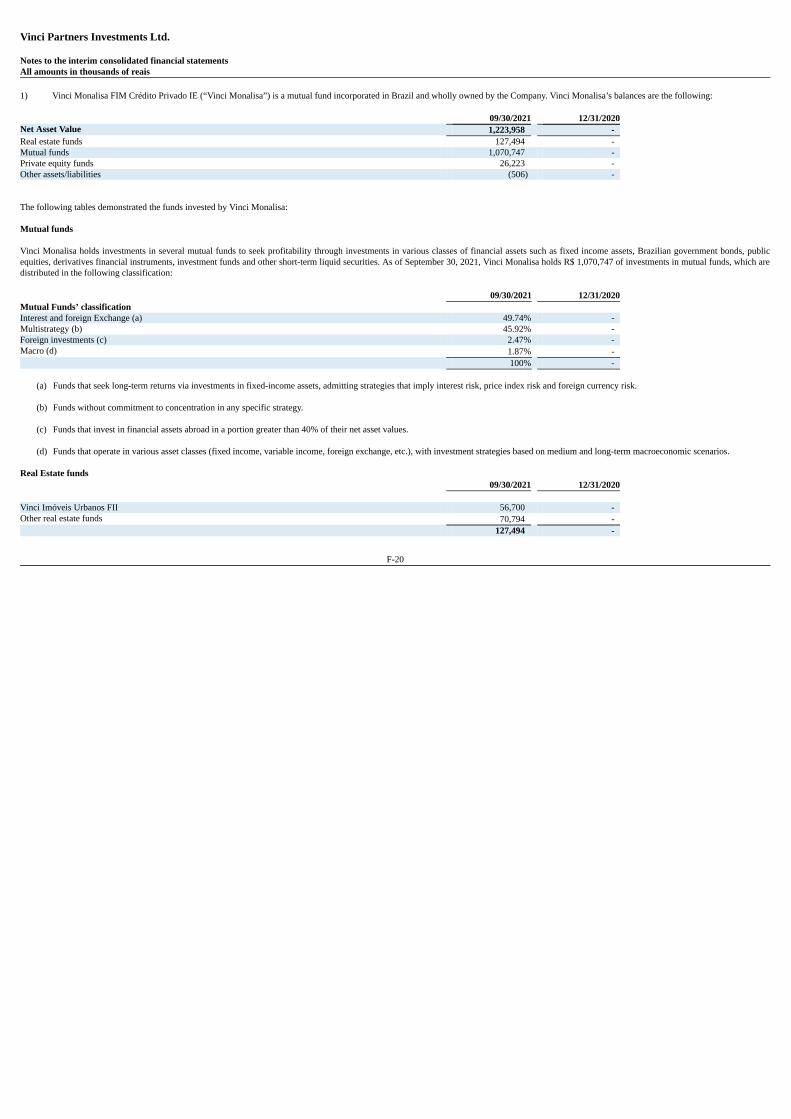
Vinci Partners Investments Ltd. Notes to the interim consolidated financial statementsAll amounts in thousands of reais 1) Vinci Monalisa FIM Crédito Privado IE (“Vinci Monalisa”) is a mutual fund incorporated in Brazil and wholly owned by the Company. Vinci Monalisa’s balances are the following: 09/30/2021 12/31/2020Net Asset Value 1,223,958 - Real estate funds 127,494 - Mutual funds 1,070,747 - Private equity funds 26,223 - Other assets/liabilities (506) - The following tables demonstrated the funds invested by Vinci Monalisa: Mutual funds Vinci Monalisa holds investments in several mutual funds to seek profitability through investments in various classes of financial assets such as fixed income assets, Brazilian government bonds, publicequities, derivatives financial instruments, investment funds and other short-term liquid securities. As of September 30, 2021, Vinci Monalisa holds R$ 1,070,747 of investments in mutual funds, which aredistributed in the following classification: 09/30/2021 12/31/2020Mutual Funds’ classification Interest and foreign Exchange (a) 49.74% - Multistrategy (b) 45.92% - Foreign investments (c) 2.47% - Macro (d) 1.87% - 100% -
(a) Funds that seek long-term returns via investments in fixed-income assets, admitting strategies that imply interest risk, price index risk and foreign currency risk.
(b) Funds without commitment to concentration in any specific strategy.
(c) Funds that invest in financial assets abroad in a portion greater than 40% of their net asset values.
(d) Funds that operate in various asset classes (fixed income, variable income, foreign exchange, etc.), with investment strategies based on medium and long-term macroeconomic scenarios. Real Estate funds 09/30/2021 12/31/2020 Vinci Imóveis Urbanos FII 56,700 - Other real estate funds 70,794 - 127,494 -
F-20
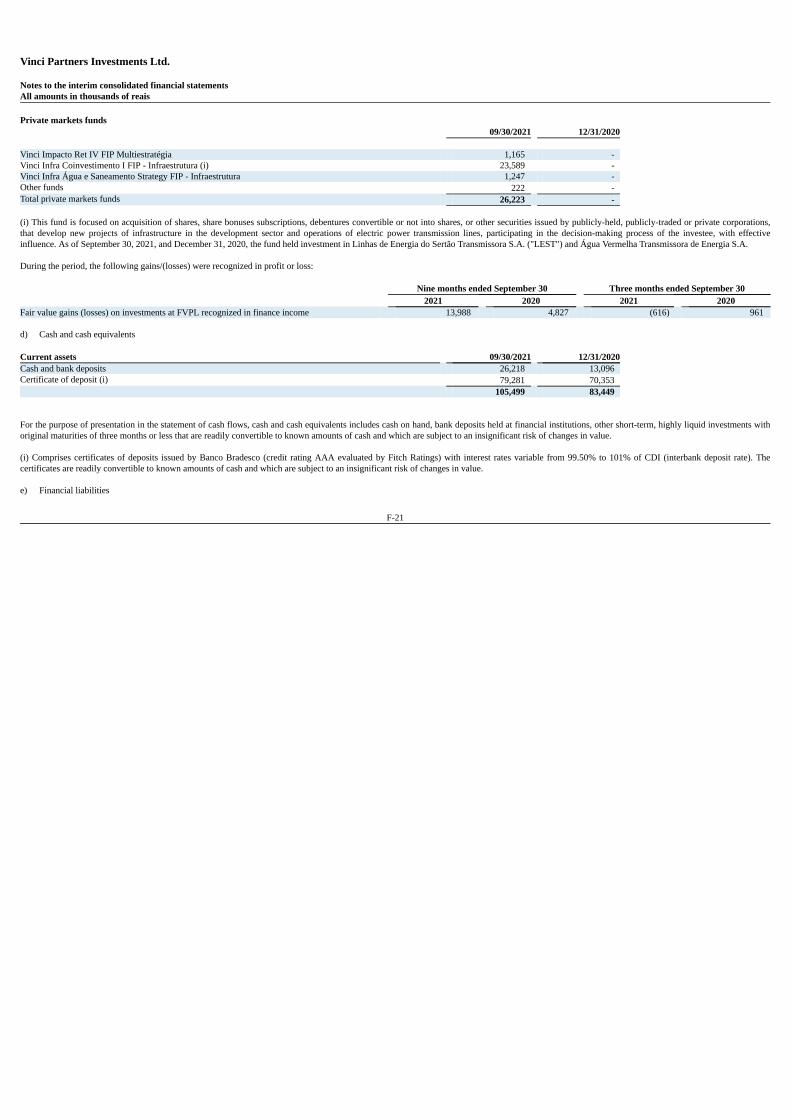
Vinci Partners Investments Ltd. Notes to the interim consolidated financial statementsAll amounts in thousands of reais Private markets funds 09/30/2021 12/31/2020 Vinci Impacto Ret IV FIP Multiestratégia 1,165 - Vinci Infra Coinvestimento I FIP - Infraestrutura (i) 23,589 - Vinci Infra Água e Saneamento Strategy FIP - Infraestrutura 1,247 - Other funds 222 - Total private markets funds 26,223 - (i) This fund is focused on acquisition of shares, share bonuses subscriptions, debentures convertible or not into shares, or other securities issued by publicly-held, publicly-traded or private corporations,that develop new projects of infrastructure in the development sector and operations of electric power transmission lines, participating in the decision-making process of the investee, with effectiveinfluence. As of September 30, 2021, and December 31, 2020, the fund held investment in Linhas de Energia do Sertão Transmissora S.A. ("LEST") and Água Vermelha Transmissora de Energia S.A. During the period, the following gains/(losses) were recognized in profit or loss: Nine months ended September 30 Three months ended September 30 2021 2020 2021 2020Fair value gains (losses) on investments at FVPL recognized in finance income 13,988 4,827 (616) 961 d) Cash and cash equivalents Current assets 09/30/2021 12/31/2020Cash and bank deposits 26,218 13,096 Certificate of deposit (i) 79,281 70,353 105,499 83,449 For the purpose of presentation in the statement of cash flows, cash and cash equivalents includes cash on hand, bank deposits held at financial institutions, other short-term, highly liquid investments withoriginal maturities of three months or less that are readily convertible to known amounts of cash and which are subject to an insignificant risk of changes in value. (i) Comprises certificates of deposits issued by Banco Bradesco (credit rating AAA evaluated by Fitch Ratings) with interest rates variable from 99.50% to 101% of CDI (interbank deposit rate). Thecertificates are readily convertible to known amounts of cash and which are subject to an insignificant risk of changes in value. e) Financial liabilities
F-21
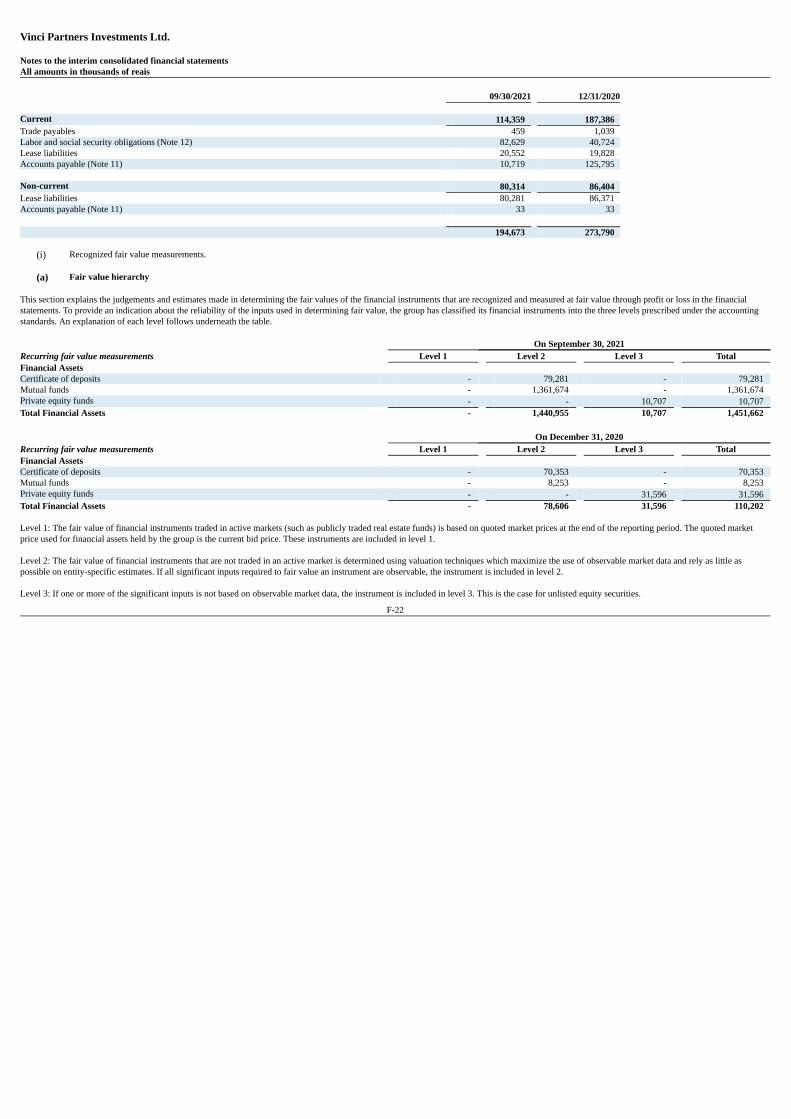
Vinci Partners Investments Ltd. Notes to the interim consolidated financial statementsAll amounts in thousands of reais 09/30/2021 12/31/2020 Current 114,359 187,386 Trade payables 459 1,039 Labor and social security obligations (Note 12) 82,629 40,724 Lease liabilities 20,552 19,828 Accounts payable (Note 11) 10,719 125,795 Non-current 80,314 86,404 Lease liabilities 80,281 86,371 Accounts payable (Note 11) 33 33 194,673 273,790
(i) Recognized fair value measurements.
(a) Fair value hierarchy
This section explains the judgements and estimates made in determining the fair values of the financial instruments that are recognized and measured at fair value through profit or loss in the financialstatements. To provide an indication about the reliability of the inputs used in determining fair value, the group has classified its financial instruments into the three levels prescribed under the accountingstandards. An explanation of each level follows underneath the table. On September 30, 2021Recurring fair value measurements Level 1 Level 2 Level 3 TotalFinancial Assets Certificate of deposits - 79,281 - 79,281 Mutual funds - 1,361,674 - 1,361,674 Private equity funds - - 10,707 10,707 Total Financial Assets - 1,440,955 10,707 1,451,662 On December 31, 2020Recurring fair value measurements Level 1 Level 2 Level 3 TotalFinancial Assets Certificate of deposits - 70,353 - 70,353 Mutual funds - 8,253 - 8,253 Private equity funds - - 31,596 31,596 Total Financial Assets - 78,606 31,596 110,202 Level 1: The fair value of financial instruments traded in active markets (such as publicly traded real estate funds) is based on quoted market prices at the end of the reporting period. The quoted marketprice used for financial assets held by the group is the current bid price. These instruments are included in level 1. Level 2: The fair value of financial instruments that are not traded in an active market is determined using valuation techniques which maximize the use of observable market data and rely as little aspossible on entity-specific estimates. If all significant inputs required to fair value an instrument are observable, the instrument is included in level 2. Level 3: If one or more of the significant inputs is not based on observable market data, the instrument is included in level 3. This is the case for unlisted equity securities.
F-22
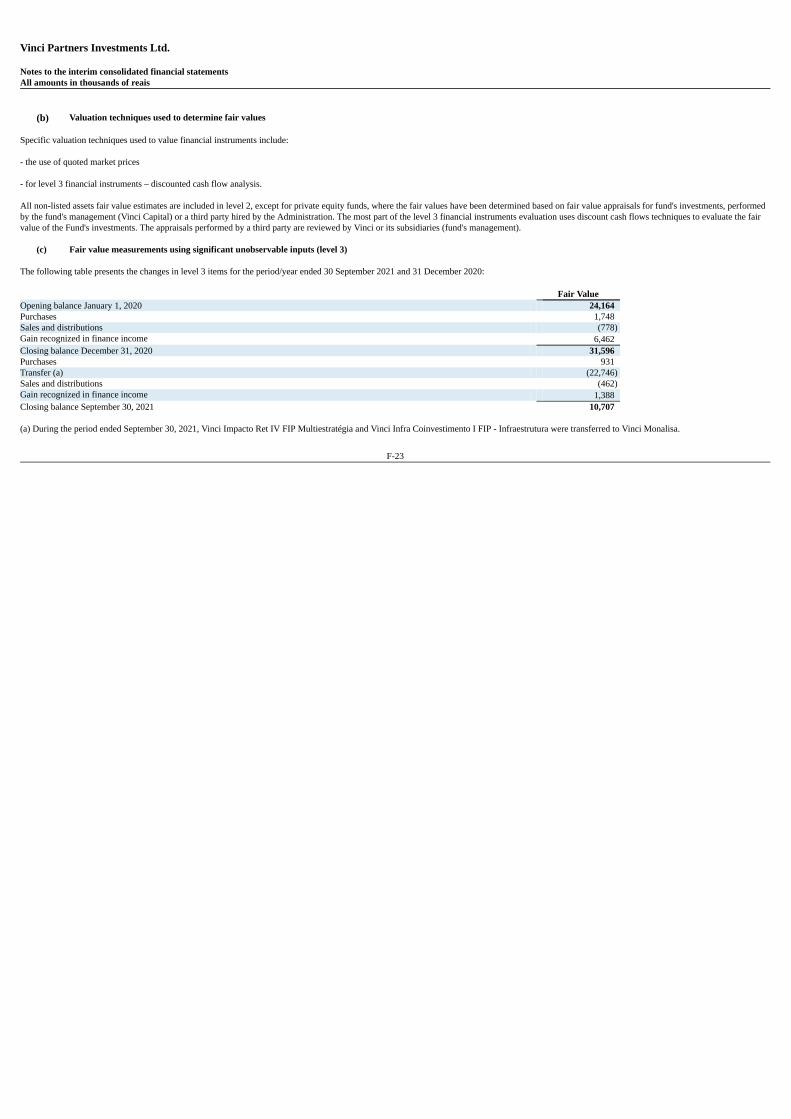
Vinci Partners Investments Ltd. Notes to the interim consolidated financial statementsAll amounts in thousands of reais
(b) Valuation techniques used to determine fair values
Specific valuation techniques used to value financial instruments include: - the use of quoted market prices - for level 3 financial instruments – discounted cash flow analysis. All non-listed assets fair value estimates are included in level 2, except for private equity funds, where the fair values have been determined based on fair value appraisals for fund's investments, performedby the fund's management (Vinci Capital) or a third party hired by the Administration. The most part of the level 3 financial instruments evaluation uses discount cash flows techniques to evaluate the fairvalue of the Fund's investments. The appraisals performed by a third party are reviewed by Vinci or its subsidiaries (fund's management).
(c) Fair value measurements using significant unobservable inputs (level 3)
The following table presents the changes in level 3 items for the period/year ended 30 September 2021 and 31 December 2020: Fair ValueOpening balance January 1, 2020 24,164 Purchases 1,748 Sales and distributions (778)Gain recognized in finance income 6,462 Closing balance December 31, 2020 31,596 Purchases 931 Transfer (a) (22,746)Sales and distributions (462)Gain recognized in finance income 1,388 Closing balance September 30, 2021 10,707 (a) During the period ended September 30, 2021, Vinci Impacto Ret IV FIP Multiestratégia and Vinci Infra Coinvestimento I FIP - Infraestrutura were transferred to Vinci Monalisa.
F-23
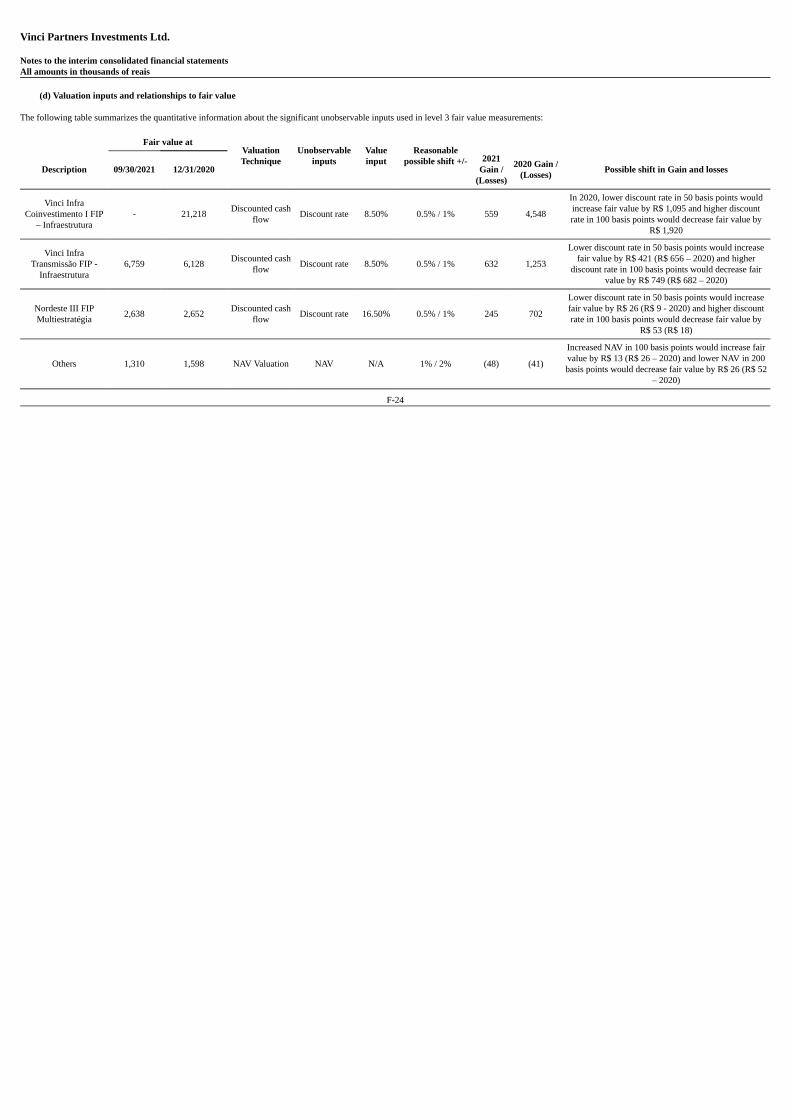
Vinci Partners Investments Ltd. Notes to the interim consolidated financial statementsAll amounts in thousands of reais
(d) Valuation inputs and relationships to fair value
The following table summarizes the quantitative information about the significant unobservable inputs used in level 3 fair value measurements:
Fair value atValuationTechnique
Unobservableinputs
Valueinput
Reasonablepossible shift +/-
Description 09/30/2021 12/31/20202021
Gain /(Losses)
2020 Gain /(Losses) Possible shift in Gain and losses
Vinci InfraCoinvestimento I FIP
– Infraestrutura- 21,218 Discounted cash
flow Discount rate 8.50% 0.5% / 1% 559 4,548
In 2020, lower discount rate in 50 basis points wouldincrease fair value by R$ 1,095 and higher discountrate in 100 basis points would decrease fair value by
R$ 1,920
Vinci InfraTransmissão FIP -
Infraestrutura6,759 6,128 Discounted cash
flow Discount rate 8.50% 0.5% / 1% 632 1,253
Lower discount rate in 50 basis points would increasefair value by R$ 421 (R$ 656 – 2020) and higher
discount rate in 100 basis points would decrease fairvalue by R$ 749 (R$ 682 – 2020)
Nordeste III FIPMultiestratégia 2,638 2,652 Discounted cash
flow Discount rate 16.50% 0.5% / 1% 245 702
Lower discount rate in 50 basis points would increasefair value by R$ 26 (R$ 9 - 2020) and higher discountrate in 100 basis points would decrease fair value by
R$ 53 (R$ 18)
Others 1,310 1,598 NAV Valuation NAV N/A 1% / 2% (48) (41)
Increased NAV in 100 basis points would increase fairvalue by R$ 13 (R$ 26 – 2020) and lower NAV in 200basis points would decrease fair value by R$ 26 (R$ 52
– 2020)
F-24
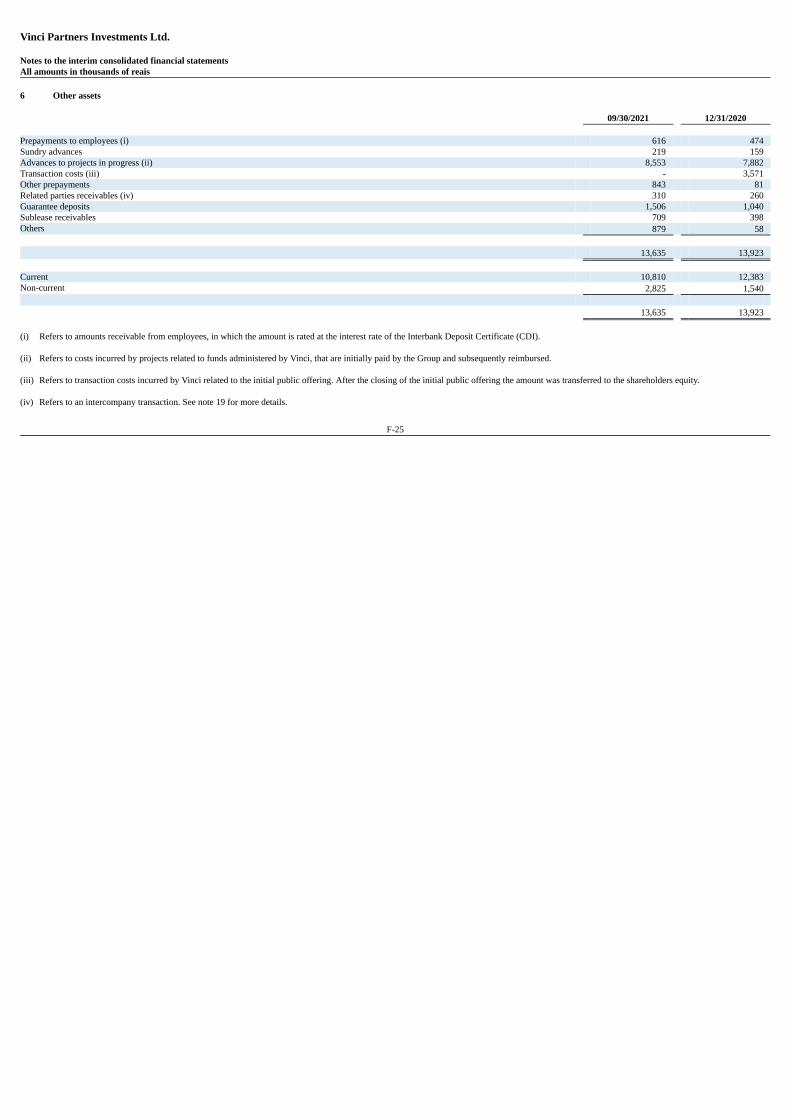
Vinci Partners Investments Ltd. Notes to the interim consolidated financial statementsAll amounts in thousands of reais 6 Other assets 09/30/2021 12/31/2020 Prepayments to employees (i) 616 474 Sundry advances 219 159 Advances to projects in progress (ii) 8,553 7,882 Transaction costs (iii) - 3,571 Other prepayments 843 81 Related parties receivables (iv) 310 260 Guarantee deposits 1,506 1,040 Sublease receivables 709 398 Others 879 58 13,635 13,923 Current 10,810 12,383 Non-current 2,825 1,540 13,635 13,923 (i) Refers to amounts receivable from employees, in which the amount is rated at the interest rate of the Interbank Deposit Certificate (CDI). (ii) Refers to costs incurred by projects related to funds administered by Vinci, that are initially paid by the Group and subsequently reimbursed. (iii) Refers to transaction costs incurred by Vinci related to the initial public offering. After the closing of the initial public offering the amount was transferred to the shareholders equity. (iv) Refers to an intercompany transaction. See note 19 for more details.
F-25
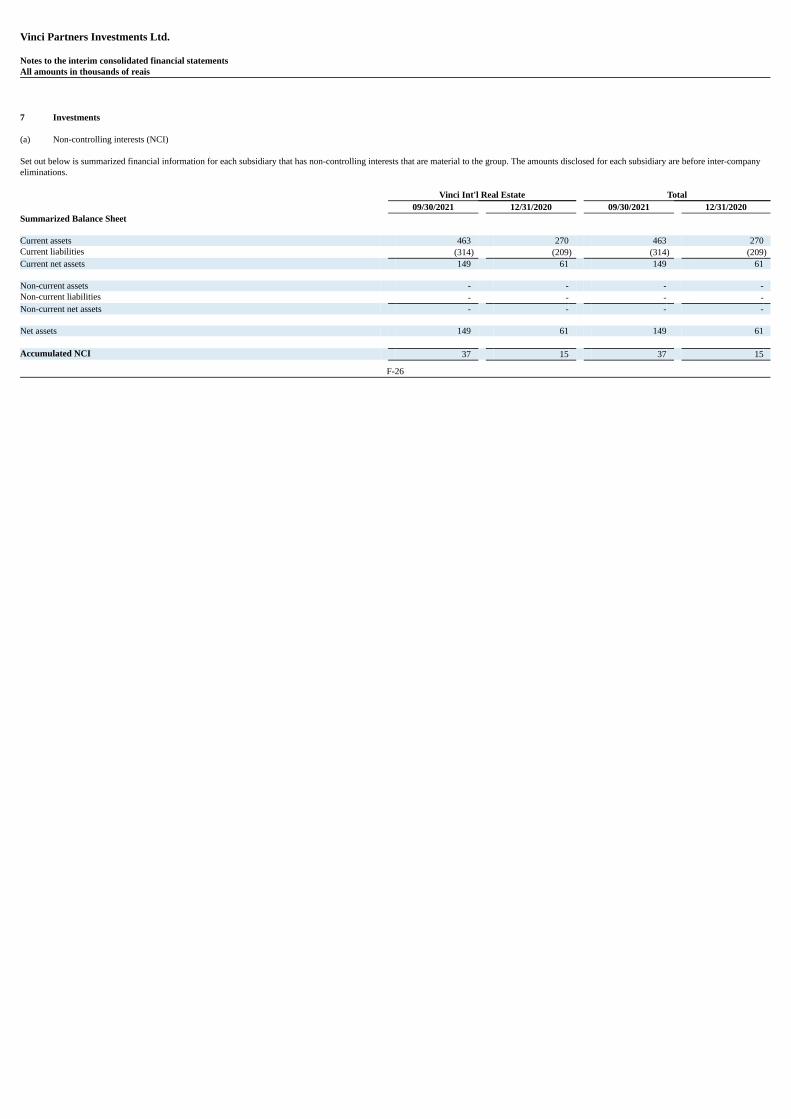
Vinci Partners Investments Ltd. Notes to the interim consolidated financial statementsAll amounts in thousands of reais
7 Investments
(a) Non-controlling interests (NCI) Set out below is summarized financial information for each subsidiary that has non-controlling interests that are material to the group. The amounts disclosed for each subsidiary are before inter-companyeliminations. Vinci Int'l Real Estate Total 09/30/2021 12/31/2020 09/30/2021 12/31/2020Summarized Balance Sheet Current assets 463 270 463 270 Current liabilities (314) (209) (314) (209)Current net assets 149 61 149 61 Non-current assets - - - - Non-current liabilities - - - - Non-current net assets - - - - Net assets 149 61 149 61 Accumulated NCI 37 15 37 15
F-26
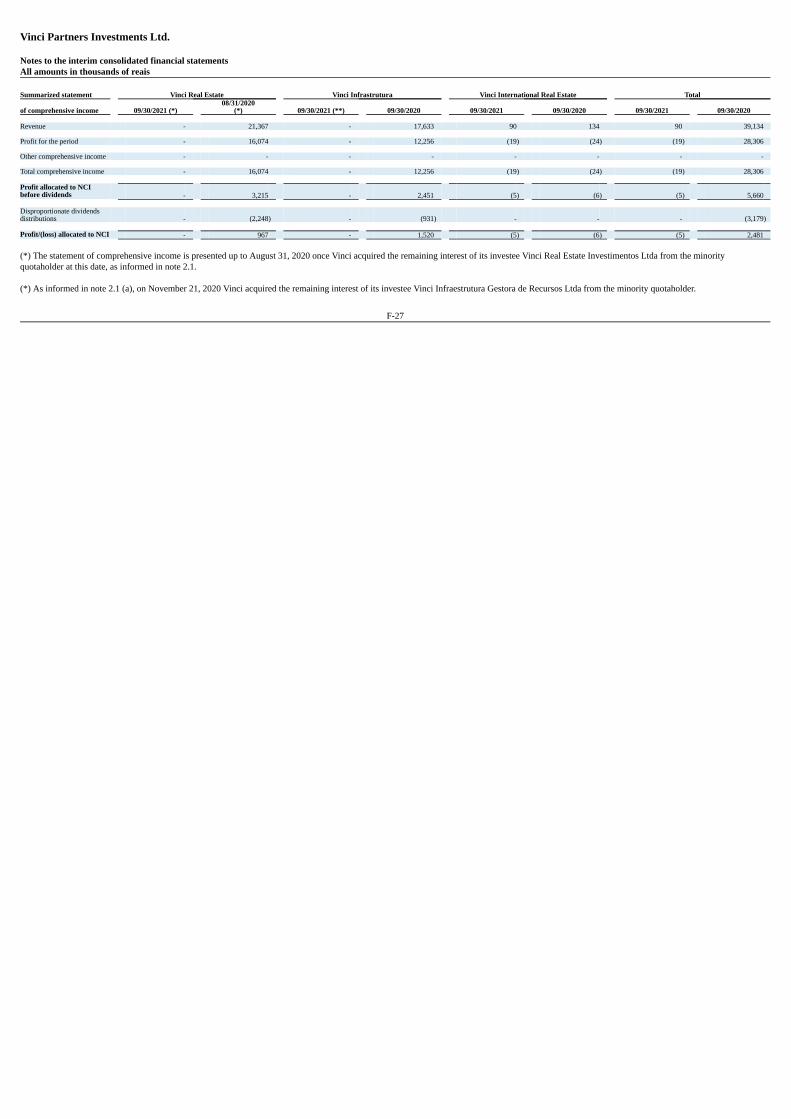
Vinci Partners Investments Ltd. Notes to the interim consolidated financial statementsAll amounts in thousands of reais Summarized statement Vinci Real Estate Vinci Infrastrutura Vinci International Real Estate Total
of comprehensive income 09/30/2021 (*) 08/31/2020(*) 09/30/2021 (**) 09/30/2020 09/30/2021 09/30/2020 09/30/2021 09/30/2020
Revenue - 21,367 - 17,633 90 134 90 39,134 Profit for the period - 16,074 - 12,256 (19) (24) (19) 28,306 Other comprehensive income - - - - - - - - Total comprehensive income - 16,074 - 12,256 (19) (24) (19) 28,306 Profit allocated to NCIbefore dividends - 3,215 - 2,451 (5) (6) (5) 5,660 Disproportionate dividendsdistributions - (2,248) - (931) - - - (3,179) Profit/(loss) allocated to NCI - 967 - 1,520 (5) (6) (5) 2,481 (*) The statement of comprehensive income is presented up to August 31, 2020 once Vinci acquired the remaining interest of its investee Vinci Real Estate Investimentos Ltda from the minorityquotaholder at this date, as informed in note 2.1. (*) As informed in note 2.1 (a), on November 21, 2020 Vinci acquired the remaining interest of its investee Vinci Infraestrutura Gestora de Recursos Ltda from the minority quotaholder.
F-27
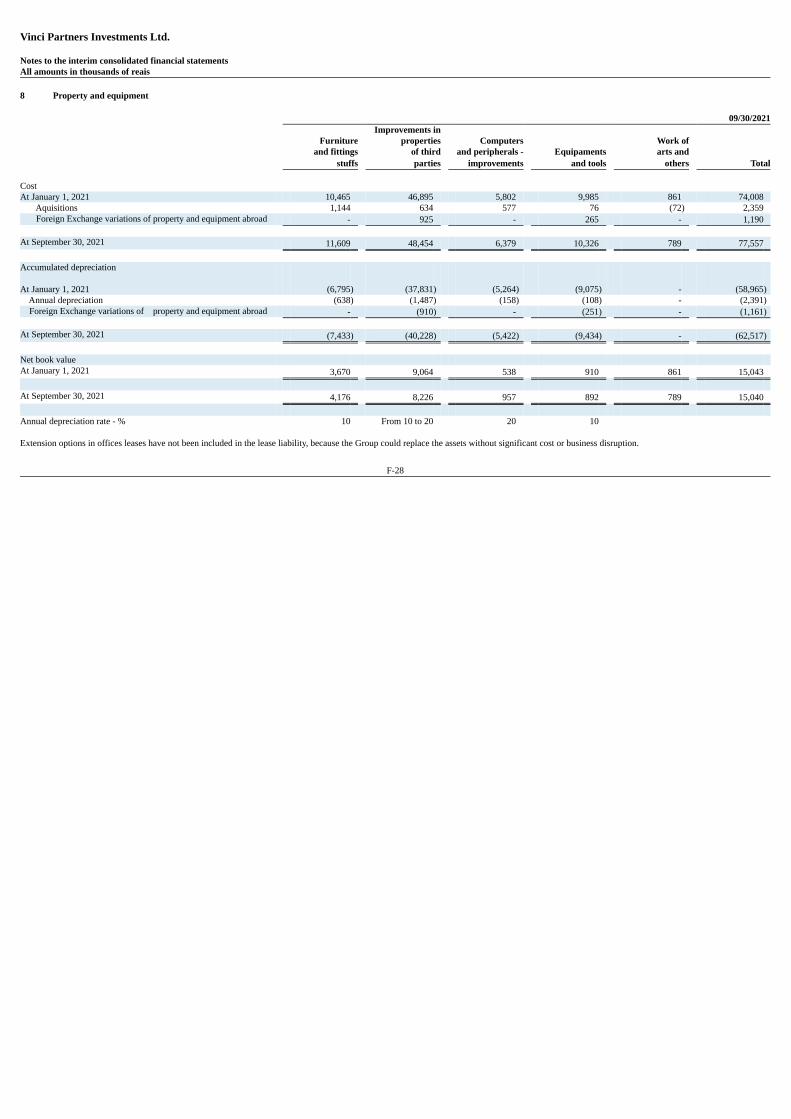
Vinci Partners Investments Ltd. Notes to the interim consolidated financial statementsAll amounts in thousands of reais 8 Property and equipment 09/30/2021
Furniture Improvements in
properties Computers Work of and fittings of third and peripherals - Equipaments arts and stuffs parties improvements and tools others Total Cost At January 1, 2021 10,465 46,895 5,802 9,985 861 74,008 Aquisitions 1,144 634 577 76 (72) 2,359 Foreign Exchange variations of property and equipment abroad - 925 - 265 - 1,190 At September 30, 2021 11,609 48,454 6,379 10,326 789 77,557 Accumulated depreciation At January 1, 2021 (6,795) (37,831) (5,264) (9,075) - (58,965) Annual depreciation (638) (1,487) (158) (108) - (2,391) Foreign Exchange variations of property and equipment abroad - (910) - (251) - (1,161) At September 30, 2021 (7,433) (40,228) (5,422) (9,434) - (62,517) Net book value At January 1, 2021 3,670 9,064 538 910 861 15,043 At September 30, 2021 4,176 8,226 957 892 789 15,040 Annual depreciation rate - % 10 From 10 to 20 20 10 Extension options in offices leases have not been included in the lease liability, because the Group could replace the assets without significant cost or business disruption.
F-28
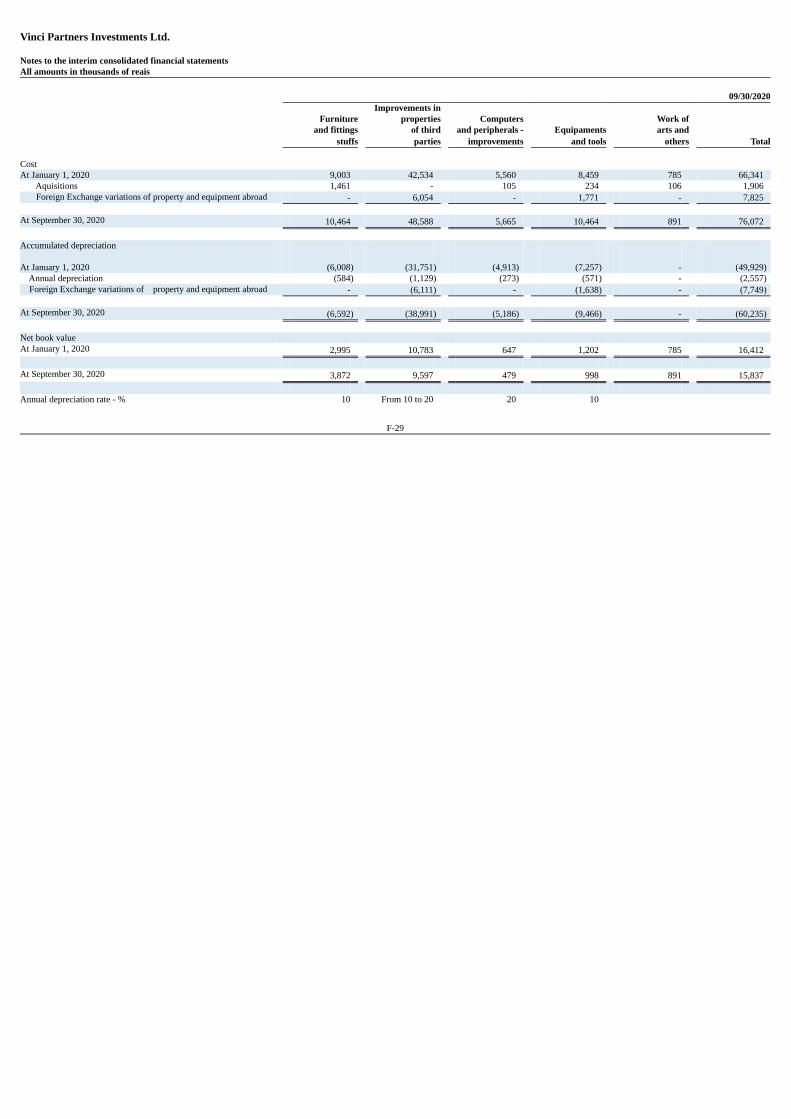
Vinci Partners Investments Ltd. Notes to the interim consolidated financial statementsAll amounts in thousands of reais 09/30/2020
Furniture Improvements in
properties Computers Work of and fittings of third and peripherals - Equipaments arts and stuffs parties improvements and tools others Total Cost At January 1, 2020 9,003 42,534 5,560 8,459 785 66,341 Aquisitions 1,461 - 105 234 106 1,906 Foreign Exchange variations of property and equipment abroad - 6,054 - 1,771 - 7,825 At September 30, 2020 10,464 48,588 5,665 10,464 891 76,072 Accumulated depreciation At January 1, 2020 (6,008) (31,751) (4,913) (7,257) - (49,929) Annual depreciation (584) (1,129) (273) (571) - (2,557) Foreign Exchange variations of property and equipment abroad - (6,111) - (1,638) - (7,749) At September 30, 2020 (6,592) (38,991) (5,186) (9,466) - (60,235) Net book value At January 1, 2020 2,995 10,783 647 1,202 785 16,412 At September 30, 2020 3,872 9,597 479 998 891 15,837 Annual depreciation rate - % 10 From 10 to 20 20 10
F-29
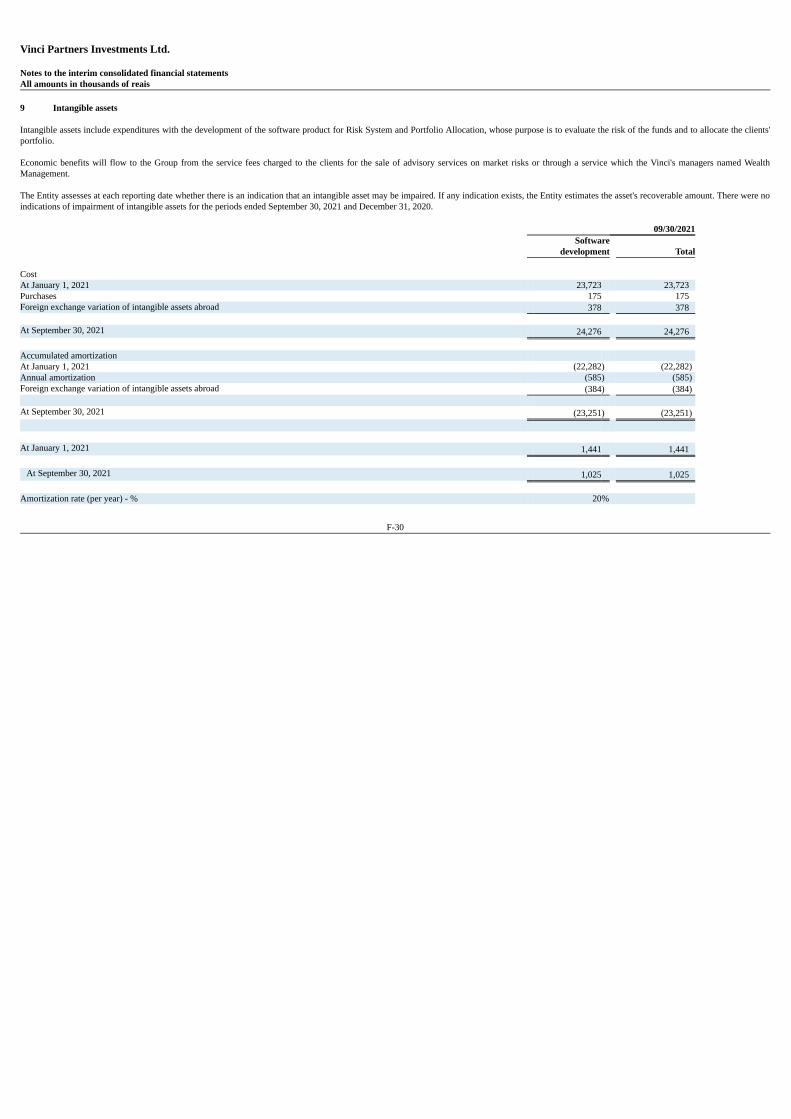
Vinci Partners Investments Ltd. Notes to the interim consolidated financial statementsAll amounts in thousands of reais 9 Intangible assets Intangible assets include expenditures with the development of the software product for Risk System and Portfolio Allocation, whose purpose is to evaluate the risk of the funds and to allocate the clients'portfolio. Economic benefits will flow to the Group from the service fees charged to the clients for the sale of advisory services on market risks or through a service which the Vinci's managers named WealthManagement. The Entity assesses at each reporting date whether there is an indication that an intangible asset may be impaired. If any indication exists, the Entity estimates the asset's recoverable amount. There were noindications of impairment of intangible assets for the periods ended September 30, 2021 and December 31, 2020. 09/30/2021
Software
development Total Cost At January 1, 2021 23,723 23,723 Purchases 175 175 Foreign exchange variation of intangible assets abroad 378 378 At September 30, 2021 24,276 24,276 Accumulated amortization At January 1, 2021 (22,282) (22,282)Annual amortization (585) (585)Foreign exchange variation of intangible assets abroad (384) (384) At September 30, 2021 (23,251) (23,251) At January 1, 2021 1,441 1,441 At September 30, 2021 1,025 1,025 Amortization rate (per year) - % 20%
F-30
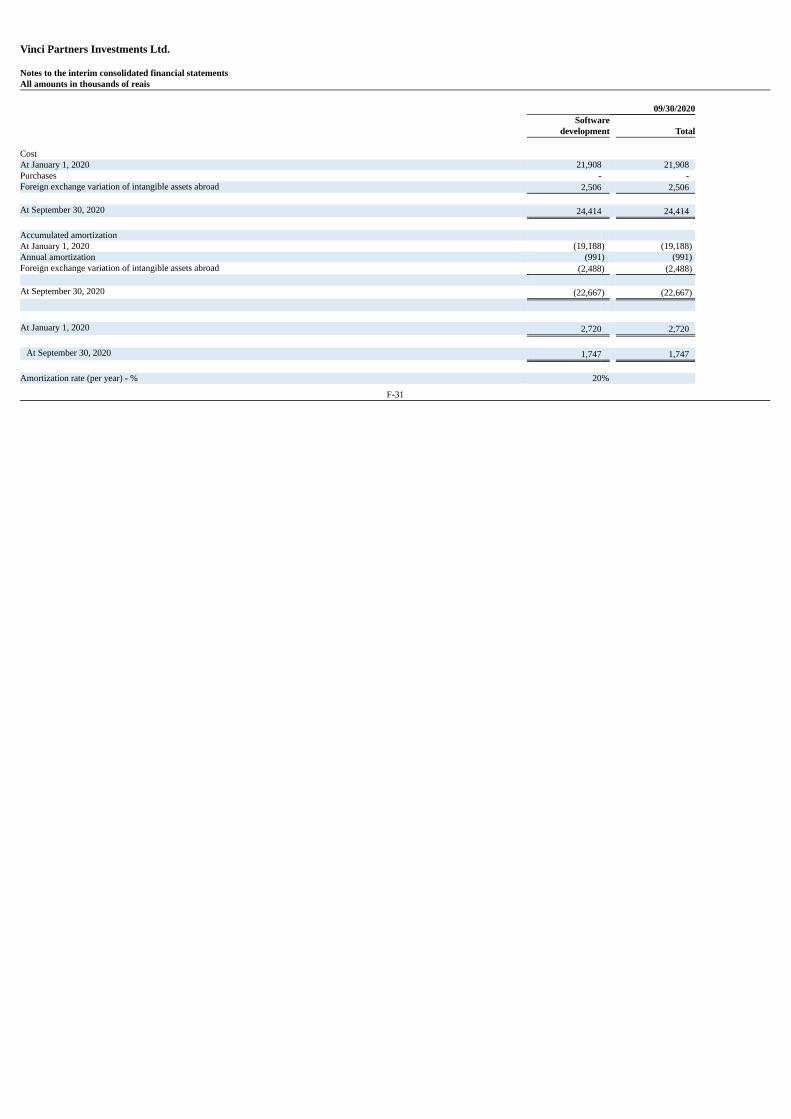
Vinci Partners Investments Ltd. Notes to the interim consolidated financial statementsAll amounts in thousands of reais 09/30/2020
Software
development Total Cost At January 1, 2020 21,908 21,908 Purchases - - Foreign exchange variation of intangible assets abroad 2,506 2,506 At September 30, 2020 24,414 24,414 Accumulated amortization At January 1, 2020 (19,188) (19,188)Annual amortization (991) (991)Foreign exchange variation of intangible assets abroad (2,488) (2,488) At September 30, 2020 (22,667) (22,667) At January 1, 2020 2,720 2,720 At September 30, 2020 1,747 1,747 Amortization rate (per year) - % 20%
F-31
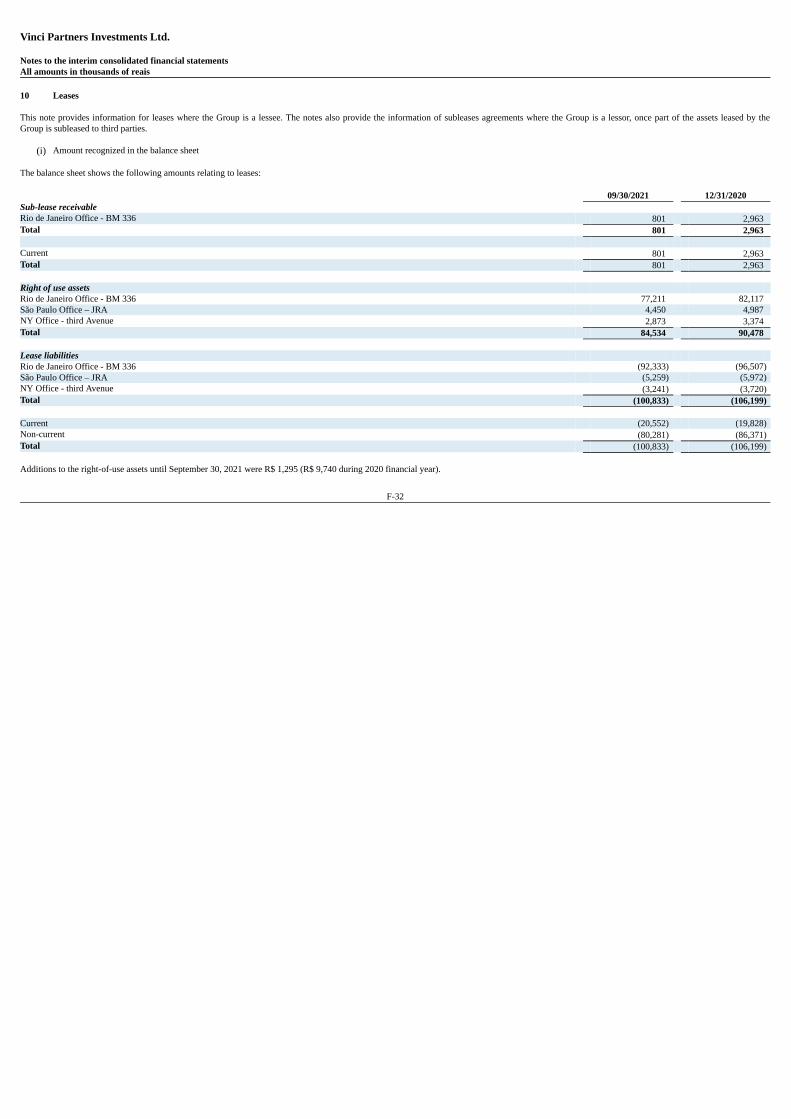
Vinci Partners Investments Ltd. Notes to the interim consolidated financial statementsAll amounts in thousands of reais 10 Leases This note provides information for leases where the Group is a lessee. The notes also provide the information of subleases agreements where the Group is a lessor, once part of the assets leased by theGroup is subleased to third parties.
(i) Amount recognized in the balance sheet The balance sheet shows the following amounts relating to leases: 09/30/2021 12/31/2020Sub-lease receivable Rio de Janeiro Office - BM 336 801 2,963 Total 801 2,963 Current 801 2,963 Total 801 2,963 Right of use assets Rio de Janeiro Office - BM 336 77,211 82,117 São Paulo Office – JRA 4,450 4,987 NY Office - third Avenue 2,873 3,374 Total 84,534 90,478 Lease liabilities Rio de Janeiro Office - BM 336 (92,333) (96,507)São Paulo Office – JRA (5,259) (5,972)NY Office - third Avenue (3,241) (3,720)Total (100,833) (106,199) Current (20,552) (19,828)Non-current (80,281) (86,371)Total (100,833) (106,199) Additions to the right-of-use assets until September 30, 2021 were R$ 1,295 (R$ 9,740 during 2020 financial year).
F-32
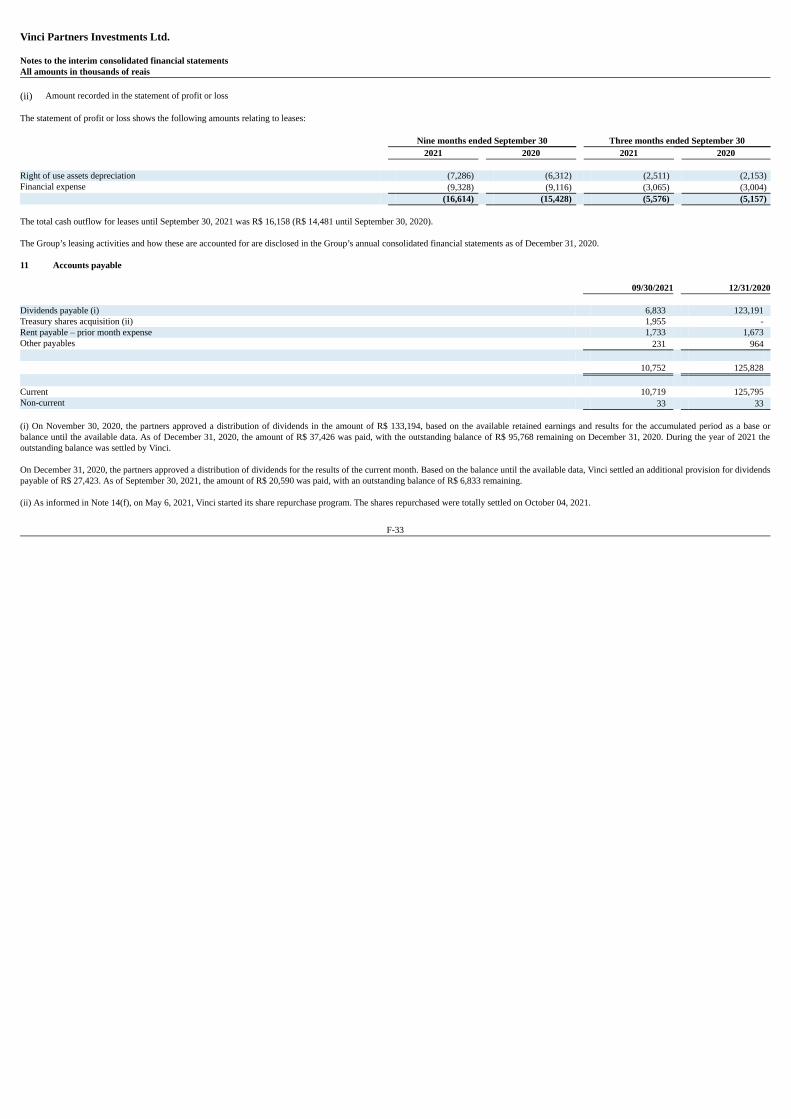
Vinci Partners Investments Ltd. Notes to the interim consolidated financial statementsAll amounts in thousands of reais (ii) Amount recorded in the statement of profit or loss The statement of profit or loss shows the following amounts relating to leases: Nine months ended September 30 Three months ended September 30 2021 2020 2021 2020 Right of use assets depreciation (7,286) (6,312) (2,511) (2,153)Financial expense (9,328) (9,116) (3,065) (3,004) (16,614) (15,428) (5,576) (5,157) The total cash outflow for leases until September 30, 2021 was R$ 16,158 (R$ 14,481 until September 30, 2020). The Group’s leasing activities and how these are accounted for are disclosed in the Group’s annual consolidated financial statements as of December 31, 2020. 11 Accounts payable 09/30/2021 12/31/2020 Dividends payable (i) 6,833 123,191 Treasury shares acquisition (ii) 1,955 - Rent payable – prior month expense 1,733 1,673 Other payables 231 964 10,752 125,828 Current 10,719 125,795 Non-current 33 33 (i) On November 30, 2020, the partners approved a distribution of dividends in the amount of R$ 133,194, based on the available retained earnings and results for the accumulated period as a base orbalance until the available data. As of December 31, 2020, the amount of R$ 37,426 was paid, with the outstanding balance of R$ 95,768 remaining on December 31, 2020. During the year of 2021 theoutstanding balance was settled by Vinci. On December 31, 2020, the partners approved a distribution of dividends for the results of the current month. Based on the balance until the available data, Vinci settled an additional provision for dividendspayable of R$ 27,423. As of September 30, 2021, the amount of R$ 20,590 was paid, with an outstanding balance of R$ 6,833 remaining. (ii) As informed in Note 14(f), on May 6, 2021, Vinci started its share repurchase program. The shares repurchased were totally settled on October 04, 2021.
F-33

Vinci Partners Investments Ltd. Notes to the interim consolidated financial statementsAll amounts in thousands of reais 12 Labor and social security obligations 09/30/2021 12/31/2020 Profit sharing 77,132 37,802 Labor provisions 5,497 2,922 82,629 40,724 Except for the profit sharing related to the unrealized performance fees, the accrual for profits sharing payable on December 31, 2020 was entirely paid in January 2021. Profit sharing is calculated based onthe performance review of each employee plus the area performance, in accordance with an Entity policy. Vinci Management estimated the profit sharing as of September 30, 2021 based on themanagement and advisory net revenue recognized and the realized performance fee up to September 30, 2021. Profit sharing will be paid in January 2022 accordingly to Vinci internal policy and after theManagement approval, which is expected to occur in the beginning of 2022. Since 2021 Vinci change its dividends distribution policy and implement a profit-sharing scheme to its employees and personnel responsible for asset management services, increasing the estimative of theprofit-sharing accrual in 2021. 13 Taxes and contributions payable 09/30/2021 12/31/2020 Income tax 14,293 14,063 Social contribution 5,056 5,082 Social Contribution onRevenues (COFINS) 1,593 1,882 Social Integration Program (PIS) 345 407 Service tax (ISS) on billing 565 1,160 Withholding Income Tax (IRRF) deducted from third parties 74 80 Others 143 204 22,069 22,878
F-34

Vinci Partners Investments Ltd. Notes to the interim consolidated financial statementsAll amounts in thousands of reais 14 Equity (a) Capital The capital comprises 42,447,349 Class A shares and 14,446,239 Class B shares with a par value of US$ 0.00005 each (12/31/2020 – 8,730,000 quotas with a par value of R$ 1.00 each quota of VinciPartners Investimentos Ltda). On March 16, 2020, the quotaholders of Vinci Partners Investimentos Ltda unanimously approved a capital increase of R$ 90. Accordingly, capital was increased from R$ 8,595 to R$ 8,685 through theissue of 90,000 quotas at R$ 1.00 each. On August 8, 2020, the quotaholders unanimously approved a capital increase of R$ 45. Accordingly, capital was increased from R$ 8,685 to R$ 8,730 through the issue of 45,000 quotas at R$ 1.00 each. On January 15, 2021, the individual partners of Vinci Partners Investimentos Ltda. contributed the entirety of their quotas into the Entity. In return for this contribution the Entity issued (1) new Class Bcommon shares to Gilberto Sayão da Silva and (2) new Class A common shares to all other quotaholders of Vinci Investimentos in exchange for the quotas, in each case in a one-to-4.77 exchange for thequotas, of Vinci Investimentos contributed to the Entity, or the Contribution. On January 28, 2021 Vinci issued 13,873,474 Class A common shares. Prior to this offering, there has been no public market for our Class A common shares. The initial public offering price per Class Acommon share was US$18.00, resulting in net proceeds of US$ 232,243 thousand (or R$ 1,266,926), after the deducting of underwriting discounts and commissions to Vinci Partners Ltd. On February 8, 2021, Vinci issued additional 1,398,014 Class A common shares. The price of the additional shares was US$18.00, resulting in net proceeds of US$ 28,636 thousand (or R$ 125,448), afterthe deducting of underwriting discounts and commissions to Vinci Partners Ltd. The Class A common shares have been approved for listing on the Nasdaq Global Select Market, or Nasdaq, under the symbol "VINP." Vinci has two classes of common shares: Class A common sharesand our Class B common shares. Class B common shares carry rights that are identical to the Class A common shares, except that (1) holders of Class B common shares are entitled to 10 votes per share, whereas holders of our Class Acommon shares are entitled to one vote per share; (2) holders of Class B common shares have certain conversion rights; (3) holders of Class B common shares are entitled to preemptive rights in the eventthat additional Class A common shares are issued in order to maintain their proportional ownership interest; and (4) Class B common shares shall not be listed on any stock exchange and will not bepublicly traded.
F-35
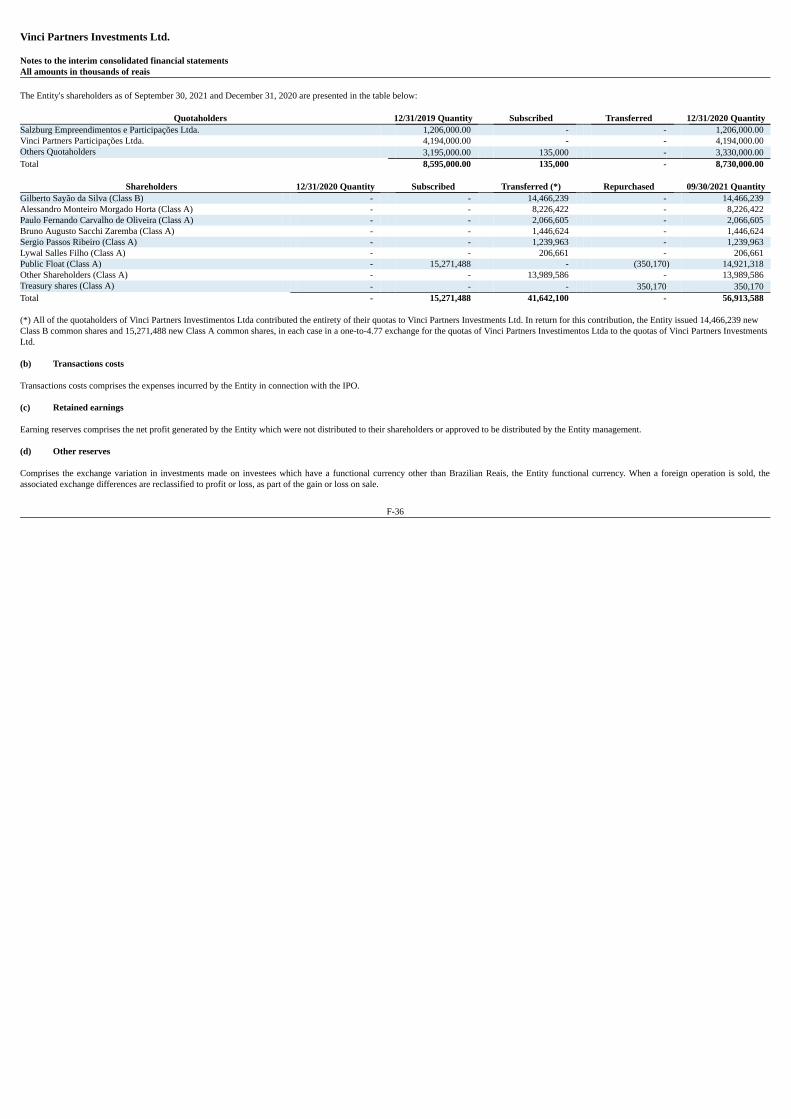
Vinci Partners Investments Ltd. Notes to the interim consolidated financial statementsAll amounts in thousands of reais The Entity's shareholders as of September 30, 2021 and December 31, 2020 are presented in the table below:
Quotaholders 12/31/2019 Quantity Subscribed Transferred 12/31/2020 QuantitySalzburg Empreendimentos e Participações Ltda. 1,206,000.00 - - 1,206,000.00 Vinci Partners Participações Ltda. 4,194,000.00 - - 4,194,000.00 Others Quotaholders 3,195,000.00 135,000 - 3,330,000.00 Total 8,595,000.00 135,000 - 8,730,000.00
Shareholders 12/31/2020 Quantity Subscribed Transferred (*) Repurchased 09/30/2021 QuantityGilberto Sayão da Silva (Class B) - - 14,466,239 - 14,466,239 Alessandro Monteiro Morgado Horta (Class A) - - 8,226,422 - 8,226,422 Paulo Fernando Carvalho de Oliveira (Class A) - - 2,066,605 - 2,066,605 Bruno Augusto Sacchi Zaremba (Class A) - - 1,446,624 - 1,446,624 Sergio Passos Ribeiro (Class A) - - 1,239,963 - 1,239,963 Lywal Salles Filho (Class A) - - 206,661 - 206,661 Public Float (Class A) - 15,271,488 - (350,170) 14,921,318 Other Shareholders (Class A) - - 13,989,586 - 13,989,586 Treasury shares (Class A) - - - 350,170 350,170 Total - 15,271,488 41,642,100 - 56,913,588 (*) All of the quotaholders of Vinci Partners Investimentos Ltda contributed the entirety of their quotas to Vinci Partners Investments Ltd. In return for this contribution, the Entity issued 14,466,239 newClass B common shares and 15,271,488 new Class A common shares, in each case in a one-to-4.77 exchange for the quotas of Vinci Partners Investimentos Ltda to the quotas of Vinci Partners InvestmentsLtd. (b) Transactions costs Transactions costs comprises the expenses incurred by the Entity in connection with the IPO. (c) Retained earnings Earning reserves comprises the net profit generated by the Entity which were not distributed to their shareholders or approved to be distributed by the Entity management. (d) Other reserves Comprises the exchange variation in investments made on investees which have a functional currency other than Brazilian Reais, the Entity functional currency. When a foreign operation is sold, theassociated exchange differences are reclassified to profit or loss, as part of the gain or loss on sale.
F-36
Vinci Partners Investments Ltd. Notes to the interim consolidated financial statementsAll amounts in thousands of reais (e) Dividends On August 18, 2021, Vinci declared a semiannual dividend distribution of US$ 0.30 per common share to shareholders as of September 01, 2021, payable on September 16, 2021. Once dividends are declared and approved by the board of directors, they will be paid on proportional basis to the owners of the common shares. For the nine-months period ended on September 30, 2021, dividends were paid in the amount of R$ 205,136 (R$ 129,832 for the nine-months period ended on September 30, 2020). (f) Treasury shares When shares recognized as equity are repurchased, the amount of the consideration paid, which includes directly attributable costs, is recognized as a deduction from equity. Repurchased shares areclassified as treasury shares and are presented in the treasury share reserve. When treasury shares are sold or reissued subsequently, the amount received is recognized as an increase in equity and theresulting surplus or deficit on the transaction is presented within share premium. On May 6, 2021, the Company announced the adoption of its share repurchase program in an aggregate amount of up to R$ 85 million (the “Repurchase Program”). The Repurchase Program may beexecuted in compliance with Rule 10b-18 under the Exchange Act. The program shall be permitted to commence after the date it is publicly disclosed and does not have a specified expiration date.Buybacks shall be made from time-to-time in open market and negotiated purchases. The specific prices, numbers of shares and timing of purchase transactions shall be determined by the Company fromtime to time in its sole discretion. On September 14, 2021, the Company intended to benefit from the affirmative defense provided by Rule 10b5-1 promulgated by the Securities and Exchange Commission under the Securities ExchangeAct of 1934. The Repurchase Program previously approved comply with the requirements of Rule 10b5-1 and will be carried out exclusively by J.P. Morgan Securities LLC (“JPMS”). JPMS acts as agenton behalf of Vinci and in accordance with the following terms: · The program is permitted to commence on October 1, 2021 and does not have a specified expiration date. · Buybacks shall be made in compliance with Rule 10b5-1(c)(1) under the Exchange Act; · The Repurchase Program respects the total amount of up to R$85 million, as previously approved. Until September 2021, 350,170 Class A common shares were repurchased, in the amount of R$ 25,801. In September 2021, the Company holds 350,170 Class A common shares in treasury.
F-37
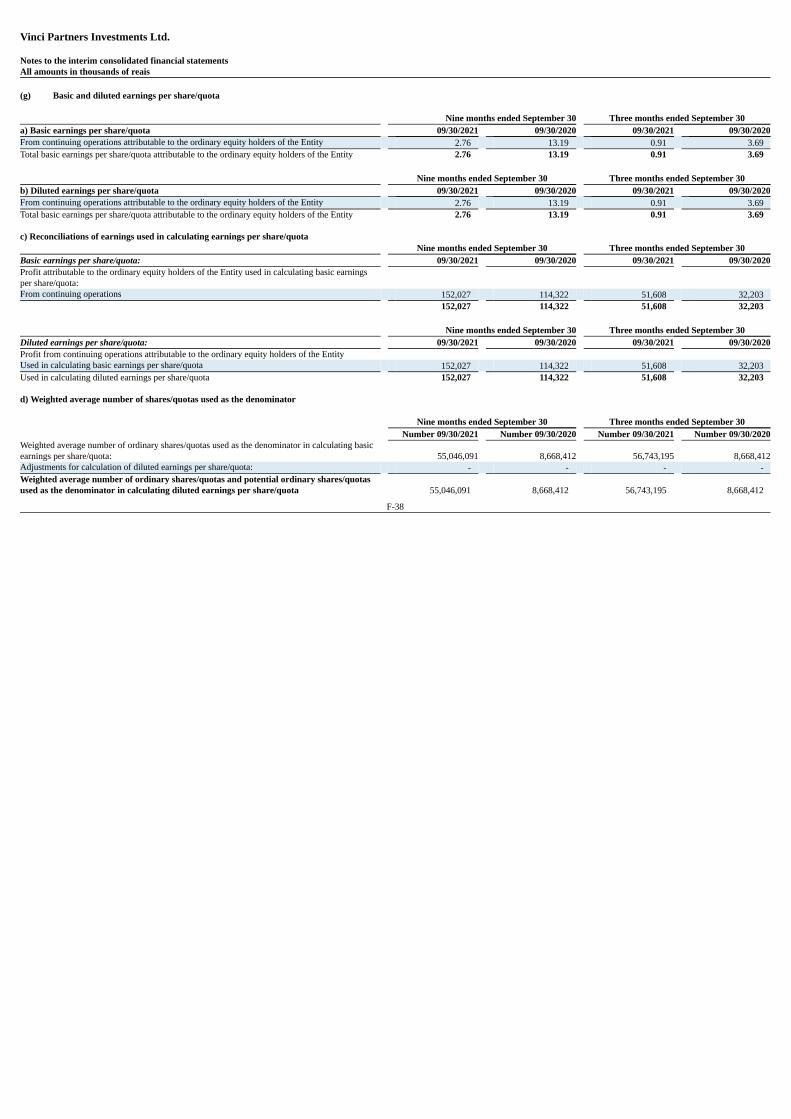
Vinci Partners Investments Ltd. Notes to the interim consolidated financial statementsAll amounts in thousands of reais (g) Basic and diluted earnings per share/quota Nine months ended September 30 Three months ended September 30a) Basic earnings per share/quota 09/30/2021 09/30/2020 09/30/2021 09/30/2020From continuing operations attributable to the ordinary equity holders of the Entity 2.76 13.19 0.91 3.69 Total basic earnings per share/quota attributable to the ordinary equity holders of the Entity 2.76 13.19 0.91 3.69 Nine months ended September 30 Three months ended September 30b) Diluted earnings per share/quota 09/30/2021 09/30/2020 09/30/2021 09/30/2020From continuing operations attributable to the ordinary equity holders of the Entity 2.76 13.19 0.91 3.69 Total basic earnings per share/quota attributable to the ordinary equity holders of the Entity 2.76 13.19 0.91 3.69 c) Reconciliations of earnings used in calculating earnings per share/quota Nine months ended September 30 Three months ended September 30Basic earnings per share/quota: 09/30/2021 09/30/2020 09/30/2021 09/30/2020Profit attributable to the ordinary equity holders of the Entity used in calculating basic earningsper share/quota: From continuing operations 152,027 114,322 51,608 32,203 152,027 114,322 51,608 32,203 Nine months ended September 30 Three months ended September 30Diluted earnings per share/quota: 09/30/2021 09/30/2020 09/30/2021 09/30/2020Profit from continuing operations attributable to the ordinary equity holders of the Entity Used in calculating basic earnings per share/quota 152,027 114,322 51,608 32,203 Used in calculating diluted earnings per share/quota 152,027 114,322 51,608 32,203 d) Weighted average number of shares/quotas used as the denominator Nine months ended September 30 Three months ended September 30 Number 09/30/2021 Number 09/30/2020 Number 09/30/2021 Number 09/30/2020Weighted average number of ordinary shares/quotas used as the denominator in calculating basicearnings per share/quota: 55,046,091 8,668,412 56,743,195 8,668,412Adjustments for calculation of diluted earnings per share/quota: - - - - Weighted average number of ordinary shares/quotas and potential ordinary shares/quotasused as the denominator in calculating diluted earnings per share/quota 55,046,091 8,668,412 56,743,195 8,668,412
F-38
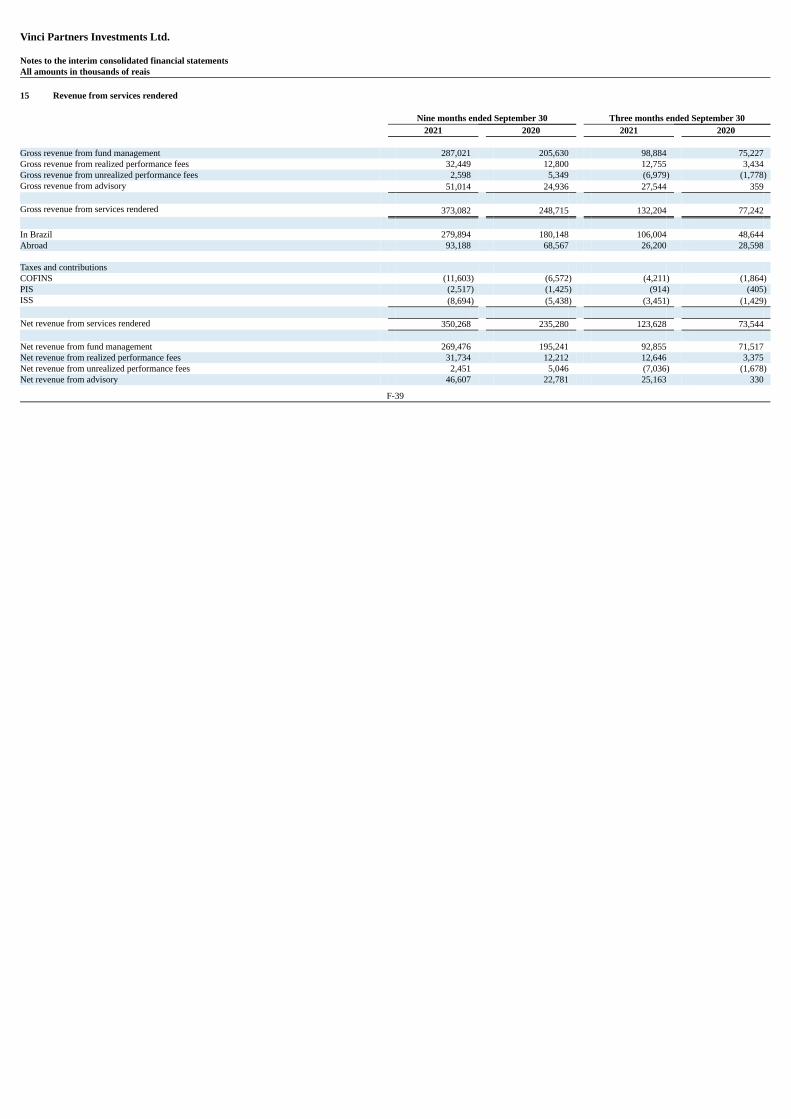
Vinci Partners Investments Ltd. Notes to the interim consolidated financial statementsAll amounts in thousands of reais 15 Revenue from services rendered Nine months ended September 30 Three months ended September 30 2021 2020 2021 2020 Gross revenue from fund management 287,021 205,630 98,884 75,227 Gross revenue from realized performance fees 32,449 12,800 12,755 3,434 Gross revenue from unrealized performance fees 2,598 5,349 (6,979) (1,778)Gross revenue from advisory 51,014 24,936 27,544 359 Gross revenue from services rendered 373,082 248,715 132,204 77,242 In Brazil 279,894 180,148 106,004 48,644 Abroad 93,188 68,567 26,200 28,598 Taxes and contributions COFINS (11,603) (6,572) (4,211) (1,864)PIS (2,517) (1,425) (914) (405)ISS (8,694) (5,438) (3,451) (1,429) Net revenue from services rendered 350,268 235,280 123,628 73,544 Net revenue from fund management 269,476 195,241 92,855 71,517 Net revenue from realized performance fees 31,734 12,212 12,646 3,375 Net revenue from unrealized performance fees 2,451 5,046 (7,036) (1,678)Net revenue from advisory 46,607 22,781 25,163 330
F-39
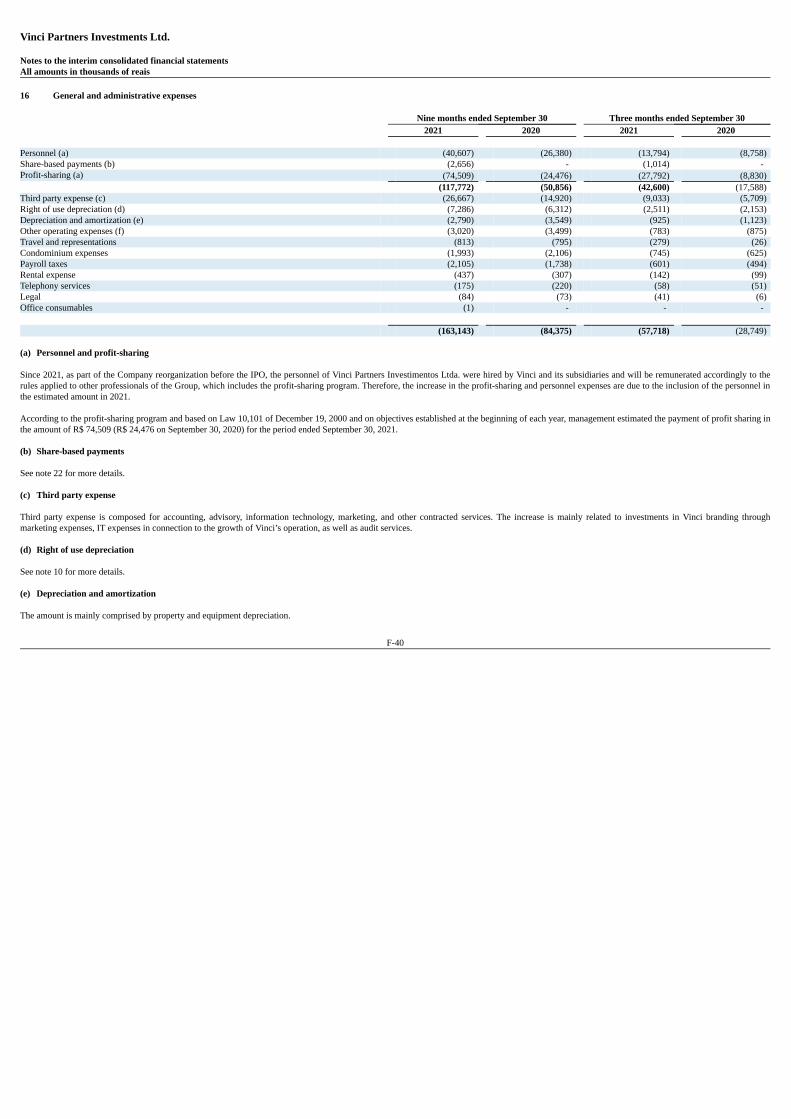
Vinci Partners Investments Ltd. Notes to the interim consolidated financial statementsAll amounts in thousands of reais 16 General and administrative expenses Nine months ended September 30 Three months ended September 30 2021 2020 2021 2020 Personnel (a) (40,607) (26,380) (13,794) (8,758)Share-based payments (b) (2,656) - (1,014) - Profit-sharing (a) (74,509) (24,476) (27,792) (8,830) (117,772) (50,856) (42,600) (17,588)Third party expense (c) (26,667) (14,920) (9,033) (5,709)Right of use depreciation (d) (7,286) (6,312) (2,511) (2,153)Depreciation and amortization (e) (2,790) (3,549) (925) (1,123)Other operating expenses (f) (3,020) (3,499) (783) (875)Travel and representations (813) (795) (279) (26)Condominium expenses (1,993) (2,106) (745) (625)Payroll taxes (2,105) (1,738) (601) (494)Rental expense (437) (307) (142) (99)Telephony services (175) (220) (58) (51)Legal (84) (73) (41) (6)Office consumables (1) - - - (163,143) (84,375) (57,718) (28,749) (a) Personnel and profit-sharing Since 2021, as part of the Company reorganization before the IPO, the personnel of Vinci Partners Investimentos Ltda. were hired by Vinci and its subsidiaries and will be remunerated accordingly to therules applied to other professionals of the Group, which includes the profit-sharing program. Therefore, the increase in the profit-sharing and personnel expenses are due to the inclusion of the personnel inthe estimated amount in 2021. According to the profit-sharing program and based on Law 10,101 of December 19, 2000 and on objectives established at the beginning of each year, management estimated the payment of profit sharing inthe amount of R$ 74,509 (R$ 24,476 on September 30, 2020) for the period ended September 30, 2021. (b) Share-based payments See note 22 for more details. (c) Third party expense Third party expense is composed for accounting, advisory, information technology, marketing, and other contracted services. The increase is mainly related to investments in Vinci branding throughmarketing expenses, IT expenses in connection to the growth of Vinci’s operation, as well as audit services. (d) Right of use depreciation See note 10 for more details. (e) Depreciation and amortization The amount is mainly comprised by property and equipment depreciation.
F-40

Vinci Partners Investments Ltd. Notes to the interim consolidated financial statementsAll amounts in thousands of reais (f) Other operating expenses The amount is mainly comprised by office expenses, including energy, cleaning, maintenance and conservation, among others several expenses. 17 Finance profit/(loss) Nine months ended September 30 Three months ended September 30 2021 2020 2021 2020 Investment income (i) 24,684 4,990 4,636 1,088 Foreign currency variation income 3,583 416 2,522 1 Financial revenue on sublease agreements 181 418 39 120 Other finance income 75 45 13 9 Finance income 28,523 5,869 7,210 1,218 Financial expense on lease agreements (9,328) (9,116) (3,065) (3,004)Bank fees (51) (68) (13) (25)Interest and arrears (80) - - - Investment losses (i) (10,696) (163) (5,252) (127)Fines on taxes (1) - - - Financial expense on liabilities at amortized cost - (203) - (104)Interest on taxes (110) - - - Foreign currency variation expense (4,053) (67) (1,783) (63)Other financial expenses (3) - (3) - Finance costs (24,322) (9,617) (10,116) (3,323) Finance profit/(loss), net 4,201 (3,748) (2,906) (2,105)
(i) Segregated investment income result is demonstrated below: Nine months ended September 30 Three months ended September 30 2021 2020 2021 2020Mutual funds and fixed income investments (*) 23,178 2,021 4,420 463 Private equity funds 1,506 2,963 216 511 Public equities funds - 6 - 114 24,684 4,990 4,636 1,088 Mutual funds (10,649) - (5,254) - Private equity funds (47) (6) 2 (6)Real Estate listed funds - (71) - (35)Public equities funds - (86) - (86) (10,696) (163) (5,252) (127)(*) Includes the financial income on investments in repurchase operations in Brazilian government securities.
F-41
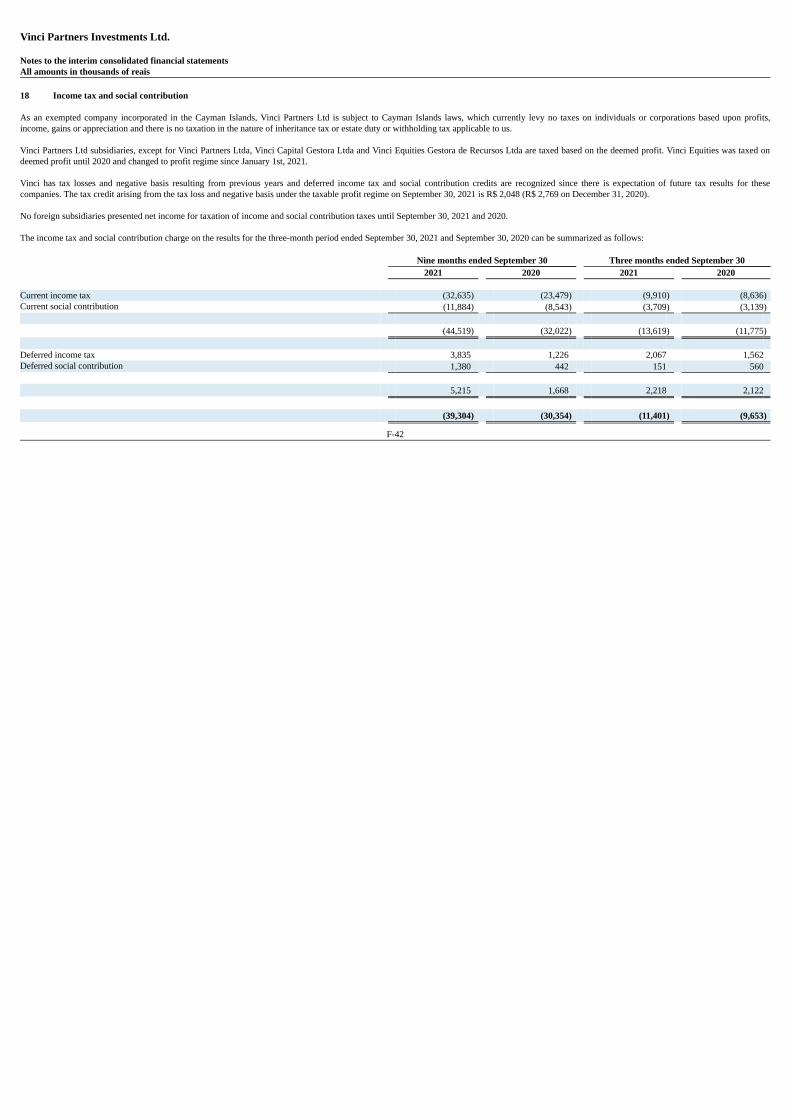
Vinci Partners Investments Ltd. Notes to the interim consolidated financial statementsAll amounts in thousands of reais 18 Income tax and social contribution As an exempted company incorporated in the Cayman Islands, Vinci Partners Ltd is subject to Cayman Islands laws, which currently levy no taxes on individuals or corporations based upon profits,income, gains or appreciation and there is no taxation in the nature of inheritance tax or estate duty or withholding tax applicable to us. Vinci Partners Ltd subsidiaries, except for Vinci Partners Ltda, Vinci Capital Gestora Ltda and Vinci Equities Gestora de Recursos Ltda are taxed based on the deemed profit. Vinci Equities was taxed ondeemed profit until 2020 and changed to profit regime since January 1st, 2021. Vinci has tax losses and negative basis resulting from previous years and deferred income tax and social contribution credits are recognized since there is expectation of future tax results for thesecompanies. The tax credit arising from the tax loss and negative basis under the taxable profit regime on September 30, 2021 is R$ 2,048 (R$ 2,769 on December 31, 2020). No foreign subsidiaries presented net income for taxation of income and social contribution taxes until September 30, 2021 and 2020. The income tax and social contribution charge on the results for the three-month period ended September 30, 2021 and September 30, 2020 can be summarized as follows: Nine months ended September 30 Three months ended September 30 2021 2020 2021 2020 Current income tax (32,635) (23,479) (9,910) (8,636)Current social contribution (11,884) (8,543) (3,709) (3,139) (44,519) (32,022) (13,619) (11,775) Deferred income tax 3,835 1,226 2,067 1,562 Deferred social contribution 1,380 442 151 560 5,215 1,668 2,218 2,122 (39,304) (30,354) (11,401) (9,653)
F-42
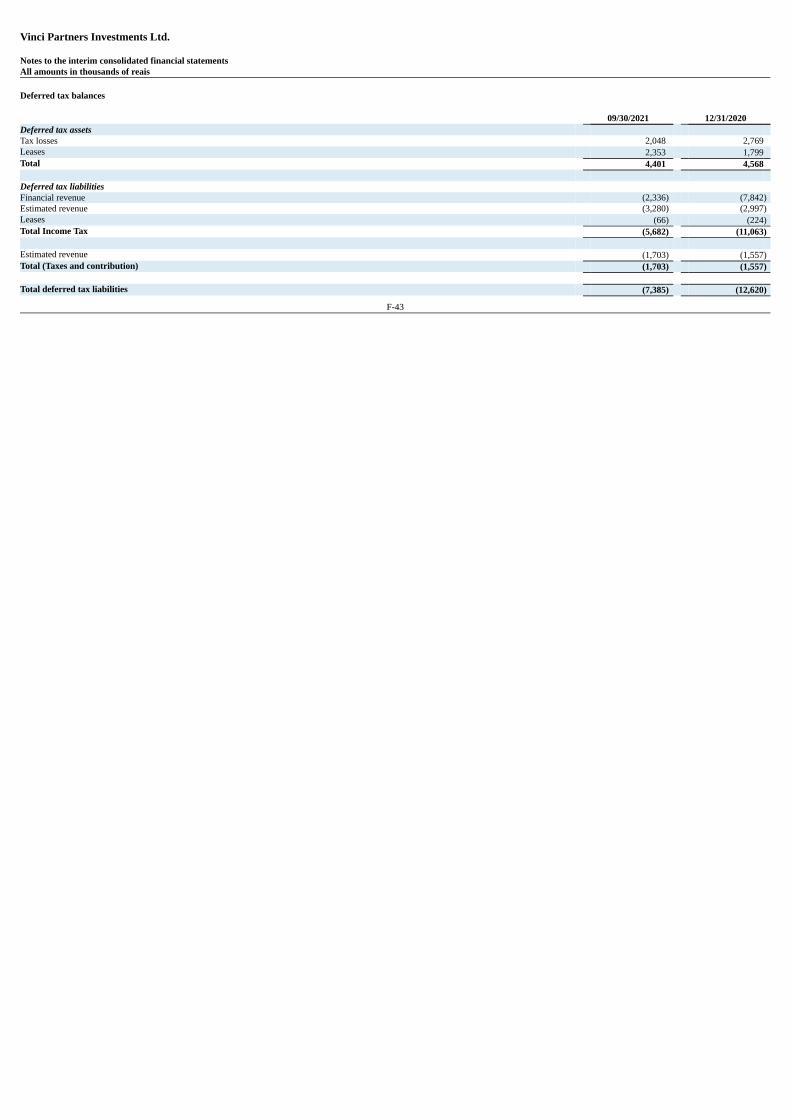
Vinci Partners Investments Ltd. Notes to the interim consolidated financial statementsAll amounts in thousands of reais Deferred tax balances 09/30/2021 12/31/2020Deferred tax assets Tax losses 2,048 2,769 Leases 2,353 1,799 Total 4,401 4,568 Deferred tax liabilities Financial revenue (2,336) (7,842)Estimated revenue (3,280) (2,997)Leases (66) (224)Total Income Tax (5,682) (11,063) Estimated revenue (1,703) (1,557)Total (Taxes and contribution) (1,703) (1,557) Total deferred tax liabilities (7,385) (12,620)
F-43
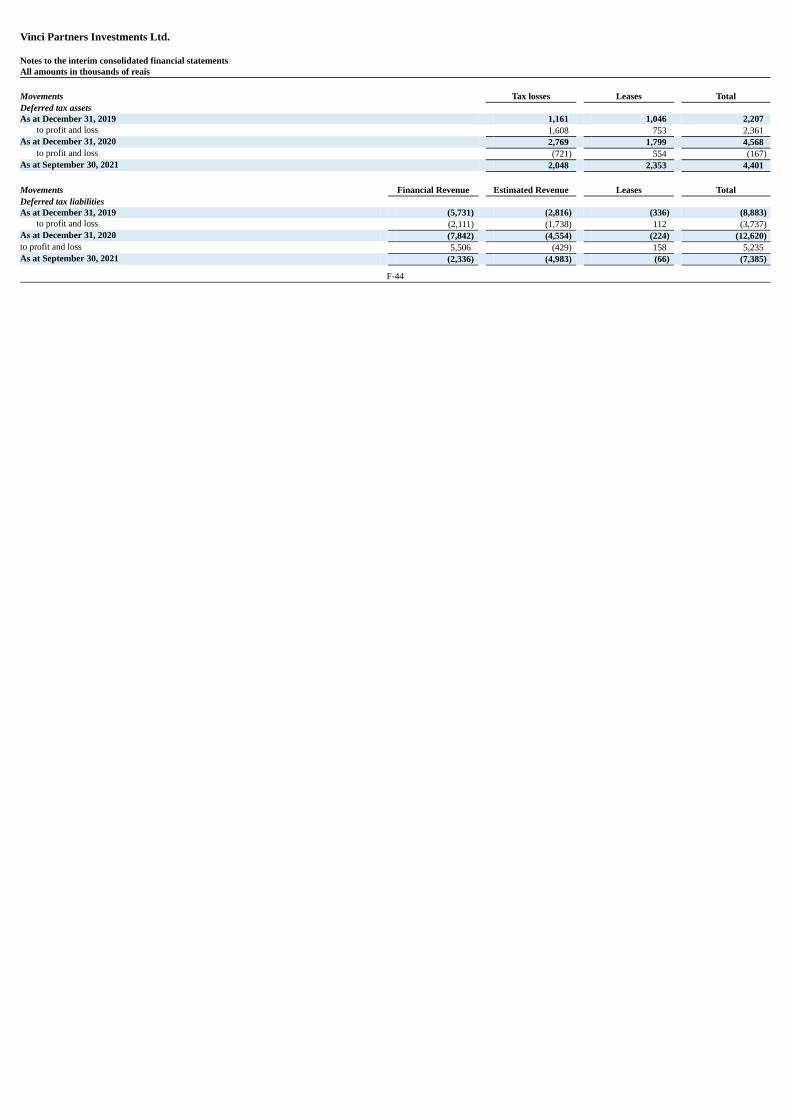
Vinci Partners Investments Ltd. Notes to the interim consolidated financial statementsAll amounts in thousands of reais Movements Tax losses Leases TotalDeferred tax assets As at December 31, 2019 1,161 1,046 2,207
to profit and loss 1,608 753 2,361 As at December 31, 2020 2,769 1,799 4,568
to profit and loss (721) 554 (167)As at September 30, 2021 2,048 2,353 4,401 Movements Financial Revenue Estimated Revenue Leases TotalDeferred tax liabilities As at December 31, 2019 (5,731) (2,816) (336) (8,883)
to profit and loss (2,111) (1,738) 112 (3,737)As at December 31, 2020 (7,842) (4,554) (224) (12,620)to profit and loss 5,506 (429) 158 5,235 As at September 30, 2021 (2,336) (4,983) (66) (7,385)
F-44
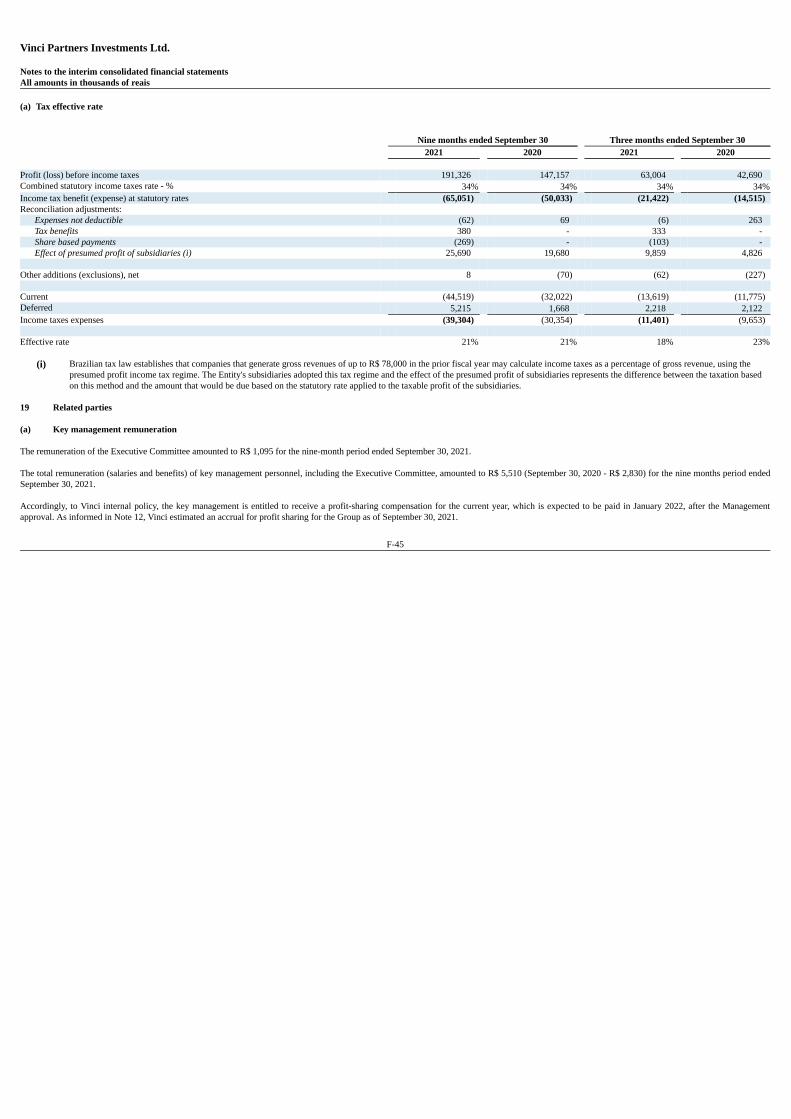
Vinci Partners Investments Ltd. Notes to the interim consolidated financial statementsAll amounts in thousands of reais (a) Tax effective rate Nine months ended September 30 Three months ended September 30 2021 2020 2021 2020 Profit (loss) before income taxes 191,326 147,157 63,004 42,690 Combined statutory income taxes rate - % 34% 34% 34% 34%Income tax benefit (expense) at statutory rates (65,051) (50,033) (21,422) (14,515)Reconciliation adjustments:
Expenses not deductible (62) 69 (6) 263 Tax benefits 380 - 333 - Share based payments (269) - (103) - Effect of presumed profit of subsidiaries (i) 25,690 19,680 9,859 4,826
Other additions (exclusions), net 8 (70) (62) (227) Current (44,519) (32,022) (13,619) (11,775)Deferred 5,215 1,668 2,218 2,122 Income taxes expenses (39,304) (30,354) (11,401) (9,653) Effective rate 21% 21% 18% 23%
(i) Brazilian tax law establishes that companies that generate gross revenues of up to R$ 78,000 in the prior fiscal year may calculate income taxes as a percentage of gross revenue, using thepresumed profit income tax regime. The Entity's subsidiaries adopted this tax regime and the effect of the presumed profit of subsidiaries represents the difference between the taxation basedon this method and the amount that would be due based on the statutory rate applied to the taxable profit of the subsidiaries.
19 Related parties (a) Key management remuneration The remuneration of the Executive Committee amounted to R$ 1,095 for the nine-month period ended September 30, 2021. The total remuneration (salaries and benefits) of key management personnel, including the Executive Committee, amounted to R$ 5,510 (September 30, 2020 - R$ 2,830) for the nine months period endedSeptember 30, 2021. Accordingly, to Vinci internal policy, the key management is entitled to receive a profit-sharing compensation for the current year, which is expected to be paid in January 2022, after the Managementapproval. As informed in Note 12, Vinci estimated an accrual for profit sharing for the Group as of September 30, 2021.
F-45
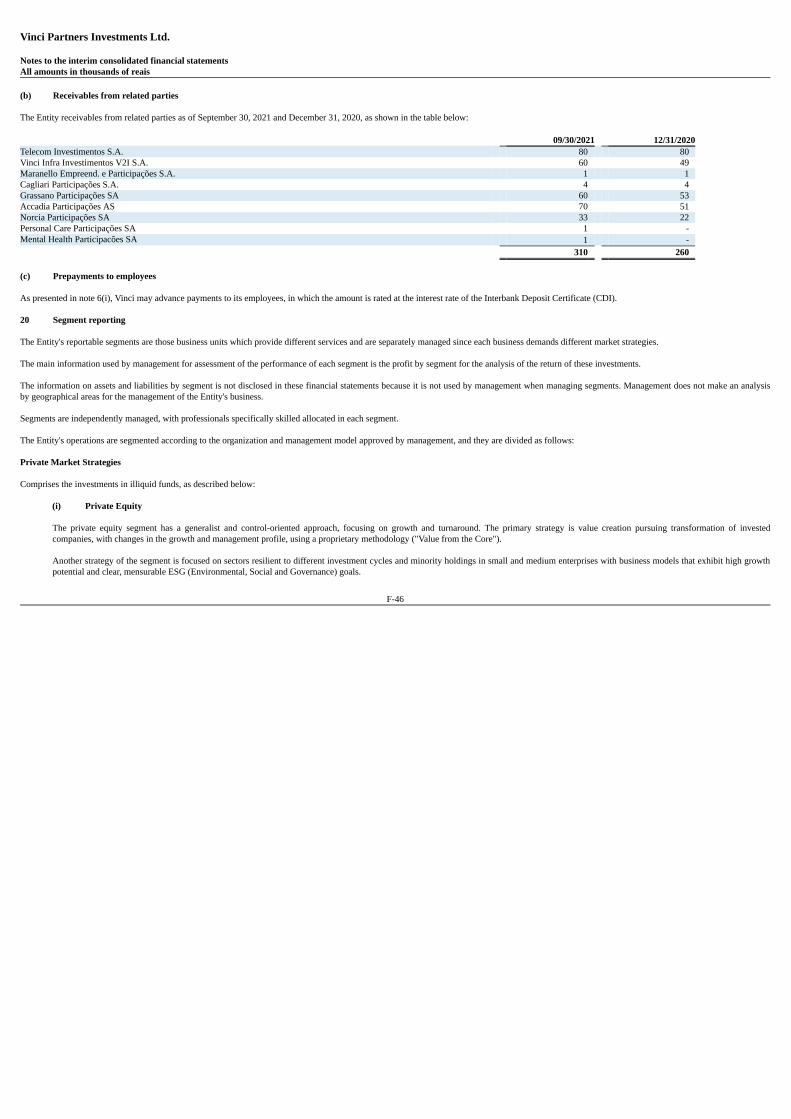
Vinci Partners Investments Ltd. Notes to the interim consolidated financial statementsAll amounts in thousands of reais (b) Receivables from related parties The Entity receivables from related parties as of September 30, 2021 and December 31, 2020, as shown in the table below: 09/30/2021 12/31/2020Telecom Investimentos S.A. 80 80 Vinci Infra Investimentos V2I S.A. 60 49 Maranello Empreend. e Participações S.A. 1 1 Cagliari Participações S.A. 4 4 Grassano Participações SA 60 53 Accadia Participações AS 70 51 Norcia Participações SA 33 22 Personal Care Participações SA 1 - Mental Health Participacões SA 1 - 310 260 (c) Prepayments to employees As presented in note 6(i), Vinci may advance payments to its employees, in which the amount is rated at the interest rate of the Interbank Deposit Certificate (CDI). 20 Segment reporting The Entity's reportable segments are those business units which provide different services and are separately managed since each business demands different market strategies. The main information used by management for assessment of the performance of each segment is the profit by segment for the analysis of the return of these investments. The information on assets and liabilities by segment is not disclosed in these financial statements because it is not used by management when managing segments. Management does not make an analysisby geographical areas for the management of the Entity's business. Segments are independently managed, with professionals specifically skilled allocated in each segment. The Entity's operations are segmented according to the organization and management model approved by management, and they are divided as follows: Private Market Strategies Comprises the investments in illiquid funds, as described below:
(i) Private Equity
The private equity segment has a generalist and control-oriented approach, focusing on growth and turnaround. The primary strategy is value creation pursuing transformation of investedcompanies, with changes in the growth and management profile, using a proprietary methodology ("Value from the Core"). Another strategy of the segment is focused on sectors resilient to different investment cycles and minority holdings in small and medium enterprises with business models that exhibit high growthpotential and clear, mensurable ESG (Environmental, Social and Governance) goals.
F-46
Vinci Partners Investments Ltd. Notes to the interim consolidated financial statementsAll amounts in thousands of reais
(ii) Real Estate
The Real Estate Investment Funds (FIIs) segment focused on mature assets and co-investment alongside a large global pension fund seeking returns from investments in various segments, such asmalls and logistics. (iii) Infrastructure
The infrastructure segment has exposure to real assets through equity and debt instruments, with active in the following sub-segments: power, oil & gas, transportation & logistic and water &sewage. (iv) Credit
This credit segment is focused on fundamental credit analysis, consistency, and long-term value creation to investors. The area dynamic approach is to tactically allocate capital between assetsclasses and adapt to different cycles. It is also sourcing of credit instruments with resilient structures and sound collateral packages.
Liquid Strategies Comprises the investments in liquid funds, as described below:
(i) Hedge Funds
The hedge fund segment manages funds though Brazilian and international financial instruments such as stock, credit, interest, foreign exchange and commodities. Monitoring and risk control arebased on different techniques such as: use of options for high conviction trades, monitoring liquidity conditions for each position, VaR monitoring, scenarios simulations (including stress test), stop lossrules on individual positions and on the portfolio level. (ii) Public equities
The public equities segment manages long-term positions based on fundamental analysis of Brazilian publicly traded companies. The mains strategy is through absolute return, dividends, and smallcaps.
Investment products and solutions Investment products and solutions segments offer financial products on an open platform basis providing portfolio and management services considering medium/long term risk allocation. Financial advisory services The financial advisory services objective is including high value-added to financial and strategic advisory services to entrepreneurs, corporate senior management teams and boards of directors, focusingprimarily on IPO advisory and M&A transactions.
F-47
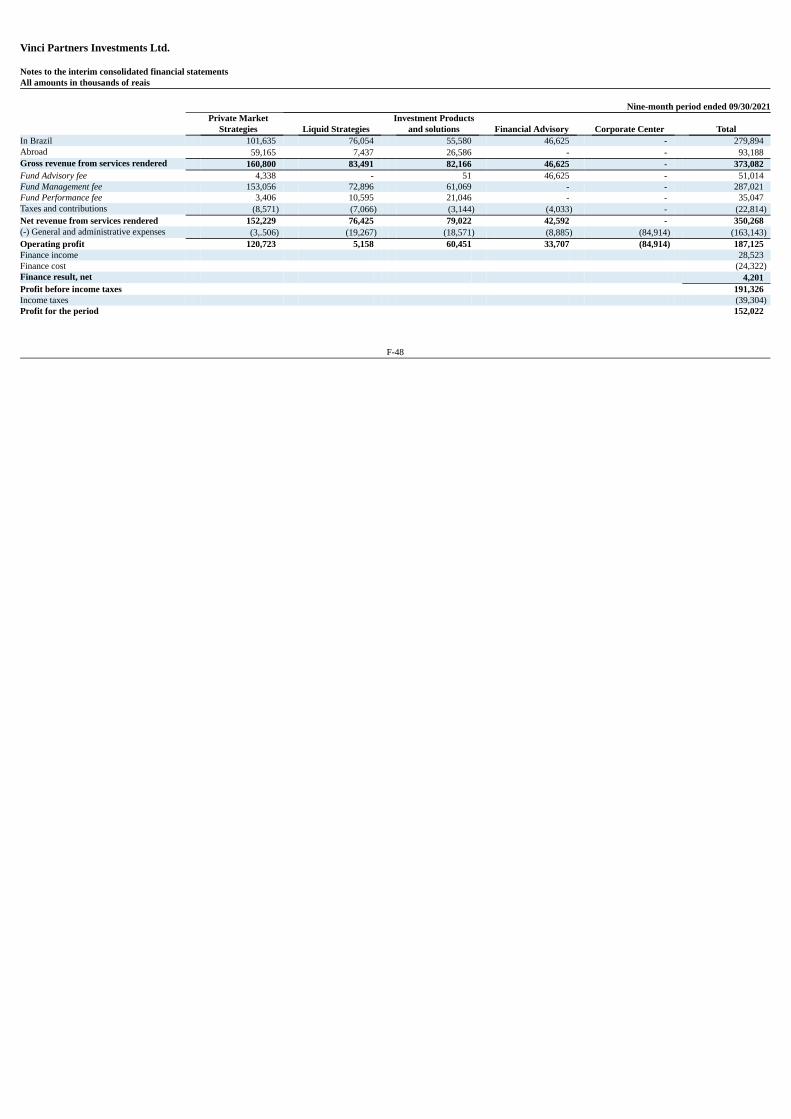
Vinci Partners Investments Ltd. Notes to the interim consolidated financial statementsAll amounts in thousands of reais Nine-month period ended 09/30/2021
Private Market
Strategies Liquid Strategies Investment Products
and solutions Financial Advisory Corporate Center TotalIn Brazil 101,635 76,054 55,580 46,625 - 279,894 Abroad 59,165 7,437 26,586 - - 93,188 Gross revenue from services rendered 160,800 83,491 82,166 46,625 - 373,082 Fund Advisory fee 4,338 - 51 46,625 - 51,014 Fund Management fee 153,056 72,896 61,069 - - 287,021 Fund Performance fee 3,406 10,595 21,046 - - 35,047 Taxes and contributions (8,571) (7,066) (3,144) (4,033) - (22,814)Net revenue from services rendered 152,229 76,425 79,022 42,592 - 350,268 (-) General and administrative expenses (3,.506) (19,267) (18,571) (8,885) (84,914) (163,143)Operating profit 120,723 5,158 60,451 33,707 (84,914) 187,125 Finance income 28,523 Finance cost (24,322)Finance result, net 4,201 Profit before income taxes 191,326 Income taxes (39,304)Profit for the period 152,022
F-48

Vinci Partners Investments Ltd. Notes to the interim consolidated financial statementsAll amounts in thousands of reais Three-month period ended 09/30/2021
Private Market
Strategies Liquid Strategies Investment Products
and solutions Financial Advisory Corporate Center TotalIn Brazil 34,859 25,297 19,212 26,636 - 106,004 Abroad 18,801 2,047 5,352 - - 26,200 Gross revenue from services rendered 53,660 27,344 24,564 26,636 - 132,204 Fund Advisory fee 900 - 8 26,636 - 27,544 Fund Management fee 51,741 25,617 21,526 - - 98,884 Fund Performance fee 1,019 1,727 3,030 - - 5,776 Taxes and contributions (2,818) (2,382) (1,072) (2,304) - (8,576)Net revenue from services rendered 50,842 24,962 23,492 24,332 - 123,628 (-) General and administrative expenses (12,412) (6,544) (5,353) (3,138) (30,271) (57,718)Operating profit 38,430 18,418 18,139 21,194 (30,271) 65,910 Finance income 7,210 Finance cost (10,116)Finance result, net (2,906)Profit before income taxes 63,004 Income taxes (11,401)Profit for the period 51,603
F-49
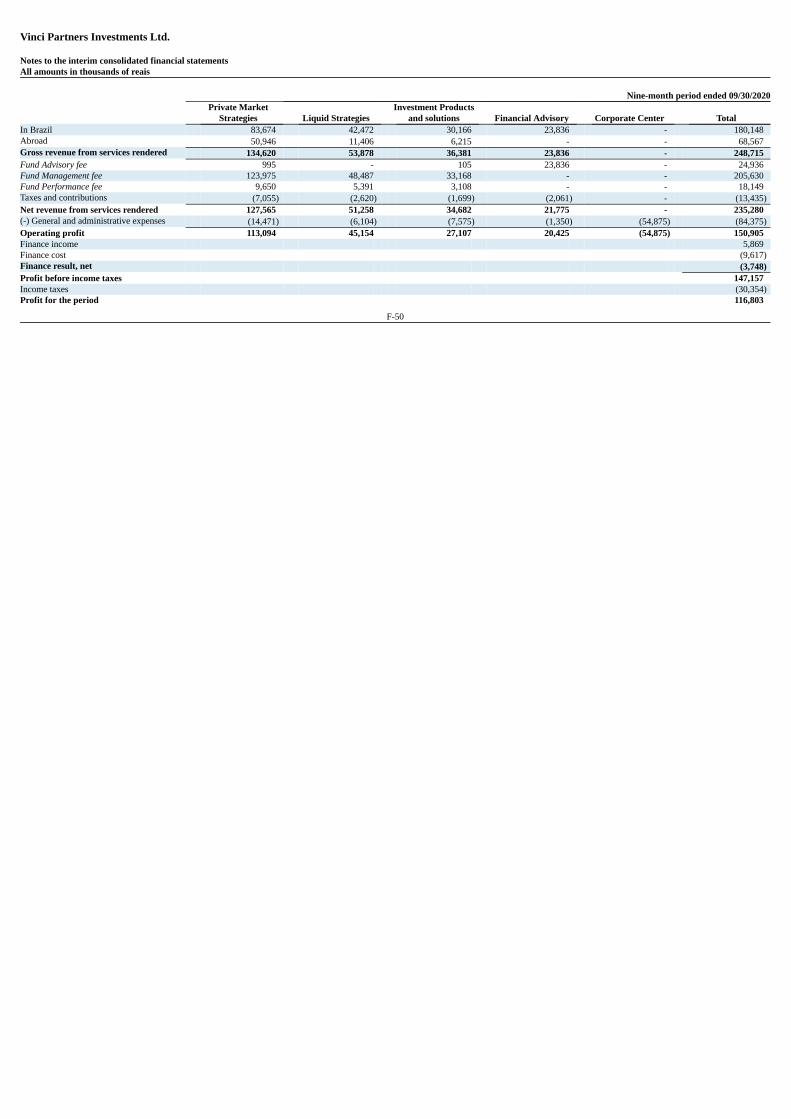
Vinci Partners Investments Ltd. Notes to the interim consolidated financial statementsAll amounts in thousands of reais Nine-month period ended 09/30/2020
Private Market
Strategies Liquid Strategies Investment Products
and solutions Financial Advisory Corporate Center TotalIn Brazil 83,674 42,472 30,166 23,836 - 180,148 Abroad 50,946 11,406 6,215 - - 68,567 Gross revenue from services rendered 134,620 53,878 36,381 23,836 - 248,715 Fund Advisory fee 995 - 105 23,836 - 24,936 Fund Management fee 123,975 48,487 33,168 - - 205,630 Fund Performance fee 9,650 5,391 3,108 - - 18,149 Taxes and contributions (7,055) (2,620) (1,699) (2,061) - (13,435)Net revenue from services rendered 127,565 51,258 34,682 21,775 - 235,280 (-) General and administrative expenses (14,471) (6,104) (7,575) (1,350) (54,875) (84,375)Operating profit 113,094 45,154 27,107 20,425 (54,875) 150,905 Finance income 5,869 Finance cost (9,617)Finance result, net (3,748)Profit before income taxes 147,157 Income taxes (30,354)Profit for the period 116,803
F-50
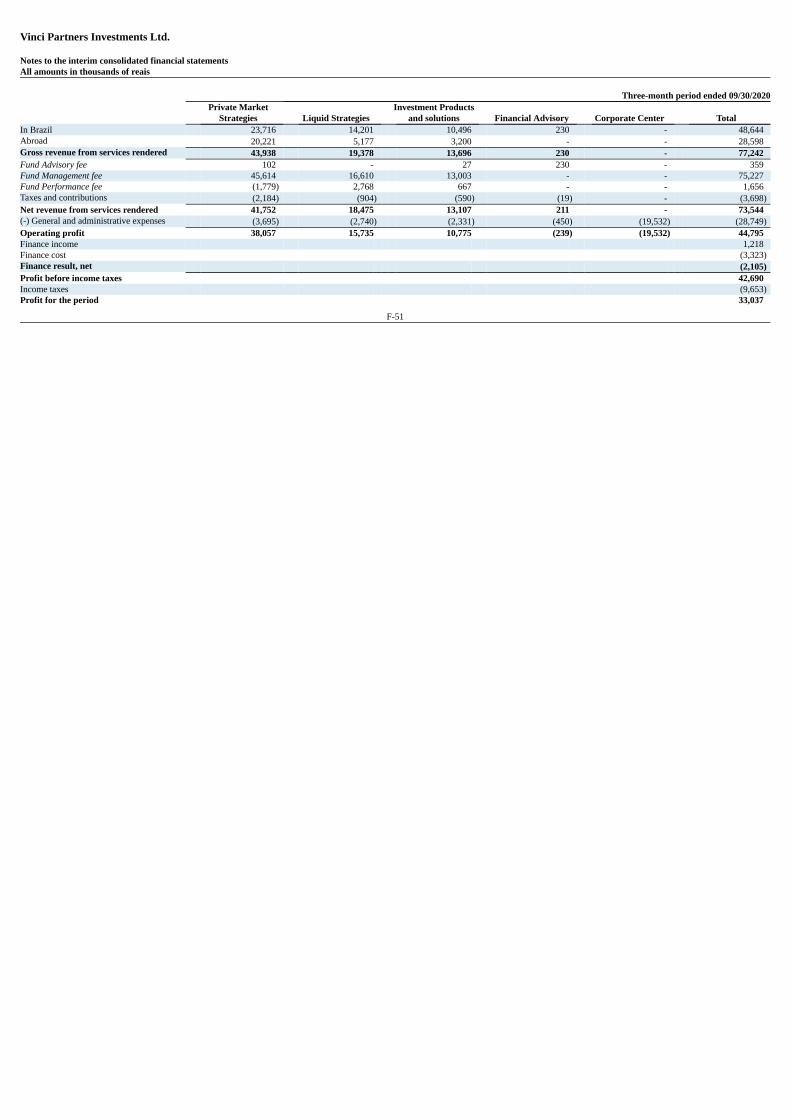
Vinci Partners Investments Ltd. Notes to the interim consolidated financial statementsAll amounts in thousands of reais Three-month period ended 09/30/2020
Private Market
Strategies Liquid Strategies Investment Products
and solutions Financial Advisory Corporate Center TotalIn Brazil 23,716 14,201 10,496 230 - 48,644 Abroad 20,221 5,177 3,200 - - 28,598 Gross revenue from services rendered 43,938 19,378 13,696 230 - 77,242 Fund Advisory fee 102 - 27 230 - 359 Fund Management fee 45,614 16,610 13,003 - - 75,227 Fund Performance fee (1,779) 2,768 667 - - 1,656 Taxes and contributions (2,184) (904) (590) (19) - (3,698)Net revenue from services rendered 41,752 18,475 13,107 211 - 73,544 (-) General and administrative expenses (3,695) (2,740) (2,331) (450) (19,532) (28,749)Operating profit 38,057 15,735 10,775 (239) (19,532) 44,795 Finance income 1,218 Finance cost (3,323)Finance result, net (2,105)Profit before income taxes 42,690 Income taxes (9,653)Profit for the period 33,037
F-51
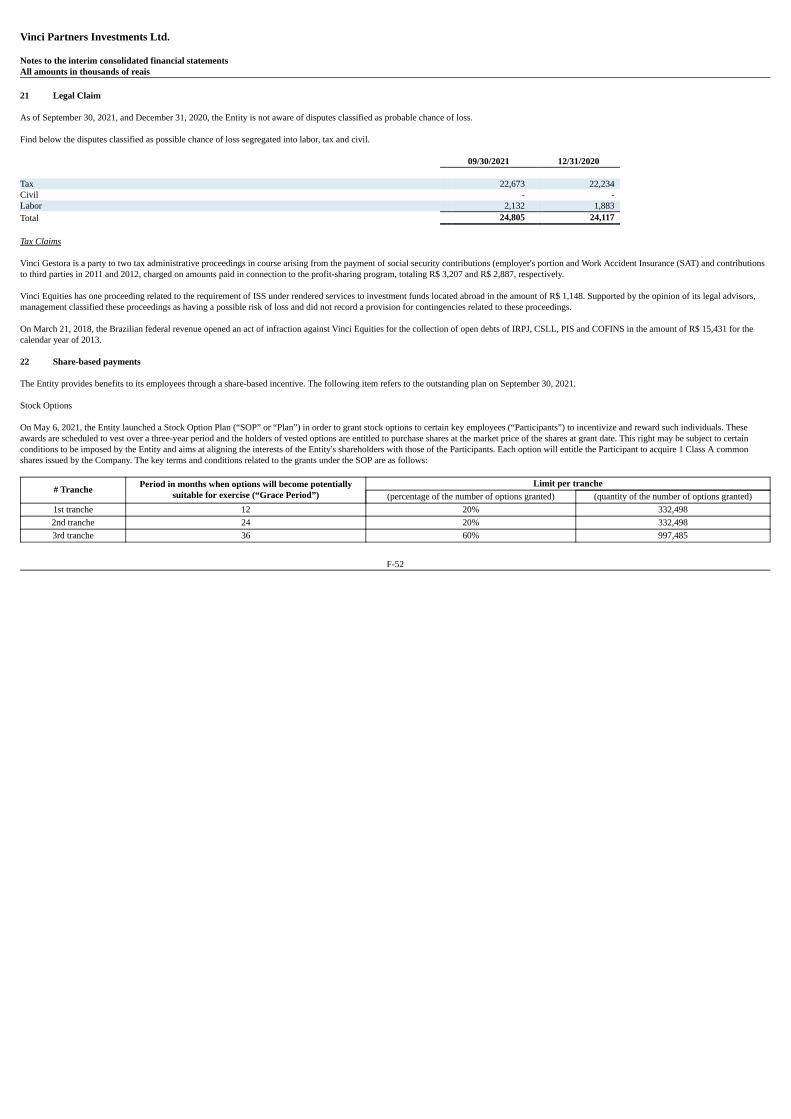
Vinci Partners Investments Ltd. Notes to the interim consolidated financial statementsAll amounts in thousands of reais 21 Legal Claim As of September 30, 2021, and December 31, 2020, the Entity is not aware of disputes classified as probable chance of loss. Find below the disputes classified as possible chance of loss segregated into labor, tax and civil.
09/30/2021 12/31/2020 Tax 22,673 22,234 Civil - - Labor 2,132 1,883 Total 24,805 24,117 Tax Claims Vinci Gestora is a party to two tax administrative proceedings in course arising from the payment of social security contributions (employer's portion and Work Accident Insurance (SAT) and contributionsto third parties in 2011 and 2012, charged on amounts paid in connection to the profit-sharing program, totaling R$ 3,207 and R$ 2,887, respectively. Vinci Equities has one proceeding related to the requirement of ISS under rendered services to investment funds located abroad in the amount of R$ 1,148. Supported by the opinion of its legal advisors,management classified these proceedings as having a possible risk of loss and did not record a provision for contingencies related to these proceedings. On March 21, 2018, the Brazilian federal revenue opened an act of infraction against Vinci Equities for the collection of open debts of IRPJ, CSLL, PIS and COFINS in the amount of R$ 15,431 for thecalendar year of 2013.
22 Share-based payments The Entity provides benefits to its employees through a share-based incentive. The following item refers to the outstanding plan on September 30, 2021. Stock Options On May 6, 2021, the Entity launched a Stock Option Plan (“SOP” or “Plan”) in order to grant stock options to certain key employees (“Participants”) to incentivize and reward such individuals. Theseawards are scheduled to vest over a three-year period and the holders of vested options are entitled to purchase shares at the market price of the shares at grant date. This right may be subject to certainconditions to be imposed by the Entity and aims at aligning the interests of the Entity's shareholders with those of the Participants. Each option will entitle the Participant to acquire 1 Class A commonshares issued by the Company. The key terms and conditions related to the grants under the SOP are as follows:
# Tranche Period in months when options will become potentiallysuitable for exercise (“Grace Period”)
Limit per tranche(percentage of the number of options granted) (quantity of the number of options granted)
1st tranche 12 20% 332,4982nd tranche 24 20% 332,4983rd tranche 36 60% 997,485
F-52
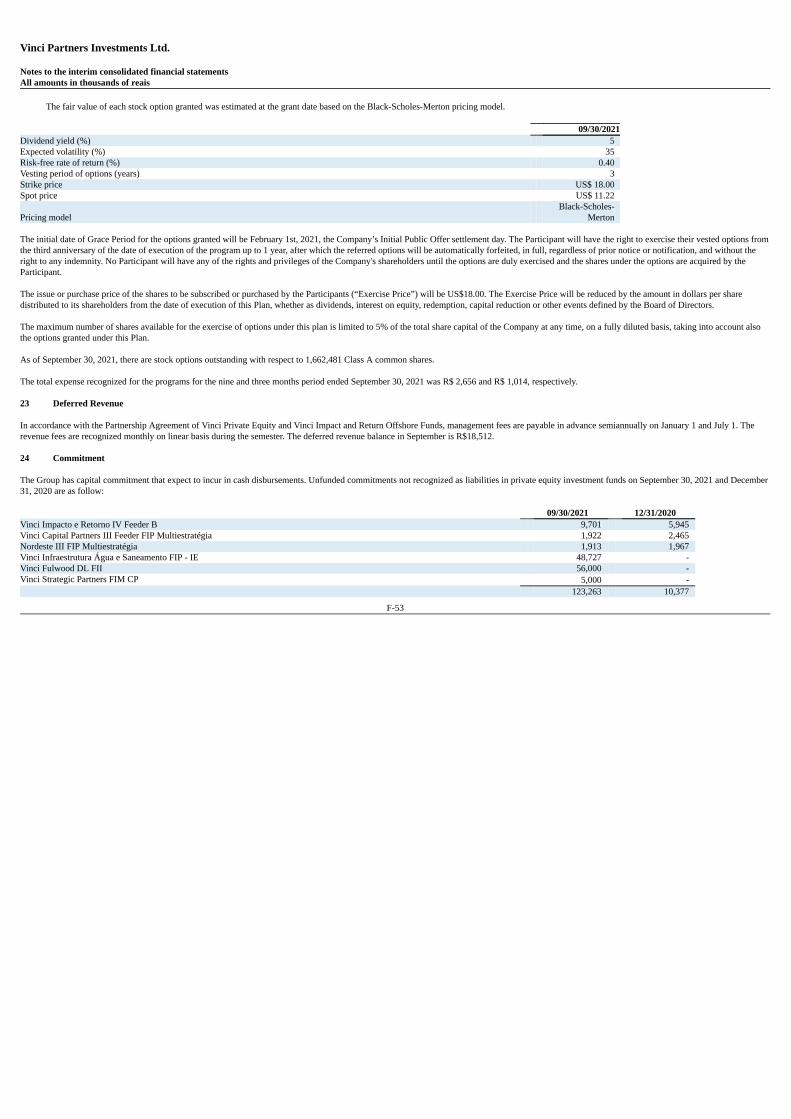
Vinci Partners Investments Ltd. Notes to the interim consolidated financial statementsAll amounts in thousands of reais
The fair value of each stock option granted was estimated at the grant date based on the Black-Scholes-Merton pricing model.
09/30/2021Dividend yield (%) 5 Expected volatility (%) 35 Risk-free rate of return (%) 0.40 Vesting period of options (years) 3 Strike price US$ 18.00 Spot price US$ 11.22
Pricing model Black-Scholes-
Merton
The initial date of Grace Period for the options granted will be February 1st, 2021, the Company’s Initial Public Offer settlement day. The Participant will have the right to exercise their vested options fromthe third anniversary of the date of execution of the program up to 1 year, after which the referred options will be automatically forfeited, in full, regardless of prior notice or notification, and without theright to any indemnity. No Participant will have any of the rights and privileges of the Company's shareholders until the options are duly exercised and the shares under the options are acquired by theParticipant. The issue or purchase price of the shares to be subscribed or purchased by the Participants (“Exercise Price”) will be US$18.00. The Exercise Price will be reduced by the amount in dollars per sharedistributed to its shareholders from the date of execution of this Plan, whether as dividends, interest on equity, redemption, capital reduction or other events defined by the Board of Directors. The maximum number of shares available for the exercise of options under this plan is limited to 5% of the total share capital of the Company at any time, on a fully diluted basis, taking into account alsothe options granted under this Plan. As of September 30, 2021, there are stock options outstanding with respect to 1,662,481 Class A common shares. The total expense recognized for the programs for the nine and three months period ended September 30, 2021 was R$ 2,656 and R$ 1,014, respectively.
23 Deferred Revenue In accordance with the Partnership Agreement of Vinci Private Equity and Vinci Impact and Return Offshore Funds, management fees are payable in advance semiannually on January 1 and July 1. Therevenue fees are recognized monthly on linear basis during the semester. The deferred revenue balance in September is R$18,512.
24 Commitment The Group has capital commitment that expect to incur in cash disbursements. Unfunded commitments not recognized as liabilities in private equity investment funds on September 30, 2021 and December31, 2020 are as follow:
09/30/2021 12/31/2020Vinci Impacto e Retorno IV Feeder B 9,701 5,945 Vinci Capital Partners III Feeder FIP Multiestratégia 1,922 2,465 Nordeste III FIP Multiestratégia 1,913 1,967 Vinci Infraestrutura Água e Saneamento FIP - IE 48,727 - Vinci Fulwood DL FII 56,000 - Vinci Strategic Partners FIM CP 5,000 - 123,263 10,377
F-53

Vinci Partners Investments Ltd. Notes to the interim consolidated financial statementsAll amounts in thousands of reais 25 Subsequent Events Accordingly to the Repurchased Program (Note 14(b)), from October 1, 2021 to November 04, 2021, 101,152 Class A common shares were repurchased by the Entity, in the amount of R$ 7,434.
F-54