initiating coverage buy - baroda e-trade
TRANSCRIPT
INITIATING COVERAGE
BOB Capital Markets Ltd is a wholly owned subsidiary of Bank of Baroda
Important disclosures, including any required research certifications, are provided at the end of this report.
BUY
TP: Rs 2,185 45% ZYDUS WELLNESS | Consumer Staples | 14 March 2022
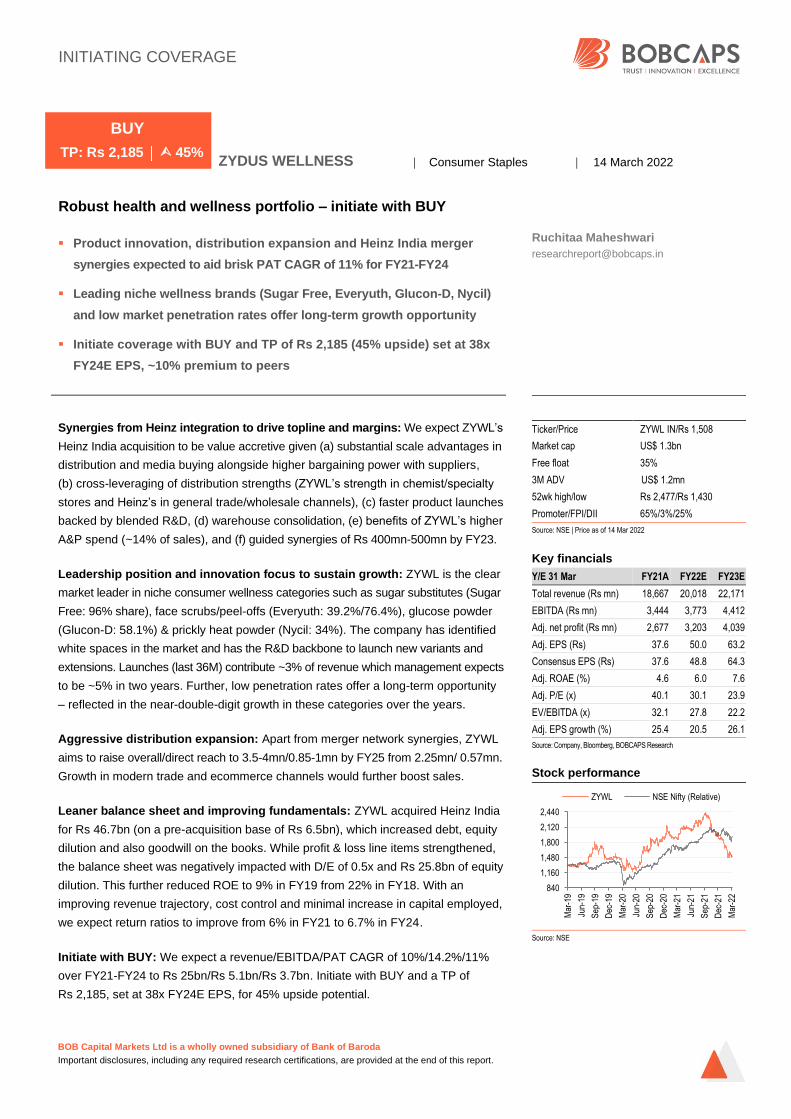
Robust health and wellness portfolio – initiate with BUY
▪ Product innovation, distribution expansion and Heinz India merger
synergies expected to aid brisk PAT CAGR of 11% for FY21-FY24
Ruchitaa Maheshwari
Ticker/Price ZYWL IN/Rs 1,508
Market cap US$ 1.3bn
Free float 35%
3M ADV US$ 1.2mn
52wk high/low Rs 2,477/Rs 1,430
Promoter/FPI/DII 65%/3%/25%
Source: NSE | Price as of 14 Mar 2022
Key financials
Y/E 31 Mar FY21A FY22E FY23E
Total revenue (Rs mn) 18,667 20,018 22,171
EBITDA (Rs mn) 3,444 3,773 4,412
Adj. net profit (Rs mn) 2,677 3,203 4,039
Adj. EPS (Rs) 37.6 50.0 63.2
Consensus EPS (Rs) 37.6 48.8 64.3
Adj. ROAE (%) 4.6 6.0 7.6
Adj. P/E (x) 40.1 30.1 23.9
EV/EBITDA (x) 32.1 27.8 22.2
Adj. EPS growth (%) 25.4 20.5 26.1
Source: Company, Bloomberg, BOBCAPS Research
Stock performance
Source: NSE
▪ Leading niche wellness brands (Sugar Free, Everyuth, Glucon-D, Nycil)
and low market penetration rates offer long-term growth opportunity
▪ Initiate coverage with BUY and TP of Rs 2,185 (45% upside) set at 38x
FY24E EPS, ~10% premium to peers
Synergies from Heinz integration to drive topline and margins: We expect ZYWL’s
Heinz India acquisition to be value accretive given (a) substantial scale advantages in
distribution and media buying alongside higher bargaining power with suppliers,
(b) cross-leveraging of distribution strengths (ZYWL’s strength in chemist/specialty
stores and Heinz’s in general trade/wholesale channels), (c) faster product launches
backed by blended R&D, (d) warehouse consolidation, (e) benefits of ZYWL’s higher
A&P spend (~14% of sales), and (f) guided synergies of Rs 400mn-500mn by FY23.
Leadership position and innovation focus to sustain growth: ZYWL is the clear
market leader in niche consumer wellness categories such as sugar substitutes (Sugar
Free: 96% share), face scrubs/peel-offs (Everyuth: 39.2%/76.4%), glucose powder
(Glucon-D: 58.1%) & prickly heat powder (Nycil: 34%). The company has identified
white spaces in the market and has the R&D backbone to launch new variants and
extensions. Launches (last 36M) contribute ~3% of revenue which management expects
to be ~5% in two years. Further, low penetration rates offer a long-term opportunity
– reflected in the near-double-digit growth in these categories over the years.
Aggressive distribution expansion: Apart from merger network synergies, ZYWL
aims to raise overall/direct reach to 3.5-4mn/0.85-1mn by FY25 from 2.25mn/ 0.57mn.
Growth in modern trade and ecommerce channels would further boost sales.
Leaner balance sheet and improving fundamentals: ZYWL acquired Heinz India
for Rs 46.7bn (on a pre-acquisition base of Rs 6.5bn), which increased debt, equity
dilution and also goodwill on the books. While profit & loss line items strengthened,
the balance sheet was negatively impacted with D/E of 0.5x and Rs 25.8bn of equity
dilution. This further reduced ROE to 9% in FY19 from 22% in FY18. With an
improving revenue trajectory, cost control and minimal increase in capital employed,
we expect return ratios to improve from 6% in FY21 to 6.7% in FY24.
Initiate with BUY: We expect a revenue/EBITDA/PAT CAGR of 10%/14.2%/11%
over FY21-FY24 to Rs 25bn/Rs 5.1bn/Rs 3.7bn. Initiate with BUY and a TP of
Rs 2,185, set at 38x FY24E EPS, for 45% upside potential.
840
1,160
1,480
1,800
2,120
2,440
Mar
-19
Jun-
19
Sep
-19
Dec
-19
Mar
-20
Jun-
20
Sep
-20
Dec
-20
Mar
-21
Jun-
21
Sep
-21
Dec
-21
Mar
-22
ZYWL NSE Nifty (Relative)

ZYDUS WELLNESS
EQUITY RESEARCH 2 14 March 2022
Contents
Focus charts ..................................................................................................... 3
Investment rationale ......................................................................................... 5
Heinz acquisition to deliver strong synergies ................................................. 5
Established leadership in niche wellness products ........................................ 7
Focus on innovation to drive growth ............................................................... 9
#1 Glucon-D: Growth to be driven by innovation ........................................ 9
#2 Sugar Free: Flagship brand with strong moats .................................... 11
#3 Complan: Deeper penetration, innovation to aid market share ........... 13
#4 Everyuth: Strong brand equity in naturals space ................................. 15
#5 Nutralite: Unlocking brand potential ..................................................... 16
#6 Nycil: Evolving into a skincare brand ................................................... 18
#7 Sampriti Ghee + Dairy: A healthier choice ........................................... 19
Aggressive distribution expansion and rising ecommerce focus ........................ 20
Widening international footprint .................................................................... 21
Financial analysis ........................................................................................... 22
Expect 10% revenue CAGR over FY21-FY24 ............................................. 22
Optically low return ratios ............................................................................. 23
Targeting debt repayment by FY23 .............................................................. 23
Operating cash flow to remain strong ........................................................... 24
Valuation methodology .................................................................................. 26
Key risks .......................................................................................................... 27
Company background .................................................................................... 28

ZYDUS WELLNESS
EQUITY RESEARCH 3 14 March 2022
Focus charts
Fig 1 – Brand-wise revenue breakup, FY20 Fig 2 – Brand-wise revenue breakup, FY21
Source: Company, BOBCAPS Research Source: Company, BOBCAPS Research
Fig 3 – Brand-wise revenue breakup, FY24E Fig 4 – Brand-wise revenue CAGR, FY21-FY24E
Source: Company, BOBCAPS Research Source: Company, BOBCAPS Research
Fig 5 – Sugar substitute market and ZYWL’s share Fig 6 – Face peel-off mask market and ZYWL’s share
Source: Company, Nielsen, Iquiva, BOBCAPS Research Source: Company, BOBCAPS Research
Sugar Free
Everyuth
Complan
Glucon-D
Nycil
Nutralite
Sampriti Ghee+Dairy
Sugar Free
Everyuth
Complan
Glucon-D
Nycil
Nutralite
Sampriti Ghee+Dairy
Sugar Free
Everyuth
Complan
Glucon-D
Nycil
Nutralite
Sampriti Ghee+Dairy Sugar Free
Everyuth
Complan
Glucon-DNycil
Nutralite
Sampriti Ghee+Butter
93%93%
93%94%94%
94%94%
94%95%
2,800
3,000
3,200
3,400
3,600
3,800
4,000
MA
T M
ar-1
7
MA
T M
ar-1
8
MA
T M
ar-1
9
MA
T M
ar-2
0
MA
T D
ec-2
1
(Rs mn) Sugar Substitute Sugar Free market share (R)
72%
74%
76%
78%
80%
82%
84%
86%
88%
0
100
200
300
400
500
600
700
800
900
1,000
MAT Mar-18 MAT Mar-19 MAT Mar-20 MAT Mar-21
(Rs mn) Peel-off Everyuth market share (R)

ZYDUS WELLNESS
EQUITY RESEARCH 4 14 March 2022
Fig 7 – Face scrub market and ZYWL’s share Fig 8 – Health food drink market and ZYWL’s share
Source: Company, BOBCAPS Research Source: Company, BOBCAPS Research
Fig 9 – Glucose powder market and ZYWL’s share Fig 10 – Prickly heat powder market and ZYWL’s share
Source: Company, BOBCAPS Research |
Source: Company, BOBCAPS Research
Fig 11 – Increased market penetration and innovations Fig 12 – Brand market share as on MAT Dec 21’
Source: Company PPT, BOBCAPS Research Source: Company, BOBCAPS Research
30%
31%
32%
33%
34%
35%
36%
37%
1,900
2,000
2,100
2,200
2,300
2,400
2,500
2,600
MAT Mar-18 MAT Mar-19 MAT Mar-20 MAT Mar-21
(Rs mn) Scrubs Everyuth market share (R)
5.0%
5.1%
5.2%
5.3%
5.4%
5.5%
5.6%
5.7%
5.8%
5.9%
6.0%
6.1%
61,500
62,000
62,500
63,000
63,500
64,000
64,500
65,000
65,500
66,000
MAT Mar-19 MAT Mar-20 MAT Mar-21
(Rs mn) HFD Complan market share (R)
58%
58%
58%
58%
59%
59%
59%
59%
59%
60%
0
2,000
4,000
6,000
8,000
10,000
12,000
MAT Mar-19 MAT Mar-20 MAT Mar-21
(Rs mn) Glucose Powder Glucon-D market share (R)
30%
31%
32%
33%
34%
35%
36%
37%
0
1,000
2,000
3,000
4,000
5,000
6,000
7,000
8,000
MAT Mar-19 MAT Mar-20 MAT Mar-21
(Rs mn) Prickly Heat Powder Nycil market share (R)
Note: Across Category is showing decline in FY21 due to inability to capture entire data because of Covid-19 restrictions

ZYDUS WELLNESS
EQUITY RESEARCH 5 14 March 2022
Investment rationale
Heinz acquisition to deliver strong synergies
The acquisition of Heinz India in Jan’19 has significantly enhanced ZYWL’s product
basket, expanding its ownership to popular brands such as Complan (health food drink),
Glucon-D (glucose power) and Nycil (prickly heat powder). The acquisition cost of
Rs 46.7bn was funded through a mix of debt and equity. The deal also included two
large manufacturing units in Aligarh (Uttar Pradesh) and Sitarganj (Uttarakhand), teams
devoted to operations, research, sales, marketing and support, and a network of more
than 800 distributors and 20,000 wholesalers in 29 states. Management estimates the
merger will fuel synergies to the tune of Rs 400mn-500mn by FY23.
On the flip side, the acquisition has brought seasonality into the portfolio with Nycil and
Glucon-D, which contribute 35-40% of revenue, being summer-centric products with
>80% of sales coming during the months of March-June.
Fig 13 – ZYWL’s product portfolio post Heinz India acquisition
Source: Company, BOBCAPS Research | Data for 12M ended 30 Jun 2018
Fig 14 – Source of funds for acquisition of Heinz India’s consumer business
Investor Source of Funds Investment (Rs bn) % of Acquisition cost
Cadila Healthcare Equity 11.75 25
Zydus Family Trust Equity 3.00 6
True North Equity 10.00 21
Pioneer Investment Fund Equity 1.00 2
9.14% secured, Redeemable NCDs Debt 15.00 32
Internal Accruals Cash 5.95 13
Source: Company, BOBCAPS Research

ZYDUS WELLNESS
EQUITY RESEARCH 6 14 March 2022
Fig 15 – Acquisition structuring
Source: Company, BOBCAPS Research
Heinz portfolio had lost ground due to lack of focus and innovation
Owing to the erstwhile parent company’s lack of focus on Indian operations, Heinz India
had reported subdued revenue and margins for the last 5-6 years, besides losing
product market share. For instance, Complan’s share has slipped from 10% to 5.5%
over the last five years. Nycil’s market share also declined from 45% in the early 2000s
to 32% in FY19. These losses were primarily due to the absence of product innovation
in the face of changing consumer demands.
Fig 16 – Heinz India’s growth metrics
Y/E March (%) FY14 FY15 FY16 FY17 FY18
Revenues (6.6) 9.6 (10.0) 1.7 (7.3)
EBITDA (44.3) 79.7 18.7 (24.2) (47.0)
PAT (26.8) 30.2 10.4 (20.2) (47.9)
EPS (26.8) 30.2 10.4 (21.6) (50.0)
Source: Company, BOBCAPS Research
Synergy benefits to reinvigorate existing and acquired brands
Following the acquisition, ZYWL has transformed Heinz India’s sales profile from a
season-neutral pharmacy-oriented network with pan-India distribution to a summer-
oriented general trade & pharmacy network with high concentration in East India. Its
average customer age has also reduced from 25+ years to 15+ years. We expect the
company to turn season-neutral soon given ZYWL’s innovation focus and R&D
capabilities. Further, the average penetration level of all portfolio brands now stands at
~20%, which we believe offers high visibility for volume growth.
Merger enriches portfolio and offers advantages of scale: At the time of the
acquisition in early 2019, ZYWL’s core business had revenue of Rs 5bn from its
Sugar Free (sugar substitute), Nutralite (dairy spread) and Everyuth (skincare)
brands. The deal enabled the company to diversify its product profile with the
addition of glucose powder Glucon-D, health drink Complan, prickly heat power
Nycil, and dairy product Sampriti Ghee, having combined annual revenue of
Rs 11.5bn at the time.
ZYDUS WELLNESS
EQUITY RESEARCH 7 14 March 2022
These brands continue to have a healthy market position and high brand recall.
Their revenue and operating margins have also improved significantly in FY20. We
believe the acquisition has doubled the size of the core business, thus providing
significant economies of scale, including better bargaining power with distributors
and savings on media buying.
Cross-leveraging of distribution network to expand product availability: The
acquired brands will benefit from ZYWL’s well-diversified cosmetic and pharma
distribution channel (direct access to nearly three-fourths of domestic chemist
stores in the country). Own brands will similarly benefit from Heinz’s general trade
(GT) channel. Moreover, ZYWL is focused on widening direct distribution coverage
under its go-to-market programme, Project Vistaar, wherein it aims to increase
overall reach from 2.25mn to 3.5mn-4mn and direct reach from 0.57mn to 0.85mn-
1mn by FY25.
The company has begun leveraging its expanded network via the launch of
‘Complan Nutrigro’ – a health drink for toddlers over the age of two. The product is
focused on doctor and pharmacy channel recommendations. ZYWL also aims to
regain the lost medical connect and market share of the original Complan brand
that targets children over the age of two and adults.
Acceleration of product launches: The company has been proactively launching
new product variants and is working to scale up acquired brands so as to capitalise
on portfolio synergies. For instance, recent brand extensions include Glucon-D
ImmunoVolt, Complan Nutrigro and Nutralite Chocospread.
Established leadership in niche wellness products
ZYWL is the undisputed market leader (as on Dec’21) in Sugar Free (96.0% share),
Everyuth face scrubs/peel-offs (39.2%/76.4%), Glucon-D (58.1%) and Nycil (34%). The
integration of Heinz India has not only broadened the portfolio with the addition of
popular, household brands and widened the addressable market, but also curbed
revenue concentration. We believe the company’s product innovation focus and strong
distribution coupled with low penetration of wellness categories in India offers a
significant long-term opportunity, as reflected in the near-double-digit growth in these
categories over the years.
Prior to the Heinz deal, ZYWL’s flagship Sugar Free brand contributed over 65% of
revenues (FY18). Post-acquisition, Sugar Free’s contribution to sales has come down to
~18% (FY21), with the newly added Glucon-D and Complan brands leading the way at
26% and 21% respectively. Personal care offerings Nycil (acquired) and Everyuth (own)
form 12% and 7% of sales respectively, while Nutralite contributes ~8%.

ZYDUS WELLNESS
EQUITY RESEARCH 8 14 March 2022
Fig 17 – Brand revenue and analysis
Brand Revenue
Share FY21 (%)
Revenue Share FY21
(Rs mn)
Retail Penetration
(%)
Market Share FY21 (%)
Key Competitors Future Strategy Seasonality
Sugar
Free ~18 3,267 12 93.6
Sweet & Healthy (Wipro),
Kaloree (Mankind), Splenda
(Heartland Food Products),
Equal (Merisant)
Distribution expansion through Heinz India’s wide general network
International expansion
Launch of new product variants
Non-seasonal
Everyuth 7 1,307 20
Peel off: 77.9
Scrub: 35.8
Facial: 6.1
Ponds (HUL), Fair & Lovely
(HUL), Nivea (Nivea), Garnier
(Loreal), Biotique (Bioveda
Action Research), Himalaya
(Himalaya Drug Co), Lotus
(Lotus Herbals)
Synergy from GT distribution network
Launch of new products
International expansion to newer geographies
Non-seasonal
Nutralite ~8 1,400 15 NA Amul, Britannia, Delicious
Launch of new product variants
Volume growth focus
Non-seasonal
Glucon D 26 4,853 12 58.4 Glucose D (Dabur), GlucoVita
(Wipro)
Reduce seasonality through launch of new products
Seasonal with 80% revenue in Summer
Complan 21 3,920 24 5.5
Horlicks – 44%, Boost 11%
(GSK/HUL), Bournvita – 15%
(Mondelez)
Launch of new variants backed by R&D team
Distribution synergies – pharmacy channels
Pan-India focus
Seasonal with 90% revenue in Summer
Nycil 12 2,240 15 35.8
Boroplus (Emami),
Dermicool (RB), Shower to
Shower (ITC)
Reduce seasonality through launch of winter products
Can create a Nycil mother brand
Seasonal with 90% revenue in Summer
Sampriti
Ghee +
Dairy
~9 1,680 NA NA
Highly fragmented market
with only 2 players holding
>10% market share
Multiple growth drivers include expansion of the retail channel and innovating through value-added dairy launches
Non-Seasonal
Source: Amazon, Flipkart, BOBCAPS Research
Fig 18 – Low retail penetration across brands provides large growth opportunity
Source: Company, BOBCAPS Research
0%
5%
10%
15%
20%
25%
30%
Sugar Free Everyuth Nutralite Nycil Glucon-D Complan

ZYDUS WELLNESS
EQUITY RESEARCH 9 14 March 2022
Focus on innovation to drive growth
The scope and ability to frequently launch product variants and extensions serves as a
key growth driver in the consumer wellness category. Over the last 2-3 years, ZYWL
has ramped up its existing portfolio with launches such as Sugar Free Green and
SugarLite in artificial sweeteners, entry into tan removal and face wash in the Everyuth
facial care segment, and introduction of mayonnaise in the Nutralite spreads segment.
In all, ZYWL rolled out 11 new products during FY21. We see further potential for
growth in products such as (1) Glucon-D (the company has been relentlessly offering
innovative products around immunity boosting), (2) Nutralite (providing low calorie and
healthy alternatives to table margarine), (3) Nycil (master brand in skincare category),
and (4) Complan (addressing white spaces in the segment to gain market share).
The company’s brand recall and market leadership coupled with increasing health
aspirations among Indian consumers bodes well for new products, and we see ample
room for fresh variants, formats and extensions within its existing and new categories.
Launches over the last 36 months contribute ~3% of current revenue, which
management expects will rise to 5% over the next two years. We discuss the
positioning, innovative extensions and growth prospects of each of the key brands below.
Fig 19 – Potential white spaces that can be explored
Glucon-D Complan Nycil Nutralite
Energy capsules Women’s Health Baby Prickly Heat Powder Sandwich Spread (Dr Oetkar)
Sports drinks (Gatorade) Mother’s Health Anti-rash Creams for Babies Garlic Butter (Amul)
Ready to Drink (Tata Plus) Adult / Old Age Lotions and Moisturizers Hazelnut Spread
Oral Rehydration Salt (Electral) sachets powder and Ready to Drink
Protein Female Hygiene
Lite (less sugar)
Weight Loss
Ready to Drink
Source: Company, BOBCAPS Research
#1 Glucon-D: Growth to be driven by innovation
ZYWL’s Glucon-D brand commands ~60% of India’s ~Rs 10bn glucose powder market
and has remained the dominant leader over the last few years. It is the largest
contributor to ZYWL’s revenue (~26% in FY21) aided by a distribution reach of 1.7mn
stores. Glucon-D is positioned as an energy booster with different variants covering the
need for different vitamins. Being a summer product, ~80% of sales occur from
January-June. However, due to Covid-19 restrictions, FY21 and FY22 were washout
years for summer-centric products.
Expect 8.3% revenue CAGR over FY21-FY24
The glucose powder category has a target audience of children to adults up to 25 years
of age and also athletes. The category grew ~11% CAGR and we expect mid-double-
digit growth from FY23 as demand normalises. In our view, ZYWL’s largest brand has
ample potential to expand given its low penetration of ~12% and ability to defend

ZYDUS WELLNESS
EQUITY RESEARCH 10 14 March 2022
market share over a long period despite the presence of large players such as Dabur
and Wipro in the category.
We expect Glucon-D to continue to grow 8.3% CAGR over FY21-FY24E, helped by the
introduction of new variants (ImmunoVolt), increased brand investment along with mass
media support and competitive trade offers (a key to win in the category). As the
product is confined to the summer season, the company can potentially de-risk it by
transforming it into a wider energy and functional drink.
Fig 20 – Glucon-D revenue and growth
Source: Company, BOBCAPS Research
Fig 21 – Competitor pricing comparison
Company Brand Powder Tablet Ready to drink Flavour Pack Size Rs/gm
ZYWL Glucon D Yes Yes No Nimbu Paani, Orange,
Regular, Strawberry, 100gm, 200gm 450gm, 1kg 0.33
Dabur Glucose-D Yes No No Orange, Lemon,
Regular
125gm, 250gm, 450gm,
500gm, 1kg 0.33
Wipro GlucoVita Yes Yes No Orange, Green Mango,
Strawberry 250gm, 400gm, tube packs 0.33
FDC Enerzal Yes No Yes (Tetrapack
and PET bottle) Orange, Lime, Apple
50gm, 100gm, 500gm, 1 kg,
200ml, 400ml 0.33
Source: Company, BOBCAPS Research
Fig 22 – Strengthening “Energy” credentials and expanding the uses
Source: Company, BOBCAPS Research
(10%)
(5%)
0%
5%
10%
15%
0
1,000
2,000
3,000
4,000
5,000
6,000
7,000
FY20 FY21 FY22E FY23E FY24E
(Rs mn) Glucon-D Growth (R)

ZYDUS WELLNESS
EQUITY RESEARCH 11 14 March 2022
#2 Sugar Free: Flagship brand with strong moats
Launched way back in 1988, Sugar Free is ZYWL’s flagship brand and enjoys a near
monopoly in the ~Rs 3.2bn sugar substitute category with ~96% market share. More
than 70% of the sales comes from chemist/pharmacy channels. The company offers
five variants – Sugar Free Natura (Sucralose based), Sugar Free Gold (Aspartame
based) and Sugar Free Green (Stevia based) – besides recently launching Sugar Lite to
compete in the regular sweetener segment.
Aimed at the health conscious, Sugar Free Green is positioned as a 100% natural
substitute because it is derived from Stevia leaves – approved by the WHO, USFDA
and FSSAI as a safe artificial sweetener. Sugar Lite is a blend of sugar and Stevia
leaves that has 50% fewer calories than normal sugar. These new categories contribute
only 2-3% of sales in the category but have been growing in high double digits over the
last few quarters and are hence expected to ramp up revenue share.
Expect 9.7% revenue CAGR over FY21-FY24
Despite the entry of several players, ZYWL has been able to maintain its leadership
position in sugar substitutes even as the brand has become synonymous with the
category. We believe the company has built a strong moat in a category that has vast
potential to grow over the next few years given India’s ballooning diabetic population
and increasingly health-conscious urban consumer. Apart from its first-mover
advantage, ZYWL has been able to consolidate its leadership due to the absence of
any significant product differentiation from competitors. A strong distribution reach has
been the other key enabler for the company.
We expect Sugar Free to grow at CAGR of 9.7% over FY21-FY24 led by more adjacent
launches (such as Sugarfree D’lite chocolates), rising diabetes, lower penetration,
higher spends, product availability and variations.
Fig 23 – Sugar Free revenue and growth
Source: Company, BOBCAPS Research
0%
2%
4%
6%
8%
10%
12%
14%
16%
18%
0
500
1,000
1,500
2,000
2,500
3,000
3,500
4,000
4,500
5,000
FY20 FY21 FY22E FY23E FY24E
(Rs mn) Sugar Free Growth (R)

ZYDUS WELLNESS
EQUITY RESEARCH 12 14 March 2022
Fig 24 – Competitor pricing comparison
Parameter Sugar Free Gold Sweet n Healthy Sugar Free Natural Equal
Manufacturer ZYWL Wipro ZYWL Higer Health Sciences
MRP (Rs) 270 270 300 370
Number of Tablets 500 300 500 600
Cost/tablet (Rs) 0.54 0.90 0.60 0.62
Source: Amazon, BOBCAPS Research
Rising diabetic population in India to drive Sugar Free growth
India is the largest consumer of sugar in the world at ~26mtpa and also has the second
largest population of diabetic patients (~74mn vs. China at ~141mn). As per the
International Diabetes Federation (IDF), the number of diabetics in India is expected to
increase from ~74mn in 2021 to ~125mn by 2045 (20-79 age group). It is also
estimated that ~57% of adults with diabetes or 53mn people are undiagnosed.
IDF projects that by 2045 India would have more than 20% of the world’s diabetics,
surpassing China. With the rising incidence of lifestyle diseases in India, we believe the
consumption of niche health products such as Sugar Free and Nutralite will increase. In
our view, ZYWL is well placed to capture this growing opportunity as the largest player
in the segment with strong brand recall.
Fig 25 – Sugar Free product timeline
Year Innovation
1988 Launched Sugarfree with Aspartame
2005 Launched Sugarfree Natura with Sucralose
2017 Launched Sugarfree green with Stevia
2018 Launched Suagrlite; Sugarfree Veda (ayurvedic Sugafree green)
2019 Launched Sugafree S’lite Chocolates
Source: Company, BOBCAPS Research
Fig 26 – Sustained innovation and rising market penetration to drive growth
Source: Company, BOBCAPS Research

ZYDUS WELLNESS
EQUITY RESEARCH 13 14 March 2022
#3 Complan: Deeper penetration, innovation to aid market share
Complan, a household name in India’s ~Rs 110bn malt-based beverage category, has
witnessed a downward spiral over the past decade following a frequent change of hands –
from GSK to Kraft Heinz and then to ZYWL – as well as frequent changes in formulation
and positioning. In 2013 it was outrun by Bournvita, which took over the second spot in
the segment after market leader Horlicks. Complan’s attempt to gain lost ground by
rehashing its product formulation in 2014 also backfired as it made the drink “less healthy
than before”. Distribution also fell to 450,000 outlets from its peak of 650,000 outlets.
Owing to these missteps, Complan’s share in the malt-based beverage category, which
stood at more than 15% in the early years of the last decade, has dwindled to just 5.5%
in FY21. Currently, rivals Horlicks and Boost together command ~55% of the malt
beverage market, followed by Bournvita at 15%, PediaSure and Ensure at 9%.
Expect ~12% revenue CAGR over FY21-FY24
As per industry estimates, India is the world’s largest malt-based drinks market at
~Rs 110bn and accounts for 22% of global retail volume sales. These drinks are
traditionally consumed as milk substitutes and marketed as nutritious products. In
addition, Indian households are likely to double their spends on health-focused foods
and beverages in the next five years as consumers increasingly switch over to healthier
alternatives and buy foods with better ingredients.
To regain lost share, ZYWL has crafted a strategy to rapidly expand the brand’s reach
in smaller towns and rural markets, besides reinstating its original positioning of offering
“2x faster growth for growing kids”. The company further aims to enhance market share
through higher media spends, consumer promotions and advocacy through doctors. It
has also relaunched ‘Complan Nutrigro’, a health supplement targeted at the age group
of 2-6 years with a focus on the original positioning of helping children grow stronger.
Further, in order to keep the product competitive, the company has not yet increased
prices despite raw material inflation.
Though the malt-based drinks market has been growing in low single digits over the last
few years (owing to lack of innovation from the market leader), we expect Complan to
revive under ZYWL’s able leadership, supported by the launch of variants, product
activations in new regions and cross-selling through the company’s pharmacy chain
network which has doubled direct distribution. With penetration at just 24%, we estimate
that Complan has headroom to grow at a ~12% CAGR over FY21-FY24.
Fig 27 – Complan revenue and growth
Source: Company, BOBCAPS Research
0%
2%
4%
6%
8%
10%
12%
14%
16%
0
1,000
2,000
3,000
4,000
5,000
6,000
FY20 FY21 FY22E FY23E FY24E
(Rs mn) Complan Growth (R)
Tamil Nadu and West Bengal
together account for ~30% of
Complan’s sales. It has the
highest market share in the East
followed by the South

ZYDUS WELLNESS
EQUITY RESEARCH 14 14 March 2022
Fig 28 – Competitor pricing and addressable white spaces
Company Brand Target Audience Potential Market Protein Content (per 100 gm)
Pack Size (Tetra Pack & Pet Bottle)
ZYWL Complan
Toddlers: 2-4 years
Toddlers: 4-6 years
Kids
Toddlers: 0-2 years
Women
Mothers
All adults
Protein
Lite or Diabetes
18gm 200gm, 450gm 500gm, 750gm, 1kg
HUL Horlicks
Toddlers: 2-4 years
Toddlers: 4-6 years
Kids
Women
Mothers
All adults
Protein
Lite or Diabetes
Toddlers: 0-2 years
Lite or Diabetes 11gm 500gm, 750gm, 1kg
Mondelez Bournvita
Toddlers: 2-4 years
Toddlers: 4-6 years
Kids
Women
Toddlers: 0-2 years
Mothers
All adults
Protein
Lite or Diabetes
7gm 75gm, 500gm, 750gm, 1kg, 2kg
Similac Pediasure and Ensure
Toddlers: 0-2 years
Toddlers: 2-4 years
Toddlers: 4-6 years
Kids
Protein (Ensure)
Lite or Diabetes (Ensure)
Women
Mothers
All adults
14.1gm 15.1gm & 30gm
200gm, 400gm, 750gm, 1kg, 2kg
Danone Protinex
Toddlers: 0-2 years
Toddlers: 2-4 years
Toddlers: 4-6 years
Kids
Mothers
Protein
All adults
Lite or Diabetes
Women 34gm 250gm, 400gm, 750gm, 1kg
Source: Amazon, BOBCAPS Research
Fig 29 – Complan: Launch of new flavours and change in positioning
Source: Company, BOBCAPS Research

ZYDUS WELLNESS
EQUITY RESEARCH 15 14 March 2022
#4 Everyuth: Strong brand equity in naturals space
Launched in in 1991, Everyuth operates in the skincare category and is positioned as a
natural brand with fruit-based face scrubs, masks and peel-offs. ZYWL leads the market
in the scrubs and peel-off sub-segments, commanding a share of 39.2% and 76.4% at
~Rs 2.5bn and Rs 0.9bn respectively in Dec 21’. However, in the highly competitive
face wash segment, its market share is just over 2%. Overall, India’s facial care market
is worth ~Rs 29bn, wherein the company has a low 6.5% market share and ranks at
No. 5. In our view, ZYWL has been unable to compete with the likes of Ponds, Garnier,
Nivea, Wow and Himalaya and will remain a lesser player.
However, over the last four years, there has been a strong consumer shift to the
Ayurveda, natural and herbal category in India – one of ZYWL’s strengths. Per the
industry estimates, India’s organic personal care products market is expected to grow
from US$ 571mn in FY20 to US$ 1.2bn in FY26, logging a CAGR of 14.7%.
Expect ~8% revenue CAGR over FY21-FY24
In a bid to leverage growing demand in the naturals category and raise its retail
penetration from the current 20%, the company recently launched the Everyuth Tan
Removal scrub and face pack, increased mass media ad spends in scrubs and peel-
offs, revamped the face wash sub-segment, and relaunched its Tulsi Turmeric face
wash with new packaging.
The facial care category has grown at ~10%+ over the last 10 years. We believe
increasing penetration of scrubs and peel-off masks coupled with premium skincare
launches such as tan removal packs would help drive revenue growth for the segment
at a CAGR of ~8% over FY21-FY24.
Fig 30 – Everyuth revenue and growth
Source: Company, BOBCAPS Research
Fig 31 – Competitor pricing comparison
Parameter Walnut Scrub Walnut Scrub Bio Walnut Scrub Walnut Scrub
Manufacturer ZYWL Himalaya Biotique Lakme
MRP (Rs) 225 135 140 250
Weight (gm) 200 100 100 100
Cost/gm (Rs) 1.13 1.35 1.40 2.50
Source: Amazon, BOBCAPS Research
0%
2%
4%
6%
8%
10%
12%
0
200
400
600
800
1,000
1,200
1,400
1,600
1,800
FY20 FY21 FY22E FY23E FY24E
(Rs mn) Everyuth Growth (R)

ZYDUS WELLNESS
EQUITY RESEARCH 16 14 March 2022
Fig 32 – Everyuth product timeline
Year Innovation
FY17 Relaunched Tulsi Turmeric Face Wash
FY18 Launched Scrub with Neem and Papaya as ingredients
FY18 Relaunched Golden Glow Peel-off
FY19 Launched Tan Removal Scrub and Tan Removal Face Pack
FY21 Launched Everyuth Aloe Cucumber Gel
FY22 Everyuth Body Lotion Range as strategic extension into Skincare space
Source: Company, BOBCAPS Research
Fig 33 – Strong brand equity in naturals space Fig 34 – Launched Everyuth body lotion as strategic extension into skincare space
Source: Company, BOBCAPS Research Source: Company, BOBCAPS Research
#5 Nutralite: Unlocking brand potential
The Nutralite brand operates in two segments of table spreads and margarine, with
market leadership in the latter category. Positioned as a healthier option to butter,
ZYWL markets its Nutralite range of products as free from cholesterol, trans fats, and
enriched with vitamins. The margarine and spread market, which the company
estimates is worth ~Rs 3.5bn, largely caters to institutional customers (HORECA,
airlines) that form ~70% of sales. The category has just 15% retail penetration.
ZYWL has also launched Nutralite Doodhshakti butter and ghee products, Nutralite
doodhshakti proteins and Nutralite choco spread.
Initiatives taken to transform the Nutralite brand
Broader category play
Convergence of Sampriti Ghee with Nutralite and launch of Nutralite Doodhshakti
Ghee and Probiotic Butter Spread
Created new identity for the Food service / Horeca segment – opportunity to widen
offerings in the segment
Widened the portfolio in spreads with Mayonnaise and launch of Chocospread

ZYDUS WELLNESS
EQUITY RESEARCH 17 14 March 2022
Expect ~10% revenue CAGR over FY21-FY24
The company had ventured into the ~Rs 8bn mayonnaise market, which is expected to
grow at a strong CAGR of 24.8% over 2022-27, as per EMR findings. We believe
Nutralite is a strong brand, which is reflected in its leadership position in the margarine
category. Given our expectations of urban growth leading to rural and the increasing
shift of consumers towards healthier options, we estimate that the category would grow
at ~10% CAGR over FY21-FY24.
Fig 35 – Nutralite revenue and growth
Source: Company, BOBCAPS Research
Fig 36 – Competitor pricing comparison
Parameter Classic Bread Spread
Lite Choco Spread Choco Spread
Mayonnaise (Veg Classic)
Mayonnaise (Veg Classic)
Manufacturer ZYWL Amul ZYWL Hershey ZYWL Veeba
MRP (Rs) 220 195 300 295 95 79
Weight (gm) 500 500 275 350 275 250
Cost/gm (Rs) 0.44 0.39 1.09 0.84 0.35 0.32
Source: Amazon, BOBCAPS Research
Fig 37 – The changing face of Nutralite
Source: Company, BOBCAPS Research
0%
2%
4%
6%
8%
10%
12%
0
200
400
600
800
1,000
1,200
1,400
1,600
1,800
2,000
FY20 FY21 FY22E FY23E FY24E
(Rs mn) Nutralite Growth (R)

ZYDUS WELLNESS
EQUITY RESEARCH 18 14 March 2022
#6 Nycil: Evolving into a skincare brand
With a 50-year heritage, Nycil is a well-known and trusted brand that has 34% share in
India’s Rs 7bn prickly heat powder market. It has seven variants: Nycil Cool Herbal,
Cool Gulabjal, Cool Sandal, Cool Aloe, Cool Lime, Cool Classic, and Classic. The
company launched Nycil Hand Sanitizers in 2020 and these are available in two
variants – Herbal and Germ Expert.
Nycil has the highest gross margin (~55%) of the four acquired brands as its raw
material is outsourced. The brand has a relatively strong presence in North and East
India, which the company plans to expand across the country.
Prickly heat powders are highly seasonal products (April-July) and require astute brand
management as purchases are largely problem/need-driven. Following its launch in
1951, Nycil rapidly became synonymous with the category and its success attracted
many competitors. Brands such as Shower to Shower (ITC), Dermicool (Paras)
Boroplus (Emami) and Candid (Glenmark) entered the fray but have not made much of
a dent in Nycil’s leadership position.
Expect ~9% revenue CAGR over FY21-FY24
In order to further drive growth, ZYWL has changed its product positioning post the
relaunch of new variants which are based on a clinically proven formula and carry new
packaging that has received a positive response from the market. It has also altered
communication to highlight a “coolness factor”, in line with competitors.
To combat seasonality of the product, we believe the company can look for brand
extensions as a skincare specialist. In FY21, ZYWL extended into the sanitizer
category. In our view, higher A&P spends, new campaigns and product push through
the pharma channel will also aid better visibility and growth. We thus expect Nycil to log
a 9.3% CAGR over FY21-FY24.
Fig 38 – Nycil revenue and growth
Source: Company, BOBCAPS Research
0%
2%
4%
6%
8%
10%
12%
0
500
1,000
1,500
2,000
2,500
3,000
3,500
FY20 FY21 FY22E FY23E FY24E
(Rs mn) Nycil Growth (R)

ZYDUS WELLNESS
EQUITY RESEARCH 19 14 March 2022
Fig 39 – Competitor pricing comparison
Parameter Nycil Cool Dermicool
Prickly Heat Shower to Shower
Boroplus Prickly Heat Powder
Candid
Manufacturer ZYWL Paras ITC Emami Glenmark
MRP (Rs) 115 117 110 110 99
Weight (gm) 150 150 150 150 120
Cost/gm (Rs) 0.77 0.78 0.73 0.73 0.83
Source: Amazon, BOBCAPS Research
Fig 40 – Nycil brand extensions: Hand Sanitizer, Wipes and Body Mist
Source: Company, BOBCAPS Research
#7 Sampriti Ghee + Dairy: A healthier choice
Sampriti Ghee is a byproduct of Complan and is largely a B2B product. The category is
highly fragmented with only two organised players having >10% market share. This
segment also includes dairy products. ZYWL entered into the dairy category in FY21
with Nutralite Doodh Shakti, probiotic butter spread and pure ghee. The new launch
was supported by print and digital campaigns. We expect revenue from this segment to
log a 14% CAGR over FY21-FY24.
Fig 41 – Sampriti Ghee + Dairy revenue and growth
Source: Company, BOBCAPS Research
0%
5%
10%
15%
20%
25%
30%
35%
40%
0
500
1,000
1,500
2,000
2,500
3,000
FY20 FY21 FY22E FY23E FY24E
(Rs mn) Sampriti Ghee+Dairy Growth (R)

ZYDUS WELLNESS
EQUITY RESEARCH 20 14 March 2022
Aggressive distribution expansion and rising ecommerce focus
Before the Heinz India acquisition, ZYWL had a limited footprint on general trade,
modern trade and ecommerce platforms. Post consolidation, the distribution network
has been strengthened to include a mix of the company’s pharmacy-oriented channels
and Heinz’s general trade channels. The number of distributors now stands at 800+.
During FY21, the modern trade and ecommerce channels accounted for ~14% of
revenue, which management is looking to increase to 18-20% during the next 5-7 years.
ZYWL also aims to widen direct distribution coverage – under go-to-market programme,
Project Vistaar, it plans to increase overall reach from 2.25mn currently to 3.5mn-4mn
by FY25 and direct reach from 0.57mn to 0.85mn-1mn. We expect this to bolster growth
in rural areas given rising affordability and increasing consumer awareness on account
of easy access to the internet, the company’s strong brand campaigns and smaller SKUs.
Average penetration level of the combined portfolio brands now stands at ~20%.
Restructuring of the distribution channel will continue to yield benefits as consumer
sentiments improve and penetration levels rise across categories in which the company
operates, especially considering its market-leading position in five of its six segments.
Fig 42 – Structured distribution network across multiple channels
Channel Distribution Network
GT or General Trade Channels Super-stockists, grocers, cosmetic stores
MT or Modern Trade D-Mart, Metro, Walmart, Reliance Retail
Pharmacy All medical stores including organised chains like Apollo Pharmacy and MedPlus
Institutional Channels CSD (Canteen Stores Department) and CPC (Central Police Canteen)
HORECA Hotels, Restaurants, Catering
Exports 25 countries across Asia, Africa, Middle East and Australia
Ecommerce platforms Amazon, Flipkart, Big Basket, Grofers, Nykaa, Udaan, Jio Mart
Source: Company, BOBCAPS Research
Fig 43 – Current distribution framework
Channel Number
Distributor & FOS 1,700 each
CFAs 65
Unified Warehouses 23
Retail Reach 225,000
Source: Company, BOBCAPS Research

ZYDUS WELLNESS
EQUITY RESEARCH 21 14 March 2022
Fig 44 – Manufacturing footprint: 5 facilities spread across 4 states
Source: Company, BOBCAPS Research
Widening international footprint
ZYWL has been steadily expanding its global footprint, aiding international business
growth of 7x over CY18-CY21. The company entered Nigeria, Taiwan, New Zealand
and Kenya in FY21 and has plans to strengthen its presence in the Middle East, Africa,
South East Asia and SAARC countries. Complan products were recently launched in
the Middle East and Nutralite products have been introduced in Malaysia. During FY20,
ZYWL incorporated a new subsidiary in Dubai, Zydus Wellness International DMCC, to
manage international operations.
The international business accounted for 3% of consolidated sales during FY21 and
ZYWL aims to increase its share to 8-10% over the next few years led by volume
growth. We expect this to spur overall topline growth going forward.
Fig 45 – International business guided to cross Rs 1bn in FY23 from Rs 560mn currently
Source: Company, BOBCAPS Research
Sugar Free franchise and Complan constitute
93% of overall business
Top 5 markets account for ~80% of the
business
3P manufacturing in GCC and New Zealand
International business contribution targeted to
rise to 8-10% in a few years from 3% current

ZYDUS WELLNESS
EQUITY RESEARCH 22 14 March 2022
Financial analysis
Expect 10% revenue CAGR over FY21-FY24
We expect ZYWL’s revenue to clock a brisk 10% CAGR over FY21-FY24 on the back of
strong volume growth across categories. Glucon-D, Everyuth, Nycil and Nutralite are all
forecast to grow in double digits led by robust market leadership and variant launches.
We estimate that Sugar Free will grow at 9-10% supported by a wider distribution
network, new launches (Sugar Green and Sugar Lite) and rising health awareness in
urban areas.
With the introduction of Complan Nutrigro, the company is exploring white spaces in the
health drinks market which we believe would bolster growth beyond the mid-single-digit
levels seen over the years. This would be further supported by product activations in
new regions, high media spends and leveraging of ZYWL’s pharmacy chain network.
Fig 46 – Revenue growth Fig 47 – Gross profit and margin
Source: Company, BOBCAPS Research Source: Company, BOBCAPS Research
At the time of its acquisition, Heinz India’s revenue was 2x of ZYWL, which led to a
spike in the FY19 and FY20 topline upon consolidation of the two entities. Gross margin
contracted by 1,320bps over FY18-FY20 due to relatively low margins in the acquired
brands, but EBITDA margin contracted just 585bps on the back of lower ad spends in
the Heinz portfolio and initial synergy benefits. ZYWL’s blended operating margin stood
at 18.4% in FY21 from 21-23% historically and gross margin settled at ~55% compared
to 69% in FY18. In FY20, the company registered a lower operating margin of 18.2%
because of one-time costs related to acquisition and an increase in commodity prices.
ZYWL’s brand recall and market share (leader in 5 of 6 categories), alongside
increasing consumer awareness and health aspirations bode well for new launches and
extensions. We believe this bodes well for new launches and extensions.The
company’s advertising spends are one of the highest amongst peers and we believe
A&P will remain elevated as it markets new variants and brings in credible brand
ambassadors (such as chef Sanjeev Kapoor for Sugar Free). However, as economies
of scale kick in for the combined entity together with manufacturing efficiencies,
distributor & warehouse rationalisation and better bargaining power, we expect EBITDA
margin to expand 220bps to 20.7% over FY21-FY24.
8
18 1920
2225
109.6
5.7 7.2 10.8 11.9
0102030405060708090100110
0
5
10
15
20
25
30
FY19 FY20 FY21 FY22E FY23E FY24E
(%)(Rs bn) Net Revenue Growth (R)
5
10 1011
12
14
64.6
55.954.7 54.7 55.0 55.5
50
55
60
65
70
5
7
9
11
13
15
FY19 FY20 FY21 FY22E FY23E FY24E
(%)(Rs bn) Gross Profit Gross Margin (R)

ZYDUS WELLNESS
EQUITY RESEARCH 23 14 March 2022
In addition, tax rates for the company would be nil till FY23 on account of excise
benefits for two of its plants in Sikkim and depreciation of intangibles worth Rs 5.4bn on
account of acquired brands. We expect a 25.2% tax rate in FY24 and an 11% CAGR in
net profit over FY21-FY24.
Fig 48 – A&P spends to remain high Fig 49 – EBITDA, PAT and Margins
Source: Company, BOBCAPS Research Source: Company, BOBCAPS Research
Optically low return ratios
Post-acquisition, return ratios plunged due to the acquired goodwill of Rs 39.2bn and
incremental debt of Rs 15bn plus raised equity of Rs 25.8bn. In FY18, ROCE/ROE
stood at 19.5%/21.5% which nosedived to 6.9%/5.4% in FY20. However, excluding
goodwill, ROCE was at ~40% for FY20. We model for return ratios of 7-8% during
FY22-FY24 but do not see this as a deterrent to value creation for shareholders.
Fig 50 – Fixed asset turnover ratio Fig 51 – Single-digit return ratios not to deter valuations
Source: Company, BOBCAPS Research Source: Company, BOBCAPS Research
Targeting debt repayment by FY23
The company took debt of Rs 15bn to fund its Heinz acquisition, causing debt to shoot
up to Rs 16bn in FY19 from Rs 363mn (pre-acquisition) in FY18. It also raised equity of
Rs 25.8bn, fueling a near-5x jump in net worth from FY18 (Rs 6.9bn pre-acquisition) to
FY19. The increased debt propelled interest cost from Rs 17mn in FY18 to ~Rs 1.4bn
in FY20.
17.218.0
12.712.3
13.013.5 13.5
10
11
12
13
14
15
16
17
18
19
FY18 FY19 FY20 FY21 FY22E FY23E FY24E
(%) A&P Spends
2 3 3 4 4 52 2 2 3 4 4
21.9
18.2 18.4 18.919.9 20.7
21.4
10.4
12.8 15.9
18.1
14.7
024681012141618202224
0
1
2
3
4
5
6
FY19 FY20 FY21 FY22E FY23E FY24E
(%)(Rs bn)EBITDA PAT
EBITDA margin (R) PAT margin (R)
2.4
4.8 4.94.6 4.5 4.6
0
1
2
3
4
5
6
FY19 FY20 FY21 FY22E FY23E FY24E
(x) Fixed Asset Turnover
7.4
6.9
6.66.8
7.9
6.7
8.9
5.4
6.0
6.7
7.9
6.77.0
6.9 6.7 7.1
8.2
7.1
4
5
6
7
8
9
10
FY19 FY20 FY21 FY22E FY23E FY24E
(%) ROCE ROE ROIC

ZYDUS WELLNESS
EQUITY RESEARCH 24 14 March 2022
During Q3FY21, ZYWL redeemed the NCD via another QIP of Rs 6.5bn and by
refinancing the low-cost debt of Rs 5.65bn at 5.01%. Thus, in the last two years, debt
levels were brought under control and stood at Rs 6bn in FY21. This led to a decline in
D/E ratio from 0.47x in FY19 to a comfortable 0.13x in FY21. Management has
indicated that it is looking to repay debt in FY23 which we expect will result in negligible
interest cost and a net debt-free balance sheet in FY24.
Fig 52 – Increased debt over FY19-FY21 to fund acquisition raised interest cost
Fig 53 – Gross debt and D/E ratio to come down
Source: Company, BOBCAPS Research Source: Company, BOBCAPS Research
Operating cash flow to remain strong
Cash generated from operations increased from Rs 1.5bn in FY18 to ~Rs 2bn in FY19
after the acquisition. We expect cumulative operating cash flows of ~Rs 12bn over
FY22-FY24 on the back of increased profitability. Working capital is likely to remain
stable even as the company continues to expand distribution.
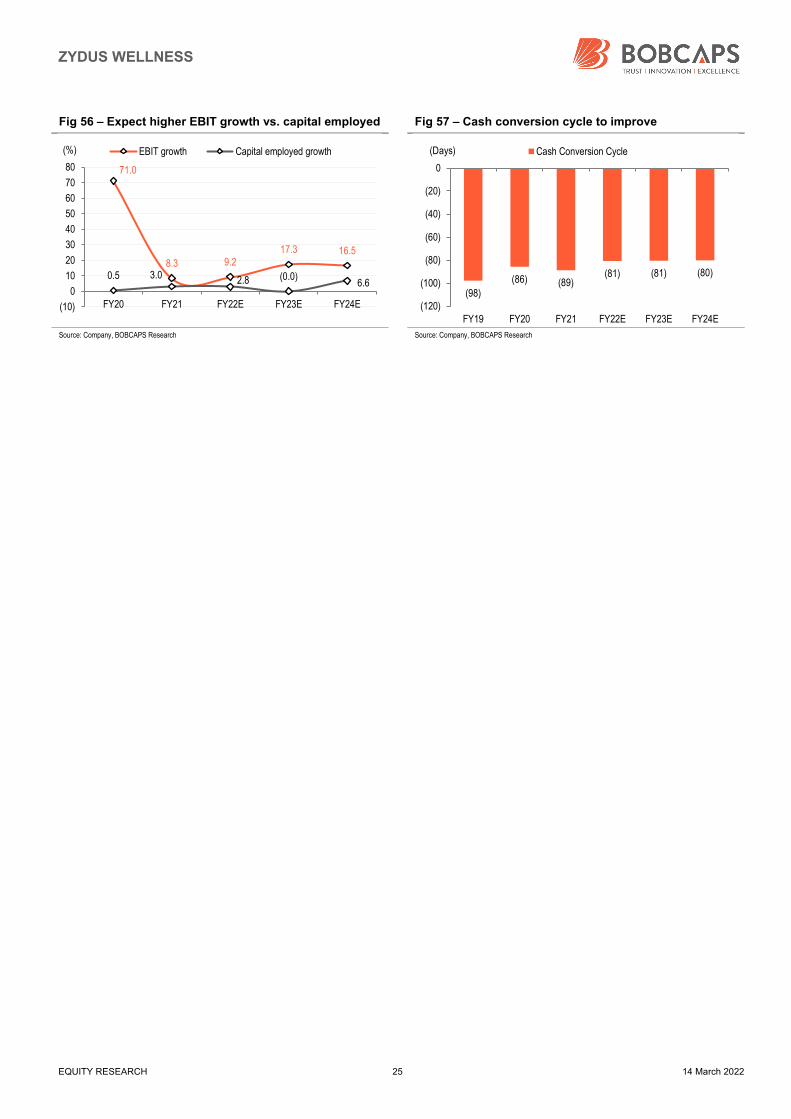
We estimate cumulative free cash flow generation of ~Rs 10bn by FY24 driven by a
better operating margin and higher asset turns. In comparison to revenue growth of
10% and EBIT growth of 14.3%, capital employed is projected to grow by 3.1% over
FY21‐FY24.
Fig 54 – CFO and FCF to improve Fig 55 – Working Capital ex-cash as a % of Sales
Source: Company, BOBCAPS Research Source: Company, BOBCAPS Research
17.5
47.5
26.3
11.5
4.40.4
0
10
20
30
40
50
FY19 FY20 FY21 FY22E FY23E FY24E
(%) Interest Cost as a % of EBIT
16 16
64
0 0
0.47 0.45
0.130.09
0.01 0.00
(0.10)
0.00
0.10
0.20
0.30
0.40
0.50
0.60
0
2
4
6
8
10
12
14
16
18
FY19 FY20 FY21 FY22E FY23E FY24E
(x)(Rs bn) Gross Debt D/E (R)
(38)
1 2 3 4 32
3 2 4 4 4
(45)(40)(35)(30)(25)(20)(15)(10)(5)
05
10
FY19 FY20 FY21 FY22E FY23E FY24E
(Rs bn)FCF CFO
259195
1,034 9381,074
1,204
3.1
1.1
5.5
4.74.8 4.9
1
2
3
4
5
6
100
300
500
700
900
1,100
1,300
FY19 FY20 FY21 FY22E FY23E FY24E
(%)(Rs mn) Working capital ex-cash % of Sales (R)
ZYDUS WELLNESS
EQUITY RESEARCH 25 14 March 2022
Fig 56 – Expect higher EBIT growth vs. capital employed Fig 57 – Cash conversion cycle to improve
Source: Company, BOBCAPS Research Source: Company, BOBCAPS Research
71.0
8.3 9.217.3 16.5
0.5 3.0 2.8 (0.0)6.6
(10)
0
10
20
30
40
50
60
70
80
FY20 FY21 FY22E FY23E FY24E
(%) EBIT growth Capital employed growth
(98)
(86) (89)(81) (81) (80)
(120)
(100)
(80)
(60)
(40)
(20)
0
FY19 FY20 FY21 FY22E FY23E FY24E
Cash Conversion Cycle(Days)

ZYDUS WELLNESS
EQUITY RESEARCH 26 14 March 2022
Valuation methodology
ZYWL is a unique play on India’s emerging health & wellness category and enjoys
market leadership in various niche segments with limited competition from large FMCG
companies. Following the acquisition of Heinz India in early 2019, the company’s
product portfolio has widened and its addressable market has grown multifold.
We expect a revenue/EBITDA/PAT CAGR of 10%/14.2%/11% over FY21-FY24 to
Rs 25bn/Rs 5.1bn/Rs 3.7bn on the back of new launches, increasing distribution
strength, a broader presence through existing brands, its ability to cater to white
spaces, and a strong gross margin which gives it the leeway to spend more on brand
building amid structural growth in the health & wellness industry. We are also positive
on ZYWL’s debt reduction measures, faster FCF generation, and superior execution.
Given the robust growth outlook, we believe the stock can command a higher multiple
than peers and have valued it at 38x FY24E EPS for a TP of Rs 2,185, which carries
45% upside. We initiate coverage with a BUY rating.
Fig 58 – One-year forward P/E band Fig 59 – P/E median band
Source: Bloomberg, BOBCAPS Research Source: Bloomberg, BOBCAPS Research
Fig 60 – One-year forward EV/EBITDA band Fig 61 – EV/EBITDA median band
Source: Bloomberg, BOBCAPS Research Source: Bloomberg, BOBCAPS Research
700
1,000
1,300
1,600
1,900
2,200
2,500
2,800
Apr
-18
Jun-
18A
ug-1
8O
ct-1
8D
ec-1
8Fe
b-19
Apr
-19
Jun-
19S
ep-1
9N
ov-1
9Ja
n-20
Mar
-20
May
-20
Jul-2
0S
ep-2
0D
ec-2
0Fe
b-21
Apr
-21
Jun-
21A
ug-2
1O
ct-2
1D
ec-2
1M
ar-2
2
(Rs)
40x
31x28x
34x
43x
37x
20
25
30
35
40
45
50
55
Apr
-18
Jun-
18
Aug
-18
Oct
-18
Dec
-18
Feb-
19
May
-19
Jul-1
9
Sep
-19
Nov
-19
Jan-
20
Mar
-20
Jun-
20
Aug
-20
Oct
-20
Dec
-20
Feb-
21
Apr
-21
(x)
Median 38.8
1030507090
110130150170190
Apr
-18
Jun-
18A
ug-1
8O
ct-1
8D
ec-1
8Fe
b-19
Apr
-19
Jun-
19S
ep-1
9N
ov-1
9Ja
n-20
Mar
-20
May
-20
Jul-2
0S
ep-2
0D
ec-2
0Fe
b-21
Apr
-21
Jun-
21A
ug-2
1O
ct-2
1D
ec-2
1M
ar-2
2
(Rs bn)
Tho
usan
ds 20x
40x
25x
35x
30x
20
25
30
35
40
45
50
55
60
65
Apr
-18
Jun-
18
Aug
-18
Oct
-18
Dec
-18
Feb-
19
May
-19
Jul-1
9
Sep
-19
Nov
-19
Jan-
20
Mar
-20
Jun-
20
Aug
-20
Oct
-20
Dec
-20
Feb-
21
Apr
-21
(x)
Median 33.0

ZYDUS WELLNESS
EQUITY RESEARCH 27 14 March 2022
Fig 62 – One-year forward P/BV band Fig 63 – P/BV median band
Source: Bloomberg, BOBCAPS Research Source: Company, BOBCAPS Research
Fig 64 – Peer comparison
Company Price (Rs)
M Cap (Rs bn)
Promoter holding (%)
Revenue growth (%) EBITDA growth (%) P/E (x)
FY20 FY21 FY20 FY21 FY20 FY21
ZYWL 1,508 95.9 64.8 109.6 5.7 18.2 18.4 45.3 36.1
Abbott 17,020 361.7 74.9 11.3 5.3 18.5 21.3 55.4 46.1
Emami 488 217.1 53.9 (1.5) 8.5 26.0 36.7 25.4 47.7
Marico 507 655.6 59.5 (0.3) 10.0 20.0 19.7 34.7 45.3
Bajaj Consumer 161 2.4 38.0 (7.2) 8.2 24.0 26.2 10.6 17.2
Source: Company, BOBCAPS Research | Price as on 14 Mar 2022
Fig 65 – Peer comparison
Company EV/EBITDA (x) EV/Sales (x) M Cap/Sales (x) ROCE Post Tax (%) P/BV (x)
FY20 FY21 FY21 FY21 FY20 FY21 FY20 FY21
ZYWL 31.3 28.9 5.3 5.1 6.9 6.6 2.1 2.0
Abbott 35.2 29.4 7.3 7.8 27.1 26.5 13.7 12.5
Emami 10.4 22.5 6.6 6.7 15.6 24.3 4.2 12.3
Marico 22.3 31.2 6.9 6.9 42.6 44.9 11.8 16.5
Bajaj Consumer 8.4 13.8 2.7 2.7 39.3 37.9 3.0 5.1
Source: Company, BOBCAPS Research
Key risks
Key downside risks to our estimates are:
failure to realise expected merger benefits,
failure of new launches,
aggressive competition from start-ups,
inability to scale up acquired brands which is typically difficult for FMCG
incumbents,
raw material price increases, and
economic slowdown/pandemic risk.
700
1000
1300
1600
1900
2200
2500
2800
Apr
-18
Jun-
18A
ug-1
8O
ct-1
8D
ec-1
8Fe
b-19
Apr
-19
Jun-
19S
ep-1
9N
ov-1
9Ja
n-20
Mar
-20
May
-20
Jul-2
0S
ep-2
0D
ec-2
0Fe
b-21
Apr
-21
Jun-
21A
ug-2
1O
ct-2
1D
ec-2
1M
ar-2
2
(Rs)
2.0x
2.8x
2.5x
1.8x
2.3x
1.5
1.7
1.9
2.1
2.3
2.5
2.7
2.9
3.1
Apr
-18
Jun-
18
Aug
-18
Oct
-18
Dec
-18
Feb-
19
May
-19
Jul-1
9
Sep
-19
Nov
-19
Jan-
20
Mar
-20
Jun-
20
Aug
-20
Oct
-20
Dec
-20
Feb-
21
Apr
-21
(x)
Median 2.3

ZYDUS WELLNESS
EQUITY RESEARCH 28 14 March 2022
Company background
Incorporated in 1988 with the Sugar Free brand, ZYWL has expanded its health and
wellness portfolio to seven brands (including four acquired via the inorganic route)
backed by robust manufacturing and distribution capabilities. The company is a
subsidiary of pharmaceutical major Cadila Healthcare (63.55% stake) and operates
through five manufacturing facilities: two in Sikkim and one each in Ahmedabad
(Gujarat), Aligarh (Uttar Pradesh) and Sitarganj (Uttarakhand).
ZYWL’s brands comprise Sugar Free (sugar substitutes), Nutralite (table and
margarine) and Everyuth (skin care). Its acquisition of Heinz India’s consumer wellness
business in Jan’19 helped expand its product portfolio, adding the popular brands
Complan (health food drink), Nycil (prickly heat power), Glucon-D (instant energy
glucose powder) and Sampriti Ghee.
The company is a market leader in several of its categories, including Sugar Free,
Everyuth scrubs, Everyuth peel-offs, Glucon-D and Nycil where it commands over 96%,
39.2%, 76.4%, 58.1% and 34% market share respectively as on MAT Dec’21.

ZYDUS WELLNESS
EQUITY RESEARCH 29 14 March 2022
Financials
Income Statement
Y/E 31 Mar (Rs mn) FY20A FY21A FY22E FY23E FY24E
Total revenue 17,668 18,667 20,018 22,171 24,815
EBITDA 3,211 3,444 3,773 4,412 5,124
Depreciation (264) (252) (288) (324) (360)
EBIT 2,947 3,192 3,486 4,089 4,765
Net interest inc./(exp.) (1,399) (838) (401) (179) (19)
Other inc./(exp.) 107 89 99 109 119
Exceptional items 44 132 0 0 0
EBT 1,717 2,594 3,203 4,039 4,886
Income taxes 205 65 0 0 (1,226)
Extraordinary items 0 0 0 0 0
Min. int./Inc. from assoc. 0 0 0 0 0
Reported net profit 1,943 2,677 3,203 4,039 3,660
Adjustments 0 0 0 0 0
Adjusted net profit 1,943 2,677 3,203 4,039 3,660
Balance Sheet
Y/E 31 Mar (Rs mn) FY20A FY21A FY22E FY23E FY24E
Accounts payables 5,045 4,386 4,693 5,130 5,688
Other current liabilities 429 297 320 355 397
Provisions 259 312 334 370 414
Debt funds 15,558 5,991 4,291 291 191
Other liabilities 0 0 0 0 0
Equity capital 577 636 636 636 636
Reserves & surplus 34,030 45,042 48,195 52,176 55,776
Shareholders’ fund 34,607 45,678 48,831 52,812 56,413
Total liab. and equities 55,897 56,664 58,469 58,958 63,103
Cash and cash eq. 824 2,527 3,716 3,174 6,151
Accounts receivables 1,182 943 1,001 1,109 1,241
Inventories 2,923 3,647 3,783 4,157 4,601
Other current assets 1,396 1,166 1,223 1,355 1,516
Investments 39,200 39,200 39,200 39,200 39,200
Net fixed assets 2,047 1,996 2,245 2,466 2,655
CWIP 35 37 44 49 55
Intangible assets 5,488 5,478 5,478 5,478 5,478
Deferred tax assets, net 0 0 0 0 0
Other assets 1,697 1,670 1,779 1,971 2,206
Total assets 54,793 56,664 58,469 58,958 63,103
Cash Flows
Y/E 31 Mar (Rs mn) FY20A FY21A FY22E FY23E FY24E
Cash flow from operations 1,606 1,920 3,591 4,257 3,926
Capital expenditures (169) (203) (544) (549) (555)
Change in investments (643) 1,104 0 0 0
Other investing cash flows 49 37 (109) (191) (235)
Cash flow from investing 843 2,858 2,938 3,516 3,137
Equities issued/Others (1,171) 8,422 (19) (20) (21)
Debt raised/repaid (484) (9,567) (1,700) (4,000) (100)
Interest expenses 0 0 0 0 0
Dividends paid (28) (28) (31) (38) (38)
Other financing cash flows 22 18 0 0 0
Cash flow from financing (819) 1,703 1,188 (542) 2,977
Chg in cash & cash eq. 1,643 824 2,527 3,716 3,174
Closing cash & cash eq. 824 2,527 3,716 3,174 6,151
Per Share
Y/E 31 Mar (Rs) FY20A FY21A FY22E FY23E FY24E
Reported EPS 31.9 37.6 50.0 63.2 57.2
Adjusted EPS 31.9 37.6 50.0 63.2 57.2
Dividend per share 0.4 0.4 0.4 0.5 0.5
Book value per share 600.2 717.9 767.4 830.0 886.6
Valuations Ratios
Y/E 31 Mar (x) FY20A FY21A FY22E FY23E FY24E
EV/Sales 5.7 5.9 5.2 4.4 3.8
EV/EBITDA 31.5 32.1 27.8 22.2 18.5
Adjusted P/E 47.3 40.1 30.1 23.9 26.4
P/BV 2.5 2.1 2.0 1.8 1.7
DuPont Analysis
Y/E 31 Mar (%) FY20A FY21A FY22E FY23E FY24E
Tax burden (Net profit/PBT) 111.9 103.2 100.0 100.0 74.9
Interest burden (PBT/EBIT) 56.2 79.1 89.3 96.2 100.0
EBIT margin (EBIT/Revenue) 17.3 17.6 17.9 18.9 19.7
Asset turnover (Rev./Avg TA) 189.3 188.3 179.3 182.3 174.0
Leverage (Avg TA/Avg Equity) 0.3 0.2 0.2 0.2 0.3
Adjusted ROAE 5.6 6.7 6.8 7.9 6.7
Ratio Analysis
Y/E 31 Mar FY20A FY21A FY22E FY23E FY24E
YoY growth (%)
Revenue 109.6 5.7 7.2 10.8 11.9
EBITDA 73.7 7.3 9.6 16.9 16.1
Adjusted EPS 3.9 25.4 20.5 26.1 (9.4)
Profitability & Return ratios (%)
EBITDA margin 18.2 18.4 18.9 19.9 20.7
EBIT margin 16.7 17.1 17.4 18.4 19.2
Adjusted profit margin 11.0 14.3 16.0 18.2 14.7
Adjusted ROAE 3.7 4.6 6.0 7.6 6.4
ROCE 6.9 6.6 6.8 7.9 6.7
Working capital days (days)
Receivables 24 18 18 18 18
Inventory 135 155 150 150 150
Payables 126 104 104 104 104
Ratios (x)
Gross asset turnover 0.4 0.4 0.4 0.4 0.4
Current ratio 1.2 1.7 1.9 1.7 2.1
Net interest coverage ratio 2.2 3.9 8.9 23.5 259.8
Adjusted debt/equity 0.4 0.1 0.0 (0.1) (0.1)
Source: Company, BOBCAPS Research | Note: TA = Total Assets

ZYDUS WELLNESS
EQUITY RESEARCH 30 14 March 2022
Disclaimer
Recommendation scale: Recommendations and Absolute returns (%) over 12 months
BUY – Expected return >+15%
HOLD – Expected return from -6% to +15%
SELL – Expected return <-6%
Note: Recommendation structure changed with effect from 21 June 2021
Our recommendation scale does not factor in short-term stock price volatility related to market fluctuations. Thus, our recommendations may not always be strictly in
line with the recommendation scale as shown above.
Ratings and Target Price (3-year history): ZYDUS WELLNESS (ZYWL IN)
B – Buy, H – Hold, S – Sell, A – Add, R – Reduce
Rating distribution
As of 28 February 2022, out of 115 rated stocks in the BOB Capital Markets Limited (BOBCAPS) coverage universe, 65 have BUY ratings, 29 have HOLD ratings, 5
are rated ADD*, 1 is rated REDUCE* and 15 are rated SELL. None of these companies have been investment banking clients in the last 12 months. (*Our ADD and
REDUCE ratings are in the process of being migrated to the new recommendation structure.)
Analyst certification
The research analyst(s) authoring this report hereby certifies that (1) all of the views expressed in this research report accurately reflect his/her personal views about
the subject company or companies and its or their securities, and (2) no part of his/her compensation was, is, or will be, directly or indirectly, related to the specific
recommendation(s) or view(s) in this report. Analysts are not registered as research analysts by FINRA and are not associated persons of BOBCAPS.
General disclaimers
BOBCAPS is engaged in the business of Institutional Stock Broking and Investment Banking. BOBCAPS is a member of the National Stock Exchange of India Limited
and BSE Limited and is also a SEBI-registered Category I Merchant Banker. BOBCAPS is a wholly owned subsidiary of Bank of Baroda which has its various
subsidiaries engaged in the businesses of stock broking, lending, asset management, life insurance, health insurance and wealth management, among others.
BOBCAPS’s activities have neither been suspended nor has it defaulted with any stock exchange authority with whom it has been registered in the last five years.
BOBCAPS has not been debarred from doing business by any stock exchange or SEBI or any other authority. No disciplinary action has been taken by any regulatory
authority against BOBCAPS affecting its equity research analysis activities.
BOBCAPS has obtained registration as a Research Entity under SEBI (Research Analysts) Regulations, 2014, having registration No.: INH000000040 valid till
03 February 2025. BOBCAPS is also a SEBI-registered intermediary for the broking business having SEBI Single Registration Certificate No.: INZ000159332 dated 20
November 2017. BOBCAPS CIN Number: U65999MH1996GOI098009.
BOBCAPS prohibits its analysts, persons reporting to analysts, and members of their households from maintaining a financial interest in the securities or derivatives of
any companies that the analysts cover. Additionally, BOBCAPS prohibits its analysts and persons reporting to analysts from serving as an officer, director, or advisory
board member of any companies that the analysts cover.
Our salespeople, traders, and other professionals may provide oral or written market commentary or trading strategies to our clients that reflect opinions contrary to the
opinions expressed herein, and our proprietary trading and investing businesses may make investment decisions that are inconsistent with the recommendations
expressed herein. In reviewing these materials, you should be aware that any or all of the foregoing, among other things, may give rise to real or potential conflicts of
interest. Additionally, other important information regarding our relationships with the company or companies that are the subject of this material is provided herein.
1,120
1,380
1,640
1,900
2,160
2,420
Mar
-19
Apr
-19
May
-19
Jun-
19
Jul-1
9
Aug
-19
Sep
-19
Oct
-19
Nov
-19
Dec
-19
Jan-
20
Feb-
20
Mar
-20
Apr
-20
May
-20
Jun-
20
Jul-2
0
Aug
-20
Sep
-20
Oct
-20
Nov
-20
Dec
-20
Jan-
21
Feb-
21
Mar
-21
Apr
-21
May
-21
Jun-
21
Jul-2
1
Aug
-21
Sep
-21
Oct
-21
Nov
-21
Dec
-21
Jan-
22
Feb-
22
Mar
-22
(Rs) ZYWL stock price

ZYDUS WELLNESS
EQUITY RESEARCH 31 14 March 2022
This material should not be construed as an offer to sell or the solicitation of an offer to buy any security in any jurisdiction where such an offer or solicitation would be
illegal. We are not soliciting any action based on this material. It is for the general information of BOBCAPS’s clients. It does not constitute a personal recommendation
or take into account the particular investment objectives, financial situations, or needs of individual clients. Before acting on any advice or recommendation in this
material, clients should consider whether it is suitable for their particular circumstances and, if necessary, seek professional advice.
The price and value of the investments referred to in this material and the income from them may go down as well as up, and investors may realize losses on any
investments. Past performance is not a guide for future performance, future returns are not guaranteed and a loss of original capital may occur. BOBCAPS does not
provide tax advice to its clients, and all investors are strongly advised to consult with their tax advisers regarding any potential investment in certain transactions —
including those involving futures, options, and other derivatives as well as non-investment-grade securities —that give rise to substantial risk and are not suitable for all
investors. The material is based on information that we consider reliable, but we do not represent that it is accurate or complete, and it should not be relied on as such.
Opinions expressed are our current opinions as of the date appearing on this material only. We endeavour to update on a reasonable basis the information discussed
in this material, but regulatory, compliance, or other reasons may prevent us from doing so.
We and our affiliates, officers, directors, and employees, including persons involved in the preparation or issuance of this material, may from time to time have “long” or
“short” positions in, act as principal in, and buy or sell the securities or derivatives thereof of companies mentioned herein and may from time to time add to or dispose
of any such securities (or investment). We and our affiliates may act as market makers or assume an underwriting commitment in the securities of companies
discussed in this document (or in related investments), may sell them to or buy them from customers on a principal basis, and may also perform or seek to perform
investment banking or advisory services for or relating to these companies and may also be represented in the supervisory board or any other committee of these
companies.
For the purpose of calculating whether BOBCAPS and its affiliates hold, beneficially own, or control, including the right to vote for directors, one per cent or more of the
equity shares of the subject company, the holdings of the issuer of the research report is also included.
BOBCAPS and its non-US affiliates may, to the extent permissible under applicable laws, have acted on or used this research to the extent that it relates to non-US
issuers, prior to or immediately following its publication. Foreign currency denominated securities are subject to fluctuations in exchange rates that could have an
adverse effect on the value or price of or income derived from the investment. In addition, investors in securities such as ADRs, the value of which are influenced by
foreign currencies, effectively assume currency risk. In addition, options involve risks and are not suitable for all investors. Please ensure that you have read and
understood the Risk disclosure document before entering into any derivative transactions.
In the US, this material is only for Qualified Institutional Buyers as defined under rule 144(a) of the Securities Act, 1933. No part of this document may be distributed in
Canada or used by private customers in the United Kingdom.
No part of this material may be (1) copied, photocopied, or duplicated in any form by any means or (2) redistributed without BOBCAPS’s prior written consent.
Company-specific disclosures under SEBI (Research Analysts) Regulations, 2014
The research analyst(s) or his/her relatives do not have any material conflict of interest at the time of publication of this research report.
BOBCAPS or its research analyst(s) or his/her relatives do not have any financial interest in the subject company. BOBCAPS or its research analyst(s) or his/her
relatives do not have actual/beneficial ownership of one per cent or more securities in the subject company at the end of the month immediately preceding the date of
publication of this report.
The research analyst(s) has not received any compensation from the subject company in the past 12 months. Compensation of the research analyst(s) is not based on
any specific merchant banking, investment banking or brokerage service transactions.
BOBCAPS or its research analyst(s) is not engaged in any market making activities for the subject company.
The research analyst(s) has not served as an officer, director or employee of the subject company.
BOBCAPS or its associates may have material conflict of interest at the time of publication of this research report.
BOBCAPS’s associates may have financial interest in the subject company. BOBCAPS’s associates may hold actual / beneficial ownership of one per cent or more
securities in the subject company at the end of the month immediately preceding the date of publication of this report.
BOBCAPS or its associates may have managed or co-managed a public offering of securities for the subject company or may have been mandated by the subject
company for any other assignment in the past 12 months.
BOBCAPS may have received compensation from the subject company in the past 12 months. BOBCAPS may from time to time solicit or perform investment banking
services for the subject company. BOBCAPS or its associates may have received compensation from the subject company in the past 12 months for services in
respect of managing or co-managing public offerings, corporate finance, investment banking or merchant banking, brokerage services or other advisory services in a
merger or specific transaction. BOBCAPS or its associates may have received compensation for products or services other than investment banking or merchant
banking or brokerage services from the subject company in the past 12 months.