aviva investors investment funds icvc
TRANSCRIPT
For the six months ended 15 April 2017 (unaudited)
Interim Report and Financial Statements
A V I V A I N V E S T O R SI N V E S T M E N T F U N D S I C V C

avivainvestors.com | Aviva Investors Investment Funds ICVC Interim Report and Financial Statements for the six months ended 15 April 2017
1
CONTENTS
Company Information* 2
Report of the Authorised Corporate Director* 3
Manager’s Market Review 4
Statement of Cross Holdings 5
Aviva Investors UK Equity Fund 6
Aviva Investors UK Equity Income Fund 15
Aviva Investors UK Growth Fund 23
Aviva Investors UK Index Tracking Fund 33
Aviva Investors UK Smaller Companies Fund 52
Aviva Investors Cash Fund 61
Aviva Investors Corporate Bond Fund 67
Aviva Investors Distribution Fund 76
Aviva Investors High Yield Bond Fund 85
Aviva Investors Higher Income Plus Fund 92
Aviva Investors Managed High Income Fund 99
Aviva Investors Monthly Income Plus Fund 108
Aviva Investors Strategic Bond Fund 116
Aviva Investors European Equity Fund 124
Aviva Investors International Index Tracking Fund 131
Aviva Investors Global Equity Income Fund 177
Aviva Investors Multi-Strategy Target Return Fund 185
Statement of the Authorised Corporate Director’s Responsibilities 208
Authorised Corporate Director’s Statement 208
Securities Financing Transactions Regulation Disclosure (Unaudited) 209
General Information 210
* These items comprise the Manager’s Report for the purposes of the rules contained in the Collective Investment Schemes Sourcebook (“the Regulations”).
Aviva Investors Investment Funds ICVC Interim Report and Financial Statements for the six months ended 15 April 2017 | avivainvestors.com
Company Information
2
AUTHORISED CORPORATE DIRECTORAviva Investors UK Fund Services LimitedSt Helen’s1 UndershaftLondon, EC3P 3DQ
Aviva Investors UK Fund Services Limited (the ACD) is a wholly owned subsidiary of Aviva Investors Holdings Limited, a company incorporated in the United Kingdom and within the Aviva Group of Companies. The ACD is a member of the Investment Association and is authorised and regulated by the Financial Conduct Authority.
Changes to Registered Office With effect from 19 December 2016, the registered office for the ACD was changed to St Helen’s, 1 Undershaft, London, EC3P 3DQ. Prior to this date, the registered office was No. 1 Poultry, London, EC2R 8EJ.
DIRECTORSI BuckleJ MisselbrookS EbenstonM Craston (resigned 8 February 2017)G Cass (resigned 8 February 2017)D Skinner (appointed 10 February 2017)J Leadsom (appointed 6 April 2017)D Clayton (appointed 5 April 2017)
ADMINISTRATOR AND REGISTRARInternational Financial Data Services (UK) LimitedIFDS HouseSt Nicholas LaneBasildonEssex, SS15 5FS
INVESTMENT MANAGERAviva Investors Global Services LimitedSt Helen’s1 UndershaftLondon, EC3P 3DQ
Aviva Investors Global Services Limited is a member of the Investment Association and is authorised and regulated by the Financial Conduct Authority. The ultimate parent company of Aviva Investors Global Services Limited is Aviva Plc.
Changes to Registered Office With effect from 19 December 2016, the registered office for the Investment Manager was changed to St Helen’s, 1 Undershaft, London, EC3P 3DQ. Prior to this date, the registered office was No. 1 Poultry, London, EC2R 8EJ.
TRUSTEE AND DEPOSITARYCitibank Europe plc, UK BranchCitigroup Centre25 Canada Square, Canary WharfLondon, E14 5LB
Citibank Europe plc is authorised and regulated by the Central Bank of Ireland, however, the UK branch is subject to Financial Conduct Authority (FCA) regulation.
INDEPENDENT AUDITORSPricewaterhouseCoopers LLP7 More London RiversideLondon, SE1 2RT
COMPANY INFORMATION
avivainvestors.com | Aviva Investors Investment Funds ICVC Interim Report and Financial Statements for the six months ended 15 April 2017
Report of the Authorised Corporate Director
3
THE COMPANYAviva Investors Investment Funds ICVC (“the Company”) is an Open-Ended Investment Company (OEIC) with variable capital incorporated in England and Wales on 9 September 1998. The property of the Company is entrusted to Citibank Europe plc, UK Branch (“the Depositary”). The shareholders are not liable for any debts of the Company.
The object of the Company is to invest the scheme property in transferable securities, money market instruments, units in collective investment schemes, deposits and derivatives and forward transactions in accordance with the COLL Sourcebook with the aim of spreading investment risk and giving its shareholders the benefit of the results of the management of that property.
The Company has an umbrella structure which means that it contains many Funds, each with a different investment objective. In the financial statements you will find an investment review for each Fund which includes details of the investment objectives. There are currently 17 Funds in the Aviva Investors Investment Funds ICVC.
With effect from 19 December 2016, the registered office for the Aviva Investors Investment Funds ICVC was changed to St Helen’s, 1 Undershaft, London, EC3P 3DQ. Prior to this date, the registered office was No. 1 Poultry, London, EC2R 8EJ.
AUTHORISED STATUSFrom 9 September 1998 the Company has been authorised as an Open-Ended Investment Company under Regulation 7 of the Open-Ended Investment Companies Regulations 1996 (superseded by Regulation 12 of the Open-Ended Investment Companies Regulations 2001).
The Company is a UCITS Scheme operating under the COLL Sourcebook and is constituted as an “umbrella company” under the Regulations, which means that the Company issues shares linked to different Funds.
THE FINANCIAL STATEMENTSWe are pleased to present the interim financial statements of the Company for the six months ended 15 April 2017. As required by the Regulations, information for each of the Funds has been included in these financial statements. On the following pages we review the performance of each of those Funds during the period. We hope that you find our review useful and informative.
ANNUAL GENERAL MEETINGSThe Company will not be holding Annual General Meetings.
CHANGES TO THE PROSPECTUSAviva Investors Multi-Strategy Target Return Fund – changes to Share Class 3With effect from 24 October 2016, the AMC in share class 3 of the Aviva Investors Multi-Strategy Target Return Fund was increased to 0.67%. The eligibility criteria for share class 3, which is aimed at institutional investors, were also changed. Please refer to the Prospectus for full details.
Aviva Investors Strategic Bond Fund – launch of Share Class 5 On 28 October 2016, a new share class 5 (income) was launched in the Aviva Investors Strategic Bond Fund. Full details of this class are set out in the Prospectus.
Aviva Investors UK Index Tracking Fund – AMC Reduction The AMC for Share Class A of the Aviva Investors UK Index Tracking Fund was changed from 0.15% to 0.10% with effect from 1 November 2016.
Aviva Investors Multi-Strategy Target Return Fund – Addition of eligible securities markets Following approval by the depositary, over the course of the period, the Mauritius Stock Exchange, the Pakistan Stock Exchange, the Abu Dhabi Securities Market, the Dubai Financial Market, the NASDAQ Dubai, Colombia Stock Exchange, the Qatar Exchange and the Moscow Exchange have been added as eligible securities markets for the Aviva Investors Multi-Strategy Target Return Fund.
SIGNIFICANT INFORMATIONOn 18 March 2017, Aviva Investors UK Fund Services Limited replaced Aviva Investors UK Funds Limited as the ISA Manager of all Aviva Investors ISA accounts. Other than the identity of the registered ISA Manager, no changes were made to the ISAs or the way they are run as a result of this change.
REPORT OF THE AUTHORISED CORPORATE DIRECTOR
Aviva Investors Investment Funds ICVC Interim Report and Financial Statements for the six months ended 15 April 2017 | avivainvestors.com
Manager’s Market Review
4
EQUITY MARKET REVIEWEquity markets posted strong performance in the six months under review as the major economies showed signs of sustainable recovery following the downturn triggered by the global financial crisis. The US continued its steady, if unspectacular improvement, while a surge in business confidence in the Eurozone suggested that growth was returning rapidly to the embattled region. More generally, equities were driven higher by clear evidence that inflation had won the battle over deflation. Hopes were also high that the pro-growth agenda of incoming US president Donald Trump would help inject impetus into US economy, which would radiate out into the rest of the world. The UK market shrugged off worries about the economic impact of June’s shock vote for Brexit to post impressive gains. Instead of fretting about future uncertainties, investors focused on the boost given to the overseas earning of British companies by a sharply weaker Sterling. This currency translation effect also lifted UK investors’ returns from overseas holdings.
FIXED INCOME – CORPORATE AND HIGH-YIELD BONDSFixed income markets were weak in the six months under review as concerns grew that central banks would be forced to prematurely wind down their monetary support in response to an acceleration of global inflation. The period saw an announcement by the European Central Bank (ECB) that it was reducing the scale of its monthly bond purchases through the quantitative easing program, while the US central bank implemented two rises in interest rates. Corporate bonds outperformed government bonds, however, as the prospects for company finances improved and income hungry investor were attracted by more competitive yields. The best performance was posted by markets that are more heavily geared into strengthening global growth, such as emerging markets and high-yield. Better quality bonds were held back concerns that the bond buying policies of the Bank of England (BoE) and the ECB were starting to fade.
April 2017Source of market data: FactSet, BloombergPast performance is not a guide to the future. The value of an investment and any income from it can go down as well as up. Investors may not get back the original amount invested. Any opinions expressed are those of the Fund manager. They should not be viewed as a guarantee of a return from an investment in the Funds. The content of the commentary should not be viewed as a recommendation to invest nor buy or sell securities.
MANAGER’S MARKET REVIEW

avivainvestors.com | Aviva Investors Investment Funds ICVC Interim Report and Financial Statements for the six months ended 15 April 2017
Statement of Cross Holdings
5
STATEMENT OF CROSS HOLDINGS
There are no cross holdings as at 15 April 2017.
Aviva Investors Investment Funds ICVC Interim Report and Financial Statements for the six months ended 15 April 2017 | avivainvestors.com
Aviva Investors UK Equity Fund
6
INVESTMENT OBJECTIVELong term capital appreciation and income.
INVESTMENT POLICYDiversified investment within the UK equity market. Individual security selections will be based on price and long term total return prospects.
The Fund may invest in any of the following financial instruments in order to achieve its investment objective: transferable securities, money market instruments, units in collective investment schemes, deposits and derivatives and forward transactions.
FUND MANAGER’S REPORTOver the six months ended 15 April 2017, the Aviva Investors UK Equity Fund delivered a total return of 7.79 per cent (share class A), net of fees, compared with an average return of 7.68 per cent for its peer group, the Investment Association UK All Companies sector. The FTSE® All-Share Index, the Fund’s benchmark, returned 7.23 per cent.
Stock selection in the financial, industrial and consumer services sectors contributed to relative performance during the review period. Amongst financials, the Fund’s holding in investment management business Rathbones performed well. The company is expanding in discretionary fund management, improving its recurring revenue stream. Intermediate Capital, a specialist investor in alternative assets such as real estate and mezzanine capital, a higher risk form of debt, was another contributor reporting better-than-expected interim results. Prudential raised its dividend payment, as a focus on Asian markets drove annual earnings growth, offsetting weakness in the UK where the insurer has withdrawn from the bulk annuity market.
Amongst industrials, several holdings with substantial Dollar earnings performed well as US economic indicators continued to improve. These included Melrose Industries, Ashtead and BBA Aviation. Engineering group Melrose reported that last year’s acquisition of US-based Nortek, which supplies extractor fans, is already making a strong contribution to earnings, while equipment leasing firm Ashtead upgraded its annual earnings forecast in December. With its exposure to the US construction industry, the company is viewed as a major beneficiary of President Trump’s plans to upgrade the nation’s infrastructure. Aircraft servicing group BBA is benefiting from the trend towards larger jets in the US corporate market as the company makes a substantial proportion of its earnings through refuelling, while its acquisition of aviation services provider Landmark has integrated well. Amongst consumer stocks, the Fund’s holding in broadcaster ITV contributed to performance. Although advertising revenues have declined, annual results revealed the company’s studios business is performing well.
The largest detractor from performance was the Fund’s holding in accountancy software group Sage. Broker reviews questioned the scope for continued revenue growth from subscription sales and highlighted the need for Sage to attract new customers for its cloud accounting solutions. However, the company has recently acquired cloud software firm Fairsail and we believe Sage is well placed to benefit from increased demand for cloud-based software solutions amongst small and medium-sized businesses.
Looking ahead, we expect political developments to shape market sentiment over the coming months. Aside from Article 50, triggered in March, heralding two years of potentially fraught negotiations on the terms of the UK’s exit from the European Union, immediately post the review period the surprise announcement of a General Election this June triggered a spike in market volatility from its benign levels since the US elections. With elections in France, and later this year in Germany, it would not be surprising to see further volatility in equity markets. Although UK economic indicators have remained broadly positive, we are concerned about the risk of a slowdown in consumer spending over the course of 2017. Recent retail sales figures have been disappointing, which suggests rising inflation is starting to squeeze consumers’ disposable incomes.
April 2017Sources: Fund and peer group performance figures – Lipper, mid to mid basis with net income reinvested in GBP, with no initial charges applied. Market data – Bloomberg. Any opinions expressed are those of the Fund manager. They should not be viewed as a guarantee of a return from an investment in the Funds. The content of the commentary should not be viewed as a recommendation to invest nor buy or sell securities. Past performance is not a guide to the future. The value of an investment and any income from it can go down as well as up. Investors may not get back the original amount invested.“FTSE” is a trade mark jointly owned by the London Stock Exchange Plc and The Financial Times Limited and is used by FTSE International Limited (“FTSE”) under Licence. FTSE does not sponsor, endorse or promote this product and is not in any way connected to it and does not accept any liability in relation to its Issue, operation and trading. All copyright in the index values and constituent list vests in FTSE.
Material Portfolio ChangesPurchases Sales
Aviva Investors Sterling Liquidity Fund Class 3, Income shares, GBP
Aviva Investors Sterling Liquidity Fund Class 3, Income shares, GBP
British American Tobacco Cineworld Group
Unilever Inmarsat
Reckitt Benckiser Group Young & Co’s Brewery, (Non-Voting)
Melrose Industries Worldpay Group
BCA Marketplace
Sports Direct International
Prudential
Essentra
DS Smith
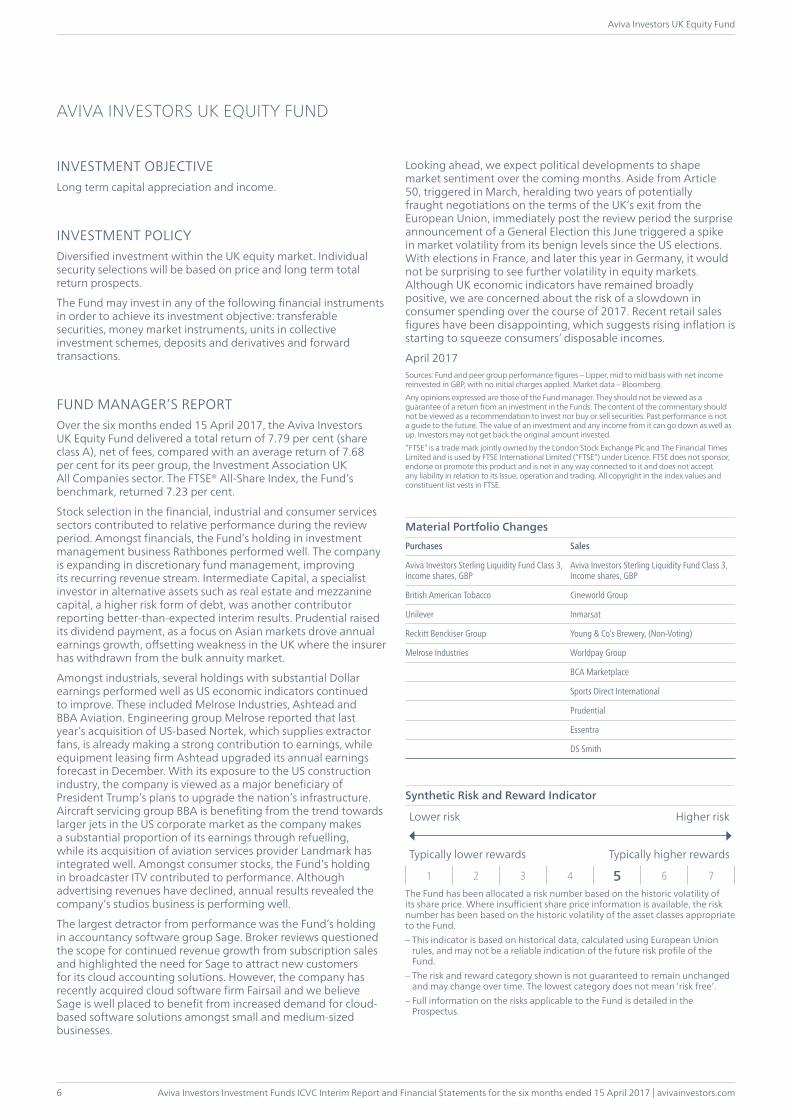
Synthetic Risk and Reward Indicator
Lower risk Higher risk
Typically lower rewards Typically higher rewards
1 2 3 4 5 6 7The Fund has been allocated a risk number based on the historic volatility of its share price. Where insufficient share price information is available, the risk number has been based on the historic volatility of the asset classes appropriate to the Fund.– This indicator is based on historical data, calculated using European Union
rules, and may not be a reliable indication of the future risk profile of the Fund.
– The risk and reward category shown is not guaranteed to remain unchanged and may change over time. The lowest category does not mean ‘risk free’.
– Full information on the risks applicable to the Fund is detailed in the Prospectus.
AVIVA INVESTORS UK EQUITY FUND
avivainvestors.com | Aviva Investors Investment Funds ICVC Interim Report and Financial Statements for the six months ended 15 April 2017
Aviva Investors UK Equity Fund
7
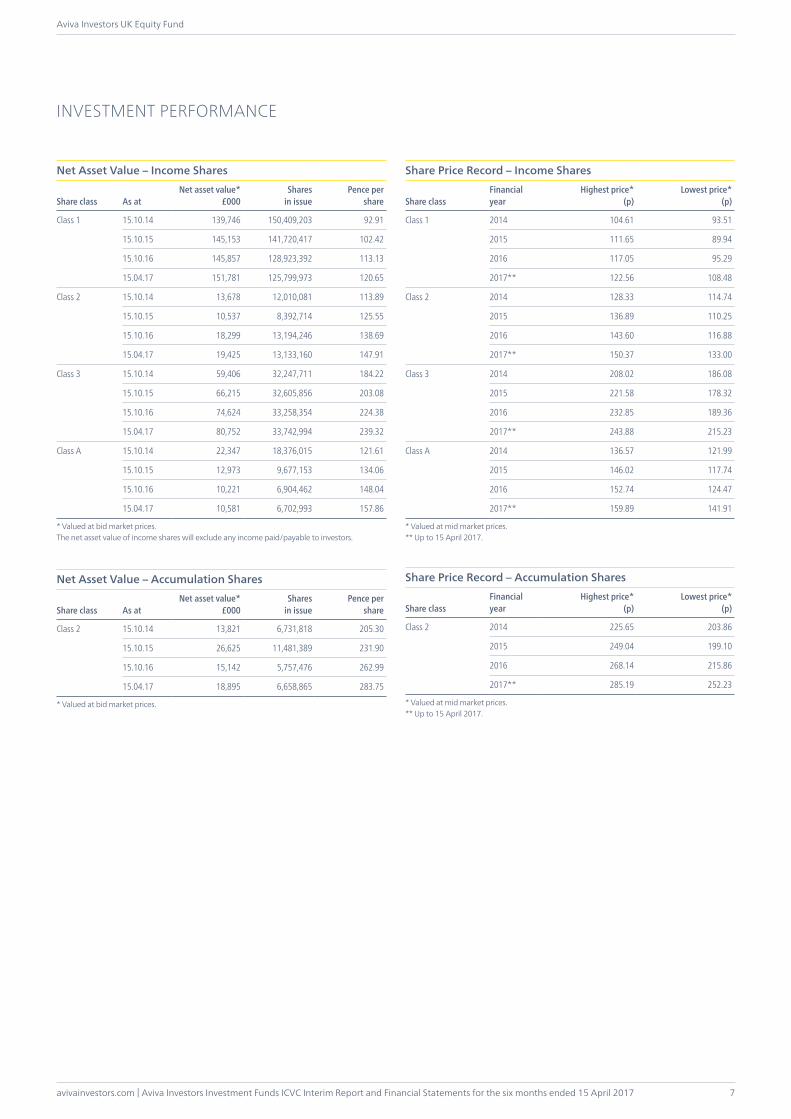
Net Asset Value – Income Shares
Share class As atNet asset value*
£000Shares
in issuePence per
share
Class 1 15.10.14 139,746 150,409,203 92.91
15.10.15 145,153 141,720,417 102.42
15.10.16 145,857 128,923,392 113.13
15.04.17 151,781 125,799,973 120.65
Class 2 15.10.14 13,678 12,010,081 113.89
15.10.15 10,537 8,392,714 125.55
15.10.16 18,299 13,194,246 138.69
15.04.17 19,425 13,133,160 147.91
Class 3 15.10.14 59,406 32,247,711 184.22
15.10.15 66,215 32,605,856 203.08
15.10.16 74,624 33,258,354 224.38
15.04.17 80,752 33,742,994 239.32
Class A 15.10.14 22,347 18,376,015 121.61
15.10.15 12,973 9,677,153 134.06
15.10.16 10,221 6,904,462 148.04
15.04.17 10,581 6,702,993 157.86
* Valued at bid market prices.The net asset value of income shares will exclude any income paid/payable to investors.
Net Asset Value – Accumulation Shares
Share class As atNet asset value*
£000Shares
in issuePence per
share
Class 2 15.10.14 13,821 6,731,818 205.30
15.10.15 26,625 11,481,389 231.90
15.10.16 15,142 5,757,476 262.99
15.04.17 18,895 6,658,865 283.75
* Valued at bid market prices.
Share Price Record – Income Shares
Share classFinancialyear
Highest price*(p)
Lowest price*(p)
Class 1 2014 104.61 93.51
2015 111.65 89.94
2016 117.05 95.29
2017** 122.56 108.48
Class 2 2014 128.33 114.74
2015 136.89 110.25
2016 143.60 116.88
2017** 150.37 133.00
Class 3 2014 208.02 186.08
2015 221.58 178.32
2016 232.85 189.36
2017** 243.88 215.23
Class A 2014 136.57 121.99
2015 146.02 117.74
2016 152.74 124.47
2017** 159.89 141.91
* Valued at mid market prices.** Up to 15 April 2017.
Share Price Record – Accumulation Shares
Share classFinancialyear
Highest price*(p)
Lowest price*(p)
Class 2 2014 225.65 203.86
2015 249.04 199.10
2016 268.14 215.86
2017** 285.19 252.23
* Valued at mid market prices.** Up to 15 April 2017.
INVESTMENT PERFORMANCE
Aviva Investors Investment Funds ICVC Interim Report and Financial Statements for the six months ended 15 April 2017 | avivainvestors.com
Aviva Investors UK Equity Fund
8
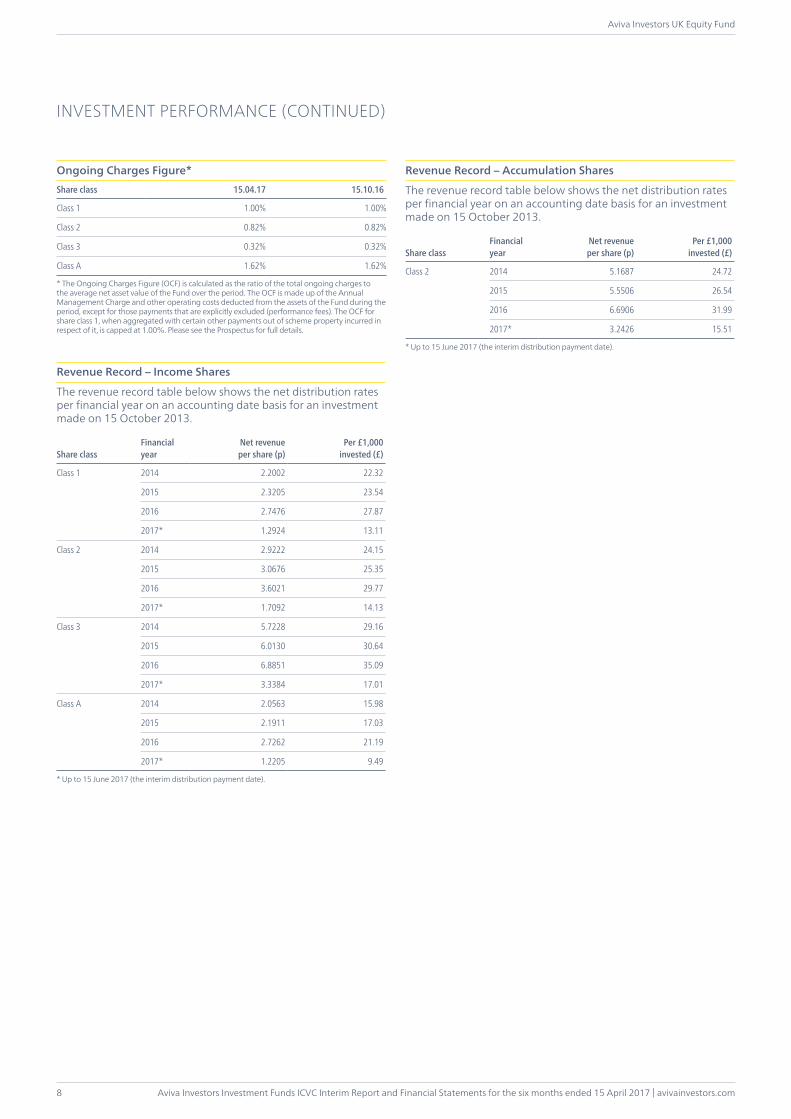
Ongoing Charges Figure*Share class 15.04.17 15.10.16
Class 1 1.00% 1.00%
Class 2 0.82% 0.82%
Class 3 0.32% 0.32%
Class A 1.62% 1.62%
* The Ongoing Charges Figure (OCF) is calculated as the ratio of the total ongoing charges to the average net asset value of the Fund over the period. The OCF is made up of the Annual Management Charge and other operating costs deducted from the assets of the Fund during the period, except for those payments that are explicitly excluded (performance fees). The OCF for share class 1, when aggregated with certain other payments out of scheme property incurred in respect of it, is capped at 1.00%. Please see the Prospectus for full details.
Revenue Record – Income Shares
The revenue record table below shows the net distribution rates per financial year on an accounting date basis for an investment made on 15 October 2013.
Share classFinancialyear
Net revenue per share (p)
Per £1,000invested (£)
Class 1 2014 2.2002 22.32
2015 2.3205 23.54
2016 2.7476 27.87
2017* 1.2924 13.11
Class 2 2014 2.9222 24.15
2015 3.0676 25.35
2016 3.6021 29.77
2017* 1.7092 14.13
Class 3 2014 5.7228 29.16
2015 6.0130 30.64
2016 6.8851 35.09
2017* 3.3384 17.01
Class A 2014 2.0563 15.98
2015 2.1911 17.03
2016 2.7262 21.19
2017* 1.2205 9.49
* Up to 15 June 2017 (the interim distribution payment date).
Revenue Record – Accumulation Shares
The revenue record table below shows the net distribution rates per financial year on an accounting date basis for an investment made on 15 October 2013.
Share classFinancialyear
Net revenue per share (p)
Per £1,000invested (£)
Class 2 2014 5.1687 24.72
2015 5.5506 26.54
2016 6.6906 31.99
2017* 3.2426 15.51
* Up to 15 June 2017 (the interim distribution payment date).
INVESTMENT PERFORMANCE (CONTINUED)
avivainvestors.com | Aviva Investors Investment Funds ICVC Interim Report and Financial Statements for the six months ended 15 April 2017
Aviva Investors UK Equity Fund
9
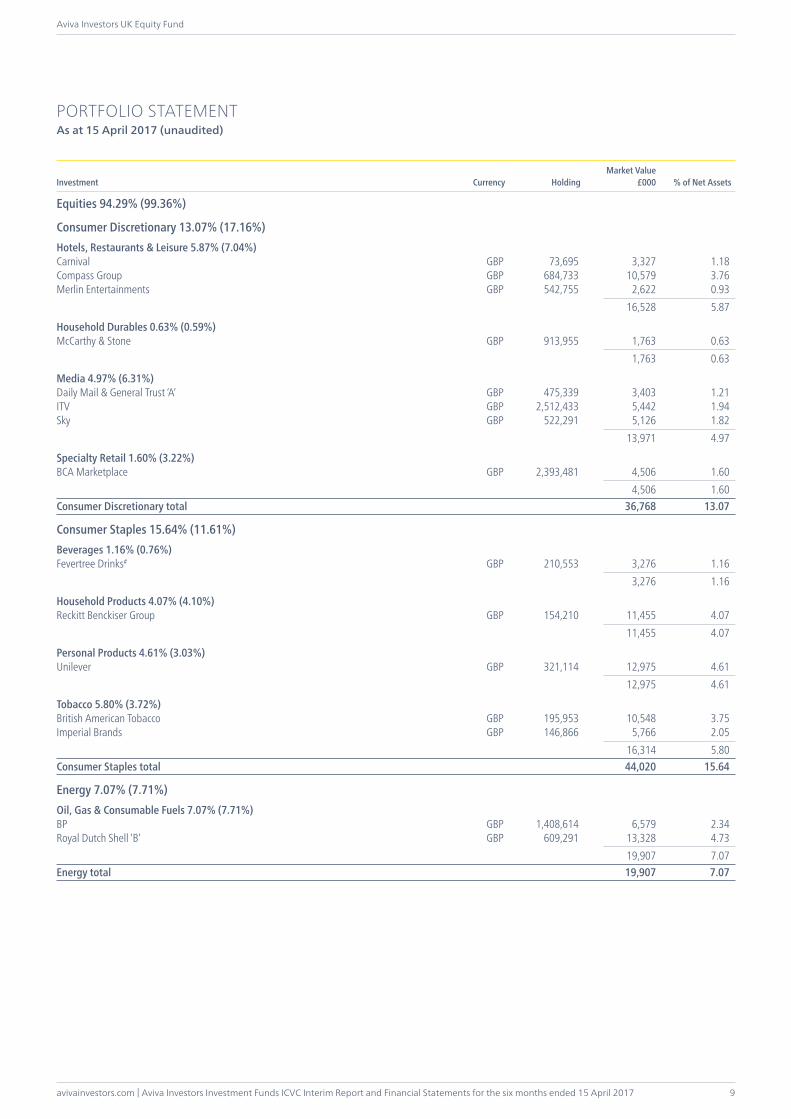
PORTFOLIO STATEMENTAs at 15 April 2017 (unaudited)
Investment Currency HoldingMarket Value
£000 % of Net Assets
Equities 94.29% (99.36%)
Consumer Discretionary 13.07% (17.16%)Hotels, Restaurants & Leisure 5.87% (7.04%)Carnival GBP 73,695 3,327 1.18Compass Group GBP 684,733 10,579 3.76Merlin Entertainments GBP 542,755 2,622 0.93 16,528 5.87
Household Durables 0.63% (0.59%)McCarthy & Stone GBP 913,955 1,763 0.63 1,763 0.63
Media 4.97% (6.31%)Daily Mail & General Trust ‘A’ GBP 475,339 3,403 1.21ITV GBP 2,512,433 5,442 1.94Sky GBP 522,291 5,126 1.82 13,971 4.97
Specialty Retail 1.60% (3.22%)BCA Marketplace GBP 2,393,481 4,506 1.60 4,506 1.60Consumer Discretionary total 36,768 13.07
Consumer Staples 15.64% (11.61%)Beverages 1.16% (0.76%)Fevertree Drinks# GBP 210,553 3,276 1.16 3,276 1.16
Household Products 4.07% (4.10%)Reckitt Benckiser Group GBP 154,210 11,455 4.07 11,455 4.07
Personal Products 4.61% (3.03%)Unilever GBP 321,114 12,975 4.61 12,975 4.61
Tobacco 5.80% (3.72%)British American Tobacco GBP 195,953 10,548 3.75Imperial Brands GBP 146,866 5,766 2.05 16,314 5.80Consumer Staples total 44,020 15.64
Energy 7.07% (7.71%)Oil, Gas & Consumable Fuels 7.07% (7.71%)BP GBP 1,408,614 6,579 2.34Royal Dutch Shell ‘B’ GBP 609,291 13,328 4.73 19,907 7.07Energy total 19,907 7.07
Aviva Investors Investment Funds ICVC Interim Report and Financial Statements for the six months ended 15 April 2017 | avivainvestors.com
Aviva Investors UK Equity Fund
10
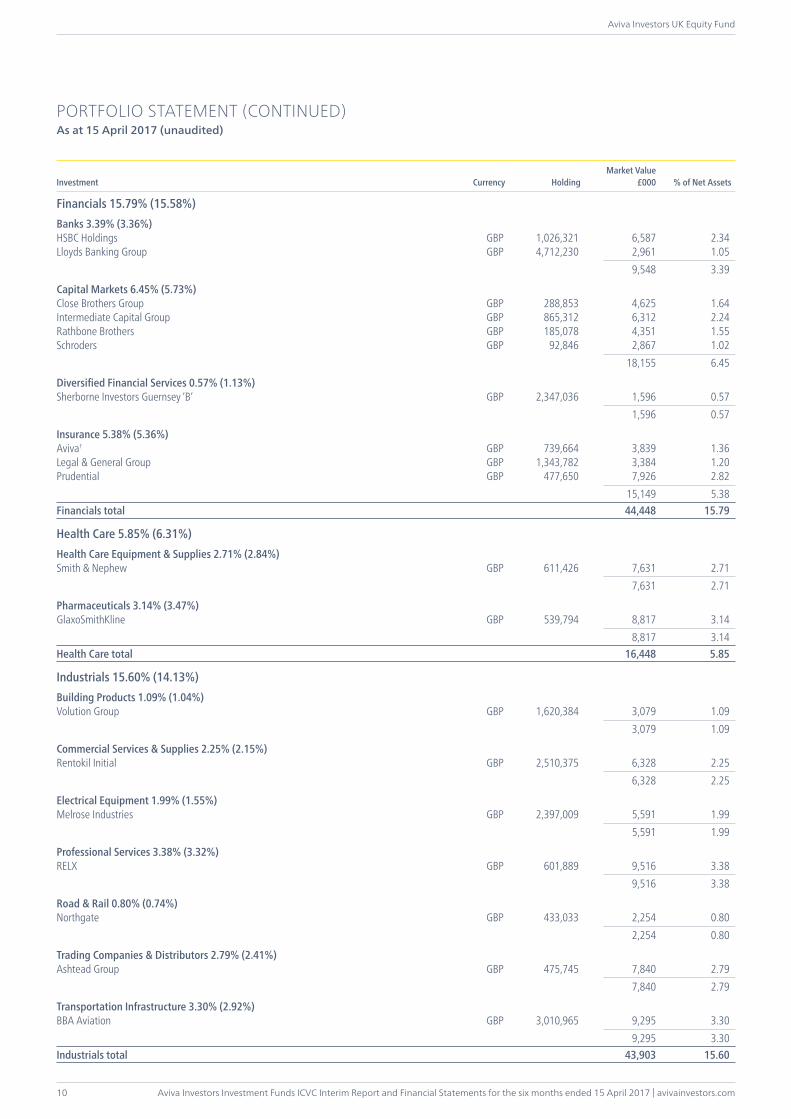
PORTFOLIO STATEMENT (CONTINUED)As at 15 April 2017 (unaudited)
Investment Currency HoldingMarket Value
£000 % of Net Assets
Financials 15.79% (15.58%)Banks 3.39% (3.36%)HSBC Holdings GBP 1,026,321 6,587 2.34Lloyds Banking Group GBP 4,712,230 2,961 1.05 9,548 3.39
Capital Markets 6.45% (5.73%)Close Brothers Group GBP 288,853 4,625 1.64Intermediate Capital Group GBP 865,312 6,312 2.24Rathbone Brothers GBP 185,078 4,351 1.55Schroders GBP 92,846 2,867 1.02 18,155 6.45
Diversified Financial Services 0.57% (1.13%)Sherborne Investors Guernsey ‘B’ GBP 2,347,036 1,596 0.57 1,596 0.57
Insurance 5.38% (5.36%)Aviva† GBP 739,664 3,839 1.36Legal & General Group GBP 1,343,782 3,384 1.20Prudential GBP 477,650 7,926 2.82 15,149 5.38Financials total 44,448 15.79
Health Care 5.85% (6.31%)Health Care Equipment & Supplies 2.71% (2.84%)Smith & Nephew GBP 611,426 7,631 2.71 7,631 2.71
Pharmaceuticals 3.14% (3.47%)GlaxoSmithKline GBP 539,794 8,817 3.14 8,817 3.14Health Care total 16,448 5.85
Industrials 15.60% (14.13%)Building Products 1.09% (1.04%)Volution Group GBP 1,620,384 3,079 1.09 3,079 1.09
Commercial Services & Supplies 2.25% (2.15%)Rentokil Initial GBP 2,510,375 6,328 2.25 6,328 2.25
Electrical Equipment 1.99% (1.55%)Melrose Industries GBP 2,397,009 5,591 1.99 5,591 1.99
Professional Services 3.38% (3.32%)RELX GBP 601,889 9,516 3.38 9,516 3.38
Road & Rail 0.80% (0.74%)Northgate GBP 433,033 2,254 0.80 2,254 0.80
Trading Companies & Distributors 2.79% (2.41%)Ashtead Group GBP 475,745 7,840 2.79 7,840 2.79
Transportation Infrastructure 3.30% (2.92%)BBA Aviation GBP 3,010,965 9,295 3.30 9,295 3.30Industrials total 43,903 15.60
avivainvestors.com | Aviva Investors Investment Funds ICVC Interim Report and Financial Statements for the six months ended 15 April 2017
Aviva Investors UK Equity Fund
11
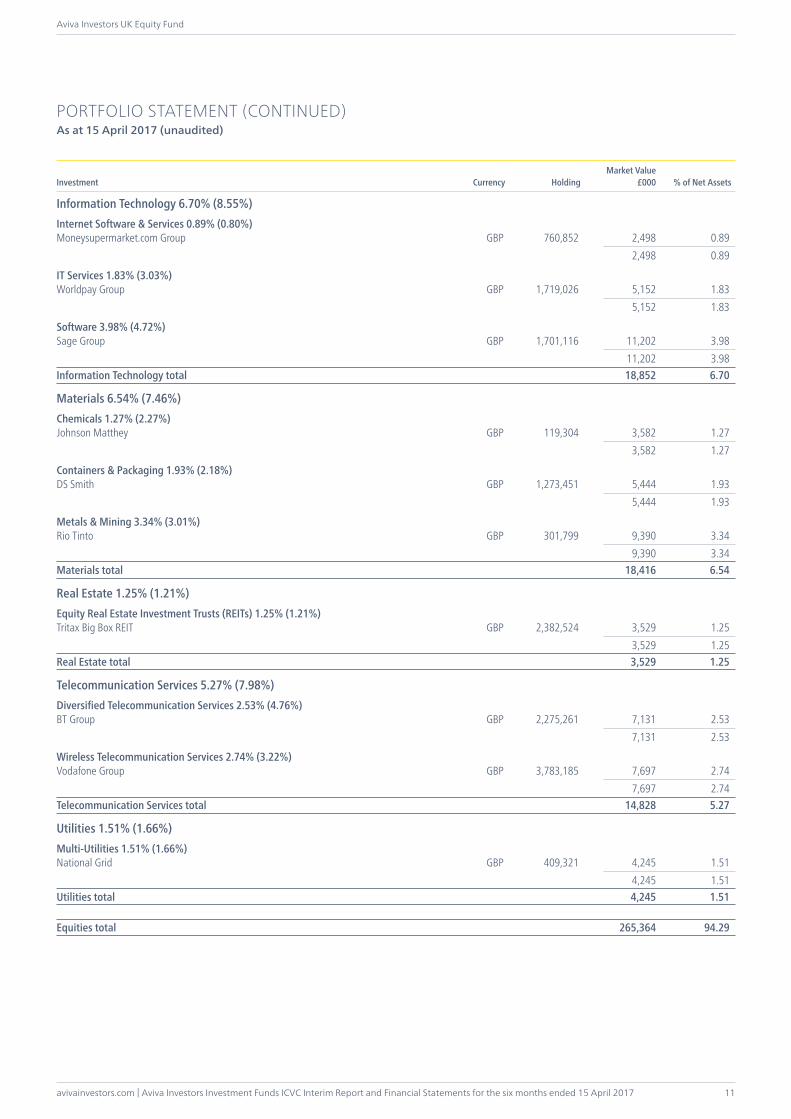
PORTFOLIO STATEMENT (CONTINUED)As at 15 April 2017 (unaudited)
Investment Currency HoldingMarket Value
£000 % of Net Assets
Information Technology 6.70% (8.55%)Internet Software & Services 0.89% (0.80%)Moneysupermarket.com Group GBP 760,852 2,498 0.89 2,498 0.89
IT Services 1.83% (3.03%)Worldpay Group GBP 1,719,026 5,152 1.83 5,152 1.83
Software 3.98% (4.72%)Sage Group GBP 1,701,116 11,202 3.98 11,202 3.98Information Technology total 18,852 6.70
Materials 6.54% (7.46%)Chemicals 1.27% (2.27%)Johnson Matthey GBP 119,304 3,582 1.27 3,582 1.27
Containers & Packaging 1.93% (2.18%)DS Smith GBP 1,273,451 5,444 1.93 5,444 1.93
Metals & Mining 3.34% (3.01%)Rio Tinto GBP 301,799 9,390 3.34 9,390 3.34Materials total 18,416 6.54
Real Estate 1.25% (1.21%)Equity Real Estate Investment Trusts (REITs) 1.25% (1.21%)Tritax Big Box REIT GBP 2,382,524 3,529 1.25 3,529 1.25Real Estate total 3,529 1.25
Telecommunication Services 5.27% (7.98%)Diversified Telecommunication Services 2.53% (4.76%)BT Group GBP 2,275,261 7,131 2.53 7,131 2.53
Wireless Telecommunication Services 2.74% (3.22%)Vodafone Group GBP 3,783,185 7,697 2.74 7,697 2.74Telecommunication Services total 14,828 5.27
Utilities 1.51% (1.66%)Multi-Utilities 1.51% (1.66%)National Grid GBP 409,321 4,245 1.51 4,245 1.51Utilities total 4,245 1.51
Equities total 265,364 94.29
Aviva Investors Investment Funds ICVC Interim Report and Financial Statements for the six months ended 15 April 2017 | avivainvestors.com
Aviva Investors UK Equity Fund
12
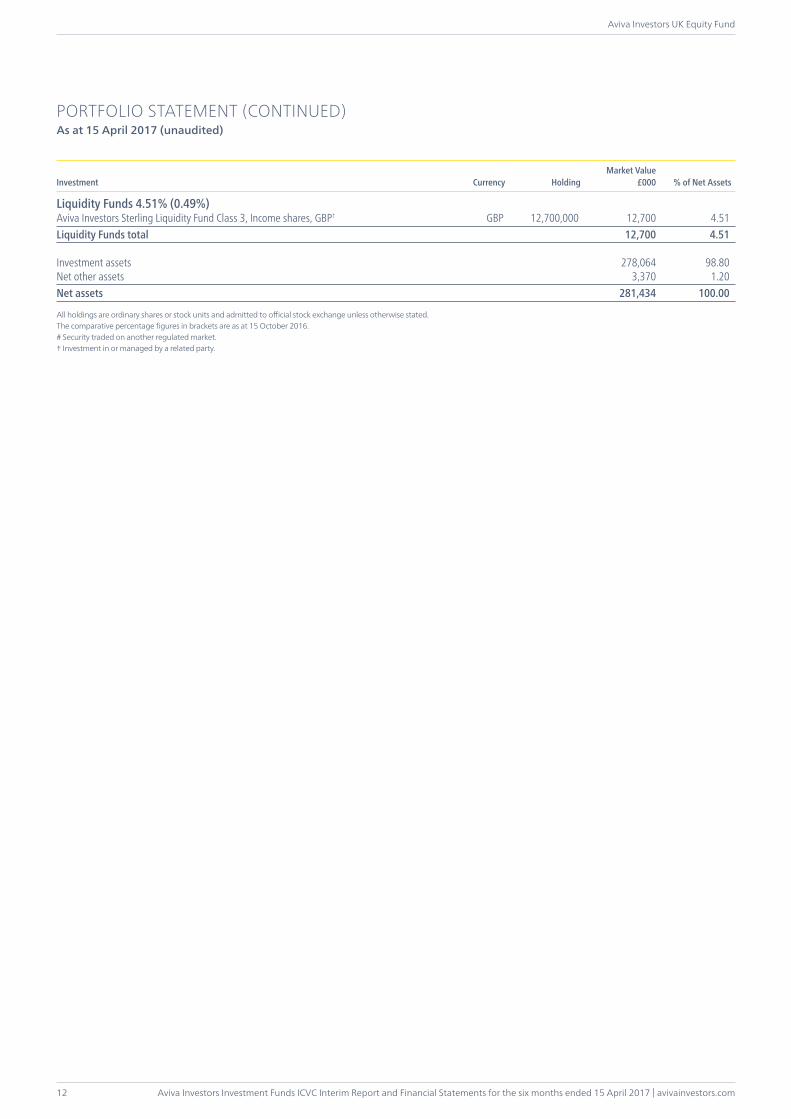
Liquidity Funds 4.51% (0.49%)Aviva Investors Sterling Liquidity Fund Class 3, Income shares, GBP† GBP 12,700,000 12,700 4.51Liquidity Funds total 12,700 4.51
Investment assets 278,064 98.80Net other assets 3,370 1.20Net assets 281,434 100.00
All holdings are ordinary shares or stock units and admitted to official stock exchange unless otherwise stated.The comparative percentage figures in brackets are as at 15 October 2016.# Security traded on another regulated market.† Investment in or managed by a related party.
PORTFOLIO STATEMENT (CONTINUED)As at 15 April 2017 (unaudited)
Investment Currency HoldingMarket Value
£000 % of Net Assets
avivainvestors.com | Aviva Investors Investment Funds ICVC Interim Report and Financial Statements for the six months ended 15 April 2017
Aviva Investors UK Equity Fund
13
£000
Six months ended15.04.17
£000 £000
Six months ended15.04.16
£000
Income
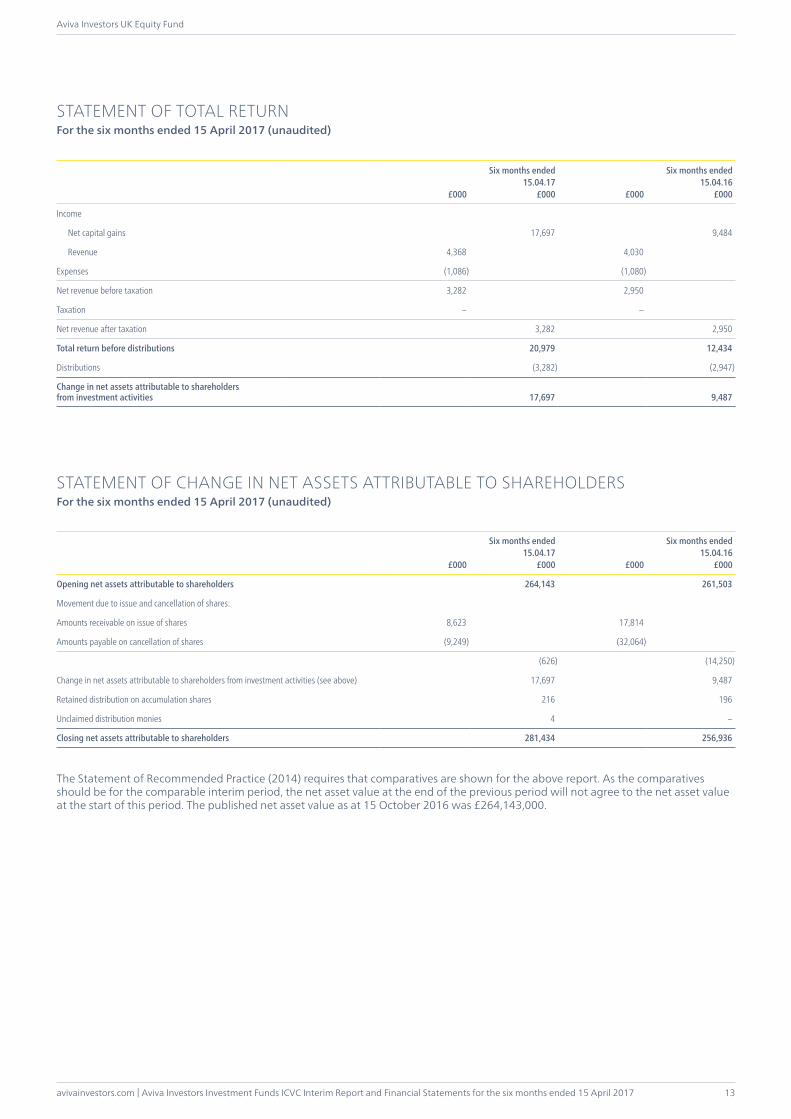
Net capital gains 17,697 9,484
Revenue 4,368 4,030
Expenses (1,086) (1,080)
Net revenue before taxation 3,282 2,950
Taxation – –
Net revenue after taxation 3,282 2,950
Total return before distributions 20,979 12,434
Distributions (3,282) (2,947)
Change in net assets attributable to shareholders from investment activities 17,697 9,487
STATEMENT OF CHANGE IN NET ASSETS ATTRIBUTABLE TO SHAREHOLDERSFor the six months ended 15 April 2017 (unaudited)
£000
Six months ended15.04.17
£000 £000
Six months ended15.04.16
£000
Opening net assets attributable to shareholders 264,143 261,503
Movement due to issue and cancellation of shares:
Amounts receivable on issue of shares 8,623 17,814
Amounts payable on cancellation of shares (9,249) (32,064)
(626) (14,250)
Change in net assets attributable to shareholders from investment activities (see above) 17,697 9,487
Retained distribution on accumulation shares 216 196
Unclaimed distribution monies 4 –
Closing net assets attributable to shareholders 281,434 256,936
The Statement of Recommended Practice (2014) requires that comparatives are shown for the above report. As the comparatives should be for the comparable interim period, the net asset value at the end of the previous period will not agree to the net asset value at the start of this period. The published net asset value as at 15 October 2016 was £264,143,000.
STATEMENT OF TOTAL RETURNFor the six months ended 15 April 2017 (unaudited)

Aviva Investors Investment Funds ICVC Interim Report and Financial Statements for the six months ended 15 April 2017 | avivainvestors.com
Aviva Investors UK Equity Fund
14
BALANCE SHEETAs at 15 April 2017 (unaudited)
As at15.04.17
£000
As at15.10.16
£000
Assets:
Investments 278,064 263,742
Current assets:
Debtors 4,135 880
Cash and bank balances 2,814 4,411
Total assets 285,013 269,033
Liabilities:
Creditors:
Distribution payable (3,059) (3,890)
Other creditors (520) (1,000)
Total liabilities (3,579) (4,890)
Net assets attributable to shareholders 281,434 264,143
ACCOUNTING POLICIESThe accounting policies applied are consistent with those of the financial statements for the year ended 15 October 2016 and are described in those annual financial statements.
avivainvestors.com | Aviva Investors Investment Funds ICVC Interim Report and Financial Statements for the six months ended 15 April 2017
Aviva Investors UK Equity Income Fund
15
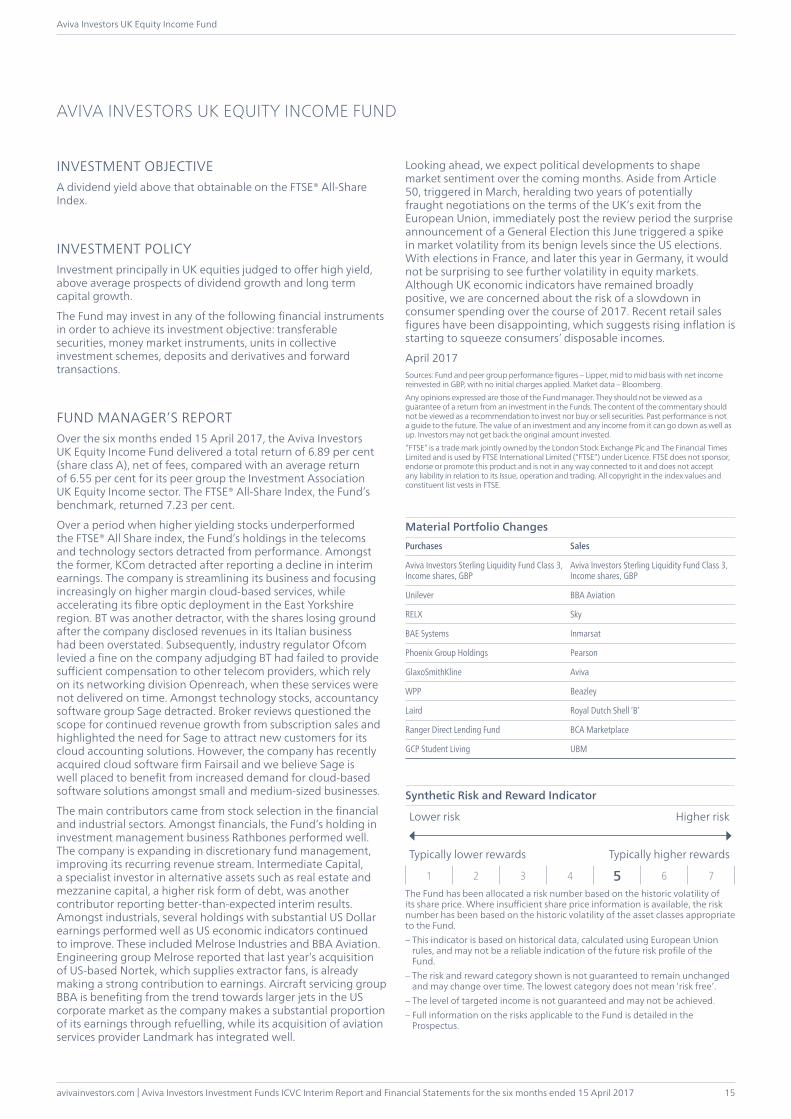
INVESTMENT OBJECTIVEA dividend yield above that obtainable on the FTSE® All-Share Index.
INVESTMENT POLICYInvestment principally in UK equities judged to offer high yield, above average prospects of dividend growth and long term capital growth.
The Fund may invest in any of the following financial instruments in order to achieve its investment objective: transferable securities, money market instruments, units in collective investment schemes, deposits and derivatives and forward transactions.
FUND MANAGER’S REPORTOver the six months ended 15 April 2017, the Aviva Investors UK Equity Income Fund delivered a total return of 6.89 per cent (share class A), net of fees, compared with an average return of 6.55 per cent for its peer group the Investment Association UK Equity Income sector. The FTSE® All-Share Index, the Fund’s benchmark, returned 7.23 per cent.
Over a period when higher yielding stocks underperformed the FTSE® All Share index, the Fund’s holdings in the telecoms and technology sectors detracted from performance. Amongst the former, KCom detracted after reporting a decline in interim earnings. The company is streamlining its business and focusing increasingly on higher margin cloud-based services, while accelerating its fibre optic deployment in the East Yorkshire region. BT was another detractor, with the shares losing ground after the company disclosed revenues in its Italian business had been overstated. Subsequently, industry regulator Ofcom levied a fine on the company adjudging BT had failed to provide sufficient compensation to other telecom providers, which rely on its networking division Openreach, when these services were not delivered on time. Amongst technology stocks, accountancy software group Sage detracted. Broker reviews questioned the scope for continued revenue growth from subscription sales and highlighted the need for Sage to attract new customers for its cloud accounting solutions. However, the company has recently acquired cloud software firm Fairsail and we believe Sage is well placed to benefit from increased demand for cloud-based software solutions amongst small and medium-sized businesses.
The main contributors came from stock selection in the financial and industrial sectors. Amongst financials, the Fund’s holding in investment management business Rathbones performed well. The company is expanding in discretionary fund management, improving its recurring revenue stream. Intermediate Capital, a specialist investor in alternative assets such as real estate and mezzanine capital, a higher risk form of debt, was another contributor reporting better-than-expected interim results. Amongst industrials, several holdings with substantial US Dollar earnings performed well as US economic indicators continued to improve. These included Melrose Industries and BBA Aviation. Engineering group Melrose reported that last year’s acquisition of US-based Nortek, which supplies extractor fans, is already making a strong contribution to earnings. Aircraft servicing group BBA is benefiting from the trend towards larger jets in the US corporate market as the company makes a substantial proportion of its earnings through refuelling, while its acquisition of aviation services provider Landmark has integrated well.
Looking ahead, we expect political developments to shape market sentiment over the coming months. Aside from Article 50, triggered in March, heralding two years of potentially fraught negotiations on the terms of the UK’s exit from the European Union, immediately post the review period the surprise announcement of a General Election this June triggered a spike in market volatility from its benign levels since the US elections. With elections in France, and later this year in Germany, it would not be surprising to see further volatility in equity markets. Although UK economic indicators have remained broadly positive, we are concerned about the risk of a slowdown in consumer spending over the course of 2017. Recent retail sales figures have been disappointing, which suggests rising inflation is starting to squeeze consumers’ disposable incomes.
April 2017Sources: Fund and peer group performance figures – Lipper, mid to mid basis with net income reinvested in GBP, with no initial charges applied. Market data – Bloomberg. Any opinions expressed are those of the Fund manager. They should not be viewed as a guarantee of a return from an investment in the Funds. The content of the commentary should not be viewed as a recommendation to invest nor buy or sell securities. Past performance is not a guide to the future. The value of an investment and any income from it can go down as well as up. Investors may not get back the original amount invested.“FTSE” is a trade mark jointly owned by the London Stock Exchange Plc and The Financial Times Limited and is used by FTSE International Limited (“FTSE”) under Licence. FTSE does not sponsor, endorse or promote this product and is not in any way connected to it and does not accept any liability in relation to its Issue, operation and trading. All copyright in the index values and constituent list vests in FTSE.
Material Portfolio ChangesPurchases Sales
Aviva Investors Sterling Liquidity Fund Class 3, Income shares, GBP
Aviva Investors Sterling Liquidity Fund Class 3, Income shares, GBP
Unilever BBA Aviation
RELX Sky
BAE Systems Inmarsat
Phoenix Group Holdings Pearson
GlaxoSmithKline Aviva
WPP Beazley
Laird Royal Dutch Shell ‘B’
Ranger Direct Lending Fund BCA Marketplace
GCP Student Living UBM
Synthetic Risk and Reward Indicator
Lower risk Higher risk
Typically lower rewards Typically higher rewards
1 2 3 4 5 6 7The Fund has been allocated a risk number based on the historic volatility of its share price. Where insufficient share price information is available, the risk number has been based on the historic volatility of the asset classes appropriate to the Fund.– This indicator is based on historical data, calculated using European Union
rules, and may not be a reliable indication of the future risk profile of the Fund.
– The risk and reward category shown is not guaranteed to remain unchanged and may change over time. The lowest category does not mean ‘risk free’.
– The level of targeted income is not guaranteed and may not be achieved.– Full information on the risks applicable to the Fund is detailed in the
Prospectus.
AVIVA INVESTORS UK EQUITY INCOME FUND
Aviva Investors Investment Funds ICVC Interim Report and Financial Statements for the six months ended 15 April 2017 | avivainvestors.com
Aviva Investors UK Equity Income Fund
16
INVESTMENT PERFORMANCE
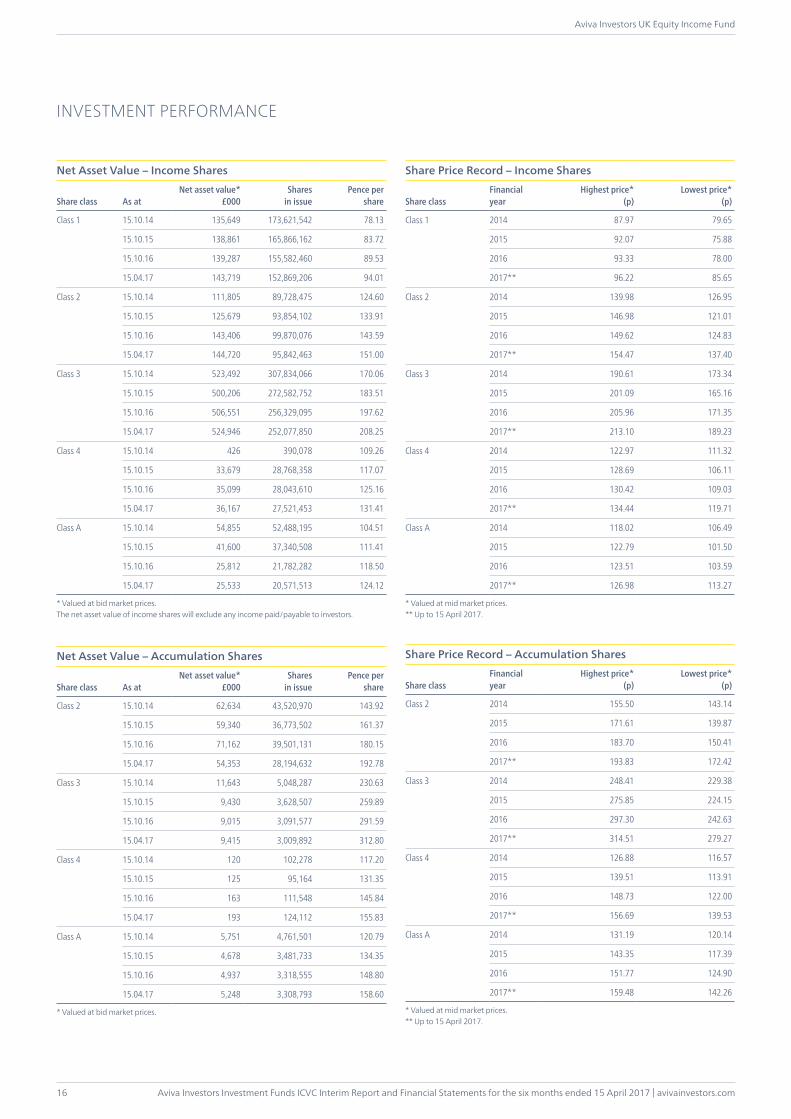
Net Asset Value – Income Shares
Share class As atNet asset value*
£000Shares
in issuePence per
share
Class 1 15.10.14 135,649 173,621,542 78.13
15.10.15 138,861 165,866,162 83.72
15.10.16 139,287 155,582,460 89.53
15.04.17 143,719 152,869,206 94.01
Class 2 15.10.14 111,805 89,728,475 124.60
15.10.15 125,679 93,854,102 133.91
15.10.16 143,406 99,870,076 143.59
15.04.17 144,720 95,842,463 151.00
Class 3 15.10.14 523,492 307,834,066 170.06
15.10.15 500,206 272,582,752 183.51
15.10.16 506,551 256,329,095 197.62
15.04.17 524,946 252,077,850 208.25
Class 4 15.10.14 426 390,078 109.26
15.10.15 33,679 28,768,358 117.07
15.10.16 35,099 28,043,610 125.16
15.04.17 36,167 27,521,453 131.41
Class A 15.10.14 54,855 52,488,195 104.51
15.10.15 41,600 37,340,508 111.41
15.10.16 25,812 21,782,282 118.50
15.04.17 25,533 20,571,513 124.12
* Valued at bid market prices.The net asset value of income shares will exclude any income paid/payable to investors.
Net Asset Value – Accumulation Shares
Share class As atNet asset value*
£000Shares
in issuePence per
share
Class 2 15.10.14 62,634 43,520,970 143.92
15.10.15 59,340 36,773,502 161.37
15.10.16 71,162 39,501,131 180.15
15.04.17 54,353 28,194,632 192.78
Class 3 15.10.14 11,643 5,048,287 230.63
15.10.15 9,430 3,628,507 259.89
15.10.16 9,015 3,091,577 291.59
15.04.17 9,415 3,009,892 312.80
Class 4 15.10.14 120 102,278 117.20
15.10.15 125 95,164 131.35
15.10.16 163 111,548 145.84
15.04.17 193 124,112 155.83
Class A 15.10.14 5,751 4,761,501 120.79
15.10.15 4,678 3,481,733 134.35
15.10.16 4,937 3,318,555 148.80
15.04.17 5,248 3,308,793 158.60
* Valued at bid market prices.
Share Price Record – Income Shares
Share classFinancialyear
Highest price*(p)
Lowest price*(p)
Class 1 2014 87.97 79.65
2015 92.07 75.88
2016 93.33 78.00
2017** 96.22 85.65
Class 2 2014 139.98 126.95
2015 146.98 121.01
2016 149.62 124.83
2017** 154.47 137.40
Class 3 2014 190.61 173.34
2015 201.09 165.16
2016 205.96 171.35
2017** 213.10 189.23
Class 4 2014 122.97 111.32
2015 128.69 106.11
2016 130.42 109.03
2017** 134.44 119.71
Class A 2014 118.02 106.49
2015 122.79 101.50
2016 123.51 103.59
2017** 126.98 113.27
* Valued at mid market prices.** Up to 15 April 2017.
Share Price Record – Accumulation Shares
Share classFinancialyear
Highest price*(p)
Lowest price*(p)
Class 2 2014 155.50 143.14
2015 171.61 139.87
2016 183.70 150.41
2017** 193.83 172.42
Class 3 2014 248.41 229.38
2015 275.85 224.15
2016 297.30 242.63
2017** 314.51 279.27
Class 4 2014 126.88 116.57
2015 139.51 113.91
2016 148.73 122.00
2017** 156.69 139.53
Class A 2014 131.19 120.14
2015 143.35 117.39
2016 151.77 124.90
2017** 159.48 142.26
* Valued at mid market prices.** Up to 15 April 2017.
avivainvestors.com | Aviva Investors Investment Funds ICVC Interim Report and Financial Statements for the six months ended 15 April 2017
Aviva Investors UK Equity Income Fund
17
INVESTMENT PERFORMANCE (CONTINUED)
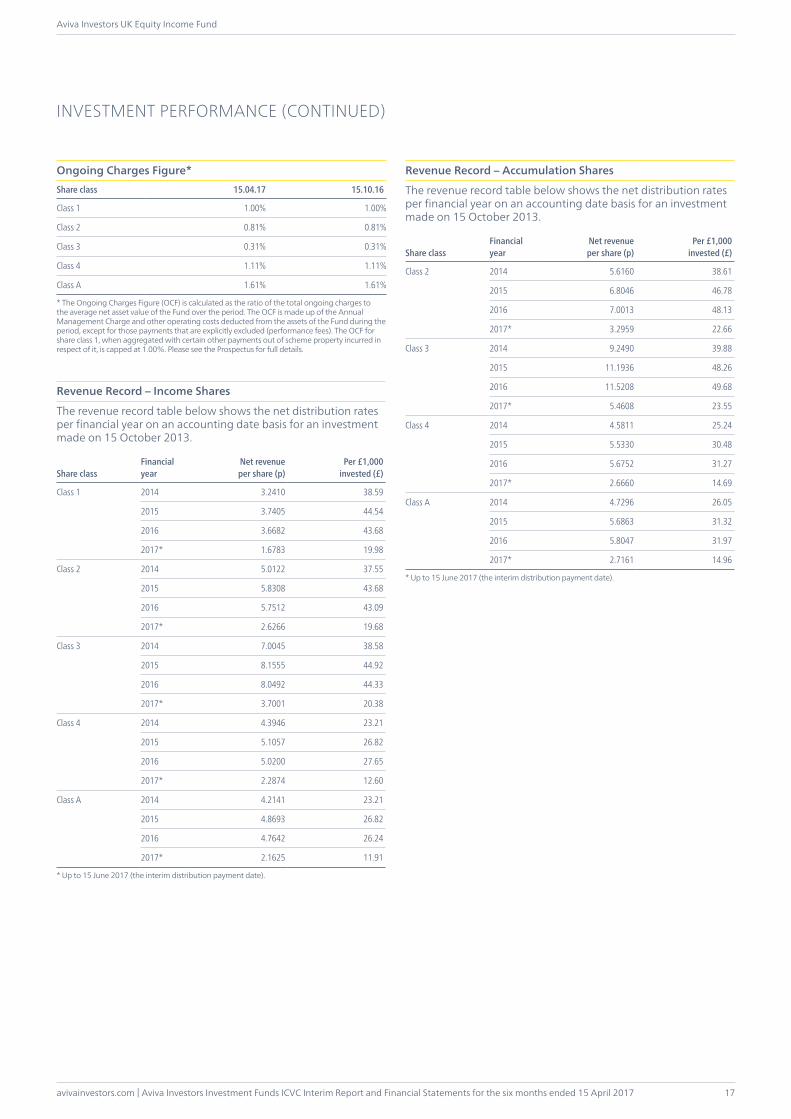
Ongoing Charges Figure*Share class 15.04.17 15.10.16
Class 1 1.00% 1.00%
Class 2 0.81% 0.81%
Class 3 0.31% 0.31%
Class 4 1.11% 1.11%
Class A 1.61% 1.61%
* The Ongoing Charges Figure (OCF) is calculated as the ratio of the total ongoing charges to the average net asset value of the Fund over the period. The OCF is made up of the Annual Management Charge and other operating costs deducted from the assets of the Fund during the period, except for those payments that are explicitly excluded (performance fees). The OCF for share class 1, when aggregated with certain other payments out of scheme property incurred in respect of it, is capped at 1.00%. Please see the Prospectus for full details.
Revenue Record – Income Shares
The revenue record table below shows the net distribution rates per financial year on an accounting date basis for an investment made on 15 October 2013.
Share classFinancialyear
Net revenue per share (p)
Per £1,000invested (£)
Class 1 2014 3.2410 38.59
2015 3.7405 44.54
2016 3.6682 43.68
2017* 1.6783 19.98
Class 2 2014 5.0122 37.55
2015 5.8308 43.68
2016 5.7512 43.09
2017* 2.6266 19.68
Class 3 2014 7.0045 38.58
2015 8.1555 44.92
2016 8.0492 44.33
2017* 3.7001 20.38
Class 4 2014 4.3946 23.21
2015 5.1057 26.82
2016 5.0200 27.65
2017* 2.2874 12.60
Class A 2014 4.2141 23.21
2015 4.8693 26.82
2016 4.7642 26.24
2017* 2.1625 11.91
* Up to 15 June 2017 (the interim distribution payment date).
Revenue Record – Accumulation Shares
The revenue record table below shows the net distribution rates per financial year on an accounting date basis for an investment made on 15 October 2013.
Share classFinancialyear
Net revenue per share (p)
Per £1,000invested (£)
Class 2 2014 5.6160 38.61
2015 6.8046 46.78
2016 7.0013 48.13
2017* 3.2959 22.66
Class 3 2014 9.2490 39.88
2015 11.1936 48.26
2016 11.5208 49.68
2017* 5.4608 23.55
Class 4 2014 4.5811 25.24
2015 5.5330 30.48
2016 5.6752 31.27
2017* 2.6660 14.69
Class A 2014 4.7296 26.05
2015 5.6863 31.32
2016 5.8047 31.97
2017* 2.7161 14.96
* Up to 15 June 2017 (the interim distribution payment date).
Aviva Investors Investment Funds ICVC Interim Report and Financial Statements for the six months ended 15 April 2017 | avivainvestors.com
Aviva Investors UK Equity Income Fund
18
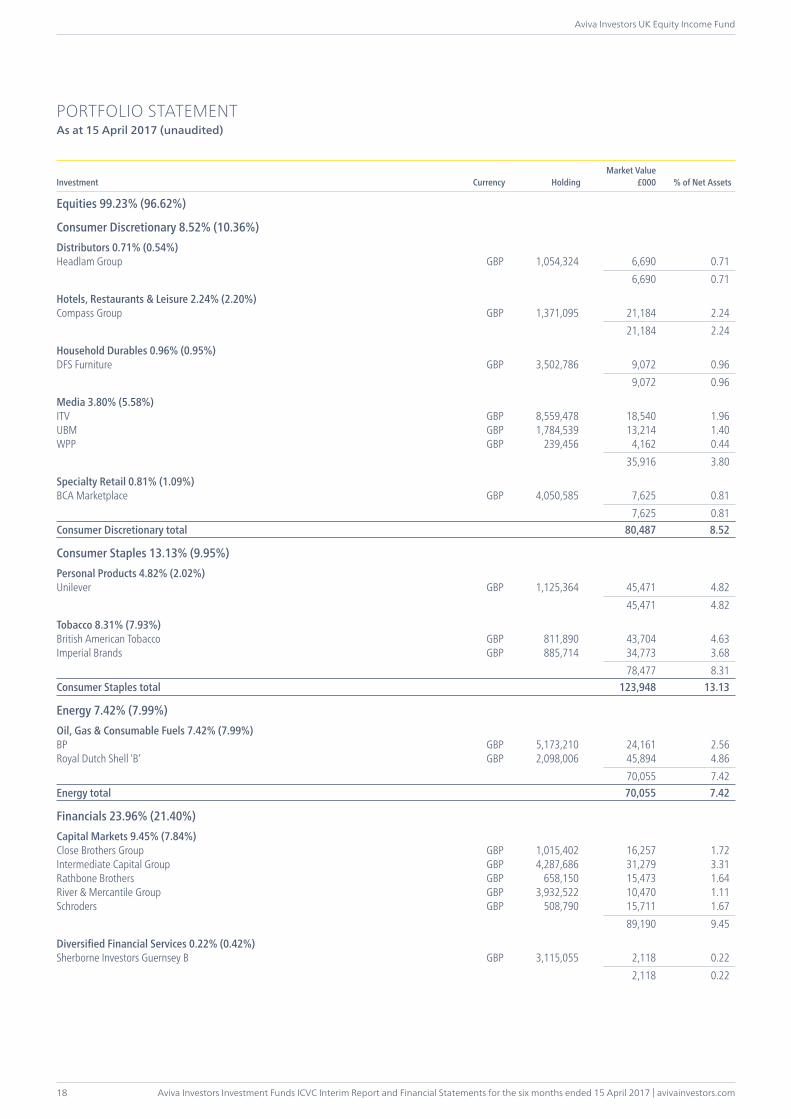
PORTFOLIO STATEMENTAs at 15 April 2017 (unaudited)
Investment Currency HoldingMarket Value
£000 % of Net Assets
Equities 99.23% (96.62%)
Consumer Discretionary 8.52% (10.36%)Distributors 0.71% (0.54%)Headlam Group GBP 1,054,324 6,690 0.71 6,690 0.71
Hotels, Restaurants & Leisure 2.24% (2.20%)Compass Group GBP 1,371,095 21,184 2.24 21,184 2.24
Household Durables 0.96% (0.95%)DFS Furniture GBP 3,502,786 9,072 0.96 9,072 0.96
Media 3.80% (5.58%)ITV GBP 8,559,478 18,540 1.96UBM GBP 1,784,539 13,214 1.40WPP GBP 239,456 4,162 0.44 35,916 3.80
Specialty Retail 0.81% (1.09%)BCA Marketplace GBP 4,050,585 7,625 0.81 7,625 0.81Consumer Discretionary total 80,487 8.52
Consumer Staples 13.13% (9.95%)Personal Products 4.82% (2.02%)Unilever GBP 1,125,364 45,471 4.82 45,471 4.82
Tobacco 8.31% (7.93%)British American Tobacco GBP 811,890 43,704 4.63Imperial Brands GBP 885,714 34,773 3.68 78,477 8.31Consumer Staples total 123,948 13.13
Energy 7.42% (7.99%)Oil, Gas & Consumable Fuels 7.42% (7.99%)BP GBP 5,173,210 24,161 2.56Royal Dutch Shell ‘B’ GBP 2,098,006 45,894 4.86 70,055 7.42Energy total 70,055 7.42
Financials 23.96% (21.40%)Capital Markets 9.45% (7.84%)Close Brothers Group GBP 1,015,402 16,257 1.72Intermediate Capital Group GBP 4,287,686 31,279 3.31Rathbone Brothers GBP 658,150 15,473 1.64River & Mercantile Group GBP 3,932,522 10,470 1.11Schroders GBP 508,790 15,711 1.67 89,190 9.45
Diversified Financial Services 0.22% (0.42%)Sherborne Investors Guernsey B GBP 3,115,055 2,118 0.22 2,118 0.22
avivainvestors.com | Aviva Investors Investment Funds ICVC Interim Report and Financial Statements for the six months ended 15 April 2017
Aviva Investors UK Equity Income Fund
19
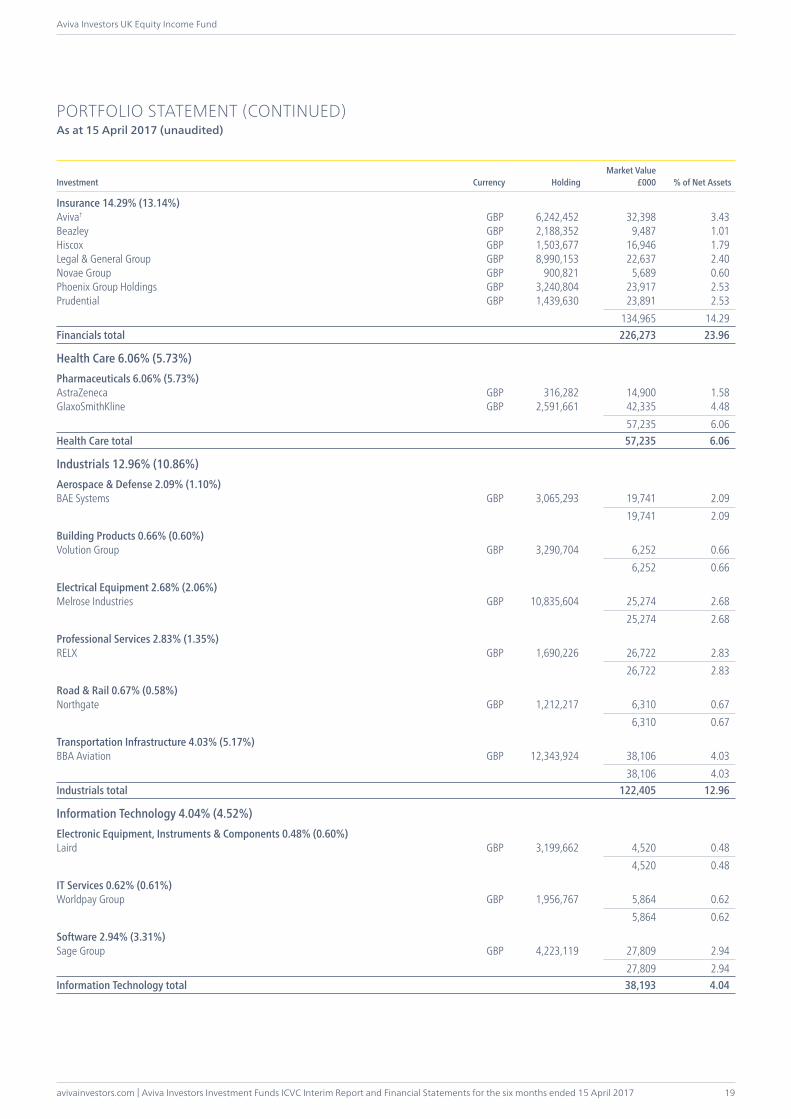
PORTFOLIO STATEMENT (CONTINUED)As at 15 April 2017 (unaudited)
Investment Currency HoldingMarket Value
£000 % of Net Assets
Insurance 14.29% (13.14%)Aviva† GBP 6,242,452 32,398 3.43Beazley GBP 2,188,352 9,487 1.01Hiscox GBP 1,503,677 16,946 1.79Legal & General Group GBP 8,990,153 22,637 2.40Novae Group GBP 900,821 5,689 0.60Phoenix Group Holdings GBP 3,240,804 23,917 2.53Prudential GBP 1,439,630 23,891 2.53 134,965 14.29Financials total 226,273 23.96
Health Care 6.06% (5.73%)Pharmaceuticals 6.06% (5.73%)AstraZeneca GBP 316,282 14,900 1.58GlaxoSmithKline GBP 2,591,661 42,335 4.48 57,235 6.06Health Care total 57,235 6.06
Industrials 12.96% (10.86%)Aerospace & Defense 2.09% (1.10%)BAE Systems GBP 3,065,293 19,741 2.09 19,741 2.09
Building Products 0.66% (0.60%)Volution Group GBP 3,290,704 6,252 0.66 6,252 0.66
Electrical Equipment 2.68% (2.06%)Melrose Industries GBP 10,835,604 25,274 2.68 25,274 2.68
Professional Services 2.83% (1.35%)RELX GBP 1,690,226 26,722 2.83 26,722 2.83
Road & Rail 0.67% (0.58%)Northgate GBP 1,212,217 6,310 0.67 6,310 0.67
Transportation Infrastructure 4.03% (5.17%)BBA Aviation GBP 12,343,924 38,106 4.03 38,106 4.03Industrials total 122,405 12.96
Information Technology 4.04% (4.52%)Electronic Equipment, Instruments & Components 0.48% (0.60%)Laird GBP 3,199,662 4,520 0.48 4,520 0.48
IT Services 0.62% (0.61%)Worldpay Group GBP 1,956,767 5,864 0.62 5,864 0.62
Software 2.94% (3.31%)Sage Group GBP 4,223,119 27,809 2.94 27,809 2.94Information Technology total 38,193 4.04
Aviva Investors Investment Funds ICVC Interim Report and Financial Statements for the six months ended 15 April 2017 | avivainvestors.com
Aviva Investors UK Equity Income Fund
20
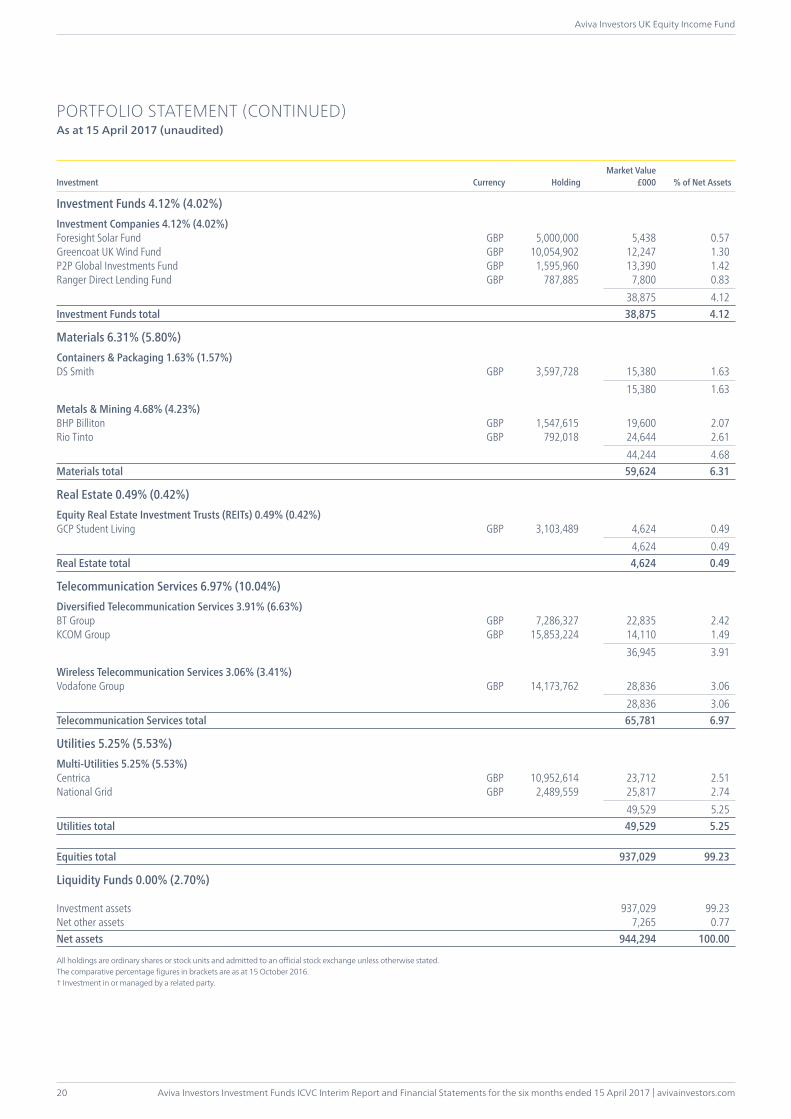
PORTFOLIO STATEMENT (CONTINUED)As at 15 April 2017 (unaudited)
Investment Currency HoldingMarket Value
£000 % of Net Assets
Investment Funds 4.12% (4.02%)Investment Companies 4.12% (4.02%)Foresight Solar Fund GBP 5,000,000 5,438 0.57Greencoat UK Wind Fund GBP 10,054,902 12,247 1.30P2P Global Investments Fund GBP 1,595,960 13,390 1.42Ranger Direct Lending Fund GBP 787,885 7,800 0.83 38,875 4.12Investment Funds total 38,875 4.12
Materials 6.31% (5.80%)Containers & Packaging 1.63% (1.57%)DS Smith GBP 3,597,728 15,380 1.63 15,380 1.63
Metals & Mining 4.68% (4.23%)BHP Billiton GBP 1,547,615 19,600 2.07Rio Tinto GBP 792,018 24,644 2.61 44,244 4.68Materials total 59,624 6.31
Real Estate 0.49% (0.42%)Equity Real Estate Investment Trusts (REITs) 0.49% (0.42%)GCP Student Living GBP 3,103,489 4,624 0.49 4,624 0.49Real Estate total 4,624 0.49
Telecommunication Services 6.97% (10.04%)Diversified Telecommunication Services 3.91% (6.63%)BT Group GBP 7,286,327 22,835 2.42KCOM Group GBP 15,853,224 14,110 1.49 36,945 3.91
Wireless Telecommunication Services 3.06% (3.41%)Vodafone Group GBP 14,173,762 28,836 3.06 28,836 3.06Telecommunication Services total 65,781 6.97
Utilities 5.25% (5.53%)Multi-Utilities 5.25% (5.53%)Centrica GBP 10,952,614 23,712 2.51National Grid GBP 2,489,559 25,817 2.74 49,529 5.25Utilities total 49,529 5.25
Equities total 937,029 99.23
Liquidity Funds 0.00% (2.70%)
Investment assets 937,029 99.23Net other assets 7,265 0.77Net assets 944,294 100.00
All holdings are ordinary shares or stock units and admitted to an official stock exchange unless otherwise stated.The comparative percentage figures in brackets are as at 15 October 2016.† Investment in or managed by a related party.
avivainvestors.com | Aviva Investors Investment Funds ICVC Interim Report and Financial Statements for the six months ended 15 April 2017
Aviva Investors UK Equity Income Fund
21
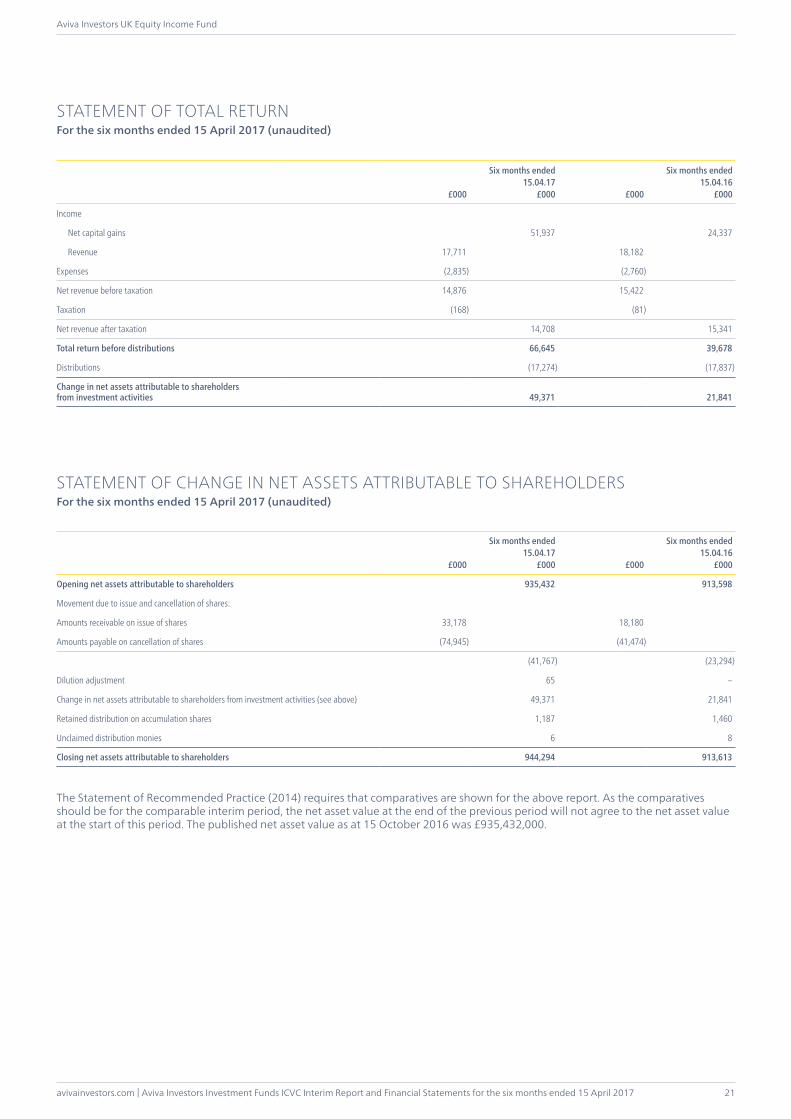
£000
Six months ended15.04.17
£000 £000
Six months ended15.04.16
£000
Income
Net capital gains 51,937 24,337
Revenue 17,711 18,182
Expenses (2,835) (2,760)
Net revenue before taxation 14,876 15,422
Taxation (168) (81)
Net revenue after taxation 14,708 15,341
Total return before distributions 66,645 39,678
Distributions (17,274) (17,837)
Change in net assets attributable to shareholders from investment activities 49,371 21,841
STATEMENT OF CHANGE IN NET ASSETS ATTRIBUTABLE TO SHAREHOLDERSFor the six months ended 15 April 2017 (unaudited)
£000
Six months ended15.04.17
£000 £000
Six months ended15.04.16
£000
Opening net assets attributable to shareholders 935,432 913,598
Movement due to issue and cancellation of shares:
Amounts receivable on issue of shares 33,178 18,180
Amounts payable on cancellation of shares (74,945) (41,474)
(41,767) (23,294)
Dilution adjustment 65 –
Change in net assets attributable to shareholders from investment activities (see above) 49,371 21,841
Retained distribution on accumulation shares 1,187 1,460
Unclaimed distribution monies 6 8
Closing net assets attributable to shareholders 944,294 913,613
The Statement of Recommended Practice (2014) requires that comparatives are shown for the above report. As the comparatives should be for the comparable interim period, the net asset value at the end of the previous period will not agree to the net asset value at the start of this period. The published net asset value as at 15 October 2016 was £935,432,000.
STATEMENT OF TOTAL RETURNFor the six months ended 15 April 2017 (unaudited)
Aviva Investors Investment Funds ICVC Interim Report and Financial Statements for the six months ended 15 April 2017 | avivainvestors.com
Aviva Investors UK Equity Income Fund
22
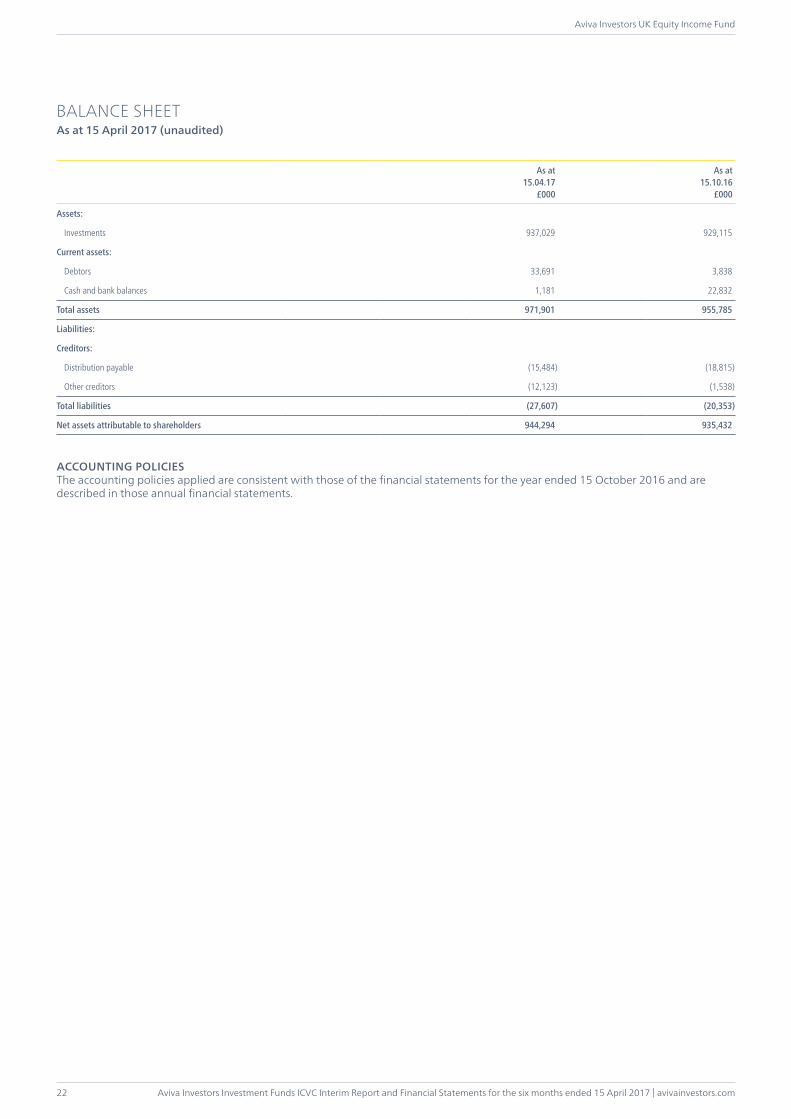
BALANCE SHEETAs at 15 April 2017 (unaudited)
As at15.04.17
£000
As at15.10.16
£000
Assets:
Investments 937,029 929,115
Current assets:
Debtors 33,691 3,838
Cash and bank balances 1,181 22,832
Total assets 971,901 955,785
Liabilities:
Creditors:
Distribution payable (15,484) (18,815)
Other creditors (12,123) (1,538)
Total liabilities (27,607) (20,353)
Net assets attributable to shareholders 944,294 935,432
ACCOUNTING POLICIESThe accounting policies applied are consistent with those of the financial statements for the year ended 15 October 2016 and are described in those annual financial statements.
avivainvestors.com | Aviva Investors Investment Funds ICVC Interim Report and Financial Statements for the six months ended 15 April 2017
Aviva Investors UK Growth Fund
23
INVESTMENT OBJECTIVELong term capital appreciation.
INVESTMENT POLICYInvestment principally in UK equities based on price and prospects of above average earnings growth.
The Fund may invest in any of the following financial instruments in order to achieve its investment objective: transferable securities, money market instruments, units in collective investment schemes, deposits and derivatives and forward transactions.
FUND MANAGER’S REPORTOver the six months ended 15 April 2017, the Aviva Investors UK Growth Fund delivered a total return of 9.76 per cent (share class A), net of fees, compared with an average return of 7.68 per cent for its peer group, the Investment Association UK All Companies sector. The FTSE® All-Share Index, the Fund’s benchmark, returned 7.23 per cent.
The Fund’s outperformance during the review period was predominantly due to stock selection. We have focused on owning shares in companies that are not considered susceptible to a risk of a trading slowdown as higher inflation starts to squeeze UK household disposable incomes, nor exposed to increasing cost pressures following Sterling’s depreciation post the EU referendum. Holdings include Next Fifteen Communications, Fevertree, Zoopla Property Group and Moneysupermarket, which all delivered strong financial results in the period. In addition, positive contribution came from the Fund’s style and size positioning, being overweight high quality companies and mid-cap companies, both of which performed well in comparison with 2016.
The Fund’s largest holding in Sanne Group, a provider of fund and corporate administration services in alternative asset markets, was the main contributor to performance, with the company upgrading earnings guidance early in the new year. Sanne’s dominant market position is becoming increasingly entrenched following five credible acquisitions since floatation, which provide the company with a global footprint to service clients in all alternative asset classes.
Two takeovers during the period, for equipment rental group Lavendon and the UK’s largest food wholesaler Booker, both contributed to fund performance. After a sustained period of bidding from both TVH Group and Loxam, Lavendon was finally acquired by the latter at a 94 per cent premium to its undisturbed share price. Booker received a bid from Tesco, attracted by Booker’s focus on the catering and fast-growing eating out markets, with potential for lucrative synergies from leveraging their different customer bases and Tesco’s buying scale. We subsequently reduced the holding in Booker on the basis the discount to the bid price was negligible for a transaction that is scheduled for completion in Spring 2018, assuming it receives the required clearance from the Competition Markets Authority. The Fund’s holding in household goods group Unilever also saw an approach from Kraft Heinz, which the Unilever board quickly rebutted on the basis it materially undervalued the company, a view which we shared. We added to the holding on share price weakness following the collapse of the deal.
An underweight position in the basic materials sector detracted from performance as mining companies performed well on an improving global growth outlook and a sustained increase in industrial metal prices over the last 12 months. We have been selective about investing in the sector given many companies have a history of weak financial delivery and higher than average debt levels. The Fund also remains underweight the Oil & Gas sector, as many market participants are starting to lose confidence that OPEC’s oil production cut announced in November will help restore equilibrium in global oil markets.
Holdings in Daily Mail & General and satellite operator Inmarsat were sold during the review period to fund new positions in Ultra Electronics, London Stock Exchange and Keywords Studios. Ultra Electronics supplies specialist equipment and components to global players in the defence, aerospace, cyber security and marine markets. We were attracted by the quality of the company’s intellectual property with the prospect of an increased commitment to defence spending in both the US and the EU. Following the collapse of the proposed merger with Deutsche Boerse, a new holding in London Stock Exchange (LSE) was initiated on valuation grounds with LSE’s position as a global exchange making it a likely candidate for industry consolidation in time. Keywords Studios, an outsourced technical services provider in the global video and mobile games industry, has performed exceptionally well since listing in July 2013, beating market expectations due to a combination of strong organic revenue growth and shrewd acquisitions. We believe the company is well-placed to benefit from continued outsourcing of the technical and support elements of game development, as gaming platforms are becoming increasingly sophisticated and difficult for developers to manage in a cost-effective manner.
Looking ahead, we expect political developments to shape market sentiment over the coming months. Aside from Article 50, triggered in March, heralding two years of potentially fraught negotiations on the terms of the UK’s exit from the European Union, immediately post the review period the surprise announcement of a General Election this June triggered a spike in market volatility from its benign levels since the US elections. With elections in France, and later this year in Germany, it would not be surprising to see further volatility in equity markets. Although UK economic indicators have remained broadly positive, we are concerned about the risk of a slowdown in consumer spending over the course of 2017. Recent retail sales figures have been disappointing, which suggests rising inflation is beginning to squeeze consumers’ disposable incomes.
April 2017Sources: Fund and peer group performance figures – Lipper, mid to mid basis with net income reinvested in GBP, with no initial charges applied. Market data – Bloomberg. Any opinions expressed are those of the Fund manager. They should not be viewed as a guarantee of a return from an investment in the Funds. The content of the commentary should not be viewed as a recommendation to invest nor buy or sell securities. Past performance is not a guide to the future. The value of an investment and any income from it can go down as well as up. Investors may not get back the original amount invested.“FTSE” is a trade mark jointly owned by the London Stock Exchange Plc and The Financial Times Limited and is used by FTSE International Limited (“FTSE”) under Licence. FTSE does not sponsor, endorse or promote this product and is not in any way connected to it and does not accept any liability in relation to its Issue, operation and trading. All copyright in the index values and constituent list vests in FTSE.
AVIVA INVESTORS UK GROWTH FUND
Aviva Investors Investment Funds ICVC Interim Report and Financial Statements for the six months ended 15 April 2017 | avivainvestors.com
Aviva Investors UK Growth Fund
24
AVIVA INVESTORS UK GROWTH FUND (CONTINUED)
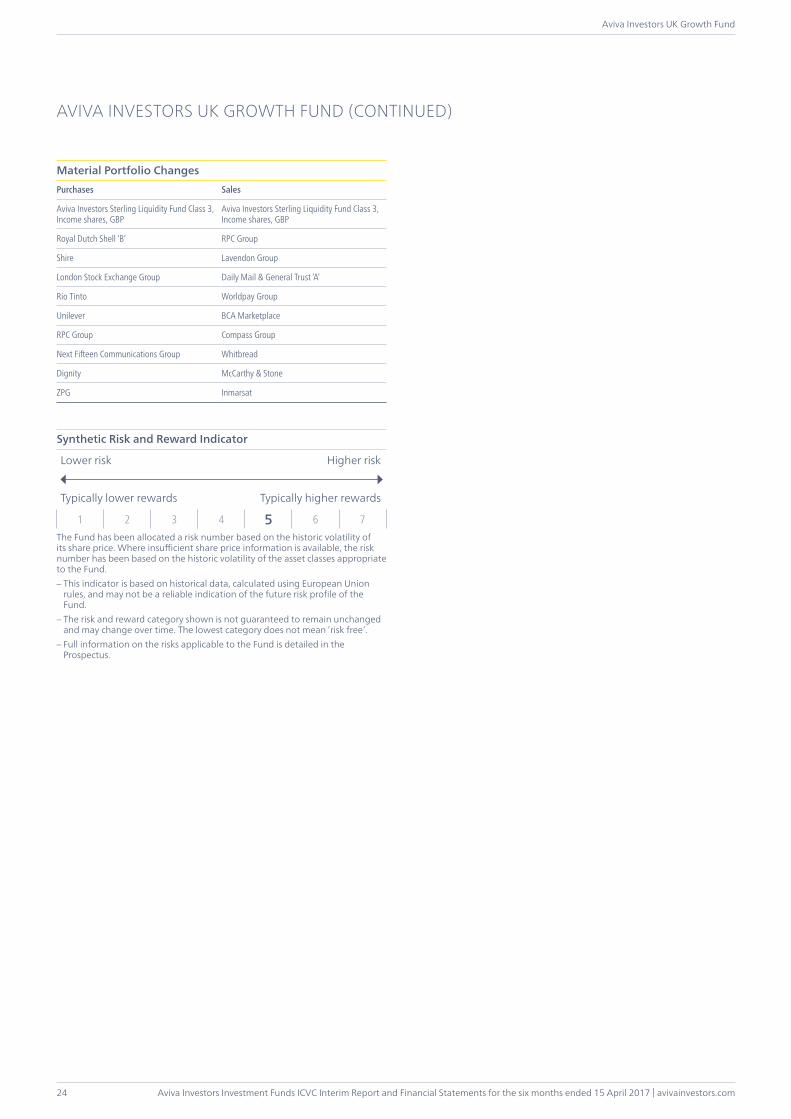
Material Portfolio ChangesPurchases Sales
Aviva Investors Sterling Liquidity Fund Class 3, Income shares, GBP
Aviva Investors Sterling Liquidity Fund Class 3, Income shares, GBP
Royal Dutch Shell ‘B’ RPC Group
Shire Lavendon Group
London Stock Exchange Group Daily Mail & General Trust ‘A’
Rio Tinto Worldpay Group
Unilever BCA Marketplace
RPC Group Compass Group
Next Fifteen Communications Group Whitbread
Dignity McCarthy & Stone
ZPG Inmarsat
Synthetic Risk and Reward Indicator
Lower risk Higher risk
Typically lower rewards Typically higher rewards
1 2 3 4 5 6 7The Fund has been allocated a risk number based on the historic volatility of its share price. Where insufficient share price information is available, the risk number has been based on the historic volatility of the asset classes appropriate to the Fund.– This indicator is based on historical data, calculated using European Union
rules, and may not be a reliable indication of the future risk profile of the Fund.
– The risk and reward category shown is not guaranteed to remain unchanged and may change over time. The lowest category does not mean ‘risk free’.
– Full information on the risks applicable to the Fund is detailed in the Prospectus.
avivainvestors.com | Aviva Investors Investment Funds ICVC Interim Report and Financial Statements for the six months ended 15 April 2017
Aviva Investors UK Growth Fund
25
INVESTMENT PERFORMANCE
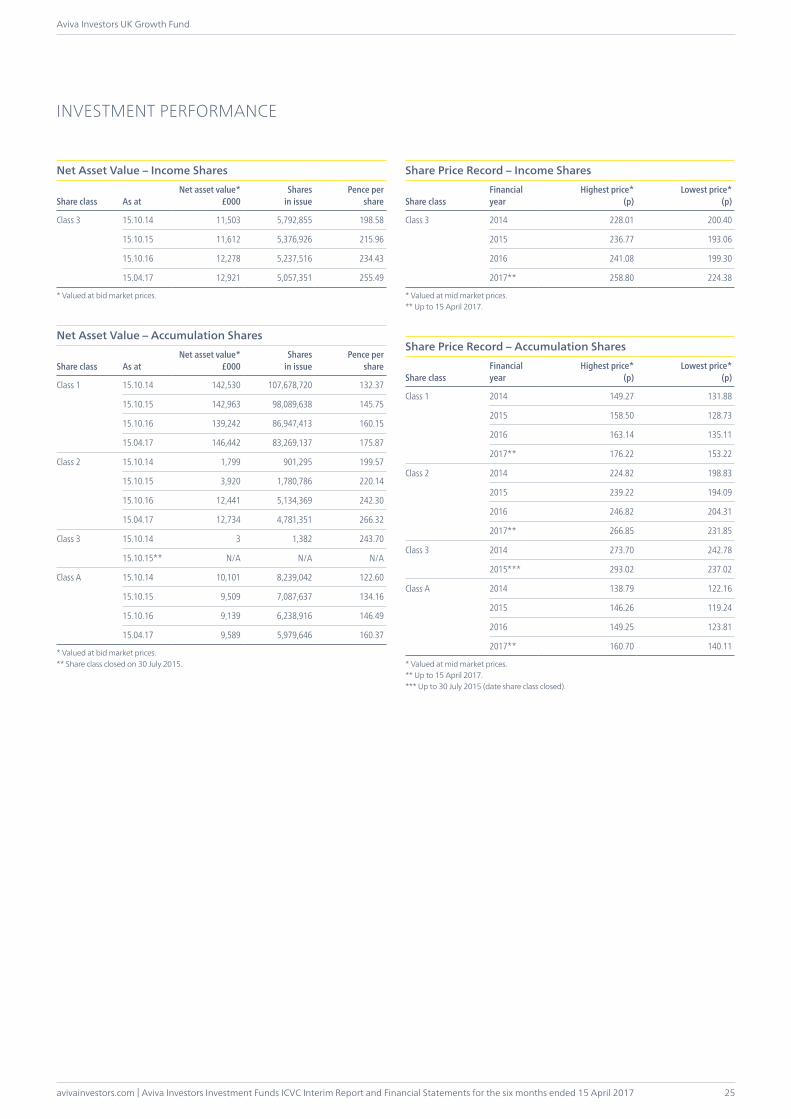
Net Asset Value – Income Shares
Share class As atNet asset value*
£000Shares
in issuePence per
share
Class 3 15.10.14 11,503 5,792,855 198.58
15.10.15 11,612 5,376,926 215.96
15.10.16 12,278 5,237,516 234.43
15.04.17 12,921 5,057,351 255.49
* Valued at bid market prices.
Net Asset Value – Accumulation Shares
Share class As atNet asset value*
£000Shares
in issuePence per
share
Class 1 15.10.14 142,530 107,678,720 132.37
15.10.15 142,963 98,089,638 145.75
15.10.16 139,242 86,947,413 160.15
15.04.17 146,442 83,269,137 175.87
Class 2 15.10.14 1,799 901,295 199.57
15.10.15 3,920 1,780,786 220.14
15.10.16 12,441 5,134,369 242.30
15.04.17 12,734 4,781,351 266.32
Class 3 15.10.14 3 1,382 243.70
15.10.15** N/A N/A N/A
Class A 15.10.14 10,101 8,239,042 122.60
15.10.15 9,509 7,087,637 134.16
15.10.16 9,139 6,238,916 146.49
15.04.17 9,589 5,979,646 160.37
* Valued at bid market prices.** Share class closed on 30 July 2015.
Share Price Record – Income Shares
Share classFinancialyear
Highest price*(p)
Lowest price*(p)
Class 3 2014 228.01 200.40
2015 236.77 193.06
2016 241.08 199.30
2017** 258.80 224.38
* Valued at mid market prices.** Up to 15 April 2017.
Share Price Record – Accumulation Shares
Share classFinancialyear
Highest price*(p)
Lowest price*(p)
Class 1 2014 149.27 131.88
2015 158.50 128.73
2016 163.14 135.11
2017** 176.22 153.22
Class 2 2014 224.82 198.83
2015 239.22 194.09
2016 246.82 204.31
2017** 266.85 231.85
Class 3 2014 273.70 242.78
2015*** 293.02 237.02
Class A 2014 138.79 122.16
2015 146.26 119.24
2016 149.25 123.81
2017** 160.70 140.11
* Valued at mid market prices.** Up to 15 April 2017.*** Up to 30 July 2015 (date share class closed).
Aviva Investors Investment Funds ICVC Interim Report and Financial Statements for the six months ended 15 April 2017 | avivainvestors.com
Aviva Investors UK Growth Fund
26
INVESTMENT PERFORMANCE (CONTINUED)
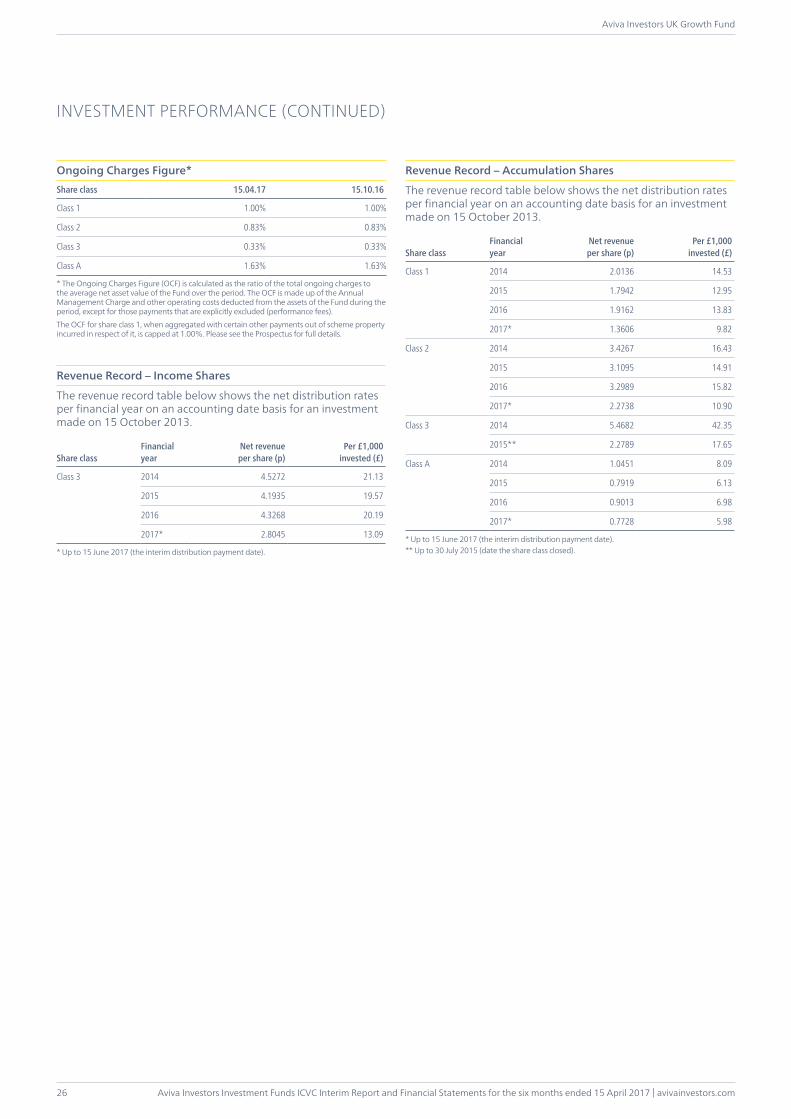
Ongoing Charges Figure*Share class 15.04.17 15.10.16
Class 1 1.00% 1.00%
Class 2 0.83% 0.83%
Class 3 0.33% 0.33%
Class A 1.63% 1.63%
* The Ongoing Charges Figure (OCF) is calculated as the ratio of the total ongoing charges to the average net asset value of the Fund over the period. The OCF is made up of the Annual Management Charge and other operating costs deducted from the assets of the Fund during the period, except for those payments that are explicitly excluded (performance fees). The OCF for share class 1, when aggregated with certain other payments out of scheme property incurred in respect of it, is capped at 1.00%. Please see the Prospectus for full details.
Revenue Record – Income Shares
The revenue record table below shows the net distribution rates per financial year on an accounting date basis for an investment made on 15 October 2013.
Share classFinancialyear
Net revenue per share (p)
Per £1,000invested (£)
Class 3 2014 4.5272 21.13
2015 4.1935 19.57
2016 4.3268 20.19
2017* 2.8045 13.09
* Up to 15 June 2017 (the interim distribution payment date).
Revenue Record – Accumulation Shares
The revenue record table below shows the net distribution rates per financial year on an accounting date basis for an investment made on 15 October 2013.
Share classFinancialyear
Net revenue per share (p)
Per £1,000invested (£)
Class 1 2014 2.0136 14.53
2015 1.7942 12.95
2016 1.9162 13.83
2017* 1.3606 9.82
Class 2 2014 3.4267 16.43
2015 3.1095 14.91
2016 3.2989 15.82
2017* 2.2738 10.90
Class 3 2014 5.4682 42.35
2015** 2.2789 17.65
Class A 2014 1.0451 8.09
2015 0.7919 6.13
2016 0.9013 6.98
2017* 0.7728 5.98
* Up to 15 June 2017 (the interim distribution payment date).** Up to 30 July 2015 (date the share class closed).
avivainvestors.com | Aviva Investors Investment Funds ICVC Interim Report and Financial Statements for the six months ended 15 April 2017
Aviva Investors UK Growth Fund
27
PORTFOLIO STATEMENTAs at 15 April 2017 (unaudited)
Investment Currency HoldingMarket Value
£000 % of Net Assets
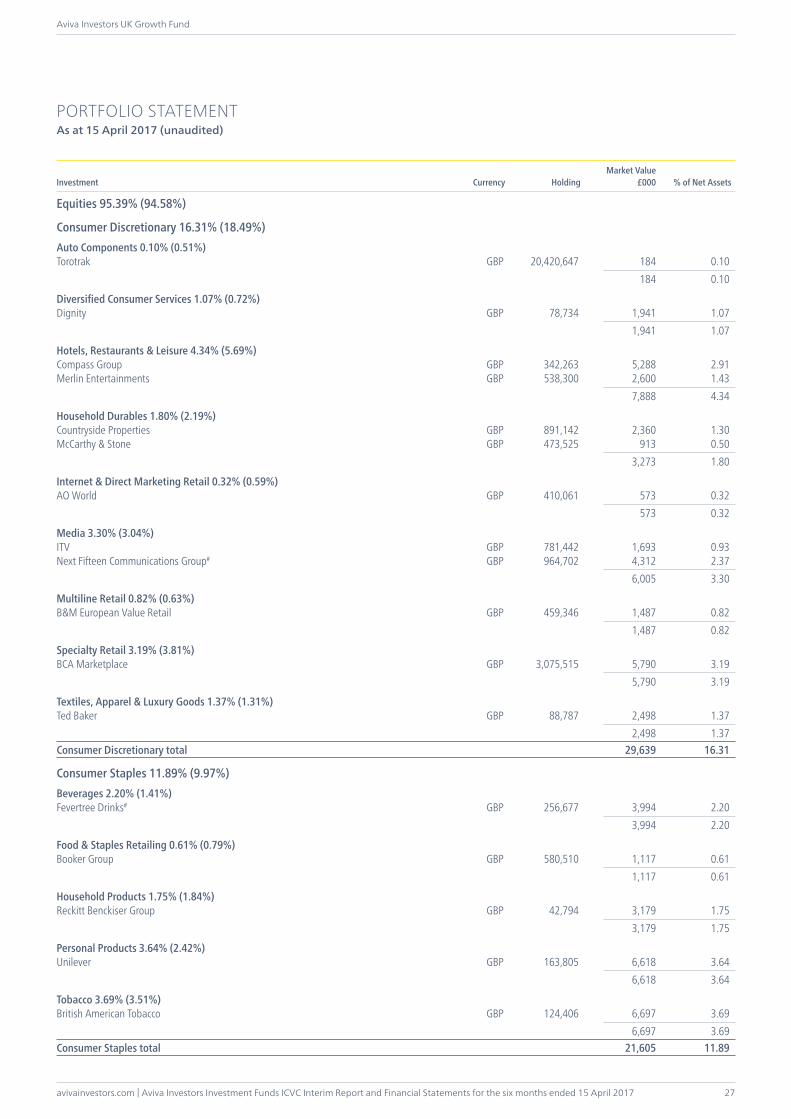
Equities 95.39% (94.58%)
Consumer Discretionary 16.31% (18.49%)Auto Components 0.10% (0.51%)Torotrak GBP 20,420,647 184 0.10 184 0.10
Diversified Consumer Services 1.07% (0.72%)Dignity GBP 78,734 1,941 1.07 1,941 1.07
Hotels, Restaurants & Leisure 4.34% (5.69%)Compass Group GBP 342,263 5,288 2.91Merlin Entertainments GBP 538,300 2,600 1.43 7,888 4.34
Household Durables 1.80% (2.19%)Countryside Properties GBP 891,142 2,360 1.30McCarthy & Stone GBP 473,525 913 0.50 3,273 1.80
Internet & Direct Marketing Retail 0.32% (0.59%)AO World GBP 410,061 573 0.32 573 0.32
Media 3.30% (3.04%)ITV GBP 781,442 1,693 0.93Next Fifteen Communications Group# GBP 964,702 4,312 2.37 6,005 3.30
Multiline Retail 0.82% (0.63%)B&M European Value Retail GBP 459,346 1,487 0.82 1,487 0.82
Specialty Retail 3.19% (3.81%)BCA Marketplace GBP 3,075,515 5,790 3.19 5,790 3.19
Textiles, Apparel & Luxury Goods 1.37% (1.31%)Ted Baker GBP 88,787 2,498 1.37 2,498 1.37Consumer Discretionary total 29,639 16.31
Consumer Staples 11.89% (9.97%)Beverages 2.20% (1.41%)Fevertree Drinks# GBP 256,677 3,994 2.20 3,994 2.20
Food & Staples Retailing 0.61% (0.79%)Booker Group GBP 580,510 1,117 0.61 1,117 0.61
Household Products 1.75% (1.84%)Reckitt Benckiser Group GBP 42,794 3,179 1.75 3,179 1.75
Personal Products 3.64% (2.42%)Unilever GBP 163,805 6,618 3.64 6,618 3.64
Tobacco 3.69% (3.51%)British American Tobacco GBP 124,406 6,697 3.69 6,697 3.69Consumer Staples total 21,605 11.89
Aviva Investors Investment Funds ICVC Interim Report and Financial Statements for the six months ended 15 April 2017 | avivainvestors.com
Aviva Investors UK Growth Fund
28
PORTFOLIO STATEMENT (CONTINUED)As at 15 April 2017 (unaudited)
Investment Currency HoldingMarket Value
£000 % of Net Assets
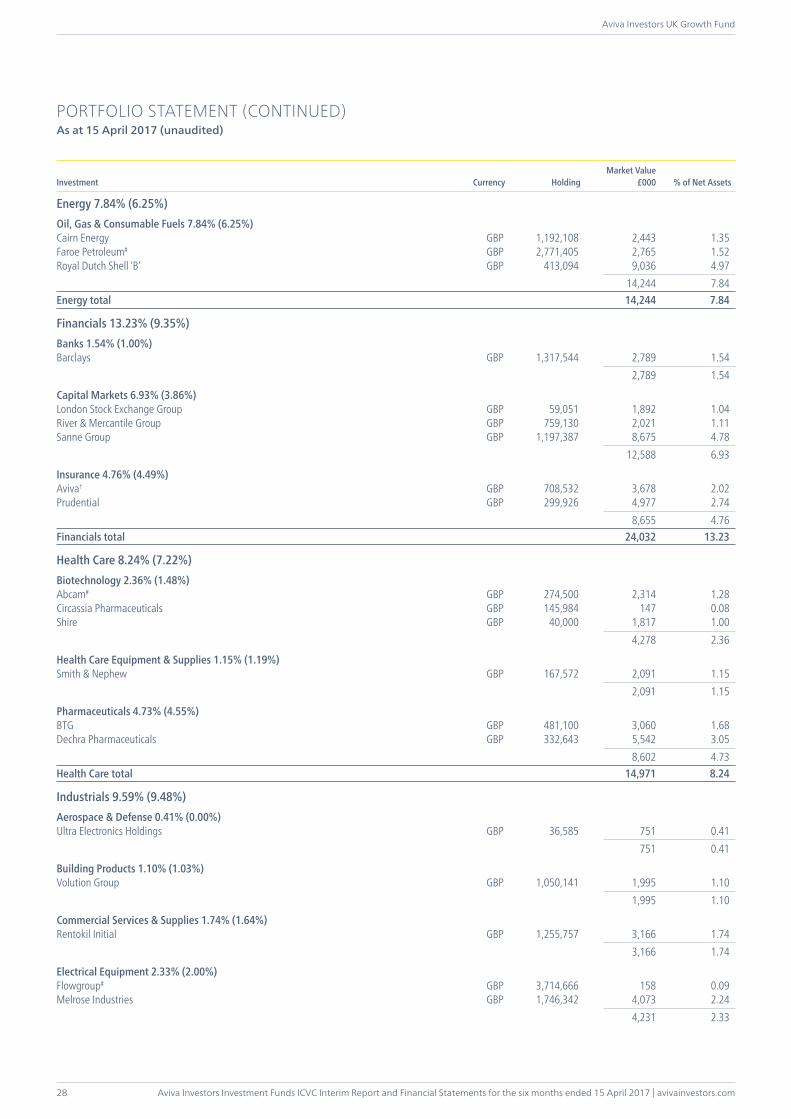
Energy 7.84% (6.25%)Oil, Gas & Consumable Fuels 7.84% (6.25%)Cairn Energy GBP 1,192,108 2,443 1.35Faroe Petroleum# GBP 2,771,405 2,765 1.52Royal Dutch Shell ‘B’ GBP 413,094 9,036 4.97 14,244 7.84Energy total 14,244 7.84
Financials 13.23% (9.35%)Banks 1.54% (1.00%)Barclays GBP 1,317,544 2,789 1.54 2,789 1.54
Capital Markets 6.93% (3.86%)London Stock Exchange Group GBP 59,051 1,892 1.04River & Mercantile Group GBP 759,130 2,021 1.11Sanne Group GBP 1,197,387 8,675 4.78 12,588 6.93
Insurance 4.76% (4.49%)Aviva† GBP 708,532 3,678 2.02Prudential GBP 299,926 4,977 2.74 8,655 4.76Financials total 24,032 13.23
Health Care 8.24% (7.22%)Biotechnology 2.36% (1.48%)Abcam# GBP 274,500 2,314 1.28Circassia Pharmaceuticals GBP 145,984 147 0.08Shire GBP 40,000 1,817 1.00 4,278 2.36
Health Care Equipment & Supplies 1.15% (1.19%)Smith & Nephew GBP 167,572 2,091 1.15 2,091 1.15
Pharmaceuticals 4.73% (4.55%)BTG GBP 481,100 3,060 1.68Dechra Pharmaceuticals GBP 332,643 5,542 3.05 8,602 4.73Health Care total 14,971 8.24
Industrials 9.59% (9.48%)Aerospace & Defense 0.41% (0.00%)Ultra Electronics Holdings GBP 36,585 751 0.41 751 0.41
Building Products 1.10% (1.03%)Volution Group GBP 1,050,141 1,995 1.10 1,995 1.10
Commercial Services & Supplies 1.74% (1.64%)Rentokil Initial GBP 1,255,757 3,166 1.74 3,166 1.74
Electrical Equipment 2.33% (2.00%)Flowgroup# GBP 3,714,666 158 0.09Melrose Industries GBP 1,746,342 4,073 2.24 4,231 2.33
avivainvestors.com | Aviva Investors Investment Funds ICVC Interim Report and Financial Statements for the six months ended 15 April 2017
Aviva Investors UK Growth Fund
29
PORTFOLIO STATEMENT (CONTINUED)As at 15 April 2017 (unaudited)
Investment Currency HoldingMarket Value
£000 % of Net Assets
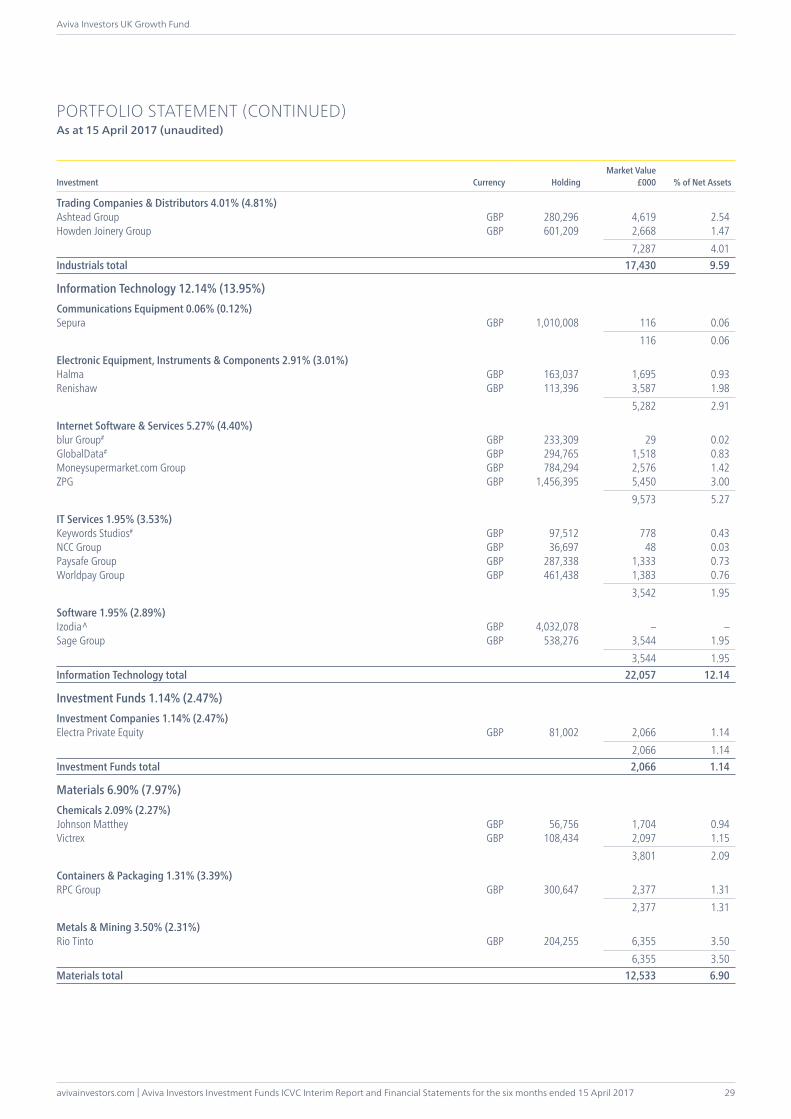
Trading Companies & Distributors 4.01% (4.81%)Ashtead Group GBP 280,296 4,619 2.54Howden Joinery Group GBP 601,209 2,668 1.47 7,287 4.01Industrials total 17,430 9.59
Information Technology 12.14% (13.95%)Communications Equipment 0.06% (0.12%)Sepura GBP 1,010,008 116 0.06 116 0.06
Electronic Equipment, Instruments & Components 2.91% (3.01%)Halma GBP 163,037 1,695 0.93Renishaw GBP 113,396 3,587 1.98 5,282 2.91
Internet Software & Services 5.27% (4.40%)blur Group# GBP 233,309 29 0.02GlobalData# GBP 294,765 1,518 0.83Moneysupermarket.com Group GBP 784,294 2,576 1.42ZPG GBP 1,456,395 5,450 3.00 9,573 5.27
IT Services 1.95% (3.53%)Keywords Studios# GBP 97,512 778 0.43NCC Group GBP 36,697 48 0.03Paysafe Group GBP 287,338 1,333 0.73Worldpay Group GBP 461,438 1,383 0.76 3,542 1.95
Software 1.95% (2.89%)Izodia^ GBP 4,032,078 – –Sage Group GBP 538,276 3,544 1.95 3,544 1.95Information Technology total 22,057 12.14
Investment Funds 1.14% (2.47%)Investment Companies 1.14% (2.47%)Electra Private Equity GBP 81,002 2,066 1.14 2,066 1.14Investment Funds total 2,066 1.14
Materials 6.90% (7.97%)Chemicals 2.09% (2.27%)Johnson Matthey GBP 56,756 1,704 0.94Victrex GBP 108,434 2,097 1.15 3,801 2.09
Containers & Packaging 1.31% (3.39%)RPC Group GBP 300,647 2,377 1.31 2,377 1.31
Metals & Mining 3.50% (2.31%)Rio Tinto GBP 204,255 6,355 3.50 6,355 3.50Materials total 12,533 6.90
Aviva Investors Investment Funds ICVC Interim Report and Financial Statements for the six months ended 15 April 2017 | avivainvestors.com
Aviva Investors UK Growth Fund
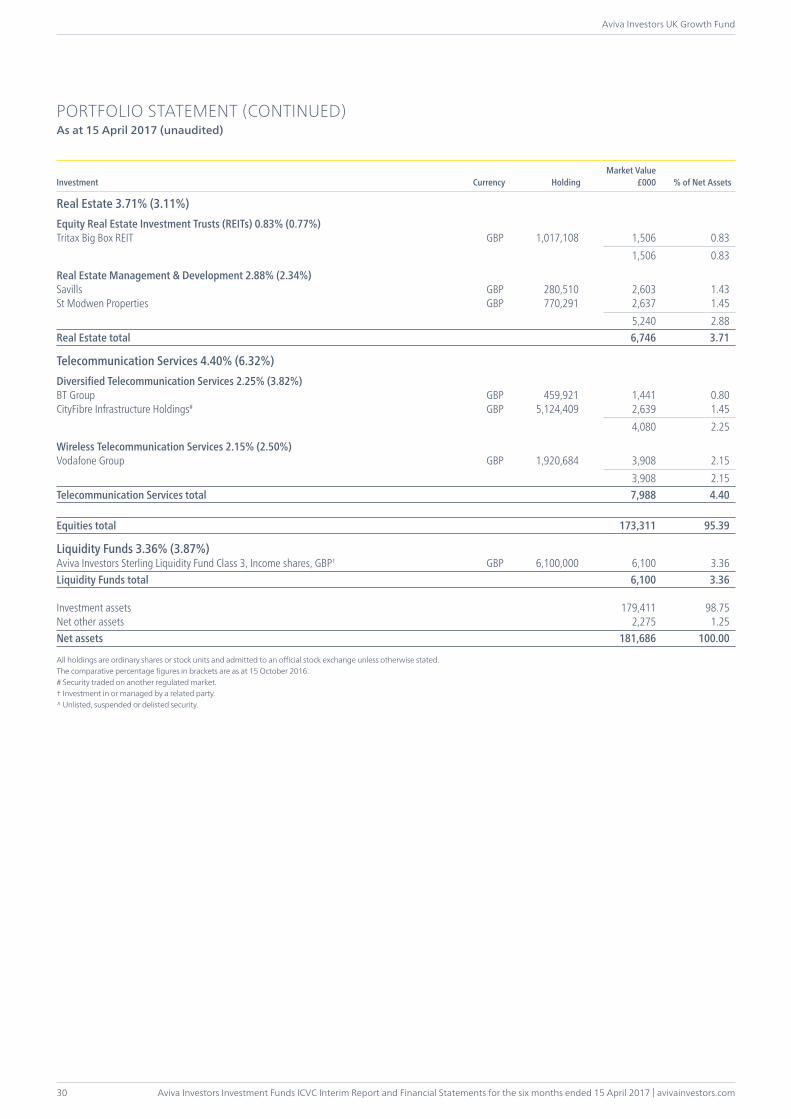
30
PORTFOLIO STATEMENT (CONTINUED)As at 15 April 2017 (unaudited)
Investment Currency HoldingMarket Value
£000 % of Net Assets
Real Estate 3.71% (3.11%)Equity Real Estate Investment Trusts (REITs) 0.83% (0.77%)Tritax Big Box REIT GBP 1,017,108 1,506 0.83 1,506 0.83
Real Estate Management & Development 2.88% (2.34%)Savills GBP 280,510 2,603 1.43St Modwen Properties GBP 770,291 2,637 1.45 5,240 2.88Real Estate total 6,746 3.71
Telecommunication Services 4.40% (6.32%)Diversified Telecommunication Services 2.25% (3.82%)BT Group GBP 459,921 1,441 0.80CityFibre Infrastructure Holdings# GBP 5,124,409 2,639 1.45 4,080 2.25
Wireless Telecommunication Services 2.15% (2.50%)Vodafone Group GBP 1,920,684 3,908 2.15 3,908 2.15Telecommunication Services total 7,988 4.40
Equities total 173,311 95.39
Liquidity Funds 3.36% (3.87%)Aviva Investors Sterling Liquidity Fund Class 3, Income shares, GBP† GBP 6,100,000 6,100 3.36Liquidity Funds total 6,100 3.36
Investment assets 179,411 98.75Net other assets 2,275 1.25Net assets 181,686 100.00
All holdings are ordinary shares or stock units and admitted to an official stock exchange unless otherwise stated.The comparative percentage figures in brackets are as at 15 October 2016.# Security traded on another regulated market.† Investment in or managed by a related party.^ Unlisted, suspended or delisted security.
avivainvestors.com | Aviva Investors Investment Funds ICVC Interim Report and Financial Statements for the six months ended 15 April 2017
Aviva Investors UK Growth Fund
31
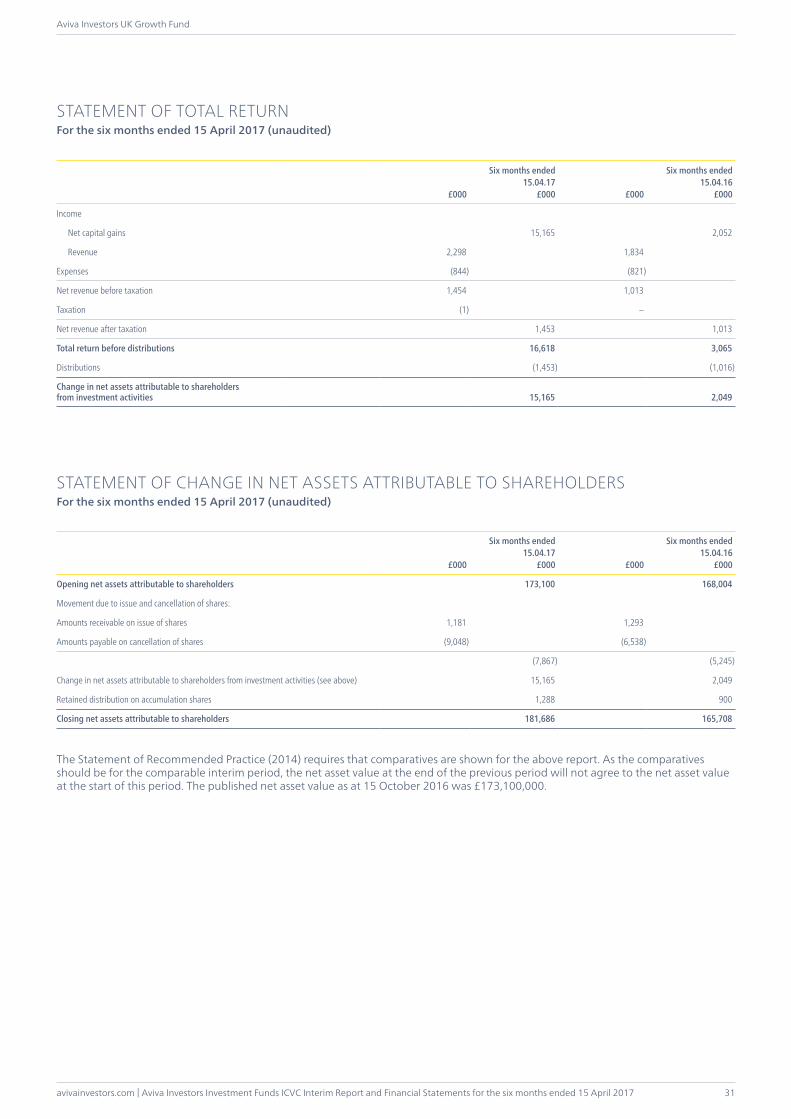
£000
Six months ended15.04.17
£000 £000
Six months ended15.04.16
£000
Income
Net capital gains 15,165 2,052
Revenue 2,298 1,834
Expenses (844) (821)
Net revenue before taxation 1,454 1,013
Taxation (1) –
Net revenue after taxation 1,453 1,013
Total return before distributions 16,618 3,065
Distributions (1,453) (1,016)
Change in net assets attributable to shareholders from investment activities 15,165 2,049
STATEMENT OF CHANGE IN NET ASSETS ATTRIBUTABLE TO SHAREHOLDERSFor the six months ended 15 April 2017 (unaudited)
£000
Six months ended15.04.17
£000 £000
Six months ended15.04.16
£000
Opening net assets attributable to shareholders 173,100 168,004
Movement due to issue and cancellation of shares:
Amounts receivable on issue of shares 1,181 1,293
Amounts payable on cancellation of shares (9,048) (6,538)
(7,867) (5,245)
Change in net assets attributable to shareholders from investment activities (see above) 15,165 2,049
Retained distribution on accumulation shares 1,288 900
Closing net assets attributable to shareholders 181,686 165,708
The Statement of Recommended Practice (2014) requires that comparatives are shown for the above report. As the comparatives should be for the comparable interim period, the net asset value at the end of the previous period will not agree to the net asset value at the start of this period. The published net asset value as at 15 October 2016 was £173,100,000.
STATEMENT OF TOTAL RETURNFor the six months ended 15 April 2017 (unaudited)

Aviva Investors Investment Funds ICVC Interim Report and Financial Statements for the six months ended 15 April 2017 | avivainvestors.com
Aviva Investors UK Growth Fund
32
BALANCE SHEETAs at 15 April 2017 (unaudited)
As at15.04.17
£000
As at15.10.16
£000
Assets:
Investments 179,411 170,423
Current assets:
Debtors 2,999 3,555
Cash and bank balances 891 1,278
Total assets 183,301 175,256
Liabilities:
Creditors:
Distribution payable (142) (119)
Other creditors (1,473) (2,037)
Total liabilities (1,615) (2,156)
Net assets attributable to shareholders 181,686 173,100
ACCOUNTING POLICIESThe accounting policies applied are consistent with those of the financial statements for the year ended 15 October 2016 and are described in those annual financial statements.
avivainvestors.com | Aviva Investors Investment Funds ICVC Interim Report and Financial Statements for the six months ended 15 April 2017
Aviva Investors UK Index Tracking Fund
33
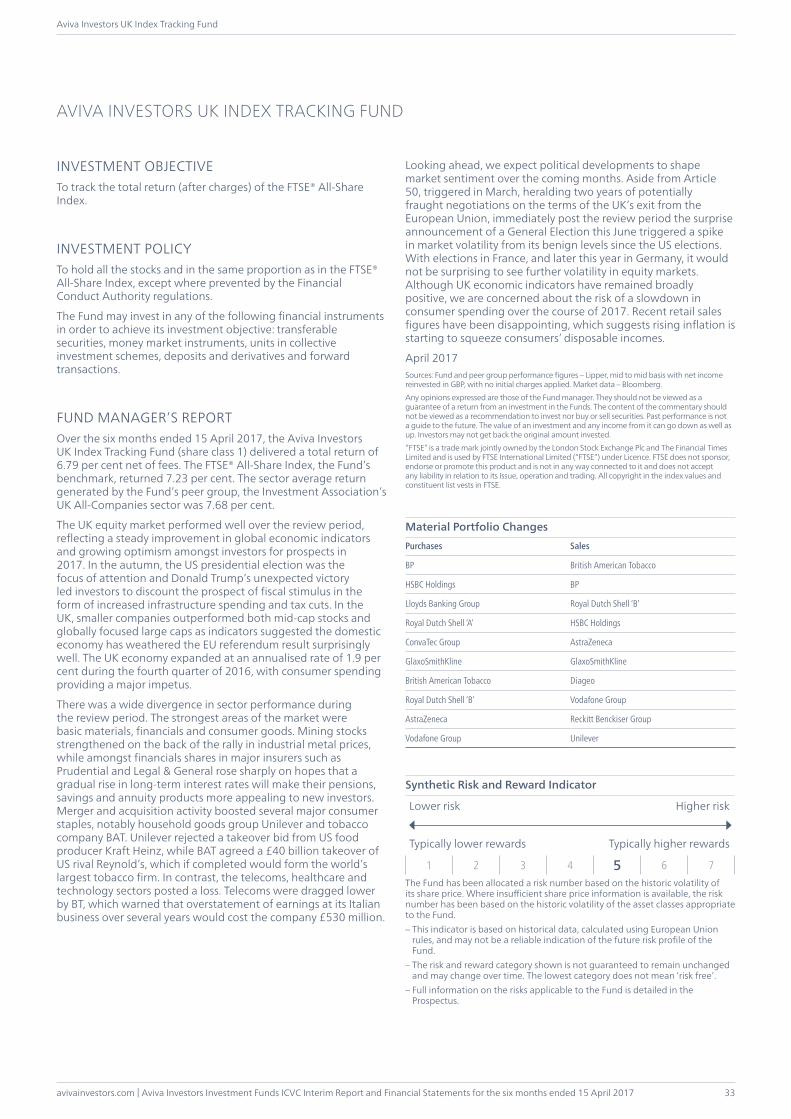
INVESTMENT OBJECTIVETo track the total return (after charges) of the FTSE® All-Share Index.
INVESTMENT POLICYTo hold all the stocks and in the same proportion as in the FTSE® All-Share Index, except where prevented by the Financial Conduct Authority regulations.
The Fund may invest in any of the following financial instruments in order to achieve its investment objective: transferable securities, money market instruments, units in collective investment schemes, deposits and derivatives and forward transactions.
FUND MANAGER’S REPORTOver the six months ended 15 April 2017, the Aviva Investors UK Index Tracking Fund (share class 1) delivered a total return of 6.79 per cent net of fees. The FTSE® All-Share Index, the Fund’s benchmark, returned 7.23 per cent. The sector average return generated by the Fund’s peer group, the Investment Association’s UK All-Companies sector was 7.68 per cent.
The UK equity market performed well over the review period, reflecting a steady improvement in global economic indicators and growing optimism amongst investors for prospects in 2017. In the autumn, the US presidential election was the focus of attention and Donald Trump’s unexpected victory led investors to discount the prospect of fiscal stimulus in the form of increased infrastructure spending and tax cuts. In the UK, smaller companies outperformed both mid-cap stocks and globally focused large caps as indicators suggested the domestic economy has weathered the EU referendum result surprisingly well. The UK economy expanded at an annualised rate of 1.9 per cent during the fourth quarter of 2016, with consumer spending providing a major impetus.
There was a wide divergence in sector performance during the review period. The strongest areas of the market were basic materials, financials and consumer goods. Mining stocks strengthened on the back of the rally in industrial metal prices, while amongst financials shares in major insurers such as Prudential and Legal & General rose sharply on hopes that a gradual rise in long-term interest rates will make their pensions, savings and annuity products more appealing to new investors. Merger and acquisition activity boosted several major consumer staples, notably household goods group Unilever and tobacco company BAT. Unilever rejected a takeover bid from US food producer Kraft Heinz, while BAT agreed a £40 billion takeover of US rival Reynold’s, which if completed would form the world’s largest tobacco firm. In contrast, the telecoms, healthcare and technology sectors posted a loss. Telecoms were dragged lower by BT, which warned that overstatement of earnings at its Italian business over several years would cost the company £530 million.
Looking ahead, we expect political developments to shape market sentiment over the coming months. Aside from Article 50, triggered in March, heralding two years of potentially fraught negotiations on the terms of the UK’s exit from the European Union, immediately post the review period the surprise announcement of a General Election this June triggered a spike in market volatility from its benign levels since the US elections. With elections in France, and later this year in Germany, it would not be surprising to see further volatility in equity markets. Although UK economic indicators have remained broadly positive, we are concerned about the risk of a slowdown in consumer spending over the course of 2017. Recent retail sales figures have been disappointing, which suggests rising inflation is starting to squeeze consumers’ disposable incomes.
April 2017Sources: Fund and peer group performance figures – Lipper, mid to mid basis with net income reinvested in GBP, with no initial charges applied. Market data – Bloomberg. Any opinions expressed are those of the Fund manager. They should not be viewed as a guarantee of a return from an investment in the Funds. The content of the commentary should not be viewed as a recommendation to invest nor buy or sell securities. Past performance is not a guide to the future. The value of an investment and any income from it can go down as well as up. Investors may not get back the original amount invested.“FTSE” is a trade mark jointly owned by the London Stock Exchange Plc and The Financial Times Limited and is used by FTSE International Limited (“FTSE”) under Licence. FTSE does not sponsor, endorse or promote this product and is not in any way connected to it and does not accept any liability in relation to its Issue, operation and trading. All copyright in the index values and constituent list vests in FTSE.
Material Portfolio ChangesPurchases Sales
BP British American Tobacco
HSBC Holdings BP
Lloyds Banking Group Royal Dutch Shell ‘B’
Royal Dutch Shell ‘A’ HSBC Holdings
ConvaTec Group AstraZeneca
GlaxoSmithKline GlaxoSmithKline
British American Tobacco Diageo
Royal Dutch Shell ‘B’ Vodafone Group
AstraZeneca Reckitt Benckiser Group
Vodafone Group Unilever
Synthetic Risk and Reward Indicator
Lower risk Higher risk
Typically lower rewards Typically higher rewards
1 2 3 4 5 6 7The Fund has been allocated a risk number based on the historic volatility of its share price. Where insufficient share price information is available, the risk number has been based on the historic volatility of the asset classes appropriate to the Fund.– This indicator is based on historical data, calculated using European Union
rules, and may not be a reliable indication of the future risk profile of the Fund.
– The risk and reward category shown is not guaranteed to remain unchanged and may change over time. The lowest category does not mean ‘risk free’.
– Full information on the risks applicable to the Fund is detailed in the Prospectus.
AVIVA INVESTORS UK INDEX TRACKING FUND
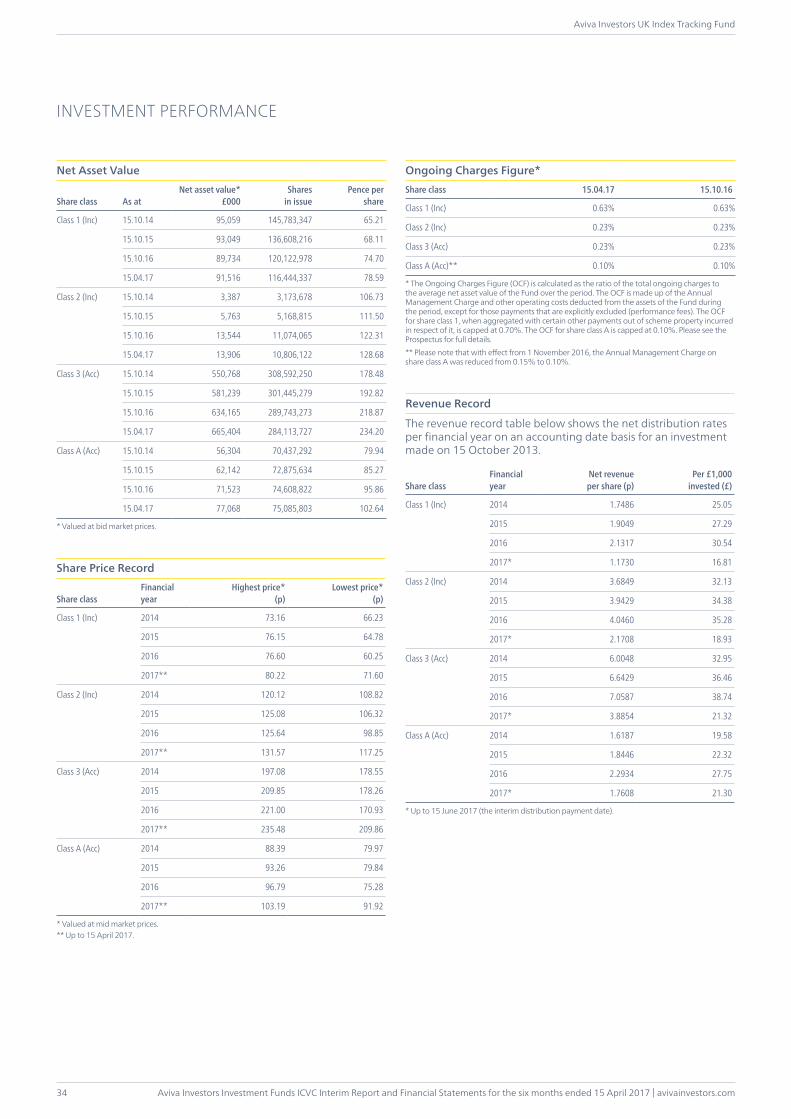
Aviva Investors Investment Funds ICVC Interim Report and Financial Statements for the six months ended 15 April 2017 | avivainvestors.com
Aviva Investors UK Index Tracking Fund
34
INVESTMENT PERFORMANCE
Net Asset Value
Share class As atNet asset value*
£000Shares
in issuePence per
share
Class 1 (Inc) 15.10.14 95,059 145,783,347 65.21
15.10.15 93,049 136,608,216 68.11
15.10.16 89,734 120,122,978 74.70
15.04.17 91,516 116,444,337 78.59
Class 2 (Inc) 15.10.14 3,387 3,173,678 106.73
15.10.15 5,763 5,168,815 111.50
15.10.16 13,544 11,074,065 122.31
15.04.17 13,906 10,806,122 128.68
Class 3 (Acc) 15.10.14 550,768 308,592,250 178.48
15.10.15 581,239 301,445,279 192.82
15.10.16 634,165 289,743,273 218.87
15.04.17 665,404 284,113,727 234.20
Class A (Acc) 15.10.14 56,304 70,437,292 79.94
15.10.15 62,142 72,875,634 85.27
15.10.16 71,523 74,608,822 95.86
15.04.17 77,068 75,085,803 102.64
* Valued at bid market prices.
Share Price Record
Share classFinancialyear
Highest price*(p)
Lowest price*(p)
Class 1 (Inc) 2014 73.16 66.23
2015 76.15 64.78
2016 76.60 60.25
2017** 80.22 71.60
Class 2 (Inc) 2014 120.12 108.82
2015 125.08 106.32
2016 125.64 98.85
2017** 131.57 117.25
Class 3 (Acc) 2014 197.08 178.55
2015 209.85 178.26
2016 221.00 170.93
2017** 235.48 209.86
Class A (Acc) 2014 88.39 79.97
2015 93.26 79.84
2016 96.79 75.28
2017** 103.19 91.92
* Valued at mid market prices.** Up to 15 April 2017.
Ongoing Charges Figure*Share class 15.04.17 15.10.16
Class 1 (Inc) 0.63% 0.63%
Class 2 (Inc) 0.23% 0.23%
Class 3 (Acc) 0.23% 0.23%
Class A (Acc)** 0.10% 0.10%
* The Ongoing Charges Figure (OCF) is calculated as the ratio of the total ongoing charges to the average net asset value of the Fund over the period. The OCF is made up of the Annual Management Charge and other operating costs deducted from the assets of the Fund during the period, except for those payments that are explicitly excluded (performance fees). The OCF for share class 1, when aggregated with certain other payments out of scheme property incurred in respect of it, is capped at 0.70%. The OCF for share class A is capped at 0.10%. Please see the Prospectus for full details.** Please note that with effect from 1 November 2016, the Annual Management Charge on share class A was reduced from 0.15% to 0.10%.
Revenue Record
The revenue record table below shows the net distribution rates per financial year on an accounting date basis for an investment made on 15 October 2013.
Share classFinancialyear
Net revenue per share (p)
Per £1,000invested (£)
Class 1 (Inc) 2014 1.7486 25.05
2015 1.9049 27.29
2016 2.1317 30.54
2017* 1.1730 16.81
Class 2 (Inc) 2014 3.6849 32.13
2015 3.9429 34.38
2016 4.0460 35.28
2017* 2.1708 18.93
Class 3 (Acc) 2014 6.0048 32.95
2015 6.6429 36.46
2016 7.0587 38.74
2017* 3.8854 21.32
Class A (Acc) 2014 1.6187 19.58
2015 1.8446 22.32
2016 2.2934 27.75
2017* 1.7608 21.30
* Up to 15 June 2017 (the interim distribution payment date).
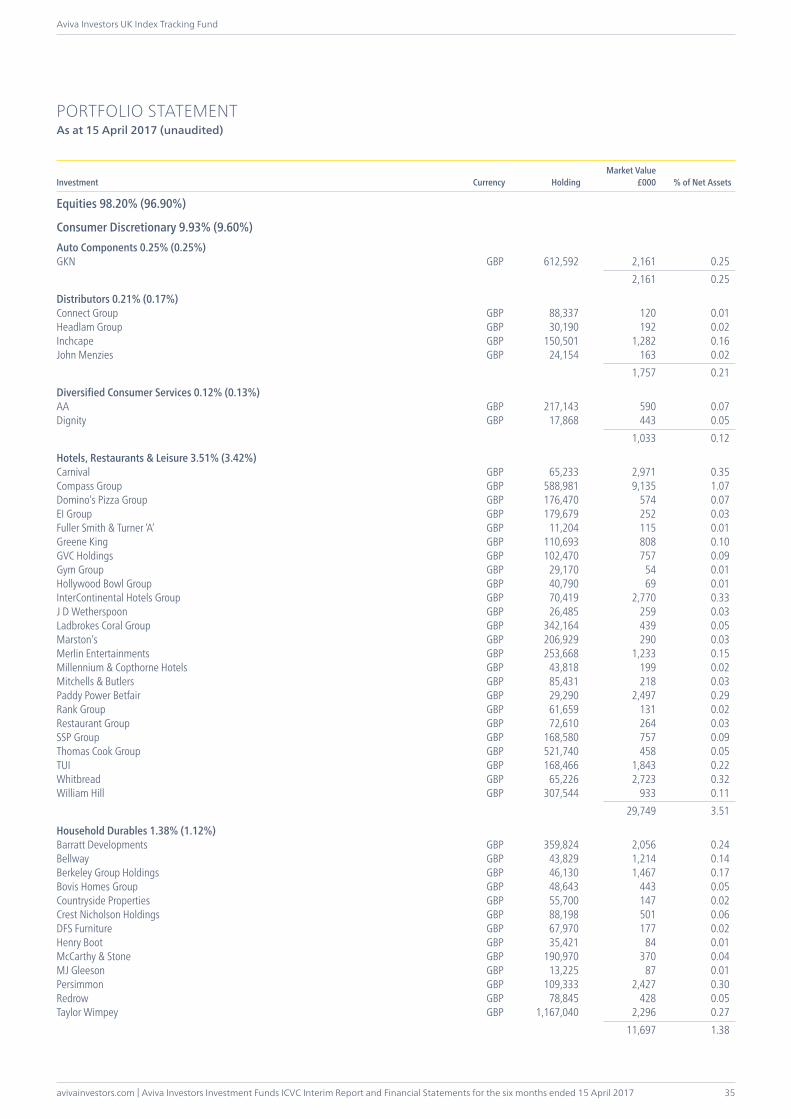
avivainvestors.com | Aviva Investors Investment Funds ICVC Interim Report and Financial Statements for the six months ended 15 April 2017
Aviva Investors UK Index Tracking Fund
35
PORTFOLIO STATEMENTAs at 15 April 2017 (unaudited)
Investment Currency HoldingMarket Value
£000 % of Net Assets
Equities 98.20% (96.90%)
Consumer Discretionary 9.93% (9.60%)Auto Components 0.25% (0.25%)GKN GBP 612,592 2,161 0.25 2,161 0.25
Distributors 0.21% (0.17%)Connect Group GBP 88,337 120 0.01Headlam Group GBP 30,190 192 0.02Inchcape GBP 150,501 1,282 0.16John Menzies GBP 24,154 163 0.02 1,757 0.21
Diversified Consumer Services 0.12% (0.13%)AA GBP 217,143 590 0.07Dignity GBP 17,868 443 0.05 1,033 0.12
Hotels, Restaurants & Leisure 3.51% (3.42%)Carnival GBP 65,233 2,971 0.35Compass Group GBP 588,981 9,135 1.07Domino’s Pizza Group GBP 176,470 574 0.07EI Group GBP 179,679 252 0.03Fuller Smith & Turner ‘A’ GBP 11,204 115 0.01Greene King GBP 110,693 808 0.10GVC Holdings GBP 102,470 757 0.09Gym Group GBP 29,170 54 0.01Hollywood Bowl Group GBP 40,790 69 0.01InterContinental Hotels Group GBP 70,419 2,770 0.33J D Wetherspoon GBP 26,485 259 0.03Ladbrokes Coral Group GBP 342,164 439 0.05Marston’s GBP 206,929 290 0.03Merlin Entertainments GBP 253,668 1,233 0.15Millennium & Copthorne Hotels GBP 43,818 199 0.02Mitchells & Butlers GBP 85,431 218 0.03Paddy Power Betfair GBP 29,290 2,497 0.29Rank Group GBP 61,659 131 0.02Restaurant Group GBP 72,610 264 0.03SSP Group GBP 168,580 757 0.09Thomas Cook Group GBP 521,740 458 0.05TUI GBP 168,466 1,843 0.22Whitbread GBP 65,226 2,723 0.32William Hill GBP 307,544 933 0.11 29,749 3.51
Household Durables 1.38% (1.12%)Barratt Developments GBP 359,824 2,056 0.24Bellway GBP 43,829 1,214 0.14Berkeley Group Holdings GBP 46,130 1,467 0.17Bovis Homes Group GBP 48,643 443 0.05Countryside Properties GBP 55,700 147 0.02Crest Nicholson Holdings GBP 88,198 501 0.06DFS Furniture GBP 67,970 177 0.02Henry Boot GBP 35,421 84 0.01McCarthy & Stone GBP 190,970 370 0.04MJ Gleeson GBP 13,225 87 0.01Persimmon GBP 109,333 2,427 0.30Redrow GBP 78,845 428 0.05Taylor Wimpey GBP 1,167,040 2,296 0.27 11,697 1.38
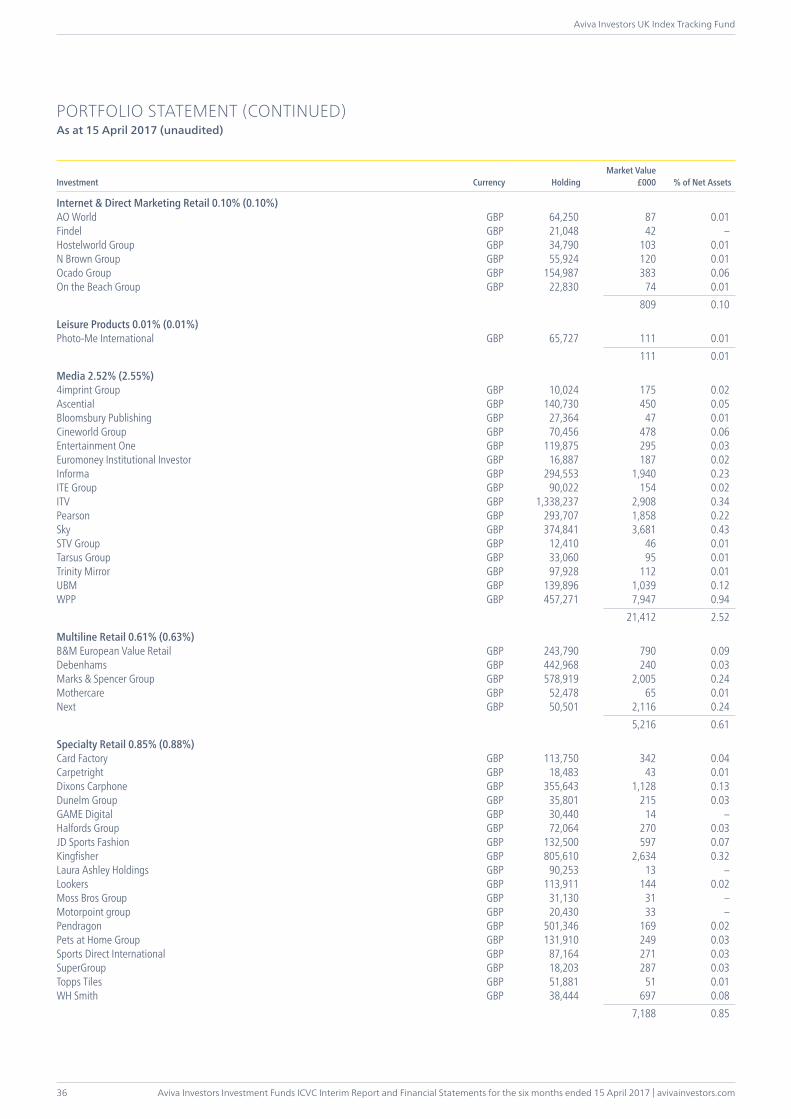
Aviva Investors Investment Funds ICVC Interim Report and Financial Statements for the six months ended 15 April 2017 | avivainvestors.com
Aviva Investors UK Index Tracking Fund
36
PORTFOLIO STATEMENT (CONTINUED)As at 15 April 2017 (unaudited)
Investment Currency HoldingMarket Value
£000 % of Net Assets
Internet & Direct Marketing Retail 0.10% (0.10%)AO World GBP 64,250 87 0.01Findel GBP 21,048 42 –Hostelworld Group GBP 34,790 103 0.01N Brown Group GBP 55,924 120 0.01Ocado Group GBP 154,987 383 0.06On the Beach Group GBP 22,830 74 0.01 809 0.10
Leisure Products 0.01% (0.01%)Photo-Me International GBP 65,727 111 0.01 111 0.01
Media 2.52% (2.55%)4imprint Group GBP 10,024 175 0.02Ascential GBP 140,730 450 0.05Bloomsbury Publishing GBP 27,364 47 0.01Cineworld Group GBP 70,456 478 0.06Entertainment One GBP 119,875 295 0.03Euromoney Institutional Investor GBP 16,887 187 0.02Informa GBP 294,553 1,940 0.23ITE Group GBP 90,022 154 0.02ITV GBP 1,338,237 2,908 0.34Pearson GBP 293,707 1,858 0.22Sky GBP 374,841 3,681 0.43STV Group GBP 12,410 46 0.01Tarsus Group GBP 33,060 95 0.01Trinity Mirror GBP 97,928 112 0.01UBM GBP 139,896 1,039 0.12WPP GBP 457,271 7,947 0.94 21,412 2.52
Multiline Retail 0.61% (0.63%)B&M European Value Retail GBP 243,790 790 0.09Debenhams GBP 442,968 240 0.03Marks & Spencer Group GBP 578,919 2,005 0.24Mothercare GBP 52,478 65 0.01Next GBP 50,501 2,116 0.24 5,216 0.61
Specialty Retail 0.85% (0.88%)Card Factory GBP 113,750 342 0.04Carpetright GBP 18,483 43 0.01Dixons Carphone GBP 355,643 1,128 0.13Dunelm Group GBP 35,801 215 0.03GAME Digital GBP 30,440 14 –Halfords Group GBP 72,064 270 0.03JD Sports Fashion GBP 132,500 597 0.07Kingfisher GBP 805,610 2,634 0.32Laura Ashley Holdings GBP 90,253 13 –Lookers GBP 113,911 144 0.02Moss Bros Group GBP 31,130 31 –Motorpoint group GBP 20,430 33 –Pendragon GBP 501,346 169 0.02Pets at Home Group GBP 131,910 249 0.03Sports Direct International GBP 87,164 271 0.03SuperGroup GBP 18,203 287 0.03Topps Tiles GBP 51,881 51 0.01WH Smith GBP 38,444 697 0.08 7,188 0.85
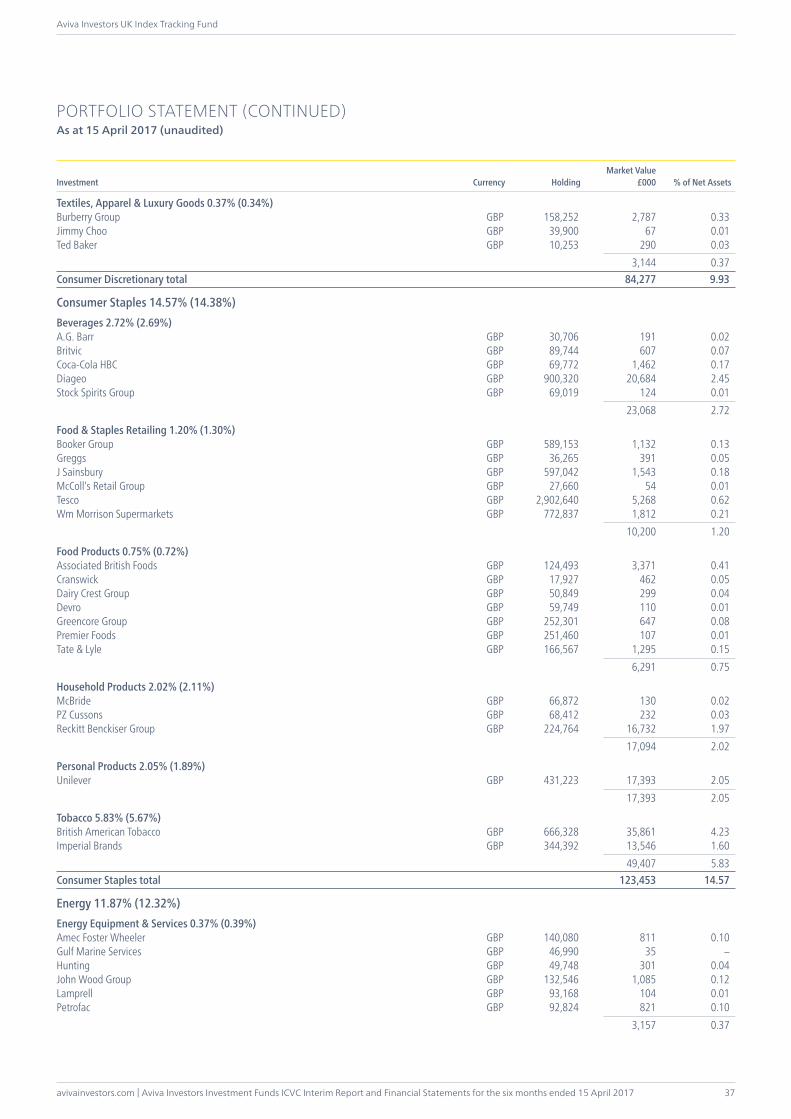
avivainvestors.com | Aviva Investors Investment Funds ICVC Interim Report and Financial Statements for the six months ended 15 April 2017
Aviva Investors UK Index Tracking Fund
37
PORTFOLIO STATEMENT (CONTINUED)As at 15 April 2017 (unaudited)
Investment Currency HoldingMarket Value
£000 % of Net Assets
Textiles, Apparel & Luxury Goods 0.37% (0.34%)Burberry Group GBP 158,252 2,787 0.33Jimmy Choo GBP 39,900 67 0.01Ted Baker GBP 10,253 290 0.03 3,144 0.37Consumer Discretionary total 84,277 9.93
Consumer Staples 14.57% (14.38%)Beverages 2.72% (2.69%)A.G. Barr GBP 30,706 191 0.02Britvic GBP 89,744 607 0.07Coca-Cola HBC GBP 69,772 1,462 0.17Diageo GBP 900,320 20,684 2.45Stock Spirits Group GBP 69,019 124 0.01 23,068 2.72
Food & Staples Retailing 1.20% (1.30%)Booker Group GBP 589,153 1,132 0.13Greggs GBP 36,265 391 0.05J Sainsbury GBP 597,042 1,543 0.18McColl’s Retail Group GBP 27,660 54 0.01Tesco GBP 2,902,640 5,268 0.62Wm Morrison Supermarkets GBP 772,837 1,812 0.21 10,200 1.20
Food Products 0.75% (0.72%)Associated British Foods GBP 124,493 3,371 0.41Cranswick GBP 17,927 462 0.05Dairy Crest Group GBP 50,849 299 0.04Devro GBP 59,749 110 0.01Greencore Group GBP 252,301 647 0.08Premier Foods GBP 251,460 107 0.01Tate & Lyle GBP 166,567 1,295 0.15 6,291 0.75
Household Products 2.02% (2.11%)McBride GBP 66,872 130 0.02PZ Cussons GBP 68,412 232 0.03Reckitt Benckiser Group GBP 224,764 16,732 1.97 17,094 2.02
Personal Products 2.05% (1.89%)Unilever GBP 431,223 17,393 2.05 17,393 2.05
Tobacco 5.83% (5.67%)British American Tobacco GBP 666,328 35,861 4.23Imperial Brands GBP 344,392 13,546 1.60 49,407 5.83Consumer Staples total 123,453 14.57
Energy 11.87% (12.32%)Energy Equipment & Services 0.37% (0.39%)Amec Foster Wheeler GBP 140,080 811 0.10Gulf Marine Services GBP 46,990 35 –Hunting GBP 49,748 301 0.04John Wood Group GBP 132,546 1,085 0.12Lamprell GBP 93,168 104 0.01Petrofac GBP 92,824 821 0.10 3,157 0.37
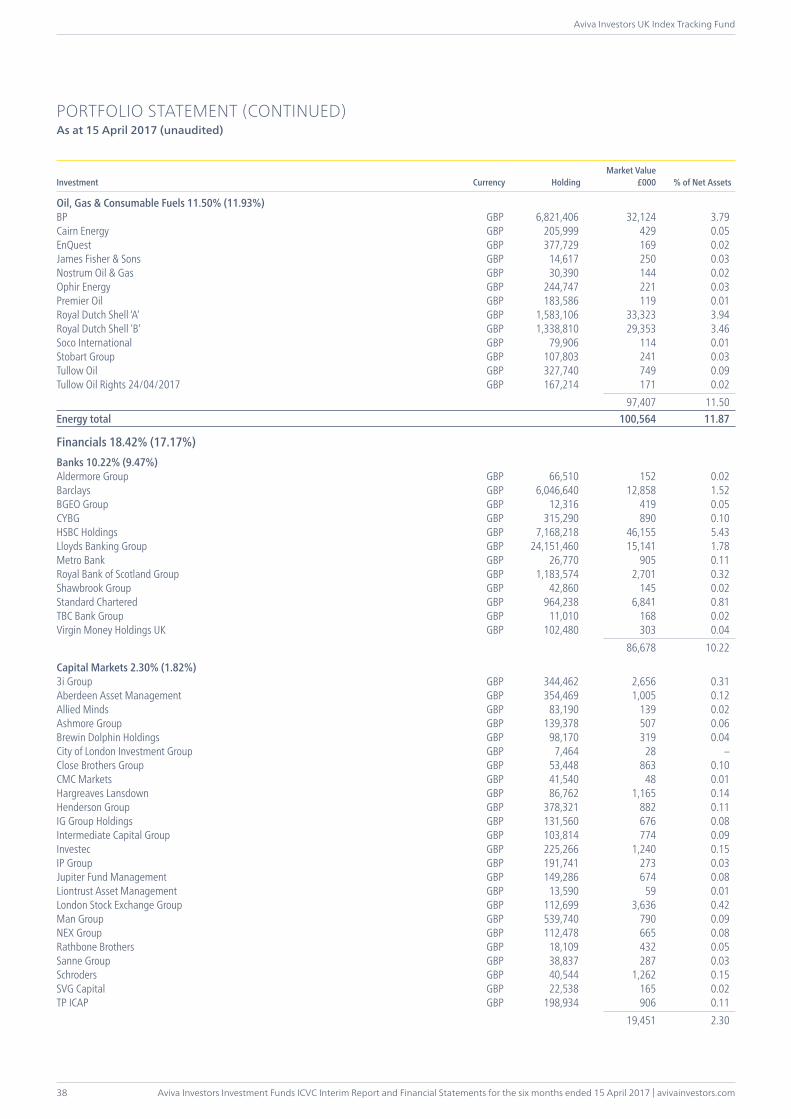
Aviva Investors Investment Funds ICVC Interim Report and Financial Statements for the six months ended 15 April 2017 | avivainvestors.com
Aviva Investors UK Index Tracking Fund
38
PORTFOLIO STATEMENT (CONTINUED)As at 15 April 2017 (unaudited)
Investment Currency HoldingMarket Value
£000 % of Net Assets
Oil, Gas & Consumable Fuels 11.50% (11.93%)BP GBP 6,821,406 32,124 3.79Cairn Energy GBP 205,999 429 0.05EnQuest GBP 377,729 169 0.02James Fisher & Sons GBP 14,617 250 0.03Nostrum Oil & Gas GBP 30,390 144 0.02Ophir Energy GBP 244,747 221 0.03Premier Oil GBP 183,586 119 0.01Royal Dutch Shell ‘A’ GBP 1,583,106 33,323 3.94Royal Dutch Shell ‘B’ GBP 1,338,810 29,353 3.46Soco International GBP 79,906 114 0.01Stobart Group GBP 107,803 241 0.03Tullow Oil GBP 327,740 749 0.09Tullow Oil Rights 24/04/2017 GBP 167,214 171 0.02 97,407 11.50Energy total 100,564 11.87
Financials 18.42% (17.17%)Banks 10.22% (9.47%)Aldermore Group GBP 66,510 152 0.02Barclays GBP 6,046,640 12,858 1.52BGEO Group GBP 12,316 419 0.05CYBG GBP 315,290 890 0.10HSBC Holdings GBP 7,168,218 46,155 5.43Lloyds Banking Group GBP 24,151,460 15,141 1.78Metro Bank GBP 26,770 905 0.11Royal Bank of Scotland Group GBP 1,183,574 2,701 0.32Shawbrook Group GBP 42,860 145 0.02Standard Chartered GBP 964,238 6,841 0.81TBC Bank Group GBP 11,010 168 0.02Virgin Money Holdings UK GBP 102,480 303 0.04 86,678 10.22
Capital Markets 2.30% (1.82%)3i Group GBP 344,462 2,656 0.31Aberdeen Asset Management GBP 354,469 1,005 0.12Allied Minds GBP 83,190 139 0.02Ashmore Group GBP 139,378 507 0.06Brewin Dolphin Holdings GBP 98,170 319 0.04City of London Investment Group GBP 7,464 28 –Close Brothers Group GBP 53,448 863 0.10CMC Markets GBP 41,540 48 0.01Hargreaves Lansdown GBP 86,762 1,165 0.14Henderson Group GBP 378,321 882 0.11IG Group Holdings GBP 131,560 676 0.08Intermediate Capital Group GBP 103,814 774 0.09Investec GBP 225,266 1,240 0.15IP Group GBP 191,741 273 0.03Jupiter Fund Management GBP 149,286 674 0.08Liontrust Asset Management GBP 13,590 59 0.01London Stock Exchange Group GBP 112,699 3,636 0.42Man Group GBP 539,740 790 0.09NEX Group GBP 112,478 665 0.08Rathbone Brothers GBP 18,109 432 0.05Sanne Group GBP 38,837 287 0.03Schroders GBP 40,544 1,262 0.15SVG Capital GBP 22,538 165 0.02TP ICAP GBP 198,934 906 0.11 19,451 2.30
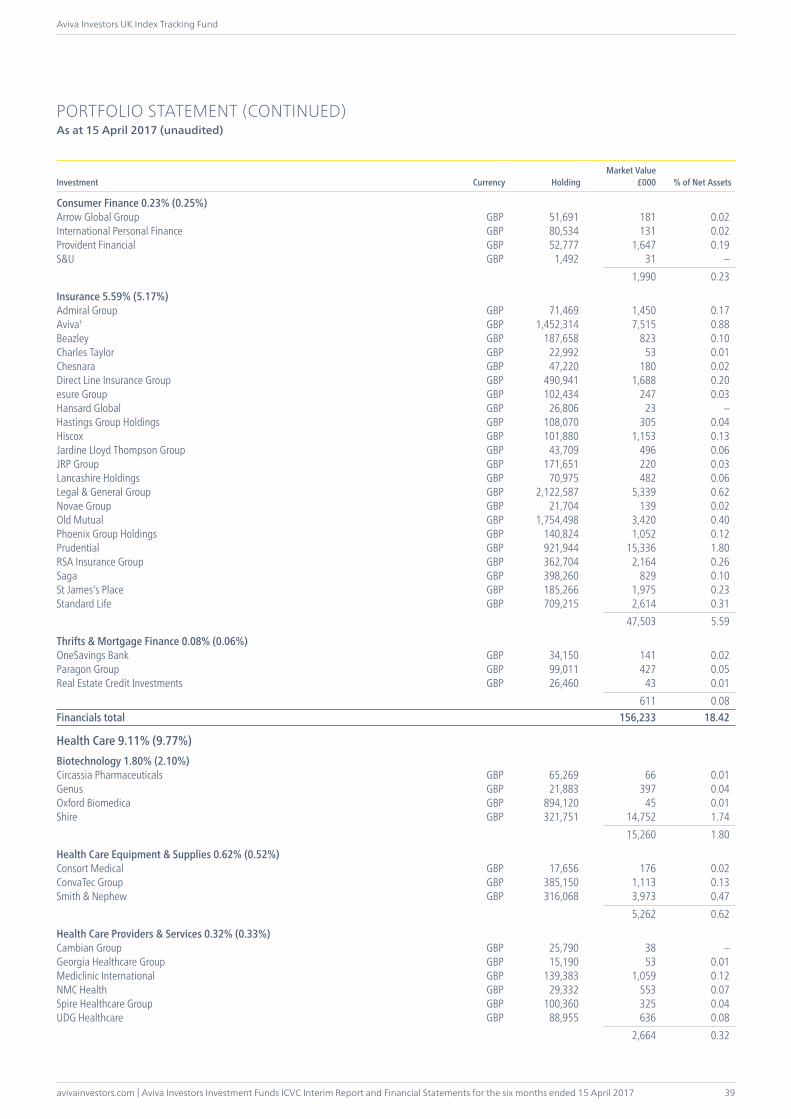
avivainvestors.com | Aviva Investors Investment Funds ICVC Interim Report and Financial Statements for the six months ended 15 April 2017
Aviva Investors UK Index Tracking Fund
39
PORTFOLIO STATEMENT (CONTINUED)As at 15 April 2017 (unaudited)
Investment Currency HoldingMarket Value
£000 % of Net Assets
Consumer Finance 0.23% (0.25%)Arrow Global Group GBP 51,691 181 0.02International Personal Finance GBP 80,534 131 0.02Provident Financial GBP 52,777 1,647 0.19S&U GBP 1,492 31 – 1,990 0.23
Insurance 5.59% (5.17%)Admiral Group GBP 71,469 1,450 0.17Aviva† GBP 1,452,314 7,515 0.88Beazley GBP 187,658 823 0.10Charles Taylor GBP 22,992 53 0.01Chesnara GBP 47,220 180 0.02Direct Line Insurance Group GBP 490,941 1,688 0.20esure Group GBP 102,434 247 0.03Hansard Global GBP 26,806 23 –Hastings Group Holdings GBP 108,070 305 0.04Hiscox GBP 101,880 1,153 0.13Jardine Lloyd Thompson Group GBP 43,709 496 0.06JRP Group GBP 171,651 220 0.03Lancashire Holdings GBP 70,975 482 0.06Legal & General Group GBP 2,122,587 5,339 0.62Novae Group GBP 21,704 139 0.02Old Mutual GBP 1,754,498 3,420 0.40Phoenix Group Holdings GBP 140,824 1,052 0.12Prudential GBP 921,944 15,336 1.80RSA Insurance Group GBP 362,704 2,164 0.26Saga GBP 398,260 829 0.10St James’s Place GBP 185,266 1,975 0.23Standard Life GBP 709,215 2,614 0.31 47,503 5.59
Thrifts & Mortgage Finance 0.08% (0.06%)OneSavings Bank GBP 34,150 141 0.02Paragon Group GBP 99,011 427 0.05Real Estate Credit Investments GBP 26,460 43 0.01 611 0.08Financials total 156,233 18.42
Health Care 9.11% (9.77%)Biotechnology 1.80% (2.10%)Circassia Pharmaceuticals GBP 65,269 66 0.01Genus GBP 21,883 397 0.04Oxford Biomedica GBP 894,120 45 0.01Shire GBP 321,751 14,752 1.74 15,260 1.80
Health Care Equipment & Supplies 0.62% (0.52%)Consort Medical GBP 17,656 176 0.02ConvaTec Group GBP 385,150 1,113 0.13Smith & Nephew GBP 316,068 3,973 0.47 5,262 0.62
Health Care Providers & Services 0.32% (0.33%)Cambian Group GBP 25,790 38 –Georgia Healthcare Group GBP 15,190 53 0.01Mediclinic International GBP 139,383 1,059 0.12NMC Health GBP 29,332 553 0.07Spire Healthcare Group GBP 100,360 325 0.04UDG Healthcare GBP 88,955 636 0.08 2,664 0.32
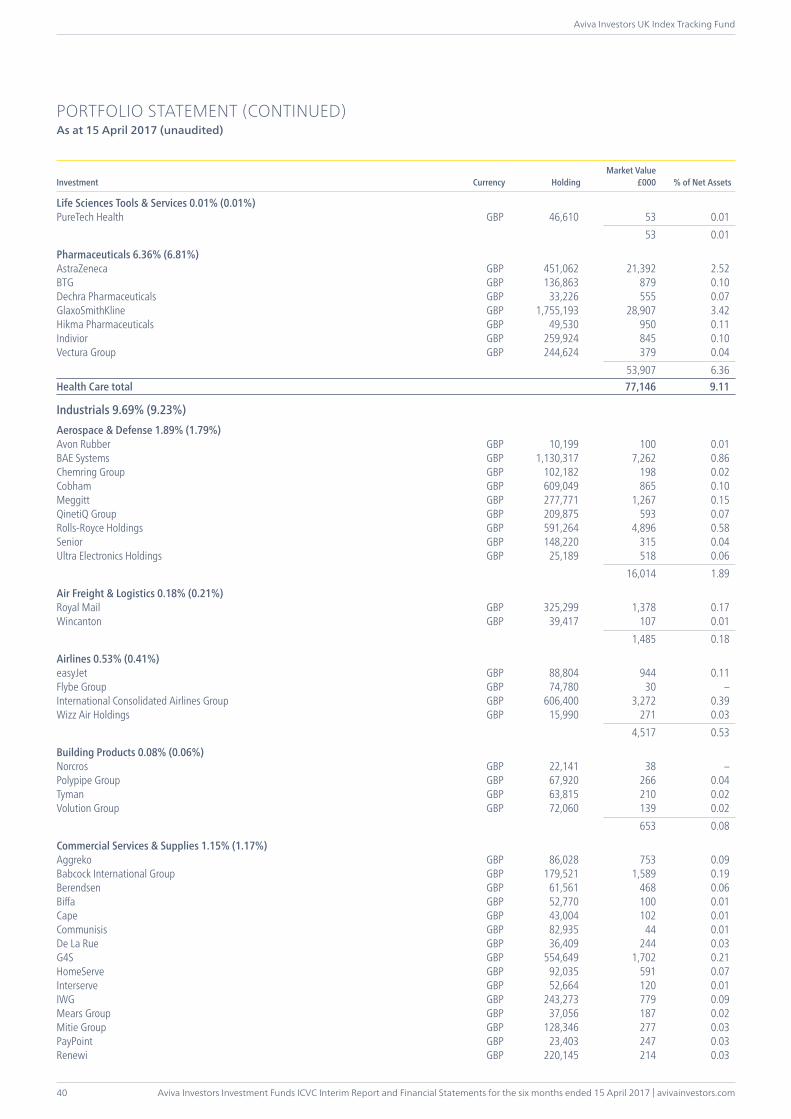
Aviva Investors Investment Funds ICVC Interim Report and Financial Statements for the six months ended 15 April 2017 | avivainvestors.com
Aviva Investors UK Index Tracking Fund
40
PORTFOLIO STATEMENT (CONTINUED)As at 15 April 2017 (unaudited)
Investment Currency HoldingMarket Value
£000 % of Net Assets
Life Sciences Tools & Services 0.01% (0.01%)PureTech Health GBP 46,610 53 0.01 53 0.01
Pharmaceuticals 6.36% (6.81%)AstraZeneca GBP 451,062 21,392 2.52BTG GBP 136,863 879 0.10Dechra Pharmaceuticals GBP 33,226 555 0.07GlaxoSmithKline GBP 1,755,193 28,907 3.42Hikma Pharmaceuticals GBP 49,530 950 0.11Indivior GBP 259,924 845 0.10Vectura Group GBP 244,624 379 0.04 53,907 6.36Health Care total 77,146 9.11
Industrials 9.69% (9.23%)Aerospace & Defense 1.89% (1.79%)Avon Rubber GBP 10,199 100 0.01BAE Systems GBP 1,130,317 7,262 0.86Chemring Group GBP 102,182 198 0.02Cobham GBP 609,049 865 0.10Meggitt GBP 277,771 1,267 0.15QinetiQ Group GBP 209,875 593 0.07Rolls-Royce Holdings GBP 591,264 4,896 0.58Senior GBP 148,220 315 0.04Ultra Electronics Holdings GBP 25,189 518 0.06 16,014 1.89
Air Freight & Logistics 0.18% (0.21%)Royal Mail GBP 325,299 1,378 0.17Wincanton GBP 39,417 107 0.01 1,485 0.18
Airlines 0.53% (0.41%)easyJet GBP 88,804 944 0.11Flybe Group GBP 74,780 30 –International Consolidated Airlines Group GBP 606,400 3,272 0.39Wizz Air Holdings GBP 15,990 271 0.03 4,517 0.53
Building Products 0.08% (0.06%)Norcros GBP 22,141 38 –Polypipe Group GBP 67,920 266 0.04Tyman GBP 63,815 210 0.02Volution Group GBP 72,060 139 0.02 653 0.08
Commercial Services & Supplies 1.15% (1.17%)Aggreko GBP 86,028 753 0.09Babcock International Group GBP 179,521 1,589 0.19Berendsen GBP 61,561 468 0.06Biffa GBP 52,770 100 0.01Cape GBP 43,004 102 0.01Communisis GBP 82,935 44 0.01De La Rue GBP 36,409 244 0.03G4S GBP 554,649 1,702 0.21HomeServe GBP 92,035 591 0.07Interserve GBP 52,664 120 0.01IWG GBP 243,273 779 0.09Mears Group GBP 37,056 187 0.02Mitie Group GBP 128,346 277 0.03PayPoint GBP 23,403 247 0.03Renewi GBP 220,145 214 0.03
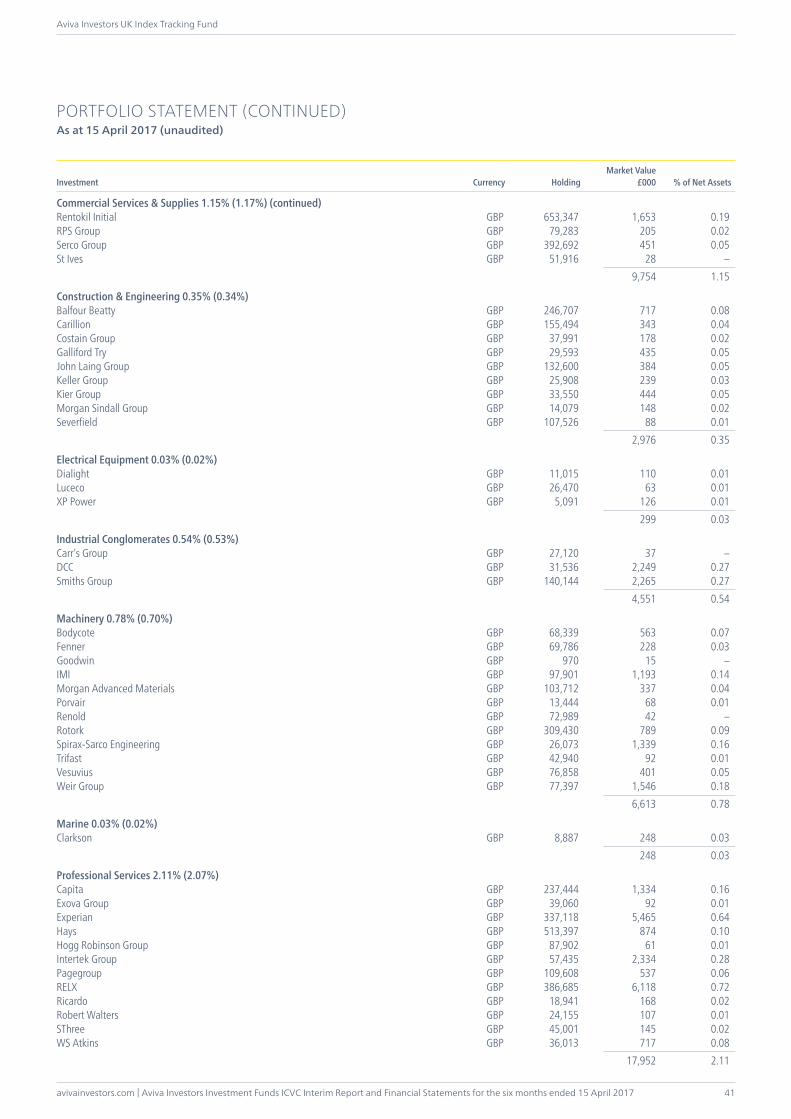
avivainvestors.com | Aviva Investors Investment Funds ICVC Interim Report and Financial Statements for the six months ended 15 April 2017
Aviva Investors UK Index Tracking Fund
41
PORTFOLIO STATEMENT (CONTINUED)As at 15 April 2017 (unaudited)
Investment Currency HoldingMarket Value
£000 % of Net Assets
Commercial Services & Supplies 1.15% (1.17%) (continued)Rentokil Initial GBP 653,347 1,653 0.19RPS Group GBP 79,283 205 0.02Serco Group GBP 392,692 451 0.05St Ives GBP 51,916 28 – 9,754 1.15
Construction & Engineering 0.35% (0.34%)Balfour Beatty GBP 246,707 717 0.08Carillion GBP 155,494 343 0.04Costain Group GBP 37,991 178 0.02Galliford Try GBP 29,593 435 0.05John Laing Group GBP 132,600 384 0.05Keller Group GBP 25,908 239 0.03Kier Group GBP 33,550 444 0.05Morgan Sindall Group GBP 14,079 148 0.02Severfield GBP 107,526 88 0.01 2,976 0.35
Electrical Equipment 0.03% (0.02%)Dialight GBP 11,015 110 0.01Luceco GBP 26,470 63 0.01XP Power GBP 5,091 126 0.01 299 0.03
Industrial Conglomerates 0.54% (0.53%)Carr’s Group GBP 27,120 37 –DCC GBP 31,536 2,249 0.27Smiths Group GBP 140,144 2,265 0.27 4,551 0.54
Machinery 0.78% (0.70%)Bodycote GBP 68,339 563 0.07Fenner GBP 69,786 228 0.03Goodwin GBP 970 15 –IMI GBP 97,901 1,193 0.14Morgan Advanced Materials GBP 103,712 337 0.04Porvair GBP 13,444 68 0.01Renold GBP 72,989 42 –Rotork GBP 309,430 789 0.09Spirax-Sarco Engineering GBP 26,073 1,339 0.16Trifast GBP 42,940 92 0.01Vesuvius GBP 76,858 401 0.05Weir Group GBP 77,397 1,546 0.18 6,613 0.78
Marine 0.03% (0.02%)Clarkson GBP 8,887 248 0.03 248 0.03
Professional Services 2.11% (2.07%)Capita GBP 237,444 1,334 0.16Exova Group GBP 39,060 92 0.01Experian GBP 337,118 5,465 0.64Hays GBP 513,397 874 0.10Hogg Robinson Group GBP 87,902 61 0.01Intertek Group GBP 57,435 2,334 0.28Pagegroup GBP 109,608 537 0.06RELX GBP 386,685 6,118 0.72Ricardo GBP 18,941 168 0.02Robert Walters GBP 24,155 107 0.01SThree GBP 45,001 145 0.02WS Atkins GBP 36,013 717 0.08 17,952 2.11
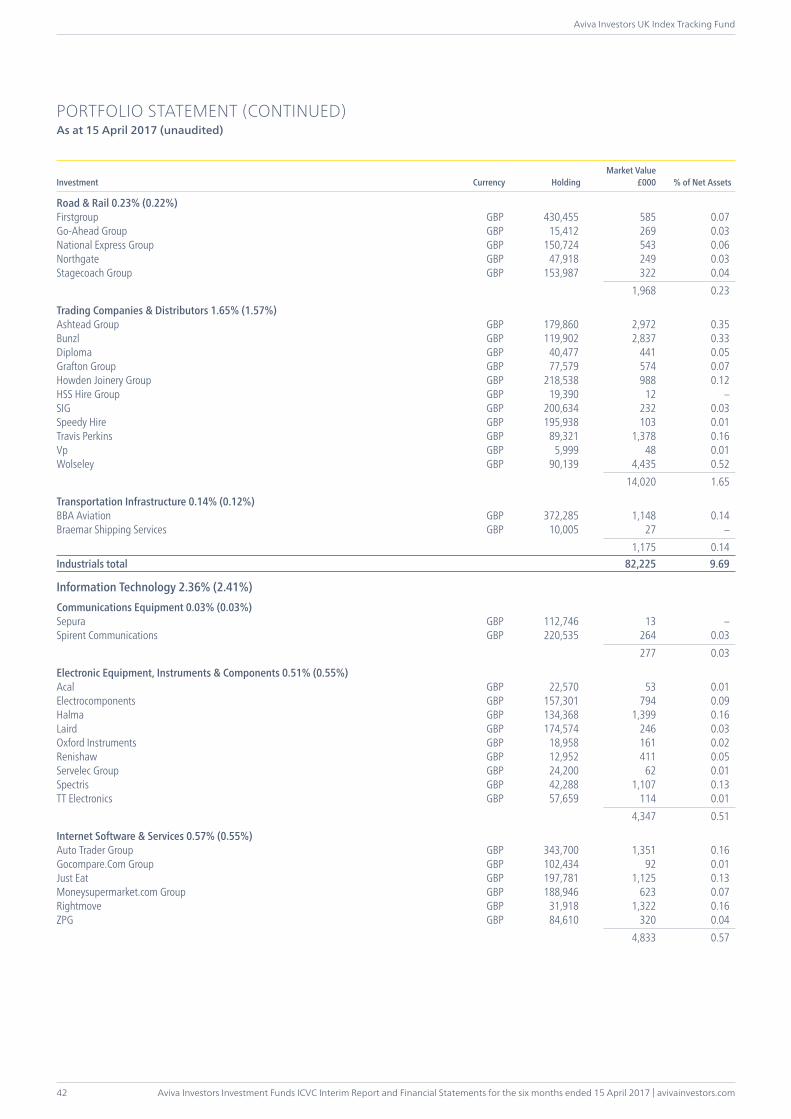
Aviva Investors Investment Funds ICVC Interim Report and Financial Statements for the six months ended 15 April 2017 | avivainvestors.com
Aviva Investors UK Index Tracking Fund
42
PORTFOLIO STATEMENT (CONTINUED)As at 15 April 2017 (unaudited)
Investment Currency HoldingMarket Value
£000 % of Net Assets
Road & Rail 0.23% (0.22%)Firstgroup GBP 430,455 585 0.07Go-Ahead Group GBP 15,412 269 0.03National Express Group GBP 150,724 543 0.06Northgate GBP 47,918 249 0.03Stagecoach Group GBP 153,987 322 0.04 1,968 0.23
Trading Companies & Distributors 1.65% (1.57%)Ashtead Group GBP 179,860 2,972 0.35Bunzl GBP 119,902 2,837 0.33Diploma GBP 40,477 441 0.05Grafton Group GBP 77,579 574 0.07Howden Joinery Group GBP 218,538 988 0.12HSS Hire Group GBP 19,390 12 –SIG GBP 200,634 232 0.03Speedy Hire GBP 195,938 103 0.01Travis Perkins GBP 89,321 1,378 0.16Vp GBP 5,999 48 0.01Wolseley GBP 90,139 4,435 0.52 14,020 1.65
Transportation Infrastructure 0.14% (0.12%)BBA Aviation GBP 372,285 1,148 0.14Braemar Shipping Services GBP 10,005 27 – 1,175 0.14Industrials total 82,225 9.69
Information Technology 2.36% (2.41%)Communications Equipment 0.03% (0.03%)Sepura GBP 112,746 13 –Spirent Communications GBP 220,535 264 0.03 277 0.03
Electronic Equipment, Instruments & Components 0.51% (0.55%)Acal GBP 22,570 53 0.01Electrocomponents GBP 157,301 794 0.09Halma GBP 134,368 1,399 0.16Laird GBP 174,574 246 0.03Oxford Instruments GBP 18,958 161 0.02Renishaw GBP 12,952 411 0.05Servelec Group GBP 24,200 62 0.01Spectris GBP 42,288 1,107 0.13TT Electronics GBP 57,659 114 0.01 4,347 0.51
Internet Software & Services 0.57% (0.55%)Auto Trader Group GBP 343,700 1,351 0.16Gocompare.Com Group GBP 102,434 92 0.01Just Eat GBP 197,781 1,125 0.13Moneysupermarket.com Group GBP 188,946 623 0.07Rightmove GBP 31,918 1,322 0.16ZPG GBP 84,610 320 0.04 4,833 0.57
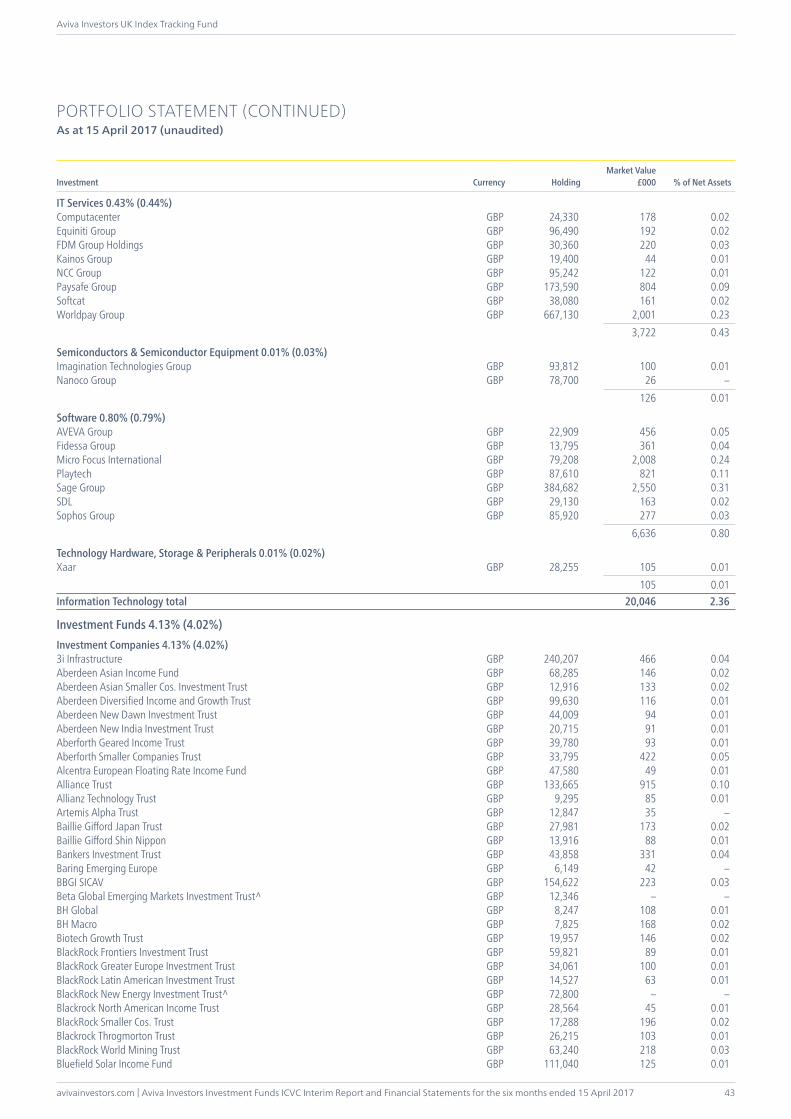
avivainvestors.com | Aviva Investors Investment Funds ICVC Interim Report and Financial Statements for the six months ended 15 April 2017
Aviva Investors UK Index Tracking Fund
43
PORTFOLIO STATEMENT (CONTINUED)As at 15 April 2017 (unaudited)
Investment Currency HoldingMarket Value
£000 % of Net Assets
IT Services 0.43% (0.44%)Computacenter GBP 24,330 178 0.02Equiniti Group GBP 96,490 192 0.02FDM Group Holdings GBP 30,360 220 0.03Kainos Group GBP 19,400 44 0.01NCC Group GBP 95,242 122 0.01Paysafe Group GBP 173,590 804 0.09Softcat GBP 38,080 161 0.02Worldpay Group GBP 667,130 2,001 0.23 3,722 0.43
Semiconductors & Semiconductor Equipment 0.01% (0.03%)Imagination Technologies Group GBP 93,812 100 0.01Nanoco Group GBP 78,700 26 – 126 0.01
Software 0.80% (0.79%)AVEVA Group GBP 22,909 456 0.05Fidessa Group GBP 13,795 361 0.04Micro Focus International GBP 79,208 2,008 0.24Playtech GBP 87,610 821 0.11Sage Group GBP 384,682 2,550 0.31SDL GBP 29,130 163 0.02Sophos Group GBP 85,920 277 0.03 6,636 0.80
Technology Hardware, Storage & Peripherals 0.01% (0.02%)Xaar GBP 28,255 105 0.01 105 0.01Information Technology total 20,046 2.36
Investment Funds 4.13% (4.02%)Investment Companies 4.13% (4.02%)3i Infrastructure GBP 240,207 466 0.04Aberdeen Asian Income Fund GBP 68,285 146 0.02Aberdeen Asian Smaller Cos. Investment Trust GBP 12,916 133 0.02Aberdeen Diversified Income and Growth Trust GBP 99,630 116 0.01Aberdeen New Dawn Investment Trust GBP 44,009 94 0.01Aberdeen New India Investment Trust GBP 20,715 91 0.01Aberforth Geared Income Trust GBP 39,780 93 0.01Aberforth Smaller Companies Trust GBP 33,795 422 0.05Alcentra European Floating Rate Income Fund GBP 47,580 49 0.01Alliance Trust GBP 133,665 915 0.10Allianz Technology Trust GBP 9,295 85 0.01Artemis Alpha Trust GBP 12,847 35 –Baillie Gifford Japan Trust GBP 27,981 173 0.02Baillie Gifford Shin Nippon GBP 13,916 88 0.01Bankers Investment Trust GBP 43,858 331 0.04Baring Emerging Europe GBP 6,149 42 –BBGI SICAV GBP 154,622 223 0.03Beta Global Emerging Markets Investment Trust^ GBP 12,346 – –BH Global GBP 8,247 108 0.01BH Macro GBP 7,825 168 0.02Biotech Growth Trust GBP 19,957 146 0.02BlackRock Frontiers Investment Trust GBP 59,821 89 0.01BlackRock Greater Europe Investment Trust GBP 34,061 100 0.01BlackRock Latin American Investment Trust GBP 14,527 63 0.01BlackRock New Energy Investment Trust^ GBP 72,800 – –Blackrock North American Income Trust GBP 28,564 45 0.01BlackRock Smaller Cos. Trust GBP 17,288 196 0.02Blackrock Throgmorton Trust GBP 26,215 103 0.01BlackRock World Mining Trust GBP 63,240 218 0.03Bluefield Solar Income Fund GBP 111,040 125 0.01
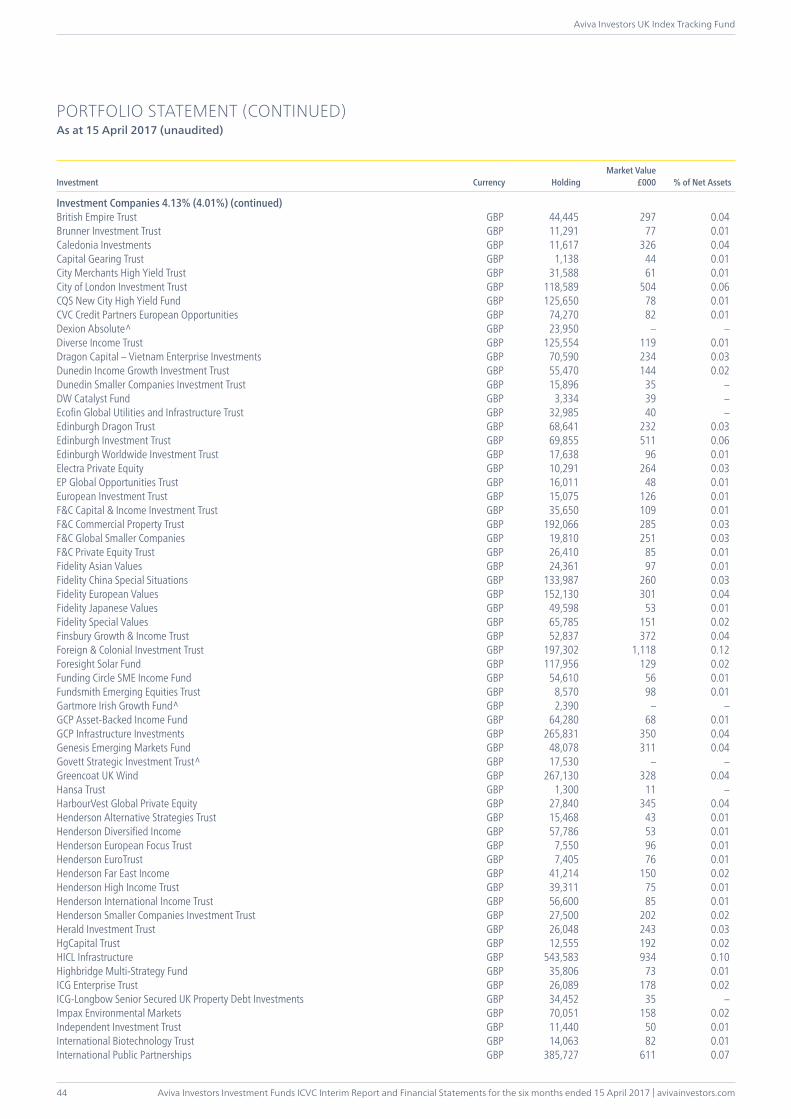
Aviva Investors Investment Funds ICVC Interim Report and Financial Statements for the six months ended 15 April 2017 | avivainvestors.com
Aviva Investors UK Index Tracking Fund
44
PORTFOLIO STATEMENT (CONTINUED)As at 15 April 2017 (unaudited)
Investment Currency HoldingMarket Value
£000 % of Net Assets
Investment Companies 4.13% (4.01%) (continued)British Empire Trust GBP 44,445 297 0.04Brunner Investment Trust GBP 11,291 77 0.01Caledonia Investments GBP 11,617 326 0.04Capital Gearing Trust GBP 1,138 44 0.01City Merchants High Yield Trust GBP 31,588 61 0.01City of London Investment Trust GBP 118,589 504 0.06CQS New City High Yield Fund GBP 125,650 78 0.01CVC Credit Partners European Opportunities GBP 74,270 82 0.01Dexion Absolute^ GBP 23,950 – –Diverse Income Trust GBP 125,554 119 0.01Dragon Capital – Vietnam Enterprise Investments GBP 70,590 234 0.03Dunedin Income Growth Investment Trust GBP 55,470 144 0.02Dunedin Smaller Companies Investment Trust GBP 15,896 35 –DW Catalyst Fund GBP 3,334 39 –Ecofin Global Utilities and Infrastructure Trust GBP 32,985 40 –Edinburgh Dragon Trust GBP 68,641 232 0.03Edinburgh Investment Trust GBP 69,855 511 0.06Edinburgh Worldwide Investment Trust GBP 17,638 96 0.01Electra Private Equity GBP 10,291 264 0.03EP Global Opportunities Trust GBP 16,011 48 0.01European Investment Trust GBP 15,075 126 0.01F&C Capital & Income Investment Trust GBP 35,650 109 0.01F&C Commercial Property Trust GBP 192,066 285 0.03F&C Global Smaller Companies GBP 19,810 251 0.03F&C Private Equity Trust GBP 26,410 85 0.01Fidelity Asian Values GBP 24,361 97 0.01Fidelity China Special Situations GBP 133,987 260 0.03Fidelity European Values GBP 152,130 301 0.04Fidelity Japanese Values GBP 49,598 53 0.01Fidelity Special Values GBP 65,785 151 0.02Finsbury Growth & Income Trust GBP 52,837 372 0.04Foreign & Colonial Investment Trust GBP 197,302 1,118 0.12Foresight Solar Fund GBP 117,956 129 0.02Funding Circle SME Income Fund GBP 54,610 56 0.01Fundsmith Emerging Equities Trust GBP 8,570 98 0.01Gartmore Irish Growth Fund^ GBP 2,390 – –GCP Asset-Backed Income Fund GBP 64,280 68 0.01GCP Infrastructure Investments GBP 265,831 350 0.04Genesis Emerging Markets Fund GBP 48,078 311 0.04Govett Strategic Investment Trust^ GBP 17,530 – –Greencoat UK Wind GBP 267,130 328 0.04Hansa Trust GBP 1,300 11 –HarbourVest Global Private Equity GBP 27,840 345 0.04Henderson Alternative Strategies Trust GBP 15,468 43 0.01Henderson Diversified Income GBP 57,786 53 0.01Henderson European Focus Trust GBP 7,550 96 0.01Henderson EuroTrust GBP 7,405 76 0.01Henderson Far East Income GBP 41,214 150 0.02Henderson High Income Trust GBP 39,311 75 0.01Henderson International Income Trust GBP 56,600 85 0.01Henderson Smaller Companies Investment Trust GBP 27,500 202 0.02Herald Investment Trust GBP 26,048 243 0.03HgCapital Trust GBP 12,555 192 0.02HICL Infrastructure GBP 543,583 934 0.10Highbridge Multi-Strategy Fund GBP 35,806 73 0.01ICG Enterprise Trust GBP 26,089 178 0.02ICG-Longbow Senior Secured UK Property Debt Investments GBP 34,452 35 –Impax Environmental Markets GBP 70,051 158 0.02Independent Investment Trust GBP 11,440 50 0.01International Biotechnology Trust GBP 14,063 82 0.01International Public Partnerships GBP 385,727 611 0.07
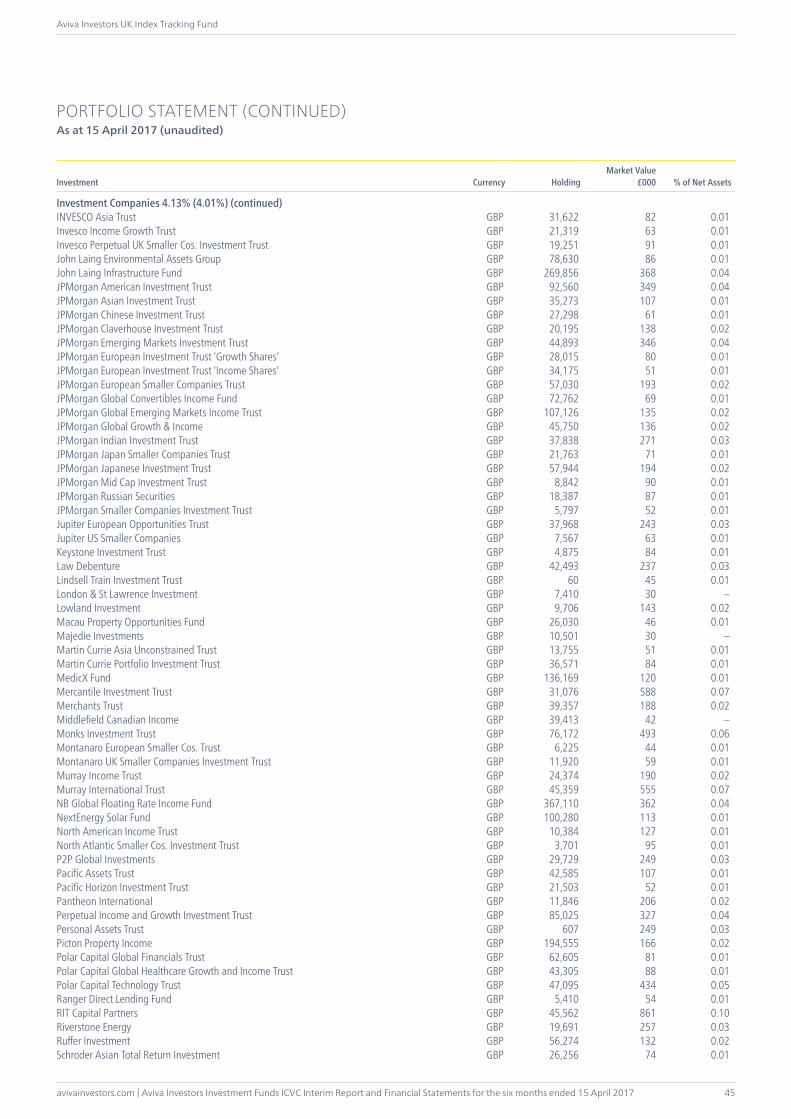
avivainvestors.com | Aviva Investors Investment Funds ICVC Interim Report and Financial Statements for the six months ended 15 April 2017
Aviva Investors UK Index Tracking Fund
45
PORTFOLIO STATEMENT (CONTINUED)As at 15 April 2017 (unaudited)
Investment Currency HoldingMarket Value
£000 % of Net Assets
Investment Companies 4.13% (4.01%) (continued)INVESCO Asia Trust GBP 31,622 82 0.01Invesco Income Growth Trust GBP 21,319 63 0.01Invesco Perpetual UK Smaller Cos. Investment Trust GBP 19,251 91 0.01John Laing Environmental Assets Group GBP 78,630 86 0.01John Laing Infrastructure Fund GBP 269,856 368 0.04JPMorgan American Investment Trust GBP 92,560 349 0.04JPMorgan Asian Investment Trust GBP 35,273 107 0.01JPMorgan Chinese Investment Trust GBP 27,298 61 0.01JPMorgan Claverhouse Investment Trust GBP 20,195 138 0.02JPMorgan Emerging Markets Investment Trust GBP 44,893 346 0.04JPMorgan European Investment Trust ‘Growth Shares’ GBP 28,015 80 0.01JPMorgan European Investment Trust ‘Income Shares’ GBP 34,175 51 0.01JPMorgan European Smaller Companies Trust GBP 57,030 193 0.02JPMorgan Global Convertibles Income Fund GBP 72,762 69 0.01JPMorgan Global Emerging Markets Income Trust GBP 107,126 135 0.02JPMorgan Global Growth & Income GBP 45,750 136 0.02JPMorgan Indian Investment Trust GBP 37,838 271 0.03JPMorgan Japan Smaller Companies Trust GBP 21,763 71 0.01JPMorgan Japanese Investment Trust GBP 57,944 194 0.02JPMorgan Mid Cap Investment Trust GBP 8,842 90 0.01JPMorgan Russian Securities GBP 18,387 87 0.01JPMorgan Smaller Companies Investment Trust GBP 5,797 52 0.01Jupiter European Opportunities Trust GBP 37,968 243 0.03Jupiter US Smaller Companies GBP 7,567 63 0.01Keystone Investment Trust GBP 4,875 84 0.01Law Debenture GBP 42,493 237 0.03Lindsell Train Investment Trust GBP 60 45 0.01London & St Lawrence Investment GBP 7,410 30 –Lowland Investment GBP 9,706 143 0.02Macau Property Opportunities Fund GBP 26,030 46 0.01Majedie Investments GBP 10,501 30 –Martin Currie Asia Unconstrained Trust GBP 13,755 51 0.01Martin Currie Portfolio Investment Trust GBP 36,571 84 0.01MedicX Fund GBP 136,169 120 0.01Mercantile Investment Trust GBP 31,076 588 0.07Merchants Trust GBP 39,357 188 0.02Middlefield Canadian Income GBP 39,413 42 –Monks Investment Trust GBP 76,172 493 0.06Montanaro European Smaller Cos. Trust GBP 6,225 44 0.01Montanaro UK Smaller Companies Investment Trust GBP 11,920 59 0.01Murray Income Trust GBP 24,374 190 0.02Murray International Trust GBP 45,359 555 0.07NB Global Floating Rate Income Fund GBP 367,110 362 0.04NextEnergy Solar Fund GBP 100,280 113 0.01North American Income Trust GBP 10,384 127 0.01North Atlantic Smaller Cos. Investment Trust GBP 3,701 95 0.01P2P Global Investments GBP 29,729 249 0.03Pacific Assets Trust GBP 42,585 107 0.01Pacific Horizon Investment Trust GBP 21,503 52 0.01Pantheon International GBP 11,846 206 0.02Perpetual Income and Growth Investment Trust GBP 85,025 327 0.04Personal Assets Trust GBP 607 249 0.03Picton Property Income GBP 194,555 166 0.02Polar Capital Global Financials Trust GBP 62,605 81 0.01Polar Capital Global Healthcare Growth and Income Trust GBP 43,305 88 0.01Polar Capital Technology Trust GBP 47,095 434 0.05Ranger Direct Lending Fund GBP 5,410 54 0.01RIT Capital Partners GBP 45,562 861 0.10Riverstone Energy GBP 19,691 257 0.03Ruffer Investment GBP 56,274 132 0.02Schroder Asian Total Return Investment GBP 26,256 74 0.01
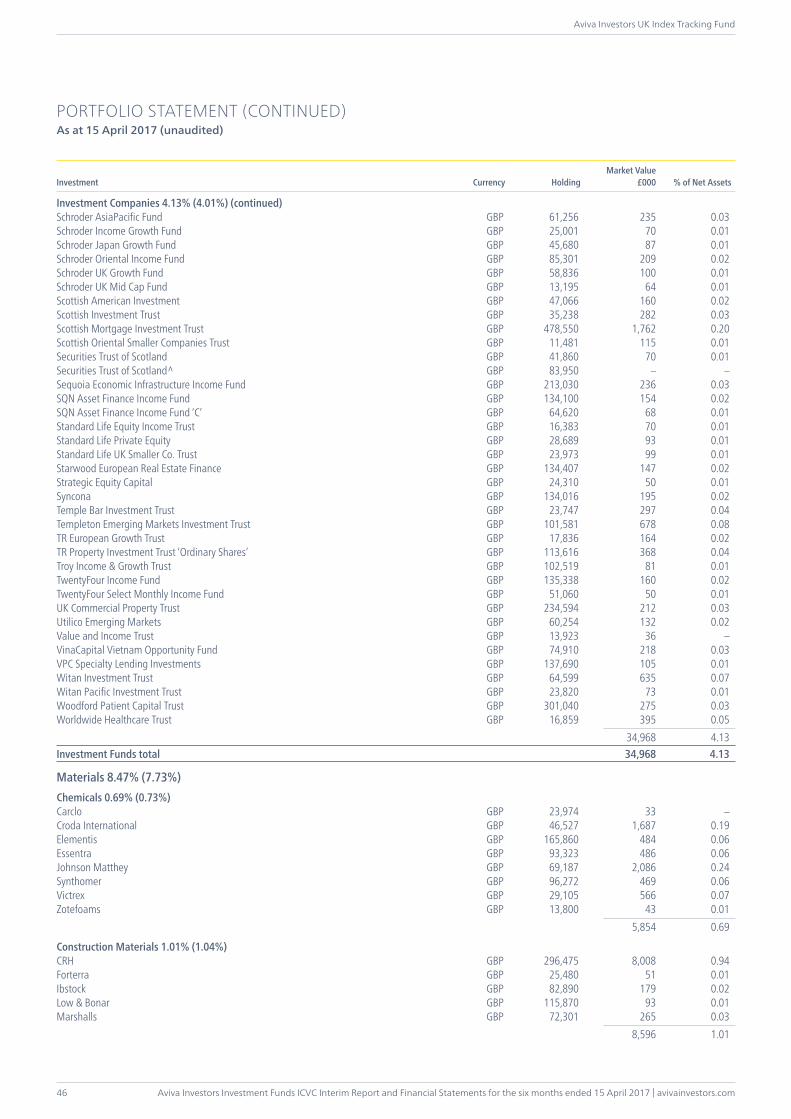
Aviva Investors Investment Funds ICVC Interim Report and Financial Statements for the six months ended 15 April 2017 | avivainvestors.com
Aviva Investors UK Index Tracking Fund
46
PORTFOLIO STATEMENT (CONTINUED)As at 15 April 2017 (unaudited)
Investment Currency HoldingMarket Value
£000 % of Net Assets
Investment Companies 4.13% (4.01%) (continued)Schroder AsiaPacific Fund GBP 61,256 235 0.03Schroder Income Growth Fund GBP 25,001 70 0.01Schroder Japan Growth Fund GBP 45,680 87 0.01Schroder Oriental Income Fund GBP 85,301 209 0.02Schroder UK Growth Fund GBP 58,836 100 0.01Schroder UK Mid Cap Fund GBP 13,195 64 0.01Scottish American Investment GBP 47,066 160 0.02Scottish Investment Trust GBP 35,238 282 0.03Scottish Mortgage Investment Trust GBP 478,550 1,762 0.20Scottish Oriental Smaller Companies Trust GBP 11,481 115 0.01Securities Trust of Scotland GBP 41,860 70 0.01Securities Trust of Scotland^ GBP 83,950 – –Sequoia Economic Infrastructure Income Fund GBP 213,030 236 0.03SQN Asset Finance Income Fund GBP 134,100 154 0.02SQN Asset Finance Income Fund ‘C’ GBP 64,620 68 0.01Standard Life Equity Income Trust GBP 16,383 70 0.01Standard Life Private Equity GBP 28,689 93 0.01Standard Life UK Smaller Co. Trust GBP 23,973 99 0.01Starwood European Real Estate Finance GBP 134,407 147 0.02Strategic Equity Capital GBP 24,310 50 0.01Syncona GBP 134,016 195 0.02Temple Bar Investment Trust GBP 23,747 297 0.04Templeton Emerging Markets Investment Trust GBP 101,581 678 0.08TR European Growth Trust GBP 17,836 164 0.02TR Property Investment Trust ‘Ordinary Shares’ GBP 113,616 368 0.04Troy Income & Growth Trust GBP 102,519 81 0.01TwentyFour Income Fund GBP 135,338 160 0.02TwentyFour Select Monthly Income Fund GBP 51,060 50 0.01UK Commercial Property Trust GBP 234,594 212 0.03Utilico Emerging Markets GBP 60,254 132 0.02Value and Income Trust GBP 13,923 36 –VinaCapital Vietnam Opportunity Fund GBP 74,910 218 0.03VPC Specialty Lending Investments GBP 137,690 105 0.01Witan Investment Trust GBP 64,599 635 0.07Witan Pacific Investment Trust GBP 23,820 73 0.01Woodford Patient Capital Trust GBP 301,040 275 0.03Worldwide Healthcare Trust GBP 16,859 395 0.05 34,968 4.13Investment Funds total 34,968 4.13
Materials 8.47% (7.73%)Chemicals 0.69% (0.73%)Carclo GBP 23,974 33 –Croda International GBP 46,527 1,687 0.19Elementis GBP 165,860 484 0.06Essentra GBP 93,323 486 0.06Johnson Matthey GBP 69,187 2,086 0.24Synthomer GBP 96,272 469 0.06Victrex GBP 29,105 566 0.07Zotefoams GBP 13,800 43 0.01 5,854 0.69
Construction Materials 1.01% (1.04%)CRH GBP 296,475 8,008 0.94Forterra GBP 25,480 51 0.01Ibstock GBP 82,890 179 0.02Low & Bonar GBP 115,870 93 0.01Marshalls GBP 72,301 265 0.03 8,596 1.01
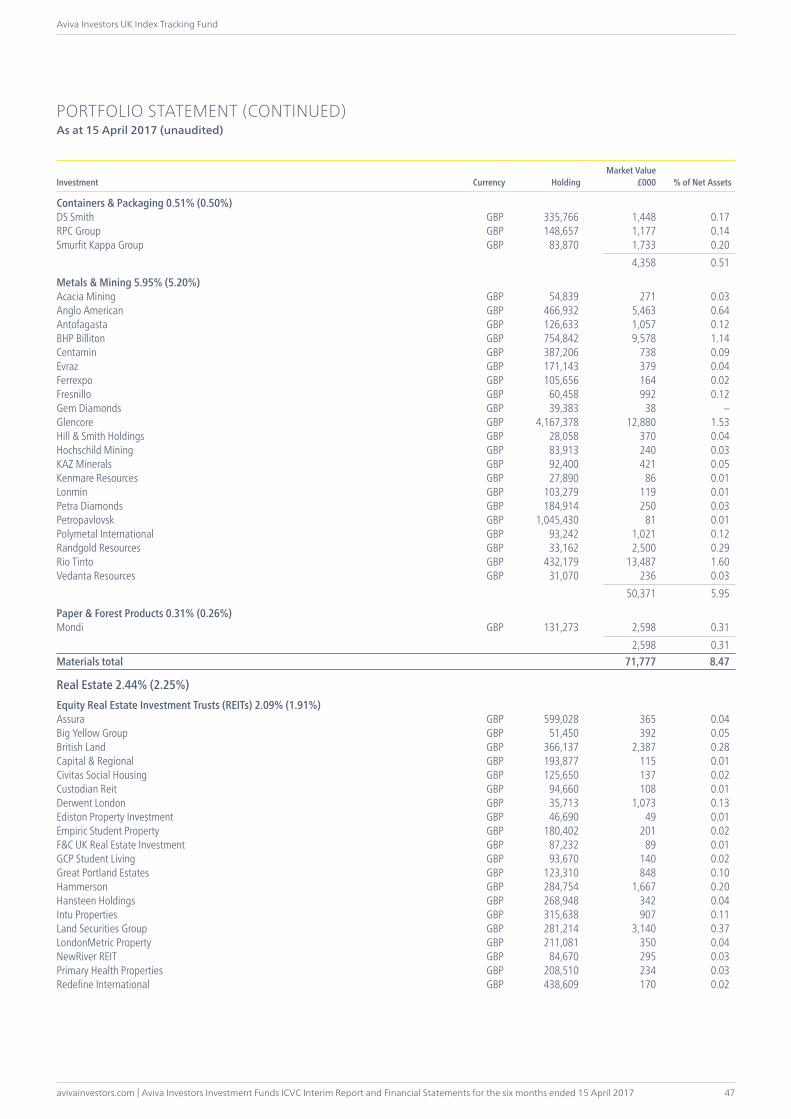
avivainvestors.com | Aviva Investors Investment Funds ICVC Interim Report and Financial Statements for the six months ended 15 April 2017
Aviva Investors UK Index Tracking Fund
47
PORTFOLIO STATEMENT (CONTINUED)As at 15 April 2017 (unaudited)
Investment Currency HoldingMarket Value
£000 % of Net Assets
Containers & Packaging 0.51% (0.50%)DS Smith GBP 335,766 1,448 0.17RPC Group GBP 148,657 1,177 0.14Smurfit Kappa Group GBP 83,870 1,733 0.20 4,358 0.51
Metals & Mining 5.95% (5.20%)Acacia Mining GBP 54,839 271 0.03Anglo American GBP 466,932 5,463 0.64Antofagasta GBP 126,633 1,057 0.12BHP Billiton GBP 754,842 9,578 1.14Centamin GBP 387,206 738 0.09Evraz GBP 171,143 379 0.04Ferrexpo GBP 105,656 164 0.02Fresnillo GBP 60,458 992 0.12Gem Diamonds GBP 39,383 38 –Glencore GBP 4,167,378 12,880 1.53Hill & Smith Holdings GBP 28,058 370 0.04Hochschild Mining GBP 83,913 240 0.03KAZ Minerals GBP 92,400 421 0.05Kenmare Resources GBP 27,890 86 0.01Lonmin GBP 103,279 119 0.01Petra Diamonds GBP 184,914 250 0.03Petropavlovsk GBP 1,045,430 81 0.01Polymetal International GBP 93,242 1,021 0.12Randgold Resources GBP 33,162 2,500 0.29Rio Tinto GBP 432,179 13,487 1.60Vedanta Resources GBP 31,070 236 0.03 50,371 5.95
Paper & Forest Products 0.31% (0.26%)Mondi GBP 131,273 2,598 0.31 2,598 0.31Materials total 71,777 8.47
Real Estate 2.44% (2.25%)Equity Real Estate Investment Trusts (REITs) 2.09% (1.91%)Assura GBP 599,028 365 0.04Big Yellow Group GBP 51,450 392 0.05British Land GBP 366,137 2,387 0.28Capital & Regional GBP 193,877 115 0.01Civitas Social Housing GBP 125,650 137 0.02Custodian Reit GBP 94,660 108 0.01Derwent London GBP 35,713 1,073 0.13Ediston Property Investment GBP 46,690 49 0.01Empiric Student Property GBP 180,402 201 0.02F&C UK Real Estate Investment GBP 87,232 89 0.01GCP Student Living GBP 93,670 140 0.02Great Portland Estates GBP 123,310 848 0.10Hammerson GBP 284,754 1,667 0.20Hansteen Holdings GBP 268,948 342 0.04Intu Properties GBP 315,638 907 0.11Land Securities Group GBP 281,214 3,140 0.37LondonMetric Property GBP 211,081 350 0.04NewRiver REIT GBP 84,670 295 0.03Primary Health Properties GBP 208,510 234 0.03Redefine International GBP 438,609 170 0.02
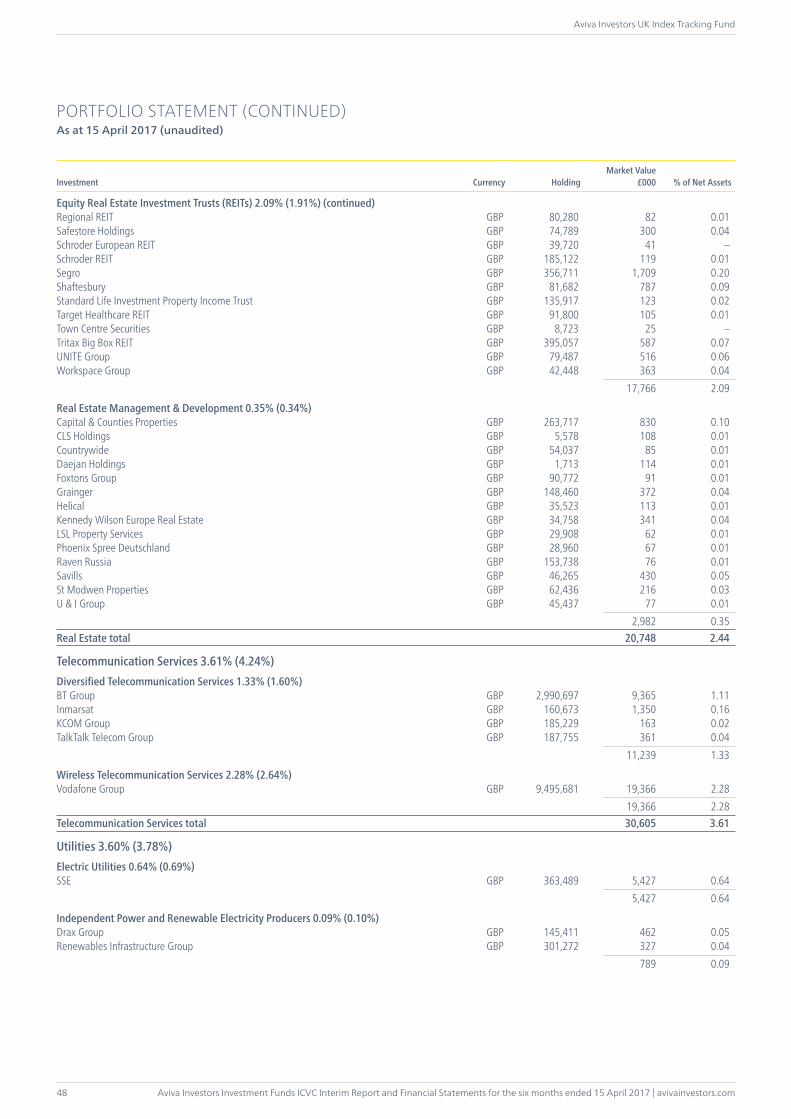
Aviva Investors Investment Funds ICVC Interim Report and Financial Statements for the six months ended 15 April 2017 | avivainvestors.com
Aviva Investors UK Index Tracking Fund
48
PORTFOLIO STATEMENT (CONTINUED)As at 15 April 2017 (unaudited)
Investment Currency HoldingMarket Value
£000 % of Net Assets
Equity Real Estate Investment Trusts (REITs) 2.09% (1.91%) (continued)Regional REIT GBP 80,280 82 0.01Safestore Holdings GBP 74,789 300 0.04Schroder European REIT GBP 39,720 41 –Schroder REIT GBP 185,122 119 0.01Segro GBP 356,711 1,709 0.20Shaftesbury GBP 81,682 787 0.09Standard Life Investment Property Income Trust GBP 135,917 123 0.02Target Healthcare REIT GBP 91,800 105 0.01Town Centre Securities GBP 8,723 25 –Tritax Big Box REIT GBP 395,057 587 0.07UNITE Group GBP 79,487 516 0.06Workspace Group GBP 42,448 363 0.04 17,766 2.09
Real Estate Management & Development 0.35% (0.34%)Capital & Counties Properties GBP 263,717 830 0.10CLS Holdings GBP 5,578 108 0.01Countrywide GBP 54,037 85 0.01Daejan Holdings GBP 1,713 114 0.01Foxtons Group GBP 90,772 91 0.01Grainger GBP 148,460 372 0.04Helical GBP 35,523 113 0.01Kennedy Wilson Europe Real Estate GBP 34,758 341 0.04LSL Property Services GBP 29,908 62 0.01Phoenix Spree Deutschland GBP 28,960 67 0.01Raven Russia GBP 153,738 76 0.01Savills GBP 46,265 430 0.05St Modwen Properties GBP 62,436 216 0.03U & I Group GBP 45,437 77 0.01 2,982 0.35Real Estate total 20,748 2.44
Telecommunication Services 3.61% (4.24%)Diversified Telecommunication Services 1.33% (1.60%)BT Group GBP 2,990,697 9,365 1.11Inmarsat GBP 160,673 1,350 0.16KCOM Group GBP 185,229 163 0.02TalkTalk Telecom Group GBP 187,755 361 0.04 11,239 1.33
Wireless Telecommunication Services 2.28% (2.64%)Vodafone Group GBP 9,495,681 19,366 2.28 19,366 2.28Telecommunication Services total 30,605 3.61
Utilities 3.60% (3.78%)Electric Utilities 0.64% (0.69%)SSE GBP 363,489 5,427 0.64 5,427 0.64
Independent Power and Renewable Electricity Producers 0.09% (0.10%)Drax Group GBP 145,411 462 0.05Renewables Infrastructure Group GBP 301,272 327 0.04 789 0.09
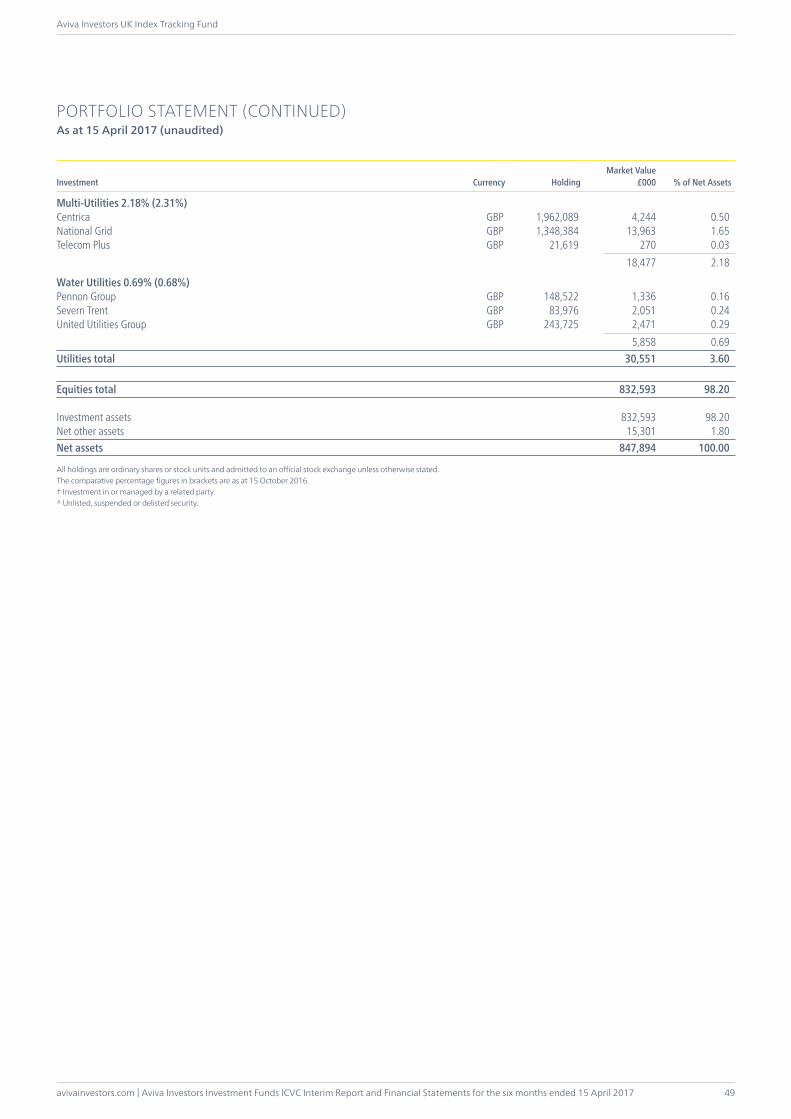
avivainvestors.com | Aviva Investors Investment Funds ICVC Interim Report and Financial Statements for the six months ended 15 April 2017
Aviva Investors UK Index Tracking Fund
49
PORTFOLIO STATEMENT (CONTINUED)As at 15 April 2017 (unaudited)
Investment Currency HoldingMarket Value
£000 % of Net Assets
Multi-Utilities 2.18% (2.31%)Centrica GBP 1,962,089 4,244 0.50National Grid GBP 1,348,384 13,963 1.65Telecom Plus GBP 21,619 270 0.03 18,477 2.18
Water Utilities 0.69% (0.68%)Pennon Group GBP 148,522 1,336 0.16Severn Trent GBP 83,976 2,051 0.24United Utilities Group GBP 243,725 2,471 0.29 5,858 0.69Utilities total 30,551 3.60
Equities total 832,593 98.20
Investment assets 832,593 98.20Net other assets 15,301 1.80Net assets 847,894 100.00
All holdings are ordinary shares or stock units and admitted to an official stock exchange unless otherwise stated.The comparative percentage figures in brackets are as at 15 October 2016.† Investment in or managed by a related party.^ Unlisted, suspended or delisted security.
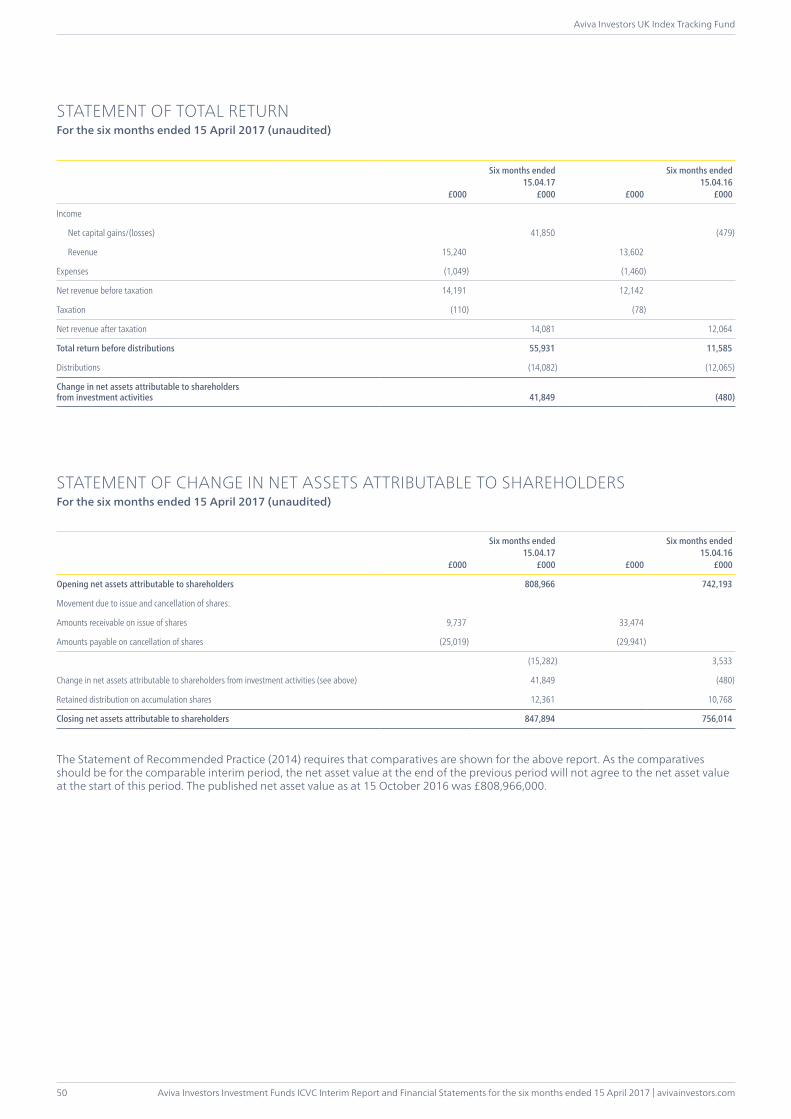
Aviva Investors Investment Funds ICVC Interim Report and Financial Statements for the six months ended 15 April 2017 | avivainvestors.com
Aviva Investors UK Index Tracking Fund
50
£000
Six months ended15.04.17
£000 £000
Six months ended15.04.16
£000
Income
Net capital gains/(losses) 41,850 (479)
Revenue 15,240 13,602
Expenses (1,049) (1,460)
Net revenue before taxation 14,191 12,142
Taxation (110) (78)
Net revenue after taxation 14,081 12,064
Total return before distributions 55,931 11,585
Distributions (14,082) (12,065)
Change in net assets attributable to shareholders from investment activities 41,849 (480)
STATEMENT OF CHANGE IN NET ASSETS ATTRIBUTABLE TO SHAREHOLDERSFor the six months ended 15 April 2017 (unaudited)
£000
Six months ended15.04.17
£000 £000
Six months ended15.04.16
£000
Opening net assets attributable to shareholders 808,966 742,193
Movement due to issue and cancellation of shares:
Amounts receivable on issue of shares 9,737 33,474
Amounts payable on cancellation of shares (25,019) (29,941)
(15,282) 3,533
Change in net assets attributable to shareholders from investment activities (see above) 41,849 (480)
Retained distribution on accumulation shares 12,361 10,768
Closing net assets attributable to shareholders 847,894 756,014
The Statement of Recommended Practice (2014) requires that comparatives are shown for the above report. As the comparatives should be for the comparable interim period, the net asset value at the end of the previous period will not agree to the net asset value at the start of this period. The published net asset value as at 15 October 2016 was £808,966,000.
STATEMENT OF TOTAL RETURNFor the six months ended 15 April 2017 (unaudited)
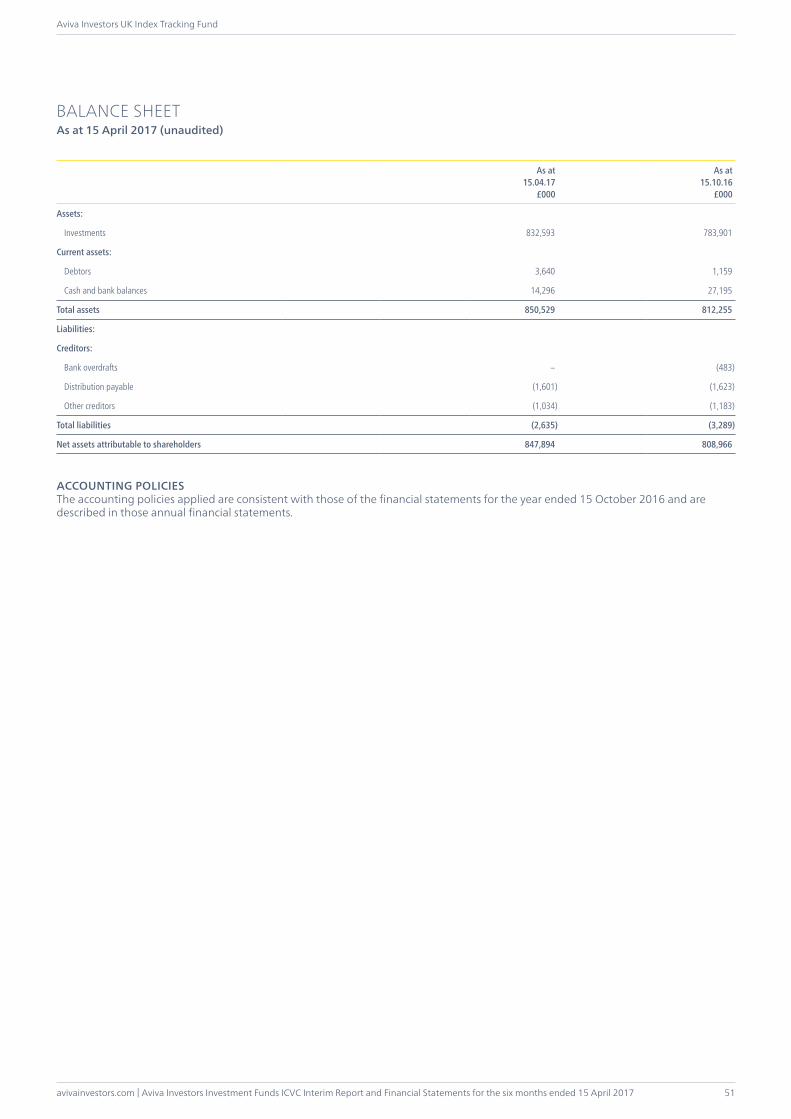
avivainvestors.com | Aviva Investors Investment Funds ICVC Interim Report and Financial Statements for the six months ended 15 April 2017
Aviva Investors UK Index Tracking Fund
51
BALANCE SHEETAs at 15 April 2017 (unaudited)
As at15.04.17
£000
As at15.10.16
£000
Assets:
Investments 832,593 783,901
Current assets:
Debtors 3,640 1,159
Cash and bank balances 14,296 27,195
Total assets 850,529 812,255
Liabilities:
Creditors:
Bank overdrafts – (483)
Distribution payable (1,601) (1,623)
Other creditors (1,034) (1,183)
Total liabilities (2,635) (3,289)
Net assets attributable to shareholders 847,894 808,966
ACCOUNTING POLICIESThe accounting policies applied are consistent with those of the financial statements for the year ended 15 October 2016 and are described in those annual financial statements.
Aviva Investors Investment Funds ICVC Interim Report and Financial Statements for the six months ended 15 April 2017 | avivainvestors.com
Aviva Investors UK Smaller Companies Fund
52
INVESTMENT OBJECTIVELong term capital appreciation.
INVESTMENT POLICYInvestment principally in smaller capitalisation UK equities judged to offer prospects of above average earnings growth.
The Fund may invest in any of the following financial instruments in order to achieve its investment objective: transferable securities, money market instruments, units in collective investment schemes, deposits and derivatives and forward transactions.
FUND MANAGER’S REPORTOver the six months ended 15 April 2017, the Aviva Investors UK Smaller Companies Fund delivered a total return of 9.28 per cent (share class 1), net of fees, compared with an average return of 14.87 per cent for its peer group the Investment Association UK Smaller Companies sector. The FTSE® Small Cap ex IT Index, the Fund’s benchmark, returned 12.04 per cent.
The main contributor to the Fund’s underperformance was the strength of the Industrials sector over the period buoyed by the weakness of Sterling. The Fund has a relatively low level of exposure to this area of the market, with only a few targeted stock picks. What we have owned has performed very well, for instance, Lavendon, the provider of power-access vehicles required in a range of construction activities, was the target of a bidding war.
At the stock level the key detractor from fund performance was its holding in NCC Group, the cyber security business. At the start of the review period, NCC Group issued a profits warning, commenting on margin pressure in its Assurance business, as well as the cancellation of three contracts and the deferral of one other. Subsequent financial quantification of that warning has led the Company’s management to initiate a full strategic review and chief executive has left the business. The Company was positioned to capitalise on the demand for cyber security services; however, the market is intensely competitive and procurement officers are increasingly reticent regarding their security budgets after a period of intense spending. As a result, we have exited the position.
Holdings in Sanne Group and Sportech performed well. Sanne Group, a provider of fund and corporate administration services in the alternative asset markets, was the largest contributor to performance, upgrading earnings guidance early in the New Year. We see the dominance of the company’s market position being reinforced with its customers following five sensible strategic acquisitions since floatation. These acquisitions provide Sanne with a global footprint to service clients across the various alternative asset classes. Sportech, a betting and gaming company, received very good news on a long-running VAT dispute, which has transformed the Company’s financial position for the better. The Supreme Court rejected HMRC’s request to contest the Court of Appeal’s decision, resulting in Sportech keeping a significant VAT refund it had already received. This money is in part being returned directly to shareholders through a share buyback programme. Sportech also announced the sale of its Football Pools Business. This is a logical next step for the company as it realises the value in that division following its modernisation programme and leaves Sportech a cleaner gaming focused business primarily based in the USA.
In terms of transactions, the holdings in market research firm GlobalData and photonics engineer Gooch and Housego (which specialises in lasers and fibre optic products) were both trimmed on valuation grounds. The shares performed very well over the review period and we remain confident on the outlook and underlying quality of these companies. We also reduced holdings in scientific instruments developer Microsaic Systems and Circassia Pharmaceutical. Our position in the self-storage company, Big Yellow Group, was increased and the managers see the tight supply dynamic of this industry as an attractive element of the investment case.
Looking ahead, we expect political developments to shape market sentiment over the coming months. Aside from Article 50, triggered in March, which has heralded two years of potentially fraught negotiations on the terms of the UK’s exit from the European Union, we have also had the surprise announcement of a General Election. This latest announcement triggered a spike in market volatility from its relatively benign level since the US elections. With elections in France, and later this year in Germany, it would be no surprise to see further volatility in equity markets. Although UK economic indicators have remained broadly positive, we remain concerned about the risk of a slowdown in consumer spending over the course of 2017 and have made portfolio changes to reflect that view. Recent retail sales figures have been disappointing, which suggests rising inflation is starting to squeeze consumers’ disposable incomes. The Fund’s core holdings in Fevertree, Sanne Group and Next Fifteen Communications align completely with our investment process and what we aim to invest in which have the following attributes: strong track records, delivered impressive organic growth and still have the potential for significant expansion in structural growth markets.
April 2017Sources: Fund and peer group performance figures – Lipper, mid to mid basis with net income reinvested in GBP, with no initial charges applied. Market data – Bloomberg. Any opinions expressed are those of the Fund manager. They should not be viewed as a guarantee of a return from an investment in the Funds. The content of the commentary should not be viewed as a recommendation to invest nor buy or sell securities. Past performance is not a guide to the future. The value of an investment and any income from it can go down as well as up. Investors may not get back the original amount invested.“FTSE” is a trade mark jointly owned by the London Stock Exchange Plc and The Financial Times Limited and is used by FTSE International Limited (“FTSE”) under Licence. FTSE does not sponsor, endorse or promote this product and is not in any way connected to it and does not accept any liability in relation to its Issue, operation and trading. All copyright in the index values and constituent list vests in FTSE.
AVIVA INVESTORS UK SMALLER COMPANIES FUND
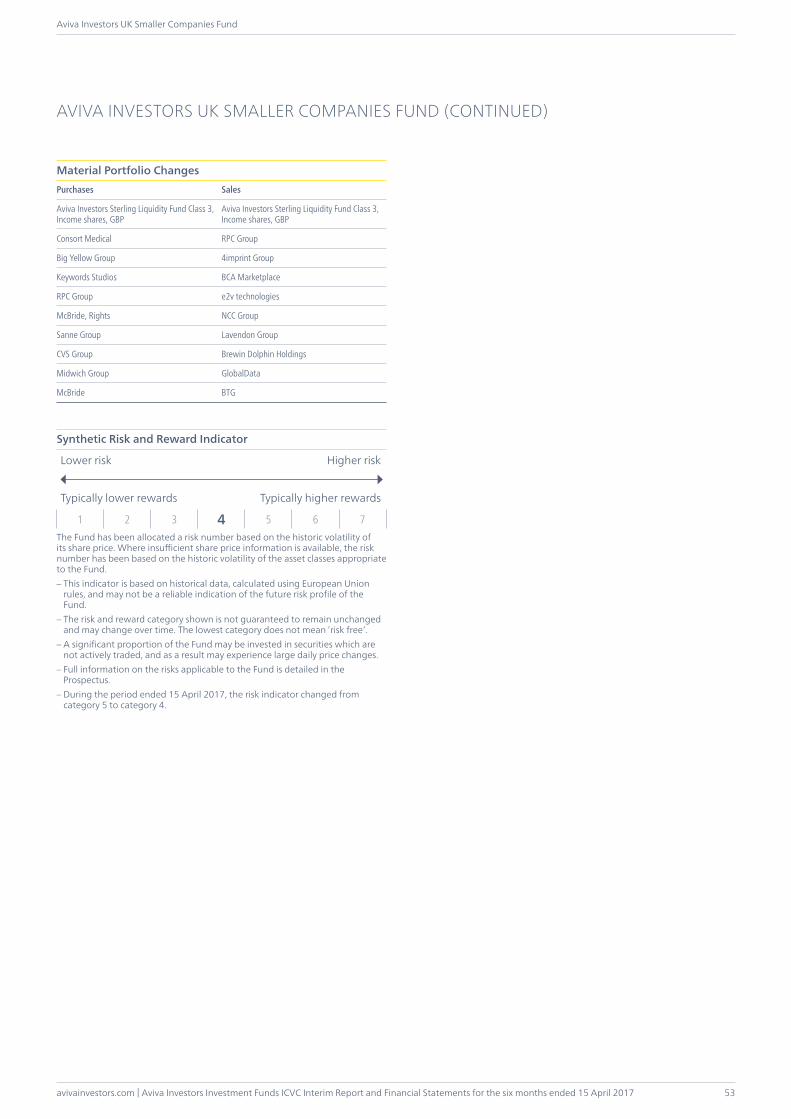
avivainvestors.com | Aviva Investors Investment Funds ICVC Interim Report and Financial Statements for the six months ended 15 April 2017
Aviva Investors UK Smaller Companies Fund
53
AVIVA INVESTORS UK SMALLER COMPANIES FUND (CONTINUED)
Material Portfolio ChangesPurchases Sales
Aviva Investors Sterling Liquidity Fund Class 3, Income shares, GBP
Aviva Investors Sterling Liquidity Fund Class 3, Income shares, GBP
Consort Medical RPC Group
Big Yellow Group 4imprint Group
Keywords Studios BCA Marketplace
RPC Group e2v technologies
McBride, Rights NCC Group
Sanne Group Lavendon Group
CVS Group Brewin Dolphin Holdings
Midwich Group GlobalData
McBride BTG
Synthetic Risk and Reward Indicator
Lower risk Higher risk
Typically lower rewards Typically higher rewards
1 2 3 4 5 6 7The Fund has been allocated a risk number based on the historic volatility of its share price. Where insufficient share price information is available, the risk number has been based on the historic volatility of the asset classes appropriate to the Fund.– This indicator is based on historical data, calculated using European Union
rules, and may not be a reliable indication of the future risk profile of the Fund.
– The risk and reward category shown is not guaranteed to remain unchanged and may change over time. The lowest category does not mean ‘risk free‘.
– A significant proportion of the Fund may be invested in securities which are not actively traded, and as a result may experience large daily price changes.
– Full information on the risks applicable to the Fund is detailed in the Prospectus.
– During the period ended 15 April 2017, the risk indicator changed from category 5 to category 4.
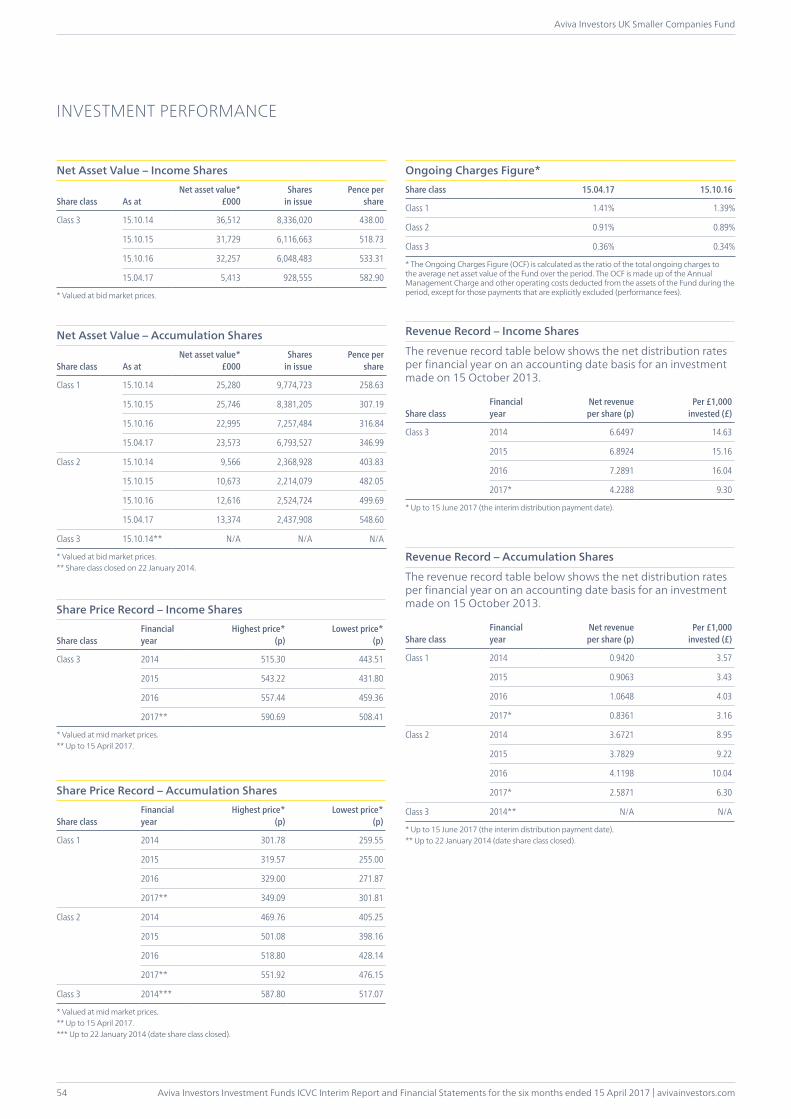
Aviva Investors Investment Funds ICVC Interim Report and Financial Statements for the six months ended 15 April 2017 | avivainvestors.com
Aviva Investors UK Smaller Companies Fund
54
INVESTMENT PERFORMANCE
Net Asset Value – Income Shares
Share class As atNet asset value*
£000Shares
in issuePence per
share
Class 3 15.10.14 36,512 8,336,020 438.00
15.10.15 31,729 6,116,663 518.73
15.10.16 32,257 6,048,483 533.31
15.04.17 5,413 928,555 582.90
* Valued at bid market prices.
Net Asset Value – Accumulation Shares
Share class As atNet asset value*
£000Shares
in issuePence per
share
Class 1 15.10.14 25,280 9,774,723 258.63
15.10.15 25,746 8,381,205 307.19
15.10.16 22,995 7,257,484 316.84
15.04.17 23,573 6,793,527 346.99
Class 2 15.10.14 9,566 2,368,928 403.83
15.10.15 10,673 2,214,079 482.05
15.10.16 12,616 2,524,724 499.69
15.04.17 13,374 2,437,908 548.60
Class 3 15.10.14** N/A N/A N/A
* Valued at bid market prices.** Share class closed on 22 January 2014.
Share Price Record – Income Shares
Share classFinancialyear
Highest price*(p)
Lowest price*(p)
Class 3 2014 515.30 443.51
2015 543.22 431.80
2016 557.44 459.36
2017** 590.69 508.41
* Valued at mid market prices.** Up to 15 April 2017.
Share Price Record – Accumulation Shares
Share classFinancialyear
Highest price*(p)
Lowest price*(p)
Class 1 2014 301.78 259.55
2015 319.57 255.00
2016 329.00 271.87
2017** 349.09 301.81
Class 2 2014 469.76 405.25
2015 501.08 398.16
2016 518.80 428.14
2017** 551.92 476.15
Class 3 2014*** 587.80 517.07
* Valued at mid market prices.** Up to 15 April 2017.*** Up to 22 January 2014 (date share class closed).
Ongoing Charges Figure*Share class 15.04.17 15.10.16
Class 1 1.41% 1.39%
Class 2 0.91% 0.89%
Class 3 0.36% 0.34%
* The Ongoing Charges Figure (OCF) is calculated as the ratio of the total ongoing charges to the average net asset value of the Fund over the period. The OCF is made up of the Annual Management Charge and other operating costs deducted from the assets of the Fund during the period, except for those payments that are explicitly excluded (performance fees).
Revenue Record – Income Shares
The revenue record table below shows the net distribution rates per financial year on an accounting date basis for an investment made on 15 October 2013.
Share classFinancialyear
Net revenue per share (p)
Per £1,000invested (£)
Class 3 2014 6.6497 14.63
2015 6.8924 15.16
2016 7.2891 16.04
2017* 4.2288 9.30
* Up to 15 June 2017 (the interim distribution payment date).
Revenue Record – Accumulation Shares
The revenue record table below shows the net distribution rates per financial year on an accounting date basis for an investment made on 15 October 2013.
Share classFinancialyear
Net revenue per share (p)
Per £1,000invested (£)
Class 1 2014 0.9420 3.57
2015 0.9063 3.43
2016 1.0648 4.03
2017* 0.8361 3.16
Class 2 2014 3.6721 8.95
2015 3.7829 9.22
2016 4.1198 10.04
2017* 2.5871 6.30
Class 3 2014** N/A N/A
* Up to 15 June 2017 (the interim distribution payment date).** Up to 22 January 2014 (date share class closed).
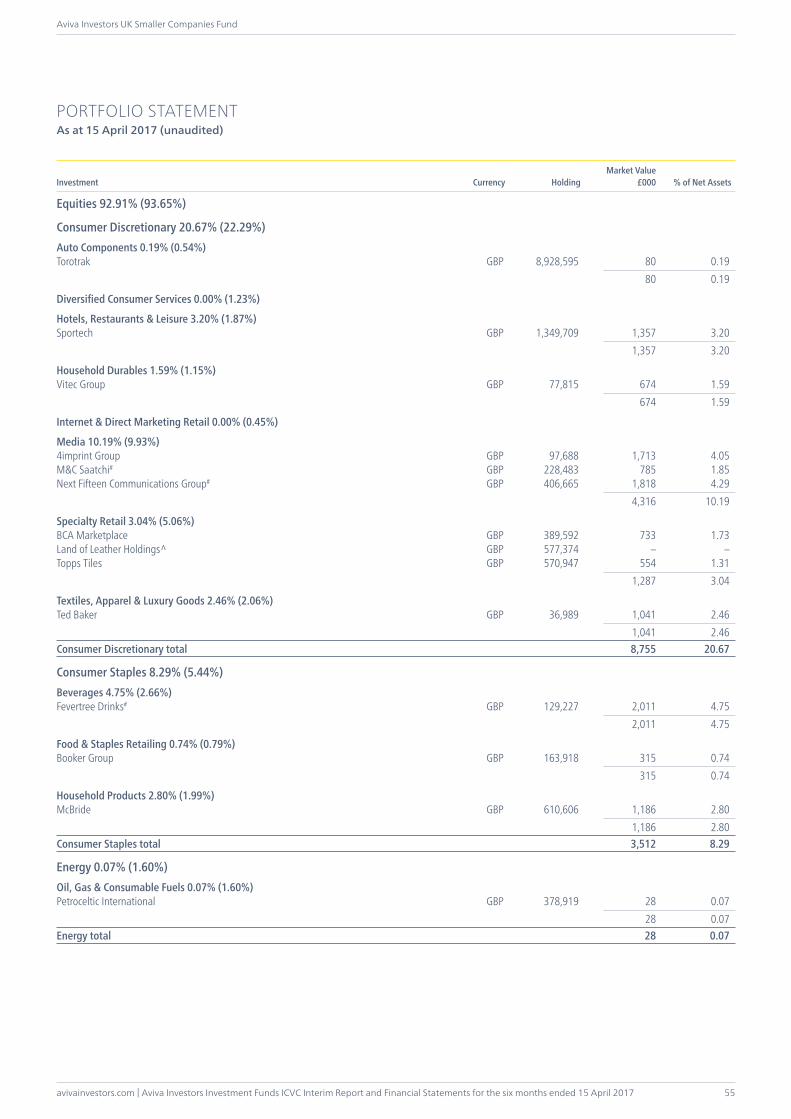
avivainvestors.com | Aviva Investors Investment Funds ICVC Interim Report and Financial Statements for the six months ended 15 April 2017
Aviva Investors UK Smaller Companies Fund
55
PORTFOLIO STATEMENTAs at 15 April 2017 (unaudited)
Investment Currency HoldingMarket Value
£000 % of Net Assets
Equities 92.91% (93.65%)
Consumer Discretionary 20.67% (22.29%)Auto Components 0.19% (0.54%)Torotrak GBP 8,928,595 80 0.19 80 0.19
Diversified Consumer Services 0.00% (1.23%)
Hotels, Restaurants & Leisure 3.20% (1.87%)Sportech GBP 1,349,709 1,357 3.20 1,357 3.20
Household Durables 1.59% (1.15%)Vitec Group GBP 77,815 674 1.59 674 1.59
Internet & Direct Marketing Retail 0.00% (0.45%)
Media 10.19% (9.93%)4imprint Group GBP 97,688 1,713 4.05M&C Saatchi# GBP 228,483 785 1.85Next Fifteen Communications Group# GBP 406,665 1,818 4.29 4,316 10.19
Specialty Retail 3.04% (5.06%)BCA Marketplace GBP 389,592 733 1.73Land of Leather Holdings^ GBP 577,374 – –Topps Tiles GBP 570,947 554 1.31 1,287 3.04
Textiles, Apparel & Luxury Goods 2.46% (2.06%)Ted Baker GBP 36,989 1,041 2.46 1,041 2.46Consumer Discretionary total 8,755 20.67
Consumer Staples 8.29% (5.44%)Beverages 4.75% (2.66%)Fevertree Drinks# GBP 129,227 2,011 4.75 2,011 4.75
Food & Staples Retailing 0.74% (0.79%)Booker Group GBP 163,918 315 0.74 315 0.74
Household Products 2.80% (1.99%)McBride GBP 610,606 1,186 2.80 1,186 2.80Consumer Staples total 3,512 8.29
Energy 0.07% (1.60%)Oil, Gas & Consumable Fuels 0.07% (1.60%)Petroceltic International GBP 378,919 28 0.07 28 0.07Energy total 28 0.07
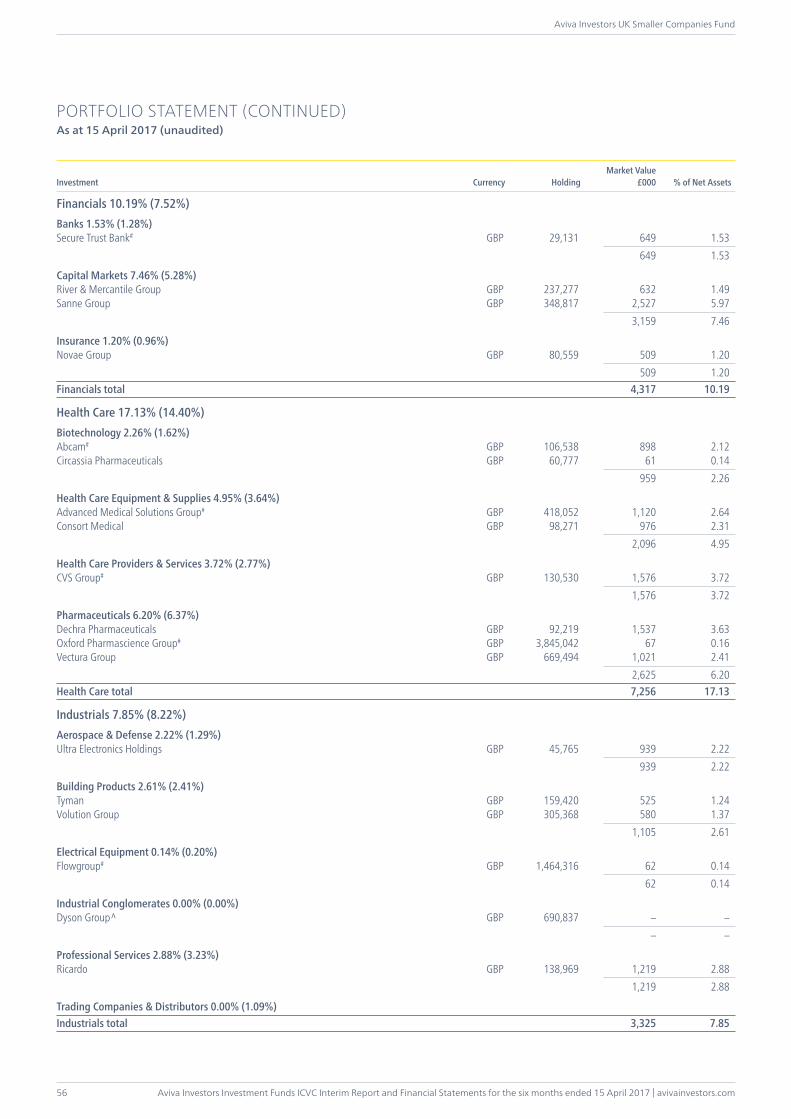
Aviva Investors Investment Funds ICVC Interim Report and Financial Statements for the six months ended 15 April 2017 | avivainvestors.com
Aviva Investors UK Smaller Companies Fund
56
PORTFOLIO STATEMENT (CONTINUED)As at 15 April 2017 (unaudited)
Investment Currency HoldingMarket Value
£000 % of Net Assets
Financials 10.19% (7.52%)Banks 1.53% (1.28%)Secure Trust Bank# GBP 29,131 649 1.53 649 1.53
Capital Markets 7.46% (5.28%)River & Mercantile Group GBP 237,277 632 1.49Sanne Group GBP 348,817 2,527 5.97 3,159 7.46
Insurance 1.20% (0.96%)Novae Group GBP 80,559 509 1.20 509 1.20Financials total 4,317 10.19
Health Care 17.13% (14.40%)Biotechnology 2.26% (1.62%)Abcam# GBP 106,538 898 2.12Circassia Pharmaceuticals GBP 60,777 61 0.14 959 2.26
Health Care Equipment & Supplies 4.95% (3.64%)Advanced Medical Solutions Group# GBP 418,052 1,120 2.64Consort Medical GBP 98,271 976 2.31 2,096 4.95
Health Care Providers & Services 3.72% (2.77%)CVS Group# GBP 130,530 1,576 3.72 1,576 3.72
Pharmaceuticals 6.20% (6.37%)Dechra Pharmaceuticals GBP 92,219 1,537 3.63Oxford Pharmascience Group# GBP 3,845,042 67 0.16Vectura Group GBP 669,494 1,021 2.41 2,625 6.20Health Care total 7,256 17.13
Industrials 7.85% (8.22%)Aerospace & Defense 2.22% (1.29%)Ultra Electronics Holdings GBP 45,765 939 2.22 939 2.22
Building Products 2.61% (2.41%)Tyman GBP 159,420 525 1.24Volution Group GBP 305,368 580 1.37 1,105 2.61
Electrical Equipment 0.14% (0.20%)Flowgroup# GBP 1,464,316 62 0.14 62 0.14
Industrial Conglomerates 0.00% (0.00%)Dyson Group^ GBP 690,837 – – – –
Professional Services 2.88% (3.23%)Ricardo GBP 138,969 1,219 2.88 1,219 2.88
Trading Companies & Distributors 0.00% (1.09%)Industrials total 3,325 7.85
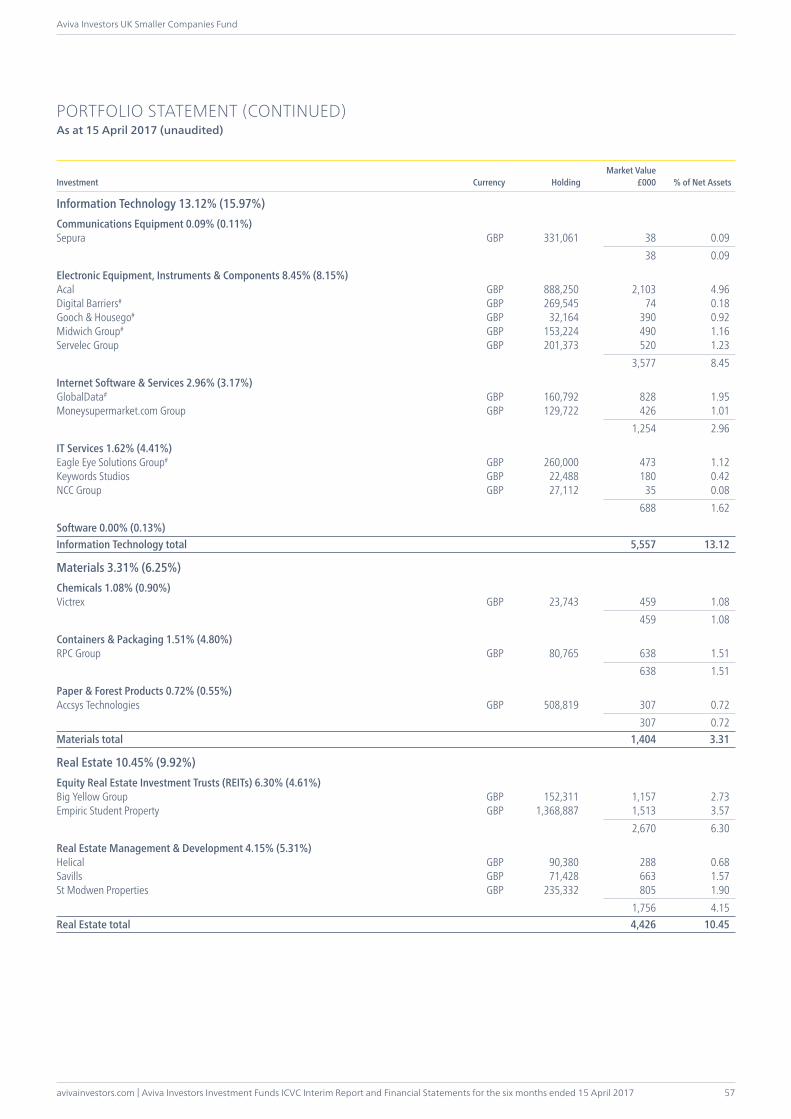
avivainvestors.com | Aviva Investors Investment Funds ICVC Interim Report and Financial Statements for the six months ended 15 April 2017
Aviva Investors UK Smaller Companies Fund
57
PORTFOLIO STATEMENT (CONTINUED)As at 15 April 2017 (unaudited)
Investment Currency HoldingMarket Value
£000 % of Net Assets
Information Technology 13.12% (15.97%)Communications Equipment 0.09% (0.11%)Sepura GBP 331,061 38 0.09 38 0.09
Electronic Equipment, Instruments & Components 8.45% (8.15%)Acal GBP 888,250 2,103 4.96Digital Barriers# GBP 269,545 74 0.18Gooch & Housego# GBP 32,164 390 0.92Midwich Group# GBP 153,224 490 1.16Servelec Group GBP 201,373 520 1.23 3,577 8.45
Internet Software & Services 2.96% (3.17%)GlobalData# GBP 160,792 828 1.95Moneysupermarket.com Group GBP 129,722 426 1.01 1,254 2.96
IT Services 1.62% (4.41%)Eagle Eye Solutions Group# GBP 260,000 473 1.12Keywords Studios GBP 22,488 180 0.42NCC Group GBP 27,112 35 0.08 688 1.62
Software 0.00% (0.13%)Information Technology total 5,557 13.12
Materials 3.31% (6.25%)Chemicals 1.08% (0.90%)Victrex GBP 23,743 459 1.08 459 1.08
Containers & Packaging 1.51% (4.80%)RPC Group GBP 80,765 638 1.51 638 1.51
Paper & Forest Products 0.72% (0.55%)Accsys Technologies GBP 508,819 307 0.72 307 0.72Materials total 1,404 3.31
Real Estate 10.45% (9.92%)Equity Real Estate Investment Trusts (REITs) 6.30% (4.61%)Big Yellow Group GBP 152,311 1,157 2.73Empiric Student Property GBP 1,368,887 1,513 3.57 2,670 6.30
Real Estate Management & Development 4.15% (5.31%)Helical GBP 90,380 288 0.68Savills GBP 71,428 663 1.57St Modwen Properties GBP 235,332 805 1.90 1,756 4.15Real Estate total 4,426 10.45
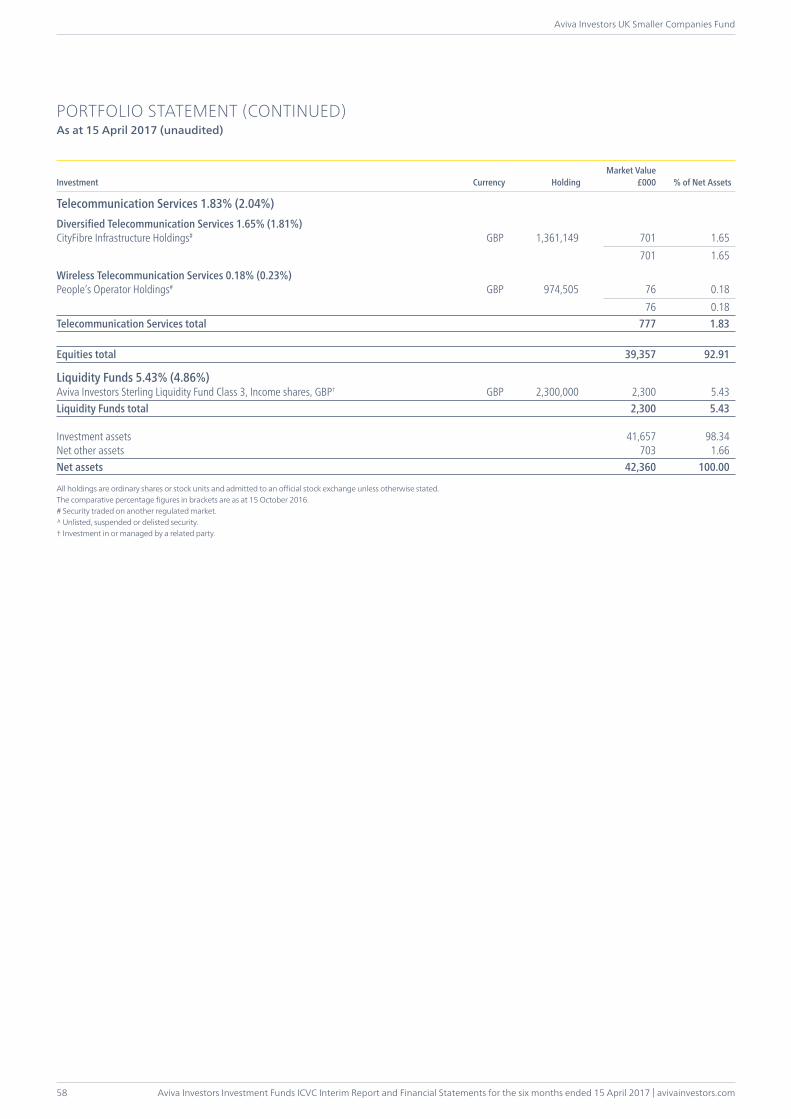
Aviva Investors Investment Funds ICVC Interim Report and Financial Statements for the six months ended 15 April 2017 | avivainvestors.com
Aviva Investors UK Smaller Companies Fund
58
PORTFOLIO STATEMENT (CONTINUED)As at 15 April 2017 (unaudited)
Investment Currency HoldingMarket Value
£000 % of Net Assets
Telecommunication Services 1.83% (2.04%)Diversified Telecommunication Services 1.65% (1.81%)CityFibre Infrastructure Holdings# GBP 1,361,149 701 1.65 701 1.65
Wireless Telecommunication Services 0.18% (0.23%)People’s Operator Holdings# GBP 974,505 76 0.18 76 0.18Telecommunication Services total 777 1.83
Equities total 39,357 92.91
Liquidity Funds 5.43% (4.86%)Aviva Investors Sterling Liquidity Fund Class 3, Income shares, GBP† GBP 2,300,000 2,300 5.43Liquidity Funds total 2,300 5.43
Investment assets 41,657 98.34Net other assets 703 1.66Net assets 42,360 100.00
All holdings are ordinary shares or stock units and admitted to an official stock exchange unless otherwise stated.The comparative percentage figures in brackets are as at 15 October 2016.# Security traded on another regulated market.^ Unlisted, suspended or delisted security.† Investment in or managed by a related party.
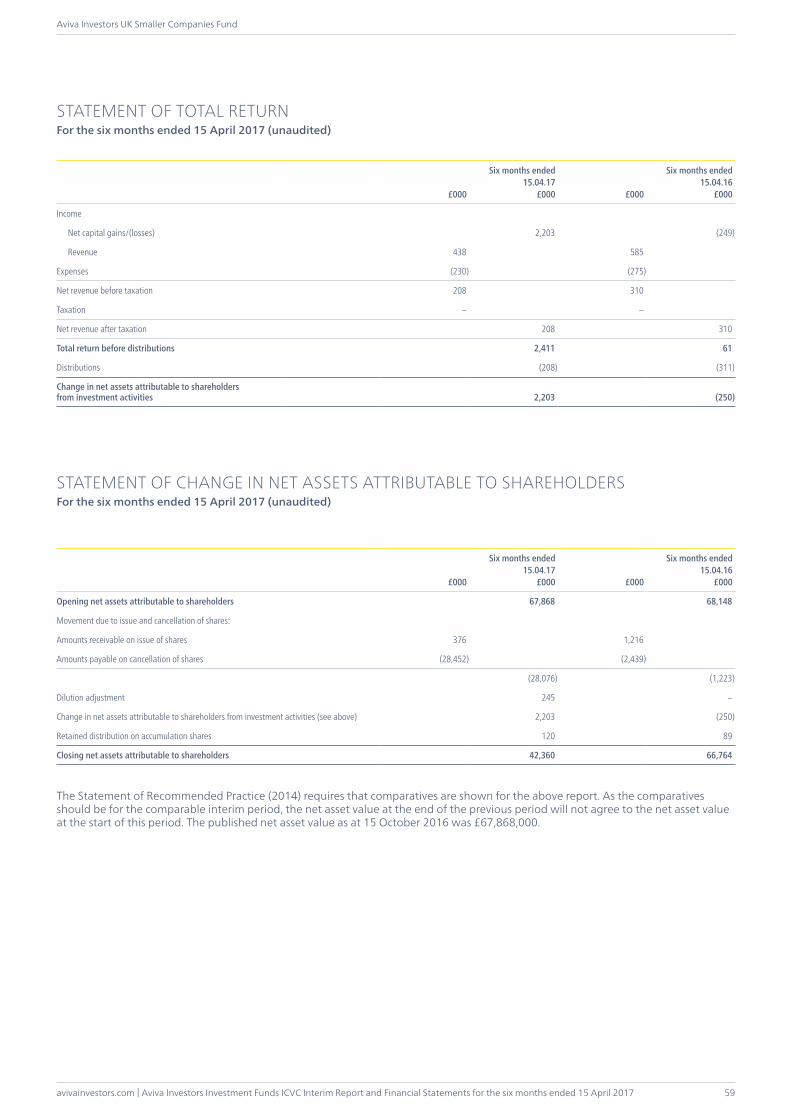
avivainvestors.com | Aviva Investors Investment Funds ICVC Interim Report and Financial Statements for the six months ended 15 April 2017
Aviva Investors UK Smaller Companies Fund
59
£000
Six months ended15.04.17
£000 £000
Six months ended15.04.16
£000
Income
Net capital gains/(losses) 2,203 (249)
Revenue 438 585
Expenses (230) (275)
Net revenue before taxation 208 310
Taxation – –
Net revenue after taxation 208 310
Total return before distributions 2,411 61
Distributions (208) (311)
Change in net assets attributable to shareholders from investment activities 2,203 (250)
STATEMENT OF CHANGE IN NET ASSETS ATTRIBUTABLE TO SHAREHOLDERSFor the six months ended 15 April 2017 (unaudited)
£000
Six months ended15.04.17
£000 £000
Six months ended15.04.16
£000
Opening net assets attributable to shareholders 67,868 68,148
Movement due to issue and cancellation of shares:
Amounts receivable on issue of shares 376 1,216
Amounts payable on cancellation of shares (28,452) (2,439)
(28,076) (1,223)
Dilution adjustment 245 –
Change in net assets attributable to shareholders from investment activities (see above) 2,203 (250)
Retained distribution on accumulation shares 120 89
Closing net assets attributable to shareholders 42,360 66,764
The Statement of Recommended Practice (2014) requires that comparatives are shown for the above report. As the comparatives should be for the comparable interim period, the net asset value at the end of the previous period will not agree to the net asset value at the start of this period. The published net asset value as at 15 October 2016 was £67,868,000.
STATEMENT OF TOTAL RETURNFor the six months ended 15 April 2017 (unaudited)

Aviva Investors Investment Funds ICVC Interim Report and Financial Statements for the six months ended 15 April 2017 | avivainvestors.com
Aviva Investors UK Smaller Companies Fund
60
BALANCE SHEETAs at 15 April 2017 (unaudited)
As at15.04.17
£000
As at15.10.16
£000
Assets:
Investments 41,657 66,856
Current assets:
Debtors 336 1,044
Cash and bank balances 773 1,168
Total assets 42,766 69,068
Liabilities:
Creditors:
Distribution payable (39) (222)
Other creditors (367) (978)
Total liabilities (406) (1,200)
Net assets attributable to shareholders 42,360 67,868
ACCOUNTING POLICIESThe accounting policies applied are consistent with those of the financial statements for the year ended 15 October 2016 and are described in those annual financial statements.
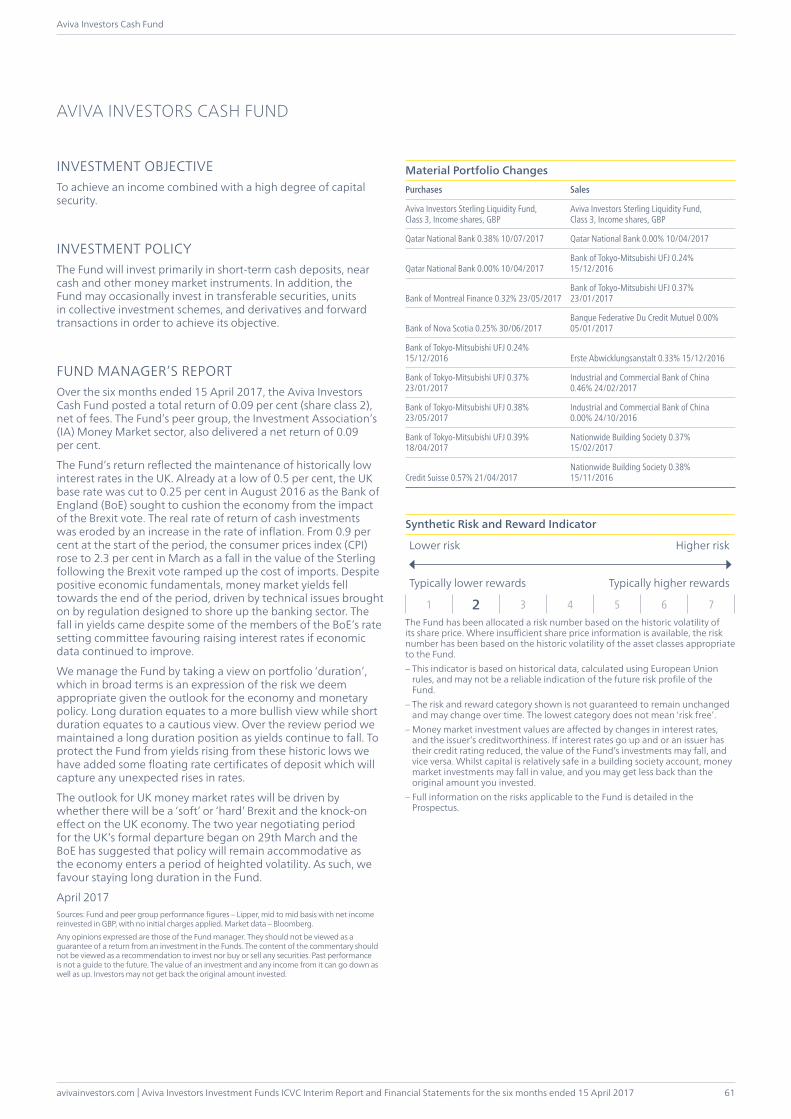
avivainvestors.com | Aviva Investors Investment Funds ICVC Interim Report and Financial Statements for the six months ended 15 April 2017
Aviva Investors Cash Fund
61
INVESTMENT OBJECTIVETo achieve an income combined with a high degree of capital security.
INVESTMENT POLICYThe Fund will invest primarily in short-term cash deposits, near cash and other money market instruments. In addition, the Fund may occasionally invest in transferable securities, units in collective investment schemes, and derivatives and forward transactions in order to achieve its objective.
FUND MANAGER’S REPORTOver the six months ended 15 April 2017, the Aviva Investors Cash Fund posted a total return of 0.09 per cent (share class 2), net of fees. The Fund’s peer group, the Investment Association’s (IA) Money Market sector, also delivered a net return of 0.09 per cent.
The Fund’s return reflected the maintenance of historically low interest rates in the UK. Already at a low of 0.5 per cent, the UK base rate was cut to 0.25 per cent in August 2016 as the Bank of England (BoE) sought to cushion the economy from the impact of the Brexit vote. The real rate of return of cash investments was eroded by an increase in the rate of inflation. From 0.9 per cent at the start of the period, the consumer prices index (CPI) rose to 2.3 per cent in March as a fall in the value of the Sterling following the Brexit vote ramped up the cost of imports. Despite positive economic fundamentals, money market yields fell towards the end of the period, driven by technical issues brought on by regulation designed to shore up the banking sector. The fall in yields came despite some of the members of the BoE’s rate setting committee favouring raising interest rates if economic data continued to improve.
We manage the Fund by taking a view on portfolio ‘duration’, which in broad terms is an expression of the risk we deem appropriate given the outlook for the economy and monetary policy. Long duration equates to a more bullish view while short duration equates to a cautious view. Over the review period we maintained a long duration position as yields continue to fall. To protect the Fund from yields rising from these historic lows we have added some floating rate certificates of deposit which will capture any unexpected rises in rates.
The outlook for UK money market rates will be driven by whether there will be a ‘soft’ or ‘hard’ Brexit and the knock-on effect on the UK economy. The two year negotiating period for the UK’s formal departure began on 29th March and the BoE has suggested that policy will remain accommodative as the economy enters a period of heighted volatility. As such, we favour staying long duration in the Fund.
April 2017Sources: Fund and peer group performance figures – Lipper, mid to mid basis with net income reinvested in GBP, with no initial charges applied. Market data – Bloomberg.Any opinions expressed are those of the Fund manager. They should not be viewed as a guarantee of a return from an investment in the Funds. The content of the commentary should not be viewed as a recommendation to invest nor buy or sell any securities. Past performance is not a guide to the future. The value of an investment and any income from it can go down as well as up. Investors may not get back the original amount invested.
Material Portfolio ChangesPurchases Sales
Aviva Investors Sterling Liquidity Fund, Class 3, Income shares, GBP
Aviva Investors Sterling Liquidity Fund, Class 3, Income shares, GBP
Qatar National Bank 0.38% 10/07/2017 Qatar National Bank 0.00% 10/04/2017
Qatar National Bank 0.00% 10/04/2017Bank of Tokyo-Mitsubishi UFJ 0.24% 15/12/2016
Bank of Montreal Finance 0.32% 23/05/2017Bank of Tokyo-Mitsubishi UFJ 0.37% 23/01/2017
Bank of Nova Scotia 0.25% 30/06/2017Banque Federative Du Credit Mutuel 0.00% 05/01/2017
Bank of Tokyo-Mitsubishi UFJ 0.24% 15/12/2016 Erste Abwicklungsanstalt 0.33% 15/12/2016
Bank of Tokyo-Mitsubishi UFJ 0.37% 23/01/2017
Industrial and Commercial Bank of China 0.46% 24/02/2017
Bank of Tokyo-Mitsubishi UFJ 0.38% 23/05/2017
Industrial and Commercial Bank of China 0.00% 24/10/2016
Bank of Tokyo-Mitsubishi UFJ 0.39% 18/04/2017
Nationwide Building Society 0.37% 15/02/2017
Credit Suisse 0.57% 21/04/2017Nationwide Building Society 0.38% 15/11/2016
Synthetic Risk and Reward Indicator
Lower risk Higher risk
Typically lower rewards Typically higher rewards
1 2 3 4 5 6 7The Fund has been allocated a risk number based on the historic volatility of its share price. Where insufficient share price information is available, the risk number has been based on the historic volatility of the asset classes appropriate to the Fund.– This indicator is based on historical data, calculated using European Union
rules, and may not be a reliable indication of the future risk profile of the Fund.
– The risk and reward category shown is not guaranteed to remain unchanged and may change over time. The lowest category does not mean ‘risk free’.
– Money market investment values are affected by changes in interest rates, and the issuer’s creditworthiness. If interest rates go up and or an issuer has their credit rating reduced, the value of the Fund’s investments may fall, and vice versa. Whilst capital is relatively safe in a building society account, money market investments may fall in value, and you may get less back than the original amount you invested.
– Full information on the risks applicable to the Fund is detailed in the Prospectus.
AVIVA INVESTORS CASH FUND
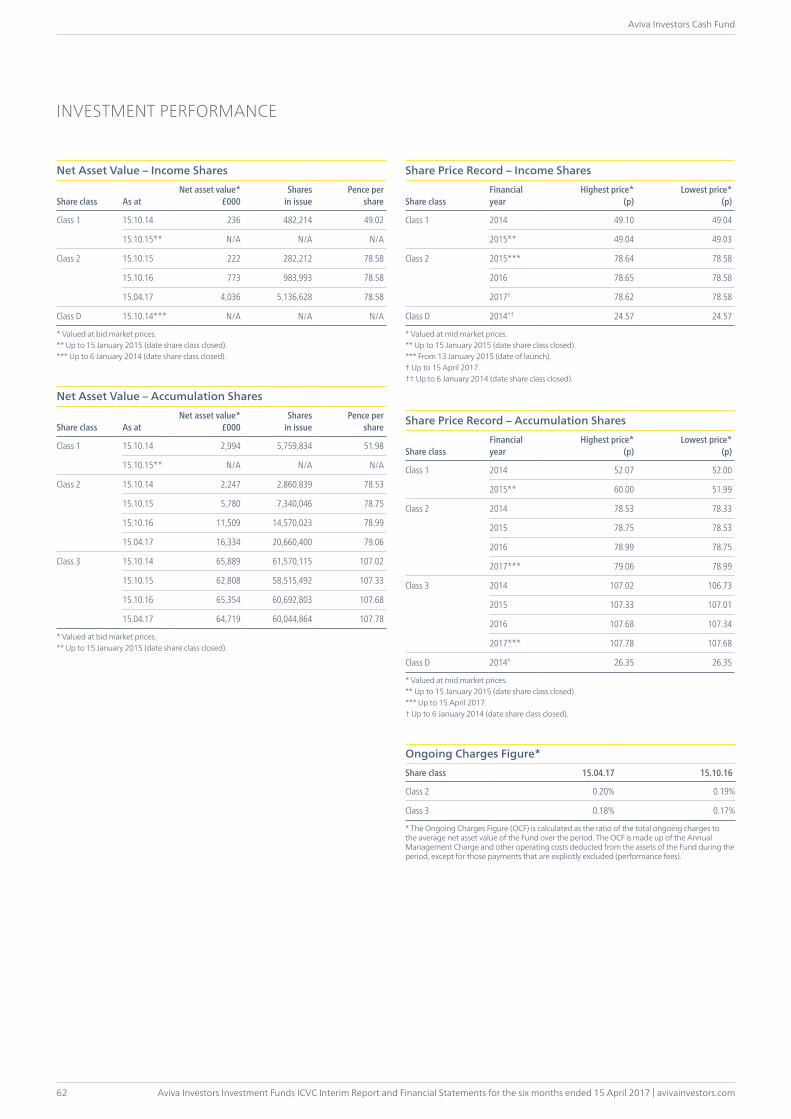
Aviva Investors Investment Funds ICVC Interim Report and Financial Statements for the six months ended 15 April 2017 | avivainvestors.com
Aviva Investors Cash Fund
62
INVESTMENT PERFORMANCE
Net Asset Value – Income Shares
Share class As atNet asset value*
£000Shares
in issuePence per
share
Class 1 15.10.14 236 482,214 49.02
15.10.15** N/A N/A N/A
Class 2 15.10.15 222 282,212 78.58
15.10.16 773 983,993 78.58
15.04.17 4,036 5,136,628 78.58
Class D 15.10.14*** N/A N/A N/A
* Valued at bid market prices.** Up to 15 January 2015 (date share class closed).*** Up to 6 January 2014 (date share class closed).
Net Asset Value – Accumulation Shares
Share class As atNet asset value*
£000Shares
in issuePence per
share
Class 1 15.10.14 2,994 5,759,834 51.98
15.10.15** N/A N/A N/A
Class 2 15.10.14 2,247 2,860,839 78.53
15.10.15 5,780 7,340,046 78.75
15.10.16 11,509 14,570,023 78.99
15.04.17 16,334 20,660,400 79.06
Class 3 15.10.14 65,889 61,570,115 107.02
15.10.15 62,808 58,515,492 107.33
15.10.16 65,354 60,692,803 107.68
15.04.17 64,719 60,044,864 107.78
* Valued at bid market prices.** Up to 15 January 2015 (date share class closed).
Share Price Record – Income Shares
Share classFinancialyear
Highest price*(p)
Lowest price*(p)
Class 1 2014 49.10 49.04
2015** 49.04 49.03
Class 2 2015*** 78.64 78.58
2016 78.65 78.58
2017† 78.62 78.58
Class D 2014†† 24.57 24.57
* Valued at mid market prices.** Up to 15 January 2015 (date share class closed).*** From 13 January 2015 (date of launch).† Up to 15 April 2017.†† Up to 6 January 2014 (date share class closed).
Share Price Record – Accumulation Shares
Share classFinancialyear
Highest price*(p)
Lowest price*(p)
Class 1 2014 52.07 52.00
2015** 60.00 51.99
Class 2 2014 78.53 78.33
2015 78.75 78.53
2016 78.99 78.75
2017*** 79.06 78.99
Class 3 2014 107.02 106.73
2015 107.33 107.01
2016 107.68 107.34
2017*** 107.78 107.68
Class D 2014† 26.35 26.35
* Valued at mid market prices.** Up to 15 January 2015 (date share class closed).*** Up to 15 April 2017.† Up to 6 January 2014 (date share class closed).
Ongoing Charges Figure*Share class 15.04.17 15.10.16
Class 2 0.20% 0.19%
Class 3 0.18% 0.17%
* The Ongoing Charges Figure (OCF) is calculated as the ratio of the total ongoing charges to the average net asset value of the Fund over the period. The OCF is made up of the Annual Management Charge and other operating costs deducted from the assets of the Fund during the period, except for those payments that are explicitly excluded (performance fees).
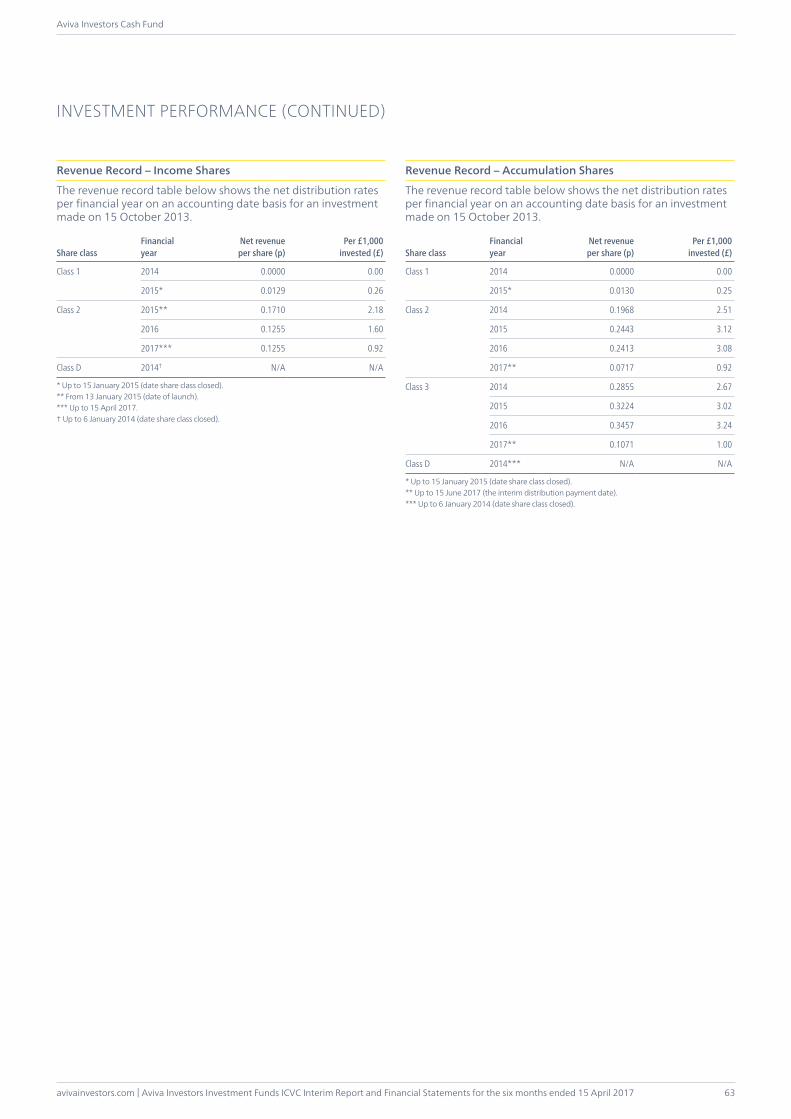
avivainvestors.com | Aviva Investors Investment Funds ICVC Interim Report and Financial Statements for the six months ended 15 April 2017
Aviva Investors Cash Fund
63
Revenue Record – Income Shares
The revenue record table below shows the net distribution rates per financial year on an accounting date basis for an investment made on 15 October 2013.
Share classFinancialyear
Net revenue per share (p)
Per £1,000invested (£)
Class 1 2014 0.0000 0.00
2015* 0.0129 0.26
Class 2 2015** 0.1710 2.18
2016 0.1255 1.60
2017*** 0.1255 0.92
Class D 2014† N/A N/A
* Up to 15 January 2015 (date share class closed).** From 13 January 2015 (date of launch).*** Up to 15 April 2017.† Up to 6 January 2014 (date share class closed).
INVESTMENT PERFORMANCE (CONTINUED)
Revenue Record – Accumulation Shares
The revenue record table below shows the net distribution rates per financial year on an accounting date basis for an investment made on 15 October 2013.
Share classFinancialyear
Net revenue per share (p)
Per £1,000invested (£)
Class 1 2014 0.0000 0.00
2015* 0.0130 0.25
Class 2 2014 0.1968 2.51
2015 0.2443 3.12
2016 0.2413 3.08
2017** 0.0717 0.92
Class 3 2014 0.2855 2.67
2015 0.3224 3.02
2016 0.3457 3.24
2017** 0.1071 1.00
Class D 2014*** N/A N/A
* Up to 15 January 2015 (date share class closed).** Up to 15 June 2017 (the interim distribution payment date).*** Up to 6 January 2014 (date share class closed).
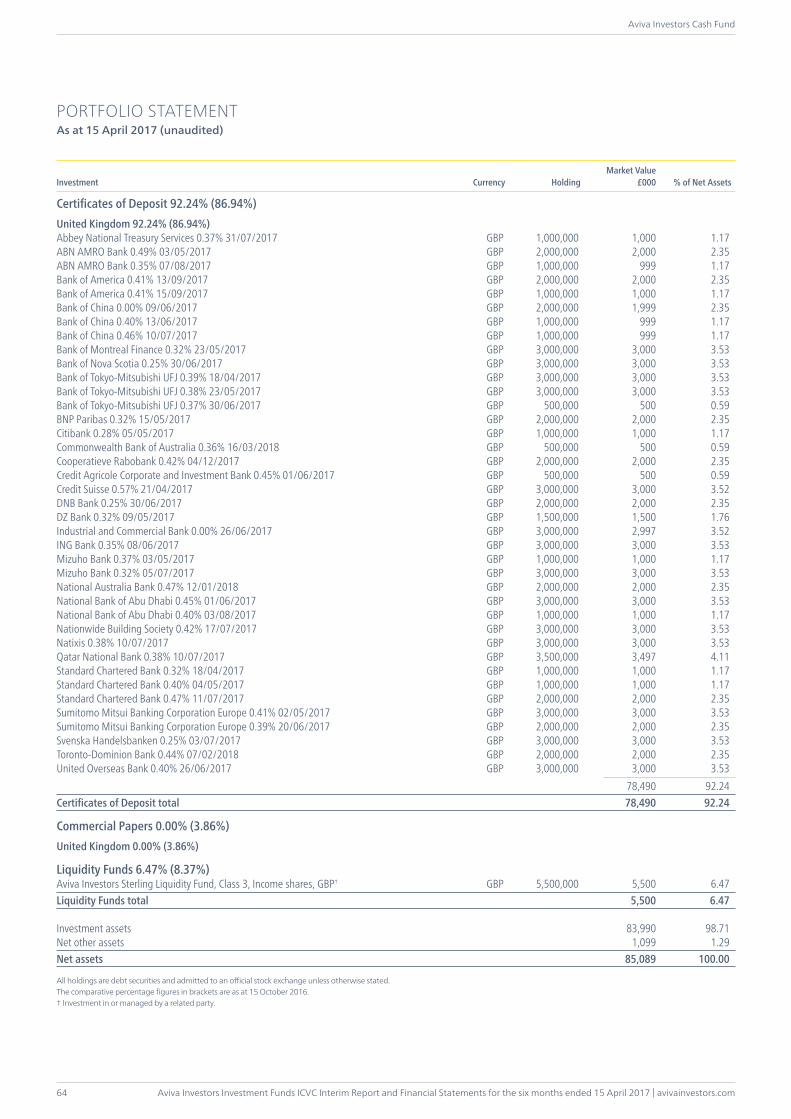
Aviva Investors Investment Funds ICVC Interim Report and Financial Statements for the six months ended 15 April 2017 | avivainvestors.com
Aviva Investors Cash Fund
64
PORTFOLIO STATEMENTAs at 15 April 2017 (unaudited)
Investment Currency HoldingMarket Value
£000 % of Net Assets
Certificates of Deposit 92.24% (86.94%)United Kingdom 92.24% (86.94%)Abbey National Treasury Services 0.37% 31/07/2017 GBP 1,000,000 1,000 1.17ABN AMRO Bank 0.49% 03/05/2017 GBP 2,000,000 2,000 2.35ABN AMRO Bank 0.35% 07/08/2017 GBP 1,000,000 999 1.17Bank of America 0.41% 13/09/2017 GBP 2,000,000 2,000 2.35Bank of America 0.41% 15/09/2017 GBP 1,000,000 1,000 1.17Bank of China 0.00% 09/06/2017 GBP 2,000,000 1,999 2.35Bank of China 0.40% 13/06/2017 GBP 1,000,000 999 1.17Bank of China 0.46% 10/07/2017 GBP 1,000,000 999 1.17Bank of Montreal Finance 0.32% 23/05/2017 GBP 3,000,000 3,000 3.53Bank of Nova Scotia 0.25% 30/06/2017 GBP 3,000,000 3,000 3.53Bank of Tokyo-Mitsubishi UFJ 0.39% 18/04/2017 GBP 3,000,000 3,000 3.53Bank of Tokyo-Mitsubishi UFJ 0.38% 23/05/2017 GBP 3,000,000 3,000 3.53Bank of Tokyo-Mitsubishi UFJ 0.37% 30/06/2017 GBP 500,000 500 0.59BNP Paribas 0.32% 15/05/2017 GBP 2,000,000 2,000 2.35Citibank 0.28% 05/05/2017 GBP 1,000,000 1,000 1.17Commonwealth Bank of Australia 0.36% 16/03/2018 GBP 500,000 500 0.59Cooperatieve Rabobank 0.42% 04/12/2017 GBP 2,000,000 2,000 2.35Credit Agricole Corporate and Investment Bank 0.45% 01/06/2017 GBP 500,000 500 0.59Credit Suisse 0.57% 21/04/2017 GBP 3,000,000 3,000 3.52DNB Bank 0.25% 30/06/2017 GBP 2,000,000 2,000 2.35DZ Bank 0.32% 09/05/2017 GBP 1,500,000 1,500 1.76Industrial and Commercial Bank 0.00% 26/06/2017 GBP 3,000,000 2,997 3.52ING Bank 0.35% 08/06/2017 GBP 3,000,000 3,000 3.53Mizuho Bank 0.37% 03/05/2017 GBP 1,000,000 1,000 1.17Mizuho Bank 0.32% 05/07/2017 GBP 3,000,000 3,000 3.53National Australia Bank 0.47% 12/01/2018 GBP 2,000,000 2,000 2.35National Bank of Abu Dhabi 0.45% 01/06/2017 GBP 3,000,000 3,000 3.53National Bank of Abu Dhabi 0.40% 03/08/2017 GBP 1,000,000 1,000 1.17Nationwide Building Society 0.42% 17/07/2017 GBP 3,000,000 3,000 3.53Natixis 0.38% 10/07/2017 GBP 3,000,000 3,000 3.53Qatar National Bank 0.38% 10/07/2017 GBP 3,500,000 3,497 4.11Standard Chartered Bank 0.32% 18/04/2017 GBP 1,000,000 1,000 1.17Standard Chartered Bank 0.40% 04/05/2017 GBP 1,000,000 1,000 1.17Standard Chartered Bank 0.47% 11/07/2017 GBP 2,000,000 2,000 2.35Sumitomo Mitsui Banking Corporation Europe 0.41% 02/05/2017 GBP 3,000,000 3,000 3.53Sumitomo Mitsui Banking Corporation Europe 0.39% 20/06/2017 GBP 2,000,000 2,000 2.35Svenska Handelsbanken 0.25% 03/07/2017 GBP 3,000,000 3,000 3.53Toronto-Dominion Bank 0.44% 07/02/2018 GBP 2,000,000 2,000 2.35United Overseas Bank 0.40% 26/06/2017 GBP 3,000,000 3,000 3.53 78,490 92.24Certificates of Deposit total 78,490 92.24
Commercial Papers 0.00% (3.86%)United Kingdom 0.00% (3.86%)
Liquidity Funds 6.47% (8.37%)Aviva Investors Sterling Liquidity Fund, Class 3, Income shares, GBP† GBP 5,500,000 5,500 6.47Liquidity Funds total 5,500 6.47
Investment assets 83,990 98.71Net other assets 1,099 1.29Net assets 85,089 100.00
All holdings are debt securities and admitted to an official stock exchange unless otherwise stated.The comparative percentage figures in brackets are as at 15 October 2016.† Investment in or managed by a related party.
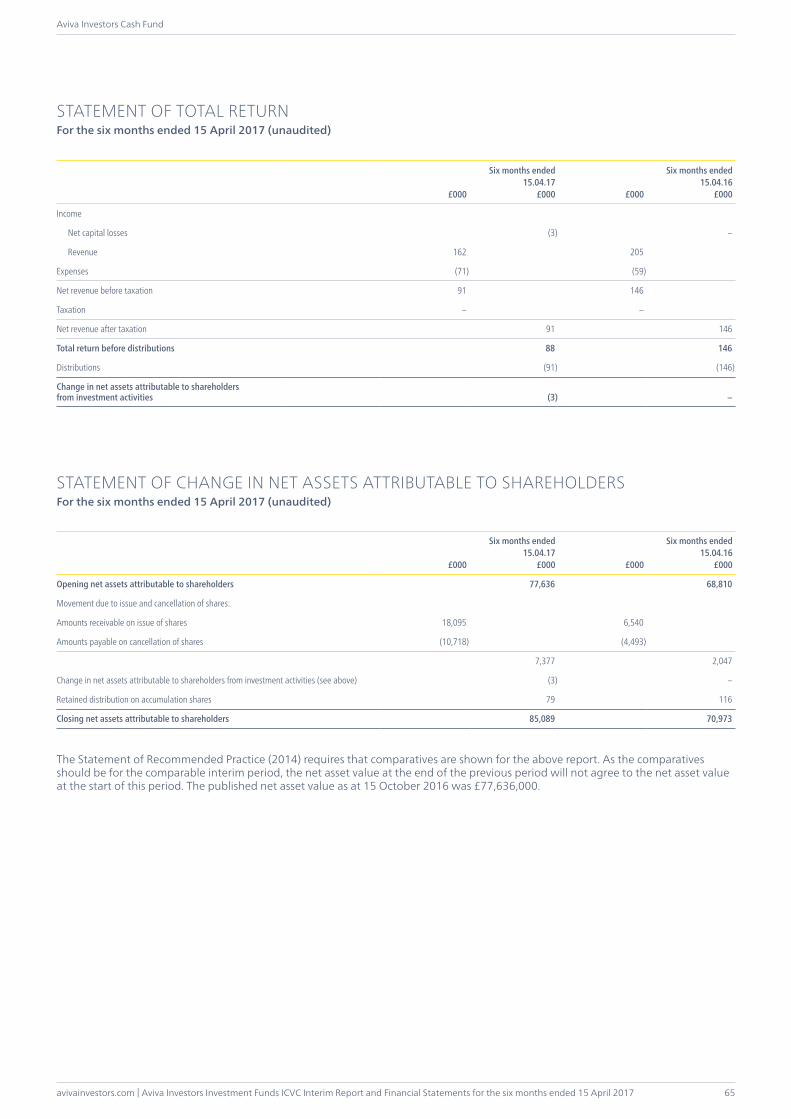
avivainvestors.com | Aviva Investors Investment Funds ICVC Interim Report and Financial Statements for the six months ended 15 April 2017
Aviva Investors Cash Fund
65
£000
Six months ended15.04.17
£000 £000
Six months ended15.04.16
£000
Income
Net capital losses (3) –
Revenue 162 205
Expenses (71) (59)
Net revenue before taxation 91 146
Taxation – –
Net revenue after taxation 91 146
Total return before distributions 88 146
Distributions (91) (146)
Change in net assets attributable to shareholders from investment activities (3) –
STATEMENT OF CHANGE IN NET ASSETS ATTRIBUTABLE TO SHAREHOLDERSFor the six months ended 15 April 2017 (unaudited)
£000
Six months ended15.04.17
£000 £000
Six months ended15.04.16
£000
Opening net assets attributable to shareholders 77,636 68,810
Movement due to issue and cancellation of shares:
Amounts receivable on issue of shares 18,095 6,540
Amounts payable on cancellation of shares (10,718) (4,493)
7,377 2,047
Change in net assets attributable to shareholders from investment activities (see above) (3) –
Retained distribution on accumulation shares 79 116
Closing net assets attributable to shareholders 85,089 70,973
The Statement of Recommended Practice (2014) requires that comparatives are shown for the above report. As the comparatives should be for the comparable interim period, the net asset value at the end of the previous period will not agree to the net asset value at the start of this period. The published net asset value as at 15 October 2016 was £77,636,000.
STATEMENT OF TOTAL RETURNFor the six months ended 15 April 2017 (unaudited)
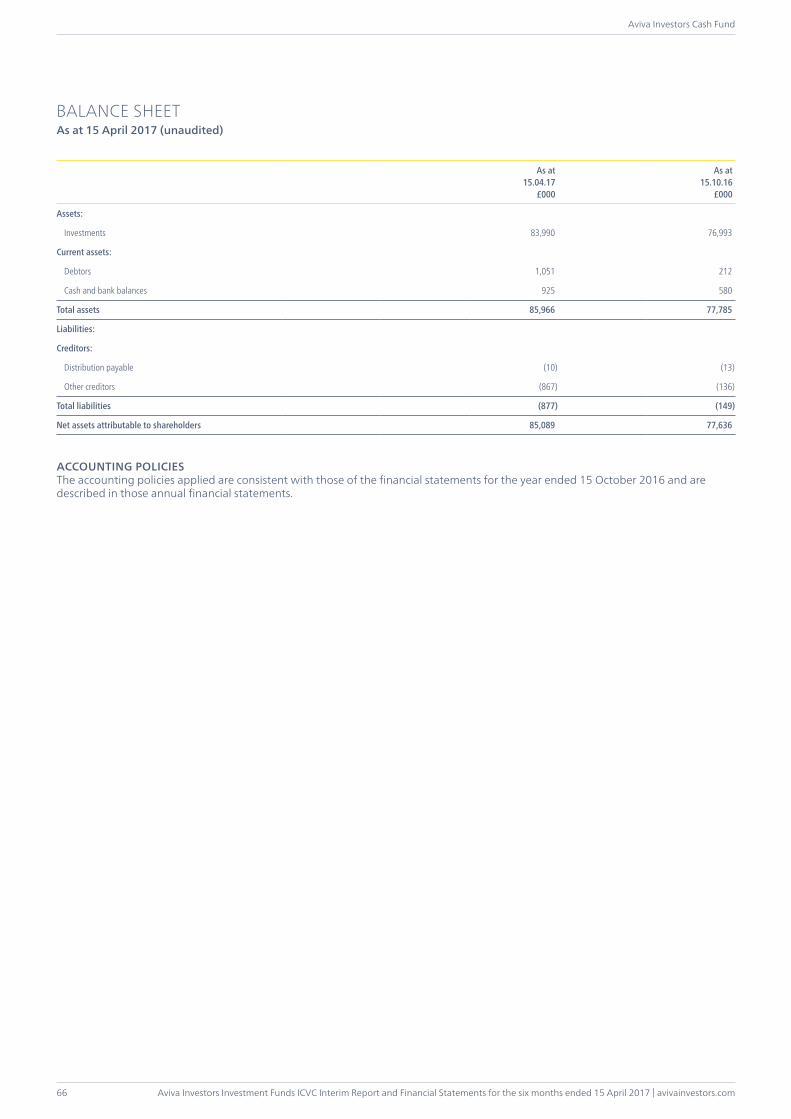
Aviva Investors Investment Funds ICVC Interim Report and Financial Statements for the six months ended 15 April 2017 | avivainvestors.com
Aviva Investors Cash Fund
66
BALANCE SHEETAs at 15 April 2017 (unaudited)
As at15.04.17
£000
As at15.10.16
£000
Assets:
Investments 83,990 76,993
Current assets:
Debtors 1,051 212
Cash and bank balances 925 580
Total assets 85,966 77,785
Liabilities:
Creditors:
Distribution payable (10) (13)
Other creditors (867) (136)
Total liabilities (877) (149)
Net assets attributable to shareholders 85,089 77,636
ACCOUNTING POLICIESThe accounting policies applied are consistent with those of the financial statements for the year ended 15 October 2016 and are described in those annual financial statements.
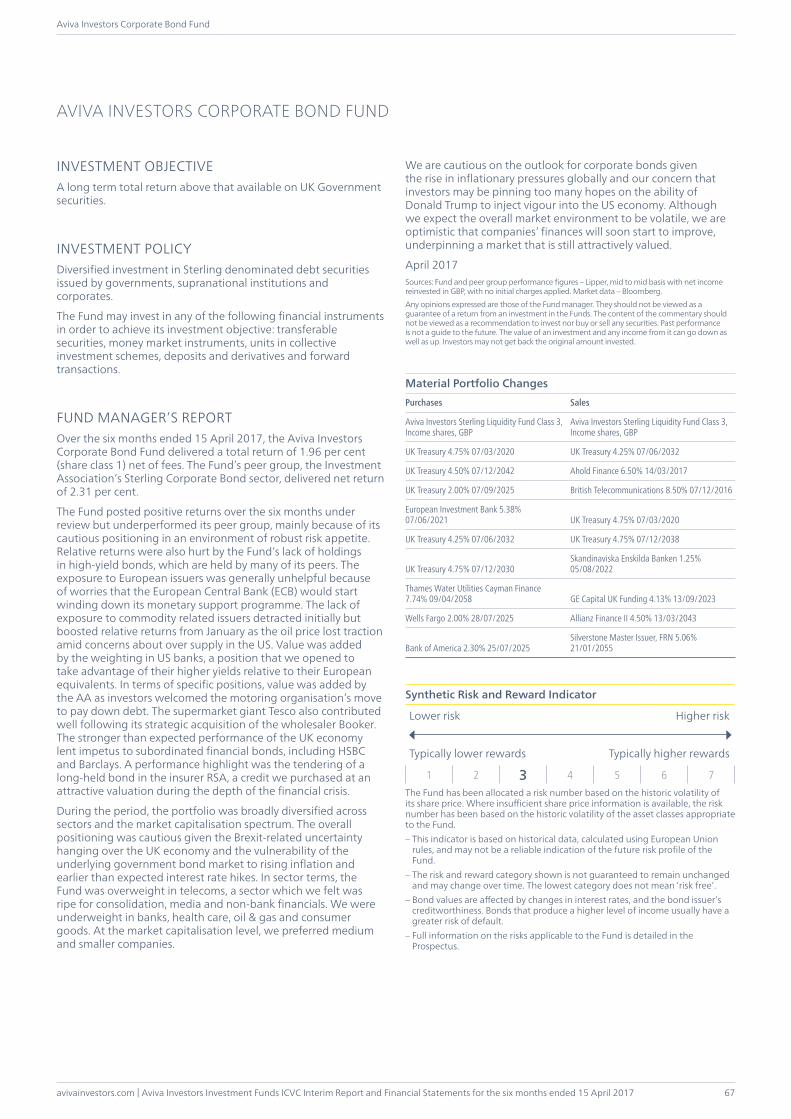
avivainvestors.com | Aviva Investors Investment Funds ICVC Interim Report and Financial Statements for the six months ended 15 April 2017
Aviva Investors Corporate Bond Fund
67
INVESTMENT OBJECTIVEA long term total return above that available on UK Government securities.
INVESTMENT POLICYDiversified investment in Sterling denominated debt securities issued by governments, supranational institutions and corporates.
The Fund may invest in any of the following financial instruments in order to achieve its investment objective: transferable securities, money market instruments, units in collective investment schemes, deposits and derivatives and forward transactions.
FUND MANAGER’S REPORTOver the six months ended 15 April 2017, the Aviva Investors Corporate Bond Fund delivered a total return of 1.96 per cent (share class 1) net of fees. The Fund’s peer group, the Investment Association’s Sterling Corporate Bond sector, delivered net return of 2.31 per cent.
The Fund posted positive returns over the six months under review but underperformed its peer group, mainly because of its cautious positioning in an environment of robust risk appetite. Relative returns were also hurt by the Fund’s lack of holdings in high-yield bonds, which are held by many of its peers. The exposure to European issuers was generally unhelpful because of worries that the European Central Bank (ECB) would start winding down its monetary support programme. The lack of exposure to commodity related issuers detracted initially but boosted relative returns from January as the oil price lost traction amid concerns about over supply in the US. Value was added by the weighting in US banks, a position that we opened to take advantage of their higher yields relative to their European equivalents. In terms of specific positions, value was added by the AA as investors welcomed the motoring organisation’s move to pay down debt. The supermarket giant Tesco also contributed well following its strategic acquisition of the wholesaler Booker. The stronger than expected performance of the UK economy lent impetus to subordinated financial bonds, including HSBC and Barclays. A performance highlight was the tendering of a long-held bond in the insurer RSA, a credit we purchased at an attractive valuation during the depth of the financial crisis.
During the period, the portfolio was broadly diversified across sectors and the market capitalisation spectrum. The overall positioning was cautious given the Brexit-related uncertainty hanging over the UK economy and the vulnerability of the underlying government bond market to rising inflation and earlier than expected interest rate hikes. In sector terms, the Fund was overweight in telecoms, a sector which we felt was ripe for consolidation, media and non-bank financials. We were underweight in banks, health care, oil & gas and consumer goods. At the market capitalisation level, we preferred medium and smaller companies.
We are cautious on the outlook for corporate bonds given the rise in inflationary pressures globally and our concern that investors may be pinning too many hopes on the ability of Donald Trump to inject vigour into the US economy. Although we expect the overall market environment to be volatile, we are optimistic that companies’ finances will soon start to improve, underpinning a market that is still attractively valued.
April 2017Sources: Fund and peer group performance figures – Lipper, mid to mid basis with net income reinvested in GBP, with no initial charges applied. Market data – Bloomberg. Any opinions expressed are those of the Fund manager. They should not be viewed as a guarantee of a return from an investment in the Funds. The content of the commentary should not be viewed as a recommendation to invest nor buy or sell any securities. Past performance is not a guide to the future. The value of an investment and any income from it can go down as well as up. Investors may not get back the original amount invested.
Material Portfolio ChangesPurchases Sales
Aviva Investors Sterling Liquidity Fund Class 3, Income shares, GBP
Aviva Investors Sterling Liquidity Fund Class 3, Income shares, GBP
UK Treasury 4.75% 07/03/2020 UK Treasury 4.25% 07/06/2032
UK Treasury 4.50% 07/12/2042 Ahold Finance 6.50% 14/03/2017
UK Treasury 2.00% 07/09/2025 British Telecommunications 8.50% 07/12/2016
European Investment Bank 5.38% 07/06/2021 UK Treasury 4.75% 07/03/2020
UK Treasury 4.25% 07/06/2032 UK Treasury 4.75% 07/12/2038
UK Treasury 4.75% 07/12/2030Skandinaviska Enskilda Banken 1.25% 05/08/2022
Thames Water Utilities Cayman Finance 7.74% 09/04/2058 GE Capital UK Funding 4.13% 13/09/2023
Wells Fargo 2.00% 28/07/2025 Allianz Finance II 4.50% 13/03/2043
Bank of America 2.30% 25/07/2025Silverstone Master Issuer, FRN 5.06% 21/01/2055
Synthetic Risk and Reward Indicator
Lower risk Higher risk
Typically lower rewards Typically higher rewards
1 2 3 4 5 6 7The Fund has been allocated a risk number based on the historic volatility of its share price. Where insufficient share price information is available, the risk number has been based on the historic volatility of the asset classes appropriate to the Fund.– This indicator is based on historical data, calculated using European Union
rules, and may not be a reliable indication of the future risk profile of the Fund.
– The risk and reward category shown is not guaranteed to remain unchanged and may change over time. The lowest category does not mean ‘risk free’.
– Bond values are affected by changes in interest rates, and the bond issuer’s creditworthiness. Bonds that produce a higher level of income usually have a greater risk of default.
– Full information on the risks applicable to the Fund is detailed in the Prospectus.
AVIVA INVESTORS CORPORATE BOND FUND
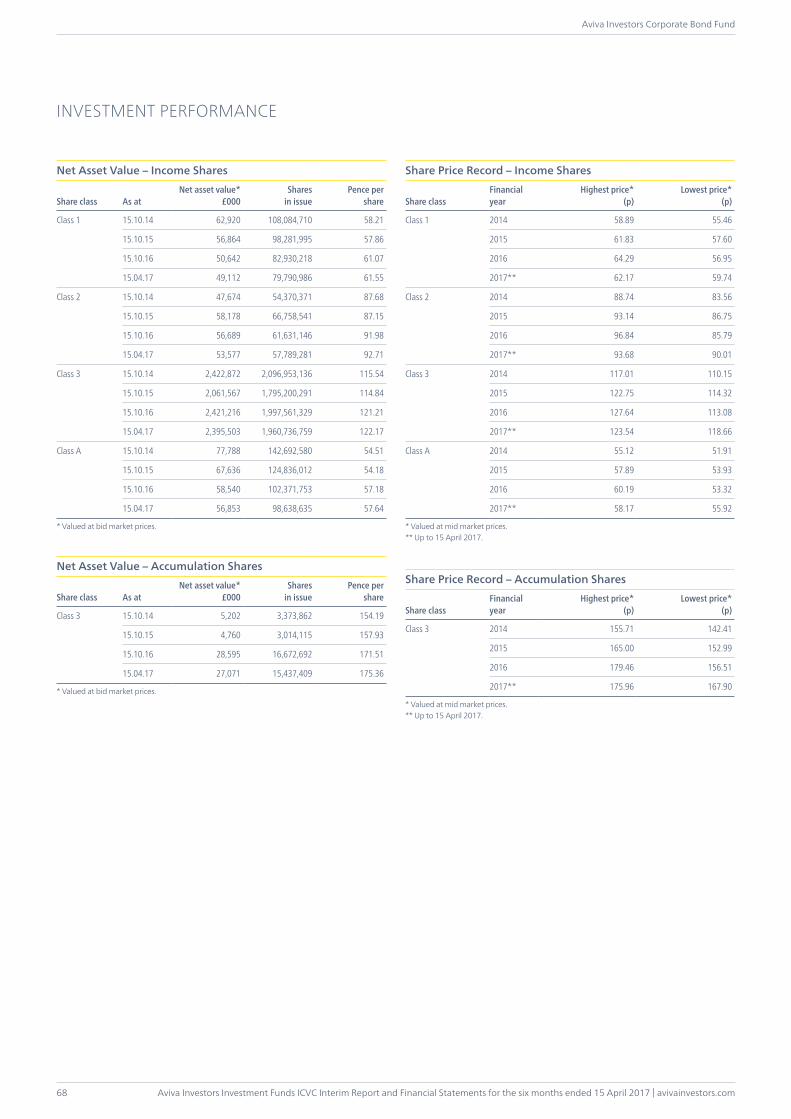
Aviva Investors Investment Funds ICVC Interim Report and Financial Statements for the six months ended 15 April 2017 | avivainvestors.com
Aviva Investors Corporate Bond Fund
68
INVESTMENT PERFORMANCE
Net Asset Value – Income Shares
Share class As atNet asset value*
£000Shares
in issuePence per
share
Class 1 15.10.14 62,920 108,084,710 58.21
15.10.15 56,864 98,281,995 57.86
15.10.16 50,642 82,930,218 61.07
15.04.17 49,112 79,790,986 61.55
Class 2 15.10.14 47,674 54,370,371 87.68
15.10.15 58,178 66,758,541 87.15
15.10.16 56,689 61,631,146 91.98
15.04.17 53,577 57,789,281 92.71
Class 3 15.10.14 2,422,872 2,096,953,136 115.54
15.10.15 2,061,567 1,795,200,291 114.84
15.10.16 2,421,216 1,997,561,329 121.21
15.04.17 2,395,503 1,960,736,759 122.17
Class A 15.10.14 77,788 142,692,580 54.51
15.10.15 67,636 124,836,012 54.18
15.10.16 58,540 102,371,753 57.18
15.04.17 56,853 98,638,635 57.64
* Valued at bid market prices.
Net Asset Value – Accumulation Shares
Share class As atNet asset value*
£000Shares
in issuePence per
share
Class 3 15.10.14 5,202 3,373,862 154.19
15.10.15 4,760 3,014,115 157.93
15.10.16 28,595 16,672,692 171.51
15.04.17 27,071 15,437,409 175.36
* Valued at bid market prices.
Share Price Record – Income Shares
Share classFinancialyear
Highest price*(p)
Lowest price*(p)
Class 1 2014 58.89 55.46
2015 61.83 57.60
2016 64.29 56.95
2017** 62.17 59.74
Class 2 2014 88.74 83.56
2015 93.14 86.75
2016 96.84 85.79
2017** 93.68 90.01
Class 3 2014 117.01 110.15
2015 122.75 114.32
2016 127.64 113.08
2017** 123.54 118.66
Class A 2014 55.12 51.91
2015 57.89 53.93
2016 60.19 53.32
2017** 58.17 55.92
* Valued at mid market prices.** Up to 15 April 2017.
Share Price Record – Accumulation Shares
Share classFinancialyear
Highest price*(p)
Lowest price*(p)
Class 3 2014 155.71 142.41
2015 165.00 152.99
2016 179.46 156.51
2017** 175.96 167.90
* Valued at mid market prices.** Up to 15 April 2017.
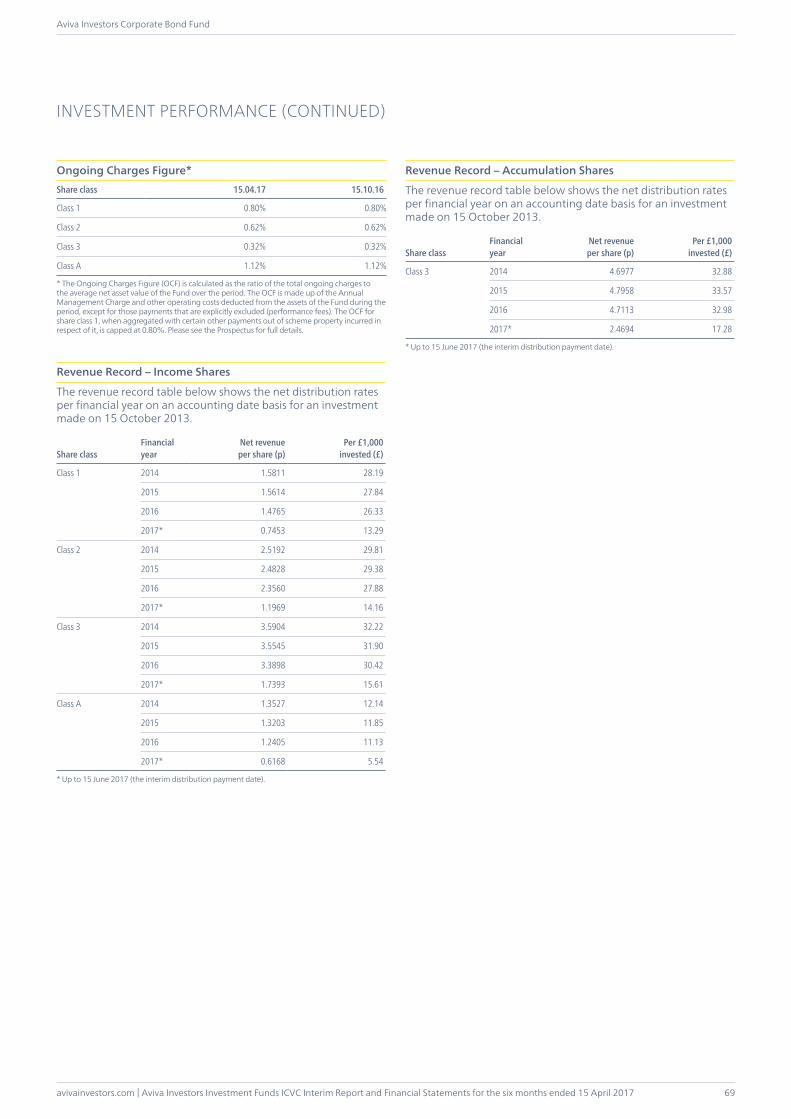
avivainvestors.com | Aviva Investors Investment Funds ICVC Interim Report and Financial Statements for the six months ended 15 April 2017
Aviva Investors Corporate Bond Fund
69
Ongoing Charges Figure*Share class 15.04.17 15.10.16
Class 1 0.80% 0.80%
Class 2 0.62% 0.62%
Class 3 0.32% 0.32%
Class A 1.12% 1.12%
* The Ongoing Charges Figure (OCF) is calculated as the ratio of the total ongoing charges to the average net asset value of the Fund over the period. The OCF is made up of the Annual Management Charge and other operating costs deducted from the assets of the Fund during the period, except for those payments that are explicitly excluded (performance fees). The OCF for share class 1, when aggregated with certain other payments out of scheme property incurred in respect of it, is capped at 0.80%. Please see the Prospectus for full details.
Revenue Record – Income Shares
The revenue record table below shows the net distribution rates per financial year on an accounting date basis for an investment made on 15 October 2013.
Share classFinancialyear
Net revenue per share (p)
Per £1,000invested (£)
Class 1 2014 1.5811 28.19
2015 1.5614 27.84
2016 1.4765 26.33
2017* 0.7453 13.29
Class 2 2014 2.5192 29.81
2015 2.4828 29.38
2016 2.3560 27.88
2017* 1.1969 14.16
Class 3 2014 3.5904 32.22
2015 3.5545 31.90
2016 3.3898 30.42
2017* 1.7393 15.61
Class A 2014 1.3527 12.14
2015 1.3203 11.85
2016 1.2405 11.13
2017* 0.6168 5.54
* Up to 15 June 2017 (the interim distribution payment date).
INVESTMENT PERFORMANCE (CONTINUED)
Revenue Record – Accumulation Shares
The revenue record table below shows the net distribution rates per financial year on an accounting date basis for an investment made on 15 October 2013.
Share classFinancialyear
Net revenue per share (p)
Per £1,000invested (£)
Class 3 2014 4.6977 32.88
2015 4.7958 33.57
2016 4.7113 32.98
2017* 2.4694 17.28
* Up to 15 June 2017 (the interim distribution payment date).
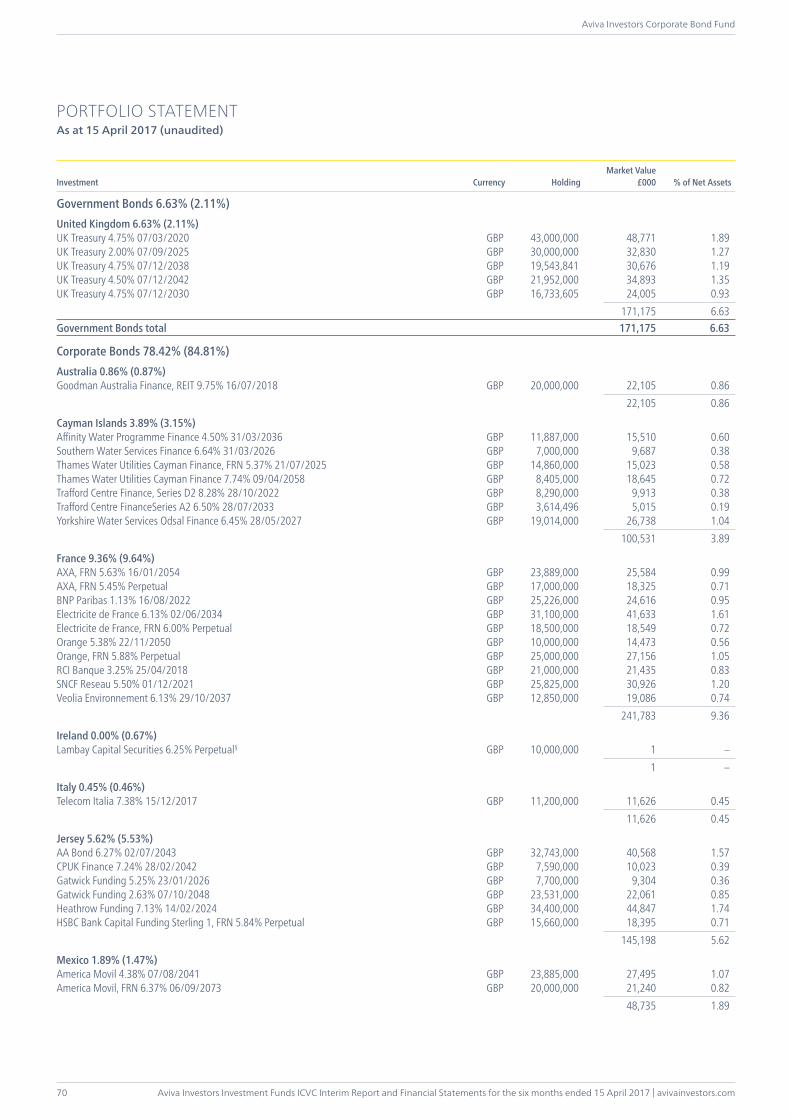
Aviva Investors Investment Funds ICVC Interim Report and Financial Statements for the six months ended 15 April 2017 | avivainvestors.com
Aviva Investors Corporate Bond Fund
70
PORTFOLIO STATEMENTAs at 15 April 2017 (unaudited)
Investment Currency HoldingMarket Value
£000 % of Net Assets
Government Bonds 6.63% (2.11%)United Kingdom 6.63% (2.11%)UK Treasury 4.75% 07/03/2020 GBP 43,000,000 48,771 1.89UK Treasury 2.00% 07/09/2025 GBP 30,000,000 32,830 1.27UK Treasury 4.75% 07/12/2038 GBP 19,543,841 30,676 1.19UK Treasury 4.50% 07/12/2042 GBP 21,952,000 34,893 1.35UK Treasury 4.75% 07/12/2030 GBP 16,733,605 24,005 0.93 171,175 6.63Government Bonds total 171,175 6.63
Corporate Bonds 78.42% (84.81%)Australia 0.86% (0.87%)Goodman Australia Finance, REIT 9.75% 16/07/2018 GBP 20,000,000 22,105 0.86 22,105 0.86
Cayman Islands 3.89% (3.15%)Affinity Water Programme Finance 4.50% 31/03/2036 GBP 11,887,000 15,510 0.60Southern Water Services Finance 6.64% 31/03/2026 GBP 7,000,000 9,687 0.38Thames Water Utilities Cayman Finance, FRN 5.37% 21/07/2025 GBP 14,860,000 15,023 0.58Thames Water Utilities Cayman Finance 7.74% 09/04/2058 GBP 8,405,000 18,645 0.72Trafford Centre Finance, Series D2 8.28% 28/10/2022 GBP 8,290,000 9,913 0.38Trafford Centre FinanceSeries A2 6.50% 28/07/2033 GBP 3,614,496 5,015 0.19Yorkshire Water Services Odsal Finance 6.45% 28/05/2027 GBP 19,014,000 26,738 1.04 100,531 3.89
France 9.36% (9.64%)AXA, FRN 5.63% 16/01/2054 GBP 23,889,000 25,584 0.99AXA, FRN 5.45% Perpetual GBP 17,000,000 18,325 0.71BNP Paribas 1.13% 16/08/2022 GBP 25,226,000 24,616 0.95Electricite de France 6.13% 02/06/2034 GBP 31,100,000 41,633 1.61Electricite de France, FRN 6.00% Perpetual GBP 18,500,000 18,549 0.72Orange 5.38% 22/11/2050 GBP 10,000,000 14,473 0.56Orange, FRN 5.88% Perpetual GBP 25,000,000 27,156 1.05RCI Banque 3.25% 25/04/2018 GBP 21,000,000 21,435 0.83SNCF Reseau 5.50% 01/12/2021 GBP 25,825,000 30,926 1.20Veolia Environnement 6.13% 29/10/2037 GBP 12,850,000 19,086 0.74 241,783 9.36
Ireland 0.00% (0.67%)Lambay Capital Securities 6.25% Perpetual§ GBP 10,000,000 1 – 1 –
Italy 0.45% (0.46%)Telecom Italia 7.38% 15/12/2017 GBP 11,200,000 11,626 0.45 11,626 0.45
Jersey 5.62% (5.53%)AA Bond 6.27% 02/07/2043 GBP 32,743,000 40,568 1.57CPUK Finance 7.24% 28/02/2042 GBP 7,590,000 10,023 0.39Gatwick Funding 5.25% 23/01/2026 GBP 7,700,000 9,304 0.36Gatwick Funding 2.63% 07/10/2048 GBP 23,531,000 22,061 0.85Heathrow Funding 7.13% 14/02/2024 GBP 34,400,000 44,847 1.74HSBC Bank Capital Funding Sterling 1, FRN 5.84% Perpetual GBP 15,660,000 18,395 0.71 145,198 5.62
Mexico 1.89% (1.47%)America Movil 4.38% 07/08/2041 GBP 23,885,000 27,495 1.07America Movil, FRN 6.37% 06/09/2073 GBP 20,000,000 21,240 0.82 48,735 1.89
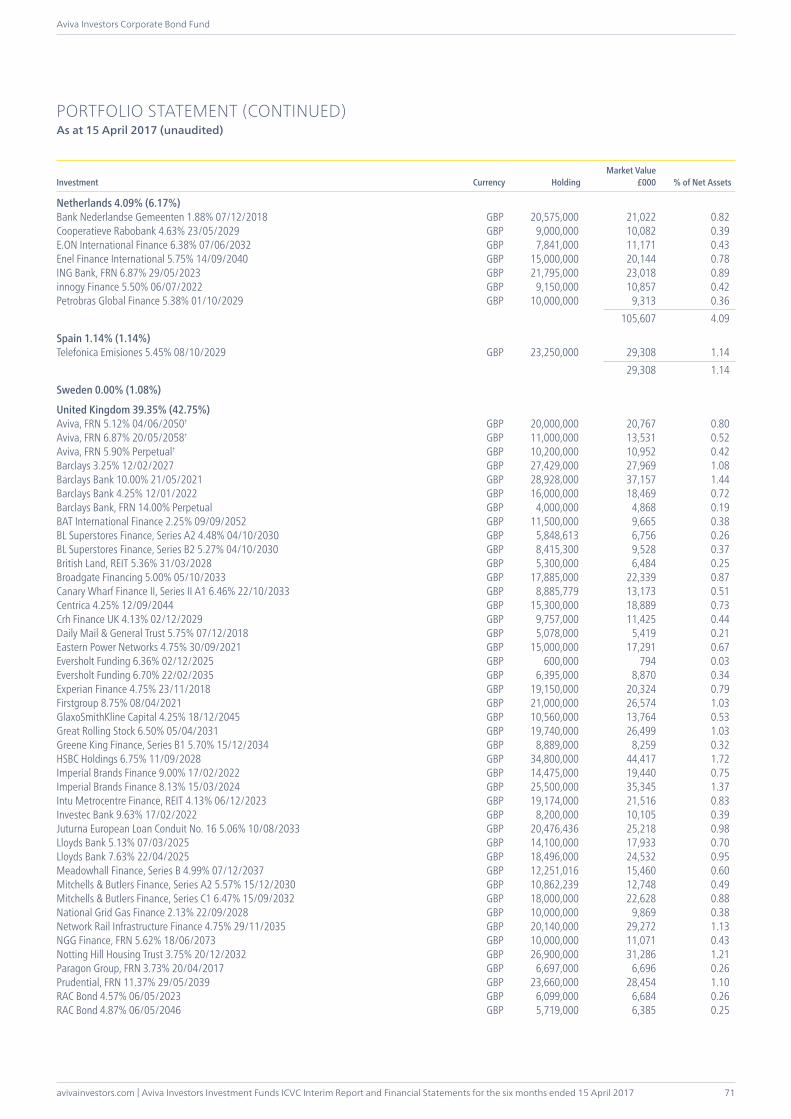
avivainvestors.com | Aviva Investors Investment Funds ICVC Interim Report and Financial Statements for the six months ended 15 April 2017
Aviva Investors Corporate Bond Fund
71
PORTFOLIO STATEMENT (CONTINUED)As at 15 April 2017 (unaudited)
Investment Currency HoldingMarket Value
£000 % of Net Assets
Netherlands 4.09% (6.17%)Bank Nederlandse Gemeenten 1.88% 07/12/2018 GBP 20,575,000 21,022 0.82Cooperatieve Rabobank 4.63% 23/05/2029 GBP 9,000,000 10,082 0.39E.ON International Finance 6.38% 07/06/2032 GBP 7,841,000 11,171 0.43Enel Finance International 5.75% 14/09/2040 GBP 15,000,000 20,144 0.78ING Bank, FRN 6.87% 29/05/2023 GBP 21,795,000 23,018 0.89innogy Finance 5.50% 06/07/2022 GBP 9,150,000 10,857 0.42Petrobras Global Finance 5.38% 01/10/2029 GBP 10,000,000 9,313 0.36 105,607 4.09
Spain 1.14% (1.14%)Telefonica Emisiones 5.45% 08/10/2029 GBP 23,250,000 29,308 1.14 29,308 1.14
Sweden 0.00% (1.08%)
United Kingdom 39.35% (42.75%)Aviva, FRN 5.12% 04/06/2050† GBP 20,000,000 20,767 0.80Aviva, FRN 6.87% 20/05/2058† GBP 11,000,000 13,531 0.52Aviva, FRN 5.90% Perpetual† GBP 10,200,000 10,952 0.42Barclays 3.25% 12/02/2027 GBP 27,429,000 27,969 1.08Barclays Bank 10.00% 21/05/2021 GBP 28,928,000 37,157 1.44Barclays Bank 4.25% 12/01/2022 GBP 16,000,000 18,469 0.72Barclays Bank, FRN 14.00% Perpetual GBP 4,000,000 4,868 0.19BAT International Finance 2.25% 09/09/2052 GBP 11,500,000 9,665 0.38BL Superstores Finance, Series A2 4.48% 04/10/2030 GBP 5,848,613 6,756 0.26BL Superstores Finance, Series B2 5.27% 04/10/2030 GBP 8,415,300 9,528 0.37British Land, REIT 5.36% 31/03/2028 GBP 5,300,000 6,484 0.25Broadgate Financing 5.00% 05/10/2033 GBP 17,885,000 22,339 0.87Canary Wharf Finance II, Series II A1 6.46% 22/10/2033 GBP 8,885,779 13,173 0.51Centrica 4.25% 12/09/2044 GBP 15,300,000 18,889 0.73Crh Finance UK 4.13% 02/12/2029 GBP 9,757,000 11,425 0.44Daily Mail & General Trust 5.75% 07/12/2018 GBP 5,078,000 5,419 0.21Eastern Power Networks 4.75% 30/09/2021 GBP 15,000,000 17,291 0.67Eversholt Funding 6.36% 02/12/2025 GBP 600,000 794 0.03Eversholt Funding 6.70% 22/02/2035 GBP 6,395,000 8,870 0.34Experian Finance 4.75% 23/11/2018 GBP 19,150,000 20,324 0.79Firstgroup 8.75% 08/04/2021 GBP 21,000,000 26,574 1.03GlaxoSmithKline Capital 4.25% 18/12/2045 GBP 10,560,000 13,764 0.53Great Rolling Stock 6.50% 05/04/2031 GBP 19,740,000 26,499 1.03Greene King Finance, Series B1 5.70% 15/12/2034 GBP 8,889,000 8,259 0.32HSBC Holdings 6.75% 11/09/2028 GBP 34,800,000 44,417 1.72Imperial Brands Finance 9.00% 17/02/2022 GBP 14,475,000 19,440 0.75Imperial Brands Finance 8.13% 15/03/2024 GBP 25,500,000 35,345 1.37Intu Metrocentre Finance, REIT 4.13% 06/12/2023 GBP 19,174,000 21,516 0.83Investec Bank 9.63% 17/02/2022 GBP 8,200,000 10,105 0.39Juturna European Loan Conduit No. 16 5.06% 10/08/2033 GBP 20,476,436 25,218 0.98Lloyds Bank 5.13% 07/03/2025 GBP 14,100,000 17,933 0.70Lloyds Bank 7.63% 22/04/2025 GBP 18,496,000 24,532 0.95Meadowhall Finance, Series B 4.99% 07/12/2037 GBP 12,251,016 15,460 0.60Mitchells & Butlers Finance, Series A2 5.57% 15/12/2030 GBP 10,862,239 12,748 0.49Mitchells & Butlers Finance, Series C1 6.47% 15/09/2032 GBP 18,000,000 22,628 0.88National Grid Gas Finance 2.13% 22/09/2028 GBP 10,000,000 9,869 0.38Network Rail Infrastructure Finance 4.75% 29/11/2035 GBP 20,140,000 29,272 1.13NGG Finance, FRN 5.62% 18/06/2073 GBP 10,000,000 11,071 0.43Notting Hill Housing Trust 3.75% 20/12/2032 GBP 26,900,000 31,286 1.21Paragon Group, FRN 3.73% 20/04/2017 GBP 6,697,000 6,696 0.26Prudential, FRN 11.37% 29/05/2039 GBP 23,660,000 28,454 1.10RAC Bond 4.57% 06/05/2023 GBP 6,099,000 6,684 0.26RAC Bond 4.87% 06/05/2046 GBP 5,719,000 6,385 0.25
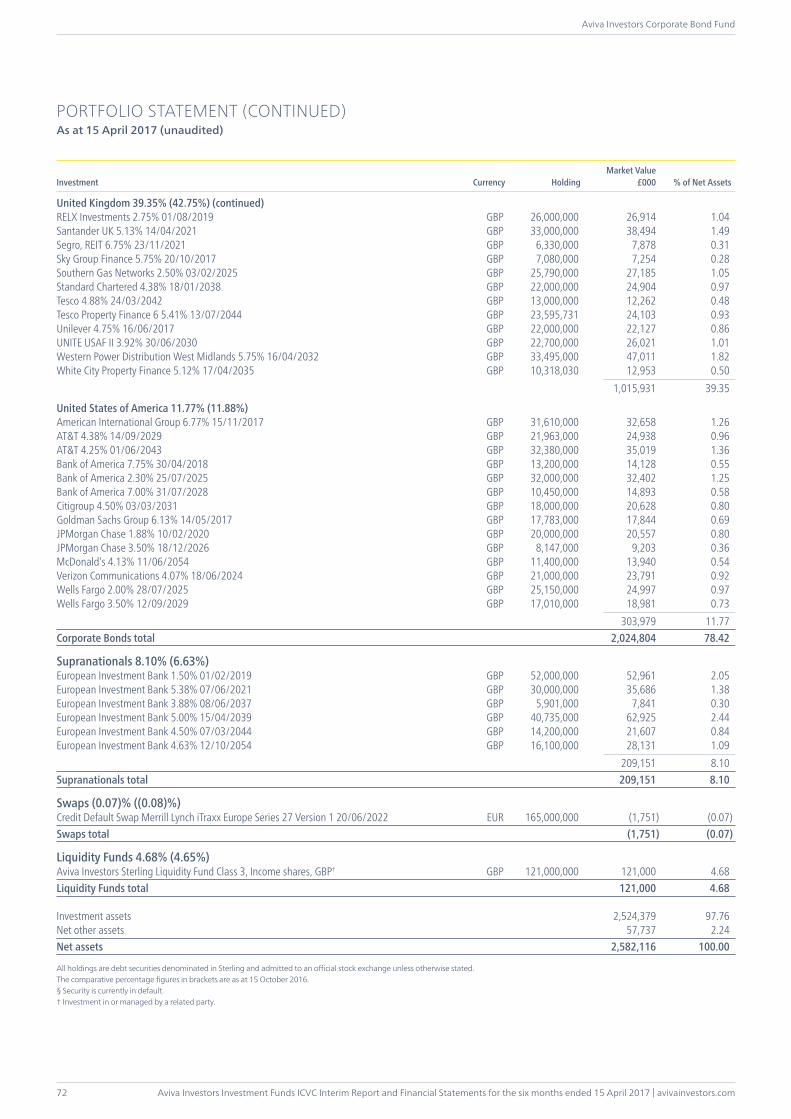
Aviva Investors Investment Funds ICVC Interim Report and Financial Statements for the six months ended 15 April 2017 | avivainvestors.com
Aviva Investors Corporate Bond Fund
72
PORTFOLIO STATEMENT (CONTINUED)As at 15 April 2017 (unaudited)
Investment Currency HoldingMarket Value
£000 % of Net Assets
United Kingdom 39.35% (42.75%) (continued)RELX Investments 2.75% 01/08/2019 GBP 26,000,000 26,914 1.04Santander UK 5.13% 14/04/2021 GBP 33,000,000 38,494 1.49Segro, REIT 6.75% 23/11/2021 GBP 6,330,000 7,878 0.31Sky Group Finance 5.75% 20/10/2017 GBP 7,080,000 7,254 0.28Southern Gas Networks 2.50% 03/02/2025 GBP 25,790,000 27,185 1.05Standard Chartered 4.38% 18/01/2038 GBP 22,000,000 24,904 0.97Tesco 4.88% 24/03/2042 GBP 13,000,000 12,262 0.48Tesco Property Finance 6 5.41% 13/07/2044 GBP 23,595,731 24,103 0.93Unilever 4.75% 16/06/2017 GBP 22,000,000 22,127 0.86UNITE USAF II 3.92% 30/06/2030 GBP 22,700,000 26,021 1.01Western Power Distribution West Midlands 5.75% 16/04/2032 GBP 33,495,000 47,011 1.82White City Property Finance 5.12% 17/04/2035 GBP 10,318,030 12,953 0.50 1,015,931 39.35
United States of America 11.77% (11.88%)American International Group 6.77% 15/11/2017 GBP 31,610,000 32,658 1.26AT&T 4.38% 14/09/2029 GBP 21,963,000 24,938 0.96AT&T 4.25% 01/06/2043 GBP 32,380,000 35,019 1.36Bank of America 7.75% 30/04/2018 GBP 13,200,000 14,128 0.55Bank of America 2.30% 25/07/2025 GBP 32,000,000 32,402 1.25Bank of America 7.00% 31/07/2028 GBP 10,450,000 14,893 0.58Citigroup 4.50% 03/03/2031 GBP 18,000,000 20,628 0.80Goldman Sachs Group 6.13% 14/05/2017 GBP 17,783,000 17,844 0.69JPMorgan Chase 1.88% 10/02/2020 GBP 20,000,000 20,557 0.80JPMorgan Chase 3.50% 18/12/2026 GBP 8,147,000 9,203 0.36McDonald’s 4.13% 11/06/2054 GBP 11,400,000 13,940 0.54Verizon Communications 4.07% 18/06/2024 GBP 21,000,000 23,791 0.92Wells Fargo 2.00% 28/07/2025 GBP 25,150,000 24,997 0.97Wells Fargo 3.50% 12/09/2029 GBP 17,010,000 18,981 0.73 303,979 11.77Corporate Bonds total 2,024,804 78.42
Supranationals 8.10% (6.63%)European Investment Bank 1.50% 01/02/2019 GBP 52,000,000 52,961 2.05European Investment Bank 5.38% 07/06/2021 GBP 30,000,000 35,686 1.38European Investment Bank 3.88% 08/06/2037 GBP 5,901,000 7,841 0.30European Investment Bank 5.00% 15/04/2039 GBP 40,735,000 62,925 2.44European Investment Bank 4.50% 07/03/2044 GBP 14,200,000 21,607 0.84European Investment Bank 4.63% 12/10/2054 GBP 16,100,000 28,131 1.09 209,151 8.10Supranationals total 209,151 8.10
Swaps (0.07)% ((0.08)%)Credit Default Swap Merrill Lynch iTraxx Europe Series 27 Version 1 20/06/2022 EUR 165,000,000 (1,751) (0.07)Swaps total (1,751) (0.07)
Liquidity Funds 4.68% (4.65%)Aviva Investors Sterling Liquidity Fund Class 3, Income shares, GBP† GBP 121,000,000 121,000 4.68Liquidity Funds total 121,000 4.68
Investment assets 2,524,379 97.76Net other assets 57,737 2.24Net assets 2,582,116 100.00
All holdings are debt securities denominated in Sterling and admitted to an official stock exchange unless otherwise stated.The comparative percentage figures in brackets are as at 15 October 2016.§ Security is currently in default.† Investment in or managed by a related party.
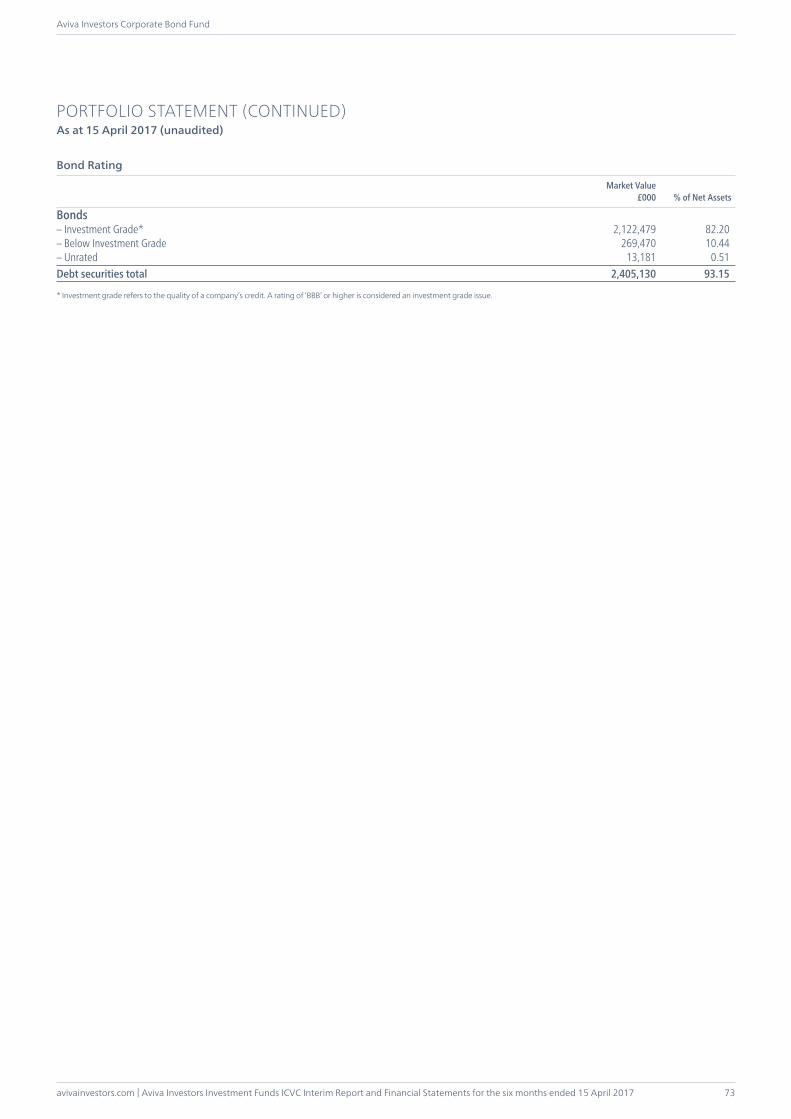
avivainvestors.com | Aviva Investors Investment Funds ICVC Interim Report and Financial Statements for the six months ended 15 April 2017
Aviva Investors Corporate Bond Fund
73
PORTFOLIO STATEMENT (CONTINUED)As at 15 April 2017 (unaudited)
Bonds – Investment Grade* 2,122,479 82.20– Below Investment Grade 269,470 10.44– Unrated 13,181 0.51Debt securities total 2,405,130 93.15
* Investment grade refers to the quality of a company’s credit. A rating of ‘BBB’ or higher is considered an investment grade issue.
Market Value£000 % of Net Assets
Bond Rating
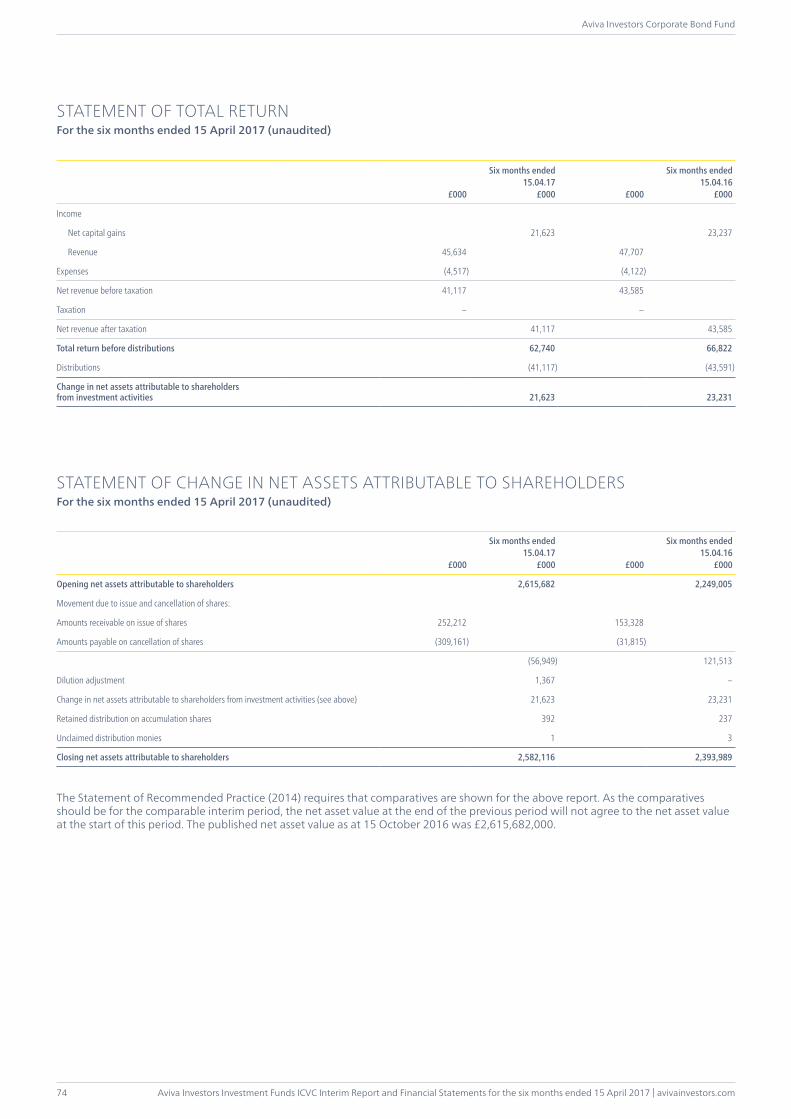
Aviva Investors Investment Funds ICVC Interim Report and Financial Statements for the six months ended 15 April 2017 | avivainvestors.com
Aviva Investors Corporate Bond Fund
74
£000
Six months ended15.04.17
£000 £000
Six months ended15.04.16
£000
Income
Net capital gains 21,623 23,237
Revenue 45,634 47,707
Expenses (4,517) (4,122)
Net revenue before taxation 41,117 43,585
Taxation – –
Net revenue after taxation 41,117 43,585
Total return before distributions 62,740 66,822
Distributions (41,117) (43,591)
Change in net assets attributable to shareholders from investment activities 21,623 23,231
STATEMENT OF CHANGE IN NET ASSETS ATTRIBUTABLE TO SHAREHOLDERSFor the six months ended 15 April 2017 (unaudited)
£000
Six months ended15.04.17
£000 £000
Six months ended15.04.16
£000
Opening net assets attributable to shareholders 2,615,682 2,249,005
Movement due to issue and cancellation of shares:
Amounts receivable on issue of shares 252,212 153,328
Amounts payable on cancellation of shares (309,161) (31,815)
(56,949) 121,513
Dilution adjustment 1,367 –
Change in net assets attributable to shareholders from investment activities (see above) 21,623 23,231
Retained distribution on accumulation shares 392 237
Unclaimed distribution monies 1 3
Closing net assets attributable to shareholders 2,582,116 2,393,989
The Statement of Recommended Practice (2014) requires that comparatives are shown for the above report. As the comparatives should be for the comparable interim period, the net asset value at the end of the previous period will not agree to the net asset value at the start of this period. The published net asset value as at 15 October 2016 was £2,615,682,000.
STATEMENT OF TOTAL RETURNFor the six months ended 15 April 2017 (unaudited)

avivainvestors.com | Aviva Investors Investment Funds ICVC Interim Report and Financial Statements for the six months ended 15 April 2017
Aviva Investors Corporate Bond Fund
75
BALANCE SHEETAs at 15 April 2017 (unaudited)
As at15.04.17
£000
As at15.10.16
£000
Assets:
Investments 2,526,130 2,568,493
Current assets:
Debtors 47,181 46,901
Cash and bank balances 36,809 28,035
Total assets 2,610,120 2,643,429
Liabilities:
Investment liabilities (1,751) (2,016)
Creditors:
Distribution payable (23,758) (20,450)
Other creditors (2,495) (5,281)
Total liabilities (28,004) (27,747)
Net assets attributable to shareholders 2,582,116 2,615,682
ACCOUNTING POLICIESThe accounting policies applied are consistent with those of the financial statements for the year ended 15 October 2016 and are described in those annual financial statements.
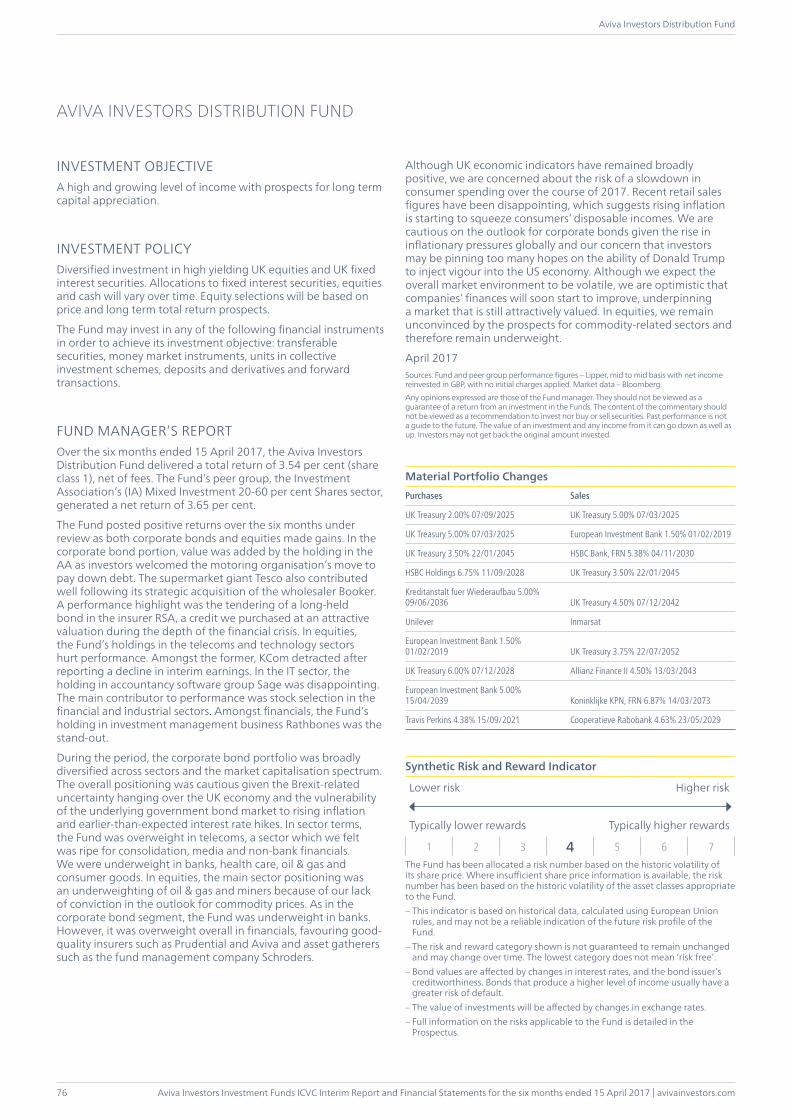
Aviva Investors Investment Funds ICVC Interim Report and Financial Statements for the six months ended 15 April 2017 | avivainvestors.com
Aviva Investors Distribution Fund
76
INVESTMENT OBJECTIVEA high and growing level of income with prospects for long term capital appreciation.
INVESTMENT POLICYDiversified investment in high yielding UK equities and UK fixed interest securities. Allocations to fixed interest securities, equities and cash will vary over time. Equity selections will be based on price and long term total return prospects.
The Fund may invest in any of the following financial instruments in order to achieve its investment objective: transferable securities, money market instruments, units in collective investment schemes, deposits and derivatives and forward transactions.
FUND MANAGER’S REPORTOver the six months ended 15 April 2017, the Aviva Investors Distribution Fund delivered a total return of 3.54 per cent (share class 1), net of fees. The Fund’s peer group, the Investment Association’s (IA) Mixed Investment 20-60 per cent Shares sector, generated a net return of 3.65 per cent.
The Fund posted positive returns over the six months under review as both corporate bonds and equities made gains. In the corporate bond portion, value was added by the holding in the AA as investors welcomed the motoring organisation’s move to pay down debt. The supermarket giant Tesco also contributed well following its strategic acquisition of the wholesaler Booker. A performance highlight was the tendering of a long-held bond in the insurer RSA, a credit we purchased at an attractive valuation during the depth of the financial crisis. In equities, the Fund’s holdings in the telecoms and technology sectors hurt performance. Amongst the former, KCom detracted after reporting a decline in interim earnings. In the IT sector, the holding in accountancy software group Sage was disappointing. The main contributor to performance was stock selection in the financial and industrial sectors. Amongst financials, the Fund’s holding in investment management business Rathbones was the stand-out.
During the period, the corporate bond portfolio was broadly diversified across sectors and the market capitalisation spectrum. The overall positioning was cautious given the Brexit-related uncertainty hanging over the UK economy and the vulnerability of the underlying government bond market to rising inflation and earlier-than-expected interest rate hikes. In sector terms, the Fund was overweight in telecoms, a sector which we felt was ripe for consolidation, media and non-bank financials. We were underweight in banks, health care, oil & gas and consumer goods. In equities, the main sector positioning was an underweighting of oil & gas and miners because of our lack of conviction in the outlook for commodity prices. As in the corporate bond segment, the Fund was underweight in banks. However, it was overweight overall in financials, favouring good-quality insurers such as Prudential and Aviva and asset gatherers such as the fund management company Schroders.
Although UK economic indicators have remained broadly positive, we are concerned about the risk of a slowdown in consumer spending over the course of 2017. Recent retail sales figures have been disappointing, which suggests rising inflation is starting to squeeze consumers’ disposable incomes. We are cautious on the outlook for corporate bonds given the rise in inflationary pressures globally and our concern that investors may be pinning too many hopes on the ability of Donald Trump to inject vigour into the US economy. Although we expect the overall market environment to be volatile, we are optimistic that companies’ finances will soon start to improve, underpinning a market that is still attractively valued. In equities, we remain unconvinced by the prospects for commodity-related sectors and therefore remain underweight.
April 2017Sources: Fund and peer group performance figures – Lipper, mid to mid basis with net income reinvested in GBP, with no initial charges applied. Market data – Bloomberg. Any opinions expressed are those of the Fund manager. They should not be viewed as a guarantee of a return from an investment in the Funds. The content of the commentary should not be viewed as a recommendation to invest nor buy or sell securities. Past performance is not a guide to the future. The value of an investment and any income from it can go down as well as up. Investors may not get back the original amount invested.
Material Portfolio ChangesPurchases Sales
UK Treasury 2.00% 07/09/2025 UK Treasury 5.00% 07/03/2025
UK Treasury 5.00% 07/03/2025 European Investment Bank 1.50% 01/02/2019
UK Treasury 3.50% 22/01/2045 HSBC Bank, FRN 5.38% 04/11/2030
HSBC Holdings 6.75% 11/09/2028 UK Treasury 3.50% 22/01/2045
Kreditanstalt fuer Wiederaufbau 5.00% 09/06/2036 UK Treasury 4.50% 07/12/2042
Unilever Inmarsat
European Investment Bank 1.50% 01/02/2019 UK Treasury 3.75% 22/07/2052
UK Treasury 6.00% 07/12/2028 Allianz Finance II 4.50% 13/03/2043
European Investment Bank 5.00% 15/04/2039 Koninklijke KPN, FRN 6.87% 14/03/2073
Travis Perkins 4.38% 15/09/2021 Cooperatieve Rabobank 4.63% 23/05/2029
Synthetic Risk and Reward Indicator
Lower risk Higher risk
Typically lower rewards Typically higher rewards
1 2 3 4 5 6 7The Fund has been allocated a risk number based on the historic volatility of its share price. Where insufficient share price information is available, the risk number has been based on the historic volatility of the asset classes appropriate to the Fund.– This indicator is based on historical data, calculated using European Union
rules, and may not be a reliable indication of the future risk profile of the Fund.
– The risk and reward category shown is not guaranteed to remain unchanged and may change over time. The lowest category does not mean ‘risk free’.
– Bond values are affected by changes in interest rates, and the bond issuer’s creditworthiness. Bonds that produce a higher level of income usually have a greater risk of default.
– The value of investments will be affected by changes in exchange rates.– Full information on the risks applicable to the Fund is detailed in the
Prospectus.
AVIVA INVESTORS DISTRIBUTION FUND
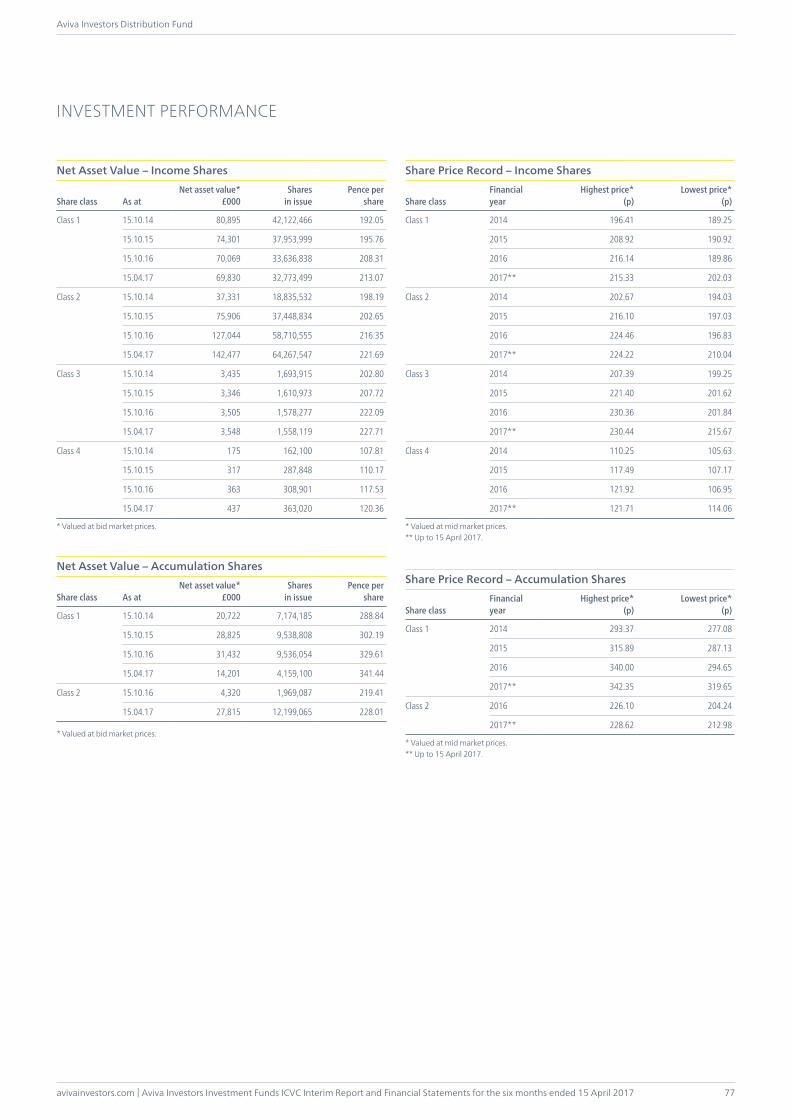
avivainvestors.com | Aviva Investors Investment Funds ICVC Interim Report and Financial Statements for the six months ended 15 April 2017
Aviva Investors Distribution Fund
77
INVESTMENT PERFORMANCE
Net Asset Value – Income Shares
Share class As atNet asset value*
£000Shares
in issuePence per
share
Class 1 15.10.14 80,895 42,122,466 192.05
15.10.15 74,301 37,953,999 195.76
15.10.16 70,069 33,636,838 208.31
15.04.17 69,830 32,773,499 213.07
Class 2 15.10.14 37,331 18,835,532 198.19
15.10.15 75,906 37,448,834 202.65
15.10.16 127,044 58,710,555 216.35
15.04.17 142,477 64,267,547 221.69
Class 3 15.10.14 3,435 1,693,915 202.80
15.10.15 3,346 1,610,973 207.72
15.10.16 3,505 1,578,277 222.09
15.04.17 3,548 1,558,119 227.71
Class 4 15.10.14 175 162,100 107.81
15.10.15 317 287,848 110.17
15.10.16 363 308,901 117.53
15.04.17 437 363,020 120.36
* Valued at bid market prices.
Net Asset Value – Accumulation Shares
Share class As atNet asset value*
£000Shares
in issuePence per
share
Class 1 15.10.14 20,722 7,174,185 288.84
15.10.15 28,825 9,538,808 302.19
15.10.16 31,432 9,536,054 329.61
15.04.17 14,201 4,159,100 341.44
Class 2 15.10.16 4,320 1,969,087 219.41
15.04.17 27,815 12,199,065 228.01
* Valued at bid market prices.
Share Price Record – Income Shares
Share classFinancialyear
Highest price*(p)
Lowest price*(p)
Class 1 2014 196.41 189.25
2015 208.92 190.92
2016 216.14 189.86
2017** 215.33 202.03
Class 2 2014 202.67 194.03
2015 216.10 197.03
2016 224.46 196.83
2017** 224.22 210.04
Class 3 2014 207.39 199.25
2015 221.40 201.62
2016 230.36 201.84
2017** 230.44 215.67
Class 4 2014 110.25 105.63
2015 117.49 107.17
2016 121.92 106.95
2017** 121.71 114.06
* Valued at mid market prices.** Up to 15 April 2017.
Share Price Record – Accumulation Shares
Share classFinancialyear
Highest price*(p)
Lowest price*(p)
Class 1 2014 293.37 277.08
2015 315.89 287.13
2016 340.00 294.65
2017** 342.35 319.65
Class 2 2016 226.10 204.24
2017** 228.62 212.98
* Valued at mid market prices.** Up to 15 April 2017.
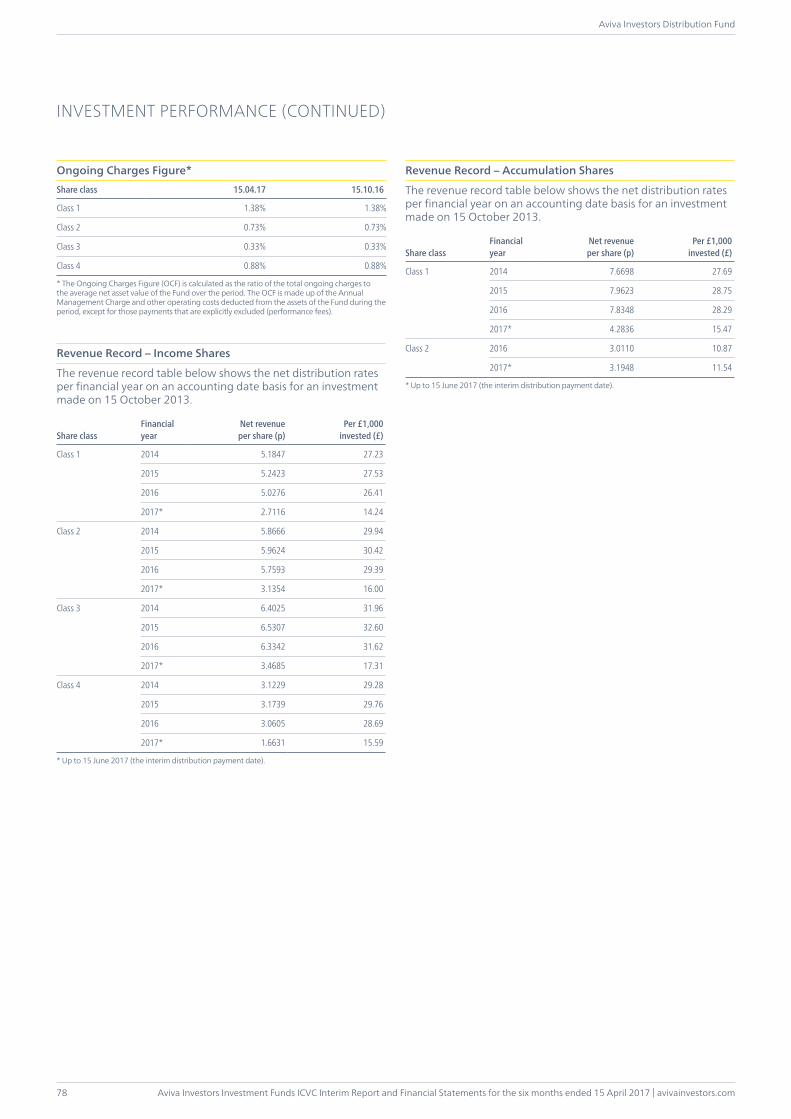
Aviva Investors Investment Funds ICVC Interim Report and Financial Statements for the six months ended 15 April 2017 | avivainvestors.com
Aviva Investors Distribution Fund
78
Ongoing Charges Figure*Share class 15.04.17 15.10.16
Class 1 1.38% 1.38%
Class 2 0.73% 0.73%
Class 3 0.33% 0.33%
Class 4 0.88% 0.88%
* The Ongoing Charges Figure (OCF) is calculated as the ratio of the total ongoing charges to the average net asset value of the Fund over the period. The OCF is made up of the Annual Management Charge and other operating costs deducted from the assets of the Fund during the period, except for those payments that are explicitly excluded (performance fees).
Revenue Record – Income Shares
The revenue record table below shows the net distribution rates per financial year on an accounting date basis for an investment made on 15 October 2013.
Share classFinancialyear
Net revenue per share (p)
Per £1,000invested (£)
Class 1 2014 5.1847 27.23
2015 5.2423 27.53
2016 5.0276 26.41
2017* 2.7116 14.24
Class 2 2014 5.8666 29.94
2015 5.9624 30.42
2016 5.7593 29.39
2017* 3.1354 16.00
Class 3 2014 6.4025 31.96
2015 6.5307 32.60
2016 6.3342 31.62
2017* 3.4685 17.31
Class 4 2014 3.1229 29.28
2015 3.1739 29.76
2016 3.0605 28.69
2017* 1.6631 15.59
* Up to 15 June 2017 (the interim distribution payment date).
INVESTMENT PERFORMANCE (CONTINUED)
Revenue Record – Accumulation Shares
The revenue record table below shows the net distribution rates per financial year on an accounting date basis for an investment made on 15 October 2013.
Share classFinancialyear
Net revenue per share (p)
Per £1,000invested (£)
Class 1 2014 7.6698 27.69
2015 7.9623 28.75
2016 7.8348 28.29
2017* 4.2836 15.47
Class 2 2016 3.0110 10.87
2017* 3.1948 11.54
* Up to 15 June 2017 (the interim distribution payment date).
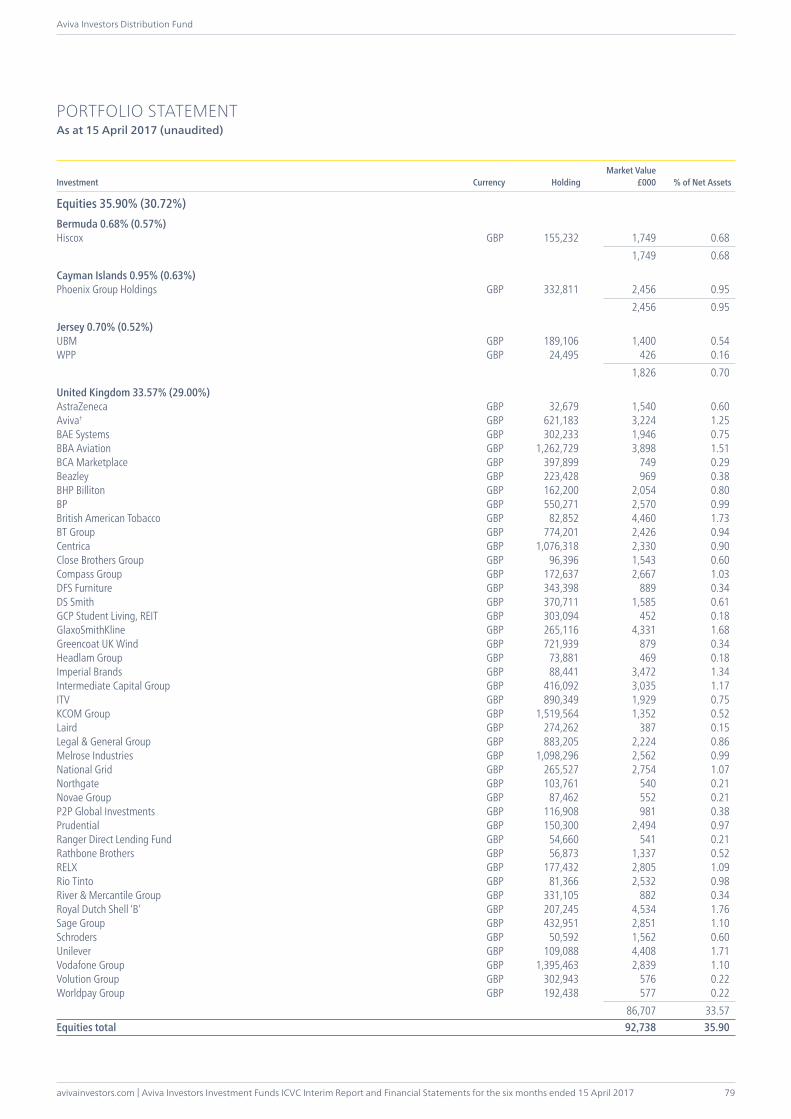
avivainvestors.com | Aviva Investors Investment Funds ICVC Interim Report and Financial Statements for the six months ended 15 April 2017
Aviva Investors Distribution Fund
79
PORTFOLIO STATEMENTAs at 15 April 2017 (unaudited)
Investment Currency HoldingMarket Value
£000 % of Net Assets
Equities 35.90% (30.72%)Bermuda 0.68% (0.57%)Hiscox GBP 155,232 1,749 0.68 1,749 0.68
Cayman Islands 0.95% (0.63%)Phoenix Group Holdings GBP 332,811 2,456 0.95 2,456 0.95
Jersey 0.70% (0.52%)UBM GBP 189,106 1,400 0.54WPP GBP 24,495 426 0.16 1,826 0.70
United Kingdom 33.57% (29.00%)AstraZeneca GBP 32,679 1,540 0.60Aviva† GBP 621,183 3,224 1.25BAE Systems GBP 302,233 1,946 0.75BBA Aviation GBP 1,262,729 3,898 1.51BCA Marketplace GBP 397,899 749 0.29Beazley GBP 223,428 969 0.38BHP Billiton GBP 162,200 2,054 0.80BP GBP 550,271 2,570 0.99British American Tobacco GBP 82,852 4,460 1.73BT Group GBP 774,201 2,426 0.94Centrica GBP 1,076,318 2,330 0.90Close Brothers Group GBP 96,396 1,543 0.60Compass Group GBP 172,637 2,667 1.03DFS Furniture GBP 343,398 889 0.34DS Smith GBP 370,711 1,585 0.61GCP Student Living, REIT GBP 303,094 452 0.18GlaxoSmithKline GBP 265,116 4,331 1.68Greencoat UK Wind GBP 721,939 879 0.34Headlam Group GBP 73,881 469 0.18Imperial Brands GBP 88,441 3,472 1.34Intermediate Capital Group GBP 416,092 3,035 1.17ITV GBP 890,349 1,929 0.75KCOM Group GBP 1,519,564 1,352 0.52Laird GBP 274,262 387 0.15Legal & General Group GBP 883,205 2,224 0.86Melrose Industries GBP 1,098,296 2,562 0.99National Grid GBP 265,527 2,754 1.07Northgate GBP 103,761 540 0.21Novae Group GBP 87,462 552 0.21P2P Global Investments GBP 116,908 981 0.38Prudential GBP 150,300 2,494 0.97Ranger Direct Lending Fund GBP 54,660 541 0.21Rathbone Brothers GBP 56,873 1,337 0.52RELX GBP 177,432 2,805 1.09Rio Tinto GBP 81,366 2,532 0.98River & Mercantile Group GBP 331,105 882 0.34Royal Dutch Shell ‘B’ GBP 207,245 4,534 1.76Sage Group GBP 432,951 2,851 1.10Schroders GBP 50,592 1,562 0.60Unilever GBP 109,088 4,408 1.71Vodafone Group GBP 1,395,463 2,839 1.10Volution Group GBP 302,943 576 0.22Worldpay Group GBP 192,438 577 0.22 86,707 33.57Equities total 92,738 35.90
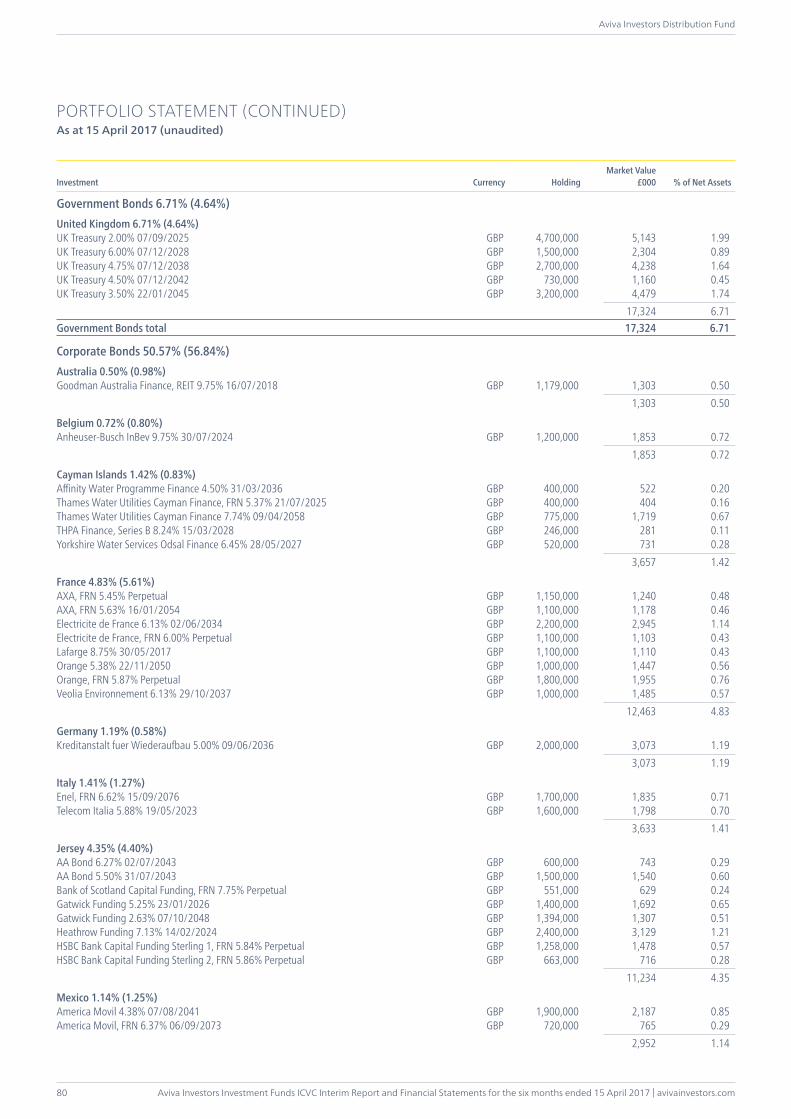
Aviva Investors Investment Funds ICVC Interim Report and Financial Statements for the six months ended 15 April 2017 | avivainvestors.com
Aviva Investors Distribution Fund
80
PORTFOLIO STATEMENT (CONTINUED)As at 15 April 2017 (unaudited)
Investment Currency HoldingMarket Value
£000 % of Net Assets
Government Bonds 6.71% (4.64%)United Kingdom 6.71% (4.64%)UK Treasury 2.00% 07/09/2025 GBP 4,700,000 5,143 1.99UK Treasury 6.00% 07/12/2028 GBP 1,500,000 2,304 0.89UK Treasury 4.75% 07/12/2038 GBP 2,700,000 4,238 1.64UK Treasury 4.50% 07/12/2042 GBP 730,000 1,160 0.45UK Treasury 3.50% 22/01/2045 GBP 3,200,000 4,479 1.74 17,324 6.71Government Bonds total 17,324 6.71
Corporate Bonds 50.57% (56.84%)Australia 0.50% (0.98%)Goodman Australia Finance, REIT 9.75% 16/07/2018 GBP 1,179,000 1,303 0.50 1,303 0.50
Belgium 0.72% (0.80%)Anheuser-Busch InBev 9.75% 30/07/2024 GBP 1,200,000 1,853 0.72 1,853 0.72
Cayman Islands 1.42% (0.83%)Affinity Water Programme Finance 4.50% 31/03/2036 GBP 400,000 522 0.20Thames Water Utilities Cayman Finance, FRN 5.37% 21/07/2025 GBP 400,000 404 0.16Thames Water Utilities Cayman Finance 7.74% 09/04/2058 GBP 775,000 1,719 0.67THPA Finance, Series B 8.24% 15/03/2028 GBP 246,000 281 0.11Yorkshire Water Services Odsal Finance 6.45% 28/05/2027 GBP 520,000 731 0.28 3,657 1.42
France 4.83% (5.61%)AXA, FRN 5.45% Perpetual GBP 1,150,000 1,240 0.48AXA, FRN 5.63% 16/01/2054 GBP 1,100,000 1,178 0.46Electricite de France 6.13% 02/06/2034 GBP 2,200,000 2,945 1.14Electricite de France, FRN 6.00% Perpetual GBP 1,100,000 1,103 0.43Lafarge 8.75% 30/05/2017 GBP 1,100,000 1,110 0.43Orange 5.38% 22/11/2050 GBP 1,000,000 1,447 0.56Orange, FRN 5.87% Perpetual GBP 1,800,000 1,955 0.76Veolia Environnement 6.13% 29/10/2037 GBP 1,000,000 1,485 0.57 12,463 4.83
Germany 1.19% (0.58%)Kreditanstalt fuer Wiederaufbau 5.00% 09/06/2036 GBP 2,000,000 3,073 1.19 3,073 1.19
Italy 1.41% (1.27%)Enel, FRN 6.62% 15/09/2076 GBP 1,700,000 1,835 0.71Telecom Italia 5.88% 19/05/2023 GBP 1,600,000 1,798 0.70 3,633 1.41
Jersey 4.35% (4.40%)AA Bond 6.27% 02/07/2043 GBP 600,000 743 0.29AA Bond 5.50% 31/07/2043 GBP 1,500,000 1,540 0.60Bank of Scotland Capital Funding, FRN 7.75% Perpetual GBP 551,000 629 0.24Gatwick Funding 5.25% 23/01/2026 GBP 1,400,000 1,692 0.65Gatwick Funding 2.63% 07/10/2048 GBP 1,394,000 1,307 0.51Heathrow Funding 7.13% 14/02/2024 GBP 2,400,000 3,129 1.21HSBC Bank Capital Funding Sterling 1, FRN 5.84% Perpetual GBP 1,258,000 1,478 0.57HSBC Bank Capital Funding Sterling 2, FRN 5.86% Perpetual GBP 663,000 716 0.28 11,234 4.35
Mexico 1.14% (1.25%)America Movil 4.38% 07/08/2041 GBP 1,900,000 2,187 0.85America Movil, FRN 6.37% 06/09/2073 GBP 720,000 765 0.29 2,952 1.14
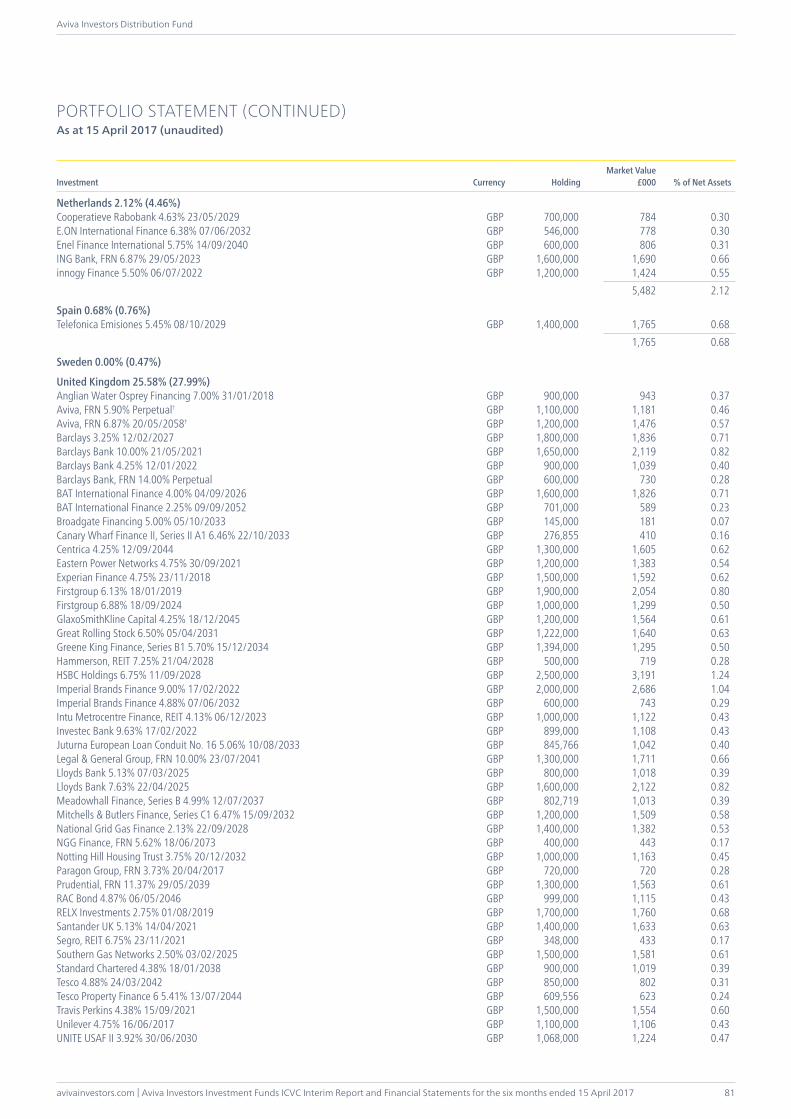
avivainvestors.com | Aviva Investors Investment Funds ICVC Interim Report and Financial Statements for the six months ended 15 April 2017
Aviva Investors Distribution Fund
81
PORTFOLIO STATEMENT (CONTINUED)As at 15 April 2017 (unaudited)
Investment Currency HoldingMarket Value
£000 % of Net Assets
Netherlands 2.12% (4.46%)Cooperatieve Rabobank 4.63% 23/05/2029 GBP 700,000 784 0.30E.ON International Finance 6.38% 07/06/2032 GBP 546,000 778 0.30Enel Finance International 5.75% 14/09/2040 GBP 600,000 806 0.31ING Bank, FRN 6.87% 29/05/2023 GBP 1,600,000 1,690 0.66innogy Finance 5.50% 06/07/2022 GBP 1,200,000 1,424 0.55 5,482 2.12
Spain 0.68% (0.76%)Telefonica Emisiones 5.45% 08/10/2029 GBP 1,400,000 1,765 0.68 1,765 0.68
Sweden 0.00% (0.47%)
United Kingdom 25.58% (27.99%)Anglian Water Osprey Financing 7.00% 31/01/2018 GBP 900,000 943 0.37Aviva, FRN 5.90% Perpetual† GBP 1,100,000 1,181 0.46Aviva, FRN 6.87% 20/05/2058† GBP 1,200,000 1,476 0.57Barclays 3.25% 12/02/2027 GBP 1,800,000 1,836 0.71Barclays Bank 10.00% 21/05/2021 GBP 1,650,000 2,119 0.82Barclays Bank 4.25% 12/01/2022 GBP 900,000 1,039 0.40Barclays Bank, FRN 14.00% Perpetual GBP 600,000 730 0.28BAT International Finance 4.00% 04/09/2026 GBP 1,600,000 1,826 0.71BAT International Finance 2.25% 09/09/2052 GBP 701,000 589 0.23Broadgate Financing 5.00% 05/10/2033 GBP 145,000 181 0.07Canary Wharf Finance II, Series II A1 6.46% 22/10/2033 GBP 276,855 410 0.16Centrica 4.25% 12/09/2044 GBP 1,300,000 1,605 0.62Eastern Power Networks 4.75% 30/09/2021 GBP 1,200,000 1,383 0.54Experian Finance 4.75% 23/11/2018 GBP 1,500,000 1,592 0.62Firstgroup 6.13% 18/01/2019 GBP 1,900,000 2,054 0.80Firstgroup 6.88% 18/09/2024 GBP 1,000,000 1,299 0.50GlaxoSmithKline Capital 4.25% 18/12/2045 GBP 1,200,000 1,564 0.61Great Rolling Stock 6.50% 05/04/2031 GBP 1,222,000 1,640 0.63Greene King Finance, Series B1 5.70% 15/12/2034 GBP 1,394,000 1,295 0.50Hammerson, REIT 7.25% 21/04/2028 GBP 500,000 719 0.28HSBC Holdings 6.75% 11/09/2028 GBP 2,500,000 3,191 1.24Imperial Brands Finance 9.00% 17/02/2022 GBP 2,000,000 2,686 1.04Imperial Brands Finance 4.88% 07/06/2032 GBP 600,000 743 0.29Intu Metrocentre Finance, REIT 4.13% 06/12/2023 GBP 1,000,000 1,122 0.43Investec Bank 9.63% 17/02/2022 GBP 899,000 1,108 0.43Juturna European Loan Conduit No. 16 5.06% 10/08/2033 GBP 845,766 1,042 0.40Legal & General Group, FRN 10.00% 23/07/2041 GBP 1,300,000 1,711 0.66Lloyds Bank 5.13% 07/03/2025 GBP 800,000 1,018 0.39Lloyds Bank 7.63% 22/04/2025 GBP 1,600,000 2,122 0.82Meadowhall Finance, Series B 4.99% 12/07/2037 GBP 802,719 1,013 0.39Mitchells & Butlers Finance, Series C1 6.47% 15/09/2032 GBP 1,200,000 1,509 0.58National Grid Gas Finance 2.13% 22/09/2028 GBP 1,400,000 1,382 0.53NGG Finance, FRN 5.62% 18/06/2073 GBP 400,000 443 0.17Notting Hill Housing Trust 3.75% 20/12/2032 GBP 1,000,000 1,163 0.45Paragon Group, FRN 3.73% 20/04/2017 GBP 720,000 720 0.28Prudential, FRN 11.37% 29/05/2039 GBP 1,300,000 1,563 0.61RAC Bond 4.87% 06/05/2046 GBP 999,000 1,115 0.43RELX Investments 2.75% 01/08/2019 GBP 1,700,000 1,760 0.68Santander UK 5.13% 14/04/2021 GBP 1,400,000 1,633 0.63Segro, REIT 6.75% 23/11/2021 GBP 348,000 433 0.17Southern Gas Networks 2.50% 03/02/2025 GBP 1,500,000 1,581 0.61Standard Chartered 4.38% 18/01/2038 GBP 900,000 1,019 0.39Tesco 4.88% 24/03/2042 GBP 850,000 802 0.31Tesco Property Finance 6 5.41% 13/07/2044 GBP 609,556 623 0.24Travis Perkins 4.38% 15/09/2021 GBP 1,500,000 1,554 0.60Unilever 4.75% 16/06/2017 GBP 1,100,000 1,106 0.43UNITE USAF II 3.92% 30/06/2030 GBP 1,068,000 1,224 0.47
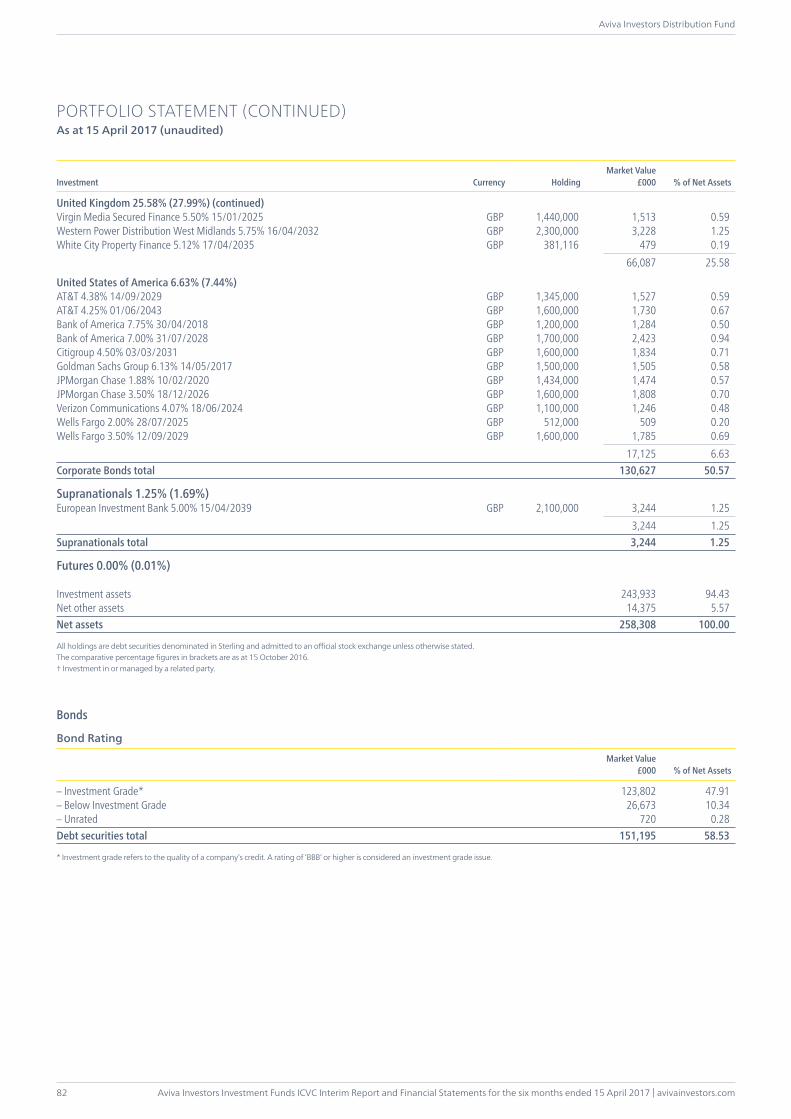
Aviva Investors Investment Funds ICVC Interim Report and Financial Statements for the six months ended 15 April 2017 | avivainvestors.com
Aviva Investors Distribution Fund
82
PORTFOLIO STATEMENT (CONTINUED)As at 15 April 2017 (unaudited)
Investment Currency HoldingMarket Value
£000 % of Net Assets
United Kingdom 25.58% (27.99%) (continued)Virgin Media Secured Finance 5.50% 15/01/2025 GBP 1,440,000 1,513 0.59Western Power Distribution West Midlands 5.75% 16/04/2032 GBP 2,300,000 3,228 1.25White City Property Finance 5.12% 17/04/2035 GBP 381,116 479 0.19 66,087 25.58
United States of America 6.63% (7.44%)AT&T 4.38% 14/09/2029 GBP 1,345,000 1,527 0.59AT&T 4.25% 01/06/2043 GBP 1,600,000 1,730 0.67Bank of America 7.75% 30/04/2018 GBP 1,200,000 1,284 0.50Bank of America 7.00% 31/07/2028 GBP 1,700,000 2,423 0.94Citigroup 4.50% 03/03/2031 GBP 1,600,000 1,834 0.71Goldman Sachs Group 6.13% 14/05/2017 GBP 1,500,000 1,505 0.58JPMorgan Chase 1.88% 10/02/2020 GBP 1,434,000 1,474 0.57JPMorgan Chase 3.50% 18/12/2026 GBP 1,600,000 1,808 0.70Verizon Communications 4.07% 18/06/2024 GBP 1,100,000 1,246 0.48Wells Fargo 2.00% 28/07/2025 GBP 512,000 509 0.20Wells Fargo 3.50% 12/09/2029 GBP 1,600,000 1,785 0.69 17,125 6.63Corporate Bonds total 130,627 50.57
Supranationals 1.25% (1.69%)European Investment Bank 5.00% 15/04/2039 GBP 2,100,000 3,244 1.25 3,244 1.25Supranationals total 3,244 1.25
Futures 0.00% (0.01%)
Investment assets 243,933 94.43Net other assets 14,375 5.57Net assets 258,308 100.00
All holdings are debt securities denominated in Sterling and admitted to an official stock exchange unless otherwise stated.The comparative percentage figures in brackets are as at 15 October 2016.† Investment in or managed by a related party.
Bonds
– Investment Grade* 123,802 47.91– Below Investment Grade 26,673 10.34– Unrated 720 0.28Debt securities total 151,195 58.53
* Investment grade refers to the quality of a company’s credit. A rating of ‘BBB’ or higher is considered an investment grade issue.
Market Value£000 % of Net Assets
Bond Rating
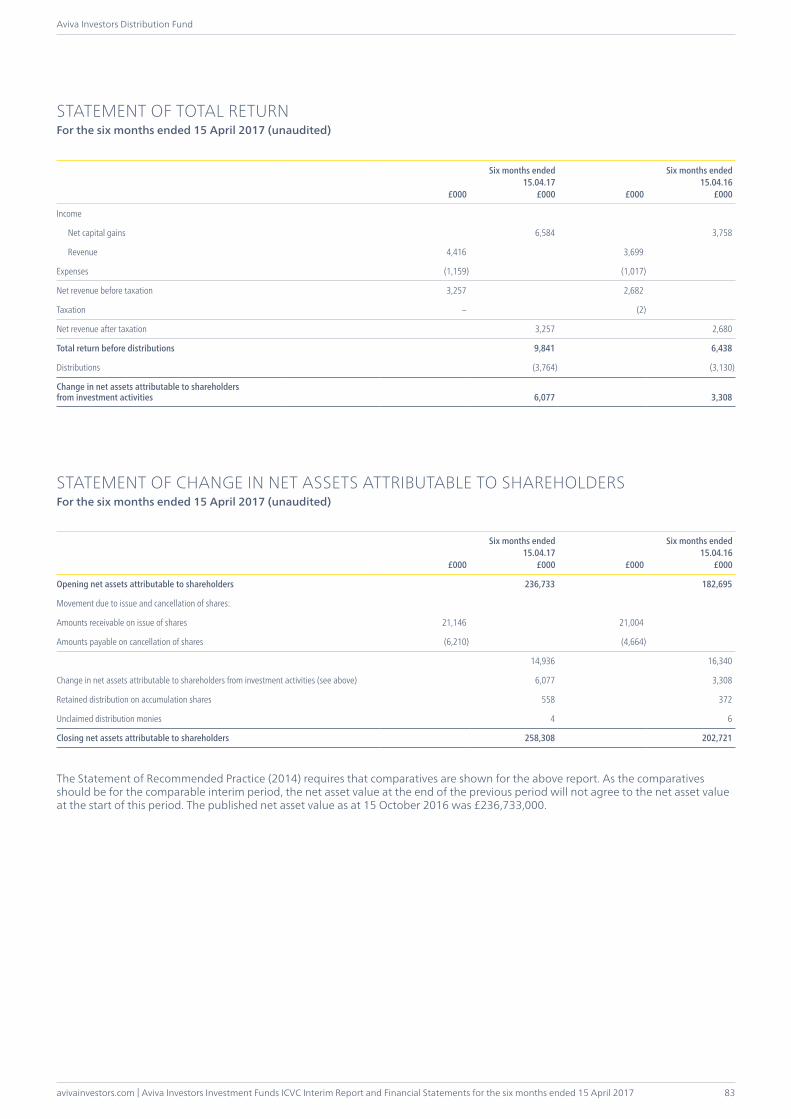
avivainvestors.com | Aviva Investors Investment Funds ICVC Interim Report and Financial Statements for the six months ended 15 April 2017
Aviva Investors Distribution Fund
83
£000
Six months ended15.04.17
£000 £000
Six months ended15.04.16
£000
Income
Net capital gains 6,584 3,758
Revenue 4,416 3,699
Expenses (1,159) (1,017)
Net revenue before taxation 3,257 2,682
Taxation – (2)
Net revenue after taxation 3,257 2,680
Total return before distributions 9,841 6,438
Distributions (3,764) (3,130)
Change in net assets attributable to shareholders from investment activities 6,077 3,308
STATEMENT OF CHANGE IN NET ASSETS ATTRIBUTABLE TO SHAREHOLDERSFor the six months ended 15 April 2017 (unaudited)
£000
Six months ended15.04.17
£000 £000
Six months ended15.04.16
£000
Opening net assets attributable to shareholders 236,733 182,695
Movement due to issue and cancellation of shares:
Amounts receivable on issue of shares 21,146 21,004
Amounts payable on cancellation of shares (6,210) (4,664)
14,936 16,340
Change in net assets attributable to shareholders from investment activities (see above) 6,077 3,308
Retained distribution on accumulation shares 558 372
Unclaimed distribution monies 4 6
Closing net assets attributable to shareholders 258,308 202,721
The Statement of Recommended Practice (2014) requires that comparatives are shown for the above report. As the comparatives should be for the comparable interim period, the net asset value at the end of the previous period will not agree to the net asset value at the start of this period. The published net asset value as at 15 October 2016 was £236,733,000.
STATEMENT OF TOTAL RETURNFor the six months ended 15 April 2017 (unaudited)
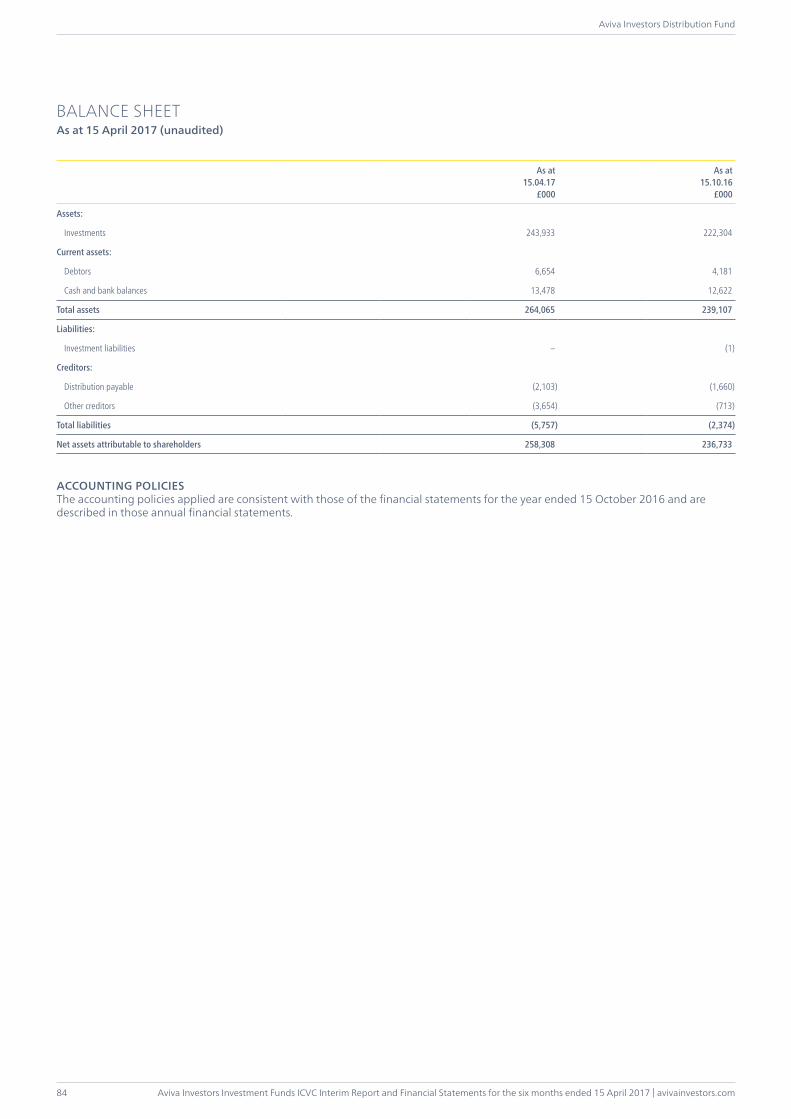
Aviva Investors Investment Funds ICVC Interim Report and Financial Statements for the six months ended 15 April 2017 | avivainvestors.com
Aviva Investors Distribution Fund
84
BALANCE SHEETAs at 15 April 2017 (unaudited)
As at15.04.17
£000
As at15.10.16
£000
Assets:
Investments 243,933 222,304
Current assets:
Debtors 6,654 4,181
Cash and bank balances 13,478 12,622
Total assets 264,065 239,107
Liabilities:
Investment liabilities – (1)
Creditors:
Distribution payable (2,103) (1,660)
Other creditors (3,654) (713)
Total liabilities (5,757) (2,374)
Net assets attributable to shareholders 258,308 236,733
ACCOUNTING POLICIESThe accounting policies applied are consistent with those of the financial statements for the year ended 15 October 2016 and are described in those annual financial statements.
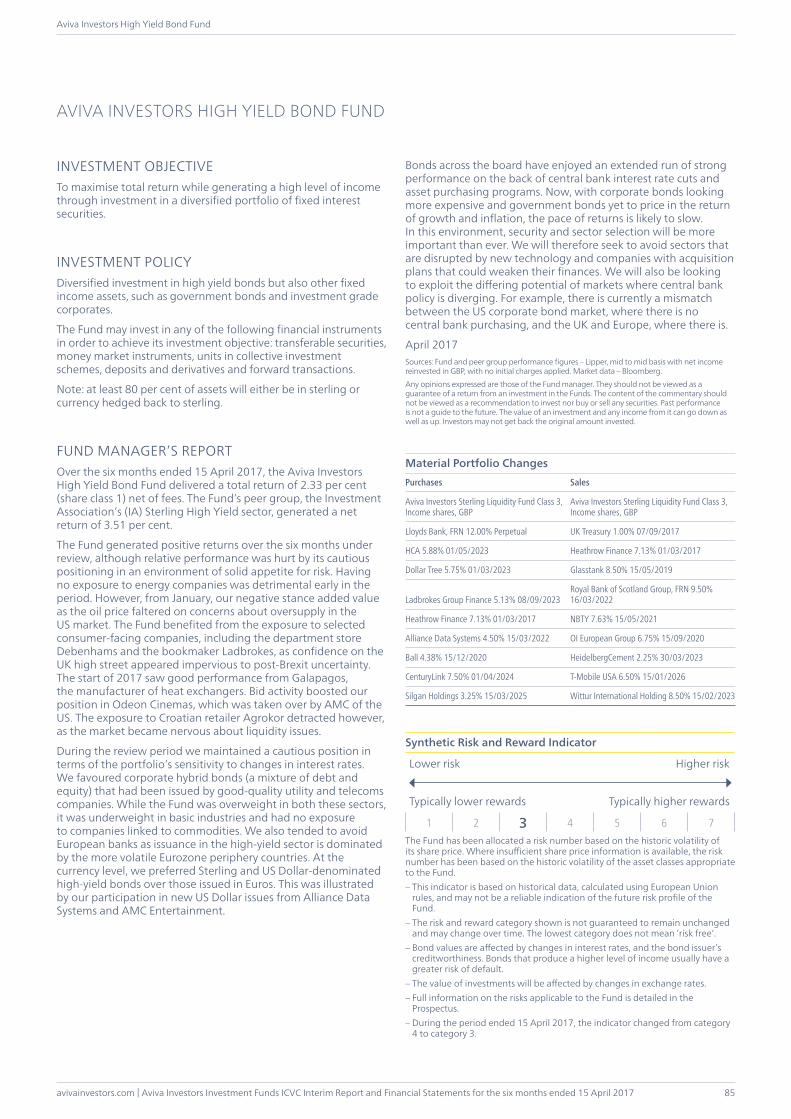
avivainvestors.com | Aviva Investors Investment Funds ICVC Interim Report and Financial Statements for the six months ended 15 April 2017
Aviva Investors High Yield Bond Fund
85
INVESTMENT OBJECTIVETo maximise total return while generating a high level of income through investment in a diversified portfolio of fixed interest securities.
INVESTMENT POLICYDiversified investment in high yield bonds but also other fixed income assets, such as government bonds and investment grade corporates.
The Fund may invest in any of the following financial instruments in order to achieve its investment objective: transferable securities, money market instruments, units in collective investment schemes, deposits and derivatives and forward transactions.
Note: at least 80 per cent of assets will either be in sterling or currency hedged back to sterling.
FUND MANAGER’S REPORTOver the six months ended 15 April 2017, the Aviva Investors High Yield Bond Fund delivered a total return of 2.33 per cent (share class 1) net of fees. The Fund’s peer group, the Investment Association’s (IA) Sterling High Yield sector, generated a net return of 3.51 per cent.
The Fund generated positive returns over the six months under review, although relative performance was hurt by its cautious positioning in an environment of solid appetite for risk. Having no exposure to energy companies was detrimental early in the period. However, from January, our negative stance added value as the oil price faltered on concerns about oversupply in the US market. The Fund benefited from the exposure to selected consumer-facing companies, including the department store Debenhams and the bookmaker Ladbrokes, as confidence on the UK high street appeared impervious to post-Brexit uncertainty. The start of 2017 saw good performance from Galapagos, the manufacturer of heat exchangers. Bid activity boosted our position in Odeon Cinemas, which was taken over by AMC of the US. The exposure to Croatian retailer Agrokor detracted however, as the market became nervous about liquidity issues.
During the review period we maintained a cautious position in terms of the portfolio’s sensitivity to changes in interest rates. We favoured corporate hybrid bonds (a mixture of debt and equity) that had been issued by good-quality utility and telecoms companies. While the Fund was overweight in both these sectors, it was underweight in basic industries and had no exposure to companies linked to commodities. We also tended to avoid European banks as issuance in the high-yield sector is dominated by the more volatile Eurozone periphery countries. At the currency level, we preferred Sterling and US Dollar-denominated high-yield bonds over those issued in Euros. This was illustrated by our participation in new US Dollar issues from Alliance Data Systems and AMC Entertainment.
Bonds across the board have enjoyed an extended run of strong performance on the back of central bank interest rate cuts and asset purchasing programs. Now, with corporate bonds looking more expensive and government bonds yet to price in the return of growth and inflation, the pace of returns is likely to slow. In this environment, security and sector selection will be more important than ever. We will therefore seek to avoid sectors that are disrupted by new technology and companies with acquisition plans that could weaken their finances. We will also be looking to exploit the differing potential of markets where central bank policy is diverging. For example, there is currently a mismatch between the US corporate bond market, where there is no central bank purchasing, and the UK and Europe, where there is.
April 2017Sources: Fund and peer group performance figures – Lipper, mid to mid basis with net income reinvested in GBP, with no initial charges applied. Market data – Bloomberg.Any opinions expressed are those of the Fund manager. They should not be viewed as a guarantee of a return from an investment in the Funds. The content of the commentary should not be viewed as a recommendation to invest nor buy or sell any securities. Past performance is not a guide to the future. The value of an investment and any income from it can go down as well as up. Investors may not get back the original amount invested.
Material Portfolio ChangesPurchases Sales
Aviva Investors Sterling Liquidity Fund Class 3, Income shares, GBP
Aviva Investors Sterling Liquidity Fund Class 3, Income shares, GBP
Lloyds Bank, FRN 12.00% Perpetual UK Treasury 1.00% 07/09/2017
HCA 5.88% 01/05/2023 Heathrow Finance 7.13% 01/03/2017
Dollar Tree 5.75% 01/03/2023 Glasstank 8.50% 15/05/2019
Ladbrokes Group Finance 5.13% 08/09/2023Royal Bank of Scotland Group, FRN 9.50% 16/03/2022
Heathrow Finance 7.13% 01/03/2017 NBTY 7.63% 15/05/2021
Alliance Data Systems 4.50% 15/03/2022 OI European Group 6.75% 15/09/2020
Ball 4.38% 15/12/2020 HeidelbergCement 2.25% 30/03/2023
CenturyLink 7.50% 01/04/2024 T-Mobile USA 6.50% 15/01/2026
Silgan Holdings 3.25% 15/03/2025 Wittur International Holding 8.50% 15/02/2023
Synthetic Risk and Reward Indicator
Lower risk Higher risk
Typically lower rewards Typically higher rewards
1 2 3 4 5 6 7The Fund has been allocated a risk number based on the historic volatility of its share price. Where insufficient share price information is available, the risk number has been based on the historic volatility of the asset classes appropriate to the Fund.– This indicator is based on historical data, calculated using European Union
rules, and may not be a reliable indication of the future risk profile of the Fund.
– The risk and reward category shown is not guaranteed to remain unchanged and may change over time. The lowest category does not mean ‘risk free‘.
– Bond values are affected by changes in interest rates, and the bond issuer’s creditworthiness. Bonds that produce a higher level of income usually have a greater risk of default.
– The value of investments will be affected by changes in exchange rates.– Full information on the risks applicable to the Fund is detailed in the
Prospectus.– During the period ended 15 April 2017, the indicator changed from category
4 to category 3.
AVIVA INVESTORS HIGH YIELD BOND FUND
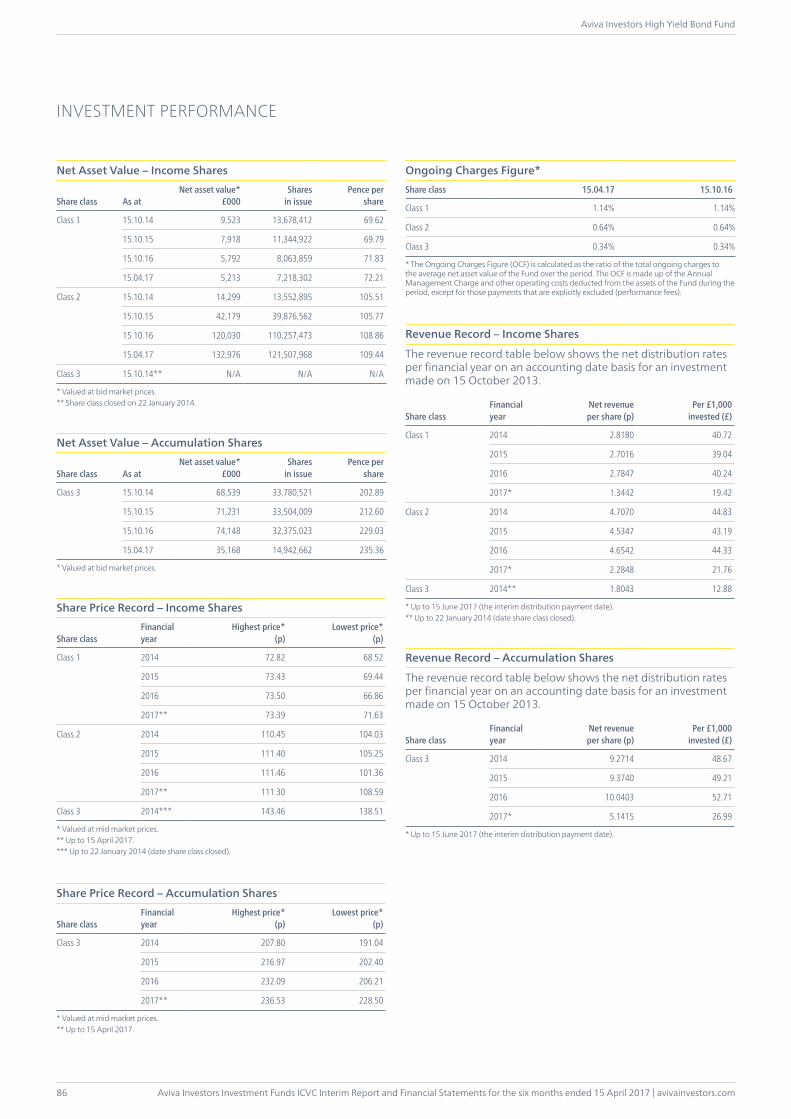
Aviva Investors Investment Funds ICVC Interim Report and Financial Statements for the six months ended 15 April 2017 | avivainvestors.com
Aviva Investors High Yield Bond Fund
86
INVESTMENT PERFORMANCE
Net Asset Value – Income Shares
Share class As atNet asset value*
£000Shares
in issuePence per
share
Class 1 15.10.14 9,523 13,678,412 69.62
15.10.15 7,918 11,344,922 69.79
15.10.16 5,792 8,063,859 71.83
15.04.17 5,213 7,218,302 72.21
Class 2 15.10.14 14,299 13,552,895 105.51
15.10.15 42,179 39,876,562 105.77
15.10.16 120,030 110,257,473 108.86
15.04.17 132,976 121,507,968 109.44
Class 3 15.10.14** N/A N/A N/A
* Valued at bid market prices.** Share class closed on 22 January 2014.
Net Asset Value – Accumulation Shares
Share class As atNet asset value*
£000Shares
in issuePence per
share
Class 3 15.10.14 68,539 33,780,521 202.89
15.10.15 71,231 33,504,009 212.60
15.10.16 74,148 32,375,023 229.03
15.04.17 35,168 14,942,662 235.36
* Valued at bid market prices.
Share Price Record – Income Shares
Share classFinancialyear
Highest price*(p)
Lowest price*(p)
Class 1 2014 72.82 68.52
2015 73.43 69.44
2016 73.50 66.86
2017** 73.39 71.63
Class 2 2014 110.45 104.03
2015 111.40 105.25
2016 111.46 101.36
2017** 111.30 108.59
Class 3 2014*** 143.46 138.51
* Valued at mid market prices.** Up to 15 April 2017.*** Up to 22 January 2014 (date share class closed).
Share Price Record – Accumulation Shares
Share classFinancialyear
Highest price*(p)
Lowest price*(p)
Class 3 2014 207.80 191.04
2015 216.97 202.40
2016 232.09 206.21
2017** 236.53 228.50
* Valued at mid market prices.** Up to 15 April 2017.
Ongoing Charges Figure*Share class 15.04.17 15.10.16
Class 1 1.14% 1.14%
Class 2 0.64% 0.64%
Class 3 0.34% 0.34%
* The Ongoing Charges Figure (OCF) is calculated as the ratio of the total ongoing charges to the average net asset value of the Fund over the period. The OCF is made up of the Annual Management Charge and other operating costs deducted from the assets of the Fund during the period, except for those payments that are explicitly excluded (performance fees).
Revenue Record – Income Shares
The revenue record table below shows the net distribution rates per financial year on an accounting date basis for an investment made on 15 October 2013.
Share classFinancialyear
Net revenue per share (p)
Per £1,000invested (£)
Class 1 2014 2.8180 40.72
2015 2.7016 39.04
2016 2.7847 40.24
2017* 1.3442 19.42
Class 2 2014 4.7070 44.83
2015 4.5347 43.19
2016 4.6542 44.33
2017* 2.2848 21.76
Class 3 2014** 1.8043 12.88
* Up to 15 June 2017 (the interim distribution payment date).** Up to 22 January 2014 (date share class closed).
Revenue Record – Accumulation Shares
The revenue record table below shows the net distribution rates per financial year on an accounting date basis for an investment made on 15 October 2013.
Share classFinancialyear
Net revenue per share (p)
Per £1,000invested (£)
Class 3 2014 9.2714 48.67
2015 9.3740 49.21
2016 10.0403 52.71
2017* 5.1415 26.99
* Up to 15 June 2017 (the interim distribution payment date).
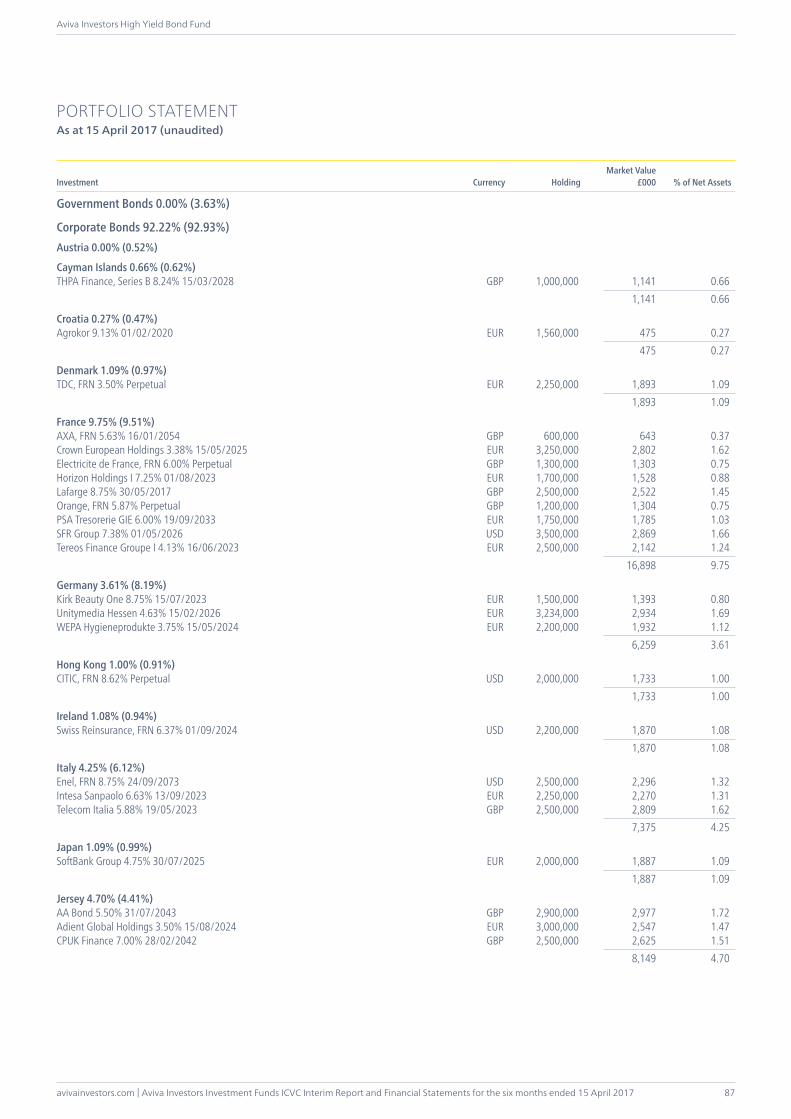
avivainvestors.com | Aviva Investors Investment Funds ICVC Interim Report and Financial Statements for the six months ended 15 April 2017
Aviva Investors High Yield Bond Fund
87
PORTFOLIO STATEMENTAs at 15 April 2017 (unaudited)
Investment Currency HoldingMarket Value
£000 % of Net Assets
Government Bonds 0.00% (3.63%)
Corporate Bonds 92.22% (92.93%)Austria 0.00% (0.52%)
Cayman Islands 0.66% (0.62%)THPA Finance, Series B 8.24% 15/03/2028 GBP 1,000,000 1,141 0.66 1,141 0.66
Croatia 0.27% (0.47%)Agrokor 9.13% 01/02/2020 EUR 1,560,000 475 0.27 475 0.27
Denmark 1.09% (0.97%)TDC, FRN 3.50% Perpetual EUR 2,250,000 1,893 1.09 1,893 1.09
France 9.75% (9.51%)AXA, FRN 5.63% 16/01/2054 GBP 600,000 643 0.37Crown European Holdings 3.38% 15/05/2025 EUR 3,250,000 2,802 1.62Electricite de France, FRN 6.00% Perpetual GBP 1,300,000 1,303 0.75Horizon Holdings I 7.25% 01/08/2023 EUR 1,700,000 1,528 0.88Lafarge 8.75% 30/05/2017 GBP 2,500,000 2,522 1.45Orange, FRN 5.87% Perpetual GBP 1,200,000 1,304 0.75PSA Tresorerie GIE 6.00% 19/09/2033 EUR 1,750,000 1,785 1.03SFR Group 7.38% 01/05/2026 USD 3,500,000 2,869 1.66Tereos Finance Groupe I 4.13% 16/06/2023 EUR 2,500,000 2,142 1.24 16,898 9.75
Germany 3.61% (8.19%)Kirk Beauty One 8.75% 15/07/2023 EUR 1,500,000 1,393 0.80Unitymedia Hessen 4.63% 15/02/2026 EUR 3,234,000 2,934 1.69WEPA Hygieneprodukte 3.75% 15/05/2024 EUR 2,200,000 1,932 1.12 6,259 3.61
Hong Kong 1.00% (0.91%)CITIC, FRN 8.62% Perpetual USD 2,000,000 1,733 1.00 1,733 1.00
Ireland 1.08% (0.94%)Swiss Reinsurance, FRN 6.37% 01/09/2024 USD 2,200,000 1,870 1.08 1,870 1.08
Italy 4.25% (6.12%)Enel, FRN 8.75% 24/09/2073 USD 2,500,000 2,296 1.32Intesa Sanpaolo 6.63% 13/09/2023 EUR 2,250,000 2,270 1.31Telecom Italia 5.88% 19/05/2023 GBP 2,500,000 2,809 1.62 7,375 4.25
Japan 1.09% (0.99%)SoftBank Group 4.75% 30/07/2025 EUR 2,000,000 1,887 1.09 1,887 1.09
Jersey 4.70% (4.41%)AA Bond 5.50% 31/07/2043 GBP 2,900,000 2,977 1.72Adient Global Holdings 3.50% 15/08/2024 EUR 3,000,000 2,547 1.47CPUK Finance 7.00% 28/02/2042 GBP 2,500,000 2,625 1.51 8,149 4.70
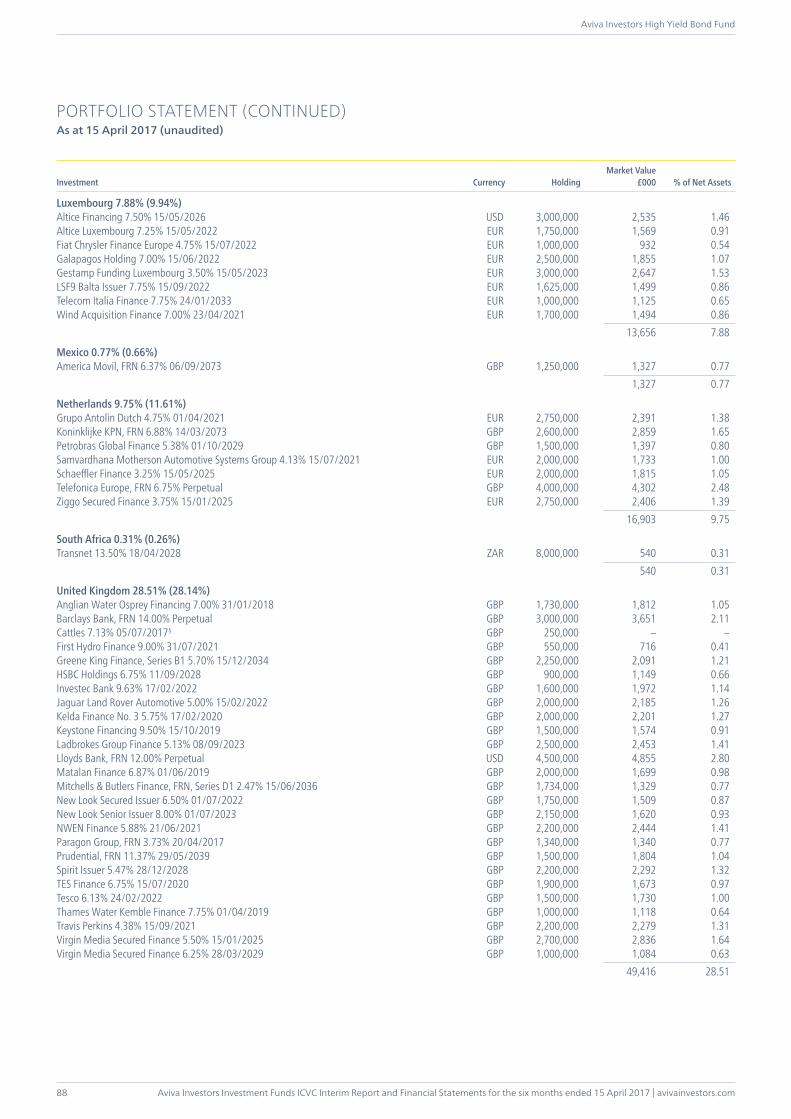
Aviva Investors Investment Funds ICVC Interim Report and Financial Statements for the six months ended 15 April 2017 | avivainvestors.com
Aviva Investors High Yield Bond Fund
88
PORTFOLIO STATEMENT (CONTINUED)As at 15 April 2017 (unaudited)
Investment Currency HoldingMarket Value
£000 % of Net Assets
Luxembourg 7.88% (9.94%)Altice Financing 7.50% 15/05/2026 USD 3,000,000 2,535 1.46Altice Luxembourg 7.25% 15/05/2022 EUR 1,750,000 1,569 0.91Fiat Chrysler Finance Europe 4.75% 15/07/2022 EUR 1,000,000 932 0.54Galapagos Holding 7.00% 15/06/2022 EUR 2,500,000 1,855 1.07Gestamp Funding Luxembourg 3.50% 15/05/2023 EUR 3,000,000 2,647 1.53LSF9 Balta Issuer 7.75% 15/09/2022 EUR 1,625,000 1,499 0.86Telecom Italia Finance 7.75% 24/01/2033 EUR 1,000,000 1,125 0.65Wind Acquisition Finance 7.00% 23/04/2021 EUR 1,700,000 1,494 0.86 13,656 7.88
Mexico 0.77% (0.66%)America Movil, FRN 6.37% 06/09/2073 GBP 1,250,000 1,327 0.77 1,327 0.77
Netherlands 9.75% (11.61%)Grupo Antolin Dutch 4.75% 01/04/2021 EUR 2,750,000 2,391 1.38Koninklijke KPN, FRN 6.88% 14/03/2073 GBP 2,600,000 2,859 1.65Petrobras Global Finance 5.38% 01/10/2029 GBP 1,500,000 1,397 0.80Samvardhana Motherson Automotive Systems Group 4.13% 15/07/2021 EUR 2,000,000 1,733 1.00Schaeffler Finance 3.25% 15/05/2025 EUR 2,000,000 1,815 1.05Telefonica Europe, FRN 6.75% Perpetual GBP 4,000,000 4,302 2.48Ziggo Secured Finance 3.75% 15/01/2025 EUR 2,750,000 2,406 1.39 16,903 9.75
South Africa 0.31% (0.26%)Transnet 13.50% 18/04/2028 ZAR 8,000,000 540 0.31 540 0.31
United Kingdom 28.51% (28.14%)Anglian Water Osprey Financing 7.00% 31/01/2018 GBP 1,730,000 1,812 1.05Barclays Bank, FRN 14.00% Perpetual GBP 3,000,000 3,651 2.11Cattles 7.13% 05/07/2017§ GBP 250,000 – –First Hydro Finance 9.00% 31/07/2021 GBP 550,000 716 0.41Greene King Finance, Series B1 5.70% 15/12/2034 GBP 2,250,000 2,091 1.21HSBC Holdings 6.75% 11/09/2028 GBP 900,000 1,149 0.66Investec Bank 9.63% 17/02/2022 GBP 1,600,000 1,972 1.14Jaguar Land Rover Automotive 5.00% 15/02/2022 GBP 2,000,000 2,185 1.26Kelda Finance No. 3 5.75% 17/02/2020 GBP 2,000,000 2,201 1.27Keystone Financing 9.50% 15/10/2019 GBP 1,500,000 1,574 0.91Ladbrokes Group Finance 5.13% 08/09/2023 GBP 2,500,000 2,453 1.41Lloyds Bank, FRN 12.00% Perpetual USD 4,500,000 4,855 2.80Matalan Finance 6.87% 01/06/2019 GBP 2,000,000 1,699 0.98Mitchells & Butlers Finance, FRN, Series D1 2.47% 15/06/2036 GBP 1,734,000 1,329 0.77New Look Secured Issuer 6.50% 01/07/2022 GBP 1,750,000 1,509 0.87New Look Senior Issuer 8.00% 01/07/2023 GBP 2,150,000 1,620 0.93NWEN Finance 5.88% 21/06/2021 GBP 2,200,000 2,444 1.41Paragon Group, FRN 3.73% 20/04/2017 GBP 1,340,000 1,340 0.77Prudential, FRN 11.37% 29/05/2039 GBP 1,500,000 1,804 1.04Spirit Issuer 5.47% 28/12/2028 GBP 2,200,000 2,292 1.32TES Finance 6.75% 15/07/2020 GBP 1,900,000 1,673 0.97Tesco 6.13% 24/02/2022 GBP 1,500,000 1,730 1.00Thames Water Kemble Finance 7.75% 01/04/2019 GBP 1,000,000 1,118 0.64Travis Perkins 4.38% 15/09/2021 GBP 2,200,000 2,279 1.31Virgin Media Secured Finance 5.50% 15/01/2025 GBP 2,700,000 2,836 1.64Virgin Media Secured Finance 6.25% 28/03/2029 GBP 1,000,000 1,084 0.63 49,416 28.51
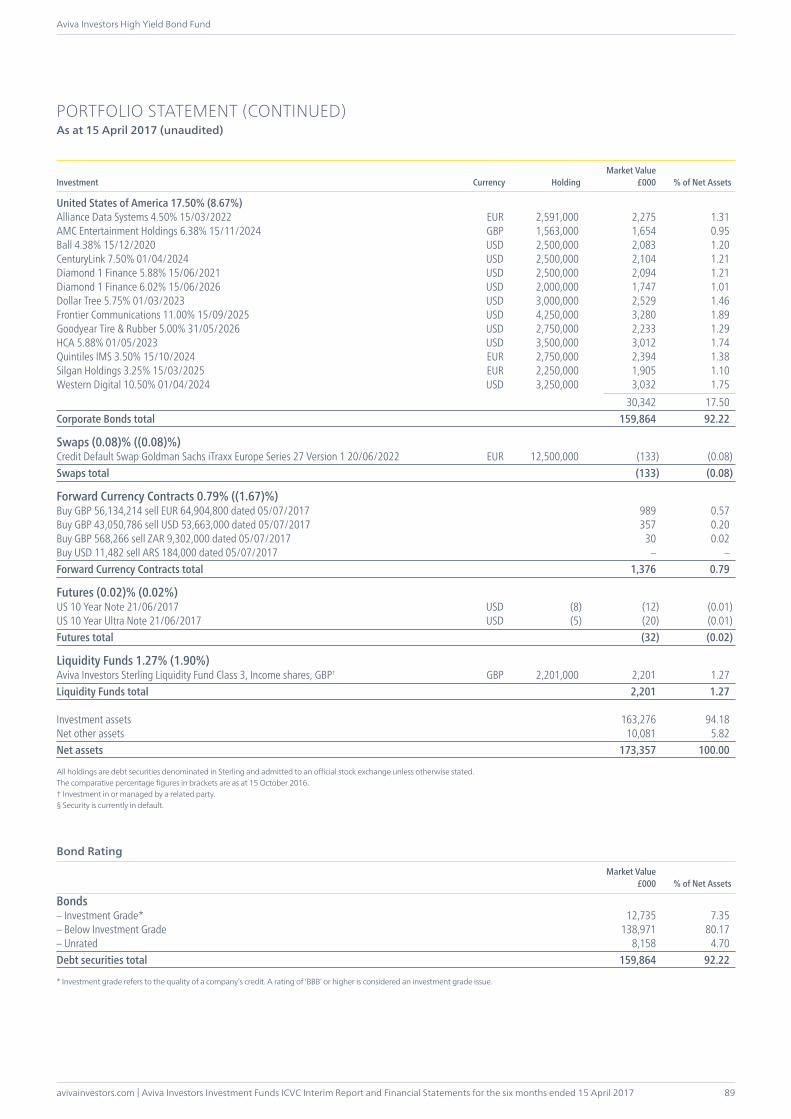
avivainvestors.com | Aviva Investors Investment Funds ICVC Interim Report and Financial Statements for the six months ended 15 April 2017
Aviva Investors High Yield Bond Fund
89
PORTFOLIO STATEMENT (CONTINUED)As at 15 April 2017 (unaudited)
Investment Currency HoldingMarket Value
£000 % of Net Assets
United States of America 17.50% (8.67%)Alliance Data Systems 4.50% 15/03/2022 EUR 2,591,000 2,275 1.31AMC Entertainment Holdings 6.38% 15/11/2024 GBP 1,563,000 1,654 0.95Ball 4.38% 15/12/2020 USD 2,500,000 2,083 1.20CenturyLink 7.50% 01/04/2024 USD 2,500,000 2,104 1.21Diamond 1 Finance 5.88% 15/06/2021 USD 2,500,000 2,094 1.21Diamond 1 Finance 6.02% 15/06/2026 USD 2,000,000 1,747 1.01Dollar Tree 5.75% 01/03/2023 USD 3,000,000 2,529 1.46Frontier Communications 11.00% 15/09/2025 USD 4,250,000 3,280 1.89Goodyear Tire & Rubber 5.00% 31/05/2026 USD 2,750,000 2,233 1.29HCA 5.88% 01/05/2023 USD 3,500,000 3,012 1.74Quintiles IMS 3.50% 15/10/2024 EUR 2,750,000 2,394 1.38Silgan Holdings 3.25% 15/03/2025 EUR 2,250,000 1,905 1.10Western Digital 10.50% 01/04/2024 USD 3,250,000 3,032 1.75 30,342 17.50Corporate Bonds total 159,864 92.22
Swaps (0.08)% ((0.08)%)Credit Default Swap Goldman Sachs iTraxx Europe Series 27 Version 1 20/06/2022 EUR 12,500,000 (133) (0.08)Swaps total (133) (0.08)
Forward Currency Contracts 0.79% ((1.67)%)Buy GBP 56,134,214 sell EUR 64,904,800 dated 05/07/2017 989 0.57Buy GBP 43,050,786 sell USD 53,663,000 dated 05/07/2017 357 0.20Buy GBP 568,266 sell ZAR 9,302,000 dated 05/07/2017 30 0.02Buy USD 11,482 sell ARS 184,000 dated 05/07/2017 – –Forward Currency Contracts total 1,376 0.79
Futures (0.02)% (0.02%)US 10 Year Note 21/06/2017 USD (8) (12) (0.01)US 10 Year Ultra Note 21/06/2017 USD (5) (20) (0.01)Futures total (32) (0.02)
Liquidity Funds 1.27% (1.90%)Aviva Investors Sterling Liquidity Fund Class 3, Income shares, GBP† GBP 2,201,000 2,201 1.27Liquidity Funds total 2,201 1.27
Investment assets 163,276 94.18Net other assets 10,081 5.82Net assets 173,357 100.00
All holdings are debt securities denominated in Sterling and admitted to an official stock exchange unless otherwise stated.The comparative percentage figures in brackets are as at 15 October 2016.† Investment in or managed by a related party.§ Security is currently in default.
Bonds– Investment Grade* 12,735 7.35– Below Investment Grade 138,971 80.17– Unrated 8,158 4.70Debt securities total 159,864 92.22
* Investment grade refers to the quality of a company’s credit. A rating of ‘BBB’ or higher is considered an investment grade issue.
Market Value£000 % of Net Assets
Bond Rating
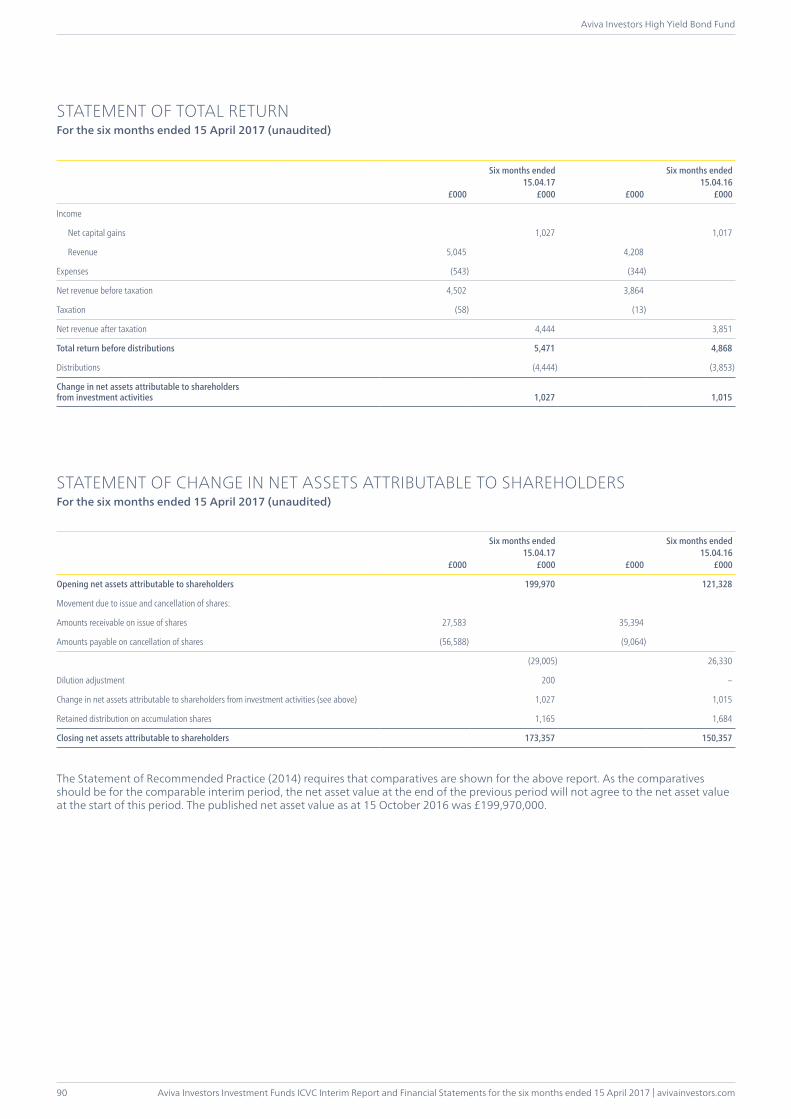
Aviva Investors Investment Funds ICVC Interim Report and Financial Statements for the six months ended 15 April 2017 | avivainvestors.com
Aviva Investors High Yield Bond Fund
90
£000
Six months ended15.04.17
£000 £000
Six months ended15.04.16
£000
Income
Net capital gains 1,027 1,017
Revenue 5,045 4,208
Expenses (543) (344)
Net revenue before taxation 4,502 3,864
Taxation (58) (13)
Net revenue after taxation 4,444 3,851
Total return before distributions 5,471 4,868
Distributions (4,444) (3,853)
Change in net assets attributable to shareholders from investment activities 1,027 1,015
STATEMENT OF CHANGE IN NET ASSETS ATTRIBUTABLE TO SHAREHOLDERSFor the six months ended 15 April 2017 (unaudited)
£000
Six months ended15.04.17
£000 £000
Six months ended15.04.16
£000
Opening net assets attributable to shareholders 199,970 121,328
Movement due to issue and cancellation of shares:
Amounts receivable on issue of shares 27,583 35,394
Amounts payable on cancellation of shares (56,588) (9,064)
(29,005) 26,330
Dilution adjustment 200 –
Change in net assets attributable to shareholders from investment activities (see above) 1,027 1,015
Retained distribution on accumulation shares 1,165 1,684
Closing net assets attributable to shareholders 173,357 150,357
The Statement of Recommended Practice (2014) requires that comparatives are shown for the above report. As the comparatives should be for the comparable interim period, the net asset value at the end of the previous period will not agree to the net asset value at the start of this period. The published net asset value as at 15 October 2016 was £199,970,000.
STATEMENT OF TOTAL RETURNFor the six months ended 15 April 2017 (unaudited)
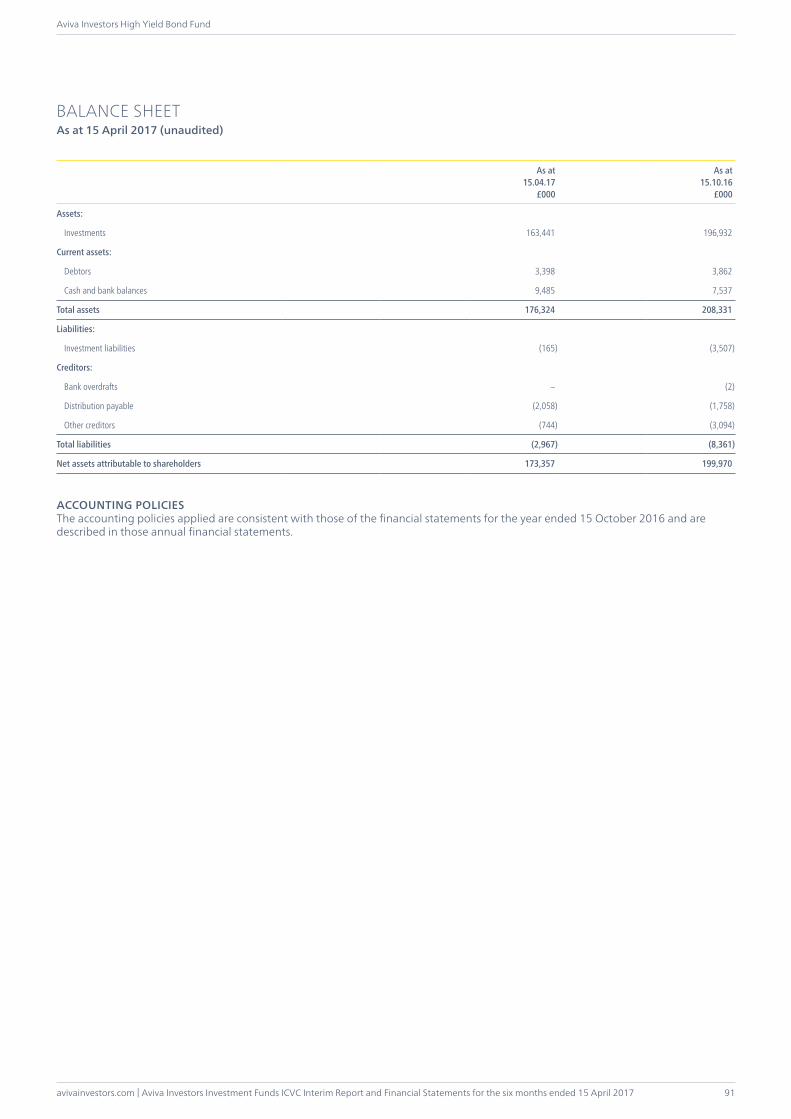
avivainvestors.com | Aviva Investors Investment Funds ICVC Interim Report and Financial Statements for the six months ended 15 April 2017
Aviva Investors High Yield Bond Fund
91
BALANCE SHEETAs at 15 April 2017 (unaudited)
As at15.04.17
£000
As at15.10.16
£000
Assets:
Investments 163,441 196,932
Current assets:
Debtors 3,398 3,862
Cash and bank balances 9,485 7,537
Total assets 176,324 208,331
Liabilities:
Investment liabilities (165) (3,507)
Creditors:
Bank overdrafts – (2)
Distribution payable (2,058) (1,758)
Other creditors (744) (3,094)
Total liabilities (2,967) (8,361)
Net assets attributable to shareholders 173,357 199,970
ACCOUNTING POLICIESThe accounting policies applied are consistent with those of the financial statements for the year ended 15 October 2016 and are described in those annual financial statements.
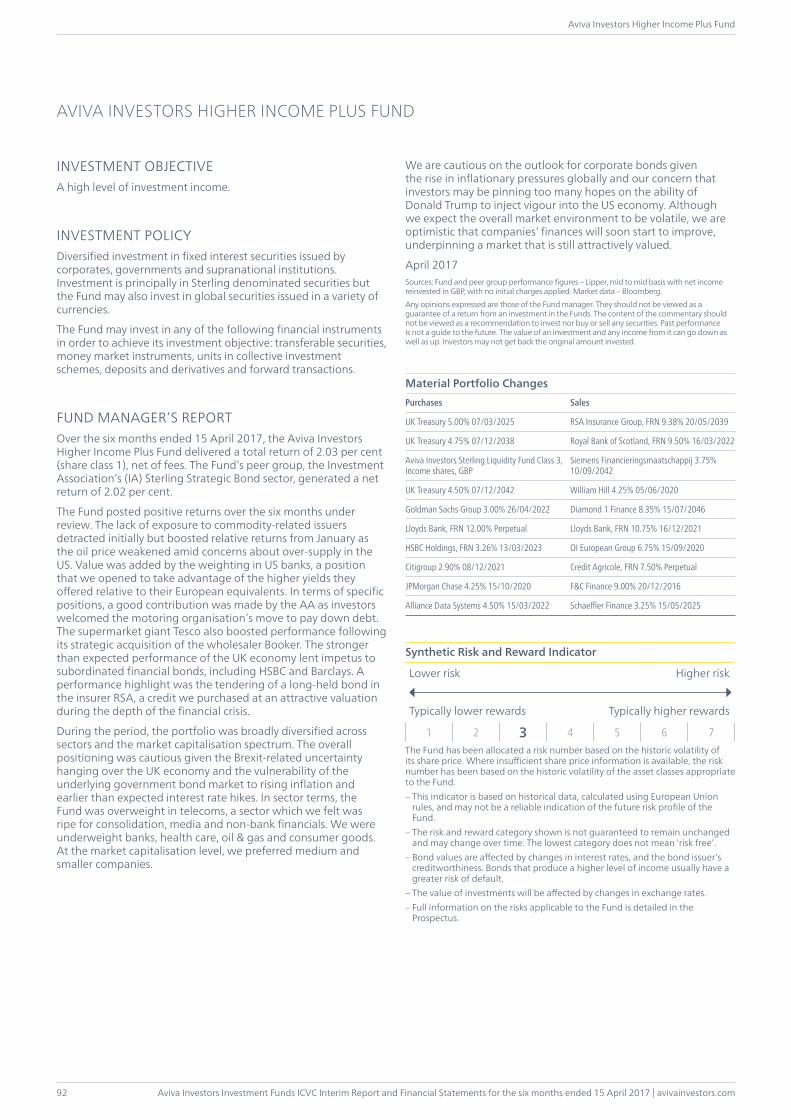
Aviva Investors Investment Funds ICVC Interim Report and Financial Statements for the six months ended 15 April 2017 | avivainvestors.com
Aviva Investors Higher Income Plus Fund
92
INVESTMENT OBJECTIVEA high level of investment income.
INVESTMENT POLICYDiversified investment in fixed interest securities issued by corporates, governments and supranational institutions. Investment is principally in Sterling denominated securities but the Fund may also invest in global securities issued in a variety of currencies.
The Fund may invest in any of the following financial instruments in order to achieve its investment objective: transferable securities, money market instruments, units in collective investment schemes, deposits and derivatives and forward transactions.
FUND MANAGER’S REPORTOver the six months ended 15 April 2017, the Aviva Investors Higher Income Plus Fund delivered a total return of 2.03 per cent (share class 1), net of fees. The Fund’s peer group, the Investment Association’s (IA) Sterling Strategic Bond sector, generated a net return of 2.02 per cent.
The Fund posted positive returns over the six months under review. The lack of exposure to commodity-related issuers detracted initially but boosted relative returns from January as the oil price weakened amid concerns about over-supply in the US. Value was added by the weighting in US banks, a position that we opened to take advantage of the higher yields they offered relative to their European equivalents. In terms of specific positions, a good contribution was made by the AA as investors welcomed the motoring organisation’s move to pay down debt. The supermarket giant Tesco also boosted performance following its strategic acquisition of the wholesaler Booker. The stronger than expected performance of the UK economy lent impetus to subordinated financial bonds, including HSBC and Barclays. A performance highlight was the tendering of a long-held bond in the insurer RSA, a credit we purchased at an attractive valuation during the depth of the financial crisis.
During the period, the portfolio was broadly diversified across sectors and the market capitalisation spectrum. The overall positioning was cautious given the Brexit-related uncertainty hanging over the UK economy and the vulnerability of the underlying government bond market to rising inflation and earlier than expected interest rate hikes. In sector terms, the Fund was overweight in telecoms, a sector which we felt was ripe for consolidation, media and non-bank financials. We were underweight banks, health care, oil & gas and consumer goods. At the market capitalisation level, we preferred medium and smaller companies.
We are cautious on the outlook for corporate bonds given the rise in inflationary pressures globally and our concern that investors may be pinning too many hopes on the ability of Donald Trump to inject vigour into the US economy. Although we expect the overall market environment to be volatile, we are optimistic that companies’ finances will soon start to improve, underpinning a market that is still attractively valued.
April 2017Sources: Fund and peer group performance figures – Lipper, mid to mid basis with net income reinvested in GBP, with no initial charges applied. Market data – Bloomberg.Any opinions expressed are those of the Fund manager. They should not be viewed as a guarantee of a return from an investment in the Funds. The content of the commentary should not be viewed as a recommendation to invest nor buy or sell any securities. Past performance is not a guide to the future. The value of an investment and any income from it can go down as well as up. Investors may not get back the original amount invested.
Material Portfolio ChangesPurchases Sales
UK Treasury 5.00% 07/03/2025 RSA Insurance Group, FRN 9.38% 20/05/2039
UK Treasury 4.75% 07/12/2038 Royal Bank of Scotland, FRN 9.50% 16/03/2022
Aviva Investors Sterling Liquidity Fund Class 3, Income shares, GBP
Siemens Financieringsmaatschappij 3.75% 10/09/2042
UK Treasury 4.50% 07/12/2042 William Hill 4.25% 05/06/2020
Goldman Sachs Group 3.00% 26/04/2022 Diamond 1 Finance 8.35% 15/07/2046
Lloyds Bank, FRN 12.00% Perpetual Lloyds Bank, FRN 10.75% 16/12/2021
HSBC Holdings, FRN 3.26% 13/03/2023 OI European Group 6.75% 15/09/2020
Citigroup 2.90% 08/12/2021 Credit Agricole, FRN 7.50% Perpetual
JPMorgan Chase 4.25% 15/10/2020 F&C Finance 9.00% 20/12/2016
Alliance Data Systems 4.50% 15/03/2022 Schaeffler Finance 3.25% 15/05/2025
Synthetic Risk and Reward Indicator
Lower risk Higher risk
Typically lower rewards Typically higher rewards
1 2 3 4 5 6 7The Fund has been allocated a risk number based on the historic volatility of its share price. Where insufficient share price information is available, the risk number has been based on the historic volatility of the asset classes appropriate to the Fund.– This indicator is based on historical data, calculated using European Union
rules, and may not be a reliable indication of the future risk profile of the Fund.
– The risk and reward category shown is not guaranteed to remain unchanged and may change over time. The lowest category does not mean ‘risk free’.
– Bond values are affected by changes in interest rates, and the bond issuer’s creditworthiness. Bonds that produce a higher level of income usually have a greater risk of default.
– The value of investments will be affected by changes in exchange rates.– Full information on the risks applicable to the Fund is detailed in the
Prospectus.
AVIVA INVESTORS HIGHER INCOME PLUS FUND
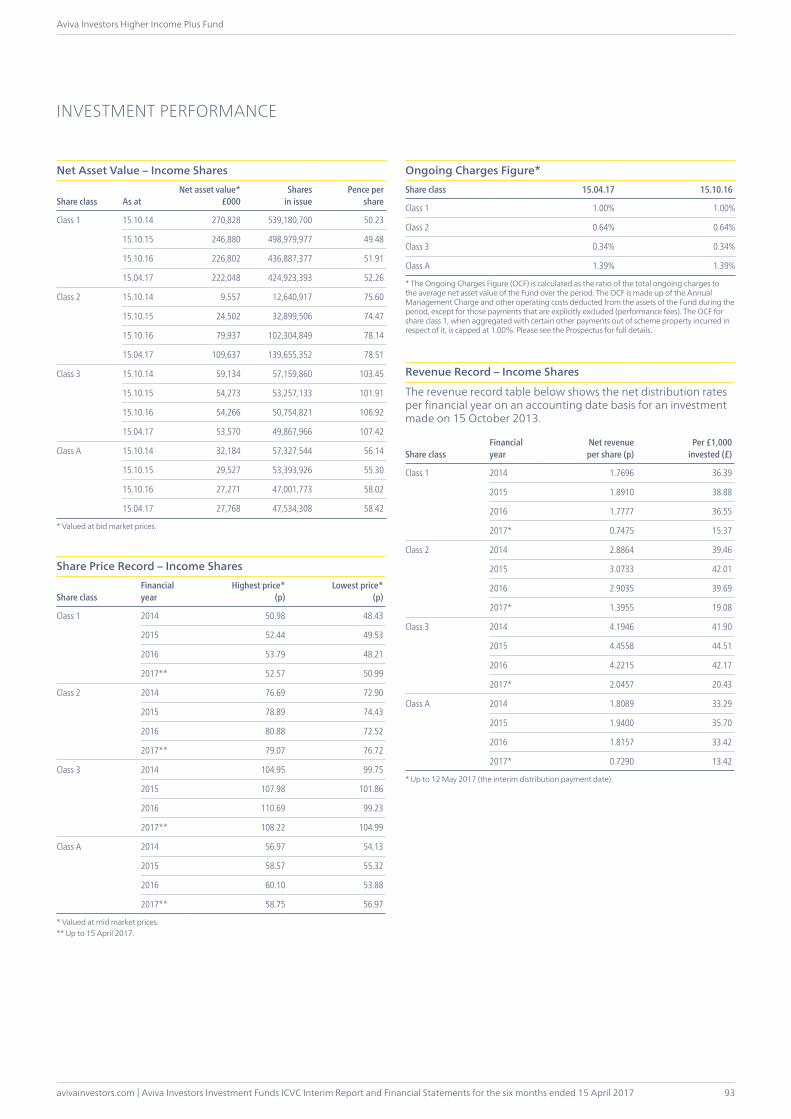
avivainvestors.com | Aviva Investors Investment Funds ICVC Interim Report and Financial Statements for the six months ended 15 April 2017
Aviva Investors Higher Income Plus Fund
93
INVESTMENT PERFORMANCE
Net Asset Value – Income Shares
Share class As atNet asset value*
£000Shares
in issuePence per
share
Class 1 15.10.14 270,828 539,180,700 50.23
15.10.15 246,880 498,979,977 49.48
15.10.16 226,802 436,887,377 51.91
15.04.17 222,048 424,923,393 52.26
Class 2 15.10.14 9,557 12,640,917 75.60
15.10.15 24,502 32,899,506 74.47
15.10.16 79,937 102,304,849 78.14
15.04.17 109,637 139,655,352 78.51
Class 3 15.10.14 59,134 57,159,860 103.45
15.10.15 54,273 53,257,133 101.91
15.10.16 54,266 50,754,821 106.92
15.04.17 53,570 49,867,966 107.42
Class A 15.10.14 32,184 57,327,544 56.14
15.10.15 29,527 53,393,926 55.30
15.10.16 27,271 47,001,773 58.02
15.04.17 27,768 47,534,308 58.42
* Valued at bid market prices.
Share Price Record – Income Shares
Share classFinancialyear
Highest price*(p)
Lowest price*(p)
Class 1 2014 50.98 48.43
2015 52.44 49.53
2016 53.79 48.21
2017** 52.57 50.99
Class 2 2014 76.69 72.90
2015 78.89 74.43
2016 80.88 72.52
2017** 79.07 76.72
Class 3 2014 104.95 99.75
2015 107.98 101.86
2016 110.69 99.23
2017** 108.22 104.99
Class A 2014 56.97 54.13
2015 58.57 55.32
2016 60.10 53.88
2017** 58.75 56.97
* Valued at mid market prices.** Up to 15 April 2017.
Ongoing Charges Figure*Share class 15.04.17 15.10.16
Class 1 1.00% 1.00%
Class 2 0.64% 0.64%
Class 3 0.34% 0.34%
Class A 1.39% 1.39%
* The Ongoing Charges Figure (OCF) is calculated as the ratio of the total ongoing charges to the average net asset value of the Fund over the period. The OCF is made up of the Annual Management Charge and other operating costs deducted from the assets of the Fund during the period, except for those payments that are explicitly excluded (performance fees). The OCF for share class 1, when aggregated with certain other payments out of scheme property incurred in respect of it, is capped at 1.00%. Please see the Prospectus for full details.
Revenue Record – Income Shares
The revenue record table below shows the net distribution rates per financial year on an accounting date basis for an investment made on 15 October 2013.
Share classFinancialyear
Net revenue per share (p)
Per £1,000invested (£)
Class 1 2014 1.7696 36.39
2015 1.8910 38.88
2016 1.7777 36.55
2017* 0.7475 15.37
Class 2 2014 2.8864 39.46
2015 3.0733 42.01
2016 2.9035 39.69
2017* 1.3955 19.08
Class 3 2014 4.1946 41.90
2015 4.4558 44.51
2016 4.2215 42.17
2017* 2.0457 20.43
Class A 2014 1.8089 33.29
2015 1.9400 35.70
2016 1.8157 33.42
2017* 0.7290 13.42
* Up to 12 May 2017 (the interim distribution payment date).
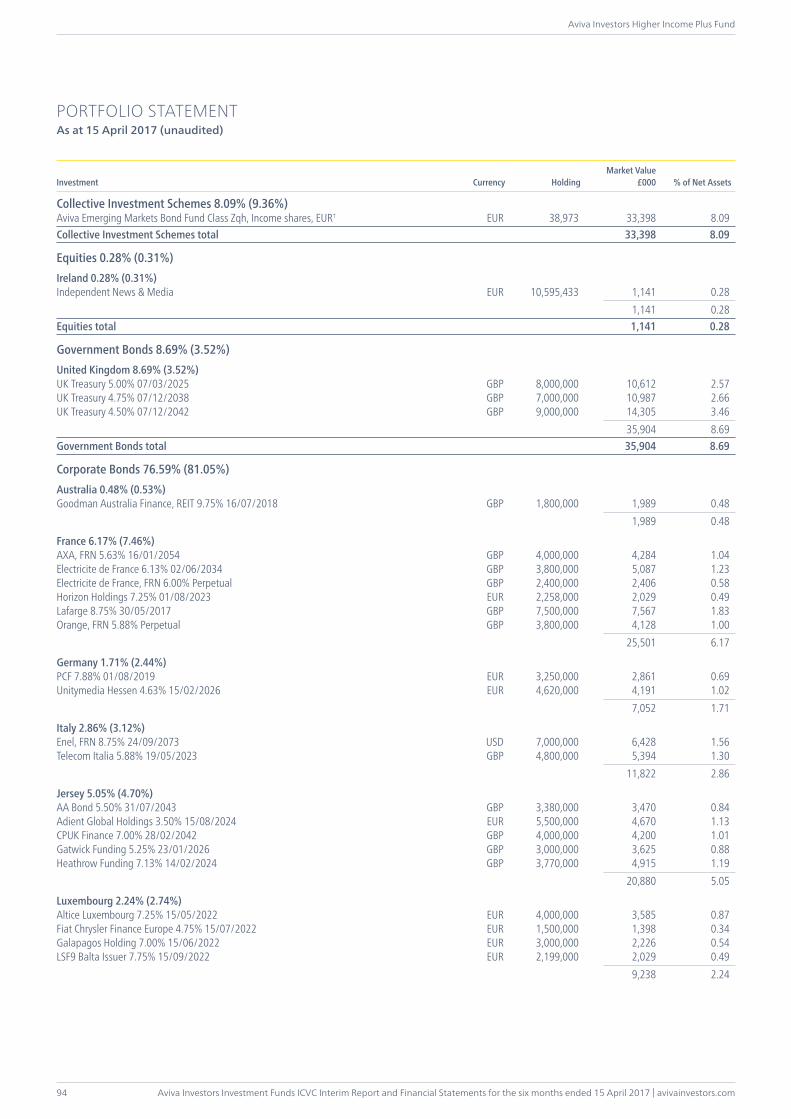
Aviva Investors Investment Funds ICVC Interim Report and Financial Statements for the six months ended 15 April 2017 | avivainvestors.com
Aviva Investors Higher Income Plus Fund
94
PORTFOLIO STATEMENTAs at 15 April 2017 (unaudited)
Investment Currency HoldingMarket Value
£000 % of Net Assets
Collective Investment Schemes 8.09% (9.36%)Aviva Emerging Markets Bond Fund Class Zqh, Income shares, EUR† EUR 38,973 33,398 8.09Collective Investment Schemes total 33,398 8.09
Equities 0.28% (0.31%)Ireland 0.28% (0.31%)Independent News & Media EUR 10,595,433 1,141 0.28 1,141 0.28Equities total 1,141 0.28
Government Bonds 8.69% (3.52%)United Kingdom 8.69% (3.52%)UK Treasury 5.00% 07/03/2025 GBP 8,000,000 10,612 2.57UK Treasury 4.75% 07/12/2038 GBP 7,000,000 10,987 2.66UK Treasury 4.50% 07/12/2042 GBP 9,000,000 14,305 3.46 35,904 8.69Government Bonds total 35,904 8.69
Corporate Bonds 76.59% (81.05%)Australia 0.48% (0.53%)Goodman Australia Finance, REIT 9.75% 16/07/2018 GBP 1,800,000 1,989 0.48 1,989 0.48
France 6.17% (7.46%)AXA, FRN 5.63% 16/01/2054 GBP 4,000,000 4,284 1.04Electricite de France 6.13% 02/06/2034 GBP 3,800,000 5,087 1.23Electricite de France, FRN 6.00% Perpetual GBP 2,400,000 2,406 0.58Horizon Holdings 7.25% 01/08/2023 EUR 2,258,000 2,029 0.49Lafarge 8.75% 30/05/2017 GBP 7,500,000 7,567 1.83Orange, FRN 5.88% Perpetual GBP 3,800,000 4,128 1.00 25,501 6.17
Germany 1.71% (2.44%)PCF 7.88% 01/08/2019 EUR 3,250,000 2,861 0.69Unitymedia Hessen 4.63% 15/02/2026 EUR 4,620,000 4,191 1.02 7,052 1.71
Italy 2.86% (3.12%)Enel, FRN 8.75% 24/09/2073 USD 7,000,000 6,428 1.56Telecom Italia 5.88% 19/05/2023 GBP 4,800,000 5,394 1.30 11,822 2.86
Jersey 5.05% (4.70%)AA Bond 5.50% 31/07/2043 GBP 3,380,000 3,470 0.84Adient Global Holdings 3.50% 15/08/2024 EUR 5,500,000 4,670 1.13CPUK Finance 7.00% 28/02/2042 GBP 4,000,000 4,200 1.01Gatwick Funding 5.25% 23/01/2026 GBP 3,000,000 3,625 0.88Heathrow Funding 7.13% 14/02/2024 GBP 3,770,000 4,915 1.19 20,880 5.05
Luxembourg 2.24% (2.74%)Altice Luxembourg 7.25% 15/05/2022 EUR 4,000,000 3,585 0.87Fiat Chrysler Finance Europe 4.75% 15/07/2022 EUR 1,500,000 1,398 0.34Galapagos Holding 7.00% 15/06/2022 EUR 3,000,000 2,226 0.54LSF9 Balta Issuer 7.75% 15/09/2022 EUR 2,199,000 2,029 0.49 9,238 2.24
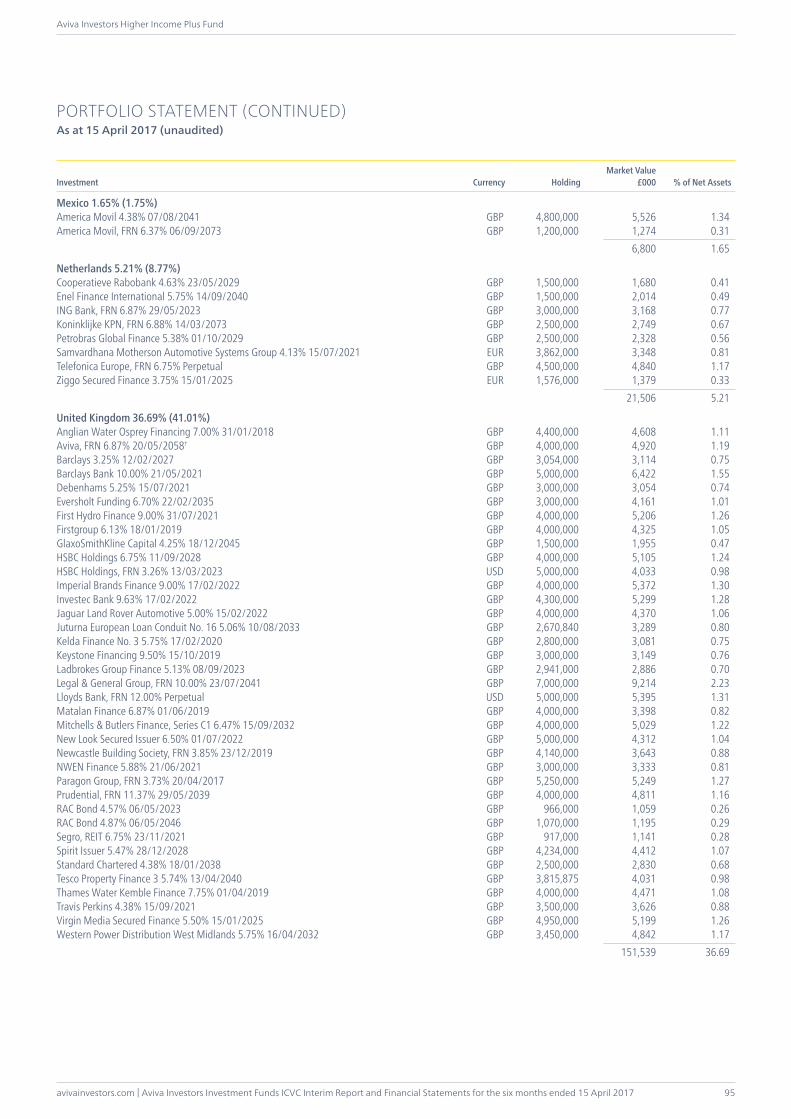
avivainvestors.com | Aviva Investors Investment Funds ICVC Interim Report and Financial Statements for the six months ended 15 April 2017
Aviva Investors Higher Income Plus Fund
95
PORTFOLIO STATEMENT (CONTINUED)As at 15 April 2017 (unaudited)
Investment Currency HoldingMarket Value
£000 % of Net Assets
Mexico 1.65% (1.75%)America Movil 4.38% 07/08/2041 GBP 4,800,000 5,526 1.34America Movil, FRN 6.37% 06/09/2073 GBP 1,200,000 1,274 0.31 6,800 1.65
Netherlands 5.21% (8.77%)Cooperatieve Rabobank 4.63% 23/05/2029 GBP 1,500,000 1,680 0.41Enel Finance International 5.75% 14/09/2040 GBP 1,500,000 2,014 0.49ING Bank, FRN 6.87% 29/05/2023 GBP 3,000,000 3,168 0.77Koninklijke KPN, FRN 6.88% 14/03/2073 GBP 2,500,000 2,749 0.67Petrobras Global Finance 5.38% 01/10/2029 GBP 2,500,000 2,328 0.56Samvardhana Motherson Automotive Systems Group 4.13% 15/07/2021 EUR 3,862,000 3,348 0.81Telefonica Europe, FRN 6.75% Perpetual GBP 4,500,000 4,840 1.17Ziggo Secured Finance 3.75% 15/01/2025 EUR 1,576,000 1,379 0.33 21,506 5.21
United Kingdom 36.69% (41.01%)Anglian Water Osprey Financing 7.00% 31/01/2018 GBP 4,400,000 4,608 1.11Aviva, FRN 6.87% 20/05/2058† GBP 4,000,000 4,920 1.19Barclays 3.25% 12/02/2027 GBP 3,054,000 3,114 0.75Barclays Bank 10.00% 21/05/2021 GBP 5,000,000 6,422 1.55Debenhams 5.25% 15/07/2021 GBP 3,000,000 3,054 0.74Eversholt Funding 6.70% 22/02/2035 GBP 3,000,000 4,161 1.01First Hydro Finance 9.00% 31/07/2021 GBP 4,000,000 5,206 1.26Firstgroup 6.13% 18/01/2019 GBP 4,000,000 4,325 1.05GlaxoSmithKline Capital 4.25% 18/12/2045 GBP 1,500,000 1,955 0.47HSBC Holdings 6.75% 11/09/2028 GBP 4,000,000 5,105 1.24HSBC Holdings, FRN 3.26% 13/03/2023 USD 5,000,000 4,033 0.98Imperial Brands Finance 9.00% 17/02/2022 GBP 4,000,000 5,372 1.30Investec Bank 9.63% 17/02/2022 GBP 4,300,000 5,299 1.28Jaguar Land Rover Automotive 5.00% 15/02/2022 GBP 4,000,000 4,370 1.06Juturna European Loan Conduit No. 16 5.06% 10/08/2033 GBP 2,670,840 3,289 0.80Kelda Finance No. 3 5.75% 17/02/2020 GBP 2,800,000 3,081 0.75Keystone Financing 9.50% 15/10/2019 GBP 3,000,000 3,149 0.76Ladbrokes Group Finance 5.13% 08/09/2023 GBP 2,941,000 2,886 0.70Legal & General Group, FRN 10.00% 23/07/2041 GBP 7,000,000 9,214 2.23Lloyds Bank, FRN 12.00% Perpetual USD 5,000,000 5,395 1.31Matalan Finance 6.87% 01/06/2019 GBP 4,000,000 3,398 0.82Mitchells & Butlers Finance, Series C1 6.47% 15/09/2032 GBP 4,000,000 5,029 1.22New Look Secured Issuer 6.50% 01/07/2022 GBP 5,000,000 4,312 1.04Newcastle Building Society, FRN 3.85% 23/12/2019 GBP 4,140,000 3,643 0.88NWEN Finance 5.88% 21/06/2021 GBP 3,000,000 3,333 0.81Paragon Group, FRN 3.73% 20/04/2017 GBP 5,250,000 5,249 1.27Prudential, FRN 11.37% 29/05/2039 GBP 4,000,000 4,811 1.16RAC Bond 4.57% 06/05/2023 GBP 966,000 1,059 0.26RAC Bond 4.87% 06/05/2046 GBP 1,070,000 1,195 0.29Segro, REIT 6.75% 23/11/2021 GBP 917,000 1,141 0.28Spirit Issuer 5.47% 28/12/2028 GBP 4,234,000 4,412 1.07Standard Chartered 4.38% 18/01/2038 GBP 2,500,000 2,830 0.68Tesco Property Finance 3 5.74% 13/04/2040 GBP 3,815,875 4,031 0.98Thames Water Kemble Finance 7.75% 01/04/2019 GBP 4,000,000 4,471 1.08Travis Perkins 4.38% 15/09/2021 GBP 3,500,000 3,626 0.88Virgin Media Secured Finance 5.50% 15/01/2025 GBP 4,950,000 5,199 1.26Western Power Distribution West Midlands 5.75% 16/04/2032 GBP 3,450,000 4,842 1.17 151,539 36.69
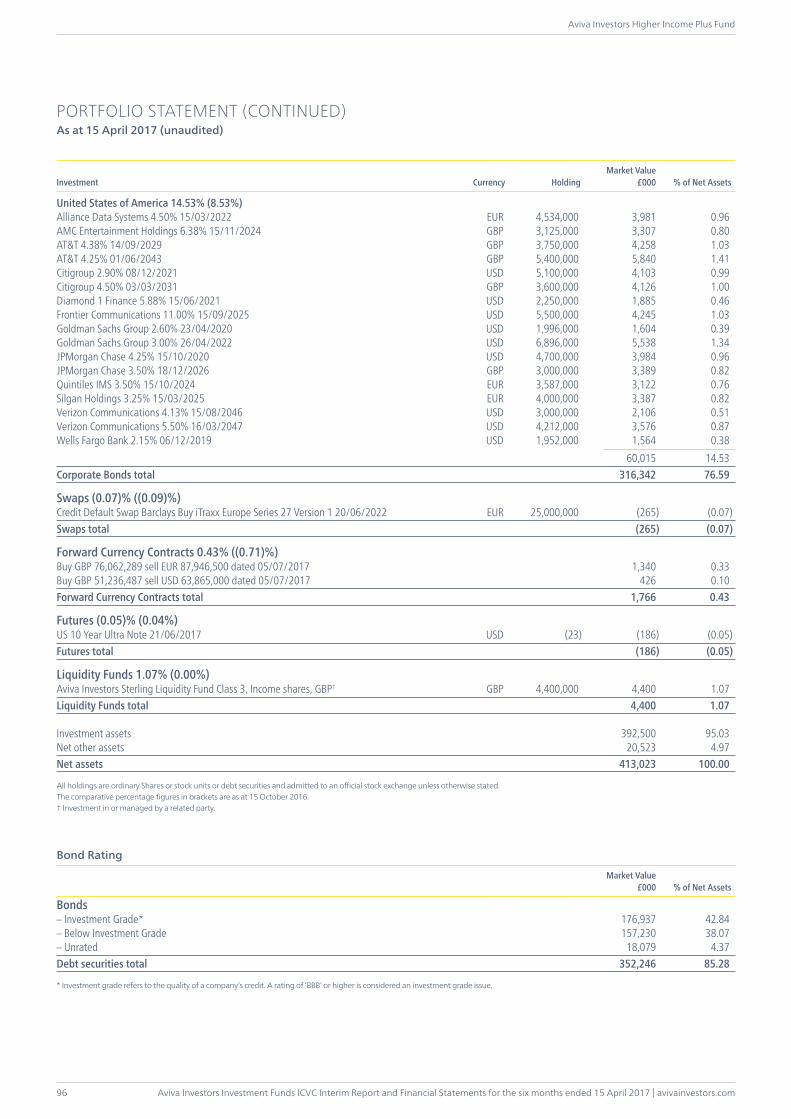
Aviva Investors Investment Funds ICVC Interim Report and Financial Statements for the six months ended 15 April 2017 | avivainvestors.com
Aviva Investors Higher Income Plus Fund
96
PORTFOLIO STATEMENT (CONTINUED)As at 15 April 2017 (unaudited)
Investment Currency HoldingMarket Value
£000 % of Net Assets
United States of America 14.53% (8.53%)Alliance Data Systems 4.50% 15/03/2022 EUR 4,534,000 3,981 0.96AMC Entertainment Holdings 6.38% 15/11/2024 GBP 3,125,000 3,307 0.80AT&T 4.38% 14/09/2029 GBP 3,750,000 4,258 1.03AT&T 4.25% 01/06/2043 GBP 5,400,000 5,840 1.41Citigroup 2.90% 08/12/2021 USD 5,100,000 4,103 0.99Citigroup 4.50% 03/03/2031 GBP 3,600,000 4,126 1.00Diamond 1 Finance 5.88% 15/06/2021 USD 2,250,000 1,885 0.46Frontier Communications 11.00% 15/09/2025 USD 5,500,000 4,245 1.03Goldman Sachs Group 2.60% 23/04/2020 USD 1,996,000 1,604 0.39Goldman Sachs Group 3.00% 26/04/2022 USD 6,896,000 5,538 1.34JPMorgan Chase 4.25% 15/10/2020 USD 4,700,000 3,984 0.96JPMorgan Chase 3.50% 18/12/2026 GBP 3,000,000 3,389 0.82Quintiles IMS 3.50% 15/10/2024 EUR 3,587,000 3,122 0.76Silgan Holdings 3.25% 15/03/2025 EUR 4,000,000 3,387 0.82Verizon Communications 4.13% 15/08/2046 USD 3,000,000 2,106 0.51Verizon Communications 5.50% 16/03/2047 USD 4,212,000 3,576 0.87Wells Fargo Bank 2.15% 06/12/2019 USD 1,952,000 1,564 0.38 60,015 14.53Corporate Bonds total 316,342 76.59
Swaps (0.07)% ((0.09)%)Credit Default Swap Barclays Buy iTraxx Europe Series 27 Version 1 20/06/2022 EUR 25,000,000 (265) (0.07)Swaps total (265) (0.07)
Forward Currency Contracts 0.43% ((0.71)%)Buy GBP 76,062,289 sell EUR 87,946,500 dated 05/07/2017 1,340 0.33Buy GBP 51,236,487 sell USD 63,865,000 dated 05/07/2017 426 0.10Forward Currency Contracts total 1,766 0.43
Futures (0.05)% (0.04%)US 10 Year Ultra Note 21/06/2017 USD (23) (186) (0.05)Futures total (186) (0.05)
Liquidity Funds 1.07% (0.00%)Aviva Investors Sterling Liquidity Fund Class 3, Income shares, GBP† GBP 4,400,000 4,400 1.07Liquidity Funds total 4,400 1.07
Investment assets 392,500 95.03Net other assets 20,523 4.97Net assets 413,023 100.00
All holdings are ordinary Shares or stock units or debt securities and admitted to an official stock exchange unless otherwise stated.The comparative percentage figures in brackets are as at 15 October 2016.† Investment in or managed by a related party.
Bonds – Investment Grade* 176,937 42.84– Below Investment Grade 157,230 38.07– Unrated 18,079 4.37Debt securities total 352,246 85.28
* Investment grade refers to the quality of a company’s credit. A rating of ‘BBB’ or higher is considered an investment grade issue.
Market Value£000 % of Net Assets
Bond Rating
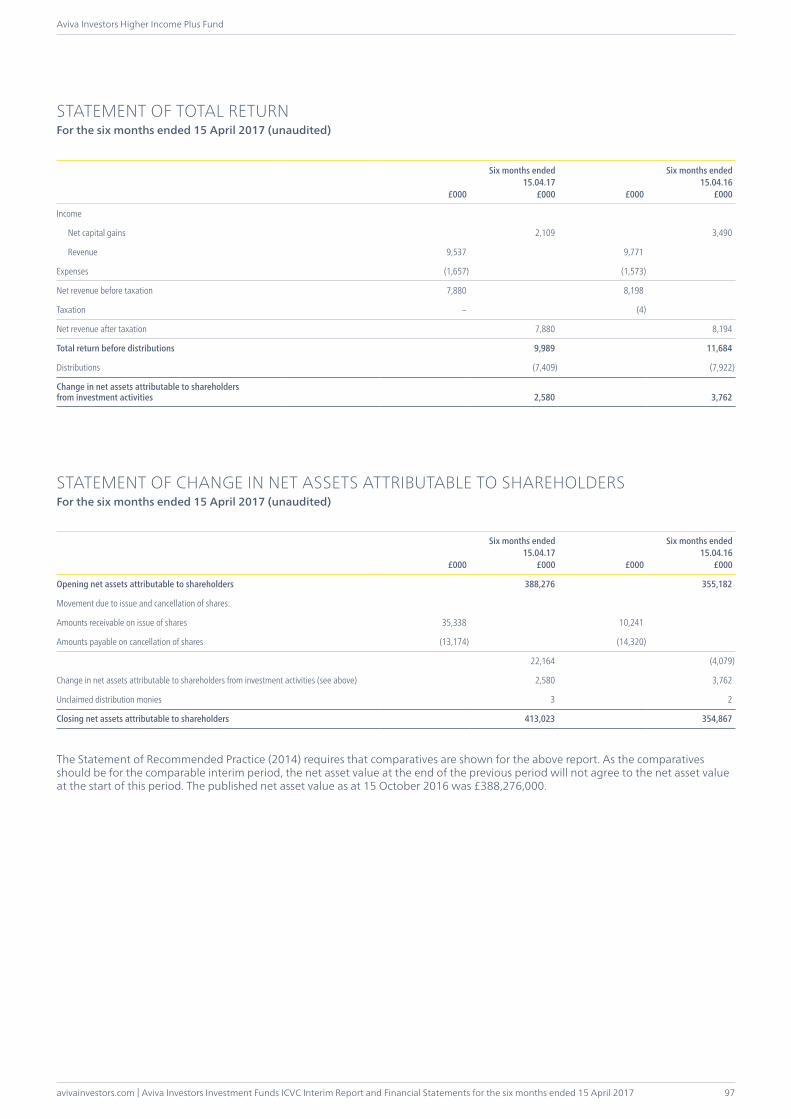
avivainvestors.com | Aviva Investors Investment Funds ICVC Interim Report and Financial Statements for the six months ended 15 April 2017
Aviva Investors Higher Income Plus Fund
97
£000
Six months ended15.04.17
£000 £000
Six months ended15.04.16
£000
Income
Net capital gains 2,109 3,490
Revenue 9,537 9,771
Expenses (1,657) (1,573)
Net revenue before taxation 7,880 8,198
Taxation – (4)
Net revenue after taxation 7,880 8,194
Total return before distributions 9,989 11,684
Distributions (7,409) (7,922)
Change in net assets attributable to shareholders from investment activities 2,580 3,762
STATEMENT OF CHANGE IN NET ASSETS ATTRIBUTABLE TO SHAREHOLDERSFor the six months ended 15 April 2017 (unaudited)
£000
Six months ended15.04.17
£000 £000
Six months ended15.04.16
£000
Opening net assets attributable to shareholders 388,276 355,182
Movement due to issue and cancellation of shares:
Amounts receivable on issue of shares 35,338 10,241
Amounts payable on cancellation of shares (13,174) (14,320)
22,164 (4,079)
Change in net assets attributable to shareholders from investment activities (see above) 2,580 3,762
Unclaimed distribution monies 3 2
Closing net assets attributable to shareholders 413,023 354,867
The Statement of Recommended Practice (2014) requires that comparatives are shown for the above report. As the comparatives should be for the comparable interim period, the net asset value at the end of the previous period will not agree to the net asset value at the start of this period. The published net asset value as at 15 October 2016 was £388,276,000.
STATEMENT OF TOTAL RETURNFor the six months ended 15 April 2017 (unaudited)
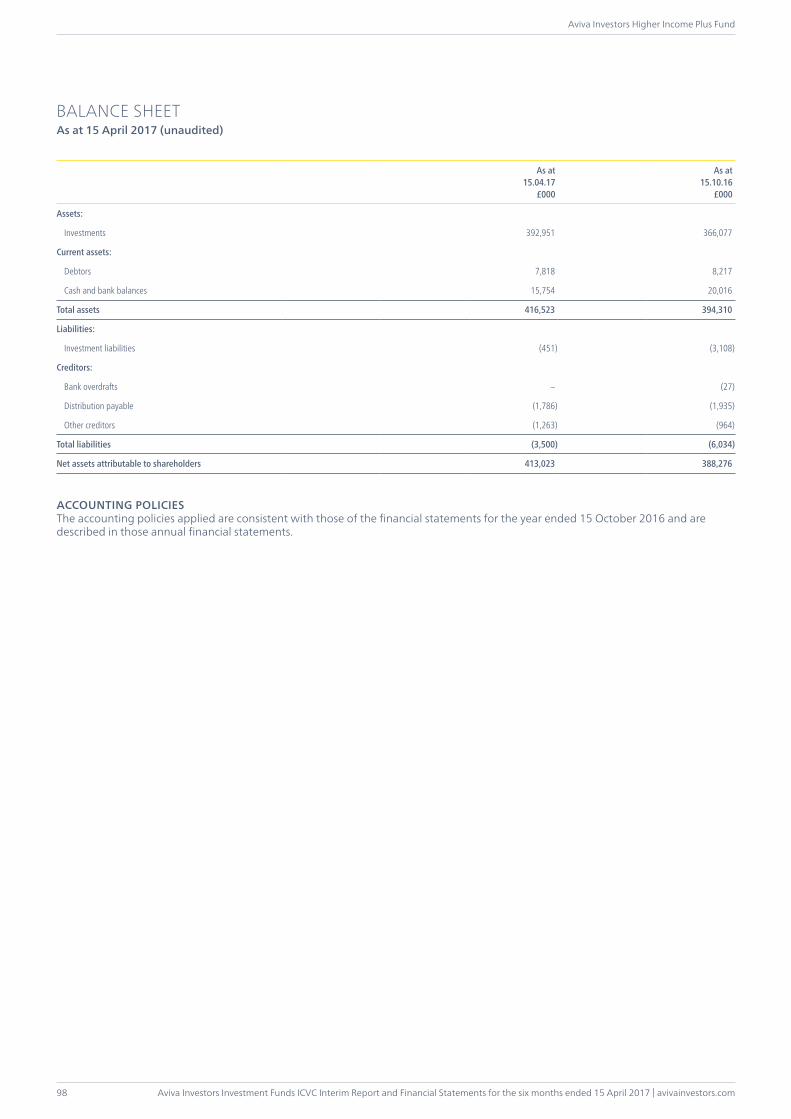
Aviva Investors Investment Funds ICVC Interim Report and Financial Statements for the six months ended 15 April 2017 | avivainvestors.com
Aviva Investors Higher Income Plus Fund
98
BALANCE SHEETAs at 15 April 2017 (unaudited)
As at15.04.17
£000
As at15.10.16
£000
Assets:
Investments 392,951 366,077
Current assets:
Debtors 7,818 8,217
Cash and bank balances 15,754 20,016
Total assets 416,523 394,310
Liabilities:
Investment liabilities (451) (3,108)
Creditors:
Bank overdrafts – (27)
Distribution payable (1,786) (1,935)
Other creditors (1,263) (964)
Total liabilities (3,500) (6,034)
Net assets attributable to shareholders 413,023 388,276
ACCOUNTING POLICIESThe accounting policies applied are consistent with those of the financial statements for the year ended 15 October 2016 and are described in those annual financial statements.
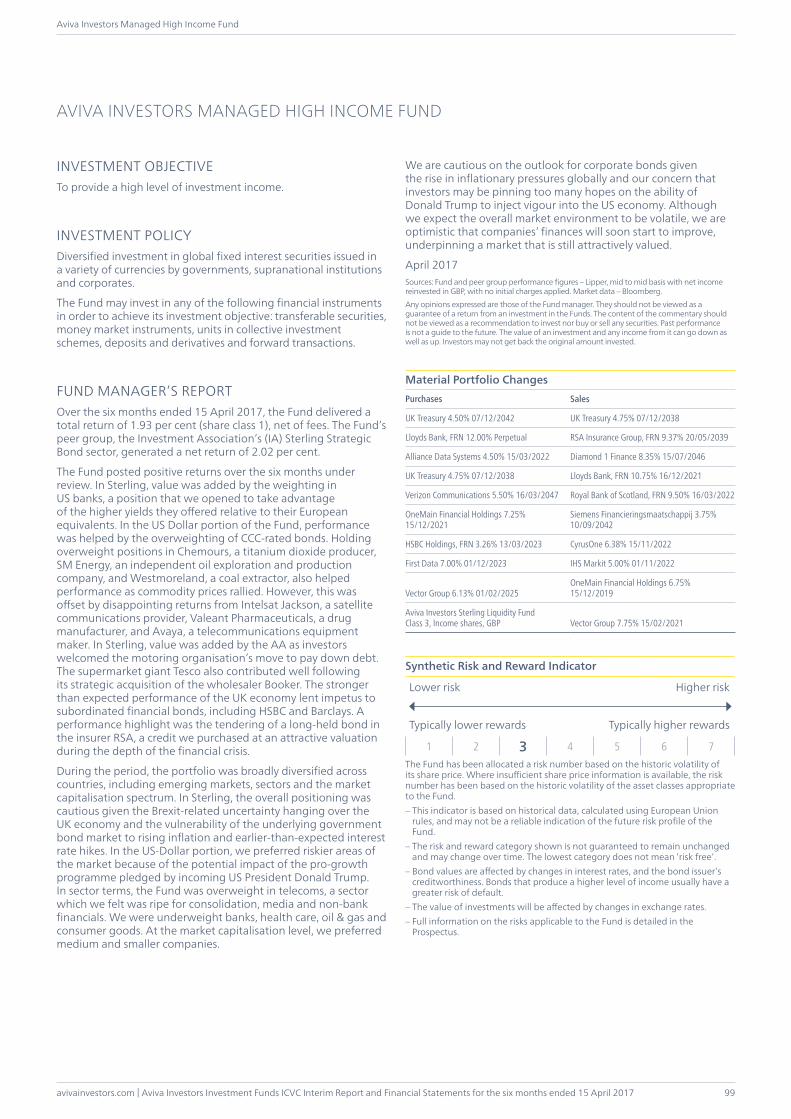
avivainvestors.com | Aviva Investors Investment Funds ICVC Interim Report and Financial Statements for the six months ended 15 April 2017
Aviva Investors Managed High Income Fund
99
INVESTMENT OBJECTIVETo provide a high level of investment income.
INVESTMENT POLICYDiversified investment in global fixed interest securities issued in a variety of currencies by governments, supranational institutions and corporates.
The Fund may invest in any of the following financial instruments in order to achieve its investment objective: transferable securities, money market instruments, units in collective investment schemes, deposits and derivatives and forward transactions.
FUND MANAGER’S REPORTOver the six months ended 15 April 2017, the Fund delivered a total return of 1.93 per cent (share class 1), net of fees. The Fund’s peer group, the Investment Association’s (IA) Sterling Strategic Bond sector, generated a net return of 2.02 per cent.
The Fund posted positive returns over the six months under review. In Sterling, value was added by the weighting in US banks, a position that we opened to take advantage of the higher yields they offered relative to their European equivalents. In the US Dollar portion of the Fund, performance was helped by the overweighting of CCC-rated bonds. Holding overweight positions in Chemours, a titanium dioxide producer, SM Energy, an independent oil exploration and production company, and Westmoreland, a coal extractor, also helped performance as commodity prices rallied. However, this was offset by disappointing returns from Intelsat Jackson, a satellite communications provider, Valeant Pharmaceuticals, a drug manufacturer, and Avaya, a telecommunications equipment maker. In Sterling, value was added by the AA as investors welcomed the motoring organisation’s move to pay down debt. The supermarket giant Tesco also contributed well following its strategic acquisition of the wholesaler Booker. The stronger than expected performance of the UK economy lent impetus to subordinated financial bonds, including HSBC and Barclays. A performance highlight was the tendering of a long-held bond in the insurer RSA, a credit we purchased at an attractive valuation during the depth of the financial crisis.
During the period, the portfolio was broadly diversified across countries, including emerging markets, sectors and the market capitalisation spectrum. In Sterling, the overall positioning was cautious given the Brexit-related uncertainty hanging over the UK economy and the vulnerability of the underlying government bond market to rising inflation and earlier-than-expected interest rate hikes. In the US-Dollar portion, we preferred riskier areas of the market because of the potential impact of the pro-growth programme pledged by incoming US President Donald Trump. In sector terms, the Fund was overweight in telecoms, a sector which we felt was ripe for consolidation, media and non-bank financials. We were underweight banks, health care, oil & gas and consumer goods. At the market capitalisation level, we preferred medium and smaller companies.
We are cautious on the outlook for corporate bonds given the rise in inflationary pressures globally and our concern that investors may be pinning too many hopes on the ability of Donald Trump to inject vigour into the US economy. Although we expect the overall market environment to be volatile, we are optimistic that companies’ finances will soon start to improve, underpinning a market that is still attractively valued.
April 2017Sources: Fund and peer group performance figures – Lipper, mid to mid basis with net income reinvested in GBP, with no initial charges applied. Market data – Bloomberg.Any opinions expressed are those of the Fund manager. They should not be viewed as a guarantee of a return from an investment in the Funds. The content of the commentary should not be viewed as a recommendation to invest nor buy or sell any securities. Past performance is not a guide to the future. The value of an investment and any income from it can go down as well as up. Investors may not get back the original amount invested.
Material Portfolio ChangesPurchases Sales
UK Treasury 4.50% 07/12/2042 UK Treasury 4.75% 07/12/2038
Lloyds Bank, FRN 12.00% Perpetual RSA Insurance Group, FRN 9.37% 20/05/2039
Alliance Data Systems 4.50% 15/03/2022 Diamond 1 Finance 8.35% 15/07/2046
UK Treasury 4.75% 07/12/2038 Lloyds Bank, FRN 10.75% 16/12/2021
Verizon Communications 5.50% 16/03/2047 Royal Bank of Scotland, FRN 9.50% 16/03/2022
OneMain Financial Holdings 7.25%15/12/2021
Siemens Financieringsmaatschappij 3.75% 10/09/2042
HSBC Holdings, FRN 3.26% 13/03/2023 CyrusOne 6.38% 15/11/2022
First Data 7.00% 01/12/2023 IHS Markit 5.00% 01/11/2022
Vector Group 6.13% 01/02/2025OneMain Financial Holdings 6.75%15/12/2019
Aviva Investors Sterling Liquidity Fund Class 3, Income shares, GBP Vector Group 7.75% 15/02/2021
Synthetic Risk and Reward Indicator
Lower risk Higher risk
Typically lower rewards Typically higher rewards
1 2 3 4 5 6 7The Fund has been allocated a risk number based on the historic volatility of its share price. Where insufficient share price information is available, the risk number has been based on the historic volatility of the asset classes appropriate to the Fund.– This indicator is based on historical data, calculated using European Union
rules, and may not be a reliable indication of the future risk profile of the Fund.
– The risk and reward category shown is not guaranteed to remain unchanged and may change over time. The lowest category does not mean ‘risk free’.
– Bond values are affected by changes in interest rates, and the bond issuer’s creditworthiness. Bonds that produce a higher level of income usually have a greater risk of default.
– The value of investments will be affected by changes in exchange rates.– Full information on the risks applicable to the Fund is detailed in the
Prospectus.
AVIVA INVESTORS MANAGED HIGH INCOME FUND
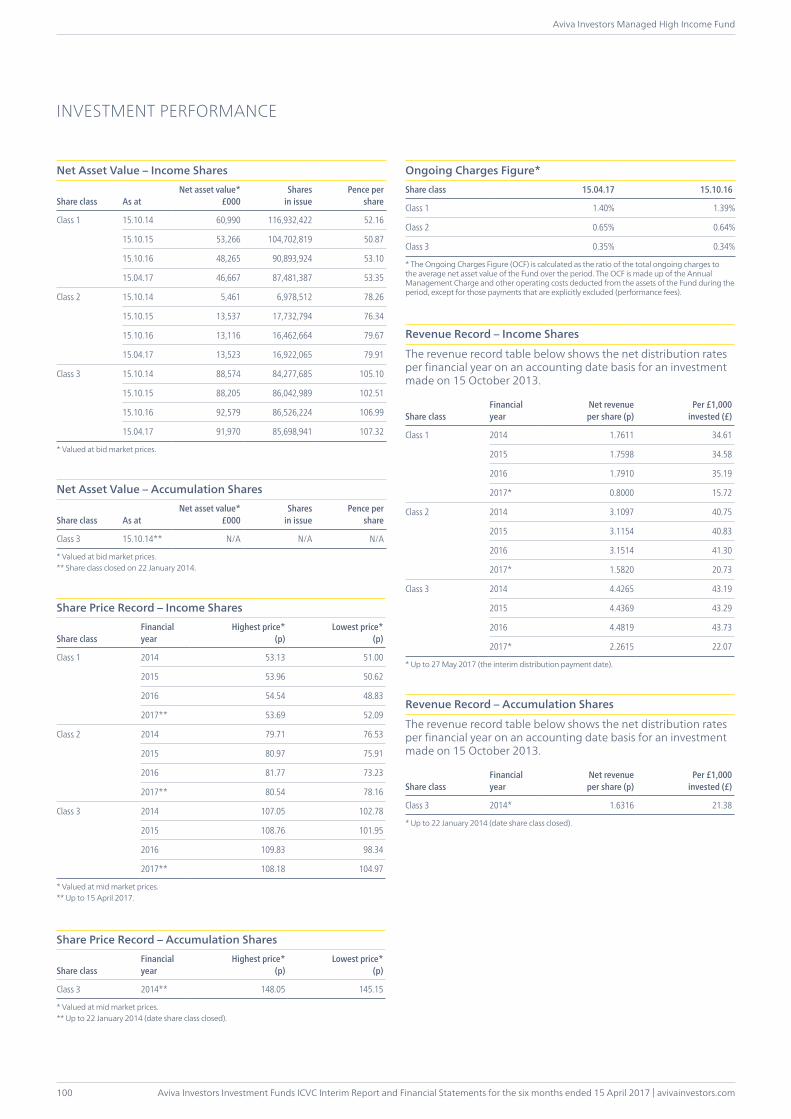
Aviva Investors Investment Funds ICVC Interim Report and Financial Statements for the six months ended 15 April 2017 | avivainvestors.com
Aviva Investors Managed High Income Fund
100
INVESTMENT PERFORMANCE
Net Asset Value – Income Shares
Share class As atNet asset value*
£000Shares
in issuePence per
share
Class 1 15.10.14 60,990 116,932,422 52.16
15.10.15 53,266 104,702,819 50.87
15.10.16 48,265 90,893,924 53.10
15.04.17 46,667 87,481,387 53.35
Class 2 15.10.14 5,461 6,978,512 78.26
15.10.15 13,537 17,732,794 76.34
15.10.16 13,116 16,462,664 79.67
15.04.17 13,523 16,922,065 79.91
Class 3 15.10.14 88,574 84,277,685 105.10
15.10.15 88,205 86,042,989 102.51
15.10.16 92,579 86,526,224 106.99
15.04.17 91,970 85,698,941 107.32
* Valued at bid market prices.
Net Asset Value – Accumulation Shares
Share class As atNet asset value*
£000Shares
in issuePence per
share
Class 3 15.10.14** N/A N/A N/A
* Valued at bid market prices.** Share class closed on 22 January 2014.
Share Price Record – Income Shares
Share classFinancialyear
Highest price*(p)
Lowest price*(p)
Class 1 2014 53.13 51.00
2015 53.96 50.62
2016 54.54 48.83
2017** 53.69 52.09
Class 2 2014 79.71 76.53
2015 80.97 75.91
2016 81.77 73.23
2017** 80.54 78.16
Class 3 2014 107.05 102.78
2015 108.76 101.95
2016 109.83 98.34
2017** 108.18 104.97
* Valued at mid market prices.** Up to 15 April 2017.
Share Price Record – Accumulation Shares
Share classFinancialyear
Highest price*(p)
Lowest price*(p)
Class 3 2014** 148.05 145.15
* Valued at mid market prices.** Up to 22 January 2014 (date share class closed).
Ongoing Charges Figure*Share class 15.04.17 15.10.16
Class 1 1.40% 1.39%
Class 2 0.65% 0.64%
Class 3 0.35% 0.34%
* The Ongoing Charges Figure (OCF) is calculated as the ratio of the total ongoing charges to the average net asset value of the Fund over the period. The OCF is made up of the Annual Management Charge and other operating costs deducted from the assets of the Fund during the period, except for those payments that are explicitly excluded (performance fees).
Revenue Record – Income Shares
The revenue record table below shows the net distribution rates per financial year on an accounting date basis for an investment made on 15 October 2013.
Share classFinancialyear
Net revenue per share (p)
Per £1,000invested (£)
Class 1 2014 1.7611 34.61
2015 1.7598 34.58
2016 1.7910 35.19
2017* 0.8000 15.72
Class 2 2014 3.1097 40.75
2015 3.1154 40.83
2016 3.1514 41.30
2017* 1.5820 20.73
Class 3 2014 4.4265 43.19
2015 4.4369 43.29
2016 4.4819 43.73
2017* 2.2615 22.07
* Up to 27 May 2017 (the interim distribution payment date).
Revenue Record – Accumulation Shares
The revenue record table below shows the net distribution rates per financial year on an accounting date basis for an investment made on 15 October 2013.
Share classFinancialyear
Net revenue per share (p)
Per £1,000invested (£)
Class 3 2014* 1.6316 21.38
* Up to 22 January 2014 (date share class closed).
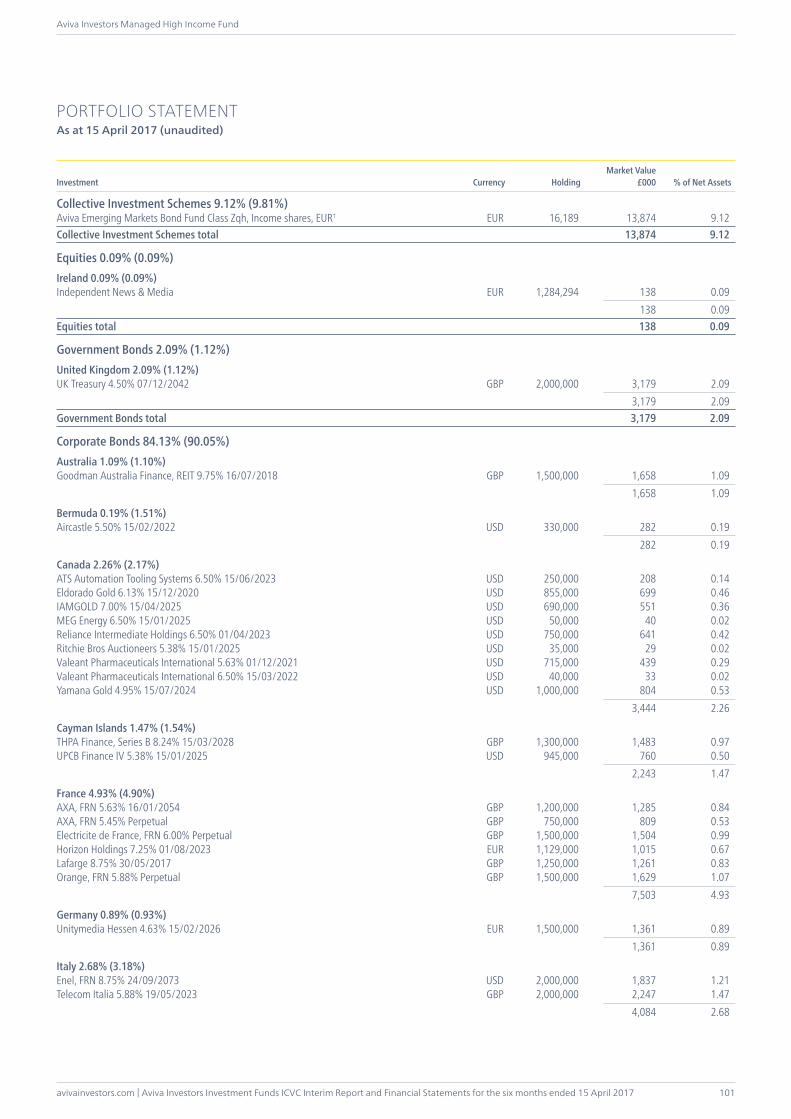
avivainvestors.com | Aviva Investors Investment Funds ICVC Interim Report and Financial Statements for the six months ended 15 April 2017
Aviva Investors Managed High Income Fund
101
PORTFOLIO STATEMENTAs at 15 April 2017 (unaudited)
Investment Currency HoldingMarket Value
£000 % of Net Assets
Collective Investment Schemes 9.12% (9.81%)Aviva Emerging Markets Bond Fund Class Zqh, Income shares, EUR† EUR 16,189 13,874 9.12Collective Investment Schemes total 13,874 9.12
Equities 0.09% (0.09%)Ireland 0.09% (0.09%)Independent News & Media EUR 1,284,294 138 0.09 138 0.09Equities total 138 0.09
Government Bonds 2.09% (1.12%)United Kingdom 2.09% (1.12%)UK Treasury 4.50% 07/12/2042 GBP 2,000,000 3,179 2.09 3,179 2.09Government Bonds total 3,179 2.09
Corporate Bonds 84.13% (90.05%)Australia 1.09% (1.10%)Goodman Australia Finance, REIT 9.75% 16/07/2018 GBP 1,500,000 1,658 1.09 1,658 1.09
Bermuda 0.19% (1.51%)Aircastle 5.50% 15/02/2022 USD 330,000 282 0.19 282 0.19
Canada 2.26% (2.17%)ATS Automation Tooling Systems 6.50% 15/06/2023 USD 250,000 208 0.14Eldorado Gold 6.13% 15/12/2020 USD 855,000 699 0.46IAMGOLD 7.00% 15/04/2025 USD 690,000 551 0.36MEG Energy 6.50% 15/01/2025 USD 50,000 40 0.02Reliance Intermediate Holdings 6.50% 01/04/2023 USD 750,000 641 0.42Ritchie Bros Auctioneers 5.38% 15/01/2025 USD 35,000 29 0.02Valeant Pharmaceuticals International 5.63% 01/12/2021 USD 715,000 439 0.29Valeant Pharmaceuticals International 6.50% 15/03/2022 USD 40,000 33 0.02Yamana Gold 4.95% 15/07/2024 USD 1,000,000 804 0.53 3,444 2.26
Cayman Islands 1.47% (1.54%)THPA Finance, Series B 8.24% 15/03/2028 GBP 1,300,000 1,483 0.97UPCB Finance IV 5.38% 15/01/2025 USD 945,000 760 0.50 2,243 1.47
France 4.93% (4.90%)AXA, FRN 5.63% 16/01/2054 GBP 1,200,000 1,285 0.84AXA, FRN 5.45% Perpetual GBP 750,000 809 0.53Electricite de France, FRN 6.00% Perpetual GBP 1,500,000 1,504 0.99Horizon Holdings 7.25% 01/08/2023 EUR 1,129,000 1,015 0.67Lafarge 8.75% 30/05/2017 GBP 1,250,000 1,261 0.83Orange, FRN 5.88% Perpetual GBP 1,500,000 1,629 1.07 7,503 4.93
Germany 0.89% (0.93%)Unitymedia Hessen 4.63% 15/02/2026 EUR 1,500,000 1,361 0.89 1,361 0.89
Italy 2.68% (3.18%)Enel, FRN 8.75% 24/09/2073 USD 2,000,000 1,837 1.21Telecom Italia 5.88% 19/05/2023 GBP 2,000,000 2,247 1.47 4,084 2.68
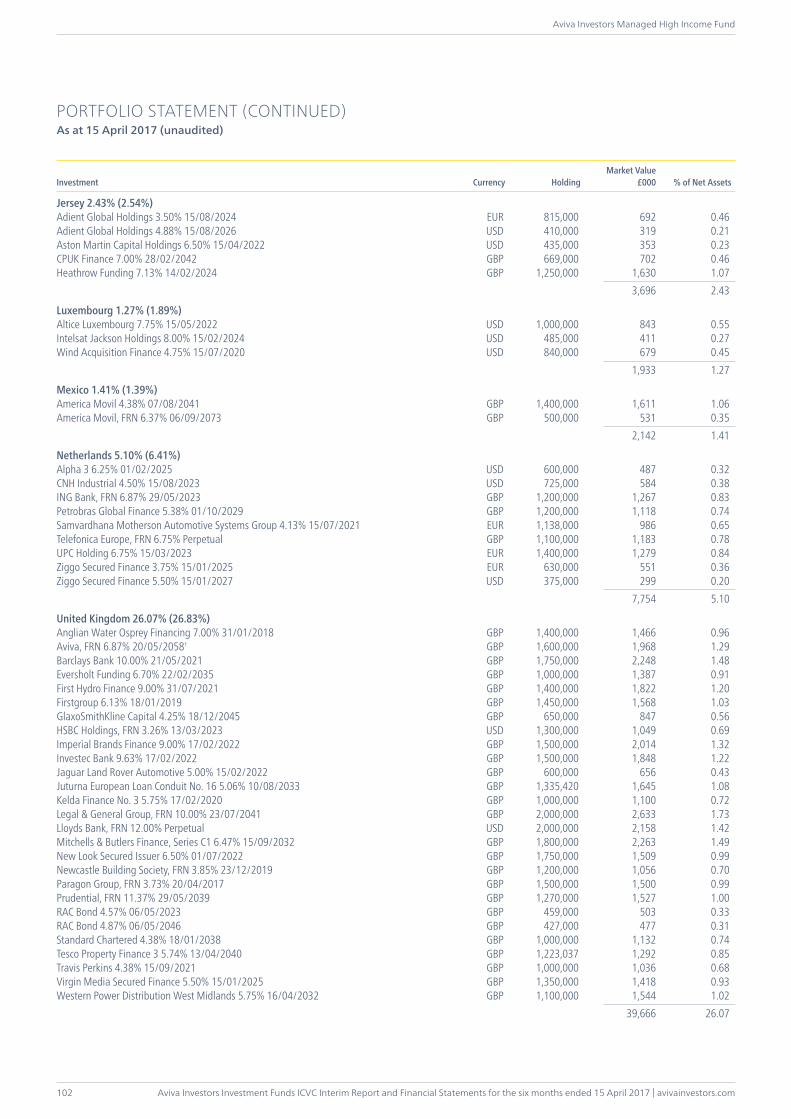
Aviva Investors Investment Funds ICVC Interim Report and Financial Statements for the six months ended 15 April 2017 | avivainvestors.com
Aviva Investors Managed High Income Fund
102
PORTFOLIO STATEMENT (CONTINUED)As at 15 April 2017 (unaudited)
Investment Currency HoldingMarket Value
£000 % of Net Assets
Jersey 2.43% (2.54%)Adient Global Holdings 3.50% 15/08/2024 EUR 815,000 692 0.46Adient Global Holdings 4.88% 15/08/2026 USD 410,000 319 0.21Aston Martin Capital Holdings 6.50% 15/04/2022 USD 435,000 353 0.23CPUK Finance 7.00% 28/02/2042 GBP 669,000 702 0.46Heathrow Funding 7.13% 14/02/2024 GBP 1,250,000 1,630 1.07 3,696 2.43
Luxembourg 1.27% (1.89%)Altice Luxembourg 7.75% 15/05/2022 USD 1,000,000 843 0.55Intelsat Jackson Holdings 8.00% 15/02/2024 USD 485,000 411 0.27Wind Acquisition Finance 4.75% 15/07/2020 USD 840,000 679 0.45 1,933 1.27
Mexico 1.41% (1.39%)America Movil 4.38% 07/08/2041 GBP 1,400,000 1,611 1.06America Movil, FRN 6.37% 06/09/2073 GBP 500,000 531 0.35 2,142 1.41
Netherlands 5.10% (6.41%)Alpha 3 6.25% 01/02/2025 USD 600,000 487 0.32CNH Industrial 4.50% 15/08/2023 USD 725,000 584 0.38ING Bank, FRN 6.87% 29/05/2023 GBP 1,200,000 1,267 0.83Petrobras Global Finance 5.38% 01/10/2029 GBP 1,200,000 1,118 0.74Samvardhana Motherson Automotive Systems Group 4.13% 15/07/2021 EUR 1,138,000 986 0.65Telefonica Europe, FRN 6.75% Perpetual GBP 1,100,000 1,183 0.78UPC Holding 6.75% 15/03/2023 EUR 1,400,000 1,279 0.84Ziggo Secured Finance 3.75% 15/01/2025 EUR 630,000 551 0.36Ziggo Secured Finance 5.50% 15/01/2027 USD 375,000 299 0.20 7,754 5.10
United Kingdom 26.07% (26.83%)Anglian Water Osprey Financing 7.00% 31/01/2018 GBP 1,400,000 1,466 0.96Aviva, FRN 6.87% 20/05/2058† GBP 1,600,000 1,968 1.29Barclays Bank 10.00% 21/05/2021 GBP 1,750,000 2,248 1.48Eversholt Funding 6.70% 22/02/2035 GBP 1,000,000 1,387 0.91First Hydro Finance 9.00% 31/07/2021 GBP 1,400,000 1,822 1.20Firstgroup 6.13% 18/01/2019 GBP 1,450,000 1,568 1.03GlaxoSmithKline Capital 4.25% 18/12/2045 GBP 650,000 847 0.56HSBC Holdings, FRN 3.26% 13/03/2023 USD 1,300,000 1,049 0.69Imperial Brands Finance 9.00% 17/02/2022 GBP 1,500,000 2,014 1.32Investec Bank 9.63% 17/02/2022 GBP 1,500,000 1,848 1.22Jaguar Land Rover Automotive 5.00% 15/02/2022 GBP 600,000 656 0.43Juturna European Loan Conduit No. 16 5.06% 10/08/2033 GBP 1,335,420 1,645 1.08Kelda Finance No. 3 5.75% 17/02/2020 GBP 1,000,000 1,100 0.72Legal & General Group, FRN 10.00% 23/07/2041 GBP 2,000,000 2,633 1.73Lloyds Bank, FRN 12.00% Perpetual USD 2,000,000 2,158 1.42Mitchells & Butlers Finance, Series C1 6.47% 15/09/2032 GBP 1,800,000 2,263 1.49New Look Secured Issuer 6.50% 01/07/2022 GBP 1,750,000 1,509 0.99Newcastle Building Society, FRN 3.85% 23/12/2019 GBP 1,200,000 1,056 0.70Paragon Group, FRN 3.73% 20/04/2017 GBP 1,500,000 1,500 0.99Prudential, FRN 11.37% 29/05/2039 GBP 1,270,000 1,527 1.00RAC Bond 4.57% 06/05/2023 GBP 459,000 503 0.33RAC Bond 4.87% 06/05/2046 GBP 427,000 477 0.31Standard Chartered 4.38% 18/01/2038 GBP 1,000,000 1,132 0.74Tesco Property Finance 3 5.74% 13/04/2040 GBP 1,223,037 1,292 0.85Travis Perkins 4.38% 15/09/2021 GBP 1,000,000 1,036 0.68Virgin Media Secured Finance 5.50% 15/01/2025 GBP 1,350,000 1,418 0.93Western Power Distribution West Midlands 5.75% 16/04/2032 GBP 1,100,000 1,544 1.02 39,666 26.07
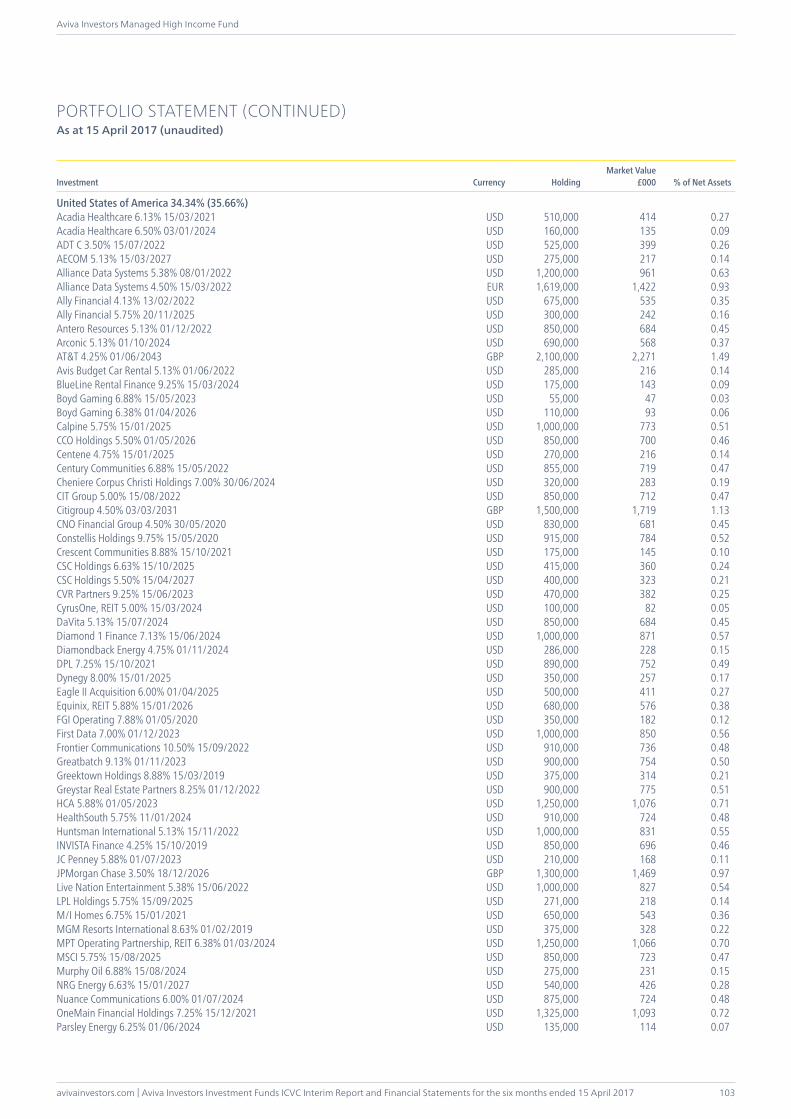
avivainvestors.com | Aviva Investors Investment Funds ICVC Interim Report and Financial Statements for the six months ended 15 April 2017
Aviva Investors Managed High Income Fund
103
PORTFOLIO STATEMENT (CONTINUED)As at 15 April 2017 (unaudited)
Investment Currency HoldingMarket Value
£000 % of Net Assets
United States of America 34.34% (35.66%)Acadia Healthcare 6.13% 15/03/2021 USD 510,000 414 0.27Acadia Healthcare 6.50% 03/01/2024 USD 160,000 135 0.09ADT C 3.50% 15/07/2022 USD 525,000 399 0.26AECOM 5.13% 15/03/2027 USD 275,000 217 0.14Alliance Data Systems 5.38% 08/01/2022 USD 1,200,000 961 0.63Alliance Data Systems 4.50% 15/03/2022 EUR 1,619,000 1,422 0.93Ally Financial 4.13% 13/02/2022 USD 675,000 535 0.35Ally Financial 5.75% 20/11/2025 USD 300,000 242 0.16Antero Resources 5.13% 01/12/2022 USD 850,000 684 0.45Arconic 5.13% 01/10/2024 USD 690,000 568 0.37AT&T 4.25% 01/06/2043 GBP 2,100,000 2,271 1.49Avis Budget Car Rental 5.13% 01/06/2022 USD 285,000 216 0.14BlueLine Rental Finance 9.25% 15/03/2024 USD 175,000 143 0.09Boyd Gaming 6.88% 15/05/2023 USD 55,000 47 0.03Boyd Gaming 6.38% 01/04/2026 USD 110,000 93 0.06Calpine 5.75% 15/01/2025 USD 1,000,000 773 0.51CCO Holdings 5.50% 01/05/2026 USD 850,000 700 0.46Centene 4.75% 15/01/2025 USD 270,000 216 0.14Century Communities 6.88% 15/05/2022 USD 855,000 719 0.47Cheniere Corpus Christi Holdings 7.00% 30/06/2024 USD 320,000 283 0.19CIT Group 5.00% 15/08/2022 USD 850,000 712 0.47Citigroup 4.50% 03/03/2031 GBP 1,500,000 1,719 1.13CNO Financial Group 4.50% 30/05/2020 USD 830,000 681 0.45Constellis Holdings 9.75% 15/05/2020 USD 915,000 784 0.52Crescent Communities 8.88% 15/10/2021 USD 175,000 145 0.10CSC Holdings 6.63% 15/10/2025 USD 415,000 360 0.24CSC Holdings 5.50% 15/04/2027 USD 400,000 323 0.21CVR Partners 9.25% 15/06/2023 USD 470,000 382 0.25CyrusOne, REIT 5.00% 15/03/2024 USD 100,000 82 0.05DaVita 5.13% 15/07/2024 USD 850,000 684 0.45Diamond 1 Finance 7.13% 15/06/2024 USD 1,000,000 871 0.57Diamondback Energy 4.75% 01/11/2024 USD 286,000 228 0.15DPL 7.25% 15/10/2021 USD 890,000 752 0.49Dynegy 8.00% 15/01/2025 USD 350,000 257 0.17Eagle II Acquisition 6.00% 01/04/2025 USD 500,000 411 0.27Equinix, REIT 5.88% 15/01/2026 USD 680,000 576 0.38FGI Operating 7.88% 01/05/2020 USD 350,000 182 0.12First Data 7.00% 01/12/2023 USD 1,000,000 850 0.56Frontier Communications 10.50% 15/09/2022 USD 910,000 736 0.48Greatbatch 9.13% 01/11/2023 USD 900,000 754 0.50Greektown Holdings 8.88% 15/03/2019 USD 375,000 314 0.21Greystar Real Estate Partners 8.25% 01/12/2022 USD 900,000 775 0.51HCA 5.88% 01/05/2023 USD 1,250,000 1,076 0.71HealthSouth 5.75% 11/01/2024 USD 910,000 724 0.48Huntsman International 5.13% 15/11/2022 USD 1,000,000 831 0.55INVISTA Finance 4.25% 15/10/2019 USD 850,000 696 0.46JC Penney 5.88% 01/07/2023 USD 210,000 168 0.11JPMorgan Chase 3.50% 18/12/2026 GBP 1,300,000 1,469 0.97Live Nation Entertainment 5.38% 15/06/2022 USD 1,000,000 827 0.54LPL Holdings 5.75% 15/09/2025 USD 271,000 218 0.14M/I Homes 6.75% 15/01/2021 USD 650,000 543 0.36MGM Resorts International 8.63% 01/02/2019 USD 375,000 328 0.22MPT Operating Partnership, REIT 6.38% 01/03/2024 USD 1,250,000 1,066 0.70MSCI 5.75% 15/08/2025 USD 850,000 723 0.47Murphy Oil 6.88% 15/08/2024 USD 275,000 231 0.15NRG Energy 6.63% 15/01/2027 USD 540,000 426 0.28Nuance Communications 6.00% 01/07/2024 USD 875,000 724 0.48OneMain Financial Holdings 7.25% 15/12/2021 USD 1,325,000 1,093 0.72Parsley Energy 6.25% 01/06/2024 USD 135,000 114 0.07
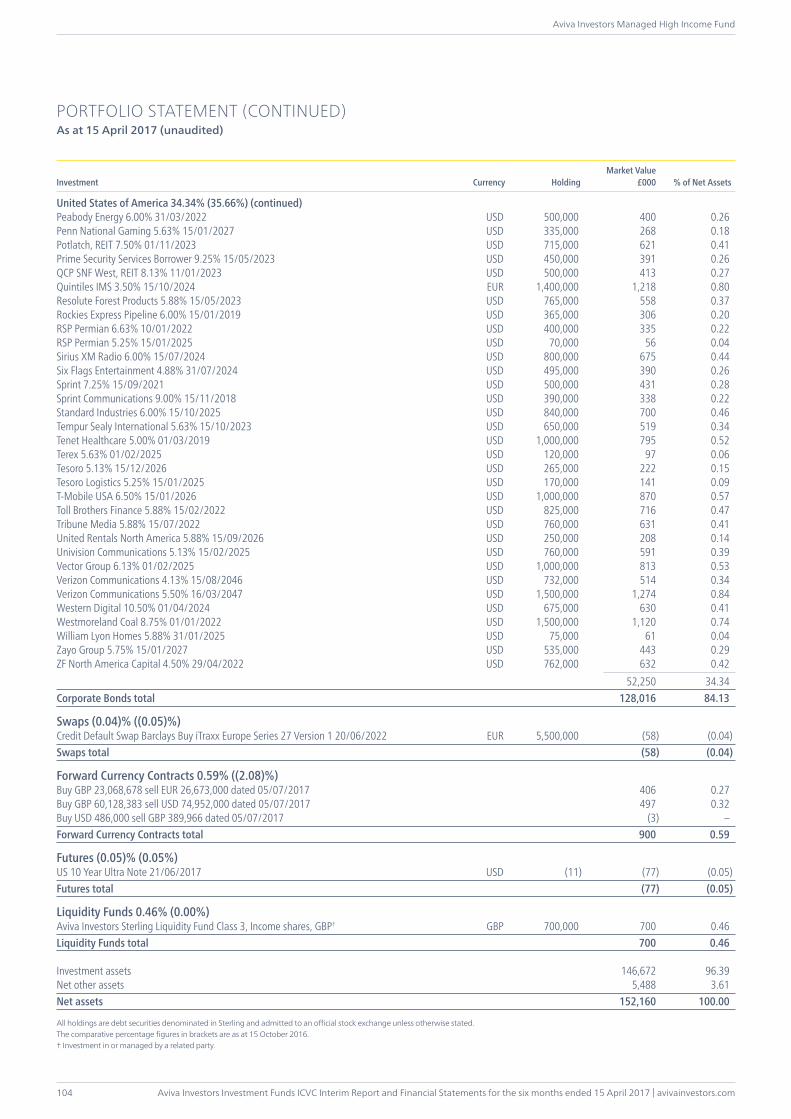
Aviva Investors Investment Funds ICVC Interim Report and Financial Statements for the six months ended 15 April 2017 | avivainvestors.com
Aviva Investors Managed High Income Fund
104
PORTFOLIO STATEMENT (CONTINUED)As at 15 April 2017 (unaudited)
Investment Currency HoldingMarket Value
£000 % of Net Assets
United States of America 34.34% (35.66%) (continued)Peabody Energy 6.00% 31/03/2022 USD 500,000 400 0.26Penn National Gaming 5.63% 15/01/2027 USD 335,000 268 0.18Potlatch, REIT 7.50% 01/11/2023 USD 715,000 621 0.41Prime Security Services Borrower 9.25% 15/05/2023 USD 450,000 391 0.26QCP SNF West, REIT 8.13% 11/01/2023 USD 500,000 413 0.27Quintiles IMS 3.50% 15/10/2024 EUR 1,400,000 1,218 0.80Resolute Forest Products 5.88% 15/05/2023 USD 765,000 558 0.37Rockies Express Pipeline 6.00% 15/01/2019 USD 365,000 306 0.20RSP Permian 6.63% 10/01/2022 USD 400,000 335 0.22RSP Permian 5.25% 15/01/2025 USD 70,000 56 0.04Sirius XM Radio 6.00% 15/07/2024 USD 800,000 675 0.44Six Flags Entertainment 4.88% 31/07/2024 USD 495,000 390 0.26Sprint 7.25% 15/09/2021 USD 500,000 431 0.28Sprint Communications 9.00% 15/11/2018 USD 390,000 338 0.22Standard Industries 6.00% 15/10/2025 USD 840,000 700 0.46Tempur Sealy International 5.63% 15/10/2023 USD 650,000 519 0.34Tenet Healthcare 5.00% 01/03/2019 USD 1,000,000 795 0.52Terex 5.63% 01/02/2025 USD 120,000 97 0.06Tesoro 5.13% 15/12/2026 USD 265,000 222 0.15Tesoro Logistics 5.25% 15/01/2025 USD 170,000 141 0.09T-Mobile USA 6.50% 15/01/2026 USD 1,000,000 870 0.57Toll Brothers Finance 5.88% 15/02/2022 USD 825,000 716 0.47Tribune Media 5.88% 15/07/2022 USD 760,000 631 0.41United Rentals North America 5.88% 15/09/2026 USD 250,000 208 0.14Univision Communications 5.13% 15/02/2025 USD 760,000 591 0.39Vector Group 6.13% 01/02/2025 USD 1,000,000 813 0.53Verizon Communications 4.13% 15/08/2046 USD 732,000 514 0.34Verizon Communications 5.50% 16/03/2047 USD 1,500,000 1,274 0.84Western Digital 10.50% 01/04/2024 USD 675,000 630 0.41Westmoreland Coal 8.75% 01/01/2022 USD 1,500,000 1,120 0.74William Lyon Homes 5.88% 31/01/2025 USD 75,000 61 0.04Zayo Group 5.75% 15/01/2027 USD 535,000 443 0.29ZF North America Capital 4.50% 29/04/2022 USD 762,000 632 0.42 52,250 34.34Corporate Bonds total 128,016 84.13
Swaps (0.04)% ((0.05)%)Credit Default Swap Barclays Buy iTraxx Europe Series 27 Version 1 20/06/2022 EUR 5,500,000 (58) (0.04)Swaps total (58) (0.04)
Forward Currency Contracts 0.59% ((2.08)%)Buy GBP 23,068,678 sell EUR 26,673,000 dated 05/07/2017 406 0.27Buy GBP 60,128,383 sell USD 74,952,000 dated 05/07/2017 497 0.32Buy USD 486,000 sell GBP 389,966 dated 05/07/2017 (3) –Forward Currency Contracts total 900 0.59
Futures (0.05)% (0.05%)US 10 Year Ultra Note 21/06/2017 USD (11) (77) (0.05)Futures total (77) (0.05)
Liquidity Funds 0.46% (0.00%)Aviva Investors Sterling Liquidity Fund Class 3, Income shares, GBP† GBP 700,000 700 0.46Liquidity Funds total 700 0.46
Investment assets 146,672 96.39Net other assets 5,488 3.61Net assets 152,160 100.00
All holdings are debt securities denominated in Sterling and admitted to an official stock exchange unless otherwise stated.The comparative percentage figures in brackets are as at 15 October 2016.† Investment in or managed by a related party.
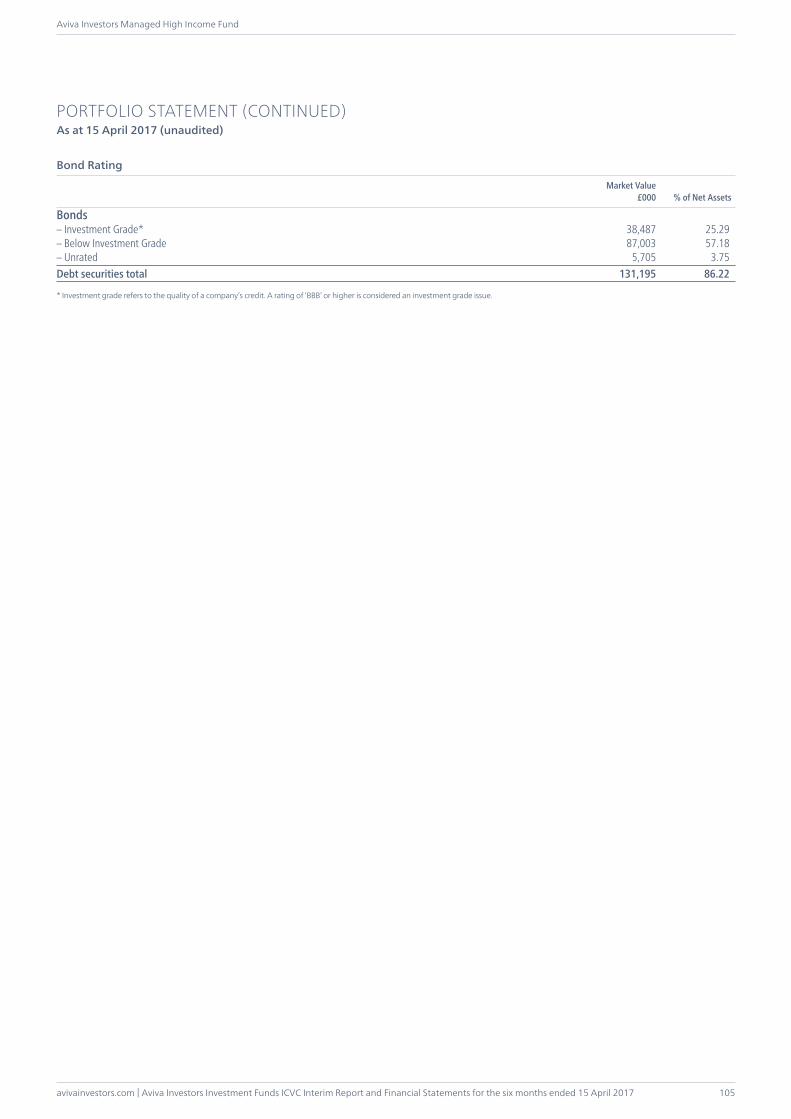
avivainvestors.com | Aviva Investors Investment Funds ICVC Interim Report and Financial Statements for the six months ended 15 April 2017
Aviva Investors Managed High Income Fund
105
Bonds– Investment Grade* 38,487 25.29 – Below Investment Grade 87,003 57.18 – Unrated 5,705 3.75 Debt securities total 131,195 86.22
* Investment grade refers to the quality of a company’s credit. A rating of ‘BBB’ or higher is considered an investment grade issue.
PORTFOLIO STATEMENT (CONTINUED)As at 15 April 2017 (unaudited)
Market Value£000 % of Net Assets
Bond Rating
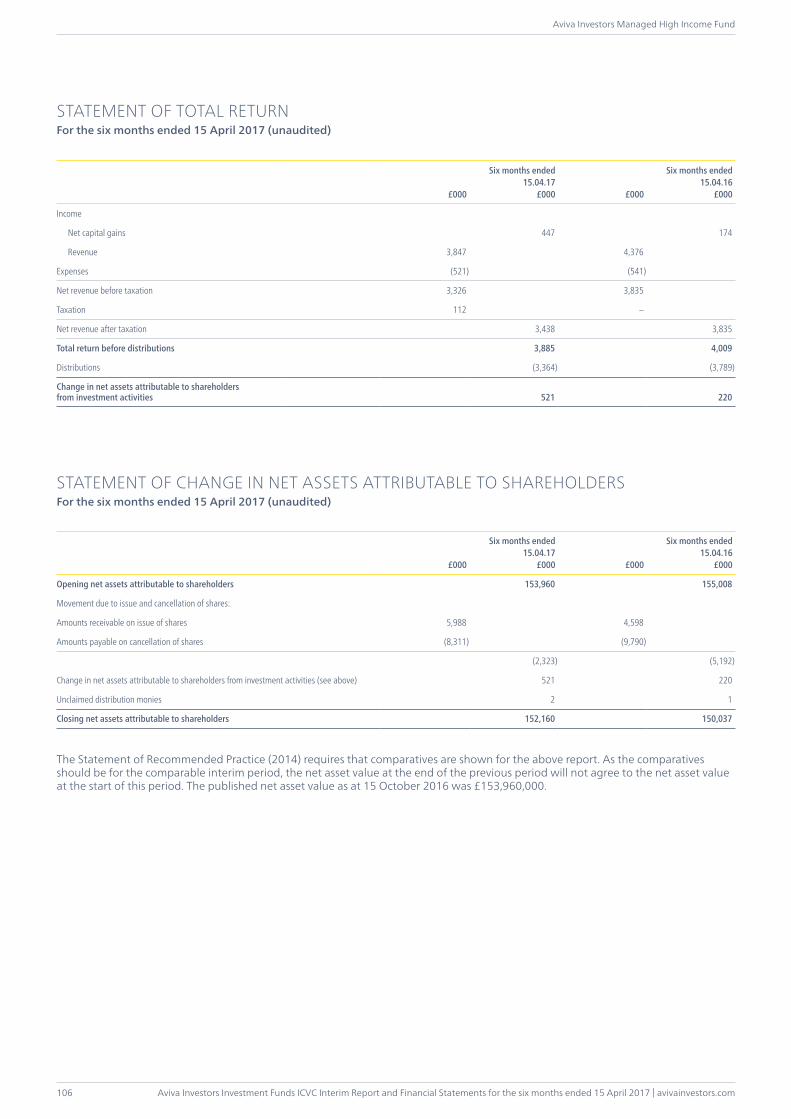
Aviva Investors Investment Funds ICVC Interim Report and Financial Statements for the six months ended 15 April 2017 | avivainvestors.com
Aviva Investors Managed High Income Fund
106
£000
Six months ended15.04.17
£000 £000
Six months ended15.04.16
£000
Income
Net capital gains 447 174
Revenue 3,847 4,376
Expenses (521) (541)
Net revenue before taxation 3,326 3,835
Taxation 112 –
Net revenue after taxation 3,438 3,835
Total return before distributions 3,885 4,009
Distributions (3,364) (3,789)
Change in net assets attributable to shareholders from investment activities 521 220
STATEMENT OF CHANGE IN NET ASSETS ATTRIBUTABLE TO SHAREHOLDERSFor the six months ended 15 April 2017 (unaudited)
£000
Six months ended15.04.17
£000 £000
Six months ended15.04.16
£000
Opening net assets attributable to shareholders 153,960 155,008
Movement due to issue and cancellation of shares:
Amounts receivable on issue of shares 5,988 4,598
Amounts payable on cancellation of shares (8,311) (9,790)
(2,323) (5,192)
Change in net assets attributable to shareholders from investment activities (see above) 521 220
Unclaimed distribution monies 2 1
Closing net assets attributable to shareholders 152,160 150,037
The Statement of Recommended Practice (2014) requires that comparatives are shown for the above report. As the comparatives should be for the comparable interim period, the net asset value at the end of the previous period will not agree to the net asset value at the start of this period. The published net asset value as at 15 October 2016 was £153,960,000.
STATEMENT OF TOTAL RETURNFor the six months ended 15 April 2017 (unaudited)

avivainvestors.com | Aviva Investors Investment Funds ICVC Interim Report and Financial Statements for the six months ended 15 April 2017
Aviva Investors Managed High Income Fund
107
BALANCE SHEETAs at 15 April 2017 (unaudited)
As at15.04.17
£000
As at15.10.16
£000
Assets:
Investments 146,810 155,681
Current assets:
Debtors 4,067 2,931
Cash and bank balances 5,913 756
Total assets 156,790 159,368
Liabilities:
Investment liabilities (138) (3,279)
Creditors:
Bank overdrafts – (12)
Distribution payable (1,375) (1,388)
Other creditors (3,117) (729)
Total liabilities (4,630) (5,408)
Net assets attributable to shareholders 152,160 153,960
ACCOUNTING POLICIESThe accounting policies applied are consistent with those of the financial statements for the year ended 15 October 2016 and are described in those annual financial statements.
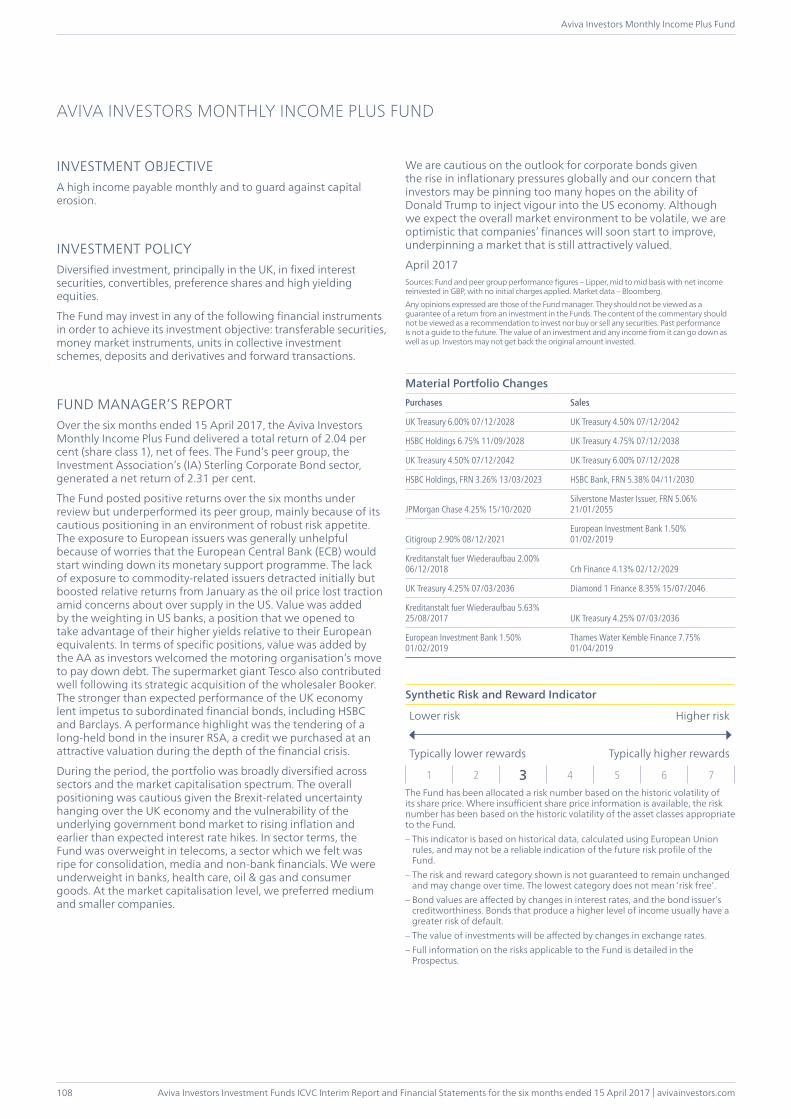
Aviva Investors Investment Funds ICVC Interim Report and Financial Statements for the six months ended 15 April 2017 | avivainvestors.com
Aviva Investors Monthly Income Plus Fund
108
INVESTMENT OBJECTIVEA high income payable monthly and to guard against capital erosion.
INVESTMENT POLICYDiversified investment, principally in the UK, in fixed interest securities, convertibles, preference shares and high yielding equities.
The Fund may invest in any of the following financial instruments in order to achieve its investment objective: transferable securities, money market instruments, units in collective investment schemes, deposits and derivatives and forward transactions.
FUND MANAGER’S REPORTOver the six months ended 15 April 2017, the Aviva Investors Monthly Income Plus Fund delivered a total return of 2.04 per cent (share class 1), net of fees. The Fund’s peer group, the Investment Association’s (IA) Sterling Corporate Bond sector, generated a net return of 2.31 per cent.
The Fund posted positive returns over the six months under review but underperformed its peer group, mainly because of its cautious positioning in an environment of robust risk appetite. The exposure to European issuers was generally unhelpful because of worries that the European Central Bank (ECB) would start winding down its monetary support programme. The lack of exposure to commodity-related issuers detracted initially but boosted relative returns from January as the oil price lost traction amid concerns about over supply in the US. Value was added by the weighting in US banks, a position that we opened to take advantage of their higher yields relative to their European equivalents. In terms of specific positions, value was added by the AA as investors welcomed the motoring organisation’s move to pay down debt. The supermarket giant Tesco also contributed well following its strategic acquisition of the wholesaler Booker. The stronger than expected performance of the UK economy lent impetus to subordinated financial bonds, including HSBC and Barclays. A performance highlight was the tendering of a long-held bond in the insurer RSA, a credit we purchased at an attractive valuation during the depth of the financial crisis.
During the period, the portfolio was broadly diversified across sectors and the market capitalisation spectrum. The overall positioning was cautious given the Brexit-related uncertainty hanging over the UK economy and the vulnerability of the underlying government bond market to rising inflation and earlier than expected interest rate hikes. In sector terms, the Fund was overweight in telecoms, a sector which we felt was ripe for consolidation, media and non-bank financials. We were underweight in banks, health care, oil & gas and consumer goods. At the market capitalisation level, we preferred medium and smaller companies.
We are cautious on the outlook for corporate bonds given the rise in inflationary pressures globally and our concern that investors may be pinning too many hopes on the ability of Donald Trump to inject vigour into the US economy. Although we expect the overall market environment to be volatile, we are optimistic that companies’ finances will soon start to improve, underpinning a market that is still attractively valued.
April 2017Sources: Fund and peer group performance figures – Lipper, mid to mid basis with net income reinvested in GBP, with no initial charges applied. Market data – Bloomberg.Any opinions expressed are those of the Fund manager. They should not be viewed as a guarantee of a return from an investment in the Funds. The content of the commentary should not be viewed as a recommendation to invest nor buy or sell any securities. Past performance is not a guide to the future. The value of an investment and any income from it can go down as well as up. Investors may not get back the original amount invested.
Material Portfolio ChangesPurchases Sales
UK Treasury 6.00% 07/12/2028 UK Treasury 4.50% 07/12/2042
HSBC Holdings 6.75% 11/09/2028 UK Treasury 4.75% 07/12/2038
UK Treasury 4.50% 07/12/2042 UK Treasury 6.00% 07/12/2028
HSBC Holdings, FRN 3.26% 13/03/2023 HSBC Bank, FRN 5.38% 04/11/2030
JPMorgan Chase 4.25% 15/10/2020Silverstone Master Issuer, FRN 5.06% 21/01/2055
Citigroup 2.90% 08/12/2021European Investment Bank 1.50% 01/02/2019
Kreditanstalt fuer Wiederaufbau 2.00% 06/12/2018 Crh Finance 4.13% 02/12/2029
UK Treasury 4.25% 07/03/2036 Diamond 1 Finance 8.35% 15/07/2046
Kreditanstalt fuer Wiederaufbau 5.63% 25/08/2017 UK Treasury 4.25% 07/03/2036
European Investment Bank 1.50% 01/02/2019
Thames Water Kemble Finance 7.75% 01/04/2019
Synthetic Risk and Reward Indicator
Lower risk Higher risk
Typically lower rewards Typically higher rewards
1 2 3 4 5 6 7The Fund has been allocated a risk number based on the historic volatility of its share price. Where insufficient share price information is available, the risk number has been based on the historic volatility of the asset classes appropriate to the Fund.– This indicator is based on historical data, calculated using European Union
rules, and may not be a reliable indication of the future risk profile of the Fund.
– The risk and reward category shown is not guaranteed to remain unchanged and may change over time. The lowest category does not mean ‘risk free’.
– Bond values are affected by changes in interest rates, and the bond issuer’s creditworthiness. Bonds that produce a higher level of income usually have a greater risk of default.
– The value of investments will be affected by changes in exchange rates.– Full information on the risks applicable to the Fund is detailed in the
Prospectus.
AVIVA INVESTORS MONTHLY INCOME PLUS FUND
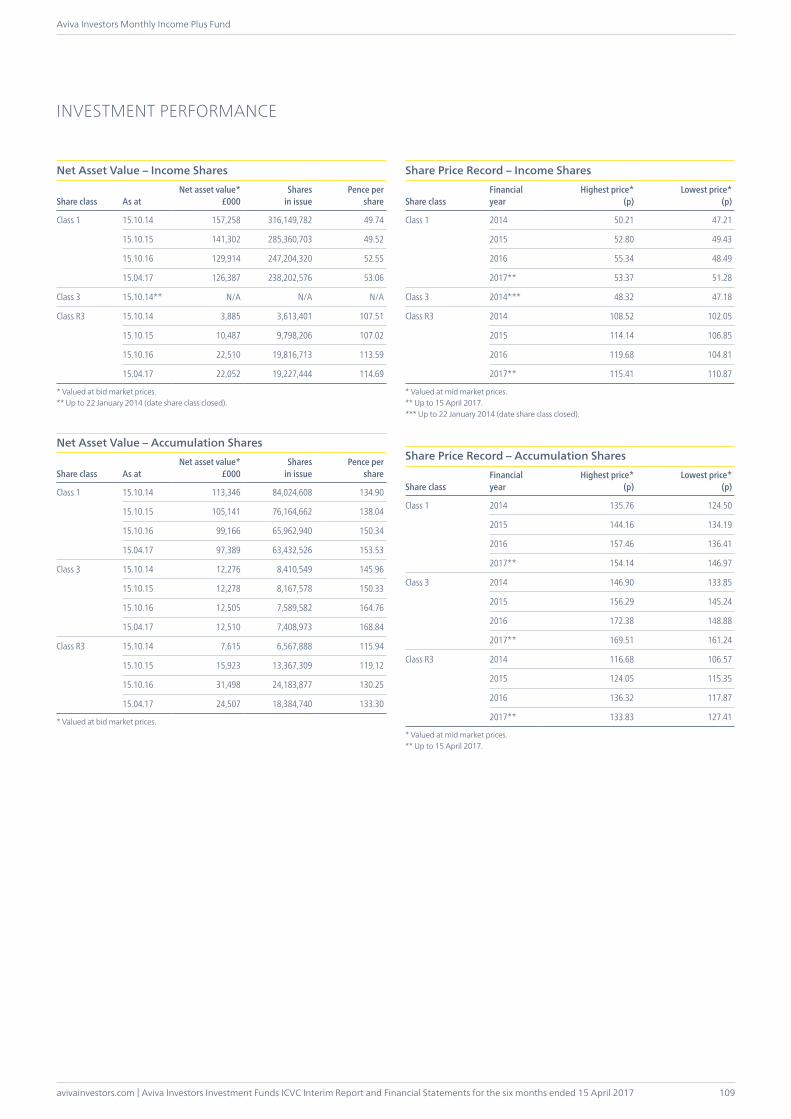
avivainvestors.com | Aviva Investors Investment Funds ICVC Interim Report and Financial Statements for the six months ended 15 April 2017
Aviva Investors Monthly Income Plus Fund
109
INVESTMENT PERFORMANCE
Net Asset Value – Income Shares
Share class As atNet asset value*
£000Shares
in issuePence per
share
Class 1 15.10.14 157,258 316,149,782 49.74
15.10.15 141,302 285,360,703 49.52
15.10.16 129,914 247,204,320 52.55
15.04.17 126,387 238,202,576 53.06
Class 3 15.10.14** N/A N/A N/A
Class R3 15.10.14 3,885 3,613,401 107.51
15.10.15 10,487 9,798,206 107.02
15.10.16 22,510 19,816,713 113.59
15.04.17 22,052 19,227,444 114.69
* Valued at bid market prices.** Up to 22 January 2014 (date share class closed).
Net Asset Value – Accumulation Shares
Share class As atNet asset value*
£000Shares
in issuePence per
share
Class 1 15.10.14 113,346 84,024,608 134.90
15.10.15 105,141 76,164,662 138.04
15.10.16 99,166 65,962,940 150.34
15.04.17 97,389 63,432,526 153.53
Class 3 15.10.14 12,276 8,410,549 145.96
15.10.15 12,278 8,167,578 150.33
15.10.16 12,505 7,589,582 164.76
15.04.17 12,510 7,408,973 168.84
Class R3 15.10.14 7,615 6,567,888 115.94
15.10.15 15,923 13,367,309 119.12
15.10.16 31,498 24,183,877 130.25
15.04.17 24,507 18,384,740 133.30
* Valued at bid market prices.
Share Price Record – Income Shares
Share classFinancialyear
Highest price*(p)
Lowest price*(p)
Class 1 2014 50.21 47.21
2015 52.80 49.43
2016 55.34 48.49
2017** 53.37 51.28
Class 3 2014*** 48.32 47.18
Class R3 2014 108.52 102.05
2015 114.14 106.85
2016 119.68 104.81
2017** 115.41 110.87
* Valued at mid market prices.** Up to 15 April 2017.*** Up to 22 January 2014 (date share class closed).
Share Price Record – Accumulation Shares
Share classFinancialyear
Highest price*(p)
Lowest price*(p)
Class 1 2014 135.76 124.50
2015 144.16 134.19
2016 157.46 136.41
2017** 154.14 146.97
Class 3 2014 146.90 133.85
2015 156.29 145.24
2016 172.38 148.88
2017** 169.51 161.24
Class R3 2014 116.68 106.57
2015 124.05 115.35
2016 136.32 117.87
2017** 133.83 127.41
* Valued at mid market prices.** Up to 15 April 2017.
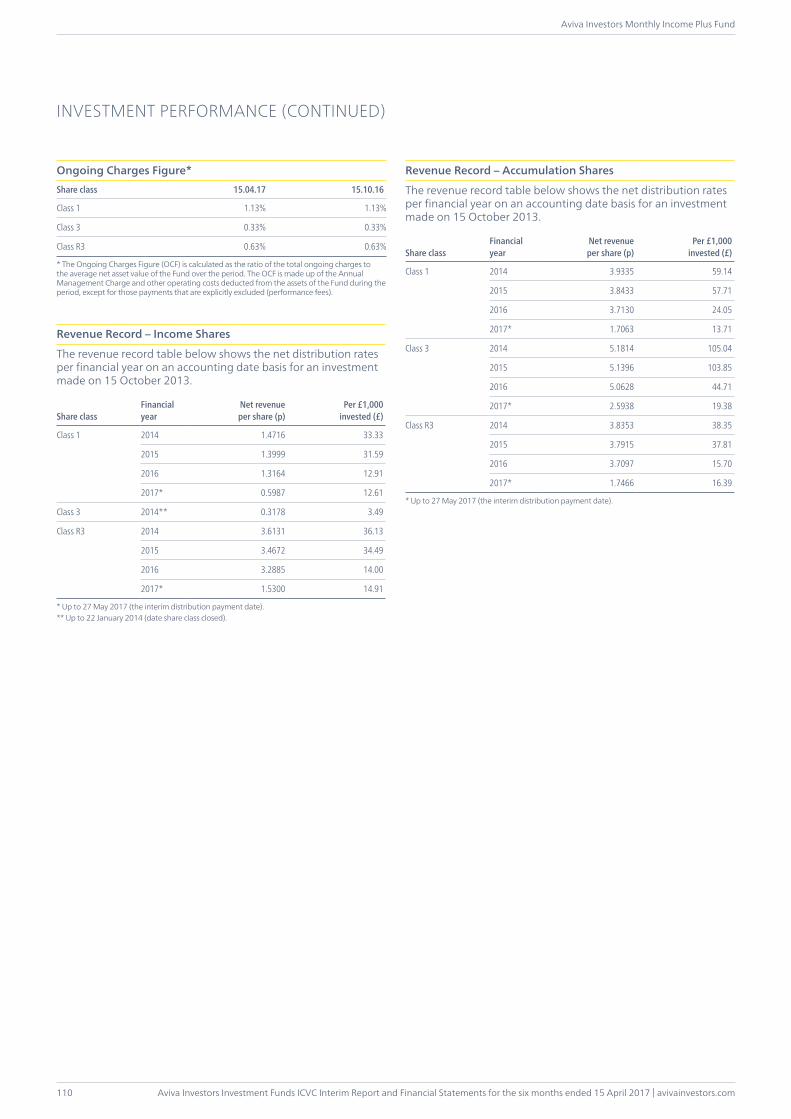
Aviva Investors Investment Funds ICVC Interim Report and Financial Statements for the six months ended 15 April 2017 | avivainvestors.com
Aviva Investors Monthly Income Plus Fund
110
INVESTMENT PERFORMANCE (CONTINUED)
Ongoing Charges Figure*Share class 15.04.17 15.10.16
Class 1 1.13% 1.13%
Class 3 0.33% 0.33%
Class R3 0.63% 0.63%
* The Ongoing Charges Figure (OCF) is calculated as the ratio of the total ongoing charges to the average net asset value of the Fund over the period. The OCF is made up of the Annual Management Charge and other operating costs deducted from the assets of the Fund during the period, except for those payments that are explicitly excluded (performance fees).
Revenue Record – Income Shares
The revenue record table below shows the net distribution rates per financial year on an accounting date basis for an investment made on 15 October 2013.
Share classFinancialyear
Net revenue per share (p)
Per £1,000invested (£)
Class 1 2014 1.4716 33.33
2015 1.3999 31.59
2016 1.3164 12.91
2017* 0.5987 12.61
Class 3 2014** 0.3178 3.49
Class R3 2014 3.6131 36.13
2015 3.4672 34.49
2016 3.2885 14.00
2017* 1.5300 14.91
* Up to 27 May 2017 (the interim distribution payment date).** Up to 22 January 2014 (date share class closed).
Revenue Record – Accumulation Shares
The revenue record table below shows the net distribution rates per financial year on an accounting date basis for an investment made on 15 October 2013.
Share classFinancialyear
Net revenue per share (p)
Per £1,000invested (£)
Class 1 2014 3.9335 59.14
2015 3.8433 57.71
2016 3.7130 24.05
2017* 1.7063 13.71
Class 3 2014 5.1814 105.04
2015 5.1396 103.85
2016 5.0628 44.71
2017* 2.5938 19.38
Class R3 2014 3.8353 38.35
2015 3.7915 37.81
2016 3.7097 15.70
2017* 1.7466 16.39
* Up to 27 May 2017 (the interim distribution payment date).
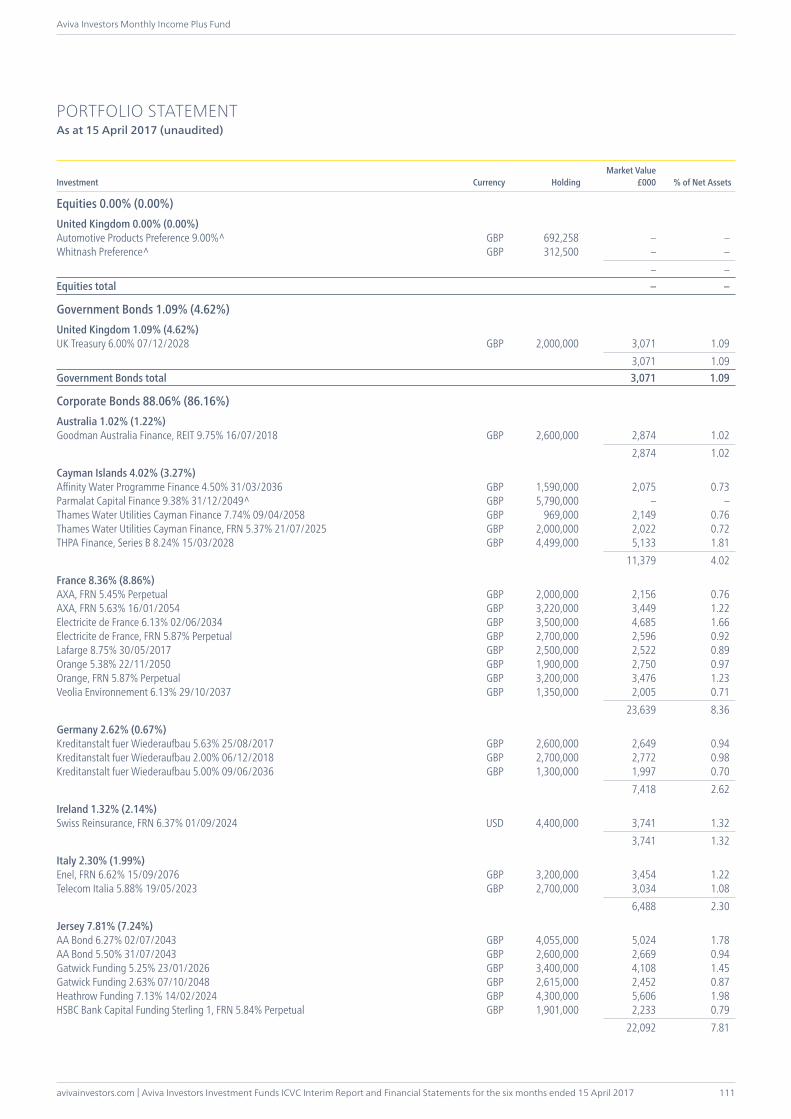
avivainvestors.com | Aviva Investors Investment Funds ICVC Interim Report and Financial Statements for the six months ended 15 April 2017
Aviva Investors Monthly Income Plus Fund
111
PORTFOLIO STATEMENTAs at 15 April 2017 (unaudited)
Investment Currency HoldingMarket Value
£000 % of Net Assets
Equities 0.00% (0.00%)United Kingdom 0.00% (0.00%)Automotive Products Preference 9.00%^ GBP 692,258 – –Whitnash Preference^ GBP 312,500 – – – –Equities total – –
Government Bonds 1.09% (4.62%)United Kingdom 1.09% (4.62%)UK Treasury 6.00% 07/12/2028 GBP 2,000,000 3,071 1.09 3,071 1.09Government Bonds total 3,071 1.09
Corporate Bonds 88.06% (86.16%)Australia 1.02% (1.22%)Goodman Australia Finance, REIT 9.75% 16/07/2018 GBP 2,600,000 2,874 1.02 2,874 1.02
Cayman Islands 4.02% (3.27%)Affinity Water Programme Finance 4.50% 31/03/2036 GBP 1,590,000 2,075 0.73Parmalat Capital Finance 9.38% 31/12/2049^ GBP 5,790,000 – –Thames Water Utilities Cayman Finance 7.74% 09/04/2058 GBP 969,000 2,149 0.76Thames Water Utilities Cayman Finance, FRN 5.37% 21/07/2025 GBP 2,000,000 2,022 0.72THPA Finance, Series B 8.24% 15/03/2028 GBP 4,499,000 5,133 1.81 11,379 4.02
France 8.36% (8.86%)AXA, FRN 5.45% Perpetual GBP 2,000,000 2,156 0.76AXA, FRN 5.63% 16/01/2054 GBP 3,220,000 3,449 1.22Electricite de France 6.13% 02/06/2034 GBP 3,500,000 4,685 1.66Electricite de France, FRN 5.87% Perpetual GBP 2,700,000 2,596 0.92Lafarge 8.75% 30/05/2017 GBP 2,500,000 2,522 0.89Orange 5.38% 22/11/2050 GBP 1,900,000 2,750 0.97Orange, FRN 5.87% Perpetual GBP 3,200,000 3,476 1.23Veolia Environnement 6.13% 29/10/2037 GBP 1,350,000 2,005 0.71 23,639 8.36
Germany 2.62% (0.67%)Kreditanstalt fuer Wiederaufbau 5.63% 25/08/2017 GBP 2,600,000 2,649 0.94Kreditanstalt fuer Wiederaufbau 2.00% 06/12/2018 GBP 2,700,000 2,772 0.98Kreditanstalt fuer Wiederaufbau 5.00% 09/06/2036 GBP 1,300,000 1,997 0.70 7,418 2.62
Ireland 1.32% (2.14%)Swiss Reinsurance, FRN 6.37% 01/09/2024 USD 4,400,000 3,741 1.32 3,741 1.32
Italy 2.30% (1.99%)Enel, FRN 6.62% 15/09/2076 GBP 3,200,000 3,454 1.22Telecom Italia 5.88% 19/05/2023 GBP 2,700,000 3,034 1.08 6,488 2.30
Jersey 7.81% (7.24%)AA Bond 6.27% 02/07/2043 GBP 4,055,000 5,024 1.78AA Bond 5.50% 31/07/2043 GBP 2,600,000 2,669 0.94Gatwick Funding 5.25% 23/01/2026 GBP 3,400,000 4,108 1.45Gatwick Funding 2.63% 07/10/2048 GBP 2,615,000 2,452 0.87Heathrow Funding 7.13% 14/02/2024 GBP 4,300,000 5,606 1.98HSBC Bank Capital Funding Sterling 1, FRN 5.84% Perpetual GBP 1,901,000 2,233 0.79 22,092 7.81
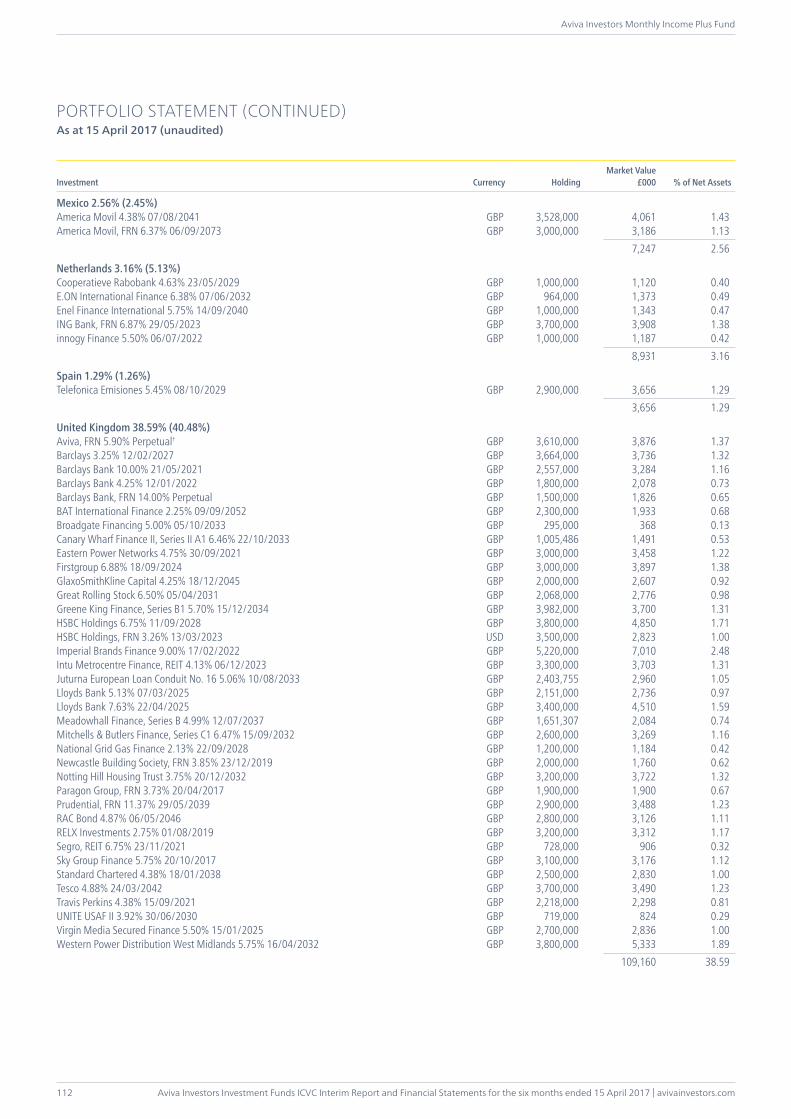
Aviva Investors Investment Funds ICVC Interim Report and Financial Statements for the six months ended 15 April 2017 | avivainvestors.com
Aviva Investors Monthly Income Plus Fund
112
PORTFOLIO STATEMENT (CONTINUED)As at 15 April 2017 (unaudited)
Investment Currency HoldingMarket Value
£000 % of Net Assets
Mexico 2.56% (2.45%)America Movil 4.38% 07/08/2041 GBP 3,528,000 4,061 1.43America Movil, FRN 6.37% 06/09/2073 GBP 3,000,000 3,186 1.13 7,247 2.56
Netherlands 3.16% (5.13%)Cooperatieve Rabobank 4.63% 23/05/2029 GBP 1,000,000 1,120 0.40E.ON International Finance 6.38% 07/06/2032 GBP 964,000 1,373 0.49Enel Finance International 5.75% 14/09/2040 GBP 1,000,000 1,343 0.47ING Bank, FRN 6.87% 29/05/2023 GBP 3,700,000 3,908 1.38innogy Finance 5.50% 06/07/2022 GBP 1,000,000 1,187 0.42 8,931 3.16
Spain 1.29% (1.26%)Telefonica Emisiones 5.45% 08/10/2029 GBP 2,900,000 3,656 1.29 3,656 1.29
United Kingdom 38.59% (40.48%)Aviva, FRN 5.90% Perpetual† GBP 3,610,000 3,876 1.37Barclays 3.25% 12/02/2027 GBP 3,664,000 3,736 1.32Barclays Bank 10.00% 21/05/2021 GBP 2,557,000 3,284 1.16Barclays Bank 4.25% 12/01/2022 GBP 1,800,000 2,078 0.73Barclays Bank, FRN 14.00% Perpetual GBP 1,500,000 1,826 0.65BAT International Finance 2.25% 09/09/2052 GBP 2,300,000 1,933 0.68Broadgate Financing 5.00% 05/10/2033 GBP 295,000 368 0.13Canary Wharf Finance II, Series II A1 6.46% 22/10/2033 GBP 1,005,486 1,491 0.53Eastern Power Networks 4.75% 30/09/2021 GBP 3,000,000 3,458 1.22Firstgroup 6.88% 18/09/2024 GBP 3,000,000 3,897 1.38GlaxoSmithKline Capital 4.25% 18/12/2045 GBP 2,000,000 2,607 0.92Great Rolling Stock 6.50% 05/04/2031 GBP 2,068,000 2,776 0.98Greene King Finance, Series B1 5.70% 15/12/2034 GBP 3,982,000 3,700 1.31HSBC Holdings 6.75% 11/09/2028 GBP 3,800,000 4,850 1.71HSBC Holdings, FRN 3.26% 13/03/2023 USD 3,500,000 2,823 1.00Imperial Brands Finance 9.00% 17/02/2022 GBP 5,220,000 7,010 2.48Intu Metrocentre Finance, REIT 4.13% 06/12/2023 GBP 3,300,000 3,703 1.31Juturna European Loan Conduit No. 16 5.06% 10/08/2033 GBP 2,403,755 2,960 1.05Lloyds Bank 5.13% 07/03/2025 GBP 2,151,000 2,736 0.97Lloyds Bank 7.63% 22/04/2025 GBP 3,400,000 4,510 1.59Meadowhall Finance, Series B 4.99% 12/07/2037 GBP 1,651,307 2,084 0.74Mitchells & Butlers Finance, Series C1 6.47% 15/09/2032 GBP 2,600,000 3,269 1.16National Grid Gas Finance 2.13% 22/09/2028 GBP 1,200,000 1,184 0.42Newcastle Building Society, FRN 3.85% 23/12/2019 GBP 2,000,000 1,760 0.62Notting Hill Housing Trust 3.75% 20/12/2032 GBP 3,200,000 3,722 1.32Paragon Group, FRN 3.73% 20/04/2017 GBP 1,900,000 1,900 0.67Prudential, FRN 11.37% 29/05/2039 GBP 2,900,000 3,488 1.23RAC Bond 4.87% 06/05/2046 GBP 2,800,000 3,126 1.11RELX Investments 2.75% 01/08/2019 GBP 3,200,000 3,312 1.17Segro, REIT 6.75% 23/11/2021 GBP 728,000 906 0.32Sky Group Finance 5.75% 20/10/2017 GBP 3,100,000 3,176 1.12Standard Chartered 4.38% 18/01/2038 GBP 2,500,000 2,830 1.00Tesco 4.88% 24/03/2042 GBP 3,700,000 3,490 1.23Travis Perkins 4.38% 15/09/2021 GBP 2,218,000 2,298 0.81UNITE USAF II 3.92% 30/06/2030 GBP 719,000 824 0.29Virgin Media Secured Finance 5.50% 15/01/2025 GBP 2,700,000 2,836 1.00Western Power Distribution West Midlands 5.75% 16/04/2032 GBP 3,800,000 5,333 1.89 109,160 38.59
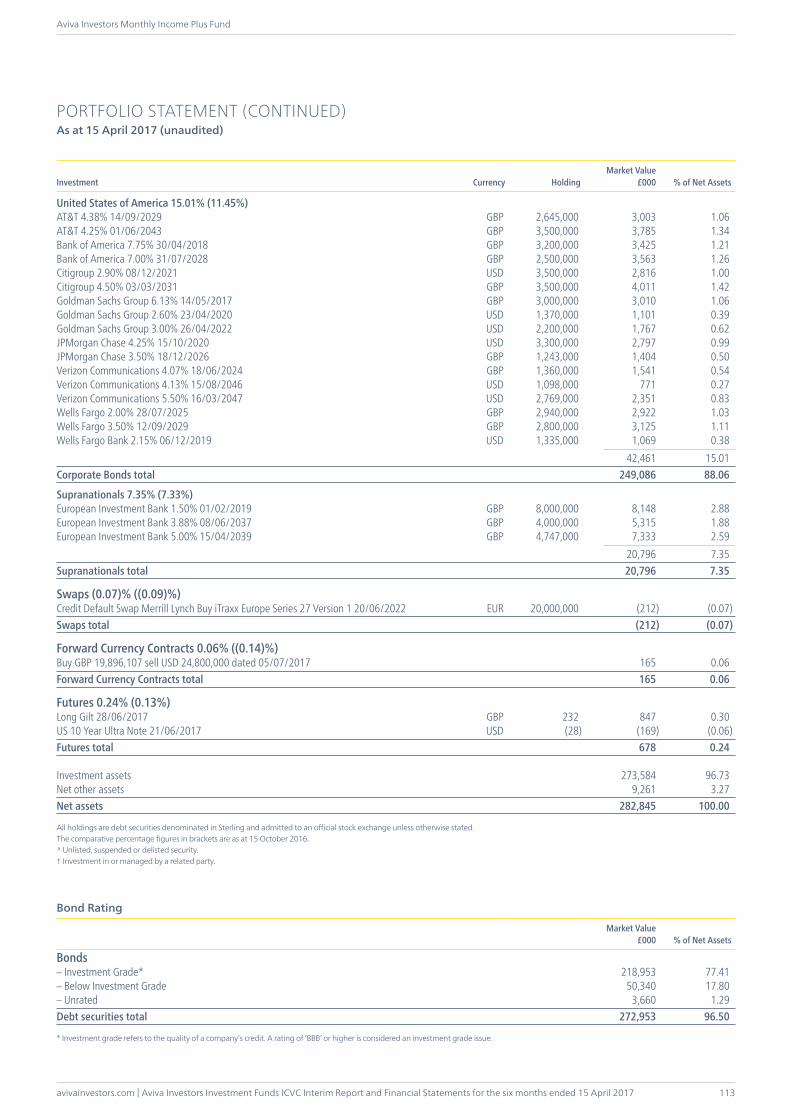
avivainvestors.com | Aviva Investors Investment Funds ICVC Interim Report and Financial Statements for the six months ended 15 April 2017
Aviva Investors Monthly Income Plus Fund
113
PORTFOLIO STATEMENT (CONTINUED)As at 15 April 2017 (unaudited)
Investment Currency HoldingMarket Value
£000 % of Net Assets
United States of America 15.01% (11.45%)AT&T 4.38% 14/09/2029 GBP 2,645,000 3,003 1.06AT&T 4.25% 01/06/2043 GBP 3,500,000 3,785 1.34Bank of America 7.75% 30/04/2018 GBP 3,200,000 3,425 1.21Bank of America 7.00% 31/07/2028 GBP 2,500,000 3,563 1.26Citigroup 2.90% 08/12/2021 USD 3,500,000 2,816 1.00Citigroup 4.50% 03/03/2031 GBP 3,500,000 4,011 1.42Goldman Sachs Group 6.13% 14/05/2017 GBP 3,000,000 3,010 1.06Goldman Sachs Group 2.60% 23/04/2020 USD 1,370,000 1,101 0.39Goldman Sachs Group 3.00% 26/04/2022 USD 2,200,000 1,767 0.62JPMorgan Chase 4.25% 15/10/2020 USD 3,300,000 2,797 0.99JPMorgan Chase 3.50% 18/12/2026 GBP 1,243,000 1,404 0.50Verizon Communications 4.07% 18/06/2024 GBP 1,360,000 1,541 0.54Verizon Communications 4.13% 15/08/2046 USD 1,098,000 771 0.27Verizon Communications 5.50% 16/03/2047 USD 2,769,000 2,351 0.83Wells Fargo 2.00% 28/07/2025 GBP 2,940,000 2,922 1.03Wells Fargo 3.50% 12/09/2029 GBP 2,800,000 3,125 1.11Wells Fargo Bank 2.15% 06/12/2019 USD 1,335,000 1,069 0.38 42,461 15.01Corporate Bonds total 249,086 88.06
Supranationals 7.35% (7.33%)European Investment Bank 1.50% 01/02/2019 GBP 8,000,000 8,148 2.88European Investment Bank 3.88% 08/06/2037 GBP 4,000,000 5,315 1.88European Investment Bank 5.00% 15/04/2039 GBP 4,747,000 7,333 2.59 20,796 7.35Supranationals total 20,796 7.35
Swaps (0.07)% ((0.09)%)Credit Default Swap Merrill Lynch Buy iTraxx Europe Series 27 Version 1 20/06/2022 EUR 20,000,000 (212) (0.07)Swaps total (212) (0.07)
Forward Currency Contracts 0.06% ((0.14)%)Buy GBP 19,896,107 sell USD 24,800,000 dated 05/07/2017 165 0.06Forward Currency Contracts total 165 0.06
Futures 0.24% (0.13%)Long Gilt 28/06/2017 GBP 232 847 0.30US 10 Year Ultra Note 21/06/2017 USD (28) (169) (0.06)Futures total 678 0.24
Investment assets 273,584 96.73Net other assets 9,261 3.27Net assets 282,845 100.00
All holdings are debt securities denominated in Sterling and admitted to an official stock exchange unless otherwise stated.The comparative percentage figures in brackets are as at 15 October 2016.^ Unlisted, suspended or delisted security.† Investment in or managed by a related party.
Market Value£000 % of Net Assets
Bond Rating
Bonds– Investment Grade* 218,953 77.41– Below Investment Grade 50,340 17.80– Unrated 3,660 1.29Debt securities total 272,953 96.50
* Investment grade refers to the quality of a company’s credit. A rating of ‘BBB’ or higher is considered an investment grade issue.
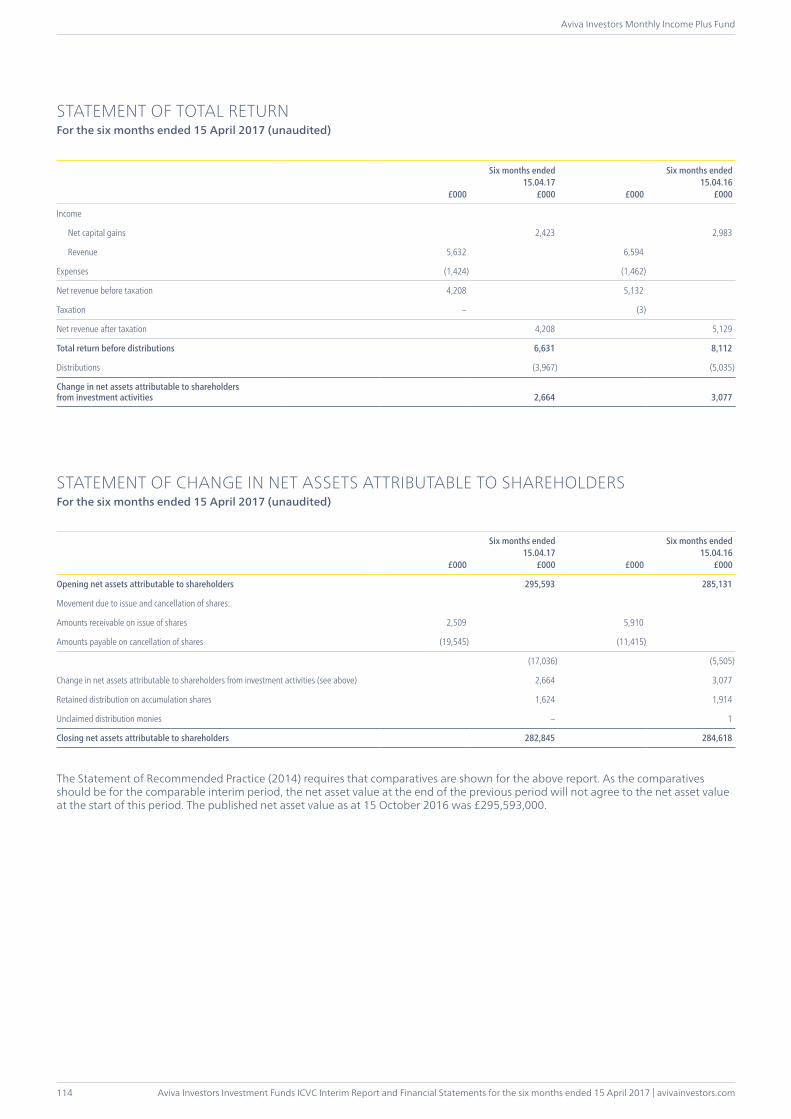
Aviva Investors Investment Funds ICVC Interim Report and Financial Statements for the six months ended 15 April 2017 | avivainvestors.com
Aviva Investors Monthly Income Plus Fund
114
£000
Six months ended15.04.17
£000 £000
Six months ended15.04.16
£000
Income
Net capital gains 2,423 2,983
Revenue 5,632 6,594
Expenses (1,424) (1,462)
Net revenue before taxation 4,208 5,132
Taxation – (3)
Net revenue after taxation 4,208 5,129
Total return before distributions 6,631 8,112
Distributions (3,967) (5,035)
Change in net assets attributable to shareholders from investment activities 2,664 3,077
STATEMENT OF CHANGE IN NET ASSETS ATTRIBUTABLE TO SHAREHOLDERSFor the six months ended 15 April 2017 (unaudited)
£000
Six months ended15.04.17
£000 £000
Six months ended15.04.16
£000
Opening net assets attributable to shareholders 295,593 285,131
Movement due to issue and cancellation of shares:
Amounts receivable on issue of shares 2,509 5,910
Amounts payable on cancellation of shares (19,545) (11,415)
(17,036) (5,505)
Change in net assets attributable to shareholders from investment activities (see above) 2,664 3,077
Retained distribution on accumulation shares 1,624 1,914
Unclaimed distribution monies – 1
Closing net assets attributable to shareholders 282,845 284,618
The Statement of Recommended Practice (2014) requires that comparatives are shown for the above report. As the comparatives should be for the comparable interim period, the net asset value at the end of the previous period will not agree to the net asset value at the start of this period. The published net asset value as at 15 October 2016 was £295,593,000.
STATEMENT OF TOTAL RETURNFor the six months ended 15 April 2017 (unaudited)

avivainvestors.com | Aviva Investors Investment Funds ICVC Interim Report and Financial Statements for the six months ended 15 April 2017
Aviva Investors Monthly Income Plus Fund
115
BALANCE SHEETAs at 15 April 2017 (unaudited)
As at15.04.17
£000
As at15.10.16
£000
Assets:
Investments 273,965 290,366
Current assets:
Debtors 5,889 5,456
Cash and bank balances 4,972 2,117
Total assets 284,826 297,939
Liabilities:
Investment liabilities (381) (668)
Creditors:
Bank overdrafts (10) –
Distribution payable (740) (852)
Other creditors (850) (826)
Total liabilities (1,981) (2,346)
Net assets attributable to shareholders 282,845 295,593
ACCOUNTING POLICIESThe accounting policies applied are consistent with those of the financial statements for the year ended 15 October 2016 and are described in those annual financial statements.
Aviva Investors Investment Funds ICVC Interim Report and Financial Statements for the six months ended 15 April 2017 | avivainvestors.com
Aviva Investors Strategic Bond Fund
116
INVESTMENT OBJECTIVETo provide a high total return from a diversified portfolio of global debt securities.
INVESTMENT POLICYDiversified investment in global fixed interest securities, including non-investment grade.
The Fund may invest in any of the following financial instruments in order to achieve its investment objective: transferable securities, money market instruments, units in collective investment schemes, deposits and derivatives and forward transactions.
Note: at least 80 per cent of assets will either be in sterling or currency hedged back to sterling.
FUND MANAGER’S REPORTOver the six months ended 15 April 2017, the Aviva Investors Strategic Bond Fund delivered a total return of 1.95 per cent (share class 1) net of fees. The Fund’s peer group, the Investment Association’s (IA) Sterling Strategic Bond sector, generated net return of 2.02 per cent.
The Fund posted a positive return in the six months under review, thanks mainly to its exposure to corporate bonds. However, relative returns were hurt by the Fund’s cautious positioning given our concerns about the sustainability of the global economic recovery, rich bond market valuations and the ability of the Trump administration to follow through on its ambitious economic stimulus agenda. The Fund’s avoidance of energy-related companies detracted from performance initially, although the renewed weakness of the oil market at the start of 2017 helped to compensate. The Fund’s holdings in conventional government bonds were unhelpful as total returns were pulled lower on concerns about rising global inflation bringing forward interest hikes from the main central banks. However, the Fund profited from having inflation heading exposure via US index-linked bonds.
The portfolio was positioned cautiously given the number of political and monetary policy uncertainties hanging over the global economy. At the global level, we favoured US and UK-based bonds, as we felt that yields would be more attractive than in the Eurozone, where central bank policy continued to depress pay-outs. With new technologies and uneven demand disrupting the commodity markets, we opted to take no exposure to energy-related corporate bonds. At the sector level, we were overweight in telecoms and underweight in basic industries. In terms of our government bond exposure, we were underweight in US treasuries but held exposure to US index-linked bonds to hedge against the potential for rising inflation. With central bank policies having distorted the market to the degree that investors were not being rewarded for taking interest rate or credit risk, we were able to achieve a competitive yield of around 3 per cent by holding certain shorter-dated, higher-quality corporate bonds.
Bonds across the board have enjoyed an extended run of strong performance on the back of central bank interest rate cuts and asset purchasing programs. Now, with corporate bonds looking more expensive and government bonds yet to price in the return of growth and inflation, the pace of returns is likely to slow. In this environment, security and sector selection will be more important than ever. We will therefore seek to avoid sectors that are disrupted by new technology and companies with acquisition plans that could weaken their finances. We will also be looking to exploit the differing potential of markets where central bank policy is diverging. For example, there is currently a mismatch between the US corporate bond market, where there is no central bank purchasing, and the UK and Europe, where there is.
April 2017Sources: Fund and peer group performance figures – Lipper, mid to mid basis with net income reinvested in GBP, with no initial charges applied. Market data – Bloomberg.Any opinions expressed are those of the Fund manager. They should not be viewed as a guarantee of a return from an investment in the Funds. The content of the commentary should not be viewed as a recommendation to invest nor buy or sell any securities. Past performance is not a guide to the future. The value of an investment and any income from it can go down as well as up. Investors may not get back the original amount invested.
Material Portfolio ChangesPurchases Sales
Aviva Investors Sterling Liquidity Fund Class 3, Income shares, GBP
Aviva Investors Sterling Liquidity Fund Class 3, Income shares, GBP
US Treasury 2.00% 15/11/2026 UK Treasury 1.00% 07/09/2017
Lloyds Bank, FRN 12.00% Perpetual Royal Bank of Scotland FRN 9.5% 16/03/2022
Goldman Sachs Group 3.00% 26/04/2022 RSA Insurance Group, FRN 9.375% 20/05/2039
Barclays Bank, FRN 14.00% Perpetual Glasstank 8.50% 15/05/2019
Dollar Tree 5.75% 01/03/2023 UK Treasury 1.25% 22/07/2018
UK Treasury 4.50% 07/12/2042 UK Treasury 4.50% 07/12/2042
US Treasury 0.75% 31/08/2018 Intesa Sanpaolo, FRN 7.70% Perpetual
HSBC Holdings, FRN 3.26% 13/03/2023Care UK Health & Social Care, FRN 5.49% 15/07/2019
JPMorgan Chase 4.25% 15/10/2020 Lloyds Bank, FRN 10.75% 16/12/2021
AVIVA INVESTORS STRATEGIC BOND FUND
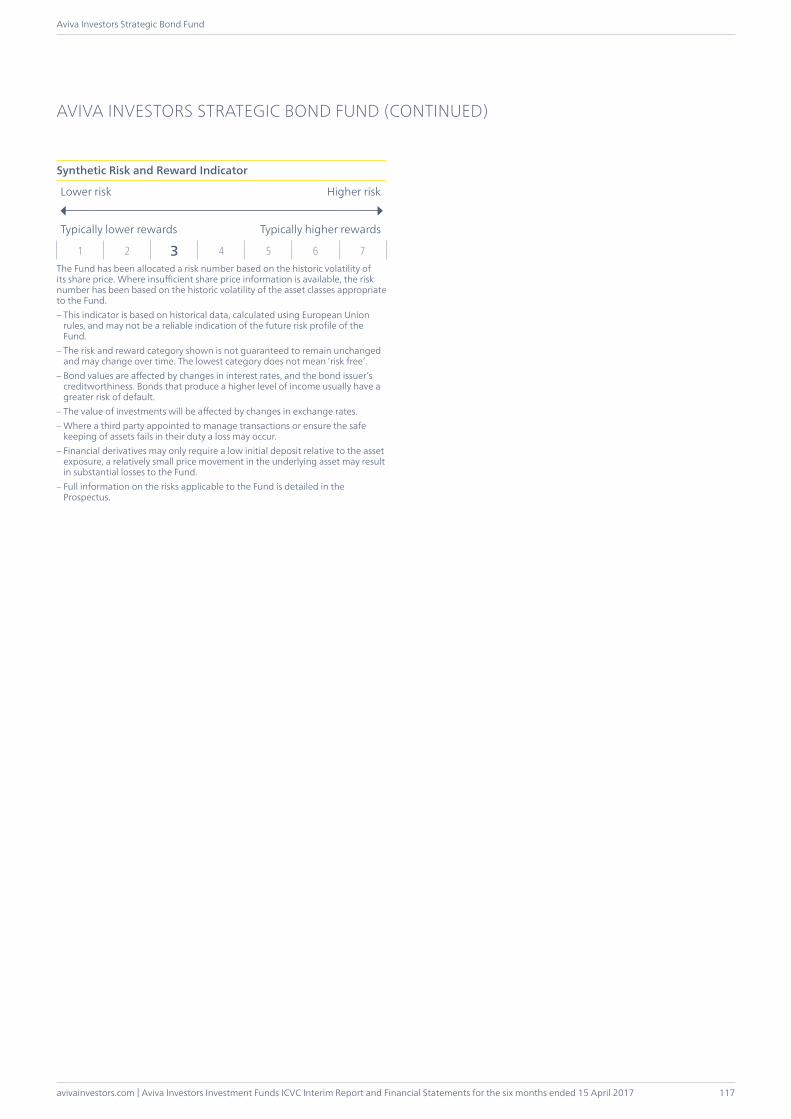
avivainvestors.com | Aviva Investors Investment Funds ICVC Interim Report and Financial Statements for the six months ended 15 April 2017
Aviva Investors Strategic Bond Fund
117
AVIVA INVESTORS STRATEGIC BOND FUND (CONTINUED)
Synthetic Risk and Reward Indicator
Lower risk Higher risk
Typically lower rewards Typically higher rewards
1 2 3 4 5 6 7The Fund has been allocated a risk number based on the historic volatility of its share price. Where insufficient share price information is available, the risk number has been based on the historic volatility of the asset classes appropriate to the Fund.– This indicator is based on historical data, calculated using European Union
rules, and may not be a reliable indication of the future risk profile of the Fund.
– The risk and reward category shown is not guaranteed to remain unchanged and may change over time. The lowest category does not mean ‘risk free’.
– Bond values are affected by changes in interest rates, and the bond issuer’s creditworthiness. Bonds that produce a higher level of income usually have a greater risk of default.
– The value of investments will be affected by changes in exchange rates.– Where a third party appointed to manage transactions or ensure the safe
keeping of assets fails in their duty a loss may occur.– Financial derivatives may only require a low initial deposit relative to the asset
exposure, a relatively small price movement in the underlying asset may result in substantial losses to the Fund.
– Full information on the risks applicable to the Fund is detailed in the Prospectus.
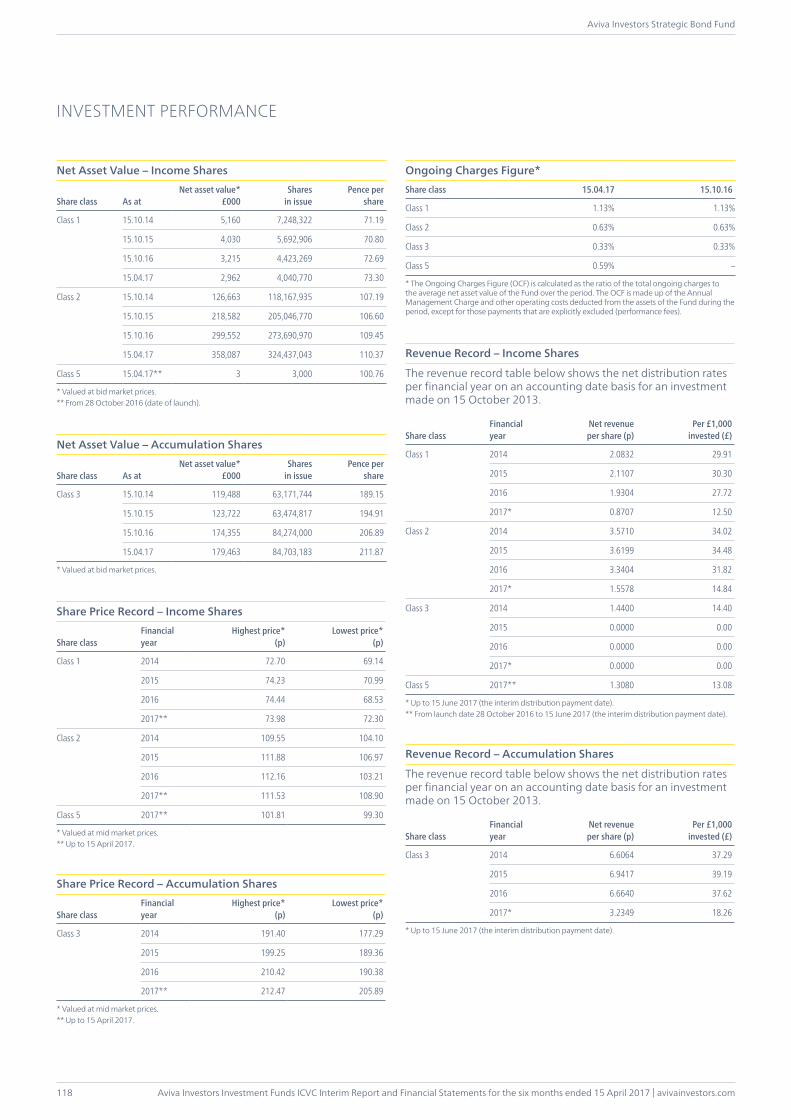
Aviva Investors Investment Funds ICVC Interim Report and Financial Statements for the six months ended 15 April 2017 | avivainvestors.com
Aviva Investors Strategic Bond Fund
118
INVESTMENT PERFORMANCE
Net Asset Value – Income Shares
Share class As atNet asset value*
£000Shares
in issuePence per
share
Class 1 15.10.14 5,160 7,248,322 71.19
15.10.15 4,030 5,692,906 70.80
15.10.16 3,215 4,423,269 72.69
15.04.17 2,962 4,040,770 73.30
Class 2 15.10.14 126,663 118,167,935 107.19
15.10.15 218,582 205,046,770 106.60
15.10.16 299,552 273,690,970 109.45
15.04.17 358,087 324,437,043 110.37
Class 5 15.04.17** 3 3,000 100.76
* Valued at bid market prices.** From 28 October 2016 (date of launch).
Net Asset Value – Accumulation Shares
Share class As atNet asset value*
£000Shares
in issuePence per
share
Class 3 15.10.14 119,488 63,171,744 189.15
15.10.15 123,722 63,474,817 194.91
15.10.16 174,355 84,274,000 206.89
15.04.17 179,463 84,703,183 211.87
* Valued at bid market prices.
Share Price Record – Income Shares
Share classFinancialyear
Highest price*(p)
Lowest price*(p)
Class 1 2014 72.70 69.14
2015 74.23 70.99
2016 74.44 68.53
2017** 73.98 72.30
Class 2 2014 109.55 104.10
2015 111.88 106.97
2016 112.16 103.21
2017** 111.53 108.90
Class 5 2017** 101.81 99.30
* Valued at mid market prices.** Up to 15 April 2017.
Share Price Record – Accumulation Shares
Share classFinancialyear
Highest price*(p)
Lowest price*(p)
Class 3 2014 191.40 177.29
2015 199.25 189.36
2016 210.42 190.38
2017** 212.47 205.89
* Valued at mid market prices.** Up to 15 April 2017.
Ongoing Charges Figure*Share class 15.04.17 15.10.16
Class 1 1.13% 1.13%
Class 2 0.63% 0.63%
Class 3 0.33% 0.33%
Class 5 0.59% –
* The Ongoing Charges Figure (OCF) is calculated as the ratio of the total ongoing charges to the average net asset value of the Fund over the period. The OCF is made up of the Annual Management Charge and other operating costs deducted from the assets of the Fund during the period, except for those payments that are explicitly excluded (performance fees).
Revenue Record – Income Shares
The revenue record table below shows the net distribution rates per financial year on an accounting date basis for an investment made on 15 October 2013.
Share classFinancialyear
Net revenue per share (p)
Per £1,000invested (£)
Class 1 2014 2.0832 29.91
2015 2.1107 30.30
2016 1.9304 27.72
2017* 0.8707 12.50
Class 2 2014 3.5710 34.02
2015 3.6199 34.48
2016 3.3404 31.82
2017* 1.5578 14.84
Class 3 2014 1.4400 14.40
2015 0.0000 0.00
2016 0.0000 0.00
2017* 0.0000 0.00
Class 5 2017** 1.3080 13.08
* Up to 15 June 2017 (the interim distribution payment date).** From launch date 28 October 2016 to 15 June 2017 (the interim distribution payment date).
Revenue Record – Accumulation Shares
The revenue record table below shows the net distribution rates per financial year on an accounting date basis for an investment made on 15 October 2013.
Share classFinancialyear
Net revenue per share (p)
Per £1,000invested (£)
Class 3 2014 6.6064 37.29
2015 6.9417 39.19
2016 6.6640 37.62
2017* 3.2349 18.26
* Up to 15 June 2017 (the interim distribution payment date).
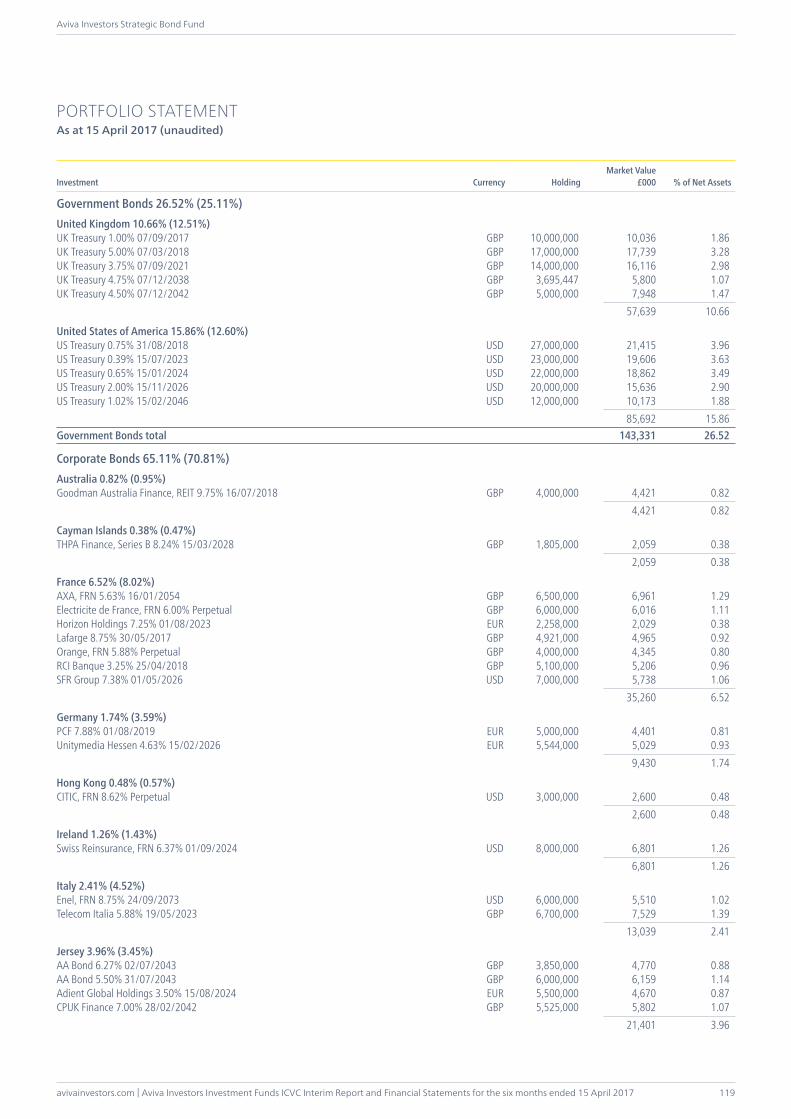
avivainvestors.com | Aviva Investors Investment Funds ICVC Interim Report and Financial Statements for the six months ended 15 April 2017
Aviva Investors Strategic Bond Fund
119
PORTFOLIO STATEMENTAs at 15 April 2017 (unaudited)
Investment Currency HoldingMarket Value
£000 % of Net Assets
Government Bonds 26.52% (25.11%)United Kingdom 10.66% (12.51%)UK Treasury 1.00% 07/09/2017 GBP 10,000,000 10,036 1.86UK Treasury 5.00% 07/03/2018 GBP 17,000,000 17,739 3.28UK Treasury 3.75% 07/09/2021 GBP 14,000,000 16,116 2.98UK Treasury 4.75% 07/12/2038 GBP 3,695,447 5,800 1.07UK Treasury 4.50% 07/12/2042 GBP 5,000,000 7,948 1.47 57,639 10.66
United States of America 15.86% (12.60%)US Treasury 0.75% 31/08/2018 USD 27,000,000 21,415 3.96US Treasury 0.39% 15/07/2023 USD 23,000,000 19,606 3.63US Treasury 0.65% 15/01/2024 USD 22,000,000 18,862 3.49US Treasury 2.00% 15/11/2026 USD 20,000,000 15,636 2.90US Treasury 1.02% 15/02/2046 USD 12,000,000 10,173 1.88 85,692 15.86Government Bonds total 143,331 26.52
Corporate Bonds 65.11% (70.81%)Australia 0.82% (0.95%)Goodman Australia Finance, REIT 9.75% 16/07/2018 GBP 4,000,000 4,421 0.82 4,421 0.82
Cayman Islands 0.38% (0.47%)THPA Finance, Series B 8.24% 15/03/2028 GBP 1,805,000 2,059 0.38 2,059 0.38
France 6.52% (8.02%)AXA, FRN 5.63% 16/01/2054 GBP 6,500,000 6,961 1.29Electricite de France, FRN 6.00% Perpetual GBP 6,000,000 6,016 1.11Horizon Holdings 7.25% 01/08/2023 EUR 2,258,000 2,029 0.38Lafarge 8.75% 30/05/2017 GBP 4,921,000 4,965 0.92Orange, FRN 5.88% Perpetual GBP 4,000,000 4,345 0.80RCI Banque 3.25% 25/04/2018 GBP 5,100,000 5,206 0.96SFR Group 7.38% 01/05/2026 USD 7,000,000 5,738 1.06 35,260 6.52
Germany 1.74% (3.59%)PCF 7.88% 01/08/2019 EUR 5,000,000 4,401 0.81Unitymedia Hessen 4.63% 15/02/2026 EUR 5,544,000 5,029 0.93 9,430 1.74
Hong Kong 0.48% (0.57%)CITIC, FRN 8.62% Perpetual USD 3,000,000 2,600 0.48 2,600 0.48
Ireland 1.26% (1.43%)Swiss Reinsurance, FRN 6.37% 01/09/2024 USD 8,000,000 6,801 1.26 6,801 1.26
Italy 2.41% (4.52%)Enel, FRN 8.75% 24/09/2073 USD 6,000,000 5,510 1.02Telecom Italia 5.88% 19/05/2023 GBP 6,700,000 7,529 1.39 13,039 2.41
Jersey 3.96% (3.45%)AA Bond 6.27% 02/07/2043 GBP 3,850,000 4,770 0.88AA Bond 5.50% 31/07/2043 GBP 6,000,000 6,159 1.14Adient Global Holdings 3.50% 15/08/2024 EUR 5,500,000 4,670 0.87CPUK Finance 7.00% 28/02/2042 GBP 5,525,000 5,802 1.07 21,401 3.96
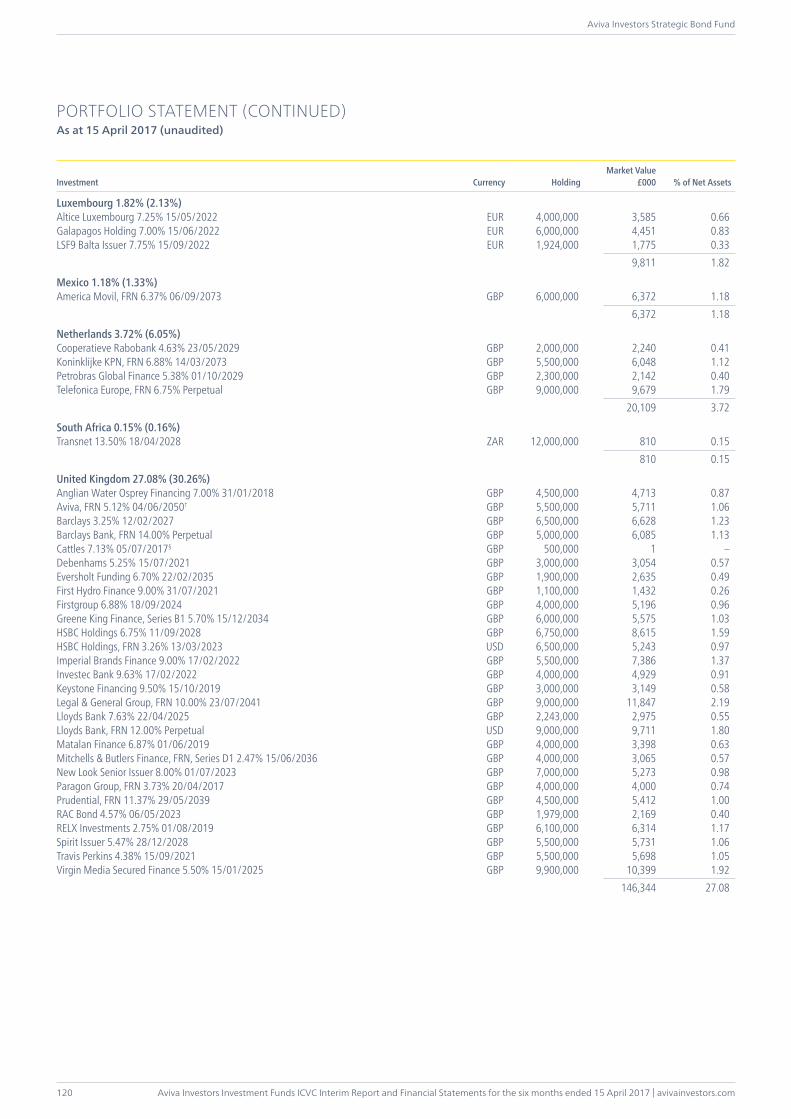
Aviva Investors Investment Funds ICVC Interim Report and Financial Statements for the six months ended 15 April 2017 | avivainvestors.com
Aviva Investors Strategic Bond Fund
120
PORTFOLIO STATEMENT (CONTINUED)As at 15 April 2017 (unaudited)
Investment Currency HoldingMarket Value
£000 % of Net Assets
Luxembourg 1.82% (2.13%)Altice Luxembourg 7.25% 15/05/2022 EUR 4,000,000 3,585 0.66Galapagos Holding 7.00% 15/06/2022 EUR 6,000,000 4,451 0.83LSF9 Balta Issuer 7.75% 15/09/2022 EUR 1,924,000 1,775 0.33 9,811 1.82
Mexico 1.18% (1.33%)America Movil, FRN 6.37% 06/09/2073 GBP 6,000,000 6,372 1.18 6,372 1.18
Netherlands 3.72% (6.05%)Cooperatieve Rabobank 4.63% 23/05/2029 GBP 2,000,000 2,240 0.41Koninklijke KPN, FRN 6.88% 14/03/2073 GBP 5,500,000 6,048 1.12Petrobras Global Finance 5.38% 01/10/2029 GBP 2,300,000 2,142 0.40Telefonica Europe, FRN 6.75% Perpetual GBP 9,000,000 9,679 1.79 20,109 3.72
South Africa 0.15% (0.16%)Transnet 13.50% 18/04/2028 ZAR 12,000,000 810 0.15 810 0.15
United Kingdom 27.08% (30.26%)Anglian Water Osprey Financing 7.00% 31/01/2018 GBP 4,500,000 4,713 0.87Aviva, FRN 5.12% 04/06/2050† GBP 5,500,000 5,711 1.06Barclays 3.25% 12/02/2027 GBP 6,500,000 6,628 1.23Barclays Bank, FRN 14.00% Perpetual GBP 5,000,000 6,085 1.13Cattles 7.13% 05/07/2017§ GBP 500,000 1 –Debenhams 5.25% 15/07/2021 GBP 3,000,000 3,054 0.57Eversholt Funding 6.70% 22/02/2035 GBP 1,900,000 2,635 0.49First Hydro Finance 9.00% 31/07/2021 GBP 1,100,000 1,432 0.26Firstgroup 6.88% 18/09/2024 GBP 4,000,000 5,196 0.96Greene King Finance, Series B1 5.70% 15/12/2034 GBP 6,000,000 5,575 1.03HSBC Holdings 6.75% 11/09/2028 GBP 6,750,000 8,615 1.59HSBC Holdings, FRN 3.26% 13/03/2023 USD 6,500,000 5,243 0.97Imperial Brands Finance 9.00% 17/02/2022 GBP 5,500,000 7,386 1.37Investec Bank 9.63% 17/02/2022 GBP 4,000,000 4,929 0.91Keystone Financing 9.50% 15/10/2019 GBP 3,000,000 3,149 0.58Legal & General Group, FRN 10.00% 23/07/2041 GBP 9,000,000 11,847 2.19Lloyds Bank 7.63% 22/04/2025 GBP 2,243,000 2,975 0.55Lloyds Bank, FRN 12.00% Perpetual USD 9,000,000 9,711 1.80Matalan Finance 6.87% 01/06/2019 GBP 4,000,000 3,398 0.63Mitchells & Butlers Finance, FRN, Series D1 2.47% 15/06/2036 GBP 4,000,000 3,065 0.57New Look Senior Issuer 8.00% 01/07/2023 GBP 7,000,000 5,273 0.98Paragon Group, FRN 3.73% 20/04/2017 GBP 4,000,000 4,000 0.74Prudential, FRN 11.37% 29/05/2039 GBP 4,500,000 5,412 1.00RAC Bond 4.57% 06/05/2023 GBP 1,979,000 2,169 0.40RELX Investments 2.75% 01/08/2019 GBP 6,100,000 6,314 1.17Spirit Issuer 5.47% 28/12/2028 GBP 5,500,000 5,731 1.06Travis Perkins 4.38% 15/09/2021 GBP 5,500,000 5,698 1.05Virgin Media Secured Finance 5.50% 15/01/2025 GBP 9,900,000 10,399 1.92 146,344 27.08
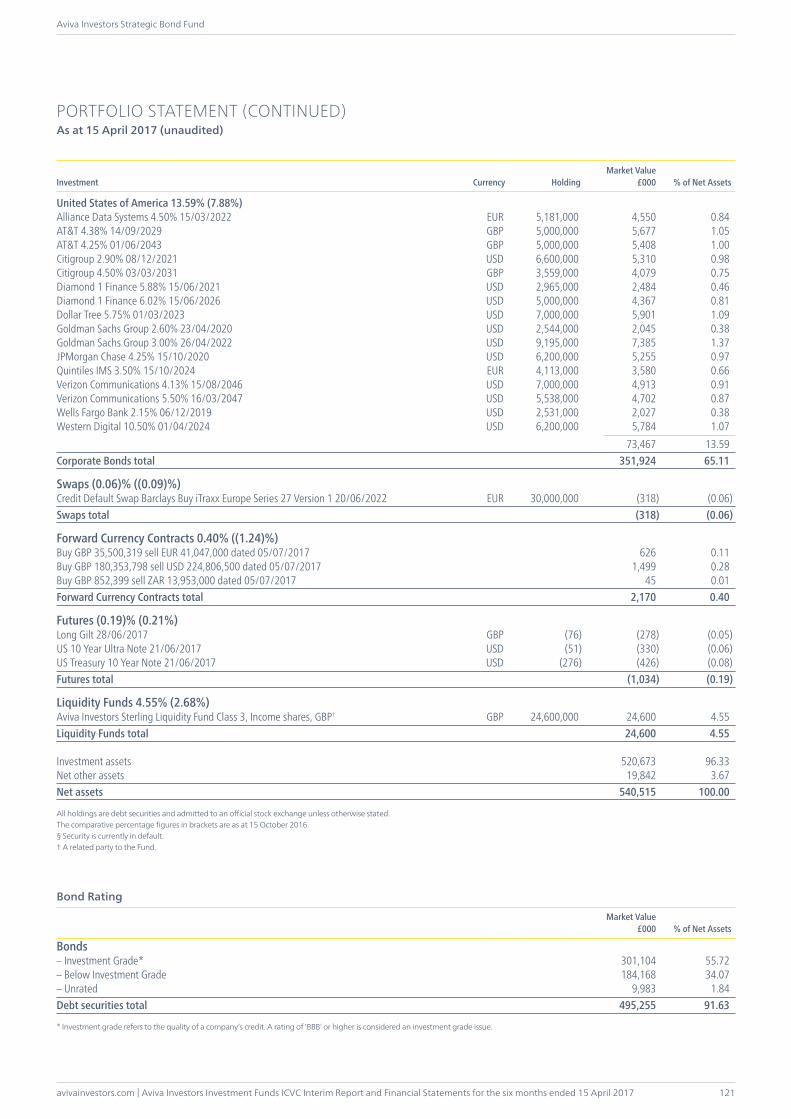
avivainvestors.com | Aviva Investors Investment Funds ICVC Interim Report and Financial Statements for the six months ended 15 April 2017
Aviva Investors Strategic Bond Fund
121
PORTFOLIO STATEMENT (CONTINUED)As at 15 April 2017 (unaudited)
Investment Currency HoldingMarket Value
£000 % of Net Assets
United States of America 13.59% (7.88%)Alliance Data Systems 4.50% 15/03/2022 EUR 5,181,000 4,550 0.84AT&T 4.38% 14/09/2029 GBP 5,000,000 5,677 1.05AT&T 4.25% 01/06/2043 GBP 5,000,000 5,408 1.00Citigroup 2.90% 08/12/2021 USD 6,600,000 5,310 0.98Citigroup 4.50% 03/03/2031 GBP 3,559,000 4,079 0.75Diamond 1 Finance 5.88% 15/06/2021 USD 2,965,000 2,484 0.46Diamond 1 Finance 6.02% 15/06/2026 USD 5,000,000 4,367 0.81Dollar Tree 5.75% 01/03/2023 USD 7,000,000 5,901 1.09Goldman Sachs Group 2.60% 23/04/2020 USD 2,544,000 2,045 0.38Goldman Sachs Group 3.00% 26/04/2022 USD 9,195,000 7,385 1.37JPMorgan Chase 4.25% 15/10/2020 USD 6,200,000 5,255 0.97Quintiles IMS 3.50% 15/10/2024 EUR 4,113,000 3,580 0.66Verizon Communications 4.13% 15/08/2046 USD 7,000,000 4,913 0.91Verizon Communications 5.50% 16/03/2047 USD 5,538,000 4,702 0.87Wells Fargo Bank 2.15% 06/12/2019 USD 2,531,000 2,027 0.38Western Digital 10.50% 01/04/2024 USD 6,200,000 5,784 1.07 73,467 13.59Corporate Bonds total 351,924 65.11
Swaps (0.06)% ((0.09)%)Credit Default Swap Barclays Buy iTraxx Europe Series 27 Version 1 20/06/2022 EUR 30,000,000 (318) (0.06)Swaps total (318) (0.06)
Forward Currency Contracts 0.40% ((1.24)%)Buy GBP 35,500,319 sell EUR 41,047,000 dated 05/07/2017 626 0.11Buy GBP 180,353,798 sell USD 224,806,500 dated 05/07/2017 1,499 0.28Buy GBP 852,399 sell ZAR 13,953,000 dated 05/07/2017 45 0.01Forward Currency Contracts total 2,170 0.40
Futures (0.19)% (0.21%)Long Gilt 28/06/2017 GBP (76) (278) (0.05)US 10 Year Ultra Note 21/06/2017 USD (51) (330) (0.06)US Treasury 10 Year Note 21/06/2017 USD (276) (426) (0.08)Futures total (1,034) (0.19)
Liquidity Funds 4.55% (2.68%)Aviva Investors Sterling Liquidity Fund Class 3, Income shares, GBP† GBP 24,600,000 24,600 4.55Liquidity Funds total 24,600 4.55
Investment assets 520,673 96.33Net other assets 19,842 3.67Net assets 540,515 100.00
All holdings are debt securities and admitted to an official stock exchange unless otherwise stated.The comparative percentage figures in brackets are as at 15 October 2016.§ Security is currently in default.† A related party to the Fund.
Market Value£000 % of Net Assets
Bond Rating
Bonds– Investment Grade* 301,104 55.72 – Below Investment Grade 184,168 34.07 – Unrated 9,983 1.84 Debt securities total 495,255 91.63
* Investment grade refers to the quality of a company’s credit. A rating of ‘BBB’ or higher is considered an investment grade issue.
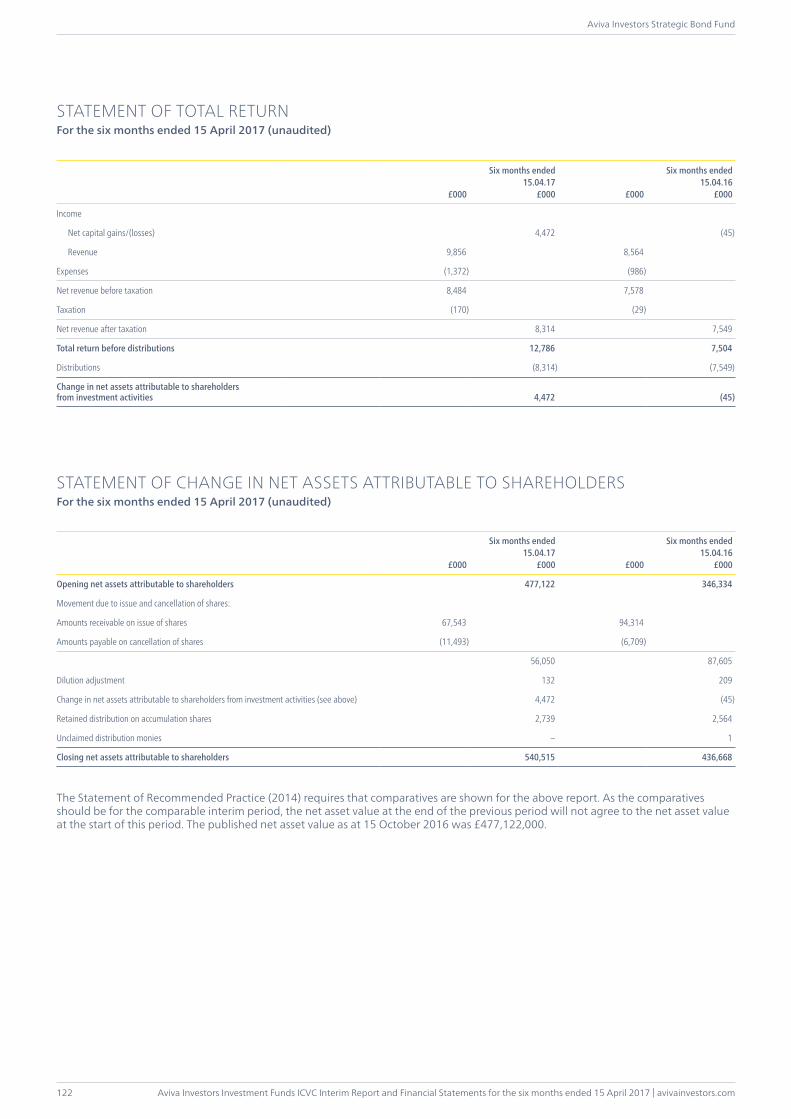
Aviva Investors Investment Funds ICVC Interim Report and Financial Statements for the six months ended 15 April 2017 | avivainvestors.com
Aviva Investors Strategic Bond Fund
122
£000
Six months ended15.04.17
£000 £000
Six months ended15.04.16
£000
Income
Net capital gains/(losses) 4,472 (45)
Revenue 9,856 8,564
Expenses (1,372) (986)
Net revenue before taxation 8,484 7,578
Taxation (170) (29)
Net revenue after taxation 8,314 7,549
Total return before distributions 12,786 7,504
Distributions (8,314) (7,549)
Change in net assets attributable to shareholders from investment activities 4,472 (45)
STATEMENT OF CHANGE IN NET ASSETS ATTRIBUTABLE TO SHAREHOLDERSFor the six months ended 15 April 2017 (unaudited)
£000
Six months ended15.04.17
£000 £000
Six months ended15.04.16
£000
Opening net assets attributable to shareholders 477,122 346,334
Movement due to issue and cancellation of shares:
Amounts receivable on issue of shares 67,543 94,314
Amounts payable on cancellation of shares (11,493) (6,709)
56,050 87,605
Dilution adjustment 132 209
Change in net assets attributable to shareholders from investment activities (see above) 4,472 (45)
Retained distribution on accumulation shares 2,739 2,564
Unclaimed distribution monies – 1
Closing net assets attributable to shareholders 540,515 436,668
The Statement of Recommended Practice (2014) requires that comparatives are shown for the above report. As the comparatives should be for the comparable interim period, the net asset value at the end of the previous period will not agree to the net asset value at the start of this period. The published net asset value as at 15 October 2016 was £477,122,000.
STATEMENT OF TOTAL RETURNFor the six months ended 15 April 2017 (unaudited)
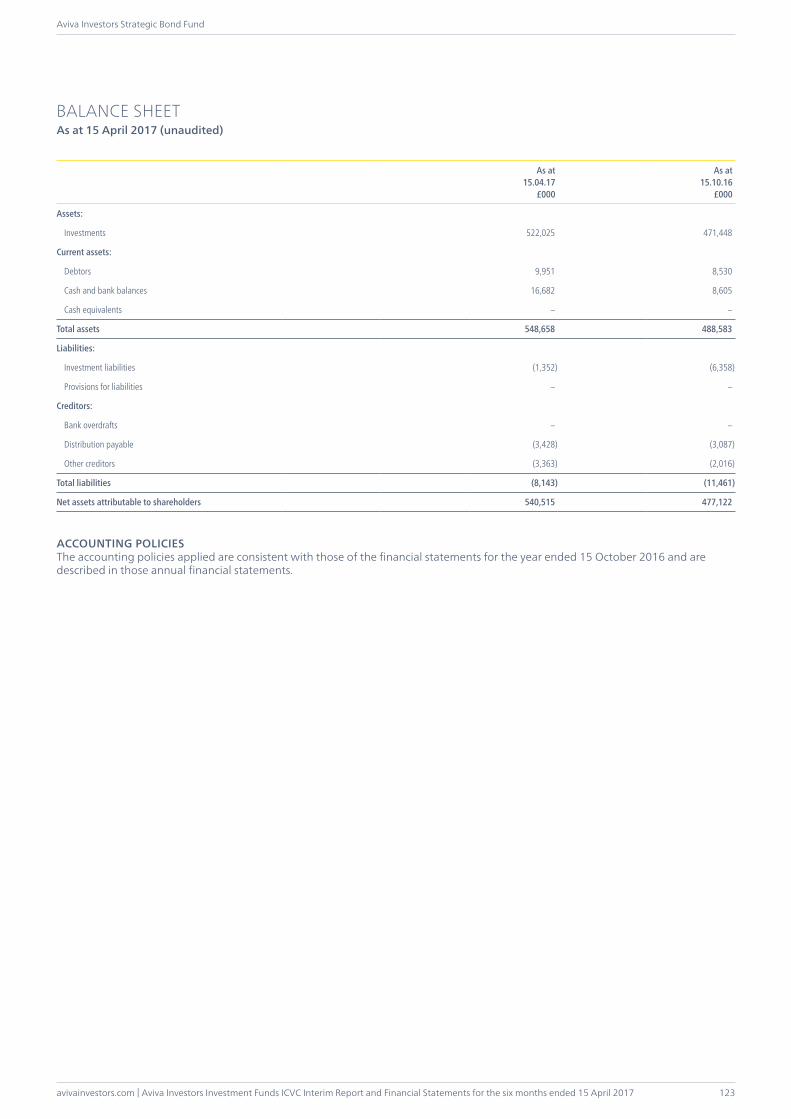
avivainvestors.com | Aviva Investors Investment Funds ICVC Interim Report and Financial Statements for the six months ended 15 April 2017
Aviva Investors Strategic Bond Fund
123
BALANCE SHEETAs at 15 April 2017 (unaudited)
As at15.04.17
£000
As at15.10.16
£000
Assets:
Investments 522,025 471,448
Current assets:
Debtors 9,951 8,530
Cash and bank balances 16,682 8,605
Cash equivalents – –
Total assets 548,658 488,583
Liabilities:
Investment liabilities (1,352) (6,358)
Provisions for liabilities – –
Creditors:
Bank overdrafts – –
Distribution payable (3,428) (3,087)
Other creditors (3,363) (2,016)
Total liabilities (8,143) (11,461)
Net assets attributable to shareholders 540,515 477,122
ACCOUNTING POLICIESThe accounting policies applied are consistent with those of the financial statements for the year ended 15 October 2016 and are described in those annual financial statements.
Aviva Investors Investment Funds ICVC Interim Report and Financial Statements for the six months ended 15 April 2017 | avivainvestors.com
Aviva Investors European Equity Fund
124
INVESTMENT OBJECTIVELong term capital appreciation.
INVESTMENT POLICYDiversified investment within and across European equity markets. Allocations to individual markets will vary over time. Individual equity selections will be based on price and long term total return prospects.
The Fund may invest in any of the following financial instruments in order to achieve its investment objective: transferable securities, money market instruments, units in collective investment schemes, deposits and derivatives and forward transactions.
FUND MANAGER’S REPORTOver the six months ended 15 April 2017, the Aviva Investors European Equity Fund delivered a total return of 5.18 per cent (share class A), net of fees, compared to an average return of 5.54 per cent for its peer group the Investment Association Europe excluding UK sector. The Fund’s benchmark, the FTSE® AW Europe ex UK Index, returned 6.69 per cent.
The Fund’s limited exposure to financials detracted from relative performance over the review period. Following Donald Trump’s unexpected victory in the US presidential election, markets focused on the pro-growth policy stance that the new Republican administration is expected to pursue. The prospect of higher spending on infrastructure projects and lower taxes led investors to factor in higher inflation and an acceleration in US interest rate hikes. The resultant rise in global bond yields benefited the financial sector, particularly banking stocks where higher long-term interest rates are positive for profit margins on lending. Positioning in the banking sector, where the Fund focuses on holdings with relatively better capitalised, higher return business models, meant that the Fund did not have exposure to Banco Santander, Unicredit and Societe Generale. All these stocks performed well, detracting from performance. In addition, the Fund’s holding in Intertrust, a provider of legal and corporate financial services, disappointed as the company issued a profits warning.
Within the healthcare sector the Fund retained an emphasis on small cap stocks. The holding in 4D Pharma detracted on concerns over rising research and development costs as the company concluded phase one clinical trials for its treatment for irritable bowel syndrome and is developing a treatment for pediatric Crohn’s disease. Towards the end of the review period Amplitude Surgical, a manufacturer of hip and knee implants, announced full year results that disappointed the market, delivering lower margins than expected mainly due to country-mix growth. After a meeting with the management of the company, we remain confident about Amplitude’s long-term earnings prospects. Amongst industrials the Fund’s holding in Finnish group Kone, a leader in the escalator and lift industry, weakened after the company reported third quarter cash flow was slightly worse than the market expected, although profits were in line with forecasts.
The Fund’s largest overweight position, relative to the benchmark, is in technology stocks. The main contributor was Dutch semiconductor equipment maker ASML, which delivered strong performance on the back of encouraging fourth quarter results. The company is a leader in its market and its innovative and expensive EUV (extreme ultraviolet lithography) technology is gaining traction. Amongst consumer stocks, the main contributor was Anglo-Dutch group Unilever. The company’s share price rose after a takeover bid from US-listed Kraft Heinz. Although the bid was quickly shelved, we think this will encourage Unilever’s management to place a greater emphasis on shareholder value and we decided to increase our stake.
Looking at the prospects for European equities, the reporting season for the fourth quarter highlighted a continuation of the upward trend in earnings which we saw in the previous quarter. It is also worth noting we are also seeing an improvement in earnings revisions, with 2017 growth expectations being revised higher compared to where they were at the start of the year. From a valuation perspective, European markets appear relatively attractive in comparison with other developed markets, although we would caution this with the political uncertainty of elections in both France and later this year in Germany, which may mean that some investors remain on the sidelines.
April 2017Sources: Fund and peer group performance figures – Lipper, mid to mid basis with net income reinvested in GBP, with no initial charges applied. Market data – Bloomberg. Any opinions expressed are those of the Fund manager. They should not be viewed as a guarantee of a return from an investment in the Funds. The content of the commentary should not be viewed as a recommendation to invest nor buy or sell securities. Past performance is not a guide to the future. The value of an investment and any income from it can go down as well as up. Investors may not get back the original amount invested.“FTSE” is a trade mark jointly owned by the London Stock Exchange Plc and The Financial Times Limited and is used by FTSE International Limited (“FTSE”) under Licence. FTSE does not sponsor, endorse or promote this product and is not in any way connected to it and does not accept any liability in relation to its Issue, operation and trading. All copyright in the index values and constituent list vests in FTSE.
AVIVA INVESTORS EUROPEAN EQUITY FUND
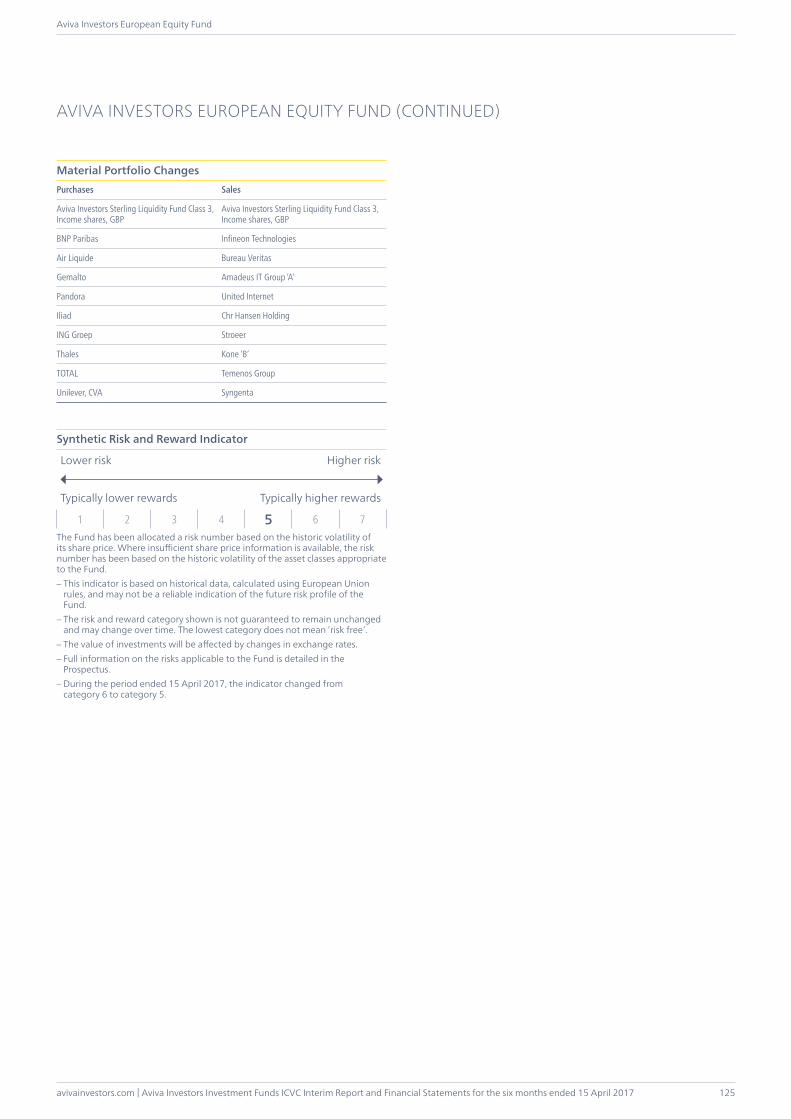
avivainvestors.com | Aviva Investors Investment Funds ICVC Interim Report and Financial Statements for the six months ended 15 April 2017
Aviva Investors European Equity Fund
125
AVIVA INVESTORS EUROPEAN EQUITY FUND (CONTINUED)
Material Portfolio ChangesPurchases Sales
Aviva Investors Sterling Liquidity Fund Class 3, Income shares, GBP
Aviva Investors Sterling Liquidity Fund Class 3, Income shares, GBP
BNP Paribas Infineon Technologies
Air Liquide Bureau Veritas
Gemalto Amadeus IT Group ‘A’
Pandora United Internet
Iliad Chr Hansen Holding
ING Groep Stroeer
Thales Kone ‘B’
TOTAL Temenos Group
Unilever, CVA Syngenta
Synthetic Risk and Reward Indicator
Lower risk Higher risk
Typically lower rewards Typically higher rewards
1 2 3 4 5 6 7The Fund has been allocated a risk number based on the historic volatility of its share price. Where insufficient share price information is available, the risk number has been based on the historic volatility of the asset classes appropriate to the Fund.– This indicator is based on historical data, calculated using European Union
rules, and may not be a reliable indication of the future risk profile of the Fund.
– The risk and reward category shown is not guaranteed to remain unchanged and may change over time. The lowest category does not mean ‘risk free’.
– The value of investments will be affected by changes in exchange rates.– Full information on the risks applicable to the Fund is detailed in the
Prospectus.– During the period ended 15 April 2017, the indicator changed from
category 6 to category 5.
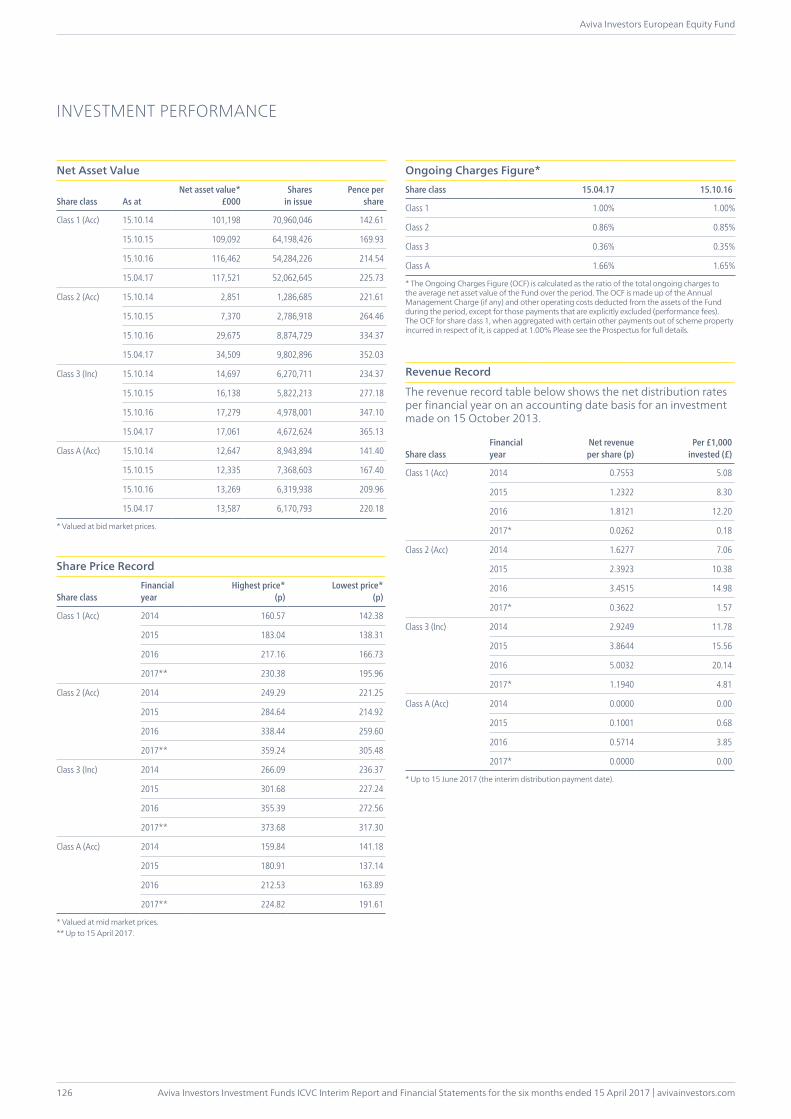
Aviva Investors Investment Funds ICVC Interim Report and Financial Statements for the six months ended 15 April 2017 | avivainvestors.com
Aviva Investors European Equity Fund
126
INVESTMENT PERFORMANCE
Net Asset Value
Share class As atNet asset value*
£000Shares
in issuePence per
share
Class 1 (Acc) 15.10.14 101,198 70,960,046 142.61
15.10.15 109,092 64,198,426 169.93
15.10.16 116,462 54,284,226 214.54
15.04.17 117,521 52,062,645 225.73
Class 2 (Acc) 15.10.14 2,851 1,286,685 221.61
15.10.15 7,370 2,786,918 264.46
15.10.16 29,675 8,874,729 334.37
15.04.17 34,509 9,802,896 352.03
Class 3 (Inc) 15.10.14 14,697 6,270,711 234.37
15.10.15 16,138 5,822,213 277.18
15.10.16 17,279 4,978,001 347.10
15.04.17 17,061 4,672,624 365.13
Class A (Acc) 15.10.14 12,647 8,943,894 141.40
15.10.15 12,335 7,368,603 167.40
15.10.16 13,269 6,319,938 209.96
15.04.17 13,587 6,170,793 220.18
* Valued at bid market prices.
Share Price Record
Share classFinancialyear
Highest price*(p)
Lowest price*(p)
Class 1 (Acc) 2014 160.57 142.38
2015 183.04 138.31
2016 217.16 166.73
2017** 230.38 195.96
Class 2 (Acc) 2014 249.29 221.25
2015 284.64 214.92
2016 338.44 259.60
2017** 359.24 305.48
Class 3 (Inc) 2014 266.09 236.37
2015 301.68 227.24
2016 355.39 272.56
2017** 373.68 317.30
Class A (Acc) 2014 159.84 141.18
2015 180.91 137.14
2016 212.53 163.89
2017** 224.82 191.61
* Valued at mid market prices.** Up to 15 April 2017.
Ongoing Charges Figure*Share class 15.04.17 15.10.16
Class 1 1.00% 1.00%
Class 2 0.86% 0.85%
Class 3 0.36% 0.35%
Class A 1.66% 1.65%
* The Ongoing Charges Figure (OCF) is calculated as the ratio of the total ongoing charges to the average net asset value of the Fund over the period. The OCF is made up of the Annual Management Charge (if any) and other operating costs deducted from the assets of the Fund during the period, except for those payments that are explicitly excluded (performance fees). The OCF for share class 1, when aggregated with certain other payments out of scheme property incurred in respect of it, is capped at 1.00% Please see the Prospectus for full details.
Revenue Record
The revenue record table below shows the net distribution rates per financial year on an accounting date basis for an investment made on 15 October 2013.
Share classFinancialyear
Net revenue per share (p)
Per £1,000invested (£)
Class 1 (Acc) 2014 0.7553 5.08
2015 1.2322 8.30
2016 1.8121 12.20
2017* 0.0262 0.18
Class 2 (Acc) 2014 1.6277 7.06
2015 2.3923 10.38
2016 3.4515 14.98
2017* 0.3622 1.57
Class 3 (Inc) 2014 2.9249 11.78
2015 3.8644 15.56
2016 5.0032 20.14
2017* 1.1940 4.81
Class A (Acc) 2014 0.0000 0.00
2015 0.1001 0.68
2016 0.5714 3.85
2017* 0.0000 0.00
* Up to 15 June 2017 (the interim distribution payment date).
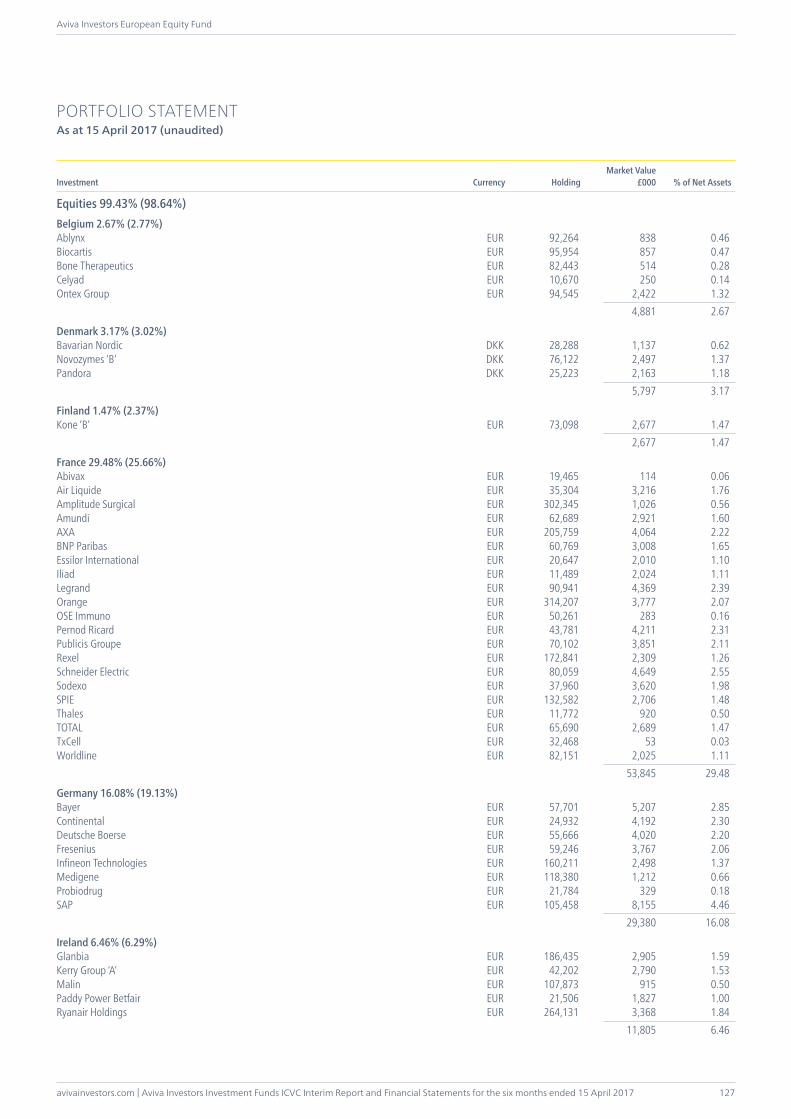
avivainvestors.com | Aviva Investors Investment Funds ICVC Interim Report and Financial Statements for the six months ended 15 April 2017
Aviva Investors European Equity Fund
127
PORTFOLIO STATEMENTAs at 15 April 2017 (unaudited)
Investment Currency HoldingMarket Value
£000 % of Net Assets
Equities 99.43% (98.64%)Belgium 2.67% (2.77%)Ablynx EUR 92,264 838 0.46Biocartis EUR 95,954 857 0.47Bone Therapeutics EUR 82,443 514 0.28Celyad EUR 10,670 250 0.14Ontex Group EUR 94,545 2,422 1.32 4,881 2.67
Denmark 3.17% (3.02%)Bavarian Nordic DKK 28,288 1,137 0.62Novozymes ‘B’ DKK 76,122 2,497 1.37Pandora DKK 25,223 2,163 1.18 5,797 3.17
Finland 1.47% (2.37%)Kone ‘B’ EUR 73,098 2,677 1.47 2,677 1.47
France 29.48% (25.66%)Abivax EUR 19,465 114 0.06Air Liquide EUR 35,304 3,216 1.76Amplitude Surgical EUR 302,345 1,026 0.56Amundi EUR 62,689 2,921 1.60AXA EUR 205,759 4,064 2.22BNP Paribas EUR 60,769 3,008 1.65Essilor International EUR 20,647 2,010 1.10Iliad EUR 11,489 2,024 1.11Legrand EUR 90,941 4,369 2.39Orange EUR 314,207 3,777 2.07OSE Immuno EUR 50,261 283 0.16Pernod Ricard EUR 43,781 4,211 2.31Publicis Groupe EUR 70,102 3,851 2.11Rexel EUR 172,841 2,309 1.26Schneider Electric EUR 80,059 4,649 2.55Sodexo EUR 37,960 3,620 1.98SPIE EUR 132,582 2,706 1.48Thales EUR 11,772 920 0.50TOTAL EUR 65,690 2,689 1.47TxCell EUR 32,468 53 0.03Worldline EUR 82,151 2,025 1.11 53,845 29.48
Germany 16.08% (19.13%)Bayer EUR 57,701 5,207 2.85Continental EUR 24,932 4,192 2.30Deutsche Boerse EUR 55,666 4,020 2.20Fresenius EUR 59,246 3,767 2.06Infineon Technologies EUR 160,211 2,498 1.37Medigene EUR 118,380 1,212 0.66Probiodrug EUR 21,784 329 0.18SAP EUR 105,458 8,155 4.46 29,380 16.08
Ireland 6.46% (6.29%)Glanbia EUR 186,435 2,905 1.59Kerry Group ‘A’ EUR 42,202 2,790 1.53Malin EUR 107,873 915 0.50Paddy Power Betfair EUR 21,506 1,827 1.00Ryanair Holdings EUR 264,131 3,368 1.84 11,805 6.46
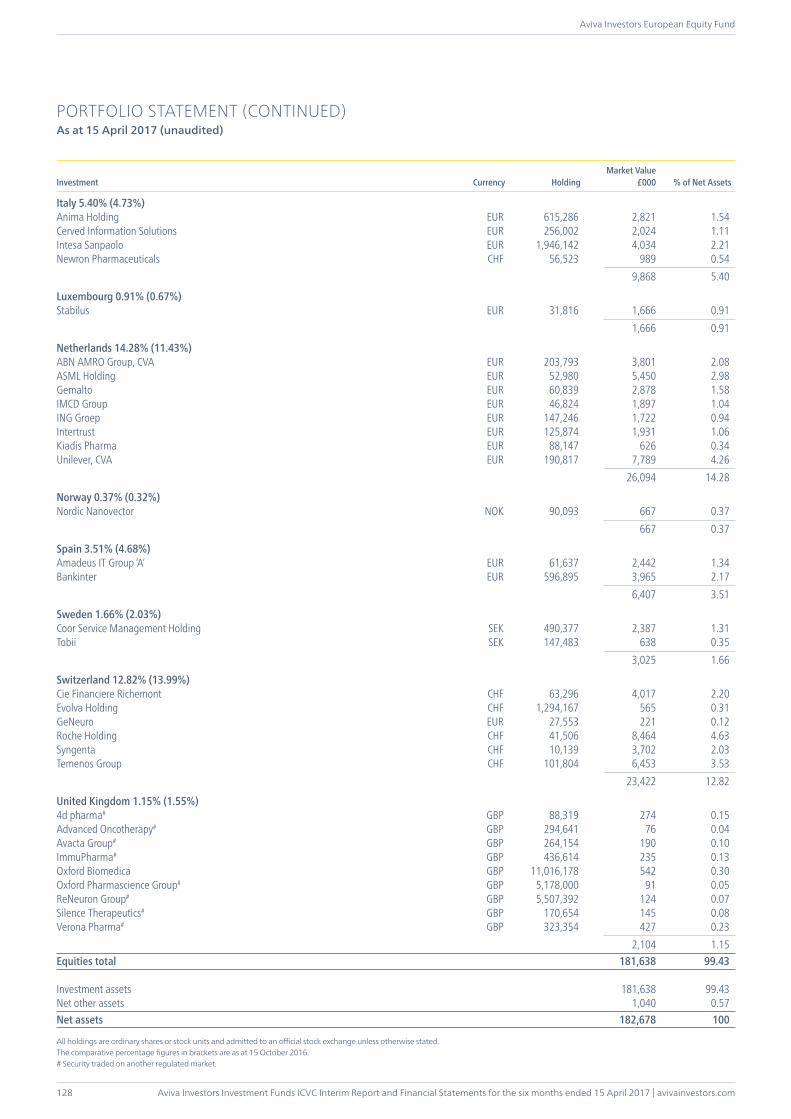
Aviva Investors Investment Funds ICVC Interim Report and Financial Statements for the six months ended 15 April 2017 | avivainvestors.com
Aviva Investors European Equity Fund
128
PORTFOLIO STATEMENT (CONTINUED)As at 15 April 2017 (unaudited)
Investment Currency HoldingMarket Value
£000 % of Net Assets
Italy 5.40% (4.73%)Anima Holding EUR 615,286 2,821 1.54Cerved Information Solutions EUR 256,002 2,024 1.11Intesa Sanpaolo EUR 1,946,142 4,034 2.21Newron Pharmaceuticals CHF 56,523 989 0.54 9,868 5.40
Luxembourg 0.91% (0.67%)Stabilus EUR 31,816 1,666 0.91 1,666 0.91
Netherlands 14.28% (11.43%)ABN AMRO Group, CVA EUR 203,793 3,801 2.08ASML Holding EUR 52,980 5,450 2.98Gemalto EUR 60,839 2,878 1.58IMCD Group EUR 46,824 1,897 1.04ING Groep EUR 147,246 1,722 0.94Intertrust EUR 125,874 1,931 1.06Kiadis Pharma EUR 88,147 626 0.34Unilever, CVA EUR 190,817 7,789 4.26 26,094 14.28
Norway 0.37% (0.32%)Nordic Nanovector NOK 90,093 667 0.37 667 0.37
Spain 3.51% (4.68%)Amadeus IT Group ‘A’ EUR 61,637 2,442 1.34Bankinter EUR 596,895 3,965 2.17 6,407 3.51
Sweden 1.66% (2.03%)Coor Service Management Holding SEK 490,377 2,387 1.31Tobii SEK 147,483 638 0.35 3,025 1.66
Switzerland 12.82% (13.99%)Cie Financiere Richemont CHF 63,296 4,017 2.20Evolva Holding CHF 1,294,167 565 0.31GeNeuro EUR 27,553 221 0.12Roche Holding CHF 41,506 8,464 4.63Syngenta CHF 10,139 3,702 2.03Temenos Group CHF 101,804 6,453 3.53 23,422 12.82
United Kingdom 1.15% (1.55%)4d pharma# GBP 88,319 274 0.15Advanced Oncotherapy# GBP 294,641 76 0.04Avacta Group# GBP 264,154 190 0.10ImmuPharma# GBP 436,614 235 0.13Oxford Biomedica GBP 11,016,178 542 0.30Oxford Pharmascience Group# GBP 5,178,000 91 0.05ReNeuron Group# GBP 5,507,392 124 0.07Silence Therapeutics# GBP 170,654 145 0.08Verona Pharma# GBP 323,354 427 0.23 2,104 1.15Equities total 181,638 99.43
Investment assets 181,638 99.43Net other assets 1,040 0.57Net assets 182,678 100
All holdings are ordinary shares or stock units and admitted to an official stock exchange unless otherwise stated.The comparative percentage figures in brackets are as at 15 October 2016.# Security traded on another regulated market.

avivainvestors.com | Aviva Investors Investment Funds ICVC Interim Report and Financial Statements for the six months ended 15 April 2017
Aviva Investors European Equity Fund
129
£000
Six months ended15.04.17
£000 £000
Six months ended15.04.16
£000
Income
Net capital gains 9,100 16,149
Revenue 1,024 740
Expenses (871) (755)
Net revenue/(expense) before taxation 153 (15)
Taxation (94) 32
Net revenue after taxation 59 17
Total return before distributions 9,159 16,166
Distributions (108) (84)
Change in net assets attributable to shareholders from investment activities 9,051 16,082
STATEMENT OF CHANGE IN NET ASSETS ATTRIBUTABLE TO SHAREHOLDERSFor the six months ended 15 April 2017 (unaudited)
£000
Six months ended15.04.17
£000 £000
Six months ended15.04.16
£000
Opening net assets attributable to shareholders 176,685 144,935
Movement due to issue and cancellation of shares:
Amounts receivable on issue of shares 6,056 4,508
Amounts payable on cancellation of shares (9,163) (6,467)
(3,107) (1,959)
Change in net assets attributable to shareholders from investment activities (see above) 9,051 16,082
Retained distribution on accumulation shares 49 30
Closing net assets attributable to shareholders 182,678 159,088
The Statement of Recommended Practice (2014) requires that comparatives are shown for the above report. As the comparatives should be for the comparable interim period, the net asset value at the end of the previous period will not agree to the net asset value at the start of this period. The published net asset value as at 15 October 2016 was £176,685,000.
STATEMENT OF TOTAL RETURNFor the six months ended 15 April 2017 (unaudited)

Aviva Investors Investment Funds ICVC Interim Report and Financial Statements for the six months ended 15 April 2017 | avivainvestors.com
Aviva Investors European Equity Fund
130
BALANCE SHEETAs at 15 April 2017 (unaudited)
As at15.04.17
£000
As at15.10.16
£000
Assets:
Investments 181,638 174,277
Current assets:
Debtors 749 359
Cash and bank balances 1,417 2,829
Total assets 183,804 177,465
Liabilities:
Creditors:
Distribution payable (56) (201)
Other creditors (1,070) (579)
Total liabilities (1,126) (780)
Net assets attributable to shareholders 182,678 176,685
ACCOUNTING POLICIESThe accounting policies applied are consistent with those of the financial statements for the year ended 15 October 2016 and are described in those annual financial statements.
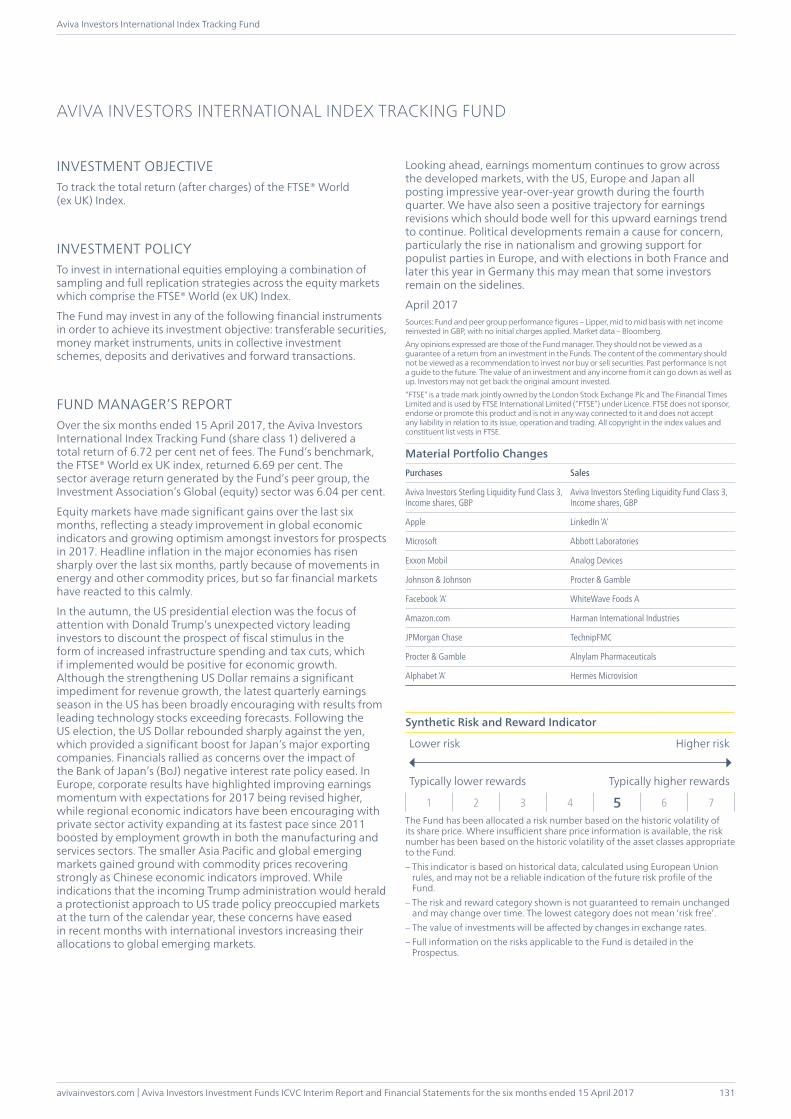
avivainvestors.com | Aviva Investors Investment Funds ICVC Interim Report and Financial Statements for the six months ended 15 April 2017
Aviva Investors International Index Tracking Fund
131
INVESTMENT OBJECTIVETo track the total return (after charges) of the FTSE® World (ex UK) Index.
INVESTMENT POLICYTo invest in international equities employing a combination of sampling and full replication strategies across the equity markets which comprise the FTSE® World (ex UK) Index.
The Fund may invest in any of the following financial instruments in order to achieve its investment objective: transferable securities, money market instruments, units in collective investment schemes, deposits and derivatives and forward transactions.
FUND MANAGER’S REPORTOver the six months ended 15 April 2017, the Aviva Investors International Index Tracking Fund (share class 1) delivered a total return of 6.72 per cent net of fees. The Fund’s benchmark, the FTSE® World ex UK index, returned 6.69 per cent. The sector average return generated by the Fund’s peer group, the Investment Association’s Global (equity) sector was 6.04 per cent.
Equity markets have made significant gains over the last six months, reflecting a steady improvement in global economic indicators and growing optimism amongst investors for prospects in 2017. Headline inflation in the major economies has risen sharply over the last six months, partly because of movements in energy and other commodity prices, but so far financial markets have reacted to this calmly.
In the autumn, the US presidential election was the focus of attention with Donald Trump’s unexpected victory leading investors to discount the prospect of fiscal stimulus in the form of increased infrastructure spending and tax cuts, which if implemented would be positive for economic growth. Although the strengthening US Dollar remains a significant impediment for revenue growth, the latest quarterly earnings season in the US has been broadly encouraging with results from leading technology stocks exceeding forecasts. Following the US election, the US Dollar rebounded sharply against the yen, which provided a significant boost for Japan’s major exporting companies. Financials rallied as concerns over the impact of the Bank of Japan’s (BoJ) negative interest rate policy eased. In Europe, corporate results have highlighted improving earnings momentum with expectations for 2017 being revised higher, while regional economic indicators have been encouraging with private sector activity expanding at its fastest pace since 2011 boosted by employment growth in both the manufacturing and services sectors. The smaller Asia Pacific and global emerging markets gained ground with commodity prices recovering strongly as Chinese economic indicators improved. While indications that the incoming Trump administration would herald a protectionist approach to US trade policy preoccupied markets at the turn of the calendar year, these concerns have eased in recent months with international investors increasing their allocations to global emerging markets.
Looking ahead, earnings momentum continues to grow across the developed markets, with the US, Europe and Japan all posting impressive year-over-year growth during the fourth quarter. We have also seen a positive trajectory for earnings revisions which should bode well for this upward earnings trend to continue. Political developments remain a cause for concern, particularly the rise in nationalism and growing support for populist parties in Europe, and with elections in both France and later this year in Germany this may mean that some investors remain on the sidelines.
April 2017Sources: Fund and peer group performance figures – Lipper, mid to mid basis with net income reinvested in GBP, with no initial charges applied. Market data – Bloomberg. Any opinions expressed are those of the Fund manager. They should not be viewed as a guarantee of a return from an investment in the Funds. The content of the commentary should not be viewed as a recommendation to invest nor buy or sell securities. Past performance is not a guide to the future. The value of an investment and any income from it can go down as well as up. Investors may not get back the original amount invested.“FTSE” is a trade mark jointly owned by the London Stock Exchange Plc and The Financial Times Limited and is used by FTSE International Limited (“FTSE”) under Licence. FTSE does not sponsor, endorse or promote this product and is not in any way connected to it and does not accept any liability in relation to its issue, operation and trading. All copyright in the index values and constituent list vests in FTSE.
Material Portfolio ChangesPurchases Sales
Aviva Investors Sterling Liquidity Fund Class 3, Income shares, GBP
Aviva Investors Sterling Liquidity Fund Class 3, Income shares, GBP
Apple LinkedIn ‘A‘
Microsoft Abbott Laboratories
Exxon Mobil Analog Devices
Johnson & Johnson Procter & Gamble
Facebook ‘A’ WhiteWave Foods A
Amazon.com Harman International Industries
JPMorgan Chase TechnipFMC
Procter & Gamble Alnylam Pharmaceuticals
Alphabet ‘A’ Hermes Microvision
Synthetic Risk and Reward Indicator
Lower risk Higher risk
Typically lower rewards Typically higher rewards
1 2 3 4 5 6 7The Fund has been allocated a risk number based on the historic volatility of its share price. Where insufficient share price information is available, the risk number has been based on the historic volatility of the asset classes appropriate to the Fund.– This indicator is based on historical data, calculated using European Union
rules, and may not be a reliable indication of the future risk profile of the Fund.
– The risk and reward category shown is not guaranteed to remain unchanged and may change over time. The lowest category does not mean ‘risk free’.
– The value of investments will be affected by changes in exchange rates.– Full information on the risks applicable to the Fund is detailed in the
Prospectus.
AVIVA INVESTORS INTERNATIONAL INDEX TRACKING FUND
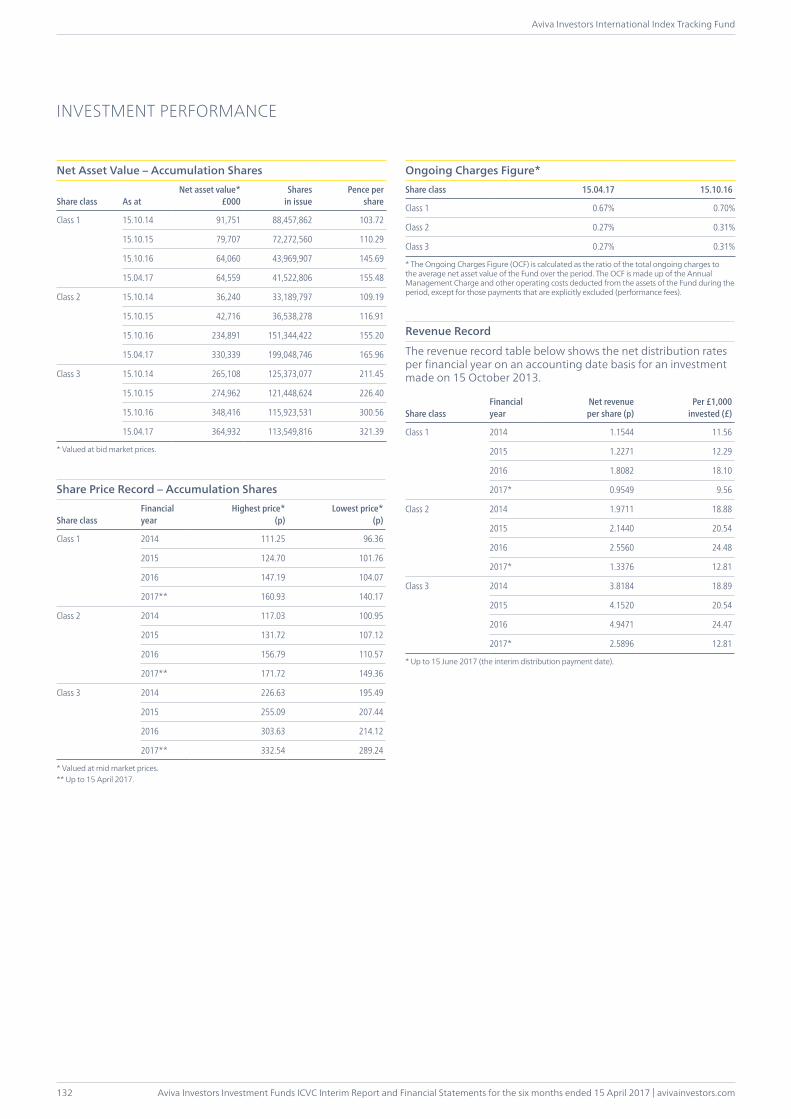
Aviva Investors Investment Funds ICVC Interim Report and Financial Statements for the six months ended 15 April 2017 | avivainvestors.com
Aviva Investors International Index Tracking Fund
132
INVESTMENT PERFORMANCE
Net Asset Value – Accumulation Shares
Share class As atNet asset value*
£000Shares
in issuePence per
share
Class 1 15.10.14 91,751 88,457,862 103.72
15.10.15 79,707 72,272,560 110.29
15.10.16 64,060 43,969,907 145.69
15.04.17 64,559 41,522,806 155.48
Class 2 15.10.14 36,240 33,189,797 109.19
15.10.15 42,716 36,538,278 116.91
15.10.16 234,891 151,344,422 155.20
15.04.17 330,339 199,048,746 165.96
Class 3 15.10.14 265,108 125,373,077 211.45
15.10.15 274,962 121,448,624 226.40
15.10.16 348,416 115,923,531 300.56
15.04.17 364,932 113,549,816 321.39
* Valued at bid market prices.
Share Price Record – Accumulation Shares
Share classFinancialyear
Highest price*(p)
Lowest price*(p)
Class 1 2014 111.25 96.36
2015 124.70 101.76
2016 147.19 104.07
2017** 160.93 140.17
Class 2 2014 117.03 100.95
2015 131.72 107.12
2016 156.79 110.57
2017** 171.72 149.36
Class 3 2014 226.63 195.49
2015 255.09 207.44
2016 303.63 214.12
2017** 332.54 289.24
* Valued at mid market prices.** Up to 15 April 2017.
Ongoing Charges Figure*Share class 15.04.17 15.10.16
Class 1 0.67% 0.70%
Class 2 0.27% 0.31%
Class 3 0.27% 0.31%
* The Ongoing Charges Figure (OCF) is calculated as the ratio of the total ongoing charges to the average net asset value of the Fund over the period. The OCF is made up of the Annual Management Charge and other operating costs deducted from the assets of the Fund during the period, except for those payments that are explicitly excluded (performance fees).
Revenue Record
The revenue record table below shows the net distribution rates per financial year on an accounting date basis for an investment made on 15 October 2013.
Share classFinancialyear
Net revenue per share (p)
Per £1,000invested (£)
Class 1 2014 1.1544 11.56
2015 1.2271 12.29
2016 1.8082 18.10
2017* 0.9549 9.56
Class 2 2014 1.9711 18.88
2015 2.1440 20.54
2016 2.5560 24.48
2017* 1.3376 12.81
Class 3 2014 3.8184 18.89
2015 4.1520 20.54
2016 4.9471 24.47
2017* 2.5896 12.81
* Up to 15 June 2017 (the interim distribution payment date).
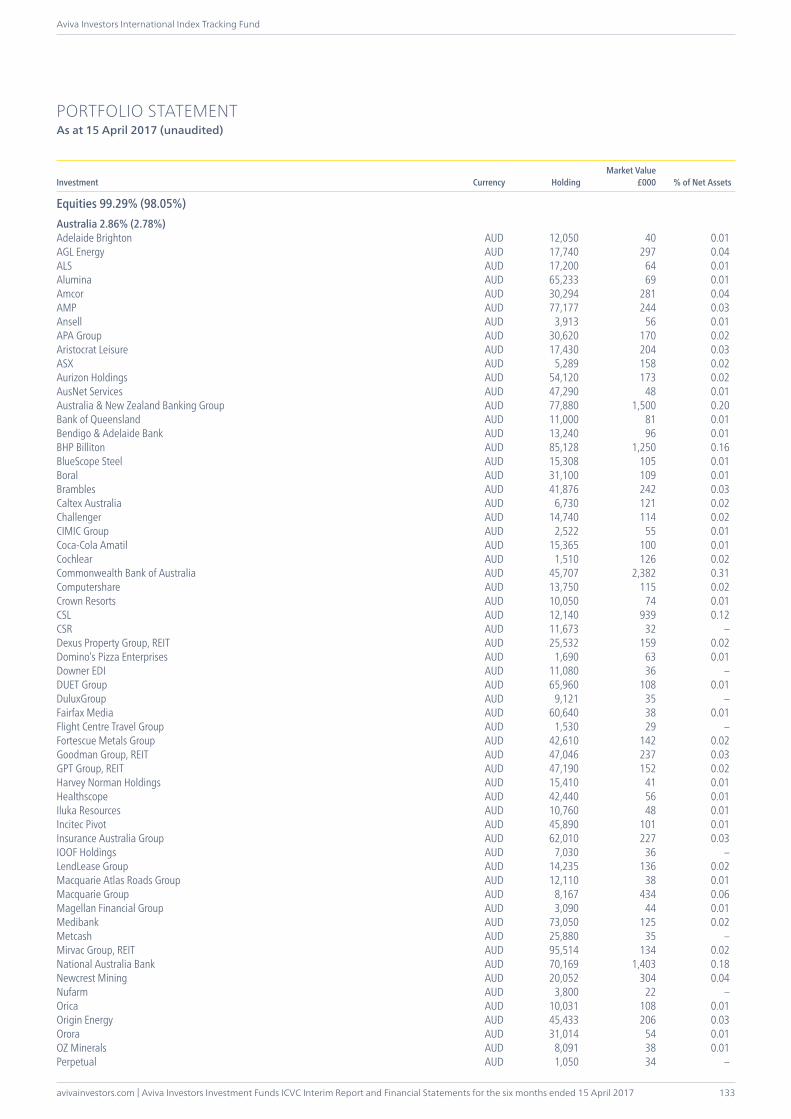
avivainvestors.com | Aviva Investors Investment Funds ICVC Interim Report and Financial Statements for the six months ended 15 April 2017
Aviva Investors International Index Tracking Fund
133
PORTFOLIO STATEMENTAs at 15 April 2017 (unaudited)
Investment Currency HoldingMarket Value
£000 % of Net Assets
Equities 99.29% (98.05%)Australia 2.86% (2.78%)Adelaide Brighton AUD 12,050 40 0.01AGL Energy AUD 17,740 297 0.04ALS AUD 17,200 64 0.01Alumina AUD 65,233 69 0.01Amcor AUD 30,294 281 0.04AMP AUD 77,177 244 0.03Ansell AUD 3,913 56 0.01APA Group AUD 30,620 170 0.02Aristocrat Leisure AUD 17,430 204 0.03ASX AUD 5,289 158 0.02Aurizon Holdings AUD 54,120 173 0.02AusNet Services AUD 47,290 48 0.01Australia & New Zealand Banking Group AUD 77,880 1,500 0.20Bank of Queensland AUD 11,000 81 0.01Bendigo & Adelaide Bank AUD 13,240 96 0.01BHP Billiton AUD 85,128 1,250 0.16BlueScope Steel AUD 15,308 105 0.01Boral AUD 31,100 109 0.01Brambles AUD 41,876 242 0.03Caltex Australia AUD 6,730 121 0.02Challenger AUD 14,740 114 0.02CIMIC Group AUD 2,522 55 0.01Coca-Cola Amatil AUD 15,365 100 0.01Cochlear AUD 1,510 126 0.02Commonwealth Bank of Australia AUD 45,707 2,382 0.31Computershare AUD 13,750 115 0.02Crown Resorts AUD 10,050 74 0.01CSL AUD 12,140 939 0.12CSR AUD 11,673 32 –Dexus Property Group, REIT AUD 25,532 159 0.02Domino’s Pizza Enterprises AUD 1,690 63 0.01Downer EDI AUD 11,080 36 –DUET Group AUD 65,960 108 0.01DuluxGroup AUD 9,121 35 –Fairfax Media AUD 60,640 38 0.01Flight Centre Travel Group AUD 1,530 29 –Fortescue Metals Group AUD 42,610 142 0.02Goodman Group, REIT AUD 47,046 237 0.03GPT Group, REIT AUD 47,190 152 0.02Harvey Norman Holdings AUD 15,410 41 0.01Healthscope AUD 42,440 56 0.01Iluka Resources AUD 10,760 48 0.01Incitec Pivot AUD 45,890 101 0.01Insurance Australia Group AUD 62,010 227 0.03IOOF Holdings AUD 7,030 36 –LendLease Group AUD 14,235 136 0.02Macquarie Atlas Roads Group AUD 12,110 38 0.01Macquarie Group AUD 8,167 434 0.06Magellan Financial Group AUD 3,090 44 0.01Medibank AUD 73,050 125 0.02Metcash AUD 25,880 35 –Mirvac Group, REIT AUD 95,514 134 0.02National Australia Bank AUD 70,169 1,403 0.18Newcrest Mining AUD 20,052 304 0.04Nufarm AUD 3,800 22 –Orica AUD 10,031 108 0.01Origin Energy AUD 45,433 206 0.03Orora AUD 31,014 54 0.01OZ Minerals AUD 8,091 38 0.01Perpetual AUD 1,050 34 –
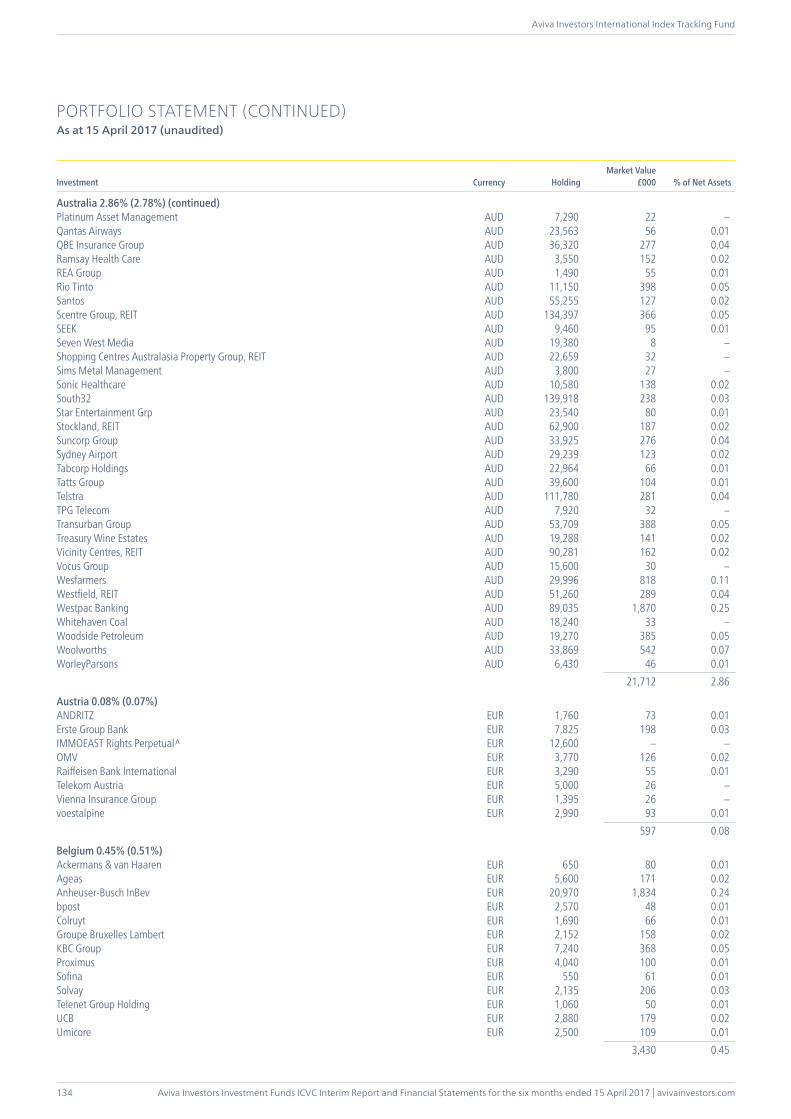
Aviva Investors Investment Funds ICVC Interim Report and Financial Statements for the six months ended 15 April 2017 | avivainvestors.com
Aviva Investors International Index Tracking Fund
134
PORTFOLIO STATEMENT (CONTINUED)As at 15 April 2017 (unaudited)
Investment Currency HoldingMarket Value
£000 % of Net Assets
Australia 2.86% (2.78%) (continued)Platinum Asset Management AUD 7,290 22 –Qantas Airways AUD 23,563 56 0.01QBE Insurance Group AUD 36,320 277 0.04Ramsay Health Care AUD 3,550 152 0.02REA Group AUD 1,490 55 0.01Rio Tinto AUD 11,150 398 0.05Santos AUD 55,255 127 0.02Scentre Group, REIT AUD 134,397 366 0.05SEEK AUD 9,460 95 0.01Seven West Media AUD 19,380 8 –Shopping Centres Australasia Property Group, REIT AUD 22,659 32 –Sims Metal Management AUD 3,800 27 –Sonic Healthcare AUD 10,580 138 0.02South32 AUD 139,918 238 0.03Star Entertainment Grp AUD 23,540 80 0.01Stockland, REIT AUD 62,900 187 0.02Suncorp Group AUD 33,925 276 0.04Sydney Airport AUD 29,239 123 0.02Tabcorp Holdings AUD 22,964 66 0.01Tatts Group AUD 39,600 104 0.01Telstra AUD 111,780 281 0.04TPG Telecom AUD 7,920 32 –Transurban Group AUD 53,709 388 0.05Treasury Wine Estates AUD 19,288 141 0.02Vicinity Centres, REIT AUD 90,281 162 0.02Vocus Group AUD 15,600 30 –Wesfarmers AUD 29,996 818 0.11Westfield, REIT AUD 51,260 289 0.04Westpac Banking AUD 89,035 1,870 0.25Whitehaven Coal AUD 18,240 33 –Woodside Petroleum AUD 19,270 385 0.05Woolworths AUD 33,869 542 0.07WorleyParsons AUD 6,430 46 0.01 21,712 2.86
Austria 0.08% (0.07%)ANDRITZ EUR 1,760 73 0.01Erste Group Bank EUR 7,825 198 0.03IMMOEAST Rights Perpetual^ EUR 12,600 – –OMV EUR 3,770 126 0.02Raiffeisen Bank International EUR 3,290 55 0.01Telekom Austria EUR 5,000 26 –Vienna Insurance Group EUR 1,395 26 –voestalpine EUR 2,990 93 0.01 597 0.08
Belgium 0.45% (0.51%)Ackermans & van Haaren EUR 650 80 0.01Ageas EUR 5,600 171 0.02Anheuser-Busch InBev EUR 20,970 1,834 0.24bpost EUR 2,570 48 0.01Colruyt EUR 1,690 66 0.01Groupe Bruxelles Lambert EUR 2,152 158 0.02KBC Group EUR 7,240 368 0.05Proximus EUR 4,040 100 0.01Sofina EUR 550 61 0.01Solvay EUR 2,135 206 0.03Telenet Group Holding EUR 1,060 50 0.01UCB EUR 2,880 179 0.02Umicore EUR 2,500 109 0.01 3,430 0.45
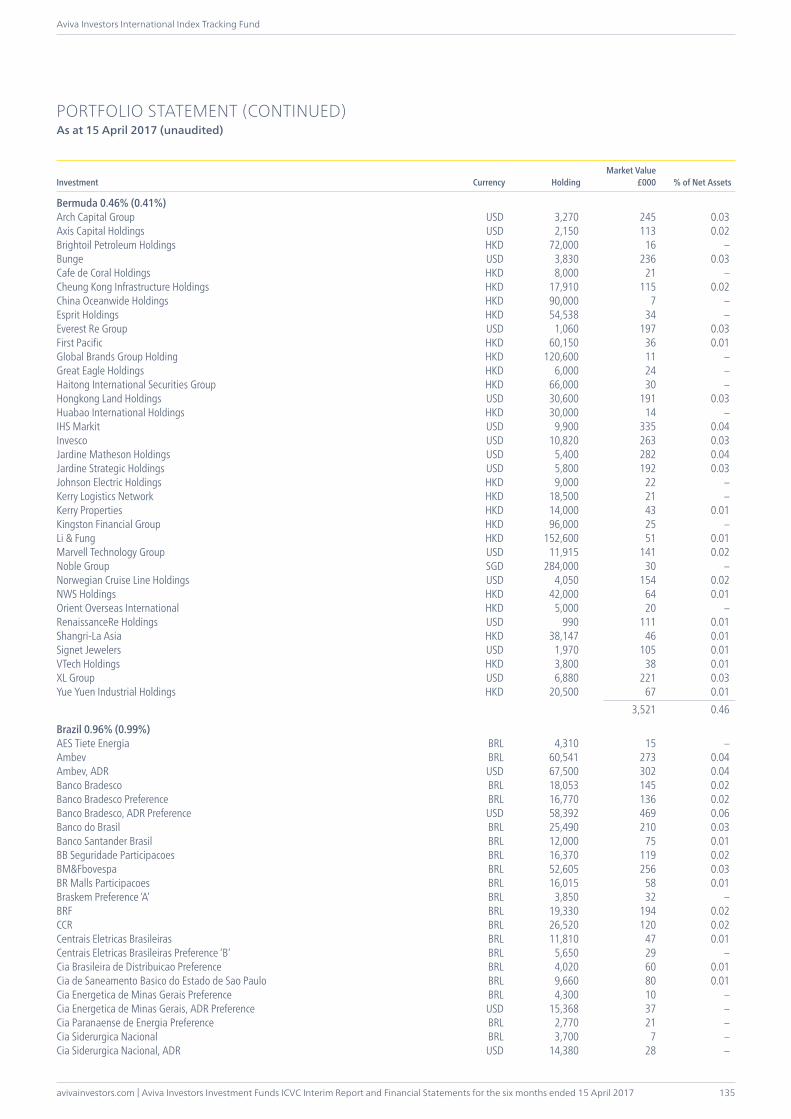
avivainvestors.com | Aviva Investors Investment Funds ICVC Interim Report and Financial Statements for the six months ended 15 April 2017
Aviva Investors International Index Tracking Fund
135
PORTFOLIO STATEMENT (CONTINUED)As at 15 April 2017 (unaudited)
Investment Currency HoldingMarket Value
£000 % of Net Assets
Bermuda 0.46% (0.41%)Arch Capital Group USD 3,270 245 0.03Axis Capital Holdings USD 2,150 113 0.02Brightoil Petroleum Holdings HKD 72,000 16 –Bunge USD 3,830 236 0.03Cafe de Coral Holdings HKD 8,000 21 –Cheung Kong Infrastructure Holdings HKD 17,910 115 0.02China Oceanwide Holdings HKD 90,000 7 –Esprit Holdings HKD 54,538 34 –Everest Re Group USD 1,060 197 0.03First Pacific HKD 60,150 36 0.01Global Brands Group Holding HKD 120,600 11 –Great Eagle Holdings HKD 6,000 24 –Haitong International Securities Group HKD 66,000 30 –Hongkong Land Holdings USD 30,600 191 0.03Huabao International Holdings HKD 30,000 14 –IHS Markit USD 9,900 335 0.04Invesco USD 10,820 263 0.03Jardine Matheson Holdings USD 5,400 282 0.04Jardine Strategic Holdings USD 5,800 192 0.03Johnson Electric Holdings HKD 9,000 22 –Kerry Logistics Network HKD 18,500 21 –Kerry Properties HKD 14,000 43 0.01Kingston Financial Group HKD 96,000 25 –Li & Fung HKD 152,600 51 0.01Marvell Technology Group USD 11,915 141 0.02Noble Group SGD 284,000 30 –Norwegian Cruise Line Holdings USD 4,050 154 0.02NWS Holdings HKD 42,000 64 0.01Orient Overseas International HKD 5,000 20 –RenaissanceRe Holdings USD 990 111 0.01Shangri-La Asia HKD 38,147 46 0.01Signet Jewelers USD 1,970 105 0.01VTech Holdings HKD 3,800 38 0.01XL Group USD 6,880 221 0.03Yue Yuen Industrial Holdings HKD 20,500 67 0.01 3,521 0.46
Brazil 0.96% (0.99%)AES Tiete Energia BRL 4,310 15 –Ambev BRL 60,541 273 0.04Ambev, ADR USD 67,500 302 0.04Banco Bradesco BRL 18,053 145 0.02Banco Bradesco Preference BRL 16,770 136 0.02Banco Bradesco, ADR Preference USD 58,392 469 0.06Banco do Brasil BRL 25,490 210 0.03Banco Santander Brasil BRL 12,000 75 0.01BB Seguridade Participacoes BRL 16,370 119 0.02BM&Fbovespa BRL 52,605 256 0.03BR Malls Participacoes BRL 16,015 58 0.01Braskem Preference ‘A’ BRL 3,850 32 –BRF BRL 19,330 194 0.02CCR BRL 26,520 120 0.02Centrais Eletricas Brasileiras BRL 11,810 47 0.01Centrais Eletricas Brasileiras Preference ‘B’ BRL 5,650 29 –Cia Brasileira de Distribuicao Preference BRL 4,020 60 0.01Cia de Saneamento Basico do Estado de Sao Paulo BRL 9,660 80 0.01Cia Energetica de Minas Gerais Preference BRL 4,300 10 –Cia Energetica de Minas Gerais, ADR Preference USD 15,368 37 –Cia Paranaense de Energia Preference BRL 2,770 21 –Cia Siderurgica Nacional BRL 3,700 7 –Cia Siderurgica Nacional, ADR USD 14,380 28 –
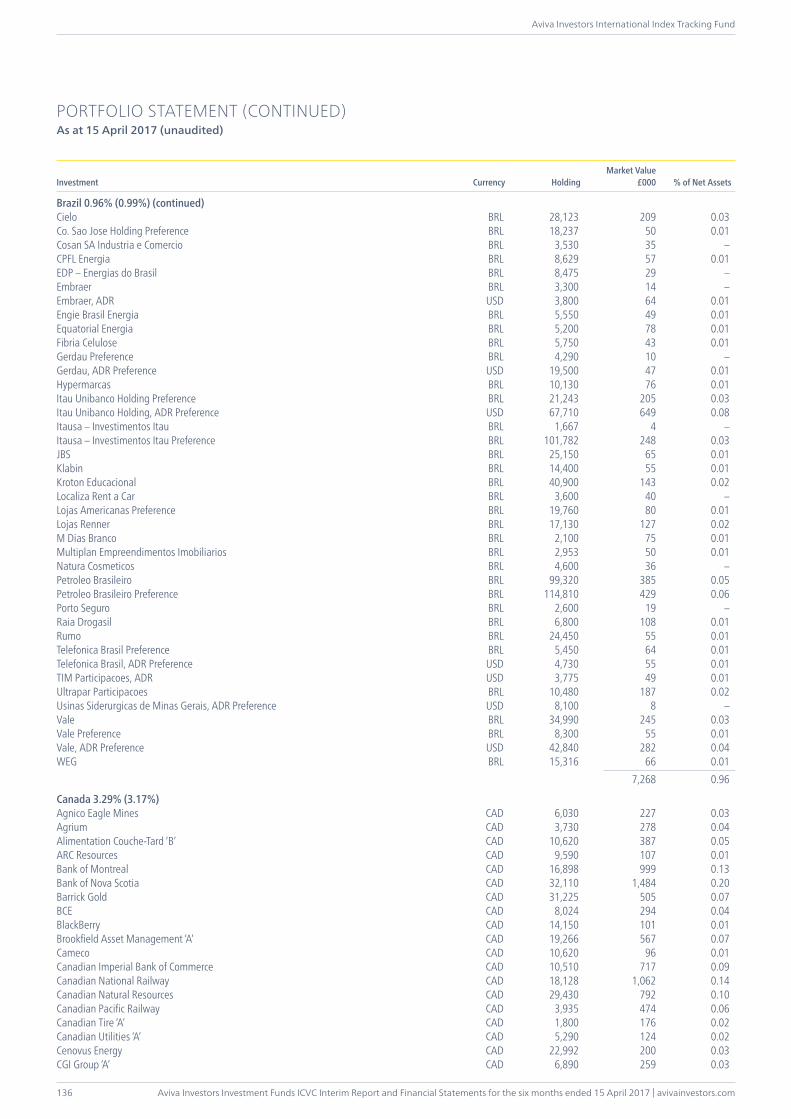
Aviva Investors Investment Funds ICVC Interim Report and Financial Statements for the six months ended 15 April 2017 | avivainvestors.com
Aviva Investors International Index Tracking Fund
136
PORTFOLIO STATEMENT (CONTINUED)As at 15 April 2017 (unaudited)
Investment Currency HoldingMarket Value
£000 % of Net Assets
Brazil 0.96% (0.99%) (continued)Cielo BRL 28,123 209 0.03Co. Sao Jose Holding Preference BRL 18,237 50 0.01Cosan SA Industria e Comercio BRL 3,530 35 –CPFL Energia BRL 8,629 57 0.01EDP – Energias do Brasil BRL 8,475 29 –Embraer BRL 3,300 14 –Embraer, ADR USD 3,800 64 0.01Engie Brasil Energia BRL 5,550 49 0.01Equatorial Energia BRL 5,200 78 0.01Fibria Celulose BRL 5,750 43 0.01Gerdau Preference BRL 4,290 10 –Gerdau, ADR Preference USD 19,500 47 0.01Hypermarcas BRL 10,130 76 0.01Itau Unibanco Holding Preference BRL 21,243 205 0.03Itau Unibanco Holding, ADR Preference USD 67,710 649 0.08Itausa – Investimentos Itau BRL 1,667 4 –Itausa – Investimentos Itau Preference BRL 101,782 248 0.03JBS BRL 25,150 65 0.01Klabin BRL 14,400 55 0.01Kroton Educacional BRL 40,900 143 0.02Localiza Rent a Car BRL 3,600 40 –Lojas Americanas Preference BRL 19,760 80 0.01Lojas Renner BRL 17,130 127 0.02M Dias Branco BRL 2,100 75 0.01Multiplan Empreendimentos Imobiliarios BRL 2,953 50 0.01Natura Cosmeticos BRL 4,600 36 –Petroleo Brasileiro BRL 99,320 385 0.05Petroleo Brasileiro Preference BRL 114,810 429 0.06Porto Seguro BRL 2,600 19 –Raia Drogasil BRL 6,800 108 0.01Rumo BRL 24,450 55 0.01Telefonica Brasil Preference BRL 5,450 64 0.01Telefonica Brasil, ADR Preference USD 4,730 55 0.01TIM Participacoes, ADR USD 3,775 49 0.01Ultrapar Participacoes BRL 10,480 187 0.02Usinas Siderurgicas de Minas Gerais, ADR Preference USD 8,100 8 –Vale BRL 34,990 245 0.03Vale Preference BRL 8,300 55 0.01Vale, ADR Preference USD 42,840 282 0.04WEG BRL 15,316 66 0.01 7,268 0.96
Canada 3.29% (3.17%)Agnico Eagle Mines CAD 6,030 227 0.03Agrium CAD 3,730 278 0.04Alimentation Couche-Tard ‘B’ CAD 10,620 387 0.05ARC Resources CAD 9,590 107 0.01Bank of Montreal CAD 16,898 999 0.13Bank of Nova Scotia CAD 32,110 1,484 0.20Barrick Gold CAD 31,225 505 0.07BCE CAD 8,024 294 0.04BlackBerry CAD 14,150 101 0.01Brookfield Asset Management ‘A’ CAD 19,266 567 0.07Cameco CAD 10,620 96 0.01Canadian Imperial Bank of Commerce CAD 10,510 717 0.09Canadian National Railway CAD 18,128 1,062 0.14Canadian Natural Resources CAD 29,430 792 0.10Canadian Pacific Railway CAD 3,935 474 0.06Canadian Tire ‘A’ CAD 1,800 176 0.02Canadian Utilities ‘A’ CAD 5,290 124 0.02Cenovus Energy CAD 22,992 200 0.03CGI Group ‘A’ CAD 6,890 259 0.03
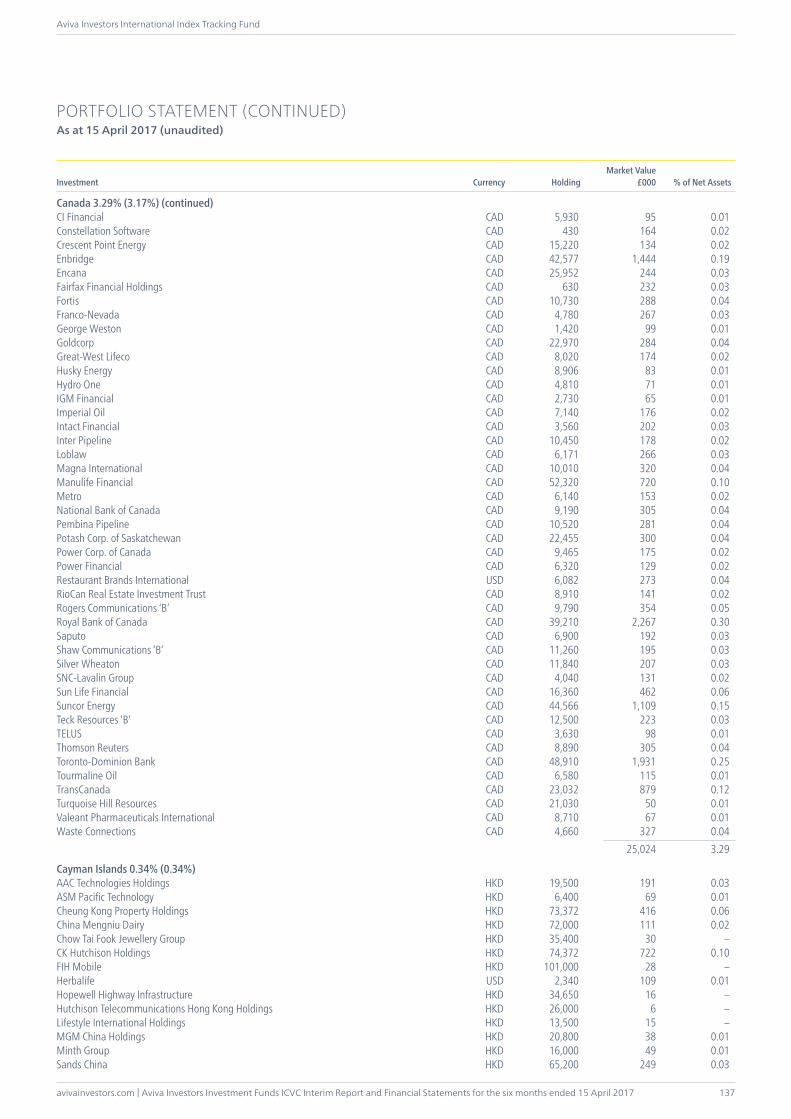
avivainvestors.com | Aviva Investors Investment Funds ICVC Interim Report and Financial Statements for the six months ended 15 April 2017
Aviva Investors International Index Tracking Fund
137
PORTFOLIO STATEMENT (CONTINUED)As at 15 April 2017 (unaudited)
Investment Currency HoldingMarket Value
£000 % of Net Assets
Canada 3.29% (3.17%) (continued)CI Financial CAD 5,930 95 0.01Constellation Software CAD 430 164 0.02Crescent Point Energy CAD 15,220 134 0.02Enbridge CAD 42,577 1,444 0.19Encana CAD 25,952 244 0.03Fairfax Financial Holdings CAD 630 232 0.03Fortis CAD 10,730 288 0.04Franco-Nevada CAD 4,780 267 0.03George Weston CAD 1,420 99 0.01Goldcorp CAD 22,970 284 0.04Great-West Lifeco CAD 8,020 174 0.02Husky Energy CAD 8,906 83 0.01Hydro One CAD 4,810 71 0.01IGM Financial CAD 2,730 65 0.01Imperial Oil CAD 7,140 176 0.02Intact Financial CAD 3,560 202 0.03Inter Pipeline CAD 10,450 178 0.02Loblaw CAD 6,171 266 0.03Magna International CAD 10,010 320 0.04Manulife Financial CAD 52,320 720 0.10Metro CAD 6,140 153 0.02National Bank of Canada CAD 9,190 305 0.04Pembina Pipeline CAD 10,520 281 0.04Potash Corp. of Saskatchewan CAD 22,455 300 0.04Power Corp. of Canada CAD 9,465 175 0.02Power Financial CAD 6,320 129 0.02Restaurant Brands International USD 6,082 273 0.04RioCan Real Estate Investment Trust CAD 8,910 141 0.02Rogers Communications ‘B’ CAD 9,790 354 0.05Royal Bank of Canada CAD 39,210 2,267 0.30Saputo CAD 6,900 192 0.03Shaw Communications ‘B’ CAD 11,260 195 0.03Silver Wheaton CAD 11,840 207 0.03SNC-Lavalin Group CAD 4,040 131 0.02Sun Life Financial CAD 16,360 462 0.06Suncor Energy CAD 44,566 1,109 0.15Teck Resources ‘B’ CAD 12,500 223 0.03TELUS CAD 3,630 98 0.01Thomson Reuters CAD 8,890 305 0.04Toronto-Dominion Bank CAD 48,910 1,931 0.25Tourmaline Oil CAD 6,580 115 0.01TransCanada CAD 23,032 879 0.12Turquoise Hill Resources CAD 21,030 50 0.01Valeant Pharmaceuticals International CAD 8,710 67 0.01Waste Connections CAD 4,660 327 0.04 25,024 3.29
Cayman Islands 0.34% (0.34%)AAC Technologies Holdings HKD 19,500 191 0.03ASM Pacific Technology HKD 6,400 69 0.01Cheung Kong Property Holdings HKD 73,372 416 0.06China Mengniu Dairy HKD 72,000 111 0.02Chow Tai Fook Jewellery Group HKD 35,400 30 –CK Hutchison Holdings HKD 74,372 722 0.10FIH Mobile HKD 101,000 28 –Herbalife USD 2,340 109 0.01Hopewell Highway Infrastructure HKD 34,650 16 –Hutchison Telecommunications Hong Kong Holdings HKD 26,000 6 –Lifestyle International Holdings HKD 13,500 15 –MGM China Holdings HKD 20,800 38 0.01Minth Group HKD 16,000 49 0.01Sands China HKD 65,200 249 0.03
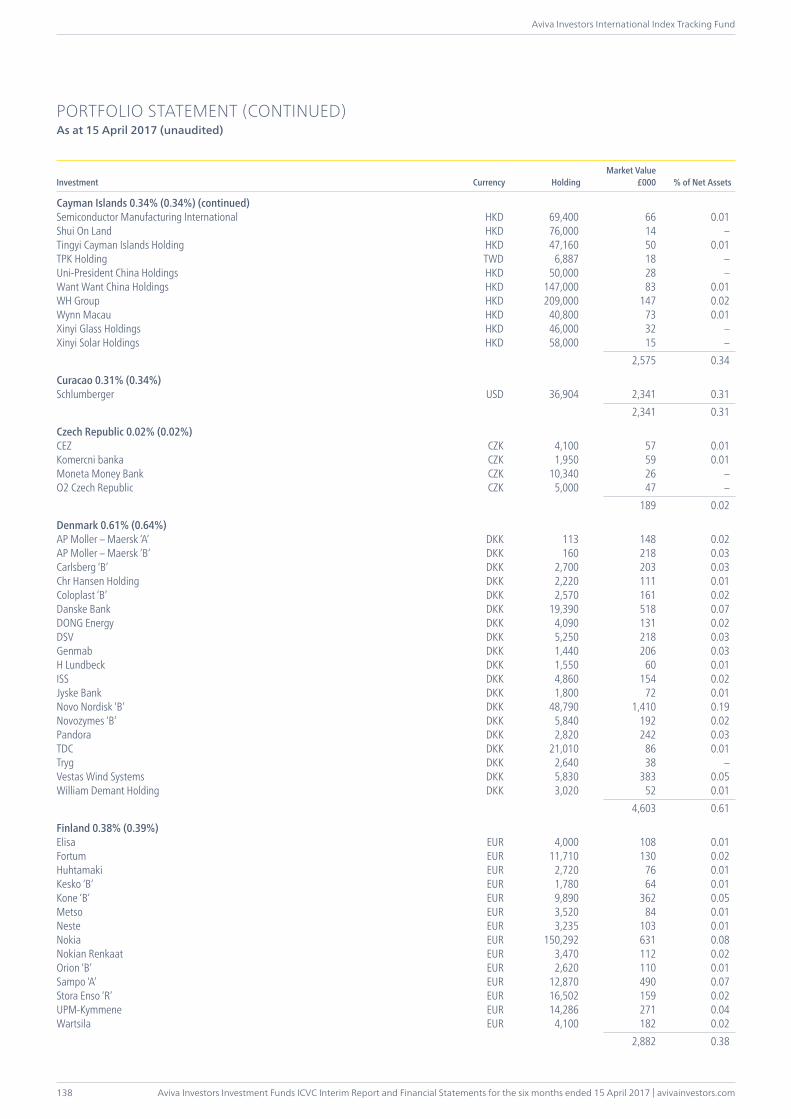
Aviva Investors Investment Funds ICVC Interim Report and Financial Statements for the six months ended 15 April 2017 | avivainvestors.com
Aviva Investors International Index Tracking Fund
138
PORTFOLIO STATEMENT (CONTINUED)As at 15 April 2017 (unaudited)
Investment Currency HoldingMarket Value
£000 % of Net Assets
Cayman Islands 0.34% (0.34%) (continued)Semiconductor Manufacturing International HKD 69,400 66 0.01Shui On Land HKD 76,000 14 –Tingyi Cayman Islands Holding HKD 47,160 50 0.01TPK Holding TWD 6,887 18 –Uni-President China Holdings HKD 50,000 28 –Want Want China Holdings HKD 147,000 83 0.01WH Group HKD 209,000 147 0.02Wynn Macau HKD 40,800 73 0.01Xinyi Glass Holdings HKD 46,000 32 –Xinyi Solar Holdings HKD 58,000 15 – 2,575 0.34
Curacao 0.31% (0.34%)Schlumberger USD 36,904 2,341 0.31 2,341 0.31
Czech Republic 0.02% (0.02%)CEZ CZK 4,100 57 0.01Komercni banka CZK 1,950 59 0.01Moneta Money Bank CZK 10,340 26 –O2 Czech Republic CZK 5,000 47 – 189 0.02
Denmark 0.61% (0.64%)AP Moller – Maersk ‘A’ DKK 113 148 0.02AP Moller – Maersk ‘B’ DKK 160 218 0.03Carlsberg ‘B’ DKK 2,700 203 0.03Chr Hansen Holding DKK 2,220 111 0.01Coloplast ‘B’ DKK 2,570 161 0.02Danske Bank DKK 19,390 518 0.07DONG Energy DKK 4,090 131 0.02DSV DKK 5,250 218 0.03Genmab DKK 1,440 206 0.03H Lundbeck DKK 1,550 60 0.01ISS DKK 4,860 154 0.02Jyske Bank DKK 1,800 72 0.01Novo Nordisk ‘B’ DKK 48,790 1,410 0.19Novozymes ‘B’ DKK 5,840 192 0.02Pandora DKK 2,820 242 0.03TDC DKK 21,010 86 0.01Tryg DKK 2,640 38 –Vestas Wind Systems DKK 5,830 383 0.05William Demant Holding DKK 3,020 52 0.01 4,603 0.61
Finland 0.38% (0.39%)Elisa EUR 4,000 108 0.01Fortum EUR 11,710 130 0.02Huhtamaki EUR 2,720 76 0.01Kesko ‘B’ EUR 1,780 64 0.01Kone ‘B’ EUR 9,890 362 0.05Metso EUR 3,520 84 0.01Neste EUR 3,235 103 0.01Nokia EUR 150,292 631 0.08Nokian Renkaat EUR 3,470 112 0.02Orion ‘B’ EUR 2,620 110 0.01Sampo ‘A’ EUR 12,870 490 0.07Stora Enso ‘R’ EUR 16,502 159 0.02UPM-Kymmene EUR 14,286 271 0.04Wartsila EUR 4,100 182 0.02 2,882 0.38
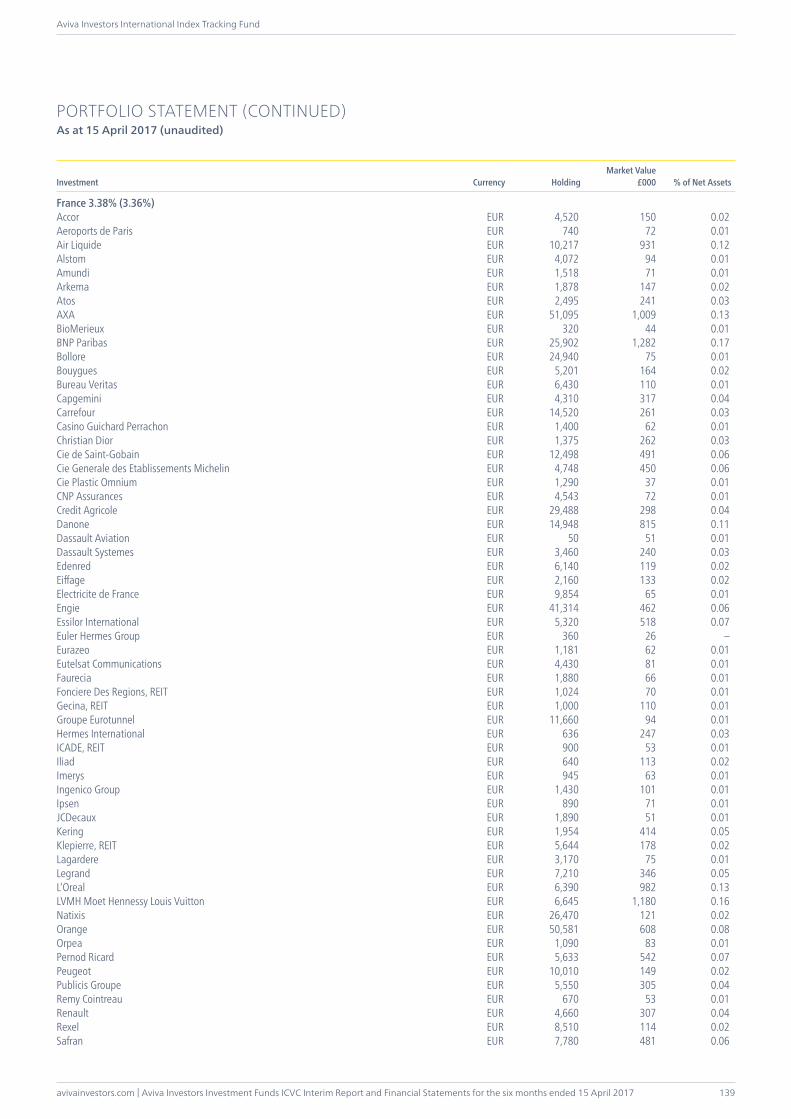
avivainvestors.com | Aviva Investors Investment Funds ICVC Interim Report and Financial Statements for the six months ended 15 April 2017
Aviva Investors International Index Tracking Fund
139
PORTFOLIO STATEMENT (CONTINUED)As at 15 April 2017 (unaudited)
Investment Currency HoldingMarket Value
£000 % of Net Assets
France 3.38% (3.36%)Accor EUR 4,520 150 0.02Aeroports de Paris EUR 740 72 0.01Air Liquide EUR 10,217 931 0.12Alstom EUR 4,072 94 0.01Amundi EUR 1,518 71 0.01Arkema EUR 1,878 147 0.02Atos EUR 2,495 241 0.03AXA EUR 51,095 1,009 0.13BioMerieux EUR 320 44 0.01BNP Paribas EUR 25,902 1,282 0.17Bollore EUR 24,940 75 0.01Bouygues EUR 5,201 164 0.02Bureau Veritas EUR 6,430 110 0.01Capgemini EUR 4,310 317 0.04Carrefour EUR 14,520 261 0.03Casino Guichard Perrachon EUR 1,400 62 0.01Christian Dior EUR 1,375 262 0.03Cie de Saint-Gobain EUR 12,498 491 0.06Cie Generale des Etablissements Michelin EUR 4,748 450 0.06Cie Plastic Omnium EUR 1,290 37 0.01CNP Assurances EUR 4,543 72 0.01Credit Agricole EUR 29,488 298 0.04Danone EUR 14,948 815 0.11Dassault Aviation EUR 50 51 0.01Dassault Systemes EUR 3,460 240 0.03Edenred EUR 6,140 119 0.02Eiffage EUR 2,160 133 0.02Electricite de France EUR 9,854 65 0.01Engie EUR 41,314 462 0.06Essilor International EUR 5,320 518 0.07Euler Hermes Group EUR 360 26 –Eurazeo EUR 1,181 62 0.01Eutelsat Communications EUR 4,430 81 0.01Faurecia EUR 1,880 66 0.01Fonciere Des Regions, REIT EUR 1,024 70 0.01Gecina, REIT EUR 1,000 110 0.01Groupe Eurotunnel EUR 11,660 94 0.01Hermes International EUR 636 247 0.03ICADE, REIT EUR 900 53 0.01Iliad EUR 640 113 0.02Imerys EUR 945 63 0.01Ingenico Group EUR 1,430 101 0.01Ipsen EUR 890 71 0.01JCDecaux EUR 1,890 51 0.01Kering EUR 1,954 414 0.05Klepierre, REIT EUR 5,644 178 0.02Lagardere EUR 3,170 75 0.01Legrand EUR 7,210 346 0.05L’Oreal EUR 6,390 982 0.13LVMH Moet Hennessy Louis Vuitton EUR 6,645 1,180 0.16Natixis EUR 26,470 121 0.02Orange EUR 50,581 608 0.08Orpea EUR 1,090 83 0.01Pernod Ricard EUR 5,633 542 0.07Peugeot EUR 10,010 149 0.02Publicis Groupe EUR 5,550 305 0.04Remy Cointreau EUR 670 53 0.01Renault EUR 4,660 307 0.04Rexel EUR 8,510 114 0.02Safran EUR 7,780 481 0.06
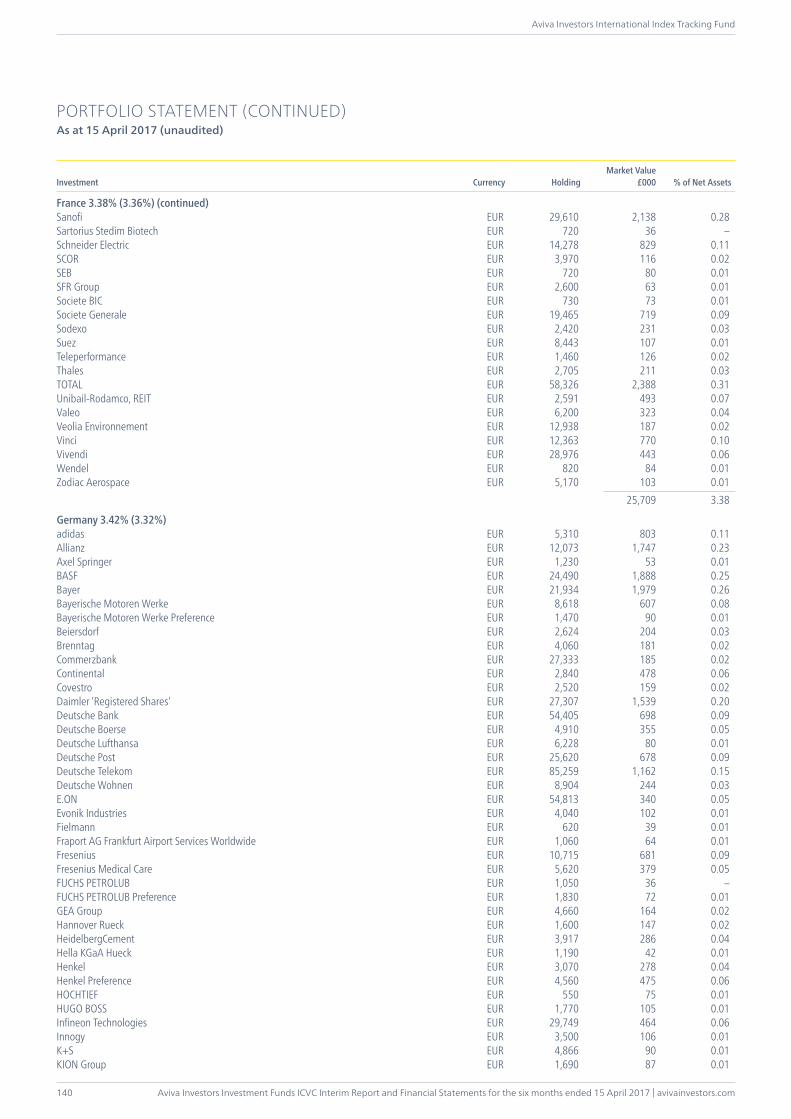
Aviva Investors Investment Funds ICVC Interim Report and Financial Statements for the six months ended 15 April 2017 | avivainvestors.com
Aviva Investors International Index Tracking Fund
140
PORTFOLIO STATEMENT (CONTINUED)As at 15 April 2017 (unaudited)
Investment Currency HoldingMarket Value
£000 % of Net Assets
France 3.38% (3.36%) (continued)Sanofi EUR 29,610 2,138 0.28Sartorius Stedim Biotech EUR 720 36 –Schneider Electric EUR 14,278 829 0.11SCOR EUR 3,970 116 0.02SEB EUR 720 80 0.01SFR Group EUR 2,600 63 0.01Societe BIC EUR 730 73 0.01Societe Generale EUR 19,465 719 0.09Sodexo EUR 2,420 231 0.03Suez EUR 8,443 107 0.01Teleperformance EUR 1,460 126 0.02Thales EUR 2,705 211 0.03TOTAL EUR 58,326 2,388 0.31Unibail-Rodamco, REIT EUR 2,591 493 0.07Valeo EUR 6,200 323 0.04Veolia Environnement EUR 12,938 187 0.02Vinci EUR 12,363 770 0.10Vivendi EUR 28,976 443 0.06Wendel EUR 820 84 0.01Zodiac Aerospace EUR 5,170 103 0.01 25,709 3.38
Germany 3.42% (3.32%)adidas EUR 5,310 803 0.11Allianz EUR 12,073 1,747 0.23Axel Springer EUR 1,230 53 0.01BASF EUR 24,490 1,888 0.25Bayer EUR 21,934 1,979 0.26Bayerische Motoren Werke EUR 8,618 607 0.08Bayerische Motoren Werke Preference EUR 1,470 90 0.01Beiersdorf EUR 2,624 204 0.03Brenntag EUR 4,060 181 0.02Commerzbank EUR 27,333 185 0.02Continental EUR 2,840 478 0.06Covestro EUR 2,520 159 0.02Daimler ‘Registered Shares’ EUR 27,307 1,539 0.20Deutsche Bank EUR 54,405 698 0.09Deutsche Boerse EUR 4,910 355 0.05Deutsche Lufthansa EUR 6,228 80 0.01Deutsche Post EUR 25,620 678 0.09Deutsche Telekom EUR 85,259 1,162 0.15Deutsche Wohnen EUR 8,904 244 0.03E.ON EUR 54,813 340 0.05Evonik Industries EUR 4,040 102 0.01Fielmann EUR 620 39 0.01Fraport AG Frankfurt Airport Services Worldwide EUR 1,060 64 0.01Fresenius EUR 10,715 681 0.09Fresenius Medical Care EUR 5,620 379 0.05FUCHS PETROLUB EUR 1,050 36 –FUCHS PETROLUB Preference EUR 1,830 72 0.01GEA Group EUR 4,660 164 0.02Hannover Rueck EUR 1,600 147 0.02HeidelbergCement EUR 3,917 286 0.04Hella KGaA Hueck EUR 1,190 42 0.01Henkel EUR 3,070 278 0.04Henkel Preference EUR 4,560 475 0.06HOCHTIEF EUR 550 75 0.01HUGO BOSS EUR 1,770 105 0.01Infineon Technologies EUR 29,749 464 0.06Innogy EUR 3,500 106 0.01K+S EUR 4,866 90 0.01KION Group EUR 1,690 87 0.01
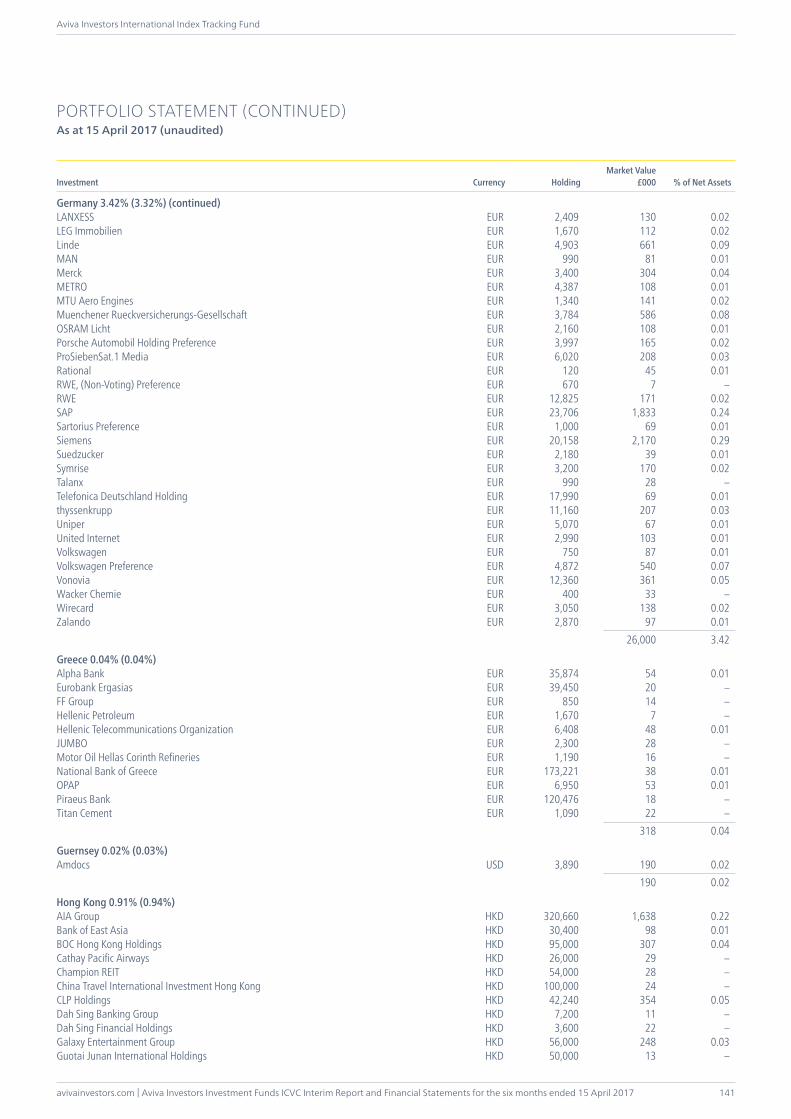
avivainvestors.com | Aviva Investors Investment Funds ICVC Interim Report and Financial Statements for the six months ended 15 April 2017
Aviva Investors International Index Tracking Fund
141
PORTFOLIO STATEMENT (CONTINUED)As at 15 April 2017 (unaudited)
Investment Currency HoldingMarket Value
£000 % of Net Assets
Germany 3.42% (3.32%) (continued)LANXESS EUR 2,409 130 0.02LEG Immobilien EUR 1,670 112 0.02Linde EUR 4,903 661 0.09MAN EUR 990 81 0.01Merck EUR 3,400 304 0.04METRO EUR 4,387 108 0.01MTU Aero Engines EUR 1,340 141 0.02Muenchener Rueckversicherungs-Gesellschaft EUR 3,784 586 0.08OSRAM Licht EUR 2,160 108 0.01Porsche Automobil Holding Preference EUR 3,997 165 0.02ProSiebenSat.1 Media EUR 6,020 208 0.03Rational EUR 120 45 0.01RWE, (Non-Voting) Preference EUR 670 7 –RWE EUR 12,825 171 0.02SAP EUR 23,706 1,833 0.24Sartorius Preference EUR 1,000 69 0.01Siemens EUR 20,158 2,170 0.29Suedzucker EUR 2,180 39 0.01Symrise EUR 3,200 170 0.02Talanx EUR 990 28 –Telefonica Deutschland Holding EUR 17,990 69 0.01thyssenkrupp EUR 11,160 207 0.03Uniper EUR 5,070 67 0.01United Internet EUR 2,990 103 0.01Volkswagen EUR 750 87 0.01Volkswagen Preference EUR 4,872 540 0.07Vonovia EUR 12,360 361 0.05Wacker Chemie EUR 400 33 –Wirecard EUR 3,050 138 0.02Zalando EUR 2,870 97 0.01 26,000 3.42
Greece 0.04% (0.04%)Alpha Bank EUR 35,874 54 0.01Eurobank Ergasias EUR 39,450 20 –FF Group EUR 850 14 –Hellenic Petroleum EUR 1,670 7 –Hellenic Telecommunications Organization EUR 6,408 48 0.01JUMBO EUR 2,300 28 –Motor Oil Hellas Corinth Refineries EUR 1,190 16 –National Bank of Greece EUR 173,221 38 0.01OPAP EUR 6,950 53 0.01Piraeus Bank EUR 120,476 18 –Titan Cement EUR 1,090 22 – 318 0.04
Guernsey 0.02% (0.03%)Amdocs USD 3,890 190 0.02 190 0.02
Hong Kong 0.91% (0.94%)AIA Group HKD 320,660 1,638 0.22Bank of East Asia HKD 30,400 98 0.01BOC Hong Kong Holdings HKD 95,000 307 0.04Cathay Pacific Airways HKD 26,000 29 –Champion REIT HKD 54,000 28 –China Travel International Investment Hong Kong HKD 100,000 24 –CLP Holdings HKD 42,240 354 0.05Dah Sing Banking Group HKD 7,200 11 –Dah Sing Financial Holdings HKD 3,600 22 –Galaxy Entertainment Group HKD 56,000 248 0.03Guotai Junan International Holdings HKD 50,000 13 –
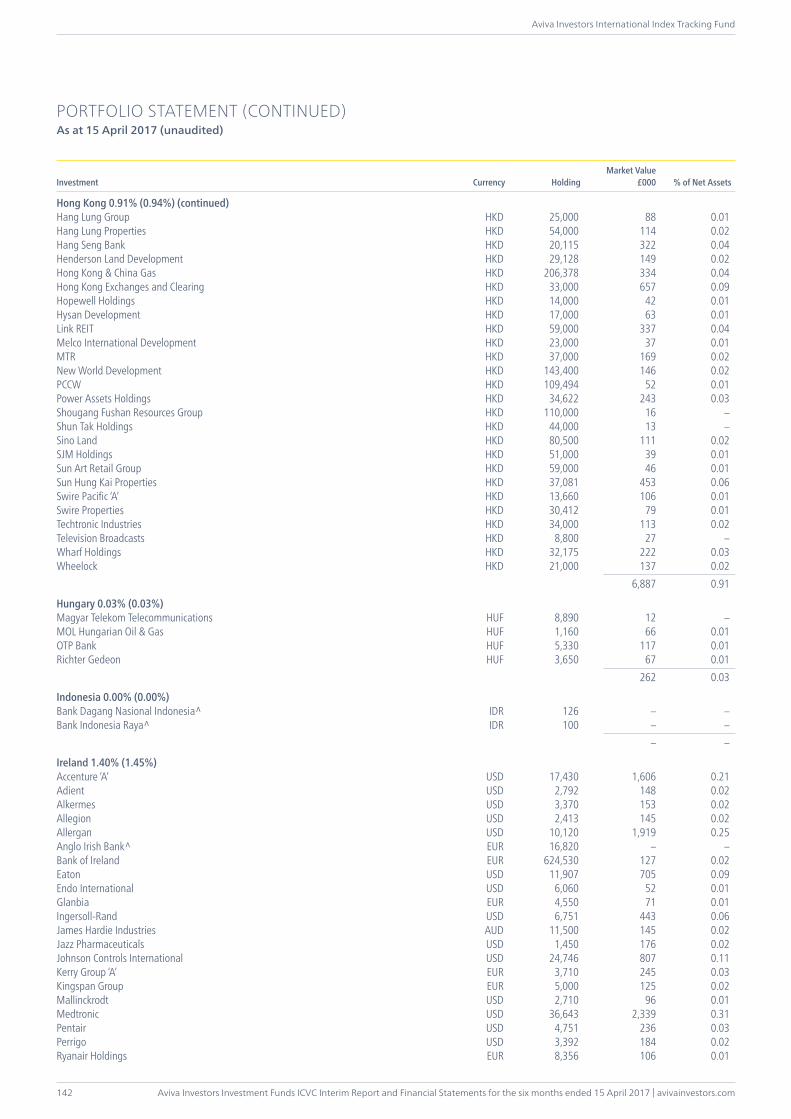
Aviva Investors Investment Funds ICVC Interim Report and Financial Statements for the six months ended 15 April 2017 | avivainvestors.com
Aviva Investors International Index Tracking Fund
142
PORTFOLIO STATEMENT (CONTINUED)As at 15 April 2017 (unaudited)
Investment Currency HoldingMarket Value
£000 % of Net Assets
Hong Kong 0.91% (0.94%) (continued)Hang Lung Group HKD 25,000 88 0.01Hang Lung Properties HKD 54,000 114 0.02Hang Seng Bank HKD 20,115 322 0.04Henderson Land Development HKD 29,128 149 0.02Hong Kong & China Gas HKD 206,378 334 0.04Hong Kong Exchanges and Clearing HKD 33,000 657 0.09Hopewell Holdings HKD 14,000 42 0.01Hysan Development HKD 17,000 63 0.01Link REIT HKD 59,000 337 0.04Melco International Development HKD 23,000 37 0.01MTR HKD 37,000 169 0.02New World Development HKD 143,400 146 0.02PCCW HKD 109,494 52 0.01Power Assets Holdings HKD 34,622 243 0.03Shougang Fushan Resources Group HKD 110,000 16 –Shun Tak Holdings HKD 44,000 13 –Sino Land HKD 80,500 111 0.02SJM Holdings HKD 51,000 39 0.01Sun Art Retail Group HKD 59,000 46 0.01Sun Hung Kai Properties HKD 37,081 453 0.06Swire Pacific ‘A’ HKD 13,660 106 0.01Swire Properties HKD 30,412 79 0.01Techtronic Industries HKD 34,000 113 0.02Television Broadcasts HKD 8,800 27 –Wharf Holdings HKD 32,175 222 0.03Wheelock HKD 21,000 137 0.02 6,887 0.91
Hungary 0.03% (0.03%)Magyar Telekom Telecommunications HUF 8,890 12 –MOL Hungarian Oil & Gas HUF 1,160 66 0.01OTP Bank HUF 5,330 117 0.01Richter Gedeon HUF 3,650 67 0.01 262 0.03
Indonesia 0.00% (0.00%)Bank Dagang Nasional Indonesia^ IDR 126 – –Bank Indonesia Raya^ IDR 100 – – – –
Ireland 1.40% (1.45%)Accenture ‘A’ USD 17,430 1,606 0.21Adient USD 2,792 148 0.02Alkermes USD 3,370 153 0.02Allegion USD 2,413 145 0.02Allergan USD 10,120 1,919 0.25Anglo Irish Bank^ EUR 16,820 – –Bank of Ireland EUR 624,530 127 0.02Eaton USD 11,907 705 0.09Endo International USD 6,060 52 0.01Glanbia EUR 4,550 71 0.01Ingersoll-Rand USD 6,751 443 0.06James Hardie Industries AUD 11,500 145 0.02Jazz Pharmaceuticals USD 1,450 176 0.02Johnson Controls International USD 24,746 807 0.11Kerry Group ‘A’ EUR 3,710 245 0.03Kingspan Group EUR 5,000 125 0.02Mallinckrodt USD 2,710 96 0.01Medtronic USD 36,643 2,339 0.31Pentair USD 4,751 236 0.03Perrigo USD 3,392 184 0.02Ryanair Holdings EUR 8,356 106 0.01
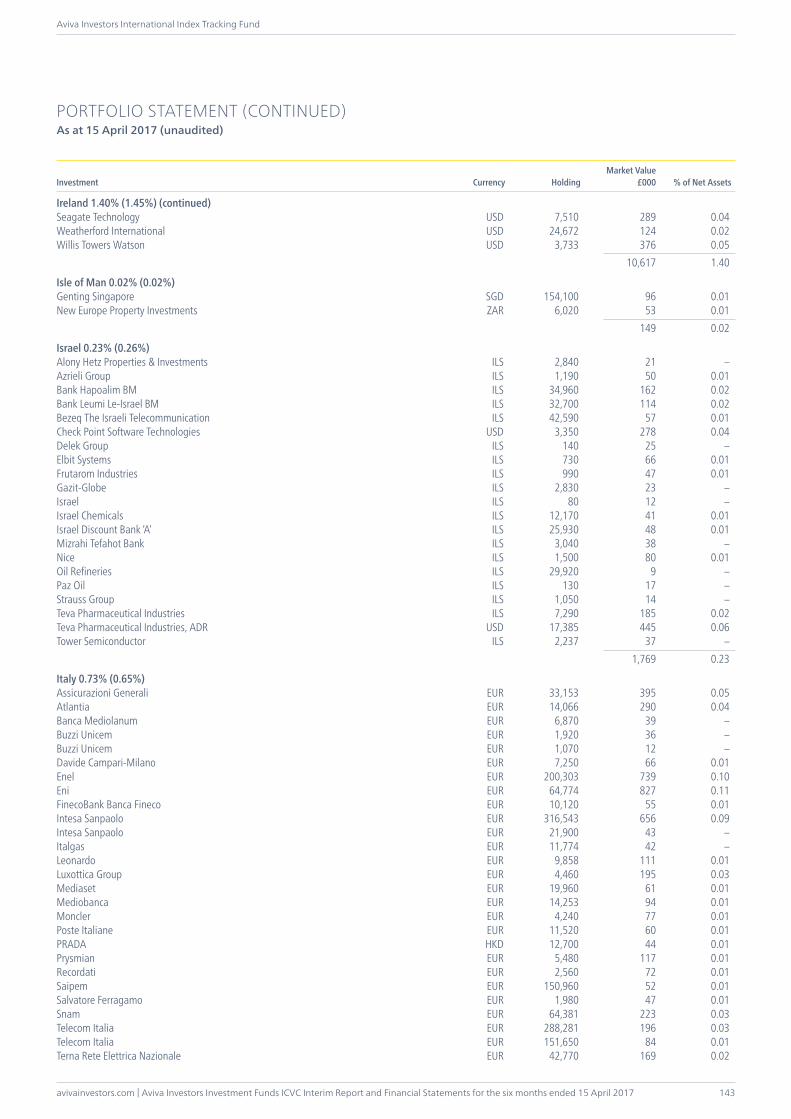
avivainvestors.com | Aviva Investors Investment Funds ICVC Interim Report and Financial Statements for the six months ended 15 April 2017
Aviva Investors International Index Tracking Fund
143
PORTFOLIO STATEMENT (CONTINUED)As at 15 April 2017 (unaudited)
Investment Currency HoldingMarket Value
£000 % of Net Assets
Ireland 1.40% (1.45%) (continued)Seagate Technology USD 7,510 289 0.04Weatherford International USD 24,672 124 0.02Willis Towers Watson USD 3,733 376 0.05 10,617 1.40
Isle of Man 0.02% (0.02%)Genting Singapore SGD 154,100 96 0.01New Europe Property Investments ZAR 6,020 53 0.01 149 0.02
Israel 0.23% (0.26%)Alony Hetz Properties & Investments ILS 2,840 21 –Azrieli Group ILS 1,190 50 0.01Bank Hapoalim BM ILS 34,960 162 0.02Bank Leumi Le-Israel BM ILS 32,700 114 0.02Bezeq The Israeli Telecommunication ILS 42,590 57 0.01Check Point Software Technologies USD 3,350 278 0.04Delek Group ILS 140 25 –Elbit Systems ILS 730 66 0.01Frutarom Industries ILS 990 47 0.01Gazit-Globe ILS 2,830 23 –Israel ILS 80 12 –Israel Chemicals ILS 12,170 41 0.01Israel Discount Bank ‘A’ ILS 25,930 48 0.01Mizrahi Tefahot Bank ILS 3,040 38 –Nice ILS 1,500 80 0.01Oil Refineries ILS 29,920 9 –Paz Oil ILS 130 17 –Strauss Group ILS 1,050 14 –Teva Pharmaceutical Industries ILS 7,290 185 0.02Teva Pharmaceutical Industries, ADR USD 17,385 445 0.06Tower Semiconductor ILS 2,237 37 – 1,769 0.23
Italy 0.73% (0.65%)Assicurazioni Generali EUR 33,153 395 0.05Atlantia EUR 14,066 290 0.04Banca Mediolanum EUR 6,870 39 –Buzzi Unicem EUR 1,920 36 –Buzzi Unicem EUR 1,070 12 –Davide Campari-Milano EUR 7,250 66 0.01Enel EUR 200,303 739 0.10Eni EUR 64,774 827 0.11FinecoBank Banca Fineco EUR 10,120 55 0.01Intesa Sanpaolo EUR 316,543 656 0.09Intesa Sanpaolo EUR 21,900 43 –Italgas EUR 11,774 42 –Leonardo EUR 9,858 111 0.01Luxottica Group EUR 4,460 195 0.03Mediaset EUR 19,960 61 0.01Mediobanca EUR 14,253 94 0.01Moncler EUR 4,240 77 0.01Poste Italiane EUR 11,520 60 0.01PRADA HKD 12,700 44 0.01Prysmian EUR 5,480 117 0.01Recordati EUR 2,560 72 0.01Saipem EUR 150,960 52 0.01Salvatore Ferragamo EUR 1,980 47 0.01Snam EUR 64,381 223 0.03Telecom Italia EUR 288,281 196 0.03Telecom Italia EUR 151,650 84 0.01Terna Rete Elettrica Nazionale EUR 42,770 169 0.02
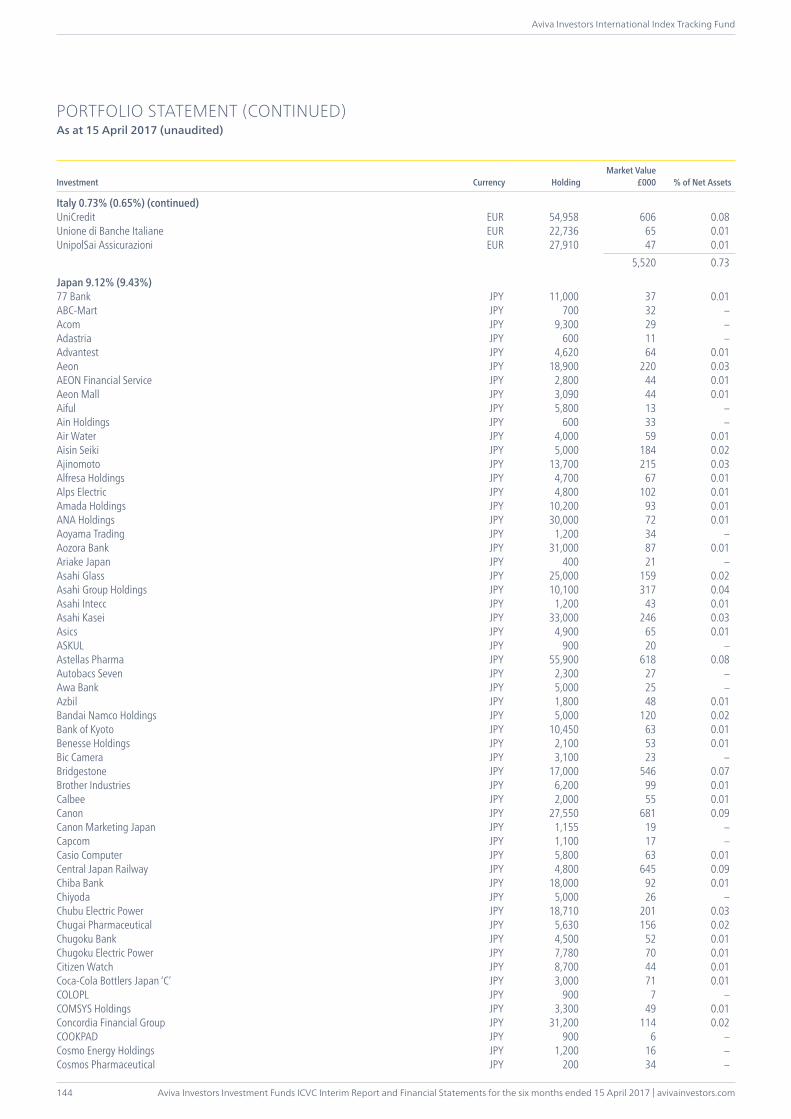
Aviva Investors Investment Funds ICVC Interim Report and Financial Statements for the six months ended 15 April 2017 | avivainvestors.com
Aviva Investors International Index Tracking Fund
144
PORTFOLIO STATEMENT (CONTINUED)As at 15 April 2017 (unaudited)
Investment Currency HoldingMarket Value
£000 % of Net Assets
Italy 0.73% (0.65%) (continued)UniCredit EUR 54,958 606 0.08Unione di Banche Italiane EUR 22,736 65 0.01UnipolSai Assicurazioni EUR 27,910 47 0.01 5,520 0.73
Japan 9.12% (9.43%)77 Bank JPY 11,000 37 0.01ABC-Mart JPY 700 32 –Acom JPY 9,300 29 –Adastria JPY 600 11 –Advantest JPY 4,620 64 0.01Aeon JPY 18,900 220 0.03AEON Financial Service JPY 2,800 44 0.01Aeon Mall JPY 3,090 44 0.01Aiful JPY 5,800 13 –Ain Holdings JPY 600 33 –Air Water JPY 4,000 59 0.01Aisin Seiki JPY 5,000 184 0.02Ajinomoto JPY 13,700 215 0.03Alfresa Holdings JPY 4,700 67 0.01Alps Electric JPY 4,800 102 0.01Amada Holdings JPY 10,200 93 0.01ANA Holdings JPY 30,000 72 0.01Aoyama Trading JPY 1,200 34 –Aozora Bank JPY 31,000 87 0.01Ariake Japan JPY 400 21 –Asahi Glass JPY 25,000 159 0.02Asahi Group Holdings JPY 10,100 317 0.04Asahi Intecc JPY 1,200 43 0.01Asahi Kasei JPY 33,000 246 0.03Asics JPY 4,900 65 0.01ASKUL JPY 900 20 –Astellas Pharma JPY 55,900 618 0.08Autobacs Seven JPY 2,300 27 –Awa Bank JPY 5,000 25 –Azbil JPY 1,800 48 0.01Bandai Namco Holdings JPY 5,000 120 0.02Bank of Kyoto JPY 10,450 63 0.01Benesse Holdings JPY 2,100 53 0.01Bic Camera JPY 3,100 23 –Bridgestone JPY 17,000 546 0.07Brother Industries JPY 6,200 99 0.01Calbee JPY 2,000 55 0.01Canon JPY 27,550 681 0.09Canon Marketing Japan JPY 1,155 19 –Capcom JPY 1,100 17 –Casio Computer JPY 5,800 63 0.01Central Japan Railway JPY 4,800 645 0.09Chiba Bank JPY 18,000 92 0.01Chiyoda JPY 5,000 26 –Chubu Electric Power JPY 18,710 201 0.03Chugai Pharmaceutical JPY 5,630 156 0.02Chugoku Bank JPY 4,500 52 0.01Chugoku Electric Power JPY 7,780 70 0.01Citizen Watch JPY 8,700 44 0.01Coca-Cola Bottlers Japan ‘C’ JPY 3,000 71 0.01COLOPL JPY 900 7 –COMSYS Holdings JPY 3,300 49 0.01Concordia Financial Group JPY 31,200 114 0.02COOKPAD JPY 900 6 –Cosmo Energy Holdings JPY 1,200 16 –Cosmos Pharmaceutical JPY 200 34 –
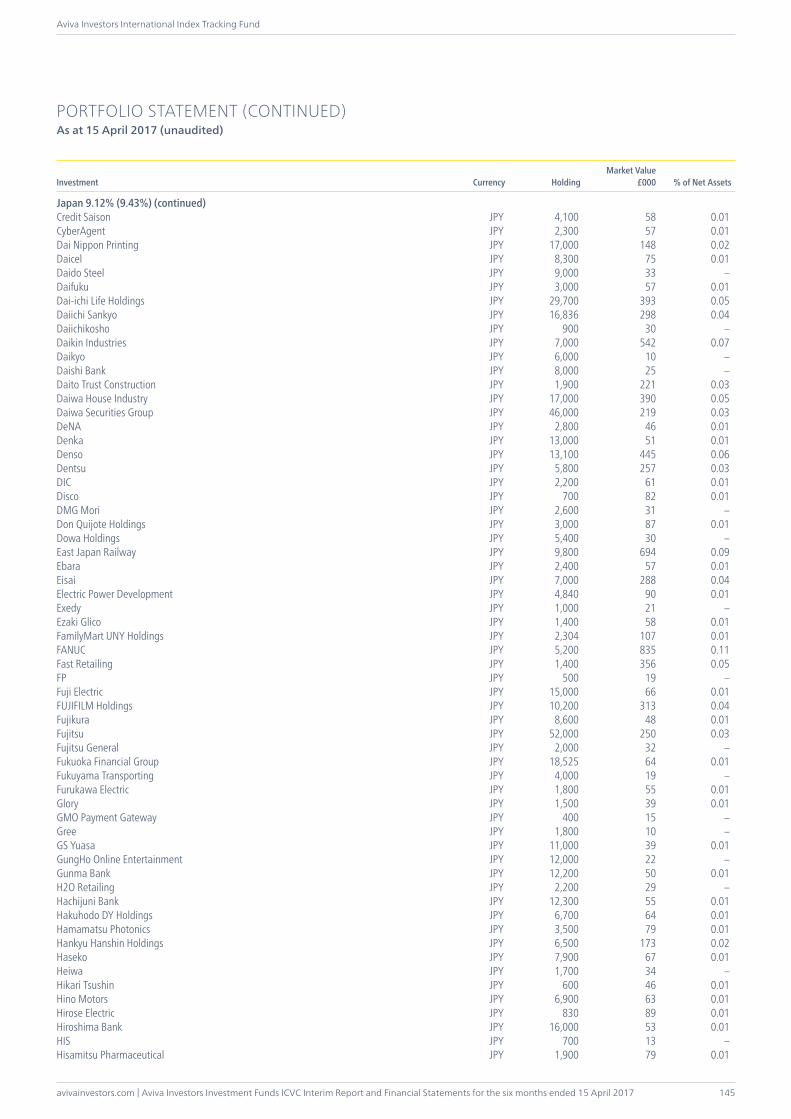
avivainvestors.com | Aviva Investors Investment Funds ICVC Interim Report and Financial Statements for the six months ended 15 April 2017
Aviva Investors International Index Tracking Fund
145
PORTFOLIO STATEMENT (CONTINUED)As at 15 April 2017 (unaudited)
Investment Currency HoldingMarket Value
£000 % of Net Assets
Japan 9.12% (9.43%) (continued)Credit Saison JPY 4,100 58 0.01CyberAgent JPY 2,300 57 0.01Dai Nippon Printing JPY 17,000 148 0.02Daicel JPY 8,300 75 0.01Daido Steel JPY 9,000 33 –Daifuku JPY 3,000 57 0.01Dai-ichi Life Holdings JPY 29,700 393 0.05Daiichi Sankyo JPY 16,836 298 0.04Daiichikosho JPY 900 30 –Daikin Industries JPY 7,000 542 0.07Daikyo JPY 6,000 10 –Daishi Bank JPY 8,000 25 –Daito Trust Construction JPY 1,900 221 0.03Daiwa House Industry JPY 17,000 390 0.05Daiwa Securities Group JPY 46,000 219 0.03DeNA JPY 2,800 46 0.01Denka JPY 13,000 51 0.01Denso JPY 13,100 445 0.06Dentsu JPY 5,800 257 0.03DIC JPY 2,200 61 0.01Disco JPY 700 82 0.01DMG Mori JPY 2,600 31 –Don Quijote Holdings JPY 3,000 87 0.01Dowa Holdings JPY 5,400 30 –East Japan Railway JPY 9,800 694 0.09Ebara JPY 2,400 57 0.01Eisai JPY 7,000 288 0.04Electric Power Development JPY 4,840 90 0.01Exedy JPY 1,000 21 –Ezaki Glico JPY 1,400 58 0.01FamilyMart UNY Holdings JPY 2,304 107 0.01FANUC JPY 5,200 835 0.11Fast Retailing JPY 1,400 356 0.05FP JPY 500 19 –Fuji Electric JPY 15,000 66 0.01FUJIFILM Holdings JPY 10,200 313 0.04Fujikura JPY 8,600 48 0.01Fujitsu JPY 52,000 250 0.03Fujitsu General JPY 2,000 32 –Fukuoka Financial Group JPY 18,525 64 0.01Fukuyama Transporting JPY 4,000 19 –Furukawa Electric JPY 1,800 55 0.01Glory JPY 1,500 39 0.01GMO Payment Gateway JPY 400 15 –Gree JPY 1,800 10 –GS Yuasa JPY 11,000 39 0.01GungHo Online Entertainment JPY 12,000 22 –Gunma Bank JPY 12,200 50 0.01H2O Retailing JPY 2,200 29 –Hachijuni Bank JPY 12,300 55 0.01Hakuhodo DY Holdings JPY 6,700 64 0.01Hamamatsu Photonics JPY 3,500 79 0.01Hankyu Hanshin Holdings JPY 6,500 173 0.02Haseko JPY 7,900 67 0.01Heiwa JPY 1,700 34 –Hikari Tsushin JPY 600 46 0.01Hino Motors JPY 6,900 63 0.01Hirose Electric JPY 830 89 0.01Hiroshima Bank JPY 16,000 53 0.01HIS JPY 700 13 –Hisamitsu Pharmaceutical JPY 1,900 79 0.01
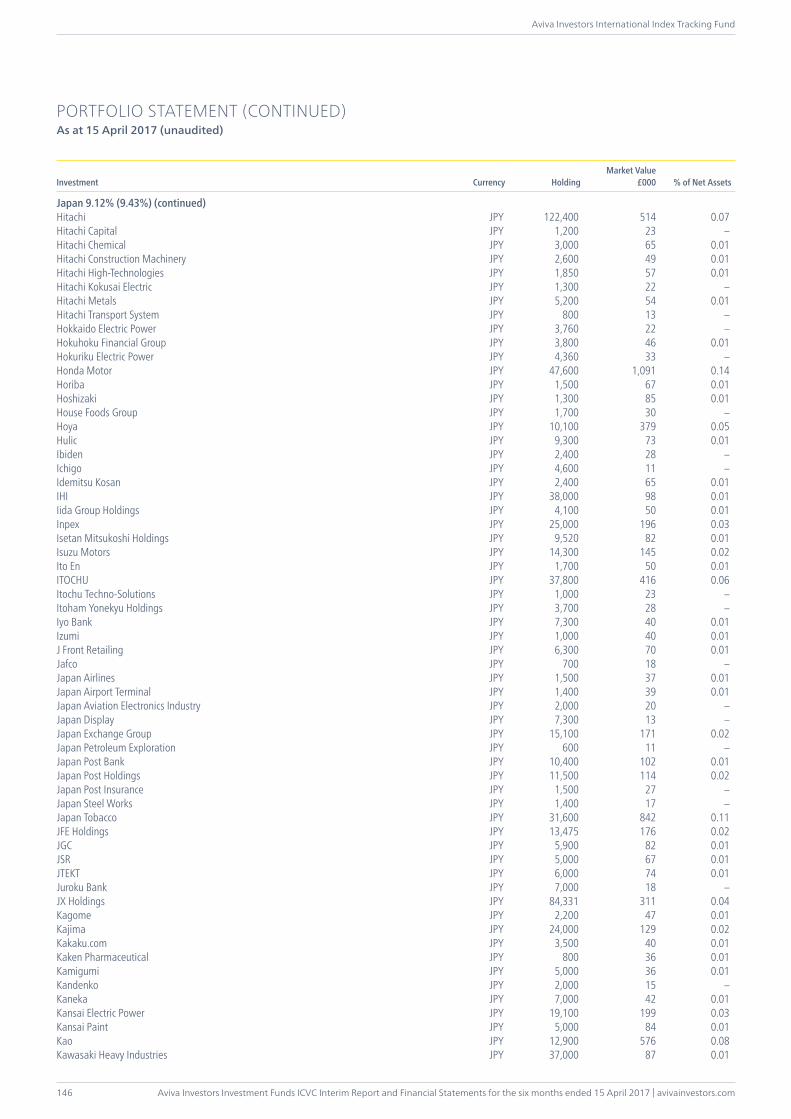
Aviva Investors Investment Funds ICVC Interim Report and Financial Statements for the six months ended 15 April 2017 | avivainvestors.com
Aviva Investors International Index Tracking Fund
146
PORTFOLIO STATEMENT (CONTINUED)As at 15 April 2017 (unaudited)
Investment Currency HoldingMarket Value
£000 % of Net Assets
Japan 9.12% (9.43%) (continued)Hitachi JPY 122,400 514 0.07Hitachi Capital JPY 1,200 23 –Hitachi Chemical JPY 3,000 65 0.01Hitachi Construction Machinery JPY 2,600 49 0.01Hitachi High-Technologies JPY 1,850 57 0.01Hitachi Kokusai Electric JPY 1,300 22 –Hitachi Metals JPY 5,200 54 0.01Hitachi Transport System JPY 800 13 –Hokkaido Electric Power JPY 3,760 22 –Hokuhoku Financial Group JPY 3,800 46 0.01Hokuriku Electric Power JPY 4,360 33 –Honda Motor JPY 47,600 1,091 0.14Horiba JPY 1,500 67 0.01Hoshizaki JPY 1,300 85 0.01House Foods Group JPY 1,700 30 –Hoya JPY 10,100 379 0.05Hulic JPY 9,300 73 0.01Ibiden JPY 2,400 28 –Ichigo JPY 4,600 11 –Idemitsu Kosan JPY 2,400 65 0.01IHI JPY 38,000 98 0.01Iida Group Holdings JPY 4,100 50 0.01Inpex JPY 25,000 196 0.03Isetan Mitsukoshi Holdings JPY 9,520 82 0.01Isuzu Motors JPY 14,300 145 0.02Ito En JPY 1,700 50 0.01ITOCHU JPY 37,800 416 0.06Itochu Techno-Solutions JPY 1,000 23 –Itoham Yonekyu Holdings JPY 3,700 28 –Iyo Bank JPY 7,300 40 0.01Izumi JPY 1,000 40 0.01J Front Retailing JPY 6,300 70 0.01Jafco JPY 700 18 –Japan Airlines JPY 1,500 37 0.01Japan Airport Terminal JPY 1,400 39 0.01Japan Aviation Electronics Industry JPY 2,000 20 –Japan Display JPY 7,300 13 –Japan Exchange Group JPY 15,100 171 0.02Japan Petroleum Exploration JPY 600 11 –Japan Post Bank JPY 10,400 102 0.01Japan Post Holdings JPY 11,500 114 0.02Japan Post Insurance JPY 1,500 27 –Japan Steel Works JPY 1,400 17 –Japan Tobacco JPY 31,600 842 0.11JFE Holdings JPY 13,475 176 0.02JGC JPY 5,900 82 0.01JSR JPY 5,000 67 0.01JTEKT JPY 6,000 74 0.01Juroku Bank JPY 7,000 18 –JX Holdings JPY 84,331 311 0.04Kagome JPY 2,200 47 0.01Kajima JPY 24,000 129 0.02Kakaku.com JPY 3,500 40 0.01Kaken Pharmaceutical JPY 800 36 0.01Kamigumi JPY 5,000 36 0.01Kandenko JPY 2,000 15 –Kaneka JPY 7,000 42 0.01Kansai Electric Power JPY 19,100 199 0.03Kansai Paint JPY 5,000 84 0.01Kao JPY 12,900 576 0.08Kawasaki Heavy Industries JPY 37,000 87 0.01
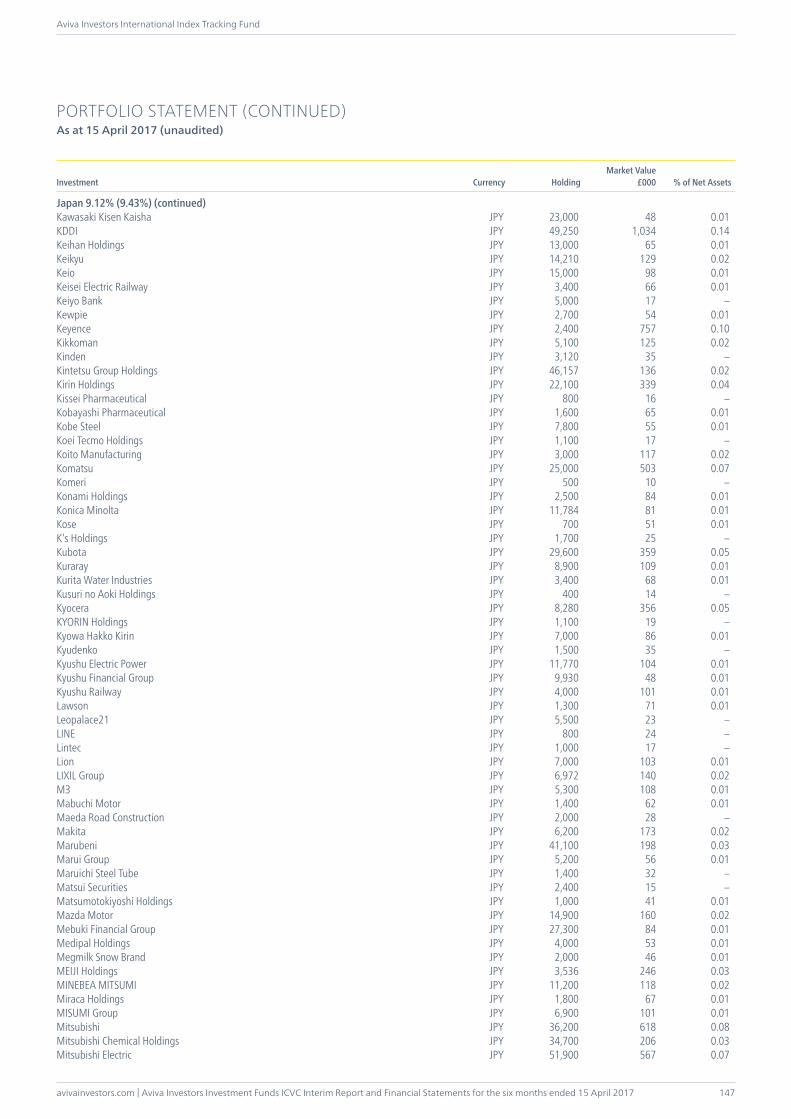
avivainvestors.com | Aviva Investors Investment Funds ICVC Interim Report and Financial Statements for the six months ended 15 April 2017
Aviva Investors International Index Tracking Fund
147
PORTFOLIO STATEMENT (CONTINUED)As at 15 April 2017 (unaudited)
Investment Currency HoldingMarket Value
£000 % of Net Assets
Japan 9.12% (9.43%) (continued)Kawasaki Kisen Kaisha JPY 23,000 48 0.01KDDI JPY 49,250 1,034 0.14Keihan Holdings JPY 13,000 65 0.01Keikyu JPY 14,210 129 0.02Keio JPY 15,000 98 0.01Keisei Electric Railway JPY 3,400 66 0.01Keiyo Bank JPY 5,000 17 –Kewpie JPY 2,700 54 0.01Keyence JPY 2,400 757 0.10Kikkoman JPY 5,100 125 0.02Kinden JPY 3,120 35 –Kintetsu Group Holdings JPY 46,157 136 0.02Kirin Holdings JPY 22,100 339 0.04Kissei Pharmaceutical JPY 800 16 –Kobayashi Pharmaceutical JPY 1,600 65 0.01Kobe Steel JPY 7,800 55 0.01Koei Tecmo Holdings JPY 1,100 17 –Koito Manufacturing JPY 3,000 117 0.02Komatsu JPY 25,000 503 0.07Komeri JPY 500 10 –Konami Holdings JPY 2,500 84 0.01Konica Minolta JPY 11,784 81 0.01Kose JPY 700 51 0.01K’s Holdings JPY 1,700 25 –Kubota JPY 29,600 359 0.05Kuraray JPY 8,900 109 0.01Kurita Water Industries JPY 3,400 68 0.01Kusuri no Aoki Holdings JPY 400 14 –Kyocera JPY 8,280 356 0.05KYORIN Holdings JPY 1,100 19 –Kyowa Hakko Kirin JPY 7,000 86 0.01Kyudenko JPY 1,500 35 –Kyushu Electric Power JPY 11,770 104 0.01Kyushu Financial Group JPY 9,930 48 0.01Kyushu Railway JPY 4,000 101 0.01Lawson JPY 1,300 71 0.01Leopalace21 JPY 5,500 23 –LINE JPY 800 24 –Lintec JPY 1,000 17 –Lion JPY 7,000 103 0.01LIXIL Group JPY 6,972 140 0.02M3 JPY 5,300 108 0.01Mabuchi Motor JPY 1,400 62 0.01Maeda Road Construction JPY 2,000 28 –Makita JPY 6,200 173 0.02Marubeni JPY 41,100 198 0.03Marui Group JPY 5,200 56 0.01Maruichi Steel Tube JPY 1,400 32 –Matsui Securities JPY 2,400 15 –Matsumotokiyoshi Holdings JPY 1,000 41 0.01Mazda Motor JPY 14,900 160 0.02Mebuki Financial Group JPY 27,300 84 0.01Medipal Holdings JPY 4,000 53 0.01Megmilk Snow Brand JPY 2,000 46 0.01MEIJI Holdings JPY 3,536 246 0.03MINEBEA MITSUMI JPY 11,200 118 0.02Miraca Holdings JPY 1,800 67 0.01MISUMI Group JPY 6,900 101 0.01Mitsubishi JPY 36,200 618 0.08Mitsubishi Chemical Holdings JPY 34,700 206 0.03Mitsubishi Electric JPY 51,900 567 0.07
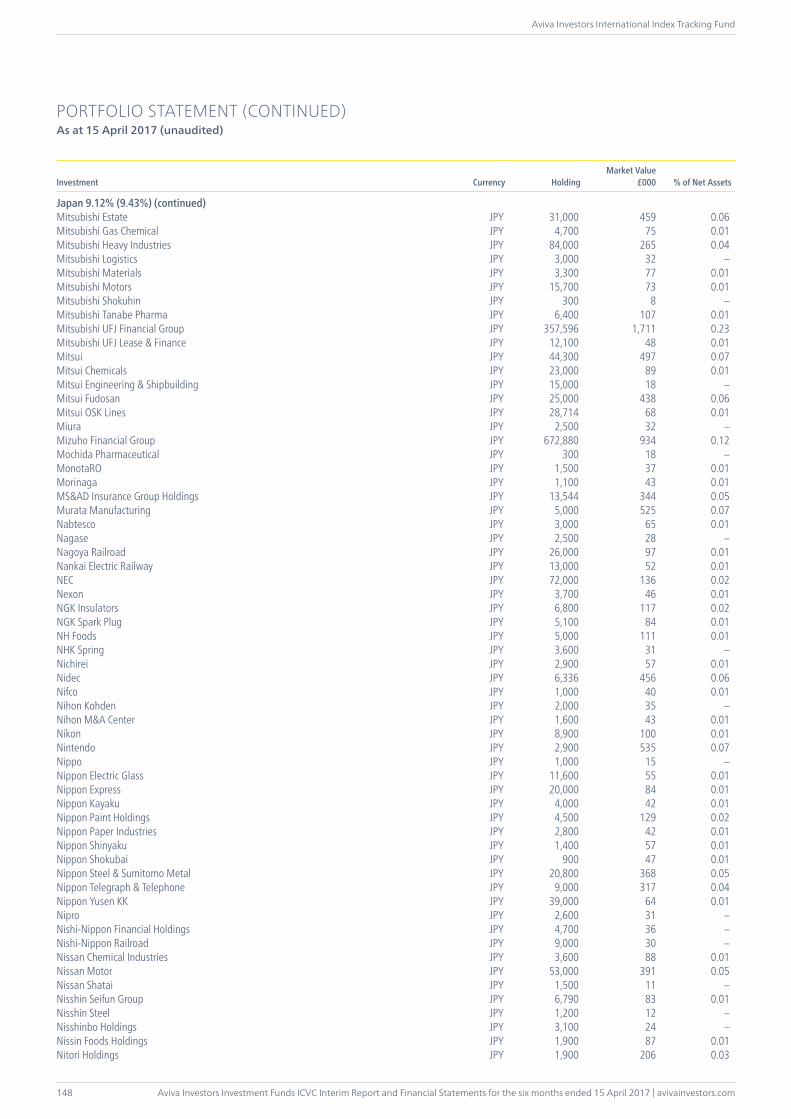
Aviva Investors Investment Funds ICVC Interim Report and Financial Statements for the six months ended 15 April 2017 | avivainvestors.com
Aviva Investors International Index Tracking Fund
148
PORTFOLIO STATEMENT (CONTINUED)As at 15 April 2017 (unaudited)
Investment Currency HoldingMarket Value
£000 % of Net Assets
Japan 9.12% (9.43%) (continued)Mitsubishi Estate JPY 31,000 459 0.06Mitsubishi Gas Chemical JPY 4,700 75 0.01Mitsubishi Heavy Industries JPY 84,000 265 0.04Mitsubishi Logistics JPY 3,000 32 –Mitsubishi Materials JPY 3,300 77 0.01Mitsubishi Motors JPY 15,700 73 0.01Mitsubishi Shokuhin JPY 300 8 –Mitsubishi Tanabe Pharma JPY 6,400 107 0.01Mitsubishi UFJ Financial Group JPY 357,596 1,711 0.23Mitsubishi UFJ Lease & Finance JPY 12,100 48 0.01Mitsui JPY 44,300 497 0.07Mitsui Chemicals JPY 23,000 89 0.01Mitsui Engineering & Shipbuilding JPY 15,000 18 –Mitsui Fudosan JPY 25,000 438 0.06Mitsui OSK Lines JPY 28,714 68 0.01Miura JPY 2,500 32 –Mizuho Financial Group JPY 672,880 934 0.12Mochida Pharmaceutical JPY 300 18 –MonotaRO JPY 1,500 37 0.01Morinaga JPY 1,100 43 0.01MS&AD Insurance Group Holdings JPY 13,544 344 0.05Murata Manufacturing JPY 5,000 525 0.07Nabtesco JPY 3,000 65 0.01Nagase JPY 2,500 28 –Nagoya Railroad JPY 26,000 97 0.01Nankai Electric Railway JPY 13,000 52 0.01NEC JPY 72,000 136 0.02Nexon JPY 3,700 46 0.01NGK Insulators JPY 6,800 117 0.02NGK Spark Plug JPY 5,100 84 0.01NH Foods JPY 5,000 111 0.01NHK Spring JPY 3,600 31 –Nichirei JPY 2,900 57 0.01Nidec JPY 6,336 456 0.06Nifco JPY 1,000 40 0.01Nihon Kohden JPY 2,000 35 –Nihon M&A Center JPY 1,600 43 0.01Nikon JPY 8,900 100 0.01Nintendo JPY 2,900 535 0.07Nippo JPY 1,000 15 –Nippon Electric Glass JPY 11,600 55 0.01Nippon Express JPY 20,000 84 0.01Nippon Kayaku JPY 4,000 42 0.01Nippon Paint Holdings JPY 4,500 129 0.02Nippon Paper Industries JPY 2,800 42 0.01Nippon Shinyaku JPY 1,400 57 0.01Nippon Shokubai JPY 900 47 0.01Nippon Steel & Sumitomo Metal JPY 20,800 368 0.05Nippon Telegraph & Telephone JPY 9,000 317 0.04Nippon Yusen KK JPY 39,000 64 0.01Nipro JPY 2,600 31 –Nishi-Nippon Financial Holdings JPY 4,700 36 –Nishi-Nippon Railroad JPY 9,000 30 –Nissan Chemical Industries JPY 3,600 88 0.01Nissan Motor JPY 53,000 391 0.05Nissan Shatai JPY 1,500 11 –Nisshin Seifun Group JPY 6,790 83 0.01Nisshin Steel JPY 1,200 12 –Nisshinbo Holdings JPY 3,100 24 –Nissin Foods Holdings JPY 1,900 87 0.01Nitori Holdings JPY 1,900 206 0.03
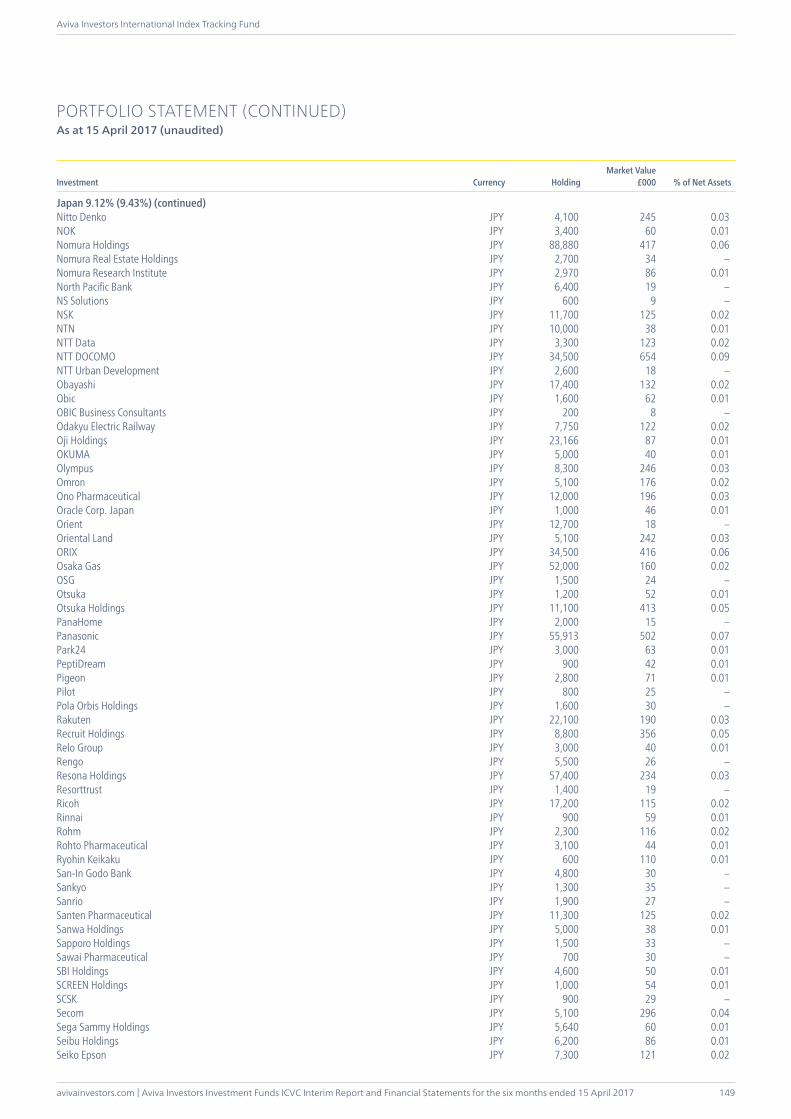
avivainvestors.com | Aviva Investors Investment Funds ICVC Interim Report and Financial Statements for the six months ended 15 April 2017
Aviva Investors International Index Tracking Fund
149
PORTFOLIO STATEMENT (CONTINUED)As at 15 April 2017 (unaudited)
Investment Currency HoldingMarket Value
£000 % of Net Assets
Japan 9.12% (9.43%) (continued)Nitto Denko JPY 4,100 245 0.03NOK JPY 3,400 60 0.01Nomura Holdings JPY 88,880 417 0.06Nomura Real Estate Holdings JPY 2,700 34 –Nomura Research Institute JPY 2,970 86 0.01North Pacific Bank JPY 6,400 19 –NS Solutions JPY 600 9 –NSK JPY 11,700 125 0.02NTN JPY 10,000 38 0.01NTT Data JPY 3,300 123 0.02NTT DOCOMO JPY 34,500 654 0.09NTT Urban Development JPY 2,600 18 –Obayashi JPY 17,400 132 0.02Obic JPY 1,600 62 0.01OBIC Business Consultants JPY 200 8 –Odakyu Electric Railway JPY 7,750 122 0.02Oji Holdings JPY 23,166 87 0.01OKUMA JPY 5,000 40 0.01Olympus JPY 8,300 246 0.03Omron JPY 5,100 176 0.02Ono Pharmaceutical JPY 12,000 196 0.03Oracle Corp. Japan JPY 1,000 46 0.01Orient JPY 12,700 18 –Oriental Land JPY 5,100 242 0.03ORIX JPY 34,500 416 0.06Osaka Gas JPY 52,000 160 0.02OSG JPY 1,500 24 –Otsuka JPY 1,200 52 0.01Otsuka Holdings JPY 11,100 413 0.05PanaHome JPY 2,000 15 –Panasonic JPY 55,913 502 0.07Park24 JPY 3,000 63 0.01PeptiDream JPY 900 42 0.01Pigeon JPY 2,800 71 0.01Pilot JPY 800 25 –Pola Orbis Holdings JPY 1,600 30 –Rakuten JPY 22,100 190 0.03Recruit Holdings JPY 8,800 356 0.05Relo Group JPY 3,000 40 0.01Rengo JPY 5,500 26 –Resona Holdings JPY 57,400 234 0.03Resorttrust JPY 1,400 19 –Ricoh JPY 17,200 115 0.02Rinnai JPY 900 59 0.01Rohm JPY 2,300 116 0.02Rohto Pharmaceutical JPY 3,100 44 0.01Ryohin Keikaku JPY 600 110 0.01San-In Godo Bank JPY 4,800 30 –Sankyo JPY 1,300 35 –Sanrio JPY 1,900 27 –Santen Pharmaceutical JPY 11,300 125 0.02Sanwa Holdings JPY 5,000 38 0.01Sapporo Holdings JPY 1,500 33 –Sawai Pharmaceutical JPY 700 30 –SBI Holdings JPY 4,600 50 0.01SCREEN Holdings JPY 1,000 54 0.01SCSK JPY 900 29 –Secom JPY 5,100 296 0.04Sega Sammy Holdings JPY 5,640 60 0.01Seibu Holdings JPY 6,200 86 0.01Seiko Epson JPY 7,300 121 0.02
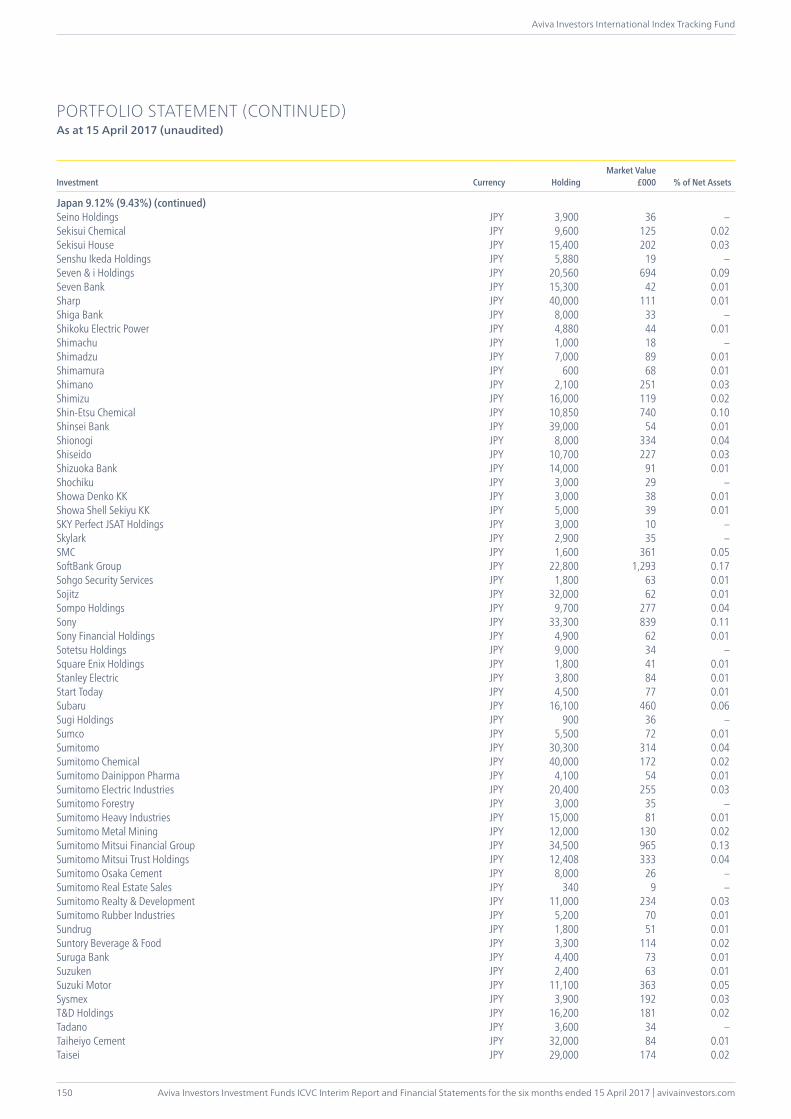
Aviva Investors Investment Funds ICVC Interim Report and Financial Statements for the six months ended 15 April 2017 | avivainvestors.com
Aviva Investors International Index Tracking Fund
150
PORTFOLIO STATEMENT (CONTINUED)As at 15 April 2017 (unaudited)
Investment Currency HoldingMarket Value
£000 % of Net Assets
Japan 9.12% (9.43%) (continued)Seino Holdings JPY 3,900 36 –Sekisui Chemical JPY 9,600 125 0.02Sekisui House JPY 15,400 202 0.03Senshu Ikeda Holdings JPY 5,880 19 –Seven & i Holdings JPY 20,560 694 0.09Seven Bank JPY 15,300 42 0.01Sharp JPY 40,000 111 0.01Shiga Bank JPY 8,000 33 –Shikoku Electric Power JPY 4,880 44 0.01Shimachu JPY 1,000 18 –Shimadzu JPY 7,000 89 0.01Shimamura JPY 600 68 0.01Shimano JPY 2,100 251 0.03Shimizu JPY 16,000 119 0.02Shin-Etsu Chemical JPY 10,850 740 0.10Shinsei Bank JPY 39,000 54 0.01Shionogi JPY 8,000 334 0.04Shiseido JPY 10,700 227 0.03Shizuoka Bank JPY 14,000 91 0.01Shochiku JPY 3,000 29 –Showa Denko KK JPY 3,000 38 0.01Showa Shell Sekiyu KK JPY 5,000 39 0.01SKY Perfect JSAT Holdings JPY 3,000 10 –Skylark JPY 2,900 35 –SMC JPY 1,600 361 0.05SoftBank Group JPY 22,800 1,293 0.17Sohgo Security Services JPY 1,800 63 0.01Sojitz JPY 32,000 62 0.01Sompo Holdings JPY 9,700 277 0.04Sony JPY 33,300 839 0.11Sony Financial Holdings JPY 4,900 62 0.01Sotetsu Holdings JPY 9,000 34 –Square Enix Holdings JPY 1,800 41 0.01Stanley Electric JPY 3,800 84 0.01Start Today JPY 4,500 77 0.01Subaru JPY 16,100 460 0.06Sugi Holdings JPY 900 36 –Sumco JPY 5,500 72 0.01Sumitomo JPY 30,300 314 0.04Sumitomo Chemical JPY 40,000 172 0.02Sumitomo Dainippon Pharma JPY 4,100 54 0.01Sumitomo Electric Industries JPY 20,400 255 0.03Sumitomo Forestry JPY 3,000 35 –Sumitomo Heavy Industries JPY 15,000 81 0.01Sumitomo Metal Mining JPY 12,000 130 0.02Sumitomo Mitsui Financial Group JPY 34,500 965 0.13Sumitomo Mitsui Trust Holdings JPY 12,408 333 0.04Sumitomo Osaka Cement JPY 8,000 26 –Sumitomo Real Estate Sales JPY 340 9 –Sumitomo Realty & Development JPY 11,000 234 0.03Sumitomo Rubber Industries JPY 5,200 70 0.01Sundrug JPY 1,800 51 0.01Suntory Beverage & Food JPY 3,300 114 0.02Suruga Bank JPY 4,400 73 0.01Suzuken JPY 2,400 63 0.01Suzuki Motor JPY 11,100 363 0.05Sysmex JPY 3,900 192 0.03T&D Holdings JPY 16,200 181 0.02Tadano JPY 3,600 34 –Taiheiyo Cement JPY 32,000 84 0.01Taisei JPY 29,000 174 0.02
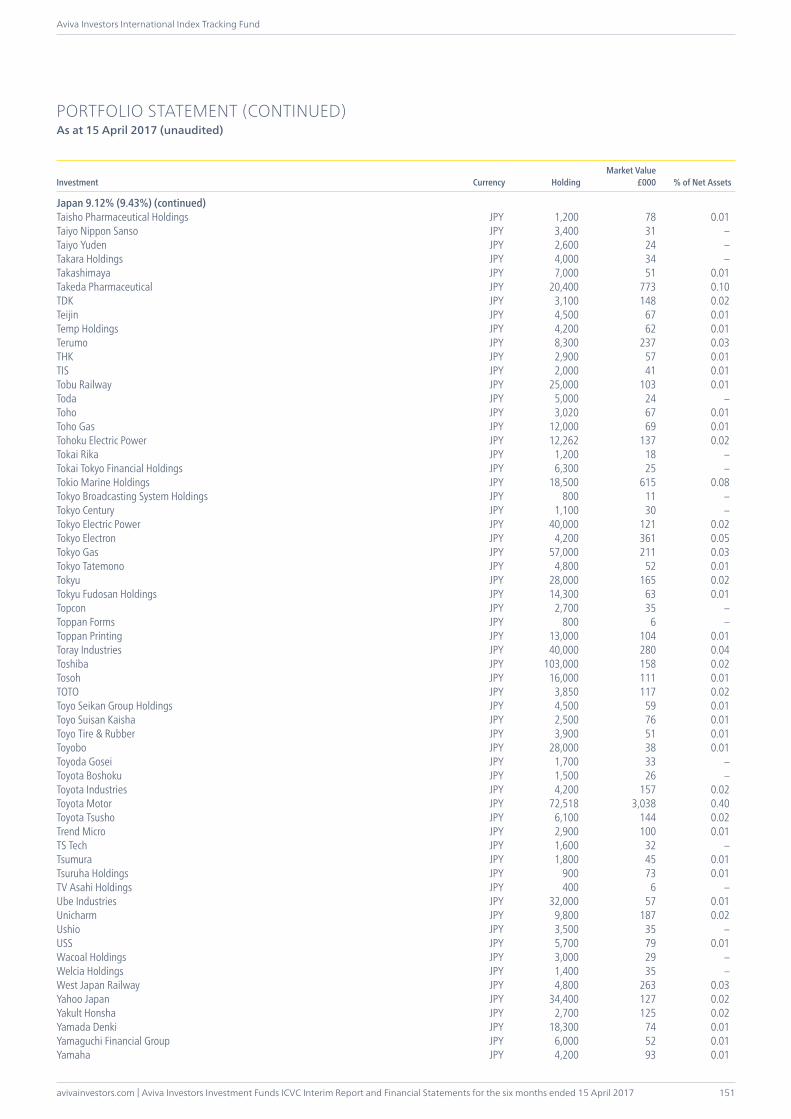
avivainvestors.com | Aviva Investors Investment Funds ICVC Interim Report and Financial Statements for the six months ended 15 April 2017
Aviva Investors International Index Tracking Fund
151
PORTFOLIO STATEMENT (CONTINUED)As at 15 April 2017 (unaudited)
Investment Currency HoldingMarket Value
£000 % of Net Assets
Japan 9.12% (9.43%) (continued)Taisho Pharmaceutical Holdings JPY 1,200 78 0.01Taiyo Nippon Sanso JPY 3,400 31 –Taiyo Yuden JPY 2,600 24 –Takara Holdings JPY 4,000 34 –Takashimaya JPY 7,000 51 0.01Takeda Pharmaceutical JPY 20,400 773 0.10TDK JPY 3,100 148 0.02Teijin JPY 4,500 67 0.01Temp Holdings JPY 4,200 62 0.01Terumo JPY 8,300 237 0.03THK JPY 2,900 57 0.01TIS JPY 2,000 41 0.01Tobu Railway JPY 25,000 103 0.01Toda JPY 5,000 24 –Toho JPY 3,020 67 0.01Toho Gas JPY 12,000 69 0.01Tohoku Electric Power JPY 12,262 137 0.02Tokai Rika JPY 1,200 18 –Tokai Tokyo Financial Holdings JPY 6,300 25 –Tokio Marine Holdings JPY 18,500 615 0.08Tokyo Broadcasting System Holdings JPY 800 11 –Tokyo Century JPY 1,100 30 –Tokyo Electric Power JPY 40,000 121 0.02Tokyo Electron JPY 4,200 361 0.05Tokyo Gas JPY 57,000 211 0.03Tokyo Tatemono JPY 4,800 52 0.01Tokyu JPY 28,000 165 0.02Tokyu Fudosan Holdings JPY 14,300 63 0.01Topcon JPY 2,700 35 –Toppan Forms JPY 800 6 –Toppan Printing JPY 13,000 104 0.01Toray Industries JPY 40,000 280 0.04Toshiba JPY 103,000 158 0.02Tosoh JPY 16,000 111 0.01TOTO JPY 3,850 117 0.02Toyo Seikan Group Holdings JPY 4,500 59 0.01Toyo Suisan Kaisha JPY 2,500 76 0.01Toyo Tire & Rubber JPY 3,900 51 0.01Toyobo JPY 28,000 38 0.01Toyoda Gosei JPY 1,700 33 –Toyota Boshoku JPY 1,500 26 –Toyota Industries JPY 4,200 157 0.02Toyota Motor JPY 72,518 3,038 0.40Toyota Tsusho JPY 6,100 144 0.02Trend Micro JPY 2,900 100 0.01TS Tech JPY 1,600 32 –Tsumura JPY 1,800 45 0.01Tsuruha Holdings JPY 900 73 0.01TV Asahi Holdings JPY 400 6 –Ube Industries JPY 32,000 57 0.01Unicharm JPY 9,800 187 0.02Ushio JPY 3,500 35 –USS JPY 5,700 79 0.01Wacoal Holdings JPY 3,000 29 –Welcia Holdings JPY 1,400 35 –West Japan Railway JPY 4,800 263 0.03Yahoo Japan JPY 34,400 127 0.02Yakult Honsha JPY 2,700 125 0.02Yamada Denki JPY 18,300 74 0.01Yamaguchi Financial Group JPY 6,000 52 0.01Yamaha JPY 4,200 93 0.01
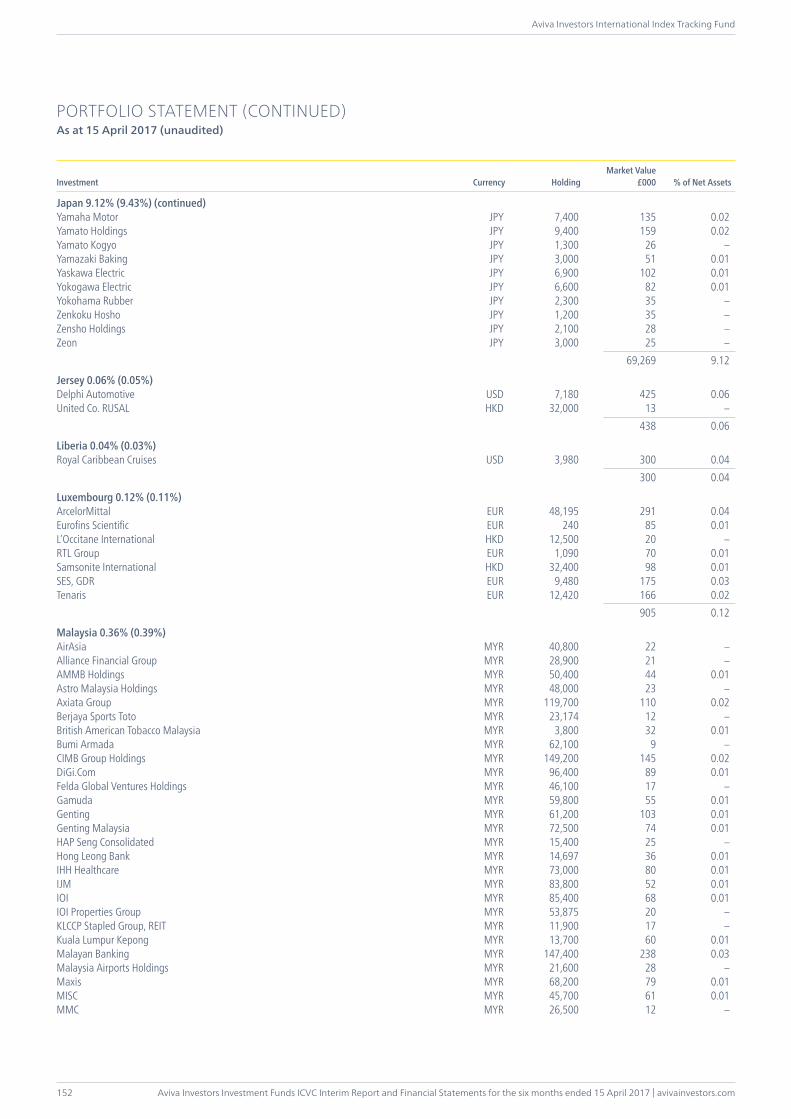
Aviva Investors Investment Funds ICVC Interim Report and Financial Statements for the six months ended 15 April 2017 | avivainvestors.com
Aviva Investors International Index Tracking Fund
152
PORTFOLIO STATEMENT (CONTINUED)As at 15 April 2017 (unaudited)
Investment Currency HoldingMarket Value
£000 % of Net Assets
Japan 9.12% (9.43%) (continued)Yamaha Motor JPY 7,400 135 0.02Yamato Holdings JPY 9,400 159 0.02Yamato Kogyo JPY 1,300 26 –Yamazaki Baking JPY 3,000 51 0.01Yaskawa Electric JPY 6,900 102 0.01Yokogawa Electric JPY 6,600 82 0.01Yokohama Rubber JPY 2,300 35 –Zenkoku Hosho JPY 1,200 35 –Zensho Holdings JPY 2,100 28 –Zeon JPY 3,000 25 – 69,269 9.12
Jersey 0.06% (0.05%)Delphi Automotive USD 7,180 425 0.06United Co. RUSAL HKD 32,000 13 – 438 0.06
Liberia 0.04% (0.03%)Royal Caribbean Cruises USD 3,980 300 0.04 300 0.04
Luxembourg 0.12% (0.11%)ArcelorMittal EUR 48,195 291 0.04Eurofins Scientific EUR 240 85 0.01L’Occitane International HKD 12,500 20 –RTL Group EUR 1,090 70 0.01Samsonite International HKD 32,400 98 0.01SES, GDR EUR 9,480 175 0.03Tenaris EUR 12,420 166 0.02 905 0.12
Malaysia 0.36% (0.39%)AirAsia MYR 40,800 22 –Alliance Financial Group MYR 28,900 21 –AMMB Holdings MYR 50,400 44 0.01Astro Malaysia Holdings MYR 48,000 23 –Axiata Group MYR 119,700 110 0.02Berjaya Sports Toto MYR 23,174 12 –British American Tobacco Malaysia MYR 3,800 32 0.01Bumi Armada MYR 62,100 9 –CIMB Group Holdings MYR 149,200 145 0.02DiGi.Com MYR 96,400 89 0.01Felda Global Ventures Holdings MYR 46,100 17 –Gamuda MYR 59,800 55 0.01Genting MYR 61,200 103 0.01Genting Malaysia MYR 72,500 74 0.01HAP Seng Consolidated MYR 15,400 25 –Hong Leong Bank MYR 14,697 36 0.01IHH Healthcare MYR 73,000 80 0.01IJM MYR 83,800 52 0.01IOI MYR 85,400 68 0.01IOI Properties Group MYR 53,875 20 –KLCCP Stapled Group, REIT MYR 11,900 17 –Kuala Lumpur Kepong MYR 13,700 60 0.01Malayan Banking MYR 147,400 238 0.03Malaysia Airports Holdings MYR 21,600 28 –Maxis MYR 68,200 79 0.01MISC MYR 45,700 61 0.01MMC MYR 26,500 12 –
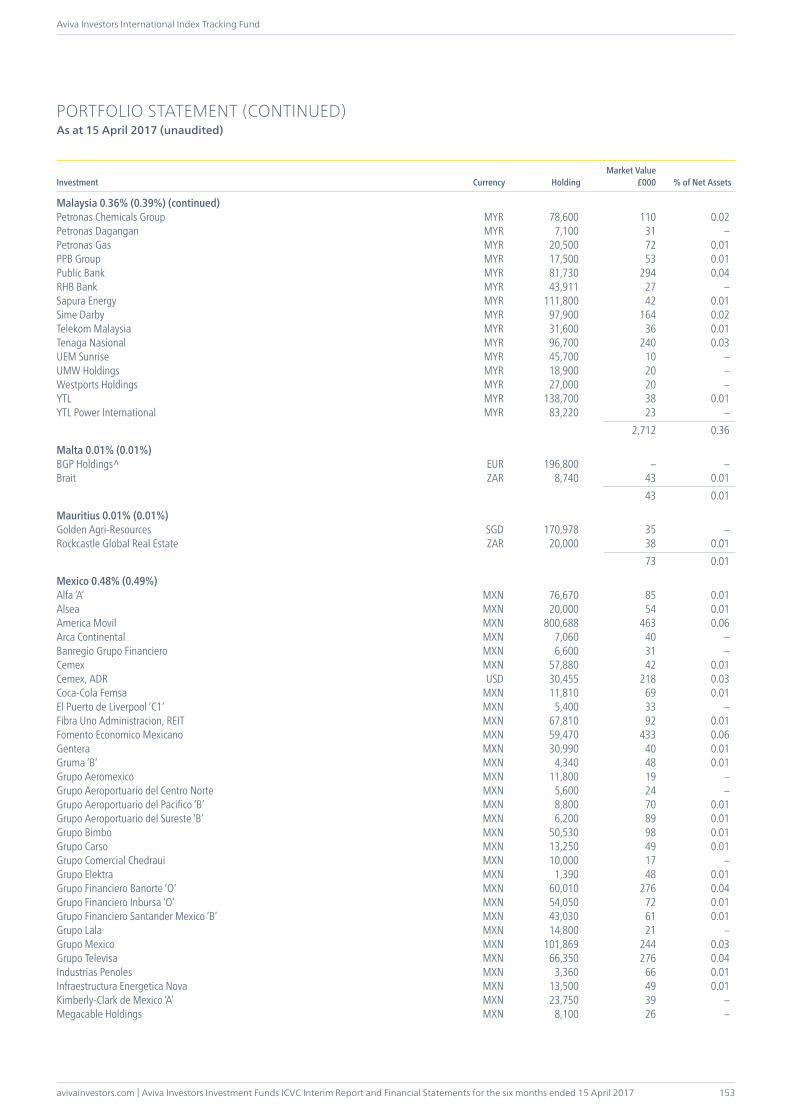
avivainvestors.com | Aviva Investors Investment Funds ICVC Interim Report and Financial Statements for the six months ended 15 April 2017
Aviva Investors International Index Tracking Fund
153
PORTFOLIO STATEMENT (CONTINUED)As at 15 April 2017 (unaudited)
Investment Currency HoldingMarket Value
£000 % of Net Assets
Malaysia 0.36% (0.39%) (continued)Petronas Chemicals Group MYR 78,600 110 0.02Petronas Dagangan MYR 7,100 31 –Petronas Gas MYR 20,500 72 0.01PPB Group MYR 17,500 53 0.01Public Bank MYR 81,730 294 0.04RHB Bank MYR 43,911 27 –Sapura Energy MYR 111,800 42 0.01Sime Darby MYR 97,900 164 0.02Telekom Malaysia MYR 31,600 36 0.01Tenaga Nasional MYR 96,700 240 0.03UEM Sunrise MYR 45,700 10 –UMW Holdings MYR 18,900 20 –Westports Holdings MYR 27,000 20 –YTL MYR 138,700 38 0.01YTL Power International MYR 83,220 23 – 2,712 0.36
Malta 0.01% (0.01%)BGP Holdings^ EUR 196,800 – –Brait ZAR 8,740 43 0.01 43 0.01
Mauritius 0.01% (0.01%)Golden Agri-Resources SGD 170,978 35 –Rockcastle Global Real Estate ZAR 20,000 38 0.01 73 0.01
Mexico 0.48% (0.49%)Alfa ‘A’ MXN 76,670 85 0.01Alsea MXN 20,000 54 0.01America Movil MXN 800,688 463 0.06Arca Continental MXN 7,060 40 –Banregio Grupo Financiero MXN 6,600 31 –Cemex MXN 57,880 42 0.01Cemex, ADR USD 30,455 218 0.03Coca-Cola Femsa MXN 11,810 69 0.01El Puerto de Liverpool ‘C1’ MXN 5,400 33 –Fibra Uno Administracion, REIT MXN 67,810 92 0.01Fomento Economico Mexicano MXN 59,470 433 0.06Gentera MXN 30,990 40 0.01Gruma ‘B’ MXN 4,340 48 0.01Grupo Aeromexico MXN 11,800 19 –Grupo Aeroportuario del Centro Norte MXN 5,600 24 –Grupo Aeroportuario del Pacifico ‘B’ MXN 8,800 70 0.01Grupo Aeroportuario del Sureste ‘B’ MXN 6,200 89 0.01Grupo Bimbo MXN 50,530 98 0.01Grupo Carso MXN 13,250 49 0.01Grupo Comercial Chedraui MXN 10,000 17 –Grupo Elektra MXN 1,390 48 0.01Grupo Financiero Banorte ‘O’ MXN 60,010 276 0.04Grupo Financiero Inbursa ‘O’ MXN 54,050 72 0.01Grupo Financiero Santander Mexico ‘B’ MXN 43,030 61 0.01Grupo Lala MXN 14,800 21 –Grupo Mexico MXN 101,869 244 0.03Grupo Televisa MXN 66,350 276 0.04Industrias Penoles MXN 3,360 66 0.01Infraestructura Energetica Nova MXN 13,500 49 0.01Kimberly-Clark de Mexico ‘A’ MXN 23,750 39 –Megacable Holdings MXN 8,100 26 –
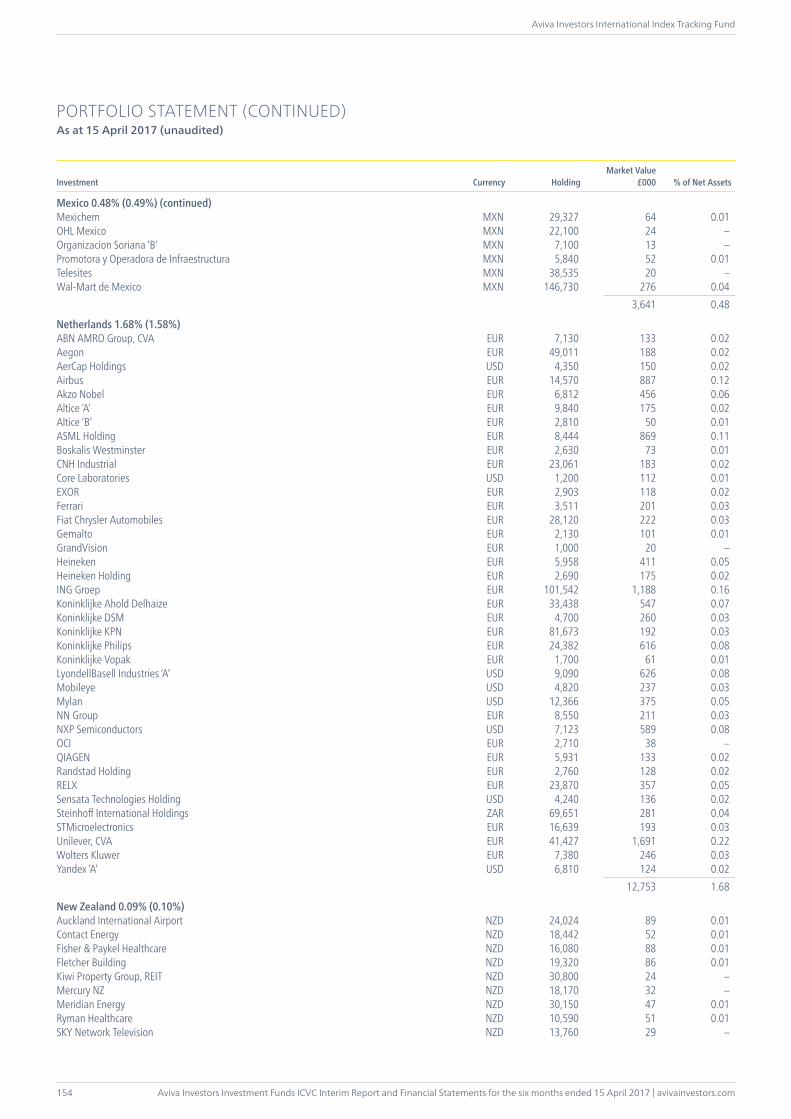
Aviva Investors Investment Funds ICVC Interim Report and Financial Statements for the six months ended 15 April 2017 | avivainvestors.com
Aviva Investors International Index Tracking Fund
154
PORTFOLIO STATEMENT (CONTINUED)As at 15 April 2017 (unaudited)
Investment Currency HoldingMarket Value
£000 % of Net Assets
Mexico 0.48% (0.49%) (continued)Mexichem MXN 29,327 64 0.01OHL Mexico MXN 22,100 24 –Organizacion Soriana ‘B’ MXN 7,100 13 –Promotora y Operadora de Infraestructura MXN 5,840 52 0.01Telesites MXN 38,535 20 –Wal-Mart de Mexico MXN 146,730 276 0.04 3,641 0.48
Netherlands 1.68% (1.58%)ABN AMRO Group, CVA EUR 7,130 133 0.02Aegon EUR 49,011 188 0.02AerCap Holdings USD 4,350 150 0.02Airbus EUR 14,570 887 0.12Akzo Nobel EUR 6,812 456 0.06Altice ‘A’ EUR 9,840 175 0.02Altice ‘B’ EUR 2,810 50 0.01ASML Holding EUR 8,444 869 0.11Boskalis Westminster EUR 2,630 73 0.01CNH Industrial EUR 23,061 183 0.02Core Laboratories USD 1,200 112 0.01EXOR EUR 2,903 118 0.02Ferrari EUR 3,511 201 0.03Fiat Chrysler Automobiles EUR 28,120 222 0.03Gemalto EUR 2,130 101 0.01GrandVision EUR 1,000 20 –Heineken EUR 5,958 411 0.05Heineken Holding EUR 2,690 175 0.02ING Groep EUR 101,542 1,188 0.16Koninklijke Ahold Delhaize EUR 33,438 547 0.07Koninklijke DSM EUR 4,700 260 0.03Koninklijke KPN EUR 81,673 192 0.03Koninklijke Philips EUR 24,382 616 0.08Koninklijke Vopak EUR 1,700 61 0.01LyondellBasell Industries ‘A’ USD 9,090 626 0.08Mobileye USD 4,820 237 0.03Mylan USD 12,366 375 0.05NN Group EUR 8,550 211 0.03NXP Semiconductors USD 7,123 589 0.08OCI EUR 2,710 38 –QIAGEN EUR 5,931 133 0.02Randstad Holding EUR 2,760 128 0.02RELX EUR 23,870 357 0.05Sensata Technologies Holding USD 4,240 136 0.02Steinhoff International Holdings ZAR 69,651 281 0.04STMicroelectronics EUR 16,639 193 0.03Unilever, CVA EUR 41,427 1,691 0.22Wolters Kluwer EUR 7,380 246 0.03Yandex ‘A’ USD 6,810 124 0.02 12,753 1.68
New Zealand 0.09% (0.10%)Auckland International Airport NZD 24,024 89 0.01Contact Energy NZD 18,442 52 0.01Fisher & Paykel Healthcare NZD 16,080 88 0.01Fletcher Building NZD 19,320 86 0.01Kiwi Property Group, REIT NZD 30,800 24 –Mercury NZ NZD 18,170 32 –Meridian Energy NZD 30,150 47 0.01Ryman Healthcare NZD 10,590 51 0.01SKY Network Television NZD 13,760 29 –
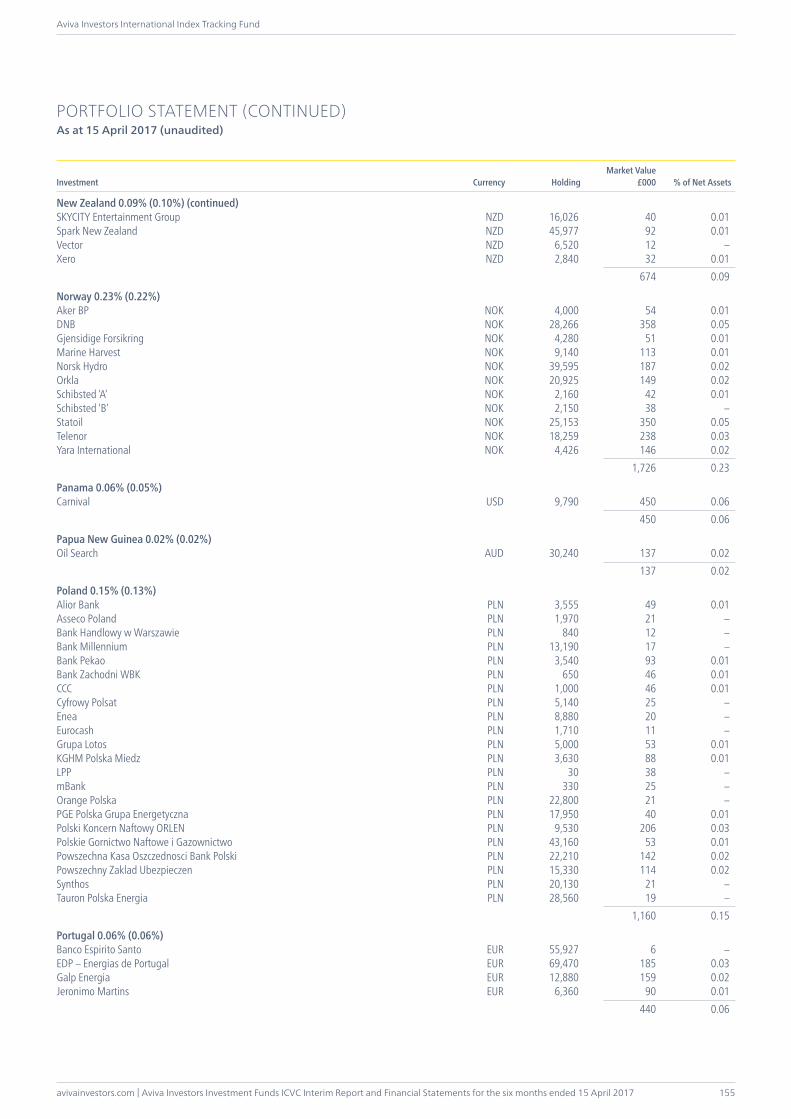
avivainvestors.com | Aviva Investors Investment Funds ICVC Interim Report and Financial Statements for the six months ended 15 April 2017
Aviva Investors International Index Tracking Fund
155
PORTFOLIO STATEMENT (CONTINUED)As at 15 April 2017 (unaudited)
Investment Currency HoldingMarket Value
£000 % of Net Assets
New Zealand 0.09% (0.10%) (continued)SKYCITY Entertainment Group NZD 16,026 40 0.01Spark New Zealand NZD 45,977 92 0.01Vector NZD 6,520 12 –Xero NZD 2,840 32 0.01 674 0.09
Norway 0.23% (0.22%)Aker BP NOK 4,000 54 0.01DNB NOK 28,266 358 0.05Gjensidige Forsikring NOK 4,280 51 0.01Marine Harvest NOK 9,140 113 0.01Norsk Hydro NOK 39,595 187 0.02Orkla NOK 20,925 149 0.02Schibsted ‘A’ NOK 2,160 42 0.01Schibsted ‘B’ NOK 2,150 38 –Statoil NOK 25,153 350 0.05Telenor NOK 18,259 238 0.03Yara International NOK 4,426 146 0.02 1,726 0.23
Panama 0.06% (0.05%)Carnival USD 9,790 450 0.06 450 0.06
Papua New Guinea 0.02% (0.02%)Oil Search AUD 30,240 137 0.02 137 0.02
Poland 0.15% (0.13%)Alior Bank PLN 3,555 49 0.01Asseco Poland PLN 1,970 21 –Bank Handlowy w Warszawie PLN 840 12 –Bank Millennium PLN 13,190 17 –Bank Pekao PLN 3,540 93 0.01Bank Zachodni WBK PLN 650 46 0.01CCC PLN 1,000 46 0.01Cyfrowy Polsat PLN 5,140 25 –Enea PLN 8,880 20 –Eurocash PLN 1,710 11 –Grupa Lotos PLN 5,000 53 0.01KGHM Polska Miedz PLN 3,630 88 0.01LPP PLN 30 38 –mBank PLN 330 25 –Orange Polska PLN 22,800 21 –PGE Polska Grupa Energetyczna PLN 17,950 40 0.01Polski Koncern Naftowy ORLEN PLN 9,530 206 0.03Polskie Gornictwo Naftowe i Gazownictwo PLN 43,160 53 0.01Powszechna Kasa Oszczednosci Bank Polski PLN 22,210 142 0.02Powszechny Zaklad Ubezpieczen PLN 15,330 114 0.02Synthos PLN 20,130 21 –Tauron Polska Energia PLN 28,560 19 – 1,160 0.15
Portugal 0.06% (0.06%)Banco Espirito Santo EUR 55,927 6 –EDP – Energias de Portugal EUR 69,470 185 0.03Galp Energia EUR 12,880 159 0.02Jeronimo Martins EUR 6,360 90 0.01 440 0.06
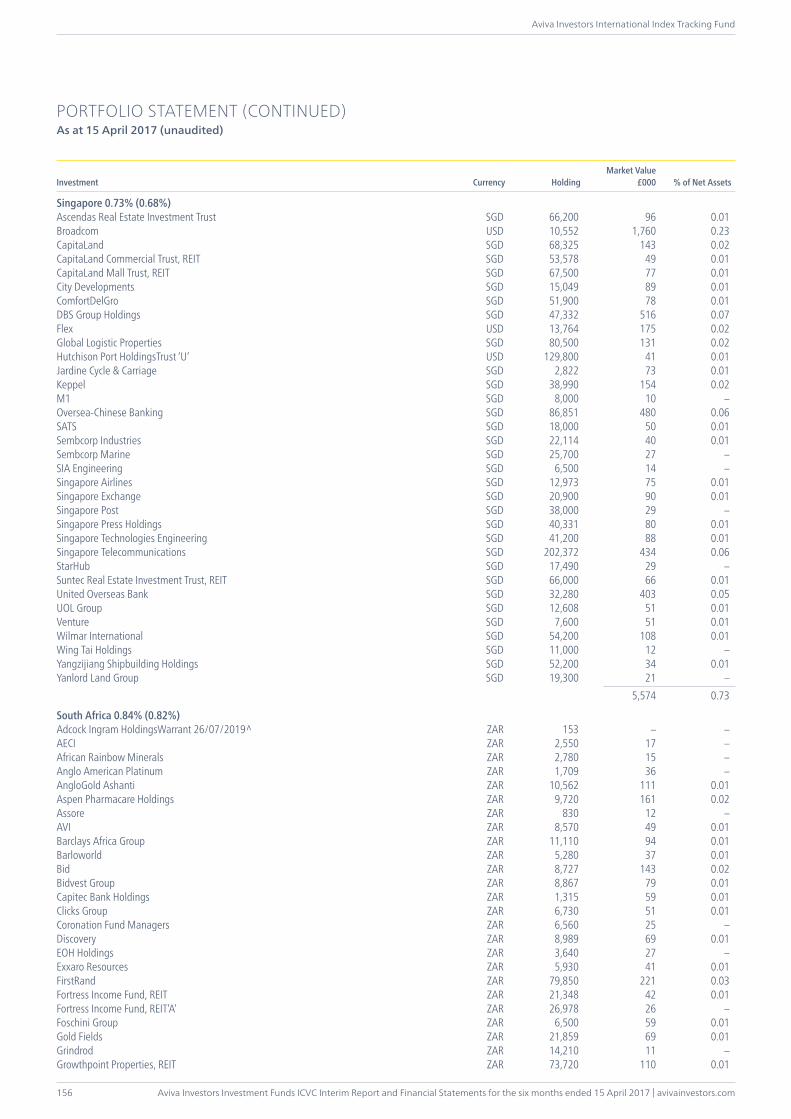
Aviva Investors Investment Funds ICVC Interim Report and Financial Statements for the six months ended 15 April 2017 | avivainvestors.com
Aviva Investors International Index Tracking Fund
156
PORTFOLIO STATEMENT (CONTINUED)As at 15 April 2017 (unaudited)
Investment Currency HoldingMarket Value
£000 % of Net Assets
Singapore 0.73% (0.68%)Ascendas Real Estate Investment Trust SGD 66,200 96 0.01Broadcom USD 10,552 1,760 0.23CapitaLand SGD 68,325 143 0.02CapitaLand Commercial Trust, REIT SGD 53,578 49 0.01CapitaLand Mall Trust, REIT SGD 67,500 77 0.01City Developments SGD 15,049 89 0.01ComfortDelGro SGD 51,900 78 0.01DBS Group Holdings SGD 47,332 516 0.07Flex USD 13,764 175 0.02Global Logistic Properties SGD 80,500 131 0.02Hutchison Port HoldingsTrust ‘U’ USD 129,800 41 0.01Jardine Cycle & Carriage SGD 2,822 73 0.01Keppel SGD 38,990 154 0.02M1 SGD 8,000 10 –Oversea-Chinese Banking SGD 86,851 480 0.06SATS SGD 18,000 50 0.01Sembcorp Industries SGD 22,114 40 0.01Sembcorp Marine SGD 25,700 27 –SIA Engineering SGD 6,500 14 –Singapore Airlines SGD 12,973 75 0.01Singapore Exchange SGD 20,900 90 0.01Singapore Post SGD 38,000 29 –Singapore Press Holdings SGD 40,331 80 0.01Singapore Technologies Engineering SGD 41,200 88 0.01Singapore Telecommunications SGD 202,372 434 0.06StarHub SGD 17,490 29 –Suntec Real Estate Investment Trust, REIT SGD 66,000 66 0.01United Overseas Bank SGD 32,280 403 0.05UOL Group SGD 12,608 51 0.01Venture SGD 7,600 51 0.01Wilmar International SGD 54,200 108 0.01Wing Tai Holdings SGD 11,000 12 –Yangzijiang Shipbuilding Holdings SGD 52,200 34 0.01Yanlord Land Group SGD 19,300 21 – 5,574 0.73
South Africa 0.84% (0.82%)Adcock Ingram HoldingsWarrant 26/07/2019^ ZAR 153 – –AECI ZAR 2,550 17 –African Rainbow Minerals ZAR 2,780 15 –Anglo American Platinum ZAR 1,709 36 –AngloGold Ashanti ZAR 10,562 111 0.01Aspen Pharmacare Holdings ZAR 9,720 161 0.02Assore ZAR 830 12 –AVI ZAR 8,570 49 0.01Barclays Africa Group ZAR 11,110 94 0.01Barloworld ZAR 5,280 37 0.01Bid ZAR 8,727 143 0.02Bidvest Group ZAR 8,867 79 0.01Capitec Bank Holdings ZAR 1,315 59 0.01Clicks Group ZAR 6,730 51 0.01Coronation Fund Managers ZAR 6,560 25 –Discovery ZAR 8,989 69 0.01EOH Holdings ZAR 3,640 27 –Exxaro Resources ZAR 5,930 41 0.01FirstRand ZAR 79,850 221 0.03Fortress Income Fund, REIT ZAR 21,348 42 0.01Fortress Income Fund, REIT’A’ ZAR 26,978 26 –Foschini Group ZAR 6,500 59 0.01Gold Fields ZAR 21,859 69 0.01Grindrod ZAR 14,210 11 –Growthpoint Properties, REIT ZAR 73,720 110 0.01
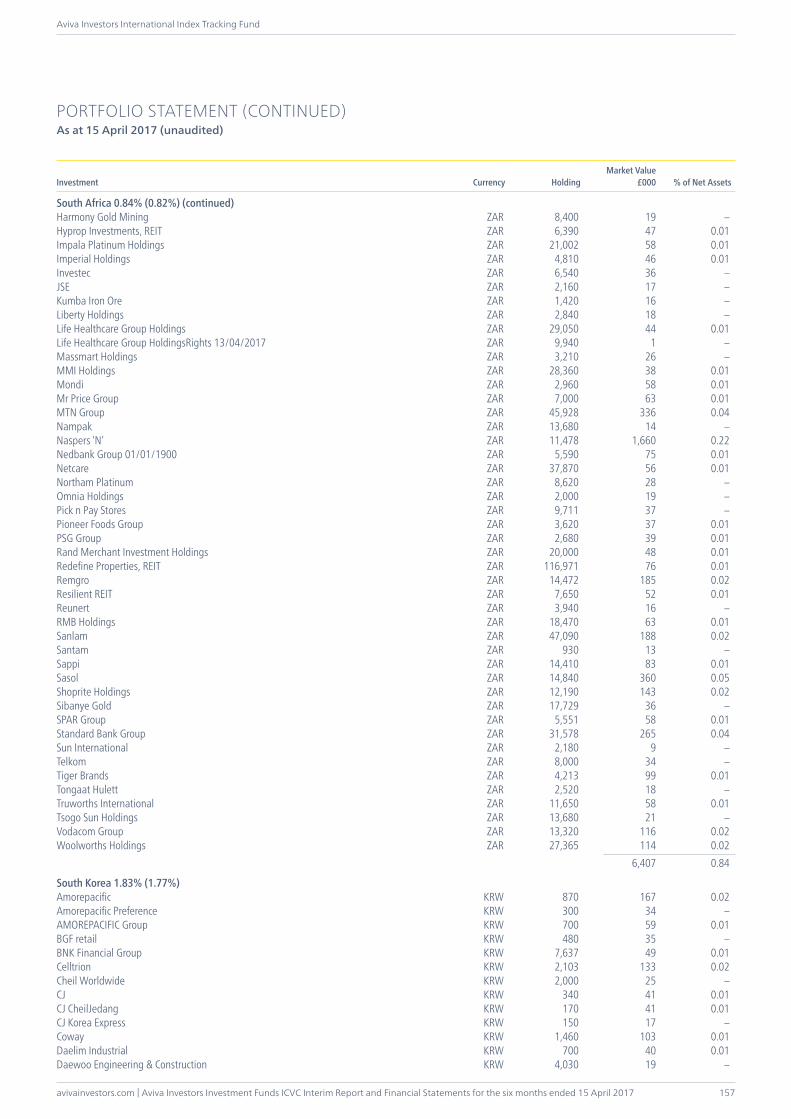
avivainvestors.com | Aviva Investors Investment Funds ICVC Interim Report and Financial Statements for the six months ended 15 April 2017
Aviva Investors International Index Tracking Fund
157
PORTFOLIO STATEMENT (CONTINUED)As at 15 April 2017 (unaudited)
Investment Currency HoldingMarket Value
£000 % of Net Assets
South Africa 0.84% (0.82%) (continued)Harmony Gold Mining ZAR 8,400 19 –Hyprop Investments, REIT ZAR 6,390 47 0.01Impala Platinum Holdings ZAR 21,002 58 0.01Imperial Holdings ZAR 4,810 46 0.01Investec ZAR 6,540 36 –JSE ZAR 2,160 17 –Kumba Iron Ore ZAR 1,420 16 –Liberty Holdings ZAR 2,840 18 –Life Healthcare Group Holdings ZAR 29,050 44 0.01Life Healthcare Group HoldingsRights 13/04/2017 ZAR 9,940 1 –Massmart Holdings ZAR 3,210 26 –MMI Holdings ZAR 28,360 38 0.01Mondi ZAR 2,960 58 0.01Mr Price Group ZAR 7,000 63 0.01MTN Group ZAR 45,928 336 0.04Nampak ZAR 13,680 14 –Naspers ‘N’ ZAR 11,478 1,660 0.22Nedbank Group 01/01/1900 ZAR 5,590 75 0.01Netcare ZAR 37,870 56 0.01Northam Platinum ZAR 8,620 28 –Omnia Holdings ZAR 2,000 19 –Pick n Pay Stores ZAR 9,711 37 –Pioneer Foods Group ZAR 3,620 37 0.01PSG Group ZAR 2,680 39 0.01Rand Merchant Investment Holdings ZAR 20,000 48 0.01Redefine Properties, REIT ZAR 116,971 76 0.01Remgro ZAR 14,472 185 0.02Resilient REIT ZAR 7,650 52 0.01Reunert ZAR 3,940 16 –RMB Holdings ZAR 18,470 63 0.01Sanlam ZAR 47,090 188 0.02Santam ZAR 930 13 –Sappi ZAR 14,410 83 0.01Sasol ZAR 14,840 360 0.05Shoprite Holdings ZAR 12,190 143 0.02Sibanye Gold ZAR 17,729 36 –SPAR Group ZAR 5,551 58 0.01Standard Bank Group ZAR 31,578 265 0.04Sun International ZAR 2,180 9 –Telkom ZAR 8,000 34 –Tiger Brands ZAR 4,213 99 0.01Tongaat Hulett ZAR 2,520 18 –Truworths International ZAR 11,650 58 0.01Tsogo Sun Holdings ZAR 13,680 21 –Vodacom Group ZAR 13,320 116 0.02Woolworths Holdings ZAR 27,365 114 0.02 6,407 0.84
South Korea 1.83% (1.77%)Amorepacific KRW 870 167 0.02Amorepacific Preference KRW 300 34 –AMOREPACIFIC Group KRW 700 59 0.01BGF retail KRW 480 35 –BNK Financial Group KRW 7,637 49 0.01Celltrion KRW 2,103 133 0.02Cheil Worldwide KRW 2,000 25 –CJ KRW 340 41 0.01CJ CheilJedang KRW 170 41 0.01CJ Korea Express KRW 150 17 –Coway KRW 1,460 103 0.01Daelim Industrial KRW 700 40 0.01Daewoo Engineering & Construction KRW 4,030 19 –
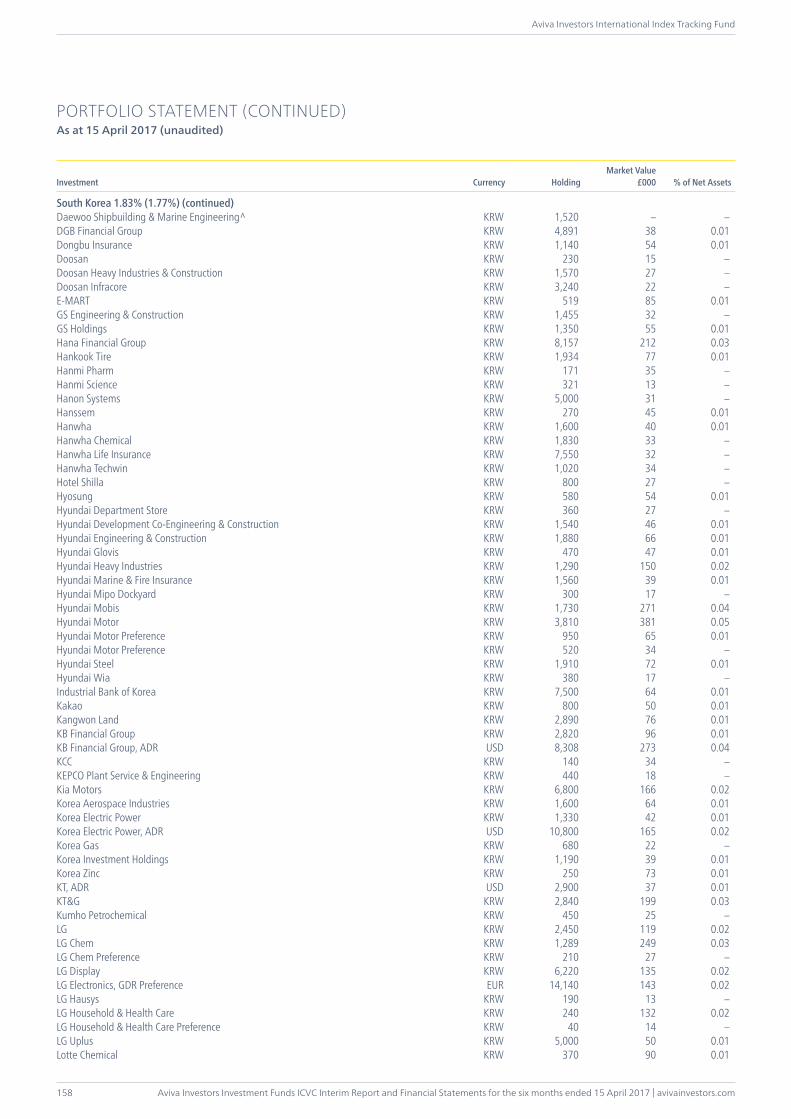
Aviva Investors Investment Funds ICVC Interim Report and Financial Statements for the six months ended 15 April 2017 | avivainvestors.com
Aviva Investors International Index Tracking Fund
158
PORTFOLIO STATEMENT (CONTINUED)As at 15 April 2017 (unaudited)
Investment Currency HoldingMarket Value
£000 % of Net Assets
South Korea 1.83% (1.77%) (continued)Daewoo Shipbuilding & Marine Engineering^ KRW 1,520 – –DGB Financial Group KRW 4,891 38 0.01Dongbu Insurance KRW 1,140 54 0.01Doosan KRW 230 15 –Doosan Heavy Industries & Construction KRW 1,570 27 –Doosan Infracore KRW 3,240 22 –E-MART KRW 519 85 0.01GS Engineering & Construction KRW 1,455 32 –GS Holdings KRW 1,350 55 0.01Hana Financial Group KRW 8,157 212 0.03Hankook Tire KRW 1,934 77 0.01Hanmi Pharm KRW 171 35 –Hanmi Science KRW 321 13 –Hanon Systems KRW 5,000 31 –Hanssem KRW 270 45 0.01Hanwha KRW 1,600 40 0.01Hanwha Chemical KRW 1,830 33 –Hanwha Life Insurance KRW 7,550 32 –Hanwha Techwin KRW 1,020 34 –Hotel Shilla KRW 800 27 –Hyosung KRW 580 54 0.01Hyundai Department Store KRW 360 27 –Hyundai Development Co-Engineering & Construction KRW 1,540 46 0.01Hyundai Engineering & Construction KRW 1,880 66 0.01Hyundai Glovis KRW 470 47 0.01Hyundai Heavy Industries KRW 1,290 150 0.02Hyundai Marine & Fire Insurance KRW 1,560 39 0.01Hyundai Mipo Dockyard KRW 300 17 –Hyundai Mobis KRW 1,730 271 0.04Hyundai Motor KRW 3,810 381 0.05Hyundai Motor Preference KRW 950 65 0.01Hyundai Motor Preference KRW 520 34 –Hyundai Steel KRW 1,910 72 0.01Hyundai Wia KRW 380 17 –Industrial Bank of Korea KRW 7,500 64 0.01Kakao KRW 800 50 0.01Kangwon Land KRW 2,890 76 0.01KB Financial Group KRW 2,820 96 0.01KB Financial Group, ADR USD 8,308 273 0.04KCC KRW 140 34 –KEPCO Plant Service & Engineering KRW 440 18 –Kia Motors KRW 6,800 166 0.02Korea Aerospace Industries KRW 1,600 64 0.01Korea Electric Power KRW 1,330 42 0.01Korea Electric Power, ADR USD 10,800 165 0.02Korea Gas KRW 680 22 –Korea Investment Holdings KRW 1,190 39 0.01Korea Zinc KRW 250 73 0.01KT, ADR USD 2,900 37 0.01KT&G KRW 2,840 199 0.03Kumho Petrochemical KRW 450 25 –LG KRW 2,450 119 0.02LG Chem KRW 1,289 249 0.03LG Chem Preference KRW 210 27 –LG Display KRW 6,220 135 0.02LG Electronics, GDR Preference EUR 14,140 143 0.02LG Hausys KRW 190 13 –LG Household & Health Care KRW 240 132 0.02LG Household & Health Care Preference KRW 40 14 –LG Uplus KRW 5,000 50 0.01Lotte Chemical KRW 370 90 0.01
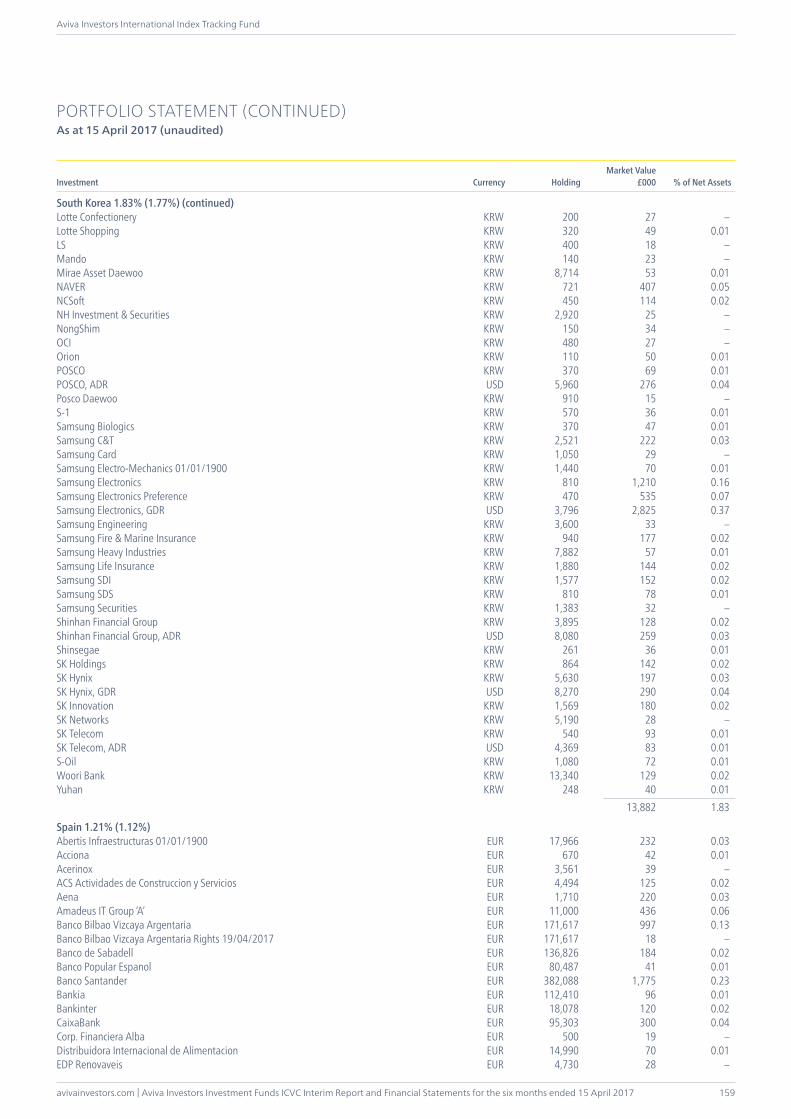
avivainvestors.com | Aviva Investors Investment Funds ICVC Interim Report and Financial Statements for the six months ended 15 April 2017
Aviva Investors International Index Tracking Fund
159
PORTFOLIO STATEMENT (CONTINUED)As at 15 April 2017 (unaudited)
Investment Currency HoldingMarket Value
£000 % of Net Assets
South Korea 1.83% (1.77%) (continued)Lotte Confectionery KRW 200 27 –Lotte Shopping KRW 320 49 0.01LS KRW 400 18 –Mando KRW 140 23 –Mirae Asset Daewoo KRW 8,714 53 0.01NAVER KRW 721 407 0.05NCSoft KRW 450 114 0.02NH Investment & Securities KRW 2,920 25 –NongShim KRW 150 34 –OCI KRW 480 27 –Orion KRW 110 50 0.01POSCO KRW 370 69 0.01POSCO, ADR USD 5,960 276 0.04Posco Daewoo KRW 910 15 –S-1 KRW 570 36 0.01Samsung Biologics KRW 370 47 0.01Samsung C&T KRW 2,521 222 0.03Samsung Card KRW 1,050 29 –Samsung Electro-Mechanics 01/01/1900 KRW 1,440 70 0.01Samsung Electronics KRW 810 1,210 0.16Samsung Electronics Preference KRW 470 535 0.07Samsung Electronics, GDR USD 3,796 2,825 0.37Samsung Engineering KRW 3,600 33 –Samsung Fire & Marine Insurance KRW 940 177 0.02Samsung Heavy Industries KRW 7,882 57 0.01Samsung Life Insurance KRW 1,880 144 0.02Samsung SDI KRW 1,577 152 0.02Samsung SDS KRW 810 78 0.01Samsung Securities KRW 1,383 32 –Shinhan Financial Group KRW 3,895 128 0.02Shinhan Financial Group, ADR USD 8,080 259 0.03Shinsegae KRW 261 36 0.01SK Holdings KRW 864 142 0.02SK Hynix KRW 5,630 197 0.03SK Hynix, GDR USD 8,270 290 0.04SK Innovation KRW 1,569 180 0.02SK Networks KRW 5,190 28 –SK Telecom KRW 540 93 0.01SK Telecom, ADR USD 4,369 83 0.01S-Oil KRW 1,080 72 0.01Woori Bank KRW 13,340 129 0.02Yuhan KRW 248 40 0.01 13,882 1.83
Spain 1.21% (1.12%)Abertis Infraestructuras 01/01/1900 EUR 17,966 232 0.03Acciona EUR 670 42 0.01Acerinox EUR 3,561 39 –ACS Actividades de Construccion y Servicios EUR 4,494 125 0.02Aena EUR 1,710 220 0.03Amadeus IT Group ‘A’ EUR 11,000 436 0.06Banco Bilbao Vizcaya Argentaria EUR 171,617 997 0.13Banco Bilbao Vizcaya Argentaria Rights 19/04/2017 EUR 171,617 18 –Banco de Sabadell EUR 136,826 184 0.02Banco Popular Espanol EUR 80,487 41 0.01Banco Santander EUR 382,088 1,775 0.23Bankia EUR 112,410 96 0.01Bankinter EUR 18,078 120 0.02CaixaBank EUR 95,303 300 0.04Corp. Financiera Alba EUR 500 19 –Distribuidora Internacional de Alimentacion EUR 14,990 70 0.01EDP Renovaveis EUR 4,730 28 –
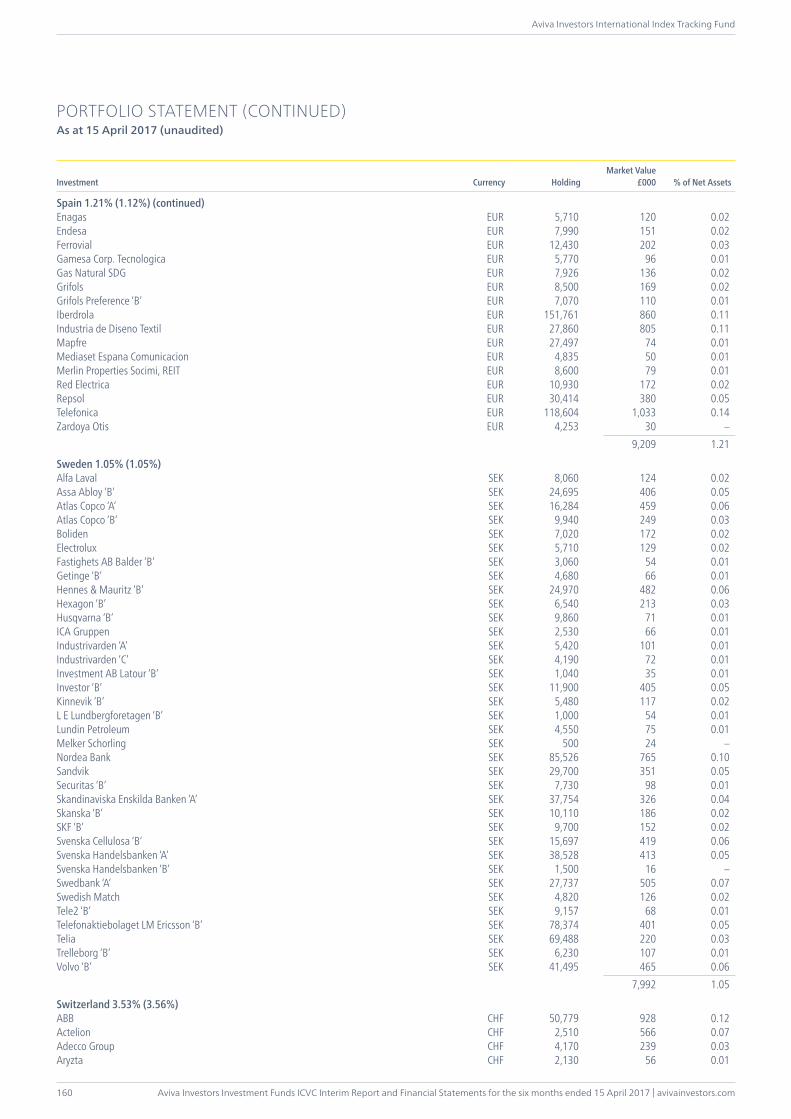
Aviva Investors Investment Funds ICVC Interim Report and Financial Statements for the six months ended 15 April 2017 | avivainvestors.com
Aviva Investors International Index Tracking Fund
160
PORTFOLIO STATEMENT (CONTINUED)As at 15 April 2017 (unaudited)
Investment Currency HoldingMarket Value
£000 % of Net Assets
Spain 1.21% (1.12%) (continued)Enagas EUR 5,710 120 0.02Endesa EUR 7,990 151 0.02Ferrovial EUR 12,430 202 0.03Gamesa Corp. Tecnologica EUR 5,770 96 0.01Gas Natural SDG EUR 7,926 136 0.02Grifols EUR 8,500 169 0.02Grifols Preference ‘B’ EUR 7,070 110 0.01Iberdrola EUR 151,761 860 0.11Industria de Diseno Textil EUR 27,860 805 0.11Mapfre EUR 27,497 74 0.01Mediaset Espana Comunicacion EUR 4,835 50 0.01Merlin Properties Socimi, REIT EUR 8,600 79 0.01Red Electrica EUR 10,930 172 0.02Repsol EUR 30,414 380 0.05Telefonica EUR 118,604 1,033 0.14Zardoya Otis EUR 4,253 30 – 9,209 1.21
Sweden 1.05% (1.05%)Alfa Laval SEK 8,060 124 0.02Assa Abloy ‘B’ SEK 24,695 406 0.05Atlas Copco ‘A’ SEK 16,284 459 0.06Atlas Copco ‘B’ SEK 9,940 249 0.03Boliden SEK 7,020 172 0.02Electrolux SEK 5,710 129 0.02Fastighets AB Balder ‘B’ SEK 3,060 54 0.01Getinge ‘B’ SEK 4,680 66 0.01Hennes & Mauritz ‘B’ SEK 24,970 482 0.06Hexagon ‘B’ SEK 6,540 213 0.03Husqvarna ‘B’ SEK 9,860 71 0.01ICA Gruppen SEK 2,530 66 0.01Industrivarden ‘A’ SEK 5,420 101 0.01Industrivarden ‘C’ SEK 4,190 72 0.01Investment AB Latour ‘B’ SEK 1,040 35 0.01Investor ‘B’ SEK 11,900 405 0.05Kinnevik ‘B’ SEK 5,480 117 0.02L E Lundbergforetagen ‘B’ SEK 1,000 54 0.01Lundin Petroleum SEK 4,550 75 0.01Melker Schorling SEK 500 24 –Nordea Bank SEK 85,526 765 0.10Sandvik SEK 29,700 351 0.05Securitas ‘B’ SEK 7,730 98 0.01Skandinaviska Enskilda Banken ‘A’ SEK 37,754 326 0.04Skanska ‘B’ SEK 10,110 186 0.02SKF ‘B’ SEK 9,700 152 0.02Svenska Cellulosa ‘B’ SEK 15,697 419 0.06Svenska Handelsbanken ‘A’ SEK 38,528 413 0.05Svenska Handelsbanken ‘B’ SEK 1,500 16 –Swedbank ‘A’ SEK 27,737 505 0.07Swedish Match SEK 4,820 126 0.02Tele2 ‘B’ SEK 9,157 68 0.01Telefonaktiebolaget LM Ericsson ‘B’ SEK 78,374 401 0.05Telia SEK 69,488 220 0.03Trelleborg ‘B’ SEK 6,230 107 0.01Volvo ‘B’ SEK 41,495 465 0.06 7,992 1.05
Switzerland 3.53% (3.56%)ABB CHF 50,779 928 0.12Actelion CHF 2,510 566 0.07Adecco Group CHF 4,170 239 0.03Aryzta CHF 2,130 56 0.01
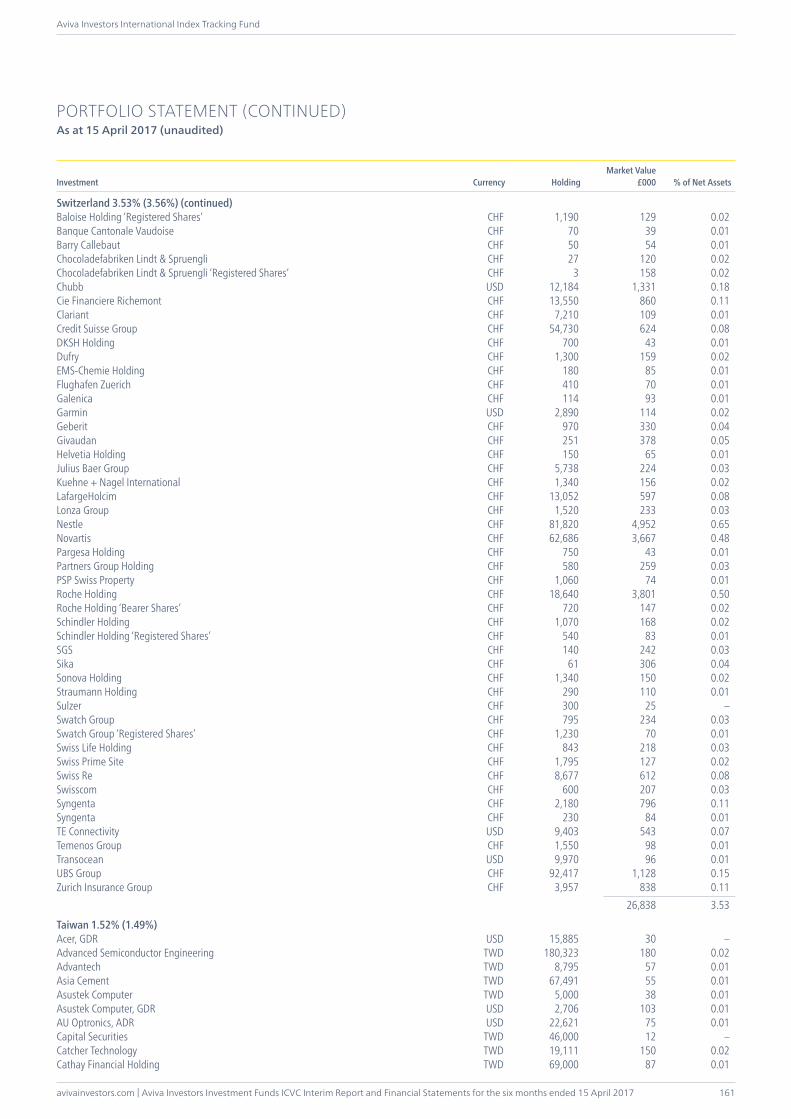
avivainvestors.com | Aviva Investors Investment Funds ICVC Interim Report and Financial Statements for the six months ended 15 April 2017
Aviva Investors International Index Tracking Fund
161
PORTFOLIO STATEMENT (CONTINUED)As at 15 April 2017 (unaudited)
Investment Currency HoldingMarket Value
£000 % of Net Assets
Switzerland 3.53% (3.56%) (continued)Baloise Holding ‘Registered Shares’ CHF 1,190 129 0.02Banque Cantonale Vaudoise CHF 70 39 0.01Barry Callebaut CHF 50 54 0.01Chocoladefabriken Lindt & Spruengli CHF 27 120 0.02Chocoladefabriken Lindt & Spruengli ‘Registered Shares’ CHF 3 158 0.02Chubb USD 12,184 1,331 0.18Cie Financiere Richemont CHF 13,550 860 0.11Clariant CHF 7,210 109 0.01Credit Suisse Group CHF 54,730 624 0.08DKSH Holding CHF 700 43 0.01Dufry CHF 1,300 159 0.02EMS-Chemie Holding CHF 180 85 0.01Flughafen Zuerich CHF 410 70 0.01Galenica CHF 114 93 0.01Garmin USD 2,890 114 0.02Geberit CHF 970 330 0.04Givaudan CHF 251 378 0.05Helvetia Holding CHF 150 65 0.01Julius Baer Group CHF 5,738 224 0.03Kuehne + Nagel International CHF 1,340 156 0.02LafargeHolcim CHF 13,052 597 0.08Lonza Group CHF 1,520 233 0.03Nestle CHF 81,820 4,952 0.65Novartis CHF 62,686 3,667 0.48Pargesa Holding CHF 750 43 0.01Partners Group Holding CHF 580 259 0.03PSP Swiss Property CHF 1,060 74 0.01Roche Holding CHF 18,640 3,801 0.50Roche Holding ‘Bearer Shares’ CHF 720 147 0.02Schindler Holding CHF 1,070 168 0.02Schindler Holding ‘Registered Shares’ CHF 540 83 0.01SGS CHF 140 242 0.03Sika CHF 61 306 0.04Sonova Holding CHF 1,340 150 0.02Straumann Holding CHF 290 110 0.01Sulzer CHF 300 25 –Swatch Group CHF 795 234 0.03Swatch Group ‘Registered Shares’ CHF 1,230 70 0.01Swiss Life Holding CHF 843 218 0.03Swiss Prime Site CHF 1,795 127 0.02Swiss Re CHF 8,677 612 0.08Swisscom CHF 600 207 0.03Syngenta CHF 2,180 796 0.11Syngenta CHF 230 84 0.01TE Connectivity USD 9,403 543 0.07Temenos Group CHF 1,550 98 0.01Transocean USD 9,970 96 0.01UBS Group CHF 92,417 1,128 0.15Zurich Insurance Group CHF 3,957 838 0.11 26,838 3.53
Taiwan 1.52% (1.49%)Acer, GDR USD 15,885 30 –Advanced Semiconductor Engineering TWD 180,323 180 0.02Advantech TWD 8,795 57 0.01Asia Cement TWD 67,491 55 0.01Asustek Computer TWD 5,000 38 0.01Asustek Computer, GDR USD 2,706 103 0.01AU Optronics, ADR USD 22,621 75 0.01Capital Securities TWD 46,000 12 –Catcher Technology TWD 19,111 150 0.02Cathay Financial Holding TWD 69,000 87 0.01
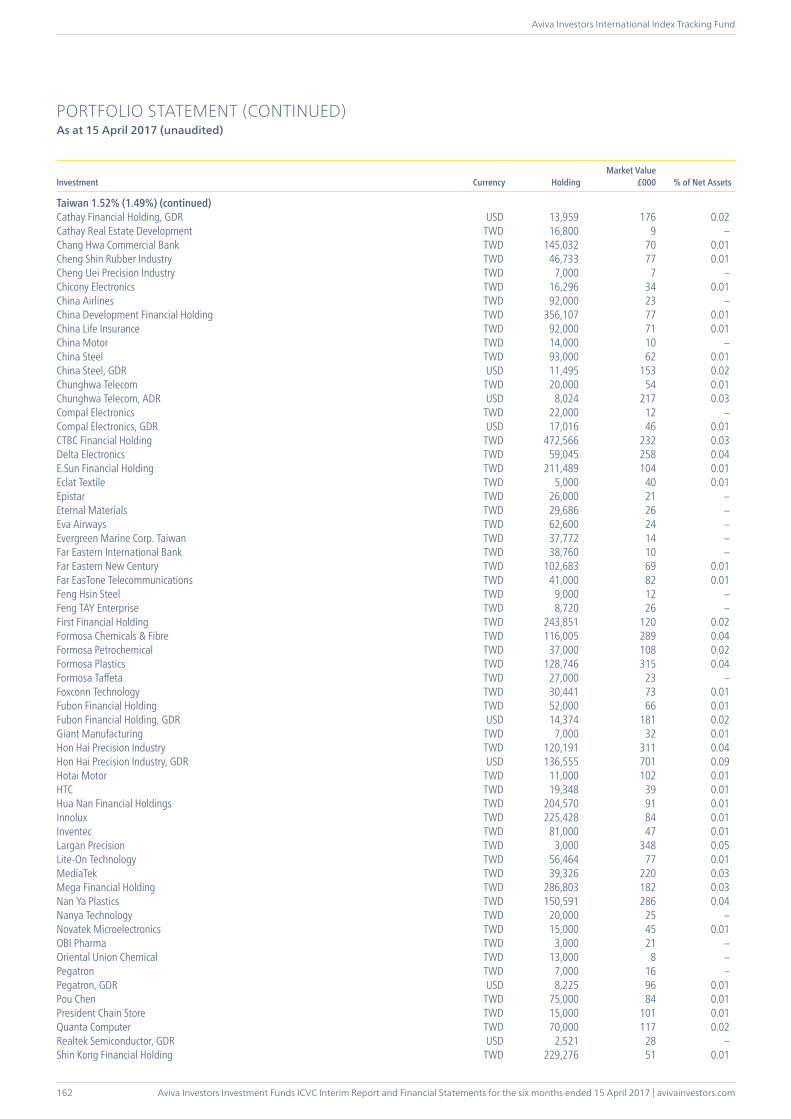
Aviva Investors Investment Funds ICVC Interim Report and Financial Statements for the six months ended 15 April 2017 | avivainvestors.com
Aviva Investors International Index Tracking Fund
162
PORTFOLIO STATEMENT (CONTINUED)As at 15 April 2017 (unaudited)
Investment Currency HoldingMarket Value
£000 % of Net Assets
Taiwan 1.52% (1.49%) (continued)Cathay Financial Holding, GDR USD 13,959 176 0.02Cathay Real Estate Development TWD 16,800 9 –Chang Hwa Commercial Bank TWD 145,032 70 0.01Cheng Shin Rubber Industry TWD 46,733 77 0.01Cheng Uei Precision Industry TWD 7,000 7 –Chicony Electronics TWD 16,296 34 0.01China Airlines TWD 92,000 23 –China Development Financial Holding TWD 356,107 77 0.01China Life Insurance TWD 92,000 71 0.01China Motor TWD 14,000 10 –China Steel TWD 93,000 62 0.01China Steel, GDR USD 11,495 153 0.02Chunghwa Telecom TWD 20,000 54 0.01Chunghwa Telecom, ADR USD 8,024 217 0.03Compal Electronics TWD 22,000 12 –Compal Electronics, GDR USD 17,016 46 0.01CTBC Financial Holding TWD 472,566 232 0.03Delta Electronics TWD 59,045 258 0.04E.Sun Financial Holding TWD 211,489 104 0.01Eclat Textile TWD 5,000 40 0.01Epistar TWD 26,000 21 –Eternal Materials TWD 29,686 26 –Eva Airways TWD 62,600 24 –Evergreen Marine Corp. Taiwan TWD 37,772 14 –Far Eastern International Bank TWD 38,760 10 –Far Eastern New Century TWD 102,683 69 0.01Far EasTone Telecommunications TWD 41,000 82 0.01Feng Hsin Steel TWD 9,000 12 –Feng TAY Enterprise TWD 8,720 26 –First Financial Holding TWD 243,851 120 0.02Formosa Chemicals & Fibre TWD 116,005 289 0.04Formosa Petrochemical TWD 37,000 108 0.02Formosa Plastics TWD 128,746 315 0.04Formosa Taffeta TWD 27,000 23 –Foxconn Technology TWD 30,441 73 0.01Fubon Financial Holding TWD 52,000 66 0.01Fubon Financial Holding, GDR USD 14,374 181 0.02Giant Manufacturing TWD 7,000 32 0.01Hon Hai Precision Industry TWD 120,191 311 0.04Hon Hai Precision Industry, GDR USD 136,555 701 0.09Hotai Motor TWD 11,000 102 0.01HTC TWD 19,348 39 0.01Hua Nan Financial Holdings TWD 204,570 91 0.01Innolux TWD 225,428 84 0.01Inventec TWD 81,000 47 0.01Largan Precision TWD 3,000 348 0.05Lite-On Technology TWD 56,464 77 0.01MediaTek TWD 39,326 220 0.03Mega Financial Holding TWD 286,803 182 0.03Nan Ya Plastics TWD 150,591 286 0.04Nanya Technology TWD 20,000 25 –Novatek Microelectronics TWD 15,000 45 0.01OBI Pharma TWD 3,000 21 –Oriental Union Chemical TWD 13,000 8 –Pegatron TWD 7,000 16 –Pegatron, GDR USD 8,225 96 0.01Pou Chen TWD 75,000 84 0.01President Chain Store TWD 15,000 101 0.01Quanta Computer TWD 70,000 117 0.02Realtek Semiconductor, GDR USD 2,521 28 –Shin Kong Financial Holding TWD 229,276 51 0.01
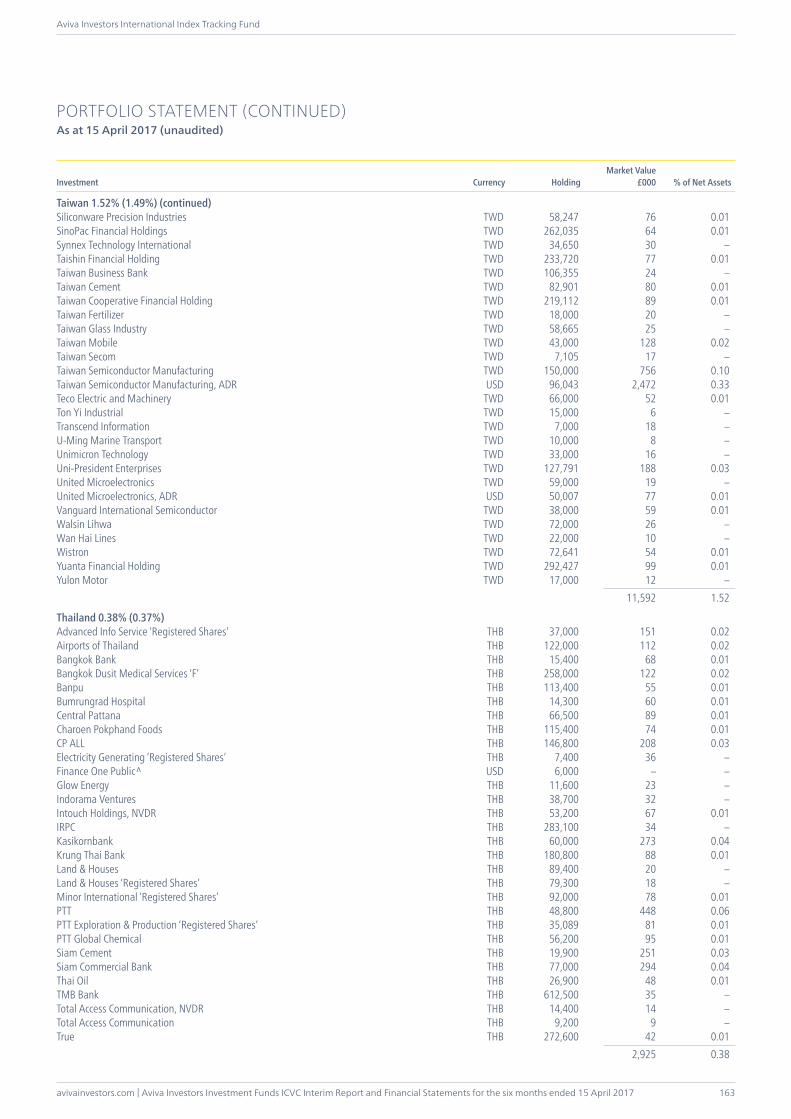
avivainvestors.com | Aviva Investors Investment Funds ICVC Interim Report and Financial Statements for the six months ended 15 April 2017
Aviva Investors International Index Tracking Fund
163
PORTFOLIO STATEMENT (CONTINUED)As at 15 April 2017 (unaudited)
Investment Currency HoldingMarket Value
£000 % of Net Assets
Taiwan 1.52% (1.49%) (continued)Siliconware Precision Industries TWD 58,247 76 0.01SinoPac Financial Holdings TWD 262,035 64 0.01Synnex Technology International TWD 34,650 30 –Taishin Financial Holding TWD 233,720 77 0.01Taiwan Business Bank TWD 106,355 24 –Taiwan Cement TWD 82,901 80 0.01Taiwan Cooperative Financial Holding TWD 219,112 89 0.01Taiwan Fertilizer TWD 18,000 20 –Taiwan Glass Industry TWD 58,665 25 –Taiwan Mobile TWD 43,000 128 0.02Taiwan Secom TWD 7,105 17 –Taiwan Semiconductor Manufacturing TWD 150,000 756 0.10Taiwan Semiconductor Manufacturing, ADR USD 96,043 2,472 0.33Teco Electric and Machinery TWD 66,000 52 0.01Ton Yi Industrial TWD 15,000 6 –Transcend Information TWD 7,000 18 –U-Ming Marine Transport TWD 10,000 8 –Unimicron Technology TWD 33,000 16 –Uni-President Enterprises TWD 127,791 188 0.03United Microelectronics TWD 59,000 19 –United Microelectronics, ADR USD 50,007 77 0.01Vanguard International Semiconductor TWD 38,000 59 0.01Walsin Lihwa TWD 72,000 26 –Wan Hai Lines TWD 22,000 10 –Wistron TWD 72,641 54 0.01Yuanta Financial Holding TWD 292,427 99 0.01Yulon Motor TWD 17,000 12 – 11,592 1.52
Thailand 0.38% (0.37%)Advanced Info Service ‘Registered Shares’ THB 37,000 151 0.02Airports of Thailand THB 122,000 112 0.02Bangkok Bank THB 15,400 68 0.01Bangkok Dusit Medical Services ‘F’ THB 258,000 122 0.02Banpu THB 113,400 55 0.01Bumrungrad Hospital THB 14,300 60 0.01Central Pattana THB 66,500 89 0.01Charoen Pokphand Foods THB 115,400 74 0.01CP ALL THB 146,800 208 0.03Electricity Generating ‘Registered Shares’ THB 7,400 36 –Finance One Public^ USD 6,000 – –Glow Energy THB 11,600 23 –Indorama Ventures THB 38,700 32 –Intouch Holdings, NVDR THB 53,200 67 0.01IRPC THB 283,100 34 –Kasikornbank THB 60,000 273 0.04Krung Thai Bank THB 180,800 88 0.01Land & Houses THB 89,400 20 –Land & Houses ‘Registered Shares’ THB 79,300 18 –Minor International ‘Registered Shares’ THB 92,000 78 0.01PTT THB 48,800 448 0.06PTT Exploration & Production ‘Registered Shares’ THB 35,089 81 0.01PTT Global Chemical THB 56,200 95 0.01Siam Cement THB 19,900 251 0.03Siam Commercial Bank THB 77,000 294 0.04Thai Oil THB 26,900 48 0.01TMB Bank THB 612,500 35 –Total Access Communication, NVDR THB 14,400 14 –Total Access Communication THB 9,200 9 –True THB 272,600 42 0.01 2,925 0.38
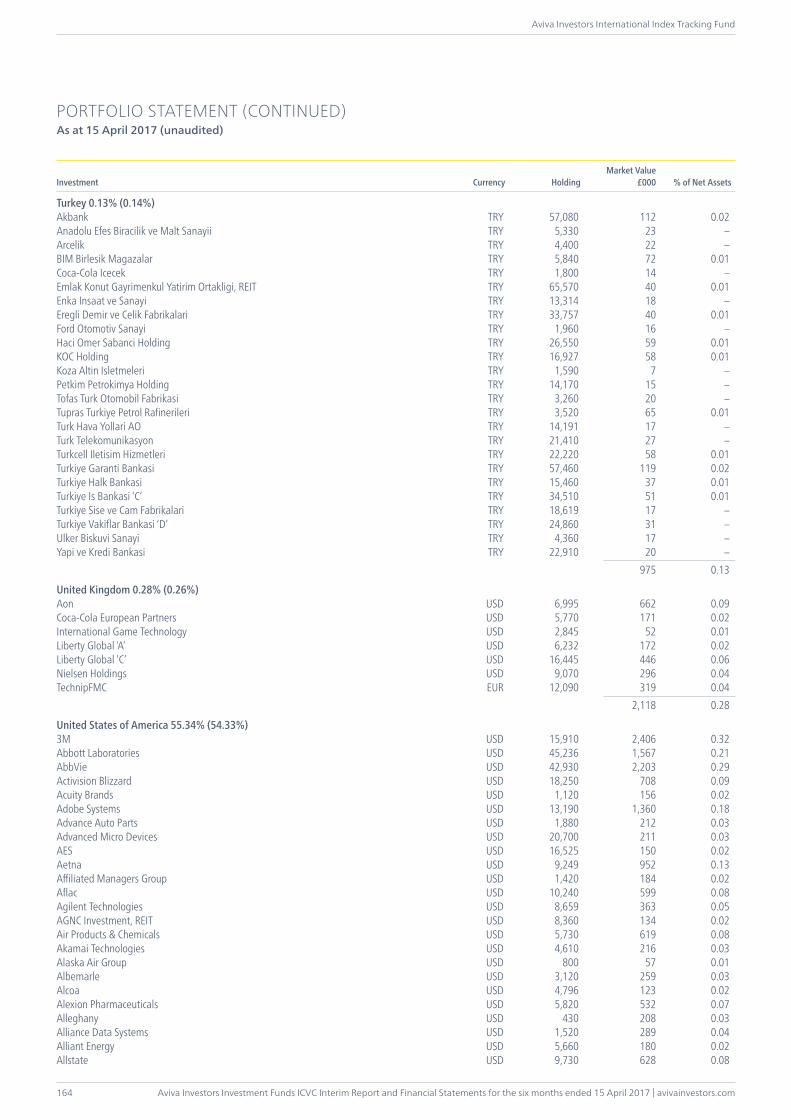
Aviva Investors Investment Funds ICVC Interim Report and Financial Statements for the six months ended 15 April 2017 | avivainvestors.com
Aviva Investors International Index Tracking Fund
164
PORTFOLIO STATEMENT (CONTINUED)As at 15 April 2017 (unaudited)
Investment Currency HoldingMarket Value
£000 % of Net Assets
Turkey 0.13% (0.14%)Akbank TRY 57,080 112 0.02Anadolu Efes Biracilik ve Malt Sanayii TRY 5,330 23 –Arcelik TRY 4,400 22 –BIM Birlesik Magazalar TRY 5,840 72 0.01Coca-Cola Icecek TRY 1,800 14 –Emlak Konut Gayrimenkul Yatirim Ortakligi, REIT TRY 65,570 40 0.01Enka Insaat ve Sanayi TRY 13,314 18 –Eregli Demir ve Celik Fabrikalari TRY 33,757 40 0.01Ford Otomotiv Sanayi TRY 1,960 16 –Haci Omer Sabanci Holding TRY 26,550 59 0.01KOC Holding TRY 16,927 58 0.01Koza Altin Isletmeleri TRY 1,590 7 –Petkim Petrokimya Holding TRY 14,170 15 –Tofas Turk Otomobil Fabrikasi TRY 3,260 20 –Tupras Turkiye Petrol Rafinerileri TRY 3,520 65 0.01Turk Hava Yollari AO TRY 14,191 17 –Turk Telekomunikasyon TRY 21,410 27 –Turkcell Iletisim Hizmetleri TRY 22,220 58 0.01Turkiye Garanti Bankasi TRY 57,460 119 0.02Turkiye Halk Bankasi TRY 15,460 37 0.01Turkiye Is Bankasi ‘C’ TRY 34,510 51 0.01Turkiye Sise ve Cam Fabrikalari TRY 18,619 17 –Turkiye Vakiflar Bankasi ‘D’ TRY 24,860 31 –Ulker Biskuvi Sanayi TRY 4,360 17 –Yapi ve Kredi Bankasi TRY 22,910 20 – 975 0.13
United Kingdom 0.28% (0.26%)Aon USD 6,995 662 0.09Coca-Cola European Partners USD 5,770 171 0.02International Game Technology USD 2,845 52 0.01Liberty Global ‘A’ USD 6,232 172 0.02Liberty Global ‘C’ USD 16,445 446 0.06Nielsen Holdings USD 9,070 296 0.04TechnipFMC EUR 12,090 319 0.04 2,118 0.28
United States of America 55.34% (54.33%)3M USD 15,910 2,406 0.32Abbott Laboratories USD 45,236 1,567 0.21AbbVie USD 42,930 2,203 0.29Activision Blizzard USD 18,250 708 0.09Acuity Brands USD 1,120 156 0.02Adobe Systems USD 13,190 1,360 0.18Advance Auto Parts USD 1,880 212 0.03Advanced Micro Devices USD 20,700 211 0.03AES USD 16,525 150 0.02Aetna USD 9,249 952 0.13Affiliated Managers Group USD 1,420 184 0.02Aflac USD 10,240 599 0.08Agilent Technologies USD 8,659 363 0.05AGNC Investment, REIT USD 8,360 134 0.02Air Products & Chemicals USD 5,730 619 0.08Akamai Technologies USD 4,610 216 0.03Alaska Air Group USD 800 57 0.01Albemarle USD 3,120 259 0.03Alcoa USD 4,796 123 0.02Alexion Pharmaceuticals USD 5,820 532 0.07Alleghany USD 430 208 0.03Alliance Data Systems USD 1,520 289 0.04Alliant Energy USD 5,660 180 0.02Allstate USD 9,730 628 0.08
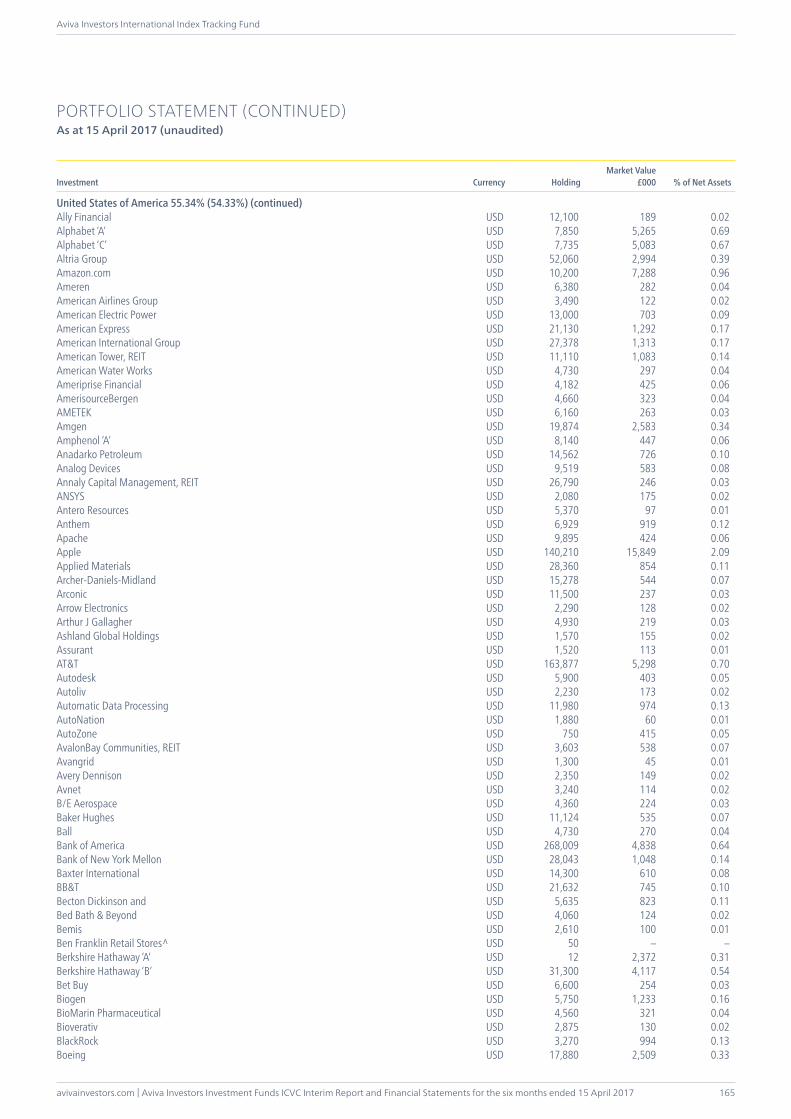
avivainvestors.com | Aviva Investors Investment Funds ICVC Interim Report and Financial Statements for the six months ended 15 April 2017
Aviva Investors International Index Tracking Fund
165
PORTFOLIO STATEMENT (CONTINUED)As at 15 April 2017 (unaudited)
Investment Currency HoldingMarket Value
£000 % of Net Assets
United States of America 55.34% (54.33%) (continued)Ally Financial USD 12,100 189 0.02Alphabet ‘A’ USD 7,850 5,265 0.69Alphabet ‘C’ USD 7,735 5,083 0.67Altria Group USD 52,060 2,994 0.39Amazon.com USD 10,200 7,288 0.96Ameren USD 6,380 282 0.04American Airlines Group USD 3,490 122 0.02American Electric Power USD 13,000 703 0.09American Express USD 21,130 1,292 0.17American International Group USD 27,378 1,313 0.17American Tower, REIT USD 11,110 1,083 0.14American Water Works USD 4,730 297 0.04Ameriprise Financial USD 4,182 425 0.06AmerisourceBergen USD 4,660 323 0.04AMETEK USD 6,160 263 0.03Amgen USD 19,874 2,583 0.34Amphenol ‘A’ USD 8,140 447 0.06Anadarko Petroleum USD 14,562 726 0.10Analog Devices USD 9,519 583 0.08Annaly Capital Management, REIT USD 26,790 246 0.03ANSYS USD 2,080 175 0.02Antero Resources USD 5,370 97 0.01Anthem USD 6,929 919 0.12Apache USD 9,895 424 0.06Apple USD 140,210 15,849 2.09Applied Materials USD 28,360 854 0.11Archer-Daniels-Midland USD 15,278 544 0.07Arconic USD 11,500 237 0.03Arrow Electronics USD 2,290 128 0.02Arthur J Gallagher USD 4,930 219 0.03Ashland Global Holdings USD 1,570 155 0.02Assurant USD 1,520 113 0.01AT&T USD 163,877 5,298 0.70Autodesk USD 5,900 403 0.05Autoliv USD 2,230 173 0.02Automatic Data Processing USD 11,980 974 0.13AutoNation USD 1,880 60 0.01AutoZone USD 750 415 0.05AvalonBay Communities, REIT USD 3,603 538 0.07Avangrid USD 1,300 45 0.01Avery Dennison USD 2,350 149 0.02Avnet USD 3,240 114 0.02B/E Aerospace USD 4,360 224 0.03Baker Hughes USD 11,124 535 0.07Ball USD 4,730 270 0.04Bank of America USD 268,009 4,838 0.64Bank of New York Mellon USD 28,043 1,048 0.14Baxter International USD 14,300 610 0.08BB&T USD 21,632 745 0.10Becton Dickinson and USD 5,635 823 0.11Bed Bath & Beyond USD 4,060 124 0.02Bemis USD 2,610 100 0.01Ben Franklin Retail Stores^ USD 50 – –Berkshire Hathaway ‘A’ USD 12 2,372 0.31Berkshire Hathaway ‘B’ USD 31,300 4,117 0.54Bet Buy USD 6,600 254 0.03Biogen USD 5,750 1,233 0.16BioMarin Pharmaceutical USD 4,560 321 0.04Bioverativ USD 2,875 130 0.02BlackRock USD 3,270 994 0.13Boeing USD 17,880 2,509 0.33
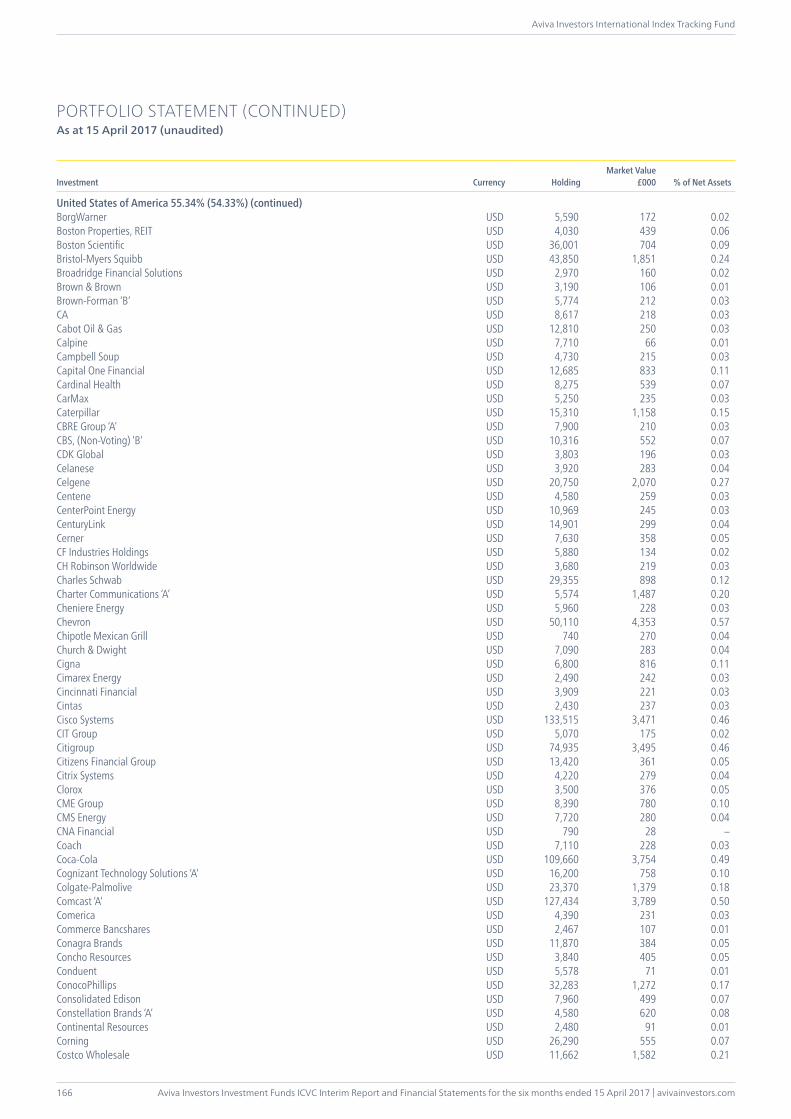
Aviva Investors Investment Funds ICVC Interim Report and Financial Statements for the six months ended 15 April 2017 | avivainvestors.com
Aviva Investors International Index Tracking Fund
166
PORTFOLIO STATEMENT (CONTINUED)As at 15 April 2017 (unaudited)
Investment Currency HoldingMarket Value
£000 % of Net Assets
United States of America 55.34% (54.33%) (continued)BorgWarner USD 5,590 172 0.02Boston Properties, REIT USD 4,030 439 0.06Boston Scientific USD 36,001 704 0.09Bristol-Myers Squibb USD 43,850 1,851 0.24Broadridge Financial Solutions USD 2,970 160 0.02Brown & Brown USD 3,190 106 0.01Brown-Forman ‘B’ USD 5,774 212 0.03CA USD 8,617 218 0.03Cabot Oil & Gas USD 12,810 250 0.03Calpine USD 7,710 66 0.01Campbell Soup USD 4,730 215 0.03Capital One Financial USD 12,685 833 0.11Cardinal Health USD 8,275 539 0.07CarMax USD 5,250 235 0.03Caterpillar USD 15,310 1,158 0.15CBRE Group ‘A’ USD 7,900 210 0.03CBS, (Non-Voting) ‘B’ USD 10,316 552 0.07CDK Global USD 3,803 196 0.03Celanese USD 3,920 283 0.04Celgene USD 20,750 2,070 0.27Centene USD 4,580 259 0.03CenterPoint Energy USD 10,969 245 0.03CenturyLink USD 14,901 299 0.04Cerner USD 7,630 358 0.05CF Industries Holdings USD 5,880 134 0.02CH Robinson Worldwide USD 3,680 219 0.03Charles Schwab USD 29,355 898 0.12Charter Communications ‘A’ USD 5,574 1,487 0.20Cheniere Energy USD 5,960 228 0.03Chevron USD 50,110 4,353 0.57Chipotle Mexican Grill USD 740 270 0.04Church & Dwight USD 7,090 283 0.04Cigna USD 6,800 816 0.11Cimarex Energy USD 2,490 242 0.03Cincinnati Financial USD 3,909 221 0.03Cintas USD 2,430 237 0.03Cisco Systems USD 133,515 3,471 0.46CIT Group USD 5,070 175 0.02Citigroup USD 74,935 3,495 0.46Citizens Financial Group USD 13,420 361 0.05Citrix Systems USD 4,220 279 0.04Clorox USD 3,500 376 0.05CME Group USD 8,390 780 0.10CMS Energy USD 7,720 280 0.04CNA Financial USD 790 28 –Coach USD 7,110 228 0.03Coca-Cola USD 109,660 3,754 0.49Cognizant Technology Solutions ‘A’ USD 16,200 758 0.10Colgate-Palmolive USD 23,370 1,379 0.18Comcast ‘A’ USD 127,434 3,789 0.50Comerica USD 4,390 231 0.03Commerce Bancshares USD 2,467 107 0.01Conagra Brands USD 11,870 384 0.05Concho Resources USD 3,840 405 0.05Conduent USD 5,578 71 0.01ConocoPhillips USD 32,283 1,272 0.17Consolidated Edison USD 7,960 499 0.07Constellation Brands ‘A’ USD 4,580 620 0.08Continental Resources USD 2,480 91 0.01Corning USD 26,290 555 0.07Costco Wholesale USD 11,662 1,582 0.21
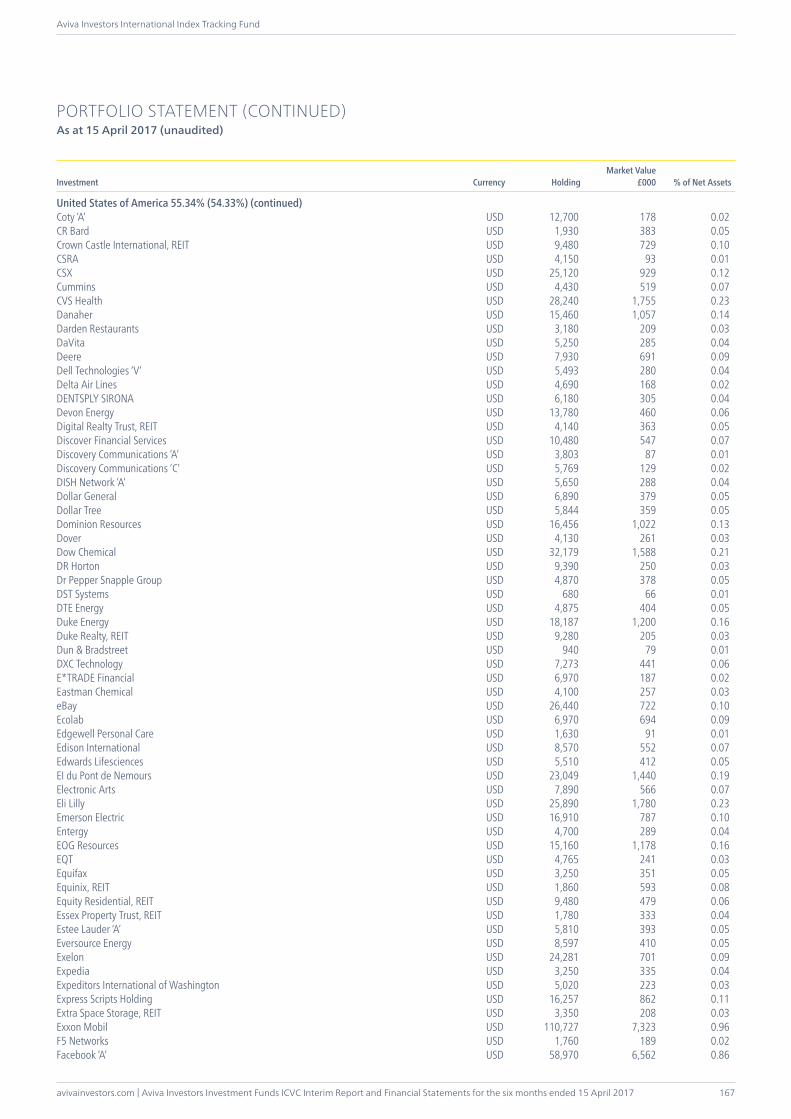
avivainvestors.com | Aviva Investors Investment Funds ICVC Interim Report and Financial Statements for the six months ended 15 April 2017
Aviva Investors International Index Tracking Fund
167
PORTFOLIO STATEMENT (CONTINUED)As at 15 April 2017 (unaudited)
Investment Currency HoldingMarket Value
£000 % of Net Assets
United States of America 55.34% (54.33%) (continued)Coty ‘A’ USD 12,700 178 0.02CR Bard USD 1,930 383 0.05Crown Castle International, REIT USD 9,480 729 0.10CSRA USD 4,150 93 0.01CSX USD 25,120 929 0.12Cummins USD 4,430 519 0.07CVS Health USD 28,240 1,755 0.23Danaher USD 15,460 1,057 0.14Darden Restaurants USD 3,180 209 0.03DaVita USD 5,250 285 0.04Deere USD 7,930 691 0.09Dell Technologies ‘V’ USD 5,493 280 0.04Delta Air Lines USD 4,690 168 0.02DENTSPLY SIRONA USD 6,180 305 0.04Devon Energy USD 13,780 460 0.06Digital Realty Trust, REIT USD 4,140 363 0.05Discover Financial Services USD 10,480 547 0.07Discovery Communications ‘A’ USD 3,803 87 0.01Discovery Communications ‘C’ USD 5,769 129 0.02DISH Network ‘A’ USD 5,650 288 0.04Dollar General USD 6,890 379 0.05Dollar Tree USD 5,844 359 0.05Dominion Resources USD 16,456 1,022 0.13Dover USD 4,130 261 0.03Dow Chemical USD 32,179 1,588 0.21DR Horton USD 9,390 250 0.03Dr Pepper Snapple Group USD 4,870 378 0.05DST Systems USD 680 66 0.01DTE Energy USD 4,875 404 0.05Duke Energy USD 18,187 1,200 0.16Duke Realty, REIT USD 9,280 205 0.03Dun & Bradstreet USD 940 79 0.01DXC Technology USD 7,273 441 0.06E*TRADE Financial USD 6,970 187 0.02Eastman Chemical USD 4,100 257 0.03eBay USD 26,440 722 0.10Ecolab USD 6,970 694 0.09Edgewell Personal Care USD 1,630 91 0.01Edison International USD 8,570 552 0.07Edwards Lifesciences USD 5,510 412 0.05EI du Pont de Nemours USD 23,049 1,440 0.19Electronic Arts USD 7,890 566 0.07Eli Lilly USD 25,890 1,780 0.23Emerson Electric USD 16,910 787 0.10Entergy USD 4,700 289 0.04EOG Resources USD 15,160 1,178 0.16EQT USD 4,765 241 0.03Equifax USD 3,250 351 0.05Equinix, REIT USD 1,860 593 0.08Equity Residential, REIT USD 9,480 479 0.06Essex Property Trust, REIT USD 1,780 333 0.04Estee Lauder ‘A’ USD 5,810 393 0.05Eversource Energy USD 8,597 410 0.05Exelon USD 24,281 701 0.09Expedia USD 3,250 335 0.04Expeditors International of Washington USD 5,020 223 0.03Express Scripts Holding USD 16,257 862 0.11Extra Space Storage, REIT USD 3,350 208 0.03Exxon Mobil USD 110,727 7,323 0.96F5 Networks USD 1,760 189 0.02Facebook ‘A’ USD 58,970 6,562 0.86
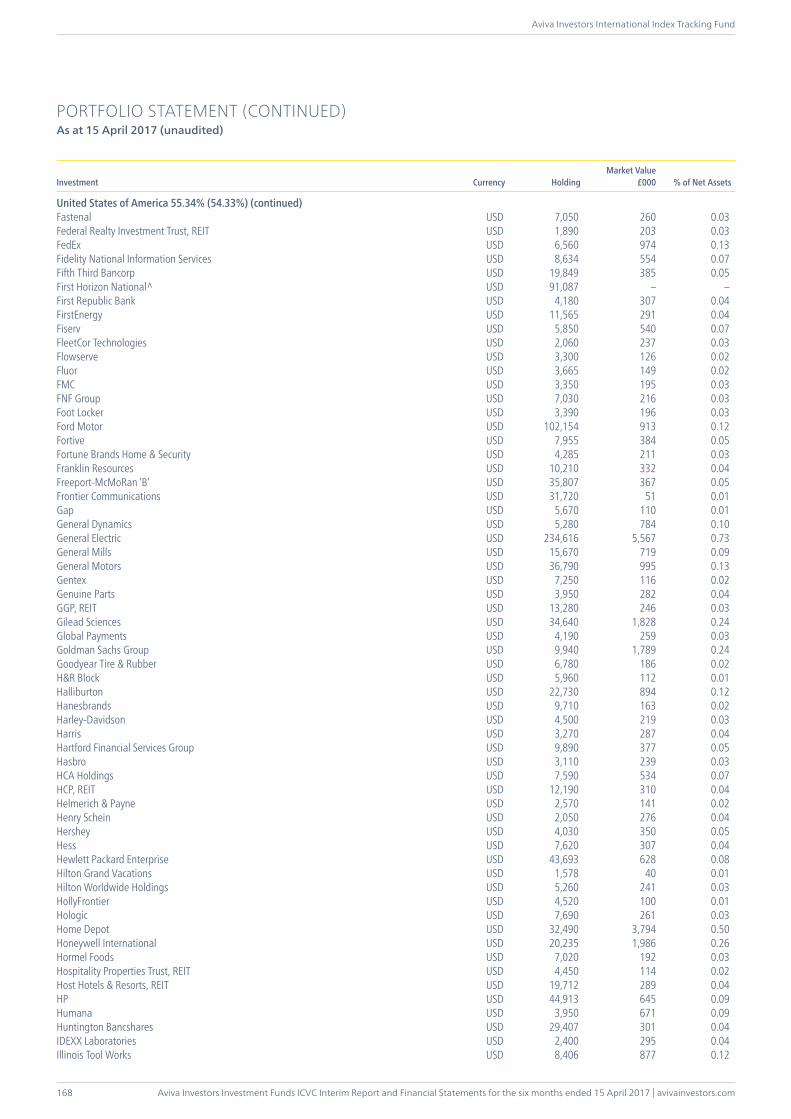
Aviva Investors Investment Funds ICVC Interim Report and Financial Statements for the six months ended 15 April 2017 | avivainvestors.com
Aviva Investors International Index Tracking Fund
168
PORTFOLIO STATEMENT (CONTINUED)As at 15 April 2017 (unaudited)
Investment Currency HoldingMarket Value
£000 % of Net Assets
United States of America 55.34% (54.33%) (continued)Fastenal USD 7,050 260 0.03Federal Realty Investment Trust, REIT USD 1,890 203 0.03FedEx USD 6,560 974 0.13Fidelity National Information Services USD 8,634 554 0.07Fifth Third Bancorp USD 19,849 385 0.05First Horizon National^ USD 91,087 – –First Republic Bank USD 4,180 307 0.04FirstEnergy USD 11,565 291 0.04Fiserv USD 5,850 540 0.07FleetCor Technologies USD 2,060 237 0.03Flowserve USD 3,300 126 0.02Fluor USD 3,665 149 0.02FMC USD 3,350 195 0.03FNF Group USD 7,030 216 0.03Foot Locker USD 3,390 196 0.03Ford Motor USD 102,154 913 0.12Fortive USD 7,955 384 0.05Fortune Brands Home & Security USD 4,285 211 0.03Franklin Resources USD 10,210 332 0.04Freeport-McMoRan ‘B’ USD 35,807 367 0.05Frontier Communications USD 31,720 51 0.01Gap USD 5,670 110 0.01General Dynamics USD 5,280 784 0.10General Electric USD 234,616 5,567 0.73General Mills USD 15,670 719 0.09General Motors USD 36,790 995 0.13Gentex USD 7,250 116 0.02Genuine Parts USD 3,950 282 0.04GGP, REIT USD 13,280 246 0.03Gilead Sciences USD 34,640 1,828 0.24Global Payments USD 4,190 259 0.03Goldman Sachs Group USD 9,940 1,789 0.24Goodyear Tire & Rubber USD 6,780 186 0.02H&R Block USD 5,960 112 0.01Halliburton USD 22,730 894 0.12Hanesbrands USD 9,710 163 0.02Harley-Davidson USD 4,500 219 0.03Harris USD 3,270 287 0.04Hartford Financial Services Group USD 9,890 377 0.05Hasbro USD 3,110 239 0.03HCA Holdings USD 7,590 534 0.07HCP, REIT USD 12,190 310 0.04Helmerich & Payne USD 2,570 141 0.02Henry Schein USD 2,050 276 0.04Hershey USD 4,030 350 0.05Hess USD 7,620 307 0.04Hewlett Packard Enterprise USD 43,693 628 0.08Hilton Grand Vacations USD 1,578 40 0.01Hilton Worldwide Holdings USD 5,260 241 0.03HollyFrontier USD 4,520 100 0.01Hologic USD 7,690 261 0.03Home Depot USD 32,490 3,794 0.50Honeywell International USD 20,235 1,986 0.26Hormel Foods USD 7,020 192 0.03Hospitality Properties Trust, REIT USD 4,450 114 0.02Host Hotels & Resorts, REIT USD 19,712 289 0.04HP USD 44,913 645 0.09Humana USD 3,950 671 0.09Huntington Bancshares USD 29,407 301 0.04IDEXX Laboratories USD 2,400 295 0.04Illinois Tool Works USD 8,406 877 0.12
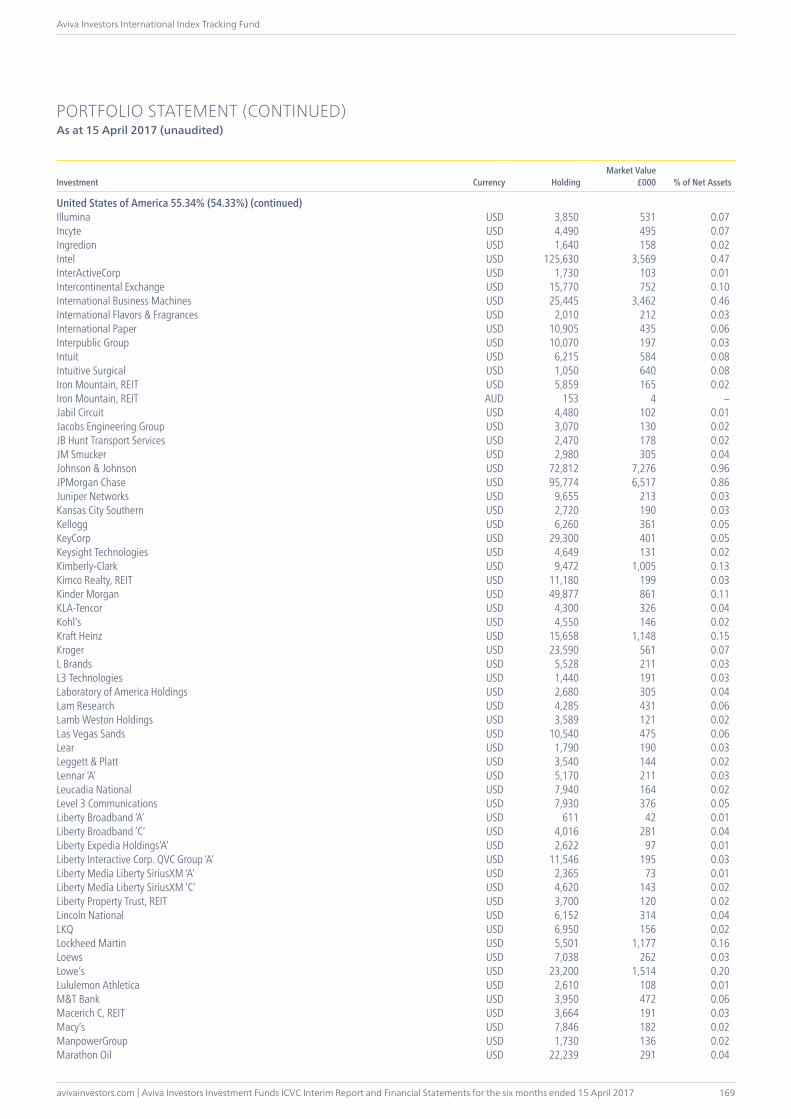
avivainvestors.com | Aviva Investors Investment Funds ICVC Interim Report and Financial Statements for the six months ended 15 April 2017
Aviva Investors International Index Tracking Fund
169
PORTFOLIO STATEMENT (CONTINUED)As at 15 April 2017 (unaudited)
Investment Currency HoldingMarket Value
£000 % of Net Assets
United States of America 55.34% (54.33%) (continued)Illumina USD 3,850 531 0.07Incyte USD 4,490 495 0.07Ingredion USD 1,640 158 0.02Intel USD 125,630 3,569 0.47InterActiveCorp USD 1,730 103 0.01Intercontinental Exchange USD 15,770 752 0.10International Business Machines USD 25,445 3,462 0.46International Flavors & Fragrances USD 2,010 212 0.03International Paper USD 10,905 435 0.06Interpublic Group USD 10,070 197 0.03Intuit USD 6,215 584 0.08Intuitive Surgical USD 1,050 640 0.08Iron Mountain, REIT USD 5,859 165 0.02Iron Mountain, REIT AUD 153 4 –Jabil Circuit USD 4,480 102 0.01Jacobs Engineering Group USD 3,070 130 0.02JB Hunt Transport Services USD 2,470 178 0.02JM Smucker USD 2,980 305 0.04Johnson & Johnson USD 72,812 7,276 0.96JPMorgan Chase USD 95,774 6,517 0.86Juniper Networks USD 9,655 213 0.03Kansas City Southern USD 2,720 190 0.03Kellogg USD 6,260 361 0.05KeyCorp USD 29,300 401 0.05Keysight Technologies USD 4,649 131 0.02Kimberly-Clark USD 9,472 1,005 0.13Kimco Realty, REIT USD 11,180 199 0.03Kinder Morgan USD 49,877 861 0.11KLA-Tencor USD 4,300 326 0.04Kohl’s USD 4,550 146 0.02Kraft Heinz USD 15,658 1,148 0.15Kroger USD 23,590 561 0.07L Brands USD 5,528 211 0.03L3 Technologies USD 1,440 191 0.03Laboratory of America Holdings USD 2,680 305 0.04Lam Research USD 4,285 431 0.06Lamb Weston Holdings USD 3,589 121 0.02Las Vegas Sands USD 10,540 475 0.06Lear USD 1,790 190 0.03Leggett & Platt USD 3,540 144 0.02Lennar ‘A’ USD 5,170 211 0.03Leucadia National USD 7,940 164 0.02Level 3 Communications USD 7,930 376 0.05Liberty Broadband ‘A’ USD 611 42 0.01Liberty Broadband ‘C’ USD 4,016 281 0.04Liberty Expedia Holdings’A’ USD 2,622 97 0.01Liberty Interactive Corp. QVC Group ‘A’ USD 11,546 195 0.03Liberty Media Liberty SiriusXM ‘A’ USD 2,365 73 0.01Liberty Media Liberty SiriusXM ‘C’ USD 4,620 143 0.02Liberty Property Trust, REIT USD 3,700 120 0.02Lincoln National USD 6,152 314 0.04LKQ USD 6,950 156 0.02Lockheed Martin USD 5,501 1,177 0.16Loews USD 7,038 262 0.03Lowe’s USD 23,200 1,514 0.20Lululemon Athletica USD 2,610 108 0.01M&T Bank USD 3,950 472 0.06Macerich C, REIT USD 3,664 191 0.03Macy’s USD 7,846 182 0.02ManpowerGroup USD 1,730 136 0.02Marathon Oil USD 22,239 291 0.04
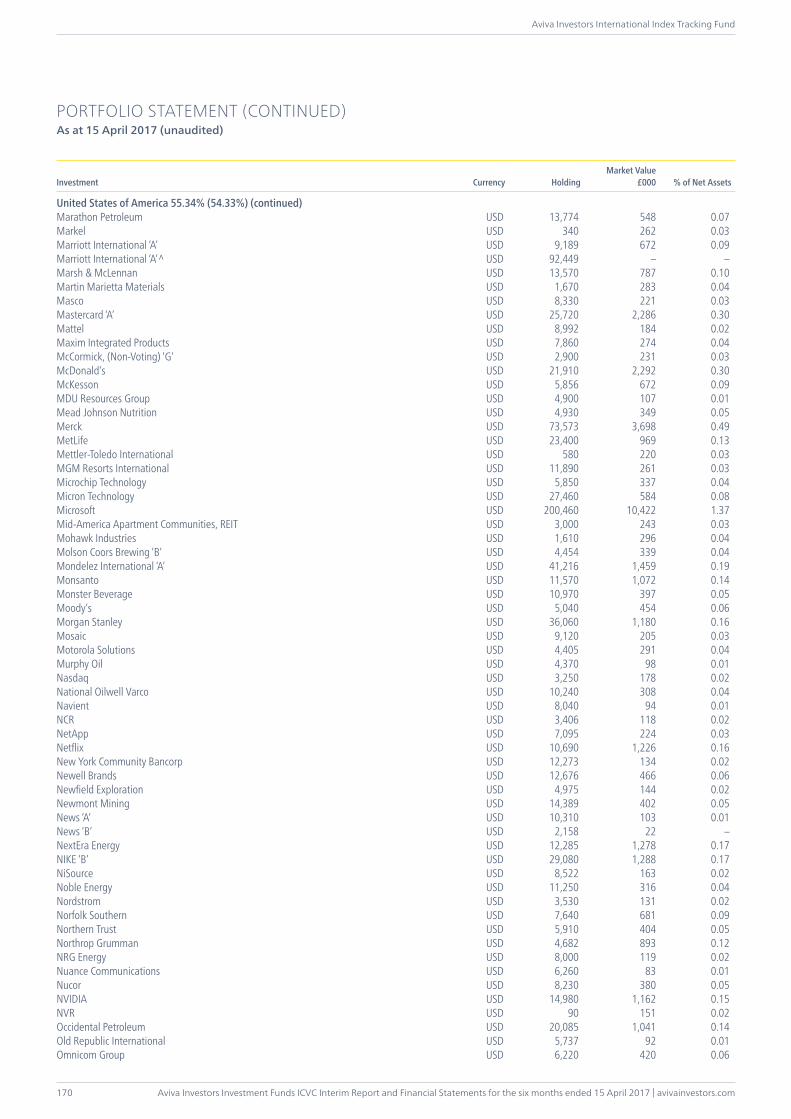
Aviva Investors Investment Funds ICVC Interim Report and Financial Statements for the six months ended 15 April 2017 | avivainvestors.com
Aviva Investors International Index Tracking Fund
170
PORTFOLIO STATEMENT (CONTINUED)As at 15 April 2017 (unaudited)
Investment Currency HoldingMarket Value
£000 % of Net Assets
United States of America 55.34% (54.33%) (continued)Marathon Petroleum USD 13,774 548 0.07Markel USD 340 262 0.03Marriott International ‘A’ USD 9,189 672 0.09Marriott International ‘A’^ USD 92,449 – –Marsh & McLennan USD 13,570 787 0.10Martin Marietta Materials USD 1,670 283 0.04Masco USD 8,330 221 0.03Mastercard ‘A’ USD 25,720 2,286 0.30Mattel USD 8,992 184 0.02Maxim Integrated Products USD 7,860 274 0.04McCormick, (Non-Voting) ‘G’ USD 2,900 231 0.03McDonald’s USD 21,910 2,292 0.30McKesson USD 5,856 672 0.09MDU Resources Group USD 4,900 107 0.01Mead Johnson Nutrition USD 4,930 349 0.05Merck USD 73,573 3,698 0.49MetLife USD 23,400 969 0.13Mettler-Toledo International USD 580 220 0.03MGM Resorts International USD 11,890 261 0.03Microchip Technology USD 5,850 337 0.04Micron Technology USD 27,460 584 0.08Microsoft USD 200,460 10,422 1.37Mid-America Apartment Communities, REIT USD 3,000 243 0.03Mohawk Industries USD 1,610 296 0.04Molson Coors Brewing ‘B’ USD 4,454 339 0.04Mondelez International ‘A’ USD 41,216 1,459 0.19Monsanto USD 11,570 1,072 0.14Monster Beverage USD 10,970 397 0.05Moody’s USD 5,040 454 0.06Morgan Stanley USD 36,060 1,180 0.16Mosaic USD 9,120 205 0.03Motorola Solutions USD 4,405 291 0.04Murphy Oil USD 4,370 98 0.01Nasdaq USD 3,250 178 0.02National Oilwell Varco USD 10,240 308 0.04Navient USD 8,040 94 0.01NCR USD 3,406 118 0.02NetApp USD 7,095 224 0.03Netflix USD 10,690 1,226 0.16New York Community Bancorp USD 12,273 134 0.02Newell Brands USD 12,676 466 0.06Newfield Exploration USD 4,975 144 0.02Newmont Mining USD 14,389 402 0.05News ‘A’ USD 10,310 103 0.01News ‘B’ USD 2,158 22 –NextEra Energy USD 12,285 1,278 0.17NIKE ‘B’ USD 29,080 1,288 0.17NiSource USD 8,522 163 0.02Noble Energy USD 11,250 316 0.04Nordstrom USD 3,530 131 0.02Norfolk Southern USD 7,640 681 0.09Northern Trust USD 5,910 404 0.05Northrop Grumman USD 4,682 893 0.12NRG Energy USD 8,000 119 0.02Nuance Communications USD 6,260 83 0.01Nucor USD 8,230 380 0.05NVIDIA USD 14,980 1,162 0.15NVR USD 90 151 0.02Occidental Petroleum USD 20,085 1,041 0.14Old Republic International USD 5,737 92 0.01Omnicom Group USD 6,220 420 0.06
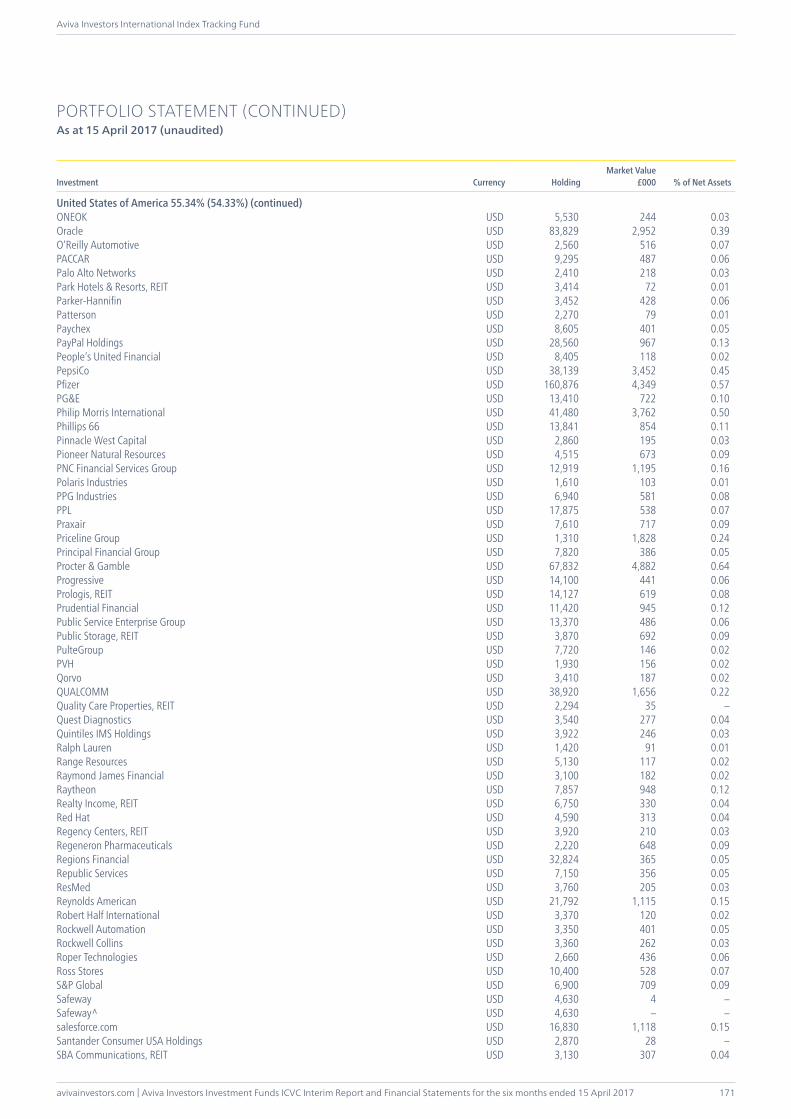
avivainvestors.com | Aviva Investors Investment Funds ICVC Interim Report and Financial Statements for the six months ended 15 April 2017
Aviva Investors International Index Tracking Fund
171
PORTFOLIO STATEMENT (CONTINUED)As at 15 April 2017 (unaudited)
Investment Currency HoldingMarket Value
£000 % of Net Assets
United States of America 55.34% (54.33%) (continued)ONEOK USD 5,530 244 0.03Oracle USD 83,829 2,952 0.39O’Reilly Automotive USD 2,560 516 0.07PACCAR USD 9,295 487 0.06Palo Alto Networks USD 2,410 218 0.03Park Hotels & Resorts, REIT USD 3,414 72 0.01Parker-Hannifin USD 3,452 428 0.06Patterson USD 2,270 79 0.01Paychex USD 8,605 401 0.05PayPal Holdings USD 28,560 967 0.13People’s United Financial USD 8,405 118 0.02PepsiCo USD 38,139 3,452 0.45Pfizer USD 160,876 4,349 0.57PG&E USD 13,410 722 0.10Philip Morris International USD 41,480 3,762 0.50Phillips 66 USD 13,841 854 0.11Pinnacle West Capital USD 2,860 195 0.03Pioneer Natural Resources USD 4,515 673 0.09PNC Financial Services Group USD 12,919 1,195 0.16Polaris Industries USD 1,610 103 0.01PPG Industries USD 6,940 581 0.08PPL USD 17,875 538 0.07Praxair USD 7,610 717 0.09Priceline Group USD 1,310 1,828 0.24Principal Financial Group USD 7,820 386 0.05Procter & Gamble USD 67,832 4,882 0.64Progressive USD 14,100 441 0.06Prologis, REIT USD 14,127 619 0.08Prudential Financial USD 11,420 945 0.12Public Service Enterprise Group USD 13,370 486 0.06Public Storage, REIT USD 3,870 692 0.09PulteGroup USD 7,720 146 0.02PVH USD 1,930 156 0.02Qorvo USD 3,410 187 0.02QUALCOMM USD 38,920 1,656 0.22Quality Care Properties, REIT USD 2,294 35 –Quest Diagnostics USD 3,540 277 0.04Quintiles IMS Holdings USD 3,922 246 0.03Ralph Lauren USD 1,420 91 0.01Range Resources USD 5,130 117 0.02Raymond James Financial USD 3,100 182 0.02Raytheon USD 7,857 948 0.12Realty Income, REIT USD 6,750 330 0.04Red Hat USD 4,590 313 0.04Regency Centers, REIT USD 3,920 210 0.03Regeneron Pharmaceuticals USD 2,220 648 0.09Regions Financial USD 32,824 365 0.05Republic Services USD 7,150 356 0.05ResMed USD 3,760 205 0.03Reynolds American USD 21,792 1,115 0.15Robert Half International USD 3,370 120 0.02Rockwell Automation USD 3,350 401 0.05Rockwell Collins USD 3,360 262 0.03Roper Technologies USD 2,660 436 0.06Ross Stores USD 10,400 528 0.07S&P Global USD 6,900 709 0.09Safeway USD 4,630 4 –Safeway^ USD 4,630 – –salesforce.com USD 16,830 1,118 0.15Santander Consumer USA Holdings USD 2,870 28 –SBA Communications, REIT USD 3,130 307 0.04
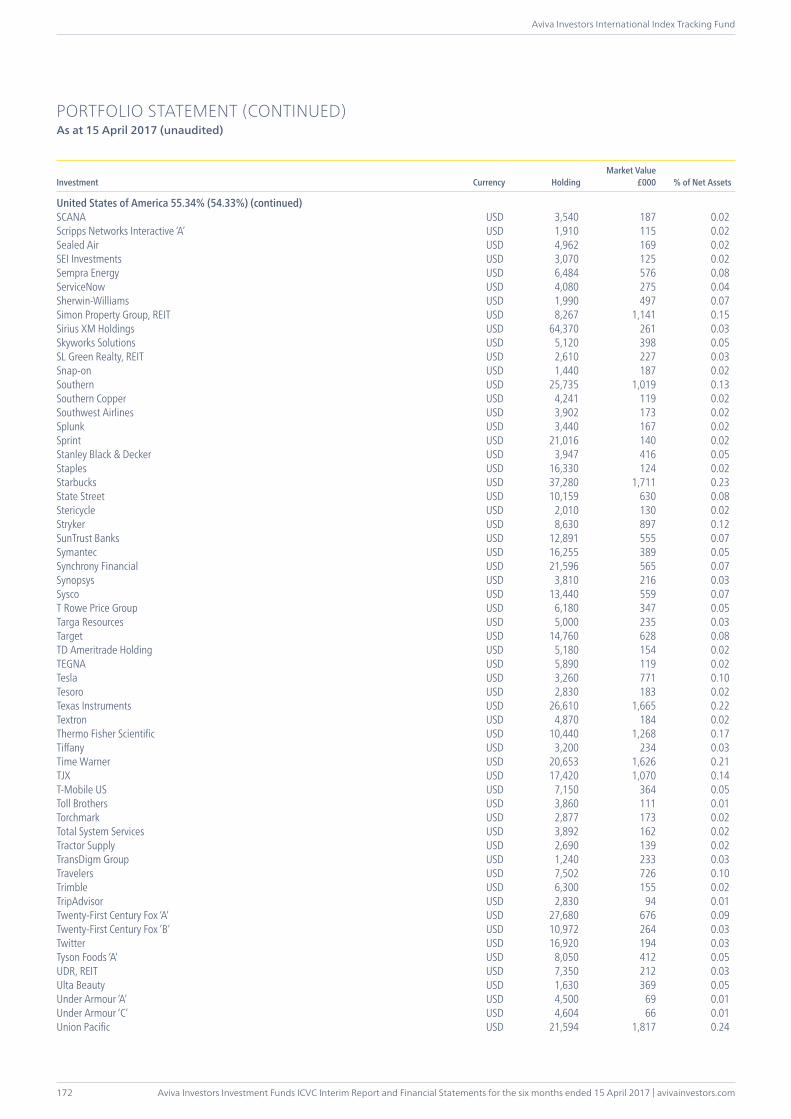
Aviva Investors Investment Funds ICVC Interim Report and Financial Statements for the six months ended 15 April 2017 | avivainvestors.com
Aviva Investors International Index Tracking Fund
172
PORTFOLIO STATEMENT (CONTINUED)As at 15 April 2017 (unaudited)
Investment Currency HoldingMarket Value
£000 % of Net Assets
United States of America 55.34% (54.33%) (continued)SCANA USD 3,540 187 0.02Scripps Networks Interactive ‘A’ USD 1,910 115 0.02Sealed Air USD 4,962 169 0.02SEI Investments USD 3,070 125 0.02Sempra Energy USD 6,484 576 0.08ServiceNow USD 4,080 275 0.04Sherwin-Williams USD 1,990 497 0.07Simon Property Group, REIT USD 8,267 1,141 0.15Sirius XM Holdings USD 64,370 261 0.03Skyworks Solutions USD 5,120 398 0.05SL Green Realty, REIT USD 2,610 227 0.03Snap-on USD 1,440 187 0.02Southern USD 25,735 1,019 0.13Southern Copper USD 4,241 119 0.02Southwest Airlines USD 3,902 173 0.02Splunk USD 3,440 167 0.02Sprint USD 21,016 140 0.02Stanley Black & Decker USD 3,947 416 0.05Staples USD 16,330 124 0.02Starbucks USD 37,280 1,711 0.23State Street USD 10,159 630 0.08Stericycle USD 2,010 130 0.02Stryker USD 8,630 897 0.12SunTrust Banks USD 12,891 555 0.07Symantec USD 16,255 389 0.05Synchrony Financial USD 21,596 565 0.07Synopsys USD 3,810 216 0.03Sysco USD 13,440 559 0.07T Rowe Price Group USD 6,180 347 0.05Targa Resources USD 5,000 235 0.03Target USD 14,760 628 0.08TD Ameritrade Holding USD 5,180 154 0.02TEGNA USD 5,890 119 0.02Tesla USD 3,260 771 0.10Tesoro USD 2,830 183 0.02Texas Instruments USD 26,610 1,665 0.22Textron USD 4,870 184 0.02Thermo Fisher Scientific USD 10,440 1,268 0.17Tiffany USD 3,200 234 0.03Time Warner USD 20,653 1,626 0.21TJX USD 17,420 1,070 0.14T-Mobile US USD 7,150 364 0.05Toll Brothers USD 3,860 111 0.01Torchmark USD 2,877 173 0.02Total System Services USD 3,892 162 0.02Tractor Supply USD 2,690 139 0.02TransDigm Group USD 1,240 233 0.03Travelers USD 7,502 726 0.10Trimble USD 6,300 155 0.02TripAdvisor USD 2,830 94 0.01Twenty-First Century Fox ‘A’ USD 27,680 676 0.09Twenty-First Century Fox ‘B’ USD 10,972 264 0.03Twitter USD 16,920 194 0.03Tyson Foods ‘A’ USD 8,050 412 0.05UDR, REIT USD 7,350 212 0.03Ulta Beauty USD 1,630 369 0.05Under Armour ‘A’ USD 4,500 69 0.01Under Armour ‘C’ USD 4,604 66 0.01Union Pacific USD 21,594 1,817 0.24
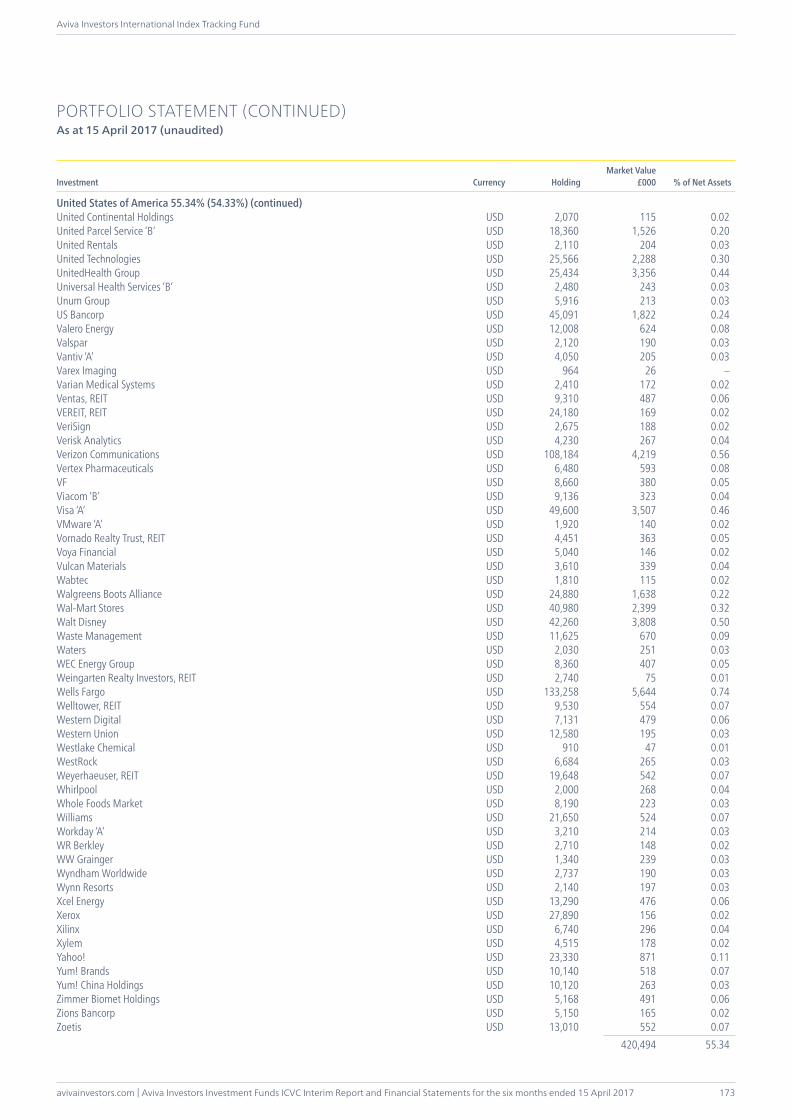
avivainvestors.com | Aviva Investors Investment Funds ICVC Interim Report and Financial Statements for the six months ended 15 April 2017
Aviva Investors International Index Tracking Fund
173
PORTFOLIO STATEMENT (CONTINUED)As at 15 April 2017 (unaudited)
Investment Currency HoldingMarket Value
£000 % of Net Assets
United States of America 55.34% (54.33%) (continued)United Continental Holdings USD 2,070 115 0.02United Parcel Service ‘B’ USD 18,360 1,526 0.20United Rentals USD 2,110 204 0.03United Technologies USD 25,566 2,288 0.30UnitedHealth Group USD 25,434 3,356 0.44Universal Health Services ‘B’ USD 2,480 243 0.03Unum Group USD 5,916 213 0.03US Bancorp USD 45,091 1,822 0.24Valero Energy USD 12,008 624 0.08Valspar USD 2,120 190 0.03Vantiv ‘A’ USD 4,050 205 0.03Varex Imaging USD 964 26 –Varian Medical Systems USD 2,410 172 0.02Ventas, REIT USD 9,310 487 0.06VEREIT, REIT USD 24,180 169 0.02VeriSign USD 2,675 188 0.02Verisk Analytics USD 4,230 267 0.04Verizon Communications USD 108,184 4,219 0.56Vertex Pharmaceuticals USD 6,480 593 0.08VF USD 8,660 380 0.05Viacom ‘B’ USD 9,136 323 0.04Visa ‘A’ USD 49,600 3,507 0.46VMware ‘A’ USD 1,920 140 0.02Vornado Realty Trust, REIT USD 4,451 363 0.05Voya Financial USD 5,040 146 0.02Vulcan Materials USD 3,610 339 0.04Wabtec USD 1,810 115 0.02Walgreens Boots Alliance USD 24,880 1,638 0.22Wal-Mart Stores USD 40,980 2,399 0.32Walt Disney USD 42,260 3,808 0.50Waste Management USD 11,625 670 0.09Waters USD 2,030 251 0.03WEC Energy Group USD 8,360 407 0.05Weingarten Realty Investors, REIT USD 2,740 75 0.01Wells Fargo USD 133,258 5,644 0.74Welltower, REIT USD 9,530 554 0.07Western Digital USD 7,131 479 0.06Western Union USD 12,580 195 0.03Westlake Chemical USD 910 47 0.01WestRock USD 6,684 265 0.03Weyerhaeuser, REIT USD 19,648 542 0.07Whirlpool USD 2,000 268 0.04Whole Foods Market USD 8,190 223 0.03Williams USD 21,650 524 0.07Workday ‘A’ USD 3,210 214 0.03WR Berkley USD 2,710 148 0.02WW Grainger USD 1,340 239 0.03Wyndham Worldwide USD 2,737 190 0.03Wynn Resorts USD 2,140 197 0.03Xcel Energy USD 13,290 476 0.06Xerox USD 27,890 156 0.02Xilinx USD 6,740 296 0.04Xylem USD 4,515 178 0.02Yahoo! USD 23,330 871 0.11Yum! Brands USD 10,140 518 0.07Yum! China Holdings USD 10,120 263 0.03Zimmer Biomet Holdings USD 5,168 491 0.06Zions Bancorp USD 5,150 165 0.02Zoetis USD 13,010 552 0.07 420,494 55.34
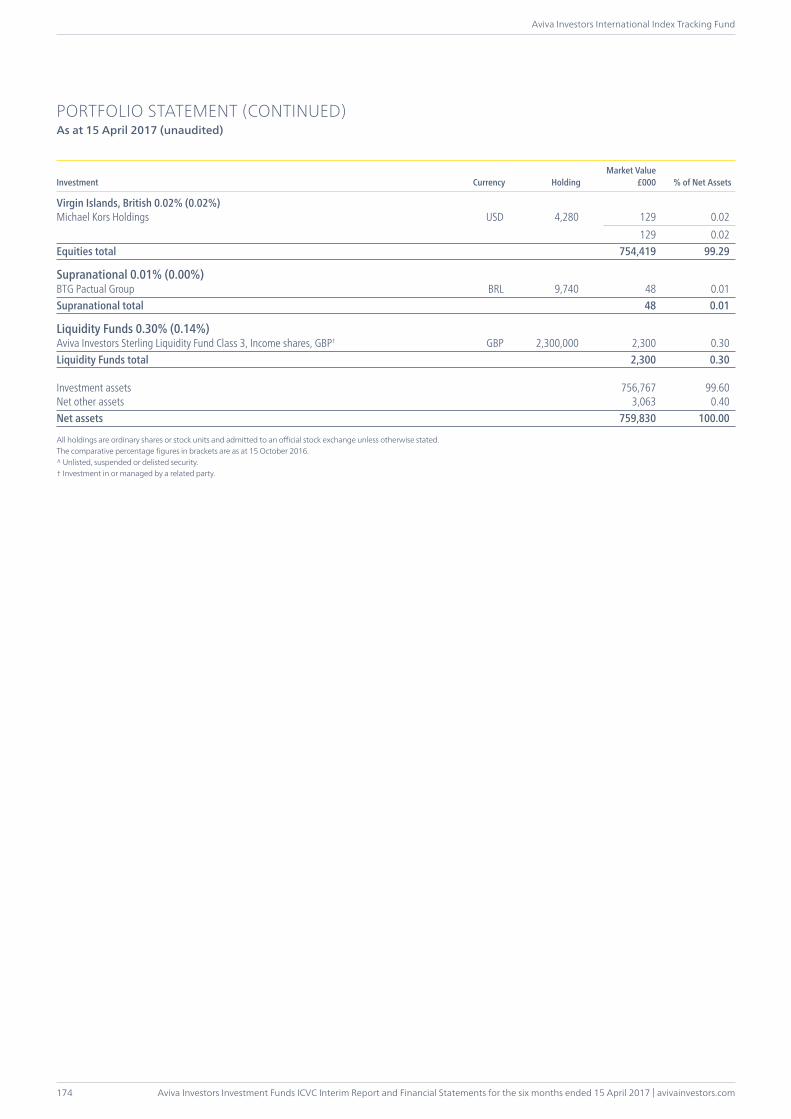
Aviva Investors Investment Funds ICVC Interim Report and Financial Statements for the six months ended 15 April 2017 | avivainvestors.com
Aviva Investors International Index Tracking Fund
174
PORTFOLIO STATEMENT (CONTINUED)As at 15 April 2017 (unaudited)
Investment Currency HoldingMarket Value
£000 % of Net Assets
Virgin Islands, British 0.02% (0.02%)Michael Kors Holdings USD 4,280 129 0.02 129 0.02Equities total 754,419 99.29
Supranational 0.01% (0.00%)BTG Pactual Group BRL 9,740 48 0.01Supranational total 48 0.01
Liquidity Funds 0.30% (0.14%)Aviva Investors Sterling Liquidity Fund Class 3, Income shares, GBP† GBP 2,300,000 2,300 0.30Liquidity Funds total 2,300 0.30
Investment assets 756,767 99.60Net other assets 3,063 0.40Net assets 759,830 100.00
All holdings are ordinary shares or stock units and admitted to an official stock exchange unless otherwise stated.The comparative percentage figures in brackets are as at 15 October 2016.^ Unlisted, suspended or delisted security.† Investment in or managed by a related party.
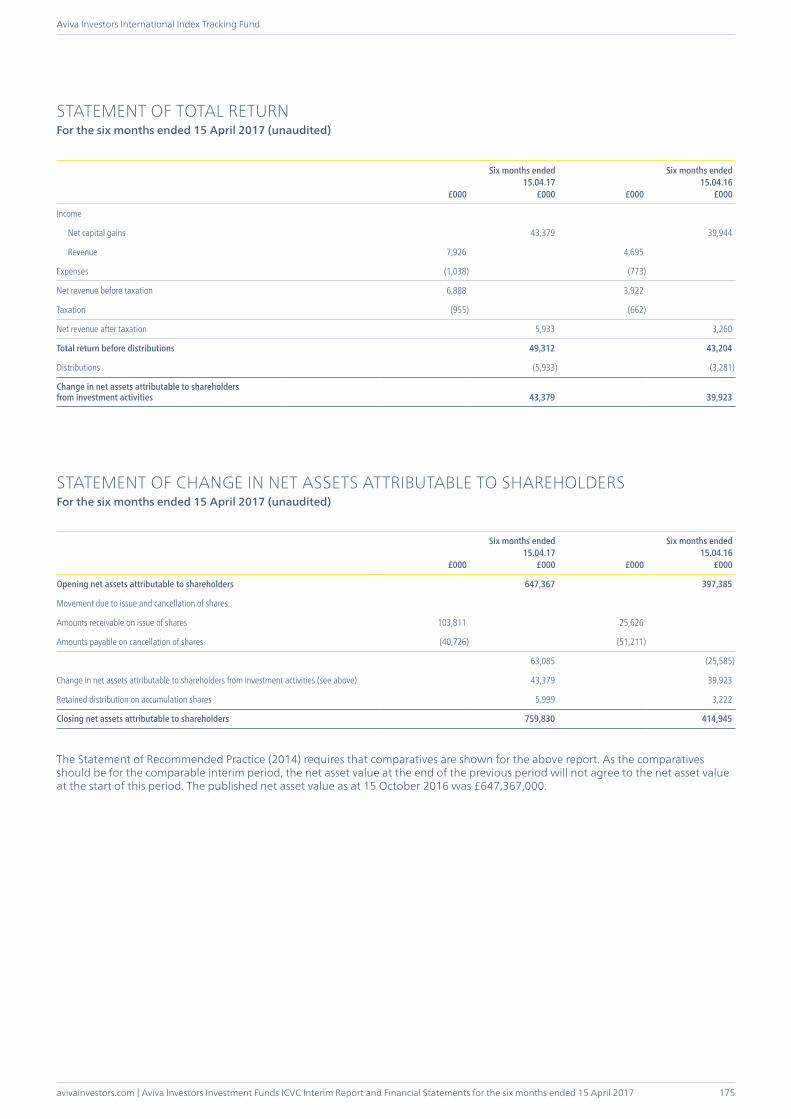
avivainvestors.com | Aviva Investors Investment Funds ICVC Interim Report and Financial Statements for the six months ended 15 April 2017
Aviva Investors International Index Tracking Fund
175
£000
Six months ended15.04.17
£000 £000
Six months ended15.04.16
£000
Income
Net capital gains 43,379 39,944
Revenue 7,926 4,695
Expenses (1,038) (773)
Net revenue before taxation 6,888 3,922
Taxation (955) (662)
Net revenue after taxation 5,933 3,260
Total return before distributions 49,312 43,204
Distributions (5,933) (3,281)
Change in net assets attributable to shareholders from investment activities 43,379 39,923
STATEMENT OF CHANGE IN NET ASSETS ATTRIBUTABLE TO SHAREHOLDERSFor the six months ended 15 April 2017 (unaudited)
£000
Six months ended15.04.17
£000 £000
Six months ended15.04.16
£000
Opening net assets attributable to shareholders 647,367 397,385
Movement due to issue and cancellation of shares:
Amounts receivable on issue of shares 103,811 25,626
Amounts payable on cancellation of shares (40,726) (51,211)
63,085 (25,585)
Change in net assets attributable to shareholders from investment activities (see above) 43,379 39,923
Retained distribution on accumulation shares 5,999 3,222
Closing net assets attributable to shareholders 759,830 414,945
The Statement of Recommended Practice (2014) requires that comparatives are shown for the above report. As the comparatives should be for the comparable interim period, the net asset value at the end of the previous period will not agree to the net asset value at the start of this period. The published net asset value as at 15 October 2016 was £647,367,000.
STATEMENT OF TOTAL RETURNFor the six months ended 15 April 2017 (unaudited)
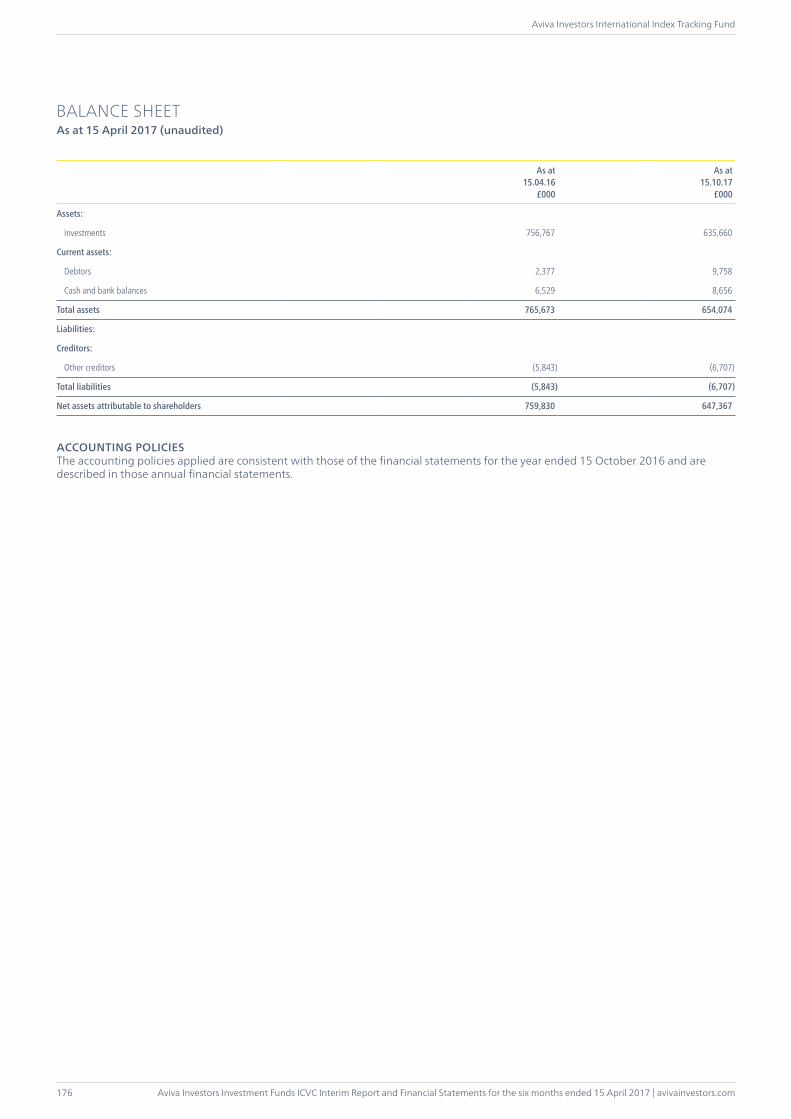
Aviva Investors Investment Funds ICVC Interim Report and Financial Statements for the six months ended 15 April 2017 | avivainvestors.com
Aviva Investors International Index Tracking Fund
176
BALANCE SHEETAs at 15 April 2017 (unaudited)
As at15.04.16
£000
As at15.10.17
£000
Assets:
Investments 756,767 635,660
Current assets:
Debtors 2,377 9,758
Cash and bank balances 6,529 8,656
Total assets 765,673 654,074
Liabilities:
Creditors:
Other creditors (5,843) (6,707)
Total liabilities (5,843) (6,707)
Net assets attributable to shareholders 759,830 647,367
ACCOUNTING POLICIESThe accounting policies applied are consistent with those of the financial statements for the year ended 15 October 2016 and are described in those annual financial statements.
avivainvestors.com | Aviva Investors Investment Funds ICVC Interim Report and Financial Statements for the six months ended 15 April 2017
Aviva Investors Global Equity Income Fund
177
INVESTMENT OBJECTIVETo provide an annualised income yield at least one and a quarter times that of the annual income yield obtainable on the MSCI World Index (GBP), with the potential for capital growth. Income on the Fund will be paid quarterly. The income aim is a 12 month rolling target and is before the deduction of charges and after the deduction of tax for a UK basic rate income taxpayer. For the purposes of measuring the income aim the annual income yield of the Index will also be calculated on a 12 month rolling basis.
INVESTMENT POLICYThe Fund aims to achieve the investment objective by investing principally in global equities judged to offer above average dividend yields with prospects of dividend growth and the potential for long term capital growth. The Fund may also invest in other transferable securities, collective investment schemes, money market instruments, deposits, cash, near cash, derivatives and forward transactions.
FUND MANAGER’S REPORTOver the six months ended 15 April 2017, the Aviva Investors Global Equity Income Fund (share class 1) returned 5.56 per cent net of fees, in comparison with a sector average return of 5.33 per cent for the Investment Association Global Equity Income sector. The MSCI World Index†, the Fund’s benchmark, returned 6.63 per cent.
Over a period when higher yielding equities underperformed the World index, stock selection in the consumer sectors detracted from performance most notably the Fund’s holdings in L Brands, Prosiebensat and Royal Ahold Delhaize. Shares in US lingerie retailer L Brands weakened on sluggish sales growth at its Victoria’s Secret chain, while the company issued a cautious trading update as higher promotional expenses and continued investment in China are forecast to dilute earnings growth. As a result, we exited the position earlier this year. German media group Prosiebensat detracted as the company’s share price weakened on management’s decision to raise more funds, via a share sale, to finance further digital acquisitions. However, in recent months the shares have begun to regain ground with the company reporting a sharp rise in annual revenues and commenting that trading had begun well in 2017, boosted by a continued recovery in the German economy. Dutch food retailer Royal Ahold Delhaize reported earnings below forecasts as pricing pressures in the US, where it faces stiff competition from WalMart, have eroded margins.
The main contributors to performance over the review period were the Fund’s holdings in US aircraft manufacturer Boeing, investment bank JP Morgan Chase and insurer Legal & General. Boeing gained ground in anticipation that the Trump administration will increase defence spending and lower corporation tax. The company’s recent annual earnings forecast for 2017 was higher than the market had expected, with a substantial backlog of orders for civilian aircraft and new defence contracts secured from the Pentagon. JP Morgan Chase performed well as investors took a more positive view of the earnings outlook for the US banking sector under the new Republican administration, given the prospect of looser regulation, higher interest margins and less stringent capital standards. Legal & General recently reported annual earnings growth across all its major business units, benefitting particularly from the uplift in bulk annuity business and demand for liability-driven investment products in the pension fund marketplace.
The Fund added a new position in US semiconductor manufacturer Broadcom; we view this as a well diversified business across a range of applications such as smartphones, data centres and storage. With significant cash generation and a more shareholder-friendly capital return policy there is ample room for the dividend to grow, which we see as very attractive in the current market environment. We also initiated a position in Dutch bank ING, which is a well-capitalised retail bank. Loan growth has remained strong and we expect the gradual shift to more fee-based products to help support net interest margins in the prevailing low interest rate environment. The recent pick-up in economic activity in the Eurozone should also be positive for ING’s earnings growth prospects.
Looking ahead, earnings momentum continues to grow across the developed markets, with the US, Europe and Japan all posting impressive year-over-year growth during the fourth quarter. We have also seen a positive trajectory for earnings revisions which should bode well for this upward earnings trend to continue. From a valuation perspective, European markets appear more attractive than the US although political developments remain a cause for concern, particularly the rise in nationalism and growing support for populist parties. With elections in both France and later this year in Germany this may mean that some investors remain on the side lines.
April 2017Sources: Fund and peer group performance figures – Lipper, mid to mid basis with net income reinvested in GBP, with no initial charges applied. Market data – Bloomberg. Any opinions expressed are those of the Fund manager. They should not be viewed as a guarantee of a return from an investment in the Funds. The content of the commentary should not be viewed as a recommendation to invest nor buy or sell stocks. Past performance is not a guide to the future. The value of an investment and any income from it can go down as well as up. Investors may not get back the original amount invested.† MSCI makes no express or implied warranties or representations and shall have no liability whatsoever with respect to any MSCI data contained herein. The MSCI data may not be further redistributed or used as a basis for other indices or any securities or financial products. This report is not approved, endorsed, reviewed or produced by MSCI. None of the MSCI data is intended to constitute investment advice or a recommendation to make (or refrain from making) any kind of investment decision and may not be relied on as such.
AVIVA INVESTORS GLOBAL EQUITY INCOME FUND
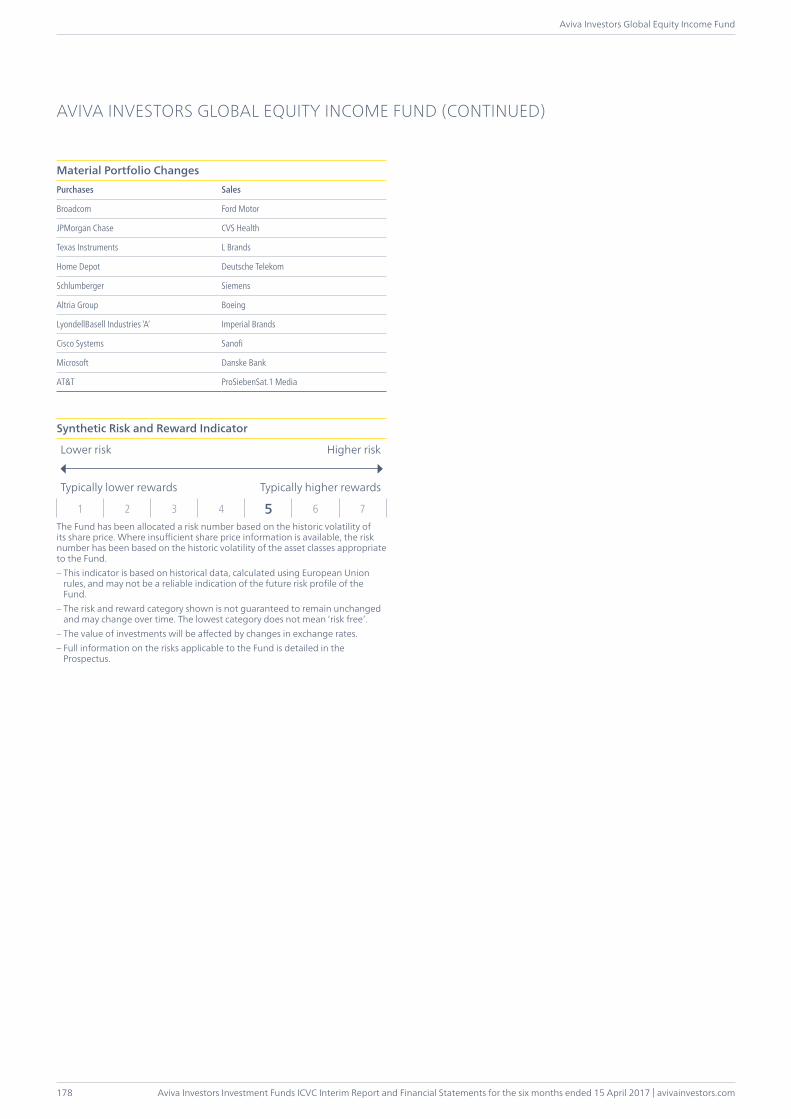
Aviva Investors Investment Funds ICVC Interim Report and Financial Statements for the six months ended 15 April 2017 | avivainvestors.com
Aviva Investors Global Equity Income Fund
178
Material Portfolio ChangesPurchases Sales
Broadcom Ford Motor
JPMorgan Chase CVS Health
Texas Instruments L Brands
Home Depot Deutsche Telekom
Schlumberger Siemens
Altria Group Boeing
LyondellBasell Industries ‘A’ Imperial Brands
Cisco Systems Sanofi
Microsoft Danske Bank
AT&T ProSiebenSat.1 Media
Synthetic Risk and Reward Indicator
Lower risk Higher risk
Typically lower rewards Typically higher rewards
1 2 3 4 5 6 7The Fund has been allocated a risk number based on the historic volatility of its share price. Where insufficient share price information is available, the risk number has been based on the historic volatility of the asset classes appropriate to the Fund.– This indicator is based on historical data, calculated using European Union
rules, and may not be a reliable indication of the future risk profile of the Fund.
– The risk and reward category shown is not guaranteed to remain unchanged and may change over time. The lowest category does not mean ‘risk free’.
– The value of investments will be affected by changes in exchange rates.– Full information on the risks applicable to the Fund is detailed in the
Prospectus.
AVIVA INVESTORS GLOBAL EQUITY INCOME FUND (CONTINUED)
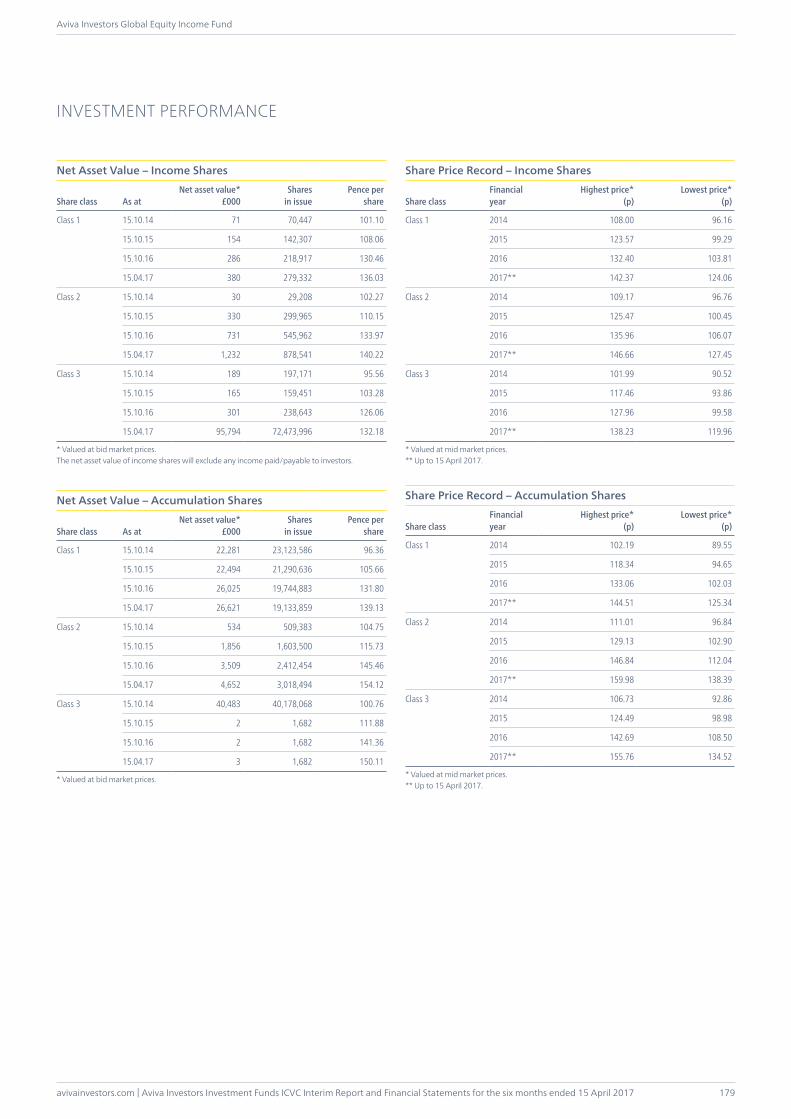
avivainvestors.com | Aviva Investors Investment Funds ICVC Interim Report and Financial Statements for the six months ended 15 April 2017
Aviva Investors Global Equity Income Fund
179
INVESTMENT PERFORMANCE
Net Asset Value – Income Shares
Share class As atNet asset value*
£000Shares
in issuePence per
share
Class 1 15.10.14 71 70,447 101.10
15.10.15 154 142,307 108.06
15.10.16 286 218,917 130.46
15.04.17 380 279,332 136.03
Class 2 15.10.14 30 29,208 102.27
15.10.15 330 299,965 110.15
15.10.16 731 545,962 133.97
15.04.17 1,232 878,541 140.22
Class 3 15.10.14 189 197,171 95.56
15.10.15 165 159,451 103.28
15.10.16 301 238,643 126.06
15.04.17 95,794 72,473,996 132.18
* Valued at bid market prices.The net asset value of income shares will exclude any income paid/payable to investors.
Net Asset Value – Accumulation Shares
Share class As atNet asset value*
£000Shares
in issuePence per
share
Class 1 15.10.14 22,281 23,123,586 96.36
15.10.15 22,494 21,290,636 105.66
15.10.16 26,025 19,744,883 131.80
15.04.17 26,621 19,133,859 139.13
Class 2 15.10.14 534 509,383 104.75
15.10.15 1,856 1,603,500 115.73
15.10.16 3,509 2,412,454 145.46
15.04.17 4,652 3,018,494 154.12
Class 3 15.10.14 40,483 40,178,068 100.76
15.10.15 2 1,682 111.88
15.10.16 2 1,682 141.36
15.04.17 3 1,682 150.11
* Valued at bid market prices.
Share Price Record – Income Shares
Share classFinancialyear
Highest price*(p)
Lowest price*(p)
Class 1 2014 108.00 96.16
2015 123.57 99.29
2016 132.40 103.81
2017** 142.37 124.06
Class 2 2014 109.17 96.76
2015 125.47 100.45
2016 135.96 106.07
2017** 146.66 127.45
Class 3 2014 101.99 90.52
2015 117.46 93.86
2016 127.96 99.58
2017** 138.23 119.96
* Valued at mid market prices.** Up to 15 April 2017.
Share Price Record – Accumulation Shares
Share classFinancialyear
Highest price*(p)
Lowest price*(p)
Class 1 2014 102.19 89.55
2015 118.34 94.65
2016 133.06 102.03
2017** 144.51 125.34
Class 2 2014 111.01 96.84
2015 129.13 102.90
2016 146.84 112.04
2017** 159.98 138.39
Class 3 2014 106.73 92.86
2015 124.49 98.98
2016 142.69 108.50
2017** 155.76 134.52
* Valued at mid market prices.** Up to 15 April 2017.
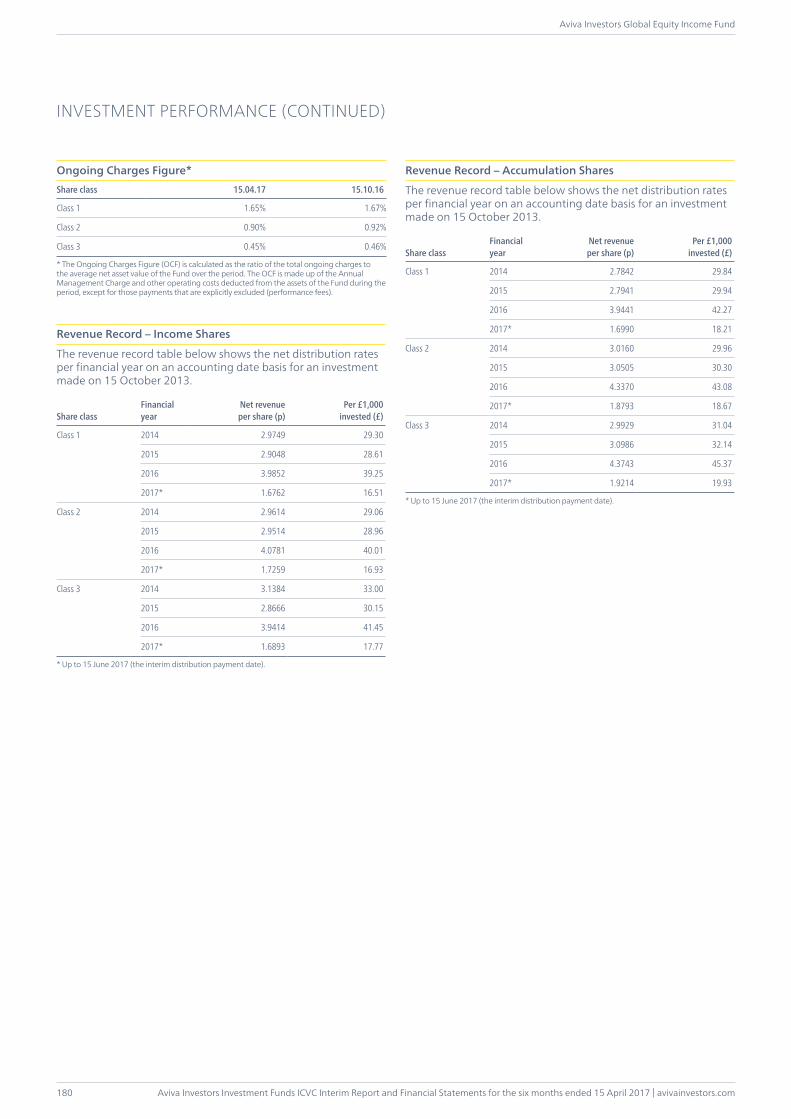
Aviva Investors Investment Funds ICVC Interim Report and Financial Statements for the six months ended 15 April 2017 | avivainvestors.com
Aviva Investors Global Equity Income Fund
180
Ongoing Charges Figure*Share class 15.04.17 15.10.16
Class 1 1.65% 1.67%
Class 2 0.90% 0.92%
Class 3 0.45% 0.46%
* The Ongoing Charges Figure (OCF) is calculated as the ratio of the total ongoing charges to the average net asset value of the Fund over the period. The OCF is made up of the Annual Management Charge and other operating costs deducted from the assets of the Fund during the period, except for those payments that are explicitly excluded (performance fees).
Revenue Record – Income Shares
The revenue record table below shows the net distribution rates per financial year on an accounting date basis for an investment made on 15 October 2013.
Share classFinancialyear
Net revenue per share (p)
Per £1,000invested (£)
Class 1 2014 2.9749 29.30
2015 2.9048 28.61
2016 3.9852 39.25
2017* 1.6762 16.51
Class 2 2014 2.9614 29.06
2015 2.9514 28.96
2016 4.0781 40.01
2017* 1.7259 16.93
Class 3 2014 3.1384 33.00
2015 2.8666 30.15
2016 3.9414 41.45
2017* 1.6893 17.77
* Up to 15 June 2017 (the interim distribution payment date).
Revenue Record – Accumulation Shares
The revenue record table below shows the net distribution rates per financial year on an accounting date basis for an investment made on 15 October 2013.
Share classFinancialyear
Net revenue per share (p)
Per £1,000invested (£)
Class 1 2014 2.7842 29.84
2015 2.7941 29.94
2016 3.9441 42.27
2017* 1.6990 18.21
Class 2 2014 3.0160 29.96
2015 3.0505 30.30
2016 4.3370 43.08
2017* 1.8793 18.67
Class 3 2014 2.9929 31.04
2015 3.0986 32.14
2016 4.3743 45.37
2017* 1.9214 19.93
* Up to 15 June 2017 (the interim distribution payment date).
INVESTMENT PERFORMANCE (CONTINUED)
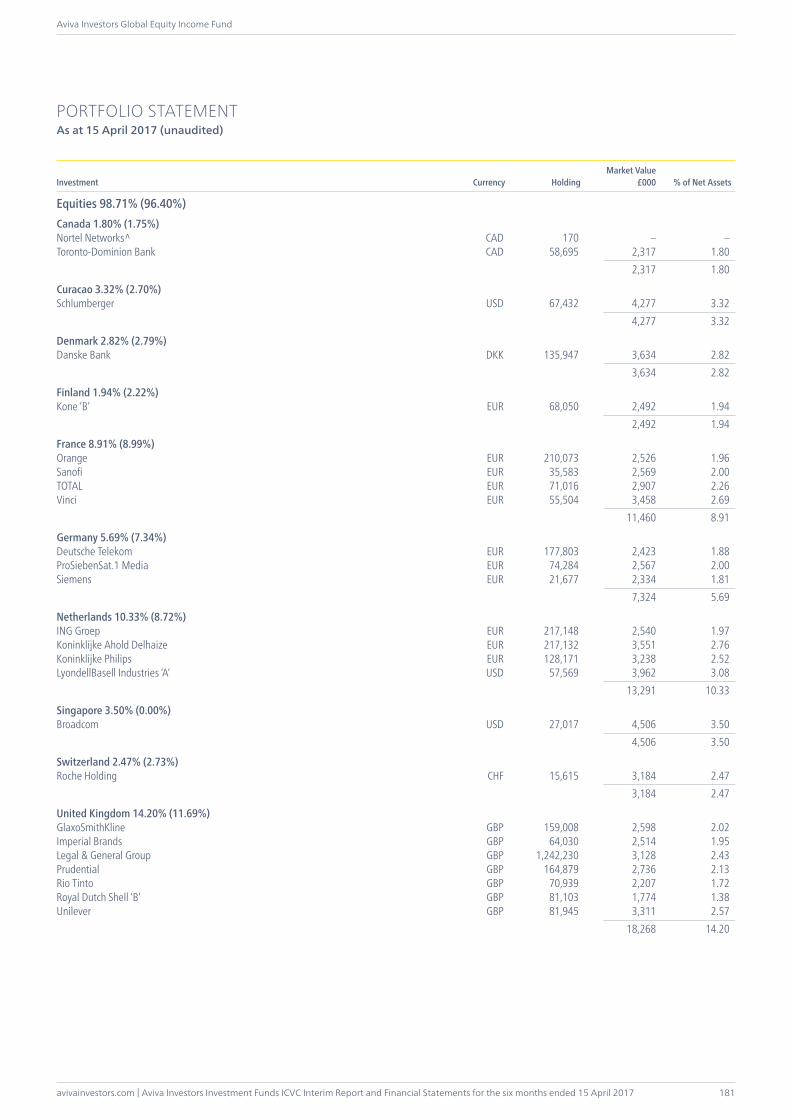
avivainvestors.com | Aviva Investors Investment Funds ICVC Interim Report and Financial Statements for the six months ended 15 April 2017
Aviva Investors Global Equity Income Fund
181
PORTFOLIO STATEMENTAs at 15 April 2017 (unaudited)
Investment Currency HoldingMarket Value
£000 % of Net Assets
Equities 98.71% (96.40%)Canada 1.80% (1.75%)Nortel Networks^ CAD 170 – –Toronto-Dominion Bank CAD 58,695 2,317 1.80 2,317 1.80
Curacao 3.32% (2.70%)Schlumberger USD 67,432 4,277 3.32 4,277 3.32
Denmark 2.82% (2.79%)Danske Bank DKK 135,947 3,634 2.82 3,634 2.82
Finland 1.94% (2.22%)Kone ‘B’ EUR 68,050 2,492 1.94 2,492 1.94
France 8.91% (8.99%)Orange EUR 210,073 2,526 1.96Sanofi EUR 35,583 2,569 2.00TOTAL EUR 71,016 2,907 2.26Vinci EUR 55,504 3,458 2.69 11,460 8.91
Germany 5.69% (7.34%)Deutsche Telekom EUR 177,803 2,423 1.88ProSiebenSat.1 Media EUR 74,284 2,567 2.00Siemens EUR 21,677 2,334 1.81 7,324 5.69
Netherlands 10.33% (8.72%)ING Groep EUR 217,148 2,540 1.97Koninklijke Ahold Delhaize EUR 217,132 3,551 2.76Koninklijke Philips EUR 128,171 3,238 2.52LyondellBasell Industries ‘A’ USD 57,569 3,962 3.08 13,291 10.33
Singapore 3.50% (0.00%)Broadcom USD 27,017 4,506 3.50 4,506 3.50
Switzerland 2.47% (2.73%)Roche Holding CHF 15,615 3,184 2.47 3,184 2.47
United Kingdom 14.20% (11.69%)GlaxoSmithKline GBP 159,008 2,598 2.02Imperial Brands GBP 64,030 2,514 1.95Legal & General Group GBP 1,242,230 3,128 2.43Prudential GBP 164,879 2,736 2.13Rio Tinto GBP 70,939 2,207 1.72Royal Dutch Shell ‘B’ GBP 81,103 1,774 1.38Unilever GBP 81,945 3,311 2.57 18,268 14.20
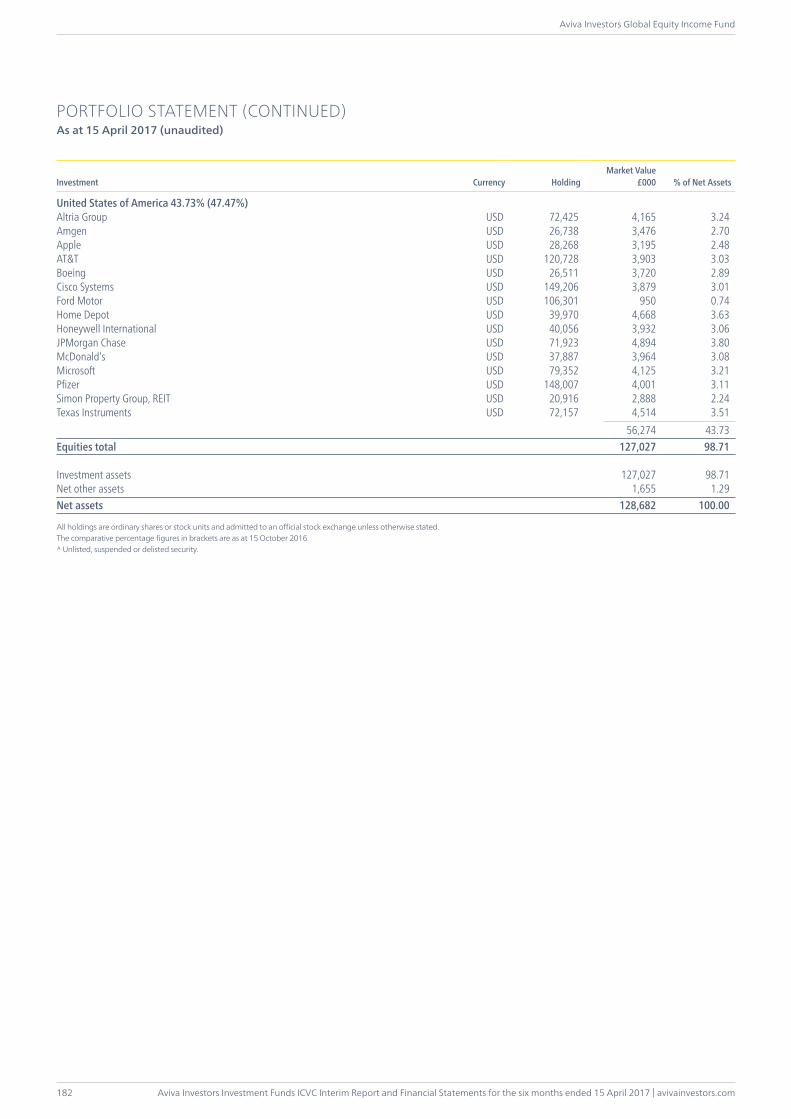
Aviva Investors Investment Funds ICVC Interim Report and Financial Statements for the six months ended 15 April 2017 | avivainvestors.com
Aviva Investors Global Equity Income Fund
182
PORTFOLIO STATEMENT (CONTINUED)As at 15 April 2017 (unaudited)
Investment Currency HoldingMarket Value
£000 % of Net Assets
United States of America 43.73% (47.47%)Altria Group USD 72,425 4,165 3.24Amgen USD 26,738 3,476 2.70Apple USD 28,268 3,195 2.48AT&T USD 120,728 3,903 3.03Boeing USD 26,511 3,720 2.89Cisco Systems USD 149,206 3,879 3.01Ford Motor USD 106,301 950 0.74Home Depot USD 39,970 4,668 3.63Honeywell International USD 40,056 3,932 3.06JPMorgan Chase USD 71,923 4,894 3.80McDonald’s USD 37,887 3,964 3.08Microsoft USD 79,352 4,125 3.21Pfizer USD 148,007 4,001 3.11Simon Property Group, REIT USD 20,916 2,888 2.24Texas Instruments USD 72,157 4,514 3.51 56,274 43.73Equities total 127,027 98.71
Investment assets 127,027 98.71Net other assets 1,655 1.29Net assets 128,682 100.00
All holdings are ordinary shares or stock units and admitted to an official stock exchange unless otherwise stated.The comparative percentage figures in brackets are as at 15 October 2016.^ Unlisted, suspended or delisted security.
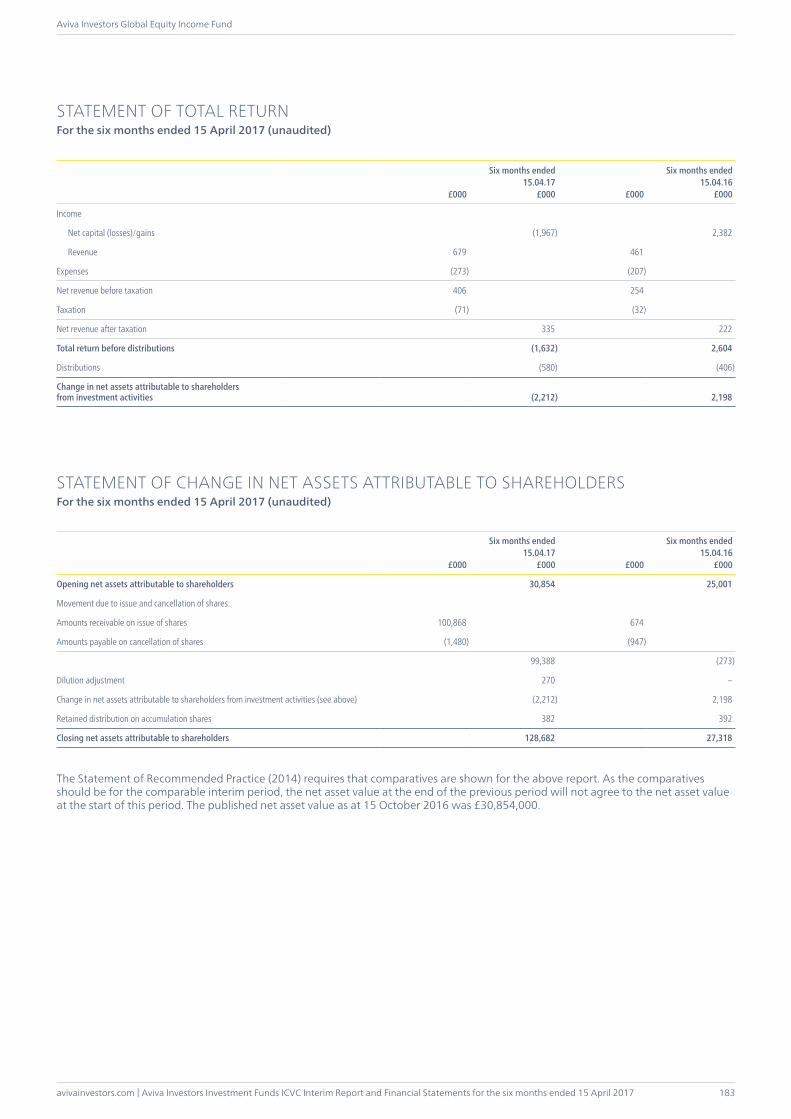
avivainvestors.com | Aviva Investors Investment Funds ICVC Interim Report and Financial Statements for the six months ended 15 April 2017
Aviva Investors Global Equity Income Fund
183
£000
Six months ended15.04.17
£000 £000
Six months ended15.04.16
£000
Income
Net capital (losses)/gains (1,967) 2,382
Revenue 679 461
Expenses (273) (207)
Net revenue before taxation 406 254
Taxation (71) (32)
Net revenue after taxation 335 222
Total return before distributions (1,632) 2,604
Distributions (580) (406)
Change in net assets attributable to shareholders from investment activities (2,212) 2,198
STATEMENT OF CHANGE IN NET ASSETS ATTRIBUTABLE TO SHAREHOLDERSFor the six months ended 15 April 2017 (unaudited)
£000
Six months ended15.04.17
£000 £000
Six months ended15.04.16
£000
Opening net assets attributable to shareholders 30,854 25,001
Movement due to issue and cancellation of shares:
Amounts receivable on issue of shares 100,868 674
Amounts payable on cancellation of shares (1,480) (947)
99,388 (273)
Dilution adjustment 270 –
Change in net assets attributable to shareholders from investment activities (see above) (2,212) 2,198
Retained distribution on accumulation shares 382 392
Closing net assets attributable to shareholders 128,682 27,318
The Statement of Recommended Practice (2014) requires that comparatives are shown for the above report. As the comparatives should be for the comparable interim period, the net asset value at the end of the previous period will not agree to the net asset value at the start of this period. The published net asset value as at 15 October 2016 was £30,854,000.
STATEMENT OF TOTAL RETURNFor the six months ended 15 April 2017 (unaudited)
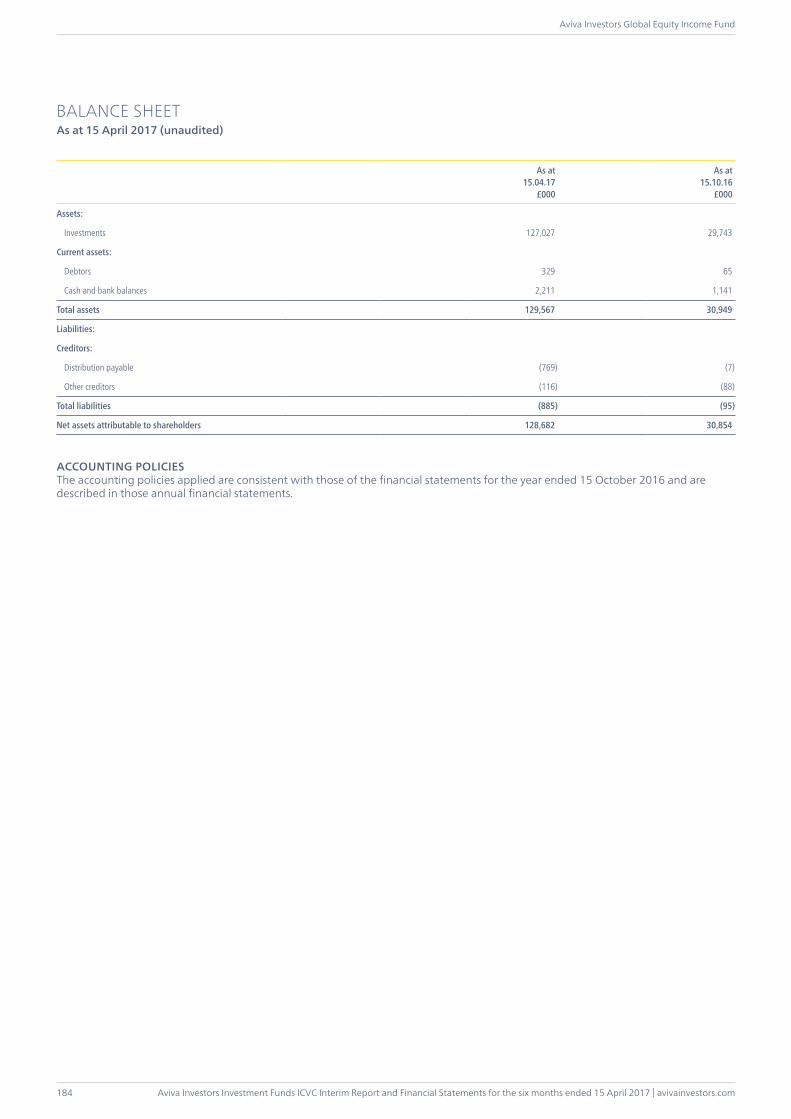
Aviva Investors Investment Funds ICVC Interim Report and Financial Statements for the six months ended 15 April 2017 | avivainvestors.com
Aviva Investors Global Equity Income Fund
184
BALANCE SHEETAs at 15 April 2017 (unaudited)
As at15.04.17
£000
As at15.10.16
£000
Assets:
Investments 127,027 29,743
Current assets:
Debtors 329 65
Cash and bank balances 2,211 1,141
Total assets 129,567 30,949
Liabilities:
Creditors:
Distribution payable (769) (7)
Other creditors (116) (88)
Total liabilities (885) (95)
Net assets attributable to shareholders 128,682 30,854
ACCOUNTING POLICIESThe accounting policies applied are consistent with those of the financial statements for the year ended 15 October 2016 and are described in those annual financial statements.
avivainvestors.com | Aviva Investors Investment Funds ICVC Interim Report and Financial Statements for the six months ended 15 April 2017
Aviva Investors Multi-Strategy Target Return Fund
185
INVESTMENT OBJECTIVETo deliver a positive return over rolling three year periods regardless of the prevailing stock market environment. The Fund aims to generate a positive return, on average 5% per annum above the Bank of England Base Rate before the deduction of charges, over rolling three year periods. In seeking to target this level of return the Fund also aims to manage volatility to a target of less than half the volatility of global equities, measured over the same rolling three year periods. These aims, however, are not guaranteed and it may not always be possible to achieve positive returns or to achieve the target level of volatility over rolling three year periods, or over any period of investment. Consequently, investors’ capital is at risk.
INVESTMENT POLICYIn aiming to achieve the investment objective the Fund may invest globally in any of the following financial instruments: transferable securities, money market instruments, fixed interest securities, units in collective investment schemes, derivatives, forwards and deposits.
The Fund will make significant use of derivative instruments including: futures, options, swaps, swaptions and forwards. The Fund may take both long and synthetic short positions and derivative usage may include but is not limited to derivatives on interest rates, inflation rates, bonds, credit, equity, financial indices, volatility, dividend payments and currencies. Derivatives usage may be for the purposes of hedging, efficient portfolio management, or investment purposes and may be exchange traded or traded off exchange through market counterparties. The use of derivative instruments as part of the investment policy will mean that the Fund may, from time to time, have substantial holdings in liquid assets including deposits and money market instruments.
FUND MANAGER’S REPORTOver the six months to 15 April 2017, the Aviva Investors Multi-Strategy Target Return Fund posted a total return of 0.38 per cent (share class 6) net of fees. Over the same period, the Fund’s peer group, the Investment Association’s Targeted Absolute Return sector, delivered a net return of 1.68 per cent.
Market return strategies fared well over the period with positions favouring European and Japanese equities making the strongest contributions, along with our US high yield credit position. Within opportunistic return strategies, our positions aiming to benefit from a global reflationary environment added to returns, namely our negative stance towards 10-year German Bunds, our position anticipating rising US inflation as well as our positions aiming to benefit from rising long-term bond yields relative to short-term yields in the US and Australia. On the downside, risk-reducing strategies detracted from performance. These included strategies anticipating equity market volatility. Also, our positions favouring the US Dollar against the Korean Won and Saudi Riyal hurt relative performance. Finally our position anticipating weakness in the US biotechnology sector also weighed on returns.
When constructing the portfolio we maintain an investment horizon of three years. That means we continually monitor both existing and potential new positions to assess the expected performance over that horizon.
As part of this process, we made a number of changes to the portfolio. In the fourth quarter of 2016, we raised the Fund’s exposure to the global reflationary theme, adding to existing positions anticipating rises in US equities and inflation. Later, at the start of 2017, we switched existing exposure into more attractively valued assets within the theme, notably closing our negative stance towards German Bunds position and entering a European banks position. Also, as a way to balance the Fund’s exposure to our reflationary theme, we added a position expecting weaker UK inflation and a trade that anticipated the yields of longer-dated Swedish government bonds falling relative to shorter-dated yields. Furthermore, we removed our negative stance on the US biotechnology sector position and replaced our UK relative value position with a US relative value position. We continue to identify attractive investment opportunities within emerging market debt. As such we have opened positions favouring Turkish hard currency government bonds and the Turkish Lira.
April 2017Sources: Fund and peer group performance figures – Lipper, mid to mid basis with net income reinvested in GBP, with no initial charges applied. Market data – Bloomberg. Any opinions expressed are those of the Fund manager. They should not be viewed as a guarantee of a return from an investment in the Funds. The content of the commentary should not be viewed as a recommendation to invest nor buy or sell securities. Past performance is not a guide to the future. The value of an investment and any income from it can go down as well as up. Investors may not get back the original amount invested.
AVIVA INVESTORS MULTI-STRATEGY TARGET RETURN FUND
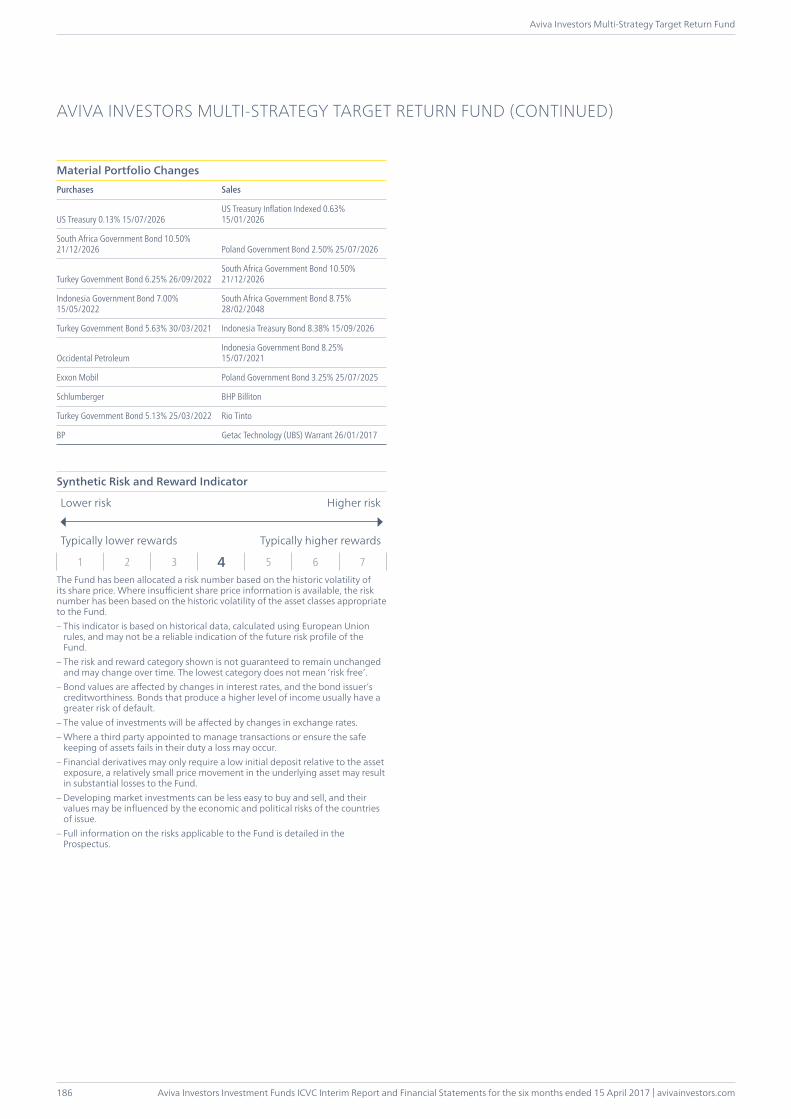
Aviva Investors Investment Funds ICVC Interim Report and Financial Statements for the six months ended 15 April 2017 | avivainvestors.com
Aviva Investors Multi-Strategy Target Return Fund
186
AVIVA INVESTORS MULTI-STRATEGY TARGET RETURN FUND (CONTINUED)
Material Portfolio ChangesPurchases Sales
US Treasury 0.13% 15/07/2026US Treasury Inflation Indexed 0.63% 15/01/2026
South Africa Government Bond 10.50% 21/12/2026 Poland Government Bond 2.50% 25/07/2026
Turkey Government Bond 6.25% 26/09/2022South Africa Government Bond 10.50% 21/12/2026
Indonesia Government Bond 7.00% 15/05/2022
South Africa Government Bond 8.75% 28/02/2048
Turkey Government Bond 5.63% 30/03/2021 Indonesia Treasury Bond 8.38% 15/09/2026
Occidental Petroleum Indonesia Government Bond 8.25% 15/07/2021
Exxon Mobil Poland Government Bond 3.25% 25/07/2025
Schlumberger BHP Billiton
Turkey Government Bond 5.13% 25/03/2022 Rio Tinto
BP Getac Technology (UBS) Warrant 26/01/2017
Synthetic Risk and Reward Indicator
Lower risk Higher risk
Typically lower rewards Typically higher rewards
1 2 3 4 5 6 7The Fund has been allocated a risk number based on the historic volatility of its share price. Where insufficient share price information is available, the risk number has been based on the historic volatility of the asset classes appropriate to the Fund.– This indicator is based on historical data, calculated using European Union
rules, and may not be a reliable indication of the future risk profile of the Fund.
– The risk and reward category shown is not guaranteed to remain unchanged and may change over time. The lowest category does not mean ‘risk free’.
– Bond values are affected by changes in interest rates, and the bond issuer’s creditworthiness. Bonds that produce a higher level of income usually have a greater risk of default.
– The value of investments will be affected by changes in exchange rates.– Where a third party appointed to manage transactions or ensure the safe
keeping of assets fails in their duty a loss may occur.– Financial derivatives may only require a low initial deposit relative to the asset
exposure, a relatively small price movement in the underlying asset may result in substantial losses to the Fund.
– Developing market investments can be less easy to buy and sell, and their values may be influenced by the economic and political risks of the countries of issue.
– Full information on the risks applicable to the Fund is detailed in the Prospectus.
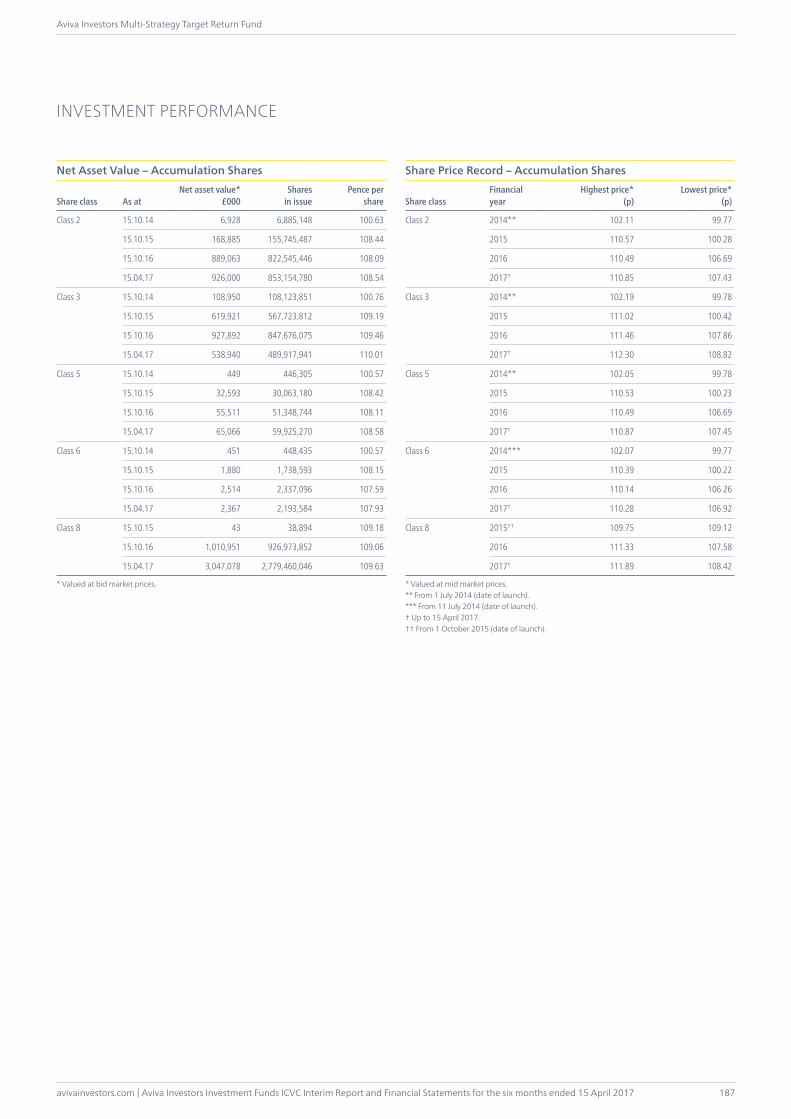
avivainvestors.com | Aviva Investors Investment Funds ICVC Interim Report and Financial Statements for the six months ended 15 April 2017
Aviva Investors Multi-Strategy Target Return Fund
187
INVESTMENT PERFORMANCE
Net Asset Value – Accumulation Shares
Share class As atNet asset value*
£000Shares
in issuePence per
share
Class 2 15.10.14 6,928 6,885,148 100.63
15.10.15 168,885 155,745,487 108.44
15.10.16 889,063 822,545,446 108.09
15.04.17 926,000 853,154,780 108.54
Class 3 15.10.14 108,950 108,123,851 100.76
15.10.15 619,921 567,723,812 109.19
15.10.16 927,892 847,676,075 109.46
15.04.17 538,940 489,917,941 110.01
Class 5 15.10.14 449 446,305 100.57
15.10.15 32,593 30,063,180 108.42
15.10.16 55,511 51,348,744 108.11
15.04.17 65,066 59,925,270 108.58
Class 6 15.10.14 451 448,435 100.57
15.10.15 1,880 1,738,593 108.15
15.10.16 2,514 2,337,096 107.59
15.04.17 2,367 2,193,584 107.93
Class 8 15.10.15 43 38,894 109.18
15.10.16 1,010,951 926,973,852 109.06
15.04.17 3,047,078 2,779,460,046 109.63
* Valued at bid market prices.
Share Price Record – Accumulation Shares
Share classFinancialyear
Highest price*(p)
Lowest price*(p)
Class 2 2014** 102.11 99.77
2015 110.57 100.28
2016 110.49 106.69
2017† 110.85 107.43
Class 3 2014** 102.19 99.78
2015 111.02 100.42
2016 111.46 107.86
2017† 112.30 108.82
Class 5 2014** 102.05 99.78
2015 110.53 100.23
2016 110.49 106.69
2017† 110.87 107.45
Class 6 2014*** 102.07 99.77
2015 110.39 100.22
2016 110.14 106.26
2017† 110.28 106.92
Class 8 2015†† 109.75 109.12
2016 111.33 107.58
2017† 111.89 108.42
* Valued at mid market prices.** From 1 July 2014 (date of launch).*** From 11 July 2014 (date of launch).† Up to 15 April 2017.†† From 1 October 2015 (date of launch).
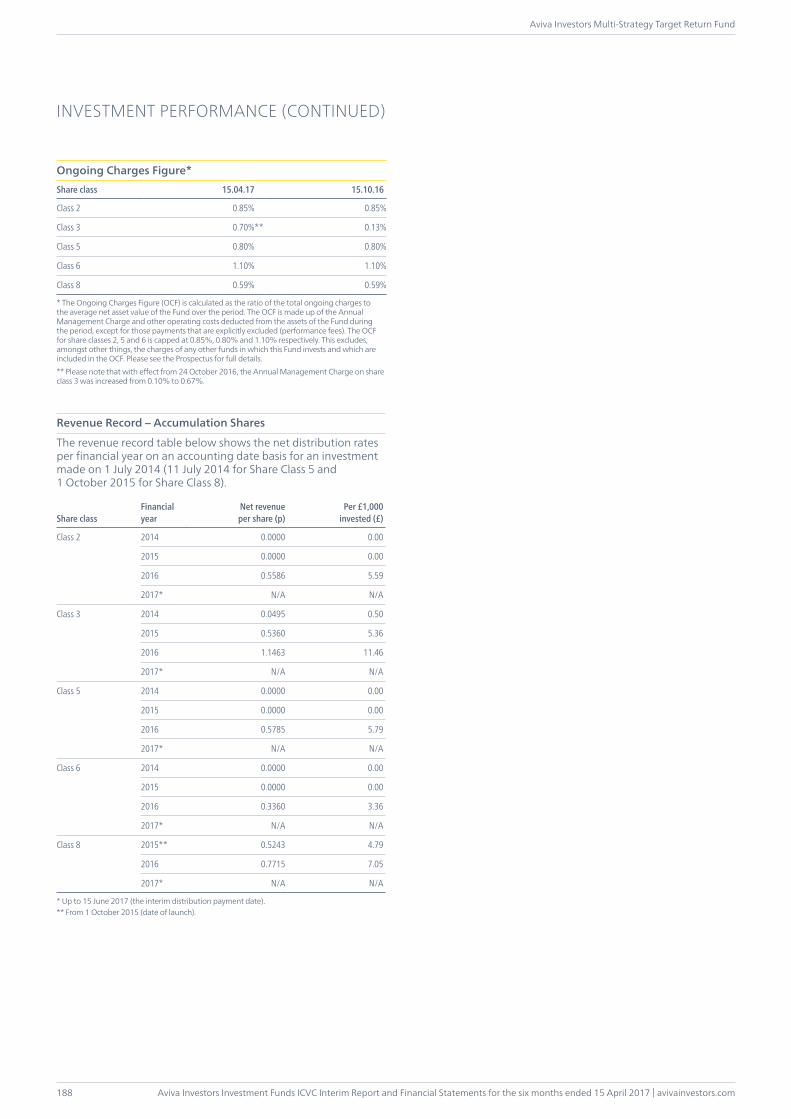
Aviva Investors Investment Funds ICVC Interim Report and Financial Statements for the six months ended 15 April 2017 | avivainvestors.com
Aviva Investors Multi-Strategy Target Return Fund
188
INVESTMENT PERFORMANCE (CONTINUED)
Ongoing Charges Figure*Share class 15.04.17 15.10.16
Class 2 0.85% 0.85%
Class 3 0.70%** 0.13%
Class 5 0.80% 0.80%
Class 6 1.10% 1.10%
Class 8 0.59% 0.59%
* The Ongoing Charges Figure (OCF) is calculated as the ratio of the total ongoing charges to the average net asset value of the Fund over the period. The OCF is made up of the Annual Management Charge and other operating costs deducted from the assets of the Fund during the period, except for those payments that are explicitly excluded (performance fees). The OCF for share classes 2, 5 and 6 is capped at 0.85%, 0.80% and 1.10% respectively. This excludes, amongst other things, the charges of any other funds in which this Fund invests and which are included in the OCF. Please see the Prospectus for full details. ** Please note that with effect from 24 October 2016, the Annual Management Charge on share class 3 was increased from 0.10% to 0.67%.
Revenue Record – Accumulation Shares
The revenue record table below shows the net distribution rates per financial year on an accounting date basis for an investment made on 1 July 2014 (11 July 2014 for Share Class 5 and 1 October 2015 for Share Class 8).
Share classFinancialyear
Net revenue per share (p)
Per £1,000invested (£)
Class 2 2014 0.0000 0.00
2015 0.0000 0.00
2016 0.5586 5.59
2017* N/A N/A
Class 3 2014 0.0495 0.50
2015 0.5360 5.36
2016 1.1463 11.46
2017* N/A N/A
Class 5 2014 0.0000 0.00
2015 0.0000 0.00
2016 0.5785 5.79
2017* N/A N/A
Class 6 2014 0.0000 0.00
2015 0.0000 0.00
2016 0.3360 3.36
2017* N/A N/A
Class 8 2015** 0.5243 4.79
2016 0.7715 7.05
2017* N/A N/A
* Up to 15 June 2017 (the interim distribution payment date).** From 1 October 2015 (date of launch).
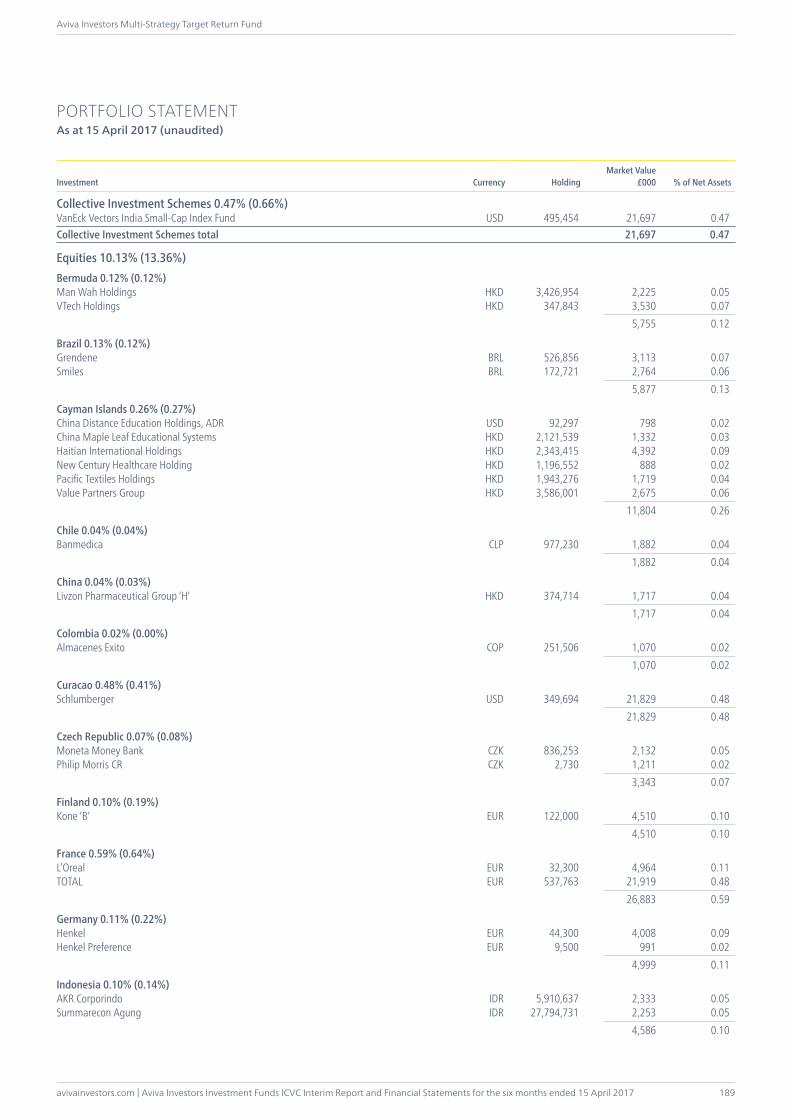
avivainvestors.com | Aviva Investors Investment Funds ICVC Interim Report and Financial Statements for the six months ended 15 April 2017
Aviva Investors Multi-Strategy Target Return Fund
189
PORTFOLIO STATEMENTAs at 15 April 2017 (unaudited)
Investment Currency HoldingMarket Value
£000 % of Net Assets
Collective Investment Schemes 0.47% (0.66%)VanEck Vectors India Small-Cap Index Fund USD 495,454 21,697 0.47Collective Investment Schemes total 21,697 0.47
Equities 10.13% (13.36%)Bermuda 0.12% (0.12%)Man Wah Holdings HKD 3,426,954 2,225 0.05VTech Holdings HKD 347,843 3,530 0.07 5,755 0.12
Brazil 0.13% (0.12%)Grendene BRL 526,856 3,113 0.07Smiles BRL 172,721 2,764 0.06 5,877 0.13
Cayman Islands 0.26% (0.27%)China Distance Education Holdings, ADR USD 92,297 798 0.02China Maple Leaf Educational Systems HKD 2,121,539 1,332 0.03Haitian International Holdings HKD 2,343,415 4,392 0.09New Century Healthcare Holding HKD 1,196,552 888 0.02Pacific Textiles Holdings HKD 1,943,276 1,719 0.04Value Partners Group HKD 3,586,001 2,675 0.06 11,804 0.26
Chile 0.04% (0.04%)Banmedica CLP 977,230 1,882 0.04 1,882 0.04
China 0.04% (0.03%)Livzon Pharmaceutical Group ‘H’ HKD 374,714 1,717 0.04 1,717 0.04
Colombia 0.02% (0.00%)Almacenes Exito COP 251,506 1,070 0.02 1,070 0.02
Curacao 0.48% (0.41%)Schlumberger USD 349,694 21,829 0.48 21,829 0.48
Czech Republic 0.07% (0.08%)Moneta Money Bank CZK 836,253 2,132 0.05Philip Morris CR CZK 2,730 1,211 0.02 3,343 0.07
Finland 0.10% (0.19%)Kone ‘B’ EUR 122,000 4,510 0.10 4,510 0.10
France 0.59% (0.64%)L’Oreal EUR 32,300 4,964 0.11TOTAL EUR 537,763 21,919 0.48 26,883 0.59
Germany 0.11% (0.22%)Henkel EUR 44,300 4,008 0.09Henkel Preference EUR 9,500 991 0.02 4,999 0.11
Indonesia 0.10% (0.14%)AKR Corporindo IDR 5,910,637 2,333 0.05Summarecon Agung IDR 27,794,731 2,253 0.05 4,586 0.10
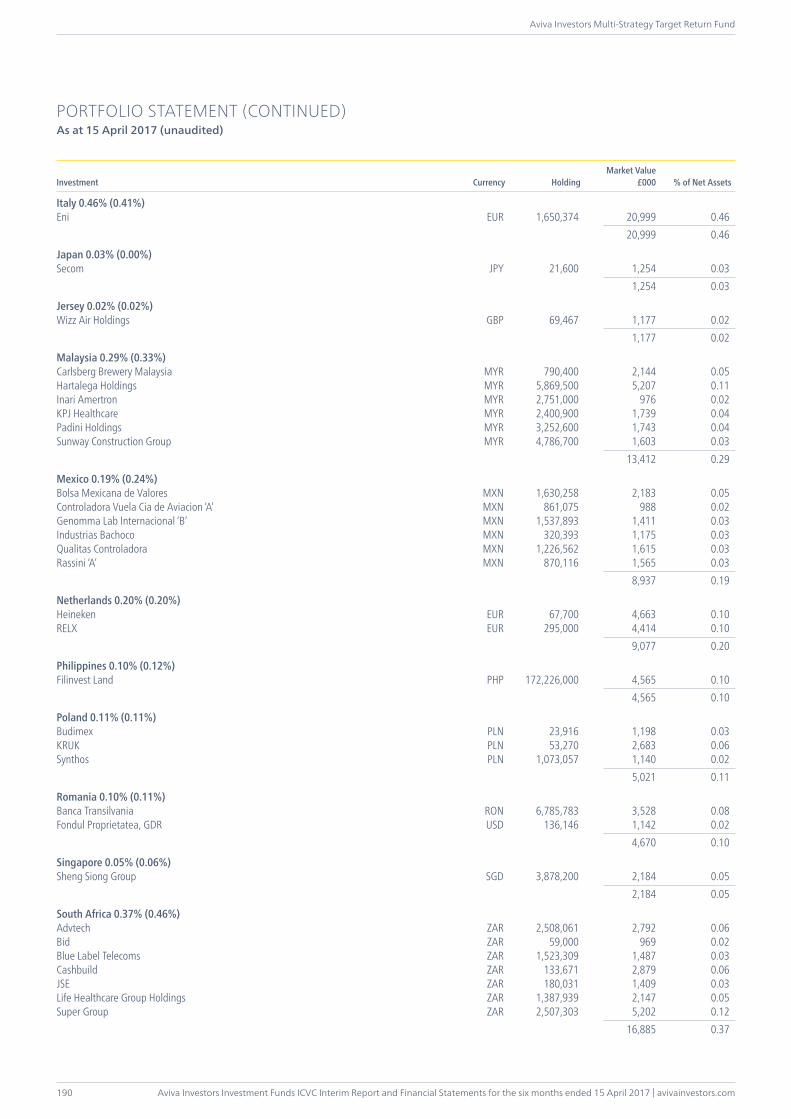
Aviva Investors Investment Funds ICVC Interim Report and Financial Statements for the six months ended 15 April 2017 | avivainvestors.com
Aviva Investors Multi-Strategy Target Return Fund
190
PORTFOLIO STATEMENT (CONTINUED)As at 15 April 2017 (unaudited)
Investment Currency HoldingMarket Value
£000 % of Net Assets
Italy 0.46% (0.41%)Eni EUR 1,650,374 20,999 0.46 20,999 0.46
Japan 0.03% (0.00%)Secom JPY 21,600 1,254 0.03 1,254 0.03
Jersey 0.02% (0.02%)Wizz Air Holdings GBP 69,467 1,177 0.02 1,177 0.02
Malaysia 0.29% (0.33%)Carlsberg Brewery Malaysia MYR 790,400 2,144 0.05Hartalega Holdings MYR 5,869,500 5,207 0.11Inari Amertron MYR 2,751,000 976 0.02KPJ Healthcare MYR 2,400,900 1,739 0.04Padini Holdings MYR 3,252,600 1,743 0.04Sunway Construction Group MYR 4,786,700 1,603 0.03 13,412 0.29
Mexico 0.19% (0.24%)Bolsa Mexicana de Valores MXN 1,630,258 2,183 0.05Controladora Vuela Cia de Aviacion ‘A’ MXN 861,075 988 0.02Genomma Lab Internacional ‘B’ MXN 1,537,893 1,411 0.03Industrias Bachoco MXN 320,393 1,175 0.03Qualitas Controladora MXN 1,226,562 1,615 0.03Rassini ‘A’ MXN 870,116 1,565 0.03 8,937 0.19
Netherlands 0.20% (0.20%)Heineken EUR 67,700 4,663 0.10RELX EUR 295,000 4,414 0.10 9,077 0.20
Philippines 0.10% (0.12%)Filinvest Land PHP 172,226,000 4,565 0.10 4,565 0.10
Poland 0.11% (0.11%)Budimex PLN 23,916 1,198 0.03KRUK PLN 53,270 2,683 0.06Synthos PLN 1,073,057 1,140 0.02 5,021 0.11
Romania 0.10% (0.11%)Banca Transilvania RON 6,785,783 3,528 0.08Fondul Proprietatea, GDR USD 136,146 1,142 0.02 4,670 0.10
Singapore 0.05% (0.06%)Sheng Siong Group SGD 3,878,200 2,184 0.05 2,184 0.05
South Africa 0.37% (0.46%)Advtech ZAR 2,508,061 2,792 0.06Bid ZAR 59,000 969 0.02Blue Label Telecoms ZAR 1,523,309 1,487 0.03Cashbuild ZAR 133,671 2,879 0.06JSE ZAR 180,031 1,409 0.03Life Healthcare Group Holdings ZAR 1,387,939 2,147 0.05Super Group ZAR 2,507,303 5,202 0.12 16,885 0.37
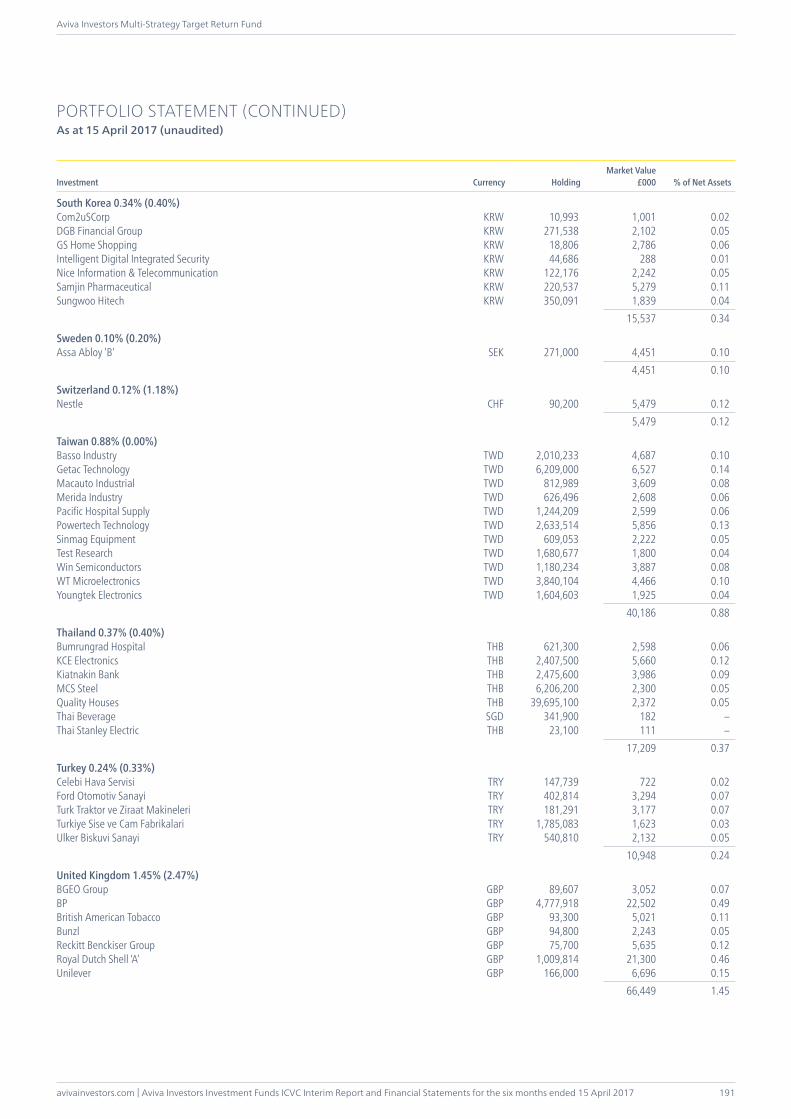
avivainvestors.com | Aviva Investors Investment Funds ICVC Interim Report and Financial Statements for the six months ended 15 April 2017
Aviva Investors Multi-Strategy Target Return Fund
191
PORTFOLIO STATEMENT (CONTINUED)As at 15 April 2017 (unaudited)
Investment Currency HoldingMarket Value
£000 % of Net Assets
South Korea 0.34% (0.40%)Com2uSCorp KRW 10,993 1,001 0.02DGB Financial Group KRW 271,538 2,102 0.05GS Home Shopping KRW 18,806 2,786 0.06Intelligent Digital Integrated Security KRW 44,686 288 0.01Nice Information & Telecommunication KRW 122,176 2,242 0.05Samjin Pharmaceutical KRW 220,537 5,279 0.11Sungwoo Hitech KRW 350,091 1,839 0.04 15,537 0.34
Sweden 0.10% (0.20%)Assa Abloy ‘B’ SEK 271,000 4,451 0.10 4,451 0.10
Switzerland 0.12% (1.18%)Nestle CHF 90,200 5,479 0.12 5,479 0.12
Taiwan 0.88% (0.00%)Basso Industry TWD 2,010,233 4,687 0.10Getac Technology TWD 6,209,000 6,527 0.14Macauto Industrial TWD 812,989 3,609 0.08Merida Industry TWD 626,496 2,608 0.06Pacific Hospital Supply TWD 1,244,209 2,599 0.06Powertech Technology TWD 2,633,514 5,856 0.13Sinmag Equipment TWD 609,053 2,222 0.05Test Research TWD 1,680,677 1,800 0.04Win Semiconductors TWD 1,180,234 3,887 0.08WT Microelectronics TWD 3,840,104 4,466 0.10Youngtek Electronics TWD 1,604,603 1,925 0.04 40,186 0.88
Thailand 0.37% (0.40%)Bumrungrad Hospital THB 621,300 2,598 0.06KCE Electronics THB 2,407,500 5,660 0.12Kiatnakin Bank THB 2,475,600 3,986 0.09MCS Steel THB 6,206,200 2,300 0.05Quality Houses THB 39,695,100 2,372 0.05Thai Beverage SGD 341,900 182 –Thai Stanley Electric THB 23,100 111 – 17,209 0.37
Turkey 0.24% (0.33%)Celebi Hava Servisi TRY 147,739 722 0.02Ford Otomotiv Sanayi TRY 402,814 3,294 0.07Turk Traktor ve Ziraat Makineleri TRY 181,291 3,177 0.07Turkiye Sise ve Cam Fabrikalari TRY 1,785,083 1,623 0.03Ulker Biskuvi Sanayi TRY 540,810 2,132 0.05 10,948 0.24
United Kingdom 1.45% (2.47%)BGEO Group GBP 89,607 3,052 0.07BP GBP 4,777,918 22,502 0.49British American Tobacco GBP 93,300 5,021 0.11Bunzl GBP 94,800 2,243 0.05Reckitt Benckiser Group GBP 75,700 5,635 0.12Royal Dutch Shell ‘A’ GBP 1,009,814 21,300 0.46Unilever GBP 166,000 6,696 0.15 66,449 1.45
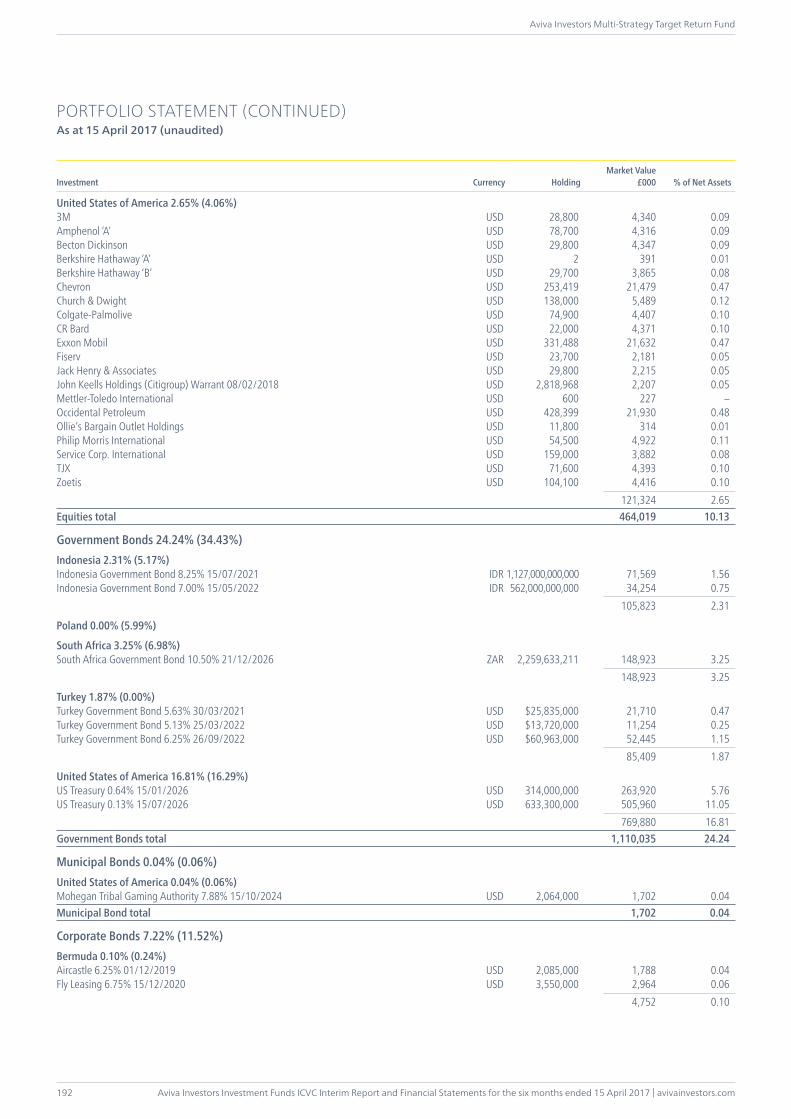
Aviva Investors Investment Funds ICVC Interim Report and Financial Statements for the six months ended 15 April 2017 | avivainvestors.com
Aviva Investors Multi-Strategy Target Return Fund
192
PORTFOLIO STATEMENT (CONTINUED)As at 15 April 2017 (unaudited)
Investment Currency HoldingMarket Value
£000 % of Net Assets
United States of America 2.65% (4.06%)3M USD 28,800 4,340 0.09Amphenol ‘A’ USD 78,700 4,316 0.09Becton Dickinson USD 29,800 4,347 0.09Berkshire Hathaway ‘A’ USD 2 391 0.01Berkshire Hathaway ‘B’ USD 29,700 3,865 0.08Chevron USD 253,419 21,479 0.47Church & Dwight USD 138,000 5,489 0.12Colgate-Palmolive USD 74,900 4,407 0.10CR Bard USD 22,000 4,371 0.10Exxon Mobil USD 331,488 21,632 0.47Fiserv USD 23,700 2,181 0.05Jack Henry & Associates USD 29,800 2,215 0.05John Keells Holdings (Citigroup) Warrant 08/02/2018 USD 2,818,968 2,207 0.05Mettler-Toledo International USD 600 227 –Occidental Petroleum USD 428,399 21,930 0.48Ollie’s Bargain Outlet Holdings USD 11,800 314 0.01Philip Morris International USD 54,500 4,922 0.11Service Corp. International USD 159,000 3,882 0.08TJX USD 71,600 4,393 0.10Zoetis USD 104,100 4,416 0.10 121,324 2.65Equities total 464,019 10.13
Government Bonds 24.24% (34.43%)Indonesia 2.31% (5.17%)Indonesia Government Bond 8.25% 15/07/2021 IDR 1,127,000,000,000 71,569 1.56Indonesia Government Bond 7.00% 15/05/2022 IDR 562,000,000,000 34,254 0.75 105,823 2.31
Poland 0.00% (5.99%)
South Africa 3.25% (6.98%)South Africa Government Bond 10.50% 21/12/2026 ZAR 2,259,633,211 148,923 3.25 148,923 3.25
Turkey 1.87% (0.00%)Turkey Government Bond 5.63% 30/03/2021 USD $25,835,000 21,710 0.47Turkey Government Bond 5.13% 25/03/2022 USD $13,720,000 11,254 0.25Turkey Government Bond 6.25% 26/09/2022 USD $60,963,000 52,445 1.15 85,409 1.87
United States of America 16.81% (16.29%)US Treasury 0.64% 15/01/2026 USD 314,000,000 263,920 5.76US Treasury 0.13% 15/07/2026 USD 633,300,000 505,960 11.05 769,880 16.81Government Bonds total 1,110,035 24.24
Municipal Bonds 0.04% (0.06%)United States of America 0.04% (0.06%)Mohegan Tribal Gaming Authority 7.88% 15/10/2024 USD 2,064,000 1,702 0.04Municipal Bond total 1,702 0.04
Corporate Bonds 7.22% (11.52%)Bermuda 0.10% (0.24%)Aircastle 6.25% 01/12/2019 USD 2,085,000 1,788 0.04Fly Leasing 6.75% 15/12/2020 USD 3,550,000 2,964 0.06 4,752 0.10
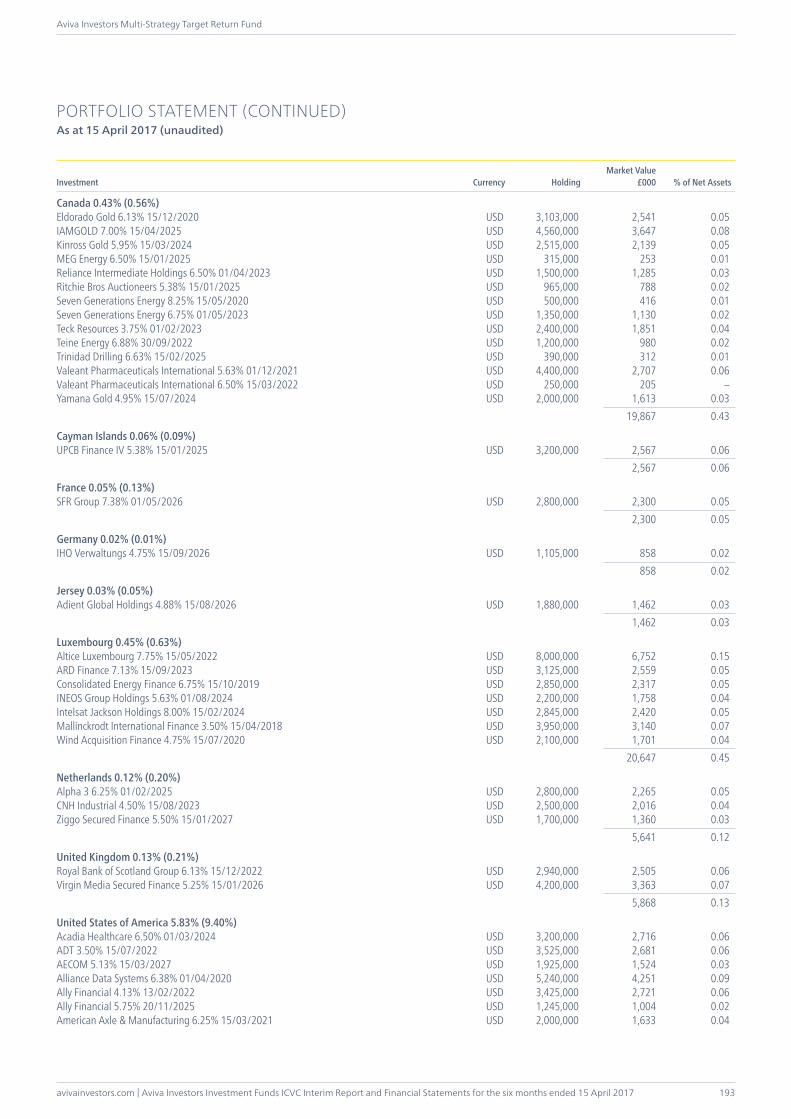
avivainvestors.com | Aviva Investors Investment Funds ICVC Interim Report and Financial Statements for the six months ended 15 April 2017
Aviva Investors Multi-Strategy Target Return Fund
193
PORTFOLIO STATEMENT (CONTINUED)As at 15 April 2017 (unaudited)
Investment Currency HoldingMarket Value
£000 % of Net Assets
Canada 0.43% (0.56%)Eldorado Gold 6.13% 15/12/2020 USD 3,103,000 2,541 0.05IAMGOLD 7.00% 15/04/2025 USD 4,560,000 3,647 0.08Kinross Gold 5.95% 15/03/2024 USD 2,515,000 2,139 0.05MEG Energy 6.50% 15/01/2025 USD 315,000 253 0.01Reliance Intermediate Holdings 6.50% 01/04/2023 USD 1,500,000 1,285 0.03Ritchie Bros Auctioneers 5.38% 15/01/2025 USD 965,000 788 0.02Seven Generations Energy 8.25% 15/05/2020 USD 500,000 416 0.01Seven Generations Energy 6.75% 01/05/2023 USD 1,350,000 1,130 0.02Teck Resources 3.75% 01/02/2023 USD 2,400,000 1,851 0.04Teine Energy 6.88% 30/09/2022 USD 1,200,000 980 0.02Trinidad Drilling 6.63% 15/02/2025 USD 390,000 312 0.01Valeant Pharmaceuticals International 5.63% 01/12/2021 USD 4,400,000 2,707 0.06Valeant Pharmaceuticals International 6.50% 15/03/2022 USD 250,000 205 –Yamana Gold 4.95% 15/07/2024 USD 2,000,000 1,613 0.03 19,867 0.43
Cayman Islands 0.06% (0.09%)UPCB Finance IV 5.38% 15/01/2025 USD 3,200,000 2,567 0.06 2,567 0.06
France 0.05% (0.13%)SFR Group 7.38% 01/05/2026 USD 2,800,000 2,300 0.05 2,300 0.05
Germany 0.02% (0.01%)IHO Verwaltungs 4.75% 15/09/2026 USD 1,105,000 858 0.02 858 0.02
Jersey 0.03% (0.05%)Adient Global Holdings 4.88% 15/08/2026 USD 1,880,000 1,462 0.03 1,462 0.03
Luxembourg 0.45% (0.63%)Altice Luxembourg 7.75% 15/05/2022 USD 8,000,000 6,752 0.15ARD Finance 7.13% 15/09/2023 USD 3,125,000 2,559 0.05Consolidated Energy Finance 6.75% 15/10/2019 USD 2,850,000 2,317 0.05INEOS Group Holdings 5.63% 01/08/2024 USD 2,200,000 1,758 0.04Intelsat Jackson Holdings 8.00% 15/02/2024 USD 2,845,000 2,420 0.05Mallinckrodt International Finance 3.50% 15/04/2018 USD 3,950,000 3,140 0.07Wind Acquisition Finance 4.75% 15/07/2020 USD 2,100,000 1,701 0.04 20,647 0.45
Netherlands 0.12% (0.20%)Alpha 3 6.25% 01/02/2025 USD 2,800,000 2,265 0.05CNH Industrial 4.50% 15/08/2023 USD 2,500,000 2,016 0.04Ziggo Secured Finance 5.50% 15/01/2027 USD 1,700,000 1,360 0.03 5,641 0.12
United Kingdom 0.13% (0.21%)Royal Bank of Scotland Group 6.13% 15/12/2022 USD 2,940,000 2,505 0.06Virgin Media Secured Finance 5.25% 15/01/2026 USD 4,200,000 3,363 0.07 5,868 0.13
United States of America 5.83% (9.40%)Acadia Healthcare 6.50% 01/03/2024 USD 3,200,000 2,716 0.06ADT 3.50% 15/07/2022 USD 3,525,000 2,681 0.06AECOM 5.13% 15/03/2027 USD 1,925,000 1,524 0.03Alliance Data Systems 6.38% 01/04/2020 USD 5,240,000 4,251 0.09Ally Financial 4.13% 13/02/2022 USD 3,425,000 2,721 0.06Ally Financial 5.75% 20/11/2025 USD 1,245,000 1,004 0.02American Axle & Manufacturing 6.25% 15/03/2021 USD 2,000,000 1,633 0.04
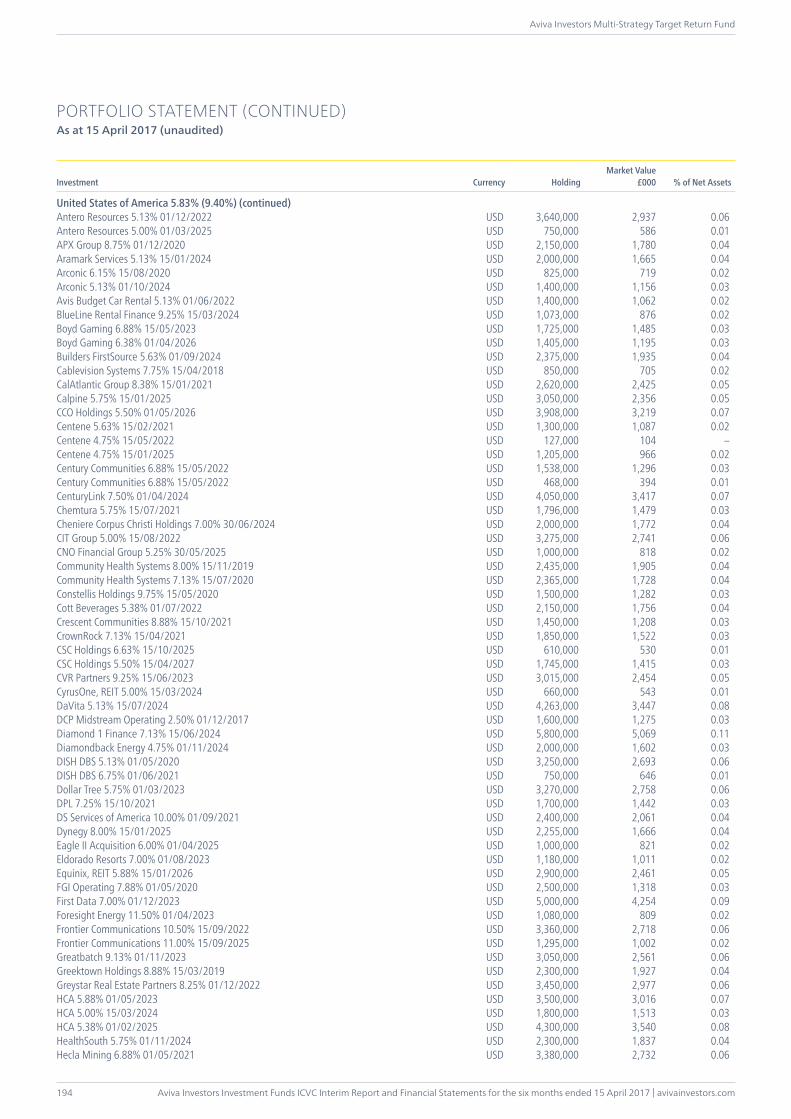
Aviva Investors Investment Funds ICVC Interim Report and Financial Statements for the six months ended 15 April 2017 | avivainvestors.com
Aviva Investors Multi-Strategy Target Return Fund
194
PORTFOLIO STATEMENT (CONTINUED)As at 15 April 2017 (unaudited)
Investment Currency HoldingMarket Value
£000 % of Net Assets
United States of America 5.83% (9.40%) (continued)Antero Resources 5.13% 01/12/2022 USD 3,640,000 2,937 0.06Antero Resources 5.00% 01/03/2025 USD 750,000 586 0.01APX Group 8.75% 01/12/2020 USD 2,150,000 1,780 0.04Aramark Services 5.13% 15/01/2024 USD 2,000,000 1,665 0.04Arconic 6.15% 15/08/2020 USD 825,000 719 0.02Arconic 5.13% 01/10/2024 USD 1,400,000 1,156 0.03Avis Budget Car Rental 5.13% 01/06/2022 USD 1,400,000 1,062 0.02BlueLine Rental Finance 9.25% 15/03/2024 USD 1,073,000 876 0.02Boyd Gaming 6.88% 15/05/2023 USD 1,725,000 1,485 0.03Boyd Gaming 6.38% 01/04/2026 USD 1,405,000 1,195 0.03Builders FirstSource 5.63% 01/09/2024 USD 2,375,000 1,935 0.04Cablevision Systems 7.75% 15/04/2018 USD 850,000 705 0.02CalAtlantic Group 8.38% 15/01/2021 USD 2,620,000 2,425 0.05Calpine 5.75% 15/01/2025 USD 3,050,000 2,356 0.05CCO Holdings 5.50% 01/05/2026 USD 3,908,000 3,219 0.07Centene 5.63% 15/02/2021 USD 1,300,000 1,087 0.02Centene 4.75% 15/05/2022 USD 127,000 104 –Centene 4.75% 15/01/2025 USD 1,205,000 966 0.02Century Communities 6.88% 15/05/2022 USD 1,538,000 1,296 0.03Century Communities 6.88% 15/05/2022 USD 468,000 394 0.01CenturyLink 7.50% 01/04/2024 USD 4,050,000 3,417 0.07Chemtura 5.75% 15/07/2021 USD 1,796,000 1,479 0.03Cheniere Corpus Christi Holdings 7.00% 30/06/2024 USD 2,000,000 1,772 0.04CIT Group 5.00% 15/08/2022 USD 3,275,000 2,741 0.06CNO Financial Group 5.25% 30/05/2025 USD 1,000,000 818 0.02Community Health Systems 8.00% 15/11/2019 USD 2,435,000 1,905 0.04Community Health Systems 7.13% 15/07/2020 USD 2,365,000 1,728 0.04Constellis Holdings 9.75% 15/05/2020 USD 1,500,000 1,282 0.03Cott Beverages 5.38% 01/07/2022 USD 2,150,000 1,756 0.04Crescent Communities 8.88% 15/10/2021 USD 1,450,000 1,208 0.03CrownRock 7.13% 15/04/2021 USD 1,850,000 1,522 0.03CSC Holdings 6.63% 15/10/2025 USD 610,000 530 0.01CSC Holdings 5.50% 15/04/2027 USD 1,745,000 1,415 0.03CVR Partners 9.25% 15/06/2023 USD 3,015,000 2,454 0.05CyrusOne, REIT 5.00% 15/03/2024 USD 660,000 543 0.01DaVita 5.13% 15/07/2024 USD 4,263,000 3,447 0.08DCP Midstream Operating 2.50% 01/12/2017 USD 1,600,000 1,275 0.03Diamond 1 Finance 7.13% 15/06/2024 USD 5,800,000 5,069 0.11Diamondback Energy 4.75% 01/11/2024 USD 2,000,000 1,602 0.03DISH DBS 5.13% 01/05/2020 USD 3,250,000 2,693 0.06DISH DBS 6.75% 01/06/2021 USD 750,000 646 0.01Dollar Tree 5.75% 01/03/2023 USD 3,270,000 2,758 0.06DPL 7.25% 15/10/2021 USD 1,700,000 1,442 0.03DS Services of America 10.00% 01/09/2021 USD 2,400,000 2,061 0.04Dynegy 8.00% 15/01/2025 USD 2,255,000 1,666 0.04Eagle II Acquisition 6.00% 01/04/2025 USD 1,000,000 821 0.02Eldorado Resorts 7.00% 01/08/2023 USD 1,180,000 1,011 0.02Equinix, REIT 5.88% 15/01/2026 USD 2,900,000 2,461 0.05FGI Operating 7.88% 01/05/2020 USD 2,500,000 1,318 0.03First Data 7.00% 01/12/2023 USD 5,000,000 4,254 0.09Foresight Energy 11.50% 01/04/2023 USD 1,080,000 809 0.02Frontier Communications 10.50% 15/09/2022 USD 3,360,000 2,718 0.06Frontier Communications 11.00% 15/09/2025 USD 1,295,000 1,002 0.02Greatbatch 9.13% 01/11/2023 USD 3,050,000 2,561 0.06Greektown Holdings 8.88% 15/03/2019 USD 2,300,000 1,927 0.04Greystar Real Estate Partners 8.25% 01/12/2022 USD 3,450,000 2,977 0.06HCA 5.88% 01/05/2023 USD 3,500,000 3,016 0.07HCA 5.00% 15/03/2024 USD 1,800,000 1,513 0.03HCA 5.38% 01/02/2025 USD 4,300,000 3,540 0.08HealthSouth 5.75% 01/11/2024 USD 2,300,000 1,837 0.04Hecla Mining 6.88% 01/05/2021 USD 3,380,000 2,732 0.06
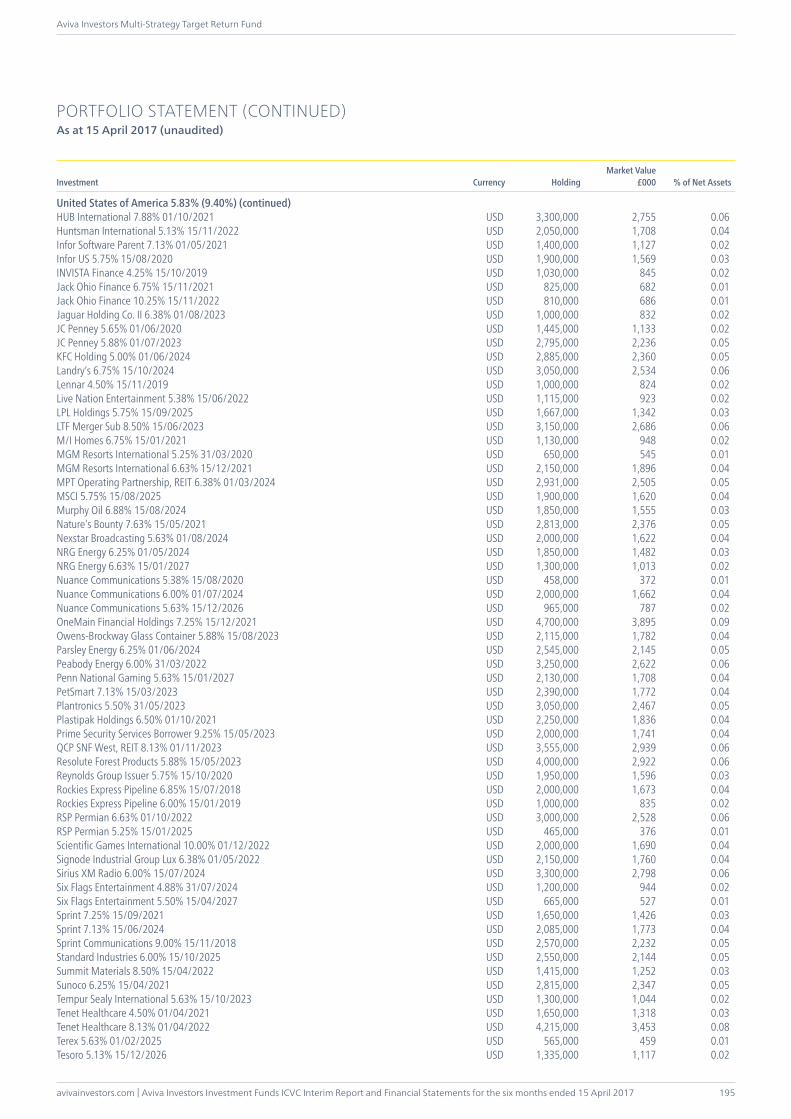
avivainvestors.com | Aviva Investors Investment Funds ICVC Interim Report and Financial Statements for the six months ended 15 April 2017
Aviva Investors Multi-Strategy Target Return Fund
195
United States of America 5.83% (9.40%) (continued)HUB International 7.88% 01/10/2021 USD 3,300,000 2,755 0.06Huntsman International 5.13% 15/11/2022 USD 2,050,000 1,708 0.04Infor Software Parent 7.13% 01/05/2021 USD 1,400,000 1,127 0.02Infor US 5.75% 15/08/2020 USD 1,900,000 1,569 0.03INVISTA Finance 4.25% 15/10/2019 USD 1,030,000 845 0.02Jack Ohio Finance 6.75% 15/11/2021 USD 825,000 682 0.01Jack Ohio Finance 10.25% 15/11/2022 USD 810,000 686 0.01Jaguar Holding Co. II 6.38% 01/08/2023 USD 1,000,000 832 0.02JC Penney 5.65% 01/06/2020 USD 1,445,000 1,133 0.02JC Penney 5.88% 01/07/2023 USD 2,795,000 2,236 0.05KFC Holding 5.00% 01/06/2024 USD 2,885,000 2,360 0.05Landry’s 6.75% 15/10/2024 USD 3,050,000 2,534 0.06Lennar 4.50% 15/11/2019 USD 1,000,000 824 0.02Live Nation Entertainment 5.38% 15/06/2022 USD 1,115,000 923 0.02LPL Holdings 5.75% 15/09/2025 USD 1,667,000 1,342 0.03LTF Merger Sub 8.50% 15/06/2023 USD 3,150,000 2,686 0.06M/I Homes 6.75% 15/01/2021 USD 1,130,000 948 0.02MGM Resorts International 5.25% 31/03/2020 USD 650,000 545 0.01MGM Resorts International 6.63% 15/12/2021 USD 2,150,000 1,896 0.04MPT Operating Partnership, REIT 6.38% 01/03/2024 USD 2,931,000 2,505 0.05MSCI 5.75% 15/08/2025 USD 1,900,000 1,620 0.04Murphy Oil 6.88% 15/08/2024 USD 1,850,000 1,555 0.03Nature’s Bounty 7.63% 15/05/2021 USD 2,813,000 2,376 0.05Nexstar Broadcasting 5.63% 01/08/2024 USD 2,000,000 1,622 0.04NRG Energy 6.25% 01/05/2024 USD 1,850,000 1,482 0.03NRG Energy 6.63% 15/01/2027 USD 1,300,000 1,013 0.02Nuance Communications 5.38% 15/08/2020 USD 458,000 372 0.01Nuance Communications 6.00% 01/07/2024 USD 2,000,000 1,662 0.04Nuance Communications 5.63% 15/12/2026 USD 965,000 787 0.02OneMain Financial Holdings 7.25% 15/12/2021 USD 4,700,000 3,895 0.09Owens-Brockway Glass Container 5.88% 15/08/2023 USD 2,115,000 1,782 0.04Parsley Energy 6.25% 01/06/2024 USD 2,545,000 2,145 0.05Peabody Energy 6.00% 31/03/2022 USD 3,250,000 2,622 0.06Penn National Gaming 5.63% 15/01/2027 USD 2,130,000 1,708 0.04PetSmart 7.13% 15/03/2023 USD 2,390,000 1,772 0.04Plantronics 5.50% 31/05/2023 USD 3,050,000 2,467 0.05Plastipak Holdings 6.50% 01/10/2021 USD 2,250,000 1,836 0.04Prime Security Services Borrower 9.25% 15/05/2023 USD 2,000,000 1,741 0.04QCP SNF West, REIT 8.13% 01/11/2023 USD 3,555,000 2,939 0.06Resolute Forest Products 5.88% 15/05/2023 USD 4,000,000 2,922 0.06Reynolds Group Issuer 5.75% 15/10/2020 USD 1,950,000 1,596 0.03Rockies Express Pipeline 6.85% 15/07/2018 USD 2,000,000 1,673 0.04Rockies Express Pipeline 6.00% 15/01/2019 USD 1,000,000 835 0.02RSP Permian 6.63% 01/10/2022 USD 3,000,000 2,528 0.06RSP Permian 5.25% 15/01/2025 USD 465,000 376 0.01Scientific Games International 10.00% 01/12/2022 USD 2,000,000 1,690 0.04Signode Industrial Group Lux 6.38% 01/05/2022 USD 2,150,000 1,760 0.04Sirius XM Radio 6.00% 15/07/2024 USD 3,300,000 2,798 0.06Six Flags Entertainment 4.88% 31/07/2024 USD 1,200,000 944 0.02Six Flags Entertainment 5.50% 15/04/2027 USD 665,000 527 0.01Sprint 7.25% 15/09/2021 USD 1,650,000 1,426 0.03Sprint 7.13% 15/06/2024 USD 2,085,000 1,773 0.04Sprint Communications 9.00% 15/11/2018 USD 2,570,000 2,232 0.05Standard Industries 6.00% 15/10/2025 USD 2,550,000 2,144 0.05Summit Materials 8.50% 15/04/2022 USD 1,415,000 1,252 0.03Sunoco 6.25% 15/04/2021 USD 2,815,000 2,347 0.05Tempur Sealy International 5.63% 15/10/2023 USD 1,300,000 1,044 0.02Tenet Healthcare 4.50% 01/04/2021 USD 1,650,000 1,318 0.03Tenet Healthcare 8.13% 01/04/2022 USD 4,215,000 3,453 0.08Terex 5.63% 01/02/2025 USD 565,000 459 0.01Tesoro 5.13% 15/12/2026 USD 1,335,000 1,117 0.02
PORTFOLIO STATEMENT (CONTINUED)As at 15 April 2017 (unaudited)
Investment Currency HoldingMarket Value
£000 % of Net Assets
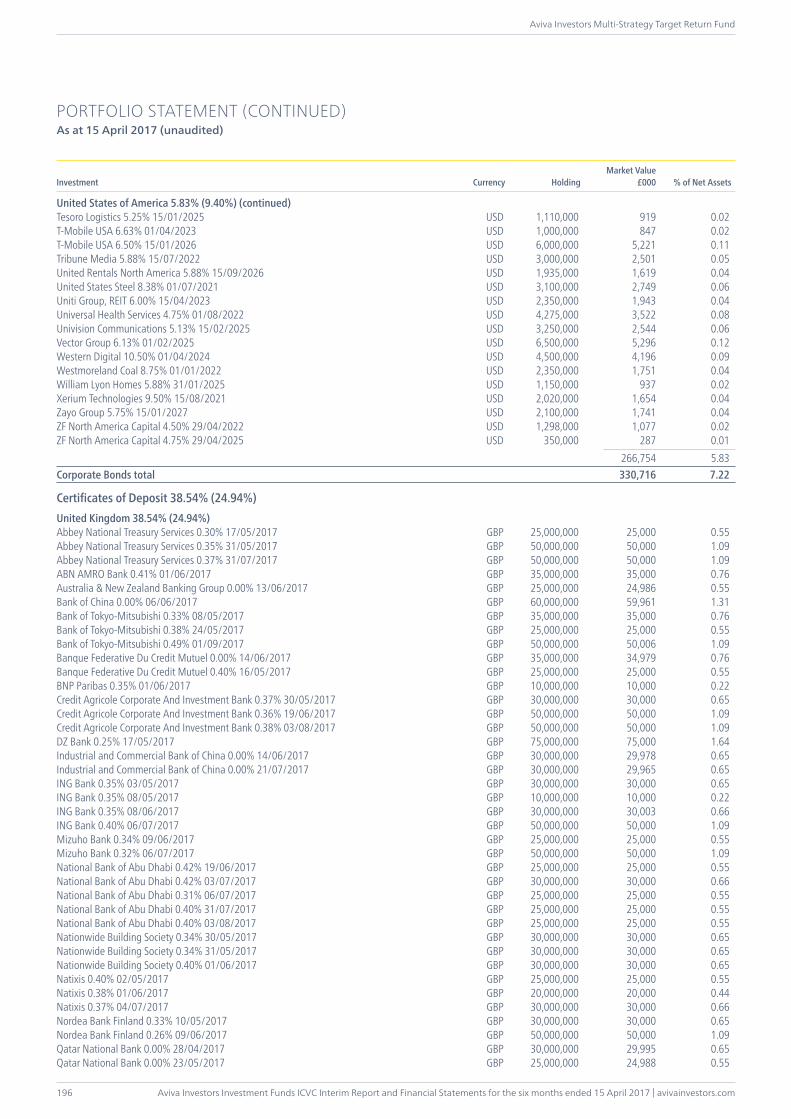
Aviva Investors Investment Funds ICVC Interim Report and Financial Statements for the six months ended 15 April 2017 | avivainvestors.com
Aviva Investors Multi-Strategy Target Return Fund
196
United States of America 5.83% (9.40%) (continued)Tesoro Logistics 5.25% 15/01/2025 USD 1,110,000 919 0.02T-Mobile USA 6.63% 01/04/2023 USD 1,000,000 847 0.02T-Mobile USA 6.50% 15/01/2026 USD 6,000,000 5,221 0.11Tribune Media 5.88% 15/07/2022 USD 3,000,000 2,501 0.05United Rentals North America 5.88% 15/09/2026 USD 1,935,000 1,619 0.04United States Steel 8.38% 01/07/2021 USD 3,100,000 2,749 0.06Uniti Group, REIT 6.00% 15/04/2023 USD 2,350,000 1,943 0.04Universal Health Services 4.75% 01/08/2022 USD 4,275,000 3,522 0.08Univision Communications 5.13% 15/02/2025 USD 3,250,000 2,544 0.06Vector Group 6.13% 01/02/2025 USD 6,500,000 5,296 0.12Western Digital 10.50% 01/04/2024 USD 4,500,000 4,196 0.09Westmoreland Coal 8.75% 01/01/2022 USD 2,350,000 1,751 0.04William Lyon Homes 5.88% 31/01/2025 USD 1,150,000 937 0.02Xerium Technologies 9.50% 15/08/2021 USD 2,020,000 1,654 0.04Zayo Group 5.75% 15/01/2027 USD 2,100,000 1,741 0.04ZF North America Capital 4.50% 29/04/2022 USD 1,298,000 1,077 0.02ZF North America Capital 4.75% 29/04/2025 USD 350,000 287 0.01 266,754 5.83Corporate Bonds total 330,716 7.22
Certificates of Deposit 38.54% (24.94%)United Kingdom 38.54% (24.94%)Abbey National Treasury Services 0.30% 17/05/2017 GBP 25,000,000 25,000 0.55Abbey National Treasury Services 0.35% 31/05/2017 GBP 50,000,000 50,000 1.09Abbey National Treasury Services 0.37% 31/07/2017 GBP 50,000,000 50,000 1.09ABN AMRO Bank 0.41% 01/06/2017 GBP 35,000,000 35,000 0.76Australia & New Zealand Banking Group 0.00% 13/06/2017 GBP 25,000,000 24,986 0.55Bank of China 0.00% 06/06/2017 GBP 60,000,000 59,961 1.31Bank of Tokyo-Mitsubishi 0.33% 08/05/2017 GBP 35,000,000 35,000 0.76Bank of Tokyo-Mitsubishi 0.38% 24/05/2017 GBP 25,000,000 25,000 0.55Bank of Tokyo-Mitsubishi 0.49% 01/09/2017 GBP 50,000,000 50,006 1.09Banque Federative Du Credit Mutuel 0.00% 14/06/2017 GBP 35,000,000 34,979 0.76Banque Federative Du Credit Mutuel 0.40% 16/05/2017 GBP 25,000,000 25,000 0.55BNP Paribas 0.35% 01/06/2017 GBP 10,000,000 10,000 0.22Credit Agricole Corporate And Investment Bank 0.37% 30/05/2017 GBP 30,000,000 30,000 0.65Credit Agricole Corporate And Investment Bank 0.36% 19/06/2017 GBP 50,000,000 50,000 1.09Credit Agricole Corporate And Investment Bank 0.38% 03/08/2017 GBP 50,000,000 50,000 1.09DZ Bank 0.25% 17/05/2017 GBP 75,000,000 75,000 1.64Industrial and Commercial Bank of China 0.00% 14/06/2017 GBP 30,000,000 29,978 0.65Industrial and Commercial Bank of China 0.00% 21/07/2017 GBP 30,000,000 29,965 0.65ING Bank 0.35% 03/05/2017 GBP 30,000,000 30,000 0.65ING Bank 0.35% 08/05/2017 GBP 10,000,000 10,000 0.22ING Bank 0.35% 08/06/2017 GBP 30,000,000 30,003 0.66ING Bank 0.40% 06/07/2017 GBP 50,000,000 50,000 1.09Mizuho Bank 0.34% 09/06/2017 GBP 25,000,000 25,000 0.55Mizuho Bank 0.32% 06/07/2017 GBP 50,000,000 50,000 1.09National Bank of Abu Dhabi 0.42% 19/06/2017 GBP 25,000,000 25,000 0.55National Bank of Abu Dhabi 0.42% 03/07/2017 GBP 30,000,000 30,000 0.66National Bank of Abu Dhabi 0.31% 06/07/2017 GBP 25,000,000 25,000 0.55National Bank of Abu Dhabi 0.40% 31/07/2017 GBP 25,000,000 25,000 0.55National Bank of Abu Dhabi 0.40% 03/08/2017 GBP 25,000,000 25,000 0.55Nationwide Building Society 0.34% 30/05/2017 GBP 30,000,000 30,000 0.65Nationwide Building Society 0.34% 31/05/2017 GBP 30,000,000 30,000 0.65Nationwide Building Society 0.40% 01/06/2017 GBP 30,000,000 30,000 0.65Natixis 0.40% 02/05/2017 GBP 25,000,000 25,000 0.55Natixis 0.38% 01/06/2017 GBP 20,000,000 20,000 0.44Natixis 0.37% 04/07/2017 GBP 30,000,000 30,000 0.66Nordea Bank Finland 0.33% 10/05/2017 GBP 30,000,000 30,000 0.65Nordea Bank Finland 0.26% 09/06/2017 GBP 50,000,000 50,000 1.09Qatar National Bank 0.00% 28/04/2017 GBP 30,000,000 29,995 0.65Qatar National Bank 0.00% 23/05/2017 GBP 25,000,000 24,988 0.55
PORTFOLIO STATEMENT (CONTINUED)As at 15 April 2017 (unaudited)
Investment Currency HoldingMarket Value
£000 % of Net Assets
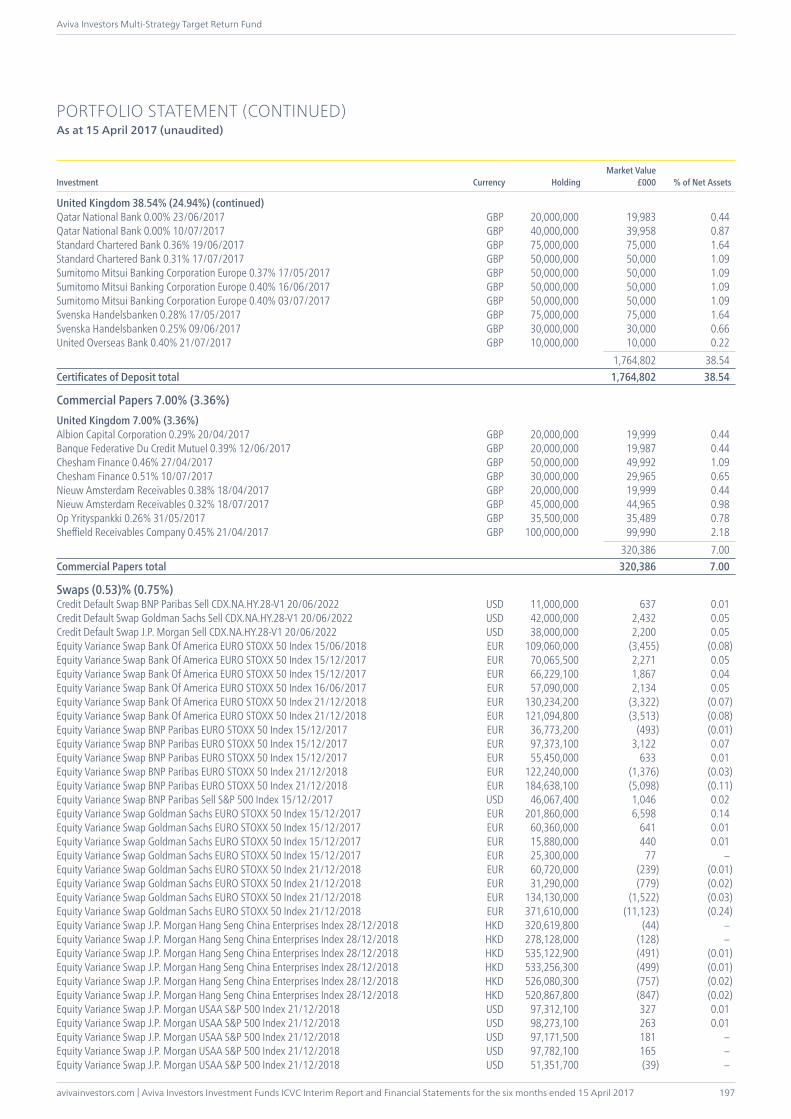
avivainvestors.com | Aviva Investors Investment Funds ICVC Interim Report and Financial Statements for the six months ended 15 April 2017
Aviva Investors Multi-Strategy Target Return Fund
197
PORTFOLIO STATEMENT (CONTINUED)As at 15 April 2017 (unaudited)
Investment Currency HoldingMarket Value
£000 % of Net Assets
United Kingdom 38.54% (24.94%) (continued)Qatar National Bank 0.00% 23/06/2017 GBP 20,000,000 19,983 0.44Qatar National Bank 0.00% 10/07/2017 GBP 40,000,000 39,958 0.87Standard Chartered Bank 0.36% 19/06/2017 GBP 75,000,000 75,000 1.64Standard Chartered Bank 0.31% 17/07/2017 GBP 50,000,000 50,000 1.09Sumitomo Mitsui Banking Corporation Europe 0.37% 17/05/2017 GBP 50,000,000 50,000 1.09Sumitomo Mitsui Banking Corporation Europe 0.40% 16/06/2017 GBP 50,000,000 50,000 1.09Sumitomo Mitsui Banking Corporation Europe 0.40% 03/07/2017 GBP 50,000,000 50,000 1.09Svenska Handelsbanken 0.28% 17/05/2017 GBP 75,000,000 75,000 1.64Svenska Handelsbanken 0.25% 09/06/2017 GBP 30,000,000 30,000 0.66United Overseas Bank 0.40% 21/07/2017 GBP 10,000,000 10,000 0.22 1,764,802 38.54Certificates of Deposit total 1,764,802 38.54
Commercial Papers 7.00% (3.36%)United Kingdom 7.00% (3.36%)Albion Capital Corporation 0.29% 20/04/2017 GBP 20,000,000 19,999 0.44Banque Federative Du Credit Mutuel 0.39% 12/06/2017 GBP 20,000,000 19,987 0.44Chesham Finance 0.46% 27/04/2017 GBP 50,000,000 49,992 1.09Chesham Finance 0.51% 10/07/2017 GBP 30,000,000 29,965 0.65Nieuw Amsterdam Receivables 0.38% 18/04/2017 GBP 20,000,000 19,999 0.44Nieuw Amsterdam Receivables 0.32% 18/07/2017 GBP 45,000,000 44,965 0.98Op Yrityspankki 0.26% 31/05/2017 GBP 35,500,000 35,489 0.78Sheffield Receivables Company 0.45% 21/04/2017 GBP 100,000,000 99,990 2.18 320,386 7.00Commercial Papers total 320,386 7.00
Swaps (0.53)% (0.75%)Credit Default Swap BNP Paribas Sell CDX.NA.HY.28-V1 20/06/2022 USD 11,000,000 637 0.01Credit Default Swap Goldman Sachs Sell CDX.NA.HY.28-V1 20/06/2022 USD 42,000,000 2,432 0.05Credit Default Swap J.P. Morgan Sell CDX.NA.HY.28-V1 20/06/2022 USD 38,000,000 2,200 0.05Equity Variance Swap Bank Of America EURO STOXX 50 Index 15/06/2018 EUR 109,060,000 (3,455) (0.08)Equity Variance Swap Bank Of America EURO STOXX 50 Index 15/12/2017 EUR 70,065,500 2,271 0.05Equity Variance Swap Bank Of America EURO STOXX 50 Index 15/12/2017 EUR 66,229,100 1,867 0.04Equity Variance Swap Bank Of America EURO STOXX 50 Index 16/06/2017 EUR 57,090,000 2,134 0.05Equity Variance Swap Bank Of America EURO STOXX 50 Index 21/12/2018 EUR 130,234,200 (3,322) (0.07)Equity Variance Swap Bank Of America EURO STOXX 50 Index 21/12/2018 EUR 121,094,800 (3,513) (0.08)Equity Variance Swap BNP Paribas EURO STOXX 50 Index 15/12/2017 EUR 36,773,200 (493) (0.01)Equity Variance Swap BNP Paribas EURO STOXX 50 Index 15/12/2017 EUR 97,373,100 3,122 0.07Equity Variance Swap BNP Paribas EURO STOXX 50 Index 15/12/2017 EUR 55,450,000 633 0.01Equity Variance Swap BNP Paribas EURO STOXX 50 Index 21/12/2018 EUR 122,240,000 (1,376) (0.03)Equity Variance Swap BNP Paribas EURO STOXX 50 Index 21/12/2018 EUR 184,638,100 (5,098) (0.11)Equity Variance Swap BNP Paribas Sell S&P 500 Index 15/12/2017 USD 46,067,400 1,046 0.02Equity Variance Swap Goldman Sachs EURO STOXX 50 Index 15/12/2017 EUR 201,860,000 6,598 0.14Equity Variance Swap Goldman Sachs EURO STOXX 50 Index 15/12/2017 EUR 60,360,000 641 0.01Equity Variance Swap Goldman Sachs EURO STOXX 50 Index 15/12/2017 EUR 15,880,000 440 0.01Equity Variance Swap Goldman Sachs EURO STOXX 50 Index 15/12/2017 EUR 25,300,000 77 –Equity Variance Swap Goldman Sachs EURO STOXX 50 Index 21/12/2018 EUR 60,720,000 (239) (0.01)Equity Variance Swap Goldman Sachs EURO STOXX 50 Index 21/12/2018 EUR 31,290,000 (779) (0.02)Equity Variance Swap Goldman Sachs EURO STOXX 50 Index 21/12/2018 EUR 134,130,000 (1,522) (0.03)Equity Variance Swap Goldman Sachs EURO STOXX 50 Index 21/12/2018 EUR 371,610,000 (11,123) (0.24)Equity Variance Swap J.P. Morgan Hang Seng China Enterprises Index 28/12/2018 HKD 320,619,800 (44) –Equity Variance Swap J.P. Morgan Hang Seng China Enterprises Index 28/12/2018 HKD 278,128,000 (128) –Equity Variance Swap J.P. Morgan Hang Seng China Enterprises Index 28/12/2018 HKD 535,122,900 (491) (0.01)Equity Variance Swap J.P. Morgan Hang Seng China Enterprises Index 28/12/2018 HKD 533,256,300 (499) (0.01)Equity Variance Swap J.P. Morgan Hang Seng China Enterprises Index 28/12/2018 HKD 526,080,300 (757) (0.02)Equity Variance Swap J.P. Morgan Hang Seng China Enterprises Index 28/12/2018 HKD 520,867,800 (847) (0.02)Equity Variance Swap J.P. Morgan USAA S&P 500 Index 21/12/2018 USD 97,312,100 327 0.01Equity Variance Swap J.P. Morgan USAA S&P 500 Index 21/12/2018 USD 98,273,100 263 0.01Equity Variance Swap J.P. Morgan USAA S&P 500 Index 21/12/2018 USD 97,171,500 181 –Equity Variance Swap J.P. Morgan USAA S&P 500 Index 21/12/2018 USD 97,782,100 165 –Equity Variance Swap J.P. Morgan USAA S&P 500 Index 21/12/2018 USD 51,351,700 (39) –
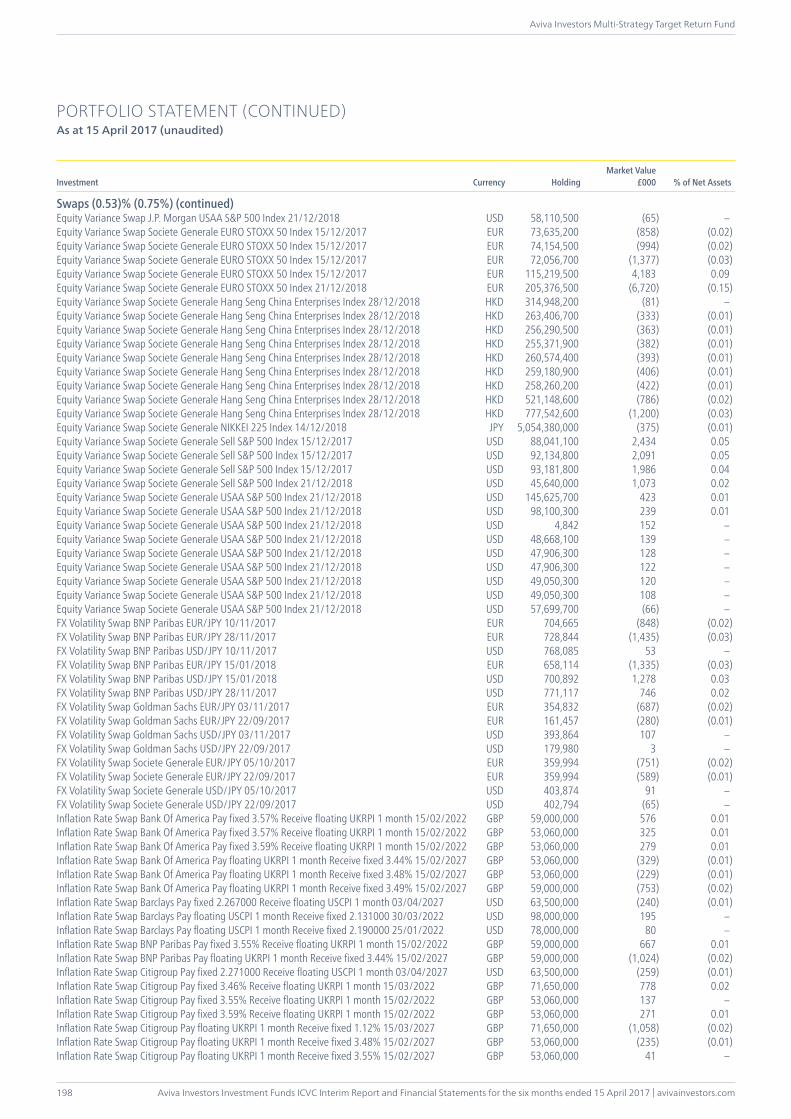
Aviva Investors Investment Funds ICVC Interim Report and Financial Statements for the six months ended 15 April 2017 | avivainvestors.com
Aviva Investors Multi-Strategy Target Return Fund
198
PORTFOLIO STATEMENT (CONTINUED)As at 15 April 2017 (unaudited)
Investment Currency HoldingMarket Value
£000 % of Net Assets
Swaps (0.53)% (0.75%) (continued)Equity Variance Swap J.P. Morgan USAA S&P 500 Index 21/12/2018 USD 58,110,500 (65) –Equity Variance Swap Societe Generale EURO STOXX 50 Index 15/12/2017 EUR 73,635,200 (858) (0.02)Equity Variance Swap Societe Generale EURO STOXX 50 Index 15/12/2017 EUR 74,154,500 (994) (0.02)Equity Variance Swap Societe Generale EURO STOXX 50 Index 15/12/2017 EUR 72,056,700 (1,377) (0.03)Equity Variance Swap Societe Generale EURO STOXX 50 Index 15/12/2017 EUR 115,219,500 4,183 0.09Equity Variance Swap Societe Generale EURO STOXX 50 Index 21/12/2018 EUR 205,376,500 (6,720) (0.15)Equity Variance Swap Societe Generale Hang Seng China Enterprises Index 28/12/2018 HKD 314,948,200 (81) –Equity Variance Swap Societe Generale Hang Seng China Enterprises Index 28/12/2018 HKD 263,406,700 (333) (0.01)Equity Variance Swap Societe Generale Hang Seng China Enterprises Index 28/12/2018 HKD 256,290,500 (363) (0.01)Equity Variance Swap Societe Generale Hang Seng China Enterprises Index 28/12/2018 HKD 255,371,900 (382) (0.01)Equity Variance Swap Societe Generale Hang Seng China Enterprises Index 28/12/2018 HKD 260,574,400 (393) (0.01)Equity Variance Swap Societe Generale Hang Seng China Enterprises Index 28/12/2018 HKD 259,180,900 (406) (0.01)Equity Variance Swap Societe Generale Hang Seng China Enterprises Index 28/12/2018 HKD 258,260,200 (422) (0.01)Equity Variance Swap Societe Generale Hang Seng China Enterprises Index 28/12/2018 HKD 521,148,600 (786) (0.02)Equity Variance Swap Societe Generale Hang Seng China Enterprises Index 28/12/2018 HKD 777,542,600 (1,200) (0.03)Equity Variance Swap Societe Generale NIKKEI 225 Index 14/12/2018 JPY 5,054,380,000 (375) (0.01)Equity Variance Swap Societe Generale Sell S&P 500 Index 15/12/2017 USD 88,041,100 2,434 0.05Equity Variance Swap Societe Generale Sell S&P 500 Index 15/12/2017 USD 92,134,800 2,091 0.05Equity Variance Swap Societe Generale Sell S&P 500 Index 15/12/2017 USD 93,181,800 1,986 0.04Equity Variance Swap Societe Generale Sell S&P 500 Index 21/12/2018 USD 45,640,000 1,073 0.02Equity Variance Swap Societe Generale USAA S&P 500 Index 21/12/2018 USD 145,625,700 423 0.01Equity Variance Swap Societe Generale USAA S&P 500 Index 21/12/2018 USD 98,100,300 239 0.01Equity Variance Swap Societe Generale USAA S&P 500 Index 21/12/2018 USD 4,842 152 –Equity Variance Swap Societe Generale USAA S&P 500 Index 21/12/2018 USD 48,668,100 139 –Equity Variance Swap Societe Generale USAA S&P 500 Index 21/12/2018 USD 47,906,300 128 –Equity Variance Swap Societe Generale USAA S&P 500 Index 21/12/2018 USD 47,906,300 122 –Equity Variance Swap Societe Generale USAA S&P 500 Index 21/12/2018 USD 49,050,300 120 –Equity Variance Swap Societe Generale USAA S&P 500 Index 21/12/2018 USD 49,050,300 108 –Equity Variance Swap Societe Generale USAA S&P 500 Index 21/12/2018 USD 57,699,700 (66) –FX Volatility Swap BNP Paribas EUR/JPY 10/11/2017 EUR 704,665 (848) (0.02)FX Volatility Swap BNP Paribas EUR/JPY 28/11/2017 EUR 728,844 (1,435) (0.03)FX Volatility Swap BNP Paribas USD/JPY 10/11/2017 USD 768,085 53 –FX Volatility Swap BNP Paribas EUR/JPY 15/01/2018 EUR 658,114 (1,335) (0.03)FX Volatility Swap BNP Paribas USD/JPY 15/01/2018 USD 700,892 1,278 0.03FX Volatility Swap BNP Paribas USD/JPY 28/11/2017 USD 771,117 746 0.02FX Volatility Swap Goldman Sachs EUR/JPY 03/11/2017 EUR 354,832 (687) (0.02)FX Volatility Swap Goldman Sachs EUR/JPY 22/09/2017 EUR 161,457 (280) (0.01)FX Volatility Swap Goldman Sachs USD/JPY 03/11/2017 USD 393,864 107 –FX Volatility Swap Goldman Sachs USD/JPY 22/09/2017 USD 179,980 3 –FX Volatility Swap Societe Generale EUR/JPY 05/10/2017 EUR 359,994 (751) (0.02)FX Volatility Swap Societe Generale EUR/JPY 22/09/2017 EUR 359,994 (589) (0.01)FX Volatility Swap Societe Generale USD/JPY 05/10/2017 USD 403,874 91 –FX Volatility Swap Societe Generale USD/JPY 22/09/2017 USD 402,794 (65) –Inflation Rate Swap Bank Of America Pay fixed 3.57% Receive floating UKRPI 1 month 15/02/2022 GBP 59,000,000 576 0.01Inflation Rate Swap Bank Of America Pay fixed 3.57% Receive floating UKRPI 1 month 15/02/2022 GBP 53,060,000 325 0.01Inflation Rate Swap Bank Of America Pay fixed 3.59% Receive floating UKRPI 1 month 15/02/2022 GBP 53,060,000 279 0.01Inflation Rate Swap Bank Of America Pay floating UKRPI 1 month Receive fixed 3.44% 15/02/2027 GBP 53,060,000 (329) (0.01)Inflation Rate Swap Bank Of America Pay floating UKRPI 1 month Receive fixed 3.48% 15/02/2027 GBP 53,060,000 (229) (0.01)Inflation Rate Swap Bank Of America Pay floating UKRPI 1 month Receive fixed 3.49% 15/02/2027 GBP 59,000,000 (753) (0.02)Inflation Rate Swap Barclays Pay fixed 2.267000 Receive floating USCPI 1 month 03/04/2027 USD 63,500,000 (240) (0.01)Inflation Rate Swap Barclays Pay floating USCPI 1 month Receive fixed 2.131000 30/03/2022 USD 98,000,000 195 –Inflation Rate Swap Barclays Pay floating USCPI 1 month Receive fixed 2.190000 25/01/2022 USD 78,000,000 80 –Inflation Rate Swap BNP Paribas Pay fixed 3.55% Receive floating UKRPI 1 month 15/02/2022 GBP 59,000,000 667 0.01Inflation Rate Swap BNP Paribas Pay floating UKRPI 1 month Receive fixed 3.44% 15/02/2027 GBP 59,000,000 (1,024) (0.02)Inflation Rate Swap Citigroup Pay fixed 2.271000 Receive floating USCPI 1 month 03/04/2027 USD 63,500,000 (259) (0.01)Inflation Rate Swap Citigroup Pay fixed 3.46% Receive floating UKRPI 1 month 15/03/2022 GBP 71,650,000 778 0.02Inflation Rate Swap Citigroup Pay fixed 3.55% Receive floating UKRPI 1 month 15/02/2022 GBP 53,060,000 137 –Inflation Rate Swap Citigroup Pay fixed 3.59% Receive floating UKRPI 1 month 15/02/2022 GBP 53,060,000 271 0.01Inflation Rate Swap Citigroup Pay floating UKRPI 1 month Receive fixed 1.12% 15/03/2027 GBP 71,650,000 (1,058) (0.02)Inflation Rate Swap Citigroup Pay floating UKRPI 1 month Receive fixed 3.48% 15/02/2027 GBP 53,060,000 (235) (0.01)Inflation Rate Swap Citigroup Pay floating UKRPI 1 month Receive fixed 3.55% 15/02/2027 GBP 53,060,000 41 –
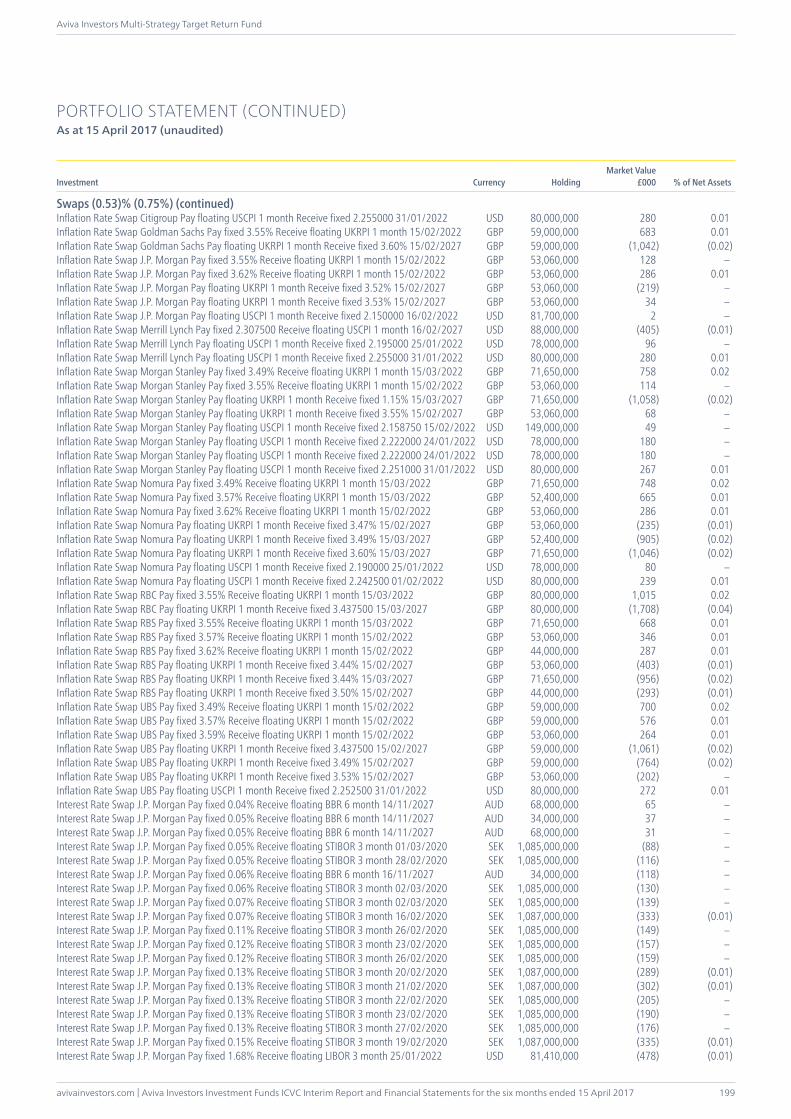
avivainvestors.com | Aviva Investors Investment Funds ICVC Interim Report and Financial Statements for the six months ended 15 April 2017
Aviva Investors Multi-Strategy Target Return Fund
199
PORTFOLIO STATEMENT (CONTINUED)As at 15 April 2017 (unaudited)
Investment Currency HoldingMarket Value
£000 % of Net Assets
Swaps (0.53)% (0.75%) (continued)Inflation Rate Swap Citigroup Pay floating USCPI 1 month Receive fixed 2.255000 31/01/2022 USD 80,000,000 280 0.01Inflation Rate Swap Goldman Sachs Pay fixed 3.55% Receive floating UKRPI 1 month 15/02/2022 GBP 59,000,000 683 0.01Inflation Rate Swap Goldman Sachs Pay floating UKRPI 1 month Receive fixed 3.60% 15/02/2027 GBP 59,000,000 (1,042) (0.02)Inflation Rate Swap J.P. Morgan Pay fixed 3.55% Receive floating UKRPI 1 month 15/02/2022 GBP 53,060,000 128 –Inflation Rate Swap J.P. Morgan Pay fixed 3.62% Receive floating UKRPI 1 month 15/02/2022 GBP 53,060,000 286 0.01Inflation Rate Swap J.P. Morgan Pay floating UKRPI 1 month Receive fixed 3.52% 15/02/2027 GBP 53,060,000 (219) –Inflation Rate Swap J.P. Morgan Pay floating UKRPI 1 month Receive fixed 3.53% 15/02/2027 GBP 53,060,000 34 –Inflation Rate Swap J.P. Morgan Pay floating USCPI 1 month Receive fixed 2.150000 16/02/2022 USD 81,700,000 2 –Inflation Rate Swap Merrill Lynch Pay fixed 2.307500 Receive floating USCPI 1 month 16/02/2027 USD 88,000,000 (405) (0.01)Inflation Rate Swap Merrill Lynch Pay floating USCPI 1 month Receive fixed 2.195000 25/01/2022 USD 78,000,000 96 –Inflation Rate Swap Merrill Lynch Pay floating USCPI 1 month Receive fixed 2.255000 31/01/2022 USD 80,000,000 280 0.01Inflation Rate Swap Morgan Stanley Pay fixed 3.49% Receive floating UKRPI 1 month 15/03/2022 GBP 71,650,000 758 0.02Inflation Rate Swap Morgan Stanley Pay fixed 3.55% Receive floating UKRPI 1 month 15/02/2022 GBP 53,060,000 114 –Inflation Rate Swap Morgan Stanley Pay floating UKRPI 1 month Receive fixed 1.15% 15/03/2027 GBP 71,650,000 (1,058) (0.02)Inflation Rate Swap Morgan Stanley Pay floating UKRPI 1 month Receive fixed 3.55% 15/02/2027 GBP 53,060,000 68 –Inflation Rate Swap Morgan Stanley Pay floating USCPI 1 month Receive fixed 2.158750 15/02/2022 USD 149,000,000 49 –Inflation Rate Swap Morgan Stanley Pay floating USCPI 1 month Receive fixed 2.222000 24/01/2022 USD 78,000,000 180 –Inflation Rate Swap Morgan Stanley Pay floating USCPI 1 month Receive fixed 2.222000 24/01/2022 USD 78,000,000 180 –Inflation Rate Swap Morgan Stanley Pay floating USCPI 1 month Receive fixed 2.251000 31/01/2022 USD 80,000,000 267 0.01Inflation Rate Swap Nomura Pay fixed 3.49% Receive floating UKRPI 1 month 15/03/2022 GBP 71,650,000 748 0.02Inflation Rate Swap Nomura Pay fixed 3.57% Receive floating UKRPI 1 month 15/03/2022 GBP 52,400,000 665 0.01Inflation Rate Swap Nomura Pay fixed 3.62% Receive floating UKRPI 1 month 15/02/2022 GBP 53,060,000 286 0.01Inflation Rate Swap Nomura Pay floating UKRPI 1 month Receive fixed 3.47% 15/02/2027 GBP 53,060,000 (235) (0.01)Inflation Rate Swap Nomura Pay floating UKRPI 1 month Receive fixed 3.49% 15/03/2027 GBP 52,400,000 (905) (0.02)Inflation Rate Swap Nomura Pay floating UKRPI 1 month Receive fixed 3.60% 15/03/2027 GBP 71,650,000 (1,046) (0.02)Inflation Rate Swap Nomura Pay floating USCPI 1 month Receive fixed 2.190000 25/01/2022 USD 78,000,000 80 –Inflation Rate Swap Nomura Pay floating USCPI 1 month Receive fixed 2.242500 01/02/2022 USD 80,000,000 239 0.01Inflation Rate Swap RBC Pay fixed 3.55% Receive floating UKRPI 1 month 15/03/2022 GBP 80,000,000 1,015 0.02Inflation Rate Swap RBC Pay floating UKRPI 1 month Receive fixed 3.437500 15/03/2027 GBP 80,000,000 (1,708) (0.04)Inflation Rate Swap RBS Pay fixed 3.55% Receive floating UKRPI 1 month 15/03/2022 GBP 71,650,000 668 0.01Inflation Rate Swap RBS Pay fixed 3.57% Receive floating UKRPI 1 month 15/02/2022 GBP 53,060,000 346 0.01Inflation Rate Swap RBS Pay fixed 3.62% Receive floating UKRPI 1 month 15/02/2022 GBP 44,000,000 287 0.01Inflation Rate Swap RBS Pay floating UKRPI 1 month Receive fixed 3.44% 15/02/2027 GBP 53,060,000 (403) (0.01)Inflation Rate Swap RBS Pay floating UKRPI 1 month Receive fixed 3.44% 15/03/2027 GBP 71,650,000 (956) (0.02)Inflation Rate Swap RBS Pay floating UKRPI 1 month Receive fixed 3.50% 15/02/2027 GBP 44,000,000 (293) (0.01)Inflation Rate Swap UBS Pay fixed 3.49% Receive floating UKRPI 1 month 15/02/2022 GBP 59,000,000 700 0.02Inflation Rate Swap UBS Pay fixed 3.57% Receive floating UKRPI 1 month 15/02/2022 GBP 59,000,000 576 0.01Inflation Rate Swap UBS Pay fixed 3.59% Receive floating UKRPI 1 month 15/02/2022 GBP 53,060,000 264 0.01Inflation Rate Swap UBS Pay floating UKRPI 1 month Receive fixed 3.437500 15/02/2027 GBP 59,000,000 (1,061) (0.02)Inflation Rate Swap UBS Pay floating UKRPI 1 month Receive fixed 3.49% 15/02/2027 GBP 59,000,000 (764) (0.02)Inflation Rate Swap UBS Pay floating UKRPI 1 month Receive fixed 3.53% 15/02/2027 GBP 53,060,000 (202) –Inflation Rate Swap UBS Pay floating USCPI 1 month Receive fixed 2.252500 31/01/2022 USD 80,000,000 272 0.01Interest Rate Swap J.P. Morgan Pay fixed 0.04% Receive floating BBR 6 month 14/11/2027 AUD 68,000,000 65 –Interest Rate Swap J.P. Morgan Pay fixed 0.05% Receive floating BBR 6 month 14/11/2027 AUD 34,000,000 37 –Interest Rate Swap J.P. Morgan Pay fixed 0.05% Receive floating BBR 6 month 14/11/2027 AUD 68,000,000 31 –Interest Rate Swap J.P. Morgan Pay fixed 0.05% Receive floating STIBOR 3 month 01/03/2020 SEK 1,085,000,000 (88) –Interest Rate Swap J.P. Morgan Pay fixed 0.05% Receive floating STIBOR 3 month 28/02/2020 SEK 1,085,000,000 (116) –Interest Rate Swap J.P. Morgan Pay fixed 0.06% Receive floating BBR 6 month 16/11/2027 AUD 34,000,000 (118) –Interest Rate Swap J.P. Morgan Pay fixed 0.06% Receive floating STIBOR 3 month 02/03/2020 SEK 1,085,000,000 (130) –Interest Rate Swap J.P. Morgan Pay fixed 0.07% Receive floating STIBOR 3 month 02/03/2020 SEK 1,085,000,000 (139) –Interest Rate Swap J.P. Morgan Pay fixed 0.07% Receive floating STIBOR 3 month 16/02/2020 SEK 1,087,000,000 (333) (0.01)Interest Rate Swap J.P. Morgan Pay fixed 0.11% Receive floating STIBOR 3 month 26/02/2020 SEK 1,085,000,000 (149) –Interest Rate Swap J.P. Morgan Pay fixed 0.12% Receive floating STIBOR 3 month 23/02/2020 SEK 1,085,000,000 (157) –Interest Rate Swap J.P. Morgan Pay fixed 0.12% Receive floating STIBOR 3 month 26/02/2020 SEK 1,085,000,000 (159) –Interest Rate Swap J.P. Morgan Pay fixed 0.13% Receive floating STIBOR 3 month 20/02/2020 SEK 1,087,000,000 (289) (0.01)Interest Rate Swap J.P. Morgan Pay fixed 0.13% Receive floating STIBOR 3 month 21/02/2020 SEK 1,087,000,000 (302) (0.01)Interest Rate Swap J.P. Morgan Pay fixed 0.13% Receive floating STIBOR 3 month 22/02/2020 SEK 1,085,000,000 (205) –Interest Rate Swap J.P. Morgan Pay fixed 0.13% Receive floating STIBOR 3 month 23/02/2020 SEK 1,085,000,000 (190) –Interest Rate Swap J.P. Morgan Pay fixed 0.13% Receive floating STIBOR 3 month 27/02/2020 SEK 1,085,000,000 (176) –Interest Rate Swap J.P. Morgan Pay fixed 0.15% Receive floating STIBOR 3 month 19/02/2020 SEK 1,087,000,000 (335) (0.01)Interest Rate Swap J.P. Morgan Pay fixed 1.68% Receive floating LIBOR 3 month 25/01/2022 USD 81,410,000 (478) (0.01)
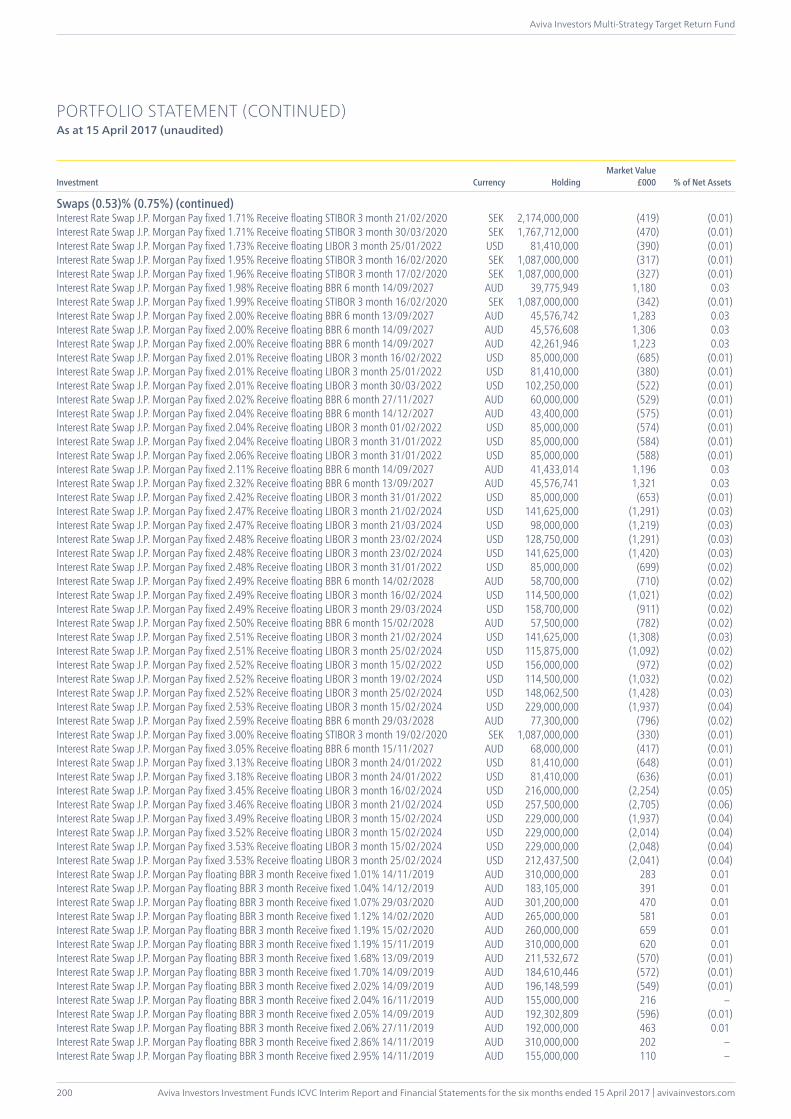
Aviva Investors Investment Funds ICVC Interim Report and Financial Statements for the six months ended 15 April 2017 | avivainvestors.com
Aviva Investors Multi-Strategy Target Return Fund
200
PORTFOLIO STATEMENT (CONTINUED)As at 15 April 2017 (unaudited)
Investment Currency HoldingMarket Value
£000 % of Net Assets
Swaps (0.53)% (0.75%) (continued)Interest Rate Swap J.P. Morgan Pay fixed 1.71% Receive floating STIBOR 3 month 21/02/2020 SEK 2,174,000,000 (419) (0.01)Interest Rate Swap J.P. Morgan Pay fixed 1.71% Receive floating STIBOR 3 month 30/03/2020 SEK 1,767,712,000 (470) (0.01)Interest Rate Swap J.P. Morgan Pay fixed 1.73% Receive floating LIBOR 3 month 25/01/2022 USD 81,410,000 (390) (0.01)Interest Rate Swap J.P. Morgan Pay fixed 1.95% Receive floating STIBOR 3 month 16/02/2020 SEK 1,087,000,000 (317) (0.01)Interest Rate Swap J.P. Morgan Pay fixed 1.96% Receive floating STIBOR 3 month 17/02/2020 SEK 1,087,000,000 (327) (0.01)Interest Rate Swap J.P. Morgan Pay fixed 1.98% Receive floating BBR 6 month 14/09/2027 AUD 39,775,949 1,180 0.03Interest Rate Swap J.P. Morgan Pay fixed 1.99% Receive floating STIBOR 3 month 16/02/2020 SEK 1,087,000,000 (342) (0.01)Interest Rate Swap J.P. Morgan Pay fixed 2.00% Receive floating BBR 6 month 13/09/2027 AUD 45,576,742 1,283 0.03Interest Rate Swap J.P. Morgan Pay fixed 2.00% Receive floating BBR 6 month 14/09/2027 AUD 45,576,608 1,306 0.03Interest Rate Swap J.P. Morgan Pay fixed 2.00% Receive floating BBR 6 month 14/09/2027 AUD 42,261,946 1,223 0.03Interest Rate Swap J.P. Morgan Pay fixed 2.01% Receive floating LIBOR 3 month 16/02/2022 USD 85,000,000 (685) (0.01)Interest Rate Swap J.P. Morgan Pay fixed 2.01% Receive floating LIBOR 3 month 25/01/2022 USD 81,410,000 (380) (0.01)Interest Rate Swap J.P. Morgan Pay fixed 2.01% Receive floating LIBOR 3 month 30/03/2022 USD 102,250,000 (522) (0.01)Interest Rate Swap J.P. Morgan Pay fixed 2.02% Receive floating BBR 6 month 27/11/2027 AUD 60,000,000 (529) (0.01)Interest Rate Swap J.P. Morgan Pay fixed 2.04% Receive floating BBR 6 month 14/12/2027 AUD 43,400,000 (575) (0.01)Interest Rate Swap J.P. Morgan Pay fixed 2.04% Receive floating LIBOR 3 month 01/02/2022 USD 85,000,000 (574) (0.01)Interest Rate Swap J.P. Morgan Pay fixed 2.04% Receive floating LIBOR 3 month 31/01/2022 USD 85,000,000 (584) (0.01)Interest Rate Swap J.P. Morgan Pay fixed 2.06% Receive floating LIBOR 3 month 31/01/2022 USD 85,000,000 (588) (0.01)Interest Rate Swap J.P. Morgan Pay fixed 2.11% Receive floating BBR 6 month 14/09/2027 AUD 41,433,014 1,196 0.03Interest Rate Swap J.P. Morgan Pay fixed 2.32% Receive floating BBR 6 month 13/09/2027 AUD 45,576,741 1,321 0.03Interest Rate Swap J.P. Morgan Pay fixed 2.42% Receive floating LIBOR 3 month 31/01/2022 USD 85,000,000 (653) (0.01)Interest Rate Swap J.P. Morgan Pay fixed 2.47% Receive floating LIBOR 3 month 21/02/2024 USD 141,625,000 (1,291) (0.03)Interest Rate Swap J.P. Morgan Pay fixed 2.47% Receive floating LIBOR 3 month 21/03/2024 USD 98,000,000 (1,219) (0.03)Interest Rate Swap J.P. Morgan Pay fixed 2.48% Receive floating LIBOR 3 month 23/02/2024 USD 128,750,000 (1,291) (0.03)Interest Rate Swap J.P. Morgan Pay fixed 2.48% Receive floating LIBOR 3 month 23/02/2024 USD 141,625,000 (1,420) (0.03)Interest Rate Swap J.P. Morgan Pay fixed 2.48% Receive floating LIBOR 3 month 31/01/2022 USD 85,000,000 (699) (0.02)Interest Rate Swap J.P. Morgan Pay fixed 2.49% Receive floating BBR 6 month 14/02/2028 AUD 58,700,000 (710) (0.02)Interest Rate Swap J.P. Morgan Pay fixed 2.49% Receive floating LIBOR 3 month 16/02/2024 USD 114,500,000 (1,021) (0.02)Interest Rate Swap J.P. Morgan Pay fixed 2.49% Receive floating LIBOR 3 month 29/03/2024 USD 158,700,000 (911) (0.02)Interest Rate Swap J.P. Morgan Pay fixed 2.50% Receive floating BBR 6 month 15/02/2028 AUD 57,500,000 (782) (0.02)Interest Rate Swap J.P. Morgan Pay fixed 2.51% Receive floating LIBOR 3 month 21/02/2024 USD 141,625,000 (1,308) (0.03)Interest Rate Swap J.P. Morgan Pay fixed 2.51% Receive floating LIBOR 3 month 25/02/2024 USD 115,875,000 (1,092) (0.02)Interest Rate Swap J.P. Morgan Pay fixed 2.52% Receive floating LIBOR 3 month 15/02/2022 USD 156,000,000 (972) (0.02)Interest Rate Swap J.P. Morgan Pay fixed 2.52% Receive floating LIBOR 3 month 19/02/2024 USD 114,500,000 (1,032) (0.02)Interest Rate Swap J.P. Morgan Pay fixed 2.52% Receive floating LIBOR 3 month 25/02/2024 USD 148,062,500 (1,428) (0.03)Interest Rate Swap J.P. Morgan Pay fixed 2.53% Receive floating LIBOR 3 month 15/02/2024 USD 229,000,000 (1,937) (0.04)Interest Rate Swap J.P. Morgan Pay fixed 2.59% Receive floating BBR 6 month 29/03/2028 AUD 77,300,000 (796) (0.02)Interest Rate Swap J.P. Morgan Pay fixed 3.00% Receive floating STIBOR 3 month 19/02/2020 SEK 1,087,000,000 (330) (0.01)Interest Rate Swap J.P. Morgan Pay fixed 3.05% Receive floating BBR 6 month 15/11/2027 AUD 68,000,000 (417) (0.01)Interest Rate Swap J.P. Morgan Pay fixed 3.13% Receive floating LIBOR 3 month 24/01/2022 USD 81,410,000 (648) (0.01)Interest Rate Swap J.P. Morgan Pay fixed 3.18% Receive floating LIBOR 3 month 24/01/2022 USD 81,410,000 (636) (0.01)Interest Rate Swap J.P. Morgan Pay fixed 3.45% Receive floating LIBOR 3 month 16/02/2024 USD 216,000,000 (2,254) (0.05)Interest Rate Swap J.P. Morgan Pay fixed 3.46% Receive floating LIBOR 3 month 21/02/2024 USD 257,500,000 (2,705) (0.06)Interest Rate Swap J.P. Morgan Pay fixed 3.49% Receive floating LIBOR 3 month 15/02/2024 USD 229,000,000 (1,937) (0.04)Interest Rate Swap J.P. Morgan Pay fixed 3.52% Receive floating LIBOR 3 month 15/02/2024 USD 229,000,000 (2,014) (0.04)Interest Rate Swap J.P. Morgan Pay fixed 3.53% Receive floating LIBOR 3 month 15/02/2024 USD 229,000,000 (2,048) (0.04)Interest Rate Swap J.P. Morgan Pay fixed 3.53% Receive floating LIBOR 3 month 25/02/2024 USD 212,437,500 (2,041) (0.04)Interest Rate Swap J.P. Morgan Pay floating BBR 3 month Receive fixed 1.01% 14/11/2019 AUD 310,000,000 283 0.01Interest Rate Swap J.P. Morgan Pay floating BBR 3 month Receive fixed 1.04% 14/12/2019 AUD 183,105,000 391 0.01Interest Rate Swap J.P. Morgan Pay floating BBR 3 month Receive fixed 1.07% 29/03/2020 AUD 301,200,000 470 0.01Interest Rate Swap J.P. Morgan Pay floating BBR 3 month Receive fixed 1.12% 14/02/2020 AUD 265,000,000 581 0.01Interest Rate Swap J.P. Morgan Pay floating BBR 3 month Receive fixed 1.19% 15/02/2020 AUD 260,000,000 659 0.01Interest Rate Swap J.P. Morgan Pay floating BBR 3 month Receive fixed 1.19% 15/11/2019 AUD 310,000,000 620 0.01Interest Rate Swap J.P. Morgan Pay floating BBR 3 month Receive fixed 1.68% 13/09/2019 AUD 211,532,672 (570) (0.01)Interest Rate Swap J.P. Morgan Pay floating BBR 3 month Receive fixed 1.70% 14/09/2019 AUD 184,610,446 (572) (0.01)Interest Rate Swap J.P. Morgan Pay floating BBR 3 month Receive fixed 2.02% 14/09/2019 AUD 196,148,599 (549) (0.01)Interest Rate Swap J.P. Morgan Pay floating BBR 3 month Receive fixed 2.04% 16/11/2019 AUD 155,000,000 216 –Interest Rate Swap J.P. Morgan Pay floating BBR 3 month Receive fixed 2.05% 14/09/2019 AUD 192,302,809 (596) (0.01)Interest Rate Swap J.P. Morgan Pay floating BBR 3 month Receive fixed 2.06% 27/11/2019 AUD 192,000,000 463 0.01Interest Rate Swap J.P. Morgan Pay floating BBR 3 month Receive fixed 2.86% 14/11/2019 AUD 310,000,000 202 –Interest Rate Swap J.P. Morgan Pay floating BBR 3 month Receive fixed 2.95% 14/11/2019 AUD 155,000,000 110 –
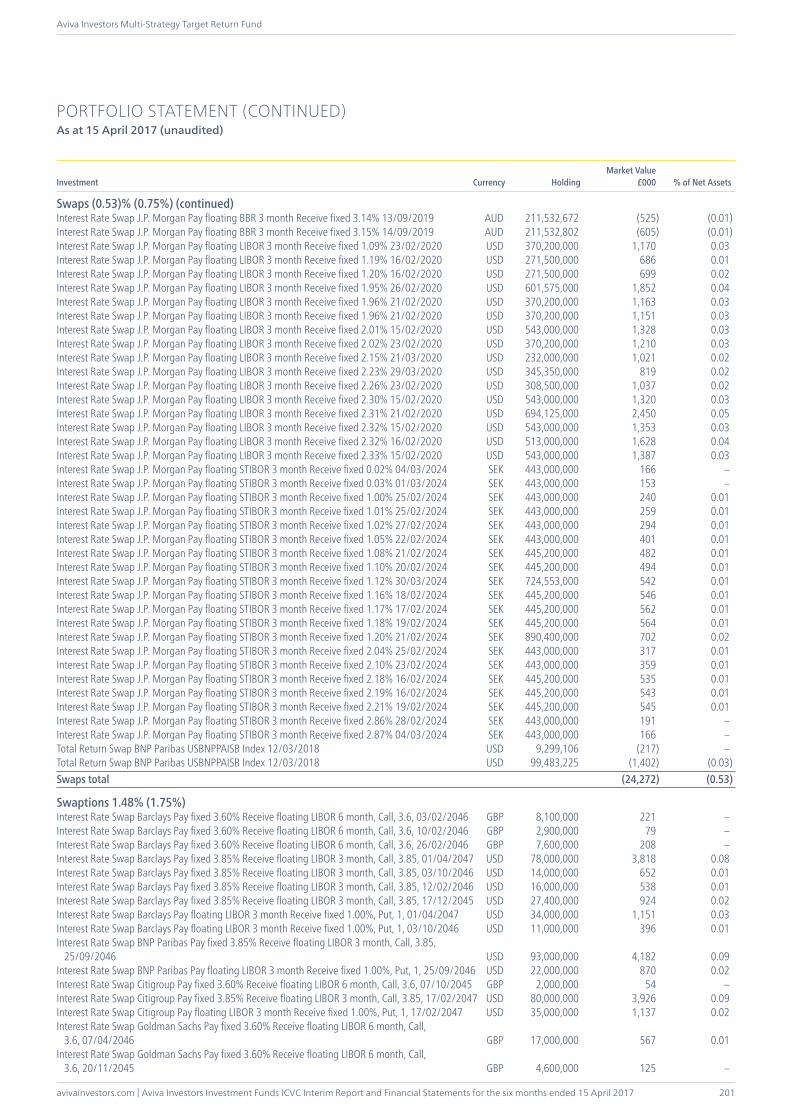
avivainvestors.com | Aviva Investors Investment Funds ICVC Interim Report and Financial Statements for the six months ended 15 April 2017
Aviva Investors Multi-Strategy Target Return Fund
201
PORTFOLIO STATEMENT (CONTINUED)As at 15 April 2017 (unaudited)
Investment Currency HoldingMarket Value
£000 % of Net Assets
Swaps (0.53)% (0.75%) (continued)Interest Rate Swap J.P. Morgan Pay floating BBR 3 month Receive fixed 3.14% 13/09/2019 AUD 211,532,672 (525) (0.01)Interest Rate Swap J.P. Morgan Pay floating BBR 3 month Receive fixed 3.15% 14/09/2019 AUD 211,532,802 (605) (0.01)Interest Rate Swap J.P. Morgan Pay floating LIBOR 3 month Receive fixed 1.09% 23/02/2020 USD 370,200,000 1,170 0.03Interest Rate Swap J.P. Morgan Pay floating LIBOR 3 month Receive fixed 1.19% 16/02/2020 USD 271,500,000 686 0.01Interest Rate Swap J.P. Morgan Pay floating LIBOR 3 month Receive fixed 1.20% 16/02/2020 USD 271,500,000 699 0.02Interest Rate Swap J.P. Morgan Pay floating LIBOR 3 month Receive fixed 1.95% 26/02/2020 USD 601,575,000 1,852 0.04Interest Rate Swap J.P. Morgan Pay floating LIBOR 3 month Receive fixed 1.96% 21/02/2020 USD 370,200,000 1,163 0.03Interest Rate Swap J.P. Morgan Pay floating LIBOR 3 month Receive fixed 1.96% 21/02/2020 USD 370,200,000 1,151 0.03Interest Rate Swap J.P. Morgan Pay floating LIBOR 3 month Receive fixed 2.01% 15/02/2020 USD 543,000,000 1,328 0.03Interest Rate Swap J.P. Morgan Pay floating LIBOR 3 month Receive fixed 2.02% 23/02/2020 USD 370,200,000 1,210 0.03Interest Rate Swap J.P. Morgan Pay floating LIBOR 3 month Receive fixed 2.15% 21/03/2020 USD 232,000,000 1,021 0.02Interest Rate Swap J.P. Morgan Pay floating LIBOR 3 month Receive fixed 2.23% 29/03/2020 USD 345,350,000 819 0.02Interest Rate Swap J.P. Morgan Pay floating LIBOR 3 month Receive fixed 2.26% 23/02/2020 USD 308,500,000 1,037 0.02Interest Rate Swap J.P. Morgan Pay floating LIBOR 3 month Receive fixed 2.30% 15/02/2020 USD 543,000,000 1,320 0.03Interest Rate Swap J.P. Morgan Pay floating LIBOR 3 month Receive fixed 2.31% 21/02/2020 USD 694,125,000 2,450 0.05Interest Rate Swap J.P. Morgan Pay floating LIBOR 3 month Receive fixed 2.32% 15/02/2020 USD 543,000,000 1,353 0.03Interest Rate Swap J.P. Morgan Pay floating LIBOR 3 month Receive fixed 2.32% 16/02/2020 USD 513,000,000 1,628 0.04Interest Rate Swap J.P. Morgan Pay floating LIBOR 3 month Receive fixed 2.33% 15/02/2020 USD 543,000,000 1,387 0.03Interest Rate Swap J.P. Morgan Pay floating STIBOR 3 month Receive fixed 0.02% 04/03/2024 SEK 443,000,000 166 –Interest Rate Swap J.P. Morgan Pay floating STIBOR 3 month Receive fixed 0.03% 01/03/2024 SEK 443,000,000 153 –Interest Rate Swap J.P. Morgan Pay floating STIBOR 3 month Receive fixed 1.00% 25/02/2024 SEK 443,000,000 240 0.01Interest Rate Swap J.P. Morgan Pay floating STIBOR 3 month Receive fixed 1.01% 25/02/2024 SEK 443,000,000 259 0.01Interest Rate Swap J.P. Morgan Pay floating STIBOR 3 month Receive fixed 1.02% 27/02/2024 SEK 443,000,000 294 0.01Interest Rate Swap J.P. Morgan Pay floating STIBOR 3 month Receive fixed 1.05% 22/02/2024 SEK 443,000,000 401 0.01Interest Rate Swap J.P. Morgan Pay floating STIBOR 3 month Receive fixed 1.08% 21/02/2024 SEK 445,200,000 482 0.01Interest Rate Swap J.P. Morgan Pay floating STIBOR 3 month Receive fixed 1.10% 20/02/2024 SEK 445,200,000 494 0.01Interest Rate Swap J.P. Morgan Pay floating STIBOR 3 month Receive fixed 1.12% 30/03/2024 SEK 724,553,000 542 0.01Interest Rate Swap J.P. Morgan Pay floating STIBOR 3 month Receive fixed 1.16% 18/02/2024 SEK 445,200,000 546 0.01Interest Rate Swap J.P. Morgan Pay floating STIBOR 3 month Receive fixed 1.17% 17/02/2024 SEK 445,200,000 562 0.01Interest Rate Swap J.P. Morgan Pay floating STIBOR 3 month Receive fixed 1.18% 19/02/2024 SEK 445,200,000 564 0.01Interest Rate Swap J.P. Morgan Pay floating STIBOR 3 month Receive fixed 1.20% 21/02/2024 SEK 890,400,000 702 0.02Interest Rate Swap J.P. Morgan Pay floating STIBOR 3 month Receive fixed 2.04% 25/02/2024 SEK 443,000,000 317 0.01Interest Rate Swap J.P. Morgan Pay floating STIBOR 3 month Receive fixed 2.10% 23/02/2024 SEK 443,000,000 359 0.01Interest Rate Swap J.P. Morgan Pay floating STIBOR 3 month Receive fixed 2.18% 16/02/2024 SEK 445,200,000 535 0.01Interest Rate Swap J.P. Morgan Pay floating STIBOR 3 month Receive fixed 2.19% 16/02/2024 SEK 445,200,000 543 0.01Interest Rate Swap J.P. Morgan Pay floating STIBOR 3 month Receive fixed 2.21% 19/02/2024 SEK 445,200,000 545 0.01Interest Rate Swap J.P. Morgan Pay floating STIBOR 3 month Receive fixed 2.86% 28/02/2024 SEK 443,000,000 191 –Interest Rate Swap J.P. Morgan Pay floating STIBOR 3 month Receive fixed 2.87% 04/03/2024 SEK 443,000,000 166 –Total Return Swap BNP Paribas USBNPPAISB Index 12/03/2018 USD 9,299,106 (217) –Total Return Swap BNP Paribas USBNPPAISB Index 12/03/2018 USD 99,483,225 (1,402) (0.03)Swaps total (24,272) (0.53)
Swaptions 1.48% (1.75%)Interest Rate Swap Barclays Pay fixed 3.60% Receive floating LIBOR 6 month, Call, 3.6, 03/02/2046 GBP 8,100,000 221 –Interest Rate Swap Barclays Pay fixed 3.60% Receive floating LIBOR 6 month, Call, 3.6, 10/02/2046 GBP 2,900,000 79 –Interest Rate Swap Barclays Pay fixed 3.60% Receive floating LIBOR 6 month, Call, 3.6, 26/02/2046 GBP 7,600,000 208 –Interest Rate Swap Barclays Pay fixed 3.85% Receive floating LIBOR 3 month, Call, 3.85, 01/04/2047 USD 78,000,000 3,818 0.08Interest Rate Swap Barclays Pay fixed 3.85% Receive floating LIBOR 3 month, Call, 3.85, 03/10/2046 USD 14,000,000 652 0.01Interest Rate Swap Barclays Pay fixed 3.85% Receive floating LIBOR 3 month, Call, 3.85, 12/02/2046 USD 16,000,000 538 0.01Interest Rate Swap Barclays Pay fixed 3.85% Receive floating LIBOR 3 month, Call, 3.85, 17/12/2045 USD 27,400,000 924 0.02Interest Rate Swap Barclays Pay floating LIBOR 3 month Receive fixed 1.00%, Put, 1, 01/04/2047 USD 34,000,000 1,151 0.03Interest Rate Swap Barclays Pay floating LIBOR 3 month Receive fixed 1.00%, Put, 1, 03/10/2046 USD 11,000,000 396 0.01Interest Rate Swap BNP Paribas Pay fixed 3.85% Receive floating LIBOR 3 month, Call, 3.85,
25/09/2046 USD 93,000,000 4,182 0.09Interest Rate Swap BNP Paribas Pay floating LIBOR 3 month Receive fixed 1.00%, Put, 1, 25/09/2046 USD 22,000,000 870 0.02Interest Rate Swap Citigroup Pay fixed 3.60% Receive floating LIBOR 6 month, Call, 3.6, 07/10/2045 GBP 2,000,000 54 –Interest Rate Swap Citigroup Pay fixed 3.85% Receive floating LIBOR 3 month, Call, 3.85, 17/02/2047 USD 80,000,000 3,926 0.09Interest Rate Swap Citigroup Pay floating LIBOR 3 month Receive fixed 1.00%, Put, 1, 17/02/2047 USD 35,000,000 1,137 0.02Interest Rate Swap Goldman Sachs Pay fixed 3.60% Receive floating LIBOR 6 month, Call,
3.6, 07/04/2046 GBP 17,000,000 567 0.01Interest Rate Swap Goldman Sachs Pay fixed 3.60% Receive floating LIBOR 6 month, Call,
3.6, 20/11/2045 GBP 4,600,000 125 –
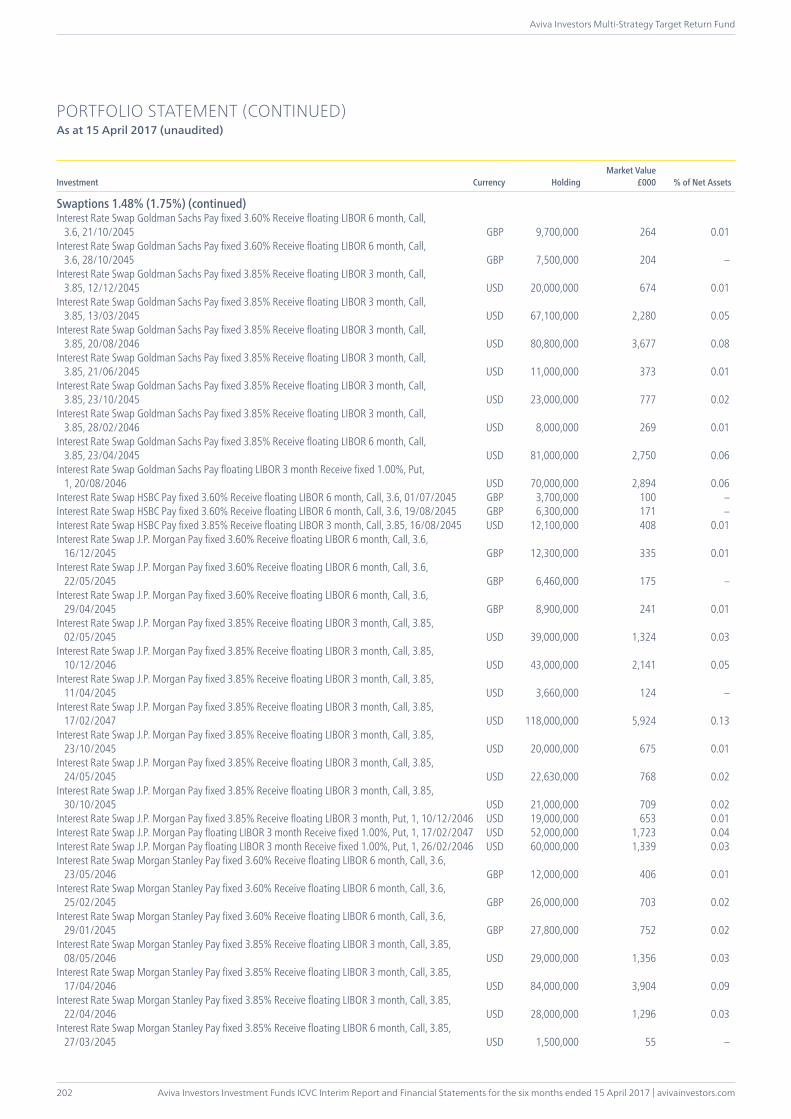
Aviva Investors Investment Funds ICVC Interim Report and Financial Statements for the six months ended 15 April 2017 | avivainvestors.com
Aviva Investors Multi-Strategy Target Return Fund
202
PORTFOLIO STATEMENT (CONTINUED)As at 15 April 2017 (unaudited)
Investment Currency HoldingMarket Value
£000 % of Net Assets
Swaptions 1.48% (1.75%) (continued)Interest Rate Swap Goldman Sachs Pay fixed 3.60% Receive floating LIBOR 6 month, Call,
3.6, 21/10/2045 GBP 9,700,000 264 0.01Interest Rate Swap Goldman Sachs Pay fixed 3.60% Receive floating LIBOR 6 month, Call,
3.6, 28/10/2045 GBP 7,500,000 204 –Interest Rate Swap Goldman Sachs Pay fixed 3.85% Receive floating LIBOR 3 month, Call,
3.85, 12/12/2045 USD 20,000,000 674 0.01Interest Rate Swap Goldman Sachs Pay fixed 3.85% Receive floating LIBOR 3 month, Call,
3.85, 13/03/2045 USD 67,100,000 2,280 0.05Interest Rate Swap Goldman Sachs Pay fixed 3.85% Receive floating LIBOR 3 month, Call,
3.85, 20/08/2046 USD 80,800,000 3,677 0.08Interest Rate Swap Goldman Sachs Pay fixed 3.85% Receive floating LIBOR 3 month, Call,
3.85, 21/06/2045 USD 11,000,000 373 0.01Interest Rate Swap Goldman Sachs Pay fixed 3.85% Receive floating LIBOR 3 month, Call,
3.85, 23/10/2045 USD 23,000,000 777 0.02Interest Rate Swap Goldman Sachs Pay fixed 3.85% Receive floating LIBOR 3 month, Call,
3.85, 28/02/2046 USD 8,000,000 269 0.01Interest Rate Swap Goldman Sachs Pay fixed 3.85% Receive floating LIBOR 6 month, Call,
3.85, 23/04/2045 USD 81,000,000 2,750 0.06Interest Rate Swap Goldman Sachs Pay floating LIBOR 3 month Receive fixed 1.00%, Put,
1, 20/08/2046 USD 70,000,000 2,894 0.06Interest Rate Swap HSBC Pay fixed 3.60% Receive floating LIBOR 6 month, Call, 3.6, 01/07/2045 GBP 3,700,000 100 –Interest Rate Swap HSBC Pay fixed 3.60% Receive floating LIBOR 6 month, Call, 3.6, 19/08/2045 GBP 6,300,000 171 –Interest Rate Swap HSBC Pay fixed 3.85% Receive floating LIBOR 3 month, Call, 3.85, 16/08/2045 USD 12,100,000 408 0.01Interest Rate Swap J.P. Morgan Pay fixed 3.60% Receive floating LIBOR 6 month, Call, 3.6,
16/12/2045 GBP 12,300,000 335 0.01Interest Rate Swap J.P. Morgan Pay fixed 3.60% Receive floating LIBOR 6 month, Call, 3.6,
22/05/2045 GBP 6,460,000 175 –Interest Rate Swap J.P. Morgan Pay fixed 3.60% Receive floating LIBOR 6 month, Call, 3.6,
29/04/2045 GBP 8,900,000 241 0.01Interest Rate Swap J.P. Morgan Pay fixed 3.85% Receive floating LIBOR 3 month, Call, 3.85,
02/05/2045 USD 39,000,000 1,324 0.03Interest Rate Swap J.P. Morgan Pay fixed 3.85% Receive floating LIBOR 3 month, Call, 3.85,
10/12/2046 USD 43,000,000 2,141 0.05Interest Rate Swap J.P. Morgan Pay fixed 3.85% Receive floating LIBOR 3 month, Call, 3.85,
11/04/2045 USD 3,660,000 124 –Interest Rate Swap J.P. Morgan Pay fixed 3.85% Receive floating LIBOR 3 month, Call, 3.85,
17/02/2047 USD 118,000,000 5,924 0.13Interest Rate Swap J.P. Morgan Pay fixed 3.85% Receive floating LIBOR 3 month, Call, 3.85,
23/10/2045 USD 20,000,000 675 0.01Interest Rate Swap J.P. Morgan Pay fixed 3.85% Receive floating LIBOR 3 month, Call, 3.85,
24/05/2045 USD 22,630,000 768 0.02Interest Rate Swap J.P. Morgan Pay fixed 3.85% Receive floating LIBOR 3 month, Call, 3.85,
30/10/2045 USD 21,000,000 709 0.02Interest Rate Swap J.P. Morgan Pay fixed 3.85% Receive floating LIBOR 3 month, Put, 1, 10/12/2046 USD 19,000,000 653 0.01Interest Rate Swap J.P. Morgan Pay floating LIBOR 3 month Receive fixed 1.00%, Put, 1, 17/02/2047 USD 52,000,000 1,723 0.04Interest Rate Swap J.P. Morgan Pay floating LIBOR 3 month Receive fixed 1.00%, Put, 1, 26/02/2046 USD 60,000,000 1,339 0.03Interest Rate Swap Morgan Stanley Pay fixed 3.60% Receive floating LIBOR 6 month, Call, 3.6,
23/05/2046 GBP 12,000,000 406 0.01Interest Rate Swap Morgan Stanley Pay fixed 3.60% Receive floating LIBOR 6 month, Call, 3.6,
25/02/2045 GBP 26,000,000 703 0.02Interest Rate Swap Morgan Stanley Pay fixed 3.60% Receive floating LIBOR 6 month, Call, 3.6,
29/01/2045 GBP 27,800,000 752 0.02Interest Rate Swap Morgan Stanley Pay fixed 3.85% Receive floating LIBOR 3 month, Call, 3.85,
08/05/2046 USD 29,000,000 1,356 0.03Interest Rate Swap Morgan Stanley Pay fixed 3.85% Receive floating LIBOR 3 month, Call, 3.85,
17/04/2046 USD 84,000,000 3,904 0.09Interest Rate Swap Morgan Stanley Pay fixed 3.85% Receive floating LIBOR 3 month, Call, 3.85,
22/04/2046 USD 28,000,000 1,296 0.03Interest Rate Swap Morgan Stanley Pay fixed 3.85% Receive floating LIBOR 6 month, Call, 3.85,
27/03/2045 USD 1,500,000 55 –
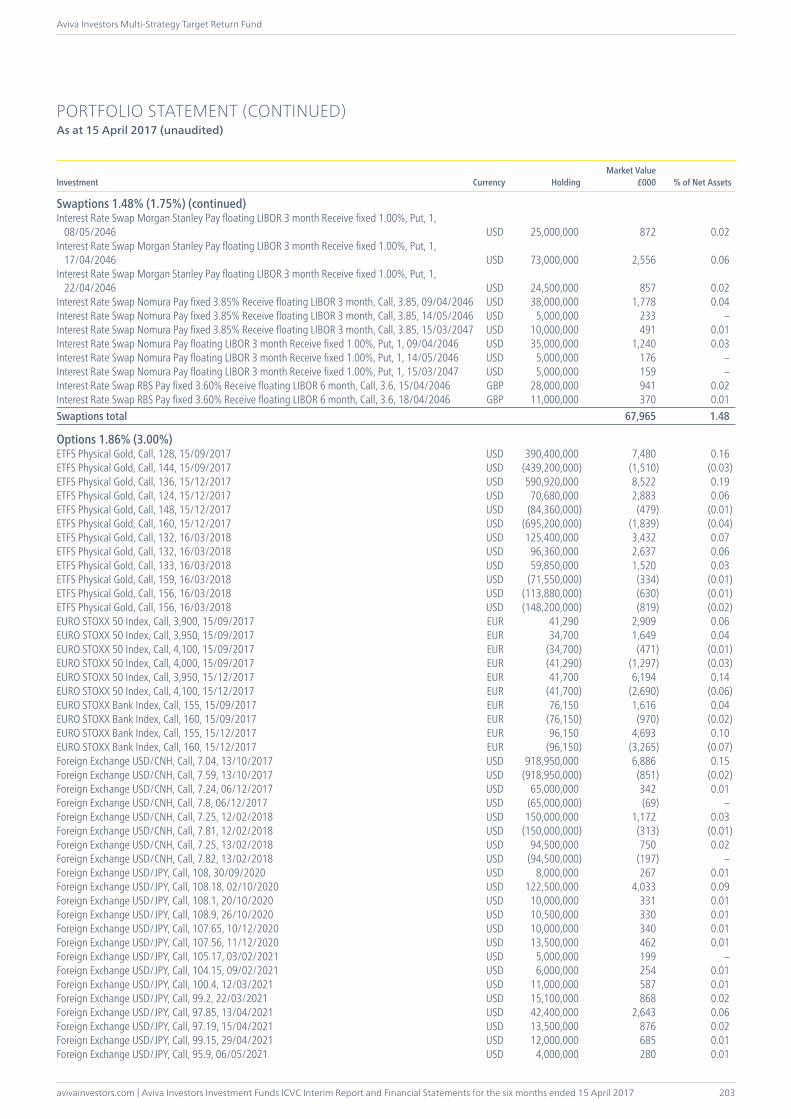
avivainvestors.com | Aviva Investors Investment Funds ICVC Interim Report and Financial Statements for the six months ended 15 April 2017
Aviva Investors Multi-Strategy Target Return Fund
203
PORTFOLIO STATEMENT (CONTINUED)As at 15 April 2017 (unaudited)
Investment Currency HoldingMarket Value
£000 % of Net Assets
Swaptions 1.48% (1.75%) (continued)Interest Rate Swap Morgan Stanley Pay floating LIBOR 3 month Receive fixed 1.00%, Put, 1,
08/05/2046 USD 25,000,000 872 0.02Interest Rate Swap Morgan Stanley Pay floating LIBOR 3 month Receive fixed 1.00%, Put, 1,
17/04/2046 USD 73,000,000 2,556 0.06Interest Rate Swap Morgan Stanley Pay floating LIBOR 3 month Receive fixed 1.00%, Put, 1,
22/04/2046 USD 24,500,000 857 0.02Interest Rate Swap Nomura Pay fixed 3.85% Receive floating LIBOR 3 month, Call, 3.85, 09/04/2046 USD 38,000,000 1,778 0.04Interest Rate Swap Nomura Pay fixed 3.85% Receive floating LIBOR 3 month, Call, 3.85, 14/05/2046 USD 5,000,000 233 –Interest Rate Swap Nomura Pay fixed 3.85% Receive floating LIBOR 3 month, Call, 3.85, 15/03/2047 USD 10,000,000 491 0.01Interest Rate Swap Nomura Pay floating LIBOR 3 month Receive fixed 1.00%, Put, 1, 09/04/2046 USD 35,000,000 1,240 0.03Interest Rate Swap Nomura Pay floating LIBOR 3 month Receive fixed 1.00%, Put, 1, 14/05/2046 USD 5,000,000 176 –Interest Rate Swap Nomura Pay floating LIBOR 3 month Receive fixed 1.00%, Put, 1, 15/03/2047 USD 5,000,000 159 –Interest Rate Swap RBS Pay fixed 3.60% Receive floating LIBOR 6 month, Call, 3.6, 15/04/2046 GBP 28,000,000 941 0.02Interest Rate Swap RBS Pay fixed 3.60% Receive floating LIBOR 6 month, Call, 3.6, 18/04/2046 GBP 11,000,000 370 0.01Swaptions total 67,965 1.48
Options 1.86% (3.00%)ETFS Physical Gold, Call, 128, 15/09/2017 USD 390,400,000 7,480 0.16ETFS Physical Gold, Call, 144, 15/09/2017 USD (439,200,000) (1,510) (0.03)ETFS Physical Gold, Call, 136, 15/12/2017 USD 590,920,000 8,522 0.19ETFS Physical Gold, Call, 124, 15/12/2017 USD 70,680,000 2,883 0.06ETFS Physical Gold, Call, 148, 15/12/2017 USD (84,360,000) (479) (0.01)ETFS Physical Gold, Call, 160, 15/12/2017 USD (695,200,000) (1,839) (0.04)ETFS Physical Gold, Call, 132, 16/03/2018 USD 125,400,000 3,432 0.07ETFS Physical Gold, Call, 132, 16/03/2018 USD 96,360,000 2,637 0.06ETFS Physical Gold, Call, 133, 16/03/2018 USD 59,850,000 1,520 0.03ETFS Physical Gold, Call, 159, 16/03/2018 USD (71,550,000) (334) (0.01)ETFS Physical Gold, Call, 156, 16/03/2018 USD (113,880,000) (630) (0.01)ETFS Physical Gold, Call, 156, 16/03/2018 USD (148,200,000) (819) (0.02)EURO STOXX 50 Index, Call, 3,900, 15/09/2017 EUR 41,290 2,909 0.06EURO STOXX 50 Index, Call, 3,950, 15/09/2017 EUR 34,700 1,649 0.04EURO STOXX 50 Index, Call, 4,100, 15/09/2017 EUR (34,700) (471) (0.01)EURO STOXX 50 Index, Call, 4,000, 15/09/2017 EUR (41,290) (1,297) (0.03)EURO STOXX 50 Index, Call, 3,950, 15/12/2017 EUR 41,700 6,194 0.14EURO STOXX 50 Index, Call, 4,100, 15/12/2017 EUR (41,700) (2,690) (0.06)EURO STOXX Bank Index, Call, 155, 15/09/2017 EUR 76,150 1,616 0.04EURO STOXX Bank Index, Call, 160, 15/09/2017 EUR (76,150) (970) (0.02)EURO STOXX Bank Index, Call, 155, 15/12/2017 EUR 96,150 4,693 0.10EURO STOXX Bank Index, Call, 160, 15/12/2017 EUR (96,150) (3,265) (0.07)Foreign Exchange USD/CNH, Call, 7.04, 13/10/2017 USD 918,950,000 6,886 0.15Foreign Exchange USD/CNH, Call, 7.59, 13/10/2017 USD (918,950,000) (851) (0.02)Foreign Exchange USD/CNH, Call, 7.24, 06/12/2017 USD 65,000,000 342 0.01Foreign Exchange USD/CNH, Call, 7.8, 06/12/2017 USD (65,000,000) (69) –Foreign Exchange USD/CNH, Call, 7.25, 12/02/2018 USD 150,000,000 1,172 0.03Foreign Exchange USD/CNH, Call, 7.81, 12/02/2018 USD (150,000,000) (313) (0.01)Foreign Exchange USD/CNH, Call, 7.25, 13/02/2018 USD 94,500,000 750 0.02Foreign Exchange USD/CNH, Call, 7.82, 13/02/2018 USD (94,500,000) (197) –Foreign Exchange USD/JPY, Call, 108, 30/09/2020 USD 8,000,000 267 0.01Foreign Exchange USD/JPY, Call, 108.18, 02/10/2020 USD 122,500,000 4,033 0.09Foreign Exchange USD/JPY, Call, 108.1, 20/10/2020 USD 10,000,000 331 0.01Foreign Exchange USD/JPY, Call, 108.9, 26/10/2020 USD 10,500,000 330 0.01Foreign Exchange USD/JPY, Call, 107.65, 10/12/2020 USD 10,000,000 340 0.01Foreign Exchange USD/JPY, Call, 107.56, 11/12/2020 USD 13,500,000 462 0.01Foreign Exchange USD/JPY, Call, 105.17, 03/02/2021 USD 5,000,000 199 –Foreign Exchange USD/JPY, Call, 104.15, 09/02/2021 USD 6,000,000 254 0.01Foreign Exchange USD/JPY, Call, 100.4, 12/03/2021 USD 11,000,000 587 0.01Foreign Exchange USD/JPY, Call, 99.2, 22/03/2021 USD 15,100,000 868 0.02Foreign Exchange USD/JPY, Call, 97.85, 13/04/2021 USD 42,400,000 2,643 0.06Foreign Exchange USD/JPY, Call, 97.19, 15/04/2021 USD 13,500,000 876 0.02Foreign Exchange USD/JPY, Call, 99.15, 29/04/2021 USD 12,000,000 685 0.01Foreign Exchange USD/JPY, Call, 95.9, 06/05/2021 USD 4,000,000 280 0.01
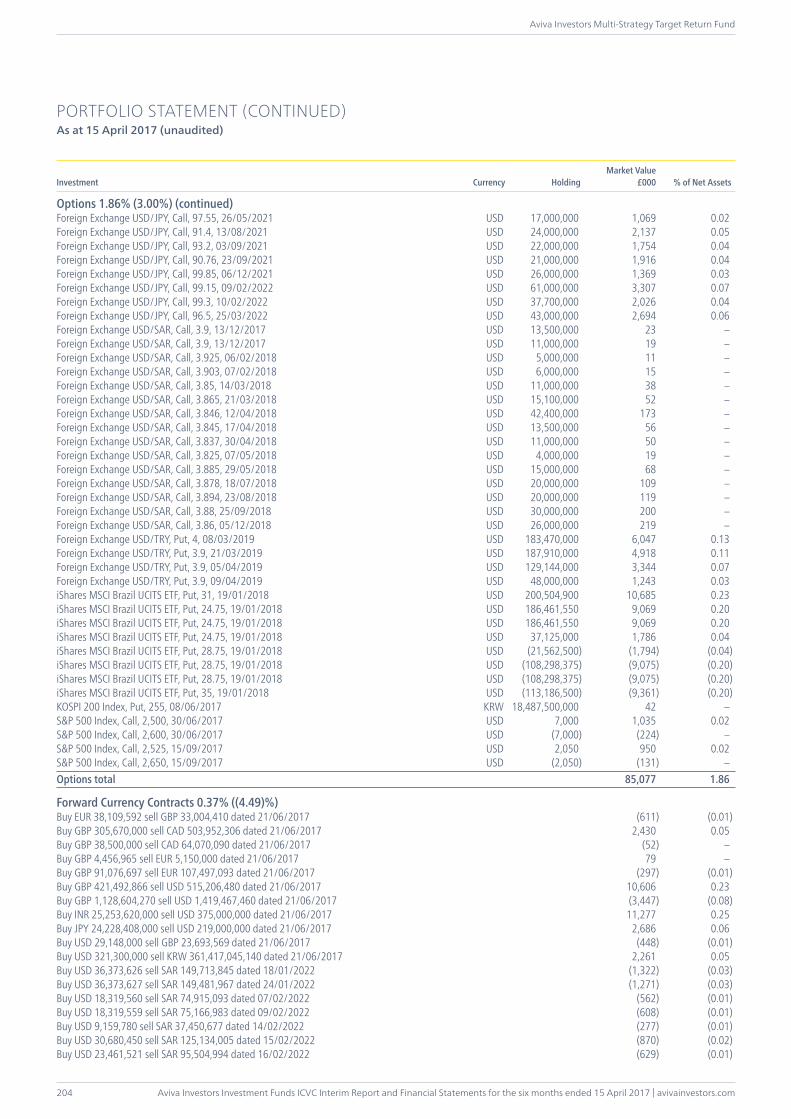
Aviva Investors Investment Funds ICVC Interim Report and Financial Statements for the six months ended 15 April 2017 | avivainvestors.com
Aviva Investors Multi-Strategy Target Return Fund
204
PORTFOLIO STATEMENT (CONTINUED)As at 15 April 2017 (unaudited)
Investment Currency HoldingMarket Value
£000 % of Net Assets
Options 1.86% (3.00%) (continued)Foreign Exchange USD/JPY, Call, 97.55, 26/05/2021 USD 17,000,000 1,069 0.02Foreign Exchange USD/JPY, Call, 91.4, 13/08/2021 USD 24,000,000 2,137 0.05Foreign Exchange USD/JPY, Call, 93.2, 03/09/2021 USD 22,000,000 1,754 0.04Foreign Exchange USD/JPY, Call, 90.76, 23/09/2021 USD 21,000,000 1,916 0.04Foreign Exchange USD/JPY, Call, 99.85, 06/12/2021 USD 26,000,000 1,369 0.03Foreign Exchange USD/JPY, Call, 99.15, 09/02/2022 USD 61,000,000 3,307 0.07Foreign Exchange USD/JPY, Call, 99.3, 10/02/2022 USD 37,700,000 2,026 0.04Foreign Exchange USD/JPY, Call, 96.5, 25/03/2022 USD 43,000,000 2,694 0.06Foreign Exchange USD/SAR, Call, 3.9, 13/12/2017 USD 13,500,000 23 –Foreign Exchange USD/SAR, Call, 3.9, 13/12/2017 USD 11,000,000 19 –Foreign Exchange USD/SAR, Call, 3.925, 06/02/2018 USD 5,000,000 11 –Foreign Exchange USD/SAR, Call, 3.903, 07/02/2018 USD 6,000,000 15 –Foreign Exchange USD/SAR, Call, 3.85, 14/03/2018 USD 11,000,000 38 –Foreign Exchange USD/SAR, Call, 3.865, 21/03/2018 USD 15,100,000 52 –Foreign Exchange USD/SAR, Call, 3.846, 12/04/2018 USD 42,400,000 173 –Foreign Exchange USD/SAR, Call, 3.845, 17/04/2018 USD 13,500,000 56 –Foreign Exchange USD/SAR, Call, 3.837, 30/04/2018 USD 11,000,000 50 –Foreign Exchange USD/SAR, Call, 3.825, 07/05/2018 USD 4,000,000 19 –Foreign Exchange USD/SAR, Call, 3.885, 29/05/2018 USD 15,000,000 68 –Foreign Exchange USD/SAR, Call, 3.878, 18/07/2018 USD 20,000,000 109 –Foreign Exchange USD/SAR, Call, 3.894, 23/08/2018 USD 20,000,000 119 –Foreign Exchange USD/SAR, Call, 3.88, 25/09/2018 USD 30,000,000 200 –Foreign Exchange USD/SAR, Call, 3.86, 05/12/2018 USD 26,000,000 219 –Foreign Exchange USD/TRY, Put, 4, 08/03/2019 USD 183,470,000 6,047 0.13Foreign Exchange USD/TRY, Put, 3.9, 21/03/2019 USD 187,910,000 4,918 0.11Foreign Exchange USD/TRY, Put, 3.9, 05/04/2019 USD 129,144,000 3,344 0.07Foreign Exchange USD/TRY, Put, 3.9, 09/04/2019 USD 48,000,000 1,243 0.03iShares MSCI Brazil UCITS ETF, Put, 31, 19/01/2018 USD 200,504,900 10,685 0.23iShares MSCI Brazil UCITS ETF, Put, 24.75, 19/01/2018 USD 186,461,550 9,069 0.20iShares MSCI Brazil UCITS ETF, Put, 24.75, 19/01/2018 USD 186,461,550 9,069 0.20iShares MSCI Brazil UCITS ETF, Put, 24.75, 19/01/2018 USD 37,125,000 1,786 0.04iShares MSCI Brazil UCITS ETF, Put, 28.75, 19/01/2018 USD (21,562,500) (1,794) (0.04)iShares MSCI Brazil UCITS ETF, Put, 28.75, 19/01/2018 USD (108,298,375) (9,075) (0.20)iShares MSCI Brazil UCITS ETF, Put, 28.75, 19/01/2018 USD (108,298,375) (9,075) (0.20)iShares MSCI Brazil UCITS ETF, Put, 35, 19/01/2018 USD (113,186,500) (9,361) (0.20)KOSPI 200 Index, Put, 255, 08/06/2017 KRW 18,487,500,000 42 –S&P 500 Index, Call, 2,500, 30/06/2017 USD 7,000 1,035 0.02S&P 500 Index, Call, 2,600, 30/06/2017 USD (7,000) (224) –S&P 500 Index, Call, 2,525, 15/09/2017 USD 2,050 950 0.02S&P 500 Index, Call, 2,650, 15/09/2017 USD (2,050) (131) –Options total 85,077 1.86
Forward Currency Contracts 0.37% ((4.49)%)Buy EUR 38,109,592 sell GBP 33,004,410 dated 21/06/2017 (611) (0.01)Buy GBP 305,670,000 sell CAD 503,952,306 dated 21/06/2017 2,430 0.05Buy GBP 38,500,000 sell CAD 64,070,090 dated 21/06/2017 (52) –Buy GBP 4,456,965 sell EUR 5,150,000 dated 21/06/2017 79 –Buy GBP 91,076,697 sell EUR 107,497,093 dated 21/06/2017 (297) (0.01)Buy GBP 421,492,866 sell USD 515,206,480 dated 21/06/2017 10,606 0.23Buy GBP 1,128,604,270 sell USD 1,419,467,460 dated 21/06/2017 (3,447) (0.08)Buy INR 25,253,620,000 sell USD 375,000,000 dated 21/06/2017 11,277 0.25Buy JPY 24,228,408,000 sell USD 219,000,000 dated 21/06/2017 2,686 0.06Buy USD 29,148,000 sell GBP 23,693,569 dated 21/06/2017 (448) (0.01)Buy USD 321,300,000 sell KRW 361,417,045,140 dated 21/06/2017 2,261 0.05Buy USD 36,373,626 sell SAR 149,713,845 dated 18/01/2022 (1,322) (0.03)Buy USD 36,373,627 sell SAR 149,481,967 dated 24/01/2022 (1,271) (0.03)Buy USD 18,319,560 sell SAR 74,915,093 dated 07/02/2022 (562) (0.01)Buy USD 18,319,559 sell SAR 75,166,983 dated 09/02/2022 (608) (0.01)Buy USD 9,159,780 sell SAR 37,450,677 dated 14/02/2022 (277) (0.01)Buy USD 30,680,450 sell SAR 125,134,005 dated 15/02/2022 (870) (0.02)Buy USD 23,461,521 sell SAR 95,504,994 dated 16/02/2022 (629) (0.01)
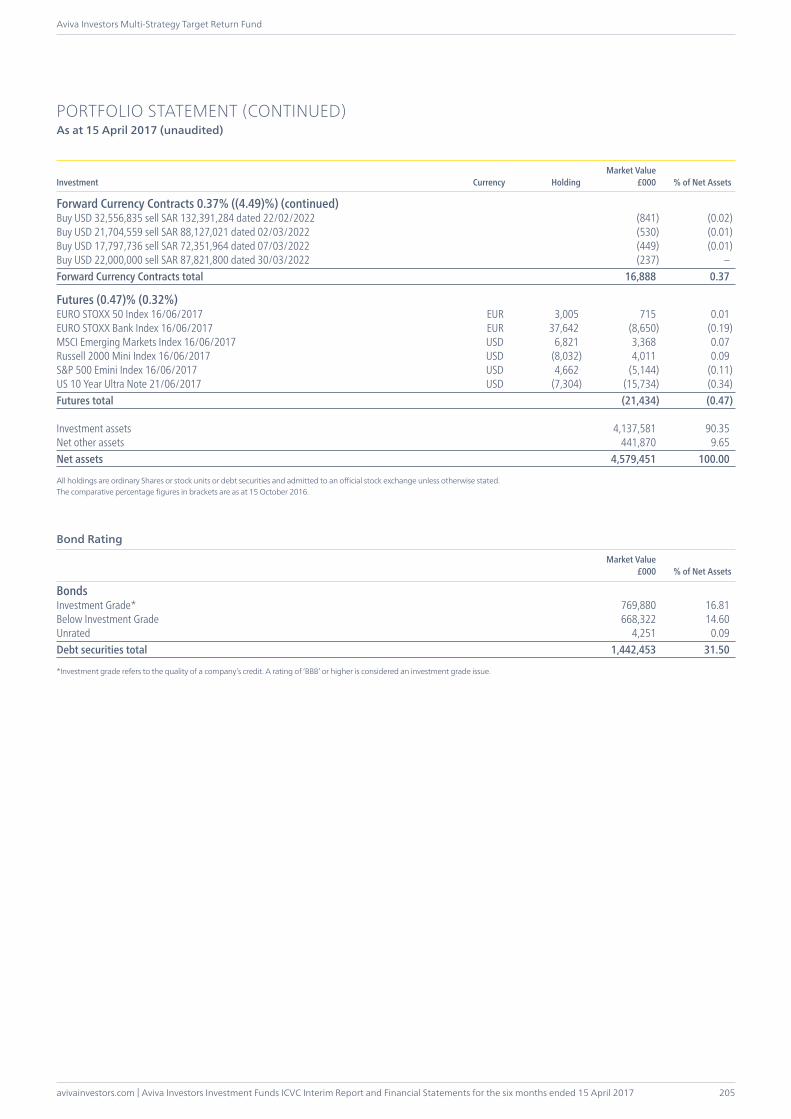
avivainvestors.com | Aviva Investors Investment Funds ICVC Interim Report and Financial Statements for the six months ended 15 April 2017
Aviva Investors Multi-Strategy Target Return Fund
205
PORTFOLIO STATEMENT (CONTINUED)As at 15 April 2017 (unaudited)
Investment Currency HoldingMarket Value
£000 % of Net Assets
Forward Currency Contracts 0.37% ((4.49)%) (continued)Buy USD 32,556,835 sell SAR 132,391,284 dated 22/02/2022 (841) (0.02)Buy USD 21,704,559 sell SAR 88,127,021 dated 02/03/2022 (530) (0.01)Buy USD 17,797,736 sell SAR 72,351,964 dated 07/03/2022 (449) (0.01)Buy USD 22,000,000 sell SAR 87,821,800 dated 30/03/2022 (237) –Forward Currency Contracts total 16,888 0.37
Futures (0.47)% (0.32%)EURO STOXX 50 Index 16/06/2017 EUR 3,005 715 0.01EURO STOXX Bank Index 16/06/2017 EUR 37,642 (8,650) (0.19)MSCI Emerging Markets Index 16/06/2017 USD 6,821 3,368 0.07Russell 2000 Mini Index 16/06/2017 USD (8,032) 4,011 0.09S&P 500 Emini Index 16/06/2017 USD 4,662 (5,144) (0.11)US 10 Year Ultra Note 21/06/2017 USD (7,304) (15,734) (0.34)Futures total (21,434) (0.47)
Investment assets 4,137,581 90.35Net other assets 441,870 9.65Net assets 4,579,451 100.00
All holdings are ordinary Shares or stock units or debt securities and admitted to an official stock exchange unless otherwise stated.The comparative percentage figures in brackets are as at 15 October 2016.
BondsInvestment Grade* 769,880 16.81Below Investment Grade 668,322 14.60Unrated 4,251 0.09Debt securities total 1,442,453 31.50
*Investment grade refers to the quality of a company’s credit. A rating of ‘BBB’ or higher is considered an investment grade issue.
Market Value£000 % of Net Assets
Bond Rating
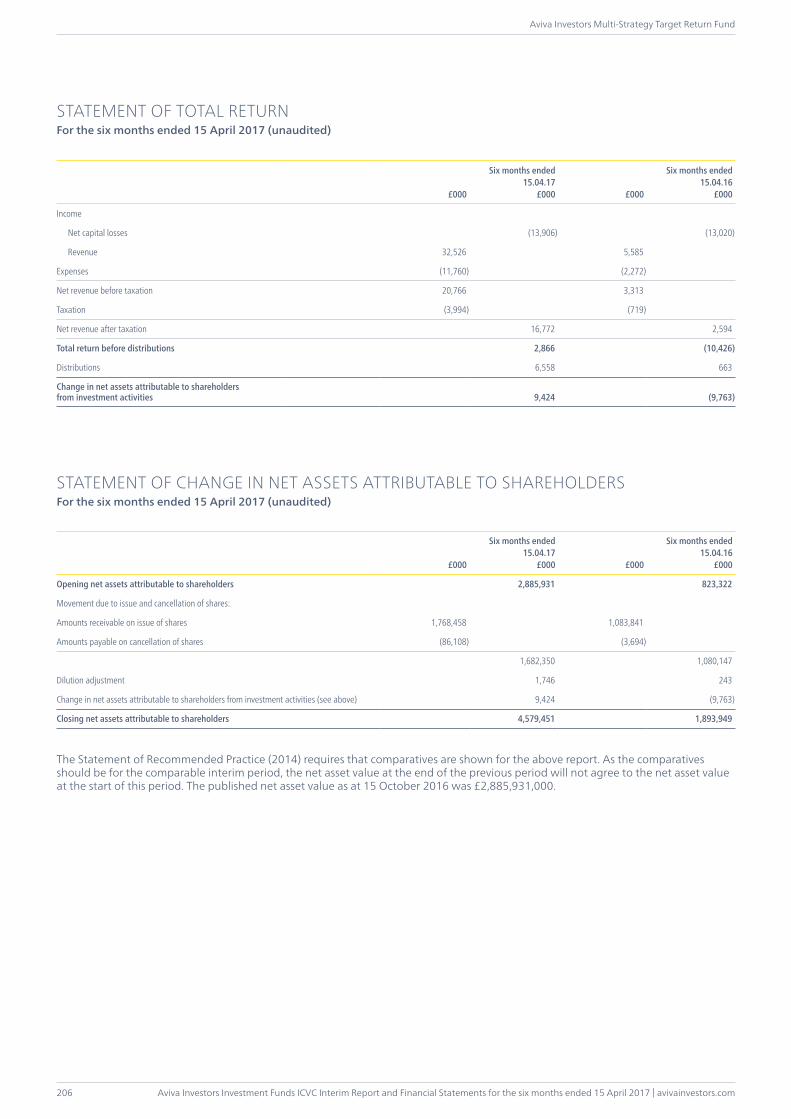
Aviva Investors Investment Funds ICVC Interim Report and Financial Statements for the six months ended 15 April 2017 | avivainvestors.com
Aviva Investors Multi-Strategy Target Return Fund
206
£000
Six months ended15.04.17
£000 £000
Six months ended15.04.16
£000
Income
Net capital losses (13,906) (13,020)
Revenue 32,526 5,585
Expenses (11,760) (2,272)
Net revenue before taxation 20,766 3,313
Taxation (3,994) (719)
Net revenue after taxation 16,772 2,594
Total return before distributions 2,866 (10,426)
Distributions 6,558 663
Change in net assets attributable to shareholders from investment activities 9,424 (9,763)
STATEMENT OF CHANGE IN NET ASSETS ATTRIBUTABLE TO SHAREHOLDERSFor the six months ended 15 April 2017 (unaudited)
£000
Six months ended15.04.17
£000 £000
Six months ended15.04.16
£000
Opening net assets attributable to shareholders 2,885,931 823,322
Movement due to issue and cancellation of shares:
Amounts receivable on issue of shares 1,768,458 1,083,841
Amounts payable on cancellation of shares (86,108) (3,694)
1,682,350 1,080,147
Dilution adjustment 1,746 243
Change in net assets attributable to shareholders from investment activities (see above) 9,424 (9,763)
Closing net assets attributable to shareholders 4,579,451 1,893,949
The Statement of Recommended Practice (2014) requires that comparatives are shown for the above report. As the comparatives should be for the comparable interim period, the net asset value at the end of the previous period will not agree to the net asset value at the start of this period. The published net asset value as at 15 October 2016 was £2,885,931,000.
STATEMENT OF TOTAL RETURNFor the six months ended 15 April 2017 (unaudited)

avivainvestors.com | Aviva Investors Investment Funds ICVC Interim Report and Financial Statements for the six months ended 15 April 2017
Aviva Investors Multi-Strategy Target Return Fund
207
BALANCE SHEETAs at 15 April 2017 (unaudited)
As at15.04.17
£000
As at15.10.16
£000
Assets:
Investments 4,342,608 2,786,351
Current assets:
Debtors 122,700 63,145
Cash and bank balances 436,340 300,905
Total assets 4,901,648 3,150,401
Liabilities:
Investment liabilities (205,027) (198,719)
Creditors:
Bank overdrafts – (675)
Other creditors (117,170) (65,076)
Total liabilities (322,197) (264,470)
Net assets attributable to shareholders 4,579,451 2,885,931
ACCOUNTING POLICIESThe accounting policies applied are consistent with those of the financial statements for the year ended 15 October 2016 and are described in those annual financial statements.
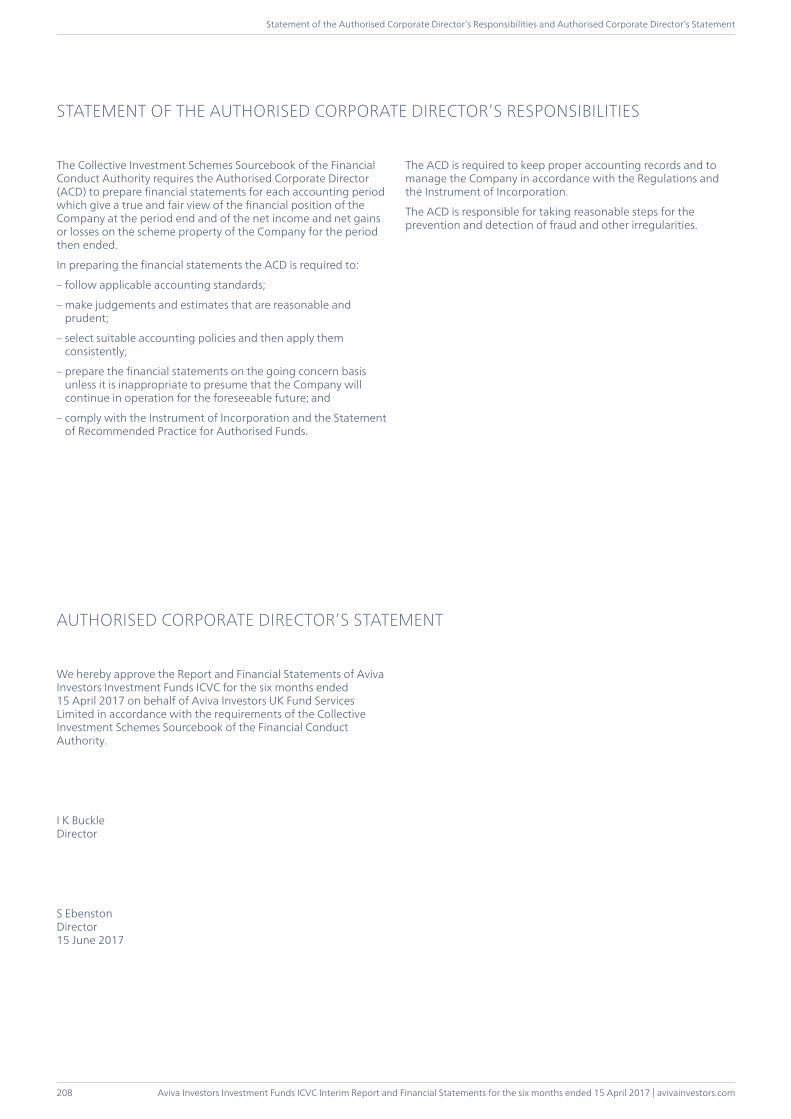
Aviva Investors Investment Funds ICVC Interim Report and Financial Statements for the six months ended 15 April 2017 | avivainvestors.com
Statement of the Authorised Corporate Director’s Responsibilities and Authorised Corporate Director’s Statement
208
The Collective Investment Schemes Sourcebook of the Financial Conduct Authority requires the Authorised Corporate Director (ACD) to prepare financial statements for each accounting period which give a true and fair view of the financial position of the Company at the period end and of the net income and net gains or losses on the scheme property of the Company for the period then ended.
In preparing the financial statements the ACD is required to:
– follow applicable accounting standards;
– make judgements and estimates that are reasonable and prudent;
– select suitable accounting policies and then apply them consistently;
– prepare the financial statements on the going concern basis unless it is inappropriate to presume that the Company will continue in operation for the foreseeable future; and
– comply with the Instrument of Incorporation and the Statement of Recommended Practice for Authorised Funds.
We hereby approve the Report and Financial Statements of Aviva Investors Investment Funds ICVC for the six months ended 15 April 2017 on behalf of Aviva Investors UK Fund Services Limited in accordance with the requirements of the Collective Investment Schemes Sourcebook of the Financial Conduct Authority.
I K BuckleDirector
S EbenstonDirector15 June 2017
STATEMENT OF THE AUTHORISED CORPORATE DIRECTOR’S RESPONSIBILITIES
AUTHORISED CORPORATE DIRECTOR’S STATEMENT
The ACD is required to keep proper accounting records and to manage the Company in accordance with the Regulations and the Instrument of Incorporation.
The ACD is responsible for taking reasonable steps for the prevention and detection of fraud and other irregularities.
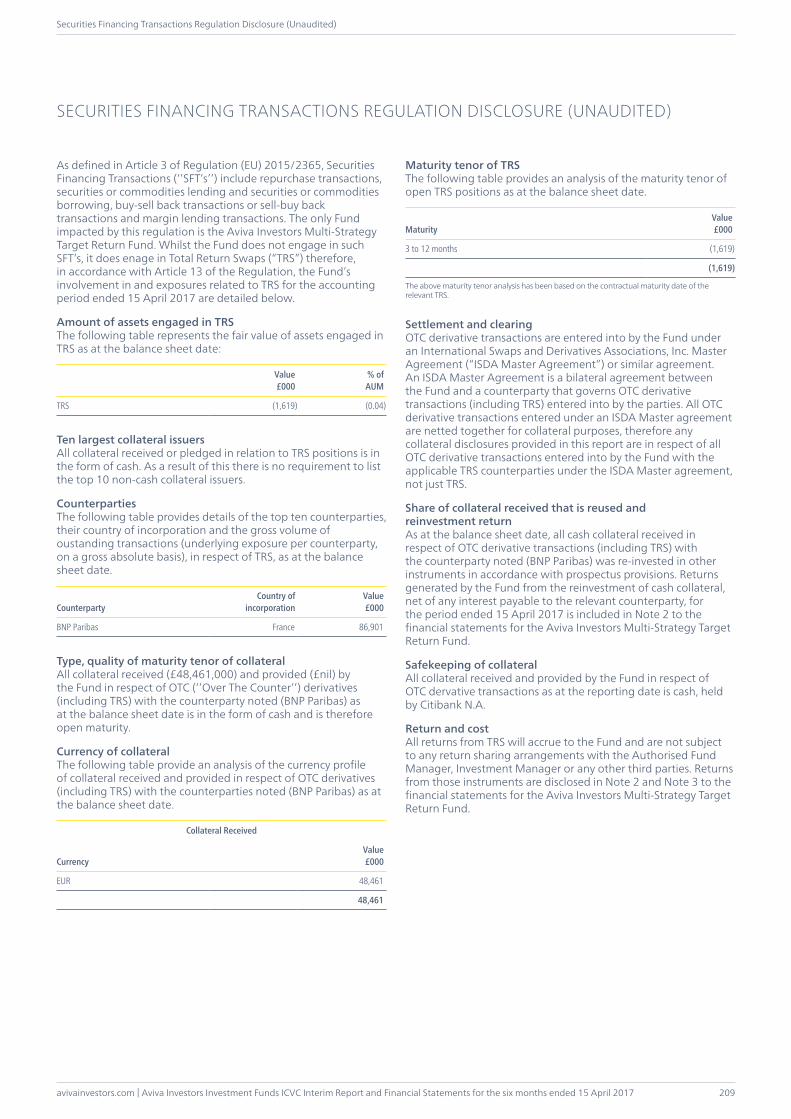
avivainvestors.com | Aviva Investors Investment Funds ICVC Interim Report and Financial Statements for the six months ended 15 April 2017
Securities Financing Transactions Regulation Disclosure (Unaudited)
209
As defined in Article 3 of Regulation (EU) 2015/2365, Securities Financing Transactions (‘’SFT’s’’) include repurchase transactions, securities or commodities lending and securities or commodities borrowing, buy-sell back transactions or sell-buy back transactions and margin lending transactions. The only Fund impacted by this regulation is the Aviva Investors Multi-Strategy Target Return Fund. Whilst the Fund does not engage in such SFT’s, it does enage in Total Return Swaps (“TRS”) therefore, in accordance with Article 13 of the Regulation, the Fund’s involvement in and exposures related to TRS for the accounting period ended 15 April 2017 are detailed below.
Amount of assets engaged in TRSThe following table represents the fair value of assets engaged in TRS as at the balance sheet date:
Value£000
% ofAUM
TRS (1,619) (0.04)
Ten largest collateral issuersAll collateral received or pledged in relation to TRS positions is in the form of cash. As a result of this there is no requirement to list the top 10 non-cash collateral issuers.
CounterpartiesThe following table provides details of the top ten counterparties, their country of incorporation and the gross volume of oustanding transactions (underlying exposure per counterparty, on a gross absolute basis), in respect of TRS, as at the balance sheet date.
CounterpartyCountry of
incorporationValue£000
BNP Paribas France 86,901
Type, quality of maturity tenor of collateralAll collateral received (£48,461,000) and provided (£nil) by the Fund in respect of OTC (‘’Over The Counter’’) derivatives (including TRS) with the counterparty noted (BNP Paribas) as at the balance sheet date is in the form of cash and is therefore open maturity.
Currency of collateralThe following table provide an analysis of the currency profile of collateral received and provided in respect of OTC derivatives (including TRS) with the counterparties noted (BNP Paribas) as at the balance sheet date.
Collateral Received
CurrencyValue£000
EUR 48,461
48,461
SECURITIES FINANCING TRANSACTIONS REGULATION DISCLOSURE (UNAUDITED)
Maturity tenor of TRSThe following table provides an analysis of the maturity tenor of open TRS positions as at the balance sheet date.
MaturityValue£000
3 to 12 months (1,619)
(1,619)
The above maturity tenor analysis has been based on the contractual maturity date of the relevant TRS.
Settlement and clearingOTC derivative transactions are entered into by the Fund under an International Swaps and Derivatives Associations, Inc. Master Agreement (“ISDA Master Agreement”) or similar agreement. An ISDA Master Agreement is a bilateral agreement between the Fund and a counterparty that governs OTC derivative transactions (including TRS) entered into by the parties. All OTC derivative transactions entered under an ISDA Master agreement are netted together for collateral purposes, therefore any collateral disclosures provided in this report are in respect of all OTC derivative transactions entered into by the Fund with the applicable TRS counterparties under the ISDA Master agreement, not just TRS.
Share of collateral received that is reused andreinvestment returnAs at the balance sheet date, all cash collateral received in respect of OTC derivative transactions (including TRS) with the counterparty noted (BNP Paribas) was re-invested in other instruments in accordance with prospectus provisions. Returns generated by the Fund from the reinvestment of cash collateral, net of any interest payable to the relevant counterparty, for the period ended 15 April 2017 is included in Note 2 to the financial statements for the Aviva Investors Multi-Strategy Target Return Fund.
Safekeeping of collateralAll collateral received and provided by the Fund in respect of OTC dervative transactions as at the reporting date is cash, held by Citibank N.A.
Return and cost All returns from TRS will accrue to the Fund and are not subject to any return sharing arrangements with the Authorised Fund Manager, Investment Manager or any other third parties. Returns from those instruments are disclosed in Note 2 and Note 3 to the financial statements for the Aviva Investors Multi-Strategy Target Return Fund.
Aviva Investors Investment Funds ICVC Interim Report and Financial Statements for the six months ended 15 April 2017 | avivainvestors.com
General Information
210
Investments in Aviva Investors Investment Funds ICVC are intended to be medium to long term investments and should not be considered as a short term investment.
Past performance is not a guide to the future.
The value of an investment in the funds and the revenue from it may go down as well as up, and you may not get back the original amount invested.
Where funds are invested abroad, the value of your investment may rise and fall purely on account of movement in exchange rates.
Please refer to the Prospectus (which is available on the internet at www.avivainvestors.com or from the ACD on request) for a full description of the risks involved when investing in the Funds.
Any future returns and opinions expressed are those of the Investment Manager and should not be relied upon as indicating any guarantee of return from investment in the funds.
The performance figure given for each fund (source: Aviva Investors) is based on midday values (with the exception of Aviva Investors UK Index Tracking Fund which is based on 5 p.m. values). The performance figure given for each comparative index (source: Lipper) is based on close of business values. Hence any over/under performance may be adversely or favourably affected by this time difference.
The information contained within this document should not be construed as a recommendation to purchase or sell stocks.
Publication of PricesInformation on the prices of Shares will be available by calling 0800 051 2003 or on the internet at www.avivainvestors.com. Calls may be recorded for training or monitoring purposes. Calls are free from landlines and mobiles.
GENERAL INFORMATION

Aviva Investors UK Fund Services Limited.Registered in England No. 1973412. Authorised and regulated by the Financial Conduct Authority. FCA Registered No. 119310.Registered address: St Helen’s, 1 Undershaft, London, EC3P 3DQ.An Aviva company.