geo-engineering reconnaissance of the 2010 maule, chile earthquake
TRANSCRIPT

GEO-ENGINEERING EXTREME EVENTS RECONNAISSANCE (GEER) ASSOCIATION Turning Disaster in Knowledge
Geo-engineering Reconnaissance of the 2010 Maule, Chile Earthquake Report of the NSF Sponsored GEER Association Team Editors: Jonathan Bray and David Frost GEER Team Leaders: Jonathan Bray, UC Berkeley; David Frost, Georgia Tech; Ramon Verdugo, Universidad de Chile; Christian Ledezma, Pontificia Univ. Católica de Chile; and Terry Eldridge, Golder Associates Lead Authors: Pedro Arduino, Univ. of Washington; Scott Ashford, Oregon State Univ.;Dominic Assimaki, Georgia Tech; Jonathan Bray, UC Berkeley; Terry Eldridge, Golder Assoc.; David Frost, Georgia Tech; Youssef Hashash, Univ. of Illinois; Tara Hutchinson, UC San Diego; Laurie Johnson, Laurie Johnson Consulting; Keith Kelson, Fugro William Lettis & Assoc.; Robert Kayen, US Geological Survey; Christian Ledezma, Pontificia Univ. Católica de Chile; Robb Moss, California Polytechnic State Univ. San Luis Obispo; George Mylonakis, Univ. of Patras; Scott Olson, Univ. of Illinois; Kyle Rollins, Brigham Young Univ.; Nicholas Sitar, UC Berkeley; Jonathan Stewart, UC Los Angeles; Alfredo Urzúa, Prototype Engineering Inc.; Ramon Verdugo, Universidad de Chile; Rob Witter, DOGAMI; and Nick Zoa, Univ. of Maryland Contributing Authors: David Baska, Terracon; Jim Bay, Utah State Univ.; Rodrigo Betanzo, Universidad de Concepcion; Ramon Boroschek, Universidad de Chile; Gabriel Candia, UC Berkeley; Leonardo Dorador, Universidad de Chile; Aldo Faúndez, Servicio de Salud Arauco; Gabriel Ferrer, Pontificia Univ. Catolica de Chile; Lenart González, Golder Assoc.; Katherine Jones, UC Berkeley; Dong Youp Kwak, UC Los Angeles; Jaimé Salazar Lagos, Burgos Arquitectos; José Miguel Lopez, Vale Exploraciones; Walter Lopez, UC Los Angeles; Claudio Medina, Golder Assoc.; Eduardo Miranda, Stanford Univ.; Gonzalo Montalva, Universidad de Concepcion; Sebastian Maureira, Universidad de Chile; William Siembieda, California Polytechnic State Univ. San Luis Obispo; Constanza Tapia, Pontificia Univ. Catolica de Chile; Mesut Turel, Georgia Tech; and Claudia Welkner, Golder Assoc.
GEER Association Report No. GEER-022
Version 2: May 25, 2010
1

NSF AWARD ACKNOWLEDGMENT
The information contained in this report is based upon work supported by the National Science Foundation through the Geotechnical Engineering Program under Grant No. CMMI-103431. Any opinions, findings, and conclusions or recommendations expressed in this material are those of the authors and do not necessarily reflect the views of the NSF. The recommendation of support of this RAPID proposal by the NSF Geotechnical Engineering Program Director, Dr. John L. Daniels, is greatly appreciated.
The GEER Association is made possible by the vision and support of the NSF Geotechnical Engineering Program Directors: Dr. Richard Fragaszy and the late Dr. Cliff Astill. GEER members donate their time, talent, and resources to collect time-sensitive field observations of the effects of extreme events. The GEER Association web site, which contains additional information, may be found at:
http://www.geerassociation.org
2

Acknowledgments and Collaborations Extreme Event Reconnaissance is a challenging activity that requires extremely careful planning and implementation. Safety is always of paramount importance. In many cases, the hazards are not just the result of already existing collapses but are just as likely to be the result of additional extreme events such as earthquake aftershocks or delayed collapse of already weakened infrastructure systems due to ongoing rescue and recovery activities. To ensure that individuals participating in such reconnaissance activities due so with the utmost attention to safety, GEER has developed a culture of safety and collaboration as it plans and implements its activities and considers these two factors to be critical components of their work. The response to the February 27, 2010 Maule, Chile event was no exception to this approach and thus GEER is particularly grateful for the collegial interactions and collaborations it had with a variety of organizations both within the US as well as in Chile in support of the individuals deployed there. The collaborations and cooperation with the following organizations is most gratefully recognized: U.S. National Science Foundation (NSF) U.S. Geological Survey (USGS) Earthquake Engineering Research Institute (EERI) Pacific Earthquake Engineering Research Center (PEER) Tsunami Ocean Sciences Group (TOSG) Mid-America Earthquake Center (MAE) American Society of Civil Engineers (ASCE) Universidad de Chile Pontificia Universidad Católica de Chile Universidad de Concepción CODELCO, Vicepresidencia de Proyectos Golder Associates Burgos Arquitectos Vale Exploraciones Chilean Air Force Dr. Rafael Avaria, Hospital Curanilahue The assistance of Karina Morales, Universidad de Concepcion with accommodation and logistics for team members in Concepcion and Gabriela Mesias, Golder Associates Santiago with overall logistics and meeting planning was invaluable. The support of Gustavo Peters who devoted significant time to safely driving team members in and around Concepcion is also appreciated. Coordination with Dr. Jack Moehle of UC Berkeley, who led the EERI LFE team, and with Dr. Steve Mahin of UC Berkeley, who is the Director of the PEER Center, was very helpful. GEER Team D benefited greatly from logistical support and coordination with the Mid America Earthquake Center team led by Professor Amr Elnashai and specifically on the ground by Professor Jeff Roessler both from UIUC. Finally, the assistance and guidance of Interim NSF Program Director, Dr. John Daniels in encouraging submission of and support for the RAPID proposal submitted by Jonathan Bray, UC Berkeley, and David Frost, Georgia Tech, and funded by NSF under Grant # CMMI-1034831 to support the response of the GEER Teams in Chile is recognized. His early recognition of both the scale of this event as well as its relevance to future similar events in the US enabled a timely and effective response from GEER. Finally, the careful reviewing and format homogenizing by Paula Fowler, Georgia Tech significantly enhanced the final report and is much appreciated.
3
Executive Summary
The February 27, 2010 Maule, Chile earthquake (Mw = 8.8) is the fifth largest earthquake to occur since 1900. Its effects were felt along 600 km of the central Chile coast. Initial field observations suggest that tectonic displacement of the hanging wall produced both uplift of over 2 m and subsidence of up to 1 m in coastal regions. The tsunami initiated by the rupture devastated parts of the coast and killed hundreds of people. Strong shaking lasted for over a minute in some areas, and widespread damage occurred in some cities. A large number of significant aftershocks contributed additional damage to an already fragile infrastructure.
The earthquake tested numerous modern structures and facilities. Most of these systems performed well, although some did not. Most often, poor performance resulted from construction deficiencies or oversights in the design process related to structural detailing or recognition of geotechnical effects, such as liquefaction.
This major earthquake was the subject of several post-earthquake reconnaissance efforts. This report presents the observations of the NSF-sponsored Geo-engineering Extreme Events Reconnaissance (GEER) team. GEER team members included engineers, geologists, and scientists from Chile and the United States. The GEER team worked closely with other reconnaissance teams, including EERI, USGS, NIST, FEMA, TOSG, PEER, and ASCE, amongst others, to document the geotechnical effects of this significant event so that our understanding of earthquakes can be improved and we may turn disasters such as this one into knowledge for advancing societal resilience.
In this report, key observations were carefully documented and geo-referenced with the use of GPS and other geospatial tools such as Google Earth. A selected number of critical sites were further characterized using advanced tools, such as LiDAR, SASW, and DCPT. Reconnaissance was performed remotely using satellite imagery, efficiently through aerial reconnaissance, and in detail through coordinated ground-based reconnaissance studies.
This report includes a brief summary of engineering seismology and earthquake ground motions for this event, a description of the use of remote sensing to provide insight into damage patterns, and an in-depth discussion of the important role of coastal uplift and subsidence resulting from the underlying tectonic movement. Localized damage patterns observed during the 2010 Chile earthquake and findings from previous earthquake studies indicate that seismic site effects were also important in this earthquake.
Soil liquefaction occurred at many sites, and often led to ground failure and lateral spreading. Of special interest are the effects of liquefaction on the built environment. Several buildings were damaged significantly due to foundation movements resulting from liquefaction. Liquefaction-induced ground failure displaced and distorted waterfront structures, which adversely impacted the operation of some of Chile’s key port facilities. Critical lifeline structures, such as bridges, railroads, and road embankments, were damaged by ground shaking and ground failure. The damage to some sections of Ruta 5, the primary North-South highway in Chile, was pervasive, which disrupted the flow of supplies and traffic following the event.
Most dams, levees, and mine tailings dams performed well. However, several key earth structures experienced some distress, and in one case a liquefaction-induced tailings dam failure produced a flow slide that killed a family of four. Most earth retention systems, such as retaining walls and basement walls, proved to be inherently robust. Landsliding was not pervasive, which appears to have resulted from native slopes that are generally composed of competent earth materials and the relatively low groundwater levels present at the end of the dry season.
All of these consequences impact how society responds to, plans for, and rebuilds after a major earthquake, which will occur again in this region and other regions such as the Pacific Northwest. GEER team urban planners, geologists, and engineers documented the impacts of the geologic and tsunami hazards and identified the challenges and opportunities that will confront Chile as it rebuilds and addresses these hazards in the future. Careful documentation of the geotechnical effects of the 2010 Chile earthquake will enable advancements in the art and science of engineering that will save lives during the next major event.
4

Geo‐Engineering Reconnaissance of the February 27, 2010 Chile Earthquake
Table of Contents
Acknowledgments and Collaborations
Executive Summary
1.0 Introduction and Scope of Reconnaissance
2.0 Engineering Seismology and Earthquake Ground Motions
3.0 Remote Sensing and Pre/Post Imagery
4.0 Regional Geology and Coastal Uplift/Subsidence
5.0 Site Effects and Damage Patterns
6.0 Liquefaction and Lateral Spreading
7.0 Effects of Ground Failure on Buildings
8.0 Effects of Ground Failure on Ports, Harbors and Industrial Facilities
9.0 Effects of Ground Failure on Bridges, Roads, Railroads and Lifeline Systems
10.0 Slope Stability and Landslides
11.0 Dams, Levees, and Mine Tailings Dams
12.0 Retaining Structures
13.0 Tsunami Effects
14.0 Geologic and Tsunami Hazards, Urban Planning, and Reconstruction
15.0 Characterizations Using Advanced Reconnaissance Tools
5

1.0 INTRODUCTION AND SCOPE OF RECONNAISSANCE
On February 27, 2010, a magnitude Mw 8.8 earthquake occurred off the coast of Maule, Chile. The epicenter was located 35.909oS 72.733oW at a depth of about 35 km. The earthquake took place at the boundary of the Nazca and South American plates where they converge at a rate of about 80 mm per year as the Nazca plate is moves below the South American plate. The effects of the earthquake were observed over a wide area from Valparaiso to the North to the Araucania region around Temuco to the South. Apart from the immediate consequences of the earthquake, the subduction of the Nazca plate resulted in a tsunami that affected a significant portion of the Chile coast from Iloca to the North to Tirua to the South. GEER deployed a multi-phase team to Chile following the event with support from NSF. As is GEER practice, reconnaissance teams include both US based personnel as well as “in country” based personnel from academia and practice. This approach ensures complete sensitivity to local issues and concerns as well as the benefit of local experience and contacts to enable robust well coordinated reconnaissance activities to be undertaken. GEER Team A was on the ground from Friday March 5th through Saturday March 13th. The focus of activities for Team A was to define the extent of geotechnical damage resulting from the strong ground motion. Team activities consisted of both aerial reconnaissance flights (conducted with assistance of Chilean Air Force) as well private fixed and rotary wing operators as well as extensive ground reconnaissance efforts that extended from the Santiago-Valparaiso region at the North to the Lebu-Collipuli region to the South, a distance of some 550 km and from the coast to East of Highway 5, a distance of some 120 km. The ground reconnaissance activities ranged from both regional level assessments of ground failure as well as earthquake and tsunami consequences to more detailed studies of specific failures of geotechnical interest including liquefaction and lateral spreading, embankment settlements and failures, geologic uplift/subsidence, tsunami scour, dam/tailings impoundment performance and landslide/slope failures. Team A was led by GEER Co-Chair David Frost (Georgia Tech) and included US members Robb Moss (Cal Poly San Luis Obispo), Keith Kelson (Fugro William Lettis & Associates), Nick Sitar (UC Berkeley), Alfredo Urzua (Boston College), Gonzalo Montalvo (Washington State University and University of Concepcion). The US members were joined by Chilean colleagues Ramon Verdugo (Universidad de Chile), Christian Ledezma (Pontificia Universidad Catolica de Chile), Terry Eldridge (Golder Associates Santiago), Lenart Gonzalez (Golder Associates Santiago), Gabriel Ferrer (Pontificia Universidad Catolica de Chile) and Claudia Welker, (Golder Associates Santiago). GEER Team B was on the ground from Saturday March 13th through Thursday March 18th. The focus of activities for Team B was to conduct extensive ground studies in some of the more heavily damaged areas such as Concepcion and the surrounding area as well as continue studies along the coast with a focus on both geologic uplift/subsidence as well as relationships between geologic hazards and urban planning/reconstruction. Additional efforts focused on the effects of ground failure on bridges, highways, railroads and lifeline systems. Specific studies focused on examining damage to bridge foundations due to lateral spreading, liquefaction and slope failures as well as building foundations due to liquefaction, settlement and slop failures. Observations made during both Team A and Team B ground reconnaissance efforts were also used to identify possible candidate sites for subsequent testing and study by Team C as noted below. Team B was led by GEER Chair Jon Bray (UC Berkeley) and included US members Pedro Arduino (University of Washington), Scott Ashford (Oregon State University), Dominic Assimaki (Georgia Tech), Gabriel Candia (UC Berkeley), Tara Hutchinson (UC San Diego), Laurie Johnson (LJC Inc.), George Mylonakis (University of Patras), Kyle Rollins (Brigham Young University), John Stewart (UCLA) and
6
Rob Witter (DOGAMI, State of Oregon). The US members were joined by Chilean colleagues Ruben Boroschek (Universidad de Chile) and Sebastian Maureira (Universidad de Chile). GEER Team C was on the ground from Tuesday March 23rd through Monday March 29th. Team C visited a series of sites identified by Teams A and B and conducted LiDAR, SASW and DCPT tests to characterize subsurface conditions and/or infrastructure geometry. To the extent possible, these studies focused on perishable data that could not be guaranteed to remain in the immediate post-event geometry or condition. The team worked predominantly on sites in the Concepcion area including bridge, embankment and structure failure case histories. They also conducted measurements at a tailings dam failure and at several highway embankments between Talca and Curico as well as at several bridge sites in Santiago. Team C was led by Rob Kayen (USGS) and included US member Scott Olson (University of Illinois Urbana-Champaign). They were joined by Chilean colleagues Valentina Peredo (Universidad de Chile), Sabastian Maureira (Universidad de Chile) and Lenart Gonzalez (Golder Associates Santiago). GEER Team D was on the ground from Monday April 12th through Saturday April 17th. Team D was tasked with visiting a number of sites where additional measurements were considered desirable based on observations of the earlier GEER teams as well as to make additional SASW measurements at selected sites. Additional emphasis on the performance of fill soils in some port facilities as well as transportation infrastructure was a focus of this Team. Team D was led by Youssef Hashash (University of Illinois Urbana-Champaign) and included US member Jim Bay (Utah State University). They were joined by Chilean colleague Gabriel Ferrer (Pontificia Universidad Catolica de Chile). Home base logistical and technical support for all phases of the GEER team deployment was provided by Katherine Jones (UC Berkeley) and Mesut Turel (Georgia Tech). Coordination with other organizations was facilitated by scheduled teleconferences arranged by the USGS Earthquake Hazards Program as well as directly with other organizations including Earthquake Engineering Research Institute (EERI), the Pacific Earthquake Engineering Research Center (PEER), the Ocean Sciences Tsunami Group and the Mid-America Earthquake Center (MAE). This report summarizes the observations from the initial reconnaissance conducted by all phases of the GEER team. Given the potential importance of the findings of this event to similar tectonic settings in the US and around the world, it is expected that additional information and interpretations will be made available as they are collected.
7
2.0 ENGINEERING SEISMOLOGY AND EARTHQUAKE GROUND MOTIONS
2.1 Tectonic Setting
The information presented in this section is derived from the USGS “Earthquake Summary” web
site (http://earthquake.usgs.gov/earthquakes/eqinthenews/2010/us2010tfan/#summary). Additional information on the geology in the region affected by the 2010 Mw=8.8 Chile earthquake is
presented in Section 3 of this report.
The Mw = 8.8 Offshore Maule, Chile earthquake occurred in a subduction zone in which the Nazca
plate passes eastward and downward beneath the South American plate. The rate of convergence
of the two plates is 70 mm/year.
Human inhabitants of the Chilean coast report numerous major prior events in this region. One of
the first recorded events was a shock near Concepción in 1562. Another earthquake in 1570
triggered a tsunami that led Spaniards to rebuild Concepción on higher ground. Earthquakes in
1730 (apparently near Valparaíso) and 1751 (Concepción) generated tsunamis that caused
flooding and damage in Japan. The effects of an 1835 earthquake near Concepción were
observed by Charles Darwin and Robert FitzRoy. A 1906 earthquake near Valparaíso of
magnitude 8.2 generated a tsunami that produced run up heights in Hawaii as great as 3.5 m. The
southern extent of that earthquake overlaps with the northern extent of the 2010 event. To the
south of the 2010 earthquake zone is the source of the giant 1960 earthquake of magnitude 9.5,
which was the largest 20th
earthquake world-wide. Since 1960, the largest event prior to the 2010
earthquake was a magnitude 8.0 earthquake north of Valparaíso in 1985. That event generated a
Pacific Ocean tsunami that reached heights of 9 m on the Chilean coast near Coquimbo and
affected boats in Hawaii.
Ruegg et al. (2009) identified the Concepción–Constitución area (S35o–S37
o) as a “mature
seismic gap, since no large subduction earthquake has occurred there since 1835.” They noted
that the convergence of about 68 mm/year since the last large interpolate subduction earthquake
of 1935 would have accumulated more than 10 m of displacement. Ruegg et al. (2009) warn,
“Therefore, in a worst case scenario, the area already has a potential for an earthquake of
magnitude as large as 8–8.5, should it happen in the near future.” Thus, earth scientists were
aware of the potential for a large earthquake in the south central Chile area.
2.2 Earthquake of February 27 2010
The mainshock occurred at 3:34 am local time on February 27, 2010. Its epicenter is located at
S36.027° W72.834°
(http://earthquake.usgs.gov/earthquakes/eqinthenews/2010/us2010tfan/neic_tfan_cmt.php). The USGS
moment tensor solution indicates a seismic moment of 1.8×10²²
N⋅m, moment magnitude of MW
= 8.8, and hypocentral depth of 30 km. Based on the regional tectonics, the critical nodal plane
from the moment tensor solution strikes 14° west of due north and dips at 19° to the east.
Figure 2.1 shows a Google Earth image superimposed with the mainshock location and
aftershock locations segregated by date (those within the first 48 hours of the event and those
8

occurring subsequently). Aftershocks within the first 48 hours are often assumed to result from
redistribution of the stress in the mainshock rupture zone (Benioff, 1985; Kiratzi et al. 1985).
Aftershock locations were obtained from the USGS server. Most of the aftershocks occur in a
region approximately 530 km long (along strike) by 180 km wide. Figure 2.2 shows the
aftershock distribution color-coded by depth along with a section of the aftershock pattern, which
shows the dipping fault surface. The closest distance from the fault to the coastal areas of Chile
was approximately 25 km.
The surface projection of a finite fault model of the mainshock is also shown in Figure 2.1. This
finite fault model was generated by Gaven Hayes based on waveform inversion (image from
http://earthquake.usgs.gov/earthquakes/eqinthenews/2010/us2010tfan/finite_fault.php). The
rectangular model strikes at 17.5° west of north and dips at 18.0° to the east. The seismic
moment release based upon this plane is 2.39×1029
+029 dyne⋅cm. There are two zones of high
slip, with the maximum slip being approximately 14.5 m.
Figure 2.1. Google Earth image superimposed with aftershock distribution (locations
from USGS) and fault plane solution from G. Hayes (obtained from USGS web page)
9

Figure 2.2. Aftershock distribution by depth. Star indicates hypocenter of mainshock.
Figure from USGS web page
(http://neic.usgs.gov/neis/eq_depot/2010/eq_100227_tfan/neic_tfan_c.html
2.3 Ground Motions
Seismograph networks in the portions of Chile that experienced strong ground motion from
Offshore Maule earthquake are maintained by RENADIC
Departamento de Ingenieria Civil, Universidad de Chile = National Network of Seismic
Monitoring Devices – Department of Civil Engineering, University of Chile)
. Aftershock distribution by depth. Star indicates hypocenter of mainshock.
Figure from USGS web page
http://neic.usgs.gov/neis/eq_depot/2010/eq_100227_tfan/neic_tfan_c.html).
portions of Chile that experienced strong ground motion from
Offshore Maule earthquake are maintained by RENADIC (Red National de Acelerografos
Departamento de Ingenieria Civil, Universidad de Chile = National Network of Seismic
Department of Civil Engineering, University of Chile), RENASIS (Red
. Aftershock distribution by depth. Star indicates hypocenter of mainshock.
portions of Chile that experienced strong ground motion from the
de Acelerografos
Departamento de Ingenieria Civil, Universidad de Chile = National Network of Seismic
, RENASIS (Red
10

National de Acelerografos Departamento de Sismológica, Universidad de Chile = National
Network of Seismic Monitoring Devices – Seismology Department, University of Chile), and
Pontificia Universidad Católica de Chile (Catholic University of Chile).
As of this writing, preliminary results from the portions of the RENADIC and RENASIS
networks have been released in a series of web reports (http://www.terremotosuchile.cl/). These
reports contain plots of acceleration waveforms and response spectra for selected stations. Table
2.1 lists stations that recorded the earthquake in the RENADIC and RENASIS networks based
on personal communication with C. Ledezma (April 21 2010). The locations of those stations are
shown in Figure 2.3. Also shown in the table are the peak horizontal acceleration (maximum of
the two horizontal components) for stations described in the available web reports. Data for
stations without a reported PHA or “Data Report Reference” in Table 2.1 is not available in the
web reports.
With the exception of the four RENASIS stations, the data released to date does not include
digital acceleration files, or response spectra. An example of the type of records that are
currently available in the Boroschek et al. (2010) preliminary reports is shown in Figure 2.4.
Figure 2.3. Locations of stations maintained by RENADIC and RENASIS that recorded
mainshock
We understand that the Pontificia Universidad Católica array is concentrated in Concepción,
which was strongly shaken by this event. There are unconfirmed reports that these stations did
11

not record the mainshock or its principal aftershocks due to maintenance problems. However, no
official reports on station locations or data availability are available as of this writing.
Table 2.1. Information on RENADIC and RENASIS strong motion data released in plots
within PDF files (as of 18 May 2010)
Station Code: Station Name PHA
(g) Lat Long Source
Data Report
Reference2
SAN: Universidad de Chile Depto Ing. Civil (Interior Edificio) Santiago
0.17 -33.4572 -70.6617 RENADIC BEA 2010a
SANM1: Estación Metro Mirador Santiago
0.24 -33.5135 -70.6060 RENADIC BEA 2010a
CRS1: CRS MAIPU RM 0.56 -33.5087 -70.7719 RENADIC BEA 2010a
FSR: Hosp. Tisne RM 0.30 -33.5006 -70.5792 RENADIC BEA2010a
RIO1: Hosp. Sotero de Río RM 0.27 -33.5769 -70.5811 RENADIC BEA 2010a
CUR1: Hosp. Curico 0.47 -34.9808 -71.2364 RENADIC BEA2010b
VLCH: Hosp. Valdivia 0.14 -39.8306 -73.2390 RENADIC BEA 2010b
VDMM1: Vina del Mar (Marga Marga) 0.35 -33.0482 -71.5099 RENADIC BEA 2010c
VDMC1: Vina del Mar (Centro) 0.33 -33.0256 -71.5508 RENADIC BEA2010c
CCSP: Colegio San Pedro, Concepción 0.65 RENASIS UC, 2010
CLCH: Cerro Calán, Santiago 0.23 -33.3961 -70.5369 RENASIS UC, 2010
ANTU: Campus Antumapu, Santiago 0.27 -33.5691 -70.6335 RENASIS UC, 2010
ROC1: Cerro El Roble 0.19 -32.9759 -71.0156 RENASIS UC, 2010
UTF: VALPARAISO – UTFSM -33.0346 -71.5956
MAT1: MATANZAS -33.9604 -71.8734
RAN1: RANCAGUA - HOSPITAL REGIONAL
-34.1645 -70.7417
PICH: PICHILEMU -34.3871 -72.0136
ILOC: ILOCA -34.9362 -72.1811
HUAL1: HUALAÑE -34.9765 -71.8053
CONS: CONSTITUCION -35.3401 -72.4057
TALC: TALCA -35.4299 -71.6649
CQNS1: CAUQUENES -35.9628 -72.3242
COCH: COBQUECURA -36.1307 -72.7945
CCHI: CHILLAN -36.6043 -72.1042
TALU1: TALCAHUANO – USGS -36.7591 -73.1221
CON: CONCEPCION - Colegio Inmac. Conc.
-36.8281 -73.0483
CONC: CONCEPCION-COLEGIO Ma Inmaculada
-36.8221 -73.0599
AGCH: ANGOL -37.7947 -72.7081
VLCH: VALDIVIA – HOSPITAL -39.8306 -73.2390 1 Station code assigned in this report (no superscript indicates station code from Chilean source) 2 BEA=Boroschek et al.; UC = Universidad de Chile
12

Figure 2.4. Acceleration-time series recorded at the Hospital in Curico during the 2010 Mw=8.8 Chile
Earhquake
2.4 References Benioff, H., 1955. Mechanism and strain characteristics of the White Wolf fault as indicated by the
aftershock sequence. In: “Earthquakes in Kern County, California, during 1952”. Calif. Dept. Nat. Res.
Div. Mines, Bull., 171, 199-202.
Boroschek, R., Soto, P., Leon, R., and Comte, D. (2010a). “Informe preliminary, RED Nacional de
acelerografos, terremoto centro sur Chile, 27 de Febrero 2010,” Informe Preliminar No. 2, Facultad de
Ciencias Fisicas Y Matematicas, Universidad de Chile. 5 March 2010.
Boroschek, R., Soto, P., Leon, R., and Comte, D. (2010b). “Informe preliminary, RED Nacional de
acelerografos, terremoto centro sur Chile, 27 de Febrero 2010,” Informe Preliminar No. 3, Facultad de
Ciencias Fisicas Y Matematicas, Universidad de Chile. 15 March 2010.
Boroschek, R., Soto, P., Leon, R., and Comte, D. (2010c). “Informe preliminary, RED Nacional de
acelerografos, terremoto centro sur Chile, 27 de Febrero 2010,” Informe Preliminar No. 4, Facultad de
Ciencias Fisicas Y Matematicas, Universidad de Chile. 5 April 2010.
13

Kiratzi, A.A., Karakaisis, G.F., Papadimitriou, E.E. and Papazachos, B.C. 1985. Seismic source-
parameter relations for earthquakes in Greece. Pure Appl. Geophys., 123, 27-41.
Ruegg, J.C., Rudloff, A., Vigny, C., Madariaga, R., de Chabalier, J.B., Campos, J., Kausel, E., Barrientos,
S., and Dimitrov, D. (2009). “Interseismic strain accumulation measured by GPS in the seismic gap
between Constitución and Concepción in Chile.” Physics of the Earth and Planetary Interiors, 175, 78-
85.
Universidad de Chile, (2010). “Informe technico, terramoto Cauquenes 27 Febrero 2010,” Servecio
Sismologico. 3 April 2010.
14
3.0 REMOTE SENSING AND PRE/POST IMAGERY
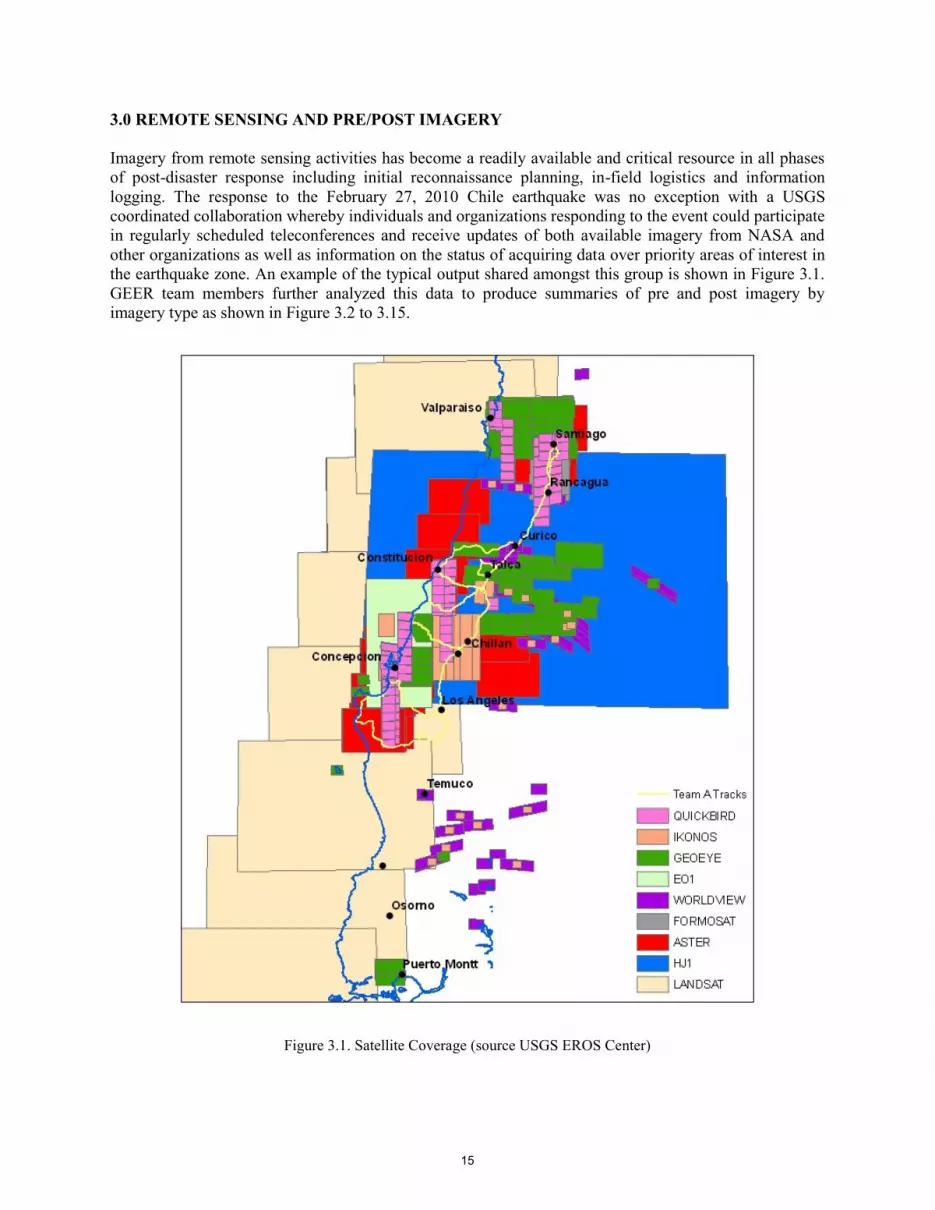
Imagery from remote sensing activities has become a readily available and critical resource in all phases
of post-disaster response including initial reconnaissance planning, in-field logistics and information
logging. The response to the February 27, 2010 Chile earthquake was no exception with a USGS
coordinated collaboration whereby individuals and organizations responding to the event could participate
in regularly scheduled teleconferences and receive updates of both available imagery from NASA and
other organizations as well as information on the status of acquiring data over priority areas of interest in
the earthquake zone. An example of the typical output shared amongst this group is shown in Figure 3.1.
GEER team members further analyzed this data to produce summaries of pre and post imagery by
imagery type as shown in Figure 3.2 to 3.15.
Figure 3.1. Satellite Coverage (source USGS EROS Center)
15
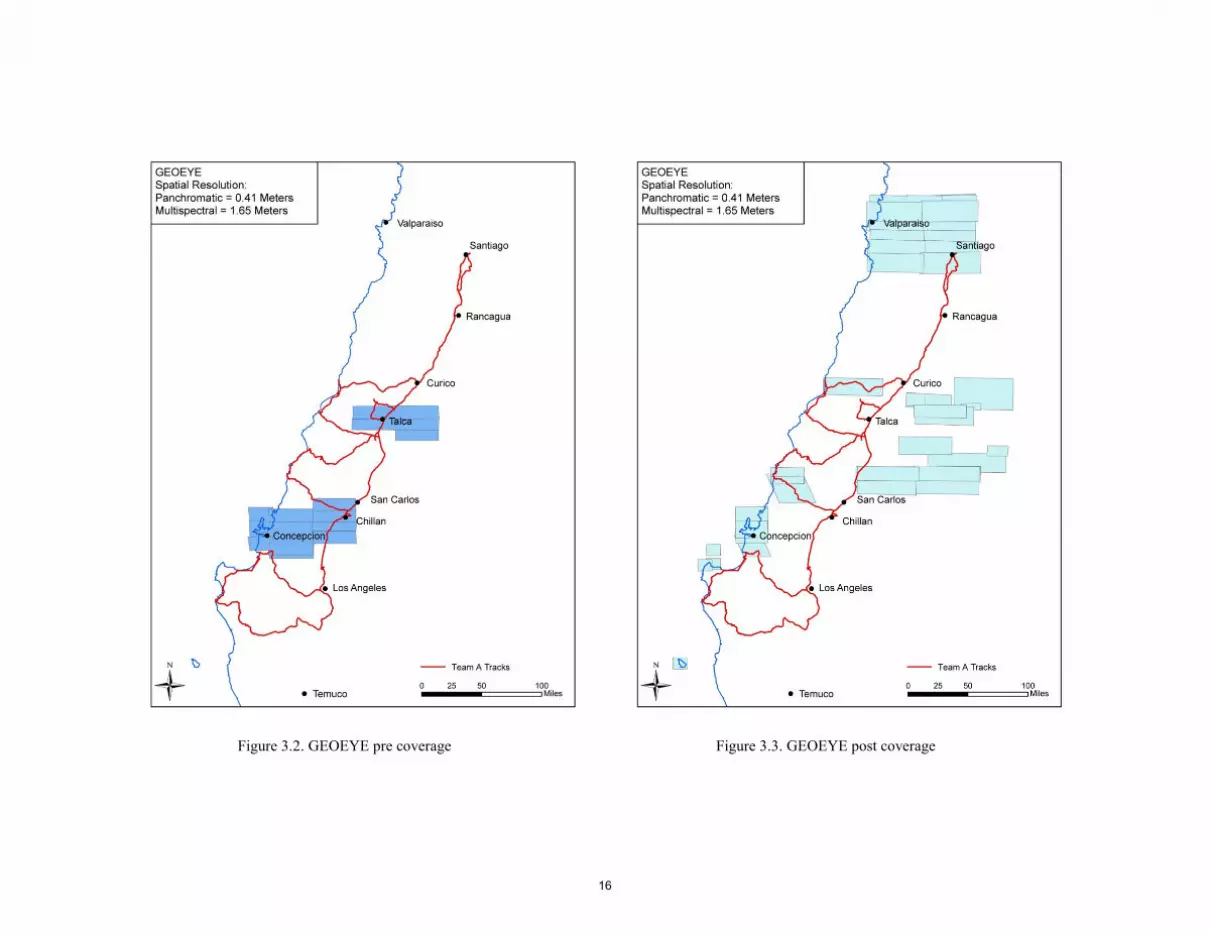
Figure 3.2. GEOEYE pre coverage Figure 3.3. GEOEYE post coverage
16
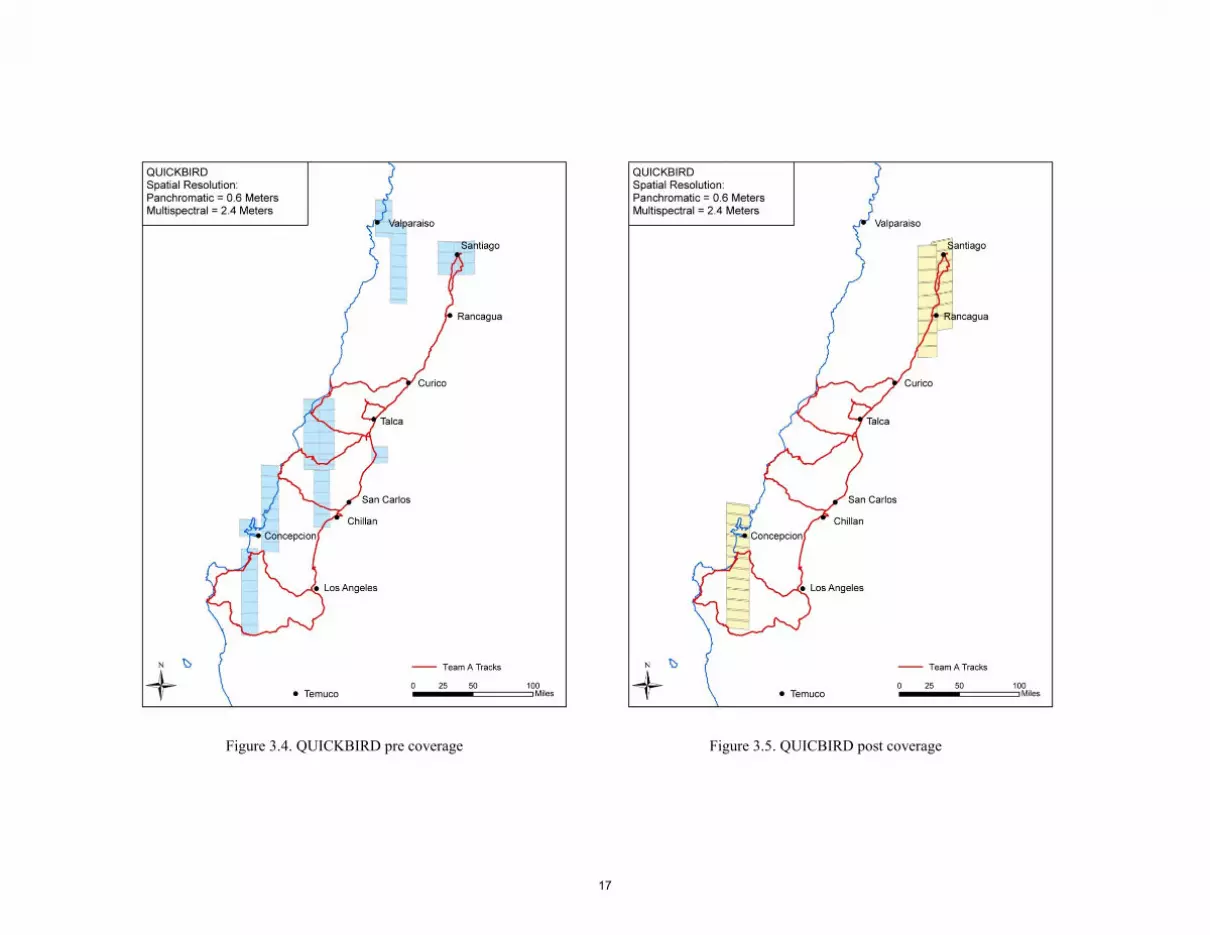
Figure 3.4. QUICKBIRD pre coverage Figure 3.5. QUICBIRD post coverage
17

Figure 3.6. WORLDVIEW pre coverage Figure 3.7. WORLDVIEW post coverage
18

Figure 3.8. EO-1 pre coverage Figure 3.9. EO-1 post coverage
19
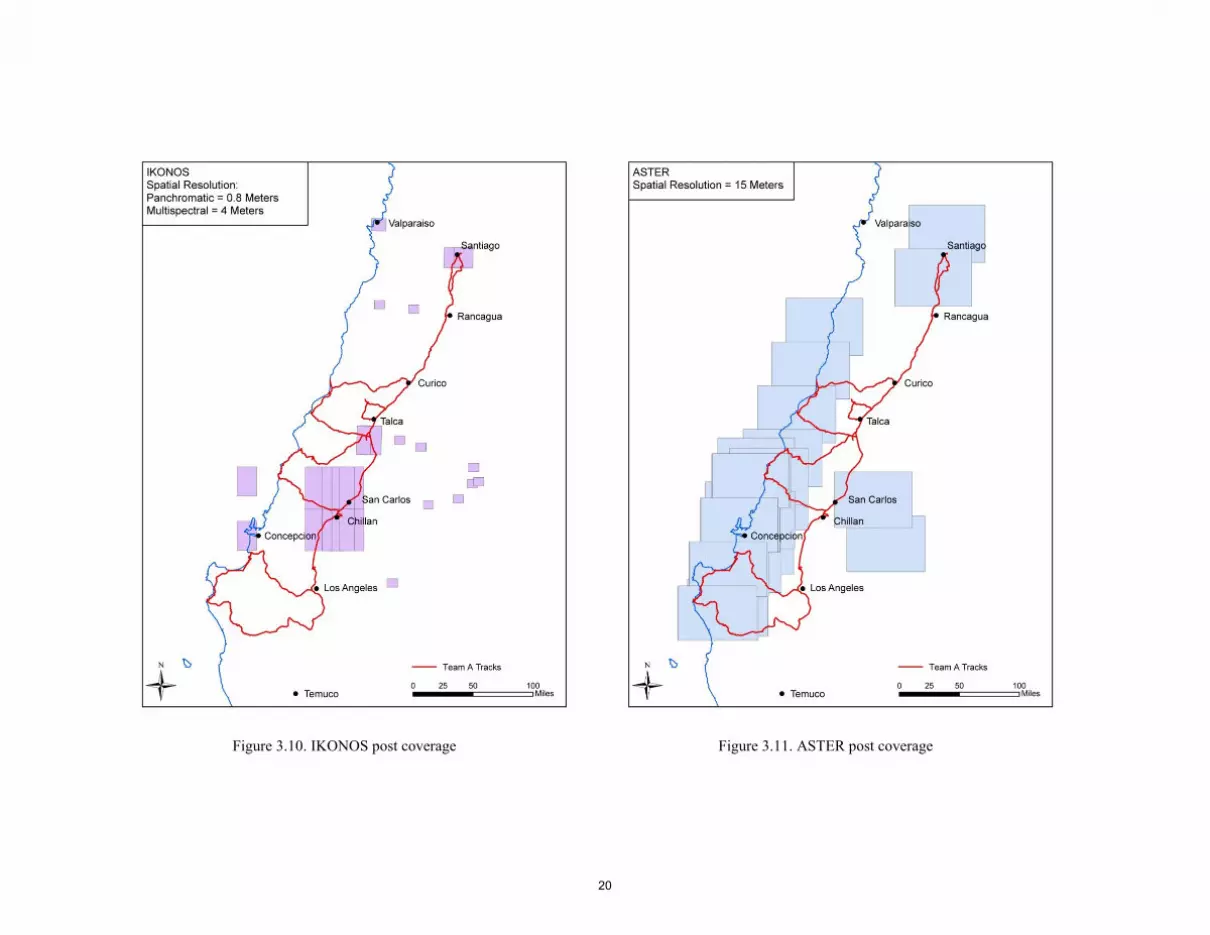
Figure 3.10. IKONOS post coverage Figure 3.11. ASTER post coverage
20

Figure 3.12. FORMOSAT post coverage Figure 3.13. HJ-1 post coverage
21

Figure 3.14. JAXA AVNIR post coverage Figure 3.15. CBERS post coverage
22
Figures 3.2 to 3.15 show the tracks of the areas in which much of the ground reconnaissance of Team A
was conducted. This effectively reflects the entire area over which strong ground motion effects produced
geotechnical distress and/or failures. The activities of Teams B, C and D were generally contained within
this same area. For detailed geotechnical reconnaissance activities, it is critical to have high resolution pre
and post event image pairs. In general, the areas where high resolution imagery is available do not include
many of the areas where significant geotechnical impacts were observed.
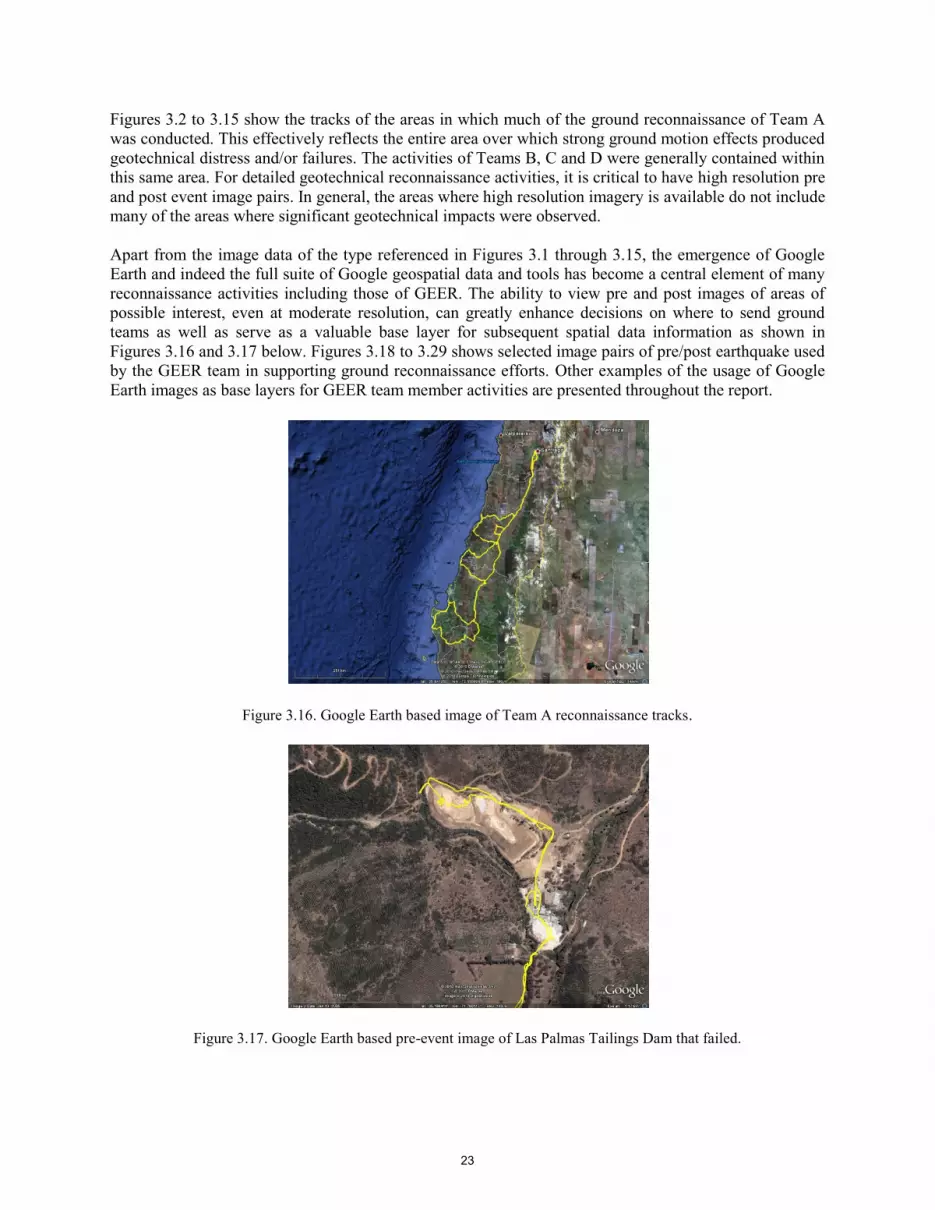
Apart from the image data of the type referenced in Figures 3.1 through 3.15, the emergence of Google
Earth and indeed the full suite of Google geospatial data and tools has become a central element of many
reconnaissance activities including those of GEER. The ability to view pre and post images of areas of
possible interest, even at moderate resolution, can greatly enhance decisions on where to send ground
teams as well as serve as a valuable base layer for subsequent spatial data information as shown in
Figures 3.16 and 3.17 below. Figures 3.18 to 3.29 shows selected image pairs of pre/post earthquake used
by the GEER team in supporting ground reconnaissance efforts. Other examples of the usage of Google
Earth images as base layers for GEER team member activities are presented throughout the report.
Figure 3.16. Google Earth based image of Team A reconnaissance tracks.
Figure 3.17. Google Earth based pre-event image of Las Palmas Tailings Dam that failed.
23

Figure 3.18. Pre/Post Imagery of Iloca (34.924° S, 72.179° W)
Tsunami
Damage
24

Figure 3.19. Pre/Post Imagery of Iloca (34.936° S, 72.181° W)
Tsunami
Damage
25

Figure 3.20. Pre/Post Imagery of Talcahuano (36.729° S, 73.104° W)
Levee
Breach
26

Figure 3.21. Pre/Post Imagery of Talcahuano (36.738° S, 73.097° W)
Tsunami
Damage
27

Figure 3.22. Pre/Post Imagery of Talcahuano (36.739° S, 73.094° W)
Tsunami
Damage
28

Figure 3.23. Pre/Post Imagery of Talcahuano (36.734° S, 73.079° W)
Tsunami
Run-up &
Scour
29
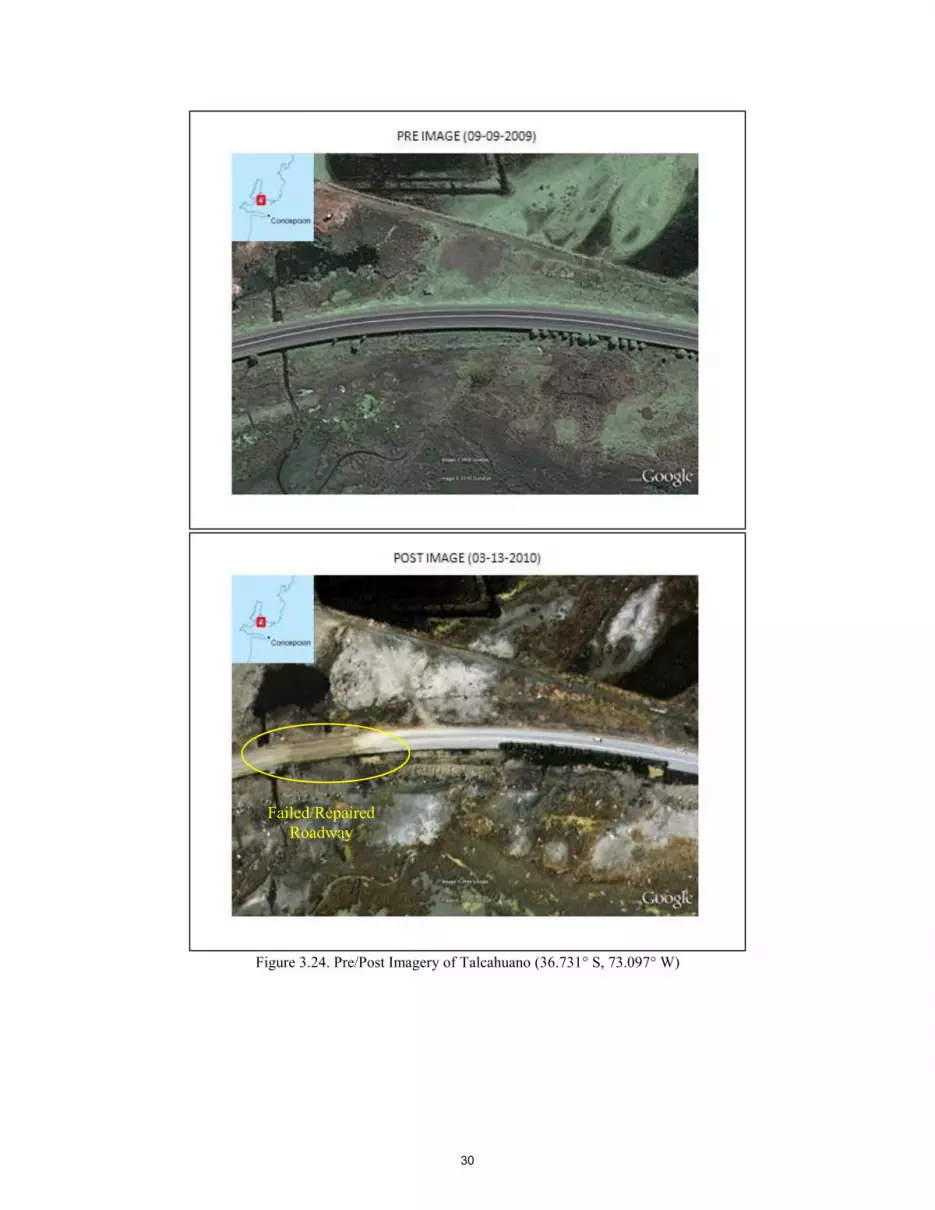
Figure 3.24. Pre/Post Imagery of Talcahuano (36.731° S, 73.097° W)
Failed/Repaired
Roadway
30

Figure 3.25. Pre/Post Imagery of Concepcion (36.815° S, 73.066° W)
Failed
Highway
Embankment
31

Figure 3.26. Pre/Post Imagery of Concepcion (36.819° S, 73.066° W)
Failed Highway
Bridge
32

Figure 3.27. Pre/Post Imagery of Concepcion (36.828° S, 73.062° W)
Collapsed
Building
33

Figure 3.28. Pre/Post Imagery of Constitucion (35.326° S, 72.409° W)
Tsunami
Damage
34

Figure 3.29. Pre/Post Imagery of Constitucion (35.337° S, 72.403° W)
Tsunami
Damage
35

4.0 REGIONAL GEOLOGIC SETTING AND TECTONIC DEFORMATION Tectonic deformation caused by the Mw 8.8 Maule earthquake influenced the pattern and amount of geotechnical damage, structural damage, and loss of life. The observed pattern deformation along the coast and inland is consistent with regional fault deformation models for the Nazca-South America Plate interface. The tectonic deformation from the February 27 Chile earthquake and its effects on the built environment provide useful information from which to evaluate possible patterns of deformation and damage from a large earthquake along the Cascadia subduction zone in the Pacific Northwest of North America. One of the most noticeable aspects of this earthquake is the vast distance over which ground shaking, surface deformation, and consequent damage occurred. Ground-surface effects of this earthquake occurred over a north-south length of more than 600 km (375 mi), including damage to port facilities in Valparaiso on the north, to coastal uplift observed as far south as Tirua. By comparison with the Cascadia subduction zone in the northwestern United States, this is roughly equivalent to the entire coastline for the states of Washington and Oregon. Long-term tectonic subsidence in the Central Valley of Chile has resulted in a north-south structural basin containing young sediments that probably influence strong ground motions; the long-term development of the Central Valley probably reflects the cumulative effects of multiple episodes of earthquake-related subsidence similar to that from the February 27 earthquake. The purpose of the geologic reconnaissance of areas affected by the Chile earthquake was to document the pattern and amount of tectonic deformation, and provide a basis for understanding patterns of structural damage related to strong ground shaking, liquefaction, landsliding, and tsunami waves. A reconnaissance evaluation of possible surface-fault rupture following a large aftershock on March 11 also provides information on possible tectonic deformation from related non-subduction earthquakes. Field efforts included several aerial reconnaissance flights, and visits to many sites within the extensive area affected by this earthquake. The aerial reconnaissance program included two high-altitude flights with the Chilean Air Force Aerial Photogrammetric Survey (SAF), during SAF’s photo-documentation of damaged regions. These flights occurred on Sunday March 3 (from Constitución south to Arauco) and Wednesday March 10 (from San Antonio to Concepción and Isla Santa María). A low-altitude flight was conducted on March 9 with a privately operated, low-wing Cessna aircraft, and included observations along the coast from Curanipe south to the latitude of Cañete (including reconnaissance over Isla Santa María), along the Andean foothills from Curicó to Digua, and several traverses across the Central Valley and the Coast Ranges between the latitudes of Curicó and Lebu. A fourth flight was completed on March 12 with a high-wing Cessna 172, and included observations and in the area between Pichilemu, Navidad, and Litueche. Collectively, these flights covered the coastline of central Chile with a linear distance of approximately 460 km, within the central part of the earthquake rupture area. Ground reconnaissance was conducted between March 3 and 18 in several traverses that included coastal observations, as well as site visits in the coastal mountains and the central valley. Coastal field reconnaissance covered approximately 380 km of the central Chilean coastline between Lebu and Pichilemu, and focused on collecting information on the amount of vertical deformation (uplift versus subsidence) produced by the earthquake. 4.1 Regional Tectonic and Geologic Setting South-central Chile is one of the most seismically active areas on Earth (Lomnitz, 2004), largely because it overlies the plate boundary between the Nazca and South America tectonic plates (Figure 4.1). Along the Chile plate margin, the oceanic Nazca plate is subbducting beneath the South American continent at a rate of about 66 to 68 mm/yr (Ruegg et al., 2009; Melnick et al., 2009). For comparison, this rate of convergence is substantially greater than the rate along the Cascadia subduction zone in the Pacific Northwest of North America (about 36 mm/yr; Atwater et al., 2005), which is reflected by more frequent large to great earthquakes within the historical record along the Chile margin. In the area of the February 27, 2010 Chile earthquake, the plate convergence is slightly oblique, and has a secondary component of dextral slip. The plate margin also is associated with a primary dextral slip fault zone, the Liquiñe-Ofquí
36
fault zone (LOFZ), which is located near the western margin of the high-altitude Andean foreland mountain range (Figure 4.1) and has a long-term geologic slip rate of about 13 mm/yr (Melnick et al., 2009). Of particular interest to the occurrence and effects of the recent earthquake along the south-central Chile margin is a simplification of the regional tectonic processes provided by Atwater et al. (2005) (Figure 4.2). As described by Atwater et al. (2005), the process of plate subduction involves the descent of the oceanic plate (in this case, the Nazca plate, west of the coastline) beneath the South American continent, in a “stick-slip” fashion. Between large-magnitude earthquakes, these plates are coupled at relatively shallow depths, and as convergence continues the continental plate undergoes contraction and aseismic tectonic subsidence, while onshore areas undergo tectonic uplift (Figure 4.2). As described on Figure 4.2, coseismic energy release during a large earthquake often results in sudden uplift of the edge of the continental plate, production of tsunami, and subsidence in the area inboard from the trench. This model has been developed based on geologic, seismologic, and geophysical observations before and after several historical earthquakes, and provides a framework for understanding surface deformation and tsunami effects observed after the recent earthquake. In particular, an important physical feature that can be identified following a large subduction zone earthquake is termed the “hingeline”, or the line that separates areas of coseismic uplift and subsidence. This line of no net permanent land-level change can be identified via geologic observation (e.g., Plafker and Savage, 1970), Global Positioning Satellite (GPS) measurements, InSAR data, and/or seismologic models. As applied to geotechnical engineering along coastlines, the hingeline delineates areas that can experience substantially different processes immediately following the coseismic deformation (e.g., submergence or emergence); in non-coastal areas of deformation, differences in geotechnical effects on either side of the hingeline may be subtle (e.g., minor changes in slope gradients, differences in ground motion parameters in areas of long-term subsidence and sediment accumulation). In south-central Chile, the overall geologic setting is largely controlled by the long-term, repeated occurrence of aseismic uplift of the continent, punctuated by sudden, coseismic coastal uplift and inland subsidence. These processes affect the geologic characteristics of onshore regions, and thus affect the geotechnical responses to strong ground motion and permanent ground deformation. South-central Chile consists of four primary geologic domains (Melnick et al., 2009): (1) the Coastal Platform, consisting of Cenozoic marine deposits and terraces, (2) the Coastal ranges, consisting of Permo-Triassic metamorphic rocks and older granitic rocks, (3) the Central Depression, including Cenozoic volcanic rocks overlain by semi-consolidated and unconsolidated alluvial sediments in the central valley, and (4) the Main Cordillera (Patagonian Andes), consisting of Mesozoic and Cenozoic volcanic rocks. These rock types and sedimentary basins influence the pattern of site-specific strong ground motions, and thus affect geotechnical responses to earthquake shaking. As a rough generalization, the Coastal Platform is underlain by variable materials that are comparable (at a first approximation) with NEHRP soil classes ranging from type B to C to D; the Coast ranges probably are underlain by NEHRP soil classes B and BC; the Central valley is underlain by classes C and D; and the Patagonian Andes are underlain mostly by classes B and perhaps BC. These relationships suggest that the Central valley, which is an area of long-term sediment accumulation, likely experiences substantial amplification of strong ground motions with respect to the adjacent areas (see Section 5, below). As more data from this earthquake are processed, it will be of interest to compare the geotechnical responses amongst the primary geologic domains.
37

Figure 4.1. (from Melnick et al., 2009) A: Major seismotectonic features along the Chilean
coastline of South America, including rupture segments of large historical earthquakes; LOFZ: Liquiñe-Ofquí fault zone; B: Major Quaternary faults within south-central Chile, seismotectonic segments, rupture zones of large historical earthquakes, and main tectonic features of the south-
central Andean convergent margin.
38

Figure 4.2. (after Atwater et al., 2005) Schematic illustration of (left) typical subduction zone; (middle) surface deformation during aseismic intervals; and (right) surface deformation during coseismic rupture, and schematic location of the “hingeline”, or line separating the areas of net
uplift and net subsidence.
4.2 Earthquake Surface Deformation 4.2.1 Previous Historical Observations The historical record of large earthquakes in central Chile extends back approximately 500 years, as summarized recently by Barrientos (1987), Cisternas et al. (2005) and Melnick et al. (2009). These workers use the historical record to delineate three rupture segments in the region, including the Valparaiso segment (which ruptured most recently in 1985), the Concepción segment (which ruptured in 1835), and the Valdivia segment (which ruptured in 1960). All of these earthquakes produced substantial vertical deformation of the coastal and inland valley regions. Coseismic uplift during the 1835 earthquake, as measured from uplifted tidal organisms by Darwin and FitzRoy (Darwin, 1851), included a maximum uplift of 3.0 m at Isla Santa María, 2.4 m at Isla Quiriquina in the Bay of Concepción, 1.8 m at Tubul, 1.5 m at the harbor of Talcahuano, and 0.6 m at Isla Mocha. This pattern of uplift is distinctly different from that produced by the 1960 M9.5 Valdivia earthquake and its primary foreshock, as reported by Plafker and Savage (1970) and Nelson and Manley (1992). Uplift in 1960 occurred only at the northern end of the Valdivia rupture; the town of Lebu was uplifted approximately 1.3 m, and both the town of Tirua and Isla Mocha uplifted about 1 m. Observations of little or no uplift in Arauco and Lota from this earthquake (Plafker and Savage, 1970) would be consistent with northeastward tilting of the nearshore and coastal areas at the northern end of the 1960 surface-deformation field. The majority of vertical surface deformation from the 1960 earthquake was net subsidence of the coastline south of Tirua. Tectonic subsidence of the region east of the coastline in 1960 was as much as 2 m, based on pre- and post-earthquake surveys (Plafker and Savage, 1970). The pattern of surface deformation produced by the 2010 earthquake will likely be known with excellent resolution as a result of spatially extensive and precise GPS and InSAR technological advancements. Collectively, the 1835, 1960, 1985, and 2010 earthquake will provide an assessment of surface deformation during the most-recent earthquake cycle over a distance of about 1500 km along the Chilean coast.
4.2.2 Surface Deformation Models
39

Seismological and GPS data also have provided preliminary models of expected surface deformation, which were available at the time of this initial field reconnaissance and helped guide field traverses (http://tectonics.caltech.edu/slip_history/2010_chile/prelim-gps.html; http://earthquake.usgs.gov/earthquakes/eqinthenews/2010/us2010tfan/finite_fault.php). The model of regional surface deformation used to guide field reconnaissance used initial fault slip estimates from the U.S. Geological Survey, which is based on seismological data (Figure 4.3, left panel). Preliminary fault dislocation model by K. Wang (personal comm.., 2010) predicts both horizontal and vertical coseismic displacements (Figure 4.3, right panel). Wang’s model suggests that the coastline adjacent to the rupture plane could have a variable pattern of uplift and subsidence, as a result of different amounts of slip along the fault rupture plane. The level of detail available from this model far exceeds the accuracy of measurements of vertical deformation produced by past ruptures, but will be refined by InSAR and GPS data sets from the 2010 earthquake. Notably, the surface deformation model shown in Figure 4.3 depicts a sinuous hingeline that crosses the coastline in the central part of the rupture area. Overall, this model predicts a maximum of about 2 m of vertical uplift of the coast adjacent to the initial epicenter, near the town of Cobquecura, and from about 1 to 2 m of uplift of the coast between the towns of Tirua and Constitución. The model predicts as much as 1 m of subsidence between Constitución and Bucalemu, and minor uplift near Pichilemu. In addition, the model predicts as much as1 m of subsidence in the entire Central Valley, from Santiago on the north to Los Angeles on the south (Figure 4.3, right panel).
Figure 4.3. Left: fault slip (color in m) model by Gavin Hayes (USGS) inverted from seismic data. Right: coseismic vertical deformation (color in m) and horizontal displacements (arrows)
predicted by a uniform half-space dislocation model (personal communication, K. Wang, March 2010).
4.2.3 GEER Team Coastal Field Observations Field observations were made along the coastline in the central part of earthquake rupture zone, primarily between the towns of Lebu in the south and Pichilemu in the north (Figure 4.4). The objective of this
40
reconnaissance was to compare field observations with preliminary geophysical models of earthquake surface deformation that predicted regions of coastal uplift and subsidence along the length of the rupture area (e.g., Figure 4.3). The field effort included interviews of local residents, fishermen and public officials to gather anecdotal accounts of changes in sea level, noticeable shifts in the shoreline and erosion that may reflect earthquake-related vertical deformation. At selected coastal sites, the amount of uplift or subsidence was estimated from the upper growth limits of marine intertidal organisms, such as algae, mussels, and barnacles, whose growth is strongly influenced by tidal variation. Measurements of estimated uplift based on these features have uncertainties of ± 0.5 m, but nevertheless define broad spatial variations in the magnitude of vertical deformation along the coast.
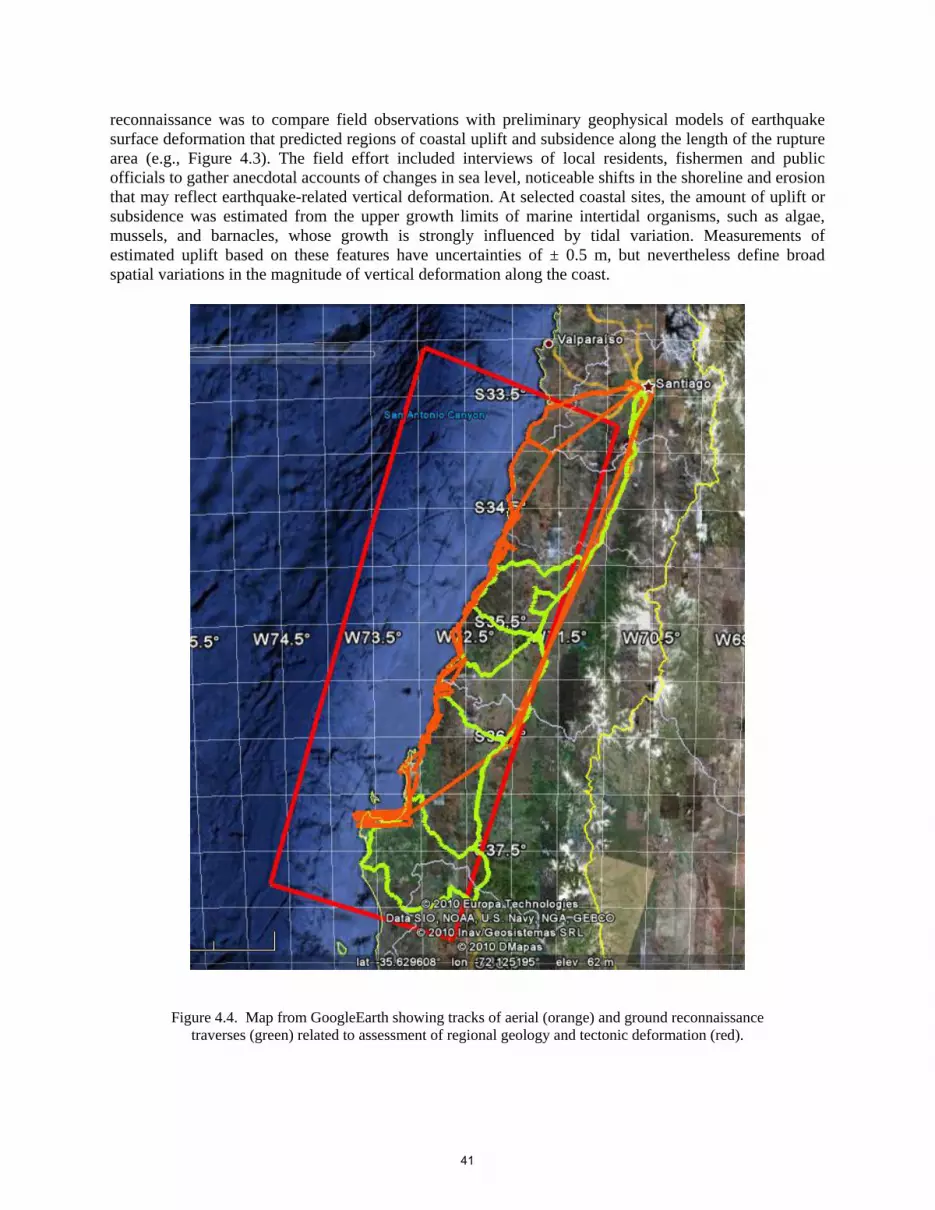
Figure 4.4. Map from GoogleEarth showing tracks of aerial (orange) and ground reconnaissance
traverses (green) related to assessment of regional geology and tectonic deformation (red).
41

4.2.4 Araco Peninsula and Lebu Aerial reconnaissance on March 9 included observation of the Arauco Peninsula and the town of Lebu on the southwestern side of the peninsula, and demonstrated the presence of uplifted (formerly active) wave-cut bedrock platforms (Figure 4.5). From the air, these platforms appear white where covered by bleached intertidal marine organisms, and brown where covered by kelp. It is notable that kelp debris on these platforms was preserved, rather than being removed by tsunami waves. A lighthouse northwest of the Lebu Harbor inlet is on an island that was uplifted enough to nearly form a peninsula (Figure 4.6); the lighthouse appeared to be undamaged by subsequent tsunami waves.
Figure 4.5. Oblique aerial photograph looking south along the western coastline of the Arauco Peninsula, showing uplifted (formerly) modern wave-cut platform and exposed tidal zone.
(S37.540303° W73.623628°; 1701 hrs on 03/09/2010).
42
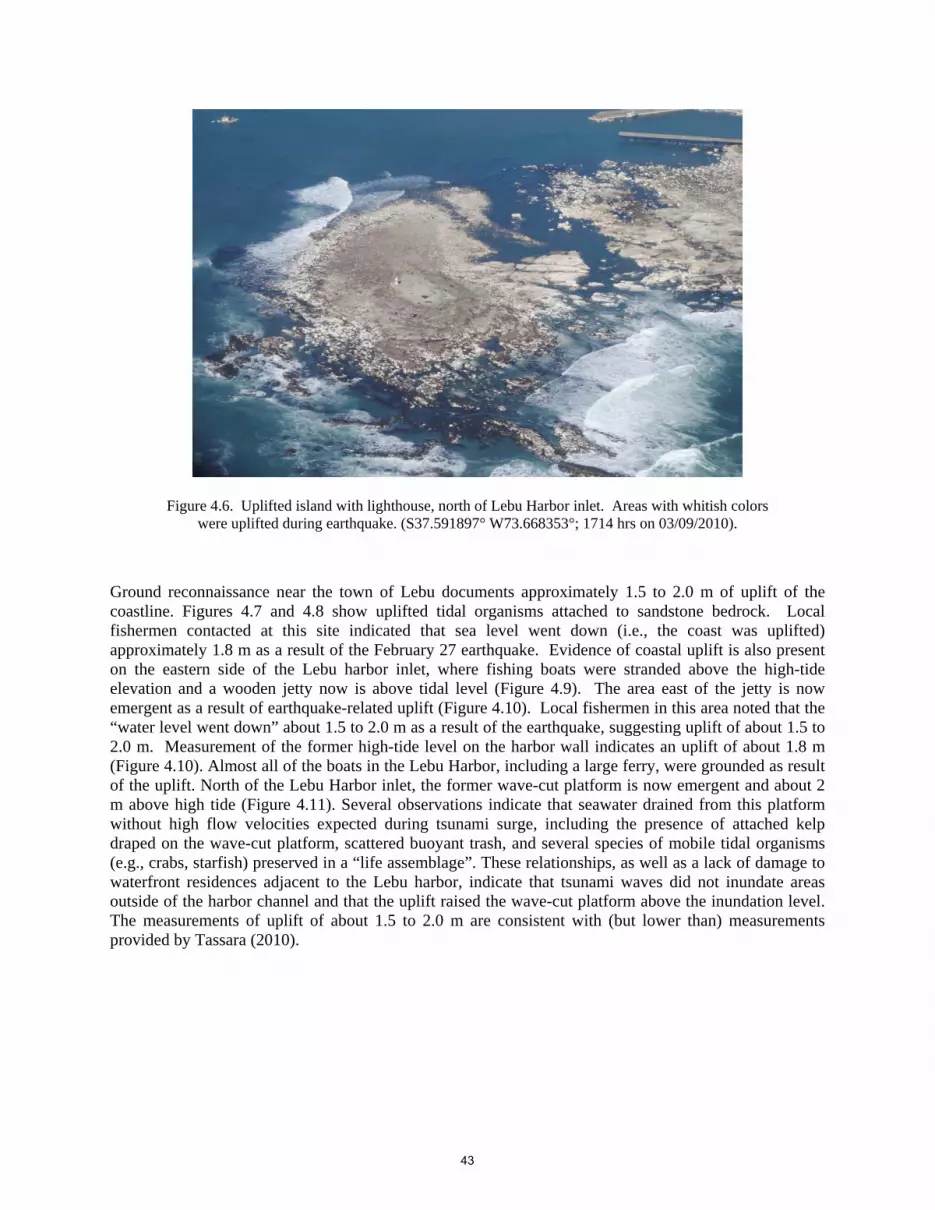
Figure 4.6. Uplifted island with lighthouse, north of Lebu Harbor inlet. Areas with whitish colors were uplifted during earthquake. (S37.591897° W73.668353°; 1714 hrs on 03/09/2010).
Ground reconnaissance near the town of Lebu documents approximately 1.5 to 2.0 m of uplift of the coastline. Figures 4.7 and 4.8 show uplifted tidal organisms attached to sandstone bedrock. Local fishermen contacted at this site indicated that sea level went down (i.e., the coast was uplifted) approximately 1.8 m as a result of the February 27 earthquake. Evidence of coastal uplift is also present on the eastern side of the Lebu harbor inlet, where fishing boats were stranded above the high-tide elevation and a wooden jetty now is above tidal level (Figure 4.9). The area east of the jetty is now emergent as a result of earthquake-related uplift (Figure 4.10). Local fishermen in this area noted that the “water level went down” about 1.5 to 2.0 m as a result of the earthquake, suggesting uplift of about 1.5 to 2.0 m. Measurement of the former high-tide level on the harbor wall indicates an uplift of about 1.8 m (Figure 4.10). Almost all of the boats in the Lebu Harbor, including a large ferry, were grounded as result of the uplift. North of the Lebu Harbor inlet, the former wave-cut platform is now emergent and about 2 m above high tide (Figure 4.11). Several observations indicate that seawater drained from this platform without high flow velocities expected during tsunami surge, including the presence of attached kelp draped on the wave-cut platform, scattered buoyant trash, and several species of mobile tidal organisms (e.g., crabs, starfish) preserved in a “life assemblage”. These relationships, as well as a lack of damage to waterfront residences adjacent to the Lebu harbor, indicate that tsunami waves did not inundate areas outside of the harbor channel and that the uplift raised the wave-cut platform above the inundation level. The measurements of uplift of about 1.5 to 2.0 m are consistent with (but lower than) measurements provided by Tassara (2010).
43
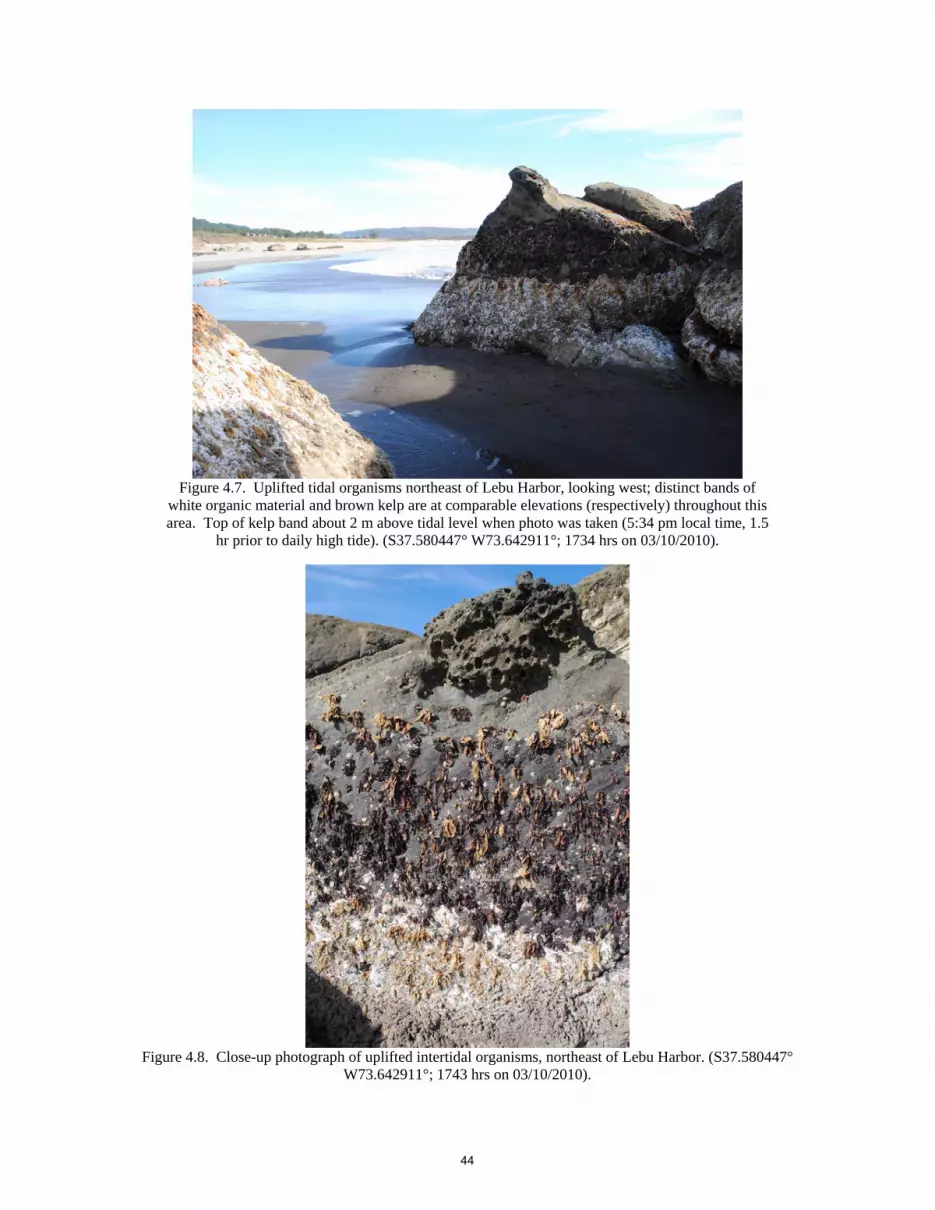
Figure 4.7. Uplifted tidal organisms northeast of Lebu Harbor, looking west; distinct bands of
white organic material and brown kelp are at comparable elevations (respectively) throughout this area. Top of kelp band about 2 m above tidal level when photo was taken (5:34 pm local time, 1.5
hr prior to daily high tide). (S37.580447° W73.642911°; 1734 hrs on 03/10/2010).
Figure 4.8. Close-up photograph of uplifted intertidal organisms, northeast of Lebu Harbor. (S37.580447°
W73.642911°; 1743 hrs on 03/10/2010).
44

Figure 4.9. Eastern margin of Lebu Harbor, with stranded fishing boat and emergent wooden jetty; area to right was former tidal flat adjacent to harbor channel. Present high tide water level to left of boats. (S37.600789° W73.656317°; 1800 hrs on 03/10/2010).
Figure 4.10. Fishing boats in Lebu harbor, stranded along uplifted western margin of harbor
channel. Former high tide mark on harbor quay wall was indicated by local fishermen; measurement from high tide level on March 10 indicates uplift of 1.8 m + 0.2 m of the harbor
quay wall. (S37.603694° W73.654372°; 1832 hrs on 03/10/2010).
45
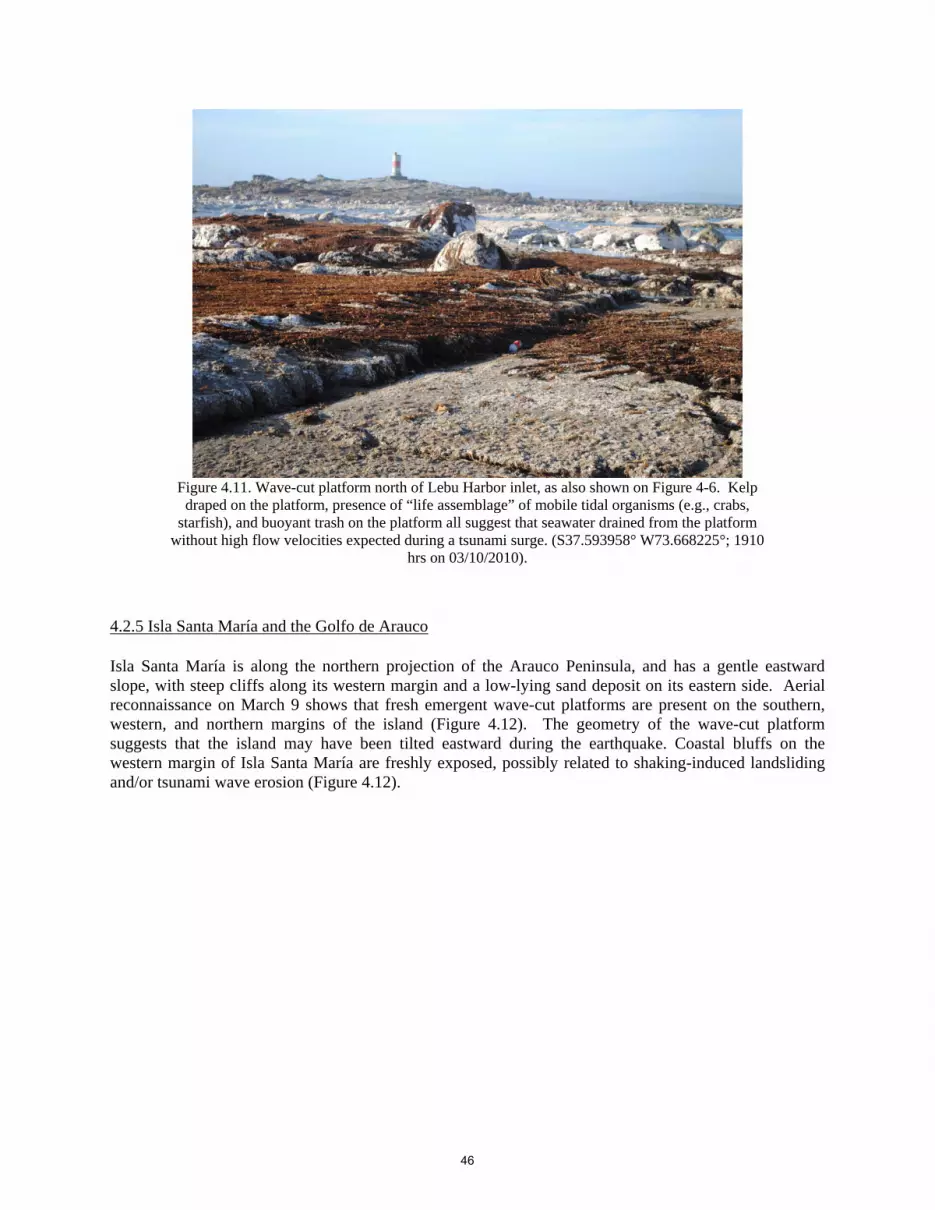
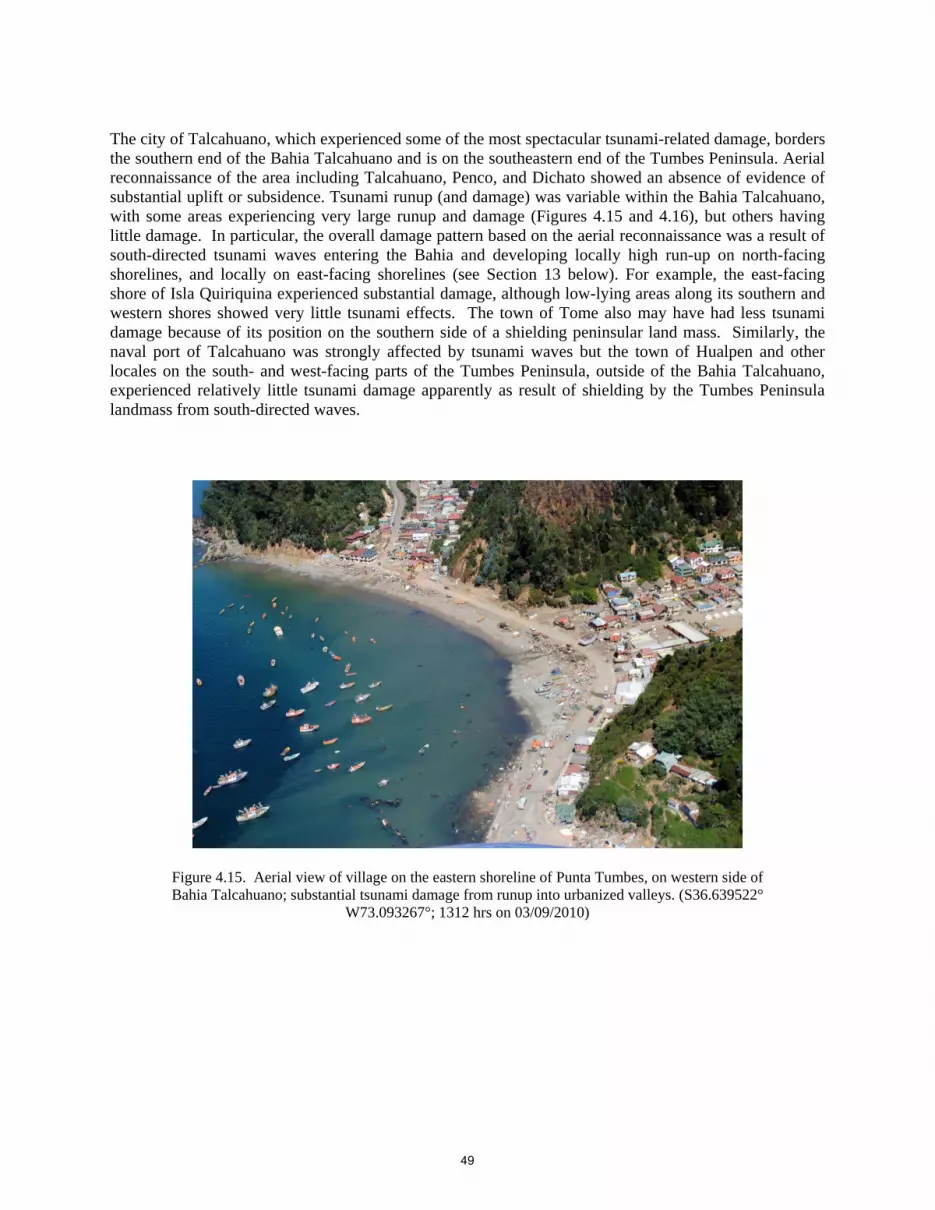
Figure 4.11. Wave-cut platform north of Lebu Harbor inlet, as also shown on Figure 4-6. Kelp
draped on the platform, presence of “life assemblage” of mobile tidal organisms (e.g., crabs, starfish), and buoyant trash on the platform all suggest that seawater drained from the platform
without high flow velocities expected during a tsunami surge. (S37.593958° W73.668225°; 1910 hrs on 03/10/2010).
4.2.5 Isla Santa María and the Golfo de Arauco Isla Santa María is along the northern projection of the Arauco Peninsula, and has a gentle eastward slope, with steep cliffs along its western margin and a low-lying sand deposit on its eastern side. Aerial reconnaissance on March 9 shows that fresh emergent wave-cut platforms are present on the southern, western, and northern margins of the island (Figure 4.12). The geometry of the wave-cut platform suggests that the island may have been tilted eastward during the earthquake. Coastal bluffs on the western margin of Isla Santa María are freshly exposed, possibly related to shaking-induced landsliding and/or tsunami wave erosion (Figure 4.12).
46

Figure 4.12. Northern end of Isla Santa Maria, looking south toward wave-cut platforms on uplifted coastline and islands. (S37.593958° W73.668225°; 1910 hrs on 03/9/2010).
The coastline of Golfo de Arauco exhibits evidence of considerably less uplift than along the western side of the Arauco Peninsula. The town of Arauco lies at an elevation of about 10 m, about 500 m south of the north-facing coastline, and was not affected by tsunami inundation. On the eastern shore of the Golfo de Arauco, the similarly low-lying village of Laraquete experienced tsunami damage only along houses fronting the beach. Field observations and local anecdotal evidence indicates that active tidal channel in Laraquete was uplifted such that the channel floor is now exposed and small boats were stranded (Figure 4.13). This uplift was estimated by locals to be about 0.5 m, which is consistent with the evidence that the tsunami wave progressed upstream up the tidal channel without damage to residences on the channel banks. Similarly, at Playa Blanca in the town of Lota on the eastern shore of the Golfo de Arauco, raised mussel colonies inhabiting rocky intertidal habitats suggest uplift of about 0.9 m, and a local witness indicated that the shoreline shifted westward by 15 to 25 m (as a result of uplift). These results are consistent with observations by Tassara (2010). The difference in amounts of uplift between Lota and Isla Santa María may reflect a gentle eastward tilting from the earthquake, or simply variability in uplift within the deformed region. The coastline from Lota northward to the towns of Coronel, San Pedro de La Paz, and Hualpen, and to the mouth of Rio Bio Bio (a reach of approximately 25 km) experienced relatively little uplift, on the basis of our observations during aerial reconnaissance. Along this reach, low-lying shore-parallel beach dunes remained relatively intact, nearby residences and engineered structures appeared to show no substantial damage, tsunami runup appeared to be relatively limited. The relatively small amount of tsunami damage in this area contrasts with the substantial damage from tsunami on the northern side of the city of Concepción and in Golfo de Talcahuano (see below).
47

Figure 4.13. Ground view looking north in village of Laraquete, from the highway bridge toward the estuary outlet. Fishing boats stranded on left bank; tsunami high water mark approximately at the bank crest. Light, wooden-frame residences on both banks were unaffected by tsunami waves confined within existing tidal channel. Local witness indicated that the sea level went down about 0.5 m after the earthquake, and that the estuary bottom had not been exposed before (i.e., uplift of
about 0.5 m). (S37.166661° W73.184481°; 1238 hrs on 03/10/2010)
Figure 4.14. Raised mussel colonies inhabiting rocky intertidal habitats at Playa Blanca in Lota suggest the earthquake uplifted this area by about 0.9 m. A local witness attests to uplift at this site saying the shoreline has shifted westward by 15 to 25 m. (S37.058390° W73.142323°; 1701
hrs on 03/16/2010). 4.2.6 Concepción, Talcahuano, and Dichato
48
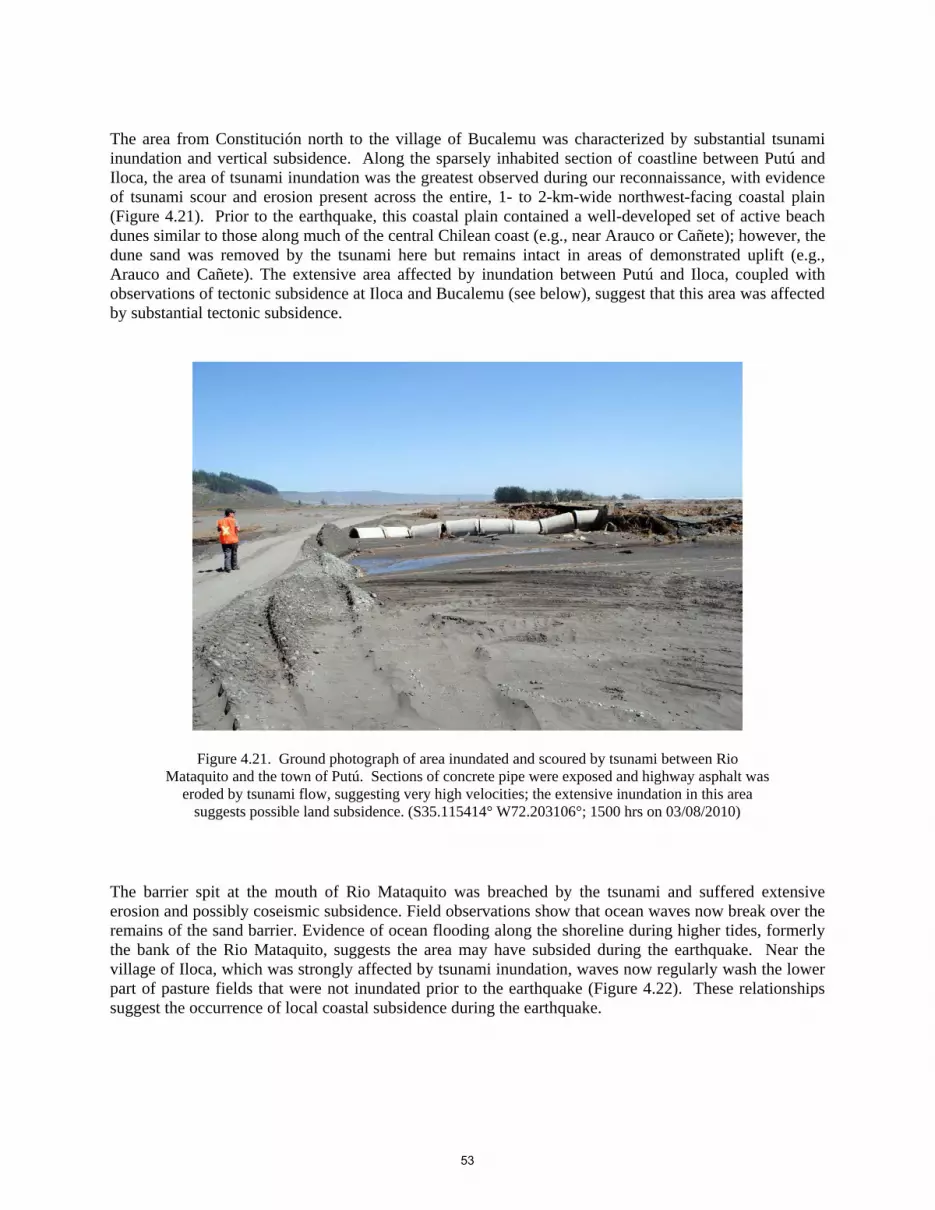
The city of Talcahuano, which experienced some of the most spectacular tsunami-related damage, borders the southern end of the Bahia Talcahuano and is on the southeastern end of the Tumbes Peninsula. Aerial reconnaissance of the area including Talcahuano, Penco, and Dichato showed an absence of evidence of substantial uplift or subsidence. Tsunami runup (and damage) was variable within the Bahia Talcahuano, with some areas experiencing very large runup and damage (Figures 4.15 and 4.16), but others having little damage. In particular, the overall damage pattern based on the aerial reconnaissance was a result of south-directed tsunami waves entering the Bahia and developing locally high run-up on north-facing shorelines, and locally on east-facing shorelines (see Section 13 below). For example, the east-facing shore of Isla Quiriquina experienced substantial damage, although low-lying areas along its southern and western shores showed very little tsunami effects. The town of Tome also may have had less tsunami damage because of its position on the southern side of a shielding peninsular land mass. Similarly, the naval port of Talcahuano was strongly affected by tsunami waves but the town of Hualpen and other locales on the south- and west-facing parts of the Tumbes Peninsula, outside of the Bahia Talcahuano, experienced relatively little tsunami damage apparently as result of shielding by the Tumbes Peninsula landmass from south-directed waves.
Figure 4.15. Aerial view of village on the eastern shoreline of Punta Tumbes, on western side of Bahia Talcahuano; substantial tsunami damage from runup into urbanized valleys. (S36.639522°
W73.093267°; 1312 hrs on 03/09/2010)
49

Figure 4.16. Aerial view looking west of town of Dichato, showing tsunami damage focused on north-facing shoreline in Bahia Talcahuano. (S36.548022° W72.922225°; 1301 hrs on
03/09/2010) 4.2.7 Dichato to Constitución
North along the coastline from Dichato, aerial reconnaissance indicates substantial tsunami runup in this sparsely populated area (Figures 4.17, 4.18, and 4.19). North of Curanipe, field observations suggest substantial uplift. Near the town of Pelluhue, measurement of the upper growth limit of tidal marine organisms (adjusted for hourly tidal changes) suggests the earthquake raised the shoreline by 2.0 ± 0.5 m. Local fishermen interviewed in Pelluhue corroborate that the earthquake caused the shoreline to move west and sea level to drop by about 2 m (Figure 4.20). Similarly, rocky intertidal areas exposed just after low tide at Los Pellines appear to be uplifted about 1.6 m based on upper growth limits of mussels and algae (also adjusted for local tidal level). Therefore, in the epicentral area surrounding Cobquecura, the initial reconnaissance observations suggest that the coastline may have been uplifted about 2 m, but nevertheless was inundated locally by substantial tsunami waves.
50

Figure 4.17. Aerial view looking north at village of Vegas de Itata, showing substantial tsunami damage. No evidence was observed of substantial uplift of this area. (S36.429192° W72.871433°;
1255 hrs on 03/09/2010)
Figure 4.18. Aerial view looking southwest of shoreline at latitude of town of Cobquecura, near the Feb 27 epicenter. The tsunami extended up the tributary valley but apparently did not produce damage of residential structures close to the west-facing shore. (S36.172950° W72.808775°; 1242
hrs on 03/09/2010)
51

Figure 4.19. Aerial view looking south at village of Curanipe, including evidence of tsunami damage (i.e., red truck beneath bridge). Field observations of wave-cut platforms in this area
indicate earthquake-related uplift of approximately 2 m. (S35.843297° W72.631214°; 1225 hrs on 03/09/2010)
Figure 4.20. Intertidal mussels and algae exposed on rocky reefs south of Pelluhue suggest as much as 2.0 m of uplift. (S35.821915° W72.602106°, 1706 hrs on 03/17/2010).
4.2.8 Constitución to Bucalemu
52
The area from Constitución north to the village of Bucalemu was characterized by substantial tsunami inundation and vertical subsidence. Along the sparsely inhabited section of coastline between Putú and Iloca, the area of tsunami inundation was the greatest observed during our reconnaissance, with evidence of tsunami scour and erosion present across the entire, 1- to 2-km-wide northwest-facing coastal plain (Figure 4.21). Prior to the earthquake, this coastal plain contained a well-developed set of active beach dunes similar to those along much of the central Chilean coast (e.g., near Arauco or Cañete); however, the dune sand was removed by the tsunami here but remains intact in areas of demonstrated uplift (e.g., Arauco and Cañete). The extensive area affected by inundation between Putú and Iloca, coupled with observations of tectonic subsidence at Iloca and Bucalemu (see below), suggest that this area was affected by substantial tectonic subsidence.
Figure 4.21. Ground photograph of area inundated and scoured by tsunami between Rio Mataquito and the town of Putú. Sections of concrete pipe were exposed and highway asphalt was
eroded by tsunami flow, suggesting very high velocities; the extensive inundation in this area suggests possible land subsidence. (S35.115414° W72.203106°; 1500 hrs on 03/08/2010)
The barrier spit at the mouth of Rio Mataquito was breached by the tsunami and suffered extensive erosion and possibly coseismic subsidence. Field observations show that ocean waves now break over the remains of the sand barrier. Evidence of ocean flooding along the shoreline during higher tides, formerly the bank of the Rio Mataquito, suggests the area may have subsided during the earthquake. Near the village of Iloca, which was strongly affected by tsunami inundation, waves now regularly wash the lower part of pasture fields that were not inundated prior to the earthquake (Figure 4.22). These relationships suggest the occurrence of local coastal subsidence during the earthquake.
53

Figure 4.22. Ground photograph looking south from near Iloca, along the present coastline. Inundated grassy area in middle ground suggests substantial subsidence to as far north as the town of Iloca. The amount of subsidence at this location was not determined. (S34.982047° W72.181792°; 1354 hrs on
03/08/2010) Evidence for coseismic subsidence at Bucalemu includes a dramatic eastward (landward) shift in the shoreline, extensive erosion of the beach, and a previously protected lagoon that is now inundated by ocean waves. Pre-earthquake images of Bucalemu show a 25-m-wide sandy beach that is now submerged (Figures 4.23 and 4.24). Field observation suggests that the present shoreline is located about 150 m east of the pre-earthquake shoreline (Figure 4.25). These changes may be related to both tsunami scour and tectonic subsidence. The field observations favor the interpretation that the beach at Bucalemu was lowered about 0.5 m during the earthquake.
54

Figure 4.23. Photograph from Panoramio website. View of Playa Bucalemu in 2007, showing the bridge and statue visible in post-earthquake photographs. Photo available at:
http://www.panoramio.com/photo/3369082. Before the 2010 earthquake, the bridge at Bucalemu was located ~25 m east of the shoreline.
Figure 4.24. Erosion by tsunami waves and, possibly, an undetermined amount of coseismic subsidence has shifted the shoreline approximately 150 m eastward into an area formerly occupied
by a shallow lagoon. (S34.641883° W72.042919°, 1012 hrs on 03/15/2010).
55
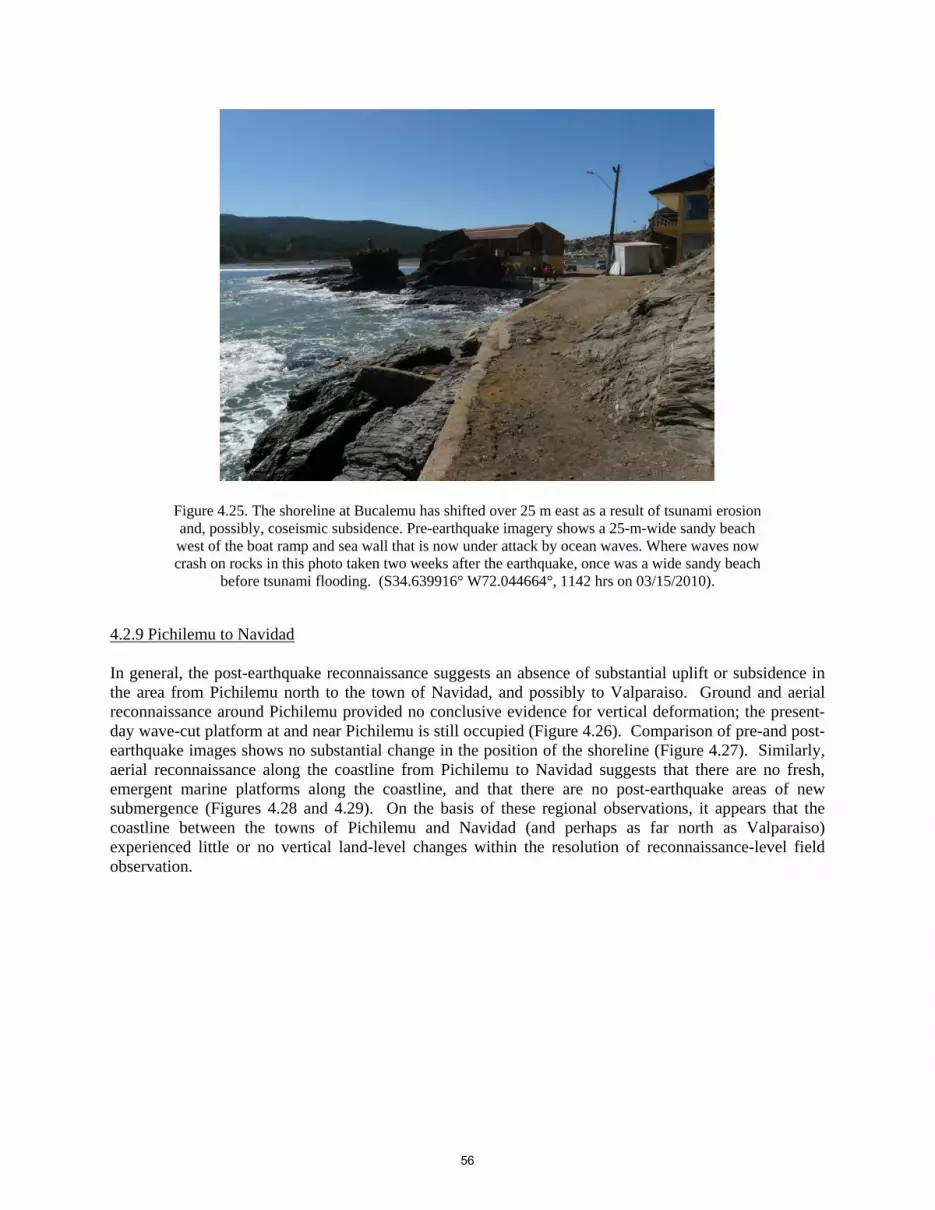
Figure 4.25. The shoreline at Bucalemu has shifted over 25 m east as a result of tsunami erosion and, possibly, coseismic subsidence. Pre-earthquake imagery shows a 25-m-wide sandy beach west of the boat ramp and sea wall that is now under attack by ocean waves. Where waves now crash on rocks in this photo taken two weeks after the earthquake, once was a wide sandy beach
before tsunami flooding. (S34.639916° W72.044664°, 1142 hrs on 03/15/2010).
4.2.9 Pichilemu to Navidad In general, the post-earthquake reconnaissance suggests an absence of substantial uplift or subsidence in the area from Pichilemu north to the town of Navidad, and possibly to Valparaiso. Ground and aerial reconnaissance around Pichilemu provided no conclusive evidence for vertical deformation; the present-day wave-cut platform at and near Pichilemu is still occupied (Figure 4.26). Comparison of pre-and post-earthquake images shows no substantial change in the position of the shoreline (Figure 4.27). Similarly, aerial reconnaissance along the coastline from Pichilemu to Navidad suggests that there are no fresh, emergent marine platforms along the coastline, and that there are no post-earthquake areas of new submergence (Figures 4.28 and 4.29). On the basis of these regional observations, it appears that the coastline between the towns of Pichilemu and Navidad (and perhaps as far north as Valparaiso) experienced little or no vertical land-level changes within the resolution of reconnaissance-level field observation.
56

Figure 4.26. Aerial view looking northwest of shoreline in town of Pichilemu, showing bedrock underlying low-elevation marine terrace. The town of Pichilemu sustained local tsunami damage at elevations lower than this marine terrace or areas not protected by beach dunes. (S34.389619°
W72.016661°; 1552 hrs on 03/12/2010)
Figure 4.27. (A) Pre-earthquake satellite image of Pichilemu. (B) The same site after the February 27, 2010 earthquake shows no discernible evidence of changes in the shoreline that could be
attributed to tectonic vertical land-level change.
57

Figure 4.28. Aerial view looking southeast at shoreline on remote coastline between Pichilemu and Navidad, showing low-elevation marine terrace on far right, and thick marine deposits underlying high marine terrace in background. No evidence of earthquake-related uplift or
subsidence was observed in this area. (S34.233969° W71.992883°; 1457 hrs on 03/12/2010)
Figure 4.29. Aerial view looking east at shoreline at mouth of Rio Rapel near town of Navidad, showing low-elevation bedrock marine terrace in center, and thick marine deposits underlying
high marine terrace. No evidence of earthquake-related uplift or subsidence was observed in this area. (S34.898536° W71.844794°; 1511 hrs on 03/12/2010)
58

4.2.10 Summary of Tectonic Deformation The February 27 earthquake produced uplift and subsidence along the central Chile coastline and this pattern of deformation may have influenced the effects of tsunami on coastal communities. The Arauco Peninsula and Isla Santa María experienced substantial uplift, and may have been tilted eastward. The coastline from about Arauco north to about the latitude of the epicenter (near Cobquecura), or perhaps as far north as Curanipe, appears also to have experienced uplift. The apparently lesser amount of coastal uplift in this area may be related to distance eastward from the fault tip in the offshore trench, rather than north-south variations in deformation. Field geologic evidence suggests that the area north of Curanipe, from at least the town of Constitucion north to the village of Bucalemu may have experienced net subsidence during the earthquake. The area north of Pichilemu to Navidad appears to have experienced little or no change in elevation. Overall, the area characterized by tectonic subsidence (e.g., between Constitución and Bucalemu) experienced substantial tsunami damage. Areas characterized by substantial uplift (i.e., more than about 2 m) experienced comparatively lesser amounts of tsunami damage, with run-up commonly taking advantage of existing river channels rather than broad inundation of coastal lowlands. Substantial tsunami damage in areas of lesser coastal uplift (e.g., Dichato and Talcahuano) may be related to factors other than tectonic deformation (e.g., tsunami wave generation or dynamics).
4.3 Investigation of Possible Surface Fault Rupture from M6.9 Aftershock of March 11
On March 11 at 11:39 am (local time), a large aftershock beneath the Coast Ranges, in the area between the towns of Pichilemu and Litueche. The USGS assigned a magnitude M6.9 to this rupture, which has an epicenter is approximately 120 km northeast of the mainshock. The depth of the event is given by the USGS at 11 km, although this depth was set by the location program and has not been calculated (http://earthquake.usgs.gov/earthquakes/eqinthenews/2010/us2010tsa6/). Focal mechanism solutions provided on the USGS website (http://earthquake.usgs.gov/earthquakes/eqinthenews/2010/us2010tsa6/#scitech) indicate normal-fault displacement along moderately dipping, northeast- or northwest-striking fault planes. These parameters raise the possibility that the earthquake could be associated surface-fault rupture on a relatively shallow crustal fault. The GEER team completed a limited field reconnaissance to address this possibility. At the time of the aftershock, several members of the GEER team were on a damaged bridge on Ruta 5 south of Chillan (about 275 km south of the epicenter). The shock was not strong or long-lasting, and the team resumed assessment of the bridge damage. Upon returning to the vehicle, we logged onto the USGS website and considered the possibility that this was a shallow crustal event, and developed a plan to address the possibility of surface rupture. In Santiago that night, the team reviewed Google Earth and noticed many geomorphic features that could be related to a shallow crustal fault reaching the ground surface, including several northwest-trending escarpments and linear features in the epicentral area, and a prominent escarpment near Estero Topocalma. The following morning (March 12), the team split into two sorties to assess possible surface rupture, with one group driving immediately to Pichilemu to make field observations along northwest-trending geomorphic features between Pichilemu and Litueche. A second team consisting arranged for a high-wing aerial reconnaissance flight, although cloudy weather on the coast that morning precluded an immediate departure from Santiago. This second team then left Santiago by car and followed the first team to the epicentral region and the town of Pichilemu, with the intent of flying from the Pichilemu “airstrip” when the weather was more favorable for aerial reconnaissance. The first team arrived in Pichilemu at about 11:00 am and conducted a field reconnaissance of the area including some of the northwest-trending
59
geomorphic features. Although this team observed several cracks along and across roadways and adjacent fields, none was judged consistent with normal faulting as suggested by the focal mechanism solution published on the USGS website. The second team approached the epicentral area from the north, driving from Embalse Rapel (Rapel Dam) through the town of Litueche. No ground cracks were encountered along the asphalt highway from Embalse Rapel to Litueche, and then to Pichilemu. The second team arrived in Pichilemu at about 2 pm and immediately boarded a high-wing Cessna 172 at the Pichilemu airstrip for a recon of the epicentral area and possible northwest-trending lineaments. The flight circled the area directly northwest of Pichilemu, which was interpreted to be a possible up-dip projection of a northeast-dipping normal fault plane from the epicentral area; no recent potentially fault-related features were observed in barren and cropped fields on the valley floors, as well as on high, grass-covered emergent marine terraces. The flight continued north along the coastline from Pichilemu to Navidad to assess sea cliff exposures and the along-strike projections of possible northwest-trending faults; the epicentral area was not accessible by airplane at that time because of low cloud cover and the irregular topography. No recent potentially fault-related features were observed along the coastal bluffs, or across a well-developed series of emergent marine terraces. Upon reaching the Rio Rapel near Navidad, the flight turned back southeastward in an attempt to pass over the epicentral area from the north. Again, low cloud cover precluded traversing the actual epicentral location; although the up-dip projection of a possible southwest-dipping normal fault plane was traversed in the hills between Navidad and Litueche. Again, no evidence of recent potentially fault-related features was observed in the alluviated valleys or on the wooded hillslopes. The recon also included a traverse along the Estero Topocalma near the village of Topocalma (about 32 km north of Pichilemu), focusing on viewing a prominent west-facing escarpment on the northern side of the estero. No evidence of surface rupture was observed on stabilized sand dunes and alluvial fans flanking this escarpment. The flight returned to the coastline for a second review of the coastal bluffs and emergent marine terrace sequence from Estero Topocalma south to Pichilemu, again finding no evidence of surface rupture from the previous day’s earthquake. Coupled with the field observations made by the field team near Pichilemu, no evidence of recent surface rupture was observed in the area between Pichilemu, Navidad, and Litueche. We acknowledge that neither the flight nor the ground reconnaissance traversed the actual epicentral area, which is remote and difficult to access. However, the ground and aerial traverses criss-crossed the area that would include reasonable up-dip projections of either northeast-dipping or southwest-dipping faults, as well as along-strike projections of such faults to both the northwest and the southeast. Lighting conditions during the aerial overflight were not ideal, and we did not canvass the entire epicentral area, but the amount of effort led to the conclusion that observations were adequate to indicate an absence of surface rupture related to the March 11 aftershock. In conclusion, this reconnaissance strongly suggests that there was no substantial surface rupture associated with the M6.9 aftershock.
4.4 Summary and Recommendations In summary, an important aspect of this earthquake is the pattern of coastal uplift and subsidence, which varied from north to south. At the southern end of the rupture zone, the Arauco Peninsula experienced uplift and gentle eastward tilting, as exemplified by approximately 2 m of coastal uplift on Isla Santa Maria and at the town of Lebu. The uplift affected harbor facilities, produced an emergent marine platform, and exposed the intertidal zone. In the central part of the rupture zone, coastal subsidence occurred over a distance of about 50 km between the towns of Constitucion and Bucalemu, resulting in drowned tidal flats and local areas of significant tsunami scour erosion. The coastline adjacent to the northern part of the rupture, from about the town of Pichilemu to Valparaiso, appears to have experienced little or no uplift/subsidence. Importantly, the areas of coastal subsidence were exposed to the greatest
60

tsunami runup and scour, and experienced significant damage from tsunami waves, while the areas of substantial uplift, in general, experienced relatively little damage from tsunami waves. In some cases (i.e., the towns of Arauco and Pichilemu), continuous beach dunes provided sufficient protection from the incoming tsunami wave. In others (i.e., the well-publicized damage in Concepcion and Dichato), damage was related to both strong ground motions and tsunami runup. These cities experienced only slight coseismic (but pre-tsunami) uplift, but might have been inundated to a greater degree if the coastline had instead subsided. 4.5 References Atwater, B. F., Musumi-Rokkaku, S., Satake, K., Tsuji, Y., Ueda, K. & Yamaguchi, D. K. 2005. The
Orphan Tsunami of 1700. Japanese clues to a parent earthquake in North America: United States Geological Survey and University of Washington Press, 133 pp., ISBN 0 295 98535 6.
Barrientos, S., 1987, Is the Pichilemu‐Talcahuano (Chile) a seismic gap? Seismological Research Letters, 61, 43– 48.
Cisternas, M., et al.,2005, Predecessors of the giant 1960 Chile earthquake, Nature, 437, 404– 407, doi:10.1038/nature03943.
Darwin, C.,1851, Geological Observations of South America, Smith and Elder, London, 279 pp. Lomnitz, C., 2004, Major earthquakes of Chile: A historical survey, 1535-1960: Seis. Res. Let.; 75 (3); p.
368-378; DOI: 10.1785/gssrl.75.3.368 Melnick, D., B. Bookhagen, M. R. Strecker, and H. P. Echtler, 2009, Segmentation of megathrust rupture
zones from fore-arc deformation patterns over hundreds to millions of years, Arauco peninsula, Chile, J. Geophys. Res., 114, B01407, doi:10.1029/2008JB005788.
Nelson, R., and W. Manley, 1992, Holocene coseismic and aseismic uplift of the Isla Mocha, south-central Chile, Quat. Int., 15–16, 61–76, doi:10.1016/1040-6182(92)90036-2.
Plafker, G., and J. C. Savage, 1970, Mechanism of the Chilean earthquake of May 21 and 22, 1960, Geol. Soc. Am. Bull., 81, 1001 – 1030, doi:10.1130/0016-7606(1970)81[1001:MOTCEO]2.0.CO;2.
Ruegg, J.C., et al., 2009, Interseismic strain accumulation measured by GPS in the seismic gap between Constitución and Concepción in Chile, Physics of the Earth and Planetary Interiors, 175, 78-85.
Tassara, A. 2010, Preliminary estimates of coastal uplift at the southern limit of the Mw 8.8 Maule earthquake, unpublished report.
61

5.0 SITE EFFECTS AND DAMAGE PATTERNS
Site effects were investigated with respect to the structural damage variability within regions characterized by non-uniform soil conditions and/or subsurface geology. The towns of Santiago, Vina del Mar and Talca observations are summarized below.
5.1 The City of Santiago
The city of Santiago de Chile is located in the so-called Central Depression, a basin surrounded by the Main and Coastal ranges of the Andes (western 70◦ and southern 33◦). This basin spans 80 km long and 30 km wide, and it is mainly elongated in the N-S direction, and is characterized by three main alluvial cones that drain the Andean Cordillera: cones of Colina, Mapocho and Maipo. Due to the geomorphological setting, the basin is filled with alluvial sediments (Valenzuela 1978), primarily composed by pebbles, gravels, clays and volcanic ashes (Morales-Jerez, 2002). The pebbles and gravels are mainly located in the eastern and southern part of the basin. Clayey material is mostly present in the north; whereas a transition zone is found in the centre of the valley. In the Pudahuel district, a 40-m-thick layer of ashes (Pudahuel ignimbrite, also known as pumices) is known to seat at the top of the sedimentary column. The stiff pumice probably comes from a major eruption of the Maipo volcano, located at around 120 km to the southeast, at the head of the Maipo valley. According to Bravo (1992) and Gueguen (1994), the mechanical properties of soil deposits in the Santiago basin are listed in Table 5.1.
Figure 5.1. Satellite image and geology map of the Santiago basin
The city was shown to be prone to site effects during the Valparaiso earthquake in 1985 (Monge 1986), when the seismic intensities (MSK) derived from observed damage to one-storey adobe and one storey un-reinforced masonry houses were reported locally much higher (up to IX) than expected (VI) according to regional intensity attenuation relations (Astroza & Monge 1987; Astroza et al. 1993). The highest intensities were concentrated in areas with poor soils conditions, in the fine-grained alluvial deposit and in the ashes deposits (Astroza & Monge 1991). Despite this first-order correlation between soil conditions and damage, however, some parts of the most damaged areas are not built on soft sediments, and some soft sediment areas did not show strong damage during the 1985 earthquake (Fernandez Mariscal 2003); these effects were attributed to the geometry of the basin and the geology of deep sediments.
62

Table 5.1 Mechanical properties (P- andS-waves velocity, density) at various depths of the three main formations observed in the basin of Santiago (gravels, clays and ashes; after Bravo 1992; Gueguen 1994). Modified from Bonnefy et al (2008)
Depth [m] Vs [m/sec] Density [g/cm3] Gravels 0-20 480-720 2-2.3
200 1300 2.1 Clays 0-20 120-350 1.2-1.8
50 550 2.1 Ashes 0-20 180-450 1.15-1.7
5.2 Americo Vespucio Norte Ring Road
During the reconnaissance, four bridge sites were inspected along the road Americo Vespucio Norte, the Northern section of Santiago’s ring road. Their locations are depicted in Figure 5.2. The damage intensity was highly variable, with two bridges fully collapsed (DA008a, DA009) and two showing minor structural damage such as shear key cracking (DA008, RL001).
Figure 5.2. Four Americo Vespucio Ring Road bridges visited during the reconnaissance.
Investigating potential correlation between the bridge damage patterns and the underlying soil conditions, the locations of the four inspected bridges are depicted on a geology map of the Santiago Metropolitan Area in Figure 5.3. The soil conditions at the four bridge sites appear to be similar, characterized as Finos del Noroeste which are silts and clays of high plasticity horizontally stratified as thin interchangeable layers. The site conditions at the locations of the four bridge sites are characteristic of Class C/D sites according to the NEHRP soil classification system.
Figure 5.4 depicts the locations of the bridge sites on the geological map by Iriarte-Diaz (2003), along with typical N-S cross section of the valley geology. The depth to bedrock-basement at the bridge sites as approximately interpreted from the cross-section does not show clear correlation with the damage states.
63

Figure 5.3. Location of the four bridge sites on the geology map of Santiago Metropolitan Area (Dr. Christian Ledezma, personal communication; approximate map overlay on Google Earth)
Figure 5.4. Location of the four bridge sites on the map of geological cross-sections in the North-Western part of Santiago de Chile; and Geological cross-section along profile 6NS (Iriarte-Diaz, 2003).
Site DA008 (minor damage) is located on clay/silty clay, DA008a (collapsed) on clay/silty sand, and sites RL001 (minor damage) and DA009 (damaged) on sandy silt or silt.
6NS
64

Site DA008 (S33.3660°S W70.6891°) – Paso San Martin
The bridge suffered repairable structural damage, characterized by shear key failure as shown in Figures 5.5a and 5.5b below. Longitudinal and transverse deck movement was also documented, leading to joint damage between the deck segments (Figure 5.5c). The two pile-diameter-deep excavation shown in Figure 5.5d, revealed no foundation failure. According to the local geology map, the soil profile at the site is clay and silty clay.
(a) (b)
(c) (d)
Figure 5.5. Paso San Martin (S33.3660° W70.6891°, 1122 hrs on 03/14/2010). Shear key failure and longitudinal, transverse deck displacement.
Site DA008a (S33.3759° W70.7476°) – Paso Superior Lo Echevers
The bridge suffered collapse of the east direction deck of the highway (see Figure 5.6). According to the local geology map, the soil profile at the site is clayey/silty sand.
65

Figure 5.6. Paso Superior Lo Echevers (S33.3759° W70.7476°). Collapse of the eastbound deck of the Americo Vespucio Norte ring road (Source:
http://www.flickr.com/photos/consulta_recorridos/).
Site RL001 (S33.3865° W70.7601°) – Paso Lo Boza
The bridge suffered minor damage, primarily shear key failure and subsequent displacement of the deck in the transverse direction (see Figure 5.7). According to the local geology map, the soil profile at the site is sandy silt.
Figure 5.7. Paso Lo Boza (S33.3865° W70.7601°). Minor structural damage of shear keys (Source: Dr.
Roberto Leon, personal communication).
Site DA009 (S33.3945° W70.7700°)– Paso Miraflores
The bridge suffered collapse of the east direction deck of the highway (see Figure 5.8). According to the local geology map, the soil profile at the site is sandy silt.
66
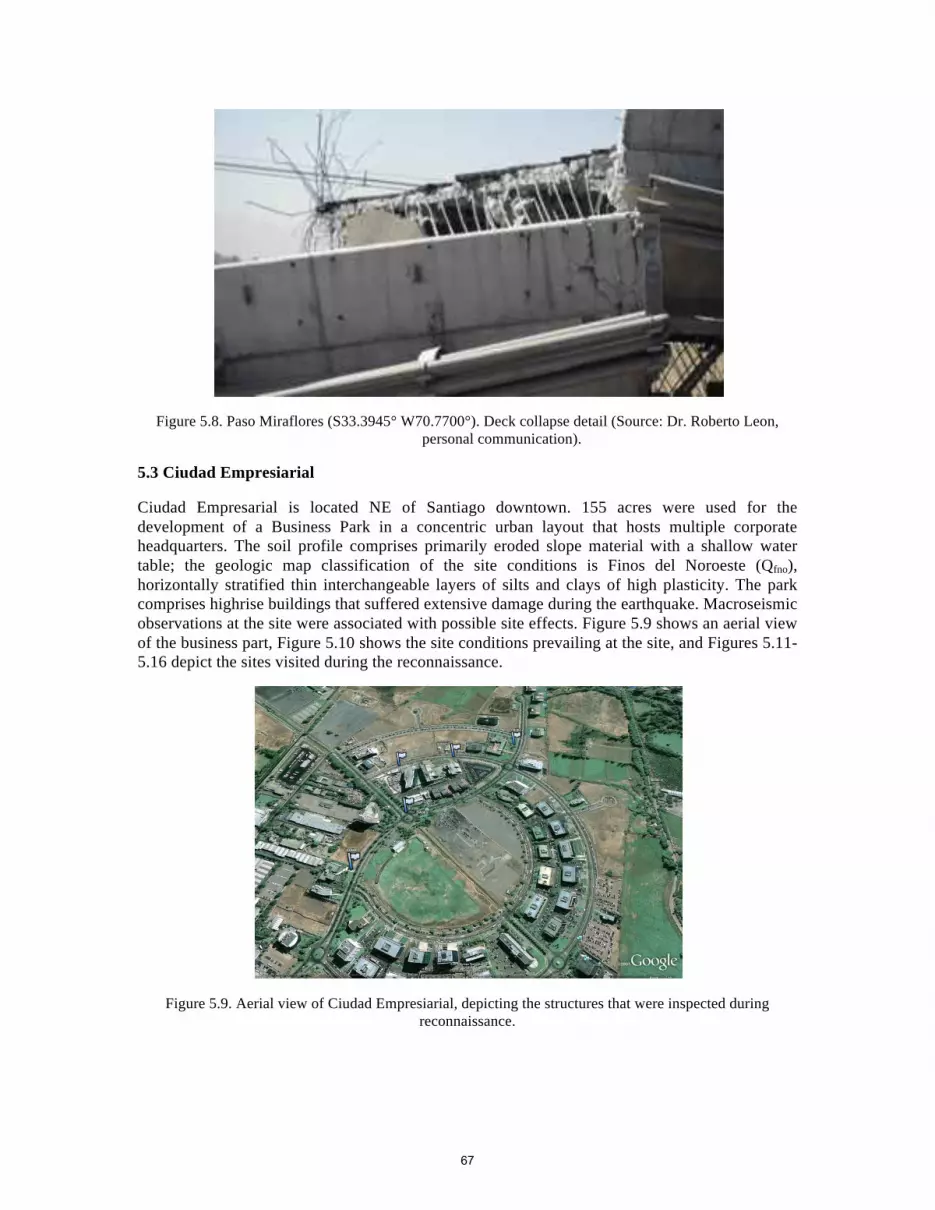
Figure 5.8. Paso Miraflores (S33.3945° W70.7700°). Deck collapse detail (Source: Dr. Roberto Leon,
personal communication).
5.3 Ciudad Empresiarial
Ciudad Empresarial is located NE of Santiago downtown. 155 acres were used for the development of a Business Park in a concentric urban layout that hosts multiple corporate headquarters. The soil profile comprises primarily eroded slope material with a shallow water table; the geologic map classification of the site conditions is Finos del Noroeste (Qfno), horizontally stratified thin interchangeable layers of silts and clays of high plasticity. The park comprises highrise buildings that suffered extensive damage during the earthquake. Macroseismic observations at the site were associated with possible site effects. Figure 5.9 shows an aerial view of the business part, Figure 5.10 shows the site conditions prevailing at the site, and Figures 5.11-5.16 depict the sites visited during the reconnaissance.
Figure 5.9. Aerial view of Ciudad Empresiarial, depicting the structures that were inspected during reconnaissance.
67

Figure 5.10. Geologic map of Santiago, zoom in Ciudad Empresiarial business park. The geologic material at the site is Finos del Noroeste (Qfno), horizontally stratified thin interchangeable layers of
silts and clays of high plasticity.
(a)
(b)
Figure 5.11 (continued)
68

(c)
(d) (e)
Figure 5.11. Site DA003 (S33.387985° W70.618815°, 1015 hrs on 03/14/2010) 6-story commercial building. Damage of non-structural elements (glass windows, red brick façade) (Figures 11a,b)
and emergency staircase (Figures 11c,d). Evidence of ground deformation (Figure 11e).
69

Figure 5.12. Site DA004 (S33.387652° W70.617122°, 1047 hrs on 03/14/2010) Identical 7-story buildings connected; damage was observed in only one of the two.
Figure 5.13. Site DA005 (S33.387652° W70.617123°, 1053 hrs on 03/14/2010) Overtopped art.
70

Figure 5.14. Site DA005 (S33.387652° W70.617123°, 1054 hrs on 03/14/2010) 12-story building with severe structural damage.
Figure 5.15. Site DA006 (S33.389586° W70.618349°, 1056 hrs on 03/14/2010) 5-story building, structural damage.
71

Figure 5.16. Site DA007 (S33.391163° W70.619502°, 1057 hrs on 03/14/2010) Minor external damage – non-structural. Overtopped art.
Overall, the business park was severely damaged, with 7 buildings that failed and were closed to the public. No total collapse was documented and no casualties were reported at the site, while the only evidence of soil deformation is shown in Figure 11e. The damaged structures ranged from a 5- to 12-stories, which to first approximation corresponds to 0.5-1.2 sec resonant periods (0.8-2 Hz).
Bonnefoy et al (2008) conducted extensive ambient vibration measurements in the basin of Santiago de Chile (Chile), evaluating the reliability of the horizontal-to-vertical amplitude spectra ratio method (H/V) as a tool to provide qualitative and quantitative information of site conditions in complex geological media. Results from this study showing the spatial distribution of the H/V peaks according to their frequencies are depicted in Figure 5.17: (red) 0.3–0.5, (blue) 0.51–1.2, (yellow) 1.21–5 and (green) 5.1–10 Hz. Circles display frequencies for clear peaked H/V curves, whereas squares depict frequencies for peaks of low amplitude. The surface geology is shown in background, while the green circle corresponds to the location of Ciudad Empresiarial. As can be readily seen, the resonant frequencies at the site of the business park as identified by means of H/V ratios range from 0.5-5Hz, consistent with the structural resonant periods of the damaged structures. This is an indication that site effects may have contributed to the concentrated structural damage at the site.
72
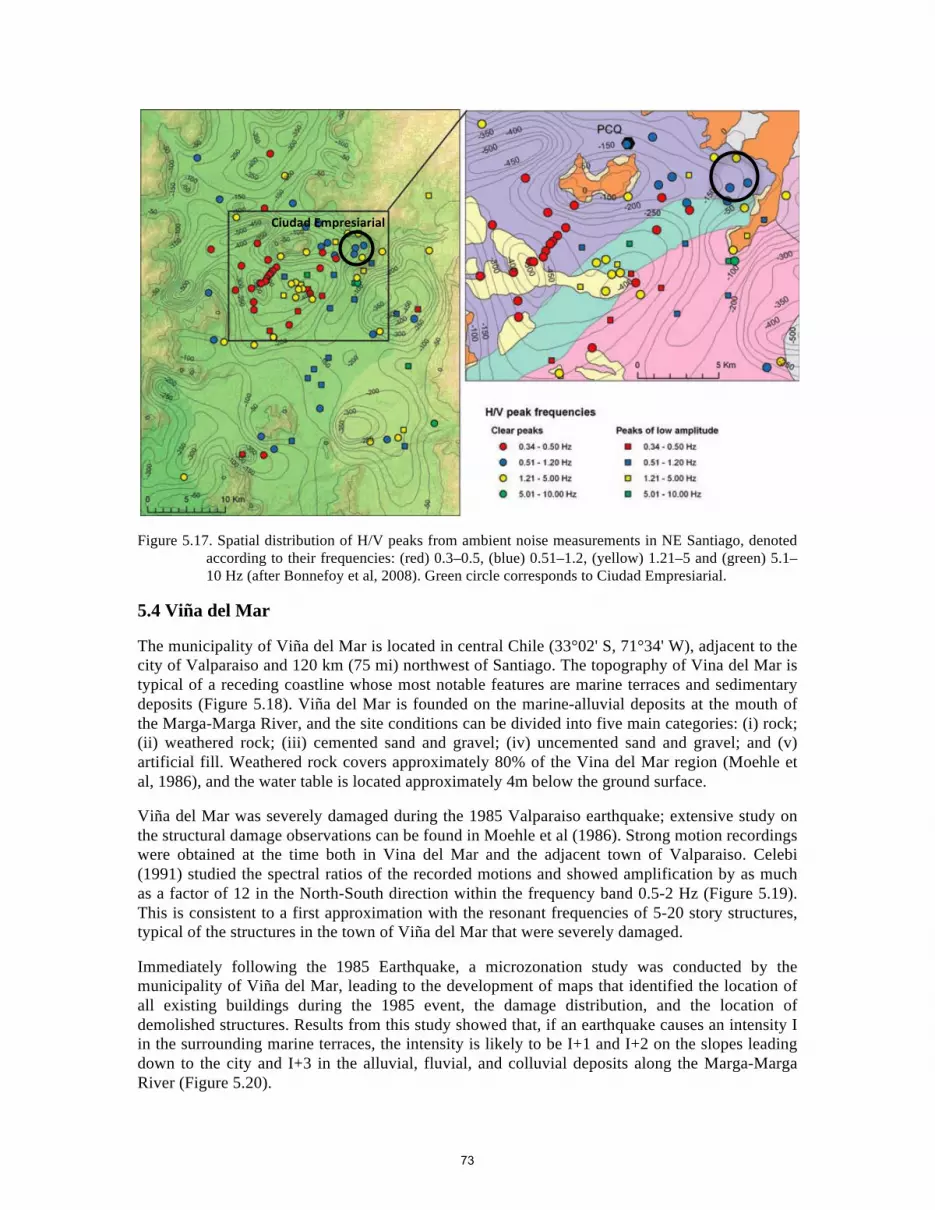
Figure 5.17. Spatial distribution of H/V peaks from ambient noise measurements in NE Santiago, denoted according to their frequencies: (red) 0.3–0.5, (blue) 0.51–1.2, (yellow) 1.21–5 and (green) 5.1–10 Hz (after Bonnefoy et al, 2008). Green circle corresponds to Ciudad Empresiarial.
5.4 Viña del Mar
The municipality of Viña del Mar is located in central Chile (33°02' S, 71°34' W), adjacent to the city of Valparaiso and 120 km (75 mi) northwest of Santiago. The topography of Vina del Mar is typical of a receding coastline whose most notable features are marine terraces and sedimentary deposits (Figure 5.18). Viña del Mar is founded on the marine-alluvial deposits at the mouth of the Marga-Marga River, and the site conditions can be divided into five main categories: (i) rock; (ii) weathered rock; (iii) cemented sand and gravel; (iv) uncemented sand and gravel; and (v) artificial fill. Weathered rock covers approximately 80% of the Vina del Mar region (Moehle et al, 1986), and the water table is located approximately 4m below the ground surface.
Viña del Mar was severely damaged during the 1985 Valparaiso earthquake; extensive study on the structural damage observations can be found in Moehle et al (1986). Strong motion recordings were obtained at the time both in Vina del Mar and the adjacent town of Valparaiso. Celebi (1991) studied the spectral ratios of the recorded motions and showed amplification by as much as a factor of 12 in the North-South direction within the frequency band 0.5-2 Hz (Figure 5.19). This is consistent to a first approximation with the resonant frequencies of 5-20 story structures, typical of the structures in the town of Viña del Mar that were severely damaged.
Immediately following the 1985 Earthquake, a microzonation study was conducted by the municipality of Viña del Mar, leading to the development of maps that identified the location of all existing buildings during the 1985 event, the damage distribution, and the location of demolished structures. Results from this study showed that, if an earthquake causes an intensity I in the surrounding marine terraces, the intensity is likely to be I+1 and I+2 on the slopes leading down to the city and I+3 in the alluvial, fluvial, and colluvial deposits along the Marga-Marga River (Figure 5.20).
CiudadEmpresiarial
73

Indeed, the same damage pattern was observed during reconnaissance of the 2010 event. Five severely damaged buildings were inspected, all located in the vicinity of the Marga-Marga river mouth and thus founded on soft soil conditions. Note that during the microzonation study following the 1985 Earthquake, the Municipality of Viña del Mar mapped the location of buildings with 5 or more stories (Figure 5.21). The buildings inspected during reconnaissance after the 2010 Earthquake are also shown on this map (also depicted on the aerial view of Google Earth), and are clearly located in the immediate vicinity of the river. Figures 5.22-5.26 depict the structural damage observations of the reconnaissance team.
Figure 5.18. Geology of the Viña del Mar/Valparaiso region. Site conditions are described as weathered rock.
74

Figure 5.19. Acceleration seismograms of 3 March 1985 Central Chile earthquake (MS = 7.8) recorded at the strong-motion stations VINA (Viña del Mar) and VAL (UTFSM-Valparaiso) and their corresponding spectral ratios (after Celebi, 2003).
Figure 5.20. Anticipated Modified Mercalli Intensity in the town of Viña Del Mar (Moehle et al, 1986).
75

Figure 5.21. Buildings inspected during reconnaissance in Viña del Mar. Bottom figure depicts the location of buildings of 5-stories or higher, as mapped during microzonation study that followed the
1985 Valparaiso Earthquake (from Moehle et al, 1986).
76

Figure 5.22 Site DA017 (S 33.018904° W 71.559206°, 1714 hrs on 03/14/2010) Damaged 9-story building.
Figure 5.23. (continued)
77

Figure 5.23. Site DA018 (S 33.017386° W 71.557107°, 18:48 hrs on 03/14/2010) Damaged 6-story building. Evidence of ground settlement.
78

Figure 5.24. (continued)
79
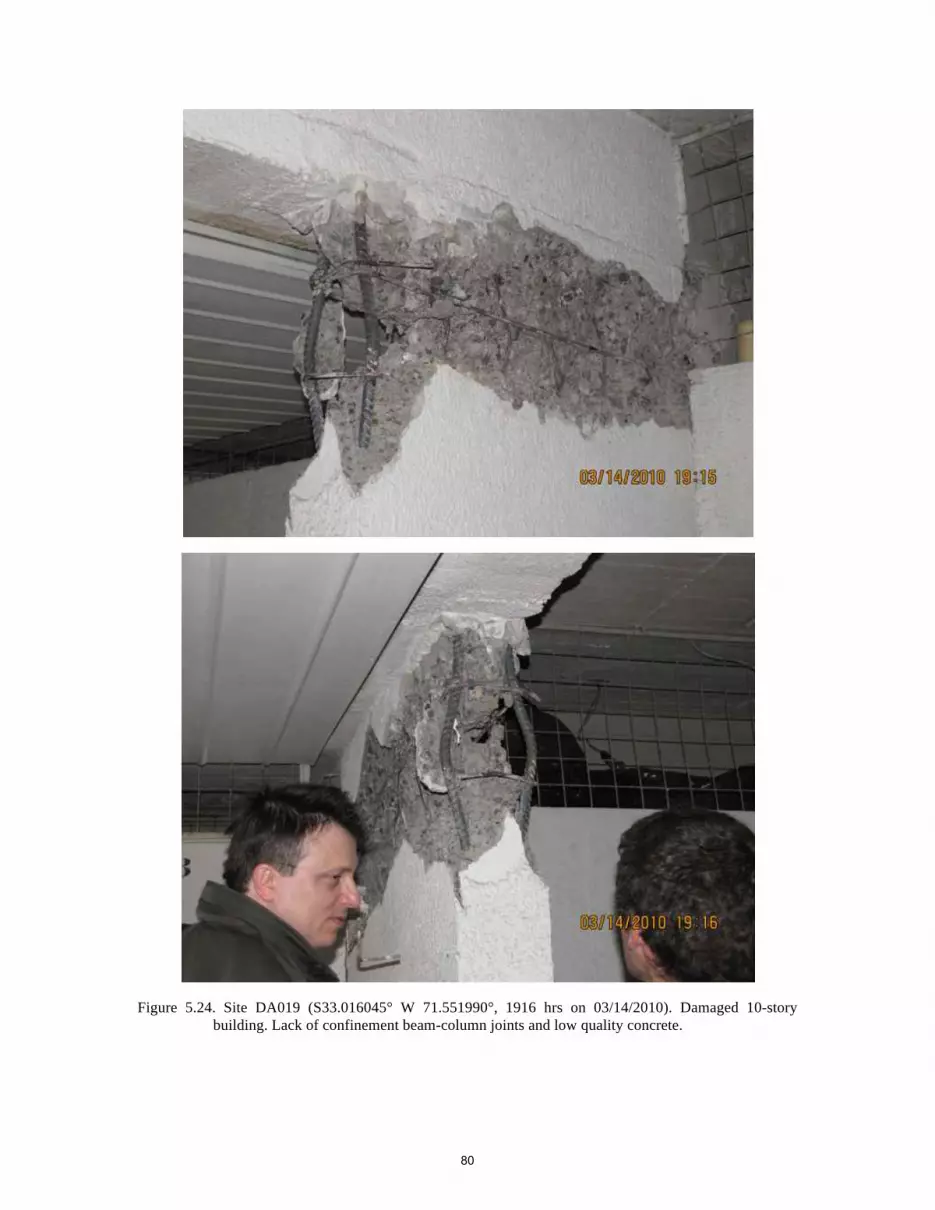
Figure 5.24. Site DA019 (S33.016045° W 71.551990°, 1916 hrs on 03/14/2010). Damaged 10-story building. Lack of confinement beam-column joints and low quality concrete.
80

Figure 5.25. Site DA020 (S 33.018678° W 71.556288°, 1953 hrs on 03/14/2010). Diagonal cracks of columns in all the floors of 19-story building.
Figure 5.26. (continued)
81

Figure 5.26. Site DA027 (S 33.020074° W 71.544055°, 1945 hrs on 03/15/2010). Heavily damaged 20-story building, lack of confinement at beam-column joints.
5.5 The city of Talca
The city of Talca, with a population of 200,000 people, is approximately 250 km south of Santiago, 60 km northwest of the epicenter of the 2010 Earthquake. The typical construction type is adobe and unreinforced masonry, which is primarily used for older buildings with 2-4 stories (dating back to before the 1960s-70s). Modern buildings that were designed according to current codes suffered minor, repairable damage, while a large number of adobe and unreinforced masonry constructions suffered significant damage, including disintegration of walls and subsequent collapse.
Figure 5.27. (continued)
82
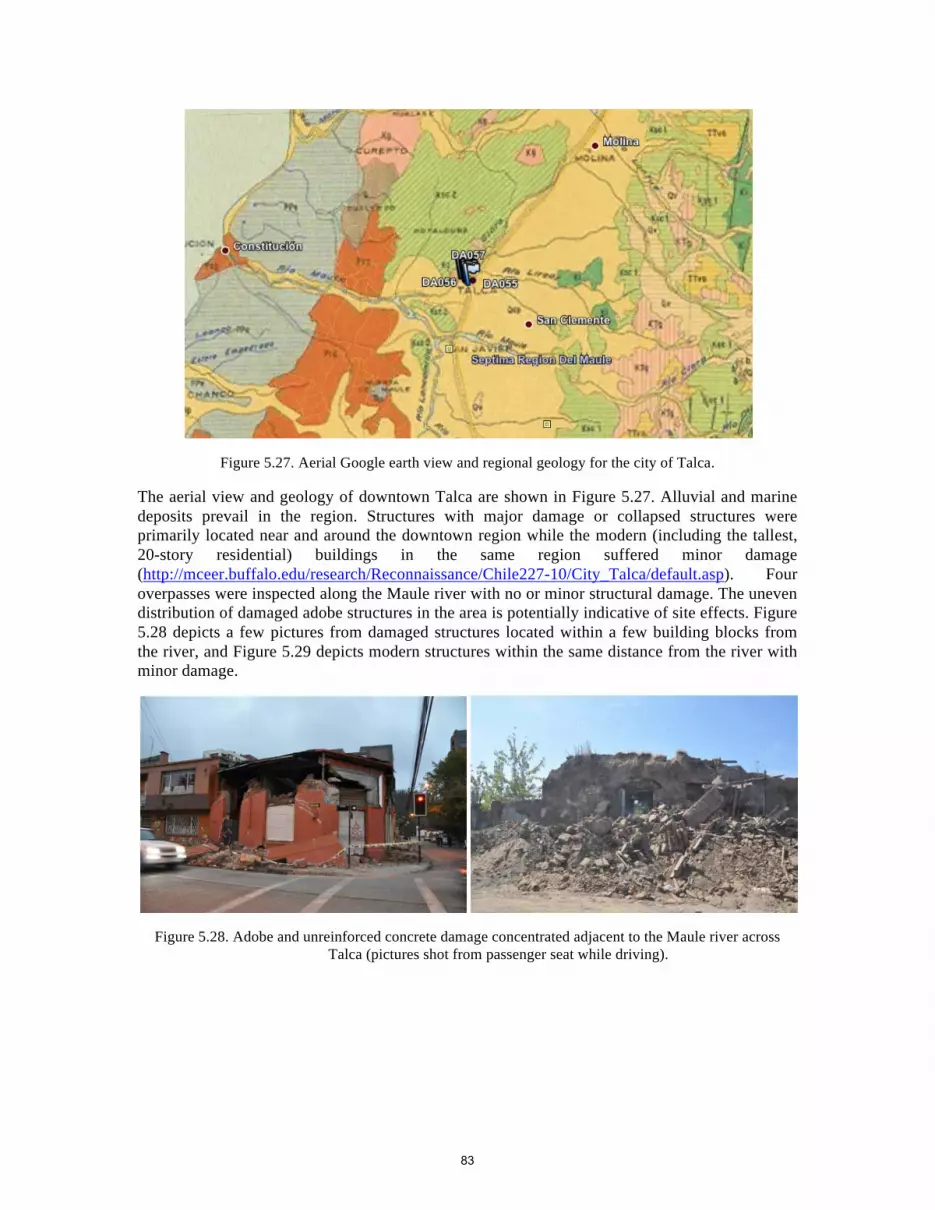
Figure 5.27. Aerial Google earth view and regional geology for the city of Talca.
The aerial view and geology of downtown Talca are shown in Figure 5.27. Alluvial and marine deposits prevail in the region. Structures with major damage or collapsed structures were primarily located near and around the downtown region while the modern (including the tallest, 20-story residential) buildings in the same region suffered minor damage (http://mceer.buffalo.edu/research/Reconnaissance/Chile227-10/City_Talca/default.asp). Four overpasses were inspected along the Maule river with no or minor structural damage. The uneven distribution of damaged adobe structures in the area is potentially indicative of site effects. Figure 5.28 depicts a few pictures from damaged structures located within a few building blocks from the river, and Figure 5.29 depicts modern structures within the same distance from the river with minor damage.
Figure 5.28. Adobe and unreinforced concrete damage concentrated adjacent to the Maule river across Talca (pictures shot from passenger seat while driving).
83

Figure 5.29. (continued)
84
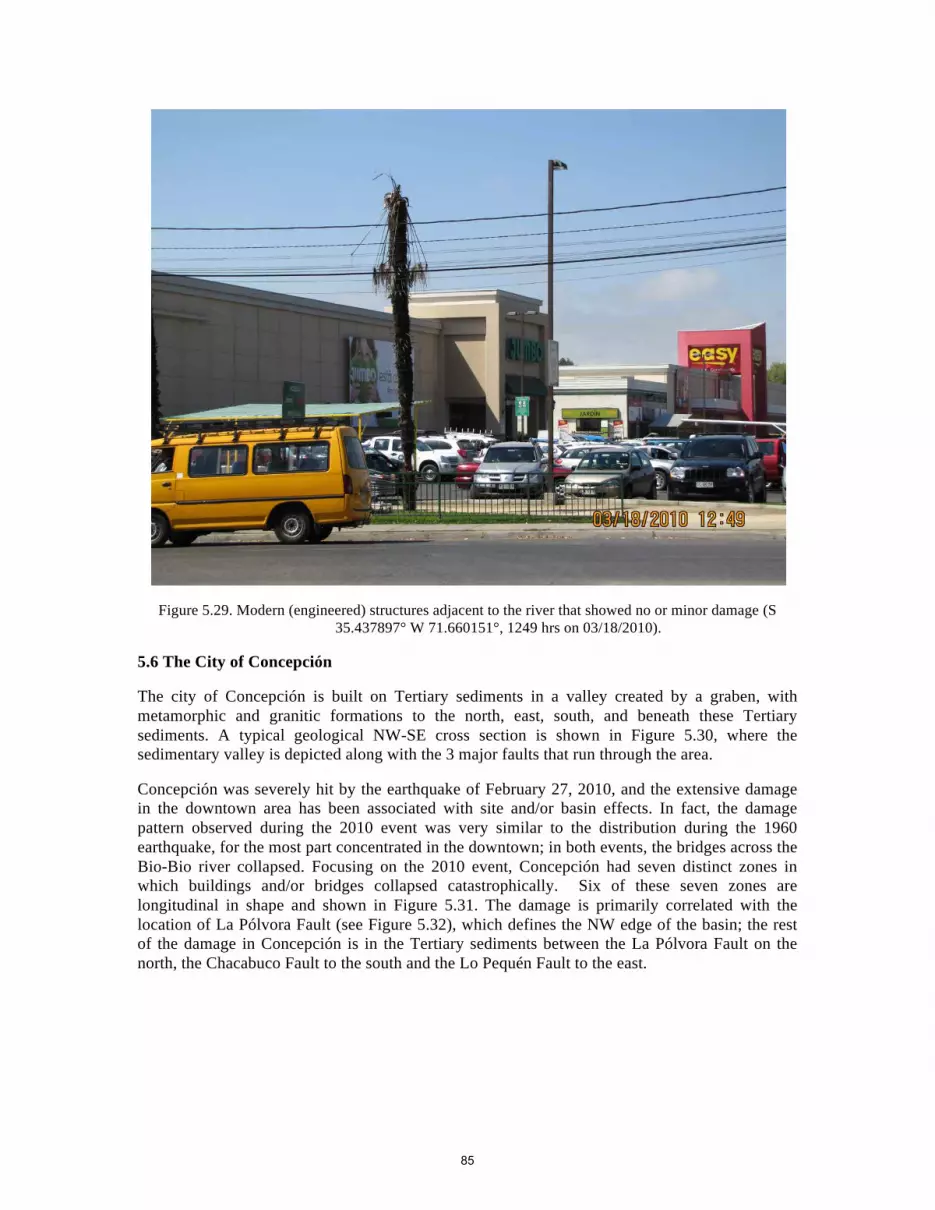
Figure 5.29. Modern (engineered) structures adjacent to the river that showed no or minor damage (S 35.437897° W 71.660151°, 1249 hrs on 03/18/2010).
5.6 The City of Concepción
The city of Concepción is built on Tertiary sediments in a valley created by a graben, with metamorphic and granitic formations to the north, east, south, and beneath these Tertiary sediments. A typical geological NW-SE cross section is shown in Figure 5.30, where the sedimentary valley is depicted along with the 3 major faults that run through the area.
Concepción was severely hit by the earthquake of February 27, 2010, and the extensive damage in the downtown area has been associated with site and/or basin effects. In fact, the damage pattern observed during the 2010 event was very similar to the distribution during the 1960 earthquake, for the most part concentrated in the downtown; in both events, the bridges across the Bio-Bio river collapsed. Focusing on the 2010 event, Concepción had seven distinct zones in which buildings and/or bridges collapsed catastrophically. Six of these seven zones are longitudinal in shape and shown in Figure 5.31. The damage is primarily correlated with the location of La Pólvora Fault (see Figure 5.32), which defines the NW edge of the basin; the rest of the damage in Concepción is in the Tertiary sediments between the La Pólvora Fault on the north, the Chacabuco Fault to the south and the Lo Pequén Fault to the east.
85
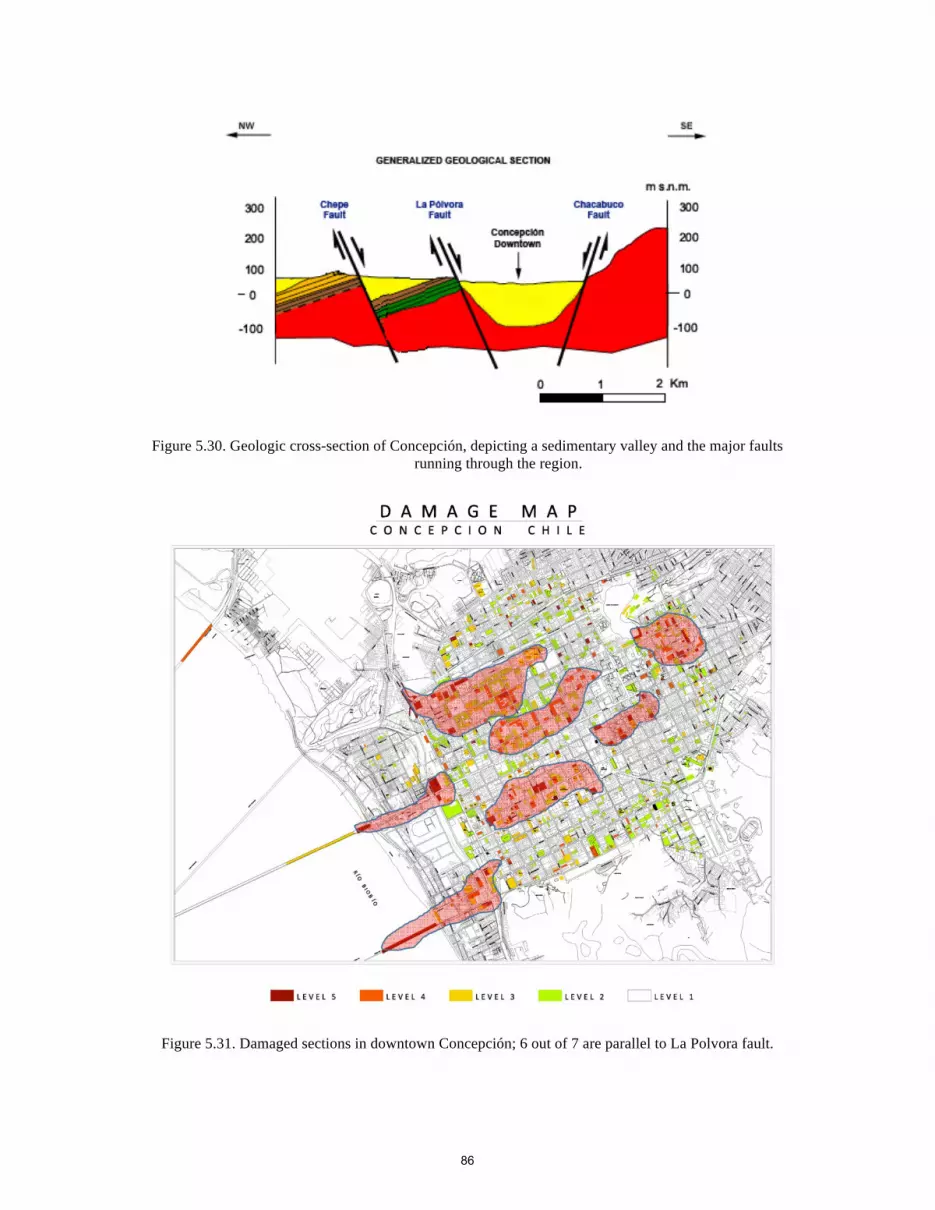
Figure 5.30. Geologic cross-section of Concepción, depicting a sedimentary valley and the major faults running through the region.
Figure 5.31. Damaged sections in downtown Concepción; 6 out of 7 are parallel to La Polvora fault.
86
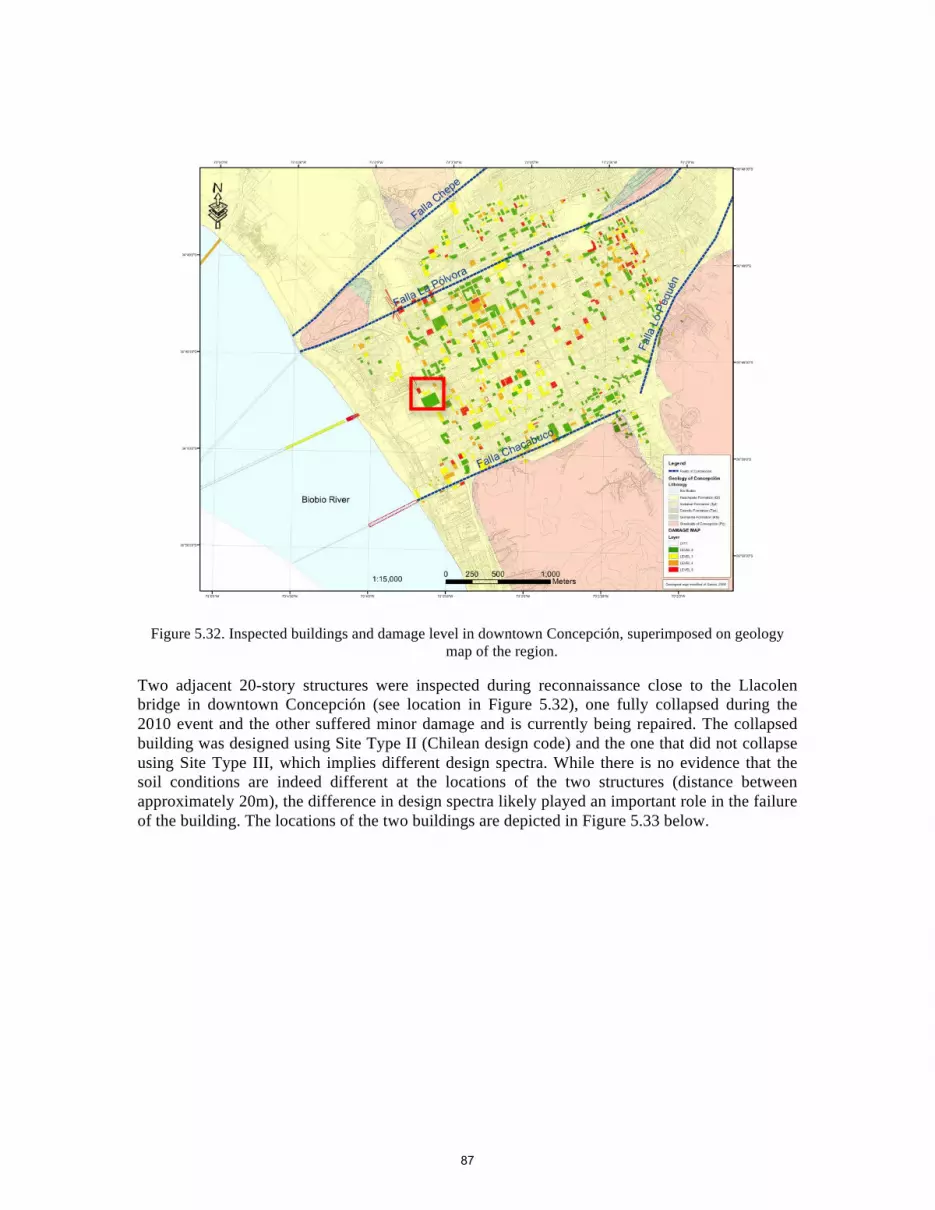
Figure 5.32. Inspected buildings and damage level in downtown Concepción, superimposed on geology map of the region.
Two adjacent 20-story structures were inspected during reconnaissance close to the Llacolen bridge in downtown Concepción (see location in Figure 5.32), one fully collapsed during the 2010 event and the other suffered minor damage and is currently being repaired. The collapsed building was designed using Site Type II (Chilean design code) and the one that did not collapse using Site Type III, which implies different design spectra. While there is no evidence that the soil conditions are indeed different at the locations of the two structures (distance between approximately 20m), the difference in design spectra likely played an important role in the failure of the building. The locations of the two buildings are depicted in Figure 5.33 below.
87

Figure 5.33. Locations of two adjacent buildings designed with using different site conditions in Conception (map and aerial view).
88
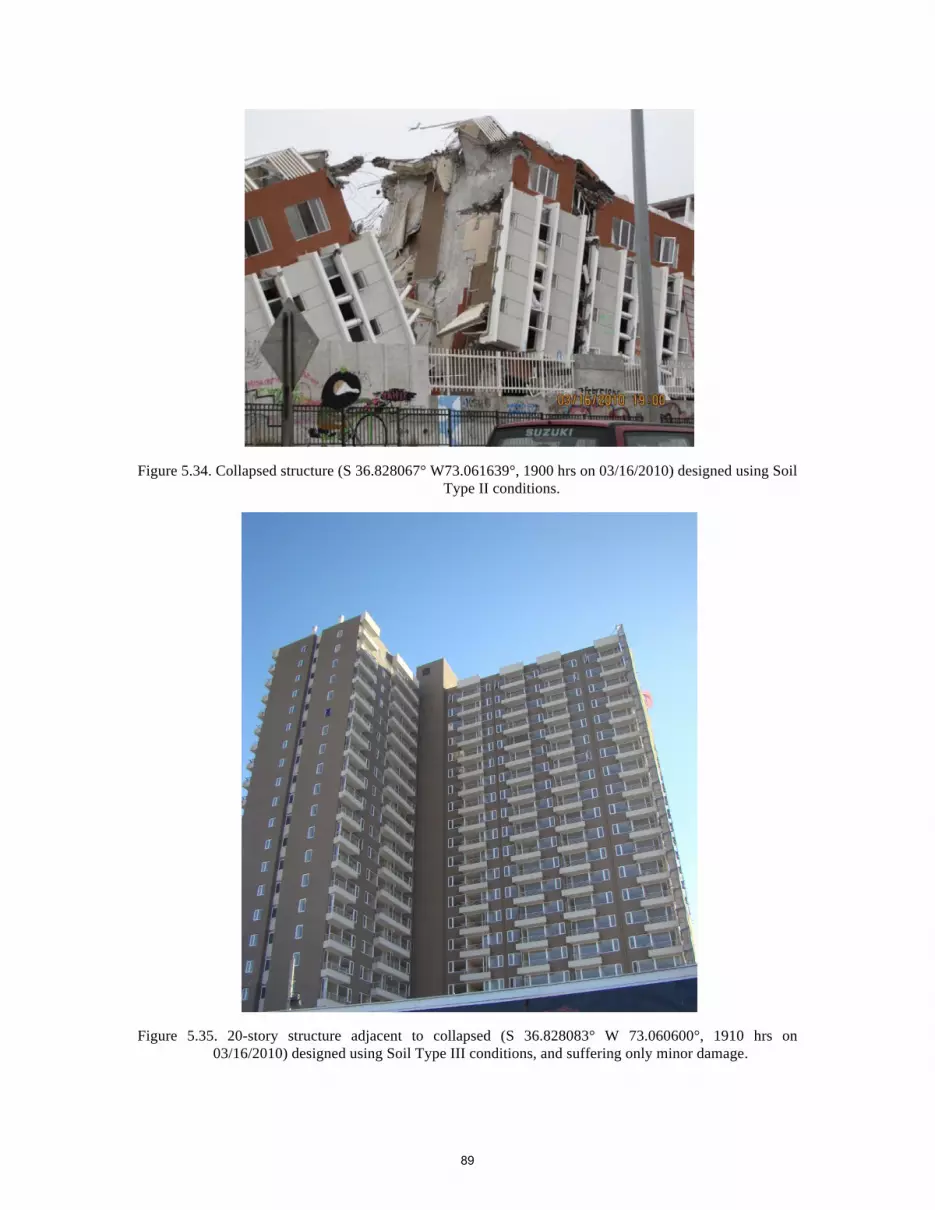
Figure 5.34. Collapsed structure (S 36.828067° W73.061639°, 1900 hrs on 03/16/2010) designed using Soil Type II conditions.
Figure 5.35. 20-story structure adjacent to collapsed (S 36.828083° W 73.060600°, 1910 hrs on 03/16/2010) designed using Soil Type III conditions, and suffering only minor damage.
89

5.7 References
Astroza, M. & Monge, J. (1987). Zonificacion sismica de la ciudad de Santiago, in Proceedings of the XXIV Jornadas Sudamericanas de Ingeneria Estructural,Vol. 5, Porto Alegre, Brasil, June 29–July 3, pp. 221–235, ANAIS, Porto Alegre, Brasil.
Astroza, M. & Monge, J. (1991). Seismic microzones in the city of Santiago. Relation damage-geological unit, in Proceedings of the Fourth International Conference on Seismic Zonation,Vol. 3, Stanford, CA, USA, August 25 –29, pp. 595–601, Earthquake Engineering Research Institute, Stanford, CA, USA.
Astroza, M., Monge, J. & Valera, J. (1993). Intensidades del sismo del 3 de marzo 1985 en la region Metropolitana y el litoral central. Ingeneria sismica, el caso del sismo del 3 de marzo 1985 (In Spanish), Instituto Ingenieros de Chile, Ediciones Pedagogicas Chilenas S.A., Ediciones Dolmen, pp. 103–117.
Bonnefoy-Claudet S., Stephane Baize, Luis Fabian Bonilla, Catherine Berge-Thierry, Cesar Pasten, Jaime Campos, Philippe Volant and Ramon Verdugo (2008). Site effect evaluation in the basin of Santiago de Chile using ambient noise measurements Geophys. J. Int.
Celebi M. (1991). Topographical and geological amplification: Case studies and engineering applications, Structural Safety, 10 pp. 199-217
Fernandez Marescal, J.C. (2003). Respuesta sismica de la Cuenca de Santiago, region metropolitana de Santiago, Escala 1:100000, 1 mapa. SERNAGEOMIN, carta geologica de Chile, Serie Geologia Ambiental, 1, ISSN:0717–7305.
Iriarte-Diaz, S. (2003). Impact of urban recharge on long-term management of Santiago Norte aquifer, Santiago–Chile, Master thesis. Waterloo University, Notario, Canada.
Moehle J., Wood S. and Wight J. (1986). The 1985 Chilean Earthquake: Observations of earthquake-resistant construction in Vina del Mar, Report to the NATIONAL SCIENCE FOUNDATION, Research Grants ECE 86-03789, ECE 86-03604,and ECE 86-06089
Morales-Jerez, F.R. (2002). Definicion de aquiferos en la Cuenca del Rio Maipo (In Spanish), Master thesis. University of Chile, Santiago de Chile, Chile.
Valenzuela, G.B. (1978). Suelo de fundacion del gran Santiago (In Spanish with English abstract), Instituto de Investigaciones Geologicas, 33, 1–27.
90

6.0 LIQUEFACTION AND LATERAL SPREADING
6.1 Overview
This section of the report summarizes some of the observations of the GEER team with respect to seismic soil liquefaction and lateral spreading deformations. Other observations are summarized throughout the report, particularly where the effects of liquefaction and/or lateral spreading impacted various infrastructure systems. The information was collected from aerial and ground reconnaissance conducted by various members of the team starting on 3/6/2010. The region affected by the M8.8 event was on the order of 600 km long and 150 km wide. This covers a large geographic area consisting of coastal areas adjacent to inland river valleys that flow from the Andes to the coast in a roughly east-west direction. The Pan American highway runs north-south along the central valley agricultural region that relies on the river systems for water. A coastal range of low mountains separates the central valley from the ocean but the river systems are geologically older than the mountain building and have incised through the uplift to continue relatively unimpeded to the coast in a westerly direction. This presence of a large number of rivers contributed to the widespread observations of liquefaction of loose saturated river sediments. Liquefaction and subsequent deformations primarily had an engineering impact on the transportation corridors, causing consistent damage to highways and bridges crossing the river systems.
6.2 Occurrence of Liquefaction
Liquefaction herein is defined as significant strength loss in loose saturated granular soils due to seismic induced excess pore pressures. The contractive behavior of loose granular soils leads to the generation of excess pore pressures when these saturated soils are sheared. The shearing is caused by seismic ground motions strong enough to strain the soil in a plastic manner. As strength is reduced, deformations can occur due to a driving static shear stress such as sloping ground, embankment loads, and building loads amongst others. These deformations are often referred to as lateral spreading deformations and are primarily co-seismic. As the strong ground motions causing the excess pore pressures cease, the excess pore pressures will dissipate and strength will be regained thereby limiting deformations. The static strength will again exceed the static stress. This is opposed to flow failures where even after strong ground shaking ceases the static strength remains less than the static stress and deformations continue until a balance is achieved. Excess pore pressures can be seismically generated in fined grained soils as well but are generally limited and unless the fine grained soil is sensitive (large peak to residual strength) then the strength loss and deformations are generally much smaller than in loose granular soils undergoing liquefaction.
Liquefaction was observed to have occurred over a large area of Chile affected by the earthquake. The widespread presence of river sediments and the long duration of the event most likely contributed to the large number of observations of liquefaction. Based on strong motion records processed to date, ground shaking in the Santiago area lasted for upwards of 1.5 minutes (Figure 6.1). Anecdotal reports of even longer durations were heard for areas closer to the epicenter. Long duration events subject loose saturated granular soils to a significant number of strain cycles/strain reversals and subsequent generation of excess pore pressure. Liquefaction was observed in areas as far north as Vina Del Mar and Valparaiso, and as far south as Arauco and Lebu. The eastern observations are bounded by the area just east of the Pan American highway. Figure 6.2 shows estimated extents of liquefaction and the relative spatial density. Because of the widespread nature of liquefaction from this event the spatial density is shown as zones of low, medium, and high occurrence. In areas of high spatial density soils that were susceptible to liquefaction were observed to have liquefied. In areas of low spatial density there was intermittent liquefaction of susceptible soils. The liquefaction observations may indicate that the central region east of the epicenter experienced less intense ground shaking, which agrees with the lesser amount of damage to adobe structures in this region.
91

Figure 6.1. Typical ground motion from the Santiago area showing the long duration which can produce a large number of strain cycles in liquefiable sediments.
The particle size and relative density of granular soils played an important role in the occurrence of liquefaction in this event. As the rivers travel from east to west the slope and therefore the energy for transporting particles decreases. The rivers begin on the steep flanks of the Andes and travel downstream to the coast with lessening gradient. The soils in the Santiago are primarily composed of gravels because of the proximity to the Andes and the high transport force of the rivers systems there. As the rivers approach the coast downstream “fining” or a decrease in the median particle size is observed as a function of the decreasing sediment transport capacity. Excess pore pressures that result in strength loss and deformations can be sustained much more readily in finer granular material than coarser granular material because the permeability of the material with respect to the rate of loading; excess pore pressures will dissipate more slowly in a fine sand than a coarse gravel.
92

Figure 6.2. Spatial distribution of observed liquefaction. Because of the widespread nature of liquefaction it is shown here in terms of zones of low, median, and high spatial density. Observations include surface evidence of
liquefied ejecta and lateral spreading.
A higher energy depositional environment will also result in denser material, material less susceptible to contractive behavior that produces excess pore pressures. Gravels are large particles that require a large amount of energy to deposit. This high energy tends to deposit the gravels in a dense state, less susceptible to the contractive behavior needed to generate excess pore pressures. Dune and beach sands are the same in this respect. Dune and beach sands were subjected to the same strong ground shaking as the river sands in this event but showed almost no evidence of liquefaction. The higher energy environment that deposits dune and beach sands results in a denser state, less susceptible to contractive behavior that can lead to excess pore pressure generation when subjected to cyclic strains.
Spatial Density of Observed Liquefaction
Low
Medium
High
Epicenter
Rupture Plane
93

6.3 Aerial and Ground Observations
During aerial reconnaissance, ground surface manifestation of liquefaction was observed in the following watersheds from north to south; Rio Maipo, Rio Rapel, Estero Nilahue, Lago Vichuquen, Rio Mataquito, Rio Maule, Rio Itata, Rio Bio Bio, Rio Carampangue, and others. Figures 6.3 and 6.4 show what these manifestations look like from altitudes of 1000-2000 m. Lower altitude flyovers show closer detail of these features in Figures 6.5 with ejecta coming from the ground fissures. Lateral deformations were widely observed along the edges of river banks. Disassembled blocks that translate and rotate, often called lateral spreading, are the most common evidence of subsurface layers that experienced strength loss via liquefaction. When observed on the ground the size and scale of these lateral spreading features can be readily seen (Figures 6.6). Similar lateral spreading features were found in many other locations, one of which is discussed in the next section.
Figure 6.3. Lateral spreading feature observed along Rio Maipo towards the northern extents of damage (S33.9913o
W71.5316 o, 12:30, 3/6/2010).
94

Figure 6.4. Liquefaction ejected and lateral spreading features observed along Carampangue River towards the southern extents of damage (~S37.2780o , ~W73.2541 o, 17:00, 3/6/2010).
Figure 6.5. Lower elevation view of fissures and liquefaction ejecta. This was taken along the lower Rio Bio Bio near Concepcion (~S36.8239o , ~W73.0944 o, 15:00, 3/6/2010). The dark surface sediment is from the Rio Laja that intersects the Bio Bio approximately 20-30 km upstream from this point. The light ejected sediment is supplied by
the main stem of the Rio Bio Bio upstream of the Rio Laja.
95
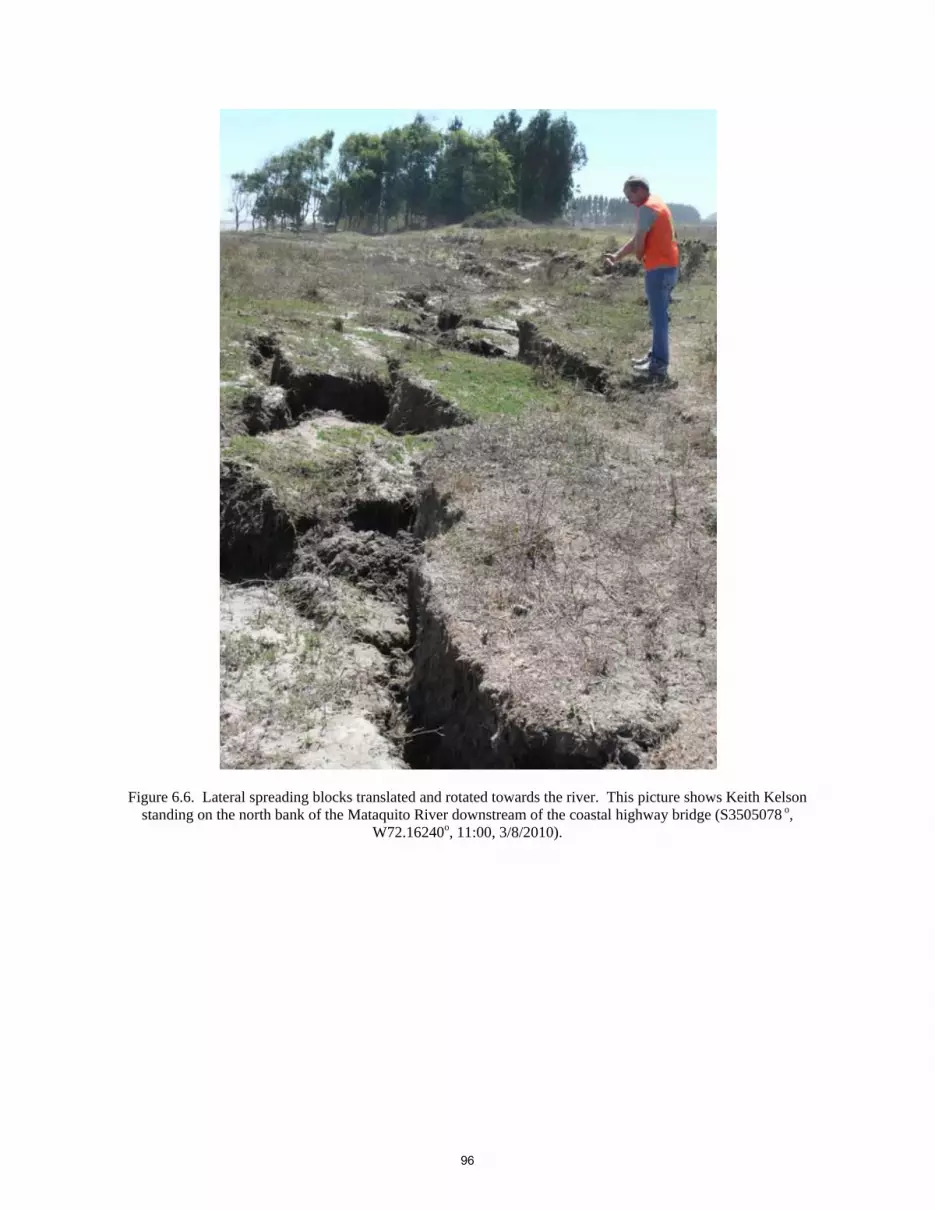
Figure 6.6. Lateral spreading blocks translated and rotated towards the river. This picture shows Keith Kelson standing on the north bank of the Mataquito River downstream of the coastal highway bridge (S3505078 o,
W72.16240o, 11:00, 3/8/2010).
96

Section 6.4 Liquefaction and Lateral Spread in Central Conception A large liquefaction-induced lateral spread was observed along the southwestern edge of the shoreline of the Tres Pascuales lagoon in Concepcion, just south of Universidad San Sebastian (S36.8152°, W73.0459°). The spread extended approximately 85 m west of the lagoon and along shore for about 100 m. Evidence of liquefaction boils was noted within the undeveloped land area (Figure 6.7). The lateral spreading occurred in a small park along the lake shown in Figure 6.8a, and continued through an open space to the south of the park (Figure 6.8b) into an area further south that was undergoing construction (Figure 6.8c). The lateral spread continued southward where the extension of the ground pulled apart modest homes in a poor neighborhood (Figure 6.8d). Severe separation and distortion of fences between properties within the spread zone were observed, and both underground and above ground structures were observed to be impacted. It was believed that an underground tank uplifted at the affected gas station (S36.8156°, W73.0464°) at the west end of the extent of ground failure as shown in Figure 6.9.
Figure 6.7. Liquefaction boils in undeveloped land area along west shore of Tres Pasquales lagoon in Concepcion
(S36.8155°, W73.0460°; 3/14/2010)
97
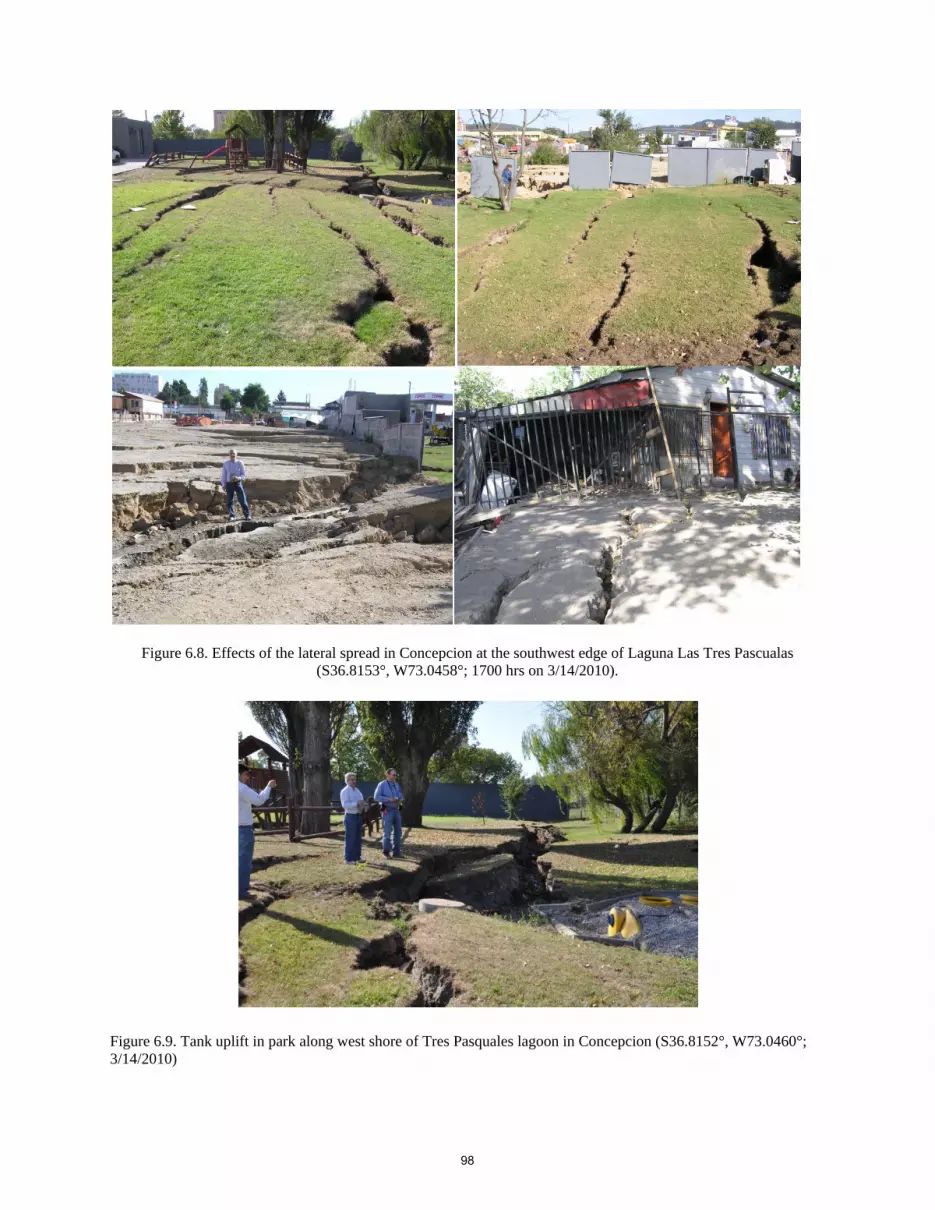
Figure 6.8. Effects of the lateral spread in Concepcion at the southwest edge of Laguna Las Tres Pascualas (S36.8153°, W73.0458°; 1700 hrs on 3/14/2010).
Figure 6.9. Tank uplift in park along west shore of Tres Pasquales lagoon in Concepcion (S36.8152°, W73.0460°; 3/14/2010)
98
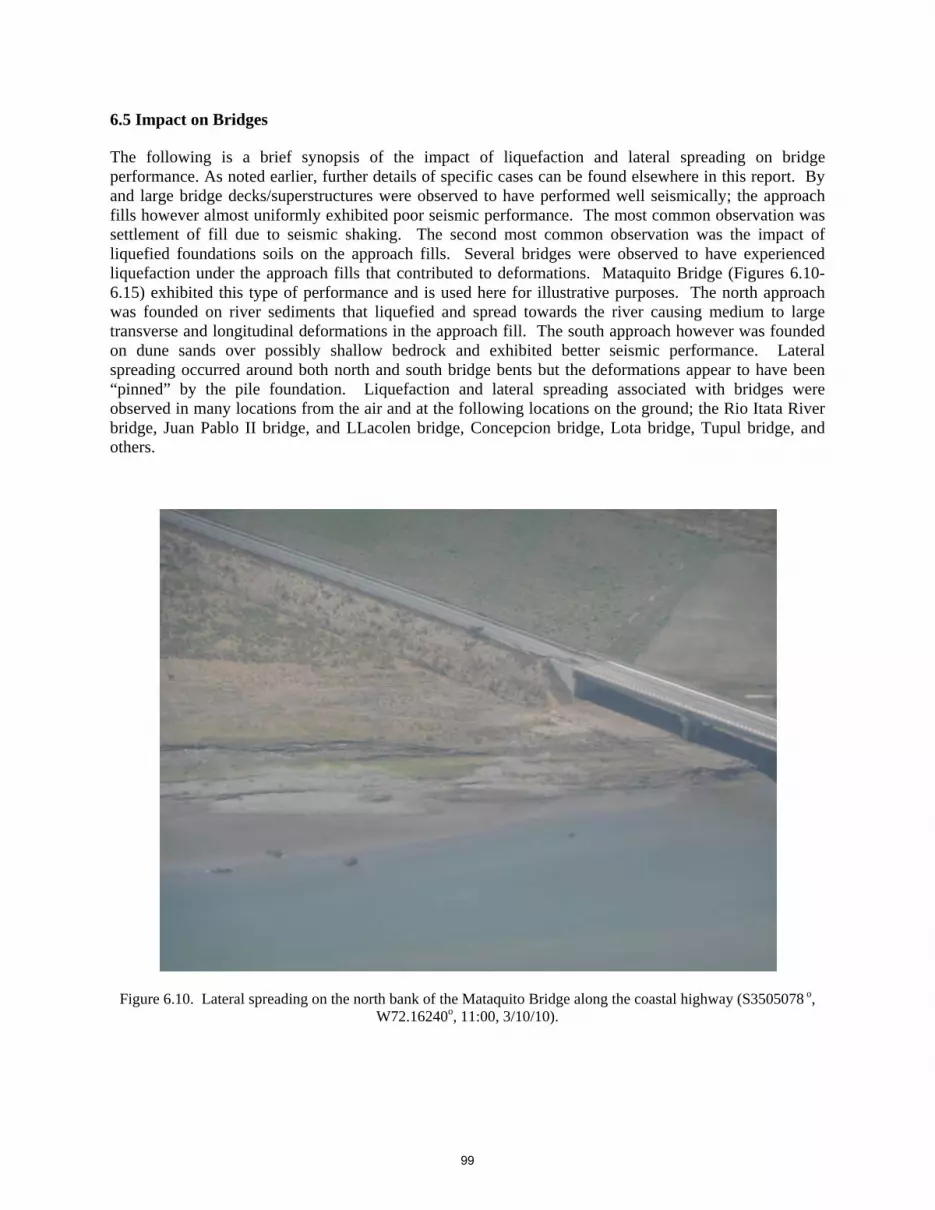
6.5 Impact on Bridges
The following is a brief synopsis of the impact of liquefaction and lateral spreading on bridge performance. As noted earlier, further details of specific cases can be found elsewhere in this report. By and large bridge decks/superstructures were observed to have performed well seismically; the approach fills however almost uniformly exhibited poor seismic performance. The most common observation was settlement of fill due to seismic shaking. The second most common observation was the impact of liquefied foundations soils on the approach fills. Several bridges were observed to have experienced liquefaction under the approach fills that contributed to deformations. Mataquito Bridge (Figures 6.10-6.15) exhibited this type of performance and is used here for illustrative purposes. The north approach was founded on river sediments that liquefied and spread towards the river causing medium to large transverse and longitudinal deformations in the approach fill. The south approach however was founded on dune sands over possibly shallow bedrock and exhibited better seismic performance. Lateral spreading occurred around both north and south bridge bents but the deformations appear to have been “pinned” by the pile foundation. Liquefaction and lateral spreading associated with bridges were observed in many locations from the air and at the following locations on the ground; the Rio Itata River bridge, Juan Pablo II bridge, and LLacolen bridge, Concepcion bridge, Lota bridge, Tupul bridge, and others.
Figure 6.10. Lateral spreading on the north bank of the Mataquito Bridge along the coastal highway (S3505078 o, W72.16240o, 11:00, 3/10/10).
99

Figure 6.11. Ground based image of the previous photo (S3505078 o, W72.16240o, 11:00, 3/8/2010).
Figure 6.12. Impact of liquefaction and lateral spreading on the north approach fill of Mataquito Bridge (S3505078 o, W72.16240o, 11:00, 3/8./2010).
100
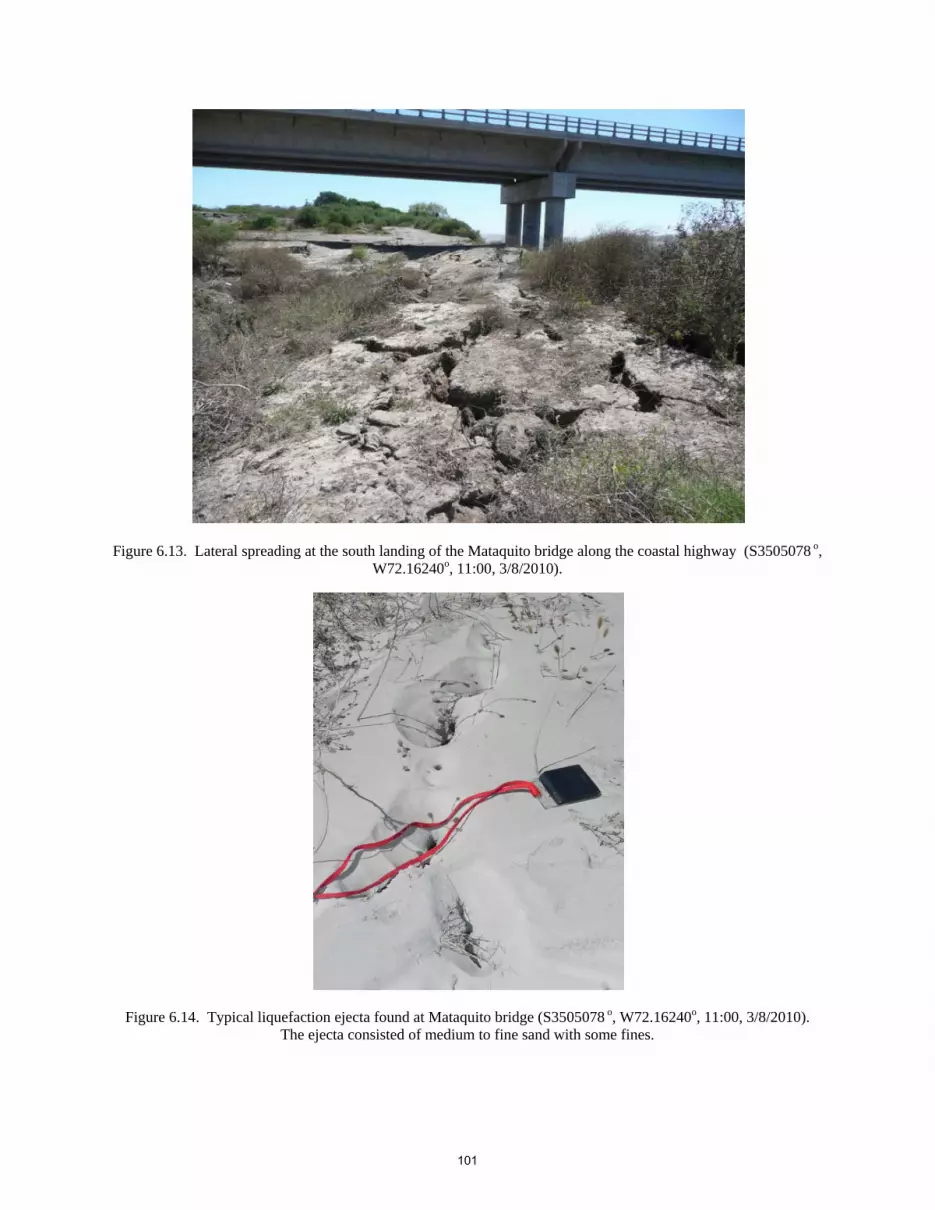
Figure 6.13. Lateral spreading at the south landing of the Mataquito bridge along the coastal highway (S3505078 o, W72.16240o, 11:00, 3/8/2010).
Figure 6.14. Typical liquefaction ejecta found at Mataquito bridge (S3505078 o, W72.16240o, 11:00, 3/8/2010). The ejecta consisted of medium to fine sand with some fines.
101

Figure 6.15. Ejecta in the foreground and lateral spreading cracks in the back ground along the south landing of the Mataquito bridge (S3505078 o, W72.16240o, 11:00, 3/8/2010).
6.6 Impact on Pan American Highway
The Pan American highway crosses many rivers, water ways, canals, and ditches in the central region of Chile; this being an agricultural region with east-west trending water ways at 30-50 km spacing and the highway trending north-south. Most bridges at river crossings along the highway performed reasonably well, similar to what was described in the previous section. Surface evidence of liquefaction was observed and deformations had some impact on the approach fills. The most frequent damage along the Pan American was observed to correlate with relatively un-engineered water crossings such as canals and ditches. Systematic failures of the road foundation was seen where culverts, box sections, and other minor water conduits intersected the highway (e.g. Figures 6.16 and 6.17).
102
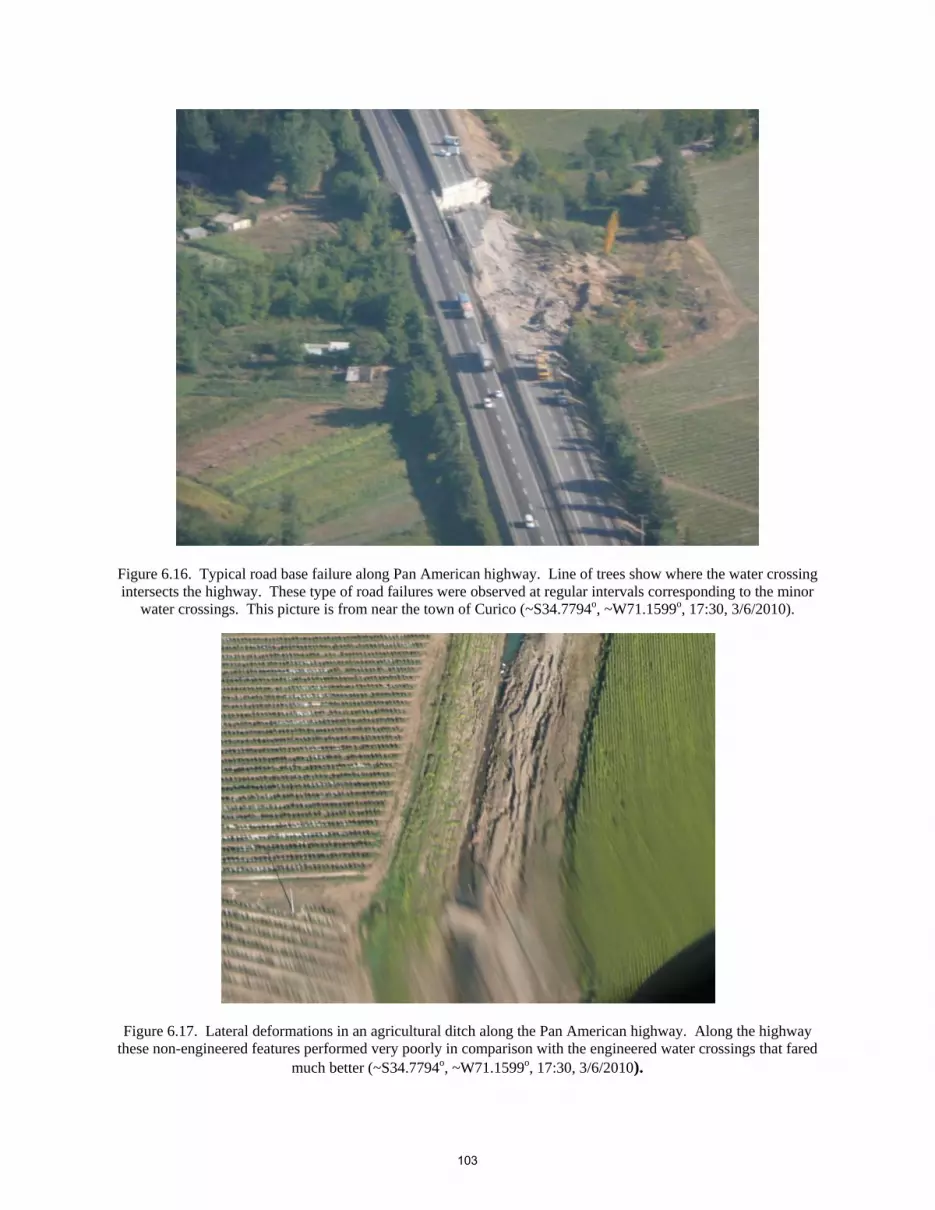
Figure 6.16. Typical road base failure along Pan American highway. Line of trees show where the water crossing intersects the highway. These type of road failures were observed at regular intervals corresponding to the minor
water crossings. This picture is from near the town of Curico (~S34.7794o, ~W71.1599o, 17:30, 3/6/2010).
Figure 6.17. Lateral deformations in an agricultural ditch along the Pan American highway. Along the highway these non-engineered features performed very poorly in comparison with the engineered water crossings that fared
much better (~S34.7794o, ~W71.1599o, 17:30, 3/6/2010).
103

6.7 Impacts on Tank Structures
Many silos and tanks were observed to have suffered damage due to the earthquake. Whereas some of these tanks and silos failed due to the strong ground shaking with high long period motion content, there were several documented to have failed due to liquefied foundation conditions. Figure 6.18 shows an example of this near Arauco. Other liquefaction effects include tanks that became buoyant when the higher unit weight soil fluidized. This was observed in San Fernando (Figure 6.19), Chillan, Aruaco and Lebu, for example.
Figure 6.18. Leaning tank due to liquefaction of the foundation soil, near Arauco (S37.2458o, W73.3197o).
Figure 6.19. Tanks buoyed above the ground surface when the higher unit weight soil fluidized due to excess pore pressure generation. This occurred near San Fernando (~S34.5898o, ~W70.9890o)
104
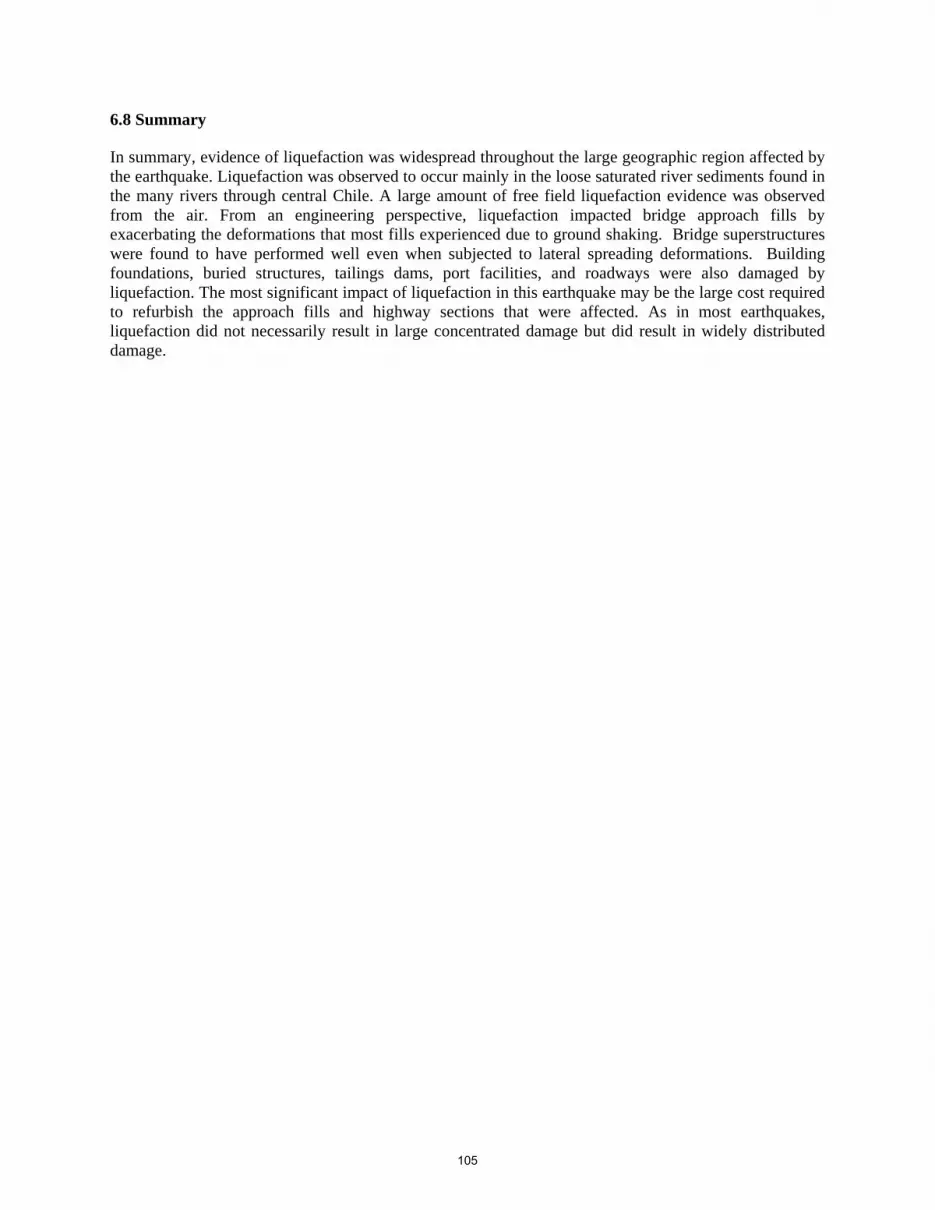
6.8 Summary
In summary, evidence of liquefaction was widespread throughout the large geographic region affected by the earthquake. Liquefaction was observed to occur mainly in the loose saturated river sediments found in the many rivers through central Chile. A large amount of free field liquefaction evidence was observed from the air. From an engineering perspective, liquefaction impacted bridge approach fills by exacerbating the deformations that most fills experienced due to ground shaking. Bridge superstructures were found to have performed well even when subjected to lateral spreading deformations. Building foundations, buried structures, tailings dams, port facilities, and roadways were also damaged by liquefaction. The most significant impact of liquefaction in this earthquake may be the large cost required to refurbish the approach fills and highway sections that were affected. As in most earthquakes, liquefaction did not necessarily result in large concentrated damage but did result in widely distributed damage.
105

7.0 EFFECTS OF GROUND FAILURE ON BUILDINGS 7.1 General Several urbanized areas were strongly shaken by the February 27, 2010 Mw=8.8 Chile earthquake. Most buildings within the affected areas performed well, especially modern buildings. However, many older buildings performed poorly particularly in areas with a large concentration of unreinforced masonry and low-rise adobe construction, such as in the cities of Curico and Talca. In contrast to other regions affected by the earthquake where shaking has been initially reported to have strongest energy content within the 0.8-2.0 second range, regions such as Curico may have observed high acceleration levels within the low period range (e.g., in the period range of 0.1-0.2 s, spectral demands greater than 1.4 g were measured at one station in Curico).1 Within the city center of Curico, where many historic adobe structures are located, nearly 90% of the structures were destroyed. Similarly, in the city of Talca, 67km WSW of Curico, nearly every home in the city’s center was severely damaged and most historic structures were flattened, whereas taller, well-designed structures appeared to perform relatively well with the exception of damage to nonstructural elements (Figure 7.1a). Nonetheless, given the widespread construction type and earthquake characteristics across the broad extent of this event, there certainly were a number of cases in which modern buildings performed poorly, such as the high-rise office building located in downtown Concepción that is shown in Figure 7.1b. The structural performance of buildings is being documented by the EERI LFE team as well as by other post-earthquake reconnaissance teams, so the reader should consult their reports for comprehensive documentation of the structural performance of buildings during this earthquake. The GEER team focused on those buildings whose seismic performance appeared to be affected by ground failure. Therefore, in this section of the report, several important cases that provide insight regarding the effects of ground failure on buildings are documented. There are other cases described in this report that involve building performance affected by ground failure. For example, the reader is referred to Section 8.4 which describes the performance of several buildings at the fish packing industrial facility near the Port of San Vicente.
(a) (b) Figure 7.1. (a) Typical construction type and observed damage within the city of Talca (S36.8323°,W73.0554°;
1230 hrs on 3/18/2010) and (b) Significant structural damage, including partial collapse of a floor, of a modern high-rise building in downtown Concepción (S36.8296° W73.0550°; 2000 hrs on 03/17/2010).
1 Boroschek, R., Soto, P., Leon, R., and Comte, D. (2010). Informe Preliminar Red Nacional De Acelerografos Terremoto Centro Sur Chile 27 de Febrero de 2010 – Informe Preliminar No. 4. Departmento de Ingenieria Civil & Departmento de Geofisica. (in Spanish).
106

7.2 Hospital Provincial in Curanilahue Liquefaction-induced ground deformations affected the seismic performance of the new hospital facility built in the City of Curanilahue, which is about 80 km southwest of Concepción. The new hospital facility and the reported site conditions will be described first. Information on the hospital facility was shared by Mr. Aldo A. Faúndez Contreras, the architect of record of the new hospital design. Observations made by the initial GEER team that visited the site will then follow. This site was also characterized by a follow-on GEER team, and the details of their characterization are described in Section 15 of this report. The modern hospital facility was opened in 2008. It replaced older one-story structures. GoogleEarth images of the site on April 15, 2005 and November 15, 2009 are shown in Figure 7.2. Construction in Curanilahue is generally of one to two stories, except for a few buildings that are taller. The new hospital facility has 10 structurally isolated wings with heights ranging from one to six stories, with the taller ones being amongst the tallest buildings in the city. Elevation and plan views of the hospital are shown in Figure 7.3. A map denoting the wing numbering and number of stories, which will be referred to in subsequent discussions, is shown in Figure 7.4. An exterior image of the hospital is shown in Figure 7.5. A soil mechanics report dated September 23, 2003 that was prepared by Mr Ricardo Valdebenito V. of VST Ingenieros, Ltda. of Santiago was shared with us. The project’s soil mechanics report states that the natural soils present at the site are heterogeneous. The top soil layer is an artificial fill of thickness 0.7 m that contains silt, debris, and coal. Directly below the fill there is a clayey silt/sandy silt/silty clay material with a thickness of about 1.6 m, medium to high water content, low consistency, and medium to high PI. Below this layer, between depths of 2.3 m and 3.4 m, there is a silty sand and clayey gravel stratum with a thickness of about 1.1 m, high water content, low plasticity with presence of subrounded gravel particles (d=3.8 cm max.), followed by a 0.8 m thick stratum of medium to high PI clayey gravel with high water content (stones with max size 23 cm). The last stratum identified through SPT sampling (at a depth greater than 3.4 m) is composed of clayey silt with high water content, medium consistency, and high plasticity. Groundwater was measured at an average depth of 0.87 m, varying between 0.65 m and 1.60 m throughout the site. There is lateral variability across the site, and the report indicates that an old channel of the adjacent channelized river was found running through the site under Wings 1A to 1F. Based on a second phase study that included an electrical resistivity survey, Mr. Valdebenito concluded that at depths between 4 m and 8 m there is large grain sediment and sand in a fine soil matrix and that there is a low resistivity stratum, typical of clayey soils, between depths of 8 m and 10 m. The matrix of the river deposit that is between depths of 4 m and 8 m appeared to be silty sands to sandy silts of low to moderate plasticity. The study shows that there is no evidence of organic silt layers, which are commonly found in Curanilahue. Additionally, compacted earth fill was placed on the north side of the hospital to raise the grade so that entrance on the north side was into the hospital’s second floor, whereas the entrances into the hospital from the south side of the hospital and interior courtyards was at the first floor. Mr. Valdebenito classified this site as Class III according to the Chilean Seismic Code NCh433 (equivalent to Soil class D in IBC 2006). The characteristics of soil Class III in NCh433 are defined as:
• Non-saturated sand, with relative density 55%<Dr<75% or NSPT>20 (without overburden pressure correction of 0.10MPa), or
• Gravel or non saturated sand, with relative compaction less than 95% of the modified proctor, or • Cohesive soil, with undrained shear strength between 0.025 MPa to 0.10MPa regardless of the
water table, or • Saturated sand with N between 20 to 40 (normalized to overburden pressure of 0.10MPa)
The PGA at this site according to NCh433 is 0.4g (coastal regions).
107

Figure 7.2. (a) April 15, 2005 image and (b) November 15, 2009 image of Curanilahue hospital site (GoogleEarth;
S37.47355° W73.34799°)
Figure 7.3. Front elevation looking to the south and plan drawings of the hospital (courtesy of Mr. Aldo A. Faúndez
Contreras)
108
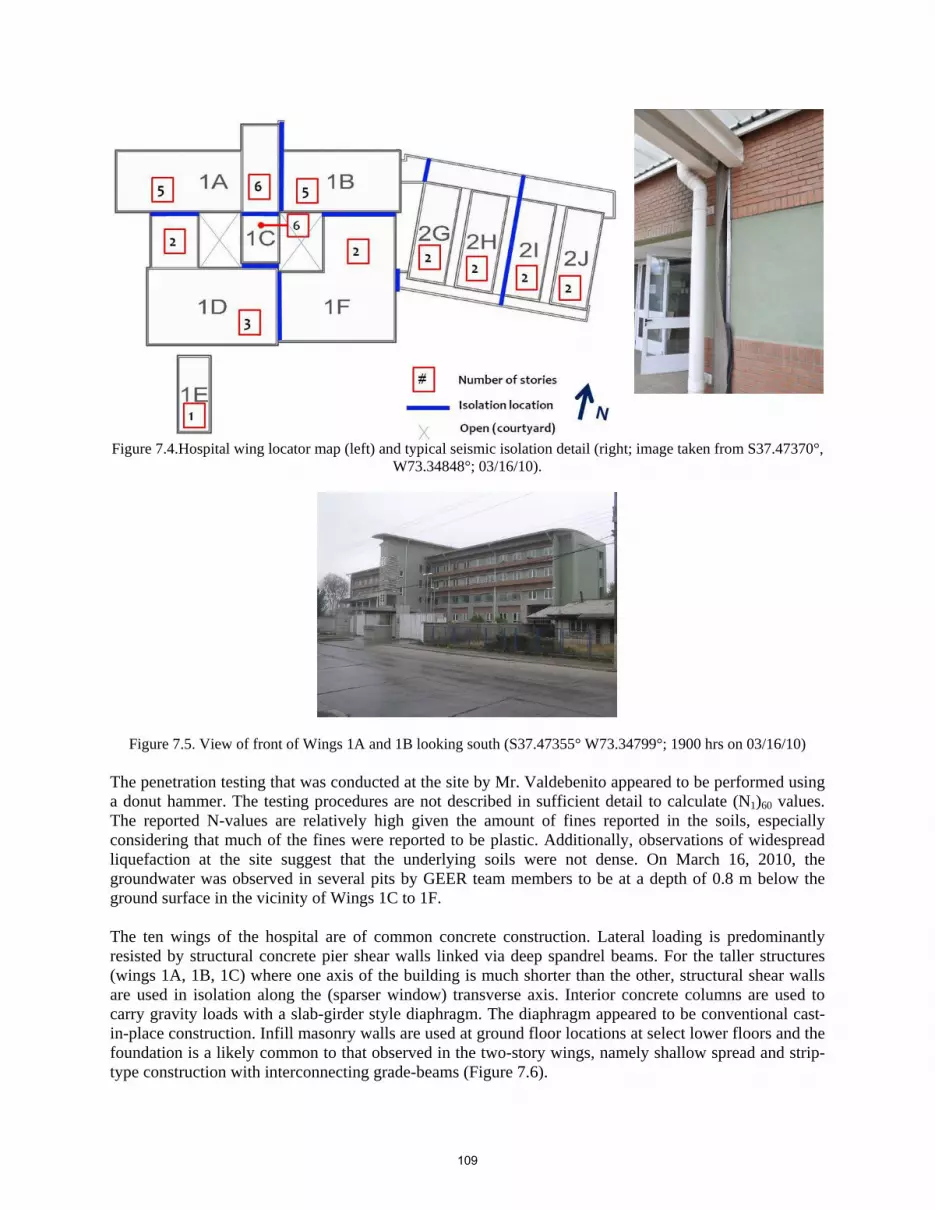
Figure 7.4.Hospital wing locator map (left) and typical seismic isolation detail (right; image taken from S37.47370°, W73.34848°; 03/16/10).
Figure 7.5. View of front of Wings 1A and 1B looking south (S37.47355° W73.34799°; 1900 hrs on 03/16/10) The penetration testing that was conducted at the site by Mr. Valdebenito appeared to be performed using a donut hammer. The testing procedures are not described in sufficient detail to calculate (N1)60 values. The reported N-values are relatively high given the amount of fines reported in the soils, especially considering that much of the fines were reported to be plastic. Additionally, observations of widespread liquefaction at the site suggest that the underlying soils were not dense. On March 16, 2010, the groundwater was observed in several pits by GEER team members to be at a depth of 0.8 m below the ground surface in the vicinity of Wings 1C to 1F. The ten wings of the hospital are of common concrete construction. Lateral loading is predominantly resisted by structural concrete pier shear walls linked via deep spandrel beams. For the taller structures (wings 1A, 1B, 1C) where one axis of the building is much shorter than the other, structural shear walls are used in isolation along the (sparser window) transverse axis. Interior concrete columns are used to carry gravity loads with a slab-girder style diaphragm. The diaphragm appeared to be conventional cast-in-place construction. Infill masonry walls are used at ground floor locations at select lower floors and the foundation is a likely common to that observed in the two-story wings, namely shallow spread and strip-type construction with interconnecting grade-beams (Figure 7.6).
109
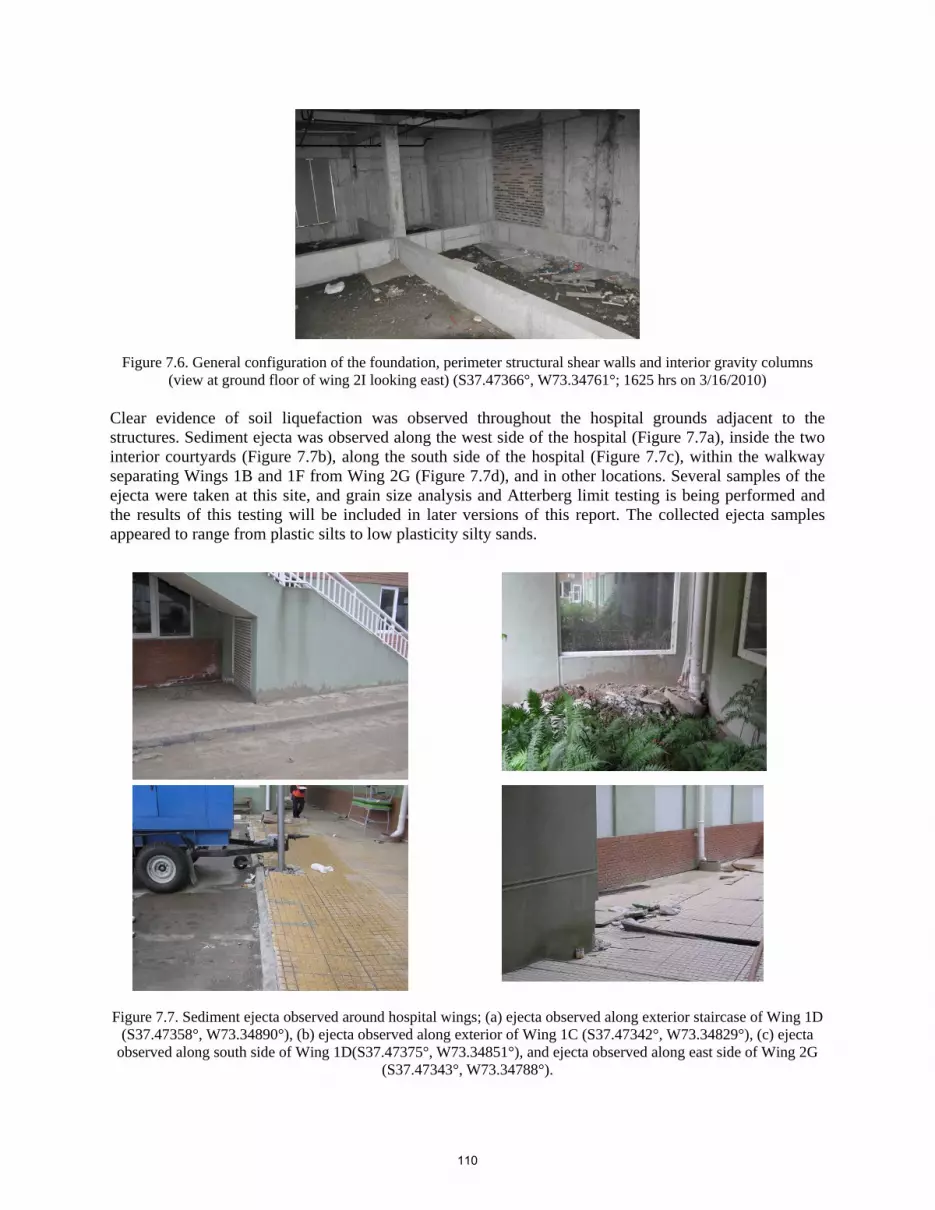
Figure 7.6. General configuration of the foundation, perimeter structural shear walls and interior gravity columns (view at ground floor of wing 2I looking east) (S37.47366°, W73.34761°; 1625 hrs on 3/16/2010)
Clear evidence of soil liquefaction was observed throughout the hospital grounds adjacent to the structures. Sediment ejecta was observed along the west side of the hospital (Figure 7.7a), inside the two interior courtyards (Figure 7.7b), along the south side of the hospital (Figure 7.7c), within the walkway separating Wings 1B and 1F from Wing 2G (Figure 7.7d), and in other locations. Several samples of the ejecta were taken at this site, and grain size analysis and Atterberg limit testing is being performed and the results of this testing will be included in later versions of this report. The collected ejecta samples appeared to range from plastic silts to low plasticity silty sands.
Figure 7.7. Sediment ejecta observed around hospital wings; (a) ejecta observed along exterior staircase of Wing 1D (S37.47358°, W73.34890°), (b) ejecta observed along exterior of Wing 1C (S37.47342°, W73.34829°), (c) ejecta
observed along south side of Wing 1D(S37.47375°, W73.34851°), and ejecta observed along east side of Wing 2G (S37.47343°, W73.34788°).
110
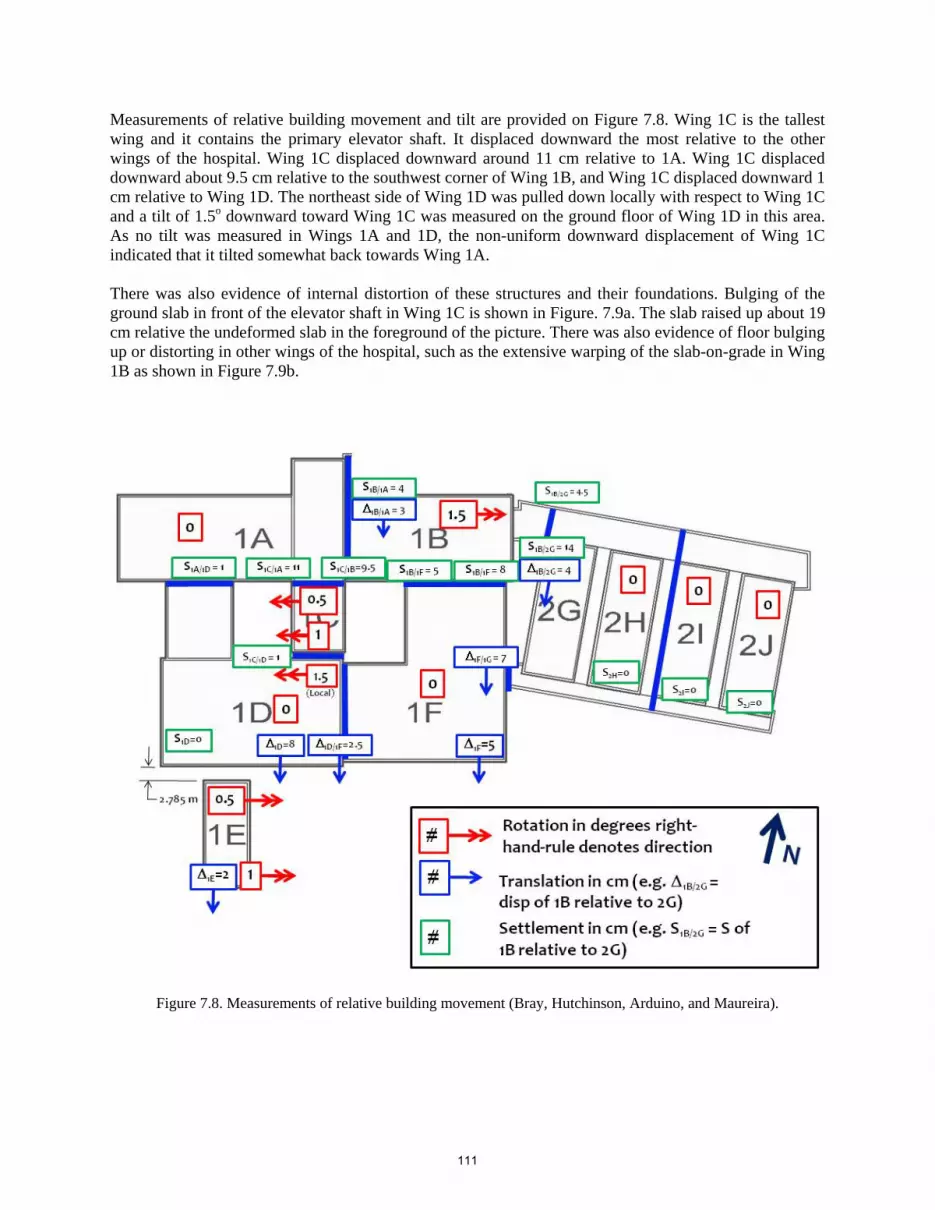
Measurements of relative building movement and tilt are provided on Figure 7.8. Wing 1C is the tallest wing and it contains the primary elevator shaft. It displaced downward the most relative to the other wings of the hospital. Wing 1C displaced downward around 11 cm relative to 1A. Wing 1C displaced downward about 9.5 cm relative to the southwest corner of Wing 1B, and Wing 1C displaced downward 1 cm relative to Wing 1D. The northeast side of Wing 1D was pulled down locally with respect to Wing 1C and a tilt of 1.5o downward toward Wing 1C was measured on the ground floor of Wing 1D in this area. As no tilt was measured in Wings 1A and 1D, the non-uniform downward displacement of Wing 1C indicated that it tilted somewhat back towards Wing 1A. There was also evidence of internal distortion of these structures and their foundations. Bulging of the ground slab in front of the elevator shaft in Wing 1C is shown in Figure. 7.9a. The slab raised up about 19 cm relative the undeformed slab in the foreground of the picture. There was also evidence of floor bulging up or distorting in other wings of the hospital, such as the extensive warping of the slab-on-grade in Wing 1B as shown in Figure 7.9b.
Figure 7.8. Measurements of relative building movement (Bray, Hutchinson, Arduino, and Maureira).
111

Figure 7.9. Distortion of the slab-on-grade: (a) floor bulging in front of elevator shaft inWing 1C (S37.47345°, W73.34835°), and (b) floor distortion in eastern hallway of Wing 1B (S37.4733°, W73.3478°).
Relative movement between Wings 1B and 2G was apparent at the connection of these two wings as shown in Figure 7.10. At the northeast corner of the Wing 1B extension adjacent to the northwest corner of Wing 2G, Wing 1B displaced 4.5 cm downward and 4 cm southward relative to Wing 2G. The downward movement of Wing 1B relative to Wing 2G at the location of the photograph shown in Figure 7.10 was 14 cm. The measured relative offset between these two wings, however, was non-uniform, which suggested that Wing 1B tilted with respect to Wing 2G, which appeared not to tilt. The tilt of Wing 1B was reliably measured to be 1.5o with its top displacing to the south relative to its base. The southeast corner of Wing 1B displaced downward 8 cm relative to Wing 1F.The northwest corner of Wing 1B displaced downward 4 cm relative to Wing 1A. Wing 1B also displaced laterally to the south about 4 cm relative to Wing 2G. Wing 1F and Wing 1D did not have noticeable tilt, and although sediment ejecta were found along its southern sides, no significant relative downward movement with respect to the surrounding walkway was observed. However, the walkway pavement indicated that these wings displaced laterally to the south. At the location of the photograph in Figure 7.7c, Wing 1D displaced southward 8 cm. Wing 1D displaced 2.5 cm southward relative to Wing 1F. The southeast corner of Wing 1F displaced southward 5 cm. Wing 1F displaced southward 7 cm relative to the southwest extension of Wing 2G.
Figure 7.10. Relative movement between Wing 1B (in the background) and Wing 2G (in the foreground)
(S37.47335°, W73.34786°; 03/16/10).
112

Wings 2G, 2H, 2I, and 2J, which are 2-story structures, did not appear to undergo significant movement. Ejecta were found adjacent to these wings, and some hairline fractures were observed in its brick facing on its south side and on the north side aligned with the concrete frame outline. However, no tilt or relative ground movements were observed. There was settlement of the earth fill placed on its north side. Wing 1E is separated from Wing 1D by a walkway. The horizontal separation of the northwest corner of Wing 1E from Wing 1D was measured to be 2.785 m. Compression of the sidewalk separating these two wings was observed but could not be measured reliably. Wing 1E did translate to the south 2 cm as indicated by compression of its adjacent curb on its south side. A tilt of the top of Wing 1E toward the south of 1o was measured in its southern side. The northern side of Wing 1E only appeared to tilt toward the south 0.5o. There was no significant downward movement of Wing 1E relative to the surrounding ground. Structural and nonstructural damage was observed throughout the hospital; however, the extent of structural damage was minimal due to the isolation gap provided between the wings. The most pronounced damage was associated with closure of the seismic gap and resulting contact between wings, and in particular, Wing 1C and its neighboring structures (1A, 1B, and 1F). Select locations of shear wall damage were noted; however the extent of this was minimal. Figure 7.11 provides a map of the more pronounced structural damage observed, with photographic documentation associated with the map provided in Figure 7.12. Nonstructural damage was largely confined to partition walls and ceiling systems. Due to the isolation of the various wings, the building services were designed with significant flexibility in mechanical, electrical and plumbing systems crossing the various wings. Engineers on site at the time of the team’s visit noted no disruption to the mechanical, electrical, and plumbing systems within the wings. An example of the flexibility of the design connections and resulting good performance is shown in Figure 7.13. Detailed review of the immediate post-event nonstructural damage was conducted by Professor Eduardo Miranda of Stanford University and interested readers should consult his findings.
Figure 7.11. Damage map denoting select locations of observed perimeter damage; refer to Figure 7.12 for photographs and description of observation associated with letter annotations in this figure.
113

(a) (b) (c)
(d1) (d2) (e)
(f) (g)
Figure 7.12 Most pronounced structural damage observations. (a) approach ramp to entrance bay at wing 1A (S37.473084°,W73.348712°), (b) pounding damage and resulting permanent gap developed between wings 1A-1C
due to the easterly rocking of wing 1C (note the gap was measured by hospital staff as 37 cm after the main event on February 27, 2010) (S37.473376°, W73.348452°), (c) damage to shear wall of wing 1C due to contact with wing 1D (S37.473537°, W73.348488°), (d1) elevation view of the interface between wing 1B-1C and (d2) local view at the roof line of wing 1B observing the pounding between these two wings (S37.473406°,W73.348304°), (e) vertical
cracks in masonry in-fill of wing 2H (S37.473713°, W73.347839°), (f) fallen masonry façade and spalling of structural wall of wing 1F due to impact with wing 1B (S37.473494°, W73.347948°), and (g) cracking damage at in-
fill and structural shear wall interface at front of wing 2I-2J (S37.473528°, W73.347363°). Images taken at 1430, 1715, 1415, 1725, 1725, 1350, 1625, and 1645 hrs, respectively, on 3/16/2010.
114

(a) (b) Figure 7.13. Generally good performance of building services equipment in the hospital building (note the blue tank
in the background of the image of part (a) was unanchored and slide laterally, resulting in the lateral shift of the lower pipe run in the foreground). All connections were intact and operational for these service equipment. (images
taken in wing 1F, approximately S37.473577°, W73.348042°; 1345 hrs on 3/16/2010).
Slight evidence of liquefaction was observed to the north of the hospital in the parking lot area of a market (Figure 7.14a). Minor pavement distress and minor uplift of manholes in this area were observed. However, the pervasive liquefaction that was observed at the hospital was not observed here or at other locations in the city. Lastly, ground failure was observed near the river that is located south of the hospital (Figure 7.14b); however, the street that ran along the north side of the river showed no damage to its north, which indicates that the ground failure near the river was localized and did not extend to the hospital grounds.
(a) (b)
Figure 7.14. (a) Curled sidewalk north across the street from the hospital (S37.4727°,W73.3477°) and (b) ground failure near the river south of the hospital (S37.4742°, W73.3471°; at 1930 and 1830 hrs, respectively, on
3/16/2010).
115

7.3 Four 8-Story Buildings (Condominio los Presidentes) in Concepción The four 8-story condominium buildings named the Condominio los Presidentes, located at Los Gorriones No. 512, Comuna de Hualpén, Concepción, underwent liquefaction-induced movement and were damaged by seismically induced permanent ground movement and by strong shaking. Information about the site was shared by Ms. Gaby Correa who represents some of the residents in the complex. Images of the master plan for the site were obtained from the condominium sales office, which was open at the time of the teams visit (Figure 7.15). The master plan indicates that six similar 8-story buildings will eventually occupy the site. The two buildings at the south end of the property were built first approximately three years ago. The two buildings in the center of the property going from south to north were constructed a year later. These two buildings were not fully occupied at the time of the earthquake. The final two buildings at the north end of the property have not been built yet. The southwest building, which is called the Riesco Building, is shown in the background of the photograph shown in Figure 7.16, and the southeast building, which is called the Errázuriz Building, is shown in the foreground of this photograph. The northeast and northwest buildings are referred to as the Montt and Bulnes buildings, respectively.
N
Figure 7.15. Master plan at the Condominio los Presidentes site.
116

Figure 7.16. Southern most buildings at the four 8-story condominium building site (S36.791026°; W73.081235°;
1300 hrs on 03/17/10).
We were told by Ms. Gaby Correa that this area was marshy ground before it was developed. They placed sandy fill at the site to raise the ground level. During the GEER visit on March 17, 2010, groundwater was observed at a depth of 0.5 m. The structures are founded on shallow foundations that appear to be spread footings with interconnected grade beams. The exterior footings appeared to be an inverted T-strip foundation with a base width of 1.4 m and a stem width of 20 cm. The slab-on-grade is a floating slab at the first floor living spaces. The state of compaction of the sandy fill is not known. However, it is likely that the sandy fill that would support structures would have been compacted to a higher density than the sandy fill placed in the open spaces. Individual buildings have a footprint of 11.43 m by 25.65 m, with two apartment units on each of the north and south wings of the buildings (Figure 7.17). The estimated height of the buildings was 18.7 m, with the first floor measuring 2.3 m. The apartment unit pairs are separated by a full height elevator and stairwell approximately centered along the core of the building. Seismic load resistance in the longitudinal direction of shaking is provided by a full height structural shear wall at the elevator shaft of length 345 cm, with some redundancy and gravity load support provided by short wall segments within the apartment units’ walls on either side of windows. The transverse axis of the buildings is absent openings, therefore, the full transverse length of the building comprises a structural shear wall for gravity and seismic load resistance. The perimeter wall thickness was measured as 15 cm, while interior partition walls were full height and measured as 7 cm thick. Along the longitudinal axis of the buildings, a 270 cm long by 78 cm deep coupling beam provides continuity in load transfer (Figure 7.18). As shown in Figure 7.19, evidence of liquefaction of the gray sandy fill was present throughout the site. Sediment ejecta, ground cracking, ground settlement, and other evidence of liquefaction could be seen throughout the site. In the left photograph of Figure 7.19, sediment ejecta, ground settlement, ground cracks, and tilt of the guard room at the condominium entrance are seen. In the right photograph of Figure 7.19, similar evidence of liquefaction is seen inside the fenced area of the property.
117

Figure 7.17. Architectural plan of the Riesco, Errázuriz, Montt, and Bulnes buildings (image taken at 1615 hrs on
3/17/2010).
Figure 7.18. Elevation of the Riesco building depicting the general components of the structural system of the
building (image taken at S36.790929°, W73.081296°; 1400 hrs on 3/17/2010).
118
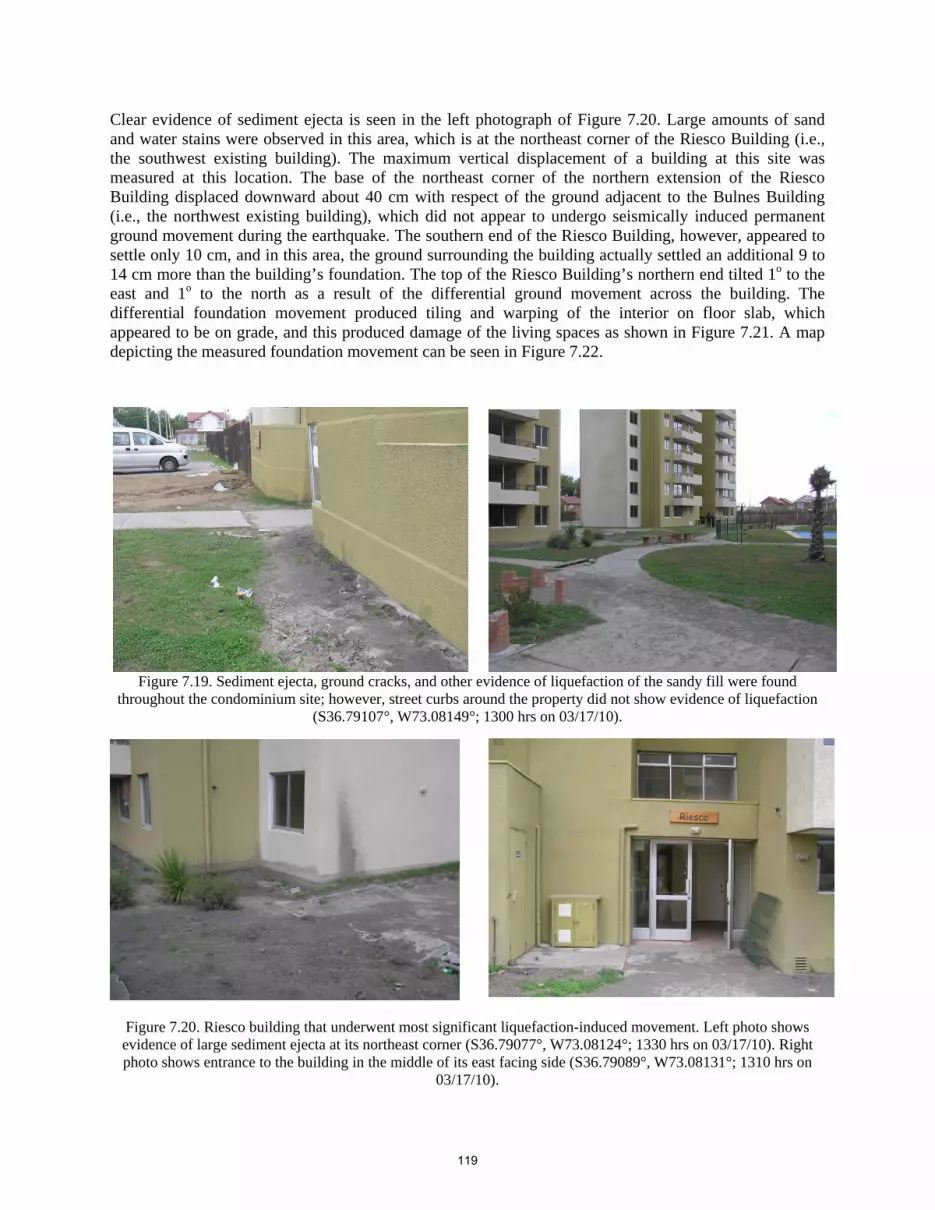
Clear evidence of sediment ejecta is seen in the left photograph of Figure 7.20. Large amounts of sand and water stains were observed in this area, which is at the northeast corner of the Riesco Building (i.e., the southwest existing building). The maximum vertical displacement of a building at this site was measured at this location. The base of the northeast corner of the northern extension of the Riesco Building displaced downward about 40 cm with respect of the ground adjacent to the Bulnes Building (i.e., the northwest existing building), which did not appear to undergo seismically induced permanent ground movement during the earthquake. The southern end of the Riesco Building, however, appeared to settle only 10 cm, and in this area, the ground surrounding the building actually settled an additional 9 to 14 cm more than the building’s foundation. The top of the Riesco Building’s northern end tilted 1o to the east and 1o to the north as a result of the differential ground movement across the building. The differential foundation movement produced tiling and warping of the interior on floor slab, which appeared to be on grade, and this produced damage of the living spaces as shown in Figure 7.21. A map depicting the measured foundation movement can be seen in Figure 7.22.
Figure 7.19. Sediment ejecta, ground cracks, and other evidence of liquefaction of the sandy fill were found throughout the condominium site; however, street curbs around the property did not show evidence of liquefaction
(S36.79107°, W73.08149°; 1300 hrs on 03/17/10).
Figure 7.20. Riesco building that underwent most significant liquefaction-induced movement. Left photo shows evidence of large sediment ejecta at its northeast corner (S36.79077°, W73.08124°; 1330 hrs on 03/17/10). Right photo shows entrance to the building in the middle of its east facing side (S36.79089°, W73.08131°; 1310 hrs on
03/17/10).
119

Figure 7.21. Evidence of interior damage to Riesco Building due to differential foundation movement (S36.79085°,
W73.08128°; 1320 hrs on 03/17/10).
Figure 7.22. Schematic plan view of the Riesco building depicting measured movement of foundation. (note that rotation about the transverse axis of the building is believed to largely hinge about the shear wall-coupling beam
interface as shown in Figure 7.23 (Bray, Hutchinson, Arduino, and Maureira).
120
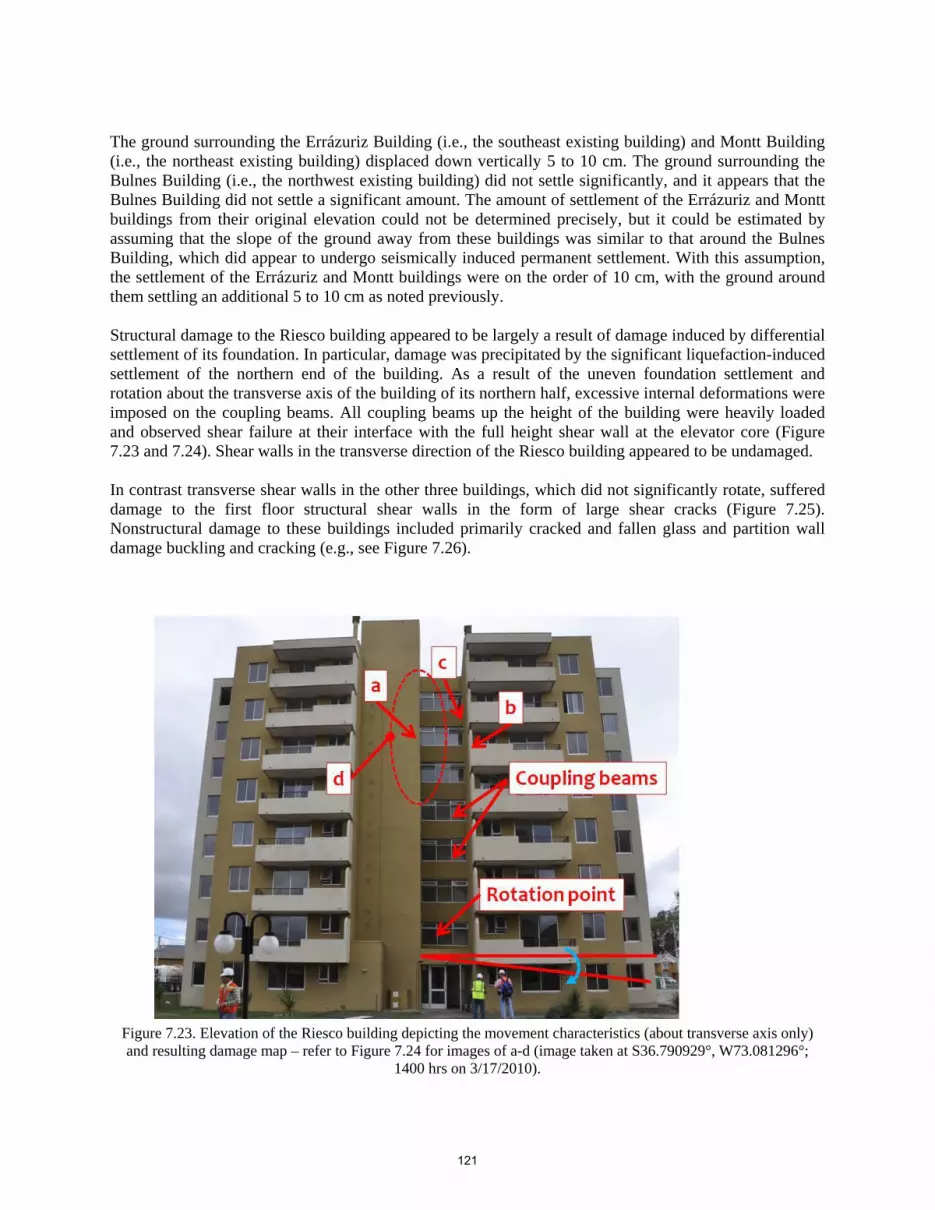
The ground surrounding the Errázuriz Building (i.e., the southeast existing building) and Montt Building (i.e., the northeast existing building) displaced down vertically 5 to 10 cm. The ground surrounding the Bulnes Building (i.e., the northwest existing building) did not settle significantly, and it appears that the Bulnes Building did not settle a significant amount. The amount of settlement of the Errázuriz and Montt buildings from their original elevation could not be determined precisely, but it could be estimated by assuming that the slope of the ground away from these buildings was similar to that around the Bulnes Building, which did appear to undergo seismically induced permanent settlement. With this assumption, the settlement of the Errázuriz and Montt buildings were on the order of 10 cm, with the ground around them settling an additional 5 to 10 cm as noted previously. Structural damage to the Riesco building appeared to be largely a result of damage induced by differential settlement of its foundation. In particular, damage was precipitated by the significant liquefaction-induced settlement of the northern end of the building. As a result of the uneven foundation settlement and rotation about the transverse axis of the building of its northern half, excessive internal deformations were imposed on the coupling beams. All coupling beams up the height of the building were heavily loaded and observed shear failure at their interface with the full height shear wall at the elevator core (Figure 7.23 and 7.24). Shear walls in the transverse direction of the Riesco building appeared to be undamaged. In contrast transverse shear walls in the other three buildings, which did not significantly rotate, suffered damage to the first floor structural shear walls in the form of large shear cracks (Figure 7.25). Nonstructural damage to these buildings included primarily cracked and fallen glass and partition wall damage buckling and cracking (e.g., see Figure 7.26).
Figure 7.23. Elevation of the Riesco building depicting the movement characteristics (about transverse axis only) and resulting damage map – refer to Figure 7.24 for images of a-d (image taken at S36.790929°, W73.081296°;
1400 hrs on 3/17/2010).
121
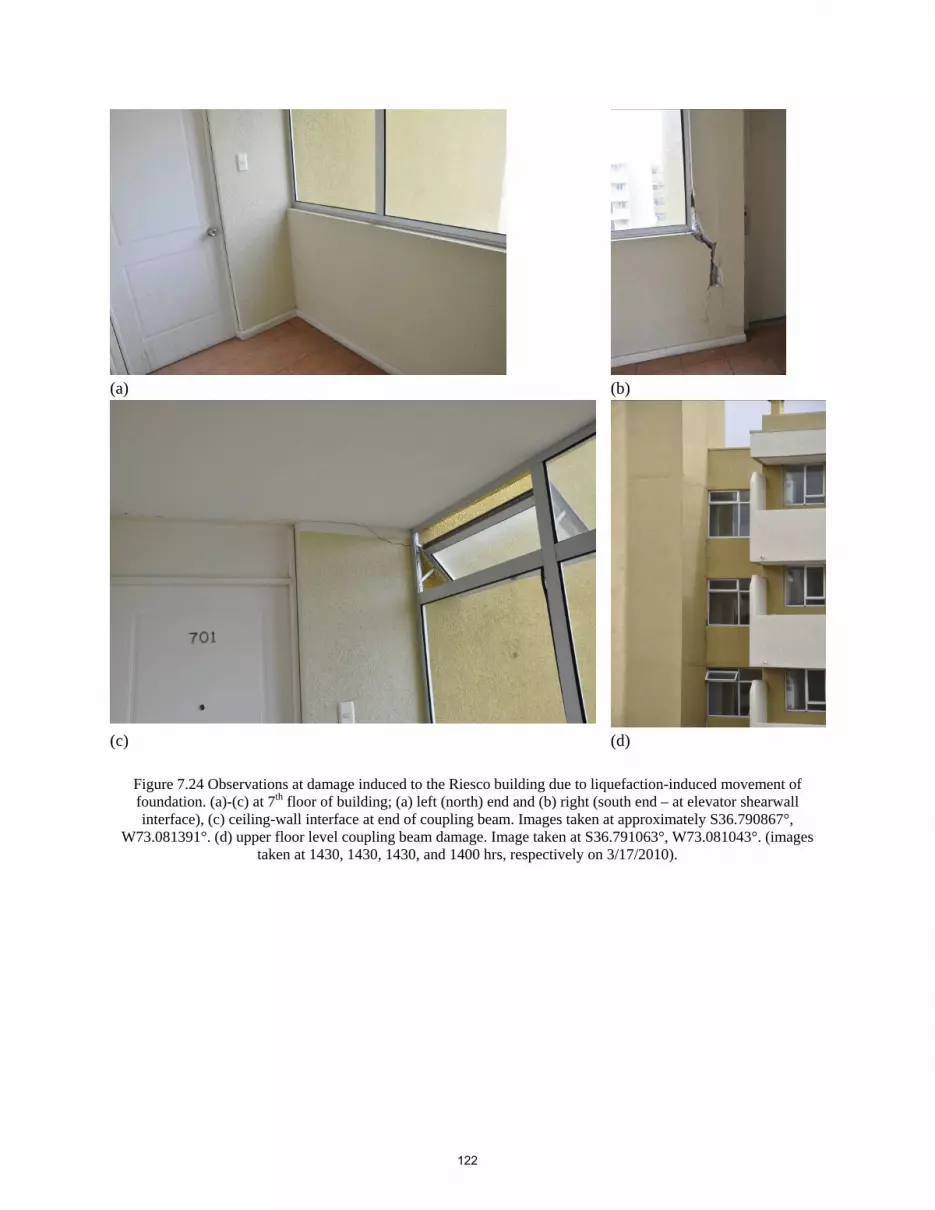
(a) (b)
(c) (d)
Figure 7.24 Observations at damage induced to the Riesco building due to liquefaction-induced movement of foundation. (a)-(c) at 7th floor of building; (a) left (north) end and (b) right (south end – at elevator shearwall interface), (c) ceiling-wall interface at end of coupling beam. Images taken at approximately S36.790867°,
W73.081391°. (d) upper floor level coupling beam damage. Image taken at S36.791063°, W73.081043°. (images taken at 1430, 1430, 1430, and 1400 hrs, respectively on 3/17/2010).
122

Figure 7.25 Damage to ground floor shear walls of the Montt building (S36.790737°, W73.080901°; 1545 hrs on
3/17/2010)
(a) (b) Figure 7.26.Typical nonstructural damage to nonstructural components in the buildings. Interior partition wall due to
bulging of the ground slab (ground floor Errázuriz building, S36.791063°, W73.081043°; 1415 and 1430 hrs, respectively, on 3/17/2010)
123
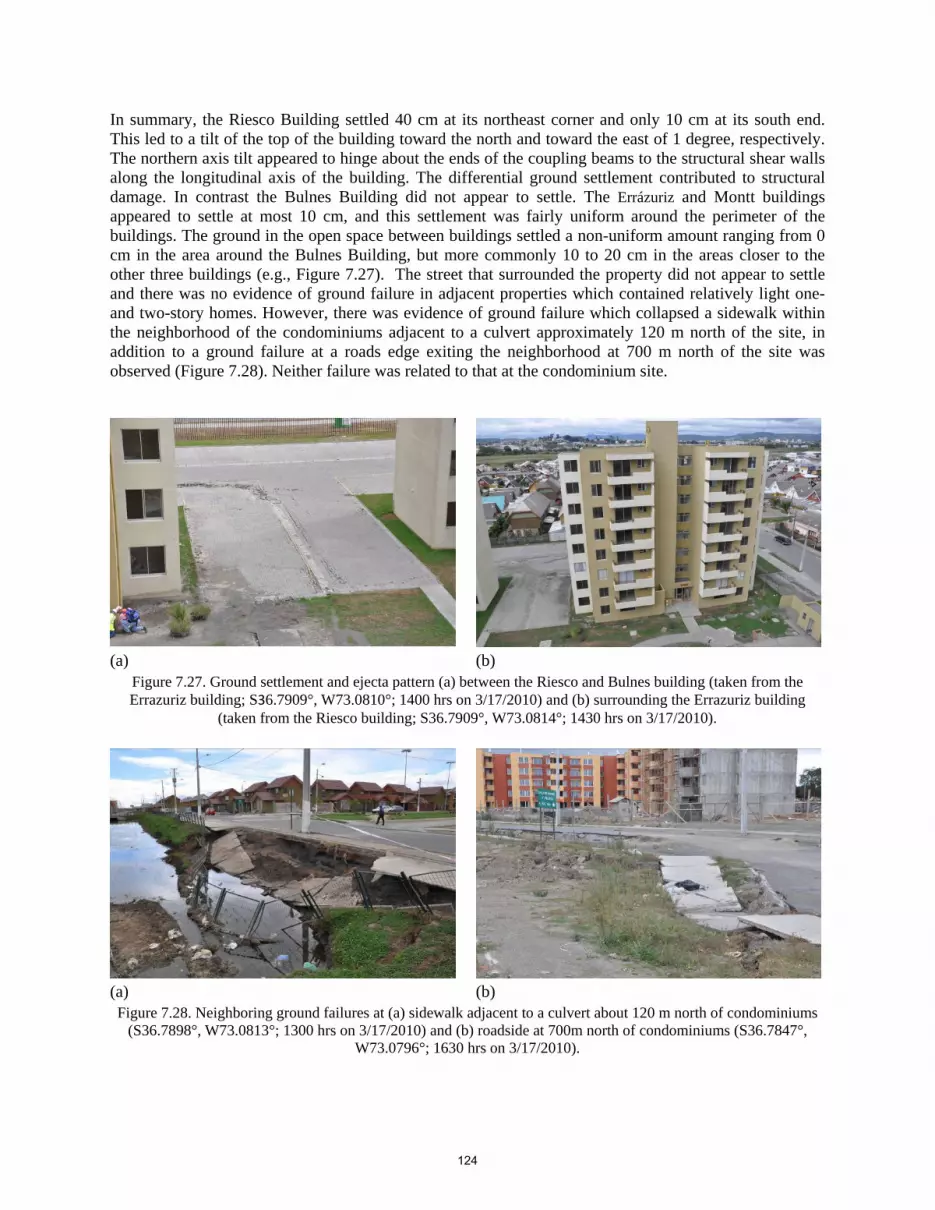
In summary, the Riesco Building settled 40 cm at its northeast corner and only 10 cm at its south end. This led to a tilt of the top of the building toward the north and toward the east of 1 degree, respectively. The northern axis tilt appeared to hinge about the ends of the coupling beams to the structural shear walls along the longitudinal axis of the building. The differential ground settlement contributed to structural damage. In contrast the Bulnes Building did not appear to settle. The Errázuriz and Montt buildings appeared to settle at most 10 cm, and this settlement was fairly uniform around the perimeter of the buildings. The ground in the open space between buildings settled a non-uniform amount ranging from 0 cm in the area around the Bulnes Building, but more commonly 10 to 20 cm in the areas closer to the other three buildings (e.g., Figure 7.27). The street that surrounded the property did not appear to settle and there was no evidence of ground failure in adjacent properties which contained relatively light one- and two-story homes. However, there was evidence of ground failure which collapsed a sidewalk within the neighborhood of the condominiums adjacent to a culvert approximately 120 m north of the site, in addition to a ground failure at a roads edge exiting the neighborhood at 700 m north of the site was observed (Figure 7.28). Neither failure was related to that at the condominium site.
(a) (b)
Figure 7.27. Ground settlement and ejecta pattern (a) between the Riesco and Bulnes building (taken from the Errazuriz building; S36.7909°, W73.0810°; 1400 hrs on 3/17/2010) and (b) surrounding the Errazuriz building
(taken from the Riesco building; S36.7909°, W73.0814°; 1430 hrs on 3/17/2010).
(a) (b) Figure 7.28. Neighboring ground failures at (a) sidewalk adjacent to a culvert about 120 m north of condominiums
(S36.7898°, W73.0813°; 1300 hrs on 3/17/2010) and (b) roadside at 700m north of condominiums (S36.7847°, W73.0796°; 1630 hrs on 3/17/2010).
124
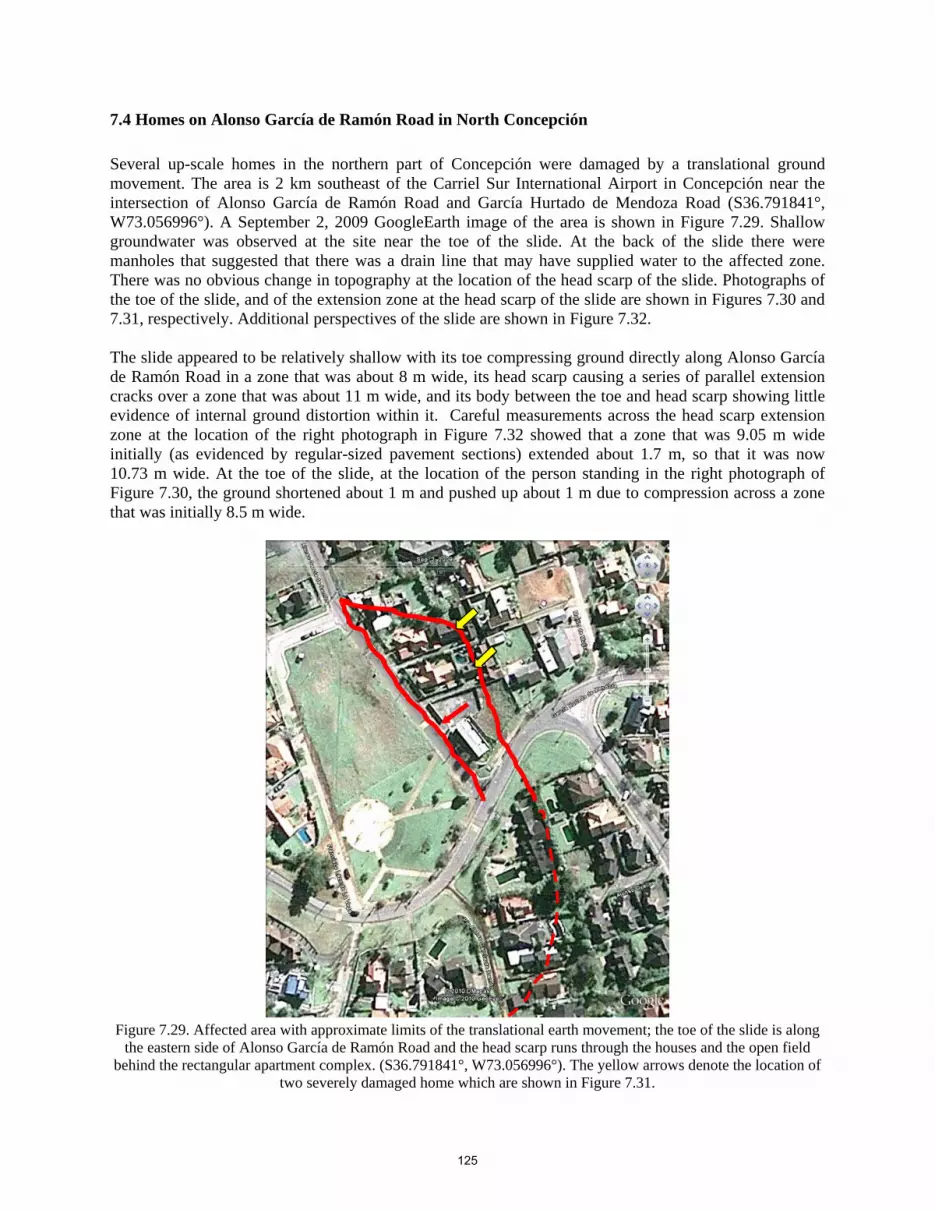
7.4 Homes on Alonso García de Ramón Road in North Concepción Several up-scale homes in the northern part of Concepción were damaged by a translational ground movement. The area is 2 km southeast of the Carriel Sur International Airport in Concepción near the intersection of Alonso García de Ramón Road and García Hurtado de Mendoza Road (S36.791841°, W73.056996°). A September 2, 2009 GoogleEarth image of the area is shown in Figure 7.29. Shallow groundwater was observed at the site near the toe of the slide. At the back of the slide there were manholes that suggested that there was a drain line that may have supplied water to the affected zone. There was no obvious change in topography at the location of the head scarp of the slide. Photographs of the toe of the slide, and of the extension zone at the head scarp of the slide are shown in Figures 7.30 and 7.31, respectively. Additional perspectives of the slide are shown in Figure 7.32. The slide appeared to be relatively shallow with its toe compressing ground directly along Alonso García de Ramón Road in a zone that was about 8 m wide, its head scarp causing a series of parallel extension cracks over a zone that was about 11 m wide, and its body between the toe and head scarp showing little evidence of internal ground distortion within it. Careful measurements across the head scarp extension zone at the location of the right photograph in Figure 7.32 showed that a zone that was 9.05 m wide initially (as evidenced by regular-sized pavement sections) extended about 1.7 m, so that it was now 10.73 m wide. At the toe of the slide, at the location of the person standing in the right photograph of Figure 7.30, the ground shortened about 1 m and pushed up about 1 m due to compression across a zone that was initially 8.5 m wide.
Figure 7.29. Affected area with approximate limits of the translational earth movement; the toe of the slide is along
the eastern side of Alonso García de Ramón Road and the head scarp runs through the houses and the open field behind the rectangular apartment complex. (S36.791841°, W73.056996°). The yellow arrows denote the location of
two severely damaged home which are shown in Figure 7.31.
125

Figure 7.30. View to the north showing toe of slide in left photo, and view to the northwest of toe of slide along Alonso García de Ramón Road (right photo taken near its intersection with García Hurtado de Mendoza Road;
S36.79146°, W73.05754°; 1200 hrs on 3/17/10).
Figure 7.31. View of extension zone in open field behind apartment building (left photo(S36.79126°, W 73.05714°; 1120 hrs on 03/17/10), and view of damage to a home due to ground extension across its foundation (right photo,
S36.79108°, W73.05728°; 1200 hrs on 3/17/2010).
Figure 7.32. View of toe of translation slide in foreground of left photo (also note that the driveway behind the toe is not damaged(S 36.79134°, W 73.05762°; 1150 hrs on 03/17/10), and view of the head scarp of the translation slide
at back of driveway in the right photo (S36.79126°, W73.05719°; 1130 hrs on 03/17/10).
126
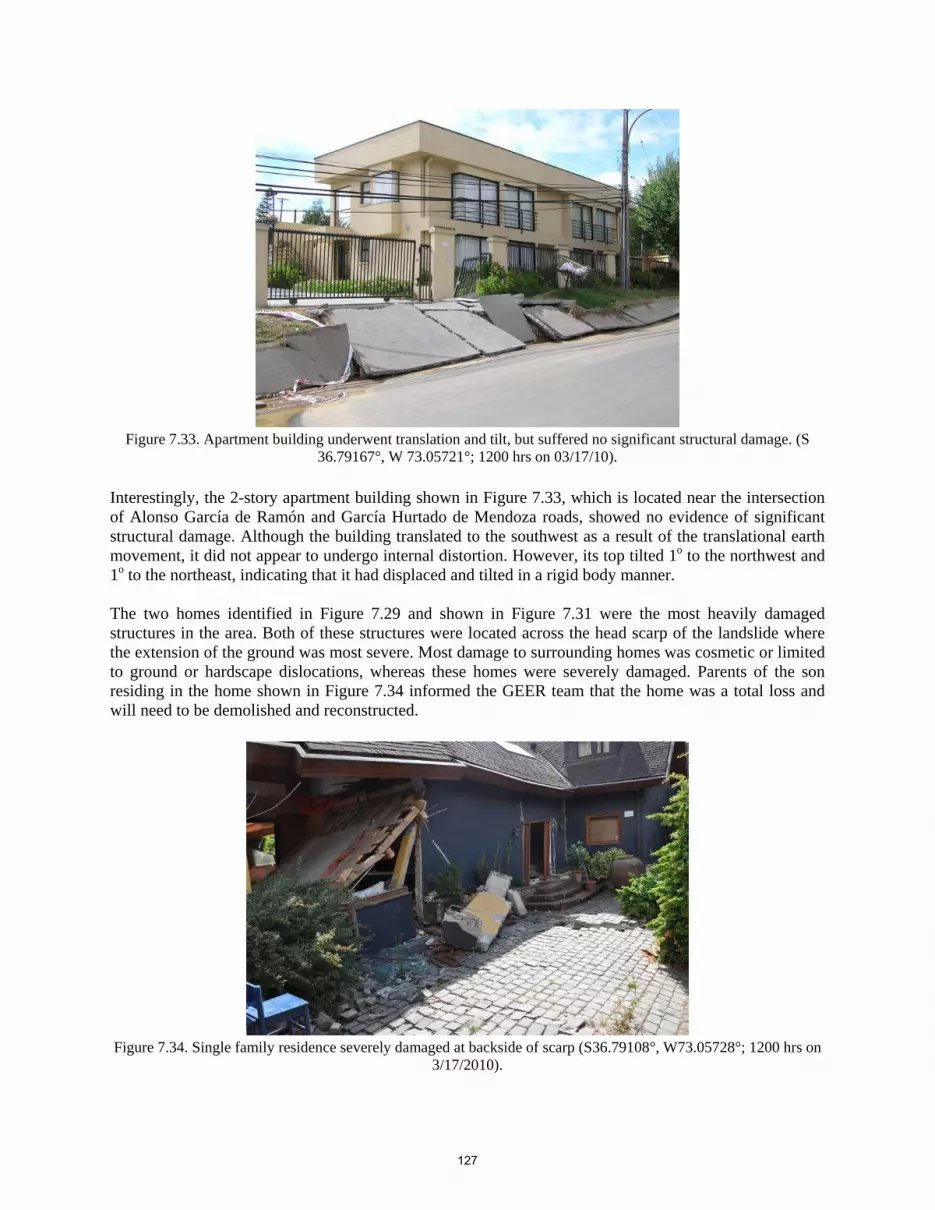
Figure 7.33. Apartment building underwent translation and tilt, but suffered no significant structural damage. (S
36.79167°, W 73.05721°; 1200 hrs on 03/17/10).
Interestingly, the 2-story apartment building shown in Figure 7.33, which is located near the intersection of Alonso García de Ramón and García Hurtado de Mendoza roads, showed no evidence of significant structural damage. Although the building translated to the southwest as a result of the translational earth movement, it did not appear to undergo internal distortion. However, its top tilted 1o to the northwest and 1o to the northeast, indicating that it had displaced and tilted in a rigid body manner. The two homes identified in Figure 7.29 and shown in Figure 7.31 were the most heavily damaged structures in the area. Both of these structures were located across the head scarp of the landslide where the extension of the ground was most severe. Most damage to surrounding homes was cosmetic or limited to ground or hardscape dislocations, whereas these homes were severely damaged. Parents of the son residing in the home shown in Figure 7.34 informed the GEER team that the home was a total loss and will need to be demolished and reconstructed.
Figure 7.34. Single family residence severely damaged at backside of scarp (S36.79108°, W73.05728°; 1200 hrs on
3/17/2010).
127

7.5 Two-Wing Apartment Building at 1343 Salas, Concepción
The EERI Reconnaissance Team observed damage of the south wing of a 13-story building located at 1343 Salas (S36.82044, W73.06164). The apartment building consisted of 2 rectangular wings in an offset T-shape (denoted as north and south wing in Figure 7.35). The north wings longitudinal axis runs approximately east-west, while the south wings longitudinal axis runs approximately north-south. The response of the two wings was extremely different. The north wing suffered only moderate damage, while the damage to the south wing was significant, including a residual tilt to the east of the entire wing. Residual tilt is believed to largely be attributed to cumulative structural damage. Failure was observed in the walls of the south wing, manifested as local shear as well as horizontal cracking (Figure 7.36). Although minor settlement was observed around both wings, pavement buckling was observed on the west, south, and east sides of the south wing (Figure 7.37), leading the EERI team to suspect that the south end foundation of the south wing underwent rocking during the shaking (Figures 7.37 and 7.38). The foundation below the north end (east-west running walls) of the south wing did not manifest pavement buckling. This may be due to restraint provided at the north end of the south wing foundation from the north wing. Minor pounding between the north and south wings was evident in the upper stories of the east side (Figure 7.39). It should be noted that the cracking pattern observed at the south end of the south wing was not pure shear as would be observed in well designed Chilean construction practice, but rather tension-type failure manifesting nearly horizontal crack patterns (Figure 7.37). For more information on the structural performance, refer to the EERI Reconnaissance Report.
Figure 7.35. Annotated GoogleEarth image of 1343 Salas two wing apartment complex (S36.8205°, W73.0619°) (Image taken on March 11, 2010).
128

Figure 7.36. Elevation view of 1343 Salas, looking north. North wing in is the background, while the south wing is in the foreground. Note shear and horizontal cracks in the wall on first floor of south wing. (S36.8205°, W73.0619°;
1458 hrs on 03/17/10).
(a) (b)
Figure 7.37. Pavement buckling on the west side of the south wing (a) looking south and (b) looking north (note the utility settlement off to the left of the photograph and the diminishing intensity of damage to the structure, with
greatest damage at south end – foreground of photograph) (S36.8205°, W73.0619°; 03/17/10). .
129
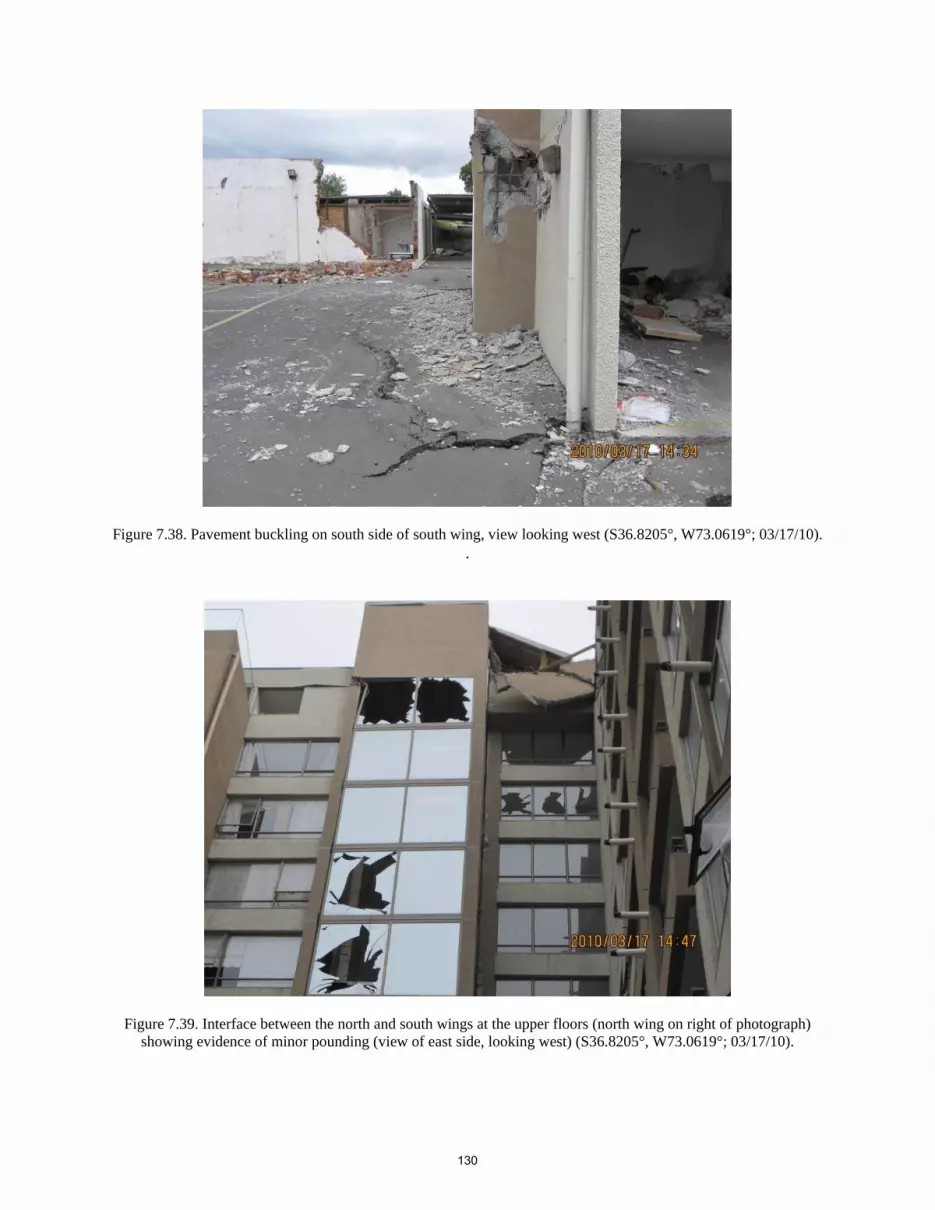
Figure 7.38. Pavement buckling on south side of south wing, view looking west (S36.8205°, W73.0619°; 03/17/10). .
Figure 7.39. Interface between the north and south wings at the upper floors (north wing on right of photograph) showing evidence of minor pounding (view of east side, looking west) (S36.8205°, W73.0619°; 03/17/10).
130

8.0 EFFECTS OF GROUND FAILURE ON PORTS, HARBORS, AND INDUSTRIAL FACILITIES 8.1 Introduction Chile’s formidable natural barriers, the Andes in the West and the Atacama desert in the North, effectively isolate the country from the outside world (Rough Guides, 2009). Given Chile’s extensive coastline, ports provide the only means for importing and exporting large quantites of goods and merchandise. Early in the 21st century, 95% of Chielan exports and almost 90% of imports are carried out through port facilites. The country has about 35 operational ports, 10 of which are state-owned and 25 privatetely owned. The export trade consists mainly of agricultural products, textiles, copper in the north and wood products in the south. Given the limited inland waterways, which are navigable for only a little over 700 km and are located mainly in the southern Lake District, the vast majority of ports are located along the coastline (http://www.nationsencyclopedia.com/economies/Americas/Chile.html). The most important ports are those in Valparaiso, San Antonio, Conception and Coronel. In addition to civil ports, a number of military ports exist – notably in Valparaiso and Talcahuano. In the period 3/13 to 3/18, GEER team members inspected a number of ports in Valparaiso, San Antonio, Conception and Coronel. Additional information came from EERI team members and local engineers. A summary of these observations is provided in this section.
Figure 8.1. Location of lateral spread displacement measurements relative to sheet pile wall at Coronel Port. Photo
from Google EarthTM (S37.0281o, W73.1507o).
131
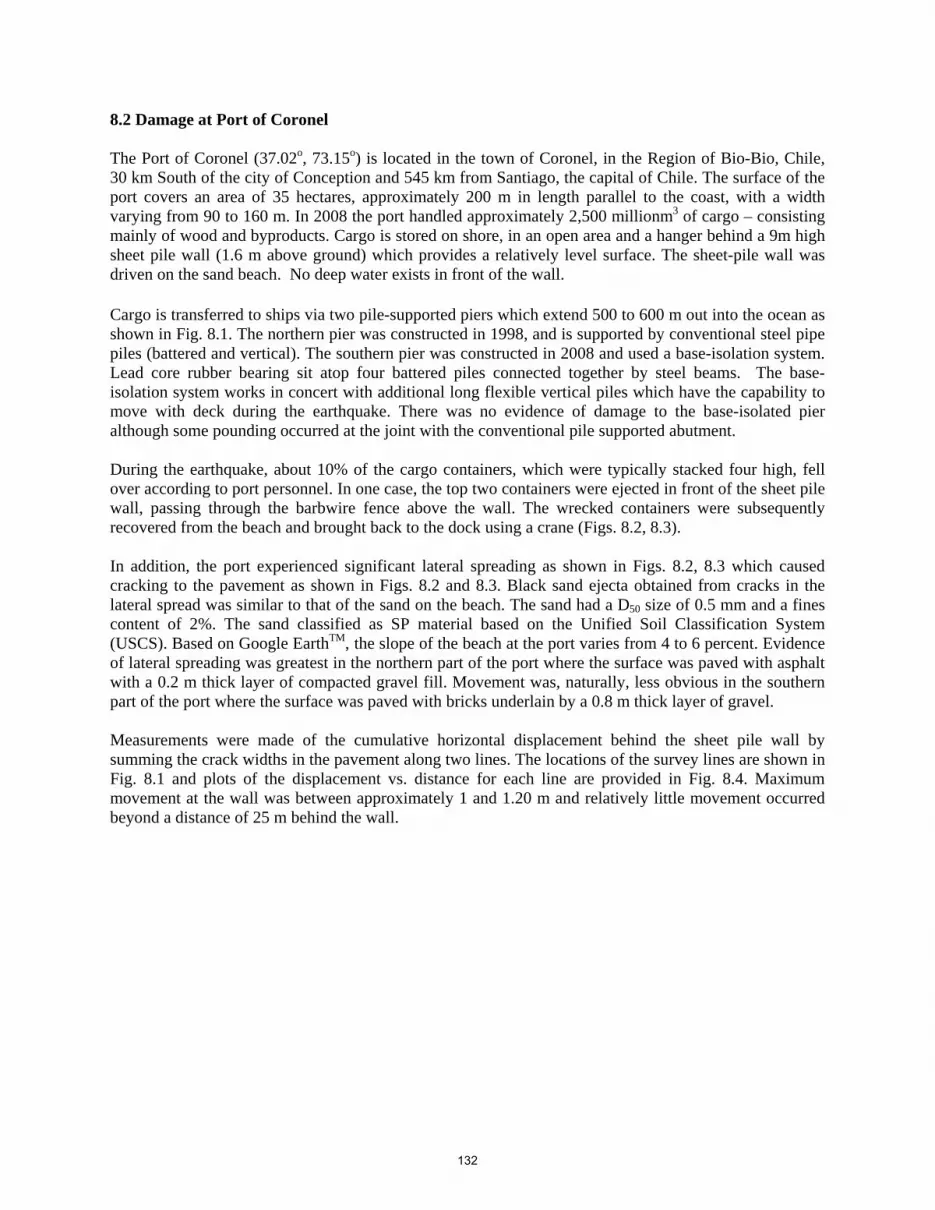
8.2 Damage at Port of Coronel The Port of Coronel (37.02o, 73.15o) is located in the town of Coronel, in the Region of Bio-Bio, Chile, 30 km South of the city of Conception and 545 km from Santiago, the capital of Chile. The surface of the port covers an area of 35 hectares, approximately 200 m in length parallel to the coast, with a width varying from 90 to 160 m. In 2008 the port handled approximately 2,500 millionm3 of cargo – consisting mainly of wood and byproducts. Cargo is stored on shore, in an open area and a hanger behind a 9m high sheet pile wall (1.6 m above ground) which provides a relatively level surface. The sheet-pile wall was driven on the sand beach. No deep water exists in front of the wall. Cargo is transferred to ships via two pile-supported piers which extend 500 to 600 m out into the ocean as shown in Fig. 8.1. The northern pier was constructed in 1998, and is supported by conventional steel pipe piles (battered and vertical). The southern pier was constructed in 2008 and used a base-isolation system. Lead core rubber bearing sit atop four battered piles connected together by steel beams. The base-isolation system works in concert with additional long flexible vertical piles which have the capability to move with deck during the earthquake. There was no evidence of damage to the base-isolated pier although some pounding occurred at the joint with the conventional pile supported abutment. During the earthquake, about 10% of the cargo containers, which were typically stacked four high, fell over according to port personnel. In one case, the top two containers were ejected in front of the sheet pile wall, passing through the barbwire fence above the wall. The wrecked containers were subsequently recovered from the beach and brought back to the dock using a crane (Figs. 8.2, 8.3). In addition, the port experienced significant lateral spreading as shown in Figs. 8.2, 8.3 which caused cracking to the pavement as shown in Figs. 8.2 and 8.3. Black sand ejecta obtained from cracks in the lateral spread was similar to that of the sand on the beach. The sand had a D50 size of 0.5 mm and a fines content of 2%. The sand classified as SP material based on the Unified Soil Classification System (USCS). Based on Google EarthTM, the slope of the beach at the port varies from 4 to 6 percent. Evidence of lateral spreading was greatest in the northern part of the port where the surface was paved with asphalt with a 0.2 m thick layer of compacted gravel fill. Movement was, naturally, less obvious in the southern part of the port where the surface was paved with bricks underlain by a 0.8 m thick layer of gravel. Measurements were made of the cumulative horizontal displacement behind the sheet pile wall by summing the crack widths in the pavement along two lines. The locations of the survey lines are shown in Fig. 8.1 and plots of the displacement vs. distance for each line are provided in Fig. 8.4. Maximum movement at the wall was between approximately 1 and 1.20 m and relatively little movement occurred beyond a distance of 25 m behind the wall.
132

Figure 8.2. Photograph of lateral spread displacements at the Port of Coronel (S37.028680°, W73.150054°; 1445 hrs, 03/17/2010).
Figure 8.3. Photograph of lateral spread displacements at the Port of Coronel. The wrecked container was part of a
stack and was ejected in front of the sheet pile wall, passing through the barbwire fence above the wall. It was subsequently recovered from the beach and brought back to the dock using a crane (S37.028680°, W73.150054°;
1440 hrs, 03/17/2010).
133

0.00
0.20
0.40
0.60
0.80
1.00
1.20
1.40
0 5 10 15 20 25 30
Distance from Sheetpile Wall Face (m)
Cum
ulat
ive
Hor
izon
tal D
ispl
acem
ent (
m)
Line 1Line 2
Figure 8.4. Cumulative horizontal displacement vs. distance from the sheet pile face resulting from lateral spreading
at the port of Coronel, Chile. (Rollins, Mylonakis, and Assimaki). At least four large sinkholes developed at the port sometime after the earthquake. The sinkholes were typically about 3.5 m in diameter and extended to a depth of 2.2 to 2.4m as shown in Fig. 8.5. These dimensions are approximate, as some of the sinkholes were excavated after the earthquake. At the bottom of one hole a crack or gap in an underground pipeline could be observed as shown in the right photo of Fig. 8.5. Sand could flow into this gap eventually producing a cave-in at the ground surface. A major pipeline runs parallel to shore in the North-South direction. Secondary pipelines run perpendicular to the sheet-pile wall at a number of locations as highlighted in the photo in Fig. 8.6. These pipelines would be subjected to longitudinal strain due to lateral spreading which could cause distress to the pipes.
Figure 8.5. Development of sinkholes (2.2 m deep, 3.5 m diameter) as a result of crack (gap) in pipe (S37.0339 o, W73.1467o; 1513 hrs, 03/17/2010).
134
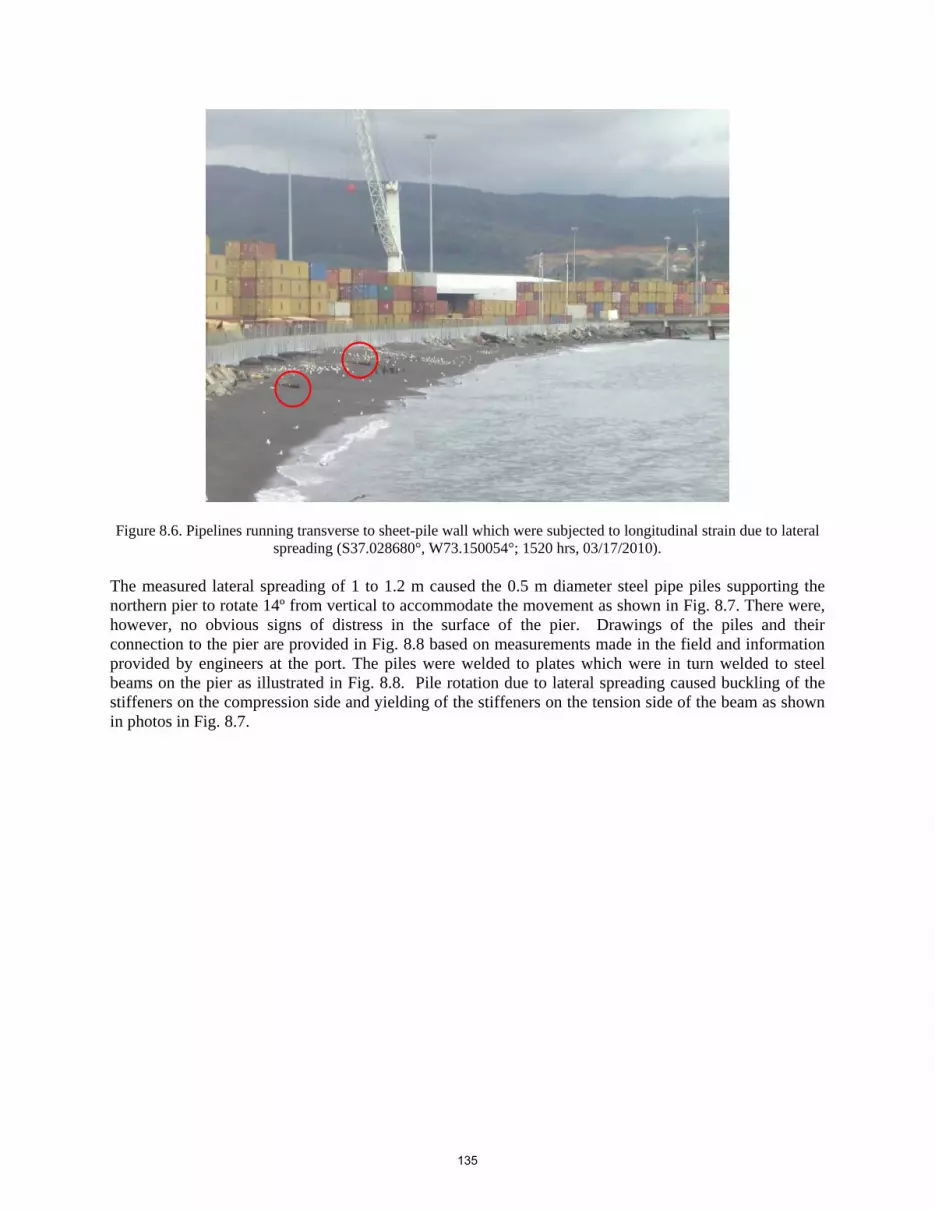
Figure 8.6. Pipelines running transverse to sheet-pile wall which were subjected to longitudinal strain due to lateral spreading (S37.028680°, W73.150054°; 1520 hrs, 03/17/2010).
The measured lateral spreading of 1 to 1.2 m caused the 0.5 m diameter steel pipe piles supporting the northern pier to rotate 14º from vertical to accommodate the movement as shown in Fig. 8.7. There were, however, no obvious signs of distress in the surface of the pier. Drawings of the piles and their connection to the pier are provided in Fig. 8.8 based on measurements made in the field and information provided by engineers at the port. The piles were welded to plates which were in turn welded to steel beams on the pier as illustrated in Fig. 8.8. Pile rotation due to lateral spreading caused buckling of the stiffeners on the compression side and yielding of the stiffeners on the tension side of the beam as shown in photos in Fig. 8.7.
135

(a)
(b) (c)Figure 8.7. (a) Rotation of pile supported pier at Port of Coronel due to lateral spreading. The rotation of the pile led to (b) buckling and (c) yielding of stiffeners on connection beam (S37.0280°, W73.1508°; 1555 hrs, 03/17/2010).
136

Notes: Pile Diam = 50 cm Pile Length = 15 m Wall thickness = 14 mm No concrete fill Welded to 62 cm x 62 cm x 2.5 cm plate
14º
2.2 m
Ground
0.85 m
12.5 mm stiffners
62 cm x 62 cm x 2.5 cm plate
2.2 m
Ground
0.90 m
12.5 mm stiffners
25.4 mm
50 cm diameter pipe pile (14 mm wall thickness)
Displaced pile after lateral spreading
(a)
(b)
Figure 8.8. Drawing of pile cap with battered piles before and after lateral spreading (a) longitudinal section and (b)
transverse section (S37.0280°, W73.1508°). (Rollins, Mylonakis, and Assimaki)
137

Damaged piles due lateral spreading Lateral spread
measurement line
Figure 8.9. Location of lateral spread measurement line and damaged pile cap with battered piles supporting pier at
fishermen port north of the main Port at Coronel (S37.024622°, W73.155272°).
Figure 8.10. Photograph of lateral spreading which destroyed pavement and cracked walls at the fishermen’s Port of
Coronel (S37.0247°, W73.1550°; 1348 hrs, 03/17/2010).
138

In a small fishing port located about 600 m north of the main port (37.024o, 73.156o), liquefaction-induced lateral spreading also produced significant damage to paved areas and a small pier extending 80 m into the ocean. An aerial view of the pier and the line along which displacement measurements were made is provided Fig. 8.9. A photograph of the damage to the pavement and adjacent wall produced by lateral spreading is shown in Fig. 8.10. Horizontal ground displacements were measured relative to a concrete wall on the beach as shown in Fig. 8.9 by summing crack widths in the concrete pavement. Maximum displacements reached nearly 3 m and movement extended about 90 m behind the wall (Fig. 8.11). Ground slope above water level at this location ranged from 3.5 to 5%.
0
0.5
1
1.5
2
2.5
3
0 20 40 60 80Distance from Wall Face (m)
Cum
ulat
ive
Hor
izon
tal D
ispl
acem
ent (
m)
100
Figure 8.11. Cumulative horizontal displacement vs. distance from wall face due to lateral spreading at Pier on small
fishermen’s port at north end of Port of Coronel. (Rollins, Mylonakis, and Assimaki). Damage to the pier, which was subjected to the 3 m measured previously, is shown in Fig. 8.12. The pier was pulled apart in the landward side with gaps of 0.5 and 1.1 m between two segments; however, at the seaward end, the pier appears to be in compression as no gaps were present and the pier appears to have moved upward relative to the rest of the pier. The pier was supported by a combination of battered piles and vertical piles. Battered piles were used on alternating supports along the pier. A photo of a pile cap supported by battered piles is provided in Fig. 8.13. Based on field measurements, the batter was approximately forward 20º for the seaward pile and backward 20º for the landward pile. A sketch of the pile cap before and after the earthquake is provided in Fig. 8.14. When subjected to the large lateral spread movements induced by earthquake, the leading row pile remained embedded in the cap, while the trailing row pile pulled out of the pile cap. Relative to the pile cap, the trailing row pile moved down 0.8 m and horizontally 0.3 m so that it was within 10 cm of impacting the leading row pile.
139

Figure 8.12. Damage to pile supported pier at small fishermen’s Port of Coronel due to lateral spreading (S37.024319°, W73.156210°; 1321 hrs, 03/17/2010).
Figure 8.13. Photograph of pile cap with battered piles supporting pier at small fishermen’s Port of Coronel showing
pull out of trailing row piles (S37.024319°, W73.156210°; 1322 hrs, 03/17/2010).
140

1.4 m
0.85 m
0.3 m
Notes: Pile Diam = 33 cm Wall thickness = 8 mm 4 - 12 mm bar Pile batter = ± 20° Embedment = 40 cm
Ground Surface Elev. Unknown
1.4 m
0.85 m
0.5 m
Ground
≈ 0.3 m≈ 0.8 m
Pile Cap
Pile Cap
Before Earthquake
After Earthquake and Lateral Spreading
Figure 8.14. Measurements of pile cap with battered piles supporting pier at small fishermen’s Port of Coronel before and after lateral spreading. (Rollins, Mylonakis, and Assimaki).
141

8.3 Damage of Port at Valparaiso Access to the private port at Valparaiso could not be obtained during this investigation; however, lateral movement and settlement was measured at an adjacent public dock as shown in Figs. 8.15 & 8.16. In addition, several pictures of the main port were taken from the outside, which showed significant damage, as discussed below.
Apparent lateral spreading at Berth 5
Lateral displacement and settlement behind dock wall
Figure 8.15. Google EarthTM photo of Valparaiso port area (S33.0364 o, W71.6267o).
The public dock consists of a concrete-block gravity wall about 1m thick which extends about 5.5 m above water level. No sand boils were observed at the site, so it is not possible to determine if the movement was a result of liquefaction or simply lateral pressure on the wall. Outward movement of the wall led to settlement of about 20cm in a section behind the wall as shown in the figure. A plot of cumulative horizontal displacement vs. distance behind the wall is provided in Fig. 8.17. As stated earlier, the main dock of the port of Valparaiso could not be inspected at the time of the visit. However, pictures taken from the street behind the quay wall (Fig. 8.19) show signs of severe settlement of the backfill – possibly of the order of 0.3-0.5m at Berth 5. Likewise, pictures of the dock taken from the upper floor of a nearby building shows significant bulging of the quay wall towards the water over a length of 200m, accompanied by severe cracks on the asphalt pavement behind the wall (Fig 8.18). The overall opening of these cracks could be of the order of 1m or higher. This berth experienced 0.5m of lateral displacement as a result of the M8.0 Santiago earthquake in 1985. Although the observed damage could be unrepaired damage from the 1985 quake, as suggested by local engineers, given the extent of the deformations and the potential serviceability problems, these effects are likely a result of the 2010
142

earthquake. This view is reinforced by Google EarthTM images taken before the earthquake, which do not show damage on the dock.
Figure 8.16. Photograph of lateral movement and vertical displacement of ground behind public dock at port of Valparaiso (S33.0375°, W71.6274°; 1452 hrs, 03/15/2010).
0
10
20
30
40
50
60
0 5 10 15 20 25 30 35 40
Distance from Wall Face (m)
Cum
ulat
ive
Hor
izon
tal
Dis
plac
emen
t (cm
)
Horizontal Movement
Figure 8.17. Plot of cumulative horizontal displacement vs. distance from free-face. (Rollins, Assimaki and
Mylonakis).
143
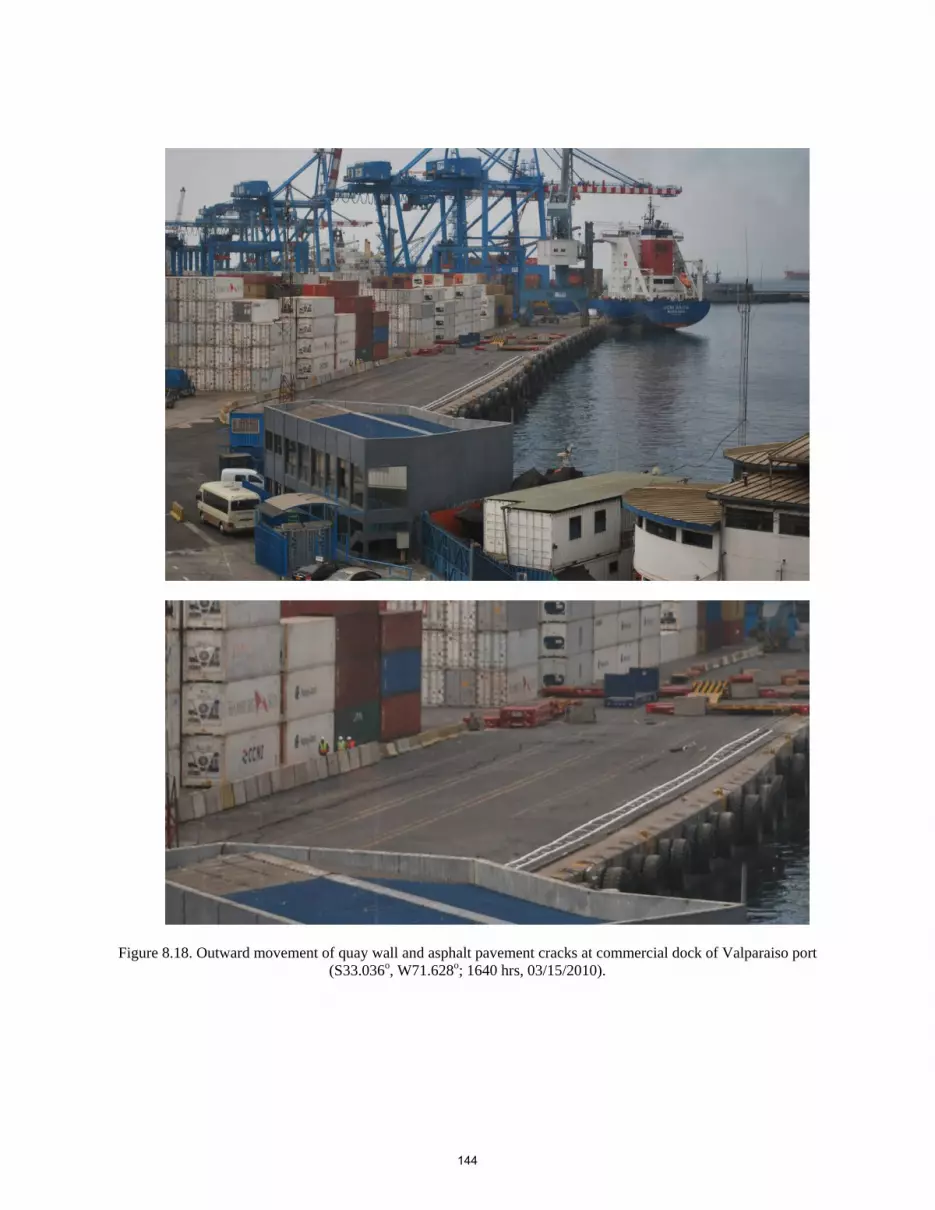
Figure 8.18. Outward movement of quay wall and asphalt pavement cracks at commercial dock of Valparaiso port (S33.036o, W71.628o; 1640 hrs, 03/15/2010).
144

Figure 8.19. Settlement in backfill behind the quay wall at commercial dock of Valparaiso port (S33.034o, W71.627o; 1620 hrs, 03/15/2010).
8.4 Port at Conception Area (San Vicente International Terminal - SVIT) Lateral spread and liquefaction was observed at the Concepcion port area (S36.727 o, W73.1322 36°), including the neighboring San Vincente International Terminal (Figure 8.20). On the day of site visit however, the GEER team was not able to gain access to the SVIT although the SVIT is known to have suffered significant damage due to liquefaction and lateral spreading ground. At the time of the visit, local port engineers indicated the SVIT wharf moved approximately 50 cm with cracks in the pavement approximately 2-3m deep. Due to lack of access to SVIT, the ensuing discussion documents damage to surrounding port structures. Most notably, the fishing industry in this area was at a halt due both to damage at a fishing wharf, and more importantly damage to a nearby fish packaging facility. In contrast, petroleum facilities in this area, which provide a significant portion of gasoline to the country, were further from the coastline and therefore suffered little damage and only minimal disruption of activity. Figure 8.21 documents the approximate extent of lateral spread observed at the fishing wharf area, while Figure 8.22 shows photographs of the spread. Figures 8.23-8.25 present documentation regarding the damaged fish packaging facility, in total three buildings were to be demolished due to significant movement of the ground and resulting building damage. Amongst these, a four story slender masonry building exhibited significant tilt and uplift/settlement about both axes (Fig 8.24). Despite the significant damage to the fish packaging facility, a number of neighboring structures were operational (Fig 8.26). The water level was noted to have risen by approximately 1-2 meters in this area (Fig 8.27 and 8.28), though tsunami waves were not observed by locals. The team visited and met with a manager of the Petrobas gas facility, which is one of a number of petroleum facilities in the port area. One tank was noted to have tilted approximately one degree (Fig 8.29 and 8.30), with sand boils observed nearest to the roadway portion of this facility (Fig 8.29). The tank was constructed in 1968, had dimensions of 11.6m diameter and 12m height, and was full during the earthquake.
145

Figure 8.20. Google EarthTM overview of Concépcion port area (S36.727 o, W73.1322 o).
Figure 8.21. Lateral spread at fishing wharf area (S36.7252°, W73.1320°) denoted by red boundary. Note that spread
likely continued to the East of the area documented.
146

(a) S36.7256°, W73.1324° (b) S36.7255°, W73.1323°
Figure 8.22. Photographs of lateral spread at fishing wharf (1110 hrs, 03/15/2010).
Figure 8.23. Damage to fish packaging facility (S36.7260°, W73.1288°; 1356 hrs, 03/15/2010).
147

Figure 8.24. Damage to fish packaging facility (S36.7260°, W73.1288°; 1345 hrs, 03/15/2010).
A four story frame building with masonry façade (approximate 8.5m x 16m plan dimensions) tilted approximately 1.5 degrees about its long axis and 3 degrees about its short axis (into photograph). Displacement of the front (South face) of the building were approximated as 30 cm uplift (South-East) and 11 cm settlement (North-East).
Figure 8.25. Damage to fish packaging facility (S36.7260°, W73.1288°; 1400 hrs, 03/15/2010).
148

Figure 8.26. Google EarthTM overview map of fish packaging facility and neighboring structures (S36.7259°, W73.1291°).
Figure 8.27. Damage to structures neighboring the fish packaging facility (S36.7267°, W73.1282°; 1200 hrs, 03/15/2010). Note the scum level at the base of the structure of approximately 1-2 m evidence of the water rise.
149

Figure 8.28. Evidence of water level rise at port area – neighboring fish packaging facility (S36.7267°, W73.1282°; 1200 hrs, 03/15/2010).
Figure 8.29. Location of Petrobas gas facility relative to other port structures (S36.7270°, W73.1271°).
150

Figure 8.30. Tilted water tank at Petrobas gas facility (S36.7270°, W73.1272°; 1250 hrs, 03/15/2010).
8.5 Damage at Port of San Antonio The Port of San Antonio is Chile’s largest port and the busiest port on South America’s west coast (http://www.worldportsource.com/ports/CHL_Puerto_San_Antonio_124.php). Located on the shores of central Chile, in the town of San Antonio, in the Valparaíso Region, it is situated 80 km west from the outskirts of the country’s capital Santiago (http://ports.com/chile/puerto-san-antonio/.) According to the above sources, the port occupies almost 500 hectares, comprising of approximately of 350 hectares of water and 145 hectares of land. Maximum water depth exceeds 10 meters. In 2007 the port handled over 12 million tons of cargo. Construction of the modern port began in 1910, but it was only in 1936 that the port acquired an electrical plant, new warehouses, housing for workers, and facilities capable of handling large sea-going vessels. The 1985 M8.0 earthquake destroyed much of the harbor’s infrastructure. A major reconstruction project started in 1992, which was completed in 1997 with a total cost of more than $23 billion. In 2002, the port’s activity reached a new high, as it moved over nine million tons of cargo. In 2003, the National Ministry of Goods reserved 101 hectares of land to the south of the port for the development of the harbor. In 2005, the South Molo extension began. Surprisingly, despite the magnitude of the Feb 27, 2010 event, little damage was observed in the port. Indeed, with the exception on several minor cracks measuring no more than 5cm on the asphalt pavement behind the quay wall (Figs. 8.31, 8.32) and some rock falls (Fig 8.33), most of the port appears to be undamaged. No surface evidence of soil liquefaction was observed. The satisfactory performance is attributed to the reconstruction of 1992-1997.
151

Figure 8.31. Cracks on asphalt pavement behind quay wall in San Antonio Port (S33.5870°, W71.6132°; 1456 hrs,
03/14/2010).
Figure 8.32. Cracks on brick pavement behind quay wall in San Antonio Port (S33.5830°, W71.6138°; 1432 hrs, 03/14/2010).
152

Figure 8.33. Rockfalls in San Antonio Port (S33.587°, W71.613°; 1446 hrs, 03/14/2010).
Notable exceptions are an old dock (apparently not part of the reconstruction) which suffered very severe damage (Fig. 8.34) and a wharf structure supported on combinations of vertical and raked steel piles. Displacements in excess of 1m were observed (Fig. 8.35) leading to failure of the connections at the pile heads (Fig. 8.36). The settlement of the piles – a consequence of liquefaction - is also evident the figure.
Figure 8.34. Severely damaged old dock in San Antonio Port (S33.5817°, W71.6154°; 1448 hrs, 03/14/2010).
153

Figure 8.35. Separation from lateral pile screen of wharf structure in San Antonio Port (S33.5817°, W71.6154°; 1526 hrs, 03/14/2010).
Figure 8.36. Failure of head connection between wharf and raked piles in San Antonio Port (S33.5817°, W71.6154°; 1527 hrs, 03/14/2010).
154
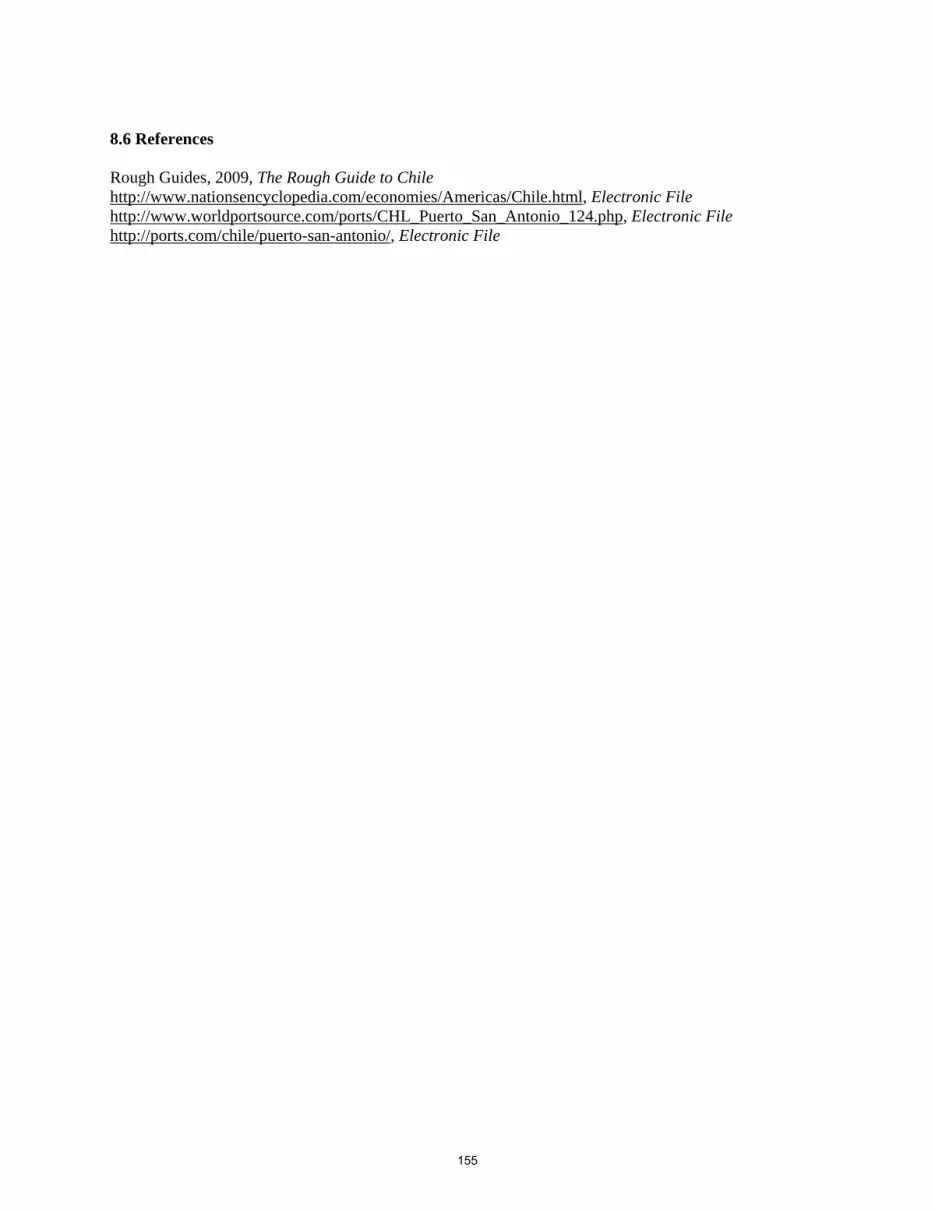
8.6 References Rough Guides, 2009, The Rough Guide to Chile http://www.nationsencyclopedia.com/economies/Americas/Chile.html, Electronic File http://www.worldportsource.com/ports/CHL_Puerto_San_Antonio_124.php, Electronic File http://ports.com/chile/puerto-san-antonio/, Electronic File
155

9.0 EFFECTS OF GROUND FAILURE ON BRIDGES, ROADS, RAILROADS, AND LIFELINE SYSTEMS 9.1 Introduction The February 27, 2010, Mw=8.8 Maule earthquake caused significant damage to Chile’s infrastructure. Evaluation of the performance of this infrastructure required covering a large area (approximately 600km x 100km); including several regions and metropolitan areas. Chile’s two largest urban centers (Santiago and Concepción) are within the impacted area. These cities are connected by an important highway network, which runs primarily in the north-south direction (main highway Route 5), and a large number of rivers that run predominantly in the east-west direction. Therefore many bridges, roads, railroads and water crossings present in this area were affected by the earthquake strong shaking. Most bridge structures performed well during the earthquake. From a geotechnical perspective the most significant bridge damage appeared to be associated with lateral spreading or strong shaking. The most sizable failures were near river crossings along the coast where several bridge spans became unseated (e.g., in Tubul and Concepción) due to both lateral spreading and strong shaking. However, strong shaking appeared to be the cause of most widespread damage, including a large number of overcrossings along Route 5 inland, as well as a number of underpasses and connectors in Santiago. The strong shaking in many of these cases appeared to be related to seismic site effects (e.g., local soil conditions or subsurface topography), as the damage appeared to be quite localized and nearby similar structures were undamaged (e.g., Quilicura area of Santiago or near Ercilla along Route 5 in the south). While damage was widespread to these smaller bridge structures, in general they performed well in that few totally collapsed onto the underlying roadway. Those that did completely collapse within the inland areas along Route 5 may be attributed to older construction and poor detailing. Retaining walls, MSE walls, and tie-back walls associated with transportation structures, including bridge abutments, appeared to perform well throughout the affected region. Even in locations of significant lateral spreading, which caused considerable damage, bridge abutments performed well. Widespread damage was observed in roads. Perhaps the most widespread geotechnical related issue was associated with settlement of compacted earth fills throughout the affected region. While there were isolated cases of embankment fill failures resulting in the closure of roadways (e.g., in and north of Lota), most noticeable were the patches of gravel quickly placed after the earthquake to compensate for settlement of bridge approach fills and culvert backfills. While generally not a life safety concern, these widespread settlements were a nuisance, leading to traffic problems. Railroads were also damaged during the earthquake. The most common failure was associated with embankment loss of stability due to ground shaking, loss of rail alignment, and unseated railroad bridges. Nevertheless, in most cases the damage appeared to be limited and repairable, indicating good railroad performance despite the strong shaking that affected the region. The following sub-sections of this section of the report include brief descriptions of selected bridge, roads, and railroad damage cases investigated by the GEER team during its visit in March 2010. 9.2 Bridges along Bio Bio River near Concepción The Biobío River is the second largest river in Chile. It originates in the Andes and flows 380 km to the Gulf of Arauco on the Pacific Ocean. The river is Chile's second-longest river and the widest river in Chile, with an average width of 1 km. Close to the Pacific ocean the river crosses the Metropolitan area of
156

Concepción; which includes the cities of Talcahuano, San Pedro de la Paz, Lota, Coronel, and Concepción itself. In Concepción, the river is crossed by four bridges (Figure 9.1): Llacolén Bridge (2000), Juan Pablo II Bridge (1973), La Mochita bridge, Biobío Bridge (1942) and Biobío Railroad Bridge (1889). As a metropolitan area Concepción is the second-largest conurbation in Chile, with 900,000 inhabitants. During the February 27th earthquake these bridges were structurally damaged compromising normal business activities in the whole region. Due to their importance each bridge is analyzed separately.
Figure 9.1. Aerial view of Concepción metropolitan area and Bio-Bio river main crossings
9.3 Llacolén Bridge (north approach), the Middle Bridge across the River Bio Bio in Concepción The Llacolén Bridge in Concepción was constructed in 2000 and spans 2,160 m across the Bio Bio river supporting four lanes of vehicular as well as pedestrian access to downtown Concepción (Figure 9.1). During the earthquake the north approach (S36.830108°; W73.067991°) suffered deck unseating and lateral spreading shore (Figure 9.2). Ground damage at this approach was observed to extend inland into the southbound traffic lane of Calle Nueva road and south below the bridge’s exit ramp continuing along a pedestrian walkway (Figure 9.4). Calle Nueva parallels the coastline and runs under the approach to the bridge. The lateral spreading ground resulted in unseating of the west and east bound traffic support deck (Figure 9.5). Flexural cracks on the river-side face of the 1.5 m diameter support columns were observed near the ground surface typically tightly spaced at approximately 0.10-0.20 m on center (Figure 9.6). The distribution of flexural cracking was more severe for those columns supporting the unseated deck, however, all columns at the north shoreline support observed flexural cracking at their construction joint (between 2-2.5m above ground surface). Ground settlement of 0.25-0.30 m was also noted to surround each of the exit ramp bents (Figure 9.7).
157

Figure 9.2. Plan view of the Bio Bio river region locating the damaged region of the Llacolén bridge in Concepción
(S36.830108°, W73.067991°)
Figure 9.3. Elevation photograph of the Llacolén bridge in Concepción (S36.830108°, W73.067991°).
158

Figure 9.4. Plan view of the North approach to the damaged Llacolén bridge in Concepción (S36.830108°,
W73.067991°).
Figure 9.5. Deck unseating at Llacolén bridge in Concepción. (note the temporary deck supporting approach traffic). View South (S36.829707°, W73.068220°, 1809 hrs on 3/14/2010) and (b) view north (S36.830380°, W73.067541°,
1911 hrs on 3/14/2010).
159

Figure 9.6. Substructure of the north approach at the damaged Llacolén bridge in Concepción showing the unseated deck in the foreground. Flexural cracking of the column supports was observed at ground level and extending to the
construction joint (2-2.5m above groun
Figure 9.7. Ground settlement surrounding an exit ramp support bent at the Llacolén bridge in Concepción
(S36.830380°, W73.067541°, 1901 hrs. on 3/14/2010).
9.4 Juan Pablo II Bridge, the North Bridge across the River Bio Bio, in Concepción The Juan Pablo II Bridge (S36.815864°; W73.083674°), also known as Puente Nuevo (New Bridge), is the longest vehicular bridge in Chile with 2310 m in length. The bridge, shown in Figure 9.8, connects the cities of Concepción and San Pedro de la Paz across the Bio-Bio River. The bridge was designed by E.W.H Gifford & Partners and opened to the public in 1974. The bridge consists of 70 spans (L = 33 m, W = 21.9 m) each one composed of 7 reinforced concrete girders and a concrete slab. The segments sit on reinforced concrete bents with drilled pier supports. Figure 9.9(b) shows an example of a typicalbridge bent configuration.
160
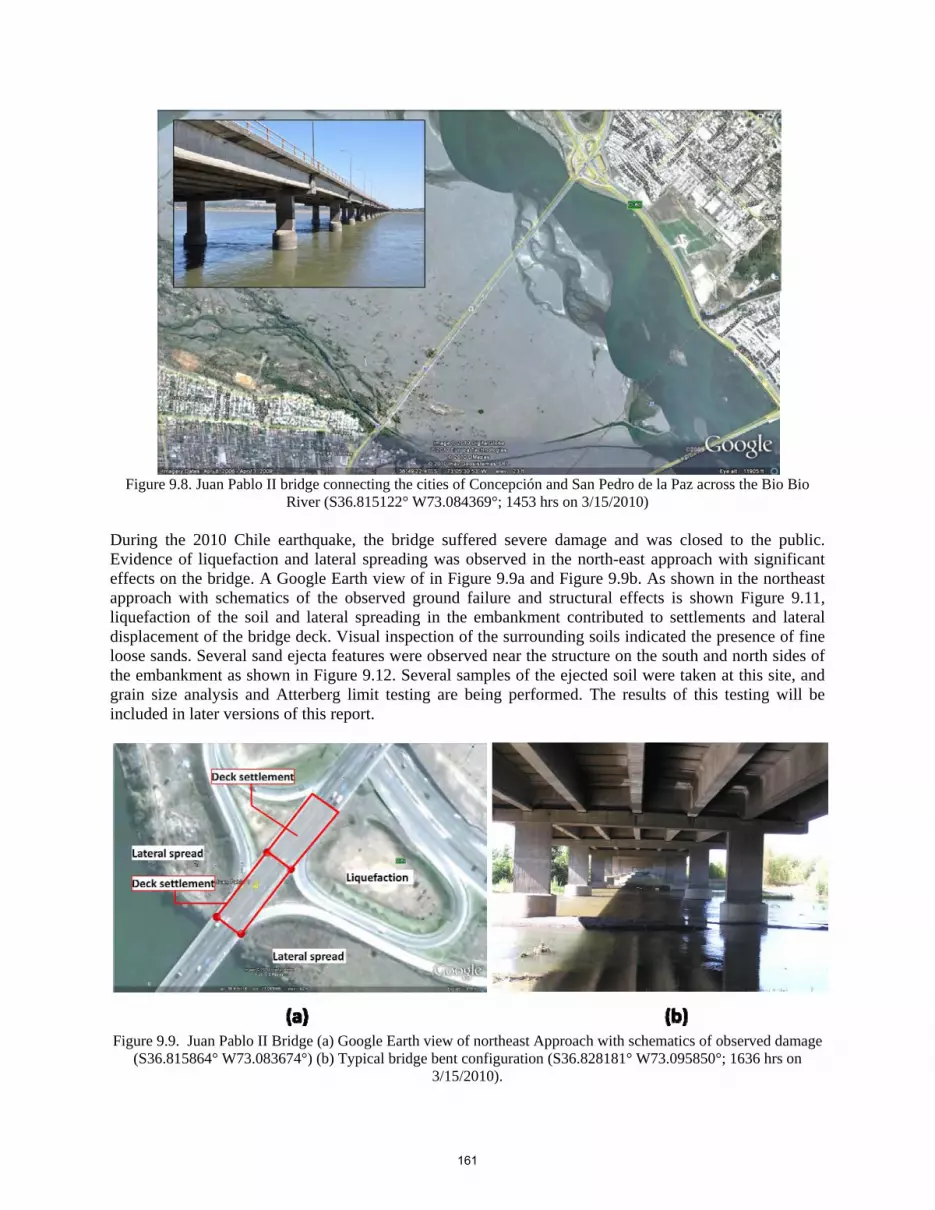
Figure 9.8. Juan Pablo II bridge connecting the cities of Concepción and San Pedro de la Paz across the Bio Bio
River (S36.815122° W73.084369°; 1453 hrs on 3/15/2010) During the 2010 Chile earthquake, the bridge suffered severe damage and was closed to the public. Evidence of liquefaction and lateral spreading was observed in the north-east approach with significant effects on the bridge. A Google Earth view of in Figure 9.9a and Figure 9.9b. As shown in the northeast approach with schematics of the observed ground failure and structural effects is shown Figure 9.11, liquefaction of the soil and lateral spreading in the embankment contributed to settlements and lateral displacement of the bridge deck. Visual inspection of the surrounding soils indicated the presence of fine loose sands. Several sand ejecta features were observed near the structure on the south and north sides of the embankment as shown in Figure 9.12. Several samples of the ejected soil were taken at this site, and grain size analysis and Atterberg limit testing are being performed. The results of this testing will be included in later versions of this report.
Figure 9.9. Juan Pablo II Bridge (a) Google Earth view of northeast Approach with schematics of observed damage
(S36.815864° W73.083674°) (b) Typical bridge bent configuration (S36.828181° W73.095850°; 1636 hrs on 3/15/2010).
161
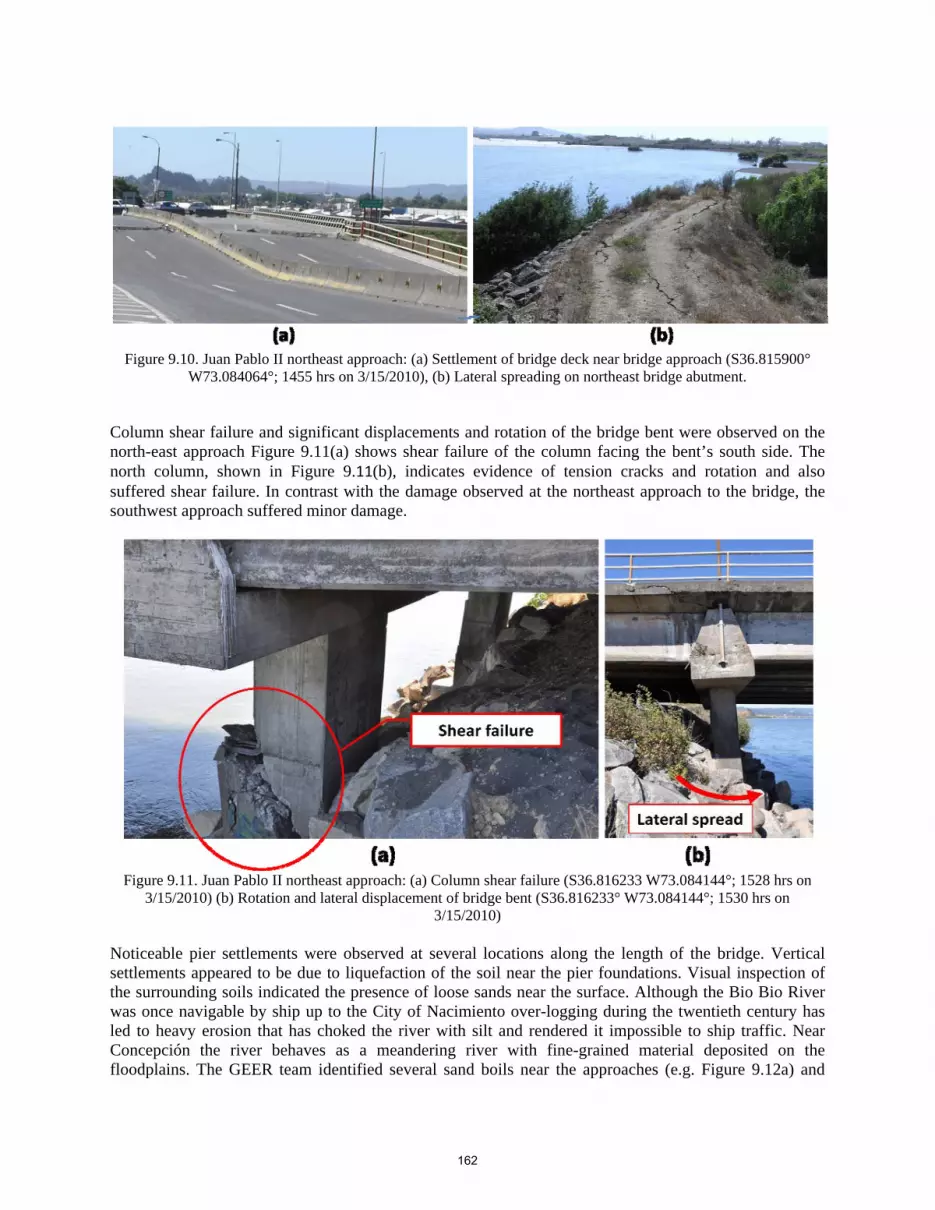
Figure 9.10. Juan Pablo II northeast approach: (a) Settlement of bridge deck near bridge approach (S36.815900°
W73.084064°; 1455 hrs on 3/15/2010), (b) Lateral spreading on northeast bridge abutment.
Column shear failure and significant displacements and rotation of the bridge bent were observed on the north-east approach Figure 9.11(a) shows shear failure of the column facing the bent’s south side. The north column, shown in Figure 9.11(b), indicates evidence of tension cracks and rotation and also suffered shear failure. In contrast with the damage observed at the northeast approach to the bridge, the southwest approach suffered minor damage.
Figure 9.11. Juan Pablo II northeast approach: (a) Column shear failure (S36.816233 W73.084144°; 1528 hrs on
3/15/2010) (b) Rotation and lateral displacement of bridge bent (S36.816233° W73.084144°; 1530 hrs on 3/15/2010)
Noticeable pier settlements were observed at several locations along the length of the bridge. Vertical settlements appeared to be due to liquefaction of the soil near the pier foundations. Visual inspection of the surrounding soils indicated the presence of loose sands near the surface. Although the Bio Bio River was once navigable by ship up to the City of Nacimiento over-logging during the twentieth century has led to heavy erosion that has choked the river with silt and rendered it impossible to ship traffic. Near Concepción the river behaves as a meandering river with fine-grained material deposited on the floodplains. The GEER team identified several sand boils near the approaches (e.g. Figure 9.12a) and
162

along the bridge spans (in sections not covered by water). The presence of fine material is clearly shown in Figure 9.12(b).
Figure 9.12. Juan Pablo II bridge: (a) Sand ejecta near northeast approach and (S36.815619° W73.083311°; 1522 hrs
on 3/15/2010) (b) Fine-grained material in the floodplains (S36.825592° W73.093264° on 3/15/2010). Settlements on the order of 0.50 m to 0.70 m were observed in piers #73-76 and piers #113-116 as indicated in Figure 9.13 (odd numbers for piers on the north side and even numbers for piers on the south side). The bridge deck accommodated these settlements with large vertical deformations and relatively minor damage of the asphaltic layer. This is observed in Figure 9.14(b). Settlements of piers # 73, 75, 113 and 115 on the south side were larger than those of piers #74, 76, 114, and 116 on the north side indicating rotation of the bridge bents.
Figure 9.13. Juan Pablo II bridge – Pier settlements (S36.815122° W73.084369°; 1453 hrs on 3/15/2010)
163

Figure 9.14. Juan Pablo II bridge (a) View of bridge bent settlement (S36.826596° W73.094345° on 3/15/2010)(b)
View of bridge deck settlement (S36.826596° W73.094345° on 3/15/2010)
Although the GEER team had no direct access to the piers subjected to liquefaction and settlement it was possible to obtain some photos of the affected foundations. Figure 9.15(a) and (b) show a top view of a pier corresponding to pier group #113-116 and a close-up of the soil-pier interface. The figure shows the effects of liquefaction of the soil surrounding the pier with soil depressions and standing water covering an annular section around the pier. The soil in the vicinity of the pier shows evidence of water being brought to the surface and accumulation of sand probably ejected during the liquefaction event.
Figure 9.15. Juan Pablo II bridge–Evidence of liquefaction at piers subjected to settlements. (a) column and pier, (b)
detail of pier and surrounding soil. (S36.826596° W73.094345° on 3/15/2010)
9.5 La Mochita Bridge, a Four-Span Bridge Parallel to the River Bio Bio in Concepción La Mochita bridge, shown in Figure 9.16 (S36.846841°; W73.055496°), is a 4-span concrete bridge supported by seat-type abutments at each end and two-column bents at the interior locations. At this site, ground failure occurred which induced transverse movement of the bridge superstructure.
164

The bridge, which was constructed in 2005, spans north-south along the east bank of the Bio-Bio river, crossing a small inlet of water which fronts a water treatment facility in south Concepción. Bents are comprised of two 1.20 m diameter concrete columns (estimated) with pin connections at the deck, which are restrained vertically with a pair of tie bars integrated with a concrete block assembly (vertical restrainer blocks). The column bases are integrated with a concrete cap embedded below the ground. The bridge superstructure is composed of precast I-girders and a concrete slab. Bents 2 and 3 are founded on a soil mass that slopes towards the east water inlet. The high point of the soil mass is between 6-10 m east of the Bio-Bio river, with the low point at the water level of the east inlet, which at the time of the teams visit was below the base of the pile cap. The bridge superstructure shifted transversely largely as a unit towards the east due to failure of the soil mass surrounding bents 2 and 3. Upon inspection of the ground at bents 2 and 3, significant spreading-like failure towards the water treatment plant inlet water was observed (Figure 9.17). This failure may have been attribute to either a deep seated slope instability or liquefaction-induced lateral spreading mechanism. Sand boils below the bridge were observed near bent #2 and 3 (Figure 9.18). Follow-up site investigation is being conducted by GEER to more fully understand the characteristics of soils at the site and understand the underlying ground failure mechanism. Measurements taken by the team on March 15, 2010 indicated that the north end of the bridge deck shifted 0.5 m to the east relative to the approach fill, while the south end of the bridge shifted 0.9 m towards the east relative to the approach fill on that side. Bents 2 and 3 subassemblies (columns, bent cap and pile cap) were observed to rotate about the longitudinal axis of the bridge towards the east in consistent fashion with the deck movement. Rotations of bents 2 and 3 were measured as 2 and 4 degrees, respectively (Figure 9.19a). Bent 1 could not be accessed at the time of the teams visit, however, views from the land mass at bent 2 indicate that the deck moved independently of bent 1 (Figure 9.19b). In addition, ground failure was not immediately visible from this vantage point, or above the north shore of the bridge. Movement of the abutments was observed to be minimal, with the resulting damage to the superstructure largely attributed to the rotation of the bents (Figure 9.21). It is noted that movement of the bridge resulted in damage on both east and west end transverse shear keys of the interior bents (Figure 9.22). In addition, the approach road from the north observed significant ground movement and distress leading to the bridge (Figure 9.23).
165

Figure 9.16. Plan view of the La Mochita bridge in south Concepción describing observed damage (S36.846841° W73.055496°).
Figure 9.17. Ground failure at the La Mochita bridge, (a) looking north at bent #3 (S36.847389°, W73.055219°; 1831 hrs on 3/15/2010) and (b) looking north at bent #2 (S36.847495°, W73.055027°; 1835 hrs on 3/15/2010)
166

(a)
(b)
Figure 9.18. La Mochita bridge: (a) Sand boils observed below the bridge (S36.847456°, W73.055129°; 1830 hrs on 3/15/2010), and (b)View looking north (S36.847453° W73.055225°; 1830 hrs on 3/15/2010)
Figure 9.19. La Mochita bridge: (a) Rotation of bent #3 and surrounding ground failure at La Mochita bridge. View looking south (S36.847302°, W73.055151°; 1835hrs on 3/15/2010), and (b) Transverse shift of deck relative to bent #1. (the tilt of bent #1 could not be measured at the time of site visit). Ground failure surrounding bent #1 was not
observed from this vantage point. View looking north (S36.847049°, W73.055443°; 1835 hrs on 3/15/2010).
Figure 9.20. Transverse shift of deck relative to south abutment at the La Mochita bridge (S36.847547°,
W73.054876°; 1834 hrs on 3/15/2010).
167

Figure 9.21. La Mochita bridge (a)Transverse gap developed between deck and south abutment. View looking north.
(-36.847798°, -73.054797°; 1856 hrs on 3/15/2010), (b) Damage at the south abutment-road-deck interface due to transverse shift of the deck. View looking north. (S36.847761°, W73.054777°; 1856 hrs on 3/15/2010).
Figure 9.22. Damage to transverse shear keys at bent #3 due to movement of the La Mochita bridge (S36.847405°,
W73.055084°; 1830 hrs on 3/15/2010).
168

Figure 9.23. Damage to the approach road north of the La Mochita Bridge (S36.846473°, W73.055881° on
3/15/2010). View looking north. The Bio Bio river is shown on the left (west) of the view. 9.6 Puente Bio Bio (Puente Viejo) in Concepción The Bio-Bio bridge, also known as Puente Viejo (Old Bridge), was built in the 1930s and inaugurated in 1937. The bridge connected the cities of Concepción and San Pedro de la Paz and had a length of 1,419 m. For many years it was the only vehicular bridge connecting the two cities. Due to its precarious structural condition the bridge was closed in May 2002 and used only for pedestrian transit. During the 2010 Chile earthquake the bridge suffered severe damaged with many slab sections collapsing (Figure 9.24a). Several bridge bents also collapsed during the seismic event (Figure 9.25). Evidence of liquefaction was observed at the East bridge abutment with visible lateral deformations and vertical settlements.
Figure 9.24. Puente Bio-Bio: (a) Collapsed slabs (S36.836789° W73.062203° on 3/15/2010), (b) Evidence of lateral
spreading near East bridge approach (S36.837311° -73.061831°; 1753 hrs on 3/15/2010).
169
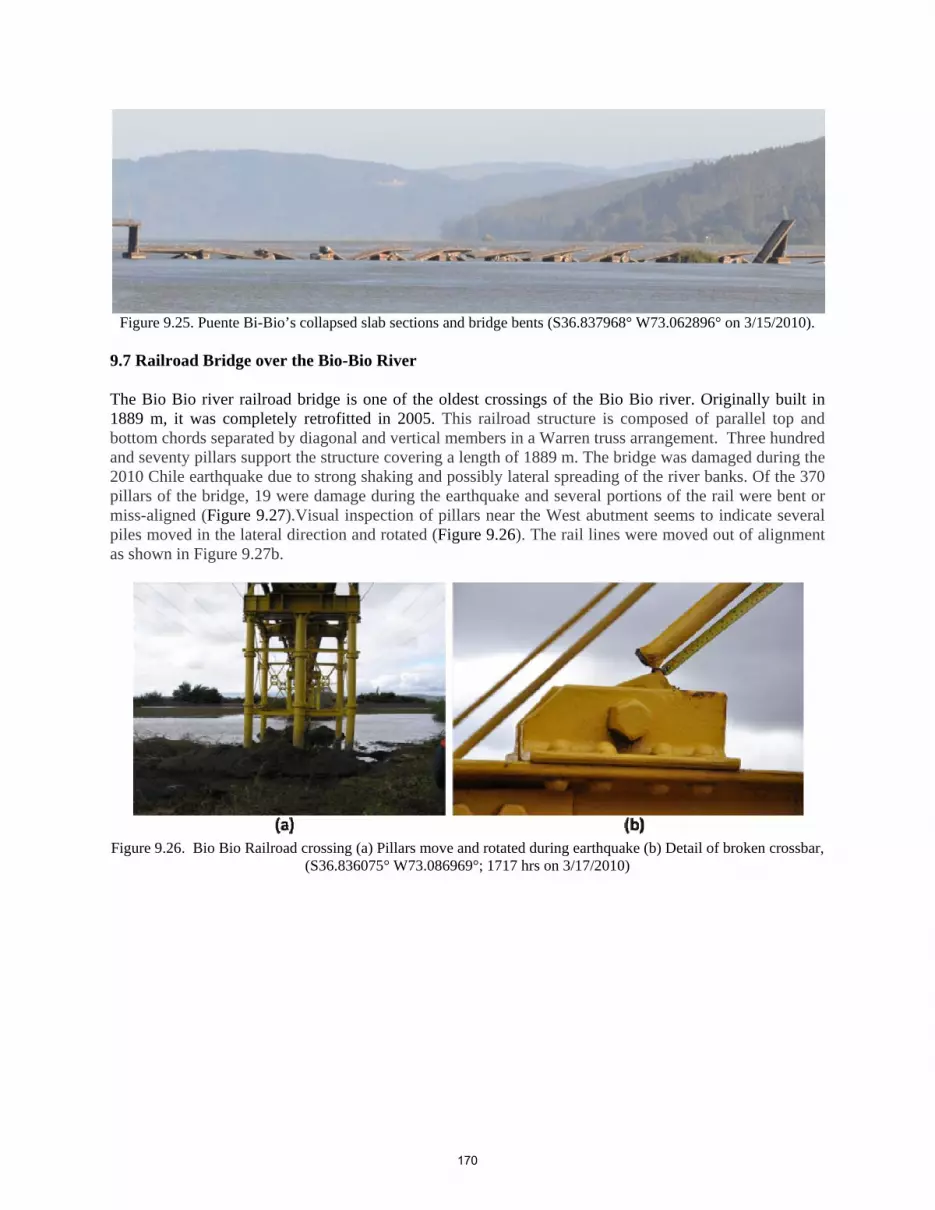
Figure 9.25. Puente Bi-Bio’s collapsed slab sections and bridge bents (S36.837968° W73.062896° on 3/15/2010).
9.7 Railroad Bridge over the Bio-Bio River The Bio Bio river railroad bridge is one of the oldest crossings of the Bio Bio river. Originally built in 1889 m, it was completely retrofitted in 2005. This railroad structure is composed of parallel top and bottom chords separated by diagonal and vertical members in a Warren truss arrangement. Three hundred and seventy pillars support the structure covering a length of 1889 m. The bridge was damaged during the 2010 Chile earthquake due to strong shaking and possibly lateral spreading of the river banks. Of the 370 pillars of the bridge, 19 were damage during the earthquake and several portions of the rail were bent or miss-aligned (Figure 9.27).Visual inspection of pillars near the West abutment seems to indicate several piles moved in the lateral direction and rotated (Figure 9.26). The rail lines were moved out of alignment as shown in Figure 9.27b.
Figure 9.26. Bio Bio Railroad crossing (a) Pillars move and rotated during earthquake (b) Detail of broken crossbar,
(S36.836075° W73.086969°; 1717 hrs on 3/17/2010)
170

Figure 9.27. Bio Bio Railroad crossing (a) rails aligned before earthquake, (b) rails bended after earthquake
(S36.836097° W73.087094° on 3/17/2010)
9.8 River Crossings in Talca The City of Talca suffered significant damage due to earthquake shaking. The damage was predominantly associated with low-rise adobe and unreinforced masonry construction (Figure 9.28). Taller, well-designed structures performed relatively well, with the exception of damage to exterior cladding and contents in the upper floors (RMS, 2010). The GEER team did not conduct an extensive survey of building damage within the city; rather the team focused on regions near the Rio Claro, which runs along the west edge of the city, extending north-south parallel with Route 5 (Figure 9.29). In addition, the team inspected areas along a branch of the river running east-west towards the southern edge of the city. Bridges crossing the east-west branch of the river were primarily short span (less than 50 m long) slab bridges (Figure 9.31). Of the bridges inspected along the branch of the Rio Claro, no visible damage to the structure or surrounding ground was observed. Two long span bridges that cross the Rio Claro), one a vehicular bridge, the other a pedestrian bridge (Puente Rio Claro Nuevo and Puente Rio Claro Viejo) (Figure 9.31) were of interest. Both structures are constructed of reinforced concrete, and of a girder-slab type configuration with the vehicular bridge bents supported on pier walls and the pedestrian bridge bents supported on angled multi-column subassemblies integral with a pier cap at both base and column head. Local ground failure was observed approximately 50 m north of the Puente Rio Claro Nuevo (vehicular bridge) (Figure 9.32 and Figure 9.33). Two distinct regions were observed, a smaller lateral spread near shore (Figure 9.33), and a larger ground failure more characteristic of a soft clay failure confined within a park area (Figure 9.32). Soils near the shore area were predominantly gravely materials, likely with pockets of sand (one sand boil was observed at the near shore failure), whereas the park area indicated the presence of a soft clayey material. The ground failure extended approximately 90 m by 33 m north-south, however, it had no impact on the vehicular bridge, as it was open to traffic with no visible distress noted from the team’s inspection on the east shore area. In contrast, the Puente Rio Claro Viejo (pedestrian bridge) suffered unseating of the longitudinally spanning girders and subsequent shear failure of the
171
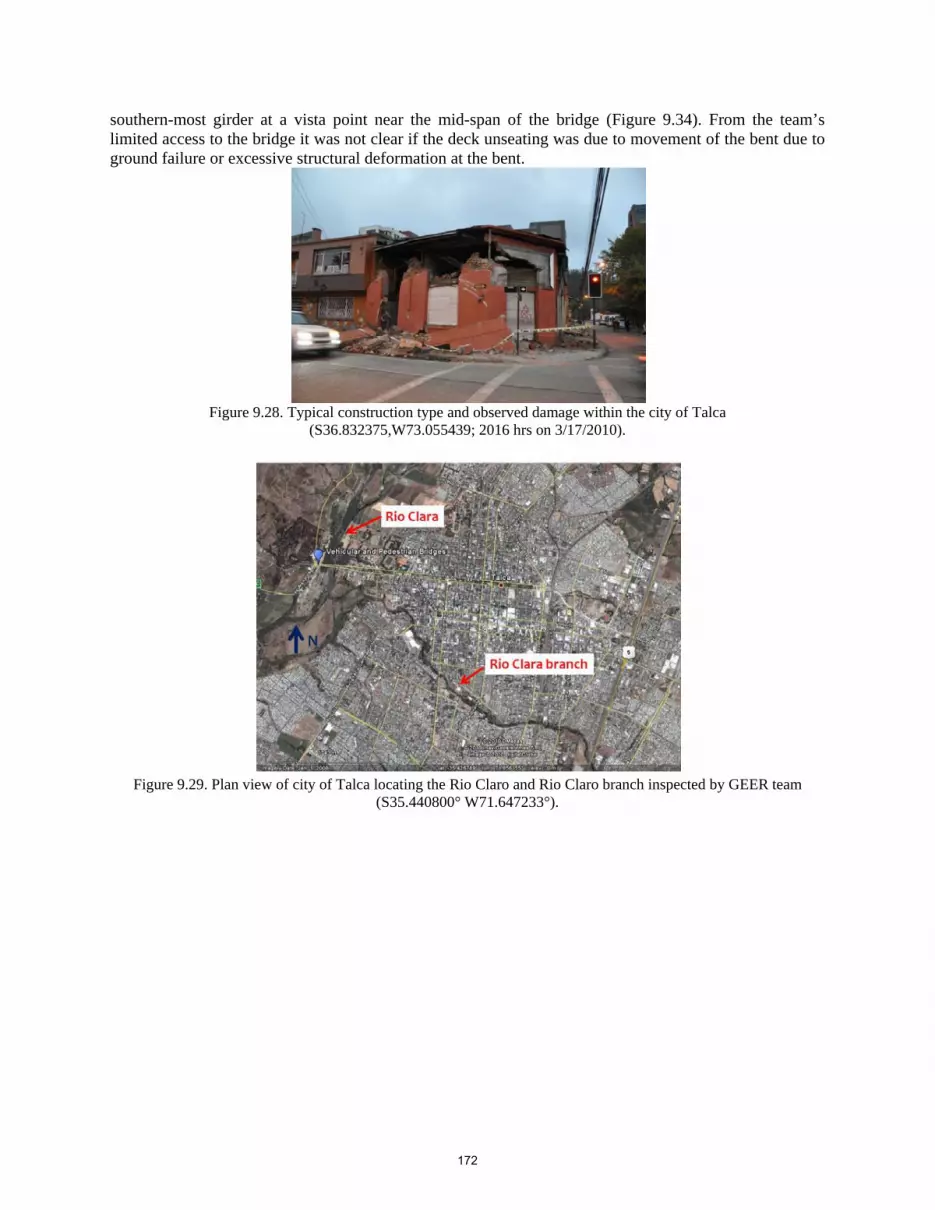
southern-most girder at a vista point near the mid-span of the bridge (Figure 9.34). From the team’s limited access to the bridge it was not clear if the deck unseating was due to movement of the bent due to ground failure or excessive structural deformation at the bent.
Figure 9.28. Typical construction type and observed damage within the city of Talca
(S36.832375,W73.055439; 2016 hrs on 3/17/2010).
Figure 9.29. Plan view of city of Talca locating the Rio Claro and Rio Claro branch inspected by GEER team
(S35.440800° W71.647233°).
172

Figure 9.30. (a) Typical short span bridge construction on the branch of the Rio Claro, city of Talca (S35.428011° W71.670269°; 1302 hrs on 3/18/2010). (b) Bridges were observed to remain undamaged
(S35.428086° W71.669894°; 1303 hrs on 3/18/2010).
Figure 9.31. Plan view of the Puente Rio Claro Nuevo and Puente Rio Claro Viejo, locating the observed ground
failure area to the north (S35.420772° W71.682932°).
Figure 9.32. Ground failure in a park area near the shore of the Rio Claro in Talca (S35.419919°, W71.682289°;
1408 hrs on 3/18/2010), views looking north and south, for left and right images, respectively.
173

Figure 9.33. Near shore lateral spread on the western shore of the Rio Claro in Talca, view looking south.
(S35.419682°, W71.682359° on 3/18/2010). Both the pedestrian and vehicular crossing bridges are shown in the background.
Figure 9.34. Deck unseating and shear failure of longitudinal spanning girders of the Talca pedestrian bridge at the
vista area (S35.421044, W71.683197; 1354 hrs on 3/18/2010) 9.9 Undercrossings and Connectors for Autopista Vespucio Norte Express in Quilicura Several transportation structures along the Autopista Vespucio Norte Express (i.e., Vespucio Norte Expressway) were damaged in the Quilicura area of North West Santiago (Figure 9.35). There was at least one collapse and several spans were unseated requiring temporary support (Figure 9.36). Both older and newer structures were damaged, and the damage appeared to be the result of strong shaking. Since the damage appeared localized only as the Vespucio Norte Expressway came through the Quilicura area, it is suspected that local site effects, resulting from either soil conditions or subsurface topography contributed to the strong shaking. Retaining walls and mechanically stabilized embankment (MSE) walls appeared to perform well in the area (Figure 9.37). No other signs of geotechnical conditions influencing the performance, such as liquefaction or slope movements, were observed.
174

Figure 9.35. (a) Damaged shear key is an example of typical performance on bridges along this section of Vespucio Norte Expressway in Quilicura (S33.365585, W70.688657; 814 hrs on 3/19/2010), (b) Close up of damaged shear
key along Vespucio Norte Expressway (S33.365893, W70.688584; 817 hrs on 3/19/2010).
Figure 9.36 (a). Example of one of the newer under crossings that suffered damage along the Vespucio Norte
Expressway. The right span became unseated due to excessive transverse movement (S33.36245, W70.688865; 829 hrs on 3/19/2010) (b) Close-up of shear key area on bent cap, with metal shear key or keeper bar hanging on right side of bent cap. Note complete unseating of I-girder on right side of bent cap (S33.366638, W70.689301; 837 hrs
on 3/19/2010).
175

Figure 9.37. Retaining walls and mechanically-stabilized-embankment (MSE) walls appeared to perform well in the Quilicura area of Santiago (S33.366137, W70.688913; 824 hrs on 3/19/2010)
176
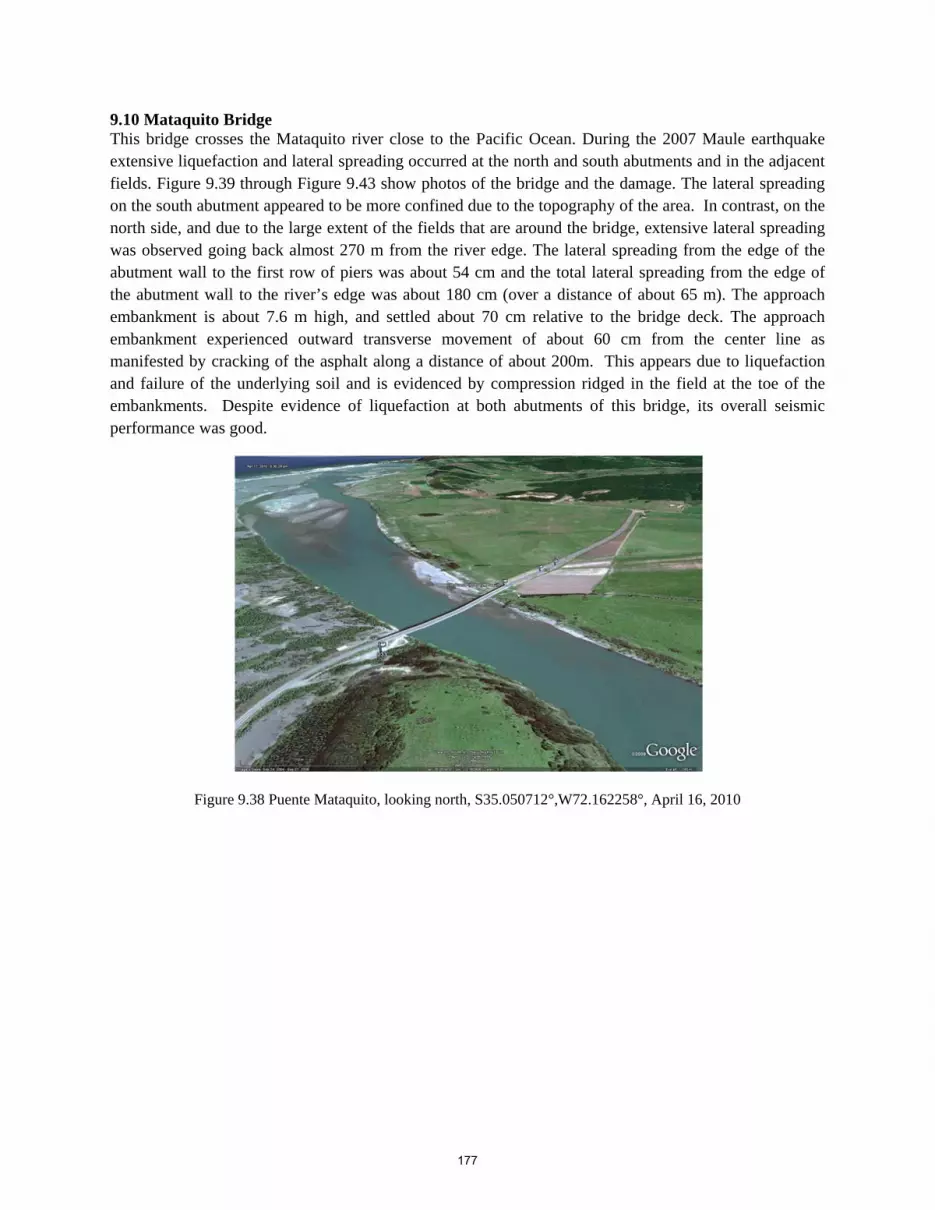
9.10 Mataquito Bridge This bridge crosses the Mataquito river close to the Pacific Ocean. During the 2007 Maule earthquake extensive liquefaction and lateral spreading occurred at the north and south abutments and in the adjacent fields. Figure 9.39 through Figure 9.43 show photos of the bridge and the damage. The lateral spreading on the south abutment appeared to be more confined due to the topography of the area. In contrast, on the north side, and due to the large extent of the fields that are around the bridge, extensive lateral spreading was observed going back almost 270 m from the river edge. The lateral spreading from the edge of the abutment wall to the first row of piers was about 54 cm and the total lateral spreading from the edge of the abutment wall to the river’s edge was about 180 cm (over a distance of about 65 m). The approach embankment is about 7.6 m high, and settled about 70 cm relative to the bridge deck. The approach embankment experienced outward transverse movement of about 60 cm from the center line as manifested by cracking of the asphalt along a distance of about 200m. This appears due to liquefaction and failure of the underlying soil and is evidenced by compression ridged in the field at the toe of the embankments. Despite evidence of liquefaction at both abutments of this bridge, its overall seismic performance was good.
Figure 9.38 Puente Mataquito, looking north, S35.050712°,W72.162258°, April 16, 2010
177

Figure 9.39 (a) Lateral spreading on the south end of the bridge, Puente Mataquito, S35.050712°,W72.162258°, April 16, 2010. (b)Lateral spreading on the north end of the bridge, Puente Mataquito, S35.050712°,W72.162258°,
April 16, 2010.
Figure 9.40. (a) Settlement of the north abutment of the bridge, 70 cm offset at the bridge deck, Puente Mataquito, S35.050712°,W72.162258°, April 16, 2010. (b) Cracking and transverse movement (60 cm on each side) of
embankment due to liquefaction of underlying soi
178
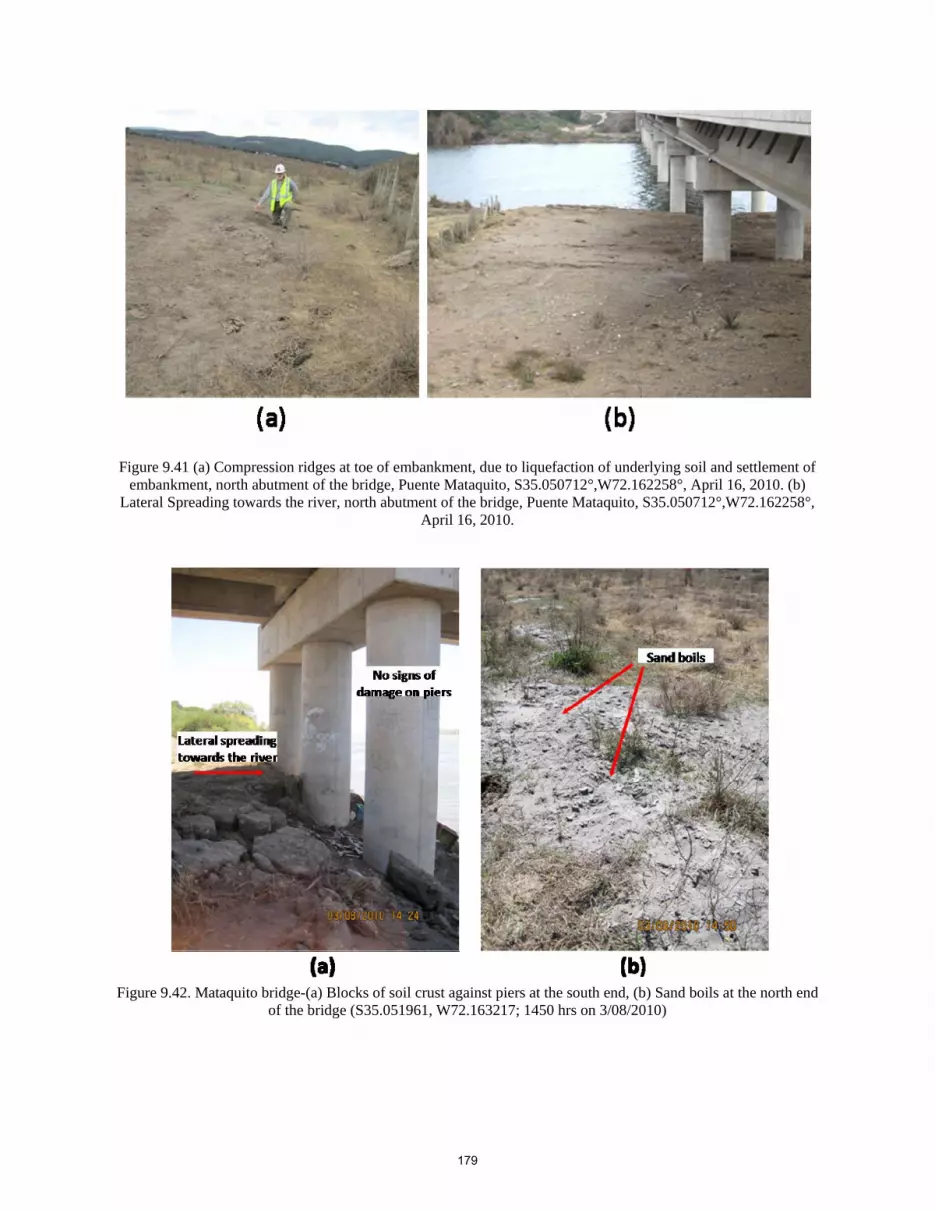
Figure 9.41 (a) Compression ridges at toe of embankment, due to liquefaction of underlying soil and settlement of embankment, north abutment of the bridge, Puente Mataquito, S35.050712°,W72.162258°, April 16, 2010. (b)
Lateral Spreading towards the river, north abutment of the bridge, Puente Mataquito, S35.050712°,W72.162258°, April 16, 2010.
Figure 9.42. Mataquito bridge-(a) Blocks of soil crust against piers at the south end, (b) Sand boils at the north end
of the bridge (S35.051961, W72.163217; 1450 hrs on 3/08/2010)
179
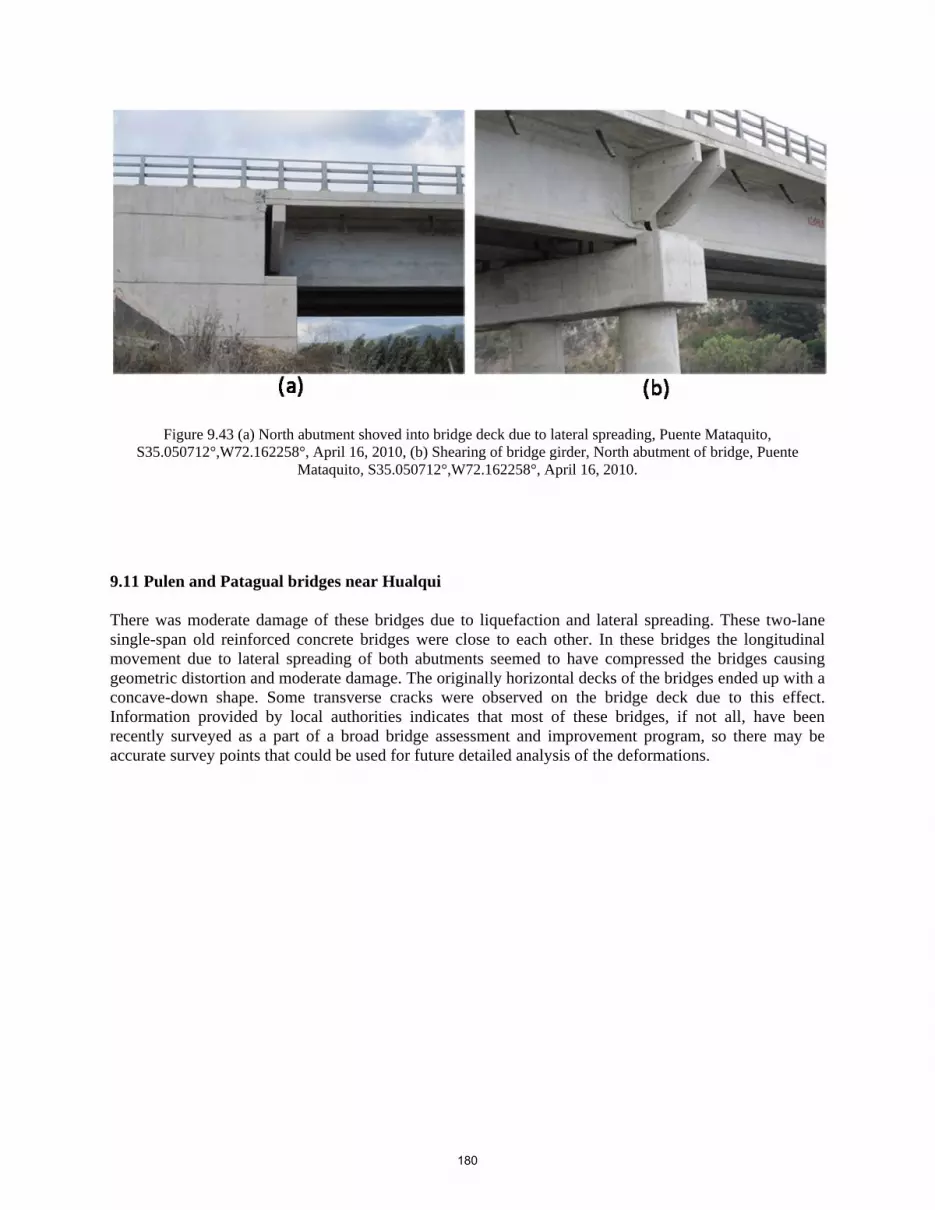
Figure 9.43 (a) North abutment shoved into bridge deck due to lateral spreading, Puente Mataquito, S35.050712°,W72.162258°, April 16, 2010, (b) Shearing of bridge girder, North abutment of bridge, Puente
Mataquito, S35.050712°,W72.162258°, April 16, 2010. 9.11 Pulen and Patagual bridges near Hualqui There was moderate damage of these bridges due to liquefaction and lateral spreading. These two-lane single-span old reinforced concrete bridges were close to each other. In these bridges the longitudinal movement due to lateral spreading of both abutments seemed to have compressed the bridges causing geometric distortion and moderate damage. The originally horizontal decks of the bridges ended up with a concave-down shape. Some transverse cracks were observed on the bridge deck due to this effect. Information provided by local authorities indicates that most of these bridges, if not all, have been recently surveyed as a part of a broad bridge assessment and improvement program, so there may be accurate survey points that could be used for future detailed analysis of the deformations.
180

Figure 9.44. Pulen Bridge-(a)Evidence of lateral spreading at the north abutment (b) Loss of longitudinal alignment
of steel I-beam (S37.112036, W72.986902, 1225 hrs on 3/10/2010)
Figure 9.45. Patagual Bridge-(a) Ground movement at the abutment (b) Sidewalk crack in the transverse direction
on the top of the bridge deck(S37.111325, W72.987583, 1257 hrs on 3/10/2010). 9.12 Laraquete Bridge Two bridges were inspected in the Town of Laraquete, which is 50 km south of Concepción: A pedestrian two span bridge and an adjacent vehicular three span reinforced concrete bridge. The pedestrian bridge experienced damage due to foundation settlement of the middle bent with an estimated 0.50 m vertical deformation. Figure 9.47 shows the deformed bridge with noticeable inclination of the bridge deck. The adjacent reinforced concrete bridge, shown in Figure 9.46, suffered minor damage near the approaches due to pounding with the concrete structure and settlement due to poorly compacted fill. This bridge did not show evidence of foundation settlement.
181
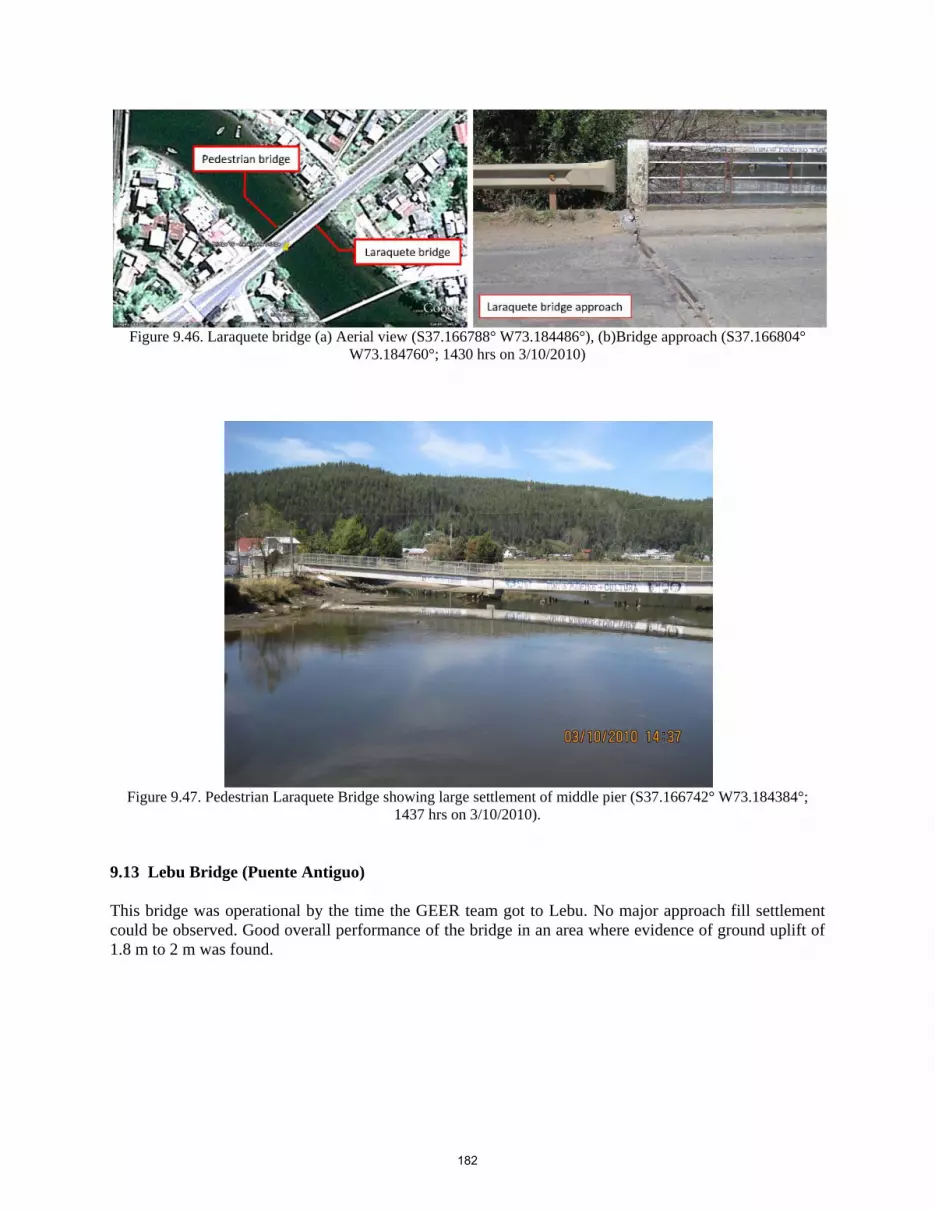
Figure 9.46. Laraquete bridge (a) Aerial view (S37.166788° W73.184486°), (b)Bridge approach (S37.166804°
W73.184760°; 1430 hrs on 3/10/2010)
Figure 9.47. Pedestrian Laraquete Bridge showing large settlement of middle pier (S37.166742° W73.184384°;
1437 hrs on 3/10/2010).
9.13 Lebu Bridge (Puente Antiguo) This bridge was operational by the time the GEER team got to Lebu. No major approach fill settlement could be observed. Good overall performance of the bridge in an area where evidence of ground uplift of 1.8 m to 2 m was found.
182
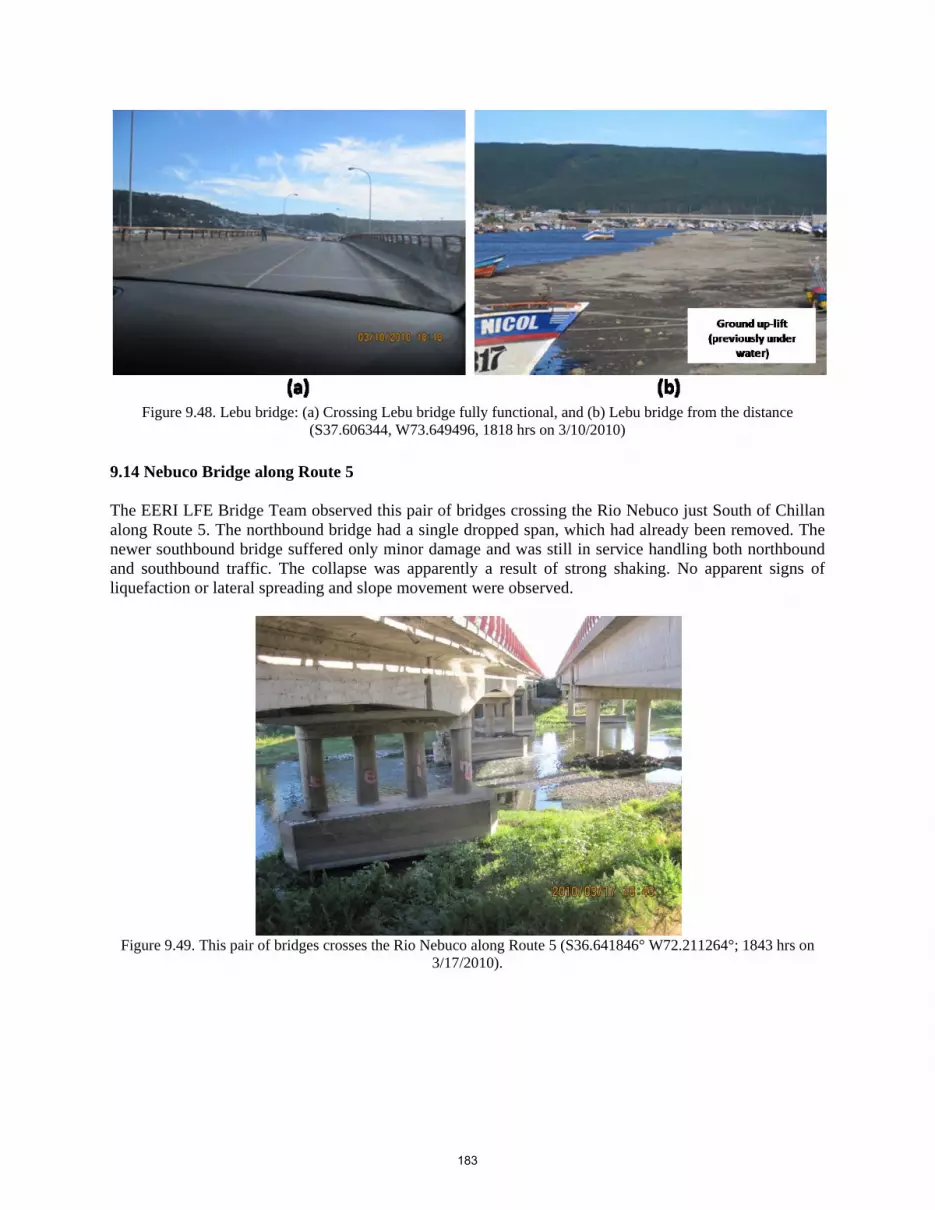
Figure 9.48. Lebu bridge: (a) Crossing Lebu bridge fully functional, and (b) Lebu bridge from the distance
(S37.606344, W73.649496, 1818 hrs on 3/10/2010) 9.14 Nebuco Bridge along Route 5 The EERI LFE Bridge Team observed this pair of bridges crossing the Rio Nebuco just South of Chillan along Route 5. The northbound bridge had a single dropped span, which had already been removed. The newer southbound bridge suffered only minor damage and was still in service handling both northbound and southbound traffic. The collapse was apparently a result of strong shaking. No apparent signs of liquefaction or lateral spreading and slope movement were observed.
Figure 9.49. This pair of bridges crosses the Rio Nebuco along Route 5 (S36.641846° W72.211264°; 1843 hrs on
3/17/2010).
183

9.15 Damage to Bridge and Roadway near Tubul A roadway and bridge near the small town of Tubul were damaged due to ground failure. The layout of the bridge and roadway is shown in Figure 9.50. The roadway is about 0.33 km long and single span bridges cross the river on the east and west ends. Damage to the roadway and the bridge on the east end closed the road to traffic following the earthquake. The two lane roadway, with an embankment height of about 2 m, traverses a swampy, low-lying area adjacent to a small river which flows northward into the Pacific Ocean. Therefore, soils in this area are likely to be soft and saturated. The eastern bridge, which is about 50 m long, is supported by steel beams, which rest on a seat type abutment.
Figure 9.50. Damage to roadway and bridge due to ground failure near town of Tubul, Chile (S37.254345º,
W73.437021º).
Lateral spreading toward the river produced ground displacement of about 0.6 m to 0.7 m at the west abutment. The bridge beams appear to have acted as a strut to limit displacement at the top of the abutment. This led to an offset of about 0.30 m to 0.35 m between the bridge abutment and a retaining wall adjacent to the abutment as shown in Figure 9.51(c). The displacement and rotation of abutment was still sufficient to deform the vertical restraining bars connecting the base of the abutment and the bridge beams by about 0.35 m as shown in the photo in Figure 9.51(b). Displacement of the abutment relative to the beams also led to shearing of the outer edge of the abutment wall as it impacted the bridge beam as shown in Figure 9.51(a). On both sides of the roadway, slumps developed along nearly the entire length of the roadway leaving vertical scarps 1.0 to 2.0 m in height as shown in Figure 9.52. The slopes on both sides of the roadway appear to have rotated downward causing an upward heave and rotation of the outer edge of the failure surface similar to a bearing capacity failure surface. In addition to the slumping along the sides of the road, the middle section of the road experienced lateral displacement towards the north as evidenced by the bow in the centerline of the road evident in Figure 9.52(a).
184

Figure 9.51. Damage to bridge abutment due to lateral spreading of soil around bridge abutment. (a) abutment wall
movement relative to beams, (b) deformation of vertical restraining bar due to abutment movement relative to beams, (c) movement of retaining wall relative to abutment. (S37.254345º, W73.437021º; 1911 hrs on 3/17/2010)
Figure 9.52. Photos showing scarps along both sides of the roadway due to bearing capacity failure in soil
underlying the fill. Note lateral spreading in upper photo (S37.254161º, W73.437577º on 3/17/2010)
185

9.16 Road and Railroad Embankment Failures North of Lota Several large ground failure areas were observed north of Lota along Route 160. Two failures resulted in damage to a roadway embankment section (denoted herein as the “south bound failure” and “north bound failure”; Figure 9.55, 9.56 and 9.57), while a third failure resulted in damage to an elevated railroad section (denoted as “railroad failure”; Figure 9.53 and Figure 9.56). Minor side road spreading-like failures were also noted near the approach abutments to two short span overpass bridges, north of the embankment failures, as well as just north of the short span bridges. The area east of Route 160 is largely marshy with low lying organic material (Figure 9.53). South of the north bound failure and east of the south bound failure of the elevated roadway sections is a small housing development. The north bound ground failure appeared to be deeply seated, perhaps due to softening of the foundation materials. It was not clear whether the south bound failure was due to a deep seated foundation failure or due to poorly compacted earth fill in the embankment section. A gray sandy fill overlaid by compacted clay fill was used in the elevated road embankment. The roadway elevation was approximately 10–15m above the valley area (10 m nearest to the overcrossing bridges, with high point above the housing development area). The bridge overcrossings, and therefore the road embankments, of the north and south bound sections may have been constructed at different times, as evident in the differences in construction type of the bridges (Figure 9.56(a)). The neighboring elevated railroad failure is characterized by a slumping and spreading of the elevated section, which is likely due to movement of the compacted fill (Figure 9.56(b)). The railroad was approximately 5-7 m above the low lying marshy area along its failure zone.
Figure 9.53. Plan view of approximate affected area (Google Earth image at S37.0734°, W73.1469°).
186

Figure 9.54. View looking north on route 160 showing south bound and north bound failure areas (S37.0744°,
W73.1480°; 1220 hrs on 3/16/2010).
Figure 9.55. Lota (a)View looking south on route 160 showing north bound failure area (S37.0730°,W73.1475°;
1145 hrs on 3/16/2010) (b)View looking north on route 160 showing south bound failure area (S37.0746°, W73.1479°; 1215 hrs on 3/16/2010).
Figure 9.56. Lota (a) Slab and girder-type overpasses at northern end of road embankment failure area, showing
railroad and supporting ground settlement. View looking west. (S37.0729°, W73.1469°; 1150 hrs on 3/16/2010), (b) Ground failure below elevated railroad east of road embankment failure. (image looking east; S37.0727°,
W73.1471°; 1150 hrs on 3/16/2010)
187

9.17 Collapsed of Embankment Fills near Copihue and Parral Two collapsed embankment fills were identified near Copihue and Parral. The first, shown in Figure 9.57, occurred on a straight section of Ruta 5 located ~ 8 km North of Parral (S36.0796 W71.7881). The Southbound lanes collapsed to the West and appeared to involve a shallow translational slide in near surface foundation soils as evidenced by the location of the failed soil mass including a mound of soil pushed up at West toe of the embankment (Figure 9.57a). The embankment failed along a length of approximately 150 m at a location where a low lying softer soil area was located at the toe.
Figure 9.57. This embankment fill collapsed together with an overhead near Copihue, north of Parral, closing the
South bound of Route 5 (a) View from the South, (b) View from the North (S36.087891, W71.791513, 1325 hrs on 3/11/2010)
The second failure, shown in Figure 9.58, occurred on an overpass of Ruta 5 located ~ 13 km North of Parral. (S36.0347 , W71.7558). The overpass embankment was curved and the embankment failed over a length of about 80 m towards the outside of the curved section. Again, the failure appeared to involve a shallow translational slide in the near surface foundation soils as evidenced by the intact failed soil mass and the mound of soil pushed up at the toe (Figure 9.58a). Foundation soils in the region appeared to be relatively competent (unlike the above case) suggesting possible elevated pore pressures in the foundation soils played a role in the observed failure with 3-D effects leading to failure to the outside of the curved embankment section as opposed to the inside of the embankment. The outside section of the slide mass remained completely intact as evidenced in Figure 9.58b.
Figure 9.58. Curved overpass embankment failure 13 km North of Parral (a) Translational 3-D slide failure, (S36.0343 W71.7568; 1405 hrs on 3/11/2010) and (b) Failed outside of the curved embankment (S36.0347
W71.7558; 1409 hrs on 3/11/2010)
188

9.18 Ground Failure along Highway 5 near Paine Abutment and embankment failures were common along Route 5. Figure 9.59 and Figure 9.60 show typical highway failures due to poor compaction of the embankment fill and abutments near Paine 62 km South of Santiago. The same scenario repeated at multiple sites. In contrast, mechanically stabilized retaining structures performed exceptionally well. Figure 9.59 shows the failure of an overpass bridge. The figure shows cracks on the sloping ground that propagated away from the abutment, and reduced in size away from the bridge. It seems cracks succeeded the abutment failure. The structural damage of the overpass was caused by differential settlement of the supports. Figure 9.60 shows the failure of the highway shoulder and pavement due to poor compaction of the fill material.
Figure 9.59. Highway 5 crossing near Paine; (a)View of bridge approach from East (S33.854592° W70.747687°; 1118 hrs on 3/16/2010); (b) View of damaged bridge abutment (S33.854211° W70.747784°; 1120 hrs on
3/16/2010)
Figure 9.60. Highway 5 failure near Paine; (a)shoulder settlement due to poorly compacted soil (S33.864897° W70.742222° 1203 hrs on 3/16/2010), and (b) road failure due to poorly compacted soil (S33.864897°
W70.742222°; 1204 hrs on 03/16/2010)
189

Route 5 Sur overpass embankment, to Retiro at Tucapel Mill Overpass
Team D performed SASW measurement s on a damaged overpass embankment on the right side of the north bound lane of Route 5 Sur. The damage of the embankment appears to be due to shaking and bulging of the embankment material. The underlying soils appear to be intact with no evidence of loss of loss of strength. The embankment bulged laterally and settled. The overpass embankment to the left of the north bound lane does not show signs of damage.
Figure 9.61 Ruta 5 Sur overpass embankment, looking north, to Retiro at Tucapel Mill (S36.051209°,W71.768005°).
Figure 9.62 (a) Damage to overpadd embankment, Ruta 5 Sur overpass embankment, to Retiro at Tucapel Mill, April 15, 2010 (S36.051209°,W71.768005°), (b) SASW line, Ruta 5 Sur overpass embankment, to Retiro at Tucapel
Mill, April 15, 2010 (S36.051209°,W71.768005°).
190
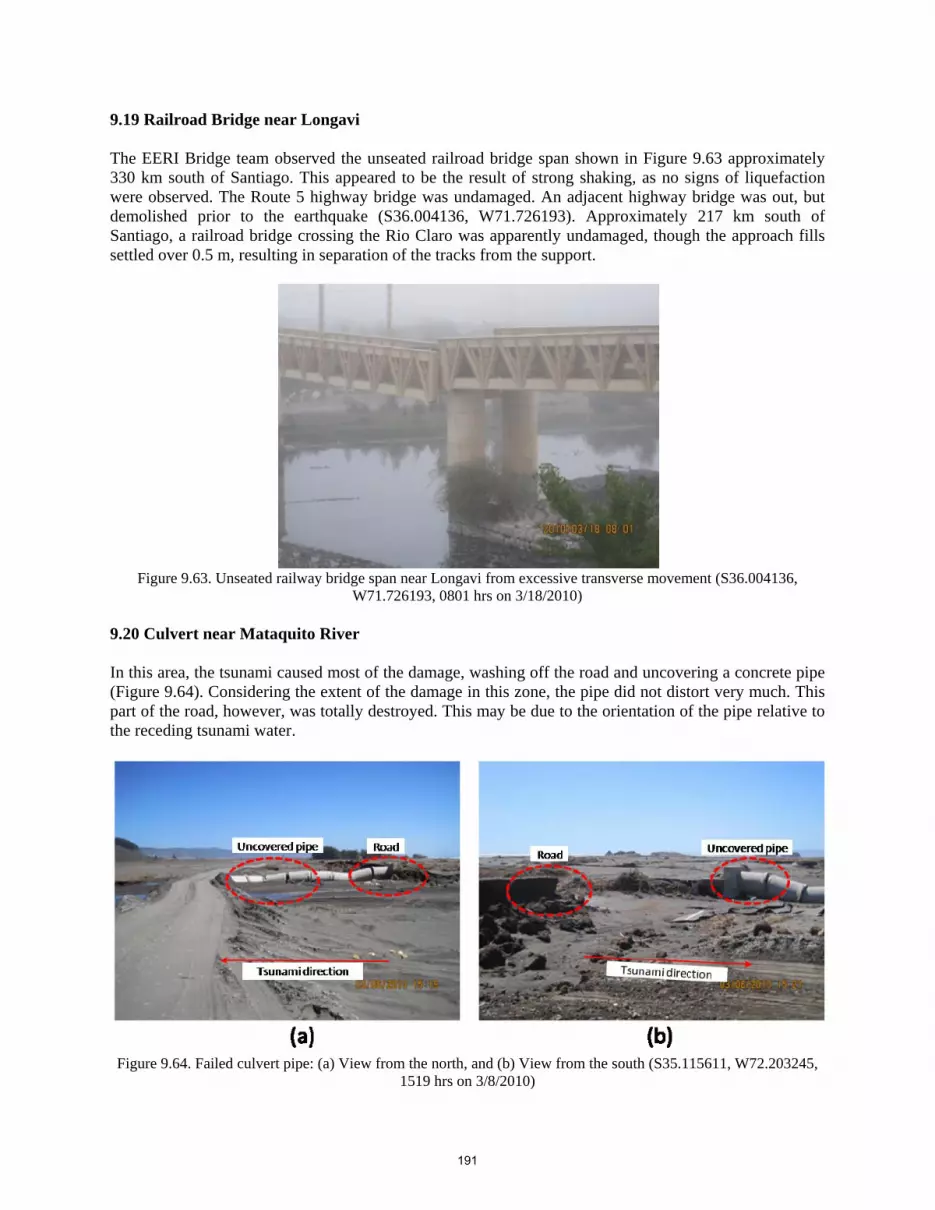
9.19 Railroad Bridge near Longavi The EERI Bridge team observed the unseated railroad bridge span shown in Figure 9.63 approximately 330 km south of Santiago. This appeared to be the result of strong shaking, as no signs of liquefaction were observed. The Route 5 highway bridge was undamaged. An adjacent highway bridge was out, but demolished prior to the earthquake (S36.004136, W71.726193). Approximately 217 km south of Santiago, a railroad bridge crossing the Rio Claro was apparently undamaged, though the approach fills settled over 0.5 m, resulting in separation of the tracks from the support.
Figure 9.63. Unseated railway bridge span near Longavi from excessive transverse movement (S36.004136,
W71.726193, 0801 hrs on 3/18/2010) 9.20 Culvert near Mataquito River In this area, the tsunami caused most of the damage, washing off the road and uncovering a concrete pipe (Figure 9.64). Considering the extent of the damage in this zone, the pipe did not distort very much. This part of the road, however, was totally destroyed. This may be due to the orientation of the pipe relative to the receding tsunami water.
Figure 9.64. Failed culvert pipe: (a) View from the north, and (b) View from the south (S35.115611, W72.203245,
1519 hrs on 3/8/2010)
191
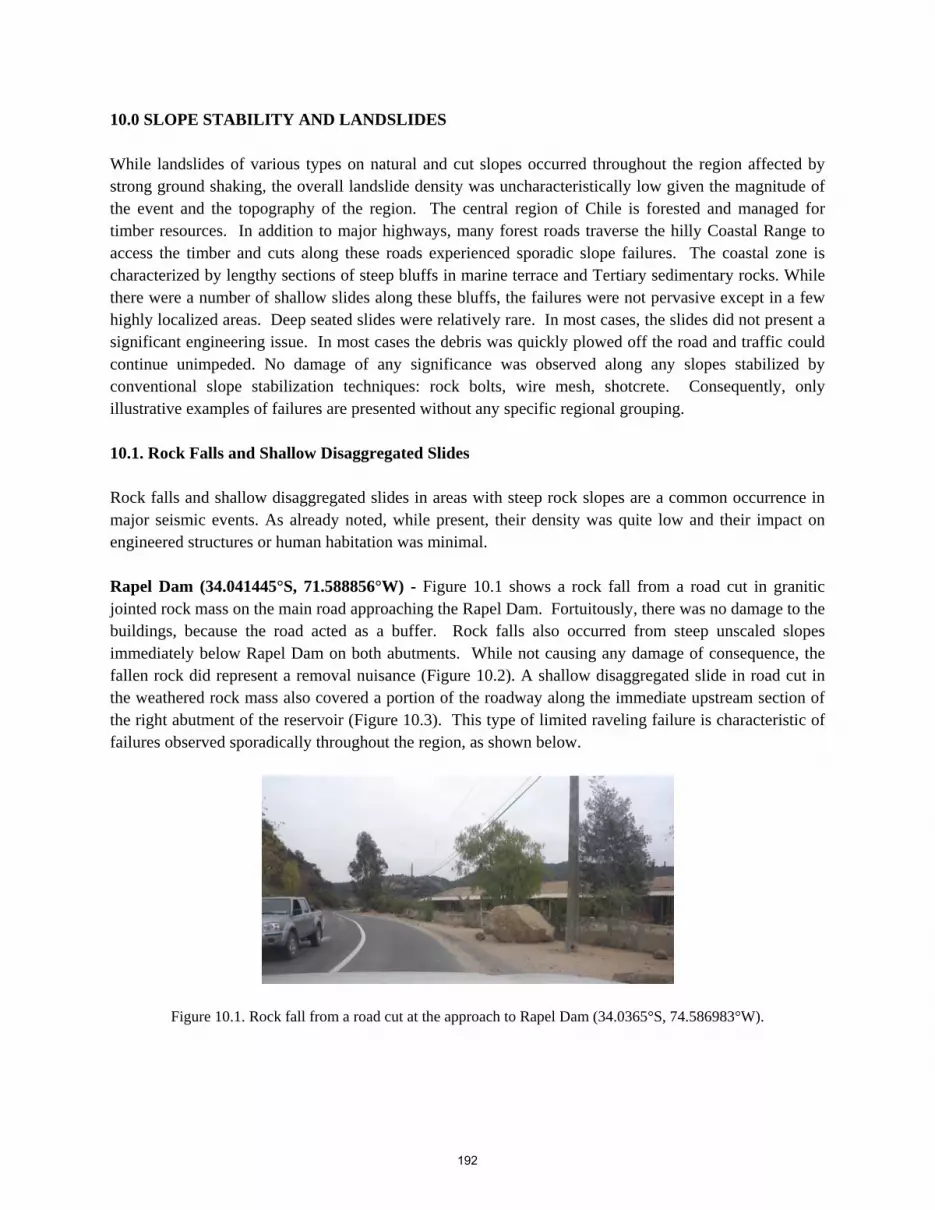
10.0 SLOPE STABILITY AND LANDSLIDES While landslides of various types on natural and cut slopes occurred throughout the region affected by strong ground shaking, the overall landslide density was uncharacteristically low given the magnitude of the event and the topography of the region. The central region of Chile is forested and managed for timber resources. In addition to major highways, many forest roads traverse the hilly Coastal Range to access the timber and cuts along these roads experienced sporadic slope failures. The coastal zone is characterized by lengthy sections of steep bluffs in marine terrace and Tertiary sedimentary rocks. While there were a number of shallow slides along these bluffs, the failures were not pervasive except in a few highly localized areas. Deep seated slides were relatively rare. In most cases, the slides did not present a significant engineering issue. In most cases the debris was quickly plowed off the road and traffic could continue unimpeded. No damage of any significance was observed along any slopes stabilized by conventional slope stabilization techniques: rock bolts, wire mesh, shotcrete. Consequently, only illustrative examples of failures are presented without any specific regional grouping. 10.1. Rock Falls and Shallow Disaggregated Slides Rock falls and shallow disaggregated slides in areas with steep rock slopes are a common occurrence in major seismic events. As already noted, while present, their density was quite low and their impact on engineered structures or human habitation was minimal. Rapel Dam (34.041445°S, 71.588856°W) - Figure 10.1 shows a rock fall from a road cut in granitic jointed rock mass on the main road approaching the Rapel Dam. Fortuitously, there was no damage to the buildings, because the road acted as a buffer. Rock falls also occurred from steep unscaled slopes immediately below Rapel Dam on both abutments. While not causing any damage of consequence, the fallen rock did represent a removal nuisance (Figure 10.2). A shallow disaggregated slide in road cut in the weathered rock mass also covered a portion of the roadway along the immediate upstream section of the right abutment of the reservoir (Figure 10.3). This type of limited raveling failure is characteristic of failures observed sporadically throughout the region, as shown below.
Figure 10.1. Rock fall from a road cut at the approach to Rapel Dam (34.0365°S, 74.586983°W).
192

Figure 10.2. Rock fall from the downstream left abutment of Rapel Dam (34.04167°S, 71.59263°W).
Figure 10.3. Shallow raveling failure of a road cut in weathered and heavily jointed granitic rock at Rapel Dam (34.0407421°S, 71.587153°W).
193

Road Cut Failures – Sporadic failures in road cuts were noted throughout the region and their size and characteristics typically reflected the height of the cut and the competency of the source material. More competent rock types exhibited larger size boulders within the failed mass while less competent source materials exhibited more disaggregated masses of smaller boulders and particles. Figure 10.4 shows a relatively extensive failure in a cut in jointed welded tuff north of El Manzano along the western edge of Lago Rapel. Figure 10.5 is a shallow failure in an approximately 15 m (45 ft) high cut in highly weathered rock on the road from Nacimiento to Santa Juana. The volume of the material was just enough to overtop the barrier, but not enough to damage it or to impede traffic. Figure 10.6 is a cut in Holocene fluvial sand deposits just North of Pulen bridge (Bridge Case No. 9) that simply sloughed along most of its face. The failure was shallow and had no effect on traffic. Similar shallow slides were observed on numerous highway overpass fills which typically appeared to be densely compacted sand with very few fines. Finally, Figure 10.7 is a bench failure in a high, ~ 30 m, benched road cut in residual soil/heavily weathered rock. The failure appears to have occurred along a daylighting joint surface that was unrecognized when the uppermost bench was cut. An immediately adjacent, identically benched slope showed no signs of failure; hence, joint orientation most likely controlled the location and mode of failure.
Figure 10.4. Road cut failure in jointed welded tuff north of El Manzano. The height of the cut is about 6 m (20 feet). Picture looking NE (34.144076°S, 71.38000°W).
194
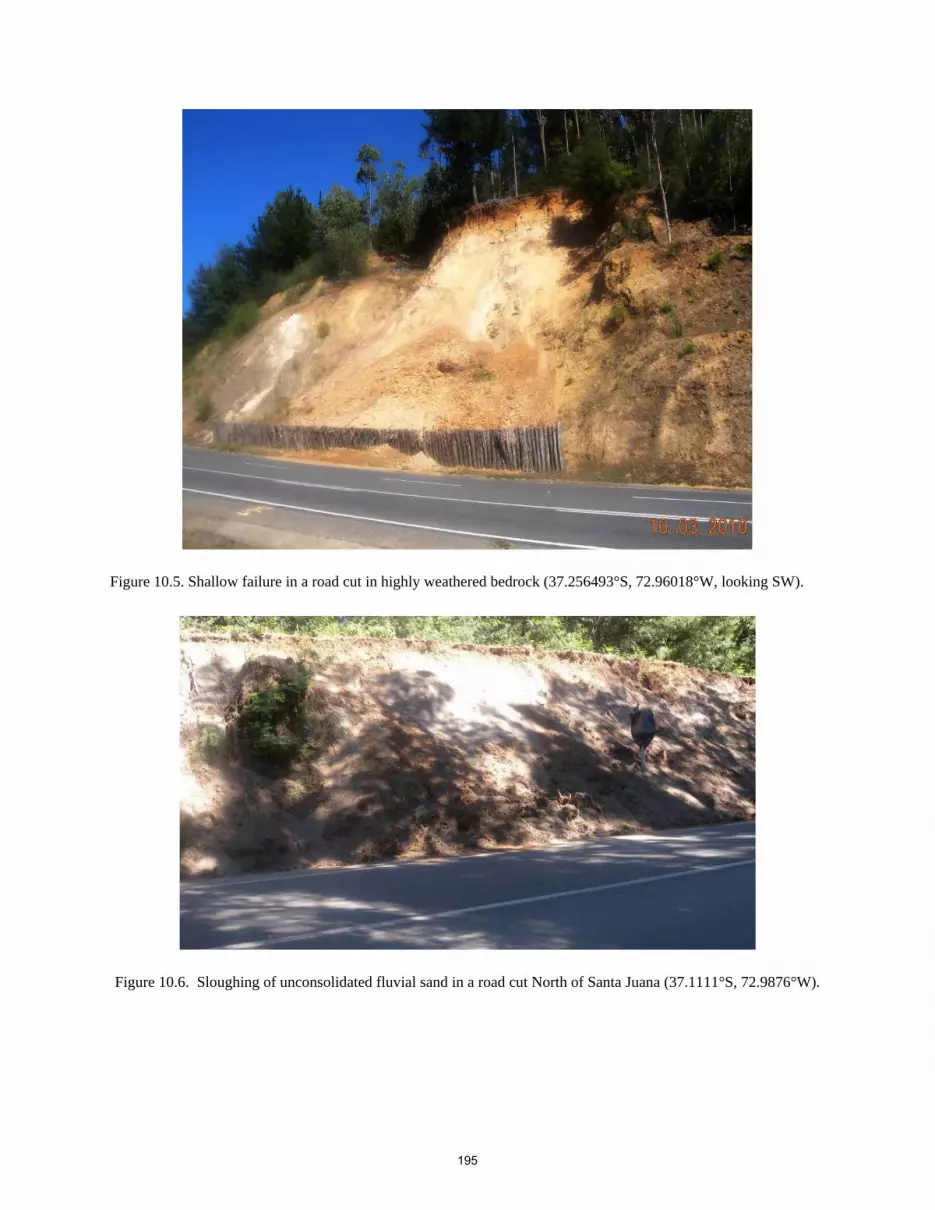
Figure 10.5. Shallow failure in a road cut in highly weathered bedrock (37.256493°S, 72.96018°W, looking SW).
Figure 10.6. Sloughing of unconsolidated fluvial sand in a road cut North of Santa Juana (37.1111°S, 72.9876°W).
195

Figure 10.7. Bench failure along a daylighting joint in a road cut in deeply weathered rock south of Lota (37.1213°S, 73.1550°W).
Failures in Coastal Bluffs – Tectonically uplifted Tertiary sediments and more recent beach terrace deposits form steep coastal bluffs along most of the affected coastline. The bluffs are particularly steep where they are directly at the beach level while in other locations they are less steep and slightly set back. In general, these types of slopes are susceptible to shallow raveling and sloughing, and such was the case in this event. However, as already noted, the failures tended to be concentrated in a few localities with only occasional failures along large sections of the coastline. This was quite surprising given the magnitude of the earthquake and duration of shaking. Lebu and Arauco region - The active tectonic uplift along the section of the coast between just south of Lebu and extending northward toward Arauco has produced a series of prominent headlands in uplifted Tertiary sedimentary rocks capped by younger marine terrace deposits. These headlands reach heights of as much as 200 meters and drop abruptly and steeply to narrow rocky beaches. The steep seaward slopes would have been expected to have been subject to slope failure and indeed numerous slope failures were in evidence and they were locally pervasive. Figure 10.8 shows the headland just southwest of Lebu with the town of Lebu in the distance. As can be seen, whole sections of the slopes are denuded by shallow raveling and sloughing, however, deep seated rotational or block failures are not observed. Local evidence suggests that the coast was inundated by a tsunami and the toes of the slopes exhibit evidence of wave erosion. Hence, it is possible and likely that at least some of the landslide material has been removed by the tsunami wave action. Similar setting but less frequent failures are exhibited along the bluffs north of Pta Carneros just southwest of Arauco as shown in Figure 10.9.
196
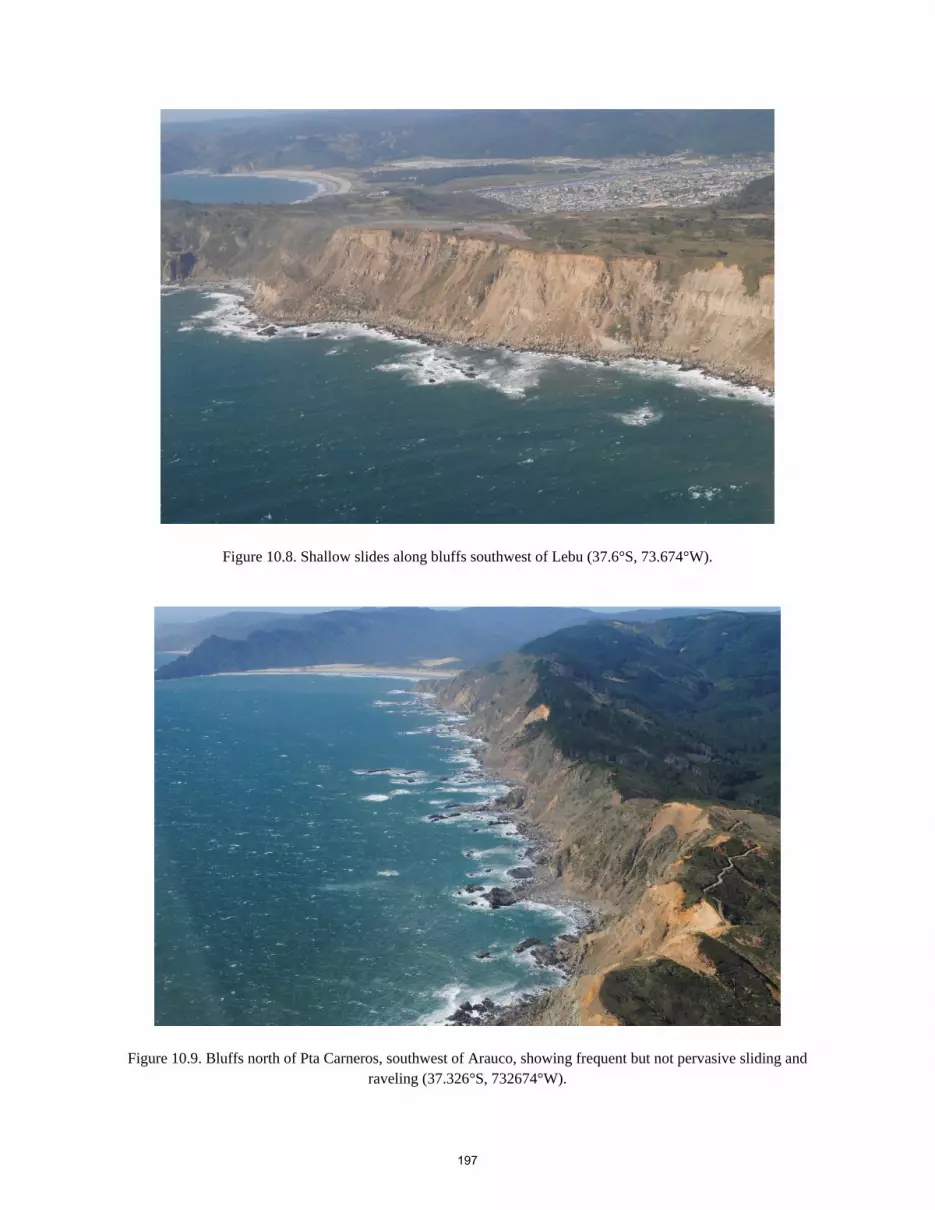
Figure 10.8. Shallow slides along bluffs southwest of Lebu (37.6°S, 73.674°W).
Figure 10.9. Bluffs north of Pta Carneros, southwest of Arauco, showing frequent but not pervasive sliding and raveling (37.326°S, 732674°W).
197

The character of the coastline changes to the north of Arauco, with softer sediments exposed in the terrace and beach bluff slopes. The slopes tend to be more gentle and more densely vegetated. Similarly slope failures are less frequent although when they occurred they had greater impact as road alignments take advantage of the less rugged coastal zone. A series of slides occurred at the seaward ends of low ridges in soft sandstones west of Arauco, with two of the slides closing the coastal road. The aerial view of the general setting is shown in Figure 10.10 with the town of Tubul in the distance and Arauco off the picture to the distant left (SE). A view of a slide that closed the road just West of Arauco is shown in Figure 10.11.
Figure 10.10. Aerial view of the coastal bluffs West of Arauco (37.2205°S, 73.443°W).
Figure 10.11. Shallow failure along a truncated ridge forcing road closure West of Arauco (37.2437°S, 73.413°W) .
198

Concepcion Area – Very similar types of highly localized landslides occurred on bluffs in Tertiary sedimentary rocks in the region around Concepcion. Figure 10.12 shows steep bluffs on the eastern shore of Isla Quiriquina which experienced shallow raveling which mostly denuded the slopes. However, several larger failures occurred in this area as well. Figure 10.13 shows a large complex of shallow coalescing slides located on the western shore of Pta Tumbes just north of Talcahuano. While this landslide complex in Teritiary sedimentary rocks was one of the most extensive failures noted along the entire coastline, pre-existing photography suggests that this was a previously disturbed area used as a quarry with a history of prior sliding. This conclusion is supported by the fact that very few other slides are found in the vicinity. However, a well documented large failure of a road cut occurred across the bay just north of Tome (Figure 10.14). The road cut in interbedded sandstone and shale is about a year old and the estimated volume of the slide is 3200 cubic meters (Jose Miguel, personal communication).
Figure 10.12. Shallow failures and raveling in Tertiary sedimentary rocks on Isla Quiriquina (36.627°S, 73.05°W).
Figure 10.13. Disagregated landslide complex, Punta Tumbes looking West (36.66°S, 73.098°W).
199
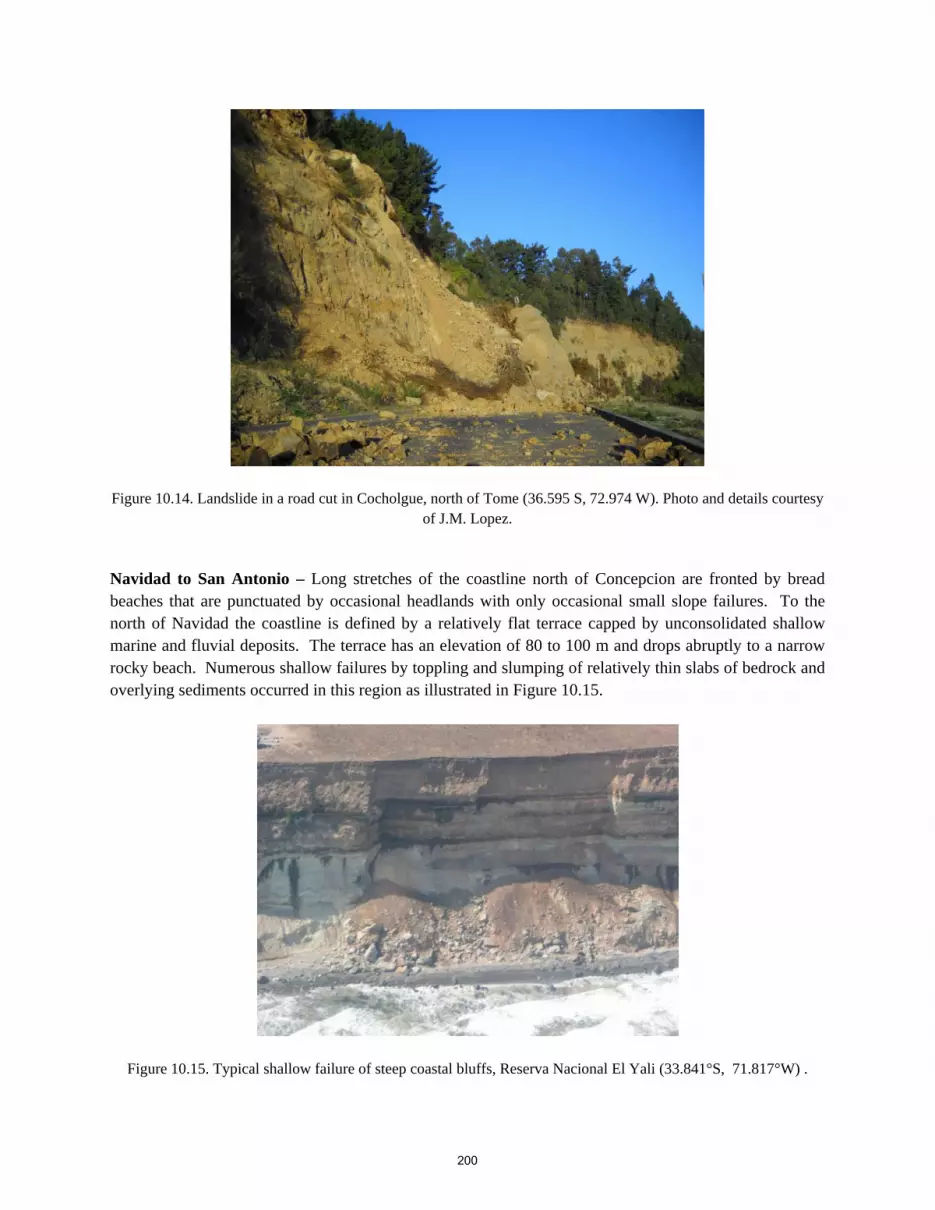
Figure 10.14. Landslide in a road cut in Cocholgue, north of Tome (36.595 S, 72.974 W). Photo and details courtesy of J.M. Lopez.
Navidad to San Antonio – Long stretches of the coastline north of Concepcion are fronted by bread beaches that are punctuated by occasional headlands with only occasional small slope failures. To the north of Navidad the coastline is defined by a relatively flat terrace capped by unconsolidated shallow marine and fluvial deposits. The terrace has an elevation of 80 to 100 m and drops abruptly to a narrow rocky beach. Numerous shallow failures by toppling and slumping of relatively thin slabs of bedrock and overlying sediments occurred in this region as illustrated in Figure 10.15.
Figure 10.15. Typical shallow failure of steep coastal bluffs, Reserva Nacional El Yali (33.841°S, 71.817°W) .
200

Interior Region – Widely scattered occasional disaggregated slides in natural slopes seemed to occur without any particular association with lithology or damage to nearby infrastructure as already shown at Rapel Dam. Figure 10.16 is an example of a typical small failure from a steep slope which occurred just below the Colbun Dam which suffered no damage.
Figure 10.16. Typical shallow disaggregated slide, Colbun Dam (35.668°S, 71.351°W) . Given the paucity of sliding and rock falls in the main event, or at least lack of any significant damage due to them, it is interesting that rock falls and shallow raveling type failure was captured on camera in the foothills of the Andes during the M 6.9 event on March 11 (Figure 10.17). The site is east of San Fernando, in the direction of the Tiguiririca volcano, roughly 160 km east south east from the epicenter of the event, in steep terrain in highly fractured volcanic rock of the Coya-Machali Formation. Hence, rock falls presumably occurred in the main event but were not observed due to darkness and were apparently not considered significant enough to be reported as they did not cause damage of any consequence.
Figure 10.17. Rock falls and shallow debris slides following the M 6.9 event on March 11, 2010 (approx. 34.8°S, 70.5°W). Note, the time in the picture is 20 minutes off. Picture courtesy of Cristian Avila.
201

10.2 Deep-Seated Slides In general, deep-seated block or rotational slides were notable by their general absence. The one observed large failure, a deep-seated block slump, occurred in the coastal terrace in the El Yali National Park (Figure 10.18). The failure is clearly joint controlled, however, the exact reason for the size of this slump in an area otherwise characterized by relatively minor toppling or slumping (see Figure 10.15) is not readily apparent without further investigation.
Figure 10.18. Deep-seated bedrock slump in Tertiary sedimentary bedrock capped by marine terrace sediments (33.846°S, 71.821°W).
10.3 Summary he general paucity of landsliding is best illustrated by the fact that even clearly identifiable areas of prior extensive landslide activity had little or no evidence of seismically triggered slides. For example, Figure 10.19 shows an old landslide complex along the coastal ridge just north of Lebu. The only evidence of sliding is seen at the lowermost portions of the slopes which form the back of the beach. Overall the most likely explanation is that the earthquake occurred during the dry season and groundwater levels were low and the slopes were quite dry, as evidence of past debris flows and other rainfall triggered slides was abundant throughout the region. In addition, apparently the intensity of shaking was focused in relatively small zones within the whole region and in those locations the landslide activity was greater as well.
202

Figure 10.19. Old landslide complex north of Lebu showing no evidence of seismically-induced slope movement (37.561°S, 71.64°W).
203

11.0 DAMS, LEVEES, AND MINE TAILINGS DAMS 11. 1 Water Storage Dams The Hydraulic Works Directorate of the Government of Chile (Dirección de Obras Hidráulicas) reported that the vast majority of dams in Chile suffered no damage from the February 27, 2010 earthquake. Three water storage dams were identified with damage:
• Lliu Lliu (S33.096005o, W71.219220o); • Huelehueico (S37.81667o, W72.51667o); and, • Coihueco (S36.637166°, W71.797530°).
The earthquake occurred towards the end of the dry season in Chile when reservoir levels are normally low. No un-managed water releases were reported. Coihueco is the only one of these dams visited by GEER personnel during March 2010. 11.1.1 Coiheuco Dam (S36.637166°, W71.797530°) The Coiheuco Dam was visited by two GEER teams. The first visit was on March 10, 2010 and the second visit was on March 14, 2010. The dam was built during the period from 1964 to 1970 and has a maximum height of 31 m and a crest length of 1040 m. A Google Earth image of the dam taken before the earthquake with the reservoir full is shown in Figure 11.1a. The typical section used for the dam is shown in Figure 11.1b. It was not clear if soil liquefaction occurred at this site as potential evidence of liquefaction was destroyed by the time the GEER team arrived. Several slumps occurred in the upstream shell. A scarp is visible at the upstream crest and toe bulging occurs along the upstream toe. The left (west) abutment slump is most significant with clear toe bulging (Figure 11.2). A second slump occurs to the east with lesser amounts of toe bulging (Figure 11.3). There is another small area of crest movement further to the east (Figure 11.4). A small dam on the west side of the impoundment, to the south of the main dam, shows cracking along the crest (Figure 11.5).
Figure 11.1a. Google Earth Image of Coihueco Dam taken in December 2007
Main Dam
Side Dam
204
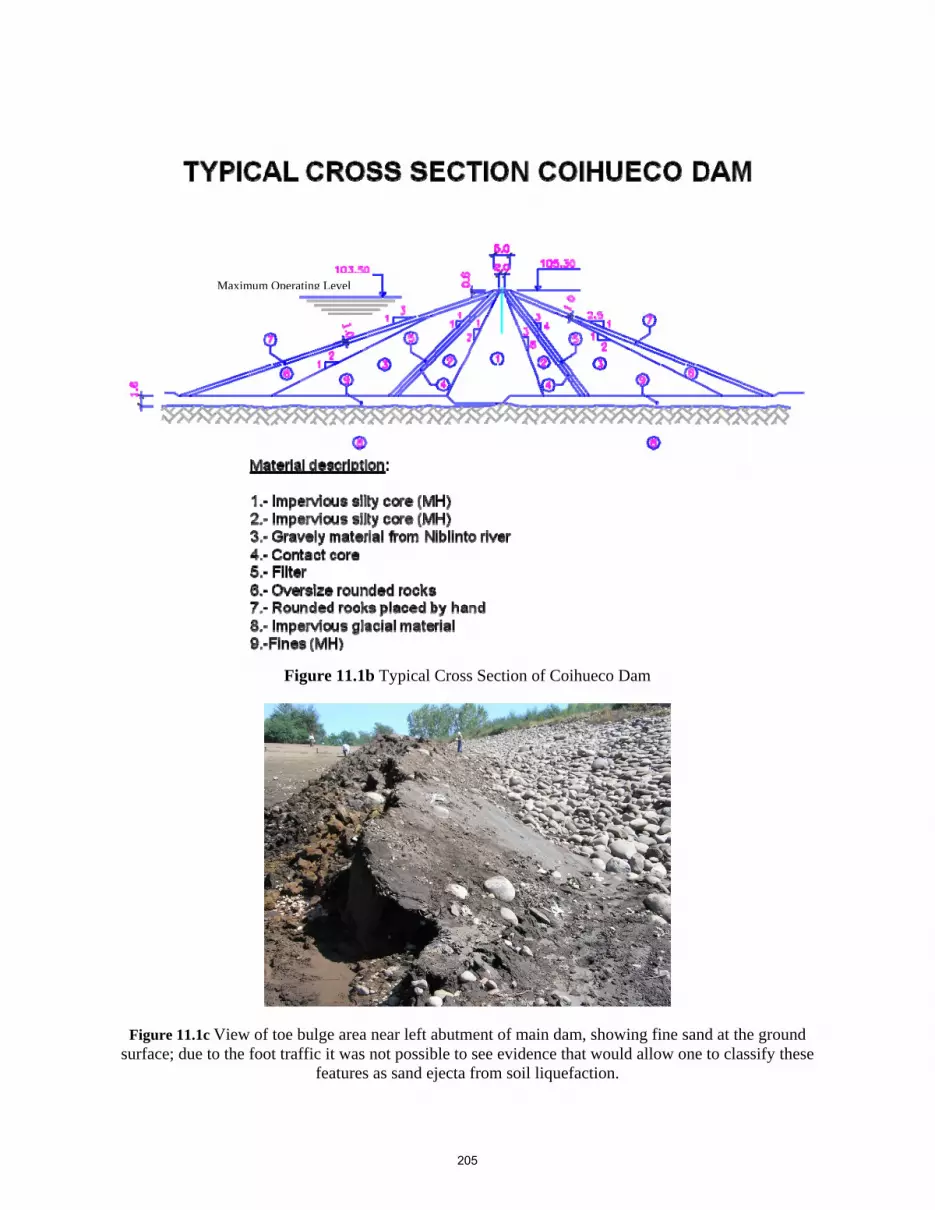
Figure 11.1b Typical Cross Section of Coihueco Dam
Figure 11.1c View of toe bulge area near left abutment of main dam, showing fine sand at the ground surface; due to the foot traffic it was not possible to see evidence that would allow one to classify these
features as sand ejecta from soil liquefaction.
Maximum Operating Level
205

Figure 11.2. March 10, 2010. Slump of the upstream face of Coihueco Dam near the left abutment (S36.637166°, W71.797530°)
Scarp at Dam Crest Bulging at Toe
Figure 11.3. March 10, 2010. Slumping at Coiheuco Dam Crest and Bulging at Dam Toe. (S36.636508°, W71.792505°)
206
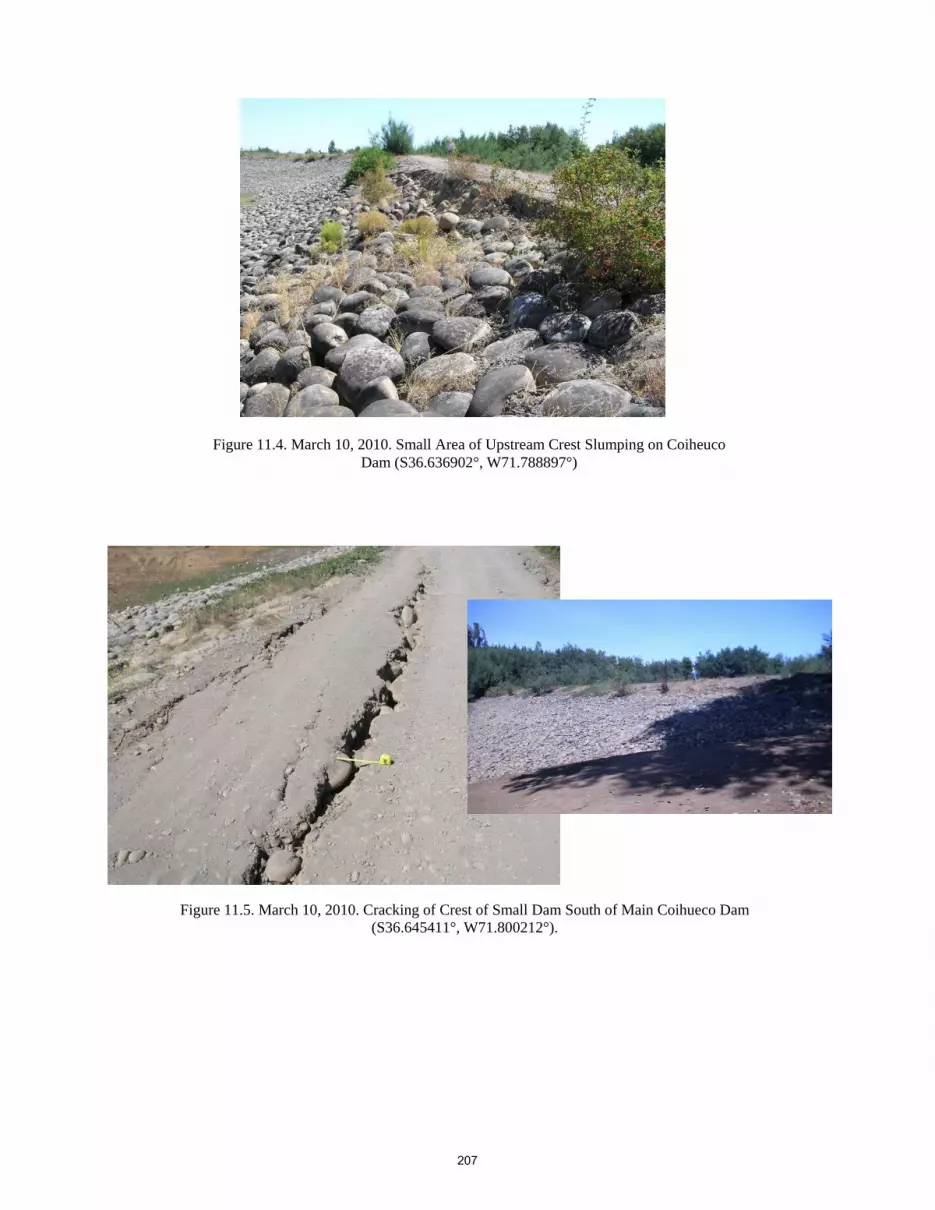
Figure 11.4. March 10, 2010. Small Area of Upstream Crest Slumping on Coiheuco Dam (S36.636902°, W71.788897°)
Figure 11.5. March 10, 2010. Cracking of Crest of Small Dam South of Main Coihueco Dam (S36.645411°, W71.800212°).
207

Rapel Concrete Dam (34.0413oS 71.5893oW) Observations of the Rapel Concrete Dam were made from helicopter on March 10, 2010. The dam was functioning and no signs of damage were observed. A leak upstream of one of the gates is reported to pre-date the February 27, 2010 earthquake. Figure 11.7. March 10, 2010 – View of Upstream of Rapel Concrete Dam
(S34.043786o, W71.592053o)
Figure 11.6. March 10, 2010. Rapel Concrete Dam Downstream Face (S34.038754o, W71.590223o)
208

TAILINGS DAMS There are no published reports of damage to operating tailings dams due to the February 27, 2010 earthquake. One tailings dam at a closed facility failed, creating a flow slide that travelled downhill several hundred meters. Tailings Tranque Ovejeria (33.0527o S, 70.8007o W) Tranque Ovejeria is a modern tailings sand dam. The dam is constructed using the downstream technique. Sand is produced from the tailings in hydro-cyclones and discharged onto the downstream face of the dam. The sand is spread by a bulldozer and compacted. An underdrain system is used to maintain a low phreatic surface in the dam. Tailings and the cyclone overflow are discharged into the impoundment. A geosynthetic liner is installed on the upstream face to reduce seepage into the dam from the tailings pond. The dam was visited by GEER personnel on March 9, 2010 and a follow-up reconnaisance was made by helicopter on March 10, 2010. Both the on-ground inspection and the helicopter reconnaissance identified no problems with the tailings sand dam. There were many expressions of high pore pressure (sand boils) in the tailings upstream of the dam and the maximum settlement of the tailings near the dam was about 0.5 m, representing a strain of about 1%. The liner on the upstream showed no signs of dam. Several large valves rest directly on the liner, and there was not stretching or tearing of the liner at these valves. No cracks were observed on the crest or on the downstream face.
Figure 11.8. March 10, 2010 View of Ovejeria Tailings Dam from Helicopter (S33.054182o, W70.768953o)
209

Figure 11.9. March 9, 2010 View from the Left Abutment Along the Ovejeria Tailings Dam (S33.049364o, W70.785354o)
Figure 11.10. March 9, 2010 View along the Upstream Face of the Ovejeria Tailings Dam. There is no damage to the liner and no signs of slumping of the sand beneath the liner
(S33.052911o, W70.807067o)
210
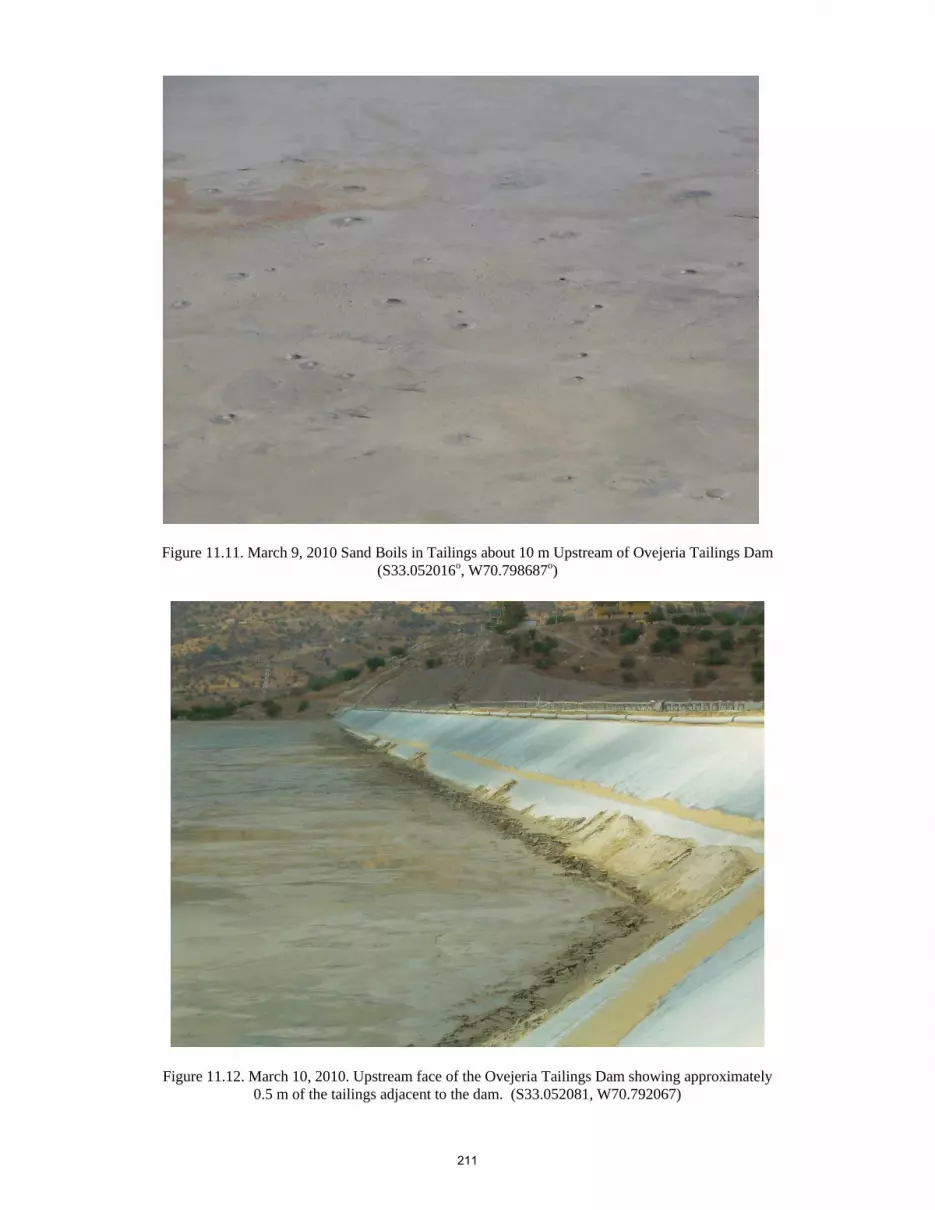
Figure 11.11. March 9, 2010 Sand Boils in Tailings about 10 m Upstream of Ovejeria Tailings Dam (S33.052016o, W70.798687o)
Figure 11.12. March 10, 2010. Upstream face of the Ovejeria Tailings Dam showing approximately 0.5 m of the tailings adjacent to the dam. (S33.052081, W70.792067)
211
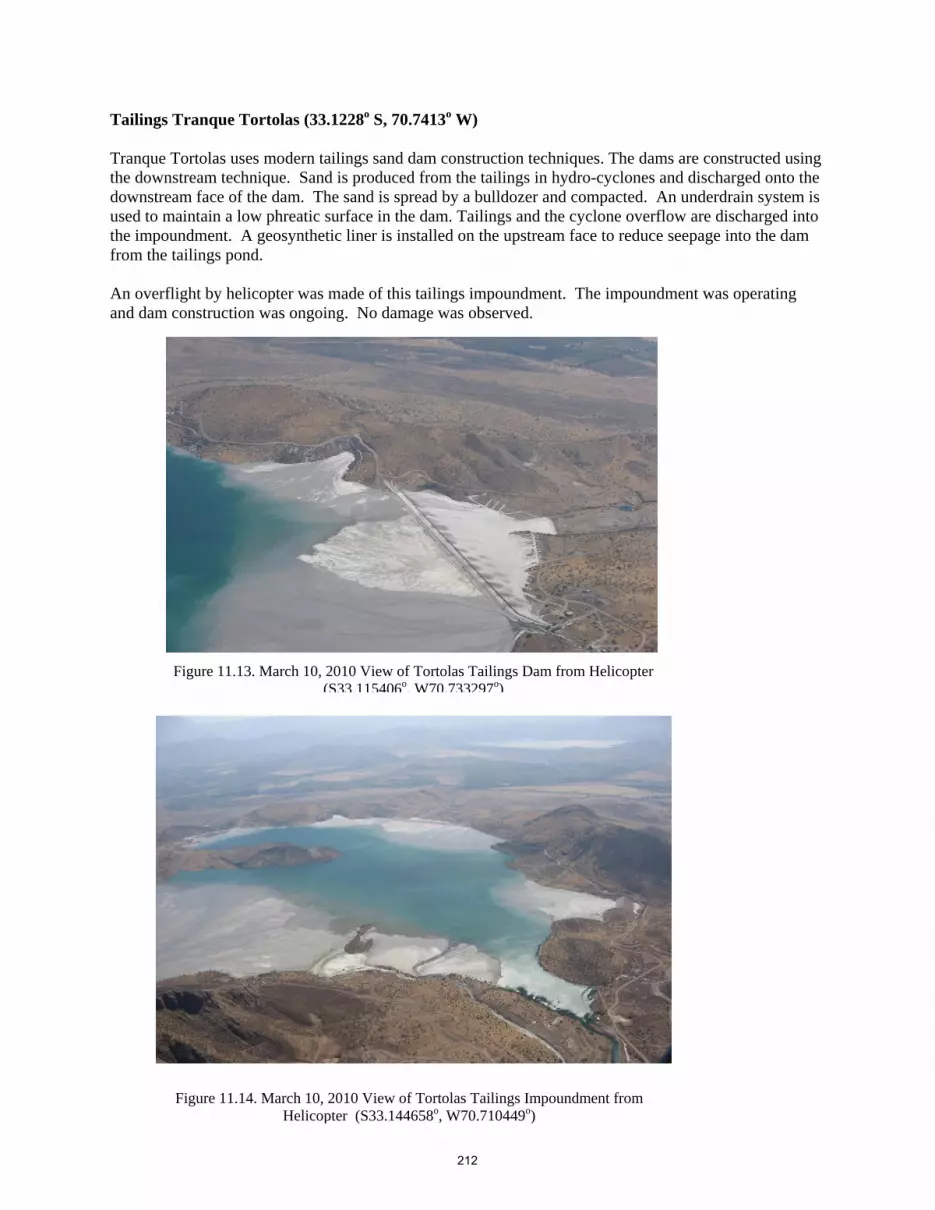
Tailings Tranque Tortolas (33.1228o S, 70.7413o W)
Tranque Tortolas uses modern tailings sand dam construction techniques. The dams are constructed using the downstream technique. Sand is produced from the tailings in hydro-cyclones and discharged onto the downstream face of the dam. The sand is spread by a bulldozer and compacted. An underdrain system is used to maintain a low phreatic surface in the dam. Tailings and the cyclone overflow are discharged into the impoundment. A geosynthetic liner is installed on the upstream face to reduce seepage into the dam from the tailings pond. An overflight by helicopter was made of this tailings impoundment. The impoundment was operating and dam construction was ongoing. No damage was observed.
Figure 11.13. March 10, 2010 View of Tortolas Tailings Dam from Helicopter (S33.115406o, W70.733297o)
Figure 11.14. March 10, 2010 View of Tortolas Tailings Impoundment from Helicopter (S33.144658o, W70.710449o)
212
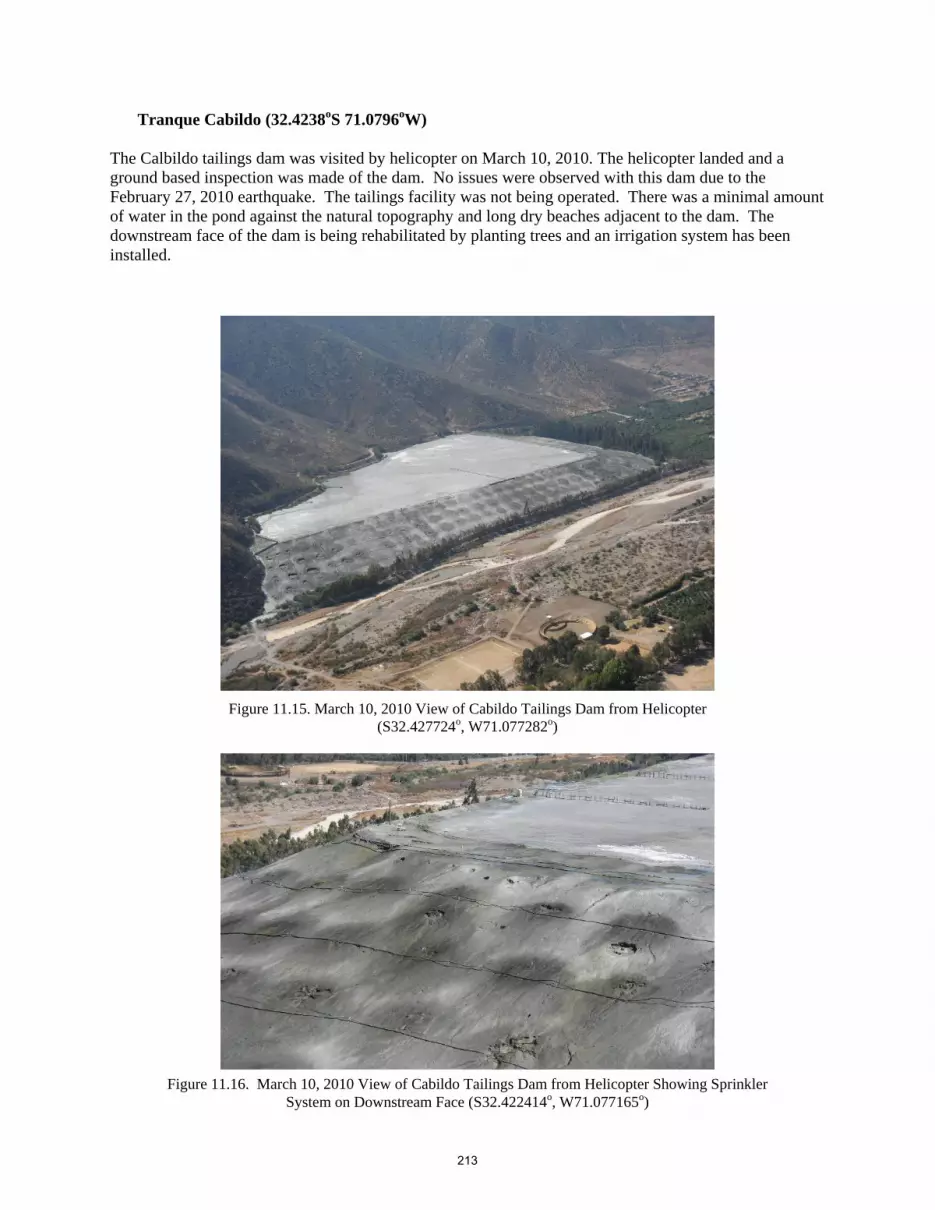
Tranque Cabildo (32.4238oS 71.0796oW) The Calbildo tailings dam was visited by helicopter on March 10, 2010. The helicopter landed and a ground based inspection was made of the dam. No issues were observed with this dam due to the February 27, 2010 earthquake. The tailings facility was not being operated. There was a minimal amount of water in the pond against the natural topography and long dry beaches adjacent to the dam. The downstream face of the dam is being rehabilitated by planting trees and an irrigation system has been installed.
Figure 11.15. March 10, 2010 View of Cabildo Tailings Dam from Helicopter (S32.427724o, W71.077282o)
Figure 11.16. March 10, 2010 View of Cabildo Tailings Dam from Helicopter Showing Sprinkler System on Downstream Face (S32.422414o, W71.077165o)
213
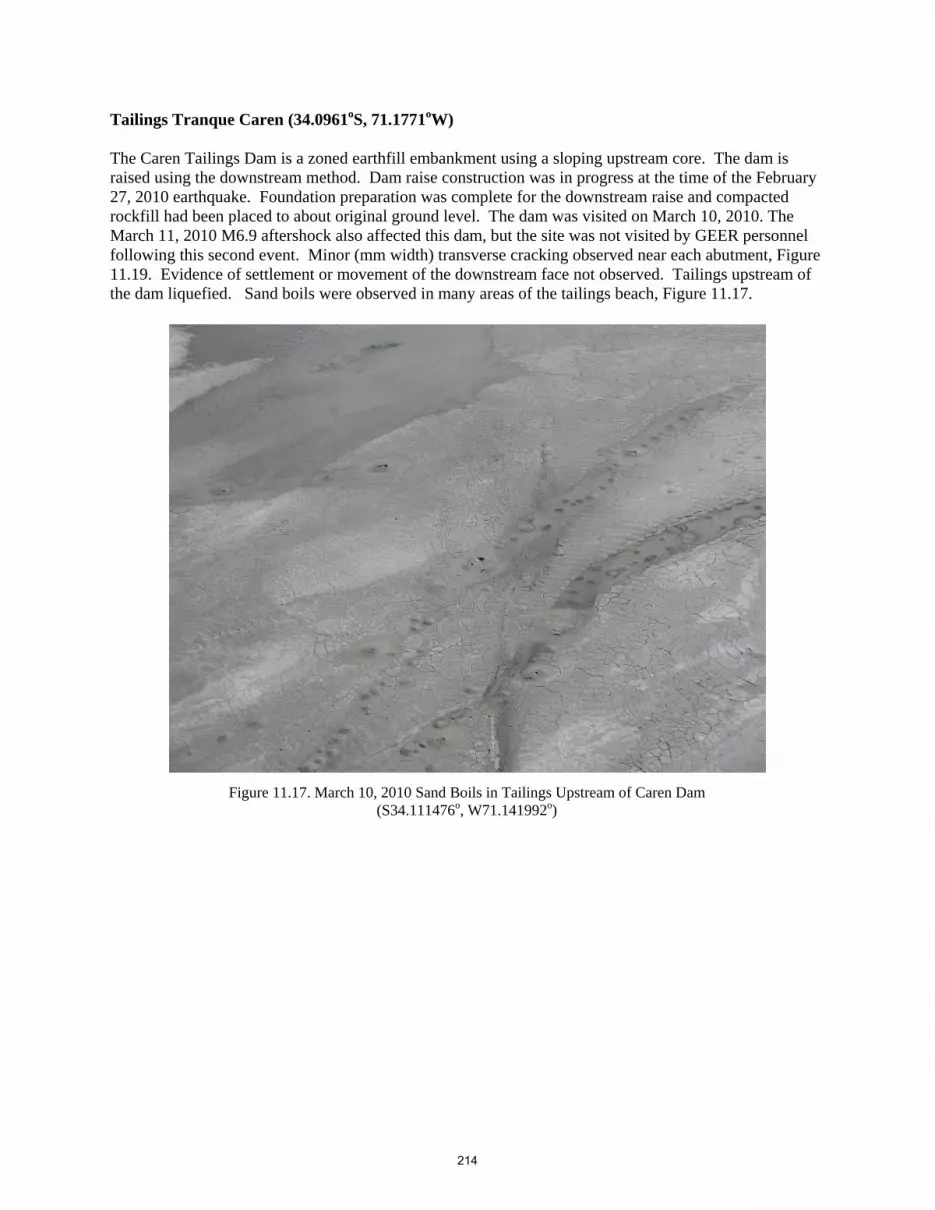
Tailings Tranque Caren (34.0961oS, 71.1771oW) The Caren Tailings Dam is a zoned earthfill embankment using a sloping upstream core. The dam is raised using the downstream method. Dam raise construction was in progress at the time of the February 27, 2010 earthquake. Foundation preparation was complete for the downstream raise and compacted rockfill had been placed to about original ground level. The dam was visited on March 10, 2010. The March 11, 2010 M6.9 aftershock also affected this dam, but the site was not visited by GEER personnel following this second event. Minor (mm width) transverse cracking observed near each abutment, Figure 11.19. Evidence of settlement or movement of the downstream face not observed. Tailings upstream of the dam liquefied. Sand boils were observed in many areas of the tailings beach, Figure 11.17.
Figure 11.17. March 10, 2010 Sand Boils in Tailings Upstream of Caren Dam (S34.111476o, W71.141992o)
214

Figure 11.18. March 10, 2010 View from Helicopter Towards the Left Abutment of the Caren Tailings Dam (S34.093959o, W71.175046o)
Figure 11.19. March 10, 2010 Millimeter Width Transverse Crack Near the Left Abutment of Caren Tailings Dam (S34.096050o, W71.180748o)
215
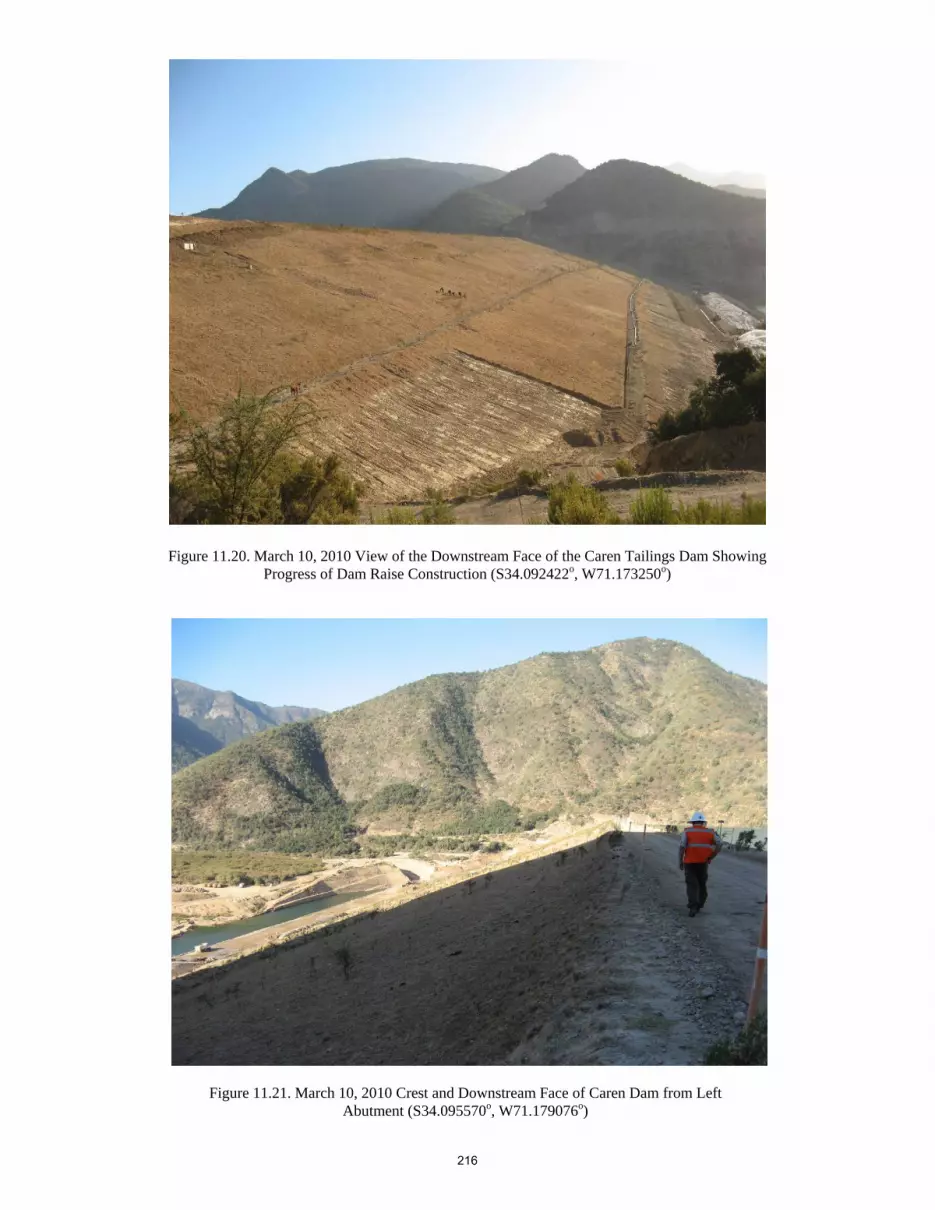
Figure 11.21. March 10, 2010 Crest and Downstream Face of Caren Dam from Left Abutment (S34.095570o, W71.179076o)
Figure 11.20. March 10, 2010 View of the Downstream Face of the Caren Tailings Dam Showing Progress of Dam Raise Construction (S34.092422o, W71.173250o)
216
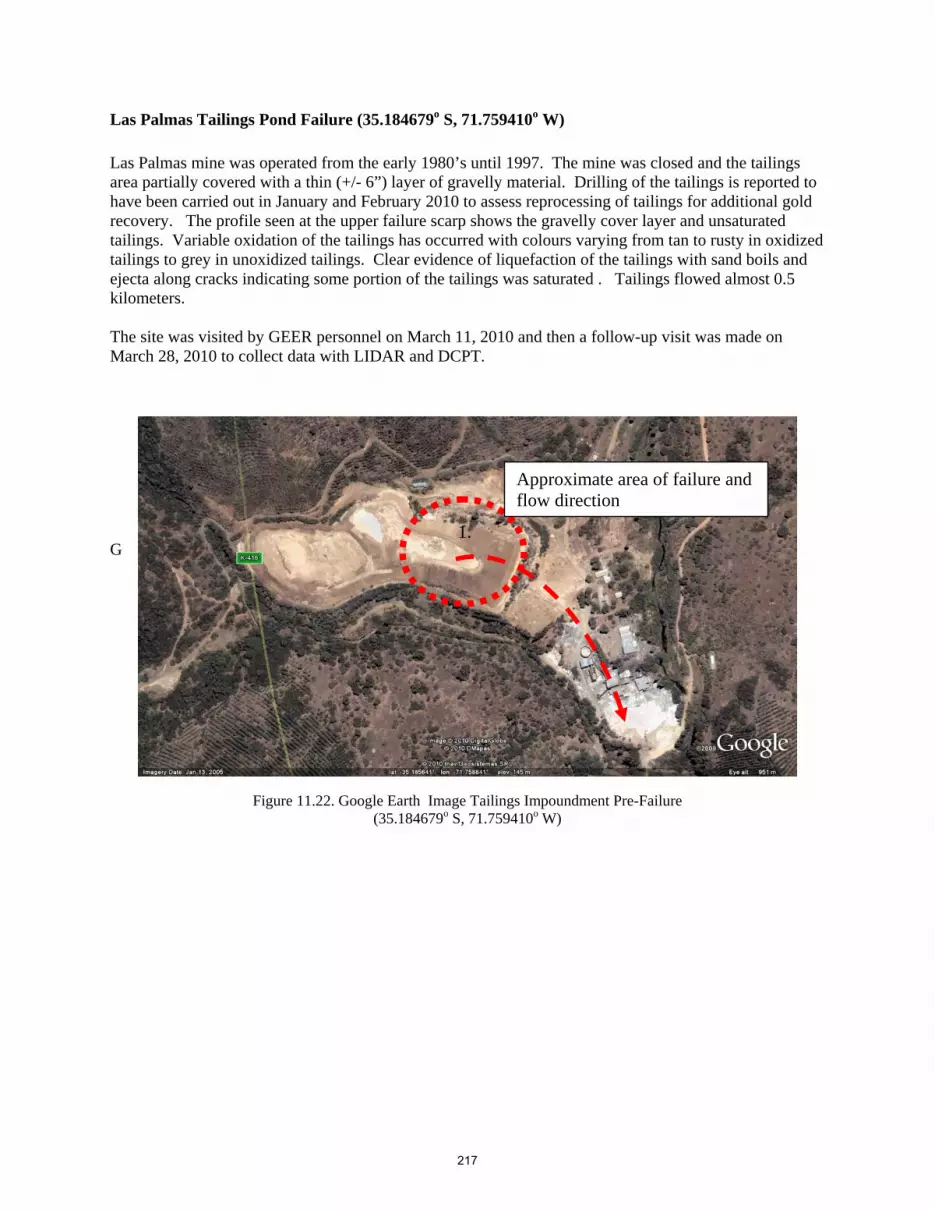
Las Palmas Tailings Pond Failure (35.184679o S, 71.759410o W) Las Palmas mine was operated from the early 1980’s until 1997. The mine was closed and the tailings area partially covered with a thin (+/- 6”) layer of gravelly material. Drilling of the tailings is reported to have been carried out in January and February 2010 to assess reprocessing of tailings for additional gold recovery. The profile seen at the upper failure scarp shows the gravelly cover layer and unsaturated tailings. Variable oxidation of the tailings has occurred with colours varying from tan to rusty in oxidized tailings to grey in unoxidized tailings. Clear evidence of liquefaction of the tailings with sand boils and ejecta along cracks indicating some portion of the tailings was saturated . Tailings flowed almost 0.5 kilometers. The site was visited by GEER personnel on March 11, 2010 and then a follow-up visit was made on March 28, 2010 to collect data with LIDAR and DCPT. G
1.
Approximate area of failure and flow direction
Figure 11.22. Google Earth Image Tailings Impoundment Pre-Failure (35.184679o S, 71.759410o W)
217

Figure 11.23. March 11, 2010. Upper Scarp of Failed Tailings Impoundment Looking Southwest (35.184679o S, 71.759410o W)
Figure 11.24. Upper Scarp of Failed Tailings Impoundment Looking Northeast (35.184679o S, 71.759410o W)
218

Figure 11.26. March 11, 2010. View Along Flowpath of Tailings (35.18468o S, 71.759410o W)
Figure 11.25. March 11, 2010. View Along Flowpath of Tailings (35.18468o S, 71.759410o W)
219

Figure 11.28. March 11, 2010. Side View of Tailings Flow (35.187204o S, 71.757997o W)
Figure 11.27. March 11, 2010. Side View of Tailings Flow (35.186864o , 71.757873oW)
220

Figure 11.29. March 11, 2010. Gravelly Cover Layer Over Oxidized and Unsaturated Tailings (35.184679o S, 71.759410o W)
Figure 11.30. March 11, 2010. Variably Oxidized Tailings – Unsaturated Conditions in Upper Portion of Tailings Impoundment (S35.18728o, W71.75781o)
221

Figure 11.31. March 11, 2010. Sand Boil in Tailings (S35.18872o, W71.75764o)
Figure 11.32. March 11, 2010. Sand Boil In Tailings along Flow Path (S35.18872o, W71.75777o)
222

Figure 11.33. March 11, 2010. Tailings Sand Boil Due to March 11, 2010 M6.9 Earthquake near Rancagua (S35.184146o, W71.761118o)
Figure 11.34. March 11, 2010. Ejecta of Tailings from Cracks Indicating Liquefaction of Tailings ( S35.183986°, W71.761844°)
223
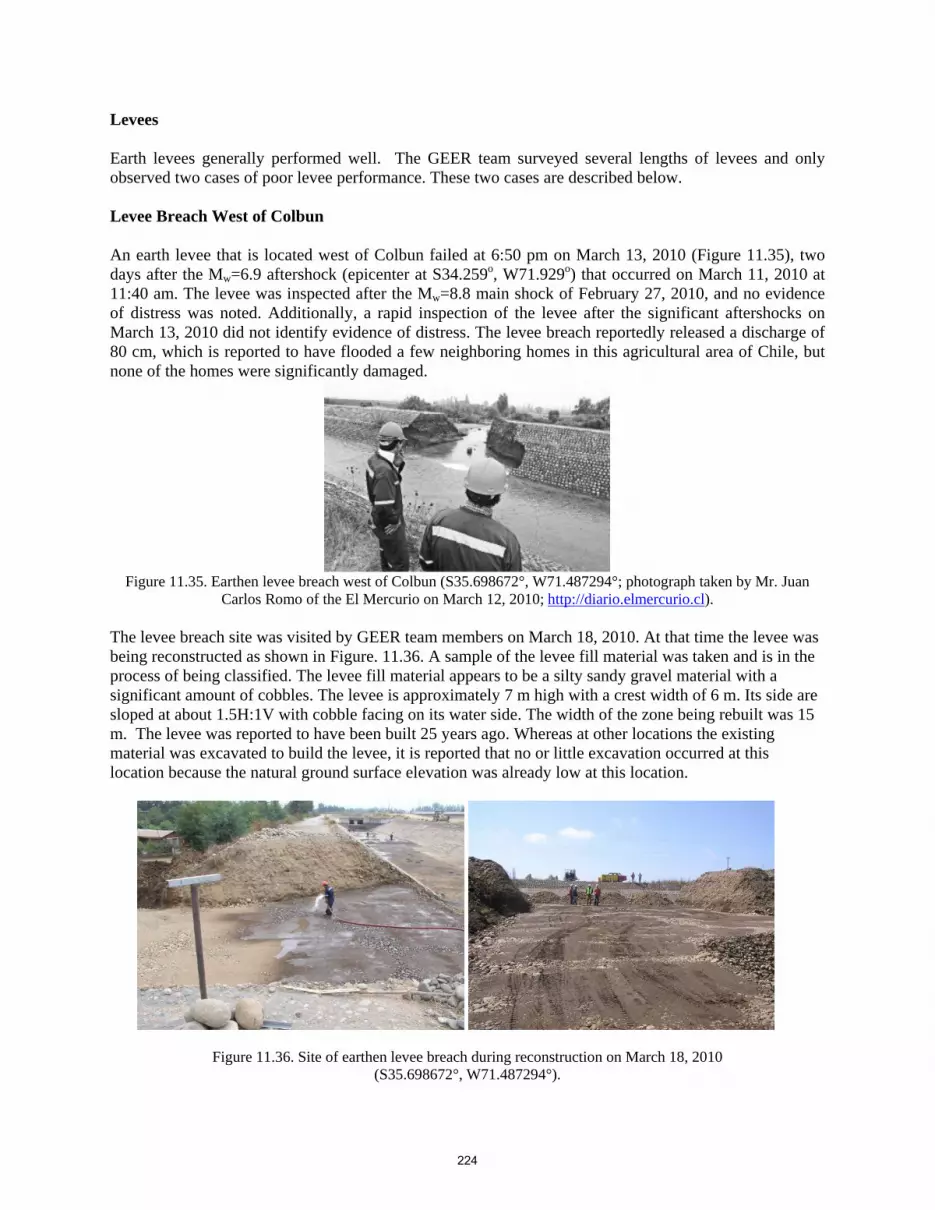
Levees Earth levees generally performed well. The GEER team surveyed several lengths of levees and only observed two cases of poor levee performance. These two cases are described below. Levee Breach West of Colbun An earth levee that is located west of Colbun failed at 6:50 pm on March 13, 2010 (Figure 11.35), two days after the Mw=6.9 aftershock (epicenter at S34.259o, W71.929o) that occurred on March 11, 2010 at 11:40 am. The levee was inspected after the Mw=8.8 main shock of February 27, 2010, and no evidence of distress was noted. Additionally, a rapid inspection of the levee after the significant aftershocks on March 13, 2010 did not identify evidence of distress. The levee breach reportedly released a discharge of 80 cm, which is reported to have flooded a few neighboring homes in this agricultural area of Chile, but none of the homes were significantly damaged.
Figure 11.35. Earthen levee breach west of Colbun (S35.698672°, W71.487294°; photograph taken by Mr. Juan
Carlos Romo of the El Mercurio on March 12, 2010; http://diario.elmercurio.cl).
The levee breach site was visited by GEER team members on March 18, 2010. At that time the levee was being reconstructed as shown in Figure. 11.36. A sample of the levee fill material was taken and is in the process of being classified. The levee fill material appears to be a silty sandy gravel material with a significant amount of cobbles. The levee is approximately 7 m high with a crest width of 6 m. Its side are sloped at about 1.5H:1V with cobble facing on its water side. The width of the zone being rebuilt was 15 m. The levee was reported to have been built 25 years ago. Whereas at other locations the existing material was excavated to build the levee, it is reported that no or little excavation occurred at this location because the natural ground surface elevation was already low at this location.
Figure 11.36. Site of earthen levee breach during reconstruction on March 18, 2010 (S35.698672°, W71.487294°).
224
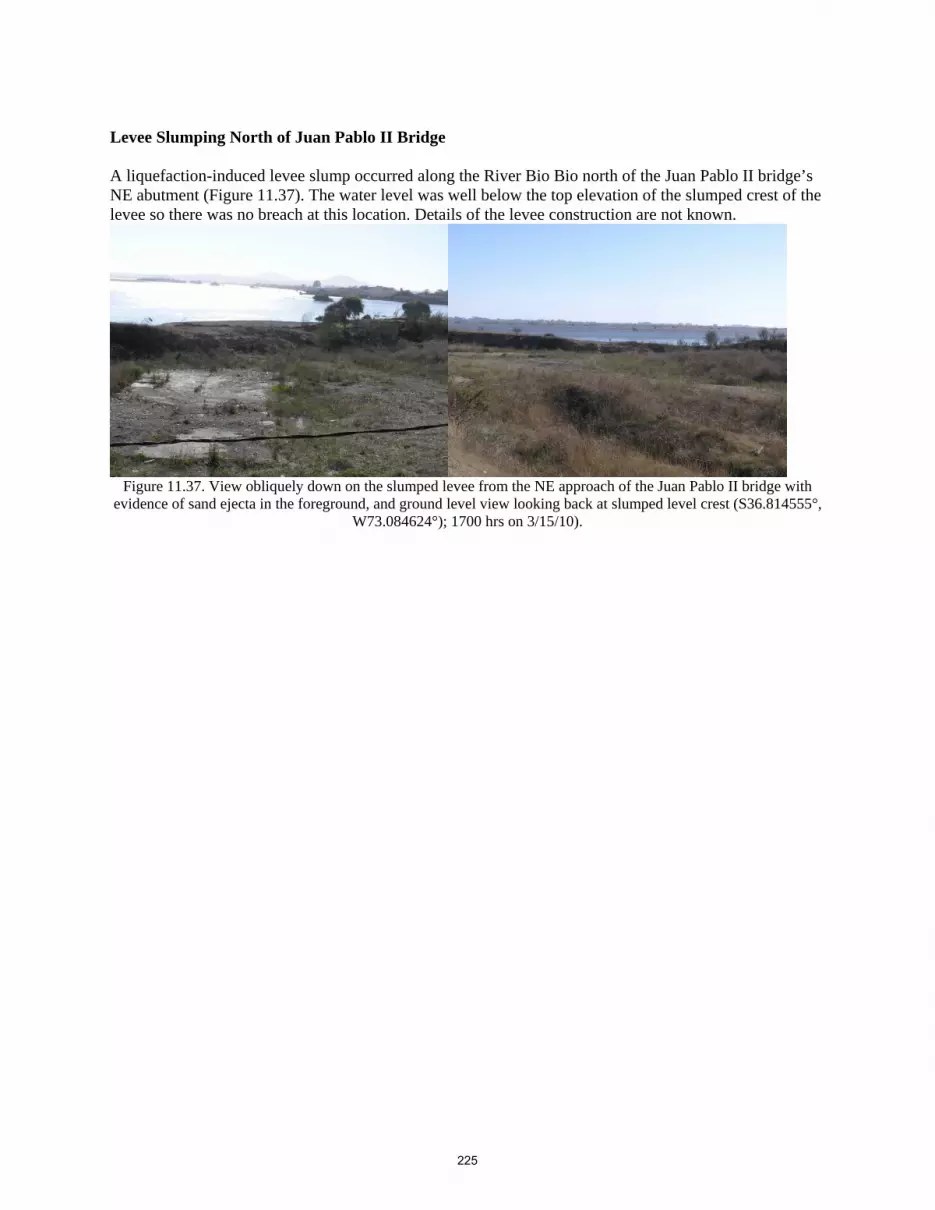
Levee Slumping North of Juan Pablo II Bridge A liquefaction-induced levee slump occurred along the River Bio Bio north of the Juan Pablo II bridge’s NE abutment (Figure 11.37). The water level was well below the top elevation of the slumped crest of the levee so there was no breach at this location. Details of the levee construction are not known.
Figure 11.37. View obliquely down on the slumped levee from the NE approach of the Juan Pablo II bridge with
evidence of sand ejecta in the foreground, and ground level view looking back at slumped level crest (S36.814555°, W73.084624°); 1700 hrs on 3/15/10).
225

Mine Rock Dumps Soldado (32.65556oS 71.1145oW) Overflight by helicopter made. No evidence of movement of these high rock dumps.
Figure 11.38. March 10, 2010. Soldado Waste Dump (S32.654695o, W71.121352o)
226

12.0 RETAINING STRUCTURES The seismic design of retaining structures is an area of ongoing discussion with the active development of the latest generation of codes and hence the performance of retaining structures in the February 27th event was of great immediate interest. Many different types of retaining structures, ranging from modern mechanically stabilized walls and bridge abutment to older cantilever and gravity concrete structures were subjected to strong ground motions during the M 8.8 event. Their performance was uniformly good, if not excellent, and no significant problems have been reported or observed during the reconnaissance. Similarly, no basement wall damage of any kind has been reported. The rare failures or damage when noted appeared to be due to construction defects. The purpose of this section of the report is to thus show examples of various types of structures observed during the reconnaissance in order to provide baseline documentation for possible future detailed analyses. Mechanically Stabilized Retaining Walls – Mechanically stabilized earth embankment walls, specifically Reinforced Earth walls, have been used in Chile quite extensively for highway embankments, particularly for overpasses and bridge abutments. In the greater Santiago metropolitan area there are numerous underpasses, overpasses and sidehill fills retained with Reinforced Earth walls. Their performance was excellent even when bridges supported by the abutments failed by sliding off their seats as happened in a number of instances as shown in Figure 12.1. The same level of performance occurred along the major north-south freeway, Route 5. Figure 12.2 shows a Reinforced Earth abutment of a collapsed bridge across a rail line. In this case, the approach embankment to the North of this failed railroad overpass had a major failure as well (see Section 9.15), however, the abutments themselves showed no signs of appreciable deformation. In this case, the adjacent older bridge with multiple supports also performed very well and showed no evidence of damage.
Figure 12.1. Intersection of Americo Vespucio Norte and Independencia. Abutment of a collapsed bridge. (33°21'57.83"S, 70°41'17.71"W)
227
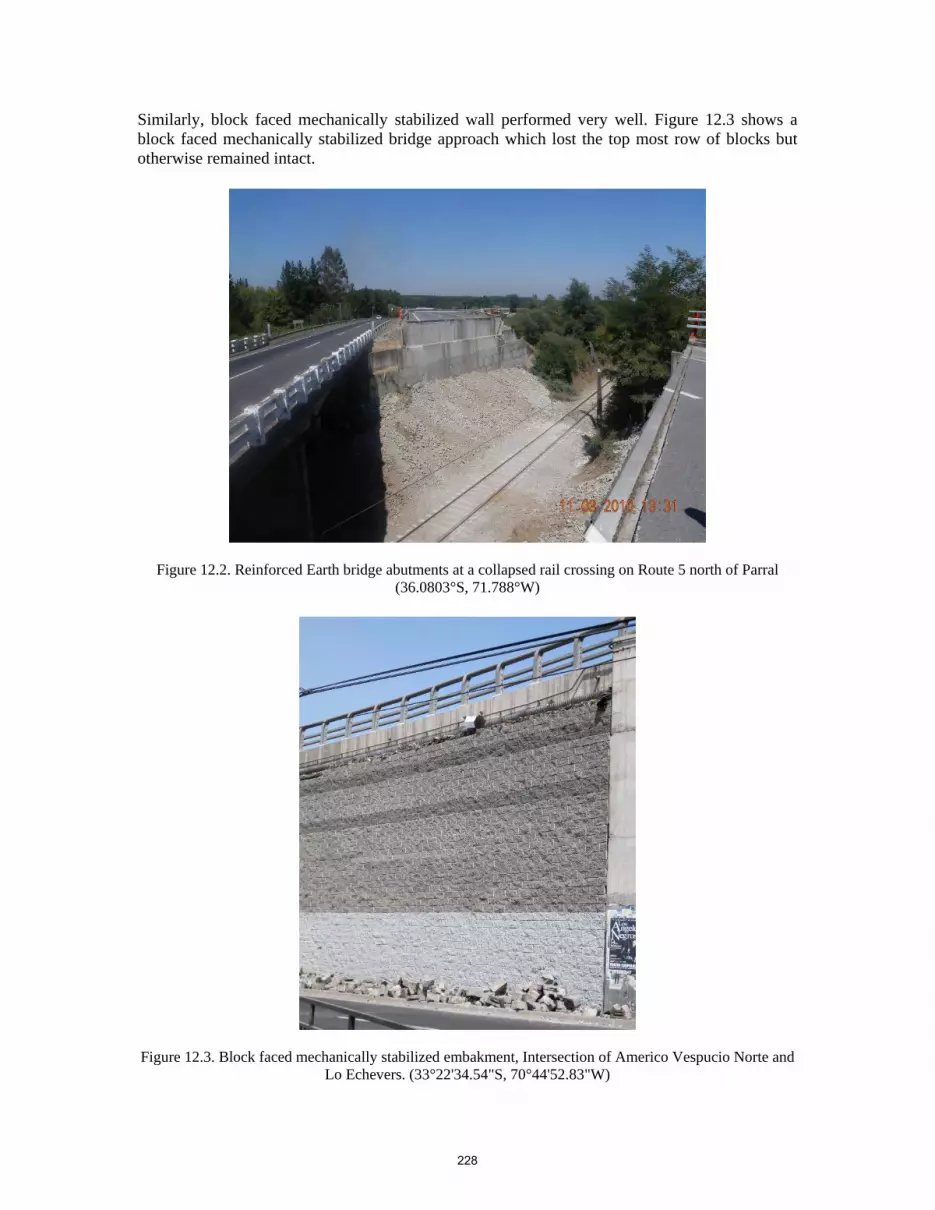
Similarly, block faced mechanically stabilized wall performed very well. Figure 12.3 shows a block faced mechanically stabilized bridge approach which lost the top most row of blocks but otherwise remained intact.
Figure 12.2. Reinforced Earth bridge abutments at a collapsed rail crossing on Route 5 north of Parral (36.0803°S, 71.788°W)
Figure 12.3. Block faced mechanically stabilized embakment, Intersection of Americo Vespucio Norte and Lo Echevers. (33°22'34.54"S, 70°44'52.83"W)
228

Figure 12.4 shows a photograph of yet another typical MSE retaining structure. This wall, located west of Chillan, was approximately 6 m high and exhibited no damage despite surficial slope instability in the adjacent approach fill slope.
Figure 12.4 Undamaged MSE wingwall on overpass structure over highway 152 west of Chillan despite sliding of adjacent fill slope (S36.6588, W72.2776). Conventional, Concrete Gravity and Cantilever Structures – Conventional concrete gravity and retaining structures similarly performed very well in many different settings. Figure 12.5 shows an overpass structure on the coastal highway just south of Coronel, about 140 km south of the epicenter in an area which experienced significant shaking. The structure experienced no distress and the bridge structures were fully functional after the event.
229

Figure 12.5. Multiple retaining structures for highway overpass structures south end of Coronel (37.0455°S, 73.1421°W)
Most importantly, there were numerous bridge approach embankments that were shaken with sufficient intensity to experience surficial slumping, yet the abutment forming retaining walls performed very well and showed no evidence of damage. The bridge decks on the other hand were often offset and the concrete seats were spalled or completely fractured. Figure 12.5 shows one such bridge approach embankment and abutment wall on Route 5 north of Chillan. The bridge deck had temporary scaffolding supporting it at the other abutment as it was close to sliding off.
Figure 12.6. Surficial sloughing on a bridge approach embankment, with the abotment showing no evidence of damage, Route 5, north of Chillan.
230
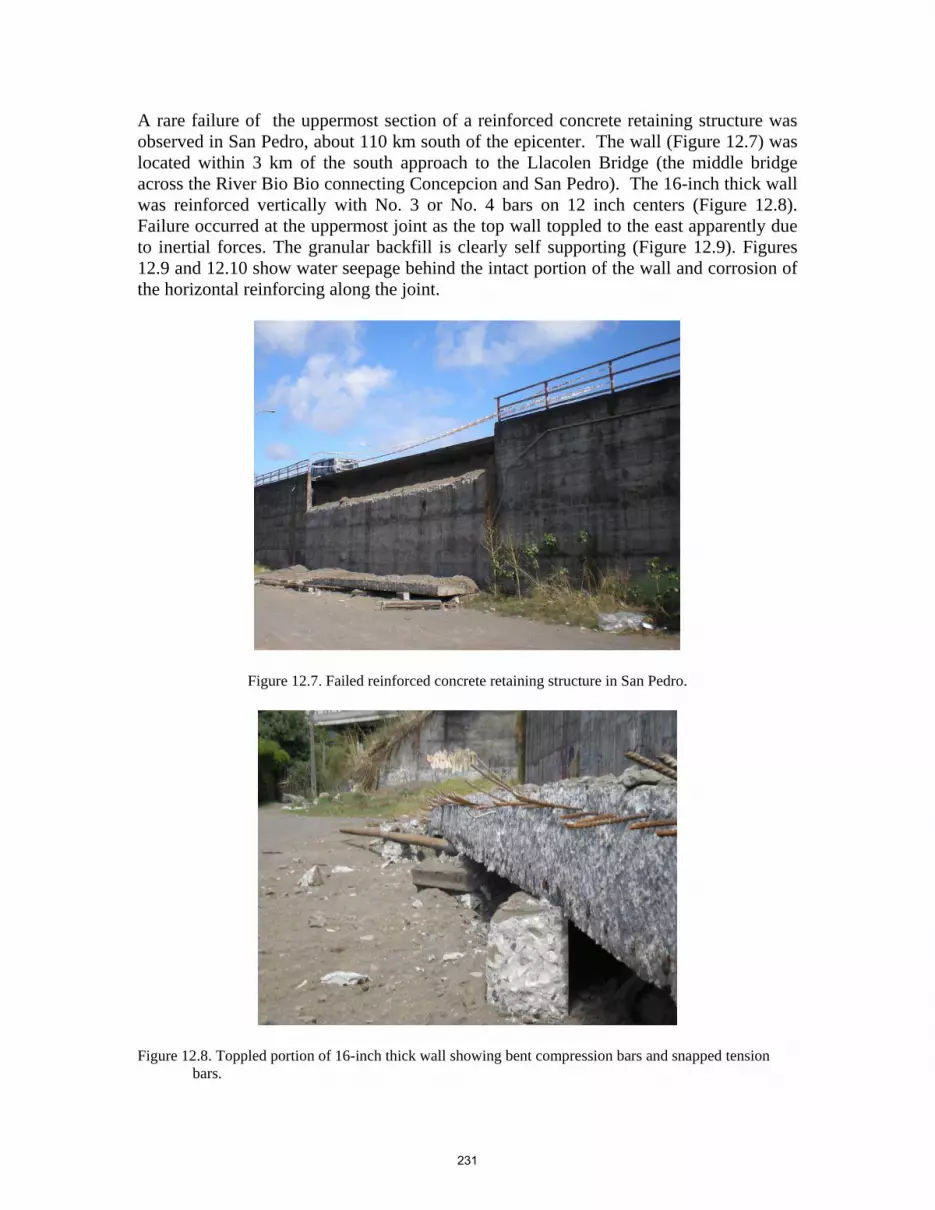
A rare failure of the uppermost section of a reinforced concrete retaining structure was observed in San Pedro, about 110 km south of the epicenter. The wall (Figure 12.7) was located within 3 km of the south approach to the Llacolen Bridge (the middle bridge across the River Bio Bio connecting Concepcion and San Pedro). The 16-inch thick wall was reinforced vertically with No. 3 or No. 4 bars on 12 inch centers (Figure 12.8). Failure occurred at the uppermost joint as the top wall toppled to the east apparently due to inertial forces. The granular backfill is clearly self supporting (Figure 12.9). Figures 12.9 and 12.10 show water seepage behind the intact portion of the wall and corrosion of the horizontal reinforcing along the joint.
Figure 12.7. Failed reinforced concrete retaining structure in San Pedro.
Figure 12.8. Toppled portion of 16-inch thick wall showing bent compression bars and snapped tension
bars.
231

Figure 12.9. Granular fill soils and water seepage evident behind failed portion of wall.
Figure 12.10. Corrosion of horizontal reinforcing steel where water entered the joint. Temporary Retaining Structures – Temporary retaining structures were not widely observed; however, those observed performed well. Figure 12.11 shows a temporary shoring system in Santiago that appears to have been constructed some months before the earthquake given the vegetative growth on the wall face. The vertical members and single row of tieback anchors appeared undamaged while the exposed gravels between the vertical members did experience some raveling.
232
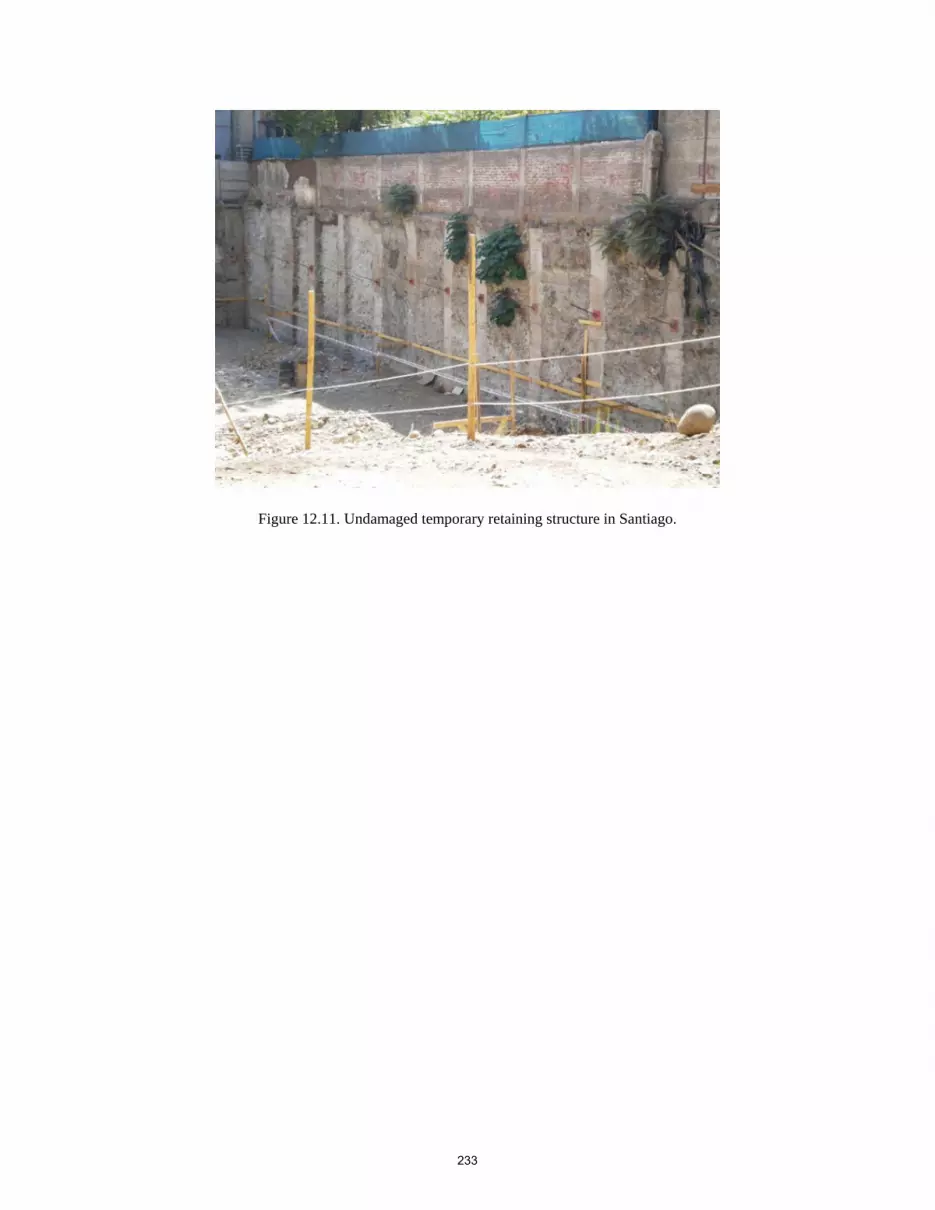
Figure 12.11. Undamaged temporary retaining structure in Santiago.
233

13.0 TSUNAMI EFFECTS One of the major consequences of the February 27, 2010 earthquake was the tsunami generated by sea floor deformation. While detailed ground reconnaissance of the height and distance of run-up resulting from the tsunami along the coast was beyond the scope of activities being conducted by the GEER team, there was nevertheless the opportunity to make measurements in selected locations along the coast to better understand the pattern of uplift and subsidence as detailed in Section 4 of this report. In addition, a few members of the GEER team conducted a more focused study of tsunami inundation extent and associated consequences for the city of Dichato and these are presented in this chapter. Careful measurements of inundation height and distance were made by the NSF funded Tsunami Ocean Sciences Group under the leadership of Costas Synolakis of the University of Southern California and Hermann Fritz of Georgia Tech along the Chile coast from as far North as San Antonio to as far South as Tirua. Results from these extensive tsunami reconnaissance studies will be published elsewhere. GEER team observations focused on patterns of tsunami-related damage documented during aerial reconnaissance and cataloguing simple tsunami characteristics including minimum flow depth measurements and delineating the landward limit of inundation where possible. We also asked local residents to describe the tsunami waves including: (1) the time of wave arrival; (2) whether the first tsunami wave involved sea level rise or sea level fall; (3) the number of tsunami waves; (4) the largest tsunami wave; (5) the direction of wave arrival and other descriptive characteristics of the event. The following summary descriptions of tsunami impacts documented along the coast is organized by area from south to north, including Laraquete, Talcahuano, Dichato, Curanipe to Constitución, Iloca to Bucalemu, and Pichilemu. 13.1 Laraquete In Laraquete, sand blanketing the road along the beach and accounts from local residents indicate the tsunami reached the first row of houses. Considerable flooding of the beach and along the river channel is evident by deep scouring that damaged the outfall of a storm sewer near the river bank (Figure 13.1). At one beach front house a car was pushed tens of meters landward and water marks on the foundation indicate a minimum flow depth of 0.55 m (Figure 13.2). 13.2 Talcahuano Several flow depth measurements and interviews of witnesses provide information about tsunami impacts at Talcahuano. Visual surveys of damage and estimates of tsunami inundation by the Chilean government (http://www.ine.cl/canales/sala_prensa/noticias/2010/marzo/not190310.php) show the greatest impacts affected nearshore areas along the Bahia Concepcion and the Rio Andalien. Gas station attendants in Talcahuano recall three waves arriving around 4 am. Second hand accounts report a 15-m-high wave at a beach along the Tumbes Peninsula. In a different account, a worker at a storage warehouse on the waterfront who witnessed the wave said the tsunami arrived about 1.5 hours after the earthquake and commenced as a slow rise in sea level.
234

Figure 13.1. Tsunami scoured out the foundation of this storm sewer outfall at Laraquete
(S37.165352° W73.188051, 1907 hrs on 03/16/2010).
Figure 13.2. Beach-front homes in Laraquete were inundated by the tsunami. At this
woman’s home, tsunami flow depths reached at least 0.55 m, which transported the white car from the street to the backyard. The tape measure left of the woman indicates the flow depth measured from a water stain on the building (S37.165650° W73.188136, 1915 hrs
on 03/16/2010).
235
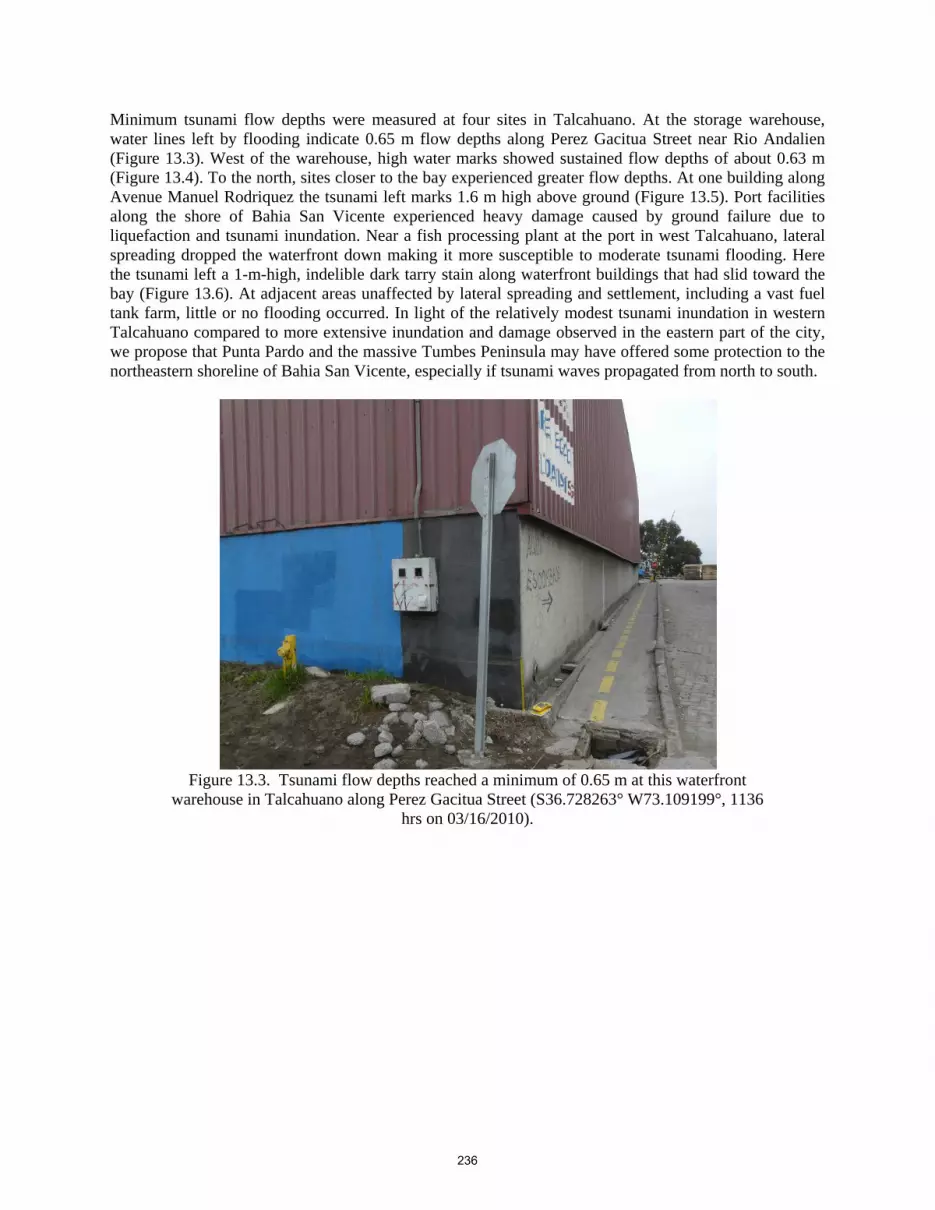
Minimum tsunami flow depths were measured at four sites in Talcahuano. At the storage warehouse, water lines left by flooding indicate 0.65 m flow depths along Perez Gacitua Street near Rio Andalien (Figure 13.3). West of the warehouse, high water marks showed sustained flow depths of about 0.63 m (Figure 13.4). To the north, sites closer to the bay experienced greater flow depths. At one building along Avenue Manuel Rodriquez the tsunami left marks 1.6 m high above ground (Figure 13.5). Port facilities along the shore of Bahia San Vicente experienced heavy damage caused by ground failure due to liquefaction and tsunami inundation. Near a fish processing plant at the port in west Talcahuano, lateral spreading dropped the waterfront down making it more susceptible to moderate tsunami flooding. Here the tsunami left a 1-m-high, indelible dark tarry stain along waterfront buildings that had slid toward the bay (Figure 13.6). At adjacent areas unaffected by lateral spreading and settlement, including a vast fuel tank farm, little or no flooding occurred. In light of the relatively modest tsunami inundation in western Talcahuano compared to more extensive inundation and damage observed in the eastern part of the city, we propose that Punta Pardo and the massive Tumbes Peninsula may have offered some protection to the northeastern shoreline of Bahia San Vicente, especially if tsunami waves propagated from north to south.
Figure 13.3. Tsunami flow depths reached a minimum of 0.65 m at this waterfront
warehouse in Talcahuano along Perez Gacitua Street (S36.728263° W73.109199°, 1136 hrs on 03/16/2010).
236
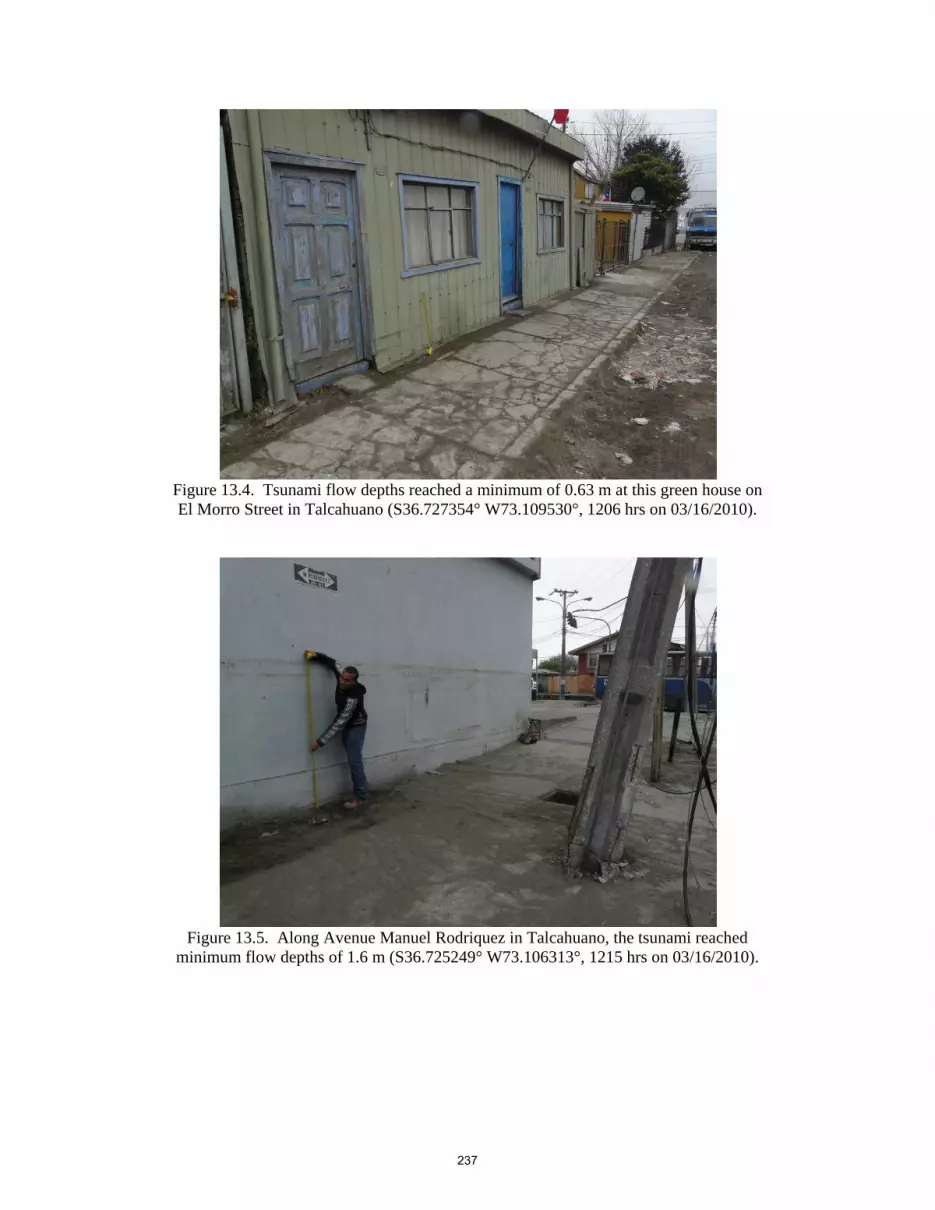
Figure 13.4. Tsunami flow depths reached a minimum of 0.63 m at this green house on El Morro Street in Talcahuano (S36.727354° W73.109530°, 1206 hrs on 03/16/2010).
Figure 13.5. Along Avenue Manuel Rodriquez in Talcahuano, the tsunami reached
minimum flow depths of 1.6 m (S36.725249° W73.106313°, 1215 hrs on 03/16/2010).
237

Figure 13.6. One-meter high dark stains on buildings at Talcahuano port facilities along
Bahia San Vicente mark the elevation of the tsunami. Major damage of port facilities, including a fish processing plant were caused by a combination of factors, including
modest tsunami inundation in areas that dropped vertically due to liquefaction-induced lateral spreading (S36.727076° W73.128058°, 1258 hrs on 03/16/2010).
13.3 Tsunami Observations in Dichato 13.3.1 Population distribution The largest town in Coliumo Bay is Dichato, located at the South end of the bay that measures approximately 2 km West to East and 2.5 km South to North. Many of the homes in Dichato are built on the floodplain of a small river called the Rio Dichato. Pingueral is a gated residential community, about 2 kilometers north of Dichato, on the east side of the bay. Pingueral has a wide swimming beach that faces northwest towards the Pacific Ocean. There are three small fishing communities built on the steep hillsides of the west side of the bay. From south to north, they are Las Vegas de Coliumo, Caleta de Medio and Los Morros de Coliumo. On the northwest corner of the bay is Nocochea Beach, where there are about 25 vacation homes built along a beach facing north towards the Pacific Ocean. The location of the various population centers are shown in Figure 13.7. 13.3.2 General observations The maximum inland incursion of the tsunami in the Dichato area was about 2.2 kilometers. Based on ground measurements, it is estimated that the maximum depth of the water in the town of Dichato was about 6 m, and about 6.5 m in the agricultural valley that extends to the South of Coliumo Bay west of Dichato as shown in Figure 13.8. A photograph of a large portion of the town of Dichato taken during an aerial reconnaissance flight is shown in Figure 13.9. An expanded view of the inundation extent and depth based on ground observations at the location of the black open dots is shown in Figure 13.10. Structure locations are overlaid in Figure 13.11. Most residents of the Dichato area agree that the first wave arrived within an hour after the earthquake. A second set of waves entered Coliumo Bay between 6:30 and 7:00 am. A third surge of water entered the bay at about 10:00 a.m. Depending on location, the largest and most destructive waves were either the second or third set of waves. Eyewitness accounts stated that the waves did not generally advance as cresting breakers, but moved into the bay and onto the land as surges, first causing flooding and then creating an outwash that carried structures and debris back into the ocean.
238

Coliumo Bay remained agitated and large surges continued to inundate the low-lying south end of the bay until mid-to-late afternoon on February 27th. The variations in how the tsunami affected different areas around Coliumo Bay are dramatic. The homes facing directly onto the Pacific in Necochea experienced the smallest waves and the least tsunami damage; whereas, many of those structures built inside Coliumo Bay were washed away, especially those built less than 5 meters above sea level. 13.3.3 Water flow observations Walls and structures on the east and west sides of Dichato were moved away from the bay, while walls and structures in the center of town were carried north towards the bay. This is consistent with a report from one witness who reported that the tsunami seemed to advance south along both sides of the bay into the east and west sides of town, and then to combine together in the center of Dichato before flooding back towards the bay through the center of town. Evidence suggests that the tsunamis created a clockwise water flow within Coliumo Bay. The greatest flooding and deepest water in Dichato was on the eastern side of town. Residents of Pingueral witnessed a slow-moving vortex at the mouth of Coliumo Bay which circulated houses, boats and debris in a clockwise direction from about 7:00 a.m. until 2:00 p.m. The center of this vortex is marked on the map in Figure 13.8 with a red dot. After the tsunami, the beaches of the east shore of the bay were relatively clean, while the south and west sides of the bay were choked with debris. Although the motion of the water was primarily north-south, fishermen on the west side of the bay observed east-west surges during the morning of the 27th February. Large waves that struck the west side of the bay seemed to have been reflected off the eastern shore. Pre and post event image pairs showing tsunami damage are given in Figures 13.12 and 13.13.
239

Figure 13.7 Location of population centers around Coliumo Bay (after Zoa et al.).
240

Figure 13.8 Inundation extent and depth for Dichato region based on ground observations by Zoa et al.
241

Figure 13.9 Aerial reconnaissance photograph of portion of Dichato and Coliumo Bay (S 36.5488° W72.9314°)
242

Figure 13.10 Inundation extent and contours of inundation depth in Dichato by Zoa et al.
243

Figure 13.11 Inundation extent and contours of inundation depth showing structures in Dichato by Zoa et al.
244

13.3.4 Additional observations and reports Immediately after the earthquake, residents of Pingueral moved to a ridge east of town at an elevation of about 60 meters. From this viewpoint, they noted that the ocean was as smooth as a lake. There was no wind, swells or ripples. As the full moon was setting to the northwest, its reflection was visible as a circle on the surface of the ocean. From 4:05 until 4:20 a.m., the moon´s reflection on the ocean stretched slowly from a circle into an oval, elongating towards the shore. This change in the shape of the moon´s reflection indicates that a change in the curvature of the ocean was taking place. At 4:20 a.m., three dark lines appeared on the northwest horizon, advancing towards the coast. All that remains of the Pingueral marina is a section of a floating pier which is anchored offshore. All structures and boats are missing. Almost no debris is present on the eastern shore near where the marina used to be. Near Rio Dichato, there is a stand of mature pine trees. Seaweed was observed hanging from the branches of these trees approximately 6 m above ground level. There were freshly broken branches 7 m above the ground. The seaweed in the trees seems to be a reliable indicator that the water depth was at least 6 m in this area. The tree branches may have been broken by one of the fishing boats washed inland. On the west side of Dichato there are two 10 story apartment buildings. These buildings incurred no obvious structural damage as shown in the pre and post images in Figure 13.14 and the aerial reconnaissance photo in Figure 13.15. They withstood the earthquake and at least one 3 m wave. Although the first floor apartments and the basement show significant flooding damage, the upper floor apartments were intact and were available to be reoccupied after the residents cleaned up broken items inside them. Behind the 10-story apartment buildings are about a dozen homes and shops which are constructed of lightweight materials, such as wood and corrugated metal. Little damage occurred to these structures suggesting that they may have been sheltered from a direct impact from the tsunami by the 10-story apartment buildings located between them and the bay. A pre and post image pair for the area further to the East of the apartment buildings shows significant damage to smaller structures much further inland (Figure 13.16). Severe damage to homes in central Dichato illustrate the effects of the tsunami with a wave depth of about 5 meters (Figures 13.17 and 13.18). Sea water surged 2.2 km into the agricultural valley southwest of Dichato as previously shown in Figure 13.19. Several large fishing boats and other vessels remain beached in these fields and farmlands, which are now brown and dead due to salt poisoning. Residents of Nicochea Beach described the earthquake strong motion as being sufficient to throw objects into the air and break every breakable object in their houses. Across the bay in Pingueral, a survivor of the 1960 earthquake in Valdivia reported that there was no violent motion in the February 27th earthquake, only long, rolling motion. Objects on his kitchen counters remained in place and nothing in his house was broken during the earthquake.
245

Figure 13.12 Pre/Post Imagery of Dichato (S36.546°, W72.933°)
246

Tsunami Damage
Figure 13.13 Pre/Post Imagery of Dichato (S36.548°, W72.935°)
247

Intact High-rise Buildings
Figure 13.14 Pre/Post Imagery of Dichato (S36.548°, W72.942°)
248
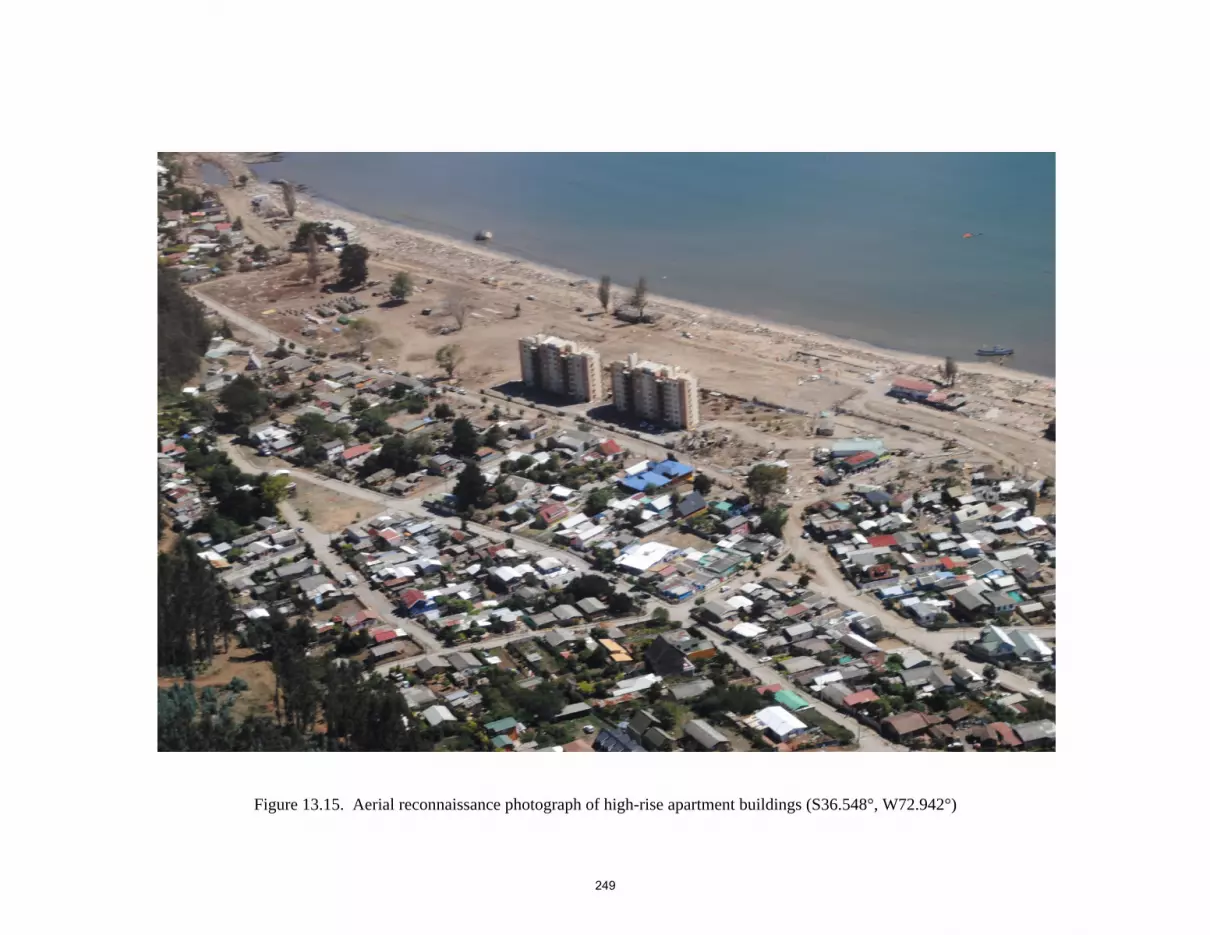
Figure 13.15. Aerial reconnaissance photograph of high-rise apartment buildings (S36.548°, W72.942°)
249
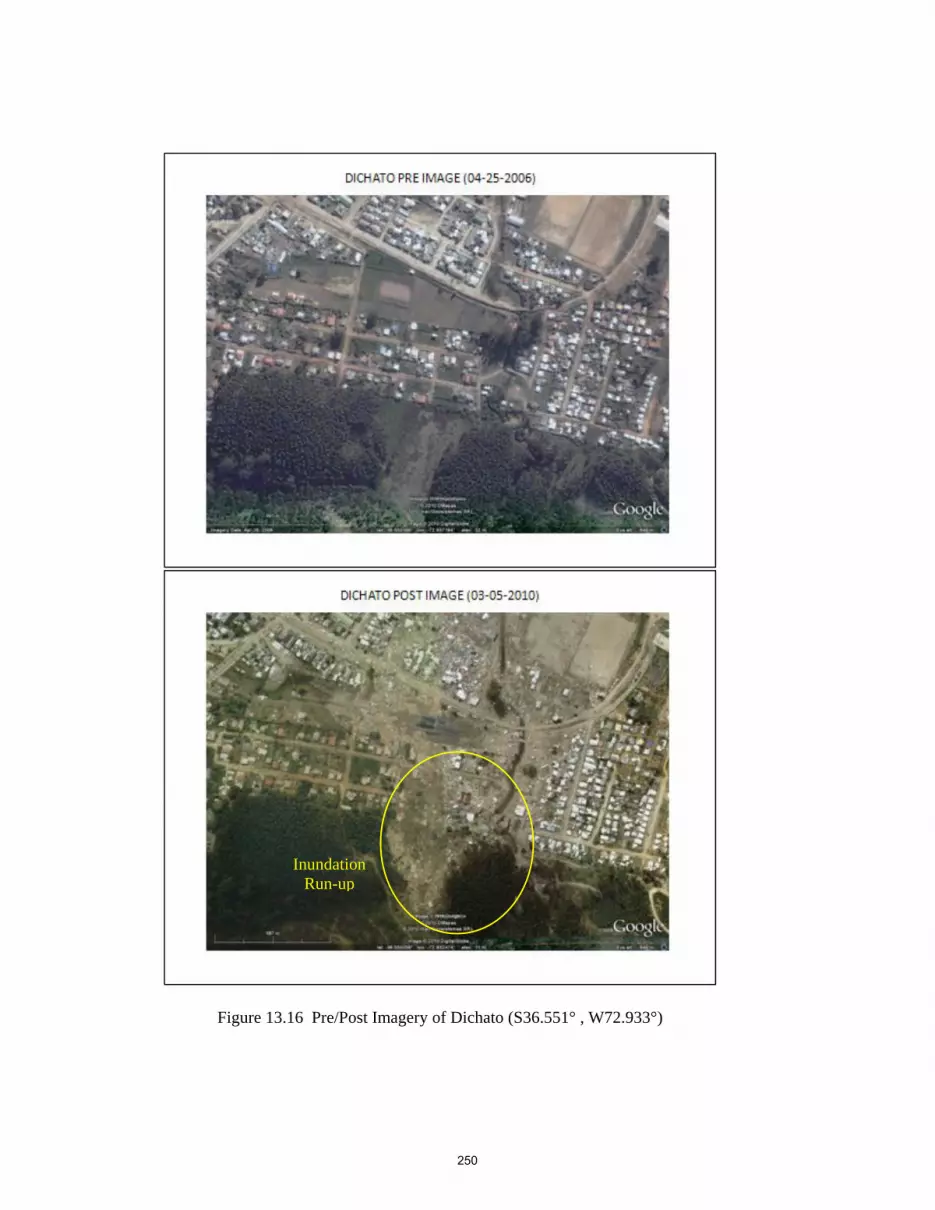
Inundation Run-up
Figure 13.16 Pre/Post Imagery of Dichato (S36.551° , W72.933°)
250
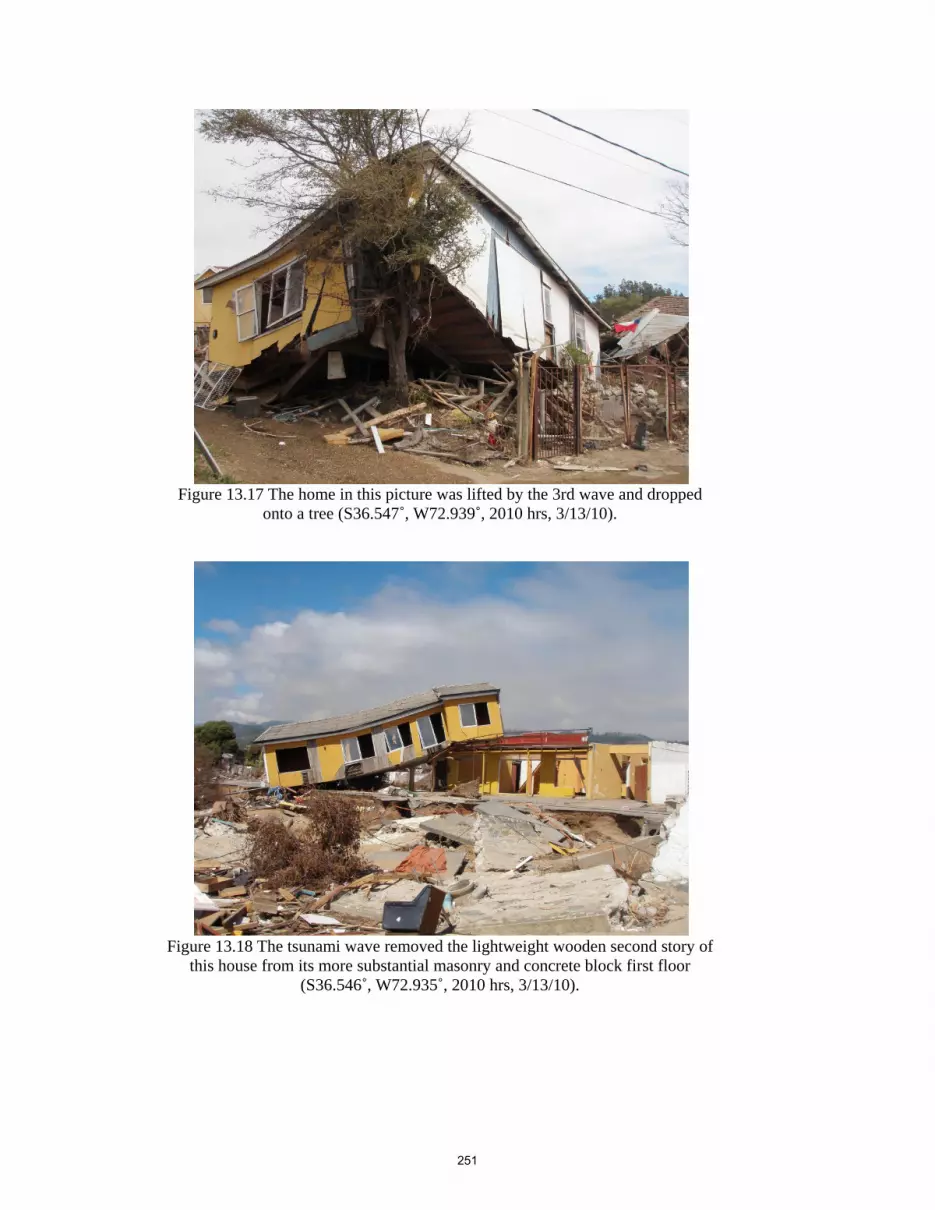
Figure 13.17 The home in this picture was lifted by the 3rd wave and dropped
onto a tree (S36.547˚, W72.939˚, 2010 hrs, 3/13/10).
Figure 13.18 The tsunami wave removed the lightweight wooden second story of
this house from its more substantial masonry and concrete block first floor (S36.546˚, W72.935˚, 2010 hrs, 3/13/10).
251

13.3.5 Changes in stream channels The course of the Rio Dichato has been altered as shown in Figure 13.17. Prior to the earthquake, the river meandered through a neighborhood with gardens abutting the river, before exiting to the bay at the east end of town. The tsunami´s greatest water depth -- and presumably the most destructive erosional power -- was in the area of this meander. The tsunami removed the soft sediments that formed a barrier between the river and the bay and the meander has been eliminated. Now, the mouth of the river is about 100 meters southwest of its former location. A delta is forming where a neighborhood used to be. The area of the former river bed is now a low-lying mudflat, which floods at high tide. There is a lagoon and stream at the north end of Pengueral. The lagoon is separated from the lagoon by a sandbar. During the flooding which occurred from 10:00 to 10:30 a.m., water flowed in and out over the sandbar 3 or 4 times. After the last flood retreated, residents noted that the sandbar had changed shape, with more sand at the southern end. Also in Pengueral, there are five wooden houses which were lifted, with their foundations somewhat intact, and moved several meters towards the east and southeast, parallel to the flooding which surged up the stream valley north of Pingueral.
252
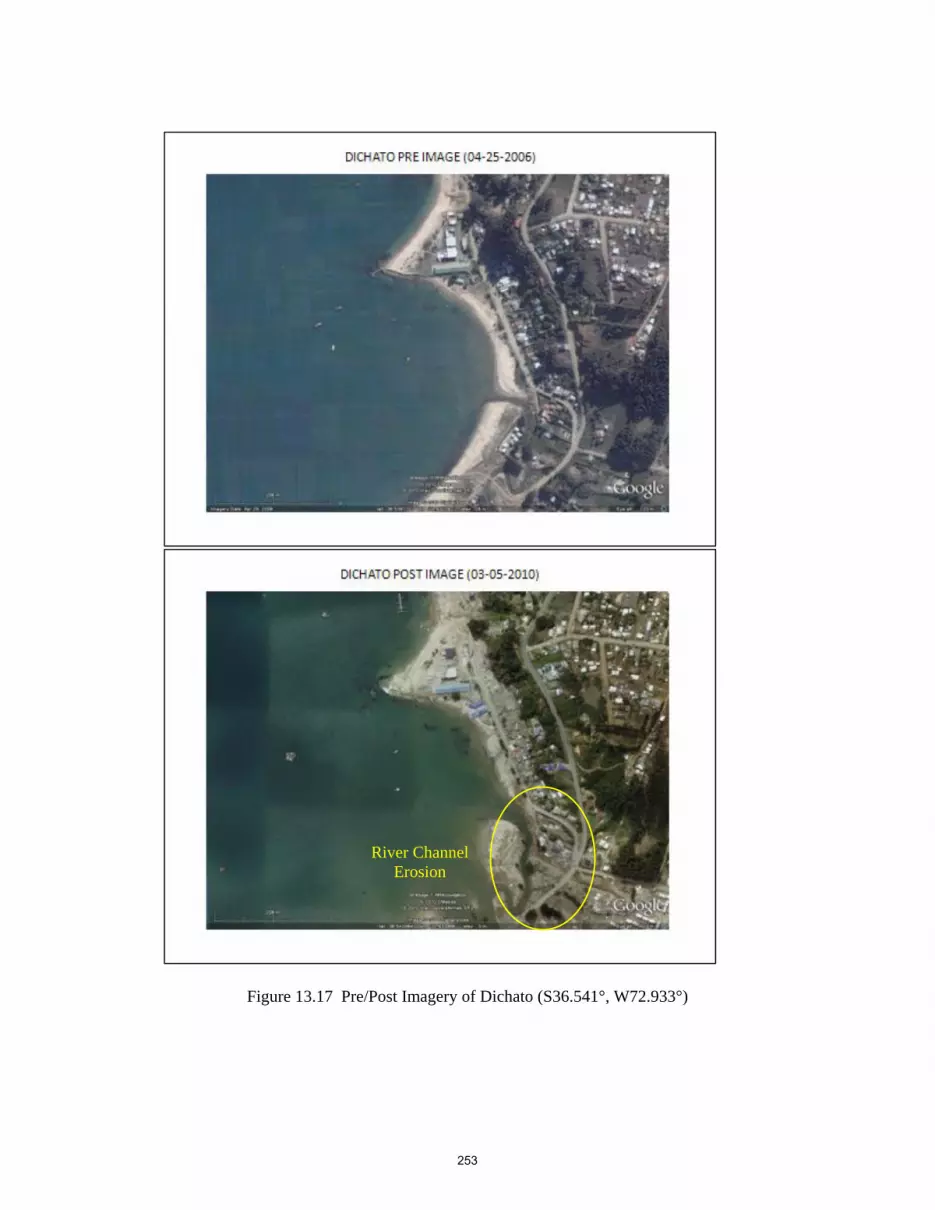
River Channel Erosion
Figure 13.17 Pre/Post Imagery of Dichato (S36.541°, W72.933°)
253
13.4 Curanipe to Constitución Communities we visited along the coast between Curanipe and Constitución were particularly hard hit by tsunami inundation. At Curanipe two local women we interviewed reported that the tsunami came from the north and noted that much of the sand had been removed from the beach, possibly due to erosion by the tsunami. Emilia Sagado Alveal, a Curinape resident, said she witnessed the first wave arrive about 10 minutes after the earthquake. She remembers three waves in all and the water nearly covered the Roca San Pedro leaving only the cross on top above water (Figure 13.20). Alveal also indicated that geographers from the Universidad de Catolica had surveyed the area and estimated average tsunami wave heights of 6.5 m. Water stains on the wall of a restaurant near the beach indicate that minimum flow depths at this site were about 1 m (Figure 13.21). At El Torreon, a small beach community south of Pelluhue, the tsunami destroyed a number of houses and caused at least 5 fatalities (Figure 13.22). Witnesses interviewed included Chilean Army Lieutenant Alfredo Diaz and local residents of the community. One resident reported that the earthquake seemed to last for 5 minutes and the first tsunami wave arrived about 30 minutes later at 4:05 am. Some witnesses noted that the ocean did not recede after the earthquake and they assumed no tsunami was coming until the first wave arrived. A total of 7 to 13 waves continued to arrive over the next 4 hours, according to different accounts. The flow depths remained high until 8 am when the water level started to retreat. At one house that partially survived the tsunami, water marks indicate minimum flow depths between 1.6 and 2.2 m (Figure 13.23). The brother of the owner of the house said debris carried by the tsunami broke the windows on the first floor not the wave and also noted that water did not enter the second floor. In communities between Pelluhue and Constitución , buildings in low-lying areas within a few hundred meters of the coast sustained heavy damage. For example, beach front houses in the small fishing village of Los Pellines were severely impacted as was a derelict wood pulp processing plant in Las Cañas. However, in other areas coastal dunes appeared to present barriers to tsunami inundation preventing more extensive damage. In Reserva Nacional Frederico Albert near Chanco, 3- to 4-m-high dunes on the beach apparently prevented the tsunami from penetrating further inland (Figure 13.24). We did not conduct detailed surveys of tsunami impacts in Constitución . A rapid tour of the tsunami impacted area by car confirmed reports of extensive damage to the city along the south bank of Rio Maule. We noted high water marks on several buildings in Constitución that suggest minimum tsunami flow depths were near 2 m at sites close to the river (Figure 13.25). Further information on the tsunami impacts at Constitución and tsunami runup estimates, including high resolution inundation maps have been compiled by Armijo et al. (2010).
254
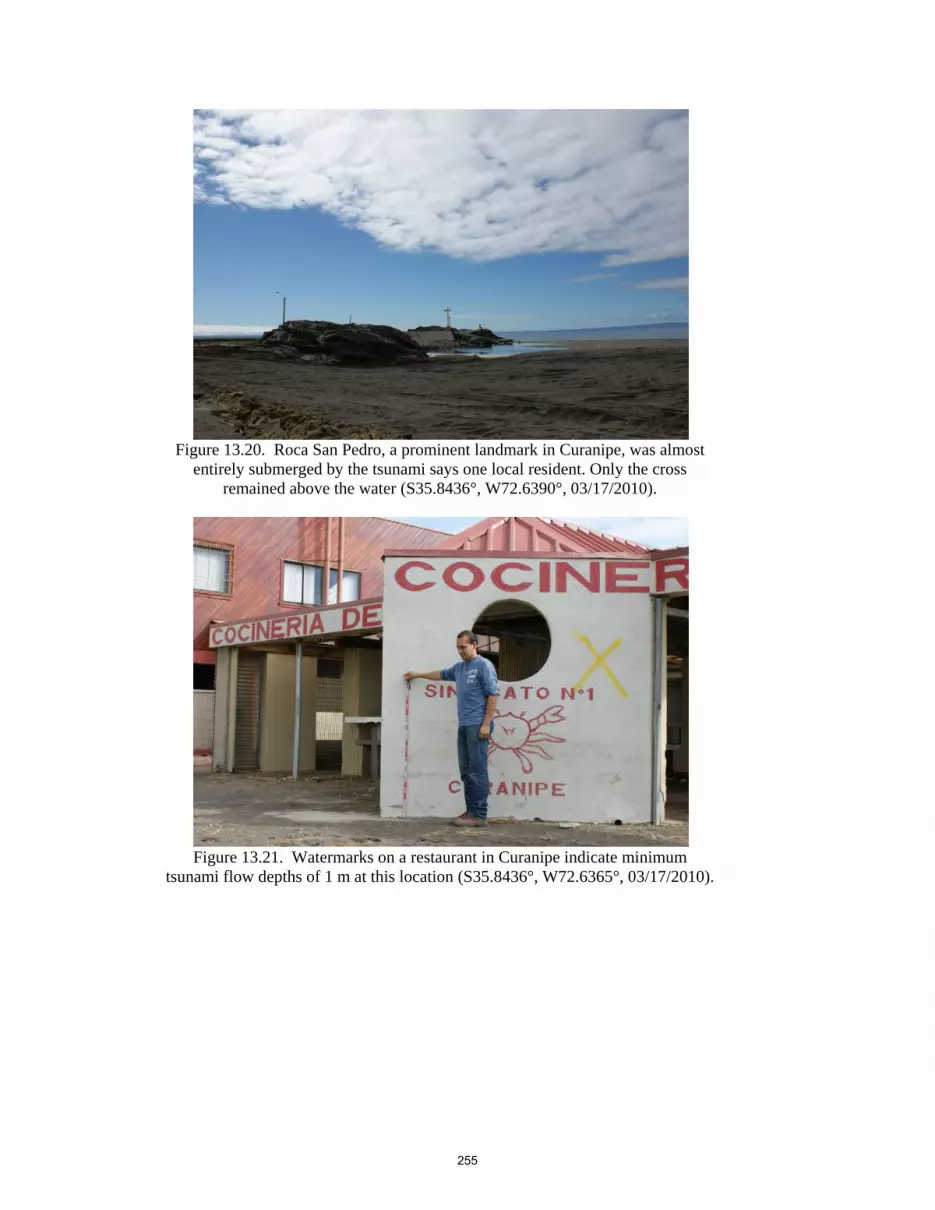
Figure 13.20. Roca San Pedro, a prominent landmark in Curanipe, was almost
entirely submerged by the tsunami says one local resident. Only the cross remained above the water (S35.8436°, W72.6390°, 03/17/2010).
Figure 13.21. Watermarks on a restaurant in Curanipe indicate minimum
tsunami flow depths of 1 m at this location (S35.8436°, W72.6365°, 03/17/2010).
255

Figure 13.22. The blue and white two-story house in the beach community of El Torreon was heavily damaged by the tsunami and all but the walls of the adjacent vacation house was destroyed. The tsunami arrived at 4:05 am, about 30 minutes after the earthquake, and the water remained high for four hours when it started
to retreat around 8 am (S35.8215°, W72.5990°, 03/17/2010).
256

Figure 13.23. On this post inside the first floor of a beach front house in El Torreon, a small community south of Pelluhue, visible lines mark the water
height 1.6 m above the ground providing a minimum estimate of the tsunami flow depth at this location (S35.8214°, W72.8215°, ~1556 hrs on 03/17/2010).
257
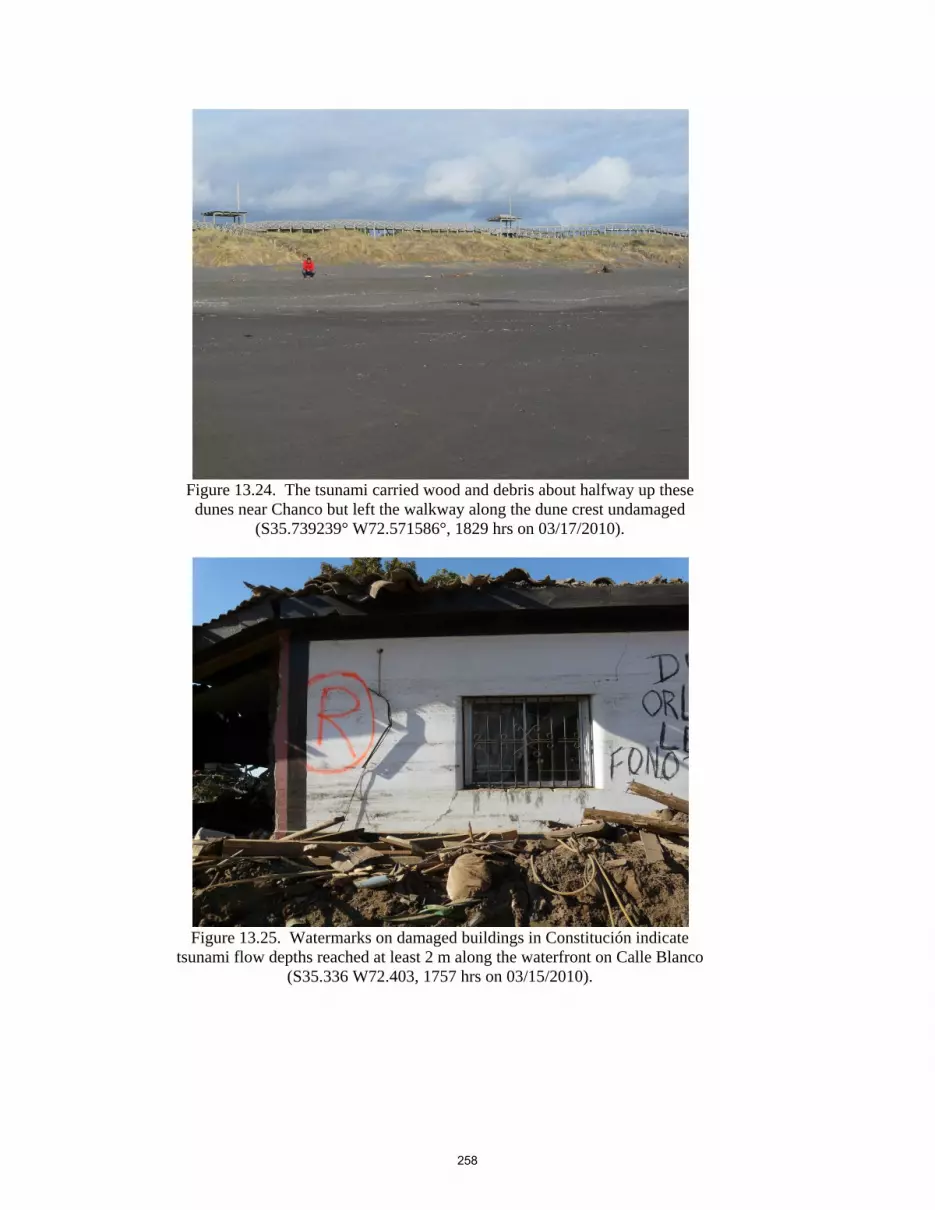
Figure 13.24. The tsunami carried wood and debris about halfway up these
dunes near Chanco but left the walkway along the dune crest undamaged (S35.739239° W72.571586°, 1829 hrs on 03/17/2010).
Figure 13.25. Watermarks on damaged buildings in Constitución indicate
tsunami flow depths reached at least 2 m along the waterfront on Calle Blanco (S35.336 W72.403, 1757 hrs on 03/15/2010).
258
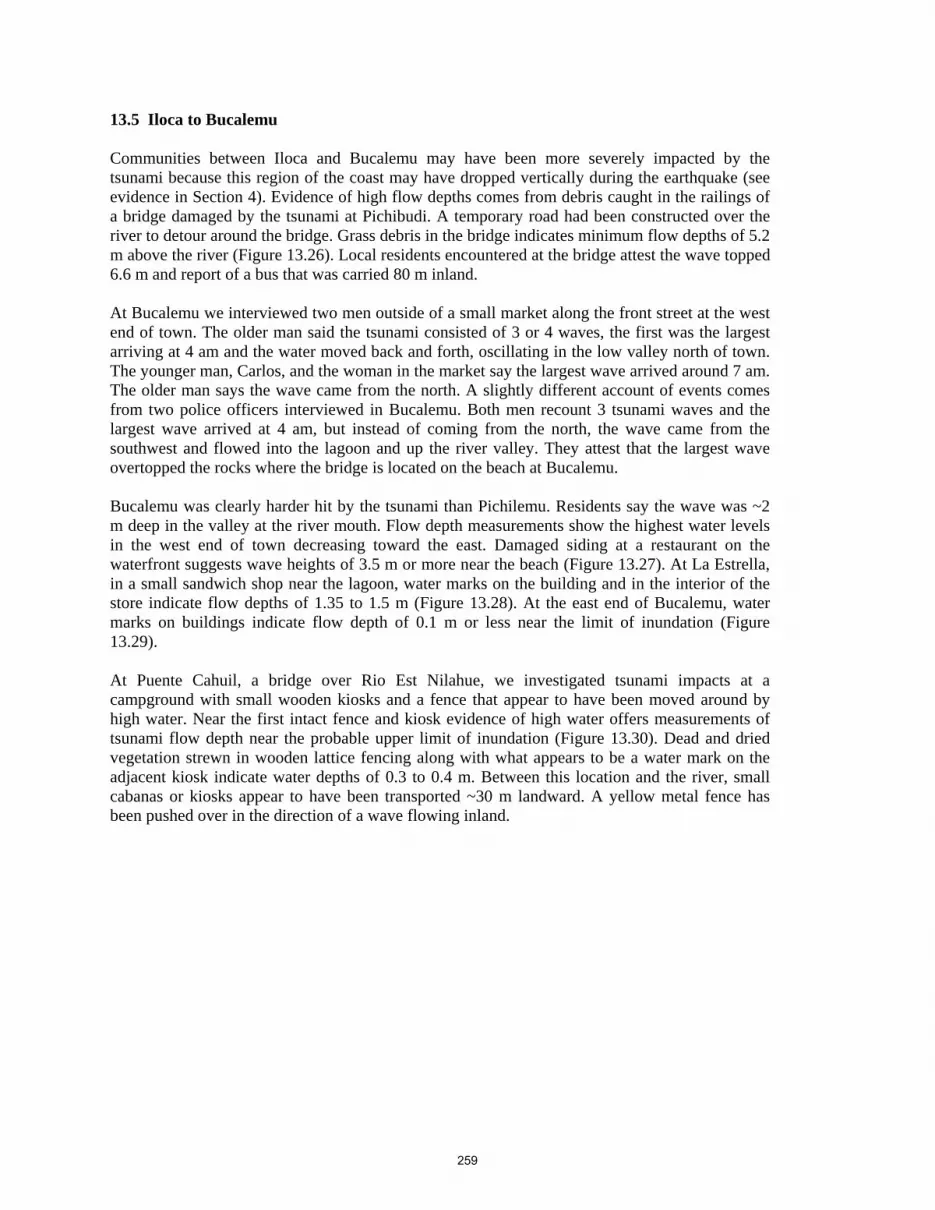
13.5 Iloca to Bucalemu Communities between Iloca and Bucalemu may have been more severely impacted by the tsunami because this region of the coast may have dropped vertically during the earthquake (see evidence in Section 4). Evidence of high flow depths comes from debris caught in the railings of a bridge damaged by the tsunami at Pichibudi. A temporary road had been constructed over the river to detour around the bridge. Grass debris in the bridge indicates minimum flow depths of 5.2 m above the river (Figure 13.26). Local residents encountered at the bridge attest the wave topped 6.6 m and report of a bus that was carried 80 m inland. At Bucalemu we interviewed two men outside of a small market along the front street at the west end of town. The older man said the tsunami consisted of 3 or 4 waves, the first was the largest arriving at 4 am and the water moved back and forth, oscillating in the low valley north of town. The younger man, Carlos, and the woman in the market say the largest wave arrived around 7 am. The older man says the wave came from the north. A slightly different account of events comes from two police officers interviewed in Bucalemu. Both men recount 3 tsunami waves and the largest wave arrived at 4 am, but instead of coming from the north, the wave came from the southwest and flowed into the lagoon and up the river valley. They attest that the largest wave overtopped the rocks where the bridge is located on the beach at Bucalemu. Bucalemu was clearly harder hit by the tsunami than Pichilemu. Residents say the wave was ~2 m deep in the valley at the river mouth. Flow depth measurements show the highest water levels in the west end of town decreasing toward the east. Damaged siding at a restaurant on the waterfront suggests wave heights of 3.5 m or more near the beach (Figure 13.27). At La Estrella, in a small sandwich shop near the lagoon, water marks on the building and in the interior of the store indicate flow depths of 1.35 to 1.5 m (Figure 13.28). At the east end of Bucalemu, water marks on buildings indicate flow depth of 0.1 m or less near the limit of inundation (Figure 13.29). At Puente Cahuil, a bridge over Rio Est Nilahue, we investigated tsunami impacts at a campground with small wooden kiosks and a fence that appear to have been moved around by high water. Near the first intact fence and kiosk evidence of high water offers measurements of tsunami flow depth near the probable upper limit of inundation (Figure 13.30). Dead and dried vegetation strewn in wooden lattice fencing along with what appears to be a water mark on the adjacent kiosk indicate water depths of 0.3 to 0.4 m. Between this location and the river, small cabanas or kiosks appear to have been transported ~30 m landward. A yellow metal fence has been pushed over in the direction of a wave flowing inland.
259

Figure 13.26. Debris clinging to the railing of this damaged bridge in Pichibudi suggests minimum tsunami flow depths reached 5.15 m. Local residents reported flow depths of 6.65 m above the creek. Anecdotal accounts suggest the tsunami moved a bus 80 m up the creek valley. Tsunami damage along coast becomes
heavier toward the south of this site in Iloca (S34.880055° W72.155819°, 1515 hrs on 03/15/2010).
260

Figure 13.27. Damaged siding on this building suggests tsunami flow depths
reached at least 3.5 m at the west end of Bucalemu (S34.640097° W72.044194°, 1130 hrs on 03/15/2010).
Figure 13.28. Tsunami flow depths reached a minimum of 1.5 m along the
waterfront in Bucalemu (S34.641882° W72.043158°, 1051 hrs on 03/15/2010).
261

Figure 13.29. Tsunami flow depths at the east end of Bucalemu reached 0.1 m or less near the landward limit of tsunami inundation (S34.642586° W72.037371°,
1228 hrs on 03/15/2010).
Figure 13.30. At Puente Cahuil tsunami flow depths reached a minimum of 0.3
to 0.4 m and pushed kiosks at a campground several tens of meters landward (S34.479276° W72.017610°, 1922 hrs on 03/14/2010).
262

13.6 Pichilemu The impact of the tsunami in Pichilemu was considerably less relative to the severe damage observed at locations to the south. Residents report that at least 3 waves arrived beginning about 10 minutes after the earthquake. The first two waves were slow rises of water level, the third wave was the largest. Other witnesses noted that there was no receding wave at Playa Hermosa and Playa Infernio. The tsunami did fill a small lagoon north of Pichilemu, evident as you enter the town, then the water flowed out. Debris dangling from limbs of trees east of the lagoon indicate minimum flow depths of 2.5 to 3 m (Figure 13.31). Tracing the wrack line of debris inland showed that tsunami inundation in the lagoon extended several hundred meters east of the beach (Figure 13.32). North of town, we encountered a surfer and two friends walking along a street near the western margin of a lagoon. Inundation by the tsunami at this site was evident as a wrack line, or line of debris chiefly composed of dried reeds from the marsh in the nearby lagoon to the west. The surfers recalled the first wave arrived at about 4 am and approached from north to south. They remember several waves arriving between 4 am and 7 am. The daughter in law of the owner of Cabanas Gusman-Lyon testified that the height of the first wave reached about 1.5 m high on a chain-link fence near the beach and about the same height in a small shed a few meters away (Figure 13.33). She said the first wave arrived between 3:30 and 4 am in the morning. Our interviews with people in Pichilemu and elsewhere converged on a common theme: the wave came from the north and traveled to the south. After talking with multiple (3 to 4) witnesses with consistent accounts, it appears that along this part of the coastline the tsunami had a directionality and approached the shore from the north. One man said the wave struck the large rocks at the tip of Punta del Lobos. Other witnesses interviewed at Punta del Lobos attest that the tsunami overtopped the sea stacks, which from the overlook at the point appear to be about 15 m above sea level.
263
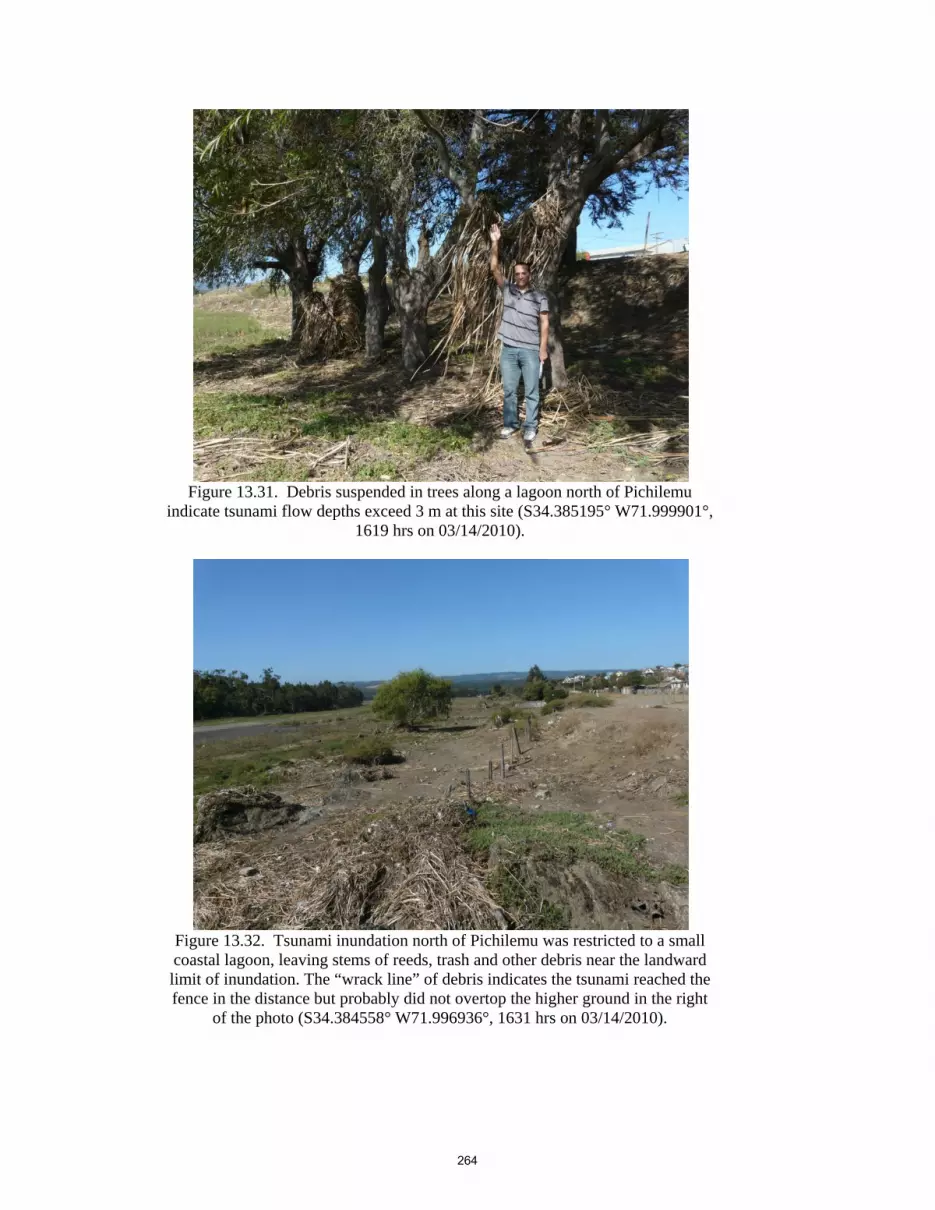
Figure 13.31. Debris suspended in trees along a lagoon north of Pichilemu
indicate tsunami flow depths exceed 3 m at this site (S34.385195° W71.999901°, 1619 hrs on 03/14/2010).
Figure 13.32. Tsunami inundation north of Pichilemu was restricted to a small coastal lagoon, leaving stems of reeds, trash and other debris near the landward limit of inundation. The “wrack line” of debris indicates the tsunami reached the fence in the distance but probably did not overtop the higher ground in the right
of the photo (S34.384558° W71.996936°, 1631 hrs on 03/14/2010).
264

Figure 13.33. Below Cabanas Gusman-Lyon, a local lodging along the water
front in Pichimelu, tsunami flow depths reached about 1.5 m, destroyed a wooden fence (in this photo the fence has been replaced by a new one) and
washed away cars in the parking area (S34.384288° W72.003774°, 1711 hrs on 03/14/2010).
265

14.0 GEOLOGIC AND TSUNAMI HAZARDS, URBAN PLANNING, AND RECONSTRUCTION 14.1 Introduction
The February 27 earthquake and tsunami resulted in substantial geotechnical and structural damage as well as loss of life. The geologic setting and patterns of damage offer a variety of challenges to rebuilding in Chile. There are also several important lessons for geologic hazards mitigation and planning in earthquake and tsunami-prone regions of the U.S. and Canada, particularly in the Cascadia subduction zone area of the West Coast, and elsewhere.
The purpose of the urban planning mission of the GEER team was to assess the geologic and tsunami impacts of the February 27 earthquake and identify urban risk management lessons for the U.S. Another key purpose was to identify candidate areas for potential long-term monitoring of post-disaster rebuilding actions in Chile.
Field reconnaissance between March 14 and 18, 2010 covered over 350 km of the central Chilean coastline between Pichilemu and Laraquete. The coastal region experienced some of the most significant damage from the tsunami, vertical deformation (uplift versus subsidence), and other geologic effects. Much more limited assessments were made of damage-affected areas in the central Chile Valley region, Santiago, Vina del Mar, and Valparaiso. Other information has been gleaned from media accounts and other reconnaissance reports, as well as collaborations with other investigators including members of the GEER team, as well as Nicholas Zoa, and William Siembieda – a member of the Earthquake Engineering Research Institute’s Learning from Earthquakes reconnaissance team.
14. 2 Earthquake Impacts
The M8.8 earthquake occurred at 3:34 am in the early morning hours of Saturday, February 27, 2010. Given the time of day and day of the week, few people were driving, on the streets or at work, and thus were not much affected by falling debris or damage to highways, bridges, and roadways. Instead, most were sleeping, and because it was the end of summer, many people were camping and staying in tourist facilities along Chile’s central coast. A major tsunami struck much of the epicentral coast within minutes of the mainshock.
A “state of catastrophe” was declared in 6 of Chile’s 15 regions – Valparaiso, Metropolitana, Libertador O’Higgins, Araucania, Biobio and Maule. As of April 7, the Government of Chile's (GoC's) official death toll was 486 people, with 79 still reported as missing (U.S. AID 2010). The GoC confirmed that the earthquake and tsunami affected more than 1.8 million people in the four most affected regions – almost 1/8th of the country’s population (U.S. AID 2010). At least 30 cities and towns were badly damage. Infrastructure, including roads, bridges, ports, airports, utilities and communication networks also sustained significant damage, with the most severe damage along the coast and in parts of the central valley; see Figure 14.1. As of March 29, the GOC is reporting that approximately 370,000 housing units were damaged by the February 27 earthquake (U.S. AID 2010); see Table 14.1.
The major industries of the region – fishing, shipping, mining, refineries, forestry, winemaking, and agriculture – were all disrupted by the earthquake, some with long-term consequences for local and, in some instances, regional economies. Details are still forthcoming. Schools, including colleges and universities, were on summer break at the time of the earthquake, so damages have not been as well reported. However, school damage was extensive across central Chile. To avoid delaying the start of the school year, the Government of Chile is merging schools and installing portable classrooms while repairs take place (Burgoine 2010). Chile’s healthcare system also sustained heavy damage. Chile’s Minister of
266

Health reports that 7 hospitals in south central Chile were not operational and another 11 are severely damaged (Burgoine 2010). They estimate that hospital rebuilding will cost USD 3.6 billion - four times the national hospital investment plan that was just launched in November 2009 (Burgoine 2010).
Figure 14.1. Extent of Earthquake and Tsunami Affected Area in Chile (Source: U.S. AID, March 14, 2010)
267

Table 14.1. Estimate of Housing Damage (As of March 29, 2010)
Housing Units Destroyed
Housing Units Significantly Damaged
Housing Units with Minor Damage
Total Housing Units
Coast 7,931 8,607 15,384 31,922 Urban Adobe 26,038 28,153 14,869 69,060 Rural Adobe 24,538 19,783 22,052 66,373 Multi-unit Public Housing
5,489 15,015 50,955 71,459
Multi-unit Private Housing
17,449 37,356 76,433 131,238
Total 81,444 108,914 179,693 370,051 (Source: Government of Chile)
Total economic loss estimates range from USD15 to 30 billion which, at a conversion rate of 520 Chilean Pesos (CLP), translates to 8 to 16 trillion CLP (10% to 15% of Chile's real GDP (EQECAT 2010). EQECAT expects that most of the damage, 55% to 65%, would be to residential structures, with commercial damage accounting for 20% to 30% of the total and industrial damage making up 15% to 20%. As of March 8, 2010, insurance industry estimates ranged from USD2 to 8 billion (or as much as 25% of total economic losses) (EQECAT 2010). A large degree of uncertainty in the loss estimate mainly accounts for the extent of infrastructure damage which in some cases is still unknown. While electricity and telecommunication systems are being restored fairly rapidly, water, wastewater, and transportation damages are going to take much longer to repair which can significantly escalate business interruption losses.
14.3 Urban Planning and Risk Reduction Overview
After a large-scale disaster like the February 27 earthquake, there are immense psychological, economic and political pressures to enable repairs and reconstruction as quickly as possible. Taking time to evaluate damage causes and patterns, assess future risks, and consider actions to reduce future risk may be seen as interfering with rapid recovery. However, the post-disaster period can provide unprecedented financial resources and other opportunities to reduce future risk and make other improvements. Given the relatively high level of awareness of seismic risk in Chile, and its advanced building codes and emergency preparedness systems, this earthquake provides an important case study as to how risk reduction or other improvements are made as part of the recovery.
In their landmark study, Land Use Planning After Earthquakes, William Spangle et al. studied the factors influencing rebuilding decisions following damaging earthquakes in Alaska (1964); Santa Rosa, California (1969); San Fernando, California (1971), Skopje (former Yugoslavia) (1963), and Managua, Nicaragua (1972), as well as Laguna Beach, California after a major landslide (1978) (William Spangle and Associates et al. 1980). Their interest was in understanding the effectiveness of post-disaster land use planning for achieving risk reduction in the rebuilding. They found that improved safety, post-disaster, is more easily achieved through improved structural design and construction than through changing land use. However, in specific instances, changing land use is the best response (William Spangle and Associates et al. 1980, 11).
Chile has had seismic design provisions in its codes since 1935, and the standards are comparable with the U.S. Generally, seismic codes get stricter with time and most of the recent construction in Chile follows the 1996 and 2003 updates to Chile’s Seismic Design Code. The codes apply to new construction,
268

but it is unclear how the codes guide building retrofits or the extent to which seismic retrofitting has been required. Chilean engineers estimate that about 25% of the country’s building stock is older without any seismic design provisions, and that only about 3% of the country’s new construction is not to code; these are usually informal or illegal housing and non-engineered structures.
Possible structural and building code related responses that Chile may undertake in the aftermath of the 2010 earthquake include: enhanced seismic provisions for new construction, seismic retrofit requirements for existing construction, and structural hardening for storm surge and tsunami loading. It is not yet clear how storm surge and tsunami loading are addressed in Chile’s current codes.
Chile also has a multi-governmental framework of land use planning with a National Ministry of Planning; strong regional planning offices that provide broad-based regional planning; and local planning agencies that are more directly involved in the siting and permitting of development and actual land use decision making. More research is needed to fully understand Chile’s planning system, but input from local engineers and architects, and fellow planning researchers, revealed the following preliminary information:
• Chile has the regulatory framework to support land use planning and zoning. Recent (2006/2007) changes in national planning law have required regional and local planning agencies to update plans but many have not done so yet.
• Chile has had an active housing and urban development program focused on providing housing to replace informal settlements throughout the country.
• Chile has a coastal zone management act that provides a framework for planning and specifying desired land uses in coastal areas.
• Starting around 2004/2005, the Chilean Navy has been developing tsunami inundation flood maps for coastal areas. They are published on the Navy’s website (SHOA website address still unconfirmed). While this information may have been available, it is not believed to be widely known, nor have most coastal cities incorporated the information into local plans, planning policies, and planning and building practices.
• The availability of hazard mapping for flooding, known faults, earthquake-induced landslides, vulnerable soils, areas of strong shaking, and areas of liquefaction is unknown. Its use in siting structures and building design is also unknown. Local architects do not feel that they receive adequate academic training on how to apply such information if it exists. Hazard zonation does not appear to be a part of local planning practice.
• Chile has planning and building inspection procedures, in addition to stringent building codes, but code violations and lax enforcement by local governments have been raised as issues of concern in light of the spectacular failures of some newer buildings.
As part of the restoration and rebuilding, there are also a range of possible land use responses that Chile’s national government, as well as local and regional governments, may pursue in the restoration and rebuilding. They include:
• Changes in land use plans and regulations • Changes in land use or occupancy • Relocation of facilities • Redevelopment • Land acquisition
269
In additional to structural and land use decisions, there are other possible risk reduction responses that Chile may choose to pursue. They include public education about hazards and risk, and enhanced warning and response planning.
According to William Spangle et al (1980, 11), the key factors influencing post-disaster risk reduction decisions are:
• The cause and extent of damage • The ability to delineate hazardous areas and evaluate the level of risk pertaining to potential uses
in those areas • Post-earthquake authority and capabilities of local government to impose building and land use
limitations • Availability of, and conditions for the use of, any large blocks of funding, such as from the
national government, for post-earthquake recovery.
The following parts of this section of the report explore these issues in further detail with an emphasis on identifying causes and extent of damage in areas that are likely to have long-term rebuilding challenges, as well as opportunities for significant risk reduction and other improvements as part of the rebuilding.
14.4 Causes and Extent of Damage
This section summarizes observations made from the entire GEER team on the extent of damage from tsunami inundation as well as the following geologic effects:
• Severe shaking and site amplification of ground motions • Coastal uplift and subsidence • Liquefaction and lateral spreading • Landsliding
More details on the causes and extent of damage can be found in the other, referenced sections of the GEER report. By no means is this an exhaustive analysis. Instead, its main purpose, at this early stage post-disaster, is to identify candidate areas to continue to monitor as part of the recovery as well as issues for further study.
14.4.1 Severe shaking and site amplification of ground motions.
Strong shaking lasted for over ninety seconds in some areas and shaking intensities of VII and greater were felt over a vast area, affecting 12 million people (USGS, 2010). As a result, subsequent damage and ground-surface effects occurred over a north-south length of more than 600 km (375 mi). This is roughly equivalent to the entire coastline for the states of Washington and Oregon along the Cascadia subduction zone, or the distance between Los Angeles and San Francisco along the San Andreas system in California. Long duration ground motions and their effects on buildings and infrastructure are directly relevant to rupture scenarios for a Cascadia megathrust earthquake in the Pacific Northwest as well as to a large San Andreas Fault event, like the M7.8 Great Southern California Shakeout scenario.
According to zoning in Chile’s seismic building code, buildings in the earthquake-affected region must be constructed to withstand up to 0.4 g (force of gravity) in peak ground accelerations. Available ground motion records are showing ground motions that are less than 0.4 g. And, commensurately, shaking damage was minimal in most modern, engineered structures. However, the strong shaking was
270
particularly harmful to adobe, unreinforced masonry, and other non-engineering buildings. As the housing damage statistics show, 50,576 (62 %) of the 81,444 housing units that were totally destroyed were adobe structures. About half of these structures were in more urban settings, while others are classified as rural dwellings. It is unclear how the GoC is making its urban-rural distinction. It is also unclear how the GoC is treating coastal adobe structures, since it has a separate count for coastal dwellings (see Table 14.1).
Concentrations of collapsed and heavily damaged structures due to strong shaking were observed in both the central valley and coastal areas during the reconnaissance. Chile’s central valley is a basin of young alluvial soils. Towns are typically built alongside rivers and the young sediments likely influenced strong ground motions. Further study is needed to characterize whether soft alluviums or other site affects contributed significantly to the damage patterns and may need to be considered as part of the rebuilding. Some of the localities with significant concentrations of shaking-related damage are shown (in roughly north to south order) in Table 14.2. Strong shaking related damage occurred throughout the coastal areas; however, much of it was erased by the tsunami. Pockets remain, particularly in areas of older building stock that were not within the tsunami’s path.
Areas of concentrated damage in older and more vulnerable building stock are potential areas where changes in land use or large-scale redevelopment may be likely. It has been reported that the city of Chillan, in the central valley area, experienced heavy damage in a 1939 earthquake. It has been an explanation for why there was less damage in Chillan in the 2010 earthquake. Subsequent investigations of Chillan should verify post-1939 reconstruction, structural and land use risk reductions made as part of the rebuilding, and building performance in the 2010 earthquake. Chillan could be a good comparative case study with Talca or other central valley cities that had a higher percentage of older buildings that suffered extensive damage in 2010.
Section 5 details observations of soft soil related ground amplification and damage in select areas of Santiago, Vina del Mar, and Talca. The Santiago and Vina del Mar observations focused on site effects at modern, engineered structures. Additional pockets of heavy damage also exist in the older parts of several other central valley and coastal area cities. Two examples are Parral (37,822 population) and Cauquenes (41,217 population) located on the western side of the central valley. In these two localities, local commerce was functioning and much of the town was inhabited and active. These areas are less likely to consider substantive land use changes or redevelopment. It is unclear at this time whether building owners will be required to repair or rebuild to higher seismic standards.
14.4.2 Tsunami Inundation
The February 27, 2010 earthquake in Chile generated a tsunami that arrived within 30 minutes of the earthquake in the epicentral region of the Chileans coast. Towns in this region of the coast, such as Talcahuano, Constitucion, and Curanipe, had wave heights of 3 to 4 meters. Within an hour, the tsunami struck further north near the ports of San Antonio and Valparaiso with heights of 0.75 to 2.5 meters, as well as to the south. Tsunami inundation extended over 1 kilometer inland in some areas and also propagated much further up the mouths of rivers and streams.
Section 13 details the impacts of the tsunami along Chile’s coast, and Section 4 provides details on wave measurements taken as part of the investigations of coastal deformation. This section of the report focuses on areas of the coastline where tsunami damage was most extensive. Table 14.3 lists from north to south, the most heavily impacted localities where risk reduction measures, such as changes in building codes and land uses, may be implemented as part of the recovery. In particular, the towns of Bucalemu, Constitucion (see Figures 14.2 and 14.3), Curanipe (see Figures 14.4 and 14.5), Dichato, and Talcahuano (see Figure 14.6) sustained extensive damage. Some cases also had pre-existing economic challenges and
271
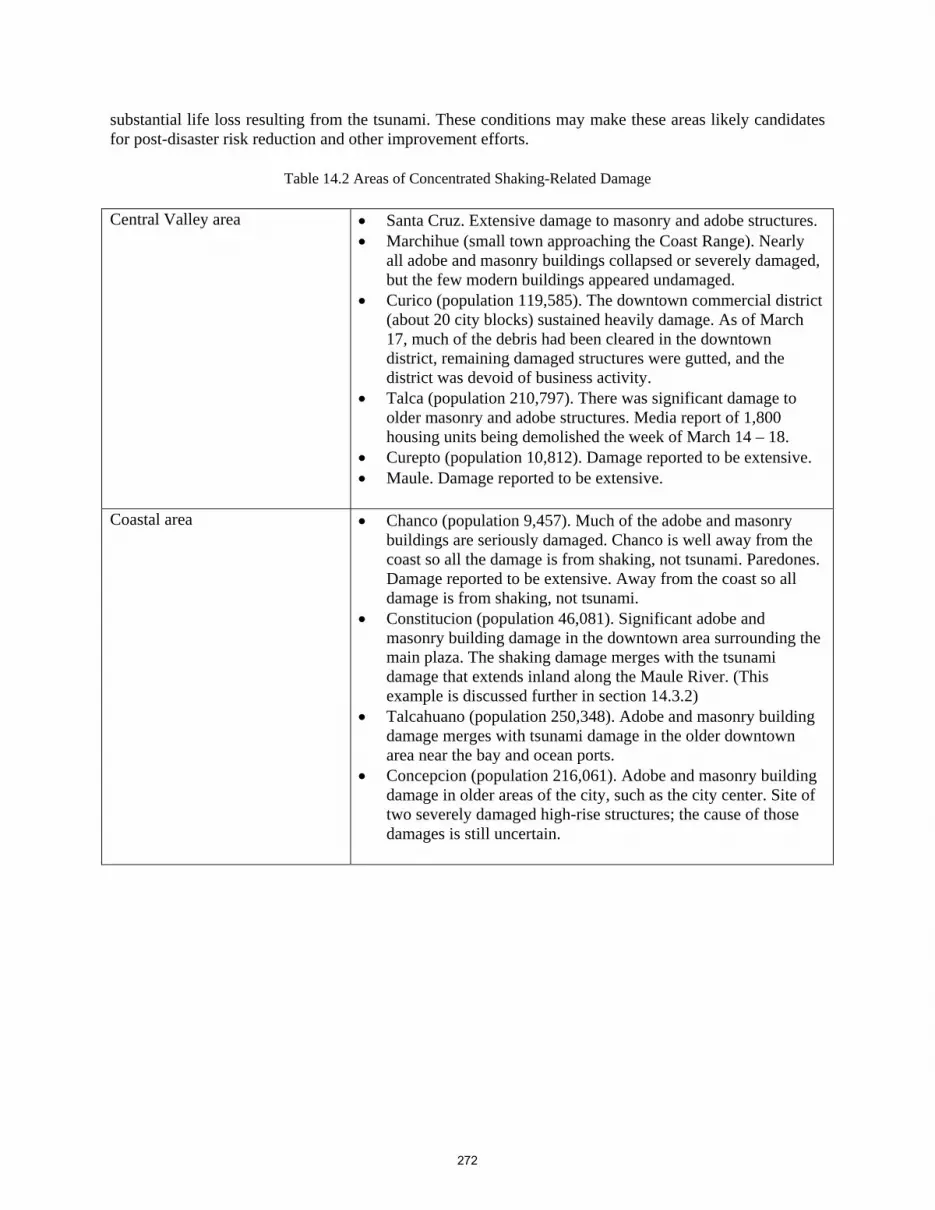
substantial life loss resulting from the tsunami. These conditions may make these areas likely candidates for post-disaster risk reduction and other improvement efforts.
Table 14.2 Areas of Concentrated Shaking-Related Damage
Central Valley area • Santa Cruz. Extensive damage to masonry and adobe structures. • Marchihue (small town approaching the Coast Range). Nearly
all adobe and masonry buildings collapsed or severely damaged, but the few modern buildings appeared undamaged.
• Curico (population 119,585). The downtown commercial district (about 20 city blocks) sustained heavily damage. As of March 17, much of the debris had been cleared in the downtown district, remaining damaged structures were gutted, and the district was devoid of business activity.
• Talca (population 210,797). There was significant damage to older masonry and adobe structures. Media report of 1,800 housing units being demolished the week of March 14 – 18.
• Curepto (population 10,812). Damage reported to be extensive. • Maule. Damage reported to be extensive.
Coastal area • Chanco (population 9,457). Much of the adobe and masonry buildings are seriously damaged. Chanco is well away from the coast so all the damage is from shaking, not tsunami. Paredones. Damage reported to be extensive. Away from the coast so all damage is from shaking, not tsunami.
• Constitucion (population 46,081). Significant adobe and masonry building damage in the downtown area surrounding the main plaza. The shaking damage merges with the tsunami damage that extends inland along the Maule River. (This example is discussed further in section 14.3.2)
• Talcahuano (population 250,348). Adobe and masonry building damage merges with tsunami damage in the older downtown area near the bay and ocean ports.
• Concepcion (population 216,061). Adobe and masonry building damage in older areas of the city, such as the city center. Site of two severely damaged high-rise structures; the cause of those damages is still uncertain.
272

Figure 14.2. Constitucion. Debris removal and road clearing still underway in the tsunami inundation zone along the Maule River. (S35.340323°, W72.396772°; 16:54 hours on 3/15/2010).
Figure 14.3. Constitucion. Tsunami damage merges with shaking related damage in the older section of the city center with its many adobe and unreinforced masonry buildings.
(S35.335383°, W72.410055°; 17:25 hours on 3/15/2010).
273
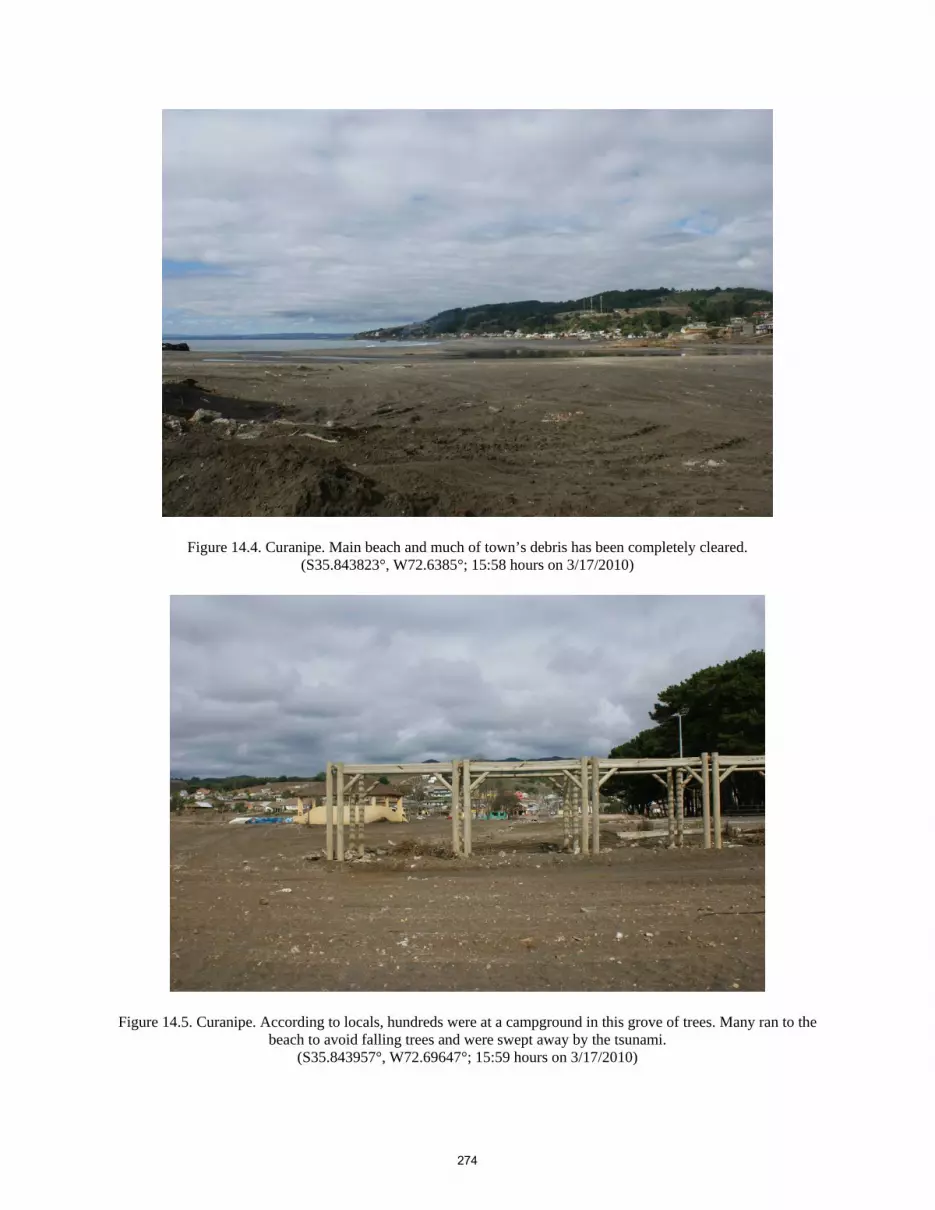
Figure 14.4. Curanipe. Main beach and much of town’s debris has been completely cleared. (S35.843823°, W72.6385°; 15:58 hours on 3/17/2010)
Figure 14.5. Curanipe. According to locals, hundreds were at a campground in this grove of trees. Many ran to the beach to avoid falling trees and were swept away by the tsunami.
(S35.843957°, W72.69647°; 15:59 hours on 3/17/2010)
274
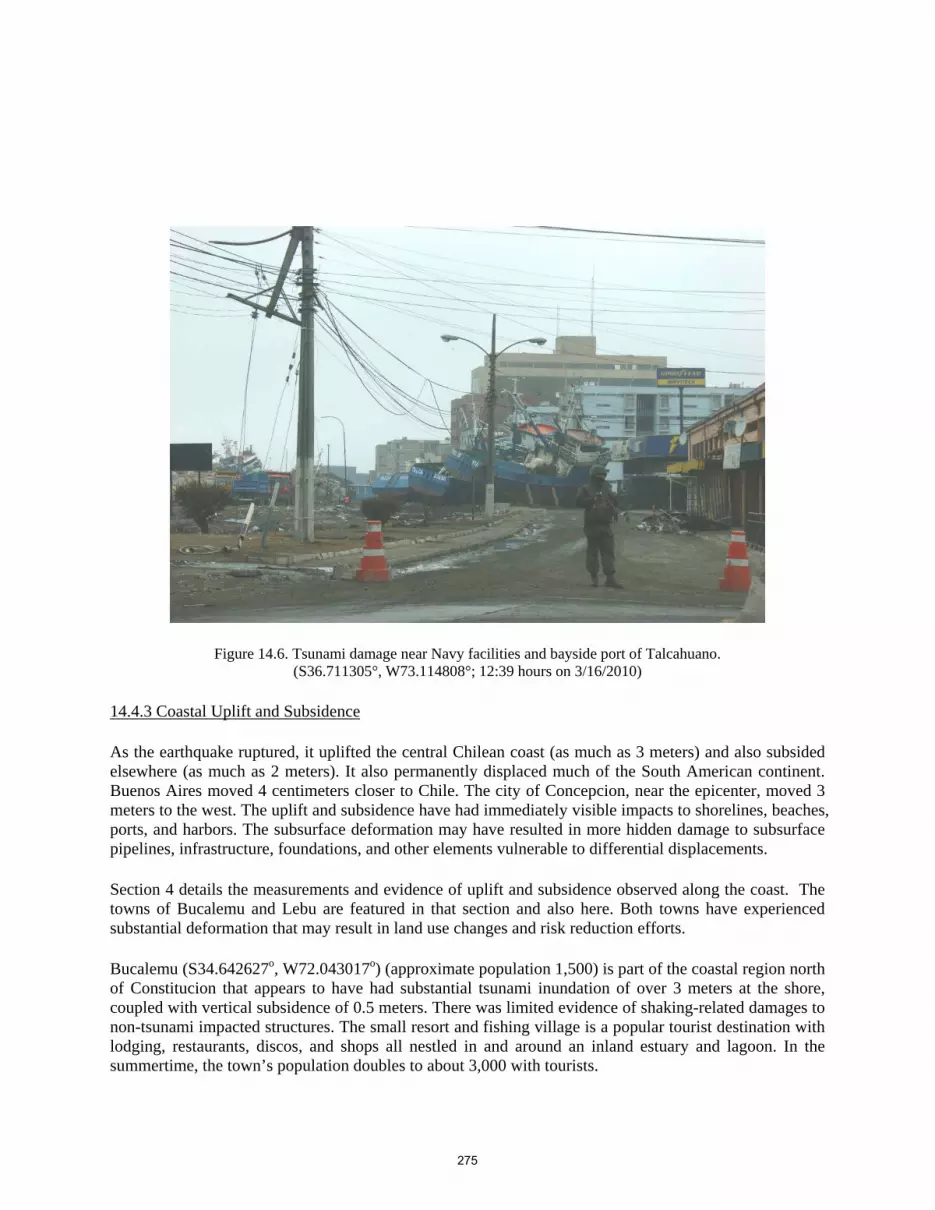
Figure 14.6. Tsunami damage near Navy facilities and bayside port of Talcahuano. (S36.711305°, W73.114808°; 12:39 hours on 3/16/2010)
14.4.3 Coastal Uplift and Subsidence
As the earthquake ruptured, it uplifted the central Chilean coast (as much as 3 meters) and also subsided elsewhere (as much as 2 meters). It also permanently displaced much of the South American continent. Buenos Aires moved 4 centimeters closer to Chile. The city of Concepcion, near the epicenter, moved 3 meters to the west. The uplift and subsidence have had immediately visible impacts to shorelines, beaches, ports, and harbors. The subsurface deformation may have resulted in more hidden damage to subsurface pipelines, infrastructure, foundations, and other elements vulnerable to differential displacements.
Section 4 details the measurements and evidence of uplift and subsidence observed along the coast. The towns of Bucalemu and Lebu are featured in that section and also here. Both towns have experienced substantial deformation that may result in land use changes and risk reduction efforts.
Bucalemu (S34.642627o, W72.043017o) (approximate population 1,500) is part of the coastal region north of Constitucion that appears to have had substantial tsunami inundation of over 3 meters at the shore, coupled with vertical subsidence of 0.5 meters. There was limited evidence of shaking-related damages to non-tsunami impacted structures. The small resort and fishing village is a popular tourist destination with lodging, restaurants, discos, and shops all nestled in and around an inland estuary and lagoon. In the summertime, the town’s population doubles to about 3,000 with tourists.
275

Table 14.3 Areas of Concentrated Tsunami-related Damage
Pichelemu (25,000 approx. pop.)
The dunes, bluffs, and levees protected much of the town. Tsunami damage extended across the main beach road and also propagated up a channel on the north end of town. Beach front redevelopment is likely and may involve structural and land use changes, such as building elevations, setbacks and reductions in occupancies.
Bucalemu (1,500 approx. pop.)
The tsunami inundated the small lagoon area and propagated up the channel, depositing fishing boats more than 100 meters to the east of the coast highway bridge (and more than 1 kilometer from the shoreline). Houses, discos, cabanas, and campgrounds were destroyed. (This example is discussed further in section 14.4.3)
Boyeruca Small village with reportedly substantial tsunami damage. It was not part of this investigation.
Lipimavidia Small village where tsunami damage appears to have been reduced somewhat by the dunes. But, it still crossed the road in lower-lying areas and inundated structures along the inland side of the coast road as well.
Iloca The town was heavily damaged by the tsunami. The north end of the town sustained less damage than the south side.
Constitucion (46,081 pop.)
Tsunami damage is quite extensive. The tsunami reportedly traveled more than 4 kilometers up the Maule river. Damage also extends inland for several blocks from the river and the beach front (e.g., 10 blocks long and 3 to 4 blocks inland).
Los Pellines A small village that may have been suffering economically before the earthquake due to a nearby paper pulp plant closing. Tsunami damage impacted the beachfront and streamfront structures.
Pelluhue A resort and fishing village. Low-lying areas, around beaches, coves, and the mouths of streams, were hit hard by the tsunami. There were tsunami-related deaths in beachfront motels.
Curanipe A resort and fishing village with an extensive beach that had camping grounds, discos, tourist accommodations, and housing. Low-lying areas, around beaches, coves, and the mouths of streams, were hit hard by the tsunami. There were tsunami-related deaths in the campgrounds and beachfront hotels and discos. Locals reported that local government considerations of changes in land use were already underway.
Dichato One of hardest hit towns. Only buildings on higher ground were undamaged. A number of stronger structures also survived, but with substantial first floor damage. A boat was swept inland over 3 kilometers.
Penco Tsunami damage both in the town and the port. Penco received substantive debris from neighboring Talcahuano port, including containers and a marine ship.
Talcahuano (250,348 pop.)
Tsunami damage is extensive at the Navy port, bayfront and oceanfront port facilities, and in the older downtown area near the bay and port. The ocean front and downtown areas may have been in decline prior to the earthquake and may be a focus for post-earthquake redevelopment.
276

Local policeman say that there were many cabanas, campgrounds, and discos along the estuary, and about 500 people were in this low-lying area when the earthquake hit (see Figures 14.7a and 14.7b). There was a lot of moonlight and many people were out dancing. There was no tsunami alarm. But, many of the local people, firemen and police shouted to get out knowing that a tsunami might strike after the earthquake shaking stopped. Some saw the ocean receding and knew it was a forewarning of tsunami. Vacationers jumped into their cars and drove inland and up into the hills above the town. The tsunami was up to 2 meters deep in the estuary valley area and penetrated nearly 1 kilometer up the river, pushing fishing boats upstream under the coast highway bridge.
Prior to the earthquake, the town had been embarking in a fairly significant capital improvement project that included expansion of the lagoon and construction of a boardwalk along the shore (see Figures 14.8 and 14.9). Local residents say that the lagoon used to be only 10 meters wide and did not have a permanent opening to the sea and the rough waves like it does now. They say the beach extended about 20 meters beyond the arched, orange bridge out next to the pub building at the rocky point. Now the waves are crashing up against the pub building (see Figure 14.10). The cement boat launch ramp next to the pub building is now under water and the beach that local fisherman used to pull their boats up onto is gone.
Bucalemu’s physical geography has been dramatically altered by the earthquake and tsunami. High-density tourist-oriented uses that were previous adjacent to the estuary may be much more vulnerable to flooding, storm surge, and tsunami hazards. As part of the rebuilding, changes in land use, reductions in allowable densities, and condemnation or acquisition of low-lying areas both along the estuary and the adjusted shoreline, may be considered in addition to other risk reduction and community improvement measures.
Figure 14.7a and 14.7b Bucalemu.. Much of the tsunami debris and damaged structures had already been removed from the low-lying area along the estuary that had campgrounds, hotels, restaurants, and discos. As many as 500
people were in this area when the earthquake struck. (S34.62552°, W72.038395°; 09:05 hours on 3/15/2010)
277

Figure 14.8. Bucalemu. Prior to the earthquake, the town had been expanding the lagoon and constructing a boardwalk along the shore. (S34.642367°, W72.040965°; 09:06 hours on 3/15/2010)
Figure 14.9. Bucalemu. Local residents say the beach extended about 20 meters beyond the arched, orange bridge out next to the pub building at the rocky point. (S34.641713°, W72.043115°; 09:09 hours on 3/15/2010)
278

Figure 14.10. Bucalemu. Waves crashing up against the pub building. The cement boat launch ramp and former beach are now submerged after the tsunami. (S34.474325°, W72.023918°; 10:42 hours on 3/15/2010)
Lebu (S37.591897°, W73.668353°) is part of the coastal region that had as much as 2 meters of uplift in the February 27 earthquake. Lebu is the capital of the province of Arauco. Its economy centers on fishing, forestry, trade, and services. It is also home Lebu mine (Carvil), the last coal mine in the area following the closure of Lota, Schwager and Trongol; it has been kept open with state subsidies.
Coseismic uplift has stranded boats in Lebu’s harbor (see Figure 14.11). The lighthouse northwest of the Lebu Harbor inlet is on an island that was uplifted enough to almost form a peninsula. Lebu will likely have significant land use planning issues as part of the rebuilding that may include relocation and construction of the harbor and appropriation of rights to the newly-created land. This area was also uplifted in the 1960 earthquake, so there are historic decisions and ongoing risk management issues to be studied as well.
14.4.4 Liquefaction and Lateral Spreading
Evidence of ground cracking, liquefaction, and lateral spreading have been documented across a vast region that is roughly 600 kilometers long and 100 kilometers wide. River sediments were especially vulnerable to ground deformation, and observations were made along many of the regions large, east-west trending watersheds the flow into the Pacific Ocean. Areas alongside lakes, bays, and ports were also especially vulnerable. Section 6 documents in much greater detail the ground deformation observations made as part of the GEER reconnaissance.
279

Figure 14.11. Boats stranded in Lebu’s Harbor. (S37.603694° W73.654372°; 1800 hrs on 03/10/2010).
For the most part, these deformations are fairly distinct occurrences and were not a significant contributor to the overall damage levels. However, there are some potential areas for more focused study. A key concern is ports and bridges, where ground deformations were a consistent cause of damage; sites should be remediated as part of the repairs. There were also a few instances where the future stability and suitability of building sites may be questioned as part of the rebuilding. Two such observations are briefly discussed below, and are good candidates for long-term observation.
Lateral spreading along the banks of Lago Vichuquen (S34.796068o, W72.078810o), near the Laguna Torca National Reserve, severely impacted the road bed, underground utilities, and lakeside properties (see Figures 14.12, 14.13, and 14.14). Much of the ground underlying a small lakeside cabana hotel has been affected. Over 50 feet of shoreline was submerged and there was evidence for submarine landsliding as well. Sections of lawn, trees, and boat docks were all submerged. The shore side piers of several cabanas were also submerged and there was evidence of structural damage as well. The future viability of this property is definitely in question since there is not adequate land area between the cabanas and the road to setback and reconstruct. Ground deformation was observed in another location along the lake road but did not appear to be a consistent feature along the shoreline. Other boat docks along the shoreline did not appear damaged or submerged, but further study is needed.
280

Figure 14.12. Lago Vichuquen,. Lateral spreading on the inland side of the lakefront road. (S34.39097°, W72.077815°; 12:46 hours on 3/15/2010)
Figure 14.13. Lago Vichuquen. Lateral spreading has affected much of the ground underlying a small lakeside cabana hotel. Some shore side piers of the cabanas were submerged and there was evidence of structural damage as
well. (S34.796345°, W72.07885°; 12:58 hours on 3/15/2010)
281

Figure 14.14. Lago Vichuquen, March 15. The lawn, trees, and boat docks are all submerged and there was evidence for submarine landsliding as well. (S34.79634°, W72.078852°; 12:52 hours on 3/15/2010)
Several port side properties at Port San Vicente in Talcahuano were also significantly damaged by lateral spreading and ground deformation (S36.72593o, W73.12872o). Two fish processing plants, Alimentos Marinos and Concession Maritima, were both severely damaged and not in operation on March 15 (see Figures 14.15 and 14.16).
Port San Vicente is a major fish processing facility and the two plant closures are likely to have prolonged impacts on the region’s fishing economy. On March 14, fishing boats were observed dropping their loads in the harbor since the plants were not operational. Alimentos Marinos employed 300 people directly and another 300 indirectly. Insurance adjustors were onsite on March 15 and the former plant manager said the facility will likely not be rebuilt in this location. This type of relocation could have significant local economic ripple effects. The suitability of the port side land for rebuilding is also a major question. Across the port road from the two damaged plant is a tank farm facility that had no observable damage (see Figure 14.17). Perhaps, the tank farm had better site preparations as part of its construction. Also, the port road was slightly elevated from surrounding lands and may be part of a levee system along a former shoreline. The fish processing facility may be sited on much more vulnerable bay fills than the tank farm. Additional study is needed to clarify these concerns.
282

Figure 14.15. Port San Vicente, Talcahuano. The damaged Alimentos Marinos fish processing plant will likely not
be rebuilt at this port. (S36.725983°, W73.128817°; 11:45 hours on 3/16/2010)
Figure 14.16. Port San Vicente, Talcahuano. The damaged Concession Maritima fish processing plant. (S36.725892°, W73.128678°; 11:50 hours on 3/16/2010)
283
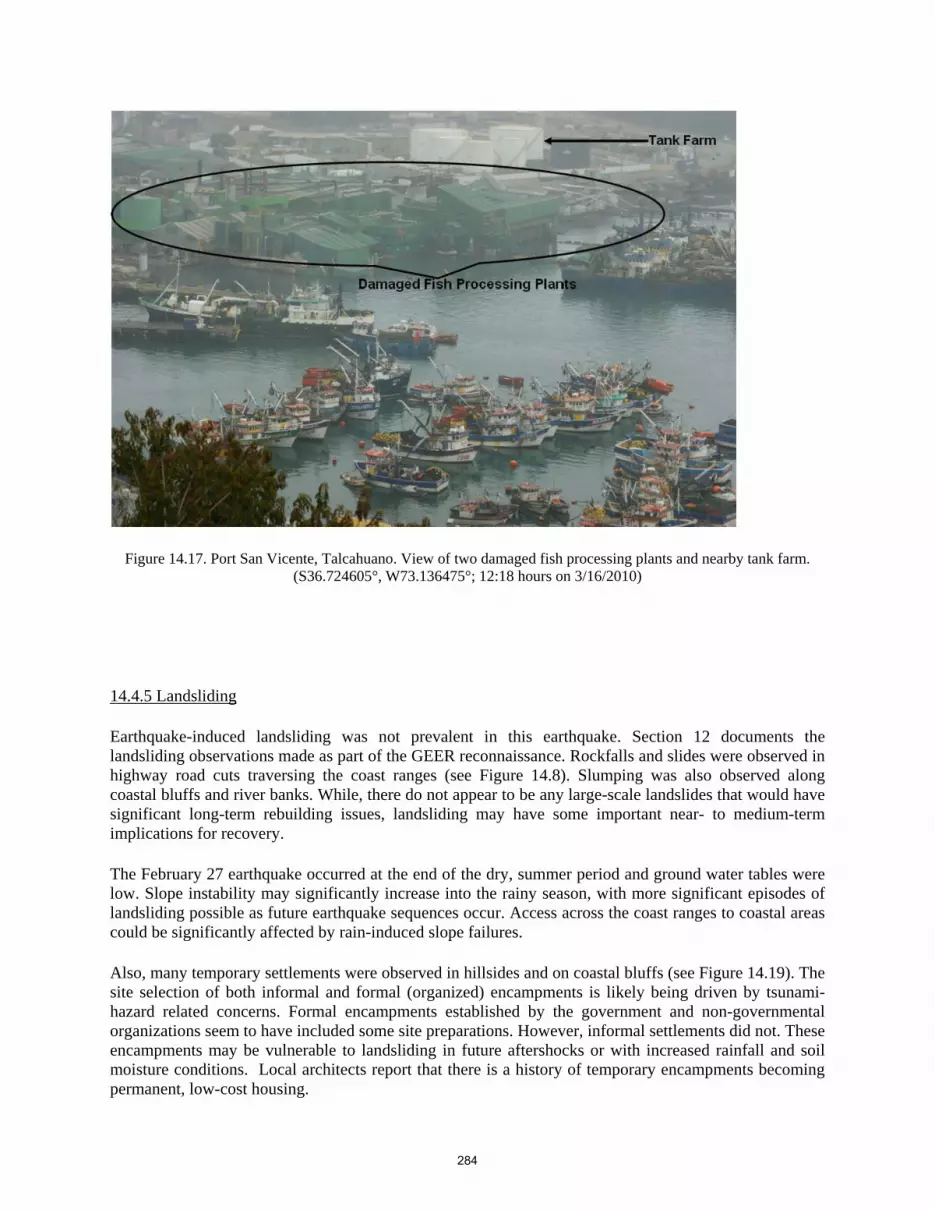
Figure 14.17. Port San Vicente, Talcahuano. View of two damaged fish processing plants and nearby tank farm. (S36.724605°, W73.136475°; 12:18 hours on 3/16/2010)
14.4.5 Landsliding
Earthquake-induced landsliding was not prevalent in this earthquake. Section 12 documents the landsliding observations made as part of the GEER reconnaissance. Rockfalls and slides were observed in highway road cuts traversing the coast ranges (see Figure 14.8). Slumping was also observed along coastal bluffs and river banks. While, there do not appear to be any large-scale landslides that would have significant long-term rebuilding issues, landsliding may have some important near- to medium-term implications for recovery.
The February 27 earthquake occurred at the end of the dry, summer period and ground water tables were low. Slope instability may significantly increase into the rainy season, with more significant episodes of landsliding possible as future earthquake sequences occur. Access across the coast ranges to coastal areas could be significantly affected by rain-induced slope failures.
Also, many temporary settlements were observed in hillsides and on coastal bluffs (see Figure 14.19). The site selection of both informal and formal (organized) encampments is likely being driven by tsunami-hazard related concerns. Formal encampments established by the government and non-governmental organizations seem to have included some site preparations. However, informal settlements did not. These encampments may be vulnerable to landsliding in future aftershocks or with increased rainfall and soil moisture conditions. Local architects report that there is a history of temporary encampments becoming permanent, low-cost housing.
284

Figure 14.18. Lota Alto, Bio Bio region. Failures on the road cuts along one of two main highways leading to the Port of Coronel and surrounding coastal cities. (S37.047677°, W73.061597°; 15:30 hours on 3/16/2010)
Figure 14.19. Temporary housing settlement being established in the hills above the coast near the town of Lipimavidia. (S34.853393°, W72.135148°; 13:41 hours on 3/15/2010)
285

14.5 Post-Earthquake Evaluations of Hazards and Risk
There is a tremendous need for timely and credible evaluations of the hazards as well as future risks throughout the region affected by the February 27 earthquake. Low-lying coastal, bay, and riverine areas that had tsunami inundation, as well as areas with concentrated building damage, should be given priority for evaluation. Priority areas for mapping might include, put should not be limited to, Bucalemu, Constitucion, Curanipe Dichato, Talca, and Talcahuano, as well as specific sites in Santiago, Valparaiso, and Vina del Mar.
As a first step, high hazard areas should be delineated and followed by more detailed studies. Areas with problems for tsunami evacuation also should be identified to assist with evacuation route design and education efforts. Hazard delineation can be accomplished fairly readily, but evaluating future risk is far more difficult. The earthquake affected region has experienced many large earthquakes in the past century, including the Chillan Earthquake (M7.7) of 1939, which damaged an area covering 45,000 square kilometers and killed 30,000 people; and the catastrophic series of earthquakes and tsunamis in May and June of 1960 that killed hundreds, displaced about 1 million people, destroyed over 400,000 houses, and resulted in damage totaling over $417 million (1960 U.S. dollars) (RMS 2009). The risk of future earthquakes and tsunamis, and their consequence, need further study, particularly in light of geologic and tsunami impacts of the 2010 earthquake and the improved building stock that will likely result from the rebuilding.
It is hoped that the series of tsunami inundation flood maps developed prior to the earthquake will be widely distributed to local governments and private landowners in the most heavily affected areas. Additional damage and hazard mapping efforts are reportedly underway in some of the most heavily impacted areas, like Constitucion and Dichato.
14.6 Post-earthquake Authority and Capacity of Local Governments for Risk Reduction
Initial investigations suggest that local governments will have authority for post-earthquake land use and rebuilding considerations, but there capacity to deal with technical issues of hazards evaluation and risk reduction is uncertain. Technical assistance may be needed for hazards mapping, risk evaluation, policymaking and decision making, and enforcement.
More education and training is needed, particularly with local government decisionmakers, architects, planners, as well as landowners. These stakeholders need to understand the process and purpose of hazard and risk evaluations, as well as how to interpret and use the resulting information in decision making. Such education and training will be critical if there is political will and the desire to reduce future risk as part of the rebuilding process.
In rebuilding, local governments should consider reconstructing easily accessible and well-marked tsunami evacuation routes and shelters in areas where access may have been more limited prior to the earthquake. Additional consideration should be given as to whether to allow high-density and tourist related uses in tsunami hazard areas. Such uses include campgrounds, hotels, and nightclubs. The public also need to be involved in post-earthquake planning and decision making. It is unclear how versed Chile’s local governments are in public involvement processes.
Priority localities for monitoring recovery and rebuilding decision making are: Bucalemu, Constitucion, Concepcion, Curanipe, Curico, Dichato, Lebu, and Talca.
286

14.7 National Policies and Plans for Post-Earthquake Recovery
Soon after taking office on March 11, President Pinera created a special reconstruction team to advise on the rebuilding effort and also began reviewing the national budget to make adjusts in2010 to help finance reconstruction (Burgoine 2010).
Based on observations in mid-March, the national government’s initial priorities in recovery have been to help disaster-impacted populations with basic food, water, and shelter needs; repair and reconstruct the main highways and bridges; inspect buildings; and remove debris.
Interviews with impacted residents verified that most were receiving basic assistance of food, water, and shelter, but there were a few exceptions where these services had been delayed or were insufficient. Most residents interviewed did not expect to receive government assistance for rebuilding their damaged homes or businesses.
On March 29, the GoC announced plans for a national housing reconstruction plan called “Chile United to Build Better” (Van der Horst 2010). The plan will cost approximately $2.5 billion and will provide housing subsidies to assist nearly 196,000 families affected by the February earthquake and tsunami. Housing subsidies will be provided between April 2010 and April 2012 and will target the most vulnerable and middle-income families. Additional details of the subsidies, conditions for funding, are needed.
Based on initial investigations, however, hazard mitigation does not appear to be an integral part of national, regional, or local planning or disaster management policies. There do not appear to be any guidelines to require mitigation as part of post-disaster assistance, such as the local and state hazard mitigation planning requirements of the U.S. Disaster Mitigation Act, or post-disaster assistance requirements of the U.S. Stafford Act.
But, it is early in the recovery and government agencies, at all levels, are only beginning to plan for the rebuilding. Given Chile’s fairly robust framework of building standards and planning regulations, there are many potentially valuable lessons to be learned (at the national, regional, and local levels) on how risk reduction and other improvements are considered and addressed in rebuilding from the February 27 earthquake.
14.8 References
Burgoine, Laura. 2010. Pinera's Plans Budget Changes. The Santiago Times, March 10. http://www.santiagotimes.cl.
RMS (Risk Management Solutions, Inc.). 2009. RiskLink 9.0 South America Earthquake Model. Model Documentation. http://www.rms.com
USGS 2010. PAGER Data on M8.8 Earthquake of February 27, 2010 in Chile. http://www.usgs.gov. U.S. AID, Agency for International Development. 2010. Chile - Earthquake, Fact Sheet #17, Fiscal Year
(FY) 2010, April 8, 2010. April 8. http://www.reliefweb.int/rw/rwb.nsf/db900sid/MYAI-84C2T9/$File/full_report.pdf.
Van der Horst, Loretta. 2010. Chile Budgets US$2.5 Billion For Rebuilding And Repairing Homes. The Santiago Times, March 30. http://www.santiagotimes.cl.
William Spangle and Associates, Earth Science Associates, H. J. Degenkolb & Associates, George S. Duggar, and Norman Williams. 1980. Land Use Planning After Earthquakes. Portola Valley, CA: William Spangle and Associates, Inc. www.spangleassociates.com.
287
15.0 SITE CHARACTERIZATION USING ADVANCED RECONNAISSANCE TOOLS
15.1 Advanced Tools Reconnaissance Approach
The Phase C reconnaissance effort was led by Dr. Robert Kayen (US Geological Survey & UCLA), and included Professor Scott Olson (University of Illinois), Dr. Lenart Gonzalez (Golder Assoc., Santiago, Chile), Sebastian Mauriera (Graduate Student, University of Chile), and Valentina Peredo (Undergraduate Student, University of Chile). This team focused exclusively on performing field tests for characterizing the soil properties, ground conditions, and surface manifestations of deformations at sites deemed highest priority by the Phase A & B teams, because site conditions or soil properties were likely to change during reconstruction, or the properties of the geotechnical failure were needed to analyze the failure mode(s). The third reconnaissance group returned from Chile on March 31, 2010, and field data are still being processed. This section provides an overview of the equipment used in the field, the sites that were tested, and preliminary data from the testing effort. All processed data will be available in the final report. The Phase C team used a dynamic cone penetration test system (DCPT) originally designed by Dr. George Sowers (Sowers and Hedges 1966) and built by Humboldt Manufacturing Co. This system utilizes a 15-lb drop weight on an E-rod slide drive to penetrate an oversized 45° apex angle cone. The cone is oversized to reduce rod friction behind the tip. Spectral analysis of surface waves (SASW) was used to non-invasively measure soil stiffness to depths between 8 and 30 meters. The SASW system employed 1-Hz sensors, a signal analyzer, and a sledge to impact the ground and create random vibrations. Using a sledge limited the depth of surface wave dispersion measurement to shallow depths of 8 to 15m. For some sites, the Phase C team hand-dropped a steel 140-lb SPT donut weight from a height ranging from 30 to 45 cm to generate lower-frequency signals. It may be possible to invert profiles in excess of 20 meters using the heavier SPT drop weight, although these data are still being processed. Surface mapping of damaged sites was performed using a terrestrial laser scanner (TLS-LIDAR, or LIDAR). One or more of the three tests, DCPT, SASW, and LIDAR, were performed at a total ten locations from March 24 to 28, 2010. The test locations are listed in Table 1, and mapped in Figures 15.1 through 15.3.
288

Figure 15.1. Sites investigated during the Phase C reconnaissance. Five sites are located in Concepcion (see Figure 15.2). South of the city, the team investigated the embankment
failure on the coast highway and at Curanilahue Hospital. North of the city, the team investigated the Curiheuco Dam, the Ruta 5 overpass embankment failure, and the
tailings pond failure at Las Palmas mine.
Figure 15.2. Site investigations in Concepcion. Testing was performed at: [1] the Llacolen Bridge approach deck collapse; [2] the collapsed building near the Llacolen
289

Bridge; [3] the West Bridge (Juan Pablo II) liquefaction site; [4] the 8-storey building liquefaction settlement site; and [5] the Parallel bridge liquefaction site.
Figure 15.3. Site investigation at the new Provincial Hospital of Curanilahue south of Concepcion. The SASW and DCPT sites are located along a walkway on the southwest
corner of the Hospital. Additional hand auger holes were drilled in the interior courtyards, but encountered only structural fill.
The Phase D reconnaissance effort was led by Professor Youssef Hashash (University of Illinois at Urbana-Champaign) and included Professor Jame Bay (Utah State University) and Gabriel Ferrer Zagle (Graduate Student, Pontificia Universidad Católica de Chile, Santiago). The team traveled along with the team from Mid-America Earthqauke Center. This team was tasked to acquire data at a sites , identified, but not covered by previous GEER teams and included collection of geometric and shear wave velocity data using SASW. The team also collected data that represented targets of opportunity. The team arrived in Chile On Monday April 11th 2010, and departed on Saturday April 17th 2010. In addition to visit to damaged sites defined by Phase 2 team, Team D visited with faculty and engineers at Pontificia Universidad Católica de Chile and University of Chile. Phase D team used spectral analysis of surface waves (SASW) to non-invasively measure soil stiffness. The team used a sledge hammer or a steel SPT donut weight to generate the signals. The sites visited and tested by Team D are listed in Table 2 and shown in Figures 15.4- 15.7.
290

Figure 15.4 Sites visited and GPS tracks (black lines – blue arrows) of areas traveled by Team D
291

Figure 15.5 Sites visited around Santiago (Team D)
Figure 15.6 Sites Visited between Santiago and Concepcion (Team D)
292

Figure 15.7 Sites visited around Concepcion (Team D)
15.2 Dynamic Cone Penetration (DCPT) Sowers and Hedges (1966) developed a dynamic cone penetration test system (DCPT) for shallow foundation and site characterization testing, and the system is built by Humboldt Manufacturing Co. This system utilizes a 15-lb drop weight on an E-rod slide drive (as shown in Figure 15.8) to penetrate an oversized 45° apex angle cone to depths up to about 6 meters during these site investigations. The cone is oversized to reduce rod friction behind the tip. Hand auger holes were drilled in conjunction with the DCPT to determine stratigraphy (to depths slightly below the groundwater table), minimize rod friction, and collect soil samples (Figure 15.9). Dynamic cone penetration tests were performed at seven of the ten highest priority sites to refusal (typically the DCPT refused in gravelly soils) or to a depth of about 6 meters, when we ran out of rods. In most cases, the DCPT/hand augers were able to delineate the stratigraphy at shallow depths, identify the depth to the ground water table, and allow us to retrieve soil samples for subsequent index testing (these results are not currently available). In addition, the DCPT provided a viable wave source at shallow depths for the SASW testing described subsequently (see Figure 15.10).
293
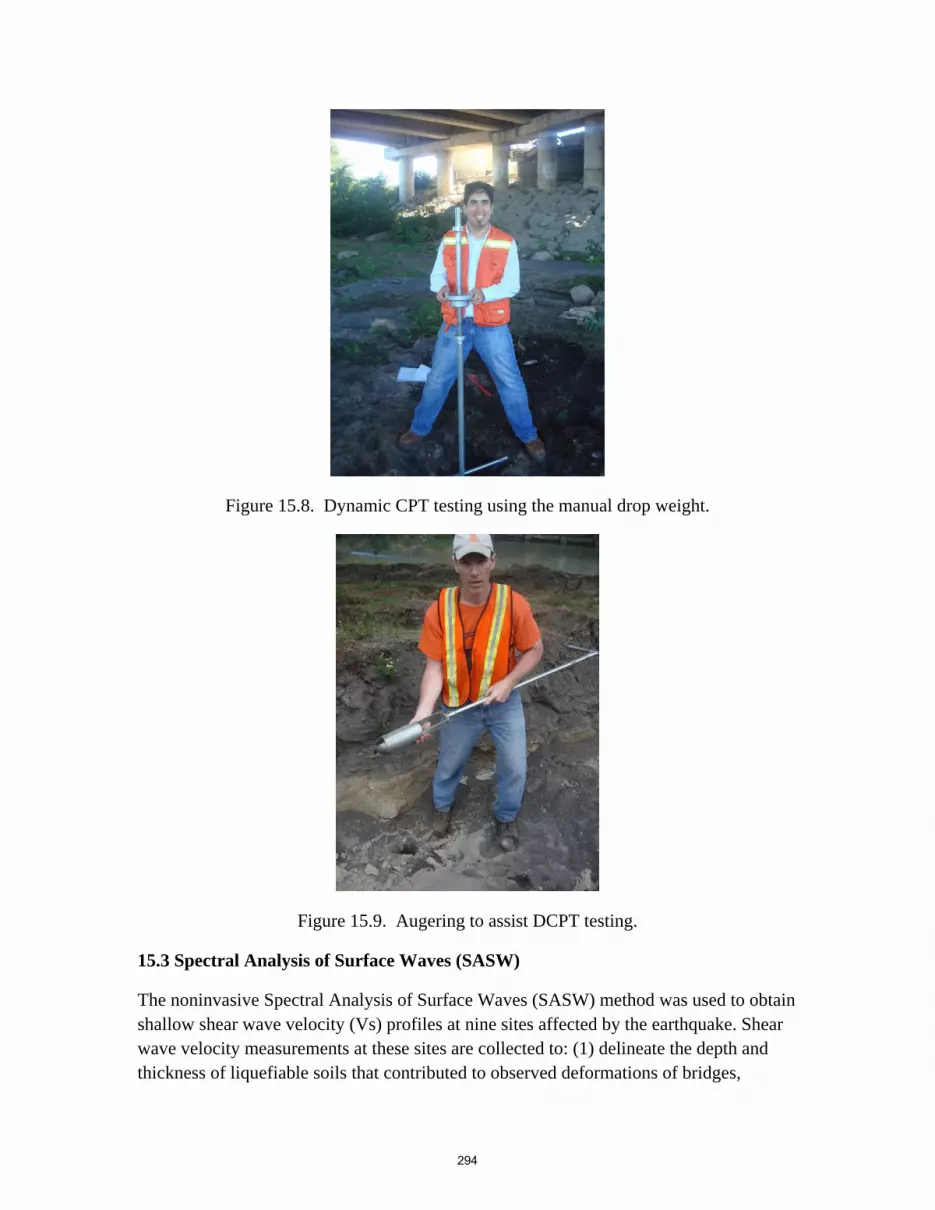
Figure 15.8. Dynamic CPT testing using the manual drop weight.
Figure 15.9. Augering to assist DCPT testing.
15.3 Spectral Analysis of Surface Waves (SASW)
The noninvasive Spectral Analysis of Surface Waves (SASW) method was used to obtain shallow shear wave velocity (Vs) profiles at nine sites affected by the earthquake. Shear wave velocity measurements at these sites are collected to: (1) delineate the depth and thickness of liquefiable soils that contributed to observed deformations of bridges,
294
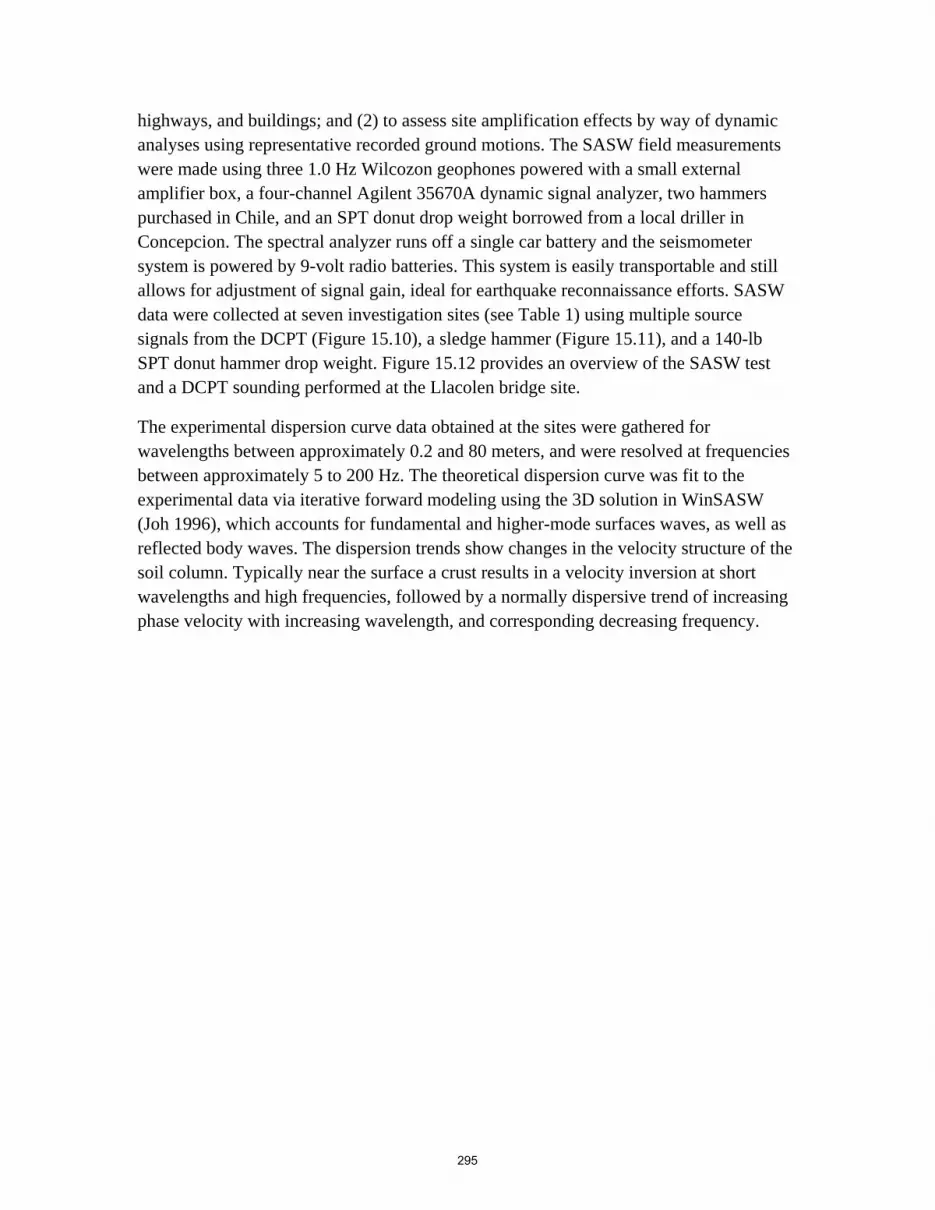
highways, and buildings; and (2) to assess site amplification effects by way of dynamic analyses using representative recorded ground motions. The SASW field measurements were made using three 1.0 Hz Wilcozon geophones powered with a small external amplifier box, a four-channel Agilent 35670A dynamic signal analyzer, two hammers purchased in Chile, and an SPT donut drop weight borrowed from a local driller in Concepcion. The spectral analyzer runs off a single car battery and the seismometer system is powered by 9-volt radio batteries. This system is easily transportable and still allows for adjustment of signal gain, ideal for earthquake reconnaissance efforts. SASW data were collected at seven investigation sites (see Table 1) using multiple source signals from the DCPT (Figure 15.10), a sledge hammer (Figure 15.11), and a 140-lb SPT donut hammer drop weight. Figure 15.12 provides an overview of the SASW test and a DCPT sounding performed at the Llacolen bridge site.
The experimental dispersion curve data obtained at the sites were gathered for wavelengths between approximately 0.2 and 80 meters, and were resolved at frequencies between approximately 5 to 200 Hz. The theoretical dispersion curve was fit to the experimental data via iterative forward modeling using the 3D solution in WinSASW (Joh 1996), which accounts for fundamental and higher-mode surfaces waves, as well as reflected body waves. The dispersion trends show changes in the velocity structure of the soil column. Typically near the surface a crust results in a velocity inversion at short wavelengths and high frequencies, followed by a normally dispersive trend of increasing phase velocity with increasing wavelength, and corresponding decreasing frequency.
295
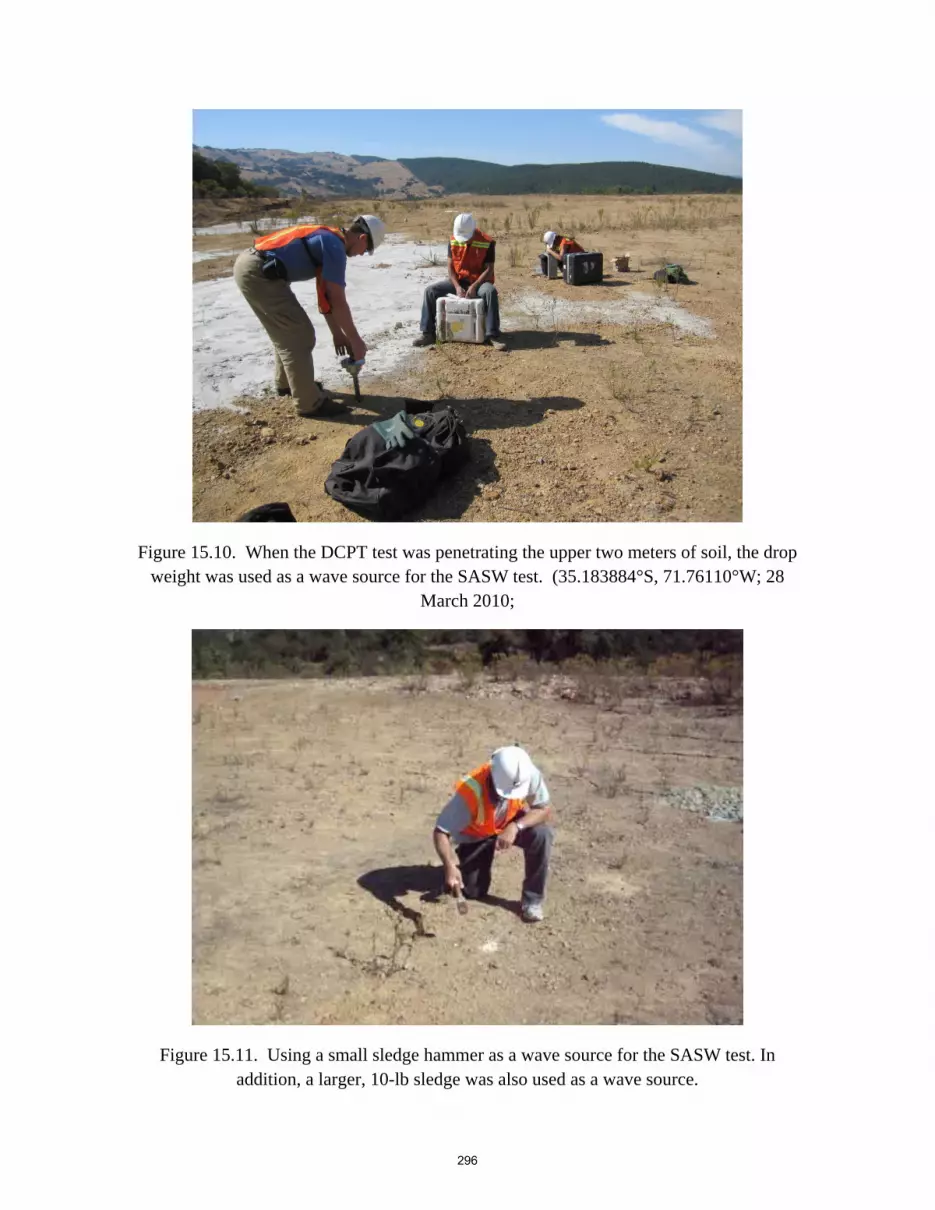
Figure 15.10. When the DCPT test was penetrating the upper two meters of soil, the drop weight was used as a wave source for the SASW test. (35.183884°S, 71.76110°W; 28
March 2010;
Figure 15.11. Using a small sledge hammer as a wave source for the SASW test. In addition, a larger, 10-lb sledge was also used as a wave source.
296
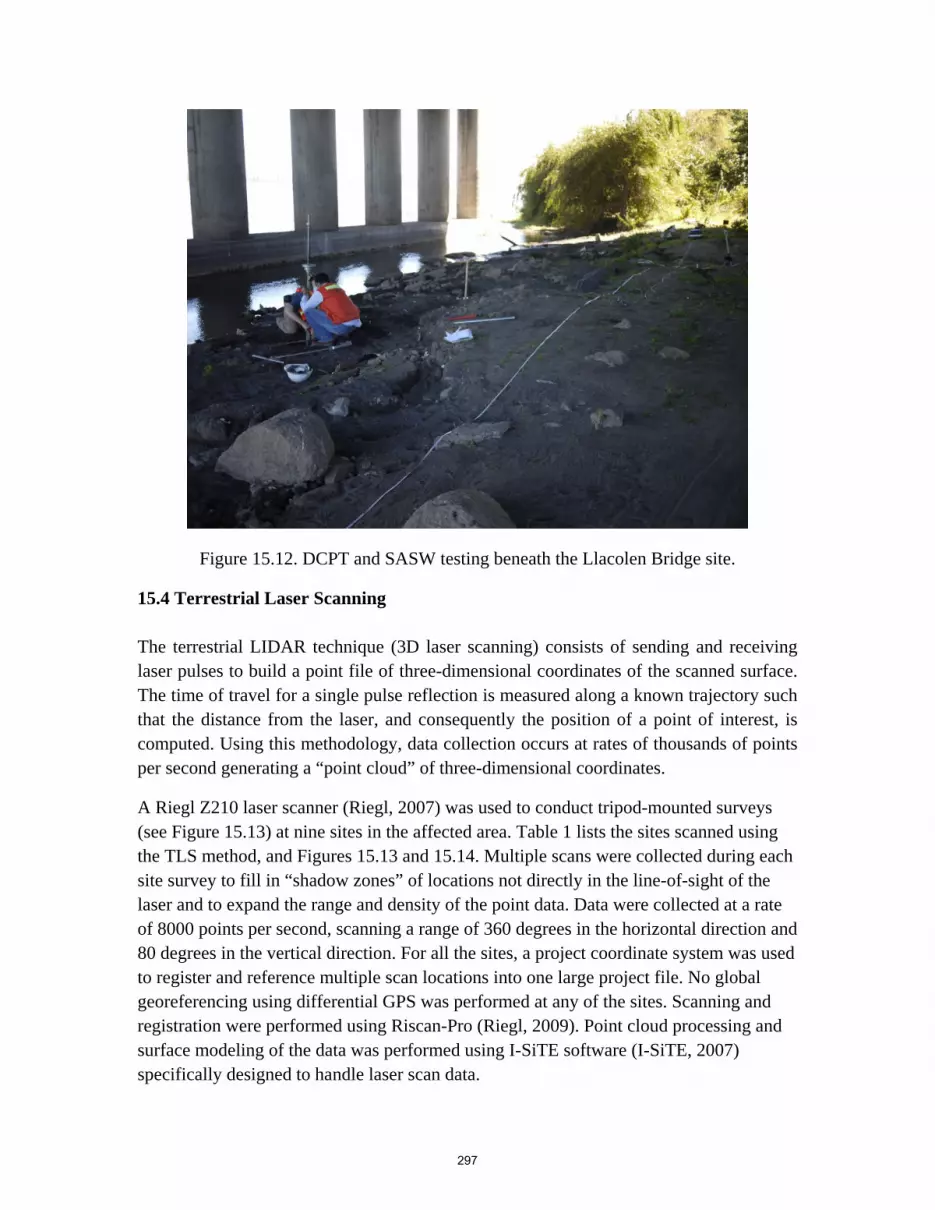
Figure 15.12. DCPT and SASW testing beneath the Llacolen Bridge site.
15.4 Terrestrial Laser Scanning The terrestrial LIDAR technique (3D laser scanning) consists of sending and receiving laser pulses to build a point file of three-dimensional coordinates of the scanned surface. The time of travel for a single pulse reflection is measured along a known trajectory such that the distance from the laser, and consequently the position of a point of interest, is computed. Using this methodology, data collection occurs at rates of thousands of points per second generating a “point cloud” of three-dimensional coordinates.
A Riegl Z210 laser scanner (Riegl, 2007) was used to conduct tripod-mounted surveys (see Figure 15.13) at nine sites in the affected area. Table 1 lists the sites scanned using the TLS method, and Figures 15.13 and 15.14. Multiple scans were collected during each site survey to fill in “shadow zones” of locations not directly in the line-of-sight of the laser and to expand the range and density of the point data. Data were collected at a rate of 8000 points per second, scanning a range of 360 degrees in the horizontal direction and 80 degrees in the vertical direction. For all the sites, a project coordinate system was used to register and reference multiple scan locations into one large project file. No global georeferencing using differential GPS was performed at any of the sites. Scanning and registration were performed using Riscan-Pro (Riegl, 2009). Point cloud processing and surface modeling of the data was performed using I-SiTE software (I-SiTE, 2007) specifically designed to handle laser scan data.
297

The registration of LIDAR data involves merging two, or more, individual scans data to form a single model of the reconnaissance site area, termed the registration process. Two methods are used to register individual scans, reflector-based registration or point cloud-based registration. Between five and ten 5-centimeter diameter reflectors were placed in the target area of each reconnaissance site, identified in the individual scans, and rescanned at ultra-high resolution to determine the reflector center. A least square best fit model was used to translate and rotate the individual scans to merge them together. For several sites (Curanilue Hospital, Las Palmas Tailings Pond, and the Parallel bridge), it was impossible to place reflectors. For these sites, a best fit translation and rotation registration process, using millions of points, aligns the overlapping data within a pair of point cloud data-scans. For example, at the Llaracon bridge approach deck failure, we digitally removed bridge deck to digitally view the lateral spread in plan view (Figure 15.20). In this figure, the approach deck collapse is at the bottom of the image (also seen in the photograph in Figure 15.14). The cylindrical cross section of the bridge piers that displaced riverward can be seen just above (west) of the bridge collapse. The first river-crossing pier is at the top of image, and can also be seen in Figure 15.14.
Point data from each set of scans were subjected to a series of filters to remove non-ground surface and extraneous laser returns from the point clouds. Points reflected from vegetation, power lines, and other non-ground or water conveyance features were manually cropped from each of the point clouds. Next, an isolated point filter was used to remove single point instances occurring above the land surface. These isolated points are usually a result of reflections from moisture in the atmosphere. Topographic filters that select the lowest point in the point clouds were used to remove vegetation from point clouds. Here, the entire data set was divided into 5 to 10 cm square bins, and only the lowest points within the bins are selected.
The final product of LIDAR data processing is the generation of three-dimensional surface models. A linear interpolation method is used in the processing of surface models: linear interpolation is used to generate surface edges of TIN facets between points. Triangular irregular network (TIN) models represent a topographic surface of each area. After filtering (see above), a TIN surface was generated from each scan file using either a spherical surface algorithm (curved facets) or a linear topographic algorithm (flat facets) (I-Site, 2007).
298

Figure 15.13 Terrestrial laser scanning with a Riegl z420 LIDAR unit at the Las Palmas Mine tailings dam failure. The system uses a PC for data acquisition and a car battery to
power the laser.
Figure 15.14 Terrestrial laser scanning with a Riegl z420 LIDAR unit at the West Bio Bio River (Juan Pablo 2) bridge.
299
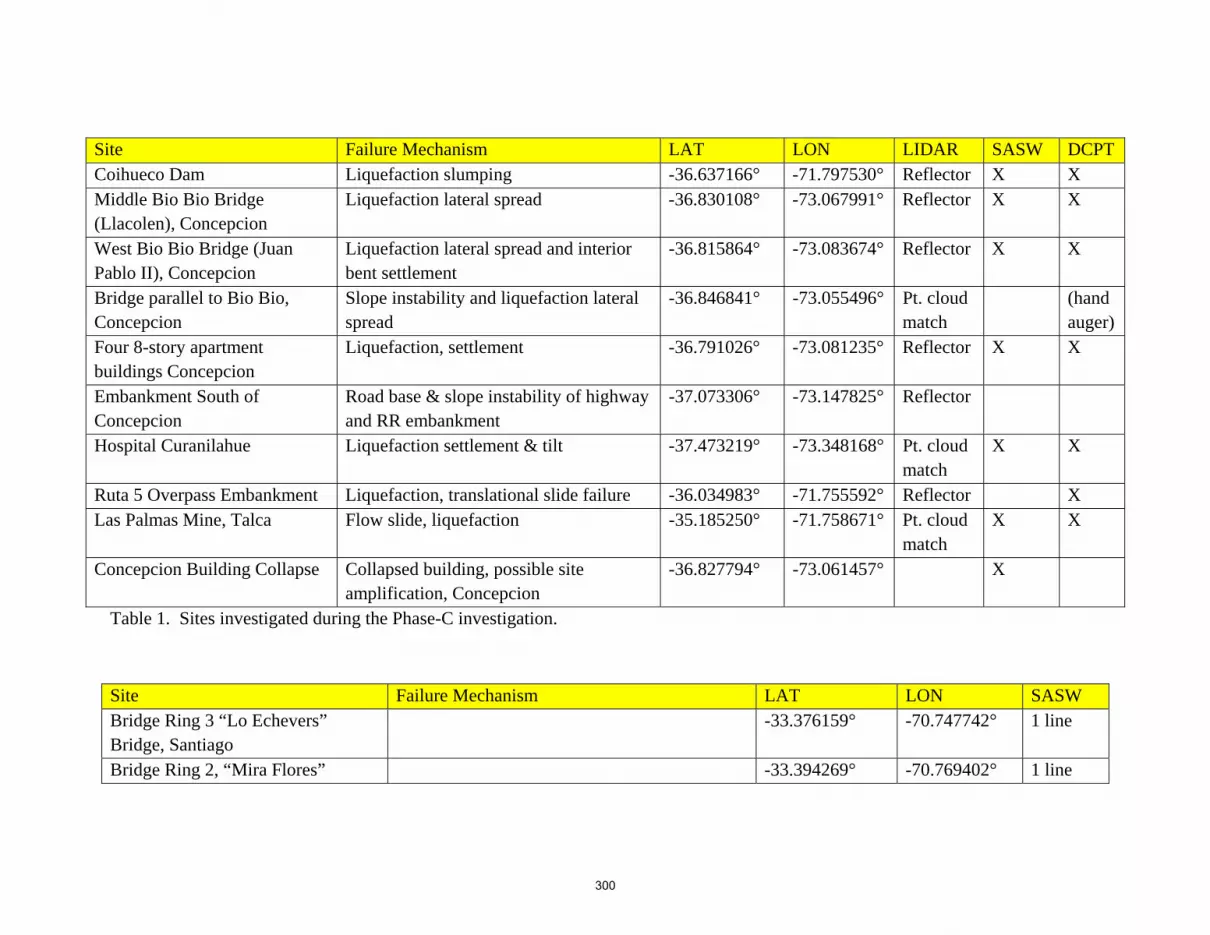
Site Failure Mechanism LAT LON LIDAR SASW DCPT Coihueco Dam Liquefaction slumping -36.637166° -71.797530° Reflector X X Middle Bio Bio Bridge (Llacolen), Concepcion
Liquefaction lateral spread -36.830108° -73.067991° Reflector X X
West Bio Bio Bridge (Juan Pablo II), Concepcion
Liquefaction lateral spread and interior bent settlement
-36.815864° -73.083674° Reflector X X
Bridge parallel to Bio Bio, Concepcion
Slope instability and liquefaction lateral spread
-36.846841° -73.055496° Pt. cloud match
(hand auger)
Four 8-story apartment buildings Concepcion
Liquefaction, settlement -36.791026° -73.081235° Reflector X X
Embankment South of Concepcion
Road base & slope instability of highway and RR embankment
-37.073306° -73.147825° Reflector
Hospital Curanilahue Liquefaction settlement & tilt -37.473219° -73.348168° Pt. cloud match
X X
Ruta 5 Overpass Embankment Liquefaction, translational slide failure -36.034983° -71.755592° Reflector X Las Palmas Mine, Talca Flow slide, liquefaction -35.185250° -71.758671° Pt. cloud
match X X
Concepcion Building Collapse Collapsed building, possible site amplification, Concepcion
-36.827794° -73.061457° X
Table 1. Sites investigated during the Phase-C investigation.
Site Failure Mechanism LAT LON SASW Bridge Ring 3 “Lo Echevers” Bridge, Santiago
-33.376159° -70.747742° 1 line
Bridge Ring 2, “Mira Flores” -33.394269° -70.769402° 1 line
300
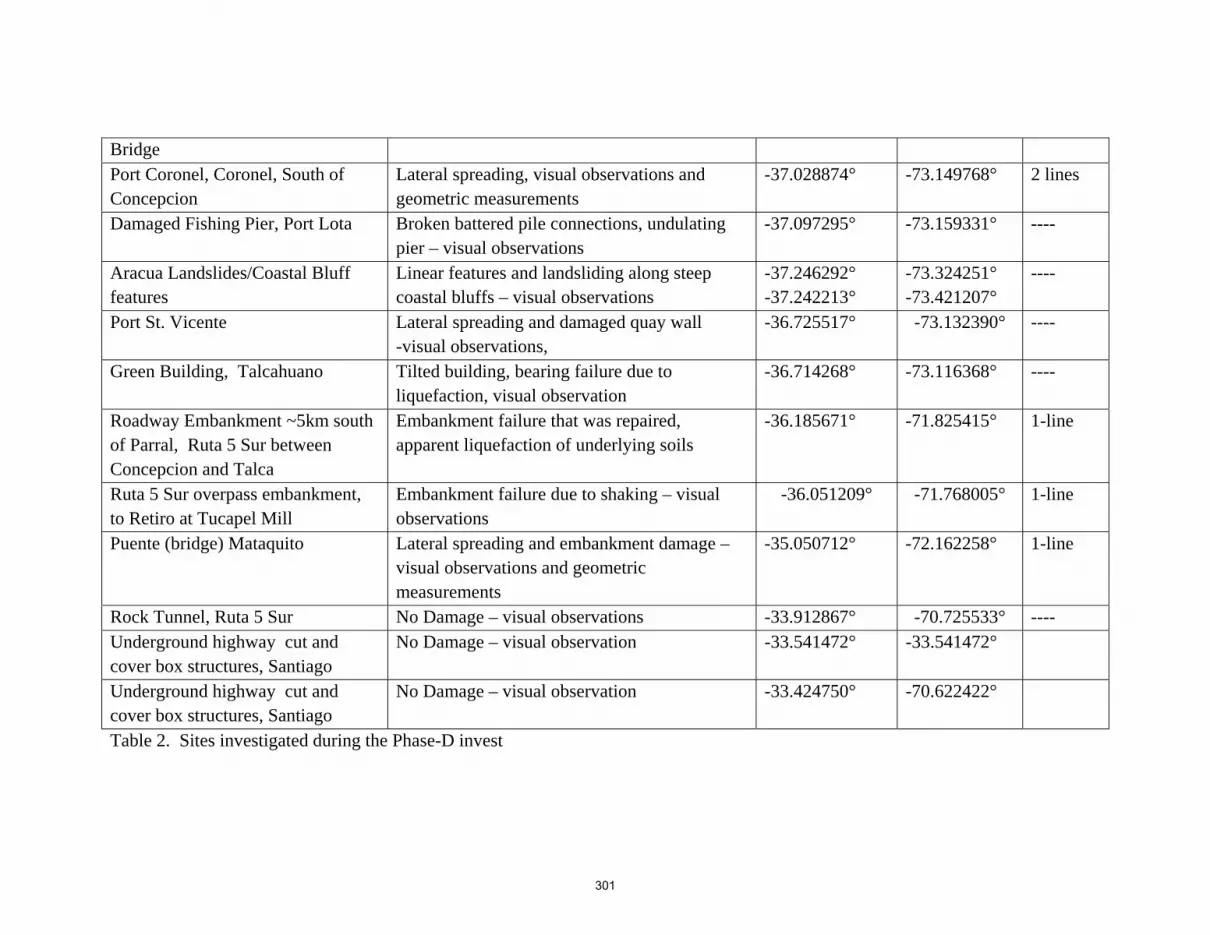
Bridge Port Coronel, Coronel, South of Concepcion
Lateral spreading, visual observations and geometric measurements
-37.028874° -73.149768° 2 lines
Damaged Fishing Pier, Port Lota Broken battered pile connections, undulating pier – visual observations
-37.097295° -73.159331° ----
Aracua Landslides/Coastal Bluff features
Linear features and landsliding along steep coastal bluffs – visual observations
-37.246292° -37.242213°
-73.324251° -73.421207°
----
Port St. Vicente Lateral spreading and damaged quay wall -visual observations,
-36.725517° -73.132390° ----
Green Building, Talcahuano Tilted building, bearing failure due to liquefaction, visual observation
-36.714268° -73.116368° ----
Roadway Embankment ~5km south of Parral, Ruta 5 Sur between Concepcion and Talca
Embankment failure that was repaired, apparent liquefaction of underlying soils
-36.185671° -71.825415° 1-line
Ruta 5 Sur overpass embankment, to Retiro at Tucapel Mill
Embankment failure due to shaking – visual observations
-36.051209° -71.768005° 1-line
Puente (bridge) Mataquito Lateral spreading and embankment damage – visual observations and geometric measurements
-35.050712° -72.162258° 1-line
Rock Tunnel, Ruta 5 Sur No Damage – visual observations -33.912867° -70.725533° ---- Underground highway cut and cover box structures, Santiago
No Damage – visual observation -33.541472° -33.541472°
Underground highway cut and cover box structures, Santiago
No Damage – visual observation -33.424750° -70.622422°
Table 2. Sites investigated during the Phase-D invest
301

15.5 Data sets for Sites Investigated During Phase C & D
Data set for Coiheco Dam (S36.637166°, W71.797530°)
The Coiheuco Dam was visited by three GEER teams. The first visit was on March 10, 2010, the second visit was on March 14, and the third visit was on March 28. The dam was built during the period from 1964 to 1970 and has a maximum height of 31 m and a crest length of 1040 m. A Google Earth image of the dam is shown in Section 11. It was not clear if soil liquefaction occurred at this site as potential evidence of liquefaction was not apparent to the GEER teams. Several slumps occurred in the upstream shell. The upstream-left (west) abutment slump was most damaged with a well defined head scarp and toe bulging (LIDAR image Figure 15.15 and 15.16). A second slump to the east had lesser amounts of toe bulging. Team C performed LIDAR scans on the west slump. In Figure 15.15 a well defined head-scarp can be seen at the crest of the dam and, following the fall-line from the scarp (RED line), a bulge of compressed material can be seen at the lower portion of the slope defining the toe of the slump. Figure 15.16, a cross section cutting through the slump is presented along with lidar data for the adjacent unfailed upstream shell (accentuated with a RED line). There is a volumetric balance between evacuated material from the head scarp and the volume at the toe bulge at the base of the slope. The hinge point of the material and accretion appears to be approximately half way down the slope. Team C conducted one DCPT sounding near the waterline (after the reservoir was drawn down). The sounding and profile is illustrated in Figure 15.17. As illustrated in the figure, the soils were fine-grained – primarily volcanic silty clays derived from the Chillan volcano located approximately 30 km to the west of the dam site. Dynamic penetration in this material ranged from about 3 to 12 blows in the upper 3 m, then increased approximately linearly with depth. In addition, Team C members hand-dug a shallow trench in the upstream slope after removing the riprap from the slope surface. The near-surface soil in the upstream shell consisted of gravelly sand and sandy gravel (see Figure 15.7). The large grain size of the materials precluded the use of DCPT here.
302

Figure 15.15. Oblique view of slump at the Coihueco Dam (36.63782°S, 71.79700°W; 27 March 2010; 13:00)
Figure 15.16. Cross section view through the slump at the Coihueco Dam, and adjacent un-failed upstream shell, accented with a Red Line (36.63782°S, 71.79700°W; 27 March
2010; 13:00).
303

Figure 15.17. DCPT and hand auger logs from sounding performed at toe of upstream slide at Coihueco Dam (36.63782°S, 71.79700°W; 27 March 2010; 13:00) and log from hand-dug trench in upstream slope (36.63737°S, 71.79674°W; 27 March 2010; 16:00).
304

Figure 15.18 Shear Wave velocity log using the SASW method for the slide portion of the Coihueco Dam (36.63782°S, 71.79700°W).
Data set for the north Concepcion side of the Llacolen Bridge across the Bio Bio River(S36.830108°; W73.067991°)
The north approach of the Llacolen Bridge suffered deck unseating due to lateral spreading of the bridge piers. The Llacolen Bridge in Concepcion was constructed in 2000 and spans 2,160 m of the Bio Bio river. The bridge supports four lanes of vehicular traffic pedestrian walkways. The lateral spreading unseated the traffic support deck. Ground settlement of 0.25-0.30 m was also noted to surround each of the exit ramp bents.
305
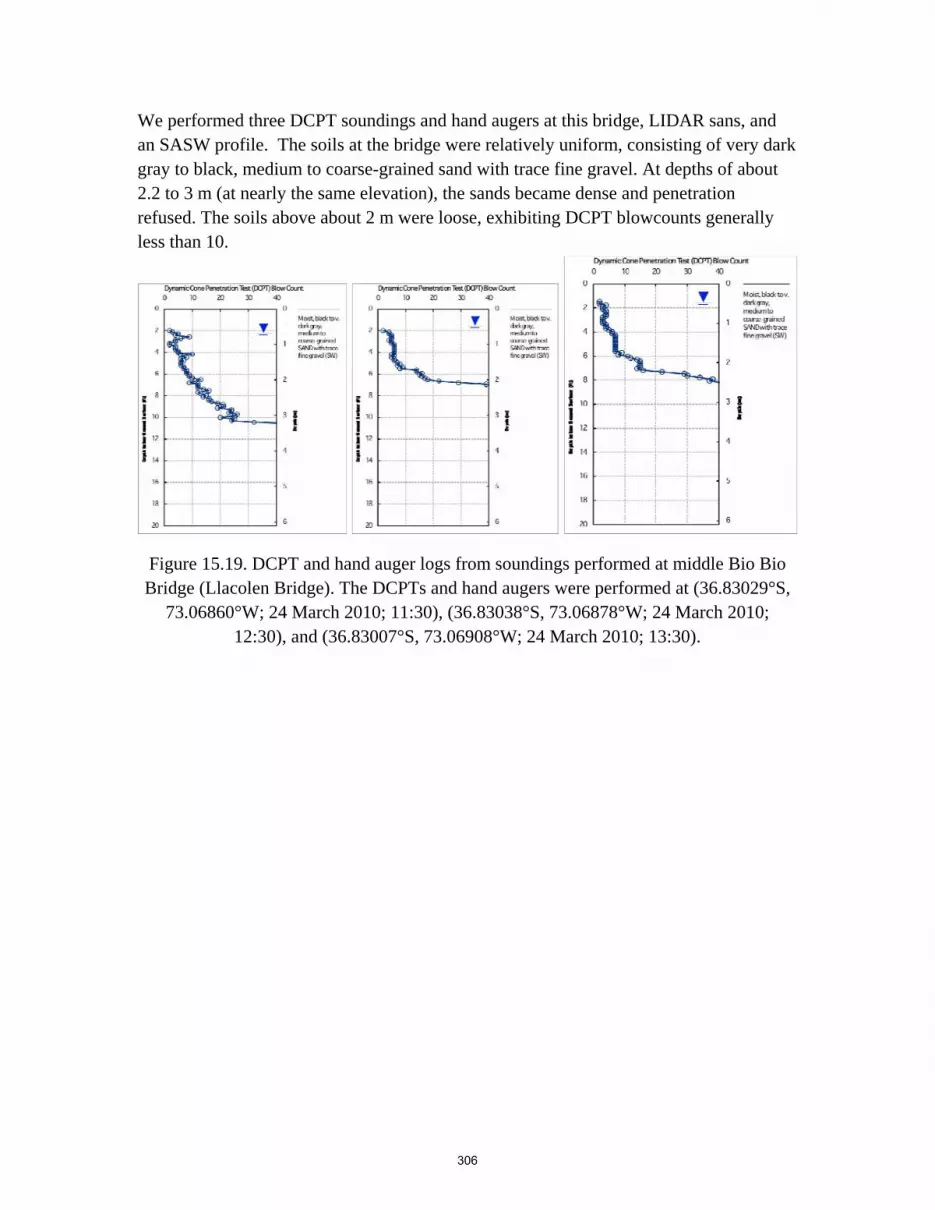
We performed three DCPT soundings and hand augers at this bridge, LIDAR sans, and an SASW profile. The soils at the bridge were relatively uniform, consisting of very dark gray to black, medium to coarse-grained sand with trace fine gravel. At depths of about 2.2 to 3 m (at nearly the same elevation), the sands became dense and penetration refused. The soils above about 2 m were loose, exhibiting DCPT blowcounts generally less than 10.
Figure 15.19. DCPT and hand auger logs from soundings performed at middle Bio Bio Bridge (Llacolen Bridge). The DCPTs and hand augers were performed at (36.83029°S,
73.06860°W; 24 March 2010; 11:30), (36.83038°S, 73.06878°W; 24 March 2010; 12:30), and (36.83007°S, 73.06908°W; 24 March 2010; 13:30).
306

Figure 15.20. Plan view of the LIDAR scans at the Llacolen approach with the bridge deck digitally removed. The unseated approach deck is at the bottom-middle of the image adjacent to and against the circular columns. Outward tilting of the riverward
(upper) columns is evident, as are fissures in the soil due to lateral spreading.
Figure 15.21 Shear Wave velocity log using the SASW method for the Llacolen Bridge approach embankment.
307

Data set for the Juan Pablo II Bridge, the North Bridge across the Bio Bio River, in Concepcion (S36.815864°; W73.083674°)
The Juan Pablo II Bridge is the longest vehicular bridge in Chile with a length of 2310 m and suffered lateral spreading on the North-East approach and liquefaction-induced settlements along the length of the bridge The Juan Pablo II Bridge connects Concepcion and San Pedro de la Paz. The bridge, designed by E.W.H Gifford & Partners and opened to the public in 1974, has 70 33m spans, each composed of 7 reinforced concrete girders and a concrete slab. The segments sit on reinforced concrete bents with drilled pier supports. Severe liquefaction and lateral spreading at the north-east approach embankment settled the bridge piers, dropping and laterally displacing the bridge deck. The team performed two DCPT soundings and hand augers at this bridge, as well as LIDAR scans and one SASW shear wave velocity profile near the settled pier at the approach embankment. Both DCPT soundings were performed to depths of about 6 m, and we terminated the soundings only because we ran out of DCPT rods. The soils below about 0.5 m consisted of loose to medium dense, poorly and well-graded sands, similar to those observed at the Llacolen Bridge.
Figure 15.22 . Plan view of the LIDAR scans at the Jan Pablo II bridge approach clover leaf ovals (south is up). Bridge damage was located on the west (right) riverward side of
the interchange with the riverfront highway (S36.815864°; W73.083674°).
308

Figure 15.23. Settled bridge pier at the approach embankment of the Juan Pablo II Bridge (S36.815864°; W73.083674°).
Figure 15.24. Distorted bridge centerline guard wall and settle deck above the north east approach embankment.
309

Figure 15.25. DCPT and hand auger logs from soundings performed at Juan Pablo II Bridge. The DCPTs and hand augers were performed at (36.81565°S, 73.08342°W; 25
March 2010; 11:00) and (36.81573°S, 73.08297°W; 25 March 2010; 14:00).
Figure 15.26. Shear Wave velocity log using the SASW method for the southwest oval soil near the settled approach embankment of the Juan Pablo II Bridge.
310

Data set for the La Mochita Four-Span Bridge Parallel to the River Bio Bio in Concepcion (S36.846841°; W73.055496°)
La Mochita is a 4-span concrete bridge supported by seat-type abutments at each end and two-column bents at the interior locations. At this site, ground failure induced transverse movement of the bridge superstructure. The bridge, constructed in 2005 spans a small inlet of water that fronts a water treatment facility along the east bank of the Bio-Bio river. The bridge superstructure shifted transversely as a unit towards the east due to failure of soil surrounding bents 2 and 3. A lateral spread failure moved soil towards the inlet. This failure is attributed to liquefaction-induced lateral spreading. Measurements taken by the team on March 15, 2010 indicated that the north end of the bridge deck shifted 0.5 m to the east relative to the approach fill, while the south end of the bridge shifted 0.9 m towards the east relative to the approach fill on that side. As a result of our schedule, we were unable to perform any DCPTs at this site, though we did take LIDAR scans. Team C members were able to perform a visual reconnaissance of the site and drill a single hand-auger hole from the base of a large crack below the bridge. As illustrated in Figure 15.27, the major damage at the site resulted from liquefaction-induced lateral spreading in a direction transverse to the longitudinal axis of the bridge. The large cracks at the site were filled with sand boils, which are visible in the photograph (Figure 15.27). The soils in the hand-augered borehole consisted of moist to wet, very dark gray to black, medium- to coarse-grained sand with trace fine gravel, consistent with the soils encountered at the other Bio Bio River bridges in Concepcion.
311

Figure 15.27. Liquefaction-induced lateral spread at Concepcion bridge parallel to the Bio Bio River. (36.84722°S, 73.05530°W; 27 March 2010; 09:25)
Figure 15.28 Plan view of the La Mochita bridge crossing (North to the right).
312
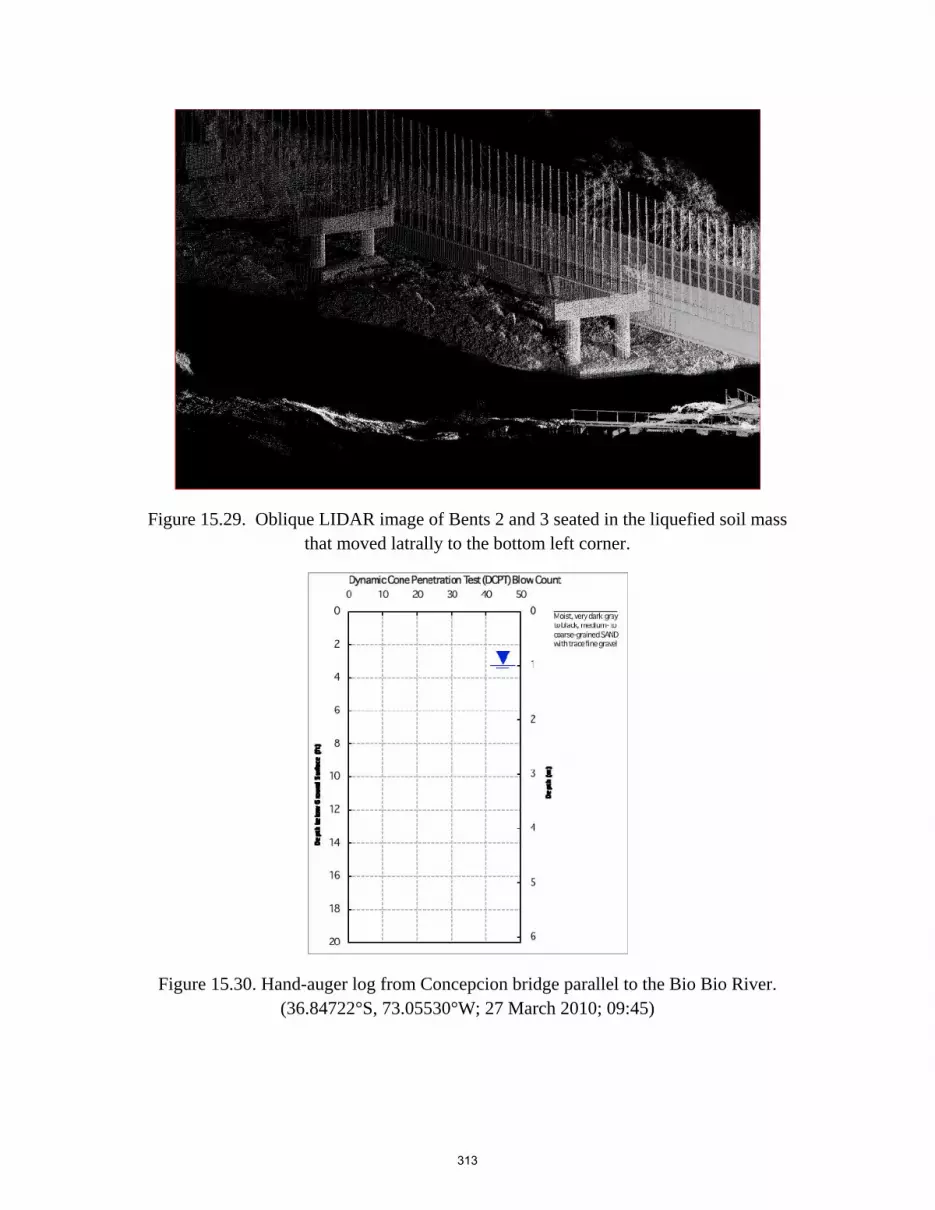
Figure 15.29. Oblique LIDAR image of Bents 2 and 3 seated in the liquefied soil mass that moved latrally to the bottom left corner.
Figure 15.30. Hand-auger log from Concepcion bridge parallel to the Bio Bio River. (36.84722°S, 73.05530°W; 27 March 2010; 09:45)
313
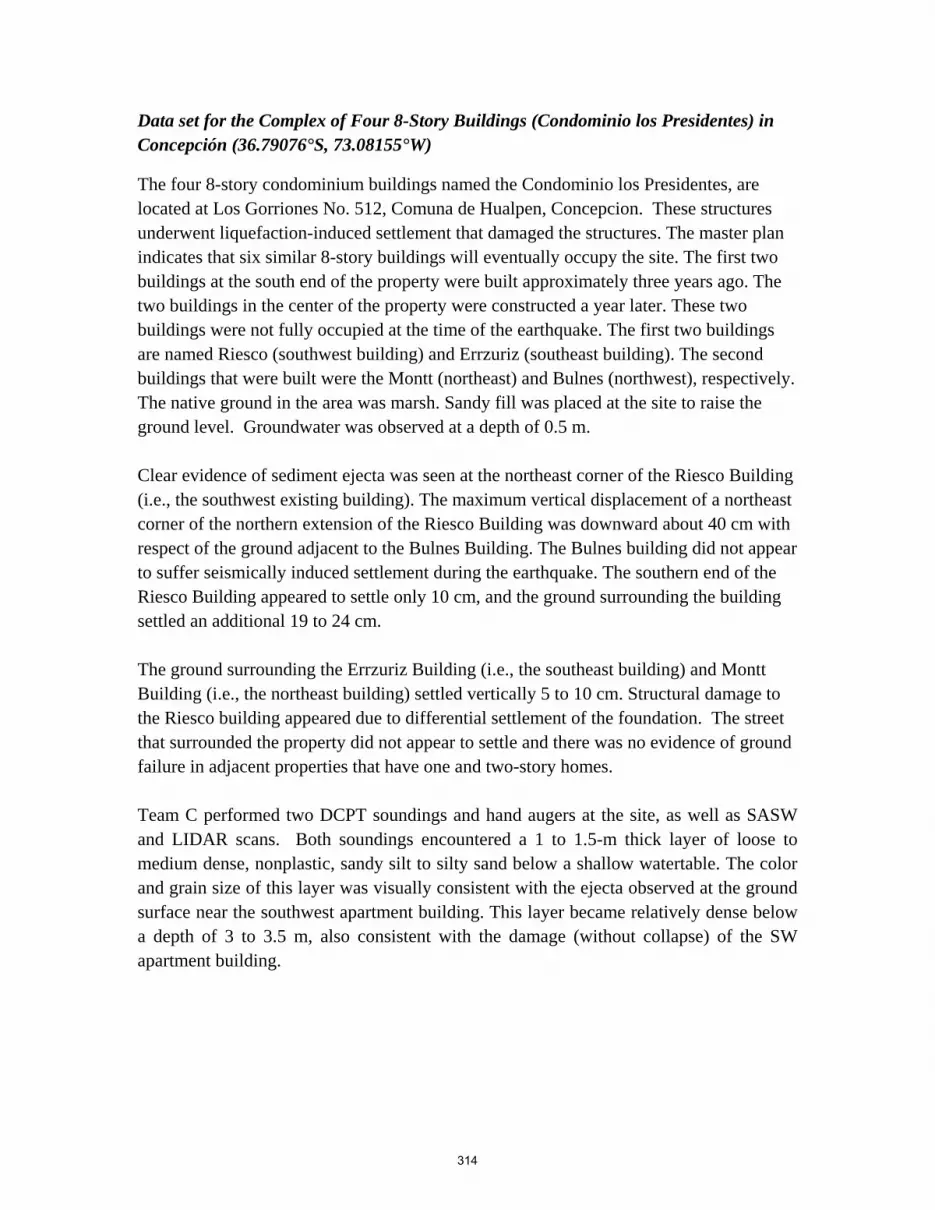
Data set for the Complex of Four 8-Story Buildings (Condominio los Presidentes) in Concepción (36.79076°S, 73.08155°W)
The four 8-story condominium buildings named the Condominio los Presidentes, are located at Los Gorriones No. 512, Comuna de Hualpen, Concepcion. These structures underwent liquefaction-induced settlement that damaged the structures. The master plan indicates that six similar 8-story buildings will eventually occupy the site. The first two buildings at the south end of the property were built approximately three years ago. The two buildings in the center of the property were constructed a year later. These two buildings were not fully occupied at the time of the earthquake. The first two buildings are named Riesco (southwest building) and Errzuriz (southeast building). The second buildings that were built were the Montt (northeast) and Bulnes (northwest), respectively. The native ground in the area was marsh. Sandy fill was placed at the site to raise the ground level. Groundwater was observed at a depth of 0.5 m. Clear evidence of sediment ejecta was seen at the northeast corner of the Riesco Building (i.e., the southwest existing building). The maximum vertical displacement of a northeast corner of the northern extension of the Riesco Building was downward about 40 cm with respect of the ground adjacent to the Bulnes Building. The Bulnes building did not appear to suffer seismically induced settlement during the earthquake. The southern end of the Riesco Building appeared to settle only 10 cm, and the ground surrounding the building settled an additional 19 to 24 cm. The ground surrounding the Errzuriz Building (i.e., the southeast building) and Montt Building (i.e., the northeast building) settled vertically 5 to 10 cm. Structural damage to the Riesco building appeared due to differential settlement of the foundation. The street that surrounded the property did not appear to settle and there was no evidence of ground failure in adjacent properties that have one and two-story homes. Team C performed two DCPT soundings and hand augers at the site, as well as SASW and LIDAR scans. Both soundings encountered a 1 to 1.5-m thick layer of loose to medium dense, nonplastic, sandy silt to silty sand below a shallow watertable. The color and grain size of this layer was visually consistent with the ejecta observed at the ground surface near the southwest apartment building. This layer became relatively dense below a depth of 3 to 3.5 m, also consistent with the damage (without collapse) of the SW apartment building.
314
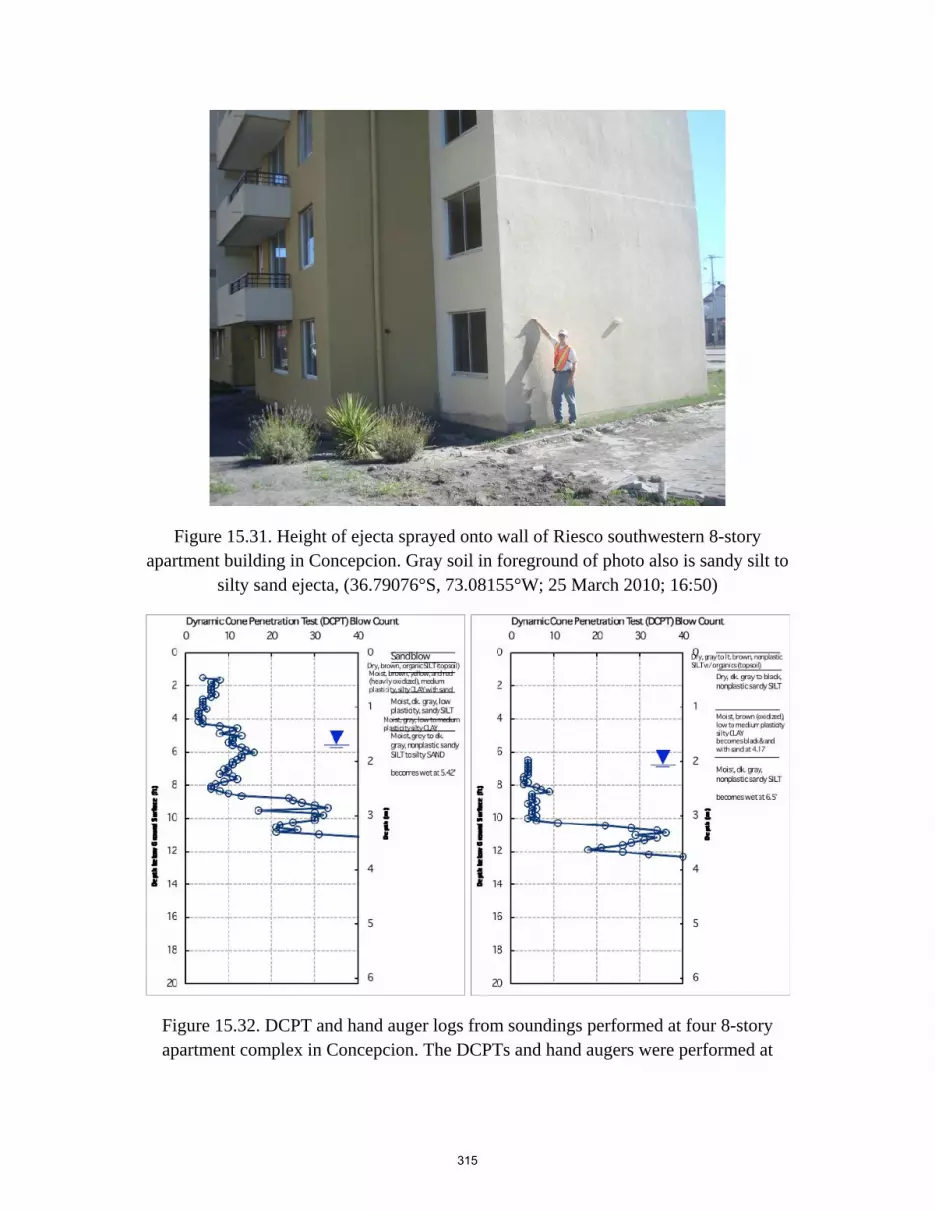
Figure 15.31. Height of ejecta sprayed onto wall of Riesco southwestern 8-story apartment building in Concepcion. Gray soil in foreground of photo also is sandy silt to
silty sand ejecta, (36.79076°S, 73.08155°W; 25 March 2010; 16:50)
Figure 15.32. DCPT and hand auger logs from soundings performed at four 8-story apartment complex in Concepcion. The DCPTs and hand augers were performed at
315

(36.79076°S, 73.08155°W; 25 March 2010; 17:00) and (36.79098°S, 73.08167°W; 25 March 2010; 19:00).
Figure 15.33.Shear wave velocity profile for the four 8-story buildings by the SASW method
316

Figure 15.34. Oblique view of the 4- eight story buildings. The Riesco (southwestern) building is in front, the Errzuriz (southeast building) is to the left, the Montt is to the right
(northeast) and Bulnes is in the background (northwest).
Figure 15.35. Detailed LIDAR imagery of settlement of soil around the Riesco Building (Southwest).
317
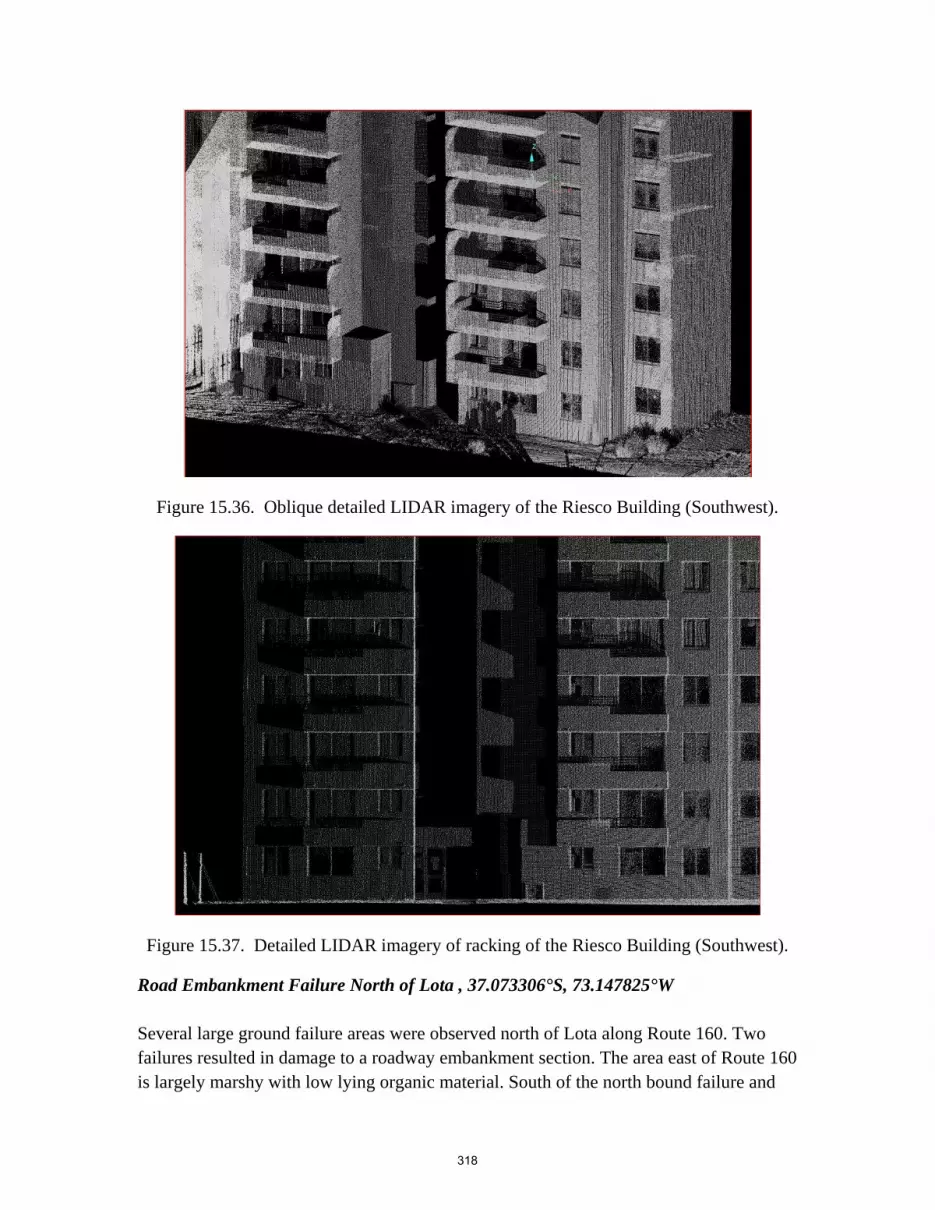
Figure 15.36. Oblique detailed LIDAR imagery of the Riesco Building (Southwest).
Figure 15.37. Detailed LIDAR imagery of racking of the Riesco Building (Southwest).
Road Embankment Failure North of Lota , 37.073306°S, 73.147825°W Several large ground failure areas were observed north of Lota along Route 160. Two failures resulted in damage to a roadway embankment section. The area east of Route 160 is largely marshy with low lying organic material. South of the north bound failure and
318
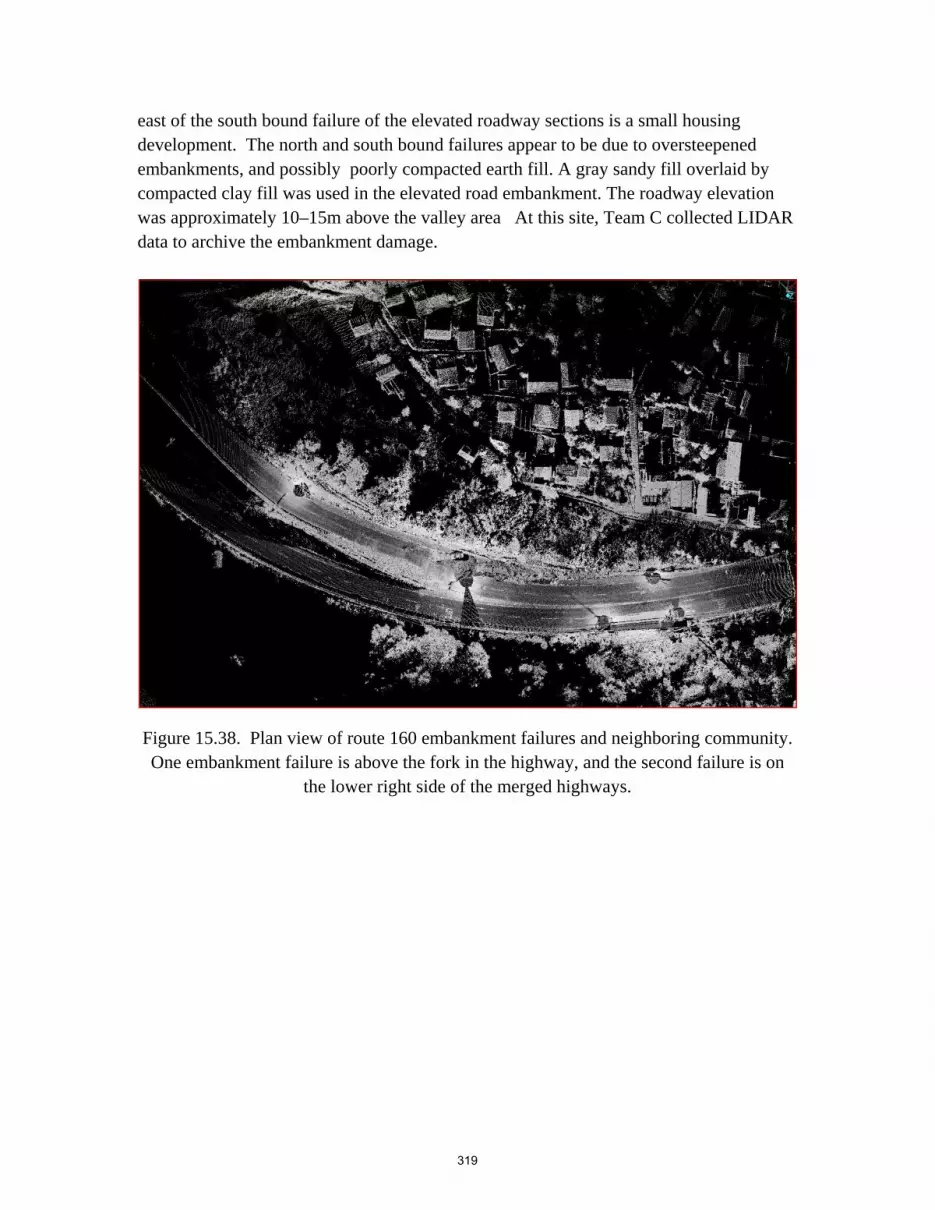
east of the south bound failure of the elevated roadway sections is a small housing development. The north and south bound failures appear to be due to oversteepened embankments, and possibly poorly compacted earth fill. A gray sandy fill overlaid by compacted clay fill was used in the elevated road embankment. The roadway elevation was approximately 10–15m above the valley area At this site, Team C collected LIDAR data to archive the embankment damage.
Figure 15.38. Plan view of route 160 embankment failures and neighboring community. One embankment failure is above the fork in the highway, and the second failure is on
the lower right side of the merged highways.
319

Figure 15.39. Oblique view of route 160 east side embankment failure at the fork in the highway (note vehicle in slide for scale).
Figure 15.40. Oblique view of route 160 embankment failure along the west side of the merged highways.
320
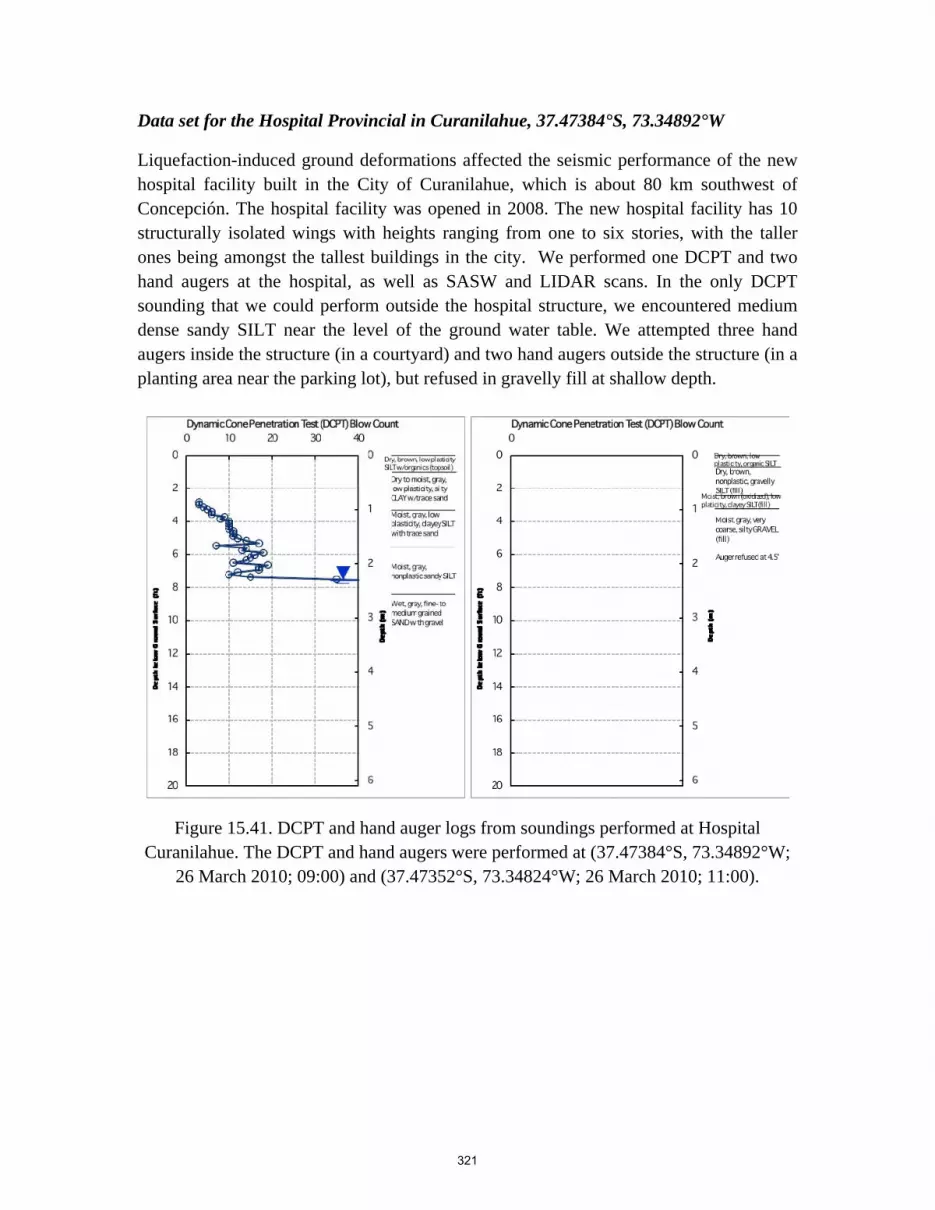
Data set for the Hospital Provincial in Curanilahue, 37.47384°S, 73.34892°W
Liquefaction-induced ground deformations affected the seismic performance of the new hospital facility built in the City of Curanilahue, which is about 80 km southwest of Concepción. The hospital facility was opened in 2008. The new hospital facility has 10 structurally isolated wings with heights ranging from one to six stories, with the taller ones being amongst the tallest buildings in the city. We performed one DCPT and two hand augers at the hospital, as well as SASW and LIDAR scans. In the only DCPT sounding that we could perform outside the hospital structure, we encountered medium dense sandy SILT near the level of the ground water table. We attempted three hand augers inside the structure (in a courtyard) and two hand augers outside the structure (in a planting area near the parking lot), but refused in gravelly fill at shallow depth.
Figure 15.41. DCPT and hand auger logs from soundings performed at Hospital Curanilahue. The DCPT and hand augers were performed at (37.47384°S, 73.34892°W;
26 March 2010; 09:00) and (37.47352°S, 73.34824°W; 26 March 2010; 11:00).
321

Figure 15.42. Shear wave velocity profile for the Provincial Hospital of Curanilahue by the SASW method
Figure 15.43. Oblique view of the entire complex of buildings at the Provincial Hospital of Curanilahue, 37.47352°S, 73.34824°W.
322

Figure 15.44. Oblique view of the north east side of Provincial Hospital of Curanilahue, 37.47352°S, 73.34824°W. The SASW test was performed along the three light posts
above the circle.
Figure 15.45. Oblique view of the east courtyard of the Provincial Hospital of Curanilahue, 37.47352°S, 73.34824°W. Liquefaction induced structural settlement is
clearly evident along the courtyard perimeter.
323
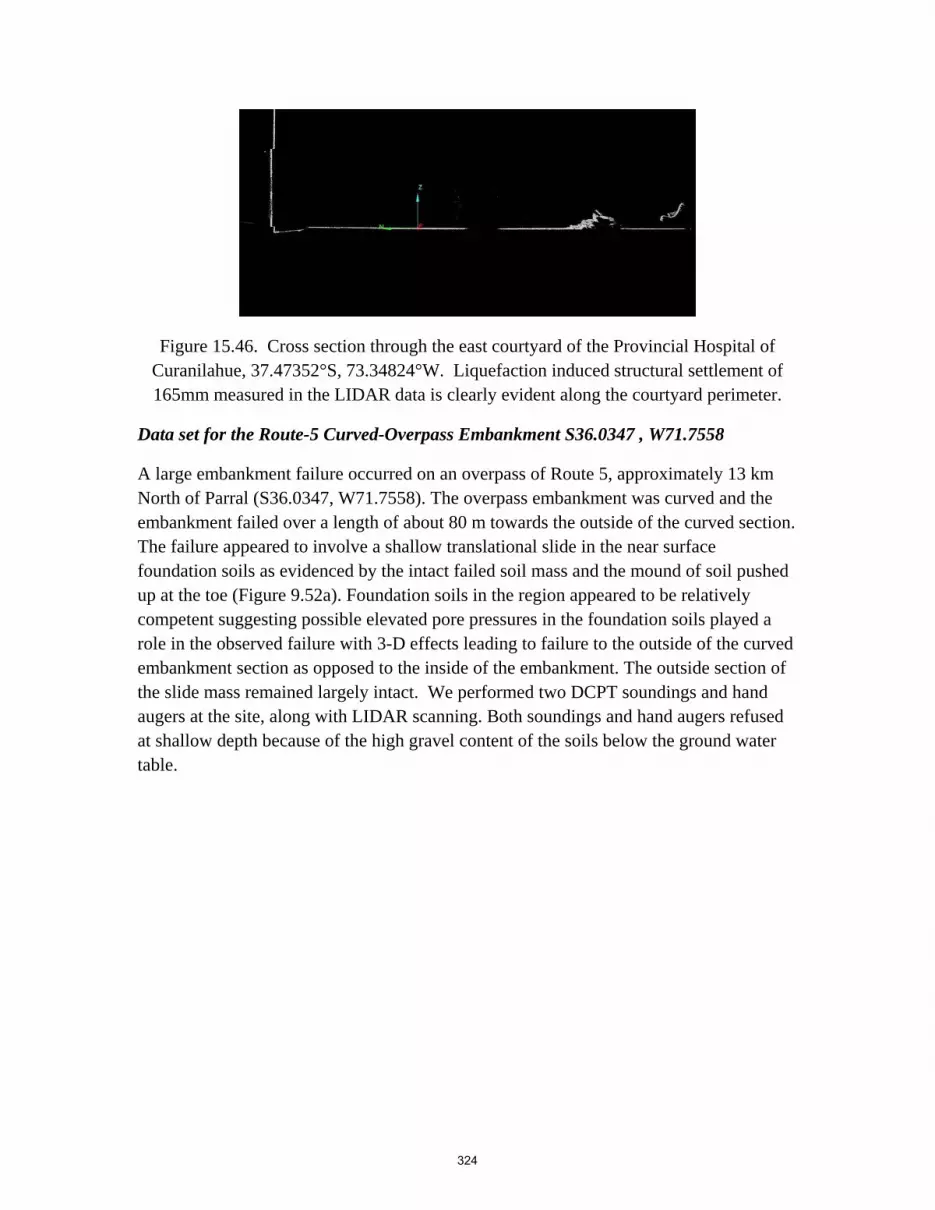
Figure 15.46. Cross section through the east courtyard of the Provincial Hospital of Curanilahue, 37.47352°S, 73.34824°W. Liquefaction induced structural settlement of 165mm measured in the LIDAR data is clearly evident along the courtyard perimeter.
Data set for the Route-5 Curved-Overpass Embankment S36.0347 , W71.7558
A large embankment failure occurred on an overpass of Route 5, approximately 13 km North of Parral (S36.0347, W71.7558). The overpass embankment was curved and the embankment failed over a length of about 80 m towards the outside of the curved section. The failure appeared to involve a shallow translational slide in the near surface foundation soils as evidenced by the intact failed soil mass and the mound of soil pushed up at the toe (Figure 9.52a). Foundation soils in the region appeared to be relatively competent suggesting possible elevated pore pressures in the foundation soils played a role in the observed failure with 3-D effects leading to failure to the outside of the curved embankment section as opposed to the inside of the embankment. The outside section of the slide mass remained largely intact. We performed two DCPT soundings and hand augers at the site, along with LIDAR scanning. Both soundings and hand augers refused at shallow depth because of the high gravel content of the soils below the ground water table.
324

Figure 15.47. Oblique view of the Route 5 overpass embankment failure from the southeast side. The outside curve can be seen to have slid out laterally into the field.
Figure 15.48. Closeup of the Route 5 overpass embankment failure from the southeast side. The embankment along the outside curve can be seen to have slid out laterally 16m
into the field.
325

Figure 15.49. Oblique view of the Route 5 overpass embankment failure from the northwest side. Much of the roadbed slumped into the graben left behind as the outside
slid out laterally to the southwest.
Figure 15.50. Cross-section view of the Route 5 overpass embankment failure from the east. The outside curve slid out laterally opening a large 16 meter graben.
326

Figure 15.51. DCPT and hand auger logs from soundings performed at Ruta 5 Overpass Embankment. The DCPTs and hand augers were performed at (36.03459°S,
71.75611°W; 27 March 2010; 18:30) and (36.03488°S, 71.75610°W; 27 March 2010; 19:30).
Data set for the Las Palmas Tailings Pond Failure, Talca (35.184679° S, 71.759410° W) We performed two DCPT soundings at the tailings dam site, as well as SASW above the head scarp and LIDAR, but did not perform any hand augers at the site. At the time of the investigation, the tailings were relatively stiff, likely as a result of water draining out of the tailings mass following the failure. Las Palmas mine was operated from the early 1980’s until 1997. The mine was closed and the tailings area partially covered with a thin layer of gravelly material. Clear evidence of liquefaction of the tailings with sand boils and ejecta along cracks indicating some portion of the tailings was saturated. Tailings flowed 280-320 meters from the headscarp to the snout toe, and some highly fluidized debris ran out almost 0.5 kilometers. The site was visited by GEER personnel on March 11, 2010 and then a follow-up visit was made on March 28, 2010 to collect data with LIDAR and DCPT.
327

Figure 15.52. DCPT logs from soundings performed at Las Palmas Mine, Talca. The DCPTs were performed at (35.183884°S, 71.76110°W; 28 March 2010; 12:00) and
(35.18629°S, 71.75771°W; 28 March 2010; 14:00).
Figure 15.53. Shear wave velocity profile for the Las Palmas Tailings Dam by the SASW method
328
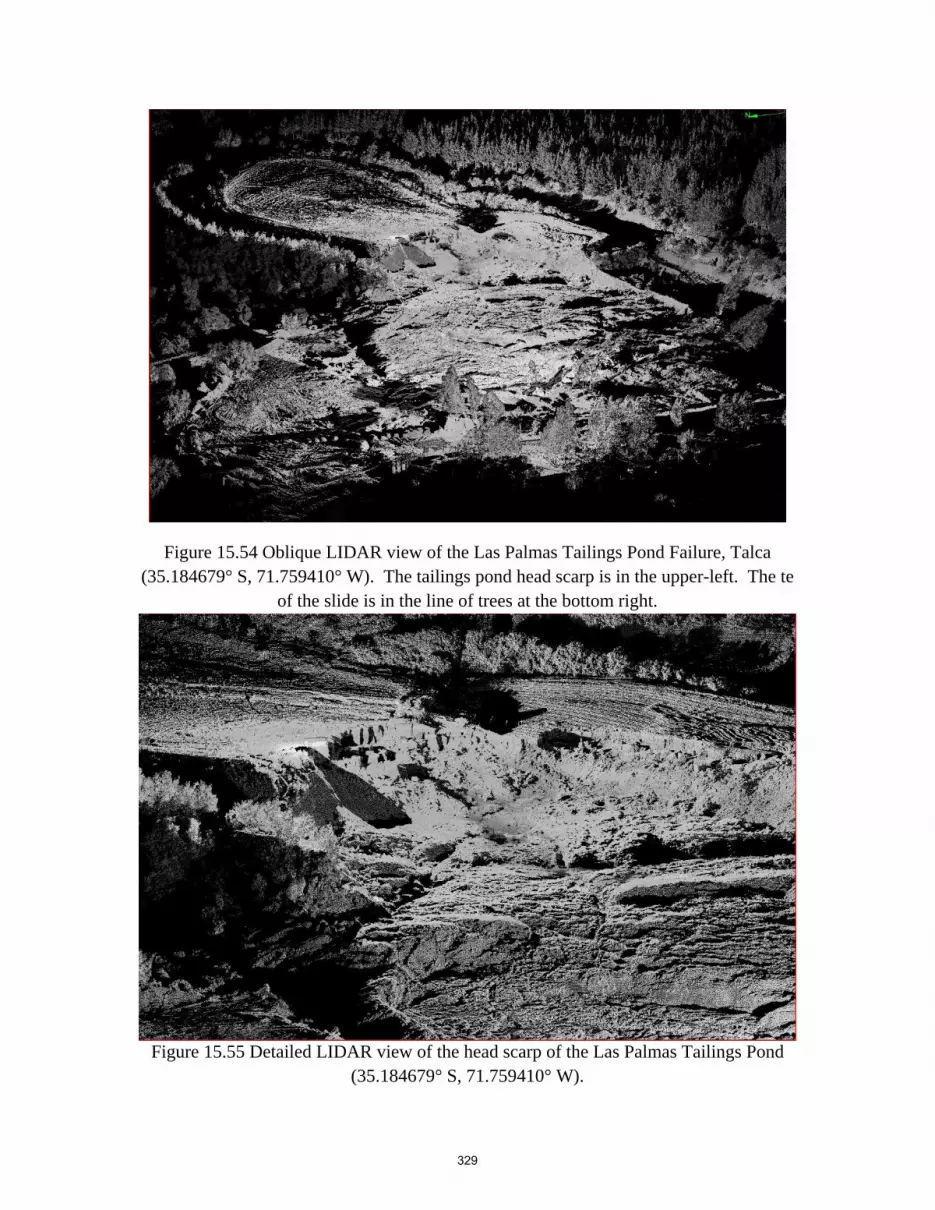
Figure 15.54 Oblique LIDAR view of the Las Palmas Tailings Pond Failure, Talca (35.184679° S, 71.759410° W). The tailings pond head scarp is in the upper-left. The te
of the slide is in the line of trees at the bottom right.
Figure 15.55 Detailed LIDAR view of the head scarp of the Las Palmas Tailings Pond (35.184679° S, 71.759410° W).
329
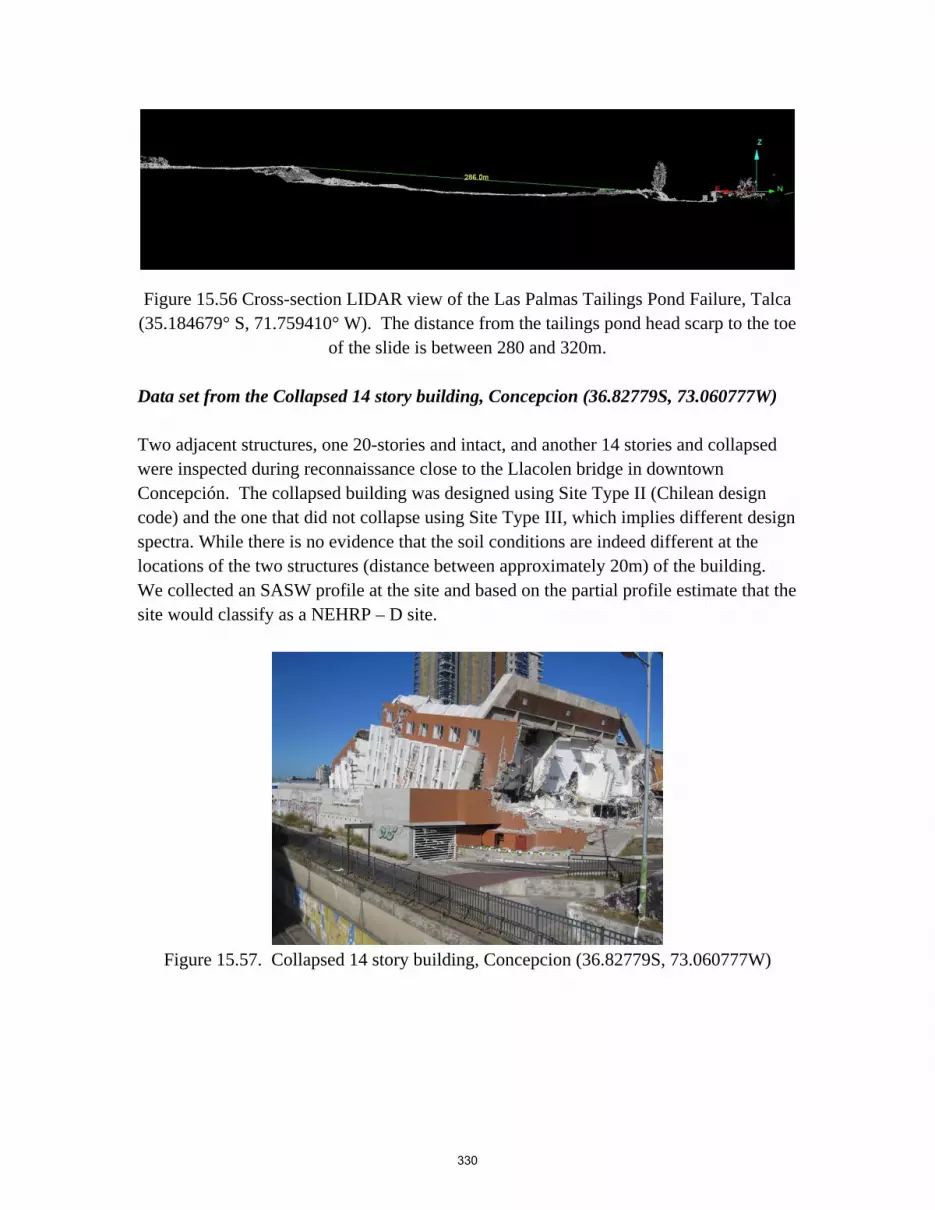
Figure 15.56 Cross-section LIDAR view of the Las Palmas Tailings Pond Failure, Talca (35.184679° S, 71.759410° W). The distance from the tailings pond head scarp to the toe
of the slide is between 280 and 320m. Data set from the Collapsed 14 story building, Concepcion (36.82779S, 73.060777W) Two adjacent structures, one 20-stories and intact, and another 14 stories and collapsed were inspected during reconnaissance close to the Llacolen bridge in downtown Concepción. The collapsed building was designed using Site Type II (Chilean design code) and the one that did not collapse using Site Type III, which implies different design spectra. While there is no evidence that the soil conditions are indeed different at the locations of the two structures (distance between approximately 20m) of the building. We collected an SASW profile at the site and based on the partial profile estimate that the site would classify as a NEHRP – D site.
Figure 15.57. Collapsed 14 story building, Concepcion (36.82779S, 73.060777W)
330
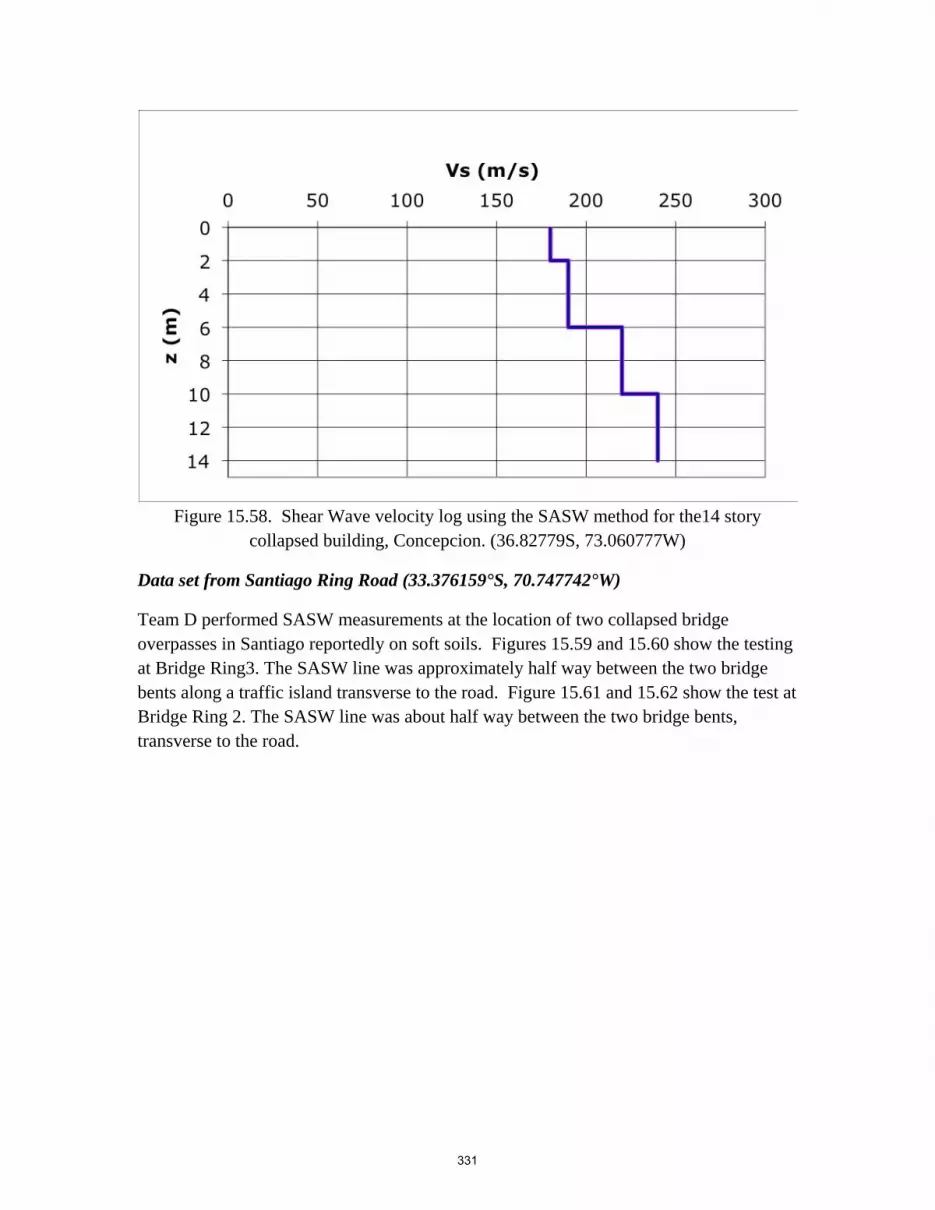
Figure 15.58. Shear Wave velocity log using the SASW method for the14 story
collapsed building, Concepcion. (36.82779S, 73.060777W)
Data set from Santiago Ring Road (33.376159°S, 70.747742°W)
Team D performed SASW measurements at the location of two collapsed bridge overpasses in Santiago reportedly on soft soils. Figures 15.59 and 15.60 show the testing at Bridge Ring3. The SASW line was approximately half way between the two bridge bents along a traffic island transverse to the road. Figure 15.61 and 15.62 show the test at Bridge Ring 2. The SASW line was about half way between the two bridge bents, transverse to the road.
331

Figure 15.59 Bridge Ring 3 “Lo Echevers” Bridge, Santiago, 33.376159°S, 70.747742°W
Figure 15.60 SASW line and test, Bridge Ring 3 “Lo Echevers” Bridge, Santiago, 33.376159°S, 70.747742°W, April 13, 2010
332

Figure 15.61 Bridge Ring 2, “Mira Flores” Bridge, Santiago, -33.394269°S,-70.769402°W
Figure 15.62 SASW Line and Test, Bridge Ring 2, “Mira Flores” Bridge, Santiago, -33.394269°,-70.769402°, April 13, 2010.
333
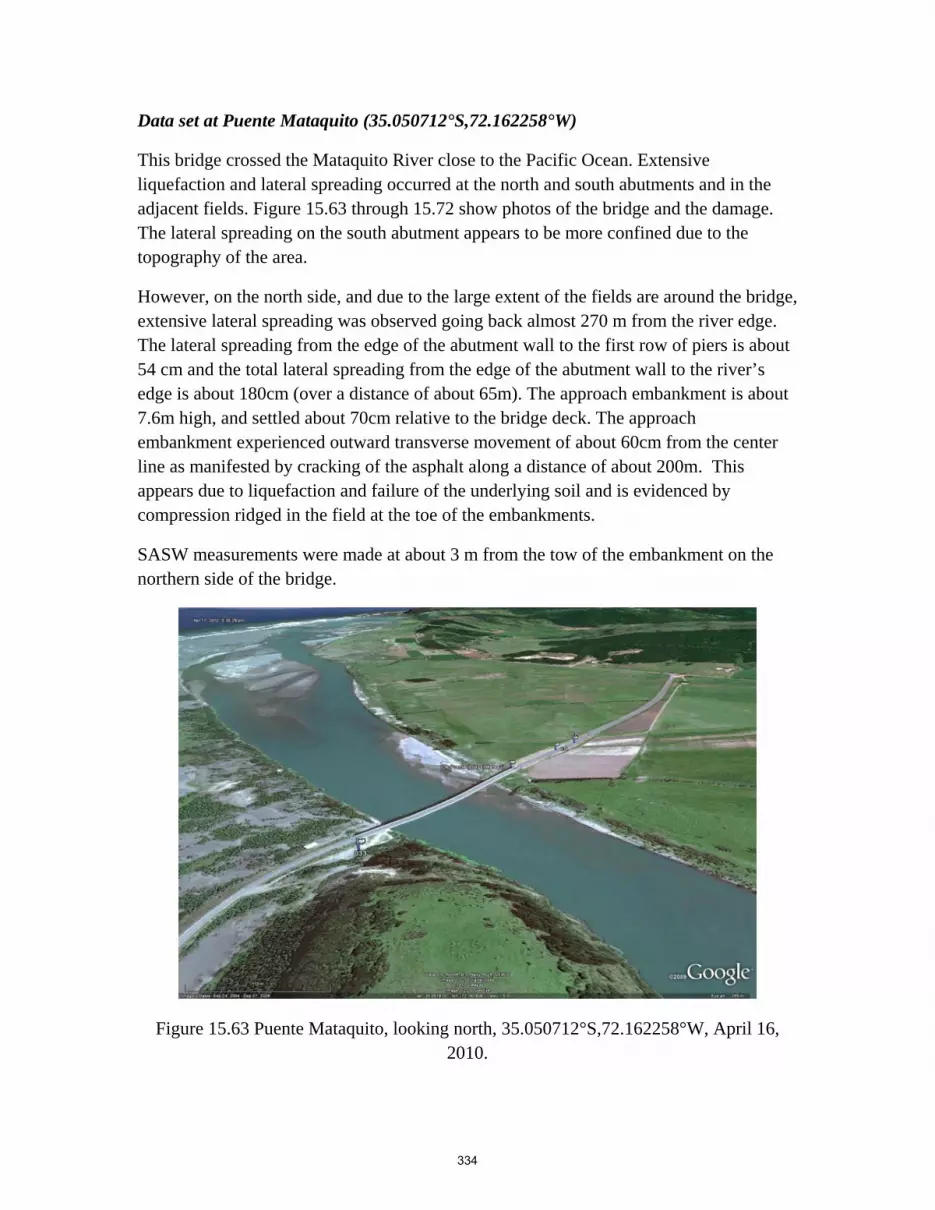
Data set at Puente Mataquito (35.050712°S,72.162258°W)
This bridge crossed the Mataquito River close to the Pacific Ocean. Extensive liquefaction and lateral spreading occurred at the north and south abutments and in the adjacent fields. Figure 15.63 through 15.72 show photos of the bridge and the damage. The lateral spreading on the south abutment appears to be more confined due to the topography of the area.
However, on the north side, and due to the large extent of the fields are around the bridge, extensive lateral spreading was observed going back almost 270 m from the river edge. The lateral spreading from the edge of the abutment wall to the first row of piers is about 54 cm and the total lateral spreading from the edge of the abutment wall to the river’s edge is about 180cm (over a distance of about 65m). The approach embankment is about 7.6m high, and settled about 70cm relative to the bridge deck. The approach embankment experienced outward transverse movement of about 60cm from the center line as manifested by cracking of the asphalt along a distance of about 200m. This appears due to liquefaction and failure of the underlying soil and is evidenced by compression ridged in the field at the toe of the embankments.
SASW measurements were made at about 3 m from the tow of the embankment on the northern side of the bridge.
Figure 15.63 Puente Mataquito, looking north, 35.050712°S,72.162258°W, April 16, 2010.
334

Figure 15.64 Lateral spreading on the south end of the bridge, Puente Mataquito, 35.050712°S,72.162258°W, April 16, 2010.
Figure 15.65 Lateral spreading on the north end of the bridge, Puente Mataquito, 35.050712°S,72.162258°W April 16, 2010.
335

Figure 15.66 Settlement of the north abutment of the bridge, 70 cm offset at the bridge deck, Puente Mataquito, 35.050712°S, 72.162258°W, April 16, 2010.
Figure 15.67 Cracking and transverse movement (60 cm on each side) of embankment due to liquefaction of underlying soil, north abutment of the bridge, Puente Mataquito,
35.050712°S,72.162258°W, April 16, 2010.
336

Figure 15.68 Compression ridges at toe of embankment, due to liquefaction of underlying soil and settlement of embankment, north abutment of the bridge, Puente Mataquito,
35.050712°S, 72.162258°W, April 16, 2010.
Figure 15.69 Lateral Spreading towards the river, north abutment of the bridge, Puente Mataquito, 35.050712°S, 72.162258°W, April 16, 2010.
337

Figure 15.70 North abutment shoved into bridge deck due to lateral spreading, Puente Mataquito, 35.050712°S, 72.162258°W, April 16, 2010.
Figure 15.71 Shearing of bridge girder, North abutment of bridge, Puente Mataquito, 35.050712°S, 72.162258°W , April 16, 2010.
338

Figure 15.72 SASW line, parallel to northern approach embankment, Puente Mataquito, 35.050712°S,72.162258°W, April 16, 2010.
Data set at Port Coronel (37.028874°S, 73.149768°W).
Team D made SASW measurements in the Port of Coronel where lateral spreading was experience. Figure 15.73 through 17.78 show the corresponding photos. SASW measurements were made along two lines parallel to the sheet pile wall. The first line is about 7 from the sheet pile wall in an area that experienced large lateral deformations while the second line was made 27m from the sheet pile wall in area that experienced limited deformations.
339

The sheet pile wall was embedded about 4-6m below the ground surface and protruded about 15-2m above the ground surface. At waypoint 11 (see Figure 15.73) we measured outward movement of about 110cm, while port official report their survey gives about 150cm, but the measurement extended all the way back to the ware houses. At waypoint 12 we measured lateral displacements of about 40 cm, and at waypoint 13 we measured outward movement of 10cm.
Figure 15.73 Port Coronel, area marked by GPS tracks along the coast experienced lateral spreading (37.028874°S, 73.149768°W).
340

Figure 15.74 SASW line 1, and lateral spreading looking north, Port Coronel, April 14, 2010 (37.028874°S, 73.149768°W).
Figure 15.75 SASW line 2, and lateral spreading looking north, Port Coronel, April 14, 2010 (37.028874°S, 73.149768°W).
341
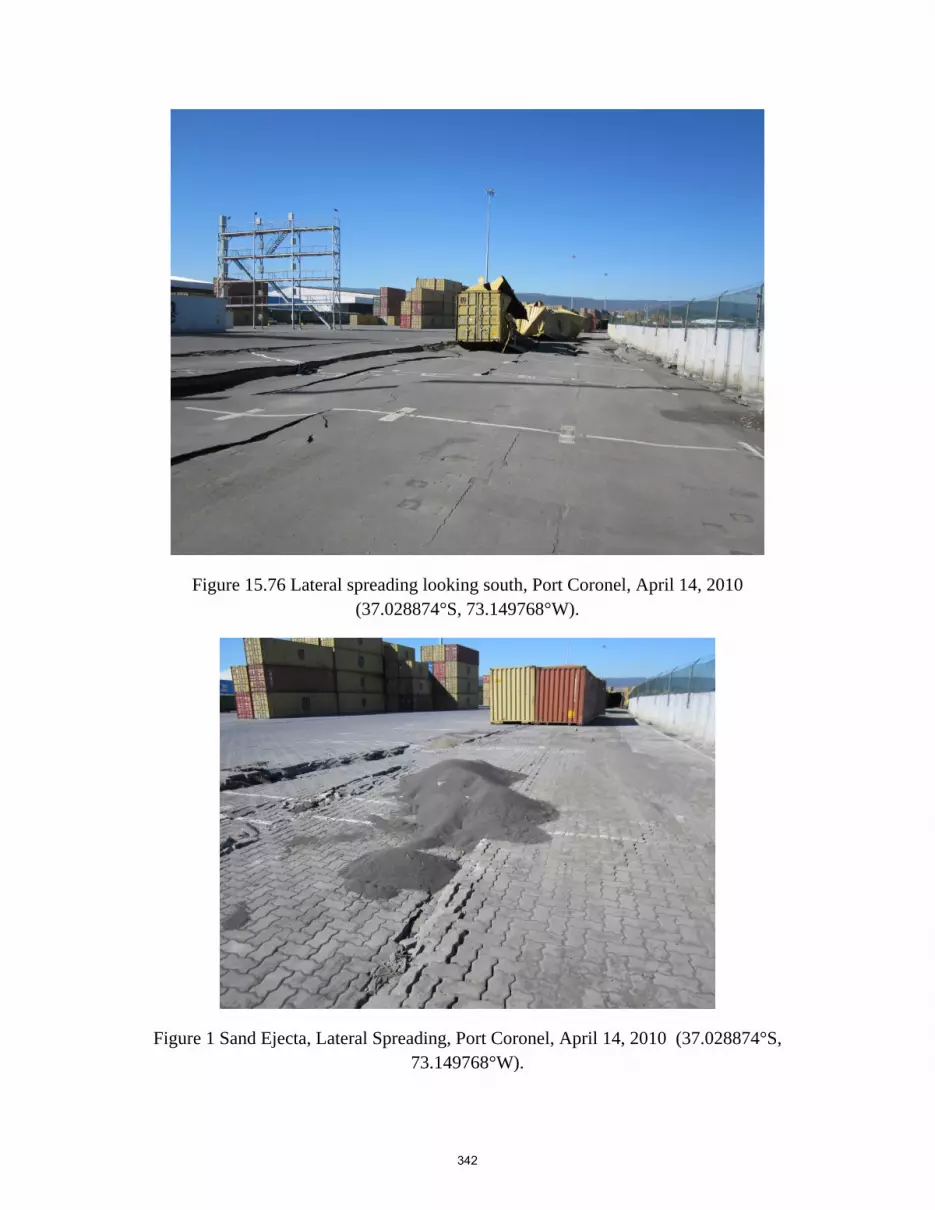
Figure 15.76 Lateral spreading looking south, Port Coronel, April 14, 2010 (37.028874°S, 73.149768°W).
Figure 1 Sand Ejecta, Lateral Spreading, Port Coronel, April 14, 2010 (37.028874°S, 73.149768°W).
342

Figure 15.78 Seaside view of the sheet pile wall that experienced lateral spreading, Port Coronel, April 14, 2010 (37.028874°S, 73.149768°W).
Data set Roadway Embankment ~5km south of Parral (36.185671°S, 71.825415°W)
Team D performed SASW test along a repaired roadway embankment as illustrated in Figure 15.79 through 15.81. The failed section was bounded by two streams Figure 15.79 and it is likely that the failure of the embankment was due to loss of strength in the underlying soils (liquefaction) during shaking.
343

Figure 15.79 Roadway Embankment ~5km south of Parral, north is up, Ruta 5 Sur (36.185671°S,71.825415°W)
Figure 15.80 North bound lane looking south, Repaired Roadway Embankment ~5km south of Parral, Ruta 5 Sur, April 15, 2010 (36.185671°S, 71.825415°W)
344

Figure 15.81 SASW line, North bound lane looking south, Roadway Embankment ~5km south of Parral, Ruta 5 Sur, April 15, 2010 (-36.185671°S,-71.825415°W).
Data set at Ruta 5 Sur overpass embankment, to Retiro at Tucapel Mill Overpass (36.051209°S , 71.768005°W).
Team D performed SASW measurements on a damaged overpass embankment on the right side of the north bound lane of Ruta 5 sur (Figure 15.82 through 15.84). The damage of the embankment appears to be due to shaking and bulging of the embankment material. The underlying soil appeared to be intact with no evidence of loss of loss of strength. The embankment bulged laterally and settled. The overpass embankment to the left of the north bound lane does not show signs of damage.
345

Figure 15.82 Ruta 5 Sur overpass embankment, looking north, to Retiro at Tucapel Mill (36.051209°S, 71.768005°W).
346

Figure 15.83 Damage to over padded embankment, Ruta 5 Sur overpass embankment, to Retiro at Tucapel Mill, April 15, 2010 (36.051209°S, 71.768005°W).
Figure 15.84 SASW line, Ruta 5 Sur overpass embankment, to Retiro at Tucapel Mill, April 15, 2010 (36.051209°S, 71.768005°W).
347