genetic diversity studies in certain indigenous mango ( mangifera indica l) varieties
TRANSCRIPT

Indian J. Plant Genet. Resour. 28(1): 153–160 (2015)
Indian J. Plant Genet. Resour. 28(1): 153-160 (2015)DOI 10.5958/0976-1926.2015.00019.4
Genetic Diversity Studies in Certain Indigenous Mango (Mangifera indica L) Varieties MR Dinesh1*, KV Ravishankar2, Bhuwon Sthapit3, VA Parthasarathy4, BS Sandya1, P Nischita2 and B Lavanya2
1Department of Fruit Science, ICAR-Indian Institute of Horticultural Research, Hesaraghatta, Bengaluru-560089, Karnataka, India2Department of Biotechnology, ICAR-Indian Institute of Horticultural Research, Hesaraghatta, Bengaluru-560089, Karnataka, India3UNEP-GEF/TFT Project, Bioversity International, Bioversity-Nepal Office, 93.4 Dharahara, Pokhara-11, Nepal4UNEP-GEF/TFT Project, ICAR-Indian Institute of Horticultural Research, Hesaraghatta, Bengaluru-560089, Karnataka, India
(Received: 14 January 2015; Revised: 12 February 2015; Accepted: 13 March 2015)
The large seedling diversity of mango has not been fully evaluated. The evaluation of seedling diversity was carried out for morphological traits in the Chittoor area of Andhra Pradesh in India. The statistical analysis carried out for fruit characteristics showed significant differences among the varieties for various fruit characteristics. Molecular characterization was carried out using microsatellite markers. Most of the indigenous varieties from Kalepalli region are grouped in the same cluster. It is interesting to note that the morphological characterization and molecular characterization follow almost the same pattern suggesting the genetic control of these fruit characters. The study shows that the diversity observed within a geographic region is derived from the varieties that are being grown in that region. The promising seedling varieties selected with desirable traits would help the farmer in benefit sharing as and when they are registered. In addition it would help in ‘on farm conservation’ and use of these varieties in crop improvement programmes.
Key Words: Characterization, Clusters, Conservation, Diversity, Landraces
IntroductionThe mango (Mangifera indica L) originated in northeastern India, the Indo-Myanmar border region and Bangladesh (Chittagong Hill tract), where it is still found in feral state, with very small fruits and it is under cultivation in India for at least 4000 years with over 1000 varieties recognized (Mukherjee, 1953). Almost all of them are selections made from naturally occurring open-pollinated seedlings. Seven centers of diversity have been recognized in India (Yadav and Rajan, 1993). In the Peninsular Indian region, Chittoor is one of the main centers of mango growing, wherein several indigenous landraces were observed under cultivation. These indigenous varieties are known as ‘naati’ types in local language. Most of these seedling types are regular bearers having desirable traits, which were located by survey under the “UNEP/GEF project on “Conservation and Sustainable Use of Cultivated and Wild Tropical Fruit Diversity: Promoting Sustainable Livelihoods, Food Security and Ecosystem Services”. The genetic variability studies were conducted utilizing these seedling
originated naati types utilizing microsatellite markers. Molecular tools including both nuclear marker and cytoplasmic markers are currently playing major role in population studies, phytogeography, mapping, parentage analysis. Many different molecular markers have been used in mango for cultivar identification, such as RAPD (Rajwana et al., 2008; Marcela et al., 2009), ISSR (Sagar et al., 2007; Pandit et al., 2007), AFLP (Yamanaka et al., 2006), and SSR (Schnell et al., 2005, 2006) for clonal identification and for roughly estimating genetic relationships among genotypes. Mangifera germplasm has been collected and analyzed using simple sequence repeat (SSR) markers recently by Dillon et al. (2013, 2014). Microsatellites has greater importance due to their abundant occurrence throughout the genome of all the eukaryotes due to their co-dominant nature high level polymorphism because of it variation in repeat lengths (Ravishankar et al., 2011). Hence, a study was undertaken to assess genetic variability of naati (seedling) mango varieties in Chittoor, Andhra Pradesh of India for seedlings of desirable traits for further commercialization
*Author for Correspondence: E-mail: [email protected]
Indian J. Plant Genet. Resour. 28(1): 153–160 (2015)
Dinesh et al.154
or for home garden conditions or for crop improvement could be selected.
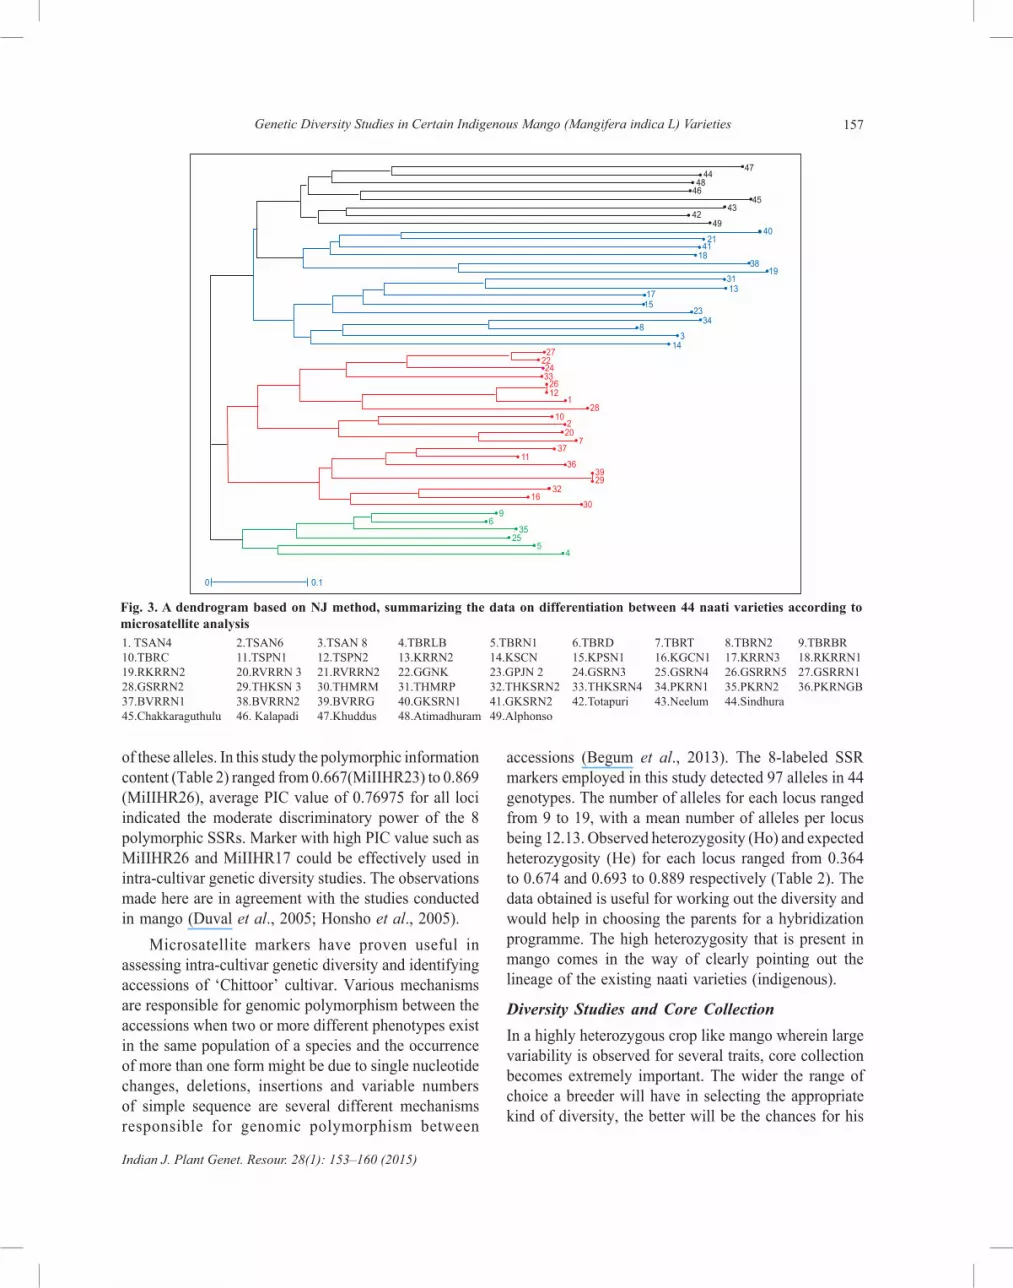
Materials and MethodsThe Polakala, Talupulapalle and Bangarupalyam regions of Chittoor district in Andhra Pradesh has a dry and hot climate with low temperatures of 12-18° C in winter and high temperatures of 38-46° C during summer and an average rainfall of 918.1 mm/year. The soil of the region is generally red sandy loam and in some places clayey soils are also seen. A total of 44 naati types spreading across the villages of three communities belonging to 21 farmers were identified through survey. The genetic diversity studies were conducted utilizing these 44 naati (indigenous) types. The 44 indigenous varieties were evaluated for fruit characteristics viz., fruit weight, fruit length, fruit width, skin weight, stone weight, TSS and pulp percentage using ‘Bioversity International Descriptors (2006). Evaluation was carried out by taking fruit samples in five replicates. The variance analysis (ANOVA) was carried out using RCBD. The total carotenoids were determined colorimetrically as per the method described by AOAC (1995). The clustering was carried out using the UPGMA method. The molecular characterization was carried out using SSR markers, which comprised of DNA isolation and polymorphism analysis. The genetic analysis was carried out based on the data generated. Total genomic DNA was extracted from the leaf material using the modified CTAB method (Ravishankar et al., 2000). The concentration of DNA was determined by spectrophotometer at 260nm. The integrity was determined by agarose gel electrophoresis (0.8%).
PCR and Polymorphism AnalysisThe fluorescence based PCR method proposed by Schuelke (2000) was used to amplify the microsatellites in a quick, accurate and efficient manner. PCR amplification was performed in a 20µl volume containing 75-100 ng pomegranate DNA, Taq Buffer 10X (Tris with 15mM MgCl2, pH-9)-2.85µl, 1mM dNTPs- 3.5 µl, locus labeled forward specific primer (5µM)- 2.0µl, reverse primer (5µM)- 2.0µl, Nuclease free water-5.65µl and 1.0 unit of Taq DNA polymerase. PCR was performed on Life Pro Thermocycler with the following temperature profile: 94°C for 2 min followed by 35 cycles at 94°C for 30s, 30s at optimal annealing temperature of 55°C and 72°C
for 1min. A final extension reaction was allowed to proceed at 72°C for 5min. Amplified products were initially separated on 3% agarose gel for confirmation of the amplification. These samples were separated on the automatic 96 capillary automated DNA Sequencer. The raw data generated was analyzed and compiled using Peak Scanner V1.0 software for detecting the alleles. This produces a size curve based on the known size standard fragments, with the help of which the unknown fragment sizes are determined. The results obtained were used for genetic analysis using Cervus 3.0 software (Kalinowski et al., 2007) for determining the number of alleles, observed heterozygosity (Ho), expected heterozygosity (He) and Polymorphic Information Content (PIC). The genetic similarity and genetic distance between 44 genotypes was estimated by the Neighbour Joining method using Darwin software (Perrier et al., 2003; Perrier and Jacquemoud-Collet., 2006).
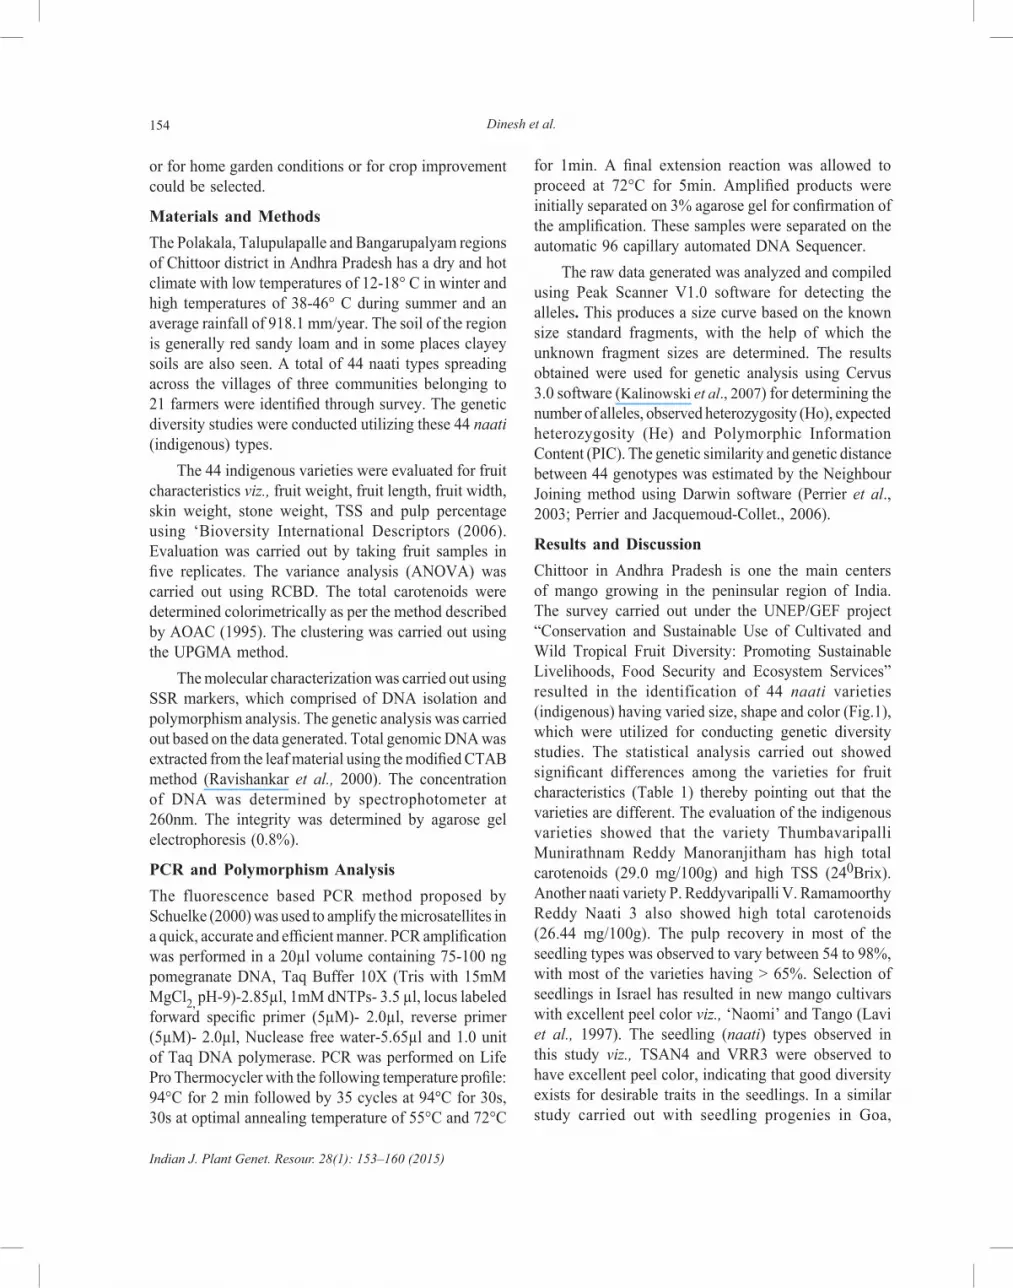
Results and DiscussionChittoor in Andhra Pradesh is one the main centers of mango growing in the peninsular region of India. The survey carried out under the UNEP/GEF project “Conservation and Sustainable Use of Cultivated and Wild Tropical Fruit Diversity: Promoting Sustainable Livelihoods, Food Security and Ecosystem Services” resulted in the identification of 44 naati varieties (indigenous) having varied size, shape and color (Fig.1), which were utilized for conducting genetic diversity studies. The statistical analysis carried out showed significant differences among the varieties for fruit characteristics (Table 1) thereby pointing out that the varieties are different. The evaluation of the indigenous varieties showed that the variety Thumbavaripalli Munirathnam Reddy Manoranjitham has high total carotenoids (29.0 mg/100g) and high TSS (240Brix). Another naati variety P. Reddyvaripalli V. Ramamoorthy Reddy Naati 3 also showed high total carotenoids (26.44 mg/100g). The pulp recovery in most of the seedling types was observed to vary between 54 to 98%, with most of the varieties having > 65%. Selection of seedlings in Israel has resulted in new mango cultivars with excellent peel color viz., ‘Naomi’ and Tango (Lavi et al., 1997). The seedling (naati) types observed in this study viz., TSAN4 and VRR3 were observed to have excellent peel color, indicating that good diversity exists for desirable traits in the seedlings. In a similar study carried out with seedling progenies in Goa,
Indian J. Plant Genet. Resour. 28(1): 153–160 (2015)
Genetic Diversity Studies in Certain Indigenous Mango (Mangifera indica L) Varieties 155
Fig. 1. Variation for shape, size and colour in the Naati types of Chittoor
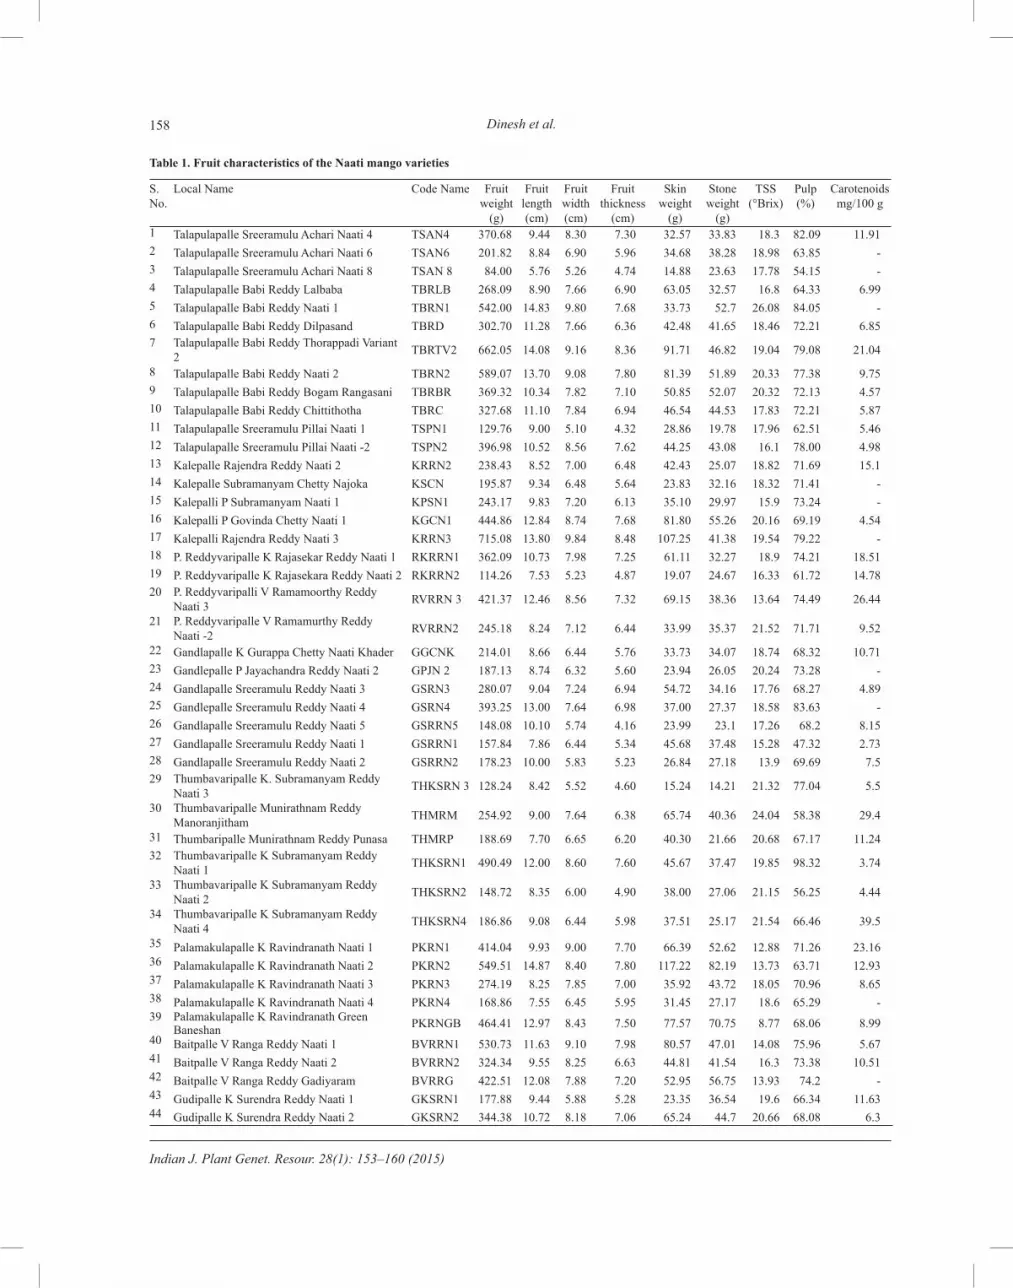
Nagabhushan and Mathew (1994) reported excellent peel colour in certian seedling type’s viz., Mankurad, Salcete Mussarat, Malgesh, Xavier, Udgo, Saccrchi, Colaco, Furtado and others. Uttar Pradesh region of India is one of the diversity centres for seedling mango types. The evaluation of seedling types carried out by Teaotia and Srivastava (1979) showed that the variety Gaurjit is a good sucking type and the variety Kare-Ka-Fazli is a very high yielder having good fruit size. In the Chittoor seedling types also it was noticed that they are regular and heavy bearers. Hence, the evaluation and conservation of ‘naati’ seedlings can be a very viable method in the improvement of a heterozygous crop like mango. The diversity analysis carried out using morphological characteristics showed two main clusters (Fig. 2). In the first cluster the commercial varieties Kalapadi, Sindhura, Khuddus, Athi Madhuram and Alphonso are grouped with the naati varieties of Talupulapalli. The varieties TBRBR, and TBRLB, both of which have good peel colour is grouped with the commercial variety Khuddus, which has attractive peel colour. The other coloured variety Totapuri is grouped with the coloured variety RVRRN3, which also is similar to Totapuri in shape. The interesting feature is that probably the coloured varietis are descendants of today’s commercial variety Khuddus. The clustering to a large extent is based on
the location of the seedling in a particular region. The seedlings of Talupulapalli are grouped in the same cluster to a large extent and that of Palamakulapalli and Reddyvaripalli are also grouped in the same cluster. In a study on morphological characterization vis-à-vis molecular characterization, Vasugi et al. (2013) have opined that morphological characterization of quantitative characteristics would follow the pattern of molecular characterization in mango. The diversity analysis carried out from the molecular data showed 3 main clusters (Fig. 2). It can be seen from the diagram that varieties from Talupulapalli and Gandlapalli, which are from nearby places are grouped in the same cluster to a large extent. Similarly majority of the indigenous varieties from Kalepalli are grouped in the same cluster. It also shows that some of the commercial varieties like Neelum are grouped with these varieties, which shows that they may be open pollinated seedlings of Neelum. The variety Khuddus, a colored variety is grouped with Talupulapalli varieties, which also have good peel color. This gives an indication that these seedling varieties would have developed from the same pedigree as Khuddus. The phylogenetic tree shows Gandlapalli Sreeramulu Reddy Naati 5, Talapulapalli Sreeramulu Pillai Naati 2 are closely related varieties. The two indigenous colored varieties RVRRN3 and

Indian J. Plant Genet. Resour. 28(1): 153–160 (2015)
Dinesh et al.156
17742153825112392034535837244938431841930152144881019293451322214443347272328314628401132
0
-160
-320
-480
-640
-800
-960
-1120
-12800 5
10 15
20 25
30 35
40 45
Similarity
Fig. 2. Cluster diagram based on morphological characteristics
TBRT7 are grouped together. Similar to the evaluation of naati seedlings the ‘Appemidi’ types from the Western Ghats regions were studied by Vasugi et al. (2012), who concluded that genotypes belonging to different geographic region might have evolved from the existing mango gene pool from which they were selected by local people to domesticate them in different areas for cultivation. Karibasappa et al. (1999) observed by canonical analysis and cluster analysis eleven clusters in sixty-nine genotypes of mango. They concluded that geographic diversity might not necessarily be related with genetic diversity. Ravishankar et al. (2000), studied the genetic diversity in eighteen commercial varieties of mango grown in India using RAPD analysis, they observed two major groups; one consisting of northern, eastern and western varieties, another consisting of southern cultivars, their study also indicated that the variety Kesar from western region of India was associated with Neelum and Rumani. This study showed that genetic diversity within a particular region. Karihaloo et al. (2003) in a similar study by RAPD analysis in 29 Indian mango cultivars found that the varieties irrespective of the number of embryos they possessed were grouped
together based on the region and genetic diversity existed within the regions. The population in one region need not follow the same pattern as that of the other. The success of molecular markers in characterizing and analyzing genetic diversity in mango has been demonstrated by a number of studies. Valdomiro and Paulo Sarmanho (2004) used RAPD markers to detect genetic polymorphism in the mango germplasm, suggesting that this technique may be useful tool for germplasm evaluation and management and also for directing crossings in the breeding programmes. SSR analysis has great potential for mango improvement and can be performed for variety identification, validation of parentages, and estimation of genetic variation in existing populations and characterization of intra-cultivar diversity. Ravishankar et al. (2011) observed that microsatellites have greater importance due to the abundant occurrence throughout the genome of all the eukaryotes, their co-dominant nature, high level polymorphism as a result of the variation in repeat lengths. Begum et al. (2013) observed that the PIC value provides approximation by taking into account the number of alleles at a locus and the relative frequencies
Indian J. Plant Genet. Resour. 28(1): 153–160 (2015)
Genetic Diversity Studies in Certain Indigenous Mango (Mangifera indica L) Varieties 157
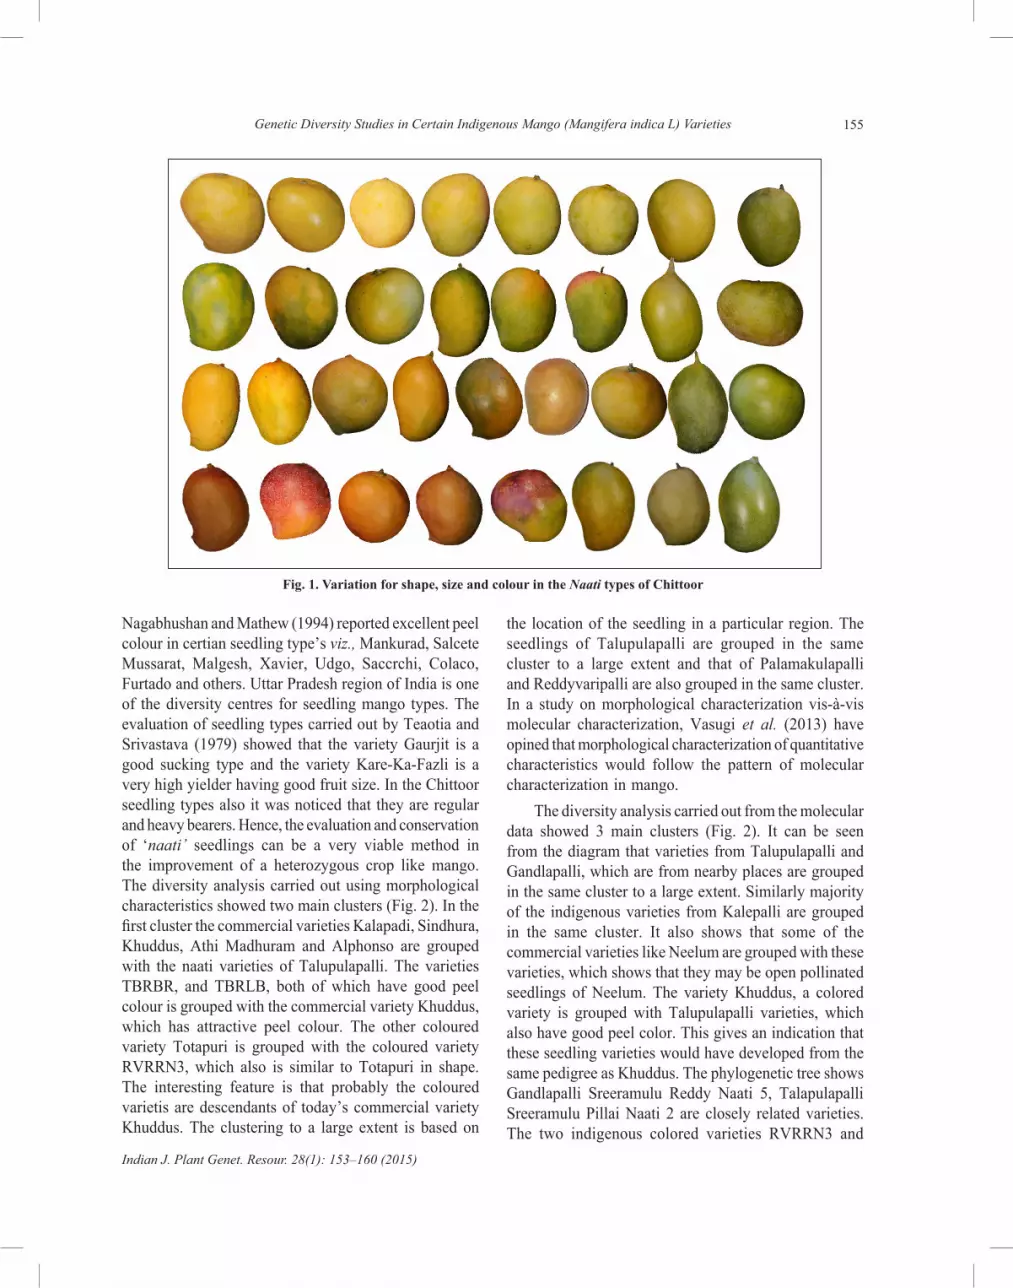
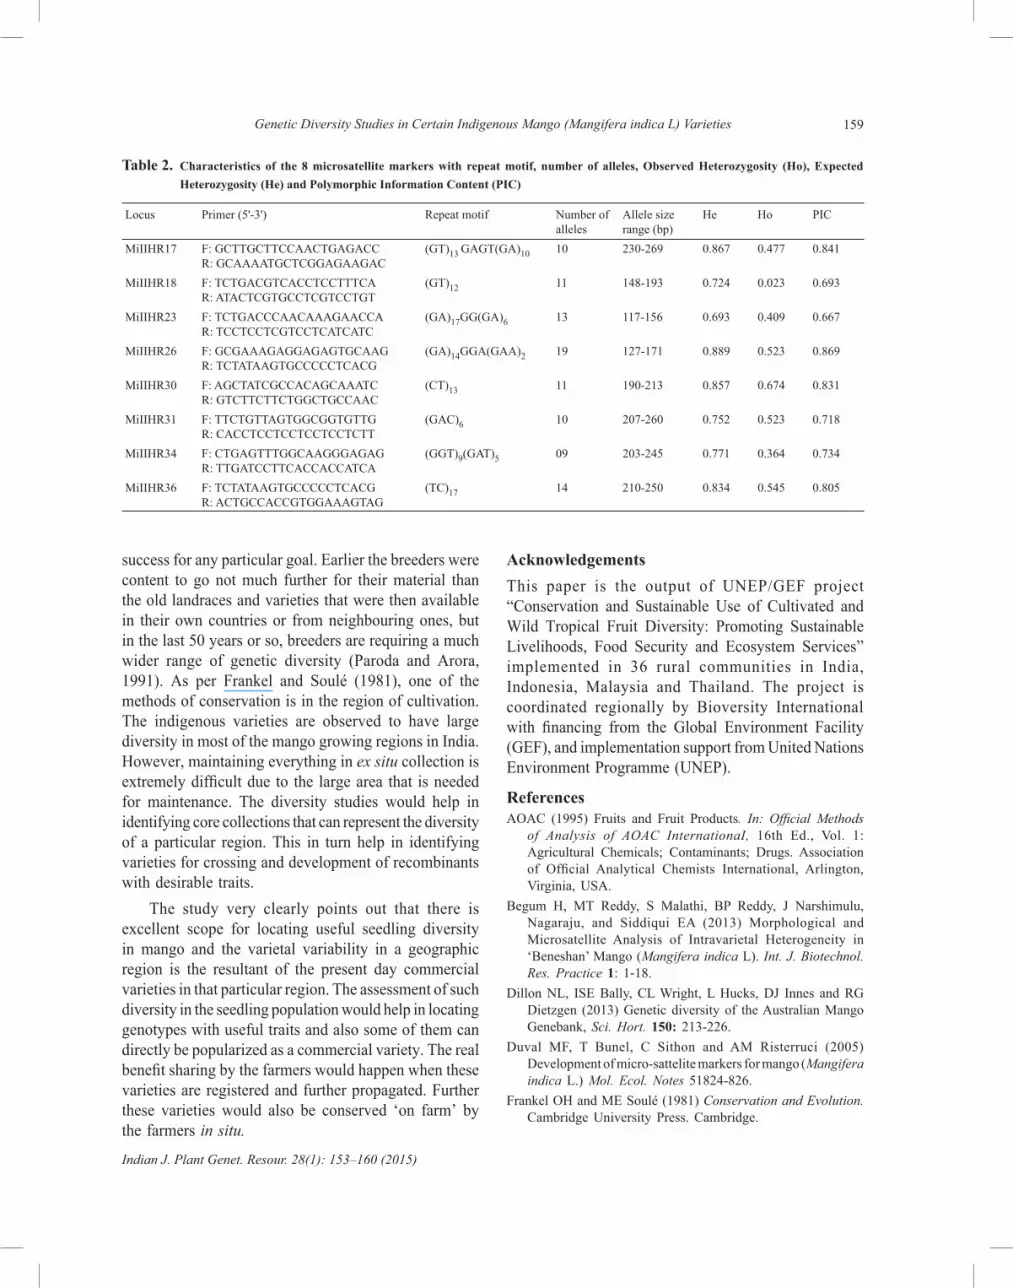
of these alleles. In this study the polymorphic information content (Table 2) ranged from 0.667(MiIIHR23) to 0.869 (MiIIHR26), average PIC value of 0.76975 for all loci indicated the moderate discriminatory power of the 8 polymorphic SSRs. Marker with high PIC value such as MiIIHR26 and MiIIHR17 could be effectively used in intra-cultivar genetic diversity studies. The observations made here are in agreement with the studies conducted in mango (Duval et al., 2005; Honsho et al., 2005). Microsatellite markers have proven useful in assessing intra-cultivar genetic diversity and identifying accessions of ‘Chittoor’ cultivar. Various mechanisms are responsible for genomic polymorphism between the accessions when two or more different phenotypes exist in the same population of a species and the occurrence of more than one form might be due to single nucleotide changes, deletions, insertions and variable numbers of simple sequence are several different mechanisms responsible for genomic polymorphism between
accessions (Begum et al., 2013). The 8-labeled SSR markers employed in this study detected 97 alleles in 44 genotypes. The number of alleles for each locus ranged from 9 to 19, with a mean number of alleles per locus being 12.13. Observed heterozygosity (Ho) and expected heterozygosity (He) for each locus ranged from 0.364 to 0.674 and 0.693 to 0.889 respectively (Table 2). The data obtained is useful for working out the diversity and would help in choosing the parents for a hybridization programme. The high heterozygosity that is present in mango comes in the way of clearly pointing out the lineage of the existing naati varieties (indigenous).
Diversity Studies and Core CollectionIn a highly heterozygous crop like mango wherein large variability is observed for several traits, core collection becomes extremely important. The wider the range of choice a breeder will have in selecting the appropriate kind of diversity, the better will be the chances for his
Fig. 3. A dendrogram based on NJ method, summarizing the data on differentiation between 44 naati varieties according to microsatellite analysis1. TSAN4 2.TSAN6 3.TSAN 8 4.TBRLB 5.TBRN1 6.TBRD 7.TBRT 8.TBRN2 9.TBRBR10.TBRC 11.TSPN1 12.TSPN2 13.KRRN2 14.KSCN 15.KPSN1 16.KGCN1 17.KRRN3 18.RKRRN119.RKRRN2 20.RVRRN 3 21.RVRRN2 22.GGNK 23.GPJN 2 24.GSRN3 25.GSRN4 26.GSRRN5 27.GSRRN128.GSRRN2 29.THKSN 3 30.THMRM 31.THMRP 32.THKSRN2 33.THKSRN4 34.PKRN1 35.PKRN2 36.PKRNGB37.BVRRN1 38.BVRRN2 39.BVRRG 40.GKSRN1 41.GKSRN2 42.Totapuri 43.Neelum 44.Sindhura45.Chakkaraguthulu 46. Kalapadi 47.Khuddus 48.Atimadhuram 49.Alphonso
4744
4846
4543
4249
4021
4118
3819
311317
1523
348
314
27222433
2612
128
10220
737
1136
3929
3216
309
635
255
4
0.10
Indian J. Plant Genet. Resour. 28(1): 153–160 (2015)
Dinesh et al.158
Table 1. Fruit characteristics of the Naati mango varieties
S. No.
Local Name Code Name Fruit weight
(g)
Fruitlength (cm)
Fruit width(cm)
Fruit thickness
(cm)
Skin weight
(g)
Stone weight
(g)
TSS (°Brix)
Pulp (%)
Carotenoidsmg/100 g
1 Talapulapalle Sreeramulu Achari Naati 4 TSAN4 370.68 9.44 8.30 7.30 32.57 33.83 18.3 82.09 11.912 Talapulapalle Sreeramulu Achari Naati 6 TSAN6 201.82 8.84 6.90 5.96 34.68 38.28 18.98 63.85 -3 Talapulapalle Sreeramulu Achari Naati 8 TSAN 8 84.00 5.76 5.26 4.74 14.88 23.63 17.78 54.15 -4 Talapulapalle Babi Reddy Lalbaba TBRLB 268.09 8.90 7.66 6.90 63.05 32.57 16.8 64.33 6.995 Talapulapalle Babi Reddy Naati 1 TBRN1 542.00 14.83 9.80 7.68 33.73 52.7 26.08 84.05 -6 Talapulapalle Babi Reddy Dilpasand TBRD 302.70 11.28 7.66 6.36 42.48 41.65 18.46 72.21 6.857 Talapulapalle Babi Reddy Thorappadi Variant
2 TBRTV2 662.05 14.08 9.16 8.36 91.71 46.82 19.04 79.08 21.04
8 Talapulapalle Babi Reddy Naati 2 TBRN2 589.07 13.70 9.08 7.80 81.39 51.89 20.33 77.38 9.759 Talapulapalle Babi Reddy Bogam Rangasani TBRBR 369.32 10.34 7.82 7.10 50.85 52.07 20.32 72.13 4.5710 Talapulapalle Babi Reddy Chittithotha TBRC 327.68 11.10 7.84 6.94 46.54 44.53 17.83 72.21 5.8711 Talapulapalle Sreeramulu Pillai Naati 1 TSPN1 129.76 9.00 5.10 4.32 28.86 19.78 17.96 62.51 5.4612 Talapulapalle Sreeramulu Pillai Naati -2 TSPN2 396.98 10.52 8.56 7.62 44.25 43.08 16.1 78.00 4.9813 Kalepalle Rajendra Reddy Naati 2 KRRN2 238.43 8.52 7.00 6.48 42.43 25.07 18.82 71.69 15.114 Kalepalle Subramanyam Chetty Najoka KSCN 195.87 9.34 6.48 5.64 23.83 32.16 18.32 71.41 -15 Kalepalli P Subramanyam Naati 1 KPSN1 243.17 9.83 7.20 6.13 35.10 29.97 15.9 73.24 -16 Kalepalli P Govinda Chetty Naati 1 KGCN1 444.86 12.84 8.74 7.68 81.80 55.26 20.16 69.19 4.5417 Kalepalli Rajendra Reddy Naati 3 KRRN3 715.08 13.80 9.84 8.48 107.25 41.38 19.54 79.22 -18 P. Reddyvaripalle K Rajasekar Reddy Naati 1 RKRRN1 362.09 10.73 7.98 7.25 61.11 32.27 18.9 74.21 18.5119 P. Reddyvaripalle K Rajasekara Reddy Naati 2 RKRRN2 114.26 7.53 5.23 4.87 19.07 24.67 16.33 61.72 14.7820 P. Reddyvaripalli V Ramamoorthy Reddy
Naati 3 RVRRN 3 421.37 12.46 8.56 7.32 69.15 38.36 13.64 74.49 26.44
21 P. Reddyvaripalle V Ramamurthy Reddy Naati -2 RVRRN2 245.18 8.24 7.12 6.44 33.99 35.37 21.52 71.71 9.52
22 Gandlapalle K Gurappa Chetty Naati Khader GGCNK 214.01 8.66 6.44 5.76 33.73 34.07 18.74 68.32 10.7123 Gandlepalle P Jayachandra Reddy Naati 2 GPJN 2 187.13 8.74 6.32 5.60 23.94 26.05 20.24 73.28 -24 Gandlapalle Sreeramulu Reddy Naati 3 GSRN3 280.07 9.04 7.24 6.94 54.72 34.16 17.76 68.27 4.8925 Gandlepalle Sreeramulu Reddy Naati 4 GSRN4 393.25 13.00 7.64 6.98 37.00 27.37 18.58 83.63 -26 Gandlapalle Sreeramulu Reddy Naati 5 GSRRN5 148.08 10.10 5.74 4.16 23.99 23.1 17.26 68.2 8.1527 Gandlapalle Sreeramulu Reddy Naati 1 GSRRN1 157.84 7.86 6.44 5.34 45.68 37.48 15.28 47.32 2.7328 Gandlapalle Sreeramulu Reddy Naati 2 GSRRN2 178.23 10.00 5.83 5.23 26.84 27.18 13.9 69.69 7.529 Thumbavaripalle K. Subramanyam Reddy
Naati 3 THKSRN 3 128.24 8.42 5.52 4.60 15.24 14.21 21.32 77.04 5.5
30 Thumbavaripalle Munirathnam Reddy Manoranjitham THMRM 254.92 9.00 7.64 6.38 65.74 40.36 24.04 58.38 29.4
31 Thumbaripalle Munirathnam Reddy Punasa THMRP 188.69 7.70 6.65 6.20 40.30 21.66 20.68 67.17 11.2432 Thumbavaripalle K Subramanyam Reddy
Naati 1 THKSRN1 490.49 12.00 8.60 7.60 45.67 37.47 19.85 98.32 3.74
33 Thumbavaripalle K Subramanyam Reddy Naati 2 THKSRN2 148.72 8.35 6.00 4.90 38.00 27.06 21.15 56.25 4.44
34 Thumbavaripalle K Subramanyam Reddy Naati 4 THKSRN4 186.86 9.08 6.44 5.98 37.51 25.17 21.54 66.46 39.5
35 Palamakulapalle K Ravindranath Naati 1 PKRN1 414.04 9.93 9.00 7.70 66.39 52.62 12.88 71.26 23.1636 Palamakulapalle K Ravindranath Naati 2 PKRN2 549.51 14.87 8.40 7.80 117.22 82.19 13.73 63.71 12.9337 Palamakulapalle K Ravindranath Naati 3 PKRN3 274.19 8.25 7.85 7.00 35.92 43.72 18.05 70.96 8.6538 Palamakulapalle K Ravindranath Naati 4 PKRN4 168.86 7.55 6.45 5.95 31.45 27.17 18.6 65.29 -39 Palamakulapalle K Ravindranath Green
Baneshan PKRNGB 464.41 12.97 8.43 7.50 77.57 70.75 8.77 68.06 8.9940 Baitpalle V Ranga Reddy Naati 1 BVRRN1 530.73 11.63 9.10 7.98 80.57 47.01 14.08 75.96 5.6741 Baitpalle V Ranga Reddy Naati 2 BVRRN2 324.34 9.55 8.25 6.63 44.81 41.54 16.3 73.38 10.5142 Baitpalle V Ranga Reddy Gadiyaram BVRRG 422.51 12.08 7.88 7.20 52.95 56.75 13.93 74.2 -43 Gudipalle K Surendra Reddy Naati 1 GKSRN1 177.88 9.44 5.88 5.28 23.35 36.54 19.6 66.34 11.6344 Gudipalle K Surendra Reddy Naati 2 GKSRN2 344.38 10.72 8.18 7.06 65.24 44.7 20.66 68.08 6.3
Indian J. Plant Genet. Resour. 28(1): 153–160 (2015)
Genetic Diversity Studies in Certain Indigenous Mango (Mangifera indica L) Varieties 159
success for any particular goal. Earlier the breeders were content to go not much further for their material than the old landraces and varieties that were then available in their own countries or from neighbouring ones, but in the last 50 years or so, breeders are requiring a much wider range of genetic diversity (Paroda and Arora, 1991). As per Frankel and Soulé (1981), one of the methods of conservation is in the region of cultivation. The indigenous varieties are observed to have large diversity in most of the mango growing regions in India. However, maintaining everything in ex situ collection is extremely difficult due to the large area that is needed for maintenance. The diversity studies would help in identifying core collections that can represent the diversity of a particular region. This in turn help in identifying varieties for crossing and development of recombinants with desirable traits. The study very clearly points out that there is excellent scope for locating useful seedling diversity in mango and the varietal variability in a geographic region is the resultant of the present day commercial varieties in that particular region. The assessment of such diversity in the seedling population would help in locating genotypes with useful traits and also some of them can directly be popularized as a commercial variety. The real benefit sharing by the farmers would happen when these varieties are registered and further propagated. Further these varieties would also be conserved ‘on farm’ by the farmers in situ.
AcknowledgementsThis paper is the output of UNEP/GEF project “Conservation and Sustainable Use of Cultivated and Wild Tropical Fruit Diversity: Promoting Sustainable Livelihoods, Food Security and Ecosystem Services” implemented in 36 rural communities in India, Indonesia, Malaysia and Thailand. The project is coordinated regionally by Bioversity International with financing from the Global Environment Facility (GEF), and implementation support from United Nations Environment Programme (UNEP).
ReferencesAOAC (1995) Fruits and Fruit Products. In: Official Methods
of Analysis of AOAC InternationaI, 16th Ed., Vol. 1: Agricultural Chemicals; Contaminants; Drugs. Association of Official Analytical Chemists International, Arlington, Virginia, USA.
Begum H, MT Reddy, S Malathi, BP Reddy, J Narshimulu, Nagaraju, and Siddiqui EA (2013) Morphological and Microsatellite Analysis of Intravarietal Heterogeneity in ‘Beneshan’ Mango (Mangifera indica L). Int. J. Biotechnol. Res. Practice 1: 1‐18.
Dillon NL, ISE Bally, CL Wright, L Hucks, DJ Innes and RG Dietzgen (2013) Genetic diversity of the Australian Mango Genebank, Sci. Hort. 150: 213-226.
Duval MF, T Bunel, C Sithon and AM Risterruci (2005) Development of micro-sattelite markers for mango (Mangifera indica L.) Mol. Ecol. Notes 51824-826.
Frankel OH and ME Soulé (1981) Conservation and Evolution. Cambridge University Press. Cambridge.
Table 2. Characteristics of the 8 microsatellite markers with repeat motif, number of alleles, Observed Heterozygosity (Ho), Expected Heterozygosity (He) and Polymorphic Information Content (PIC)
Locus Primer (5'-3') Repeat motif Number of alleles
Allele size range (bp)
He Ho PIC
MiIIHR17 F: GCTTGCTTCCAACTGAGACCR: GCAAAATGCTCGGAGAAGAC
(GT)13 GAGT(GA)10 10 230-269 0.867 0.477 0.841
MiIIHR18 F: TCTGACGTCACCTCCTTTCAR: ATACTCGTGCCTCGTCCTGT
(GT)12 11 148-193 0.724 0.023 0.693
MiIIHR23 F: TCTGACCCAACAAAGAACCAR: TCCTCCTCGTCCTCATCATC
(GA)17GG(GA)6 13 117-156 0.693 0.409 0.667
MiIIHR26 F: GCGAAAGAGGAGAGTGCAAGR: TCTATAAGTGCCCCCTCACG
(GA)14GGA(GAA)2 19 127-171 0.889 0.523 0.869
MiIIHR30 F: AGCTATCGCCACAGCAAATCR: GTCTTCTTCTGGCTGCCAAC
(CT)13 11 190-213 0.857 0.674 0.831
MiIIHR31 F: TTCTGTTAGTGGCGGTGTTGR: CACCTCCTCCTCCTCCTCTT
(GAC)6 10 207-260 0.752 0.523 0.718
MiIIHR34 F: CTGAGTTTGGCAAGGGAGAGR: TTGATCCTTCACCACCATCA
(GGT)9(GAT)5 09 203-245 0.771 0.364 0.734
MiIIHR36 F: TCTATAAGTGCCCCCTCACGR: ACTGCCACCGTGGAAAGTAG
(TC)17 14 210-250 0.834 0.545 0.805

Indian J. Plant Genet. Resour. 28(1): 153–160 (2015)
Dinesh et al.160
Honsho C, K Nishiyama, W Eiadthong and K Yonemori (2005) Isolation and characterization of new microsatellite markers in mango (Mangifera indica). Mol. Ecol. Notes 5: 152-154.
Kalinowski ST, ML Taper and TC Marshall (2007) Revising how the computer program CERVUS accommodates genotyping error increases success in paternity assignment. Mol. Ecol. 16: 1099-1006.
Karibasappa GS, Nalawadi, GS Sulikeri and NC Hulmani (1999) Characterization of mango germplasm in North Karnataka, India: Cluster Analysis. Indian J. Plant Genet. Resour. 12: 341-347.
Karihaloo. JL, Dwivedi YK, Sunil A and Gaikwad AB (2003) Analysis of genetic diversity of Indian mango cultivars using RAPD markers. J. Hort. Sci. Biotechnol. 78:285–289.
Marcela DM, SG Ingrid, RGE, Manuel and H Jaramillo (2009) Analysis of diversity among six populations of Colombian mango (Mangifera indica L. cv. Hilacha) using RAPDs markers. Electronic J. Biotechnol. 12:1-6.
Mukherjee SK (1953) The mango – its botany, cultivation, uses and future improvement, especially as observed in India. Econ. Bot. 7: 130–162.
Nagabhushanam S and PA Mathew (1994) Promising cultivars for Goa. Indian Hort. 42–45.
Pandit SS, S Mitra, AP Giri, KH Pujari, BP Patil, ND Jambhale and VS Gupta (2007) Genetic diversity of mango cultivars using inter simple sequence repeat markers. Curr. Sci. 93: 1135–1141.
Paroda RS and RK Arora (1991) Plant Genetic Resources: General Perspective. In Plant Genetic Resources Conservation and Management Concepts and Approaches .International Board for Plant Genetic Resources, Regional Office for South and Southeast Asia, New Delhi-110012, India.
Perrier X, A Flori and F Bonnot (2003) Data analysis methods. In: Hamon P, Seguin M, Perrier X, Glaszmann JC (ed). Genetic diversity of cultivated tropical plants. Montpellier (France): Enfield, Science Publishers 43-76.
Perrier X and JP Jacquemoud-Collet (2006) DARwin software.http://darwin.cirad.fr/.
Rajwana IA, N Tabbasam, AU Malik, S Malik, A Rahman and Y Zafar (2008) Assessment of genetic diversity among mango
(Mangifera indica L.) genotypes using RAPD markers. Sci. Hort. 117: 297-301.
Ravishankar KV, Mani, BHR, Anand L and Dinesh MR (2011) Development of new microsatellite markers from mango (Mangifera indica) and cross-species amplification. Am. J. Bot. 98, e96–e99.
Ravishankar KV, L Anand and MR Dinesh (2000) Assessment of genetic relatedness among a few Indian mango cultivars using RAPD markers. J. Hort. Sci. Biotechnol. 75: 198-201.
Sagar SP, M Sirsha, PG Ashok, HP Keshav, PP Bhimarao, DJ Narayan and SG Vidya (2007) Genetic diversity analysis of mango cultivars using inter simple sequence repeat markers. Curr. Sci. 93: 135–1141.
Schnell RJ, CT Olano, WE Quintanilla and W Meerow (2005) Isolation and characterization of 15 microsatellite mango (Mangifera indica L.) and cross-species amplification in closely related taxa. Mol. Ecol. Notes 5: 625–627.
Schnell RJ, CT Olano, WE Quintanilla and W Meerow (2005) Mango genetic diversity analysis and pedigree inferences for Florida cultivars using microsatellite markers. J. Am. Soc. Hort. Sci. 131: 1-11.
Schuelke M (2000) An economic method for the fluorescent labeled of PCR fragment. Nature Biotechnol. 18: 233-234.
Teaotia SS and RP Srivastava (1979) Study of some important commercial varieties of mango of eastern Uttar Pradesh. Indian J. Hort. 18: 65-79.
Vasugi C, MR Dinesh, K Sekar, KS Shivashankara, B Padmakar and KV Ravishankar (2012) Genetic diversity in unique indigenous mango accessions (Appemidi) of the Western Ghats for certain fruit characteristics. Curr. Sci.103:199-207.
Yadav IS and Rajan S (1993) Genetic Resources of Mango. Adv. Hort. 1: 77-93.
Yamanka N, M Hasran, DH Xu, H Tsunematsu, S Idris and T Ban (2006) Genetic relationship and diversity of four Mangifera species revealed through AFLP analysis. Genet. Resour. Crop Evol. 53: 949-954.
Valdomiro Aurélio BDS and SDC Paulo (2004) Genetic variability in mango genotypes detected by RAPD markers Acta Hort. 645: 303-310.