efficiency analysis of organic mango (mangifera indica) outgrowerout-grower farm management types:...
TRANSCRIPT
Efficiency Analysis of Organic Mango (MangiferaIndica) OutgrowerOut-grower Farm Management Types:The Case of Integrated Tamale Fruit Company (ITFC)OutgrowerOut-growers in Northern Region
Mr. Bunbom Edward Daadi*, Joeseph Amikusunu Joseph Amikuzunu(PhD) and Mr. Issahaku Gazali
Department of Climate Change and Food Security (CCFS),University for Development Studies, Tamale, Ghana
Corresponding Authors: Email: [email protected] Tel: +233 206204990Email: [email protected]: +233 244 818174
AbstractTo improve farmers’ income from production, farm resourceshave to be applied efficiently. This study estimated andassessed differences in technical and input-use of the twofarm management types (group management and individualmanagement). Data was obtained from a random sample of 204out-growers through the use of structured questionnaire. Atranscendental logarithmic (translog) stochastic productionfrontier was employed using the maximum likelihood method,from which farm-specific technical efficiency wascalculated. Average production response function was alsoestimated and used to derive allocative efficiency ratiosfor the inputs. The result shows that farmers underindividual farm management are about 42%, more technicallyefficient than those under group farm management. The groupmanaged farms are less technically efficient because, femalefarmers found among them are not efficient, lack of
1
commitment to managing farms and too large groups forleaders to effectively control. In puts are inefficientlyallocated, thus farmers under both management types need toincrease their investment in weeding and reduce pesticideuse. Education/training of out-growers, aimed at addressingspecific needs are required to improve both technical andallocative efficiency, while frequent farm demonstrations,breaking large groups into smaller ones and strategic shiftfrom group to individual plantations are some of the ways toimproving technical efficiency.
Key words: Integrated Tamale Fruit Company, Technical efficiency, farm management type, mango out-growers.
1. Introduction
Mango production in the Northern Region has been recognized
as a way of fighting poverty in the area and has
consequently gained the attention of government as
reflecting reflected in the strategies of the Food and
Agriculture Sector Development Plan (FASDEP). The plan
identified mango as a crop to focus on in the Northern
region Region due to agro-ecological suitability.
Responsibility for implementation of policy programmes does
not rest on government alone. Indeed, government can play
only facilitating and coordinating roles in this pursuit.
2
Success will depend largely on multi-stakeholder efforts
whereby the private sector is expected to play some crucial
roles, including making or financing investment in the
sector and opening market channels for access by less
privileged farmers (MoFA, 2007).
The Integrated Tamale Fruit Company (ITFC) is one of such
organizations that are is actively playing the expected
roles of the private sector in the Northern Region. This
company is able to produce and export high quality grade
mangoes from inaccessible areas, . which This means that
further development is possible if transportation networks
improve. (USAID/TIPCEE, 2009).
ITFC has been assisting subsistence farmers to cultivate
mango since 2001 in the communities surrounding its nucleus
farms, through an out-growers scheme. ITFC sees the
outgrowerout-grower scheme as a way of getting the required
volumes to enable it command a higher degree of market power
in the organic mango export markets, as well as accessing3
greater productive capacity and reducing average cost of
operations.
While pursuing their corporate objectives, they also support
the poverty reduction goal of the Government of Ghana by
providing the local people with sustainable income
generating ventures throughlivelihoods through the
establishment of organic mango farms (UNDP, 2007). In an
attempt to balance the need to contribute towards poverty
reduction among rural farmers and meeting international
market requirements, ITFC developed its outgrowerout-grower
mango production scheme scheme(UNDP, 2007),. which This
scheme consists of two types of farm management
organization: the individually managed and the group managed
mango farms. Under the individual management system farms of
limited size (0.4- 4 hectares) are owned by a single farming
household whose head is registered by ITFC as a farmer. and
a Farm farm business account is created in the name of the
farmer. Group managed farms on the other hand, range from 2
to over 40 hectares and are owned by a number of farming
4
households that form a group. The group has a leadership
made up of a chairman, secretary and treasurer. The farm is
divided among registered group members in 0.4 hectare lots.
Like in the case of individual farm management however, an
individual account is created by ITFC in the name of each
member.
In collaboration with bilateral donors, ITFC has financed
the establishment of farms under both types of management.
Outputs from farms of both systems appear satisfactory and
farmers have earned significant levels of income well over
their previous earnings (UNDP, 2007). However, there remain
some unanswered questions about the income earning
potentials of the farmers under the outgrowerout-grower
scheme. These include whether maximum possible outputs are
obtained with given levels of inputs and which farm
management type is more efficient and thus contributes more
towards the goal of improving incomes of rural people in
Northern Region. ITFC cannot answer these questions from
empirical evidence. It is against this background that the
5
study seeks to quantify technical and allocative efficiency
levels of farmers under each farm management system so as to
estimate losses that can be attributed to socio-economic and
management characteristics. The main objective of the study
is to analyze the efficiency of organic mango outgrowerout-
grower farm management types operated by ITFC. The specific
objectives are to:
1. Estimate and compare technical efficiency (TE) levels of
outgrowerout-growers under the two farm management types.
2. Identify and quantify the socio-economic/management
attributes of farm/farmers that influence technical
efficiency of the outgrowerout-growers.
3. Estimate input use allocative efficiency of outgrowerout-
growers under the two farm management types.
2. Productivity and Efficiency
Production involves converting a given sets of inputs into
output(s) and thereforeoutput. Therefore, the amount of
output obtained at the end of any production process depends6
on the amount of inputs applied and how these inputs are
combined. While the level of input set gives scale effect
(Coelli, 2005), inputs coordination determines how effective
input-to-output conversion will be, considering physical
quantities, values or both (Han, 1991). The combination of
scale and input coordination (quantities and values) effects
on output is referred to as productivity. It is defined,
simply, as the ratio of output to input or input to output
(Sartorius and Kirsten, 2004).
Productivity is a function of three elements: technical
efficiency, scale efficiency and allocation efficiency,
measurements of which are typically concerned with
profitability of decision-making units (Livio and Massimo,
2002). Performance indicators that are often considered
under productivity are cost per unit output, output per
hour, and output per area (Horngren et al., 1999). In
finance, measures of productivity include earnings per share
(EPS), return on investment (ROI), economic value added
7
(EVA) and cash flow return on investment (Ittner and
Larcker, 1998).
A closely related and more specific concept to productivity
in production analysis is the concept of efficiency, which
does not only examine output from a given input, but further
compares the output to what can be achieved with the given
input set.
According to Heyne (2008), economists view efficiency as a
relationship between ends and means and when they say a
situation is inefficient, it implies they could achieve the
desired ends with less means, or the means employed could
produce more of the ends desired, whereby “less” and “more”
necessarily refer to value. Meaning, economic efficiency is
measured by the relationship between the value of the ends
and the value of the means rather than physical quantities.
Efficiency is, therefore, a measure of how well the
production or input transformation process is performing. It
indicates how well an organization uses its resources to
8
produce goods and services. Thus, it focuses on resources
(inputs), goods (outputs), and the rates (productivity) at
which inputs are used to produce or deliver the outputs
(OAG, 2007). This statement seems to define efficiency more
empirically than just a relationship as Heyne (2008) does.
Farell (1957)’s work on the measurement of productivity
efficiency which proposed three components of a firm’s
efficiency resulted in better understanding of the concept
of efficiency. These are technical, allocative and economic
efficiencies.
3. Technical Efficiency
In terms of output, technical efficiency (TE) is measured as
a ratio of realized output(Y) to the potential output(Y*)
from a given set of inputs. It is generally assumed that the
potential output is obtained by following the best practice
methods, given a technology (Karagiannis, 2009) which
defines a production frontier. Generally, the production
frontier is specified as below;
9
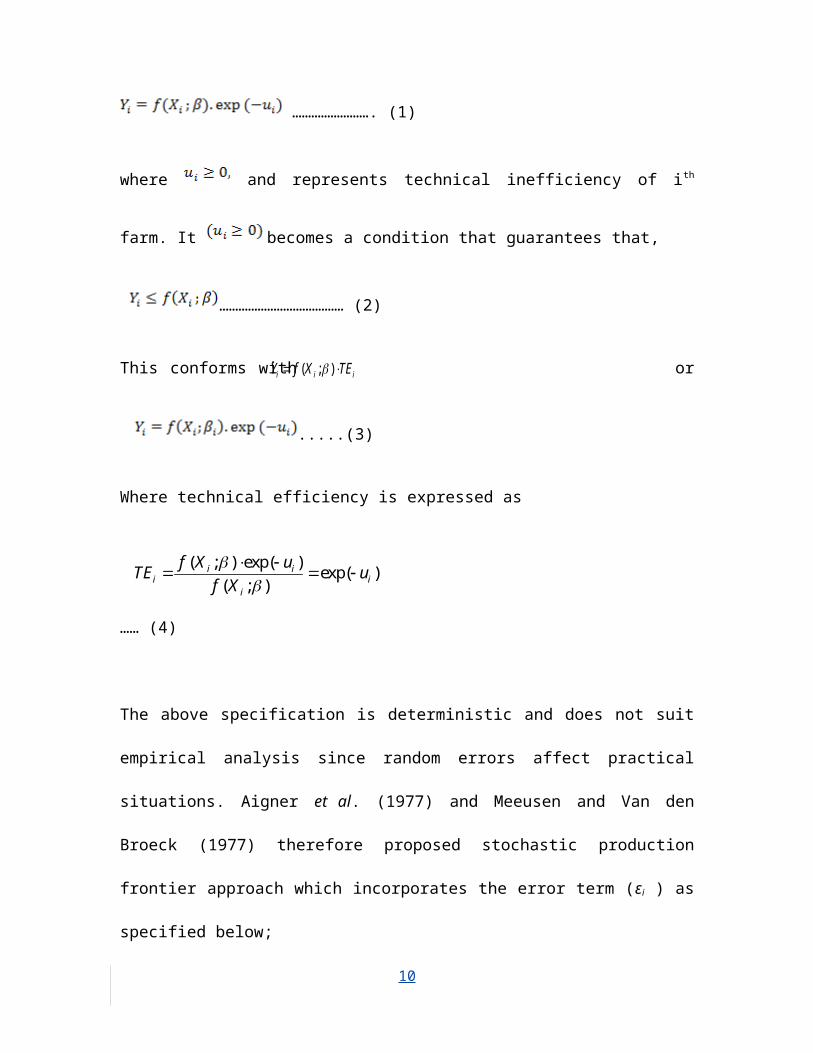
……………………. (1)
where and represents technical inefficiency of ith
farm. It becomes a condition that guarantees that,
………………………………… (2)
This conforms with or
.....(3)
Where technical efficiency is expressed as
…… (4)
The above specification is deterministic and does not suit
empirical analysis since random errors affect practical
situations. Aigner et al. (1977) and Meeusen and Van den
Broeck (1977) therefore proposed stochastic production
frontier approach which incorporates the error term (εi ) as
specified below;
10
( ; )i i iY f X TE
( ; ) exp( ) exp( )( ; )i i
i ii
f X uTE uf X
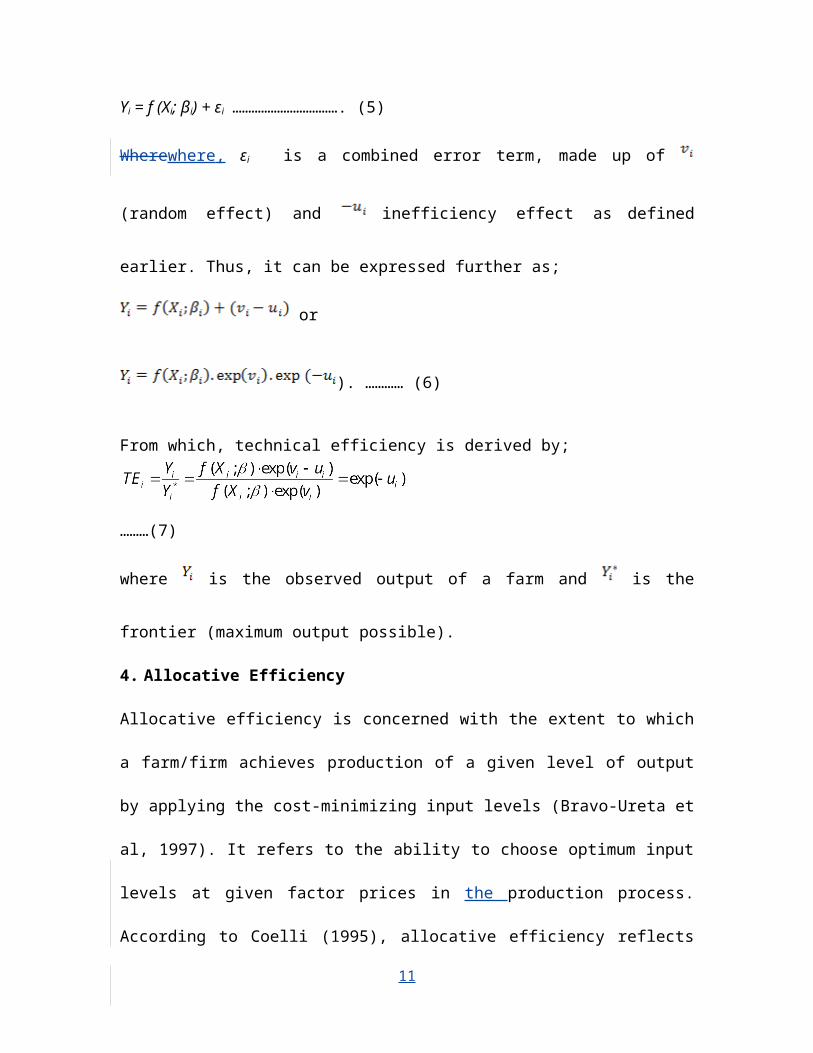
Yi = f (Xi; βi) + εi ……………………………. (5)
Wherewhere, εi is a combined error term, made up of
(random effect) and inefficiency effect as defined
earlier. Thus, it can be expressed further as;
or
). ………… (6)
From which, technical efficiency is derived by;
………(7)
where is the observed output of a farm and is the
frontier (maximum output possible).
4. Allocative Efficiency
Allocative efficiency is concerned with the extent to which
a farm/firm achieves production of a given level of output
by applying the cost-minimizing input levels (Bravo-Ureta et
al, 1997). It refers to the ability to choose optimum input
levels at given factor prices in the production process.
According to Coelli (1995), allocative efficiency reflects
11
the ability of a firm to use inputs in optimal proportions,
given their prices. Kopp and Diewert (1982) measured
allocative efficiency as the ratio of economically efficient
cost to technically efficient cost.
Empirically, two measures of allocative efficiency are being
assessed in efficiency literature. These are firm-specific
allocative efficiency for all inputs by a firm and input-use
allocative efficiency among firms under consideration.
The former is determined by estimating a minimum cost
frontier for a set of data from which the efficiency
estimate for each farm is derived. Estimates obtained this
way are said to contain technical efficiency elements, thus
Coelli (2005) calls them cost efficiency estimates instead
of allocative. Again, some authorities researchers think
such estimates are bias and should not be combined with
estimated TE estimated through the procedure above to
produce economic efficiency, unless Cobb-Douglas production
12
and cost functions are appropriate for the data set (Bravo-
Ureta and Pinheiro, 1997).
For Regarding the latter, In this case, for an input to be
efficiently allocated in a production process, it must be
employed at a level at which the marginal value product
(MVP) is equal to marginal factor cost (Barnett, 2004; Al-
hassan, 2004; Oluwatayo et al., 2008 and Omonona et al.,
2010). Input-use allocative efficiency estimates are
therefore traditionally obtained by estimating a production
function (average) for the data using OLS. The estimated
average production function of farms under consideration is
subjected to marginal analysis to obtain factor elasticities
(E) and marginal physical products (MPPs). MPP is derived
from the production function by; first, taking the
derivative (E) with respect to the input. It is then
multiplied by the ratio of average output to average input.
The MVP is the product of MPP and output price (Py). If the
price (a unit cost) of the input known as Marginal Factor
Cost (MFC) is provided, an index (R) for determining
13
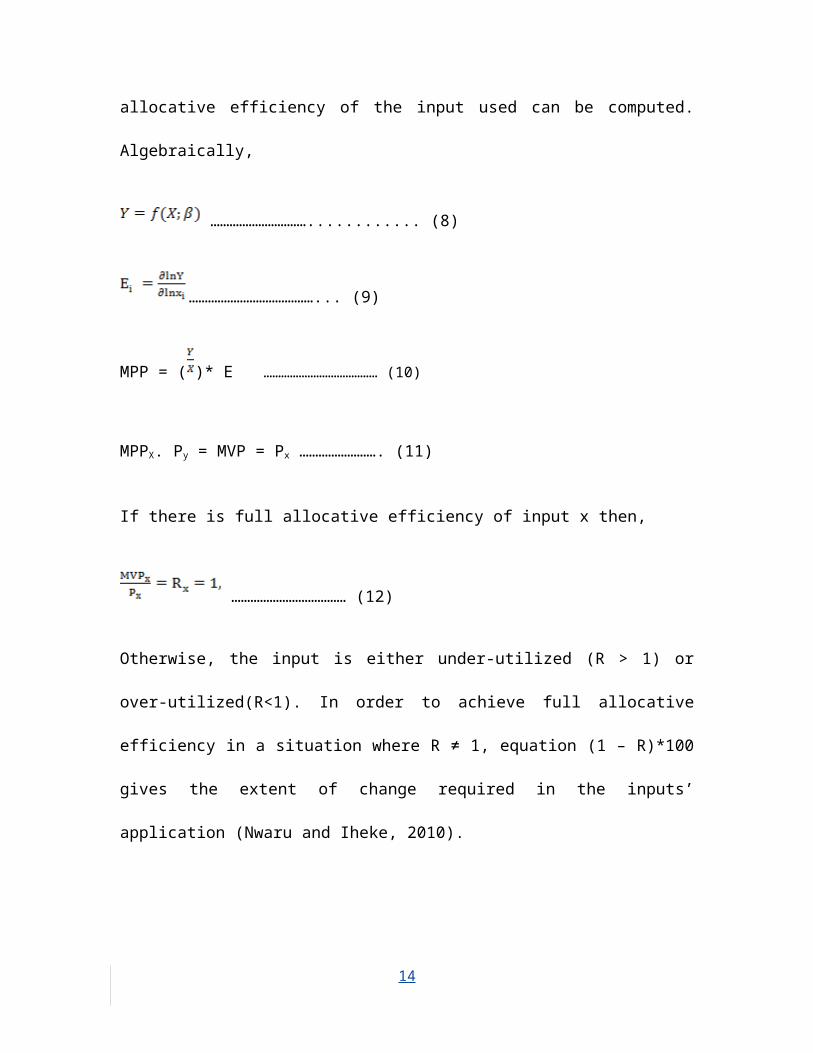
allocative efficiency of the input used can be computed.
Algebraically,
…………………………............ (8)
…………………………………... (9)
MPP = ( )* E ………………………………… (10)
MPPX. Py = MVP = Px ……………………. (11)
If there is full allocative efficiency of input x then,
……………………………… (12)
Otherwise, the input is either under-utilized (R > 1) or
over-utilized(R<1). In order to achieve full allocative
efficiency in a situation where R ≠ 1, equation (1 – R)*100
gives the extent of change required in the inputs’
application (Nwaru and Iheke, 2010).
14
In this study, because there was interaction between inputs
and their cross terms (suggesting that C-D frontier function
is not appropriate for the data) and there was the need to
avoid subjecting the estimates of the study to
methodological dispute pointed out above, the latter
approach to estimating allocative efficiency was adopted.
Though deterministic, applying this approach on a stochastic
average production function places the resultant allacative
allocative efficiency estimates between deterministic and
stochastic estimates.
5. Methodology
5.1 Study Area
The study covered the operational area of ITFC which
includes Savelugu-Nanton, Tolon-Kumbungu, West Manprusi
Mamprusi and Karaga districts of the Northern Region.
5.2. Sampling Procedure and Size
The sample was drawn from a total population of 1400 organic
mango outgrowerout-growers with some owning infant
15
plantations. A list of all the farmers obtained from the
scheme management was used as the sampling frame to draw the
sample. This was stratified into group managed and
individual managed farms after which, simple random sampling
procedure was used to obtain a representative sample from
group outgrowerout-growers, whilst a census of the
individual outgrowerout-growers was employed because their
number was small (53 outgrowerout-growers).
Sample size was determined based on a categorical variable
(Farm management type) since that gives a larger sample size
than if it is based on a continuous variable when the margin
of error and alpha level are set at 5% and 0.05 respectively
(Bartlett, 2001). Therefore the proportions of the
outgrowerout-grower categories (number of outgrowerout-
growers under each farm management type) in the
outgrowerout-grower population were determined from the list
of outgrowerout-growers and used to evaluate sample size
determination formula below.
N = t2 (p) (q)/d2 ………………………………. (13)
16
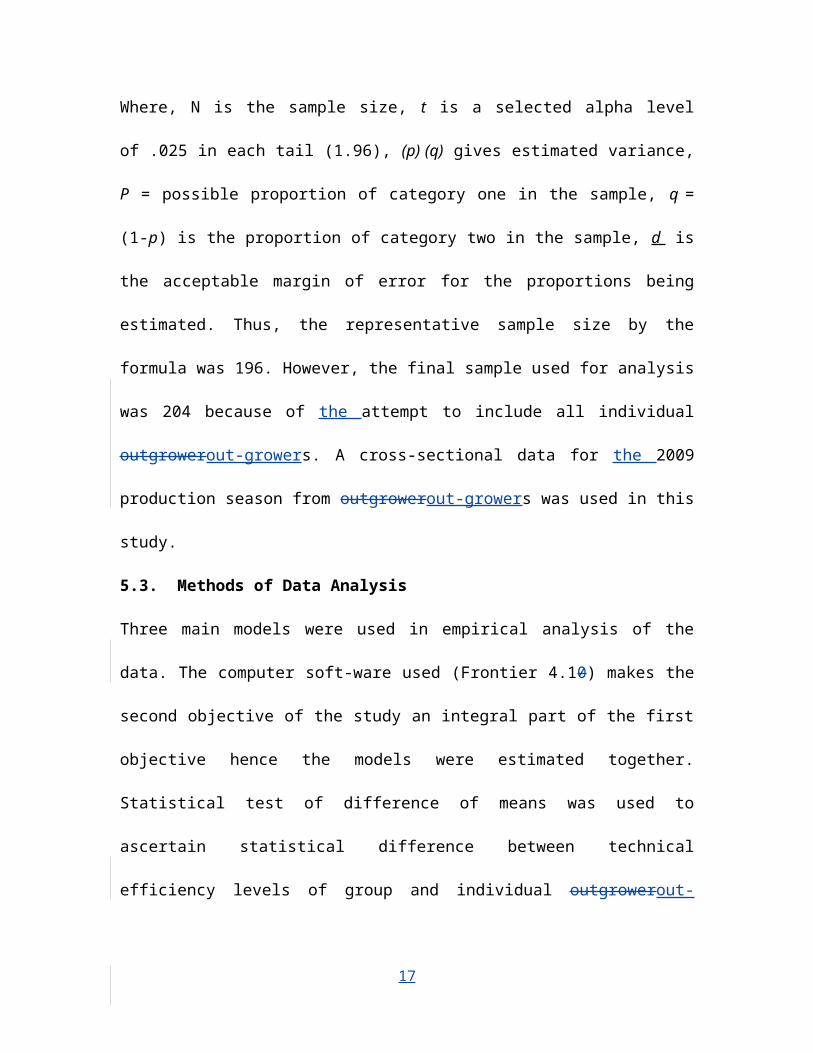
Where, N is the sample size, t is a selected alpha level
of .025 in each tail (1.96), (p) (q) gives estimated variance,
P = possible proportion of category one in the sample, q =
(1-p) is the proportion of category two in the sample, d is
the acceptable margin of error for the proportions being
estimated. Thus, the representative sample size by the
formula was 196. However, the final sample used for analysis
was 204 because of the attempt to include all individual
outgrowerout-growers. A cross-sectional data for the 2009
production season from outgrowerout-growers was used in this
study.
5.3. Methods of Data Analysis
Three main models were used in empirical analysis of the
data. The computer soft-ware used (Frontier 4.10) makes the
second objective of the study an integral part of the first
objective hence the models were estimated together.
Statistical test of difference of means was used to
ascertain statistical difference between technical
efficiency levels of group and individual outgrowerout-
17
growers. Analytical methods used to achieve the objectives
are presented below.
5.4. Empirical Specification of Technical Efficiency Model
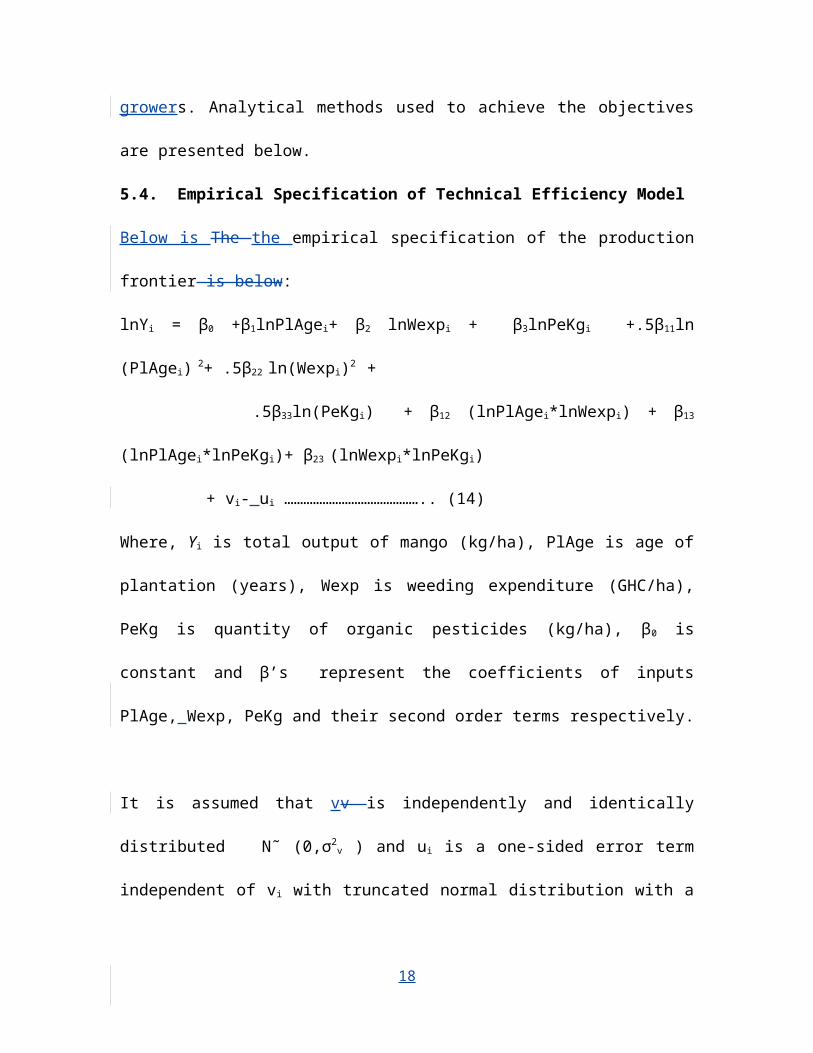
Below is The the empirical specification of the production
frontier is below:
lnYi = β0 +β1lnPlAgei+ β2 lnWexpi + β3lnPeKgi +.5β11ln
(PlAgei) 2+ .5β22 ln(Wexpi)2 +
.5β33ln(PeKgi) + β12 (lnPlAgei*lnWexpi) + β13
(lnPlAgei*lnPeKgi)+ β23 (lnWexpi*lnPeKgi)
+ vi- ui …………………………………….. (14)
Where, Yi is total output of mango (kg/ha), PlAge is age of
plantation (years), Wexp is weeding expenditure (GHC/ha),
PeKg is quantity of organic pesticides (kg/ha), β0 is
constant and β’s represent the coefficients of inputs
PlAge, Wexp, PeKg and their second order terms respectively.
It is assumed that vv is independently and identically
distributed N῀ (0,σ2v ) and ui is a one-sided error term
independent of vi with truncated normal distribution with a
18
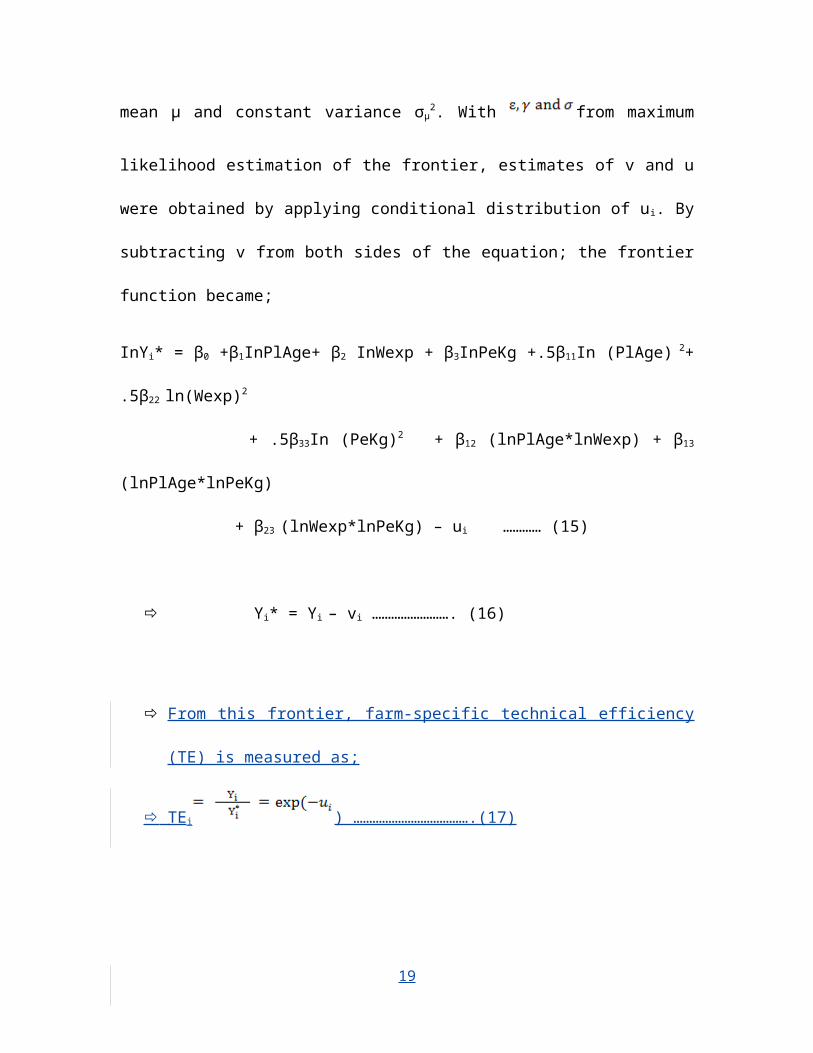
mean μ and constant variance σμ2. With from maximum
likelihood estimation of the frontier, estimates of v and u
were obtained by applying conditional distribution of ui. By
subtracting v from both sides of the equation; the frontier
function became;
InYi* = β0 +β1InPlAge+ β2 InWexp + β3InPeKg +.5β11In (PlAge) 2+
.5β22 ln(Wexp)2
+ .5β33In (PeKg)2 + β12 (lnPlAge*lnWexp) + β13
(lnPlAge*lnPeKg)
+ β23 (lnWexp*lnPeKg) – ui ………… (15)
Yi* = Yi – vi ……………………. (16)
From this frontier, farm-specific technical efficiency
(TE) is measured as;
TEi ) ……………………………….(17)
19
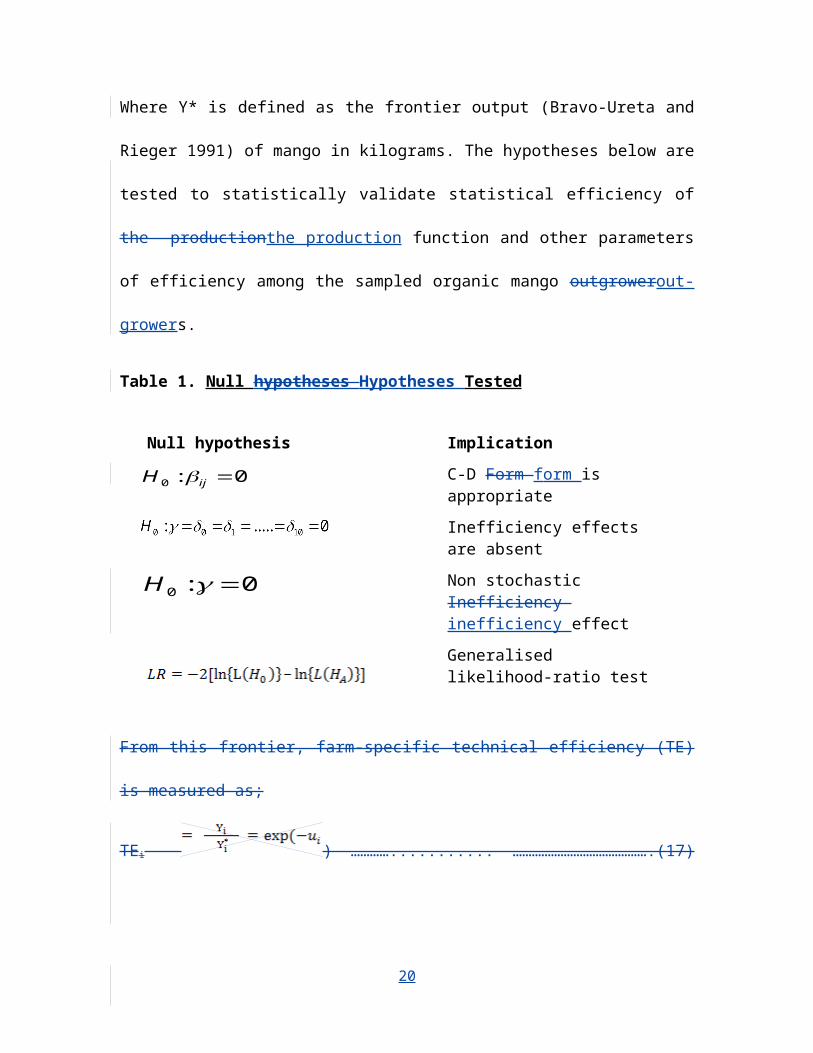
Where Y* is defined as the frontier output (Bravo-Ureta and
Rieger 1991) of mango in kilograms. The hypotheses below are
tested to statistically validate statistical efficiency of
the productionthe production function and other parameters
of efficiency among the sampled organic mango outgrowerout-
growers.
Table 1. Null hypotheses Hypotheses Tested
Null hypothesis ImplicationC-D Form form is appropriateInefficiency effects are absentNon stochastic Inefficiency inefficiency effectGeneralised likelihood-ratio test
From this frontier, farm-specific technical efficiency (TE)
is measured as;
TEi ) …………........... …………………………………….(17)
20
0 : 0ijH
0 : 0H
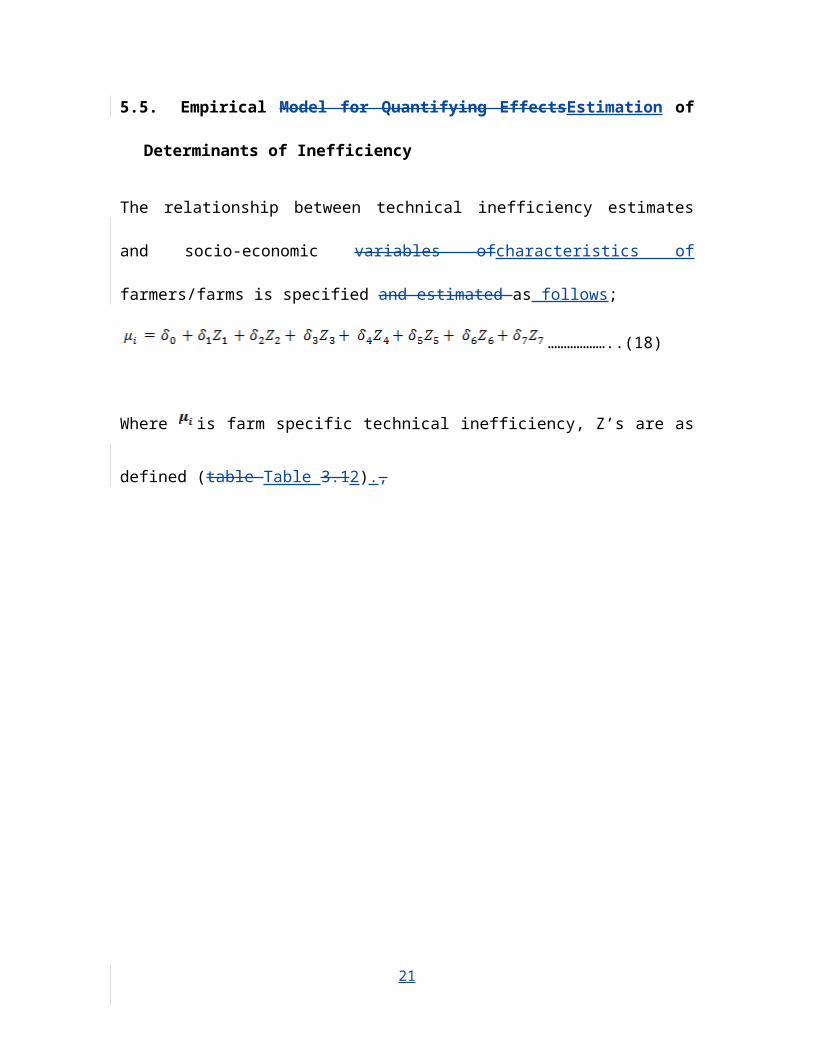
5.5. Empirical Model for Quantifying EffectsEstimation of
Determinants of Inefficiency
The relationship between technical inefficiency estimates
and socio-economic variables ofcharacteristics of
farmers/farms is specified and estimated as follows;
………………..(18)
Where is farm specific technical inefficiency, Z’s are as
defined (table Table 3.12).,
21
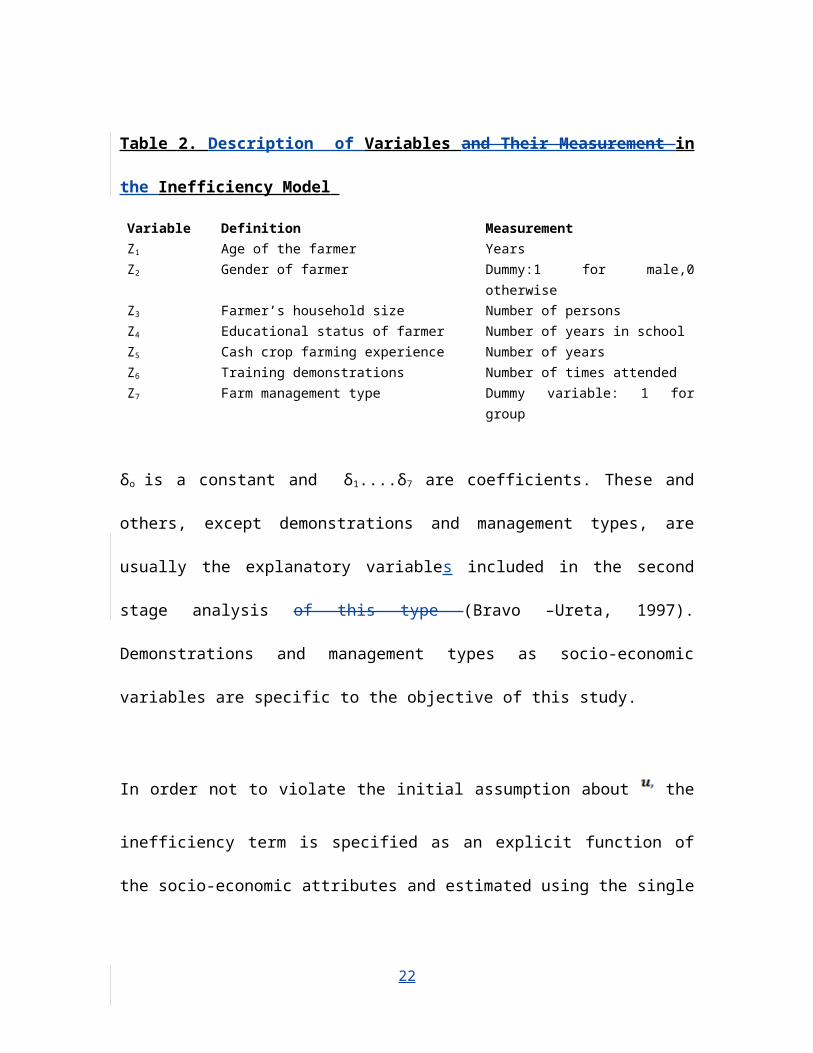
Table 2. Description of Variables and Their Measurement in
the Inefficiency Model
Variable Definition MeasurementZ1 Age of the farmer YearsZ2 Gender of farmer Dummy:1 for male,0
otherwiseZ3 Farmer’s household size Number of personsZ4 Educational status of farmer Number of years in schoolZ5 Cash crop farming experience Number of yearsZ6 Training demonstrations Number of times attendedZ7 Farm management type Dummy variable: 1 for
group
δo is a constant and δ1....δ7 are coefficients. These and
others, except demonstrations and management types, are
usually the explanatory variables included in the second
stage analysis of this type (Bravo –Ureta, 1997).
Demonstrations and management types as socio-economic
variables are specific to the objective of this study.
In order not to violate the initial assumption about the
inefficiency term is specified as an explicit function of
the socio-economic attributes and estimated using the single
22
stage estimation procedure specified by Coelli et al.
(1995).
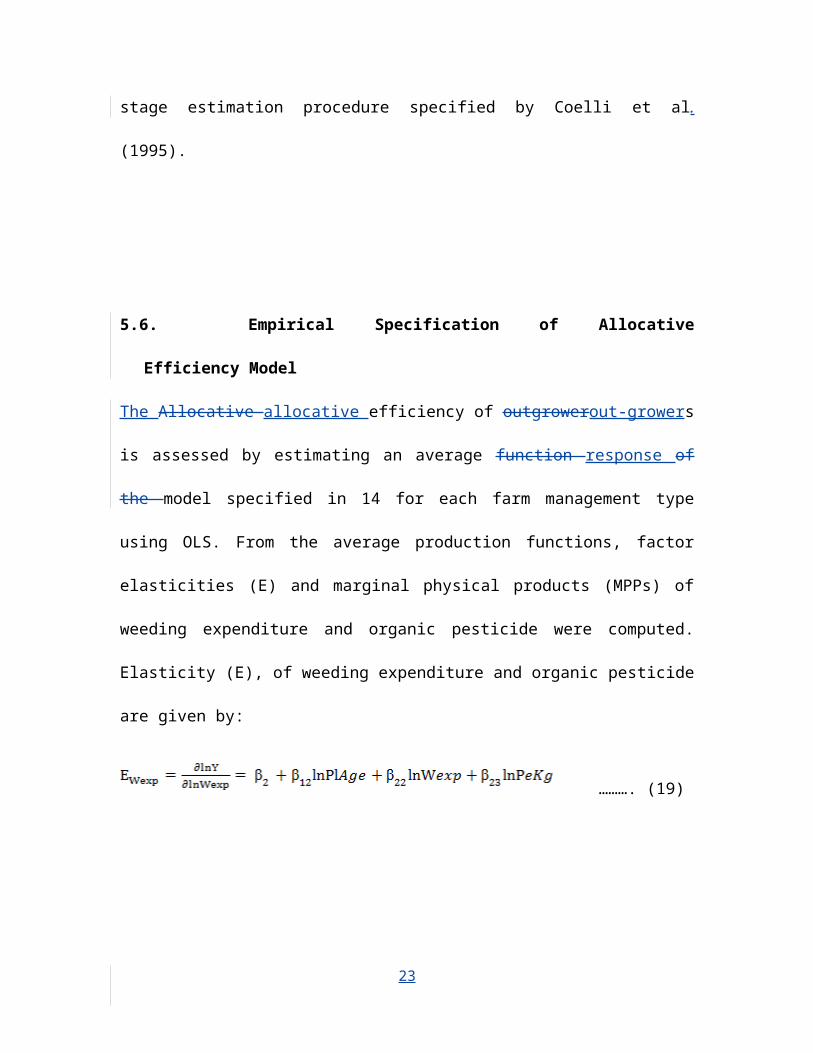
5.6. Empirical Specification of Allocative
Efficiency Model
The Allocative allocative efficiency of outgrowerout-growers
is assessed by estimating an average function response of
the model specified in 14 for each farm management type
using OLS. From the average production functions, factor
elasticities (E) and marginal physical products (MPPs) of
weeding expenditure and organic pesticide were computed.
Elasticity (E), of weeding expenditure and organic pesticide
are given by:
………. (19)
23
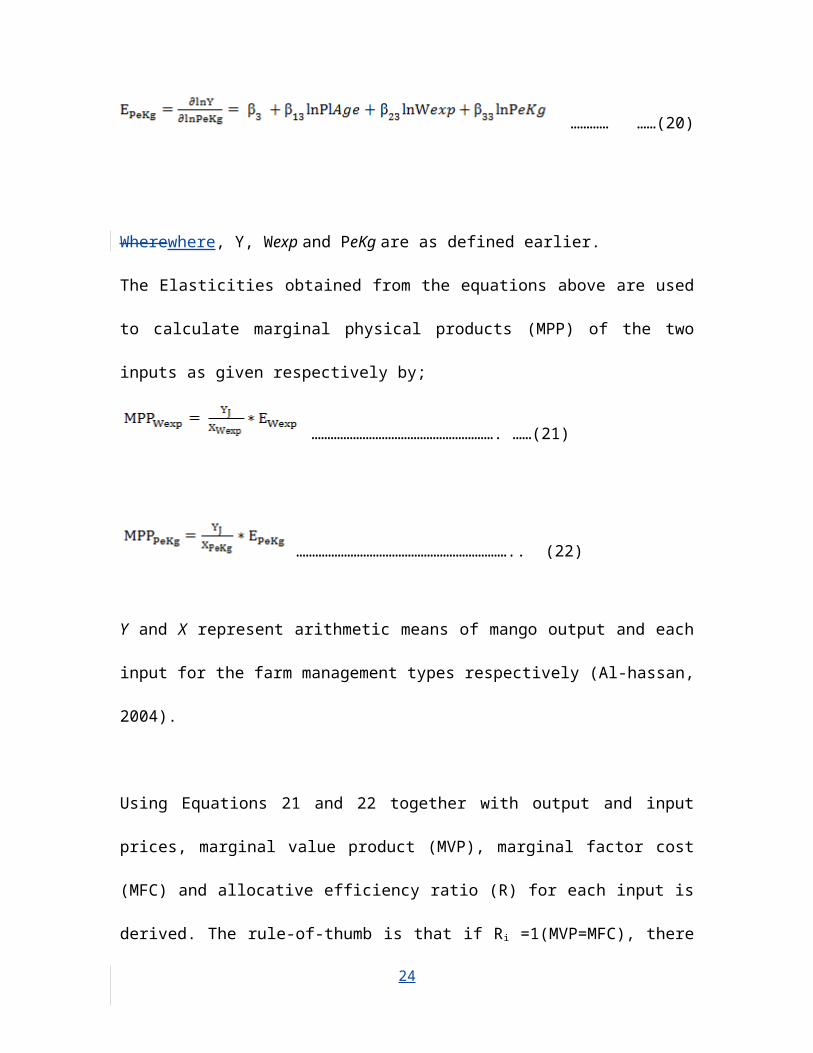
………… ……(20)
Wherewhere, Y, Wexp and PeKg are as defined earlier.
The Elasticities obtained from the equations above are used
to calculate marginal physical products (MPP) of the two
inputs as given respectively by;
…………………………………………………. ……(21)
………………………………………………………….. (22)
Y and X represent arithmetic means of mango output and each
input for the farm management types respectively (Al-hassan,
2004).
Using Equations 21 and 22 together with output and input
prices, marginal value product (MVP), marginal factor cost
(MFC) and allocative efficiency ratio (R) for each input is
derived. The rule-of-thumb is that if Ri =1(MVP=MFC), there
24
is full allocative efficient efficiency for input i, Ri >
1=> input i is underutilized and Ri< 1=> over utilization of
ith input is applied. Input utilization indices (Rs) are
tested by the t-test to evaluate whether they are
statistically different from one. The extent to which
outgrowerout-growers need to change the utilization of the
inputs in question so that full allocative efficiency is
achieved is evaluated by the formula below.
………………………………………………………………..(23) Where is the
extent of change required, is the allocative efficiency
ratio of input i for jth farm management type.
6. Result and Discussion
6.1 Summary Statistics
Table 3 reports the summary of socio-economic attributes,
farm characteristics and levels of some inputs. The mean
ages of for the group and individual outgrowerout-growers
are 43 and 44 years respectively. These are not
statistically different, hence an average outgrowerout-
25
grower is middle aged. There is also no statistical
difference between mean household sizes of outgrowerout-
growers of for twothe two the farm management types. The
average number of persons per household is 6, for both
groups.
Level of formal education attained by outgrowerout-growers
is generally low depicting high illiteracy situation in
rural Northern Region. An average group outgrowerout-grower
had only two years of formal schooling, one year
statistically less than an individual outgrowerout-grower.
Therefore, the highest level of formal education attained by
an outgrowerout-grower is lower primary school.
On the average, an organic mango outgrowerout-grower under
ITFC project have has about two decades of experience in
farming cash crops like cotton, soya bean through farm
credit programs. However, the experience was solely in the
production of the annual cash crops mentioned until the
beginning of ITFC’s programme in 2001.
26
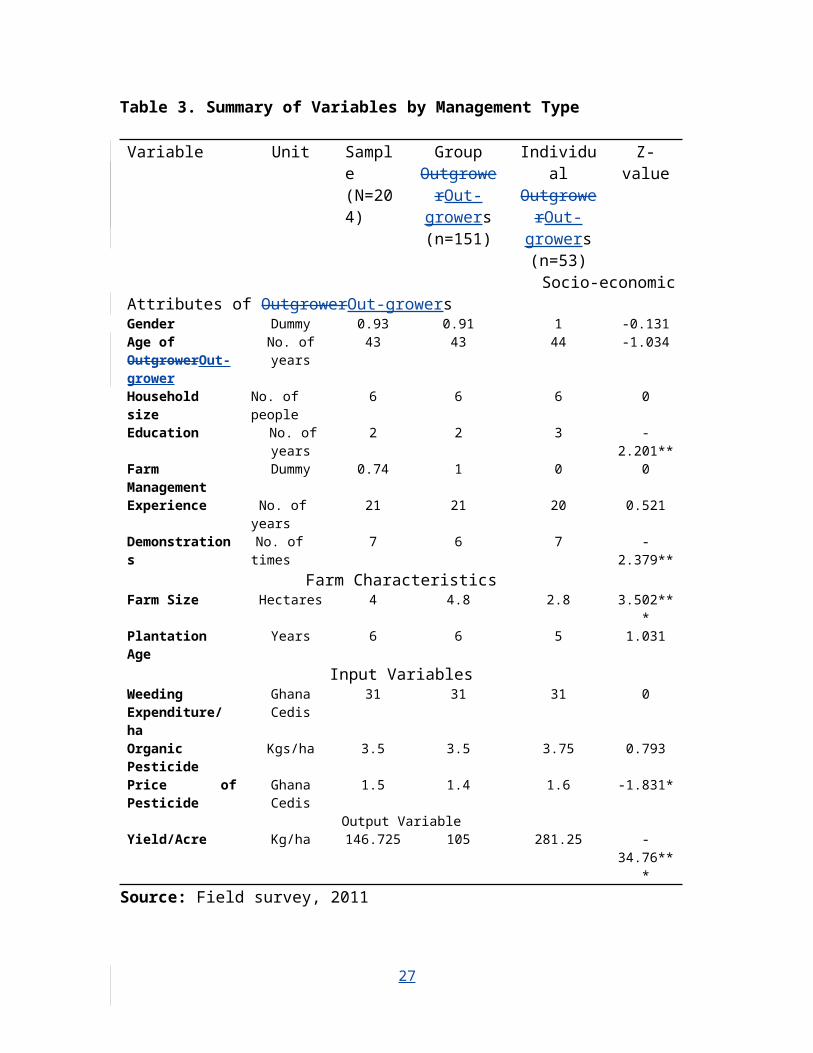
Table 3. Summary of Variables by Management Type
Variable Unit Sample(N=204)
GroupOutgrowerOut-
growers(n=151)
Individual
OutgrowerOut-growers(n=53)
Z-value
Socio-economicAttributes of OutgrowerOut-growersGender Dummy 0.93 0.91 1 -0.131Age of OutgrowerOut-grower
No. ofyears
43 43 44 -1.034
Householdsize
No. of people
6 6 6 0
Education No. ofyears
2 2 3 -2.201**
FarmManagement
Dummy 0.74 1 0 0
Experience No. of years
21 21 20 0.521
Demonstrations
No. of times
7 6 7 -2.379**
Farm CharacteristicsFarm Size Hectares 4 4.8 2.8 3.502**
*PlantationAge
Years 6 6 5 1.031
Input VariablesWeedingExpenditure/ha
GhanaCedis
31 31 31 0
OrganicPesticide
Kgs/ha 3.5 3.5 3.75 0.793
Price ofPesticide
GhanaCedis
1.5 1.4 1.6 -1.831*
Output VariableYield/Acre Kg/ha 146.725 105 281.25 -
34.76***
Source: Field survey, 2011
27
ITFC organizes biannual farm demonstrations for all its
outgrowerout-growers. These practical training sessions are
meant to improve outgrowerout-growers’ technical skills in
carrying out their farm operations. However, there is
significant difference between group and individuals
outgrowerout-growers in terms of attendance at the training
sessions. The average individual outgrowerout-grower attends
one more demonstration session than the average group
outgrowerout-grower. This is an indication that individual
outgrowerout-growers are more committed to measures that
will improve upon their farm output than group outgrowerout-
growers. This evidence, according to Aditya (2008), is
contrary to expectation that group operations will be more
effective because the group encourages its members to
participate in activities that they may not do as
individuals.
Group farms are generally larger than individual farms
(Table 3). Farms belonging to group outgrowerout-growers are
about twice the sizes of those belonging to individual
28
outgrowerout-growers. It should be noted however, that farm
size as a characteristic does not indicate scale of
production for a group outgrowerout-grower since each group
outgrowerout-grower is limited to 0.4 hectares. Rather, it
suggests the size of the group managing the farm. This means
that, though group farms are larger, a group outgrowerout-
grower as an individual does not enjoy scale efficiency. On
the other hand, farm size indicates scale of production
among individual outgrowerout-growers since an individual
outgrowerout-grower owns 0.4 or more hectares; hence they
may have scale efficiency.
The age of plantations is about the same across farm
management types. All farms in the sample are within the
first of three agronomic age groupings-developing bearers,
stabilized bearers and aging bearers. This means that all
farms are young and still growing; hence output is expected
to increase each year, all other conditions remaining
optimal.
29
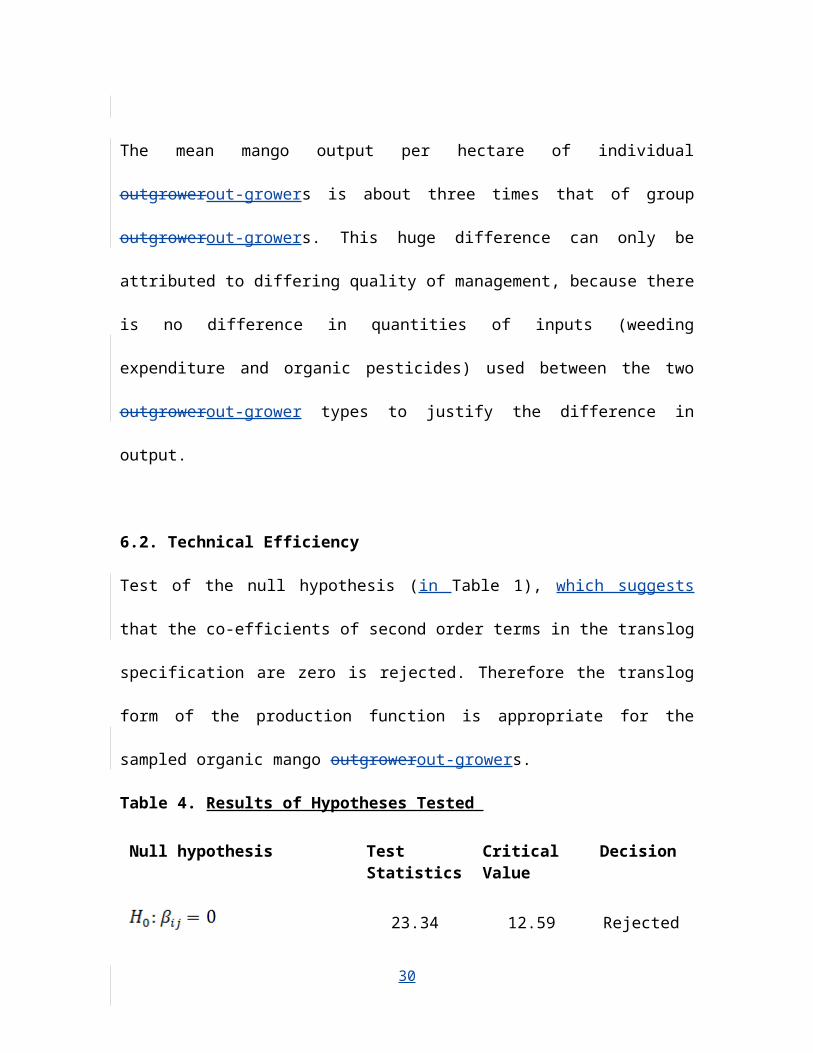
The mean mango output per hectare of individual
outgrowerout-growers is about three times that of group
outgrowerout-growers. This huge difference can only be
attributed to differing quality of management, because there
is no difference in quantities of inputs (weeding
expenditure and organic pesticides) used between the two
outgrowerout-grower types to justify the difference in
output.
6.2. Technical Efficiency
Test of the null hypothesis (in Table 1), which suggests
that the co-efficients of second order terms in the translog
specification are zero is rejected. Therefore the translog
form of the production function is appropriate for the
sampled organic mango outgrowerout-growers.
Table 4. Results of Hypotheses Tested
Null hypothesis TestStatistics
CriticalValue
Decision
23.34 12.59 Rejected
30
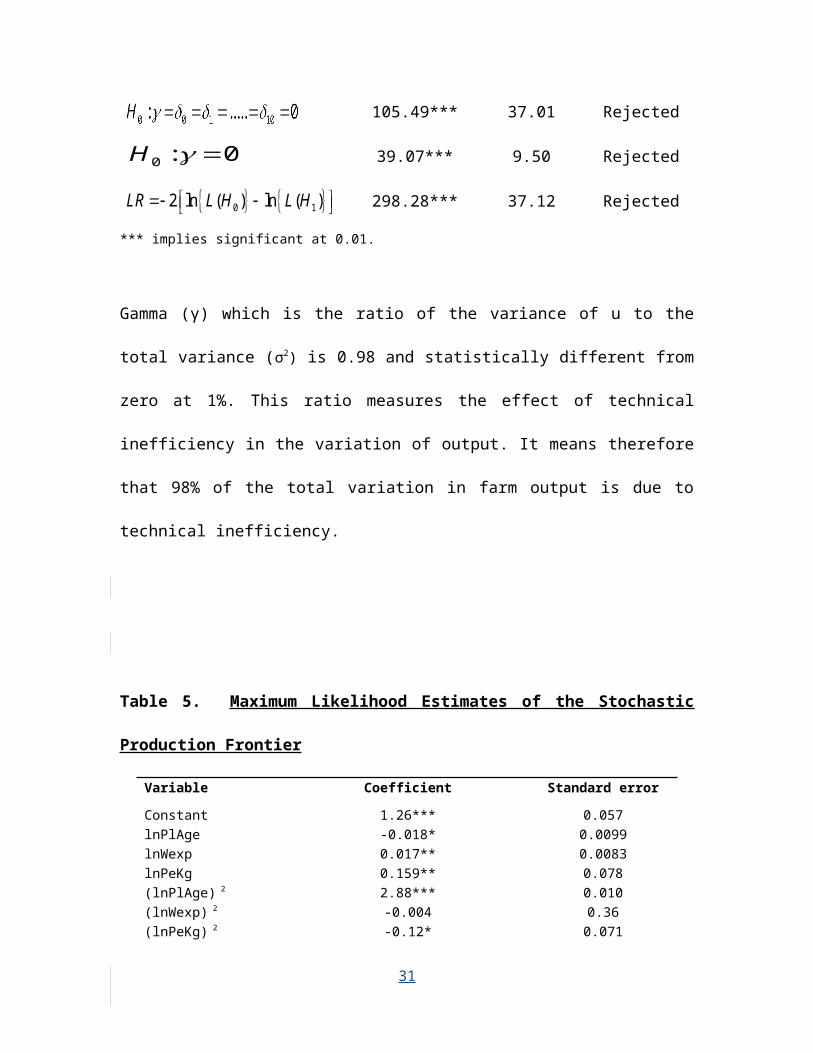
105.49*** 37.01 Rejected
39.07*** 9.50 Rejected
298.28*** 37.12 Rejected
*** implies significant at 0.01.
Gamma (γ) which is the ratio of the variance of u to the
total variance (σ2) is 0.98 and statistically different from
zero at 1%. This ratio measures the effect of technical
inefficiency in the variation of output. It means therefore
that 98% of the total variation in farm output is due to
technical inefficiency.
Table 5. Maximum Likelihood Estimates of the Stochastic
Production Frontier
Variable Coefficient Standard error
Constant 1.26*** 0.057lnPlAge -0.018* 0.0099lnWexp 0.017** 0.0083lnPeKg 0.159** 0.078(lnPlAge) 2 2.88*** 0.010(lnWexp) 2 -0.004 0.36(lnPeKg) 2 -0.12* 0.071
31
0 12 ln ( ) ln ( )LR L H L H
0 : 0H
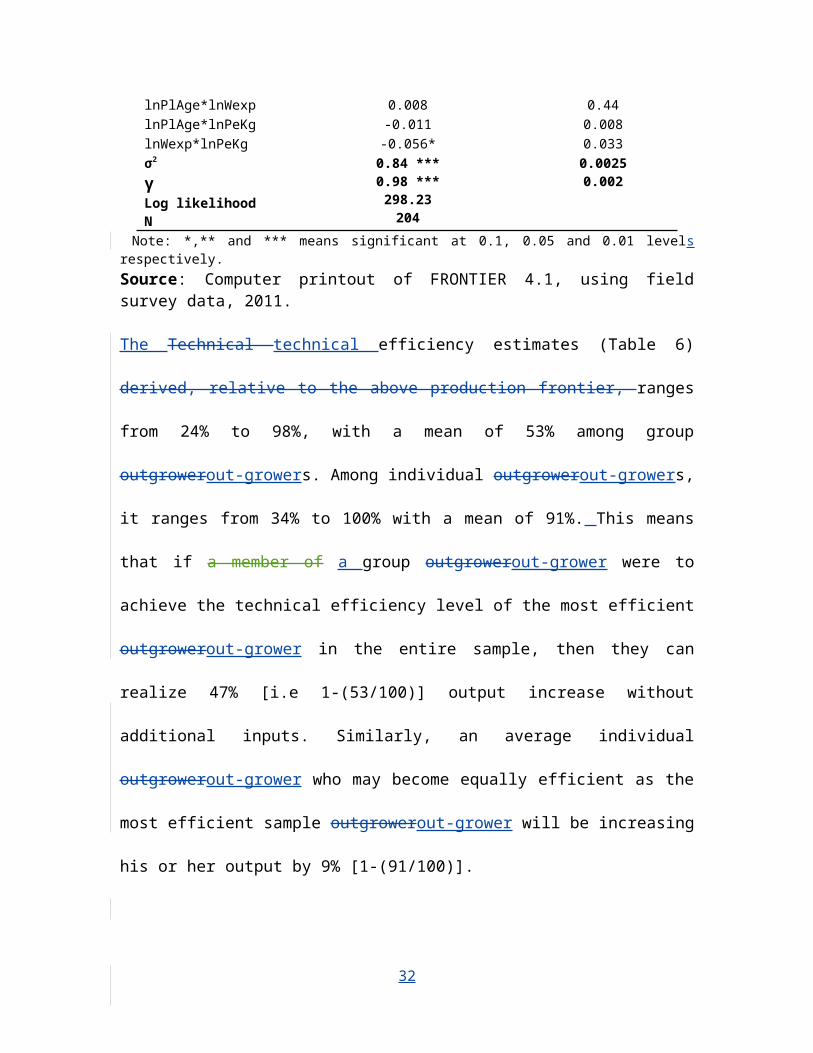
lnPlAge*lnWexp 0.008 0.44lnPlAge*lnPeKg -0.011 0.008lnWexp*lnPeKg -0.056* 0.033σ2
γLog likelihoodN
0.84 ***0.98 ***298.23204
0.00250.002
Note: *,** and *** means significant at 0.1, 0.05 and 0.01 levelsrespectively.Source: Computer printout of FRONTIER 4.1, using fieldsurvey data, 2011.
The Technical technical efficiency estimates (Table 6)
derived, relative to the above production frontier, ranges
from 24% to 98%, with a mean of 53% among group
outgrowerout-growers. Among individual outgrowerout-growers,
it ranges from 34% to 100% with a mean of 91%. This means
that if a member of a group outgrowerout-grower were to
achieve the technical efficiency level of the most efficient
outgrowerout-grower in the entire sample, then they can
realize 47% [i.e 1-(53/100)] output increase without
additional inputs. Similarly, an average individual
outgrowerout-grower who may become equally efficient as the
most efficient sample outgrowerout-grower will be increasing
his or her output by 9% [1-(91/100)].
32
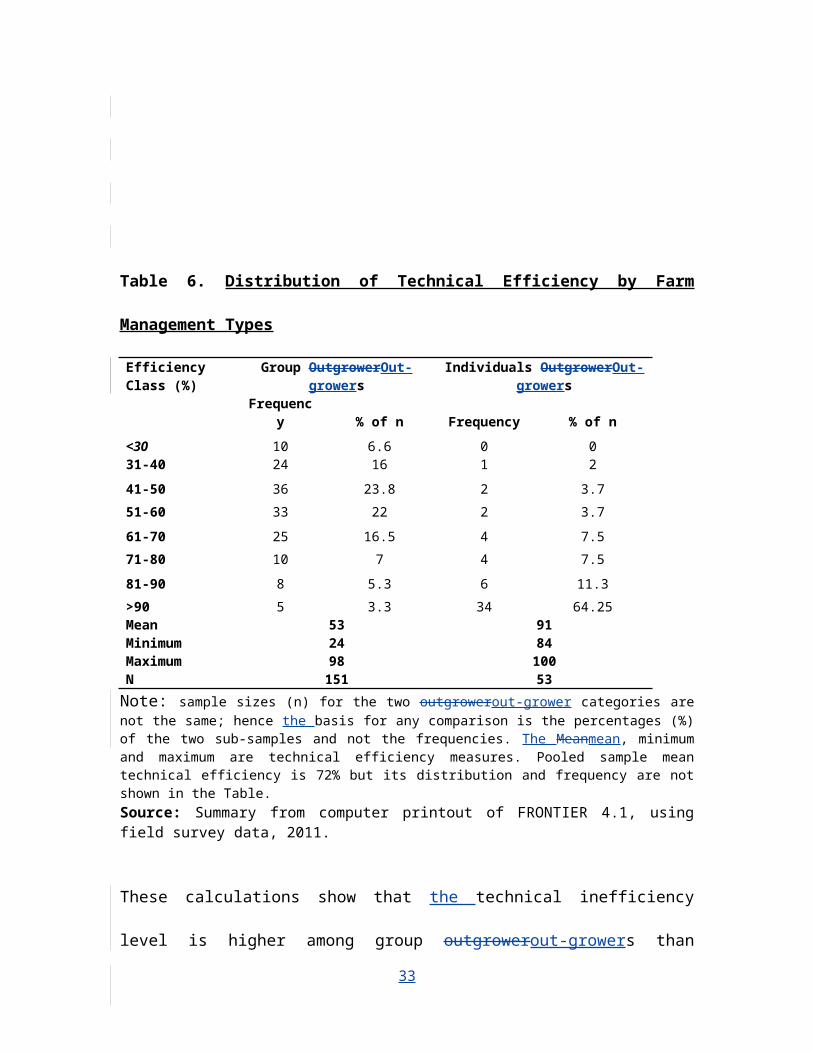
Table 6. Distribution of Technical Efficiency by Farm
Management Types
Efficiency Class (%)
Group OutgrowerOut-growers
Individuals OutgrowerOut-growers
Frequency % of n Frequency % of n
<30 10 6.6 0 031-40 24 16 1 241-50 36 23.8 2 3.751-60 33 22 2 3.761-70 25 16.5 4 7.571-80 10 7 4 7.581-90 8 5.3 6 11.3>90 5 3.3 34 64.25MeanMinimumMaximumN
532498151
918410053
Note: sample sizes (n) for the two outgrowerout-grower categories arenot the same; hence the basis for any comparison is the percentages (%)of the two sub-samples and not the frequencies. The Meanmean, minimumand maximum are technical efficiency measures. Pooled sample meantechnical efficiency is 72% but its distribution and frequency are notshown in the Table.Source: Summary from computer printout of FRONTIER 4.1, usingfield survey data, 2011.
These calculations show that the technical inefficiency
level is higher among group outgrowerout-growers than
33
individual outgrowerout-growers. Therefore, more efficiency
gains can be realized by improving management practices
among group outgrowerout-growers than among individual
outgrowerout-growers. The mean technical efficiency of the
pooled sampled outgrowerout-growers is 72% which is greater
than 34% found among rice farmers in the Upper East Region
(Al-hassan, 2004). It is however, the same as Amos (2007)
found among small-holder cocoa farmers in Nigeria, but less
than the 86% that Muhammed-Lawal (2007) found among small-
holder sweet orange producers also in Nigeria.
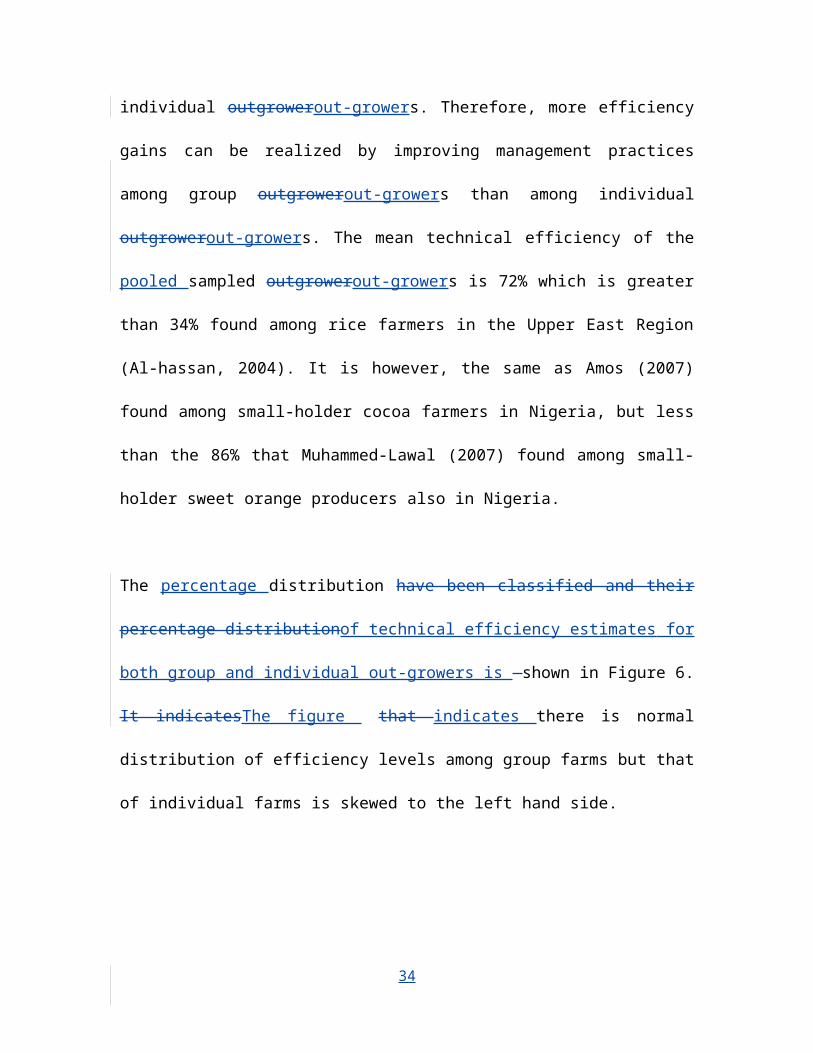
The percentage distribution have been classified and their
percentage distributionof technical efficiency estimates for
both group and individual out-growers is shown in Figure 6.
It indicatesThe figure that indicates there is normal
distribution of efficiency levels among group farms but that
of individual farms is skewed to the left hand side.
34
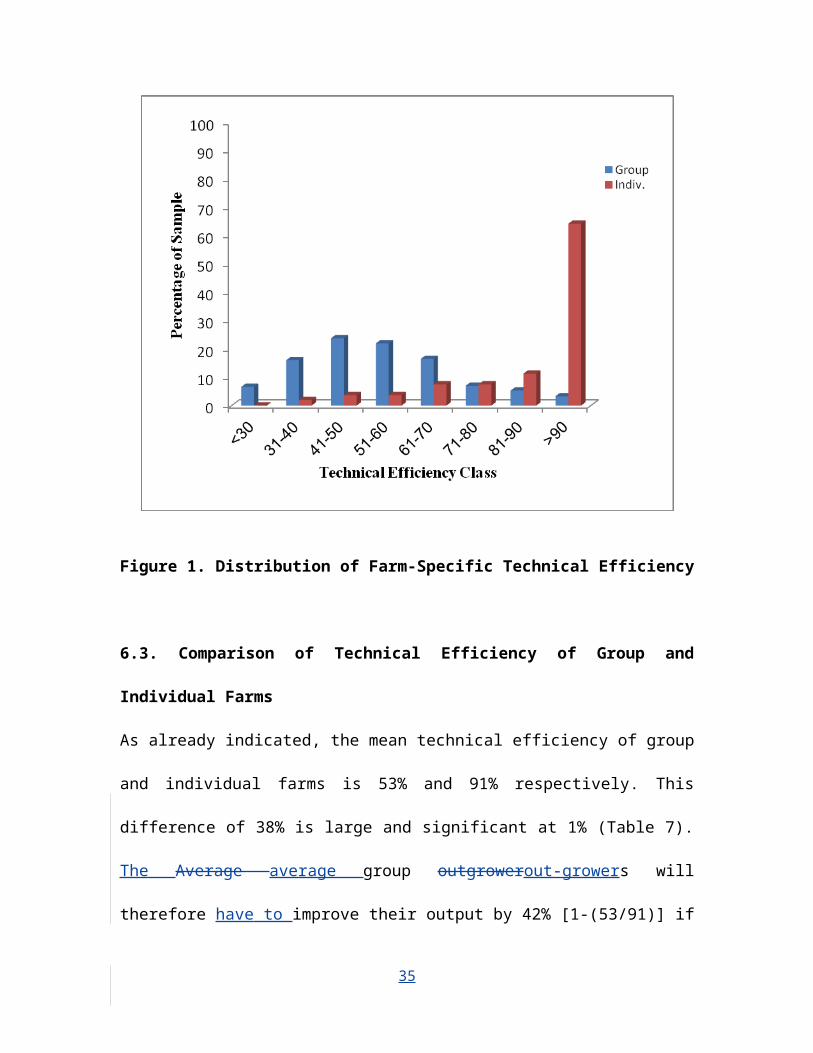
Figure 1. Distribution of Farm-Specific Technical Efficiency
6.3. Comparison of Technical Efficiency of Group and
Individual Farms
As already indicated, the mean technical efficiency of group
and individual farms is 53% and 91% respectively. This
difference of 38% is large and significant at 1% (Table 7).
The Average average group outgrowerout-growers will
therefore have to improve their output by 42% [1-(53/91)] if
35
they were are to become as efficient as an average
individual outgrowerout-grower.
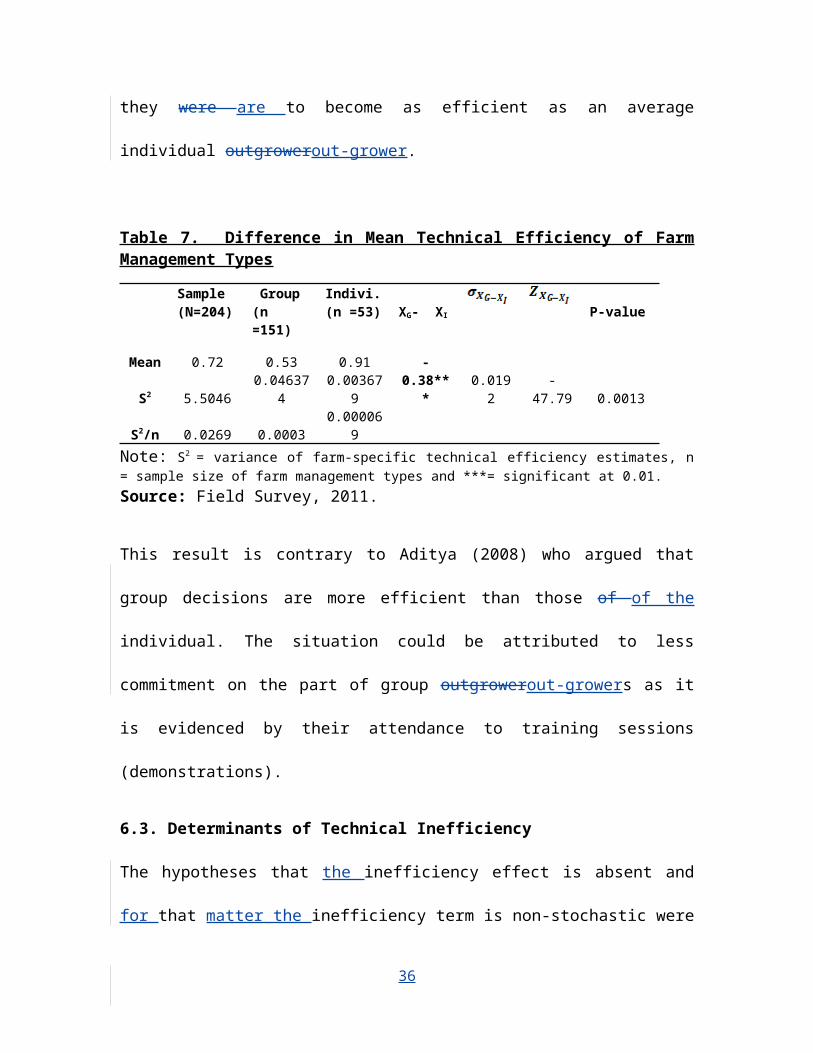
Table 7. Difference in Mean Technical Efficiency of FarmManagement Types
Sample(N=204)
Group (n=151)
Indivi.(n =53) XG- XI P-value
Mean 0.72 0.53 0.91 -0.38**
*0.0192
-47.79 0.0013S2 5.5046
0.046374
0.003679
S2/n 0.0269 0.00030.00006
9Note: S2 = variance of farm-specific technical efficiency estimates, n= sample size of farm management types and ***= significant at 0.01.Source: Field Survey, 2011.
This result is contrary to Aditya (2008) who argued that
group decisions are more efficient than those of of the
individual. The situation could be attributed to less
commitment on the part of group outgrowerout-growers as it
is evidenced by their attendance to training sessions
(demonstrations).
6.3. Determinants of Technical Inefficiency
The hypotheses that the inefficiency effect is absent and
for that matter the inefficiency term is non-stochastic were
36
rejected (Table 4). These meanThis means that variation in
output is partly due to inefficiency and this inefficiency
is stochastic respectively.
This study excluded some of the usual variables like
extension contact, access to credit and contract
relationship with input suppliers or produce buyers in that
analysis because, such characteristics are constants with
no variation among all outgrowerout-growers under the ITFC
project. However, the number of demonstration sessions an
outgrowerout-grower attended since the establishment of his
or her farm was used in place of extension contact. The
Other other variable which is specific to this study (and
not usual in the literature) is the type of farm management
an outgrowerout-grower belongs to. The model estimated to
explain inefficiency of outgrowerout-growers is presented in
Table 8.
The model shows that the age of the outgrowerout-grower,
education, household size and experience have no significant
37
effect on inefficiency whilst gender of outgrowerout-grower,
farm demonstration visits and farm management type hashave
significant effects on inefficiency. Gender, was measured as
dummy with value of 1 for males, therefore a negative and
significant relationship with technical inefficiency means
that male outgrowerout-growers are more technically
efficient than their female counterparts. Traditionally,
women in the Northern region do not have control over family
labour. Also, farm operations like weeding and spraying are
male dominated activities. Therefore, women who have mango
farms are likely to use only hired labour for which they may
pay more than their male counterpart and experience delays
in farm operations; because hired labour may not be readily
available at times they have to perform major farm
operations like weeding.
Another socio-economic variable considered in the analysis
is the number of technical training sessions
(demonstrations) organized by ITFC that an outgrowerout-
grower attended. Its result also shows a negative and
38
significant relationship. This implies outgrowerout-growers
who attended more sessions are less inefficient; hence the
training helps to improve upon the technical efficiency
levels of the outgrowerout-growers. This agrees is
consistent with Al-hassan (2004) that through extension,
farmers acquire skills in inputs mobilization, inputs use
and disease control which enable them to reduce
inefficiency.
Finally, the result concerning the farm management type also
shows positive relationship with inefficiency estimates.
Farm management type was specified as a dummy variable with
a value of 1 for group farms. Therefore, group outgrowerout-
growers are more technically inefficient than the individual
outgrowerout-growers. As pointed out in section 1, farm
sanitation and crop protection are poor on group farms
because group members are not committed to carrying out farm
operations as individual outgrowerout-growers do. Higher
incidence of failure to weed, pest and disease infestation,
bushfire destruction of plantation and farmer failure
39
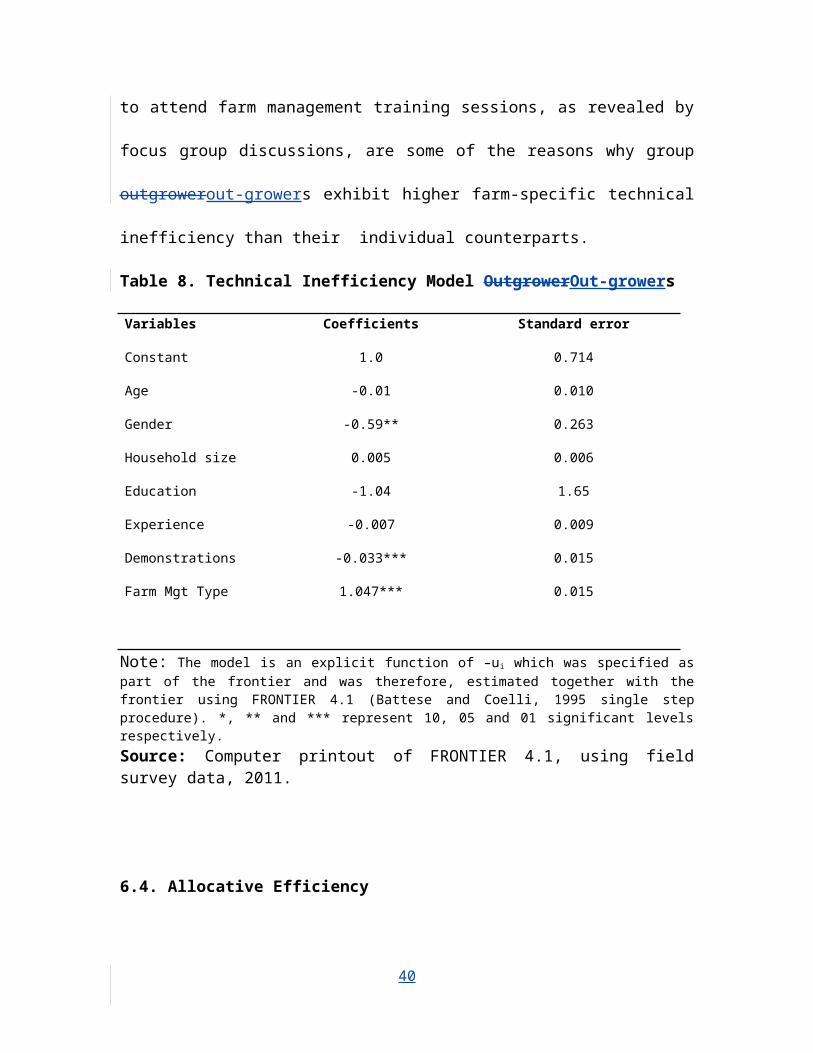
to attend farm management training sessions, as revealed by
focus group discussions, are some of the reasons why group
outgrowerout-growers exhibit higher farm-specific technical
inefficiency than their individual counterparts.
Table 8. Technical Inefficiency Model OutgrowerOut-growers
Variables Coefficients Standard error
Constant 1.0 0.714
Age -0.01 0.010
Gender -0.59** 0.263
Household size 0.005 0.006
Education -1.04 1.65
Experience -0.007 0.009
Demonstrations -0.033*** 0.015
Farm Mgt Type 1.047*** 0.015
Note: The model is an explicit function of –ui which was specified aspart of the frontier and was therefore, estimated together with thefrontier using FRONTIER 4.1 (Battese and Coelli, 1995 single stepprocedure). *, ** and *** represent 10, 05 and 01 significant levelsrespectively.Source: Computer printout of FRONTIER 4.1, using fieldsurvey data, 2011.
6.4. Allocative Efficiency
40
The preceding sections presented technical efficiency levels
and their determinants among outgrowerout-growers of the two
farm management types, using the translog production
frontier derived from output and inputs observations only.
Because the procedure allowed no inference about economic
efficiency (Schmidt and Lovell, 1979), the third objective
examines allocative efficiency of organic mango
outgrowerout-growers is assessed by measuring how they
allocate expenditure on weeding and organic pesticides. This
was achieved by estimating separate average production
function for either of the farm management types (appendix
D) from which input elasticities (E), marginal value
products (MVP), Marginal marginal factor cost (MFC) and
allocative ratios (R) of the two inputs were computed
(Table 8).
a) Weeding expenditure
The results (Table 9) show that the allocative efficiency
ratio (R) for weeding expenditure is greater than one (1)
among outgrowerout-growers of both farm management types
41
(1.83 and 1.91 respectively). This means that outgrowerout-
growers of both farm management types spent less than they
should on weeding but the under-spending is more among
individual outgrowerout-growers. This means that farms are
not being weeded properly. The Response responses from
sampled outgrowerout-growers show that group outgrowerout-
growers often contract out their weeding operations while
individual outgrowerout-growers normally engage labourers on
wage basis to weed their mango farms. What this suggests is
that, the marginal value product (MVP) of a Ghana cedi Cedi
spent on contract weeding operation is less than that of a
Ghana cedi spent on paying wages of a labourer to weed.
Hence expenditure on hired labour weeding must be increased
more than that of contract weeding, should so boththat both
become equal to marginal factor cost (MFC) which is one
Ghana cediCedi.
b) Organic Pesticide
Contrary to the result of weeding expenditure, that of
organic pesticide indicates over-utilization among
42
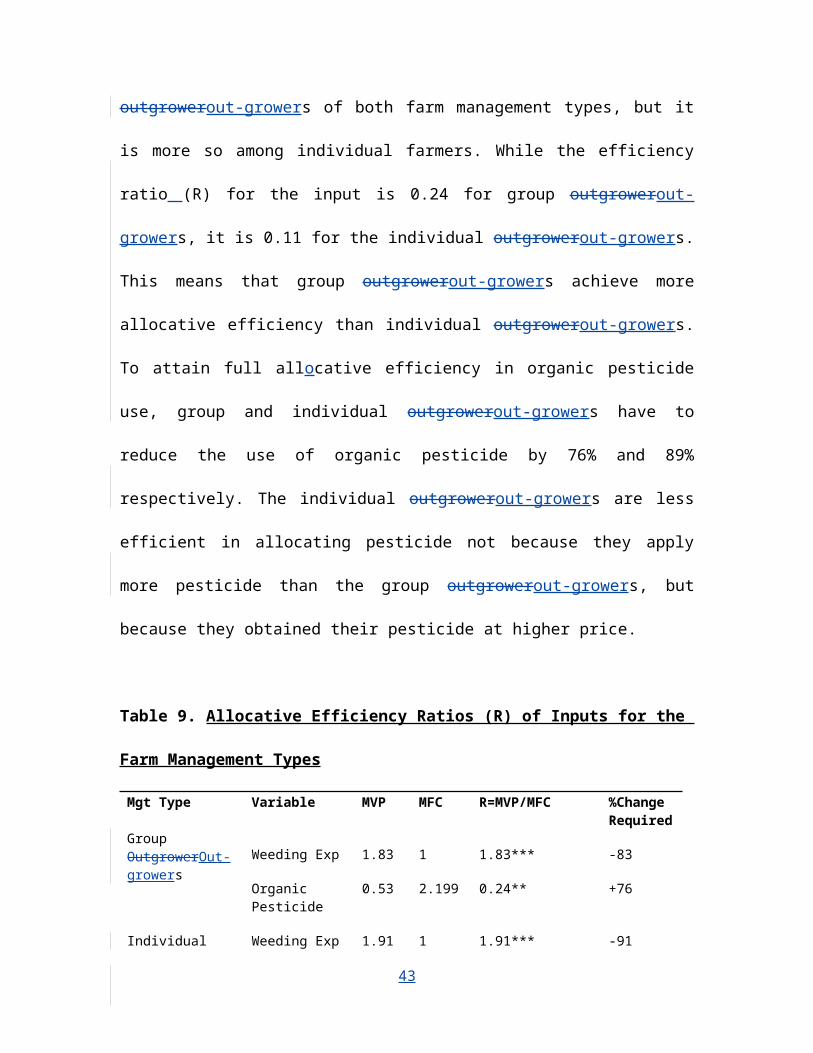
outgrowerout-growers of both farm management types, but it
is more so among individual farmers. While the efficiency
ratio (R) for the input is 0.24 for group outgrowerout-
growers, it is 0.11 for the individual outgrowerout-growers.
This means that group outgrowerout-growers achieve more
allocative efficiency than individual outgrowerout-growers.
To attain full allocative efficiency in organic pesticide
use, group and individual outgrowerout-growers have to
reduce the use of organic pesticide by 76% and 89%
respectively. The individual outgrowerout-growers are less
efficient in allocating pesticide not because they apply
more pesticide than the group outgrowerout-growers, but
because they obtained their pesticide at higher price.
Table 9. Allocative Efficiency Ratios (R) of Inputs for the
Farm Management Types
Mgt Type Variable MVP MFC R=MVP/MFC %ChangeRequired
GroupOutgrowerOut-growers
Weeding Exp 1.83 1 1.83*** -83
OrganicPesticide
0.53 2.199 0.24** +76
Individual Weeding Exp 1.91 1 1.91*** -91
43
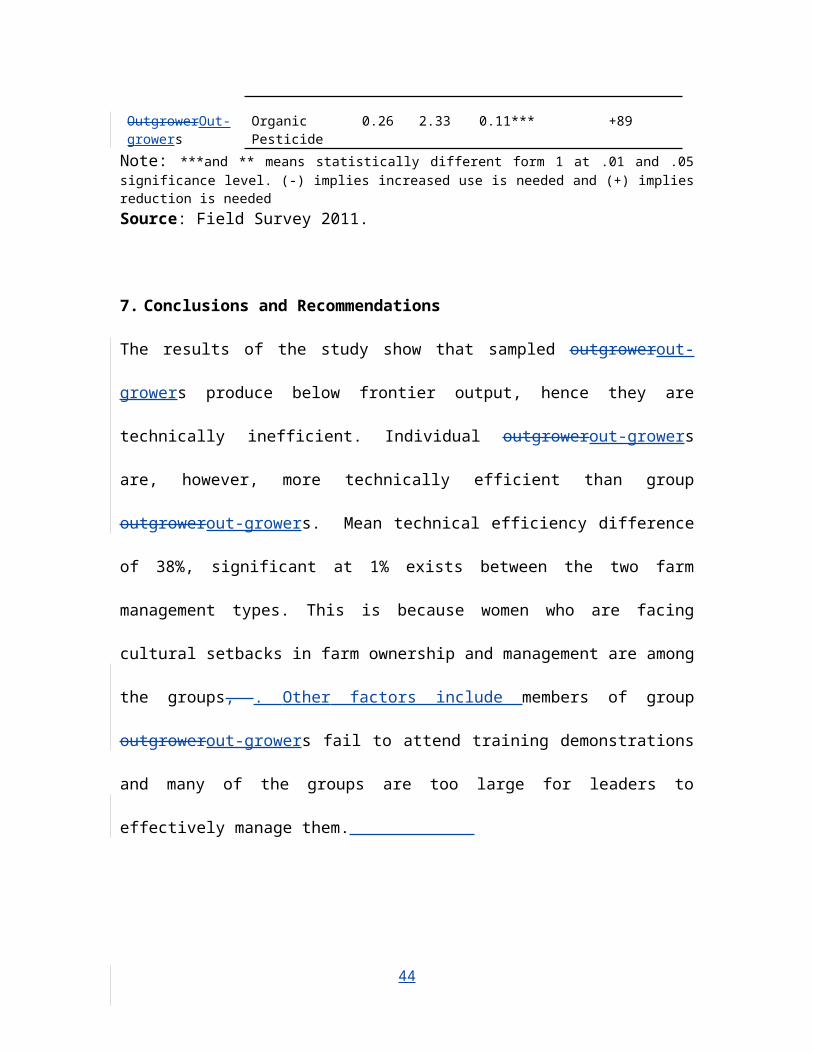
OutgrowerOut-growers
OrganicPesticide
0.26 2.33 0.11*** +89
Note: ***and ** means statistically different form 1 at .01 and .05significance level. (-) implies increased use is needed and (+) impliesreduction is neededSource: Field Survey 2011.
7. Conclusions and Recommendations
The results of the study show that sampled outgrowerout-
growers produce below frontier output, hence they are
technically inefficient. Individual outgrowerout-growers
are, however, more technically efficient than group
outgrowerout-growers. Mean technical efficiency difference
of 38%, significant at 1% exists between the two farm
management types. This is because women who are facing
cultural setbacks in farm ownership and management are among
the groups, . Other factors include members of group
outgrowerout-growers fail to attend training demonstrations
and many of the groups are too large for leaders to
effectively manage them.
44
In terms of allocating the two main inputs (weeding
expenditure and organic pesticide) under the prevailing
prices, group outgrowerout-growers are more efficient than
individual outgrowerout-growers though both under-spent on
weeding and over-utilized organic pesticide. In order to
attain full allocative efficiency in weeding expenses, group
outgrowerout-growers need to increase their weeding
expenditure by 83% whilst individual outgrowerout-growers
need to increase theirs by 91%. For organic pesticides,
group outgrowerout-growers have to reduce its use by 76%
whilst individual outgrowerout-growers need to do so by 89%.
Therefore, the study concludes that individual farm
management is better than group farm management in terms of
technical efficiency while the reverse is true in terms of
input allocation efficiency. However, the additional
allocative efficiency that group farms have over individual
farms is not enough to compensate for the huge short-fall in
technical efficiency. Besides, technical efficiency is a
necessary condition for economic efficiency; hence
45
recommendations are tilted towards improving technical
efficiency.
First, the few women among the group outgrowerout-growers
have been found to exhibit lower efficiency than their male
counterparts and therefore, an affirmative action in the
form of special training is needed to help them overcome the
socio-cultural setbacks that prevent them from effectively
managing their farms. Secondly, demonstrations on farm
operations that are organized periodically by ITFC have
significant positive effect on technical efficiency of
outgrowerout-growers and should be organized more
frequently, especially for group outgrowerout-growers.
Thirdly, scheme management needs to make conscious efforts
to break up large groups into sub-groups with membership not
exceeding 5, with well structured leadership to improve
loyalty and commitment to farm management operations among
the group outgrowerout-growers. Fourthly, outgrowerout-
growers, especially the individuals, need to weed their
46
farms more frequently. Through improvedWith improved farm
sanitation, this will help reduce pest infestation and its
associated need to spray is reduced, thus optimizing the
investment they make in organic pesticide. Alternatively,
farmers will also have to establish a trusty relationship
with pesticide suppliers so that they can negotiate for
lower prices in a longthe long-run.
Finally, if the corporate objectives of ITFC are to be
realized, the project’s strategic plan should consider
shifting support to establishment of more individually
managed farms, rather than groups.
REFERENCES
Aditya Sachdeva (2008) The Right Decision Every Time, Lotus
Press, New Delhi.
47
Aigner, Dennis J.; C. A. Knot Lovell; and Peter Schmidt
(1977) “Formulation and
Estimation of Stochastic Frontier Production
Function Models.” Journal of
Econometrics 6, no.1, pp. 21–37.
Al-hassan Seidu (2004) Farm-Specific Technical Efficiency,
Resource Use and
Employment: An Analysis of Smallholder Rice Farmers
in the Upper East Region of
Ghana, Thesis submitted to the University of Ghana,
Legon for the award of Doctor
Philosophy Degree in Agricultural Economics.
Barnett (2004) “Dimensions and Economics: Some
Problems”,Quarterly Journal of
australian Economis. Vol. 7 ,no 1 pp. 95-104.
Bravo-Ureta, Boris E., and Laszlo Rieger (1991) “Dairy Farm
Efficiency Measurement
48
Using Stochastic Frontiers and Neoclassical
Duality.” American Journal of
Agriculture Economics 73, no. 2: 421–28.
Bravo-Ureta and Pinheiro (1997) “Technical, Economic and
Allocative Efficiency in
Peasant Farming: Evidence from the Dominican
Republic”The Developing
Economies 35 no 1, pp.48-67.
Coelli T. J. (1995) “Recent Developments in Frontier
Modeling and Efficiency
Measurement”, Australian Journal of Agricultural Economics,
vol.39 no3, pp. 219-
245.
Coelli, T.J.; Rao, D.S.P.; O'Donnell, C.J.; Battese, G.E.
(2005) An Introduction
to Efficiency and Productivity Analysis, 2nd
Edition, Springer.
49
Farrell, Michael J. (1957) “The Measurement of Production
Efficiency.” Journal of the
Royal Statistics Society, Series A, 120, Part 3: pp. 253–290.
Food and Agricultural Organization (2009) “Increasing
incomes and food security of
small farmers in West and Central Africa through
exports of organic and fair-trade
tropical products”, Project impact study in Ghana;
Mango.
Han, K.H. (1991). “A productivity measurementof activities
at the micro level
“ManagementAccountingResearch.vol.2 no4, pp. 249-261.
Heyne Paul (2008). “Efficiency”. The concise Encyclopedia of
Economics, pp1157-1166.
50
Homgren, C.T., Foster, G., Datar, S.M., and Uliana, E.
(1999). Cost Accounting in South
Africa. Prentice Hall South Africa.
Ittner, C. D. and Larckner,D.F. (1998). Innovationsin
performancemeasurement:
Trends and research implications.Journal of
ManagementAccounting Research, vol.
pp.10 205-10238.
Karagiannis ,Giannis and Vangelis Tzouvelekas (2009)
“Measuring Technical Efficiency
in the Stochastic Varying Coefficient Frontier
Model”, Department of Economics,
University of Greece.
Livio, C. and Massimo,G. (2002).The Efficiency Measurement
of Factories via Data
Envelopement Analysis, Systems Analysis Modelling
Simulation.vol. 42 issue,
51
pp.1521.
Meeusen, Wim, and Julien van den Broeck. (1977) “Efficiency
Estimation from
Cobb- Douglas Production Function with Composed
Error” International Economic
Review 18, no. 2, pp. 435–44.
Ministry of Food and Agriculture (2007) Food and
Agricultural Sector Development
Policy II (FASDEP), 1st Draft, 2ndrevision, May 2007.
Muhammed-Lawal A., (2007) “Efficiency of Sweet Orange
Production Among Small
Scale Farmers In Osun State”, African Journal of General
Agriculture, Volume 3
No 2 http://www/asopah.org, 17/12/2011.
Nwaru, J. C. and O. R. Iheke (2010) “Comparative Analysis Of
Resource Use Efficiency
52
In Rice Production Systems In Abia State Of Nigeria”
Journal of American Sciences
vol.6 (11).
Office of the Auditor General of Canada (2007)
“Understanding Efficiency”, Auditing of
efficiency. http:// www.oag-bvg.gc.ca , 07/11/2011.
Oluwatayo, I. B., Sekumade A. B. and Adesoji S.A. (2008)
“Resources Use Efficiency of
Maize Farmers in Rural Nigeria: Evidence from Ekiti
State”, World Journal of
Agricultural Science, vol. 4, pp.91-99.
Omonona ,B.T., Egbetokun, O.A. and Akanbi A.T. (2010) “Farmers
Resource – Use and
Technical Efficiency inCowpea Production in
Nigeria”, Economic Analysis &
Policy, Vol. 40 No. 1.
53
Sartorius Kurt and J Kirsten (2004) “The Cost Efficiency
of Small Farm Inclusion in
Agribusiness Supply Chains” South African Journal of
Accounring Research
Vol. 18 , No. 1, pp. 87-113.
United Nations Development Program (2007). “Case Study of
Integrated Tamale Fruit
Company: Organic Mangoes Improving Livelihoods for
the Poor”, Bulletin-
Growing Inclusive Markets.
www.growinginclusivemarkets.org 28/09/2010.
United States Agency For International Development
(USAID) /Santo Domingo
(2004).Training in Pruning of Mango. Dominican
Republic Competitiveness and
Fiscal Policy Reform Contract Report submitted by
Chemonics International Inc.
54
USAID and TIPCEE (2009), “Ghana Assessing Economic Benefits:
The Case of Banana,
Mango, and Rice”, A Publication on dialogue on
evidence-based policy making as
promoted by the Ministry of Trade and Industry and
the Ministry of Food and
Agriculture.
55