formulation optimization of sustained-release ammonio methacrylate copolymer microspheres. effects...
TRANSCRIPT

Pharmaceutics 2011, 3, 830-847; doi:10.3390/pharmaceutics3040830
pharmaceutics ISSN 1999-4923
www.mdpi.com/journal/pharmaceutics
Article
Formulation Optimization of Sustained-Release Ammonio Methacrylate Copolymer Microspheres. Effects of Log P and Concentration of Polar Cosolvents, and Role of the Drug/Copolymer Ratio
Péter Sipos 1,*, Róbert Rajkó 2, Klára Pintye-Hódi 1, István Erős 1 and Piroska Szabó-Révész 1
1 Department of Pharmaceutical Technology, University of Szeged, Eotvos str. 6, 6720 Szeged,
Hungary 2 Department of Mechanical and Process Engineering, University of Szeged, Dugonics squ. 13, 6720
Szeged, Hungary
* Author to whom correspondence should be addressed; E-Mail: [email protected];
Tel./Fax: +36 62 545 577.
Received: 29 June 2011; in revised form: 11 October 2011 / Accepted: 27 October 2011 /
Published: 10 November 2011
Abstract: The objectives of this work were the formulation optimization of the preparation
process parameters and to evaluate spray-dried sustained-release microspheres using
ammonio methacrylate copolymer (AMC) as a polymer matrix. The effects of log P and
the concentrations of the cosolvents (acetone, methyl ethyl ketone and n-butyl acetate) and
different drug/copolymer ratios as independent variables on the physicochemical
parameters (the W1/O emulsion viscosity, the microsphere production yield, the average
particle size, the encapsulation efficiency) and the cumulative in vitro drug release as
dependent variables were studied. The optimization was carried out on the basis of the 33
factorial design study. The optimization process results showed that addition of polar
cosolvents proved effective, linear relationships were observed between the independent
and the dependent variables. The best conditions were achieved by microspheres prepared
by using a low/medium cosolvent log P, cosolvent concentration of 25–50% v/v and a
drug/copolymer ratio of 1:16. The microspheres ensured sustained release with Nernst and
Baker-Lonsdale release profiles.
Keywords: microspheres; formulation optimization; cosolvents; drug/copolymer ratio;
spray drying; factorial design study
OPEN ACCESS
Pharmaceutics 2011, 3 831
1. Introduction
The value of microparticulate delivery systems as orally administered controlled-release dosage
forms has been evident for years. Microencapsulation is used for extending the drug action, to control
drug release kinetics, minimize side effects and reduce gastric irritations. Appropriate preparation
techniques should be designed and complex investigations of the effects of the emphasized
physicochemical factors should be performed to overcome the drawbacks of the microparticles.
Optimization of the preparation process is advantageous for efficient drug entrapment; the factors may
alter the distribution of the microparticle parameters markedly, determining the drug release
mechanism.
Selection of the organic solvent may determine drug characteristics such as crystal form and
solubility. The addition of a polar cosolvent to CH2Cl2 or replacement of CH2Cl2 may act in two
different ways: increasing the polymer precipitation rate and at the same time decreasing the
encapsulation efficiency (EE), due to the confluence of the aqueous phases of the multiple emulsion;
thus, there can be a sensitive balance between these opposite effects. The integrity of the forming
microsphere wall is controlled by the rate of migration of the organic solvent to the outer aqueous
phase and also by the rate of evaporation from this phase. The rate of solvent extraction is limited by
the water-solubility of the organic solvent used, while the evaporation rate depends on its boiling
point. At the water-organic phase interface, cosolvents with low affinity for the polymer are the first to
diffuse out from the W1/O emulsion droplet, depending on their physicochemical properties [1]. The
use of organic solvents in order to prepare microspheres has been investigated previously, Class 2
solvents according to ICH e.g., chloroform [2], 1,2-dichloroethane [3], cyclohexane [4],
dichloromethane (CH2Cl2) [5,6] and methanol [7,8]; and Class 3 solvents as acetone (Me2CO) [8,9],
ethanol [10,11], and ethyl acetate [12]. Removal of organic solvents during manufacturing is critical,
and it is therefore an industrial requirement to test the amount of residual organic solvents.
The model drug (diclofenac sodium) was a non-steroidal anti-inflammatory drug. In consequence of
its short half-life and therefore the need for multiple dosing, which involves the increased risk of
adverse effects, the achievement of sustained release is of great importance. Diclofenac sodium
carriers have been investigated to improve the pharmacological efficiency, as alginate microspheres
[13], thermo-responsive gelatine microspheres [14], compressed matrix pellets [15],
alginate/hydroxyapatite composite beads [16] and liposomes [17]. The polymer component applied
was biocompatible and non-biodegradable ammonio methacrylate copolymer (AMC), which has been
used as a retardant in the formulation of sustained-release pellets [18], matrix tablets [19],
thermosensitive membranes [20], microparticles [21], tablet coatings [22], chitosan particle coating
[11] and spray-dried vaccine carriers [23]. The main advantages expected from AMC are insolubility
in the digestive juice and a pH-independent slow release, which is diffusion-controlled through the
polymer wall and the pores formed during the droplet-hardening process [24].
The protective colloid was poly(vinyl alcohol) to prevent the W1/O droplets from coalescing, and
the amphiphilic polyethylene glycol stearate was applied as a plasticizer of the copolymer in order to
make the polymer chains more flexible [25]. To improve the stability of the W1/O/W2 emulsions,
nonionic surfactants were used. One of the methods of preparation of microparticles is the
spray-drying of the drug-polymer solution [26] or multiple emulsion [27,28]. During the spray-drying

Pharmaceutics 2011, 3 832
process, the rapid solvent evaporation leads to quick polymer solidification, resulting in a higher EE,
and it can be used to minimize the time necessary for microsphere formation.
The main objective was to optimize the formulation parameters of drug containing matrix system
with a sustained release profile, to ensure microsphere product quality and a potential for scaling-up
for further investigations towards oral administration. The present work was designed to evaluate the
effects of three Class 3 cosolvents on the characteristics of the microspheres. A 33 factorial design was
used to investigate the effects of three independent variables: log P, the concentrations of Class 3 polar
cosolvents, and different drug/copolymer ratios.
Although the release profile is a useful feedback for the evaluation and recognition of coherences in
matrix systems, it is complicated to draw conclusions regarding the structure of the microspheres from
the release profiles without an adequate amount of supporting evidence [29]. Accordingly, the external
morphology, the production yield, average particle size, encapsulation efficiency (EE), and the
cumulative percentage drug release (Q6) were measured as dependent variables. The required
parameters were low W1/O emulsion viscosity (η) and particle size; relatively high production yield
and EE; and Q6 value in the ranges 40–80% in 6 h.
2. Experimental Section
2.1. Materials
Diclofenac sodium (Ph.Eur. 7) was used as hydrophilic model drug (Sigma, Hungary). Ammonio
Methacrylate Copolymer Type B (AMC, MW 150 000) (Ph.Eur. 7) was used as matrix-forming
copolymer (Eudragit; Evonik Ind., Essen, Germany). The solvent dichloromethane (CH2Cl2) and the
cosolvents, acetone (Me2CO), methyl ethyl ketone (MeCOEt) and n-butyl acetate (nBuOAc) were of
reagent grade (Sigma, Hungary). At the concentrations used, the cosolvents are water-miscible
(Me2CO) or partially miscible (MeCOEt and nBuOAc), their physicochemical data were from
chemical databases (Table 1). The non-ionic surfactants sorbitan mono-oleate and polyoxyethylene
20 sorbitan mono-oleate (MW = 428 and 1309, respectively), the protective carrier poly(vinyl alcohol)
(MW = 72 000) and the plasticizer PEG stearate were of pharmacopoeial grade (MW = 328)
(Ph.Eur. 7) (VWR Co., Hungary).
Table 1. Physicochemical properties of the organic solvents used.
Used
solvents
ICH
Class
Log P Boiling point
(°C)
Visc.a
(mPas)
Sol. in water
(g·100 mL−1)
Saturationb
Me2CO 3 0.234 56.5 0.360 miscible Mixing
MeCOEt 3 0.736 79.6 0.415 29.0 -
CH2Cl2 2 1.511 39.5 0.475 1.3 Rapid
nBuOAc 3 1.822 125.0 0.730 0.7 Rapid a: absolute viscosity data from preliminary measurements (relative density of water = 1.000); b: saturation at
maximum cosolvent concentration (75% v/v) in the aqueous phase.

Pharmaceutics 2011, 3 833
2.2. Preparation of Microspheres
A W1/O/W2 multiple emulsion was prepared by a two-step emulsification procedure. An aqueous
solution of the drug was dispersed by homogenization (17 600 rpm, 5 min) (Heidolph Diax 900,
Heidolph, Germany) into the organic phase, which consisted of CH2Cl2 or a CH2Cl2-cosolvent
mixture, the copolymer, plasticizer and emulsifier. The resulting W1/O emulsion was added to the W2
phase, containing protective carrier and the O/W emulsifier, under continuous stirring at 1500 rpm.
The multiple emulsion was then spray-dried using a Büchi B-191 Laboratory Spray-dryer (Büchi Co.,
Flawil, Switzerland) with a standard 0.7 mm nozzle. The microspheres were separated in the novel
high-performance cyclone. Spray-drying was carried out under the same conditions: at 11.6 1 min−1 air
flow, 5 bar pressure, and 2.1 mL·min−1 pump flow rate. The inlet temperature was set above the
boiling points of the cosolvents (125 °C), and the outlet temperature varied in the range 89 ± 5 °C. The
final products were stored under controlled humidity conditions at 4 °C. The preparation yield was
calculated as the ratio of the actual and theoretical masses of the microsphere batch.
2.3. W1/O Primary Emulsion Characterization
The dynamic viscosity of the W1/O emulsions (η) were measured at 20 ± 1 °C with a rotational
viscometer (Brookfield DV-III, Brookfield Co., UK), at a constant shear rate of 130 1 s−1 (n = 5).
Immediately after preparation of all the examined W1/O/W2 emulsions, without dilution, microscopic
observations were made with a LEICA LaborLux S image analyser at 100× magnification (LEICA
Co., Germany).
2.4. Microsphere Characterization
2.4.1. Particle Size Analysis
Microspheres (0.5 g) were suspended in surfactant-free deionized water, and sized by laser
diffractometry without sonication, using a Malvern Mastersizer laser sizer (Malvern Instruments,
Malvern, UK) (n = 5). The weighted average of the volume distribution (D [4.3]) was used to describe
particle size (μm). The width of the particle size distributions was expressed by the SPAN parameter
(width of the particle size distribution based on the 10%, 50% and 90% quantile).
2.4.2. Morphological Study by Scanning Electron Microscopy
Surface characteristics and external morphology were determined by SEM, using the Hitachi S2400
instrument (Hitachi Scientific Instruments, Tokyo, Japan). A Polaron sputter coating apparatus
(Polaron Equipment, Greenhill, UK) was applied to induce electric conductivity on the surface of the
sample. The air pressure was 1.3–13 mPa. The surface and shape structure were examined with a
Hitachi S2400 instrument (Hitachi Scientific Instruments, Tokyo, Japan).
2.4.3. Determination of Drug Encapsulation Efficiency
The encapsulation efficiency (EE, %) was determined with an energy-dispersive X-ray fluorescence
analyser (MiniPal, Philips Analytical, The Netherlands). The spectrum was evaluated by non-linear

Pharmaceutics 2011, 3 834
least squares fitting. Pressed microsphere samples were prepared (n = 7). X-ray tube type:
low-powered with side window; anode material: Rh; software-controlled tube setting; tube filters:
5 filters selected by software. Measurement conditions: He gas inlet pressure: 1 bar, measuring time:
600 s; conditions set: 4 kV, 1000 μA. The calibration revealed a linear model (R2 = 0.994, n = 9). EE
was calculated as the ratio of the actual and the theoretical loading of drug as in other studies [8].
2.4.4. In Vitro Release Study
A modified paddle Apparatus II (Ph.Eur. 7) was used for the experiments. Dissolution was
performed in surfactant-free phosphate-buffered saline (PBS) (pH 7.42) at 37 ± 0.5 °C, at a mixing rate
of 100 1 min−1. Samples were taken at given intervals and then replaced with fresh PBS. The drug
content was analyzed by HPLC (HPLC system 1280, Jasco Co., Japan) method at 276 nm, after
filtration with a 0.45 μm Millex PVDF filter. The analysis was performed at 25°C with a Luna RP-C18
column (USP L1, 5 μm particle diameter, 4.6 × 150 mm) (Phenomenex Inc., USA). The mobile phase
consisting of methanol-NaH2PO4 buffer at pH 2.5 with ortho-phosphoric acid (66:34), was pumped at
1.0 mL min−1. Calibrations were made by the external standard method (R2 = 0.997, n = 9). Six types
of kinetic models were applied to process: the zero-order and first-order release equations [30], the
Higuchi square root of time equation, the Hixson-Crowell cube root model, the Baker-Lonsdale model
and the Nernst equation.
2.4.5. Analysis of Residual Organic Solvent
The levels of residual organic solvents and cosolvents were determined by GC analysis, using a HP
6890 GC static head-space instrument with a set of standard organic solvent concentrations. The
temperatures and GC conditions were as follows for CH2Cl2, Me2CO and MeCOEt: injector temp.
250 °C, inlet gas: He (0.285 bar), oven initial temp.: 35 °C, oven final temp.: 240 °C, make-up gas: N2;
detector: FID, temp.: 320 °C. The capillary column was a DB-624. The conditions for nBuOAc were:
injector temp: 200 °C, inlet gas: He (0.285 bar), oven initial temp.: 50 °C, oven final temp.: 200 °C,
make-up gas: N2; detector: FID, temp.: 250 °C. The capillary column was a Stabilwax. The calibrations
revealed a linear model (R2 ≥ 0.995, n = 9).
2.5. Statistical Analysis
To evaluate the contribution of each factor with different levels on responses, a 3-factor, 3-level
factorial based design was conducted, using Statistica for Windows® software Version 7.1 (StatSoft
Inc., USA). The factors selected as independent variables were: log P of cosolvents (X1), cosolvent
concentrations (% v/v) (X2) and the drug/copolymer ratios (X3).
The batches were distinguished by the log P value of the cosolvents. Thus, Me2CO (batch S1-S9),
MeCOEt (batch S10-S18), or nBuOAc (batch S19-S27) were mixed individually with CH2Cl2. Several
parameters were examined as dependent variables: η (Y1), the production yield (Y2), particle size (Y3),
EE (Y4) and Q6 (Y5). Table 2 shows the levels and actual values of the independent variables. The
results were confirmed and specified by analysis of variance (one-way ANOVA) (p < 0.05). For
evaluation of the results, the correlation coefficients (R2) and the p values were calculated.
Pharmaceutics 2011, 3 835
Table 2. Levels and values of the independent variables (non-randomized).
Levels Values
X1 (log P) X2 (cosolvent conc.) (% v/v) X3 (drug/copolymer ratio)
−1 0.234 (Me2CO) 25 1:32
0 0.736 (MeCOEt) 50 1:24
+1 1.822 (nBuOAc) 75 1:16
Table 3. The microsphere batches investigated in factorial design.
X1 (−1) (0) (+1)
S1 S10 S19
S2 S11 S20
S3 S12 S21
S4 S13 S22
S5 S14 S23
S6 S15 S24
S7 S16 S25
S8 S17 S26
S9 S18 S27
X2 −1 0 +1
X3 −1 0 +1 −1 0 +1 −1 0 +1
The batch of S0A-S0B-S0C was prepared with CH2Cl2 alone with the levels of X3: −1/0/+1, respectively.
3. Results and discussion
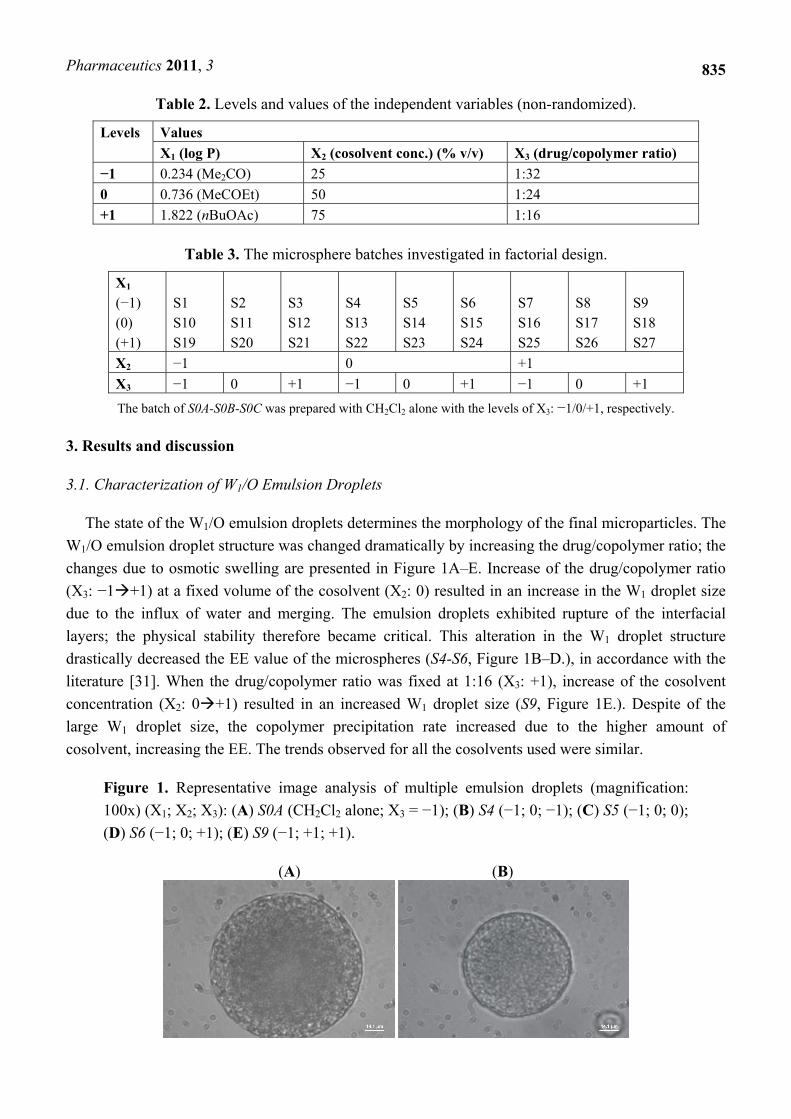
3.1. Characterization of W1/O Emulsion Droplets
The state of the W1/O emulsion droplets determines the morphology of the final microparticles. The
W1/O emulsion droplet structure was changed dramatically by increasing the drug/copolymer ratio; the
changes due to osmotic swelling are presented in Figure 1A–E. Increase of the drug/copolymer ratio
(X3: −1+1) at a fixed volume of the cosolvent (X2: 0) resulted in an increase in the W1 droplet size
due to the influx of water and merging. The emulsion droplets exhibited rupture of the interfacial
layers; the physical stability therefore became critical. This alteration in the W1 droplet structure
drastically decreased the EE value of the microspheres (S4-S6, Figure 1B–D.), in accordance with the
literature [31]. When the drug/copolymer ratio was fixed at 1:16 (X3: +1), increase of the cosolvent
concentration (X2: 0+1) resulted in an increased W1 droplet size (S9, Figure 1E.). Despite of the
large W1 droplet size, the copolymer precipitation rate increased due to the higher amount of
cosolvent, increasing the EE. The trends observed for all the cosolvents used were similar.
Figure 1. Representative image analysis of multiple emulsion droplets (magnification:
100x) (X1; X2; X3): (A) S0A (CH2Cl2 alone; X3 = −1); (B) S4 (−1; 0; −1); (C) S5 (−1; 0; 0);
(D) S6 (−1; 0; +1); (E) S9 (−1; +1; +1).
(A) (B)

Pharmaceutics 2011, 3 836
Figure 1. Cont.
(C) (D)
(E)
3.2. SEM Evaluation of the Microspheres
Surface characteristics and external morphology were analyzed using SEM (Figure 2A–F). The
surface of the microparticle was affected by the independent variables. The rate of the emulsion
droplets hardening and therefore the rate of AMC matrix preparation were different before the
spray-drying. The drug-free microspheres, prepared with CH2Cl2 alone, exhibited an intact and smooth
surface (Figure 2A). The drug-containing microspheres prepared with CH2Cl2 alone displayed
spherical particles with a smooth surface, without agglomeration (Figure 2B).
Figure 2. SEM evaluation of microsphere products (X1; X2; X3): (A) Drug-free sample
without number (CH2Cl2 100% v/v); (B) S0C (CH2Cl2 100% v/v; X3 = +1); (C) S9 (−1; +1;
+1); (D) S18 (0; +1; +1) and (E) S27 (+1; +1; +1).
(A) (B)

Pharmaceutics 2011, 3 837
Figure 2. Cont.
(C) (D)
(E)
When CH2Cl2-cosolvent mixtures were used (S1-S27), the morphology of the microspheres varied
with the nature of the cosolvent. Figure 2C–E show the most critical cases when microspheres were
prepared at high cosolvent concentration (X2: +1) and at a high drug/copolymer ratio (X3: +1). The
trends observed for all the cosolvents used were similar. As compared the microspheres prepared with
less water-soluble cosolvents (MeCOEt and nBuOAc), the use of Me2CO (Batch S1-S9) led to a dense
microsphere structure, in which, despite the pores and the depressed surface, the drug release could
ensure a sustained profile. As a result of rapid solvent diffusion, and therefore the fast precipitation of
the copolymer, the particles were regularly shaped, but minor or gross distortions could also be
observed (S9, Figure 2C). When MeCOEt, as a less water-soluble cosolvent, was added to CH2Cl2
(Batch S10-S18), more spherical particles with distorted surface morphology were observed, and there
were several aggregated microparticles (S18, Figure 2D). In fact, the formation of these ‘groups of
particles’ arose from the fusion of the semifinished microparticle walls at the interface, because the
emulsion droplets could not be divided during the spray-drying process. The cosolvent nBuOAc, as the
least water-soluble cosolvent, decreased te rate of solvent extraction, leading to microparticles with
porous and rough surface (S27, Figure 2E).
3.3. Microspheres Prepared with CH2Cl2 100% v/v
With increasing level of X3 (−1 +1), the η decreased by 40%, from 30.9 to 18.6 mPas, particle
size increased from 54 μm to 130 μm, and EE decreased considerably by 73%. The Nernst dissolution
profile best followed the release profile of batch S0A-S0C (R2 > 0.955), and the release rate reached a
plateau, after a slow dissolution. The absence of a burst effect could be due to the preferential location
of the drug inside the deep sections of the copolymer matrix.

Pharmaceutics 2011, 3 838
3.4. Y1 Response: Investigation of the W1/O Emulsion Viscosity
Table 4 shows the factorial design layout for the variables and the measured values of the
responses. The precipitation of the polymer, and hence the microsphere formation, depends on the
diffusion-controlled solvent removal process, the organic phase viscosity and the cosolvent
concentration [32]. The viscosity is of great importance: dispersing of the droplet in the watery phase
or spray-drying depends on the droplet viscosity. Batch S19-S27 with the highest η ensured
microspheres with a porous surface, with a low production yield, low EE value, but higher particle size
and Q6 value with the levels of X3 = 0 and +1. It was observed that log P of the cosolvent (X1) was
more of a controlling factor in the viscosity of the examined phases; however, the cosolvent
concentration (X2) and the drug/copolymer ratio (X3) had significant complementary effects.
The rate of extraction of the polar cosolvent from the W1/O emulsion to the W2 phase is higher than
that for CH2Cl2; thus, the organic phase viscosity increased rapidly and polymer precipitation therefore
occurrs earlier. The increase of the X2 factor level resulted in a decreased organic phase viscosity, and
therefore an increased mixing efficiency. This tendency also held true for X3, keeping X2 constant. The
W1/O emulsion, prepared purely with CH2Cl2 (S0A-S0C) had higher η (18.6–30.9 mPas) than those of
the emulsions prepared with the cosolvents examined (6.4–22.7 mPas). The lipophilic components
dissolved in the CH2Cl2 + MeCOEt mixtures led to a stronger viscosity dependence than when pure
CH2Cl2 and MeCOEt were mixed. At constant X2, η decreased with increasing X3, similarly in the case
of Me2CO and nBuOAc. The η decreased to a larger extent at constant X3 with increasing X2; this
change was statistically significant (R2 = 0.976, p = 0.002). Both the linear (b1) and the quadratic (b11)
effects of the independent variables on η were statistically significant (R2 = 0.998, p < 0.008)
(Table 4). X1 had the main (positive) effect on η (b1: 4.68), but the increased levels of X2 and X3
decreased it, and a synergistic interaction between X2 and X3 (b23: 0.53) was also observed. The
required effect is a low η, which could be ensured by low and medium (−1;0) X1, all level of X2 and
low level (−1) of X3.
Table 4. Coefficients for the mathematical models. Linear (b0–b3), synergistic (b12–b23)
and quadratic (b11–b33) effects of the independent variables on the dependent variables
(Y1–Y5).
Resp. b0 b1 b2 b3 b12 b13 b23 b11 b22 b33 R2
Y1 12.49 4.68 −2.22 −1.25 0.30 −0.49 0.53 −1.74 −0.32 −0.07 0.9988
Y2 59.05 −10.38 1.86 −6.63 3.93 −0.39 0.00 5.35 −3.39 −0.64 0.9449
Y3 186.07 26.71 −15.05 20.17 −23.29 −0.93 −1.69 −7.88 27.31 2.12 0.9875
Y4 26.76 −1.82 3.45 −10.9 −0.66 2.72 −1.21 1.66 −0.76 −1.46 0.9784
Y5 51.64 31.07 −0.41 5.71 −14.34 0.25 4.44 10.58 4.41 3.58 0.9057
Y1: W1/O viscosity (mPas); Y2: Production yield (%); Y3: Average particle size (μm); Y4: EE (%); Y5: Cumulative release in 6h (μg/mL)
3.5. Y2 Response: Investigation of Microsphere Production Yield
The production yield ranged from 26.1 to 74.6%, depending notably on the process parameters, and
the viscosity and stability of the multiple emulsion to be dried. As expected, the production yield was
dependent of the drug/copolymer ratio, as demonstrated by the variation between microspheres

Pharmaceutics 2011, 3 839
prepared at the same level of the X3 factor. The decrease of η led to a decrease in the efficacy of the
spray-drying process and consequently in the production yield. The production yield decreased in
parallel with the increase of X1 and X3. Low and medium (−1 and 0) levels of X1, high (+1) level of X2
and low level (−1) of X3 resulted in a higher production yield (65–72%). X3 was confirmed as the
limiting factor, the linear (b3) effect of X3 had great influence (–6.63) (R2 = 0.944). It was observed
that the use of nBuOAc and the high (+1) level of X3 affected the production yield most adversely.
Increase of X3 caused a decrease in the production yield, due to the low precipitation rate of the
hardening W1/O emulsion droplet. Low (−1) level of X3 demonstrated the highest production yield
(45.1–62.1 %), indicating that this ratio could be used successfully at high cosolvent concentration
(75% v/v) to achieve the convenient production yield during the spray-drying.
3.6. Y3 Response: Investigation of Particle Size
The particle size data were in the range of 120.6–313.4 μm (fine to moderately fine, Ph.Eur. 7.).
The SPAN parameter overall varied from 1.04E+00 to 4.84E+00, reflecting a homogeneous size
distribution. The rates of extraction and evaporation rate of the organic solvent and polar cosolvents
are determined by their water-solubilities and boiling points, respectively. Generally, a high solvent
extraction rate can lead to fast microsphere formation, no merging of the emulsion droplets and
therefore a low particle size [33].
The average size (D [4,3]) of the microspheres showed a trend of decreased size with increased
W1/O viscosity in the batches. X1 had high effect on particle size (b1 = 26.71); its increase afforded the
same sequence as for the boiling points (Me2CO < MeCOEt << nBuOAc) and resulted in an increased
particle size, while their water-solubilities exhibited the opposite sequence. nBuOAc has the highest
viscosity, resulting in a more viscous W1/O emulsion, which made it difficult to form small multiple
emulsion droplets, as reported earlier [28]. S19-S21 had the highest η (17.6–22.7 mPas), but did not
ensure the highest particle size. In fact, S0A and S0B, prepared with CH2Cl2 alone, had relatively high
η (20.5 and 30.9 mPas), with the lowest particle size (54 and 107 μm), indicating the joint effect of the
independent variables. The effects of all the factors, and the quadratic effect of X2 (b22: 27.31) were
found to be significant.
There was a tendency for increasing amount of drug in the W1 phase to lead to a decreased
production yield and an increased particle size, which proved to be opposite effects. The microspheres
obtained at drug/copolymer ratio of 1:16 (X3; +1) were characterized by the maximum particle size in
every batch. High (+1) level of X2, and low (−1) level of X1 and X3 decreased particle size. When
nBuOAc was used (X1; +1) at medium concentration (X2; 0), microspheres were formed with the
maximum particle size (278–313 μm), because the increase in the CH2Cl2-nBuOAc viscosity resulted
in merged droplets or in a reduction of the efficiency of disruption of the W1/O emulsion into droplets.
The trends observed for the various batches were practically the same: particle size at constant X2
increased with increasing X3 level, while at constant X3 and increasing X2 levels, particle size
increased up to 50% cosolvent content, and dropped at 75% content, due to the decreased viscosity of
the emulsion droplets. The negative sign of the X2 effect (b2: −15.05) confirmed this incident.

Pharmaceutics 2011, 3 840
3.7. Y4 Response: Investigation of Drug Encapsulation Efficiency (EE)
The value of EE is the result of a sensitive balance between two main key factors as opposite
effects, the rate of CH2Cl2+cosolvent migration to the W2 phase and the duration of copolymer
precipitation.
Addition of a polar cosolvent and therefore fast partitioning and extraction could decrease the
interfacial tension between the organic and aqueous phases, and form a dense wall, which can prevent
the confluence of the aqueous phases, and ensure a dense microparticle structure with high EE [34].
Rapid increase in the η viscosity led to a reduction in the drug partitioning into the W2 phase, and the
more viscous W1/O emulsion was less fragmented; these effects resulted in drug retention [2]. On the
other hand, the addition of a cosolvent could increase the microsphere porosity, leading to drug loss
during the preparation and therefore a lower EE [34]. On the basis of preliminary studies [35] the used
drug/copolymer ratios can ensure the molecular dispersion of drug in the copolymer matrix.
EE varied in the ranges of 10.5–53.3%, the factorial design indicated a good fit (R2 = 0.978).
Cosolvent log P at all levels, cosolvent concentrations at medium or high (X2; 0 and +1) levels and low
drug/copolymer ratio (X3; −1) yielded microspheres with the highest EE (33.4–53.3%). The
appreciable effects of X2 (b2: 3.45) and X3 (b2: −10.9) on EE indicated main effects that differed in
magnitude and mathematical sign.
The use of polar cosolvents ensures a driving force for CH2Cl2 and the W1 phase to enter the W2
phase. A high (+1) level of X2 and a low (−1) level of X3 led to the maximum of EE, which confirmed
that the polar cosolvent can leave the W1/O emulsion faster, resulting in the fast solidification of the
copolymer and in more drug in the W1 droplets. Moreover the droplets may have remained in the
liquid form for a longer period of time if nBuOAc were used, leading to a greater drug leakage, which
was reflected in the decreased EE values (11.4–38.4%); however the more viscous W1/O emulsion
could be less likely fragmented, resulting in drug retention.
3.8. Y5 Response: Investigation of Cumulative Drug Release (Q6)
In this study, significant effect of cosolvent logP (cosolvent type) on drug release, and significant
but less determinant the cosolvent and drug/copolymer ratios, was observed. Q6 varied in the ranges of
3.26–100%. The preliminary thermoanalytical and Raman spectroscopical preformulation studies
showed stable character of the drug in the microspheres and revealed an absence of considerable
drug-copolymer interaction, which could be responsible for the additional retaining effect of the drug,
altering the drug release rate [36]. The release pattern was found to be complex, the goodness of fit for
the kinetic models used ranked in the sequence of Hixson-Crowell < Baker-Lonsdale ≅ Higuchi <
Nernst. The Nernst dissolution profile best followed the release profile of S0A-S0C; after a slow
dissolution the release rate reached a plateau (R2 > 0.955). The absence of a burst effect could be due
to the preferential location of drug inside the deep sections of the copolymer matrix. For batches
without a burst effect, the Baker-Lonsdale and Higuchi models were found to provide best fit. Batches
reaching a plateau after 2 h conformed to the Hixson-Crowell model (R2 > 0.95). The absence of an
initial burst was observed for batch S1-S9; the rapid Me2CO diffusion could lead to a dense copolymer
matrix, eliminating the burst release, and thus the rate of drug diffusion was attenuated
(Q6: 3.2–48.6 h). In contrast, a high burst release was observed for batch S19-S27 (nBuOAc)

Pharmaceutics 2011, 3 841
(Q6: 47.1–100.0 h). Pore diffusion, disruption or disintegration of the matrix, as expressed in the burst
effect, became more predominant at high drug/copolymer ratio.
Due to the relatively low Q6 values, the CH2Cl2-Me2CO mixture could be useful when sustained
release for a longer period is the required dissolution profile. At constant X2, an increase of X3 was
found to improve the dissolution of drug appreciably. The release profiles of S1-S5 proved linear,
conforming the Higuchi equation (R2 > 0.973), and S6-S9 followed the Hixson-Crowell release profile
(R2 > 0.932). This confirmed dissolution rate limitation of drug release from microparticles and
revealed to no dramatic changes in the structure of them meanwhile [37].
S10-S12 (X2; −1) fitted the Baker-Lonsdale model (R2 > 0.941), describing release profiles from
matrices with uniform drug distribution, while the release profile of S14-S16 (X2; 0, +1) fitted the
Nernst model (R2 > 0.962). S17-S18 (X2; 0, +1) did not meet the requirements (max. 80% in 6 h).The
nBuOAc has the highest boiling point and viscosity of the cosolvents used; since the rate of
evaporation of the solvent depends on its boiling point, the influence of the slow evaporation combined
with the higher viscosity was more evident for this batch, resulting in microspheres with a large
specific surface area, low EE, a porous nature and hence a high release rate with initial burst. A
possible reason for the high drug release could be the formation of large pores and deep channels,
explained by the rapid extraction of nPrOH from the W1/O emulsion, which may act in this way as an
effective pore-forming agent. Q6 was accompanied by a burst release effect, followed by the sustained
release of 70–86% over 6 h. The release from S20-S21 and S23-S24 (X3: 0;+1) was fast (t90 < 0.70 h),
the amounts released exceeded the aims, the surface defects could be responsible for the burst effect.
S19, S22 and S25-S27 (X3; −1) satisfied the Nernst equation with a good fit (R2 > 0.977).
Figure 3. Effect of cosolvent log P (factor X1) and concentration (factor X2) on rate of
drug release (X1; X2; X3): S1 (−1; −1; −1), S7 (−1; +1; −1), S10 (0; −1; −1), S16 (0; +1;
−1), S19 (+1; −1; −1) and S25 (+1; +1; −1).
0
20
40
60
80
0 60 120 180 240 300 360
release time (min)
cum
ulat
ive
drug
rele
ase
(%)
S10
S7
S16
S19
S25
S1
X1 proved statistically significant in its linear (b1: 31.07), quadratic (b11: 10.58) and interaction
(b12: −14.34) effects. The joint effects of X1 and X2 on the cumulative drug release rate are reflected by
the following representative release profiles (b12 = −14.34), where S1, S10 and S19 (X2 = −1) and S7,
Pharmaceutics 2011, 3 842
S16, S19 (X2 = +1), when X3 was kept constant (−1). In spite of their different release behavior, the
production yields (62–74%), particle size (108–205 μm), and EE (33–53%) values of these batches
were similar; thus, mainly the log P and concentration of the cosolvents appeared to determine the
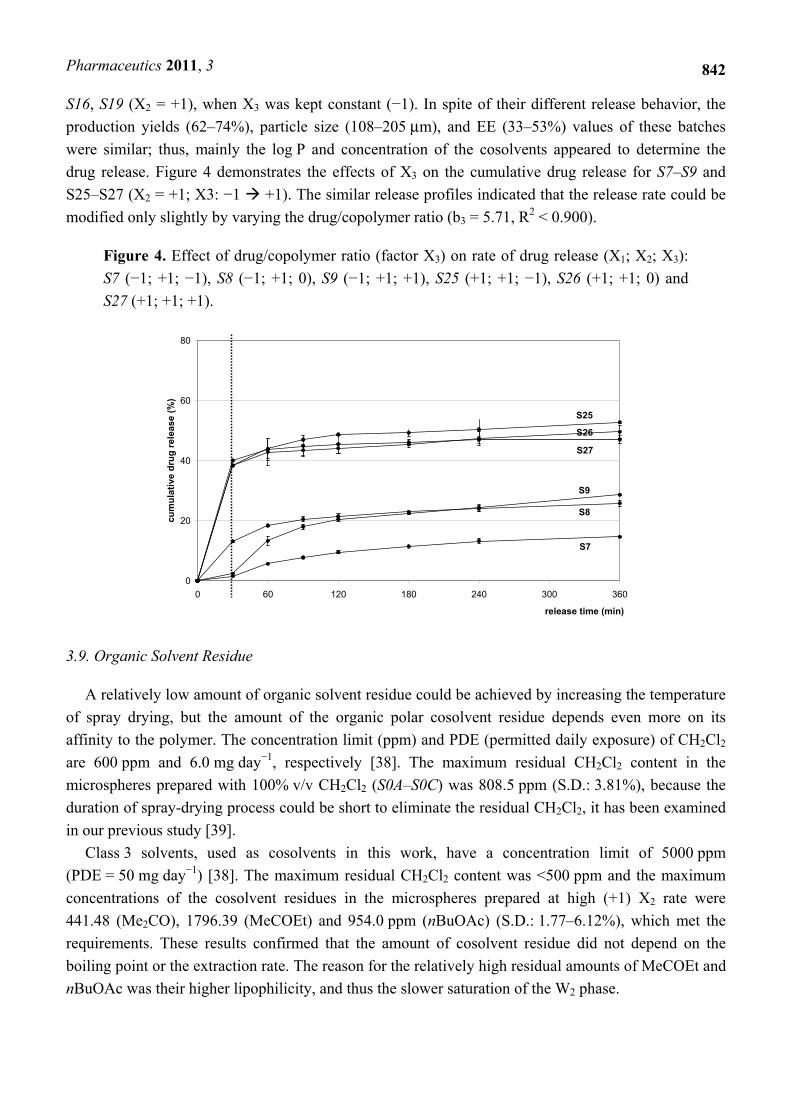
drug release. Figure 4 demonstrates the effects of X3 on the cumulative drug release for S7–S9 and
S25–S27 (X2 = +1; X3: −1 +1). The similar release profiles indicated that the release rate could be
modified only slightly by varying the drug/copolymer ratio (b3 = 5.71, R2 < 0.900).
Figure 4. Effect of drug/copolymer ratio (factor X3) on rate of drug release (X1; X2; X3):
S7 (−1; +1; −1), S8 (−1; +1; 0), S9 (−1; +1; +1), S25 (+1; +1; −1), S26 (+1; +1; 0) and
S27 (+1; +1; +1).
0
20
40
60
80
0 60 120 180 240 300 360
release time (min)
cum
ulat
ive
drug
rele
ase
(%)
S25
S8
S9
S27
S26
S7
3.9. Organic Solvent Residue
A relatively low amount of organic solvent residue could be achieved by increasing the temperature
of spray drying, but the amount of the organic polar cosolvent residue depends even more on its
affinity to the polymer. The concentration limit (ppm) and PDE (permitted daily exposure) of CH2Cl2
are 600 ppm and 6.0 mg day−1, respectively [38]. The maximum residual CH2Cl2 content in the
microspheres prepared with 100% v/v CH2Cl2 (S0A–S0C) was 808.5 ppm (S.D.: 3.81%), because the
duration of spray-drying process could be short to eliminate the residual CH2Cl2, it has been examined
in our previous study [39].
Class 3 solvents, used as cosolvents in this work, have a concentration limit of 5000 ppm
(PDE = 50 mg day−1) [38]. The maximum residual CH2Cl2 content was <500 ppm and the maximum
concentrations of the cosolvent residues in the microspheres prepared at high (+1) X2 rate were
441.48 (Me2CO), 1796.39 (MeCOEt) and 954.0 ppm (nBuOAc) (S.D.: 1.77–6.12%), which met the
requirements. These results confirmed that the amount of cosolvent residue did not depend on the
boiling point or the extraction rate. The reason for the relatively high residual amounts of MeCOEt and
nBuOAc was their higher lipophilicity, and thus the slower saturation of the W2 phase.

Pharmaceutics 2011, 3 843
4. Conclusions
The individual and joint effects of independent variables {log P of cosolvent (X1); cosolvent
concentration (X2); and drug/copolymer ratio (X3)} on the properties of spray-dried AMC-based
microspheres were investigated with a factorial-based design. This work is based on the fact that the
use of polar cosolvents in the multiple emulsion method can increase the risk of confluence of the
aqueous phases, and thus the decreased stability of the multiple emulsion could cause appreciable
alterations in the microsphere properties.
The factorial design allowed selection of the levels of the independent variables yielding an
optimum microsphere product. Table 5 summarizes the optimization process between the required
levels of the independent variables, furnishing a basis for predictions of further quantitative data. Low
and medium (−1;0) levels of X1, X2 and X3, as independent variables, were used to obtain
microspheres with a relatively high production yield (Y2: 45.1–71.5%), low particle size (Y3: 120.6–
205.4 μm) and high EE (Y4: 41.8–53.3%). For sustained and relatively low drug release, MeCOEt as
cosolvent was appropriate at low and medium (−1 and 0) levels of X2 and X3, as was Me2CO at
medium level (0) of X2 factor. The following results were obtained as concerns the independent
variables:
Table 5. Optimization of levels of independent variables according to required effects.
X2 (−1) X2 (0) X2 (+1)
X1 (−1) Y1-Y4 Y1-Y4 Y1-Y4 X3 (−1)
Y1-Y4 Y1-Y5 Y1-Y3; Y5 X3 (0)
Y1-Y4 Y1-Y5 Y1-Y3; Y5 X3 (+1)
X1 (0) Y1-Y5 Y1-Y5 Y1-Y4 X3 (−1)
Y1-Y5 Y1-Y5 Y1-Y3 X3 (0)
Y1-Y5 Y1-Y5 Y1-Y3 X3 (+1)
X1 (+1) Y2-Y4 Y2; Y4 Y1-Y5 X3 (−1)
Y3-Y4 Y4 Y1; Y3; Y5 X3 (0)
Y3-Y4 Y4 Y1; Y3; Y5 X3 (+1)
Required effects, as Y1—low W1/O viscosity; Y2—high production yield; Y3—low particle size;
Y4—high EE and Y5—Q6 40–80% in 6 h, can be ensured by the compositions highlighted.
—Log P of cosolvent (X1): The CH2Cl2-cosolvent composition was the key factor controlling the
properties of the microspheres according to the demand of the formulator. Although the effects of the
polar cosolvents used proved complicated, linear relationship was observed between the cosolvent
properties and the measured responses, indicating a strong influence of the W1/O viscosity on the
microsphere physicochemical parameters. Me2CO and MeCOEt were clearly the best cosolvents in
this work, the examined dependent variables reaching the optimum. Me2CO and MeCOEt best
increased the precipitation of the copolymer, ensured low W1/O viscosity and increased the hardening
of copolymer, indicating the final sequence nBuOAc < Me2CO ≈ MeCOEt in accordance with
the aims.
—Concentration of cosolvent (X2): A medium concentration of the less toxic and more polar
cosolvents had a much higher positive effect than a high concentration. However, the cosolvents at a
high concentration ratio were found to leave low residual impurities. Conversely, X2 at high (+1) level,

Pharmaceutics 2011, 3 844
in spite of the rapid preparation process, the less stable W1/O emulsion droplets could not retain the
drug inside during preparation, and EE decreased due to the osmotic effect of the W1 phase.
—The drug/copolymer ratio (X3): The sequence 1:32 < 1:24 ≈ 1:16 for drug/copolymer ratio
made this variable optimum, for optimization of the microsphere characteristics, X3 at medium and
high level proved most effective. At this ratio, the W1 droplet size decreased the possibility of
confluence of the aqueous phases, improving EE. Future studies appear important to increase the
EE values.
Conflict of Interest
The authors declare no conflict of interest.
Acknowledgements
The authors thank Mónika Kovács (Human Co., Hungary) for her kind help with Gas
chromatography (static head-space) measurements. This work was supported by TÁMOP research
project 4.2.1/B-09/1/KONV-2010–0005.
References
1. Godbee, J.; Scott, E.; Pattamunuch, P.; Chen, S.; Mathiowitz, E. Role of solvent/non-solvent ratio
on microsphere formation using the solvent removal method. J. Microencapsul. 2004, 21,
151–160.
2. Sohier, J.; van Dijkhuizen-Radersma, R.; de Groot, K.; Bezemer, J.M. Release of small water-
soluble drugs from multiblock copolymer microspheres: a feasibility study. Eur. J. Pharm.
Biopharm. 2003, 55, 221–228.
3. Constantin, M.; Fundueanu, G.; Bortolotti, F.; Cortesi, R.; Ascenzi, P.; Menegatti, E. Preparation
and characterisation of poly(vinyl alcohol)/cyclodextrine microspheres as matrix for inclusion and
separattion of drugs. Int. J. Pharm. 2004, 285, 87–96.
4. Biju, S.S.; Saisivam, S.; Maria Gerald Rajan, N.S.; Mishra, P.R. Dual coated erodible
microcapsules for modified release of diclofenac sodium. Eur. J. Pharm. Biopharm. 2004, 58,
61–67.
5. Lee, E.S.; Kwon, M.J.; Lee, H.; Na, K.; Kim, J.J. In vitro study of lysozyme in poly(lactide-co-
glycolide) microspheres with sucrose acetate isobutyrate. Eur. J. Pharm. Sci. 2006, 29, 435–441.
6. Li, Z.; Li, L.; Zhang, H.; Li, X.; Luo, F.; Mei, X. Development of interferon alpha-2b
microspheres with constant release. Int. J. Pharm. 2011, 410, 48–53.
7. Arica, B.; Kas, H.S.; Orman, M.N.; Hincal, A.A. Biodegradable bromocryptine mesylate
microspheres prepared by a solvent evaporation technique. I: Evaluation of formulation variables
on microsphere characteristics for brain delivery. J. Microencapsul. 2002, 19, 473–484.
8. Saravanan, M.; Anupama, B. Development and evaluation of ethylcellulose floating microspheres
loaded with ranitidine hydrochloride by novel solvent evaporation-matrix erosion method.
Carbohydr. Polymer. 2011, 85, 592–598.

Pharmaceutics 2011, 3 845
9. Peltonen, L.; Koistinen, P.; Karjalainen, M.; Häkkinen, A.; Hirvonen, J. The effect of cosolvents
on the formulation of nanoparticles from low-molecular-weight poly(l)lactide. AAPS
PharmSciTechn 2002, 3, 1–7.
10. Wang, F.J.; Wang, C.H. Sustained release of etonidazole from spray dried microspheres prepared
by non-halogenated solvents. J. Control. Release 2002, 81, 263–280.
11. Jose, S.; Prema, M.T.; Chacko, A.J.; Thomas, A.C.; Souto, E.B. Colon specific chitosan
microspheres for chronotherapy of chronic stable angina. Colloids Surf. B Biointerfaces 2011, 83,
277–283.
12. Li, X.; Zhang, Y.; Yan, R.; Jia, W.; Yuan, M.; Deng, X.; Huang, Z. Influence of process
parameters on the protein stability encapsulated in poly-DL-lactide-poly(ethylene glycol)
microspheres. J. Control. Release 2000, 68, 41–52.
13. Jayant, R.D.; McShane, M.J.; Srivastava, R. In vitro and in vivo evaluation of anti-inflammatory
agents using nanoengineered alginate carriers: Towards localized implant inflammation
suppression. Int. J. Pharm. 2011, 403, 268–275.
14. Curcio, M.; Spizzirri, U.G.; Iemma, F.; Puoci, F.; Cirillo, G.; Parisi, O.I.; Picci, N. Grafted
thermo-responsive gelatine microspheres as delivery systems in triggered drug release. Eur. J.
Pharm. Biopharm. 2010, 76, 48–55.
15. Abdul, S.; Chandewar, A.V.; Jaiswal, S.B. A flexible technology for modified-release drugs:
Multiple-unit pellet system (MUPS). J. Control. Release 2010, 147, 2–16.
16. Zhang, J.; Wang, Q.; Wang, A. In situ generation of sodium alginate/hydroxyapatite beads as
drug-controlled release matrices. Acta Biomaterialia 2010, 6, 445–454.
17. Manconi, M.; Mura, S.; Sinico, C.; Fadda, A.M.; Vila, A.O.; Molina, F. Development and
characterization of liposomes containing glycols as carriers for diclofenac. Colloid. Surf. A 2009,
342, 53–58.
18. Kramar, A.; Turk, S.; Vrečer, F. Statistical optimisation of diclofenac sustained release pellets
coated with polymetacrylic films. Int. J. Pharm. 2003, 256, 43–52.
19. González-Rodríguez, M.L.; Maestrelli, F.; Mura, P.; Rabasco, A.M. In vitro release of sodium
diclofenac from a central core matrix tablet aimed for colonic drug delivery. Eur. J. Pharm. Sci.
2003, 20, 125–131.
20. Fujimori, J.; Yoshihashi, Y.; Yonemochi, E.; Terada, K. Application of Eudragit RS to thermo-
sensitive drug delivery systems. J. Control. Release 2005, 102, 49–57.
21. Trapani, A.; Laquintana, V.; Denora, N.; Lopedota, A.; Cutrignelli, A.; Franco, M.; Trapani, G.;
Liso, G. Eudragit RS 100 microparticles containing 2-hydroxypropyl-β-cyclodextrin and
glutathione: Physicochemical characterization, drug release and transport studies. Eur. J. Pharm.
Sci. 2007, 30, 64–74.
22. Wu, P.C.; Huang, Y.B.; Chang, J.S.; Tsai, M.J.; Tsai, Y.H. Design and evaluation of sustained
release microspheres of potassium chloride prepared by Eudragit. Eur. J. Pharm. Sci. 2003, 19,
115–122.
23. Año, G.; Esquisabel, A.; Pastor, M.; Talavera, A.; Cedré, B.; Fernández, S.; Sifontes, S.;
Aranguren, Y.; Falero, G.; García, L.; Solís, R.L.; Pedraz, J.L. A new oral vaccine candidate
based on the microencapsulation by spray-drying of inactivated Vibrio cholerae. Vaccine 2011,
doi:10.1016/j.vaccine.2011.05.098

Pharmaceutics 2011, 3 846
24. Kim, B.K.; Hwang, S.J.; Park, J.B.; Park, H.J. Preparation and characterization of drug-loaded
polymethacrylate microspheres by an emulsion solvent evaporation method. J. Microencapsul.
2002, 19, 811–822.
25. Kumar, V.; Kang, J.; Yang, T. Preparation and characterization of spray-dried oxidized cellulose
microparticles. Pharmaceut. Dev. Technol. 2001, 6, 449–458.
26. Huh, Y.; Cho, H.-J.; Yoon, I.-S.; Choi, M.-K.; Kim, J.S.; Oh, E.; Chung, S.-J.; Shim, Ch.-K.;
Kim, D.-D. Preparation and evaluation of spray-dried hyaluronic acid microspheres for intranasal
delivery of fexofenadine hydrochloride. Eur. J. Pharm. Sci. 2010, 40, 9–15.
27. Haswani, D.K.; Nettey, H.; Oettinger, C.; D’Souza, M.J. Formulation, characterization and
pharmacokinetic evaluation of gentamicin sulphate loaded albumin microspheres. J. Microencaps.
2006, 23, 875–886.
28. Lee, H.Y.; Chan, L.W.; Dolzhenko, A.V.; Heng, P.W.S. Influence of viscosity and uronic acid
composition of alginates on the preparation of alginate films and microspheres produced by
emulsification. J. Microencaps. 2006, 23, 912–927.
29. Benita, S. Microencapsulation: Methods and Industrial Applications; Marcel Dekker Inc.: New
York, NY, USA, 1996.
30. Ahuja, N.; Katare, O.P.; Singh, B. Studies on dissolution enhancement and mathematical
modeling of drug release of a poorly water-soluble drug using water-soluble carriers. Eur. J.
Pharm. Sci. 2007, 65, 26–38.
31. Lindenstruth, K.; Müller, B.W. W/O/W multiple emulsions with diclofenac sodium. Eur. J.
Pharm. Biopharm. 2004, 58, 621–627.
32. Senuma, Y.; Lowe, C.; Zweifel, Y.; Hilborn, J.G.; Marison, I. Alginate hydrogel microspheres
and microspheres by spinning disk atomization. Biotechnol. Bioeng. 2000, 67, 616–622.
33. Ruan, G.; Feng, S.S.; Li, Q.T. Effects of material hydrophobicity on physical properties of
polymeric microspheres formed by double emulsion process. J. Control. Release 2002, 84,
151–160.
34. Obeidat, W.M.; Price, J.C. Viscosity of polymer solution phase and other factors controlling the
dissolution of theophylline microspheres prepared by the emulsion solvent evaporation method. J.
Microencapsul. 2003, 20, 57–65.
35. Sipos, P.; Szűcs, M.; Szabó, A.; Erős, I.; Szabó-Révész, P. An assessment of the interactions
between diclofenac sodium and ammonio methacrylate copolymer using thermal analysis and
Raman spectroscopy. J. Pharm. Biomed. Anal. 2008, 46, 288–294.
36. Sipos, P.; Szabó, A.; Erős, I.; Szabó-Révész, P. A DSC and Raman spectroscopy study of
microspheres prepared with polar cosolvents by different techniques. J. Therm. Anal. Cal. 2008,
94, 109–118.
37. Karasulu, E.; Karasulu, H.Y.; Ertan, G.; Kirilmaz, L.; Güneri, T. Extended release lipophilic
indomethacin microspheres: formulation factors and mathematical equations fitted drug release
rates. Eur. J. Pharm. Sci. 2003, 19, 99–104.
38. ICH Harmonised Tripartite Guideline. Impurities: Guideline for Residual Solvents, Q3C (R4);
ICH: Geneva, Switzerland, 2009.

Pharmaceutics 2011, 3 847
39. Sipos, P.; Csóka, I.; Srčič, S.; Pintye-Hódi, K.; Erős, I. Influence of preparation conditions on the
properties of Eudragit microspheres produced by a double emulsion method. Drug Dev. Res.
2005, 64, 41–54.
© 2011 by the authors; licensee MDPI, Basel, Switzerland. This article is an open access article
distributed under the terms and conditions of the Creative Commons Attribution license
(http://creativecommons.org/licenses/by/3.0/).