first-principles prediction of structures and properties ... - mdpi
TRANSCRIPT

First-Principles Prediction of Structures and Properties in Crystals
Andreas Hermann and Dominik Kurzydłowski
www.mdpi.com/journal/crystals
Edited by
Printed Edition of the Special Issue Published in Crystals

First-Principles Prediction of Structures and Properties in Crystals

First-Principles Prediction of Structures and Properties in Crystals
Special Issue Editors
Andreas Hermann Dominik Kurzydłowski
MDPI • Basel • Beijing • Wuhan • Barcelona • Belgrade
Special Issue Editors
Andreas Hermann
The University of Edinburgh
UK
Dominik Kurzydłowski
Cardinal Stefan Wyszyński University Poland
Editorial Office
MDPI
St. Alban-Anlage 66
4052 Basel, Switzerland
This is a reprint of articles from the Special Issue published online in the open access journal Crystals
(ISSN 2073-4352) in 2019 (available at: https://www.mdpi.com/journal/crystals/special issues/
First-Principles).
For citation purposes, cite each article independently as indicated on the article page online and as
indicated below:
LastName, A.A.; LastName, B.B.; LastName, C.C. Article Title. Journal Name Year, Article Number,
Page Range.
ISBN 978-3-03921-670-3 (Pbk)
ISBN 978-3-03921-671-0 (PDF)
c© 2019 by the authors. Articles in this book are Open Access and distributed under the Creative
Commons Attribution (CC BY) license, which allows users to download, copy and build upon
published articles, as long as the author and publisher are properly credited, which ensures maximum
dissemination and a wider impact of our publications.
The book as a whole is distributed by MDPI under the terms and conditions of the Creative Commons
license CC BY-NC-ND.
Contents
About the Special Issue Editors . . . . . . . . . . . . . . . . . . . . . . . . . . . . . . . . . . . . . vii
Andreas Hermann and Dominik Kurzydłowski
First-Principles Prediction of Structures and Properties in CrystalsReprinted from: Crystals 2019, 9, 463, doi:10.3390/cryst9090463 . . . . . . . . . . . . . . . . . . . . 1
Nisha Geng, Tiange Bi, Niloofar Zarifi, Yan Yan, and Eva Zurek
A First-Principles Exploration of NaxSy Binary Phases at 1 atm and Under PressureReprinted from: Crystals 2019, 9, 441, doi:10.3390/cryst9090441 . . . . . . . . . . . . . . . . . . . . 4
Edward Higgins, Phil Hasnip, Matt Probert
Simultaneous Prediction of the Magnetic and Crystal Structure of Materials Using a Genetic AlgorithmReprinted from: Crystals 2019, 9, 439, doi:10.3390/cryst9090439 . . . . . . . . . . . . . . . . . . . . 21
Mariana Derzsi, Adam Grzelak, Paweł Kondratiuk, Kamil Tokar and Wojciech Grochala Quest for Compounds at the Verge of Charge Transfer Instabilities: The Case of Silver(II) Chloride Reprinted from: Crystals 2019, 9, 423, doi:10.3390/cryst9080423 . . . . . . . . . . . . . . . . . . . . 40
Wilayat Khan, Sikander Azam, Inam Ullah, Malika Rani, Ayesha Younus, Muhammad Irfan,
Paweł Czaja and Iwan V. Kityk
Insight into the Optoelectronic and Thermoelectric Properties of Mn Doped ZnTe from FirstPrinciples CalculationReprinted from: Crystals 2019, 9, 247, doi:10.3390/cryst9050247 . . . . . . . . . . . . . . . . . . . 59
Qing Peng, Guangyu Wang, Gui-Rong Liu and Suvranu De
Van der Waals Density Functional Theory vdW-DFq for Semihard MaterialsReprinted from: Crystals 2019, 9, 243, doi:10.3390/cryst9050243 . . . . . . . . . . . . . . . . . . . . 74
Dong Chen, Jiwei Geng, Yi Wu, Mingliang Wang and Cunjuan Xia
Insight into Physical and Thermodynamic Properties of X3Ir (X = Ti, V, Cr, Nb and Mo)Compounds Influenced by Refractory Elements: A First-Principles CalculationReprinted from: Crystals 2019, 9, 104, doi:10.3390/cryst9020104 . . . . . . . . . . . . . . . . . . . . 89
Qing Peng, Nanjun Chen, Danhong Huang, Eric R. Heller , David A. Cardimona and Fei Gao
First-Principles Assessment of the Structure and Stability of 15 Intrinsic Point Defects inZinc-Blende Indium ArsenideReprinted from: Crystals 2019, 9, 48, doi:10.3390/cryst9010048 . . . . . . . . . . . . . . . . . . . . 104
v

About the Special Issue Editors
Andreas Hermann is a Reader (associate professor) in the School of Physics and Astronomy at the University of Edinburgh, UK. He obtained his PhD in Sciences from Massey University, New Zealand, in 2010. After moving to a postdoctoral position at Cornell University, USA, in 2013 he joined the faculty at the University of Edinburgh. He works in computational materials science, with a particular focus on first-principles calculations of condensed matter systems. As member of Edinburgh’s Centre for Science at Extreme Conditions, part of his research focuses on the properties of materials under extreme pressure and temperature conditions. This includes the pressure responses of molecular systems and minerals, with implications for geo- and planetary sciences, but also exploring computationally the synthesis of new materials with interesting electronic or mechanical properties, such as polyhydrides or superhard materials. He has co-authored over 70 peer-reviewed publications and two review articles on light-element superconductivity and chemical bonding under pressure.
Dominik Kurzydłowski is an associate professor at the Faculty of Mathematics and Natural Sciences at the Cardinal Stefan Wyszy nski University in Warsaw. He obtained his PhD in Chemistry from the University of Warsaw in 2013. After completing his post-doctoral research stay in the group of dr. Mikhail Eremets at the Max Planck Institute of Chemistry (Mainz, Germany), in 2014 he joined the Cardinal Stefan Wyszy nski University. His research interest encompass the electronic and magnetic properties of fluorides, as well as the high-pressure chemistry of these compounds. In his research he employs both experimental (Raman scattering, X-ray diffraction), and theoretical methods (solid-
state density functional theory).
vii

crystals
Editorial
First-Principles Prediction of Structures andProperties in Crystals
Andreas Hermann 1,* and Dominik Kurzydłowski 2,*
1 Centre for Science at Extreme Conditions, School of Physics and Astronomy and SUPA, The University ofEdinburgh, EH9 3FD Edinburgh, UK
2 Faculty of Mathematics and Natural Sciences, Cardinal Stefan Wyszynski University, 01-815 Warsaw, Poland* Correspondence: [email protected] (A.H.); [email protected] (D.K.);
Tel.: +44-131-650-5824 (A.H.); +48-22-380-96-30 (D.K.)
Received: 3 September 2019; Accepted: 3 September 2019; Published: 4 September 2019
The term “first-principles calculations” is a synonym for the numerical determination of theelectronic structure of atoms, molecules, clusters, or materials from ‘first principles’, i.e., withoutany approximations to the underlying quantum-mechanical equations that govern the behavior ofelectrons and nuclei in these systems. In principle, these calculations allow us to learn about structural,mechanical, electronic, optical, and many more properties of molecules and materials without havingto resort to any empirical or effective models. Of course, solving the quantum many-particle problemis very hard; the application of the clamped nuclei or Born–Oppenheimer approximations removes theatomic nuclei from the problem but leaves behind the many-electron problem that is still impossible tosolve analytically for any interesting system.
Quantum chemists have risen to the challenge since the late 1920s by developing a successionof approximate approaches that, crucially, can be extended systematically towards solving the fullmany-electron problem. For small molecular systems, the best of these methods (such as coupled clustertheory) can determine electronic properties such as the ionization potential as accurately and preciselyas the best experiments. These approaches cannot be scaled well to extended, crystalline systems,and it was the development of density functional theory (DFT) in the 1960s that opened the door toaccurate “first-principles” calculations of crystalline materials. DFT comes with its own methodologicalchallenges and restrictions, first and foremost that a crucial component of the electron–electroninteraction, the exchange-correlation energy, is only known in a myriad of approximations andcannot be extended systematically towards the true expression. Nonetheless, DFT calculations haveshown from the beginning that they provide a reasonably accurate means to reproduce and explainexperimentally measured properties of crystals [1].
However, the challenge of whether first-principles calculations can evolve from an explanatory to atruly predictive tool was acknowledged, most colorfully in John Maddox’s famous statement in thelate 1980s about the “continuing scandal in the physical sciences”—the failure to predict the crystalstructures of materials on the basis of their chemical composition alone [2]. This ‘scandal’ has beentackled over the last two decades: more accurate calculations, smarter algorithms that borrow fromdata science, biological evolution, and machine learning, all combined with increased computingpower, allowing us to use DFT for truly predictive purposes [3–5].
Yet, challenges remain: complex chemical compositions, variable external conditions (such aspressure), defects, or properties that rely on collective excitations—all represent computational and/ormethodological bottlenecks. This Special Issue comprises a collection of papers that use DFT to tacklesome of these challenges and thus highlight what can (and cannot yet) be achieved using first-principlescalculations of crystals.
In Reference [6], Geng et al. have used evolutionary algorithms to predict crystal structures andelectronic properties of binary Na–S compounds under pressure. This material class is of interest for
Crystals 2019, 9, 463; doi:10.3390/cryst9090463 www.mdpi.com/journal/crystals1
Crystals 2019, 9, 463
use in battery materials, but the authors show that high pressure favors the formation of metalliccompounds with intriguing superconducting properties. Their work searches for stable and metastablephases across different pressures and a wide range of chemical compositions, and the authors usequantum chemical approaches and density functional perturbation theory to obtain the full picture ofthe new compounds’ electronic structure and superconductivity.
In Reference [7], Higgins et al. present a methodological advancement of a crystal structureprediction tool based on genetic algorithms, which accounts for the magnetic as well as the crystalstructure of a material by treating the localized magnetic moments as degrees of freedom on par withthe atomic positions and unit cell dimensions. They demonstrate that their approach can predictcomplex magnetic structures that can form at the interfaces of magnets and semiconductors.
In Reference [8], Derzsi et al. predict the structural, electronic, and magnetic properties of anelusive metal halide, AgCl2. They show that structure prediction can be done both in a physicallybiased way (following imaginary phonon modes of reasonable candidate structures) and in an unbiasedway (exploring configurational space using evolutionary algorithms). The authors examine in detail thedifficulties of DFT to properly capture the charge transfer and magnetic properties of this compoundand place the resultant most stable structure in a wider context of metal halide compounds.
In Reference [9], Khan et al. explore the electronic and transport properties of Mn-doped ZnTe.The host material is a promising thermoelectric, and the authors show that this is also true for thedoped materials, whilst doping reduces the electronic band gap towards values that are useful foroptoelectronic applications. The combination of defects, magnetism, and transport properties makesthis a very challenging problem.
In Reference [10], Peng et al. tackle a methodological issue of DFT: how best to describe non-localelectronic correlations of the London dispersion type. They introduce a new dispersion-correctedexchange-correlation functional that relies on a single adjustable parameter, q, which is present in theexchange part of the functional. The authors use the new approach to optimize the mass densities of atest set of molecular and layered materials and show that it outperforms two standard density-baseddispersion correction methods.
In Reference [11], Chen et al. study the properties of a class of metal-iridium compounds, X3Ir, for aset of early 3d and 4d transition metals. They focus on physical properties such as elastic moduli andsound velocities and are able to identify trends between the different metals, relate their calculations toexperimental data, and correlate them to details of the electronic structures of the compounds.
In Reference [12], Peng et al. survey a large set of possible point defects in an exemplary III–Vsemiconductor, InAs. These calculations necessitate the use of large supercells of the host materialcrystal structure, and the authors consider a wide range of possible local charge states for the differentdefects. How to treat such charged point defects in a fully periodic framework remains a point ofinterest to the community, and the present work contributes to the body of work from first-principlescalculations in this area.
In summary, this Special Issue highlights several of the frontiers of first-principles calculations incrystals: the prediction of crystal structures of materials, which remains the foundation to determineany and all of their properties; treating symmetry-breaking events such as defect formation ordoping, which can significantly change materials’ properties; calculating collective atomic or electronicexcitations, which requires perturbative approaches that relegate the standard DFT calculation to asmall first step; and developing new and improved ways to capture exchange-correlation effects inmany-electron systems. The present papers show that impressive progress has been made on all thesefrontiers to allow truly predictive first-principles studies of crystalline materials and their properties.
We would like to thank all authors who have contributed their excellent papers to this Special Issue,the large number of reviewers who provided constructive and helpful feedback on all submissions,and the editorial staff at Crystals for their fast and professional handling of all manuscripts during thesubmission process and for the help provided throughout.
Conflicts of Interest: The authors declare no conflict of interest.
2
Crystals 2019, 9, 463
References
1. Yin, M.T.; Cohen, M.L. Microscopic Theory of the Phase Transformation and Lattice Dynamics of Si.Phys. Rev. Lett. 1980, 45, 1004–1007. [CrossRef]
2. Maddox, J. Crystals from first principles. Nature 1988, 335, 201. [CrossRef]3. Jain, A.; Ong, S.P.; Hautier, G.; Chen, W.; Richards, W.D.; Dacek, S.; Cholia, S.; Gunter, D.; Skinner, D.;
Ceder, G.; et al. Commentary: The Materials Project: A materials genome approach to accelerating materialsinnovation. APL Mater. 2013, 1, 011002. [CrossRef]
4. Butler, K.T.; Davies, D.W.; Cartwright, H.; Isayev, O.; Walsh, A. Machine learning for molecular and materialsscience. Nature 2018, 559, 547–555. [CrossRef] [PubMed]
5. Oganov, A.R.; Pickard, C.J.; Zhu, Q.; Needs, R.J. Structure prediction drives materials discovery.Nat. Rev. Mater. 2019, 4, 331–348. [CrossRef]
6. Geng, N.; Bi, T.; Zarifi, N.; Yan, Y.; Zurek, E. A First-Principles Exploration of NaxSy Binary Phases at 1 atmand Under Pressure. Crystals 2019, 9, 441. [CrossRef]
7. Higgins, E.J.; Hasnip, P.J.; Probert, M.I.J. Simultaneous Prediction of the Magnetic and Crystal Structure ofMaterials Using a Genetic Algorithm. Crystals 2019, 9, 439. [CrossRef]
8. Derzsi, M.; Grzelak, A.; Kondratiuk, P.; Tokár, K.; Grochala, W. Quest for Compounds at the Verge of ChargeTransfer Instabilities: The Case of Silver(II) Chloride. Crystals 2019, 9, 423. [CrossRef]
9. Khan, W.; Azam, S.; Ullah, I.; Rani, M.; Younus, A.; Irfan, M.; Czaja, P.; Kityk, I.V. Insight into theOptoelectronic and Thermoelectric Properties of Mn Doped ZnTe from First Principles Calculation. Crystals2019, 9, 247. [CrossRef]
10. Peng, Q.; Wang, G.; Liu, G.-R.; De, S. Van der Waals Density Functional Theory vdW-DFq for SemihardMaterials. Crystals 2019, 9, 243. [CrossRef]
11. Chen, D.; Geng, J.; Wu, Y.; Wang, M.; Xia, C. Insight into Physical and Thermodynamic Properties of X3Ir(X = Ti, V, Cr, Nb and Mo) Compounds Influenced by Refractory Elements: A First-Principles Calculation.Crystals 2019, 9, 104. [CrossRef]
12. Peng, Q.; Chen, N.; Huang, D.; Heller, E.; Cardimona, D.; Gao, F. First-Principles Assessment of the Structureand Stability of 15 Intrinsic Point Defects in Zinc-Blende Indium Arsenide. Crystals 2019, 9, 48. [CrossRef]
© 2019 by the authors. Licensee MDPI, Basel, Switzerland. This article is an open accessarticle distributed under the terms and conditions of the Creative Commons Attribution(CC BY) license (http://creativecommons.org/licenses/by/4.0/).
3
crystals
Article
A First-Principles Exploration of NaxSy Binary Phasesat 1 atm and Under Pressure
Nisha Geng 1, Tiange Bi 1, Niloofar Zarifi 1, Yan Yan 1,2 and Eva Zurek 1,*
1 Department of Chemistry, University at Buffalo, Buffalo, NY 14260, USA2 School of Sciences, Changchun University, Changchun 130022, China* Correspondence: [email protected]
Received: 1 August 2019; Accepted: 20 August 2019; Published: 24 August 2019
Abstract: Interest in Na-S compounds stems from their use in battery materials at 1 atm, as well asthe potential for superconductivity under pressure. Evolutionary structure searches coupled withDensity Functional Theory calculations were employed to predict stable and low-lying metastablephases of sodium poor and sodium rich sulfides at 1 atm and within 100–200 GPa. At ambientpressures, four new stable or metastable phases with unbranched sulfur motifs were predicted: Na2S3
with C2/c and Imm2 symmetry, C2-Na2S5 and C2-Na2S8. Van der Waals interactions were shownto affect the energy ordering of various polymorphs. At high pressure, several novel phases thatcontained a wide variety of zero-, one-, and two-dimensional sulfur motifs were predicted, and theirelectronic structures and bonding were analyzed. At 200 GPa, P4/mmm-Na2S8 was predicted tobecome superconducting below 15.5 K, which is close to results previously obtained for the β-Pophase of elemental sulfur. The structures of the most stable M3S and M4S, M = Na, phases differedfrom those previously reported for compounds with M = H, Li, K.
Keywords: high-pressure; crystal structure prediction; electronic structure; battery materials;superconductivity
1. Introduction
At atmospheric pressures, the size of the metal atom is thought to be important in determining thealkali metal polysulfide stoichiometries that are stable. In the case of the lightest alkali, lithium,only Li2S and Li2S2 have been made [1], whereas for the heavier metal atoms (M = K, Rb, Cs)the known phases include M2Sn with n = 1–6 [2–5]. The solid state Na-S system is particularlyfascinating, with manuscripts reporting the failed synthesis of previously published stoichiometries,or the synthesis of new polymorphs. Na2S, Na2S2, Na2S4 and Na2S5 are stable or metastable atatmospheric conditions [2,6–8]. Two polymorphs of Na2S2 are known: the α form with three formulaunits per cell that is stable below 170 ◦C, and the higher temperature β form with two formula unitsper cell [9]. Several studies have failed to synthesize or isolate Na2S3, with the reaction productsyielding a mixture of Na2S2 and Na2S4 instead [6]. A novel synthesis route in liquid ammonia yieldedNa2S3, but the product decomposed around 100 ◦C [10]. The crystal structure of α-Na2S5 has beensolved [11], and several metastable polymorphs with this stoichiometry have been detected via Ramanspectroscopy [2] and X-ray diffraction [8], but their structures were not determined. This amazingstructural versatility is in part due to the ability of sulfur to form anionic polysulfide chains, S2−
n ,with various lengths. Only unbranched chains are found in the sodium polysulfides, but they mayhave different arrangements or conformations.
Research on the Na-S system has been motivated by Kummer and Weber’s development of thebattery containing these two elements at the Ford Motor Company in 1966 [12–14]. The advantages ofthe Na-S battery include the fact that it is made from inexpensive materials, has a long cycle lifetime,
Crystals 2019, 9, 441; doi:10.3390/cryst9090441 www.mdpi.com/journal/crystals4
Crystals 2019, 9, 441
and it can deliver high-energy densities [15–18]. Density functional theory (DFT) calculations [19–21]and experiments [20] have been carried out to study the ambient pressure phases with Na2Sn, n > 1.Momida and co-workers only considered the known phases. They found that the inclusion ofdispersion, as implemented in Grimme’s PBE-D2 functional, did not substantially influence theirstructural parameters nor their energies, in contrast to the results for elemental sulfur [19]. DFTcalculations have concluded that, based upon the energy alone, β-Na2S2 is somewhat more stable thanα-Na2S2 [19,20]. Crystal structure prediction (CSP) techniques coupled with DFT calculations havebeen employed to search for new ambient pressure phases [20,21]. Mali and co-workers computed theenthalpies of formation of the novel Cmme-Na2S3 and C2-Na2S6 phases, and found that they lay onlyslightly above the convex hull, suggesting these crystalline lattices may be metastable. A novel lowenergy polymorph of Na2S5 was predicted, and a higher energy ε polymorph was synthesized. Bothof these were computed to be more stable than the known α phase. Wang and co-workers predicteda new polymorph, γ-Na2S2, which was somewhat higher in energy than the known α and β forms [21].Moreover, a C2/c symmetry Na2S3 structure, which contained V-shaped S2−
3 units, was found to bethermodynamically and dynamically stable.
The pressure induced structural transitions, as well as the electronic and optical properties ofthe dialkali sulfides have been studied extensively. At ambient conditions, Li2S, Na2S, K2S and Rb2Sassume the antifluorite (anti-CaF2) structure [22,23], whereas Cs2S crystallizes in an anticottunite(anti-PbCl2) structure [24]. Li2S and Na2S transform to an isotypic anticottunite phase at 12 GPa [25],and 7 GPa [26]. A further transition to an Ni2In phase occurs at 30–45 GPa [27] and 16 GPa [26] in thesesystems, respectively. The sequence of phase transitions for Rb2S are: anti-CaF2 → anti-PbCl2 → Ni2Inat 0.7 and 2.6 GPa [28]. Cs2S assumes a distorted Ni2In structure by 5 GPa [29]. Many of these phasetransitions were either predicted or confirmed via theoretical calculations [30]. Recently, CSP has beenused to search for the most stable structures of Li2S, Na2S [31], and K2S at higher pressures [31,32].Na2S was predicted to transform into an anti-AlB2 phase at 162 GPa, and an anti-KHg2 structure at232–244 GPa [31].
The discovery of conventional superconductivity in a hydride of sulfur that has beenidentified as Im3m-H3S has invigorated the quest for high-temperature superconductors with uniquestoichiometries [33]. The superconducting critical temperature, Tc, measured for this material wasa record breaking 203 K at 150 GPa [34]. Because the valence shells of the alkali metal hydrides areisoelectronic with hydrogen, Kokail and co-workers hypothesized that the alkali sulfides could alsobe good superconductors [35]. CSP was employed to search for stable structures in the metal richLi-S [35], and K-S [36] phase diagrams under pressure, however most of the phases found had noor low Tc. The only exception was a Fm3m-Li3S structure whose Tc reached a maximum of 80 K at500 GPa, a pressure at which it was metastable [35].
Herein, we carry out a comprehensive theoretical investigation that employs an evolutionarystructure search to predict the most stable, and low-lying metastable phases in the metal rich and metalpoor regions of the Na-S phase diagram at 1 atm, as well as 100–200 GPa. In addition to identifyingmany of the known or previously predicted ambient pressure phases, novel polymorphs with theNa2S3, Na2S5, and Na2S8 stoichiometries, which could potentially be synthesized, are found, and theirproperties are reported. Dynamically stable Na3S and Na4S phases, whose structures are related to theantifluorite Na2S phase, lie ∼70 meV/atom above the 0 GPa convex hull. (Meta)stable structures inthe sulfur rich region of the phase diagram at 100 GPa contain a wide range of sulfur motifs including:zero-dimensional dimers or trimers, one-dimensional zigzag or branched tertiary chains, as wellas fused square or cyclohexane motifs. By 200 GPa, most of the predicted phases are comprised oftwo-dimensional square nets or cubic-like lattices. The most stable Na3S and Na4S phases at 200 GPadid not bear any resemblance to H3S [37], or the sulfides of lithium [35] and potassium [36] whosesuperconducting properties have previously been investigated. We hope the structural diversity of thephases predicted herein inspires the directed synthesis of new sulfides of sodium.
5
Crystals 2019, 9, 441
2. Computational Details
Evolutionary structure searches were carried out to find stable and low-lying metastable crystalsin the Na-S phase diagram: in the sulfur rich region the Na2Sn stoichiometry with n = 2–6, 8, and inthe metal rich region the NanS stoichiometry with n = 2–4 were considered. The calculations werecarried out using the open-source evolutionary algorithm (EA) XTALOPT [38,39] version 10 [40],wherein duplicate structures were removed from the breeding pool via the XTALCOMP algorithm [41],and random symmetric structures were created in the first generation using RANDSPG [42]. EAsearches were performed on structures containing 1–4 formula units in the primitive cell at 0, 100,150 and 200 GPa. Minimum interatomic distance constraints were chosen to generate the startingstructures in each generation. The minimum distances between Na-Na, Na-S and S-S atoms were setto 1.86, 1.45, and 1.04 Å, respectively. To improve the efficiency of the CSP searches, and increase thesize of the unit cell that could be considered, the evolutionary search was seeded with experimentallydetermined and theoretically predicted structures from the literature, when available. The most stablestructures found in the high pressure EA searches were optimized between 100 and 200 GPa, and theirrelative enthalpies and equations of states (EOS) are provided in the Supplementary Materials.
Geometry optimizations and electronic structure calculations including the densities of states(DOS), band structures, electron localization functions (ELFs) and Bader charges were carried out usingDFT as implemented in the Vienna Ab-Initio Simulation Package (VASP) [43,44]. The bonding of selectphases was further analyzed by calculating the crystal orbital Hamilton populations (COHP) and thenegative of the COHP integrated to the Fermi level (-iCOHP) using the LOBSTER package [45]. At allpressures, the gradient-corrected exchange and correlation functional of Perdew–Burke–Ernzerhof(PBE) [46] was employed. It has been shown that it is important to include van der Waals (vdW)interactions to obtain reasonable estimates for the volume of α-S at 1 atm [19]. Therefore, the most stablestructures from the 0 GPa PBE EA searches were reoptimized with the optB88-vdW functional [47,48].In the EA searches, we employed plane-wave basis set cutoff of 325–400 eV, and the k-point mesheswere produced by the Γ-centered Monkhorst–Pack scheme with the number of divisions along eachreciprocal lattice vector chosen so that the product of this number with the real lattice constant was30 Å. This value was increased to 50 Å for precise optimizations. The atomic potentials were describedusing the projector augmented wave (PAW) method [49]. The S 3s23p4 electrons were treated explicitlyin all of the calculations. At 0 GPa the Na 3s1 valence electron configuration was used, and athigher pressures an Na 2s22p63s1 valence configuration was employed. For precise optimizations,the plane-wave basis set cutoffs were increased to 700 eV at 0 GPa, and 1000 eV at high pressures.
To verify the dynamic stability phonon band structures were calculated via the supercellapproach [50,51], wherein the dynamical matrices were calculated using the PHONOPY code [52].The electron–phonon coupling (EPC) calculations were performed using the Quantum Espresso (QE)program [53]. The Na (2s22p63s1) and S (3s23p4) pseudopotentials, obtained from the PSlibrary [54],were generated by the method of Trouiller–Martins [55] with the PBE functional, and an energy cutoffof 90 Ry was chosen. The Brillouin zone sampling scheme of Methfessel–Paxton [56] and 24 × 24× 6 k-point grid and a 8 × 8 × 2 q-point grid were used for P4/mmm Na2S8 at 200 GPa. The EPCparameter, λ, was calculated using a set of Gaussian broadenings with an increment of 0.02 Ry from0.0 to 0.600 Ry. The broadening for which λ was converged to within 0.05 Ry was 0.10 Ry. Tc wasestimated using the Allen–Dynes modified McMillan equation [57] with a renormalized Coulombpotential, μ∗, of 0.1.
3. Results and Discussion
3.1. Stable and Metastable Na-S Phases at Atmospheric Conditions
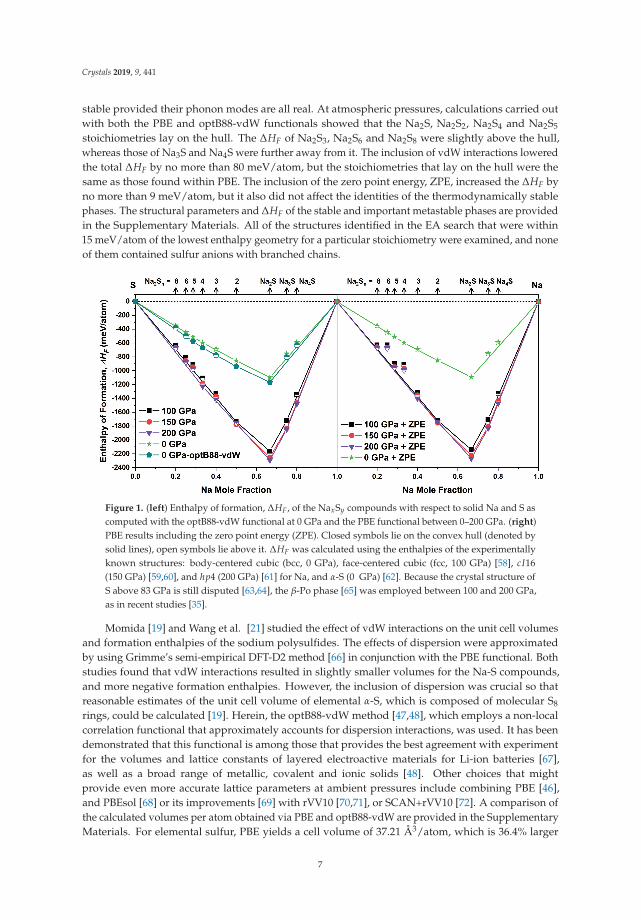
The enthalpies of formation, ΔHF, of the most stable Na-S phases found in our EA searchesare plotted in Figure 1 as a function of pressure. The phases whose ΔHF lie on the convex hull arethermodynamically stable, while those whose ΔHF are not too far from the hull may be metastable
6
Crystals 2019, 9, 441
stable provided their phonon modes are all real. At atmospheric pressures, calculations carried outwith both the PBE and optB88-vdW functionals showed that the Na2S, Na2S2, Na2S4 and Na2S5
stoichiometries lay on the hull. The ΔHF of Na2S3, Na2S6 and Na2S8 were slightly above the hull,whereas those of Na3S and Na4S were further away from it. The inclusion of vdW interactions loweredthe total ΔHF by no more than 80 meV/atom, but the stoichiometries that lay on the hull were thesame as those found within PBE. The inclusion of the zero point energy, ZPE, increased the ΔHF byno more than 9 meV/atom, but it also did not affect the identities of the thermodynamically stablephases. The structural parameters and ΔHF of the stable and important metastable phases are providedin the Supplementary Materials. All of the structures identified in the EA search that were within15 meV/atom of the lowest enthalpy geometry for a particular stoichiometry were examined, and noneof them contained sulfur anions with branched chains.
Figure 1. (left) Enthalpy of formation, ΔHF, of the NaxSy compounds with respect to solid Na and S ascomputed with the optB88-vdW functional at 0 GPa and the PBE functional between 0–200 GPa. (right)PBE results including the zero point energy (ZPE). Closed symbols lie on the convex hull (denoted bysolid lines), open symbols lie above it. ΔHF was calculated using the enthalpies of the experimentallyknown structures: body-centered cubic (bcc, 0 GPa), face-centered cubic (fcc, 100 GPa) [58], cI16(150 GPa) [59,60], and hp4 (200 GPa) [61] for Na, and α-S (0 GPa) [62]. Because the crystal structure ofS above 83 GPa is still disputed [63,64], the β-Po phase [65] was employed between 100 and 200 GPa,as in recent studies [35].
Momida [19] and Wang et al. [21] studied the effect of vdW interactions on the unit cell volumesand formation enthalpies of the sodium polysulfides. The effects of dispersion were approximatedby using Grimme’s semi-empirical DFT-D2 method [66] in conjunction with the PBE functional. Bothstudies found that vdW interactions resulted in slightly smaller volumes for the Na-S compounds,and more negative formation enthalpies. However, the inclusion of dispersion was crucial so thatreasonable estimates of the unit cell volume of elemental α-S, which is composed of molecular S8
rings, could be calculated [19]. Herein, the optB88-vdW method [47,48], which employs a non-localcorrelation functional that approximately accounts for dispersion interactions, was used. It has beendemonstrated that this functional is among those that provides the best agreement with experimentfor the volumes and lattice constants of layered electroactive materials for Li-ion batteries [67],as well as a broad range of metallic, covalent and ionic solids [48]. Other choices that mightprovide even more accurate lattice parameters at ambient pressures include combining PBE [46],and PBEsol [68] or its improvements [69] with rVV10 [70,71], or SCAN+rVV10 [72]. A comparison ofthe calculated volumes per atom obtained via PBE and optB88-vdW are provided in the SupplementaryMaterials. For elemental sulfur, PBE yields a cell volume of 37.21 Å3/atom, which is 36.4% larger
7
Crystals 2019, 9, 441
than the experimental volume of 25.76 Å3/atom [73]. The optB88-vdW functional yields a volumeof 24.90 Å3/atom (c.f. 26.88 Å3/atom with PBE-D2 [19]), which is only 3.4% lower than experiment.In Na-S systems that contained at least 50 mole % sodium, the difference between the PBE andoptB88-vdW volumes was <4%, otherwise the difference ranged from 5–16%, depending on thestoichiometry and polymorph. For Na2S, α-Na2S2, β-Na2S2, Na2S4, and Na2S5 optB88-vdW yieldedvolumes of 22.77, 21.51, 21.90, 21.85, and 22.38 Å3/atom, respectively, which differs by <4% fromMomida’s PBE-D2 results [19]. The 0 K optB88-vdW ΔHF values for the most stable Na2S, Na2S2,Na2S4, and Na2S5 polymorphs were calculated to be −1.17, −0.94, −0.67, and −0.58 eV/atom, whichis in good agreement with the experimental ΔH0
F values at 298.15 K of −1.26, −1.03, −0.71, and −0.61eV/atom, respectively [74].
The anti-CaF2 Na2S structure with Fm3m symmetry was the lowest point on the 0 GPa convexhull [19–21], and the Na2S2 stoichiometry had the second most negative ΔHF. Our EA searches wereseeded only with the known α and β-Na2S2 polymorphs, but they also readily identified a higherenergy γ-Na2S2 phase that has recently been predicted [21]. All of these three polymorphs arecomprised of Na+ cations and S−2 anions. In agreement with previous DFT calculations [19–21], theβ polymorph was computed to have the lowest ΔHF, followed by the α, and the γ configurations.The PBE/optB88-vdW differences in energy between the α and β structures were comparable to thedifference between the β and γ structures, 4/8 meV/atom and 5/9 meV/atom, respectively.
In addition to Na2S and Na2S2, the Na2S4 and Na2S5 stoichiometries also lay on the PBE andoptB88-vdW convex hulls. The EA search was seeded with the known I42d-Na2S4 structure [75],which contains an unbranched S2−
4 chain whose S-S bond angle and dihedral angle were computedto be 111.3◦ and 96.7◦, within PBE, respectively. No other polymorphs with comparable energieswere found.
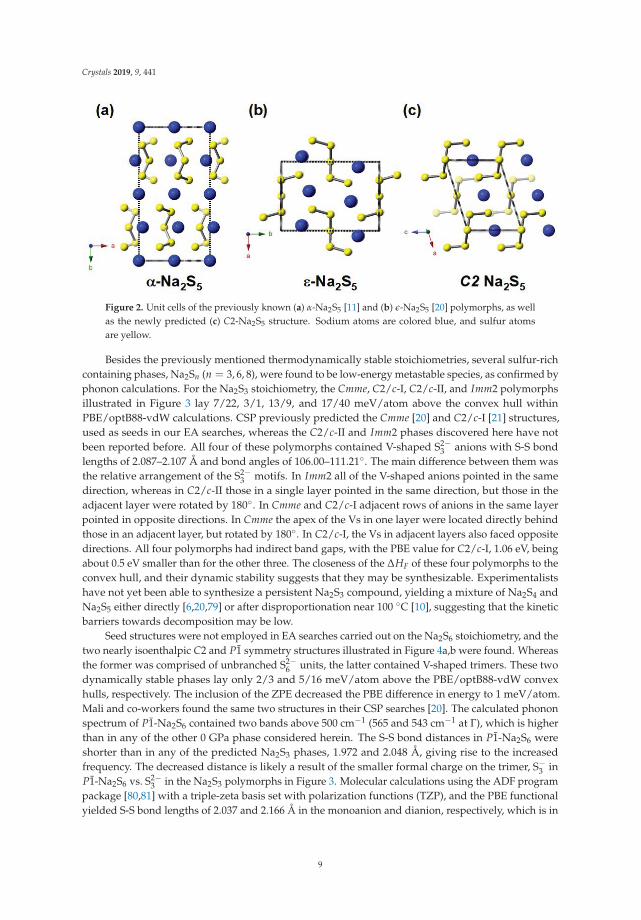
The EA search was also seeded with the α-Na2S5 [11] and ε-Na2S5 [20] polymorphs illustratedin Figure 2a,b. In the α form, the unbranched S2−
5 anion adopts a bent (cis) configuration, whereas,in the ε form, it is stretched (trans), as in K2S5 [76], Rb2S5 [77] and Cs2S5 [78]. PBE and PBE-D2calculations have shown that neither the α nor the ε phases lay on the convex hull [19,20], but CSP hasfound another currently unsynthesized phase with stretched S2−
5 anions that was thermodynamicallystable [20]. The coordinates of this phase were not provided in Ref. [20], however it appears to bedifferent from the lowest enthalpy C2 symmetry Na2S5 phase from our EA searches shown in Figure 2c.In the structure of Mali and co-workers [20], neighboring S2−
5 chains point in opposite directions(similar to what is observed in the ε phase along the b-lattice vector), whereas in C2-Na2S5 they facethe same direction. C2-Na2S5 lay on the PBE convex hull, and it’s enthalpy was 4 and 5 meV/atomlower than the ε and α polymorphs, respectively. The order of stability was not affected by the ZPEcontributions. On the other hand, within optB88-vdW, the ε phase, which lay on the convex hull,had the lowest enthalpy with the α and C2 phases being 3 and 25 meV/atom higher, respectively.These results suggest that other energetically competitive polymorphs, based upon unbranched S2−
5units with either cis or trans geometries, could potentially be constructed, and that the computedenergy ordering depends upon the method used to treat dispersion. PBE calculations showed thatall three Na2S5 polymorphs had indirect band gaps with values of 1.73, 1.47, and 1.30 eV for the ε, α,and C2 phases, respectively (see the Supplementary Materials). Better estimates could be obtainedusing hybrid density functionals or GW, however the PBE results suggest that the conformation of theS2−
5 anion and the geometry of the cell both have an effect on the band gap.
8
Crystals 2019, 9, 441
Figure 2. Unit cells of the previously known (a) α-Na2S5 [11] and (b) ε-Na2S5 [20] polymorphs, as wellas the newly predicted (c) C2-Na2S5 structure. Sodium atoms are colored blue, and sulfur atomsare yellow.
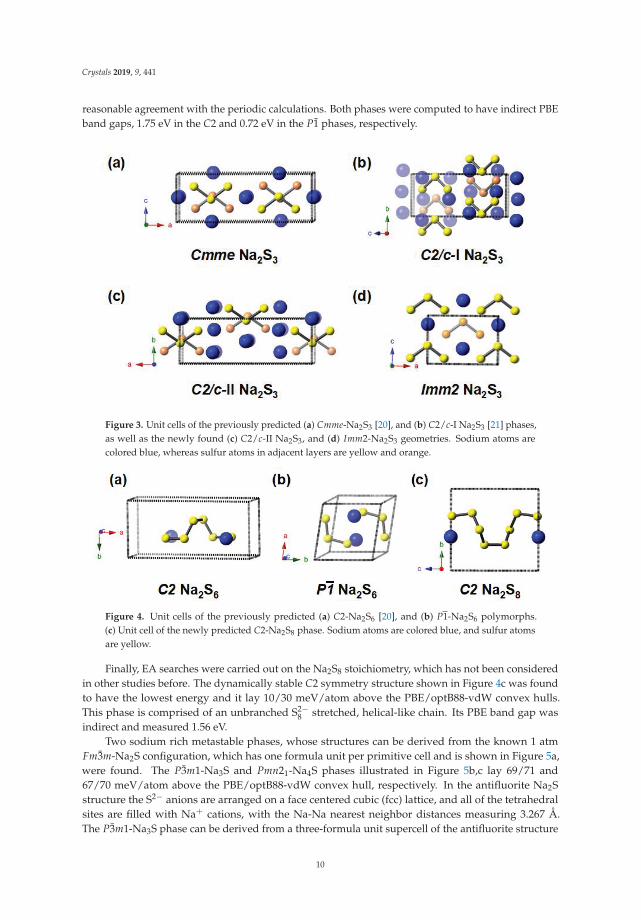
Besides the previously mentioned thermodynamically stable stoichiometries, several sulfur-richcontaining phases, Na2Sn (n = 3, 6, 8), were found to be low-energy metastable species, as confirmed byphonon calculations. For the Na2S3 stoichiometry, the Cmme, C2/c-I, C2/c-II, and Imm2 polymorphsillustrated in Figure 3 lay 7/22, 3/1, 13/9, and 17/40 meV/atom above the convex hull withinPBE/optB88-vdW calculations. CSP previously predicted the Cmme [20] and C2/c-I [21] structures,used as seeds in our EA searches, whereas the C2/c-II and Imm2 phases discovered here have notbeen reported before. All four of these polymorphs contained V-shaped S2−
3 anions with S-S bondlengths of 2.087–2.107 Å and bond angles of 106.00–111.21◦. The main difference between them wasthe relative arrangement of the S2−
3 motifs. In Imm2 all of the V-shaped anions pointed in the samedirection, whereas in C2/c-II those in a single layer pointed in the same direction, but those in theadjacent layer were rotated by 180◦. In Cmme and C2/c-I adjacent rows of anions in the same layerpointed in opposite directions. In Cmme the apex of the Vs in one layer were located directly behindthose in an adjacent layer, but rotated by 180◦. In C2/c-I, the Vs in adjacent layers also faced oppositedirections. All four polymorphs had indirect band gaps, with the PBE value for C2/c-I, 1.06 eV, beingabout 0.5 eV smaller than for the other three. The closeness of the ΔHF of these four polymorphs to theconvex hull, and their dynamic stability suggests that they may be synthesizable. Experimentalistshave not yet been able to synthesize a persistent Na2S3 compound, yielding a mixture of Na2S4 andNa2S5 either directly [6,20,79] or after disproportionation near 100 ◦C [10], suggesting that the kineticbarriers towards decomposition may be low.
Seed structures were not employed in EA searches carried out on the Na2S6 stoichiometry, and thetwo nearly isoenthalpic C2 and P1 symmetry structures illustrated in Figure 4a,b were found. Whereasthe former was comprised of unbranched S2−
6 units, the latter contained V-shaped trimers. These twodynamically stable phases lay only 2/3 and 5/16 meV/atom above the PBE/optB88-vdW convexhulls, respectively. The inclusion of the ZPE decreased the PBE difference in energy to 1 meV/atom.Mali and co-workers found the same two structures in their CSP searches [20]. The calculated phononspectrum of P1-Na2S6 contained two bands above 500 cm−1 (565 and 543 cm−1 at Γ), which is higherthan in any of the other 0 GPa phase considered herein. The S-S bond distances in P1-Na2S6 wereshorter than in any of the predicted Na2S3 phases, 1.972 and 2.048 Å, giving rise to the increasedfrequency. The decreased distance is likely a result of the smaller formal charge on the trimer, S−3 inP1-Na2S6 vs. S2−
3 in the Na2S3 polymorphs in Figure 3. Molecular calculations using the ADF programpackage [80,81] with a triple-zeta basis set with polarization functions (TZP), and the PBE functionalyielded S-S bond lengths of 2.037 and 2.166 Å in the monoanion and dianion, respectively, which is in
9
Crystals 2019, 9, 441
reasonable agreement with the periodic calculations. Both phases were computed to have indirect PBEband gaps, 1.75 eV in the C2 and 0.72 eV in the P1 phases, respectively.
Figure 3. Unit cells of the previously predicted (a) Cmme-Na2S3 [20], and (b) C2/c-I Na2S3 [21] phases,as well as the newly found (c) C2/c-II Na2S3, and (d) Imm2-Na2S3 geometries. Sodium atoms arecolored blue, whereas sulfur atoms in adjacent layers are yellow and orange.
Figure 4. Unit cells of the previously predicted (a) C2-Na2S6 [20], and (b) P1-Na2S6 polymorphs.(c) Unit cell of the newly predicted C2-Na2S8 phase. Sodium atoms are colored blue, and sulfur atomsare yellow.
Finally, EA searches were carried out on the Na2S8 stoichiometry, which has not been consideredin other studies before. The dynamically stable C2 symmetry structure shown in Figure 4c was foundto have the lowest energy and it lay 10/30 meV/atom above the PBE/optB88-vdW convex hulls.This phase is comprised of an unbranched S2−
8 stretched, helical-like chain. Its PBE band gap wasindirect and measured 1.56 eV.
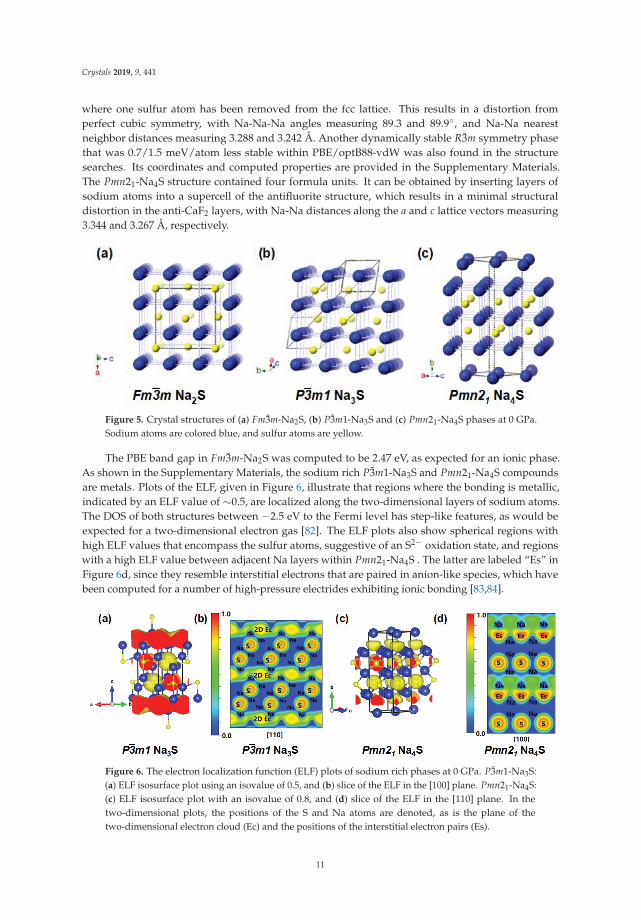
Two sodium rich metastable phases, whose structures can be derived from the known 1 atmFm3m-Na2S configuration, which has one formula unit per primitive cell and is shown in Figure 5a,were found. The P3m1-Na3S and Pmn21-Na4S phases illustrated in Figure 5b,c lay 69/71 and67/70 meV/atom above the PBE/optB88-vdW convex hull, respectively. In the antifluorite Na2Sstructure the S2− anions are arranged on a face centered cubic (fcc) lattice, and all of the tetrahedralsites are filled with Na+ cations, with the Na-Na nearest neighbor distances measuring 3.267 Å.The P3m1-Na3S phase can be derived from a three-formula unit supercell of the antifluorite structure
10
Crystals 2019, 9, 441
where one sulfur atom has been removed from the fcc lattice. This results in a distortion fromperfect cubic symmetry, with Na-Na-Na angles measuring 89.3 and 89.9◦, and Na-Na nearestneighbor distances measuring 3.288 and 3.242 Å. Another dynamically stable R3m symmetry phasethat was 0.7/1.5 meV/atom less stable within PBE/optB88-vdW was also found in the structuresearches. Its coordinates and computed properties are provided in the Supplementary Materials.The Pmn21-Na4S structure contained four formula units. It can be obtained by inserting layers ofsodium atoms into a supercell of the antifluorite structure, which results in a minimal structuraldistortion in the anti-CaF2 layers, with Na-Na distances along the a and c lattice vectors measuring3.344 and 3.267 Å, respectively.
Figure 5. Crystal structures of (a) Fm3m-Na2S, (b) P3m1-Na3S and (c) Pmn21-Na4S phases at 0 GPa.Sodium atoms are colored blue, and sulfur atoms are yellow.
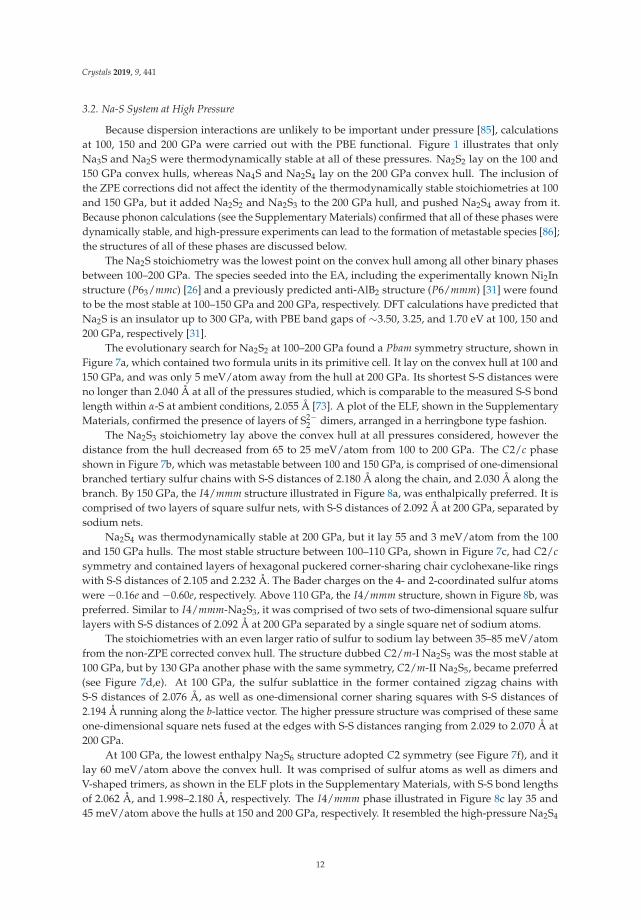
The PBE band gap in Fm3m-Na2S was computed to be 2.47 eV, as expected for an ionic phase.As shown in the Supplementary Materials, the sodium rich P3m1-Na3S and Pmn21-Na4S compoundsare metals. Plots of the ELF, given in Figure 6, illustrate that regions where the bonding is metallic,indicated by an ELF value of ∼0.5, are localized along the two-dimensional layers of sodium atoms.The DOS of both structures between −2.5 eV to the Fermi level has step-like features, as would beexpected for a two-dimensional electron gas [82]. The ELF plots also show spherical regions withhigh ELF values that encompass the sulfur atoms, suggestive of an S2− oxidation state, and regionswith a high ELF value between adjacent Na layers within Pmn21-Na4S . The latter are labeled “Es” inFigure 6d, since they resemble interstitial electrons that are paired in anion-like species, which havebeen computed for a number of high-pressure electrides exhibiting ionic bonding [83,84].
Figure 6. The electron localization function (ELF) plots of sodium rich phases at 0 GPa. P3m1-Na3S:(a) ELF isosurface plot using an isovalue of 0.5, and (b) slice of the ELF in the [100] plane. Pmn21-Na4S:(c) ELF isosurface plot with an isovalue of 0.8, and (d) slice of the ELF in the [110] plane. In thetwo-dimensional plots, the positions of the S and Na atoms are denoted, as is the plane of thetwo-dimensional electron cloud (Ec) and the positions of the interstitial electron pairs (Es).
11
Crystals 2019, 9, 441
3.2. Na-S System at High Pressure
Because dispersion interactions are unlikely to be important under pressure [85], calculationsat 100, 150 and 200 GPa were carried out with the PBE functional. Figure 1 illustrates that onlyNa3S and Na2S were thermodynamically stable at all of these pressures. Na2S2 lay on the 100 and150 GPa convex hulls, whereas Na4S and Na2S4 lay on the 200 GPa convex hull. The inclusion ofthe ZPE corrections did not affect the identity of the thermodynamically stable stoichiometries at 100and 150 GPa, but it added Na2S2 and Na2S3 to the 200 GPa hull, and pushed Na2S4 away from it.Because phonon calculations (see the Supplementary Materials) confirmed that all of these phases weredynamically stable, and high-pressure experiments can lead to the formation of metastable species [86];the structures of all of these phases are discussed below.
The Na2S stoichiometry was the lowest point on the convex hull among all other binary phasesbetween 100–200 GPa. The species seeded into the EA, including the experimentally known Ni2Instructure (P63/mmc) [26] and a previously predicted anti-AlB2 structure (P6/mmm) [31] were foundto be the most stable at 100–150 GPa and 200 GPa, respectively. DFT calculations have predicted thatNa2S is an insulator up to 300 GPa, with PBE band gaps of ∼3.50, 3.25, and 1.70 eV at 100, 150 and200 GPa, respectively [31].
The evolutionary search for Na2S2 at 100–200 GPa found a Pbam symmetry structure, shown inFigure 7a, which contained two formula units in its primitive cell. It lay on the convex hull at 100 and150 GPa, and was only 5 meV/atom away from the hull at 200 GPa. Its shortest S-S distances wereno longer than 2.040 Å at all of the pressures studied, which is comparable to the measured S-S bondlength within α-S at ambient conditions, 2.055 Å [73]. A plot of the ELF, shown in the SupplementaryMaterials, confirmed the presence of layers of S2−
2 dimers, arranged in a herringbone type fashion.The Na2S3 stoichiometry lay above the convex hull at all pressures considered, however the
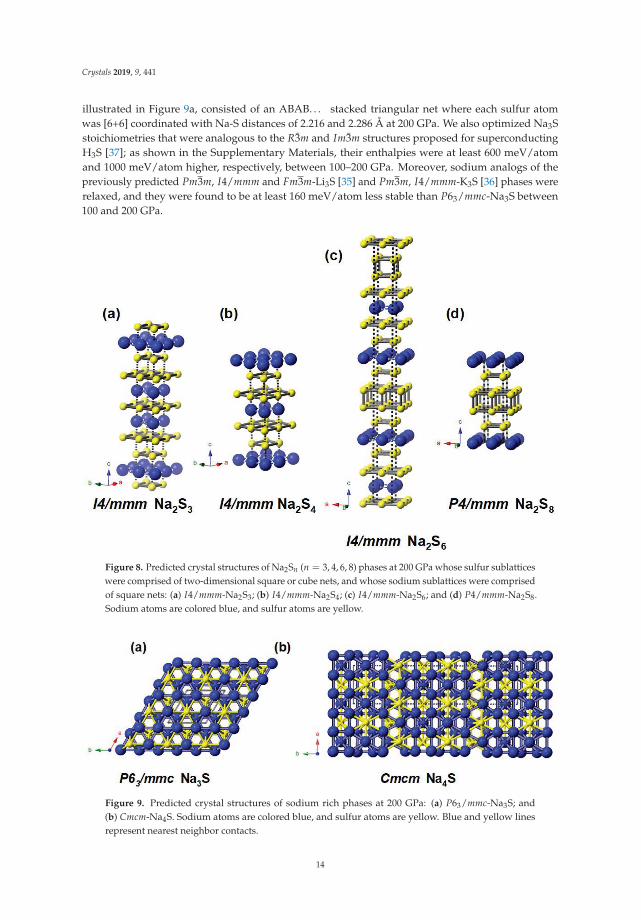
distance from the hull decreased from 65 to 25 meV/atom from 100 to 200 GPa. The C2/c phaseshown in Figure 7b, which was metastable between 100 and 150 GPa, is comprised of one-dimensionalbranched tertiary sulfur chains with S-S distances of 2.180 Å along the chain, and 2.030 Å along thebranch. By 150 GPa, the I4/mmm structure illustrated in Figure 8a, was enthalpically preferred. It iscomprised of two layers of square sulfur nets, with S-S distances of 2.092 Å at 200 GPa, separated bysodium nets.
Na2S4 was thermodynamically stable at 200 GPa, but it lay 55 and 3 meV/atom from the 100and 150 GPa hulls. The most stable structure between 100–110 GPa, shown in Figure 7c, had C2/csymmetry and contained layers of hexagonal puckered corner-sharing chair cyclohexane-like ringswith S-S distances of 2.105 and 2.232 Å. The Bader charges on the 4- and 2-coordinated sulfur atomswere −0.16e and −0.60e, respectively. Above 110 GPa, the I4/mmm structure, shown in Figure 8b, waspreferred. Similar to I4/mmm-Na2S3, it was comprised of two sets of two-dimensional square sulfurlayers with S-S distances of 2.092 Å at 200 GPa separated by a single square net of sodium atoms.
The stoichiometries with an even larger ratio of sulfur to sodium lay between 35–85 meV/atomfrom the non-ZPE corrected convex hull. The structure dubbed C2/m-I Na2S5 was the most stable at100 GPa, but by 130 GPa another phase with the same symmetry, C2/m-II Na2S5, became preferred(see Figure 7d,e). At 100 GPa, the sulfur sublattice in the former contained zigzag chains withS-S distances of 2.076 Å, as well as one-dimensional corner sharing squares with S-S distances of2.194 Å running along the b-lattice vector. The higher pressure structure was comprised of these sameone-dimensional square nets fused at the edges with S-S distances ranging from 2.029 to 2.070 Å at200 GPa.
At 100 GPa, the lowest enthalpy Na2S6 structure adopted C2 symmetry (see Figure 7f), and itlay 60 meV/atom above the convex hull. It was comprised of sulfur atoms as well as dimers andV-shaped trimers, as shown in the ELF plots in the Supplementary Materials, with S-S bond lengthsof 2.062 Å, and 1.998–2.180 Å, respectively. The I4/mmm phase illustrated in Figure 8c lay 35 and45 meV/atom above the hulls at 150 and 200 GPa, respectively. It resembled the high-pressure Na2S4
12
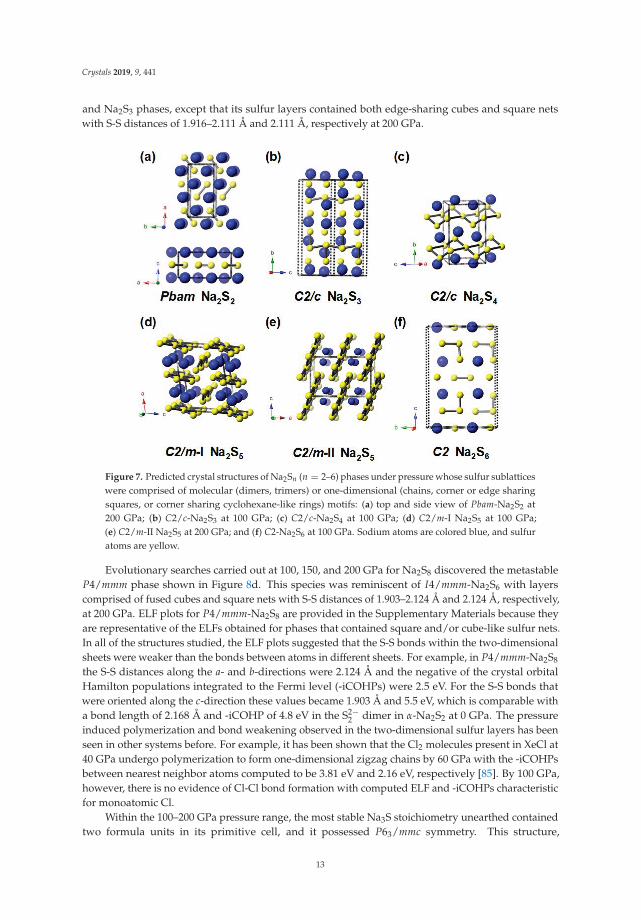
Crystals 2019, 9, 441
and Na2S3 phases, except that its sulfur layers contained both edge-sharing cubes and square netswith S-S distances of 1.916–2.111 Å and 2.111 Å, respectively at 200 GPa.
Figure 7. Predicted crystal structures of Na2Sn (n = 2–6) phases under pressure whose sulfur sublatticeswere comprised of molecular (dimers, trimers) or one-dimensional (chains, corner or edge sharingsquares, or corner sharing cyclohexane-like rings) motifs: (a) top and side view of Pbam-Na2S2 at200 GPa; (b) C2/c-Na2S3 at 100 GPa; (c) C2/c-Na2S4 at 100 GPa; (d) C2/m-I Na2S5 at 100 GPa;(e) C2/m-II Na2S5 at 200 GPa; and (f) C2-Na2S6 at 100 GPa. Sodium atoms are colored blue, and sulfuratoms are yellow.
Evolutionary searches carried out at 100, 150, and 200 GPa for Na2S8 discovered the metastableP4/mmm phase shown in Figure 8d. This species was reminiscent of I4/mmm-Na2S6 with layerscomprised of fused cubes and square nets with S-S distances of 1.903–2.124 Å and 2.124 Å, respectively,at 200 GPa. ELF plots for P4/mmm-Na2S8 are provided in the Supplementary Materials because theyare representative of the ELFs obtained for phases that contained square and/or cube-like sulfur nets.In all of the structures studied, the ELF plots suggested that the S-S bonds within the two-dimensionalsheets were weaker than the bonds between atoms in different sheets. For example, in P4/mmm-Na2S8
the S-S distances along the a- and b-directions were 2.124 Å and the negative of the crystal orbitalHamilton populations integrated to the Fermi level (-iCOHPs) were 2.5 eV. For the S-S bonds thatwere oriented along the c-direction these values became 1.903 Å and 5.5 eV, which is comparable witha bond length of 2.168 Å and -iCOHP of 4.8 eV in the S2−
2 dimer in α-Na2S2 at 0 GPa. The pressureinduced polymerization and bond weakening observed in the two-dimensional sulfur layers has beenseen in other systems before. For example, it has been shown that the Cl2 molecules present in XeCl at40 GPa undergo polymerization to form one-dimensional zigzag chains by 60 GPa with the -iCOHPsbetween nearest neighbor atoms computed to be 3.81 eV and 2.16 eV, respectively [85]. By 100 GPa,however, there is no evidence of Cl-Cl bond formation with computed ELF and -iCOHPs characteristicfor monoatomic Cl.
Within the 100–200 GPa pressure range, the most stable Na3S stoichiometry unearthed containedtwo formula units in its primitive cell, and it possessed P63/mmc symmetry. This structure,
13
Crystals 2019, 9, 441
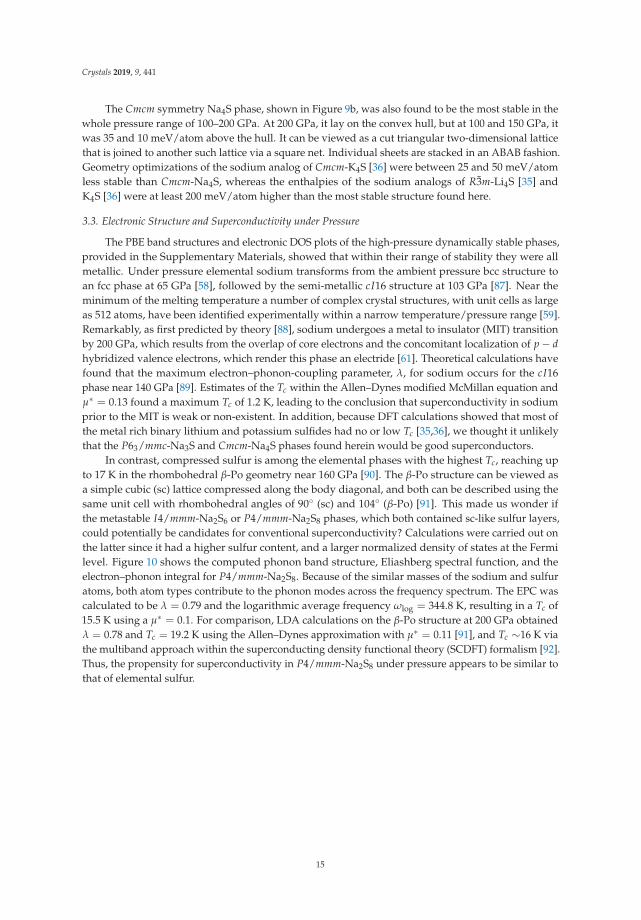
illustrated in Figure 9a, consisted of an ABAB. . . stacked triangular net where each sulfur atomwas [6+6] coordinated with Na-S distances of 2.216 and 2.286 Å at 200 GPa. We also optimized Na3Sstoichiometries that were analogous to the R3m and Im3m structures proposed for superconductingH3S [37]; as shown in the Supplementary Materials, their enthalpies were at least 600 meV/atomand 1000 meV/atom higher, respectively, between 100–200 GPa. Moreover, sodium analogs of thepreviously predicted Pm3m, I4/mmm and Fm3m-Li3S [35] and Pm3m, I4/mmm-K3S [36] phases wererelaxed, and they were found to be at least 160 meV/atom less stable than P63/mmc-Na3S between100 and 200 GPa.
Figure 8. Predicted crystal structures of Na2Sn (n = 3, 4, 6, 8) phases at 200 GPa whose sulfur sublatticeswere comprised of two-dimensional square or cube nets, and whose sodium sublattices were comprisedof square nets: (a) I4/mmm-Na2S3; (b) I4/mmm-Na2S4; (c) I4/mmm-Na2S6; and (d) P4/mmm-Na2S8.Sodium atoms are colored blue, and sulfur atoms are yellow.
Figure 9. Predicted crystal structures of sodium rich phases at 200 GPa: (a) P63/mmc-Na3S; and(b) Cmcm-Na4S. Sodium atoms are colored blue, and sulfur atoms are yellow. Blue and yellow linesrepresent nearest neighbor contacts.
14
Crystals 2019, 9, 441
The Cmcm symmetry Na4S phase, shown in Figure 9b, was also found to be the most stable in thewhole pressure range of 100–200 GPa. At 200 GPa, it lay on the convex hull, but at 100 and 150 GPa, itwas 35 and 10 meV/atom above the hull. It can be viewed as a cut triangular two-dimensional latticethat is joined to another such lattice via a square net. Individual sheets are stacked in an ABAB fashion.Geometry optimizations of the sodium analog of Cmcm-K4S [36] were between 25 and 50 meV/atomless stable than Cmcm-Na4S, whereas the enthalpies of the sodium analogs of R3m-Li4S [35] andK4S [36] were at least 200 meV/atom higher than the most stable structure found here.
3.3. Electronic Structure and Superconductivity under Pressure
The PBE band structures and electronic DOS plots of the high-pressure dynamically stable phases,provided in the Supplementary Materials, showed that within their range of stability they were allmetallic. Under pressure elemental sodium transforms from the ambient pressure bcc structure toan fcc phase at 65 GPa [58], followed by the semi-metallic cI16 structure at 103 GPa [87]. Near theminimum of the melting temperature a number of complex crystal structures, with unit cells as largeas 512 atoms, have been identified experimentally within a narrow temperature/pressure range [59].Remarkably, as first predicted by theory [88], sodium undergoes a metal to insulator (MIT) transitionby 200 GPa, which results from the overlap of core electrons and the concomitant localization of p − dhybridized valence electrons, which render this phase an electride [61]. Theoretical calculations havefound that the maximum electron–phonon-coupling parameter, λ, for sodium occurs for the cI16phase near 140 GPa [89]. Estimates of the Tc within the Allen–Dynes modified McMillan equation andμ∗ = 0.13 found a maximum Tc of 1.2 K, leading to the conclusion that superconductivity in sodiumprior to the MIT is weak or non-existent. In addition, because DFT calculations showed that most ofthe metal rich binary lithium and potassium sulfides had no or low Tc [35,36], we thought it unlikelythat the P63/mmc-Na3S and Cmcm-Na4S phases found herein would be good superconductors.
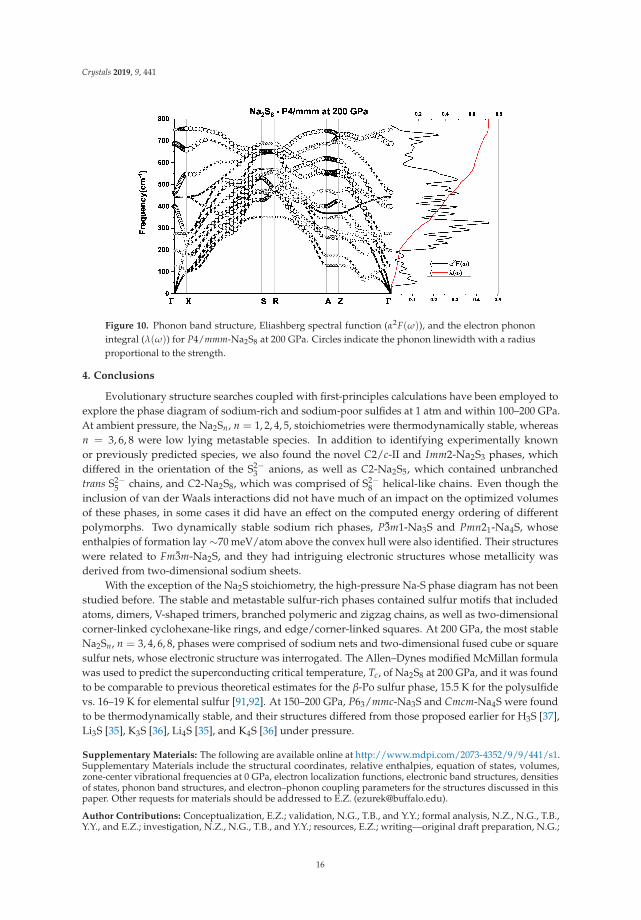
In contrast, compressed sulfur is among the elemental phases with the highest Tc, reaching upto 17 K in the rhombohedral β-Po geometry near 160 GPa [90]. The β-Po structure can be viewed asa simple cubic (sc) lattice compressed along the body diagonal, and both can be described using thesame unit cell with rhombohedral angles of 90◦ (sc) and 104◦ (β-Po) [91]. This made us wonder ifthe metastable I4/mmm-Na2S6 or P4/mmm-Na2S8 phases, which both contained sc-like sulfur layers,could potentially be candidates for conventional superconductivity? Calculations were carried out onthe latter since it had a higher sulfur content, and a larger normalized density of states at the Fermilevel. Figure 10 shows the computed phonon band structure, Eliashberg spectral function, and theelectron–phonon integral for P4/mmm-Na2S8. Because of the similar masses of the sodium and sulfuratoms, both atom types contribute to the phonon modes across the frequency spectrum. The EPC wascalculated to be λ = 0.79 and the logarithmic average frequency ωlog = 344.8 K, resulting in a Tc of15.5 K using a μ∗ = 0.1. For comparison, LDA calculations on the β-Po structure at 200 GPa obtainedλ = 0.78 and Tc = 19.2 K using the Allen–Dynes approximation with μ∗ = 0.11 [91], and Tc ∼16 K viathe multiband approach within the superconducting density functional theory (SCDFT) formalism [92].Thus, the propensity for superconductivity in P4/mmm-Na2S8 under pressure appears to be similar tothat of elemental sulfur.
15
Crystals 2019, 9, 441
Figure 10. Phonon band structure, Eliashberg spectral function (α2F(ω)), and the electron phononintegral (λ(ω)) for P4/mmm-Na2S8 at 200 GPa. Circles indicate the phonon linewidth with a radiusproportional to the strength.
4. Conclusions
Evolutionary structure searches coupled with first-principles calculations have been employed toexplore the phase diagram of sodium-rich and sodium-poor sulfides at 1 atm and within 100–200 GPa.At ambient pressure, the Na2Sn, n = 1, 2, 4, 5, stoichiometries were thermodynamically stable, whereasn = 3, 6, 8 were low lying metastable species. In addition to identifying experimentally knownor previously predicted species, we also found the novel C2/c-II and Imm2-Na2S3 phases, whichdiffered in the orientation of the S2−
3 anions, as well as C2-Na2S5, which contained unbranchedtrans S2−
5 chains, and C2-Na2S8, which was comprised of S2−8 helical-like chains. Even though the
inclusion of van der Waals interactions did not have much of an impact on the optimized volumesof these phases, in some cases it did have an effect on the computed energy ordering of differentpolymorphs. Two dynamically stable sodium rich phases, P3m1-Na3S and Pmn21-Na4S, whoseenthalpies of formation lay ∼70 meV/atom above the convex hull were also identified. Their structureswere related to Fm3m-Na2S, and they had intriguing electronic structures whose metallicity wasderived from two-dimensional sodium sheets.
With the exception of the Na2S stoichiometry, the high-pressure Na-S phase diagram has not beenstudied before. The stable and metastable sulfur-rich phases contained sulfur motifs that includedatoms, dimers, V-shaped trimers, branched polymeric and zigzag chains, as well as two-dimensionalcorner-linked cyclohexane-like rings, and edge/corner-linked squares. At 200 GPa, the most stableNa2Sn, n = 3, 4, 6, 8, phases were comprised of sodium nets and two-dimensional fused cube or squaresulfur nets, whose electronic structure was interrogated. The Allen–Dynes modified McMillan formulawas used to predict the superconducting critical temperature, Tc, of Na2S8 at 200 GPa, and it was foundto be comparable to previous theoretical estimates for the β-Po sulfur phase, 15.5 K for the polysulfidevs. 16–19 K for elemental sulfur [91,92]. At 150–200 GPa, P63/mmc-Na3S and Cmcm-Na4S were foundto be thermodynamically stable, and their structures differed from those proposed earlier for H3S [37],Li3S [35], K3S [36], Li4S [35], and K4S [36] under pressure.
Supplementary Materials: The following are available online at http://www.mdpi.com/2073-4352/9/9/441/s1.Supplementary Materials include the structural coordinates, relative enthalpies, equation of states, volumes,zone-center vibrational frequencies at 0 GPa, electron localization functions, electronic band structures, densitiesof states, phonon band structures, and electron–phonon coupling parameters for the structures discussed in thispaper. Other requests for materials should be addressed to E.Z. ([email protected]).
Author Contributions: Conceptualization, E.Z.; validation, N.G., T.B., and Y.Y.; formal analysis, N.Z., N.G., T.B.,Y.Y., and E.Z.; investigation, N.Z., N.G., T.B., and Y.Y.; resources, E.Z.; writing—original draft preparation, N.G.;
16
Crystals 2019, 9, 441
writing—review and editing, E.Z.; visualization, N.G., T.B., and Y.Y.; supervision, E.Z.; project administration,E.Z.; and funding acquisition, E.Z., and Y.Y.
Funding: E.Z. acknowledges the NSF (DMR-1827815) for funding. Support was provided by the Centerfor Computational Research at the University at Buffalo [93]. Y.Y. acknowledges the National NaturalScience Foundation of China Grant No. 11404035, Jilin Provincial Natural Science Foundation of China GrantNo. 20190201127JC, and Jilin Province Education Department “13th Five-Year” Science and Technology ResearchProject Grant No. JJKH20180941KJ.
Conflicts of Interest: The authors declare no conflict of interest.
References
1. Okamoto, H. The Li-S (lithium-sulfur) system. J. Phase Equilib. 1995, 16, 94–97. [CrossRef]2. Janz, G.J.; Coutts, J.W.; Downey, J.R.; Roduner, E. Raman studies of sulfur-containing anions in inorganic
polysulfides. Potassium polysulfides. Inorg. Chem. 1976, 15, 1755–1759. [CrossRef]3. Sangster, J.; Pelton, A.D. The K-S (potassium-sulfur) system. J. Phase Equilib. 1997, 18, 82–88. [CrossRef]4. Sangster, J.; Pelton, A.D. The Rb-S (rubidium-sulfur) system. J. Phase Equilib. 1997, 18, 97–100. [CrossRef]5. Sangster, J.; Pelton, A.D. The Cs-S (cesium-sulfur) system. J. Phase Equilib. 1997, 18, 78–81. [CrossRef]6. Oei, D.G. Sodium-sulfur system. I. Differential thermal analysis. Inorg. Chem. 1973, 12, 435–437. [CrossRef]7. Sangster, J.; Pelton, A.D. The Na-S (sodium-sulfur) system. J. Phase Equilib. 1977, 18, 89–96. [CrossRef]8. Rosen, E.; Tegman, R. A preparative and X-ray powder diffraction study of the polysulfides Na2S2, Na2S4
and Na2S5. Acta Chem. Scand. 1971, 25, 3329–3336. [CrossRef]9. Föppl, H.; Busmann, E.; Frorath, F.K. Die kristallstrukturen von α-Na2S2 und K2S2, β-Na2S2 und Na2Se2.
Z. Anorg. Allg. Chem. 1962, 314, 12–20. [CrossRef]10. Oei, D.G. Sodium-sulfur system. II. Polysulfides of sodium. Inorg. Chem. 1973, 12, 438–441. [CrossRef]11. Böttcher, P.; Keller, R. Die kristallstruktur des α-Na2S5/The crystal structure of α-Na2S5. Z. Naturforsch. B
1984, 39, 577–581. [CrossRef]12. Weber, N. Ford gives Na-S battery details. Chem. Eng. News 1966, 44, 32–33.13. Kummer, J.T.; Weber, N. Battery Having a Molten Alkali Metal Anode and Molten Sulfur Cathode.
U.S. Patent 3,413,150, 26 November 1968.14. Yao, Y.F.Y.; Kummer, J.T. Ion exchange properties of and rates of ionic diffusion in beta-alumina. J. Inorg.
Nucl. Chem. 1967, 29, 2453–2475.15. Ellis, B.L.; Nazar, L.F. Sodium and sodium-ion energy storage batteries. Curr. Opin. Solid State Mater. Sci.
2012, 16, 168–177. [CrossRef]16. Hueso, K.B.; Armand, M.; Rojo, T. High temperature sodium batteries: Status, challenges and future trends.
Energy Environ. Sci. 2013, 6, 734–749. [CrossRef]17. Dunn, B.; Kamath, H.; Tarascon, J.M. Electrical energy storage for the grid: A battery of choices. Science
2011, 334, 928–935. [CrossRef] [PubMed]18. Nikiforidis, G.; van de Sanden, M.C.M.; Tsampas, M.N. High and intermediate temperature sodium-sulfur
batteries for energy storage: Development, challenges and perspectives. RSC Adv. 2019, 9, 5649–5673.[CrossRef]
19. Momida, H.; Yamashita, T.; Oguchi, T. First-principles study on structural and electronic properties of α-Sand Na–S crystals. J. Phys. Soc. Jpn. 2014, 83, 124713. [CrossRef]
20. Mali, G.; Patel, M.U.M.; Mazaj, M.; Dominko, R. Stable crystalline forms of Na polysulfides: Experimentversus ab initio computational prediction. Chem. Eur. J. 2016, 22, 3355–3360. [CrossRef]
21. Wang, Y.; Hao, Y.; Xu, L.C.; Yang, Z.; Di, M.Y.; Liu, R.; Li, X. Insight into the discharge products andmechanism of room-temperature sodium-sulfur batteries: A first-principles study. J. Phys. Chem. C 2019,123, 3988–3995. [CrossRef]
22. Zintl, E.; Harder, A.; Dauth, B. Gitterstruktur der oxyde, sulfide, selenide und telluride des lithiums,natriums und kaliums. Z. Elektrochem. Angew. Phys. Chem. 1934, 40, 588–593.
23. May, K. Die kristallstruktur des rubidium-sulfids Rb2S. Z. Kristallogr. 1936, 94, 412–413. [CrossRef]24. Sommer, H.; Hoppe, R. Die Kristallstruktur von Cs2S. mit einer Bemerkung über Cs2Se, Cs2Te, Rb2Se und
Rb2Te. Z. Anorg. Allg. Chem. 1977, 429, 118–130. [CrossRef]25. Grzechnik, A.; Vegas, A.; Syassen, K.; Loa, I.; Hanfland, M.; Jansen, M. Reversible antifluorite to anticotunnite
phase transition in Li2S at high pressures. J. Solid State Chem. 2000, 154, 603–611. [CrossRef]
17
Crystals 2019, 9, 441
26. Vegas, A.; Grzechnik, A.; Syassen, K.; Loa, I.; Hanfland, M.; Jansen, M. Reversible phase transitions inNa2S under pressure: A comparison with the cation array in Na2SO4. Acta Crystallogr. 2001, B57, 151–156.[CrossRef]
27. Barkalov, O.I.; Naumov, P.G.; Felser, C.; Medvedev, S.A. Pressure-induced transition to Ni2In-type phase inlithium sulfide(Li2S). Solid State Sci. 2016, 61, 220–224. [CrossRef]
28. Santamaría-Pérez, D.; Vegas, A.; Muehle, C.; Jansen, M. High-pressure experimental study on Rb2S:Antifluorite to Ni2In-type phase transitions. Acta Crystallogr. 2011, B67, 109–115. [CrossRef]
29. Santamaría-Pérez, D.; Vegas, A.; Muehle, C.; Jansen, M. Structural behaviour of alkaline sulfides undercompression: High-pressure experimental study on Cs2S. J. Chem. Phys. 2011, 135, 054511. [CrossRef]
30. Schön, J.C.; Cancarevic, Ž.; Jansen, M. Structure prediction of high-pressure phases for alkali metal sulfides.J. Chem. Phys. 2004, 121, 2289–2304. [CrossRef]
31. Verma, A.K.; Modak, P.; Sharma, S.M. Structural phase transitions in Li2S, Na2S and K2S under compression.J. Alloy. Compd. 2017, 710, 460–467. [CrossRef]
32. Li, Y.; Jin, X.; Cui, T.; Zhuang, Q.; Lv, Q.; Wu, G.; Meng, X.; Bao, K.; Liu, B.; Zhou, Q. Structural stability andelectronic property in K2S under pressure. RSC Adv. 2017, 7, 7424–7430. [CrossRef]
33. Yao, Y.; Tse, J.S. Superconducting hydrogen sulfide. Chem. Eur. J. 2018, 24, 1769–1778. [CrossRef]34. Drozdov, A.P.; Eremets, M.I.; Troyan, I.A.; Ksenofontov, V.; Shylin, S.I. Conventional superconductivity at
203 kelvin at high pressures in the sulfur hydride system. Nature 2015, 525, 73–76. [CrossRef]35. Kokail, C.; Heil, C.; Boeri, L. Search for high-Tc conventional superconductivity at megabar pressures in the
lithium-sulfur system. Phys. Rev. B 2016, 94, 060502. [CrossRef]36. Li, Y.; Jin, X.; Cui, T.; Zhuang, Q.; Zhang, D.; Meng, X.; Bao, K.; Liu, B.; Zhou, Q. Unexpected stable
stoichiometries and superconductivity of potassium-rich sulfides. RSC Adv. 2017, 7, 44884–44889. [CrossRef]37. Duan, D.; Liu, Y.; Tian, F.; Li, D.; Huang, X.; Zhao, Z.; Yu, H.; Liu, B.; Tian, W.; Cui, T. Pressure-induced
metallization of dense (H2S)2H2 with high-Tc superconductivity. Sci. Rep. 2014, 4, 6968. [CrossRef]38. Lonie, D.C.; Zurek, E. XtalOpt: An open-source evolutionary algorithm for crystal structure prediction.
Comput. Phys. Commun. 2011, 182, 372–387. [CrossRef]39. XtalOpt. Available online: http://xtalopt.github.io (accessed on 19 August 2019).40. Avery, P.; Falls, Z.; Zurek, E. XtalOpt Version r10: An open-source evolutionary algorithm for crystal
structure prediction. Comput. Phys. Commun. 2017, 217, 210–211. [CrossRef]41. Lonie, D.C.; Zurek, E. Identifying duplicate crystal structures: XtalComp, an open-source solution. Comput.
Phys. Commun. 2012, 183, 690–697. [CrossRef]42. Avery, P.; Zurek, E. RandSpg: An open-source program for generating atomistic crystal structures with
specific spacegroups. Comput. Phys. Commun. 2017, 213, 208–216. [CrossRef]43. Kresse, G.; Hafner, J. Ab initio molecular dynamics for liquid metals. Phys. Rev. B 1993, 47, 558–561.
[CrossRef]44. Kresse, G.; Joubert, D. From ultrasoft pseudopotentials to the projector augmented-wave method. Phys. Rev.
B 1999, 59, 1758–1775. [CrossRef]45. Maintz, S.; Deringer, V.L.; Tchougréeff, A.L.; Dronskowski, R. LOBSTER: A tool to extract chemical bonding
from plane-wave based DFT. J. Comput. Chem. 2016, 37, 1030–1035. [CrossRef]46. Perdew, J.P.; Burke, K.; Ernzerhof, M. Generalized gradient approximation made simple. Phys. Rev. Lett.
1996, 77, 3865–3868. [CrossRef]47. Klimeš, J.; Bowler, D.R.; Michaelides, A. Chemical accuracy for the van der Waals density functional. J. Phys.
Condens. Matter 2010, 22, 022201. [CrossRef]48. Klimeš, J.; Bowler, D.R.; Michaelides, A. Van der Waals density functionals applied to solids. Phys. Rev. B
2011, 83, 195131. [CrossRef]49. Blöchl, P.E. Projector augmented-wave method. Phys. Rev. B 1994, 50, 17953–17979. [CrossRef]50. Parlinski, K.; Li, Z.Q.; Kawazoe, Y. First-principles determination of the soft mode in cubic ZrO2. Phys. Rev.
Lett. 1997, 78, 4063–4066. [CrossRef]51. Chaput, L.; Togo, A.; Tanaka, I.; Hug, G. Phonon-phonon interactions in transition metals. Phys. Rev. B 2011,
84, 094302. [CrossRef]52. Togo, A.; Tanaka, I. First principles phonon calculations in materials science. Scr. Mater. 2015, 108, 1–5.
[CrossRef]
18
Crystals 2019, 9, 441
53. Giannozzi, P.; Baroni, S.; Bonini, N.; Calandra, M.; Car, R.; Cavazzoni, C.; Ceresoli, D.; Chiarotti, G.L.;Cococcioni, M.; Dabo, I.; et al. QUANTUM ESPRESSO: A modular and open-source software project forquantum simulations of materials. J. Phys. Condens. Matter 2009, 21, 395502. [CrossRef]
54. Dal Corso, A. Pseudopotentials periodic table: From H to Pu. Comput. Mater. Sci. 2014, 95, 337–350.[CrossRef]
55. Troullier, N.; Martins, J.L. Efficient pseudopotentials for plane-wave calculations. Phys. Rev. B 1991,43, 1993–2006. [CrossRef]
56. Methfessel, M.; Paxton, A.T. High-precision sampling for Brillouin-zone integration in metals. Phys. Rev. B1989, 40, 3616–3621. [CrossRef]
57. Allen, P.B.; Dynes, R.C. Transition temperature of strong-coupled superconductors reanalyzed. Phys. Rev. B1975, 12, 905–922. [CrossRef]
58. Hanfland, M.; Loa, I.; Syassen, K. Sodium under pressure: Bcc to fcc structural transition andpressure-volume relation to 100 GPa. Phys. Rev. B 2002, 65, 184109. [CrossRef]
59. Gregoryanz, E.; Lundegaard, L.F.; McMahon, M.I.; Guillaume, C.; Nelmes, R.J.; Mezouar, M. Structuraldiversity of sodium. Science 2008, 320, 1054–1057. [CrossRef]
60. McMahon, M.I.; Gregoryanz, E.; Lundegaard, L.F.; Loa, I.; Guillaume, C.; Nelmes, R.J.; Kleppe, A.K.;Amboage, M.; Wilhelm, H.; Jephcoat, A.P. Structure of sodium above 100 GPa by single-crystal x-raydiffraction. Proc. Natl. Acad. Sci. U. S. A. 2007, 104, 17297–17299. [CrossRef]
61. Ma, Y.; Eremets, M.; Oganov, A.R.; Xie, Y.; Trojan, I.; Medvedev, S.; Lyakhov, A.O.; Valle, M.; Prakapenka, V.Transparent dense sodium. Nature 2009, 458, 182–185. [CrossRef]
62. Meyer, B. Elemental sulfur. Chem. Rev. 1976, 76, 367–388. [CrossRef]63. Zakharov, O.; Cohen, M.L. Theory of structural, electronic, vibrational, and superconducting properties of
high-pressure phases of sulfur. Phys. Rev. B 1995, 52, 12572–12578. [CrossRef]64. Gavryushkin, P.N.; Litasov, K.D.; Dobrosmislov, S.S.; Popov, Z.I. High-pressure phases of sulfur: Topological
analysis and crystal structure prediction. Phys. Status Solidi B 2017, 254, 1600857. [CrossRef]65. Luo, H.; Greene, R.G.; Ruoff, A.L. β-Po phase of sulfur at 162 GPa: X-ray diffraction study to 212 GPa. Phys.
Rev. Lett. 1993, 71, 2943–2946. [CrossRef]66. Grimme, S. Semiempirical GGA-type density functional constructed with a long-range dispersion correction.
J. Comput. Chem. 2006, 27, 1787–1799. [CrossRef]67. Lozano, A.; Escribano, B.; Akhmatskaya, E.; Carrasco, J. Assessment of van der Waals inclusive density
functional theory methods for layered electroactive materials. Phys. Chem. Chem. Phys. 2017, 19, 10133–10139.[CrossRef]
68. Perdew, J.P.; Ruzsinszky, A.; Csonka, G.I.; Vydrov, O.A.; Scuseria, G.E.; Constantin, L.A.; Zhou, X.; Burke, K.Restoring the density-gradient expansion for exchange in solids and surfaces. Phys. Rev. Lett. 2008,100, 136406. [CrossRef]
69. Constantin, L.A.; Terentjevs, A.; Della Sala, F.; Fabiano, E. Gradient-dependent upper bound for theexchange-correlation energy and application to density functional theory. Phys. Rev. B 2015, 91, 041120.[CrossRef]
70. Peng, H.; Perdew, J.P. Rehabilitation of the Perdew-Burke-Ernzerhof generalized gradient approximation forlayered materials. Phys. Rev. B 2017, 95, 081105. [CrossRef]
71. Terentjev, A.V.; Constantin, L.A.; Pitarke, J. Dispersion-corrected PBEsol exchange-correlation functional.Phys. Rev. B 2018, 98, 214108. [CrossRef]
72. Peng, H.; Yang, Z.H.; Perdew, J.P.; Sun, J. Versatile van der Waals density functional based ona meta-generalized gradient approximation. Phys. Rev. X 2016, 6, 041005. [CrossRef]
73. Rettig, S.J.; Trotter, J. Refinement of the structure of orthorhombic sulfur, α-S8. Acta Cryst. 1987, C43,2260–2262. [CrossRef]
74. Wagman, D.D.; Evans, W.H.; Parker, V.B.; Schumm, R.H.; Halow, I.; Bailey, S.M.; Churney, K.L.; Nuttall, R.L.The NBS tables of chemical thermodynamic properties. J. Phys. Chem. Ref. Data 1982, 11 (Suppl. 2), 1–392.
75. Tegman, R. The crystal structure of sodium tetrasulphide, Na2S4. Acta Cryst. 1973, B29, 1463–1469.[CrossRef]
76. Kelly, B.; Woodward, P. Crystal structure of dipotassium pentasulphide. J. Chem. Soc. Dalton Trans.1976, 1314–1316. [CrossRef]
19
Crystals 2019, 9, 441
77. Böttcher, P. Synthesis and crystal structure of the dirubidiumpentachalcogenides Rb2S5 and Rb2Se5.Z. Kristallogr. Cryst. Mater. 1979, 150, 65–73. [CrossRef]
78. Böttcher, P.; Kruse, K. Darstellung und kristallstruktur von dicaesiumpentasulfid (Cs2S5). J. Less CommonMet. 1982, 83, 115–125. [CrossRef]
79. Janz, G.J.; Downey, J.R.; Roduner, E.; Wasilczyk, G.J.; Coutts, J.W.; Eluard, A. Raman studies ofsulfur-containing anions in inorganic polysulfides. Sodium polysulfides. Inorg. Chem. 1976, 15, 1759–1763.[CrossRef]
80. Te Velde, G.; Bickelhaupt, F.M.; Baerends, E.J.; Fonseca Guerra, C.; van Gisbergen, S.J.A.; Snijders, J.G.;Ziegler, T. Chemistry with ADF. J. Comput. Chem. 2001, 22, 931–967. [CrossRef]
81. ADF2018. SCM, Theoretical Chemistry, Vrije Universiteit, Amsterdam, The Netherlands. Available online:http://www.scm.com (accessed on 19 August 2019).
82. Feng, J.; Hennig, R.G.; Ashcroft, N.; Hoffmann, R. Emergent reduction of electronic state dimensionality indense ordered Li-Be alloys. Nature 2008, 451, 445–458. [CrossRef]
83. Miao, M. Helium chemistry: React with nobility. Nat. Chem. 2017, 9, 409–410. [CrossRef]84. Liu, Z.; Botana, J.; Hermann, A.; Zurek, E.; Yan, D.; Lin, H.; Miao, M. Reactivity of He with ionic compounds
under high pressure. Nat. Commun. 2018, 9, 951. [CrossRef]85. Zarifi, N.; Liu, H.; Tse, J.S.; Zurek, E. Crystal structures and electronic properties of Xe-Cl compounds at
high pressure. J. Phys. Chem. C 2018, 122, 2941–2950. [CrossRef]86. Mishra, A.K.; Muramatsu, T.; Liu, H.; Geballe, Z.M.; Somayazulu, M.; Ahart, M.; Baldini, M.; Meng, Y.;
Zurek, E.; Hemley, R.J. New calcium hydrides with mixed atomic and molecular hydrogen. J. Phys. Chem. C2018, 122, 19370–19378. [CrossRef]
87. Gregoryanz, E.; Degtyareva, O.; Somayazulu, M.; Hemley, R.J.; Mao, H.K. Melting of dense sodium. Phys.Rev. Lett. 2005, 94, 185502. [CrossRef]
88. Neaton, J.B.; Ashcroft, N.W. On the constitution of sodium at higher densities. Phys. Rev. Lett. 2001,86, 2830–2833. [CrossRef]
89. Tutchton, R.; Chen, X.; Wu, Z. Is sodium a superconductor under high pressure? J. Chem. Phys. 2017,146, 014705. [CrossRef]
90. Struzhkin, V.V.; Hemley, R.J.; Mao, H.K.; Timofeev, Y.A. Superconductivity at 10–17 K in compressed sulphur.Nature 1997, 390, 382–384. [CrossRef]
91. Rudin, S.P.; Liu, A.Y. Predicted simple-cubic phase and superconducting properties for compressed sulfur.Phys. Rev. Lett. 1999, 83, 3049–3052. [CrossRef]
92. Monni, M.; Bernardini, F.; Sanna, A.; Profeta, G.; Massidda, S. Origin of the critical temperature discontinuityin superconducting sulfur under high pressure. Phys. Rev. B 2017, 95, 064516. [CrossRef]
93. Center for Computational Research, University at Buffalo. Available online: http://hdl.handle.net/10477/79221 (accessed on 19 August 2019).
c© 2019 by the authors. Licensee MDPI, Basel, Switzerland. This article is an open accessarticle distributed under the terms and conditions of the Creative Commons Attribution(CC BY) license (http://creativecommons.org/licenses/by/4.0/).
20
crystals
Article
Simultaneous Prediction of the Magnetic and CrystalStructure of Materials Using a Genetic Algorithm
Edward J. Higgins, Phil J. Hasnip and Matt I.J. Probert *
Department of Physics, University of York, Heslington, York YO10 5DD, UK* Correspondence: [email protected]; Tel.: +44-1904-322239
Received: 15 July 2019; Accepted: 16 August 2019; Published: 23 August 2019
Abstract: We introduce a number of extensions and enhancements to a genetic algorithm for crystalstructure prediction, to make it suitable to study magnetic systems. The coupling between magneticproperties and crystal structure means that it is essential to take a holistic approach, and we presentfor the first time, a genetic algorithm that performs a simultaneous global optimisation of bothmagnetic structure and crystal structure. We first illustrate the power of this approach on a noveltest system—the magnetic Lennard–Jones potential—which we define. Then we study the complexinterface structures found at the junction of a Heusler alloy and a semiconductor substrate as foundin a proposed spintronic device and show the impact of the magnetic interface structure on the deviceperformance.
Keywords: structure prediction; magnetic materials; genetic algorithm; global optimisation; ab initio;DFT; structural fingerprint; magnetic Lennard–Jones; Heusler alloy; half-Heusler alloy
1. Introduction
In order to meet the challenges posed by modern and emerging technologies, it is increasinglynecessary to look beyond existing, known materials. Many fields, from solar cells to spintronicdevices, call for materials with unprecedented performance characteristics, or even entirely newbehavior. Searching for new materials experimentally is expensive and time-consuming, but the adventof efficient, accurate computational materials modeling offers a potential way forward. Magneticmaterials are of particular interest, with applications from fast, high-density data storage such asmagnetic RAM devices [1] and heat-assisted magnetic recording (HAMR) [2], to new spintronic andquantum devices, such as spin-valves [3,4]. Magnetic materials include conventional ferromagnetsalong with more exotic structures, such as antiferromagnets, ferrimagnets, and spin glasses. Thesematerials are already at the heart of many important technologies, but play an increasingly importantrole in developing and future technologies.
Many of the strong permanent magnets in use today rely on rare-earth elements [5] and there isconcern over the sustainability of these elements’ availability [6]. Therefore, developing ferromagnetsmade from more readily available materials is desirable.
In order to determine a material’s properties, it is not sufficient to know its chemical composition,it is also vital to understand the crystal structure of the material. In general, atoms will arrangethemselves in a material so as to minimise the total (free) energy. One method to determine crystalstructure is to estimate an initial atomic configuration, compute the atomic forces and lattice cell stressaccording to a suitable model, and then adjust the atomic positions and lattice parameters in orderto minimise the energy (where the forces and stresses are zero). This procedure works well if theinitial geometry is sufficiently close to the true ground state, and this workflow has been the backboneof computational materials studies for many decades. However, the resultant optimised structureonly represents the local energy minimum; that is, this procedure finds the lowest energy structure
Crystals 2019, 9, 439; doi:10.3390/cryst9090439 www.mdpi.com/journal/crystals21
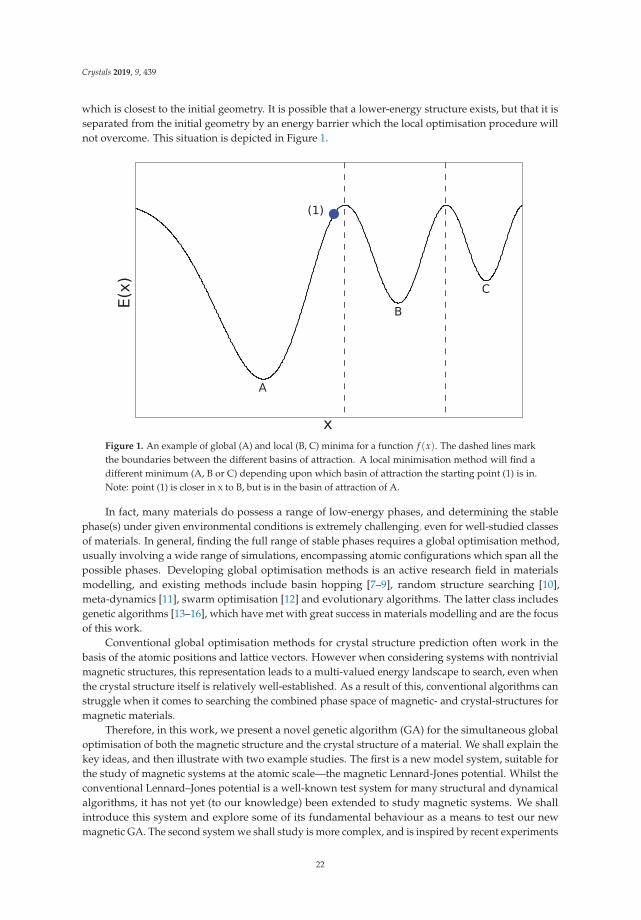
Crystals 2019, 9, 439
which is closest to the initial geometry. It is possible that a lower-energy structure exists, but that it isseparated from the initial geometry by an energy barrier which the local optimisation procedure willnot overcome. This situation is depicted in Figure 1.
E(x)
A
BC
(1)
xFigure 1. An example of global (A) and local (B, C) minima for a function f (x). The dashed lines markthe boundaries between the different basins of attraction. A local minimisation method will find adifferent minimum (A, B or C) depending upon which basin of attraction the starting point (1) is in.Note: point (1) is closer in x to B, but is in the basin of attraction of A.
In fact, many materials do possess a range of low-energy phases, and determining the stablephase(s) under given environmental conditions is extremely challenging, even for well-studied classesof materials. In general, finding the full range of stable phases requires a global optimisation method,usually involving a wide range of simulations, encompassing atomic configurations which span all thepossible phases. Developing global optimisation methods is an active research field in materialsmodelling, and existing methods include basin hopping [7–9], random structure searching [10],meta-dynamics [11], swarm optimisation [12] and evolutionary algorithms. The latter class includesgenetic algorithms [13–16], which have met with great success in materials modelling and are the focusof this work.
Conventional global optimisation methods for crystal structure prediction often work in thebasis of the atomic positions and lattice vectors. However when considering systems with nontrivialmagnetic structures, this representation leads to a multi-valued energy landscape to search, even whenthe crystal structure itself is relatively well-established. As a result of this, conventional algorithms canstruggle when it comes to searching the combined phase space of magnetic- and crystal-structures formagnetic materials.
Therefore, in this work, we present a novel genetic algorithm (GA) for the simultaneous globaloptimisation of both the magnetic structure and the crystal structure of a material. We shall explain thekey ideas, and then illustrate with two example studies. The first is a new model system, suitable forthe study of magnetic systems at the atomic scale—the magnetic Lennard-Jones potential. Whilst theconventional Lennard–Jones potential is a well-known test system for many structural and dynamicalalgorithms, it has not yet (to our knowledge) been extended to study magnetic systems. We shallintroduce this system and explore some of its fundamental behaviour as a means to test our newmagnetic GA. The second system we shall study is more complex, and is inspired by recent experiments
22
Crystals 2019, 9, 439
on spintronic systems, and is an interface between a Heusler alloy and a Ge substrate. We shall use themagnetic GA to find the optimal interface structure and show how the novel predicted structure canexplain the experimental data.
2. Materials and Methods
2.1. Materials Modelling
The first step in finding a stable crystal structure is to have a reasonable model for the energy ofany particular atomic configuration. There are two main classes of models in this context: classicalforcefields; and quantum mechanical methods.
Classical forcefields are multivariate functions which take the atomic species and positions asinput, and return the internal energy of the system and the atomic forces (the first derivative of theenergy with respect to the atomic positions). Since atomic interactions depend on the positions ofthe atoms relative to each other, rather than the absolute positions themselves, forcefields are usuallyexpressed in terms of bond lengths and, depending on the particular forcefield, bond angles and bondtorsions. One of the earliest and simplest interatomic forcefields was proposed by Lennard–Jones [17],and expresses the energy ELJ of an atomic configuration as
ELJ = ∑i,j �=i
4εij
⎡⎣(σij
rij
)12
−(
σij
rij
)6⎤⎦, (1)
where rij is the distance between atoms i and j and εij and σij are parameters of the potential whichcontrol the equilibrium bond energy and bond-length, respectively.
Forcefields are generally computationally cheap and simulations of millions of atoms may becarried out routinely. The main drawbacks of forcefield methods are the need to select and parameterisean appropriate forcefield for the material, and the inability of most forcefields to model dynamicchanges in chemistry such as bond breaking or formation.
Quantum mechanical approaches centre on solving the many-body Schrödinger equation for theelectrons and nuclei which comprise the material. These approaches have two principal advantagesover forcefield methods: they are parameter-free since the form of the Schrödinger equation isknown exactly; and by modeling the electrons explicitly, the approaches handle seamlessly chemicalcomplexities such as bond formation and breaking, or environmentally-dependent oxidation states.There is one significant drawback, however, in that this is an extremely computationally intensivetask and solving the many-body Schrödinger equation in its original form is unfeasible for materials.Most practical quantum-mechanical materials simulations are based on a reformulation of quantummechanics known as density functional theory (DFT).
DFT is founded on the Hohenberg-Kohn theorem [18], which proves that the ground state energyof a many-body quantum system is a unique, universal functional of the particle density and has noexplicit dependence on the many-body wavefunction. Kohn and Sham [19] used this to demonstrate aformal link between the ground state of the many-body Schrödinger equation, and the ground state ofa related auxiliary set of coupled single-particle equations. Crucially, these auxiliary equations may besolved with far less computational resources than the original many-body expressions [20,21].
In principle the mapping between the many-body system and the auxiliary system is exact,but there is one term in the auxiliary equations which is unknown: the exchange-correlation potential.The exchange-correlation potential must be approximated in practical calculations, with the mostcommon approximations being built on known limits and numerically-exact results for weaklyinteracting electron gases, e.g., the approximation of Perdew, Burke and Ernzerhof [22]. Despite theseapproximations, DFT has enjoyed popularity and great success in a wide range of materialssimulations [23,24].
23
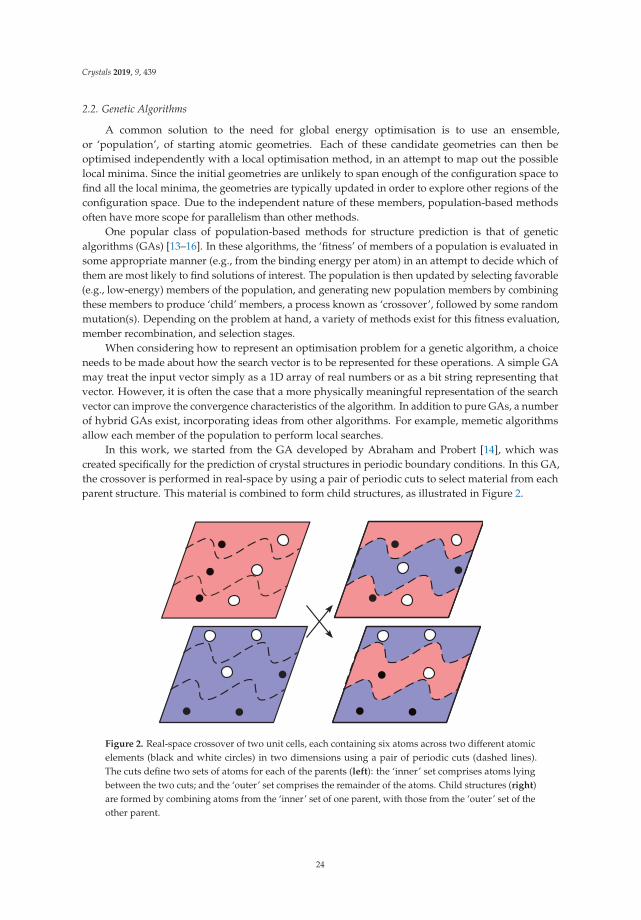
Crystals 2019, 9, 439
2.2. Genetic Algorithms
A common solution to the need for global energy optimisation is to use an ensemble,or ‘population’, of starting atomic geometries. Each of these candidate geometries can then beoptimised independently with a local optimisation method, in an attempt to map out the possiblelocal minima. Since the initial geometries are unlikely to span enough of the configuration space tofind all the local minima, the geometries are typically updated in order to explore other regions of theconfiguration space. Due to the independent nature of these members, population-based methodsoften have more scope for parallelism than other methods.
One popular class of population-based methods for structure prediction is that of geneticalgorithms (GAs) [13–16]. In these algorithms, the ‘fitness’ of members of a population is evaluated insome appropriate manner (e.g., from the binding energy per atom) in an attempt to decide which ofthem are most likely to find solutions of interest. The population is then updated by selecting favorable(e.g., low-energy) members of the population, and generating new population members by combiningthese members to produce ‘child’ members, a process known as ‘crossover’, followed by some randommutation(s). Depending on the problem at hand, a variety of methods exist for this fitness evaluation,member recombination, and selection stages.
When considering how to represent an optimisation problem for a genetic algorithm, a choiceneeds to be made about how the search vector is to be represented for these operations. A simple GAmay treat the input vector simply as a 1D array of real numbers or as a bit string representing thatvector. However, it is often the case that a more physically meaningful representation of the searchvector can improve the convergence characteristics of the algorithm. In addition to pure GAs, a numberof hybrid GAs exist, incorporating ideas from other algorithms. For example, memetic algorithmsallow each member of the population to perform local searches.
In this work, we started from the GA developed by Abraham and Probert [14], which wascreated specifically for the prediction of crystal structures in periodic boundary conditions. In this GA,the crossover is performed in real-space by using a pair of periodic cuts to select material from eachparent structure. This material is combined to form child structures, as illustrated in Figure 2.
Figure 2. Real-space crossover of two unit cells, each containing six atoms across two different atomicelements (black and white circles) in two dimensions using a pair of periodic cuts (dashed lines).The cuts define two sets of atoms for each of the parents (left): the ‘inner’ set comprises atoms lyingbetween the two cuts; and the ‘outer’ set comprises the remainder of the atoms. Child structures (right)are formed by combining atoms from the ‘inner’ set of one parent, with those from the ‘outer’ set of theother parent.
24
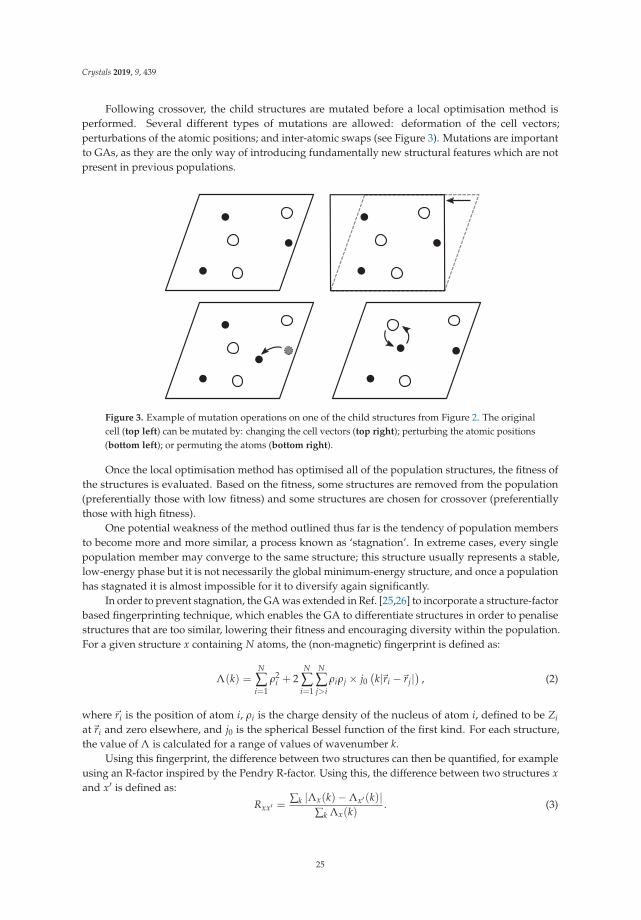
Crystals 2019, 9, 439
Following crossover, the child structures are mutated before a local optimisation method isperformed. Several different types of mutations are allowed: deformation of the cell vectors;perturbations of the atomic positions; and inter-atomic swaps (see Figure 3). Mutations are importantto GAs, as they are the only way of introducing fundamentally new structural features which are notpresent in previous populations.
Figure 3. Example of mutation operations on one of the child structures from Figure 2. The originalcell (top left) can be mutated by: changing the cell vectors (top right); perturbing the atomic positions(bottom left); or permuting the atoms (bottom right).
Once the local optimisation method has optimised all of the population structures, the fitness ofthe structures is evaluated. Based on the fitness, some structures are removed from the population(preferentially those with low fitness) and some structures are chosen for crossover (preferentiallythose with high fitness).
One potential weakness of the method outlined thus far is the tendency of population membersto become more and more similar, a process known as ‘stagnation’. In extreme cases, every singlepopulation member may converge to the same structure; this structure usually represents a stable,low-energy phase but it is not necessarily the global minimum-energy structure, and once a populationhas stagnated it is almost impossible for it to diversify again significantly.
In order to prevent stagnation, the GA was extended in Ref. [25,26] to incorporate a structure-factorbased fingerprinting technique, which enables the GA to differentiate structures in order to penalisestructures that are too similar, lowering their fitness and encouraging diversity within the population.For a given structure x containing N atoms, the (non-magnetic) fingerprint is defined as:
Λ(k) =N
∑i=1
ρ2i + 2
N
∑i=1
N
∑j>i
ρiρj × j0(k|�ri −�rj|
), (2)
where �ri is the position of atom i, ρi is the charge density of the nucleus of atom i, defined to be Ziat�ri and zero elsewhere, and j0 is the spherical Bessel function of the first kind. For each structure,the value of Λ is calculated for a range of values of wavenumber k.
Using this fingerprint, the difference between two structures can then be quantified, for exampleusing an R-factor inspired by the Pendry R-factor. Using this, the difference between two structures xand x′ is defined as:
Rxx′ =∑k |Λx(k)− Λx′(k)|
∑k Λx(k). (3)
25
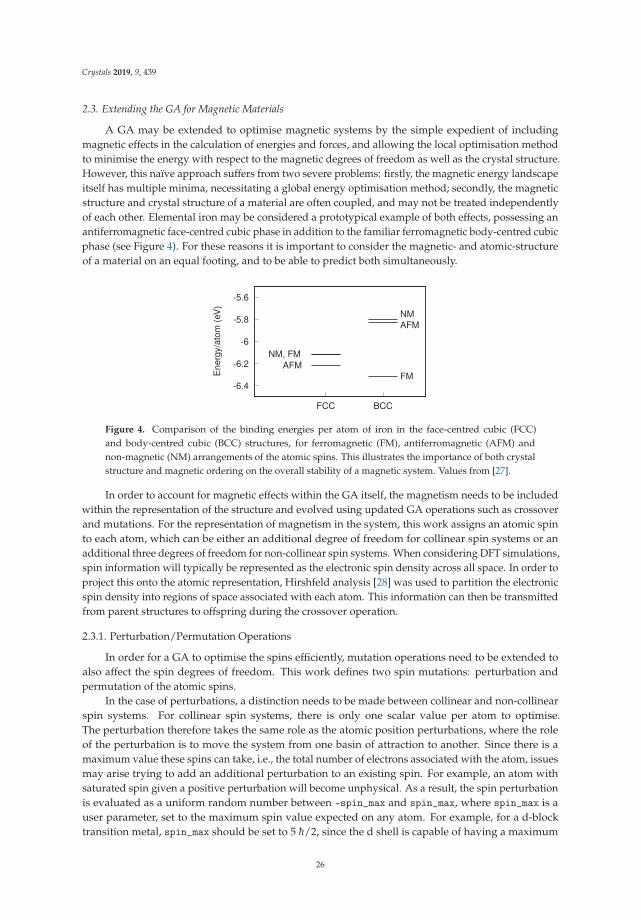
Crystals 2019, 9, 439
2.3. Extending the GA for Magnetic Materials
A GA may be extended to optimise magnetic systems by the simple expedient of includingmagnetic effects in the calculation of energies and forces, and allowing the local optimisation methodto minimise the energy with respect to the magnetic degrees of freedom as well as the crystal structure.However, this naïve approach suffers from two severe problems: firstly, the magnetic energy landscapeitself has multiple minima, necessitating a global energy optimisation method; secondly, the magneticstructure and crystal structure of a material are often coupled, and may not be treated independentlyof each other. Elemental iron may be considered a prototypical example of both effects, possessing anantiferromagnetic face-centred cubic phase in addition to the familiar ferromagnetic body-centred cubicphase (see Figure 4). For these reasons it is important to consider the magnetic- and atomic-structureof a material on an equal footing, and to be able to predict both simultaneously.
-6.4
-6.2
-6
-5.8
-5.6
FCC BCC
NM, FMAFM
AFMNM
FMEner
gy/a
tom
(eV)
Figure 4. Comparison of the binding energies per atom of iron in the face-centred cubic (FCC)and body-centred cubic (BCC) structures, for ferromagnetic (FM), antiferromagnetic (AFM) andnon-magnetic (NM) arrangements of the atomic spins. This illustrates the importance of both crystalstructure and magnetic ordering on the overall stability of a magnetic system. Values from [27].
In order to account for magnetic effects within the GA itself, the magnetism needs to be includedwithin the representation of the structure and evolved using updated GA operations such as crossoverand mutations. For the representation of magnetism in the system, this work assigns an atomic spinto each atom, which can be either an additional degree of freedom for collinear spin systems or anadditional three degrees of freedom for non-collinear spin systems. When considering DFT simulations,spin information will typically be represented as the electronic spin density across all space. In order toproject this onto the atomic representation, Hirshfeld analysis [28] was used to partition the electronicspin density into regions of space associated with each atom. This information can then be transmittedfrom parent structures to offspring during the crossover operation.
2.3.1. Perturbation/Permutation Operations
In order for a GA to optimise the spins efficiently, mutation operations need to be extended toalso affect the spin degrees of freedom. This work defines two spin mutations: perturbation andpermutation of the atomic spins.
In the case of perturbations, a distinction needs to be made between collinear and non-collinearspin systems. For collinear spin systems, there is only one scalar value per atom to optimise.The perturbation therefore takes the same role as the atomic position perturbations, where the roleof the perturbation is to move the system from one basin of attraction to another. Since there is amaximum value these spins can take, i.e., the total number of electrons associated with the atom, issuesmay arise trying to add an additional perturbation to an existing spin. For example, an atom withsaturated spin given a positive perturbation will become unphysical. As a result, the spin perturbationis evaluated as a uniform random number between -spin_max and spin_max, where spin_max is auser parameter, set to the maximum spin value expected on any atom. For example, for a d-blocktransition metal, spin_max should be set to 5 h/2, since the d shell is capable of having a maximum
26
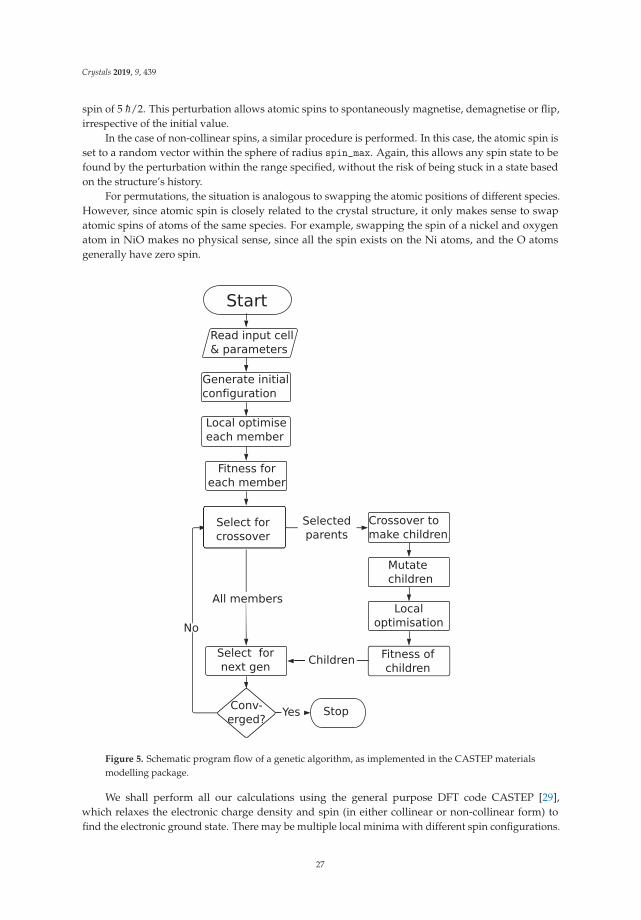
Crystals 2019, 9, 439
spin of 5 h/2. This perturbation allows atomic spins to spontaneously magnetise, demagnetise or flip,irrespective of the initial value.
In the case of non-collinear spins, a similar procedure is performed. In this case, the atomic spin isset to a random vector within the sphere of radius spin_max. Again, this allows any spin state to befound by the perturbation within the range specified, without the risk of being stuck in a state basedon the structure’s history.
For permutations, the situation is analogous to swapping the atomic positions of different species.However, since atomic spin is closely related to the crystal structure, it only makes sense to swapatomic spins of atoms of the same species. For example, swapping the spin of a nickel and oxygenatom in NiO makes no physical sense, since all the spin exists on the Ni atoms, and the O atomsgenerally have zero spin.
Start
Read input cell & parameters
Generate initial configuration
Local optimiseeach member
Fitness foreach member
Crossover tomake children
Select for crossover
Mutatechildren
Local optimisation
Fitness ofchildren
StopConv-erged?
Yes
Select for next gen
Children
No
All members
Selectedparents
Figure 5. Schematic program flow of a genetic algorithm, as implemented in the CASTEP materialsmodelling package.
We shall perform all our calculations using the general purpose DFT code CASTEP [29],which relaxes the electronic charge density and spin (in either collinear or non-collinear form) tofind the electronic ground state. There may be multiple local minima with different spin configurations.
27
Crystals 2019, 9, 439
Hence the input atomic spin from the GA is used to initialise the electron density, and CASTEP thenacts as a local optimiser for the atomic spin. This process may then be repeated as CASTEP performs ageometry optimisation to find the (local) minimum energy configuration of atomic positions and cellvectors (Figure 5).
2.3.2. Magnetic Fingerprinting
To encourage diversity in the population, it is important to be able to quantify the differencesbetween structures. In Abraham and Probert [25,26], a fingerprint was introduced that wastranslationally and rotationally invariant, and could successfully distinguish different structures.However, it will fail to distinguish two magnetic systems that have the same crystal structure buta different arrangement of spins. Hence we propose an augmented fingerprint Λaug, inspired bymagnetic scattering experiments, that can differentiate magnetic structures [30]:
Λaug(k) = Λ(k) + q2Λmagn(k) (4)
where Λ(k) is the original crystal structure fingerprint as defined in Equation (2) and
Λmagn(k) =N
∑i=1
S2i + 2
N
∑i=1
N
∑j>i
SiSj × j0(k|�ri −�rj|
)(5)
is the magnetic structure fingerprint term. Here Si is the spin on atom i and q is some scaling parameterwhich allows the overall fingerprint to be more or less sensitive with respect to differences in magneticstructure and crystal structure.
The R-factor in Equation (3) can be used with this augmented fingerprint to quantify the differencebetween two magnetic structures. As an example, the effect of perturbations on a 6-atom Fe unit cellis shown in Figure 6. The black crosses represent the R-factor difference of structure with perturbedatomic positions with respect to the original reference structure. The red squares and blue circlesrepresent similar perturbations with an additional perturbation to the atomic spins. Here a valueof q = 5 was used to make significantly different spin structures (ΔS ≥ h/2) appear as different assignificantly different crystal structures (Δr > 0.2 Å), both of which can be represented by an R-factordifference of Rxx′ > 0.03.
2.4. Case Studies
2.4.1. Fictional Magnetic Potential: LJ + S
In order to test the GA on magnetic systems, a pair-potential model including magnetic effects wasdefined. Since a significant portion of these effects are intrinsically quantum mechanical or many-bodyin nature, it is difficult to capture all of these effects in empirical potentials without limiting them tosome specific regime. Magnetic moments on isolated atoms tend to arise from partially filled electronicstates, as dictated by Hund’s rules. As a result, atoms with nonzero magnetic moments tend to bepolyvalent, causing an additional challenge to empirical pair potentials.
Since magnetic effects are often too complex to include explicitly in pair-potentials, their effectsare usually included implicitly through the mechanical and thermal properties used to parameterisethem [31]. There are some empirical potentials however that try to explicitly include magneticeffects [31–33] and some machine learning models have been trained to deal with magnetic systems [34].These models tend to require far more complex effects than simply pair-wise interactions.
Given all this, attempting to describe real magnetic materials using a pair-potential is beyond thescope of this work. Instead, the spatial dependence of the energy from the standard (non-magnetic)Lennard-Jones potential was combined with the magnetic dependence of the energy from thelattice-based Heisenberg model in order to create a potential which behaves somewhat like a magneticmaterial. This work defines a generalised magnetic Lennard-Jones potential as:
28
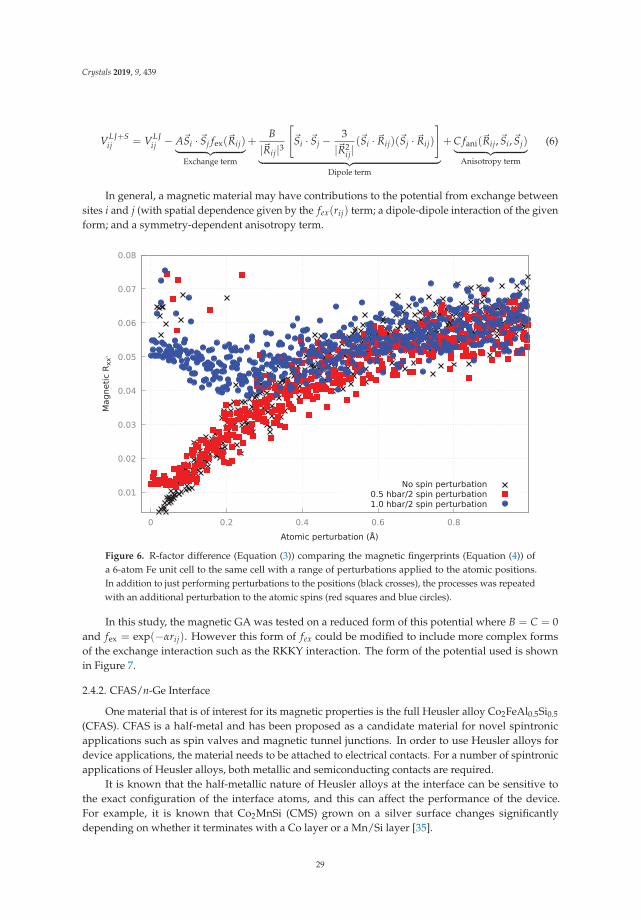
Crystals 2019, 9, 439
VLJ+Sij = VLJ
ij − A�Si · �Sj fex(�Rij)︸ ︷︷ ︸Exchange term
+B
|�Rij|3
[�Si · �Sj − 3
|�R2ij|(�Si · �Rij)(�Sj · �Rij)
]︸ ︷︷ ︸
Dipole term
+C fani(�Rij,�Si,�Sj)︸ ︷︷ ︸Anisotropy term
(6)
In general, a magnetic material may have contributions to the potential from exchange betweensites i and j (with spatial dependence given by the fex(rij) term; a dipole-dipole interaction of the givenform; and a symmetry-dependent anisotropy term.
0.01
0.02
0.03
0.04
0.05
0.06
0.07
0.08
0 0.2 0.4 0.6 0.8
Mag
netic
Rxx
'
Atomic perturbation (Å)
0.5 hbar/2 spin perturbation1.0 hbar/2 spin perturbation
No spin perturbation
Figure 6. R-factor difference (Equation (3)) comparing the magnetic fingerprints (Equation (4)) ofa 6-atom Fe unit cell to the same cell with a range of perturbations applied to the atomic positions.In addition to just performing perturbations to the positions (black crosses), the processes was repeatedwith an additional perturbation to the atomic spins (red squares and blue circles).
In this study, the magnetic GA was tested on a reduced form of this potential where B = C = 0and fex = exp(−αrij). However this form of fex could be modified to include more complex formsof the exchange interaction such as the RKKY interaction. The form of the potential used is shownin Figure 7.
2.4.2. CFAS/n-Ge Interface
One material that is of interest for its magnetic properties is the full Heusler alloy Co2FeAl0.5Si0.5
(CFAS). CFAS is a half-metal and has been proposed as a candidate material for novel spintronicapplications such as spin valves and magnetic tunnel junctions. In order to use Heusler alloys fordevice applications, the material needs to be attached to electrical contacts. For a number of spintronicapplications of Heusler alloys, both metallic and semiconducting contacts are required.
It is known that the half-metallic nature of Heusler alloys at the interface can be sensitive tothe exact configuration of the interface atoms, and this can affect the performance of the device.For example, it is known that Co2MnSi (CMS) grown on a silver surface changes significantlydepending on whether it terminates with a Co layer or a Mn/Si layer [35].
29
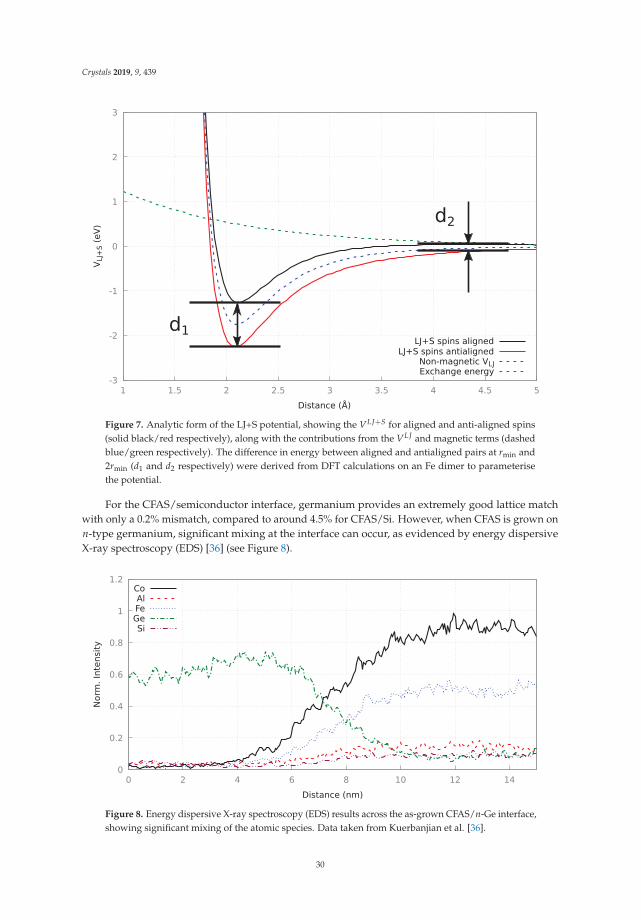
Crystals 2019, 9, 439
-3
-2
-1
0
1
2
3
1 1.5 2 2.5 3 3.5 4 4.5 5
V LJ+
S(e
V)
Distance (Å)
LJ+S spins antialignedNon-magnetic VLJExchange energy
d1
d2
LJ+S spins aligned
Figure 7. Analytic form of the LJ+S potential, showing the VLJ+S for aligned and anti-aligned spins(solid black/red respectively), along with the contributions from the VLJ and magnetic terms (dashedblue/green respectively). The difference in energy between aligned and antialigned pairs at rmin and2rmin (d1 and d2 respectively) were derived from DFT calculations on an Fe dimer to parameterisethe potential.
For the CFAS/semiconductor interface, germanium provides an extremely good lattice matchwith only a 0.2% mismatch, compared to around 4.5% for CFAS/Si. However, when CFAS is grown onn-type germanium, significant mixing at the interface can occur, as evidenced by energy dispersiveX-ray spectroscopy (EDS) [36] (see Figure 8).
0
0.2
0.4
0.6
0.8
1
1.2
0 2 4 6 8 10 12 14
Norm
. Int
ensit
y
Distance (nm)
CoAlFeGeSi
Figure 8. Energy dispersive X-ray spectroscopy (EDS) results across the as-grown CFAS/n-Ge interface,showing significant mixing of the atomic species. Data taken from Kuerbanjian et al. [36].
30
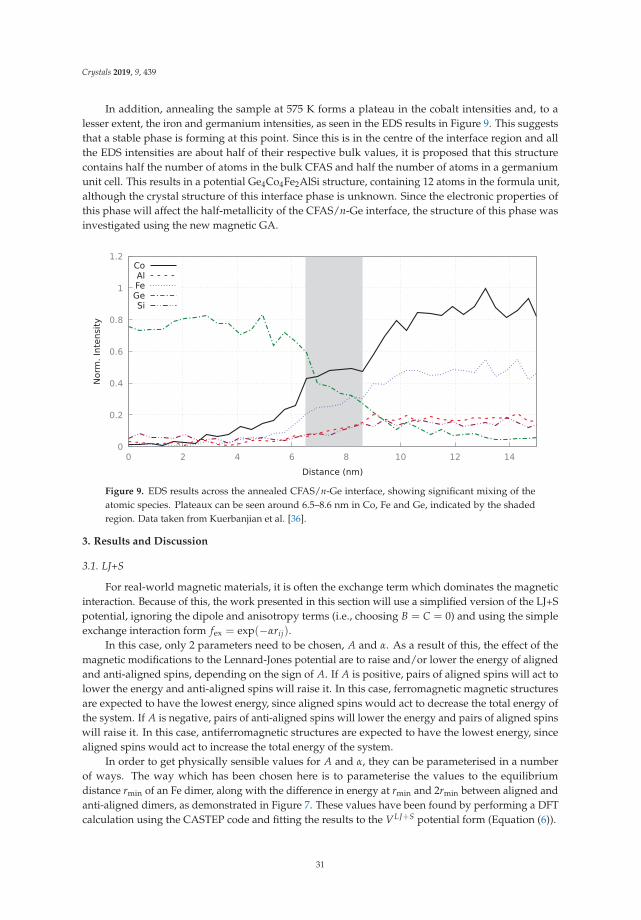
Crystals 2019, 9, 439
In addition, annealing the sample at 575 K forms a plateau in the cobalt intensities and, to alesser extent, the iron and germanium intensities, as seen in the EDS results in Figure 9. This suggeststhat a stable phase is forming at this point. Since this is in the centre of the interface region and allthe EDS intensities are about half of their respective bulk values, it is proposed that this structurecontains half the number of atoms in the bulk CFAS and half the number of atoms in a germaniumunit cell. This results in a potential Ge4Co4Fe2AlSi structure, containing 12 atoms in the formula unit,although the crystal structure of this interface phase is unknown. Since the electronic properties ofthis phase will affect the half-metallicity of the CFAS/n-Ge interface, the structure of this phase wasinvestigated using the new magnetic GA.
0
0.2
0.4
0.6
0.8
1
1.2
0 2 4 6 8 10 12 14
Norm
. Int
ensit
y
Distance (nm)
CoAlFeGeSi
Figure 9. EDS results across the annealed CFAS/n-Ge interface, showing significant mixing of theatomic species. Plateaux can be seen around 6.5–8.6 nm in Co, Fe and Ge, indicated by the shadedregion. Data taken from Kuerbanjian et al. [36].
3. Results and Discussion
3.1. LJ+S
For real-world magnetic materials, it is often the exchange term which dominates the magneticinteraction. Because of this, the work presented in this section will use a simplified version of the LJ+Spotential, ignoring the dipole and anisotropy terms (i.e., choosing B = C = 0) and using the simpleexchange interaction form fex = exp(−αrij).
In this case, only 2 parameters need to be chosen, A and α. As a result of this, the effect of themagnetic modifications to the Lennard-Jones potential are to raise and/or lower the energy of alignedand anti-aligned spins, depending on the sign of A. If A is positive, pairs of aligned spins will act tolower the energy and anti-aligned spins will raise it. In this case, ferromagnetic magnetic structuresare expected to have the lowest energy, since aligned spins would act to decrease the total energy ofthe system. If A is negative, pairs of anti-aligned spins will lower the energy and pairs of aligned spinswill raise it. In this case, antiferromagnetic structures are expected to have the lowest energy, sincealigned spins would act to increase the total energy of the system.
In order to get physically sensible values for A and α, they can be parameterised in a numberof ways. The way which has been chosen here is to parameterise the values to the equilibriumdistance rmin of an Fe dimer, along with the difference in energy at rmin and 2rmin between aligned andanti-aligned dimers, as demonstrated in Figure 7. These values have been found by performing a DFTcalculation using the CASTEP code and fitting the results to the VLJ+S potential form (Equation (6)).
31
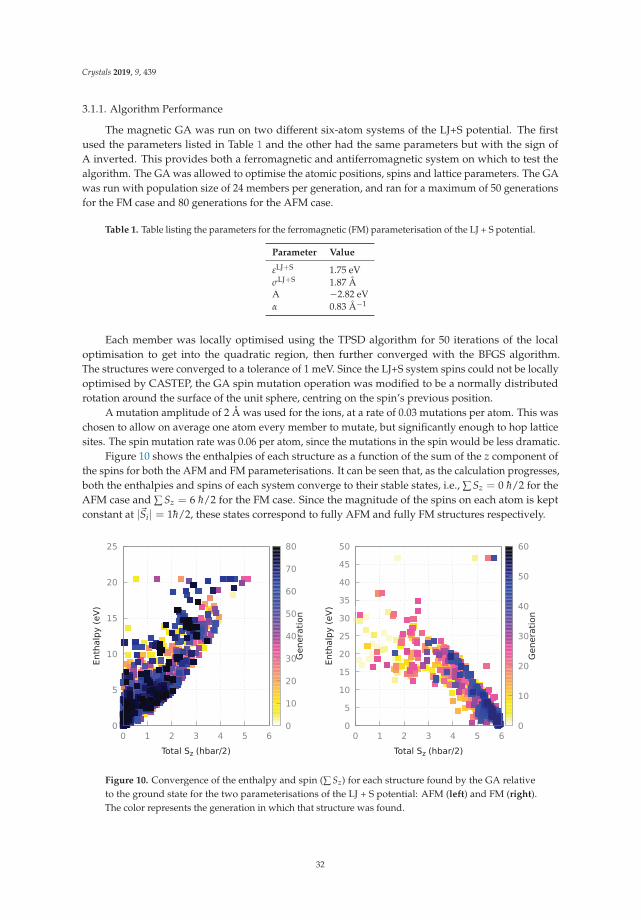
Crystals 2019, 9, 439
3.1.1. Algorithm Performance
The magnetic GA was run on two different six-atom systems of the LJ+S potential. The firstused the parameters listed in Table 1 and the other had the same parameters but with the sign ofA inverted. This provides both a ferromagnetic and antiferromagnetic system on which to test thealgorithm. The GA was allowed to optimise the atomic positions, spins and lattice parameters. The GAwas run with population size of 24 members per generation, and ran for a maximum of 50 generationsfor the FM case and 80 generations for the AFM case.
Table 1. Table listing the parameters for the ferromagnetic (FM) parameterisation of the LJ + S potential.
Parameter Value
εLJ+S 1.75 eVσLJ+S 1.87 ÅA −2.82 eVα 0.83 Å−1
Each member was locally optimised using the TPSD algorithm for 50 iterations of the localoptimisation to get into the quadratic region, then further converged with the BFGS algorithm.The structures were converged to a tolerance of 1 meV. Since the LJ+S system spins could not be locallyoptimised by CASTEP, the GA spin mutation operation was modified to be a normally distributedrotation around the surface of the unit sphere, centring on the spin’s previous position.
A mutation amplitude of 2 Å was used for the ions, at a rate of 0.03 mutations per atom. This waschosen to allow on average one atom every member to mutate, but significantly enough to hop latticesites. The spin mutation rate was 0.06 per atom, since the mutations in the spin would be less dramatic.
Figure 10 shows the enthalpies of each structure as a function of the sum of the z component ofthe spins for both the AFM and FM parameterisations. It can be seen that, as the calculation progresses,both the enthalpies and spins of each system converge to their stable states, i.e., ∑ Sz = 0 h/2 for theAFM case and ∑ Sz = 6 h/2 for the FM case. Since the magnitude of the spins on each atom is keptconstant at |�Si| = 1h/2, these states correspond to fully AFM and fully FM structures respectively.
0
5
10
15
20
25
0 1 2 3 4 5 6
Enth
alpy
(eV)
Total Sz (hbar/2)
0
10
20
30
40
50
60
70
80
Gen
erat
ion
0
5
10
15
20
25
30
35
40
45
50
0 1 2 3 4 5 6
Enth
alpy
(eV)
Total Sz (hbar/2)
0
10
20
30
40
50
60G
ener
atio
n
Figure 10. Convergence of the enthalpy and spin (∑ Sz) for each structure found by the GA relativeto the ground state for the two parameterisations of the LJ + S potential: AFM (left) and FM (right).The color represents the generation in which that structure was found.
32
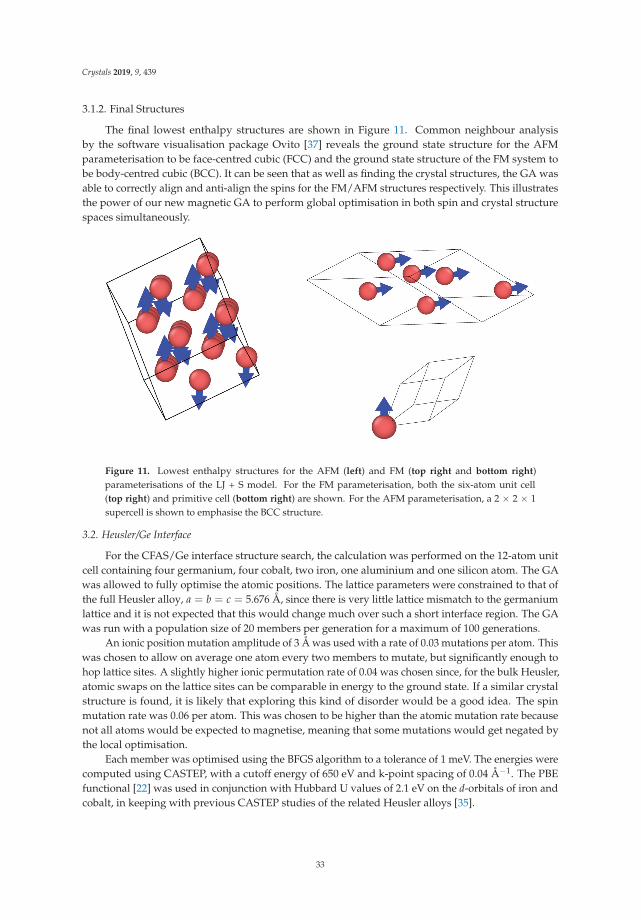
Crystals 2019, 9, 439
3.1.2. Final Structures
The final lowest enthalpy structures are shown in Figure 11. Common neighbour analysisby the software visualisation package Ovito [37] reveals the ground state structure for the AFMparameterisation to be face-centred cubic (FCC) and the ground state structure of the FM system tobe body-centred cubic (BCC). It can be seen that as well as finding the crystal structures, the GA wasable to correctly align and anti-align the spins for the FM/AFM structures respectively. This illustratesthe power of our new magnetic GA to perform global optimisation in both spin and crystal structurespaces simultaneously.
Figure 11. Lowest enthalpy structures for the AFM (left) and FM (top right and bottom right)parameterisations of the LJ + S model. For the FM parameterisation, both the six-atom unit cell(top right) and primitive cell (bottom right) are shown. For the AFM parameterisation, a 2 × 2 × 1supercell is shown to emphasise the BCC structure.
3.2. Heusler/Ge Interface
For the CFAS/Ge interface structure search, the calculation was performed on the 12-atom unitcell containing four germanium, four cobalt, two iron, one aluminium and one silicon atom. The GAwas allowed to fully optimise the atomic positions. The lattice parameters were constrained to that ofthe full Heusler alloy, a = b = c = 5.676 Å, since there is very little lattice mismatch to the germaniumlattice and it is not expected that this would change much over such a short interface region. The GAwas run with a population size of 20 members per generation for a maximum of 100 generations.
An ionic position mutation amplitude of 3 Å was used with a rate of 0.03 mutations per atom. Thiswas chosen to allow on average one atom every two members to mutate, but significantly enough tohop lattice sites. A slightly higher ionic permutation rate of 0.04 was chosen since, for the bulk Heusler,atomic swaps on the lattice sites can be comparable in energy to the ground state. If a similar crystalstructure is found, it is likely that exploring this kind of disorder would be a good idea. The spinmutation rate was 0.06 per atom. This was chosen to be higher than the atomic mutation rate becausenot all atoms would be expected to magnetise, meaning that some mutations would get negated bythe local optimisation.
Each member was optimised using the BFGS algorithm to a tolerance of 1 meV. The energies werecomputed using CASTEP, with a cutoff energy of 650 eV and k-point spacing of 0.04 Å−1. The PBEfunctional [22] was used in conjunction with Hubbard U values of 2.1 eV on the d-orbitals of iron andcobalt, in keeping with previous CASTEP studies of the related Heusler alloys [35].
33
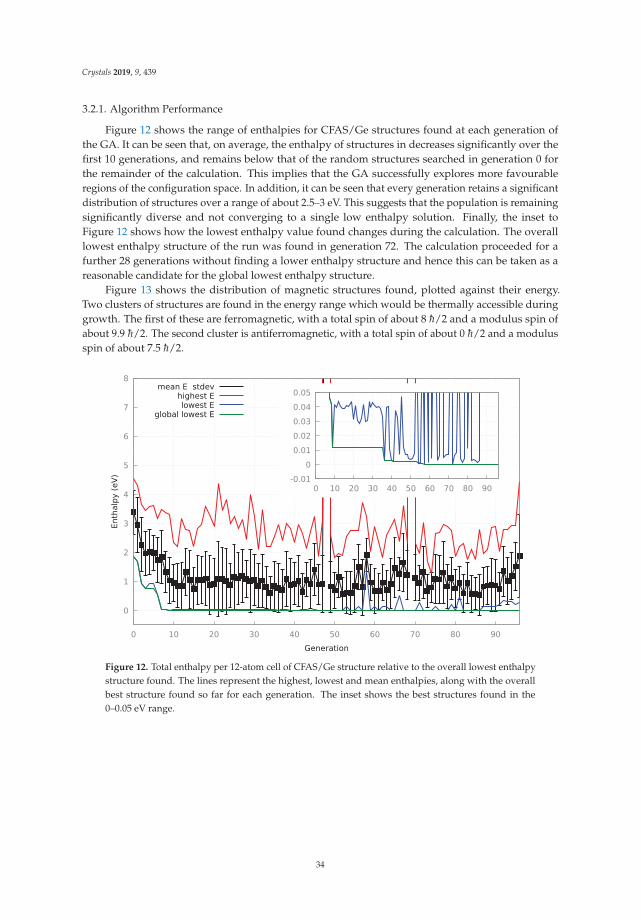
Crystals 2019, 9, 439
3.2.1. Algorithm Performance
Figure 12 shows the range of enthalpies for CFAS/Ge structures found at each generation ofthe GA. It can be seen that, on average, the enthalpy of structures in decreases significantly over thefirst 10 generations, and remains below that of the random structures searched in generation 0 forthe remainder of the calculation. This implies that the GA successfully explores more favourableregions of the configuration space. In addition, it can be seen that every generation retains a significantdistribution of structures over a range of about 2.5–3 eV. This suggests that the population is remainingsignificantly diverse and not converging to a single low enthalpy solution. Finally, the inset toFigure 12 shows how the lowest enthalpy value found changes during the calculation. The overalllowest enthalpy structure of the run was found in generation 72. The calculation proceeded for afurther 28 generations without finding a lower enthalpy structure and hence this can be taken as areasonable candidate for the global lowest enthalpy structure.
Figure 13 shows the distribution of magnetic structures found, plotted against their energy.Two clusters of structures are found in the energy range which would be thermally accessible duringgrowth. The first of these are ferromagnetic, with a total spin of about 8 h/2 and a modulus spin ofabout 9.9 h/2. The second cluster is antiferromagnetic, with a total spin of about 0 h/2 and a modulusspin of about 7.5 h/2.
0
1
2
3
4
5
6
7
8
0 10 20 30 40 50 60 70 80 90
Enth
alpy
(eV)
Generation
mean E stdevhighest Elowest E
global lowest E
-0.010
0.010.020.030.040.05
0 10 20 30 40 50 60 70 80 90
Figure 12. Total enthalpy per 12-atom cell of CFAS/Ge structure relative to the overall lowest enthalpystructure found. The lines represent the highest, lowest and mean enthalpies, along with the overallbest structure found so far for each generation. The inset shows the best structures found in the0–0.05 eV range.
34
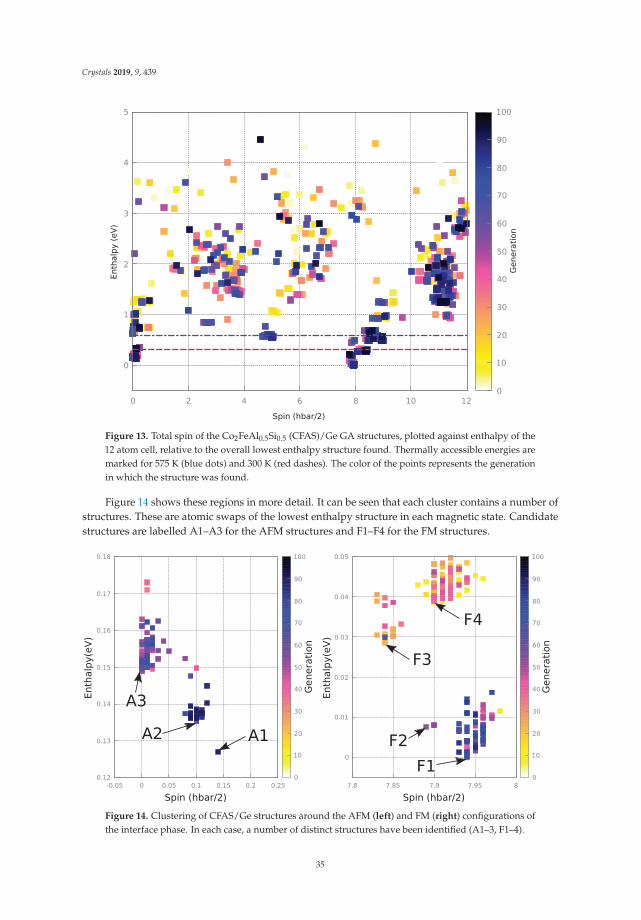
Crystals 2019, 9, 439
Figure 13. Total spin of the Co2FeAl0.5Si0.5 (CFAS)/Ge GA structures, plotted against enthalpy of the12 atom cell, relative to the overall lowest enthalpy structure found. Thermally accessible energies aremarked for 575 K (blue dots) and 300 K (red dashes). The color of the points represents the generationin which the structure was found.
Figure 14 shows these regions in more detail. It can be seen that each cluster contains a number ofstructures. These are atomic swaps of the lowest enthalpy structure in each magnetic state. Candidatestructures are labelled A1–A3 for the AFM structures and F1–F4 for the FM structures.
0.12
0.13
0.14
0.15
0.16
0.17
0.18
-0.05 0 0.05 0.1 0.15 0.2 0.25
Enthalpy
(eV)
Spin (hbar/2)
0
10
20
30
40
50
60
70
80
90
100
Gene
ratio
n
0
0.01
0.02
0.03
0.04
0.05
7.8 7.85 7.9 7.95 8
Enthalpy
(eV)
Spin (hbar/2)
0
10
20
30
40
50
60
70
80
90
100Ge
neratio
n
A3A2 A1
F3
F2F1
F4
Figure 14. Clustering of CFAS/Ge structures around the AFM (left) and FM (right) configurations ofthe interface phase. In each case, a number of distinct structures have been identified (A1–3, F1–4).
35
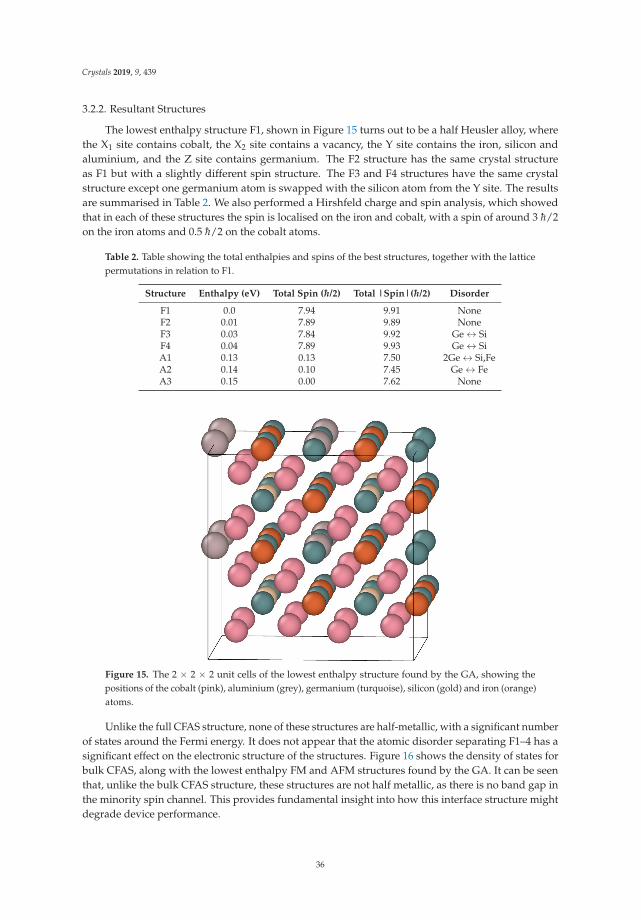
Crystals 2019, 9, 439
3.2.2. Resultant Structures
The lowest enthalpy structure F1, shown in Figure 15 turns out to be a half Heusler alloy, wherethe X1 site contains cobalt, the X2 site contains a vacancy, the Y site contains the iron, silicon andaluminium, and the Z site contains germanium. The F2 structure has the same crystal structureas F1 but with a slightly different spin structure. The F3 and F4 structures have the same crystalstructure except one germanium atom is swapped with the silicon atom from the Y site. The resultsare summarised in Table 2. We also performed a Hirshfeld charge and spin analysis, which showedthat in each of these structures the spin is localised on the iron and cobalt, with a spin of around 3 h/2on the iron atoms and 0.5 h/2 on the cobalt atoms.
Table 2. Table showing the total enthalpies and spins of the best structures, together with the latticepermutations in relation to F1.
Structure Enthalpy (eV) Total Spin (h/2) Total |Spin|(h/2) Disorder
F1 0.0 7.94 9.91 NoneF2 0.01 7.89 9.89 NoneF3 0.03 7.84 9.92 Ge ↔ SiF4 0.04 7.89 9.93 Ge ↔ SiA1 0.13 0.13 7.50 2Ge ↔ Si,FeA2 0.14 0.10 7.45 Ge ↔ FeA3 0.15 0.00 7.62 None
Figure 15. The 2 × 2 × 2 unit cells of the lowest enthalpy structure found by the GA, showing thepositions of the cobalt (pink), aluminium (grey), germanium (turquoise), silicon (gold) and iron (orange)atoms.
Unlike the full CFAS structure, none of these structures are half-metallic, with a significant numberof states around the Fermi energy. It does not appear that the atomic disorder separating F1–4 has asignificant effect on the electronic structure of the structures. Figure 16 shows the density of states forbulk CFAS, along with the lowest enthalpy FM and AFM structures found by the GA. It can be seenthat, unlike the bulk CFAS structure, these structures are not half metallic, as there is no band gap inthe minority spin channel. This provides fundamental insight into how this interface structure mightdegrade device performance.
36
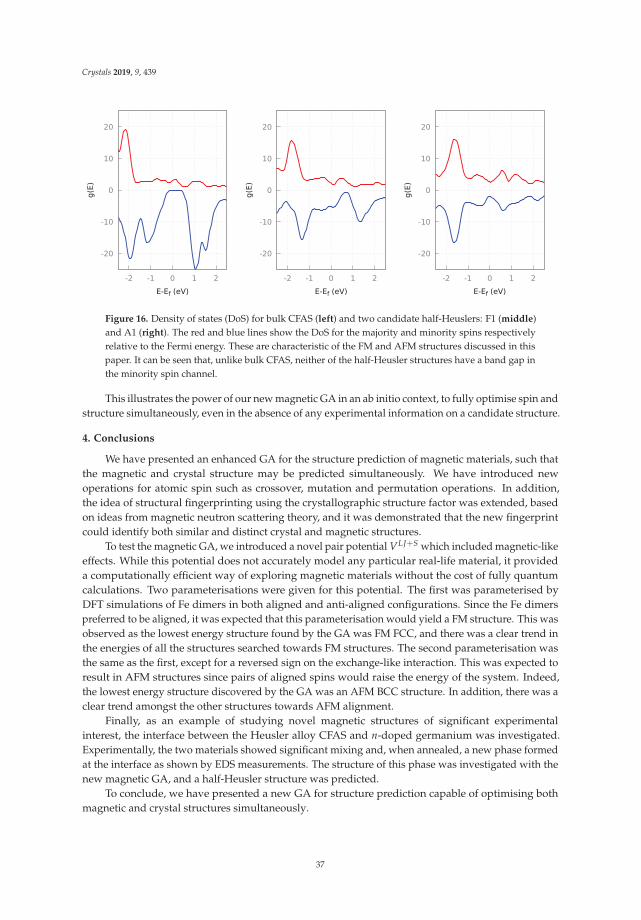
Crystals 2019, 9, 439
-20
-10
0
10
20
-2 -1 0 1 2
g(E)
E-Ef (eV)
-20
-10
0
10
20
-2 -1 0 1 2
g(E)
E-Ef (eV)
-20
-10
0
10
20
-2 -1 0 1 2
g(E)
E-Ef (eV)
Figure 16. Density of states (DoS) for bulk CFAS (left) and two candidate half-Heuslers: F1 (middle)and A1 (right). The red and blue lines show the DoS for the majority and minority spins respectivelyrelative to the Fermi energy. These are characteristic of the FM and AFM structures discussed in thispaper. It can be seen that, unlike bulk CFAS, neither of the half-Heusler structures have a band gap inthe minority spin channel.
This illustrates the power of our new magnetic GA in an ab initio context, to fully optimise spin andstructure simultaneously, even in the absence of any experimental information on a candidate structure.
4. Conclusions
We have presented an enhanced GA for the structure prediction of magnetic materials, such thatthe magnetic and crystal structure may be predicted simultaneously. We have introduced newoperations for atomic spin such as crossover, mutation and permutation operations. In addition,the idea of structural fingerprinting using the crystallographic structure factor was extended, basedon ideas from magnetic neutron scattering theory, and it was demonstrated that the new fingerprintcould identify both similar and distinct crystal and magnetic structures.
To test the magnetic GA, we introduced a novel pair potential VLJ+S which included magnetic-likeeffects. While this potential does not accurately model any particular real-life material, it provideda computationally efficient way of exploring magnetic materials without the cost of fully quantumcalculations. Two parameterisations were given for this potential. The first was parameterised byDFT simulations of Fe dimers in both aligned and anti-aligned configurations. Since the Fe dimerspreferred to be aligned, it was expected that this parameterisation would yield a FM structure. This wasobserved as the lowest energy structure found by the GA was FM FCC, and there was a clear trend inthe energies of all the structures searched towards FM structures. The second parameterisation wasthe same as the first, except for a reversed sign on the exchange-like interaction. This was expected toresult in AFM structures since pairs of aligned spins would raise the energy of the system. Indeed,the lowest energy structure discovered by the GA was an AFM BCC structure. In addition, there was aclear trend amongst the other structures towards AFM alignment.
Finally, as an example of studying novel magnetic structures of significant experimentalinterest, the interface between the Heusler alloy CFAS and n-doped germanium was investigated.Experimentally, the two materials showed significant mixing and, when annealed, a new phase formedat the interface as shown by EDS measurements. The structure of this phase was investigated with thenew magnetic GA, and a half-Heusler structure was predicted.
To conclude, we have presented a new GA for structure prediction capable of optimising bothmagnetic and crystal structures simultaneously.
37
Crystals 2019, 9, 439
Author Contributions: The different contributions of the authors to this study were as follows: conceptualisation,M.I.J.P.; methodology, E.J.H., P.J.H., M.I.J.P.; software, E.J.H., M.I.J.P.; manuscript preparation, E.J.H., P.J.H., M.I.J.P.
Funding: E.J.H. was financially supported by EPSRC under the DTA scheme. Computing resources on ARCHERwere provided by UKCP under EPSRC grant EP/P022561/1. P.J.H. was funded by EPSRC grant EP/R025770/1.
Acknowledgments: The authors wish to acknowledge Balati Kuerbanjiang and Vlado Lazarov for providing theEDS experimental results and for discussion on the CFAS study.
Conflicts of Interest: The authors declare no conflict of interest. The funders had no role in the design of thestudy; in the collection, analyses, or interpretation of data; in the writing of the manuscript, or in the decision topublish the results.
Abbreviations
The following abbreviations are used in this manuscript:
CFAS Co2FeAlSi (cobalt iron aluminium silicide; a half-metallic Heusler alloy)DFT Density Functional TheoryGA Genetic AlgorithmLJ Lennard-JonesLJ+S Lennard-Jones with spinEDS Energy dispersive X-ray spectroscopyDoS Density of States
References
1. Comstock, R.L. Review modern magnetic materials in data storage. J. Mater. Sci. Mater. Electron. 2002,13, 509–523. [CrossRef]
2. Weller, D.; Parker, G.; Mosendz, O.; Lyberatos, A.; Mitin, D.; Safonova, N.Y.; Albrecht, M. Review article:FePt heat assisted magnetic recording media. J. Vac. Sci. Technol. B 2016, 34, 060801. [CrossRef]
3. Balke, B.; Wurmehl, S.; Fecher, G.H.; Felser, C.; Kübler, J. Rational design of new materials for spintronics:Co2FeZ ( Z = Al, Ga, Si, Ge). Sci. Technol. Adv. Mater. 2008, 9, 014102. [CrossRef] [PubMed]
4. Li, X.; Yang, J. First-principles design of spintronics materials. Natl. Sci. Rev. 2016, 3, 365–381. [CrossRef]5. Coey, J. Rare-earth magnets. Endeavour 1995, 19, 146–151. [CrossRef]6. Alonso, E.; Sherman, A.M.; Wallington, T.J.; Everson, M.P.; Field, F.R.; Roth, R.; Kirchain, R.E. Evaluating rare
earth element availability: A case with revolutionary demand from clean technologies. Environ. Sci. Technol.2012, 46, 3406–3414. [CrossRef] [PubMed]
7. Wales, D.J.; Scheraga, H.A. Global optimization of clusters, crystals, and biomolecules. Science 1999,285, 1368–1372. [CrossRef] [PubMed]
8. Amsler, M.; Goedecker, S. Crystal structure prediction using the minima hopping method. J. Chem. Phys.2010, 133, 224104. [CrossRef]
9. Panosetti, C.; Krautgasser, K.; Palagin, D.; Reuter, K.; Maurer, R.J. Global materials structure search withchemically motivated coordinates. Nano Lett. 2015, 15, 8044–8048. [CrossRef]
10. Pickard, C.J.; Needs, R.J. Ab initio random structure searching. J. Phys. Condens. Matter 2011, 23, 053201.[CrossRef]
11. Woodley, S.M.; Catlow, R. Crystal structure prediction from first principles. Nat. Mater. 2008, 7, 937–946.[CrossRef] [PubMed]
12. Wang, Y.; Lv, J.; Zhu, L.; Ma, Y. Crystal structure prediction via particle-swarm optimization. Phys. Rev. B2010, 82, 094116. [CrossRef]
13. Woodley, S.M.; Battle, P.D.; Gale, J.D.; Richard, A.; Catlow, C. The prediction of inorganic crystal structuresusing a genetic algorithm and energy minimisation. Phys. Chem. Chem. Phys. 1999, 1, 2535–2542. [CrossRef]
14. Abraham, N.L.; Probert, M.I.J. A periodic genetic algorithm with real-space representation for crystalstructure and polymorph prediction. Phys. Rev. B 2006, 73, 224104. [CrossRef]
15. Glass, C.W.; Oganov, A.R.; Hansen, N. USPEX—Evolutionary crystal structure prediction. Comput. Phys.Commun. 2006, 175, 713 – 720. [CrossRef]
16. Lonie, D.C.; Zurek, E. XtalOpt: An open-source evolutionary algorithm for crystal structure prediction.Comput. Phys. Commun. 2011, 182, 372–387. [CrossRef]
38
Crystals 2019, 9, 439
17. Lennard-Jones, J.E. Cohesion. Proc. Phys. Soc. 1931, 43, 461. [CrossRef]18. Hohenberg, P.; Kohn, W. Inhomogeneous electron gas. Phys. Rev. 1964, 136, B864–B871. [CrossRef]19. Kohn, W.; Sham, L.J. Self-Consistent equations including exchange and correlation effects. Phys. Rev. 1965,
140, A1133–A1138. [CrossRef]20. Payne, M.C.; Teter, M.P.; Allan, D.C.; Arias, T.A.; Joannopoulos, J.D. Iterative minimization techniques for
ab initio total-energy calculations: Molecular dynamics and conjugate gradients. Rev. Mod. Phys. 1992,64, 1045–1097. [CrossRef]
21. Woods, N.; Payne, M.; Hasnip, P. Computing the self-consistent field in Kohn-Sham density functionaltheory. J. Phys. Condens. Matter 2019, 31, 453001. [CrossRef] [PubMed]
22. Perdew, J.P.; Burke, K.; Ernzerhof, M. Generalized gradient approximation made simple. Phys. Rev. Lett.1996, 77, 3865–3868. [CrossRef] [PubMed]
23. Jones, R.O.; Gunnarsson, O. The density functional formalism, its applications and prospects. Rev. Mod. Phys.1989, 61, 689–746. [CrossRef]
24. Hasnip, P.J.; Refson, K.; Probert, M.I.J.; Yates, J.R.; Clark, S.J.; Pickard, C.J. Density functional theory in thesolid state. Philos. Trans. R. Soc. A Math. Phys. Eng. Sci. 2014, 372. [CrossRef] [PubMed]
25. Abraham, N.; Probert, M. Improved real-space genetic algorithm for crystal structure and polymorphprediction. Phys. Rev. B 2008, 77, 134117. [CrossRef]
26. Abraham, N.L.; Probert, M.I.J. Erratum: Improved real-space genetic algorithm for crystal structure andpolymorph prediction [Phys. Rev. B 77, 134117 (2008)]. Phys. Rev. B 2016, 94, 059904. [CrossRef]
27. Kübler, J. Magnetic moments of ferromagnetic and antiferromagnetic bcc and fcc iron. Phys. Lett. A 1981,81, 81–83. [CrossRef]
28. Hirshfeld, F.L. Bonded-atom fragments for describing molecular charge densities. Theor. Chim. Acta 1977,44, 129–138. [CrossRef]
29. Clark, S.J.; Segall, M.D.; Pickard, C.J.; Hasnip, P.J.; Probert, M.I.; Refson, K.; Payne, M.C. First principlesmethods using CASTEP. Z. Für Krist.-Cryst. Mater. 2005, 220, 567–570. [CrossRef]
30. Bacon, G. Neutron Diffraction Monographs on the Physics and Chemistry of Materials; Oxford University Press:New York, NY, USA, 1975.
31. Harrison, R.J.; Krasko, G.L. Magnetic-state-dependent interatomic potential for iron (abstract). J. Appl. Phys.1990, 67, 4585. [CrossRef]
32. Dudarev, S.L.; Derlet, P.M. A ‘magnetic’ interatomic potential for molecular dynamics simulations. J. Phys.Condens. Matter 2005, 17, 7097. [CrossRef]
33. Ackland, G.J. Two-band second moment model for transition metals and alloys. J. Nucl. Mater. 2006,351, 20–27. [CrossRef]
34. Dragoni, D.; Daff, T.D.; Csányi, G.; Marzari, N. Achieving DFT accuracy with a machine-learning interatomicpotential: Thermomechanics and defects in bcc ferromagnetic iron. Phys. Rev. Mater. 2018, 2, 013808.[CrossRef]
35. Nedelkoski, Z.; Hasnip, P.J.; Sanchez, A.M.; Kuerbanjiang, B.; Higgins, E.; Oogane, M.; Hirohata, A.;Bell, G.R.; Lazarov, V.K. The effect of atomic structure on interface spin-polarization of half-metallic spinvalves: Co2MnSi/Ag epitaxial interfaces. Appl. Phys. Lett. 2015, 107, 212404. [CrossRef]
36. Kuerbanjiang, B.; Fujita, Y.; Yamada, M.; Yamada, S.; Sanchez, A.M.; Hasnip, P.J.; Ghasemi, A.;Kepaptsoglou, D.; Bell, G.; Sawano, K.; et al. Correlation between spin transport signal andHeusler/semiconductor interface quality in lateral spin-valve devices. Phys. Rev. B 2018, 98, 115304.[CrossRef]
37. Stukowski, A. Visualization and analysis of atomistic simulation data with OVITO—The open visualizationtool. Model. Simul. Mater. Sci. Eng. 2009, 18, 015012. [CrossRef]
c© 2019 by the authors. Licensee MDPI, Basel, Switzerland. This article is an open accessarticle distributed under the terms and conditions of the Creative Commons Attribution(CC BY) license (http://creativecommons.org/licenses/by/4.0/).
39
crystals
Article
Quest for Compounds at the Verge of Charge TransferInstabilities: The Case of Silver(II) Chloride †
Mariana Derzsi 1,2,*, Adam Grzelak 1, Paweł Kondratiuk 1,‡, Kamil Tokár 2,3 and
Wojciech Grochala 1,*
1 Center of New Technologies, University of Warsaw, Zwirki i Wigury 93, 02089 Warsaw, Poland2 Advanced Technologies Research Institute, Faculty of Materials Science and Technology in Trnava,
Slovak University of Technology in Bratislava, 917 24 Trnava, Slovakia3 Institute of Physics, Slovak Academy of Sciences, 845 11 Bratislava, Slovakia* Correspondence: [email protected] (M.D.); [email protected] (W.G.)† This work is dedicated to the memory of Kazimierz Fajans (1887–1975).‡ Current Address: Institute of Theoretical Physics, Faculty of Physics, University of Warsaw,
02089 Warsaw, Poland.
Received: 5 July 2019; Accepted: 9 August 2019; Published: 15 August 2019
Abstract: Electron-transfer processes constitute one important limiting factor governing stabilityof solids. One classical case is that of CuI2, which has never been prepared at ambient pressureconditions due to feasibility of charge transfer between metal and nonmetal (CuI2 → CuI + 1
2 I2).Sometimes, redox instabilities involve two metal centers, e.g., AgO is not an oxide of divalent silverbut rather silver(I) dioxoargentate(III), Ag(I)[Ag(III)O2]. Here, we look at the particularly interestingcase of a hypothetical AgCl2 where both types of redox instabilities operate simultaneously. Sincestandard redox potential of the Ag(II)/Ag(I) redox pair reaches some 2 V versus Normal HydrogenElectrode (NHE), it might be expected that Ag(II) would oxidize Cl− anion with great ease (standardredox potential of the 1
2 Cl2/Cl− pair is + 1.36 V versus Normal Hydrogen Electrode). However, ionicAg(II)Cl2 benefits from long-distance electrostatic stabilization to a much larger degree than Ag(I)Cl +12 Cl2, which affects relative stability. Moreover, Ag(II) may disproportionate in its chloride, just likeit does in an oxide; this is what AuCl2 does, its formula corresponding in fact to Au(I)[Au(III)Cl4].Formation of polychloride substructure, as for organic derivatives of Cl3− anion, is yet anotherpossibility. All that creates a very complicated potential energy surface with a few chemically distinctminima i.e., diverse polymorphic forms present. Here, results of our theoretical study for AgCl2will be presented including outcome of evolutionary algorithm structure prediction method, and thechemical identity of the most stable form will be uncovered together with its presumed magneticproperties. Contrary to previous rough estimates suggesting substantial instability of AgCl2, we findthat AgCl2 is only slightly metastable (by 52 meV per formula unit) with respect to the knownAgCl and 1
2 Cl2, stable with respect to elements, and simultaneously dynamically (i.e., phonon)stable. Thus, our results point out to conceivable existence of AgCl2 which should be targeted vianon-equilibrium approaches.
Keywords: silver; chlorine; learning algorithms; crystal structure; magnetic properties
1. Introduction
Electron-transfer processes constitute one important limiting factor governing stability of solids.One classic case is that of CuI2, which has never been prepared at ambient pressure conditions dueto feasibility of charge transfer between metal and nonmetal. The energy of ligand-to-metal-charge
Crystals 2019, 9, 423; doi:10.3390/cryst9080423 www.mdpi.com/journal/crystals40
Crystals 2019, 9, 423
transfer (LMCT) is negative for CuI2 which results in instability and phase separation, according to theEquation (1):
CuI2 → CuI +12
I2 (1)
While the process of oxidation of iodide anions by Cu(II) is well-known to every chemistryfreshman, it remains somewhat difficult to explain to a comprehensive school pupil, based on thevalues of standard redox potentials, E0, for the relevant species in aqueous solutions. The reason forthat is that the E0 value for the Cu(II)/Cu(I) redox pair is + 0.16 V versus NHE (Normal HydrogenElectrode), while that for the I2/2 I− is + 0.54 V, i.e., I2 is formally a slightly better stronger oxidizerthan Cu(II). The detailed explanation necessitates departure from the aqueous conditions (note, E0
values are the feature of solvated species in aqueous solutions). Since Cu(II) in aqueous solutionsis very strongly solvated by water molecules acting as a Lewis base (H2O→ Cu(II)), and this effectsurpassed the one of coordination of water molecules to Cu(I), the oxidizing properties of naked Cu(II)are certainly stronger than those of solvated ions. Simultaneously, since I− anion is coordinated bywater molecules acting like Lewis acid (OH2 . . . I−) (and coordination to anion is stronger than toneutral I2 molecules) the E0 value for the I2/2 I− redox pair is actually larger than the one for unsolvatedspecies. This helps to explain why the balance of a redox reaction for the phases in the solid state, i.e.,lacking any solvent, is different from the one which might be guessed based on the plain E0 values.
Attempts to more quantitatively explain the lack of stability of CuI2 at ambient (p,T) conditionsinvolve discussions of ionization potential of monovalent metal, ionic polarizabilities, as well as latticeenergies of relevant solids. Over 60 years ago, following early considerations by Fajans [1], Morrisestimated the standard molar free energy of formation of CuI2 [2]. The obtained value was slightlypositive, some 1 kcal/mole [2], see also [3]. Since the respective value for CuI is large and negative(circa −16.6 kcal/mole), it is natural that formation of CuI2 is strongly disfavored. This, of course,may change under high pressure conditions, which—due to beneficial pV factor allowing to crowdcations and anions together in the lattice—often favor formation of species at high oxidation states.
Sometimes redox instabilities involve two metal centers rather than metal and nonmetal, e.g.,AgO is not an oxide of divalent silver but rather silver(I) dioxoargentate(III), Ag(I)[Ag(III)O2] [4,5]:
2 Ag(II)→ Ag(I) + Ag(III) (2)
The analogous behavior has been theoretically predicted for AuO, as well [6]. It is important tonotice that the disproportionation reactions of this type are always energy uphill in the gas phase,and they are relatively rare for extended solids. In the case of silver, the energy of reaction proceedingaccording to Equation (2) is positive and very large, some 13.3 eV, as may be estimated from relevantionization potentials (this value corresponds to the Mott-Hubbard U energy in the gas phase). The factthat the process takes place in AgO according to Equation (2) is given by several important factors,such as departure from ionic formulation, and the fact that U is strongly screened in solids. The rule ofa thumb is that disproportionation processes are facile (i) in a Lewis-basic environment, (ii) especiallywhen there is strong mixing of metal and nonmetal states i.e., pronounced covalence of chemicalbonding, (iii) when the pV factor at elevated pressure, which prefers packing of unequal spheres,dominates the energetic terms, and (iv) at low temperatures [7]. AgO is in fact a nice exemplificationof condition (i), since it is disproportionated, while its more Lewis acidic derivative, AgSO4, isnot [8]. Another good example is that of Au(II)(SbF6)2, which is, comproportionated, a genuine Au(II)compound [9], while its parent basic fluoride, AuF2, has never been prepared in the solid phase, as itis subject to phase separation via disproportionation to Au and AuF3. Moreover, AgO exemplifiescondition (ii), since the chemical bonding between Ag and O is remarkably covalent in this compound,which leads to a phonon-driven disproportionation [10]. Finally, AgO, also exemplifies condition (iii),since it remains disproportionated to a pressure of at least 1 mln atm [11].
Here, we look at the particularly interesting case of an elusive AgCl2 where, as we will see,both types of redox instabilities may happen. Since the standard redox potential of the Ag(II)/Ag(I)
41
Crystals 2019, 9, 423
redox pair reaches some +2.0 V versus NHE and the respective value for the 12 Cl2/Cl− pair is
+1.36 V, it might naturally be expected that Ag(II) would oxidize Cl− anion with great ease (theabove-mentioned arguments valid for CuI2 are also valid for AgCl2). However, ionic Ag(II)Cl2 benefitsfrom long-distance electrostatic stabilization to a much larger degree than Ag(I)Cl+ 1
2 Cl2, which shouldaffect relative stability. Moreover, since the Ag(II)–Cl bonding is naturally expected to be quite covalent,similarly to the Ag(II)–O one in AgO (Cl and O have nearly identical electronegativities), Ag(II) mightdisproportionate in its chloride, just like it does in oxide. This is in fact what related AuCl2 does,its true formula corresponding in fact to Au(I)[Au(III)Cl4] [12]. Formation of polychloride substructure,as for organic derivatives of Cl3− anion [13,14], or a mixed chloride-polychloride (Ag(I)2(Cl)(Cl3)),is yet another possibility. Last but not the least, AgCl2 featuring an unpaired electron at the transitionmetal center may choose to form exotic Ag–Ag bond, as is observed for AuSO4 [15]. All that creates acomplicated potential energy surface with a few chemically distinct minima, i.e., diverse polymorphicforms present, and this renders theoretical predictions troublesome.
The major aim of this work is to theoretically predict crystal structure, stability, and presumedelectronic and magnetic properties of the most stable form of AgCl2. We would like also tocomputationally verify early predictions by Morris who estimated the free enthalpy of reaction:
AgCl2 → AgCl and12
Cl2 (3)
to be strongly negative, some −96.4 kJ/mole [2]. Finally, we will briefly discuss the anticipated impactof elevated pressure on the course of the reaction described by Equation (3), as well as magneticproperties of the most stable phases found.
2. Methodology
This study has begun in resemblance with our previous theoretical search for AgSO4, where wehave employed the method of following imaginary phonon modes to reach dynamically stable structuralmodels [16,17]. Using this method, we have optimized the hypothetical AgCl2 crystal in all knowncrystal structure polytypes taken by metal dihalides, MX2 (X = F, Cl, Br, I) (i.e., over 40 structure types)using the plane-wave code VASP (Vienna Ab-initio Simulation Package) [18–22], and subsequentlycalculated phonon dispersion curves for each model using the program PHONON [23]. In cases whereat least one imaginary phonon was detected (signaling dynamic instability), we followed the normalcoordinate of this mode to reach another, lower symmetry and lower energy structure [17,24], and wereexamined phonons after optimization. Due to complexity and CPU burden of the task this preliminaryquest was conducted with LDA functional and lower plane-wave cut-off equal to 400 eV. In the secondapproach, the evolutionary algorithm approach was applied using XtalOpt [25–28] in combinationwith VASP and using GGA (general gradient approximation) with Perdew-Burke-Ernzerhof functionaladapted for solids (PBEsol) and plane-wave cutoffs of 520 eV. Using the evolutionary algorithms, wehave considered unit cells containing 2, 4, and 8 formula units and generated a pool of 2183 structures.The lowest energy structures originating from both methods were ultimately recalculated withspin-polarization, on-site Coulomb interactions and van der Waals corrections, as outlined below.Magnetic models were constructed for polymorphic forms containing genuine Ag(II) paramagneticcenters and the lowest energy spin arrangements were found using the rotationally invariant densityfunctional theory DFT + U method introduced by Liechtenstein et al. where the values of bothHubbard U and the Hund J parameter are set explicitly [29]. The U and J parameters were set onlyfor d orbitals of the Ag atoms and the values of 5 eV and 1 eV were used, respectively [30]. The vander Waals interactions were accounted for using the DFT-D3 correction method of Grimme et al. withBecke-Jonson damping [31]. Additionally, the hybrid DFT calculations with HSE06 functional wereused to calculate the mixed-valence AgIAgIIICl2 solution that could not be properly stabilized at theDFT level.
42
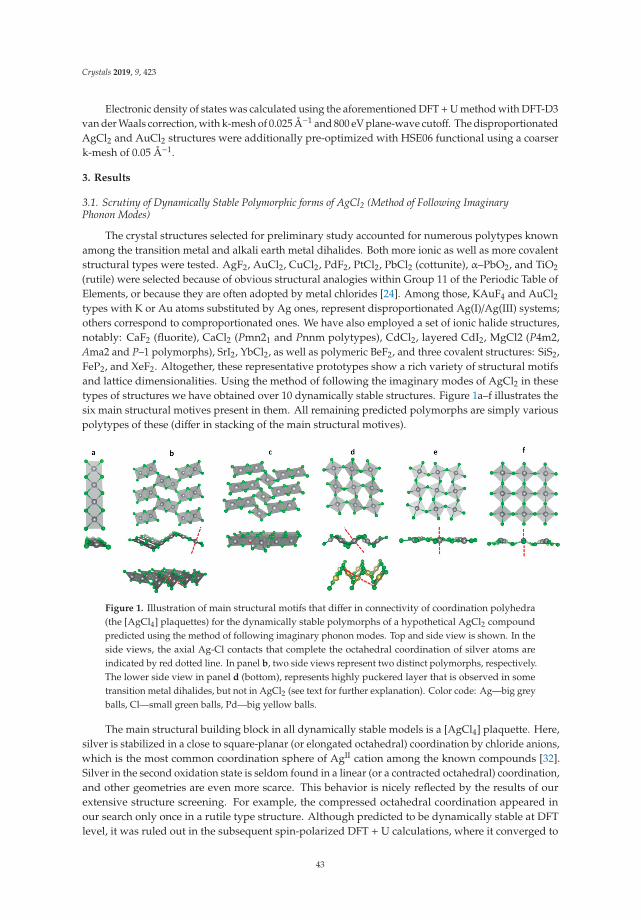
Crystals 2019, 9, 423
Electronic density of states was calculated using the aforementioned DFT+U method with DFT-D3van der Waals correction, with k-mesh of 0.025 Å−1 and 800 eV plane-wave cutoff. The disproportionatedAgCl2 and AuCl2 structures were additionally pre-optimized with HSE06 functional using a coarserk-mesh of 0.05 Å−1.
3. Results
3.1. Scrutiny of Dynamically Stable Polymorphic forms of AgCl2 (Method of Following ImaginaryPhonon Modes)
The crystal structures selected for preliminary study accounted for numerous polytypes knownamong the transition metal and alkali earth metal dihalides. Both more ionic as well as more covalentstructural types were tested. AgF2, AuCl2, CuCl2, PdF2, PtCl2, PbCl2 (cottunite), α–PbO2, and TiO2
(rutile) were selected because of obvious structural analogies within Group 11 of the Periodic Table ofElements, or because they are often adopted by metal chlorides [24]. Among those, KAuF4 and AuCl2types with K or Au atoms substituted by Ag ones, represent disproportionated Ag(I)/Ag(III) systems;others correspond to comproportionated ones. We have also employed a set of ionic halide structures,notably: CaF2 (fluorite), CaCl2 (Pmn21 and Pnnm polytypes), CdCl2, layered CdI2, MgCl2 (P4m2,Ama2 and P–1 polymorphs), SrI2, YbCl2, as well as polymeric BeF2, and three covalent structures: SiS2,FeP2, and XeF2. Altogether, these representative prototypes show a rich variety of structural motifsand lattice dimensionalities. Using the method of following the imaginary modes of AgCl2 in thesetypes of structures we have obtained over 10 dynamically stable structures. Figure 1a–f illustrates thesix main structural motives present in them. All remaining predicted polymorphs are simply variouspolytypes of these (differ in stacking of the main structural motives).
Figure 1. Illustration of main structural motifs that differ in connectivity of coordination polyhedra(the [AgCl4] plaquettes) for the dynamically stable polymorphs of a hypothetical AgCl2 compoundpredicted using the method of following imaginary phonon modes. Top and side view is shown. In theside views, the axial Ag-Cl contacts that complete the octahedral coordination of silver atoms areindicated by red dotted line. In panel b, two side views represent two distinct polymorphs, respectively.The lower side view in panel d (bottom), represents highly puckered layer that is observed in sometransition metal dihalides, but not in AgCl2 (see text for further explanation). Color code: Ag—big greyballs, Cl—small green balls, Pd—big yellow balls.
The main structural building block in all dynamically stable models is a [AgCl4] plaquette. Here,silver is stabilized in a close to square-planar (or elongated octahedral) coordination by chloride anions,which is the most common coordination sphere of AgII cation among the known compounds [32].Silver in the second oxidation state is seldom found in a linear (or a contracted octahedral) coordination,and other geometries are even more scarce. This behavior is nicely reflected by the results of ourextensive structure screening. For example, the compressed octahedral coordination appeared inour search only once in a rutile type structure. Although predicted to be dynamically stable at DFTlevel, it was ruled out in the subsequent spin-polarized DFT + U calculations, where it converged to
43
Crystals 2019, 9, 423
a square-planar coordination. The 2 + 4 coordination is indeed more common for fluorides in rutilestructure (PdF2 and NiF2), but no such chloride is known. In one case, a butterfly penta-coordination(i.e., close to a tetragonal pyramide) was obtained, where the silver atoms are displaced out of theplain formed by the [AgCl4] plaquettes (Figure 1f). Such geometry has been previously observed forAgII in two high-pressure polymorphs of AgF2: a layered and a tubular one [33]. In both, the silveratoms depart from the center of the ideally flat square-planar [AgF4] units to achieve batter packingwhile simultaneously preserving the local Jahn−Teller distortion. The AgCl2 structure with thebutterfly silver coordination is topologically equivalent to the layered HP1 polymorph of AgF2. Indeed,it exhibits the lowest calculated volume among the predicted dynamically stable structures and thusit should be stabilized at high pressure (see section 3). Our scrutiny of AgCl2 polytypes providestheoretical evidence that the butterfly coordination is indeed a natural response of octahedral AgII
sites (4 + 2 coordination) to high pressures and it permits more effective packing of 4 + 1 + 1 distorted[AgIIX6] units.
The [AgIIX4] squares show three distinct connectivity patterns in the dynamically stablepolymorphs. They are connected either by corners, edges or via a combination of the two, while theresulting lattice is one- or two-dimensional at most. This comes as no surprise since it is natural forthe strongly Jahn-Teller active cation to exhibit reduced structural dimensionality in its compounds.Here, the edge sharing always results in one-dimensional chains that have a shape of infinite molecularribbons (Figure 1a). On the other hand, corner and combined corner plus edge sharing leads always tolayered structures (Figure 1b–f). No polymorphs with isolated [AgCl4] units or three-dimensionalconnectivity were found. Additionally, it may be noticed that each chlorine atom is always sharedbetween two Ag cations thus AgCl2 strictly avoids chlorine terminals in its structures. This, too, is quitenatural, since AgII is an electron deficient and Lewis acidic cation, which attempts to satisfy its need forelectronic density by having at least four anions in its coordination sphere; at AgCl2 stoichiometry thisimplies ligand sharing, i.e., [AgCl4/2]. The charge depletion on Cl atoms affects the halogen-halogeninteractions, as discussed in Supplementary Materials (S1).
Structures with infinite ribbons are characteristic of dihalides containing Jahn-Teller active cationsand are also present in cuprates such as LiCu2O2 [34] and LiCuVO4 [35]. In halides, the ribbons haveneutral charge and these structures are held together by van der Waals interactions. In the cuprates,the ribbons are present as anionic species [CuO2]2−∞, whose charge is compensated by the presenceof additional metal cations. Although observed in majority of halides containing Jahn-Teller ionsincluding CuCl2, CuBr2, PdCl2, PtCl2, and CrCl2, they have never been observed in compounds ofsilver. Importantly, for AgCl2 this structure polytype has the lowest computed energy as will bediscussed later in the text.
Three district structural patterns are observed among the layered polymorphs. In the first case,fragments of the ribbons may be distinguished that consist of two [AgCl4] units sharing one edge.These [Ag2Cl6] dimers then interconnect into layers by sharing corners (Figure 1b). Another structuralpattern is formed by alternation of the same dimmers with single squares (Figure 1c). The thirdtype of layers is formed by squares sharing only corners (Figure 1d–f). The layered polymorphscontaining the dimeric units are unique among the halides. They are closely related to orthorhombicramsdellite [36] and monoclinic γ-MnO2 polymorph form [37]. The ramsdellite structure consists ofthree-dimensional network of double chains of edge-sharing MnO6 octahedra while in the γ-MnO2
the double chains alternate with single chains of MnO6 octahedra (Figure 2a,b). In the predictedAgCl2 polymorphs with the dimeric [Ag2Cl6] units (Figure 1b), the three-dimensional network of theramsdellite structure is reduced to two-dimensional one due to Jahn-Teller distortion of the octahedrathat takes place in the direction parallel to the propagation of the chains. The same relation existsbetween the AgCl2 polymorph formed by alternation of the [Ag2Cl6] dimers with [AgCl4] squares(figure 1c) and the γ-MnO2 structure. Although no such halides exist, the ramsdellite-related AgCl2structure has its zero-dimensional analogues in 4d and 5d transition metal pentachlorides such asMoCl5, Ta2Cl10, NbCl5, WCl5. They consist of dimeric M2Cl10 units of edge-sharing MCl6 octahedra
44
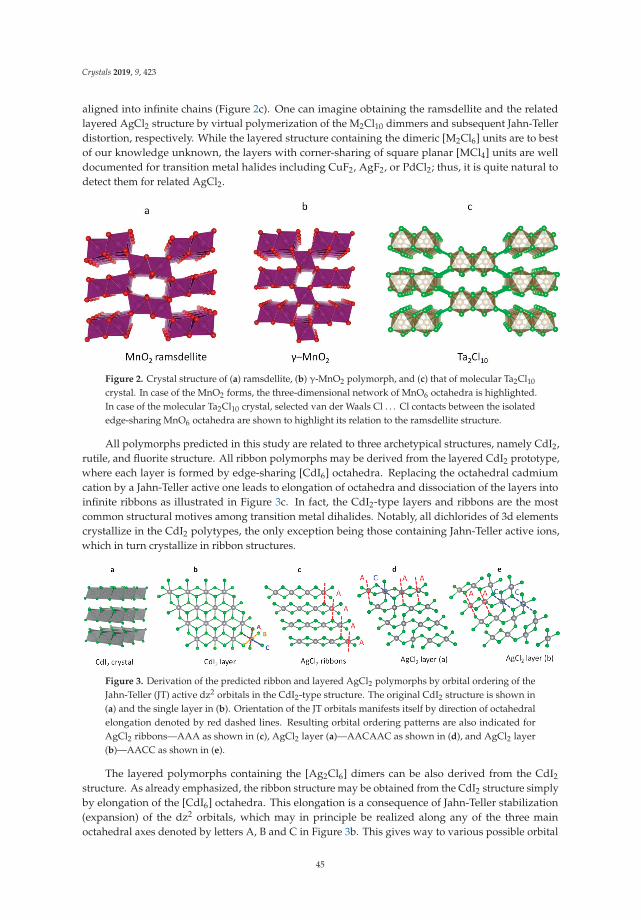
Crystals 2019, 9, 423
aligned into infinite chains (Figure 2c). One can imagine obtaining the ramsdellite and the relatedlayered AgCl2 structure by virtual polymerization of the M2Cl10 dimmers and subsequent Jahn-Tellerdistortion, respectively. While the layered structure containing the dimeric [M2Cl6] units are to bestof our knowledge unknown, the layers with corner-sharing of square planar [MCl4] units are welldocumented for transition metal halides including CuF2, AgF2, or PdCl2; thus, it is quite natural todetect them for related AgCl2.
Figure 2. Crystal structure of (a) ramsdellite, (b) γ-MnO2 polymorph, and (c) that of molecular Ta2Cl10
crystal. In case of the MnO2 forms, the three-dimensional network of MnO6 octahedra is highlighted.In case of the molecular Ta2Cl10 crystal, selected van der Waals Cl . . . Cl contacts between the isolatededge-sharing MnO6 octahedra are shown to highlight its relation to the ramsdellite structure.
All polymorphs predicted in this study are related to three archetypical structures, namely CdI2,rutile, and fluorite structure. All ribbon polymorphs may be derived from the layered CdI2 prototype,where each layer is formed by edge-sharing [CdI6] octahedra. Replacing the octahedral cadmiumcation by a Jahn-Teller active one leads to elongation of octahedra and dissociation of the layers intoinfinite ribbons as illustrated in Figure 3c. In fact, the CdI2-type layers and ribbons are the mostcommon structural motives among transition metal dihalides. Notably, all dichlorides of 3d elementscrystallize in the CdI2 polytypes, the only exception being those containing Jahn-Teller active ions,which in turn crystallize in ribbon structures.
Figure 3. Derivation of the predicted ribbon and layered AgCl2 polymorphs by orbital ordering of theJahn-Teller (JT) active dz2 orbitals in the CdI2-type structure. The original CdI2 structure is shown in(a) and the single layer in (b). Orientation of the JT orbitals manifests itself by direction of octahedralelongation denoted by red dashed lines. Resulting orbital ordering patterns are also indicated forAgCl2 ribbons—AAA as shown in (c), AgCl2 layer (a)—AACAAC as shown in (d), and AgCl2 layer(b)—AACC as shown in (e).
The layered polymorphs containing the [Ag2Cl6] dimers can be also derived from the CdI2
structure. As already emphasized, the ribbon structure may be obtained from the CdI2 structure simplyby elongation of the [CdI6] octahedra. This elongation is a consequence of Jahn-Teller stabilization(expansion) of the dz2 orbitals, which may in principle be realized along any of the three mainoctahedral axes denoted by letters A, B and C in Figure 3b. This gives way to various possible orbital
45
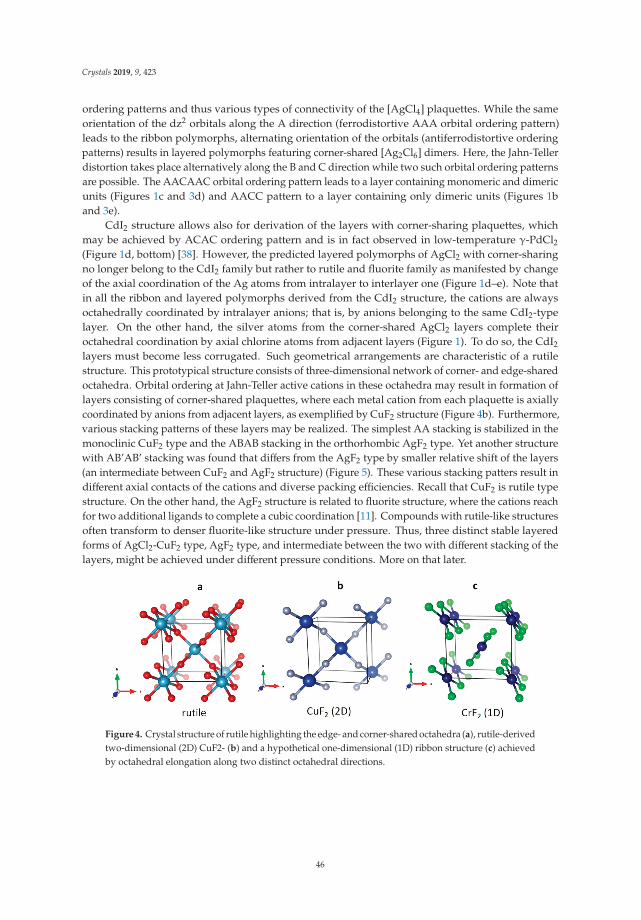
Crystals 2019, 9, 423
ordering patterns and thus various types of connectivity of the [AgCl4] plaquettes. While the sameorientation of the dz2 orbitals along the A direction (ferrodistortive AAA orbital ordering pattern)leads to the ribbon polymorphs, alternating orientation of the orbitals (antiferrodistortive orderingpatterns) results in layered polymorphs featuring corner-shared [Ag2Cl6] dimers. Here, the Jahn-Tellerdistortion takes place alternatively along the B and C direction while two such orbital ordering patternsare possible. The AACAAC orbital ordering pattern leads to a layer containing monomeric and dimericunits (Figures 1c and 3d) and AACC pattern to a layer containing only dimeric units (Figures 1band 3e).
CdI2 structure allows also for derivation of the layers with corner-sharing plaquettes, whichmay be achieved by ACAC ordering pattern and is in fact observed in low-temperature γ-PdCl2(Figure 1d, bottom) [38]. However, the predicted layered polymorphs of AgCl2 with corner-sharingno longer belong to the CdI2 family but rather to rutile and fluorite family as manifested by changeof the axial coordination of the Ag atoms from intralayer to interlayer one (Figure 1d–e). Note thatin all the ribbon and layered polymorphs derived from the CdI2 structure, the cations are alwaysoctahedrally coordinated by intralayer anions; that is, by anions belonging to the same CdI2-typelayer. On the other hand, the silver atoms from the corner-shared AgCl2 layers complete theiroctahedral coordination by axial chlorine atoms from adjacent layers (Figure 1). To do so, the CdI2
layers must become less corrugated. Such geometrical arrangements are characteristic of a rutilestructure. This prototypical structure consists of three-dimensional network of corner- and edge-sharedoctahedra. Orbital ordering at Jahn-Teller active cations in these octahedra may result in formation oflayers consisting of corner-shared plaquettes, where each metal cation from each plaquette is axiallycoordinated by anions from adjacent layers, as exemplified by CuF2 structure (Figure 4b). Furthermore,various stacking patterns of these layers may be realized. The simplest AA stacking is stabilized in themonoclinic CuF2 type and the ABAB stacking in the orthorhombic AgF2 type. Yet another structurewith AB’AB’ stacking was found that differs from the AgF2 type by smaller relative shift of the layers(an intermediate between CuF2 and AgF2 structure) (Figure 5). These various stacking patters result indifferent axial contacts of the cations and diverse packing efficiencies. Recall that CuF2 is rutile typestructure. On the other hand, the AgF2 structure is related to fluorite structure, where the cations reachfor two additional ligands to complete a cubic coordination [11]. Compounds with rutile-like structuresoften transform to denser fluorite-like structure under pressure. Thus, three distinct stable layeredforms of AgCl2-CuF2 type, AgF2 type, and intermediate between the two with different stacking of thelayers, might be achieved under different pressure conditions. More on that later.
Figure 4. Crystal structure of rutile highlighting the edge- and corner-shared octahedra (a), rutile-derivedtwo-dimensional (2D) CuF2- (b) and a hypothetical one-dimensional (1D) ribbon structure (c) achievedby octahedral elongation along two distinct octahedral directions.
46
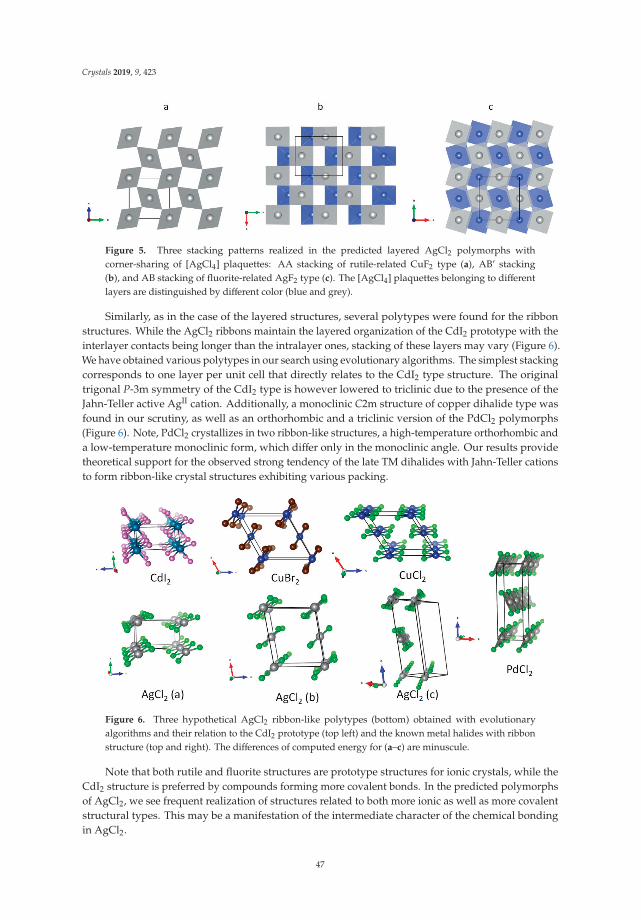
Crystals 2019, 9, 423
Figure 5. Three stacking patterns realized in the predicted layered AgCl2 polymorphs withcorner-sharing of [AgCl4] plaquettes: AA stacking of rutile-related CuF2 type (a), AB’ stacking(b), and AB stacking of fluorite-related AgF2 type (c). The [AgCl4] plaquettes belonging to differentlayers are distinguished by different color (blue and grey).
Similarly, as in the case of the layered structures, several polytypes were found for the ribbonstructures. While the AgCl2 ribbons maintain the layered organization of the CdI2 prototype with theinterlayer contacts being longer than the intralayer ones, stacking of these layers may vary (Figure 6).We have obtained various polytypes in our search using evolutionary algorithms. The simplest stackingcorresponds to one layer per unit cell that directly relates to the CdI2 type structure. The originaltrigonal P-3m symmetry of the CdI2 type is however lowered to triclinic due to the presence of theJahn-Teller active AgII cation. Additionally, a monoclinic C2m structure of copper dihalide type wasfound in our scrutiny, as well as an orthorhombic and a triclinic version of the PdCl2 polymorphs(Figure 6). Note, PdCl2 crystallizes in two ribbon-like structures, a high-temperature orthorhombic anda low-temperature monoclinic form, which differ only in the monoclinic angle. Our results providetheoretical support for the observed strong tendency of the late TM dihalides with Jahn-Teller cationsto form ribbon-like crystal structures exhibiting various packing.
Figure 6. Three hypothetical AgCl2 ribbon-like polytypes (bottom) obtained with evolutionaryalgorithms and their relation to the CdI2 prototype (top left) and the known metal halides with ribbonstructure (top and right). The differences of computed energy for (a–c) are minuscule.
Note that both rutile and fluorite structures are prototype structures for ionic crystals, while theCdI2 structure is preferred by compounds forming more covalent bonds. In the predicted polymorphsof AgCl2, we see frequent realization of structures related to both more ionic as well as more covalentstructural types. This may be a manifestation of the intermediate character of the chemical bondingin AgCl2.
47
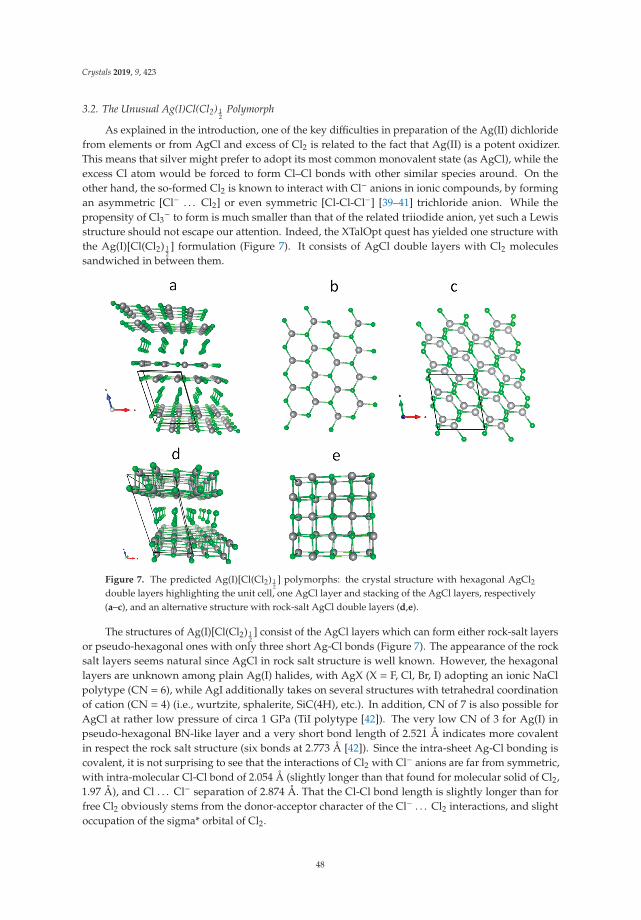
Crystals 2019, 9, 423
3.2. The Unusual Ag(I)Cl(Cl2) 12
Polymorph
As explained in the introduction, one of the key difficulties in preparation of the Ag(II) dichloridefrom elements or from AgCl and excess of Cl2 is related to the fact that Ag(II) is a potent oxidizer.This means that silver might prefer to adopt its most common monovalent state (as AgCl), while theexcess Cl atom would be forced to form Cl–Cl bonds with other similar species around. On theother hand, the so-formed Cl2 is known to interact with Cl− anions in ionic compounds, by formingan asymmetric [Cl− . . . Cl2] or even symmetric [Cl-Cl-Cl−] [39–41] trichloride anion. While thepropensity of Cl3− to form is much smaller than that of the related triiodide anion, yet such a Lewisstructure should not escape our attention. Indeed, the XTalOpt quest has yielded one structure withthe Ag(I)[Cl(Cl2) 1
2] formulation (Figure 7). It consists of AgCl double layers with Cl2 molecules
sandwiched in between them.
Figure 7. The predicted Ag(I)[Cl(Cl2) 1
2] polymorphs: the crystal structure with hexagonal AgCl2
double layers highlighting the unit cell, one AgCl layer and stacking of the AgCl layers, respectively(a–c), and an alternative structure with rock-salt AgCl double layers (d,e).
The structures of Ag(I)[Cl(Cl2) 12] consist of the AgCl layers which can form either rock-salt layers
or pseudo-hexagonal ones with only three short Ag-Cl bonds (Figure 7). The appearance of the rocksalt layers seems natural since AgCl in rock salt structure is well known. However, the hexagonallayers are unknown among plain Ag(I) halides, with AgX (X = F, Cl, Br, I) adopting an ionic NaClpolytype (CN = 6), while AgI additionally takes on several structures with tetrahedral coordinationof cation (CN = 4) (i.e., wurtzite, sphalerite, SiC(4H), etc.). In addition, CN of 7 is also possible forAgCl at rather low pressure of circa 1 GPa (TiI polytype [42]). The very low CN of 3 for Ag(I) inpseudo-hexagonal BN-like layer and a very short bond length of 2.521 Å indicates more covalentin respect the rock salt structure (six bonds at 2.773 Å [42]). Since the intra-sheet Ag-Cl bonding iscovalent, it is not surprising to see that the interactions of Cl2 with Cl− anions are far from symmetric,with intra-molecular Cl-Cl bond of 2.054 Å (slightly longer than that found for molecular solid of Cl2,1.97 Å), and Cl . . . Cl− separation of 2.874 Å. That the Cl-Cl bond length is slightly longer than forfree Cl2 obviously stems from the donor-acceptor character of the Cl− . . . Cl2 interactions, and slightoccupation of the sigma* orbital of Cl2.
48
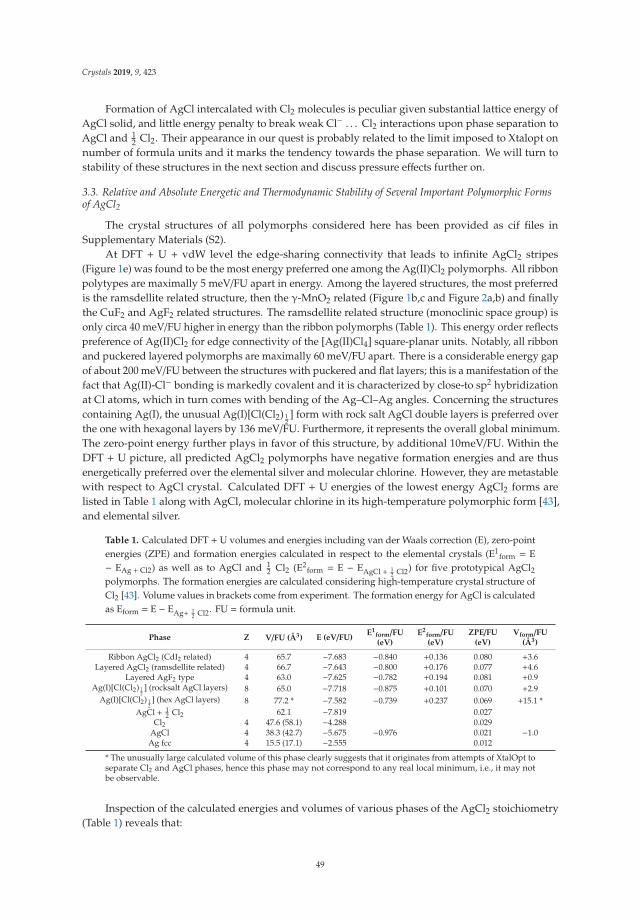
Crystals 2019, 9, 423
Formation of AgCl intercalated with Cl2 molecules is peculiar given substantial lattice energy ofAgCl solid, and little energy penalty to break weak Cl− . . . Cl2 interactions upon phase separation toAgCl and 1
2 Cl2. Their appearance in our quest is probably related to the limit imposed to Xtalopt onnumber of formula units and it marks the tendency towards the phase separation. We will turn tostability of these structures in the next section and discuss pressure effects further on.
3.3. Relative and Absolute Energetic and Thermodynamic Stability of Several Important Polymorphic Formsof AgCl2
The crystal structures of all polymorphs considered here has been provided as cif files inSupplementary Materials (S2).
At DFT + U + vdW level the edge-sharing connectivity that leads to infinite AgCl2 stripes(Figure 1e) was found to be the most energy preferred one among the Ag(II)Cl2 polymorphs. All ribbonpolytypes are maximally 5 meV/FU apart in energy. Among the layered structures, the most preferredis the ramsdellite related structure, then the γ-MnO2 related (Figure 1b,c and Figure 2a,b) and finallythe CuF2 and AgF2 related structures. The ramsdellite related structure (monoclinic space group) isonly circa 40 meV/FU higher in energy than the ribbon polymorphs (Table 1). This energy order reflectspreference of Ag(II)Cl2 for edge connectivity of the [Ag(II)Cl4] square-planar units. Notably, all ribbonand puckered layered polymorphs are maximally 60 meV/FU apart. There is a considerable energy gapof about 200 meV/FU between the structures with puckered and flat layers; this is a manifestation of thefact that Ag(II)-Cl− bonding is markedly covalent and it is characterized by close-to sp2 hybridizationat Cl atoms, which in turn comes with bending of the Ag–Cl–Ag angles. Concerning the structurescontaining Ag(I), the unusual Ag(I)[Cl(Cl2) 1
2] form with rock salt AgCl double layers is preferred over
the one with hexagonal layers by 136 meV/FU. Furthermore, it represents the overall global minimum.The zero-point energy further plays in favor of this structure, by additional 10meV/FU. Within theDFT + U picture, all predicted AgCl2 polymorphs have negative formation energies and are thusenergetically preferred over the elemental silver and molecular chlorine. However, they are metastablewith respect to AgCl crystal. Calculated DFT + U energies of the lowest energy AgCl2 forms arelisted in Table 1 along with AgCl, molecular chlorine in its high-temperature polymorphic form [43],and elemental silver.
Table 1. Calculated DFT + U volumes and energies including van der Waals correction (E), zero-pointenergies (ZPE) and formation energies calculated in respect to the elemental crystals (E1
form = E− EAg + Cl2) as well as to AgCl and 1
2 Cl2 (E2form = E − EAgCl + 1
2 Cl2) for five prototypical AgCl2polymorphs. The formation energies are calculated considering high-temperature crystal structure ofCl2 [43]. Volume values in brackets come from experiment. The formation energy for AgCl is calculatedas Eform = E − EAg+ 1
2 Cl2. FU = formula unit.
Phase Z V/FU (Å3) E (eV/FU)E1
form/FU(eV)
E2form/FU(eV)
ZPE/FU(eV)
Vform/FU(Å3)
Ribbon AgCl2 (CdI2 related) 4 65.7 −7.683 −0.840 +0.136 0.080 +3.6Layered AgCl2 (ramsdellite related) 4 66.7 −7.643 −0.800 +0.176 0.077 +4.6
Layered AgF2 type 4 63.0 −7.625 −0.782 +0.194 0.081 +0.9Ag(I)[Cl(Cl2) 1
2] (rocksalt AgCl layers) 8 65.0 −7.718 −0.875 +0.101 0.070 +2.9
Ag(I)[Cl(Cl2) 12] (hex AgCl layers) 8 77.2 * −7.582 −0.739 +0.237 0.069 +15.1 *
AgCl + 12 Cl2 62.1 −7.819 0.027
Cl2 4 47.6 (58.1) −4.288 0.029AgCl 4 38.3 (42.7) −5.675 −0.976 0.021 −1.0Ag fcc 4 15.5 (17.1) −2.555 0.012
* The unusually large calculated volume of this phase clearly suggests that it originates from attempts of XtalOpt toseparate Cl2 and AgCl phases, hence this phase may not correspond to any real local minimum, i.e., it may notbe observable.
Inspection of the calculated energies and volumes of various phases of the AgCl2 stoichiometry(Table 1) reveals that:
49
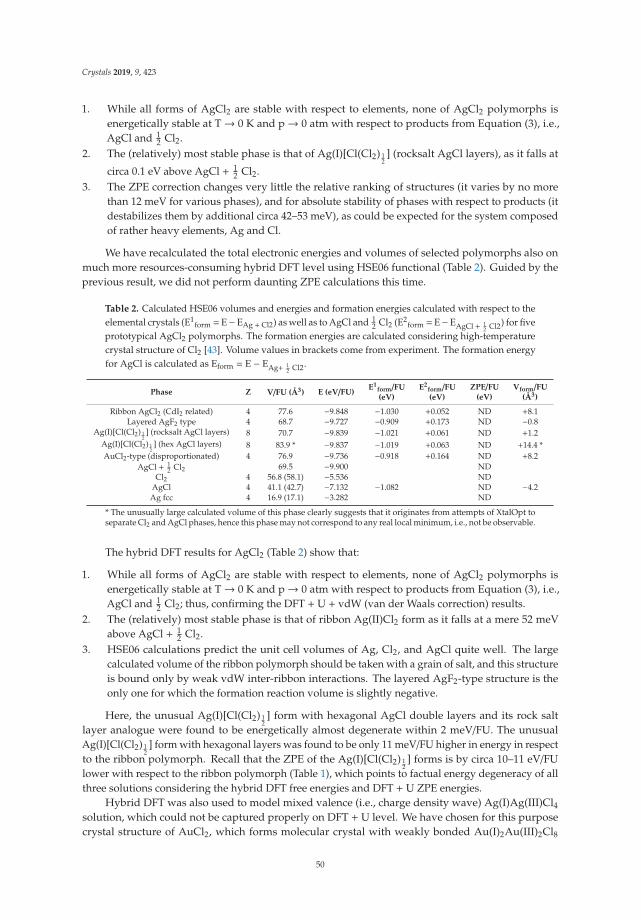
Crystals 2019, 9, 423
1. While all forms of AgCl2 are stable with respect to elements, none of AgCl2 polymorphs isenergetically stable at T→ 0 K and p→ 0 atm with respect to products from Equation (3), i.e.,AgCl and 1
2 Cl2.2. The (relatively) most stable phase is that of Ag(I)[Cl(Cl2) 1
2] (rocksalt AgCl layers), as it falls at
circa 0.1 eV above AgCl + 12 Cl2.
3. The ZPE correction changes very little the relative ranking of structures (it varies by no morethan 12 meV for various phases), and for absolute stability of phases with respect to products (itdestabilizes them by additional circa 42–53 meV), as could be expected for the system composedof rather heavy elements, Ag and Cl.
We have recalculated the total electronic energies and volumes of selected polymorphs also onmuch more resources-consuming hybrid DFT level using HSE06 functional (Table 2). Guided by theprevious result, we did not perform daunting ZPE calculations this time.
Table 2. Calculated HSE06 volumes and energies and formation energies calculated with respect to theelemental crystals (E1
form = E− EAg + Cl2) as well as to AgCl and 12 Cl2 (E2
form = E− EAgCl + 12 Cl2) for five
prototypical AgCl2 polymorphs. The formation energies are calculated considering high-temperaturecrystal structure of Cl2 [43]. Volume values in brackets come from experiment. The formation energyfor AgCl is calculated as Eform = E − EAg+ 1
2 Cl2.
Phase Z V/FU (Å3) E (eV/FU)E1
form/FU(eV)
E2form/FU(eV)
ZPE/FU(eV)
Vform/FU(Å3)
Ribbon AgCl2 (CdI2 related) 4 77.6 −9.848 −1.030 +0.052 ND +8.1Layered AgF2 type 4 68.7 −9.727 −0.909 +0.173 ND −0.8
Ag(I)[Cl(Cl2) 12] (rocksalt AgCl layers) 8 70.7 −9.839 −1.021 +0.061 ND +1.2
Ag(I)[Cl(Cl2) 12] (hex AgCl layers) 8 83.9 * −9.837 −1.019 +0.063 ND +14.4 *
AuCl2-type (disproportionated) 4 76.9 −9.736 −0.918 +0.164 ND +8.2AgCl + 1
2 Cl2 69.5 −9.900 NDCl2 4 56.8 (58.1) −5.536 ND
AgCl 4 41.1 (42.7) −7.132 −1.082 ND −4.2Ag fcc 4 16.9 (17.1) −3.282 ND
* The unusually large calculated volume of this phase clearly suggests that it originates from attempts of XtalOpt toseparate Cl2 and AgCl phases, hence this phase may not correspond to any real local minimum, i.e., not be observable.
The hybrid DFT results for AgCl2 (Table 2) show that:
1. While all forms of AgCl2 are stable with respect to elements, none of AgCl2 polymorphs isenergetically stable at T→ 0 K and p→ 0 atm with respect to products from Equation (3), i.e.,AgCl and 1
2 Cl2; thus, confirming the DFT + U + vdW (van der Waals correction) results.2. The (relatively) most stable phase is that of ribbon Ag(II)Cl2 form as it falls at a mere 52 meV
above AgCl + 12 Cl2.
3. HSE06 calculations predict the unit cell volumes of Ag, Cl2, and AgCl quite well. The largecalculated volume of the ribbon polymorph should be taken with a grain of salt, and this structureis bound only by weak vdW inter-ribbon interactions. The layered AgF2-type structure is theonly one for which the formation reaction volume is slightly negative.
Here, the unusual Ag(I)[Cl(Cl2) 12] form with hexagonal AgCl double layers and its rock salt
layer analogue were found to be energetically almost degenerate within 2 meV/FU. The unusualAg(I)[Cl(Cl2) 1
2] form with hexagonal layers was found to be only 11 meV/FU higher in energy in respect
to the ribbon polymorph. Recall that the ZPE of the Ag(I)[Cl(Cl2) 12] forms is by circa 10–11 eV/FU
lower with respect to the ribbon polymorph (Table 1), which points to factual energy degeneracy of allthree solutions considering the hybrid DFT free energies and DFT + U ZPE energies.
Hybrid DFT was also used to model mixed valence (i.e., charge density wave) Ag(I)Ag(III)Cl4solution, which could not be captured properly on DFT + U level. We have chosen for this purposecrystal structure of AuCl2, which forms molecular crystal with weakly bonded Au(I)2Au(III)2Cl8
50
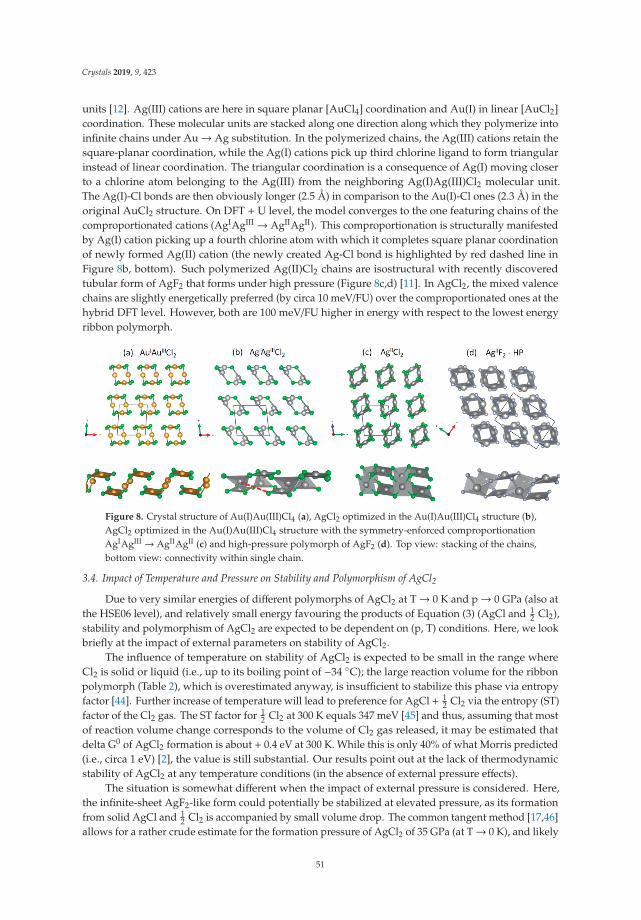
Crystals 2019, 9, 423
units [12]. Ag(III) cations are here in square planar [AuCl4] coordination and Au(I) in linear [AuCl2]coordination. These molecular units are stacked along one direction along which they polymerize intoinfinite chains under Au→ Ag substitution. In the polymerized chains, the Ag(III) cations retain thesquare-planar coordination, while the Ag(I) cations pick up third chlorine ligand to form triangularinstead of linear coordination. The triangular coordination is a consequence of Ag(I) moving closerto a chlorine atom belonging to the Ag(III) from the neighboring Ag(I)Ag(III)Cl2 molecular unit.The Ag(I)-Cl bonds are then obviously longer (2.5 Å) in comparison to the Au(I)-Cl ones (2.3 Å) in theoriginal AuCl2 structure. On DFT + U level, the model converges to the one featuring chains of thecomproportionated cations (AgIAgIII → AgIIAgII). This comproportionation is structurally manifestedby Ag(I) cation picking up a fourth chlorine atom with which it completes square planar coordinationof newly formed Ag(II) cation (the newly created Ag-Cl bond is highlighted by red dashed line inFigure 8b, bottom). Such polymerized Ag(II)Cl2 chains are isostructural with recently discoveredtubular form of AgF2 that forms under high pressure (Figure 8c,d) [11]. In AgCl2, the mixed valencechains are slightly energetically preferred (by circa 10 meV/FU) over the comproportionated ones at thehybrid DFT level. However, both are 100 meV/FU higher in energy with respect to the lowest energyribbon polymorph.
Figure 8. Crystal structure of Au(I)Au(III)Cl4 (a), AgCl2 optimized in the Au(I)Au(III)Cl4 structure (b),AgCl2 optimized in the Au(I)Au(III)Cl4 structure with the symmetry-enforced comproportionationAgIAgIII → AgIIAgII (c) and high-pressure polymorph of AgF2 (d). Top view: stacking of the chains,bottom view: connectivity within single chain.
3.4. Impact of Temperature and Pressure on Stability and Polymorphism of AgCl2
Due to very similar energies of different polymorphs of AgCl2 at T→ 0 K and p→ 0 GPa (also atthe HSE06 level), and relatively small energy favouring the products of Equation (3) (AgCl and 1
2 Cl2),stability and polymorphism of AgCl2 are expected to be dependent on (p, T) conditions. Here, we lookbriefly at the impact of external parameters on stability of AgCl2.
The influence of temperature on stability of AgCl2 is expected to be small in the range whereCl2 is solid or liquid (i.e., up to its boiling point of −34 ◦C); the large reaction volume for the ribbonpolymorph (Table 2), which is overestimated anyway, is insufficient to stabilize this phase via entropyfactor [44]. Further increase of temperature will lead to preference for AgCl + 1
2 Cl2 via the entropy (ST)factor of the Cl2 gas. The ST factor for 1
2 Cl2 at 300 K equals 347 meV [45] and thus, assuming that mostof reaction volume change corresponds to the volume of Cl2 gas released, it may be estimated thatdelta G0 of AgCl2 formation is about + 0.4 eV at 300 K. While this is only 40% of what Morris predicted(i.e., circa 1 eV) [2], the value is still substantial. Our results point out at the lack of thermodynamicstability of AgCl2 at any temperature conditions (in the absence of external pressure effects).
The situation is somewhat different when the impact of external pressure is considered. Here,the infinite-sheet AgF2-like form could potentially be stabilized at elevated pressure, as its formationfrom solid AgCl and 1
2 Cl2 is accompanied by small volume drop. The common tangent method [17,46]allows for a rather crude estimate for the formation pressure of AgCl2 of 35 GPa (at T→ 0 K), and likely
51
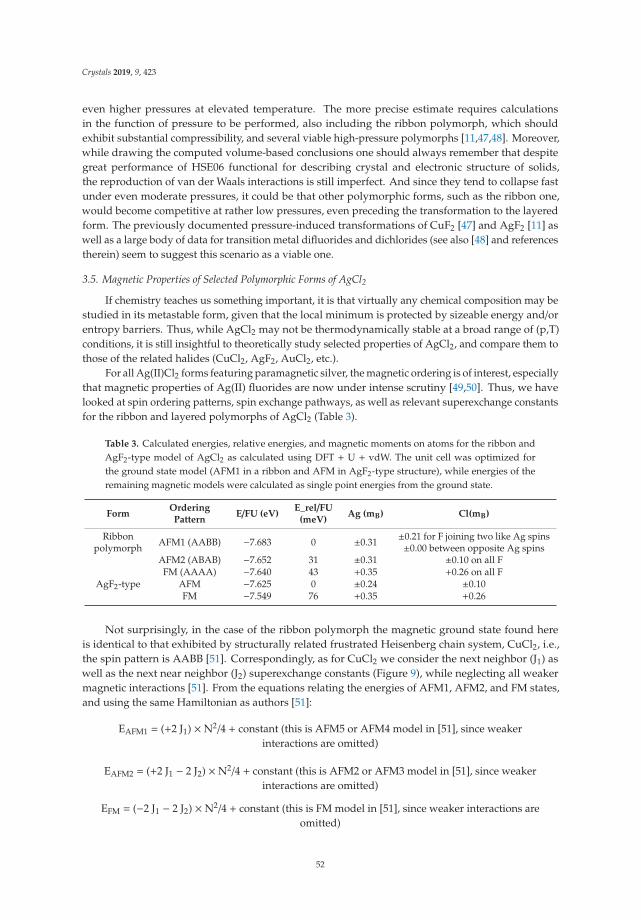
Crystals 2019, 9, 423
even higher pressures at elevated temperature. The more precise estimate requires calculationsin the function of pressure to be performed, also including the ribbon polymorph, which shouldexhibit substantial compressibility, and several viable high-pressure polymorphs [11,47,48]. Moreover,while drawing the computed volume-based conclusions one should always remember that despitegreat performance of HSE06 functional for describing crystal and electronic structure of solids,the reproduction of van der Waals interactions is still imperfect. And since they tend to collapse fastunder even moderate pressures, it could be that other polymorphic forms, such as the ribbon one,would become competitive at rather low pressures, even preceding the transformation to the layeredform. The previously documented pressure-induced transformations of CuF2 [47] and AgF2 [11] aswell as a large body of data for transition metal difluorides and dichlorides (see also [48] and referencestherein) seem to suggest this scenario as a viable one.
3.5. Magnetic Properties of Selected Polymorphic Forms of AgCl2
If chemistry teaches us something important, it is that virtually any chemical composition may bestudied in its metastable form, given that the local minimum is protected by sizeable energy and/orentropy barriers. Thus, while AgCl2 may not be thermodynamically stable at a broad range of (p,T)conditions, it is still insightful to theoretically study selected properties of AgCl2, and compare them tothose of the related halides (CuCl2, AgF2, AuCl2, etc.).
For all Ag(II)Cl2 forms featuring paramagnetic silver, the magnetic ordering is of interest, especiallythat magnetic properties of Ag(II) fluorides are now under intense scrutiny [49,50]. Thus, we havelooked at spin ordering patterns, spin exchange pathways, as well as relevant superexchange constantsfor the ribbon and layered polymorphs of AgCl2 (Table 3).
Table 3. Calculated energies, relative energies, and magnetic moments on atoms for the ribbon andAgF2-type model of AgCl2 as calculated using DFT + U + vdW. The unit cell was optimized forthe ground state model (AFM1 in a ribbon and AFM in AgF2-type structure), while energies of theremaining magnetic models were calculated as single point energies from the ground state.
FormOrderingPattern
E/FU (eV)E_rel/FU
(meV)Ag (mB) Cl(mB)
Ribbonpolymorph AFM1 (AABB) −7.683 0 ±0.31 ±0.21 for F joining two like Ag spins
±0.00 between opposite Ag spinsAFM2 (ABAB) −7.652 31 ±0.31 ±0.10 on all FFM (AAAA) −7.640 43 +0.35 +0.26 on all F
AgF2-type AFM −7.625 0 ±0.24 ±0.10FM −7.549 76 +0.35 +0.26
Not surprisingly, in the case of the ribbon polymorph the magnetic ground state found hereis identical to that exhibited by structurally related frustrated Heisenberg chain system, CuCl2, i.e.,the spin pattern is AABB [51]. Correspondingly, as for CuCl2 we consider the next neighbor (J1) aswell as the next near neighbor (J2) superexchange constants (Figure 9), while neglecting all weakermagnetic interactions [51]. From the equations relating the energies of AFM1, AFM2, and FM states,and using the same Hamiltonian as authors [51]:
EAFM1 = (+2 J1) × N2/4 + constant (this is AFM5 or AFM4 model in [51], since weakerinteractions are omitted)
EAFM2 = (+2 J1 − 2 J2) × N2/4 + constant (this is AFM2 or AFM3 model in [51], since weakerinteractions are omitted)
EFM = (−2 J1 − 2 J2) × N2/4 + constant (this is FM model in [51], since weaker interactions areomitted)
52
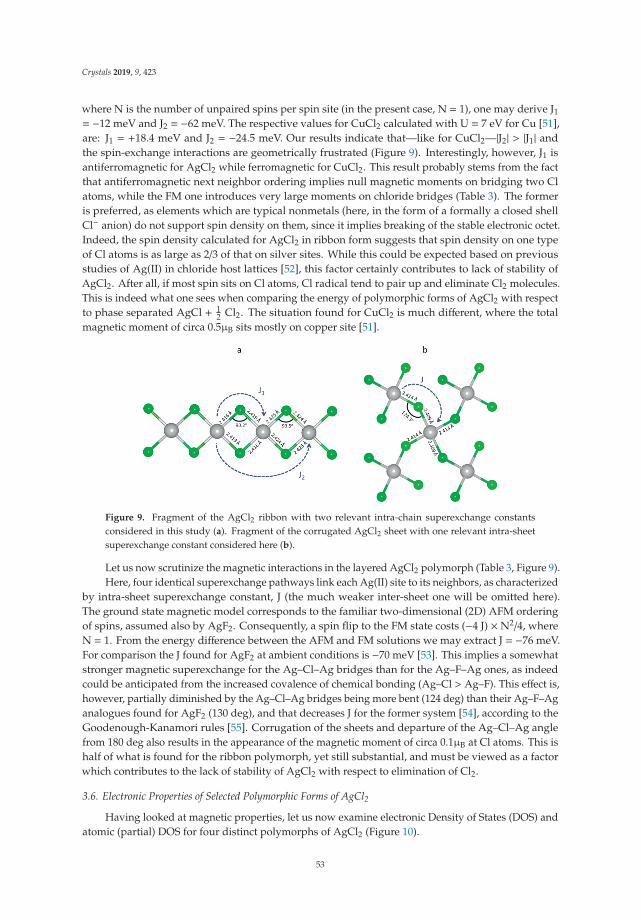
Crystals 2019, 9, 423
where N is the number of unpaired spins per spin site (in the present case, N = 1), one may derive J1
= −12 meV and J2 = −62 meV. The respective values for CuCl2 calculated with U = 7 eV for Cu [51],are: J1 = +18.4 meV and J2 = −24.5 meV. Our results indicate that—like for CuCl2—|J2| > |J1| andthe spin-exchange interactions are geometrically frustrated (Figure 9). Interestingly, however, J1 isantiferromagnetic for AgCl2 while ferromagnetic for CuCl2. This result probably stems from the factthat antiferromagnetic next neighbor ordering implies null magnetic moments on bridging two Clatoms, while the FM one introduces very large moments on chloride bridges (Table 3). The formeris preferred, as elements which are typical nonmetals (here, in the form of a formally a closed shellCl− anion) do not support spin density on them, since it implies breaking of the stable electronic octet.Indeed, the spin density calculated for AgCl2 in ribbon form suggests that spin density on one typeof Cl atoms is as large as 2/3 of that on silver sites. While this could be expected based on previousstudies of Ag(II) in chloride host lattices [52], this factor certainly contributes to lack of stability ofAgCl2. After all, if most spin sits on Cl atoms, Cl radical tend to pair up and eliminate Cl2 molecules.This is indeed what one sees when comparing the energy of polymorphic forms of AgCl2 with respectto phase separated AgCl + 1
2 Cl2. The situation found for CuCl2 is much different, where the totalmagnetic moment of circa 0.5μB sits mostly on copper site [51].
Figure 9. Fragment of the AgCl2 ribbon with two relevant intra-chain superexchange constantsconsidered in this study (a). Fragment of the corrugated AgCl2 sheet with one relevant intra-sheetsuperexchange constant considered here (b).
Let us now scrutinize the magnetic interactions in the layered AgCl2 polymorph (Table 3, Figure 9).Here, four identical superexchange pathways link each Ag(II) site to its neighbors, as characterized
by intra-sheet superexchange constant, J (the much weaker inter-sheet one will be omitted here).The ground state magnetic model corresponds to the familiar two-dimensional (2D) AFM orderingof spins, assumed also by AgF2. Consequently, a spin flip to the FM state costs (−4 J) ×N2/4, whereN = 1. From the energy difference between the AFM and FM solutions we may extract J = −76 meV.For comparison the J found for AgF2 at ambient conditions is −70 meV [53]. This implies a somewhatstronger magnetic superexchange for the Ag–Cl–Ag bridges than for the Ag–F–Ag ones, as indeedcould be anticipated from the increased covalence of chemical bonding (Ag–Cl > Ag–F). This effect is,however, partially diminished by the Ag–Cl–Ag bridges being more bent (124 deg) than their Ag–F–Aganalogues found for AgF2 (130 deg), and that decreases J for the former system [54], according to theGoodenough-Kanamori rules [55]. Corrugation of the sheets and departure of the Ag–Cl–Ag anglefrom 180 deg also results in the appearance of the magnetic moment of circa 0.1μB at Cl atoms. This ishalf of what is found for the ribbon polymorph, yet still substantial, and must be viewed as a factorwhich contributes to the lack of stability of AgCl2 with respect to elimination of Cl2.
3.6. Electronic Properties of Selected Polymorphic Forms of AgCl2
Having looked at magnetic properties, let us now examine electronic Density of States (DOS) andatomic (partial) DOS for four distinct polymorphs of AgCl2 (Figure 10).
53
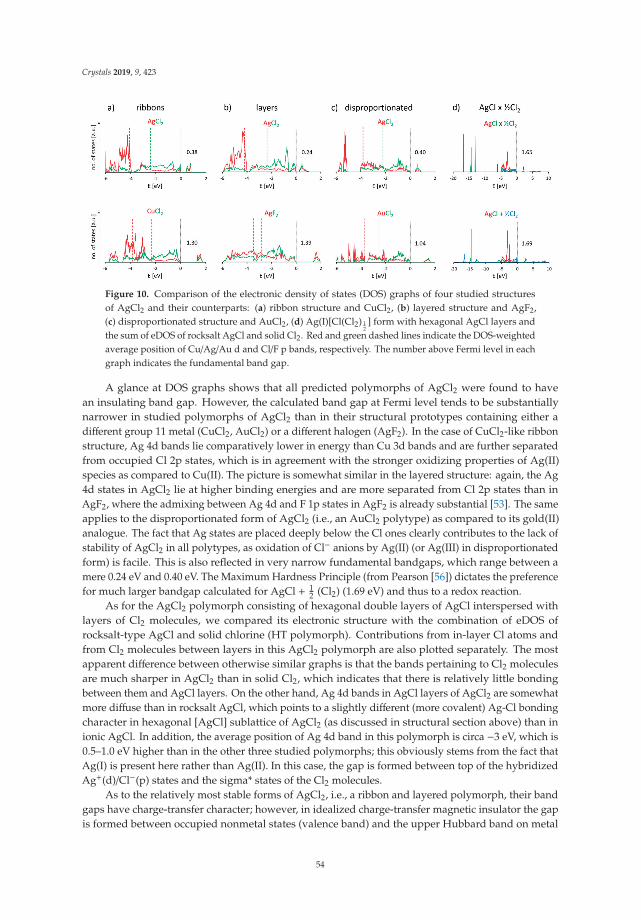
Crystals 2019, 9, 423
Figure 10. Comparison of the electronic density of states (DOS) graphs of four studied structuresof AgCl2 and their counterparts: (a) ribbon structure and CuCl2, (b) layered structure and AgF2,(c) disproportionated structure and AuCl2, (d) Ag(I)[Cl(Cl2) 1
2] form with hexagonal AgCl layers and
the sum of eDOS of rocksalt AgCl and solid Cl2. Red and green dashed lines indicate the DOS-weightedaverage position of Cu/Ag/Au d and Cl/F p bands, respectively. The number above Fermi level in eachgraph indicates the fundamental band gap.
A glance at DOS graphs shows that all predicted polymorphs of AgCl2 were found to havean insulating band gap. However, the calculated band gap at Fermi level tends to be substantiallynarrower in studied polymorphs of AgCl2 than in their structural prototypes containing either adifferent group 11 metal (CuCl2, AuCl2) or a different halogen (AgF2). In the case of CuCl2-like ribbonstructure, Ag 4d bands lie comparatively lower in energy than Cu 3d bands and are further separatedfrom occupied Cl 2p states, which is in agreement with the stronger oxidizing properties of Ag(II)species as compared to Cu(II). The picture is somewhat similar in the layered structure: again, the Ag4d states in AgCl2 lie at higher binding energies and are more separated from Cl 2p states than inAgF2, where the admixing between Ag 4d and F 1p states in AgF2 is already substantial [53]. The sameapplies to the disproportionated form of AgCl2 (i.e., an AuCl2 polytype) as compared to its gold(II)analogue. The fact that Ag states are placed deeply below the Cl ones clearly contributes to the lack ofstability of AgCl2 in all polytypes, as oxidation of Cl− anions by Ag(II) (or Ag(III) in disproportionatedform) is facile. This is also reflected in very narrow fundamental bandgaps, which range between amere 0.24 eV and 0.40 eV. The Maximum Hardness Principle (from Pearson [56]) dictates the preferencefor much larger bandgap calculated for AgCl + 1
2 (Cl2) (1.69 eV) and thus to a redox reaction.As for the AgCl2 polymorph consisting of hexagonal double layers of AgCl interspersed with
layers of Cl2 molecules, we compared its electronic structure with the combination of eDOS ofrocksalt-type AgCl and solid chlorine (HT polymorph). Contributions from in-layer Cl atoms andfrom Cl2 molecules between layers in this AgCl2 polymorph are also plotted separately. The mostapparent difference between otherwise similar graphs is that the bands pertaining to Cl2 moleculesare much sharper in AgCl2 than in solid Cl2, which indicates that there is relatively little bondingbetween them and AgCl layers. On the other hand, Ag 4d bands in AgCl layers of AgCl2 are somewhatmore diffuse than in rocksalt AgCl, which points to a slightly different (more covalent) Ag-Cl bondingcharacter in hexagonal [AgCl] sublattice of AgCl2 (as discussed in structural section above) than inionic AgCl. In addition, the average position of Ag 4d band in this polymorph is circa −3 eV, which is0.5–1.0 eV higher than in the other three studied polymorphs; this obviously stems from the fact thatAg(I) is present here rather than Ag(II). In this case, the gap is formed between top of the hybridizedAg+(d)/Cl−(p) states and the sigma* states of the Cl2 molecules.
As to the relatively most stable forms of AgCl2, i.e., a ribbon and layered polymorph, their bandgaps have charge-transfer character; however, in idealized charge-transfer magnetic insulator the gapis formed between occupied nonmetal states (valence band) and the upper Hubbard band on metal
54
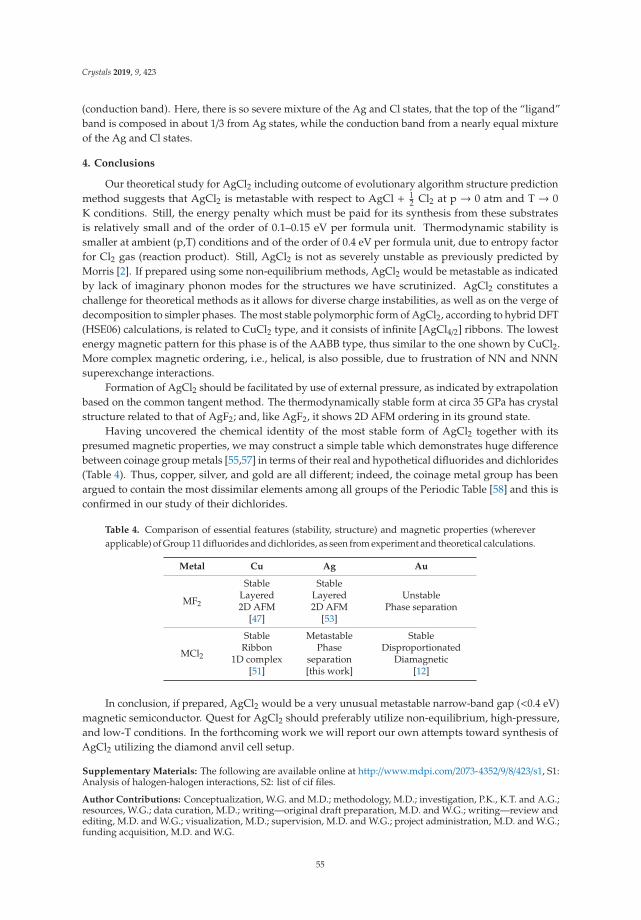
Crystals 2019, 9, 423
(conduction band). Here, there is so severe mixture of the Ag and Cl states, that the top of the “ligand”band is composed in about 1/3 from Ag states, while the conduction band from a nearly equal mixtureof the Ag and Cl states.
4. Conclusions
Our theoretical study for AgCl2 including outcome of evolutionary algorithm structure predictionmethod suggests that AgCl2 is metastable with respect to AgCl + 1
2 Cl2 at p → 0 atm and T → 0K conditions. Still, the energy penalty which must be paid for its synthesis from these substratesis relatively small and of the order of 0.1–0.15 eV per formula unit. Thermodynamic stability issmaller at ambient (p,T) conditions and of the order of 0.4 eV per formula unit, due to entropy factorfor Cl2 gas (reaction product). Still, AgCl2 is not as severely unstable as previously predicted byMorris [2]. If prepared using some non-equilibrium methods, AgCl2 would be metastable as indicatedby lack of imaginary phonon modes for the structures we have scrutinized. AgCl2 constitutes achallenge for theoretical methods as it allows for diverse charge instabilities, as well as on the verge ofdecomposition to simpler phases. The most stable polymorphic form of AgCl2, according to hybrid DFT(HSE06) calculations, is related to CuCl2 type, and it consists of infinite [AgCl4/2] ribbons. The lowestenergy magnetic pattern for this phase is of the AABB type, thus similar to the one shown by CuCl2.More complex magnetic ordering, i.e., helical, is also possible, due to frustration of NN and NNNsuperexchange interactions.
Formation of AgCl2 should be facilitated by use of external pressure, as indicated by extrapolationbased on the common tangent method. The thermodynamically stable form at circa 35 GPa has crystalstructure related to that of AgF2; and, like AgF2, it shows 2D AFM ordering in its ground state.
Having uncovered the chemical identity of the most stable form of AgCl2 together with itspresumed magnetic properties, we may construct a simple table which demonstrates huge differencebetween coinage group metals [55,57] in terms of their real and hypothetical difluorides and dichlorides(Table 4). Thus, copper, silver, and gold are all different; indeed, the coinage metal group has beenargued to contain the most dissimilar elements among all groups of the Periodic Table [58] and this isconfirmed in our study of their dichlorides.
Table 4. Comparison of essential features (stability, structure) and magnetic properties (whereverapplicable) of Group 11 difluorides and dichlorides, as seen from experiment and theoretical calculations.
Metal Cu Ag Au
MF2
StableLayered2D AFM
[47]
StableLayered2D AFM
[53]
UnstablePhase separation
MCl2
StableRibbon
1D complex[51]
MetastablePhase
separation[this work]
StableDisproportionated
Diamagnetic[12]
In conclusion, if prepared, AgCl2 would be a very unusual metastable narrow-band gap (<0.4 eV)magnetic semiconductor. Quest for AgCl2 should preferably utilize non-equilibrium, high-pressure,and low-T conditions. In the forthcoming work we will report our own attempts toward synthesis ofAgCl2 utilizing the diamond anvil cell setup.
Supplementary Materials: The following are available online at http://www.mdpi.com/2073-4352/9/8/423/s1, S1:Analysis of halogen-halogen interactions, S2: list of cif files.
Author Contributions: Conceptualization, W.G. and M.D.; methodology, M.D.; investigation, P.K., K.T. and A.G.;resources, W.G.; data curation, M.D.; writing—original draft preparation, M.D. and W.G.; writing—review andediting, M.D. and W.G.; visualization, M.D.; supervision, M.D. and W.G.; project administration, M.D. and W.G.;funding acquisition, M.D. and W.G.
55
Crystals 2019, 9, 423
Funding: Preliminary studies conducted a decade ago were performed within the TEAM project of the Foundationof Polish Science. Subsequent careful scrutiny was possible due to funding from the Polish National Science Centervia Maestro project (UMO-2017/26/A/ST5/00570). AG’s contribution was financed from Preludium project fromNCN (2017/25/N/ST5/01976). MD and KT also acknowledge the Scientific Grant Agency of the Slovak Republic,grant No. VG 1/0223/19.
Acknowledgments: Most calculations were performed at the Interdisciplinary Center for Mathematical andComputational Modelling, the University of Warsaw, at Okeanos machine, within the project ADVANCE++(GA76-19). MD and KT thank the Centre of operations of the Slovak Academy of Sciences for providingcomputational resources (supercomputer Aurel) within computation grant “Novel inorganic compounds fromab initio”.
Conflicts of Interest: The authors declare no conflict of interest.
References
1. Fajans, K. Electronic Structure of Some Molecules and Crystals. Ceramic Age 1949, 54, 288.2. Morris, D.F.C. The instability of some dihalides of copper and silver. J. Phys. Chem. Solids 1958, 7, 214–217.
[CrossRef]3. Rossini, F.D.; Wagman, D.D.; Evans, W.H.; Levine, S.; Jaffe, I. Selected values of chemical thermodynamic
properties. Circular of National Bureau of Standards No. 500. 1952. Available online: https://archive.org/details/circularofbureau500ross/page/n7 (accessed on 14 August 2019).
4. Scatturin, V.; Bellon, P.L.; Zannetti, R. Planar coordination of the group IB elements: Crystal structure of Ag(II) oxide. J. Inorg. Nucl. Chem. 1958, 8, 462–467. [CrossRef]
5. Yvon, K.; Bezinge, A.; Tissot, P.; Fischer, P. Structure and magnetic properties of tetragonal silver(I, III) oxide,AgO. J. Solid State Chem. 1986, 65, 225–230. [CrossRef]
6. Hermann, A.; Derzsi, M.; Grochala, W.; Hoffmann, R. AuO: Evolving from dis- to comproportionation andback again. Inorg. Chem. 2016, 55, 1278–1286. [CrossRef] [PubMed]
7. Gammons, C.H.; Yu, Y.; Williams-Jones, A.E. The disproportionation of gold(I) chloride complexes at 25 to200 C. Geochim. Cosmochim. Acta 1997, 61, 1971–1983. [CrossRef]
8. Malinowski, P.J.; Derzsi, M.; Gaweł, B.; Łasocha, W.; Jaglicic, Z.; Mazej, Z.; Grochala, W. AgIISO4: A GenuineSulfate of Divalent Silver with Anomalously Strong One-Dimensional Antiferromagnetic Interactions.Angew. Chem. Int. Ed. Engl. 2010, 49, 1683–1686. [CrossRef] [PubMed]
9. Elder, S.H.; Lucier, G.M.; Hollander, F.J.; Bartlett, N. Synthesis of Au(II) fluoro complexes and their structuraland magnetic properties. J. Am. Chem. Soc. 1997, 119, 1020–1026. [CrossRef]
10. Derzsi, M.; Piekarz, P.; Grochala, W. Structures of late transition metal monoxides from Jahn-Teller instabilitiesin the rock salt lattice. Phys. Rev. Lett. 2014, 113, 025505. [CrossRef]
11. Grzelak, A.; Gawraczynski, J.; Jaron, T.; Sommayazulu, M.; Derzsi, M.; Struzhkin, V.V.; Grochala, W.Persistence of Mixed and Non-intermediate Valence in the High-Pressure Structure of Silver(I,III) Oxide,AgO: A Combined Raman, X-ray Diffraction (XRD), and Density Functional Theory (DFT) Study. Inorg. Chem.2017, 56, 5804–5812. [CrossRef]
12. Dell’amico, D.B.; Calderazzo, F.; Marchetti, F.; Merlino, S. Synthesis and molecular structure of [Au4Cl8], andthe isolation of [Pt(CO)Cl5]− in thionyl chloride. J. Chem. Soc., Dalton Trans.: Inorg. Chem. 1982, 2257–2260.[CrossRef]
13. Brückner, R.; Haller, H.; Steinhauer, S.; Müller, C.; Riedel, S. A 2D Polychloride Network Held Together byHalogen–Halogen Interactions. Angew. Chem. Int. Ed. Engl. 2015, 54, 15579–15583. [CrossRef] [PubMed]
14. Taraba, J.; Zak, Z. Diphenyldichlorophosphonium Trichloride−Chlorine Solvate 1:1, [PPh2Cl2]+Cl3−·Cl2:An Ionic Form of Diphenyltrichlorophosphorane. Crystal Structures of [PPh2Cl2]+Cl3−·Cl2 and[(PPh2Cl2)+]2[InCl5]2−. Inorg. Chem. 2003, 42, 3591–3594. [CrossRef] [PubMed]
15. Wickleder, M.S. AuSO4: A True Gold(II) Sulfate with an Au24+ Ion. Z. Anorg. Allg. Chem. 2001, 627,
2112–2114. [CrossRef]16. Derzsi, M.; Dymkowski, K.; Grochala, W. The Theoretical Quest for Sulfate of Ag2+: Genuine Ag(II)SO4,
Diamagnetic Ag(I)2S2O8, or Rather Mixed-Valence Ag(I)[Ag(III)(SO4)2]? Inorg. Chem. 2010, 49, 2735–2742.[CrossRef] [PubMed]
17. Kurzydłowski, D.; Grochala, W. Elusive AuF in the solid state as accessed via high pressurecomproportionation. Chem. Commun. 2008, 1073–1075. [CrossRef] [PubMed]
56
Crystals 2019, 9, 423
18. Kresse, G.; Hafner, J. Ab initio molecular dynamics for liquid metals. Phys. Rev. B: Condens. MatterMater. Phys. 1993, 47, 558–561. [CrossRef] [PubMed]
19. Kresse, G.; Hafner, J. Ab initio molecular-dynamics simulation of the liquid-metal–amorphous-semiconductortransition in germanium. Phys. Rev. B: Condens. Matter Mater. Phys. 1994, 49, 14251–14269. [CrossRef]
20. Kresse, G.; Furthmüller, J. Efficiency of ab-initio total energy calculations for metals and semiconductorsusing a plane-wave basis set. Comput. Mater. Sci. 1996, 6, 15–50. [CrossRef]
21. Kresse, G.; Furthmüller, J. Efficient iterative schemes for ab initio total-energy calculations using a plane-wavebasis set. Phys. Rev. B: Condens. Matter Mater. Phys. 1996, 54, 11169–11186. [CrossRef]
22. Kresse, G.; Joubert, D. From ultrasoft pseudopotentials to the projector augmented-wave method. Phys. Rev.B: Condens. Matter Mater. Phys. 1999, 59, 1758–1775. [CrossRef]
23. Parlinski, K. PHONON Software. 2010. Available online: http://wolf.ifj.edu.pl/phonon/ (accessed on 2January 2008).
24. Zurek, E.; Grochala, W. Predicting crystal structures and properties of matter under extreme conditions viaquantum mechanics: The pressure is on. Phys. Chem. Chem. Phys. 2015, 17, 2917–2934. [CrossRef] [PubMed]
25. Lonie, D.C.; Zurek, E. XtalOpt: An open-source evolutionary algorithm for crystal structure prediction.Comput. Phys. Commun. 2011, 182, 372–387. [CrossRef]
26. Zurek, E.; Hoffmann, R.; Ashcroft, N.W.; Oganov, A.; Lyakhov, A.O. A little bit of lithium does a lot forhydrogen. Proc. Nat. Acad. Sci. USA 2009, 106, 17640–17643. [CrossRef] [PubMed]
27. Baettig, P.; Zurek, E. Pressure-Stabilized Sodium Polyhydrides: NaHn (n > 1). Phys. Rev. Lett. 2011, 106,237002. [CrossRef]
28. Hooper, J.; Zurek, E. Rubidium Polyhydrides Under Pressure: Emergence of the Linear H3− Species.
Chem. Eur. J. 2012, 18, 5013–5021. [CrossRef]29. Liechtenstein, A.I.; Anisimov, V.I.; Zaane, J. Density-functional theory and strong interactions: Orbital
ordering in Mott-Hubbard insulators. Phys. Rev. B 1995, 52, R5467. [CrossRef]30. Kasinathan, D.; Kyker, A.B.; Singh, D.J. Origin of ferromagnetism in Cs2AgF4: The importance of Ag–F
covalency. Phys. Rev. B 2006, 73, 214420. [CrossRef]31. Grimme, S.; Antony, J.; Ehrlich, S.; Krieg, S. A consistent and accurate ab initio parametrization of density
functional dispersion correction (DFT-D) for the 94 elements H-Pu. J. Chem. Phys. 2010, 132, 154104.[CrossRef]
32. Grochala, W.; Hoffmann, R. Real and Hypothetical Intermediate-Valence AgII/AgIII and AgII/AgI FluorideSystems as Potential Superconductors. Angew. Chem. Int. Ed. Engl. 2001, 40, 2742–2781. [CrossRef]
33. Grzelak, A.; Gawraczynski, J.; Jaron, T.; Kurzydłowski, D.; Mazej, Z.; Leszczynski, P.J.; Prakapenka, V.B.;Derzsi, M.; Struzhkin, V.V.; Grochala, W. Metal fluoride nanotubes featuring square-planar building blocksin a high-pressure polymorph of AgF2. Dalton Trans. 2017, 46, 14742–14745. [CrossRef] [PubMed]
34. Park, S.; Choi, Y.J.; Zhang, C.L.; Cheong, S.W. Ferroelectricity in an S = 12 Chain Cuprate. Phys. Rev. Lett.
2007, 98, 057601. [CrossRef] [PubMed]35. Gibson, B.J.; Kremer, R.K.; Prokofiev, A.V.; Assmus, W.; McIntyre, G.J. Incommensurate antiferromagnetic
order in the S = 12 quantum chain compound LiCuVO4. Physica B 2004, 350, e253. [CrossRef]36. Yahia, H.B.; Shikano, M.; Tabuchi, M.; Kobayashi, H.; Avdeev, M.; Tan, T.T.; Liu, S.; Ling, C.D. Synthesis and
characterization of the crystal and magnetic structures and properties of the hydroxyfluorides Fe(OH)F andCo(OH)F. Inorg. Chem. 2014, 53, 365–374. [CrossRef] [PubMed]
37. Hill, L.I.; Verbaere, A. On the structural defects in synthetic γ-MnO2s. J. Solid State Chem. 2004, 177, 4706–4723.[CrossRef]
38. Evers, J.; Beck, W.; Göbel, M.; Jakob, S.; Mayer, P.; Oehlinger, G.; Rotter, M.; Klapötke, T. The Structuresof δ-PdCl2 and γ-PdCl2: Phases with Negative Thermal Expansion in One Direction. Angew. Chem. Int.Ed. Engl. 2010, 49, 5677–5682. [CrossRef] [PubMed]
39. Brückner, R.; Haller, H.; Ellwanger, M.; Riedel, S. Polychloride Monoanions from [Cl3]− to [Cl9]−: A RamanSpectroscopic and Quantum Chemical Investigation. Chem. Eur. J. 2012, 18, 5741–5747. [CrossRef]
40. Riedel, E.F.; Willett, R.D. NQR study of the trichloride ion. Evidence for three-center four-electron bonding.J. Am. Chem. Soc. 1975, 97, 701–704. [CrossRef]
41. Redeker, F.A.; Beckers, H.; Riedel, S. Matrix-isolation and comparative far-IR investigation of free linear[Cl3]− and a series of alkali trichlorides. Chem. Commun. 2017, 53, 12958–12961. [CrossRef]
57
Crystals 2019, 9, 423
42. Hull, S.; Keen, D.A. Pressure-induced phase transitions in AgCl, AgBr, and AgI. Phys. Rev. B 1999, 59,750–761. [CrossRef]
43. Donohue, J.; Goodman, S.H. Interatomic distances in solid chlorine. Acta Cryst. 1965, 18, 568–569. [CrossRef]44. Jenkins, H.D.B.; Glasser, L. Volume-based thermodynamics: Estimations for 2:2 salts. Inorg. Chem. 2006, 45,
1754–1756. [CrossRef] [PubMed]45. NIST. gov chemistry webbook database 2019. Available online: https://webbook.nist.gov/chemistry/ (accessed
on 2 July 2019).46. Horvath-Bordon, E.; Riedel, R.; Zerr, A.; McMillan, P.F.; Auffermann, G.; Prots, Y.; Bronger, W.; Kniep, R.;
Kroll, P. High-pressure chemistry of nitride-based materials. Chem. Soc. Rev. 2006, 35, 987–1014. [CrossRef][PubMed]
47. Kurzydłowski, D. The Jahn-Teller distortion at high pressure: The case of copper difluoride. Crystals 2018,8, 140.
48. López-Moreno, S.; Romero, A.H.; Mejía-López, J.; Muñoz, A. First-principles study of pressure-inducedstructural phase transitions in MnF2. Phys. Chem. Chem. Phys. 2016, 18, 33250–33263. [CrossRef] [PubMed]
49. Kurzydłowski, D.; Grochala, W. Prediction of extremely strong antiferromagnetic superexchange in silver (II)fluorides: Challenging the oxocuprates (II). Angew. Chem. Int. Ed. Engl. 2017, 56, 10114–10117. [CrossRef]
50. Kurzydłowski, D.; Grochala, W. Large exchange anisotropy in quasi-one-dimensional spin- 12 fluoride
antiferromagnets with a d(z2)1 ground state. Phys. Rev. B 2017, 96, 155140. [CrossRef]51. Banks, M.G.; Kremer, R.K.; Hoch, C.; Simon, A.; Ouladdiaf, B.; Broto, J.-M.; Rakoto, H.; Lee, C.; Whangbo, M.-H.
Magnetic ordering in the frustrated Heisenberg chain system cupric chloride CuCl2. Phys. Rev. B 2009,80, 024404. [CrossRef]
52. Aramburu, J.A.; Moreno, M. Bonding of Ag2+ in KCl lattice. Solid State Commun. 1986, 58, 305–309. [CrossRef]53. Gawraczynski, J.; Kurzydłowski, D.; Ewings, R.A.; Bandaru, S.; Gadomski, W.; Mazej, Z.; Ruani, G.;
Bergenti, I.; Jaron, T.; Ozarowski, A.; et al. Silver route to cuprate analogs. Proc. Nat. Acad. Sci. USA 2019,116, 1495–1500. [CrossRef]
54. Kurzydłowski, D.; Derzsi, M.; Barone, P.; Grzelak, A.; Struzhkin, V.V.; Lorenzana, J.; Grochala, W. Dramaticenhancement of spin–spin coupling and quenching of magnetic dimensionality in compressed silverdifluoride. Chem. Commun. 2018, 54, 10252–10255. [CrossRef] [PubMed]
55. Pyykkö, P. Theoretical chemistry of gold. Chem. Soc. Rev. 2008, 37, 1967–1997. [CrossRef] [PubMed]56. Pearson, R.G. Recent advances in the concept of hard and soft acids and bases. J. Chem. Educ. 1987, 64,
561–567. [CrossRef]57. Schwerdtfeger, P. Relativistic effects in properties of gold. Heteroatom Chem. 2002, 13, 578–584. [CrossRef]58. Grochala, W.; Mazej, Z. Unique silver (II) fluorides: The emerging electronic and magnetic materials.
Phil. Trans. A 2015, 373, 20140179. [CrossRef] [PubMed]
© 2019 by the authors. Licensee MDPI, Basel, Switzerland. This article is an open accessarticle distributed under the terms and conditions of the Creative Commons Attribution(CC BY) license (http://creativecommons.org/licenses/by/4.0/).
58
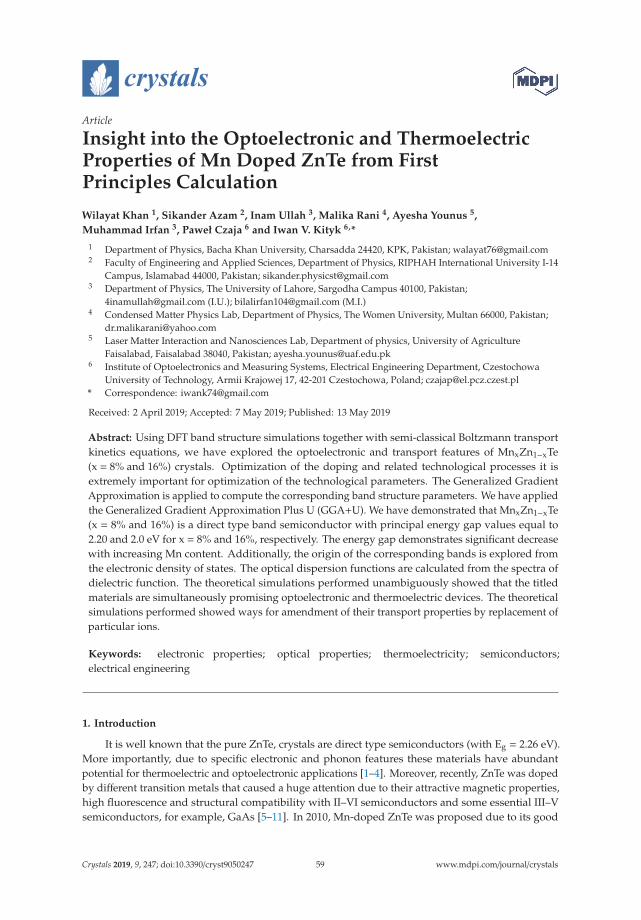
crystals
Article
Insight into the Optoelectronic and ThermoelectricProperties of Mn Doped ZnTe from FirstPrinciples Calculation
Wilayat Khan 1, Sikander Azam 2, Inam Ullah 3, Malika Rani 4, Ayesha Younus 5,
Muhammad Irfan 3, Paweł Czaja 6 and Iwan V. Kityk 6,*
1 Department of Physics, Bacha Khan University, Charsadda 24420, KPK, Pakistan; [email protected] Faculty of Engineering and Applied Sciences, Department of Physics, RIPHAH International University I-14
Campus, Islamabad 44000, Pakistan; [email protected] Department of Physics, The University of Lahore, Sargodha Campus 40100, Pakistan;
[email protected] (I.U.); [email protected] (M.I.)4 Condensed Matter Physics Lab, Department of Physics, The Women University, Multan 66000, Pakistan;
[email protected] Laser Matter Interaction and Nanosciences Lab, Department of physics, University of Agriculture
Faisalabad, Faisalabad 38040, Pakistan; [email protected] Institute of Optoelectronics and Measuring Systems, Electrical Engineering Department, Czestochowa
University of Technology, Armii Krajowej 17, 42-201 Czestochowa, Poland; [email protected]* Correspondence: [email protected]
Received: 2 April 2019; Accepted: 7 May 2019; Published: 13 May 2019
Abstract: Using DFT band structure simulations together with semi-classical Boltzmann transportkinetics equations, we have explored the optoelectronic and transport features of MnxZn1−xTe(x = 8% and 16%) crystals. Optimization of the doping and related technological processes it isextremely important for optimization of the technological parameters. The Generalized GradientApproximation is applied to compute the corresponding band structure parameters. We have appliedthe Generalized Gradient Approximation Plus U (GGA+U). We have demonstrated that MnxZn1−xTe(x = 8% and 16%) is a direct type band semiconductor with principal energy gap values equal to2.20 and 2.0 eV for x = 8% and 16%, respectively. The energy gap demonstrates significant decreasewith increasing Mn content. Additionally, the origin of the corresponding bands is explored fromthe electronic density of states. The optical dispersion functions are calculated from the spectra ofdielectric function. The theoretical simulations performed unambiguously showed that the titledmaterials are simultaneously promising optoelectronic and thermoelectric devices. The theoreticalsimulations performed showed ways for amendment of their transport properties by replacement ofparticular ions.
Keywords: electronic properties; optical properties; thermoelectricity; semiconductors;electrical engineering
1. Introduction
It is well known that the pure ZnTe, crystals are direct type semiconductors (with Eg = 2.26 eV).More importantly, due to specific electronic and phonon features these materials have abundantpotential for thermoelectric and optoelectronic applications [1–4]. Moreover, recently, ZnTe was dopedby different transition metals that caused a huge attention due to their attractive magnetic properties,high fluorescence and structural compatibility with II–VI semiconductors and some essential III–Vsemiconductors, for example, GaAs [5–11]. In 2010, Mn-doped ZnTe was proposed due to its good
Crystals 2019, 9, 247; doi:10.3390/cryst9050247 www.mdpi.com/journal/crystals59
Crystals 2019, 9, 247
theoretical band gap [12,13]. Thus, it can be used as a spintronic material and for studies of itsmagnetic properties.
For practical applications, the existence and optimization of the existing technology is a very hottopic. However, without reliable band structure parameters it is not possible to predict the ways inwhich the technology will further improve.
Addition of the transition metals opens a rare opportunity to vary their optoelectronic andthermal features in the desired directions. This is caused by a high flexibility of the 3d TM orbitalseffectively interacting with the p orbitals of the anionic dopants. Many of them possess the localizedd-states within the energy gap. Very interesting is use of ZnTe for the fabrication of green LED (lightemitting diodes) [14] and various devices like THz emitters and detectors. The principal parametersare determined by the valence band state features originating from p Te states and their coordinationby the cationic environment possessing space localized d-states. Today the main detectors in thevisible spectral rage are based on Si. However, the band dispersion near the top of the valence bandwith respect to the bottom of conduction band is not very suitable for such applications. Conversely,the ZnTe has a suitable band energy gap and relatively high quantum efficiency. However, a strongdensity-functional theory (DFT) band structure calculation is absent, and most of the research in thisdirection are based on the oversimplified models without the band structure dispersion in k-space.Therefore, focusing on studies on ZnTe band dispersion and its changes after d-states doping isextremely important for the design of optoelectronic and thermoelectric devices of photodetectors [15].
Among a lot of technological approaches for thin-film ZnTe production, like molecular beamepitaxy, thermal vacuum evaporation, vapor phase epitaxy, physical vapor transport, hot wallevaporation, metallic–organic vapor phase epitaxy and electrodeposition [16–25], it is clear that theonly way to amend these methods is knowledge about the principal changes of the hyperfine bandstructure after doping by 3d elements, and the origin of electronic states. In several works [26,27],the optoelectronic features of ZnX (X = O, S, Se, Te) have been studied within a framework of a DFTapproach. However, the influence of doping has not been explored yet.
The goal of our manuscript is to study the effect of Mn impurities on optical and thermoelectricproperties. Using first principles, and the total energy method, we have firstly applied the GeneralizedGradient Approximation (GGA) in order to study the MnxZn1−xTe (x = 8% and 16%) band structuredispersion. It is shown that, indicates that GGA method is not enough get the exit gap therefore wehave included a Hubbard-like contribution of the Mn d states, according to the so-called GeneralizedGradient Approximation Plus U (GGA+U) is able to open the big band gap.
Following the reasons presented above in the present work we present studies of the band structurefor the ZnTe single crystals doped by Mn using the first principle DFT method for the bulk materialof MnxZn1−xTe (x = 8% and 16%), The results obtained may be very useful for the further materialsengineering optimization of the technological doping processes to achieve enhanced optoelectronicand thermoelectric features.
2. DFT Calculation Technique
MnxZn1−xTe (x = 8% and 18%) possesses tetragonal symmetry. The basic lattice unit cell structuresare depicted in Figure 1. We have applied the Full Potential Linear Augmented Plane wave method(FP-LAPW) method and at the beginning we optimized the initial structures within a framework of theone-electron WIEN2k package. GGA+U was used to evaluate the band electronic structure dispersionand the related optical function dispersion of the titled MnxZn1−xTe (x = 8% and 16%) materials.
We extended the primitive cell of ZnTe to 2 × 2 × 2 supercell containing 32 atoms (Zn and Tecontains both 16 atoms), and used the supercell to simulate Mn doped systems. For the Mn doped ZnTe,one Zn atom substitutes for one/two (8/16 %) Zn, and denoted such systems as MnxZn1−xTe (x = 8%and 18%). For the MnxZn1−xTe (x = 8% and 18%) the muffin tin (MT) spheres radii were assumed tobe equal to 1.8 and 2.0 Bohr, respectively. The values used for plane cutoff and harmonic expansionwere lmax = 10 and RMTKmax = 8.0. The condition for the energy convergence in the self-consistent
60
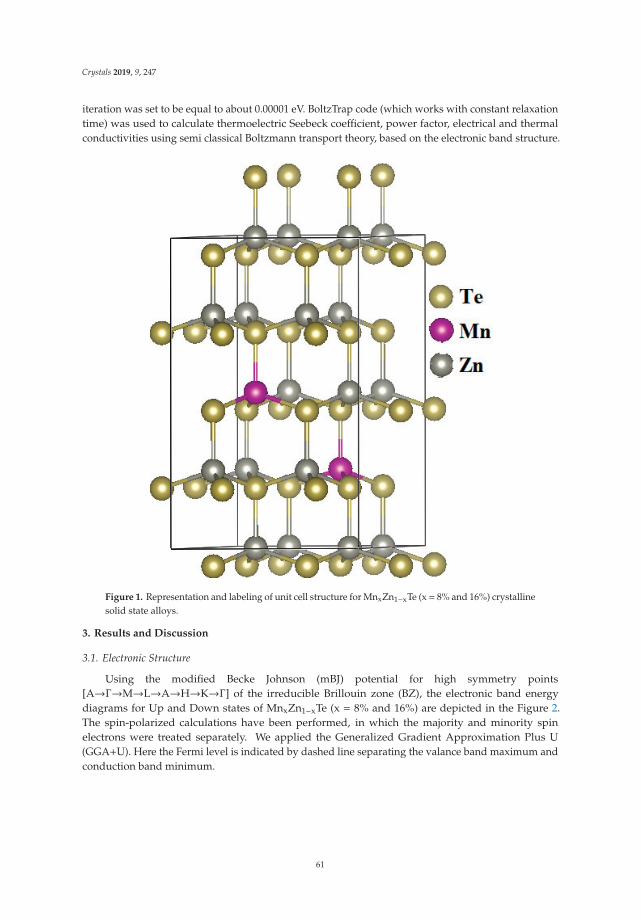
Crystals 2019, 9, 247
iteration was set to be equal to about 0.00001 eV. BoltzTrap code (which works with constant relaxationtime) was used to calculate thermoelectric Seebeck coefficient, power factor, electrical and thermalconductivities using semi classical Boltzmann transport theory, based on the electronic band structure.
Figure 1. Representation and labeling of unit cell structure for MnxZn1−xTe (x = 8% and 16%) crystallinesolid state alloys.
3. Results and Discussion
3.1. Electronic Structure
Using the modified Becke Johnson (mBJ) potential for high symmetry points[A→Γ→M→L→A→H→K→Γ] of the irreducible Brillouin zone (BZ), the electronic band energydiagrams for Up and Down states of MnxZn1−xTe (x = 8% and 16%) are depicted in the Figure 2.The spin-polarized calculations have been performed, in which the majority and minority spinelectrons were treated separately. We applied the Generalized Gradient Approximation Plus U(GGA+U). Here the Fermi level is indicated by dashed line separating the valance band maximum andconduction band minimum.
61
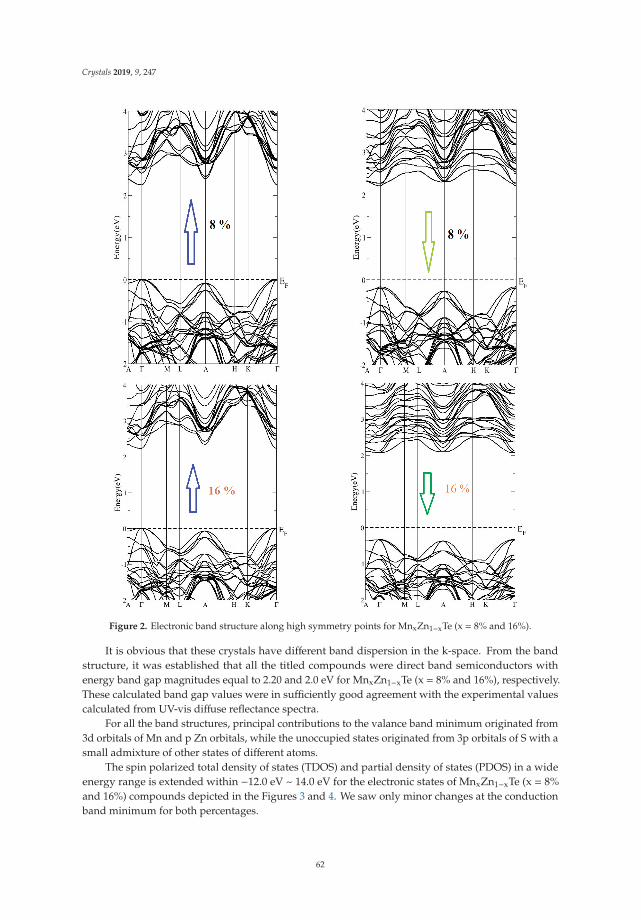
Crystals 2019, 9, 247
Figure 2. Electronic band structure along high symmetry points for MnxZn1−xTe (x = 8% and 16%).
It is obvious that these crystals have different band dispersion in the k-space. From the bandstructure, it was established that all the titled compounds were direct band semiconductors withenergy band gap magnitudes equal to 2.20 and 2.0 eV for MnxZn1−xTe (x = 8% and 16%), respectively.These calculated band gap values were in sufficiently good agreement with the experimental valuescalculated from UV-vis diffuse reflectance spectra.
For all the band structures, principal contributions to the valance band minimum originated from3d orbitals of Mn and p Zn orbitals, while the unoccupied states originated from 3p orbitals of S with asmall admixture of other states of different atoms.
The spin polarized total density of states (TDOS) and partial density of states (PDOS) in a wideenergy range is extended within −12.0 eV ~ 14.0 eV for the electronic states of MnxZn1−xTe (x = 8%and 16%) compounds depicted in the Figures 3 and 4. We saw only minor changes at the conductionband minimum for both percentages.
62
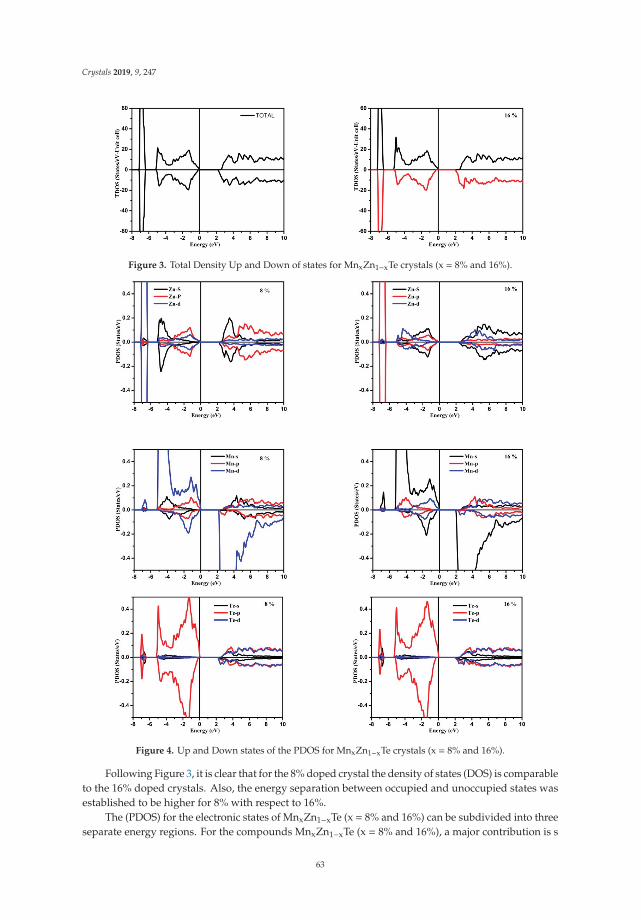
Crystals 2019, 9, 247
Figure 3. Total Density Up and Down of states for MnxZn1−xTe crystals (x = 8% and 16%).
Figure 4. Up and Down states of the PDOS for MnxZn1−xTe crystals (x = 8% and 16%).
Following Figure 3, it is clear that for the 8% doped crystal the density of states (DOS) is comparableto the 16% doped crystals. Also, the energy separation between occupied and unoccupied states wasestablished to be higher for 8% with respect to 16%.
The (PDOS) for the electronic states of MnxZn1−xTe (x = 8% and 16%) can be subdivided into threeseparate energy regions. For the compounds MnxZn1−xTe (x = 8% and 16%), a major contribution is s
63
Crystals 2019, 9, 247
orbitals of Te with a small admixture coming from Zn s/p/d. For an energy interval extending within−7.2 . . . 6.5 eV, the PDOS, for the compounds MnxZn1−xTe (x = 8% and 18%) had a major contributiondue to d and p originated Zn band states, along with the small contribution Te-p and Mn-s atoms.
In Mn, doped ZnTe Mn-s/p/d stats played a crucial role for reported energy range (−4.0–4.0 eV).A strong hybridization was observed between Zn s/p and d states along with the Mn s/p/d states. Itsrole in conduction bands became more prominent than the valence band.
3.2. Optical Function Dispersion
Study of the optical properties is important for understanding the electronic structure of thematerials. These can be attained from the complex dielectric function ε(ω) which is expressed as
ε(ω) = ε1(ω) + iε2(ω) (1)
The imaginary part ε2(ω) is found from the momentum dipole transition matrix elements betweenthe occupied and the unoccupied electronic states, and has been computed using Equation (1) [28],
ε2i j(ω) =
4π2e2
Vm2ω2 ×∑
knn′σ〈knσ|pi
∣∣∣kn′σ⟩⟨kn′σ∣∣∣pj|knσ〉 × fkn(1− fkn′)σ(Ekn′ −kn −�ω) (2)
The dispersion of the real part of the dielectric function ε(ω) was computed using the imaginarypart by using Kramer’s- Kronig relations.
ε1(ω) = 1 +2π
P
∞∫0
ω′ε2(ω′)ω′2 −ω2
dω′ (3)
The symbol P represents the principal value of the integral.With the help of real and imaginary part dispersions for dielectric function, other optical properties
were calculated. The complex index of refraction is written as
n(ω) = n(ω) + ik(ω) (4)
Here n(ω) is refractive index and k(ω) is extinction coefficient can be obtained fromdielectric function.
n(ω) =
⎛⎜⎜⎜⎜⎜⎜⎜⎝ε1(ω) +
(ε2
1(ω) + ε22(ω)
)1/2
2
⎞⎟⎟⎟⎟⎟⎟⎟⎠1/2
(5)
At low frequency (i.e., ω = 0), the real part of the refractive index is called the static refractive coefficient
n0 = [ε(0)]12 .
So, from the complex dielectric function dispersion which contains both real and imaginary partsall the other optical functions were also calculated, such as absorption coefficient I(ω), energy lossfunction L(ω) and reflectivity R(ω). As the reflectivity is the percentage of reflected ray intensity onthe incident ray intensity of electromagnetic waves on the system, it can be expressed as
R(ω) =(n(ω) − 1)2 −K(ω)2
(n(ω) + 1)2 −K(ω)2 (6)
The absorption coefficient is the power absorbed in a unit length of solid, and is calculated byusing this formula
I(ω) =4πP(ω)λ0
(7)
64
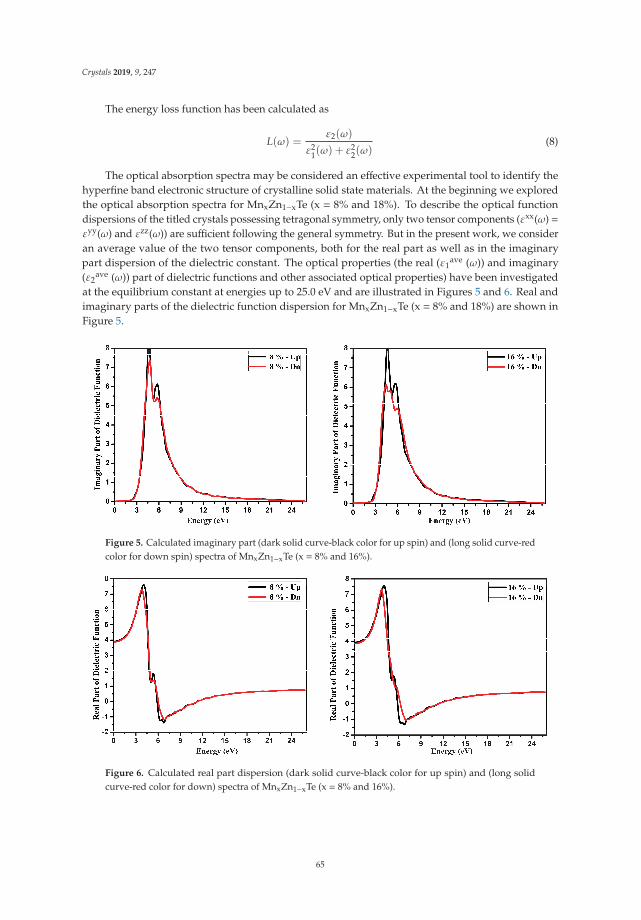
Crystals 2019, 9, 247
The energy loss function has been calculated as
L(ω) =ε2(ω)
ε21(ω) + ε
22(ω)
(8)
The optical absorption spectra may be considered an effective experimental tool to identify thehyperfine band electronic structure of crystalline solid state materials. At the beginning we exploredthe optical absorption spectra for MnxZn1−xTe (x = 8% and 18%). To describe the optical functiondispersions of the titled crystals possessing tetragonal symmetry, only two tensor components (εxx(ω) =εyy(ω) and εzz(ω)) are sufficient following the general symmetry. But in the present work, we consideran average value of the two tensor components, both for the real part as well as in the imaginarypart dispersion of the dielectric constant. The optical properties (the real (ε1
ave (ω)) and imaginary(ε2
ave (ω)) part of dielectric functions and other associated optical properties) have been investigatedat the equilibrium constant at energies up to 25.0 eV and are illustrated in Figures 5 and 6. Real andimaginary parts of the dielectric function dispersion for MnxZn1−xTe (x = 8% and 18%) are shown inFigure 5.
Figure 5. Calculated imaginary part (dark solid curve-black color for up spin) and (long solid curve-redcolor for down spin) spectra of MnxZn1−xTe (x = 8% and 16%).
Figure 6. Calculated real part dispersion (dark solid curve-black color for up spin) and (long solidcurve-red color for down) spectra of MnxZn1−xTe (x = 8% and 16%).
65
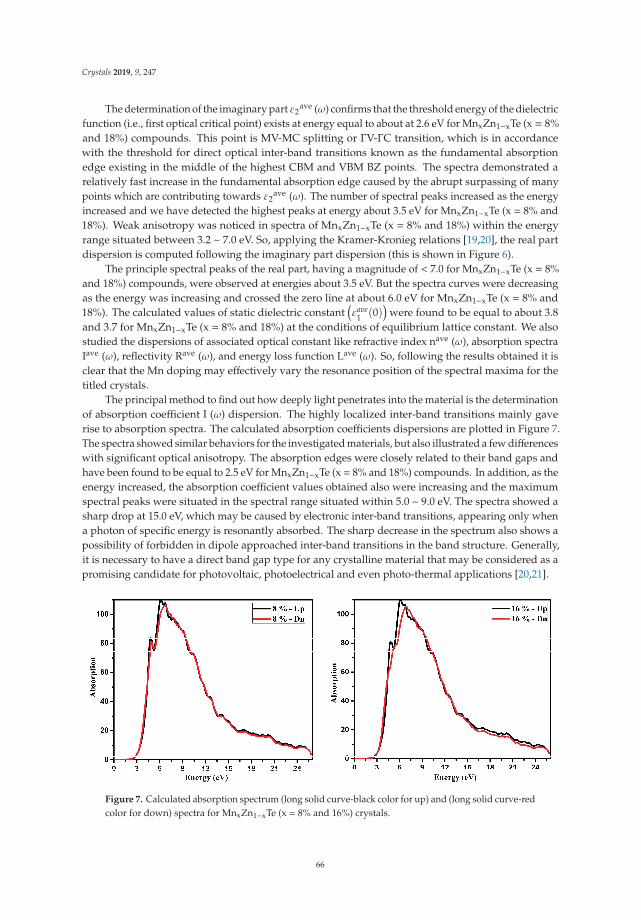
Crystals 2019, 9, 247
The determination of the imaginary part ε2ave (ω) confirms that the threshold energy of the dielectric
function (i.e., first optical critical point) exists at energy equal to about at 2.6 eV for MnxZn1−xTe (x = 8%and 18%) compounds. This point is MV-MC splitting or ΓV-ΓC transition, which is in accordancewith the threshold for direct optical inter-band transitions known as the fundamental absorptionedge existing in the middle of the highest CBM and VBM BZ points. The spectra demonstrated arelatively fast increase in the fundamental absorption edge caused by the abrupt surpassing of manypoints which are contributing towards ε2
ave (ω). The number of spectral peaks increased as the energyincreased and we have detected the highest peaks at energy about 3.5 eV for MnxZn1−xTe (x = 8% and18%). Weak anisotropy was noticed in spectra of MnxZn1−xTe (x = 8% and 18%) within the energyrange situated between 3.2 ~ 7.0 eV. So, applying the Kramer-Kronieg relations [19,20], the real partdispersion is computed following the imaginary part dispersion (this is shown in Figure 6).
The principle spectral peaks of the real part, having a magnitude of < 7.0 for MnxZn1−xTe (x = 8%and 18%) compounds, were observed at energies about 3.5 eV. But the spectra curves were decreasingas the energy was increasing and crossed the zero line at about 6.0 eV for MnxZn1−xTe (x = 8% and18%). The calculated values of static dielectric constant
(εave
1 (0))
were found to be equal to about 3.8and 3.7 for MnxZn1−xTe (x = 8% and 18%) at the conditions of equilibrium lattice constant. We alsostudied the dispersions of associated optical constant like refractive index nave (ω), absorption spectraIave (ω), reflectivity Rave (ω), and energy loss function Lave (ω). So, following the results obtained it isclear that the Mn doping may effectively vary the resonance position of the spectral maxima for thetitled crystals.
The principal method to find out how deeply light penetrates into the material is the determinationof absorption coefficient I (ω) dispersion. The highly localized inter-band transitions mainly gaverise to absorption spectra. The calculated absorption coefficients dispersions are plotted in Figure 7.The spectra showed similar behaviors for the investigated materials, but also illustrated a few differenceswith significant optical anisotropy. The absorption edges were closely related to their band gaps andhave been found to be equal to 2.5 eV for MnxZn1−xTe (x = 8% and 18%) compounds. In addition, as theenergy increased, the absorption coefficient values obtained also were increasing and the maximumspectral peaks were situated in the spectral range situated within 5.0 ~ 9.0 eV. The spectra showed asharp drop at 15.0 eV, which may be caused by electronic inter-band transitions, appearing only whena photon of specific energy is resonantly absorbed. The sharp decrease in the spectrum also shows apossibility of forbidden in dipole approached inter-band transitions in the band structure. Generally,it is necessary to have a direct band gap type for any crystalline material that may be considered as apromising candidate for photovoltaic, photoelectrical and even photo-thermal applications [20,21].
Figure 7. Calculated absorption spectrum (long solid curve-black color for up) and (long solid curve-redcolor for down) spectra for MnxZn1−xTe (x = 8% and 16%) crystals.
66
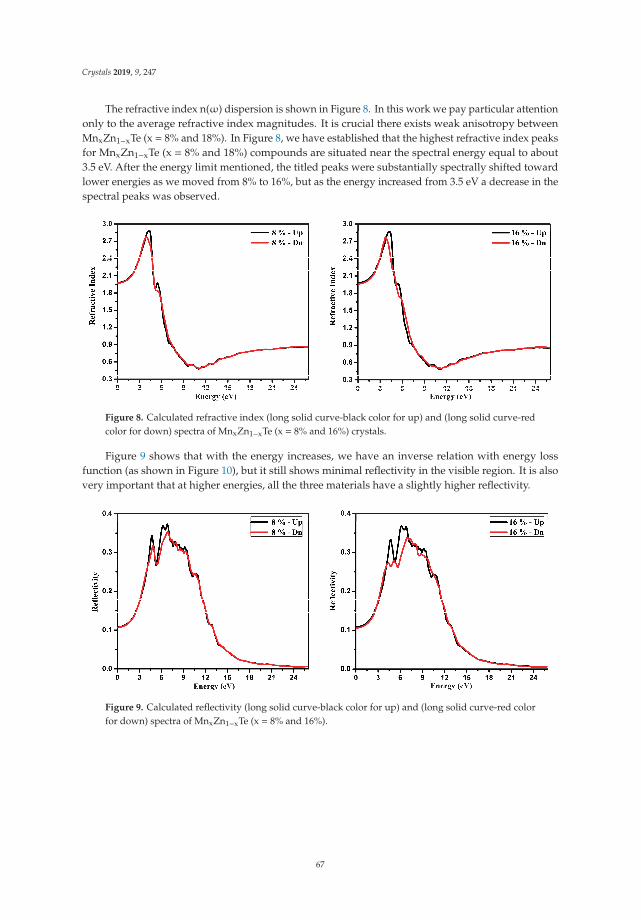
Crystals 2019, 9, 247
The refractive index n(ω) dispersion is shown in Figure 8. In this work we pay particular attentiononly to the average refractive index magnitudes. It is crucial there exists weak anisotropy betweenMnxZn1−xTe (x = 8% and 18%). In Figure 8, we have established that the highest refractive index peaksfor MnxZn1−xTe (x = 8% and 18%) compounds are situated near the spectral energy equal to about3.5 eV. After the energy limit mentioned, the titled peaks were substantially spectrally shifted towardlower energies as we moved from 8% to 16%, but as the energy increased from 3.5 eV a decrease in thespectral peaks was observed.
Figure 8. Calculated refractive index (long solid curve-black color for up) and (long solid curve-redcolor for down) spectra of MnxZn1−xTe (x = 8% and 16%) crystals.
Figure 9 shows that with the energy increases, we have an inverse relation with energy lossfunction (as shown in Figure 10), but it still shows minimal reflectivity in the visible region. It is alsovery important that at higher energies, all the three materials have a slightly higher reflectivity.
Figure 9. Calculated reflectivity (long solid curve-black color for up) and (long solid curve-red colorfor down) spectra of MnxZn1−xTe (x = 8% and 16%).
67
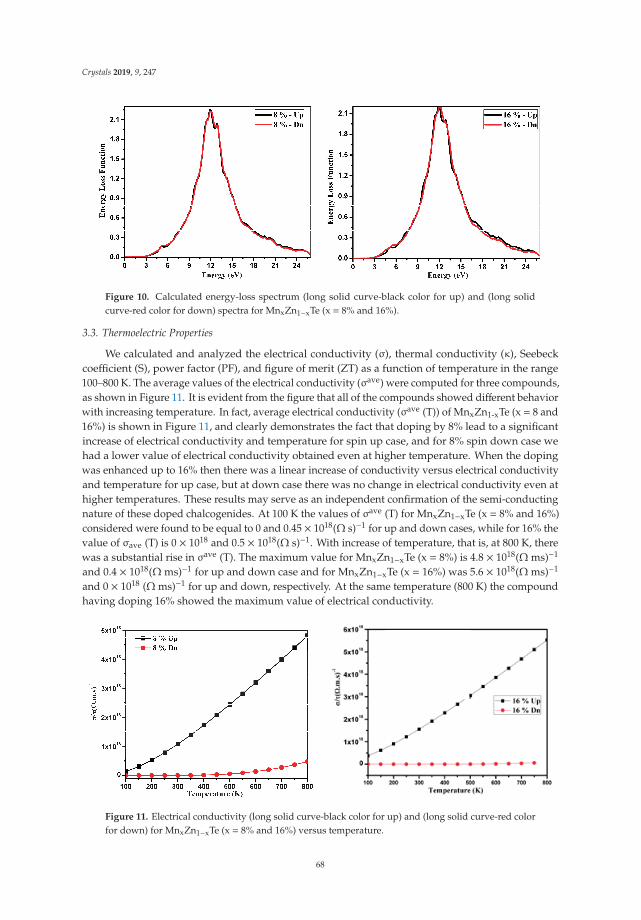
Crystals 2019, 9, 247
Figure 10. Calculated energy-loss spectrum (long solid curve-black color for up) and (long solidcurve-red color for down) spectra for MnxZn1−xTe (x = 8% and 16%).
3.3. Thermoelectric Properties
We calculated and analyzed the electrical conductivity (σ), thermal conductivity (κ), Seebeckcoefficient (S), power factor (PF), and figure of merit (ZT) as a function of temperature in the range100–800 K. The average values of the electrical conductivity (σave) were computed for three compounds,as shown in Figure 11. It is evident from the figure that all of the compounds showed different behaviorwith increasing temperature. In fact, average electrical conductivity (σave (T)) of MnxZn1-xTe (x = 8 and16%) is shown in Figure 11, and clearly demonstrates the fact that doping by 8% lead to a significantincrease of electrical conductivity and temperature for spin up case, and for 8% spin down case wehad a lower value of electrical conductivity obtained even at higher temperature. When the dopingwas enhanced up to 16% then there was a linear increase of conductivity versus electrical conductivityand temperature for up case, but at down case there was no change in electrical conductivity even athigher temperatures. These results may serve as an independent confirmation of the semi-conductingnature of these doped chalcogenides. At 100 K the values of σave (T) for MnxZn1−xTe (x = 8% and 16%)considered were found to be equal to 0 and 0.45 × 10¹⁸(Ω s)−1 for up and down cases, while for 16% thevalue of σave (T) is 0 × 1018 and 0.5 × 10¹⁸(Ω s)−1. With increase of temperature, that is, at 800 K, therewas a substantial rise in σave (T). The maximum value for MnxZn1−xTe (x = 8%) is 4.8 × 10¹⁸(Ω ms)−1
and 0.4 × 10¹⁸(Ω ms)−1 for up and down case and for MnxZn1−xTe (x = 16%) was 5.6 × 10¹⁸(Ω ms)−1
and 0 × 1018 (Ω ms)−1 for up and down, respectively. At the same temperature (800 K) the compoundhaving doping 16% showed the maximum value of electrical conductivity.
Figure 11. Electrical conductivity (long solid curve-black color for up) and (long solid curve-red colorfor down) for MnxZn1−xTe (x = 8% and 16%) versus temperature.
68
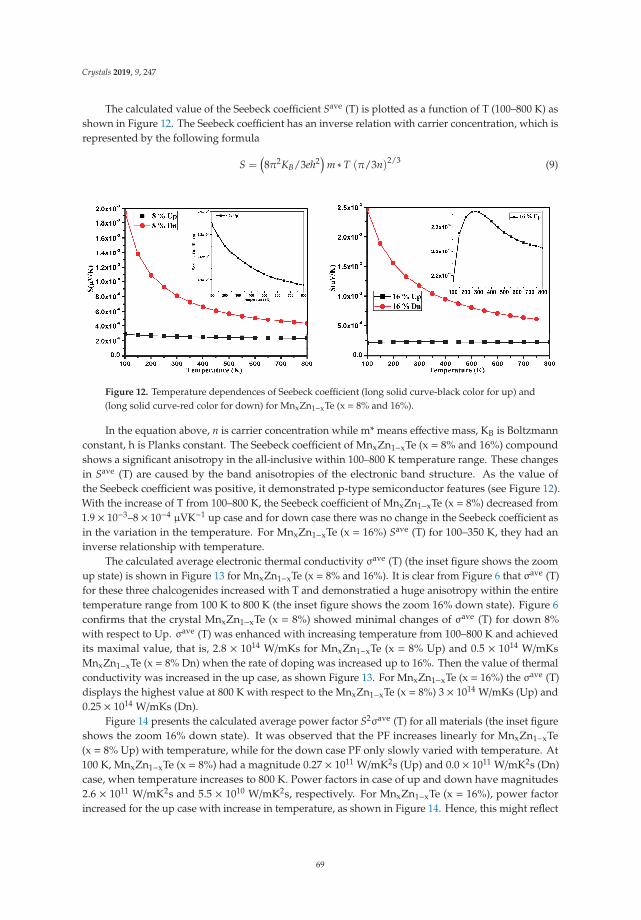
Crystals 2019, 9, 247
The calculated value of the Seebeck coefficient Save (T) is plotted as a function of T (100–800 K) asshown in Figure 12. The Seebeck coefficient has an inverse relation with carrier concentration, which isrepresented by the following formula
S =(8π2KB/3eh2
)m ∗ T (π/3n)2/3 (9)
Figure 12. Temperature dependences of Seebeck coefficient (long solid curve-black color for up) and(long solid curve-red color for down) for MnxZn1−xTe (x = 8% and 16%).
In the equation above, n is carrier concentration while m* means effective mass, KB is Boltzmannconstant, h is Planks constant. The Seebeck coefficient of MnxZn1−xTe (x = 8% and 16%) compoundshows a significant anisotropy in the all-inclusive within 100–800 K temperature range. These changesin Save (T) are caused by the band anisotropies of the electronic band structure. As the value ofthe Seebeck coefficient was positive, it demonstrated p-type semiconductor features (see Figure 12).With the increase of T from 100–800 K, the Seebeck coefficient of MnxZn1−xTe (x = 8%) decreased from1.9 × 10−3–8 × 10⁻⁴ μVK−1 up case and for down case there was no change in the Seebeck coefficient asin the variation in the temperature. For MnxZn1−xTe (x = 16%) Save (T) for 100–350 K, they had aninverse relationship with temperature.
The calculated average electronic thermal conductivity σave (T) (the inset figure shows the zoomup state) is shown in Figure 13 for MnxZn1−xTe (x = 8% and 16%). It is clear from Figure 6 that σave (T)for these three chalcogenides increased with T and demonstratied a huge anisotropy within the entiretemperature range from 100 K to 800 K (the inset figure shows the zoom 16% down state). Figure 6confirms that the crystal MnxZn1−xTe (x = 8%) showed minimal changes of σave (T) for down 8%with respect to Up. σave (T) was enhanced with increasing temperature from 100–800 K and achievedits maximal value, that is, 2.8 × 10¹⁴ W/mKs for MnxZn1−xTe (x = 8% Up) and 0.5 × 10¹⁴ W/mKsMnxZn1−xTe (x = 8% Dn) when the rate of doping was increased up to 16%. Then the value of thermalconductivity was increased in the up case, as shown Figure 13. For MnxZn1−xTe (x = 16%) the σave (T)displays the highest value at 800 K with respect to the MnxZn1−xTe (x = 8%) 3 × 10¹⁴ W/mKs (Up) and0.25 × 1014 W/mKs (Dn).
Figure 14 presents the calculated average power factor S2σave (T) for all materials (the inset figureshows the zoom 16% down state). It was observed that the PF increases linearly for MnxZn1−xTe(x = 8% Up) with temperature, while for the down case PF only slowly varied with temperature. At100 K, MnxZn1−xTe (x = 8%) had a magnitude 0.27 × 10¹¹ W/mK2s (Up) and 0.0 × 10¹¹ W/mK2s (Dn)case, when temperature increases to 800 K. Power factors in case of up and down have magnitudes2.6 × 1011 W/mK2s and 5.5 × 10¹⁰ W/mK2s, respectively. For MnxZn1−xTe (x = 16%), power factorincreased for the up case with increase in temperature, as shown in Figure 14. Hence, this might reflect
69
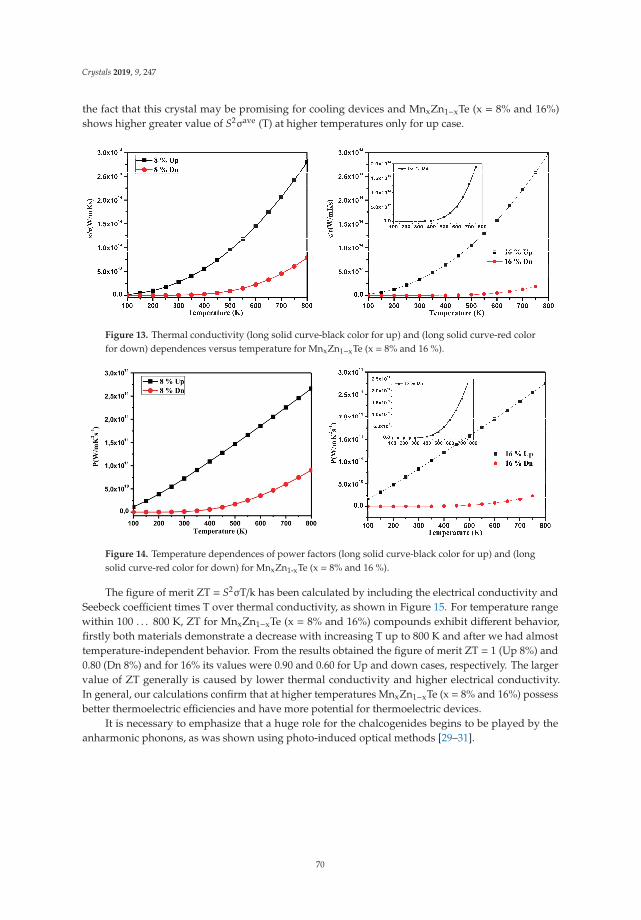
Crystals 2019, 9, 247
the fact that this crystal may be promising for cooling devices and MnxZn1−xTe (x = 8% and 16%)shows higher greater value of S2σave (T) at higher temperatures only for up case.
Figure 13. Thermal conductivity (long solid curve-black color for up) and (long solid curve-red colorfor down) dependences versus temperature for MnxZn1−xTe (x = 8% and 16 %).
Figure 14. Temperature dependences of power factors (long solid curve-black color for up) and (longsolid curve-red color for down) for MnxZn1-xTe (x = 8% and 16 %).
The figure of merit ZT = S2σT/k has been calculated by including the electrical conductivity andSeebeck coefficient times T over thermal conductivity, as shown in Figure 15. For temperature rangewithin 100 . . . 800 K, ZT for MnxZn1−xTe (x = 8% and 16%) compounds exhibit different behavior,firstly both materials demonstrate a decrease with increasing T up to 800 K and after we had almosttemperature-independent behavior. From the results obtained the figure of merit ZT = 1 (Up 8%) and0.80 (Dn 8%) and for 16% its values were 0.90 and 0.60 for Up and down cases, respectively. The largervalue of ZT generally is caused by lower thermal conductivity and higher electrical conductivity.In general, our calculations confirm that at higher temperatures MnxZn1−xTe (x = 8% and 16%) possessbetter thermoelectric efficiencies and have more potential for thermoelectric devices.
It is necessary to emphasize that a huge role for the chalcogenides begins to be played by theanharmonic phonons, as was shown using photo-induced optical methods [29–31].
70
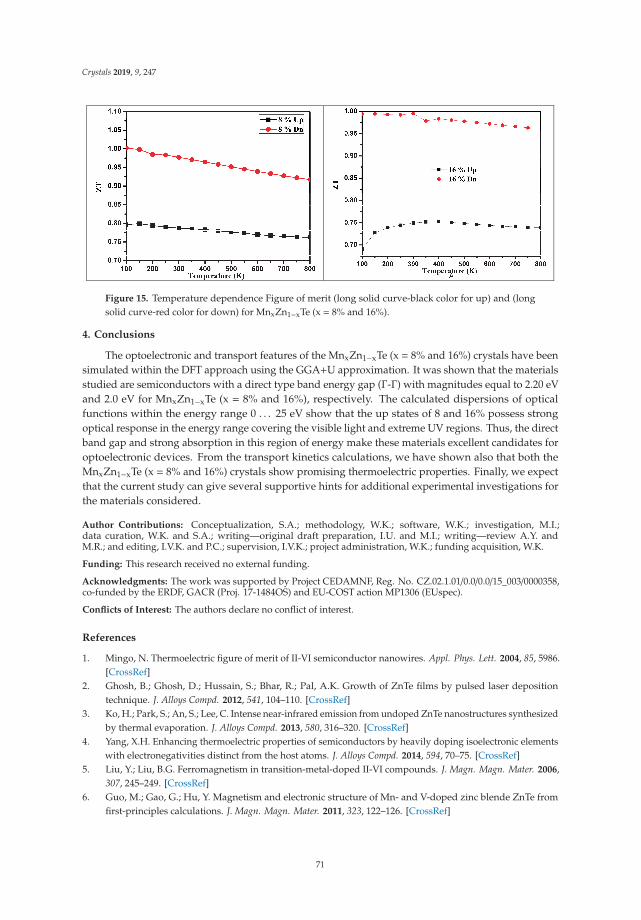
Crystals 2019, 9, 247
Figure 15. Temperature dependence Figure of merit (long solid curve-black color for up) and (longsolid curve-red color for down) for MnxZn1−xTe (x = 8% and 16%).
4. Conclusions
The optoelectronic and transport features of the MnxZn1−xTe (x = 8% and 16%) crystals have beensimulated within the DFT approach using the GGA+U approximation. It was shown that the materialsstudied are semiconductors with a direct type band energy gap (Γ-Γ) with magnitudes equal to 2.20 eVand 2.0 eV for MnxZn1−xTe (x = 8% and 16%), respectively. The calculated dispersions of opticalfunctions within the energy range 0 . . . 25 eV show that the up states of 8 and 16% possess strongoptical response in the energy range covering the visible light and extreme UV regions. Thus, the directband gap and strong absorption in this region of energy make these materials excellent candidates foroptoelectronic devices. From the transport kinetics calculations, we have shown also that both theMnxZn1−xTe (x = 8% and 16%) crystals show promising thermoelectric properties. Finally, we expectthat the current study can give several supportive hints for additional experimental investigations forthe materials considered.
Author Contributions: Conceptualization, S.A.; methodology, W.K.; software, W.K.; investigation, M.I.;data curation, W.K. and S.A.; writing—original draft preparation, I.U. and M.I.; writing—review A.Y. andM.R.; and editing, I.V.K. and P.C.; supervision, I.V.K.; project administration, W.K.; funding acquisition, W.K.
Funding: This research received no external funding.
Acknowledgments: The work was supported by Project CEDAMNF, Reg. No. CZ.02.1.01/0.0/0.0/15_003/0000358,co-funded by the ERDF, GACR (Proj. 17-1484OS) and EU-COST action MP1306 (EUspec).
Conflicts of Interest: The authors declare no conflict of interest.
References
1. Mingo, N. Thermoelectric figure of merit of II-VI semiconductor nanowires. Appl. Phys. Lett. 2004, 85, 5986.[CrossRef]
2. Ghosh, B.; Ghosh, D.; Hussain, S.; Bhar, R.; Pal, A.K. Growth of ZnTe films by pulsed laser depositiontechnique. J. Alloys Compd. 2012, 541, 104–110. [CrossRef]
3. Ko, H.; Park, S.; An, S.; Lee, C. Intense near-infrared emission from undoped ZnTe nanostructures synthesizedby thermal evaporation. J. Alloys Compd. 2013, 580, 316–320. [CrossRef]
4. Yang, X.H. Enhancing thermoelectric properties of semiconductors by heavily doping isoelectronic elementswith electronegativities distinct from the host atoms. J. Alloys Compd. 2014, 594, 70–75. [CrossRef]
5. Liu, Y.; Liu, B.G. Ferromagnetism in transition-metal-doped II-VI compounds. J. Magn. Magn. Mater. 2006,307, 245–249. [CrossRef]
6. Guo, M.; Gao, G.; Hu, Y. Magnetism and electronic structure of Mn- and V-doped zinc blende ZnTe fromfirst-principles calculations. J. Magn. Magn. Mater. 2011, 323, 122–126. [CrossRef]
71
Crystals 2019, 9, 247
7. Saito, H.; Zayets, V.; Yamagata, S.; Ando, K. Room-Temperature Ferromagnetism in a II-VI Diluted MagneticSemiconductor ZN1-CrxTe. Phys. Rev. Lett. 2003, 90, 207202. [CrossRef]
8. Reddy, D.R.; Reddy, B.K. Laser-like mechanoluminescence in ZnMeTe-diluted magnetic semiconductor.Appl. Phys. Lett. 2002, 81, 460–462. [CrossRef]
9. Imamura, M.; Okada, A. Magnetooptical Properties of ZnMeTe Films Grown on Sapphire Substrates.IEEE Trans. Magn. 2006, 42, 3078–3080. [CrossRef]
10. Kulatov, E.; Uspenskii, Y.; Mariette, H.; Cilbert, J.; Ferrand, D.; Nakayama, H.; Ohta, H. Ab Initio study ofMagnetism in III-V- and II-VI-Based Diluted Magnetic Semiconductors. J. Supercond. Nov. Magn. 2003, 16,123–126. [CrossRef]
11. Cheng, J.; Li, D.; Cheng, T.; Ren, B.; Wang, G.; Li, J. Aqueous synthesis of high-fluorescence ZdZnTe alloyedquantum dots. J. Alloys Compd. 2014, 589, 539–544. [CrossRef]
12. Sandratskii, L.M.; Bruno, P. Density functional theory of high-TC ferromagnetism of (ZnCr)Te. J. Phys.Condens. Matter. 2003, 15, 585–590. [CrossRef]
13. Wang, X.L.; Dou, S.X.; Zhang, C. Zero-gap materials for future spintronics, electronics and optics. NPG Asia Mater.2010, 2, 31–38. [CrossRef]
14. Shan, C.X.; Fan, X.W.; Zhang, J.Y.; Zhang, Z.Z.; Wang, X.H.; Ma, J.G.; Lu, Y.M.; Liu, Y.C.; Shen, D.Z.;Kong, X.G.; et al. Structural and luminescent properties of ZnTe film grown on silicon by metalorganicchemical vapor deposition. J. Vac. Sci. Technol. A 2002, 20, 1886–1890. [CrossRef]
15. Rao, G.K.; Bangera, K.V.; Shivakumar, G.K. Studies on the photoconductivity of vacuum deposited ZnTethin films. Mater. Res. Bull. 2010, 45, 1357–1360. [CrossRef]
16. Raju, K.N.; Vijayalakshmi, R.P.; Venugopal, R.; Reddy, D.R.; Reddy, B.K. Effect of substrate temperatureon the structural, optical and electrical properties of vacuum-evaporated ZnTe films. Mater. Lett. 1992, 13,336–341. [CrossRef]
17. Su, C.H.; Volz, M.P.; Gillies, D.C.; Szofran, F.R.; Lehoczky, S.L.; Dudley, M.; Yao, G.D.; Zhou, W. Growthof ZnTe by physical vapor transport and traveling heater method. J. Cryst. Growth 1993, 128, 627–632.[CrossRef]
18. Khan, M.R.H. Interface properties of a CdTe-ZnTe heterojunction. J. Phys. D Appl. Phys. 1994, 27, 2190–2193.[CrossRef]
19. Tao, I.W.; Jurkovic, M.; Wang, W.I. Doping of ZnTe by molecular beam epitaxy. Appl. Phys. Lett. 1994, 64,1848. [CrossRef]
20. Maiti, B.; Gupta, P.; Chaudhuri, S.; Pal, A.K. Grain boundary effect in polycrystalline ZnTe films. Thin SolidFilms 1994, 239, 104–111. [CrossRef]
21. Wolf, K.; Stanzl, H.; Naumov, A.; Wagner, H.P.; Kuhn, W.; Hahn, B.; Gebhardt, W. Growth and doping of ZnTeand ZnSe epilayers with metalorganic vapour phase epitaxy. J. Cryst. Growth 1994, 138, 412–417. [CrossRef]
22. Neumann-Spallart, M.; Konigstein, C. Electrodeposition of zinc telluride. Thin Solid Films 1995, 265, 33–39.[CrossRef]
23. Bozzini, B.; Lenardi, C.; Lovergine, N. Electrodeposition ofstoichiometric polycrystalline ZnTe on n+-GaAsand Ni-P. Mater. Chem. Phys. 2000, 66, 219–228. [CrossRef]
24. Jun, Y.; Kim, K.J.; Kim, D. Electrochemical synthesis of cu-doped znte films as back contacts to cdte solarcells. Met. Mater. 1999, 5, 279–285. [CrossRef]
25. Arico, A.S.; Silvestro, D.; Antonucci, P.L.; Giordano, N.; Antonucci, V. Electrodeposited Thin Film ZnTeSemiconductors for Photovoltaic Applications. Adv. Perform. Mater. 1997, 4, 115–125. [CrossRef]
26. Karazhanov, S.Z.; Ravindran, P.; Kjekshus, A.; Fjellvag, H.; Svensson, B.G. Electronic structure and opticalproperties of Zn X (X = O, S, Se, Te): A density functional study. Phys. Rev. B 2007, 75, 155104. [CrossRef]
27. Huang, M.Z.; Ching, W.Y. Calculation of optical excitations in cube semiconductors. I. Electronic structureand linear response. Phys. Rev. B 1993, 47, 9449. [CrossRef]
28. Subhan, F.; Azam, S.; Khan, G.; Irfan, M.; Muhammad, S.; Al-Sehemi, A.G.; Naqib, S.H.; Khenata, R.; Khan, S.;Kityk, I.V.; et al. Elastic and optoelectronic properties of CaTa2O6 compounds: Cubic and orthorhombicphases. J. Alloys Compd. 2019, 785, 232–239. [CrossRef]
29. Kityk, I.V. IR-induced Second Harmonic Generation in Sb2Te3-BaF2-PbCl2 Glasses. J. Phys. Chem. B 2003,107, 10083–10087. [CrossRef]
72

Crystals 2019, 9, 247
30. Kityk, I.V. IR-stimulated second harmonic generation in Sb2Te2Se-BaF2-PbCl2 glasses. J. Mod. Opt. 2004, 51,1179–1189.
31. Shpotyuk, O.I.; Kityk, I.V.; Kasperczyk, J. Mechanism of reversible photoinduced optical effects in amorphousAs2S3. J. Non Cryst. Solids 1997, 215, 218–225. [CrossRef]
© 2019 by the authors. Licensee MDPI, Basel, Switzerland. This article is an open accessarticle distributed under the terms and conditions of the Creative Commons Attribution(CC BY) license (http://creativecommons.org/licenses/by/4.0/).
73
crystals
Article
Van der Waals Density Functional Theory vdW-DFqfor Semihard Materials
Qing Peng 1,2,3,*, Guangyu Wang 4, Gui-Rong Liu 4 and Suvranu De 1
1 Department of Mechanical, Aerospace and Nuclear Engineering, Rensselaer Polytechnic Institute,Troy, NY 12180, USA; [email protected]
2 School of Power and Mechanical Engineering, Wuhan University, Wuhan 430072, Hubei, China3 Nuclear Engineering and Radiological Sciences, University of Michigan, Ann Arbor, MI 48109, USA4 School of Aerospace Systems, University of Cincinnati, Cincinnati, OH 45221, USA;
[email protected] (G.W.); [email protected] (G.-R.L.)* Correspondence: [email protected]
Received: 9 April 2019; Accepted: 2 May 2019; Published: 8 May 2019
Abstract: There are a large number of materials with mild stiffness, which are not as soft as tissuesand not as strong as metals. These semihard materials include energetic materials, molecular crystals,layered materials, and van der Waals crystals. The integrity and mechanical stability are mainlydetermined by the interactions between instantaneously induced dipoles, the so called Londondispersion force or van der Waals force. It is challenging to accurately model the structural andmechanical properties of these semihard materials in the frame of density functional theory wherethe non-local correlation functionals are not well known. Here, we propose a van der Waals densityfunctional named vdW-DFq to accurately model the density and geometry of semihard materials.Using β-cyclotetramethylene tetranitramine as a prototype, we adjust the enhancement factor ofthe exchange energy functional with generalized gradient approximations. We find this method tobe simple and robust over a wide tuning range when calibrating the functional on-demand withexperimental data. With a calibrated value q = 1.05, the proposed vdW-DFq method shows goodperformance in predicting the geometries of 11 common energetic material molecular crystals andthree typical layered van der Waals crystals. This success could be attributed to the similar electroniccharge density gradients, suggesting a wide use in modeling semihard materials. This method couldbe useful in developing non-empirical density functional theories for semihard and soft materials.
Keywords: density functional theory; van der Waals corrections; semihard materials;molecular crystals
1. Introduction
Semihard materials generally consist of molecules. Energetic materials are a common class ofsemihard materials with light composites of elements C, H, O, and N, of which the molecular sizesare moderate (ranging from 10 to 1000 atoms) leading to fast chemical kinetics so that the chemicalreactions during decomposition or detonation occurs in a few picoseconds. To gain high energydensities, these molecules are mostly bonded via intermolecular London dispersion forces to formmolecular crystals (Figure 1a–k), which belong to semihard materials since they have mild hardness.The mass density is closely related to the energy density and detonation performance. Therefore,the accurate prediction of the mass density within 3% of experimental values is critical in predictingthe reaction rate and energy density. In general, Density Functional Theory (DFT) [1] is a reliable andpopular tool to predict material properties and material designs. However, the London dispersionforce is poorly described with conventional semi-local approximations to DFT [2] since it is essentially
Crystals 2019, 9, 243; doi:10.3390/cryst9050243 www.mdpi.com/journal/crystals74
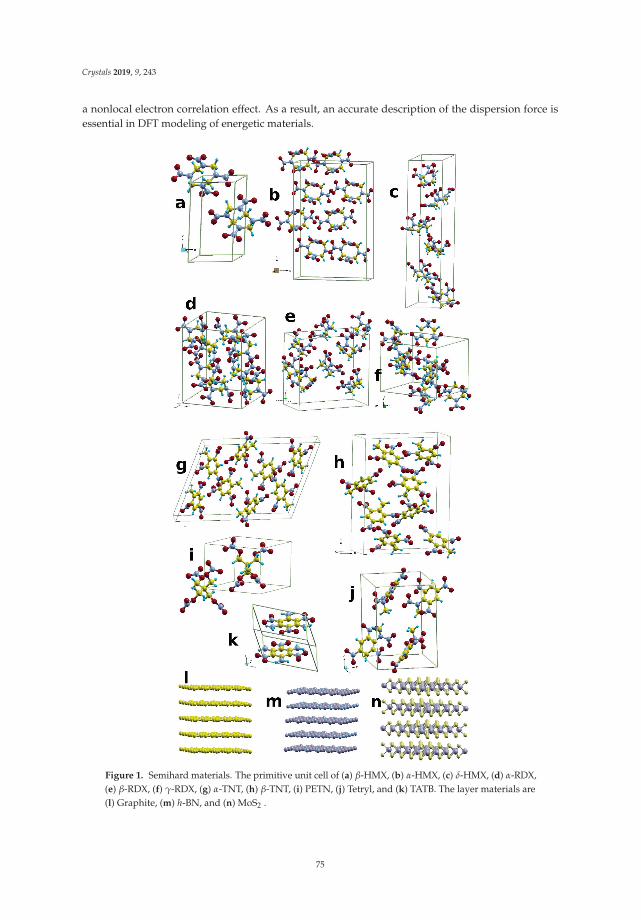
Crystals 2019, 9, 243
a nonlocal electron correlation effect. As a result, an accurate description of the dispersion force isessential in DFT modeling of energetic materials.
Figure 1. Semihard materials. The primitive unit cell of (a) β-HMX, (b) α-HMX, (c) δ-HMX, (d) α-RDX,(e) β-RDX, (f) γ-RDX, (g) α-TNT, (h) β-TNT, (i) PETN, (j) Tetryl, and (k) TATB. The layer materials are(l) Graphite, (m) h-BN, and (n) MoS2 .
75
Crystals 2019, 9, 243
There are extensive studies to improve the modeling of dispersion, or van der Waals (vdW)interactions [2,3], such as DFT-D [4–9], vdW-TS [10,11], DFT-vdWsur f [12], and vdW-DF [13–16]methods. The DFT-D1 and DFT-D2 methods are classified as the 1st rung of Jacob’s Ladder forDFT-based dispersion correction schemes according to Klimes and Michaelides [3]. The DFT-D3and vdW-TS methods belong to the next rung that has environment dependent C6 corrections.Non-local density functionals like DFT-DF and DFT-DF2 methods sit in the 3rd rung [3], of which theoverall accuracy increases, as well as the computational demand. Recently, a few improvements invdW-DF methods have been proposed, including optPBE-vdW, optB88-vdW, optB86b-vdW [17,18],vdW-DF2-C09 [19], vdW-DF-cx [20], rev-vdW-DF2 [21], PBE+rVV10 [22], PBEsol+rVV10 [23],SCAN+rVV10 [24], and SG4+rVV10 [25]. These methods are designed to minimize the error ofthe binding energies and interaction energy curves in a certain collection of materials, such as the S22data set [26], aiming for a general use for all materials. The accuracy of these models on energeticmaterials like HMX has not been assessed yet. We found that the prediction of the mass density inHMX is still not satisfied, as opposed to the claimed success in many other materials. Here we proposea vdW-DF-based method (we denote it as vdW-DFq) using a single parameter to tune the exchangefunctional so that the target mass density can be achieved. We are looking for a reliable model for aparticular material, instead of a general formula for all materials.
The cyclotetramethylene tetranitramine (HMX) shown in Figure 1a–c is an important secondaryexplosive. The P21/c monoclinic crystal structure, namely β-phase, (Figure 1a) is thermodynamicallythe most stable phase of HMX under ambient conditions. β-HMX has a high detonation velocity andhigh energy density. HMX is most commonly used in military and industrial applications includingautomobile air bags, rocket propellants, and polymer-bonded explosives. Therefore, β-HMX has beenextensively studied [27–29]. We focus on β-HMX as a representative of semihard materials because ofits moderate bulk modulus (around 15 GPa).
2. Methodology
Within the DFT frame work, the van der Waals density functional (vdW-DF) [13] is good for bothcovalent and van der Waals (vdW) interactions in a seamless fashion. The exchange correlation energyExc as sum of exchange energy Ex and correlation energy Ec is expressed as
Exc = Ex + Ec = EGGAx + ELDA
c + ENLc (1)
where EGGAx is the exchange energy within the generalized gradient approximation (GGA) [30], ELDA
cis the short-range correlation energy within the local density approximation (LDA) [31], and ENL
c isthe non-local correlation energy is long-range beyond LDA. ENL
c could be expressed as
ENLc =
12
∫ ∫drdr′n(r)φ(d, d′)n(r′), (2)
where n(r) is the electron density at the point r, and φ(d, d′) is the vdW kernel [13], d = q0(r)|r − r′|),d = q0(r
′)|r − r′|), q0 is a function of n(r) and its gradient |∇n(r)|, which determines the long-rangeasymptote as well as the short-range damping of the vdW kernel. The choice of LDA for the short-rangecorrelation is to avoid possible double counting of the gradient on n(r) and |∇n(r)|. Ultimately, thischoice implicitly implies that the only non-local correlation term is due to vdW interactions, wherethe vdW kernel is actually derived in a way to model dispersion. The computational cost for vdW-DFcalculations is marginal as compared with orbital dependent functionals and recent developmentsin efficient algorithms [32–34]. As a result, vdW-DF calculations are feasible in large calculations at acomputational cost comparable with that of conventional semi-local DFT, at about only 30% additionalcomputation time from the authors’ experience.
76
Crystals 2019, 9, 243
The general form of the GGA exchange energy functional is given as
EGGAx =
∫drn(r)εuni f
x [n(r)]FGGAX [s(r)], (3)
where εuni fx (n) = −3kF/4π with kF = (3π2n)
13 is the exchange energy for the uniform electron gas,
FGGAX (s) is the GGA enhancement factor, which distinguishes one GGA from another. The variable s
in FGGAX (s) is the dimensionless reduced gradient, defined as
s =|∇n|
2(3π2n)1/3n. (4)
The reduced gradient expresses how fast the density varies on the scale of the local Fermiwavelength kF. When s is set to zero, the GGA functional reduces to LDA. There are quite a fewproposals of the EGGA
x for vdW-DF [17–19,32].The nonlocal vdW-DF consistently overestimates the inter-fragment distance, although it improves
the description of van der Waals interactions over conventional semi-local DFT. The original vdW-DFuses the revised Perdew-Burke-Ernzerhof (revPBE) [35] exchange functional for weakly interactingmolecular pairs. However, the revPBE exchange correction is too repulsive at small separations [36].Therefore, a few efforts are devoted to develop a better exchange functional for the nonlocal correlationfunctional. Klimeš et al. [17,18] have introduced several exchange functionals with accurate bindingenergies of molecular duplexes in the S22 data set [37]. Cooper constructed an exchange functional(named C09x) based on revPBE [19]. The second version of vdW-DF (vdW-DF2) uses the revisedPW86 (rPW86) exchange functional [14]. Additionally, there are a few other nonlocal correlationfunctionals [38–41].
Recently a vdW-DF optimized semi-empirically based on the Bayesian error estimation namedBEEF was proposed [42]. Hamada also proposed an exchange functional for the second version ofvdW-DF (vdW-DF2). The so called rev-vdW-DF2 [21] is based on the GGA exchange functional ofoptB86b [18] with a revised q value of 0.7114 (as named B86R). A very recent study suggests thatrev-vdW-DF2 is very accurate for weakly bound solids overall compared to other methods. However,it is still not satisfactory on our demanded accurancy in geometry. Nevertheless, the performanceof the improved functionals depend on the system, and for the applications to a variety of systemsincluding surfaces and interfaces, which consist of materials with different bonding natures, accuracyof vdW-DF has yet to be improved.
It is worth noting that all these methods are targeting general materials and all the properties,which is definitely a non-trivial work because the exchange enhancement factor is hard to satisfy in allsystems where the reduced density gradient is different from case to case. In some cases, one needsa well tailored density functional only for a particular property of interest. For example, the massdensity is the primary concern in prediction of the detonation performance of energetic materials.Thus, a relatively simple, accurate, and tunable density functional theory is indispensable.
To obtain an accurate exchange functional for vdW-DF, the following properties are consideredhere. First, EGGA
x should recover the second-order gradient expansion approximation (GEA) [43] at theslowly varying density limit as
FGEAX (s) = 1 + μs2, (5)
with μ = 10/81. This property plays an important role in predicting equilibrium geometries for solidsand surfaces [44]. This constraint has been applied in other exchange functionals [18,20,45]. It is worthpointing out that C09 employs μ = 0.0864. Second, at large gradient limit, it proposed that Fx shouldhave s2/5 dependence so that it can avoid the spurious binding from exchange only. So far only Perdewand Wang (PW86) [46] and Becke (B86b) [47] exchange functionals fulfill this reqirement [45].
77
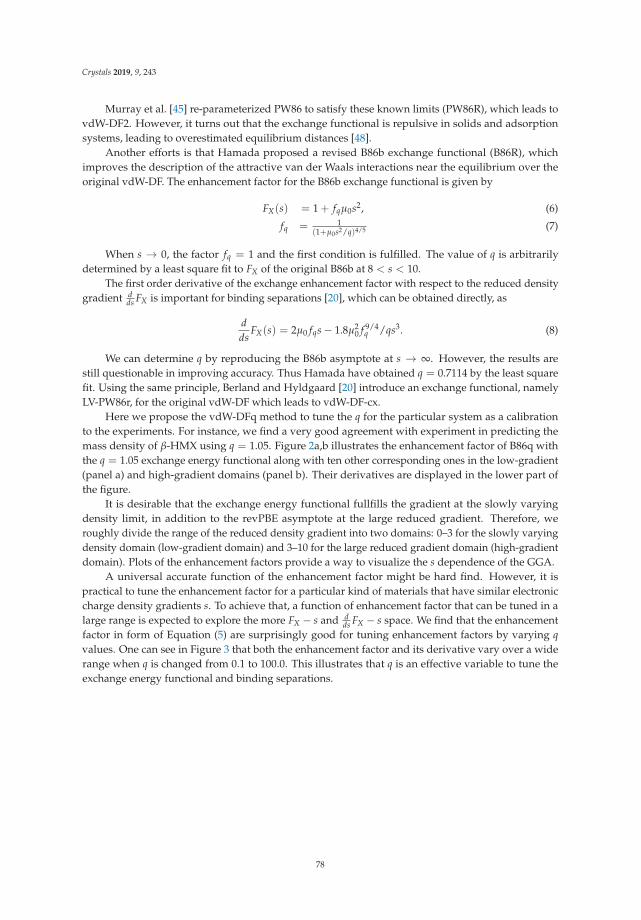
Crystals 2019, 9, 243
Murray et al. [45] re-parameterized PW86 to satisfy these known limits (PW86R), which leads tovdW-DF2. However, it turns out that the exchange functional is repulsive in solids and adsorptionsystems, leading to overestimated equilibrium distances [48].
Another efforts is that Hamada proposed a revised B86b exchange functional (B86R), whichimproves the description of the attractive van der Waals interactions near the equilibrium over theoriginal vdW-DF. The enhancement factor for the B86b exchange functional is given by
FX(s) = 1 + fqμ0s2, (6)
fq = 1(1+μ0s2/q)4/5 (7)
When s → 0, the factor fq = 1 and the first condition is fulfilled. The value of q is arbitrarilydetermined by a least square fit to FX of the original B86b at 8 < s < 10.
The first order derivative of the exchange enhancement factor with respect to the reduced densitygradient d
ds FX is important for binding separations [20], which can be obtained directly, as
dds
FX(s) = 2μ0 fqs − 1.8μ20 f 9/4
q /qs3. (8)
We can determine q by reproducing the B86b asymptote at s → ∞. However, the results arestill questionable in improving accuracy. Thus Hamada have obtained q = 0.7114 by the least squarefit. Using the same principle, Berland and Hyldgaard [20] introduce an exchange functional, namelyLV-PW86r, for the original vdW-DF which leads to vdW-DF-cx.
Here we propose the vdW-DFq method to tune the q for the particular system as a calibrationto the experiments. For instance, we find a very good agreement with experiment in predicting themass density of β-HMX using q = 1.05. Figure 2a,b illustrates the enhancement factor of B86q withthe q = 1.05 exchange energy functional along with ten other corresponding ones in the low-gradient(panel a) and high-gradient domains (panel b). Their derivatives are displayed in the lower part ofthe figure.
It is desirable that the exchange energy functional fullfills the gradient at the slowly varyingdensity limit, in addition to the revPBE asymptote at the large reduced gradient. Therefore, weroughly divide the range of the reduced density gradient into two domains: 0–3 for the slowly varyingdensity domain (low-gradient domain) and 3–10 for the large reduced gradient domain (high-gradientdomain). Plots of the enhancement factors provide a way to visualize the s dependence of the GGA.
A universal accurate function of the enhancement factor might be hard find. However, it ispractical to tune the enhancement factor for a particular kind of materials that have similar electroniccharge density gradients s. To achieve that, a function of enhancement factor that can be tuned in alarge range is expected to explore the more FX − s and d
ds FX − s space. We find that the enhancementfactor in form of Equation (5) are surprisingly good for tuning enhancement factors by varying qvalues. One can see in Figure 3 that both the enhancement factor and its derivative vary over a widerange when q is changed from 0.1 to 100.0. This illustrates that q is an effective variable to tune theexchange energy functional and binding separations.
78
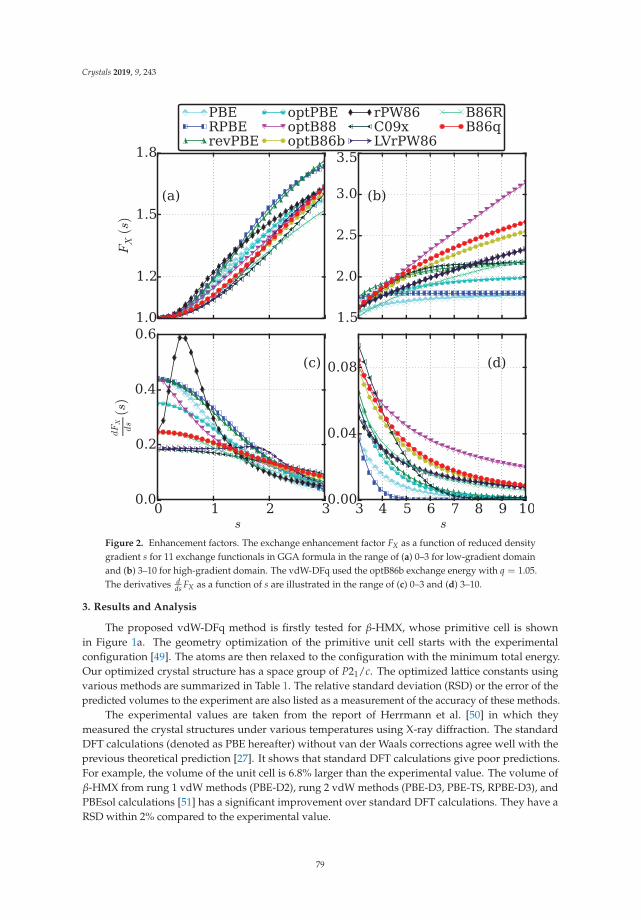
Crystals 2019, 9, 243
Figure 2. Enhancement factors. The exchange enhancement factor FX as a function of reduced densitygradient s for 11 exchange functionals in GGA formula in the range of (a) 0–3 for low-gradient domainand (b) 3–10 for high-gradient domain. The vdW-DFq used the optB86b exchange energy with q = 1.05.The derivatives d
ds FX as a function of s are illustrated in the range of (c) 0–3 and (d) 3–10.
3. Results and Analysis
The proposed vdW-DFq method is firstly tested for β-HMX, whose primitive cell is shownin Figure 1a. The geometry optimization of the primitive unit cell starts with the experimentalconfiguration [49]. The atoms are then relaxed to the configuration with the minimum total energy.Our optimized crystal structure has a space group of P21/c. The optimized lattice constants usingvarious methods are summarized in Table 1. The relative standard deviation (RSD) or the error of thepredicted volumes to the experiment are also listed as a measurement of the accuracy of these methods.
The experimental values are taken from the report of Herrmann et al. [50] in which theymeasured the crystal structures under various temperatures using X-ray diffraction. The standardDFT calculations (denoted as PBE hereafter) without van der Waals corrections agree well with theprevious theoretical prediction [27]. It shows that standard DFT calculations give poor predictions.For example, the volume of the unit cell is 6.8% larger than the experimental value. The volume ofβ-HMX from rung 1 vdW methods (PBE-D2), rung 2 vdW methods (PBE-D3, PBE-TS, RPBE-D3), andPBEsol calculations [51] has a significant improvement over standard DFT calculations. They have aRSD within 2% compared to the experimental value.
79
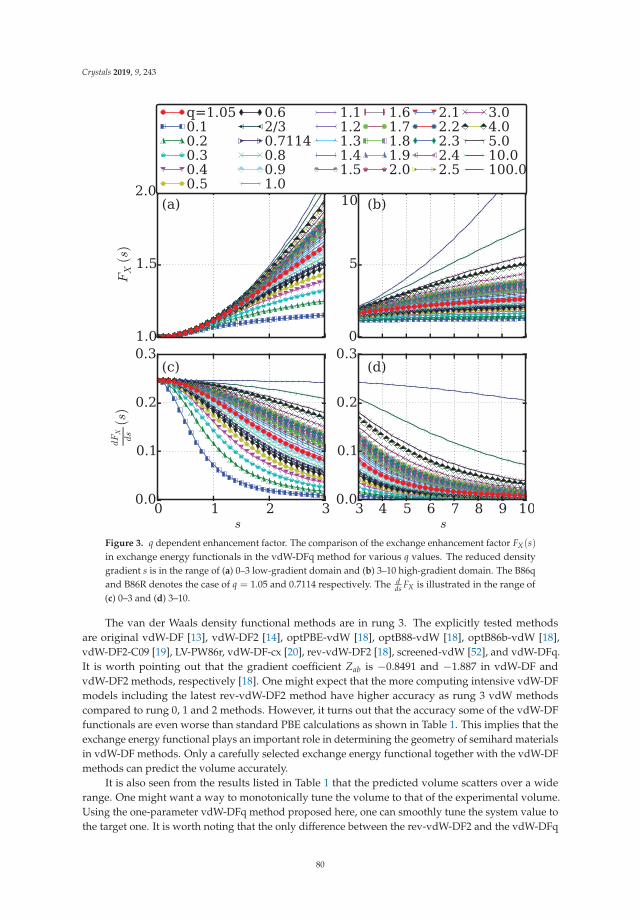
Crystals 2019, 9, 243
Figure 3. q dependent enhancement factor. The comparison of the exchange enhancement factor FX(s)in exchange energy functionals in the vdW-DFq method for various q values. The reduced densitygradient s is in the range of (a) 0–3 low-gradient domain and (b) 3–10 high-gradient domain. The B86qand B86R denotes the case of q = 1.05 and 0.7114 respectively. The d
ds FX is illustrated in the range of(c) 0–3 and (d) 3–10.
The van der Waals density functional methods are in rung 3. The explicitly tested methodsare original vdW-DF [13], vdW-DF2 [14], optPBE-vdW [18], optB88-vdW [18], optB86b-vdW [18],vdW-DF2-C09 [19], LV-PW86r, vdW-DF-cx [20], rev-vdW-DF2 [18], screened-vdW [52], and vdW-DFq.It is worth pointing out that the gradient coefficient Zab is −0.8491 and −1.887 in vdW-DF andvdW-DF2 methods, respectively [18]. One might expect that the more computing intensive vdW-DFmodels including the latest rev-vdW-DF2 method have higher accuracy as rung 3 vdW methodscompared to rung 0, 1 and 2 methods. However, it turns out that the accuracy some of the vdW-DFfunctionals are even worse than standard PBE calculations as shown in Table 1. This implies that theexchange energy functional plays an important role in determining the geometry of semihard materialsin vdW-DF methods. Only a carefully selected exchange energy functional together with the vdW-DFmethods can predict the volume accurately.
It is also seen from the results listed in Table 1 that the predicted volume scatters over a widerange. One might want a way to monotonically tune the volume to that of the experimental volume.Using the one-parameter vdW-DFq method proposed here, one can smoothly tune the system value tothe target one. It is worth noting that the only difference between the rev-vdW-DF2 and the vdW-DFq
80
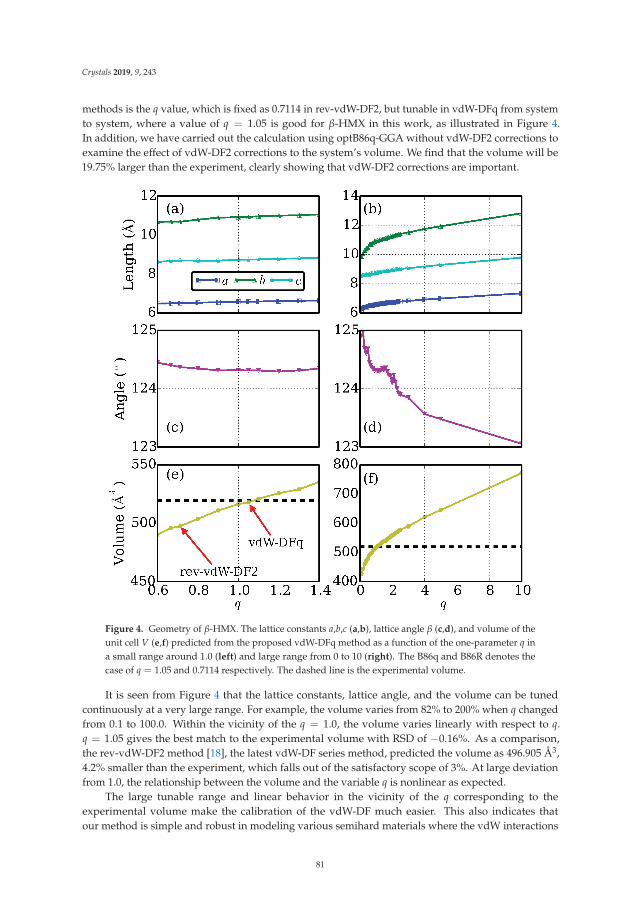
Crystals 2019, 9, 243
methods is the q value, which is fixed as 0.7114 in rev-vdW-DF2, but tunable in vdW-DFq from systemto system, where a value of q = 1.05 is good for β-HMX in this work, as illustrated in Figure 4.In addition, we have carried out the calculation using optB86q-GGA without vdW-DF2 corrections toexamine the effect of vdW-DF2 corrections to the system’s volume. We find that the volume will be19.75% larger than the experiment, clearly showing that vdW-DF2 corrections are important.
Figure 4. Geometry of β-HMX. The lattice constants a,b,c (a,b), lattice angle β (c,d), and volume of theunit cell V (e,f) predicted from the proposed vdW-DFq method as a function of the one-parameter q ina small range around 1.0 (left) and large range from 0 to 10 (right). The B86q and B86R denotes thecase of q = 1.05 and 0.7114 respectively. The dashed line is the experimental volume.
It is seen from Figure 4 that the lattice constants, lattice angle, and the volume can be tunedcontinuously at a very large range. For example, the volume varies from 82% to 200% when q changedfrom 0.1 to 100.0. Within the vicinity of the q = 1.0, the volume varies linearly with respect to q.q = 1.05 gives the best match to the experimental volume with RSD of −0.16%. As a comparison,the rev-vdW-DF2 method [18], the latest vdW-DF series method, predicted the volume as 496.905 Å3,4.2% smaller than the experiment, which falls out of the satisfactory scope of 3%. At large deviationfrom 1.0, the relationship between the volume and the variable q is nonlinear as expected.
The large tunable range and linear behavior in the vicinity of the q corresponding to theexperimental volume make the calibration of the vdW-DF much easier. This also indicates thatour method is simple and robust in modeling various semihard materials where the vdW interactions
81
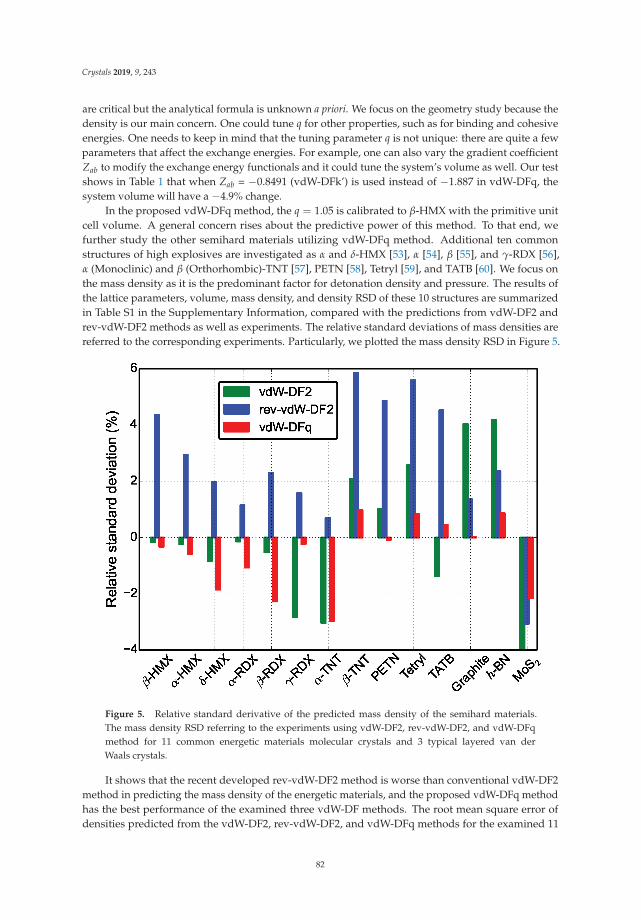
Crystals 2019, 9, 243
are critical but the analytical formula is unknown a priori. We focus on the geometry study because thedensity is our main concern. One could tune q for other properties, such as for binding and cohesiveenergies. One needs to keep in mind that the tuning parameter q is not unique: there are quite a fewparameters that affect the exchange energies. For example, one can also vary the gradient coefficientZab to modify the exchange energy functionals and it could tune the system’s volume as well. Our testshows in Table 1 that when Zab = −0.8491 (vdW-DFk’) is used instead of −1.887 in vdW-DFq, thesystem volume will have a −4.9% change.
In the proposed vdW-DFq method, the q = 1.05 is calibrated to β-HMX with the primitive unitcell volume. A general concern rises about the predictive power of this method. To that end, wefurther study the other semihard materials utilizing vdW-DFq method. Additional ten commonstructures of high explosives are investigated as α and δ-HMX [53], α [54], β [55], and γ-RDX [56],α (Monoclinic) and β (Orthorhombic)-TNT [57], PETN [58], Tetryl [59], and TATB [60]. We focus onthe mass density as it is the predominant factor for detonation density and pressure. The results ofthe lattice parameters, volume, mass density, and density RSD of these 10 structures are summarizedin Table S1 in the Supplementary Information, compared with the predictions from vdW-DF2 andrev-vdW-DF2 methods as well as experiments. The relative standard deviations of mass densities arereferred to the corresponding experiments. Particularly, we plotted the mass density RSD in Figure 5.
Figure 5. Relative standard derivative of the predicted mass density of the semihard materials.The mass density RSD referring to the experiments using vdW-DF2, rev-vdW-DF2, and vdW-DFqmethod for 11 common energetic materials molecular crystals and 3 typical layered van derWaals crystals.
It shows that the recent developed rev-vdW-DF2 method is worse than conventional vdW-DF2method in predicting the mass density of the energetic materials, and the proposed vdW-DFq methodhas the best performance of the examined three vdW-DF methods. The root mean square error ofdensities predicted from the vdW-DF2, rev-vdW-DF2, and vdW-DFq methods for the examined 11
82
Crystals 2019, 9, 243
molecular crystals is 1.7%, 3.7%, and 1.4%, respectively. These results indicate that vdW-DFq methodwith q = 1.05 might be a good first-principles approach to study energetic materials. This successcould be attributed to the similar electronic charge density gradients, because all these materials arecomposed of similar elements of carbon, nitrogen, oxygen, and hydrogen, and all have similar massdensities around 1.9 g/cm3.
In addition to energetic materials, we further study the mass density of the layered van derWaals crystals [61,62]. Graphite, hexagonal boron nitride (h-BN), and molybdenum disulfide (MoS2)are typical layered crystals. Their lattice parameters, volume, mass density, and density RSD aresummarized in Table S1 in the Supplementary Information.
As shown in Figure 5, the vdW-DFq method prediction also has good agreements withexperimental measurements. The performance of the vdW-DFq method is better than the vdW-DF2 andrev-vdW-DF2 methods in the layered van der Waals crystals. For the total 14 structures, the root meansquare error of densities is 5.52%, 3.46%, and 1.37% for the vdW-DF2, rev-vdW-DF2, and vdW-DFqmethods, respectively. The better performance of the vdW-DFq method over the vdW-DF2 andrev-vdW-DF2 methods in predicting the geometries of the 14 representative molecular crystals impliesthat the proposed vdW-DFq method could also have good performance in modeling other semihardmaterials. It is reasonable because the q value is calibrated and thus “localized” to semihard materials,as opposed to the other two methods which aim at a universal method for all materials.
It is worth mentioning that graphite, h-BN, and MoS2 are actually highly anisotropic materials.The success of our vdW-DFq method also suggests that, in some cases, finding correct equilibriumconfigurations does not necessarily imply finding the correct dispersion interactions [63], but acompromise of various approximations, which, however, vary from case to case. From this aspect,it evidences the essential role of q that is tunable to optimize such an accommodation. It might beexpected that vdW-DFq method is a handy tool for various vdW systems on-demand.
4. Conclusions
In summary, we assess the performance of van der Waals (vdW) density functionals in predictingthe geometry of semihard materials. We propose a one-parameter empirical van der Waals densityfunctional named vdW-DFq to continuously tune the lattice constants by adjusting the enhancementfactor of the exchange energy functionals. We illustrate that the lattice constants and volumes canbe tuned over a wide range, and with a linear behavior in the vicinity of the q corresponding to theexperimental volume. The application on β-HMX shows that our method is simple and robust inmodeling various semihard materials. By one-parameter tuning, the vdW density functional can bewell calibrated to the experimental value. This method provides a controllable approach to accuratelymodel the mechanical, electrical, chemical, and other properties within the framework of van der Waalsdensity functionals. Further study on the 10 energetic material molecular crystals and 3 layered van derWaals crystals shows that the proposed vdW-DFq method has better performance than the vdW-DF2and rev-vdW-DF2 methods in predicting the geometries, which indicates that the vdW-DFq methodcould be good at modeling semihard materials. Our investigation might also inspire computationalphysicists to develop a better non-empirical vdW density functional. Nevertheless, our vdW-DFqmethod is a on-demand handy tool for various vdW systems by tuning q value.
83
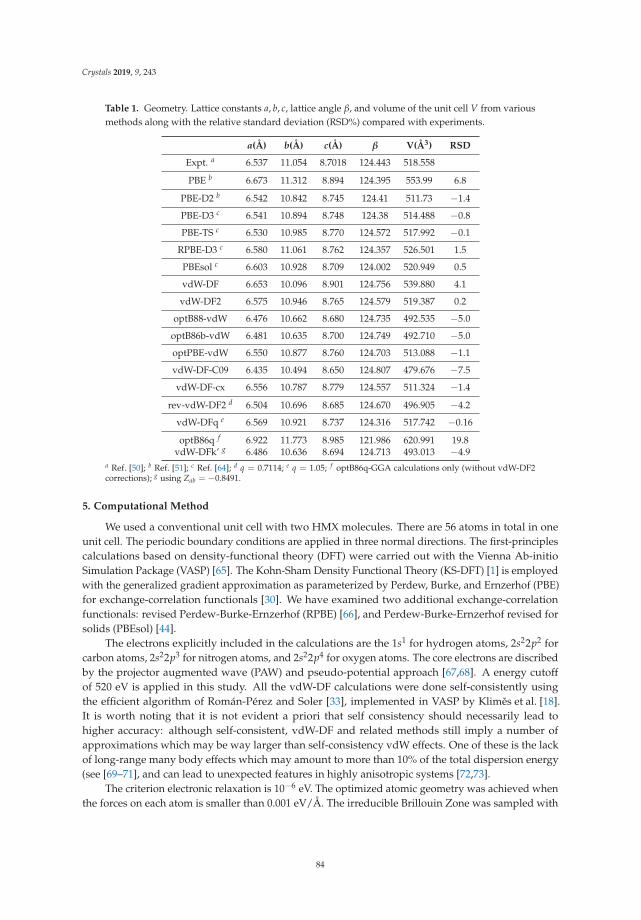
Crystals 2019, 9, 243
Table 1. Geometry. Lattice constants a, b, c, lattice angle β, and volume of the unit cell V from variousmethods along with the relative standard deviation (RSD%) compared with experiments.
a(Å) b(Å) c(Å) β V(Å3) RSD
Expt. a 6.537 11.054 8.7018 124.443 518.558
PBE b 6.673 11.312 8.894 124.395 553.99 6.8
PBE-D2 b 6.542 10.842 8.745 124.41 511.73 −1.4
PBE-D3 c 6.541 10.894 8.748 124.38 514.488 −0.8
PBE-TS c 6.530 10.985 8.770 124.572 517.992 −0.1
RPBE-D3 c 6.580 11.061 8.762 124.357 526.501 1.5
PBEsol c 6.603 10.928 8.709 124.002 520.949 0.5
vdW-DF 6.653 10.096 8.901 124.756 539.880 4.1
vdW-DF2 6.575 10.946 8.765 124.579 519.387 0.2
optB88-vdW 6.476 10.662 8.680 124.735 492.535 −5.0
optB86b-vdW 6.481 10.635 8.700 124.749 492.710 −5.0
optPBE-vdW 6.550 10.877 8.760 124.703 513.088 −1.1
vdW-DF-C09 6.435 10.494 8.650 124.807 479.676 −7.5
vdW-DF-cx 6.556 10.787 8.779 124.557 511.324 −1.4
rev-vdW-DF2 d 6.504 10.696 8.685 124.670 496.905 −4.2
vdW-DFq e 6.569 10.921 8.737 124.316 517.742 −0.16
optB86q f 6.922 11.773 8.985 121.986 620.991 19.8vdW-DFk’ g 6.486 10.636 8.694 124.713 493.013 −4.9
a Ref. [50]; b Ref. [51]; c Ref. [64]; d q = 0.7114; e q = 1.05; f optB86q-GGA calculations only (without vdW-DF2corrections); g using Zab = −0.8491.
5. Computational Method
We used a conventional unit cell with two HMX molecules. There are 56 atoms in total in oneunit cell. The periodic boundary conditions are applied in three normal directions. The first-principlescalculations based on density-functional theory (DFT) were carried out with the Vienna Ab-initioSimulation Package (VASP) [65]. The Kohn-Sham Density Functional Theory (KS-DFT) [1] is employedwith the generalized gradient approximation as parameterized by Perdew, Burke, and Ernzerhof (PBE)for exchange-correlation functionals [30]. We have examined two additional exchange-correlationfunctionals: revised Perdew-Burke-Ernzerhof (RPBE) [66], and Perdew-Burke-Ernzerhof revised forsolids (PBEsol) [44].
The electrons explicitly included in the calculations are the 1s1 for hydrogen atoms, 2s22p2 forcarbon atoms, 2s22p3 for nitrogen atoms, and 2s22p4 for oxygen atoms. The core electrons are discribedby the projector augmented wave (PAW) and pseudo-potential approach [67,68]. A energy cutoffof 520 eV is applied in this study. All the vdW-DF calculations were done self-consistently usingthe efficient algorithm of Román-Pérez and Soler [33], implemented in VASP by Klimes et al. [18].It is worth noting that it is not evident a priori that self consistency should necessarily lead tohigher accuracy: although self-consistent, vdW-DF and related methods still imply a number ofapproximations which may be way larger than self-consistency vdW effects. One of these is the lackof long-range many body effects which may amount to more than 10% of the total dispersion energy(see [69–71], and can lead to unexpected features in highly anisotropic systems [72,73].
The criterion electronic relaxation is 10−6 eV. The optimized atomic geometry was achieved whenthe forces on each atom is smaller than 0.001 eV/Å. The irreducible Brillouin Zone was sampled with
84
Crystals 2019, 9, 243
a 5 × 3 × 4 Gamma-centered k-mesh. The other 13 structures are optimized using similar parametersin DFT calculations.
Supplementary Materials: The following are available at http://www.mdpi.com/2073-4352/9/5/243/s1,Supplementary information includes the lattice parameters, volume, mass density, and density relative standarddeviation of other 13 structures and is available in the online version of the paper. Correspondence and requestsfor materials should be addressed to Q.P. ([email protected]). About how to use our method in VASP.We therefore write a “howto” file, as the supplementary.
Author Contributions: Conceptualization, Q.P.; computation, Q.P., G.W.; writing—original draft preparation,Q.P.; writing—review and editing, Q.P., G.W, G.-R.L., S.D.; supervision, S.D.; project administration, S.D.; fundingacquisition, S.D., G.-R.L.
Funding: The authors would like to acknowledge the generous financial support from the Defense ThreatReduction Agency (DTRA) Grant # HDTRA1-13-1-0025 and the Office of Naval Research grants ONR Award #N00014-08-1-0462 and # N00014-12-1-0527.
Acknowledgments: We thank Shengbai Zhang, Jianwei Sun, and Chen Huang for helpful discussions.Computational resources were provided by Rensselaer Polytechnic Institute through AMOS, the IBM BlueGene/Q system at the Center for Computational Innovations.
Conflicts of Interest: The authors declare no competing interests.
References
1. Hohenberg, P.; Kohn, W. Inhomogeneous electron gas. Phys. Rev. 1964, 136, B864. [CrossRef]2. Hermann, J.; DiStasio, R.A., Jr.; Tkatchenko, A. First-Principles Models for van der Waals Interactions in
Molecules and Materials: Concepts, Theory, and Applications. Chem. Rev. 2017, 117, 4714–4758. [CrossRef]3. Klimes, J.; Michaelides, A. Perspective: Advances and challenges in treating van der waals dispersion forces
in density functional theory. J. Chem. Phys. 2012, 137, 120901. [CrossRef] [PubMed]4. Grimme, S. Accurate description of van der Waals complexes by density functional theory including
empirical corrections. J. Comput. Chem. 2004, 25, 1463–1473. [CrossRef] [PubMed]5. Grimme, S. Semiempirical GGA-type density functional constructed with a long-range dispersion correction.
J. Comput. Chem. 2006, 27, 1787–1799. [CrossRef] [PubMed]6. Grimme, S.; Antony, J.; Ehrlich, S.; Krieg, H. A consistent and accurate ab initio parametrization of density
functional dispersion correction (DFT-D) for the 94 elements H-Pu. J. Chem. Phys. 2010, 132, 154104.[CrossRef]
7. Goerigk, L.; Grimme, S. A thorough benchmark of density functional methods for general main groupthermochemistry, kinetics, and noncovalent interactions. Phys. Chem. Chem. Phys. 2011, 13, 6670–6688.[CrossRef] [PubMed]
8. Grimme, S.; Ehrlich, S.; Goerigk, L. Effect of the damping function in dispersion corrected density functionaltheory. J. Comput. Chem. 2011, 32, 1456–1465. [CrossRef]
9. Caldeweyher, E.; Bannwarth, C.; Grimme, S. Extension of the D3 dispersion coefficient model. J. Chem. Phys.2017, 147, 034112. [CrossRef] [PubMed]
10. Tkatchenko, A.; Scheffler, M. Accurate molecular van der waals interactions from ground-state electrondensity and free-atom reference data. Phys. Rev. Lett. 2009, 102, 073005 . [CrossRef]
11. Tkatchenko, A.; DiStasio, R.A.; Car, R.; Scheffler, M. Accurate and efficient method for many-body van derwaals interactions. Phys. Rev. Lett. 2012, 108, 236402. [CrossRef]
12. Ruiz, V.G.; Liu, W.; Tkatchenko, A. Density-functional theory with screened van der waals interactionsapplied to atomic and molecular adsorbates on close-packed and non-close-packed surfaces. Phys. Rev. B2016, 93, 035118. [CrossRef]
13. Dion, M.; Rydberg, H.; Schröder, E.; Langreth, D.C.; Lundqvist, B.I. Van der waals density functional forgeneral geometries. Phys. Rev. Lett. 2004, 92, 246401. [CrossRef]
14. Lee, K.; Murray, D.; Kong, L.; Lundqvist, B.I.; Langreth, D.C. . Higher-accuracy van der waals densityfunctional. Phys. Rev. B 2010, 82, 081101. [CrossRef]
15. Hyldgaard, P.; Berland, K.; Schröder, E. Interpretation of van der waals density functionals. Phys. Rev. B2014, 90, 075148. [CrossRef]
85
Crystals 2019, 9, 243
16. Berland, K.; Cooper, V.R.; Lee, K.; Schroeder, E.; Thonhauser, T.; Hyldgaard, P.; Lundqvist, B.I. Van derWaals forces in density functional theory: A review of the vdW-DF method. Rep. Prog. Phys. 2015,78, 066501.[CrossRef] [PubMed]
17. Klimeš, J.; Bowler, D.R.; Michaelides, A. Chemical accuracy for the van der waals density functional. J. Phys.Condens. Matter 2010, 22, 022201. [CrossRef]
18. Klimeš, J.; Bowler, D.R.; Michaelides, A. Van der waals density functionals applied to solids. Phys. Rev. B2011, 83, 195131. [CrossRef]
19. Cooper, V.R. Van der waals density functional: An appropriate exchange functional. Phys. Rev. B 2010,81, 161104. [CrossRef]
20. Berland, K.; Hyldgaard, P. Exchange functional that tests the robustness of the plasmon description of thevan der waals density functional. Phys. Rev. B 2014, 89, 035412 [CrossRef]
21. Hamada, I. van der waals density functional made accurate. Phys. Rev. B 2014, 89, 121103. [CrossRef]22. Peng, H.; Perdew, J.P. Rehabilitation of the perdew-burke-ernzerhof generalized gradient approximation for
layered materials. Phys. Rev. B 2017, 95, 081105. [CrossRef]23. Terentjev, A.V.; Constantin, L.A.; Pitarke, J.M. Dispersion-corrected pbesol exchange-correlation functional.
Phys. Rev. B 2018, 98, 214108. [CrossRef]24. Peng, H.; Yang, Z.; Perdew, J.P.; Sun, J. Versatile van der waals density functional based on a meta-generalized
gradient approximation. Phys. Rev. X 2016, 6, 041005. [CrossRef]25. Terentjev, A.V.; Cortona, P.; Constantin, L.A.; Pitarke, J.M.; Sala, F.D.; Fabiano, E. Solid-state testing of a
van-der-waals-corrected exchange-correlation functional based on the semiclassical atom theory. Computation2018, 6, 7. [CrossRef]
26. Csonka, G.I.; Perdew, J.P.; Ruzsinszky, A.; Philipsen, P.H.T.; Lebègue, S.; Paier, J.; Vydrov, O.A.; Ángyán,J.G. Assessing the performance of recent density functionals for bulk solids. Phys. Rev. B 2009, 79, 155107.[CrossRef]
27. Conroy, M.W.; Oleynik, I.I.; Zybin, S.V.; White, C.T. First-principles anisotropic constitutive relationships inbeta-cyclotetramethylene tetranitramine (beta-HMX). J. Appl. Phys. 2008, 104, 053506. [CrossRef]
28. Landerville, A.C.; Conroy, M.W.; Budzevich, M.M.; Lin, Y.; White, C.T.; Oleynik, I.I. Equations of statefor energetic materials from density functional theory with van der Waals, thermal, and zero-point energycorrections. Appl. Phys. Lett. 2010, 97, 251908. [CrossRef]
29. Cui, H.-L.; Ji, G.-F.; Chen, X.-R.; Zhang, Q.-M.; Wei, D.-W.; Zhao, F. Phase transitions and mechanicalproperties of octahydro-1,3,5,7-tetranitro-1,3,5,7-tetrazocine in different crystal phases by moleculardynamics simulation. J. Chem. Eng. Data 2010, 5, 3121–3129. [CrossRef]
30. Perdew, J.P.; Burke, K.; Ernzerhof, M. Generalized gradient approximation made simple. Phys. Rev. Lett.1996, 77, 3865. [CrossRef]
31. Ceperley, D.M.; Alder, B.J. Ground state of the electron gas by a stochastic method. Phys. Rev. Lett. 1980, 45,566–569. [CrossRef]
32. Gulans, A.; Puska, M.J.; Nieminen, R.M. Linear-scaling self-consistent implementation of the van der waalsdensity functional. Phys. Rev. B 2009, 79, 201105. [CrossRef]
33. Román-Pérez, G.; Soler, J.M. Efficient implementation of a van der waals density functional: Application todouble-wall carbon nanotubes. Phys. Rev. Lett. 2009, 103, 096102. [CrossRef] [PubMed]
34. Wu, J.; Gygi, F. A simplified implementation of van der waals density functionals for first-principlesmolecular dynamics applications. J. Chem. Phys. 2012, 136, 224107. [CrossRef] [PubMed]
35. Zhang, Y.; Yang, W. Comment on “generalized gradient approximation made simple”. Phys. Rev. Lett. 1998,80, 890. [CrossRef]
36. Puzder, A.; Dion, M.; Langreth, D.C. Binding energies in benzene dimers: Nonlocal density functionalcalculations. J. Chem. Phys. 2006, 124, 164105. [CrossRef]
37. Jurecka, P.; Sponer, J.; Cerny, J.; Hobza, P. Benchmark database of accurate (mp2 and ccsd(t) complete basisset limit) interaction energies of small model complexes, dna base pairs, and amino acid pairs. Phys. Chem.Chem. Phys. 2006, 8, 1985–1993. [CrossRef]
38. Vydrov, O.A.; Voorhis, T.V. Nonlocal van der waals density functional: The simpler the better. J. Chem. Phys.2010, 133, 244103. [CrossRef]
39. Vydrov, O.A.; Voorhis, T.V. Nonlocal van der waals density functional made simple. Phys. Rev. Lett. 2009,103, 063004. [CrossRef]
86
Crystals 2019, 9, 243
40. Vydrov, O.A.; Voorhis, T.V. Implementation and assessment of a simple nonlocal van der waals densityfunctional. J. Chem. Phys. 2010, 13, 164113. [CrossRef]
41. Sabatini, R.; Gorni, T.; de Gironcoli, S. Nonlocal van der waals density functional made simple and efficient.Phys. Rev. B 2013, 87, 041108. [CrossRef]
42. Wellendorff, J.; Lundgaard, K.T.; Møgelhøj, A.; Petzold, V.; Landis, D.D.; Nørskov, J.K.; Bligaard, T.;Jacobsen, K.W. Density functionals for surface science: Exchange-correlation model development withbayesian error estimation. Phys. Rev. B 2012, 85, 23514. [CrossRef]
43. Kohn, W.; Sham, L.J. Self-consistent equations including exchange and correlation effects. Phys. Rev. 1965,140, A1133–A1138. [CrossRef]
44. Perdew, J.P.; Ruzsinszky, A.; Csonka, G.I.; Vydrov, O.A.; Scuseria, G.E.; Constantin, L.A.; Zhou, X.; Burke, K.Restoring the density-gradient expansion for exchange in solids and surfaces. Phys. Rev. Lett. 2008,100, 136406. [CrossRef]
45. Murray, E.D.; Lee, K.; Langreth, D.C. Investigation of exchange energy density functional accuracy forinteracting molecules. J. Chem. Theory Comput. 2009, 5, 2754–2762. [CrossRef] [PubMed]
46. Perdew, J.P.; Wang, Y. Accurate and simple density functional for the electronic exchange energy: Generalizedgradient approximation. Phys. Rev. B 1986, 33, 8800–8802. [CrossRef]
47. Becke, A.D. On the large-gradient behavior of the density functional exchange energy. J. Chem. Phys. 1986,85, 7184–7187. [CrossRef]
48. Hamada, I.; Otani, M. Comparative van der waals density-functional study of graphene on metal surfaces.Phys. Rev. B 2010, 82, 153412. [CrossRef]
49. Choi, C.S.; Boutin, H.P. A study of crystal structure of beta-cyclotetramethylene tetranitramine by neutrondiffraction. Acta Crystallogr. Sect. B Struct. Sci. 1970, B 26, 1235. [CrossRef]
50. Herrmann, M.; Engel, W.; Eisenreich, N. Thermal-analysis of the phases of hmx using X-ray diffraction.Z. Krist. 1993, 204, 121–128.
51. Peng, Q.; Rahul; Wang, G.; Liu, G.R.; De, S. Structures, mechanical properties, equations of state, andelectronic properties of β-hmx under hydrostatic pressures: A dft-d2 study. Phys. Chem. Chem. Phys. 2014,16, 19972–19983, . [CrossRef]
52. Tao, J.; Zheng, F.; Gebhardt, J.; Perdew, J.P.; Rappe, A.M. Screened van der waals correction to densityfunctional theory for solids. Phys. Rev. Mater. 2017, 1, 020802. [CrossRef]
53. Cady, H.H.; Larson, A.C.; Cromer, D.T. The crystal structure of α-HMX and a refinement of the structure ofβ-HMX. Acta Crystallogr. 1963, 16, 617–623. [CrossRef]
54. Choi, C.S.; Prince, E. The crystal structure of cyclotrimethylenetrinitramine. Acta Crystallogr. Sect. BStruct. Sci. 1972, B28, 2857–2862. [CrossRef]
55. Millar, D.I.A.; Oswald, I.D.H.; Francis, D.J.; Marshall, W.G.; Pulham, C.R.; Cumming, A.S. The crystalstructure of beta-rdx-an elusive form of an explosive revealed. Chem. Commun. 2009, 562–564. [CrossRef][PubMed]
56. Olinger, B.; Roof, B.; Cady, H.H. The linear and volume compression of beta-hmx and rdx to 9 gpa.In Symposium (Int) on High Dynamic Pressures; S INT COMP MIL DENS: Paris, France, 1978; pp. 3–8.
57. Golovina, N.I.; Titkov, A.N.; Raevskii, A.V.; Atovmyan, L.O. Kinetics and mechanism of phase transitions inthe crystals of 2,4,6-trinitrotoluene and benzotrifuroxane. J. Solid State Chem. 1994, 113, 229–238. [CrossRef]
58. Cady, H.H.; Larson, A.C. Pentaerythritol tetranitrate II: Its crystal structure and transformation to PETN I:An algorithm for refinement of crystal structures with poor data. Acta Crystallogr. Sect. 1975, 31, 1864–1869.[CrossRef]
59. Cady, H.H. The crystal structure of N-methyl-N-2,4,6-tetranitroaniline (tetryl). Acta Crystallogr. 1967, 23,601–609. [CrossRef]
60. Cady, H.H.; Larson, A.C. The crystal structure of 1,3,5-triamino-2,4,6-trinitrobenzene. Acta Crystallogr. 1965,18, 485–496. [CrossRef]
61. Björkman, T.; Gulans, A.; Krasheninnikov, A.V.; Nieminen, R.M. Van der waals bonding in layered compoundsfrom advanced density-functional first-principles calculations. Phys. Rev. Lett. 2012, 108, 235502. [CrossRef]
62. Geim, A.K.; Grigorieva, I.V. Van der Waals heterostructures. Nature 2013, 499, 419–425. [CrossRef]63. Ambrosetti, A.; Ferri, N.; DiStasio, R.A.; Tkatchenko, A. Wavelike charge density fluctuations and van der
waals interactions at the nanoscale. Science 2016, 351, 1171–1176. [CrossRef]
87
Crystals 2019, 9, 243
64. Peng, Q.; Rahul; Wang, G.; Liu, G.R.; Grimme, S.; De, S. Predicting Elastic Properties of β-HMX fromFirst-principles calculations. J. Phys. Chem. B 2015, 119, 5896–5903. [CrossRef]
65. Kresse, G.; Hafner, J. Ab initio molecular dynamics for liquid metals. Phys. Rev. B 1993, 47, 558. [CrossRef]66. Hammer, B.; Hansen, L.B.; Nørskov, J.K. Improved adsorption energetics within density-functional theory
using revised perdew-burke-ernzerhof functionals. Phys. Rev. B 1999, 59, 7413–7421. [CrossRef]67. Blöchl, P.E. Projector augmented-wave method. Phys. Rev. B 1994, 50, 17953–17979. [CrossRef]68. Jones, R.O.; Gunnarsson, O. The density functional formalism, its applications and prospects. Rev. Mod. Phys.
1989, 61, 689–746. [CrossRef]69. Ambrosetti, A.; Alfè, D.; DiStasio, R.A.; Tkatchenko, A. Hard numbers for large molecules: Toward exact
energetics for supramolecular systems. J. Phys. Chem. Lett. 2014, 5, 849–855. [CrossRef]70. Ambrosetti, A.; Reilly, A.M.; DiStasio, R.A.; Tkatchenko, A. Long-range correlation energy calculated from
coupled atomic response functions. J. Chem. Phys. 2014, 140, 18A508. [CrossRef]71. Reilly, A.M.; Tkatchenko, A. Seamless and accurate modeling of organic molecular materials. J. Phys.
Chem. Lett. 2013, 4, 1028–1033. [CrossRef]72. Ambrosetti, A.; Silvestrelli, P.L. Hidden by graphene—Towards effective screening of interface van der
waals interactions via monolayer coating. Carbon 2018, 139, 486–491. [CrossRef]73. Ambrosetti, A.; Silvestrelli, P.L. Faraday-like screening by two-dimensional nanomaterials:
A scale-dependent tunable effect. J. Phys. Chem. Lett. 2019, 10, 2044–2050. [CrossRef] [PubMed]
c© 2019 by the authors. Licensee MDPI, Basel, Switzerland. This article is an open accessarticle distributed under the terms and conditions of the Creative Commons Attribution(CC BY) license (http://creativecommons.org/licenses/by/4.0/).
88
crystals
Article
Insight into Physical and Thermodynamic Propertiesof X3Ir (X = Ti, V, Cr, Nb and Mo) CompoundsInfluenced by Refractory Elements: AFirst-Principles Calculation
Dong Chen 1,2,3, Jiwei Geng 1, Yi Wu 2, Mingliang Wang 1,* and Cunjuan Xia 2,*
1 State Key Laboratory of Metal Matrix Composites, Shanghai Jiao Tong University, No. 800 Dongchuan Road,Shanghai 200240, China; [email protected] (D.C.); [email protected] (J.G.)
2 School of Materials Science & Engineering, Shanghai Jiao Tong University, No. 800 Dongchuan Road,Shanghai 200240, China; [email protected]
3 Anhui Province Engineering Research Center of Aluminium Matrix Composites, Huaibei 235000, China* Correspondence: [email protected] (M.W.); [email protected] (C.X.);
Tel.: +86-21-34202540 (M.W. & C.X.)
Received: 21 January 2019; Accepted: 14 February 2019; Published: 18 February 2019
Abstract: The effects of refractory metals on physical and thermodynamic properties of X3Ir (X = Ti, V,Cr, Nb and Mo) compounds were investigated using local density approximation (LDA) andgeneralized gradient approximation (GGA) methods within the first-principles calculations basedon density functional theory. The optimized lattice parameters were both in good compliance withthe experimental parameters. The GGA method could achieve an improved structural optimizationcompared to the LDA method, and thus was utilized to predict the elastic, thermodynamic andelectronic properties of X3Ir (X = Ti, V, Cr, Nb and Mo) compounds. The calculated mechanicalproperties (i.e., elastic constants, elastic moduli and elastic anisotropic behaviors) were rationalizedand discussed in these intermetallics. For instance, the derived bulk moduli exhibited the sequenceof Ti3Ir < Nb3Ir < V3Ir < Cr3Ir < Mo3Ir. This behavior was discussed in terms of the volume of unitcell and electron density. Furthermore, Debye temperatures were derived and were found to showgood consistency with the experimental values, indicating the precision of our calculations. Finally,the electronic structures were analyzed to explain the ductile essences in the iridium compounds.
Keywords: Ir-based intermetallics; refractory metals; elastic properties; ab initio calculations
1. Introduction
Ir-based superalloys have received intensive interest in the last decades due to their high meltingtemperature as well as their improved strength, oxidation resistance and corrosion resistance athigher temperatures [1–5]. Consequently, these intermetallics can be deemed a suitable choice forhigh-temperature applications. For example, the cubic L12 intermetallic compounds Ir3X (X = Ti,Zr, Hf, Nb and Ta) containing refractory elements could be proposed as “refractory superalloys”based on their higher melting points and superior mechanical properties at higher temperatures [3–5].Terada et al. [6] conducted measurements on thermal properties (i.e., thermal conductivity and thermalexpansion) from 300 to 1100 K, and found that the L12 Ir3X (X = Ti, Zr, Hf, Nb and Ta) compoundswere characterized by a larger thermal conductivity and a smaller thermal expansion. Chen et al. [7]exhibited the elastic constants and moduli of binary L12 Ir-based compounds at ground states byfirst-principles calculations, and reported the higher elastic moduli of these compounds together withtheir brittle characteristics in nature. Liu et al. [8] studied the elastic and thermodynamic properties of
Crystals 2019, 9, 104; doi:10.3390/cryst9020104 www.mdpi.com/journal/crystals89
Crystals 2019, 9, 104
Ir3Nb and Ir3V under varying pressure (0–50 GPa) and temperature (0–1200 K), and found that bothcompounds were stable without phase transformations.
Meanwhile, the typical refractory intermetallics should also include A15 cubic structurecompounds with refractory metal elements. For example, Pan et al. [9] reported the mechanicaland electronic properties of Nb3Si using the first-principles method. By combining the first-principlesmethod with quasi harmonic approximation, Papadimitriou et al. [10–12] critically investigated themechanical and thermodynamic properties of Nb3X (X = Al, Ge, Si and Sn). Chihi et al. [13] theoreticallyevaluated the elastic and thermodynamic properties of V3X (X = Si, Ge and Sn) intermetallics utilizingthe first-principles calculations. Jalborg et al. [14] determined the electronic structure of V3Ir, V3Pt andV3Au using the self-consistent semi relativistic linear muffin-tin orbital (LMTO) band calculations.Paduani et al. [15] investigated the chemical bonding behavior and estimated the electron-phononcoupling constants of V3X (X = Ni, Pd, Pt) by the full-potential linearized augmented-plane-wave(FP-LAPW) method.
Therefore, the Ir-based intermetallics with A15 crystal structure should also have the potentialto be applied as structural materials. These compounds have been studied for their structural andelectronic properties. For instance, Standanmann et al. [16] determined the lattice parameters of A15X3Ir (X = Ti, V, Cr, Nb and Mo) compounds. Meschel et al. [17] reported the experimental standardenthalpy of formation for V3Ir. Paduani and Kuhnen [18] studied the band structure and Fermisurface of V3Ir using the FP-LAPW method, and discussed Knight shift behavior in the compound.Paduani et al. [19] reported the electronic properties of Nb3Ir via FP-LAPW calculations. Nevertheless,to our knowledge, the elastic and thermodynamic properties of X3Ir (X = Ti, V, Cr, Nb and Mo)intermetallics have rarely been discussed.
This research is divided into the following parts. In the second section, the computational methodsof X3Ir (X = Ti, V, Cr, Nb and Mo) intermetallics are offered in detail. In the third section, the resultsand discussions are presented and discussed based on the effects of refractory metals on the physicaland thermodynamic properties of X3Ir compounds, including structural properties, elastic propertie,anisotropic behaviors, anisotropic sound velocities, Debye temperatures, and electronic structures.In the fourth section, the conclusions are drawn and presented in detail.
2. Materials and Methods
The first-principles calculations were performed using the CASTEP code, which is basedon the pseudopotential plane-wave within density functional theory [20,21]. Using the ultrasoftpseudopotential [22] to model the ion-electron exchange-correlation, both the generalized gradientapproximation (GGA) with the function proposed by Perdew, Burke and Ernzer (PBE) [23,24] andthe local density approximation (LDA) with Ceperley–Alder form [25] were used. Additionally,the basis atom states were set as: Ti3s33p63d35s2, V3s23p63d35s2, Cr3s23p63d54s1, Nb4s24p64d45s1,Mo4s24p64d55s1 and Ir5d76s2. Through a series of tests, the cutoff energy of 400 eV was determined.In addition, a 10 × 10 × 10 k-point mesh in the Brillouin zone was set for the special points samplingintegration for the intermetallics. Both lattice constants and atom coordinates should be optimizedvia minimizing the total energy. Furthermore, the Brodyden–Fletcher–Goldfarb–Shanno (BFGS)minimization scheme was used for the geometric optimization [26,27]. Overall, the maximum stresshas to be within 0.02 GPa, the maximum ionic force has to be within 0.01 eV/Å, the maximumionic displacement has to be within 5.0 × 10⁻⁴ Å and the difference of the total energy hasto be within 5.0 × 10⁻⁶ eV/atom for the geometrical optimization. Finally, the total energy andelectronic structure were calculated, followed by cell optimization with a self-consistent field tolerance(5.0 × 10⁻⁷ eV/atom). Using the corrected tetrahedron Blöchl method, the total energies at equilibriumstructures were derived [28].
90
Crystals 2019, 9, 104
3. Results
3.1. Structural Properties
The X3Ir (X = Ti, V, Cr, Nb and Mo) intermetallics have a A15 cubic structure with the cP8 (No. 223)space group. In a unit cell, six X atoms and two Ir atoms are dominated at the sites of 6c (0.25, 0, 0.5)and 2a (0, 0, 0), respectively. For the sake of performing structural property optimizations on IrX3
compounds, the GGA method as well as the LDA method were utilized. The results are exhibited inTable 1, showing that the derived lattice constants using both methods are close to the experimentalvalues [29–33].
Table 1. The optimized and experimental lattice parameters, the calculated deviations and densities forX3Ir (X = Ti, V, Cr, Nb and Mo) compounds.
Compounds a0 (Å) aexp (Å)Calculated
Deviation (%)Density (g/cm3)
Ti3Ir 5.010 a 5.012 c −0.041 a 8.872 a
4.901 b −2.223 b 9.479 b
V3Ir 4.7842 a 4.7876 d −0.072 a 10.463 a
4.6913 b −2.012 b 11.099 b
Cr3Ir 4.652 a 4.685 e −0.712 a 11.489 a
4.651 b −0.732 b 11.496 b
Nb3Ir 5.1585 a 5.135 f 0.457 a 11.394 a
5.0777 b −1.116 b 11.946 b
Mo3Ir 4.9874 a 4.9703 g 0.344 a 12.986 a
4.9199 b −1.014 b 13.387 b
a: From the GGA method in this work: Theoretical values. b: From the LDA method in this work: Theoretical values.c: From Reference [29]: Experimental values. d: From Reference [30]: Experimental values. e: From Reference [31]:Experimental values. f: From Reference [32]: Experimental values. g: From Reference [33]: Experimental values.
In most compounds, the lattice constants generated by the GGA method offer much smallercalculated deviations than the LDA method (Table 1). For instance, the a0(GGA) has the calculateddeviation of −0.041%, and a0(LDA) has the calculated deviation of −2.223% in comparison with aexp
in Ti3Ir. Clearly, the GGA method exhibited better reliability for structural optimization, and thusgiving a superior quality of calculation over the LDA method. As a result, the following calculationwork was accomplished only by GGA method.
3.2. Elastic Constants
In the crystalline materials, the elastic constant represented the capability of resisting theexterior imposed stress. In such manners, a whole package of elastic constants was achieved tocharacterize mechanical properties of crystals. By imposing small strains to the equilibrium unit cell,elastic constants can be computed by determining the corresponding variations in the total energy.Theoretically, the elastic strain energy was formulated by Equation (1):
U =ΔEV0
=12∑6
i ∑6j Cijeiej (1)
where V0 represents the cell volume at equilibrium state; ΔE represents the energy difference; ei and ejrepresent the strains; Cij (ij = 1, 2, 3, 4, 5 and 6) represent the elastic constants.
In cubic structures, C11, C12 and C44 are nonzero elastic constants without mutual dependence.In Table 2, the calculated elastic constants (Cij) for X3Ir intermetallics are shown, accompanied by theavailable theoretical values [18,34–36] for comparison.
91
Crystals 2019, 9, 104
Table 2. The elastic constant (Cij), Cauthy pressure (C12-C44), bulk modulus (B), shear modulus (G),Young’s modulus (E), Poisson’s ratio (v) and B/G ratio for X3Ir (X = Ti, V, Cr, Nb and Mo) intermetallics.
CompoundsCij C12–C44
(GPa)B (GPa) G (GPa) E (GPa) v B/GC11
(GPa)C44
(GPa)C12
(GPa)
Ti3Ir 183.8 52.8 166.0 114.2 171.9 26.5 75.7 0.427 6.483207.2 a 48.8 a 153.1 a 104.3 a 171.1 a 38.5 a 107.4 a 0.395 a 4.446 a
V3Ir 471.5 109.4 136.8 27.4 248.4 129.8 331.7 0.277 1.913279.89 b
Cr3Ir 478.6 89.6 190.2 100.4 286.3 108.5 289.0 0.332 2.639
Nb3Ir 433.7 84.5 123.7 39.2 227.0 108.0 279.7 0.295 2.102216.4 c
Mo3Ir 512.7 87.6 175.8 88.2 288.1 114.2 302.6 0.325 2.523297.5 d
a: From Reference [34]: Theoretical values. b: From Reference [18]: Theoretical values. c: From Reference [35]:Theoretical values. d: From Reference [36]: Theoretical values.
In the elastic constant, a larger C44 corresponds to a stronger resistance to monoclinic shear in the(100) plane, and therefore symbolizes a larger shear modulus. For instance, V3Ir has the largest C44 andshear modulus, exhibiting a superior capability to resist the shear stress. Furthermore, the compressiveresistance along the x axis is reflected by C11. For each compound, the derived C11 exhibited the biggestvalue among elastic constants, suggesting that is has the greatest incompressibility under x uniaxialstress. Among the compounds, Mo3Ir was the least compressible along the x axis because it had thebiggest C11 (512.7 GPa), and Ti3Ir was the most compressible owing to its small C11 (183.8 GPa)
Utilizing Born’s criteria [37,38], the essence of mechanical stability should be evaluated for cubiccrystals:
C11 > 0; C44 > 0; C11 − C12 > 0; C11 + 2 C12 > 0 (2)
Using the values in Table 2, all X3Ir compounds were found to have mechanical stability bysatisfying the Born’s criteria at the ground state.
The Cauchy pressure, illustrated as (C12–C44) [39], should be an effective indicator to evaluatethe ductile/brittle nature of cubic crystals. In Pettifor’s work [40], a more positive Cauchy pressuresymbolized better ductility in the compound [41]. In Table 2, the Cauchy pressures for X3Ir compoundswere all positive in the order of V3Ir < Nb3Ir < Mo3Ir < Cr3Ir < Ti3Ir, which means that X3Ir compoundsare naturally ductile. Such a result is in good compliance with the Cauchy pressure of Ti3Ir providedby Rajagopalan [34]. Similarly, other A15 cubic crystals (i.e., V3X (X = Si and Ge) [13], Nb3X (X = Al,Ge, Si and Sn) [10] and Nb3X (X = Al, Ga, In, Sn and Sb) [42]) have ductile characters owing to theirpositive Cauchy pressures.
3.3. Elastic Properties
Once the elastic constants were achieved, the elastic moduli (i.e., bulk modulus (B) and shearmodulus (G)) could be computed by means of the Voigt–Reuss–Hill (VRH) method [43]. In cubicstructures, the equations are exhibited as [44–46]:
BV = BR =13(C11 + 2C12) (3a)
GV =15(C11 − C12 + 3C44) (3b)
GR =5(C11 − C12)C44
4C44 + 3(C11 − C12)(3c)
92
Crystals 2019, 9, 104
B =BV + BG
2(3d)
G =GV + GG
2(3e)
When the elastic moduli are achieved, the Young’s modulus (E) and Poisson’s ratio (ν) should becalculated in the second step [47]:
E =9BG
3B + G(3f)
ν =3B − 2G
2(3B + G)(3g)
Lastly, the computed elastic moduli for X3Ir compounds using the VRH method are tabulated inTable 2 in combination with the available theoretical results for comparison [18,34–36]. Comparably,our calculated bulk moduli showed satisfactory agreement with the theoretical values for Ti3Ir [34],Nb3Ir [35] and Mo3Ir [36], and a value slightly smaller smaller than the theoretical one for V3Ir [18].
Analytically, the resisting capability against volume fluctuation under pressure is determinedby the bulk modulus. For X3Ir (X = Ti, V, Cr, Nb and Mo) intermetallics, the bulk moduli showedthe sequence of Ti3Ir < Nb3Ir < V3Ir < Cr3Ir < Mo3Ir. In References [48,49], a larger equilibrium cellvolume was reported to correspond to a lower bulk modulus in the cubic crystal. Observably, sucha conclusion is effective when the alloying elements are in the same cycle of the periodic table ofelements (Figure 1a). For example, the bulk moduli are improved in the order of Ti3Ir < V3Ir < Cr3Irdepending on the reduced equilibrium cell volume. Similarly, the bulk modulus of Nb3Ir is smallerthan that of Mo3Ir with the larger equilibrium cell volume of Nb3Ir (Figure 1a). Nevertheless, whenthe alloying elements are in the same group of the periodic table, the conclusion is valid for Nb3Ir <V3Ir, but ineffective for Cr3Ir < Mo3Ir, where Mo3Ir actually has a larger equilibrium cell volume.
Figure 1. The relationship between bulk modulus and (a) volume of the unit cell or (b) electron density.
In order to further illustrate the relationship between the equilibrium cell volume and the bulkmodulus of X3Ir intermetallics, the linear dependence of the electron density on the bulk modulus isexhibited in Figure 1b. Clearly, dividing the bonding valence (ZB) by the volume per atom (VM) candeduce the electron density (n) in metallic compounds [50]. For X3Ir compounds, the electron density(n) can be formulated as:
n(X3 Ir) = ZB(X3 Ir)/VM(X3 Ir) (4a)
where VM(X3Ir) represents the volume (cm3/mol) of X3Ir.Rationalized by Vegard’s law [51], ZB(X3Ir) showed a bonding valence in (el/atom), and the
Reference [52] tabulated the bonding valence of the pure element:
ZB(X3 Ir) = (3ZB(X) + ZB(Ir))/4 (4b)
93
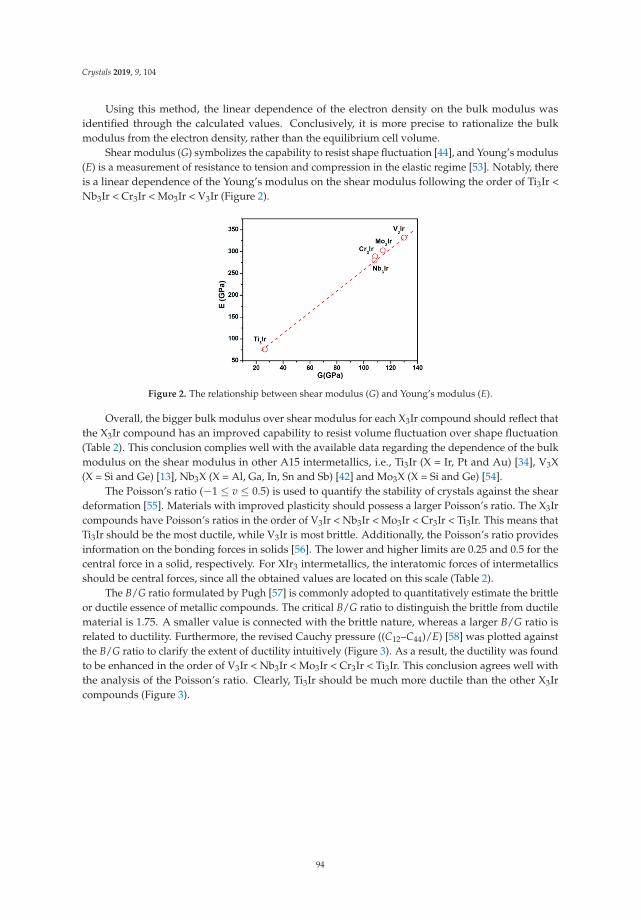
Crystals 2019, 9, 104
Using this method, the linear dependence of the electron density on the bulk modulus wasidentified through the calculated values. Conclusively, it is more precise to rationalize the bulkmodulus from the electron density, rather than the equilibrium cell volume.
Shear modulus (G) symbolizes the capability to resist shape fluctuation [44], and Young’s modulus(E) is a measurement of resistance to tension and compression in the elastic regime [53]. Notably, thereis a linear dependence of the Young’s modulus on the shear modulus following the order of Ti3Ir <Nb3Ir < Cr3Ir < Mo3Ir < V3Ir (Figure 2).
Figure 2. The relationship between shear modulus (G) and Young’s modulus (E).
Overall, the bigger bulk modulus over shear modulus for each X3Ir compound should reflect thatthe X3Ir compound has an improved capability to resist volume fluctuation over shape fluctuation(Table 2). This conclusion complies well with the available data regarding the dependence of the bulkmodulus on the shear modulus in other A15 intermetallics, i.e., Ti3Ir (X = Ir, Pt and Au) [34], V3X(X = Si and Ge) [13], Nb3X (X = Al, Ga, In, Sn and Sb) [42] and Mo3X (X = Si and Ge) [54].
The Poisson’s ratio (−1 ≤ v ≤ 0.5) is used to quantify the stability of crystals against the sheardeformation [55]. Materials with improved plasticity should possess a larger Poisson’s ratio. The X3Ircompounds have Poisson’s ratios in the order of V3Ir < Nb3Ir < Mo3Ir < Cr3Ir < Ti3Ir. This means thatTi3Ir should be the most ductile, while V3Ir is most brittle. Additionally, the Poisson’s ratio providesinformation on the bonding forces in solids [56]. The lower and higher limits are 0.25 and 0.5 for thecentral force in a solid, respectively. For XIr3 intermetallics, the interatomic forces of intermetallicsshould be central forces, since all the obtained values are located on this scale (Table 2).
The B/G ratio formulated by Pugh [57] is commonly adopted to quantitatively estimate the brittleor ductile essence of metallic compounds. The critical B/G ratio to distinguish the brittle from ductilematerial is 1.75. A smaller value is connected with the brittle nature, whereas a larger B/G ratio isrelated to ductility. Furthermore, the revised Cauchy pressure ((C12–C44)/E) [58] was plotted againstthe B/G ratio to clarify the extent of ductility intuitively (Figure 3). As a result, the ductility was foundto be enhanced in the order of V3Ir < Nb3Ir < Mo3Ir < Cr3Ir < Ti3Ir. This conclusion agrees well withthe analysis of the Poisson’s ratio. Clearly, Ti3Ir should be much more ductile than the other X3Ircompounds (Figure 3).
94
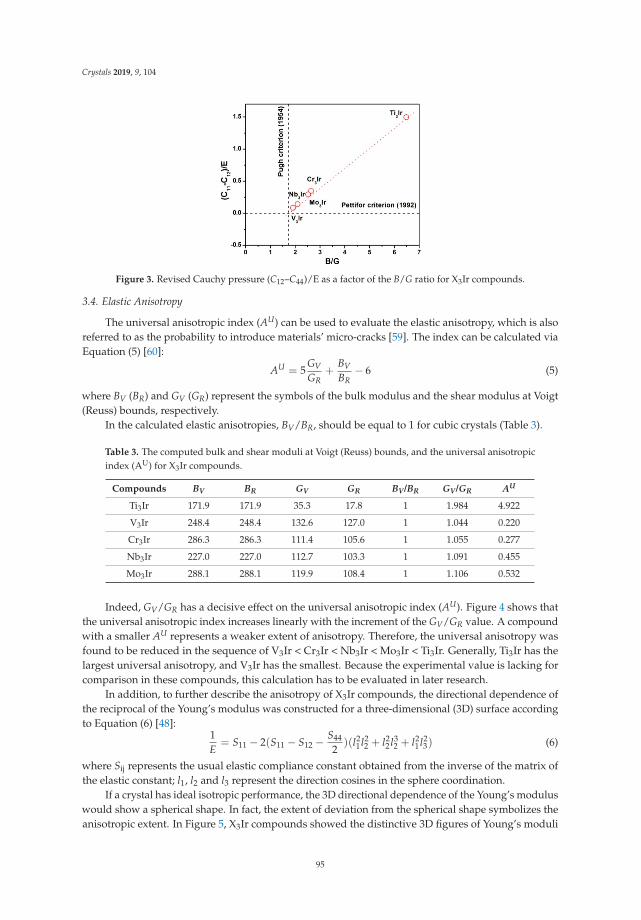
Crystals 2019, 9, 104
Figure 3. Revised Cauchy pressure (C12–C44)/E as a factor of the B/G ratio for X3Ir compounds.
3.4. Elastic Anisotropy
The universal anisotropic index (AU) can be used to evaluate the elastic anisotropy, which is alsoreferred to as the probability to introduce materials’ micro-cracks [59]. The index can be calculated viaEquation (5) [60]:
AU = 5GVGR
+BVBR
− 6 (5)
where BV (BR) and GV (GR) represent the symbols of the bulk modulus and the shear modulus at Voigt(Reuss) bounds, respectively.
In the calculated elastic anisotropies, BV/BR, should be equal to 1 for cubic crystals (Table 3).
Table 3. The computed bulk and shear moduli at Voigt (Reuss) bounds, and the universal anisotropicindex (AU) for X3Ir compounds.
Compounds BV BR GV GR BV/BR GV/GR AU
Ti3Ir 171.9 171.9 35.3 17.8 1 1.984 4.922
V3Ir 248.4 248.4 132.6 127.0 1 1.044 0.220
Cr3Ir 286.3 286.3 111.4 105.6 1 1.055 0.277
Nb3Ir 227.0 227.0 112.7 103.3 1 1.091 0.455
Mo3Ir 288.1 288.1 119.9 108.4 1 1.106 0.532
Indeed, GV/GR has a decisive effect on the universal anisotropic index (AU). Figure 4 shows thatthe universal anisotropic index increases linearly with the increment of the GV/GR value. A compoundwith a smaller AU represents a weaker extent of anisotropy. Therefore, the universal anisotropy wasfound to be reduced in the sequence of V3Ir < Cr3Ir < Nb3Ir < Mo3Ir < Ti3Ir. Generally, Ti3Ir has thelargest universal anisotropy, and V3Ir has the smallest. Because the experimental value is lacking forcomparison in these compounds, this calculation has to be evaluated in later research.
In addition, to further describe the anisotropy of X3Ir compounds, the directional dependence ofthe reciprocal of the Young’s modulus was constructed for a three-dimensional (3D) surface accordingto Equation (6) [48]:
1E= S11 − 2(S11 − S12 − S44
2)(l2
1 l22 + l2
2 l32 + l2
1 l23) (6)
where Sij represents the usual elastic compliance constant obtained from the inverse of the matrix ofthe elastic constant; l1, l2 and l3 represent the direction cosines in the sphere coordination.
If a crystal has ideal isotropic performance, the 3D directional dependence of the Young’s moduluswould show a spherical shape. In fact, the extent of deviation from the spherical shape symbolizes theanisotropic extent. In Figure 5, X3Ir compounds showed the distinctive 3D figures of Young’s moduli
95
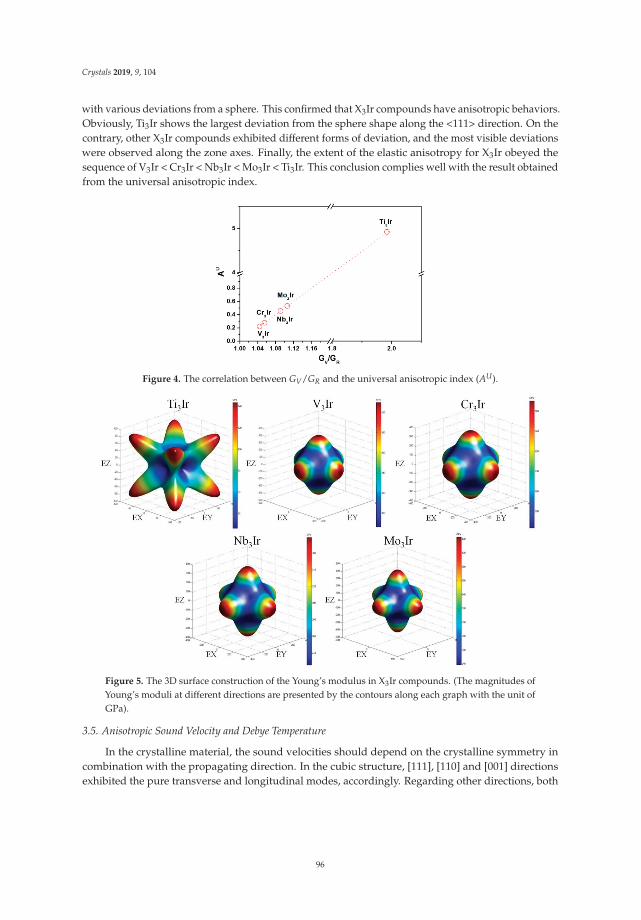
Crystals 2019, 9, 104
with various deviations from a sphere. This confirmed that X3Ir compounds have anisotropic behaviors.Obviously, Ti3Ir shows the largest deviation from the sphere shape along the <111> direction. On thecontrary, other X3Ir compounds exhibited different forms of deviation, and the most visible deviationswere observed along the zone axes. Finally, the extent of the elastic anisotropy for X3Ir obeyed thesequence of V3Ir < Cr3Ir < Nb3Ir < Mo3Ir < Ti3Ir. This conclusion complies well with the result obtainedfrom the universal anisotropic index.
Figure 4. The correlation between GV/GR and the universal anisotropic index (AU).
Figure 5. The 3D surface construction of the Young’s modulus in X3Ir compounds. (The magnitudes ofYoung’s moduli at different directions are presented by the contours along each graph with the unit ofGPa).
3.5. Anisotropic Sound Velocity and Debye Temperature
In the crystalline material, the sound velocities should depend on the crystalline symmetry incombination with the propagating direction. In the cubic structure, [111], [110] and [001] directionsexhibited the pure transverse and longitudinal modes, accordingly. Regarding other directions, both
96
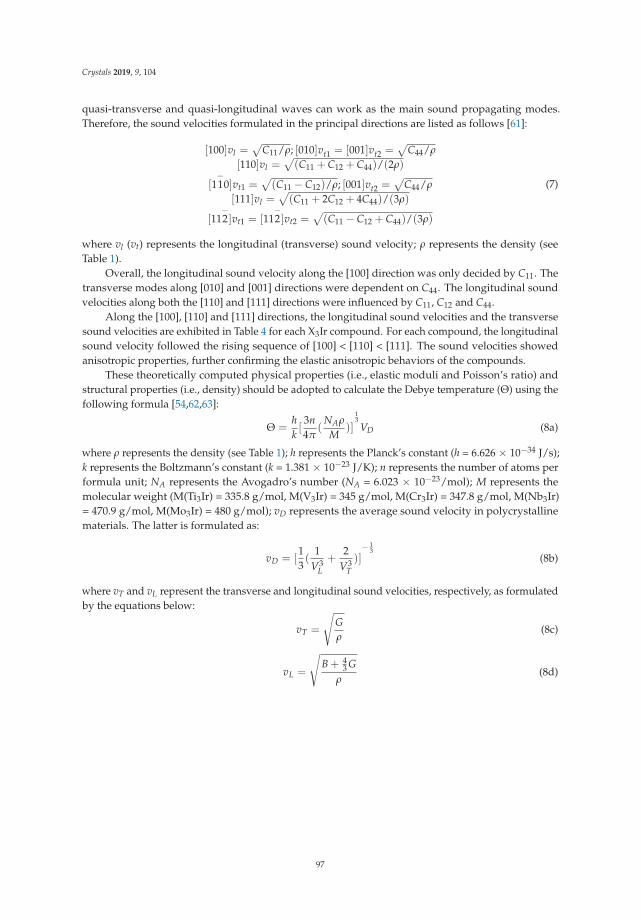
Crystals 2019, 9, 104
quasi-transverse and quasi-longitudinal waves can work as the main sound propagating modes.Therefore, the sound velocities formulated in the principal directions are listed as follows [61]:
[100]vl =√
C11/ρ; [010]vt1 = [001]vt2 =√
C44/ρ
[110]vl =√(C11 + C12 + C44)/(2ρ)
[1−10]vt1 =
√(C11 − C12)/ρ; [001]vt2 =
√C44/ρ
[111]vl =√(C11 + 2C12 + 4C44)/(3ρ)
[11−2]vt1 = [11
−2]vt2 =
√(C11 − C12 + C44)/(3ρ)
(7)
where vl (vt) represents the longitudinal (transverse) sound velocity; ρ represents the density (seeTable 1).
Overall, the longitudinal sound velocity along the [100] direction was only decided by C11. Thetransverse modes along [010] and [001] directions were dependent on C44. The longitudinal soundvelocities along both the [110] and [111] directions were influenced by C11, C12 and C44.
Along the [100], [110] and [111] directions, the longitudinal sound velocities and the transversesound velocities are exhibited in Table 4 for each X3Ir compound. For each compound, the longitudinalsound velocity followed the rising sequence of [100] < [110] < [111]. The sound velocities showedanisotropic properties, further confirming the elastic anisotropic behaviors of the compounds.
These theoretically computed physical properties (i.e., elastic moduli and Poisson’s ratio) andstructural properties (i.e., density) should be adopted to calculate the Debye temperature (Θ) using thefollowing formula [54,62,63]:
Θ =hk[3n4π
(NAρ
M)]
13VD (8a)
where ρ represents the density (see Table 1); h represents the Planck’s constant (h = 6.626 × 10⁻³⁴ J/s);k represents the Boltzmann’s constant (k = 1.381 × 10⁻²³ J/K); n represents the number of atoms performula unit; NA represents the Avogadro’s number (NA = 6.023 × 10⁻²³/mol); M represents themolecular weight (M(Ti3Ir) = 335.8 g/mol, M(V3Ir) = 345 g/mol, M(Cr3Ir) = 347.8 g/mol, M(Nb3Ir)= 470.9 g/mol, M(Mo3Ir) = 480 g/mol); vD represents the average sound velocity in polycrystallinematerials. The latter is formulated as:
vD = [13(
1V3
L+
2V3
T)]− 1
3(8b)
where vT and vL represent the transverse and longitudinal sound velocities, respectively, as formulatedby the equations below:
vT =
√Gρ
(8c)
vL =
√B + 4
3 Gρ
(8d)
97
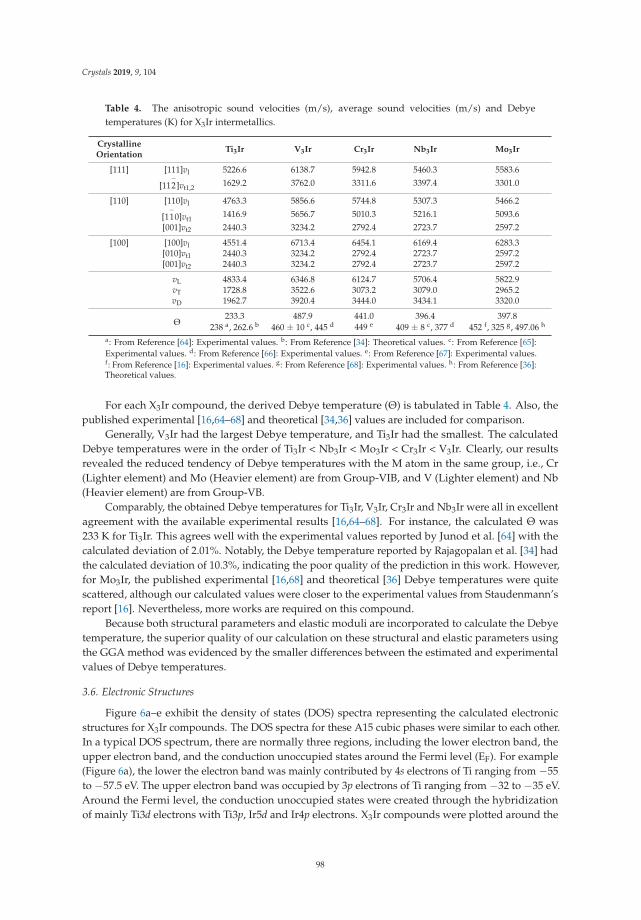
Crystals 2019, 9, 104
Table 4. The anisotropic sound velocities (m/s), average sound velocities (m/s) and Debyetemperatures (K) for X3Ir intermetallics.
CrystallineOrientation
Ti3Ir V3Ir Cr3Ir Nb3Ir Mo3Ir
[111] [111]vl 5226.6 6138.7 5942.8 5460.3 5583.6
[11−2]vt1,2
1629.2 3762.0 3311.6 3397.4 3301.0
[110] [110]vl 4763.3 5856.6 5744.8 5307.3 5466.2
[1−10]vt1
1416.9 5656.7 5010.3 5216.1 5093.6[001]vt2 2440.3 3234.2 2792.4 2723.7 2597.2
[100] [100]vl 4551.4 6713.4 6454.1 6169.4 6283.3[010]vt1 2440.3 3234.2 2792.4 2723.7 2597.2[001]vt2 2440.3 3234.2 2792.4 2723.7 2597.2
vL 4833.4 6346.8 6124.7 5706.4 5822.9vT 1728.8 3522.6 3073.2 3079.0 2965.2vD 1962.7 3920.4 3444.0 3434.1 3320.0
Θ233.3 487.9 441.0 396.4 397.8
238 a, 262.6 b 460 ± 10 c, 445 d 449 e 409 ± 8 c, 377 d 452 f, 325 g, 497.06 h
a: From Reference [64]: Experimental values. b: From Reference [34]: Theoretical values. c: From Reference [65]:Experimental values. d: From Reference [66]: Experimental values. e: From Reference [67]: Experimental values.f: From Reference [16]: Experimental values. g: From Reference [68]: Experimental values. h: From Reference [36]:Theoretical values.
For each X3Ir compound, the derived Debye temperature (Θ) is tabulated in Table 4. Also, thepublished experimental [16,64–68] and theoretical [34,36] values are included for comparison.
Generally, V3Ir had the largest Debye temperature, and Ti3Ir had the smallest. The calculatedDebye temperatures were in the order of Ti3Ir < Nb3Ir < Mo3Ir < Cr3Ir < V3Ir. Clearly, our resultsrevealed the reduced tendency of Debye temperatures with the M atom in the same group, i.e., Cr(Lighter element) and Mo (Heavier element) are from Group-VIB, and V (Lighter element) and Nb(Heavier element) are from Group-VB.
Comparably, the obtained Debye temperatures for Ti3Ir, V3Ir, Cr3Ir and Nb3Ir were all in excellentagreement with the available experimental results [16,64–68]. For instance, the calculated Θ was233 K for Ti3Ir. This agrees well with the experimental values reported by Junod et al. [64] with thecalculated deviation of 2.01%. Notably, the Debye temperature reported by Rajagopalan et al. [34] hadthe calculated deviation of 10.3%, indicating the poor quality of the prediction in this work. However,for Mo3Ir, the published experimental [16,68] and theoretical [36] Debye temperatures were quitescattered, although our calculated values were closer to the experimental values from Staudenmann’sreport [16]. Nevertheless, more works are required on this compound.
Because both structural parameters and elastic moduli are incorporated to calculate the Debyetemperature, the superior quality of our calculation on these structural and elastic parameters usingthe GGA method was evidenced by the smaller differences between the estimated and experimentalvalues of Debye temperatures.
3.6. Electronic Structures
Figure 6a–e exhibit the density of states (DOS) spectra representing the calculated electronicstructures for X3Ir compounds. The DOS spectra for these A15 cubic phases were similar to each other.In a typical DOS spectrum, there are normally three regions, including the lower electron band, theupper electron band, and the conduction unoccupied states around the Fermi level (EF). For example(Figure 6a), the lower the electron band was mainly contributed by 4s electrons of Ti ranging from −55to −57.5 eV. The upper electron band was occupied by 3p electrons of Ti ranging from −32 to −35 eV.Around the Fermi level, the conduction unoccupied states were created through the hybridizationof mainly Ti3d electrons with Ti3p, Ir5d and Ir4p electrons. X3Ir compounds were plotted around the
98
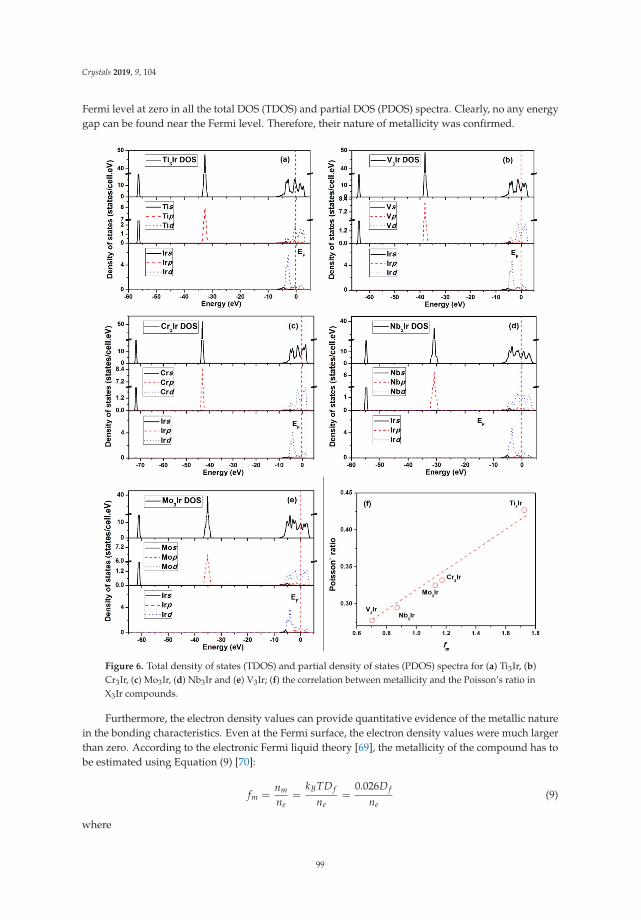
Crystals 2019, 9, 104
Fermi level at zero in all the total DOS (TDOS) and partial DOS (PDOS) spectra. Clearly, no any energygap can be found near the Fermi level. Therefore, their nature of metallicity was confirmed.
Figure 6. Total density of states (TDOS) and partial density of states (PDOS) spectra for (a) Ti3Ir, (b)Cr3Ir, (c) Mo3Ir, (d) Nb3Ir and (e) V3Ir; (f) the correlation between metallicity and the Poisson’s ratio inX3Ir compounds.
Furthermore, the electron density values can provide quantitative evidence of the metallic naturein the bonding characteristics. Even at the Fermi surface, the electron density values were much largerthan zero. According to the electronic Fermi liquid theory [69], the metallicity of the compound has tobe estimated using Equation (9) [70]:
fm =nm
ne=
kBTDf
ne=
0.026Df
ne(9)
where
99
Crystals 2019, 9, 104
kB represents the Boltzmann constant (k = 1.381 × 10⁻²³ J/K);T represents the absolute temperature;Df represents the DOS value at the Fermi level;
nm and ne represent the thermally excited electrons and valence electron density of the cell, respectively;ne is calculated by ne = N/Vcell (N represents the total number of valence electrons; Vcell represents thecell volume).
Using the calculated metallicity values (fm), the correlation between metallicity and Poisson’sratios can be constructed for X3Ir compounds (Figure 6f). It was found that the Poisson’s ratios werediminished with the reduction in metallicity in compounds with the order of V3Ir < Nb3Ir < Mo3Ir< Cr3Ir < Ti3Ir. This indicated that a compound with higher metallicity in its bonds should possessbetter ductility.
4. Conclusions
The effects of refractory metals on physical and thermodynamic properties of X3Ir (X = Ti, V, Cr,Nb and Mo) intermetallics were investigated utilizing first-principles calculations. The conclusions arelisted as follows:
(1) Using the GGA method to structurally optimized the unit cell, smaller calculation deviations forlattice constants were achieved as compared to those achieved using the LDA method.
(2) The calculated bulk moduli exhibited the increasing sequence of Ti3Ir < Nb3Ir < V3Ir < Cr3Ir <Mo3Ir. Furthermore, the bulk moduli showed a linear relationship with electron densities. TheYoung’s modulus showed a linear dependence on shear modulus following the order of Ti3Ir <Nb3Ir < Cr3Ir < Mo3Ir < V3Ir.
(3) Based on the discussions on the Cauchy pressure, Poisson’s ratio and B/G ratio, the ductile essencewas found to be enhanced in the order of V3Ir < Nb3Ir < Mo3Ir < Cr3Ir < Ti3Ir.
(4) For X3Ir compounds, the extent of the elastic anisotropy for X3Ir obeyed the increasing sequenceof V3Ir < Cr3Ir < Nb3Ir < Mo3Ir < Ti3Ir via the analyses of the universal anisotropic indexes and3D surface constructions.
(5) The Debye temperatures obtained for Ti3Ir, V3Ir, Cr3Ir and Nb3Ir were all in good agreementwith the results from experiments. Such good compliance proved the superior quality of ourcalculations of the structural and elastic properties, since the computation of Debye temperatureis concerned with both structural and elastic parameters.
(6) The calculated electronic structures for X3Ir compounds showed similar features in the DOSspectra. Furthermore, the metallicity of the compounds was calculated, and was correlated withthe Poisson’s ratios. This indicated that a compound with higher metallicity in its bonds shouldpossess better ductility.
Author Contributions: In this work, D.C. has contributed on the conceptualization, investigation, data curation,formal analysis, and writing—original draft preparation. J.G. has contributed on the investigation, data curation,and writing—review and editing. Y.W. has contributed on the formal analysis, and writing—review and editingand funding acquisition. M.W. has contributed on the conceptualization, investigation, data curation, formalanalysis, and writing—review and editing. C.X. has contributed on the conceptualization, investigation, formalanalysis, writing—review and editing and funding acquisition.
Funding: This work was sponsored by the National Key Research and Development Program of China (Grant No.2018YFB1106302) and the project (Grant No. 2017WAMC002) sponsored by Anhui Province Engineering ResearchCenter of Aluminum Matrix Composites (China).
Conflicts of Interest: The authors have declared no conflict of interest.
100
Crystals 2019, 9, 104
References and Notes
1. Yamaguchi, M.; Inui, H.; Ito, K. High-temperature structural intermetallics. Acta Mater. 2000, 48, 307–322.[CrossRef]
2. Yu, X.; Yamabe-Mitarai, Y.; Ro, Y.; Harada, H. New developed quaternary refractory superalloys. Intemetallics2000, 8, 619–622. [CrossRef]
3. Yamabe-Mitarai, Y.; Gu, Y.; Huang, C.; Völkl, R.; Harada, H. Platinum-group-metal-based intermetallics ashigh-temperature structural materials. JOM 2004, 56, 34–39. [CrossRef]
4. Yamabe-Mitari, Y.; Ro, Y.; Maruko, T.; Harada, H. Microstructure dependence of strength of Ir-base refractorysuperalloys. Intermetallics 1999, 7, 49–58. [CrossRef]
5. Yamabe-Mitarai, Y.; Ro, Y.; Nakazawa, S. Temperature dependence of the flow stress of Ir-based L12
intermetallics. Intermetallics 2001, 9, 423–429. [CrossRef]6. Terada, Y.; Ohkubo, K.; Miura, S.; Sanchez, J.M.; Mohri, T. Thermal conductivity and thermal expansion of
Ir3X (X = Ti, Zr, Hf, V, Nb, Ta) compounds for high-temperature applications. Mater. Chem. Phys. 2003, 80,385–390. [CrossRef]
7. Chen, K.; Zhao, L.R.; Tse, J.S. Ab initio study of elastic properties of Ir and Ir3X compounds. J. Appl. Phys.2003, 93, 2414–2417. [CrossRef]
8. Liu, N.; Wang, X.; Wan, Y. Firstprinciple calculations of elastic and thermodynamic properties of Ir3Nb andIr3V with L12 structure under high pressure. Intermetallics 2015, 66, 103–110. [CrossRef]
9. Pan, Y.; Lin, Y.; Xue, Q.; Ren, C.; Wang, H. Relationship between Si concentration and mechanical propertiesof Nb-Si compounds: A first-principles study. Mater. Des. 2016, 89, 676–683. [CrossRef]
10. Papadimitriou, I.; Utton, C.; Scott, A.; Tsakiropoulos, P. Ab Initio Study of Binary and Ternary Nb3(X,Y) A15Intermetallic Phases (X,Y = Al, Ge, Si, Sn). Metall. Mater. Trans. A 2015, 46, 566–576. [CrossRef]
11. Papadimitriou, I.; Utton, C.; Tsakiropoulos, P. Ab initio investigation of the intermetallics in the Nb-Sn binarysystem. Acta Mater. 2015, 86, 23–33. [CrossRef]
12. Papadimitriou, I.; Utton, C.; Tsakiropoulos, P. Ab initio investigation of the Nb-Al system. Comput. Mater.Sci. 2015, 107, 116–121. [CrossRef]
13. Chihi, T.; Fatmi, M. Theoretical prediction of the structural, elastic, electronic and thermodynamic propertiesof V3M (M = Si, Ge and Sn) compounds. Superlatt. Microstruc. 2012, 52, 697–703. [CrossRef]
14. Jarlborg, T.; Junod, A.; Peter, M. Electronic structure, superconductivity, and spin fluctuations in the A15compounds A3B: A =V, Nb; B=Ir, Pt, Au. Phys. Rev. B 1983, 27, 1558–1567. [CrossRef]
15. Paduani, C.; Kuhnen, C.A. Band structure calculations in isoelectronic V3B compounds: B=Ni, Pd and Pt.Solid State Commun. 2010, 150, 1303–1307. [CrossRef]
16. Staudenmann, J.L.; DeFacio, B.; Testardi, L.R.; Werner, S.A.; Flükiger, R.; Muller, J. Debye classes in A15compounds. Phys. Rev. B 1981, 24, 6446. [CrossRef]
17. Meschel, S.V.; Kleppa, O.J. The standard enthalpies of formation of some intermetallic compounds oftransition metals by high temperature direct synthesis calorimetry. J. Alloy. Compd. 2006, 415, 143–149.[CrossRef]
18. Paduani, C.; Kuhnen, C.A. Electronic structure of A15-type compounds: V3Co, V3Rh, V3Ir and V3Os.Eur. Phys. J. B 2009, 69, 331–336. [CrossRef]
19. Paduani, C. Electronic properties of the A-15 Nb-based intermetallics Nb3(Os,Ir,Pt,Au). Solid State Commun.2007, 144, 352–356. [CrossRef]
20. Segall, M.D.; Lindan, P.J.D.; Probert, M.J.; Pickard, C.J.; Hasnip, P.J.; Clark, S.J.; Payne, M.C. First-principlessimulation: Ideas, illustrations and the CASTEP code. J. Phys. Condens. Matter 2002, 14, 2717–2744. [CrossRef]
21. Clark, S.J.; Segall, M.D.; Pickard, C.J.; Hasnip, P.J.; Probert, M.J.; Refson, K.; Payne, M.C. First principlesmethods using CASTEP. Zeitschrift fuer Kristallographie 2005, 220, 567–570. [CrossRef]
22. Vanderbilt, D. Soft self-consistent pseudopotentials in a generalized eigenvalue formalism. Phys. Rev. B 1990,41, 7892–7895. [CrossRef]
23. Perdew, J.P.; Wang, Y. Accurate and simple analytic representation of the electron-gas correlation energy.Phys. Rev. B 1992, 45, 13244–13249. [CrossRef]
24. Perdew, J.P.; Burke, K.; Ernzerhof, M. Generalized Gradient Approximation Made Simple. Phys. Rev. Lett.1996, 77, 3865–3868. [CrossRef]
101
Crystals 2019, 9, 104
25. Perdew, J.P.; Zunger, A. Self-interaction correction to density-functional approximations for many-electronsystems. Phys. Rev. B 1981, 23, 5048–5079. [CrossRef]
26. Shanno, D.F. Conditioning of quasi-Newton methods for function minimization. Math. Comput. 1970, 24,647–656. [CrossRef]
27. Fischer, T.H.; Almlof, J. General Methods for Geometry and Wave Function Optimization. J. Chem. Phys.1992, 96, 9768–9774. [CrossRef]
28. Blöchl, P.E.; Jepsen, O.; Andersen, O.K. Improved tetrahedron method for Brillouin-zone integrations.Phys. Rev. B 1994, 49, 16223–16233. [CrossRef]
29. Ti3Ir, ICSD No. 641115.30. V3Ir, ICSD No. 104591.31. Cr3Ir, ICSD No. 102780.32. Nb3Ir, ICSD No. 640833.33. Mo3Ir, ICSD No.600761.34. Rajagopalan, M.; Gandhi, R.R. First principles study of structural, electronic, mechanical and thermal
properties of A15 intermetallic compounds Ti3X (X = Au, Pt, Ir). Phys. B 2012, 407, 4731–4734. [CrossRef]35. Paduani, C. Structural and electronic properties of the A-15 compounds Nb3Rh and Nb3Ir. Phys. B 2007, 393,
105–109. [CrossRef]36. Subhashree, G.; Sankar, S.; Krithiga, R. Superconducting properties of Mo3Os,Mo3Pt,Mo3Ir from first
principle calculations. Mod. Phys. Lett. B 2014, 28, 1450233. [CrossRef]37. Afaq, A.; Rizwan, M.; Bakar, A. Computational investigations of XMgGa (X = Li, Na) half Heusler compounds
for thermo-elastic and vibrational properties. Phys. B 2019, 554, 102–106. [CrossRef]38. Heciri, D.; Belkhir, H.; Belghit, R.; Bouhafs, B.; Khenata, R.; Ahmed, R.; Bouhemadou, A.; Ouahrani, T.;
Wang, X.; Omrani, S.B. Insight into the structural, elastic and electronic properties of tetragonal inter-alkalimetal chalcogenides CsNaX (X = S, Se, and Te) from first-principles calculations. Mater. Chem. Phys. 2019,221, 125–137. [CrossRef]
39. He, D.G.; Lin, Y.C.; Jiang, X.Y.; Yin, L.X.; Wang, L.H.; Wu, Q. Dissolution mechanisms and kinetics of δ phasein an aged Ni-based superalloy in hot deformation process. Mater. Des. 2018, 156, 262–271. [CrossRef]
40. Pettifor, D.G. Theoretical predictions of structure and related properties of intermetallics. Mater. Sci. Technol.1992, 8, 345–349. [CrossRef]
41. Fatima, B.; Chouhan, S.S.; Acharya, N.; Sanyal, S.P. Theoretical prediction of the electronic structure, bondingbehavior and elastic moduli of scandium intermetallics. Intermetallics 2014, 53, 129–139. [CrossRef]
42. Sundareswari, M.; Ramasubramanian, S.; Rajagopalan, M. Elastic and thermodynamical properties of A15Nb3X (X = Al,Ga,In,Sn and Sb) compounds-First principles DFT study. Solid State Commun. 2010, 150,2057–2060. [CrossRef]
43. Han, Y.; Wu, Y.; Li, T.; Khenata, R.; Yang, T.; Wang, X. Electronic, Magnetic, Half-Metallic, and MechanicalProperties of a New Equiatomic Quaternary Heusler Compound YRhTiGe: A First-Principles Study. Materials2018, 11, 797. [CrossRef]
44. Chen, D.; Chen, Z.; Wu, Y.; Wang, M.; Ma, N.; Wang, H. First-principles investigation of mechanical,electronic and optical properties of Al3Sc intermetallic compound under pressure. Comput. Mater. Sci. 2014,91, 165–172. [CrossRef]
45. Salma, M.U.; Rahman, M.A. Study of structural, elastic, electronic, mechanical, optical and thermodynamicproperties of NdPb3 intermetallic compound: DFT based calculations. Comput. Condens. Matter 2018, 15,42–47. [CrossRef]
46. Luan, X.; Qin, H.; OrcID, F.L.; Dai, Z.; Yi, Y.; Li, Q. The Mechanical Properties and Elastic Anisotropies ofCubic Ni3Al from First Principles Calculations. Crystals 2018, 8, 307. [CrossRef]
47. Sultana, F.; Uddin, M.M.; Ali, M.A.; Hossain, M.M.; Naqib, S.H.; Islam, A.K.M.A. First principles study ofM2InC (M = Zr, Hf and Ta) MAX phases: The effect of M atomic species. Results Phys. 2018, 11, 869–876.[CrossRef]
48. Chen, S.; Sun, Y.; Duan, Y.H.; Huang, B.; Peng, M.J. Phase stability, structural and elastic properties ofC15-type Laves transition-metal compounds MCo2 from first-principles calculations. J. Alloy. Compd. 2015,630, 202–208. [CrossRef]
49. Li, C.X.; Duan, Y.H.; Hu, W.-C. Electronic structure, elastic anisotropy, thermal conductivity and opticalproperties of calcium apatite Ca5(PO4)3X (X = F, Cl or Br). J. Alloy. Compd. 2015, 619, 66–77. [CrossRef]
102
Crystals 2019, 9, 104
50. Huang, S.; Zhang, C.H.; Li, R.Z.; Shen, J.; Chen, N.X. Site preference and alloying effect on elastic propertiesof ternary B2 RuAl-based alloys. Intermetallics 2014, 51, 24–29. [CrossRef]
51. Jacob, K.T.; Raj, S.; Rannesh, L. Vegard’s law: A fundamental relation or an approximation? Inter. J. Mater.Res. 2007, 98, 776–779. [CrossRef]
52. Li, C.; Wu, P. Correlation of Bulk Modulus and the Constituent Element Properties of Binary IntermetallicCompounds. Chem. Mater. 2001, 13, 4642–4648. [CrossRef]
53. Chen, D.; Chen, Z.; Wu, Y.; Wang, M.; Ma, N.; Wang, H. First-principles study of mechanical and electronicproperties of TiB compound under pressure. Intermetallics 2014, 52, 64–71. [CrossRef]
54. Zhong, S.Y.; Chen, Z.; Wang, M.; Chen, D. Structural, elastic and thermodynamic properties of Mo3Si andMo3Ge. Eur. Phys. J. B 2016, 89, 6. [CrossRef]
55. Lebga, N.; Daoud, S.; Sun, X.W.; Bioud, N.; Latreche, A. Mechanical and Thermophysical Properties of CubicRock-Salt AlN Under High Pressure. J. Electr. Mater. 2018, 47, 3430–3439. [CrossRef]
56. Fu, H.; Li, D.; Peng, F.; Gao, T.; Cheng, X. Ab initio calculations of elastic constants and thermodynamicproperties of NiAl under high pressures. Comput. Mater. Sci. 2008, 44, 774–778. [CrossRef]
57. Pugh, S.F. XCII. Relations between the elastic moduli and the plastic properties of polycrystalline puremetals. Philos. Mag. 1954, 45, 823–843. [CrossRef]
58. Niu, H.Y.; Chen, X.Q.; Liu, P.T.; Xing, W.W.; Cheng, X.Y.; Li, D.Z.; Li, Y.Y. Extra-electron induced covalentstrengthening and generalization of intrinsic ductile-to-brittle criterion. Sci. Rep. 2012, 2, 718. [CrossRef]
59. Han, C.; Chai, C.; Fan, Q.; Yang, J.; Yang, Y. Structural, Electronic, and Thermodynamic Properties ofTetragonal t-SixGe3-xN4. Materials 2018, 11, 397. [CrossRef]
60. Belghit, R.; Belkhir, H.; Kadri, M.T.; Heciri, D.; Bououdin, M.; Ahuja, R. Structural, elastic, electronic andoptical properties of novel antiferroelectric KNaX (X = S, Se, and Te) compounds: First principles study.Phys. B 2018, 545, 18–29. [CrossRef]
61. Duan, Y.H.; Sun, Y.; Peng, M.J.; Zhou, S.G. Anisotropic elastic properties of the Ca-Pb compounds. J. Alloy.Compd. 2014, 595, 14–21. [CrossRef]
62. Vajeeston, P.; Ravindran, P.; Fjellvag, H. Prediction of structural, lattice dynamical, and mechanical propertiesof CaB2. RSC Adv. 2012, 2, 11687–11694. [CrossRef]
63. Haque, E.; Hossain, M.A. First-principles study of elastic, electronic, thermodynamic, and thermoelectrictransport properties of TaCoSn. Results Phys. 2018, 10, 458–465. [CrossRef]
64. Junod, A.; Flukiger, R.; Muller, J. Supraconductivite et chaleur specifique dans les alliages A15 a base detitane. J. Phys. Chem. Solids 1976, 37, 27–31. [CrossRef]
65. Spitzli, P. Chaleur spécifique d’alliages de structure A 15. Physik der kondensierten Materie 1971, 13, 22–58.66. Junod, A.; Bischel, D.; Muller, J. Eliashberg inversion of superconducting state thermodynamics. Helv. Phys.
Acta 1979, 52, 580. [CrossRef]67. Flükiger, R.; Heiniger, F.; Junod, A.; Muller, J.; Spitzli, P.; Staudenmann, J.L. Chaleur specifique et
supraconductivite dans des alliages de structure A 15 a base de chrome. J. Phys. Chem. Solids 1971, 32,459–463. [CrossRef]
68. Morin, F.J.; Maita, J.P. Specific Heats of Transition Metal Superconductors. Phys. Rev. 1963, 129, 1115. [CrossRef]69. Misawa, S. The 3-Dimensional Fermi Liquid Description for the Iron-Based Superconductors. J. Low Temp.
Phys. 2018, 190, 45–66. [CrossRef]70. Li, Y.; Gao, Y.; Xiao, B.; Min, T.; Fan, Z.; Ma, S.; Xu, L. Theoretical study on the stability, elasticity, hardness
and electronic structures of W-C binary compounds. J. Alloy. Compd. 2010, 502, 28–37. [CrossRef]
© 2019 by the authors. Licensee MDPI, Basel, Switzerland. This article is an open accessarticle distributed under the terms and conditions of the Creative Commons Attribution(CC BY) license (http://creativecommons.org/licenses/by/4.0/).
103
crystals
Article
First-Principles Assessment of the Structure andStability of 15 Intrinsic Point Defects in Zinc-BlendeIndium Arsenide
Qing Peng 1,*, Nanjun Chen 1, Danhong Huang 2, Eric R. Heller 3, David A. Cardimona 2 and
Fei Gao 1,*
1 Nuclear Engineering and Radiological Sciences, University of Michigan, Ann Arbor, MI 48109, USA;[email protected]
2 Space Vehicles Directorate, Air Force Research Laboratory, Kirtland AFB, Albuquerque, NM 87117, USA;[email protected] (D.H.); [email protected] (D.A.C.)
3 Materials and Manufacturing Directorate, Air Force Research Laboratory, Wright Patterson AFB, OH 45433,USA; [email protected]
* Correspondence: [email protected] (Q.P.); [email protected] (F.G.)
Received: 4 December 2018; Accepted: 15 January 2019; Published: 17 January 2019
Abstract: Point defects are inevitable, at least due to thermodynamics, and essential for engineeringsemiconductors. Herein, we investigate the formation and electronic structures of fifteen differentkinds of intrinsic point defects of zinc blende indium arsenide (zb-InAs ) using first-principlescalculations. For As-rich environment, substitutional point defects are the primary intrinsic pointdefects in zb-InAs until the n-type doping region with Fermi level above 0.32 eV is reached, where thedominant intrinsic point defects are changed to In vacancies. For In-rich environment, In tetrahedralinterstitial has the lowest formation energy till n-type doped region with Fermi level 0.24 eV wheresubstitutional point defects InAs take over. The dumbbell interstitials prefer < 110 > configurations.For tetrahedral interstitials, In atoms prefer 4-As tetrahedral site for both As-rich and In-richenvironments until the Fermi level goes above 0.26 eV in n-type doped region, where In atomsacquire the same formation energy at both tetrahedral sites and the same charge state. This implies afast diffusion along the t − T − t path among the tetrahedral sites for In atoms. The In vacancies VIndecrease quickly and monotonically with increasing Fermi level and has a q = −3e charge state at thesame time. The most popular vacancy-type defect is VIn in an As-rich environment, but switchesto VAs in an In-rich environment at light p-doped region when Fermi level below 0.2 eV. This studysheds light on the relative stabilities of these intrinsic point defects, their concentrations and possiblediffusions, which is expected useful in defect-engineering zb-InAs based semiconductors, as well asthe material design for radiation-tolerant electronics.
Keywords: point defects; formation energy; indium arsenide; first-principles; charged defects
1. Introduction
The III-V zinc-blende semiconductors are among the most important semiconductors, and haverecently received much attention since they have potential to be employed as base materialsfor light-emitting diodes, infrared photodetectors, and spintronic devices, e.g., quantum-dot andquantum-well applications [1–3]. The materials have been the subject of interest in a large varietyof experimental and theoretical investigations [4–6]. The III-V semiconductors are strong candidatesto be incorporated into high-performance opto-electronics due to their direct band gap and highelectron mobility [7,8]. In the family of III-V materials, InAs stands out because of its very high electronmobility which can be as much as three times higher than those in InGaAs and GaAs [7,9]. Meanwhile,
Crystals 2019, 9, 48; doi:10.3390/cryst9010048 www.mdpi.com/journal/crystals104
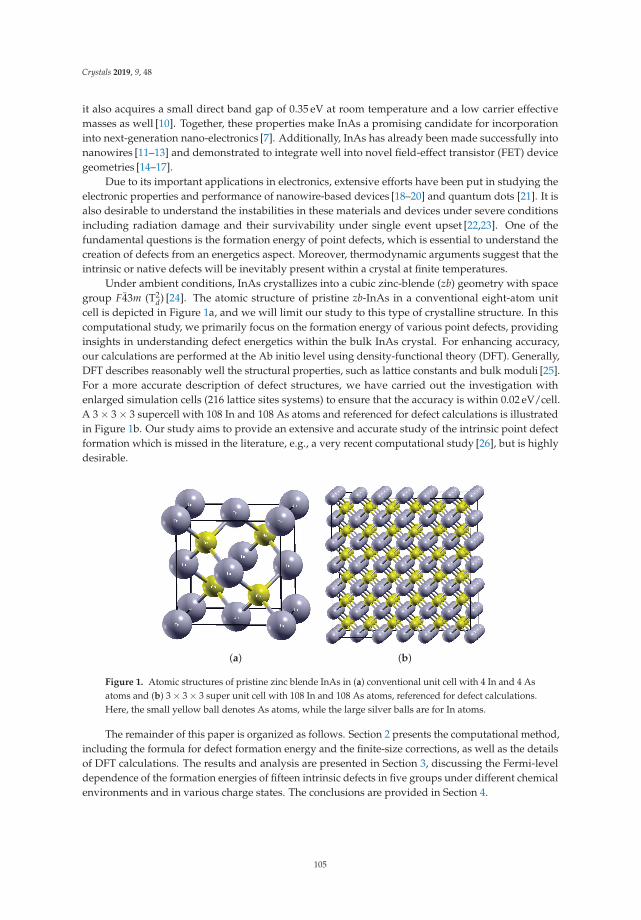
Crystals 2019, 9, 48
it also acquires a small direct band gap of 0.35 eV at room temperature and a low carrier effectivemasses as well [10]. Together, these properties make InAs a promising candidate for incorporationinto next-generation nano-electronics [7]. Additionally, InAs has already been made successfully intonanowires [11–13] and demonstrated to integrate well into novel field-effect transistor (FET) devicegeometries [14–17].
Due to its important applications in electronics, extensive efforts have been put in studying theelectronic properties and performance of nanowire-based devices [18–20] and quantum dots [21]. It isalso desirable to understand the instabilities in these materials and devices under severe conditionsincluding radiation damage and their survivability under single event upset [22,23]. One of thefundamental questions is the formation energy of point defects, which is essential to understand thecreation of defects from an energetics aspect. Moreover, thermodynamic arguments suggest that theintrinsic or native defects will be inevitably present within a crystal at finite temperatures.
Under ambient conditions, InAs crystallizes into a cubic zinc-blende (zb) geometry with spacegroup F43m (T2
d) [24]. The atomic structure of pristine zb-InAs in a conventional eight-atom unitcell is depicted in Figure 1a, and we will limit our study to this type of crystalline structure. In thiscomputational study, we primarily focus on the formation energy of various point defects, providinginsights in understanding defect energetics within the bulk InAs crystal. For enhancing accuracy,our calculations are performed at the Ab initio level using density-functional theory (DFT). Generally,DFT describes reasonably well the structural properties, such as lattice constants and bulk moduli [25].For a more accurate description of defect structures, we have carried out the investigation withenlarged simulation cells (216 lattice sites systems) to ensure that the accuracy is within 0.02 eV/cell.A 3 × 3 × 3 supercell with 108 In and 108 As atoms and referenced for defect calculations is illustratedin Figure 1b. Our study aims to provide an extensive and accurate study of the intrinsic point defectformation which is missed in the literature, e.g., a very recent computational study [26], but is highlydesirable.
(a) (b)
Figure 1. Atomic structures of pristine zinc blende InAs in (a) conventional unit cell with 4 In and 4 Asatoms and (b) 3 × 3 × 3 super unit cell with 108 In and 108 As atoms, referenced for defect calculations.Here, the small yellow ball denotes As atoms, while the large silver balls are for In atoms.
The remainder of this paper is organized as follows. Section 2 presents the computational method,including the formula for defect formation energy and the finite-size corrections, as well as the detailsof DFT calculations. The results and analysis are presented in Section 3, discussing the Fermi-leveldependence of the formation energies of fifteen intrinsic defects in five groups under different chemicalenvironments and in various charge states. The conclusions are provided in Section 4.
105
Crystals 2019, 9, 48
2. Methods
2.1. Defect Formation Energy
To reduce the artificial self-image interactions imposed by periodic-boundary conditions, defectsare generally modeled in an enlarged super cell. The selection of the super-cell size is a compromisebetween the accuracy and the computing demands. In general, the formation energy for a defectwith charges in a semiconductor or an insulator has contributions from both ions and electrons. In asuper-cell formalism, for a defect or impurity X in a charge state q, its formation energy E f (Xq) iscomputed by
E f (Xq, EF) = Etot(Xq)− Etotbulk(q = 0)
− ∑i
Δniμi + q(EVBM + EF) + Ecorr , (1)
where Etot(Xq) is the total energy of the super-cell containing the defect X in the charge state q,Etot
bulk(q = 0) denotes the total energy of the pristine bulk supercell which is neutral and free of anydefects, Δni represents the number of atoms of species i added to (Δni >0) or removed from (Δni <0)the supercell as a result of the defect formation, and μi = μbulk
i + Δμi corresponds to the chemicalpotential of element species i. When an atom is added to the system, the associated electrons arealso added to the system and contribute to the formation energy. Such a contribution is described bythe chemical potential of electrons, known as the Fermi level EF at zero temperature. Here, EF of asemiconductor is treated as an independent variable that can take any value within the bandgap. It isworth noting that EF is measured with respect to EVBM, the energy of valence band maximum (VBM)of the bulk material.
Since the exact value of the chemical potential μi in Eqaution (1) cannot be determined, it is treatedas a parameter for the formation energy calculations. As such, the defect formation energies are givenin the limiting conditions of As-rich and In-rich growth regimes. In the As-rich regime, the chemicalpotential of As atoms is assumed to be the value in bulk As, whereas in the In-rich (As-poor) regime,it corresponds to the chemical-potential difference between InAs and bulk In (and vice versa for thechemical potential of In). For an in-depth discussion of formation-energy calculations, the reader isreferred to the following papers [27–30].
The correction term Ecorr in Equation (1) is used to remove the errors introduced by finite size(L) effects and periodic-boundary conditions, such as spurious overlaps of neighboring defect wavefunctions and, in case of charged defects, Coulomb interactions between image charges. There isstill extensive debate on the performance and applicability of different schemes of corrections [31–33],e.g., Makov and Payne (MP) scheme [34], alignment-only scheme [35], Freysoldt, Neugebauer andVan de Walle (FNV) scheme [36], Lany and Zunger (LZ) scheme [37]. The mutual relation betweenvarious schemes and defining the conditions for their applications are discussed by Komsa et al. [38].The classical MP scheme is adopted in this paper and gives the correction terms as
Ecorr(q, L) = Ecorrmono + Ecorr
quad = −αq2
εL+
A3
L3 . (2)
Here, the first term is the monopole Madelung term [32], while the second term is the third-orderquadrupole electrostatic correction. In addition, α is the Madelung constant of the crystal, q is thecharge of a defect state, embedded in a uniform compensating background charge, with the unit of e(the positive electron charge). ε is the static dielectric constant. The third-order parameter A3 is takenas a fitting parameter.
Several early studies indicated that the quadrupole correction does not always improve results,leaving its utility somewhat in question [39,40]. Therefore, in this paper we only consider the leadingterm of the monopole Madelung correction. The Madelung constant α is 1.638 for zinc blende cubic
106
Crystals 2019, 9, 48
lattice of point charges, and 2.8373 for simple cubic lattice of point charges. Within the approximationof a single charge monopole, we adopt α = 2.8373 for the cubic system. ε = 15.15 is chosen for thestatic dielectric constant of InAs.
2.2. Details of Density Functional Theory Calculations
The conventional unit cell contains eight atoms (four In and four As atoms). We useda 3 × 3 × 3 supercell containing 216 regular lattice sites, which consists of 108 In and 108 Asatoms before including defects. The total energies of the system and forces on each atom arecharacterized via first-principles calculations within the framework of DFT. All DFT calculationsare carried out with the Vienna Ab-initio Simulation Package (VASP) [41,42] which is based on theKohn-Sham density-functional theory (KS-DFT) [43,44] with generalized gradient approximationfor the exchange-correlation functionals [45] as parameterized by Perdew, Burke and Ernzerhof(PBE) and revised for solids (PBEsol) [46]. The electrons explicitly included in the calculations arethe 4d105s25p1 electrons (13 electrons) and the 4s24p3 electrons (5 electrons) for each of In and Asatom, respectively. The core electrons are replaced by the projector augmented wave (PAW) andpseudo-potential approach [47,48]. A plane-wave cutoff of 400 eV is used in the geometry relaxation toreduce Pulay stress. For all other calculations, we employ a plane-wave cutoff of 240 eV with accurateand dense k-mesh, where the irreducible Brillouin Zone is sampled with a Gamma-centered 3 × 3 × 3k-mesh. Moreover, the calculations were performed at zero temperature. The criterion for stopping therelaxation of the electronic degrees of freedom is set by requiring the total energy change to be smallerthan 10−5 eV. The optimized atomic geometry is achieved through minimizing Hellmann-Feynmanforces acting on each atom until the maximum forces on ions become smaller than 0.01 eV/Å.
After the geometry optimization of a perfect crystal, we introduce defects by either removalof an appropriate atom to create a vacancy, or addition of an extra atom to create an interstitial ina pre-specified position (tetrahedral or dumbbell). The resulting structures were allowed to relaxenergetically, permitting atoms to move in all three dimensions. Here, all geometry optimizations wereperformed using the classical conjugate gradient algorithm.
It is well known that GGA level exchange correlation functions severely underestimate the bandgaps of semiconductors, although the the total energy of the system could be obtained with fairly andsatisfactorily accurate [49]. More accurate bandgap prediction require higher level exchange correlationfunctionals including GW and HSE methods [25]. However, because the defective systems are ingeneral contain hundreds of atoms, for example, about 216 atoms in this study, it is unfeasible to carryout higher levels (GW, or HSE for example) calculations. Therefore, here we used the experimental(0.417 eV) of the band gap throughout this study, as previous efforts [31,49,50].
3. Results and Analysis
3.1. Atomic Structures of Intrinsic Defects
Under the ambient condition, InAs, one of the most important III-V semiconductors, has a cubic3C zinc-blende crystalline configuration, We first optimized the geometry of the pristine zb-InAs withlattice parameters measured between 6.0584 Å and 6.060 Å [51]. Our result with the lattice parameterof 6.058 Å from GGA-PBEsol agrees well with previous GGA-PBE results of 6.059 Å [20], PBE-PW91results of 6.061 Å [52], and experiment of 6.0588 Å reported by Thompson, Rowe, and Bubenstein in1969 [53].
We then generated fifteen different defect configurations for intrinsic point defects in zb-InAs ,as depicted in Figure 2. Each defect configuration sits around the center of a 3 × 3 × 3 supercell with216 lattice sites, which ensures that the interactions between images become negligible. All these defectconfigurations are fully relaxed so that the maximum amplitude of the forces on every atom is lessthan 0.02 eV/Å . The final relaxed atomic structures of these fifteen configurations in neutral states(charge q = 0) are displayed in Figure 2. For denotation of these point defects, we take the form of
107
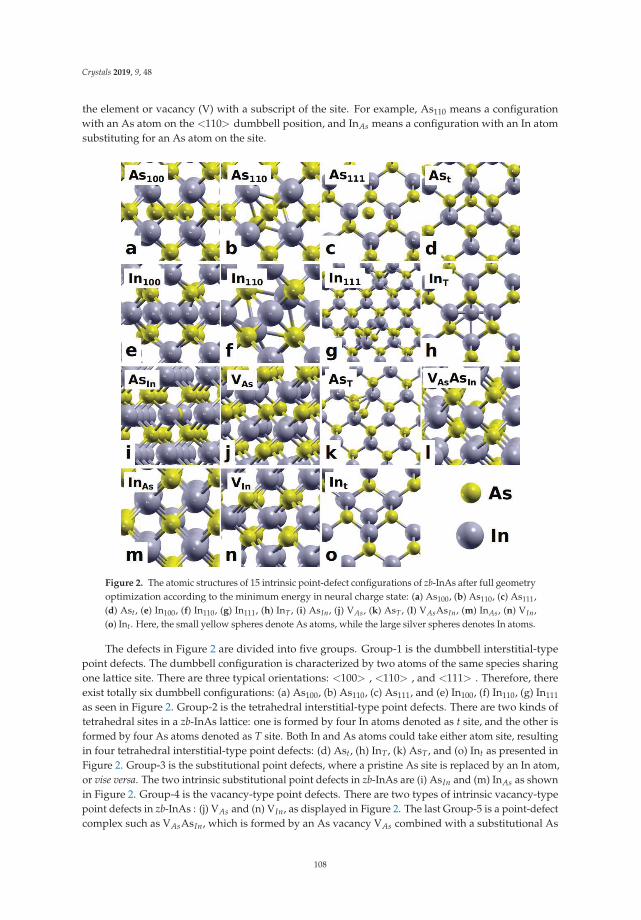
Crystals 2019, 9, 48
the element or vacancy (V) with a subscript of the site. For example, As110 means a configurationwith an As atom on the <110> dumbbell position, and InAs means a configuration with an In atomsubstituting for an As atom on the site.
Figure 2. The atomic structures of 15 intrinsic point-defect configurations of zb-InAs after full geometryoptimization according to the minimum energy in neural charge state: (a) As100, (b) As110, (c) As111,(d) Ast, (e) In100, (f) In110, (g) In111, (h) InT , (i) AsIn, (j) VAs, (k) AsT , (l) VAsAsIn, (m) InAs, (n) VIn,(o) Int. Here, the small yellow spheres denote As atoms, while the large silver spheres denotes In atoms.
The defects in Figure 2 are divided into five groups. Group-1 is the dumbbell interstitial-typepoint defects. The dumbbell configuration is characterized by two atoms of the same species sharingone lattice site. There are three typical orientations: <100> , <110> , and <111> . Therefore, thereexist totally six dumbbell configurations: (a) As100, (b) As110, (c) As111, and (e) In100, (f) In110, (g) In111
as seen in Figure 2. Group-2 is the tetrahedral interstitial-type point defects. There are two kinds oftetrahedral sites in a zb-InAs lattice: one is formed by four In atoms denoted as t site, and the other isformed by four As atoms denoted as T site. Both In and As atoms could take either atom site, resultingin four tetrahedral interstitial-type point defects: (d) Ast, (h) InT , (k) AsT , and (o) Int as presented inFigure 2. Group-3 is the substitutional point defects, where a pristine As site is replaced by an In atom,or vise versa. The two intrinsic substitutional point defects in zb-InAs are (i) AsIn and (m) InAs as shownin Figure 2. Group-4 is the vacancy-type point defects. There are two types of intrinsic vacancy-typepoint defects in zb-InAs : (j) VAs and (n) VIn, as displayed in Figure 2. The last Group-5 is a point-defectcomplex such as VAsAsIn, which is formed by an As vacancy VAs combined with a substitutional As
108
Crystals 2019, 9, 48
atom on the nearest-neighbor In site (AsIn), as demonstrated by Figure 2o. This defect is interestingbecause an In vacancy VIn could attract a nearby As atom to fill it up, resulting in the VAsAsIn complex.It is worth pointing out that the relaxed atomic structures of the dumbbell interstitial-type defect ofIn111 and tetrahedral interstitial-type defect of AsT are also point-defect complexes, indicating they arehighly unstable. Next, we investigate the formation energies of all these different types of defects.
3.2. Defect Formation Energies
The formation energies of defects are computed according to Equation (1) for different chargestates from q = −4 to q = 4. In order to estimate the uncertainties caused by the finite size of supercellsas well as the spurious image interactions, we therefore evaluate the corrections, as detailed in Section 2.As a result, we find the deviations up to 0.01 eV for defects with a charge of q = ±4. We regard thesevalues as unavoidable uncertainties which nevertheless do not significantly alter the main conclusions.
It is clear from the formula in Equation (1) that the formation energies of intrinsic defects willdepend on the choice of chemical potentials, i.e., the choice of reservoir with which equilibrium isachieved. The chemical potentials are constrained by equilibrium conditions, which varies from case tocase, location to location, time to time. Here we only consider two extreme conditions: (1) As-rich and(2) In-rich. Our results of the chemical potentials are computed as μbulk
As = −3.014 eV, μbulkIn = −2.389
eV, and μbulkInAs = −6.574 eV.
Another factor we need to consider is the Fermi level EF, which is required for counting theformation energies from the electrons’ contribution. However, the exact value of EF is very sensitiveto local environments including doping concentrations. Consequently, we have expressed the defectformation energy as a function of EF which varies in the whole range of the electronic band gap.The experimental value of the bandgap is 0.417 [51]. We adopted this value as the range for EFin our study. In fact, the formation energy depends linearly on the Fermi level, as manifested inEquation (1). The band-gap predicted from PBE solid is 0.142 eV, which is severely underestimatedfrom the experimental value of 0.417 eV, because the artificial self-interaction of electrons are notexcluded [54]. Here we have applied the “extended gap scheme” to map the calculated transfer levelsonto the experimental band gap [39]. The regime near the edge of the valence bands or VBM is thep-type doped where EF is small. The regime near the edge of the conduction bands or CBM is then-type doped and EF is large and comparable to the band gap. The two two different regimes aredislayed in the figures of the formation energies to mark the doping stage through out this study.
The formation energies of fifteen defect configurations in the dilute limit are computed usingthe supercell method as aforementioned. It is worth mentioning that although the point defects aregenerated in a non-equilibrium process, the relative formation energies of different configurations canshed light on preferential locations and determine the accessible ground-state charge states, as well ascharge-state transition levels [54]. The formation energies as functions of EF in the As-rich and In-richenvironments for all these intrinsic defects in zb-InAs with all possible charge states from −4 to +4 aredisplayed in the upper and lower panels of Figure 3, respectively. Our results show the distinctivetrend and significant variations of the formation energies under various charge states as functions ofEF for each point defect in both As-rich and In-rich environments. All calculated formation energieslie between 1.0 eV and 9.0 eV. The general trend is that the formation energy decreases for negativecharge state (q < 0) but increases for positive charge state (q > 0) with increasing EF. The slope ofthe formation energy as a function of EF is positively correlated with the charge state. For q = +4e,the amount of the increment in formation energy is more than 1.5 eV as EF changes from VBM (0 eV)to CBM (0.417 eV).
109
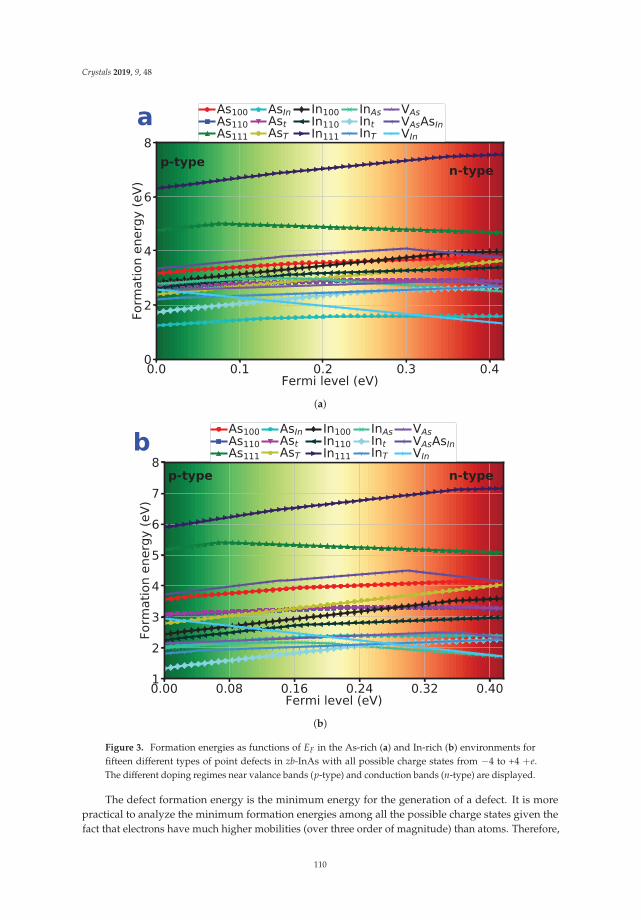
Crystals 2019, 9, 48
(a)
(b)
Figure 3. Formation energies as functions of EF in the As-rich (a) and In-rich (b) environments forfifteen different types of point defects in zb-InAs with all possible charge states from −4 to +4 +e.The different doping regimes near valance bands (p-type) and conduction bands (n-type) are displayed.
The defect formation energy is the minimum energy for the generation of a defect. It is morepractical to analyze the minimum formation energies among all the possible charge states given thefact that electrons have much higher mobilities (over three order of magnitude) than atoms. Therefore,
110
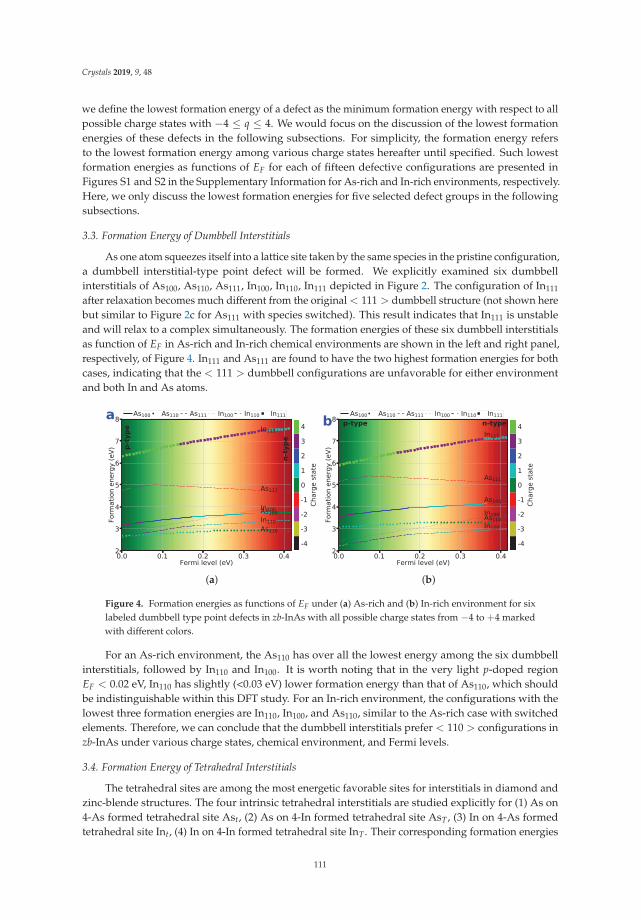
Crystals 2019, 9, 48
we define the lowest formation energy of a defect as the minimum formation energy with respect to allpossible charge states with −4 ≤ q ≤ 4. We would focus on the discussion of the lowest formationenergies of these defects in the following subsections. For simplicity, the formation energy refersto the lowest formation energy among various charge states hereafter until specified. Such lowestformation energies as functions of EF for each of fifteen defective configurations are presented inFigures S1 and S2 in the Supplementary Information for As-rich and In-rich environments, respectively.Here, we only discuss the lowest formation energies for five selected defect groups in the followingsubsections.
3.3. Formation Energy of Dumbbell Interstitials
As one atom squeezes itself into a lattice site taken by the same species in the pristine configuration,a dumbbell interstitial-type point defect will be formed. We explicitly examined six dumbbellinterstitials of As100, As110, As111, In100, In110, In111 depicted in Figure 2. The configuration of In111
after relaxation becomes much different from the original < 111 > dumbbell structure (not shown herebut similar to Figure 2c for As111 with species switched). This result indicates that In111 is unstableand will relax to a complex simultaneously. The formation energies of these six dumbbell interstitialsas function of EF in As-rich and In-rich chemical environments are shown in the left and right panel,respectively, of Figure 4. In111 and As111 are found to have the two highest formation energies for bothcases, indicating that the < 111 > dumbbell configurations are unfavorable for either environmentand both In and As atoms.
(a) (b)
Figure 4. Formation energies as functions of EF under (a) As-rich and (b) In-rich environment for sixlabeled dumbbell type point defects in zb-InAs with all possible charge states from −4 to +4 markedwith different colors.
For an As-rich environment, the As110 has over all the lowest energy among the six dumbbellinterstitials, followed by In110 and In100. It is worth noting that in the very light p-doped regionEF < 0.02 eV, In110 has slightly (<0.03 eV) lower formation energy than that of As110, which shouldbe indistinguishable within this DFT study. For an In-rich environment, the configurations with thelowest three formation energies are In110, In100, and As110, similar to the As-rich case with switchedelements. Therefore, we can conclude that the dumbbell interstitials prefer < 110 > configurations inzb-InAs under various charge states, chemical environment, and Fermi levels.
3.4. Formation Energy of Tetrahedral Interstitials
The tetrahedral sites are among the most energetic favorable sites for interstitials in diamond andzinc-blende structures. The four intrinsic tetrahedral interstitials are studied explicitly for (1) As on4-As formed tetrahedral site Ast, (2) As on 4-In formed tetrahedral site AsT , (3) In on 4-As formedtetrahedral site Int, (4) In on 4-In formed tetrahedral site InT . Their corresponding formation energies
111
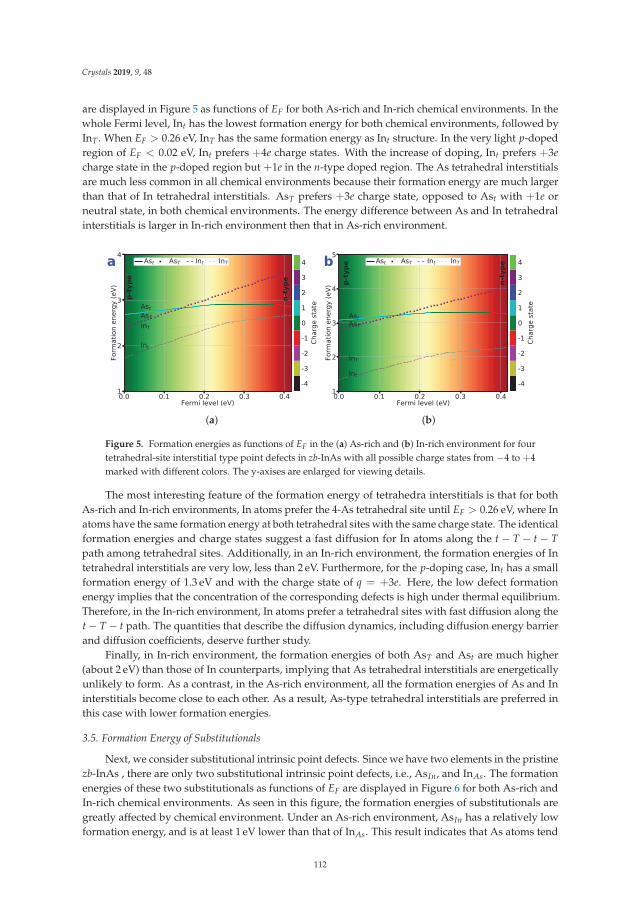
Crystals 2019, 9, 48
are displayed in Figure 5 as functions of EF for both As-rich and In-rich chemical environments. In thewhole Fermi level, Int has the lowest formation energy for both chemical environments, followed byInT . When EF > 0.26 eV, InT has the same formation energy as Int structure. In the very light p-dopedregion of EF < 0.02 eV, Int prefers +4e charge states. With the increase of doping, Int prefers +3echarge state in the p-doped region but +1e in the n-type doped region. The As tetrahedral interstitialsare much less common in all chemical environments because their formation energy are much largerthan that of In tetrahedral interstitials. AsT prefers +3e charge state, opposed to Ast with +1e orneutral state, in both chemical environments. The energy difference between As and In tetrahedralinterstitials is larger in In-rich environment then that in As-rich environment.
(a) (b)
Figure 5. Formation energies as functions of EF in the (a) As-rich and (b) In-rich environment for fourtetrahedral-site interstitial type point defects in zb-InAs with all possible charge states from −4 to +4marked with different colors. The y-axises are enlarged for viewing details.
The most interesting feature of the formation energy of tetrahedra interstitials is that for bothAs-rich and In-rich environments, In atoms prefer the 4-As tetrahedral site until EF > 0.26 eV, where Inatoms have the same formation energy at both tetrahedral sites with the same charge state. The identicalformation energies and charge states suggest a fast diffusion for In atoms along the t − T − t − Tpath among tetrahedral sites. Additionally, in an In-rich environment, the formation energies of Intetrahedral interstitials are very low, less than 2 eV. Furthermore, for the p-doping case, Int has a smallformation energy of 1.3 eV and with the charge state of q = +3e. Here, the low defect formationenergy implies that the concentration of the corresponding defects is high under thermal equilibrium.Therefore, in the In-rich environment, In atoms prefer a tetrahedral sites with fast diffusion along thet − T − t path. The quantities that describe the diffusion dynamics, including diffusion energy barrierand diffusion coefficients, deserve further study.
Finally, in In-rich environment, the formation energies of both AsT and Ast are much higher(about 2 eV) than those of In counterparts, implying that As tetrahedral interstitials are energeticallyunlikely to form. As a contrast, in the As-rich environment, all the formation energies of As and Ininterstitials become close to each other. As a result, As-type tetrahedral interstitials are preferred inthis case with lower formation energies.
3.5. Formation Energy of Substitutionals
Next, we consider substitutional intrinsic point defects. Since we have two elements in the pristinezb-InAs , there are only two substitutional intrinsic point defects, i.e., AsIn, and InAs. The formationenergies of these two substitutionals as functions of EF are displayed in Figure 6 for both As-rich andIn-rich chemical environments. As seen in this figure, the formation energies of substitutionals aregreatly affected by chemical environment. Under an As-rich environment, AsIn has a relatively lowformation energy, and is at least 1 eV lower than that of InAs. This result indicates that As atoms tend
112
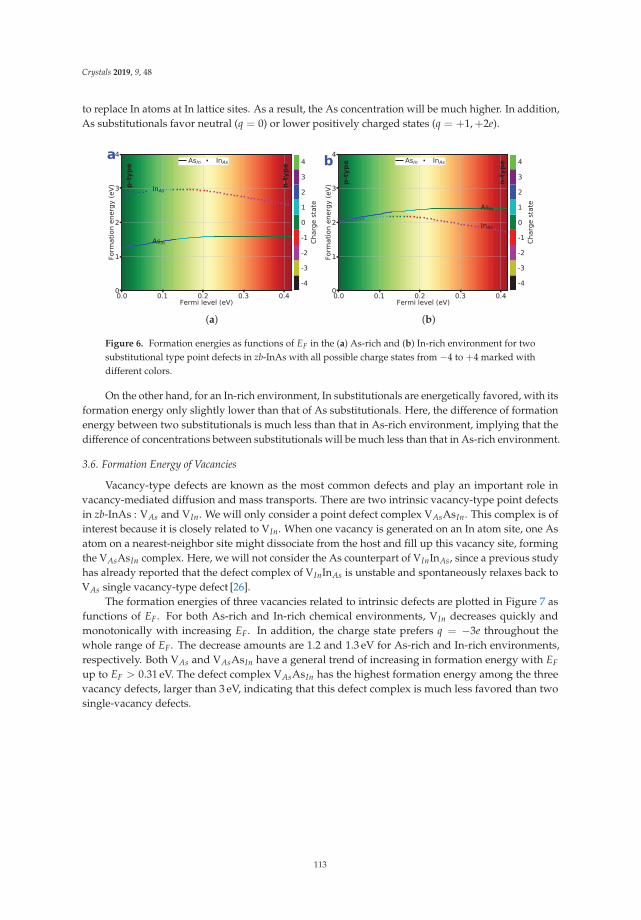
Crystals 2019, 9, 48
to replace In atoms at In lattice sites. As a result, the As concentration will be much higher. In addition,As substitutionals favor neutral (q = 0) or lower positively charged states (q = +1,+2e).
(a) (b)
Figure 6. Formation energies as functions of EF in the (a) As-rich and (b) In-rich environment for twosubstitutional type point defects in zb-InAs with all possible charge states from −4 to +4 marked withdifferent colors.
On the other hand, for an In-rich environment, In substitutionals are energetically favored, with itsformation energy only slightly lower than that of As substitutionals. Here, the difference of formationenergy between two substitutionals is much less than that in As-rich environment, implying that thedifference of concentrations between substitutionals will be much less than that in As-rich environment.
3.6. Formation Energy of Vacancies
Vacancy-type defects are known as the most common defects and play an important role invacancy-mediated diffusion and mass transports. There are two intrinsic vacancy-type point defectsin zb-InAs : VAs and VIn. We will only consider a point defect complex VAsAsIn. This complex is ofinterest because it is closely related to VIn. When one vacancy is generated on an In atom site, one Asatom on a nearest-neighbor site might dissociate from the host and fill up this vacancy site, formingthe VAsAsIn complex. Here, we will not consider the As counterpart of VInInAs, since a previous studyhas already reported that the defect complex of VInInAs is unstable and spontaneously relaxes back toVAs single vacancy-type defect [26].
The formation energies of three vacancies related to intrinsic defects are plotted in Figure 7 asfunctions of EF. For both As-rich and In-rich chemical environments, VIn decreases quickly andmonotonically with increasing EF. In addition, the charge state prefers q = −3e throughout thewhole range of EF. The decrease amounts are 1.2 and 1.3 eV for As-rich and In-rich environments,respectively. Both VAs and VAsAsIn have a general trend of increasing in formation energy with EFup to EF > 0.31 eV. The defect complex VAsAsIn has the highest formation energy among the threevacancy defects, larger than 3 eV, indicating that this defect complex is much less favored than twosingle-vacancy defects.
113
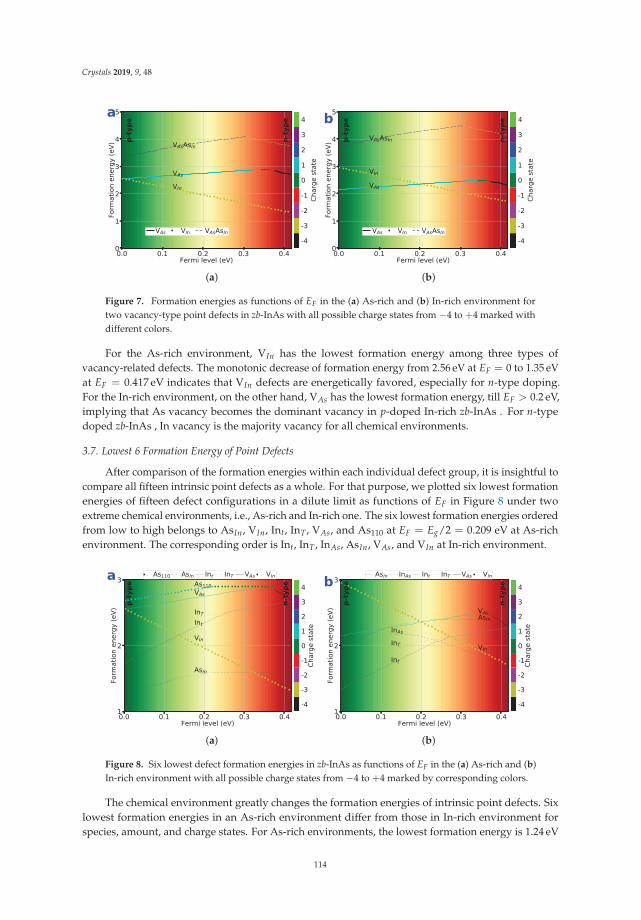
Crystals 2019, 9, 48
(a) (b)
Figure 7. Formation energies as functions of EF in the (a) As-rich and (b) In-rich environment fortwo vacancy-type point defects in zb-InAs with all possible charge states from −4 to +4 marked withdifferent colors.
For the As-rich environment, VIn has the lowest formation energy among three types ofvacancy-related defects. The monotonic decrease of formation energy from 2.56 eV at EF = 0 to 1.35 eVat EF = 0.417 eV indicates that VIn defects are energetically favored, especially for n-type doping.For the In-rich environment, on the other hand, VAs has the lowest formation energy, till EF > 0.2 eV,implying that As vacancy becomes the dominant vacancy in p-doped In-rich zb-InAs . For n-typedoped zb-InAs , In vacancy is the majority vacancy for all chemical environments.
3.7. Lowest 6 Formation Energy of Point Defects
After comparison of the formation energies within each individual defect group, it is insightful tocompare all fifteen intrinsic point defects as a whole. For that purpose, we plotted six lowest formationenergies of fifteen defect configurations in a dilute limit as functions of EF in Figure 8 under twoextreme chemical environments, i.e., As-rich and In-rich one. The six lowest formation energies orderedfrom low to high belongs to AsIn, VIn, Int, InT , VAs, and As110 at EF = Eg/2 = 0.209 eV at As-richenvironment. The corresponding order is Int, InT , InAs, AsIn, VAs, and VIn at In-rich environment.
(a) (b)
Figure 8. Six lowest defect formation energies in zb-InAs as functions of EF in the (a) As-rich and (b)In-rich environment with all possible charge states from −4 to +4 marked by corresponding colors.
The chemical environment greatly changes the formation energies of intrinsic point defects. Sixlowest formation energies in an As-rich environment differ from those in In-rich environment forspecies, amount, and charge states. For As-rich environments, the lowest formation energy is 1.24 eV
114
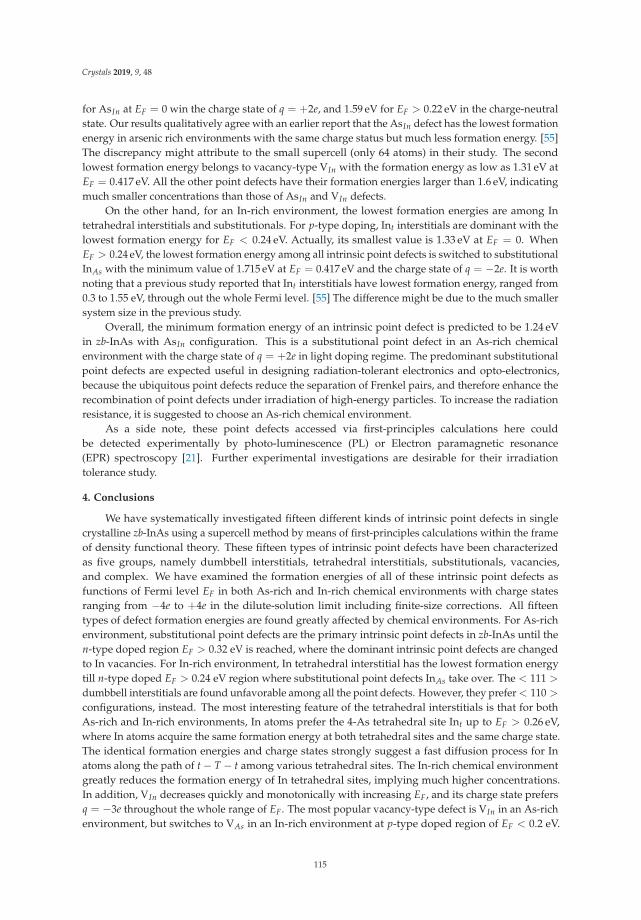
Crystals 2019, 9, 48
for AsIn at EF = 0 win the charge state of q = +2e, and 1.59 eV for EF > 0.22 eV in the charge-neutralstate. Our results qualitatively agree with an earlier report that the AsIn defect has the lowest formationenergy in arsenic rich environments with the same charge status but much less formation energy. [55]The discrepancy might attribute to the small supercell (only 64 atoms) in their study. The secondlowest formation energy belongs to vacancy-type VIn with the formation energy as low as 1.31 eV atEF = 0.417 eV. All the other point defects have their formation energies larger than 1.6 eV, indicatingmuch smaller concentrations than those of AsIn and VIn defects.
On the other hand, for an In-rich environment, the lowest formation energies are among Intetrahedral interstitials and substitutionals. For p-type doping, Int interstitials are dominant with thelowest formation energy for EF < 0.24 eV. Actually, its smallest value is 1.33 eV at EF = 0. WhenEF > 0.24 eV, the lowest formation energy among all intrinsic point defects is switched to substitutionalInAs with the minimum value of 1.715 eV at EF = 0.417 eV and the charge state of q = −2e. It is worthnoting that a previous study reported that Int interstitials have lowest formation energy, ranged from0.3 to 1.55 eV, through out the whole Fermi level. [55] The difference might be due to the much smallersystem size in the previous study.
Overall, the minimum formation energy of an intrinsic point defect is predicted to be 1.24 eVin zb-InAs with AsIn configuration. This is a substitutional point defect in an As-rich chemicalenvironment with the charge state of q = +2e in light doping regime. The predominant substitutionalpoint defects are expected useful in designing radiation-tolerant electronics and opto-electronics,because the ubiquitous point defects reduce the separation of Frenkel pairs, and therefore enhance therecombination of point defects under irradiation of high-energy particles. To increase the radiationresistance, it is suggested to choose an As-rich chemical environment.
As a side note, these point defects accessed via first-principles calculations here couldbe detected experimentally by photo-luminescence (PL) or Electron paramagnetic resonance(EPR) spectroscopy [21]. Further experimental investigations are desirable for their irradiationtolerance study.
4. Conclusions
We have systematically investigated fifteen different kinds of intrinsic point defects in singlecrystalline zb-InAs using a supercell method by means of first-principles calculations within the frameof density functional theory. These fifteen types of intrinsic point defects have been characterizedas five groups, namely dumbbell interstitials, tetrahedral interstitials, substitutionals, vacancies,and complex. We have examined the formation energies of all of these intrinsic point defects asfunctions of Fermi level EF in both As-rich and In-rich chemical environments with charge statesranging from −4e to +4e in the dilute-solution limit including finite-size corrections. All fifteentypes of defect formation energies are found greatly affected by chemical environments. For As-richenvironment, substitutional point defects are the primary intrinsic point defects in zb-InAs until then-type doped region EF > 0.32 eV is reached, where the dominant intrinsic point defects are changedto In vacancies. For In-rich environment, In tetrahedral interstitial has the lowest formation energytill n-type doped EF > 0.24 eV region where substitutional point defects InAs take over. The < 111 >
dumbbell interstitials are found unfavorable among all the point defects. However, they prefer < 110 >
configurations, instead. The most interesting feature of the tetrahedral interstitials is that for bothAs-rich and In-rich environments, In atoms prefer the 4-As tetrahedral site Int up to EF > 0.26 eV,where In atoms acquire the same formation energy at both tetrahedral sites and the same charge state.The identical formation energies and charge states strongly suggest a fast diffusion process for Inatoms along the path of t − T − t among various tetrahedral sites. The In-rich chemical environmentgreatly reduces the formation energy of In tetrahedral sites, implying much higher concentrations.In addition, VIn decreases quickly and monotonically with increasing EF, and its charge state prefersq = −3e throughout the whole range of EF. The most popular vacancy-type defect is VIn in an As-richenvironment, but switches to VAs in an In-rich environment at p-type doped region of EF < 0.2 eV.
115
Crystals 2019, 9, 48
Our results shed light on relative stabilities of these intrinsic point defects, as well as their relativeconcentrations and possible diffusions. This study is expected very insightful in defect-engineeringthe zb-InAs based semiconductors, as well as material design for radiation resistant electronics andopto-electronics.
Supplementary Materials: The following are available online at http://www.mdpi.com/2073-4352/9/1/48/s1:Figure S1: Defect formation energy in As-rich environment, Figure S2: Defect formation energy in In-richenvironment.
Author Contributions: Conceptualization, F.G., D.H. and E.R.H.; computations, Q.P. and N.C.; writing-originaldraft preparation, Q.P.; writing-review and editing, F.G., D.H., E.R.H., D.A.C., N.C.; supervision, F.G. and D.H.;project administration, F.G.
Funding: This research was funded by Air Force Research Laboratory (AFRL) and Air Force Office of ScientificResearch (AFOSR)
Acknowledgments: The authors would like to acknowledge the generous financial support from the Air ForceResearch Laboratory (AFRL). D.H. would like to thank the Air Force Office of Scientific Research (AFOSR) forsupport.
Conflicts of Interest: There are no conflicts of interest to declare.
Data Availability: The datasets generated during and/or analyzed during the current study are available fromthe corresponding author on reasonable request.
References
1. Razeghi, M. High-power laser-diodes based on ingaasp alloys. Nature 1994, 369, 631–633. [CrossRef]2. Kim, S.-W.; Sujith, S.; Lee, B.Y. InAsxSb1-x alloy nanocrystals for use in the near infrared. Chem. Commun.
2006, 4811–4813. [CrossRef]3. Marshall, A.R.J.; Tan, C.H.; Steer, M.J.; David, J.P.R. Electron dominated impact ionization and avalanche
gain characteristics in InAs photodiodes. Appl. Phys. Lett. 2008, 93, 111107. [CrossRef]4. Chelikowsky, J.R.; Cohen, M.L. Nonlocal pseudopotential calculations for the electronic structure of eleven
diamond and zinc-blende semiconductors. Phys. Rev. B 1976, 14, 556–582. [CrossRef]5. Gorczyca, I.; Christensen, N.E.; Alouani, M. Calculated optical and structural properties of InP under
pressure. Phys. Rev. B 1989, 39, 7705–7712. [CrossRef]6. Chang, K.J.; Froyen, S.; Cohen, M.L. Pressure coefficients of band gaps in semiconductor. Solid State Commun.
1984, 50, 105–107. [CrossRef]7. Del Alamo, J.A. Nanometre-scale electronics with III-V compound semiconductors. Nature 2011, 479, 317–323.
[CrossRef]8. Jones, K.S.; Lind, A.G.; Hatem, C.; Moffatt, S.; Ridgway, M.C. A Brief Review of Doping Issues in III-V
Semiconductors. ECS Trans. 2013, 53, 97–105. [CrossRef]9. Dayeh, S.A.; Susac, D.A.; Kavanagh, K.L.; Yu, E.T.; Wang, D. Structural and Room-Temperature Transport
Properties of Zinc Blende and Wurtzite InAs Nanowires. Adv. Funct. Mater. 2009, 19, 2102–2108. [CrossRef]10. Adachi, S. Properties of Semiconductor Alloys: Group-IV, III-V and II-VI Semiconductors; Wiley Online Library:
Hoboken, NJ, USA, 2009.11. Park, H.D.; Prokes, S.M.; Cammarata, R.C. Growth of epitaxial InAs nanowires in a simple closed system.
Appl. Phys. Lett. 2005, 87, 063110. [CrossRef]12. Dayeh, S.A.; Yu, E.T.; Wang, D. III-V nanowire growth mechanism: V/III ratio and temperature effects.
Nano Lett. 2007, 7, 2486–2490. [CrossRef] [PubMed]13. Dick, K.A.; Deppert, K.; Martensson, T.; Mandl, B.; Samuelson, L.; Seifert, W. Failure of the vapor-liquid-solid
mechanism in Au-assisted MOVPE growth of InAs nanowires. Nano Lett. 2005, 5, 761–764. [CrossRef][PubMed]
14. Bashouti, M.Y.; Tung, R.T.; Haick, H. Tuning the Electrical Properties of Si Nanowire Field-Effect Transistorsby Molecular Engineering. Small 2009, 5, 2761–2769. [CrossRef]
15. Dayeh, S.A.; Aplin, D.P.R.; Zhou, X.; Yu, P.K.L.; Yu, E.T.; Wang, D. High electron mobility InAs nanowirefield-effect transistors. Small 2007, 3, 326–332. [CrossRef] [PubMed]
116
Crystals 2019, 9, 48
16. Dayeh, S.A.; Yu, E.T.; Wang, D. Transport Coefficients of InAs Nanowires as a Function of Diameter. Small2009, 5, 77–81. [CrossRef] [PubMed]
17. Park, D.W.; Jeon, S.G.; Lee, C.-R.; Lee, S.J.; Song, J.Y.; Kim, J.O.; Noh, S.K.; Leem, J.-Y.; Kim, J.S. Structuraland electrical properties of catalyst-free Si-doped InAs nanowires formed on Si(111). Sci. Rep. 2015, 5, 16652.[CrossRef] [PubMed]
18. Ning, F.; Tang, L.-M.; Zhang, Y.; Chen, K.-Q. First-principles study of quantum confinement and surfaceeffects on the electronic properties of InAs nanowires. J. Appl. Phys. 2013, 114, 224304. [CrossRef]
19. Alam, K.; Sajjad, R.N. Electronic Properties and Orientation-Dependent Performance of InAs NanowireTransistors. IEEE Trans. Electron Devices 2010, 57, 2880–2885. [CrossRef]
20. Dos Santos, C.L.; Piquini, P. Diameter dependence of mechanical, electronic, and structural properties ofInAs and InP nanowires: A first-principles study. Phys. Rev. B 2010, 81, 075408. [CrossRef]
21. Repp, S.; Weber, S.; Erdem, E. Defect Evolution of Nonstoichiometric ZnO Quantum Dots. J. Phys. Chem. C2016, 120, 25124–25130. [CrossRef]
22. Dodd, P.E.; Massengill, L.W. Basic mechanisms and modeling of single-event upset in digital microelectronics.IEEE Trans. Nucl. Sci. 2003, 50, 583–602. [CrossRef]
23. Ziegler, J.F.; Lanford, W.A. Effect of Cosmic Rays on Computer Memories. Science 1979, 206, 776–788.[CrossRef] [PubMed]
24. Dick, K.A.; Caroff, P.; Bolinsson, J.; Messing, M.E.; Johansson, J.; Deppert, K.; Wallenberg, L.R.; Samuelson, L.Control of III-V nanowire crystal structure by growth parameter tuning. Semicond. Sci. Technol. 2010, 25,024009. [CrossRef]
25. Kim, Y.-S.; Hummer, K.; Kresse, G. Accurate band structures and effective masses for InP, InAs, and InSbusing hybrid functionals. Phys. Rev. B 2009, 80, 035203. [CrossRef]
26. Reveil, M.; Huang, H.-L.; Chen, H.-T.; Liu, J.; Thompson, M.O.; Clancy, P. Ab Initio Studies of the Diffusionof Intrinsic Defects and Silicon Dopants in Bulk InAs. Langmuir 2017, 33, 11484–11489. [CrossRef] [PubMed]
27. Wang, J.; Lukose, B.; Thompson, M.O.; Clancy, P. Ab initio modeling of vacancies, antisites, and Si dopantsin ordered InGaAs. J. Appl. Phys. 2017, 121, 045106. [CrossRef]
28. Northrup, J.E.; Zhang, S.B. Dopant and defect energetics - Si in GaAs. Phys. Rev. B 1993, 47, 6791–6794.[CrossRef]
29. Lee, C.-W.; Lukose, B.; Thompson, M.O.; Clancy, P. Energetics of neutral Si dopants in InGaAs: An ab initioand semiempirical Tersoff model study. Phys. Rev. B 2015, 91, 094108. [CrossRef]
30. Lee, S.G.; Chang, K.J. Energetics and hydrogen passivation of carbon-related defects in InAs andIn0.5Ga0.5As. Phys. Rev. B 1996, 53, 9784–9790. [CrossRef]
31. Freysoldt, C.; Grabowski, B.; Hickel, T.; Neugebauer, J.; Kresse, G.; Janotti, A.; Van de Walle, C.G.First-principles calculations for point defects in solids. Rev. Mod. Phys. 2014, 86, 253–305. [CrossRef]
32. Leslie, M.; Gillan, N.J. The energy and elastic dipole tensor of defects in ionic crystals calculated by thesupercell method. J. Phys. C Solid State Phys. 1985, 18, 973. [CrossRef]
33. Schultz, P.A. Charged Local Defects in Extended Systems. Phys. Rev. Lett. 2000, 84, 1942–1945. [CrossRef][PubMed]
34. Makov, G.; Payne, M.C. Periodic boundary conditions in ab initio calculations. Phys. Rev. B 1995, 51,4014–4022. [CrossRef]
35. Van de Walle, C.G.; Neugebauer, J. First-principles calculations for defects and impurities: Applications toIII-nitrides. J. Appl. Phys. 2004, 95, 3851–3879. [CrossRef]
36. Freysoldt, C.; Neugebauer, J.; Van de Walle, C.G. Fully Ab Initio Finite-Size Corrections for Charged-DefectSupercell Calculations. Phys. Rev. Lett. 2009, 102, 016402. [CrossRef] [PubMed]
37. Lany, S.; Zunger, A. Assessment of correction methods for the band-gap problem and for finite-size effects insupercell defect calculations: Case studies for ZnO and GaAs. Phys. Rev. B 2008, 78, 235104. [CrossRef]
38. Komsa, H.-P.; Rantala, T.T.; Pasquarello, A. Finite-size supercell correction schemes for charged defectcalculations. Phys. Rev. B 2012, 86, 045112. [CrossRef]
39. Castleton, C.W.M.; Höglund, A.; Mirbt, S. Managing the supercell approximation for charged defects insemiconductors: Finite-size scaling, charge correction factors, the band-gap problem, and the ab initiodielectric constant. Phys. Rev. B 2006, 73, 035215. [CrossRef]
40. Taylor, S.E.; Bruneval, F. Understanding and correcting the spurious interactions in charged supercells.Phys. Rev. B 2011, 84, 075155. [CrossRef]
117
Crystals 2019, 9, 48
41. Kresse, G.; Hafner, J. Ab initio molecular dynamics for liquid metals. Phys. Rev. B 1993, 47, 558–561.[CrossRef]
42. Kresse, G.; Furthuller, J. Efficiency of ab-initio total energy calculations for metals and semiconductors usinga plane-wave basis set. Comput. Mater. Sci. 1996, 6, 15–50. [CrossRef]
43. Hohenberg, P.; Kohn, W. Inhomogeneous electron gas. Phys. Rev. 1964, 136, B864. [CrossRef]44. Kohn, W.; Sham, L.J. Self-consistent equations including exchange and correlation effects. Phys. Rev. 1965,
140, A1133. [CrossRef]45. Perdew, J.P.; Burke, K.; Ernzerhof, M. Generalized Gradient Approximation Made Simple. Phys. Rev. Lett.
1996, 77, 3865–3868. [CrossRef] [PubMed]46. Perdew, J.P.; Ruzsinszky, A.; Csonka, G.I.; Vydrov, O.A.; Scuseria, G.E.; Constantin, L.A.; Zhou, X.; Burke, K.
Restoring the density-gradient expansion for exchange in solids and surfaces. Phys. Rev. Lett. 2008,100, 136406. [CrossRef]
47. Blöchl, P.E. Projector augmented-wave method. Phys. Rev. B 1994, 50, 17953–17979. [CrossRef]48. Jones, R.O.; Gunnarsson, O. The density functional formalism, its applications and prospects. Rev. Mod. Phys.
1989, 61, 689–746. [CrossRef]49. Bechstedt, F.; Belabbes, A. Structure, energetics, and electronic states of III-V compound polytypes. J. Phys.
Condens. Matter 2013, 25, 273201. [CrossRef] [PubMed]50. Tahini, H.A.; Chroneos, A.; Murphy, S.T.; Schwingenschlögl, U.; Grimes, R.W. Vacancies and defect levels in
III–V semiconductors. J. Appl. Phys. 2013, 114, 063517. [CrossRef]51. Madelung, O.; Schulz, M.; Weiss, H. (Eds.) Semiconductors, Physics of Group IV Elements and III-V Compounds;
Springer-Verlag: New York, NY, USA, 1982; Volumn 17.52. Shu, H.; Liang, P.; Wang, L.; Chen, X.; Lu, W. Tailoring electronic properties of InAs nanowires by surface
functionalization. J. Appl. Phys. 2011, 110, 103713. [CrossRef]53. Thompson, A.G.; Rowe, J.E.; Rubenste, M. Preparation and Optical Properties of InAs1-xPx Alloys.
J. Appl. Phys. 1969, 40, 3280–3288. [CrossRef]54. Dreyer, C.E.; Alkauskas, A.; Lyons, J.L.; Janotti, A.; Van de Walle, C.G. First-Principles Calculations of Point
Defects for Quantum Technologies. Annu. Rev. Mater. Res. 2018, 48, 1–26. [CrossRef]55. Höglund, A.; Castleton, C.W.M.; Göthelid, M.; Johansson, B.; Mirbt, S. Point defects on the (110) surfaces of
InP, InAs, and InSb: A comparison with bulk. Phys. Rev. B 2006, 74, 075332. [CrossRef]
c© 2019 by the authors. Licensee MDPI, Basel, Switzerland. This article is an open accessarticle distributed under the terms and conditions of the Creative Commons Attribution(CC BY) license (http://creativecommons.org/licenses/by/4.0/).
118

MDPISt. Alban-Anlage 66
4052 BaselSwitzerland
Tel. +41 61 683 77 34Fax +41 61 302 89 18
www.mdpi.com
Crystals Editorial OfficeE-mail: [email protected]
www.mdpi.com/journal/crystals


MDPI St. Alban-Anlage 66 4052 Basel Switzerland
Tel: +41 61 683 77 34 Fax: +41 61 302 89 18
www.mdpi.com ISBN 978-3-03921-671-0