apparent viscosity prediction of water-based muds using - mdpi
TRANSCRIPT
energies
Article
Apparent Viscosity Prediction of Water-Based Muds UsingEmpirical Correlation and an Artificial Neural Network
Emad A. Al-Khdheeawi 1,2,* and Doaa Saleh Mahdi 2
1 Department of Petroleum Engineering, Curtin University, Kensington 6151, Australia2 Petroleum Technology Department, University of Technology, Baghdad 10066, Iraq* Correspondence: [email protected]
Received: 24 June 2019; Accepted: 7 August 2019; Published: 9 August 2019�����������������
Abstract: Apparent viscosity is of one of the main rheological properties of drilling fluid. Monitoringapparent viscosity during drilling operations is very important to prevent various drilling problemsand improve well cleaning efficiency. Apparent viscosity can be measured in the laboratory usingrheometer or viscometer devices. However, this laboratory measurement is a time-consumingoperation. Thus, in this paper, we have developed a new empirical correlation and a new artificialneural network model to predict the apparent viscosity of drilling fluid as a function of two simple andfast measurements of drilling mud (i.e., March funnel viscosity and mud density). 142 experimentalmeasurements for different drilling mud samples have been used to develop the new correlation.The calculated apparent viscosity from the developed correlation and neural network model hasbeen compared with the measured apparent viscosity from the laboratory. The results show thatthe developed correlation and neural network model predict the apparent viscosity with very goodaccuracy. The new correlation and neural network models predict the apparent viscosity with acorrelation coefficient (R) of 98.8% and 98.1% and an average absolute error (AAE) of 8.6% and 10.9%,respectively, compared to the R of 89.2% and AAE of 20.3% if the literature correlations are used.Thus, we conclude that the newly developed correlation and artificial neural network (ANN) modelsare preferable to predict the apparent viscosity of drilling fluid.
Keywords: rheological properties; drilling mud; apparent viscosity; marsh funnel; mud weight
1. Introduction
Drilling mud, or drilling fluid, represents any fluid which used during an oil well drillingoperation [1]. Generally, drilling fluid pumps from the surface tanks to the well bottom via the drillstring and bit and circulates back to the surface tanks through the annulus (i.e., the annular spacebetween the drill string and the open hole or casing) [2]. In drilling mud, solids are suspended inwater or oleic fluid with surfactants. The solids provide weight to the drilling fluid for pressurecontrol, which represents the main objective of the drilling mud [3]. Furthermore, drilling mud hasmany other functions, including removing the cutting from the well bottom to the surface, sealingpermeable reservoirs, transmitting the hydraulic power to the bit, reducing the formation damage, andcooling, lubricating the drill string, etc. [4]. The majority of the used drilling fluids are water-based.In water-based mud, the used liquid can be either freshwater or saltwater, which have been used inthis study. Water-based muds are preferable because they are cheap, easy to prepare, and able tomitigate most well control problems [5]. Water-based mud can be classified into three types, which areinhibitive, non-inhibitive, and polymer fluids [2]. Drilling mud also can be a gaseous or nonaqueousbase [4,5]. Drilling mud viscosity is one of the rheological properties of drilling mud [5]. Viscosityrepresents a measure of matter’s resistance to a deforming force [3]. Thus, drilling mud viscosity needsto be adequately measured and controlled. Generally, the amount of drilling mud viscosity must be
Energies 2019, 12, 3067; doi:10.3390/en12163067 www.mdpi.com/journal/energies
Energies 2019, 12, 3067 2 of 10
sufficient to suspend the mud solids. Thus, a drilling cutting’s retention in drilling mud depends onthe drilling mud’s viscosity. Viscosity is highly affected by the shear rate. Increasing the shear rate inhigh viscosity drilling muds improves the retention of the solids on the drilling mud and decreases theperformance of high shear solid removal tools (e.g., shale shaker) [6]. However, decreasing the shearrate in high viscosity drilling muds decreases the performance of the low shear solid removal tools(e.g., centrifuges) because the viscosity is inversely proportional to the solid settling velocity and theefficiency of separation [7]. Drilling fluid viscosity can be altered favourably for downhole conditionsby using nanomaterials [8–10]. However, such complexities in the composition of viscosity predictionhave not been considered in this study.
Even though apparent viscosity can be measured in the lab using a VG meter apparatus, this labmeasurement is considered a time-consuming operation. There were some previous studies carried outin this area, which resulted in the development of new empirical correlations to predict the apparentviscosity of drilling mud.
Pitt [11] introduced a correlation (µa = ρ (t − 25)) to predict the apparent drilling fluid viscosity (µa)as a function of Marsh funnel viscosity (t) and mud weight (ρ), with a correlation coefficient of 89.2.He used a numerical model to simulate the drilling mud’s flow behavior in a Marsh funnel.
Elkatatny et al. [12] developed new empirical correlations to estimate the apparent viscosity of thedrilling fluid as a function of mud density, solid percent, and Marsh funnel viscosity using an artificialneural network (ANN).
Thus, here, a new correlation and a new artificial neural network model have been developedto estimate the apparent viscosity of drilling fluid as a function of March funnel viscosity and muddensity using 142 experimental measurements.
2. Artificial Neural Network
An Artificial neural network (ANN) is considered an important tool to solve non-linear andcomplex problems between any input and output parameters [13–21]. ANNs have various applicationsin different fields (e.g., medicine, electronics, aerospace, petroleum industry, and chemistry) [22–25].The structure of the ANN model comprises of three different components, which are a learningalgorithm, transfer function, and network architecture [13–21]. In addition, each ANN model shouldbe made up of at least three layers (i.e., input, hidden and output layers). Some ANN models may havemultiple hidden layers. These layers are connected to each other by weights, which is an adjustmentbetween the layers is the main factor affecting the neural network performance. Further, the number ofhidden layer neurons affects the neural network’s performance (i.e., reducing the number of hiddenlayer neurons results in underfitting, while increasing the number of hidden layer neurons leads tooverfitting) [26]. Hidden layers are usually assigned to a transfer function (tan or log), while outputlayers usually assign to an activation function (per line). Thus, it is essential to optimize the numberof neurons in the hidden layer. Network training is the first step in the development of a neuralnetwork model. Hence, the input data processes from the input layer to the output layer via the hiddenlayer. In the output layer, the predicted data will be compared with the actual data. This trainingprocesses continuously until the average error between the measured and predicted data reached theuser-defined value.
3. Experimental Measurements
This section covers the used experimental procedure to measure the field data (i.e., apparentviscosity, Marsh Funnel viscosity, and mud weight) that are used in this study to develop the newmathematical model.
3.1. Drilling Mud Preparation
In order to prepare the required experimental data to develop the new correlation for predictingapparent viscosity, 142 laboratory and field experiments were performed on two different types of
Energies 2019, 12, 3067 3 of 10
drilling mud: Ferro Chrome Lignosulfonate (FCL) mud, and Salt Saturated mud (SSM), which is awater-based mud containing high concentrations of sodium chloride (NaCl) [4]. First, for both typesof water-based drilling mud, the PH of water was treated to be approximately 9 by adding causticSoda (NaOH). Second, the water March Funnel viscosity increased by using Bentonite for the FCLmuds and hydrated Bentonite or Attapulgite for the SSM muds. Carboxymethyl cellulose (CMC), andStarch were used to control the fluid loss and filtration of the FCL and SSM muds, respectively. Finally,for both FCL and SSM muds, Barite was used to increase the mixture density in order to obtain therequired drilling mud weight [27].
3.2. Apparent Viscosity Measurement
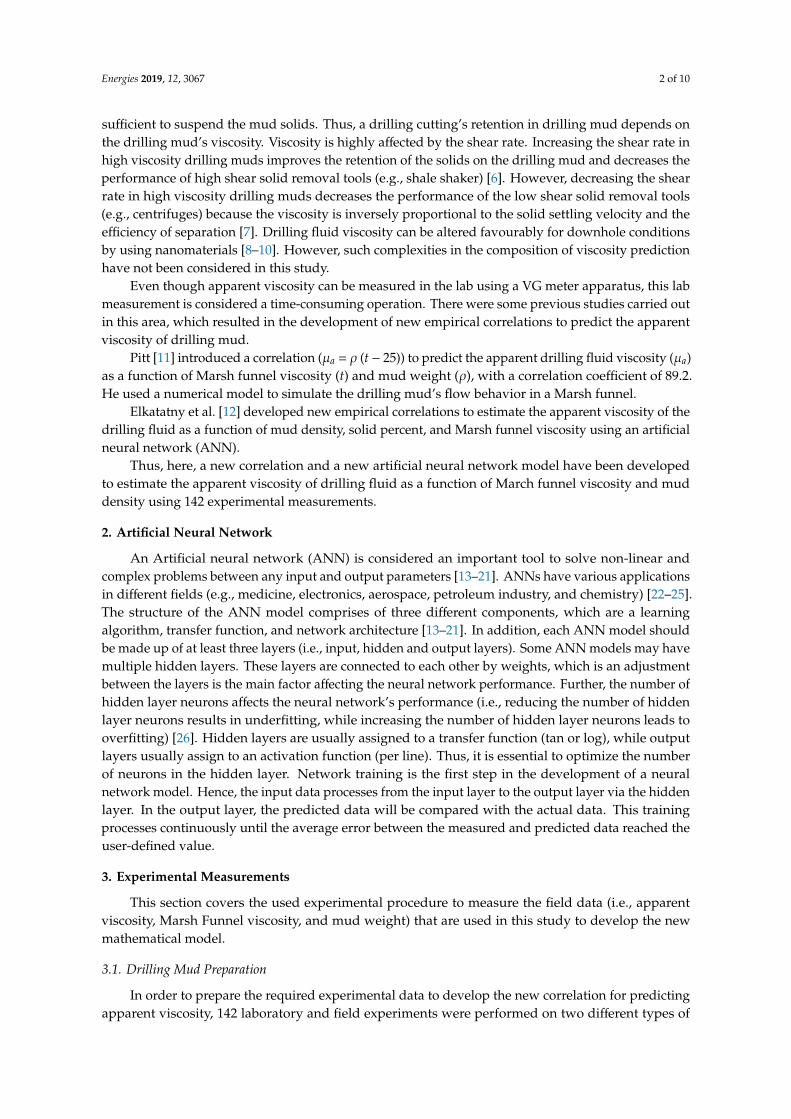
Drilling fluids can be classified into two main groups: Newtonian fluids and non-Newtonianfluids [3]. Viscosity is independent of the shear rate in Newtonian fluids, while it is a function ofthe shear rate in non-Newtonian fluids. Apparent viscosity and the other rheological properties(i.e., plastic viscosity, yield point, and gel strengths) of non-Newtonian drilling fluids are measuredin the oil industry using the Bingham Plastic mathematical rheological model [28,29]. All aboverheological properties are calculated from VG meter readings (i.e., R300 and R600). In the BinghamPlastic model, it is assumed that the curve of shear stress vs. the shear rate is a straight line, which shouldnot cross the origin (i.e., the curve intercept point with the shear stress, which is called the yield point,should be more than zero) (Figure 1) [30]. The Bingham Plastic model uses the following equations:
τ = PV(γ
300) + YP (1)
PV = R600 −R300 (2)
YP = R300 − PV (3)
µa =R600
2(4)
where τ = shear stress (lb/100 ft2), γ = shear rate (sec−1), PV = plastic viscosity (cP), YP = yield point(lb/100 ft2), and µa = apparent viscosity (cP).
Energies 2019, 12, x FOR PEER REVIEW 3 of 11
drilling mud: Ferro Chrome Lignosulfonate (FCL) mud, and Salt Saturated mud (SSM), which is a water-based mud containing high concentrations of sodium chloride (NaCl) [4]. First, for both types of water-based drilling mud, the PH of water was treated to be approximately 9 by adding caustic Soda (NaOH). Second, the water March Funnel viscosity increased by using Bentonite for the FCL muds and hydrated Bentonite or Attapulgite for the SSM muds. Carboxymethyl cellulose (CMC), and Starch were used to control the fluid loss and filtration of the FCL and SSM muds, respectively. Finally, for both FCL and SSM muds, Barite was used to increase the mixture density in order to obtain the required drilling mud weight [27].
3.2. Apparent Viscosity Measurement
Drilling fluids can be classified into two main groups: Newtonian fluids and non-Newtonian fluids [3]. Viscosity is independent of the shear rate in Newtonian fluids, while it is a function of the shear rate in non-Newtonian fluids. Apparent viscosity and the other rheological properties (i.e., plastic viscosity, yield point, and gel strengths) of non-Newtonian drilling fluids are measured in the oil industry using the Bingham Plastic mathematical rheological model [28,29]. All above rheological properties are calculated from VG meter readings (i.e., R300 and R600). In the Bingham Plastic model, it is assumed that the curve of shear stress vs. the shear rate is a straight line, which should not cross the origin (i.e., the curve intercept point with the shear stress, which is called the yield point, should be more than zero) (Figure 1) [30]. The Bingham Plastic model uses the following equations:
𝑃𝑉 300 𝑌𝑃 (1) 𝑃𝑉 𝑅 𝑅 (2) 𝑌𝑃 𝑅 PV (3) 𝜇 𝑅2 (4)
where τ = shear stress (lb/100 ft2), γ = shear rate (sec–1), PV = plastic viscosity (cP), YP = yield point (lb/100 ft2), and μa = apparent viscosity (cP).
Figure 1. Bingham plastic model fluid behavior [30].
3.3. Marsh Funnel Viscosity Measurement
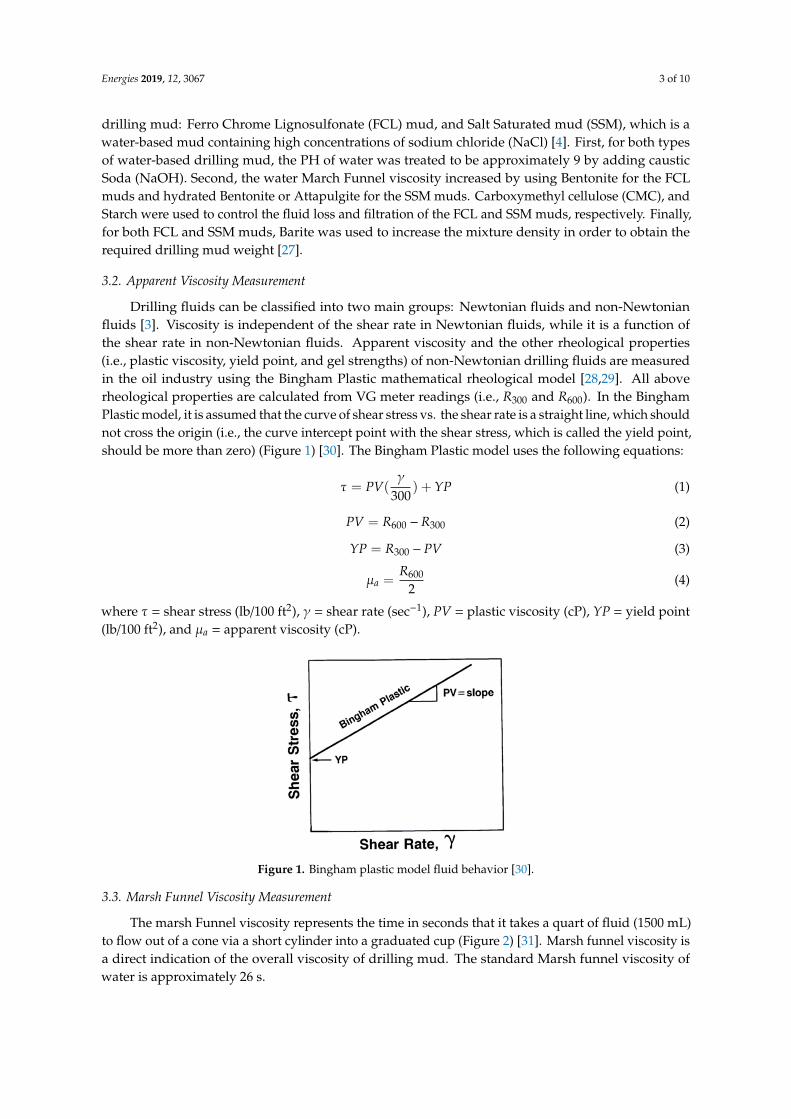
The marsh Funnel viscosity represents the time in seconds that it takes a quart of fluid (1500 mL) to flow out of a cone via a short cylinder into a graduated cup (Figure 2) [31]. Marsh funnel viscosity is a direct indication of the overall viscosity of drilling mud. The standard Marsh funnel viscosity of water is approximately 26 seconds.
Figure 1. Bingham plastic model fluid behavior [30].
3.3. Marsh Funnel Viscosity Measurement
The marsh Funnel viscosity represents the time in seconds that it takes a quart of fluid (1500 mL)to flow out of a cone via a short cylinder into a graduated cup (Figure 2) [31]. Marsh funnel viscosity isa direct indication of the overall viscosity of drilling mud. The standard Marsh funnel viscosity ofwater is approximately 26 s.
Energies 2019, 12, 3067 4 of 10Energies 2019, 12, x FOR PEER REVIEW 4 of 11
Figure 2. March funnel.
3.4. Mud Weight Measurement
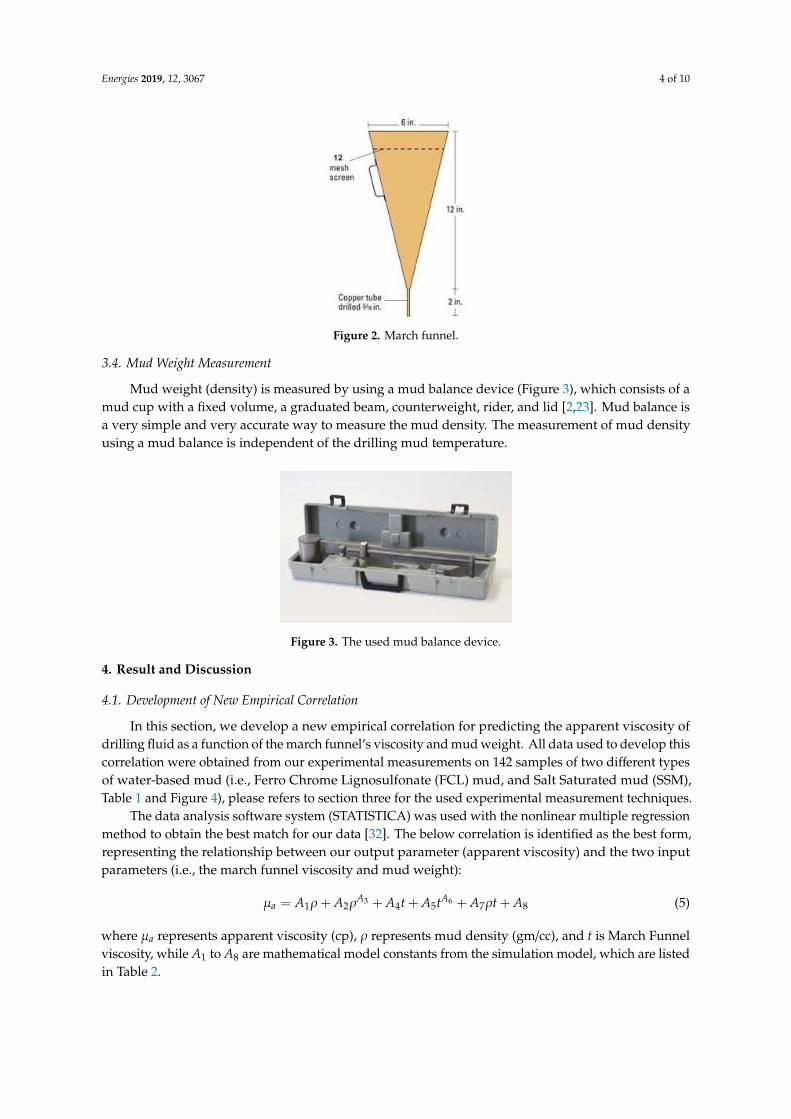
Mud weight (density) is measured by using a mud balance device (Figure 3), which consists of a mud cup with a fixed volume, a graduated beam, counterweight, rider, and lid [2,23]. Mud balance is a very simple and very accurate way to measure the mud density. The measurement of mud density using a mud balance is independent of the drilling mud temperature.
Figure 3. The used mud balance device.
4. Result and Discussion
4.1. Development of New Empirical Correlation
In this section, we develop a new empirical correlation for predicting the apparent viscosity of drilling fluid as a function of the march funnel’s viscosity and mud weight. All data used to develop this correlation were obtained from our experimental measurements on 142 samples of two different types of water-based mud (i.e., Ferro Chrome Lignosulfonate (FCL) mud, and Salt Saturated mud (SSM), Table 1 and Figure 4), please refers to section three for the used experimental measurement techniques.
Figure 2. March funnel.
3.4. Mud Weight Measurement
Mud weight (density) is measured by using a mud balance device (Figure 3), which consists of amud cup with a fixed volume, a graduated beam, counterweight, rider, and lid [2,23]. Mud balance isa very simple and very accurate way to measure the mud density. The measurement of mud densityusing a mud balance is independent of the drilling mud temperature.
Energies 2019, 12, x FOR PEER REVIEW 4 of 11
Figure 2. March funnel.
3.4. Mud Weight Measurement
Mud weight (density) is measured by using a mud balance device (Figure 3), which consists of a mud cup with a fixed volume, a graduated beam, counterweight, rider, and lid [2,23]. Mud balance is a very simple and very accurate way to measure the mud density. The measurement of mud density using a mud balance is independent of the drilling mud temperature.
Figure 3. The used mud balance device.
4. Result and Discussion
4.1. Development of New Empirical Correlation
In this section, we develop a new empirical correlation for predicting the apparent viscosity of drilling fluid as a function of the march funnel’s viscosity and mud weight. All data used to develop this correlation were obtained from our experimental measurements on 142 samples of two different types of water-based mud (i.e., Ferro Chrome Lignosulfonate (FCL) mud, and Salt Saturated mud (SSM), Table 1 and Figure 4), please refers to section three for the used experimental measurement techniques.
Figure 3. The used mud balance device.
4. Result and Discussion
4.1. Development of New Empirical Correlation
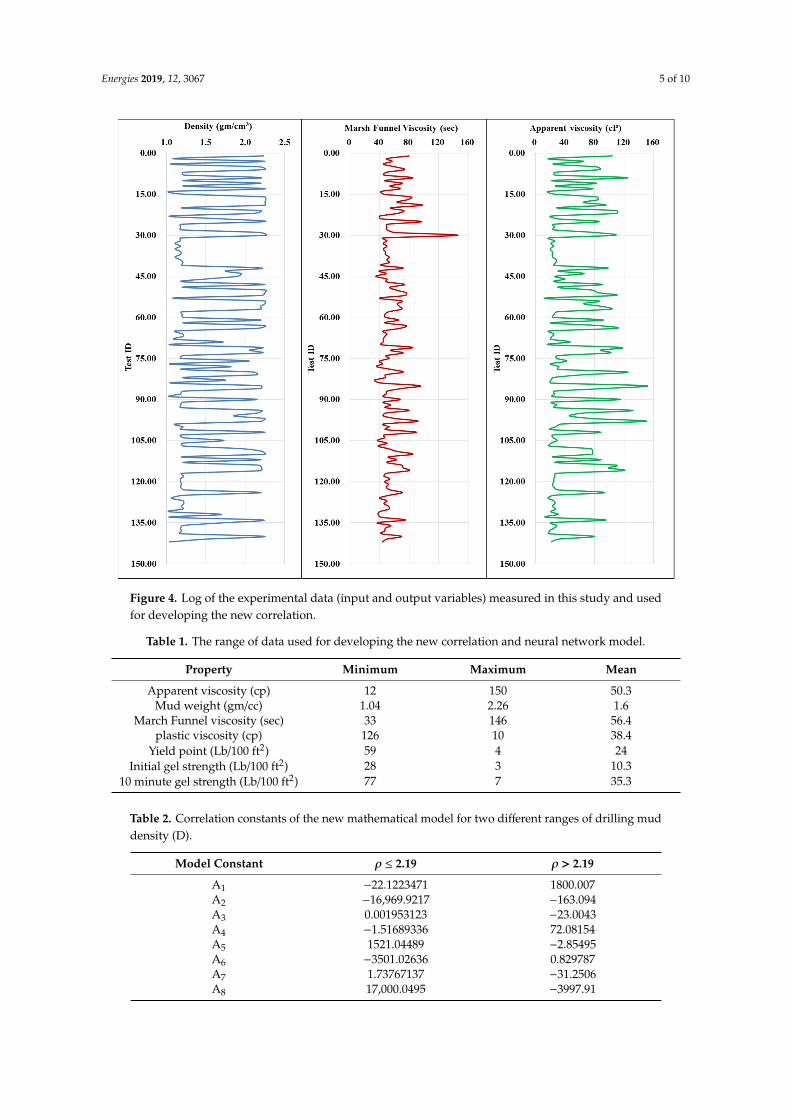
In this section, we develop a new empirical correlation for predicting the apparent viscosity ofdrilling fluid as a function of the march funnel’s viscosity and mud weight. All data used to develop thiscorrelation were obtained from our experimental measurements on 142 samples of two different typesof water-based mud (i.e., Ferro Chrome Lignosulfonate (FCL) mud, and Salt Saturated mud (SSM),Table 1 and Figure 4), please refers to section three for the used experimental measurement techniques.
The data analysis software system (STATISTICA) was used with the nonlinear multiple regressionmethod to obtain the best match for our data [32]. The below correlation is identified as the best form,representing the relationship between our output parameter (apparent viscosity) and the two inputparameters (i.e., the march funnel viscosity and mud weight):
µa = A1ρ+ A2ρA3 + A4t + A5tA6 + A7ρt + A8 (5)
where µa represents apparent viscosity (cp), ρ represents mud density (gm/cc), and t is March Funnelviscosity, while A1 to A8 are mathematical model constants from the simulation model, which are listedin Table 2.
Energies 2019, 12, 3067 5 of 10Energies 2019, 12, x FOR PEER REVIEW 5 of 11
Figure 4. Log of the experimental data (input and output variables) measured in this study and used for developing the new correlation.
Table 1. The range of data used for developing the new correlation and neural network model.
Property Minimum Maximum Mean Apparent viscosity (cp) 12 150 50.3
Mud weight (gm/cc) 1.04 2.26 1.6 March Funnel viscosity (sec) 33 146 56.4
plastic viscosity (cp) 126 10 38.4 Yield point (Lb/100 ft2) 59 4 24
Initial gel strength (Lb/100 ft2) 28 3 10.3 10 minute gel strength (Lb/100 ft2) 77 7 35.3
The data analysis software system (STATISTICA) was used with the nonlinear multiple regression method to obtain the best match for our data [32]. The below correlation is identified as the best form, representing the relationship between our output parameter (apparent viscosity) and the two input parameters (i.e., the march funnel viscosity and mud weight): 𝜇 𝐴 ρ 𝐴 ρ 𝐴 t 𝐴 t 𝐴 ρt 𝐴 (5)
where μa represents apparent viscosity (cp), ρ represents mud density (gm/cc), and t is March Funnel viscosity, while A1 to A8 are mathematical model constants from the simulation model, which are listed in Table 2.
Figure 4. Log of the experimental data (input and output variables) measured in this study and usedfor developing the new correlation.
Table 1. The range of data used for developing the new correlation and neural network model.
Property Minimum Maximum Mean
Apparent viscosity (cp) 12 150 50.3Mud weight (gm/cc) 1.04 2.26 1.6
March Funnel viscosity (sec) 33 146 56.4plastic viscosity (cp) 126 10 38.4
Yield point (Lb/100 ft2) 59 4 24Initial gel strength (Lb/100 ft2) 28 3 10.3
10 minute gel strength (Lb/100 ft2) 77 7 35.3
Table 2. Correlation constants of the new mathematical model for two different ranges of drilling muddensity (D).
Model Constant ρ ≤ 2.19 ρ > 2.19
A1 −22.1223471 1800.007A2 −16,969.9217 −163.094A3 0.001953123 −23.0043A4 −1.51689336 72.08154A5 1521.04489 −2.85495A6 −3501.02636 0.829787A7 1.73767137 −31.2506A8 17,000.0495 −3997.91
Energies 2019, 12, 3067 6 of 10
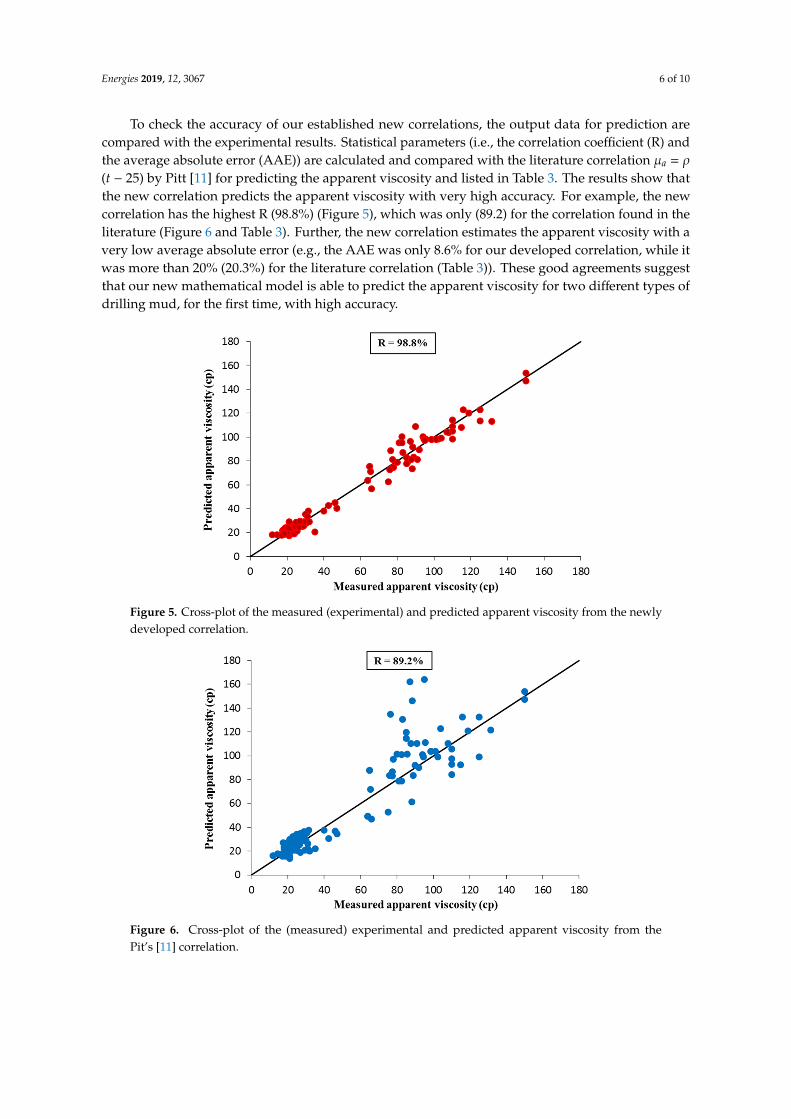
To check the accuracy of our established new correlations, the output data for prediction arecompared with the experimental results. Statistical parameters (i.e., the correlation coefficient (R) andthe average absolute error (AAE)) are calculated and compared with the literature correlation µa = ρ(t − 25) by Pitt [11] for predicting the apparent viscosity and listed in Table 3. The results show thatthe new correlation predicts the apparent viscosity with very high accuracy. For example, the newcorrelation has the highest R (98.8%) (Figure 5), which was only (89.2) for the correlation found in theliterature (Figure 6 and Table 3). Further, the new correlation estimates the apparent viscosity with avery low average absolute error (e.g., the AAE was only 8.6% for our developed correlation, while itwas more than 20% (20.3%) for the literature correlation (Table 3)). These good agreements suggestthat our new mathematical model is able to predict the apparent viscosity for two different types ofdrilling mud, for the first time, with high accuracy.
Energies 2019, 12, x FOR PEER REVIEW 6 of 11
Table 2. Correlation constants of the new mathematical model for two different ranges of drilling mud density (D).
Model Constant ρ ≤ 2.19 ρ > 2.19 A1 -22.1223471 1800.007 A2 -16969.9217 -163.094 A3 0.001953123 -23.0043 A4 -1.51689336 72.08154 A5 1521.04489 -2.85495 A6 -3501.02636 0.829787 A7 1.73767137 -31.2506 A8 17000.0495 -3997.91
To check the accuracy of our established new correlations, the output data for prediction are compared with the experimental results. Statistical parameters (i.e., the correlation coefficient (R) and the average absolute error (AAE)) are calculated and compared with the literature correlation μa = ρ (t-25) by Pitt [11] for predicting the apparent viscosity and listed in Table 3. The results show that the new correlation predicts the apparent viscosity with very high accuracy. For example, the new correlation has the highest R (98.8%) (Figure 5), which was only (89.2) for the correlation found in the literature (Figure 6 and Table 3). Further, the new correlation estimates the apparent viscosity with a very low average absolute error (e.g., the AAE was only 8.6% for our developed correlation, while it was more than 20% (20.3%) for the literature correlation (Table 3)). These good agreements suggest that our new mathematical model is able to predict the apparent viscosity for two different types of drilling mud, for the first time, with high accuracy.
Figure 5. Cross-plot of the measured (experimental) and predicted apparent viscosity from the newly developed correlation.
Figure 5. Cross-plot of the measured (experimental) and predicted apparent viscosity from the newlydeveloped correlation.
Energies 2019, 12, x FOR PEER REVIEW 7 of 11
Figure 6. Cross-plot of the (measured) experimental and predicted apparent viscosity from the Pit's [11] correlation.
Table 3. The statistical accuracy of the developed correlation, literature correlation and artificial neural network (ANN) model.
Correlation Correlation coefficient, R (%) Average absolute Error, AAE (%) Pitt's correlation [11] 89.2 20.3
This study (correlation) 98.8 8.6 This study (ANN) 98.2 10.9
4.2. Development of an Artificial Neural Network Model
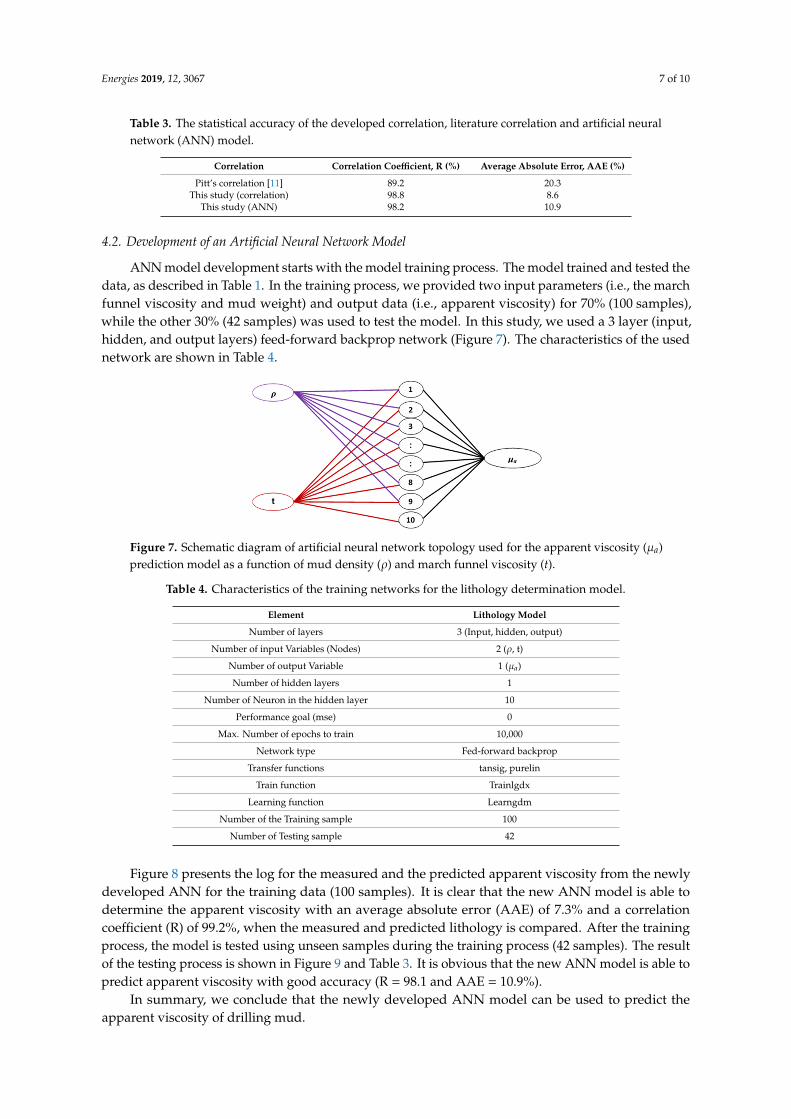
ANN model development starts with the model training process. The model trained and tested the data, as described in Table 1. In the training process, we provided two input parameters (i.e., the march funnel viscosity and mud weight) and output data (i.e., apparent viscosity) for 70% (100 samples), while the other 30% (42 samples) was used to test the model. In this study, we used a 3 layer (input, hidden, and output layers) feed-forward backprop network (Figure 7). The characteristics of the used network are shown in Table 4.
Figure 7. Schematic diagram of artificial neural network topology used for the apparent viscosity (μa) prediction model as a function of mud density (ρ) and march funnel viscosity (t).
Table 4. Characteristics of the training networks for the lithology determination model.
Element Lithology Model Number of layers 3 (Input, hidden, output)
Number of input Variables (Nodes) 2 (ρ, t)
Figure 6. Cross-plot of the (measured) experimental and predicted apparent viscosity from thePit’s [11] correlation.
Energies 2019, 12, 3067 7 of 10
Table 3. The statistical accuracy of the developed correlation, literature correlation and artificial neuralnetwork (ANN) model.
Correlation Correlation Coefficient, R (%) Average Absolute Error, AAE (%)
Pitt’s correlation [11] 89.2 20.3This study (correlation) 98.8 8.6
This study (ANN) 98.2 10.9
4.2. Development of an Artificial Neural Network Model
ANN model development starts with the model training process. The model trained and tested thedata, as described in Table 1. In the training process, we provided two input parameters (i.e., the marchfunnel viscosity and mud weight) and output data (i.e., apparent viscosity) for 70% (100 samples),while the other 30% (42 samples) was used to test the model. In this study, we used a 3 layer (input,hidden, and output layers) feed-forward backprop network (Figure 7). The characteristics of the usednetwork are shown in Table 4.
Energies 2019, 12, x FOR PEER REVIEW 7 of 11
Figure 6. Cross-plot of the (measured) experimental and predicted apparent viscosity from the Pit's [11] correlation.
Table 3. The statistical accuracy of the developed correlation, literature correlation and artificial neural network (ANN) model.
Correlation Correlation coefficient, R (%) Average absolute Error, AAE (%) Pitt's correlation [11] 89.2 20.3
This study (correlation) 98.8 8.6 This study (ANN) 98.2 10.9
4.2. Development of an Artificial Neural Network Model
ANN model development starts with the model training process. The model trained and tested the data, as described in Table 1. In the training process, we provided two input parameters (i.e., the march funnel viscosity and mud weight) and output data (i.e., apparent viscosity) for 70% (100 samples), while the other 30% (42 samples) was used to test the model. In this study, we used a 3 layer (input, hidden, and output layers) feed-forward backprop network (Figure 7). The characteristics of the used network are shown in Table 4.
Figure 7. Schematic diagram of artificial neural network topology used for the apparent viscosity (μa) prediction model as a function of mud density (ρ) and march funnel viscosity (t).
Table 4. Characteristics of the training networks for the lithology determination model.
Element Lithology Model Number of layers 3 (Input, hidden, output)
Number of input Variables (Nodes) 2 (ρ, t)
Figure 7. Schematic diagram of artificial neural network topology used for the apparent viscosity (µa)prediction model as a function of mud density (ρ) and march funnel viscosity (t).
Table 4. Characteristics of the training networks for the lithology determination model.
Element Lithology Model
Number of layers 3 (Input, hidden, output)
Number of input Variables (Nodes) 2 (ρ, t)
Number of output Variable 1 (µa)
Number of hidden layers 1
Number of Neuron in the hidden layer 10
Performance goal (mse) 0
Max. Number of epochs to train 10,000
Network type Fed-forward backprop
Transfer functions tansig, purelin
Train function Trainlgdx
Learning function Learngdm
Number of the Training sample 100
Number of Testing sample 42
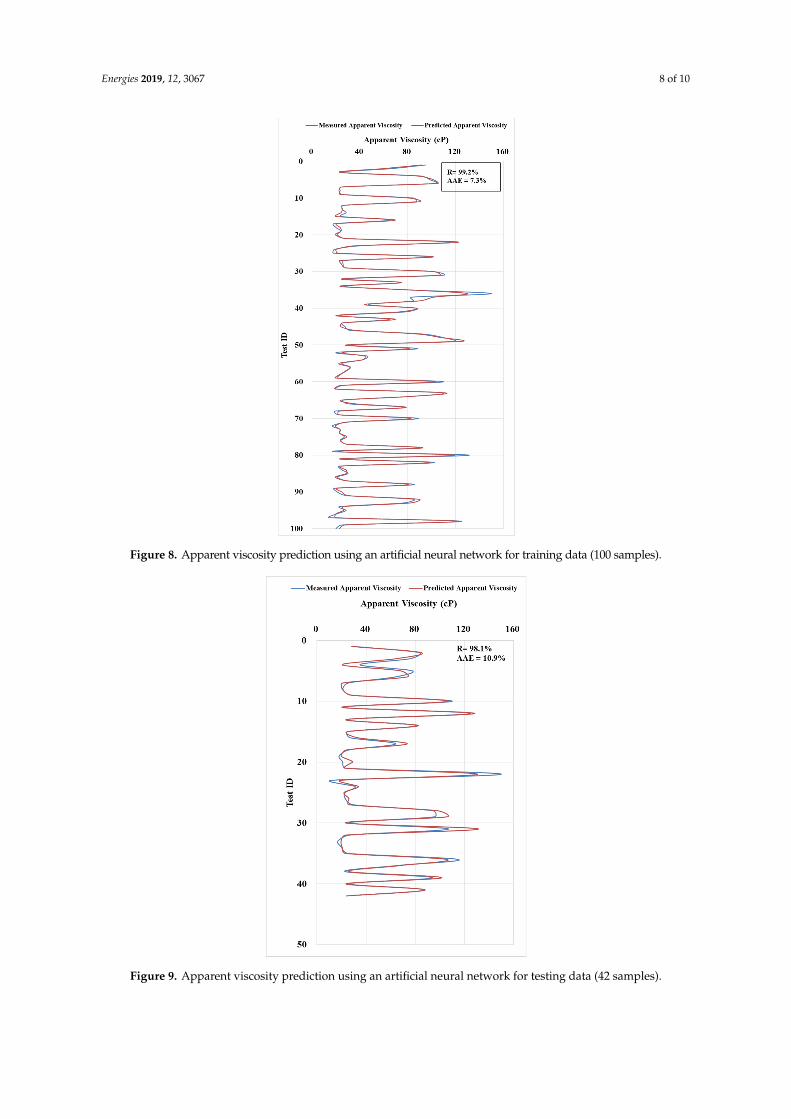
Figure 8 presents the log for the measured and the predicted apparent viscosity from the newlydeveloped ANN for the training data (100 samples). It is clear that the new ANN model is able todetermine the apparent viscosity with an average absolute error (AAE) of 7.3% and a correlationcoefficient (R) of 99.2%, when the measured and predicted lithology is compared. After the trainingprocess, the model is tested using unseen samples during the training process (42 samples). The resultof the testing process is shown in Figure 9 and Table 3. It is obvious that the new ANN model is able topredict apparent viscosity with good accuracy (R = 98.1 and AAE = 10.9%).
In summary, we conclude that the newly developed ANN model can be used to predict theapparent viscosity of drilling mud.
Energies 2019, 12, 3067 8 of 10
Energies 2019, 12, x FOR PEER REVIEW 8 of 11
Number of output Variable 1 (μa) Number of hidden layers 1
Number of Neuron in the hidden layer 10 Performance goal (mse) 0
Max. Number of epochs to train 10000 Network type Fed-forward backprop
Transfer functions tansig, purelin Train function Trainlgdx
Learning function Learngdm Number of the Training sample 100
Number of Testing sample 42
Figure 8 presents the log for the measured and the predicted apparent viscosity from the newly developed ANN for the training data (100 samples). It is clear that the new ANN model is able to determine the apparent viscosity with an average absolute error (AAE) of 7.3% and a correlation coefficient (R) of 99.2%, when the measured and predicted lithology is compared. After the training process, the model is tested using unseen samples during the training process (42 samples). The result of the testing process is shown in Figure 9 and Table 3. It is obvious that the new ANN model is able to predict apparent viscosity with good accuracy (R = 98.1 and AAE = 10.9%).
In summary, we conclude that the newly developed ANN model can be used to predict the apparent viscosity of drilling mud.
Figure 8. Apparent viscosity prediction using an artificial neural network for training data (100 samples).
Figure 8. Apparent viscosity prediction using an artificial neural network for training data (100 samples).Energies 2019, 12, x FOR PEER REVIEW 9 of 11
Figure 9. Apparent viscosity prediction using an artificial neural network for testing data (42 samples).
5. Conclusions
Apparent viscosity is an important drilling fluid property, and monitoring this property during drilling operations is vital to prevent many drilling issues [5]. Even though apparent viscosity can be measured experimentally using a VG meter device, such a measurement is an expensive and time-consuming operation. Thus, in this paper, we have presented a new field correlation and a new artificial neural network model to estimate the drilling mud apparent viscosity directly from two simples and fast drilling mud measurements (i.e., march funnel viscosity and mud density). To do this, we have performed 142 laboratory measurements for two different drilling mud samples (i.e., FCL and SSM). Then, these obtained, experimental data were used with a data analysis software system and neural network to develop a new correlation and neural network model. The results obtained from the new correlation and neural network were compared with the measured apparent viscosity from the laboratory. In addition, the statistical accuracy of the new correlation and neural network model were compared with the correlation in the literature [11]. The results show that the new correlation provides promising results and could be further improved to increase its acceptability. The results show that the R coefficient and AAE for the new correlation are 98.8% and 8.6%, respectively. In addition, our results show that the newly developed artificial neural network model provides promising results (e.g., the results show that the newly developed artificial neural network model predicts the apparent viscosity with R= 98.2 and AAE = 10.9). Thus, we conclude that the newly developed correlation and ANN model are preferable to predict the apparent viscosity of drilling mud.
Author Contributions: Conceptualization, E.A.A.; methodology, D.S.M. and E.A.A.; software, D.S.M.; validation, D.S.M. and E.A.A.; formal analysis, D.S.M. and E.A.A.; investigation, D.S.M. and E.A.A; resources,
Figure 9. Apparent viscosity prediction using an artificial neural network for testing data (42 samples).
Energies 2019, 12, 3067 9 of 10
5. Conclusions
Apparent viscosity is an important drilling fluid property, and monitoring this property duringdrilling operations is vital to prevent many drilling issues [5]. Even though apparent viscosity canbe measured experimentally using a VG meter device, such a measurement is an expensive andtime-consuming operation. Thus, in this paper, we have presented a new field correlation and a newartificial neural network model to estimate the drilling mud apparent viscosity directly from twosimples and fast drilling mud measurements (i.e., march funnel viscosity and mud density). To do this,we have performed 142 laboratory measurements for two different drilling mud samples (i.e., FCL andSSM). Then, these obtained, experimental data were used with a data analysis software system andneural network to develop a new correlation and neural network model. The results obtained from thenew correlation and neural network were compared with the measured apparent viscosity from thelaboratory. In addition, the statistical accuracy of the new correlation and neural network model werecompared with the correlation in the literature [11]. The results show that the new correlation providespromising results and could be further improved to increase its acceptability. The results show that theR coefficient and AAE for the new correlation are 98.8% and 8.6%, respectively. In addition, our resultsshow that the newly developed artificial neural network model provides promising results (e.g., theresults show that the newly developed artificial neural network model predicts the apparent viscositywith R= 98.2 and AAE = 10.9). Thus, we conclude that the newly developed correlation and ANNmodel are preferable to predict the apparent viscosity of drilling mud.
Author Contributions: Conceptualization, E.A.A.-K.; methodology, D.S.M. and E.A.A.-K.; software, D.S.M.;validation, D.S.M. and E.A.A.-K.; formal analysis, D.S.M. and E.A.A.-K.; investigation, D.S.M. and E.A.A.-K.;resources, D.S.M. and E.A.A.-K.; data curation, D.S.M. and E.A.A.-K.; writing—original draft preparation, D.S.M.;writing—review and editing, E.A.A.-K.
Funding: This research received no external funding.
Conflicts of Interest: The authors declare no conflict of interest.
References
1. Caenn, R.; Darley, H.C.; Gray, G.R. Composition and Properties of Drilling and Completion Fluids; Gulf ProfessionalPublishing: Oxford, UK, 2011.
2. Darley, H.C.; Gray, G.R. Composition and Properties of Drilling and Completion Fluids; Gulf ProfessionalPublishing: Houston, TX, USA, 1988.
3. Balhoff, M.T.; Lake, L.W.; Bommer, P.W.; Lewis, W.E.; Weber, M.J.; Calderin, J.M. Rheological and yield stressmeasurements of non-Newtonian fluids using a Marsh Funnel. J. Pet. Sci. Eng. 2011, 77, 393–402. [CrossRef]
4. ASME Shale Shaker Committee. Drilling Fluids Processing Handbook; Elsevier: Amsterdam, The Netherlands, 2011.5. Bourgoyne, A.T.; Millheim, K.K.; Chenevert, M.E.; Young, F.S., Jr. Applied Drilling Engineering; Society of
Petroleum Engineers: Richardson, TX, USA, 1986.6. Hall, H.; Thompson, H.; Nuss, F. Ability of drilling mud to lift bit cuttings. J. Pet. Technol. 1950, 2, 35–46.
[CrossRef]7. Hussaini, S.M.; Azar, J.J. Experimental study of drilled cuttings transport using common drilling muds.
Soc. Pet. Eng. J. 1983, 23, 11–20. [CrossRef]8. Boyou, N.V.; Ismail, I.; Sulaiman, W.R.W.; Haddad, A.S.; Husein, N.; Hui, H.T.; Nadaraja, K. Experimental
investigation of hole cleaning in directional drilling by using nano-enhanced water-based drilling fluids.J. Pet. Sci. Eng. 2019, 176, 220–231. [CrossRef]
9. Rafati, R.; Smith, S.R.; Haddad, A.S.; Novara, R.; Hamidi, H. Effect of nanoparticles on the modifications ofdrilling fluids properties: A review of recent advances. J. Pet. Sci. Eng. 2018, 161, 61–76. [CrossRef]
10. Smith, S.R.; Rafati, R.; Haddad, A.S.; Cooper, A.; Hamidi, H. Application of aluminium oxide nanoparticlesto enhance rheological and filtration properties of water based muds at HPHT conditions. Colloids Surf. APhysicochem. Eng. Asp. 2018, 537, 361–371. [CrossRef]
11. Pitt, M. The Marsh funnel and drilling fluid viscosity: A new equation for field use. SPE Drill. Complet. 2000,15, 3–6. [CrossRef]
Energies 2019, 12, 3067 10 of 10
12. Elkatatny, S.; Tariq, Z.; Mahmoud, M. Real time prediction of drilling fluid rheological properties usingArtificial Neural Networks visible mathematical model (white box). J. Pet. Sci. Eng. 2016, 146, 1202–1210.[CrossRef]
13. Asadisaghandi, J.; Tahmasebi, P. Comparative evaluation of back-propagation neural network learningalgorithms and empirical correlations for prediction of oil PVT properties in Iran oilfields. J. Pet. Sci. Eng.2011, 78, 464–475. [CrossRef]
14. Tahmasebi, P.; Hezarkhani, A. Application of adaptive neuro-fuzzy inference system for grade estimation;case study, sarcheshmeh porphyry copper deposit, Kerman, Iran. Aust. J. Basic Appl. Sci. 2010, 4, 408–420.
15. Tahmasebi, P.; Hezarkhani, A. Application of a modular feedforward neural network for grade estimation.Nat. Resour. Res. 2011, 20, 25–32. [CrossRef]
16. Tahmasebi, P.; Hezarkhani, A. A hybrid neural networks-fuzzy logic-genetic algorithm for grade estimation.Comput. Geosci. 2012, 42, 18–27. [CrossRef] [PubMed]
17. Tahmasebi, P.; Hezarkhani, A. A fast and independent architecture of artificial neural network for permeabilityprediction. J. Pet. Sci. Eng. 2012, 86, 118–126. [CrossRef]
18. Le Van, S.; Chon, B. Artificial neural network model for alkali-surfactant-polymer flooding in viscous oilreservoirs: Generation and application. Energies 2016, 9, 1081. [CrossRef]
19. Le Van, S.; Chon, B. Applicability of an Artificial Neural Network for Predicting Water-Alternating-CO2
Performance. Energies 2017, 10, 842. [CrossRef]20. Le Van, S.; Chon, B.H. Evaluating the critical performances of a CO2-Enhanced oil recovery process using
artificial neural network models. J. Pet. Sci. Eng. 2017, 157, 207–222. [CrossRef]21. Le Van, S.; Chon, B.H. Effective prediction and management of a CO2 flooding process for enhancing oil
recovery using artificial neural networks. J. Energy Resour. Technol. 2018, 140, 032906. [CrossRef]22. Mohaghegh, S. Virtual-intelligence applications in petroleum engineering: Part 1—Artificial neural networks.
J. Pet. Technol. 2000, 52, 64–73. [CrossRef]23. Mohagheghian, E.; Zafarian-Rigaki, H.; Motamedi-Ghahfarrokhi, Y.; Hemmati-Sarapardeh, A. Using an
artificial neural network to predict carbon dioxide compressibility factor at high pressure and temperature.Korean J. Chem. Eng. 2015, 32, 2087–2096. [CrossRef]
24. Al-Khdheeawi, E.A.; Feng, R.; Mahdi, D.S. Lithology Determination from Drilling Data Using ArtificialNeural Network. In Proceedings of the 53rd US Rock Mechanics/Geomechanics Symposium, New York, NY,USA, 23–26 June 2019.
25. Al-Khdheeawi, E.A.; Hussain, A.B.; Dunia, A.-S. Undersaturated Oil Compressibility Prediction for MishrifReservoir in the Southern Iraqi Oil Fields Using Artificial Neural Network. J. Pet. Res. Stud. 2014, 377, 54–72.
26. Ramgulam, A.; Ertekin, T.; Flemings, P.B. Utilization of Artificial Neural Networks in the Optimization ofHistory Matching. Ph.D. Thesis, Pennsylvania State University, Stecker Ridge, PA, USA, 2006.
27. American Petroleum Institute. Recommended Practice for Field Testing Water-based Drilling Fluids; AmericanPetroleum Institute: Washington, DC, USA, 2017.
28. Skelland, A.H.P. Non-Newtonian Flow and Heat Transfer; Wiley: New York, NY, USA, 1967.29. Bingham, E.C. Fluidity and Plasticity; McGraw-Hill: New York, NY, USA, 1922; Volume 2.30. Azar, J.J.; Samuel, G.R. Drilling Engineering; PennWell books: Tulsa, OK, USA, 2007.31. Marsh, H.N. Properties and treatment of rotary mud. Trans. AIME 1931, 92, 234–251. [CrossRef]32. Baker, H.A.; Al-Shamma’a, D.A.; Al-Khdheeawi, E.A. New Correlation for Predicting Undersaturated Oil
Compressibility for Mishrif Reservoir in the Southern Iraqi Oil Fields. J. Eng. 2013, 19, 1158–1168.
© 2019 by the authors. Licensee MDPI, Basel, Switzerland. This article is an open accessarticle distributed under the terms and conditions of the Creative Commons Attribution(CC BY) license (http://creativecommons.org/licenses/by/4.0/).