fertility differential in rural areas of pauri garhwal: a regression approach
TRANSCRIPT
International Journal of Advanced Research in
Management and Social Sciences ISSN: 2278-6236
Vol. 2 | No. 8 | August 2013 www.garph.co.uk IJARMSS | 161
FERTILITY DIFFERENTIAL IN RURAL AREAS OF PAURI GARHWAL:
A REGRESSION APPROACH
Pankaj Bahuguna*
O.K. Belwal**
Abstract: Fertility is one of the important demographic indicators in Pauri Garhwal which are
responsible for unusual changes in population distributions. A major part of this paper
attempts to study fertility differentials in different sub-groups in the population by taking
into consideration the various socio-economic variables such as literacy, religion, the
proportion of scheduled caste and age at marriage. In order to examine the differentials in
fertility for rural areas of study area, a regression model approach is used to measure the
extent of the interaction of different type of effects of various socio-economic and
demographic variables.
The relationship between the fertility levels and socio-economic variables shows that female
literacy and the number of females attending school were negatively related to fertility in
the rural areas of the study area, whereas the other socio-economic variables showed a
positive relationship. It has been concluded that rapid industrialisation and various economic
development plans are likely to bring about a suitable change in the attribute of the people.
This may be achieved by providing better and higher educational facilities and occupational
alternatives to the girls.
Keywords: Literacy, industrialisation, economic development, socio-economic and
demographic variables
*Research Scholar, H.N.B. Garhwal University, Srinagar Garhwal, Uttarakhand
**Professor, H.N.B. Garhwal University, Srinagar Garhwal, Uttarakhand
International Journal of Advanced Research in
Management and Social Sciences ISSN: 2278-6236
Vol. 2 | No. 8 | August 2013 www.garph.co.uk IJARMSS | 162
1. INTRODUCTION
Fertility is also one of the three principal components of population dynamics that
determines the size and structure of the population of a country. Differentials in fertility
behaviour and fertility levels in different areas and among population strata or
characteristics have been among the most pervasive findings in demography Rele, (1987) [1].
In 2011, Pauri Garhwal had population of 686,527 of which male and female were 326,406
and 360,121 respectively. There was change of -1.51 percent in the population compared to
population as per 2001(increase of 3.91 percent) census of India 2011, [2]. Clearly, fertility is
expected to decline with improvements in social conditions and in the presence of better
infant survival. Fertility of uneducated females is generally compared with fertility of
educated females. The important factor for declining fertility is education. Several studies
conducted in India have confirmed that there exist a strong inverse relationship between
education and fertility Mahadevan, 1988, 1987, 1979 [3, 4, 5]; Krishnamurthy, 1984 [6].
Education and health are two other areas that require sustained attention. Despite
significant advances, in many areas, gaps remain between girls and boys enrolment and
participation in education with gender disparities being far more severe in study with
greater rural and poor populations Amartya, (2001) [7]. Rural children and those with a
mother with no education are twice as likely to be out of school. In addition, illiteracy
among rural women remains an area of concern. While efforts have been made to broaden
the range of health services and quality of care, women living in rural areas still face
significant barriers to health care and reproductive health. Fertility rates in rural areas are
generally higher than those of urban areas due to rural women’s lower access to education,
family planning and healthcare services. Rural areas also have some of the highest rates of
maternal mortality and obstetric fistula Safilios, 1985 [8].
Women living in rural areas play an essential role to effectively mitigate and adapt to
climate change and ensure more sustainable rural development. Rural women often depend
on access to natural resources for food and fuel, and they are often more aware of the
urgency to manage resources in a sustainable manner and to preserve biological diversity.
The contribution of women and their role in the family as well as in the economic
development and social transformation are pivotal. Women constitute 90 per cent of total
marginal workers of the country. Rural women who are engaged in agriculture form 78 per
International Journal of Advanced Research in
Management and Social Sciences ISSN: 2278-6236
Vol. 2 | No. 8 | August 2013 www.garph.co.uk IJARMSS | 163
cent of all women in regular work Roy, (2003) [9]. The other issues that impact the
empowerment of rural women, including specific groups of women such as girls/young
women, indigenous, older women or women with disabilities, need to be further examined.
Now-a-days economic development is one of the factors that have changed the entire
scenario of social and cultural environment within the country especially for the women.
The rural women are engaged in small-scale entrepreneurship programme. Through that
they were economically empowered and attaining status in family and community
Samantha, (2005) [10].
Although there has been progress in women’s participation in decision-making globally,
women status and say-so in household decision-making increases with income, the under-
representation of women from rural areas in political and public life remains high in most
societies. Women can effectively undertake both the production and processing oriented
enterprises. Entrepreneurship development among rural women helps to enhance their
personal capabilities and increase decision-making status in the family and society as a
whole Roy, 2003 [11].
Most of the rural poor, in particular women, is represented in the low-productivity
employment segment of the rural economy both in subsistence farming and agricultural
wage labour and in non-farm self-employment. Access to decent work remains limited in
both agricultural and non-agricultural work. Work is generally more likely to be either
unpaid or low-wage, informal, vulnerable, and to lack social protection. For women, many
barriers persist to their equal access to decent work, including the lack of education and
training and child-care services, as well as constraints due to unequal care and household
responsibilities Arunachalam, (2005) [12].
2. PROBLEM FORMULATION
To show the effect of educational and occupational status on fertility. A model on fertility is
fitted (multiple regression model is used).
To show the impact of awareness regarding social, health, contraceptives on fertility.
3. METHODOLOGY
For determining the most responsible factor for declining fertility in rural areas, a random
sample of 240 respondents are selected from 24 villages (10 respondent from each village)
of Pauri Garhwal for investigation by questionnaire and relevant data are collected. The
International Journal of Advanced Research in
Management and Social Sciences ISSN: 2278-6236
Vol. 2 | No. 8 | August 2013 www.garph.co.uk IJARMSS | 164
total sample came to 240. Structured questionnaire with all the necessary details was
prepared and the details are then assessed on the selected sampling units. The details
collected are age of women at marriage, type of family, education of women, employment
of women and spouse, Income of women and spouse. Statistical package such as SPSS is
applied to analyse the collected data and compute the objective functions. Multiple
regression model is used for number of children and various fertility affecting variables.
Various diagrammatic representations are used to show the fertility levels with reference to
different factors.
4. PROBLEM SOLUTION
The objective of this paper is to study and compare the fertility level, pattern and
differentials in this study area, according to some socio-economic variables and try to
determine, as far as possible, the factors that are responsible for the fertility decline.
Fertility differentials among sterilized couples have also been analysed.
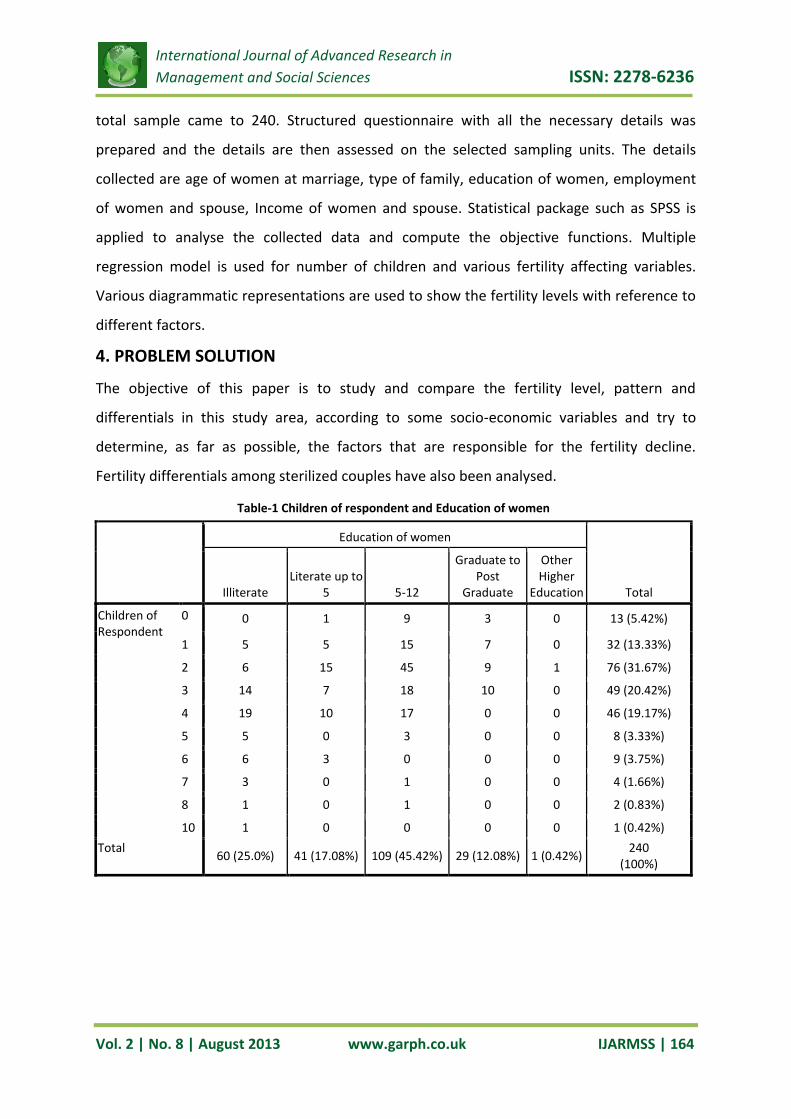
Table-1 Children of respondent and Education of women
Education of women
Total Illiterate Literate up to
5 5-12
Graduate to Post
Graduate
Other Higher
Education
Children of Respondent
0 0 1 9 3 0 13 (5.42%)
1 5 5 15 7 0 32 (13.33%)
2 6 15 45 9 1 76 (31.67%)
3 14 7 18 10 0 49 (20.42%)
4 19 10 17 0 0 46 (19.17%)
5 5 0 3 0 0 8 (3.33%)
6 6 3 0 0 0 9 (3.75%)
7 3 0 1 0 0 4 (1.66%)
8 1 0 1 0 0 2 (0.83%)
10 1 0 0 0 0 1 (0.42%)
Total 60 (25.0%) 41 (17.08%) 109 (45.42%) 29 (12.08%) 1 (0.42%)
240 (100%)
International Journal of Advanced Research in
Management and Social Sciences ISSN: 2278-6236
Vol. 2 | No. 8 | August 2013 www.garph.co.uk IJARMSS | 165
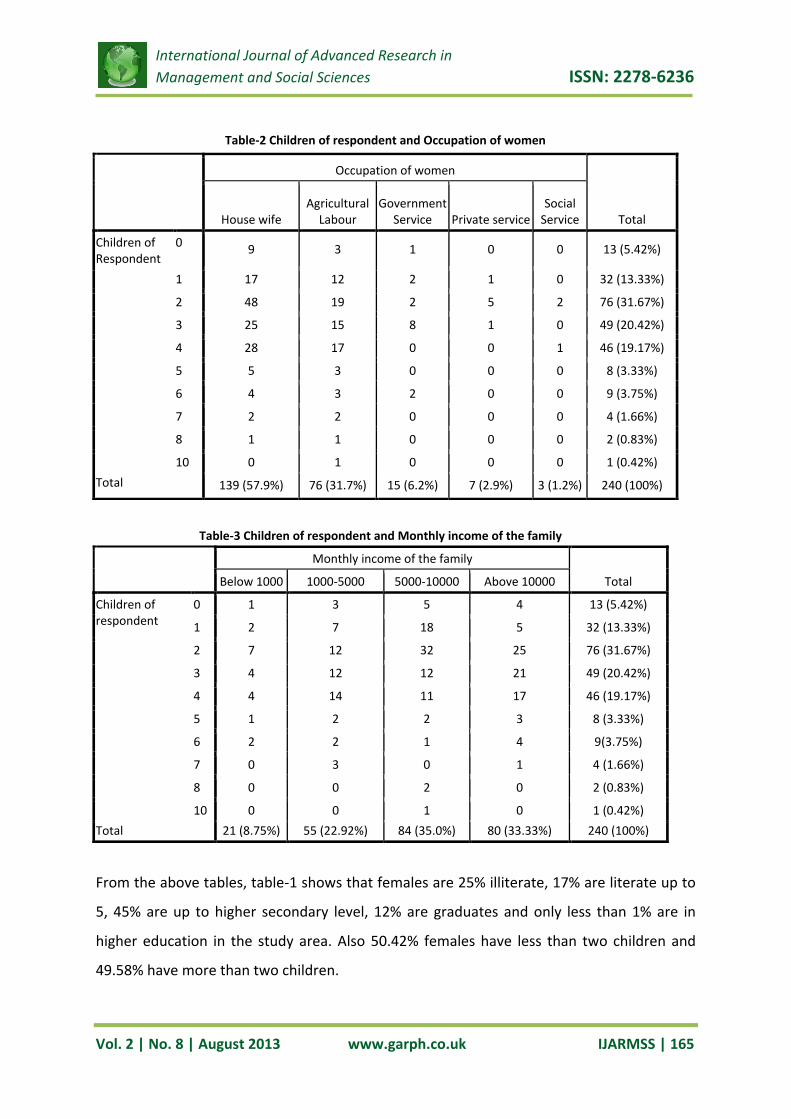
From the above tables, table-1 shows that females are 25% illiterate, 17% are literate up to
5, 45% are up to higher secondary level, 12% are graduates and only less than 1% are in
higher education in the study area. Also 50.42% females have less than two children and
49.58% have more than two children.
Table-2 Children of respondent and Occupation of women
Occupation of women
Total House wife Agricultural
Labour Government
Service Private service Social
Service
Children of Respondent
0 9 3 1 0 0 13 (5.42%)
1 17 12 2 1 0 32 (13.33%)
2 48 19 2 5 2 76 (31.67%)
3 25 15 8 1 0 49 (20.42%)
4 28 17 0 0 1 46 (19.17%)
5 5 3 0 0 0 8 (3.33%)
6 4 3 2 0 0 9 (3.75%)
7 2 2 0 0 0 4 (1.66%)
8 1 1 0 0 0 2 (0.83%)
10 0 1 0 0 0 1 (0.42%)
Total 139 (57.9%) 76 (31.7%) 15 (6.2%) 7 (2.9%) 3 (1.2%) 240 (100%)
Table-3 Children of respondent and Monthly income of the family
Monthly income of the family
Total Below 1000 1000-5000 5000-10000 Above 10000
Children of respondent
0 1 3 5 4 13 (5.42%)
1 2 7 18 5 32 (13.33%)
2 7 12 32 25 76 (31.67%)
3 4 12 12 21 49 (20.42%)
4 4 14 11 17 46 (19.17%)
5 1 2 2 3 8 (3.33%)
6 2 2 1 4 9(3.75%)
7 0 3 0 1 4 (1.66%)
8 0 0 2 0 2 (0.83%)
10 0 0 1 0 1 (0.42%)
Total 21 (8.75%) 55 (22.92%) 84 (35.0%) 80 (33.33%) 240 (100%)
International Journal of Advanced Research in
Management and Social Sciences ISSN: 2278-6236
Vol. 2 | No. 8 | August 2013 www.garph.co.uk IJARMSS | 166
Table-2 shows that the occupational status of females are 58% housewife, 32% are
agricultural labour, 6% are in Government service, 3% are in private service and only 1% are
in social service in the study area.
Table-3 shows that the 9% families are in below 1000 income level, 23% are in 1000-5000
income level, 35% are in 5000-10000 income level and 33% are in above 10000 income level
in the study area.
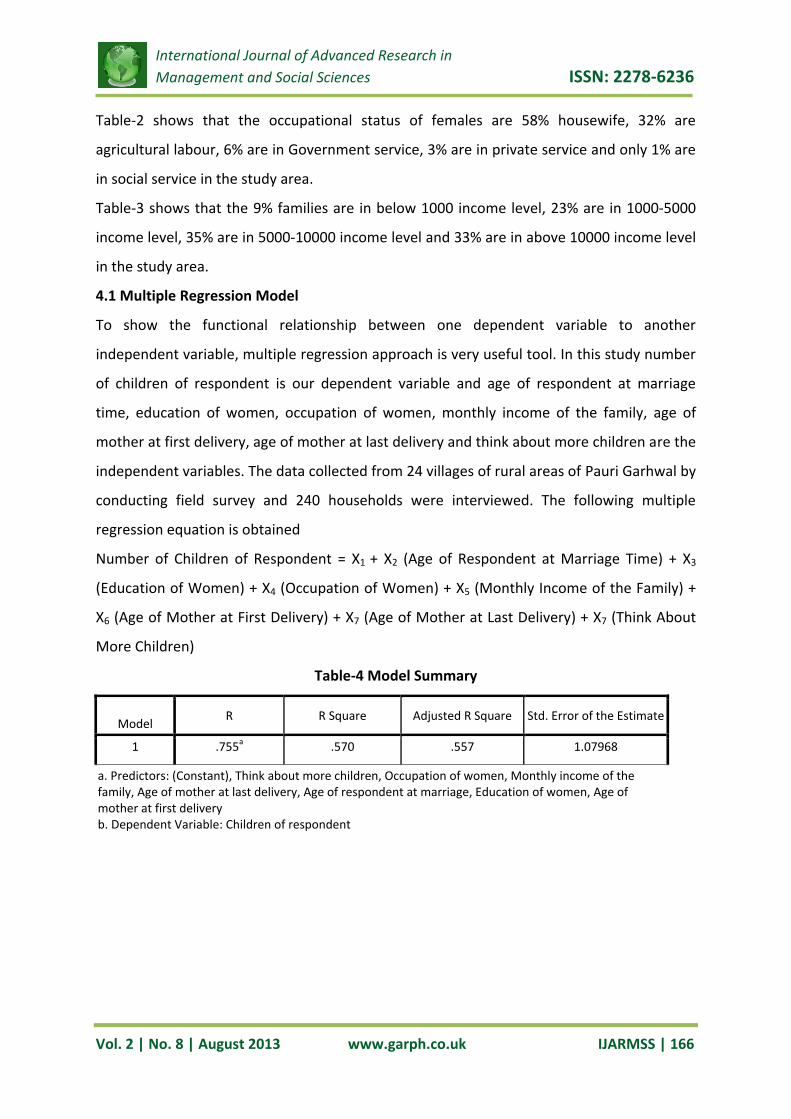
4.1 Multiple Regression Model
To show the functional relationship between one dependent variable to another
independent variable, multiple regression approach is very useful tool. In this study number
of children of respondent is our dependent variable and age of respondent at marriage
time, education of women, occupation of women, monthly income of the family, age of
mother at first delivery, age of mother at last delivery and think about more children are the
independent variables. The data collected from 24 villages of rural areas of Pauri Garhwal by
conducting field survey and 240 households were interviewed. The following multiple
regression equation is obtained
Number of Children of Respondent = X1 + X2 (Age of Respondent at Marriage Time) + X3
(Education of Women) + X4 (Occupation of Women) + X5 (Monthly Income of the Family) +
X6 (Age of Mother at First Delivery) + X7 (Age of Mother at Last Delivery) + X7 (Think About
More Children)
Table-4 Model Summary
Model R R Square Adjusted R Square Std. Error of the Estimate
1 .755a .570 .557 1.07968
a. Predictors: (Constant), Think about more children, Occupation of women, Monthly income of the family, Age of mother at last delivery, Age of respondent at marriage, Education of women, Age of mother at first delivery b. Dependent Variable: Children of respondent
International Journal of Advanced Research in
Management and Social Sciences ISSN: 2278-6236
Vol. 2 | No. 8 | August 2013 www.garph.co.uk IJARMSS | 167
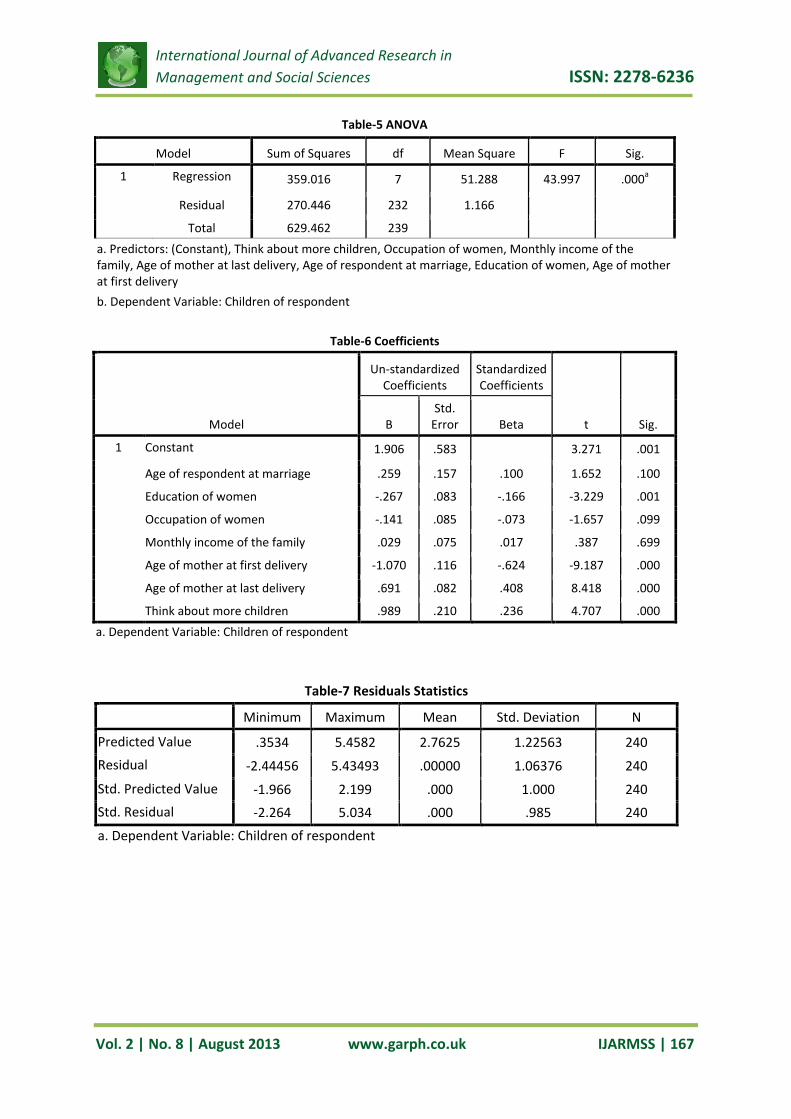
Table-6 Coefficients
Table-5 ANOVA
Model Sum of Squares df Mean Square F Sig.
1 Regression 359.016 7 51.288 43.997 .000a
Residual 270.446 232 1.166
Total 629.462 239
a. Predictors: (Constant), Think about more children, Occupation of women, Monthly income of the family, Age of mother at last delivery, Age of respondent at marriage, Education of women, Age of mother at first delivery
b. Dependent Variable: Children of respondent
Model
Un-standardized Coefficients
Standardized Coefficients
t Sig. B Std.
Error Beta
1 Constant 1.906 .583 3.271 .001
Age of respondent at marriage .259 .157 .100 1.652 .100
Education of women -.267 .083 -.166 -3.229 .001
Occupation of women -.141 .085 -.073 -1.657 .099
Monthly income of the family .029 .075 .017 .387 .699
Age of mother at first delivery -1.070 .116 -.624 -9.187 .000
Age of mother at last delivery .691 .082 .408 8.418 .000
Think about more children .989 .210 .236 4.707 .000
a. Dependent Variable: Children of respondent
Table-7 Residuals Statistics
Minimum Maximum Mean Std. Deviation N
Predicted Value .3534 5.4582 2.7625 1.22563 240
Residual -2.44456 5.43493 .00000 1.06376 240
Std. Predicted Value -1.966 2.199 .000 1.000 240
Std. Residual -2.264 5.034 .000 .985 240
a. Dependent Variable: Children of respondent
International Journal of Advanced Research in
Management and Social Sciences ISSN: 2278-6236
Vol. 2 | No. 8 | August 2013 www.garph.co.uk IJARMSS | 168
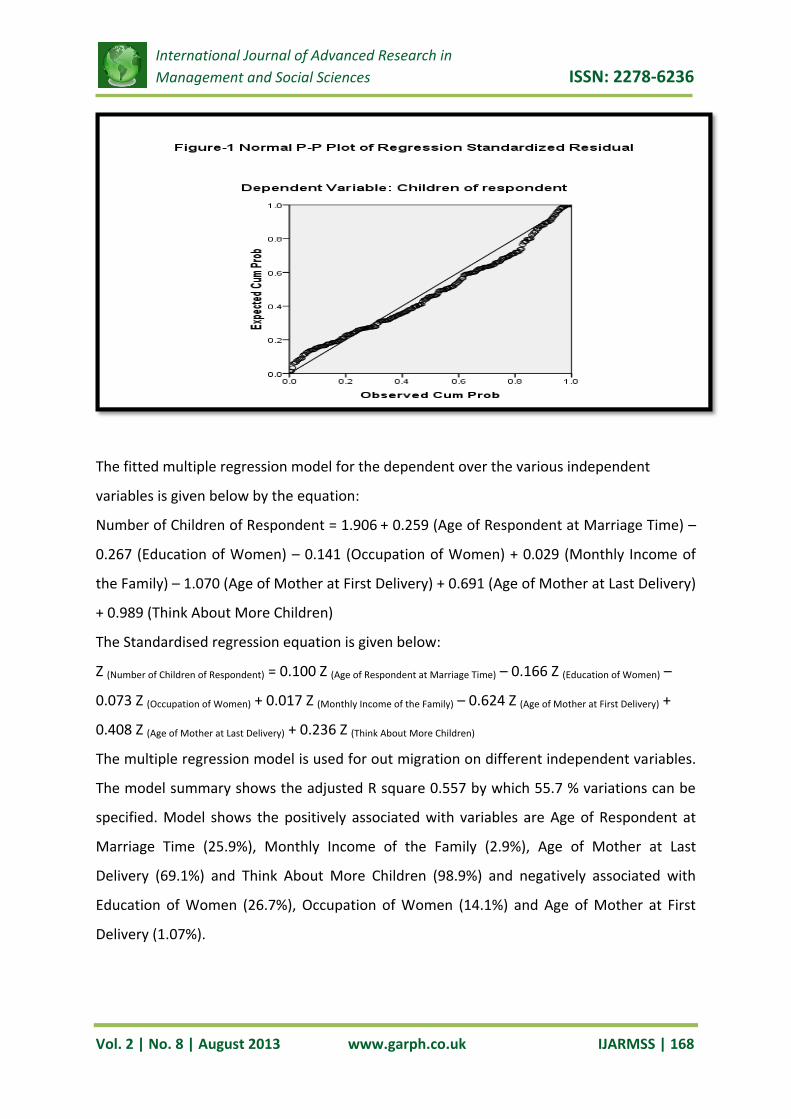
The fitted multiple regression model for the dependent over the various independent
variables is given below by the equation:
Number of Children of Respondent = 1.906 + 0.259 (Age of Respondent at Marriage Time) –
0.267 (Education of Women) – 0.141 (Occupation of Women) + 0.029 (Monthly Income of
the Family) – 1.070 (Age of Mother at First Delivery) + 0.691 (Age of Mother at Last Delivery)
+ 0.989 (Think About More Children)
The Standardised regression equation is given below:
Z (Number of Children of Respondent) = 0.100 Z (Age of Respondent at Marriage Time) – 0.166 Z (Education of Women) –
0.073 Z (Occupation of Women) + 0.017 Z (Monthly Income of the Family) – 0.624 Z (Age of Mother at First Delivery) +
0.408 Z (Age of Mother at Last Delivery) + 0.236 Z (Think About More Children)
The multiple regression model is used for out migration on different independent variables.
The model summary shows the adjusted R square 0.557 by which 55.7 % variations can be
specified. Model shows the positively associated with variables are Age of Respondent at
Marriage Time (25.9%), Monthly Income of the Family (2.9%), Age of Mother at Last
Delivery (69.1%) and Think About More Children (98.9%) and negatively associated with
Education of Women (26.7%), Occupation of Women (14.1%) and Age of Mother at First
Delivery (1.07%).
International Journal of Advanced Research in
Management and Social Sciences ISSN: 2278-6236
Vol. 2 | No. 8 | August 2013 www.garph.co.uk IJARMSS | 169
Table-8 Knowledge regarding health, social awareness, Interaction with media communication and Age of
Respondent at marriage
Age of respondent at marriage
Total Below 18 years 18-21 years 22-25 years 26-30 years
Awareness regarding Health
0 16 11 3 0 30 (12.50%)
1 13 17 3 0 33 (13.75%)
2 8 13 2 0 23 (9.58%)
3 9 25 2 0 36 (15.00%)
4 15 80 22 1 118(49.17%)
Total 61 (25.42%) 146 (60.83%) 32 (13.33%) 1 (0.42%) 240 (100%)
Knowledge regarding social awareness
0 7 6 0 0 13 (5.43%)
1 12 19 4 0 35 (14.58%)
2 16 21 7 0 44 (18.33%)
3 13 35 2 0 50 (20.83%)
4 13 65 19 1 98 (40.83%)
Total 61 (25.42%) 146 (60.83%) 32 (13.33%) 1 (0.42%) 240 (100%)
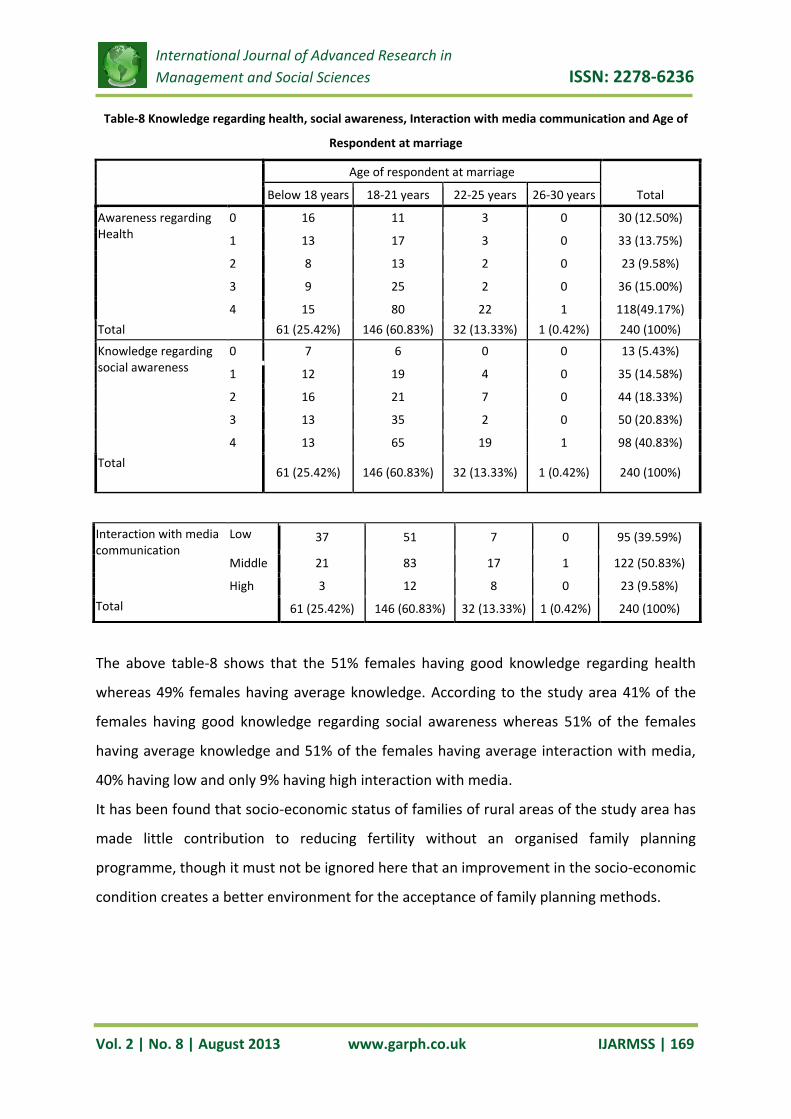
The above table-8 shows that the 51% females having good knowledge regarding health
whereas 49% females having average knowledge. According to the study area 41% of the
females having good knowledge regarding social awareness whereas 51% of the females
having average knowledge and 51% of the females having average interaction with media,
40% having low and only 9% having high interaction with media.
It has been found that socio-economic status of families of rural areas of the study area has
made little contribution to reducing fertility without an organised family planning
programme, though it must not be ignored here that an improvement in the socio-economic
condition creates a better environment for the acceptance of family planning methods.
Interaction with media communication
Low 37 51 7 0 95 (39.59%)
Middle 21 83 17 1 122 (50.83%)
High 3 12 8 0 23 (9.58%)
Total 61 (25.42%) 146 (60.83%) 32 (13.33%) 1 (0.42%) 240 (100%)
International Journal of Advanced Research in
Management and Social Sciences ISSN: 2278-6236
Vol. 2 | No. 8 | August 2013 www.garph.co.uk IJARMSS | 170
Table-9 Think about more children and Age of respondent at marriage
Age of respondent at marriage
Total Below 18
years 18-21 years 22-25 years 26-30 years
Think about more children Yes 4 33 7 0 44 (18.33%)
No 57 113 25 1 196 (81.67%)
Total 61 (25.42%) 146 (60.83%) 32 (13.33%) 1 (0.42%) 240 (100%)
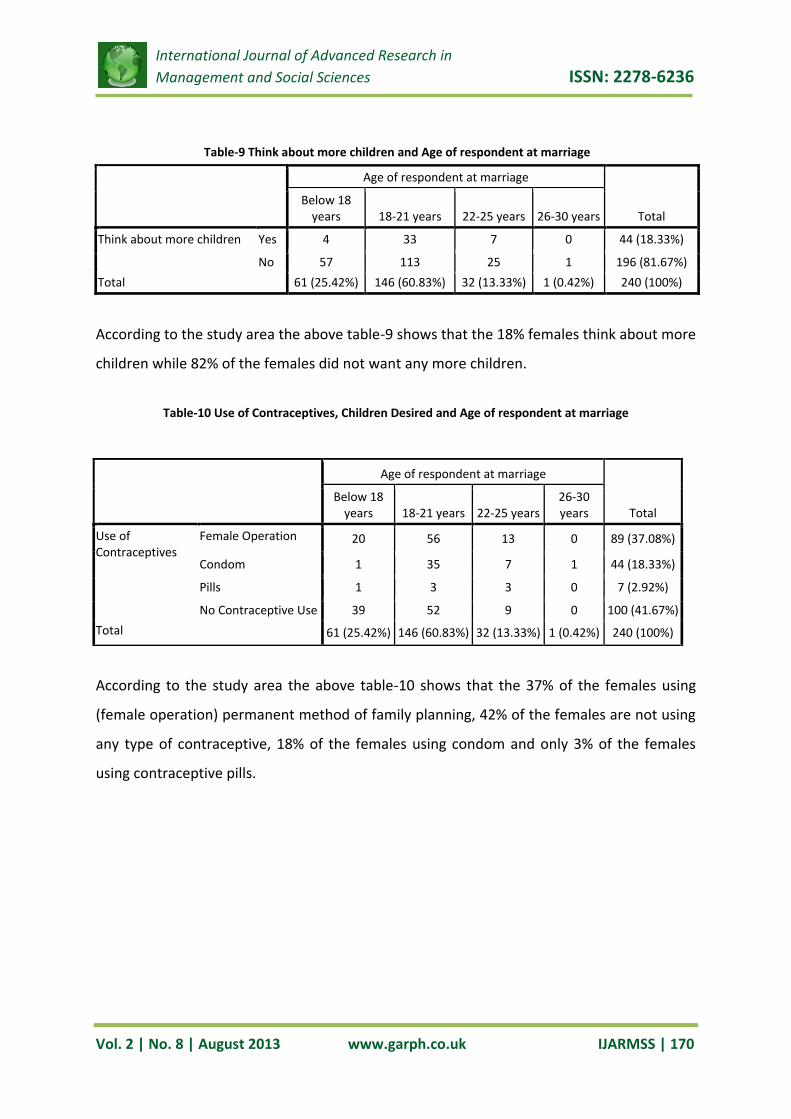
According to the study area the above table-9 shows that the 18% females think about more
children while 82% of the females did not want any more children.
Table-10 Use of Contraceptives, Children Desired and Age of respondent at marriage
According to the study area the above table-10 shows that the 37% of the females using
(female operation) permanent method of family planning, 42% of the females are not using
any type of contraceptive, 18% of the females using condom and only 3% of the females
using contraceptive pills.
Age of respondent at marriage
Total Below 18
years 18-21 years 22-25 years 26-30 years
Use of Contraceptives
Female Operation 20 56 13 0 89 (37.08%)
Condom 1 35 7 1 44 (18.33%)
Pills 1 3 3 0 7 (2.92%)
No Contraceptive Use 39 52 9 0 100 (41.67%)
Total 61 (25.42%) 146 (60.83%) 32 (13.33%) 1 (0.42%) 240 (100%)
International Journal of Advanced Research in
Management and Social Sciences ISSN: 2278-6236
Vol. 2 | No. 8 | August 2013 www.garph.co.uk IJARMSS | 171
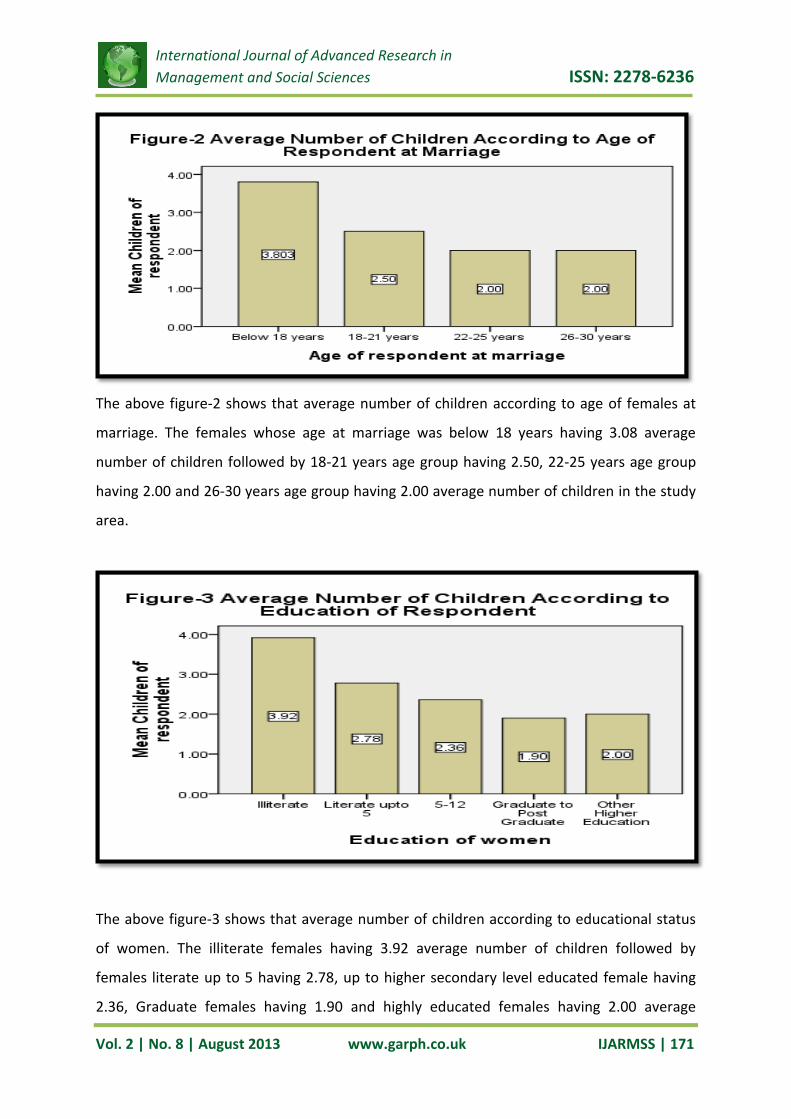
The above figure-2 shows that average number of children according to age of females at
marriage. The females whose age at marriage was below 18 years having 3.08 average
number of children followed by 18-21 years age group having 2.50, 22-25 years age group
having 2.00 and 26-30 years age group having 2.00 average number of children in the study
area.
The above figure-3 shows that average number of children according to educational status
of women. The illiterate females having 3.92 average number of children followed by
females literate up to 5 having 2.78, up to higher secondary level educated female having
2.36, Graduate females having 1.90 and highly educated females having 2.00 average
International Journal of Advanced Research in
Management and Social Sciences ISSN: 2278-6236
Vol. 2 | No. 8 | August 2013 www.garph.co.uk IJARMSS | 172
number of children in the study area. Educational status of females is highly responsible for
fertility decline.
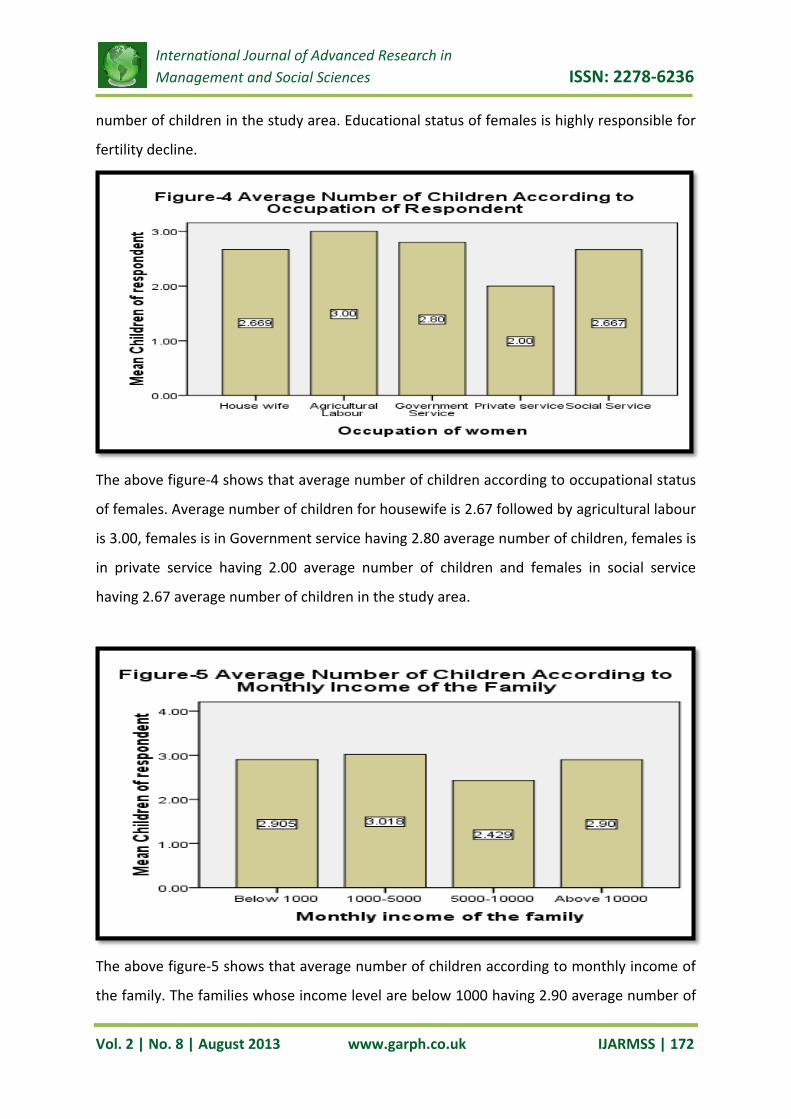
The above figure-4 shows that average number of children according to occupational status
of females. Average number of children for housewife is 2.67 followed by agricultural labour
is 3.00, females is in Government service having 2.80 average number of children, females is
in private service having 2.00 average number of children and females in social service
having 2.67 average number of children in the study area.
The above figure-5 shows that average number of children according to monthly income of
the family. The families whose income level are below 1000 having 2.90 average number of
International Journal of Advanced Research in
Management and Social Sciences ISSN: 2278-6236
Vol. 2 | No. 8 | August 2013 www.garph.co.uk IJARMSS | 173
children followed by families are in income level 1000-5000 having 3.02, income level 5000-
10000 having 2.43 and income level above 10000 having 2.90 average number of children in
the study area.
5. CONCLUSION AND DISCUSSION
These results suggest that the correlation between poverty and the fertility rate is explained
by the other three variables; that is, those poor people tend to have higher fertility than
others because they also have higher infant mortality, lower levels of education and less
access to family planning services.
The percentage of non-agricultural workers has played a major role in determining the
variations in the age of marriage of girls. Female literacy has insignificant impact and
urbanisation has a very significant negative effect.
The value of adjusted R2 (55.7% variation explained) indicated that the impact of fertility
affecting variables in predicting fertility index was different in each region. The relationship
between women status and fertility is examined. The results of the study show that fertility
rate was correlated with all of the socio economic indicators. It was negatively associated
with levels of women education, occupation of women, and age of mother at first delivery
and positively associated with age of women at marriage, monthly income of the family, age
of mother at last delivery and desired number of children.
The analysis implies that in the early stage of development in the short run, the positive
relationship may be explained by an improvement in the study variables. It is only after that
point at which some economic threshold is reached that we may observe as a result of the
decline in demand for children, the generally accepted negative relationship between
economic status and fertility.
The results of this analysis suggest that policies focused on improving female education at
the primary school level, reducing infant mortality, and improving the availability and
quality of family planning services would have mutually reinforcing effects on fertility
decline.
REFERENCES
[1] Rele, J.R. (1987): ‘Fertility Levels and Trends in India, 1951-81’, Population and
Development Review, 13, No 3, p.p. 513-530.
International Journal of Advanced Research in
Management and Social Sciences ISSN: 2278-6236
Vol. 2 | No. 8 | August 2013 www.garph.co.uk IJARMSS | 174
[2] Government of India (2011): Census of India, Uttarakhand Provisional Population Figure,
Uttarakhand.
[3] Mahadevan, K. (1988): Determinants of Religious And Case Differentials In Fertility, A
Village Study In Fertility And Mortality Theory, Methodology And Empirical Issues (Ed.) K.
Mahadevan, Sage Publication, New Delhi.
[4] Mahadevan, K. (1987): Social Development, Cultural Change and Fertility Decline: A
Study of Fertility Change in Kerala; Sage Publications, New Delhi.
[5] Mahadevan, K. (1979): Sociology of Fertility; Sterling Publishers, New Delhi.
[6] Krishnamurthy, S. (1984): A Note on the Relation of Education, Economic Status and Age
at Marriage to Fertility in Community Development Block, South India, Bulletin. Girh and
Fwt, IX (1):7.
[7] Amartya, S. (2001): Many Faces of Gender Inequality, India's National Magazine. Volume
18 - Issue 22, Oct. 27 - Nov. 09, 2001.
[8] Safilios, R.C. (1985): The Status of Women and Fertility in the Third World in the 1970-80
Decade, The Population Council, Centre For Policy Studies, New York.
[9] Roy, Ashine (2003): Development of Women: An Assessment, Rajat Publication, New
Delhi.
[10] Samantha, R.K. (2005): Empowering Rural Women: Issues, Opportunities and
Approaches, The Women Press, Delhi.
[11] Roy, Ashine (2003): Women in Power and Decision Making, Rajat Publication, New
Delhi.
[12] Arunachalam, Jaya (2005): Women’s Equality: A Struggle For Survival, Gyan Publishing
House, New Delhi.