slowdowns of fertility decline: when should we call it a 'fertility
TRANSCRIPT

DEMOGRAPHIC RESEARCH
VOLUME 46, ARTICLE 26, PAGES 737766PUBLISHED 22 APRIL 2022https://www.demographic-research.org/Volumes/Vol46/26/DOI: 10.4054/DemRes.2022.46.26
Research Article
Slowdowns of fertility decline:When should we call it a ‘fertility stall’?
Michael Grimm
Isabel Günther
Kenneth Harttgen
Stephan Klasen
© 2022 Grimm, Günther, Harttgen & Klasen.
This open-access work is published under the terms of the Creative CommonsAttribution 3.0 Germany (CC BY 3.0 DE), which permits use, reproduction,and distribution in any medium, provided the original author(s) and sourceare given credit.See https://creativecommons.org/licenses/by/3.0/de/legalcode.

Contents
1 Introduction 738
2 Data and methodology 7412.1 Data 7412.2 Measures of fertility stalls 7452.3 A new measure of conditional fertility stalls 746
3 Results 7493.1 Long-lasting versus temporary fertility stalls 7513.2 Unconditional versus conditional fertility stalls 753
4 Conclusion 759
References 761

Demographic Research: Volume 46, Article 26Research Article
https://www.demographic-research.org 737
Slowdowns of fertility decline:When should we call it a ‘fertility stall’?
Michael Grimm1
Isabel Günther2
Kenneth Harttgen3
Stephan Klasen4*
Abstract
BACKGROUNDThe phenomenon of fertility stalls in Africa has recently received much attention in theliterature yet hasn’t lead to clear-cut conclusions.
OBJECTIVEWe test the robustness of past findings by comparing alternative definitions and byextending the sample to most recent years. We further propose the concept of aconditional fertility stall, identifying countries that have a relatively high level of fertilitydespite a relatively high level of socioeconomic development.
METHODSWe use aggregate and survey data from various sources, describe variation in fertilityacross countries, and relate differences using regression techniques to socioeconomiccovariates. We use predicted residuals to identify deviations from expected levels anddefine these as conditional fertility stalls.
1 (Corresponding author) University of Passau, School of Business, Economics and Information Sciences,Passau, Germany. Email: [email protected] ETH Zürich, Department of Humanities, Social and Political Sciences, Nadel – Center for Development andCooperation, Zürich, Switzerland. Email: [email protected] ETH Zürich, Department of Humanities, Social and Political Sciences, Nadel – Center for Development andCooperation, Zürich, Switzerland. Email: [email protected] Previously University of Göttingen, Department of Economics and Courant Research Center‚ ‘Poverty,equity, and growth in developing and transition countries,’ Göttingen, Germany.* Stephan Klasen passed away on 27 October 2020. He has substantially contributed to the conceptualisation ofthis paper and the first draft.

Grimm et al.: Slowdowns of fertility decline
738 https://www.demographic-research.org
RESULTSThe fertility in some countries, such as Nigeria and Uganda, is too high given their levelof GDP per capita, female education, and child mortality. Here noneconomic conditionsseem to hold back the transition. Other countries, such as Nepal and Bangladesh, have acontinuation of the transition that seems to require further economic development: Inthese countries, fertility is just at or even below the level that the prevailing economicconditions predict.
CONCLUSIONOur concept shows that long-lasting unconditional fertility stalls are rare and that aslowdown of the fertility transition can in many cases be explained by a stagnation insocioeconomic development. Policy recommendations should take this distinctionbetween unconditional and conditional fertility stalls into consideration.
CONTRIBUTIONWe expand the literature on the conceptualisation and the measurement of fertility stalls.
1. Introduction
For a long time it has been assumed that the demographic transition is a stylised fact, thatsooner or later all countries will experience the transition from high fertility levels tofertility at the replacement level (i.e., around two children born to each mother)(Notestein 1945; Coale 1973; Landry 1982; Chesnais 1993; Lee 2008). This transitiontypically starts with a decline in mortality, even though in some countries, such as France,the fertility decline seems to have preceded the mortality decline. Moreover, thedemographic transition often goes hand in hand with economic development (Galor andWeil 2000; Galor 2011). Whether economic development is a necessary precondition forthe demographic transition remains debated, but the literature suggests that higherincomes and education and lower mortality lead to a reduction in the number of childrenborn (see, for example, Schultz 1997; Wolpin 1998; Breirova and Duflo 2004; Nobles,Frankenberg, and Thomas 2014; Lavy and Zablotsky 2015). While the demographictransition took more than a century in most European countries, the pace of the transitionhas been much faster in Asia and Latin America (see, for example, Bloom andWilliamson 1998).
None of the sub-Saharan African countries has completed the fertility transitionexcept South Africa and Mauritius, but even in these two countries fertility varies greatlyacross socioeconomic groups (Canning, Raja, and Yazbeck 2015). While some countriesin sub-Saharan Africa have not even started the fertility transition (e.g., Chad), many haveseen declines in fertility rates that came to a standstill or even increased again (e.g.,

Demographic Research: Volume 46, Article 26
https://www.demographic-research.org 739
Ghana, Nigeria). These latter phenomena are referred to as fertility stalls in the literature(Bongaarts 2006, 2008; Garenne 2008; Schoumaker 2019).
The World Population Prospects 2019 revision assumes that the total fertility rate(TFR), that is, the total number of children a woman is expected to give birth to, will bearound three in 2050 in Africa (United Nations 2019). Yet, this assumption seems overlyoptimistic if some countries find themselves in a fertility stall. Given that youthunderemployment is already a concern in most countries in the region (InternationalLabour Organization 2020), policymakers should be concerned about a thoroughunderstanding of population dynamics. For example, the median and the high/lowfertility scenarios of the World Population Prospects for sub-Saharan Africa show hugedifferences with potentially strong implications for population growth and developmentchallenges. Whereas the median scenario for 2100 predicts a total population of 4.2billion on the African continent, the high and low variants predict a population of up to5.9 or ‘only’ 3.0 billion, respectively.5
Given these concerns, several studies have analysed fertility stalls (Agyei-Mensah2005, 2007; Askew, Maggwa, and Francis 2017; Bongaarts 2006, 2008, 2017; Bongaartsand Casterline 2013; Ezeh, Mberu, and Emina 2009; Garenne 2008; Garenne et al. 2015;Gerland, Biddlecom, and Kantorová 2017; Goujon, Lutz, and KC 2015; Guengant 2017;Howse 2015; Kebede, Goujon, and Lutz 2019; Machiyama 2010; Moultrie et al. 2008;Schoumaker 2009, 2019; Shapiro and Gebreselassie 2008; Shapiro and Hinde 2017). Yet,in this literature it is debated how to measure such a fertility stall: How many years ofnondeclining (or slow-declining) fertility constitute a stall? Is only stagnating fertility afertility stall, or is a slowdown in fertility decline already a fertility stall? Are stallsconditional on a country’s socioeconomic development?
In this paper, we test the robustness of previous findings by comparing alternativedefinitions and by including countries outside Africa into the analysis. We also expandthe observation period to the most recent years. Second, we propose a new definition ofa fertility stall, which is also inspired by the economic theory of fertility transition (see,for example, Becker 1981; Lee 1997; Galor and Weil 1996, 2000). We call such a fertilitystall a conditional fertility stall. A conditional fertility stall refers to a situation in whicha country faces a relatively high fertility level despite a relatively low level of childmortality and a relatively high level of income and mothers’ education, assuming thatthese three forces are important preconditions for fertility to decline. In other words, webelieve that as long as child mortality is high and female education and incomes are low,the socioeconomic circumstances are unfavourable for a long-lasting fertility decline. Insuch a situation parents tend to have many children; hence, we believe it is important todifferentiate between unconditional fertility stalls, as independent of the circumstancesunder which they occur as previous literature has done, and conditional fertility stalls,
5 United Nations Data 2019, https://population.un.org/wpp/.

Grimm et al.: Slowdowns of fertility decline
740 https://www.demographic-research.org
referring to situations where fertility remains high despite progress in socioeconomicdevelopment. The policy implications of a slowdown in fertility decline because ofsocioeconomic stagnation or despite socioeconomic progress are quite different; and sucha differentiation is important. Therefore, our analysis is related to the studies by Goujon,Lutz, and KC (2015) and Kebede, Goujon, and Lutz (2019), who show that fertility stallsare highly correlated with a lack of improvements in female education – a situation wewould classify as an unconditional stall.
This paper makes two contributions to the literature. First, we revisit the list ofcountries with fertility stalls according to the definitions of Bongaarts (2008) andSchoumaker (2009, 2019) and test the sensitivity to alternative approaches used in theliterature. In doing so, we also include low- and middle-income countries outside Africainto the analysis and take a long-term perspective by choosing a long observationwindow. Second, we propose a new definition of a fertility stall, which focuses onconditional fertility stalls.
Our major findings are that 10 out of 80 countries in our sample show fertility stalls(conditional or unconditional) independent of the measure used. Only about one-third ofcountries that have been identified as facing a fertility stall by Schoumaker (2009) orBongaarts (2008) ten years ago would still be classified as fertility-stall countries today.The analysis by Schoumaker (2019) goes in a similar direction. He shows that at leastmajor stalls are often not lasting: Either they fade out or they turn into slight stalls.
Moreover, there is little overlap between countries with long-lasting conditional andunconditional fertility stalls. Countries with long-lasting conditional fertility stalls (lessthan ten years) are the Democratic Republic of the Congo (henceforth referred to asDRC), Gabon, Kyrgyz Republic, Mali, Mauritania, Mongolia, Uganda, and Zambia.Kyrgyz Republic and Mongolia are the only countries with a long-lasting conditional stalloutside Africa. Countries with long-lasting unconditional fertility stalls 6 are Benin,Cameroon, Colombia, Egypt, Ghana, Indonesia, Pakistan, Peru, Senegal, and Zimbabwe.These countries have a high level of fertility that is explained by a low level ofsocioeconomic development and therefore do not fall in the category of conditionalfertility stalls.
Hence, our analysis has two interesting implications. First, it suggests that in manycases high fertility can be explained by low economic development. Second, it suggeststhat many countries with a low level of fertility should have an even lower level giventhe socioeconomic environment in which they happen. Thus, one should refer, moreaccurately, to a slow – rather than a stalled – demographic transition in many sub-SaharanAfrican countries. In several cases, there is nothing particular about the sub-Saharan
6 We found these by applying the definition that declines in fertility rates are less than 0.05 children per womenbetween two surveys as applied by New Security Beat (2013). See methodology section and also Table S5 inthe Online Appendix.

Demographic Research: Volume 46, Article 26
https://www.demographic-research.org 741
African fertility transition. However, countries such as Congo (Rep.), Gabon, KyrgyzRepublic, Mali, Mauritania, Mongolia, Niger, Nigeria, Sudan, Uganda, and Zambiadeserve a more detailed analysis to understand why fertility is high despite relatively highlevels of income and education and low levels of child mortality.
The remainder of this paper is structured as follows: The next section presents thedata and the various approaches to determine a fertility stall, including the concept of aconditional fertility stall that we propose. Section 3 presents the results. Section 4concludes.
2. Data and methodology
2.1 Data
We use microdata from the Demographic and Health Surveys (DHS), the MultipleIndicator Cluster Surveys (MICS), the World Fertility Survey (WFS), and the WorldDevelopment Indicators (WDI). The DHS are administered by ICF International, fundedby USAID, and implemented by National Statistical Offices since 1984. The MICS arepart of UNICEF’s strategy to invest in data collection. They have been conducted since1995 by National Statistics Offices. The WFS is used to cover the periods of the late1970s and the beginning of the 1980s. The WFS was launched in 1972 by theInternational Statistical Institute and provided by the Office of Population Research atPrinceton University. All three data sets are nationally representative, have beenconducted several times as cross-sectional surveys, and are widely used in populationstudies. The DHS, MICS, and WFS are designed to collect demographic, health, andsocioeconomic data from women of reproductive age, their children, and theirhouseholds. Questionnaires are harmonised across countries, which allows cross-countrycomparisons. Our sample of countries is restricted to countries for which at least twosurvey rounds are available. The WDI data provides us with information on GDP percapita at the country level.
In total, we use data from 80 countries to calculate changes in fertility over timebetween 1992 and 2016. These countries have at least two survey rounds available. Justover half (41) of these 80 countries are in sub-Saharan Africa. The sample consists ofdata stemming from a total of 369 surveys. On average, four survey rounds per countryare available, and we pool all surveys into one large multicountry, multiyear microdataset (see Table S1 and S2 in the Online Appendix for a list of all included countries andyears). To study changes in the pace of fertility declines, we further restrict the sample tocountries for which at least three surveys are available. This leaves us with a sample of56 countries and 321 surveys.

Grimm et al.: Slowdowns of fertility decline
742 https://www.demographic-research.org
To measure a country’s fertility level, we use the total fertility rate (TFR), which isthe most widely used measure of a country’s period fertility (see Table 1 and S1, OnlineAppendix). The TFR can be defined as the average number of births a woman wouldhave during her reproductive life if she had experienced the age-specific fertility ratesobserved in a specific period, often three years (Bongaarts and Feeney 1998; Myrskylä,Kohler, and Billari 2009). The TFR is available for many countries and periods, and itssimplicity makes it easy to interpret.7 To calculate the TFR by country and survey year,we use the information on retrospective birth histories of women aged 15 to 49 in theDHS, MICS, and WFS data.8
Table 1 shows the TFR and the pace of fertility decline by country and period forcountries with at least three surveys available. Given that DHS, MICS, and WFS are notconducted in the exact same years across countries (see Table S1, Online Appendix), wefollow the approach by Bongaarts (2008) and calculate changes in fertility for the periodscirca 1992–1998, circa 1998–2004, and circa 2004–2010. Like Schoumaker (2019), weadd the period circa 2010–2016. The pace of fertility decline by period is calculated asthe unweighted annualised decline (increase) between two consecutive periods:annualised period change = [(TFRt – TFRt–1) / (periodt – periodt–1)] × (–1). Hence,declines in fertility between two periods are presented as positive numbers. In particular,to annualise the pace of fertility decline, we use the effective survey years within eachperiod (e.g., Angola 2007 for the period 2004–2010 and Angola 2011 for the period2010–2016). This means that for the period 2004 to 2010 the effective years used tocalculate the annualised period change would be four years (2007–2011).
7 DHS surveys are the main source of estimates of TFR in developing countries. The data of the retrospectivebirth histories in the DHS allows the direct estimation of the TFR. This means that the estimates of the TFR arebased on the quality and accuracy of the events and dates in the birth histories. An example for a potential biasis the omission of children who died, which will result in a downward bias in fertility rates (Pullum, Assaf, andStaveteig 2017). A number of DHS reports have compared the DHS estimates of fertility with other sources offertility estimates, and the overall quality of the DHS data to produce fertility estimates has been analysed (e.g.,Schoumaker 2014; Pullum, Assaf, and Staveteig 2017; Pullum and Staveteig 2017). Although these reportspoint to a number of cases in which a DHS estimate was substantially higher or lower than expected, thesereports conclude that most surveys have produced estimates of good quality.8 To calculate the TFR, we use the TFR2 Stata command. The TFR2 command produces the official DHS andWFS total fertility rates from the microdata. The command transforms the birth history data into a table ofnumber of births and number of years of exposure. The age-specific fertility rates and TFRs are then computedapplying a Poisson regression model (Schoumaker 2012). The advantage of calculating the TFR directly fromthe microdata is that the standard deviation and confidence intervals for the TFR can be obtained.

Demographic Research: Volume 46, Article 26
https://www.demographic-research.org 743
Table 1: Total fertility rate and the unweighted annualised pace of fertilitydecline for countries with at least three surveys available
TFR Pace of fertility decline
Sub-Sahara Africa ca 1992 ca 1998 ca 2004 ca 2010 ca 2016ca 1992 toca 1998
ca 1998 toca 2004
ca 2004 toca 2010
ca 2010 toca 2016
(Angola) 5.8 6.3 6.2 –0.13 0.02
Benin 6.0 5.6 5.3 5.7 0.07 0.04 –0.05
Burkina Faso 6.5 6.4 5.9 6.0 5.3 0.01 0.14 –0.02 0.11
Burundi 6.9 6.4 5.8 0.14
Cameroon 5.8 4.8 5.0 5.1 4.9 0.14 –0.03 –0.02 0.07
(Chad) 6.4 6.3 6.4 0.00
Congo (Rep.) 4.8 5.1 4.4 –0.04 0.23
Cote d’Ivoire 5.3 5.2 5.0 4.6 0.03 0.09
Ethiopia 5.5 5.4 4.8 4.6 0.02 0.10 0.05
Ghana 5.8 4.4 4.4 4.2 4.2 0.19 0.00 0.04 0.00
Guinea 5.5 5.7 5.1 4.8 –0.03 0.09 0.06
Kenya 6.0 4.7 4.9 4.6 3.8 0.19 –0.04 0.05 0.12
Lesotho 3.5 3.3 3.3 0.05 0.01
Liberia 6.7 5.2 5.4 4.5 –0.07 0.19
Madagascar 6.1 6.0 5.2 5.0 4.2 0.03 0.11 0.03 0.15
Malawi 6.7 6.3 6.2 5.5 4.7 0.05 0.02 0.12 0.21
Mali 7.1 6.7 6.7 6.2 0.04 0.00
Mauritania 5.0 5.1 –0.04
Mozambique 5.2 5.5 6.0 5.3 –0.06 –0.07 0.10
Namibia 5.4 4.2 3.6 3.6 0.15 0.09
(Niger) 7.0 7.2 7.0 7.6 –0.04 0.02 –0.10
Nigeria 6.0 5.7 5.9 5.5 –0.04 0.08
Rwanda 6.2 5.8 6.1 5.0 4.2 0.05 –0.05 0.26 0.14
Senegal 6.2 5.7 5.1 5.0 4.9 0.08 0.06 0.04 0.01
Sierra Leone 5.1 4.9 4.1 0.04 0.19
Sudan 4.7 5.7 5.2 0.14
Swaziland 3.8 3.7 3.3 0.06 0.09
Tanzania 6.2 5.7 5.7 5.5 5.0 0.09 0.00 0.04 0.07
Togo 6.4 5.2 4.6 0.12
Uganda 7.1 6.8 6.2 5.6 0.09 0.11
Zambia 6.5 6.1 5.9 6.2 5.3 0.10 0.03 –0.06 0.13
Zimbabwe 4.9 4.0 3.8 3.9 4.2 0.11 0.02 –0.03 –0.05

Grimm et al.: Slowdowns of fertility decline
744 https://www.demographic-research.org
Table 1: (Continued)
TFR Pace of fertility decline
ca 1992 ca 1998 ca 2004 ca 2010 ca 2016ca 1992 toca 1998
ca 1998 toca 2004
ca 2004 toca 2010
ca 2010 toca 2016
North Africa and not Africa
(Armenia) 1.7 1.7 1.7 1.7 0.00 0.00 –0.01
Bangladesh 3.4 3.3 2.9 2.3 2.3 0.03 0.06 0.11 0.01
Bolivia 4.9 4.2 3.8 3.5 0.11 0.08 0.06
Cambodia 3.8 3.4 3.0 2.7 0.07 0.07 0.08
Colombia 3.0 2.6 2.4 2.1 0.04 0.04 0.05
Dominican Republic 3.5 2.9 3.0 2.4 2.5 0.07 –0.02 0.11 –0.01
Egypt 4.0 3.5 3.2 3.0 3.5 0.06 0.09 0.03 –0.07
Guatemala 5.5 5.1 5.0 3.1 0.05 0.02
Guyana 2.5 2.8 2.6 –0.07 0.03
Haiti 4.8 4.7 3.9 3.5 3.0 0.02 0.13 0.06 0.13
India 4.0 2.8 2.7 2.2 0.20 0.02
Indonesia 3.0 2.8 2.6 2.6 2.4 0.03 0.03 0.00 0.03
Iraq 4.3 4.5 3.6 –0.04 0.13
Jordan 5.6 4.4 3.6 3.8 3.1 0.17 0.09 –0.06 0.12
Kyrgyz Republic 3.4 3.6 4.0 –0.02 –0.09
Morocco 4.3 2.5
Nepal 4.6 3.6 2.6 2.3 0.13 0.15 0.07
Pakistan 4.9 4.1 3.8 3.6 0.04 0.05
Paraguay 4.7 2.5
Peru 3.8 3.2 2.5 2.6 2.6 0.07 0.08 –0.01 0.01
Philippines 4.1 3.7 3.5 3.3 2.9 0.07 0.04 0.05 0.06
Tunisia 4.2 2.1 2.1 0.00
Turkey 2.5 2.6 2.2 –0.02 0.08
Yemen 7.7 6.9 4.4
Notes: The unweighted annualised decline is calculated between each consecutive period. The annualised change per period iscalculated as annualised period change = [(TFRt – TFRt–1) / (periodt – periodt–1)] (–1). Hence, declines are positive numbers. If morethan one TFR is available per period, the average is taken before calculating the annualised change (and also the average surveyyear). Only countries with at least three surveys available and for which at least two growth rates of consecutive periods can becalculated are used. For a complete list of countries, see Table S1 (Online Appendix). Pre- and post-transition countries are in brackets.Post-transition country: Armenia. Pre-transition countries: Angola, Chad, Niger.Source: DHS/MICS/WFS data; calculations by the authors.
Some periods consist of two TFRs (see Table S1, Online Appendix). In this case,we used the mean TFR and survey year to calculate the pace of fertility decline betweentwo consecutive periods. For example, in Burundi, two surveys are available for theperiod 2010–2016: 2012 and 2016 with a TFR of 6.1 and 5.5, respectively. We took theaverage of the TFRs ((6.1 + 5.5) / 2 = 5.8) and the average of survey years

Demographic Research: Volume 46, Article 26
https://www.demographic-research.org 745
((2016 + 2012) / 2 = 2014) and used this TFR and survey year to calculate the annualisedchange between the periods 2016 and 2010.9
2.2 Measures of fertility stalls
The literature has used different definitions of a fertility stall, but the general idea remainsthe same: “a stall implies that an ongoing fertility transition is interrupted by a period ofno significant change in fertility before the country reaches the end of the transition”(Bongaarts 2008: 109). Two steps are thus necessary to identify countries with stallingfertility. First, a criterion must be used to determine whether a fertility transition hasstarted. Second, one needs to determine what constitutes an interruption of the decline infertility.
With regard to the first criterion, Schoumaker (2009, 2019) assumes that a fertilitytransition has begun if either the TFR in one survey is at least 10% lower than it was in aprevious survey or if the TFR in the second survey is lower than the average number ofchildren ever born among women aged 40 to 49 in the first survey.10 Bongaarts (2008) inturn assumes that a fertility transition is underway if the TFR has decreased by at least10% compared to a previous survey or, alternatively, if contraceptive prevalence amongmarried women is over 10%. The use of contraceptive prevalence is proposed on theground that, according to Bongaarts, a 10% increase in contraceptive prevalencecorresponds approximately to a 10% decrease in fertility.
Taking both definitions into account, five countries in our sample are considered ashaving not started the fertility transition yet: Angola, Chad, DRC, Niger, and Sudan.Countries are classified as being post-transition countries if the fertility rate has reachedthe replacement level (less than or equal to two). The three countries in our sample thatcan be classified as post-transition countries are Albania, Armenia, and Vietnam.
In this study, we use three different definitions of a fertility stall that have previouslybeen proposed in the literature. The first measure defines countries as stalling only if thedecline of the TFR has stopped (i.e., where the TFR in one survey is at least as high asthe TFR in the previous survey) (Schoumaker 2009). The second definition classifiesfertility as stalling if the annual fertility decline is smaller than 0.05 children born (NewSecurity Beat 2013), thus, if countries do not show a clear decline in fertility levels overtime (between two consecutive surveys). The third definition defines countries as stalling
9 As a robustness check we also used the most recent TFR of a period instead of the mean. However, this didnot change the overall picture of countries being classified as stalling countries and would reduce our samplesize.10 In addition, Schoumaker (2019), like Bongaarts (2008), requires that the prevalence of contraception amongmarried women be at least 10%.

Grimm et al.: Slowdowns of fertility decline
746 https://www.demographic-research.org
if there is a statistically significant deceleration in the pace of fertility decline (Bongaarts2008).11 This definition requires, however, at least three or more surveys to allow for theanalysis of changes in the pace of fertility decline over two successive periods. FollowingBongaarts (2008), we use the standard errors of the change in the TFR12 and calculate thesignificance (p < 0.05) with a one-tailed t-test.13
Our first contribution to the literature is a comparison of these measures and anextension to countries outside Africa. As in Schoumaker (2019), we expand theobservation window to the most recent years.14 Differences between measures will, ofcourse, be driven not only by differences in concepts but also by data accuracy and thesensitivity to specific assumptions that each concept requires (i.e., all concepts imply thedetermination of certain thresholds).
2.3 A new measure of conditional fertility stalls
Our second contribution is a new conceptualisation of fertility stalls. We start from theassumption that a fertility decline is typically initiated by several structural changes. Weconsider three forces to be particularly important: child mortality, female education, andincome. Improved survival chances reduce the necessity to ‘have many children’ toensure that a certain number of children survives to adulthood (Becker 1981; Schultz1997; Wolpin 1998). Increased survival rates also increase the return on investments inchildren, such as education, and hence may contribute to a substitution away from manychildren towards few but well-educated and well-nourished children (Becker 1981).Women who are better educated have better opportunities in the labour market, andtherefore education increases women’s cost of time, which should also reduce the numberof children parents want to have (Becker 1981; Galor and Weil 1996). In addition, highereducated mothers demand higher education for their own children and in turn will reducethe number of children born (Breierova and Duflo 2004; Chicoine 2012; Lavy andZablotsky 2015; Pradhan and Canning 2016; Günther and Harttgen 2016) – the quantity–quality trade-off of children as described by Becker (1981). Education could also beconducive to higher female empowerment, which could in turn enable mothers to have
11 Note that this does not provide any information about that actual pace of fertility decline.12 The standard errors of the TFR by country and survey are provided by the TFR2 command (Schoumaker2012). The sample size is directly taken from the birth history data.13 Similar to Bongaarts (2008), we use p < 0.05 as a significance cut-off. As robustness checks we also usep < 0.1 and p < 0.01. Changing the significance cut-off leads to only minor changes in the list of countriesexperiencing a stall (Haiti, Lesotho, and Peru are not significant at p < 0.01; Burkina Faso becomes significantat p < 0.1; see also Table S3, Online Appendix).14 Schoumaker (2019) also uses three different measures of (unconditional) fertility stalls: (1) whether there isno decline or even an increase in the TFR between two surveys, (2) whether the decrease in the TFR betweentwo surveys is statistically significant, and (3) whether the pace in fertility decline is statistically significant.

Demographic Research: Volume 46, Article 26
https://www.demographic-research.org 747
more influence when it comes to the decision of how many children a couple wants tohave. Since in many countries women prefer fewer children than men, this could furtheraccelerate the fertility transition (Doepke and Tertilt 2018). Income as a more generalmeasure of economic development (including higher urbanisation and industrialisation)will further induce parents to increasingly substitute child quantity with quality if, asassumed by Becker (1981), the income elasticity of demand for quality is higher than forquantity. Income might also be correlated with technological change, which can furtherenhance this substitution (Galor and Weil 2000). An extensive empirical literature hasshown the strong relationship between reduced child mortality, increased femaleeducation, and increased income on the one hand and declining fertility on the other hand(see, for example, Lee 1997; Schultz 1997; Klasen 1999; Breierova and Duflo 2004;Bhalotra and Van Soest 2008; Lavy and Zablotsky 2015; Canning et al. 2013; Liu 2014;Nobles, Frankenberg, and Thomas 2014; Dang and Rogers 2015).
Of course, other forces such as improved access to contraception (see, for example,Singh, Bankole, and Darroch 2017), information campaigns (see, for example,McQueston, Silverman, and Glassman 2012), and religious and legal regulations (see, forexample, Heaton 2011), among others, also have an impact on fertility levels. However,our definition of conditional fertility stalls focuses on persistently high levels of fertilitydespite socioeconomic development. Other forces that have been identified in theliterature to reduce fertility can be directly influenced by policy. Hence, if we identify aconditional fertility stall, that means the policies are likely not in place for a furtherfertility reduction or social norms related to having many children seem to be strong(Canning et al. 2013). On the other hand, if the socioeconomic development stagnates,the context is not favourable for a further decline in fertility, unless parents have in themeanwhile formed strong preferences for fewer children independent of mortality,education, and income (see, for example, Canning et al. 2013) because of socialinteractions, diffusion effects, or social norms – which are possibly also enhanced byfamily planning services that may further affect preferences. It is unlikely that changesin regulations and policies will in that case lead to a further fertility reduction.
Hence, our second contribution is the concept of a conditional fertility stall, whichidentifies a fertility stall if fertility is much higher than what observed levels of childmortality, female education, and income would predict. This concept implies, forinstance, that in very poor countries with an economic structure that is still largely basedon agriculture and where female education is low and income grows little, there is noreason to expect a significant decline of fertility.
To determine whether a country experiences a conditional fertility stall, we use thedata described above and merge it at the level of each country (i) and for each surveyyear (t) with information on female secondary education and GDP per capita drawn from

Grimm et al.: Slowdowns of fertility decline
748 https://www.demographic-research.org
the WDI.15 Under-five mortality can be calculated directly from the DHS, MICS, andWFS data. We pool all data and regress the TFR on under-five mortality (U5M), femaleeducation (EDU), and (log) GDP per capita:16
𝑇𝐹𝑅𝑖𝑡 = 𝛼 + 𝛽1𝐺𝐷𝑃𝑖𝑡 + 𝛽2𝑈5𝑀𝑖𝑡 + 𝛽3𝐸𝐷𝑈𝑖𝑡 + 𝜀𝑖𝑡 (1).
Using the estimated coefficients, we predict for each country and survey year theTFR conditional on under-five mortality, female education, and GDP per capita.Subtracting this prediction from the observed TFR in that same year yields a residual. Alarge positive residual indicates that a given country in a given year has a fertility levelsignificantly higher than what the fundamentals would predict:
𝑅𝑒𝑠𝑖𝑑𝑢𝑎𝑙𝑖𝑡 = 𝑇𝐹𝑅𝑖𝑡 – 𝑇𝐹𝑅𝚤𝑡 (2).
If this residual is larger than 1 standard deviation of the residuals, we consider thiscountry to be experiencing a conditional fertility stall. In our sample, 1 standard deviationof the residuals corresponds to 0.83 children.
Using standard deviations of a variable as a threshold to determine whether adifference is large is common practice in empirical studies in social sciences. Forexample, children are defined as undernourished if they show an anthropometric indicator(e.g., height for age) that is below –2 standard deviations from a reference population(World Health Organization 1995). For power calculations in behavioural experimentalresearch, 0.8 standard deviations is often considered a large effect size (see, for example,Cohen 1988). We chose a rather high level of standard deviation of 1 (and 0.83 children)as a cut-off given that the computed residuals include a measurement error in fertility andin the explanatory variables; we might therefore over- or underestimate conditionalfertility stalls for certain countries if the chosen threshold was too low. Of course, thethreshold can be altered and the sensitivity of the results with respect to alternativethresholds can be tested.17 The question of defining thresholds has also been a challengefor previous definitions of unconditional fertility stalls (Bongaarts 2008).
Note that we deliberately do not control for period or country fixed effects in theseregressions. Doing so would mean that we net out from our residual period- and country-specific effects unrelated to the country-specific socioeconomic fundamental forces.However, we are exactly interested in these other policies, or normative forces, which
15 World Development Indicators, https://datatopics.worldbank.org/world-development-indicators/.16 The data on TFR, U5M, and EDU are calculated from the DHS, WFS, and MICS microdata, while the GDPper capita is taken from the WDI.17 For example, if we altered the threshold to 0.8 standard deviations (0.66 children) – which is similar to powercalculations in experimental research – the results remain fairly stable. See Table 4 for the respective residualsfor each country.

Demographic Research: Volume 46, Article 26
https://www.demographic-research.org 749
should be captured by the residual. In other words, our interest is in the fertility levelconditional on mortality, female education, and income but not conditional on specificcountry characteristics, such as, for example, subsidies for contraception or informationcampaigns that directly reduce fertility. Yet, for completeness and comparison we willshow estimates with country and year fixed effects in the Online Appendix.
It is also important to note that we define our concept in levels and not in changes.Directly analysing changes would, of course, be an interesting alternative, but empiricallythere is little difference between the two concepts in the long term. A country that has afertility level above the predicted one given its level of development has unlikely seenlarger than predicted fertility declines in the past. Moreover, a country which has fertilityfalling faster over time than is predicted by its level of development will sooner or lateralso have lower fertility levels than predicted by its level of development. Conversely,countries that have a fertility level below the predicted one given its socioeconomicdevelopment but which is rising will sooner or later also enter the status of a level higherthan predicted. Moreover, from a methodological perspective, focusing on levels insteadof changes has two further advantages: First, levels are in relative terms less affected bymeasurement error than changes over time. Second, one can also estimate a conditionalfertility stall for countries for which only one survey is available.
3. Results
Fertility in sub-Saharan Africa is still at a much higher level than in most other low- andmiddle-income countries outside Africa and has also been falling at a slower pace thanin other regions of the world, especially between 1998 and 2004 (see Table 2 and Figure1).18 Various studies (especially those published shortly before 2010) have thereforesuggested that sub-Saharan African countries have experienced fertility stalls since thebeginning of the 21st century. Yet, in recent years, the absolute annual fertility decline inmany, but not all, sub-Saharan African countries has caught up with non-Africancountries again and even outpaced the non-African countries on average (Figure 1).
18 Table 2 and Figure 1 are based on an unbalanced country panel since the DHS is not evenly distributed acrosstime periods. This means that the trends shown in Table 2 and Figure 1 might be influenced by the sample ofcountries entering each time period. As a robustness check, we re-estimate Table 2 and Figure 1 based on abalanced panel (11 countries from sub-Saharan Africa, 8 from non-sub-Saharan Africa). Although there aresome changes in the levels, the trends of Table 2 and Figure 1 based on the unbalanced panel do not change ifwe use a balanced panel. Results are available from the authors upon request.

Grimm et al.: Slowdowns of fertility decline
750 https://www.demographic-research.org
Table 2: Total fertility rates by country, region, and period
Total Sub-Sahara Africa North Africa and non-Africa
Period N Mean Sd N Mean Sd N Mean Sd
ca. 1987 23 6.4 (1.3) 8 7.0 (0.4) 15 6.1 (1.5)
ca. 1992 54 5.1 (1.4) 25 6.1 (0.8) 27 4.1 (1.1)
ca. 1998 41 4.6 (1.4) 21 5.6 (0.8) 19 3.4 (0.9)
ca. 2004 58 4.5 (1.5) 31 5.5 (1.0) 27 3.3 (1.0)
ca. 2010 61 4.5 (1.4) 41 5.3 (0.9) 20 2.9 (0.7)
ca. 2016 84 4.3 (1.2) 59 4.9 (0.8) 25 2.9 (0.7)
Notes: N = Number of surveys. Total number of surveys: 321. Total number of countries: 56 (sub-Saharan Africa: 34, non-Africa: 22).Only countries are used for which at least three surveys are available. For a list of countries and surveys, see Table S1 (OnlineAppendix).Source: DHS/MICS/WFS data; calculations by the authors.
Figure 1: Unweighted average pace of TFR decline
Notes: The mean annualised decline in TFR is calculated as simple unweighted averages of annualised changes in TFR per period.Number of countries: 34 (Africa), 22 (non-Africa). The horizontal dotted line = average annual decline for least developed countries1990−2016. Only countries are used for which at least three surveys are available. Pre- and post-transition countries are excluded.For the respective growth rates for each period, see Table 1. For a list of countries, see Table S1 (Online Appendix).Source: DHS/MICS/WFS data; calculations by the authors.

Demographic Research: Volume 46, Article 26
https://www.demographic-research.org 751
3.1 Long-lasting versus temporary fertility stalls
Using three alternative variants regarding the interruption of a fertility decline (seeSection 2.2), we find a similar set of countries being classified as experiencing a fertilitystall (see Table S3, Online Appendix). Depending on the definition used, 13 to 27countries experienced a recent unconditional fertility stall, most of them are located insub-Saharan Africa.19 Over the past two survey rounds, 12 countries in transition evenshowed an increase of fertility.20 A total of 10 countries – Benin, Dominican Republic,Egypt, Guinea, Mauritania, Mozambique, Namibia, Nepal, Nigeria, and Rwanda –experienced a fertility stall for the two or three most recent surveys according to all threedefinitions.
However, our calculations also indicate that all definitions proposed in the literatureare sensitive to the period under consideration. For example, many countries that havebeen classified as being in an unconditional fertility stall at the beginning of the 21st
century by Schoumaker (2009) or Bongaarts (2008) (see Table S4, Online Appendix)have shown fertility declines in more recent years (see Table 1) and hence are no longerexperiencing a stall. For example, Kenya experienced an increase in the TFR between1998 and 2003 from 4.7 to 4.9, but more recently it experienced a decline from 4.6 in2009 to 3.7 in 2015. The TFR in Cameroon increased between 1998 and 2011 from 4.8to 5.1 but decreased slightly to 4.9 again in 2014. On the other hand, some countries thatwere in transition at the beginning of the 21st century are now in an unconditional fertilitystall. For example, this is the case for Benin. Hence, countries move in and out ofunconditional fertility stalls; long-lasting unconditional fertility stalls of ten years or moreare rare. A country’s status of facing a demographic transition or an unconditional fertilitystall seems to change rapidly.
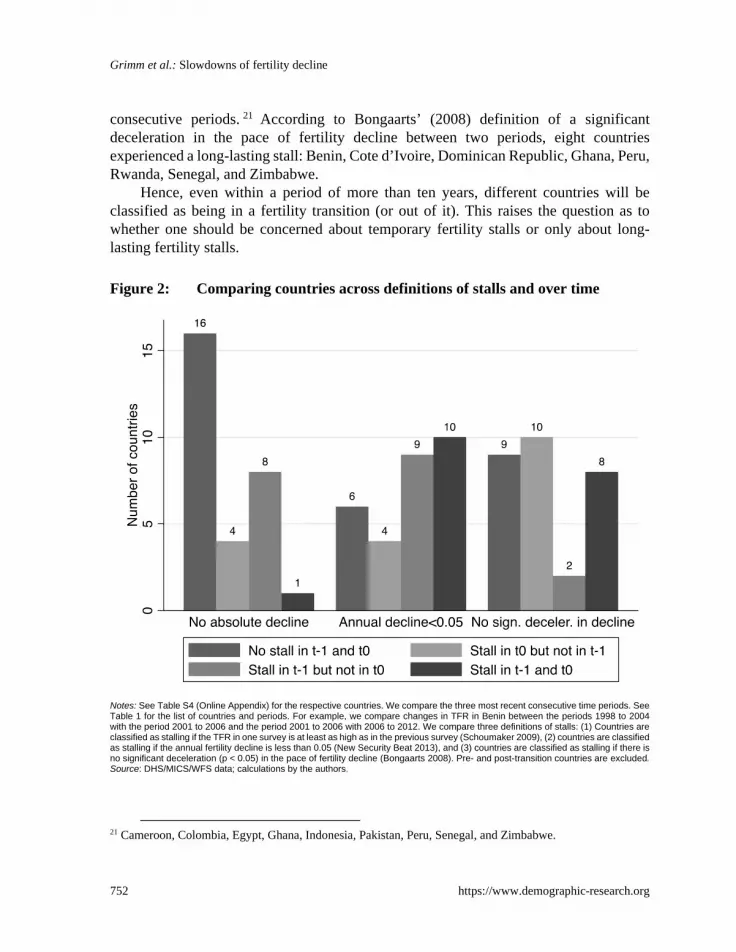
Figure 2 shows the number of countries that experienced a long-lasting fertility stallfor the different definitions we discussed above. Using the definition based on ‘no declinebetween two surveys (or periods),’ we find that only 1 out of the 56 countries in oursample experienced a fertility stall over two consecutive periods: Zimbabwe (see alsoTable S5, Online Appendix). The number of countries with a long-lasting fertility stallobviously increases when less strict definitions of an unconditional fertility stall are used,that is, if a fertility stall is considered to be in place when the pace of fertility decline islower than 0.05 and not lower than or equal to 0. According to the definition of an annualfertility decline of less than 0.05, nine countries in transition experienced a stall in two
19 Note that also Namibia experienced a long-lasting unconditional fertility stall when looking at the TFR inTable 1 between 2004 and 2016 (see also Table S3, Online Appendix). However, since we look at changes inthe TFR between only two or three consecutive periods, Namibia is not considered in this list because no surveyis available for the period 2010.20 Cameroon, Colombia, Egypt, Ghana, Guyana, Indonesia, Kyrgyz Republic, Lesotho, Pakistan, Peru, Senegal,and Zimbabwe.
Grimm et al.: Slowdowns of fertility decline
752 https://www.demographic-research.org
consecutive periods. 21 According to Bongaarts’ (2008) definition of a significantdeceleration in the pace of fertility decline between two periods, eight countriesexperienced a long-lasting stall: Benin, Cote d’Ivoire, Dominican Republic, Ghana, Peru,Rwanda, Senegal, and Zimbabwe.
Hence, even within a period of more than ten years, different countries will beclassified as being in a fertility transition (or out of it). This raises the question as towhether one should be concerned about temporary fertility stalls or only about long-lasting fertility stalls.
Figure 2: Comparing countries across definitions of stalls and over time
Notes: See Table S4 (Online Appendix) for the respective countries. We compare the three most recent consecutive time periods. SeeTable 1 for the list of countries and periods. For example, we compare changes in TFR in Benin between the periods 1998 to 2004with the period 2001 to 2006 and the period 2001 to 2006 with 2006 to 2012. We compare three definitions of stalls: (1) Countries areclassified as stalling if the TFR in one survey is at least as high as in the previous survey (Schoumaker 2009), (2) countries are classifiedas stalling if the annual fertility decline is less than 0.05 (New Security Beat 2013), and (3) countries are classified as stalling if there isno significant deceleration (p < 0.05) in the pace of fertility decline (Bongaarts 2008). Pre- and post-transition countries are excluded.Source: DHS/MICS/WFS data; calculations by the authors.
21 Cameroon, Colombia, Egypt, Ghana, Indonesia, Pakistan, Peru, Senegal, and Zimbabwe.

Demographic Research: Volume 46, Article 26
https://www.demographic-research.org 753
3.2 Unconditional versus conditional fertility stalls
As we argued above, we think it is important to distinguish between unconditional andconditional fertility stalls. Previous measures are all based on unconditional fertilitystalls; that is, they measure whether fertility has come to a standstill after a period offertility decline independent of whether the socioeconomic context was favourable for afurther decline in fertility. We think that from a policy point of view it is important tounderstand whether we would expect lower levels of fertility conditional on observedlevels of income, female education, and child mortality.
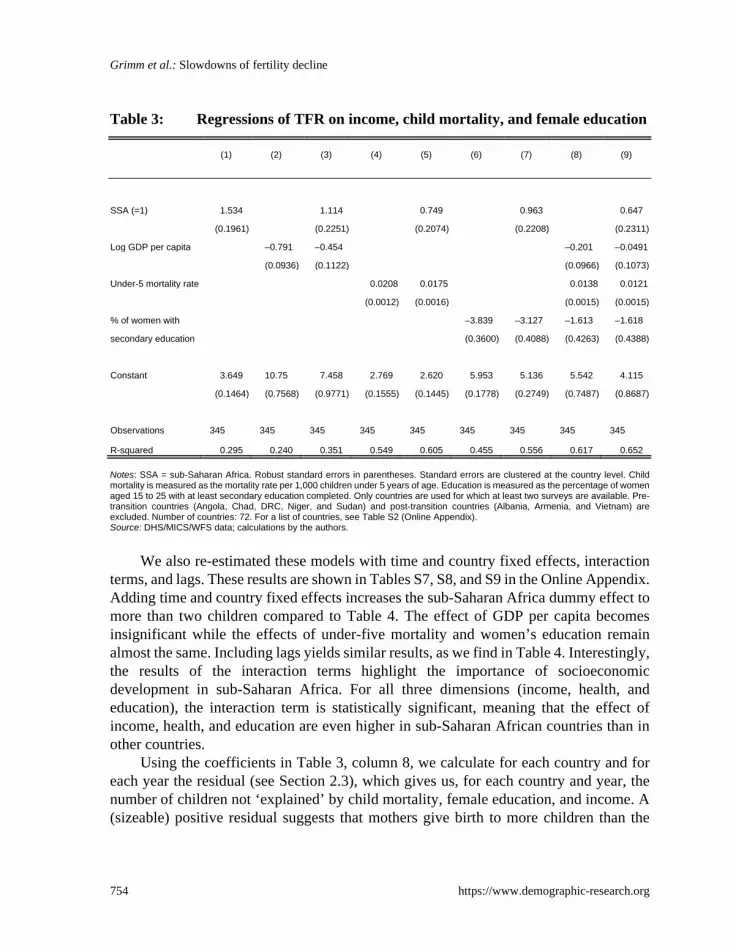
Table 3 shows the results of regressions of the TFR on under-five mortality, femaleeducation, and income (at the national level).22 The dummy for sub-Saharan Africa incolumn 1 suggests that countries in sub-Saharan Africa have on average 1.5 morechildren than countries in other regions of the world. By introducing income (columns 2and 3), child mortality (columns 4 and 5), and women’s education (columns 6 and 7), wenote that the under-five mortality rate leads to the largest reduction of the coefficientassociated with the sub-Saharan African dummy. Hence, child mortality explains a largepart of the difference in fertility between sub-Saharan African countries and other low-and middle-income countries. We also see that these three variables can explain a largeshare in the differences in the TFR observed across all countries and time. The R2 incolumn (8), which shows if all three variables are introduced at the same time, impliesthat these variables explain more than 60% of the total variance in the TFR. As some ofthe countries in our sample may recently have changed their education system, we alsochecked whether the results are robust if we focus on only younger women aged between15 and 25 (results are shown in Table S6, Online Appendix). The results do not change.
22 Pre-transition countries (Angola, Chad, DRC, Niger, and Sudan) and post-transition countries (Albania,Armenia, and Vietnam) are excluded.
Grimm et al.: Slowdowns of fertility decline
754 https://www.demographic-research.org
Table 3: Regressions of TFR on income, child mortality, and female education
(1) (2) (3) (4) (5) (6) (7) (8) (9)
SSA (=1) 1.534 1.114 0.749 0.963 0.647
(0.1961) (0.2251) (0.2074) (0.2208) (0.2311)
Log GDP per capita –0.791 –0.454 –0.201 –0.0491
(0.0936) (0.1122) (0.0966) (0.1073)
Under-5 mortality rate 0.0208 0.0175 0.0138 0.0121
(0.0012) (0.0016) (0.0015) (0.0015)
% of women with –3.839 –3.127 –1.613 –1.618
secondary education (0.3600) (0.4088) (0.4263) (0.4388)
Constant 3.649 10.75 7.458 2.769 2.620 5.953 5.136 5.542 4.115
(0.1464) (0.7568) (0.9771) (0.1555) (0.1445) (0.1778) (0.2749) (0.7487) (0.8687)
Observations 345 345 345 345 345 345 345 345 345
R-squared 0.295 0.240 0.351 0.549 0.605 0.455 0.556 0.617 0.652
Notes: SSA = sub-Saharan Africa. Robust standard errors in parentheses. Standard errors are clustered at the country level. Childmortality is measured as the mortality rate per 1,000 children under 5 years of age. Education is measured as the percentage of womenaged 15 to 25 with at least secondary education completed. Only countries are used for which at least two surveys are available. Pre-transition countries (Angola, Chad, DRC, Niger, and Sudan) and post-transition countries (Albania, Armenia, and Vietnam) areexcluded. Number of countries: 72. For a list of countries, see Table S2 (Online Appendix).Source: DHS/MICS/WFS data; calculations by the authors.
We also re-estimated these models with time and country fixed effects, interactionterms, and lags. These results are shown in Tables S7, S8, and S9 in the Online Appendix.Adding time and country fixed effects increases the sub-Saharan Africa dummy effect tomore than two children compared to Table 4. The effect of GDP per capita becomesinsignificant while the effects of under-five mortality and women’s education remainalmost the same. Including lags yields similar results, as we find in Table 4. Interestingly,the results of the interaction terms highlight the importance of socioeconomicdevelopment in sub-Saharan Africa. For all three dimensions (income, health, andeducation), the interaction term is statistically significant, meaning that the effect ofincome, health, and education are even higher in sub-Saharan African countries than inother countries.
Using the coefficients in Table 3, column 8, we calculate for each country and foreach year the residual (see Section 2.3), which gives us, for each country and year, thenumber of children not ‘explained’ by child mortality, female education, and income. A(sizeable) positive residual suggests that mothers give birth to more children than the

Demographic Research: Volume 46, Article 26
https://www.demographic-research.org 755
socioeconomic circumstances would predict; a (sizeable) negative residual suggests theopposite.
The residuals are shown in Table 4 for each country for the latest DHS/MICS survey(see Table S10 in the Online Appendix for the residuals for all countries and surveyyears). Residuals for each country and each year are shown in Figure 3 for Uganda only,as a matter of illustration, and in Figure S1 in the Online Appendix for all countries.
Figure S2 in the Online Appendix shows the distribution of the residuals. Asexpected they follow a bell shape centred around 0. We also used our final specificationto run a Bayesian regression model to obtain the posterior probability of experiencing astall. Figure S3 in the Online Appendix shows the probability distribution of the residualsbased on a Bayesian regression model using the model as in Table 3, column 8. Usingthe cut-off of 1 standard deviation of a residual, the probability of experiencing a stall is16%.
Figure 3: Fertility residuals by survey year: regression of fertility on GDP percapita, under-five mortality, and share of secondary education(Uganda)
Note: The residuals are based on the regression results shown in Table 4.Source: DHS/MICS/WFS data; calculations by the authors.

Grimm et al.: Slowdowns of fertility decline
756 https://www.demographic-research.org
Table 4: Fertility residuals by country: regression of fertility on GDP percapita, under-five mortality, and share of secondary education (latestsurvey)
CountrySurveyyear
Residualsfrom Table 3
Residuals as %of predicted TFR
Surveyyear
Residualsfrom Table 3
Residuals as %of predicted TFR
Sub-Sahara Africa Non-sub-Sahara Africa
Nigeria 2017 1.19 25.6 Kyrgyz R. 2018 0.99 33.4Zambia 2014 1.16 28.4 Mongolia 2018 0.81 30.5
Mali 2018 1.07 20.6 Tajikistan 2017 0.65 20.7Uganda 2016 0.98 22.3 Egypt 2014 0.51 17.3Congo (Rep.) 2015 0.97 28.1 Yemen 2013 0.49 12.3Gabon 2012 0.92 28.8 Ecuador 1987 0.33 8.6Mauritania 2015 0.83 19.4 Mexico 1987 0.30 8.1
Sao Tome & P. 2016 0.65 17.3 Iraq 2018 0.25 7.3Benin 2018 0.63 12.5 Jordan 2018 0.05 2.1Timor-Leste 2016 0.62 17.2 Bolivia 2008 –0.06 1.6Burundi 2016 0.58 11.7 Guyana 2014 –0.13 4.9Mozambique 2018 0.57 11.8 Trinidad & T. 1987 –0.15 4.7Namibia 2013 0.51 16.3 Peru 2012 –0.16 5.9Cameroon 2014 0.47 10.6 Philippines 2017 –0.29 9.7Ghana 2016 0.43 11.4 Paraguay 2016 –0.38 13.0Senegal 2017 0.41 9.8 Nicaragua 2001 –0.40 11.1Zimbabwe 2015 0.34 9.3 Dominican R. 2014 –0.41 14.1Tanzania 2017 0.33 7.4 Honduras 2012 –0.47 13.8Burkina F. 2018 0.26 5.3 Maldives 2017 –0.53 19.9Gambia 2018 0.03 0.6 Guatemala 2015 –0.56 15.1Comoros 2012 –0.09 2.0 Colombia 2010 –0.56 20.7Kenya 2015 –0.09 2.4 Sri Lanka 1987 –0.62 18.9Rwanda 2017 –0.11 2.7 Indonesia 2017 –0.66 21.3Swaziland 2014 –0.17 4.9 El Salvador 2014 –0.66 22.5South Africa 2016 –0.17 6.2 Kazakhstan 1999 –0.69 25.1Cote d’Ivoire 2016 –0.22 4.6 Brazil 1996 –0.75 22.9Togo 2017 –0.26 5.7 Tunisia 2018 –0.88 29.9Ethiopia 2016 –0.28 5.8 Pakistan 2018 –0.96 21.3Guinea 2018 –0.41 7.9 Moldova 2012 –1.02 32.3Madagascar 2016 –0.43 9.5 Cambodia 2014 –1.03 27.4Liberia 2016 –0.44 9.5 Haiti 2016 –1.26 29.5Malawi 2017 –0.46 9.8 Laos 2017 –1.28 31.7Lesotho 2014 –1.01 23.6 Turkey 2003 –1.37 38.1Sierra Leone 2017 –1.08 20.9 Morocco 2004 –1.41 36.3
Bangladesh 2014 –1.42 38.4India 2015 –1.49 40.5Nepal 2016 –1.54 39.6
Notes: The residuals are based on the regression results shown in Table 3 (column 8). Pre-transition countries (Angola, Chad, DRC.,Niger, and Sudan) and post-transition countries (Albania, Armenia, and Vietnam) are excluded. Number of countries: 72. For a list ofcountries, see Table S2 (Online Appendix). The dashed line refers to the cut-off of 1 standard deviation of the residuals (0.83). SeeTable S10 (Online Appendix) for the residuals for all countries and survey years.Source: DHS/MICS/WFS data; calculations by the authors.

Demographic Research: Volume 46, Article 26
https://www.demographic-research.org 757
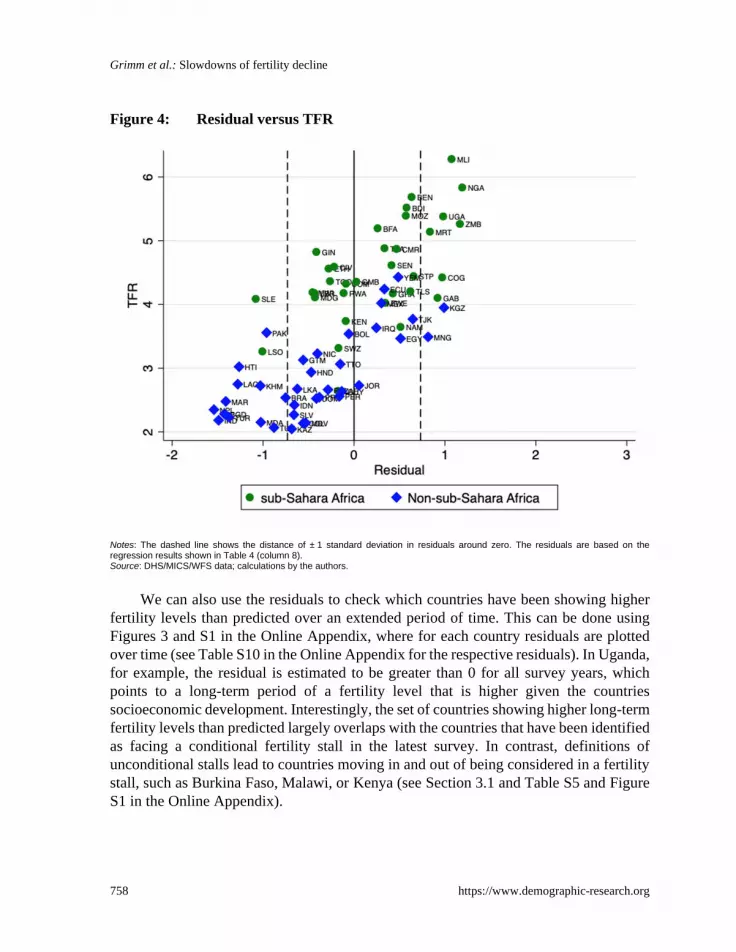
Defining a fertility stall as cases where the residual is larger than 1 standarddeviation (0.83) of the residuals identifies the following 9 countries as being in a fertilitystall for the most recent available DHS/MICS survey: Zambia, Nigeria, Mali, Uganda,Congo (Rep.), Gabon, Mauritania, Kyrgyz Republic, and Mongolia (Table 4).23 This isgraphically also shown in Figure 4, which plots residuals versus the TFR for countries insub-Sahara Africa and other countries.
For comparison, the 16 countries that are classified to be in a stall applying thedefinition of Bongaarts (2008) (no significant increase in the pace of fertility decline) forthe last available DHS/MICS surveys are Benin, Cote d’Ivoire, Egypt, Guinea,Mauritania, Mozambique, Namibia, Nigeria, Rwanda, Swaziland, Nepal, Pakistan,Colombia, Dominican Republic, Haiti, and Peru (Table S3, Online Appendix). There isan overlap of only two countries (Mauritania and Nigeria). This is due to the fact that formany countries (with stagnating fertility), lower fertility levels are not expected giventheir level of socioeconomic development. For example, fertility in Rwanda evolved asexpected given the country’s progress in terms of income, female education, and childmortality; that is, Rwanda constitutes an unconditional fertility stall but not a conditionalstall. Moreover, our concept also pinpoints those cases that have not been classified asbeing in a stall by previous studies because fertility did decline, but our approach revealsthat in fact fertility was still higher than what would be expected from the observed levelsof income, female education, and child mortality. For instance, this is the case for Zambiaand Uganda.
23 See Table S10 in the Online Appendix for the residuals for all countries and survey years.
Grimm et al.: Slowdowns of fertility decline
758 https://www.demographic-research.org
Figure 4: Residual versus TFR
Notes: The dashed line shows the distance of ± 1 standard deviation in residuals around zero. The residuals are based on theregression results shown in Table 4 (column 8).Source: DHS/MICS/WFS data; calculations by the authors.
We can also use the residuals to check which countries have been showing higherfertility levels than predicted over an extended period of time. This can be done usingFigures 3 and S1 in the Online Appendix, where for each country residuals are plottedover time (see Table S10 in the Online Appendix for the respective residuals). In Uganda,for example, the residual is estimated to be greater than 0 for all survey years, whichpoints to a long-term period of a fertility level that is higher given the countriessocioeconomic development. Interestingly, the set of countries showing higher long-termfertility levels than predicted largely overlaps with the countries that have been identifiedas facing a conditional fertility stall in the latest survey. In contrast, definitions ofunconditional stalls lead to countries moving in and out of being considered in a fertilitystall, such as Burkina Faso, Malawi, or Kenya (see Section 3.1 and Table S5 and FigureS1 in the Online Appendix).

Demographic Research: Volume 46, Article 26
https://www.demographic-research.org 759
The demographic implications for countries with conditional stalls can be large.Even if fertility does not stop falling, the higher than predicted fertility will generate asubstantial demographic momentum. For example, in a country such as Uganda, whereactual fertility has been above predicted fertility by about one child per woman for thepast 25 years (see Figure 3), this translates into almost 20 million more people by 2050.24
Obviously, the method we propose is not without limitations and hinges a lot on thedata quality at hand. First, the computed residuals include measurement errors in fertility,and in the explanatory variables we might therefore over- or underestimate fertility stallsfor certain countries. To limit this problem, we consider fertility stalls only where theresidual is large. Users can alter this threshold and check the sensitivity of their resultswith respect to alternative assumptions. Second, our predicted fertility depends on theaverage correlation between education, income, and mortality across the world between1980 and 2016. This implies that with our approach we can expect always about half ofthe country-years to show a positive residual and half a negative residual. This alsosuggests that one should not focus on small deviations but residuals above a certainsizeable threshold.
4. Conclusion
In this paper, we have shown that there are only a few countries which face lastingunconditional fertility stalls. For example, Zimbabwe has shown no significant fertilitydecline over the last 15 years. Moreover, we have shown that little overlap exists betweencountries that show unconditional and what we call conditional fertility stalls (i.e., lowfertility despite high levels of socioeconomic development). We believe the distinctionbetween unconditional and conditional stalls is important to understand fertility dynamicsand design effective policy responses.
For countries that show conditional fertility stalls, the socioeconomic developmentfavouring reductions in fertility seem to be in place, but other forces (e.g., limited accessto family planning services or high fertility norms) keep fertility at a high level and mustbe addressed by policy. We identified the following countries with an ongoingconditional fertility stall: Zambia, Nigeria, Mali, Uganda, Congo (Rep.), Gabon,Mauritania, Kyrgyz Republic, and Mongolia. In these countries, fertility is too high giventheir level of GDP per capita, female education, and child mortality.
On the other hand, in other countries a continuation of the fertility transition seemsto require policies that accelerate socioeconomic structural change, including growth of
24 This is estimated by comparing the high with the low variant of the UN population projections where thedifference in the TFR is about 1. The high variant projects 98 million people, the low variant 81 million peoplein Uganda by 2050. The estimate for 2019 is 44 million (United Nations 2019).

Grimm et al.: Slowdowns of fertility decline
760 https://www.demographic-research.org
GDP per capita, increased female education, and reduced child mortality. This is the casein Tanzania or Zimbabwe. In these countries, fertility is at the level that the prevailingeconomic conditions would predict.

Demographic Research: Volume 46, Article 26
https://www.demographic-research.org 761
References
Agyei‐Mensah, S. (2005). The fertility transition in Ghana revisited. Paper presented atthe XXV IUSSP International Population Conference, Tours, France, July 18–23,2005.
Agyei‐Mensah, S. (2007). New times, new families: The stall in Ghanaian fertility. Paperpresented at the African Population Conference, Arusha, Tanzania, December 10–14, 2007.
Askew, I., Maggwa, N., and Francis, O. (2017). Fertility transitions in Ghana and Kenya:Trends, determinants, and implications for policy and programs. Population andDevelopment Review 43(S1): 289–307. doi:10.1111/padr.12010.
Becker, G.S. (1981). A treatise on the family. Cambridge: Harvard University Press.
Bhalotra, S. and Van Soest, A. (2008). Birth-spacing, fertility and neonatal mortality inIndia: Dynamics, frailty, and fecundity. Journal of Econometrics 143(2): 274–290. doi:10.1016/j.jeconom.2007.10.005.
Bloom, D.E. and Williamson, J.G. (1998). Demographic transitions and economicmiracles in emerging Asia. World Bank Economic Review 12(3): 419–455.doi:10.1093/wber/12.3.419.
Bongaarts, J. (2006). The causes of stalling fertility transitions. Studies in FamilyPlanning 37(16): 1–16. doi:10.1111/j.1728-4465.2006.00079.x.
Bongaarts, J. (2008). Fertility transitions in developing countries: Progress or stagnation?Studies in Family Planning 39(2): 105–110. doi:10.1111/j.1728-4465.2008.00157.x.
Bongaarts, J. (2017). Africa’s unique fertility transition. Population and DevelopmentReview 43(S1): 39–58. doi:10.1111/j.1728-4457.2016.00164.x.
Bongaarts, J. and Casterline, J. (2013). Fertility transition: Is sub-Saharan Africadifferent? Population and Development Review 38(S1): 153–168. doi:10.1111/j.1728-4457.2013.00557.x.
Bongaarts, J. and Feeney, G. (1998). On the quantum and tempo of fertility. Populationand Development Review 24(2): 271–291. doi:10.31899/pgy6.1010.
Breierova, L. and Duflo, E. (2004). The impact of education on fertility and childmortality: Do fathers really matter less than mothers? (NBER Working Paper10513). Cambridge: National Bureau of Economic Research. doi:10.3386/w10513.

Grimm et al.: Slowdowns of fertility decline
762 https://www.demographic-research.org
Canning, D., Günther, I., Linnemayr, S., and Bloom, D. (2013). Fertility choice, mortalityexpectations, and interdependent preferences: An empirical analysis. EuropeanEconomic Review 63: 273–289. doi:10.1016/j.euroecorev.2013.07.005.
Canning, D., Raja, S., and Yazbeck, A.S. (2015). Africa’s demographic transition:Dividend or disaster? Washington, D.C.: World Bank. doi:10.1596/978-1-4648-0489-2.
Chesnais, J.-C. (1993). The demographic transition: Stages, patterns, and economicimplications: A longitudinal study of sixty-seven countries covering the period1720–1984. Oxford: Oxford University Press.
Chicoine, L. (2012). Education and fertility: Evidence from a policy change in Kenya.Bonn: Institute of Labor Economics (IZA Discussion Papers 6778). doi:10.2139/ssrn.2157920.
Coale, A.J. (1973). The demographic transition reconsidered. In: International Union forthe Scientific Study of Population (ed.). International Population Conference,Liege 1973 (Vol. 1). Liege: Ordina Editions: 53–73.
Cohen, J. (1988). Statistical power analysis for the behavioral sciences. New York:Routledge.
Dang, H.H. and Rogers, F.H. (2016). The decision to invest in child quality over quantity:Household size and household investment in education in Vietnam. World BankEconomic Review 30(1): 104–142. doi:10.1596/27694.
Doepke, M. and Tertilt, M. (2018). Women’s empowerment, the gender gap in desiredfertility, and fertility outcomes in developing countries. American EconomicReview Papers and Proceedings 108: 358–62.
Ezeh, A.C., Mberu, B.U., and Emina, J.O. (2009). Stall in fertility decline in EasternAfrican countries: Regional analysis of patterns, determinants and implications.Philosophical Transactions of the Royal Society of London B: Biological Sciences364(1532): 2991–3007. doi:10.1098/rstb.2009.0166.
Galor, O. (2011). Unified growth theory. Princeton: Princeton University Press.doi:10.1515/9781400838868.
Galor, O. and Weil, D.N. (1996). The gender gap, fertility, and growth. AmericanEconomic Review 86(3): 374–387.
Galor, O. and Weil, D.N. (2000). Population, technology, and growth: From Malthusianstagnation to the demographic transition and beyond. American Economic Review90(4): 806–828. doi:10.1257/aer.90.4.806.

Demographic Research: Volume 46, Article 26
https://www.demographic-research.org 763
Garenne, M. (2008). Situations of fertility stall in sub-Saharan Africa. African PopulationStudies 23(2). doi:10.11564/23-2-319.
Garenne, M., McCaa, R., Odimegwu, C., Adedini, S., and Chemhaka, G. (2015). Readingfertility stalls in census data: The case of Kenya. Paper presented at the PopulationAssociation of America 2015 Annual Meeting, San Diego, USA, April 30–May2, 2015.
Gerland, P., Biddlecom, A., and Kantorová, V. (2017). Patterns of fertility decline andthe impact of alternative scenarios of future fertility change in sub‐Saharan Africa.Population and Development Review 43(S1): 21–38. doi:10.1111/padr.12011.
Goujon, A., Lutz, W., and KC, S. (2015). Education stalls and subsequent stalls in Africanfertility: A descriptive overview. Demographic Research 33(47): 1281–1296.doi:10.4054/DemRes.2015.33.47.
Guengant, J.-P. (2017). Africa’s population: history, current status and projections. In:Groth, H. and May, J.F. (eds.). Africa’s population: In search of a demographicdividend. Cham: Springer International Publishing: 11–31. doi:10.1007/978-3-319-46889-1_2.
Günther, I. and Harttgen, K. (2016). Desired fertility and number of children born acrosstime and space. Demography 53(1): 55–83. doi:10.1007/s13524-015-0451-9.
Heaton, T.B. (2011). Does religion influence fertility in developing countries. PopulationResearch and Policy Review 30(3): 449–465. doi:10.1007/s11113-010-9196-8.
Howse, K. (2015). What is fertility stalling and why does it matter? Population Horizons12(1): 13–23. doi:10.1515/pophzn-2015-0003.
International Labour Organization (2020). World employment and social outlook: Trends2020. Geneva: International Labour Office.
Kebede, E., Goujon, A., and Lutz, W. (2019). Stalls in Africa’s fertility decline partlyresult from disruptions in female education. Proceedings of the National Academyof Sciences 116(8): 2891–2896. doi:10.1073/pnas.1717288116.
Klasen, S. (1999). Does gender inequality reduce growth and development? Evidencefrom cross-country regressions. (Policy Research Report on Gender andDevelopment Working Paper 7). Washington, D.C.: World Bank.
Landry, A. (1982). La révolution démographique: Études et essais sur les problèmes dela population. Paris: INED-Presses Universitaires de France.

Grimm et al.: Slowdowns of fertility decline
764 https://www.demographic-research.org
Lavy, V. and Zablotsky, A. (2015). Women’s schooling and fertility under low femalelabor force participation: Evidence from mobility restrictions in Israel. Journal ofPublic Economics 124(C): 105–121. doi:10.1016/j.jpubeco.2015.02.009.
Lee, R.D. (1997). Population dynamics: Equilibrium, disequilibrium, and consequencesof fluctuations. In: Rosenzweig, M.R. and Stark, O. (eds.). Handbook ofpopulation and family economics (Vol. lB). Amsterdam: North-Holland: 1063–1115. doi:10.1016/S1574-003X(97)80011-6.
Lee, R.D. (2008). Demographic transition. In: Durlauf, S.N. and Blume, L.E. (eds.). TheNew Palgrave dictionary of economics: Second Edition (Vol. 2). Basingstoke:Palgrave Macmillan: 433–438.
Liu, H. (2014). The quality–quantity trade-off: evidence from the relaxation of China’sone-child policy. Journal of Population Economics 27(2): 565–602. doi:10.1007/s00148-013-0478-4.
Machiyama, K. (2010). A Re-examination of recent fertility declines in sub-SaharanAfrica. (DHS Working Paper 68). Calverton: ICF Macro.
McQueston, K., Silverman, R., and Glassman, A. (2012). Adolescent fertility in low- andmiddle-income countries: Effects and solutions. (CGD Working Paper 295).Washington, D.C.: Center for Global Development.
Moultrie, A.T., Hosegood, V., McGrath, N., Hill, C., Herbst, K., and Newell, M.L.(2008). Refining the criteria for stalled fertility declines: an application to ruralKwaZulu-Natal, South Africa, 1990–2005. Studies in Family Planning 39(1): 39–48. doi:10.1111/j.1728-4465.2008.00149.x.
Myrskylä, M., Kohler, H.-P., and Billari, F.C. (2009). Advances in development reversefertility declines. Nature 460(7256): 741–743. doi:10.1038/nature08230.
New Security Beat (2013). Why has the demographic transition stalled in sub-SaharanAfrica? [electronic resource]. Washington, D.C.: Environmental Change andSecurity Program, Woodrow Wilson International Center for Scholars.https://www.newsecuritybeat.org/2013/08/demographic-transition-stalled-sub-saharan-africa/.
Nobles, J., Frankenberg, E., and Thomas, D. (2014). The effects of mortality on fertility:Population dynamics after a natural disaster. (NBER Working Paper 20448).Cambridge: National Bureau of Economic Research. doi:10.3386/w20448.
Notestein, F.W. (1945). Population – The long view. In: Schultz, T.W. (ed.). Food forthe World. Chicago: University of Chicago Press: 36–57.

Demographic Research: Volume 46, Article 26
https://www.demographic-research.org 765
Pradhan, E. and Canning, D. (2016). The effect of schooling on teenage fertility:Evidence from the 1994 Education Reform in Ethiopia. (PGDA Working Papers12816). Cambridge: Program on the Global Demography of Aging.
Pullum, T. and Staveteig, S. (2017). An assessment of the quality and consistency of ageand date reporting in DHS surveys, 2000–2015. (DHS Methodological Reports19). Rockville: ICF.
Pullum, T., Assaf, S., and Staveteig, S. (2017). Comparisons of DHS estimates of fertilityand mortality with other estimates. (DHS Methodological Reports 21). Rockville:ICF.
Schoumaker, B. (2009). Stalls in fertility transitions in sub-Saharan Africa: Real orspurious? Louvain-la-Neuve: Département des Sciences de la Population et duDéveloppement, Université catholique de Louvain (Document de Travail 30).
Schoumaker, B. (2012). Tfr2: A Stata module for computing fertility rates and TFRs frombirth histories. Paper presented at the Population Association of America 2012Annual Meeting, San Francisco, USA, May 3–5, 2012.
Schoumaker, B. (2014). Quality and consistency of DHS fertility estimates, 1990 to 2012.(DHS Methodological Reports 12). Rockville: ICF International.
Schoumaker, B. (2019). Stalls in fertility transitions in sub‐Saharan Africa: Revisitingthe evidence. Studies in Family Planning 50(3): 257–278. doi:10.1111/sifp.12098.
Schultz, T.P. (1997). Demand for children in low income countries. In: Rosenzweig,M.R. and Stark, O. (eds.). Handbook of population and family economics (Vol.1A). Amsterdam: North-Holland: 349–430. doi:10.1016/S1574-003X(97)80025-6.
Shapiro, D. and Gebreselassi, T. (2008). Fertility transition in sub-Saharan Africa: Fallingand stalling. African Population Studies 23(1): 3–23. doi:10.11564/23-1-310.
Shapiro, D. and Hinde, A. (2017). On the pace of fertility decline in Sub-Saharan Africa.Demographic Research 37(40): 1327–1338. doi:10.4054/DemRes.2017.37.40.
Singh, S., Bankole, A., and Darroch, J.E. (2017). The impact of contraceptive use andabortion on fertility in sub-Saharan Africa: Estimates for 2003–2014. Populationand Development Review 43(S1): 141–165. doi:10.1111/padr.12027.
United Nations (2019). World population prospects: The 2019 revision. New York:United Nations.

Grimm et al.: Slowdowns of fertility decline
766 https://www.demographic-research.org
Wolpin, K.L. (1998). The impact of infant and child mortality risk on fertility. In:Montgomery, M.R. and Cohen, B. (eds.). From death to birth: Mortality declineand reproductive change. Washington D.C.: National Academy Press: 74–111.
World Health Organization (1995). Physical status: The use and interpretation ofanthropometry. Geneva: World Health Organization (WHO Technical Report854).