extraction of social context and application to personal multimedia exploration
TRANSCRIPT
Extraction of Social Context and Application to PersonalMultimedia Exploration
Brett Adams, Dinh Phung, Svetha VenkateshDepartment of Computing
Curtin University of TechnologyGPO Box U1987, Perth, 6845, W. Australia
{adamsb,phungquo,svetha}@cs.curtin.edu.au
ABSTRACTPersonal media collections are often viewed and managedalong the social dimension, the places we spend time at andthe people we see, thus tools for extracting and using thisinformation are required. We present novel algorithms foridentifying socially significant places termed social spheresunobtrusively from GPS traces of daily life, and label themas one of Home, Work, or Other, with quantitative evalua-tion of 9 months taken from 5 users. We extract locationalco-presence of these users and formulate a novel measure ofsocial tie strength based on frequency of interaction, andthe nature of spheres it occurs within. Comparative userstudies of a multimedia browser designed to demonstratethe utility of social metadata indicate the usefulness of asimple interface allowing navigation and filtering in theseterms. We note the application of social context is po-tentially much broader than personal media management,including context-aware device behaviour, life logs, socialnetworks, and location-aware information services.
Categories and Subject DescriptorsH.3.1 [Information Storage and Retrieval]: ContentAnalysis and Indexing; H.5.1 [Information Interfaces andPresentation]: Multimedia Information Systems
General TermsAlgorithms, Human Factors, Experimentation
KeywordsMultimedia browsing, social context
1. INTRODUCTIONPersonal captured media, such as photos and videos, have
become increasingly easy to capture, but hard to use, au-thor, and share. We can ‘save’ our memories, but they aredifficult to reminisce over and communicate. Our capacity
Permission to make digital or hard copies of all or part of this work forpersonal or classroom use is granted without fee provided that copies arenot made or distributed for profit or commercial advantage and that copiesbear this notice and the full citation on the first page. To copy otherwise, torepublish, to post on servers or to redistribute to lists, requires prior specificpermission and/or a fee.MM’06, October 23–27, 2006, Santa Barbara, California, USA.Copyright 2006 ACM 1-59593-447-2/06/0010 ...$5.00.
to save continues to grow and with it a sense of urgency toour managing it effectively [33]. Recognition of this has seenthe entrenchment of research in ACM communities aimedat needful technologies, including content-derived semantics[24], automatic summarization/composition/transformation[14, 18, 19], rendering of time-based media [7], multi-modalrendering [6], interpretation of the capture act [26], and evena blurring of the distinction between authoring and browsing[4] (non-acm [30]). Taken together, they all address facetsof the problem of identifying and leveraging context, a prob-lem addressed by the CHI community from the perspectiveof decreasing ‘digital burden’, e.g. [16].
The search for context is driven by the recognition thatextrinsic properties are often just as significant, if not moreso, than intrinsic. For example, a poorly-lit photo of a childmight be excluded from a query return set based on visualquality metrics alone, but be included in a system cognizantof the relative rarity of the subject or their relational sig-nificance to the searcher. Personal media is thus arguablyoften socially situated, for an individual and for communi-ties of various makeup (e.g. family, friends). Queries aboutwhich media, to whom, and how, are all inherently parame-terized by the aspects of social context referred to above; Itis a social search problem.
This work seeks to formulate and extract social contextfrom location data obtained from GPS signals, and to alesser extent from persistent audio. We cast this problemin a clustering setting and unsupervisedly discover a user’straces, formally named stays and places, where a stay is de-fined as a time-stamped location where the user has spenta reasonable amount of time (e.g., bookshop-at-3pm) and aplace, or social sphere, is defined as a time-independent loca-tion where several stays have been experienced (e.g. severalstays at the bookshop make it a familiar place for the user).We concentrate on four aspects of social context: a) Ex-traction of significant locational context for a user, whereinwe formulate methods to extract places or social speheresand stays and label social spheres as Home, Work or Other;b) Recovery of shared social spheres across multiple users;c) Social ties, indicative of the strength of bond between apair of users; and d) Construction of a multimedia explorerintegrating and using social metadata for media filtering.
GPS data is particularly challenging to abstract becausedata is missing as devices can be turned on or off arbitrarilydue to battery failure or a user’s preferences, it is intrinsi-cally noisy and the signal is often lost, particularly indoors.Addressing these issues, we present a novel solution basedon DBSCAN, a density-based clustering approach, to en-

able us to deal with large and sparse datasets. We considera multiple-user approach based on multiple social spheresets extracted from each user alone enabling us to infer lo-cational co-presence based on shared social spheres. Next,we present a novel formulation for social tie strength, basedon frequency of time spent together and the nature of socialsphere(s) it occurs within. We choose persistent audio forour experiments to infer the frequency of co-presence be-cause it has a finer resolution than locational co-presenceinferred from GPS. We then compute social tie strength be-tween the user and their acquaintances.
Personal media can then be viewed as being created withinthis web of social context, and a novel multimedia explo-ration environment is presented to demonstrate the utilityof this social metadata. Specifically, it is a multi-user spatio-temporal browser with the ability to render images, video,and movies in a unified environment, and filter media itemson time, position, labelled significant location, shared loca-tion, presence of actor, and social tie strength.
We present experimental results on a set of 5 users whocollected GPS data and media in their daily lives duringa 9 month period and persistent audio was collected for 1user for 1 month. This data set is used to evaluate the al-gorithmic performance for extracting stays, social spheres,location co-presence and social ties across these users. Oursocial metadata aware browser is then presented to the usersfor media filtering and browsing. To provide further judge-ment on the proposed framework, we present positive feed-back from a user evaluation study.
In brief, the novelty of this work lies in a) A framework formultimedia exploration embedding and using social meta-data; b) Algorithms to extract and label fundamental cat-egories for stays, social spheres, and their shared positionsfrom fragmented and noisy GPS data; and c) Formulationof social ties and their strength.
The significance of this paper can be summarized as fol-lows.
• Media are modeled appropriate to the less information-centric domain of personal media consumption – e.g.,relevance can be calculated based apriori on social tieas well as learned from user interaction with mediaover time.
• Social attributes of people and places better align withuser recall,1 and support queries of the form “Show mephotos or video from the park near home.”
• The scope of application of social context is broaderthan multimedia management. Proactive device be-haviour, integration with existing online social networktechnologies,2 personal life logs [13], as well as fusionwith GIS and search technologies,3 would all benefitfrom such a core representation of social beings.
The rest of the paper is as follows. Related work is dis-cussed in section 2. Social context is formulated and pre-sented in section 3. The multimedia explorer is presented in
1[11] note a breakdown of contextual information used toannotate media–people, events, relationship type (fiancee),activities, etc.–which we note is heavily socially situated,and ‘often relating strongly to autobiographical experience.’2E.g. www.friendster.com3‘Mashups’ with information extracted from google are apopular example.
section 4, along with the user evaluation. Finally, section 5concludes our paper with perspectives on the future work.
2. RELATED WORKRecent popularity of GPS-based devices has boosted a
growing research interest in location-based applications. Cen-tral to these applications is the need to find significant lo-cation, usually assumed to be places where a user spends aconsiderable amount of time. Early work in this field usessimple heuristics for this task. Marmasse and Schmandt [27]infer time-stamped locations (called ‘stay’ in our paper) bysimply checking for regions within a perimeter in which theGPS signal disappears and reappears. This is further im-proved in the work of [3] by setting time thresholds for thedisappearing period. Clusters are built on top of stays usingthe k-means algorithm to find main locations. User patternsof movement are then learned using Markov models basedon signatures of discovered locations. GPS signals are tem-poral in nature and thus the popular k-means algorithm hasmany problems when applied to this domain, such as sen-sitivity to noise and the need to predetermine the numberof clusters. Kang et. al [21] attempt to overcome this prob-lem with time-based clustering, which is efficient and canhandle online addition of clusters over time. Their idea isto process data points along the timeline, compile durationfor each cluster, and use a threshold to eliminate false clus-ters. However, this approach does not solve the problemof signal loss inherent to GPS devices. In another attemptto improve performance over the k-means, Zhou et al [35]extend the concept of ‘density’ in the DBSCAN algorithm[25] to ‘density-joinable’. This is further improved in [36]to deal with the time issue. The idea is to use the extratime T parameter to refine the neighbouring set of pointsand define a ‘joinable’ criteria to merge two clusters. Theirwork aims to deal directly with sparse mobile devices GPSreadings and they report a positive result on location findingwith a R-TDJ algorithm. They introduce a time relaxationscheme to solve the problem of repetitive short visits forwhich each visit alone does not accumulate enough pointsto form a cluster in DBSCAN. In our work, we can effec-tively solve this problem by not processing data points ina timeline but considering the GPS data for the whole daytogether, clustering to find the places first and then usingtime information to expand a place into stays. This avoidsthe ad-hoc determination of time relaxation in the R-TDJalgorithm.
Work aimed at extracting social context is as diverse asthe definitions given to the term. One cluster aims to extractsome form of socially significant context from multi-sensorsmore or less unsupervisedly. [22] automatically determinea user’s interruptibility as a function of personal and socialsituation. They classify activity (sitting, walking, runningetc.) from accelerometer logs, and audio scene (e.g. restau-rant, conversation, street etc.). [10] present a vision for con-tinuous personal archives augmented by context obtainedfrom opportunistic data sources, such as GPS, email, pho-tos, calendars etc. They segment, cluster and classify audioscenes (e.g. meeting, lecture, street), and present an exam-ple visualization fusing that information with email logs andhand-entered calendar appointments. The information is ex-tracted chiefly with a view to its utility in aiding recall fora continuous life log. These approaches focus on classifyingthe user’s physical situation in isolation, and environment.

The notion of a social network is salient in another clus-ter of work aimed at supporting distributed collaboration.These approaches mine various information rich sources,such as email, disk activity, online calendars, etc. in or-der to classify and represent a worker’s network of contacts.E.g., [12] mine email logs automatically to extract socialnetworks, which are then open to traditional network anal-yses (e.g. clique formation, coherence, spanning, etc.). [5]extract various work-day rhythms in order to optimize com-munication. These approaches are relationship focussed.
Thus there is still a need for multi-scale characterizationof socially salient features that includes explicit modelling ofthe interaction of the social phenomena of places and people.[20] provide a conceptual framework for designing location-aware applications, and note “such systems must integrateinformation about places with data about users personalroutines and social relationships.” We take this as moti-vation for the development of a novel, social-context-awaremedia browser.
Two aspects of personal media management systems arerelevant to this work: dealing with volume of media assets–photos and videos chief among them–and sharing them ef-fectively.
Volume creates the interrelated problems of retrieving me-dia, representing it and interacting with it. In the absenceof manual annotation, automatic indexing techniques havebeen borrowed from the general field of semantic image andvideo classification [17]. Other indices recognized as sig-nificant for personal media are implicit to the import orstorage of the media itself, such as digital camera upload‘rolls’, folders, and timestamps [14], which are often embed-ded by capture devices by default. GPS-derived location isalso used to provide a spatial index [34]. [26] explicitly usethe assumed context of home video to index video based onthe user’s intention in capturing footage. Manual annota-tion of keywords or people is assumed or supported in manycases, particularly commercial, such as PhotoMesa or Pi-casa. However, manual annotation is often not performed,due to the sheer volume of items, and the user’s paucity oftime or willingness [30]. When such indices are present, thepowerful search and interaction mechanisms they enable canbe overwhelming for users whose ability to create media isnot matched with a similar level of ‘computer savvy’ [23].There is a significant subset of personal media browsing thatis better framed as entertainment-oriented rather than goal-directed and information-centric [33].
Cutting across these issues is that of sharing media withothers. Sharing based on keyword tags (www.flickr.com) ormanual referral (www.glidedigital.com) are common meth-ods. [2] target the context of a group of friends browsing ashared image collection. Images annotated with keywordsand users present are used to drive a number of interestingevent visualizations. They introduce the concepts of eventconditioning (on user presence), event support, event in-terest based on sematic distance of metadata, event cones,and viewpoint evolution. These concepts are used to visu-alize the spatio-temporal evolution of a single user’s events,event history culminating in two friends meeting at a sharedevent, as well as slideshows of event(s) from a particularuser’s viewpoint. The MMM system of [9] allows cell phoneclient software to upload images together with annotationsto a server. Shared metadata can then be spread to un-annotated photos via similarity in location and image fea-
tures. These approaches require either explicit action by themedia owner, or else willingness at some point to invest inannotating some or all of the items in their collection.
In summary, we leverage the location and audio sensingabilities of a device already carried to unobtrusively extractsocial context in terms meaningful to the user. This is thenused to provide browsing functionality peculiar to personalmedia with zero annotation effort required by the user.
3. EXTRACTION OF SOCIAL CONTEXTIn this section we define social spheres and ties, and for-
mulate and extract them. We describe our solution to thisproblem in this section, starting with a brief discussion ondata collection and pre-processing.
3.1 Data and Pre-processingWe experiment on a set of N = 5 users4, whose social
interactions can be categorized into three groups: Family ={James, Linda, MumJ}, Workmate = {James, Neil}, andFriend = {James, Josh}5. Each user carries a GPS device,the main user James is also equipped with an audio record-ing device. A total of approximately nine months worth ofGPS data was collected, in which James accounts for fivemonths, and the rest for one month each. Audio data iscollected for one month.
GPS device is clearly the choice for most existing location-based applications since it provides crucial spatial-temporalinformation about the users. However, signals collected ina real-world scenario, such as in this paper, are extremelynoisy and fragmented. There are three main reasons forthis: the device may be turned on and off arbitrarily dueto the battery failure or user’s preferences; the noise of theGPS signal (typical accuracy is within ±15 meters, but canbe worse due to signal scatter) and the loss of signal at anytime (e.g., failure to sight satellites, or inside a building).These issues make our problem relatively more challengingthan most previously reported work. For example, data forNeil is very fragmented, the GPS is not logged continuouslybetween days, and for some days, only a few hours of dataare available.
We use three pre-processing procedures to address theseproblems. Given the GPS data for one day Vi, we use asimilar approach in [3] to search for regions where the GPSsignal disappears and reappears in the same place exceedinga certain duration threshold. We then attempt to interpolateand fill in the missing GPS signals by random points aroundthat place. We shall refer to this operator as I1(Vi). To dealwith data from users who often lose signal, or turn theirdevice off, when at home (an important social category inour work), we sometimes interpolate Vi using the previousday GPS Vi−1 and the GPS data of the following day Vi+1,if it exists. For example, if the last GPS data point of Vi−1
is recorded in the same locale as the first data point in Vi,we interpolate the data between days. We shall refer tothis operation as I2(Vi). If both I1 and I2 are applied,we simply refer to it as I. Figure 1 shows an example ofsuch interpolations applied within a day (I1) , and with thefollowing day (I2).
4Participant names have been altered for anonymity.5In real life James and Linda are a couple, MumJ is motherof James, Neil is co-worker with James, and Josh is a friendof James.

�����������������
��������������������������
�����������������������
Figure 1: Example of interpolation applied for11/12/2005 James’s gps data.
GPS readings also come with velocity measures. We canmake use of this information to speed up and improve theclustering process. A GPS reading recorded at a positionwhen the user is moving at high speed clearly implies itis not a place of interest, we therefore remove these pointsfrom the dataset before clustering. The speed threshold isset automatically to the mean velocity obtained from oneday’s GPS data V . We refer to this operation as R(V ).
3.2 Social Sphere or PlacesWe desire automated discovery of significant places. Us-
ing GPS data collected for a particular user, we seek to findan efficient method to partition the data into clusters thatare meaningful to the user, where ‘meaningful’ means thatthey are important to the users socially. Largely differentfrom previous work on GPS-based location discovery (e.g.,[15]) where categorical aspects of the places are ignored inthe clustering process, our primary interest is in discover-ing clusters that have social functions. More precisely, wedistinguish a social sphere or place l by the fact that l willbe visited for a considerable amount of time and repeatedlyover time. For example, ‘Home’ and ‘Work’ are the most ob-vious social spheres or places in our definition; going to thesame cinema is another example whereas a one-time stop ata beach is not. Our algorithm thus consists of two parts: aclustering engine that performs place discovery on a dailybasis, and a mechanism to add, update, and refine the setof places over time.
Given GPS readings, a simple method to cluster the datais the k-means algorithm. While k-means is simple, intu-itive and easy to implement, it suffers from three disad-vantages: (i) the number of clusters k must be specified inadvance, (ii) it favors symmetric shapes (e.g, circles or el-liptics), and thus is unable to handle arbitrary shapes, and(iii) it is sensitive to noise and initialization points. Thefirst two problems are more serious to us, since firstly forany arbitrary date, we have very little, if any, knowledgeabout the places, and secondly the GPS readings are trajec-tory data, and thus often do not possess symmetric clusters.The first problem is sometimes overcome in the literature bysequentially running the k-means for different k and pickingthe one that returns the highest average silhouette values,which measures the distance of a point p to other pointswithin its cluster (inner-distance) and to points of differentclusters (intra-distance). Unfortunately, computing averagesilhouette value for each k-means run is computationallyexpensive. Our experiment shows that even though the per-formance of this approach is relatively good, it could takealmost three hours to run for processing a single day of data.
To circumvent the problems of k-means, we propose theof use of dbscan[25]6, a density-based clustering algorithm.The main features of dbscan are: (i) it can handle arbi-trary cluster shapes, and thus is particularly suitable forlarge and sparse data sets, (ii) it requires no initialization,and always gives the same results given the same input pa-rameters, and (iii) it is able to exclude noise, outliers andabnormal points. These features make dbscan particularapplicable in our setting. We refer the readers to [25] fora full treatment of dbscan, and only summarize the keyideas. dbscan is founded upon three concepts: directlydensity reachable (→), density reachable (Ã) and densityconnected (↔). Parameters required for this algorithm area pair (ε, D), where ε used to draw a perimeter around apoint p to form its neighbouring set N(p | ε), and D servesas a threshold to test if two points p and q are directly den-sity reachable. Two points p and q are then called densityreachable, p à q if there is a sequence of points {p1, . . . , pl}linking them in directly reachable manner, i.e., p → p1,pi → pi+1 ∀i = 2, . . . , l − 1, and pl → q. Finally, p is calleddensity connected to q if we can find a point o that is densityreachable from both p and q.
q(ε,D)−→ p ⇔ q ∈ N(p | ε) and |N(p | ε)| > D
p à q ⇔ ∃ p1, .., pl st. p → p1 → . . . → pl → q
p ↔ q ⇔ ∃ o st. p à o and q à o
A cluster C is then defined as a maximum set of pointsthat are pairwise density connected. dbscan searches forclusters based on optimization criteria that maximizes density-reachability by seeding core points (a point inside the clus-ter and determined by looking at the number of points in itsneighbouring set) and expanding around these points basedon reachability condition.
The worst case complexity of computing the neighbour-ing sets for all points is O(n2) where n is the number ofdata points. If R∗-tree representation is used, this complex-ity reduces to O(n log n). Thus, dbscan directly poses twoproblems: (1) It can be slow given its complexity, and (2) wemust specify the parameters (ε, D). These problems can beresolved effectively in our setting. Before applying dbscan,the data is filtered of points above a speed threshold as dis-cussed earlier. For our dataset, this stage usually resultson an average in 30 − 50% reduction in the data points.Importantly, it improves clustering accuracy by eliminat-ing noisy (redundant) data points. Regarding the param-eters, the dbscan proposed in [25] is also equipped with aheuristics-based procedure to automatically tune the param-eters. However, since our primary interest is the dominantplaces, our choices for (ε, D) can be reasonably set. Wechoose ε = 0.001, which is roughly equivalent to 60m, dou-bling the inherent noise in GPS device, and D = 5×60 whichis approximately the number of points generated in 5 min-utes, the minimum duration we assume a user must spendat a location before it potentially becomes significant.
Recall that we seek to find ‘stays’ and ‘places’ from GPSdata, where a stay is a time-dependent unit (e.g., bookshop-1pm-2pm) and a place is where several stays are experi-enced. Assume our data over N days from a user is given
6dbscan stands for Density-Based Spatial Clustering of Ap-plications with Noise, and note here that the term ‘density’refers to the concept of ‘denseness, and not ‘density’ as inprobability density functions.

in the form {X1, . . . , XN}, where Xi is the data collectedfor the i-th day from a user, dbscan(X, ε, D) returns a setof clusters C and a vector of corresponding weights ω. Theoutline of our stay and place finding algorithm is shownin Algorithm1. This algorithm computes all accumulatedplaces stored in {P, φ, m} where Pj is the jth place coordi-nates, φj is a weight associated with that place measuredas an accumulated number of points belonging to that placeover time, mj is a count on the number of stays that occurat Pj . All of these tasks are included in routine Update(.).
The set of stays discovered for each day is stored in Si
via routine FindStay(.) which performs a simple task of fur-ther using time information to segment a cluster (place) intosmaller time-stamped chunks (stays) if there is temporal dis-continuity in that cluster. Each stay sj ∈ Si is given anunique ID, its start/stop time, and the coordinate of thestay.
Algorithm 1 DBSCAN-based clustering of stays andplaces.
1: P = ∅, φ = ∅, m = ∅2: for i = 1 to N do3: V i =R◦I1([X
i]) {remove points after interpol.}4: (Ci, ωi) = dbscan(V i, ε, D)5: Si = FindStay(V i, Ci)6: (P, φ, m) = Update(Si, Ci, wi, P, φ, m)7: Si = UpdateLabel(Si, P )8: end for
Refining and updating discovered placesRecall that we distinguish a social sphere in our work asa place that is socially significant in the user’s mind. Twoquantitative components contribute to this distinction: theduration the user spends at that place, and the number ofre-visits. It is therefore desirable for the system not only tokeep track of and add new places, but also to refine an ex-isting place Pj based on some measure of significance basedon these components. We formulate this measure Sig[Pj ] asfollows:
Sig[Pj | µ] = φj [1−Geo (mj | µ)]
where the effect of the count mj is modeled according to ageometric Geo (x | µ) pmf parametrized by µ. We wish tomodel its effect in an exponential manner. That is, whenany place is first discovered, it is assigned the same degreeof significance, and if it is revisited, this value will increasein an exponential manner, quickly reflecting the importanceof that place.
To consistently update and refine existing clusters, we up-date Sig[Pj ] whenever Pj is revisited. Based on the measuresfor all places, an exponential distribution is fitted and a hy-pothesis testing on 95% confidence is performed to excludethose places that belong to the remaining 0.05% at the tailof the distribution.
3.3 Results: Stays and PlacesThe GPS dataset described in section 3.1 is used in our
experiment. To provide performance evaluation, we furtherask the users to provide their social landmarks as an indi-cation of the groundtruth. The user is asked to recall andprovide most meaningful places during time the data is col-lected. Given the volume of data and the imperfect mem-
ories of whereabouts, it is to be expected that some placesdiscovered by the algorithm do not have corresponding la-bels. We do not report precision for this experiment.
Figure 2 shows an example of places discovered for Joshand MumJ.
0
20
40
60
80
Home
Work
Church
Fr-Dar
ylGym
Park-
King
Stude
nt
Frd-B
oska
s
Unkwn1
Unkwn2
Unkwn3
(in th
ousa
nds)
0
10
20
30
40
Home
Son
Sho-M
el
Lake
Gym
Docto
r
Chirop
racto
rSho
p
Unkwn1
Daugh
ter
Shop-W
in
Unkwn2
(in th
ousa
nds)
Josh
MumJ
Figure 2: Weighted places discovered for MumJ (up-per) and Josh (lower) by the algorithm prior to therefining process. Notice that most ‘Unknown’ labelsare far right, indicating that they are less meaning-ful; except the one boxed in the rectangle which mayindicate MumJ forgot to label it.
The results for discovering places are shown in Table 1.Of most significance are the middle columns, which indi-cates places discovered that coincide with the groundtruth.All places identified by the users have been found. The rightcolumn indicates the number of Unknown labels before andafter the refining process. We can see that the refining pro-cess has reduced significantly the number of such Unknownlabels, and are the clusters that the user has spent time, butnot labelled. Unknown clusters, are not indicative of algo-rithmic error, and possibly correspond to places the user hadforgotten to label, or places not deemed important. Whenusers were asked about Unknown places in the first category,they were usually able to identify and label it meaningfully.The latter category of Unknown is interesting: one exam-ple is when such a cluster was referred back to the user, itwas labelled as “Traffic jam spot”, which clearly is not asignificant place socially.
Places Unknown PlacesUser Groundtruth Discovered Initial Refined
James 18 18 30 9Linda 17 17 4 3Neil 7 7 2 2
MumJ 9 9 2 0Josh 8 8 3 0
Table 1: Place discovery performance of our algo-rithm. Columns to the right report the number of‘Unknown’ places found before and after refinement.
The results for discovering stays are reported in Table 2,where the second column is the total number of stays dis-covered, S and S∗ are the number of stays corresponding toplace groundtruth before and after the refining procedurerespectively; R and R∗ are the corresponding recalls respec-tively. Linda’s relatively low recall appears to be largely dueto missing groundtruth. Her typical day is particularly infragmented time and broad in space, due to the running of

many errands. Hence while these locations qualify as signif-icant, they were overlooked during groundtruthing.
User # Stays S R S∗ R∗
James 438 350 79.9% 370 84.47%Linda 64 43 67.19% 44 68.75%Neil 23 21 91.3% 21 91.3%
MumJ 48 45 93.75% 47 97.92%Josh 60 52 86.67% 60 100%Σ 633 511 83.76% 542 88.49%
Table 2: Statistics for finding stays. S and R arestays and recall, respectively. Similarly, S∗ and R∗
are figures following refinement.
3.4 Labeling major social labelsIn our experiments discussed so far, the users have pro-
vided us with some groundtruth about their social land-marks. Ideally, we would wish to equip the system with alearning method to label places discovered by the clusteringengine. We address this problem initially in this work, aim-ing to label two useful social categories ‘Home’ and ‘Work’;and the rest will be labelled as ‘Other’. It is reasonable toassume in many cases that at night time the user will sleepat home and go to work during the daytime on weekdays.This assumption allows us to derive quick and simple meth-ods to label those categories. We describe one such methodthat works well in our case, and is shown in Algorithm 2.The algorithm attempts to discover the place correspondingto Home or Work by filtering out location data outside theassumed appropriate time ranges, and returns the clusterwith maximal duration. In the 5th line, τ(xi) is the time-constraint condition. To detect ‘Home’ we specify that τ(xi)is true iff xi are collected before 7am or after 7pm. To detect‘Work’ we set the time-constraint periods to 8am-11am and1pm-4pm and the current day is not on the weekend.
Algorithm 2 Pseudocode to label ‘Home’ and ‘Work’. De-pends on the condition τ(.), the return cluster will be either‘Home’ or ‘Work’.1: Randomly pick N days d1, . . . , dN
2: Interpolate data for each di, resulting in data Y i
3: V = ∅4: for i = 1 to N do5: extract xi from Y i st. τ(xi) is true6: V = V ∪ xi
7: end for8: [Cl, ωl] = dbscan(V, ε, D)9: Return l∗ = argmaxl{ωl}
The randomization in the first line is to account for spon-taneous phenomena in which the user may not be at workor home in our designated times. The algorithm can alsobe run repeatedly to confirm our hypothesis on ‘Home’ and‘Work’ labels if required. Figure 3 plots an example of onerun for user James. In the future, we may need more so-phisticated methods to handle varying user profiles, such ashaving many part-time jobs, a nighttime job, or even no jobat all. Such methods would need to use fundamental as-sumptions about the need for sleep or socialization, and tryalternate hypotheses about temporal patterns. Regardless,the Home/Work distinction has near universal validity [28].
HOME
Figure 3: Visualization of discovering ‘Home’ labelfor user James.
James Linda James MumJ
Fr-Dave Fr-Dave Home Son
Home Home GrandPa 2 Home
Church Church Sister Daughter
GrandPa 1 GrandPa 1 Unknown Doctor
HeathCote HeathCote Unknown Cafe
Shop-Lem Shop-Lem Unknown Gym
GrandPa 2 GrandPa 2
Work Unknown
Unknown Shop-Bull
Shop-SouthL Shop-SouthL
James Neil Linda MumJWork Work Home Son
Gym Swimming GrandPa 2 Home
Shop-Kara Unknown Lake Lake
James Josh Neil JoshChurch Church Unknown Work
GrandPa 1 Home Shop-Sal Shop-DNA
Linda Josh Neil MumJUnknown Student Shop-Chem Unknown
Church Church
GrandPa 1 Home
Table 3: Discovered shared places. No shared placesfor (Linda,Neil) and (MumJ,Josh) were found.
3.5 Results: Shared PlacesTable 3 shows the results of the shared places discovered
algorithmically. Each sub-section corresponds to a user pair.For each user pair, there is a ordered pair of matching so-cial spheres, that indicate shared co-presence. For example,James and Linda are co-located at some major social spheressuch as Home, Church, GrandParent. In real life, they area couple and spend most time outside work at significantplaces together. James and Neil are work colleagues, andshare the social sphere Work. Interestingly, James and hisMum share social spheres (Home, Son) when they visit eachother as shown in the first two entries under James andMumJ. The third entry refers to them visiting a commonrelative, James’s sister. Linda and Josh go to the sameChurch, and are siblings in real life. Similarly, all othershared relations correspond to socially significant interac-tions. Little significance can be attached to the Unknownentries as outlined before. An interesting point to note isthat some Unknown places can be labeled because of loca-tional co-presence. For example, James’ Unknown place isthe same as Linda’s place labeled Shop-Bull.
3.6 Social Ties: FormulationSocial context, in addition to place, includes relationships
termed social ties. A tie may be characterized by an ordered

pair of actors, to borrow a term from social network theory,its nature (e.g. familial, friends, work-related), the strengthof the bond, and shared social spheres. We require an es-timate of the user’s interaction with others, and there aremany ways this can be estimated, such as detection of pres-ence through audio, co-located GPS, active RFID and so on.Regardless of the technique used to assess co-presence, wefomalise social tie with respect to user i as follows: Let useri be observed over a set of S sampled periods (15 minutechunks in our case), and let li be the social sphere of thisuser at sample s. Then let pi denote the Boolean presenceof another actor j in sample s, 1 denoting present and 0 notpresent. To account for the relative importance of locationwhen users interact (e.g. home is typically more socially sig-nificant than the dry cleaners), we introduce ωL as a weightexpressing the relative significance of location li. Then, thesocial tie strength T between actors i and j is defined as:
T (i, j) =1
Ni,S
S∑s=1
pi(s, j)ωL(li(s)) (1)
Ni,S =
S∑s=1
ωL(li(s)) (2)
where Ni is a normalizing constant for actor i over the sam-ple set. T = 1 is interpreted as ‘actor j is always with i’ forthe sample set, and T = 0 as ‘j is never seen with i.’ It canbe noted T is not commutative, reflecting that the strengthof a bond from one person’s point of view isn’t necessarilyshared by the other.
Relationships carried on at familiar places imbue thoseplaces with a derivative significance, and those places inturn may imbue continuing or new relationships carried onthere with significance reciprocally. To determine locationweights, we use a media-flavoured approach: the significanceof a place is proportional to how much media is capturedthere. Let lm be 1 if media item m was created at locationi, and M be the total number of media items captured insample set S at all locations. Then, ωL is defined as:
ωL(i) =1
M
M∑m=1
lm(m, i) (3)
Other possibilities for calculating location significance in-clude location type, such as Home or Work, or cumulativetime spent there. Whatever the flavour of ωL, the assump-tion is that time spent together is a coarse indicator of sig-nificance of the relationship, and locations factor this.
3.7 Social Ties: ExtractionTo extract social ties we experiment with persistent au-
dio records together with GPS logs to obtain a record ofwhen and where the user interacts with known acquain-tances. This problem is notoriously hard for the followingreasons: a) free-placement of microphone resulting in pooraudio captures, b) free format in interaction between peo-ple resulting in interruption, no pauses between speakers,talking over each other, and c) noisy ambient environments.Though we believe this problem is still open, we presentour preliminary results by casting the problem as super-vised speaker identification from noisy ambient audio, andrelaxing it to a simpler challenge: speaker presence.
We divide a day’s log into contiguous 15 minute sectionsand seek a binary classification per speaker as to their pres-ence, with a bias toward high precision and uniform recall.Audio samples of 0.25 seconds are first classified as eitherspeech or not by decision tree. Speech samples are thenpassed to a bank of A speaker-vs-other classifiers. In thiscase, SVMs were found to perform best from among a num-ber of learners. Speaker training was performed with ap-proximately 6 minutes of speech at varying distances fromthe microphone, and the other class was generated with allbut the held-out speaker and some other speakers not partof the set of interest. Samples with more than one positiveclassification are ignored. A speaker is classed as presentin a 15 minute sample if their identified speech is above aminimum threshold of 25s and the detected speech to iden-tified speech is above a threshold proportion of 0.2, both setemperically.
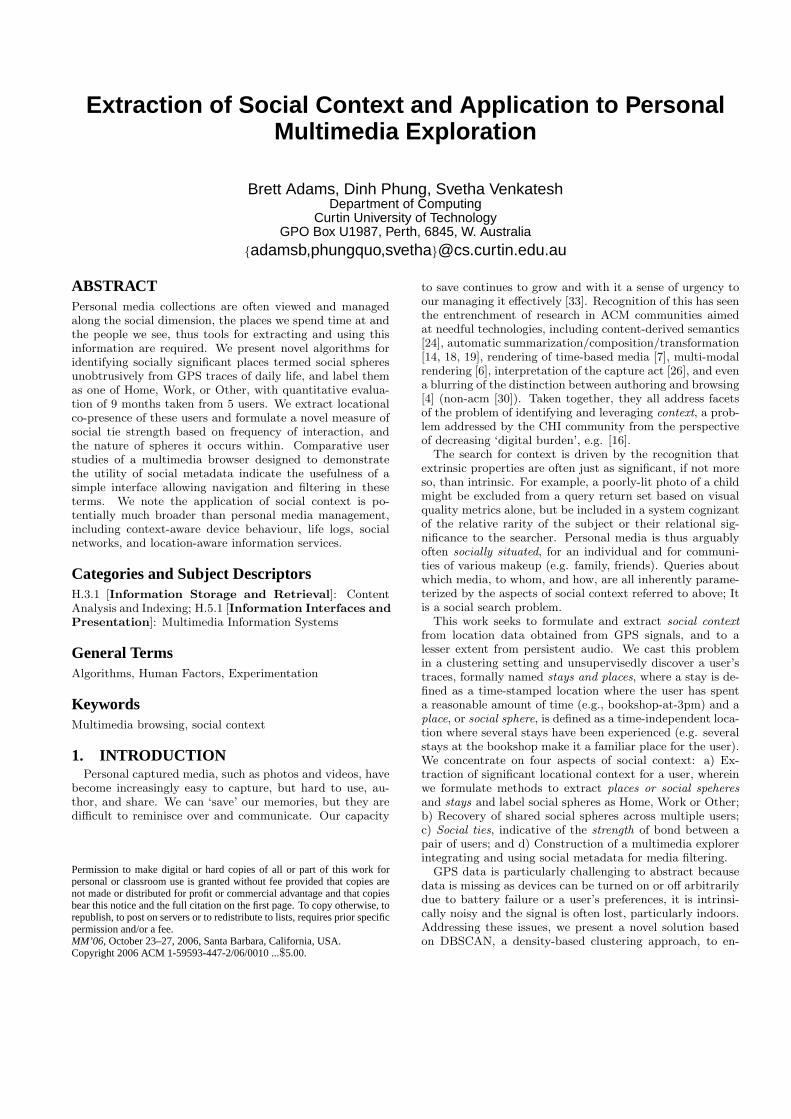
A month’s worth of audio data together with GPS loca-tion was recorded using an ultraportable Windows XP de-vice. Actor presence groundtruth was recorded at a resolu-tion of 15 minutes, from 7am until 11pm each day. Figure 4plots social tie strength, T , for the period for three differentflavours of ω calculated using media creations, place label,and duration. As expected, the user’s spouse stands out. In-terestingly, T preserves distinctions among workmates. E.g.while the user spent about the same amount of time withboth co-workers 1 and 2, the media-flavoured weights showmore time was spent interacting with co-worker 2 at work,a media creation hotspot, whereas the balance of durationspent with co-worker 1 was at a nearby cafe.
The main difficulty encountered is the false postive ratein speaker identification for this situation, as it has a level ofcomplexity greater than that encountered in classical speakeridentification settings. Our results indicate high accuracyin clean situations (Speech 95%+, Speaker ID 85%+), butlow accuracy in noisy or “entangled-speech” environments(Speech 80%, Speaker ID Pr. 43% Rc. 12%, which is aboverandom for 4 class classification but not robust enough forgeneral use). Thus although we chose speech for its richnessin conveying social situations, we now believe other factorssuch as co-presence derived from co-located GPS should beused, even if the latter has a much lower resolution in beingable to infer co-presence. Our formulation of social tie re-mains the same, but the extraction of co-presence remainsa challenging and exciting open problem.
4. MULTIMEDIA EXPLORERIn this section we present a novel media browser, Socio-
Graph, in order to demonstrate the utility of social con-text metadata for the task of personal media explorationand sharing. Specifically, it is a multi-user spatio-temporalbrowser with the ability to render images, video, and movies(structured for flexible delivery and containing cinematicand content annotation, detailed in previous work [1]) ina unified environment, and filter media items on time, po-sition, labelled significant place, shared places, presence ofactor, and social tie strength.
This metadata can be used to filter media in isolation orcombination. Spatial and temporal filtering are providedby the field of view and timeline scope, respectively; socialspheres are labelled on the map; display of media from ac-tors who share a social sphere with the user can be on oroff; actor presence at media capture can be specified to be
Spouse Co−worker 1 Co−worker 20
0.05
0.1
0.15
0.2
0.25
Soc
ial t
ie s
tren
gth
media flavouredfunction flavouredduration flavoured
Figure 4: Social tie strength, T , for a month of data.
any sub-set; and media can be thresholded on the user’ssocial tie strength with its owner. E.g., queries expressingthe following intentions can be formulated with the simpleinteractions detailed below: Find...
• Media taken at home in the previous month
• Media owned by anyone from the party I missed
• Media from the last family outing to the park near thecity
An important sub-goal of Socio-Graphs’s design was togreatly simplify and align navigation with a set of concep-tions common to personal media browsing regardless of ex-perience with computers, namely social context. This canbe viewed as an instance of aligning the software’s ‘structureor paths’ with the user’s [32], thus promoting the ‘disappear-ance of the interface’ [29].
The browsing environment is primarily 3D, first-personpoint of view. A timeline is displayed in a pane on theright. Full traversal to any latitude or longitude on theglobe is supported in order to enable visualization of sharedrepositories around the globe. Specific design decisions in-clude unified navigation; Zooming is the metaphor used inboth time and space (left and right click zoom in and outrespectively), which is able to simultaneously deal with vol-ume of items while providing a measure of orientation [31].Media item access is simplified also, lacking an array of com-plex widgets [23]. Double-clicking selects an item, and if itis time-based, clicking again plays it. Serendipity, the pos-sibility for a user to stumble upon unlooked for items, is adesirable trait [32, p. 226], and is achieved via field of viewand the hidden interplay between tie strength and sharedplace filters (e.g. adding shared places viewing relaxes thetie strength threshold at the current place in view if theinitial result set is very small). Media items entering orleaving the query set due to filter changes fade in and outdynamically, respectively, providing an additional cue as tothe effect of the new filter configuration.
A user can import photos, videos, and movies in the above-mentioned format. Time of creation for each item is ex-tracted from the EXIF header of JPEGs, and thumbnails for
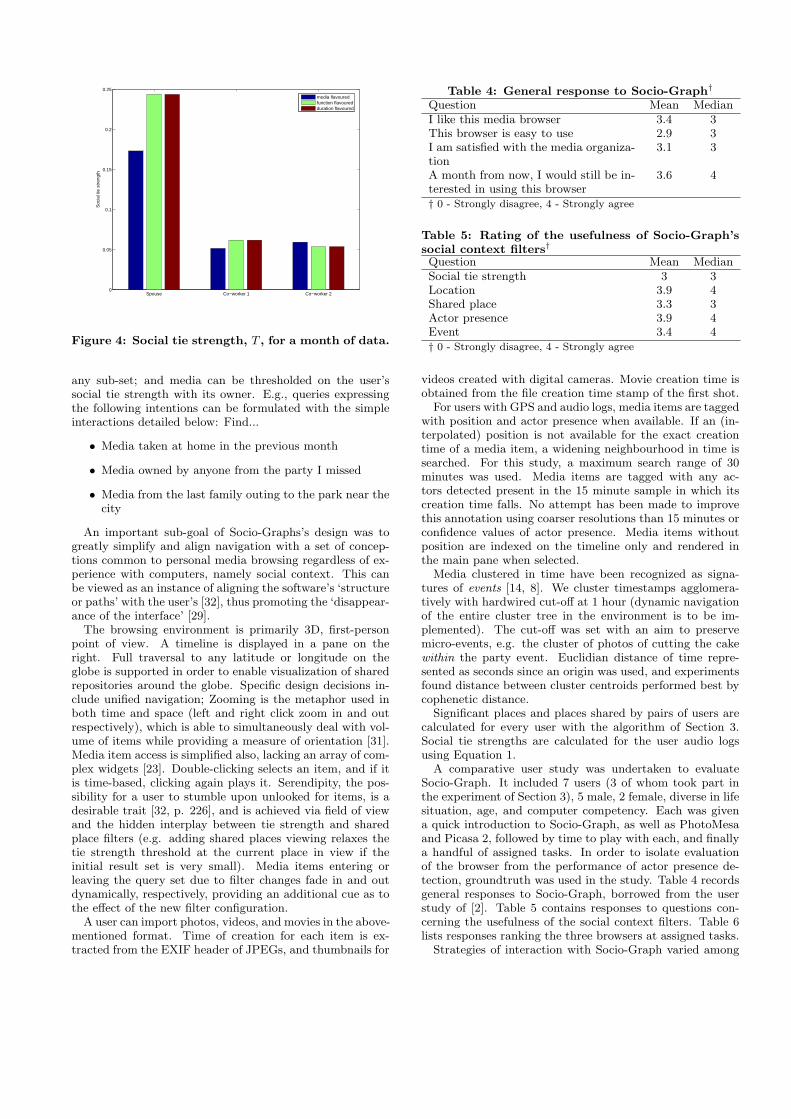
Table 4: General response to Socio-Graph†
Question Mean MedianI like this media browser 3.4 3This browser is easy to use 2.9 3I am satisfied with the media organiza-tion
3.1 3
A month from now, I would still be in-terested in using this browser
3.6 4
† 0 - Strongly disagree, 4 - Strongly agree
Table 5: Rating of the usefulness of Socio-Graph’ssocial context filters†
Question Mean MedianSocial tie strength 3 3Location 3.9 4Shared place 3.3 3Actor presence 3.9 4Event 3.4 4† 0 - Strongly disagree, 4 - Strongly agree
videos created with digital cameras. Movie creation time isobtained from the file creation time stamp of the first shot.
For users with GPS and audio logs, media items are taggedwith position and actor presence when available. If an (in-terpolated) position is not available for the exact creationtime of a media item, a widening neighbourhood in time issearched. For this study, a maximum search range of 30minutes was used. Media items are tagged with any ac-tors detected present in the 15 minute sample in which itscreation time falls. No attempt has been made to improvethis annotation using coarser resolutions than 15 minutes orconfidence values of actor presence. Media items withoutposition are indexed on the timeline only and rendered inthe main pane when selected.
Media clustered in time have been recognized as signa-tures of events [14, 8]. We cluster timestamps agglomera-tively with hardwired cut-off at 1 hour (dynamic navigationof the entire cluster tree in the environment is to be im-plemented). The cut-off was set with an aim to preservemicro-events, e.g. the cluster of photos of cutting the cakewithin the party event. Euclidian distance of time repre-sented as seconds since an origin was used, and experimentsfound distance between cluster centroids performed best bycophenetic distance.
Significant places and places shared by pairs of users arecalculated for every user with the algorithm of Section 3.Social tie strengths are calculated for the user audio logsusing Equation 1.
A comparative user study was undertaken to evaluateSocio-Graph. It included 7 users (3 of whom took part inthe experiment of Section 3), 5 male, 2 female, diverse in lifesituation, age, and computer competency. Each was givena quick introduction to Socio-Graph, as well as PhotoMesaand Picasa 2, followed by time to play with each, and finallya handful of assigned tasks. In order to isolate evaluationof the browser from the performance of actor presence de-tection, groundtruth was used in the study. Table 4 recordsgeneral responses to Socio-Graph, borrowed from the userstudy of [2]. Table 5 contains responses to questions con-cerning the usefulness of the social context filters. Table 6lists responses ranking the three browsers at assigned tasks.
Strategies of interaction with Socio-Graph varied among

a. b.
c. d.
Figure 5: a. Global zoom; b. City-wide zoom; c. Media clustered at a significant place signals an event; d.A photo at maximum zoom.
users. Some common traits included the initial choice ofa compass orientation, followed by cycles of diving in andout to inspect media. Where media for a given filter wasclustered too densely for the spatial view to be clear, theywere pulled apart by zooming within the timeline.
Tables 4 & 5 show the reaction to Socio-Graph, and thepossibility of filtering with social context, to be very positive.Curiously, both females in the study were ambivalent aboutthe browser’s ease of use. In one case, further commentsindicated the zoom metaphor, while uniform in space andtime, to be perceived as complex. This user also happenedto be a retiree with little computer experience.
Table 6 indicates Socio-Graph was clearly preferred fortasks 1 and 3, however there was more confusion over task2. This stemmed from the much larger variety of searchstrategies employed. While tasks 1 and 3 were both a shortstep away from formulation in terms of the social contextsupported by Socio-Graph, task 2 could be performed byhunting for a visual match (e.g. faces, groups of people),best supported by PhotoMesa and Picasa, specific dates (e.g.birthdays, Christmas), best supported by PhotoMesa andSocio-Graph, or specific people (e.g. babies), best supportedby Socio-Graph.
5. CONCLUSION AND FUTURE WORKWe have presented novel algorithms for extracting impor-
tant aspects of social context from daily position traces andpersistent audio: significant places, characterized by thesocially significant labels Home, Work, or Other, togetherwith shared places across users, and a measure of social tie
strength between users. Further we have presented the de-sign and evaluation of a novel personal media browser todemonstrate the utility of social context metadata. A com-parative user study indicates the usefulness of this approach.
We expect fusion of GPS position with Bluetooth, WIFI,and GSM, to allow finer resolution indoors or greater cov-erage, and have used Placelab (www.placelab.org) with thisin mind. Reliable detection of indicators of interaction arerequired if the social tie strength measure is to be effective.Future work will focus on improving extraction of speakerpresence from audio via audio scene filtering and higher or-der temporal models, together with fusion of other oppor-tunistic sources.
6. REFERENCES[1] B. Adams and S. Venkatesh. Situated event bootstrapping
and capture guidance for automated home movieauthoring. In ACM International Conference onMultimedia, Singapore, November 2005.
[2] P. Appan and H. Sundaram. Networked multimedia eventexploration. In Proceedings of the 12th annual ACMinternational conference on Multimedia, 2004.
[3] D. Ashbrook and T. Starner. Learning significant locationsand predicting user movement with gps. In Int. Symposiumon Wearable Computing, Seattle, WA, October 2002.
[4] M. Balabanovic, L. Chu, and G. Wolff. Storytelling withdigital photographs. In Proceedings of Conference onHuman Factors in Computing Systems (CHI), pages564–571. ACM Press, 2000.
[5] J. Begole, J. Tang, R. Smith, and N. Yankelovich. Workrhythms: analyzing visualizations of awareness histories of
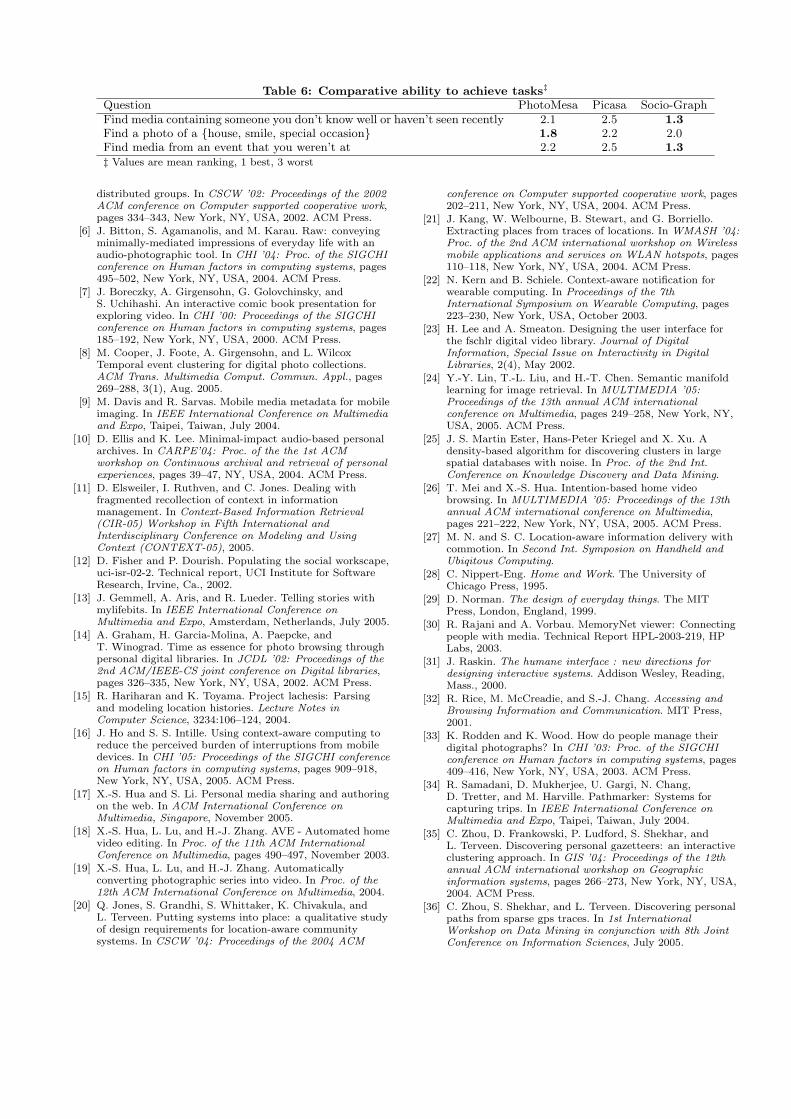
Table 6: Comparative ability to achieve tasks‡
Question PhotoMesa Picasa Socio-GraphFind media containing someone you don’t know well or haven’t seen recently 2.1 2.5 1.3Find a photo of a {house, smile, special occasion} 1.8 2.2 2.0Find media from an event that you weren’t at 2.2 2.5 1.3‡ Values are mean ranking, 1 best, 3 worst
distributed groups. In CSCW ’02: Proceedings of the 2002ACM conference on Computer supported cooperative work,pages 334–343, New York, NY, USA, 2002. ACM Press.
[6] J. Bitton, S. Agamanolis, and M. Karau. Raw: conveyingminimally-mediated impressions of everyday life with anaudio-photographic tool. In CHI ’04: Proc. of the SIGCHIconference on Human factors in computing systems, pages495–502, New York, NY, USA, 2004. ACM Press.
[7] J. Boreczky, A. Girgensohn, G. Golovchinsky, andS. Uchihashi. An interactive comic book presentation forexploring video. In CHI ’00: Proceedings of the SIGCHIconference on Human factors in computing systems, pages185–192, New York, NY, USA, 2000. ACM Press.
[8] M. Cooper, J. Foote, A. Girgensohn, and L. WilcoxTemporal event clustering for digital photo collections.ACM Trans. Multimedia Comput. Commun. Appl., pages269–288, 3(1), Aug. 2005.
[9] M. Davis and R. Sarvas. Mobile media metadata for mobileimaging. In IEEE International Conference on Multimediaand Expo, Taipei, Taiwan, July 2004.
[10] D. Ellis and K. Lee. Minimal-impact audio-based personalarchives. In CARPE’04: Proc. of the the 1st ACMworkshop on Continuous archival and retrieval of personalexperiences, pages 39–47, NY, USA, 2004. ACM Press.
[11] D. Elsweiler, I. Ruthven, and C. Jones. Dealing withfragmented recollection of context in informationmanagement. In Context-Based Information Retrieval(CIR-05) Workshop in Fifth International andInterdisciplinary Conference on Modeling and UsingContext (CONTEXT-05), 2005.
[12] D. Fisher and P. Dourish. Populating the social workscape,uci-isr-02-2. Technical report, UCI Institute for SoftwareResearch, Irvine, Ca., 2002.
[13] J. Gemmell, A. Aris, and R. Lueder. Telling stories withmylifebits. In IEEE International Conference onMultimedia and Expo, Amsterdam, Netherlands, July 2005.
[14] A. Graham, H. Garcia-Molina, A. Paepcke, andT. Winograd. Time as essence for photo browsing throughpersonal digital libraries. In JCDL ’02: Proceedings of the2nd ACM/IEEE-CS joint conference on Digital libraries,pages 326–335, New York, NY, USA, 2002. ACM Press.
[15] R. Hariharan and K. Toyama. Project lachesis: Parsingand modeling location histories. Lecture Notes inComputer Science, 3234:106–124, 2004.
[16] J. Ho and S. S. Intille. Using context-aware computing toreduce the perceived burden of interruptions from mobiledevices. In CHI ’05: Proceedings of the SIGCHI conferenceon Human factors in computing systems, pages 909–918,New York, NY, USA, 2005. ACM Press.
[17] X.-S. Hua and S. Li. Personal media sharing and authoringon the web. In ACM International Conference onMultimedia, Singapore, November 2005.
[18] X.-S. Hua, L. Lu, and H.-J. Zhang. AVE - Automated homevideo editing. In Proc. of the 11th ACM InternationalConference on Multimedia, pages 490–497, November 2003.
[19] X.-S. Hua, L. Lu, and H.-J. Zhang. Automaticallyconverting photographic series into video. In Proc. of the12th ACM International Conference on Multimedia, 2004.
[20] Q. Jones, S. Grandhi, S. Whittaker, K. Chivakula, andL. Terveen. Putting systems into place: a qualitative studyof design requirements for location-aware communitysystems. In CSCW ’04: Proceedings of the 2004 ACM
conference on Computer supported cooperative work, pages202–211, New York, NY, USA, 2004. ACM Press.
[21] J. Kang, W. Welbourne, B. Stewart, and G. Borriello.Extracting places from traces of locations. In WMASH ’04:Proc. of the 2nd ACM international workshop on Wirelessmobile applications and services on WLAN hotspots, pages110–118, New York, NY, USA, 2004. ACM Press.
[22] N. Kern and B. Schiele. Context-aware notification forwearable computing. In Proceedings of the 7thInternational Symposium on Wearable Computing, pages223–230, New York, USA, October 2003.
[23] H. Lee and A. Smeaton. Designing the user interface forthe fschlr digital video library. Journal of DigitalInformation, Special Issue on Interactivity in DigitalLibraries, 2(4), May 2002.
[24] Y.-Y. Lin, T.-L. Liu, and H.-T. Chen. Semantic manifoldlearning for image retrieval. In MULTIMEDIA ’05:Proceedings of the 13th annual ACM internationalconference on Multimedia, pages 249–258, New York, NY,USA, 2005. ACM Press.
[25] J. S. Martin Ester, Hans-Peter Kriegel and X. Xu. Adensity-based algorithm for discovering clusters in largespatial databases with noise. In Proc. of the 2nd Int.Conference on Knowledge Discovery and Data Mining.
[26] T. Mei and X.-S. Hua. Intention-based home videobrowsing. In MULTIMEDIA ’05: Proceedings of the 13thannual ACM international conference on Multimedia,pages 221–222, New York, NY, USA, 2005. ACM Press.
[27] M. N. and S. C. Location-aware information delivery withcommotion. In Second Int. Symposion on Handheld andUbiqitous Computing.
[28] C. Nippert-Eng. Home and Work. The University ofChicago Press, 1995.
[29] D. Norman. The design of everyday things. The MITPress, London, England, 1999.
[30] R. Rajani and A. Vorbau. MemoryNet viewer: Connectingpeople with media. Technical Report HPL-2003-219, HPLabs, 2003.
[31] J. Raskin. The humane interface : new directions fordesigning interactive systems. Addison Wesley, Reading,Mass., 2000.
[32] R. Rice, M. McCreadie, and S.-J. Chang. Accessing andBrowsing Information and Communication. MIT Press,2001.
[33] K. Rodden and K. Wood. How do people manage theirdigital photographs? In CHI ’03: Proc. of the SIGCHIconference on Human factors in computing systems, pages409–416, New York, NY, USA, 2003. ACM Press.
[34] R. Samadani, D. Mukherjee, U. Gargi, N. Chang,D. Tretter, and M. Harville. Pathmarker: Systems forcapturing trips. In IEEE International Conference onMultimedia and Expo, Taipei, Taiwan, July 2004.
[35] C. Zhou, D. Frankowski, P. Ludford, S. Shekhar, andL. Terveen. Discovering personal gazetteers: an interactiveclustering approach. In GIS ’04: Proceedings of the 12thannual ACM international workshop on Geographicinformation systems, pages 266–273, New York, NY, USA,2004. ACM Press.
[36] C. Zhou, S. Shekhar, and L. Terveen. Discovering personalpaths from sparse gps traces. In 1st InternationalWorkshop on Data Mining in conjunction with 8th JointConference on Information Sciences, July 2005.