multimedia news exploration and retrieval by integrating keywords, relations and visual features
TRANSCRIPT

Multimed Tools Appl (2011) 51:625–648DOI 10.1007/s11042-010-0639-3
Multimedia news exploration and retrievalby integrating keywords, relationsand visual features
Hangzai Luo · Jianping Fan · Youjie Zhou
Published online: 30 October 2010© Springer Science+Business Media, LLC 2010
Abstract Multimedia news may be organized by the keywords and categories forexploration and retrieval applications, but it is very difficult to integrate the relationand visual information into the traditional category browsing and keyword-basedsearch framework. This paper propose a new semantic model that can integratekeyword, relation and visual information in a uniform framework. Based on thissemantic representation framework, the news exploration and retrieval applicationscan be organized by not only keywords and categories but also relations andvisual properties. We also proposed a set of algorithms to automatically extractthe proposed semantic model automatically from large collection of multimedianews reports.
Keywords Multimedia news exploration · Semantic entity-relationship model ·Visual recommendation
This work is supported by Shanghai Pujiang Program under 08PJ1404600, NSF-China under60803077, Shanghai leading academic discipline project under B412 and East China NormalUniversity Science Innovation Fund.
H. Luo (B)Shanghai Key Laboratory of Trustworthy Computing,East China Normal University, Shanghai, Chinae-mail: [email protected]
J. Fan · Y. ZhouDepartment of Computer Science, University of North Carolina-Charlotte,Charlotte, NC, USA
J. Fane-mail: [email protected]
Y. Zhoue-mail: [email protected]

626 Multimed Tools Appl (2011) 51:625–648
1 Introduction
Reading or watching news is one of the most important approaches to receive infor-mation for most people. Thousands of producers generate and broadcast millions ofnews stories everyday. However, most users may have very unique interest thereforeare interested in only a few ones. As a result, it is a difficult task to find an interestingnews reports for most users. Traditionally, the news reports are organized under acategory tree with headline recommendations under each category. In addition, mostnews sites provide a keyword-based search approach to enable the users find theirnews stories of interest via keywords. However, the traditional approaches cannotsatisfy the users’ demand due to the following significant flaws.
First, it is very difficult to carry multimedia rich contents under the traditionalapproach. Even though the multimedia news contents can be organized by categoriesand keywords, the multimedia contents are used as supplement material under thisframework. However, the users may have much more interest on the multimediacontents than on the text contents sometime, especially the visual contents fromimages and video clips.
Second, the relations among news topics and news objects cannot be representedeasily under traditional framework. Even though a list of related news reports maybe listed under a category or report, the users may not be willing to read it carefullybecause it is time consuming to read the whole list.
Third, the traditional framework lacks the representation of overall summariza-tion of all news reports. As a result, it is very difficult to figure out a rough ideaof recent news events. Consequently, the users may not have detailed demand forexploration or retrieval. The classified browsing approach may show the users somehot topics, but the number of simultaneously displayed topics is very small due tothe limitation of display area. However, the interest diversity among the users maybe very large. Therefore, the hot topic recommendation can only satisfy very limitedusers. In addition, the long title is time consuming to read thus the users may notread the whole recommendation list carefully. One may argue that the users cansearch the news by keywords. But before the users know some rough idea aboutwhat happened recently, the users cannot figure out any suitable keywords for search.Thus, the keyword-based search cannot help much under this situation.
To support more efficient news browsing and organization [42], different visual-ization techniques are adopted to build an easy-to-check rough summarization ofrecent news to help the users to find their topic of interest easily. One commercialsystem, called 10 × 10 [16], organizes 100 icon images associated with 100 mostimportant keywords from text news in a 10 by 10 icon grid. The Google News aresummarized and visualized by two different ways [21, 45]. Statistical informationof news reports [35] could be put on a world map to inform the audience of the“hotness” of regions and the relations among the regions. TimeMine [40] is ableto detect the most important reports and organize them through a timeline withstatistical models of word usage. InSpire [46] transforms the text document collectionof interest to a spatial representation for visualization and analysis. ThemeRiver [17]and ThemeView [19] can visualize a large collection of documents with keywords orthemes over time.
The above visualization techniques provide easy-to-check summarization of re-cent news reports at some aspects thus can help the users to find their own topicof interest. However, none of them propose a uniform framework to model the

Multimed Tools Appl (2011) 51:625–648 627
multimedia semantics of the news reports. As a result, their summarization cannotdirectly disclose the overall multimedia semantics of recent news reports. Therefore,they cannot be widely adopted by many users. Some researchers have proposeddifferent approaches for multi-document news summarization, but most of them aresentence level [1, 2, 32] thus have similar disadvantages of hot topic recommen-dation. In addition, they cannot handle multimedia contents. NewsInEssence [36]can summarize news from multiple document that are retrieved by using predefinedkeywords or sample pages. Its summarization may be good for a specific topic, but itcannot give good general summarization of all topics.
Based on the above observations, the effective news exploration and retrievalframework must first model the multimedia semantics of news reports with asophisticated semantic model and then visualize the semantic model with propervisualization technique so that the users can directly examine the overall summariza-tion of the multimedia semantics of recent news reports. Therefore, three challengingproblems must be resolved for news exploration and retrieval applications: (1) howto model the multimedia semantics uniformly; (2) how to extract the semantic modelautomatically from multimedia news reports; (3) how to visualize and retrieve thesemantic model efficiently and effectively. In this paper we propose a uniform frame-work to resolve the above problems. In Section 2 we propose a novel semantic modelthat is able to represent multimedia semantics in a uniform framework. Section 3will introduce the automatic extraction algorithm for the proposed semantic model.The visualization and retrieval algorithms of our semantic model are introduced inSection 4. Finally we conclude in Section 5.
2 Semantic model for multimedia news
As discussed above, the first challenging problem for efficient multimedia newsexploration and retrieval is to model the multimedia semantics of large-scale newscollections with a proper semantic model. Traditional semantic models, the BoW(Bag of Words) model and the vector space model, have achieved great success ontext document search and classification applications. However, as the multimediasemantics have significant difference with the text semantics, these models performpoor on multimedia contents. To resolve this problem, we propose the semanticentity-relationship model to represent the multimedia semantics of large-scale newscollections.
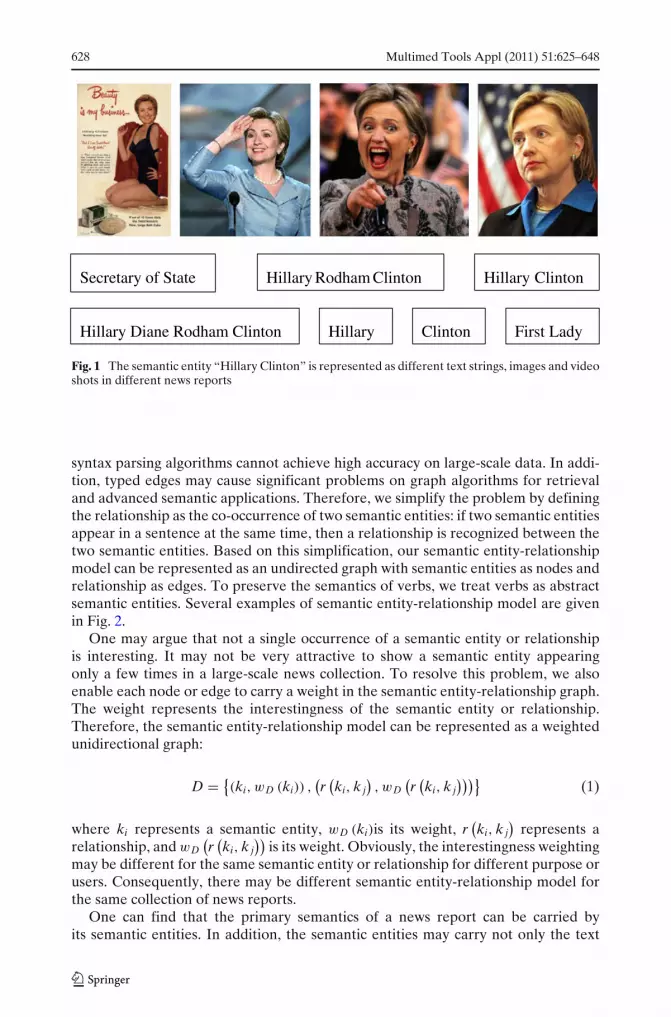
The semantic entity-relationship model is a graph formed by semantic entities asnodes and their relations as edges. The semantic entity is defined as any entity thathas stable and real semantics during a period of time. It can be a person, organiza-tion, location, number, date, product or even mathematical equation. For example,“United States”, “Secretary of State”, “Boeing 747” and “subprime mortgage crisis”are all semantic entities. Further more, each semantic entity can have different namesand visual, textual or audio properties, as shown in Fig. 1.
Aside from the semantic entities, the primary information in news reports are therelationships among semantic entities. Consequently, the semantic model must carrysuch information. To do this, graph structure is used to represent the semantic modelwith semantic entities as nodes and relationships as edges. Ideally, the relationshipamong semantic entities are defined by the verbs in sentences. However, existing
628 Multimed Tools Appl (2011) 51:625–648
Secretary of State Hillary Rodham Clinton Hillary Clinton
Hillary Diane Rodham Clinton Hillary Clinton First Lady
Fig. 1 The semantic entity “Hillary Clinton” is represented as different text strings, images and videoshots in different news reports
syntax parsing algorithms cannot achieve high accuracy on large-scale data. In addi-tion, typed edges may cause significant problems on graph algorithms for retrievaland advanced semantic applications. Therefore, we simplify the problem by definingthe relationship as the co-occurrence of two semantic entities: if two semantic entitiesappear in a sentence at the same time, then a relationship is recognized between thetwo semantic entities. Based on this simplification, our semantic entity-relationshipmodel can be represented as an undirected graph with semantic entities as nodes andrelationship as edges. To preserve the semantics of verbs, we treat verbs as abstractsemantic entities. Several examples of semantic entity-relationship model are givenin Fig. 2.
One may argue that not a single occurrence of a semantic entity or relationshipis interesting. It may not be very attractive to show a semantic entity appearingonly a few times in a large-scale news collection. To resolve this problem, we alsoenable each node or edge to carry a weight in the semantic entity-relationship graph.The weight represents the interestingness of the semantic entity or relationship.Therefore, the semantic entity-relationship model can be represented as a weightedunidirectional graph:
D = {(ki, wD (ki)) ,
(r(ki, k j
), wD
(r(ki, k j
)))}(1)
where ki represents a semantic entity, wD (ki)is its weight, r(ki, k j
)represents a
relationship, and wD(r(ki, k j
))is its weight. Obviously, the interestingness weighting
may be different for the same semantic entity or relationship for different purpose orusers. Consequently, there may be different semantic entity-relationship model forthe same collection of news reports.
One can find that the primary semantics of a news report can be carried byits semantic entities. In addition, the semantic entities may carry not only the text

Multimed Tools Appl (2011) 51:625–648 629
Fig. 2 Examples of semantic entity-relationship model
semantics but also the multimedia semantics from relevant images and video shots.Furthermore, the relations among semantic entities can be carried by the edges ofthe semantic entity-relationship model. Therefore, our proposed model can preservemore information than the traditional BoW model and vector space model. It canmodel the semantics of not only a single news report but also a collection of newsreports. Moreover, the multimedia semantics can be modeled uniformly in the model.Consequently, the proposed model is better than traditional models.
However, no matter how many nice properties it has, the model cannot beused without efficient automatic extraction algorithm and interestingness weightingalgorithm. To resolve this problem, we propose an algorithm to extract semanticentity-relationship model from a large-collection of multimedia news report. Belowwe will introduce the model extraction algorithm in the next section.
3 Automatic extraction of semantic entity-relationship model
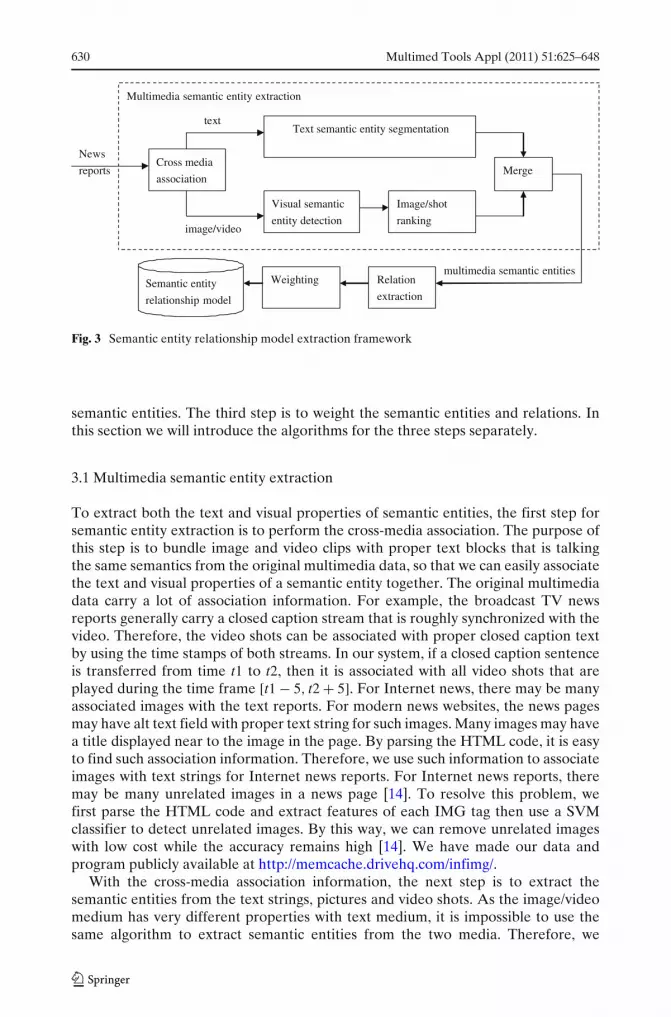
As the semantic entity-relationship model is complex, it cannot be extracted in onesimple step. Based on the structure of our proposed model and current techniquesituations, we design our model extraction framework as Fig. 3 shows. The frame-work contains three major steps. The first step is to extract the multimedia semanticentities from raw news report data. The second step is to extract relations among
630 Multimed Tools Appl (2011) 51:625–648
Multimedia semantic entity extraction
multimedia semantic entities
News
reports
Weighting Relation
extraction
Cross media
association
Text semantic entity segmentation
Visual semantic
entity detection
Image/shot
ranking
Merge
text
image/video
Semantic entity
relationship model
Fig. 3 Semantic entity relationship model extraction framework
semantic entities. The third step is to weight the semantic entities and relations. Inthis section we will introduce the algorithms for the three steps separately.
3.1 Multimedia semantic entity extraction
To extract both the text and visual properties of semantic entities, the first step forsemantic entity extraction is to perform the cross-media association. The purpose ofthis step is to bundle image and video clips with proper text blocks that is talkingthe same semantics from the original multimedia data, so that we can easily associatethe text and visual properties of a semantic entity together. The original multimediadata carry a lot of association information. For example, the broadcast TV newsreports generally carry a closed caption stream that is roughly synchronized with thevideo. Therefore, the video shots can be associated with proper closed caption textby using the time stamps of both streams. In our system, if a closed caption sentenceis transferred from time t1 to t2, then it is associated with all video shots that areplayed during the time frame [t1 − 5, t2 + 5]. For Internet news, there may be manyassociated images with the text reports. For modern news websites, the news pagesmay have alt text field with proper text string for such images. Many images may havea title displayed near to the image in the page. By parsing the HTML code, it is easyto find such association information. Therefore, we use such information to associateimages with text strings for Internet news reports. For Internet news reports, theremay be many unrelated images in a news page [14]. To resolve this problem, wefirst parse the HTML code and extract features of each IMG tag then use a SVMclassifier to detect unrelated images. By this way, we can remove unrelated imageswith low cost while the accuracy remains high [14]. We have made our data andprogram publicly available at http://memcache.drivehq.com/infimg/.
With the cross-media association information, the next step is to extract thesemantic entities from the text strings, pictures and video shots. As the image/videomedium has very different properties with text medium, it is impossible to use thesame algorithm to extract semantic entities from the two media. Therefore, we

Multimed Tools Appl (2011) 51:625–648 631
propose different algorithms for the two media. We will introduce them separatelyin the following sub sections.
3.1.1 Visual semantic entity extraction
It has been a big challenge for many years to identify as many semantic objects aspossible from images and video shots [4, 6, 10, 15, 27, 39]. Even though with the mostsophisticated techniques, it is impossible to identify semantic objects in images andvideo shots with the granularity and accuracy as we can do in text. However, thevisual semantic entities are very attractive for the users, if not more attractive thanthe text ones. As a result, there is a big gap between the users’ demand for multimediasemantic entities and the level of available technique.
As it is impractical to extract enough semantic entities directly from imagesand video shots, we propose a work around to resolve this problem. In everydaynews reports, an important event may be repeated again and again page by pageand channel by channel. Consequently, the relevant text semantic entities may beaddressed many times and may be associated with different visual semantic entitiesat different time. Apparently, it is impossible and unnecessary to present all visualsemantic entities to the users with one text semantic entity. It is good enough topresent the one best matching the semantics of the text semantic entity among thesevisual semantic entities.
Based on the above observation, in our system, the whole images and video shotsare used as visual semantic entities. Instead of identifying the detailed semanticentities from the images and video shots, we rank the images and video shots bytheir coarse visual semantic entities and concepts. We detect only the visual semanticentities and concepts from the images and video shots that are commonly interestingfor normal users, such as water, grass, crowd, sand, face, text, and so on. Apparently,it is still a challenging problem to detect these visual semantic entities from imagesand video shots. Existing approaches can be classified in three categories: (a) whole-image or physical video shot based approaches [13, 37], (b) region-based approaches[7, 8, 11, 28], and (c) object-based approaches [20]. Each category is problematic.Whole-image or physical video shot-based approaches are simple. However, featuresthat are extracted from the whole images or physical video clips carry both relevantinformation of underlying semantic entities and irrelevant background information.As a result, the classification performance may be decreased dramatically. Region-based approaches segment images and video clips into homogeneous regions andextract the features from the homogeneous regions. The problem for the region-based approaches is that the semantic entities are not necessarily homogeneousin their visual properties. Consequently, a homogeneous region may be only partof a semantic entity. The object-based approaches try to segment the images andvideo clips into semantic entities directly. Nevertheless, automatic semantic entityextraction in general is an ill-defined problem because homogeneous regions in color,texture, or motion do not correspond directly to the semantic entity [38, 44, 48].
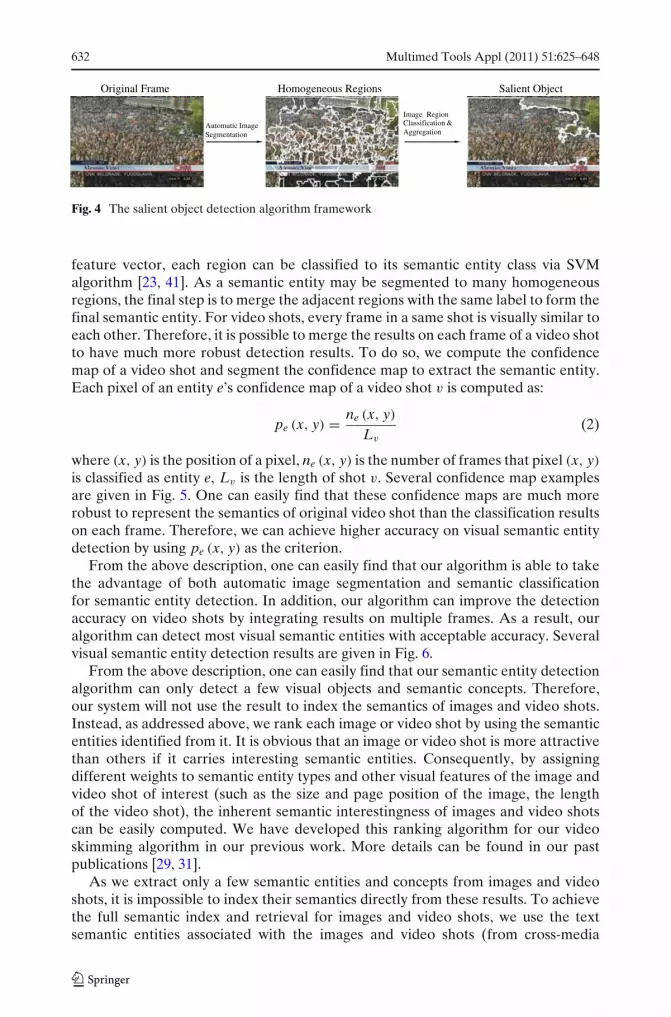
To resolve this problem, we propose a semantic entity detection algorithm byintegrating automatic image segmentation and SVM classification, as shown in Fig. 4.First, the original image or video frame is segmented to homogeneous regions viaautomatic image segmentation algorithm, such as the MeanShift algorithm [9]. Thenthe visual features (e.g. color histogram, position, size, texture) are extracted fromeach homogeneous region and form a high-dimensional feature vector. With this
632 Multimed Tools Appl (2011) 51:625–648
Automatic Image Segmentation
Image Region Classification & Aggregation
Original Frame Homogeneous Regions Salient Object
Fig. 4 The salient object detection algorithm framework
feature vector, each region can be classified to its semantic entity class via SVMalgorithm [23, 41]. As a semantic entity may be segmented to many homogeneousregions, the final step is to merge the adjacent regions with the same label to form thefinal semantic entity. For video shots, every frame in a same shot is visually similar toeach other. Therefore, it is possible to merge the results on each frame of a video shotto have much more robust detection results. To do so, we compute the confidencemap of a video shot and segment the confidence map to extract the semantic entity.Each pixel of an entity e’s confidence map of a video shot v is computed as:
pe (x, y) = ne (x, y)
Lv
(2)
where (x, y) is the position of a pixel, ne (x, y) is the number of frames that pixel (x, y)
is classified as entity e, Lv is the length of shot v. Several confidence map examplesare given in Fig. 5. One can easily find that these confidence maps are much morerobust to represent the semantics of original video shot than the classification resultson each frame. Therefore, we can achieve higher accuracy on visual semantic entitydetection by using pe (x, y) as the criterion.
From the above description, one can easily find that our algorithm is able to takethe advantage of both automatic image segmentation and semantic classificationfor semantic entity detection. In addition, our algorithm can improve the detectionaccuracy on video shots by integrating results on multiple frames. As a result, ouralgorithm can detect most visual semantic entities with acceptable accuracy. Severalvisual semantic entity detection results are given in Fig. 6.
From the above description, one can easily find that our semantic entity detectionalgorithm can only detect a few visual objects and semantic concepts. Therefore,our system will not use the result to index the semantics of images and video shots.Instead, as addressed above, we rank each image or video shot by using the semanticentities identified from it. It is obvious that an image or video shot is more attractivethan others if it carries interesting semantic entities. Consequently, by assigningdifferent weights to semantic entity types and other visual features of the image andvideo shot of interest (such as the size and page position of the image, the lengthof the video shot), the inherent semantic interestingness of images and video shotscan be easily computed. We have developed this ranking algorithm for our videoskimming algorithm in our previous work. More details can be found in our pastpublications [29, 31].
As we extract only a few semantic entities and concepts from images and videoshots, it is impossible to index their semantics directly from these results. To achievethe full semantic index and retrieval for images and video shots, we use the textsemantic entities associated with the images and video shots (from cross-media

Multimed Tools Appl (2011) 51:625–648 633
Imag
eFa
ceTe
xtT
ree
Wat
erfa
llSk
yW
ater
Cat
Sand
Skin
Fig. 5 Confidence maps examples of difference visual semantic entities

634 Multimed Tools Appl (2011) 51:625–648
Fig. 6 Examples of detected visual semantic entity. The upper-left is “water surface”, the upper-rightis “sand”, the bottom-left is “text”, the bottom-right is “face”
association) as the primary semantic index. Therefore, it is very important to extractaccurate text semantic entities from the text strings associated with images and videoshots. We propose the algorithm in the next sub section.
3.1.2 Text semantic entity extraction
The text semantic entity is similar to the named entity. As a result, a potentialapproach for detecting it is to adopt algorithms for named entity detection. The mostadvanced named entity detection algorithm is the CRF (Conditional Random Field)-based algorithm [25, 33]. However, because the CRF-based algorithm generally canonly utilize short context information and part of linguistic features, it performs verypoor on new semantic entities that the classifier have never seen in the training data.However, the new semantic entities are even more interesting than the old ones innews retrieval and exploration applications because they may really relevant to newsevents.
It is obvious the new semantic entities have significant different statistical prop-erties than common strings. Or else it will not have stable semantics thus is not asemantic entity. Therefore, a novel algorithm that can take the advantages of shortcontext information, linguistic features and statistical features are needed to detectthe semantic entity. An easy fix to achieve this is to add the statistical featuresinto the CRF feature set and use the CRF to train on the expanded features [12].Nevertheless, this method requires the system to extract statistical features of alloccurred adjacent string combinations (in a given window size, for example 6 in our

Multimed Tools Appl (2011) 51:625–648 635
Fig. 7 Text semanticentity scan
The ruling by [ Judge Susan R. Bolton ] , in a lawsuit against
1w 2w 3w 4w1c2− −
c 1c 2c
Scan Window
system) in the data no matter whether it is a potential entity or not. As the ratio ofthe true semantic entities among all adjacent string combinations is very small (1∼3%in real data), most computation power is wasted on extracting statistical features ofnon-entity strings in this method. Because the cost to extract statistical features isvery high, the overall speed is unacceptable.
To resolve this problem, we propose an approach that integrates the CRF inter-mediate probabilities, statistical features and linguistic features as the multi-modalfeatures to perform classification in multiple steps. From the viewpoint of the topmost level, our algorithm scans the input sequence of words with a variable windowand classifies the string in the scan window to entity or non-entity, as Fig. 7 shown.We name the string in the scan window as s = (w1, ..., wn), where wi is a word, and thesentence that s lies in as ξ = (..., c−2, c−1, s, c1, c2, ...), where c j is a context word. Tosimplify the implementation, we limit the maximal n to 6 in our system. It means wecheck all consecutive strings with 1 to 6 words for entity and non-entity classification.Several features are extracted for each of the classification. The features used inour system are listed in Table 1. In Table 1, Bl (s) is the probability that a semanticentity starts between c−1 and w1 in text stream based on the observation ξ . It can becomputed via a CRF model [33]. So does Br (s). Bm (s) is the average probability thatwords w2, ..., wn−1 are in the middle of an entity. It can also be extracted via a CRFmodel. Cl (s) is the inverse document frequency (IDF) [24] of c−1. Words with highidf may inherently have higher probability to lead a semantic entity, such as “the”.Therefore, Cl (s) may carry useful information for semantic entity detection. So doesCr (s). The four features discussed above can be computed in advance via manuallyannotated training data.
R (s) is the internal word relevance of s:
R (s) = n × f (s)∑n
i=1 f (wi)(3)
where f (s) is the frequency that string s occurs in recent news report sentences.R (s) measures the internal word relevance of in s. If R (s) is close to 0, it means the
Table 1 Features for semantic entity detection
Group Feature(s) Explanation
Sequence Bl (s), Bm (s) and Br (s) Label probability of wordsLinguistic Cl (s) and Cr (s) Left and right context IDFStatistical R (s) Internal relevanceStatistical El (s) and Er (s) Left and right context entropy

636 Multimed Tools Appl (2011) 51:625–648
Table 2 Context examplesof “Gulf oil spill”
Lessons of the Gulf oil spill at the 100-day markThe Gulf Oil Spill : an assessment ongoing
Gulf Oil Spill : bye-bye BonnieJuly 28, 2010 Gulf Oil Spill situation update
Tax credit from Gulf oil spill
occurrence ofs is just by chance. Therefore, only s with high R (s) can be a semanticentity. El (s) is the word context entropy measured at the position −1:
El (s) = −∑
x∈�(s,c−1)
p (x) log (p (x)) (4)
where �(s, c−1) is the set of words that may appear in front of s (i.e. at position −1),p (x) is the probability that word x appears in front of s. El (s) can be computed via alarge collection of recent news reports. So does Er (s). A semantic entity may appearin different context, as the example in Table 2. The more complex the context are, thehigher probability will s be a semantic entity. Therefore, the context entropy El (s)and Er (s) carry useful information for semantic entity detection and can be used asthe features for classification. Because the statistical features measure the propertiesof recent news reports, there is no need to train R (s), El (s) and Er (s) in advance.They are extracted from the data to be processed. In addition, to preserve as muchinformation in the feature vector as possible, we extract the statistical features for sfrom the adjacent text window (−50 and +50 words), the same report and the wholereport set of the day.
Among the above features, Bl (s), Br (s) and Bm (s) can be estimated via apre-trained CRF model thus it can be computed efficiently. Cl (s) and Cr (s) canbe retrieved from a pre-computed table thus it can also be computed efficiently.However, the statistical features R (s), El (s) and Er (s) may be very time consumingto compute. It is because there are too many instances of s in a large volume ofdata. Nevertheless, most instances of s is non-entity strings. Therefore, if we computeall features for all instances of s, most computation power is wasted on non-entitystrings. In addition, the training set for the final classifier is extremely imbalanced,resulting in bad classification performance and slow classifier training [18, 22]. Theimbalanced data set problem is very common for multimedia applications [14, 47].Therefore, it is very important to resolve this problem efficiently and effectively.
To resolve this problem, we propose to use a high recall classification algorithmto filter out most non-entity strings while preserve most entity strings before theclassification, as shown in Fig. 8. By using a high recall classification algorithm onlow cost features in advance, most non-entities are filtered out. Consequently, thefollowing steps need only to compute the features of remaining strings. As a result,the overall speed is increased significantly.
To use the proposed method, it is very important to used a classifier with veryhigh recall (close to 100%) and acceptable precision yet with very low computationcomplexity as the filter. To resolve this problem, we have proposed an automatic rulefiltering algorithm. The algorithm extracts a set of rules from the training set thatmatches much lower ratio of positive samples than in the training set. Therefore, therule set will primarily match the negative samples. By removing samples matching theextracted rule set, many negative samples can be removed and most positive samples

Multimed Tools Appl (2011) 51:625–648 637
CRF
IDF
Filter
( ) ( ) ( )sBsBsB rml ,,
( ) ( )sCsC rl ,
( )sR
Filtered non-entities
Filter
Filtered non-entities
( ) ( )sEsE rl ,
SVM
Non-entities
Entities
Filter
Filtered non-entities
Fig. 8 Automatic filter algorithm framework
can be preserved to the next step. To make this idea possible, a good rule extractionalgorithm must be proposed. Our automatic rule extraction algorithm is introducedbelow.
For a binary classification sample set �, we can safely assume the number ofpositive samples in � is much less than that of negative samples without the riskof losing the generalization ability. Let fi be the i-th dimension feature, then singledimension rules can be defined on fi as (5). It means if a sample’s i-th dimension isequal or greater than c (or equal or less than c), it matches the rule R j. More complexrules can be defined by using logic-and of multiple single dimension rules on differentdimensions, as (6) shown.
R j ≡ ( fi ≥ c) or R j ≡ ( fi ≤ c) (5)
R j ≡ R j1 ∧ R j2 ∧ R j3 . . . ∧ R jn (6)
Obviously, many rules can be extracted from � but most of them are useless andeven have negative effects. A good filtering rule must satisfy the following criteria:
1. It matches as few positive samples as possible;2. It matches as many negative samples as possible.
To select the best filtering rules for our filtering algorithm satisfying above criteria,we first use the following criterion to select the candidate rules:
α(R j) =∣∣�+(R j)
∣∣∣∣�−(R j)
∣∣ < ω
∣∣�+∣∣
|�−| (7)
where �+ (R j
)is the set of positive samples in � that matches R j, and �− (
R j)
isthe set of negative samples in � that matches R j. �+ is the set of positive samplesin �, and �− is the set of negative samples in �. 0 < ω < 1 is a constant used toguarantee selected rules will match higher proportion of negative samples than thatof the training set. However, even though the rules selected by (7) are guaranteed toreduce the negative/positive samples ratio, not all of them are suitable for filtering.Some rules may be a sub rule of other rules
(i.e. �
(R j1
) ⊆ �(R j2
)). Some rules may
match too few samples thus they may be just an over-fit. To resolve this problem, weiteratively select the best rule and apply to the training data via:
R̂ = arg maxR j
{∣∣�− (R j
)∣∣} (8)

638 Multimed Tools Appl (2011) 51:625–648
i.e. we select rules that matches the largest number of negative samples. If tworules match the same number of negative samples, the rule with lowest dimensionis selected:
R̂ = arg minR j
{∣∣Dim(R j)∣∣} (9)
where Dim(R j) is the dimension number of R j. After one rule is selected, it isapplied to the sample set: � ← � − �
(R̂
). Then another rule can be selected with
the modified data. The iteration continues until:
∣∣�(R̂
)∣∣ < λ (10)
where λ is a constant to ensure the selected rule is not an over-fit.Obviously, there are infinite number of possible rules for each dimension based
on (5) if the feature dimension is continuous. It is impossible to test all of them.Fortunately, the number of samples is finite. Therefore, the possible rules are finiteeven though for continuous features if appropriate algorithm is used to searchthe rules. As one dimensional rules are the simplest rules, we first introduce theextraction algorithm for one dimensional rules below.
To search the rules for the i-th feature dimension efficiently, our algorithmsorts the whole sample set � in the increasing order of fi. Sorted set can bedescribed as a sample sequence [v0, v1, v3 . . . vm . . .] and its relevant feature sequenceis
[fi(v0), fi(v1), fi(v3) . . . fi(vm) . . .
], where fi(v j) is the value of the i-th feature
dimension of sample v j. Then the feature sequence[
fi(v0), fi(v1), fi(v3) . . . fi(vm) . . .]
is scanned sequentially and the positive and negative samples are counted passed by.Scan stops at the j-th sample satisfying:
∣∣�+ (fi ≤ fi
(v j
))∣∣∣∣�− (
fi ≤ fi(v j
))∣∣ < ω
∣∣�+∣∣
|�−| ,∣∣�+ (
fi ≤ fi(v j+1
))∣∣∣∣�− (
fi ≤ fi(v j+1
))∣∣ ≥ ω
∣∣�+∣∣
|�−| (11)
For any c2 < fi(v j+1
), a rule satisfying (7) can be defined via (5) and thus it is
a valid candidate rule. However, it is obvious that for any c1 < c2 < fi(v j+1
), rule
R j ≡ (f j ≤ c1
)is a sub rule of rule R j ≡ (
f j ≤ c2). Based on this observation, only
one rule with c = fi(v j)+ fi(v j+1)2 is added to the candidate rule set. By scanning in the
inversed order of feature sequence[
fi(v0), fi(v1), fi(v3) . . . fi(vm) . . .], another rule
may be found by adopting the above principal. Therefore, up to two candidate rulescan be found for each dimension.
Multiple-dimension rules defined as the form of (6) consist of several sub-rulescovering different dimensions. For a n-dimension rule R j, it may be the logic-and oftwo rules:
R j = R j1 ∧ R j2 (12)
where R j1 is a n − 1 dimensional rule and R j2 is a one dimensional rule. Apparently,both R j1 and R j2 do not satisfy (7) on � even if R j satisfies it. But if we check R j2on �
(R j1
), then R j2 satisfies (7) on �
(R j1
)iff R j satisfies (7) on �. Based on this
observation, we design the multiple-dimension rules extraction algorithm as Table 3.

Multimed Tools Appl (2011) 51:625–648 639
Table 3 Multiple-dimensionrules extraction algorithm
For each combination of n dimensional features doFor each rule R j1 on the first n − 1 dimensional features do
Compute �(R j1
).
Find R j2 on �(R j1
)based on the n-th dimension.
Add R j = R j1 ∧ R j2 to the candidate rule set.End for
End for
It is easy to know the computation complexity of above rule extraction algorithm
is O((
Nk
)× Mk
), where N is the dimension of feature space, M is the number
of training samples and k is the maximal dimension of rules. Apparently, it’s tootime consuming to search rules with large k. But according to our experiments, thefiltering algorithm performs well on k = 1 or k = 2. Therefore, we only search for oneand two dimensional rules in our experiments. For k = 2, the overall computationcomplexity is O
((M × N)2).
We have evaluated our filtering algorithm on real data. To better evaluate theperformance of our algorithm, we test our algorithm on Chinese and English data.Six months of news reports (January–June 1998) from People’s Daily are used asthe training data and the LCMC [34] is used as the test data. We adopt this testcriterion because LCMC has much higher diversity on topic than People’s Dailyreports. Therefore, this test can be used to evaluate the algorithm’s ability to detectnew entities that are never meet in the training set. BNC XML1 collection is used asthe English data. As the BNC XML collection is very large, we randomly select 64MB of text as training set and another 64 MB of text as test set.
In our test, we set ω = 2−30 so that the algorithm will not remove any positivesamples from the training set. We set λ = 10 so that the extracted rules haveenough generalization ability. With this set of parameters, the results of our filteringalgorithm is shown as in Fig. 9. One can easily find that our algorithm is able toremove most negative samples with cheap features. On both dataset, the first filterstep remove more than 90% of negative samples. As this step only uses the mostcheap features, it implies that the filtering algorithm may speed up the overall entitydetection up to 10–50 times. Due to extremely high computation cost, we are unableto evaluate the real speed up gain.
After the above filtering algorithm is applied to the data, most negative samplesare removed. Then the remaining samples are feed to the final classification algo-rithm. We use SVM to train the classifier. LibSVM [5] is used in our system. Wehave evaluated the overall classification performance of the filtering algorithm plusSVM classification on the test data. The results are shown in Fig. 10. We evaluate theclassification performance by precision, recall and F-score, denoted by “P”, “R” and“F” separately in Fig. 10. We also compared our algorithm with the CRF algorithm
1Data cited herein has been extracted from the British National Corpus Online service, managedby Oxford University Computing Services on behalf of the BNC Consortium. All rights in the textscited are reserved. Please visit http://www.natcorp.ox.ac.uk/XMLedition/ for more information.

640 Multimed Tools Appl (2011) 51:625–648
(a) Chinese (b) English
0Total 1 2 3 Total 1 2 3
20
40
60
80
10092.5 90.1 99.0 98.3% %
0
20
40
60
80
100
58.9
6.514.1 11.3
Fig. 9 Filter algorithm effect. The vertical axis is the ratio of negative samples that is filtered by thealgorithm. The “1”, “2” and “3” denote the filter steps
with cheap short context features only. One can easily conclude that the statisticalfeatures do improve the entity detection performance.
3.2 Relation extraction
The semantics of news reports may be represented as two major aspects: the semanticentities and their relations. With the above algorithm, we are able to extract semanticentities efficiently and effectively. The next step is to extract the relations amongsemantic entities. Ideally, the relations should be the actions taken by the semanticentities. However, existing natural language parsing algorithms cannot extract theverbs with acceptable accuracy. Therefore, we simplify this problem by defining therelation as the simultaneous occurrence of two semantic entities. The “simultaneousoccurrence” of two entities is defined as they are addressed in a same sentence, animage or a video shot. As long as two semantic entities are identified simultaneouslyin a sentence, an image or a video shot, an undirected and typeless relation is definedbetween them. As a result, the semantic entity relationship model is an undirectedgraph with semantic entities as nodes and relations as edges.
(a) Chinese (b) English
0
10
20
30
40
50
60
70
80
0
10
20
30
40
50
60
70
P R
CRF+SVM CRF CRF+SVM CRF
F P R F
Fig. 10 Overall classification performance

Multimed Tools Appl (2011) 51:625–648 641
3.3 Weighting
With the above algorithms, all semantic entities and relations can be extracted.However, not all semantic entities and relations are equally important. If a semanticentity or relation is addressed only few times in whole day’s news reports, it maynot be an interesting news topics for most users. Therefore, the semantic entityrelationship model is useless if we cannot weight the semantic entities and therelations with the user’s interestingness.
An easy fix for this problem is to use the frequency as the weights of semanticentities and relations. The idea is that an important news topic must be addressedchannel by channel and program by program. As a result, frequent items may implymore interesting items. Based on this observation, we define the raw semantic entityrelationship model as the model with the normalized frequency as the weights of thesemantic entities and relations:
D0 = {(ki, P (ki)) ,
(r(ki, k j
), P
(r(ki, k j
)))}
P (ki) = f (ki)∑i f (ki)
P(r(ki, k j
)) = f(r(ki, k j
))
∑i
∑j f
(r(ki, k j
)) (13)
where f (∗) is the occurrence count of an item in the data collection of interest.Apparently, P (∗) is an approximation of the item probability. Therefore, the rawsemantic entity model can be used as two probability distributions in computation.
The raw semantic entity model is easy to extract and may represent some aspect ofnews topic interestingness. However, the raw frequency of an item may not directlyrelevant to its interestingness. For example, many high-frequent entities, such as“U.S.” and “Obama”, are not very attractive for most users. It is because that theaudiences are already very familiar with these items. Based on this understanding,only the unknown items is interesting for the users, analog to the “human bites vs.dog bites” example. Therefore, if we can model the user’s all knowledge with a modelK, then we can use K to predict our semantic entity relationship model and weightsthe semantic entities and relations (items in the following paper for simplicity): theworse an item is predicted, the more interesting will it be.
You may argue it is mission impossible to build an accurate user knowledgemodel because the users may learn information from uncontrollable ways, such asfrom a friend’s big mouth. However, by carefully checking all the routes a pice ofinformation is received by a user, one can easily conclude that most information willbe rooted from a public report as few people have secrete information source. As aresult, if we can collect all the public reports from Internet and TV broadcasts, thenwe can approximate the user’s knowledge model by analyzing this data collection.
Based on the above observation, the user’s knowledge model K can be extractedfrom the historical news report collection. Certainly, not all reports in the collectionmay have equal impact to K. A user may spend some time to learn an item after it hasbeen broadcasted public at the first time due to the information route delay. A usermay forget an item if she did not hear it for a long time. Therefore, the effect of anitem on a user’s knowledge model may be modeled as a learning and forgetting curve.

642 Multimed Tools Appl (2011) 51:625–648
In addition, the broadcast of an item may be modeled as a Dirac delta function. Asa result, the user knowledge mode can be computed by the convolution betweenthe items and the learning and forgetting curve according to the signal processingtheory:
K = {(ki, μ (ki))
∣∣μ (ki) = ∫f (ki, tl) gU (t − tl) dtl
}(14)
where ki is a semantic entity or relation, f (ki, tl) = δ at tl if ki is broadcasted at tland f (ki, tl) = 0 otherwise. As the convolution can be efficiently computed via wordfrequency table operations, the user knowledge model can be extracted efficientlyfrom historical news report collection.
With the user knowledge model K extracted, the next step is to predict theitems in the raw semantic entity relationship model and weights them accordingly.Apparently, K can be normalized and treated as two probability distributions.Consequently, the prediction is analog to evaluate the difference of distributions.Therefore, we use the KL-divergence to quantitatively compute the differencebetween K and D0:
d (K ‖ D0) =∑
i
P (ki) logP (ki)
μ (ki)(15)
Apparently, d (K ‖ D0) measures the total difference between K and D0. Tomeasure each item’s interestingness, (15) must be decomposed to evaluate thecontribution of each item:
w0 (ki) = P (ki) logP (ki)
μ (ki)(16)
In (16), one can observe that the interestingness measurement w0 (ki) for one certainitem ki depends on two factors: P (ki) and P(ki)
μ(ki). The first factor P (ki) characterizes
the current data distribution and the second factor P(ki)
μ(ki)characterizes the difference
with the user knowledge model K. Equation 16 may emphasize the local probabilitytoo much in some situations. For example, in real news videos, an anchorperson mayappear many times repeatedly in the same news program and may also appear indifferent news programs from the same TV channel. Thus the item for him/her mayalways have high frequency thus (16) may emphasize these items too much.Based onthis observation, only the second factor is used to characterize the interestingness ofitems:
w1 (ki) = P (ki)
μ (ki)(17)
The w1 (ki) in (17) can be normalized to simplify later computation:
w2 (ki) = w1 (ki)
maxi {w1 (ki)} (18)
Based on the above observation, w2 (ki) is a good measurement for the user’sinterestingness on semantic entities and relations. In our system, all semantic entityrelationship models will be weighted by the above algorithm:
D1 = {(ki, w2 (ki)) ,
(r(ki, k j
), w2
(r(ki, k j
)))}(19)

Multimed Tools Appl (2011) 51:625–648 643
4 Visualization and retrieval
With the above algorithms, we can extract a semantic entity relationship model thatcan preserve most multimedia semantics and user’s interestingness. However, themodel data in their raw format are unattractive apparently. In addition, the modelis very large. If all data are presented simultaneously to the users, it will be a bigchaos no matter what presentation method is used. To resolve this problem, we haveproposed to integrate the visualization techniques to visually present the model tothe user, so that the users can directly check the model via vision. In our system,hyperbolic visualization technique [26, 43] is used to visualize the model because it isdesigned for large graph and tree visualization. A control called Treebolic [3] is usedto implement the hyperbolic visualization. Several examples of the visualization aregiven in Fig. 11. Hyperbolic visualization technique also enables the user to checkthe model at different viewpoint. Several views of the model for May 3, 2010 is givenin Fig. 12.
The visualization technique not only presents the model directly to the usersbut also provides an easy way to input query. The users need only click the iconof interest on the visualization interface to specify their preference. With the clickinformation, the system is able to know the user’s current point of interest andadjust the model to adapt the user’s need. We have proposed an interestingness
(a) Model for April 27, 2010 (b) Model for April 29, 2010
(c) Model for May 1, 2010 (d) Model for May 3, 2010
Fig. 11 Semantic entity relationship models visualized with hyperbolic visualization

644 Multimed Tools Appl (2011) 51:625–648
Fig. 12 Different views of the model for May 3, 2010
propagation algorithm on a weighted graph model in our previous work [30]. Withthis algorithm, semantic entities and relations can be emphasized according to theirsemantic correlation with the clicked item. As a result, the adjusted model matchesthe user’s current point of interest better. The adjusted model can be used as theretrieve results of the clicked icon on the model. Two examples of retrieve on themodel for May 3, 2010 is given in Fig. 13.
(a) Adjusted model for "spill" (b) Adjusted model for "time square"
Fig. 13 Retrieve the model for May 3, 2010

Multimed Tools Appl (2011) 51:625–648 645
5 Conclusions
In this paper we have proposed the semantic entity relationship model to representthe multimedia semantics of news reports. We also propose a set of algorithms toextract the semantic entity relationship model from multimedia data automatically.Therefore, it is practical to automatically model the semantics of the multimedianews reports by using our model. As our model preserve keyword, relation, visualproperties and user’s interestingness in a uniform framework, our model can pro-vide more usefulness than traditional models for multimedia news exploration andretrieval. We have presented examples of exploring and retrieving our model viavisualization techniques.
References
1. Barzilay R, Elhadad N, McKeown KR (2002) Inferring strategies for sentence ordering inmultidocument news summarization. J Artif Intell Res 17:35–55
2. Bollegala D, Okazakia N, Ishizukaa M (2010) A bottom-up approach to sentence ordering formulti-document summarization. Inf Process Manag 46(1):89–109
3. Bou B (2005) Hyperbolic tree engine, generator, browser. http://treebolic.sourceforge.net/4. Carson C, Thomas M, Belongie S, Hellerstein JM, Malik J (1999) Blobworld: a system for region-
based image indexing and retrieval. In: International conference on visual information systems,pp 509–516
5. Chang C-C, Lin C-J (2001) LIBSVM: a library for support vector machines. Software availableat http://www.csie.ntu.edu.tw/∼cjlin/libsvm
6. Chang S, Chen W, Sundaram H (1998) Semantic visual templates: linking visual features to sem-antics. In: IEEE workshop on content based video search and retrieval, Chicago, IL, pp 531–535
7. Chen Y, Wang JZ (2002) A region-based fuzzy feature matching approach to content-basedimage retrieval. IEEE Trans Pattern Anal Mach Intell 24(9):1252–1267
8. Chen Y, Wang JZ (2004) Image categorization by learning and reasoning with regions. J MachLearn Res 5:913–939
9. Comanicu D, Meer P (2002) Mean shift: a robust approach toward feature space analysis. IEEETrans Pattern Anal Mach Intell 24(5):603–619
10. Fan J, Gao Y, Luo H (2008) Integrating concept ontology and multitask learning to achieve moreeffective classifier training for multilevel image annotation. IEEE Trans Image Process 17:407–426
11. Fauqueur J, Boujemaa N (2004) Region-based image retrieval: fast coarse segmentation and finecolor description. J Vis Lang Comput 15(1):69–95
12. Finkel JR, Grenager T, Manning C (2005) Incorporating non-local information into informa-tion extraction systems by gibbs sampling. In: The 43rd annual meeting of the Association forComputational Linguistics (ACL 2005), pp 363–370
13. Goh K, Li B, Chang EY (2005) Semantics and feature discovery via confidence-based ensemble.ACM TOMCCAP 1(2):168–189
14. Gong W, Luo H, Fan J (2009) Extracting informative images from web news pages via imbal-anced classification. In: ACM multimedia grand challenge, pp 1123–1124
15. Gupta A, Jain R (1997) Visual information retrieval. Commun ACM 40(5):70–7916. Harris J (2004) Tenbyten. http://tenbyten.org/10x10.html17. Havre S, Hetzler B, Nowell L (2002) Themeriver: visualizing thematic changes in large document
collections. IEEE Trans Vis Comput Graph 8(1):9–2018. He H, Garcia EA (2009) Learning from imbalanced data. IEEE Trans Knowl Data Eng 21:1263–
128419. Hetzler EG, Whitney P, Martucci L, Thomas J (1998) Multi-faceted insight through interoper-
able visual information analysis paradigms. In: IEEE symposium on information visualization,p 137
20. Hoiem D, Sukthankar R, Schneiderman H, Huston L (2004) Object-based image retrieval usingthe statistical structure of images. In: IEEE conference on computer vision and pattern recogni-tion (CVPR), pp 490–497

646 Multimed Tools Appl (2011) 51:625–648
21. In the news (2004) http://stamen.com/projects/inthenews22. Khoshgoftaar TM, Van Hulse J, Napolitano A (2007) Experimental perspectives on learning
from imbalanced data. In: ICML, vol 227. ACM, New York, pp 935–94223. Joachims T (2002) Learning to classify text using support vector machines. Kluwer, Dordrecht24. Jones KS (1972) A statistical interpretation of term specificity and its application in retrieval. J
Doc 28:11–2125. Lafferty JD, McCallum A, Pereira FCN (2001) Conditional random fields: probabilistic models
for segmenting and labeling sequence data. In: International conference on machine learning,pp 282–289
26. Lamping J, Rao R (1996) The hyperbolic browser: a focus+context technique based on hyper-bolic geometry for visualizing large hierarchies. J Vis Lang Comput 7(1):33–55
27. Li B, Goh K (2003) Confidence-based dynamic ensemble for image annotation and semanticdiscovery. In: ACM multimedia, pp 195–206
28. Louchnikova T, Marchand-Maillet S (2002) Flexible image decomposition for multimedia index-ing and retrieval. In: SPIE internet imaging, pp 203–211
29. Luo H, Fan J (2004) Concept-oriented video skimming and adaptation via semantic classification.In: ACM multimedia workshop on multimedia information retrieval (MIR), pp 213–220
30. Luo H, Fan J, Yang J, Ribarsky W, Satoh S (2007) Analyzing large-scale news video databases tosupport knowledge visualization and intuitive retrieval. In: IEEE symposium on visual analyticsscience and technology
31. Luo H, Gao Y, Xue X, Peng J, Fan J (2008) Incorporating feature hierarchy and boosting forconcept-oriented video summarization and skimming. ACM TOMCCAP 4(1):1–25
32. Madnani N, Passonneau R, Ayan NF , Conroy JM, Dorr BJ, Klavans JL, O’Leary DP,Schlesinger JD (2007) Measuring variability in sentence ordering for news summarization.In: Eleventh European workshop on natural language generation
33. McCallum A, Li W (2003) Early results for named entity recognition with conditional randomfields, feature induction and web-enhanced lexicons. In: Natural language learning at HLT-NAACL, pp 188–191
34. McEnery T, Xiao R (2004) The Lancaster corpus of Mandarin Chinese. http://www.lancs.ac.uk/fass/projects/corpus/LCMC/
35. Mehler A, Bao Y, Li X, Wang Y, Skiena S (2006) Spatial analysis of news sources. IEEE TransVis Comput Graph 12(5):765–772
36. Radev D, Otterbacher J, Winkel A, Blair-Goldensohn S (2005) Newsinessence: summarizingonline news topics. Commun ACM 48(10):95–98
37. Rubner Y, Tomasi C (1999) Texture-based image retrieval without segmentation. In: IEEEinternational conference on computer vision (ICCV), pp 1018–1024
38. Shi J, Malik J (2000) Normalized cuts and image segmentation. IEEE Trans Pattern Anal MachIntell 22(8):888–905
39. Snoek CGM, Worring M, Hauptmann AG (2006) Learning rich semantics from news videoarchives by style analysis. ACM TOMCCAP 2:91–108
40. Swan R, Jensen D (2000) Timemines: constructing timelines with statistical models of word.In: ACM SIGKDD, pp 73–80
41. Vapnik V (1995) The nature of statistical learning theory. Springer, Berlin42. Wagstaff J (2005) On news visualization. http://www.loosewireblog.com/2005/05/on_news_
visuali.html43. Walter JA, Ritter H (2002) On interactive visualization of high-dimensional data using the
hyperbolic plane. In: ACM SIGKDD44. Wang JZ, Li J, Gray RM, Wiederhold G (2001) Unsupervised multiresolution segmentation for
images with low depth of field. IEEE Trans Pattern Anal Mach Intell 23(1):85–9045. Weskamp M (2004) Newsmap. http://www.marumushi.com/apps/newsmap/index.cfm46. Wise JA, Thomas JJ, Pennock K, Lantrip D, Pottier M, Schur A, Crow V (1995) Visualizing
the non-visual: spatial analysis and interaction with information from text documents. In: IEEEsymposium on information visualization (InfoVis), pp 51–58
47. Yuan J, Li J, Zhang B (2006) Learning concepts from large scale imbalanced data sets usingsupport cluster machines. In: The 14th annual ACM international conference on multimedia,pp 441–450
48. Zhu S, Yuille AL (1996) Region competition: unifying snakes, region growing, and Bayes/MDLfor multiband image segmentation. IEEE Trans Pattern Anal Mach Intell 18(9):884–900

Multimed Tools Appl (2011) 51:625–648 647
Hangzai Luo received the B.S. degree in computer science from the Fudan University, Shanghai,China, in 1998 and the Ph.D. degree in information technology from the University of North Carolinaat Charlotte. He joined Fudan University as Lecturer in 1998. In 2007, he joined East China NormalUniversity as an Associate Professor. His research interests include computer vision, video retrieval,and statistical machine learning. Dr. Luo received a second-place award from the Department ofHomeland Security in 2007 for his excellent work on video analysis and visualization for homelandsecurity applications.
Jianping Fan received the M.S. degree in theory physics from Northwestern University, Xian,China, in 1994 and the Ph.D. degree in optical storage and computer science from ShanghaiInstitute of Optics and Fine Mechanics, Chinese Academy of Sciences, Shanghai, China, in 1997.He was a Researcher at Fudan University, Shanghai, during 1998. From 1998 to 1999, he was aResearcher with the Japan Society of Promotion of Science (JSPS), Department of InformationSystem Engineering, Osaka University, Osaka, Japan. From September 1999 to 2001, he was aResearcher in the Department of Computer Science, Purdue University, West Lafayette, IN. In2001, he joined the Department of Computer Science, University of North Carolina at Charlotte,as an Assistant Professor, and then became an Associate Professor. His research interests includecontent-based image/video analysis, classification and retrieval, surveillance videos, and statisticalmachine learning.

648 Multimed Tools Appl (2011) 51:625–648
Youjie Zhou received his B.S. degree in software engineering from the East China NormalUniversity, Shanghai, China in 2010. He is a Ph.D. student of the University of North Carolina atCharlotte.