experimental seismic performance evaluation of unreinforced brick masonry buildings
TRANSCRIPT
Experimental Seismic PerformanceEvaluation of Unreinforced BrickMasonry Buildings
Khan Shahzada,a) Akhtar Naeem Khan,b) Amr S. Elnashai,c)
Mohammad Ashraf,d) Muhammad Javed,d) Amjad Naseer,d)
and Bashir Alamd)
This paper presents an experimental study on the performance of a full-scaleunreinforced brickmasonry (URM) building system tested under quasi-static load-ing at the Earthquake Engineering Centre, University of Engineering and Technol-ogy in Peshawar, Pakistan. The configuration andmaterials used in the single-storyURM building are typical of those found in the northern areas of Pakistan affectedby the 2005 Kashmir earthquake. This study is a part of ongoing research for theearthquake impact assessment of the city of Abbottabad. Combined shear and flex-ural behavior was observed during the test. The experimental data was analyzedand is presented in the form of force-deformation hysteresis loops and envelopecurves. Based on the measured data, different performance levels have been estab-lished.Themeasured responseof the test structure is also compared to the estimatedresponse obtained using three capacity evaluation procedures and the two are foundto be in good agreement. [DOI: 10.1193/1.4000073]
INTRODUCTION
A devastating earthquake of magnitude 7.6 on the Richter scale struck the northern partsof Pakistan and Kashmir on 8 October 2005. More than 73,000 people lost their lives, 80,000were injured, and 3.5 million were left homeless (ADB/WB 2005). Most of the casualtieswere the direct result of both partial or full building collapses in one of five districts located inthe Khyber Pakhtunkhwa province (formerly known as the Northwest Frontier province, orNWFP) and Kashmir region (including Mansehra, Battagram, Abbottabad, Shangla, andKohistan). The reconnaissance survey reports indicated that a majority of the unreinforcedbuildings, including those made of stone masonry, brick masonry, and concrete blockmasonry, were either partially or completely damaged (Durrani et al. 2005).
Severe earthquakes are relatively infrequent compared to other types of natural disaster,but they have the potential to be extremely destructive. It is not possible to prevent suchdisasters, but the losses can be mitigated. The Himalayan region is considered to have
Earthquake Spectra, Volume 28, No. 3, pages 1269–1290, August 2012; © 2012, Earthquake Engineering Research Institute
a) Ph.D. student, Department of Civil Engineering, University of Engineering and Technology, Peshawar, Pakistanb) Professor, Department of Civil Engineering, University of Engineering and Technology, Peshawar, Pakistanc) Professor, Department of Civil and Environmental Engineering, University of Illinois at Urbana-Champaign,United States
d) Assistant Professor, Department of Civil Engineering, University of Engineering and Technology, Peshawar,Pakistan.
1269
the potential to produce earthquakes of magnitude 8.0 and greater once every 100 years(Chin and Scawthorn 2003). In recent history, several moderate earthquakes (i.e., Mw 5.0to Mw 5.5) have struck the northern parts of Pakistan. These earthquakes show that thenorth of Pakistan is a seismically active area.
Modern seismic codes can improve new and existing buildings through the evaluation oftheir dynamic response andmechanical performance. Improper design and detailing can makebuildings vulnerable to earthquakes. The enormous losses inflicted by the Kashmir earth-quake were mainly due to the fact that in the absence of a seismic code, buildings were eithernon-engineered or designed for gravity loads only (Javed et al. 2008, Naseer et al. 2010).
Since Pakistan lies in a seismically active region of the world and most of its buildings arevulnerable to earthquakes, a detailed study and seismic risk assessment is required. In order toperform an investigation of the existing buildings in the affected area, a pilot project wasjointly undertaken by the Department of Civil Engineering at the University of Engineeringand Technology in Peshawar, Pakistan and the Mid-America Earthquake Center at theUniversity of Illinois at Urbana-Champaign. The project included a building stock survey,a hazard assessment, and a fragility assessment of the existing buildings in the city ofAbbottabad and was based on field surveys and experimental and numerical studies.
This paper presents an experimental study, conducted as part of the research project men-tioned above, on the seismic performance evaluation of unreinforced masonry buildings(URM) in the study area. Several experimental studies have been carried out worldwideon URM elements. For instance, studies on isolated shear walls and piers have beendone by Epperson and Abrams (1989), Abrams and Shah (1992), Magenes and Calvi(1992), Anthoine et al. (1995), Manzouri et al. (1995), Tomazevic et al. (1996), Craiget al. (2002), Franklin et al. (2003). In addition, Simsir et al. (2002) studied out-of-planewalls. In Pakistan, some work has been done on the behavior of URM isolated piers byJaved (2009), Naseer et al. (2010), and Ashraf (2010), and a full-scale one-room masonrybuilding was tested by Ali (2004) through underground explosion loading. However, only afew researchers have investigated full-scale URM building systems (e.g., Magenes et al.1995, Costley and Abrams 1996, Paquette and Bruneau 2003, Yi 2004, and Yi et al. 2006).
Because of differences in material properties and building geometry, the previousresearch work on URM buildings in other parts of the world cannot be used to develop fra-gility curves and estimate the risk for buildings in Pakistan. Furthermore, the indigenousresearch is limited to isolated piers; therefore it was decided to test a typical URM buildingunder quasi-static reverse cyclic loading to ascertain its seismic response parameters.
EXPERIMENTAL PROGRAM
The building stock survey of the city of Abbottabad indicates that 73% of the stock isnon-engineered URM buildings, out of which 78% are made with burnt clay bricks withreinforced concrete rigid diaphragms. To predict the actual response of the existingURM buildings in the area, a typical model building was selected and constructed at theEarthquake Engineering Centre of the Department of Civil Engineering, University of Engi-neering and Technology in Peshawar (Figure 1). The test specimen was built with construc-tion materials commonly used in the study area.
1270 SHAHZADA ET AL.

The height of the URM structure selected was one story, replicating an internal roomwithin a building. The size and configuration of the test structure was based on the fieldpractice and testing facility. Figure 2 shows a detailed drawing of the building. The sizesof the openings and piers in the in-plane walls were selected according to the pier aspect
Figure 1. Unreinforced brick masonry test structure.
Figure 2. Details of unreinforced brick masonry test structure.
EXPERIMENTAL SEISMIC PERFORMANCE EVALUATIONOF UNREINFORCED BRICKMASONRY BUILDINGS 1271

ratios and wall density ratios of the unreinforced brick masonry buildings in the city ofAbbottabad. A window was provided in one of the out-of-plane walls in order to reducethe flange effect on one side.
The walls were constructed with 9-inch-thick brick masonry in an English bond pattern(with alternate courses of stretchers and headers), which is commonly practiced in the studyarea. Reinforced concrete lintel beams, 6 in. high and 9 in. wide were provided above allopenings. Lintel beams were reinforced with four 1
2-in. diameter longitudinal bars and
3/8-in. diameter stirrups spaced at 6 in. on center. The reinforced concrete roof slabwas 6 in. thick and reinforced with 1
2-in. diameter bars spaced at 9 in. center-to-center
in both directions. To simulate vertical precompression from the adjacent parts of the build-ing, 13.5 in. walls were provided all around the slab over the center line of the walls. Tosimulate dead load from the roof treatment, a 10-inch-thick layer of sand was provided ontop of the roof. The model was constructed on a 7.5-inch-thick reinforced concrete footingthat was secured to the strong floor.
The materials used in the construction of the test structure are given in Table 1. Thecompressive strength and modulus of elasticity of the masonry are based on tests con-ducted on masonry prisms measuring 16 in. long by 16 in. high by 9 in. thick, accordingto ASTM International’s C1314 – 11a Standard Test Method for Compressive Strength ofMasonry Prisms, as shown in Figure 3. Diagonal tensile strength was calculated fromdiagonal compression tests on masonry prisms measuring 27 in. long by 27 in. highby 9 in. thick, as shown in Figure 4. The diagonal strength of the masonry was verylow, which was probably due to the weak bond established between the mortar andbrick because a high initial rate of absorption. The compressive strength of the mortarwas determined according to ASTM International’s C-109/109M 11b Standard TestMethod for Compressive Strength of Hydraulic Cement Mortars. The cement-to-sandratio of 1:6 (one part cement to six parts sand) was based on observations from thefield survey of Abbottabad.
TEST SETUP AND PROCEDURE
The lateral load was applied using a hydraulic jack attached to the strong wall andwas provided with swivel (moment hinges) at each end to release the moment, as shown
Table 1. Material properties
f b Masonry unit compressive strength, psi 1803f mo Compressive strength of mortar, psi 733- Water absorption of bricks, % 23.0- Initial rate of absorption, g/min/30 in.2 91.7f m Masonry compressive strength, psi 438f tu Masonry diagonal tensile strength, psi 7.3Em Elastic modulus of masonry, ksi 178γm Specific weight of masonry material, pcf 93.3
1272 SHAHZADA ET AL.

Figure 4. Diagonal compression test of masonry specimen.
Figure 3. Compressive strength test of masonry prism.
EXPERIMENTAL SEISMIC PERFORMANCE EVALUATIONOF UNREINFORCED BRICKMASONRY BUILDINGS 1273
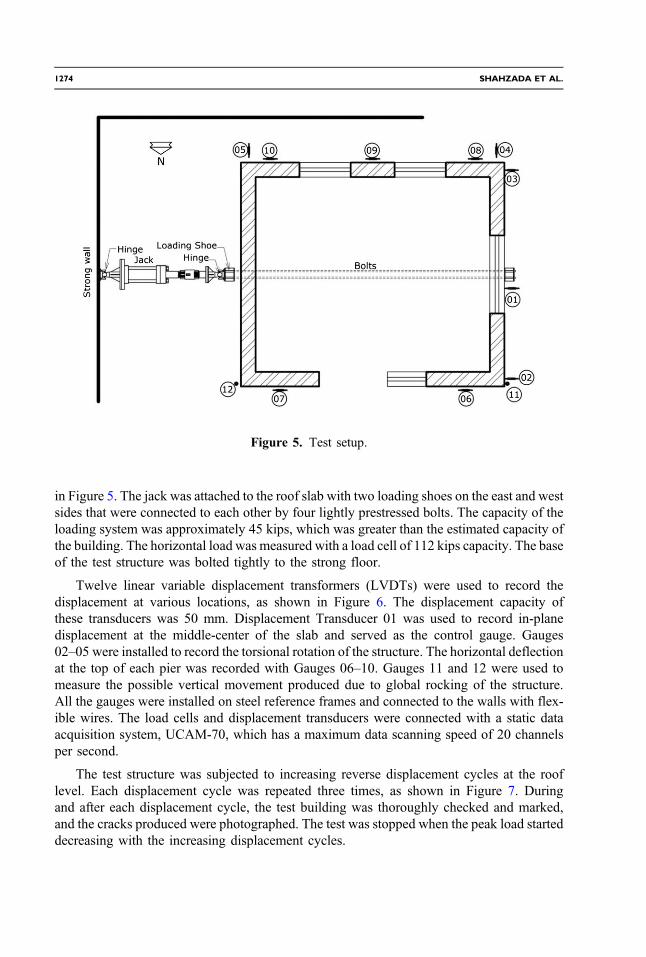
in Figure 5. The jack was attached to the roof slab with two loading shoes on the east and westsides that were connected to each other by four lightly prestressed bolts. The capacity of theloading system was approximately 45 kips, which was greater than the estimated capacity ofthe building. The horizontal load was measured with a load cell of 112 kips capacity. The baseof the test structure was bolted tightly to the strong floor.
Twelve linear variable displacement transformers (LVDTs) were used to record thedisplacement at various locations, as shown in Figure 6. The displacement capacity ofthese transducers was 50 mm. Displacement Transducer 01 was used to record in-planedisplacement at the middle-center of the slab and served as the control gauge. Gauges02–05 were installed to record the torsional rotation of the structure. The horizontal deflectionat the top of each pier was recorded with Gauges 06–10. Gauges 11 and 12 were used tomeasure the possible vertical movement produced due to global rocking of the structure.All the gauges were installed on steel reference frames and connected to the walls with flex-ible wires. The load cells and displacement transducers were connected with a static dataacquisition system, UCAM-70, which has a maximum data scanning speed of 20 channelsper second.
The test structure was subjected to increasing reverse displacement cycles at the rooflevel. Each displacement cycle was repeated three times, as shown in Figure 7. Duringand after each displacement cycle, the test building was thoroughly checked and marked,and the cracks produced were photographed. The test was stopped when the peak load starteddecreasing with the increasing displacement cycles.
Figure 5. Test setup.
1274 SHAHZADA ET AL.

RESULTS AND DISCUSSION
DAMAGE MECHANISM
The damage states of the test structure at different story drift levels are shown inFigures 8–11. Detailed descriptions of the damage patterns at different story drift levelsare given in Table 2.
Cracking started at the beginning of the test, indicating that masonry buildings behavenonlinearly even at very low drift ratios. Since the lateral load was resisted mainly by thein-plane walls (the north and south walls), these suffered more damage in comparison to the
Figure 6. Instrumentation of the test structure.
-0.8
-0.6
-0.4
-0.2
0.0
0.2
0.4
0.6
0.8
Dis
plac
emen
t (in
ch)
Figure 7. Displacement pattern.
EXPERIMENTAL SEISMIC PERFORMANCE EVALUATIONOF UNREINFORCED BRICKMASONRY BUILDINGS 1275

Figure 8. Crack propagation in walls of full-scale URM structure at 0.18% story drift.
Figure 9. Crack propagation in walls of full-scale URM structure at 0.30% drift.
1276 SHAHZADA ET AL.

out-of-plane walls. The behavior of the structure as a whole may be characterized as a com-bination of shear and flexure. Vertical cracks, mostly following the mortar bed and headjoints, were also observed. These were produced by vertical stress and increased as a resultof overturning moments. It was noted that cracks developed at the interface of the mortar andbricks due to the weak bond between the two.
Pier P1 on the north wall developed vertical compression and flexural rocking cracks,while flexural, shear, and vertical cracks were observed in Pier P2 on the same wall. Typicaldiagonal shear cracks, originating from the opening corners and propagating toward the outer
Figure 10. Crack propagation in walls of full-scale URM structure at 0.36% story drift.
Figure 11. Final damage pattern of the test structure.
EXPERIMENTAL SEISMIC PERFORMANCE EVALUATIONOF UNREINFORCED BRICKMASONRY BUILDINGS 1277

corners, were observed in the south wall. These cracks were produced due to rocking and thestress concentration at the opening corners. Some vertical compression cracks were alsoobserved in Piers P3 and P5. Pier P4, the central one on the south wall, first rocked andthen developed diagonal shear cracks at a higher drift ratio. Besides flexural cracks developedin out-of-plane walls, some vertical cracks were also observed at the intersection of the southwall with the east and west walls. These cracks developed because of the poor connectionsbetween the two orthogonal walls.
Similar crack patterns were observed in unreinforced brick masonry buildings damagedduring the Kashmir earthquake (Javed et al. 2008, Naseer et al. 2010), as shown in Figures 12and 13.
FORCE-DEFORMATION BEHAVIOR
The force-deformation behavior of the test structure is given in Figure 14 in the form offorce-deflection hysteresis loops and envelope curves. Story drift is expressed as a ratio of thelateral story displacement to the story height at the load level. As a sign convention, displa-cement and the corresponding load recorded during the westward movement of the jack werecalled positive displacements/loads and vice versa. The envelope curves were obtained by
Table 2. Damage propagation
StoryDrift (%) Damage Description
GoverningFailure Mode
ReferencedFigures
0.18 Stepped shear cracks were observed at the leftand right bottom corners of sill wall of thesoutheast in-plane wall. Small vertical andhorizontal cracks were also noted.
Rocking Figure 8
0.30 The existing cracks widened and new crackswere observed. Stepped shear cracks werenoticed in the spandrel wall above Pier P1.Horizontal and horizontal-cum-vertical crackswere also noticed in the out-of-plane wall.
Rocking andvertical splitting
Figure 9
0.36 Horizontal-cum-vertical cracks were observedin Pier P4. Stepped shear and horizontal crackswere noted in the southeast out-of-plane wall.A horizontal crack was also noted in thenorthwest out-of-plane wall.
Rocking andvertical splitting
Figure 10
0.42 Vertical and horizontal cracks were noticedin Pier P1. Vertical cracks were also observedin Pier P2. Stepped shear cracks were noted inPier P5. The existing cracks in the out-of-planewall widened and new cracks appeared.Stepped shear cracks, vertical, and horizontalcracks were observed in the southeastout-of-plane wall.
Global/localrocking and shear
Figure 11
1278 SHAHZADA ET AL.

joining the points corresponding to peak load in the positive and negative direction of eachdisplacement cycle. The shape of the loops represents predominantly shear behavior, whichwas nonlinear from the beginning of test. The stiffness degraded with increasing displace-ment cycles and became almost zero at a story drift of 0.20%. The structure reached its peak
Figure 12. Rocking failure of masonry piers in 2005 Kashmir earthquake (Javed 2008).
Figure 13. Diagonal cracks produced at opening of a building in 2005 Kashmir earthquake(Javed 2008).
EXPERIMENTAL SEISMIC PERFORMANCE EVALUATIONOF UNREINFORCED BRICKMASONRY BUILDINGS 1279

resistance at a story drift of 0.23%, after which strength degradation started at a slow rate. Thestrength was degraded by 5% of the peak load at a story drift of 0.41% and the test wasstopped at this point. The structure could have been tested further, but instead it was retro-fitted and retested.
FLANGE EFFECT
Behavior in the positive and negative load directions was expected to be asymmetric dueto the provision of a window in one of the out-of-plane walls. However, this was not the case.Instead, the positive and negative envelope curves followed almost the same path. This mayhave been because the effective flange width was less than the actual flange width, resultingin the same flange effect in both directions.
SPANDREL DEFORMATION
Figure 15 shows the difference between the displacements recorded at story level and atpier-top level, with the variation in story drift for each of five piers.
For Piers P1 and P2 of the north wall, the difference varied linearly up to a story drift of0.15%, at which point the test structure yielded. This difference could have been due to theglobal rocking and deformation produced in the spandrel. As described later, the effect ofglobal rocking was negligible before the test structure yielded (0.15% drift); this differencecould have been due to deformation in the spandrels. Beyond a story drift of 0.15%, rockingseems to have been the main reason for the difference, because it was more in the positivedirection for P1 and in the negative direction for P2. Similar variations were also noted in thedeformation pattern of Piers P3 and P5, the two end piers of south wall. However the dif-ference in displacement of Pier P4, the middle pier, was very small in both directions becausethe global rocking effect was minimal in the middle. Some permanent residual deformationwas also noticed in the positive direction of Pier P5 of the south wall.
-30
-20
-10
0
10
20
30
-0.5 -0.4 -0.3 -0.2 -0.1 0 0.1 0.2 0.3 0.4 0.5
Story Drift (%)
Lat
eral
Loa
d, k
ips.
0
5
10
15
20
25
30
0 0.1 0.2 0.3 0.4 0.5
Story Drift (%)
Lat
eral
Loa
d, k
ips.
Positive Loading
Negative Loading
Average
Figure 14. Force-deflection hysteresis response of full-scale unreinforced brick masonry build-ing: (a) Hysteresis loops and (b) envelope curves.
1280 SHAHZADA ET AL.

TORSIONAL EFFECTS
During the design stage of the model, an attempt was made to keep the lateral stiffness ofboth in-plane walls the same in order to avoid any torsional movement. To record anypossible torsional effects two out-of-plane gauges (Gauges 4 and 5) were installed. The dia-phragm rotation was calculated as the sum of the displacement recorded by these gaugesdivided by the distance between gauges, as shown in Figure 16. The variation of diaphragmrotation with story drift is also shown in Figure 16. The maximum rotation was 0.001 radiansð0.06°Þ, which is negligible. The rotation was smaller in the positive direction than in thenegative load direction. The reason for this difference could have been imperfections in themasonry materials or different lateral stiffness in the out-of-plane walls.
-20
-15
-10
-5
0
5
10
15
20
-0.5 -0.3 -0.1 0.1 0.3 0.5
Story Drift (%)
Dif
fere
nce
(in
x 10
0)
Pier P1
-20
-15
-10
-5
0
5
10
15
20
-0.5 -0.3 -0.1 0.1 0.3 0.5
Story Drift (%)
Dif
fere
nce
(in
x 10
0) Pier P2
-20
-15
-10
-5
0
5
10
15
20
-0.5 -0.3 -0.1 0.1 0.3 0.5
Story Drift (%)
Dif
fere
nce
(in
x 10
0) Pier P3
-20
-15
-10
-5
0
5
10
15
20
-0.5 -0.3 -0.1 0.1 0.3 0.5
Story Drift (%)
Dif
fere
nce
(in
x 10
0) Pier P4
-20
-15
-10
-5
0
5
10
15
20
-0.6 -0.4 -0.2 0 0.2 0.4 0.6
Story Drift (%)
Dif
fere
nce
(in
x 10
0) Pier P5
Figure 15. Relationship of building story displacement to displacement at the top of each pier.
EXPERIMENTAL SEISMIC PERFORMANCE EVALUATIONOF UNREINFORCED BRICKMASONRY BUILDINGS 1281

GLOBAL ROCKING
The global rocking of the test structure was measured by installing two displacementtransducers (Displacement Transducers 11 and 12) to record the vertical displacement atthe west and east sides of the building, as shown in Figure 6. The vertical displacementswere practically zero until a story drift of 0.15% in both the positive and negative directions,indicating that global rocking started after 0.15% story drift (see Figure 17). At a story drift of0.40%, a maximum of 0.08 in. of vertical displacement was recorded on both the west andeast sides.
HYSTERETIC DAMPING
The variation of hysteretic damping expressed as equivalent viscous damping with storydrift is shown in Figure 18. Equivalent viscous damping is calculated as the ratio of dissipatedenergy ðEdÞ and input energy ðEinpÞ in accordance with Equation 1.
EQ-TARGET;temp:intralink-;e1;41;305ξeq ¼Ed
2πEinp(1)
Figure 16. Effect of torsion produced in the form of diaphragm rotation.
-0.1
-0.05
0
0.05
0.1
-0.6 -0.4 -0.2 0 0.2 0.4 0.6
Story Drift (%)
Ver
tical
Dis
plac
emen
t (in
ch)
West Side
East Side
Figure 17. Global rocking of test structure: Variation of vertical displacement with story drift.
1282 SHAHZADA ET AL.

The dissipated energy, which is equal to the area enclosed by the hysteresis loop, is adirect function of cracks produced in the specimen. The damping remains practically constantwithin the range of testing, with an average value of 6.7%. A slight increase in the dampingwas noticed beyond a story drift of 0.15%. Studies performed on isolated piers (Javed 2009,Ashraf 2010) found similar results for hysteretic damping.
BILINEAR IDEALIZATION
The average force-deflection envelope curve is idealized to be a bilinear, elasto-plasticcurve using the equal energy principle, as shown in Figure 19. The ultimate state is defined asthe point where the lateral strength is dropped by 20%. Since the ultimate state is not known,from the existing trend it is assumed to have occurred at a drift of 0.50%. The three
0
2
4
6
8
0 0.1 0.2 0.3 0.4 0.5 0.6
Story Drift (%)
Equ
ival
ent V
isco
us D
ampi
ng (
%)
Figure 18. Equivalent viscous damping of full-scale unreinforced masonry building.
CP
LS
IO
0
5
10
15
20
25
30
0 0.1 0.2 0.3 0.4 0.5 0.6
Story Drift (%)
Lat
eral
Loa
d, k
ips.
Figure 19. Force-deflection envelope and idealized bilinear curve of full-scale unreinforcedmasonry building.
EXPERIMENTAL SEISMIC PERFORMANCE EVALUATIONOF UNREINFORCED BRICKMASONRY BUILDINGS 1283

parameters—lateral stiffness, yield strength, and ultimate story drift—defining the bilinearelasto-plastic curve, are 421.3 kips/in., 22.2 kips, and 0.50%, respectively.
DisplacementductilityðμDÞ isdefinedas theratioofultimatedrift toyielddrift.Theyieldandultimate storydrifts for the test structurewere0.04%and0.50%, respectively.Thedisplacementductility is thus 0.50/0.04=12.5.The responsemodification factor (R) anddisplacement ampli-fication factor ðCdÞ, as defined from the equal energy principle, are given by:
EQ-TARGET;temp:intralink-;e2;41;561R ¼ffiffiffiffiffiffiffiffiffiffiffiffiffi2μ − 1
p(2)
EQ-TARGET;temp:intralink-;e3;41;531Cd ¼μffiffiffiffiffiffiffiffiffiffiffiffiffi
2μ − 1p (3)
The response modification factor and displacement amplification factor as calculatedfrom Equations 2 and 3 are 4.90 and 2.60, respectively. According to Eurocode 8, therecommended response modification factor for unreinforced brick masonry buildingsis 1.50 (CEN 1995). The high values for deformation capacity could be due to thefollowing:
1. The high deformation capacity of an unreinforced building is due to the rocking andsliding of the structure and its components (i.e., masonry piers), rather than the duc-tility of its materials.
2. The quasi-static test, which is conducted at a lower strain rate, is considered to beconservative for stiffness and strength but not for deformation capacity. The defor-mation capacity of a structure with shear critical piers tested under cyclic loading isgreater than that under dynamic loading. However, the effects of strain rate are lesssignificant for rocking critical structures.
PERFORMANCE LEVELS
Three performance levels mentioned in the American Society of Civil Engineers’ (ASCE)standard ASCE/SEI 41-06—immediate occupancy (IO), life safety (LS), and collapse preven-tion (CP)—are presented in the form of story drift and the corresponding base shear coefficient(the ratio of the lateral load to the total weight of the test structure) in Table 3 (ASCE2006). Thetotal weight of the building was calculated to be 75.1 kips. The drift corresponding to the yieldpoint on the elasto-plastic curve is taken as the IO performance level up to which there is nopermanent deformation or strength degradation. The CP performance level is taken as theultimate drift at which the lateral strength dropped by 20%, and drift corresponding to LS istaken as 75% of CP level, as recommended in the ASCE standard.
Table 3. Building performance levels
Performance Levels Story Drift (%) Base Shear Coefficient
IO 0.04 0.22LS 0.38 0.31CP 0.50 0.26
1284 SHAHZADA ET AL.

MEASURED RESPONSE VERSUS ESTIMATED RESPONSE
The measured response of the test structure was compared with its estimated responsebased on:
1. ASCE/SEI 41-062. The Magenes and Calvi Model (Magenes and Calvi 1997)3. The Lang Model (Lang 2002)
All of the five piers (Figure 20) were assumed to be fixed at both ends because of the rigidfooting at the base secured to a strong floor, and the deep spandrel and rigid diaphragm at thetop. Flange effect was considered in the estimation of the elastic stiffness of each pier. How-ever, global rocking (overturning moment) and flange effect were not considered in the lat-eral strength calculation. The material properties given in Table 1 were used for the analysis.The shear modulus was taken to be 40% of the elastic modulus. The model proposed byMagenes and Calvi doesn’t consider the estimation of elastic stiffness. The other two models,however, use the mechanics-based approach, considering both flexural and shear deforma-tions, to estimate the elastic stiffness of piers. In the present analysis the lateral stiffness of thestructure is calculated as the sum of the values for stiffness of the individual piers correctedfor height, as given in Equation 4.
EQ-TARGET;temp:intralink-;e4;62;409kb ¼Xni¼1
kpiHpi
Hw(4)
Where kb and Hw are the lateral stiffness and height of the horizontal load level, respectively,and kpi and Hpi are the lateral stiffness and height of ith pier, respectively.
The ultimate pier drift is converted to wall drift using the equation (Equation 5) originallyproposed by Lang (2002) and adopted by Javed (2009).
Figure 20. Definition of piers for estimating lateral response of model.
EXPERIMENTAL SEISMIC PERFORMANCE EVALUATIONOF UNREINFORCED BRICKMASONRY BUILDINGS 1285

EQ-TARGET;temp:intralink-;e5;41;640δuw ¼�1þ Hp
Hb
�δupδyp
− 1
��δyw (5)
Where δup and δyp are the ultimate and yield drifts of the pier, respectively, δuw and δyw are theultimate and yield drifts of the wall, respectively, and Hp and Hw are the heights of the pierand wall respectively. The height of the wall is equal to the distance from the base to thehorizontal load level. δyw is assumed to be equal to δyp. The diaphragm is assumed to be rigidand connected to the wall such that the displacements at the top of walls are equal.
ASCE STANDARD
Three failure modes—rocking, bed-joint sliding shear, and toe crushing—are consideredin ASCE’s standard for URM piers. In this standard, the lateral strength is estimated as thelowest strength calculated from equations Equations 7-3, 7-4, and 7-5. Further, rocking isconsidered to be a deformation control action, while bed-joint sliding shear and toe crushingare considered to be force-control actions. A complete force-deformation curve for a URMpier is defined in Figure 7-1(b) of the standard. The deformation capacities d (correspondingto peak strength) and e (corresponding to a 40% degradation in lateral strength) are given inTable 7-4 of the standard. Points B and C of the curve are assumed to have the same strength,while points C and D have the same drift.
MAGENES AND CALVI MODEL
Magenes and Calvi proposed the following three equations to estimate the lateral strengthas the minimum strength corresponding to toe crushing ðVtcÞ, shear sliding ðVslÞ, and diag-onal tension failure ðVdtÞ of URM piers:
EQ-TARGET;temp:intralink-;e6;41;342Vtc ¼ ψL2ptpHp
p2
�1 −
p0.85f ’m
�(6)
EQ-TARGET;temp:intralink-;e7;41;287Vsl ¼ μP (7)
EQ-TARGET;temp:intralink-;e8;41;253Vdt ¼f tuLpt
b
ffiffiffiffiffiffiffiffiffiffiffiffiffiffi1þ p
f tu
r; b ¼ Hp
Lp; 1.0 ≤ b ≤ 1.5 (8)
Where ψ is the boundary condition factor, taken to be 2 when the pier is fixed at both endsand 1 when the pier is fixed on one end and free to rotate on the other; p is the vertical stresson the pier; f ’m is the compressive strength of the masonry; Lp, Hp, and tp are the length,height, and thickness of the pier, respectively; μ represents the sliding coefficient of themasonry joints; P is the vertical load on the pier; and f tu is the diagonal tensile strengthof the masonry. Equation 6, above, is equivalent to Equation 7-5 of the ASCE standardexcept for the factor 0.85, which is 0.70 in the standard.
Magenes and Calvi considered toe crushing as the ultimate result of rocking and recom-mended a limiting drift value of 1.0% for rocking mode and 0.50% for the other two shearfailure modes.
1286 SHAHZADA ET AL.

LANG MODEL
Lang (2002) proposed a different approach for the estimation of lateral load capacity of aURM building based on a theory of elasticity. The lateral load capacity, which violatesneither the stress nor the sliding criteria, is:
EQ-TARGET;temp:intralink-;e9;62;586Vm ¼ f my·lw·t·N· tan ϕ
N þ N·ðtan ϕÞ2 þ 2·f my·t·ho· tan ϕ(9)
Where f my is the compressive strength of masonry parallel to the bed joints, taken as 30% ofthe compressive strength of the masonry perpendicular to bed joints; ϕ is the angle of theinternal friction of the masonry; lw, t, and ho are the length, thickness, and height to the pointof inflection (equal to half the height of the pier in the present case) of the pier, respectively;and N is the total vertical load on the pier.
The ultimate drift of the pier is taken to be 0.80%, which is modified for vertical stressand pier aspect ratio according to the equation given below:
EQ-TARGET;temp:intralink-;e10;62;456δu ¼0.8ð0.8 − 0.25σnÞ hp∕lw < 0.5
ð0.8 − 0.25σnÞ 0.5 < hp∕lw < 1.5
1.2ð0.8 − 0.25σnÞ hp∕lw > 0.5
8<: (10)
where σn is the vertical stress in MPa, and hp is the height of pier. An upper limit on pierductility—the ratio of ultimate drift to yield drift of the pier—is set at 12.
COMPARISON
The measured and estimated lateral stiffness, lateral strength, and ultimate drift of the teststructure are shown in Table 4. The estimated stiffness is greater than the measured stiffnessby 10%. The reason for this difference is that the measured stiffness is based on the secant
Table 4. Measured vs. estimated force-deformation characteristics
Force-DeformationParameters
Stiffness,kips/in.
Strength,kips
UltimateDrift, (%) Failure Mode
MeasuredResponse
421.3 23.9 0.50 Mixed shear-rocking failure mode with globalrocking. Piers toward ends (P1, P2, P3, P5)showed some vertical cracks, P4 showedrocking mode toward the test end
ASCE Standard 462.4 16.4 0.31 Piers P1, P3, P4, and P5 failed due to rockingwhile P2 showed a bed-joint shear slidingfailure mode
Magenes andCalvi
- 16.7 0.26 Piers P1 and P4 failed due to toe crushing, andP2, P3, and P5 showed diagonal shear sliding
Lang 462.4 16.3 0.14 The lateral load corresponds to a conditionwhere the maximum stresses and sliding occursimultaneously
EXPERIMENTAL SEISMIC PERFORMANCE EVALUATIONOF UNREINFORCED BRICKMASONRY BUILDINGS 1287

stiffness while the estimated stiffness is the initial elastic stiffness, which should be greaterthan the secant stiffness because of the nonlinear behavior. Other researchers have definedfactors to calculate the effective stiffness of a pier from its elastic stiffness; for example, Javed(2009) used a factor of 0.75 and Lang (2002) defined a range from 0.50–0.70. In the currentstudy the factor comes out to be 0.90, which is quite high when compared with the valuesprovided by previous researchers.
The estimated lateral strengths from all three methods match each other but are 46% lessthan the measured strength. This significant difference is due to the effects of the overturningmoment and flange behavior, which are neglected in the estimated strength. Thus the over-turning moment and flange behavior have a significant effect on lateral strength. However,strength, as defined by ASCE 41, is in the lower bounds for force-based actions and in theexpected range for displacement-based actions. They are not intended to represent actualstrengths because of uncertainty and safety. The actual strength will certainly be higherthan the estimated strength.
All three models conservatively estimate the ultimate drift of the test structure. Globalrocking, which was neglected in the estimated response, is the main reason for the differencein the measured and estimated deformation capacities. Furthermore, rocking is a stablemechanism that may have a very high deflection capacity but the models limit the deflectioncapacity to avoid any associated failure. The ultimate drift from the model proposed by theLang Model is relatively low because of the limit imposed on the ductility of the pier.
CONCLUDING REMARKS
A full-scale unreinforced brick masonry building was tested under reverse cyclic quasi-static loading to evaluate the seismic performance of a typical brick masonry building innorthern Pakistan. The measured response was compared with the estimated responseusing methodologies proposed by various researchers around the world. The following con-clusions can be made:
• The properties of the materials used in the construction of unreinforced brickmasonry buildings in Pakistan, namely the initial rate of absorption (IRA) of thebricks and the compressive strength of the mortar, are different from those com-monly used in other parts of the world. The IRA is very high (91.7 g/min/30in.2) which results in a very weak bond between the bricks and mortar and, con-sequently, low diagonal tensile strength (7.3 psi) and compressive strength (438 psi).
• The damage pattern of the test structure was a combination of shear and flexuralcracks. However, the predominant failure mode was shear. High compressive stres-ses developed at the two ends of the in-plane walls due to overturning moments,resulting in vertical splitting at the wall corners.
• The test structure has a very large deformation capacity, resulting in a high ductilityfactor (12.5), response modification factor (4.9), and displacement amplification fac-tor (2.6), which is due to global rocking of the test structure. The results, however,could not be generalized for other URM buildings with different configurations.
• The equivalent viscous damping (6.0%) and the effective stiffness (90% of the ana-lytical elastic stiffness) of the test structure are almost similar to those of other URMbuildings tested worldwide.
1288 SHAHZADA ET AL.

• Any of the three models—the ASCE standard, the Magenes and Calvi Model, or theLang Model—can be used for the lateral load capacity evaluation of URM buildingsconstructed in northern Pakistan. The models conservatively estimate the lateralstrength (70% of the actual strength) and deformation capacity. The difference isdue to the neglected contribution of the flange effect and global rocking, andthe inherent safety margins in code values.
ACKNOWLEDGEMENTS
The authors are grateful to the Higher Education Commission of Pakistan for providingfinancial support under the International Linkages of Pakistani Universities with ForeignUniversities project. The University of Engineering and Technology in Peshawar providedsupport through access to their testing facilities. Valuable comments and suggestions weremade by Professor D. P. Abrams, University of Illinois at Urbana-Champaign. These con-tributions are highly appreciated. The authors are grateful to the reviewers for their precioussuggestions and comments, which have enhanced the quality of the paper. The first author isgrateful to the Mid-America Earthquake Center, at the University of Illinois at Urbana-Cham-paign for hosting him as a visiting scholar.
REFERENCES
Abrams, D. P., and Shah, N., 1992. Cyclic load testing of unreinforced masonry walls, AdvancedConstruction Technology Center Rep. No. 92-26-10, College of Engineering, University ofIllinois at Urbana-Champaign, Advanced Construction Technology Center, Urbana, IL.
Ali, Q., 2004. Seismic Performance Study of Brick Masonry Building Systems in PeshawarRegion, Ph.D. Thesis, University of Engineering and Technology, Peshawar, Pakistan.
American Society of Civil Engineers (ASCE), 2006. Seismic Rehabilitation of Existing Buildings,ASCE/SEI 41-06, Reston, VA.
Anthoine, A., Magonette, G., and Magenes, G., 1995. Shear compression testing and analysis ofbrick masonry walls, Proc., 10th European Conf. on Earthquake Engineering, Taylor andFrancis, Rotterdam, The Netherlands, 1657–1662.
Asian Development Bank/World Bank (ADB/WB), 2005. Preliminary Damage and NeedsAssessment-Pakistan 2005 Earthquake, Report No. ADB-WB 2005.
Ashraf, M., 2010. Development of Cost-effective and Efficient Retrofitting Technique forMasonry Buildings in Pakistan, ongoing Ph.D. research at the Department of Civil Engineer-ing, University of Engineering and Technology, Peshawar, Pakistan
Chin, W. F., and Scawthorn, C., 2003. Earthquake Engineering Handbook, CRC Press, BocaRaton, FL, 2–5.
Costley, A. C., and Abrams, D. P., 1996. Dynamic Response of Unreinforced Masonry Buildingswith Flexible Diaphragms, NCEER-96-0001, University of Buffalo, NY.
Craig, J., Goodno, B., Towashiraporn, P., and Park, J., 2002. Fragility reduction estimations forURM buildings using response modification, Paper No. 805, 12th European Conference onEarthquake Engineering Research, September 9–13, 2002, London, UK.
Durrani, A. J., Elnashai, A. S., Hashash, Y. M. A., Kim, S. J., and Masud, A., 2005. The KashmirEarthquake of October 08, 2005: A Quick Look Report, Mid-America Earthquake Center,University of Illinois at Urbana-Champaign.
EXPERIMENTAL SEISMIC PERFORMANCE EVALUATIONOF UNREINFORCED BRICKMASONRY BUILDINGS 1289

Epperson, G. S., and Abrams, D. P., 1989. Nondestructive Evaluation of Masonry Buildings, Rep.No. 89-26-03, College of Engineering, University of Illinois at Urbana-Champaign, AdvancedConstruction Technology Center, Urbana, IL.
European Committee for Standardization (CEN), 1995. General rules and rules for buildings –Seismic actions and general requirements for structures, Eurocode 8: Design Provisions forEarthquake Resistance of Structures, Brussels, Belgium.
Franklin, S., Lynch, J., and Abrams, D. P., 2003. Performance of Rehabilitated URM ShearWalls: Flexural Behavior of Piers (CD-ROM), Mid-America Earthquake Center, Universityof Illinois at Urbana-Champaign, Urbana, IL.
Javed, M., Khan, A. N., and Magenes, G., 2008. Performance of masonry structures during earth-quake -2005 in Kashmir, Mehran University Research Journal of Engineering & Technology27, 271–282.
Javed, M., 2009. Seismic Risk Assessment of Un-reinforced Brick Masonry Buildings System ofNorthern Pakistan, Ph.D. thesis, Department of Civil Engineering, University of Engineeringand Technology, Peshawar, Pakistan.
Lang, K., 2002. Seismic Vulnerability of Existing Buildings, Ph.D. Thesis, Institute of StructuralEngineering, Swiss Federal Institute of Technology, Zurich, Switzerland.
Magenes, G., and Calvi, G. M., 1992. Cyclic behavior of brick masonry walls, Proc., 10th worldConf. on Earthquake Engineering, A. A. Balkema, Madrid, Spain, 3517–3522.
Magenes, G., Kingsley, G. R., and Calvi, G. M., 1995. Seismic Testing of a Full-Scale, Two-StoryMasonry Building: Test Procedure and Measured Experimental Response, Università degliStudi di Pavia, Italy.
Magenes, G., and Calvi, G. M., 1997. In-plane seismic response of brick masonry walls, Earth-quake Engineering and Structural Dynamics 26, 1091–1112
Manzouri, T., Shing, P. B., Amadei, B., Schuller, M., and Atkinson, R., 1995. Repair and Retrofitof Unreinforced Masonry Walls: Experimental Evaluation and Finite Element Analysis. Rep.No. CU/SR-95/2, Department of Civil, Environmental, and Architectural Engineering,University of Colorado, Boulder.
Naseer, A., 2009. Performance Behavior of Confined Brick Masonry Buildings under SeismicDemand, Ph.D. Thesis, University of Engineering and Technology, Peshawar, Pakistan.
Naseer, A., Khan, A. N., Ali, Q., and Hussain, Z., 2010. Observed seismic behavior of buildingsin northern Pakistan during the 2005 Kashmir earthquake, Earthquake Spectra 26, 425–449.
Paquette, J., and Bruneau, M., 2003. Pseudo-dynamic testing of an unreinforced masonry build-ing with flexible diaphragm, Journal of Structural Engineering 129, 708–716.
Simsir, C., Aschheim, M., and Abrams, D., 2002. Influence of diaphragm flexibility on theout-of-plane response of unreinforced masonry bearing walls, Proc., 9th North AmericanMasonry Conf. (CD-ROM), Clemson, SC.
Tomazevic, M., Lutman, M., and Petcovic, L., 1996. Seismic behavior of masonry walls: Experi-mental simulation, Journal of Structural Engineering, ASCE, 122, 1040–1047.
Yi, T., 2004. Large-Scale Testing of a Two Story URM Structure, Ph.D. Thesis, Georgia Instituteof Technology, Atlanta, GA.
Yi, T., Moon, F. L., Leon, R. T., and Kahn, L. F., 2006. Lateral load tests on a two-story unrein-forced masonry building, Journal of Structural Engineering 132, 643–652.
(Received 29 September 2010; accepted 27 September 2011)
1290 SHAHZADA ET AL.