time-dependent prestress losses in historic clay brick masonry walls seismically strengthened using...
TRANSCRIPT

1
Time dependent prestress losses in historic clay brick masonry 1
walls seismically strengthened using unbonded posttensioning 2
Najif Ismail, S.M. ASCE 3
Senior Lecturer, School of Architecture Building and Engineering, Otago Polytechnic, Private Bag 1910, 4 Dunedin 9054, New Zealand; [email protected] 5
Jason M. Ingham, M. ASCE 6
Associate Professor, Department of Civil & Environmental Engineering, University of Auckland, 7 Private Bag 92019, Auckland 1142, New Zealand; [email protected] 8
Abstract 9
Time dependent prestress losses in historic unreinforced clay brick masonry (URM) walls 10
strengthened using unbonded posttensioning were investigated, with a particular emphasis on 11
masonry shortening resulting due to creep and shrinkage. An experimental program was 12
undertaken that involved continuous monitoring of masonry shortening occurring in 13
prestressed URM wallettes over a period of 180 days. The test wallettes were extracted from 14
a real historic URM building and were subjected to varying magnitudes of prestress, 15
representing axial stresses that would be developed at the wall base when strengthened using 16
unbonded posttensioning. A rheological model is proposed for predicting masonry creep 17
shortening, which can subsequently be used to predict posttensioning losses. It was 18
established that a prestress loss of up to 16.4% for normal threaded steel bars and up to 5.4% 19
for sheathed greased seven wire strands can be expected in posttensioned historic URM walls 20
when the tendons are posttensioned to a stress of 0.5fpu. 21
Keywords 22
Time dependent losses; masonry; seismic strengthening; masonry creep; masonry shrinkage; 23
posttensioning. 24
25

2
Introduction 26
Current masonry codes provide guidelines for assessing posttensioning (PT) losses, with 27
these losses typically attributed to shrinkage, creep, tendon relaxation, elastic shortening, 28
anchorage seating, tendon undulation, friction and thermal effects (AS 2001; BS 2000; CEN 29
2005; CSA 2004; MSJC 2008; NZS 2004; PCI 1975). Of these factors, steel relaxation, 30
shrinkage and creep are the most important factors that will influence the design and 31
longevity of an adequate retrofit. However, for historic clay brick masonry walls shrinkage 32
losses or masonry expansion are unlikely to be large because of the significant age of the 33
masonry materials. For analysis and design of prestressed masonry an effective prestress fse is 34
calculated using Equation 1, which is defined as the PT stress after all losses have occurred. 35
In Equation 1, the total PT stress loss is the sum of PT losses due to tendon relaxation, 36
masonry shrinkage and masonry creep (refer Equation 2). 37
(1)
(2)
where fpsi = initially applied PT stress, Δfpr = PT stress loss due to steel relaxation, Δfsh = PT 38
stress loss due to masonry shrinkage, and Δfcr = PT stress loss due to masonry creep 39
shortening. More masonry shortening is expected in historic URM walls than in newly 40
constructed URM walls due to the presence of relatively larger amount of highly deformable 41
bed joint mortar. However, as historic masonry walls have already been subjected to 42
sustained overburden weights for a considerable span of time, which is likely to have resulted 43
in expulsion of water and air voids, suggesting the masonry shortening to be less in historic 44
masonry than in new URM construction. These unique characteristics of historic URM walls 45
suggest that prestress losses due to masonry shrinkage and creep shortening can be expected 46
to be significantly different from that observed in new URM construction, motivating the 47

3
initiation of an experimental investigation of masonry shrinkage and creep shortening in real 48
historic URM wallettes. Some experimental studies have already investigated the PT losses in 49
historic clay brick masonry but because of the large variation observed between the results of 50
these studies and the typical codified PT loss parameters, there still exists considerable 51
uncertainty. Therefore, an experimental program investigating the time dependent shortening 52
in historical URM walls was undertaken. 53
PT losses due to tendon relaxation 54
Tendon relaxation losses, Δfpr, are influenced by the tendon type (constituent steel properties) 55
and the end anchorage details, which are normally quantified as a percentage of the initially 56
applied tendon stress, fpsi. The relaxation loss parameter, kr, is normally provided by the PT 57
tendon manufacturer, which is experimentally determined over a period of 1000 hours. 58
Literature suggests the ultimate relaxation losses to be 3 times the value suggested for 1000 59
hours (CEN 2005). The Prestressed Concrete Institute recommended Equation 3 (PCI 1975) 60
to establish relaxation loss at any given time after prestressing, which was later adapted by 61
Laursen (2002) to determine the ultimate relaxation loss for a PT strand and is reproduced 62
herein as Equation 4. 63
[
(
)] for
(3)
( ) (4)
4
where t = time since the application of PT stress and fpy = nominal specified tendon tensile 64
yield strength. 65
PT losses due to masonry shrinkage and creep 66
Masonry undergoes deformation when subjected to sustained loading over long periods of 67
time, which eventually causes axial shortening in prestressed masonry. The axial shortening 68
due to sustained axial loading is termed as creep. Typically, masonry creep is quantified by a 69
creep parameter, kc (also known as specific creep), which is defined as creep strain per MPa 70
of initially applied sustained prestress and depends upon the constituent masonry materials. 71
Another widely accepted parameter for quantifying masonry creep shortening is the masonry 72
creep ratio (also referred to as ultimate creep compliance), Cc, which is the ratio of the long 73
term masonry shortening to the initial elastic masonry shortening. 74
It should also be noted that shrinkage of masonry occurs due to drying process of the mortar, 75
which is unlikely to happen in historic URM buildings considered for a PT seismic retrofit 76
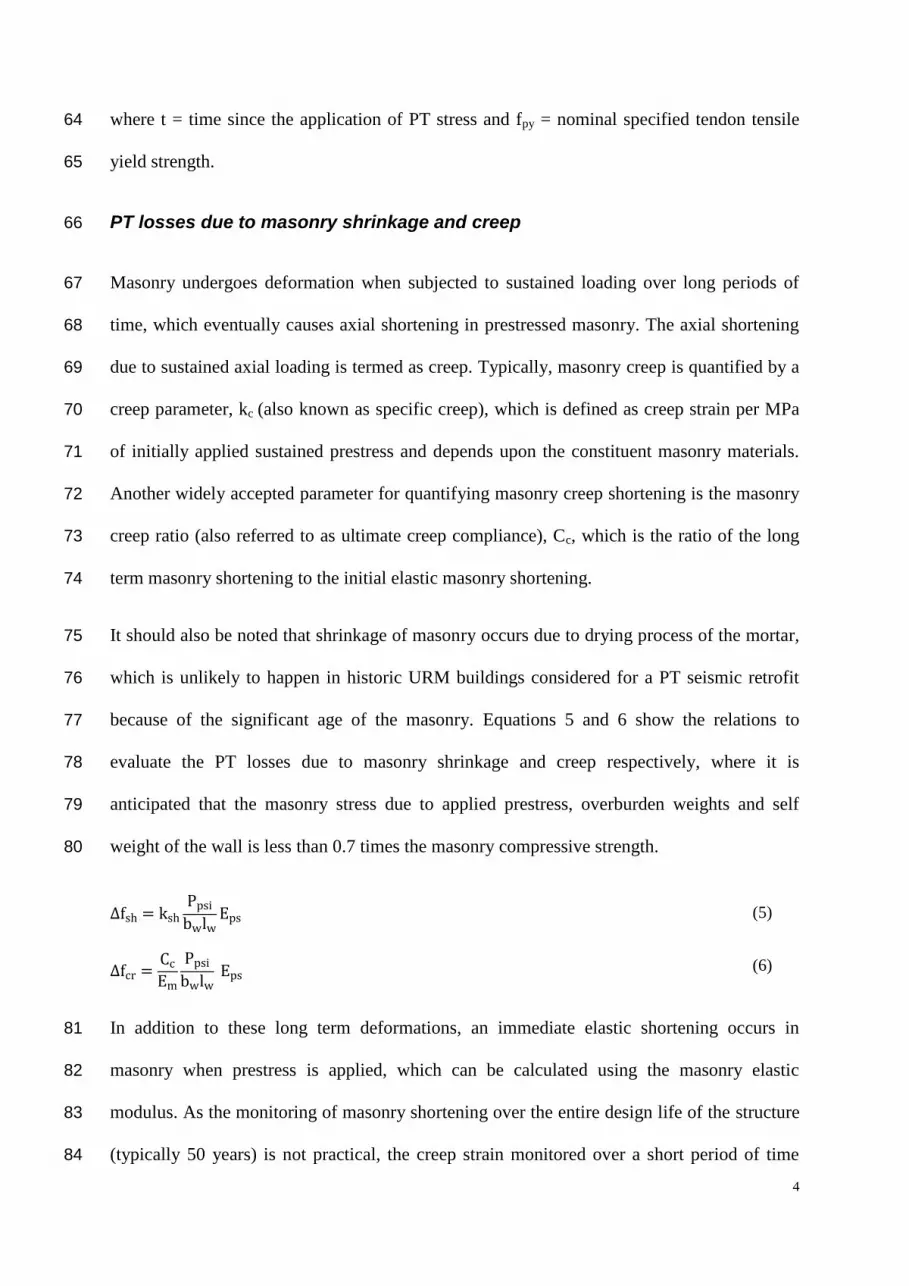
because of the significant age of the masonry. Equations 5 and 6 show the relations to 77
evaluate the PT losses due to masonry shrinkage and creep respectively, where it is 78
anticipated that the masonry stress due to applied prestress, overburden weights and self 79
weight of the wall is less than 0.7 times the masonry compressive strength. 80
(5)
(6)
In addition to these long term deformations, an immediate elastic shortening occurs in 81
masonry when prestress is applied, which can be calculated using the masonry elastic 82
modulus. As the monitoring of masonry shortening over the entire design life of the structure 83
(typically 50 years) is not practical, the creep strain monitored over a short period of time 84
5
(only after the creep strain curve had levelled out) can be extrapolated using a rheological 85
model. Figure 1 shows an illustration of the masonry shortening occurring in prestressed 86
masonry walls, where to is the time when PT is applied and the dotted lines show the losses 87
that can occur in new URM construction but that are less likely to occur in historic URM 88
walls. Note that time dependent masonry shortening also varies due to masonry material 89
degradation and that masonry shortening in realistic URM walls results in variable prestress 90
instead of remaining constant (Anand and Rahman 1991), suggesting the use of an 91
incremental or superposition procedure to be more appropriate to estimate masonry 92
shortening than the additive approach adopted herein. However, such incremental analysis is 93
laborious and its routine utilisation in design practice is questionable. 94
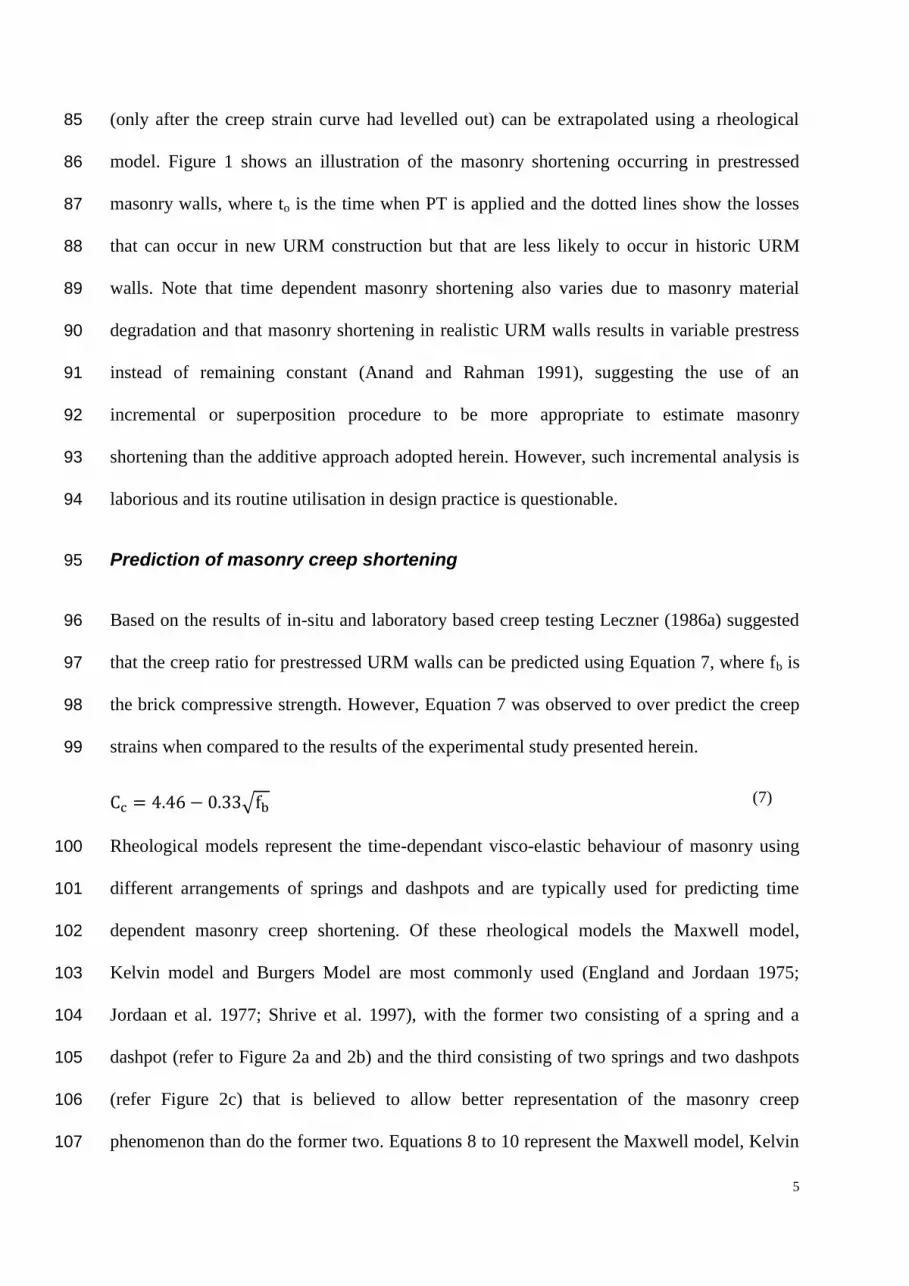
Prediction of masonry creep shortening 95
Based on the results of in-situ and laboratory based creep testing Leczner (1986a) suggested 96
that the creep ratio for prestressed URM walls can be predicted using Equation 7, where fb is 97
the brick compressive strength. However, Equation 7 was observed to over predict the creep 98
strains when compared to the results of the experimental study presented herein. 99
√ (7)
Rheological models represent the time-dependant visco-elastic behaviour of masonry using 100
different arrangements of springs and dashpots and are typically used for predicting time 101
dependent masonry creep shortening. Of these rheological models the Maxwell model, 102
Kelvin model and Burgers Model are most commonly used (England and Jordaan 1975; 103
Jordaan et al. 1977; Shrive et al. 1997), with the former two consisting of a spring and a 104
dashpot (refer to Figure 2a and 2b) and the third consisting of two springs and two dashpots 105
(refer Figure 2c) that is believed to allow better representation of the masonry creep 106
phenomenon than do the former two. Equations 8 to 10 represent the Maxwell model, Kelvin 107

6
model and Burgers model respectively, where εc(t) is the sum of elastic shortening strain and 108
the continued creep shortening, λ is the parameter related to delayed strain response of 109
masonry, Em is the masonry modulus of elasticity, fmi is the magnitude of initially applied 110
prestress, and t is the time in days after prestressing. 111
( )
(8)
( ) (
) (9)
( )
(
) (10)
Based on the results of in-situ creep testing Hughes and Harvey (1995) established Equation 112
11 to determine the parameter for delayed strain response of masonry, where Em is the 113
masonry modulus of elasticity in MPa. 114
(11)
Shrive et al. (1997) substituted for the value of λ from Equation 10 into a modified Burgers 115
model and established Equation 12 for calculation of the creep ratio after t days from the 116
application of prestress, Cc (t). 117
( ) ( ) ( (
) ) (12)
where Em is the masonry modulus of elasticity in MPa, and t is the time in days from the 118
application of prestress. The predicted creep ratio is then multiplied by an aging coefficient χ 119
(refer Equation 13) to account for the significant age of the masonry that has already been 120
subjected to sustained overburden loading for numerous years. The aging coefficient has 121
previously been used in prestressed concrete design (Ghali and Favre 1986), and was 122
determined herein empirically to match the experimental curves. 123

7
( ) [( ) ( (
) )] (13)
Precedent experimental programs investigating masonry creep 124
Several research studies have investigated the nature and magnitude of PT losses that occur in 125
post-tensioned masonry, including the experimental programs discussed below. Schubert & 126
Wesche (1984) proposed creep and shrinkage parameters for concrete and clay brick masonry 127
which are reported in Table 1. Lenczner (1986b) studied the creep strain of a historic URM 128
tower block located in the United Kingdom over a period of eight years and found the total 129
masonry shortening to be roughly twice the magnitude of initial elastic shortening. Studies 130
have also reported creep strain causing failure of historic URM buildings (Binda et al. 1992), 131
emphasising the importance of masonry creep when considering the longevity of PT 132
strengthening of historic URM buildings. 133
Curtin et al. (1982) estimated PT loss by monitoring masonry shortening strains in 134
prestressed URM assemblages and suggested that a PT loss of up to 20% can be expected in 135
newly constructed clay brick masonry walls. Hughes and Harvey (1995) observed the creep 136
strain of a nine storey URM building over 6000 days (with individual test results spanning 137
over 400 days) and observed the creep coefficient, Cc, to range from 0.3 to 3.0. Anand and 138
Bhatia (1996) investigated the creep strain in URM walls, by monitoring the creep strain in 139
several prestressed URM wall specimens over a period of 300 days and by performing micro-140
level finite element analysis of URM piers over an extended period of time. The study 141
suggested that the long term creep strain can be conservatively estimated by using a masonry 142
creep ratio of 1.5. 143
Shrive et al. (1997) investigated the creep shortening occurring in clay brick masonry walls 144
by monitoring creep strains of a total of 188 five brick high clay brick masonry prisms, which 145

8
were subjected to varying magnitudes of prestress. The test prisms were constructed using 146
different mortar compositions and were tested in moist and dry conditions. The test prisms 147
were prestressed using symmetrically located high strength threaded steel bars. Series 1 of the 148
testing program had strength and stiffness characteristics similar to prevalent heritage URM 149
materials and therefore the results of only series 1 are used herein. Experimentally 150
determined values of creep parameters for clay brick masonry reported in the aforementioned 151
research studies, together with the codified values of these masonry creep parameters, are 152
presented in Table 1. 153
Masonry shrinkage and creep testing 154
A total of six URM wallettes extracted from a historic URM building known to be originally 155
constructed in 1881 were subjected to varying magnitudes of prestress and the resulting 156
masonry shortening was monitored over a period of 180 days. All test wallettes were capped 157
using dental plaster to uniformly distribute the prestress over the entire contact surface, which 158
were subsequently prestressed to represent the axial stresses developed at the base of a typical 159
posttensioned historic URM wall. The geometric dimensions of test wallettes and the 160
magnitude of applied prestress are given in Table 2. Test wallettes were given the notation 161
WAB-N or WPT-N, where W refers to wallettes, AB refers to as-built control wallette, PT 162
refers to prestressed wallettes, and N denotes the test number. 163
Material properties 164
Testing was conducted on URM wallettes extracted from a heritage URM building (hereafter 165
referred to as the Old Supreme Court) situated at Wellington, New Zealand. The old Supreme 166
Court was originally constructed in 1881 and served as the Supreme Court for 100 years up to 167
1980, when it was vacated and fell into decline. The building possesses considerable heritage 168
value and is registered as a category I historic building (building having special historical 169
9
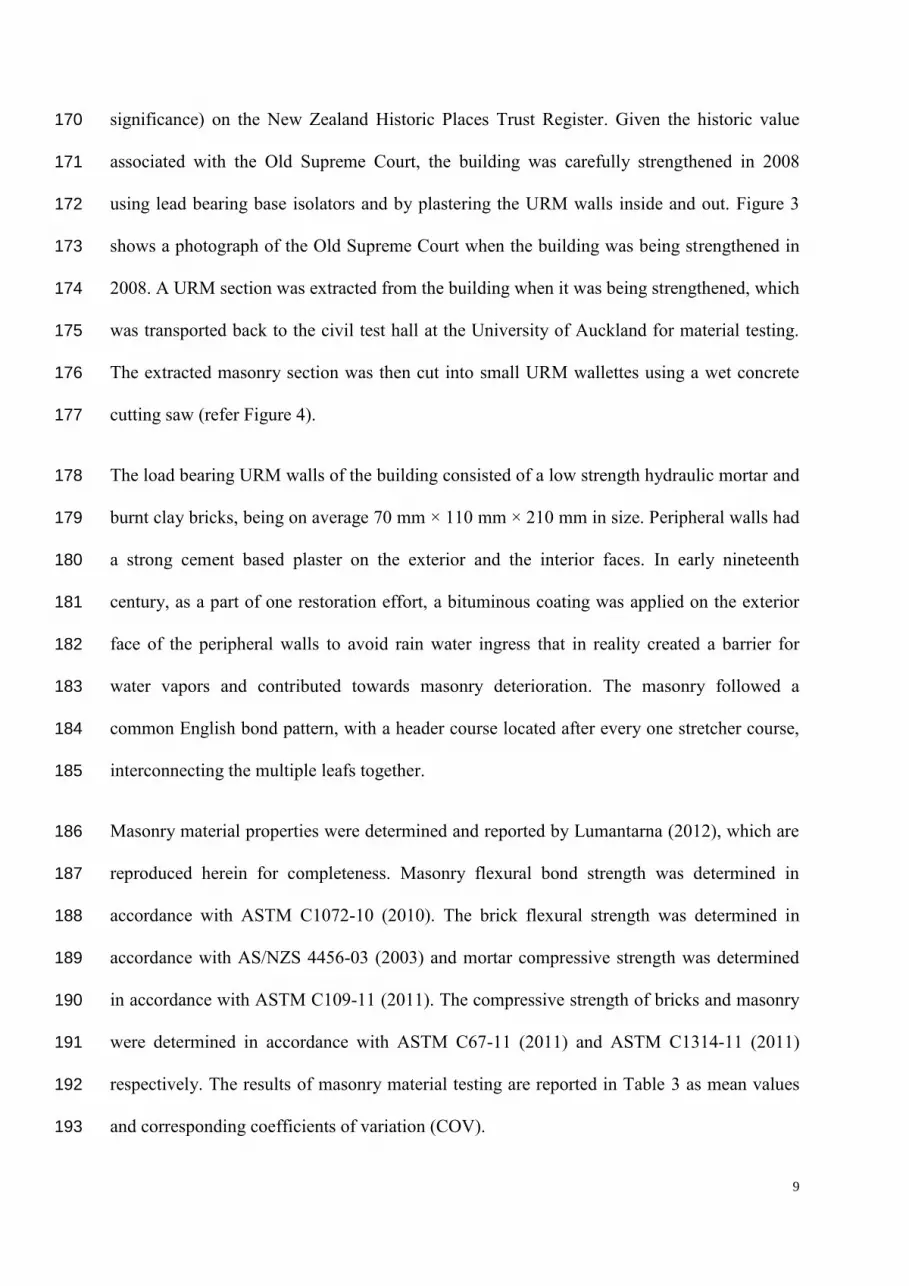
significance) on the New Zealand Historic Places Trust Register. Given the historic value 170
associated with the Old Supreme Court, the building was carefully strengthened in 2008 171
using lead bearing base isolators and by plastering the URM walls inside and out. Figure 3 172
shows a photograph of the Old Supreme Court when the building was being strengthened in 173
2008. A URM section was extracted from the building when it was being strengthened, which 174
was transported back to the civil test hall at the University of Auckland for material testing. 175
The extracted masonry section was then cut into small URM wallettes using a wet concrete 176
cutting saw (refer Figure 4). 177
The load bearing URM walls of the building consisted of a low strength hydraulic mortar and 178
burnt clay bricks, being on average 70 mm × 110 mm × 210 mm in size. Peripheral walls had 179
a strong cement based plaster on the exterior and the interior faces. In early nineteenth 180
century, as a part of one restoration effort, a bituminous coating was applied on the exterior 181
face of the peripheral walls to avoid rain water ingress that in reality created a barrier for 182
water vapors and contributed towards masonry deterioration. The masonry followed a 183
common English bond pattern, with a header course located after every one stretcher course, 184
interconnecting the multiple leafs together. 185
Masonry material properties were determined and reported by Lumantarna (2012), which are 186
reproduced herein for completeness. Masonry flexural bond strength was determined in 187
accordance with ASTM C1072-10 (2010). The brick flexural strength was determined in 188
accordance with AS/NZS 4456-03 (2003) and mortar compressive strength was determined 189
in accordance with ASTM C109-11 (2011). The compressive strength of bricks and masonry 190
were determined in accordance with ASTM C67-11 (2011) and ASTM C1314-11 (2011) 191
respectively. The results of masonry material testing are reported in Table 3 as mean values 192
and corresponding coefficients of variation (COV). 193

10
Testing details 194
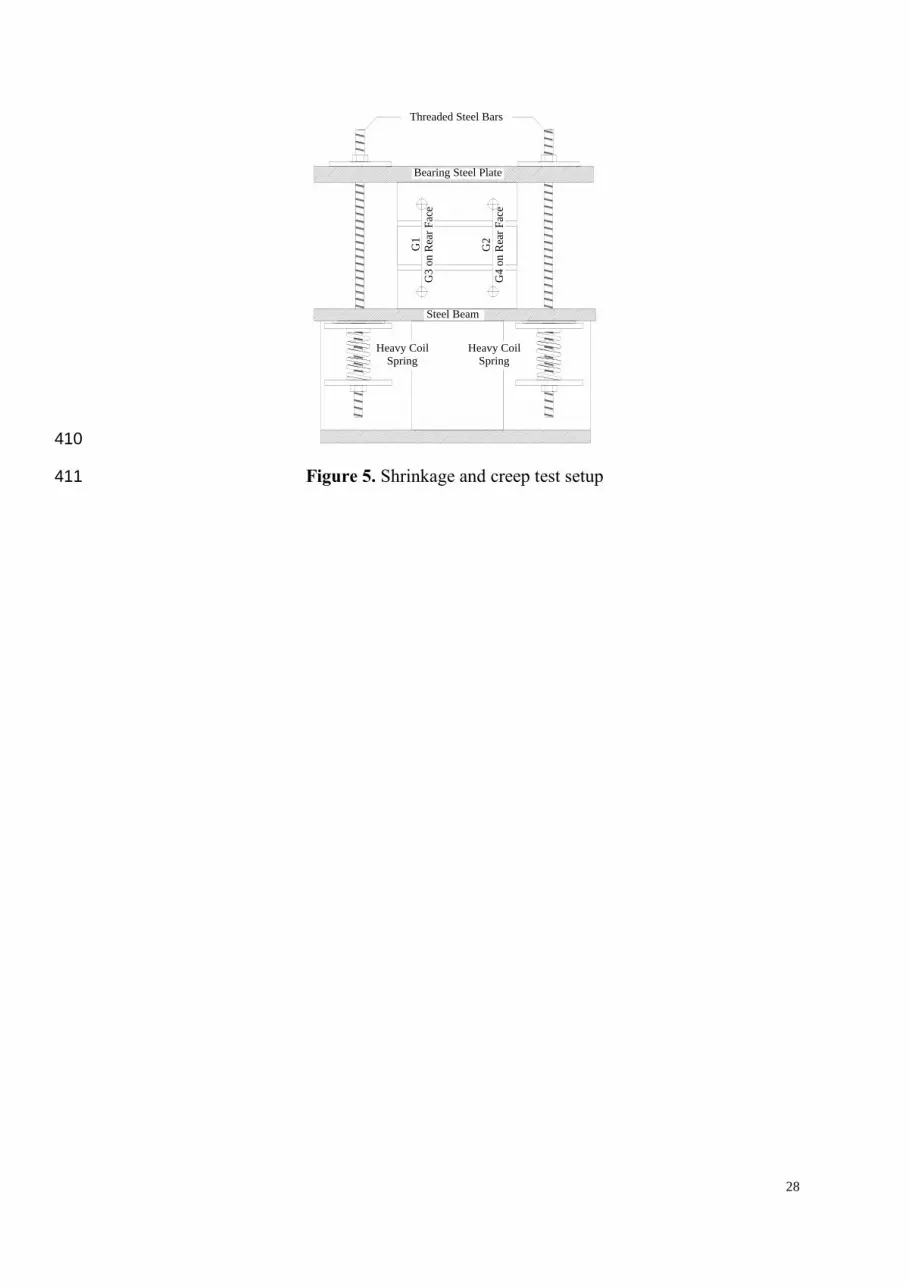
Figure 5 shows the test setup used for shrinkage and creep testing. Test wallettes were 195
sandwiched between a steel I-beam and a 50 mm steel bearing plate. Uniform axial stress 196
(prestress) was applied to test wallettes using two externally located 20 mm threaded steel 197
bars, with a heavy coil spring placed at the bottom of each PT bar to roughly maintain the 198
magnitude of applied prestress and to ensure a uniform stress distribution. An assembly 199
consisting of a 200 kN load cell and a 200 kN hydraulic jack was used for the application of 200
pre-selected magnitudes of prestress. Typical hexagonal nut end anchorage assemblies were 201
used for locking off the posttensioning. 202
The elastic masonry shortening was measured during the PT application process, over a 203
gauge length of 100 mm at four different locations on the masonry assemblage, which were 204
marked prior to the application of prestress by mounting eight Demec points directly onto the 205
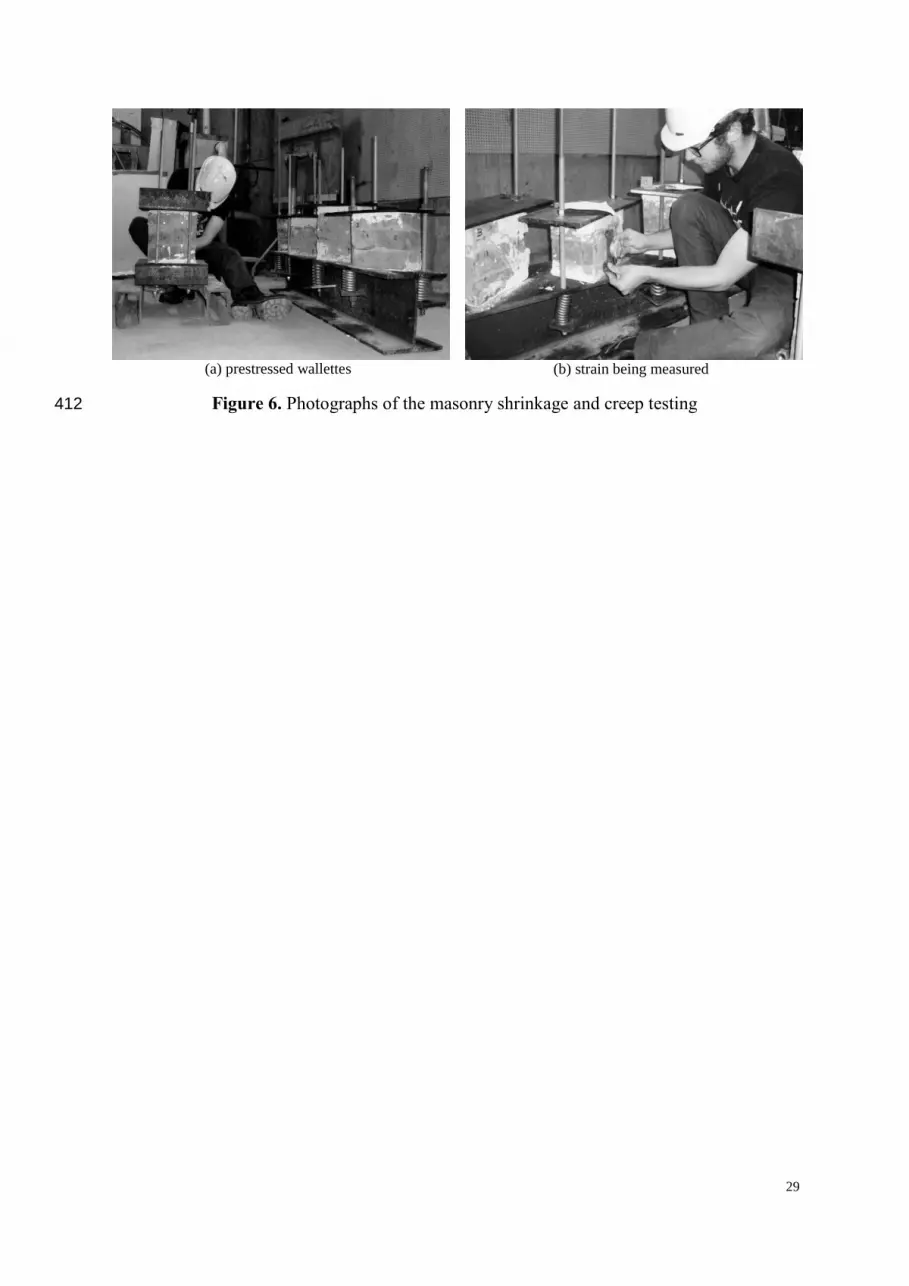
masonry surface in the uniform stress region. For measuring the continuing masonry 206
shortening strains, a demountable mechanical displacement gauge having a precision of 207
0.002 mm was used (see Figure 6). The displacement gauge was checked throughout the data 208
collection period using an INVAR steel bar, which was known to have a very low coefficient 209
of thermal expansion. Masonry shortening measurements were made over 180 days, with 210
these measurements made twice a day over the first 20 days and subsequently once a week 211
when the masonry creep continued to occur at a relatively slower rate. The masonry 212
shortening curves for all wallettes were observed to stabilize by the time measurement was 213
discontinued. 214
Testing results 215
A summary of test results is presented in Table 4. Estimates about the initial elastic masonry 216
shortening were made using a masonry modulus of elasticity of 300f'm (NZSEE 2011), where 217

11
f'm is the masonry compressive strength. The predicted elastic masonry shortening values 218
were found to fit well with the experimentally measured values (refer to Table 4). The 219
maximum experimentally measured specific creep values were calculated by dividing the 220
measured masonry creep strain by the magnitude of initially applied prestress and 221
subsequently the corresponding masonry creep ratio values were calculated by dividing the 222
ultimate specific creep by the initial elastic strain per unit applied prestress. It should be noted 223
that these two masonry creep parameters can also be correlated as Cc = kc × Em, where Em is 224
the masonry elastic modulus. A maximum shortening strain of 90 µε was also observed in the 225
unstressed wallette, which was attributed to the drying of heavily water saturated wallettes 226
(due to the wet cutting process). In precedent experimental programs, it was established that 227
most of the masonry creep occurs within the first year after prestressing (Anand and Bhatia 228
1996; Anand and Rahman 1991; Hughes and Harvey 1995; Lenczner 1986a; Lenczner 229
1986b; Shrive et al. 1997). Therefore, the specific creep and creep ratio values were then 230
extrapolated using the modified Burgers model (refer Equation 13) to conservatively predict 231
the masonry specific creep after 2 years (refer Figure 8d) from the application of prestress. 232
Ambient air temperature and relative humidity 233
Figure 7a and 7b show the variation of the ambient air temperature and relative humidity 234
during the testing. Strains measured in unstressed wallette were used to investigate the strain 235
attributed to environmental changes and total experimentally determined shortening strain 236
attributable to masonry creep was calculated as the difference between the total measured 237
shortening strain in prestressed wallettes and that from the unstressed wallette. It should be 238
noted that the ambient environmental conditions during the testing (inside the civil test hall) 239
were considered to result in strains exceeding those expected for walls in a realistic 240
environment, which is characterised by a lower average temperature and relatively higher 241
humidity. 242
12
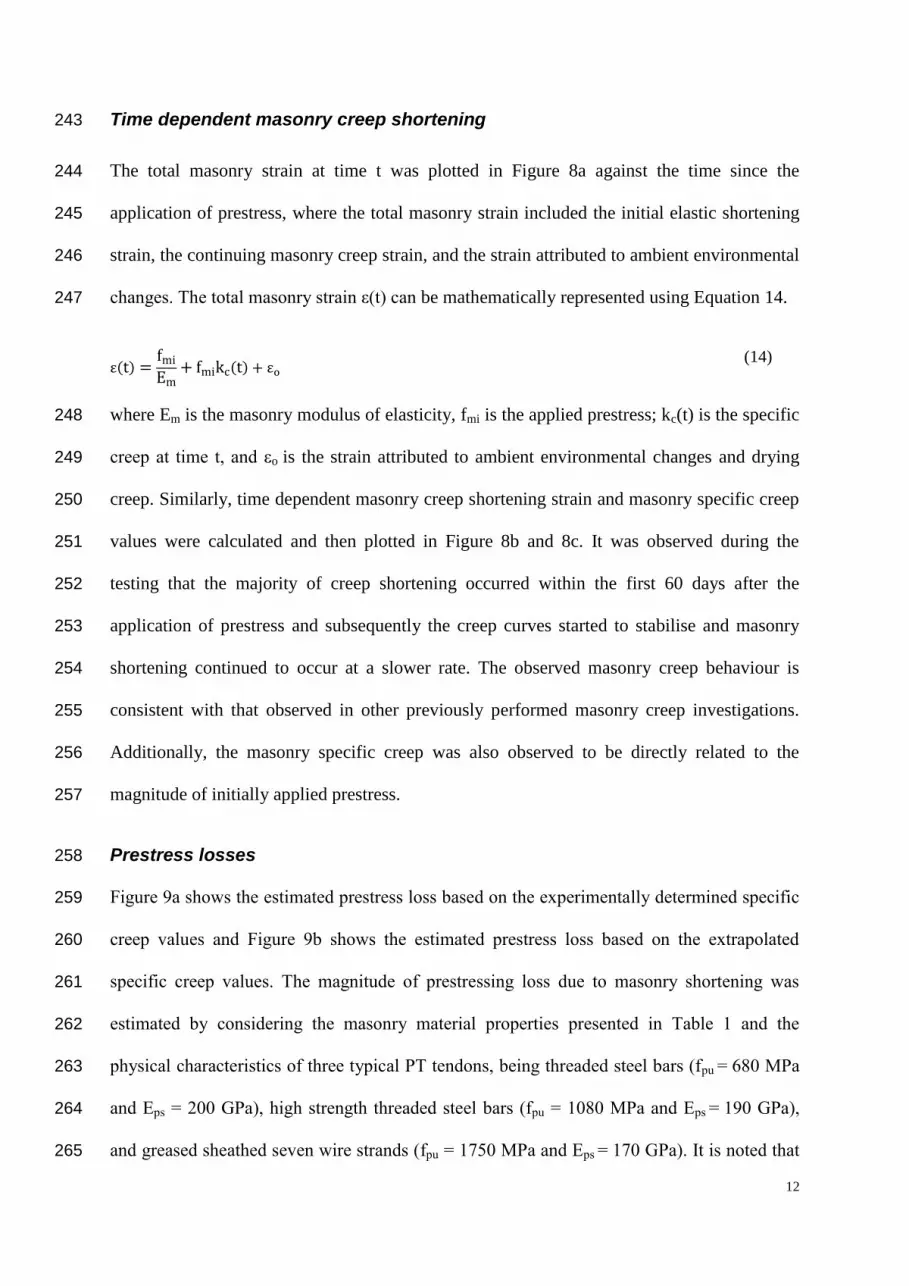
Time dependent masonry creep shortening 243
The total masonry strain at time t was plotted in Figure 8a against the time since the 244
application of prestress, where the total masonry strain included the initial elastic shortening 245
strain, the continuing masonry creep strain, and the strain attributed to ambient environmental 246
changes. The total masonry strain ε(t) can be mathematically represented using Equation 14. 247
( ) ( )
(14)
where Em is the masonry modulus of elasticity, fmi is the applied prestress; kc(t) is the specific 248
creep at time t, and εo is the strain attributed to ambient environmental changes and drying 249
creep. Similarly, time dependent masonry creep shortening strain and masonry specific creep 250
values were calculated and then plotted in Figure 8b and 8c. It was observed during the 251
testing that the majority of creep shortening occurred within the first 60 days after the 252
application of prestress and subsequently the creep curves started to stabilise and masonry 253
shortening continued to occur at a slower rate. The observed masonry creep behaviour is 254
consistent with that observed in other previously performed masonry creep investigations. 255
Additionally, the masonry specific creep was also observed to be directly related to the 256
magnitude of initially applied prestress. 257
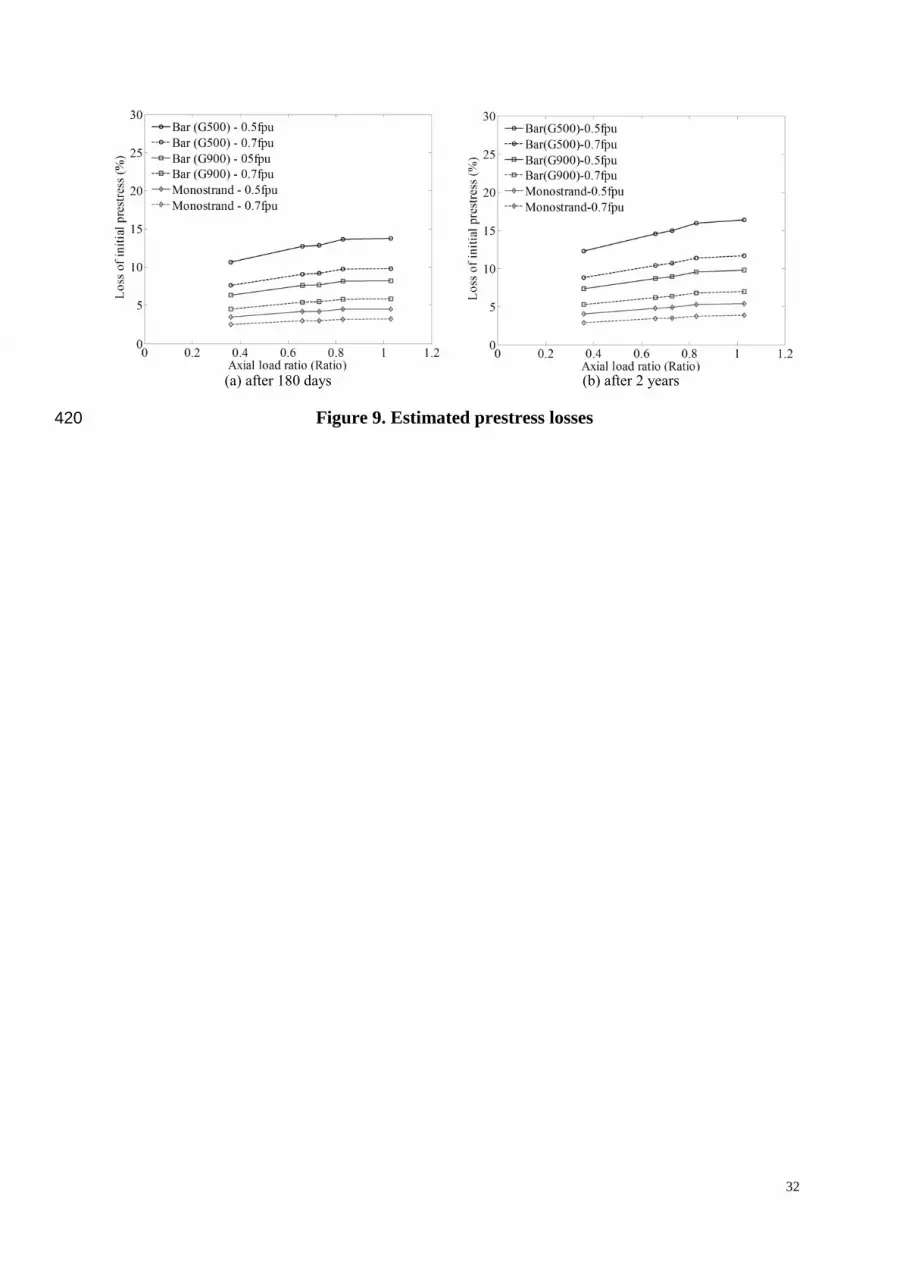
Prestress losses 258
Figure 9a shows the estimated prestress loss based on the experimentally determined specific 259
creep values and Figure 9b shows the estimated prestress loss based on the extrapolated 260
specific creep values. The magnitude of prestressing loss due to masonry shortening was 261
estimated by considering the masonry material properties presented in Table 1 and the 262
physical characteristics of three typical PT tendons, being threaded steel bars (fpu = 680 MPa 263
and Eps = 200 GPa), high strength threaded steel bars (fpu = 1080 MPa and Eps = 190 GPa), 264
and greased sheathed seven wire strands (fpu = 1750 MPa and Eps = 170 GPa). It is noted that 265
13
the axial load ratio in real walls is calculated using total prestress due to both the overburden 266
weight and the applied posttensioning, with the former normally being a small fraction of the 267
latter and thus can be ignored to simplify the prestress loss calculations. It can be seen that a 268
PT loss of up to 16.4% can be expected for a normal threaded steel bars (fpu = 680 MPa), 269
whereas high strength steel bars (fpu = 1080 MPa) and a monostrand (fpu = 1750 MPa) are 270
expected to result in relatively smaller prestress losses of up to 9.8% and 5.4% respectively 271
when posttensioned to a tendon stress of 0.5fpu, where fpu is the ultimate strength of the PT 272
tendon. 273
Recommended values of PT loss parameters 274
Table 5 presents the recommended values for parameters ksh, Cc, and kr for a PT seismic 275
retrofit design of historic URM walls. The shrinkage and creep prestress loss parameters for 276
concrete masonry walls were established on the basis of experimental investigations 277
performed by Laursen (2002) and Wight (2006). The relaxation prestress loss parameter (kr) 278
for typical PT bar and PT strand was established using technical literature provided by the 279
manufacturers. However, it is noted that for different prestressing systems it may vary and be 280
established by interrogating associated technical literature. The shrinkage and creep prestress 281
loss parameters for URM walls were established based on the results from the creep and 282
shrinkage testing reported herein. 283
Summary and Conclusions 284
Theoretical considerations for the prediction of PT losses and an overview of precedent 285
experimental programs investigating time dependent masonry shortening are first presented, 286
with a particular emphasis given to prestress losses occurring in clay brick masonry walls. 287
Existing rheological models for predicting creep shortening in newly constructed clay brick 288

14
masonry walls were discussed and an adapted rheological model with an appropriate aging 289
coefficient was proposed to predict creep shortening occurring in prestressed historic URM 290
walls. An experimental program was undertaken to investigate time dependent masonry 291
shortening, involving the measurement of masonry strains in six (6) prestressed URM 292
wallettes over a period of 180 days. The test wallettes used in the experimental program were 293
extracted from a real historic URM building, which was originally constructed in 1881 and 294
possesses a special historical significance. From experimental results masonry creep 295
coefficients were investigated and were subsequently used to predict time dependent PT 296
losses. The key findings of the experimental program are: 297
Large variations between the codified and experimentally determined masonry creep 298
parameters were observed, necessitating further experimental investigations. 299
Initial masonry shortening matched the theoretically determined masonry elastic 300
shortening. 301
The majority of masonry shortening occurred during the first 60 days from the 302
application of prestress and subsequently the masonry shortening continued to occur 303
at a relatively slower rate until the measurement was discontinued. 304
After 180 days from prestressing, the experimentally determined specific creep values 305
ranged from 181 µε/MPa to 234 µε/MPa. 306
The specific creep values after 2 years from the application of prestress were 307
estimated using a proposed rheological model that resulted in specific creep values 308
ranging from 209 µε/MPa (analogous to a creep ratio of 0.41) to 278 µε/MPa 309
(analogous to a creep ratio of 0.55). 310

15
A prestress loss of 16.4% was estimated to occur when a threaded steel bar (having an 311
ultimate tensile strength of 680 MPa) is posttensioned to a stress of 0.5fpu, whereas a 312
relatively smaller prestress loss of 5.4% was estimated when a sheathed, greased 313
seven wire strand (having an ultimate tensile strength of 1750 MPa) is posttensioned 314
to a stress of 0.5fpu, where fpu is the ultimate tensile strength of the tendon. 315
Acknowledgments 316
The Higher Education Commission of Pakistan provided funding for the doctoral studies of 317
the first author. Financial support for the testing reported herein was provided by the New 318
Zealand Foundation for Research Science and Technology. Reids Construction Systems 319
supplied the posttenstioning materials. Ronald Lumantarna, Benoit Rozier, Anatole Weil and 320
Tek Goon Ang are thanked for their help with the testing program. 321
References 322
Anand, S. C., and Bhatia, N. (1996). "Prestress loss due to creep in post-tensioned clay 323
masonry." 1996 CCMS of the ASCE Symposium in Conjunction with Structures 324
Congress XIV, Chicago, USA, 49-60. 325
Anand, S. C., and Rahman, M. A. (1991). "Numerical modelling of creep in composite 326
masonry walls." Journal of Structural Engineering,, 117(7), 2149-2165. 327
AS. (2001). AS 3700-01: Masonry structures, Standards Australia International, Sydney, 328
NSW, Australia. 329
AS/NZS. (2003). AS/NZS 4456-03: Masonry Units, Segmental Pavers and Flags - Methods 330
of Test, Standards Australia, Sydney, Australia. 331
16
ASTM. (2011). ASTM C67-11: Standard test methods for sampling and testing brick and 332
structural clay tile, American Society for Testing and Materials International, West 333
Conshohoken, USA. 334
ASTM. (2011). ASTM C109-11: Standard test method for compressive strength of hydraulic 335
cement mortars, American Society for Testing and Materials International, West 336
Conshohoken, USA. 337
ASTM. (2010). ASTM C1072-10: Standard test method for measurement of masonry flexural 338
bond strength, American Society for Testing and Materials International, West 339
Conshohoken, USA. 340
ASTM. (2011). ASTM C1314-11: Standard test method for compressive strength of masonry 341
prisms, American Society for Testing and Materials International, West 342
Conshohoken, USA. 343
Binda, L., Gatti, G., Mangano, G., Poggi, C., and Sacchi-Landriani, G. (1992). "The collapse 344
of civic tower of Pavia." Masonry International, 6(1), 11-20. 345
BS. (2000). BS 5628:2000-2: British standard code of practice for use of masonry. Part 2: 346
Structural use of reinforced and prestressed masonry, British Standards Institutation, 347
London, UK. 348
CEN. (2005). EN 1996-05 - Eurocode 6: Design of masonry structures, Comite Europeen de 349
Normalisation (European Committee for Standardization), Brussels, Belgium. 350
CSA. (2004). CSA S304.1-04: Design of masonry structures, Canadian Standards 351
Association, Mississauga, Ontario, Canada. 352

17
Curtin, W. G., Shaw, G., Beck, J. K., and Bray, W. (1982). Structural masonry designer's 353
manual, Blackwell Science Ltd, Oxford. 354
England, G. L., and Jordaan, I. J. (1975). "Time dependant and steady state stress in concrete 355
structures with steel reinforcement at normal and raised temperature." Magazine of 356
Concrete Research, 27(92), 131-142. 357
Ghali, A., and Favre, R. (1986). Concrete structures: stress and deformations, Chapman & 358
Hall Ltd., London, United Kingdom. 359
Hughes, T. G., and Harvey, R. J. (1995). "Creep measured in a brick masonry tower block " 360
Masonry International, 9(1), 50-56. 361
Jordaan, I. J., England, G. L., and Khalifa, M. A. (1977). "Creep of concrete, a consistent 362
engineering approach." ASCE Journal of the Structural Division, 103(3), 475-491. 363
Laursen, P. T. (2002). "Seismic analysis and design of post-tensioned concrete masonry 364
walls," PhD Thesis, University of Auckland, Auckland. 365
Lenczner, D. (1986a). "Creep and prestress losses in brick masonry." The Structural 366
Engineer, 64B(3), 57-62. 367
Lenczner, D. (1986b). "In-situ measurements of creep movement in a brick masonry tower 368
block." Masonry International, 8(1), 17-20. 369
Lumantarna, R. (2012). "Characterisation of materials in URM buildings in New Zealand," 370
PhD Thesis, University of Auckland, Auckland, New Zealand. 371
MSJC. (2008). ACI 530-08/ASCE 5-08/TMS 402-08:Building code requirements for masonry 372
structures, The Masonry Society, Boulder, CO, USA. 373

18
National Library of New Zealand (2012). "Supreme Court Building, Wellington, New 374
Zealand, [ca 1881]." Photographs of Wellington and district, Reference Number PA-375
Group-00190, <http://mp.natlib.govt.nz/detail/?id=106914&l=mi>. (19 April 2012, 376
2012). 377
NZSEE. (2011). Assessment and improvement of unreinforced masonry buildings for 378
earthquake resistance, New Zealand Society for Earthquake Engineering, Wellington. 379
PCI. (1975). "Recommendations for estimating prestress losses." Journal of the Prestressed 380
Concrete Institute, 20(4), 43-75. 381
Schubert, P., and Wesche, K. (1984). Verformung and Rissesicherheit von Mauerwerk 382
(Deformations and cracking behaviour of masonry), MauerwerkKalender Ernst & 383
Sohn, Berlin, Germany. 384
Shrive, N. G., Sayed-Ahmed, E. Y., and Tilleman, D. (1997). "Creep analysis of clay 385
masonry assemblages." Canadian Journal of Civil Engineering, 24(3), 367-379 386
Wight, G. D. (2006). "Seismic performance of a post-tensioned concrete masonry wall 387
system " PhD Thesis, University of Auckland, Auckland. 388

19
Tables 389
Table 1. Masonry shrinkage and creep parameters 390
Reference Clay Brick Masonry* New Concrete Masonry
Cc kc ksh Cc kc ksh
Ratio µε µε Ratio µε µε
BS 5628 (2000) 1.5 759# 0 3.0 210## 500
TMS 402 (2008) 0.02# 10 0 0.5## 36 100
AS 3700 (2001) 0.5-0.6 253-304# 0 2.5 170## 700
S 304.1 (2004) 1.0-3.0 506-1517# 0 3.0-4.0 210-280## 100-200
EC 06 (2005) 0.7 354# 0 1.5 105## 150
Laursen (2002) - - - 1.5-3.4 105-282 373-388
Wight (2006) - - - 1.7-3.4 115-282 435-738
Schubert & Wesche (1984) 0.5-1.7 253-860# 0 - - -
Lenczner (1986b) 2.0** 1011# 0 - - -
Shrive et al. (1997) 0.5-1.7 253-860# 0 - - -
Anand & Bhatia (1996) 1.5 759# 0 - - -
Where: Cc = masonry creep ratio; kc = masonry specific creep; and ksh = masonry shrinkage parameter.
*old masonry with weak hydraulic mortar and saturated bricks, **found experimentally over a period of 8 years in a historic URM building
located in UK, #analogous value calculated using Em = 300f’m and f’m = 6.59 MPa, ##analogous value calculated using Em = 800f’m and f’m = 18 MPa (Wight 2006)
391
20
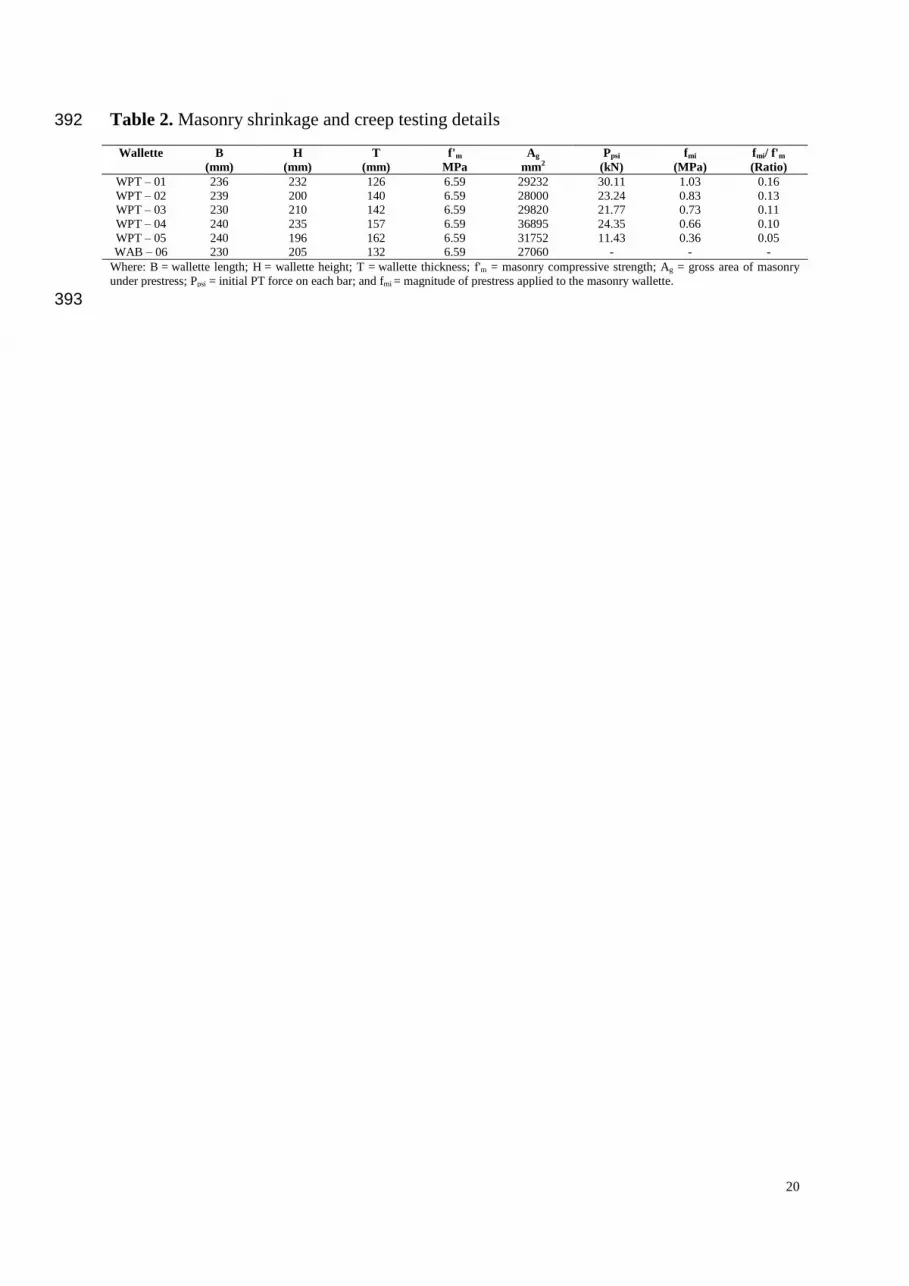
Table 2. Masonry shrinkage and creep testing details 392
Wallette B
(mm)
H
(mm)
T
(mm)
f'm
MPa
Ag
mm2
Ppsi
(kN)
fmi
(MPa)
fmi/ f'm
(Ratio)
WPT – 01 236 232 126 6.59 29232 30.11 1.03 0.16
WPT – 02 239 200 140 6.59 28000 23.24 0.83 0.13 WPT – 03 230 210 142 6.59 29820 21.77 0.73 0.11
WPT – 04 240 235 157 6.59 36895 24.35 0.66 0.10
WPT – 05 240 196 162 6.59 31752 11.43 0.36 0.05 WAB – 06 230 205 132 6.59 27060 - - -
Where: B = wallette length; H = wallette height; T = wallette thickness; f'm = masonry compressive strength; Ag = gross area of masonry
under prestress; Ppsi = initial PT force on each bar; and fmi = magnitude of prestress applied to the masonry wallette.
393

21
Table 3. Masonry material properties 394
Measure f'b fr f'j f'm C ϕs Em
(MPa) (MPa) (MPa) (MPa) (MPa) (Ratio) (GPa)
Mean 17.68 0.40 1.87 6.59 0.43 0.92 1.98 CoV 0.12 0.22 0.15 0.23 - - -
Where: CoV = coefficient of variation; f'b = brick compressive strength; fr = masonry flexural bond strength; f'j = mortar compressive
strength; f'm = masonry compressive strength; C = masonry cohesion; ϕs = masonry coefficient of friction; and Em = masonry elastic modulus calculated as Em = 300f'm.
395

22
Table 4. Summary of results 396
Test Wallette fmi
(MPa)
εi
(µε)
εi,t
(µε)
εtu
(µε)
εcu
(µε)
kc
(µε/MPa)
Cc
Ratio
k'c
(µε/MPa)
C'c
Ratio
χ
-
WPT – 01 1.03 565 521 895 241 234 0.43 278 0.55 0.080 WPT – 02 0.83 476 420 758 193 232 0.40 271 0.54 0.078
WPT – 03 0.73 388 369 637 160 219 0.41 254 0.50 0.073
WPT – 04 0.66 349 334 582 143 217 0.41 247 0.49 0.071 WPT – 05 0.36 222 182 377 65 181 0.29 209 0.41 0.060
Where: fmi = magnitude of prestress applied to the masonry wallette; εi = measured masonry elastic shortening; εi,t = predicted masonry
elastic shortening; εtu = maximum measured total masonry shortening strain; εcu = maximum measured masonry creep strain; kc = measured masonry specific creep; Cc = measured masonry creep ratio; k'c = extrapolated masonry specific creep; C'c = extrapolated masonry creep
ratio; and χ = aging coefficient empirically determined to match the experimental curve.
397

23
Table 5. Prestress loss parameters 398
Masonry ksh Cc kr
Type µε B S
URM 0 0.55 0.040 0.025
CM 400 3.00 0.040 0.025
Where: URM = historic unreinforced clay brick masonry; CM = concrete block masonry; B = Grade 500 threaded steel bar; S = seven wire, sheathed and greased
strand; Cc = masonry creep parameter; kc = masonry specific creep; and
ksh = masonry shrinkage parameter.
399 400

24
Figures 401
Maso
nry
sh
ort
en
ing
str
ain
Time
Elastic shortening
Basic creep
Drying creep
Shrinkage
to t
Extraploation
402
Figure 1. Time dependent masonry creep 403
404

25
(a) Maxwell model (b) Kelvin model (c) Burgers model
Figure 2. Representation of basic rheological models 405
406

26
(a) After construction in 1881 (b) Being strengthened in 2008
Figure 3. Old Supreme Court Building 407
408

27
(a) cutting of extracted URM section (b) further cutting to uniform size
Figure 4. Preparation of test wallettes from the extracted URM section 409
28
Heavy Coil
Spring
Threaded Steel Bars
G1
G3 o
n R
ear
Fac
e
G2
G4 o
n R
ear
Fac
e
Bearing Steel Plate
Steel Beam
Heavy Coil
Spring
410
Figure 5. Shrinkage and creep test setup 411
29
(a) prestressed wallettes (b) strain being measured
Figure 6. Photographs of the masonry shrinkage and creep testing 412

30
413 (a) averaged ambient air temperature 414
415 (b) averaged relative humidity 416
Figure 7. Ambient air temperature and relative humidity 417
418

31
(a) total masonry shortening strain (b) masonry creep strain
(c) masonry specific creep strain (d) extrapolation up to 2 years
Figure 8. Time dependent masonry shortening and prestress loss 419
0 5000 10000 150000
50
100
150
200
250
300
Time since Prestressing (Hours)
Sp
ecif
ic C
reep
(m
icro
stra
in)
WPT-1
WPT-2
WPT-3
WPT-4
Experimental
Extrapolated using model
WPT-2(Model)
WPT-3(Model)
WPT-4(Model)
WPT-5(Model)
0 5000 10000 150000
50
100
150
200
250
300
Time since Prestressing (Hours)
Sp
ecif
ic C
reep
(m
icro
stra
in)
WPT-1
WPT-2
WPT-3
WPT-4
Experimental
Extrapolated using model
WPT-2(Model)
WPT-3(Model)
WPT-4(Model)
WPT-5(Model)
32
(a) after 180 days (b) after 2 years
Figure 9. Estimated prestress losses 420