material properties of existing unreinforced clay brick masonry buildings in new zealand
TRANSCRIPT

MATERIAL PROPERTIES OF EXISTING
UNREINFORCED CLAY BRICK MASONRY BUILDINGS
IN NEW ZEALAND
Nasser Almesfer1, Dmytro Y. Dizhur
2, Ronald Lumantarna
3,
Jason M. Ingham4
SUMMARY
The material properties of New Zealand’s heritage clay brick unreinforced masonry (URM) buildings
were investigated and are reported herein. Material data was collected from a total of 98 New Zealand
clay brick URM buildings and a database was compiled that was comprised of various masonry material
properties. The intention behind the reporting of information and data presented herein was to provide
indicative values to the professional engineering community to aid as preliminary input when
undertaking detailed building assessments for cases where in-situ testing and brick and mortar sample
extraction are not feasible. The data presented is also used to support the relationships for URM material
properties that have been recommended by the authors for incorporation into the next version of the
NZSEE seismic assessment guidelines for URM buildings. Although researchers from Europe, USA,
India and Australia have previously studied the material properties of clay brick unreinforced masonry,
knowledge on New Zealand URM material properties was poor at the time the study commenced.
Therefore, a research programme was undertaken that was focused on both in-situ testing and laboratory
testing of samples extracted from existing New Zealand clay brick URM buildings.
1 Structural Engineer, EQ Struc Ltd
2 Post-doctoral fellow, Department of Civil and Environmental Engineering, University of Auckland, Auckland, New Zealand
3 National Sales Engineer, Reids Construction Systems Ltd
4 Professor, Department of Civil and Environmental Engineering, University of Auckland, Auckland, New Zealand
INTRODUCTION
Unreinforced masonry (URM) buildings are generally New
Zealand’s oldest buildings, representing both a large and a
significant component of the nation’s architectural heritage.
Whilst URM buildings are prevalent worldwide, New Zealand
has the comparative advantage that our URM building stock
was constructed over a short time frame spanning from about
1880 to 1935 and most buildings have a regular and widely
repeated geometry and detailing that facilitates the
development of seismic assessment guidelines that have the
potential for a greater degree of accuracy than is possible in
many other parts of the world where the URM building stock
is far more diverse.
URM construction is evidently vulnerable to large magnitude
earthquakes [1, 2, 3]. The most recent New Zealand examples
of the vulnerability of URM buildings to earthquakes were the
4th September 2010 Darfield earthquake and the 22nd February
2011 Christchurch earthquake [4, 5, 6] where most URM
buildings in the Christchurch area were severely damaged (see
Figure 1), leading to fatalities. Today many URM buildings
still exist in various parts of New Zealand and due to their
likely poor earthquake performance, seismic assessment and
retrofit of these remaining URM buildings will probably be
required in most cases in order to avoid building demolition,
recognising that these buildings not only represent a
significant architectural heritage, but also occupy a significant
proportion of the nation’s building stock.
Figure 1: Damaged URM building resulting from the 2011
Christchurch earthquake.
Design practitioners have communicated the importance of
obtaining better material data for URM buildings in order to
improve the accuracy, and therefore the cost effectiveness of
their seismic assessments, computer modelling, and retrofit
designs. The study reported herein concentrated specifically
on the material properties of pre-1950s New Zealand URM
BULLETIN OF THE NEW ZEALAND SOCIETY FOR EARTHQUAKE ENGINEERING, Vol. 47, No. 2, June 2014
75

buildings that were constructed using solid, uncored clay
bricks having approximate dimensions of 230 mm × 110 mm
× 76 mm, and lime-based mortar (in alignment with Russell
[7]). This construction type is still largely used in developing
countries such as India and Indonesia [8, 9, 10, 11], and
researchers from USA, Australia and Europe have previously
studied the material properties of clay brick unreinforced
masonry.
A clay brick unreinforced masonry assemblage has
nonhomogeneous, inelastic and orthotropic material
characteristics, whose properties are influenced by both the
brick unit and mortar properties. Therefore, this study aimed
to investigate the brick unit and mortar properties separately,
and to then relate the brick unit and mortar properties to the
masonry assemblage properties.
PAST STUDIES AND COMMON TEST METHODS TO
DETERMINE URM MATERIAL PROPERTIES
Clay bricks
Clay bricks are a principal structural component of
unreinforced clay brick masonry buildings, and researchers
[10, 11, 12] have commonly used the clay brick compressive
strength as a principal parameter to predict masonry
compressive strength, which furthermore is the basis for
estimating masonry Modulus of Elasticity and stress-strain
behaviour [11]. However, the extraction of clay bricks from
heritage URM buildings for compression testing is often
prohibited due to the building’s heritage significance. NZSEE
[13] recommends the use of physical properties such as colour
to classify clay bricks, which was shown by Lumantarna [14]
to not be an appropriate basis for a brick classification scheme
as there was no measured correlation between brick colour
and brick compressive strength (see Figure 2). Overseas
researchers [15, 16] have suggested the use of different
techniques to determine the brick compressive strength, such
as the Schmidt hammer test and the ultrasonic pulse velocity
test.
Figure 2: Brick compressive strength vs. visible colour plot.
Another non-destructive testing technique is the Mohs scratch
test, which is used to estimate material properties based on the
material’s resistance to abrasion, and is associated with the
Mohs hardness scale. Mohs numbers of 1 to 10 are used to
rank minerals with distinct hardness, and the scratch number
assigned to the tested sample is equal to the Mohs number of
the mineral that scratches it [17]. The scratch test is
principally similar to the abrasion test described by Shalabi et
al. [18], where the resistance of one material against another
material of a different hardness is tested. Shalabi et al. [18]
also reported that there is a linear relationship between the
compressive strength of rocks and their abrasion hardness.
However, the feasibility of the above techniques to
characterise New Zealand heritage clay bricks had not been
rigorously verified prior to commencement of the reported
study.
Mortar
The mortar compressive strength has also been used
previously by a number of researchers [10, 11, 12] for the
prediction of masonry compressive strength. However, mortar
samples extracted from existing URM buildings are typically
of an irregular shape, and thus these samples are not suitable
for standardised compression testing. Procedures for the
compression testing of irregular mortar samples have been
studied by a number of authors [19, 20, 21] who have
performed laboratory experiments and finite element
modelling to investigate the influence that sample dimensions
had on the measured value of the mortar compressive strength.
Other authors have investigated procedures to estimate the
mortar aggregate to binder ratio [22] and to predict the
mineral constituents of mortar [23, 24, 25].
Masonry assemblage
The material properties of a masonry assemblage have
typically been studied using a single leaf, stack bonded
brick/mortar composite of a given brick-height (referred to as
a “masonry prism”). Kaushik et al. [11] used laboratory-
constructed masonry prisms to study the relationships between
brick unit compressive strength, mortar compressive strength,
masonry compressive strength, masonry compression stress-
strain behaviour and masonry Modulus of Elasticity, whilst
other authors [26, 27] used laboratory constructed masonry
prisms to relate the brick unit, mortar and masonry
compressive strengths to the masonry flexural bond strength
and shear bond strength. However, it is noted that these
studies mostly focused on newly made laboratory-constructed
samples, and thus the applicability of these studies to New
Zealand heritage URM required investigation.
Masonry compressive strength is one of the most important
properties for the assessment and design of masonry elements
[11]. However, compression testing of masonry prisms is not
always practical, and therefore many researchers [9, 10, 11,
28, 29] have attempted to develop an empirical expression
relating the brick unit, mortar and masonry compressive
strengths in a form such as shown in Equation 1 [30]:
m b jf Kf f
(1)
where, K, α, and β are constants, and ƒ’ƅ, ƒ’j and ƒ’m are the
brick unit, mortar and masonry compressive strengths
respectively. Eurocode 6 [30] recommends a range of K
values, depending on the brick unit properties and the
brick/mortar bond configuration, while prescribing α and β as
0.7 and 0.3 respectively. The value of β is lower than α, which
indicates that the masonry compressive strength (ƒ’m) is
influenced to a greater extent by the brick unit compressive
strength (ƒ’ƅ) than by the mortar compressive strength (ƒ’j ). It
is noted that the constants proposed by Eurocode 6 [30] are
used to estimate the 5% lower characteristic compressive
strength of masonry, instead of the mean compressive
strength.
Modulus of Elasticity
The masonry Modulus of Elasticity (Em) is commonly
calculated as the chord modulus of the linear part of the
masonry compression stress-strain curve, which is typically
defined to be between 5% and 33% of the ultimate masonry
compressive strength (ƒ’m) [1, 31]. The relationship between
0
10
20
30
40
50
Co
mp
ress
ive
Stre
ngt
h (
MP
a)
76

masonry compressive strength and Modulus of Elasticity can
be expressed as:
m mE kf (2)
where k is a constant that varies from one recommendation to
another. The MSJC code [32] and FEMA 306 [33] from North
America recommend that Em is equal to 700f’m for modern
masonry and equal to 550f’m for existing masonry
respectively, whilst the Canadian masonry code [34] suggests
a slightly higher value of Em = 850 f’m for modern masonry.
Masonry bond strength
Several studies have been previously conducted to investigate
masonry bond properties. The brick/mortar bond development
is effectively a mechanical process that is influenced by binder
hydration occurring at the brick surface and in the brick unit
pores [35, 36, 37]. Grenley [38] investigated various
brick/mortar combinations and found that the masonry flexural
bond, tensile bond and compressive strengths generally
increased with increasing brick unit and mortar compressive
strengths. The masonry bond-compressive strength
relationships that were obtained for the various combinations
showed strong correlations, although the influence that mortar
compressive strength had on the masonry bond strength could
not be neglected. Samarasinghe and Lawrence [39] performed
shear tests on masonry triplets replicating new masonry
construction and observed that masonry prisms that were
constructed using pre-wetted brick units had higher bed joint
shear strengths than those constructed using dry or completely
saturated brick units. These researchers also observed that the
bed joint shear strength increased with increasing mortar
compressive strength.
The brick/mortar bond failure of masonry prisms when
subjected to bond wrench and shear bond tests can be
classified as follows [26, 40, 41]:
Type A: Failure at one brick/mortar interface;
Type B: Failure at both brick/mortar interfaces;
Type C: Failure within the mortar joint;
Type D: Failure within the brick unit;
Type E: Combination of failure within the brick unit and
mortar joint.
Venkatarama Reddy and Gupta [41] observed four different
types of failure (types A, C, D and E) for their experiments.
Failure type E was the most common type observed, whilst
failure types C and D generally occurred when weak mortar
and weak block units respectively were used. Failure type A
was exhibited by prisms that were constructed using
moderately strong cement-soil blocks. Sarangapani et al. [26]
did not observe failure type C when testing masonry prisms,
whereas failure type D and a combination of failure types A
and D were frequently observed for prisms constructed using
weak brick units and strong mortar. These researchers also
reported that failure type A mostly occurred when the
brick/mortar interface bond strength was lower than the mortar
joint flexural strength, and therefore this failure type was
exhibited by almost all prisms that were constructed without
bond enhancement.
TEST PROGRAM
Vintage clay bricks and irregular mortar samples were
extracted from existing New Zealand URM buildings, and
were subjected to a series of non-destructive tests before being
tested in compression. The relationships between the non-
destructive test results and the clay brick and mortar
compressive strengths were studied, and non-destructive
testing techniques that were most suitable for estimating clay
brick and mortar compressive strengths in-situ were proposed.
The compressive strength and compressive stiffness of
masonry were studied using masonry prisms (see Figure 3)
that were both extracted from existing buildings and were
constructed in the laboratory. Empirical relationships relating
the brick unit, mortar and masonry compressive strengths as
well as relating the masonry compressive strength to the
masonry Modulus of Elasticity were derived.
Figure 3: Masonry prism with displacement gauge.
Finally, the flexural bond strength and shear bond strength of
masonry were studied using field extracted and laboratory
constructed masonry prisms. Empirical relationships relating
the mortar compressive strength to the flexural bond strength
and to the bed joint cohesion were derived.
METHODOLOGY
The compressive strength of the brick units that were used in
the construction of each prism combination was determined
following the half brick compression test ASTM C 67 - 03a
[42], which involves cutting extracted brick units into halves
and capping these half bricks prior to compression testing
using gypsum plaster for the capping material (see Figure 4).
The purpose of this investigation was to correlate the
measured brick compressive strength using a standard test to
the measured compressive strength of the prism, again using a
standard test.
Figure 4: Gypsum plaster capping (left, and brick
compression testing (right).
Irregular mortar samples were extracted from each field site
and carefully cut in the laboratory to form rectangular test
pieces, then capped using gypsum plaster and tested in
compression following the procedure reported by Lumantarna
[14], (see Figure 5).
The method to determine mortar compressive strength is
detailed in ASTM C 109-08 [43]. This method involves
testing of 50 mm cube mortar samples, which generally are not
attainable in existing buildings as most mortar joints are only
77

12 to 18 mm thick. Consequently, irregular mortar samples
were cut into approximately cubical sizes with two parallel
sides (top and bottom). The height of the mortar samples
exceeded 15 mm in order to satisfactorily maintain the
proportion between sample size and the maximum aggregate
size. The prepared samples were then capped using gypsum
plaster to ensure a uniform stress distribution and tested in
compression [20].
Figure 5: Irregular mortar samples (left) and mortar
compression test (right).
The height to least lateral dimension (h/t) ratio of the mortar
samples was measured and used to determine the mortar
compressive strength correction factors by interpolation of the
data presented in Table 1. The compression test result was
then divided by the corresponding correction factors listed in
Table 1. Refer to Lumantarna [14] for further details regarding
the correction factors and the influence of height to thickness
ratio on mortar compressive strength.
Table 1: Height to thickness ratio correction factor for
mortar compressive strength
h/t ratio 0.6 0.7 0.8 0.9 1.0 1.1 1.2
Correction
factor 1.3 1.225 1.15 1.075 1.00 0.925 0.85
For the laboratory constructed prisms, varying mortar mix
proportions were selected to simulate a wide range of mortar
properties, and the materials used in the mortar were ordinary
Portland cement, hydrated lime and river sand. Most of the
mortar mix proportions chosen were based on the proportions
recommended in ASTM C 270 - 08a [43] and the typical
material proportions for New Zealand historic mortar as
reported in NZSEE [13], except for mortar grades B and E,
which were approximated by the mason that assisted in the
sample construction process. The water/cement ratio of each
mortar grade was kept constant to maintain between-batch
consistency. It is noted that these mortar cubes were prepared
simultaneously with the laboratory constructed prisms. The
compressive strength of each mortar grade was determined
using 50 mm mortar cubes that were prepared as prescribed in
ASTM C 109 - 08 [43]. After approximately 28 days of curing
at room temperature (20 ± 5º C) these mortar cubes were
tested in compression following ASTM C 109 - 08 [43].
The bond wrench test AS 3700-2001 [44] was adopted for
both in-situ and laboratory applications due to its greater
portability in comparison to the ASTM C 1072 - 00a [45] test
setup, and therefore the bond wrench test was more suitable
for in-situ testing. The bond wrench arm was constructed as
stipulated in AS 3700-2001 [44], with a hook connector
installed at the end of the bond wrench arm. An empty
container was attached to the hook and then gradually filled
using sand to apply bending stresses to the mortar joint until
flexural bond failure occurred (see Figure 6). The weight of
the bucket and sand was measured to the nearest 0.01 gram
and used to calculate the flexural bond failure stress.
(a) Plan view
(b) Elevation view
Figure 6: Flexural bond test-setup (AS 3700-2001).
The in-situ shear test ASTM C 1531 - 03 [46] and the triplet
shear test Rilem TC 127-MS.B.4 [47] were adopted for on-site
and laboratory shear bond testing respectively, with the
majority of tests being performed using the in-situ shear test.
The in-situ shear tests were performed without flat jacks, and
the triplet shear tests were performed whilst subjected to
different levels of axial pre-compression load. The hydraulic
jack was loaded using a pressure controlled hydraulic pump
and a displacement gauge was attached on the wall face
adjacent to the vertical cut joint, to identify when bed-joint
sliding failure occurred (see Figure 7). It was also noted that
the contribution of collar joints was not considered in the bed
joint shear strength calculation as the collar joints were mostly
poorly laid, and therefore their contribution to the bed joint
shear strength was minimal.
Figure 7: In-situ shear test.
For the triplet shear test, prisms were placed between two steel
plates that were interconnected using four steel rods. The axial
pre-compression load was applied by tightening the nuts at the
ends of the steel rods and the value of the pre-compression
load was recorded using a load cell. The sample was prepared
such that the middle course of the prisms consisted of a full
brick unit (see Figure 8).
78

Figure 8: Laboratory shear triplet.
The triplet shear tests were performed whilst being subjected
to axial pre-compression stresses of 0.2 MPa, 0.4 MPa and
0.6 MPa. The shear strength of the mortar joints can be
represented by the Mohr-Coulomb friction law as per
Equation (3) [42, 47, 48]:
c N (3)
where = shear stress at a given axial compression, c = shear
stress at zero axial compression (cohesion), µ = coefficient of
friction, and N = axial compression stress. Therefore, the
mortar bed joint cohesion could be derived because the triplet
shear tests were performed at different levels of axial pre-
compression load.
Source of extracted samples
The brick and mortar samples were extracted from 98
buildings (referred to as field sites) which were constructed
between 1881 and the 1940s, which coincides with the time
period during which URM construction was popular in New
Zealand. Although variability in the constituent material
properties amongst URM buildings is expected, these field
sites are deemed to be representative of the majority of New
Zealand URM buildings. Figure 9 below shows the locations
of the field sites. Refer to Appendix A for more details on
each field site.
Figure 9: Map of New Zealand showing the location of
field sites.
TEST RESULTS AND DISCUSSION
Mohs scratch test - brick
A statistical analysis of the relationship between brick unit
compressive strength and Mohs scratch number was
performed using the R software package [49]. The brick unit
compressive strength-Mohs scratch number relationship was
expressed using the box and whisker plots shown in Figure
10, which were calculated according to Peck et al. [50]. It is
noted that the group median was used to express each brick
category (each box and whisker plot) as median is less
influenced by data extremes than is the mean, and therefore
was considered to be suitable when dealing with a large data
population. Figure 10 shows that the median compressive
strengths of brick units with scratch numbers of 2.5, 3.0 and
4.0 were 13.3 MPa, 27.5 MPa and 37.2 MPa, respectively. It
was found that an increase in brick unit compressive strength
generally correlated with an increased Mohs scratch number.
The Mohs scratch numbers were generally consistent within
each brick group, except for some brick groups where slight
variability in the numbers was obtained. The majority of the
samples were scratched using an aluminium pick (Mohs
scratch number 2.5, 89 samples), whilst there were 41 and 27
samples that were scratched using a copper coin (Mohs
scratch number 3.0) and an iron nail (Mohs scratch number
4.0) respectively. The brick surface abrasion resistance may
be affected by weathering, and hence it is important to
consider scraping off the potentially weathered surface of the
brick prior to performing the scratch test in order to obtain a
more accurate result.
Figure 10: Relationship between brick unit compressive
strength and Mohs scratch number (157 data
considered).
The data presented in Figure 10 consisted of a data set from
earlier studies published by Lumantarna [14], whereas a
larger brick compressive strength data set is presented in
Figure 11 (which also includes all the data from Figure 10),
along with the relative frequency of strength bands. Based on
Figure 10 a scratch index of 2.5 would correlate with an
anticipated upper limit of brick unit compressive strength of
approximately 30 MPa, and therefore potentially include up to
80% of the compressive strength data set shown in Figure 11.
This observation illustrates the inherent uncertainty and
potential inaccuracy associated with use of the scratch test to
forecast compressive strength, particularly for a scratch index
of 2.5, and hence it is recommended that engineers undertake
a sensitivity analysis to consider what effect a high or low
brick compressive strength may have on their assessments.
The Mohs scratch test should only be performed if extraction
of brick samples from the building is not possible.
2.5 3 4
10
20
30
40
50
Scratch Index
Co
mp
ressiv
e S
tre
ng
th (
MP
a)
Hamilton, 1 site
Auckland, 40 sites
Te Awamutu, 1 site
Gisborne, 2 sites
Wellington, 2 sites
Whanganui, 2 sites
Christchurch,
50 sites
79

Figure 11: Brick compressive strength frequency
distribution (367 data considered).
Brick unit Modulus of Rupture
The brick unit Modulus of Rupture (MoR) and compressive
strengths of 8 different brick groups are shown in Figure 12.
The brick unit Modulus of Rupture strength generally
increased with increasing brick unit compressive strength. The
average brick unit compressive strength ranged between
10.0 MPa and 28.9 MPa, whilst the average brick unit
Modulus of Rupture strength varied from 0.9 MPa to
3.8 MPa. The Coefficient of Variation (CoV) values of the
Modulus of Rupture strength were generally higher than those
of the brick unit compressive strength (CoV MoR ranging
from 0.15 to 0.39 and CoV ƒ’ƅ ranging between 0.17 and
0.30). Figure 12 illustrates the brick unit Modulus of Rupture
strength-compressive strength relationship. It was established
that the brick unit Modulus of Rupture strength can be
satisfactorily equated to:
0.12 bMoR f (4)
which is similar to the 0.10ƒ’ƅ value recommended in NZSEE
[13], and the associated coefficient of determination (R2)
value of 72% was deemed to be satisfactory, especially when
considering the variability of New Zealand vintage solid clay
bricks.
Figure 12: Relationship between brick Modulus of Rupture
strength and brick compressive strength.
Mohs scratch test - mortar
The normalised mortar compressive strength-Mohs scratch
number relationship was expressed using the box and whisker
plots shown in Figure 13, which were again calculated
according to Peck et al. [50]. Similar to that for clay bricks,
the group median was used to express each mortar category
(each box and whisker plot) as median is less influenced by
data extremes than is the mean, and therefore was considered
to be suitable when dealing with a large data population.
Figure 13 shows that the median normalised compressive
strengths of mortar samples having scratch numbers of 1.5,
2.0, and 2.5 were 1.4 MPa, 5.5 MPa, and 7.4 MPa,
respectively.
Figure 13: Relationship between mortar compressive
strength and Mohs scratch number.
It was found that the normalised mortar compressive strength
generally increased with an increase in the Mohs scratch
number. The Mohs scratch numbers were generally consistent
within each mortar group, except for some mortar groups
where slight variability in the scratch numbers was observed.
The samples were scratched easily with a fingernail (Mohs
scratch number 1.5, 223 samples), whilst there were 92 and 42
samples that were scratched with a fingernail (Mohs scratch
number 2.0) and an aluminium pick (Mohs scratch number
2.5) respectively.
Figure 14: Mortar compressive strength frequency
distribution (357 data considered).
The Kruskal - Wallis test [51] revealed that each mortar
category originated from samples which had a distinct median,
suggesting that the modified Mohs scratch test is an adequate
technique to categorise mortar samples according to their
compressive strengths. However, each Mohs scratch number
represents a wide mortar compressive strength range as
supported by Figure 14, where a scratch index of 1.5 (from
Figure 13 potentially having an upper mortar compressive
strength of approximately 3.0 MPa) includes up to 70% of the
mortar compressive strength data set. Consequently this
testing technique should be reserved for cases where there is
no budget available for extraction of samples, or when sample
extraction from heritage URM buildings is not permitted. If
this testing technique is used, the scratch test needs to be
undertaken at a suitable mortar depth due to possible mortar
repointing.
Data from Figure 14 is represented in Figure 15 with higher
resolution strength bands, indicating that the most frequently
0%
20%
40%
60%
80%
100%
0
5
10
15
20
25
30
Cu
mu
lati
ve %
Freq
uen
cy (
%)
Brick compressive strength (MPa)
Frequency
Cumulative %
y = 0.1222x R² = 0.7199
0
1
2
3
4
5
6
0 5 10 15 20 25 30 35 40
Mo
du
lus
of
Ru
ptu
re (
MP
a)
Brick compressive Strength (MPa)
1.5 2 2.5
02
46
81
01
2
Scratch Index
Co
mp
ressiv
e S
tre
ng
th (
MP
a)
0%
20%
40%
60%
80%
100%
0
5
10
15
20
25
30
Cu
mu
lati
ve %
Freq
uen
cy (
%)
Mortar compressive strength (MPa)
Frequency
Cumulative %
80

encountered mortar strengths ranged between 0.6 MPa and
1.5 MPa, with approximately 40% of all samples having
compressive strengths of less than 1.5 MPa.
Figure 15: Mortar compressive strength frequency
distribution (2); (357 data considered).
Prediction of masonry compressive strength
An expression relating the brick unit, mortar and masonry
compressive strengths was derived to enable prediction of the
compressive strength of existing URM buildings using only
the brick unit and mortar compressive strengths, so that
expensive and time consuming prism compression tests can be
avoided. In general, the masonry compressive strength
increased with increasing brick unit and mortar compressive
strengths. The field extracted sample test results were
combined with those of the laboratory constructed samples,
and a non-linear regression analysis was performed to
determine the relationships between ƒ’ƅ, ƒ’j and ƒ’m for the
combined data set, allowing the resemblance of the laboratory
constructed samples to the field extracted samples to be
assessed. A three dimensional plot relating ƒ’ƅ, ƒ’j and ƒ’m of
the combined database was generated using DataFit 9.0 [52]
as illustrated in Figure 16. It was shown that the ƒ’ƅ, ƒ’j and
ƒ’m relationships of the laboratory constructed samples
converged with those of the field extracted samples. The
surface plot in Figure 16 represents the prediction of masonry
compressive strength for different brick unit and mortar
properties. A predictive equation relating ƒ’ƅ, ƒ’j and ƒ’m in
the form of the Eurocode 6 expression [30] was derived, and
constants K, α, and β were found to be 0.75, 0.75 and 0.31,
respectively, as show in equation 5.
Figure 16: Three-dimensional plot relating ƒ’ƅ, ƒ’j and ƒ’m.
0.75 0.310.75m b jf f f (5)
In agreement with previous studies [10, 11, 12, 30], the β
value (0.31) was found to be lower than the value (0.75),
which implied that the mortar compressive strength had less
influence on the masonry compressive strength than did the
brick unit compressive strength. An R2 value of 87% was
obtained, which was deemed to be satisfactory, especially
when considering that this equation suited both field extracted
and laboratory constructed masonry.
Prediction of masonry Modulus of Elasticity
As masonry Modulus of Elasticity is an important property for
linear and non-linear structural analysis, a predictive
expression relating the masonry Modulus of Elasticity to the
masonry compressive strength was derived. The masonry
Modulus of Elasticity generally increased with increasing
masonry compressive strength. The masonry Modulus of
Elasticity-compressive strength relationship of the combined
dataset for both the field extracted and the laboratory
constructed prisms is illustrated in Figure 17, showing good
agreement between the two separate data sets. For the
combined dataset, Em could be satisfactorily determined from
equation 6 below. This expression had an R2 value of 76%,
which was deemed to satisfactorily predict the masonry
Modulus of Elasticity.
294m mE f (6)
Figure 17: Relationship between masonry compressive
strength and masonry Modulus of Elasticity.
When compared with the k values recommended elsewhere,
the derived k value of 294 that is presented in equation 6 for
New Zealand historic clay brick masonry was notably low,
although this derived value was within the range observed by
Drysdale et al. [1] and Kaushik et al. [11]. It is also noted that
one important reason for the derived value being lower than is
customarily recommended was that the masonry Modulus of
Elasticity was intentionally calculated using the stress and
strain ordinates at 0.05ƒ’m and 0.70ƒ’m instead of those
located at 0.05ƒ’m and 0.33ƒ’m as used by previous
researchers. This adopted calculation method generated a
stiffness value appropriately reflecting the likely stiffness as
appropriate for linear or non-linear analysis of the in-plane
response of masonry walls or piers when the true stress-strain
relationship is approximated by an elastic-perfectly plastic
relationship, and therefore although the derived Em values
were low, they were thought to be representative for use in
both linear and non-linear seismic analyses.
Modulus of Elasticity values were also established from flat
jack tests undertaken in accordance with ASTM C 1197 – 04,
and these tests have repeatedly led to higher values of
Modulus of Elasticity than is proposed above. However, it is
noted that in general these flat jack tests were undertaken for
0%
20%
40%
60%
80%
100%
0
5
10
15
20
25
Cu
mu
lati
ve %
Freq
uen
cy (
%)
Mortar compressive strength (MPa)
Frequency
Cumulative %
y = 294x R² = 0.76
0
2000
4000
6000
8000
10000
12000
0 5 10 15 20 25 30 35 40
E (M
Pa)
f'm (MPa)
Field Samples
Lab Samples
Linear (Combined)
81
lower levels of peak stress, when compared to the crushing of
masonry prisms, and hence a higher Modulus of Elasticity
would be expected for testing to a reduced stress level.
Higher Modulus of Elasticity values were particularly
noticeable for masonry having a higher compressive strength.
It is recommended that a sensitivity study be conducted on the
effects that the adopted Modulus of Elasticity has on the
outcome of the building seismic assessment and that on-site
testing be conducted where uncertainty in the value of
masonry Modulus of Elasticity has a significant influence on
the determination.
Flexural bond strength
A minimum of three bond wrench couplet samples were tested
for each brick/mortar combination, with most prisms
exhibiting a flexural bond failure within the mortar joint
(failure type C). It was concluded that these bond failures
within the mortar joints occurred because the heritage
buildings investigated in this experimental programme were
constructed using lime-rich mortars, and therefore the mortar
did not have sufficient strength to resist the applied tensile
force. Furthermore, it was found that samples which exhibited
brick/mortar interface bond failure (failure type A) had lower
flexural bond strengths than those which exhibited failure type
C. It was thought that samples that exhibited brick/mortar
interface bond failure were either disturbed during their
preparation or were not constructed properly (referred to as
“lesser” samples), and thus resulting in low flexural bond
strengths being recorded.
The average flexural bond strength of the field samples ranged
from 0.031 MPa to 0.345 MPa. The variability in the bond
wrench test results (CoV between 0.11 and 0.33) was thought
to be reasonable when considering the irregular nature of
URM construction. Figure 18 shows that the average masonry
flexural bond strength increased with increasing average
mortar compressive strength. Figure 18 also shows that the
masonry flexural bond strength, ƒ’fb, can be satisfactorily
equated to:
0.03fb jf f (7)
Figure 18: Flexural bond strength-mortar compressive
strength relationship.
Bed-joint cohesion
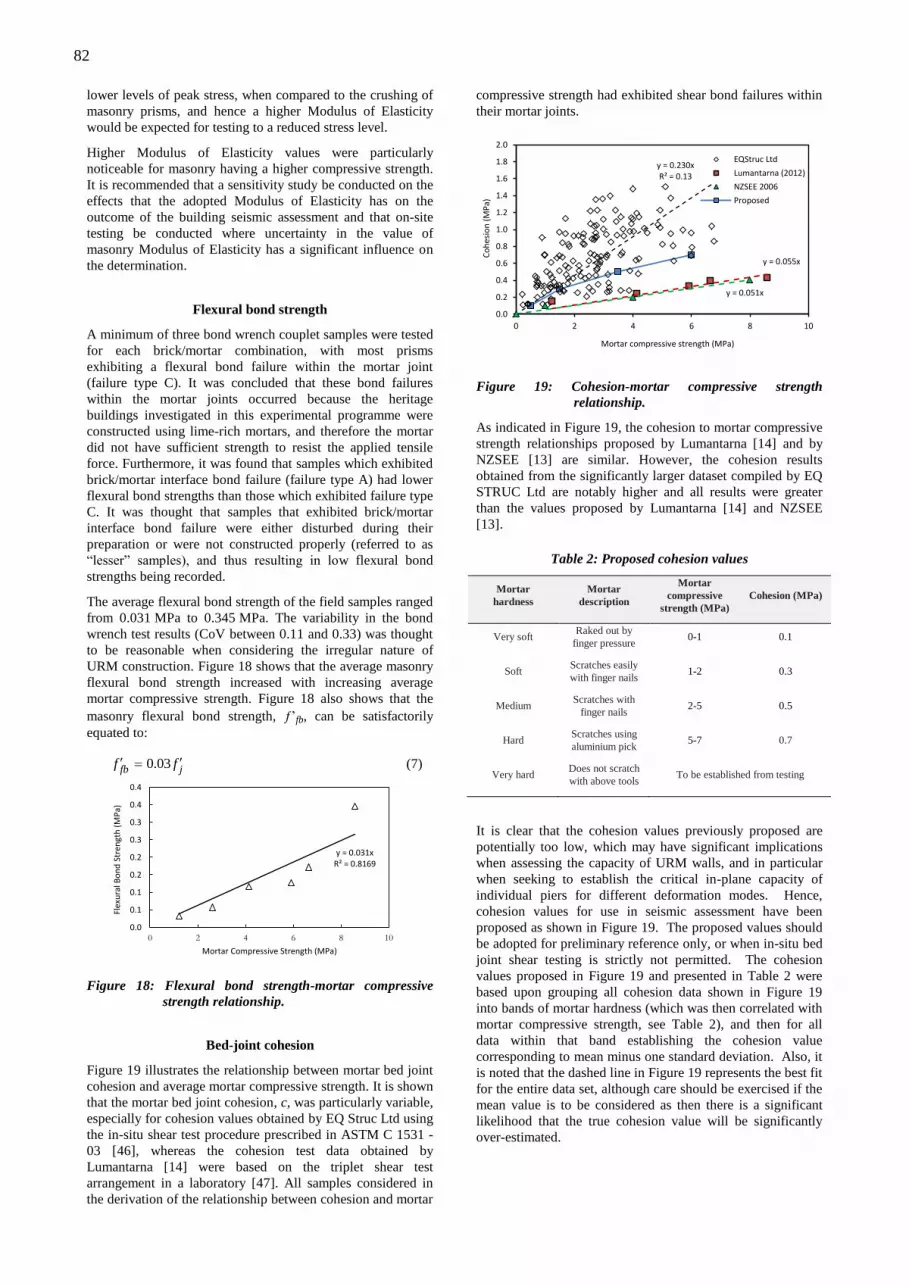
Figure 19 illustrates the relationship between mortar bed joint
cohesion and average mortar compressive strength. It is shown
that the mortar bed joint cohesion, c, was particularly variable,
especially for cohesion values obtained by EQ Struc Ltd using
the in-situ shear test procedure prescribed in ASTM C 1531 -
03 [46], whereas the cohesion test data obtained by
Lumantarna [14] were based on the triplet shear test
arrangement in a laboratory [47]. All samples considered in
the derivation of the relationship between cohesion and mortar
compressive strength had exhibited shear bond failures within
their mortar joints.
Figure 19: Cohesion-mortar compressive strength
relationship.
As indicated in Figure 19, the cohesion to mortar compressive
strength relationships proposed by Lumantarna [14] and by
NZSEE [13] are similar. However, the cohesion results
obtained from the significantly larger dataset compiled by EQ
STRUC Ltd are notably higher and all results were greater
than the values proposed by Lumantarna [14] and NZSEE
[13].
Table 2: Proposed cohesion values
Mortar
hardness Mortar
description
Mortar
compressive
strength (MPa) Cohesion (MPa)
Very soft Raked out by
finger pressure 0-1 0.1
Soft Scratches easily
with finger nails 1-2 0.3
Medium Scratches with
finger nails 2-5 0.5
Hard Scratches using
aluminium pick 5-7 0.7
Very hard Does not scratch
with above tools To be established from testing
It is clear that the cohesion values previously proposed are
potentially too low, which may have significant implications
when assessing the capacity of URM walls, and in particular
when seeking to establish the critical in-plane capacity of
individual piers for different deformation modes. Hence,
cohesion values for use in seismic assessment have been
proposed as shown in Figure 19. The proposed values should
be adopted for preliminary reference only, or when in-situ bed
joint shear testing is strictly not permitted. The cohesion
values proposed in Figure 19 and presented in Table 2 were
based upon grouping all cohesion data shown in Figure 19
into bands of mortar hardness (which was then correlated with
mortar compressive strength, see Table 2), and then for all
data within that band establishing the cohesion value
corresponding to mean minus one standard deviation. Also, it
is noted that the dashed line in Figure 19 represents the best fit
for the entire data set, although care should be exercised if the
mean value is to be considered as then there is a significant
likelihood that the true cohesion value will be significantly
over-estimated.
y = 0.031x R² = 0.8169
0.0
0.1
0.1
0.2
0.2
0.3
0.3
0.4
0.4
0 2 4 6 8 10
Flex
ura
l Bo
nd
Str
engt
h (
MP
a)
Mortar Compressive Strength (MPa)
y = 0.230x R² = 0.13
y = 0.055x
y = 0.051x
0.0
0.2
0.4
0.6
0.8
1.0
1.2
1.4
1.6
1.8
2.0
0 2 4 6 8 10
Co
hes
ion
(M
Pa)
Mortar compressive strength (MPa)
EQStruc Ltd
Lumantarna (2012)
NZSEE 2006
Proposed
82

CONCLUSIONS
The research reported herein was conducted with the aim to
develop a comprehensive data set to inform potential revision
of the unreinforced masonry material property
recommendations prescribed in NZSEE [13]. To achieve this
aim, an experimental programme that focused mainly on the
testing of clay bricks, mortar and masonry prisms that were
extracted from New Zealand heritage URM buildings was
undertaken. Further data that greatly expanded the complete
data set was provided by EQ Struc limited, derived from in-
situ testing of URM buildings as part of seismic assessments.
It was found that an increase in brick unit compressive
strength generally correlated with an increased Mohs
scratch number. However, each Mohs scratch number
represents a wide range of brick unit compressive strength,
and therefore it is recommended that this testing technique
be reserved for cases where destructive testing is not
permitted.
The brick unit Modulus of Rupture strength generally
increased with increasing brick unit compressive strength,
and can be equated to 0.12ƒ’ƅ.
It was found that an increase in the normalised mortar
compressive strength generally led to an increase in the
Mohs scratch number. It was also suggested that this
testing technique be reserved for cases where sample
extraction is not permitted.
The masonry compressive strength was found to increase
with increasing brick unit and mortar compressive
strengths.
When the data sets for the field extracted and the
laboratory constructed sample test results were combined,
Em was equated to 294ƒ’m. Em attained from in-situ flat
jack tests has repeatedly led to higher values, perhaps due
to loading to lower stress levels. Higher Em values were
particularly noticeable for masonry with higher values of
f’m. It is recommended that a sensitivity study be
conducted on the effects of Em on the outcome of the
building assessment and that on-site testing be conducted
if deemed necessary.
The masonry flexural bond strength was related to the
mortar compressive strength and equated to 0.03ƒ’j.
Bed joint cohesion was related to the mortar compressive
strength, and cohesion values for specific ranges of mortar
compressive strength have been proposed for the purposes
of preliminary building assessment.
The above recommendations are based on a limited number of
samples with highly variable results and are not intended as a
substitute to detailed material investigation and in-situ testing.
It is always preferable to perform detailed material
investigations of URM buildings, and values suggested herein
should be adopted only for preliminary reference or when in-
situ testing and material sample extraction is strictly not
permitted. When future opportunities for sample extraction
arise, it is recommended that both compression tests and
modified Mohs scratch tests on heritage clay bricks and mortar
be performed to further populate the brick unit and mortar
scratch test database. The brick unit Modulus of Rupture
strength and Modulus of Elasticity database can also be
enriched by performing Modulus of Rupture tests and half
brick compression tests whilst incorporating displacement
gauges. It is thought that with an expanded database of
material properties derived from samples extracted from
existing URM buildings, predictive equations and numerical
models for seismic assessment and retrofit design can be
further refined in future.
ACKNOWLEDGEMENTS
The authors would like to thank EQ Struc Ltd for their help in
providing material testing data. Funding for this study was
provided by the Foundation for Research, Science and
Technology and the New Zealand Natural Hazards Research
Platform.
REFERENCES
1 Drysdale, R., Hamid, A., Baker, L. (1999). ‘Masonry
Structures: Behaviour and Design’, The Masonry
Society, Boulder, Colorado, United States.
2 Megget, L. (2006). ‘From brittle to ductile: 75 years of
seismic design in New Zealand’, Bulletin of The New
Zealand Society for Earthquake Engineering, 39(3):
158-169.
3 Paulay, T., Priestley, M.J.N. (1992). ‘Seismic design of
reinforced concrete and masonry buildings’, John Wiley
& Sons, New York, United States.
4 Moon, L., Dizhur, D., Senaldi, I., Derakhshan, H.,
Griffith, M., Magenes, G., Ingham, J. (2014). ‘The
demise of the URM building stock in Christchurch
during the 2010–2011 Canterbury earthquake sequence’,
Earthquake Spectra, 30(1): 253-276.
5 Dizhur, D., Ingham, J. M., Moon, L., Griffith, M.C.,
Schultz, A., Senaldi, I., Magenes, G., Dickie, J., Lissel,
S., Centeno, J., Ventura, C., Leite, J., Lourenco, P.
(2011). ‘Performance of masonry buildings and
churches in the 22 February 2011 Christchurch
earthquake’, Bulletin of New Zealand Society for
Earthquake Engineering, 44(4): 279-297.
6 Dizhur, D., Ismail, N., Knox, C. Lumantarna, R.
Ingham, J.M. (2010). ‘Performance of unreinforced and
retrofitted masonry buildings during the 2010 Darfield
earthquake’, Bulletin of the New Zealand Society for
Earthquake Engineering, 43(4): 321-339.
7 Russell, A. (2010). ‘Characterisation and seismic
assessment of unreinforced masonry buildings’,
Doctoral Dissertation, The University of Auckland,
Auckland, New Zealand.
8 Basoenondo, E.A. (2008). ‘Lateral load response of
Cikarang brickwall structures: An experimental study’,
Doctoral Dissertation, Queensland University of
Technology, Brisbane, Australia.
9 Deodhar, S.V. (2000). ‘Strength of brick masonry
prisms in compression’, Journal of the Institution of
Engineers (India), 81(3): 133-137.
10 Gumaste, K.S., Nanjunda Rao, K.S., Venkatarama
Reddy, B.V., Jagadish, K.S. (2006). ‘Strength and
elasticity of brick masonry prisms and wallettes under
compression’, Materials and Structures, 40(2): 241-253.
11 Kaushik, H. B., Rai, D. C., Jain, S. K. (2007a). ‘Stress-
strain characteristics of clay brick masonry under
uniaxial compression’, Journal of Materials in Civil
Engineering, 19(9): 728-738.
12 Darayatnam, P. (1987). ‘Brick and reinforced brick
structures’, Oxford and IBH, New Delhi, India.
83
13 NZSEE (2006). ‘Assessment and improvement of the
structural performance of buildings in earthquakes’, New
Zealand Society for Earthquake Engineering,
Wellington, New Zealand.
14 Lumantarna, R. (2012). ‘Material characterisation of
New Zealand's clay brick unreinforced masonry
buildings’, Doctoral Dissertation, The University of
Auckland, Auckland, New Zealand.
15 Brozovsky, J., Zach, J. (2007). ‘Non-destructive testing
of solid brick compression strength in structures’, IV
Conferencia Panamericana de END, Buenos Aires,
Argentina, October.
16 Brozovsky, J., Zach, J., Brozovsky Jr., J. (2008).
‘Determining the strength of solid burnt bricks in
historical structures’, 9th International Conference on
NDT of Art, Jerusalem, Israel 25 -30 May.
17 Tabor, D. (1956). ‘The physical meaning of indentation
and scratch hardness’, British Journal of Applied
Physics, 7(5): 159-166.
18 Shalabi, F.I., Cording, E.J., Al-Hattamleh, O.H. (2007).
‘Estimation of rock engineering properties using
hardness tests’, Engineering Geology, 90(3-4): 138-147.
19 Magalhães, A., Veiga, R. (2009). ‘Physical and
mechanical characterisation of historic mortars:
Application to the evaluation of the state of
conservation’, Materiales de Construccion, 59(295): 61-
77.
20 Válek, J., Veiga, R. (2005). ‘Characterisation of
mechanical properties of historic mortars - testing of
irregular samples’, Structural Studies, Repairs and
Maintenance of Heritage Architecture XI, Malta, 22 -24
June.
21 Drdácký, M., Mašín, D., Mekonone, M.D., Slížková, Z.
(2008). ‘Compression tests on non-standard historic
mortar specimens’, Historical Mortar Conference,
Lisbon, Portugal, 24 -26 September.
22 Biggs, D., Forsberg, T. (2001). ‘Field techniques for
mortar replication’, 9th Canadian Masonry Symposium,
Fredericton, Canada, June.
23 Moriconi, G., Castellano, M.G., Collepardi, M. (1994).
‘Mortar deterioration of the masonry walls in historic
buildings. A case history: Vanvitelli's Mole in Ancona’,
Materials and Structures, 27(7): 408-414.
24 Moropoulou, A., Bakolas, A., Bisbikou, K. (1995).
‘Characterization of ancient, byzantine and later historic
mortars by thermal and X-ray diffraction techniques’,
Thermochimica Acta, 269-270: 779-795.
25 Sabbioni, C., Zappia, G., Riontino, C., Blanco-Varela,
M.T., Aguilera, J., Puertas, F., Van Balen, K.,
Toumbakari, E.E. (2001). ‘Atmospheric deterioration of
ancient and modern hydraulic mortars’, Atmospheric
Environment, 35(3): 539-548.
26 Sarangapani, G., Venkatarama Reddy, B.V., Jagadish,
K.S. (2005). ‘Brick-mortar bond and masonry
compressive strength’, Journal of Materials in Civil
Engineering, 17(2): 229-237.
27 Venu Madhava Rao, K., Venkatarama Reddy, B. V.,
Jagadish, K. S. (1996). ‘Flexural bond strength of
masonry using various blocks and mortars’, Materials
and Structures, 29(2): 119-124.
28 Kaushik, H. B., Rai, D. C., Jain, S. K. (2007b).
‘Uniaxial compressive stress-strain model for clay brick
masonry’, Current Science, 92(4): 497-501.
29 Ispir, M., Demir, C., Ilki, A., Kumbasar, N. (2010).
‘Material characterization of the historical unreinforced
masonry Akaretler row houses in Istanbul’, Journal of
Materials in Civil Engineering, 22(7): 702-713.
30 CEN (2005). ‘Eurocode 6: Design of masonry structures
-Part 1-1: General rules for reinforced and unreinforced
masonry structures’, EN 1996-1-1:2005, European
Committee for Standardization, Brussels, Belgium.
31 ASTM (2003). ‘Standard test method for compressive
strength of masonry prisms’, C 1314-03b, ASTM
International, Pennsylvania, United States.
32 MSJC (2002). ‘Building code requirements for masonry
structures, ACI 530-02/ASCE 5-02/TMS 402-02’,
America Concrete Institute, Structural Engineering
Institute of the American Society of Civil Engineers,
The Masonry Society, Detroit, Michigan, United States.
33 FEMA (1999). ‘Evaluation of earthquake damaged
concrete and masonry wall buildings, basic procedures
manual, ATC-43’, FEMA 306, Federal Emergency
Management Agency, California, United States.
34 CSA (2004). ‘Design of masonry structures, S304.1’,
Canadian Standards Association, Ontario, Canada.
35 Groot, C. (1993). ‘Effects of water on mortar brick
bond’, Doctoral Dissertation, University of Delft, Delft,
Netherlands.
36 Lawrence, S. J., Cao, H. T. (1987). ‘An experimental
study of the interface between brick and mortar’, Proc.,
The 4th North American Masonry Conference, Los
Angeles, California, United States, August, 1-14.
37 Sugo, H. O., Page, A. W., Lawrence, S. J. (2001). ‘The
development of mortar/unit bond’, The 9th Canadian
Masonry Symposium, Fredericton, New Brunswick,
Canada, 4 - 6 June.
38 Grenley, D. G. (1969). ‘Study of the effect of certain
modified mortars on compressive strength and flexural
strength of masonry’, Designing, engineering, and
constructing with Masonry Products, F. B. Johnson, ed.,
Gulf Publishing Company, Houston, United States, 28-
33.
39 Samarasinghe, W., Lawrence, S. J. (1992). ‘Effect of
high suction rate in low strength bricks on brick mortar
bond’, Proc., The 4th International Seminar on Structural
Masonry for Developing Countries, Madras, India,
December, 43-50.
40 Pavia, S., Hanley, R. (2010). ‘Flexural bond strength of
natural hydraulic lime mortar and clay brick’, Materials
and Structures, 43(7): 913-922.
41 Venkatarama Reddy, B. V. and Gupta, A. (2006).
‘Tensile bond strength of soil cement block masonry
couplets using cement-soil mortars’, Journal of
Materials in Civil Engineering, 18(1): 36-45.
42 ASTM (2003a). ‘Standard test methods for sampling
and testing brick and structural clay tile’, C 67 - 03a,
ASTM International, Pennsylvania, United States.
43 ASTM (2008a). ‘Standard specification for mortar for
unit masonry’, C 270 - 08a, ASTM International,
Pennsylvania, United States.
84

44 Standards Australia (2001). ‘Appendix D: Method of
test for flexural strength’, AS 3700 - 2001, Standards
Australia, Homebush, New South Wales, Australia.
45 ASTM (2000). ‘Standard test method for measurement
of masonry flexural bond strength’, C 1072 -00a, ASTM
International, Pennsylvania, United States.
46 ASTM (2003b). ‘Standard test methods for in situ
measurement of masonry mortar joint shear strength
index’, C 1531 - 03, ASTM International, Pennsylvania,
United States.
47 Rilem (1996). ‘MS-B.4 Determination of shear strength
index for masonry unit/mortar junction’, Materials and
Structures, 29(8): 459-475.
48 Lourenço, P. B., Barros, J. O., Oliveira, J. T. (2004).
‘Shear testing of stack bonded masonry’, Construction
and Building Materials, 18(2): 125-132.
49 Institute of Statistics and Mathematics (2010). ‘The R
project for statistical computing’, Institute of Statistics
and Mathematics, Vienna, Austria.
50 Peck, R., Olsen, C., Devore, J. L. (2009). ‘Introduction
to statistics and data analysis’, Brooks/Cole, Cengage
Learning, Belmont, California, United States.
51 Chi, Y. (2014). ‘R-tutorial, an R introduction to
statistics’, http://www.r-tutor.com/elementary-
statistics/non-parametric-methods/kruskal-wallis-test.
52 Oakdale Engineering (2010). ‘DataFit 9.0’, Oakdale
Engineering, Oakdale, United States.
http://www.oakdaleengr.com/.
APPENDIX A: MATERIAL PROPERTIES DATA SET
Whilst recognising the limitations of providing material
property test results without accompanying illustrations of the
appearance of the associated test samples, the data set
presented in this appendix is provided for the purpose of
demonstrating characteristic properties for clay brick URM
buildings of different ages and locations from throughout New
Zealand. The data has been obtained based on permissible
circumstances at each building site, and hence different tests
were conducted for different sites and differing numbers of
samples were collected and tested. Samples from Christchurch
were principally sourced from earthquake-damaged buildings
scheduled for demolition, whereas data from other located
derived from both buildings that were being investigated as
part of detailed seismic assessment and improvement, and
buildings scheduled for demolition.
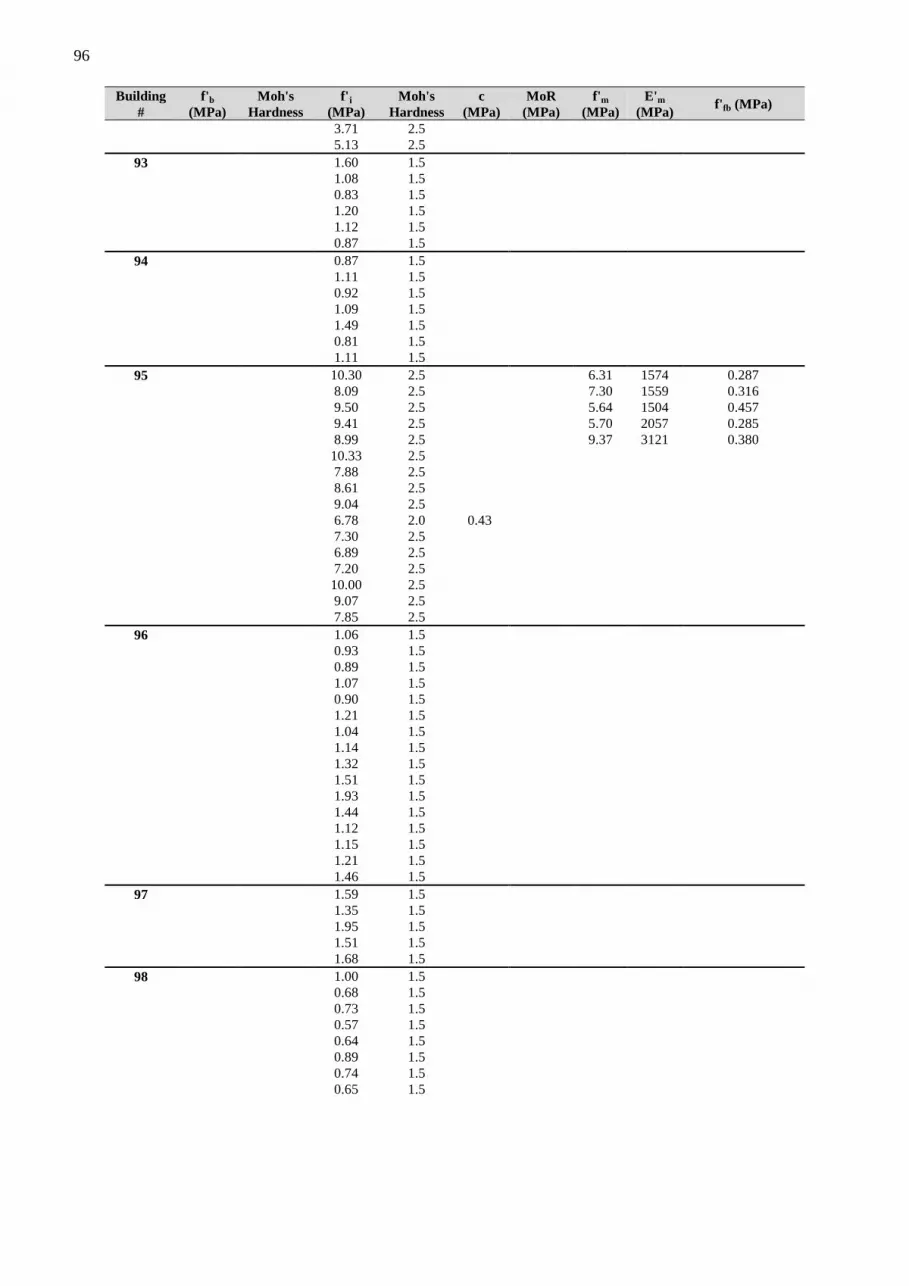
Table A1 reports the general location and building age, where
known, as also shown in Figure 9. The raw data reported in
Table A2 is presented as a resource for engineers to see typical
variations between properties within a building, variation in
properties between buildings from similar parts of New
Zealand and built at similar times, and as a potential resource
for future researchers.
85

Table A1: Details of Field Sites
Building
# Address/name City
Year
built
Building
# Address City
Year
built
1 13 Gore Street Auckland - 40 HB Auckland 1940's
2 24 Princess Street Auckland 1882 41
Corner Ward and
Anglesea Streets Hamilton 1917
3 292 Cashel Street Christchurch - 42 H Auckland 2009
4 311 Manakau Road Auckland 1924 43
75 Victoria Street
West Auckland 1886
5 317 New North Road Auckland - 44 133 Franklin Road Auckland 1886
6 CPIT F-Block Auckland - 45 200 Madras Street Christchurch -
7 Windsor Castle Auckland - 46 24 Main South Road Christchurch -
8 55 Customs Street Auckland - 47 689 Ferry Road Christchurch -
9 70 Jervois Road Auckland - 48 48 Idris road Christchurch -
10 2-6 Coles Crescent Auckland - 49 288b Lincoln Road Christchurch -
11 Textile building Auckland
1908-
1922 50 186 Ferry Road Christchurch -
12 UNITEC Auckland 1865 51 58a Sandyford Street Christchurch -
13 1 Union Street Auckland 1927 52 195 Armagh Street Christchurch -
14 144 Parnell Road Auckland 1850 53 Te Kura Street Christchurch -
15 173 Sandringham Road Auckland
Early
1900's 54 245-251 Ferry Road Christchurch -
16 2 Waverly Street Auckland 1920 55 32 Armagh Street Christchurch -
17 286 Ponsonby Road Auckland 1908 56 32 Armagh Street Christchurch -
18 9 Gore Street Auckland 1915 57 46 Armagh Street Christchurch -
19 94 Queen Street Auckland 1882 58 198 Madras Street Christchurch -
20 Alfred Nathan House Auckland 1882 59 180 Tuam Street Christchurch -
21 Old Choral Hall Auckland 1872 60 350 Lincoln Road Christchurch -
22
Waiuku War Memorial
Hall Auckland 1917 61 1 Wakefield Street Christchurch -
23 23 Shortland Street Auckland 1905 62 51 Lichfield Street Christchurch -
24 38 Taupo Quay Whanganui
Late
1910's 63 341 Cashel Street Christchurch -
25 42 Victoria Ave Whanganui - 64 301 Selwyn Street Christchurch -
26
165-167 Ponsonby
Road Auckland 1922 65 24 Union Street Christchurch -
27 203 Hobson Street Auckland 1911 66 273 Montreal Street Christchurch -
28 7 Sales Street Auckland 1920 67 194 Hereford Street Christchurch -
29 476 Mt Eden Road Auckland 1915 68 4 Donald Street Christchurch -
30 2-6 Todd Plaza Auckland
Early
1900's 69 London Streets Christchurch -
31 44 Wallace Street Wellington 1884 70 Oxford Street Christchurch -
32 30 Whitaker Place Auckland 1913 71 42 London Street Christchurch -
33 57 Customhouse Street Gisborne 1907 72 44 London Street Christchurch -
34
64 Customhouse Street,
Gisborne Gisborne 1906 73 1 Sumner Road Christchurch -
35
203-271 Victoria Street
West Auckland 1910 74
382-406 Colombo
Street Christchurch -
36 107 Dominion Road Auckland 1940s 75 437 Colombo Street Christchurch -
37 624 Te Rahu Road Te Awamutu - 76 14 Bedford Road Christchurch -
38
3176 Great North Road,
New Lynn Auckland 1880s 77 239 Manchester Street Christchurch -
39 29 Great North Road Auckland 1930s 78 135 Kilmore Street Christchurch -
86

Continued Table A1: Details of Field Sites
Building
# Address/name City
Year
built
79 305 Manchester Street Christchurch -
80 866 Colombo Street Christchurch -
81 227 Manchester Street Christchurch -
82 143 Worcester Street Christchurch -
83 203 Hereford Street Christchurch -
84 156 Gloucester Street Christchurch -
85 1047 Colombo Street Christchurch -
86 40 Phillips Street Christchurch -
87 94 Gloucester Street Christchurch -
88 25 Armagh Street Christchurch -
89 3 Aynsley Tce Christchurch -
90 789 Colombo Street Christchurch -
91 124-126 Cashel Street Christchurch -
92 237 Cambridge Tce Christchurch -
93 17 Winchester Street Christchurch -
94 1 Papanui Road Christchurch -
95 85 Lambton Quay Wellington 1881
96 AUST - -
97
49 Victoria Road,
Devonport Auckland
Early
1900s
98 AUW - -
87
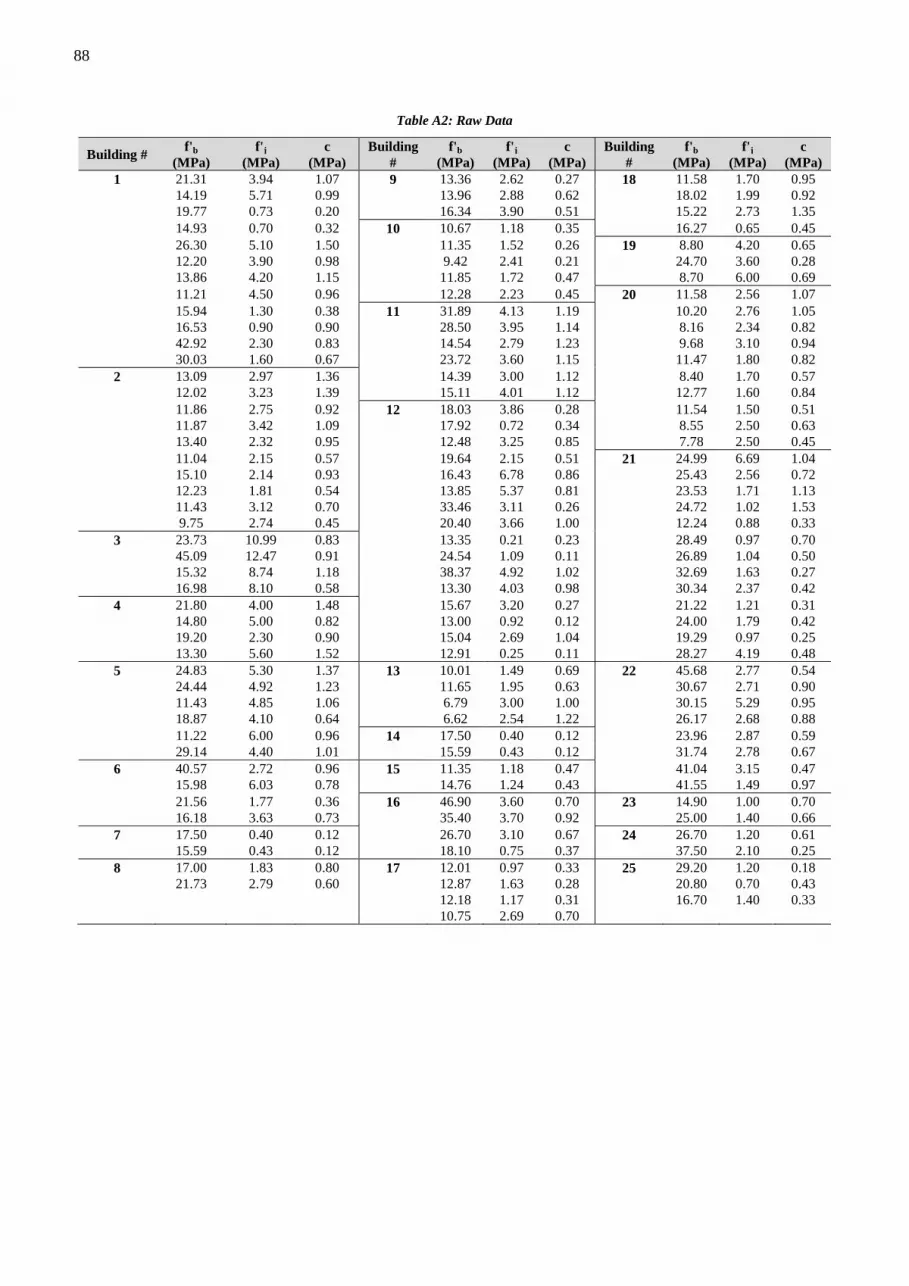
Table A2: Raw Data
Building # f'b
(MPa)
f'j
(MPa)
c
(MPa)
Building
#
f'b
(MPa)
f'j
(MPa)
c
(MPa)
Building
#
f'b
(MPa)
f'j
(MPa)
c
(MPa)
1 21.31 3.94 1.07 9 13.36 2.62 0.27 18 11.58 1.70 0.95
14.19 5.71 0.99 13.96 2.88 0.62 18.02 1.99 0.92
19.77 0.73 0.20 16.34 3.90 0.51 15.22 2.73 1.35
14.93 0.70 0.32 10 10.67 1.18 0.35 16.27 0.65 0.45
26.30 5.10 1.50 11.35 1.52 0.26 19 8.80 4.20 0.65
12.20 3.90 0.98 9.42 2.41 0.21 24.70 3.60 0.28
13.86 4.20 1.15 11.85 1.72 0.47 8.70 6.00 0.69
11.21 4.50 0.96 12.28 2.23 0.45 20 11.58 2.56 1.07
15.94 1.30 0.38 11 31.89 4.13 1.19 10.20 2.76 1.05
16.53 0.90 0.90 28.50 3.95 1.14 8.16 2.34 0.82
42.92 2.30 0.83 14.54 2.79 1.23 9.68 3.10 0.94
30.03 1.60 0.67 23.72 3.60 1.15 11.47 1.80 0.82
2 13.09 2.97 1.36 14.39 3.00 1.12 8.40 1.70 0.57
12.02 3.23 1.39 15.11 4.01 1.12 12.77 1.60 0.84
11.86 2.75 0.92 12 18.03 3.86 0.28 11.54 1.50 0.51
11.87 3.42 1.09 17.92 0.72 0.34 8.55 2.50 0.63
13.40 2.32 0.95 12.48 3.25 0.85 7.78 2.50 0.45
11.04 2.15 0.57 19.64 2.15 0.51 21 24.99 6.69 1.04
15.10 2.14 0.93 16.43 6.78 0.86 25.43 2.56 0.72
12.23 1.81 0.54 13.85 5.37 0.81 23.53 1.71 1.13
11.43 3.12 0.70 33.46 3.11 0.26 24.72 1.02 1.53
9.75 2.74 0.45 20.40 3.66 1.00 12.24 0.88 0.33
3 23.73 10.99 0.83 13.35 0.21 0.23 28.49 0.97 0.70
45.09 12.47 0.91 24.54 1.09 0.11 26.89 1.04 0.50
15.32 8.74 1.18 38.37 4.92 1.02 32.69 1.63 0.27
16.98 8.10 0.58 13.30 4.03 0.98 30.34 2.37 0.42
4 21.80 4.00 1.48 15.67 3.20 0.27 21.22 1.21 0.31
14.80 5.00 0.82 13.00 0.92 0.12 24.00 1.79 0.42
19.20 2.30 0.90 15.04 2.69 1.04 19.29 0.97 0.25
13.30 5.60 1.52 12.91 0.25 0.11 28.27 4.19 0.48
5 24.83 5.30 1.37 13 10.01 1.49 0.69 22 45.68 2.77 0.54
24.44 4.92 1.23 11.65 1.95 0.63 30.67 2.71 0.90
11.43 4.85 1.06 6.79 3.00 1.00 30.15 5.29 0.95
18.87 4.10 0.64 6.62 2.54 1.22 26.17 2.68 0.88
11.22 6.00 0.96 14 17.50 0.40 0.12 23.96 2.87 0.59
29.14 4.40 1.01 15.59 0.43 0.12 31.74 2.78 0.67
6 40.57 2.72 0.96 15 11.35 1.18 0.47 41.04 3.15 0.47
15.98 6.03 0.78 14.76 1.24 0.43 41.55 1.49 0.97
21.56 1.77 0.36 16 46.90 3.60 0.70 23 14.90 1.00 0.70
16.18 3.63 0.73 35.40 3.70 0.92 25.00 1.40 0.66
7 17.50 0.40 0.12 26.70 3.10 0.67 24 26.70 1.20 0.61
15.59 0.43 0.12 18.10 0.75 0.37 37.50 2.10 0.25
8 17.00 1.83 0.80 17 12.01 0.97 0.33 25 29.20 1.20 0.18
21.73 2.79 0.60 12.87 1.63 0.28 20.80 0.70 0.43
12.18 1.17 0.31 16.70 1.40 0.33
10.75 2.69 0.70
88

Continued Table A2: Raw Data
Building
#
f'b
(MPa)
Moh's
Hardness
f'j
(MPa)
Moh's
Hardness
c
(MPa)
MoR
(MPa)
f'm
(MPa)
E'm
(MPa) f'fb (MPa)
26 21.59 2.60 0.89
30.01 0.73 0.39
27 22.00 1.95 0.42
16.09 3.46 0.93
14.72 2.76 0.52
19.51 2.50 0.31
30.90 3.20 0.31
27.91 1.50 0.34
28 17.40 3.40 1.23
17.90 2.90 0.68
26.70 5.40 0.63
29 9.05 6.94 0.63
22.41 3.06 0.53
38.00 4.85 0.77
14.44 3.40 0.65
30 17.83 3.17 0.37
19.07 2.80 0.35
31 11.00 2.5 1.28 1.5 0.12 1.1 2.25 282 0.036
8.80 2.5 1.24 1.5 0.24 1.6 3.92 518 0.040
6.50 2.5 1.31 1.5 0.55 1.5 3.50 455 0.027
6.40 2.5 1.61 1.5 0.45 1.1 3.63 299 0.020
9.40 2.5 1.03 1.5 0.16 0.7 0.031
6.50 2.5 1.11 1.5 0.15 0.024
10.30 2.5 1.00 1.5
0.041
9.90 2.5 0.69
11.00 2.5 2.47
9.50 2.5 4.95
11.70 2.5 8.65
11.90 2.5 2.10
8.10 2.5 1.23
8.50 2.5 4.14
12.90 8.58
13.10 5.92
10.10 6.65
8.60
12.40
32 11.50 2.5 1.7
9.90 2.5 1.4
14.50 2.5 1.8
7.50 2.5 1
14.80 2.5 1
15.30 2.5 1.3
9.10 2.5 2.2
10.20 2.5 1.9
13.10 2.5
12.90 2.5
19.20 2.5
16.00 2.5
13.30 2.5
10.10 2.5
9.00 2.5
5.70 2.5
9.40 2.5
7.20 2.5
11.50
12.80
9.90
12.60
7.60
12.40
19.50
10.70
33 16.90 2.5
15.40 2.5
11.40 2.5
14.60 2.5
89

Building
#
f'b
(MPa)
Moh's
Hardness
f'j
(MPa)
Moh's
Hardness
c
(MPa)
MoR
(MPa)
f'm
(MPa)
E'm
(MPa) f'fb (MPa)
15.90 2.5
11.20 2.5
10.90 2.5
8.70 2.5
15.10 2.5
10.20 2.5
17.40 2.5
34 13.00 2.5 5.02 1.5 2.2 12.12 2401
14.20 2.5 6.86 1.5 1.3 10.11 2443
11.50 2.5 6.22 1.5 1.4 10.26 1809
11.80 2.5 4.38 2.0 1.3 11.04 1877
12.30 2.5 6.48 2.0 2.1
15.30 2.5 4.27 2.0 2.1
21.30 2.5 4.91 2.5 1.8
19.10 2.5 6.07 2.5 2.1
23.50 2.5 2.5
12.80 2.5
20.20 2.5
17.20 2.5
8.10 2.5
11.70 2.5
15.30 2.5
12.40 2.5
10.50 2.5
18.20 3.0
15.20
17.80
16.00
12.90
15.10
12.80
20.20
17.20
11.70
35 21.10 3.0 2.86 2.0 2.2 8.26 2475 0.142
15.60 3.0 3.42 2.0 3.1 6.70 1879 0.122
14.20 3.0 4.11 2.0 0.24 2.8 8.06 1756 0.095
14.80 3.0 3.91 2.0 3.6 8.04 1336 0.106
21.70 3.0 3.29 2.0
15.80 3.0 3.78 2.0
17.80 3.0 5.05 2.0
23.80 3.0 3.37 2.0
22.20 3.0 4.72 2.0
15.00 3.0 4.85 2.0
26.30 3.0 4.25 2.5
19.60 2.5 3.95 2.5
15.80 2.5 4.95 2.0
17.80 2.5 5.41 2.0
14.00 2.5
21.70 3.0
21.00 3.0
20.30 3.0
15.60
21.70
23.80
26.30
36 20.20 2.5 3.58 2.0 2 6.36 1239 0.050
19.50 2.5 2.07 2.0 1.5 5.35 2015 0.063
18.80 2.5 2.13 2.0 3.2 5.29 1555 0.058
16.10 2.5 2.40 2.0 3.1 7.25 1159
29.80 2.5 2.56 2.0 3
12.50 2.19 2.0 2
10.50 2.54 2.0 3.3
19.90 2.77 2.0 3.5
16.70 2.17 2.0 2.7
16.40 2.33 2.0 2
22.00 2.44 2.0 2.1
90

Building
#
f'b
(MPa)
Moh's
Hardness
f'j
(MPa)
Moh's
Hardness
c
(MPa)
MoR
(MPa)
f'm
(MPa)
E'm
(MPa) f'fb (MPa)
21.60 2.02 2.0
20.20 2.98 2.0
19.50 3.08 2.0
18.80 3.60 2.0
16.10 3.00 2.0
37 23.00 2.5 6.79 2.0 12.85 4573 0.094
15.70 2.5 6.60 2.0 13.11 4471 0.126
26.80 2.5 4.25 2.0 12.85 3939 0.140
19.20 2.5 5.53 2.0 0.33 12.54 3846 0.095
24.20 2.5 4.83 2.0 12.05 3382 0.179
12.30 2.5 6.15 2.5 13.11 3809
24.10 2.5 7.09 2.0
24.90 2.5 6.13 2.5
19.50 2.5
38 22.50 4.0 2.5
12.80 2.5 2.7
27.70 2.5 2.5
25.00 2.5 2.4
8.90 2.5 4.5
10.40 2.5 1.5
14.30 2.5
16.20 2.5
31.80 3.0
35.50 3.0
34.90 3.0
29.80 3.0
37.70 3.0
26.60 3.0
22.80 3.0
26.90 3.0
29.90 3.0
45.80 3.0
27.70
29.90
25.00
29.80
35.50
16.20
39 26.60 2.5 9.33 2.5 3.3 14.16 3120 0.140
19.90 2.5 7.72 2.5 3.6 13.09 3831 0.134
30.00 2.5 6.07 2.5 4.9 15.75 3695 0.206
27.70 2.5 7.66 2.0 4 17.47 5399 0.236
22.80 3.0 6.93 2.0 3.8 15.10 5387 0.151
27.70 3.0 6.47 2.5 0.39 3.7 0.162
24.90 3.0 5.14 2.5 3.1
28.70 5.39 2.5 3.9
30.80 5.07 2.5
33.60 6.77 2.5
35.80 6.61 2.5
25.90
26.40
19.90
30.00
40 28.30 3.0
27.50 3.0
42.20 3.0
34.30 3.0
32.10 3.0
32.50 3.0
41.00 3.0
31.90 3.0
34.70 3.0
32.50 3.0
41.00 3.0
31.90 3.0
34.70 3.0
41 29.40 4.0
91

Building
#
f'b
(MPa)
Moh's
Hardness
f'j
(MPa)
Moh's
Hardness
c
(MPa)
MoR
(MPa)
f'm
(MPa)
E'm
(MPa) f'fb (MPa)
40.90 4.0
42.90 4.0
26.10 4.0
38.10 4.0
31.30 4.0
22.10 4.0
44.10 4.0
44.10 4.0
30.60 4.0
24.20 4.0
35.40 4.0
34.10 4.0
38.30 4.0
34.60 4.0
42 35.80 4.0
28.30 4.0
32.70 4.0
39.60 4.0
38.80 4.0
39.80 4.0
41.50 4.0
37.20 4.0
40.20 4.0
45.10 4.0
52.10 4.0
43 6.20 0.7
11.90 1.4
6.80 0.5
13.40 1.4
13.30 1
10.50 0.9
8.00 0.6
44 4.06 2.0 8.33 2129
3.83 2.0 10.01 3394
4.55 2.0 7.43 1876
4.97 2.0 5.94 1565
5.38 2.5 6.23 2296
4.44 2.5
45 2.70 2.0
3.02 1.5
2.13 1.5
46 0.94 1.5
1.14 1.5
0.83 1.5
1.15 1.5
47 0.80 1.5
0.86 1.5
0.66 1.5
0.54 1.5
0.56 1.5
0.51 1.5
48 0.85 1.5
1.22 1.5
0.81 1.5
1.34 1.5
1.16 1.5
49 0.47 1.5
0.37 1.5
0.66 1.5
0.61 1.5
50 0.80 1.5
1.60 1.5
1.99 1.5
1.34 1.5
1.57 1.5
2.04 1.5
51 1.18 1.5
92

Building
#
f'b
(MPa)
Moh's
Hardness
f'j
(MPa)
Moh's
Hardness
c
(MPa)
MoR
(MPa)
f'm
(MPa)
E'm
(MPa) f'fb (MPa)
0.73 1.5
1.15 1.5
1.09 1.5
1.21 1.5
52 1.99 1.5
0.94 1.5
1.09 1.5
1.62 1.5
1.61 1.5
53 0.92 1.5
1.29 1.5
1.18 1.5
1.10 2.0
1.43 2.0
54 0.85 1.5
1.41 1.5
0.88 1.5
1.20 1.5
0.78 1.5
1.04 1.5
55 0.80 1.5
1.04 1.5
1.19 1.5
56 3.21 2.0
2.58 2.0
2.89 2.0
2.51 2.0
57 0.67 1.5
0.74 1.5
0.60 1.5
1.03 2.0
58 1.12 1.5
1.22 1.5
1.38 1.5
1.12 1.5
59 3.94 2.0
2.74 2.0
3.32 2.0
3.57 2.0
60 1.89 1.5
1.16 1.5
1.12 1.5
61 1.88 2.0
2.75 2.0
2.86 2.0
2.32 2.0
62 2.08 1.5
2.25 1.5
2.20 1.5
2.65 2.0
63 4.03 2.0
7.95 2.0
6.37 2.0
64 2.48 1.5
2.46 1.5
2.63 1.5
3.00 1.5
65 0.98 1.5
0.98 1.5
1.19 1.5
66 1.43 1.5
1.35 1.5
0.98 1.5
1.08 1.5
67 4.13 2.0
3.31 2.0
93

Building
#
f'b
(MPa)
Moh's
Hardness
f'j
(MPa)
Moh's
Hardness
c
(MPa)
MoR
(MPa)
f'm
(MPa)
E'm
(MPa) f'fb (MPa)
4.00 1.5
3.83 2.0
68 0.85 1.5
1.08 1.5
1.44 1.5
1.10 1.5
1.09 1.5
69 6.20 2.0
6.79 2.0
5.69 2.0
9.34 2.5
70 0.71 1.5
1.00 1.5
0.80 1.5
1.12 1.5
0.86 1.5
71 1.79 1.5
2.49 1.5
3.22 1.5
2.61 1.5
2.82 1.5
72 0.99 1.5
0.74 1.5
0.83 1.5
0.87 1.5
73 0.86 1.5
0.74 1.5
0.99 1.5
0.82 1.5
0.59 1.5
74 3.99 2.0
3.89 2.0
3.11 2.0
3.69 2.0
4.09 2.0
3.12 2.0
75 1.18 1.5
0.81 1.5
0.85 1.5
0.95 1.5
0.73 1.5
1.10 1.5
76 2.09 1.5
2.10 1.5
2.27 1.5
2.59 1.5
2.68 1.5
2.57 1.5
77 1.01 1.5
0.89 1.5
1.20 1.5
0.77 1.5
0.72 1.5
1.09 1.5
0.87 1.5
78 3.23 1.5
2.69 1.5
3.31 1.5
2.44 1.5
79 1.37 1.5
1.84 1.5
1.78 1.5
1.43 1.5
1.31 1.5
1.58 1.5
80 4.20 2.0
2.76 2.0
94

Building
#
f'b
(MPa)
Moh's
Hardness
f'j
(MPa)
Moh's
Hardness
c
(MPa)
MoR
(MPa)
f'm
(MPa)
E'm
(MPa) f'fb (MPa)
3.82 2.0
3.50 2.0
81 2.34 2.0
2.67 2.0
2.64 2.0
2.44 2.0
82 0.74 1.5
0.81 1.5
0.97 1.5
1.33 1.5
83 16.62 3.0
3.0
14.79 3.0
84 2.61 2.5
2.17 2.0
2.87 2.0
2.46 2.0
2.56 2.0
2.12 2.0
85 1.95 1.5
1.34 1.5
1.86 1.5
1.66 1.5
1.32 1.5
1.76 1.5
1.83 1.5
1.79 1.5
86 0.90 1.5
0.92 1.5
0.85 1.5
0.90 1.5
0.98 1.5
1.07 1.5
87 1.58 1.5
1.80 1.5
1.89 1.5
0.89 1.5
2.00 1.5
0.95 1.5
1.39 1.5
88 0.73 1.5
0.55 1.5
0.47 1.5
0.58 1.5
0.44 1.5
1.12 1.5
1.24 1.5
1.22 1.5
1.26 1.5
1.10 1.5
1.18 1.5
89 0.77 1.5
0.57 1.5
0.84 1.5
0.79 1.5
90 0.82 1.5
0.87 1.5
0.81 1.5
91 8.17 2.5
10.71 2.5
11.71 2.5
13.42 2.5
92 2.83 2.0
3.32 2.0
4.64 2.0
4.66 2.5
3.64 2.5
95
Building
#
f'b
(MPa)
Moh's
Hardness
f'j
(MPa)
Moh's
Hardness
c
(MPa)
MoR
(MPa)
f'm
(MPa)
E'm
(MPa) f'fb (MPa)
3.71 2.5
5.13 2.5
93 1.60 1.5
1.08 1.5
0.83 1.5
1.20 1.5
1.12 1.5
0.87 1.5
94 0.87 1.5
1.11 1.5
0.92 1.5
1.09 1.5
1.49 1.5
0.81 1.5
1.11 1.5
95 10.30 2.5 6.31 1574 0.287
8.09 2.5 7.30 1559 0.316
9.50 2.5 5.64 1504 0.457
9.41 2.5 5.70 2057 0.285
8.99 2.5 9.37 3121 0.380
10.33 2.5
7.88 2.5
8.61 2.5
9.04 2.5
6.78 2.0 0.43
7.30 2.5
6.89 2.5
7.20 2.5
10.00 2.5
9.07 2.5
7.85 2.5
96 1.06 1.5
0.93 1.5
0.89 1.5
1.07 1.5
0.90 1.5
1.21 1.5
1.04 1.5
1.14 1.5
1.32 1.5
1.51 1.5
1.93 1.5
1.44 1.5
1.12 1.5
1.15 1.5
1.21 1.5
1.46 1.5
97 1.59 1.5
1.35 1.5
1.95 1.5
1.51 1.5
1.68 1.5
98 1.00 1.5
0.68 1.5
0.73 1.5
0.57 1.5
0.64 1.5
0.89 1.5
0.74 1.5
0.65 1.5
96